UNITED STATES
SECURITIES AND EXCHANGE COMMISSION
Washington, D.C. 20549
FORM N-CSR
CERTIFIED SHAREHOLDER REPORT OF REGISTERED MANAGEMENT
INVESTMENT COMPANIES
Investment Company Act file number 811-05309
Nuveen Investment Funds, Inc.
(Exact name of registrant as specified in charter)
Nuveen Investments
333 West Wacker Drive, Chicago, IL 60606
(Address of principal executive offices) (Zip code)
Kevin J. McCarthy
Nuveen Investments
333 West Wacker Drive
Chicago, IL 60606
(Name and address of agent for service)
Registrant’s telephone number, including area code: (312) 917-7700
Date of fiscal year end: April 30
Date of reporting period: April 30, 2011
Form N-CSR is to be used by management investment companies to file reports with the Commission not later than 10 days after the transmission to stockholders of any report that is required to be transmitted to stockholders under Rule 30e-1 under the Investment Company Act of 1940 (17 CFR 270.30e-1). The Commission may use the information provided on Form N-CSR in its regulatory, disclosure review, inspection, and policy making roles.
A registrant is required to disclose the information specified by Form N-CSR, and the Commission will make this information public. A registrant is not required to respond to the collection of information contained in Form N-CSR unless the Form displays a currently valid Office of Management and Budget (“OMB”) control number. Please direct comments concerning the accuracy of the information collection burden estimate and any suggestions for reducing the burden to Secretary, Securities and Exchange Commission, 450 Fifth Street, NW, Washington, DC 20549-0609. The OMB has reviewed this collection of information under the clearance requirements of 44 U.S.C. ss.3507.
ITEM 1. REPORTS TO STOCKHOLDERS.

Mutual Funds
Nuveen Municipal Bond Funds
(formerly First American Tax Free Income Funds)
Dependable, tax-free income because it’s not what you earn, it’s what you keep.®
Annual Report
April 30, 2011
| | | | | | |
| | | Share Class / Ticker Symbol |
| | | |
| Fund | | Class A | | Class C1 | | Class I |
Nuveen Intermediate Tax Free Fund | | FAMBX | | FMBCX | | FMBIX |
Nuveen Short Tax Free Fund | | FSHAX | | — | | FSHYX |
Nuveen Tax Free Fund | | FJNTX | | FJCTX | | FYNTX |
INVESTMENT ADVISER NAME CHANGE
Effective January 1, 2011, Nuveen Asset Management, LLC, the Funds’ investment adviser, changed its name to Nuveen Fund Advisors, Inc. (“Nuveen Fund Advisors”). Concurrently, Nuveen Fund Advisors formed a wholly-owned subsidiary, Nuveen Asset Management, LLC, to house its portfolio management capabilities.
NUVEEN INVESTMENTS COMPLETES STRATEGIC COMBINATION WITH FAF ADVISORS
On December 31, 2010, Nuveen Investments completed the strategic combination between Nuveen Asset Management, LLC, the largest investment affiliate of Nuveen Investments, and FAF Advisors. As part of this transaction, U.S. Bancorp — the parent of FAF Advisors — received cash consideration and a 9.5% stake in Nuveen Investments in exchange for the long-term investment business of FAF Advisors, including investment-management responsibilities for the non-money market mutual funds of the First American Funds family.
The approximately $27 billion of mutual fund and institutional assets managed by FAF Advisors, along with the investment professionals managing these assets and other key personnel, have become part of Nuveen Asset Management, LLC. With these additions to Nuveen Asset Management, LLC, this affiliate now manages more than $100 billion of assets across a broad range of strategies from municipal and taxable fixed income to traditional and specialized equity investments.
This combination does not affect the investment objectives or strategies of the Funds in this report. Over time, Nuveen Investments expects that the combination will provide even more ways to meet the needs of investors who work with financial advisors and consultants by enhancing the multi-boutique model of Nuveen Investments, which also includes highly respected investment teams at HydePark, NWQ Investment Management, Santa Barbara Asset Management, Symphony Asset Management, Tradewinds Global Investors and Winslow Capital. Nuveen Investments managed approximately $206 billion of assets as of March 31, 2011.
| | | | | | |
| Must be preceded by or accompanied by a prospectus. | | NOT FDIC INSURED | | MAY LOSE VALUE | | NO BANK GUARANTEE |
Table of Contents
Chairman’s
Letter to Shareholders

Dear Shareholders,
In 2010, the global economy recorded another year of recovery from the financial and
economic crises of 2008, but many of the factors that caused the downturn still weigh on
the prospects for continued improvement. In the U.S., ongoing weakness in housing values
has put pressure on homeowners and mortgage lenders. Similarly, the strong earnings
recovery for corporations and banks is only slowly being translated into increased hiring or
more active lending. Globally, deleveraging by private and public borrowers has inhibited
economic growth and that process is far from complete.
Encouragingly, constructive actions are being taken by governments around the world to
deal with economic issues. In the U.S., the recent passage of a stimulatory tax bill relieved
some of the pressure on the Federal Reserve to promote economic expansion through
quantitative easing and offers the promise of sustained economic growth. A number of
European governments are undertaking programs that could significantly reduce their
budget deficits. Governments across the emerging markets are implementing various steps
to deal with global capital flows without undermining international trade and investment.
The success of these government actions could determine whether 2011 brings further
economic recovery and financial market progress. One risk associated with the
extraordinary efforts to strengthen U.S. economic growth is that the debt of the U.S.
government will continue to grow to unprecedented levels. Another risk is that over time
there could be inflationary pressures on asset values in the U.S. and abroad, because what
happens in the U.S. impacts the rest of the world economy. Also, these various actions are
being taken in a setting of heightened global economic uncertainty, primarily about the
supplies of energy and other critical commodities. In this challenging environment, your
Nuveen investment team continues to seek sustainable investment opportunities and to
remain alert to potential risks in a recovery still facing many headwinds. On your behalf, we
monitor their activities to assure they maintain their investment disciplines.
As you will note elsewhere in this report, on December 31, 2010, Nuveen Investments
completed a strategic combination with FAF Advisors, Inc., the manager of the First
American Funds. The combination adds highly respected and distinct investment teams to
meet the needs of investors and their advisors and is designed to benefit all fund
shareholders by creating a fund organization with the potential for further economies of
scale and the ability to draw from even greater talent and expertise to meet those investor
needs.
As always, I encourage you to contact your financial consultant if you have any questions
about your investment in a Nuveen Fund. On behalf of the other members of your Fund
Board, we look forward to continuing to earn your trust in the months and years ahead.
Sincerely,

Robert P. Bremner
Chairman of the Board
June 21, 2011
Portfolio Managers’ Comments
Certain statements in this report are forward-looking statements. Discussions of specific investments are for illustration only and are not intended as recommendations of individual investments. The forward-looking statements and other views expressed herein are those of the portfolio managers as of the date of this report. Actual future results or occurrences may differ significantly from those anticipated in any forward-looking statements, and the views expressed herein are subject to change at any time, due to numerous market and other factors. The Funds disclaim any obligation to update publicly or revise any forward-looking statements or views expressed herein.
Any reference to credit ratings for portfolio holdings denotes the highest rating assigned by a Nationally Recognized Statistical Rating Organization (NRSRO) such as Standard & Poor’s (S&P), Moody’s or Fitch. AAA, AA, A and BBB ratings are investment grade; BB, B, CCC, CC C, and D ratings are below investment grade. Holdings and ratings may change over time.
Nuveen Intermediate Tax Free Fund
(formerly known as First American Intermediate Tax Free Fund)
Nuveen Short Tax Free Fund
(formerly known as First American Short Tax Free Fund)
Nuveen Tax Free Fund
(formerly known as First American Tax Free Fund)
These Funds feature portfolio management by Nuveen Asset Management, LLC, an affiliate of Nuveen Investments. Recently, the Nuveen Intermediate Tax Free Fund, the Nuveen Short Tax Free Fund and the Nuveen Tax Free Fund changed their fiscal year ends to April 30. As a result, this annual report covers a ten-month period.
Portfolio managers Paul Brennan, Christopher Drahn and Douglas White examine economic and municipal market conditions, key investment strategies and the Funds’ performance during the ten months ending April 30, 2011. For the Nuveen Intermediate Tax Free Fund, Paul Brennan, CFA, CPA, who has 20 years of investment experience, assumed portfolio management responsibilities from Chris Drahn in January 2011. Chris had managed the Fund from 1994 through December 2010. For the Nuveen Short Tax Free Fund, Chris Drahn, CFA, with 31 years of investment experience, has been a co-manager on the Fund since 2002. He assumed primary responsibility for the Fund in January 2011. For the Nuveen Tax Free Fund, Doug White, CFA, with 28 years of investment experience, has been a manager on the Fund since 2001. He assumed sole responsibility for the Fund in January 2011.
What factors affected the U.S. economy and municipal market during the ten-month reporting period ended April 30, 2011?
During this period, the U.S. economy demonstrated some signs of improvement, supported by the efforts of both the Federal Reserve (Fed) and the federal government. For its part, the Fed continued to hold the benchmark fed funds rate in a target range of zero to 0.25% since cutting it to this record low level in December 2008. At its April 2011 meeting, the central bank renewed its commitment to keeping the fed funds rate at “exceptionally low levels” for an “extended period.” The Fed also left unchanged its second round of quantitative easing, which calls for purchasing $600 billion in longer-term U.S. Treasury bonds by June 30, 2011. The goal of this plan is to lower long-term interest rates and thereby stimulate economic activity and create jobs. The federal government continued to focus on implementing the economic stimulus package passed in early 2009 aimed at providing job creation, tax relief, fiscal assistance to state and local governments, and expansion of unemployment benefits and other federal social welfare programs.
In the first quarter of 2011, the U.S. economy, as measured by the U.S. gross domestic product (GDP), grew at an annualized rate of 1.8%, marking the seventh consecutive quarter of positive growth. The employment picture was somewhat improved, with the national jobless rate registering 9.0% in April 2011, down from 9.8% a year earlier. Inflation posted its largest twelve-month gain since October 2008, as the Consumer Price Index (CPI) rose 3.2% year-over-year as of April 2011, driven mainly by increased prices for energy. The core CPI (which excludes food and energy) increased 1.3% over this period. The housing market continued to be a major weak spot in the economy. For the twelve months ended March 2011 (most recent data available at the time this report was prepared), the average home price in the Standard & Poor’s (S&P)/Case-Shiller index of 20 major metropolitan areas lost 3.6%, with 12 of the 20 metropolitan areas hitting their lowest levels since housing prices peaked in 2006. As of April 2011, sales of new and existing homes fell 23.1% and 12.9%, respectively, from April 2010 levels.
The municipal bond market was affected by a significant decline in new tax-exempt issuance during this period. One reason for the decrease in new tax-exempt supply was the heavy issuance of taxable municipal debt under the Build America Bond (BAB) program, which was created as part of the American Recovery and Reinvestment Act of February 2009 and which expired December 31, 2010. Between the beginning of this reporting period on May 1, 2010, and the end of the BAB program, taxable Build America Bond issuance totaled $83.9 billion, accounting for 28% of new bonds issued in the municipal market.
After rallying strongly over most of the period, the municipal market suffered a reversal in mid-November 2010, due largely to investor concerns about inflation, the federal deficit, and deficit’s impact on demand for U.S. Treasury securities. Adding to this market pressure was media coverage of the strained finances of many state and local governments. As a result, money began to flow out of municipal bond funds, as yields rose and valuations declined. Toward the end of this period, we saw the environment in the municipal market improve, as some buyers were attracted by municipal bond valuations and yields, resulting in declining yields, and rising valuations.
Over the ten-month period ended April 30, 2011, municipal bond issuance nationwide —both tax-exempt and taxable — totaled $294 billion. Demand for municipal bonds was exceptionally strong during the majority of this period, especially from individual investors. For the first four months of 2011, municipal issuance nationwide was down 49% from the first four months of 2010. This decline reflects the heavy issuance of BABs at the end of 2010, as borrowers took advantage of the program’s favorable terms before its expiration.
How did the Funds perform during the ten-month period ended April 30, 2011?
The tables in the Fund Performance section of this report provide total return performance information for the ten-month, one-year, five-year, ten-year and since inception periods ending April 30, 2011. Each Fund’s Class A Share total returns are compared with the performance of the appropriate Barclays Capital municipal bond index and Lipper peer fund average.
What strategies were used to manage the Funds during the ten-month reporting period How did these strategies influence performance?
All of the Funds continued to employ the same fundamental investment strategies and tactics used in previous years, although our ability to implement those strategies depended on the individual characteristics of the portfolios, as well as market conditions. Going into the reporting period, we were generally comfortable with the Funds’ positionings and saw little need to make large-scale shifts to the Funds’ weightings.
Nuveen Intermediate Tax Free Fund
The Fund’s Class A Shares at net asset value (NAV) trailed the Barclays Capital 1-15 Year Blend Municipal Bond Index. However, the Fund outpaced the Lipper Intermediate Municipal Debt Funds Average.
As interest rates rose during the period, the municipal yield curve steepened with yields on ten-year and longer maturity bonds rising. However, rates went down for five- to seven-year maturities, causing the intermediate part of the yield curve to flatten versus the shortest part of the curve where yields were little changed. The Fund benefited from the flattening in the intermediate part of the curve as prices rose for these bonds, making them the best-performing maturities during the period. The Fund is focused on owning mostly intermediate maturity bonds in its portfolio.
In terms of credit quality, the Fund’s highest rated bonds outperformed, while many lower rated bonds did not perform well. Municipal bonds came under pressure during the period as intense media coverage of analysts predicting dramatic downgrades or defaults for state and local borrowers caused many retail investors to exit the marketplace. The lower rated areas of the market experienced a higher level of fund outflows, causing greater underperformance for those segments. Therefore, the Fund’s performance was slightly hindered by its overweighting in mid- and lower-grade credits, particularly A-rated and BBB-rated bonds.
In terms of sectors, the higher quality, tax-supported issues like state and local general obligation (GO) bonds were positive contributors during the ten-month period. Investors favored these sectors as the perceived credit quality of these borrowers and their revenue pledges were stronger.
The Fund’s duration, or sensitivity to interest rate movements, did not have much of a performance impact during the period. We kept the duration basically in line with the Barclays Capital benchmark and did not make any major strategic changes to it. Throughout the period, we continued to structure the Fund’s portfolio using mostly intermediate-term securities. The portfolio maintained an overall average maturity in the eight- to nine-year range, similar to the benchmark.
As in all types of market environments, our ongoing focus is to use fundamental credit research to find attractively valued bonds backed by financially solid issuers. We combine this bottom-up investing approach of seeking value where we can find it with top-down macro risk management. We didn’t make any major strategic changes to the Fund’s sector weightings during the period; however, we did make a few minor adjustments as
we found attractive individual opportunities in select categories. After the Fund experienced some bond redemptions in the GO sector, we used those proceeds to invest opportunistically in several other sectors including hospitals, appropriation and other revenue bonds. Also, we used the underperformance in tobacco settlement bonds as an opportunity to add more exposure to that sector.
We maintained the Fund’s emphasis on middle tier credits, and to a lesser extent lower tier credits, which we have done historically due to the yield premiums and manageable credit risk we believe these positions represent. We didn’t agree with the forecasts of massive defaults and downgrades, and looked at the sell-off in the lower grade areas as an opportunity to add select credits to the Fund’s portfolio. However, these additions didn’t dramatically change the Fund’s overall credit quality profile during the period.
There were downgrades of two bond insurers during this time frame, which brought several of the Fund’s bonds down one rating category. These downgrades did not affect the Fund’s performance and only slightly impacted the overall credit quality of the portfolio.
Nuveen Short Tax Free Fund
The Fund’s Class A Shares at net asset value (NAV) trailed the Barclays Capital 3-Year Municipal Bond Index. However, the Fund outpaced the Lipper Short Municipal Debt Funds Average.
As interest rates rose during the period, the municipal yield curve steepened with yields on ten-year and longer maturity bonds rising. However, rates went down for five- to seven-year maturities, causing that part of the yield curve to flatten versus the shortest part of the curve where yields were little changed. With the flattening in the middle part of the curve, intermediate bonds were the best-performing area during the period. In this environment, the Fund’s maturity structure proved beneficial to its relative performance. Because of the steep yield curve, we structured the Fund with a significant weighting in very short-term bonds maturing in less than a year combined with a number of bonds with maturities spread out across the five- to ten-year maturity spectrum in order to pick up extra yield. In comparison, the Barclays Capital benchmark is primarily comprised of bonds with maturities between two and four years. The Fund’s longer maturities balanced out the very short maturity and cash positions so that the portfolio still had an overall average maturity of approximately three years, similar to the benchmark. This strategy benefited relative performance during the period as the Fund’s five- to ten-year bonds, with their higher yields and mostly positive price movements, outperformed two- to four-year bonds. However, the Fund’s short-term and cash equivalent holdings, which served as a counter-balance to the longer weightings, provided very small returns during the period.
The Fund was rewarded for its slight overweighting in mid-grade credits, particularly A-rated and BBB-rated bonds, which generally outperformed higher quality bonds. These holdings benefited from their meaningful yield advantages and, in some cases, credit spread tightening.
In terms of sectors, the Fund’s relative performance benefited from its significant overweight versus the index in health care and continuing care retirement communities
bonds as these areas outperformed the national market overall. In the health care segment, the Fund’s hospital bonds in the shorter maturity ranges performed very well. Within the retirement care communities sector, the Fund owned a number of non-rated bonds with relatively short maturities, relatively strong yields and stable prices. The Fund’s performance was negatively impacted by a state of New Jersey transportation appropriation bond. The state’s bonds suffered as New Jersey’s budgetary problems dragged on and perceptions of its relative credit quality caused some widening of credit spreads.
We did not make any major strategic changes to the Fund’s duration, or sensitivity to interest rate movements, keeping it basically in line with the Barclays Capital benchmark’s duration. Therefore, it did not have much of a performance impact during the period.
As in all types of market environments, our ongoing focus was to use fundamental credit research to find attractively valued bonds backed by financially solid issuers. We combined this bottom-up investing approach of seeking value where we can find it with top-down macro risk management. We made a few minor adjustments to the Fund in light of market events. Overall, we cautiously reallocated some of the portfolio’s weighting out of cash equivalent investments and into modestly longer maturities. We also added slightly to the A-rated category.
With the continued steepness in the yield curve, we maintained the Fund’s structure with substantial weightings in short-term securities, counter-balanced with a number of bonds spread across the five- to ten-year maturity range. We also maintained the Fund’s emphasis on mid-quality credits, as well as health care bonds, which we have done historically due to the beneficial income attributes and manageable credit risk we believe these positions represent.
Nuveen Tax Free Fund
The Fund’s Class A Shares at net asset value (NAV) trailed the Barclays Capital Municipal Bond Index for the ten-month period. However, the Fund outpaced the Lipper General Municipal Debt Funds Average over this timeframe.
As interest rates rose during the period, the municipal yield curve steepened again with yields on ten-year and longer maturity bonds rising. As has historically often been the case, the Fund had an overweight in the longest maturity bonds, 20 years and beyond. Despite the yield curve steepening, this overweight in the longest bonds had a positive impact on the Fund’s relative performance, due largely to their incremental income contribution. Between seven and 20 years, the portfolio was relatively evenly weighted across the maturity spectrum. Yields at the short end of the curve, zero to ten years, were little changed during the period. The Fund continued to be structured with very few holdings in bonds with maturities of seven years and under. However, the holdings the Fund did have in that segment had a negative impact on performance relative to the index.
Credit spreads were mixed during the ten-month period. Compared with the Barclays Capital index, the Fund’s overweighting in A-, BBB- and non-rated bonds helped its performance. In particular, the Fund’s positions in non-rated bonds benefited results as the index has no weighting in this segment.
Certain higher quality bonds were negative contributors during the ten-month period. Both the Fund’s pre-refunded sector (the highest quality bonds because they are usually Treasury-backed municipal bonds) and its state general obligation (GO) bond sector underperformed. Even though the Fund had underweight positions in both pre-refunded bonds and state GOs, these areas still negatively affected performance versus the index.
The Fund’s relative performance benefited from several other sectors, including its significant overweight versus the index in health care (both hospitals and retirement care communities). Because hospitals were among the few issuers ineligible to use the BAB program, they benefited from increased demand from portfolio managers who wanted exposure to the sector. Also, security selection was strong in the health care sector, with many individual holdings performing well. The Fund was also rewarded for overweights in the corporate-backed sector, including industrial development and pollution control revenue bonds. Corporate-backed bonds performed well as tends to be the case when equity markets and taxable corporate bond markets rally based on an outlook for economic recovery. The transportation sector, particularly airports, had a modestly positive impact on the Fund’s performance as well.
Given the steepness of the yield curve, we kept the Fund’s duration or sensitivity to interest-rate movements longer than its benchmark throughout the ten-month period, which generally benefited the Fund’s performance versus the index. We did not make any strategic changes to duration; however, it did get slightly longer due to trading activity. We maintained the portfolio’s generally laddered structure from eight out to approximately 20 years and its overweighting in 20- to 30-year maturities. We added several holdings at the long end because we thought there were attractive opportunities in these bonds. The continued steepness of the yield curve made the values we were seeing in longer maturities that much more attractive.
We maintained an emphasis on mid-quality bonds, which we have done historically due to the value these positions have represented. The Fund continued to see downgrades among some of its bond insurers, which brought several of the Fund’s AA-rated bonds down to an A credit quality rating. However, we do not believe this negatively impacted the overall credit quality of the portfolio.
As in all types of market environments, our main focus was on using fundamental credit research to find attractively valued bonds backed by financially solid issuers. We made a few minor adjustments to the Fund in light of market events. Because industrial revenue bonds and other types of corporate-backed securities had performed so well, we decided to sell some of the Fund’s positions in that segment and reallocate to other areas of the market. We also selectively reduced the Fund’s weightings in higher quality GO bonds and some of the Fund’s AAA-rated bonds. We invested the proceeds in sectors that we believed provided value for our shareholders. For example, we found a couple of attractive opportunities in the hospital sector and added them to the portfolio during the period. The Fund is now close to its maximum weight in hospitals. We also added positions in airports, higher education and other miscellaneous revenue sectors.
As is typical, we engaged in a number of tactical sales in the Fund as opportunities arose, whereby we sell holdings that we can obtain full prices for and replace them with bonds
that we believe have more attractive long-term values. These tactical trades usually take place with investors who are looking for bonds with certain types of structures or characteristics and are willing to pay us attractive prices for bonds that we own.
Risk Considerations
Mutual fund investing involves risk; principal loss is possible. Debt or fixed income securities are subject to credit risk and interest rate risk. Market interest rate changes will cause the value of debt securities (and the value of shares of funds that invest in them) to fluctuate, and may also impact income over time. Credit risk refers to an issuer’s ability to make interest and principal payments when due.
Dividend Information
The Class A, Class C1 and Class I Shares of the Nuveen Intermediate Tax Free Fund had a dividend reduction in March 2011. The Class A and Class I Shares of the Nuveen Short Tax Free Fund experienced a dividend increase in March 2011. The Class A, Class C1 and Class I Shares of the Nuveen Tax Free Fund had a dividend reduction in March 2011.
Each Fund seeks to pay dividends at a rate that reflects the past and projected performance of the Fund. To permit a Fund to maintain a more stable monthly dividend, the Fund may pay dividends at a rate that may be more or less than the amount of net investment income actually earned by the Fund during the period. If the Fund has cumulatively earned more than it has paid in dividends, it will hold the excess in reserve as undistributed net investment income (UNII) as part of the Fund’s net asset value. Conversely, if the Fund has cumulatively paid in dividends more than it has earned, the excess will constitute a negative UNII that will likewise be reflected in the Fund’s net asset value. Each Fund will, over time, pay all its net investment income as dividends to shareholders. As of April 30, 2011, all three Funds had positive UNII balances for both tax purposes and financial reporting purposes.
Fund Performance and Expense Ratios (Unaudited)
The Fund Performance and Expense Ratios for each Fund are shown on the following pages.
Returns quoted represent past performance, which is no guarantee of future results. Current performance may be higher or lower than the performance shown. Investment returns and principal value will fluctuate so that when shares are redeemed, they may be worth more or less than their original cost. Returns without sales charges would be lower if the sales charge were included. Returns do not reflect the deduction of taxes that a shareholder would pay on Fund distributions or the redemption of Fund shares. Income is generally exempt from regular federal income taxes. Some income may be subject to state and local income taxes and to the federal alternative minimum tax. Capital gains, if any, are subject to tax.
Returns may reflect a contractual agreement between certain Funds and the investment adviser to waive certain fees and expenses; see Notes to Financial Statements, Footnote 7 — Management Fees and Other Transactions with Affiliates for more information. In addition, returns may reflect a voluntary expense limitation by the Funds’ investment adviser that may be modified or discontinued at any time without notice. For the most recent month-end performance visit www.nuveen.com or call (800) 257-8787.
Returns reflect differences in sales charges and expenses, which are primarily differences in distribution and service fees. Fund returns assume reinvestment of dividends and capital gains.
Comparative index and benchmark return information is provided for the Funds’ Class A Shares at net asset value (NAV) only.
Effective January 18, 2011, Class C Shares were renamed Class C1 Shares and Class Y Shares were renamed Class I Shares.
The expense ratios shown reflect the Funds’ total operating expenses (before fee waivers or expense reimbursements, if any) as shown in the Funds’ most recent prospectus. The expense ratios include management fees and other fees and expenses but exclude interest expense on self-deposited inverse floaters held by the Funds, if any.
Nuveen Intermediate Tax Free Fund
Fund Performance
Average Annual Total Returns as of April 30, 2011*
| | | | | | | | | | | | | | | | |
| | | Cumulative | | | | Average Annual | |
| | | | |
| | | 10-Month | | | 1-Year | | | 5-Year | | | 10-Year | |
Class A Shares at NAV | | | 2.00% | | | | 2.98% | | | | 4.41% | | | | 4.39% | |
Class A Shares at Offer | | | -1.08% | | | | -0.15% | | | | 3.78% | | | | 4.07% | |
Barclays Capital 1-15 Year Blend Municipal Bond Index*** | | | 2.37% | | | | 3.33% | | | | 5.01% | | | | N/A | |
Lipper Intermediate Municipal Debt Funds Average*** | | | 1.96% | | | | 2.68% | | | | 3.91% | | | | 4.01% | |
| | | | |
Class I Shares | | | 2.08% | | | | 3.07% | | | | 4.49% | | | | 4.50% | |
| | | | | | | | | | | | |
| | | Cumulative | | | | Average Annual | |
| | | |
| | | 10-Month | | | 1-Year | | | Since
Inception** | |
Class C1 Shares | | | 1.61% | | | | 2.48% | | | | 3.77% | |
Latest Calendar Quarter – Average Annual Total Returns as of March 31, 2011
| | | | | | | | | | | | |
| | | Average Annual | |
| | | |
| | | 1-Year | | | 5-Year | | | 10-Year | |
Class A Shares at NAV | | | 2.43% | | | | 4.07% | | | | 4.13% | |
Class A Shares at Offer | | | -0.61% | | | | 3.44% | | | | 3.81% | |
Class I Shares | | | 2.51% | | | | 4.14% | | | | 4.23% | |
| | | | | | | | |
| | | Average Annual | |
| | |
| | | 1-Year | | | Since
Inception** | |
Class C1 Shares | | | 1.92% | | | | 2.91% | |
Class A Shares have a maximum 3.00% sales charge. Class A Share purchases of $1 million or more are sold at net asset value without an up-front sales charge but may be subject to a contingent deferred sales charge (CDSC), also known as a back-end sales charge, if redeemed within eighteen months of purchase. Class C1 Shares have a 1% CDSC for redemptions within less than one year, which is not reflected in the one-year total return. Class I Shares have no sales charge and may be purchased under limited circumstances or by specified classes of investors.
| | | | | | | | |
| Expense Ratios | |
| | |
| Share Class | | Gross
Expense Ratios | | | Net
Expense
Ratios | |
Class A | | | 0.85% | | | | 0.76% | |
Class C1 | | | 1.30% | | | | 1.30% | |
Class I | | | 0.65% | | | | 0.65% | |
The investment adviser has contractually agreed to reimburse Class A Share 12b-1 fees through March 31, 2012 to the extent necessary so that total annual fund operating expenses, after fee waivers and/or expense reimbursements and excluding Acquired Fund Fees and Expenses, do not exceed 0.75% for Class A Shares. Fee waivers and/or expense reimbursements will not be terminated prior to that time without the approval of the fund’s Board of Directors. In addition, the fund’s distributor has contractually agreed to limit its Class A Share 12b-1 fees to 0.15% of average daily net assets.
Growth of an Assumed $10,000 Investment as of April 30, 2011 – Class A Shares
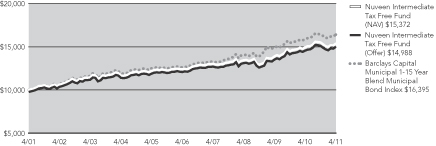
The graphs do not reflect the deduction of taxes, such as state and local income taxes or capital gains taxes, that a shareholder may pay on Fund distributions or the redemption of Fund shares.
| * | Ten-month returns are cumulative; all other returns are annualized. |
| ** | Since inception returns for Class C1 Shares are from 10/28/09. |
| *** | Refer to the Glossary of Terms Used in the Report for definitions. |
Fund Performance and Expense Ratios (Unaudited) (continued)
Nuveen Short Tax Free Fund
Fund Performance
Average Annual Total Returns as of April 30, 2011*
| | | | | | | | | | | | | | | | |
| | | Cumulative | | | | Average Annual | |
| | | | |
| | | 10-Month | | | 1-Year | | | 5-Year | | | Since
Inception** | |
Class A Shares at NAV | | | 1.41% | | | | 1.88% | | | | 3.11% | | | | 2.63% | |
Class A Shares at Offer | | | -1.17% | | | | -0.71% | | | | 2.58% | | | | 2.32% | |
Barclays Capital 3-Year Municipal Bond Index*** | | | 1.59% | | | | 2.32% | | | | 4.43% | | | | 3.84% | |
Lipper Short Municipal Debt Funds Average*** | | | 1.04% | | | | 1.42% | | | | 2.56% | | | | 2.62% | |
| | | | |
Class I Shares | | | 1.54% | | | | 2.04% | | | | 3.26% | | | | 2.78% | |
Latest Calendar Quarter – Average Annual Total Returns as of March 31, 2011
| | | | | | | | | | | | |
| | | Average Annual | |
| | | |
| | | 1-Year | | | 5-Year | | | Since
Inception** | |
Class A Shares at NAV | | | 1.56% | | | | 3.02% | | | | 2.58% | |
Class A Shares at Offer | | | -0.94% | | | | 2.49% | | | | 2.27% | |
Class I Shares | | | 1.71% | | | | 3.17% | | | | 2.73% | |
Class A Shares have a maximum 2.50% sales charge. Class A Share purchases of $250,000 or more are sold at net asset value without an up-front sales charge but may be subject to a contingent deferred sales charge (CDSC), also known as a back-end sales charge, if redeemed within eighteen months of purchase. Class I Shares have no sales charge and may be purchased under limited circumstances or by specified classes of investors.
| | | | |
| Expense Ratios | |
| |
| Share Class | | Gross
Expense
Ratios | |
Class A | | | 0.76% | |
Class I | | | 0.56% | |
Growth of an Assumed $10,000 Investment as of April 30, 2011 – Class A Shares
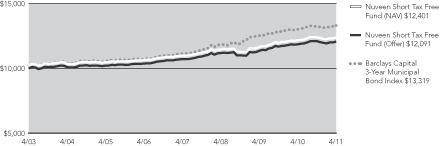
The graphs do not reflect the deduction of taxes, such as state and local income taxes or capital gains taxes, that a shareholder may pay on Fund distributions or the redemption of Fund shares.
| * | Ten-month returns are cumulative; all other returns are annualized. |
| ** | Since inception returns are from 10/25/02. |
| *** | Refer to the Glossary of Terms Used in the Report for definitions. |
Nuveen Tax Free Fund
Fund Performance
Average Annual Total Returns as of April 30, 2011*
| | | | | | | | | | | | | | | | |
| | | Cumulative | | | Average Annual | |
| | | | |
| | | 10-Month | | | 1-Year | | | 5-Year | | | 10-Year | |
Class A Shares at NAV | | | 0.98% | | | | 2.27% | | | | 3.79% | | | | 4.57% | |
Class A Shares at Offer | | | -3.31% | | | | -2.00% | | | | 2.90% | | | | 4.13% | |
Barclays Capital Municipal Bond Index*** | | | 1.38% | | | | 2.20% | | | | 4.52% | | | | 4.96% | |
Lipper General Municipal Debt Funds Average*** | | | 0.30% | | | | 0.80% | | | | 2.89% | | | | 3.38% | |
| | | | |
Class I Shares | | | 1.07% | | | | 2.37% | | | | 3.88% | | | | 4.76% | |
| | | | | | | | | | | | | | | | |
| | | Cumulative | | | Average Annual | |
| | | | |
| | | 10-Month | | | 1-Year | | | 5-Year | | | Since
Inception** | |
Class C1 Shares | | | 0.43% | | | | 1.62% | | | | 3.21% | | | | 3.87% | |
Latest Calendar Quarter – Average Annual Total Returns as of March 31, 2011
| | | | | | | | | | | | |
| | | Average Annual | |
| | | |
| | | 1-Year | | | 5-Year | | | 10-Year | |
Class A Shares at NAV | | | 1.33% | | | | 3.32% | | | | 4.21% | |
Class A Shares at Offer | | | -2.93% | | | | 2.44% | | | | 3.77% | |
Class I Shares | | | 1.41% | | | | 3.43% | | | | 4.41% | |
| | | | | | | | | | | | |
| | | Average Annual | |
| | | |
| | | 1-Year | | | 5-Year | | | Since Inception** | |
Class C1 Shares | | | 0.76% | | | | 2.76% | | | | 3.68% | |
Class A Shares have a maximum 4.20% sales charge. Class A Share purchases of $1 million or more are sold at net asset value without an up-front sales charge but may be subject to a contingent deferred sales charge (CDSC), also known as a back-end sales charge, if redeemed within eighteen months of purchase. Class C1 Shares have a 1% CDSC for redemptions within less than one year, which is not reflected in the one-year total return. Class I Shares have no sales charge and may be purchased under limited circumstances or by specified classes of investors.
| | | | | | | | |
| Expense Ratios | |
| | |
| Share Class | | Gross
Expense
Ratios | | | Net
Expense
Ratios | |
Class A | | | 0.87% | | | | 0.76% | |
Class C1 | | | 1.32% | | | | 1.32% | |
Class I | | | 0.67% | | | | 0.67% | |
The investment adviser has agreed to reimburse Class A Share 12b-1 fees through March 31, 2012 to the extent necessary so that total annual fund operating expenses, after fee waivers and/or expense reimbursements and excluding Acquired Fund Fees and Expenses, do not exceed 0.75% for Class A Shares. Fee waivers and/or expense reimbursements will not be terminated prior to that time without the approval of the fund’s Board of Directors.
Growth of an Assumed $10,000 Investment as of April 30, 2011 – Class A Shares

The graphs do not reflect the deduction of taxes, such as state and local income taxes or capital gains taxes, that a shareholder may pay on Fund distributions or the redemption of Fund shares.
| * | Ten-month returns are cumulative; all other returns are annualized. |
| ** | Since inception returns for Class C1 Shares are from 9/24/01. |
| *** | Refer to the Glossary of Terms Used in the Report for definitions. |
Yields (Unaudited) as of April 30, 2011
Dividend Yield is the most recent dividend per share (annualized) divided by the offering price per share.
The SEC 30-Day Yield is a standardized measure of a Fund’s yield that accounts for the future amortization of premiums or discounts of bonds held in the Fund’s portfolio. The SEC 30-Day Yield is computed under an SEC standardized formula and is based on the maximum offer price per share. The 30-Day Yield is computed under the same formula but is based on the net asset value (NAV) per share. Dividend Yield may differ from the SEC 30-Day Yield because the Fund may be paying out more or less than it is earning and it may not include the effect of amortization of bond premium.
The Taxable-Equivalent Yield represents the yield that must be earned on a fully taxable investment in order to equal the yield of the Fund on an after-tax basis at a specified tax rate. With respect to investments that generate qualified dividend income that is taxable at a maximum rate of 15%, the Taxable-Equivalent Yield is lower.
The SEC 30-Day Yield and Taxable-Equivalent Yield on A Shares at NAV applies only to A Shares purchased at no-load pursuant to the Fund’s policy permitting waiver of the A Share load in certain specified circumstances.
Nuveen Intermediate Tax Free Fund
| | | | | | | | | | | | | | | | |
| | | | |
| | | Dividend
Yield | | | 30-Day
Yield | | | SEC 30-Day
Yield | | | Taxable-
Equivalent
Yield1 | |
Class A Shares at NAV | | | 3.73% | | | | 3.09% | | | | — | | | | 4.29% | |
Class A Shares at Offer | | | 3.62% | | | | — | | | | 2.99% | | | | 4.15% | |
Class C1 Shares | | | 3.27% | | | | — | | | | 2.54% | | | | 3.53% | |
Class I Shares | | | 3.91% | | | | — | | | | 3.18% | | | | 4.42% | |
Nuveen Short Tax Free Fund
| | | | | | | | | | | | | | | | |
| | | | |
| | | Dividend
Yield | | | 30-Day
Yield | | | SEC 30-Day
Yield | | | Taxable-
Equivalent
Yield1 | |
Class A Shares at NAV | | | 1.74% | | | | 1.52% | | | | — | | | | 2.11% | |
Class A Shares at Offer | | | 1.70% | | | | — | | | | 1.48% | | | | 2.06% | |
Class I Shares | | | 1.92% | | | | — | | | | 1.76% | | | | 2.44% | |
Nuveen Tax Free Fund
| | | | | | | | | | | | | | | | |
| | | | |
| | | Dividend
Yield | | | 30-Day
Yield | | | SEC 30-Day
Yield | | | Taxable-
Equivalent
Yield1 | |
Class A Shares at NAV | | | 4.05% | | | | 4.51% | | | | — | | | | 6.26% | |
Class A Shares at Offer | | | 3.89% | | | | — | | | | 4.32% | | | | 6.00% | |
Class C1 Shares | | | 3.67% | | | | — | | | | 3.93% | | | | 5.46% | |
Class I Shares | | | 4.28% | | | | — | | | | 4.57% | | | | 6.35% | |
| 1 | The Taxable-Equivalent Yield is based on the Fund’s 30-Day Yield on the indicated date and a combined federal and state income tax rate of 28.0%. |
Holding Summaries (Unaudited) as of April 30, 2011
This data relates to the securities held in each Fund’s portfolio of investments. It should not be construed as a measure of performance for the Fund itself.
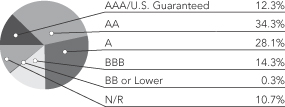
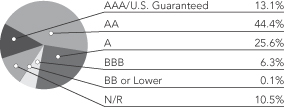
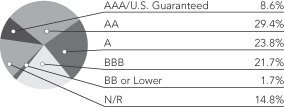
Ratings shown are the highest of Standard & Poor’s Group, Moody’s Investor Service, Inc. or Fitch, Inc. AAA includes bonds with an implied AAA rating since they are backed by U.S. Government or agency securities. AAA, AA, A and BBB ratings are investment grade; BB, B, CCC, CC, C and D ratings are below-investment grade. Holdings designated N/R are not rated by any of these national rating agencies.
Nuveen Intermediate Tax Free Fund
Bond Credit Quality1
Nuveen Short Tax Free Fund
Bond Credit Quality1
| | | | |
| Portfolio Composition1 | | | |
| Tax Obligation/General | | | 27.2% | |
| Health Care | | | 20.3% | |
| Tax Obligation/Limited | | | 11.8% | |
| Education and Civic Organizations | | | 11.6% | |
| U.S. Guaranteed | | | 9.3% | |
| Long-Term Care | | | 7.8% | |
| Utilities | | | 5.1% | |
| Other | | | 6.9% | |
| | | | |
| Portfolio Composition1 | | | |
| Health Care | | | 24.5% | |
| Education and Civic Organizations | | | 16.7% | |
| Tax Obligation/Limited | | | 16.1% | |
| Tax Obligation/General | | | 13.0% | |
| Long-Term Care | | | 9.4% | |
| Transportation | | | 7.0% | |
| Other | | | 13.3% | |
| | | | |
| States/U.S. Territories1 | | | |
| Illinois | | | 13.4% | |
| California | | | 11.0% | |
| Texas | | | 10.5% | |
| Colorado | | | 8.3% | |
| Arizona | | | 5.3% | |
| Tennessee | | | 4.4% | |
| Washington | | | 4.4% | |
| Massachusetts | | | 3.2% | |
| Kansas | | | 3.0% | |
| Minnesota | | | 2.6% | |
| Florida | | | 2.5% | |
| North Carolina | | | 2.5% | |
| Pennsylvania | | | 2.3% | |
| Wisconsin | | | 2.2% | |
| Michigan | | | 2.1% | |
| Missouri | | | 2.1% | |
| Iowa | | | 1.5% | |
| Other | | | 18.7% | |
| | | | |
| States/U.S. Territories1 | | | |
| Florida | | | 7.9% | |
| Texas | | | 7.4% | |
| Minnesota | | | 6.8% | |
| California | | | 6.7% | |
| Virginia | | | 5.0% | |
| Arizona | | | 4.6% | |
| Colorado | | | 4.4% | |
| Pennsylvania | | | 3.7% | |
| Georgia | | | 3.6% | |
| Illinois | | | 3.4% | |
| Massachusetts | | | 3.1% | |
| Ohio | | | 3.1% | |
| Missouri | | | 3.1% | |
| Michigan | | | 2.9% | |
| Iowa | | | 2.8% | |
| New York | | | 2.4% | |
| New Jersey | | | 2.4% | |
| South Carolina | | | 2.3% | |
| Indiana | | | 2.2% | |
| Mississippi | | | 2.2% | |
| Kansas | | | 2.1% | |
| Other | | | 17.9% | |
| 1 | As a percentage of total municipal bonds as of April 30, 2011. Holdings are subject to change. |
Holding Summaries (Unaudited) as of April 30, 2011 (continued)
Nuveen Tax Free Fund
Bond Credit Quality1
| | | | |
| Portfolio Composition1 | | | |
| Health Care | | | 24.6% | |
| Long-Term Care | | | 13.3% | |
| Utilities | | | 12.9% | |
| Tax Obligation/General | | | 10.9% | |
| Education and Civic Organizations | | | 10.6% | |
| Tax Obligation/Limited | | | 10.0% | |
| Transportation | | | 7.3% | |
| Other | | | 10.4% | |
| | | | |
| States/U.S. Territories1 | | | |
| Texas | | | 15.3% | |
| Arizona | | | 9.0% | |
| California | | | 8.1% | |
| Illinois | | | 7.8% | |
| South Dakota | | | 4.1% | |
| Georgia | | | 3.7% | |
| Pennsylvania | | | 3.5% | |
| Colorado | | | 3.3% | |
| Minnesota | | | 3.2% | |
| Florida | | | 2.8% | |
| Michigan | | | 2.8% | |
| Indiana | | | 2.6% | |
| Oregon | | | 2.6% | |
| Washington | | | 2.5% | |
| Wisconsin | | | 2.4% | |
| Puerto Rico | | | 2.4% | |
| Massachusetts | | | 2.0% | |
| Tennessee | | | 1.9% | |
| Wyoming | | | 1.7% | |
| Other | | | 18.3% | |
| 1 | As a percentage of total municipal bonds as of April 30, 2011. Holdings are subject to change. |
Expense Examples (Unaudited)
As a shareholder of one or more of the Funds, you incur two types of costs: (1) transaction costs, including up-front and back-end sales charges (loads) or redemption fees, where applicable; and (2) ongoing costs, including management fees; distribution and service (12b-1) fees, where applicable; and other Fund expenses. The Examples below are intended to help you understand your ongoing costs (in dollars) of investing in the Funds and to compare these costs with the ongoing costs of investing in other mutual funds.
The Examples below are based on an investment of $1,000 invested at the beginning of the period and held for the period.
The information under “Actual Performance,” together with the amount you invested, allows you to estimate actual expenses incurred over the reporting period. Simply divide your account value by $1,000 (for example, an $8,600 account value divided by $1,000 = 8.60) and multiply the result by the cost shown for your share class, in the row entitled “Expenses Incurred During Period” to estimate the expenses incurred on your account during this period.
The information under “Hypothetical Performance,” provides information about hypothetical account values and hypothetical expenses based on the respective Fund’s actual expense ratio and an assumed rate of return of 5% per year before expenses, which is not the Fund’s actual return. The hypothetical account values and expenses may not be used to estimate the actual ending account balance or expense you incurred for the period. You may use this information to compare the ongoing costs of investing in the Fund and other Funds. To do so, compare this 5% hypothetical example with the 5% hypothetical examples that appear in the shareholder reports of the other funds.
Please note that the expenses shown in the table are meant to highlight your ongoing costs only and do not reflect any transaction costs. Therefore, the hypothetical information is useful in comparing ongoing costs only, and will not help you determine the relative total costs of owning different funds or share classes. In addition, if these transaction costs were included, your costs would have been higher.
| | | | | | | | |
| Nuveen Intermediate Tax Free Fund | | | | |
| | | | | | | | | | | | | | | | | | | | | | | | | | | | |
| | | | | | | | | | | | | | | Hypothetical Performance | |
| | | Actual Performance | | | | | | (5% annualized return
before expenses) | |
| | | A Shares | | | C1 Shares | | | I Shares | | | | | | A Shares | | | C1 Shares | | | I Shares | |
| Beginning Account Value (11/01/10) | | $ | 1,000.00 | | | $ | 1,000.00 | | | $ | 1,000.00 | | | | | | | $ | 1,000.00 | | | $ | 1,000.00 | | | $ | 1,000.00 | |
| Ending Account Value (4/30/11) | | $ | 991.60 | | | $ | 989.00 | | | $ | 992.10 | | | | | | | $ | 1,021.08 | | | $ | 1,018.25 | | | $ | 1,021.47 | |
| Expenses Incurred During Period | | $ | 3.70 | | | $ | 6.51 | | | $ | 3.31 | | | | | | | $ | 3.76 | | | $ | 6.61 | | | $ | 3.36 | |
For each class of the Fund, expenses are equal to the Fund’s annualized net expense ratio of .75%, 1.32% and .67% for Classes A, C1 and I, respectively, multiplied by the average account value over the period, multiplied by 181/365 (to reflect the one-half year period).
| | | | | | | | |
| Nuveen Short Tax Free Fund | | | | |
| | | | | | | | | | | | | | | | | | | | |
| | | | | | | | | | | | Hypothetical Performance | |
| | | Actual Performance | | | | | | (5% annualized return
before expenses) | |
| | | A Shares | | | I Shares | | | | | | A Shares | | | I Shares | |
| Beginning Account Value (11/01/10) | | $ | 1,000.00 | | | $ | 1,000.00 | | | | | | | $ | 1,000.00 | | | $ | 1,000.00 | |
| Ending Account Value (4/30/11) | | $ | 999.50 | | | $ | 1,000.40 | | | | | | | $ | 1,021.17 | | | $ | 1,022.07 | |
| Expenses Incurred During Period | | $ | 3.62 | | | $ | 2.73 | | | | | | | $ | 3.66 | | | $ | 2.76 | |
For each class of the Fund, expenses are equal to the Fund’s annualized net expense ratio of .73% and .55% for Classes A and I, respectively, multiplied by the average account value over the period, multiplied by 181/365 (to reflect the one-half year period).
| | | | | | | | | | | | | | | | | | | | | | | | | | | | |
| | | | | | | | | | | | | | | Hypothetical Performance | |
| | | Actual Performance | | | | | | (5% annualized return
before expenses) | |
| | | A Shares | | | C1 Shares | | | I Shares | | | | | | A Shares | | | C1 Shares | | | I Shares | |
| Beginning Account Value (11/01/10) | | $ | 1,000.00 | | | $ | 1,000.00 | | | $ | 1,000.00 | | | | | | | $ | 1,000.00 | | | $ | 1,000.00 | | | $ | 1,000.00 | |
| Ending Account Value (4/30/11) | | $ | 973.10 | | | $ | 969.60 | | | $ | 973.80 | | | | | | | $ | 1,021.08 | | | $ | 1,018.15 | | | $ | 1,021.37 | |
| Expenses Incurred During Period | | $ | 3.67 | | | $ | 6.54 | | | $ | 3.38 | | | | | | | $ | 3.76 | | | $ | 6.71 | | | $ | 3.46 | |
For each class of the Fund, expenses are equal to the Fund’s annualized net expense ratio of .75%, 1.34% and .69% for Classes A, C1 and I, respectively, multiplied by the average account value over the period, multiplied by 181/365 (to reflect the one-half year period).
Shareholder Meeting Report (Unaudited)
A special meeting of shareholders was held in the offices of FAF Advisors, Inc. on December 17, 2010; at this meeting the shareholders were asked to vote on the election of Board Members, the approval of an Investment Advisory Agreement and the approval of an Investment Sub-Advisory Agreement.
| | | | | | | | | | | | |
| | | Nuveen Intermediate
Tax-Free Fund | | | Nuveen Short
Tax-Free Fund | | | Nuveen
Tax-Free Fund | |
To approve an investment advisory agreement with Nuveen Asset Management and an investment sub-advisory agreement between Nuveen Asset Management and Nuveen Asset Management, LLC. | | | | | | | | | | | | |
For | | | 68,881,210 | | | | 30,630,083 | | | | 43,529,911 | |
Against | | | 90,068 | | | | 1,258 | | | | 56,995 | |
Abstain | | | 59,755 | | | | 11,927 | | | | 58,675 | |
Broker Non-Votes | | | 3,808,424 | | | | 932,254 | | | | 4,151,485 | |
Total | | | 72,839,457 | | | | 31,575,522 | | | | 47,797,066 | |
Approval of the Board Members was reached as follows: | | | | | | | | | | | | |
| | | |
John P. Amboian | | | | | | | | | | | | |
For | | | 72,815,675 | | | | 31,575,522 | | | | 47,680,116 | |
Withhold | | | 23,782 | | | | — | | | | 116,950 | |
Total | | | 72,839,457 | | | | 31,575,522 | | | | 47,797,066 | |
Robert P. Bremner | | | | | | | | | | | | |
For | | | 72,812,619 | | | | 31,575,522 | | | | 47,680,035 | |
Withhold | | | 26,838 | | | | — | | | | 117,031 | |
Total | | | 72,839,457 | | | | 31,575,522 | | | | 47,797,066 | |
Jack B. Evans | | | | | | | | | | | | |
For | | | 72,809,678 | | | | 31,575,522 | | | | 47,687,836 | |
Withhold | | | 29,779 | | | | — | | | | 109,230 | |
Total | | | 72,839,457 | | | | 31,575,522 | | | | 47,797,066 | |
William C. Hunter | | | | | | | | | | | | |
For | | | 72,809,678 | | | | 31,575,522 | | | | 47,680,035 | |
Withhold | | | 29,779 | | | | — | | | | 117,031 | |
Total | | | 72,839,457 | | | | 31,575,522 | | | | 47,797,066 | |
David J. Kundert | | | | | | | | | | | | |
For | | | 72,812,619 | | | | 31,575,522 | | | | 47,680,035 | |
Withhold | | | 26,838 | | | | — | | | | 117,031 | |
Total | | | 72,839,457 | | | | 31,575,522 | | | | 47,797,066 | |
William J. Schneider | | | | | | | | | | | | |
For | | | 72,812,619 | | | | 31,575,522 | | | | 47,678,611 | |
Withhold | | | 26,838 | | | | — | | | | 118,455 | |
Total | | | 72,839,457 | | | | 31,575,522 | | | | 47,797,066 | |
Judith M. Stockdale | | | | | | | | | | | | |
For | | | 72,812,099 | | | | 31,575,522 | | | | 47,680,035 | |
Withhold | | | 27,358 | | | | — | | | | 117,031 | |
Total | | | 72,839,457 | | | | 31,575,522 | | | | 47,797,066 | |
Carole E. Stone | | | | | | | | | | | | |
For | | | 72,812,099 | | | | 31,575,522 | | | | 47,680,035 | |
Withhold | | | 27,358 | | | | — | | | | 117,031 | |
Total | | | 72,839,457 | | | | 31,575,522 | | | | 47,797,066 | |
Virginia L. Stringer | | | | | | | | | | | | |
For | | | 72,809,042 | | | | 31,575,522 | | | | 47,685,775 | |
Withhold | | | 30,415 | | | | — | | | | 111,291 | |
Total | | | 72,839,457 | | | | 31,575,522 | | | | 47,797,066 | |
Terence J. Toth | | | | | | | | | | | | |
For | | | 72,815,675 | | | | 31,575,522 | | | | 47,678,611 | |
Withhold | | | 23,782 | | | | — | | | | 118,455 | |
Total | | | 72,839,457 | | | | 31,575,522 | | | | 47,797,066 | |
Report of
Independent Registered
Public Accounting Firm
The Board of Directors and Shareholders
Nuveen Intermediate Tax Free Fund (formerly known as First American Intermediate Tax Free Fund)
Nuveen Short Tax Free Fund (formerly known as First American Short Tax Free Fund)
Nuveen Tax Free Fund (formerly known as First American Tax Free Fund)
We have audited the accompanying statements of assets and liabilities, including the portfolios of investments, of Nuveen Intermediate Tax Free Fund (formerly known as First American Intermediate Tax Free Fund), Nuveen Short Tax Free Fund (formerly known as First American Short Tax Free Fund), and Nuveen Tax Free Fund (formerly known as First American Tax Free Fund) (the “Funds”) as of April 30, 2011, and the related statements of operations, changes in net assets, and the financial highlights for each of the periods indicated therein. These financial statements and financial highlights are the responsibility of the Funds’ management. Our responsibility is to express an opinion on these financial statements and financial highlights based on our audits.
We conducted our audits in accordance with the standards of the Public Company Accounting Oversight Board (United States). Those standards require that we plan and perform the audits to obtain reasonable assurance about whether the financial statements and financial highlights are free of material misstatement. We were not engaged to perform an audit of the Funds’ internal control over financial reporting. Our audits included consideration of internal control over financial reporting as a basis for designing audit procedures that are appropriate in the circumstances, but not for the purpose of expressing an opinion on the effectiveness of the Funds’ internal control over financial reporting. Accordingly, we express no such opinion. An audit also includes examining, on a test basis, evidence supporting the amounts and disclosures in the financial statements and financial highlights, assessing the accounting principles used and significant estimates made by management, and evaluating the overall financial statement presentation. Our procedures included confirmation of securities owned as of April 30, 2011, by correspondence with the custodian and brokers. We believe that our audits provide a reasonable basis for our opinion.
In our opinion, the financial statements and financial highlights referred to above present fairly, in all material respects, the financial positions of Nuveen Intermediate Tax Free Fund (formerly known as First American Intermediate Tax Free Fund), Nuveen Short Tax Free Fund (formerly known as First American Short Tax Free Fund), and Nuveen Tax Free Fund (formerly known as First American Tax Free Fund) at April 30, 2011, and the results of their operations, the changes in their net assets, and the financial highlights for each of the periods indicated therein in conformity with U.S. generally accepted accounting principles.

Chicago, Illinois
June 24, 2011
Portfolio of Investments
Nuveen Intermediate Tax Free Fund
(formerly known as First American Intermediate Tax Free Fund)
April 30, 2011
| | | | | | | | | | | | | | | | | | | | |
Principal
Amount (000) | | | Description p | | | | | | | | | | | Value | |
| | | | | | | | | | | | | | | | | | | | |
| | | | Municipal Bonds – 98.8% | | | | | | | | | | | | | | | | |
| | | | | |
| | | | Alabama – 1.4% | | | | | | | | | | | | | | | | |
| | | | | |
| | | | Anniston Regional Medical Center Board, Northeast Alabama Regional Medical Center Project (ETM) | | | | | | | | | | | | | | | | |
| $ | 325 | | | 8.000%, 07/01/2011 | | | | | | | | | | | | | | $ | 328,852 | |
| | | | | |
| | | | Health Care Authority for Baptist Health, Series D | | | | | | | | | | | | | | | | |
| | 755 | | | 5.000%, 11/15/2015 | | | | | | | | | | | | | | | 793,535 | |
| | | | | |
| | | | Huntsville Electric System (AGM) | | | | | | | | | | | | | | | | |
| | 1,130 | | | 4.000%, 12/01/2018 | | | | | | | | | | | | | | | 1,217,541 | |
| | | | | |
| | | | Mobile, Series B | | | | | | | | | | | | | | | | |
| | 2,000 | | | 5.000%, 02/15/2020 | | | | | | | | | | | | | | | 2,174,620 | |
| | | | | |
| | | | University of Alabama at Birmingham Hospital, Series A | | | | | | | | | | | | | | | | |
| | 1,500 | | | 5.000%, 09/01/2018 | | | | | | | | | | | | | | | 1,608,300 | |
| | 4,000 | | | 5.750%, 09/01/2022 | | | | | | | | | | | | | | | 4,283,480 | |
| | 9,710 | | | Total Alabama | | | | | | | | | | | | | | | 10,406,328 | |
| | | | Alaska – 0.0% | | | | | | | | | | | | | | | | |
| | | | | |
| | | | Aleutians East Borough Project, Aleutian Pribilof Islands (ACA) | | | | | | | | | | | | | | | | |
| | 400 | | | 4.375%, 06/01/2015 | | | | | | | | | | | | | | | 365,388 | |
| | | | Arizona – 5.3% | | | | | | | | | | | | | | | | |
| | | | | |
| | | | Arizona, Series A (AGM) | | | | | | | | | | | | | | | | |
| | 1,815 | | | 4.000%, 09/01/2017 | | | | | | | | | | | | | | | 1,852,135 | |
| | | | | |
| | | | Arizona Board of Regents, Series B (AMBAC) | | | | | | | | | | | | | | | | |
| | 4,120 | | | 4.500%, 06/01/2018 | | | | | | | | | | | | | | | 4,350,555 | |
| | | | | |
| | | | Arizona Game & Fish Department, Administration Building Project | | | | | | | | | | | | | | | | |
| | 150 | | | 4.500%, 07/01/2015 | | | | | | | | | | | | | | | 161,811 | |
| | | | | |
| | | | Arizona Health Facilities Authority, The Terraces Project Series A (Pre-refunded 11/15/2013) | | | | | | | | | | | | | | | | |
| | 3,150 | | | 7.500%, 11/15/2023 | | | | | | | | | | | | | | | 3,633,116 | |
| | | | | |
| | | | Coconino & Yavapai Counties Joint Unified School District #9, Sedona School Improvement Project of 2007, Series B | | | | | | | | | | | | | | | | |
| | 1,350 | | | 5.375%, 07/01/2028 | | | | | | | | | | | | | | | 1,419,566 | |
| | | | | |
| | | | Gila County United School District #10, Payson School Improvement Project of 2006, Series A (AMBAC) | | | | | | | | | | | | | | | | |
| | 1,000 | | | 5.000%, 07/01/2016 | | | | | | | | | | | | | | | 1,111,060 | |
| | 1,050 | | | 5.000%, 07/01/2017 | | | | | | | | | | | | | | | 1,165,290 | |
| | | | | |
| | | | Gilbert Public Facilities Municipal Property Corporation | | | | | | | | | | | | | | | | |
| | 6,000 | | | 5.500%, 07/01/2027 | | | | | | | | | | | | | | | 6,368,160 | |
| | | | | |
| | | | Glendale Industrial Development Authority, Midwestern University | | | | | | | | | | | | | | | | |
| | 1,355 | | | 5.000%, 05/15/2021 | | | | | | | | | | | | | | | 1,424,390 | |
| | 2,000 | | | 5.000%, 05/15/2026 | | | | | | | | | | | | | | | 1,997,860 | |
| | | | | |
| | | | Maricopa County School District #48, Scottsdale, Series B (AGM) | | | | | | | | | | | | | | | | |
| | 295 | | | 4.750%, 07/01/2018 | | | | | | | | | | | | | | | 344,218 | |
| | | | | |
| | | | Maricopa County Unified School District #48, Scottsdale, Series B, (Pre-refunded 07/01/2016) (AGM) | | | | | | | | | | | | | | | | |
| | 290 | | | 4.750%, 07/01/2018 | | | | | | | | | | | | | | | 337,282 | |
| | 565 | | | 4.750%, 07/01/2018 | | | | | | | | | | | | | | | 615,725 | |
| | | | | |
| | | | Phoenix Civic Improvement, Airport Series A | | | | | | | | | | | | | | | | |
| | 2,000 | | | 5.000%, 07/01/2022 | | | | | | | | | | | | | | | 2,093,480 | |
| | | | | |
| | | | Phoenix Street & Highway User (ETM) | | | | | | | | | | | | | | | | |
| | 900 | | | 6.250%, 07/01/2011 | | | | | | | | | | | | | | | 908,316 | |
| | | | | |
| | | | Pima County Sewer Revenue (AGM) | | | | | | | | | | | | | | | | |
| | 2,670 | | | 5.000%, 07/01/2024 | | | | | | | | | | | | | | | 2,820,641 | |
| | | | | |
| | | | Pima County Unified School District #1, Tucson Project of 2004, Series C (FGIC) (NATL) | | | | | | | | | | | | | | | | |
| | 1,000 | | | 4.375%, 07/01/2018 | | | | | | | | | | | | | | | 1,075,450 | |
| | 1,000 | | | 4.500%, 07/01/2019 | | | | | | | | | | | | | | | 1,064,460 | |
| | | | | | | | | | | | | | | | | | | | |
Principal
Amount (000) | | | Description p | | | | | | | | | | | Value | |
| | | | | | | | | | | | | | | | | | | | |
| | | | Arizona (continued) | | | | | | | | | | | | | | | | |
| | | | | |
| | | | Scottsdale Industrial Development Authority, Scottsdale Healthcare, Series A | | | | | | | | | | | | | | | | |
| $ | 1,000 | | | 5.000%, 09/01/2020 | | | | | | | | | | | | | | $ | 1,029,450 | |
| | | | | |
| | | | Tempe Industrial Development Authority, Friendship Village Project, Series A | | | | | | | | | | | | | | | | |
| | 1,022 | | | 5.375%, 12/01/2013 | | | | | | | | | | | | | | | 973,046 | |
| | | | | |
| | | | Tucson Airport Authority (AGM) | | | | | | | | | | | | | | | | |
| | 3,760 | | | 5.000%, 06/01/2013 | | | | | | | | | | | | | | | 4,064,823 | |
| | 36,492 | | | Total Arizona | | | | | | | | | | | | | | | 38,810,834 | |
| | | | Arkansas – 0.5% | | | | | | | | | | | | | | | | |
| | | | | |
| | | | North Little Rock Health Facilities Board, Baptist Health Series B | | | | | | | | | | | | | | | | |
| | 1,000 | | | 5.750%, 12/01/2021 | | | | | | | | | | | | | | | 1,086,460 | |
| | | | | |
| | | | University of Arkansas, Fayetteville, Series B (FGIC) (NATL) | | | | | | | | | | | | | | | | |
| | 1,000 | | | 4.500%, 11/01/2016 | | | | | | | | | | | | | | | 1,103,610 | |
| | | | | |
| | | | Washington County Hospital, Regional Medical Center, Series B | | | | | | | | | | | | | | | | |
| | 1,145 | | | 5.000%, 02/01/2016 | | | | | | | | | | | | | | | 1,216,414 | |
| | 3,145 | | | Arkansas – 0.5% | | | | | | | | | | | | | | | 3,406,484 | |
| | | | California – 10.9% | | | | | | | | | | | | | | | | |
| | | | | |
| | | | ABC Unified School District Series A (NATL) | | | | | | | | | | | | | | | | |
| | 1,565 | | | 4.900%, 02/01/2020 | | | | | | | | | | | | | | | 1,625,972 | |
| | | | | |
| | | | Alameda Corridor Authority, Series A (AMBAC) | | | | | | | | | | | | | | | | |
| | 2,000 | | | 0.000%, 10/01/2014 | | | | | | | | | | | | | | | 1,704,320 | |
| | | | | |
| | | | Apple Valley Redevelopment Agency, Tax Allocation, Project Area #2 (AMBAC) | | | | | | | | | | | | | | | | |
| | 920 | | | 4.500%, 06/01/2018 | | | | | | | | | | | | | | | 879,557 | |
| | | | | |
| | | | Association of Bay Area Governments Finance Authority for Nonprofit Corporations, Children’s Hospital Series A | | | | | | | | | | | | | | | | |
| | 1,525 | | | 4.500%, 12/01/2018 | | | | | | | | | | | | | | | 1,577,841 | |
| | | | | |
| | | | Association of Bay Area Governments Finance Authority for Nonprofit Corporations, Elder Care Alliance (CMI) | | | | | | | | | | | | | | | | |
| | 335 | | | 4.500%, 08/15/2012 | | | | | | | | | | | | | | | 345,157 | |
| | 1,215 | | | 5.000%, 08/15/2017 | | | | | | | | | | | | | | | 1,247,283 | |
| | | | | |
| | | | California | | | | | | | | | | | | | | | | |
| | 1,000 | | | 5.000%, 02/01/2016 | | | | | | | | | | | | | | | 1,057,640 | |
| | 2,000 | | | 5.000%, 02/01/2017 | | | | | | | | | | | | | | | 2,111,680 | |
| | 2,000 | | | 4.000%, 08/01/2017 | | | | | | | | | | | | | | | 2,145,500 | |
| | 245 | | | 5.000%, 11/01/2018 | | | | | | | | | | | | | | | 249,214 | |
| | 500 | | | 5.000%, 08/01/2019 | | | | | | | | | | | | | | | 545,130 | |
| | 1,500 | | | 5.000%, 02/01/2021 | | | | | | | | | | | | | | | 1,574,805 | |
| | 1,000 | | | 5.000%, 12/01/2023 | | | | | | | | | | | | | | | 1,040,450 | |
| | 500 | | | 5.125%, 04/01/2024 | | | | | | | | | | | | | | | 509,450 | |
| | | | | |
| | | | California (Pre-refunded 11/01/2011) | | | | | | | | | | | | | | | | |
| | 15 | | | 5.000%, 11/01/2018 | | | | | | | | | | | | | | | 15,351 | |
| | | | | |
| | | | California Department of Water Resources and Power Supply Series H (AGM) | | | | | | | | | | | | | | | | |
| | 1,000 | | | 5.000%, 05/01/2022 | | | | | | | | | | | | | | | 1,091,760 | |
| | | | | |
| | | | California Economic Recovery, Series A | | | | | | | | | | | | | | | | |
| | 2,000 | | | 5.000%, 07/01/2020 | | | | | | | | | | | | | | | 2,248,580 | |
| | | | | |
| | | | California Educational Facilities Authority, Lutheran University, Series C | | | | | | | | | | | | | | | | |
| | 1,000 | | | 5.000%, 10/01/2024 | | | | | | | | | | | | | | | 939,370 | |
| | | | | |
| | | | California Health Facilities Financing Authority, Adventist Health Systems West, Series C | | | | | | | | | | | | | | | | |
| | 500 | | | 5.125%, 03/01/2020 | | | | | | | | | | | | | | | 522,840 | |
| | | | | |
| | | | California Health Facilities Financing Authority, Children’s Hospital of Orange County, Series A | | | | | | | | | | | | | | | | |
| | 3,000 | | | 5.750%, 11/01/2018 | | | | | | | | | | | | | | | 3,265,500 | |
| | | | | |
| | | | California Public Works Board, California State University Projects, Series B-1 | | | | | | | | | | | | | | | | |
| | 1,400 | | | 5.375%, 03/01/2025 | | | | | | | | | | | | | | | 1,405,754 | |
Portfolio of Investments
Nuveen Intermediate Tax Free Fund (continued)
April 30, 2011
| | | | | | | | | | | | | | | | | | | | |
Principal
Amount (000) | | | Description p | | | | | | | | | | | Value | |
| | | | | | | | | | | | | | | | | | | | |
| | | | California (continued) | | | | | | | | | | | | | | | | |
| | | | | |
| | | | California Public Works Board, Trustees of the California State University, Series D | | | | | | | | | | | | | | | | |
| $ | 2,245 | | | 6.000%, 04/01/2025 | | | | | | | | | | | | | | $ | 2,364,030 | |
| | | | | |
| | | | California Public Works Board, Various Capital Projects, Series G-1 | | | | | | | | | | | | | | | | |
| | 5,000 | | | 5.250%, 10/01/2024 | | | | | | | | | | | | | | | 5,028,500 | |
| | | | | |
| | | | California Statewide Communities Development Authority, Elder Care Alliance, Series A (ETM) | | | | | | | | | | | | | | | | |
| | 275 | | | 7.250%, 11/15/2011 | | | | | | | | | | | | | | | 285,241 | |
| | | | | |
| | | | California Statewide Communities Development Authority, Health Facilities, Adventist Health, Series A | | | | | | | | | | | | | | | | |
| | 700 | | | 5.000%, 03/01/2030 | | | | | | | | | | | | | | | 643,797 | |
| | | | | |
| | | | California Statewide Communities Development Authority, Henry Mayo Newhall Memorial Hospital Series B (AMBAC) (CMI) | | | | | | | | | | | | | | | | |
| | 1,000 | | | 5.200%, 10/01/2037 | | | | | | | | | | | | | | | 895,430 | |
| | | | | |
| | | | California Statewide Communities Development Authority, Kaiser Permanente, Series C, Mandatory Put 06/01/2012 @ 100 | | | | | | | | | | | | | | | | |
| | 1,230 | | | 3.850%, 11/01/2029 | | | | | | | | | | | | | | | 1,272,201 | |
| | | | | |
| | | | California Statewide Communities Development Authority, Los Angeles Jewish Home (CMI) | | | | | | | | | | | | | | | | |
| | 1,210 | | | 5.000%, 11/15/2012 | | | | | | | | | | | | | | | 1,259,053 | |
| | | | | |
| | | | California Statewide Communities Development Authority, Pollution Control, Southern California Edison Company, Series C, Mandatory Put 11/01/2016 @ 100 (FGIC) | | | | | | | | | | | | | | | | |
| | 500 | | | 4.250%, 11/01/2033 | | | | | | | | | | | | | | | 530,455 | |
| | | | | |
| | | | Desert Sands Unified School District, Election of 2001 | | | | | | | | | | | | | | | | |
| | 500 | | | 5.250%, 08/01/2023 | | | | | | | | | | | | | | | 539,840 | |
| | 2,000 | | | 5.000%, 08/01/2024 | | | | | | | | | | | | | | | 2,099,940 | |
| | | | | |
| | | | Golden State Tobacco Securitization Series A (AGM) | | | | | | | | | | | | | | | | |
| | 2,100 | | | 4.550%, 06/01/2022 | | | | | | | | | | | | | �� | | 1,959,090 | |
| | | | | |
| | | | Golden State Tobacco Securitization, California Tobacco Settlement, Series A-1 | | | | | | | | | | | | | | | | |
| | 2,215 | | | 4.500%, 06/01/2027 | | | | | | | | | | | | | | | 1,662,513 | |
| | | | | |
| | | | Grant Joint Union High School District, Election of 2006 (AGM) | | | | | | | | | | | | | | | | |
| | 1,300 | | | 0.000%, 08/01/2026 | | | | | | | | | | | | | | | 484,900 | |
| | | | | |
| | | | Las Virgenes Unified School District, Election of 2006, Series B | | | | | | | | | | | | | | | | |
| | 2,015 | | | 0.000%, 08/01/2027 | | | | | | | | | | | | | | | 749,197 | |
| | | | | |
| | | | Northern Inyo County Hospital District | | | | | | | | | | | | | | | | |
| | 1,000 | | | 6.000%, 12/01/2021 | | | | | | | | | | | | | | | 1,003,550 | |
| | | | | |
| | | | Port Oakland, Series B (NATL) | | | | | | | | | | | | | | | | |
| | 1,470 | | | 5.000%, 11/01/2018 | | | | | | | | | | | | | | | 1,578,369 | |
| | | | | |
| | | | Roseville Joint Union High School District, Series E | | | | | | | | | | | | | | | | |
| | 390 | | | 5.100%, 08/01/2019 | | | | | | | | | | | | | | | 395,581 | |
| | | | | |
| | | | San Bernardino Community College District, Election of 2002, Series A | | | | | | | | | | | | | | | | |
| | 1,000 | | | 6.500%, 08/01/2027 | | | | | | | | | | | | | | | 1,140,140 | |
| | | | | |
| | | | San Bernardino County Redevelopment Agency, Tax Allocation, San Sevaine Redevelopment Project Series A (RAAI) | | | | | | | | | | | | | | | | |
| | 575 | | | 5.000%, 09/01/2016 | | | | | | | | | | | | | | | 573,896 | |
| | | | | |
| | | | San Mateo High School, Election of 2000, Series B (FGIC) (NATL) | | | | | | | | | | | | | | | | |
| | 1,000 | | | 0.000%, 09/01/2017 | | | | | | | | | | | | | | | 805,070 | |
| | | | | |
| | | | Santa Ana Union School District, Election of 2008, Series A | | | | | | | | | | | | | | | | |
| | 1,000 | | | 5.250%, 08/01/2028 | | | | | | | | | | | | | | | 1,017,410 | |
| | | | | |
| | | | Santa Monica Community College District, 2002 Election Series C (NATL) | | | | | | | | | | | | | | | | |
| | 2,000 | | | 0.000%, 08/01/2016 | | | | | | | | | | | | | | | 1,663,360 | |
| | | | | |
| | | | Santa Paula Utility Authority, Water Revenue | | | | | | | | | | | | | | | | |
| | 2,510 | | | 5.000%, 02/01/2028 | | | | | | | | | | | | | | | 2,532,841 | |
| | 2,630 | | | 5.000%, 02/01/2029 | | | | | | | | | | | | | | | 2,648,357 | |
| | 2,765 | | | 5.000%, 02/01/2030 | | | | | | | | | | | | | | | 2,764,779 | |
| | | | | |
| | | | South Bayside Waste Management, Shoreway Environmental, Series A | | | | | | | | | | | | | | | | |
| | 2,500 | | | 5.250%, 09/01/2024 | | | | | | | | | | | | | | | 2,553,650 | |
| | 1,200 | | | 6.250%, 09/01/2029 | | | | | | | | | | | | | | | 1,263,948 | |
| | | | | | | | | | | | | | | | | | | | |
Principal
Amount (000) | | | Description p | | | | | | | | | | | Value | |
| | | | | | | | | | | | | | | | | | | | |
| | | | California (continued) | | | | | | | | | | | | | | | | |
| | | | | |
| | | | Tulare Local Health Care District, Election 2005, Series B | | | | | | | | | | | | | | | | |
| $ | 1,180 | | | 6.000%, 08/01/2022 | | | | | | | | | | | | | | $ | 1,301,257 | |
| | 1,410 | | | 6.125%, 08/01/2023 | | | | | | | | | | | | | | | 1,561,406 | |
| | 1,585 | | | 6.250%, 08/01/2024 | | | | | | | | | | | | | | | 1,734,450 | |
| | 1,265 | | | 6.375%, 08/01/2025 | | | | | | | | | | | | | | | 1,379,659 | |
| | 500 | | | 6.500%, 08/01/2026 | | | | | | | | | | | | | | | 543,620 | |
| | | | | |
| | | | Upland Community Redevelopment Agency Tax Allocation, Merged Project (AMBAC) | | | | | | | | | | | | | | | | |
| | 1,100 | | | 4.250%, 09/01/2026 | | | | | | | | | | | | | | | 861,531 | |
| | | | | |
| | | | Victor Elementary School District, Series A (FGIC) (NATL) | | | | | | | | | | | | | | | | |
| | 2,030 | | | 0.000%, 08/01/2023 | | | | | | | | | | | | | | | 967,985 | |
| | | | | |
| | | | Victor Valley High School, Election of 2008, Series A, Convertible CAB’s (AGC) | | | | | | | | | | | | | | | | |
| | 3,000 | | | 0.000% through 08/01/2019, thereafter 5.750%, 08/01/2019 | | | | | | | | | | | | | | | 1,735,410 | |
| | | | | |
| | | | West Contra Costa Unified School District, Election of 2005, Series B | | | | | | | | | | | | | | | | |
| | 2,500 | | | 6.000%, 08/01/2025 | | | | | | | | | | | | | | | 2,703,300 | |
| | | | | |
| | | | Whittier Public Finance Authority, Redevelopment Agency, Tax Allocation, Series A (AMBAC) | | | | | | | | | | | | | | | | |
| | 995 | | | 5.000%, 11/01/2021 | | | | | | | | | | | | | | | 941,031 | |
| | | | | |
| | | | Woodland Financial Authority (SGI) | | | | | | | | | | | | | | | | |
| | 815 | | | 4.700%, 03/01/2019 | | | | | | | | | | | | | | | 846,891 | |
| | 83,930 | | | Total California | | | | | | | | | | | | | | | 80,394,832 | |
| | | | | |
| | | | Colorado – 8.2% | | | | | | | | | | | | | | | | |
| | | | | |
| | | | Adams & Arapahoe Counties School District, #28J, Aurora (STAID) | | | | | | | | | | | | | | | | |
| | 1,125 | | | 5.500%, 12/01/2021 | | | | | | | | | | | | | | | 1,304,820 | |
| | | | | |
| | | | Adams County Pollution Control, Public Service Company Colorado Project, Series A (NATL) | | | | | | | | | | | | | | | | |
| | 5,000 | | | 4.375%, 09/01/2017 | | | | | | | | | | | | | | | 5,065,400 | |
| | | | | |
| | | | Colorado | | | | | | | | | | | | | | | | |
| | 150 | | | 0.000%, 03/01/2014 | | | | | | | | | | | | | | | 144,005 | |
| | | | | |
| | | | Colorado Educational & Cultural Facilities Authority, Bromley East Charter School Project, Series A, (Pre-refunded 09/15/2011) | | | | | | | | | | | | | | | | |
| | 1,200 | | | 6.750%, 09/15/2015 | | | | | | | | | | | | | | | 1,228,752 | |
| | | | | |
| | | | Colorado Educational & Cultural Facilities Authority, Cheyenne Mountain Charter School, Series A (SMO) | | | | | | | | | | | | | | | | |
| | 175 | | | 4.750%, 06/15/2022 | | | | | | | | | | | | | | | 171,071 | |
| | | | | |
| | | | Colorado Educational & Cultural Facilities Authority, Classical Academy Charter School (ETM) | | | | | | | | | | | | | | | | |
| | 140 | | | 6.375%, 12/01/2011 | | | | | | | | | | | | | | | 145,044 | |
| | | | | |
| | | | Colorado Educational & Cultural Facilities Authority, Classical Academy Charter School
(Pre-refunded 12/01/2011) | | | | | | | | | | | | | | | | |
| | 1,500 | | | 6.750%, 12/01/2016 | | | | | | | | | | | | | | | 1,556,895 | |
| | 1,500 | | | 7.250%, 12/01/2021 | | | | | | | | | | | | | | | 1,561,125 | |
| | | | | |
| | | | Colorado Educational & Cultural Facilities Authority, Pinnacle Charter School Project (ETM) | | | | | | | | | | | | | | | | |
| | 225 | | | 5.250%, 12/01/2011 | | | | | | | | | | | | | | | 231,435 | |
| | | | | |
| | | | Colorado Health Facilities Authority, Catholic Health, Series C-7 (AGM) | | | | | | | | | | | | | | | | |
| | 725 | | | 4.350%, 09/01/2020 | | | | | | | | | | | | | | | 749,686 | |
| | | | | |
| | | | Colorado Health Facilities Authority, Catholic Health Initiatives, Series D | | | | | | | | | | | | | | | | |
| | 1,500 | | | 5.125%, 10/01/2017 | | | | | | | | | | | | | | | 1,681,185 | |
| | | | | |
| | | | Colorado Health Facilities Authority, Christian Living Communities Project, Series A | | | | | | | | | | | | | | | | |
| | 600 | | | 5.250%, 01/01/2014 | | | | | | | | | | | | | | | 605,010 | |
| | 620 | | | 5.250%, 01/01/2015 | | | | | | | | | | | | | | | 621,389 | |
| | | | | |
| | | | Colorado Health Facilities Authority, Covenant Retirement Communities | | | | | | | | | | | | | | | | |
| | 500 | | | 5.000%, 12/01/2016 | | | | | | | | | | | | | | | 509,225 | |
| | | | | |
| | | | Colorado Health Facilities Authority, Longmont United Hospital, Series B (RAAI) | | | | | | | | | | | | | | | | |
| | 1,250 | | | 4.250%, 12/01/2015 | | | | | | | | | | | | | | | 1,267,925 | |
| | | | | |
| | | | Colorado Health Facilities Authority, NCMC Income Project, Series B | | | | | | | | | | | | | | | | |
| | 1,000 | | | 6.000%, 05/15/2026 | | | | | | | | | | | | | | | 1,080,310 | |
Portfolio of Investments
Nuveen Intermediate Tax Free Fund (continued)
April 30, 2011
| | | | | | | | | | | | | | | | | | | | |
Principal
Amount (000) | | | Description p | | | | | | | | | | | Value | |
| | | | | | | | | | | | | | | | | | | | |
| | | | Colorado (continued) | | | | | | | | | | | | | | | | |
| | | | | |
| | | | Colorado Health Facilities Authority, Parkview Medical Center | | | | | | | | | | | | | | | | |
| $ | 640 | | | 5.000%, 09/01/2016 | | | | | | | | | | | | | | $ | 659,405 | |
| | | | | |
| | | | Colorado Health Facilities Authority, Retirement Facilities, Liberty, Series B (ETM) | | | | | | | | | | | | | | | | |
| | 10,000 | | | 0.000%, 07/15/2020 | | | | | | | | | | | | | | | 7,357,100 | |
| | | | | |
| | | | Colorado Health Facilities Authority, Total Longterm Care National, Series A | | | | | | | | | | | | | | | | |
| | 1,400 | | | 5.250%, 11/15/2020 | | | | | | | | | | | | | | | 1,347,304 | |
| | | | | |
| | | | Colorado Health Facilities Authority, Valley View Hospital Association Project, Series A (RAAI) | | | | | | | | | | | | | | | | |
| | 500 | | | 5.000%, 05/15/2012 | | | | | | | | | | | | | | | 510,885 | |
| | 405 | | | 5.000%, 05/15/2013 | | | | | | | | | | | | | | | 417,640 | |
| | | | | |
| | | | Colorado Higher Education, Capital Construction Lease Program | | | | | | | | | | | | | | | | |
| | 1,500 | | | 5.250%, 11/01/2023 | | | | | | | | | | | | | | | 1,601,985 | |
| | | | | |
| | | | Colorado Penitentiary II | | | | | | | | | | | | | | | | |
| | 1,390 | | | 4.000%, 03/01/2015 | | | | | | | | | | | | | | | 1,495,890 | |
| | | | | |
| | | | Delta County Memorial Hospital District Enterprise | | | | | | | | | | | | | | | | |
| | 1,500 | | | 5.500%, 09/01/2025 | | | | | | | | | | | | | | | 1,521,900 | |
| | | | | |
| | | | E-470 Public Highway Authority, Series C (Convertible CABs) (NATL) | | | | | | | | | | | | | | | | |
| | 1,500 | | | 0.000% through 09/01/2011, thereafter 5.000%, 09/01/2017 | | | | | | | | | | | | | | | 1,630,350 | |
| | | | | |
| | | | El Paso County School District #20 (STAID) | | | | | | | | | | | | | | | | |
| | 1,500 | | | 5.000%, 12/15/2020 | | | | | | | | | | | | | | | 1,742,520 | |
| | 2,175 | | | 5.000%, 12/15/2021 | | | | | | | | | | | | | | | 2,525,066 | |
| | 1,530 | | | 5.000%, 12/15/2022 | | | | | | | | | | | | | | | 1,755,155 | |
| | | | | |
| | | | High Plains Metropolitan District, Series B | | | | | | | | | | | | | | | | |
| | 300 | | | 4.375%, 12/01/2015 | | | | | | | | | | | | | | | 297,972 | |
| | | | | |
| | | | Mesa County (ETM) | | | | | | | | | | | | | | | | |
| | 5,500 | | | 0.000%, 12/01/2011 | | | | | | | | | | | | | | | 5,482,565 | |
| | | | | |
| | | | Montrose Memorial Hospital | | | | | | | | | | | | | | | | |
| | 2,170 | | | 5.700%, 12/01/2017 | | | | | | | | | | | | | | | 2,232,843 | |
| | | | | |
| | | | North Range Metropolitan District #1 (ACA) | | | | | | | | | | | | | | | | |
| | 1,000 | | | 4.300%, 12/15/2019 | | | | | | | | | | | | | | | 814,820 | |
| | | | | |
| | | | Northwest Parkway Public Highway Authority Convertible CABs | | | | | | | | | | | | | | | | |
| | 2,250 | | | 0.000% through 06/15/2011, thereafter 5.250%, (ETM) (AMBAC) 06/15/2015 | | | | | | | | | | | | | | | 2,532,038 | |
| | | | | |
| | | | Platte River Power Authority, Series GG (AGM) | | | | | | | | | | | | | | | | |
| | 725 | | | 4.500%, 06/01/2017 | | | | | | | | | | | | | | | 823,868 | |
| | | | | |
| | | | Pueblo County School District #60 (STAID) | | | | | | | | | | | | | | | | |
| | 1,000 | | | 5.000%, 12/15/2022 | | | | | | | | | | | | | | | 1,158,520 | |
| | | | | |
| | | | Rangeview Library District Projects (AGC) | | | | | | | | | | | | | | | | |
| | 1,325 | | | 4.500%, 12/15/2020 | | | | | | | | | | | | | | | 1,400,339 | |
| | | | | |
| | | | Sand Creek Metropolitan School District, Limited Tax, Series A | | | | | | | | | | | | | | | | |
| | 2,190 | | | 4.250%, 12/01/2023 | | | | | | | | | | | | | | | 2,140,200 | |
| | 2,030 | | | 4.000%, 12/01/2024 | | | | | | | | | | | | | | | 1,910,027 | |
| | | | | |
| | | | Walker Field Public Airport Authority | | | | | | | | | | | | | | | | |
| | 1,000 | | | 5.000%, 12/01/2022 | | | | | | | | | | | | | | | 958,340 | |
| | 60,740 | | | Total Colorado | | | | | | | | | | | | | | | 60,240,009 | |
| | | | Connecticut – 0.1% | | | | | | | | | | | | | | | | |
| | | | | |
| | | | Connecticut Health & Educational Facilities Authority, Griffin Hospital, Series B (RAAI) | | | | | | | | | | | | | | | | |
| | 1,000 | | | 5.000%, 07/01/2014 | | | | | | | | | | | | | | | 1,047,380 | |
| | | | District of Columbia – 0.5% | | | | | | | | | | | | | | | | |
| | | | | |
| | | | District of Columbia, The Catholic University of America | | | | | | | | | | | | | | | | |
| | 3,480 | | | 5.000%, 10/01/2023 | | | | | | | | | | | | | | | 3,600,408 | |
| | | | Florida – 2.5% | | | | | | | | | | | | | | | | |
| | | | | |
| | | | Clay County School Board, Series B (NATL) | | | | | | | | | | | | | | | | |
| | 2,205 | | | 5.000%, 07/01/2018 | | | | | | | | | | | | | | | 2,330,928 | |
| | | | | | | | | | | | | | | | | | | | |
Principal
Amount (000) | | | Description p | | | | | | | | | | | Value | |
| | | | | | | | | | | | | | | | | | | | |
| | | | Florida (continued) | | | | | | | | | | | | | | | | |
| | | | | |
| | | | Halifax Hospital Medical Center, Series A | | | | | | | | | | | | | | | | |
| $ | 2,250 | | | 5.250%, 06/01/2026 | | | | | | | | | | | | | | $ | 2,180,610 | |
| | | | | |
| | | | Highlands County Health Facilities Authority, Adventist Health/Sunbelt, Series A, Mandatory Put 11/17/2015 @ 100 | | | | | | | | | | | | | | | | |
| | 2,000 | | | 6.500%, 11/15/2038 | | | | | | | | | | | | | | | 2,372,000 | |
| | | | | |
| | | | Miami-Dade County Educational Facilities Authority, University of Miami, Series A | | | | | | | | | | | | | | | | |
| | 2,520 | | | 5.150%, 04/01/2023 | | | | | | | | | | | | | | | 2,612,106 | |
| | | | | |
| | | | Miami-Dade County Water & Sewer (AGM) | | | | | | | | | | | | | | | | |
| | 5,000 | | | 5.000%, 10/01/2029 | | | | | | | | | | | | | | | 5,143,650 | |
| | | | | |
| | | | North Brevard County Hospital, Parrish Medical Center Project | | | | | | | | | | | | | | | | |
| | 2,100 | | | 5.500%, 10/01/2028 | | | | | | | | | | | | | | | 2,076,732 | |
| | | | | |
| | | | Palm Beach County Health Facilities Authority, Abbey Delray South, Life Care Retirement Community | | | | | | | | | | | | | | | | |
| | 1,400 | | | 5.250%, 10/01/2013 | | | | | | | | | | | | | | | 1,455,398 | |
| | | | | |
| | | | Vero Beach Electric, Series A (AGM) | | | | | | | | | | | | | | | | |
| | 350 | | | 4.000%, 12/01/2019 | | | | | | | | | | | | | | | 358,841 | |
| | 17,825 | | | Total Florida | | | | | | | | | | | | | | | 18,530,265 | |
| | | | Georgia – 1.4% | | | | | | | | | | | | | | | | |
| | | | | |
| | | | Atlanta Tax Allocation, Atlantic Station Project (AGC) | | | | | | | | | | | | | | | | |
| | 2,000 | | | 4.375%, 12/01/2018 | | | | | | | | | | | | | | | 2,043,940 | |
| | | | | |
| | | | DeKalb County Hospital Authority, DeKalb Medical Center Incorporated Project | | | | | | | | | | | | | | | | |
| | 1,000 | | | 6.000%, 09/01/2030 | | | | | | | | | | | | | | | 937,990 | |
| | | | | |
| | | | Fayette County School District (AGM) | | | | | | | | | | | | | | | | |
| | 500 | | | 4.125%, 03/01/2014 | | | | | | | | | | | | | | | 541,510 | |
| | 265 | | | 4.250%, 03/01/2015 | | | | | | | | | | | | | | | 291,582 | |
| | | | | |
| | | | Fulton County Residential Care Facilities, Canterbury Court Project, Series A | | | | | | | | | | | | | | | | |
| | 4,500 | | | 5.800%, 02/15/2018 | | | | | | | | | | | | | | | 4,271,895 | |
| | | | | |
| | | | Glynn-Brunswick Memorial Hospital Authority, Southeast Georgia Health, Series A | | | | | | | | | | | | | | | | |
| | 2,000 | | | 5.250%, 08/01/2023 | | | | | | | | | | | | | | | 2,028,860 | |
| | 10,265 | | | Total Georgia | | | | | | | | | | | | | | | 10,115,777 | |
| | | | Hawaii – 1.4% | | | | | | | | | | | | | | | | |
| | | | | |
| | | | Hawaii Department of Budget & Finance, Special Purpose, Series C1 | | | | | | | | | | | | | | | | |
| | 5,000 | | | 7.500%, 11/15/2015 | | | | | | | | | | | | | | | 5,049,950 | |
| | | | | |
| | | | Hawaii Pacific Health, Special Purpose, Series A | | | | | | | | | | | | | | | | |
| | 5,000 | | | 5.250%, 07/01/2030 | | | | | | | | | | | | | | | 4,450,500 | |
| | | | | |
| | | | Hawaii Pacific Health Series B | | | | | | | | | | | | | | | | |
| | 1,025 | | | 5.625%, 07/01/2030 | | | | | | | | | | | | | | | 954,982 | |
| | 11,025 | | | Total Hawaii | | | | | | | | | | | | | | | 10,455,432 | |
| | | | Idaho – 0.7% | | | | | | | | | | | | | | | | |
| | | | | |
| | | | Idaho Health Facilities Authority, Trinity Health Group, Series B | | | | | | | | | | | | | | | | |
| | 3,000 | | | 6.000%, 12/01/2023 | | | | | | | | | | | | | | | 3,325,080 | |
| | | | | |
| | | | Madison County Hospital | | | | | | | | | | | | | | | | |
| | 500 | | | 5.000%, 09/01/2012 | | | | | | | | | | | | | | | 510,420 | |
| | | | | |
| | | | University of Idaho, Series B, Mandatory Put 04/01/2018 @ 100 (AGM) | | | | | | | | | | | | | | | | |
| | 1,000 | | | 4.500%, 04/01/2041 | | | | | | | | | | | | | | | 1,058,960 | |
| | 4,500 | | | Total Idaho | | | | | | | | | | | | | | | 4,894,460 | |
| | | | Illinois – 13.2% | | | | | | | | | | | | | | | | |
| | | | | |
| | | | Bolingbrook Park District, Series A (CIFG) | | | | | | | | | | | | | | | | |
| | 1,840 | | | 4.500%, 01/01/2017 | | | | | | | | | | | | | | | 1,997,909 | |
| | | | | |
| | | | Chicago City Colleges (FGIC) (NATL) | | | | | | | | | | | | | | | | |
| | 7,000 | | | 0.000%, 01/01/2015 | | | | | | | | | | | | | | | 6,147,050 | |
| | | | | |
| | | | Chicago, Midway Airport Project, Series C (NATL) | | | | | | | | | | | | | | | | |
| | 1,300 | | | 5.500%, 01/01/2014 | | | | | | | | | | | | | | | 1,405,066 | |
Portfolio of Investments
Nuveen Intermediate Tax Free Fund (continued)
April 30, 2011
| | | | | | | | | | | | | | | | | | | | |
Principal
Amount (000) | | | Description p | | | | | | | | | | | Value | |
| | | | | | | | | | | | | | | | | | | | |
| | | | Illinois (continued) | | | | | | | | | | | | | | | | |
| | | | | |
| | | | Chicago Park District, Limited Tax, Series A | | | | | | | | | | | | | | | | |
| $ | 2,300 | | | 4.500%, 01/01/2023 | | | | | | | | | | | | | | $ | 2,301,587 | |
| | | | | |
| | | | Chicago Park District, Limited Tax, Series B (AMBAC) | | | | | | | | | | | | | | | | |
| | 5,545 | | | 5.000%, 01/01/2020 | | | | | | | | | | | | | | | 5,753,436 | |
| | | | | |
| | | | Chicago, Series A (MBIA) | | | | | | | | | | | | | | | | |
| | 2,000 | | | 5.300%, 01/01/2016 | | | | | | | | | | | | | | | 2,189,480 | |
| | | | | |
| | | | Cook County Series A (NATL) | | | | | | | | | | | | | | | | |
| | 1,000 | | | 6.250%, 11/15/2011 | | | | | | | | | | | | | | | 1,030,390 | |
| | | | | |
| | | | Cook County Community Unit School District #401, Elmbrook Park (AGM) | | | | | | | | | | | | | | | | |
| | 3,625 | | | 0.000%, 12/01/2011 | | | | | | | | | | | | | | | 3,582,914 | |
| | | | | |
| | | | Cook County High School District #205, Thornton Township (AGC) | | | | | | | | | | | | | | | | |
| | 3,465 | | | 5.250%, 12/01/2021 | | | | | | | | | | | | | | | 3,739,359 | |
| | | | | |
| | | | Cook County High School District #209, Proviso Township (AGM) | | | | | | | | | | | | | | | | |
| | 1,000 | | | 5.000%, 12/01/2016 | | | | | | | | | | | | | | | 1,080,260 | |
| | | | | |
| | | | Cook County School District #088, Bellwood Series B (AGM) | | | | | | | | | | | | | | | | |
| | 1,175 | | | 5.000%, 12/01/2017 | | | | | | | | | | | | | | | 1,291,066 | |
| | | | | |
| | | | Cook County School District #088, Bellwood, Series B (Pre-refunded 12/01/2014) (AGM) | | | | | | | | | | | | | | | | |
| | 500 | | | 5.000%, 12/01/2017 | | | | | | | | | | | | | | | 571,620 | |
| | | | | |
| | | | Cook County School District #102, La Grange (FGIC) (NATL) | | | | | | | | | | | | | | | | |
| | 2,440 | | | 0.000%, 12/01/2013 | | | | | | | | | | | | | | | 2,273,128 | |
| | | | | |
| | | | Cook County School District #123, Oak Lawn (NATL) | | | | | | | | | | | | | | | | |
| | 2,250 | | | 0.000%, 12/01/2015 | | | | | | | | | | | | | | | 1,866,645 | |
| | | | | |
| | | | Elk Grove Village (NATL) | | | | | | | | | | | | | | | | |
| | 1,000 | | | 4.125%, 01/01/2019 | | | | | | | | | | | | | | | 1,040,030 | |
| | | | | |
| | | | Granite Single Family Mortgage Series A (ETM) | | | | | | | | | | | | | | | | |
| | 240 | | | 7.750%, 10/01/2011 | | | | | | | | | | | | | | | 246,478 | |
| | | | | |
| | | | Grundy & Will Counties Community Unit School District #1 | | | | | | | | | | | | | | | | |
| | 1,550 | | | 5.875%, 02/01/2019 | | | | | | | | | | | | | | | 1,798,093 | |
| | 2,100 | | | 5.875%, 02/01/2022 | | | | | | | | | | | | | | | 2,356,515 | |
| | 2,545 | | | 5.875%, 02/01/2024 | | | | | | | | | | | | | | | 2,803,038 | |
| | | | | |
| | | | Illinois | | | | | | | | | | | | | | | | |
| | 300 | | | 5.200%, 07/01/2016 | | | | | | | | | | | | | | | 300,405 | |
| | | | | |
| | | | Illinois, Series B | | | | | | | | | | | | | | | | |
| | 1,000 | | | 5.000%, 03/01/2014 | | | | | | | | | | | | | | | 1,057,610 | |
| | 370 | | | 5.000%, 01/01/2017 | | | | | | | | | | | | | | | 393,610 | |
| | | | | |
| | | | Illinois Development Finance Authority, Elgin School District Project (AGM) | | | | | | | | | | | | | | | | |
| | 2,750 | | | 0.000%, 01/01/2018 | | | | | | | | | | | | | | | 2,051,555 | |
| | | | | |
| | | | Illinois Development Finance Authority, Midwestern University, Series B (Pre-refunded 05/15/2011) | | | | | | | | | | | | | | | | |
| | 350 | | | 5.750%, 05/15/2016 | | | | | | | | | | | | | | | 354,302 | |
| | | | | |
| | | | Illinois Educational Facilities Authority, Art Institute of Chicago Mandatory Put 03/01/2016 @ 100 | | | | | | | | | | | | | | | | |
| | 500 | | | 4.125%, 03/01/2030 | | | | | | | | | | | | | | | 518,520 | |
| | | | | |
| | | | Illinois Educational Facilities Authority, Art Institute of Chicago, Series A, Mandatory Put 03/01/2017 @ 100 | | | | | | | | | | | | | | | | |
| | 1,000 | | | 4.750%, 03/01/2030 | | | | | | | | | | | | | | | 1,060,890 | |
| | | | | |
| | | | Illinois Finance Authority, Clare at Water Tower, Series A-4 | | | | | | | | | | | | | | | | |
| | 700 | | | 5.400%, 05/15/2017 | | | | | | | | | | | | | | | 294,070 | |
| | | | | |
| | | | Illinois Finance Authority, Clare at Water Tower, Series A-5 | | | | | | | | | | | | | | | | |
| | 700 | | | 5.500%, 05/15/2018 | | | | | | | | | | | | | | | 294,070 | |
| | | | | |
| | | | Illinois Finance Authority, Clare at Water Tower, Series B | | | | | | | | | | | | | | | | |
| | 600 | | | 0.000%, 05/15/2050 | | | | | | | | | | | | | | | 3,780 | |
| | | | | |
| | | | Illinois Finance Authority, Edward Hospital, Series A (AMBAC) | | | | | | | | | | | | | | | | |
| | 1,200 | | | 6.000%, 02/01/2025 | | | | | | | | | | | | | | | 1,251,072 | |
| | 1,280 | | | 6.000%, 02/01/2026 | | | | | | | | | | | | | | | 1,323,520 | |
| | 500 | | | 6.000%, 02/01/2028 | | | | | | | | | | | | | | | 513,050 | |
| | | | | | | | | | | | | | | | | | | | |
Principal
Amount (000) | | | Description p | | | | | | | | | | | Value | |
| | | | | | | | | | | | | | | | | | | | |
| | | | Illinois (continued) | | | | | | | | | | | | | | | | |
| | | | | |
| | | | Illinois Finance Authority, Franciscan Communities, Series A | | | | | | | | | | | | | | | | |
| $ | 1,000 | | | 5.500%, 05/15/2027 | | | | | | | | | | | | | | $ | 793,020 | |
| | | | | |
| | | | Illinois Finance Authority, Friendship Village Schaumburg, Series A | | | | | | | | | | | | | | | | |
| | 1,745 | | | 5.000%, 02/15/2015 | | | | | | | | | | | | | | | 1,661,990 | |
| | | | | |
| | | | Illinois Finance Authority, Illinois Institute of Technology | | | | | | | | | | | | | | | | |
| | 1,000 | | | 6.500%, 02/01/2023 | | | | | | | | | | | | | | | 921,160 | |
| | | | | |
| | | | Illinois Finance Authority, Landing at Plymouth Project, Series A | | | | | | | | | | | | | | | | |
| | 1,320 | | | 5.250%, 05/15/2014 | | | | | | | | | | | | | | | 1,272,229 | |
| | | | | |
| | | | Illinois Finance Authority, OSF Healthcare Systems, Series A | | | | | | | | | | | | | | | | |
| | 4,000 | | | 7.000%, 11/15/2029 | | | | | | | | | | | | | | | 4,244,280 | |
| | | | | |
| | | | Illinois Finance Authority, Peoples Gas, Light and Coke Co., Series A, Mandatory Put
06/01/2016 @ 100 (AMBAC) | | | | | | | | | | | | | | | | |
| | 1,500 | | | 4.300%, 06/01/2035 | | | | | | | | | | | | | | | 1,531,095 | |
| | | | | |
| | | | Illinois Finance Authority, Roosevelt University | | | | | | | | | | | | | | | | |
| | 500 | | | 5.250%, 04/01/2022 | | | | | | | | | | | | | | | 472,155 | |
| | 4,000 | | | 5.750%, 04/01/2024 | | | | | | | | | | | | | | | 3,956,720 | |
| | 1,750 | | | 5.400%, 04/01/2027 | | | | | | | | | | | | | | | 1,621,183 | |
| | | | | |
| | | | Illinois Finance Authority, Rush University Medical Center, Series A | | | | | | | | | | | | | | | | |
| | 2,000 | | | 6.750%, 11/01/2024 | | | | | | | | | | | | | | | 2,167,120 | |
| | | | | |
| | | | Illinois Finance Authority, Rush University Medical Center, Series C | | | | | | | | | | | | | | | | |
| | 1,500 | | | 6.375%, 11/01/2029 | | | | | | | | | | | | | | | 1,547,835 | |
| | | | | |
| | | | Illinois Finance Authority, Three Crowns Park Plaza, Series A | | | | | | | | | | | | | | | | |
| | 1,870 | | | 5.500%, 02/15/2014 | | | | | | | | | | | | | | | 1,825,961 | |
| | | | | |
| | | | Illinois Health Facilities Authority, Evangelical (ETM) | | | | | | | | | | | | | | | | |
| | 300 | | | 6.750%, 04/15/2012 | | | | | | | | | | | | | | | 317,436 | |
| | | | | |
| | | | Illinois Health Facilities Authority, Mercy Hospital & Medical Center (ETM) | | | | | | | | | | | | | | | | |
| | 385 | | | 10.000%, 01/01/2015 | | | | | | | | | | | | | | | 457,415 | |
| | | | | |
| | | | Illinois Sports Facilities Authority (AMBAC) | | | | | | | | | | | | | | | | |
| | 1,405 | | | 4.750%, 06/15/2013 | | | | | | | | | | | | | | | 1,483,891 | |
| | 1,620 | | | 5.100%, 06/15/2016 | | | | | | | | | | | | | | | 1,759,692 | |
| | | | | |
| | | | Madison & Jersey Counties Unit School District #11, Alton (AGM) | | | | | | | | | | | | | | | | |
| | 2,100 | | | 0.000%, 12/01/2019 | | | | | | | | | | | | | | | 1,386,210 | |
| | | | | |
| | | | McCook | | | | | | | | | | | | | | | | |
| | 500 | | | 5.000%, 12/01/2026 | | | | | | | | | | | | | | | 511,385 | |
| | 1,000 | | | 5.100%, 12/01/2028 | | | | | | | | | | | | | | | 1,010,020 | |
| | | | | |
| | | | Metropolitan Pier & Exposition Authority, State Sales Tax, Series B (Convertible CABs) (NATL) | | | | | | | | | | | | | | | | |
| | 1,000 | | | 0.000% through 06/15/2012, thereafter 5.200%, 06/15/2017 g | | | | | | | | | | | | | | | 1,031,420 | |
| | | | | |
| | | | Rockford School District #205 (FGIC) (NATL) | | | | | | | | | | | | | | | | |
| | 500 | | | 5.000%, 02/01/2014 | | | | | | | | | | | | | | | 541,730 | |
| | | | | |
| | | | Southwestern Illinois Development Authority, Anderson Hospital | | | | | | | | | | | | | | | | |
| | 2,000 | | | 5.125%, 08/15/2026 | | | | | | | | | | | | | | | 1,801,040 | |
| | | | | |
| | | | Southwestern Illinois Development Authority, Edwardsville Community (AGM) | | | | | | | | | | | | | | | | |
| | 1,000 | | | 5.000%, 12/01/2017 | | | | | | | | | | | | | | | 1,110,150 | |
| | | | | |
| | | | Southwestern Illinois Development Authority, Local Government Program, Triad School District #2 (NATL) | | | | | | | | | | | | | | | | |
| | 1,000 | | | 5.000%, 10/01/2018 | | | | | | | | | | | | | | | 1,054,410 | |
| | | | | |
| | | | St Clair County, Alternative Revenue Source | | | | | | | | | | | | | | | | |
| | 1,000 | | | 4.500%, 10/01/2020 | | | | | | | | | | | | | | | 1,065,390 | |
| | 1,100 | | | 5.000%, 10/01/2022 | | | | | | | | | | | | | | | 1,187,923 | |
| | | | | |
| | | | Will & Grundy Counties Community College, District #525, Joliet Junior College | | | | | | | | | | | | | | | | |
| | 535 | | | 6.250%, 06/01/2024 | | | | | | | | | | | | | | | 608,498 | |
| | 1,150 | | | 5.750%, 06/01/2025 | | | | | | | | | | | | | | | 1,258,997 | |
| | 310 | | | 5.750%, 06/01/2026 | | | | | | | | | | | | | | | 337,993 | |
Portfolio of Investments
Nuveen Intermediate Tax Free Fund (continued)
April 30, 2011
| | | | | | | | | | | | | | | | | | | | |
Principal
Amount (000) | | | Description p | | | | | | | | | | | Value | |
| | | | | | | | | | | | | | | | | | | | |
| | | | Illinois (continued) | | | | | | | | | | | | | | | | |
| | | | | |
| | | | Will County School District #86, Joliet (AGM) | | | | | | | | | | | | | | | | |
| $ | 3,870 | | | 0.000%, 11/01/2017 | | | | | | | | | | | | | | $ | 2,953,081 | |
| | | | | |
| | | | Winnebago County School District 122, Harlem-Loves Park (ETM) (AGM) | | | | | | | | | | | | | | | | |
| | 1,320 | | | 0.000%, 01/01/2017 | | | | | | | | | | | | | | | 1,134,989 | |
| | | | | |
| | | | Winnebago County School District 122, Harlem-Loves Park (AGM) | | | | | | | | | | | | | | | | |
| | 1,680 | | | 0.000%, 01/01/2017 | | | | | | | | | | | | | | | 1,334,541 | |
| | 100,085 | | | Total Illinois | | | | | | | | | | | | | | | 97,251,477 | |
| | | | Indiana – 1.1% | | | | | | | | | | | | | | | | |
| | | | | |
| | | | Anderson Economic Development, Anderson University Project | | | | | | | | | | | | | | | | |
| | 710 | | | 5.000%, 10/01/2017 | | | | | | | | | | | | | | | 686,137 | |
| | | | | |
| | | | Avon Community School Building Corporation, First Mortgage (AMBAC) (STAID) | | | | | | | | | | | | | | | | |
| | 1,000 | | | 4.500%, 07/15/2020 | | | | | | | | | | | | | | | 1,046,300 | |
| | | | | |
| | | | Indiana Transportation Finance Authority, Series A (AMBAC) | | | | | | | | | | | | | | | | |
| | 1,820 | | | 5.750%, 06/01/2012 | | | | | | | | | | | | | | | 1,874,782 | |
| | | | | |
| | | | Indiana Transportation Finance Authority, Series A (ETM) (AMBAC) | | | | | | | | | | | | | | | | |
| | 180 | | | 5.750%, 06/01/2012 | | | | | | | | | | | | | | | 180,824 | |
| | | | | |
| | | | Indiana University Series K, Zero Coupon Bond (NATL) | | | | | | | | | | | | | | | | |
| | 250 | | | 0.000%, 08/01/2011 | | | | | | | | | | | | | | | 249,395 | |
| | | | | |
| | | | Portage Township Multi-School Building Corporation, First Mortgage (NATL) (STAID) | | | | | | | | | | | | | | | | |
| | 1,250 | | | 4.000%, 07/15/2018 | | | | | | | | | | | | | | | 1,341,788 | |
| | | | | |
| | | | St. Joseph County Economic Development, Holy Cross Village, Notre Dame Project, Series A | | | | | | | | | | | | | | | | |
| | 450 | | | 5.750%, 05/15/2016 | | | | | | | | | | | | | | | 444,861 | |
| | 230 | | | 5.550%, 05/15/2019 | | | | | | | | | | | | | | | 218,638 | |
| | | | | |
| | | | St. Joseph County Hospital Authority, Memorial Health System, Series A (NATL) | | | | | | | | | | | | | | | | |
| | 1,000 | | | 4.750%, 08/15/2012 | | | | | | | | | | | | | | | 1,003,140 | |
| | | | | |
| | | | Zionsville Community Schools Building, First Mortgage (Pre-refunded 01/15/2012) (FGIC) (STAID) | | | | | | | | | | | | | | | | |
| | 775 | | | 5.750%, 07/15/2015 | | | | | | | | | | | | | | | 805,132 | |
| | 7,665 | | | Total Indiana | | | | | | | | | | | | | | | 7,850,997 | |
| | | | Iowa – 1.5% | | | | | | | | | | | | | | | | |
| | | | | |
| | | | Iowa Finance Authority Retirement Community, Friendship Haven Project, Series A | | | | | | | | | | | | | | | | |
| | 500 | | | 5.750%, 11/15/2019 | | | | | | | | | | | | | | | 492,870 | |
| | | | | |
| | | | Iowa Higher Education Authority, Private College Facility, Central College Project (RAAI) | | | | | | | | | | | | | | | | |
| | 1,000 | | | 5.450%, 10/01/2026 | | | | | | | | | | | | | | | 1,000,820 | |
| | | | | |
| | | | Iowa Higher Education Authority, Private College Facility, Upper Iowa University Project | | | | | | | | | | | | | | | | |
| | 1,250 | | | 5.500%, 09/01/2025 | | | | | | | | | | | | | | | 1,288,563 | |
| | | | | |
| | | | Iowa Higher Education Authority, Wartburg College Project (Pre-refunded 10/01/2012) (ACA) | | | | | | | | | | | | | | | | |
| | 2,000 | | | 5.500%, 10/01/2028 | | | | | | | | | | | | | | | 2,140,500 | |
| | | | | |
| | | | Iowa Higher Education Authority, Wartburg College Project, Series A | | | | | | | | | | | | | | | | |
| | 925 | | | 4.700%, 10/01/2016 | | | | | | | | | | | | | | | 901,228 | |
| | 1,100 | | | 4.750%, 10/01/2017 | | | | | | | | | | | | | | | 1,060,433 | |
| | 1,155 | | | 4.800%, 10/01/2018 | | | | | | | | | | | | | | | 1,098,116 | |
| | | | | |
| | | | Iowa State Special Obligation Prison Infrastructure Fund | | | | | | | | | | | | | | | | |
| | 2,000 | | | 4.500%, 06/15/2022 | | | | | | | | | | | | | | | 2,165,120 | |
| | | | | |
| | | | Muscatine Electric (ETM) | | | | | | | | | | | | | | | | |
| | 615 | | | 9.700%, 01/01/2013 | | | | | | | | | | | | | | | 677,010 | |
| | 10,545 | | | Total Iowa | | | | | | | | | | | | | | | 10,824,660 | |
| | | | Kansas – 2.9% | | | | | | | | | | | | | | | | |
| | | | | |
| | 7,500 | | | Johnson County Residual (ETM) | | | | | | | | | | | | | | | 7,431,300 | |
| | | | | |
| | | | Johnson County Unified School District #512, Shawnee Mission | | | | | | | | | | | | | | | | |
| | 2,000 | | | 4.875%, 10/01/2019 | | | | | | | | | | | | | | | 2,271,320 | |
| | | | | |
| | | | Kansas Development Finance Authority, Adventist Health | | | | | | | | | | | | | | | | |
| | 2,200 | | | 5.500%, 11/15/2023 | | | | | | | | | | | | | | | 2,387,066 | |
| | | | | | | | | | | | | | | | | | | | |
Principal
Amount (000) | | | Description p | | | | | | | | | | | Value | |
| | | | | | | | | | | | | | | | | | | | |
| | | | Kansas (continued) | | | | | | | | | | | | | | | | |
| | | | | |
| | | | Kansas Development Finance Authority, Adventist/Sunbelt, Series D | | | | | | | | | | | | | | | | |
| $ | 1,400 | | | 5.000%, 11/15/2024 | | | | | | | | | | | | | | $ | 1,454,544 | |
| | | | | |
| | | | Kansas Development Finance Authority, Health Facilities, Hays Medical Center, Series L | | | | | | | | | | | | | | | | |
| | 1,405 | | | 4.500%, 11/15/2017 | | | | | | | | | | | | | | | 1,461,017 | |
| | | | | |
| | | | Kansas Development Finance Authority, Kansas State Projects Series K (NATL) | | | | | | | | | | | | | | | | |
| | 1,850 | | | 4.500%, 11/01/2019 | | | | | | | | | | | | | | | 2,011,302 | |
| | | | | |
| | | | Olathe Health Facilities, Olathe Medical Center | | | | | | | | | | | | | | | | |
| | 1,000 | | | 5.125%, 09/01/2021 | | | | | | | | | | | | | | | 1,040,400 | |
| | | | | |
| | | | Olathe Senior Living Facility, Catholic Care Campus, Series A | | | | | | | | | | | | | | | | |
| | 700 | | | 5.750%, 11/15/2013 | | | | | | | | | | | | | | | 702,191 | |
| | 765 | | | 5.750%, 11/15/2014 | | | | | | | | | | | | | | | 763,646 | |
| | 820 | | | 5.750%, 11/15/2015 | | | | | | | | | | | | | | | 814,006 | |
| | | | | |
| | | | Sedgwick County School District #267 (AMBAC) | | | | | | | | | | | | | | | | |
| | 1,045 | | | 5.250%, 11/01/2012 | | | | | | | | | | | | | | | 1,106,989 | |
| | | | | |
| | | | Sedgwick & Shawnee Counties, Single Family Mortgages, Series A-2 (GNMA) | | | | | | | | | | | | | | | | |
| | 165 | | | 6.700%, 06/01/2029 | | | | | | | | | | | | | | | 168,326 | |
| | 20,850 | | | Total Kansas | | | | | | | | | | | | | | | 21,612,107 | |
| | | | Kentucky – 0.5% | | | | | | | | | | | | | | | | |
| | | | | |
| | | | Kentucky Economic Development Finance Authority, Louisville Arena Project, Series A-1 (AGC) | | | | | | | | | | | | | | | | |
| | 2,000 | | | 5.750%, 12/01/2028 | | | | | | | | | | | | | | | 2,075,820 | |
| | | | | |
| | | | Kentucky Turnpike Authority (ETM) | | | | | | | | | | | | | | | | |
| | 235 | | | 6.000%, 07/01/2011 | | | | | | | | | | | | | | | 237,051 | |
| | | | | |
| | | | Louisville/Jefferson County Metropolitan Government College, Bellarmine University, Series A | | | | | | | | | | | | | | | | |
| | 1,135 | | | 6.000%, 05/01/2028 | | | | | | | | | | | | | | | 1,153,126 | |
| | 3,370 | | | Total Kentucky | | | | | | | | | | | | | | | 3,465,997 | |
| | | | Louisiana – 0.4% | | | | | | | | | | | | | | | | |
| | | | | |
| | | | Calcasieu Parish School District #23, Public School Improvement | | | | | | | | | | | | | | | | |
| | 500 | | | 4.600%, 02/15/2020 | | | | | | | | | | | | | | | 507,225 | |
| | | | | |
| | | | Louisiana, Series B (CIFG) | | | | | | | | | | | | | | | | |
| | 1,300 | | | 5.000%, 07/15/2015 | | | | | | | | | | | | | | | 1,486,524 | |
| | | | | |
| | | | Louisiana Local Government Environmental Facilities, Community Development Authority (AMT) | | | | | | | | | | | | | | | | |
| | 425 | | | 6.650%, 01/01/2025 | | | | | | | | | | | | | | | 398,165 | |
| | | | | |
| | | | Tobacco Settlement Finance Revenue, Series 2001B | | | | | | | | | | | | | | | | |
| | 600 | | | 5.875%, 05/15/2039 | | | | | | | | | | | | | | | 547,578 | |
| | 2,825 | | | Total Louisiana | | | | | | | | | | | | | | | 2,939,492 | |
| | | | Maine – 0.1% | | | | | | | | | | | | | | | | |
| | | | | |
| | | | Maine Health & Higher Educational Facilities Authority Series B (FGIC) (NATL) | | | | | | | | | �� | | | | | | | |
| | 740 | | | 4.125%, 07/01/2018 | | | | | | | | | | | | | | | 786,983 | |
| | | | Maryland – 0.1% | | | | | | | | | | | | | | | | |
| | | | | |
| | | | Westminster Educational Facilities, McDaniel College | | | | | | | | | | | | | | | | |
| | 350 | | | 5.000%, 11/01/2013 | | | | | | | | | | | | | | | 373,499 | |
| | 700 | | | 4.000%, 11/01/2015 | | | | | | | | | | | | | | | 731,094 | |
| | 1,050 | | | Total Maryland | | | | | | | | | | | | | | | 1,104,593 | |
| | | | Massachusetts – 3.1% | | | | | | | | | | | | | | | | |
| | | | | |
| | | | Massachusetts Bay Transportation Authority, Series A (COMGTY) | | | | | | | | | | | | | | | | |
| | 1,875 | | | 6.250%, 03/01/2012 | | | | | | | | | | | | | | | 1,966,087 | |
| | | | | |
| | | | Massachusetts Development Finance Agency, Health Care Facilities, AdventCare Project, Series A | | | | | | | | | | | | | | | | |
| | 2,500 | | | 6.650%, 10/15/2028 | | | | | | | | | | | | | | | 2,226,450 | |
| | | | | |
| | | | Massachusetts Development Finance Agency, Suffolk University | | | | | | | | | | | | | | | | |
| | 900 | | | 4.500%, 07/01/2021 | | | | | | | | | | | | | | | 867,879 | |
| | 1,765 | | | 4.500%, 07/01/2022 | | | | | | | | | | | | | | | 1,681,321 | |
Portfolio of Investments
Nuveen Intermediate Tax Free Fund (continued)
April 30, 2011
| | | | | | | | | | | | | | | | | | | | |
Principal
Amount (000) | | | Description p | | | | | | | | | | | Value | |
| | | | | | | | | | | | | | | | | | | | |
| | | | Massachusetts (continued) | | | | | | | | | | | | | | | | |
| $ | 1,705 | | | 4.625%, 07/01/2023 | | | | | | | | | | | | | | $ | 1,618,761 | |
| | | | | |
| | | | Massachusetts Educational Finance Authority, Issue I, Series B (AMT) | | | | | | | | | | | | | | | | |
| | 1,485 | | | 4.800%, 01/01/2017 | | | | | | | | | | | | | | | 1,509,592 | |
| | | | | |
| | | | Massachusetts Health & Educational Facilities Authority, Berkshire Health System, Series F (AGC) | | | | | | | | | | | | | | | | |
| | 2,000 | | | 5.000%, 10/01/2015 | | | | | | | | | | | | | | | 2,186,120 | |
| | | | | |
| | | | Massachusetts Health & Educational Facilities Authority, Springfield College | | | | | | | | | | | | | | | | |
| | 500 | | | 5.125%, 10/15/2022 | | | | | | | | | | | | | | | 501,215 | |
| | 2,595 | | | 5.500%, 10/15/2026 | | | | | | | | | | | | | | | 2,563,030 | |
| | | | | |
| | | | Massachusetts Health & Educational Facilities Authority, Suffolk University, Series A | | | | | | | | | | | | | | | | |
| | 3,000 | | | 6.000%, 07/01/2024 | | | | | | | | | | | | | | | 3,143,640 | |
| | | | | |
| | | | Massachusetts Port Authority (ETM) | | | | | | | | | | | | | | | | |
| | 1,975 | | | 13.000%, 07/01/2013 | | | | | | | | | | | | | | | 2,255,114 | |
| | | | | |
| | | | Massachusetts, Special Obligation, Series A | | | | | | | | | | | | | | | | |
| | 1,000 | | | 5.500%, 06/01/2013 | | | | | | | | | | | | | | | 1,091,800 | |
| | | | | |
| | | | Springfield, State Qualified Municipal Purpose Loan (AGM) (STAID) | | | | | | | | | | | | | | | | |
| | 1,400 | | | 4.500%, 08/01/2020 | | | | | | | | | | | | | | | 1,486,072 | |
| | 22,700 | | | Total Massachusetts | | | | | | | | | | | | | | | 23,097,081 | |
| | | | Michigan – 2.1% | | | | | | | | | | | | | | | | |
| | | | | |
| | | | Algonac Community Schools, School Building & Site Series I (AGM) (MQSBLF) | | | | | | | | | | | | | | | | |
| | 790 | | | 4.000%, 05/01/2019 | | | | | | | | | | | | | | | 813,953 | |
| | | | | |
| | | | Constantine Public Schools (MQSBLF) | | | | | | | | | | | | | | | | |
| | 1,075 | | | 5.000%, 05/01/2016 | | | | | | | | | | | | | | | 1,133,534 | |
| | | | | |
| | | | Detroit Water Supply System (ETM) (FGIC) | | | | | | | | | | | | | | | | |
| | 105 | | | 6.250%, 07/01/2012 | | | | | | | | | | | | | | | 108,578 | |
| | | | | |
| | | | Kalamazoo Hospital Finance Authority, Bronson Methodist Hospital, Series A (AGM) | | | | | | | | | | | | | | | | |
| | 2,675 | | | 5.000%, 05/15/2020 | | | | | | | | | | | | | | | 2,803,935 | |
| | | | | |
| | | | Michigan Hospital Finance Authority, Ascension Health Services Group, Series B | | | | | | | | | | | | | | | | |
| | 3,540 | | | 5.000%, 11/15/2023 | | | | | | | | | | | | | | | 3,661,776 | |
| | | | | |
| | | | Michigan Hospital Finance Authority, Henry Ford Health Systems Series A, (Pre-refunded 03/01/2013) | | | | | | | | | | | | | | | | |
| | 3,150 | | | 5.500%, 03/01/2015 | | | | | | | | | | | | | | | 3,430,917 | |
| | | | | |
| | | | Michigan Municipal Board Authority, Local Government Loan Program, Group, Series B (AMBAC) | | | | | | | | | | | | | | | | |
| | 600 | | | 5.000%, 12/01/2018 | | | | | | | | | | | | | | | 591,492 | |
| | | | | |
| | | | Romulus Economic Development Corporation, Partnership Project (ETM) | | | | | | | | | | | | | | | | |
| | 1,300 | | | 7.000%, 11/01/2015 (ETM) | | | | | | | | | | | | | | | 1,602,588 | |
| | | | | |
| | | | Western Michigan University (AGM) | | | | | | | | | | | | | | | | |
| | 1,300 | | | 5.000%, 11/15/2023 | | | | | | | | | | | | | | | 1,358,396 | |
| | 14,535 | | | Total Michigan | | | | | | | | | | | | | | | 15,505,169 | |
| | | | Minnesota – 2.6% | | | | | | | | | | | | | | | | |
| | | | | |
| | | | Aitkin Health Care Facilities, Riverwood Healthcare Center | | | | | | | | | | | | | | | | |
| | 1,590 | | | 5.375%, 02/01/2017 | | | | | | | | | | | | | | | 1,556,419 | |
| | | | | |
| | | | Minneapolis & St. Paul Metropolitan Airports Commission, Series A (NATL) | | | | | | | | | | | | | | | | |
| | 1,165 | | | 5.000%, 01/01/2019 | | | | | | | | | | | | | | | 1,195,337 | |
| | | | | |
| | | | Minneapolis Health Care System, Fairview Health Services Series A | | | | | | | | | | | | | | | | |
| | 2,000 | | | 6.375%, 11/15/2023 | | | | | | | | | | | | | | | 2,207,460 | |
| | | | | |
| | | | Minneapolis Hospital, St. Marys Hospital & Rehabilitation Center (ETM) | | | | | | | | | | | | | | | | |
| | 430 | | | 10.000%, 06/01/2013 | | | | | | | | | | | | | | | 471,417 | |
| | | | | |
| | | | Minneapolis National Marrow Donor Program | | | | | | | | | | | | | | | | |
| | 2,650 | | | 5.000%, 08/01/2018 | | | | | | | | | | | | | | | 2,777,518 | |
| | 3,500 | | | 4.250%, 08/01/2020 | | | | | | | | | | | | | | | 3,367,420 | |
| | | | | |
| | | | Minnesota Agricultural & Economic Development Board, Health Care System, Series A | | | | | | | | | | | | | | | | |
| | 2,135 | | | 5.875%, 11/15/2011 | | | | | | | | | | | | | | | 2,163,716 | |
| | | | | |
| | | | Minnesota Higher Education Facilities Authority, Bethel University Series 6-R | | | | | | | | | | | | | | | | |
| | 1,255 | | | 5.500%, 05/01/2020 | | | | | | | | | | | | | | | 1,270,976 | |
| | | | | | | | | | | | | | | | | | | | |
Principal
Amount (000) | | | Description p | | | | | | | | | | | Value | |
| | | | | | | | | | | | | | | | | | | | |
| | | | Minnesota (continued) | | | | | | | | | | | | | | | | |
| $ | 815 | | | 5.500%, 05/01/2021 | | | | | | | | | | | | | | $ | 815,000 | |
| | | | | |
| | | | Minnesota Higher Education Facilities Authority, College of Art & Design, Series 6-K | | | | | | | | | | | | | | | | |
| | 295 | | | 5.000%, 05/01/2012 | | | | | | | | | | | | | | | 304,806 | |
| | | | | |
| | | | Monticello-Big Lake Community Hospital District, Health Care Facilities, Series C | | | | | | | | | | | | | | | | |
| | 515 | | | 5.250%, 12/01/2011 | | | | | | | | | | | | | | | 515,031 | |
| | | | | |
| | | | St. Paul Housing & Redevelopment Authority, Allina Health System, Series A (NATL) | | | | | | | | | | | | | | | | |
| | 1,235 | | | 5.000%, 11/15/2019 | | | | | | | | | | | | | | | 1,321,240 | |
| | | | | |
| | | | St. Paul Housing & Redevelopment Authority, Allina Health System, Series A-1 | | | | | | | | | | | | | | | | |
| | 1,000 | | | 5.000%, 11/15/2024 | | | | | | | | | | | | | | | 1,017,790 | |
| | 18,585 | | | Total Minnesota | | | | | | | | | | | | | | | 18,984,130 | |
| | | | Mississippi – 0.2% | | | | | | | | | | | | | | | | |
| | | | | |
| | | | Mississippi Hospital Equipment & Facilities Authority, Mississippi Baptist Health Systems Series A | | | | | | | | | | | | | | | | |
| | 1,440 | | | 5.000%, 08/15/2016 | | | | | | | | | | | | | | | 1,547,813 | |
| | | | Missouri – 2.0% | | | | | | | | | | | | | | | | |
| | | | | |
| | | | Grundy County Industrial Development Authority, Health Facilities, Wright Memorial Hospital | | | | | | | | | | | | | | | | |
| | 1,000 | | | 5.600%, 09/01/2021 | | | | | | | | | | | | | | | 986,050 | |
| | | | | |
| | | | Hannibal Industrial Development Authority, Health Facilities, Hannibal Regional Hospital | | | | | | | | | | | | | | | | |
| | 1,405 | | | 4.350%, 03/01/2014 | | | | | | | | | | | | | | | 1,439,900 | |
| | | | | |
| | | | Kansas City Special Obligation, East Village Project Series B (AGC) | | | | | | | | | | | | | | | | |
| | 505 | | | 5.000%, 04/15/2022 | | | | | | | | | | | | | | | 549,188 | |
| | | | | |
| | | | Missouri Development Finance Board Infrastructure Facilities, Independence-Centerpoint, Series F | | | | | | | | | | | | | | | | |
| | 1,000 | | | 5.375%, 04/01/2024 | | | | | | | | | | | | | | | 1,010,210 | |
| | | | | |
| | | | Missouri Development Finance Board Infrastructure Facilities, Independence-Crackerneck Creek, Series B | | | | | | | | | | | | | | | | |
| | 2,000 | | | 5.125%, 03/01/2022 | | | | | | | | | | | | | | | 2,068,480 | |
| | | | | |
| | | | Missouri Development Finance Board Infrastructure Facilities, Independence Electric System Project, Series D | | | | | | | | | | | | | | | | |
| | 1,250 | | | 5.625%, 06/01/2029 | | | | | | | | | | | | | | | 1,260,663 | |
| | | | | |
| | | | Missouri Development Finance Board, Midwest Research Institute Project | | | | | | | | | | | | | | | | |
| | 1,130 | | | 5.000%, 11/01/2016 | | | | | | | | | | | | | | | 1,206,049 | |
| | | | | |
| | | | Missouri Health & Educational Facilities Authority, Senior Living Facilities, Lutheran, Series B | | | | | | | | | | | | | | | | |
| | 850 | | | 4.350%, 02/01/2015 | | | | | | | | | | | | | | | 880,209 | |
| | 930 | | | 4.375%, 02/01/2016 | | | | | | | | | | | | | | | 954,691 | |
| | | | | |
| | | | Missouri Joint Municipal Electric Utilities, Commission Power Project, Series A (AMBAC) | | | | | | | | | | | | | | | | |
| | 2,000 | | | 5.000%, 01/01/2018 | | | | | | | | | | | | | | | 2,154,100 | |
| | | | | |
| | | | Missouri Joint Municipal Electric Utilities, Commission Power Project, Plum Point Project (NATL) | | | | | | | | | | | | | | | | |
| | 1,000 | | | 4.200%, 01/01/2018 | | | | | | | | | | | | | | | 1,019,720 | |
| | | | | |
| | | | Osage Beach Tax Increment, Prewitts Point Project | | | | | | | | | | | | | | | | |
| | 1,650 | | | 4.800%, 05/01/2016 | | | | | | | | | | | | | | | 1,578,357 | |
| | 14,720 | | | Total Missouri | | | | | | | | | | | | | | | 15,107,617 | |
| | | | Montana – 0.8% | | | | | | | | | | | | | | | | |
| | | | | |
| | | | Montana Facility Finance Authority, Senior Living, St. Johns Lutheran Ministries Project, Series A | | | | | | | | | | | | | | | | |
| | 1,800 | | | 5.750%, 05/15/2016 | | | | | | | | | | | | | | | 1,749,042 | |
| | 1,675 | | | 6.000%, 05/15/2025 | | | | | | | | | | | | | | | 1,489,644 | |
| | | | | |
| | | | Montana Facility Finance Authority, Sisters of Charity of Leavenworth, Series B | | | | | | | | | | | | | | | | |
| | 2,500 | | | 5.000%, 01/01/2024 | | | | | | | | | | | | | | | 2,568,900 | |
| | 5,975 | | | Total Montana | | | | | | | | | | | | | | | 5,807,586 | |
| | | | Nebraska – 1.4% | | | | | | | | | | | | | | | | |
| | | | | |
| | | | Douglas County Hospital Authority #2, Immanuel Obligated Group | | | | | | | | | | | | | | | | |
| | 1,130 | | | 5.125%, 01/01/2023 | | | | | | | | | | | | | | | 1,146,114 | |
| | | | | |
| | | | Douglas County Hospital Authority #2, Nebraska Medical Center, Clarkson Regional Health Guaranty | | | | | | | | | | | | | | | | |
| | 2,860 | | | 5.000%, 11/15/2011 | | | | | | | | | | | | | | | 2,920,689 | |
Portfolio of Investments
Nuveen Intermediate Tax Free Fund (continued)
April 30, 2011
| | | | | | | | | | | | | | | | | | | | |
Principal
Amount (000) | | | Description p | | | | | | | | | | | Value | |
| | | | | | | | | | | | | | | | | | | | |
| | | | Nebraska (continued) | | | | | | | | | | | | | | | | |
| | | | | |
| | | | Douglas County Hospital Authority #3, Methodist Health | | | | | | | | | | | | | | | | |
| $ | 600 | | | 5.750%, 11/01/2028 | | | | | | | | | | | | | | $ | 603,264 | |
| | | | | |
| | | | Lancaster County Hospital Authority #1, BryanLG Medical Center Project | | | | | | | | | | | | | | | | |
| | 2,000 | | | 4.000%, 06/01/2018 | | | | | | | | | | | | | | | 1,974,180 | |
| | | | | |
| | | | Lancaster County Hospital Authority #1, Immanuel Obligated Group | | | | | | | | | | | | | | | | |
| | 735 | | | 4.750%, 01/01/2019 | | | | | | | | | | | | | | | 759,292 | |
| | 1,000 | | | 5.125%, 01/01/2023 | | | | | | | | | | | | | | | 1,022,770 | |
| | | | | |
| | | | Nebraska Investment Finance Authority, Great Plains Regional Medical Center Project (RAAI) | | | | | | | | | | | | | | | | |
| | 500 | | | 4.700%, 11/15/2011 | | | | | | | | | | | | | | | 510,210 | |
| | 500 | | | 4.800%, 11/15/2012 | | | | | | | | | | | | | | | 517,060 | |
| | 600 | | | 4.900%, 11/15/2013 | | | | | | | | | | | | | | | 617,352 | |
| | 9,925 | | | Total Nebraska | | | | | | | | | | | | | | | 10,070,931 | |
| | | | Nevada – 0.3% | | | | | | | | | | | | | | | | |
| | | | | |
| | | | Carson City Hospital, Carson-Tahoe Hospital | | | | | | | | | | | | | | | | |
| | 550 | | | 5.750%, 09/01/2011 | | | | | | | | | | | | | | | 554,862 | |
| | 580 | | | 5.750%, 09/01/2012 | | | | | | | | | | | | | | | 597,092 | |
| | | | | |
| | | | Carson City Hospital, Carson-Tahoe Hospital (ETM) | | | | | | | | | | | | | | | | |
| | 450 | | | 5.750%, 09/01/2011 | | | | | | | | | | | | | | | 457,853 | |
| | 475 | | | 5.750%, 09/01/2012 | | | | | | | | | | | | | | | 506,497 | |
| | 2,055 | | | Total Nevada | | | | | | | | | | | | | | | 2,116,304 | |
| | | | New Hampshire – 0.5% | | | | | | | | | | | | | | | | |
| | | | | |
| | | | New Hampshire Health & Education Facilities Authority, Covenant Health | | | | | | | | | | | | | | | | |
| | 1,250 | | | 5.375%, 07/01/2024 | | | | | | | | | | | | | | | 1,250,975 | |
| | | | | |
| | | | New Hampshire Health & Educational Facilities Authority, Speare Memorial Hospital | | | | | | | | | | | | | | | | |
| | 1,000 | | | 5.500%, 07/01/2025 | | | | | | | | | | | | | | | 933,630 | |
| | | | | |
| | | | New Hampshire Municipal Bond Bank Series A (NATL) | | | | | | | | | | | | | | | | |
| | 1,300 | | | 4.500%, 02/15/2020 | | | | | | | | | | | | | | | 1,421,030 | |
| | 3,550 | | | Total New Hampshire | | | | | | | | | | | | | | | 3,605,635 | |
| | | | New Jersey – 0.5% | | | | | | | | | | | | | | | | |
| | | | | |
| | | | New Jersey Economic Development Authority, Cigarette Tax | | | | | | | | | | | | | | | | |
| | 2,000 | | | 5.500%, 06/15/2016 | | | | | | | | | | | | | | | 2,111,160 | |
| | | | | |
| | | | Tobacco Settlement Financing, Series 1A | | | | | | | | | | | | | | | | |
| | 1,915 | | | 4.500%, 06/01/2023 | | | | | | | | | | | | | | | 1,619,018 | |
| | 3,915 | | | Total New Jersey | | | | | | | | | | | | | | | 3,730,178 | |
| | | | New York – 1.2% | | | | | | | | | | | | | | | | |
| | | | | |
| | | | New York, Series A | | | | | | | | | | | | | | | | |
| | 3,220 | | | 5.750%, 08/01/2015 | | | | | | | | | | | | | | | 3,400,996 | |
| | | | | |
| | | | New York, Series D (ETM) | | | | | | | | | | | | | | | | |
| | 660 | | | 5.500%, 06/01/2012 | | | | | | | | | | | | | | | 696,914 | |
| | | | | |
| | | | New York, Series D | | | | | | | | | | | | | | | | |
| | 1,340 | | | 5.500%, 06/01/2012 | | | | | | | | | | | | | | | 1,412,628 | |
| | | | | |
| | | | Tobacco Settlement Financing, Series B-1C | | | | | | | | | | | | | | | | |
| | 700 | | | 5.500%, 06/01/2019 | | | | | | | | | | | | | | | 746,571 | |
| | 200 | | | 5.500%, 06/01/2020 | | | | | | | | | | | | | | | 212,858 | |
| | | | | |
| | | | Troy Capital Resource Revenue, Rensselaer Polytechnic Institute Project, Series B | | | | | | | | | | | | | | | | |
| | 1,200 | | | 5.000%, 09/01/2019 | | | | | | | | | | | | | | | 1,316,136 | |
| | 1,000 | | | 5.000%, 09/01/2021 | | | | | | | | | | | | | | | 1,078,290 | |
| | 8,320 | | | Total New York | | | | | | | | | | | | | | | 8,864,393 | |
| | | | North Carolina – 2.5% | | | | | | | | | | | | | | | | |
| | | | | |
| | | | North Carolina Capital Facilities Finance Agency Education Facilities, Meredith College | | | | | | | | | | | | | | | | |
| | 900 | | | 5.250%, 06/01/2020 | | | | | | | | | | | | | | | 931,158 | |
| | | | | | | | | | | | | | | | | | | | |
Principal
Amount (000) | | | Description p | | | | | | | | | | | Value | |
| | | | | | | | | | | | | | | | | | | | |
| | | | North Carolina (continued) | | | | | | | | | | | | | | | | |
| | | | | |
| | | | North Carolina Eastern Power Agency, Series A (AGC) | | | | | | | | | | | | | | | | |
| $ | 1,700 | | | 5.250%, 01/01/2022 | | | | | | | | | | | | | | $ | 1,843,990 | |
| | | | | |
| | | | North Carolina Eastern Power Agency, Series D | | | | | | | | | | | | | | | | |
| | 2,955 | | | 5.375%, 01/01/2013 | | | | | | | | | | | | | | | 3,146,366 | |
| | | | | |
| | | | North Carolina Medical Care Commission Health Care Facilities, First Mortgage Presbyterian, Series B | | | | | | | | | | | | | | | | |
| | 2,035 | | | 4.875%, 10/01/2013 | | | | | | | | | | | | | | | 2,014,589 | |
| | 2,120 | | | 5.000%, 10/01/2014 | | | | | | | | | | | | | | | 2,094,390 | |
| | | | | |
| | | | North Carolina Municipal Power Agency #1, Catawba Electric, Series A | | | | | | | | | | | | | | | | |
| | 5,940 | | | 5.000%, 01/01/2026 | | | | | | | | | | | | | | | 6,142,198 | |
| | | | | |
| | | | North Carolina Municipal Power Agency #1, Catawba Electric, Series A (AGM) | | | | | | | | | | | | | | | | |
| | 2,000 | | | 5.250%, 01/01/2016 | | | | | | | | | | | | | | | 2,124,720 | |
| | 17,650 | | | Total North Carolina | | | | | | | | | | | | | | | 18,297,411 | |
| | | | North Dakota – 0.2% | | | | | | | | | | | | | | | | |
| | | | | |
| | | | Ward County Health Care Facility, Trinity Obligated Group | | | | | | | | | | | | | | | | |
| | 1,180 | | | 5.000%, 07/01/2014 | | | | | | | | | | | | | | | 1,245,726 | |
| | | | Ohio – 1.2% | | | | | | | | | | | | | | | | |
| | | | | |
| | | | Akron (AGC) | | | | | | | | | | | | | | | | |
| | 1,000 | | | 5.000%, 12/01/2015 | | | | | | | | | | | | | | | 1,121,800 | |
| | | | | |
| | | | Barberton City School District (OSDCEP) | | | | | | | | | | | | | | | | |
| | 1,260 | | | 4.750%, 12/01/2021 | | | | | | | | | | | | | | | 1,354,966 | |
| | | | | |
| | | | Buckeye Tobacco Settlement, Series A-1 | | | | | | | | | | | | | | | | |
| | 375 | | | 5.000%, 06/01/2015 | | | | | | | | | | | | | | | 381,776 | |
| | 35 | | | 5.000%, 06/01/2017 | | | | | | | | | | | | | | | 34,890 | |
| | | | | |
| | | | Buckeye Tobacco Settlement, Series A-2 | | | | | | | | | | | | | | | | |
| | 120 | | | 5.125%, 06/01/2024 | | | | | | | | | | | | | | | 92,719 | |
| | | | | |
| | | | Lake County Hospital Facilities, Lake Hospital System, Series C | | | | | | | | | | | | | | | | |
| | 1,230 | | | 5.500%, 08/15/2024 | | | | | | | | | | | | | | | 1,209,311 | |
| | | | | |
| | | | Mason City School District (AGM) | | | | | | | | | | | | | | | | |
| | 1,095 | | | 4.375%, 12/01/2019 | | | | | | | | | | | | | | | 1,186,049 | |
| | | | | |
| | | | Miami County Hospital Facilities, Upper Valley Medical Center | | | | | | | | | | | | | | | | |
| | 750 | | | 5.250%, 05/15/2016 | | | | | | | | | | | | | | | 806,715 | |
| | | | | |
| | | | Ohio Higher Education Facilities, John Carroll University Project | | | | | | | | | | | | | | | | |
| | 1,135 | | | 4.000%, 04/01/2014 | | | | | | | | | | | | | | | 1,191,353 | |
| | 1,000 | | | 4.500%, 04/01/2015 | | | | | | | | | | | | | | | 1,072,520 | |
| | | | | |
| | | | Richland County, Limited Tax, Correctional Facilities Improvement (AGC) | | | | | | | | | | | | | | | | |
| | 500 | | | 5.875%, 12/01/2024 | | | | | | | | | | | | | | | 549,730 | |
| | 8,500 | | | Total Ohio | | | | | | | | | | | | | | | 9,001,829 | |
| | | | Oklahoma – 0.7% | | | | | | | | | | | | | | | | |
| | | | | |
| | | | Cherokee County Economic Development Authority, Series A, (ETM) (AMBAC) | | | | | | | | | | | | | | | | |
| | 3,340 | | | 0.000%, 11/01/2011 (ETM) | | | | | | | | | | | | | | | 3,331,350 | |
| | | | | |
| | | | McClain County Economic Development Authority, Educational Facilities Lease, Newcastle Public Schools Project | | | | | | | | | | | | | | | | |
| | 345 | | | 5.000%, 09/01/2011 | | | | | | | | | | | | | | | 349,047 | |
| | 355 | | | 5.000%, 09/01/2012 | | | | | | | | | | | | | | | 370,048 | |
| | 250 | | | 4.125%, 09/01/2013 | | | | | | | | | | | | | | | 260,500 | |
| | | | | |
| | | | Oklahoma City Industrial & Cultural Facilities, Oklahoma City Project (AMT) | | | | | | | | | | | | | | | | |
| | 1,430 | | | 5.750%, 01/01/2023 | | | | | | | | | | | | | | | 1,248,533 | |
| | 5,720 | | | Total Oklahoma | | | | | | | | | | | | | | | 5,559,478 | |
| | | | Pennsylvania – 2.2% | | | | | | | | | | | | | | | | |
| | | | | |
| | | | Allegheny County Hospital, University of Pittsburgh Medical Center Series B | | | | | | | | | | | | | | | | |
| | 3,000 | | | 5.000%, 06/15/2018 | | | | | | | | | | | | | | | 3,319,650 | |
Portfolio of Investments
Nuveen Intermediate Tax Free Fund (continued)
April 30, 2011
| | | | | | | | | | | | | | | | | | | | |
Principal
Amount (000) | | | Description p | | | | | | | | | | | Value | |
| | | | | | | | | | | | | | | | | | | | |
| | | | Pennsylvania (continued) | | | | | | | | | | | | | | | | |
| | | | | |
| | | | Bethel Park School District (STAID) | | | | | | | | | | | | | | | | |
| $ | 1,315 | | | 4.125%, 08/01/2020 | | | | | | | | | | | | | | $ | 1,399,147 | |
| | | | | |
| | | | Delaware County College Authority, Neumann College | | | | | | | | | | | | | | | | |
| | 535 | | | 5.250%, 10/01/2020 | | | | | | | | | | | | | | | 539,226 | |
| | 1,000 | | | 5.000%, 10/01/2021 | | | | | | | | | | | | | | | 1,009,840 | |
| | 565 | | | 5.375%, 10/01/2021 | | | | | | | | | | | | | | | 565,831 | |
| | 1,050 | | | 5.000%, 10/01/2025 | | | | | | | | | | | | | | | 1,009,260 | |
| | | | | |
| | | | Delaware County Hospital Authority, Crozer-Chester Medical Center (RAAI) | | | | | | | | | | | | | | | | |
| | 1,275 | | | 5.000%, 12/15/2015 | | | | | | | | | | | | | | | 1,317,980 | |
| | 1,405 | | | 5.000%, 12/15/2017 | | | | | | | | | | | | | | | 1,406,068 | |
| | | | | |
| | | | Montgomery County Industrial Development Authority, Whitemarsh Continuing Care | | | | | | | | | | | | | | | | |
| | 1,000 | | | 6.125%, 02/01/2028 | | | | | | | | | | | | | | | 842,230 | |
| | | | | |
| | | | Philadelphia Gas Works, Ninth Series | | | | | | | | | | | | | | | | |
| | 3,000 | | | 5.000%, 08/01/2030 | | | | | | | | | | | | | | | 2,893,710 | |
| | | | | |
| | | | Westmoreland County Industrial Development Authority, Retirement Community, Redstone, Series A | | | | | | | | | | | | | | | | |
| | 1,100 | | | 5.375%, 01/01/2014 | | | | | | | | | | | | | | | 1,085,018 | |
| | 1,200 | | | 5.500%, 01/01/2016 | | | | | | | | | | | | | | | 1,169,100 | |
| | 16,445 | | | Total Pennsylvania | | | | | | | | | | | | | | | 16,557,060 | |
| | | | Puerto Rico – 0.7% | | | | | | | | | | | | | | | | |
| | | | | |
| | | | Puerto Rico Commonwealth, Public Improvement, Series A | | | | | | | | | | | | | | | | |
| | 4,000 | | | 5.000%, 07/01/2020 | | | | | | | | | | | | | | | 3,989,520 | |
| | | | | |
| | | | Puerto Rico Public Buildings Authority, Government Facilities Series M-2, Mandatory Put
07/01/2017 @ 100 (AMBAC) (COMGTY) | | | | | | | | | | | | | | | | |
| | 1,000 | | | 5.500%, 07/01/2035 | | | | | | | | | | | | | | | 1,050,010 | |
| | 5,000 | | | Total Puerto Rico | | | | | | | | | | | | | | | 5,039,530 | |
| | | | South Carolina – 1.1% | | | | | | | | | | | | | | | | |
| | | | | |
| | | | Charleston Educational Excellence Financing Corporation, Charleston County School District Project | | | | | | | | | | | | | | | | |
| | 2,000 | | | 5.000%, 12/01/2013 | | | | | | | | | | | | | | | 2,204,900 | |
| | | | | |
| | | | Lexington County Health Services District (Pre-refunded 11/01/2013) | | | | | | | | | | | | | | | | |
| | 2,000 | | | 5.500%, 11/01/2023 | | | | | | | | | | | | | | | 2,240,420 | |
| | | | | |
| | | | South Carolina Jobs Economic Development Authority, Palmetto Health Alliance | | | | | | | | | | | | | | | | |
| | 1,000 | | | 5.000%, 08/01/2018 | | | | | | | | | | | | | | | 1,011,020 | |
| | | | | |
| | | | South Carolina Jobs Economic Development Authority, Palmetto Health Alliance, Series A | | | | | | | | | | | | | | | | |
| | 645 | | | 6.000%, 08/01/2013 | | | | | | | | | | | | | | | 680,791 | |
| | | | | |
| | | | South Carolina Jobs Economic Development Authority, Palmetto Health Alliance, Series C | | | | | | | | | | | | | | | | |
| | 2,000 | | | 6.000%, 08/01/2013 | | | | | | | | | | | | | | | 2,110,980 | |
| | 7,645 | | | Total South Carolina | | | | | | | | | | | | | | | 8,248,111 | |
| | | | South Dakota – 1.3% | | | | | | | | | | | | | | | | |
| | | | | |
| | | | Deadwood Series 2005 (ACA) | | | | | | | | | | | | | | | | |
| | 2,385 | | | 5.000%, 11/01/2018 | | | | | | | | | | | | | | | 2,405,368 | |
| | | | | |
| | | | South Dakota Health & Educational Facilities Authority, Sanford Health | | | | | | | | | | | | | | | | |
| | 1,000 | | | 5.000%, 11/01/2024 | | | | | | | | | | | | | | | 1,024,210 | |
| | | | | |
| | | | South Dakota Health & Educational Facilities Authority, Vocational Education Program (AGC) | | | | | | | | | | | | | | | | |
| | 1,500 | | | 5.125%, 08/01/2028 | | | | | | | | | | | | | | | 1,557,375 | |
| | | | | |
| | | | South Dakota Health & Educational Facilities Authority, Westhills Village Retirement Community | | | | | | | | | | | | | | | | |
| | 530 | | | 4.750%, 09/01/2011 | | | | | | | | | | | | | | | 535,697 | |
| | 1,000 | | | 5.000%, 09/01/2012 | | | | | | | | | | | | | | | 1,039,070 | |
| | 1,000 | | | 5.000%, 09/01/2013 | | | | | | | | | | | | | | | 1,041,070 | |
| | 1,770 | | | 5.000%, 09/01/2025 | | | | | | | | | | | | | | | 1,701,023 | |
| | 9,185 | | | Total South Dakota | | | | | | | | | | | | | | | 9,303,813 | |
| | | | Tennessee – 4.3% | | | | | | | | | | | | | | | | |
| | | | | |
| | | | Chattanooga Health, Educational & Housing Facilities Board, Catholic Health Initiatives, Series D | | | | | | | | | | | | | | | | |
| | 2,265 | | | 6.125%, 10/01/2028 | | | | | | | | | | | | | | | 2,428,533 | |
| | | | | | | | | | | | | | | | | | | | |
Principal
Amount (000) | | | Description p | | | | | | | | | | | Value | |
| | | | | | | | | | | | | | | | | | | | |
| | | | Tennessee (continued) | | | | | | | | | | | | | | | | |
| | | | | |
| | | | Claiborne County Industrial Development Board, Lincoln Memorial University Project | | | | | | | | | | | | | | | | |
| $ | 3,460 | | | 6.125%, 10/01/2029 | | | | | | | | | | | | | | $ | 3,467,681 | |
| | | | | |
| | | | Jackson Hospital, Jackson-Madison Project | | | | | | | | | | | | | | | | |
| | 3,650 | | | 5.250%, 04/01/2023 | | | | | | | | | | | | | | | 3,782,130 | |
| | | | | |
| | | | Memphis (NATL) | | | | | | | | | | | | | | | | |
| | 2,000 | | | 5.000%, 10/01/2016 | | | | | | | | | | | | | | | 2,320,220 | |
| | | | | |
| | | | Memphis-Shelby County Sports Authority, Memphis Arena Project, Series A | | | | | | | | | | | | | | | | |
| | 4,430 | | | 5.125%, 11/01/2024 | | | | | | | | | | | | | | | 4,594,398 | |
| | | | | |
| | | | Memphis-Shelby County Sports Authority, Memphis Arena Project, Series B | | | | | | | | | | | | | | | | |
| | 1,000 | | | 5.500%, 11/01/2020 | | | | | | | | | | | | | | | 1,112,810 | |
| | 1,860 | | | 5.250%, 11/01/2025 | | | | | | | | | | | | | | | 1,927,741 | |
| | | | | |
| | | | Memphis-Shelby County Sports Authority, Memphis Arena Project, Series C (NATL) | | | | | | | | | | | | | | | | |
| | 3,175 | | | 5.000%, 11/01/2017 | | | | | | | | | | | | | | | 3,504,914 | |
| | | | | |
| | | | Shelby County Health, Educational & Housing Facility Board, Methodist Healthcare (Pre-refunded 09/01/2012) | | | | | | | | | | | | | | | | |
| | 935 | | | 6.000%, 09/01/2016 | | | | | | | | | | | | | | | 1,000,310 | |
| | 565 | | | 6.000%, 09/01/2016 | | | | | | | | | | | | | | | 604,465 | |
| | | | | |
| | | | Sullivan County Health, Educational & Housing Facilities Board, Wellmont Health System Project (RAAI) | | | | | | | | | | | | | | | | |
| | 2,000 | | | 5.000%, 09/01/2016 | | | | | | | | | | | | | | | 2,036,080 | |
| | | | | |
| | | | Sullivan County Health, Educational & Housing Facilities Board, Wellmont Health System Project (RAAI) (ETM) | | | | | | | | | | | | | | | | |
| | 1,465 | | | 6.250%, 09/01/2011 | | | | | | | | | | | | | | | 1,494,183 | |
| | 1,085 | | | 6.250%, 09/01/2012 | | | | | | | | | | | | | | | 1,159,409 | |
| | | | | |
| | | | Sullivan County Health, Educational & Housing Facilities Board, Wellmont Health System Project
(Pre-refunded 09/01/2012) | | | | | | | | | | | | | | | | |
| | 2,215 | | | 6.500%, 09/01/2013 | | | | | | | | | | | | | | | 2,396,076 | |
| | 30,105 | | | Total Tennessee | | | | | | | | | | | | | | | 31,828,950 | |
| | | | Texas – 10.4% | | | | | | | | | | | | | | | | |
| | | | | |
| | | | Alvin Independent School District, Schoolhouse (PSFG) | | | | | | | | | | | | | | | | |
| | 1,110 | | | 4.125%, 02/15/2019 | | | | | | | | | | | | | | | 1,185,391 | |
| | | | | |
| | | | Brazos River Harbor Navigation District, Brazoria County Environmental, Dow Chemical Company Project Series A-5, Mandatory Put 05/15/2012 @ 100 (AMT) | | | | | | | | | | | | | | | | |
| | 1,000 | | | 5.700%, 05/15/2033 | | | | | | | | | | | | | | | 1,033,400 | |
| | | | | |
| | | | Brownsville (NATL) | | | | | | | | | | | | | | | | |
| | 2,125 | | | 5.000%, 02/15/2017 | | | | | | | | | | | | | | | 2,322,476 | |
| | | | | |
| | | | Corinth (NATL) | | | | | | | | | | | | | | | | |
| | 1,180 | | | 4.500%, 02/15/2019 | | | | | | | | | | | | | | | 1,264,299 | |
| | | | | |
| | | | Dallas (NATL) | | | | | | | | | | | | | | | | |
| | 5,000 | | | 4.500%, 02/15/2027 | | | | | | | | | | | | | | | 5,054,350 | |
| | | | | |
| | | | Dallas County Utilities & Reclamation District, Series A (AMBAC) | | | | | | | | | | | | | | | | |
| | 5,715 | | | 5.150%, 02/15/2022 | | | | | | | | | | | | | | | 5,903,424 | |
| | | | | |
| | | | El Paso County (NATL) | | | | | | | | | | | | | | | | |
| | 2,440 | | | 5.000%, 02/15/2018 | | | | | | | | | | | | | | | 2,822,055 | |
| | | | | |
| | | | El Paso Water & Sewer, Series A (AGM) | | | | | | | | | | | | | | | | |
| | 650 | | | 4.000%, 03/01/2018 | | | | | | | | | | | | | | | 684,268 | |
| | | | | |
| | | | Elgin Independent School District, School Building (PSFG) | | | | | | | | | | | | | | | | |
| | 1,120 | | | 4.375%, 08/01/2019 | | | | | | | | | | | | | | | 1,234,330 | |
| | | | | |
| | | | Fort Bend Independent School District | | | | | | | | | | | | | | | | |
| | 2,000 | | | 4.550%, 02/15/2025 | | | | | | | | | | | | | | | 2,072,740 | |
| | | | | |
| | | | Frisco (AMBAC) | | | | | | | | | | | | | | | | |
| | 2,045 | | | 4.500%, 02/15/2016 | | | | | | | | | | | | | | | 2,303,508 | |
| | | | | |
| | | | Giddings Independent School District, School Building Series A (PSFG) | | | | | | | | | | | | | | | | |
| | 875 | | | 4.250%, 02/15/2019 | | | | | | | | | | | | | | | 956,699 | |
Portfolio of Investments
Nuveen Intermediate Tax Free Fund (continued)
April 30, 2011
| | | | | | | | | | | | | | | | | | | | |
Principal
Amount (000) | | | Description p | | | | | | | | | | | Value | |
| | | | | | | | | | | | | | | | | | | | |
| | | | Texas (continued) | | | | | | | | | | | | | | | | |
| | | | | |
| | | | Grand Prairie Independent School District, School Building Series A (PSFG) | | | | | | | | | | | | | | | | |
| $ | 635 | | | 4.500%, 02/15/2018 | | | | | | | | | | | | | | $ | 713,296 | |
| | | | | |
| | | | Grapevine Industrial Development Corporation, Air Cargo (AMT) | | | | | | | | | | | | | | | | |
| | 445 | | | 6.500%, 01/01/2024 | | | | | | | | | | | | | | | 415,866 | |
| | | | | |
| | | | Gregg County Health Facilities Development, Good Shepherd Medical Center Project, Series A | | | | | | | | | | | | | | | | |
| | 1,230 | | | 5.000%, 10/01/2013 | | | | | | | | | | | | | | | 1,260,947 | |
| | | | | |
| | | | Hale Center Educational Facilities, Wayland Baptist | | | | | | | | | | | | | | | | |
| | 875 | | | 4.000%, 03/01/2021 | | | | | | | | | | | | | | | 833,114 | |
| | 500 | | | 4.000%, 03/01/2022 | | | | | | | | | | | | | | | 468,650 | |
| | 800 | | | 4.000%, 03/01/2023 | | | | | | | | | | | | | | | 737,896 | |
| | 440 | | | 4.250%, 03/01/2025 | | | | | | | | | | | | | | | 405,640 | |
| | | | | |
| | | | Harris County Health Facilities Development Corporation, Memorial Hermann Healthcare System, Series B | | | | | | | | | | | | | | | | |
| | 1,950 | | | 7.125%, 12/01/2031 | | | | | | | | | | | | | | | 2,124,135 | |
| | | | | |
| | | | Harrison County Health Facilities Development Corporation, Good Shepherd Health System | | | | | | | | | | | | | | | | |
| | 2,270 | | | 5.000%, 07/01/2019 | | | | | | | | | | | | | | | 2,222,194 | |
| | 2,380 | | | 5.000%, 07/01/2020 | | | | | | | | | | | | | | | 2,304,149 | |
| | | | | |
| | | | Houston Health Facilities Development Corporation, Buckingham Senior Living Community, Series A, (Pre-refunded 02/15/2014) | | | | | | | | | | | | | | | | |
| | 2,000 | | | 7.000%, 02/15/2023 | | | | | | | | | | | | | | | 2,345,020 | |
| | | | | |
| | | | Howard County Junior College District (AMBAC) | | | | | | | | | | | | | | | | |
| | 715 | | | 4.250%, 02/15/2018 | | | | | | | | | | | | | | | 768,525 | |
| | | | | |
| | | | Kaufman County (AGM) | | | | | | | | | | | | | | | | |
| | 1,000 | | | 5.000%, 02/15/2017 | | | | | | | | | | | | | | | 1,030,170 | |
| | | | | |
| | | | League City Waterworks & Sewer System (AGM) | | | | | | | | | | | | | | | | |
| | 1,230 | | | 4.000%, 02/15/2018 | | | | | | | | | | | | | | | 1,326,087 | |
| | 1,315 | | | 4.375%, 02/15/2023 | | | | | | | | | | | | | | | 1,346,705 | |
| | | | | |
| | | | Lubbock Educational Facilities Authority, Lubbock Christian University | | | | | | | | | | | | | | | | |
| | 1,000 | | | 5.000%, 11/01/2016 | | | | | | | | | | | | | | | 1,074,000 | |
| | | | | |
| | | | Mansfield Independent School District, School Building (PSFG) | | | | | | | | | | | | | | | | |
| | 770 | | | 5.000%, 02/15/2022 | | | | | | | | | | | | | | | 838,692 | |
| | | | | |
| | | | North Texas Tollway Authority, First Tier, Series A | | | | | | | | | | | | | | | | |
| | 2,500 | | | 6.000%, 01/01/2024 | | | | | | | | | | | | | | | 2,676,725 | |
| | | | | |
| | | | North Texas Tollway Authority, First Tier, Series E-3, Mandatory Put 01/01/2016 @ 100 | | | | | | | | | | | | | | | | |
| | 3,000 | | | 5.750%, 01/01/2038 | | | | | | | | | | | | | | | 3,348,030 | |
| | | | | |
| | | | Northwest Texas Independent School District (PSFG) | | | | | | | | | | | | | | | | |
| | 1,000 | | | 4.500%, 02/15/2026 | | | | | | | | | | | | | | | 1,025,290 | |
| | | | | |
| | | | Odessa Housing Finance Corporation, Residual Values (ETM) (NATL) | | | | | | | | | | | | | | | | |
| | 1,465 | | | 0.000%, 06/01/2012 | | | | | | | | | | | | | | | 1,451,170 | |
| | | | | |
| | | | Plano Independent School District, School Building, Series A | | | | | | | | | | | | | | | | |
| | 1,000 | | | 5.000%, 02/15/2025 | | | | | | | | | | | | | | | 1,078,230 | |
| | | | | |
| | | | San Angelo, Series A (NATL) | | | | | | | | | | | | | | | | |
| | 875 | | | 4.400%, 02/15/2019 | | | | | | | | | | | | | | | 945,578 | |
| | | | | |
| | | | San Antonio | | | | | | | | | | | | | | | | |
| | 1,000 | | | 4.125%, 02/01/2019 | | | | | | | | | | | | | | | 1,069,580 | |
| | 1,140 | | | 4.250%, 02/01/2020 | | | | | | | | | | | | | | | 1,211,147 | |
| | | | | |
| | | | San Leanna Educational Facilities Corporation Higher Education, Saint Edwards University Project | | | | | | | | | | | | | | | | |
| | 575 | | | 5.000%, 06/01/2019 | | | | | | | | | | | | | | | 594,596 | |
| | | | | |
| | | | Sunnyvale School District, School Building (PSFG) | | | | | | | | | | | | | | | | |
| | 870 | | | 4.400%, 02/15/2020 | | | | | | | | | | | | | | | 945,890 | |
| | | | | |
| | | | Tarrant County Cultural Education Facilities Finance Corporation, Retirement Facility, Northwest Senior Housing, Edgemere Project, Series A | | | | | | | | | | | | | | | | |
| | 1,235 | | | 5.750%, 11/15/2014 | | | | | | | | | | | | | | | 1,221,168 | |
| | | | | | | | | | | | | | | | | | | | |
Principal
Amount (000) | | | Description p | | | | | | | | | | | Value | |
| | | | | | | | | | | | | | | | | | | | |
| | | | Texas (continued) | | | | | | | | | | | | | | | | |
| | | | | |
| | | | Tarrant County Cultural Education Facilities, Finance Corporation, Retirement Facility, Stayton at Museum Way, Series C-2 | | | | | | | | | | | | | | | | |
| $ | 3,000 | | | 6.500%, 11/15/2014 | | | | | | | | | | | | | | $ | 2,959,920 | |
| | | | | |
| | | | Teague Independent School District, School Building (PSFG) | | | | | | | | | | | | | | | | |
| | 2,210 | | | 5.000%, 02/15/2019 | | | | | | | | | | | | | | | 2,551,997 | |
| | | | | |
| | | | Texas Transportation Commission, First Tier | | | | | | | | | | | | | | | | |
| | 2,000 | | | 5.000%, 04/01/2017 | | | | | | | | | | | | | | | 2,333,860 | |
| | | | | |
| | | | Texas, Water Financial Assistance, Series A | | | | | | | | | | | | | | | | |
| | 1,500 | | | 5.000%, 08/01/2017 | | | | | | | | | | | | | | | 1,756,875 | |
| | | | | |
| | | | Travis County Health Facilities, Development Corporation Retirement Facilities, Querencia Barton Creek Project | | | | | | | | | | | | | | | | |
| | 1,000 | | | 5.250%, 11/15/2017 | | | | | | | | | | | | | | | 948,980 | |
| | 900 | | | 5.500%, 11/15/2025 | | | | | | | | | | | | | | | 775,062 | |
| | | | | |
| | | | Tyler Health Facilities Development Corporation, Mother Frances Hospital | | | | | | | | | | | | | | | | |
| | 1,000 | | | 5.250%, 07/01/2012 | | | | | | | | | | | | | | | 1,023,010 | |
| | | | | |
| | | | Victoria Independent School District, School Building (PSFG) | | | | | | | | | | | | | | | | |
| | 500 | | | 5.000%, 02/15/2018 | | | | | | | | | | | | | | | 576,345 | |
| | | | | |
| | | | Victoria Utilities Systems (AMBAC) | | | | | | | | | | | | | | | | |
| | 1,000 | | | 4.400%, 12/01/2019 | | | | | | | | | | | | | | | 1,066,100 | |
| | 72,585 | | | Total Texas | | | | | | | | | | | | | | | 76,611,579 | |
| | | | Washington – 4.3% | | | | | | | | | | | | | | | | |
| | | | | |
| | | | Clark County School District #37, Vancouver (AGM) | | | | | | | | | | | | | | | | |
| | 1,515 | | | 5.250%, 12/01/2014 | | | | | | | | | | | | | | | 1,723,070 | |
| | | | | |
| | | | King County School District #401, Highline Public Schools (AGM) (SBG) | | | | | | | | | | | | | | | | |
| | 500 | | | 5.250%, 12/01/2025 | | | | | | | | | | | | | | | 538,710 | |
| | | | | |
| | | | King County School District #412, Shoreline (SBG) | | | | | | | | | | | | | | | | |
| | 265 | | | 5.750%, 12/01/2021 | | | | | | | | | | | | | | | 307,146 | |
| | | | | |
| | | | Snohomish County Housing Authority | | | | | | | | | | | | | | | | |
| | 600 | | | 6.300%, 04/01/2016 | | | | | | | | | | | | | | | 607,998 | |
| | | | | |
| | | | Snohomish County, Limited Tax (Pre-refunded 12/01/2011) (NATL) | | | | | | | | | | | | | | | | |
| | 4,440 | | | 5.375%, 12/01/2019 | | | | | | | | | | | | | | | 4,571,335 | |
| | 560 | | | 5.375%, 12/01/2019 | | | | | | | | | | | | | | | 576,565 | |
| | | | | |
| | | | Spokane County School District #356, Central Valley Series B, Zero Coupon Bond (FGIC) (NATL) | | | | | | | | | | | | | | | | |
| | 5,690 | | | 0.000%, 12/01/2014 | | | | | | | | | | | | | | | 5,287,091 | |
| | | | | |
| | | | Spokane County School District #81, Spokane (NATL) | | | | | | | | | | | | | | | | |
| | 1,000 | | | 5.000%, 06/01/2016 | | | | | | | | | | | | | | | 1,162,910 | |
| | | | | |
| | | | Washington Health Care Facilities, Washington Health Services | | | | | | | | | | | | | | | | |
| | 3,125 | | | 6.250%, 07/01/2024 | | | | | | | | | | | | | | | 3,232,656 | |
| | 2,000 | | | 6.750%, 07/01/2029 | | | | | | | | | | | | | | | 2,023,500 | |
| | | | | |
| | | | Washington Higher Education Facilities Authority, Whitworth University Project | | | | | | | | | | | | | | | | |
| | 3,250 | | | 5.125%, 10/01/2024 | | | | | | | | | | | | | | | 3,226,535 | |
| | | | | |
| | | | Washington, Series C | | | | | | | | | | | | | | | | |
| | 2,275 | | | 5.500%, 07/01/2014 | | | | | | | | | | | | | | | 2,585,811 | |
| | | | | |
| | | | Washington, Series S-5, Zero Coupon Bond (FCIC) (NATL) | | | | | | | | | | | | | | | | |
| | 3,000 | | | 0.000%, 01/01/2016 | | | | | | | | | | | | | | | 2,707,230 | |
| | | | | |
| | | | Washington, Various Purpose, Series R-A (AMBAC) | | | | | | | | | | | | | | | | |
| | 3,000 | | | 5.000%, 01/01/2025 | | | | | | | | | | | | | | | 3,145,530 | |
| | 31,220 | | | Total Washington | | | | | | | | | | | | | | | 31,696,087 | |
| | | | Wisconsin – 2.2% | | | | | | | | | | | | | | | | |
| | | | | |
| | | | Door County, Series A, Crossover Refunded 09/01/2011 @ 100 (FGIC) | | | | | | | | | | | | | | | | |
| | 1,720 | | | 5.125%, 09/01/2016 | | | | | | | | | | | | | | | 1,743,254 | |
| | | | | |
| | | | Franklin Solid Waste Disposal, Waste Management Wisconsin Incorporated Series A, Mandatory Put 05/01/2016 @ 100 (AMT) | | | | | | | | | | | | | | | | |
| | 2,000 | | | 4.950%, 11/01/2016 | | | | | | | | | | | | | | | 2,099,940 | |
Portfolio of Investments
Nuveen Intermediate Tax Free Fund (continued)
April 30, 2011
| | | | | | | | | | | | | | | | | | | | |
Principal
Amount (000) | | | Description p | | | | | | | | | | | Value | |
| | | | | | | | | | | | | | | | | | | | |
| | | | Wisconsin (continued) | | | | | | | | | | | | | | | | |
| | | | | |
| | | | Wisconsin Health & Educational Facilities Authority, Aurora Health Care Incorporated, Series A | | | | | | | | | | | | | | | | |
| $ | 1,440 | | | 5.500%, 02/15/2020 | | | | | | | | | | | | | | $ | 1,440,821 | |
| | | | | |
| | | | Wisconsin Health & Educational Facilities Authority, Beloit College, Series A | | | | | | | | | | | | | | | | |
| | 2,060 | | | 6.000%, 06/01/2030 | | | | | | | | | | | | | | | 1,956,753 | |
| | | | | |
| | | | Wisconsin Health & Educational Facilities Authority, Childrens Hospital, Series B | | | | | | | | | | | | | | | | |
| | 1,350 | | | 4.350%, 08/15/2019 | | | | | | | | | | | | | | | 1,421,982 | |
| | | | | |
| | | | Wisconsin Health & Educational Facilities Authority, Eastcastle Place Incorporated Project | | | | | | | | | | | | | | | | |
| | 2,000 | | | 5.750%, 12/01/2019 | | | | | | | | | | | | | | | 1,682,260 | |
| | | | | |
| | | | Wisconsin Health & Educational Facilities Authority, Fort Healthcare Incorporated Project | | | | | | | | | | | | | | | | |
| | 1,250 | | | 5.375%, 05/01/2018 | | | | | | | | | | | | | | | 1,265,363 | |
| | | | | |
| | | | Wisconsin Health & Educational Facilities Authority, Marshfield Clinic, Series B | | | | | | | | | | | | | | | | |
| | 850 | | | 5.500%, 02/15/2013 | | | | | | | | | | | | | | | 867,586 | |
| | | | | |
| | | | Wisconsin Health & Educational Facilities Authority, Southwest Health Center, Series A | | | | | | | | | | | | | | | | |
| | 1,500 | | | 6.125%, 04/01/2024 | | | | | | | | | | | | | | | 1,430,085 | |
| | | | | |
| | | | Wisconsin Health & Educational Facilities Authority, Vernon Memorial Healthcare Incorporated Project | | | | | | | | | | | | | | | | |
| | 640 | | | 4.650%, 03/01/2015 | | | | | | | | | | | | | | | 656,422 | |
| | | | | |
| | | | Wisconsin Health & Educational Facilities Authority, Wisconsin Medical College Series A (NATL) | | | | | | | | | | | | | | | | |
| | 1,450 | | | 5.000%, 12/01/2015 | | | | | | | | | | | | | | | 1,576,368 | |
| | 16,260 | | | Total Wisconsin | | | | | | | | | | | | | | | 16,140,834 | |
| | | | Wyoming – 0.3% | | | | | | | | | | | | | | | | |
| | | | | |
| | | | Lincoln County, Pacificorp Project Mandatory Put 06/03/2013 @ 100 (AMT) | | | | | | | | | | | | | | | | |
| | 2,250 | | | 4.125%, 11/01/2025 | | | | | | | | | | | | | | | 2,324,587 | |
| $ | 719,107 | | | Total Municipal Bonds (cost $705,284,509) | | | | | | | | | | | | | | | 728,395,735 | |
| | | | | |
| Shares | | | Description p | | | | | | | | | | | Value | |
| | | | Short-Term Investments – 0.2% | | | | | | | | | | | | | | | | |
| | | | | |
| | | | Money Market Funds – 0.2% | | | | | | | | | | | | | | | | |
| | | | | |
| $ | 1,922,633 | | | First American Tax Free Obligations Fund, Class Z, 0.053% W | | | | | | | | | | | | | | | 1,922,633 | |
| | | | Total Short-Term Investments (cost $1,922,633) | | | | | | | | | | | | | | | 1,922,633 | |
| | | | Total Investments – 99.0% (cost $707,207,142) | | | | | | | | | | | | | | | 730,318,368 | |
| | | | Other Assets Less Liabilities – 1.0% | | | | | | | | | | | | | | | 7,059,775 | |
| | | | Net Assets – 100.0% | | | | | | | | | | | | | | $ | 737,378,143 | |
| | p | | All percentages shown in the Portfolio of Investments are based on net assets. |
| | g | | Convertible Capital Appreciation Bonds (Convertible CABs) initially pay no interest but accrete in value from the date of issuance through the conversion date, at which time the bonds start to accrue and pay interest on a semiannual basis until final maturity. |
| | | | During July 2010, the original issue for this security (1,000,000 par, 5.40% coupon and May, 15, 2014 maturity) was restructured into two new securities. The first security, which is 70% of the original issue, has 700,000 par, 5.400% coupon and May 15, 2017 maturity. The second security, which is the remaining 30% of the issue, has a 300,000 par, 0.000% coupon and May 15, 2050 maturity. At the end of the reporting period, the Adviser continues to accrue interest on the 700,000 par security. |
| | | | During July 2010, the original issure for this security (1,000,000 par, 5.50% coupon and May 15, 2015 maturity) was restructured into two new securities. The first security, which is 70% of the original issue, has a 700,000 par, 5.500% coupon and May 15, 2018 maturity. The second security, which is the remaining 30% of the issue, has a 300,000 par, 0.000% coupon and May 15, 2050 maturity. At the end of the reporting period, the Adviser continues to accure interest on the 700,000 par security. |
| | | | Crossover refunded securities are backed by the credit of the refunding issuer. These bonds mature at the call date and price indicated. |
| | W | | The rate shown is the annualized seven-day effective yield as of April 30, 2011. |
| | (ETM) | | Escrowed to maturity. |
Portfolio of Investments
Nuveen Short Tax Free Fund
(formerly known as the First American Short Tax Free Fund)
April 30, 2011
| | | | | | | | | | | | | | | | | | | | |
Principal
Amount (000) | | | Description p | | | | | | | | | | | Value | |
| | | | | | | | | | | | | | | | | | | | |
| | | | Municipal Bonds – 77.4% | | | | | | | | | | | | | | | | |
| | | | | |
| | | | Alaska – 0.7% | | | | | | | | | | | | | | | | |
| | | | | |
| | | | Alaska Railroad Corporation, Capital Grant Receipts (FGIC) (NATL) | | | | | | | | | | | | | | | | |
| $ | 1,825 | | | 5.000%, 08/01/2012 | | | | | | | | | | | | | | $ | 1,910,447 | |
| | | | Arizona – 2.5% | | | | | | | | | | | | | | | | |
| | | | | |
| | | | Glendale Individual Development Authority, Midwestern University | | | | | | | | | | | | | | | | |
| | 1,545 | | | 5.000%, 05/15/2019 | | | | | | | | | | | | | | | 1,664,676 | |
| | | | | |
| | | | Phoenix Civic Improvement, Series A | | | | | | | | | | | | | | | | |
| | 5,000 | | | 5.000%, 07/01/2017 | | | | | | | | | | | | | | | 5,454,900 | |
| | 6,545 | | | Total Arizona | | | | | | | | | | | | | | | 7,119,576 | |
| | | | Arkansas – 1.0% | | | | | | | | | | | | | | | | |
| | | | | |
| | | | North Little Rock Health Facilities Board, Baptist Health Series B | | | | | | | | | | | | | | | | |
| | 2,750 | | | 5.375%, 12/01/2019 | | | | | | | | | | | | | | | 2,975,280 | |
| | | | California – 4.6% | | | | | | | | | | | | | | | | |
| | | | | |
| | | | California Economic Recovery, Series A | | | | | | | | | | | | | | | | |
| | 3,000 | | | 5.000%, 07/01/2020 | | | | | | | | | | | | | | | 3,372,870 | |
| | | | | |
| | | | California School Cash Reserve Program, Series S | | | | | | | | | | | | | | | | |
| | 1,255 | | | 2.500%, 01/31/2012 | | | | | | | | | | | | | | | 1,269,407 | |
| | | | | |
| | | | California Statewide Communities Development Authority, Health Facility, Adventist Health, Series A | | | | | | | | | | | | | | | | |
| | 2,500 | | | 5.000%, 03/01/2016 | | | | | | | | | | | | | | | 2,654,175 | |
| | | | | |
| | | | Long Beach Community College, Series A | | | | | | | | | | | | | | | | |
| | 3,750 | | | 9.850%, 01/15/2013 | | | | | | | | | | | | | | | 4,294,050 | |
| | | | | |
| | | | Northern California Power Agency, Series A | | | | | | | | | | | | | | | | |
| | 500 | | | 5.000%, 07/01/2016 | | | | | | | | | | | | | | | 565,330 | |
| | | | | |
| | | | Union City Community Redevelopment Agency, Community Redevelopment | | | | | | | | | | | | | | | | |
| | 985 | | | 5.000%, 12/01/2018 | | | | | | | | | | | | | | | 977,416 | |
| | 11,990 | | | Total California | | | | | | | | | | | | | | | 13,133,248 | |
| | | | Colorado – 3.4% | | | | | | | | | | | | | | | | |
| | | | | |
| | | | Colorado Health Facilities Authority, Catholic Health Initiatives, Series A | | | | | | | | | | | | | | | | |
| | 3,345 | | | 5.000%, 07/01/2015 | | | | | | | | | | | | | | | 3,716,329 | |
| | | | | |
| | | | Colorado Health Facilities Authority, Evangelical Lutheran, Series B Mandatory Put 12/01/2014 @ 100 | | | | | | | | | | | | | | | | |
| | 2,400 | | | 5.000%, 06/01/2039 | | | | | | | | | | | | | | | 2,532,048 | |
| | | | | |
| | | | Colorado Health Facilities Authority, North Colorado Medical Center Project, Series A (AGM) | | | | | | | | | | | | | | | | |
| | 1,010 | | | 5.000%, 05/15/2013 | | | | | | | | | | | | | | | 1,073,913 | |
| | | | | |
| | | | Colorado Health Facilities Authority, Yampa Valley Medical Center Project | | | | | | | | | | | | | | | | |
| | 1,000 | | | 5.000%, 09/15/2013 | | | | | | | | | | | | | | | 1,036,540 | |
| | | | | |
| | | | Denver City & County Airport System, Series A | | | | | | | | | | | | | | | | |
| | 1,110 | | | 5.000%, 11/15/2017 | | | | | | | | | | | | | | | 1,246,685 | |
| | 8,865 | | | Total Colorado | | | | | | | | | | | | | | | 9,605,515 | |
| | | | District of Columbia – 1.3% | | | | | | | | | | | | | | | | |
| | | | | |
| | | | District of Columbia, Georgetown University, Series A | | | | | | | | | | | | | | | | |
| | 1,700 | | | 5.000%, 04/01/2014 | | | | | | | | | | | | | | | 1,834,521 | |
| | | | | |
| | | | Metropolitan Washington D.C. Airport Authority, Series B (AMT) | | | | | | | | | | | | | | | | |
| | 1,775 | | | 5.000%, 10/01/2011 | | | | | | | | | | | | | | | 1,807,873 | |
| | 3,475 | | | Total District of Columbia | | | | | | | | | | | | | | | 3,642,394 | |
| | | | Florida – 7.6% | | | | | | | | | | | | | | | | |
| | | | | |
| | | | Florida Department of Environmental Protection Preservation, Florida Forever, Series B (NATL) | | | | | | | | | | | | | | | | |
| | 10,000 | | | 5.000%, 07/01/2011 | | | | | | | | | | | | | | | 10,078,500 | |
| | | | | |
| | | | Florida Hurricane Catastrophe Fund Financial Corporation, Series A | | | | | | | | | | | | | | | | |
| | 4,000 | | | 5.250%, 07/01/2012 | | | | | | | | | | | | | | | 4,191,360 | |
Portfolio of Investments
Nuveen Short Tax Free Fund (continued)
April 30, 2011
| | | | | | | | | | | | | | | | | | | | |
Principal
Amount (000) | | | Description p | | | | | | | | | | | Value | |
| | | | | | | | | | | | | | | | | | | | |
| | | | Florida (continued) | | | | | | | | | | | | | | | | |
| | | | | |
| | | | Highlands County Health Facilities Authority, Adventist Health | | | | | | | | | | | | | | | | |
| $ | 1,000 | | | 5.000%, 11/15/2015 | | | | | | | | | | | | | | $ | 1,107,800 | |
| | 2,000 | | | 5.000%, 11/15/2016 | | | | | | | | | | | | | | | 2,217,980 | |
| | | | | |
| | | | Miami-Dade County Health Facilities Authority, Miami Children’s Hospital, Series A-1 Mandatory Put 08/01/2011 @ 100 (NATL) | | | | | | | | | | | | | | | | |
| | 1,000 | | | 4.125%, 08/01/2046 | | | | | | | | | | | | | | | 1,008,550 | |
| | | | | |
| | | | South Miami Health Facilities Authority, Baptist Health South Florida Group | | | | | | | | | | | | | | | | |
| | 2,000 | | | 5.000%, 08/15/2012 | | | | | | | | | | | | | | | 2,101,200 | |
| | | | | |
| | | | Tallahassee Energy Systems (NATL) | | | | | | | | | | | | | | | | |
| | 1,000 | | | 5.000%, 10/01/2012 | | | | | | | | | | | | | | | 1,058,170 | |
| | 21,000 | | | Total Florida | | | | | | | | | | | | | | | 21,763,560 | |
| | | | Georgia – 1.1% | | | | | | | | | | | | | | | | |
| | | | | |
| | | | DeKalb County Hospital Authority, DeKalb Medical Center Project | | | | | | | | | | | | | | | | |
| | 3,200 | | | 4.000%, 09/01/2015 | | | | | | | | | | | | | | | 3,171,328 | |
| | | | Hawaii – 0.5% | | | | | | | | | | | | | | | | |
| | | | | |
| | | | Hawaii Department of Budget & Finance, Special Purpose, Series C1 | | | | | | | | | | | | | | | | |
| | 1,500 | | | 7.500%, 11/15/2015 | | | | | | | | | | | | | | | 1,514,985 | |
| | | | Illinois – 3.3% | | | | | | | | | | | | | | | | |
| | | | | |
| | | | Illinois Finance Authority, Art Institute of Chicago Series A | | | | | | | | | | | | | | | | |
| | 4,000 | | | 5.000%, 03/01/2015 | | | | | | | | | | | | | | | 4,366,640 | |
| | | | | |
| | | | Illinois Finance Authority, Clare at Water Tower, Series A-1 Mandatory
Put 08/01/2011 @ 100 (NATL) | | | | | | | | | | | | | | | | |
| | 700 | | | 5.100%, 05/15/2014 D | | | | | | | | | | | | | | | 294,070 | |
| | | | Illinois Finance Authority, Clare at Water Tower, Series B | | | | | | | | | | | | | | | | |
| | 300 | | | 0.000%, 05/15/2050 D | | | | | | | | | | | | | | | 1,890 | |
| | | | | |
| | | | Illinois Finance Authority, Illinois Institute of Technology | | | | | | | | | | | | | | | | |
| | 500 | | | 6.250%, 02/01/2019 | | | | | | | | | | | | | | | 465,895 | |
| | | | | |
| | | | Illinois Finance Authority, Landing at Plymouth Place Project, Series A | | | | | | | | | | | | | | | | |
| | 500 | | | 5.000%, 05/15/2011 | | | | | | | | | | | | | | | 500,000 | |
| | | | | |
| | | | Illinois Finance Authority, Rush University Medical Center, Series A | | | | | | | | | | | | | | | | |
| | 1,630 | | | 5.000%, 11/01/2013 | | | | | | | | | | | | | | | 1,713,032 | |
| | 1,105 | | | 5.000%, 11/01/2014 | | | | | | | | | | | | | | | 1,169,819 | |
| | | | | |
| | | | Williamson & Johnson Counties Community Unit School District 2 | | | | | | | | | | | | | | | | |
| | 395 | | | 5.750%, 12/01/2014 | | | | | | | | | | | | | | | 430,716 | |
| | 450 | | | 5.750%, 12/01/2015 | | | | | | | | | | | | | | | 491,130 | |
| | 9,580 | | | Total Illinois | | | | | | | | | | | | | | | 9,433,192 | |
| | | | Indiana – 1.3% | | | | | | | | | | | | | | | | |
| | | | | |
| | | | Anderson Economic Development, Anderson University Project | | | | | | | | | | | | | | | | |
| | 990 | | | 5.000%, 10/01/2012 | | | | | | | | | | | | | | | 998,752 | |
| | | | | |
| | | | Crown Point, Temps-Wittenberg Village Project, Series C-2 | | | | | | | | | | | | | | | | |
| | 1,800 | | | 6.500%, 11/15/2013 | | | | | | | | | | | | | | | 1,783,782 | |
| | | | | |
| | | | Indiana Health & Educational Facilities, Financing Authority, Baptist Homes of Indiana | | | | | | | | | | | | | | | | |
| | 1,000 | | | 5.000%, 11/15/2013 | | | | | | | | | | | | | | | 1,045,080 | |
| | 3,790 | | | Total Indiana | | | | | | | | | | | | | | | 3,827,614 | |
| | | | Iowa – 2.7% | | | | | | | | | | | | | | | | |
| | | | | |
| | | | Iowa Finance Authority, Genesis Health Systems | | | | | | | | | | | | | | | | |
| | 1,150 | | | 5.000%, 07/01/2016 | | | | | | | | | | | | | | | 1,259,388 | |
| | 2,285 | | | 5.000%, 07/01/2020 | | | | | | | | | | | | | | | 2,432,680 | |
| | | | | |
| | | | Iowa Higher Education, Private College Facility, Grinnell (ETM) | | | | | | | | | | | | | | | | |
| | 4,000 | | | 2.100%, 12/01/2011 | | | | | | | | | | | | | | | 4,041,320 | |
| | 7,435 | | | Total Iowa | | | | | | | | | | | | | | | 7,733,388 | |
| | | | | | | | | | | | | | | | | | | | |
Principal
Amount (000) | | | Description p | | | | | | | | | | | Value | |
| | | | | | | | | | | | | | | | | | | | |
| | | | Kansas – 2.0% | | | | | | | | | | | | | | | | |
| | | | | |
| | | | Olathe Health Facilities, Olathe Medical Center | | | | | | | | | | | | | | | | |
| $ | 1,150 | | | 4.000%, 09/01/2012 | | | | | | | | | | | | | | $ | 1,187,030 | |
| | | | Olathe Health Facilities, Olathe Medical Center, Series A Mandatory Put 03/01/2013 @ 100 | | | | | | | | | | | | | | | | |
| | 1,350 | | | 4.125%, 09/01/2037 | | | | | | | | | | | | | | | 1,372,612 | |
| | | | | |
| | | | Wichita Hospital Improvement, Series III A | | | | | | | | | | | | | | | | |
| | 1,000 | | | 5.000%, 11/15/2014 | | | | | | | | | | | | | | | 1,088,110 | |
| | 1,000 | | | 5.000%, 11/15/2016 | | | | | | | | | | | | | | | 1,094,230 | |
| | | | | |
| | | | Wichita Hospital, Christi Health System | | | | | | | | | | | | | | | | |
| | 1,000 | | | 5.000%, 11/15/2015 | | | | | | | | | | | | | | | 1,099,210 | |
| | 5,500 | | | Total Kansas | | | | | | | | | | | | | | | 5,841,192 | |
| | | | Kentucky – 0.3% | | | | | | | | | | | | | | | | |
| | | | | |
| | | | Pikeville Hospital Refunding and Improvement, Pikeville Medical Center | | | | | | | | | | | | | | | | |
| | 750 | | | 4.000%, 03/01/2013 | | | | | | | | | | | | | | | 773,782 | |
| | | | Massachusetts – 2.0% | | | | | | | | | | | | | | | | |
| | | | | |
| | | | Massachusetts Development Finance Agency, Senior Living Facility, Groves-Lincoln, Series B2 | | | | | | | | | | | | | | | | |
| | 905 | | | 6.250%, 06/01/2014 | | | | | | | | | | | | | | | 886,240 | |
| | | | | |
| | | | Massachusetts Educational Financing Authority, Issue I, Series B, (AMT) | | | | | | | | | | | | | | | | |
| | 2,350 | | | 4.500%, 01/01/2016 | | | | | | | | | | | | | | | 2,428,349 | |
| | | | | |
| | | | Massachusetts Health & Educational Facilities Authority, Northeastern University, Series T-1 Mandatory Put 02/16/2012 @ 100 | | | | | | | | | | | | | | | | |
| | 2,000 | | | 4.125%, 10/01/2037 | | | | | | | | | | | | | | | 2,058,820 | |
| | | | | |
| | | | Massachusetts Health & Educational Facilities Authority, Springfield College | | | | | | | | | | | | | | | | |
| | 325 | | | 4.000%, 10/15/2013 | | | | | | | | | | | | | | | 336,170 | |
| | 5,580 | | | Total Massachusetts | | | | | | | | | | | | | | | 5,709,579 | |
| | | | Michigan – 2.8% | | | | | | | | | | | | | | | | |
| | | | | |
| | | | Michigan Hospital Finance Authority, Ascension Health Senior Credit Group Series B | | | | | | | | | | | | | | | | |
| | 2,030 | | | 5.000%, 11/15/2016 | | | | | | | | | | | | | | | 2,258,964 | |
| | | | | |
| | | | Walled Lake Consolidated School District | | | | | | | | | | | | | | | | |
| | 4,455 | | | 2.000%, 05/01/2013 | | | | | | | | | | | | | | | 4,476,963 | |
| | | | | |
| | | | Warren School District, School Improvement (FGIC) (NATL) | | | | | | | | | | | | | | | | |
| | 1,200 | | | 5.000%, 05/01/2012 | | | | | | | | | | | | | | | 1,246,944 | |
| | 7,685 | | | Total Michigan | | | | | | | | | | | | | | | 7,982,871 | |
| | | | Minnesota – 4.7% | | | | | | | | | | | | | | | | |
| | | | | |
| | | | Minneapolis & St. Paul Housing & Redevelopment Authority, Healthpartners Obligation Group Project | | | | | | | | | | | | | | | | |
| | 1,000 | | | 5.250%, 12/01/2012 | | | | | | | | | | | | | | | 1,044,050 | |
| | | | | |
| | | | Minneapolis & St. Paul Metropolitan Apartments, Series B, (AMT) | | | | | | | | | | | | | | | | |
| | 2,500 | | | 5.000%, 01/01/2015 | | | | | | | | | | | | | | | 2,741,400 | |
| | | | | |
| | | | Minneapolis, National Marrow Donor Program | | | | | | | | | | | | | | | | |
| | 2,500 | | | 5.000%, 08/01/2017 | | | | | | | | | | | | | | | 2,649,775 | |
| | | | | |
| | | | Minnesota Agricultural & Economic Development Board, Health Care Facilities, Essentia Series C-1, (AGC) | | | | | | | | | | | | | | | | |
| | 1,335 | | | 5.000%, 02/15/2015 | | | | | | | | | | | | | | | 1,462,412 | |
| | | | | |
| | | | Minnesota Higher Education Facilities Authority, Bethel University, Series 6-R | | | | | | | | | | | | | | | | |
| | 910 | | | 5.500%, 05/01/2016 | | | | | | | | | | | | | | | 945,008 | |
| | 1,065 | | | 5.500%, 05/01/2017 | | | | | | | | | | | | | | | 1,100,688 | |
| | | | | |
| | | | Minnesota Higher Education Facilities Authority, Hamline University, Series 7-K1 | | | | | | | | | | | | | | | | |
| | 500 | | | 3.000%, 10/01/2013 | | | | | | | | | | | | | | | 509,025 | |
| | | | | |
| | | | St. Cloud Health Care Facilities, CentraCare Health System Series A | | | | | | | | | | | | | | | | |
| | 1,000 | | | 5.000%, 05/01/2015 | | | | | | | | | | | | | | | 1,090,220 | |
Portfolio of Investments
Nuveen Short Tax Free Fund (continued)
April 30, 2011
| | | | | | | | | | | | | | | | | | | | |
Principal
Amount (000) | | | Description p | | | | | | | | | | | Value | |
| | | | | | | | | | | | | | | | | | | | |
| | | | Minnesota (continued) | | | | | | | | | | | | | | | | |
| | | | | |
| | | | St. Cloud Independent School District #742, Aid Anticipation Certificates | | | | | | | | | | | | | | | | |
| $ | 2,000 | | | 1.500%, 08/19/2011 | | | | | | | | | | | | | | $ | 2,006,760 | |
| | 12,810 | | | Total Minnesota | | | | | | | | | | | | | | | 13,549,338 | |
| | | | Mississippi – 2.1% | | | | | | | | | | | | | | | | |
| | | | | |
| | | | Mississippi Series B-1 (AGC) | | | | | | | | | | | | | | | | |
| | 3,235 | | | 4.000%, 07/01/2015 | | | | | | | | | | | | | | | 3,486,618 | |
| | | | | |
| | | | Mississippi Hospital Equipment & Facilities Authority, North Mississippi Health Services, Series 1 | | | | | | | | | | | | | | | | |
| | 2,250 | | | 5.000%, 10/01/2017 | | | | | | | | | | | | | | | 2,516,625 | |
| | 5,485 | | | Total Mississippi | | | | | | | | | | | | | | | 6,003,243 | |
| | | | Missouri – 3.0% | | | | | | | | | | | | | | | | |
| | | | | |
| | | | Kirkwood Industrial Development Authority, Aberdeen Heights, Series C-3 | | | | | | | | | | | | | | | | |
| | 3,000 | | | 6.500%, 05/15/2015 | | | | | | | | | | | | | | | 2,995,470 | |
| | | | | |
| | | | Missouri Finance Board, Infrastructure Facilities, Water Systems, Series E | | | | | | | | | | | | | | | | |
| | 2,020 | | | 4.000%, 11/01/2016 | | | | | | | | | | | | | | | 2,084,014 | |
| | | | | |
| | | | Missouri Health & Educational Facilities Authority, Rockhurst University, Series A | | | | | | | | | | | | | | | | |
| | 460 | | | 3.000%, 10/01/2012 | | | | | | | | | | | | | | | 464,476 | |
| | 475 | | | 3.000%, 10/01/2013 | | | | | | | | | | | | | | | 478,648 | |
| | | | | |
| | | | Missouri Health & Educational Facilities Authority, Webster University | | | | | | | | | | | | | | | | |
| | 2,000 | | | 5.250%, 04/01/2021 | | | | | | | | | | | | | | | 2,001,940 | |
| | | | | |
| | | | Osage Beach Tax Increment, Prewitt’s Point Project | | | | | | | | | | | | | | | | |
| | 465 | | | 4.625%, 05/01/2011 | | | | | | | | | | | | | | | 465,004 | |
| | 8,420 | | | Total Missouri | | | | | | | | | | | | | | | 8,489,552 | |
| | | | Montana – 1.0% | | | | | | | | | | | | | | | | |
| | | | | |
| | | | Montana Finance Authority, Series B | | | | | | | | | | | | | | | | |
| | 2,740 | | | 5.000%, 01/01/2019 | | | | | | | | | | | | | | | 2,995,039 | |
| | | | Nebraska – 0.1% | | | | | | | | | | | | | | | | |
| | | | | |
| | | | Central Plains Energy Project, Nebraska Gas Project #1 Series A | | | | | | | | | | | | | | | | |
| | 250 | | | 5.250%, 12/01/2021 | | | | | | | | | | | | | | | 242,350 | |
| | | | New Jersey – 2.3% | | | | | | | | | | | | | | | | |
| | | | | |
| | | | New Jersey Transportation Trust Fund, Series D | | | | | | | | | | | | | | | | |
| | 6,000 | | | 5.000%, 12/15/2018 | | | | | | | | | | | | | | | 6,541,920 | |
| | | | New Mexico – 0.7% | | | | | | | | | | | | | | | | |
| | | | | |
| | | | New Mexico Educational Assistance Foundation, Series C (AMT) | | | | | | | | | | | | | | | | |
| | 2,000 | | | 3.900%, 09/01/2014 | | | | | | | | | | | | | | | 2,095,720 | |
| | | | New York – 1.2% | | | | | | | | | | | | | | | | |
| | | | | |
| | | | New York Series A | | | | | | | | | | | | | | | | |
| | 3,435 | | | 5.000%, 08/01/2011 | | | | | | | | | | | | | | | 3,473,512 | |
| | | | North Dakota – 1.7% | | | | | | | | | | | | | | | | |
| | | | | |
| | | | Fargo Health Systems, Sanford Health | | | | | | | | | | | | | | | | |
| | 1,600 | | | 4.000%, 11/01/2012 | | | | | | | | | | | | | | | 1,657,264 | |
| | 3,040 | | | 3.500%, 11/01/2016 | | | | | | | | | | | | | | | 3,072,832 | |
| | 4,640 | | | Total North Dakota | | | | | | | | | | | | | | | 4,730,096 | |
| | | | Ohio – 0.4% | | | | | | | | | | | | | | | | |
| | | | | |
| | | | Ohio Air Quality Development Authority, Ohio Power Company, Series A Mandatory Put 06/02/2014 @ 100 | | | | | | | | | | | | | | | | |
| | 1,000 | | | 3.250%, 06/01/2041 | | | | | | | | | | | | | | | 1,010,850 | |
| | | | Oklahoma – 1.2% | | | | | | | | | | | | | | | | |
| | | | | |
| | | | Cleveland County Public Facilities Authority, Norman Public Schools Project | | | | | | | | | | | | | | | | |
| | 2,000 | | | 3.500%, 06/01/2012 | | | | | | | | | | | | | | | 2,061,320 | |
| | | | | | | | | | | | | | | | | | | | |
Principal
Amount (000) | | | Description p | | | | | | | | | | | Value | |
| | | | | | | | | | | | | | | | | | | | |
| | | | Oklahoma (continued) | | | | | | | | | | | | | | | | |
| | | | | |
| | | | Tulsa County Individual Educational Facilities Authority, Jenks Public School | | | | | | | | | | | | | | | | |
| $ | 1,125 | | | 5.000%, 09/01/2014 | | | | | | | | | | | | | | $ | 1,259,032 | |
| | 3,125 | | | Total Oklahoma | | | | | | | | | | | | | | | 3,320,352 | |
| | | | Oregon – 1.1% | | | | | | | | | | | | | | | | |
| | | | | |
| | | | Medford Hospital Facilities Authority, Asante Health System (AGM) | | | | | | | | | | | | | | | | |
| | 2,840 | | | 5.000%, 08/15/2015 | | | | | | | | | | | | | | | 3,165,663 | |
| | | | Pennsylvania – 2.9% | | | | | | | | | | | | | | | | |
| | | | | |
| | | | Allegheny County Airport Authority, Pittsburgh International Airport, Series A, (AGM) (AMT) | | | | | | | | | | | | | | | | |
| | 1,000 | | | 5.000%, 01/01/2016 | | | | | | | | | | | | | | | 1,059,440 | |
| | | | | |
| | | | Philadelphia | | | | | | | | | | | | | | | | |
| | 4,000 | | | 5.000%, 08/01/2014 | | | | | | | | | | | | | | | 4,326,160 | |
| | | | | |
| | | | Union County Hospital Authority, Evangelical Community Hospital | | | | | | | | | | | | | | | | |
| | 1,385 | | | 4.000%, 08/01/2015 | | | | | | | | | | | | | | | 1,395,997 | |
| | 1,440 | | | 4.250%, 08/01/2016 | | | | | | | | | | | | | | | 1,451,261 | |
| | 7,825 | | | Total Pennsylvania | | | | | | | | | | | | | | | 8,232,858 | |
| | | | Puerto Rico – 0.8% | | | | | | | | | | | | | | | | |
| | | | | |
| | | | Puerto Rico Commonwealth Public Improvement Series A | | | | | | | | | | | | | | | | |
| | 2,250 | | | 4.000%, 07/01/2011 | | | | | | | | | | | | | | | 2,261,272 | |
| | | | South Carolina – 2.3% | | | | | | | | | | | | | | | | |
| | | | | |
| | | | Georgetown County Pollution Control Facilities, International Paper Company Project, Series A | | | | | | | | | | | | | | | | |
| | 1,500 | | | 5.125%, 02/01/2012 | | | | | | | | | | | | | | | 1,533,165 | |
| | | | | |
| | | | Richland County Environmental Improvement, Series A | | | | | | | | | | | | | | | | |
| | 1,000 | | | 4.600%, 09/01/2012 | | | | | | | | | | | | | | | 1,032,070 | |
| | | | | |
| | | | Scago Public Facilities Corporation, Lancaster County Project (AGC) | | | | | | | | | | | | | | | | |
| | 3,315 | | | 3.500%, 12/01/2011 | | | | | | | | | | | | | | | 3,365,852 | |
| | | | | |
| | | | South Carolina Jobs-Economic Development Authority, Palmetto Health | | | | | | | | | | | | | | | | |
| | 500 | | | 5.000%, 08/01/2015 | | | | | | | | | | | | | | | 522,640 | |
| | 6,315 | | | Total South Carolina | | | | | | | | | | | | | | | 6,453,727 | |
| | | | South Dakota – 0.5% | | | | | | | | | | | | | | | | |
| | | | | |
| | | | South Dakota Health & Educational Facilities Authority, Sanford Health | | | | | | | | | | | | | | | | |
| | 1,305 | | | 4.500%, 11/01/2015 | | | | | | | | | | | | | | | 1,408,043 | |
| | | | Tennessee – 1.6% | | | | | | | | | | | | | | | | |
| | | | | |
| | | | Memphis-Shelby County Airport Authority, Series B (AMT) | | | | | | | | | | | | | | | | |
| | 1,000 | | | 5.000%, 07/01/2016 | | | | | | | | | | | | | | | 1,076,240 | |
| | | | | |
| | | | Memphis-Shelby County Sports Authority, Memphis Arena Project Series B | | | | | | | | | | | | | | | | |
| | 1,270 | | | 5.500%, 11/01/2020 | | | | | | | | | | | | | | | 1,413,269 | |
| | | | | |
| | | | Metropolitan Nashville Airport Authority, Series A | | | | | | | | | | | | | | | | |
| | 1,800 | | | 5.000%, 07/01/2016 | | | | | | | | | | | | | | | 2,016,540 | |
| | 4,070 | | | Total Tennessee | | | | | | | | | | | | | | | 4,506,049 | |
| | | | Texas – 5.2% | | | | | | | | | | | | | | | | |
| | | | | |
| | | | Dallas Fort Worth International Airport, Series A | | | | | | | | | | | | | | | | |
| | 1,000 | | | 5.000%, 11/01/2021 | | | | | | | | | | | | | | | 1,050,590 | |
| | | | | |
| | | | Harrison County Health Facilities, Good Shepherd Health Systems | | | | | | | | | | | | | | | | |
| | 1,000 | | | 4.000%, 07/01/2015 | | | | | | | | | | | | | | | 992,370 | |
| | | | | |
| | | | Lower Colorado River Authority (AMBAC) | | | | | | | | | | | | | | | | |
| | 2,615 | | | 5.000%, 05/15/2012 | | | | | | | | | | | | | | | 2,738,062 | |
| | | | | |
| | | | Lower Colorado River Authority (AMBAC) (ETM) | | | | | | | | | | | | | | | | |
| | 70 | | | 5.000%, 05/15/2012 | | | | | | | | | | | | | | | 72,999 | |
| | | | | |
| | | | Tarrant County Cultural Education Facilities, CC Young Memorial Home, Series B-2 | | | | | | | | | | | | | | | | |
| | 2,000 | | | 6.500%, 02/15/2014 | | | | | | | | | | | | | | | 1,928,760 | |
Portfolio of Investments
Nuveen Short Tax Free Fund (continued)
April 30, 2011
| | | | | | | | | | | | | | | | | | | | |
Principal
Amount (000) | | | Description p | | | | | | | | | | | Value | |
| | | | | | | | | | | | | | | | | | | | |
| | | | Texas (continued) | | | | | | | | | | | | | | | | |
| | | | | |
| | | | Tarrant County Cultural Education Facilities, Finance Corporation, Retirement Facility, Hendrick Medical Center, Series A (AGC) | | | | | | | | | | | | | | | | |
| $ | 1,425 | | | 4.000%, 09/01/2015 | | | | | | | | | | | | | | $ | 1,500,625 | |
| | 1,070 | | | 4.000%, 09/01/2016 | | | | | | | | | | | | | | | 1,123,361 | |
| | 1,355 | | | 4.375%, 09/01/2018 | | | | | | | | | | | | | | | 1,407,154 | |
| | | | | |
| | | | Tarrant County Cultural Education Facilities, Finance Corporation, Retirement Facility, Mirador Project, Series B-2 | | | | | | | | | | | | | | | | |
| | 2,000 | | | 6.250%, 11/15/2014 | | | | | | | | | | | | | | | 1,953,240 | |
| | | | | |
| | | | Tarrant County Cultural Education Facilities, Finance Corporation, Retirement Facility, Stayton at Museum Way Series C-2 | | | | | | | | | | | | | | | | |
| | 2,000 | | | 6.500%, 11/15/2014 | | | | | | | | | | | | | | | 1,973,280 | |
| | 14,535 | | | Total Texas | | | | | | | | | | | | | | | 14,740,441 | |
| | | | Virgin Islands – 0.4% | | | | | | | | | | | | | | | | |
| | | | | |
| | | | Virgin Islands Public Finance Authority, Series B | | | | | | | | | | | | | | | | |
| | 1,000 | | | 5.000%, 10/01/2019 | | | | | | | | | | | | | | | 1,068,290 | |
| | | | Virginia – 4.8% | | | | | | | | | | | | | | | | |
| | | | | |
| | | | Virginia Housing Development Authority, Commonwealth Mortgage, Series D1 (AMT) | | | | | | | | | | | | | | | | |
| | 7,000 | | | 4.300%, 01/01/2014 | | | | | | | | | | | | | | | 7,229,950 | |
| | | | | |
| | | | Virginia Public Building Authority, Series A | | | | | | | | | | | | | | | | |
| | 6,000 | | | 5.000%, 08/01/2014 | | | | | | | | | | | | | | | 6,487,860 | |
| | 13,000 | | | Total Virginia | | | | | | | | | | | | | | | 13,717,810 | |
| | | | Washington – 1.2% | | | | | | | | | | | | | | | | |
| | | | | |
| | | | Port Seattle, Series C (AMT) | | | | | | | | | | | | | | | | |
| | 1,000 | | | 5.000%, 02/01/2016 | | | | | | | | | | | | | | | 1,087,100 | |
| | | | | |
| | | | Washington Health Care Facilities Authority, Central Washington Health Services | | | | | | | | | | | | | | | | |
| | 1,225 | | | 5.000%, 07/01/2013 | | | | | | | | | | | | | | | 1,271,121 | |
| | 1,150 | | | 5.000%, 07/01/2014 | | | | | | | | | | | | | | | 1,200,255 | |
| | 3,375 | | | Total Washington | | | | | | | | | | | | | | | 3,558,476 | |
| | | | Wisconsin – 0.7% | | | | | | | | | | | | | | | | |
| | | | | |
| | | | Wisconsin Health & Educational Facilities Authority, Aurora Health Care, Series A | | | | | | | | | | | | | | | | |
| | 1,000 | | | 5.000%, 04/15/2016 | | | | | | | | | | | | | | | 1,055,210 | |
| | | | | |
| | | | Wisconsin Health & Educational Facilities Authority, St. John’s Communities | | | | | | | | | | | | | | | | |
| | 1,000 | | | 5.400%, 09/15/2014 | | | | | | | | | | | | | | | 972,030 | |
| | 2,000 | | | Total Wisconsin | | | | | | | | | | | | | | | 2,027,240 | |
| | | | Wyoming – 0.4% | | | | | | | | | | | | | | | | |
| | | | | |
| | | | Natrona County Hospitals, Wyoming Medical Center | | | | | | | | | | | | | | | | |
| | 200 | | | 4.000%, 09/15/2014 | | | | | | | | | | | | | | | 206,510 | |
| | 530 | | | 4.000%, 09/15/2015 | | | | | | | | | | | | | | | 542,884 | |
| | 300 | | | 4.000%, 09/15/2016 | | | | | | | | | | | | | | | 305,238 | |
| | 1,030 | | | Total Wyoming | | | | | | | | | | | | | | | 1,054,632 | |
| | 210,920 | | | Total Municipal Bonds (cost $217,038,656) | | | | | | | | | | | | | | | 220,784,424 | |
| | | | | |
Principal
Amount (000)/
Shares | | | Description p | | | | | | | | | | | Value | |
| | | | Short-Term Investments – 21.7% | | | | | | | | | | | | | | | | |
| | | | | |
| | | | Money Market Funds – 1.9% | | | | | | | | | | | | | | | | |
| | | | | |
| | 5,447,783 | | | First American Tax Free Obligations Fund, Class Z 0.053% W | | | | | | | | | | | | | | | 5,447,783 | |
| | | | | |
| | | | Variable Rate Demand Notes – 19.8% | | | | | | | | | | | | | | | | |
| | | | | |
| | | | California Financial Authority, Goodwill Industries - Orange County | | | | | | | | | | | | | | | | |
| | 5,385 | | | 0.330%, 10/01/2033 v | | | | | | | | | | | | | | | 5,385,000 | |
| | | | | |
| | | | Cleveland-Cuyahoga County Port Authority, Carnegie/89th Garage Project | | | | | | | | | | | | | | | | |
| | 7,610 | | | 0.240%, 01/01/2037 v | | | | | | | | | | | | | | | 7,610,000 | |
| | | | | | | | | | | | | | | | | | | | |
Principal
Amount (000) | | | Description p | | | | | | | | | | | Value | |
| | | | | | | | | | | | | | | | | | | | |
| | | | Variable Rate Demand Notes (continued) | | | | | | | | | | | | | | | | |
| | | | | |
| | | | Cohasset Power & Light Company Project Series A | | | | | | | | | | | | | | | | |
| $ | 5,420 | | | 0.270%, 06/01/2020 v | | | | | | | | | | | | | | $ | 5,420,000 | |
| | | | | |
| | | | Colorado Educational & Cultural Facilities Authority, Denver Seminary Project | | | | | | | | | | | | | | | | |
| | 2,465 | | | 0.380%, 07/01/2034 v | | | | | | | | | | | | | | | 2,465,000 | |
| | | | | |
| | | | Glendale Individual Development Authority, Senior Living Facilities, Friendship Retirement Corporation | | | | | | | | | | | | | | | | |
| | 5,500 | | | 0.380%, 01/01/2027 v | | | | | | | | | | | | | | | 5,500,000 | |
| | | | | |
| | | | Houston Higher Education Finance Corporation, Rice University Project Series A | | | | | | | | | | | | | | | | |
| | 3,000 | | | 0.240%, 11/15/2029 v | | | | | | | | | | | | | | | 3,000,000 | |
| | | | | |
| | | | Houston Independent School District, Schoolhouse | | | | | | | | | | | | | | | | |
| | 2,735 | | | 0.260%, 06/15/2031 v | | | | | | | | | | | | | | | 2,735,000 | |
| | | | | |
| | | | Indiana Health Facilities, Financing Authority, Anthony Wayne Rehabilitation Center | | | | | | | | | | | | | | | | |
| | 2,270 | | | 0.380%, 02/01/2031 v | | | | | | | | | | | | | | | 2,270,000 | |
| | | | | |
| | | | Lake Oswego Redevelopment Agency Tax Increment Series A | | | | | | | | | | | | | | | | |
| | 2,265 | | | 0.380%, 06/01/2020 v | | | | | | | | | | | | | | | 2,265,000 | |
| | | | | |
| | | | Massachusetts Bay Transportation Authority Series A-2 | | | | | | | | | | | | | | | | |
| | 3,000 | | | 0.270%, 07/01/2026 v | | | | | | | | | | | | | | | 3,000,000 | |
| | | | | |
| | | | Milwaukee Redevelopment Authority, Yankee Hill Apartments | | | | | | | | | | | | | | | | |
| | 1,100 | | | 0.280%, 09/01/2025 v | | | | | | | | | | | | | | | 1,100,000 | |
| | | | | |
| | | | New Hanover County Schools | | | | | | | | | | | | | | | | |
| | 3,390 | | | 0.280%, 02/01/2026 v | | | | | | | | | | | | | | | 3,390,000 | |
| | | | | |
| | | | New York City Transitional Finance Authority, Pierpont Morgan Library | | | | | | | | | | | | | | | | |
| | 3,300 | | | 0.220%, 02/01/2034 v | | | | | | | | | | | | | | | 3,300,000 | |
| | | | | |
| | | | Philadelphia Gas Works Series C | | | | | | | | | | | | | | | | |
| | 2,000 | | | 0.260%, 08/01/2031 v | | | | | | | | | | | | | | | 2,000,000 | |
| | | | | |
| | | | South Fulton Municipal Regional Water & Sewer Authority | | | | | | | | | | | | | | | | |
| | 6,900 | | | 0.250%, 01/01/2033 v | | | | | | | | | | | | | | | 6,900,000 | |
| $ | 56,340 | | | Total Variable Rate Demand Notes | | | | | | | | | | | | | | | 56,340,000 | |
| | | | Total Short-Term Investments (cost $61,787,783) | | | | | | | | | | | | | | | 61,787,783 | |
| | | | Total Investments – 99.1% (cost $278,826,439) | | | | | | | | | | | | | | | 282,572,207 | |
| | | | Other Assets Less Liabilities – 0.9% | | | | | | | | | | | | | | | 2,564,362 | |
| | | | Net Assets – 100.0% | | | | | | | | | | | | | | $ | 285,136,569 | |
| | p | | All percentages shown in the Portfolio of Investments are based on net assets. |
| | D | | During July 2010, the original issure for this security (1,000,000 par, 5.50% coupon and May 15, 2011 maturity) was restructured into two new securities. The first security, which is 70% of the original issue, has a 700,000 par, 5.100% coupon and May 15, 2014 maturity. The second security, which is the remaining 30% of the issue, has a 300,000 par, 0.000% coupon and May 15, 2050 maturity. At the end of the reporting period, the Adviser continues to accrue interest on the 700,000 par security. |
| | W | | The rate shown is the annualized seven-day effective yield as of April 30, 2011. |
| | v | | Investment has a maturity of more than one year, but has variable rate and demand features which qualify it as a short-term investment. The rate disclosed is that in effect at the end of the reporting period. This rate changes periodically based on market conditions or a specified market index. |
| | (ETM) | | Escrowed to maturity. |
Portfolio of Investments
Nuveen Tax Free Fund
(formerly known as First American Tax Free Fund)
April 30, 2011
| | | | | | | | | | | | | | | | | | | | |
Principal
Amount (000) | | | Description p | | | | | | | | | | | Value | |
| | | | | | | | | | | | | | | | | | | | |
| | | | Municipal Bonds – 98.2% | | | | | | | | | | | | | | | | |
| | | | | |
| | | | Alabama – 0.1% | | | | | | | | | | | | | | | | |
| | | | | |
| | | | Camden Industrial Development Board, Weyerhaeuser Company Project, Series B (Pre-refunded 12/01/2013) (AMT) | | | | | | | | | | | | | | | | |
| | | | | |
| $ | 350 | | | 6.375%, 12/01/2024 | | | | | | | | | | | | | | $ | 398,972 | |
| | | | Alaska – 1.1% | | | | | | | | | | | | | | | | |
| | | | | |
| | | | Alaska International Airports, Series A (AMT) | | | | | | | | | | | | | | | | |
| | 5,000 | | | 5.000%, 10/01/2027 | | | | | | | | | | | | | | | 4,855,300 | |
| | | | Arizona – 8.9% | | | | | | | | | | | | | | | | |
| | | | | |
| | | | Arizona Health Facilities Authority, Blood Systems | | | | | | | | | | | | | | | | |
| | 300 | | | 4.750%, 04/01/2025 | | | | | | | | | | | | | | | 290,337 | |
| | | | | |
| | | | Arizona Health Facilities Authority, The Terraces Project, Series A (Pre-refunded 11/15/2013) | | | | | | | | | | | | | | | | |
| | 3,055 | | | 7.500%, 11/15/2023 | | | | | | | | | | | | | | | 3,523,545 | |
| | | | | |
| | | | Arizona School Facilities Board | | | | | | | | | | | | | | | | |
| | 500 | | | 5.250%, 09/01/2023 | | | | | | | | | | | | | | | 516,085 | |
| | | | | |
| | | | Arizona State University Nanotechnology Project, Series A (AGC) | | | | | | | | | | | | | | | | |
| | 200 | | | 5.000%, 03/01/2034 | | | | | | | | | | | | | | | 200,050 | |
| | | | | |
| | | | Chandler | | | | | | | | | | | | | | | | |
| | 500 | | | 4.375%, 07/01/2028 | | | | | | | | | | | | | | | 505,190 | |
| | | | | |
| | | | Cottonwood Water, Senior Lien (SGI) | | | | | | | | | | | | | | | | |
| | 250 | | | 5.000%, 07/01/2017 | | | | | | | | | | | | | | | 270,045 | |
| | | | | |
| | | | Gila County Unified School District #10, Payson School Improvement Project of 2006, Series A (AMBAC) | | | | | | | | | | | | | | | | |
| | 6,630 | | | 5.250%, 07/01/2022 | | | | | | | | | | | | | | | 7,021,303 | |
| | | | | |
| | | | Gilbert Public Facilities Municipal Property | | | | | | | | | | | | | | | | |
| | 500 | | | 5.500%, 07/01/2027 | | | | | | | | | | | | | | | 530,680 | |
| | | | | |
| | | | Glendale Industrial Development Authority | | | | | | | | | | | | | | | | |
| | 200 | | | 4.625%, 12/01/2027 | | | | | | | | | | | | | | | 166,996 | |
| | | | | |
| | | | Glendale Industrial Development Authority, John C. Lincoln Health Network | | | | | | | | | | | | | | | | |
| | 100 | | | 5.000%, 12/01/2032 | | | | | | | | | | | | | | | 83,427 | |
| | | | | |
| | | | Glendale Industrial Development Authority, Midwestern University | | | | | | | | | | | | | | | | |
| | 500 | | | 5.000%, 05/15/2031 | | | | | | | | | | | | | | | 468,120 | |
| | | | | |
| | | | Greater Arizona Development Authority, Infrastructure, Series B | | | | | | | | | | | | | | | | |
| | 750 | | | 5.250%, 08/01/2026 | | | | | | | | | | | | | | | 760,005 | |
| | | | | |
| | | | Greater Arizona Development Authority, Infrastructure, Pinal County Road Project, Series 1 (NATL) | | | | | | | | | | | | | | | | |
| | 750 | | | 4.500%, 08/01/2025 | | | | | | | | | | | | | | | 732,210 | |
| | | | | |
| | | | Greenlee County School District #18, Morenci School Improvement | | | | | | | | | | | | | | | | |
| | 165 | | | 5.000%, 07/01/2012 | | | | | | | | | | | | | | | 170,410 | |
| | | | | |
| | | | Marana Municipal Property, Series A | | | | | | | | | | | | | | | | |
| | 250 | | | 5.000%, 07/01/2028 | | | | | | | | | | | | | | | 253,745 | |
| | | | | |
| | | | Maricopa County Hospital, Sun Health Corporation (Pre-refunded 04/01/2024) | | | | | | | | | | | | | | | | |
| | 200 | | | 5.000%, 04/01/2025 | | | | | | | | | | | | | | | 219,768 | |
| | | | | |
| | | | Maricopa County Industrial Development Authority, Catholic Healthcare West, Series A | | | | | | | | | | | | | | | | |
| | 500 | | | 5.375%, 07/01/2023 | | | | | | | | | | | | | | | 507,085 | |
| | 3,600 | | | 5.250%, 07/01/2032 | | | | | | | | | | | | | | | 3,351,780 | |
| | | | | |
| | | | Maricopa County Industrial Development Authority, Senior Living Healthcare, Immanuel Care, Series A (GNMA) | | | | | | | | | | | | | | | | |
| | 750 | | | 4.850%, 08/20/2026 | | | | | | | | | | | | | | | 750,742 | |
| | 500 | | | 5.000%, 08/20/2035 | | | | | | | | | | | | | | | 468,250 | |
| | | | | |
| | | | Northern Arizona University, Research Projects (AMBAC) | | | | | | | | | | | | | | | | |
| | 140 | | | 5.000%, 09/01/2023 | | | | | | | | | | | | | | | 141,485 | |
| | | | | |
| | | | Peoria Improvement District #0601 | | | | | | | | | | | | | | | | |
| | 465 | | | 4.250%, 01/01/2022 | | | | | | | | | | | | | | | 479,885 | |
| | | | | | | | | | | | | | | | | | | | |
Principal
Amount (000) | | | Description p | | | | | | | | | | | Value | |
| | | | | | | | | | | | | | | | | | | | |
| | | | Arizona (continued) | | | | | | | | | | | | | | | | |
| | | | | |
| | | | Peoria Municipal Development Authority | | | | | | | | | | | | | | | | |
| $ | 310 | | | 5.000%, 07/01/2015 | | | | | | | | | | | | | | $ | 352,303 | |
| | | | | |
| | | | Phoenix Civic Improvement, Junior Lien, Series A | | | | | | | | | | | | | | | | |
| | 4,000 | | | 5.000%, 07/01/2031 | | | | | | | | | | | | | | | 3,989,640 | |
| | | | | |
| | | | Pima County Unified School District #1, Tucson School Improvement Project of 2004
Series C (FGIC) (NATL) | | | | | | | | | | | | | | | | |
| | 730 | | | 5.000%, 07/01/2027 | | | | | | | | | | | | | | | 746,673 | |
| | | | | |
| | | | Pima County Unified School District #1, Tucson School Improvement Project of 2004, Series C,
(Pre-refunded 07/01/2017) (FGIC) (NATL) | | | | | | | | | | | | | | | | |
| | 270 | | | 5.000%, 07/01/2027 | | | | | | | | | | | | | | | 318,954 | |
| | | | | |
| | | | Pinal County | | | | | | | | | | | | | | | | |
| | 400 | | | 5.000%, 12/01/2014 | | | | | | | | | | | | | | | 432,212 | |
| | | | | |
| | | | Pinal County Industrial Development Authority, Correctional Facilities Contract, Florence West Prison Project, Series A (ACA) | | | | | | | | | | | | | | | | |
| | 250 | | | 5.000%, 10/01/2016 | | | | | | | | | | | | | | | 253,305 | |
| | | | | |
| | | | Pinal County Unified School District #1, Florence School Improvement Project of 2006, Series A (FGIC) (NATL) | | | | | | | | | | | | | | | | |
| | 1,000 | | | 5.000%, 07/01/2027 | | | | | | | | | | | | | | | 1,019,070 | |
| | | | | |
| | | | Queen Creek Improvement District #001 | | | | | | | | | | | | | | | | |
| | 300 | | | 5.000%, 01/01/2020 | | | | | | | | | | | | | | | 300,183 | |
| | | | | |
| | | | Scottsdale Industrial Development Authority, Scottsdale Healthcare, Series A | | | | | | | | | | | | | | | | |
| | 1,000 | | | 5.000%, 09/01/2022 | | | | | | | | | | | | | | | 1,006,040 | |
| | | | | |
| | | | Scottsdale Municipal Property Corporation, Excise Tax, Series C, Convertible CABs (AMBAC) | | | | | | | | | | | | | | | | |
| | 500 | | | 0.000% through 07/01/2013, thereafter 4.550%, 07/01/2021 | | | | | | | | | | | | | | | 477,540 | |
| | | | | |
| | | | Scottsdale Municipal Property Corporation, Excise Tax, Water and Sewer Development Project, Series A | | | | | | | | | | | | | | | | |
| | 4,300 | | | 5.000%, 07/01/2021 | | | | | | | | | | | | | | | 4,777,773 | |
| | | | | |
| | | | Tempe Industrial Development Authority, Friendship Village Project, Series A | | | | | | | | | | | | | | | | |
| | 1,178 | | | 5.375%, 12/01/2013 | | | | | | | | | | | | | | | 1,121,574 | |
| | | | | |
| | | | Tucson | | | | | | | | | | | | | | | | |
| | 250 | | | 5.500%, 07/01/2018 | | | | | | | | | | | | | | | 291,825 | |
| | | | | |
| | | | University Medical Center Corporation | | | | | | | | | | | | | | | | |
| | 215 | | | 5.000%, 07/01/2016 | | | | | | | | | | | | | | | 224,350 | |
| | 450 | | | 5.000%, 07/01/2024 | | | | | | | | | | | | | | | 431,721 | |
| | | | | |
| | | | Yavapai County Industrial Development Authority, Waste Management Incorporated Project, Series A1 (AMT) | | | | | | | | | | | | | | | | |
| | 400 | | | 4.900%, 03/01/2028 | | | | | | | | | | | | | | | 368,672 | |
| | | | | |
| | | | Yavapai County Industrial Development Authority, Yavapai Regional Medical Center
Series A | | | | | | | | | | | | | | | | |
| | 100 | | | 6.000%, 08/01/2033 | | | | | | | | | | | | | | | 97,122 | |
| | | | | |
| | | | Yavapai County Industrial Development Authority, Yavapai Regional Medical Center, Series A (RAAI) | | | | | | | | | | | | | | | | |
| | 375 | | | 5.250%, 08/01/2021 | | | | | | | | | | | | | | | 374,584 | |
| | | | | |
| | | | Yuma Improvement District #68 | | | | | | | | | | | | | | | | |
| | 365 | | | 4.700%, 01/01/2021 | | | | | | | | | | | | | | | 349,418 | |
| | 37,198 | | | Total Arizona | | | | | | | | | | | | | | | 38,344,102 | |
| | | | California – 7.9% | | | | | | | | | | | | | | | | |
| | | | | |
| | | | California Department of Water Resources, Central Valley Project, Series AE | | | | | | | | | | | | | | | | |
| | 2,000 | | | 5.000%, 12/01/2021 | | | | | | | | | | | | | | | 2,240,380 | |
| | | | | |
| | | | California Pollution Control Financing Authority, Solid Waste Disposal, Waste Management Incorporated Project, Series C (AMT) (GTY) | | | | | | | | | | | | | | | | |
| | 5,000 | | | 5.125%, 11/01/2023 | | | | | | | | | | | | | | | 5,002,700 | |
| | | | | |
| | | | California Statewide Communities Development Authority, St. Joseph
Series B (FGIC) | | | | | | | | | | | | | | | | |
| | 1,050 | | | 5.450%, 07/01/2026 | | | | | | | | | | | | | | | 1,042,955 | |
| | | | | |
| | | | California Statewide Communities Development Authority, St. Joseph, Series C (FGIC) | | | | | | | | | | | | | | | | |
| | 1,050 | | | 5.450%, 07/01/2026 | | | | | | | | | | | | | | | 1,042,954 | |
Portfolio of Investments
Nuveen Tax Free Fund (continued)
April 30, 2011
| | | | | | | | | | | | | | | | | | | | |
Principal
Amount (000) | | | Description p | | | | | | | | | | | Value | |
| | | | | | | | | | | | | | | | | | | | |
| | | | California (continued) | | | | | | | | | | | | | | | | |
| | | | | |
| | | | Davis Redevelopment Agency, Davis Redevelopment Project, Series A | | | | | | | | | | | | | | | | |
| $ | 400 | | | 7.000%, 12/01/2036 | | | | | | | | | | | | | | $ | 406,688 | |
| | | | | |
| | | | Loma Linda University Medical Center, Series A | | | | | | | | | | | | | | | | |
| | 1,500 | | | 8.250%, 12/01/2038 | | | | | | | | | | | | | | | 1,609,725 | |
| | | | | |
| | | | Lynwood Redevelopment Agency, Project Area A, Series A | | | | | | | | | | | | | | | | |
| | 500 | | | 7.000%, 09/01/2031 | | | | | | | | | | | | | | | 503,955 | |
| | | | | |
| | | | Poway Unified School District, Election of 2008, District 2007-1-A, Zero Coupon Bond | | | | | | | | | | | | | | | | |
| | 3,775 | | | 0.000%, 08/01/2023 | | | | | | | | | | | | | | | 1,825,930 | |
| | | | | |
| | | | Rialto Unified School District, Election of 2010, Series A, Convertible CABs (AGM) | | | | | | | | | | | | | | | | |
| | 15,000 | | | 0.000% through 08/01/2026, thereafter 7.350%, 08/01/2041 g | | | | | | | | | | | | | | | 5,178,600 | |
| | | | | |
| | | | San Francisco City & County Airports, International Airport, Series A | | | | | | | | | | | | | | | | |
| | 4,000 | | | 4.900%, 05/01/2029 | | | | | | | | | | | | | | | 3,948,200 | |
| | | | | |
| | | | Santee Community Development, Santee Community Redevelopment Project, Series A | | | | | | | | | | | | | | | | |
| | 440 | | | 7.000%, 08/01/2031 | | | | | | | | | | | | | | | 451,339 | |
| | | | | |
| | | | Southern California Public Power Authority, Transmission Project, Series A | | | | | | | | | | | | | | | | |
| | 4,000 | | | 5.000%, 07/01/2020 | | | | | | | | | | | | | | | 4,416,160 | |
| | | | | |
| | | | Temecula Redevelopment Agency, Housing Redevelopment Project #1, Series A | | | | | | | | | | | | | | | | |
| | 500 | | | 6.750%, 08/01/2031 | | | | | | | | | | | | | | | 502,315 | |
| | | | | |
| | | | Ventura County Area Housing Authority, Mira Vista Senior Apartments, Series A (AMBAC) (AMT) | | | | | | | | | | | | | | | | |
| | 1,000 | | | 5.000%, 12/01/2022 | | | | | | | | | | | | | | | 844,350 | |
| | | | | |
| | | | Victor Valley Joint Union High School District, Election of 2008, Series A, Convertible CABs (AGC) | | | | | | | | | | | | | | | | |
| | 5,000 | | | 0.000% through 08/01/2019, thereafter 5.750%, 08/01/2031 g | | | | | | | | | | | | | | | 2,892,350 | |
| | | | | |
| | | | Westminster School District, Series A1, Zero Coupon Bond (AGC) | | | | | | | | | | | | | | | | |
| | 2,485 | | | 0.000%, 08/01/2026 | | | | | | | | | | | | | | | 940,697 | |
| | 1,405 | | | 0.000%, 08/01/2028 | | | | | | | | | | | | | | | 451,370 | |
| | 2,920 | | | 0.000%, 08/01/2029 | | | | | | | | | | | | | | | 872,145 | |
| | 52,025 | | | Total California | | | | | | | | | | | | | | | 34,172,813 | |
| | | | Colorado – 3.2% | | | | | | | | | | | | | | | | |
| | | | | |
| | | | Colorado Health Facilities Authority, Covenant Retirement Communities, Series B | | | | | | | | | | | | | | | | |
| | 1,150 | | | 6.125%, 12/01/2033 | | | | | | | | | | | | | | | 1,092,695 | |
| | | | | |
| | | | Colorado Health Facilities Authority, Evangelical Lutheran | | | | | | | | | | | | | | | | |
| | 2,500 | | | 5.900%, 10/01/2027 | | | | | | | | | | | | | | | 2,507,950 | |
| | 2,000 | | | 5.000%, 06/01/2029 | | | | | | | | | | | | | | | 1,803,440 | |
| | | | | |
| | | | Colorado Health Facilities Authority, Sisters of Charity of Leavenworth, Series B | | | | | | | | | | | | | | | | |
| | 5,000 | | | 5.250%, 01/01/2025 | | | | | | | | | | | | | | | 5,122,100 | |
| | | | | |
| | | | Colorado Housing & Finance Authority, Solid Waste Disposal, Waste Management Incorporated Project (AMT) | | | | | | | | | | | | | | | | |
| | 1,590 | | | 5.700%, 07/01/2018 | | | | | | | | | | | | | | | 1,694,209 | |
| | | | | |
| | | | Denver City & County Airport System, Series A | | | | | | | | | | | | | | | | |
| | 1,500 | | | 5.000%, 11/15/2021 | | | | | | | | | | | | | | | 1,639,050 | |
| | 13,740 | | | Total Colorado | | | | | | | | | | | | | | | 13,859,444 | |
| | | | Delaware – 1.4% | | | | | | | | | | | | | | | | |
| | | | | |
| | | | Delaware Transportation Authority, Transportation System | | | | | | | | | | | | | | | | |
| | 5,000 | | | 5.000%, 07/01/2019 | | | | | | | | | | | | | | | 5,862,500 | |
| | | | Florida – 2.8% | | | | | | | | | | | | | | | | |
| | | | | |
| | | | Halifax Hospital Medical Center, Series A | | | | | | | | | | | | | | | | |
| | 375 | | | 5.000%, 06/01/2038 | | | | | | | | | | | | | | | 322,845 | |
| | | | | |
| | | | Palm Beach County Health Facilities Authority, Retirement Community, Acts Retirement Life, Series A | | | | | | | | | | | | | | | | |
| | 10,000 | | | 4.500%, 11/15/2036 | | | | | | | | | | | | | | | 7,443,400 | |
| | | | | |
| | | | Palm Beach County School Board (FGIC) (NATL) | | | | | | | | | | | | | | | | |
| | 2,415 | | | 5.000%, 08/01/2018 | | | | | | | | | | | | | | | 2,622,883 | |
| | | | | |
| | | | Port St. Lucie, Southwest Annexation District 1-B (NATL) | | | | | | | | | | | | | | | | |
| | 2,000 | | | 5.000%, 07/01/2033 | | | | | | | | | | | | | | | 1,650,040 | |
| | 14,790 | | | Total Florida | | | | | | | | | | | | | | | 12,039,168 | |
| | | | | | | | | | | | | | | | | | | | |
Principal
Amount (000) | | | Description p | | | | | | | | | | | Value | |
| | | | | | | | | | | | | | | | | | | | |
| | | | Georgia – 3.6% | | | | | | | | | | | | | | | | |
| | | | | |
| | | | DeKalb County Hospital Authority, DeKalb Medical Center Incorporated Project | | | | | | | | | | | | | | | | |
| $ | 4,000 | | | 6.000%, 09/01/2030 | | | | | | | | | | | | | | $ | 3,751,960 | |
| | | | | |
| | | | Fulton County Development Authority, Georgia Tech Athletic Association | | | | | | | | | | | | | | | | |
| | 5,000 | | | 5.750%, 10/01/2041 | | | | | | | | | | | | | | | 5,029,800 | |
| | | | | |
| | | | Fulton County Development Authority, Maxon Atlantic Station, Series A, Mandatory Put 03/01/2015 @ 100 (AMT) | | | | | | | | | | | | | | | | |
| | 2,300 | | | 5.125%, 03/01/2026 | | | | | | | | | | | | | | | 2,240,292 | |
| | | | | |
| | | | Fulton County Residential Care Facilities, Canterbury Court Project, Series A | | | | | | | | | | | | | | | | |
| | 1,500 | | | 6.125%, 02/15/2026 | | | | | | | | | | | | | | | 1,328,580 | |
| | 2,500 | | | 6.125%, 02/15/2034 | | | | | | | | | | | | | | | 2,110,650 | |
| | | | | |
| | | | Georgia Municipal Electric Authority Power, Series BB (IBC) (NATL) | | | | | | | | | | | | | | | | |
| | 1,000 | | | 5.250%, 01/01/2025 | | | | | | | | | | | | | | | 1,046,200 | |
| | 16,300 | | | Total Georgia | | | | | | | | | | | | | | | 15,507,482 | |
| | | | Hawaii – 1.0% | | | | | | | | | | | | | | | | |
| | | | | |
| | | | Hawaii Department of Budget & Finance, Special Purpose, 15 Craigside Project, Series A | | | | | | | | | | | | | | | | |
| | 1,000 | | | 8.750%, 11/15/2029 | | | | | | | | | | | | | | | 1,078,670 | |
| | 1,250 | | | 9.000%, 11/15/2044 | | | | | | | | | | | | | | | 1,355,175 | |
| | | | | |
| | | | Hawaii Department of Budget & Finance, Special Purpose, Kahala Nui Project, Series A | | | | | | | | | | | | | | | | |
| | 2,000 | | | 8.000%, 11/15/2033 | | | | | | | | | | | | | | | 2,091,240 | |
| | 4,250 | | | Total Hawaii | | | | | | | | | | | | | | | 4,525,085 | |
| | | | Idaho – 0.2% | | | | | | | | | | | | | | | | |
| | | | | |
| | | | Idaho Health Facilities Authority, Trinity Health Group, Series B | | | | | | | | | | | | | | | | |
| | 750 | | | 6.250%, 12/01/2033 | | | | | | | | | | | | | | | 793,042 | |
| | | | Illinois – 7.7% | | | | | | | | | | | | | | | | |
| | | | | |
| | | | Chicago Illinois Board of Education, Series C | | | | | | | | | | | | | | | | |
| | 2,000 | | | 5.000%, 12/01/2020 | | | | | | | | | | | | | | | 2,079,780 | |
| | | | | |
| | | | Illinois Finance Authority, Franciscan Communities, Series A | | | | | | | | | | | | | | | | |
| | 400 | | | 5.500%, 05/15/2037 | | | | | | | | | | | | | | | 287,820 | |
| | | | | |
| | | | Illinois Finance Authority, Illinois Institute of Technology | | | | | | | | | | | | | | | | |
| | 3,500 | | | 7.125%, 02/01/2034 | | | | | | | | | | | | | | | 3,208,065 | |
| | | | | |
| | | | Illinois Finance Authority, Landing at Plymouth Place Project, Series A | | | | | | | | | | | | | | | | |
| | 2,300 | | | 6.000%, 05/15/2037 | | | | | | | | | | | | | | | 1,824,475 | |
| | | | | |
| | | | Illinois Finance Authority, Roosevelt University | | | | | | | | | | | | | | | | |
| | 2,000 | | | 6.250%, 04/01/2029 | | | | | | | | | | | | | | | 2,001,160 | |
| | 2,800 | | | 5.500%, 04/01/2037 | | | | | | | | | | | | | | | 2,483,012 | |
| | | | | |
| | | | Illinois Finance Authority, Rush University Medical Center, Obligated Group
Series A | | | | | | | | | | | | | | | | |
| | 3,680 | | | 7.250%, 11/01/2030 | | | | | | | | | | | | | | | 3,982,386 | |
| | | | | |
| | | | Illinois Finance Authority, Rush University Medical Center, Obligated Group, Series C | | | | | | | | | | | | | | | | |
| | 1,265 | | | 6.625%, 11/01/2039 | | | | | | | | | | | | | | | 1,302,532 | |
| | | | | |
| | | | Illinois Finance Authority, Silver Cross Hospital & Medical Centers | | | | | | | | | | | | | | | | |
| | 3,230 | | | 5.500%, 08/15/2030 | | | | | | | | | | | | | | | 2,769,725 | |
| | 5,000 | | | 6.875%, 08/15/2038 | | | | | | | | | | | | | | | 4,977,950 | |
| | | | | |
| | | | Illinois Finance Authority, Three Crowns Park Plaza, Series A | | | | | | | | | | | | | | | | |
| | 100 | | | 5.875%, 02/15/2026 | | | | | | | | | | | | | | | 92,231 | |
| | | | | |
| | | | Illinois Health Facilities Authority, Covenant Retirement Communities | | | | | | | | | | | | | | | | |
| | 4,500 | | | 5.875%, 12/01/2031 | | | | | | | | | | | | | | | 4,173,345 | |
| | | | | |
| | | | Illinois Health Facilities Authority, Covenant Retirement Communities, Series A (RAAI) | | | | | | | | | | | | | | | | |
| | 4,000 | | | 5.500%, 12/01/2022 | | | | | | | | | | | | | | | 3,944,240 | |
| | 34,775 | | | Total Illinois | | | | | | | | | | | | | | | 33,126,721 | |
Portfolio of Investments
Nuveen Tax Free Fund (continued)
April 30, 2011
| | | | | | | | | | | | | | | | | | | | |
Principal
Amount (000) | | | Description p | | | | | | | | | | | Value | |
| | | | | | | | | | | | | | | | | | | | |
| | | | Indiana – 2.6% | | | | | | | | | | | | | | | | |
| | | | | |
| | | | Anderson Economic Development, Anderson University Project | | | | | | | | | | | | | | | | |
| $ | 425 | | | 5.000%, 10/01/2032 | | | | | | | | | | | | | | $ | 315,469 | |
| | | | | |
| | | | Indiana Health & Educational Facilities Financing Authority, Community Foundation | | | | | | | | | | | | | | | | |
| | 2,830 | | | 5.500%, 03/01/2037 | | | | | | | | | | | | | | | 2,552,688 | |
| | | | | |
| | | | Indiana Health & Educational Facilities Financing Authority, Schneck Memorial Hospital Project, Series A | | | | | | | | | | | | | | | | |
| | 400 | | | 5.250%, 02/15/2030 | | | | | | | | | | | | | | | 362,656 | |
| | | | | |
| | | | Indiana Municipal Power Agency, Power Supply, Series B (NATL) | | | | | | | | | | | | | | | | |
| | 1,000 | | | 6.000%, 01/01/2012 | | | | | | | | | | | | | | | 1,035,260 | |
| | | | | |
| | | | Indiana Transportation Finance Authority, Series A (AMBAC) | | | | | | | | | | | | | | | | |
| | 2,000 | | | 5.750%, 06/01/2012 | | | | | | | | | | | | | | | 2,060,200 | |
| | | | | |
| | | | Portage Economic Development, Ameriplex Project | | | | | | | | | | | | | | | | |
| | 1,000 | | | 5.000%, 07/15/2023 | | | | | | | | | | | | | | | 961,030 | |
| | 775 | | | 5.000%, 01/15/2027 | | | | | | | | | | | | | | | 713,070 | |
| | | | | |
| | | | Vigo County Hospital Authority, Union Hospital | | | | | | | | | | | | | | | | |
| | 3,000 | | | 8.000%, 09/01/2041 | | | | | | | | | | | | | | | 3,003,660 | |
| | 11,430 | | | Total Indiana | | | | | | | | | | | | | | | 11,004,033 | |
| | | | Iowa – 0.1% | | | | | | | | | | | | | | | | |
| | | | | |
| | | | Muscatine Electric (ETM) | | | | | | | | | | | | | | | | |
| | 280 | | | 6.700%, 01/01/2013 | | | | | | | | | | | | | | | 298,192 | |
| | | | Kansas – 1.6% | | | | | | | | | | | | | | | | |
| | | | | |
| | | | Kansas Department of Transportation, Series B2 | | | | | | | | | | | | | | | | |
| | 500 | | | 5.000%, 09/01/2022 | | | | | | | | | | | | | | | 562,680 | |
| | | | | |
| | | | Kansas Development Finance Authority, Adventist Health System | | | | | | | | | | | | | | | | |
| | 4,500 | | | 5.500%, 11/15/2029 | | | | | | | | | | | | | | | 4,683,330 | |
| | | | | |
| | | | Olathe Senior Living Facility, Catholic Care Campus, Series A | | | | | | | | | | | | | | | | |
| | 2,000 | | | 6.000%, 11/15/2038 | | | | | | | | | | | | | | | 1,674,700 | |
| | 7,000 | | | Total Kansas | | | | | | | | | | | | | | | 6,920,710 | |
| | | | Kentucky – 0.6% | | | | | | | | | | | | | | | | |
| | | | | |
| | | | Pikeville Hospital Revenue, Pikeville Medical Center | | | | | | | | | | | | | | | | |
| | 2,500 | | | 6.500%, 03/01/2041 | | | | | | | | | | | | | | | 2,510,525 | |
| | | | Louisiana – 0.2% | | | | | | | | | | | | | | | | |
| | | | | |
| | | | Jefferson Parish, Home Mortgage Authority, (ETM) (FGIC) (FHA) (VA) | | | | | | | | | | | | | | | | |
| | 1,000 | | | 7.100%, 08/01/2011 | | | | | | | | | | | | | | | 1,016,220 | |
| | | | Maryland – 1.0% | | | | | | | | | | | | | | | | |
| | | | | |
| | | | Frederick County, Series C | | | | | | | | | | | | | | | | |
| | 3,685 | | | 5.000%, 12/01/2020 | | | | | | | | | | | | | | | 4,354,712 | |
| | | | Massachusetts – 2.0% | | | | | | | | | | | | | | | | |
| | | | | |
| | | | Massachusetts Development Finance Agency, Health Care Facility, AdventCare Project, Series A | | | | | | | | | | | | | | | | |
| | 2,850 | | | 6.750%, 10/15/2037 | | | | | | | | | | | | | | | 2,456,273 | |
| | | | | |
| | | | Massachusetts Development Finance Agency, Senior Living Facility, Groves-Lincoln
Series A | | | | | | | | | | | | | | | | |
| | 1,000 | | | 7.875%, 06/01/2044 | | | | | | | | | | | | | | | 986,340 | |
| | | | | |
| | | | Massachusetts Development Finance Agency, Senior Living Facility, Groves-Lincoln, Series B2 | | | | | | | | | | | | | | | | |
| | 450 | | | 6.250%, 06/01/2014 | | | | | | | | | | | | | | | 440,671 | |
| | | | | |
| | | | Massachusetts Educational Financing Authority, Issue I, Series B (AMT) | | | | | | | | | | | | | | | | |
| | 955 | | | 5.500%, 01/01/2023 | | | | | | | | | | | | | | | 973,718 | |
| | | | | |
| | | | Massachusetts Health & Educational Facilities Authority, Suffolk University, Series A | | | | | | | | | | | | | | | | |
| | 3,000 | | | 5.750%, 07/01/2039 | | | | | | | | | | | | | | | 2,845,740 | |
| | | | | |
| | | | Massachusetts Health & Educational Facilities Authority, UMass Memorial Issue, Series D | | | | | | | | | | | | | | | | |
| | 1,000 | | | 5.000%, 07/01/2033 | | | | | | | | | | | | | | | 836,310 | |
| | 9,255 | | | Total Massachusetts | | | | | | | | | | | | | | | 8,539,052 | |
| | | | | | | | | | | | | | | | | | | | |
Principal
Amount (000) | | | Description p | | | | | | | | | | | Value | |
| | | | | | | | | | | | | | | | | | | | |
| | | | Michigan – 2.8% | | | | | | | | | | | | | | | | |
| | | | | |
| | | | Kalamazoo Hospital Finance Authority, Bronson Methodist Hospital, Series A (AGM) | | | | | | | | | | | | | | | | |
| $ | 7,665 | | | 5.000%, 05/15/2026 | | | | | | | | | | | | | | $ | 7,557,230 | |
| | | | | |
| | | | Michigan Hospital Finance Authority, McLaren Health Care, Series A | | | | | | | | | | | | | | | | |
| | 1,000 | | | 5.250%, 05/15/2018 | | | | | | | | | | | | | | | 1,086,870 | |
| | | | | |
| | | | Royal Oak Hospital Finance Authority, William Beaumont Hospital | | | | | | | | | | | | | | | | |
| | 3,000 | | | 8.000%, 09/01/2029 | | | | | | | | | | | | | | | 3,368,640 | |
| | 11,665 | | | Total Michigan | | | | | | | | | | | | | | | 12,012,740 | |
| | | | Minnesota – 3.2% | | | | | | | | | | | | | | | | |
| | | | | |
| | | | Cuyuna Range Hospital District | | | | | | | | | | | | | | | | |
| | 1,000 | | | 5.200%, 06/01/2025 | | | | | | | | | | | | | | | 908,640 | |
| | | | | |
| | | | Minneapolis Health Care System, Fairview Health Services, Series A | | | | | | | | | | | | | | | | |
| | 3,000 | | | 6.625%, 11/15/2028 | | | | | | | | | | | | | | | 3,225,180 | |
| | | | | |
| | | | Minneapolis, Mozaic Parking Project, Series A | | | | | | | | | | | | | | | | |
| | 1,000 | | | 8.500%, 01/01/2041 | | | | | | | | | | | | | | | 1,006,990 | |
| | | | | |
| | | | Minnesota Agricultural & Economic Development Board, Health Care System, Fairview Health Services, Series A | | | | | | | | | | | | | | | | |
| | 95 | | | 6.375%, 11/15/2029 | | | | | | | | | | | | | | | 95,300 | |
| | | | | |
| | | | Monticello-Big Lake Community Hospital District, Health Care Facilities, Series C | | | | | | | | | | | | | | | | |
| | 2,995 | | | 6.200%, 12/01/2022 | | | | | | | | | | | | | | | 2,854,565 | |
| | | | | |
| | | | Northern Municipal Power Agency, Series A1 | | | | | | | | | | | | | | | | |
| | 1,000 | | | 5.000%, 01/01/2019 | | | | | | | | | | | | | | | 1,109,350 | |
| | | | | |
| | | | Shakopee Health Care Facilities, St. Francis Regional Medical Center | | | | | | | | | | | | | | | | |
| | 1,000 | | | 5.250%, 09/01/2034 | | | | | | | | | | | | | | | 912,210 | |
| | | | | |
| | | | St. Paul Housing & Redevelopment Hospital Authority, HealthEast Project | | | | | | | | | | | | | | | | |
| | 2,000 | | | 6.000%, 11/15/2025 | | | | | | | | | | | | | | | 1,860,560 | |
| | 2,000 | | | 6.000%, 11/15/2030 | | | | | | | | | | | | | | | 1,750,240 | |
| | 14,090 | | | Total Minnesota | | | | | | | | | | | | | | | 13,723,035 | |
| | | | Missouri – 0.8% | | | | | | | | | | | | | | | | |
| | | | | |
| | | | Bi-State Development Agency, Missouri-Illinois Metropolitan District, St. Clair County Metrolink Project (AGM) | | | | | | | | | | | | | | | | |
| | 3,185 | | | 5.250%, 07/01/2027 | | | | | | | | | | | | | | | 3,379,795 | |
| | | | Montana – 1.1% | | | | | | | | | | | | | | | | |
| | | | | |
| | | | Forsyth Pollution Control, Northwestern Corporation (AMBAC) | | | | | | | | | | | | | | | | |
| | 2,500 | | | 4.650%, 08/01/2023 | | | | | | | | | | | | | | | 2,576,550 | |
| | | | | |
| | | | Montana Facility Finance Authority, Senior Living, St. John’s Lutheran Ministries Project, Series A | | | | | | | | | | | | | | | | |
| | 2,500 | | | 6.125%, 05/15/2036 | | | | | | | | | | | | | | | 2,087,675 | |
| | 5,000 | | | Total Montana | | | | | | | | | | | | | | | 4,664,225 | |
| | | | Nebraska – 1.1% | | | | | | | | | | | | | | | | |
| | | | | |
| | | | Nebraska Public Power District, Series B | | | | | | | | | | | | | | | | |
| | 2,750 | | | 5.000%, 01/01/2020 | | | | | | | | | | | | | | | 3,031,270 | |
| | | | | |
| | | | Washington County Wastewater Facilities, Cargill Incorporated Project (AMT) | | | | | | | | | | | | | | | | |
| | 1,700 | | | 5.900%, 11/01/2027 | | | | | | | | | | | | | | | 1,724,820 | |
| | 4,450 | | | Total Nebraska | | | | | | | | | | | | | | | 4,756,090 | |
| | | | Nevada – 1.2% | | | | | | | | | | | | | | | | |
| | | | | |
| | | | Carson City Hospital, Carson-Tahoe Hospital | | | | | | | | | | | | | | | | |
| | 2,740 | | | 5.750%, 09/01/2031 | | | | | | | | | | | | | | | 2,498,140 | |
| | | | Carson City Hospital, Carson-Tahoe Hospital (Pre-refunded 09/01/2012) | | | | | | | | | | | | | | | | |
| | 2,260 | | | 5.750%, 09/01/2031 | | | | | | | | | | | | | | | 2,432,235 | |
| | | | | |
| | | | Clark County Industrial Development, Southwest Gas Corporation Project, Series A (AMT) (FGIC) | | | | | | | | | | | | | | | 65,494 | |
| | 80 | | | 4.750%, 09/01/2036 | | | | | | | | | | | | | | | | |
| | 5,080 | | | Total Nevada | | | | | | | | | | | | | | | 4,995,869 | |
Portfolio of Investments
Nuveen Tax Free Fund (continued)
April 30, 2011
| | | | | | | | | | | | | | | | | | | | |
Principal
Amount (000) | | | Description p | | | | | | | | | | | Value | |
| | | | | | | | | | | | | | | | | | | | |
| | | | New Hampshire – 0.5% | | | | | | | | | | | | | | | | |
| | | | | |
| | | | New Hampshire Health & Educational Facilities Authority, Covenant Health | | | | | | | | | | | | | | | | |
| $ | 1,250 | | | 5.375%, 07/01/2024 | | | | | | | | | | | | | | $ | 1,250,975 | |
| | | | | |
| | | | New Hampshire Health & Educational Facilities Authority, Speare Memorial Hospital | | | | | | | | | | | | | | | | |
| | 800 | | | 5.875%, 07/01/2034 | | | | | | | | | | | | | | | 735,984 | |
| | 2,050 | | | Total New Hampshire | | | | | | | | | | | | | | | 1,986,959 | |
| | | | New York – 0.4% | | | | | | | | | | | | | | | | |
| | | | | |
| | | | Troy Capital Resource, Rensselaer Polytechnic Institute Project, Series B | | | | | | | | | | | | | | | | |
| | 1,400 | | | 5.000%, 09/01/2020 | | | | | | | | | | | | | | | 1,525,916 | |
| | | | North Carolina – 1.3% | | | | | | | | | | | | | | | | |
| | | | | |
| | | | North Carolina Medical Care Community Health Care Facilities, 1st Mortgage Presbyterian, Series B | | | | | | | | | | | | | | | | |
| | 1,500 | | | 5.200%, 10/01/2021 | | | | | | | | | | | | | | | 1,394,730 | |
| | | | | |
| | | | North Carolina, Public Improvement, Series A (Pre-refunded 03/01/2015) | | | | | | | | | | | | | | | | |
| | 3,765 | | | 5.000%, 03/01/2021 | | | | | | | | | | | | | | | 4,315,707 | |
| | 5,265 | | | Total North Carolina | | | | | | | | | | | | | | | 5,710,437 | |
| | | | North Dakota – 0.3% | | | | | | | | | | | | | | | | |
| | | | | |
| | | | West Fargo, Series A (AGC) | | | | | | | | | | | | | | | | |
| | 550 | | | 4.000%, 05/01/2017 | | | | | | | | | | | | | | | 567,556 | |
| | 540 | | | 4.000%, 05/01/2018 | | | | | | | | | | | | | | | 553,786 | |
| | 1,090 | | | Total North Dakota | | | | | | | | | | | | | | | 1,121,342 | |
| | | | Ohio – 1.3% | | | | | | | | | | | | | | | | |
| | | | | |
| | | | Lake County Hospital Facilities, Lake Hospital System, Series C | | | | | | | | | | | | | | | | |
| | 3,250 | | | 5.625%, 08/15/2029 | | | | | | | | | | | | | | | 3,077,458 | |
| | | | | |
| | | | Miami County Hospital Facilities, Refunding & Improvement, Upper Valley Medical Center | | | | | | | | | | | | | | | | |
| | 1,000 | | | 5.250%, 05/15/2026 | | | | | | | | | | | | | | | 978,210 | |
| | | | | |
| | | | Ohio Higher Educational Facility, Baldwin-Wallace College Project | | | | | | | | | | | | | | | | |
| | 1,540 | | | 5.250%, 12/01/2019 | | | | | | | | | | | | | | | 1,648,924 | |
| | 5,790 | | | Total Ohio | | | | | | | | | | | | | | | 5,704,592 | |
| | | | Oregon – 2.5% | | | | | | | | | | | | | | | | |
| | | | | |
| | | | Oregon Facilities Authority, Reed College Project, Series A | | | | | | | | | | | | | | | | |
| | 3,890 | | | 5.125%, 07/01/2041 | | | | | | | | | | | | | | | 3,975,697 | |
| | | | | |
| | | | Portland Airport, Portland International (AMT) | | | | | | | | | | | | | | | | |
| | 7,155 | | | 5.000%, 07/01/2027 | | | | | | | | | | | | | | | 7,026,138 | |
| | 11,045 | | | Total Oregon | | | | | | | | | | | | | | | 11,001,835 | |
| | | | Pennsylvania – 3.4% | | | | | | | | | | | | | | | | |
| | | | | |
| | | | Delaware County Authority College, Neumann College | | | | | | | | | | | | | | | | |
| | 1,000 | | | 6.125%, 10/01/2034 | | | | | | | | | | | | | | | 976,270 | |
| | | | | |
| | | | Erie County Industrial Development Authority, International Paper Company Project, Series A (AMT) | | | | | | | | | | | | | | | | |
| | 1,350 | | | 5.000%, 11/01/2018 | | | | | | | | | | | | | | | 1,345,828 | |
| | | | | |
| | | | Pennsylvania Economic Development Authority, Allegheny Energy Supply | | | | | | | | | | | | | | | | |
| | 5,000 | | | 7.000%, 07/15/2039 | | | | | | | | | | | | | | | 5,245,550 | |
| | | | | |
| | | | Philadelphia | | | | | | | | | | | | | | | | |
| | 2,380 | | | 6.500%, 08/01/2041 | | | | | | | | | | | | | | | 2,477,866 | |
| | | | | |
| | | | Philadelphia Gas Works, Ninth Series | | | | | | | | | | | | | | | | |
| | 2,000 | | | 5.000%, 08/01/2030 | | | | | | | | | | | | | | | 1,929,140 | |
| | | | | |
| | | | State Public School Building Authority, Delaware County Community College Project (AGM) | | | | | | | | | | | | | | | | |
| | 1,600 | | | 5.000%, 10/01/2024 | | | | | | | | | | | | | | | 1,682,224 | |
| | | | | |
| | | | Westmoreland County Industrial Development Authority, Redstone Retirement Community, Series A | | | | | | | | | | | | | | | | |
| | 1,200 | | | 5.750%, 01/01/2026 | | | | | | | | | | | | | | | 1,033,572 | |
| | 14,530 | | | Total Pennsylvania | | | | | | | | | | | | | | | 14,690,450 | |
| | | | | | | | | | | | | | | | | | | | |
Principal
Amount (000) | | | Description p | | | | | | | | | | | Value | |
| | | | | | | | | | | | | | | | | | | | |
| | | | Puerto Rico – 2.3% | | | | | | | | | | | | | | | | |
| | | | | |
| | | | Puerto Rico Commonwealth, Series A | | | | | | | | | | | | | | | | |
| $ | 550 | | | 5.000%, 07/01/2027 | | | | | | | | | | | | | | $ | 512,380 | |
| | | | | |
| | | | Puerto Rico Electric Power Authority, Series VV (NATL) | | | | | | | | | | | | | | | | |
| | 10,000 | | | 5.250%, 07/01/2029 | | | | | | | | | | | | | | | 9,515,700 | |
| | 10,550 | | | Total Puerto Rico | | | | | | | | | | | | | | | 10,028,080 | |
| | | | South Carolina – 1.1% | | | | | | | | | | | | | | | | |
| | | | | |
| | | | Georgetown County Environmental Improvement, International Paper, Series A (AMT) | | | | | | | | | | | | | | | | |
| | 700 | | | 5.550%, 12/01/2029 | | | | | | | | | | | | | | | 675,199 | |
| | | | | |
| | | | South Carolina Infrastructure, Series A | | | | | | | | | | | | | | | | |
| | 3,000 | | | 3.000%, 10/01/2024 | | | | | | | | | | | | | | | 2,825,610 | |
| | | | | |
| | | | South Carolina Jobs Economic Development Authority, Palmetto Health Alliance
Series A | | | | | | | | | | | | | | | | |
| | 1,250 | | | 6.125%, 08/01/2023 | | | | | | | | | | | | | | | 1,263,888 | |
| | | | | |
| | | | South Carolina Jobs Economic Development Authority, Palmetto Health Alliance, Series C,
(Pre-refunded 08/01/2013) | | | | | | | | | | | | | | | | |
| | 135 | | | 6.375%, 08/01/2034 | | | | | | | | | | | | | | | 151,860 | |
| | 5,085 | | | Total South Carolina | | | | | | | | | | | | | | | 4,916,557 | |
| | | | South Dakota – 4.0% | | | | | | | | | | | | | | | | |
| | | | | |
| | | | Rapid City Airport, Series A | | | | | | | | | | | | | | | | |
| | 1,000 | | | 7.000%, 12/01/2035 | | | | | | | | | | | | | | | 1,025,500 | |
| | | | | |
| | | | Rapid City Airport, Recovery Zone, Series B | | | | | | | | | | | | | | | | |
| | 2,500 | | | 7.000%, 12/01/2030 | | | | | | | | | | | | | | | 2,519,500 | |
| | | | | |
| | | | Sioux Falls Health Facilities, Dow Rummel Village Project, Series A (Pre-refunded 11/15/2012) | | | | | | | | | | | | | | | | |
| | 2,270 | | | 6.625%, 11/15/2023 | | | | | | | | | | | | | | | 2,457,139 | |
| | | | | |
| | | | South Dakota Economic Development Finance Authority, Pooled Loan Program - Davis Family, Series 4A (AMT) | | | | | | | | | | | | | | | | |
| | 1,400 | | | 6.000%, 04/01/2029 | | | | | | | | | | | | | | | 1,409,408 | |
| | | | | |
| | | | South Dakota Economic Development Finance Authority, Pooled Loan Program - Spearfish Forest, Series A (AMT) | | | | | | | | | | | | | | | | |
| | 2,000 | | | 5.875%, 04/01/2028 | | | | | | | | | | | | | | | 2,020,280 | |
| | | | | |
| | | | South Dakota Health & Educational Facilities Authority, Vocational Education Program (AGC) | | | | | | | | | | | | | | | | |
| | 6,750 | | | 5.500%, 08/01/2038 | | | | | | | | | | | | | | | 6,866,437 | |
| | | | | |
| | | | South Dakota Health & Educational Facilities Authority, Westhills Village Retirement Community | | | | | | | | | | | | | | | | |
| | 1,250 | | | 5.000%, 09/01/2031 | | | | | | | | | | | | | | | 1,128,625 | |
| | 17,170 | | | Total South Dakota | | | | | | | | | | | | | | | 17,426,889 | |
| | | | Tennessee – 1.9% | | | | | | | | | | | | | | | | |
| | | | | |
| | | | Claiborne County Industrial Development Board, Lincoln Memorial University Project | | | | | | | | | | | | | | | | |
| | 3,000 | | | 6.625%, 10/01/2039 | | | | | | | | | | | | | | | 3,022,860 | |
| | | | | |
| | | | Johnson City Health & Educational Facilities Board, Mountain States Health, Series A (Pre-refunded 07/01/2012) | | | | | | | | | | | | | | | | |
| | 2,500 | | | 7.500%, 07/01/2033 | | | | | | | | | | | | | | | 2,734,325 | |
| | | | | |
| | | | Shelby County | | | | | | | | | | | | | | | | |
| | 1,000 | | | 5.000%, 04/01/2020 | | | | | | | | | | | | | | | 1,152,250 | |
| | | | | |
| | | | Shelby County Health, Educational, & Housing Facility Board, Methodist Healthcare (Pre-refunded 09/01/2012) | | | | | | | | | | | | | | | | |
| | 1,125 | | | 6.500%, 09/01/2021 | | | | | | | | | | | | | | | 1,211,063 | |
| | 7,625 | | | Total Tennessee | | | | | | | | | | | | | | | 8,120,498 | |
| | | | Texas – 15.0% | | | | | | | | | | | | | | | | |
| | | | | |
| | | | Abilene Health Facilities Development, Sears Methodist Retirement Project | | | | | | | | | | | | | | | | |
| | 455 | | | 5.875%, 11/15/2018 | | | | | | | | | | | | | | | 388,384 | |
| | | | Abilene Health Facilities Development, Sears Methodist Retirement Project, Series A | | | | | | | | | | | | | | | | |
| | 2,280 | | | 5.875%, 11/15/2018 | | | | | | | | | | | | | | | 1,946,185 | |
Portfolio of Investments
Nuveen Tax Free Fund (continued)
April 30, 2011
| | | | | | | | | | | | | | | | | | | | |
Principal
Amount (000) | | | Description p | | | | | | | | | | | Value | |
| | | | | | | | | | | | | | | | | | | | |
| | | | Texas (continued) | | | | | | | | | | | | | | | | |
| | | | | |
| | | | Brazos County Health Facilities, Franciscan Services Corporation, St. Joseph Regional | | | | | | | | | | | | | | | | |
| $ | 3,635 | | | 5.000%, 01/01/2023 | | | | | | | | | | | | | | $ | 3,574,841 | |
| | | | | |
| | | | Bryan Electric System | | | | | | | | | | | | | | | | |
| | 3,500 | | | 5.000%, 07/01/2019 | | | | | | | | | | | | | | | 3,855,320 | |
| | | | | |
| | | | Crawford Education Facilities, University of St. Thomas Project | | | | | | | | | | | | | | | | |
| | 1,300 | | | 5.250%, 10/01/2022 | | | | | | | | | | | | | | | 1,262,989 | |
| | 1,750 | | | 5.375%, 10/01/2027 | | | | | | | | | | | | | | | 1,631,472 | |
| | | | | |
| | | | Fort Bend Independent School District, (ETM) (PSFG) | | | | | | | | | | | | | | | | |
| | 500 | | | 5.000%, 02/15/2014 | | | | | | | | | | | | | | | 557,765 | |
| | | | | |
| | | | Harris County Health Facilities Development Corporation, Memorial Hermann Healthcare System, Series B | | | | | | | | | | | | | | | | |
| | 2,000 | | | 7.250%, 12/01/2035 | | | | | | | | | | | | | | | 2,175,860 | |
| | | | | |
| | | | Harrison County Health Facilities, Good Shepherd Health Systems | | | | | | | | | | | | | | | | |
| | 3,000 | | | 5.250%, 07/01/2028 | | | | | | | | | | | | | | | 2,606,730 | |
| | | | | |
| | | | Humble Independent School District, Series A (AGC) | | | | | | | | | | | | | | | | |
| | 2,635 | | | 5.250%, 02/15/2022 | | | | | | | | | | | | | | | 2,969,065 | |
| | | | | |
| | | | Klein Independent School District, Series A (PSFG) | | | | | | | | | | | | | | | | |
| | 2,285 | | | 5.000%, 08/01/2023 | | | | | | | | | | | | | | | 2,604,649 | |
| | | | | |
| | | | Lubbock Educational Facilities Authority, Lubbock Christian University | | | | | | | | | | | | | | | | |
| | 1,000 | | | 5.125%, 11/01/2027 | | | | | | | | | | | | | | | 915,990 | |
| | 2,500 | | | 5.250%, 11/01/2037 | | | | | | | | | | | | | | | 2,143,825 | |
| | | | | |
| | | | North Texas Tollway Authority, Series C, Convertible CABs | | | | | | | | | | | | | | | | |
| | 5,440 | | | 0.000% through 09/01/2021, thereafter 6.750%, 09/01/2045 g | | | | | | | | | | | | | | | 2,944,400 | |
| | | | | |
| | | | North Texas Tollway Authority, First Tier, Series E3, Mandatory Put 01/01/2016 @ 100 | | | | | | | | | | | | | | | | |
| | 4,500 | | | 5.750%, 01/01/2038 | | | | | | | | | | | | | | | 5,022,045 | |
| | | | | |
| | | | Port Houston Authority, Harris County, Series D1 | | | | | | | | | | | | | | | | |
| | 2,000 | | | 5.000%, 10/01/2030 | | | | | | | | | | | | | | | 2,109,840 | |
| | | | | |
| | | | Red River Authority Sewer & Solid Waste Disposal, Excel Corporation Project (AMT) | | | | | | | | | | | | | | | | |
| | 3,775 | | | 6.100%, 02/01/2022 | | | | | | | | | | | | | | | 3,823,999 | |
| | | | | |
| | | | San Antonio Electric & Gas | | | | | | | | | | | | | | | | |
| | 4,000 | | | 5.000%, 02/01/2025 | | | | | | | | | | | | | | | 4,311,320 | |
| | | | | |
| | | | San Antonio Electric & Gas, Series A | | | | | | | | | | | | | | | | |
| | 10,000 | | | 5.250%, 02/01/2025 | | | | | | | | | | | | | | | 11,002,900 | |
| | | | | |
| | | | San Marcos Certificates of Obligation (AGM) | | | | | | | | | | | | | | | | |
| | 1,000 | | | 5.000%, 08/15/2025 | | | | | | | | | | | | | | | 1,048,240 | |
| | 1,000 | | | 5.000%, 08/15/2027 | | | | | | | | | | | | | | | 1,035,110 | |
| | | | | |
| | | | San Marcos Waterworks & Waste Water Systems (AGM) | | | | | | | | | | | | | | | | |
| | 1,000 | | | 5.000%, 08/15/2026 | | | | | | | | | | | | | | | 1,035,670 | |
| | | | | |
| | | | Tarrant County Cultural Education Retirement Facility, Northwest Senior Housing, Edgemere Project, Series A | | | | | | | | | | | | | | | | |
| | 1,600 | | | 6.000%, 11/15/2026 | | | | | | | | | | | | | | | 1,520,896 | |
| | | | | |
| | | | Travis County Health Facilities, Querencia Barton Creek Project | | | | | | | | | | | | | | | | |
| | 1,300 | | | 5.500%, 11/15/2025 | | | | | | | | | | | | | | | 1,119,534 | |
| | 4,100 | | | 5.650%, 11/15/2035 | | | | | | | | | | | | | | | 3,287,708 | |
| | 66,555 | | | Total Texas | | | | | | | | | | | | | | | 64,894,737 | |
| | | | Utah – 1.0% | | | | | | | | | | | | | | | | |
| | | | | |
| | | | Intermountain Power Agency, Utah Power Supply, Series A (AMBAC) | | | | | | | | | | | | | | | | |
| | 365 | | | 6.500%, 07/01/2011 | | | | | | | | | | | | | | | 368,811 | |
| | | | | |
| | | | Intermountain Power Agency, Utah Power Supply, Series A, (ETM) (AMBAC) | | | | | | | | | | | | | | | | |
| | 635 | | | 6.500%, 07/01/2011 | | | | | | | | | | | | | | | 641,845 | |
| | | | | |
| | | | Utah Charter School Finance, George Washington Academy, Series A | | | | | | | | | | | | | | | | |
| | 3,520 | | | 8.000%, 07/15/2041 | | | | | | | | | | | | | | | 3,499,478 | |
| | 4,520 | | | Total Utah | | | | | | | | | | | | | | | 4,510,134 | |
| | | | | | | | | | | | | | | | | | | | |
Principal
Amount (000) | | | Description p | | | | | | | | | | | Value | |
| | | | | | | | | | | | | | | | | | | | |
| | | | Vermont – 0.4% | | | | | | | | | | | | | | | | |
| | | | | |
| | | | Vermont Economic Development Authority, Wake Robin Corporation Project, Series A | | | | | | | | | | | | | | | | |
| $ | 1,000 | | | 5.250%, 05/01/2026 | | | | | | | | | | | | | | $ | 854,780 | |
| | | | | |
| | | | Vermont Educational & Health Buildings, Vermont Law School Project, Series A | | | | | | | | | | | | | | | | |
| | 1,000 | | | 6.250%, 01/01/2033 | | | | | | | | | | | | | | | 1,000,610 | |
| | 2,000 | | | Total Vermont | | | | | | | | | | | | | | | 1,855,390 | |
| | | | Virginia – 0.2% | | | | | | | | | | | | | | | | |
| | | | | |
| | | | Arlington County Industrial Development Authority, Berkeley Apartments (AMT) (FNMA) | | | | | | | | | | | | | | | | |
| | 1,000 | | | 5.850%, 12/01/2020 | | | | | | | | | | | | | | | 1,021,270 | |
| | | | Washington - 2.5% | | | | | | | | | | | | | | | | |
| | | | | |
| | | | Energy Northwest Washington Electric, Project 3, Series A | | | | | | | | | | | | | | | | |
| | 2,500 | | | 5.000%, 07/01/2018 | | | | | | | | | | | | | | | 2,914,400 | |
| | | | | |
| | | | Washington Health Care Facilities Authority, Central Washington Health Services | | | | | | | | | | | | | | | | |
| | 2,000 | | | 6.250%, 07/01/2024 | | | | | | | | | | | | | | | 2,068,900 | |
| | 2,000 | | | 7.000%, 07/01/2039 | | | | | | | | | | | | | | | 2,023,260 | |
| | | | | |
| | | | Washington Higher Education Facilities Authority, Whitworth University Project | | | | | | | | | | | | | | | | |
| | 3,000 | | | 5.375%, 10/01/2029 | | | | | | | | | | | | | | | 2,866,500 | |
| | | | | |
| | | | Washington Public Power Supply System, Nuclear Project #3, Series B | | | | | | | | | | | | | | | | |
| | 600 | | | 7.125%, 07/01/2016 | | | | | | | | | | | | | | | 752,544 | |
| | 10,100 | | | Total Washington | | | | | | | | | | | | | | | 10,625,604 | |
| | | | Wisconsin – 2.3% | | | | | | | | | | | | | | | | |
| | | | | |
| | | | Oneida Tribe of Indians, Retail Sales Revenue | | | | | | | | | | | | | | | | |
| | 2,500 | | | 6.500%, 02/01/2031 | | | | | | | | | | | | | | | 2,603,175 | |
| | | | | |
| | | | Wisconsin Health & Educational Facilities Authority, Beaver Dam Community Hospitals, Series A | | | | | | | | | | | | | | | | |
| | 2,000 | | | 6.750%, 08/15/2034 | | | | | | | | | | | | | | | 1,917,240 | |
| | | | | |
| | | | Wisconsin Health & Educational Facilities Authority, Beloit College, Series A | | | | | | | | | | | | | | | | |
| | 1,225 | | | 6.125%, 06/01/2039 | | | | | | | | | | | | | | | 1,129,916 | |
| | | | | |
| | | | Wisconsin Health & Educational Facilities Authority, Children’s Hospital of Wisconsin | | | | | | | | | | | | | | | | |
| | 2,000 | | | 5.250%, 08/15/2024 | | | | | | | | | | | | | | | 2,078,380 | |
| | | | | |
| | | | Wisconsin Health & Educational Facilities Authority, Eastcastle Place Incorporated Project | | | | | | | | | | | | | | | | |
| | 1,000 | | | 6.000%, 12/01/2024 | | | | | | | | | | | | | | | 797,270 | |
| | | | | |
| | | | Wisconsin Health & Educational Facilities Authority, New Castle Place Project, Series A | | | | | | | | | | | | | | | | |
| | 2,000 | | | 7.000%, 12/01/2031 | | | | | | | | | | | | | | | 1,598,100 | |
| | 10,725 | | | Total Wisconsin | | | | | | | | | | | | | | | 10,124,081 | |
| | | | Wyoming – 1.6% | | | | | | | | | | | | | | | | |
| | | | | |
| | | | Natrona County Hospital, Wyoming Medical Center Project | | | | | | | | | | | | | | | | |
| | 2,250 | | | 6.350%, 09/15/2031 | | | | | | | | | | | | | | | 2,287,733 | |
| | | | | |
| | | | Teton County Hospital District, St. John’s Medical Center | | | | | | | | | | | | | | | | |
| | 2,100 | | | 6.750%, 12/01/2022 | | | | | | | | | | | | | | | 2,084,859 | |
| | | | | |
| | | | West Park Hospital District, West Park Hospital Project, Series A | | | | | | | | | | | | | | | | |
| | 2,650 | | | 7.000%, 06/01/2040 | | | | | | | | | | | | | | | 2,666,880 | |
| | 7,000 | | | Total Wyoming | | | | | | | | | | | | | | | 7,039,472 | |
| $ | 446,298 | | | Total Municipal Bonds (cost $426,703,715) | | | | | | | | | | | | | | | 423,964,070 | |
| | | | | |
| Shares | | | Description p | | | | | | | | | | | Value | |
| | | | Short-Term Investments – 0.6% | | | | | | | | | | | | | | | | |
| | | | | |
| | | | Money Market Funds – 0.6% | | | | | | | | | | | | | | | | |
| | | | | |
| | 2,711,542 | | | First American Tax Free Obligations Fund, Class Z, 0.053% W | | | | | | | | | | | | | | | 2,711,542 | |
| | | | Total Short-Term Investments (cost $2,711,542) | | | | | | | | | | | | | | | 2,711,542 | |
| | | | Total Investments – 98.8% (cost $429,415,257) | | | | | | | | | | | | | | | 426,675,612 | |
| | | | Other Assets Less Liabilities – 1.2% | | | | | | | | | | | | | | | 5,058,670 | |
| | | | Net Assets – 100.0% | | | | | | | | | | | | | | $ | 431,734,282 | |
Portfolio of Investments
Nuveen Tax Free Fund (continued)
April 30, 2011
| | p | | All percentages shown in the Portfolio of Investments are based on net assets. |
| | | | Convertible Capital Appreciation Bonds (Convertible CABs) initially pay no interest but accrete in value from the date of issuance through the conversion date, at which time the bonds start to accrue and pay interest on a semi-annual basis until final maturity. |
| | W | | The rate shown is the annualized seven-day effective yield as of April 30, 2011. |
| | (ETM) | | Escrowed to maturity. |
Statement of Assets and Liabilities
April 30, 2011 (all dollars and shares are rounded to thousands (000), except for per share data)
| | | | | | | | | | | | |
| | | Intermediate
Tax Free | | | Short Tax Free | | | Tax Free | |
Assets | | | | | | | | | | | | |
Investments, at value (cost $707,207, $278,826 and $429,415, respectively) | | $ | 730,318 | | | $ | 282,572 | | | $ | 426,676 | |
Receivables: | | | | | | | | | | | | |
Interest | | | 10,152 | | | | 3,104 | | | | 7,017 | |
Shares sold | | | 559 | | | | 82 | | | | 120 | |
Other assets | | | 5 | | | | 6 | | | | 5 | |
Total assets | | | 741,034 | | | | 285,764 | | | | 433,818 | |
Liabilities | | | | | | | | | | | | |
Payables: | | | | | | | | | | | | |
Dividends | | | 2,124 | | | | 425 | | | | 1,383 | |
Investments purchased | | | 561 | | | | — | | | | — | |
Shares redeemed | | | 439 | | | | 42 | | | | 374 | |
Accrued expenses: | | | | | | | | | | | | |
Management fees | | | 397 | | | | 120 | | | | 221 | |
12b-1 distribution and service fees | | | 10 | | | | 1 | | | | 10 | |
Other | | | 125 | | | | 39 | | | | 96 | |
Total liabilities | | | 3,656 | | | | 627 | | | | 2,084 | |
Net assets | | $ | 737,378 | | | $ | 285,137 | | | $ | 431,734 | |
Class A Shares | | | | | | | | | | | | |
Net assets | | $ | 59,548 | | | $ | 7,790 | | | $ | 44,625 | |
Shares outstanding | | | 5,535 | | | | 780 | | | | 4,312 | |
Net asset value per share | | $ | 10.76 | | | $ | 9.98 | | | $ | 10.35 | |
Offering price per share (net asset value per share plus maximum sales charge of 3.00%, 2.50% and 4.20%, respectively, of offering price) | | $ | 11.09 | | | $ | 10.24 | | | $ | 10.80 | |
Class C1 Shares(1) | | | | | | | | | | | | |
Net assets | | $ | 3,781 | | | | N/A | | | $ | 5,654 | |
Shares outstanding | | | 350 | | | | N/A | | | | 549 | |
Net asset value and offering price per share | | $ | 10.81 | | | | N/A | | | $ | 10.29 | |
Class I Shares(1) | | | | | | | | | | | | |
Net assets | | $ | 674,049 | | | $ | 277,347 | | | $ | 381,455 | |
Shares outstanding | | | 62,835 | | | | 27,792 | | | | 36,837 | |
Net asset value and offering price per share | | $ | 10.73 | | | $ | 9.98 | | | $ | 10.36 | |
Net Assets Consist of: | | | | | | | | | | | | |
Capital paid-in | | $ | 713,624 | | | $ | 281,674 | | | $ | 446,304 | |
Undistributed (Over-distribution of) net investment income | | | 239 | | | | 522 | | | | 410 | |
Accumulated net realized gain (loss) | | | 404 | | | | (805 | ) | | | (12,241 | ) |
Net unrealized appreciation (depreciation) | | | 23,111 | | | | 3,746 | | | | (2,739 | ) |
Net assets | | $ | 737,378 | | | $ | 285,137 | | | $ | 431,734 | |
Authorized shares | | | 2 billion | | | | 2 billion | | | | 2 billion | |
Par value per share | | $ | 0.0001 | | | $ | 0.0001 | | | $ | 0.0001 | |
| N/A | - Short Tax Free does not offer Class C1 Shares. |
| (1) | - Effective January 18, 2011, Class C Shares were renamed Class C1 Shares and Class Y Shares were renamed Class I Shares. |
See accompanying notes to financial statements.
Statement of Operations (all dollars are rounded to thousands (000))
| | | | | | | | | | | | | | | | | | | | | | | | |
| | | Intermediate Tax Free | | | Short Tax Free | | | Tax Free | |
| | | Ten Months
Ended
4/30/11 | | | Year Ended
6/30/10 | | | Ten Months
Ended
4/30/11 | | | Year Ended
6/30/10 | | | Ten Months
Ended
4/30/11 | | | Year Ended
6/30/10 | |
Investment Income | | | | | | | | | | | | | | | | | | | | | | | | |
Interest and dividends from non-affiliated investments | | $ | 30,399 | | | $ | 35,115 | | | $ | 6,751 | | | $ | 6,735 | | | $ | 20,618 | | | $ | 25,384 | |
Interest and dividends from affiliated investments | | | 2 | | | | 9 | | | | 2 | | | | 8 | | | | 3 | | | | 15 | |
Total investment income | | | 30,401 | | | | 35,124 | | | | 6,753 | | | | 6,743 | | | | 20,621 | | | | 25,399 | |
Expenses | | | | | | | | | | | | | | | | | | | | | | | | |
Management fees | | | 3,431 | | | | 3,696 | | | | 1,235 | | | | 1,324 | | | | 2,139 | | | | 2,325 | |
12b-1 service fees – Class A | | | 108 | | | | 116 | | | | 17 | | | | 16 | | | | 91 | | | | 104 | |
12b-1 distribution and service fees – Class C1(1) | | | 19 | | | | 3 | | | | N/A | | | | N/A | | | | 33 | | | | 30 | |
Administration fees | | | 962 | | | | 1,677 | | | | 382 | | | | 607 | | | | 617 | | | | 1,057 | |
Shareholders’ servicing agent fees and expenses | | | 90 | | | | 75 | | | | 51 | | | | 60 | | | | 78 | | | | 80 | |
Custodian’s fees and expenses | | | 36 | | | | 37 | | | | 17 | | | | 13 | | | | 24 | | | | 23 | |
Directors’ fees and expenses | | | 22 | | | | 31 | | | | 18 | | | | 31 | | | | 19 | | | | 31 | |
Professional fees | | | 18 | | | | 51 | | | | 19 | | | | 50 | | | | 19 | | | | 50 | |
Shareholders’ reports – printing and mailing expenses | | | 51 | | | | 26 | | | | 20 | | | | 8 | | | | 35 | | | | 13 | |
Federal and state registration fees | | | 51 | | | | 46 | | | | 33 | | | | 28 | | | | 53 | | | | 37 | |
Other expenses | | | 19 | | | | 24 | | | | 14 | | | | 21 | | | | 17 | | | | 25 | |
Total expenses before expense reimbursements | | | 4,807 | | | | 5,782 | | | | 1,806 | | | | 2,158 | | | | 3,125 | | | | 3,775 | |
Expense reimbursement | | | (315 | ) | | | (598 | ) | | | (321 | ) | | | (584 | ) | | | (285 | ) | | | (485 | ) |
Expense reimbursement from regulatory settlement | | | (11 | ) | | | — | | | | — | | | | — | | | | (98 | ) | | | — | |
Net expenses | | �� | 4,481 | | | | 5,184 | | | | 1,485 | | | | 1,574 | | | | 2,742 | | | | 3,290 | |
Net investment income (loss) | | | 25,920 | | | | 29,940 | | | | 5,268 | | | | 5,169 | | | | 17,879 | | | | 22,109 | |
Realized and Unrealized Gain (Loss) | | | | | | | | | | | | | | | | | | | | | | | | |
Net realized gain (loss) from | | | | | | | | | | | | | | | | | | | | | | | | |
investments | | | 729 | | | | 1,318 | | | | 631 | | | | 2,406 | | | | (5,413 | ) | | | 801 | |
Change in net unrealized appreciation (depreciation) of investments | | | (11,689 | ) | | | 27,550 | | | | (1,305 | ) | | | 2,992 | | | | (8,937 | ) | | | 41,451 | |
Net realized and unrealized gain (loss) | | | (10,960 | ) | | | 28,868 | | | | (674 | ) | | | 5,398 | | | | (14,350 | ) | | | 42,252 | |
Net increase (decrease) in net assets from operations | | $ | 14,960 | | | $ | 58,808 | | | $ | 4,594 | | | $ | 10,567 | | | $ | 3,529 | | | $ | 64,361 | |
| N/A | – Short Tax Free does not offer Class C1 Shares. |
| (1) | – Effective January 18, 2011, Class C Shares were renamed Class C1 Shares. |
See accompanying notes to financial statements.
Statement of Changes in Net Assets (all dollars are rounded to thousands (000))
| | | | | | | | | | | | |
| | | Intermediate Tax Free | |
| | | Ten Months Ended
4/30/11 | | | Year Ended
6/30/10 | | | Year Ended
6/30/09 | |
Operations | | | | | | | | | | | | |
Net investment income (loss) | | $ | 25,920 | | | $ | 29,940 | | | $ | 28,489 | |
Net realized gain (loss) from: | | | | | | | | | | | | |
Investments | | | 729 | | | | 1,318 | | | | (457 | ) |
Futures | | | — | | | | — | | | | — | |
Change in net unrealized appreciation (depreciation) of: | | | | | | | | | | | | |
Investments | | | (11,689 | ) | | | 27,550 | | | | (2,077 | ) |
Futures | | | — | | | | — | | | | — | |
Net increase (decrease) in net assets from operations | | | 14,960 | | | | 58,808 | | | | 25,955 | |
Distributions to Shareholders | | | | | | | | | | | | |
From net investment income: | | | | | | | | | | | | |
Class A | | | (1,957 | ) | | | (1,856 | ) | | | (1,243 | ) |
Class C1(1) | | | (93 | ) | | | (16 | ) | | | — | |
Class I(1) | | | (23,353 | ) | | | (27,974 | ) | | | (28,122 | ) |
From accumulated net realized gains: | | | | | | | | | | | | |
Class A | | | (54 | ) | | | — | | | | (22 | ) |
Class C1(1) | | | (4 | ) | | | — | | | | — | |
Class I(1) | | | (639 | ) | | | — | | | | (483 | ) |
Decrease in net assets from distributions to shareholders | | | (26,100 | ) | | | (29,846 | ) | | | (29,870 | ) |
Fund Share Transactions | | | | | | | | | | | | |
Proceeds from sale of shares | | | 152,863 | | | | 216,095 | | | | 187,179 | |
Proceeds from shares issued to shareholders due to reinvestment of distributions | | | 3,355 | | | | 3,479 | | | | 3,565 | |
| | | 156,218 | | | | 219,574 | | | | 190,744 | |
Cost of shares redeemed | | | (185,242 | ) | | | (148,406 | ) | | | (167,791 | ) |
Net increase (decrease) in net assets from Fund share transactions | | | (29,024 | ) | | | 71,168 | | | | 22,953 | |
Net increase (decrease) in net assets | | | (40,164 | ) | | | 100,130 | | | | 19,038 | |
Net assets at the beginning of period | | | 777,542 | | | | 677,412 | | | | 658,374 | |
Net assets at end of period | | $ | 737,378 | | | $ | 777,542 | | | $ | 677,412 | |
Undistributed (Over-distribution of) net investment income at
the end of period | | $ | 239 | | | $ | (278 | ) | | $ | (372 | ) |
(1) – Effective January 18, 2011, Class C Shares were renamed Class C1 Shares and Class Y Shares were renamed Class I Shares.
See accompanying notes to financial statements.
Statement of Changes in Net Assets (continued) (all dollars are rounded to thousands (000))
| | | | | | | | | | | | |
| | | Short Tax Free | |
| | | Ten Months Ended
4/30/11 | | | Year Ended
6/30/10 | | | Year Ended
6/30/09 | |
Operations | | | | | | | | | | | | |
Net investment income (loss) | | $ | 5,268 | | | $ | 5,169 | | | $ | 4,528 | |
Net realized gain (loss) from: | | | | | | | | | | | | |
Investments | | | 631 | | | | 2,406 | | | | 34 | |
Futures | | | — | | | | — | | | | (2,092 | ) |
Change in net unrealized appreciation (depreciation) of: | | | | | | | | | | | | |
Investments | | | (1,305 | ) | | | 2,992 | | | | 2,012 | |
Futures | | | — | | | | — | | | | 70 | |
Net increase (decrease) in net assets from operations | | | 4,594 | | | | 10,567 | | | | 4,552 | |
Distributions to Shareholders | | | | | | | | | | | | |
From net investment income: | | | | | | | | | | | | |
Class A | | | (122 | ) | | | (116 | ) | | | (68 | ) |
Class C1(1) | | | N/A | | | | N/A | | | | N/A | |
Class I(1) | | | (4,618 | ) | | | (5,052 | ) | | | (4,419 | ) |
From accumulated net realized gains: | | | | | | | | | | | | |
Class A | | | — | | | | — | | | | — | |
Class C1(1) | | | N/A | | | | N/A | | | | N/A | |
Class I(1) | | | — | | | | — | | | | — | |
Decrease in net assets from distributions to shareholders | | | (4,740 | ) | | | (5,168 | ) | | | (4,487 | ) |
Fund Share Transactions | | | | | | | | | | | | |
Proceeds from sale of shares | | | 146,465 | | | | 260,317 | | | | 101,444 | |
Proceeds from shares issued to shareholders due to reinvestment of distributions | | | 338 | | | | 381 | | | | 265 | |
| | | 146,803 | | | | 260,698 | | | | 101,709 | |
Cost of shares redeemed | | | (179,471 | ) | | | (130,472 | ) | | | (65,741 | ) |
Net increase (decrease) in net assets from Fund share transactions | | | (32,668 | ) | | | 130,226 | | | | 35,968 | |
Net increase (decrease) in net assets | | | (32,814 | ) | | | 135,625 | | | | 36,033 | |
Net assets at the beginning of period | | | 317,951 | | | | 182,326 | | | | 146,293 | |
Net assets at end of period | | $ | 285,137 | | | $ | 317,951 | | | $ | 182,326 | |
Undistributed (Over-distribution of) net investment income at
the end of period | | $ | 522 | | | $ | (6 | ) | | $ | (7 | ) |
| N/A | – Short Tax Free does not offer Class C1 Shares. |
| (1) | – Effective January 18, 2011, Class C Shares were renamed Class C1 Shares and Class Y Shares were renamed Class I Shares. |
| | | | | | | | | | | | |
| | | Tax Free | |
| | | Ten Months Ended
4/30/11 | | | Year Ended
6/30/10 | | | Year Ended
6/30/09 | |
Operations | | | | | | | | | | | | |
Net investment income (loss) | | $ | 17,879 | | | $ | 22,109 | | | $ | 21,396 | |
Net realized gain (loss) from: | | | | | | | | | | | | |
Investments | | | (5,413 | ) | | | 801 | | | | (5,558 | ) |
Futures | | | — | | | | — | | | | (676 | ) |
Change in net unrealized appreciation (depreciation) of: | | | | | | | | | | | | |
Investments | | | (8,937 | ) | | | 41,451 | | | | (24,517 | ) |
Futures | | | — | | | | — | | | | — | |
Net increase (decrease) in net assets from operations | | | 3,529 | | | | 64,361 | | | | (9,355 | ) |
Distributions to Shareholders | | | | | | | | | | | | |
From net investment income: | | | | | | | | | | | | |
Class A | | | (1,641 | ) | | | (1,996 | ) | | | (1,662 | ) |
Class C1(1) | | | (181 | ) | | | (193 | ) | | | (138 | ) |
Class I(1) | | | (15,255 | ) | | | (20,293 | ) | | | (19,833 | ) |
From accumulated net realized gains: | | | | | | | | | | | | |
Class A | | | — | | | | — | | | | (51 | ) |
Class C1(1) | | | — | | | | — | | | | (5 | ) |
Class I(1) | | | — | | | | — | | | | (587 | ) |
Decrease in net assets from distributions to shareholders | | | (17,077 | ) | | | (22,482 | ) | | | (22,276 | ) |
Fund Share Transactions | | | | | | | | | | | | |
Proceeds from sale of shares | | | 79,316 | | | | 122,455 | | | | 106,010 | |
Proceeds from shares issued to shareholders due to reinvestment of distributions | | | 1,797 | | | | 2,262 | | | | 2,020 | |
| | | 81,113 | | | | 124,717 | | | | 108,030 | |
Cost of shares redeemed | | | (131,631 | ) | | | (90,562 | ) | | | (144,068 | ) |
Net increase (decrease) in net assets from Fund share transactions | | | (50,518 | ) | | | 34,155 | | | | (36,038 | ) |
Net increase (decrease) in net assets | | | (64,066 | ) | | | 76,034 | | | | (67,669 | ) |
Net assets at the beginning of period | | | 495,800 | | | | 419,766 | | | | 487,435 | |
Net assets at end of period | | $ | 431,734 | | | $ | 495,800 | | | $ | 419,766 | |
Undistributed (Over-distribution of) net investment income at
the end of period | | $ | 410 | | | $ | (391 | ) | | $ | (9 | ) |
| (1) | – Effective January 18, 2011, Class C Shares were renamed Class C1 Shares and Class Y Shares were renamed Class I Shares. |
See accompanying notes to financial statements.
Financial Highlights
| | | | | | | | | | | | | | | | | | | | | | | | | | | | | | | | | | | | |
| Selected data for a share outstanding throughout each period: | | | | | | | |
| | | |
| Class (Commencement Date) | | | | | | | | | | |
| | | | | | Investment Operations | | | Less Distributions | | | | | | | |
| | | | | | | | |
| INTERMEDIATE TAX FREE | | | | | | | | | | | | | | | | | | | | | | | | | |
| | | Beginning Net Asset Value | | | Net Invest- ment Income (Loss)(a) | | | Net
Realized/ Unrealized Gain (Loss) | | | Total | | | Net Invest- ment Income | | | Capital Gains(b) | | | Total | | | Ending Net Asset Value | | | Total Return(c) | |
CLASS A (12/87) | | | | | | | | | | | | | | | | | | | | | | | | | | | | | | | | | |
Year Ended 4/30 | | | | | | | | | | | | | | | | | | | | | | | | | | | | | | | | | |
2011(e) | | $ | 10.90 | | | $ | .36 | | | $ | (.14 | ) | | $ | .22 | | | $ | (.35 | ) | | $ | (.01 | ) | | $ | (.36 | ) | | $ | 10.76 | | | | 2.00 | % |
Year Ended 6/30 | | | | | | | | | | | | | | | | | | | | | | | | | | | | | | | | | |
2010 | | | 10.46 | | | | .43 | | | | .44 | | | | .87 | | | | (.43 | ) | | | — | | | | (.43 | ) | | | 10.90 | | | | 8.42 | |
2009 | | | 10.51 | | | | .45 | | | | (.03 | ) | | | .42 | | | | (.46 | ) | | | (.01 | ) | | | (.47 | ) | | | 10.46 | | | | 4.09 | |
2008 | | | 10.63 | | | | .44 | | | | (.09 | ) | | | .35 | | | | (.43 | ) | | | (.04 | ) | | | (.47 | ) | | | 10.51 | | | | 3.33 | |
2007 | | | 10.63 | | | | .44 | | | | .01 | | | | .45 | | | | (.44 | ) | | | (.01 | ) | | | (.45 | ) | | | 10.63 | | | | 4.27 | |
2006(f) | | | 10.92 | | | | .32 | | | | (.26 | ) | | | .06 | | | | (.32 | ) | | | (.03 | ) | | | (.35 | ) | | | 10.63 | | | | .56 | |
Year Ended 9/30 | | | | | | | | | | | | | | | | | | | | | | | | | | | | | | | | | |
2005 | | | 11.18 | | | | .44 | | | | (.19 | ) | | | .25 | | | | (.45 | ) | | | (.06 | ) | | | (.51 | ) | | | 10.92 | | | | 2.31 | |
CLASS C1 (10/09)(g) | | | | | | | | | | | | | | | | | | | | | | | | | | | | | | | | | |
Year Ended 4/30 | | | | | | | | | | | | | | | | | | | | | | | | | | | | | | | | | |
2011(e) | | | 10.94 | | | | .31 | | | | (.13 | ) | | | .18 | | | | (.30 | ) | | | (.01 | ) | | | (.31 | ) | | | 10.81 | | | | 1.61 | |
Year Ended 6/30 | | | | | | | | | | | | | | | | | | | | | | | | | | | | | | | | | |
2010(h) | | | 10.76 | | | | .25 | | | | .18 | | | | .43 | | | | (.25 | ) | | | — | | | | (.25 | ) | | | 10.94 | | | | 4.05 | |
CLASS I (2/94)(g) | | | | | | | | | | | | | | | | | | | | | | | | | | | | | | | | | |
Year Ended 4/30 | | | | | | | | | | | | | | | | | | | | | | | | | | | | | | | | | |
2011(e) | | | 10.87 | | | | .36 | | | | (.14 | ) | | | .22 | | | | (.35 | ) | | | (.01 | ) | | | (.36 | ) | | | 10.73 | | | | 2.08 | |
Year Ended 6/30 | | | | | | | | | | | | | | | | | | | | | | | | | | | | | | | | | |
2010 | | | 10.43 | | | | .44 | | | | .44 | | | | .88 | | | | (.44 | ) | | | — | | | | (.44 | ) | | | 10.87 | | | | 8.50 | |
2009 | | | 10.49 | | | | .45 | | | | (.04 | ) | | | .41 | | | | (.46 | ) | | | (.01 | ) | | | (.47 | ) | | | 10.43 | | | | 4.05 | |
2008 | | | 10.61 | | | | .44 | | | | (.08 | ) | | | .36 | | | | (.44 | ) | | | (.04 | ) | | | (.48 | ) | | | 10.49 | | | | 3.41 | |
2007 | | | 10.61 | | | | .45 | | | | .01 | | | | .46 | | | | (.45 | ) | | | (.01 | ) | | | (.46 | ) | | | 10.61 | | | | 4.43 | |
2006(f) | | | 10.90 | | | | .33 | | | | (.26 | ) | | | .07 | | | | (.33 | ) | | | (.03 | ) | | | (.36 | ) | | | 10.61 | | | | .67 | |
Year Ended 9/30 | | | | | | | | | | | | | | | | | | | | | | | | | | | | | | | | | |
2005 | | | 11.16 | | | | .46 | | | | (.19 | ) | | | .27 | | | | (.47 | ) | | | (.06 | ) | | | (.53 | ) | | | 10.90 | | | | 2.47 | |
| | | | | | | | | | | | | | | | | | | | | | |
| | | | | |
| |
| | | | | |
| Ratios/Supplemental Data | |
| | | | Ratios to Average
Net Assets Before
Reimbursement | | | Ratios to Average
Net Assets After
Reimbursement(d) | | | | |
Ending
Net
Assets
(000) | | | Expenses | | | Net
Invest-
ment
Income
(Loss) | | | Expenses | | | Net
Invest-
ment
Income
(Loss) | | | Portfolio
Turnover
Rate | |
| | | | | | | | | | | | | | | | | | | | | | |
| | | | | | | | | | | | | | | | | | | | | | |
| $ | 59,548 | | | | .91 | %* | | | 3.78 | %* | | | .72 | %* | | | 3.96 | %* | | | 9 | % |
| | | | | | | | | | | | | | | | | | | | | | |
| | 59,606 | | | | 1.02 | | | | 3.74 | | | | .75 | | | | 4.01 | | | | 10 | |
| | 35,017 | | | | 1.02 | | | | 4.02 | | | | .75 | | | | 4.29 | | | | 13 | |
| | 27,554 | | | | 1.02 | | | | 3.85 | | | | .77 | | | | 4.10 | | | | 19 | |
| | 29,687 | | | | 1.02 | | | | 3.91 | | | | .85 | | | | 4.08 | | | | 27 | |
| | 32,521 | | | | 1.05 | * | | | 3.75 | * | | | .85 | * | | | 3.95 | * | | | 15 | |
| | | | | | | | | | | | | | | | | | | | | | |
| | 34,658 | | | | 1.05 | | | | 3.78 | | | | .85 | | | | 3.98 | | | | 15 | |
| | | | | | | | | | | | | | | | | | | | | | |
| | | | | | | | | | | | | | | | | | | | | | |
| | 3,781 | | | | 1.34 | * | | | 3.38 | * | | | 1.31 | * | | | 3.41 | * | | | 9 | |
| | | | | | | | | | | | | | | | | | | | | | |
| | 1,484 | | | | 1.42 | * | | | 3.37 | * | | | 1.35 | * | | | 3.44 | * | | | 10 | |
| | | | | | | | | | | | | | | | | | | | | | |
| | | | | | | | | | | | | | | | | | | | | | |
| | 674,049 | | | | .70 | * | | | 3.98 | * | | | .66 | * | | | 4.02 | * | | | 9 | |
| | | | | | | | | | | | | | | | | | | | | | |
| | 716,452 | | | | .77 | | | | 3.98 | | | | .70 | | | | 4.05 | | | | 10 | |
| | 642,395 | | | | .77 | | | | 4.27 | | | | .70 | | | | 4.34 | | | | 13 | |
| | 630,820 | | | | .77 | | | | 4.10 | | | | .70 | | | | 4.17 | | | | 19 | |
| | 554,618 | | | | .77 | | | | 4.16 | | | | .70 | | | | 4.23 | | | | 27 | |
| | 596,306 | | | | .80 | * | | | 4.00 | * | | | .70 | * | | | 4.10 | * | | | 15 | |
| | | | | | | | | | | | | | | | | | | | | | |
| | 641,141 | | | | .80 | | | | 4.03 | | | | .70 | | | | 4.13 | | | | 15 | |
| (a) | Per share Net Investment Income (Loss) is calculated using the average daily shares method. |
| (b) | Distributions from Capital Gains include short-term capital gains, if any. |
| (c) | Total return is the combination of changes in net asset value without any sales charge, reinvested dividend income at net asset value and reinvested capital gains distributions at net asset value, if any. Total returns are not annualized. |
| (d) | After expense reimbursement from the Adviser, where applicable. Ratios do not reflect the effect of custodian fee credits earned on the Fund’s net cash on deposit with the custodian bank, where applicable. |
| (e) | For the ten months ended April 30, 2011. |
| (f) | For the nine months ended June 30, 2006. |
| (g) | Effective January 18, 2011, Class C Shares were renamed Class C1 Shares and Class Y Shares were renamed Class I Shares. |
| (h) | For the period October 28, 2009 (commencement of operations) through June 30, 2010. |
See accompanying notes to financial statements.
Financial Highlights (continued)
| | | | | | | | | | | | | | | | | | | | | | | | | | | | | | | | | | | | |
| Selected data for a share outstanding throughout each period: | | | | | | | |
| | | |
| Class (Commencement Date) | | | | | | | | | | |
| | | | | | Investment Operations | | | Less Distributions | | | | | | | |
| | | | | | | | |
| SHORT TAX FREE | | | | | | | | | | | | | | | | | | | | | | | | | |
| | | Beginning
Net
Asset
Value | | | Net
Invest-
ment
Income
(Loss)(a) | | | Net
Realized/
Unrealized
Gain
(Loss) | | | Total | | | Net
Invest-
ment
Income | | | Capital
Gains(b) | | | Total | | | Ending
Net
Asset
Value | | | Total
Return(c) | |
CLASS A (10/02) | | | | | | | | | | | | | | | | | | | | | | | | | | | | | | | | | |
Year Ended 4/30 | | | | | | | | | | | | | | | | | | | | | | | | | | | | | | | | | |
2011(e) | | $ | 9.98 | | | $ | .16 | | | $ | (.02 | ) | | $ | .14 | | | $ | (.14 | ) | | $ | — | | | $ | (.14 | ) | | $ | 9.98 | | | | 1.41 | % |
Year Ended 6/30 | | | | | | | | | | | | | | | | | | | | | | | | | | | | | | | | | |
2010 | | | 9.74 | | | | .20 | | | | .22 | | | | .42 | | | | (.18 | ) | | | — | | | | (.18 | ) | | | 9.98 | | | | 4.38 | |
2009 | | | 9.79 | | | | .28 | | | | (.07 | ) | | | .21 | | | | (.26 | ) | | | — | | | | (.26 | ) | | | 9.74 | | | | 2.17 | |
2008 | | | 9.70 | | | | .30 | | | | .10 | | | | .40 | | | | (.31 | ) | | | — | | | | (.31 | ) | | | 9.79 | | | | 4.17 | |
2007 | | | 9.68 | | | | .28 | | | | .03 | | | | .31 | | | | (.29 | ) | | | — | | | | (.29 | ) | | | 9.70 | | | | 3.22 | |
2006(f) | | | 9.78 | | | | .19 | | | | (.09 | ) | | | .10 | | | | (.20 | ) | | | — | | | | (.20 | ) | | | 9.68 | | | | 1.02 | |
Year Ended 9/30 | | | | | | | | | | | | | | | | | | | | | | | | | | | | | | | | | |
2005 | | | 9.96 | | | | .24 | | | | (.17 | ) | | | .07 | | | | (.25 | ) | | | — | | | | (.25 | ) | | | 9.78 | | | | .83 | |
CLASS I (10/02)(g) | | | | | | | | | | | | | | | | | | | | | | | | | | | | | | | | | |
Year Ended 4/30 | | | | | | | | | | | | | | | | | | | | | | | | | | | | | | | | | |
2011(e) | | | 9.98 | | | | .17 | | | | (.02 | ) | | | .15 | | | | (.15 | ) | | | — | | | | (.15 | ) | | | 9.98 | | | | 1.54 | |
Year Ended 6/30 | | | | | | | | | | | | | | | | | | | | | | | | | | | | | | | | | |
2010 | | | 9.74 | | | | .20 | | | | .24 | | | | .44 | | | | (.20 | ) | | | — | | | | (.20 | ) | | | 9.98 | | | | 4.53 | |
2009 | | | 9.79 | | | | .27 | | | | (.05 | ) | | | .22 | | | | (.27 | ) | | | — | | | | (.27 | ) | | | 9.74 | | | | 2.32 | |
2008 | | | 9.70 | | | | .31 | | | | .10 | | | | .41 | | | | (.32 | ) | | | — | | | | (.32 | ) | | | 9.79 | | | | 4.33 | |
2007 | | | 9.68 | | | | .31 | | | | .01 | | | | .32 | | | | (.30 | ) | | | — | | | | (.30 | ) | | | 9.70 | | | | 3.37 | |
2006(f) | | | 9.78 | | | | .21 | | | | (.10 | ) | | | .11 | | | | (.21 | ) | | | — | | | | (.21 | ) | | | 9.68 | | | | 1.13 | |
Year Ended 9/30 | | | | | | | | | | | | | | | | | | | | | | | | | | | | | | | | | |
2005 | | | 9.96 | | | | .26 | | | | (.18 | ) | | | .08 | | | | (.26 | ) | | | — | | | | (.26 | ) | | | 9.78 | | | | .67 | |
| | | | | | | | | | | | | | | | | | | | | | |
| | |
|
| | |
| Ratios/Supplemental Data | |
| | | | Ratios to Average
Net Assets Before
Reimbursement | | | Ratios to Average
Net Assets After
Reimbursement(d) | | | | |
Ending
Net
Assets
(000) | | | Expenses | | | Net
Invest-
ment
Income
(Loss) | | | Expenses | | | Net
Invest-
ment
Income
(Loss) | | | Portfolio
Turnover
Rate | |
| | | | | | | | | | | | | | | | | | | | | | |
| | | | | | | | | | | | | | | | | | | | | | |
| $ | 7,790 | | | | .89 | %* | | | 1.73 | %* | | | .71 | %* | | | 1.91 | %* | | | 21 | % |
| | | | | | | | | | | | | | | | | | | | | | |
| | 7,168 | | | | 1.06 | | | | 1.49 | | | | .74 | | | | 1.81 | | | | 45 | |
| | 3,376 | | | | 1.11 | | | | 2.35 | | | | .75 | | | | 2.71 | | | | 70 | |
| | 2,308 | | | | 1.11 | | | | 2.69 | | | | .75 | | | | 3.05 | | | | 58 | |
| | 2,410 | | | | 1.08 | | | | 2.61 | | | | .75 | | | | 2.94 | | | | 57 | |
| | 3,321 | | | | 1.08 | * | | | 2.32 | * | | | .75 | * | | | 2.65 | * | | | 22 | |
| | | | | | | | | | | | | | | | | | | | | | |
| | 4,103 | | | | 1.06 | | | | 2.15 | | | | .75 | | | | 2.46 | | | | 37 | |
| | | | | | | | | | | | | | | | | | | | | | |
| | | | | | | | | | | | | | | | | | | | | | |
| | 277,347 | | | | .67 | * | | | 1.94 | * | | | .55 | * | | | 2.06 | * | | | 21 | |
| | | | | | | | | | | | | | | | | | | | | | |
| | 310,783 | | | | .81 | | | | 1.74 | | | | .59 | | | | 1.96 | | | | 45 | |
| | 178,950 | | | | .86 | | | | 2.58 | | | | .60 | | | | 2.84 | | | | 70 | |
| | 143,985 | | | | .86 | | | | 2.94 | | | | .60 | | | | 3.20 | | | | 58 | |
| | 161,468 | | | | .83 | | | | 2.86 | | | | .60 | | | | 3.09 | | | | 57 | |
| | 235,900 | | | | .83 | * | | | 2.57 | * | | | .60 | * | | | 2.80 | * | | | 22 | |
| | | | | | | | | | | | | | | | | | | | | | |
| | 329,647 | | | | .81 | | | | 2.41 | | | | .60 | | | | 2.62 | | | | 37 | |
| (a) | Per share Net Investment Income (Loss) is calculated using the average daily shares method. |
| (b) | Distributions from Capital Gains include short-term capital gains, if any. |
| (c) | Total return is the combination of changes in net asset value without any sales charge, reinvested dividend income at net asset value and reinvested capital gains distributions at net asset value, if any. Total returns are not annualized. |
| (d) | After expense reimbursement from the Adviser, where applicable. Ratios do not reflect the effect of custodian fee credits earned on the Fund’s net cash on deposit with the custodian bank, where applicable. |
| (e) | For the ten months ended April 30, 2011. |
| (f) | For the nine months ended June 30, 2006. |
| (g) | Effective January 18, 2011, Class Y Shares were renamed Class I Shares. |
See accompanying notes to financial statements.
Financial Highlights (continued)
| | | | | | | | | | | | | | | | | | | | | | | | | | | | | | | | | | | | |
| Selected data for a share outstanding throughout each period: | | | | | | | |
| | | |
| Class (Commencement Date) | | | | | | | | | | |
| | | | | | Investment Operations | | | Less Distributions | | | | | | | |
| | | | | | | | |
| TAX FREE | | | | | | | | | | | | | | | | | | | | | | | | | |
| | | Beginning
Net
Asset
Value | | | Net
Invest-
ment
Income
(Loss) | | | Net
Realized/
Unrealized
Gain
(Loss)(a) | | | Total | | | Net
Invest-
ment
Income | | | Capital
Gains(b) | | | Total | | | Ending
Net
Asset
Value | | | Total
Return(c) | |
CLASS A (11/96) | | | | | | | | | | | | | | | | | | | | | | | | | | | | | | | | | |
Year Ended 4/30 | | | | | | | | | | | | | | | | | | | | | | | | | | | | | | | | | |
2011(e) | | $ | 10.61 | | | $ | .39 | | | $ | (.29 | ) | | $ | .10 | | | $ | (.36 | ) | | $ | — | | | $ | (.36 | ) | | $ | 10.35 | | | | 0.98 | % |
Year Ended 6/30 | | | | | | | | | | | | | | | | | | | | | | | | | | | | | | | | | |
2010 | | | 9.65 | | | | .49 | | | | .97 | | | | 1.46 | | | | (.50 | ) | | | — | | | | (.50 | ) | | | 10.61 | | | | 15.32 | |
2009 | | | 10.26 | | | | .48 | | | | (.59 | ) | | | (.11 | ) | | | (.48 | ) | | | (.02 | ) | | | (.50 | ) | | | 9.65 | | | | (.80 | ) |
2008 | | | 10.77 | | | | .45 | | | | (.46 | ) | | | (.01 | ) | | | (.44 | ) | | | (.06 | ) | | | (.50 | ) | | | 10.26 | | | | (.05 | ) |
2007 | | | 10.86 | | | | .45 | | | | — | | | | .45 | | | | (.45 | ) | | | (.09 | ) | | | (.54 | ) | | | 10.77 | | | | 4.16 | |
2006(f) | | | 11.10 | | | | .35 | | | | (.20 | ) | | | .15 | | | | (.35 | ) | | | (.04 | ) | | | (.39 | ) | | | 10.86 | | | | 1.37 | |
Year Ended | | | | | | | | | | | | | | | | | | | | | | | | | | | | | | | | | |
2005 | | | 11.18 | | | | .47 | | | | .03 | | | | .50 | | | | (.47 | ) | | | (.11 | ) | | | (.58 | ) | | | 11.10 | | | | 4.51 | |
CLASS C1 (9/01)(g) | | | | | | | | | | | | | | | | | | | | | | | | | | | | | | | | | |
Year Ended 4/30 | | | | | | | | | | | | | | | | | | | | | | | | | | | | | | | | | |
2011(e) | | | 10.56 | | | | .33 | | | | (.28 | ) | | | .05 | | | | (.32 | ) | | | — | | | | (.32 | ) | | | 10.29 | | | | 0.43 | |
Year Ended 6/30 | | | | | | | | | | | | | | | | | | | | | | | | | | | | | | | | | |
2010 | | | 9.61 | | | | .43 | | | | .96 | | | | 1.39 | | | | (.44 | ) | | | — | | | | (.44 | ) | | | 10.56 | | | | 14.60 | |
2009 | | | 10.21 | | | | .42 | | | | (.57 | ) | | | (.15 | ) | | | (.43 | ) | | | (.02 | ) | | | (.45 | ) | | | 9.61 | | | | (1.30 | ) |
2008 | | | 10.72 | | | | .39 | | | | (.45 | ) | | | (.06 | ) | | | (.39 | ) | | | (.06 | ) | | | (.45 | ) | | | 10.21 | | | | (.61 | ) |
2007 | | | 10.81 | | | | .40 | | | | .01 | | | | .41 | | | | (.41 | ) | | | (.09 | ) | | | (.50 | ) | | | 10.72 | | | | 3.76 | |
2006(f) | | | 11.05 | | | | .32 | | | | (.20 | ) | | | .12 | | | | (.32 | ) | | | (.04 | ) | | | (.36 | ) | | | 10.81 | | | | 1.06 | |
Year Ended | | | | | | | | | | | | | | | | | | | | | | | | | | | | | | | | | |
2005 | | | 11.13 | | | | .42 | | | | .03 | | | | .45 | | | | (.42 | ) | | | (.11 | ) | | | (.53 | ) | | | 11.05 | | | | 4.13 | |
CLASS I (11/96)(g) | | | | | | | | | | | | | | | | | | | | | | | | | | | | | | | | | |
Year Ended 4/30 | | | | | | | | | | | | | | | | | | | | | | | | | | | | | | | | | |
2011(e) | | | 10.62 | | | | .39 | | | | (.28 | ) | | | .11 | | | | (.37 | ) | | | — | | | | (.37 | ) | | | 10.36 | | | | 1.07 | |
Year Ended 6/30 | | | | | | | | | | | | | | | | | | | | | | | | | | | | | | | | | |
2010 | | | 9.66 | | | | .49 | | | | .97 | | | | 1.46 | | | | (.50 | ) | | | — | | | | (.50 | ) | | | 10.62 | | | | 15.36 | |
2009 | | | 10.27 | | | | .49 | | | | (.59 | ) | | | (.10 | ) | | | (.49 | ) | | | (.02 | ) | | | (.51 | ) | | | 9.66 | | | | (.75 | ) |
2008 | | | 10.78 | | | | .46 | | | | (.46 | ) | | | — | | | | (.45 | ) | | | (.06 | ) | | | (.51 | ) | | | 10.27 | | | | .04 | |
2007 | | | 10.87 | | | | .48 | | | | — | | | | .48 | | | | (.48 | ) | | | (.09 | ) | | | (.57 | ) | | | 10.78 | | | | 4.42 | |
2006(f) | | | 11.11 | | | | .37 | | | | (.20 | ) | | | .17 | | | | (.37 | ) | | | (.04 | ) | | | (.41 | ) | | | 10.87 | | | | 1.57 | |
Year Ended | | | | | | | | | | | | | | | | | | | | | | | | | | | | | | | | | |
2005 | | | 11.19 | | | | .50 | | | | .02 | | | | .52 | | | | (.49 | ) | | | (.11 | ) | | | (.60 | ) | | | 11.11 | | | | 4.77 | |
| | | | | | | | | | | | | | | | | | | | | | |
| | | | | | | | | | | | | | | | | |
| | | |
| | | | | | | | | | | |
| Ratios/Supplemental Data | |
| | | | Ratios to Average
Net Assets Before
Reimbursement | | | Ratios to Average
Net Assets After
Reimbursement(d) | | | | |
Ending
Net
Assets
(000) | | | Expenses | | | Net
Invest- ment
Income
(Loss) | | | Expenses | | | Net
Invest- ment
Income
(Loss) | | | Portfolio
Turnover
Rate | |
| | | | | | | | | | | | | | | | | | | | | | |
| | | | | | | | | | | | | | | | | | | | | | |
| $ | 44,625 | | | | .95 | %* | | | 4.18 | %* | | | .70 | %* | | | 4.43 | %* | | | 30 | % |
| | | | | | | | | | | | | | | | | | | | | | |
| | 45,885 | | | | 1.04 | | | | 4.41 | | | | .75 | | | | 4.70 | | | | 25 | |
| | 35,276 | | | | 1.04 | | | | 4.78 | | | | .75 | | | | 5.07 | | | | 34 | |
| | 35,557 | | | | 1.02 | | | | 4.04 | | | | .78 | | | | 4.28 | | | | 52 | |
| | 37,760 | | | | 1.03 | | | | 4.00 | | | | .95 | | | | 4.08 | | | | 31 | |
| | 36,519 | | | | 1.06 | * | | | 4.17 | * | | | .95 | * | | | 4.28 | * | | | 13 | |
| | | | | | | | | | | | | | | | | | | | | | |
| | 38,205 | | | | 1.06 | | | | 4.09 | | | | .95 | | | | 4.20 | | | | 8 | |
| | | | | | | | | | | | | | | | | | | | | | |
| | | | | | | | | | | | | | | | | | | | | | |
| | 5,654 | | | | 1.37 | * | | | 3.76 | * | | | 1.29 | * | | | 3.83 | * | | | 30 | |
| | | | | | | | | | | | | | | | | | | | | | |
| | 5,698 | | | | 1.44 | | | | 4.00 | | | | 1.35 | | | | 4.09 | | | | 25 | |
| | 3,442 | | | | 1.44 | | | | 4.39 | | | | 1.35 | | | | 4.48 | | | | 34 | |
| | 3,104 | | | | 1.43 | | | | 3.64 | | | | 1.35 | | | | 3.72 | | | | 52 | |
| | 2,495 | | | | 1.51 | | | | 3.51 | | | | 1.35 | | | | 3.67 | | | | 31 | |
| | 2,210 | | | | 1.81 | * | | | 3.41 | * | | | 1.35 | * | | | 3.87 | * | | | 13 | |
| | | | | | | | | | | | | | | | | | | | | | |
| | 2,712 | | | | 1.81 | | | | 3.34 | | | | 1.35 | | | | 3.80 | | | | 8 | |
| | | | | | | | | | | | | | | | | | | | | | |
| | | | | | | | | | | | | | | | | | | | | | |
| | 381,455 | | | | .72 | * | | | 4.39 | * | | | .64 | * | | | 4.47 | * | | | 30 | |
| | | | | | | | | | | | | | | | | | | | | | |
| | 444,217 | | | | .79 | | | | 4.68 | | | | .70 | | | | 4.77 | | | | 25 | |
| | 381,048 | | | | .79 | | | | 5.01 | | | | .70 | | | | 5.10 | | | | 34 | |
| | 448,774 | | | | .78 | | | | 4.28 | | | | .70 | | | | 4.36 | | | | 52 | |
| | 539,360 | | | | .78 | | | | 4.24 | | | | .70 | | | | 4.32 | | | | 31 | |
| | 455,910 | | | | .81 | * | | | 4.42 | * | | | .70 | * | | | 4.53 | * | | | 13 | |
| | | | | | | | | | | | | | | | | | | | | | |
| | 436,303 | | | | .81 | | | | 4.34 | | | | .70 | | | | 4.45 | | | | 8 | |
| (a) | Per share Net Investment Income (Loss) is calculated using the average daily shares method. |
| (b) | Distributions from Capital Gains include short-term capital gains, if any. |
| (c) | Total return is the combination of changes in net asset value without any sales charge, reinvested dividend income at net asset value and reinvested capital gains distributions at net asset value, if any. Total returns are not annualized. |
| (d) | After expense reimbursement from the Adviser, where applicable. Ratios do not reflect the effect of custodian fee credits earned on the Fund’s net cash on deposit with the custodian bank, where applicable. |
| (e) | For the ten months April 30, 2011. |
| (f) | For the nine months ended June 30, 2006. |
| (g) | Effective January 18, 2011, Class C Shares were renamed Class C1 Shares and Class Y Shares were renamed Class I Shares. |
See accompanying notes to financial statements.
Notes to Financial Statements (all dollars and shares are rounded to thousands (000))
1. General Information and Significant Accounting Policies
General Information
On July 28, 2010, U.S. Bancorp, the indirect parent company of FAF Advisors, Inc. (“FAF Advisors”), entered into an agreement to sell a portion of FAF Advisors’ asset management business to Nuveen Investments, Inc. (“Nuveen”). Included in the sale was the part of FAF Advisors’ asset management business that advises the funds included in this report. The sale closed on December 31, 2010 (the “Sale”).
In connection with the Sale, the funds’ Board of Directors was asked to consider and approve new investment advisory agreements for the funds with Nuveen Asset Management, a wholly-owned subsidiary of Nuveen. The new investment advisory agreements for each fund were submitted to the funds’ shareholders for approval and took effect on January 1, 2011. Effective January 1, 2011, the funds’ adviser, Nuveen Asset Management, changed its name to Nuveen Fund Advisors, Inc. (“Nuveen Fund Advisors” or the “Adviser”). Concurrently, the Adviser formed a wholly-owned subsidiary, Nuveen Asset Management, LLC (the “Sub-Adviser”), to house its portfolio management capabilities and to serve as the funds’ sub-adviser, and the funds’ portfolio managers became employees of the Sub-Adviser. This allocation of responsibilities between the Adviser and the Sub-Adviser affects each of the funds. The Adviser will compensate the Sub-Adviser for the portfolio management services it provides to the funds from each fund’s management fee.
There was no change in the funds’ investment objectives or policies as a result of the sale. The sale did result in a change to each fund’s name effective January 1, 2011.
The funds’ Board of Directors also approved new distribution agreements with Nuveen Investments, LLC, a wholly-owned subsidiary of Nuveen. Effective April 30, 2011, Nuveen Investments, LLC changed its name to Nuveen Securities, LLC.
First American Investment Funds, Inc. known as Nuveen Investment Funds, Inc. effective April 4, 2011 (the “Trust”), is an open-end investment company registered under the Investment Company Act of 1940, as amended. The Trust is comprised of the Nuveen Intermediate Tax Free Fund (“Intermediate Tax Free”), formerly known as First American Intermediate Tax Free Fund, Nuveen Short Tax Free Fund (“Short Tax Free”), formerly known as First American Short Tax Free Fund and Nuveen Tax Free Fund (“Tax Free”), formerly known as First American Tax Free Fund (each a “Fund” and collectively, the “Funds”), among others.
Intermediate Tax Free’s and Short Tax Free’s investment objective is to provide current income that is exempt from federal income tax to the extent consistent with preservation of capital. Tax Free’s investment objective is to provide maximum current income that is exempt from federal income tax to the extent consistent with prudent investment risk.
Under normal market conditions, as a fundamental policy, each Fund invests at least 80% of its net assets (plus the amount of any borrowings for investment purposes) in municipal securities that pay interest that is exempt from federal income tax, including the federal alternative minimum tax. Each Fund normally may invest up to 20% of its net assets in taxable obligations, including obligations the interest on which is subject to the federal alternative minimum tax. Each Fund’s most recent prospectus provides further descriptions of the Fund’s investment objective, principal investment strategies, and principal risks.
Each Fund’s most recent prospectus provides further descriptions of each Fund’s investment objective, principal investment strategies and principal risks.
During the current fiscal period, the Funds’ Board of Directors approved a change in the Funds’ fiscal and tax year ends from June 30 to April 30.
Effective January 18, 2011, Class C Shares were renamed Class C1 Shares and Class Y Shares were renamed Class I Shares. Class C1 Shares are not available for new accounts or for additional investment into existing accounts, but Class C1 Shares can be issued for purposes of dividend reinvestment.
Significant Accounting Policies
The following is a summary of significant accounting policies followed by the Funds in the preparation of their financial statements in accordance with U.S. generally accepted accounting principles (“U.S. GAAP”).
Investment Valuation
Prices of municipal bonds are provided by a pricing service approved by the Funds’ Board of Directors. These securities are generally classified as Level 2 for fair value measurement purposes. When price quotes are not readily available (which is usually the case for municipal bonds) the pricing service establishes a security’s fair value using methods that may include consideration of the following: yields or prices of investments of comparable quality, type of issue, coupon, maturity and rating, market quotes or indications of value from security dealers, evaluations of anticipated cash flows or collateral, general market conditions and other information and analysis, including the obligor’s credit characteristics considered relevant. In pricing certain securities, particularly less liquid and lower quality securities, the pricing service may consider information about a security, its issuer, or market activity provided by the Adviser. These securities are generally classified as Level 2 or Level 3 depending on the priority of the significant inputs. Investments in open-end funds are valued at their respective net asset values on the valuation date. These investment vehicles are generally classified as Level 1.
Futures contracts are valued using the closing settlement price or, in the absence of such a price, the last traded price. Futures contracts are generally classified as Level 1.
Certain securities may not be able to be priced by the pre-established pricing methods as described above. Such securities may be valued by the Funds’ Board of Directors or its designee at fair value. These securities generally include, but are not limited to, restricted securities (securities which may not be publicly sold without registration under the Securities Act of 1933, as amended) for which a pricing service is unable to provide a market price; securities whose trading has been formally suspended; debt securities that have gone into default and for which there is no current market quotation; a security whose market price is not available from a pre-established pricing source; a security with respect to which an event has occurred that is likely to materially affect the value of the security after the market has closed but before the calculation of a Fund’s net asset value (as may be the case in non-U.S. markets on which the security is primarily traded) or make it difficult or impossible to obtain a reliable market quotation; and a security whose price, as provided by the pricing service, is not deemed to reflect the security’s fair value. As a general principle, the fair value of a security would appear to be the amount that the owner might reasonably expect to receive for them in a current sale. A variety of factors may be considered in determining the fair value of these securities, which may include consideration of the following: yields or prices of investments of comparable quality, type of issue, coupon, maturity and rating, market quotes or indications of value from security dealers, evaluations of anticipated cash flows or collateral, general market conditions and other information and analysis, including the obligor’s credit characteristics considered relevant. These securities are generally classified as Level 2 or Level 3 depending on the priority of the significant inputs. Regardless of the method employed to value a particular security, all valuations are subject to review by the Funds’ Board of Directors or its designee.
Refer to Footnote 2 – Fair Value Measurements for further details on the leveling of securities held by the Funds as of the end of the reporting period.
Investment Transactions
Investment transactions are recorded on a trade date basis. Realized gains and losses from transactions are determined on the specific identification method, which is the same basis used for federal income tax purposes. Investments purchased on a when-issued/delayed delivery basis may have extended settlement periods. Any investments so purchased are subject to market fluctuation during this period. The Funds have instructed the custodian to segregate assets with a current value at least equal to the amount of the when-issued/delayed delivery purchase commitments. At April 30, 2011, the Funds had no such outstanding purchase commitments.
Investment Income
Interest income, which reflects the amortization of premiums and includes accretion of discounts for financial reporting purposes, is recorded on an accrual basis. Dividend income is recorded on the ex-dividend date. Interest income also reflects paydown gains and losses, if any.
Income Taxes
Each Fund is a separate taxpayer for federal income tax purposes. Each Fund intends to distribute substantially all of its net investment income and net capital gains to shareholders and to otherwise comply with the requirements of Subchapter M of the Internal Revenue Code applicable to regulated investment companies. Therefore, no federal income tax provision is required. Furthermore, each Fund intends to satisfy conditions that will enable interest from municipal securities, which is exempt from regular federal and designated state income taxes, to retain such tax-exempt status when distributed to shareholders of the Funds. Net realized capital gains and ordinary income distributions paid by the Funds are subject to federal taxation.
For all open tax years and all major taxing jurisdictions, management of the Funds has concluded that there are no significant uncertain tax positions that would require recognition in the financial statements. Open tax years are those that are open for examination by taxing authorities (i.e., generally the last four tax year ends and the interim tax period since then). Furthermore, management of the Funds is also not aware of any tax positions for which it is reasonably possible that the total amounts of unrecognized tax benefits will significantly change in the next twelve months.
Dividends and Distributions to Shareholders
The Funds declare dividends from their net investment income daily and pay shareholders monthly. Fund shares begin to accrue dividends on the business day after the day when the monies used to purchase Fund shares are collected by the Funds’ transfer agent.
Net realized capital gains and/or market discount from investment transactions, if any, are declared and distributed to shareholders at least annually. Furthermore, capital gains are distributed only to the extent they exceed available capital loss carryforwards.
Distributions to shareholders of net investment income, net realized capital gains and/or market discount, if any, are recorded on the ex-dividend date. The amount and timing of distributions are determined in accordance with federal income tax regulations, which may differ from U.S. GAAP.
Inverse Floating Rate Securities
Each Fund is authorized to invest in inverse floating rate securities. An inverse floating rate security is created by depositing a municipal bond, typically with a fixed interest rate, into a special purpose trust created by a broker-dealer. In turn, this trust (a) issues floating rate certificates, in face amounts equal to some fraction of the deposited bond’s par amount or market value, that typically pay short-term tax-exempt interest rates to third parties, and (b) issues to a long-term investor (such as the Fund) an inverse floating rate certificate (sometimes referred to as an “inverse floater”) that represents all remaining or residual interest in the trust. The income received by the inverse floater holder varies inversely with the short-term rate paid to the floating rate certificates’ holders, and in
Notes to Financial Statements (continued) (all dollars and shares are rounded to thousands (000))
most circumstances the inverse floater holder bears substantially all of the underlying bond’s downside investment risk and also benefits disproportionately from any potential appreciation of the underlying bond’s value. The price of an inverse floating rate security will be more volatile than that of the underlying bond because the interest rate is dependent on not only the fixed coupon rate of the underlying bond but also on the short-term interest paid on the floating rate certificates, and because the inverse floating rate security essentially bears the risk of loss of the greater face value of the underlying bond.
A Fund may purchase an inverse floating rate security in a secondary market transaction without first owning the underlying bond (referred to as an “externally-deposited inverse floater”), or instead by first selling a fixed-rate bond to a broker-dealer for deposit into the special purpose trust and receiving in turn the residual interest in the trust (referred to as a “self-deposited inverse floater”). The inverse floater held by a Fund gives the Fund the right (a) to cause the holders of the floating rate certificates to tender their notes at par, and (b) to have the broker transfer the fixed-rate bond held by the trust to the Fund, thereby collapsing the trust. An investment in an externally-deposited inverse floater is identified in the Portfolio of Investments as “(IF) – Inverse floating rate investment.” An investment in a self-deposited inverse floater is accounted for as a financing transaction. In such instances, a fixed-rate bond deposited into a special purpose trust is identified in the Portfolio of Investments as “(UB) – Underlying bond of an inverse floating rate trust reflected as a financing transaction,” with the Fund accounting for the short-term floating rate certificates issued by the trust as “Floating rate obligations” on the Statement of Assets and Liabilities. In addition, the Fund reflects in “Interest from unaffiliated investments” the entire earnings of the underlying bond and recognizes the related interest paid to the holders of the short-term floating rate certificates as “Interest expense on floating rate obligations” on the Statement of Operations.
During the ten months ended April 30, 2011, the Funds did not invest in externally-deposited inverse floaters and/or self-deposited inverse floaters.
Futures Contracts
Each Fund is subject to interest rate risk in the normal course of pursuing its investment objectives and is authorized to invest in futures contracts in attempt to manage such risk. Upon entering into a futures contract, a Fund is required to deposit with the broker an amount of cash or liquid securities equal to a specified percentage of the contract amount. This is known as the “initial margin.” Cash held by the broker to cover initial margin requirements on open futures contracts, if any, is recognized as “Deposits with brokers for open futures contracts” on the Statement of Assets and Liabilities. Subsequent payments (“variation margin”) are made or received by a Fund each day, depending on the daily fluctuation of the value of the contract. Variation margin is recognized as a receivable or payable for “Variation margin on futures contracts” on the Statement of Assets and Liabilities, when applicable.
During the period the futures contract is open, changes in the value of the contract are recognized as an unrealized gain or loss by “marking-to-market” on a daily basis to reflect the changes in market value of the contract, which is recognized as “Change in net unrealized appreciation (depreciation) of futures contracts” on the Statement of Operations. When the contract is closed or expired, the Fund records a realized gain or loss equal to the difference between the value of the contract on the closing date and value of the contract when originally entered into, which is recognized as “Net realized gain (loss) from futures contracts” on the Statement of Operations.
Risks of investments in futures contracts include the possible adverse movement in the price of the securities or indices underlying the contracts, the possibility that there may not be a liquid secondary market for the contracts and/or that a change in the value of the contract may not correlate with a change in the value of the underlying securities or indices. The Funds did not enter into futures contracts during the ten months ended April 30, 2011.
Market and Counterparty Credit Risk
In the normal course of business each Fund may invest in financial instruments and enter into financial transactions where risk of potential loss exists due to changes in the market (market risk) or failure of the other party to the transaction to perform (counterparty credit risk). The potential loss could exceed the value of the financial assets recorded on the financial statements. Financial assets, which potentially expose each Fund to counterparty credit risk, consist principally of cash due from counterparties on forward, option and swap transactions, when applicable. The extent of each Fund’s exposure to counterparty credit risk in respect to these financial assets approximates their carrying value as recorded on the Statement of Assets and Liabilities. Futures contracts, when applicable, expose a Fund to minimal counterparty credit risk as they are exchange traded and the exchange’s clearinghouse, which is counterparty to all exchange traded futures, guarantees the futures contracts against default.
Each Fund helps manage counterparty credit risk by entering into agreements only with counterparties the Adviser believes have the financial resources to honor their obligations and by having the Adviser monitor the financial stability of the counterparties. Additionally, counterparties may be required to pledge collateral daily (based on the daily valuation of the financial asset) on behalf of each Fund with a value approximately equal to the amount of any unrealized gain above a predetermined threshold. Reciprocally, when each Fund has an unrealized loss, the Funds have instructed the custodian to pledge assets of the Funds as collateral with a value approximately equal to the amount of the unrealized loss above a pre-determined threshold. Collateral pledges are monitored and subsequently adjusted if and when the valuations fluctuate, either up or down, by at least the pre-determined threshold amount.
Zero Coupon Securities
Each Fund is authorized to invest in zero coupon securities. A zero coupon security does not pay a regular interest coupon to its holders during the life of the security. Tax-exempt income to the holder of the security comes from accretion of the difference
between the original purchase price of the security at issuance and the par value of the security at maturity and is effectively paid at maturity. The market prices of zero coupon securities generally are more volatile than the market prices of securities that pay interest periodically.
Multiclass Operations and Allocations
Income and expenses of the Funds that are not directly attributable to a specific class of shares are prorated among the classes based on the relative net assets of each class. Expenses directly attributable to a class of shares, which presently only include 12b-1 distribution and shareholder service fees, are recorded to the specific class.
Income, realized and unrealized capital gains and losses of the Funds are prorated among the classes based on the relative net assets of each class.
Interfund Lending Program
During the period July 1, 2010 through December 31, 2010, pursuant to an exemptive order issued by the Securities and Exchange Commission, the Funds, along with other registered investment companies in the First American Funds family, were allowed to participate in an interfund lending program. This program provided an alternative credit facility allowing the Funds to borrow from, or lend money to, other participating funds. The Funds did not have any interfund lending transactions during the period July 1, 2010 through December 31, 2010. The exemptive order terminated with respect to the Funds on December 31, 2010, in connection with the Sale.
Indemnifications
Under the Trust’s organizational documents, its officers and directors are indemnified against certain liabilities arising out of the performance of their duties to the Trust. In addition, in the normal course of business, the Trust enters into contracts that provide general indemnifications to other parties. The Trust’s maximum exposure under these arrangements is unknown as this would involve future claims that may be made against the Trust that have not yet occurred. However, the Trust has not had prior claims or losses pursuant to these contracts and expects the risk of loss to be remote.
Use of Estimates
The preparation of financial statements in conformity with U.S. GAAP requires management to make estimates and assumptions that affect the reported amounts of assets and liabilities at the date of the financial statements and the reported amounts of increases and decreases in net assets from operations during the reporting period. Actual results may differ from those estimates.
2. Fair Value Measurements
Fair value is defined as the price that the Funds would receive upon selling an investment or transferring a liability in an orderly transaction to an independent buyer in the principal or most advantageous market of the investment. A three-tier hierarchy is used to maximize the use of observable market data and minimize the use of unobservable inputs and to establish classification of fair value measurements for disclosure purposes. Observable inputs reflect the assumptions market participants would use in pricing the asset or liability. Observable inputs are based on market data obtained from sources independent of the reporting entity. Unobservable inputs reflect the reporting entity’s own assumptions about the assumptions market participants would use in pricing the asset or liability. Unobservable inputs are based on the best information available in the circumstances. The three-tier hierarchy of inputs is summarized in the three broad levels listed below:
| | |
| Level 1 – | | Quoted prices in active markets for identical securities. |
| Level 2 – | | Other significant observable inputs (including quoted prices for similar securities, interest rates, prepayment speeds, credit risk, etc.). |
| Level 3 – | | Significant unobservable inputs (including management’s assumptions in determining the fair value of investments). |
The inputs or methodologies used for valuing securities are not an indication of the risk associated with investing in those securities. The following is a summary of each Fund’s fair value measurements as of April 30, 2011:
| | | | | | | | | | | | | | | | |
| Intermediate Tax Free | | Level 1 | | | Level 2 | | | Level 3 | | | Total | |
Investments: | | | | | | | | | | | | | | | | |
Municipal Bonds | | $ | — | | | $ | 728,396 | | | $ | — | | | $ | 728,396 | |
Short-Term Investments | | | 1,922 | | | | — | | | | — | | | | 1,922 | |
Total | | $ | 1,922 | | | $ | 728,396 | | | $ | — | | | $ | 730,318 | |
| | | | | | | | | | | | | | | | |
| Short Tax Free | | Level 1 | | | Level 2 | | | Level 3 | | | Total | |
Investments: | | | | | | | | | | | | | | | | |
Municipal Bonds | | $ | — | | | $ | 220,784 | | | $ | — | | | $ | 220,784 | |
Short-Term Investments | | | 5,448 | | | | 56,340 | | | | — | | | | 61,788 | |
Total | | $ | 5,448 | | | $ | 277,124 | | | $ | — | | | $ | 282,572 | |
Notes to Financial Statements (continued) (all dollars and shares are rounded to thousands (000))
| | | | | | | | | | | | | | | | |
| Tax Free | | Level 1 | | | Level 2 | | | Level 3 | | | Total | |
Investments: | | | | | | | | | | | | | | | | |
Municipal Bonds | | $ | — | | | $ | 423,964 | | | $ | — | | | $ | 423,964 | |
Short-Term Investments | | | 2,712 | | | | — | | | | — | | | | 2,712 | |
Total | | $ | 2,712 | | | $ | 423,964 | | | $ | — | | | $ | 426,676 | |
During the ten months ended April 30, 2011, the Funds recognized no significant transfers to/from Level 1, Level 2 or Level 3.
3. Derivative Instruments and Hedging Activities
The Funds record derivative instruments at fair value, with changes in fair value recognized on the Statement of Operations, when applicable. Even though the Funds’ investments in derivatives may represent economic hedges, they are not considered to be hedge transactions for financial reporting purposes. The Funds did not invest in derivative instruments during the ten months ended April 30, 2011.
4. Fund Shares
Transactions in Fund shares were as follows:
| | | | | | | | | | | | | | | | | | | | | | | | |
| | | Intermediate Tax Free | |
| | | Ten Months Ended
4/30/11 | | | Year Ended
6/30/10 | | | Year Ended
6/30/09 | |
| | | Shares | | | Amount | | | Shares | | | Amount | | | Shares | | | Amount | |
Shares sold: | | | | | | | | | | | | | | | | | | | | | | | | |
Class A | | | 1,844 | | | $ | 20,009 | | | | 2,980 | | | $ | 32,251 | | | | 1,244 | | | $ | 12,873 | |
Class C1(1) | | | 677 | | | | 3,003 | | | | 151 | | | | 1,645 | | | | — | | | | — | |
Class I(1) | | | 11,985 | | | | 129,851 | | | | 16,900 | | | | 182,199 | | | | 16,958 | | | | 174,306 | |
Shares issued to shareholders due to reinvestment of distributions: | | | | | | | | | | | | | | | | | | | | | | | | |
Class A | | | 128 | | | | 1,394 | | | | 115 | | | | 1,253 | | | | 87 | | | | 899 | |
Class C1(1) | | | 5 | | | | 59 | | | | 1 | | | | 10 | | | | — | | | | — | |
Class I(1) | | | 176 | | | | 1,902 | | | | 206 | | | | 2,216 | | | | 258 | | | | 2,666 | |
| | | | 14,815 | | | | 156,218 | | | | 20,353 | | | | 219,574 | | | | 18,547 | | | | 190,744 | |
Shares redeemed: | | | | | | | | | | | | | | | | | | | | | | | | |
Class A | | | (1,907 | ) | | | (20,618 | ) | | | (975 | ) | | | (10,578 | ) | | | (604 | ) | | | (6,277 | ) |
Class C1(1) | | | (468 | ) | | | (662 | ) | | | (16 | ) | | | (178 | ) | | | — | | | | — | |
Class I(1) | | | (15,239 | ) | | | (163,962 | ) | | | (12,763 | ) | | | (137,650 | ) | | | (15,803 | ) | | | (161,514 | ) |
| | | | (17,614 | ) | | | (185,242 | ) | | | (13,754 | ) | | | (148,406 | ) | | | (16,407 | ) | | | (167,791 | ) |
Net increase (decrease) | | | (2,799 | ) | | $ | (29,024 | ) | | | 6,599 | | | $ | 71,168 | | | | 2,140 | | | $ | 22,953 | |
| |
| | | Short Tax Free | |
| | | Ten Months Ended
4/30/11 | | | Year Ended
6/30/10 | | | Year Ended
6/30/09 | |
| | | Shares | | | Amount | | | Shares | | | Amount | | | Shares | | | Amount | |
Shares sold: | | | | | | | | | | | | | | | | | | | | | | | | |
Class A | | | 421 | | | $ | 4,224 | | | | 414 | | | $ | 4,089 | | | | 152 | | | $ | 1,472 | |
Class I(1) | | | 14,223 | | | | 142,241 | | | | 25,824 | | | | 256,228 | | | | 10,407 | | | | 99,972 | |
Shares issued to shareholders due to reinvestment of distributions: | | | | | | | | | | | | | | | | | | | | | | | | |
Class A | | | 7 | | | | 70 | | | | 6 | | | | 56 | | | | 5 | | | | 49 | |
Class I(1) | | | 27 | | | | 268 | | | | 33 | | | | 325 | | | | 22 | | | | 216 | |
| | | | 14,678 | | | | 146,803 | | | | 26,277 | | | | 260,698 | | | | 10,586 | | | | 101,709 | |
Shares redeemed: | | | | | | | | | | | | | | | | | | | | | | | | |
Class A | | | (366 | ) | | | (3,639 | ) | | | (49 | ) | | | (486 | ) | | | (46 | ) | | | (435 | ) |
Class I(1) | | | (17,599 | ) | | | (175,832 | ) | | | (13,089 | ) | | | (129,986 | ) | | | (6,768 | ) | | | (65,306 | ) |
| | | | (17,965 | ) | | | (179,471 | ) | | | (13,138 | ) | | | (130,472 | ) | | | (6,814 | ) | | | (65,741 | ) |
Net increase (decrease) | | | (3,287 | ) | | $ | (32,668 | ) | | | 13,139 | | | $ | 130,226 | | | | 3,772 | | | $ | 35,968 | |
| (1) | – Effective January 18, 2011, Class C Shares were renamed Class C1 Shares and Class Y Shares were renamed Class I Shares. |
| | | | | | | | | | | | | | | | | | | | | | | | |
| | | Tax Free | |
| | | Ten Months Ended
4/30/11 | | | Year Ended
6/30/10 | | | Year Ended
6/30/09 | |
| | | Shares | | | Amount | | | Shares | | | Amount | | | Shares | | | Amount | |
Shares sold: | | | | | | | | | | | | | | | | | | | | | | | | |
Class A | | | 760 | | | $ | 8,069 | | | | 1,494 | | | $ | 15,621 | | | | 677 | | | $ | 6,423 | |
Class C1(1) | | | 712 | | | | 1,146 | | | | 267 | | | | 2,769 | | | | 106 | | | | 967 | |
Class I(1) | | | 6,629 | | | | 70,101 | | | | 10,001 | | | | 104,065 | | | | 10,641 | | | | 98,620 | |
Shares issued to shareholders due to reinvestment of distributions: | | | | | | | | | | | | | | | | | | | | | | | | |
Class A | | | 88 | | | | 928 | | | | 122 | | | | 1,270 | | | | 128 | | | | 1,203 | |
Class C1(1) | | | 10 | | | | 103 | | | | 10 | | | | 101 | | | | 7 | | | | 68 | |
Class I(1) | | | 73 | | | | 766 | | | | 86 | | | | 891 | | | | 81 | | | | 749 | |
| | | | 8,272 | | | | 81,113 | | | | 11,980 | | | | 124,717 | | | | 11,640 | | | | 108,030 | |
Shares redeemed: | | | | | | | | | | | | | | | | | | | | | | | | |
Class A | | | (863 | ) | | | (8,906 | ) | | | (944 | ) | | | (9,849 | ) | | | (617 | ) | | | (5,718 | ) |
Class C1(1) | | | (712 | ) | | | (1,108 | ) | | | (95 | ) | | | (990 | ) | | | (59 | ) | | | (550 | ) |
Class I(1) | | | (11,706 | ) | | | (121,617 | ) | | | (7,678 | ) | | | (79,723 | ) | | | (14,997 | ) | | | (137,800 | ) |
| | | | (13,281 | ) | | | (131,631 | ) | | | (8,717 | ) | | | (90,562 | ) | | | (15,673 | ) | | | (144,068 | ) |
Net increase (decrease) | | | (5,009 | ) | | $ | (50,518 | ) | | | 3,263 | | | $ | 34,155 | | | | (4,033 | ) | | $ | (36,038 | ) |
| (1) | – Effective January 18, 2011, Class C Shares were renamed Class C1 Shares and Class Y Shares were renamed Class I Shares. |
5. Investment Transactions
Purchases and sales (including maturities but excluding short-term investments, when applicable) during the ten months ended April 30, 2011, were as follows:
| | | | | | | | | | | | |
| | | Intermediate
Tax Free | | | Short Tax Free | | | Tax Free | |
Purchases | | $ | 64,736 | | | $ | 60,319 | | | $ | 137,730 | |
Sales and maturities | | | 65,876 | | | | 46,745 | | | | 165,479 | |
6. Income Tax Information
The following information is presented on an income tax basis. Differences between amounts for financial statement and federal income tax purposes are primarily due to timing differences in recognizing certain gains and losses on investment transactions. To the extent that differences arise that are permanent in nature, such amounts are reclassified within the capital accounts as detailed below. Temporary differences do not require reclassification. Temporary and permanent differences do not impact the net asset values of the Funds.
At April 30, 2011 the cost and unrealized appreciation (depreciation) of investments, as determined on a federal income tax basis, were as follows:
| | | | | | | | | | | | |
| | | Intermediate
Tax Free | | | Short Tax Free | | | Tax Free | |
Cost of investments | | $ | 707,207 | | | $ | 278,826 | | | $ | 429,411 | |
Gross unrealized: | | | | | | | | | | | | |
Appreciation | | $ | 31,307 | | | $ | 5,043 | | | $ | 12,292 | |
Depreciation | | | (8,196 | ) | | | (1,297 | ) | | | (15,027 | ) |
Net unrealized appreciation (depreciation) of investments | | $ | 23,111 | | | $ | 3,746 | | | $ | (2,735 | ) |
Permanent differences, primarily due to tax equalization, resulted in reclassifications among the Funds’ components of net assets at April 30, 2011, the Funds’ tax year-end, as follows:
| | | | | | | | | | | | |
| | | Intermediate
Tax Free | | | Short Tax Free | | | Tax
Free | |
Capital paid-in | | $ | 118 | | | $ | — | | | $ | — | |
Undistributed (Over-distribution of) net investment income | | | — | | | | — | | | | — | |
Accumulated net realized gain (loss) | | | (118 | ) | | | — | | | | — | |
Notes to Financial Statements (continued) (all dollars and shares are rounded to thousands (000))
The tax components of undistributed net tax-exempt income, net ordinary income and net long-term capital gains at April 30, 2011, the Funds’ tax year end, were as follows:
| | | | | | | | | | | | |
| | | Intermediate
Tax Free | | | Short Tax Free | | | Tax Free | |
Undistributed net tax-exempt income* | | $ | 2,660 | | | $ | 989 | | | $ | 1,723 | |
Undistributed net ordinary income** | | | — | | | | 8 | | | | 246 | |
Undistributed net long-term capital gains | | | 404 | | | | — | | | | — | |
| * | Undistributed net tax exempt income (on a tax basis) has not been reduced for the dividends declared during the period April 1, 2011 through April 30, 2011 and paid on May 2, 2011. |
| ** | Net ordinary income consists of taxable market discount income and net short-term capital gains, if any. |
The tax character of distributions paid during the ten months ended April 30, 2011, and during the tax years ended June 30, 2010 and June 30, 2009, was designated for purposes of the dividends paid deduction as follows:
| | | | | | | | | | | | |
| Ten months ended April 30, 2011 | | Intermediate
Tax Free | | | Short Tax Free | | | Tax Free | |
Distributions from net tax-exempt income*** | | $ | 25,127 | | | $ | 4,684 | | | $ | 17,000 | |
Distributions from net ordinary income** | | | 185 | | | | 37 | | | | 300 | |
Distributions from net long-term capital gains**** | | | 805 | | | | — | | | | — | |
| | | |
| Tax year ended June 30, 2010 | | | | | | | | | |
Distributions from net tax-exempt income | | $ | 29,070 | | | $ | 5,064 | | | $ | 21,875 | |
Distributions from net ordinary income ** | | | 626 | | | | 18 | | | | 526 | |
Distributions from net long-term gains | | | — | | | | — | | | | — | |
| | | |
| Tax year ended June 30, 2009 | | | | | | | | | |
Distributions from net tax-exempt income | | $ | 29,152 | | | $ | 4,466 | | | $ | 21,627 | |
Distributions from net ordinary income ** | | | 307 | | | | — | | | | 26 | |
Distributions from net long-term gains | | | 201 | | | | — | | | | 643 | |
| ** | Net ordinary income consists of taxable market discount income and net short-term capital gains, if any. |
| *** | The Funds hereby designate these amounts paid during the ten months ended April 30, 2011, as Exempt Interest Dividends. |
| **** | The Funds designated as long-term capital gain dividend, pursuant to the Internal Revenue Code Section 852 (b)(3), the amount necessary to reduce earnings and profits of the Funds related to net capital gain to zero for the ten months ended April 30, 2011. |
At April 30, 2011, the Funds’ tax year end, the following Funds had unused capital loss carryforwards available for federal income tax purposes to be applied against future capital gains, if any. If not applied, the carryforwards will expire as follows:
| | | | | | | | |
| | | Short Tax Free | | | Tax Free | |
Expiration: | | | | | | | | |
April 30, 2015 | | $ | 419 | | | $ | — | |
April 30, 2017 | | | 312 | | | | — | |
April 30, 2018 | | | — | | | | 6,429 | |
April 30, 2019 | | | — | | | | 733 | |
Total | | $ | 731 | | | $ | 7,162 | |
The Funds have elected to defer net realized losses from investments incurred from November 1, 2010 through April 30, 2011, the Funds’ tax year end, (“post-October losses”) in accordance with federal income tax regulations. Post-October losses are treated as having arisen on the first day of the following fiscal year. The following Fund has elected to defer post-October losses as follows:
| | | | |
| | | Tax Free | |
Post-October capital losses | | $ | 4,686 | |
7. Management Fees and Other Transactions with Affiliates
Investment Advisory Fees
During the period July 1, 2010 through December 31, 2010, pursuant to an investment advisory agreement (the “Agreement”), FAF Advisors managed each Fund’s assets and furnished related office facilities, equipment, research, and personnel. The Agreement required each Fund to pay FAF Advisors a monthly advisory fee equal, on an annual basis, to 0.50% of each Fund’s average daily net assets.
Effective January 1, 2011, pursuant to a new investment advisory agreement (the “New Agreement”), the Funds’ new investment adviser is Nuveen Fund Advisors. Under the New Agreement, each Fund’s management fee consists of two components – a fund-level fee, based only on the amount of assets within each individual Fund, and a complex-level fee, based on the aggregate amount of all eligible fund assets managed by Nuveen Fund Advisors. This pricing structure enables Fund shareholders to benefit from growth in the assets within their Fund as well as from growth in the amount of complex-wide assets managed by Nuveen Fund Advisors.
The annual fund-level fee for each Fund, payable monthly, is calculated according to the following schedule:
| | | | | | | | | | | | |
| Average Daily Net Assets | | Intermediate
Tax Free
Fund-Level
Fee Rate | | | Short
Tax Free
Fund-Level
Fee Rate | | | Tax Free
Fund-Level
Fee Rate | |
For the first $125 million | | | .4000 | % | | | .2500 | % | | | .4000 | % |
For the next $125 million | | | .3875 | | | | .2375 | | | | .3875 | |
For the next $250 million | | | .3750 | | | | .2250 | | | | .3750 | |
For the next $500 million | | | .3625 | | | | .2125 | | | | .3625 | |
For the next $1 billion | | | .3500 | | | | .2000 | | | | .3500 | |
For net assets over $2 billion | | | .3250 | | | | .1750 | | | | .3250 | |
The annual complex-level fee for each Fund, payable monthly, is determined by taking the complex-level fee rate, which is based on the aggregate amount of “eligible assets” of all Nuveen funds as set forth in the schedule below, and making, as appropriate, an upward adjustment to that rate based upon the percentage of the particular fund’s assets that are not “eligible assets.” The complex-level fee schedule for each Fund is as follows:
| | | | |
| Complex-Level Asset Breakpoint Level* | | Effective Rate at Breakpoint Level | |
$55 billion | | | .2000 | % |
$56 billion | | | .1996 | |
$57 billion | | | .1989 | |
$60 billion | | | .1961 | |
$63 billion | | | .1931 | |
$66 billion | | | .1900 | |
$71 billion | | | .1851 | |
$76 billion | | | .1806 | |
$80 billion | | | .1773 | |
$91 billion | | | .1691 | |
$125 billion | | | .1599 | |
$200 billion | | | .1505 | |
$250 billion | | | .1469 | |
$300 billion | | | .1445 | |
| * | The complex-level fee is calculated based upon the aggregate daily “eligible assets” of all Nuveen funds. Eligible assets do not include assets attributable to investments in other Nuveen funds or assets in excess of $2 billion added to the Nuveen fund complex in connection with Nuveen Fund Advisors’ assumption of the management of the former First American Funds effective January 1, 2011. Eligible assets include closed-end fund assets managed by Nuveen Fund Advisors that are attributable to financial leverage. For these purposes, financial leverage includes the closed-end funds’ use of preferred stock and borrowings and investments in the residual interest certificates (also called inverse floating rate securities) in tender option bond (TOB) trusts, including the portion of assets held by the TOB trust that has been effectively financed by the trust’s issuance of floating rate securities, subject to an agreement by Nuveen Fund Advisors as to certain funds to limit the amount of such assets for determining eligible assets in certain circumstances. As of April 30, 2011, the complex-level fee rates for Intermediate Tax Free, Short Tax Free and Tax Free were .1982%, .1997% and .1989%, respectively. |
The management fee compensates Nuveen Fund Advisors for the overall investment advisory and administrative services and general office facilities it provides for the Funds. Effective January 1, 2011, Nuveen Fund Advisors has entered into a sub-advisory agreement with the Sub-Adviser. The Sub-Adviser will be compensated for its services to the Funds from the management fees paid to Nuveen Fund Advisors.
During the period July 1, 2010 through December 31, 2010, the Funds may have invested in related money market funds that were series of First American Funds, Inc., subject to certain limitations. In order to avoid the payment of duplicative investment advisory fees to FAF Advisors, which acted as the investment advisor to both the investing Funds and the related money market funds, FAF Advisors reimbursed each investing Fund an amount equal to that portion of FAF Advisors’ investment advisory fee received from the related money market funds that was attributable to the assets of the investing Fund. This reimbursement, if any, is recognized as a component of “Expense Reimbursement” on the Statement of Operations and terminated with respect to the Funds on December 31, 2010, in connection with the Sale.
Notes to Financial Statements (continued) (all dollars and shares are rounded to thousands (000))
During the period July 1, 2010 through December 31, 2010, FAF Advisors agreed to waive fees and reimburse other Fund expenses at least through October 31, 2010, so that total Fund operating expenses, as a percentage of each Fund’s average daily net assets, did not exceed the following amounts:
| | | | | | | | | | | | |
| | | Share Class | |
| Fund | | A | | | C(1) | | | Y(1) | |
Intermediate Tax Free | | | .75 | % | | | 1.35 | % | | | .70 | % |
Short Tax Free | | | .75 | | | | N/A | | | | .60 | |
Tax Free | | | .75 | | | | 1.35 | | | | .70 | |
| N/A | – Not applicable; Fund did not offer Class C Shares during the six months ended December 31, 2010. |
| (1) | – Effective January 18, 2011, Class C shares were renamed Class C1 Shares and Class Y Shares were renamed Class I Shares. |
Effective January 1, 2011, Nuveen Fund Advisors has contractually agreed to waive fees and reimburse other Fund expenses of each Fund so that total annual Fund operating expenses, after waivers and excluding acquired Fund fees and expenses, do not exceed the average daily net assets of any class of Fund shares in the amounts and for the time periods stated in the following table:
| | | | | | | | | | | | |
| | | Intermediate
Tax Free | | | Short
Tax Free | | | Tax Free | |
Class A | | | .75 | % | | | .75 | % | | | .75 | % |
Class C1 | | | 1.35 | | | | N/A | | | | 1.35 | |
Class I | | | .70 | | | | .60 | | | | .70 | |
Expiration Date | | | March 31, 2012 | | | | March 31, 2012 | | | | March 31, 2012 | |
| N/A | – Short Tax Free does not offer Class C1 Shares. |
Effective January 1, 2011, Nuveen Fund Advisors has also contractually agreed to reimburse Class A Share 12b-1 fees of Short Tax Free and Tax Free through March 31, 2012, to the extent necessary so that total annual fund operating expenses, after waivers and/or expense reimbursements and excluding Acquired Fund Fees and Expenses, do not exceed .75% for Class A Shares.
During the period July 1, 2010 through December 31, 2010, independent directors of the Funds may have participated and elected to defer receipt of part or all of their annual compensation under a deferred compensation plan (the “Plan”). Deferred amounts were treated as though equivalent dollar amounts had been invested in shares of selected open-end funds as designated by each director. All amounts in the Plan were 100% vested and accounts under the Plan were obligations of the Funds. Deferred amounts remain in the Funds until distributed in accordance with the Plan.
Effective January 1, 2011, independent directors may elect to defer receipt of all or a portion of the annual compensation they are entitled to receive from certain funds advised by Nuveen Fund Advisors. Under the plan, deferred amounts are treated as though equal dollar amounts had been invested in shares of select funds advised by Nuveen Fund Advisors.
Administration Fees
During the period July 1, 2010 through December 31, 2010, FAF Advisors served as the Funds’ administrator pursuant to an administration agreement between FAF Advisors and the Funds. U.S. Bancorp Fund Services, LLC (“USBFS”) served as sub-administrator pursuant to a sub-administration agreement between USBFS and FAF Advisors. FAF Advisors is a subsidiary of U.S. Bank National Association (“U.S. Bank”). Both U.S. Bank and USBFS are direct subsidiaries of U.S. Bancorp. Under the administration agreement, FAF Advisors was compensated to provide, or compensated other entities to provide, services to the Funds. These services included various legal, oversight, and administrative and accounting services. The Funds paid FAF Advisors administration fees, which were calculated daily and paid monthly, equal to the Funds’ pro rata share of an amount equal, on an annual basis, to .25% of the aggregate average daily net assets of all open-end funds in the First American Funds family up to $8 billion, .235% on the next $17 billion of the aggregate average daily net assets, .22% on the next $25 billion of the aggregate average daily net assets, and .20% of the aggregate average daily net assets in excess of $50 billion. All fees paid to the sub-administrator were paid from the administration fee. In addition to these fees, the Funds may have reimbursed FAF Advisors and the sub-administrator for any out-of-pocket expenses incurred in providing administration services. Effective January 1, 2011, FAF Advisors and USBFS no longer serve as the Funds’ administrator and sub-administrator, respectively, and the Funds have not entered into any new administration or sub-administration agreements.
Transfer Agent Fees
USBFS serves as the Funds’ transfer agent pursuant to a transfer agent agreement with the Trust. The Funds are charged transfer agent fees on a per shareholder account basis, subject to a minimum fee per share class. These fees are charged to each Fund based upon the number of accounts within each Fund. In addition to these fees, the Funds may reimburse USBFS for out-of-pocket expenses incurred in providing transfer agent services.
Custodian Fees
U.S. Bank serves as the custodian for the Fund pursuant to a custodian agreement with the Trust. The custodian fee charged for each Fund is equal to an annual rate of .005% of average daily net assets. All fees are computed daily and paid monthly. Interest earned on uninvested cash balances is used to reduce a portion of each Fund’s custodian expenses. These credits, if any, are recognized as “Custodian fee credit” on the Statement of Operations. Conversely, the custodian charges a fee for any cash overdrafts incurred, which increases the Funds’ custodian expenses.
Distribution and Shareholder Servicing (12b-1) Fees
During the period July 1, 2010 through December 31, 2010, Quasar Distributors, LLC (“Quasar”), a subsidiary of U.S. Bancorp, served as the distributor of the Funds pursuant to a distribution agreement with the Trust. Under the distribution agreement, and pursuant to a plan adopted by each Fund under Rule 12b-1 of the Investment Company Act, the Funds paid Quasar a monthly distribution and/or shareholder servicing fee equal to an annual rate of .25% and .65% of the Funds’ average daily net assets attributable to Class A and Class C Shares (renamed Class C1 Shares), respectively. No distribution or shareholder servicing fees were paid by Class Y Shares (renamed Class I Shares). These fees may have been used by Quasar to provide compensation for sales support, distribution activities, and/or shareholder servicing activities. During the period July 1, 2010 through December 31, 2010, total distribution and shareholder servicing fees waived by Quasar for the following Funds were as follows:
| | | | |
| Fund | | Amount | |
Intermediate Tax Free | | $ | 31 | |
Short Tax Free | | | 4 | |
Effective January 1, 2011, the Funds entered into a distribution agreement with Nuveen Investments LLC, who now serves as the Funds’ distributor. Under the new agreement, Class A Shares incur a .20% annual 12b-1 service fee. Class C1 Shares continue to incur a .40% annual 12b-1 distribution fee and a .25% annual 12b-1 service fee. Class I Shares will continue to not be subject to any sales charge or 12b-1 distribution or service fees. Annual distribution and service fees are based on average daily net assets.
All 12b-1 service and distribution fees collected on Class C1 Shares during the first year following a purchase were retained by Quasar and/or Nuveen Securities, LLC. to compensate for commissions advanced to financial intermediaries. During the ten months ended April 30, 2011, Quasar and/or Nuveen Securities, LLC. retained such 12b-1 fees as follows:
| | | | | | | | | | | | |
| | | Intermediate
Tax Free | | | Short Tax Free | | | Tax Free | |
12b-1 fees retained (Unaudited) | | $ | 35 | | | $ | 3 | | | $ | 26 | |
The remaining 12b-1 fees charged to the Funds were paid to compensate financial intermediaries for providing services to shareholders relating to their investments.
During the ten months ended April 30, 2011, Quasar and/or Nuveen Securities, LLC. compensated financial intermediaries directly with commission advances at the time of purchase as follows:
| | | | | | | | | | | | |
| | | Intermediate
Tax Free | | | Short Tax Free | | | Tax Free | |
Commission advances (Unaudited) | | $ | 10 | | | $ | 5 | | | $ | 4 | |
During the ten months ended April 30, 2011, Quasar and/or Nuveen Securities, LLC. collected sales charges on purchases of Class A Shares, the majority of which were paid out as concessions to financial intermediaries as follows:
| | | | | | | | | | | | |
| | | Intermediate
Tax Free | | | Short Tax Free | | | Tax Free | |
Sales charges collected (Unaudited) | | $ | 35 | | | $ | 6 | | | $ | 17 | |
Paid to financial intermediaries (Unaudited) | | | 32 | | | | 6 | | | | 16 | |
Quasar and/or Nuveen Securities, LLC. also received 12b-1 service fees on Class A Shares, substantially all of which were paid to compensate financial intermediaries for providing services to shareholders relating to their investments.
Other Fees and Expenses
In addition to the investment advisory fees, administration fees, transfer agent fees, custodian fees, and distribution and shareholder servicing fees, each Fund is responsible for paying other operating expenses, including: legal, auditing, registration fees, postage and printing of shareholder reports, fees and expenses of independent directors, insurance, and other miscellaneous expenses. During the period July 1, 2010 through December 31, 2010, legal fees and expenses of $7 were paid to a law firm of which an Assistant Secretary of the Funds was a partner.
Contingent Deferred Sales Charges
During the period July 1, 2010 through January 17, 2011, Class A Shares of Intermediate Tax Free and Short Tax Free were sold with an up-front sales charge of 2.25%. Class A Shares of Tax Free were sold with an up-front sales charge of 4.25%. Class C Shares (renamed Class C1 Shares) were subject to a contingent deferred sales charge (“CDSC”) of 1% for twelve months. Class Y Shares (renamed Class I Shares) had no sales charge and were offered only to qualifying institutional investors and certain other qualifying accounts.
Effective January 18, 2011, Class A Shares of the Funds are sold with an up-front sales charge of 3.00% for Intermediate Tax Free, 2.50% for Short Tax Free and 4.20% for Tax Free. Class A Share purchases of $250 or more for Short Tax Free and $1 million or more for Intermediate Tax Free and Tax Free are sold at net asset value without any sales charge. Class A Share purchases of the Funds may be subject to a CDSC if redeemed within eighteen months of purchase. Class C1 Shares are subject to a CDSC of 1% if redeemed within one year of purchase.
Notes to Financial Statements (continued) (all dollars and shares are rounded to thousands (000))
Quasar and Nuveen Securities, LLC collected and retained CDSC on share redemptions during the ten months ended April 30, 2011, as follows:
| | | | | | | | | | | | |
| | | Intermediate
Tax Free | | | Short Tax Free | | | Tax Free | |
CDSC retained (Unaudited) | | $ | 2 | | | $ | — | | | $ | — | |
8. Regulatory Settlements
On August 23, 2010, Intermediate Tax Free and Tax Free received settlement payments from the SEC related to the BISYS Fair Fund Settlement. The settlement was paid to funds that had used BISYS from June 1999 through June 2004. The Mercantile Funds, which subsequently merged into Intermediate Tax Free and Tax Free, had used BISYS as an administrator during this period. Because the settlement was for the overcharging of expenses to these Funds, the amounts are recognized as “Expense reimbursement from regulatory settlement” on the Statement of Operations.
9. Fund Merger
Effective after the close of business on January 29, 2010, Tax Free Fund acquired the assets and assumed the liabilities of First American Arizona Tax Free Fund (“Arizona Tax Free”). Tax Free Fund was deemed to be the accounting survivor in the merger. Shareholders of Arizona Tax Free approved the merger on January 22, 2010.
The merger was accomplished by tax free exchanges as detailed below:
| | | | | | | | | | | | | | | | |
| | | Share Class | | | | |
| Tax Free | | Class A | | | Class C | | | Class Y | | | Total | |
Net assets of Arizona Tax Free | | $ | 6,036 | | | $ | 1,500 | | | $ | 13,894 | | | $ | 21,430 | |
Arizona Tax Free shares exchanged | | | 566 | | | | 141 | | | | 1,302 | | | | 2,009 | |
Tax Free shares issued | | | 578 | | | | 144 | | | | 1,328 | | | | 2,050 | |
Net assets of Tax Free immediately before the merger | | $ | 40,838 | | | $ | 4,116 | | | $ | 415,610 | | | $ | 460,564 | |
Net assets of Tax Free immediately after the merger | | $ | 46,874 | | | $ | 5,616 | | | $ | 429,504 | | | $ | 481,994 | |
The components of Arizona Tax Free’s net assets prior to adjustments for any permanent book-to-tax differences at the merger date were as follows:
| | | | | | | | | | | | | | | | | | | | |
| | | Total
Net Assets | | | Portfolio
Capital | | | Undistributed
Net Investment
Loss | | | Accumulated
Net Realized
Loss | | | Net Unrealized
Appreciation | |
Arizona Tax Free | | $ | 21,430 | | | $ | 21,536 | | | $ | (74 | ) | | $ | (36 | ) | | $ | 4 | |
10. New Accounting Pronouncement
Fair Value Measurements and Disclosures
On May 12, 2011, the Financial Accounting Standards Board (“FASB”) issued an Accounting Standard Update (“ASU”) modifying Topic 820, Fair Value Measurements and Disclosures. At the same time, the International Accounting Standards Board (“IASB”) issued International Financial Reporting Standard (“IFRS”) 13, Fair Value Measurement. The objective by the FASB and IASB is convergence of their guidance on fair value measurements and disclosures. Specifically, the ASU requires reporting entities to disclose i) the amounts of any transfers between Level 1 and Level 2, and the reasons for the transfers, ii) for Level 3 fair value measurements, a) quantitative information about significant unobservable inputs used, b) a description of the valuation processes used by the reporting entity and c) a narrative description of the sensitivity of the fair value measurement to changes in unobservable inputs if a change in those inputs might result in a significantly higher or lower fair value measurement. The effective date of the ASU is for interim and annual periods beginning after December 15, 2011. At this time, management is evaluating the implications of this guidance and the impact it will have on the financial statement amounts and footnote disclosures, if any.
11. Subsequent Events
Name Changes
On August 31, 2011, Short Tax Free will change its name to Nuveen Short Term Municipal Bond Fund.
Trustees and Officers (Unaudited)
The management of the Funds, including general supervision of the duties performed for the Funds by the Adviser, is the responsibility of the Board of Trustees of the Funds. The number of trustees of the Funds is currently set at ten. None of the trustees who are not “interested” persons of the Funds (referred to herein as “independent trustees”) has ever been a director or employee of, or consultant to, Nuveen or its affiliates. The names and business addresses of the trustees and officers of the Funds, their principal occupations and other affiliations during the past five years, the number of portfolios each oversees and other directorships they hold are set forth below.
The Funds’ Statement of Additional Information (“SAI”) includes more information about the trustees. To request a free copy, call Nuveen Investments at (800) 257-8787 or visit the Funds’ website at www.nuveen.com.
| | | | | | | | |
Name, Birthdate and Address | | Position(s) Held with the Funds | | Year First Elected or Appointed (1) | | Principal Occupation(s) Including other Directorships During Past 5 Years | | Number of Portfolios in Fund Complex Overseen by Trustee |
| | |
| Independent Trustees: | | | | |
Robert P. Bremner (2) 8/22/40 333 W. Wacker Drive Chicago, IL 60606 | | Chairman of the Board and Trustee | | 1996 | | Private Investor and Management Consultant; Treasurer and Director, Humanities Council of Washington, D.C.; Board Member, Independent Directors Council affiliated with the Investment Company Institute. | | 245 |
Jack B. Evans 10/22/48 333 W. Wacker Drive Chicago, IL 60606 | | Trustee | | 1999 | | President, The Hall-Perrine Foundation, a private philanthropic corporation (since 1996); Director and Chairman, United Fire Group, a publicly held company; President Pro Tem of the Board of Regents for the State of Iowa University System; Director, Source Media Group; Life Trustee of Coe College and the Iowa College Foundation; formerly, Director, Alliant Energy; formerly, Director, Federal Reserve Bank of Chicago; formerly, President and Chief Operating Officer, SCI Financial Group, Inc., a regional financial services firm. | | 245 |
William C. Hunter 3/6/48 333 W. Wacker Drive Chicago, IL 60606 | | Trustee | | 2004 | | Dean, Tippie College of Business, University of Iowa (since 2006); Director (since 2004) of Xerox Corporation; Director (since 2005), Beta Gamma Sigma International Honor Society; Director of Wellmark, Inc. (since 2009); formerly, Dean and Distinguished Professor of Finance, School of Business at the University of Connecticut (2003-2006); previously, Senior Vice President and Director of Research at the Federal Reserve Bank of Chicago (1995-2003); formerly, Director (1997-2007), Credit Research Center at George Washington University. | | 245 |
David J. Kundert (2) 10/28/42 333 W. Wacker Drive Chicago, IL 60606 | | Trustee | | 2005 | | Director, Northwestern Mutual Wealth Management Company; retired (since 2004) as Chairman, JPMorgan Fleming Asset Management, President and CEO, Banc One Investment Advisors Corporation, and President, One Group Mutual Funds; prior thereto, Executive Vice President, Banc One Corporation and Chairman and CEO, Banc One Investment Management Group; Member, Board of Regents, Luther College; member of the Wisconsin Bar Association; member of Board of Directors, Friends of Boerner Botanical Gardens; member of Board of Directors and Chair of Investment Committee, Greater Milwaukee Foundation. | | 245 |
William J. Schneider (2) 9/24/44 333 W. Wacker Drive Chicago, IL 60606 | | Trustee | | 1997 | | Chairman of Miller-Valentine Partners Ltd., a real estate investment company; formerly, Senior Partner and Chief Operating Officer (retired 2004) of Miller-Valentine Group; member, University of Dayton Business School Advisory Council; member, Mid-America Health System Board; formerly, member and chair, Dayton Philharmonic Orchestra Association; formerly, member, Business Advisory Council, Cleveland Federal Reserve Bank. | | 245 |
Judith M. Stockdale 12/29/47 333 W. Wacker Drive Chicago, IL 60606 | | Trustee | | 1997 | | Executive Director, Gaylord and Dorothy Donnelley Foundation (since 1994); prior thereto, Executive Director, Great Lakes Protection Fund (1990-1994). | | 245 |
Carole E. Stone (2) 6/28/47 333 W. Wacker Drive Chicago, IL 60606 | | Trustee | | 2007 | | Director, Chicago Board Options Exchange (since 2006); Director, C2 Options Exchange, Incorporated (since 2009); formerly, Commissioner, New York State Commission on Public Authority Reform (2005-2010); formerly, Chair, New York Racing Association Oversight Board (2005-2007). | | 245 |
Trustees and Officers (Unaudited) (continued)
| | | | | | | | |
Name, Birthdate and Address | | Position(s) Held with the Funds | | Year First Elected or Appointed | | Principal Occupation(s) During Past Five Years | | Number of Portfolios in Fund Complex Overseen by Officer |
Virginia L. Stringer 8/16/44 333 West Wacker Drive Chicago, IL 60606 | | Trustee | | 2011 | | Board Member, Mutual Fund Directors Forum; Member, Governing Board, Investment Company Institute’s Independent Directors Council; governance consultant and non-profit board member; former Owner and President, Strategic Management Resources, Inc. a management consulting firm; previously, held several executive positions in general management, marketing and human resources at IBM and The Pillsbury Company; Independent Director, First American Fund Complex (1987-2010) and Chair (1997-2010). | | 245 |
Name, Birthdate and Address | | Position(s) Held with the Funds | | Year First Elected or Appointed (1) | | Principal Occupation(s) Including other Directorships During Past 5 Years | | Number of Portfolios in Fund Complex Overseen by Trustee |
Terence J. Toth (2) 9/29/59 333 W. Wacker Drive Chicago, IL 60606 | | Trustee | | 2008 | | Director, Legal & General Investment Management America, Inc. (since 2008); Managing Partner, Promus Capital (since 2008); formerly, CEO and President, Northern Trust Global Investments (2004-2007); Executive Vice President, Quantitative Management & Securities Lending (2000-2004); prior thereto, various positions with Northern Trust Company (since 1994); member: Goodman Theatre Board (since 2004); Chicago Fellowship Board (since 2005), and Catalyst Schools of Chicago Board (since 2008); formerly, member: Northern Trust Mutual Funds Board (2005-2007), Northern Trust Global Investments Board (2004-2007), Northern Trust Japan Board (2004-2007), Northern Trust Securities Inc. Board (2003-2007) and Northern Trust Hong Kong Board (1997-2004). | | 245 |
| | |
| Interested Trustee: | | | | |
John P. Amboian (3) 6/14/61 333 W. Wacker Drive Chicago, IL 60606 | | Trustee | | 2008 | | Chief Executive Officer and Chairman (since 2007), and Director (since 1999) of Nuveen Investments, Inc., formerly, President (1999-2007); Chief Executive Officer (since 2007) of Nuveen Investments Advisors, Inc.; Director (since 1998) formerly, Chief Executive Officer (2007-2010) of Nuveen Fund Advisors, Inc. | | 245 |
Name, Birthdate and Address | | Position(s) Held with the Funds | | Year First Elected or Appointed (4) | | Principal Occupation(s) During Past 5 Years | | Number of Portfolios in Fund Complex Overseen by Officer |
| | |
| Officers of the Funds: | | | | |
Gifford R. Zimmerman 9/9/56 333 W. Wacker Drive Chicago, IL 60606 | | Chief Administrative Officer | | 1988 | | Managing Director (since 2002), Assistant Secretary and Associate General Counsel of Nuveen Securities, LLC; Managing Director (since 2004) and Assistant Secretary (since 1994) of Nuveen Investments, Inc.; Managing Director (since 2002), Assistant Secretary (since 1997) and Co-General Counsel (since 2011) of Nuveen Fund Advisors, Inc.; Managing Director, Assistant Secretary and Associate General Counsel of Nuveen Asset Management, LLC (since 2011); Managing Director, Associate General Counsel and Assistant Secretary of Symphony Asset Management LLC (since 2003); Vice President and Assistant Secretary of NWQ Investment Management Company, LLC (since 2002), Nuveen Investments Advisers Inc. (since 2002), Tradewinds Global Investors LLC, and Santa Barbara Asset Management, LLC (since 2006), Nuveen HydePark Group LLC and Nuveen Investment Solutions, Inc. (since 2007) and of Winslow Capital Management Inc. (since 2010); Chief Administrative Officer and Chief Compliance Officer (since 2010) of Nuveen Commodities Asset Management, LLC; Chartered Financial Analyst. | | 245 |
| | | | | | | | |
Name, Birthdate and Address | | Position(s) Held with the Funds | | Year First Elected or Appointed (4) | | Principal Occupation(s) During Past 5 Years | | Number of Portfolios in Fund Complex Overseen by Officer |
Margo L. Cook 4/11/64 333 W. Wacker Drive Chicago, IL 60606 | | Vice President | | 2009 | | Executive Vice President (since 2008) of Nuveen Investments, Inc. and of Nuveen Fund Advisors, Inc. (since 2011); previously, Head of Institutional Asset Management (2007-2008) of Bear Stearns Asset Management; Head of Institutional Asset Management (1986-2007) of Bank of NY Mellon; Chartered Financial Analyst. | | 245 |
Lorna C. Ferguson 10/24/45 333 W. Wacker Drive Chicago, IL 60606 | | Vice President | | 1998 | | Managing Director (since 2004) of Nuveen Securities, LLC and Managing Director (since 2005) of Nuveen Fund Advisors, Inc. | | 245 |
Name, Birthdate and Address | | Position(s) Held with the Funds | | Year First Elected or Appointed (1) | | Principal Occupation(s) Including other Directorships During Past 5 Years | | Number of Portfolios in Fund Complex Overseen by Trustee |
Stephen D. Foy 5/31/54 333 W. Wacker Drive Chicago, IL 60606 | | Vice President and Controller | | 1998 | | Senior Vice President (since 2010), formerly, Vice President (1993-2010) and Funds Controller (since 1998) of Nuveen Securities, LLC; Senior Vice President (since 2010), formerly, Vice President (2005-2010) of Nuveen Fund Advisors, Inc.; Certified Public Accountant. | | 245 |
Scott S. Grace 8/20/70 333 W. Wacker Drive Chicago, IL 60606 | | Vice President and Treasurer | | 2009 | | Managing Director, Corporate Finance & Development, Treasurer (since 2009) of Nuveen Securities, LLC; Managing Director and Treasurer (since 2009) of Nuveen Fund Advisors, Inc., Nuveen Investment Solutions, Inc., Nuveen Investments Advisers, Inc., Nuveen Investments Holdings Inc. and (since (2011) Nuveen Asset Management, LLC; Vice President and Treasurer of NWQ Investment Management Company, LLC, Tradewinds Global Investors, LLC, Symphony Asset Management LLC and Winslow Capital Management, Inc.; Vice President of Santa Barbara Asset Management, LLC; formerly, Treasurer (2006-2009), Senior Vice President (2008-2009), previously, Vice President (2006-2008) of Janus Capital Group, Inc.; formerly, Senior Associate in Morgan Stanley’s Global Financial Services Group (2000-2003); Chartered Accountant Designation. | | 245 |
Walter M. Kelly 2/24/70 333 W. Wacker Drive Chicago, IL 60606 | | Chief Compliance Officer and Vice President | | 2003 | | Senior Vice President (since 2008), Vice President (2006-2008) of Nuveen Securities, LLC; Senior Vice President (since 2008) and Assistant Secretary (since 2008) of Nuveen Fund Advisors, Inc. | | 245 |
Tina M. Lazar 8/27/61 333 W. Wacker Drive Chicago, IL 60606 | | Vice President | | 2002 | | Senior Vice President (since 2009), formerly, Vice President of Nuveen Securities, LLC (1999-2009); Senior Vice President (since 2010), formerly, Vice President (2005-2010) of Nuveen Fund Advisors, Inc. | | 245 |
Larry W. Martin 7/27/51 333 West Wacker Drive Chicago, IL 60606 | | Vice President and Assistant Secretary | | 1997 | | Senior Vice President (since 2010), formerly, Vice President (1993-2010), Assistant Secretary and Assistant General Counsel of Nuveen Securities, LLC; Senior Vice President (since 2011) of Nuveen Asset Management, LLC: Senior Vice President (since 2010), formerly, Vice President (2005-2010), and Assistant Secretary of Nuveen Investments, Inc.; Senior Vice President (since 2010), formerly Vice President (2005-2010), and Assistant Secretary (since 1997) of Nuveen Fund Advisors, Inc.; Vice President and Assistant Secretary of Nuveen Investments Advisers, Inc. (since 2002), NWQ Investment Management Company, LLC, Symphony Asset Management LLC (since 2003), Tradewinds Global Investors, LLC, Santa Barbara Asset Management, LLC (since 2006), Nuveen HydePark Group, LLC and Nuveen Investment Solutions, Inc. (since 2007), and of Winslow Capital Management, Inc. (since 2010); Vice President and Assistant Secretary of Nuveen Commodities Asset Management, LLC (since 2010). | | 245 |
Trustees and Officers (Unaudited) (continued)
| | | | | | | | |
Name, Birthdate and Address | | Position(s) Held with the Funds | | Year First Elected or Appointed (1) | | Principal Occupation(s) Including other Directorships During Past 5 Years | | Number of Portfolios in Fund Complex Overseen by Trustee |
Kevin J. McCarthy 3/26/66 333 W. Wacker Drive Chicago, IL 60606 | | Vice President and Secretary | | 2007 | | Managing Director (since 2008), formerly, Vice President (2007-2008), Nuveen Securities, LLC; Managing Director (since 2008), Assistant Secretary (since 2007) and Co-General Counsel (since 2011) of Nuveen Fund Advisors, Inc.; Managing Director, Assistant Secretary and Associate General Counsel (since 2011) of Nuveen Asset Management, LLC; Managing Director (since 2008), and Assistant Secretary, Nuveen Investment Holdings, Inc.; Vice President (since 2007) and Assistant Secretary of Nuveen Investments Advisers Inc., NWQ Investment Management Company, LLC, Tradewinds Global Investors LLC, NWQ Holdings, LLC, Symphony Asset Management LLC, Santa Barbara Asset Management, LLC, Nuveen HydePark Group, LLC, Nuveen Investment Solutions, Inc. (since 2007) and of Winslow Capital Management, Inc. (since 2010); Vice President and Secretary (since 2010) of Nuveen Commodities Asset Management, LLC; prior thereto, Partner, Bell, Boyd & Lloyd LLP (1997-2007). | | 245 |
Kathleen L. Prudhomme 3/30/53 800 Nicollet Mall Minneapolis, MN 55402 | | Vice President and Assistant Secretary | | 2011 | | Managing Director, Assistant Secretary and Co-General Counsel (since 2011) of Nuveen Fund Advisors, Inc.; Managing Director, Assistant Secretary and Associate General Counsel (since 2011) of Nuveen Asset Management, LLC; Managing Director and Assistant Secretary (since 2011) of Nuveen Securities, LLC; formerly, Secretary of FASF (2004-2010); Deputy General Counsel, FAF Advisors, Inc. (2004-2010). | | 245 |
Jeffrey M. Wilson 3/13/56 333 West Wacker Drive Chicago, IL 60606 | | Vice President | | 2011 | | Senior Vice President of Nuveen Securities, LLC (since 2011), formerly, Senior Vice President of FAF Advisors, Inc. (2000-2010). | | 112 |
| (1) | Trustees serve an indefinite term until his/her successor is elected or appointed. The year first elected or appointed represents the year in which the trustee was first elected or appointed to any fund in the Nuveen Fund Complex. |
| (2) | Also serves as a trustee of the Nuveen Diversified Commodity Fund, an exchange-traded commodity pool managed by Nuveen Commodities Asset Management, LLC, an affiliate of the Adviser. |
| (3) | Mr. Amboian is an interested trustee because of his position with Nuveen Investments, Inc. and certain of its subsidiaries, which are affiliates of the Nuveen Funds. |
| (4) | Officers serve one year terms through August of each year. The year first elected or appointed represents the year in which the officer was first elected or appointed to any fund in the Nuveen Fund Complex. |
Annual Investment Management Agreement Approval Process
(Unaudited)
A. Background
Prior to January 1, 2011, FAF Advisors, Inc. (“FAF”), a wholly-owned subsidiary of U.S. Bank National Association (“U.S. Bank”), served as investment adviser to each Fund pursuant to an investment advisory agreement between First American Investment Funds, Inc. (the “Company”) and FAF (the “Prior Advisory Agreement”), and as administrator to each Fund pursuant to an administrative agreement between the Company and FAF (the “Prior Administrative Agreement”). On July 29, 2010, U.S. Bank and FAF entered into a definitive agreement with Nuveen Investments, Inc. (“Nuveen”), Nuveen Asset Management (“NAM”) and certain Nuveen affiliates, whereby NAM would acquire a portion of the asset management business of FAF (the “Transaction”). The acquired business included the assets of FAF used in providing investment advisory services, research, sales and distribution in connection with equity, fixed income, real estate, global infrastructure and asset allocation investment products (other than the money market business and closed-end funds advised by FAF), including the Funds. In connection with the Transaction, the Board of Directors (the “Prior Board”) serving the Funds as directors at that time (each a “Prior Director” and, collectively, the “Prior Directors”) considered a number of proposals designed to integrate the Funds into the Nuveen family of funds, including the appointment of NAM as investment adviser and Nuveen Investments, LLC as distributor to the Funds. The Prior Board also considered a proposal in connection with an internal restructuring of NAM (the “Restructuring”), for Nuveen Asset Management, LLC (“NAM LLC”), a wholly-owned subsidiary of NAM formed in anticipation of the Restructuring, to serve as sub-advisor for each Fund.
The Prior Board approved a new investment advisory agreement (the “New Advisory Agreement”) for each Fund with NAM and an investment sub-advisory agreement between NAM and NAM LLC (the “NAM Sub-Advisory Agreement”). At a meeting of the Funds’ stockholders held on December 17, 2010, stockholders of the Funds approved the New Advisory Agreement and the NAM Sub-Advisory Agreement. In addition, stockholders of the Company’s funds (including the Funds) elected ten directors, including one Prior Director, to the board of directors of the Company (the “New Board”).
On December 31, 2010, the Transaction closed and the New Board (which replaced the Prior Board) took effect. On January 1, 2011, the New Advisory Agreement and the NAM Sub-Advisory Agreement became effective. In addition, in connection with the Restructuring, NAM has changed its name to Nuveen Fund Advisors, Inc. (“NFA”). The following is a summary of the considerations of the Prior Board, which were set forth in a proxy statement dated November 10, 2010 (the “Proxy Statement”), in approving the New Advisory Agreement and the NAM Sub-Advisory Agreement for the Funds.
B. Prior Board Considerations
The New Advisory Agreement for each Fund was approved by the Prior Board after consideration of all factors determined to be relevant to its deliberations, including those discussed below. The Prior Board authorized the submission of the New Advisory Agreement for consideration by each Fund’s stockholders.
At meetings held in May and June of 2010, the Prior Board was apprised of the general terms of the Transaction and, as a result, began the process of considering the transition of services from FAF to NFA. In preparation for its September 21-23, 2010 meeting, the Prior Board received, in response to a written due diligence request prepared by the Prior Board and its independent legal counsel and provided to NFA and FAF, a significant amount of information covering a range of issues in advance of the meeting. To assist the Prior Board in its consideration of the New Advisory Agreement for each Fund, NFA provided materials and information about, among other things: (1) NFA and its affiliates, including their history and organizational structure, product lines, experience in providing investment advisory, administrative and other services, and financial condition, (2) the nature, extent and quality of services to be provided under the New Advisory Agreement, (3) proposed Fund fees and expenses and comparative information relating thereto, and (4) NFA’s compliance and risk management capabilities and processes. In addition, the Prior Board was provided with a memorandum from independent legal counsel outlining the legal duties of the Prior Board under the Investment Company Act of 1940, as amended (the “1940 Act”). In response to further requests from the Prior Board and its independent legal counsel, NFA and FAF provided additional information to the Prior Board following its September 21-23 meeting.
An additional in-person meeting of the Prior Board to consider the New Advisory Agreement was held on October 7, 2010, at which the members of the Prior Board in attendance, all of whom were not considered to be “interested persons” of the Company as defined in the 1940 Act (the “Independent Prior Directors”), approved the New Advisory Agreement with NFA for each Fund.
In considering the New Advisory Agreement for each Fund, the Prior Board, advised by independent legal counsel, reviewed and analyzed the factors it deemed relevant, including: (1) the nature, quality, and extent of services to be rendered to the Funds by NFA, (2) the cost of services to be provided, including Fund expense information, and (3) whether economies of scale may be realized as the Funds grow and whether fee levels are adjusted to enable Fund investors to share in these potential economies of scale.
In considering the New Advisory Agreement, the Prior Board did not identify any particular information that was all-important or controlling, and each Prior Director may have attributed different weights to the various factors discussed below. Where appropriate, the Prior Directors evaluated all information available to them regarding the Company’s funds on a fund-by-fund basis, and their determinations were made separately with respect to each such fund (including each of the Funds). The Prior Directors, all of whom were Independent Prior Directors, concluded that the terms of the New Advisory Agreement and the fee rates to be paid in light of the services to be provided to each Fund are in the best interests of each Fund, and that the New Advisory Agreement should be approved and recommended to stockholders for approval. In voting to approve the New Advisory Agreement with respect to each Fund, the Prior Board considered in particular the following factors:
Nature, Extent and Quality of Services. In considering approval of the New Advisory Agreement, the Prior Board considered the nature, extent and quality of services to be provided by NFA, including advisory services and administrative services. The Prior Board
Annual Investment Management Agreement Approval Process
(Unaudited) (continued)
reviewed materials outlining, among other things, NFA’s organizational structure and business; the types of services that NFA or its affiliates are expected to provide to the Funds; the performance record of the applicable Fund (as described in further detail below); and fund product lines offered by NFA. The Prior Board considered that affiliation with a larger fund complex and well-recognized sponsor may result in a broader distribution network, potential economies of scale with respect to other services or fees and broader shareholder services including exchange options.
With respect to personnel, the Prior Board considered information regarding retention plans for current FAF employees who would be offered employment by NFA, and the background and experience of NFA employees who would become portfolio managers as of the closing of the Transaction. The Prior Board also reviewed information regarding portfolio manager compensation arrangements to evaluate NFA’s ability to attract and retain high quality investment personnel.
In evaluating the services of NFA, the Prior Board also considered NFA’s ability to supervise the Funds’ other service providers and, given the importance of compliance, NFA’s compliance program. Among other things, the Prior Board considered the report of NFA’s chief compliance officer regarding NFA’s compliance policies and procedures.
In addition to advisory services, the Prior Board considered the quality of administrative services expected to be provided by NFA and its affiliates including product management, fund administration, oversight of service providers, shareholder services, administration of Board relations, regulatory and portfolio compliance and legal support.
The Prior Board considered that, based on representations from FAF and NFA, the Transaction would allow stockholders to continue their investment in each of the Company’s funds with the same investment objective and principal strategies. The Prior Board considered the historical investment performance of each of the Company’s funds (including each Fund) previously provided during the annual contract renewal process.
Cost of Services Provided by NFA. In evaluating the costs of the services to be provided by NFA under the New Advisory Agreement, the Prior Board received a comparison of each Fund’s annual operating expenses as of June 30, 2010 under the Prior Advisory Agreement and under the New Advisory Agreement, in each case adjusted to reflect a decrease in net assets for certain of the Company’s funds from redemptions by the U.S. Bank 401(k) Plan expected to occur prior to the closing of the Transaction. The Prior Board considered, among other things, that the advisory fee rates and other expenses would change as a result of NFA serving as investment adviser to each Fund. The Prior Board noted that the services provided by NFA under the New Advisory Agreement would include certain administrative services, which services (along with other services) were provided pursuant to the Prior Administrative Agreement and were charged separately from the advisory fee. Accordingly, the Prior Board considered that the fee rates paid under the New Advisory Agreement include bundled investment advisory and administrative fees and thus are higher than the fee rates paid under the Prior Advisory Agreement for most of the Company’s funds, but lower than the combined fee rates paid under the Prior Advisory Agreement and the Prior Administrative Agreement. The Prior Board also noted that certain administrative services provided under the Prior Administrative Agreement would not be provided under the New Advisory Agreement and will be delegated to other service providers. Similarly, certain fees paid by FAF under the Prior Administrative Agreement will not be paid by NFA under the New Advisory Agreement and will be paid directly by the Funds. However, immediately following the closing of the Transaction, the net expense ratio of each Fund was expected to be the same or lower than the Fund’s net expense ratio as of June 30, 2010, adjusted (where applicable) to reflect a decrease in net assets resulting from redemptions by the U.S. Bank 401(k) Plan expected to occur prior to the closing of the Transaction, assuming the Fund’s net assets at the time of the closing of the Transaction were no lower than their adjusted June 30 level. In addition, the Prior Board noted that NFA has committed to certain undertakings to maintain current fee caps and/or to waive fees or reimburse expenses to maintain net management fees at certain levels and Nuveen has represented to the Prior Board that Nuveen and its affiliates will not take any action that imposes an “unfair burden” on any Fund as a result of the Transaction. The Prior Board also considered that fees payable under the New Advisory Agreement include both a fund-level fee and a complex-level fee, and that schedules for the fund-level and complex-level fees contain breakpoints that are based, respectively, on Fund assets and Nuveen complex-wide assets. The Prior Board considered that breakpoints in the fund-level fee allow for the possibility that this portion of the advisory fee could decline in the future if Fund assets were to increase or increase in the future if Fund assets were to decline. The Prior Board also considered that breakpoints in the complex-level fee allow for the possibility that this portion of the advisory fee could decline in the future if complex-wide assets were to increase or increase in the future if complex-wide assets were to decline, regardless, in each case, of whether assets of the particular Fund had increased or decreased.
In considering the compensation to be paid to NFA, the Prior Board also reviewed fee information regarding NFA-sponsored funds, to the extent such funds had similar investment objectives and strategies to the Funds. The Prior Board reviewed information provided by NFA regarding similar funds managed by NFA and noted that the fee rates payable by these funds were generally comparable to the fee rates proposed for the Company’s funds. The Prior Board also compared proposed fee and expense information to the median fees and expenses of comparable funds, using information provided by an independent data service.
In evaluating the compensation, the Prior Board also considered other amounts expected to be paid to NFA by the Funds as well as any indirect benefits (such as soft dollar arrangements, if any) NFA and its affiliates are expected to receive, that are directly attributable to the management of the Funds.
The Prior Board also considered that the Funds would not bear any of the costs relating to the Transaction, including the costs of preparing, printing and mailing the Proxy Statement.
Economies of Scale. The Prior Board reviewed information regarding potential economies of scale or other efficiencies that might result from the Funds’ potential association with Nuveen. The Prior Board noted that the New Advisory Agreement provides for breakpoints in the Funds’ fund-level and complex-level management fee rates as the assets of the Funds and the assets held by the various registered investment companies sponsored by Nuveen increase, respectively. The Prior Board concluded that the structure of the investment management fee rates, with the breakpoints for the Funds under the New Advisory Agreement, reflected sharing of potential economies of scale with the Funds’ stockholders.
Conclusion. After deliberating in executive session, the members of the Prior Board in attendance, all of whom were Independent Prior Directors, approved the New Advisory Agreement with respect to each Fund, concluding that the New Advisory Agreement was in the best interests of each Fund.
NAM Sub-Advisory Agreement. The Prior Board also approved the NAM Sub-Advisory Agreement between NFA and NAM LLC as a result of the Restructuring expected to occur with NFA. The Prior Board considered that the services to be provided by NAM LLC under the NAM Sub-Advisory Agreement would not result in any material change in the nature or level of investment advisory services or administrative services provided to the Funds. In addition, the portfolio managers will continue to manage the Funds in their capacity as employees of NAM LLC. The Prior Board considered that NFA will pay a portion of the advisory fee it receives from each Fund to NAM LLC for its services as sub-advisor. The Prior Board concluded, based upon the conclusions that the Prior Board reached in connection with the approval of the New Advisory Agreement and after determining that it need not reconsider all of the factors that it had considered in connection with the approval of the New Advisory Agreement, to approve the NAM Sub-Advisory Agreement.
Notes
Notes
Glossary of Terms Used in this Report
Auction Rate Bond: An auction rate bond is a security whose interest payments are adjusted periodically through an auction process, which process typically also serves as a means for buying and selling the bond. Auctions that fail to attract enough buyers for all the shares offered for sale are deemed to have “failed,” with current holders receiving a formula-based interest rate until the next scheduled auction.
Average Annual Total Return: This is a commonly used method to express an investment’s performance over a particular, usually multi-year time period. It expresses the return that would have been necessary each year to equal the investment’s actual cumulative performance (including change in NAV or offer price and reinvested dividends and capital gains distributions, if any) over the time period being considered.
Average Effective Maturity: The market-value-weighted average of the effective maturity dates of the individual securities including cash. In the case of a bond that has been advance-refunded to a call date, the effective maturity is the date on which the bond is scheduled to be redeemed using the proceeds of an escrow account. In most other cases the effective maturity is the stated maturity date of the security.
Average Duration: Duration is a measure of the expected period over which a bond’s principal and interest will be paid, and consequently is a measure of the sensitivity of a bond’s (or bond fund’s) value to changes when market interest rates change. Generally, the longer a bond or Fund’s duration, the more the price of the bond or Fund will change as interest rates change.
Barclays Capital Municipal Bond Index: An unmanaged index comprised of fixed-rate, investment-grade tax-exempt bonds with remaining maturities of one year or more.
Barclays Capital 1-15 Year Blend Municipal Bond Index: An unmanaged index comprised of fixed-rate, investment-grade tax-exempt bonds with remaining maturities between 1 and 17 years.
Barclays Capital 3-Year Municipal Bond Index: An unmanaged index comprised of fixed-rate, investment-grade tax-exempt bonds with remaining maturities between two and four years.
Inverse Floaters: Inverse floating rate securities are created by depositing a municipal bond, typically with a fixed interest rate, into a special purpose trust created by a broker-dealer. This trust, in turn, (a) issues floating rate certificates typically paying short-term tax-exempt interest rates to third parties in amounts equal to some fraction of the deposited bond’s par amount or market value, and (b) issues an inverse floating rate certificate (sometimes referred to as an “inverse floater”) to an investor (such as a Fund) interested in gaining investment exposure to a long-term municipal bond. The income received by the holder of the inverse floater varies inversely with the short-term rate paid to the floating rate certificates’ holders, and in most circumstances the holder of the inverse floater bears substantially all of the underlying bond’s downside investment risk. The holder of the inverse floater typically also benefits disproportionately from any potential appreciation of the underlying bond’s value. Hence, an inverse floater essentially represents an investment in the underlying bond on a leveraged basis.
Lipper Intermediate Municipal Debt Funds Average: Represents all average annualized total return for all reporting funds in the Lipper Intermediate Municipal Debt Funds Category. The Lipper Intermediate Municipal Debt Funds Average contained 168, 168, 128 and 85 funds for the ten-month, 1-year, 5-year and 10-year period, respectively, ended April 30, 2011.
Lipper General Municipal Debt Funds Average: Represents all average annualized total return for all reporting funds in the Lipper General Municipal Debt Funds Category. The Lipper General Municipal Debt Funds Average contained 261, 261, 207 and 171 funds for the ten-month, 1-year, 5-year and 10-year period, respectively, ended April 30, 2011.
Lipper Short Municipal Debt Funds Average: Represents all average annualized total return for all reporting funds in the Lipper Short Municipal Debt Funds Category. The Lipper Short Municipal Debt Funds Category contained 83, 83, 56 and 34 funds for the ten-month, 1-year, 5-year and 10-year period, respectively, ended April 30, 2011.
Net Asset Value (NAV): A Fund’s NAV is the dollar value of one share in the Fund. It is calculated by subtracting the liabilities of the Fund from its total assets and then dividing the remainder by the number of shares outstanding. Fund NAVs are calculated at the end of each business day.
Pre-Refundings: Pre-Refundings, also known as advance refundings or refinancings, occur when an issuer sells new bonds and uses the proceeds to fund principal and interest payments of older existing bonds. This process often results in lower borrowing costs for bond issuers.
Fund Information
Fund Manager
Nuveen Fund Advisors, Inc.
333 West Wacker Drive
Chicago, IL 60606
Sub-Adviser
Nuveen Asset Management, LLC
333 West Wacker Drive
Chicago, IL 60606
Legal Counsel
Chapman and Cutler LLP
Chicago, IL
Independent Registered
Public Accounting Firm
Ernst & Young LLP
Chicago, IL
Custodian
U.S. Bank National Association
St. Paul, MN
Transfer Agent and
Shareholder Services
U.S. Bancorp Fund Services, LLC
615 East Michigan Street
Milwaukee, WI 53202
Quarterly Portfolio of Investments and Proxy Voting Information: You may obtain (i) each Fund’s quarterly portfolio of investments, (ii) information regarding how the Funds voted proxies relating to portfolio securities held during the most recent twelve-month period ended June 30, and (iii) a description of the policies and procedures that the Funds used to determine how to vote proxies relating to portfolio securities without charge, upon request, by calling Nuveen Investments at (800) 257-8787 or on Nuveen’s website at www.nuveen.com.
You may also obtain this and other Fund information directly from the Securities and Exchange Commission (SEC). The SEC may charge a copying fee for this information. Visit the SEC on-line at http://www.sec.gov or in person at the SEC’s Public Reference Room in Washington, D.C. Call the SEC at (202) 942-8090 for room hours and operation. You may also request Fund information by sending an e-mail request to publicinfo@sec.gov or by writing to the SEC’s Public Reference Section at 100 F Street NE, Washington, D.C. 20549.
The Financial Industry Regulatory Authority (FINRA) provides a Public Disclosure Program which supplies certain information regarding the disciplinary history of FINRA members and their associated persons in response to either telephone inquiries at (800) 289-9999 or written inquiries at www.finra.org. FINRA also provides an investor brochure that includes information describing the Public Disclosure Program.
Nuveen Investments:
Serving Investors for Generations
Since 1898, financial advisors and their clients have relied on Nuveen Investments to provide dependable investment solutions through continued adherence to proven, long-term investing principles. Today, we offer a range of high quality equity and fixed-income solutions designed to be integral components of a well-diversified core portfolio.
Focused on meeting investor needs.
Nuveen Investments is a global investment management firm that seeks to help secure the long-term goals of institutions and high net worth investors as well as the consultants and financial advisors who serve them. We market our growing range of specialized investment solutions under the high-quality brands of HydePark, NWQ, Nuveen Asset Management, Santa Barbara, Symphony, Tradewinds and Winslow Capital. In total, Nuveen Investments managed approximately $206 billion of assets as of March 31, 2011.
Find out how we can help you.
To learn more about how the products and services of Nuveen Investments may be able to help you meet your financial goals, talk to your financial advisor, or call us at (800) 257-8787. Please read the information provided carefully before you invest. Investors should consider the investment objective and policies, risk considerations, charges and expenses of any investment carefully. Where applicable, be sure to obtain a prospectus, which contains this and other relevant information. To obtain a prospectus, please contact your securities representative or Nuveen Investments, 333 W. Wacker Dr., Chicago, IL 60606. Please read the prospectus carefully before you invest or send money.
Learn more about Nuveen Funds at: www.nuveen.com/mf
Nuveen makes things e-simple.
It only takes a minute to sign up for e-Reports. Once enrolled, you’ll receive an e-mail as soon as your Nuveen Fund information is ready — no more waiting for delivery by regular mail. Just click on the link within the e-mail to see the report and save it on your computer if you wish.
Free e-Reports right to your e-mail!
www.investordelivery.com
If you receive your Nuveen Fund distributions and statements from your financial advisor or brokerage account.
OR
www.nuveen.com/accountaccess
If you receive your Nuveen Fund distributions and statements directly from Nuveen.
| | |
Distributed by Nuveen Securities, LLC 333 West Wacker Drive Chicago, IL 60606 www.nuveen.com | | |
MAN-FSIT-0411D
ITEM 2. CODE OF ETHICS.
As of the end of the period covered by this report, the registrant has adopted a code of ethics that applies to the registrant’s principal executive officer, principal financial officer, principal accounting officer or controller, or persons performing similar functions. There were no amendments to or waivers from the code during the period covered by this report. The registrant has posted the code of ethics on its website at www.nuveen.com/mf. (To view the code, click on the Shareholder Resources drop down menu box, click on Fund Governance and then click on Code of Conduct.)
ITEM 3. AUDIT COMMITTEE FINANCIAL EXPERT.
The registrant’s Board of Trustees determined that the registrant has at least one “audit committee financial expert” (as defined in Item 3 of Form N-CSR) serving on its Audit Committee. The registrant’s audit committee financial expert is Carole E. Stone, who is “independent” for purposes of Item 3 of Form N-CSR.
Ms. Stone served for five years as Director of the New York State Division of the Budget. As part of her role as Director, Ms. Stone was actively involved in overseeing the development of the State’s operating, local assistance and capital budgets, its financial plan and related documents; overseeing the development of the State’s bond-related disclosure documents and certifying that they fairly presented the State’s financial position; reviewing audits of various State and local agencies and programs; and coordinating the State’s system of internal audit and control. Prior to serving as Director, Ms Stone worked as a budget analyst/examiner with increasing levels of responsibility over a 30 year period, including approximately five years as Deputy Budget Director. Ms. Stone has also served as Chair of the New York State Racing Association Oversight Board, as Chair of the Public Authorities Control Board, as a Commissioner on the New York State Commission on Public Authority Reform and as a member of the Boards of Directors of several New York State public authorities. These positions have involved overseeing operations and finances of certain entities and assessing the adequacy of project/entity financing and financial reporting. Currently, Ms. Stone is on the Board of Directors of CBOE Holdings, Inc., of the Chicago Board Options Exchange, and of C2 Options Exchange. Ms. Stone’s position on the boards of these entities and as a member of both CBOE Holdings’ Audit Committee and its Finance Committee has involved, among other things, the oversight of audits, audit plans and preparation of financial statements.
ITEM 4. PRINCIPAL ACCOUNTANT FEES AND SERVICES.
The following tables show the amount of fees that Ernst & Young LLP, the Trust’s auditor, billed to the Trust during the Trust’s last two full fiscal years. The Audit Committee approved in advance all audit services and non-audit services that Ernst & Young LLP provided to the Trust, except for those non-audit services that were subject to the pre-approval exception under Rule 2-01 of Regulation S-X (the “pre-approval exception”). The pre-approval exception for services provided directly to the Trust waives the pre-approval requirement for services other than audit, review or attest services if: (A) the aggregate amount of all such services provided constitutes no more than 5% of the total amount of revenues paid by the Trust during the fiscal year in which the services are provided; (B) the Trust did not recognize the services as non-audit services at the time of the engagement; and (C) the services are promptly brought to the Audit Committee’s attention, and the Committee (or its delegate) approves the services before the audit is completed.
The Audit Committee has delegated certain pre-approval responsibilities to its Chairman (or, in his absence, any other member of the Audit Committee).
SERVICES THAT THE TRUST’S AUDITOR BILLED TO THE TRUST
| | | | | | | | | | | | | | | | |
Fiscal Year Ended April 30, 2011 5 | | Audit Fees Billed
to Funds 1 | | | Audit-Related Fees
Billed to Funds 2 | | | Tax Fees
Billed to Funds 3 | | | All Other Fees
Billed to Funds 4 | |
Name of Series | | | | | | | | | | | | | | | | |
Intermediate Tax Free Fund | | | 19,091 | | | | 0 | | | | 1,056 | | | | 0 | |
Short Tax Free Fund | | | 19,091 | | | | 0 | | | | 1,348 | | | | 0 | |
Tax Free Fund | | | 19,091 | | | | 0 | | | | 2,640 | | | | 0 | |
| | | | | | | | | | | | | | | | |
Total | | $ | 57,273 | | | $ | 0 | | | $ | 5,044 | | | $ | 0 | |
| 1 | | “Audit Fees” are the aggregate fees billed for professional services for the audit of the Fund’s annual financial statements and services provided in connection with statutory and regulatory filings or engagements. |
| 2 | | “Audit Related Fees” are the aggregate fees billed for assurance and related services reasonably related to the performance of the audit or review of financial statements and are not reported under “Audit Fees”. |
| 3 | | “Tax Fees” are the aggregate fees billed for professional services for tax advice, tax compliance, and tax planning. |
| 4 | | “All Other Fees” are the aggregate fees billed for products and services other than “Audit Fees”, “Audit Related Fees”, and “Tax Fees”. |
| 5 | | The funds were acquired on December 31, 2010 and changed fiscal year from June to April beginning in January, 2011. |
| | | | | | | | | | | | | | | | |
| | | Percentage Approved Pursuant to Pre-approval Exception | |
| | | Audit Fees Billed
to Funds | | | Audit-Related Fees
Billed to Funds | | | Tax Fees
Billed to Funds | | | All Other Fees
Billed to Funds | |
Name of Series | | | | | | | | | | | | | | | | |
Intermediate Tax Free Fund | | | 0 | % | | | 0 | % | | | 0 | % | | | 0 | % |
Short Tax Free Fund | | | 0 | % | | | 0 | % | | | 0 | % | | | 0 | % |
Tax Free Fund | | | 0 | % | | | 0 | % | | | 0 | % | | | 0 | % |
| | | | |
Fiscal Year Ended June 30, 2010 | | Audit Fees Billed
to Funds 1 | | | Audit-Related Fees
Billed to Funds 2 | | | Tax Fees
Billed to Funds 3 | | | All Other Fees
Billed to Funds 4 | |
Name of Series | | | | | | | | | | | | | | | | |
Intermediate Tax Free Fund | | | 111,074 | | | | 352 | | | | 21,941 | | | | 0 | |
Short Tax Free Fund | | | 111,074 | | | | 352 | | | | 21,941 | | | | 0 | |
Tax Free Fund | | | 111,074 | | | | 352 | | | | 21,941 | | | | 0 | |
| | | | | | | | | | | | | | | | |
Total | | $ | 333,222 | | | $ | 1,056 | | | $ | 65,823 | | | $ | 0 | |
| 1 | | “Audit Fees” are the aggregate fees billed for professional services for the audit of the Fund’s annual financial statements and services provided in connection with statutory and regulatory filings or engagements. |
| 2 | | “Audit Related Fees” are the aggregate fees billed for assurance and related services reasonably related to the performance of the audit or review of financial statements and are not reported under “Audit Fees”. |
| 3 | | “Tax Fees” are the aggregate fees billed for professional services for tax advice, tax compliance, and tax planning. |
| 4 | | “All Other Fees” are the aggregate fees billed for products and services other than “Audit Fees”, “Audit Related Fees”, and “Tax Fees”. |
| | | | | | | | | | | | | | | | |
| | | Percentage Approved Pursuant to Pre-approval Exception | |
| | | Audit Fees Billed
to Funds | | | Audit-Related Fees
Billed to Funds | | | Tax Fees
Billed to Funds | | | All Other Fees
Billed to Funds | |
Name of Series | | | | | | | | | | | | | | | | |
Intermediate Tax Free Fund | | | 0 | % | | | 0 | % | | | 0 | % | | | 0 | % |
Short Tax Free Fund | | | 0 | % | | | 0 | % | | | 0 | % | | | 0 | % |
Tax Free Fund | | | 0 | % | | | 0 | % | | | 0 | % | | | 0 | % |
| | | | | | | | | | | | |
Fiscal Year Ended April 30, 2011 | | Audit-Related Fees
Billed to Adviser and
Affiliated Fund
Service Providers | | | Tax Fees Billed to
Adviser and
Affiliated Fund
Service Providers | | | All Other Fees
Billed to Adviser
and Affiliated Fund
Service Providers | |
Nuveen Investment Funds, Inc. | | $ | 0 | | | $ | 0 | | | $ | 0 | |
| |
| | | Percentage Approved Pursuant to Pre-approval Exception | |
| | | Audit-Related Fees
Billed to Adviser and
Affiliated Fund
Service Providers | | | Tax Fees Billed to
Adviser and
Affiliated Fund
Service Providers | | | All Other Fees
Billed to Adviser
and Affiliated Fund
Service Providers | |
| | | 0 | % | | | 0 | % | | | 0 | % |
| | | |
Fiscal Year Ended June 30, 2010 | | Audit-Related Fees
Billed to Adviser and
Affiliated Fund
Service Providers | | | Tax Fees Billed to
Adviser and
Affiliated Fund
Service Providers | | | All Other Fees
Billed to Adviser
and Affiliated Fund
Service Providers | |
Nuveen Investment Funds, Inc. | | $ | 0 | | | $ | 0 | | | $ | 0 | |
| |
| | | Percentage Approved Pursuant to Pre-approval Exception | |
| | | Audit-Related Fees
Billed to Adviser and
Affiliated Fund
Service Providers | | | Tax Fees Billed to
Adviser and
Affiliated Fund
Service Providers | | | All Other Fees
Billed to Adviser
and Affiliated Fund
Service Providers | |
| | | 0 | % | | | 0 | % | | | 0 | % |
| | | | | | | | | | | | | | | | |
Fiscal Year Ended April 30, 2011 1 | | Total Non-Audit Fees
Billed to Trust | | | Total Non-Audit Fees
billed to Adviser and
Affiliated Fund Service
Providers (engagements
related directly to the
operations and financial
reporting of the Trust) | | | Total Non-Audit Fees
billed to Adviser and
Affiliated Fund Service
Providers (all other
engagements) | | | Total | |
Name of Series | | | | | | | | | | | | | | | | |
Intermediate Tax Free Fund | | | 1,056 | | | | 0 | | | | 0 | | | | 1,056 | |
Short Tax Free Fund | | | 1,348 | | | | 0 | | | | 0 | | | | 1,348 | |
Tax Free Fund | | | 2,640 | | | | 0 | | | | 0 | | | | 2,640 | |
| | | | | | | | | | | | | | | | |
Total | | $ | 5,044 | | | $ | 0 | | | $ | 0 | | | $ | 5,044 | |
“Non-Audit Fees Billed to Trust” represent “Tax Fees” and “All Other Fees” billed to each Fund in their respective amounts from the previous table.
| 1 | | The funds were acquired on December 31, 2010 and changed fiscal year from June to April beginning in January, 2011. |
| | | | | | | | | | | | | | | | |
Fiscal Year Ended June 30, 2010 | | Total Non-Audit Fees
Billed to Trust | | | Total Non-Audit Fees
billed to Adviser and
Affiliated Fund Service
Providers (engagements
related directly to the
operations and financial
reporting of the Trust) | | | Total Non-Audit Fees
billed to Adviser and
Affiliated Fund Service
Providers (all other
engagements) | | | Total | |
Name of Series | | | | | | | | | | | | | | | | |
Intermediate Tax Free Fund | | | 21,941 | | | | 0 | | | | 0 | | | | 21,941 | |
Short Tax Free Fund | | | 21,941 | | | | 0 | | | | 0 | | | | 21,941 | |
Tax Free Fund | | | 21,941 | | | | 0 | | | | 0 | | | | 21,941 | |
| | | | | | | | | | | | | | | | |
Total | | $ | 65,823 | | | $ | 0 | | | $ | 0 | | | $ | 65,823 | |
“Non-Audit Fees Billed to Trust” represent “Tax Fees” and “All Other Fees” billed to each Fund in their respective amounts from the previous table.
Audit Committee Pre-Approval Policies and Procedures. Generally, the Audit Committee must approve (i) all non-audit services to be performed for the Trust by the Trust’s independent accountants and (ii) all audit and non-audit services to be performed by the Trust’s independent accountants for the Affiliated Fund Service Providers with respect to the operations and financial reporting of the Trust. Regarding tax and research projects conducted by the independent accountants for the Trust and Affiliated Fund Service Providers (with respect to operations and financial reports of the Trust), such engagements will be (i) pre-approved by the Audit Committee if they are expected to be for amounts greater than $10,000; (ii) reported to the Audit Committee Chairman for his verbal approval prior to engagement if they are expected to be for amounts under $10,000 but greater than $5,000; and (iii) reported to the Audit Committee at the next Audit Committee meeting if they are expected to be for an amount under $5,000.
ITEM 5. AUDIT COMMITTEE OF LISTED REGISTRANTS
Not applicable to this registrant.
ITEM 6. SCHEDULE OF INVESTMENTS
| a) | | See Portfolio of Investments in Item 1. |
ITEM 7. DISCLOSURE OF PROXY VOTING POLICIES AND PROCEDURES FOR CLOSED-END
MANAGEMENT INVESTMENT COMPANIES
Not applicable to this registrant.
ITEM 8. PORTFOLIO MANAGERS OF CLOSED-END MANAGEMENT INVESTMENT COMPANIES
Not applicable to this registrant.
ITEM 9. PURCHASES OF EQUITY SECURITIES BY CLOSED-END MANAGEMENT INVESTMENT COMPANY AND AFFILIATED PURCHASERS
Not applicable to this registrant.
ITEM 10. SUBMISSION OF MATTERS TO A VOTE OF SECURITY HOLDERS
There have been no material changes to the procedures by which shareholders may recommend nominees to the registrant’s Board of Trustees implemented after the registrant last provided disclosure in response to this Item.
ITEM 11. CONTROLS AND PROCEDURES.
| | (a) | | The registrant’s principal executive and principal financial officers, or persons performing similar functions, have concluded that the registrant’s disclosure controls and procedures (as defined in Rule 30a-3(c) under the Investment Company Act of 1940, as amended (the “1940 Act”) (17 CFR 270.30a-3(c))) are effective, as of a date within 90 days of the filing date of this report that includes the disclosure required by this paragraph, based on their evaluation of the controls and procedures required by Rule 30a-3(b) under the 1940 Act (17 CFR 270.30a-3(b)) and Rules 13a-15(b) or 15d-15(b) under the Securities Exchange Act of 1934, as amended (the “Exchange Act”) (17 CFR 240.13a-15(b) or 240.15d-15(b)). |
| | (b) | | There were no changes in the registrant’s internal control over financial reporting (as defined in Rule 30a-3(d) under the 1940 Act (17 CFR 270.30a-3(d)) that occurred during the second fiscal quarter of the period covered by this report that has materially affected, or is reasonably likely to materially affect, the registrant’s internal control over financial reporting. |
ITEM 12. EXHIBITS
File the exhibits listed below as part of this Form.
| | |
| (a)(1) | | Any code of ethics, or amendment thereto, that is the subject of the disclosure required by Item 2, to the extent that the registrant intends to satisfy the Item 2 requirements through filing of an exhibit: Not applicable because the code is posted on registrant’s website at www.nuveen.com/mf and there were no amendments during the period covered by this report. (To view the code, click on the Shareholder Resources drop down menu box, click on Fund Governance and then Code of Conduct.) |
| |
| (a)(2) | | A separate certification for each principal executive officer and principal financial officer of the registrant as required by
Rule 30a-2(a) under the 1940 Act (17 CFR 270.30a-2(a)) in the exact form set forth below: See EX-99.CERT attached hereto. |
| |
| (a)(3) | | Any written solicitation to purchase securities under Rule 23c-1 under the 1940 Act (17 CFR 270.23c-1) sent or given during the period covered by the report by or on behalf of the registrant to 10 or more persons: Not applicable to this registrant. |
| |
| (b) | | If the report is filed under Section 13(a) or 15(d) of the Exchange Act, provide the certifications required by Rule 30a-2(b) under the 1940 Act (17 CFR 270.30a-2(b)), Rule 13a-14(b) or Rule 15d-14(b) under the Exchange Act (17 CFR 240.13a-14(b) or 240.15d-14(b)), and Section 1350 of Chapter 63 of Title 18 of the United States Code (18 U.S.C. 1350) as an Exhibit. A certification furnished pursuant to this paragraph will not be deemed “filed” for purposes of Section 18 of the Exchange Act (15 U.S.C. 78r), or otherwise subject to the liability of that section. Such certification will not be deemed to be incorporated by reference into any filing under the Securities Act of 1933 or the Exchange Act, except to the extent that the registration specifically incorporates it by reference: See EX-99.906 CERT attached hereto. |
SIGNATURES
Pursuant to the requirements of the Securities Exchange Act of 1934 and the Investment Company Act of 1940, the registrant has duly caused this report to be signed on its behalf by the undersigned, thereunto duly authorized.
(Registrant) Nuveen Investment Funds, Inc.
| | |
| |
By (Signature and Title) | | /s/ Kevin J. McCarthy |
| | Kevin J. McCarthy |
| | Vice President and Secretary |
Date July 8, 2011
Pursuant to the requirements of the Securities Exchange Act of 1934 and the Investment Company Act of 1940, this report has been signed below by the following persons on behalf of the registrant and in the capacities and on the dates indicated.
| | |
| |
By (Signature and Title) | | /s/ Gifford R. Zimmerman |
| | Gifford R. Zimmerman |
| | Chief Administrative Officer |
| | (principal executive officer) |
Date July 8, 2011
| | |
| |
| By (Signature and Title) | | /s/ Stephen D. Foy |
| | Stephen D. Foy |
| | Vice President and Controller |
| | (principal financial officer) |
Date July 8, 2011