UNITED STATES
SECURITIES AND EXCHANGE COMMISSION
Washington, D.C. 20549
FORM N-CSR
CERTIFIED SHAREHOLDER REPORT OF REGISTERED MANAGEMENT
INVESTMENT COMPANIES
Investment Company Act file number 811-05309
Nuveen Investment Funds, Inc.
(Exact name of registrant as specified in charter)
Nuveen Investments
333 West Wacker Drive, Chicago, IL 60606
(Address of principal executive offices) (Zip code)
Kevin J. McCarthy
Nuveen Investments
333 West Wacker Drive
Chicago, IL 60606
(Name and address of agent for service)
Registrant’s telephone number, including area code: (312) 917-7700
Date of fiscal year end: October 31
Date of reporting period: October 31, 2011
Form N-CSR is to be used by management investment companies to file reports with the Commission not later than 10 days after the transmission to stockholders of any report that is required to be transmitted to stockholders under Rule 30e-1 under the Investment Company Act of 1940 (17 CFR 270.30e-1). The Commission may use the information provided on Form N-CSR in its regulatory, disclosure review, inspection, and policy making roles.
A registrant is required to disclose the information specified by Form N-CSR, and the Commission will make this information public. A registrant is not required to respond to the collection of information contained in Form N-CSR unless the Form displays a currently valid Office of Management and Budget (“OMB”) control number. Please direct comments concerning the accuracy of the information collection burden estimate and any suggestions for reducing the burden to Secretary, Securities and Exchange Commission, 450 Fifth Street, NW, Washington, DC 20549-0609. The OMB has reviewed this collection of information under the clearance requirements of 44 U.S.C. ss.3507.
ITEM 1. REPORTS TO STOCKHOLDERS.

Mutual Funds
Nuveen Equity Funds
For investors seeking long-term capital appreciation potential.
Annual Report
October 31, 2011
| | | | | | | | | | |
| | | Share Class / Ticker Symbol |
| | | | | |
| Fund Name | | Class A | | Class B | | Class C | | Class R3 | | Class I |
Nuveen International Fund | | FAIAX | | FNABX | | FIACX | | ARQIX | | FAICX |
Nuveen International Select Fund | | ISACX | | — | | ICCSX | | ISRCX | | ISYCX |
Nuveen Quantitative Enhanced Core Equity Fund | | FQCAX | | — | | FQCCX | | — | | FQCYX |
Nuveen Tactical Market Opportunities Fund | | NTMAX | | — | | NTMCX | | — | | FGTYX |
LIFE IS COMPLEX.
Nuveen makes things e-simple.
It only takes a minute to sign up for e-Reports. Once enrolled, you’ll receive an e-mail as soon as your Nuveen Fund information is ready. No more waiting for delivery by regular mail. Just click on the link within the e-mail to see the report and save it on your computer if you wish.
Free e-Reports right to your e-mail!
www.investordelivery.com
If you receive your Nuveen Fund dividends and statements from your financial advisor or brokerage account.
OR
www.nuveen.com/accountaccess
If you receive your Nuveen Fund dividends and statements directly from Nuveen.
| | | | | | |
| Must be preceded by or accompanied by a prospectus. | | NOT FDIC INSURED | | MAY LOSE VALUE | | NO BANK GUARANTEE |
Table of Contents
Chairman’s
Letter to Shareholders

Dear Shareholders,
These are perplexing times for investors. The global economy continues to struggle. The solutions being implemented in the eurozone to deal with the debt crises of many of its member countries are not yet seen as sufficient by the financial markets. The political paralysis in the U.S. has prevented the compromises necessary to deal with the fiscal imbalance and government spending priorities. The efforts by individual consumers, governments and financial institutions to reduce their debts are increasing savings but reducing demand for the goods and services that drive employment. These developments are undermining the rebuilding of confidence by consumers, corporations and investors that is so essential to a resumption of economic growth.
Although it is painfully slow, progress is being made. In Europe, the turnover of a number of national governments reflects the realization by politicians and voters alike that leaders who practiced business as usual had to be replaced by leaders willing to face problems and accept the hard choices needed to resolve them. The recent coordinated efforts by central banks in the U.S. and Europe to provide liquidity to the largest European banks indicates that these monetary authorities are committed to facilitating a recovery in the European banking sector.
In the U.S., the failure of the congressionally appointed Debt Reduction Committee was a blow to those who hoped for a bipartisan effort to finally begin addressing the looming fiscal crisis. Nevertheless, Congress and the administration cannot ignore the issue for long. The Bush era tax cuts are scheduled to expire on December 31, 2012, and six months later the $1.2 trillion of mandatory across-the-board spending cuts under the Budget Control Act of 2011 begin to go into effect. Any legislative modification would require bipartisan support and the prospects for a bipartisan solution are unclear. The impact of these two developments would be a mixed blessing: a meaningful reduction in the annual budget deficit at the cost of slowing the economic recovery.
It is in these particularly volatile markets that professional investment management is most important. Skillful investment teams who have experienced challenging markets and remain committed to their investment disciplines are critical to the success of an investor’s long-term objectives. In fact, many long-term investment track records are built during challenging markets when managers are able to protect investors against these economic crosscurrents. Experienced investment teams know that volatile markets put a premium on companies and investment ideas that will weather the short-term volatility and that compelling values and opportunities are opened up when markets overreact to negative developments. By maintaining appropriate time horizons, diversification and relying on practiced investment teams, we believe that investors can achieve their long-term investment objectives.
As always, I encourage you to contact your financial consultant if you have any questions about your investment in a Nuveen Fund. On behalf of the other members of your Fund Board, we look forward to continuing to earn your trust in the months and years ahead.
Sincerely,

Robert P. Bremner
Chairman of the Board
December 21, 2011
Portfolio Managers’ Comments
Certain statements in this report are forward-looking statements. Discussions of specific investments are for illustration only and are not intended as recommendations of individual investments. The forward-looking statements and other views expressed herein are those of the portfolio managers as of the date of this report. Actual future results or occurrences may differ significantly from those anticipated in any forward-looking statements and the views expressed herein are subject to change at any time, due to numerous market and other factors. The Funds disclaim any obligation to update publicly or revise any forward-looking statements or views expressed herein.
Ratings shown are the highest rating given by one of the following national rating agencies: Standard & Poor’s Group, Moody’s Investors Service, Inc. or Fitch, Inc. Credit ratings are subject to change. AAA, AA, A, and BBB are investment grade ratings; BB, B, CCC, CC, C and D are below-investment grade ratings. Bonds backed by U.S. Government or agency securities are given an implied rating equal to the rating of such securities. Holdings designated N/R are not rated by a national rating agency.
The Nuveen International Fund (formerly known as First American International Fund) is managed by a team of managers associated with three different sub-advisers: Nuveen Asset Management, LLC, an affiliate of Nuveen Investments; Altrinisic Global Advisors, LLC; and Hansberger Global Investors, Inc.
The Nuveen International Select Fund (formerly known as First American International Select Fund) is managed by a team of managers associated with four different sub-advisers: Nuveen Asset Management, LLC, an affiliate of Nuveen Investments; Altrinsic Global Advisors, LLC; Hansberger Global Investors, Inc.; and Lazard Asset Management LLC.
The Nuveen Quantitative Enhanced Core Equity Fund (formerly known as First American Quantitative Large Cap Core Fund and Nuveen Quantitative Large Cap Core Fund) is managed by a team of managers from Nuveen Asset Management, LLC, an affiliate of Nuveen Investments. Effective May 16, 2011, the Fund changed its name from the Nuveen Quantitative Large Cap Core Fund to Nuveen Quantitative Enhanced Core Equity Fund. There were no changes in the Fund’s investment objectives, policies or portfolio management personnel.
Nuveen Tactical Market Opportunities Fund (formerly known as First American Tactical Market Opportunities Fund) is managed by a team of managers from Nuveen Asset Management, LLC, an affiliate of Nuveen Investments.
On the following pages, the portfolio management teams for the Funds examine economic and equity market conditions, key investment strategies and the Funds’ performance for the twelve-month period ended October 31, 2011.
What factors affected the economic and equity market environments during the twelve-month reporting period ended October 31, 2011?
During this period, the U.S. economy’s recovery from recession remained slow. The Federal Reserve (Fed) maintained its efforts to improve the overall economic environment by continuing to hold the benchmark fed funds rate at the record low level of zero to 0.25% that it had established in December 2008. At its November 2011 meeting (shortly after the end of this reporting period), the central bank reaffirmed its opinion that economic conditions would likely warrant keeping this rate at “exceptionally low levels” at least through mid-2013. The Fed also said that it would continue its program to extend the average maturity of its U.S. Treasury holdings by purchasing $400 billion of these securities with maturities of six to thirty years and selling an equal amount of U.S. Treasury securities with maturities of three years or less. The goals of this program, which the Fed
expects to complete by the end of June 2012, are to lower longer-term interest rates, support a stronger economic recovery, and help ensure that inflation remains at levels consistent with the Fed’s mandates of maximum employment and price stability.
In the third quarter of 2011, the U.S. economy, as measured by the U.S. gross domestic product (GDP), grew at an annualized rate of 2.0%, the best growth number since the fourth quarter of 2010 and the ninth consecutive quarter of positive growth. The Consumer Price Index (CPI) rose 3.5% year-over-year as of October 2011, while the core CPI (which excludes food and energy) increased 2.1%, edging just above the Fed’s unofficial objective of 2.0% or lower for this inflation measure. Unemployment numbers remained high, as October 2011 marked the seventh straight month with a national jobless number of 9.0% or higher. However, after the reporting period came to a close, the U.S. unemployment rate fell to 8.6% in November 2011. While the dip was a step in the right direction, it was partly due to a number of individuals dropping out of the hunt for work. The housing market also continued to be a major weak spot. For the twelve months ended September 2011 (the most recent data available at the time this report was prepared), the average home price in the Standard & Poor’s/Case-Shiller Index lost 3.6%, with 18 of the 20 major metropolitan areas reporting losses. In addition, the U.S. economic picture continued to be clouded by concerns about the European debt crisis and efforts to reduce the federal deficit.
The ongoing economic uncertainty and the continual resurfacing of the European debt issue caused a high degree of volatility in the equity markets. The first half of the period saw dramatic gains for stocks and other risk assets fueled by signs of an improving economy. However, as the summer progressed, markets fell back sharply. For much of August and September, stocks traded lower before staging a comeback in the final month of the period. Over the course of the full reporting period, larger U.S. companies generally had stronger returns than their smaller sized and overseas counterparts.
Nuveen International Fund
How did the Fund perform during the twelve-month period ended October 31, 2011?
The table in the Fund Performance and Expense Ratios section of this report provides Class A Share total returns for the Fund for the one-year, five-year and ten-year periods ended October 31, 2011. The Fund’s Class A Shares at net asset value (NAV) modestly underperformed the MSCI EAFE Index and outperformed Lipper classification average over the twelve-month period.
What strategies were used to manage the Fund during the reporting period? How did these strategies influence performance?
The Fund seeks to provide long-term capital appreciation by investing primarily in equity securities of foreign issuers that trade in U.S. or foreign markets, depositary receipts representing shares of foreign issuers, and exchange-traded funds and other investment companies that provide exposure to foreign issuers. Two of the Fund’s sub-advisers, Altrinsic Global Advisors, LLC, and Hansberger Global Investors, Inc., select stocks for the Fund according to the developed markets growth and developed markets value styles,
respectively. At the same time, the Fund’s third sub-adviser, Nuveen Asset Management, LLC, maintains strategic oversight of the Fund, which includes allocating assets among the sub-advisers (including itself), tactically adjusting the overall portfolio balance and country emphasis using index-related investments, and selecting stocks in the infrastructure sector.
Our most successful strategy for the Fund during the fiscal year was an underweight stance in Europe, which averaged 5% below the index weight. In particular, we minimized the Fund’s exposure to stocks from the eurozone’s most troubled economies — Greece, Ireland, Italy, Portugal and Spain — because we have long anticipated Europe’s sovereign debt problem. Likewise, we also avoided stocks of European banks, as they have meaningful exposure to the debt from these countries. During the period, European stocks took a sharp downturn as investors were sorely disappointed by the inability of politicians to gain a meaningful consensus on how to effectively deal with the issue. In contrast to the eurozone underweight, the Fund successfully emphasized countries like Sweden and the United Kingdom. Although monetary disruptions in the euro area would potentially harm many other nations, the U.K.’s ability to conduct its own monetary policy, plus its heavy exposure to international resources stocks, made it a safer position in our opinion. We favored Sweden because it is likewise relatively unencumbered by euro issues, as well as having a robust export-oriented industrial sector.
Our positioning in Japan also proved beneficial over the period. We held an underweight allocation to Japan early on, which aided results as its market dropped sharply in reaction to the earthquake and ensuing nuclear plant disaster in March. Following the initial steep market decline, we moved to an overweight in Japan, which proved beneficial as the Japanese market did stabilize. The country benefited from the very aggressive liquidity provided by the Bank of Japan in the wake of the disaster and the economic stimulus provided by its rebuilding efforts.
The Fund’s performance was also helped by our emphasis on significant materials producing and exporting nations, including Canada and Australia. We overweighted these countries because we continued to believe that demand, particularly for metals and minerals, would outpace supply. Indeed, heavy demand for raw materials around the world made this a successful strategy to employ. The overweight to Canada in particular was a plus as its market was more stable during the summer’s downturn. Our overweight to Australia produced slightly more mixed results, but ended the period as a positive contributor. Early on, Australia’s market lagged after its reserve bank tightened monetary policy at the same time the country was hit with devastating floods. Although Australia’s market faltered slightly, we continued to maintain our overweight based on attractive stock valuations and market fundamentals. We also favored Australia because the country is a large coal producer, a commodity that is not as impacted as oil by speculation and reduced demand. Australia’s market provided better results in the second half of the reporting period.
Offsetting these areas of strength was our overweight of approximately 3% in emerging markets, mostly through the portfolio’s positions in Brazil and China. In aggregate, emerging markets underperformed developed markets over this reporting period. Early in the period, we believed Chinese stocks had fallen back from their high level of overvaluation and that select companies in Brazil looked attractive. However, these two
key emerging markets produced disappointing returns in the first half of the period despite strong growth in their economies. Building inflationary pressures in each country led to various monetary policy tightening measures that ended up restraining performance in these markets. Although the policy steps were effective and the emerging markets staged a brief comeback in March, the situation was short-lived. As concerns about the European sovereign debt situation and a global growth slowdown escalated in mid-summer, emerging markets took another big hit. In particular, China slowed dramatically due to the export-oriented nature of its economy and concerns of speculative bubbles that could disrupt the economy by producing a “hard landing” from China’s continuing strong growth. We had continued to dramatically overweight China as we anticipated it would hold up better than it did as the country continued to re-direct toward internal growth.
Throughout the period, we also invested in equity and currency futures contracts. These futures were used as an overlay strategy to adjust the exposures created by our multi-manager framework so that the overall Fund had the desired exposures to key markets. Long and short futures contracts were used to implement various tactical market and hedging strategies. For example, in response to the concerns about the future of the euro due to the European Central Bank policies, we emphasized dollar versus euro-based investing. At the end of the period, this contributed a small benefit to returns. We initiated and still maintained at the end of the period a short position on the euro and a positive position on the dollar. Throughout the period, we also used equity contracts to underweight both India and Mexico at various times, which produced a modest benefit.
Because of our ongoing concerns about a positive resolution in Europe, we maintained the Fund’s approximately 5% underweight to developed nations, especially in the eurozone. At the end of the reporting period, the Fund had a 9% underweight in Europe, including a significant tilt away from France. We believe the fiscal austerity measures required to receive funding aid and the elevated cost of debt financing are likely to further constrain growth. This may continue to weigh on the performance of these economies and markets in the coming year. Therefore, we’ve shifted the Fund’s allocations primarily to other developed nations, while maintaining a small overexposure to emerging markets. Within the developed markets, we are continuing to focus on countries that have shown good organic growth lately. We continue to be modestly optimistic about global growth prospects while recognizing that the investing climate has many investors worried. Because of our concerns about spreading risk from the European situation, we expect to continue to underweight banks and other financial stocks until we see resolution of the heavy sovereign debt loads. Meanwhile, we will continue to emphasize commodities-based economies in the Fund, especially those involved in the metals, minerals and energy sectors. In emerging markets, we are emphasizing select companies in Brazil, which we believe will perform well despite the country’s inflation problem. We have also initiated a position in a portfolio of gold producers as a hedge.
Nuveen International Select Fund
How did the Fund perform during the twelve-month period ended October 31, 2011?
The table in the Fund Performance and Expense Ratios section of this report provides Class A Share total returns for the Fund for the one-year and since inception periods ended October 31, 2011. The Fund’s Class A Shares at net asset value (NAV) underperformed the MSCI All Country World Investable Market Index (ex US) and the Lipper classification average over the twelve-month period.
What strategies were used to manage the Fund during the reporting period? How did these strategies influence performance?
The Fund seeks to provide long-term capital appreciation by investing primarily in equity securities of foreign issuers that trade in U.S. or foreign markets, depositary receipts representing shares of foreign issuers, and exchange-traded funds and other investment companies that provide exposure to foreign issuers. Three of the Fund’s sub-advisers, Altrinsic Global Advisors, LLC; Hansberger Global Investors, Inc.; and Lazard Asset Management LLC, select stocks for the Fund according to the developed markets growth, developed markets value or emerging market styles, respectively. At the same time, the Fund’s fourth sub-adviser, Nuveen Asset Management, LLC, maintains strategic oversight of the Fund, which includes allocating assets among the sub-advisers (including itself), tactically adjusting the overall portfolio balance and country emphasis using index-related investments and selecting stocks in the infrastructure sector.
During the period, the primary cause of the Fund’s underperformance was its overweight to emerging markets. Although we significantly pulled back the overweight, it was still detrimental as these markets in aggregate underperformed developed markets over this time frame. Early in the period, the Fund moved to an overweight in China because we believed its stocks had fallen back from their high level of overvaluation. We also held a modest overweight to Brazil and an underweight to India. However, these three key emerging markets produced disappointing returns in the first half of the period despite strong growth in their economies. Building inflationary pressures in each country led to various monetary policy tightening measures that ended up restraining performance in these markets. Although the policy steps were effective and the emerging markets staged a brief comeback in March, the situation was short-lived. As concerns about the European sovereign debt situation and a global growth slowdown escalated in mid-summer, emerging markets took another big hit. In particular, China slowed dramatically due to the export-oriented nature of its economy and concerns of speculative bubbles that could disrupt the economy by producing a “hard landing” from China’s continuing strong growth. We had continued to dramatically overweight China as we anticipated it would hold up better than it did as the country continued to re-direct toward internal growth.
Also within the emerging markets, our significant overweight to Russia had mixed results, but in the end proved detrimental to the Fund’s performance. In the first part of the fiscal year, the overweight stance in Russia generated positive returns. As a low-cost producer of oil, Russia benefited from the rising cost of commodities that peaked in late spring.
However, stocks in Russia, which are generally driven by demand for energy from Europe and China and the price of energy globally, retreated based on the slowdown in energy prices that persisted throughout the summer. We maintained the Fund’s overweight because we believed that Russia’s low-cost producers would continue to perform well even if prices didn’t maintain their highs.
On the positive side, our most successful strategy by far in the Fund was our underweight to Europe, which averaged 5% below the index during the fiscal year. In particular, we minimized the Fund’s exposure to stocks from the eurozone’s most troubled economies — Greece, Ireland, Italy, Portugal and Spain — because we have long anticipated Europe’s sovereign debt problem. Likewise, we also avoided stocks of European banks, as they have meaningful exposure to the debt from these countries. During the period, European stocks took a sharp downturn as investors were sorely disappointed by the inability of politicians to gain a meaningful consensus on how to effectively deal with the issue. In contrast to the eurozone underweight, the Fund successfully emphasized countries like Sweden and the United Kingdom. Although monetary disruptions in the euro area would potentially harm many other nations, the U.K.’s ability to conduct its own monetary policy, plus its heavy exposure to international resources stocks, made it a safer position. We favored Sweden because it is likewise relatively unencumbered by euro issues, as well as having a robust export-oriented industrial sector.
Our positioning in Japan also proved beneficial over the period. We held an underweight allocation to Japan early on, which aided results as its market dropped sharply in reaction to the earthquake and ensuing nuclear plant disaster in March. Following the initial steep market decline, we moved to an overweight in Japan, which proved beneficial as the Japanese market did stabilize. The country benefited from the very aggressive liquidity provided by the Bank of Japan in the wake of the disaster and the economic stimulus provided by its rebuilding efforts.
The Fund’s performance also benefited from an emphasis on significant materials producing and exporting nations, including Canada and Australia. We overweighted these countries because we continued to believe that demand, particularly for metals and minerals, would outpace supply. Indeed, heavy demand for raw materials around the world made this a successful strategy to employ. The overweight to Canada in particular was a plus as its market was more stable during the summer’s downturn. Our overweight to Australia produced slightly more mixed results, but ended the period as a positive contributor. Early on, Australia’s market lagged after its reserve bank tightened monetary policy at the same time the country was hit with devastating floods. Although Australia’s market faltered slightly, we continued to maintain our overweight based on attractive stock valuations and market fundamentals. We also favored Australia because the country is a large coal producer, a commodity that is not as impacted by speculation and reduced demand as oil. Australia’s market provided better results in the second half of the reporting period.
Throughout the period, we also invested in equity and currency futures contracts. These futures were used as an overlay strategy to adjust the exposures created by our multi-manager framework so that the overall Fund had the desired exposures to key markets. Long and short futures contracts were used to implement various tactical market
and hedging strategies. For example, in response to the concerns about the future of the euro due to the European Central Bank policies, we emphasized dollar versus euro-based investing. We initiated and still maintain a short position on the euro and a positive position on the dollar.
Because of our ongoing concerns about a positive resolution in Europe, we are maintaining the Fund’s underweight to developed nations, especially in the eurozone. At the end of the reporting period, the Fund had a 9% underweight in Europe. We believe the fiscal austerity measures required to receive funding aid and the elevated cost of debt financing are likely to further constrain growth. This may continue to weigh on the performance of these economies and markets in the coming year. Therefore, we’ve shifted the Fund’s allocations to other developed and emerging market nations. Within the developed markets, we are continuing to focus on countries that have shown good organic growth lately. We continue to be modestly optimistic about global growth prospects while recognizing that the investing climate has many investors worried. Because of our concerns about spreading risk from the European situation, we expect to continue to underweight banks and other financial stocks until we see resolution of the heavy sovereign debt loads. Meanwhile, we will continue to emphasize commodities-based economies in the Fund, especially those involved in the metals, minerals and energy sectors.
Within emerging markets, we continue to hold an overweight position, particularly in the Pacific Rim, comprised of many small positions in countries such as Indonesia, Malaysia, Korea, Turkey and Russia as well as a modest overweight to China. Many of these countries are relatively less export oriented and we believe may be more reliant on internal growth and less sensitive to events in Europe. Conversely, we hold an underweight position in Taiwan because of its position as a major exporter of electronic and consumer products. In addition, we are maintaining a large overweight to select companies in Brazil, which we believe will perform well despite the country’s inflation problem. We have also initiated a position in a portfolio of gold producers as a hedge.
Nuveen Quantitative Enhanced Core Equity Fund
How did the Fund perform during the twelve-month period ended October 31, 2011?
The table in the Fund Performance and Expense Ratios section of this report provides Class A Share total returns for the Fund for the one-year and since inception periods ended October 31, 2011. The Fund’s Class A Shares at net asset value (NAV) underperformed the S&P 500 Index over the twelve-month period, but outperformed the Lipper classification average.
What strategies were used to manage the Fund during the reporting period? How did these strategies influence performance?
The Fund’s goal is to provide, over the long term, a total return that exceeds the return of the S&P 500 Index. In attempting to achieve this goal, the Fund primarily invests in the common stocks of companies that have market capitalizations at the time of purchase
within the range of the companies in the S&P 500 Index. To select specific stocks, we use proprietary models that help establish quantitative links between economic and market variables, investment factors and equity market returns. Our proprietary models analyze macroeconomic and market data and other statistics to determine what we believe will be the key drivers of performance in the current economy. We use historical analysis of these drivers to estimate equity market returns and the relative contribution to these returns from a comprehensive list of investment factors. We then evaluate each stock in the investable universe to determine its sensitivity to each factor and estimate a potential contribution for each stock. Our goal is to build an optimized portfolio that targets the highest expected returns, while using the proprietary models and processes described above to maintain as tight a control as possible on overall risk.
During the reporting period, performance benefited from our shifts toward stocks with several characteristics that we believed were most in favor. Our tilt toward the lower end of the S&P 500 Index’s market capitalization range was the Fund’s most significant style position, and by far the most successful strategy throughout the period. For example, the Fund’s geometric weighted average market capitalization of $41 billion was below the $48 billion calculated for the S&P 500 Index at fiscal year-end. Two other style moves were beneficial for the Fund during the period. We successfully emphasized companies with higher quality balance sheets, as measured by their lower debt-to-equity ratios, on average, during the period. We also were rewarded for our avoidance of stocks that had a high percentage of their outstanding shares being traded, which to many indicates a higher level of speculation.
In terms of the sector component of our strategy, the Fund benefited from successful relative positions in financials and basic materials. The financial sector was the worst-performing sector over this time frame. For three-fourths of the fiscal year, we successfully underweighted financials (particularly large banks) in the Fund, which our models first signaled to do in late 2007 due to weaker prospects across the sector. While we held this significant underweight, the sector fell more than 22% in August. The drop was notably worse than the broad market because of concerns that large financial institutions would suffer significant losses due to write-downs of European nations’ debts. Toward the end of the fiscal year, we made a shift back to overweighting financials when their prices were very inexpensive by historical standards. Our models indicated that continued accommodative monetary policy by the Federal Reserve might benefit profitability at banks. Financial stocks performed extremely well in the final month of the period. The Fund’s performance also benefited from an overweight in the basic materials sector, particularly metals and chemicals. Heavy demand around the world for raw materials made this emphasis a successful strategy to employ. As always, the Fund’s sector positions were consistent with our efforts to control risk exposure as tightly as possible.
Unfortunately, the Fund’s unfavorable results among other style and sector themes offset some of the above-mentioned areas of strength. For example, the Fund was negatively impacted by our tilt toward the value style through our emphasis on stocks with a higher ratio of book value to market value, and value stocks underperformed during this period. In terms of sectors, the biggest negative contribution to performance came from significantly underweighting consumer stocks, both in the staples and discretionary
groups. Our models indicated this underweight stance based on poor readings for unemployment, consumer sentiment and personal income growth. However, investors saw opportunities for consumer spending to increase from very depressed levels and bid these stocks, especially discretionaries, up during the year.
Mis-timed weightings in the technology sector also dragged slightly on performance. We started the year with an emphasis on cyclical stocks and a substantial overweight to technology. Although we were optimistic about business spending in technology, the sector’s performance was relatively flat. After the outlooks for business investment and manufacturing activity fell off abruptly in mid-summer and the markets became significantly more volatile, our models indicated a shift to an underweight. However, after the technology sector took a nosedive, it bounced back quickly to end with relatively good performance.
Our timing in energy also caused slightly negative results as the sector was by far the top-performing area of the index, advancing more than 17% during the fiscal year. We started the period with an underweight and missed out on the sector’s strong gains as oil prices rose significantly. After March, we moved to an overweight in energy stocks as our models indicated that stock prices had not increased enough in relation to the high cost of oil. However, when oil prices fell from around $113 per barrel to just below $80, these stocks experienced tremendous downside. The segment’s relative performance since we moved to an overweight at the end of March has been negative.
Performance was also hurt by our average underweight in health care stocks, particularly large pharmaceuticals. These stocks performed well during the period due to their above-average dividend yields and investors renewed interest in the segment.
We continue to monitor key indicators that have historically signified which stocks will perform best in the current environment. With the economic conditions in the United States remaining difficult and concerns abounding about Europe’s debt crisis, we expect the Federal Reserve will continue with its very accommodative monetary policy. While we believe the economics for businesses and consumers are stabilizing, companies will likely face only modest opportunities for increasing profits as cost reductions have, for the most part, taken place. We’ll continue to watch for opportunities in individual sectors and investing styles that are likely to do well in a low-growth environment, such as value investing. Also, the Fund continues to be postured with a bias toward smaller companies within the S&P 500, as many of these are less sensitive to global conditions.
Throughout the period, we also invested in S&P 500 Index futures contracts, which were used to convert cash into the equivalent of an S&P 500 Index holding. This helped to minimize tracking error to the Fund’s benchmark index resulting from cash flow activity and tactical portfolio management positioning.
Nuveen Tactical Market Opportunities Fund
How did the Fund perform during the twelve-month period ended October 31, 2011?
The table in the Fund Performance and Expense Ratios section of this report provides Class A Share total returns for the Fund for since inception period ended October 31, 2011.
The Fund’s Class A Shares at net asset value (NAV) outperformed the Bank of America Merrill Lynch 3-Month U.S. Treasury Bill Index and the Lipper classification average over the period from the Fund’s inception on February 24, 2011, through October 31, 2011.
What strategies were used to manage the Fund during the reporting period? How did these strategies influence performance?
The Fund seeks to provide investors with the potential for a positive total return over a reasonable period of time, regardless of market conditions. To accomplish this, the Fund invests in a variety of assets and periodically adjusts its allocations to fixed income, equities and cash. Other asset classes, such as currencies and commodities, are held at times to take advantage of market opportunities or to further diversify the Fund.
During this initial period for the Fund, its fixed-income component provided the biggest contribution to positive performance. The fixed-income allocation generally consisted of long duration U.S. Treasury securities, as well as exchange-traded funds (ETFs) in various fixed-income sectors, such as investment-grade credit, high-yield bonds, emerging market debt, mortgage-backed securities and preferred stock. We also included short U.S. Treasury futures at the front end of the yield curve as a view on market rates and also as a hedge for other fixed-income securities. High-yield, municipal bond and preferred stock ETFs, as well as 30-year U.S. Treasury securities, were the primary positive contributors in the fixed-income portfolio during this period.
The Fund’s equity component also provided a significant positive contribution to performance. The equity allocation included several long positions in index futures and ETFs. Overall, the Fund benefited from long positions in Germany, the S&P 500 Index, South Africa, emerging markets and Chile as well as a short position in Spain.
Long positions in Switzerland and Hong Kong detracted from the Fund’s performance. In addition, short positions in the Russell 2000 Index, the Morgan Stanley Capital International Europe, Australasia and Far East (MSCI EAFE) Index and the NASDAQ Composite Index also hindered results. Although these short positions underperformed, they were utilized as part of spread trades with positions in other countries, and did not necessarily reflect a negative outlook on the broad market. Rather, these spread trades are used to express a view of relative performance between countries, while attempting to reduce the overall volatility of the Fund.
As previously mentioned, the fixed-income component consisted of U.S. Treasury securities and a variety of fixed-income ETFs representing various sectors such as investment-grade credit, high-yield bonds, mortgage-backed securities, emerging market debt and preferred stock. These securities are held in various proportions at different times, and are a primary component of the Fund’s strategy. ETF rotation within fixed income is an ongoing process to take advantage of market conditions, the outlook for fixed-income sectors and relative yield advantages.
The equity component of the Fund generally consisted of long or short futures contracts as well as country and sector ETFs. While net equity exposure remained constrained, gross exposure was significant and reflected a view of relative country performance. These views were generally expressed with futures spread trades such as long S&P 500 Index/short Russell 2000 Index, long Germany equities/short Spanish equities and long
Indian equities/short Korean and Taiwanese equities, to name a few. Other securities, such as high-yield and preferred stock ETFs, provided equity-like exposure yet were not included in the net and gross equity market value calculation. When evaluating the proper equity risk exposure, the weights of these fixed-income ETFs are considered. From a positioning perspective, we have reduced the Fund’s net exposure to equities in general while maintaining positions in emerging markets such as Russia and spread trades such as long China/short India and long Taiwan/short Nasdaq.
Risk Considerations
Mutual fund investing involves risk; principal loss is possible. Equity investments are subject to market risk. Foreign investments involve additional risks, including currency fluctuation, political and economic instability, lack of liquidity and differing legal and accounting standards. These risks are magnified in emerging markets.
These Funds are actively managed, and each at times may use a proprietary quantitative process that projects individual stock performance based on multiple factors and current economic conditions. Stocks selected using this process could underperform if the performance of the considered factors differs from historic norms. There is no guarantee that the Funds will achieve their investment objectives. The advisor’s asset allocation decisions may be incorrect and could adversely affect Fund performance. The Funds may be exposed to the risks of the underlying securities held by an exchange-traded fund (ETF) and may bear a proportionate share of the ETF’s expenses. Derivative investing may involve a high degree of financial risk, including the risk that the loss on a derivative may be greater than the principal amount invested. The use of leverage through the use of derivatives may magnify this risk. Debt securities typically decrease in value when interest rates rise. This risk is greater for longer-term debt securities. Lower-rated and nonrated securities present a greater risk of loss to principal and interest rate than higher-rated securities. Commodity prices may be highly volatile and are affected by factors such as changes in demand, disruption in supply, and hedging and trading strategies of other market participants. Each of these asset classes may be less liquid and more volatile.
[THIS PAGE INTENTIONALLY LEFT BLANK]
Fund Performance and Expense Ratios (Unaudited)
The Fund Performance and Expense Ratios for each Fund are shown on the following eight pages.
Returns quoted represent past performance, which is no guarantee of future results. Current performance may be higher or lower than the performance shown. Investment returns and principal value will fluctuate so that when shares are redeemed, they may be worth more or less than their original cost. Returns without sales charges would be lower if the sales charge were included. Returns do not reflect the deduction of taxes that a shareholder would pay on Fund distributions or the redemption of Fund shares.
Returns may reflect a contractual agreement between certain Funds and the investment adviser to waive certain fees and expenses; see Notes to Financial Statements, Footnote 7 — Management Fees and Other Transactions with Affiliates for more information. In addition, returns may reflect a voluntary expense limitation by the Funds’ investment adviser that may be modified or discontinued at any time without notice. For the most recent month-end performance visit www.nuveen.com or call (800) 257-8787.
Returns reflect differences in sales charges and expenses, which are primarily differences in distribution and service fees. Fund returns assume reinvestment of dividends and capital gains.
Comparative index and Lipper return information is provided for the Funds’ Class A Shares at net asset value (NAV) only.
Effective January 18, 2011, Class R Shares and Class Y Shares, previously offered by FAF Advisors, Inc., were renamed Class R3 Shares and Class I Shares, respectively.
The expense ratios shown reflect the Funds’ total operating expenses (before fee waivers or expense reimbursements, if any) as shown in the Funds’ most recent prospectus. The expense ratios include management fees and other fees and expenses.
Fund Performance and Expense Ratios (Unaudited) (continued)
Nuveen International Fund
Refer to the first page of this Fund Performance and Expense Ratios section for further explanation of the information included within this page.
Fund Performance
Average Annual Total Returns as of October 31, 2011
| | | | | | | | | | | | |
| |
| | | Average Annual | |
| | | |
| | | 1-Year | | | 5-Year | | | 10-Year | |
Class A Shares at NAV | | | -3.93% | | | | -2.72% | | | | 3.67% | |
Class A Shares at maximum Offering Price | | | -9.45% | | | | -3.87% | | | | 3.06% | |
MSCI EAFE Index* | | | -3.64% | | | | -1.95% | | | | 6.19% | |
Lipper International Large-Cap Growth Fund Classification Average* | | | -5.48% | | | | -1.12% | | | | 5.47% | |
| | | |
Class B Shares w/o CDSC** | | | -4.64% | | | | -3.46% | | | | 2.88% | |
Class B Shares w/CDSC** | | | -9.40% | | | | -3.63% | | | | 2.88% | |
Class C Shares | | | -4.71% | | | | -3.44% | | | | 2.89% | |
Class R3 Shares | | | -4.10% | | | | -2.89% | | | | 3.42% | |
Class I Shares | | | -3.90% | | | | -2.52% | | | | 3.90% | |
Latest Calendar Quarter – Average Annual Total Returns as of September 30, 2011
| | | | | | | | | | | | |
| |
| | | Average Annual | |
| | | |
| | | 1-Year | | | 5-Year | | | 10-Year | |
Class A Shares at NAV | | | -8.79% | | | | -3.60% | | | | 3.05% | |
Class A Shares at maximum Offering Price | | | -14.06% | | | | -4.74% | | | | 2.44% | |
Class B Shares w/o CDSC** | | | -9.46% | | | | -4.35% | | | | 2.27% | |
Class B Shares w/CDSC** | | | -13.99% | | | | -4.52% | | | | 2.27% | |
Class C Shares | | | -9.45% | | | | -4.32% | | | | 2.28% | |
Class R3 Shares | | | -9.04% | | | | -3.79% | | | | 2.80% | |
Class I Shares | | | -8.54% | | | | -3.36% | | | | 3.31% | |
Class A Shares have a maximum 5.75% sales charge (Offering Price). Class A Share purchases of $1 million or more are sold at net asset value without an up-front sales charge but may be subject to a contingent deferred sales charge (CDSC), also known as a back-end sales charge, if redeemed within twelve months of purchase. Class B Shares have a CDSC that begins at 5% for redemptions during the first year and declines periodically until after six years when the charge becomes 0%. Class B Shares automatically convert to Class A Shares eight years after purchase. Class C Shares have a 1% CDSC for redemptions within less than twelve months, which is not reflected in the one-year total return. Class R3 Shares have no sales charge and are available to only certain retirement plans. Class I Shares have no sales charge and may be purchased under limited circumstances or by specified classes of investors.
Expense Ratios as of Most Recent Prospectus
| | | | | | | | |
| | |
| | | Gross
Expense
Ratios | | | Net
Expense
Ratios | |
Class A Shares | | | 1.66% | | | | 1.50% | |
Class B Shares | | | 2.41% | | | | 2.25% | |
Class C Shares | | | 2.41% | | | | 2.25% | |
Class R3 Shares | | | 1.91% | | | | 1.75% | |
Class I Shares | | | 1.41% | | | | 1.25% | |
The Fund’s adviser has contractually agreed to waive fees and reimburse expenses through February 29, 2012, so that total annual Fund operating expenses, after waivers and excluding any acquired Fund fees and expenses, do not exceed 1.49%, 2.24%, 2.24%, 1.74% and 1.24%, respectively, for Class A, Class B, Class C, Class R3 and Class I Shares. Fee waivers and expense reimbursements will not be terminated prior to that time without with approval of the Fund’s Board of Directors.
| * | Refer to the Glossary of Terms Used in this Report for definitions. |
| ** | Class B Shares are available only upon the exchange of Class B Shares from another Nuveen mutual fund for which U.S. Bancorp Fund Services, LLC serves as transfer agent or for purposes of dividend reinvestment, but Class B shares are not available for new accounts or for additional investment into existing accounts. |
Growth of an Assumed $10,000 Investment as of October 31, 2011 — Class A Shares
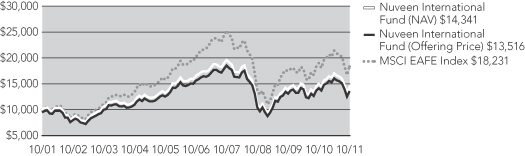
The graph does not reflect the deduction of taxes that a shareholder may pay on Fund distributions or the redemption of Fund shares.
Fund Performance and Expense Ratios (Unaudited) (continued)
Nuveen International Select Fund
Refer to the first page of this Fund Performance and Expense Ratios section for further explanation of the information included within this page.
Fund Performance
Average Annual Total Returns as of October 31, 2011
| | | | | | | | |
| |
| | | Average Annual | |
| | |
| | | 1-Year | | | Since
Inception* | |
Class A Shares at NAV | | | -6.70% | | | | -1.47% | |
Class A Shares at maximum Offering Price | | | -12.05% | | | | -2.66% | |
MSCI All Country World Investable Market Index (ex US)** | | | -4.25% | | | | -1.11% | |
Lipper International Large-Cap Growth Fund Classification Average** | | | -5.48% | | | | -2.12% | |
| | |
Class C Shares | | | -7.45% | | | | -2.21% | |
Class R3 Shares | | | -8.54% | | | | -2.07% | |
Class I Shares | | | -6.60% | | | | -1.23% | |
Latest Calendar Quarter – Average Annual Total Returns as of September 30, 2011
| | | | | | | | |
| |
| | | Average Annual | |
| | |
| | | 1-Year | | | Since
Inception* | |
Class A Shares at NAV | | | -12.03% | | | | -3.31% | |
Class A Shares at maximum Offering Price | | | -17.04% | | | | -4.50% | |
Class C Shares | | | -12.70% | | | | -4.03% | |
Class R3 Shares | | | -13.70% | | | | -3.89% | |
Class I Shares | | | -11.83% | | | | -3.07% | |
Class A Shares have a maximum 5.75% sales charge (Offering Price). Class A Share purchases of $1 million or more are sold at net asset value without an up-front sales charge but may be subject to a contingent deferred sales charge (CDSC), also known as a back-end sales charge, if redeemed within twelve months of purchase. Class C Shares have a 1% CDSC for redemptions within less than twelve months, which is not reflected in the one-year total return. Class R3 Shares have no sales charge and are available to only certain retirement plans. Class I Shares have no sales charge and may be purchased under limited circumstances or by specified classes of investors.
Expense Ratios as of Most Recent Prospectus
| | | | |
| |
| | | Expense
Ratios | |
Class A Shares | | | 1.50% | |
Class C Shares | | | 2.25% | |
Class R3 Shares | | | 1.75% | |
Class I Shares | | | 1.25% | |
The Fund’s adviser has contractually agreed to waive fees and reimburse other Fund expenses through February 29, 2012, so that total annual Fund operating expenses, after waivers and excluding any acquired Fund fees and expenses, do not exceed 1.49%, 2.24%, 1.74%, and 1.24%, respectively, for Class A, Class C, Class R3, and Class I Shares. Fee waivers and expense reimbursements will not be terminated prior to that time without the approval of the Fund’s Board of Directors.
| * | Since inception returns are from 12/21/06. |
| ** | Refer to the Glossary of Terms Used in this Report for definitions. |
Growth of an Assumed $10,000 Investment as of October 31, 2011 — Class A Shares
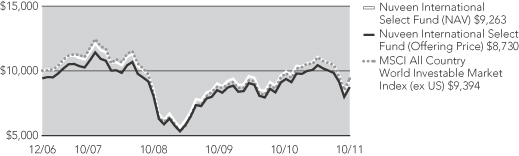
The graph does not reflect the deduction of taxes that a shareholder may pay on Fund distributions or the redemption of Fund shares.
Fund Performance and Expense Ratios (Unaudited) (continued)
Nuveen Quantitative Enhanced Core Equity Fund
Refer to the first page of this Fund Performance and Expense Ratios section for further explanation of the information included within this page.
Fund Performance
Average Annual Total Returns as of October 31, 2011
| | | | | | | | |
| |
| | | Average Annual | |
| | |
| | | 1-Year | | | Since
Inception* | |
Class A Shares | | | 6.50% | | | | -2.06% | |
S&P 500 Index** | | | 8.09% | | | | -1.31% | |
Lipper Large Cap Core Fund Classification Average** | | | 5.39% | | | | -2.03% | |
| | |
Class C Shares | | | 5.76% | | | | -2.77% | |
Class I Shares | | | 6.79% | | | | -1.80% | |
Latest Calendar Quarter – Average Annual Total Returns as of September 30, 2011
| | | | | | | | |
| |
| | | Average Annual | |
| | |
| | | 1-Year | | | Since
Inception* | |
Class A Shares | | | -0.27% | | | | -4.50% | |
Class C Shares | | | -1.00% | | | | -5.20% | |
Class I Shares | | | -0.03% | | | | -4.26% | |
Class A Shares have no sales charge and are available only through fee-based programs and certain retirement plans. Class C Shares have a 1% CDSC for redemptions within less than twelve months, which is not reflected in the one-year total return. Class I Shares have no sales charge and may be purchased under limited circumstances or by specified classes of investors.
Expense Ratios as of Most Recent Prospectus
| | | | | | | | |
| | |
| | | Gross
Expense
Ratios | | | Net
Expense
Ratios | |
Class A Shares | | | 0.99% | | | | 0.71% | |
Class C Shares | | | 1.74% | | | | 1.46% | |
Class I Shares | | | 0.74% | | | | 0.46% | |
The Fund’s adviser has contractually agreed to waive fees and reimburse expenses through February 29, 2012, so that total annual Fund operating expenses, after waivers and excluding any acquired Fund fees and expenses, do not exceed 0.70%, 1.45%, and 0.45%, respectively, for Class A, Class C and Class I Shares. Fee waivers and expense reimbursements will not be terminated prior to that time without with approval of the Fund’s Board of Directors.
| * | Since inception returns are from 7/31/07. |
| ** | Refer to the Glossary of Terms Used in this Report for definitions. |
Growth of an Assumed $10,000 Investment as of October 31, 2011 — Class A Shares
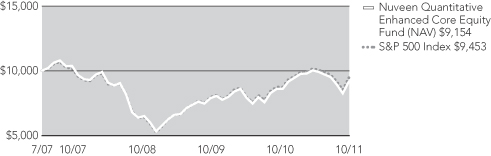
The graph does not reflect the deduction of taxes that a shareholder may pay on Fund distributions or the redemption of Fund shares.
Fund Performance and Expense Ratios (Unaudited) (continued)
Nuveen Tactical Market Opportunities Fund
Refer to the first page of this Fund Performance and Expense Ratios section for further explanation of the information included within this page.
Fund Performance
Average Annual Total Returns as of October 31, 2011*
| | | | | | | | |
| | | Average Annual | |
| | |
| | | 1-Year* | | | Since
Inception* | |
Class A Shares at NAV | | | 6.61% | | | | 6.89% | |
Class A Shares at maximum Offering Price | | | 0.45% | | | | 3.49% | |
Bank of America Merrill Lynch 3-Month U.S. Treasury Bill Index** | | | 0.13% | | | | 0.12% | |
Lipper Flexible Portfolio Fund Classification Average** | | | 3.69% | | | | 6.40% | |
| | |
Class C Shares | | | 5.87% | | | | 6.08% | |
Class I Shares | | | 6.95% | | | | 7.18% | |
Latest Calendar Quarter – Average Annual Total Returns as of September 30, 2011
| | | | | | | | |
| | | Average Annual | |
| | |
| | | 1-Year* | | | Since
Inception* | |
Class A Shares at NAV | | | 6.07% | | | | 6.58% | |
Class A Shares at maximum Offering Price | | | 0.00% | | | | 3.03% | |
Class C Shares | | | 5.33% | | | | 5.79% | |
Class I Shares | | | 6.41% | | | | 6.89% | |
Class A Shares have a maximum 5.75% sales charge (Offering Price). Class A Share purchases of $1 million or more are sold at net asset value without an up-front sales charge but may be subject to a contingent deferred sales charge (CDSC), also known as a back-end sales charge, if redeemed within twelve months of purchase. Class C Shares have a 1% CDSC for redemptions within less than twelve months, which is not reflected in the one-year total return. Class I Shares have no sales charge and may be purchased under limited circumstances or by specified classes of investors.
Expense Ratios as of Most Recent Prospectus
| | | | | | | | |
| | |
| | | Gross
Expense
Ratios | | | Net
Expense
Ratios | |
Class A Shares | | | 3.60% | | | | 1.39% | |
Class C Shares | | | 4.35% | | | | 2.14% | |
Class I Shares | | | 3.35% | | | | 1.14% | |
The Fund’s adviser has contractually agreed to waive fees and reimburse expenses through February 29, 2012, so that total annual Fund operating expenses, after waivers and excluding any acquired Fund fees and expenses, do not exceed 1.20%, 1.95%, and 0.95%, respectively, for Class A, Class C and Class I Shares. Fee waivers and expense reimbursements will not be terminated prior to that time without with approval of the Fund’s Board of Directors.
| * | Since inception returns for Class A, Class C and Class I Shares, and for the comparative index and Lipper classification average, are from 12/30/09. Class I Share returns are actual. The returns for Class A and Class C Shares are actual for the periods since class inception on 2/24/11; returns prior to class inception are Class I Share returns adjusted for differences in sales charges and expense, which are primarily differences in distribution and service fees. |
| ** | Refer to the Glossary of Terms Used in this Report for definitions. |
Growth of an Assumed $10,000 Investment as of October 31, 2011 — Class A Shares*
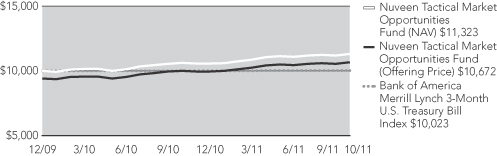
The graph does not reflect the deduction of taxes that a shareholder may pay on Fund distributions or the redemption of Fund shares.
Holding Summaries (Unaudited) as of October 31, 2011
This data relates to the securities held in each Fund’s portfolio of investments. It should not be construed as a measure of performance for the Fund itself.
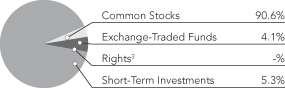
Nuveen International Fund
Portfolio Allocation1
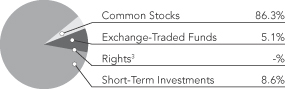
Nuveen International Select Fund
Portfolio Allocation1
| | | | |
| Portfolio Composition1 | | | |
| Financials | | | 14.3% | |
| Industrials | | | 11.7% | |
| Energy | | | 10.2% | |
| Consumer Staples | | | 9.4% | |
| Consumer Discretionary | | | 8.9% | |
| Information Technology | | | 7.6% | |
| Materials | | | 7.5% | |
| Health Care | | | 7.2% | |
| Utilities | | | 6.1% | |
| Short-Term Investments | | | 7.8% | |
| Other | | | 9.3% | |
| | | | |
| Portfolio Composition1 | | | |
| Financials | | | 21.3% | |
| Industrials | | | 10.4% | |
| Information Technology | | | 9.9% | |
| Consumer Staples | | | 9.8% | |
| Energy | | | 8.9% | |
| Materials | | | 8.7% | |
| Consumer Discretionary | | | 7.0% | |
| Utilities | | | 5.5% | |
| Telecommunication Services | | | 5.4% | |
| Short-Term Investments | | | 8.6% | |
| Other | | | 4.5% | |
| | | | |
| Country Allocation1 | | | |
| Japan | | | 16.7% | |
| United Kingdom | | | 15.9% | |
| United States | | | 13.4% | |
| Switzerland | | | 9.4% | |
| Germany | | | 8.5% | |
| Canada | | | 4.7% | |
| France | | | 4.2% | |
| Hong Kong | | | 2.6% | |
| Australia | | | 2.4% | |
| Ireland | | | 2.1% | |
| Italy | | | 2.0% | |
| Other | | | 18.1% | |
| | | | |
| Top Five Common Stock Holdings2 | |
| Roche Holding | | | 2.1% | |
| Canon | | | 1.8% | |
| Nestle | | | 1.8% | |
| GlaxoSmithKline | | | 1.6% | |
| Adidas | | | 1.4% | |
| | | | |
| Country Allocation1 | |
| United States | | | 16.5% | |
| Japan | | | 10.5% | |
| United Kingdom | | | 9.5% | |
| Brazil | | | 7.2% | |
| Switzerland | | | 5.8% | |
| Germany | | | 5.3% | |
| South Korea | | | 4.0% | |
| Canada | | | 3.9% | |
| South Africa | | | 3.2% | |
| Hong Kong | | | 2.7% | |
| France | | | 2.6% | |
| China | | | 2.5% | |
| Russia | | | 2.4% | |
| Australia | | | 2.2% | |
| India | | | 2.0% | |
| Other | | | 19.7% | |
| | | | |
| Top Five Common Stock Holdings2 | |
| Roche Holding | | | 1.4% | |
| Cielo | | | 1.2% | |
| Redecard | | | 1.2% | |
| Canon | | | 1.2% | |
| Banco do Brasil | | | 1.1% | |
| 1 | As a percentage of total investments (excluding investments in derivatives) as of October 31, 2011. Holdings are subject to change. |
| 2 | As a percentage of total common stocks as of October 31, 2011. Holdings are subject to change. |
| 3 | Rounds to less than 0.1%. |
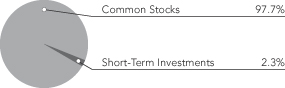
Nuveen Quantitative Enhanced Core Equity Fund
Portfolio Allocation1
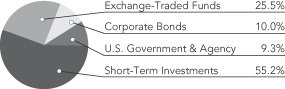
Nuveen Tactical Market Opportunities Fund
Portfolio Allocation3
| | | | |
| Portfolio Composition1 | | | |
| Financials | | | 18.8% | |
| Information Technology | | | 17.4% | |
| Energy | | | 14.9% | |
| Heath Care | | | 12.0% | |
| Industrials | | | 8.2% | |
| Consumer Staples | | | 8.1% | |
| Consumer Discretionary | | | 7.6% | |
| Utilities | | | 5.6% | |
| Short-Term Investments | | | 2.3% | |
| Other | | | 5.1% | |
| | | | |
| Top Five Common Stock Holdings2 | |
| Exxon Mobil | | | 4.1% | |
| Microsoft | | | 2.7% | |
| Chevron | | | 2.7% | |
| Apple | | | 2.3% | |
| AT&T | | | 2.3% | |
| 1 | As a percentage of total investments (excluding investments purchased with collateral from securities lending and investments in derivatives) as of October 31, 2011. Holdings are subject to change. |
| 2 | As a percentage of total common stocks as of October 31, 2011. Holdings are subject to change. |
| 3 | As a percentage of total investments (excluding investments in derivatives) as of October 31, 2011. Holdings are subject to change. |
Expense Examples (Unaudited)
As a shareholder of one or more of the Funds, you incur two types of costs: (1) transaction costs, including up-front and back-end sales charges (loads) or redemption fees, where applicable; and (2) ongoing costs, including management fees; distribution and service (12b-1) fees, where applicable; and other Fund expenses. The Examples below are intended to help you understand your ongoing costs (in dollars) of investing in the Funds and to compare these costs with the ongoing costs of investing in other mutual funds.
The Examples below are based on an investment of $1,000 invested at the beginning of the period and held for the period.
The information under “Actual Performance,” together with the amount you invested, allows you to estimate actual expenses incurred over the reporting period. Simply divide your account value by $1,000 (for example, an $8,600 account value divided by $1,000 = 8.60) and multiply the result by the cost shown for your share class, in the row entitled “Expenses Incurred During Period” to estimate the expenses incurred on your account during this period.
The information under “Hypothetical Performance,” provides information about hypothetical account values and hypothetical expenses based on the respective Fund’s actual expense ratio and an assumed rate of return of 5% per year before expenses, which is not the Fund’s actual return. The hypothetical account values and expenses may not be used to estimate the actual ending account balance or expense you incurred for the period. You may use this information to compare the ongoing costs of investing in the Fund and other Funds. To do so, compare this 5% hypothetical example with the 5% hypothetical examples that appear in the shareholder reports of the other funds.
Please note that the expenses shown in the table are meant to highlight your ongoing costs only and do not reflect any transaction costs. Therefore, the hypothetical information is useful in comparing ongoing costs only, and will not help you determine the relative total costs of owning different funds or share classes. In addition, if these transaction costs were included, your costs would have been higher.
Nuveen International Fund
| | | | | | | | | | | | | | | | | | | | | | | | | | | | | | | | | | | | | | | | | | |
| | | Actual Performance | | | | | Hypothetical Performance | |
| | | A Shares | | | B Shares | | | C Shares | | | R3 Shares | | | I Shares | | | | | A Shares | | | B Shares | | | C Shares | | | R3 Shares | | | I Shares | |
| Beginning Account Value (5/1/11) | | $ | 1,000.00 | | | $ | 1,000.00 | | | $ | 1,000.00 | | | $ | 1,000.00 | | | $ | 1,000.00 | | | | | $ | 1,000.00 | | | $ | 1,000.00 | | | $ | 1,000.00 | | | $ | 1,000.00 | | | $ | 1,000.00 | |
| Ending Account Value (10/31/11) | | $ | 845.60 | | | $ | 842.80 | | | $ | 842.10 | | | $ | 845.50 | | | $ | 845.20 | | | | | $ | 1,017.49 | | | $ | 1,013.66 | | | $ | 1,013.71 | | | $ | 1,016.43 | | | $ | 1,018.80 | |
| Expenses Incurred During Period | | $ | 6.93 | | | $ | 10.40 | | | $ | 10.40 | | | $ | 8.00 | | | $ | 5.77 | | | | | $ | 7.58 | | | $ | 11.37 | | | $ | 11.37 | | | $ | 8.74 | | | $ | 6.31 | |
For each class of the Fund, expenses are equal to the Fund’s annualized net expense ratio of 1.49%, 2.24%, 2.24%, 1.72% and 1.24% for Classes A, B, C, R3 and I, respectively, multiplied by the average account value over the period, multiplied by 184/365 (to reflect the one-half year period).
Nuveen International Select Fund
| | | | | | | | | | | | | | | | | | | | | | | | | | | | | | | | | | |
| | | Actual Performance | | | | | Hypothetical Performance | |
| | | A Shares | | | C Shares | | | R3 Shares | | | I Shares | | | | | A Shares | | | C Shares | | | R3 Shares | | | I Shares | |
| Beginning Account Value (5/1/11) | | $ | 1,000.00 | | | $ | 1,000.00 | | | $ | 1,000.00 | | | $ | 1,000.00 | | | | | $ | 1,000.00 | | | $ | 1,000.00 | | | $ | 1,000.00 | | | $ | 1,000.00 | |
| Ending Account Value (10/31/11) | | $ | 836.50 | | | $ | 832.90 | | | $ | 835.30 | | | $ | 836.80 | | | | | $ | 1,017.85 | | | $ | 1,014.06 | | | $ | 1,016.74 | | | $ | 1,019.06 | |
| Expenses Incurred During Period | | $ | 6.76 | | | $ | 10.21 | | | $ | 7.77 | | | $ | 5.65 | | | | | $ | 7.43 | | | $ | 11.22 | | | $ | 8.54 | | | $ | 6.21 | |
For each class of the Fund, expenses are equal to the Fund’s annualized net expense ratio of 1.46%, 2.21%, 1.68% and 1.22% for Classes A, C, R3 and I, respectively, multiplied by the average account value over the period, multiplied by 184/365 (to reflect the one-half year period).
Nuveen Quantitative Enhanced Core Equity Fund
| | | | | | | | | | | | | | | | | | | | | | | | | | |
| | | Actual Performance | | | | | Hypothetical Performance | |
| | | A Shares | | | C Shares | | | I Shares | | | | | A Shares | | | C Shares | | | I Shares | |
| Beginning Account Value (5/1/11) | | $ | 1,000.00 | | | $ | 1,000.00 | | | $ | 1,000.00 | | | | | $ | 1,000.00 | | | $ | 1,000.00 | | | $ | 1,000.00 | |
| Ending Account Value (10/31/11) | | $ | 912.10 | | | $ | 908.70 | | | $ | 913.50 | | | | | $ | 1,021.68 | | | $ | 1,017.90 | | | $ | 1,022.94 | |
| Expenses Incurred During Period | | $ | 3.37 | | | $ | 6.98 | | | $ | 2.17 | | | | | $ | 3.57 | | | $ | 7.37 | | | $ | 2.29 | |
For each class of the Fund, expenses are equal to the Fund’s annualized net expense ratio of .70%, 1.45% and .45% for Classes A, C and I, respectively, multiplied by the average account value over the period, multiplied by 184/365 (to reflect the one-half year period).
Nuveen Tactical Market Opportunities Fund
| | | | | | | | | | | | | | | | | | | | | | | | | | |
| | | Actual Performance | | | | | Hypothetical Performance | |
| | | A Shares | | | C Shares | | | I Shares | | | | | A Shares | | | C Shares | | | I Shares | |
| Beginning Account Value (5/1/11) | | $ | 1,000.00 | | | $ | 1,000.00 | | | $ | 1,000.00 | | | | | $ | 1,000.00 | | | $ | 1,000.00 | | | $ | 1,000.00 | |
| Ending Account Value (10/31/11) | | $ | 1,022.80 | | | $ | 1,019.20 | | | $ | 1,024.60 | | | | | $ | 1,019.41 | | | $ | 1,015.63 | | | $ | 1,020.47 | |
| Expenses Incurred During Period | | $ | 5.86 | | | $ | 9.67 | | | $ | 4.80 | | | | | $ | 5.85 | | | $ | 9.65 | | | $ | 4.79 | |
For each class of the Fund, expenses are equal to the Fund’s annualized net expense ratio of 1.15%, 1.90% and .94%, respectively, multiplied by the average account value over the period, multiplied by 184/365 (to reflect the one-half year period).
Report of
Independent Registered
Public Accounting Firm
The Board of Directors and Shareholders
Nuveen International Fund (formerly First American International Fund)
Nuveen International Select Fund (formerly First American International Select Fund)
Nuveen Quantitative Enhanced Core Equity Fund (formerly First American Quantitative Large Cap Core Fund)
Nuveen Tactical Market Opportunities Fund (formerly First American Tactical Market Opportunities Fund)
We have audited the accompanying statements of assets and liabilities, including the portfolios of investments of Nuveen International Fund (formerly First American International Fund), Nuveen International Select Fund (formerly First American International Select Fund), Nuveen Quantitative Enhanced Core Equity Fund (formerly First American Quantitative Large Cap Core Fund), and Nuveen Tactical Market Opportunities Fund (formerly First American Tactical Market Opportunities Fund) (series of Nuveen Investment Funds, Inc., formerly First American Investment Funds, Inc.) (collectively, the ”Funds”) as of October 31, 2011, and the related statements of operations for the year then ended, the statements of changes in net assets for each of the two years in the period then ended, and the financial highlights for each of the periods indicated therein. These financial statements and financial highlights are the responsibility of the Funds’ management. Our responsibility is to express an opinion on these financial statements and financial highlights based on our audits.
We conducted our audits in accordance with the standards of the Public Company Accounting Oversight Board (United States). Those standards require that we plan and perform the audit to obtain reasonable assurance about whether the financial statements and financial highlights are free of material misstatement. We were not engaged to perform an audit of the Funds’ internal control over financial reporting. Our audits included consideration of internal control over financial reporting as a basis for designing audit procedures that are appropriate in the circumstances, but not for the purpose of expressing an opinion on the effectiveness of the Funds’ internal control over financial reporting. Accordingly, we express no such opinion. An audit also includes examining, on a test basis, evidence supporting the amounts and disclosures in the financial statements and financial highlights, assessing the accounting principles used and significant estimates made by management, and evaluating the overall financial statement presentation. Our procedures included confirmation of securities owned as of October 31, 2011, by correspondence with the custodian and brokers or by other appropriate auditing procedures where replies from brokers were not received. We believe that our audits provide a reasonable basis for our opinion.
In our opinion, the financial statements and financial highlights referred to above present fairly, in all material respects, the financial position of Nuveen International Fund (formerly First American International Fund), Nuveen International Select Fund (formerly First American International Select Fund), Nuveen Quantitative Enhanced Core Equity Fund (formerly First American Quantitative Large Cap Core Fund), and Nuveen Tactical Market Opportunities Fund (formerly First American Tactical Market Opportunities Fund) at October 31, 2011, the results of their operations for the year then ended, the changes in their net assets for each of the two years in the period then ended, and the financial highlights for each of the periods indicated therein in conformity with U.S. generally accepted accounting principles.

Chicago, Illinois
December 28, 2011
Portfolio of Investments
Nuveen International Fund
(formerly known as First American International Fund)
October 31, 2011
| | | | | | | | | | | | | | |
| Shares | | | Description p | | | | | | | | Value | |
| | | | | | | | | | | | | | |
| | | | COMMON STOCKS – 87.8% | | | | | | | | | | |
| | | | | |
| | | | Australia – 2.3% | | | | | | | | | | |
| | | | | |
| | 64,649 | | | APA Group | | | | | | | | $ | 294,830 | |
| | | | | |
| | 42,246 | | | Asciano Group | | | | | | | | | 67,535 | |
| | | | | |
| | 52,219 | | | Australian Infrastructure Fund | | | | | | | | | 103,668 | |
| | | | | |
| | 48,361 | | | DUET Group | | | | | | | | | 84,282 | |
| | | | | |
| | 9,069 | | | Macquarie Atlas Roads Group — | | | | | | | | | 13,430 | |
| | | | | |
| | 49,890 | | | MAp Group | | | | | | | | | 178,021 | |
| | | | | |
| | 5,462 | | | QR National | | | | | | | | | 18,871 | |
| | | | | |
| | 21,751 | | | SP AusNet | | | | | | | | | 22,679 | |
| | | | | |
| | 63,072 | | | Spark Infrastructure Group | | | | | | | | | 80,359 | |
| | | | | |
| | 87,736 | | | Transurban Group | | | | | | | | | 481,273 | |
| | | | | |
| | 32,103 | | | Woodside Petroleum | | | | | | | | | 1,222,384 | |
| | | | | |
| | 42,462 | | | WorleyParsons | | | | | | | | | 1,232,445 | |
| | | | Total Australia | | | | | | | | | 3,799,777 | |
| | | | Austria – 0.4% | | | | | | | | | | |
| | | | | |
| | 25,435 | | | Erste Group Bank | | | | | | | | | 542,235 | |
| | | | | |
| | 579 | | | Flughafen Wien | | | | | | | | | 26,024 | |
| | | | | |
| | 4,760 | | | Oesterreichische Post | | | | | | | | | 143,560 | |
| | | | | |
| | 224 | | | Verbund AG | | | | | | | | | 6,505 | |
| | | | Total Austria | | | | | | | | | 718,324 | |
| | | | Belgium – 0.6% | | | | | | | | | | |
| | | | | |
| | 17,528 | | | Anheuser-Busch InBev | | | | | | | | | 972,035 | |
| | | | | |
| | 718 | | | Elia System Operator | | | | | | | | | 29,136 | |
| | | | Total Belgium | | | | | | | | | 1,001,171 | |
| | | | Brazil – 1.5% | | | | | | | | | | |
| | | | | |
| | 9,189 | | | Companhia de Concessoes Rodoviarias | | | | | | | | | 253,268 | |
| | | | | |
| | 3,656 | | | Companhia de Gas de Sao Paulo, Class A | | | | | | | | | 74,745 | |
| | | | | |
| | 3,060 | | | Companhia de Saneamento Basico do Estado de Sao Paulo – ADR | | | | | | | | | 166,036 | |
| | | | | |
| | 658 | | | Companhia de Saneamento de Minas Gerais | | | | | | | | | 12,303 | |
| | | | | |
| | 840 | | | Companhia de Transmissao de Energia Electrica Paulista | | | | | | | | | 24,224 | |
| | | | | |
| | 32,550 | | | Companhia Energetica de Minas Gerais – ADR | | | | | | | | | 554,652 | |
| | | | | |
| | 686 | | | Companhia Energetica do Ceara-COELCE, Class A | | | | | | | | | 13,865 | |
| | | | | |
| | 3,970 | | | Companhia Paranaense de Energia-Copel – ADR | | | | | | | | | 80,115 | |
| | | | | |
| | 950 | | | CPFL Energia – ADR | | | | | | | | | 24,690 | |
| | | | | |
| | 5,941 | | | EcoRodovias Infraestructura e Logistica — | | | | | | | | | 44,812 | |
| | | | | |
| | 20,866 | | | Energias do Brasil | | | | | | | | | 451,144 | |
| | | | | |
| | 29,856 | | | Itau Unibanco Holding – ADR | | | | | | | | | 570,847 | |
| | | | | |
| | 6,728 | | | Santos Brasil Participacoes | | | | | | | | | 99,734 | |
| | | | | |
| | 8,441 | | | Wilson Sons – BDR | | | | | | | | | 120,947 | |
| | | | Total Brazil | | | | | | | | | 2,491,382 | |
| | | | Canada – 4.6% | | | | | | | | | | |
| | | | | |
| | 4,758 | | | Agrium | | | | | | | | | 391,536 | |
| | | | | |
| | 14,611 | | | Algonquin Power & Utilities | | | | | | | | | 82,088 | |
| | | | | |
| | 2,406 | | | ATCO, Class I | | | | | | | | | 146,955 | |
| | | | | |
| | 16,196 | | | Bank of Nova Scotia | | | | | | | | | 852,072 | |
Portfolio of Investments
Nuveen International Fund (continued)
October 31, 2011
| | | | | | | | | | | | | | |
| Shares | | | Description p | | | | | | | | Value | |
| | | | | | | | | | | | | | |
| | | | Canada (continued) | | | | | | | | | | |
| | | | | |
| | 1,878 | | | Brookfield Renewable Power Fund | | | | | | | | $ | 51,455 | |
| | | | | |
| | 30,847 | | | Cameco | | | | | | | | | 661,051 | |
| | | | | |
| | 25,561 | | | Cenovus Energy | | | | | | | | | 875,498 | |
| | | | | |
| | 1,927 | | | Emera | | | | | | | | | 63,276 | |
| | | | | |
| | 23,578 | | | Enbridge | | | | | | | | | 818,392 | |
| | | | | |
| | 36,560 | | | EnCana | | | | | | | | | 793,004 | |
| | | | | |
| | 263 | | | Just Energy | | | | | | | | | 2,839 | |
| | | | | |
| | 440 | | | Keyera | | | | | | | | | 20,072 | |
| | | | | |
| | 119,749 | | | Lundin Mining — | | | | | | | | | 469,745 | |
| | | | | |
| | 63,154 | | | Manulife Financial | | | | | | | | | 834,264 | |
| | | | | |
| | 3,087 | | | Pembina Pipeline | | | | | | | | | 84,023 | |
| | | | | |
| | 26,887 | | | Suncor Energy | | | | | | | | | 857,964 | |
| | | | | |
| | 2,752 | | | TransCanada | | | | | | | | | 118,446 | |
| | | | | |
| | 4,025 | | | Veresen | | | | | | | | | 58,189 | |
| | | | | |
| | 347 | | | Westshore Terminals Investment | | | | | | | | | 8,463 | |
| | | | | |
| | 29,727 | | | Yamana Gold | | | | | | | | | 445,013 | |
| | | | Total Canada | | | | | | | | | 7,634,345 | |
| | | | Chile – 0.4% | | | | | | | | | | |
| | | | | |
| | 18,688 | | | Empresa Electrica Del Norte Grande | | | | | | | | | 51,100 | |
| | | | | |
| | 2,641 | | | Empresa Nacional de Electrcidad – ADR | | | | | | | | | 127,402 | |
| | | | | |
| | 8,007 | | | Sociedad Quimica y Minera de Chile – ADR | | | | | | | | | 468,409 | |
| | | | Total Chile | | | | | | | | | 646,911 | |
| | | | China – 1.7% | | | | | | | | | | |
| | | | | |
| | 598,000 | | | Agile Property Holdings | | | | | | | | | 539,022 | |
| | | | | |
| | 65,350 | | | China Merchants Bank | | | | | | | | | 131,952 | |
| | | | | |
| | 138,951 | | | China Suntien Green Energy, Class H | | | | | | | | | 31,601 | |
| | | | | |
| | 7,872 | | | ENN Energy Holdings | | | | | | | | | 28,446 | |
| | | | | |
| | 773,000 | | | Industrial & Commercial Bank of China, Class H | | | | | | | | | 482,710 | |
| | | | | |
| | 13,421 | | | New Oriental Education & Technology Group – ADR — | | | | | | | | | 397,798 | |
| | | | | |
| | 69,500 | | | Ping An Insurance | | | | | | | | | 515,440 | |
| | | | | |
| | 24,900 | | | Tencent Holdings | | | | | | | | | 575,877 | |
| | | | | |
| | 55,203 | | | Zhejiang Expressway, Class H | | | | | | | | | 36,306 | |
| | | | Total China | | | | | | | | | 2,739,152 | |
| | | | Czech Republic – 0.0% | | | | | | | | | | |
| | | | | |
| | 1,080 | | | CEZ | | | | | | | | | 45,669 | |
| | | | Denmark – 0.7% | | | | | | | | | | |
| | | | | |
| | 10,361 | | | Novo Nordisk, Class B | | | | | | | | | 1,099,991 | |
| | | | Finland – 0.6% | | | | | | | | | | |
| | | | | |
| | 3,019 | | | Fortum Oyj | | | | | | | | | 73,477 | |
| | | | | |
| | 144,016 | | | Nokia Oyj | | | | | | | | | 969,110 | |
| | | | Total Finland | | | | | | | | | 1,042,587 | |
| | | | France – 4.1% | | | | | | | | | | |
| | | | | |
| | 685 | | | Aeroports de Paris | | | | | | | | | 53,781 | |
| | | | | |
| | 18,493 | | | Alstom | | | | | | | | | 688,642 | |
| | | | | |
| | 53,576 | | | AXA | | | | | | | | | 861,715 | |
| | | | | |
| | 41,231 | | | Carrefour | | | | | | | | | 1,090,890 | |
| | | | | | | | | | | | | | |
| Shares | | | Description p | | | | | | | | Value | |
| | | | | | | | | | | | | | |
| | | | France (continued) | | | | | | | | | | |
| | | | | |
| | 10,471 | | | Danone | | | | | | | | $ | 725,880 | |
| | | | | |
| | 1,027 | | | Electricite de France | | | | | | | | | 30,736 | |
| | | | | |
| | 28,086 | | | Groupe Eurotunnel | | | | | | | | | 252,997 | |
| | | | | |
| | 7,427 | | | Iliad | | | | | | | | | 867,329 | |
| | | | | |
| | 6,037 | | | L’oreal | | | | | | | | | 664,706 | |
| | | | | |
| | 28 | | | Rubis | | | | | | | | | 1,591 | |
| | | | | |
| | 29,637 | | | Total | | | | | | | | | 1,546,377 | |
| | | | Total France | | | | | | | | | 6,784,644 | |
| | | | Germany – 8.3% | | | | | | | | | | |
| | | | | |
| | 29,628 | | | Adidas | | | | | | | | | 2,086,605 | |
| | | | | |
| | 57,278 | | | Aixtron | | | | | | | | | 810,995 | |
| | | | | |
| | 15,136 | | | Allianz | | | | | | | | | 1,684,064 | |
| | | | | |
| | 3,691 | | | BASF | | | | | | | | | 269,428 | |
| | | | | |
| | 14,125 | | | Bayer | | | | | | | | | 899,932 | |
| | | | | |
| | 13,310 | | | BMW | | | | | | | | | 1,081,226 | |
| | | | | |
| | 13,172 | | | Deutsche Boerse — | | | | | | | | | 725,959 | |
| | | | | |
| | 60,016 | | | E.ON | | | | | | | | | 1,447,285 | |
| | | | | |
| | 3,694 | | | Fraport Frankfuort Airport | | | | | | | | | 232,581 | �� |
| | | | | |
| | 3,234 | | | Hamburger Hafen und Logistik | | | | | | | | | 99,430 | |
| | | | | |
| | 12,240 | | | Henkel KGAA | | | | | | | | | 727,608 | |
| | | | | |
| | 13,917 | | | SAP | | | | | | | | | 841,532 | |
| | | | | |
| | 11,682 | | | Siemens | | | | | | | | | 1,224,518 | |
| | | | | |
| | 34,761 | | | Symrise | | | | | | | | | 899,787 | |
| | | | | |
| | 7,094 | | | Wacker Chemie | | | | | | | | | 714,008 | |
| | | | Total Germany | | | | | | | | | 13,744,958 | |
| | | | Hong Kong – 2.5% | | | | | | | | | | |
| | | | | |
| | 56,236 | | | Beijing Capital International Airport, Class H | | | | | | | | | 25,253 | |
| | | | | |
| | 12,070 | | | Beijing Enterprises Holdings | | | | | | | | | 66,794 | |
| | | | | |
| | 66,658 | | | Cheung Kong Holdings | | | | | | | | | 826,288 | |
| | | | | |
| | 51,957 | | | Cheung Kong Infrastructure Holdings | | | | | | | | | 278,319 | |
| | | | | |
| | 286,034 | | | China Everbright International | | | | | | | | | 82,580 | |
| | | | | |
| | 37,588 | | | China Merchants Holdings International | | | | | | | | | 115,986 | |
| | | | | |
| | 4,170 | | | China Resources Gas Group | | | | | | | | | 6,059 | |
| | | | | |
| | 352,000 | | | China Resources Land | | | | | | | | | 515,221 | |
| | | | | |
| | 272,000 | | | China Unicom | | | | | | | | | 546,888 | |
| | | | | |
| | 9,481 | | | CLP Holdings | | | | | | | | | 84,458 | |
| | | | | |
| | 20,626 | | | Cosco Pacific | | | | | | | | | 28,699 | |
| | | | | |
| | 72,137 | | | Hong Kong & China Gas | | | | | | | | | 162,638 | |
| | | | | |
| | 49,310 | | | Hopewell Highway Infrastructure | | | | | | | | | 27,199 | |
| | | | | |
| | 446,000 | | | Li & Fung | | | | | | | | | 859,529 | |
| | | | | |
| | 179,299 | | | Li Ning | | | | | | | | | 170,935 | |
| | | | | |
| | 67,903 | | | MTR | | | | | | | | | 219,191 | |
| | | | | |
| | 15,917 | | | Power Assets Holdings | | | | | | | | | 120,950 | |
| | | | | |
| | 39,943 | | | Towngas China | | | | | | | | | 21,487 | |
| | | | Total Hong Kong | | | | | | | | | 4,158,474 | |
Portfolio of Investments
Nuveen International Fund (continued)
October 31, 2011
| | | | | | | | | | | | | | |
| Shares | | | Description p | | | | | | | | Value | |
| | | | | | | | | | | | | | |
| | | | India – 0.4% | | | | | | | | | | |
| | | | | |
| | 1,815 | | | GAIL India – GDR | | | | | | | | $ | 95,560 | |
| | | | | |
| | 17,017 | | | HDFC Bank – ADR | | | | | | | | | 538,758 | |
| | | | | |
| | 30,369 | | | Power Grid | | | | | | | | | 65,074 | |
| | | | Total India | | | | | | | | | 699,392 | |
| | | | Ireland – 2.0% | | | | | | | | | | |
| | | | | |
| | 37,072 | | | Covidien | | | | | | | | | 1,743,867 | |
| | | | | |
| | 63,955 | | | CRH | | | | | | | | | 1,157,112 | |
| | | | | |
| | 44,889 | | | WPP | | | | | | | | | 464,648 | |
| | | | Total Ireland | | | | | | | | | 3,365,627 | |
| | | | Israel – 0.8% | | | | | | | | | | |
| | | | | |
| | 16,099 | | | Nice Systems – ADR — | | | | | | | | | 575,700 | |
| | | | | |
| | 17,249 | | | Teva Pharmaceutical Industries – ADR | | | | | | | | | 704,622 | |
| | | | Total Israel | | | | | | | | | 1,280,322 | |
| | | | Italy – 1.9% | | | | | | | | | | |
| | | | | |
| | 22,571 | | | Atlantia | | | | | | | | | 343,787 | |
| | | | | |
| | 2,068 | | | Autostrada Torino-Milano | | | | | | | | | 21,629 | |
| | | | | |
| | 81,931 | | | Enel | | | | | | | | | 386,559 | |
| | | | | |
| | 47,024 | | | Hera — | | | | | | | | | 76,888 | |
| | | | | |
| | 5,711 | | | IREN | | | | | | | | | 6,908 | |
| | | | | |
| | 161,100 | | | Prada — | | | | | | | | | 807,698 | |
| | | | | |
| | 32,995 | | | Saipem | | | | | | | | | 1,474,297 | |
| | | | | |
| | 4,195 | | | Societa Inizative Autostradali e Servizi — | | | | | | | | | 34,670 | |
| | | | | |
| | 43 | | | Terna-Rete Elettrica Nationale | | | | | | | | | 165 | |
| | | | Total Italy | | | | | | | | | 3,152,601 | |
| | | | Japan – 16.2% | | | | | | | | | | |
| | | | | |
| | 56,309 | | | AMADA | | | | | | | | | 373,564 | |
| | | | | |
| | 58,309 | | | Canon | | | | | | | | | 2,647,101 | |
| | | | | |
| | 7,400 | | | FANUC | | | | | | | | | 1,196,508 | |
| | | | | |
| | 280 | | | INPEX | | | | | | | | | 1,848,583 | |
| | | | | |
| | 7,818 | | | Japan Airport Terminal | | | | | | | | | 103,422 | |
| | | | | |
| | 4,978 | | | Kamigumi | | | | | | | | | 43,467 | |
| | | | | |
| | 2,992 | | | Keyence | | | | | | | | | 760,599 | |
| | | | | |
| | 45,900 | | | KOMATSU | | | | | | | | | 1,134,869 | |
| | | | | |
| | 73,362 | | | Mitsubishi | | | | | | | | | 1,508,834 | |
| | | | | |
| | 46,841 | | | Mitsui Sumitomo Insurance Group | | | | | | | | | 917,445 | |
| | | | | |
| | 51,000 | | | NGK Insulators | | | | | | | | | 587,925 | |
| | | | | |
| | 8,991 | | | Nintendo | | | | | | | | | 1,356,478 | |
| | | | | |
| | 43,655 | | | NKSJ Holdings | | | | | | | | | 873,081 | |
| | | | | |
| | 27,623 | | | Nomura Research Institute | | | | | | | | | 621,244 | |
| | | | | |
| | 1,189 | | | Rakuten | | | | | | | | | 1,303,424 | |
| | | | | |
| | 21,493 | | | SECOM | | | | | | | | | 1,016,472 | |
| | | | | |
| | 10,146 | | | SMC | | | | | | | | | 1,578,126 | |
| | | | | |
| | 18,545 | | | Sugi Holdings | | | | | | | | | 483,980 | |
| | | | | |
| | 60,993 | | | Sumitomo Metal Mining | | | | | | | | | 839,600 | |
| | | | | |
| | 449,493 | | | Sumitomo Mitsui Trust | | | | | | | | | 1,538,221 | |
| | | | | | | | | | | | | | |
| Shares | | | Description p | | | | | | | | Value | |
| | | | | | | | | | | | | | |
| | | | Japan (continued) | | | | | | | | | | |
| | | | | |
| | 84,431 | | | Suzuki Motor | | | | | | | | $ | 1,790,709 | |
| | | | | |
| | 16,600 | | | TERUMO | | | | | | | | | 843,447 | |
| | | | | |
| | 333,203 | | | The Bank of Yokohama | | | | | | | | | 1,525,542 | |
| | | | | |
| | 28,077 | | | THK | | | | | | | | | 547,193 | |
| | | | | |
| | 24,004 | | | Tokyo Gas | | | | | | | | | 103,369 | |
| | | | | |
| | 42,900 | | | Toyota Motor | | | | | | | | | 1,424,313 | |
| | | | Total Japan | | | | | | | | | 26,967,516 | |
| | | | Lebanon – 0.1% | | | | | | | | | | |
| | | | | |
| | 22,897 | | | Equatorial Energia | | | | | | | | | 149,770 | |
| | | | Luxembourg – 0.7% | | | | | | | | | | |
| | | | | |
| | 9,547 | | | Millicom International Cellular | | | | | | | | | 1,052,905 | |
| | | | | |
| | 5,626 | | | SES | | | | | | | | | 143,697 | |
| | | | Total Luxembourg | | | | | | | | | 1,196,602 | |
| | | | Malaysia – 0.2% | | | | | | | | | | |
| | | | | |
| | 137,695 | | | Sime Darby Berhad | | | | | | | | | 397,206 | |
| | | | Mexico – 0.4% | | | | | | | | | | |
| | | | | |
| | 623 | | | Grupo Aeroportuario del Sureste – ADR | | | | | | | | | 35,885 | |
| | | | | |
| | 47,789 | | | OHL Mexico — | | | | | | | | | 74,264 | |
| | | | | |
| | 18,311 | | | Wal-Mart de Mexico – ADR | | | | | | | | | 470,593 | |
| | | | Total Mexico | | | | | | | | | 580,742 | |
| | | | Netherlands – 1.2% | | | | | | | | | | |
| | | | | |
| | 37,242 | | | Heineken | | | | | | | | | 1,809,280 | |
| | | | | |
| | 3,468 | | | Koninklijke Vopak | | | | | | | | | 178,748 | |
| | | | Total Netherlands | | | | | | | | | 1,988,028 | |
| | | | New Zealand – 0.2% | | | | | | | | | | |
| | | | | |
| | 22,643 | | | Auckland International Airport | | | | | | | | | 42,752 | |
| | | | | |
| | 60,486 | | | Infratil | | | | | | | | | 90,054 | |
| | | | | |
| | 18,534 | | | Port of Tauranga | | | | | | | | | 145,062 | |
| | | | Total New Zealand | | | | | | | | | 277,868 | |
| | | | Norway – 1.5% | | | | | | | | | | |
| | | | | |
| | 3,666 | | | Hafslund, Class B | | | | | | | | | 37,443 | |
| | | | | |
| | 161,199 | | | Norsk Hydro | | | | | | | | | 835,012 | |
| | | | | |
| | 95,370 | | | Telenor ASA | | | | | | | | | 1,698,801 | |
| | | | Total Norway | | | | | | | | | 2,571,256 | |
| | | | Philippines – 0.1% | | | | | | | | | | |
| | | | | |
| | 51,453 | | | International Container Terminal Services | | | | | | | | | 66,429 | |
| | | | | |
| | 331,750 | | | Metro Pacific Investments | | | | | | | | | 25,229 | |
| | | | Total Philppines | | | | | | | | | 91,658 | |
| | | | Portugal – 0.3% | | | | | | | | | | |
| | | | | |
| | 3,593 | | | Brisa Auto-Estradas de Portugal | | | | | | | | | 12,229 | |
| | | | | |
| | 174,384 | | | Energias de Portugal | | | | | | | | | 547,830 | |
| | | | Total Portugal | | | | | | | | | 560,059 | |
| | | | Russia – 0.3% | | | | | | | | | | |
| | | | | |
| | 46,383 | | | Gazprom – ADR | | | | | | | | | 538,507 | |
Portfolio of Investments
Nuveen International Fund (continued)
October 31, 2011
| | | | | | | | | | | | | | |
| Shares | | | Description p | | | | | | | | Value | |
| | | | | | | | | | | | | | |
| | | | Singapore – 1.5% | | | | | | | | | | |
| | | | | |
| | 180,997 | | | CitySpring Infrastructure Trust | | | | | | | | $ | 53,922 | |
| | | | | |
| | 143,352 | | | ComfortDelGro | | | | | | | | | 158,843 | |
| | | | | |
| | 89,634 | | | DBS Group Holdings | | | | | | | | | 875,524 | |
| | | | | |
| | 1,427,437 | | | Golden Agri-Resources | | | | | | | | | 730,739 | |
| | | | | |
| | 10,886 | | | Hyflux | | | | | | | | | 12,363 | |
| | | | | |
| | 55,020 | | | Parkway Life – REIT | | | | | | | | | 78,515 | |
| | | | | |
| | 38,004 | | | SembCorp Industries | | | | | | | | | 125,296 | |
| | | | | |
| | 62,966 | | | Singapore Airport Terminal Services | | | | | | | | | 122,683 | |
| | | | | |
| | 209,009 | | | Singapore Post | | | | | | | | | 170,197 | |
| | | | | |
| | 19,275 | | | Singapore Telecommunications | | | | | | | | | 48,733 | |
| | | | | |
| | 123,890 | | | SMRT | | | | | | | | | 181,415 | |
| | | | Total Signapore | | | | | | | | | 2,558,230 | |
| | | | South Africa – 0.7% | | | | | | | | | | |
| | | | | |
| | 70,688 | | | MTN Group | | | | | | | | | 1,228,614 | |
| | | | South Korea – 0.5% | | | | | | | | | | |
| | | | | |
| | 2,028 | | | Samsung Electronics – GDR | | | | | | | | | 885,717 | |
| | | | Spain – 1.1% | | | | | | | | | | |
| | | | | |
| | 80,851 | | | Banco Santander | | | | | | | | | 684,308 | |
| | | | | |
| | 26,649 | | | Distribuidora International de Alimentacion — | | | | | | | | | 121,869 | |
| | | | | |
| | 2,444 | | | Enagas | | | | | | | | | 48,058 | |
| | | | | |
| | 3,964 | | | Ferrovial | | | | | | | | | 50,383 | |
| | | | | |
| | 46,924 | | | Grifols — | | | | | | | | | 872,434 | |
| | | | Total Spain | | | | | | | | | 1,777,052 | |
| | | | Sweden – 0.7% | | | | | | | | | | |
| | | | | |
| | 115,297 | | | Ericsson | | | | | | | | | 1,201,802 | |
| | | | Switzerland – 9.1% | | | | | | | | | | |
| | | | | |
| | 45,286 | | | ABB | | | | | | | | | 852,528 | |
| | | | | |
| | 20,546 | | | Adecco | | | | | | | | | 986,767 | |
| | | | | |
| | 19,122 | | | Compagnie Financiere Richemont | | | | | | | | | 1,089,277 | |
| | | | | |
| | 155 | | | Flughafen Zuerich | | | | | | | | | 59,441 | |
| | | | | |
| | 48,149 | | | Foster Wheeler | | | | | | | | | 1,026,537 | |
| | | | | |
| | 15,888 | | | Holcim | | | | | | | | | 1,006,125 | |
| | | | | |
| | 45,372 | | | Nestle | | | | | | | | | 2,624,212 | |
| | | | | |
| | 47,925 | | | Noble | | | | | | | | | 1,722,424 | |
| | | | | |
| | 22,252 | | | Novartis | | | | | | | | | 1,253,573 | |
| | | | | |
| | 18,986 | | | Roche Holding | | | | | | | | | 3,115,022 | |
| | | | | |
| | 40,849 | | | UBS | | | | | | | | | 516,258 | |
| | | | | |
| | 57,389 | | | Xstrata | | | | | | | | | 955,902 | |
| | | | Total Switzerland | | | | | | | | | 15,208,066 | |
| | | | Taiwan – 0.3% | | | | | �� | | | | | |
| | | | | |
| | 181,200 | | | Hon Hai Precision Industry | | | | | | | | | 496,738 | |
| | | | Turkey – 0.6% | | | | | | | | | | |
| | | | | |
| | 263,570 | | | Turkiye Garanti Bankasi | | | | | | | | | 924,754 | |
| | | | United Kingdom – 15.4% | | | | | | | | | | |
| | | | | |
| | 50,980 | | | Anglo American | | | | | | | | | 1,868,949 | |
| | | | | | | | | | | | | | |
| Shares | | | Description p | | | | | | | | Value | |
| | | | | | | | | | | | | | |
| | | | United Kingdom (continued) | | | | | | | | | | |
| | | | | |
| | 97,399 | | | ARM Holdings | | | | | | | | $ | 913,882 | |
| | | | | |
| | 54,836 | | | BG Group | | | | | | | | | 1,189,063 | |
| | | | | |
| | 38,012 | | | BHP Billiton | | | | | | | | | 1,196,977 | |
| | | | | |
| | 20,969 | | | BP – ADR | | | | | | | | | 926,410 | |
| | | | | |
| | 65,480 | | | British Sky Broadcasting Group | | | | | | | | | 738,317 | |
| | | | | |
| | 76,905 | | | Centrica | | | | | | | | | 366,113 | |
| | | | | |
| | 96,936 | | | Diageo | | | | | | | | | 2,006,163 | |
| | | | | |
| | 106,289 | | | GlaxoSmithKline | | | | | | | | | 2,385,373 | |
| | | | | |
| | 23,784 | | | HSBC Holdings – ADR | | | | | | | | | 1,038,409 | |
| | | | | |
| | 10,409 | | | National Grid – ADR | | | | | | | | | 521,179 | |
| | | | | |
| | 2,986 | | | Pennon Group | | | | | | | | | 33,356 | |
| | | | | |
| | 121,570 | | | Prudential | | | | | | | | | 1,255,708 | |
| | | | | |
| | 173,757 | | | Reed Elsevier | | | | | | | | | 1,487,501 | |
| | | | | |
| | 111,150 | | | Rolls-Royce Holdings | | | | | | | | | 1,251,155 | |
| | | | | |
| | 29,885 | | | Schroders | | | | | | | | | 684,013 | |
| | | | | |
| | 7,597 | | | Scottish & Southern Energy | | | | | | | | | 164,142 | |
| | | | | |
| | 4,226 | | | Severn Trent | | | | | | | | | 102,863 | |
| | | | | |
| | 62,089 | | | Standard Chartered | | | | | | | | | 1,448,803 | |
| | | | | |
| | 184,923 | | | Tesco | | | | | | | | | 1,192,274 | |
| | | | | |
| | 27,557 | | | United Utilities Group | | | | | | | | | 268,632 | |
| | | | | |
| | 71,825 | | | Vedanta Resources | | | | | | | | | 1,466,021 | |
| | | | | |
| | 55,858 | | | Vodafone Group – ADR | | | | | | | | | 1,555,087 | |
| | | | | |
| | 45,843 | | | Willis Group Holdings | | | | | | | | | 1,664,559 | |
| | | | Total United Kingdom | | | | | | | | | 25,724,949 | |
| | | | United States – 3.9% | | | | | | | | | | |
| | | | | |
| | 1,076 | | | American States Water | | | | | | | | | 37,595 | |
| | | | | |
| | 10,354 | | | American Tower, Class A — | | | | | | | | | 570,505 | |
| | | | | |
| | 1,105 | | | American Water Works | | | | | | | | | 33,736 | |
| | | | | |
| | 13,624 | | | Brookfield Infrastructure Partners | | | | | | | | | 341,826 | |
| | | | | |
| | 16,585 | | | Bunge | | | | | | | | | 1,024,455 | |
| | | | | |
| | 21 | | | California Water Service Group | | | | | | | | | 390 | |
| | | | | |
| | 3,310 | | | Chesapeake Utilities | | | | | | | | | 140,311 | |
| | | | | |
| | 940 | | | Consolidated Edison | | | | | | | | | 54,398 | |
| | | | | |
| | 7,795 | | | Crown Castle International — | | | | | | | | | 322,401 | |
| | | | | |
| | 3,687 | | | Dominion Resources | | | | | | | | | 190,212 | |
| | | | | |
| | 10,322 | | | El Paso | | | | | | | | | 258,153 | |
| | | | | |
| | 932 | | | Exelon | | | | | | | | | 41,371 | |
| | | | | |
| | 2,655 | | | ITC Holdings | | | | | | | | | 192,965 | |
| | | | | |
| | 257 | | | Kinder Morgan Management | | | | | | | | | 7,350 | |
| | | | | |
| | 1,900 | | | NextEra Energy | | | | | | | | | 107,160 | |
| | | | | |
| | 4,585 | | | NiSource | | | | | | | | | 101,283 | |
| | | | | |
| | 1,638 | | | Northeast Utilities — | | | | | | | | | 56,626 | |
| | | | | |
| | 1,080 | | | Northwest Natural Gas | | | | | | | | | 50,458 | |
| | | | | |
| | 4,039 | | | OGE Energy | | | | | | | | | 208,978 | |
| | | | | |
| | 14,536 | | | Philip Morris International | | | | | | | | | 1,015,630 | |
Portfolio of Investments (Unaudited)
Nuveen International Fund (continued)
October 31, 2011
| | | | | | | | | | | | | | |
| Shares | | | Description p | | | | | | | | Value | |
| | | | | | | | | | | | | | |
| | | | United States (continued) | | | | | | | | | | |
| | | | | |
| | 2,795 | | | PPL | | | | | | | | $ | 82,089 | |
| | | | | |
| | 14,779 | | | Questar | | | | | | | | | 284,791 | |
| | | | | |
| | 522 | | | Republic Services | | | | | | | | | 14,856 | |
| | | | | |
| | 3,496 | | | Schlumberger | | | | | | | | | 256,851 | |
| | | | | |
| | 1,176 | | | Sempra Energy | | | | | | | | | 63,186 | |
| | | | | |
| | 60 | | | SJW | | | | | | | | | 1,397 | |
| | | | | |
| | 13,171 | | | Spectra Energy | | | | | | | | | 377,086 | |
| | | | | |
| | 2,852 | | | Standard Parking — | | | | | | | | | 50,167 | |
| | | | | |
| | 3 | | | UGI | | | | | | | | | 86 | |
| | | | | |
| | 2,583 | | | UIL Holdings | | | | | | | | | 88,029 | |
| | | | | |
| | 740 | | | Unitil | | | | | | | | | 19,736 | |
| | | | | |
| | 5,101 | | | Waste Connections | | | | | | | | | 173,689 | |
| | | | | |
| | 5,984 | | | Wisconsin Energy | | | | | | | | | 194,061 | |
| | | | | |
| | 5,062 | | | Xcel Energy | | | | | | | | | 130,852 | |
| | | | Total United States | | | | | | | | | 6,492,679 | |
| | | | Total Common Stocks (cost $152,809,180) | | | | | | | | | 146,223,140 | |
| | | | EXCHANGE-TRADED FUNDS – 4.0% | | | | | | | | | | |
| | | | | |
| | | | United States – 4.0% | | | | | | | | | | |
| | | | | |
| | 97,640 | | | iShares MSCI Malysia Index Fund | | | | | | | | | 1,355,243 | |
| | | | | |
| | 11,127 | | | iShares MSCI Indonesia Investment Market Index Fund | | | | | | | | | 331,918 | |
| | | | | |
| | 62,478 | | | Market Vectors Agribusiness | | | | | | | | | 3,125,774 | |
| | | | | |
| | 31,966 | | | Market Vectors Gold Miners | | | | | | | | | 1,880,560 | |
| | | | Total Exchange-Traded Funds (cost $7,292,585) | | | | | | | | | 6,693,495 | |
| | | | RIGHTS – 0.0% | | | | | | | | | | |
| | | | | |
| | | | Spain – 0.0% | | | | | | | | | | |
| | | | | |
| | 80,851 | | | Banco Santander — | | | | | | | | | 13,984 | |
| | | | Total Rights (Cost $0) | | | | | | | | | 13,984 | |
| | | | | |
Shares/
Principal
Amount (000) | | | Description p | | | | | | | | Value | |
| | | | SHORT-TERM INVESTMENTS – 7.8% | | | | | | | | | | |
| | | | | |
| | | | Money Market Funds – 2.7% | | | | | | | | | | |
| | | | | |
| | 4,510,519 | | | State Street Institutional Liquid Reserves Fund, 0.150% W | | | | | | | | $ | 4,510,519 | |
| | | | U.S. Treasury Obligations – 5.1% | | | | | | | | | | |
| | | | | |
| | | | U.S. Treasury Bills ¨ | | | | | | | | | | |
| | | | | |
| $ | 7,440 | | | 0.022%, 03/01/2012 | | | | | | | | | 7,439,449 | |
| | | | | |
| | 1,032 | | | 0.025%, 03/08/2012 | | | | | | | | | 1,031,908 | |
| $ | 8,472 | | | Total U.S. Treasury Obligations | | | | | | | | | 8,471,357 | |
| | | | Total Short-Term Investments (cost $12,981,998) | | | | | | | | | 12,981,876 | |
| | | | Total Investments (cost $173,083,763) – 99.6% | | | | | | | | | 165,912,495 | |
| | | | Other Assets Less Liabilities – 0.4% ¯ | | | | | | | | | 625,209 | |
| | | | Net Assets – 100.0% | | | | | | | | $ | 166,537,704 | |
Investment in Derivatives at October 31, 2011
Futures Contracts outstanding:
| | | | | | | | | | | | | | | | | | | | |
| Description | | Contract
Position | | | Number of
Contracts | | | Contract
Expiration | | | Value | | | Unrealized
Appreciation
(Depreciation) | |
Amsterdam Index | | | Long | | | | 53 | | | | 11/11 | | | $ | 4,490,369 | | | $ | 136,102 | |
E-Mini MSCI EAFE | | | Short | | | | (44 | ) | | | 12/11 | | | | (3,257,980 | ) | | | (230,218 | ) |
E-Mini MSCI Emerging Market Index | | | Long | | | | 53 | | | | 12/11 | | | | 2,587,990 | | | | 26,461 | |
Euro STOXX 50 Index | | | Long | | | | 105 | | | | 12/11 | | | | 3,469,489 | | | | 535,794 | |
FTSE 100 Index | | | Long | | | | 225 | | | | 12/11 | | | | 20,037,022 | | | | 1,459,210 | |
FTSE JSE Top 40 | | | Short | | | | (120 | ) | | | 12/11 | | | | (4,407,586 | ) | | | (237,512 | ) |
Great Butlan Futures Index | | | Short | | | | (9 | ) | | | 12/11 | | | | (907,088 | ) | | | (44,416 | ) |
Mexican Bolsa Index | | | Short | | | | (169 | ) | | | 12/11 | | | | (4,588,502 | ) | | | (314,273 | ) |
NASDAQ 100 | | | Short | | | | (38 | ) | | | 12/11 | | | | (1,790,560 | ) | | | (80,028 | ) |
Nikkei 225 Index | | | Long | | | | 247 | | | | 12/11 | | | | 10,979,150 | | | | 239,714 | |
OMXS 30 Index | | | Long | | | | 292 | | | | 11/11 | | | | 4,447,798 | | | | 178,091 | |
Russell 2000 Mini Index | | | Short | | | | (113 | ) | | | 12/11 | | | | (8,354,090 | ) | | | (532,061 | ) |
SGX S&P CNX Nifty | | | Short | | | | (422 | ) | | | 11/11 | | | | (4,512,868 | ) | | | (198,340 | ) |
S&P 500 Index | | | Short | | | | (9 | ) | | | 12/11 | | | | (2,810,925 | ) | | | (156,186 | ) |
S&P TSX 60 | | | Short | | | | (73 | ) | | | 12/11 | | | | (10,204,986 | ) | | | 102,162 | |
SPI 200 | | | Long | | | | 111 | | | | 12/11 | | | | 12,528,824 | | | | 543,489 | |
| | | | | | | | | | | | | | | | | | | $ | 1,427,989 | |
| | | | For Fund portfolio compliance purposes, the Fund’s industry classifications refer to any one or more of the industry sub-classifications used by one or more widely recognized market indexes or ratings group indexes, and/or as defined by Fund management. This definition may not apply for purposes of this report which may combine industry sub-classifications into sectors for reporting ease. |
| | p | | All percentages shown in the Portfolio of Investments are based on net assets. |
| | — | | Non-income producing; issuer has not declared a dividend within the past twelve months. |
| | W | | The rate shown is the annualized seven-day effective yield as of October 31, 2011. |
| | ¨ | | Investment, or portion of investment, segregated as collateral for investments in derivatives. Yield shown is the annualized effective yield as of October 31, 2011. |
| | ¯ | | Other Assets Less Liabilities includes the net Unrealized Appreciation (Depreciation) of derivatives instruments as listed within Investments in Derivatives at October 31, 2011. |
| | ADR | | American Depositary Receipt |
| | BDR | | Brazilian Depositary Receipt |
| | GDR | | Global Depositary Receipt |
| | REIT | | Real Estate Investment Trust |
See accompanying notes to financial statements.
Portfolio of Investments
Nuveen International Select Fund
(formerly known as First American International Select Fund)
October 31, 2011
| | | | | | | | | | | | | | | | |
| Shares | | | Description p | | | | | | | | | | Value | |
| | | | | | | | | | | | | | | | |
| | | | COMMON STOCKS – 86.3% | | | | | | | | | | | | |
| | | | | | |
| | | | Argentina – 0.3% | | | | | | | | | | | | |
| | | | | | |
| | 58,254 | | | YPF Sociedad Anonima | | | | | | | | | | $ | 1,957,917 | |
| | | | Australia – 2.1% | | | | | | | | | | | | |
| | | | | | |
| | 170,856 | | | APA Group | | | | | | | | | | | 779,184 | |
| | | | | | |
| | 111,786 | | | Asciano Group | | | | | | | | | | | 178,702 | |
| | | | | | |
| | 138,003 | | | Australian Infrastructure Fund | | | | | | | | | | | 273,972 | |
| | | | | | |
| | 72,815 | | | BHP Billiton | | | | | | | | | | | 2,850,307 | |
| | | | | | |
| | 127,789 | | | DUET Group | | | | | | | | | | | 222,706 | |
| | | | | | |
| | 23,960 | | | Macquarie Atlas Roads Group — | | | | | | | | | | | 35,480 | |
| | | | | | |
| | 133,518 | | | MAp Group | | | | | | | | | | | 476,429 | |
| | | | | | |
| | 14,668 | | | QR National | | | | | | | | | | | 50,678 | |
| | | | | | |
| | 57,476 | | | SP AusNet | | | | | | | | | | | 59,929 | |
| | | | | | |
| | 169,055 | | | Spark Infrastructure Group | | | | | | | | | | | 215,390 | |
| | | | | | |
| | 231,815 | | | Transurban Group | | | | | | | | | | | 1,271,614 | |
| | | | | | |
| | 77,073 | | | Woodside Petroleum | | | | | | | | | | | 2,934,703 | |
| | | | | | |
| | 109,941 | | | WorleyParsons | | | | | | | | | | | 3,190,999 | |
| | | | Total Australia | | | | | | | | | | | 12,540,093 | |
| | | | Austria – 0.3% | | | | | | | | | | | | |
| | | | | | |
| | 63,791 | | | Erste Group Bank | | | | | | | | | | | 1,359,926 | |
| | | | | | |
| | 1,539 | | | Flughafen Wien | | | | | | | | | | | 69,173 | |
| | | | | | |
| | 12,625 | | | Oesterreichische Post | | | | | | | | | | | 380,765 | |
| | | | | | |
| | 592 | | | Verbund | | | | | | | | | | | 17,191 | |
| | | | Total Austria | | | | | | | | | | | 1,827,055 | |
| | | | Belgium – 0.4% | | | | | | | | | | | | |
| | | | | | |
| | 37,285 | | | Anheuser-Busch InBev | | | | | | | | | | | 2,067,683 | |
| | | | | | |
| | 2,128 | | | Elia System Operator | | | | | | | | | | | 86,353 | |
| | | | Total Belgium | | | | | | | | | | | 2,154,036 | |
| | | | Brazil – 7.2% | | | | | | | | | | | | |
| | | | | | |
| | 380,243 | | | Banco do Brasil | | | | | | | | | | | 5,802,701 | |
| | | | | | |
| | 225,840 | | | Cielo | | | | | | | | | | | 6,028,626 | |
| | | | | | |
| | 46,300 | | | Companhia de Bebidas das Americas – ADR | | | | | | | | | | | 1,561,236 | |
| | | | | | |
| | 74,674 | | | Companhia de Concessoes Rodoviarias | | | | | | | | | | | 2,058,173 | |
| | | | | | |
| | 9,832 | | | Companhia de Gas de Sao Paulo, Class A | | | | | | | | | | | 201,010 | |
| | | | | | |
| | 8,086 | | | Companhia de Saneamento Basico do Estado de Sao Paulo – ADR | | | | | | | | | | | 438,746 | |
| | | | | | |
| | 1,657 | | | Companhia de Saneamento de Minas Gerais | | | | | | | | | | | 30,981 | |
| | | | | | |
| | 2,181 | | | Companhia de Transmissao de Energia Electrica Paulista | | | | | | | | | | | 62,895 | |
| | | | | | |
| | 1,718 | | | Companhia Energetica do Ceara-Coelce, Class A | | | | | | | | | | | 34,723 | |
| | | | | | |
| | 253,954 | | | Companhia Energetica de Minas Gerais – ADR | | | | | | | | | | | 4,327,376 | |
| | | | | | |
| | 10,473 | | | Companhia Paranaense de Energia-Copel – ADR | | | | | | | | | | | 211,345 | |
| | | | | | |
| | 208,500 | | | Companhia Siderurgica Nacional – ADR | | | | | | | | | | | 1,951,560 | |
| | | | | | |
| | 2,511 | | | CPFL Energia – ADR | | | | | | | | | | | 65,261 | |
| | | | | | |
| | 15,955 | | | EcoRodovias Infraestructura e Logistica | | | | | | | | | | | 120,347 | |
| | | | | | |
| | 55,653 | | | Energias do Brasil | | | | | | | | | | | 1,203,273 | |
| | | | | | |
| | 190,249 | | | Hypermarcas | | | | | | | | | | | 1,034,992 | |
| | | | | | |
| | 117,202 | | | Itau Unibanco Holding – ADR | | | | | | | | | | | 2,240,902 | |
| | | | | | | | | | | | | | | | |
| Shares | | | Description p | | | | | | | | | | Value | |
| | | | | | | | | | | | | | | | |
| | | | Brazil (continued) | | | | | | | | | | | | |
| | | | | | |
| | 104,200 | | | Natura Cosmeticos | | | | | | | | | | $ | 2,033,200 | |
| | | | | | |
| | 356,630 | | | Redecard | | | | | | | | | | | 5,928,427 | |
| | | | | | |
| | 17,919 | | | Santos Brasil Participacoes | | | | | | | | | | | 265,625 | |
| | | | | | |
| | 162,995 | | | Souza Cruz | | | | | | | | | | | 2,022,188 | |
| | | | | | |
| | 10,700 | | | Usinas Siderurgicas de Minas Gerais, Class A | | | | | | | | | | | 74,850 | |
| | | | | | |
| | 167,300 | | | Vale – ADR | | | | | | | | | | | 4,251,093 | |
| | | | | | |
| | 22,634 | | | Wilson Sons – BDR | | | | | | | | | | | 324,313 | |
| | | | Total Brazil | | | | | | | | | | | 42,273,843 | |
| | | | Canada – 3.9% | | | | | | | | | | | | |
| | | | | | |
| | 11,030 | | | Agrium | | | | | | | | | | | 907,659 | |
| | | | | | |
| | 39,187 | | | Algonquin Power & Utilities | | | | | | | | | | | 220,163 | |
| | | | | | |
| | 6,462 | | | ATCO, Class I | | | | | | | | | | | 394,689 | |
| | | | | | |
| | 41,917 | | | Bank of Nova Scotia | | | | | | | | | | | 2,205,253 | |
| | | | | | |
| | 4,898 | | | Brookfield Renewable Power Fund | | | | | | | | | | | 134,201 | |
| | | | | | |
| | 102,716 | | | Cameco | | | | | | | | | | | 2,201,204 | |
| | | | | | |
| | 59,257 | | | Cenovus Energy | | | | | | | | | | | 2,029,630 | |
| | | | | | |
| | 5,040 | | | Emera | | | | | | | | | | | 165,497 | |
| | | | | | |
| | 63,081 | | | Enbridge | | | | | | | | | | | 2,189,542 | |
| | | | | | |
| | 84,737 | | | EnCana | | | | | | | | | | | 1,837,987 | |
| | | | | | |
| | 112,500 | | | First Quantum Minerals | | | | | | | | | | | 2,360,045 | |
| | | | | | |
| | 659 | | | Just Energy | | | | | | | | | | | 7,114 | |
| | | | | | |
| | 1,130 | | | Keyera | | | | | | | | | | | 51,549 | |
| | | | | | |
| | 277,700 | | | Lundin Mining — | | | | | | | | | | | 1,089,347 | |
| | | | | | |
| | 171,252 | | | Manulife Financial | | | | | | | | | | | 2,262,239 | |
| | | | | | |
| | 8,132 | | | Pembina Pipeline | | | | | | | | | | | 221,341 | |
| | | | | | |
| | 84,813 | | | Suncor Energy | | | | | | | | | | | 2,706,383 | |
| | | | | | |
| | 7,363 | | | TransCanada | | | | | | | | | | | 316,904 | |
| | | | | | |
| | 10,616 | | | Veresen | | | | | | | | | | | 153,475 | |
| | | | | | |
| | 927 | | | Westshore Terminals Investment | | | | | | | | | | | 22,609 | |
| | | | | | |
| | 68,919 | | | Yamana Gold | | | | | | | | | | | 1,031,717 | |
| | | | Total Canada | | | | | | | | | | | 22,508,548 | |
| | | | Chile – 0.4% | | | | | | | | | | | | |
| | | | | | |
| | 49,802 | | | Empresa Electrica Del Norte Grande | | | | | | | | | | | 136,177 | |
| | | | | | |
| | 6,979 | | | Empresa Nacional de Electrcidad – ADR | | | | | | | | | | | 336,667 | |
| | | | | | |
| | 31,260 | | | Sociedad Quimica y Minera de Chile – ADR | | | | | | | | | | | 1,828,710 | |
| | | | Total Chile | | | | | | | | | | | 2,301,554 | |
| | | | China – 2.5% | | | | | | | | | | | | |
| | | | | | |
| | 2,424,000 | | | Agile Property Holdings | | | | | | | | | | | 2,184,933 | |
| | | | | | |
| | 1,931,350 | | | China Construction Bank, Class H | | | | | | | | | | | 1,419,031 | |
| | | | | | |
| | 256,400 | | | China Merchants Bank | | | | | | | | | | | 517,714 | |
| | | | | | |
| | 364,789 | | | China Suntien Green Energy, Class H | | | | | | | | | | | 82,963 | |
| | | | | | |
| | 19,484 | | | ENN Energy Holdings | | | | | | | | | | | 70,406 | |
| | | | | | |
| | 3,017,000 | | | Industrial & Commercial Bank of China, Class H | | | | | | | | | | | 1,884,006 | |
| | | | | | |
| | 21,700 | | | NetEase.com – ADR — | | | | | | | | | | | 1,027,929 | |
| | | | | | |
| | 51,896 | | | New Oriental Education & Technology Group – ADR — | | | | | | | | | | | 1,538,197 | |
Portfolio of Investments
Nuveen International Select Fund (continued)
October 31, 2011
| | | | | | | | | | | | | | | | |
| Shares | | | Description p | | | | | | | | | | Value | |
| | | | | | | | | | | | | | | | |
| | | | China (continued) | | | | | | | | | | | | |
| | | | | | |
| | 285,000 | | | Ping An Insurance | | | | | | | | | | $ | 2,113,674 | |
| | | | | | |
| | 101,500 | | | Tencent Holdings | | | | | | | | | | | 2,347,449 | |
| | | | | | |
| | 249,500 | | | Weichai Power, Class H | | | | | | | | | | | 1,255,449 | |
| | | | | | |
| | 132,658 | | | Zhejiang Expressway, Class H | | | | | | | | | | | 87,246 | |
| | | | Total China | | | | | | | | | | | 14,528,997 | |
| | | | Czech Republic – 0.0% | | | | | | | | | | | | |
| | | | | | |
| | 2,834 | | | CEZ | | | | | | | | | | | 119,838 | |
| | | | Denmark – 0.3% | | | | | | | | | | | | |
| | | | | | |
| | 16,879 | | | Novo Nordisk, Class B | | | | | | | | | | | 1,791,983 | |
| | | | Egypt – 0.8% | | | | | | | | | | | | |
| | | | | | |
| | 370,485 | | | Commercial International Bank | | | | | | | | | | | 1,648,578 | |
| | | | | | |
| | 34,206 | | | Eastern Tobacco | | | | | | | | | | | 539,040 | |
| | | | | | |
| | 23,297 | | | Mobinil | | | | | | | | | | | 403,195 | |
| | | | | | |
| | 45,175 | | | Orascom Construction Industries | | | | | | | | | | | 1,824,147 | |
| | | | Total Egypt | | | | | | | | | | | 4,414,960 | |
| | | | Finland – 0.4% | | | | | | | | | | | | |
| | | | | | |
| | 8,079 | | | Fortum Oyj | | | | | | | | | | | 196,628 | |
| | | | | | |
| | 333,869 | | | Nokia Oyj | | | | | | | | | | | 2,246,665 | |
| | | | Total Finland | | | | | | | | | | | 2,443,293 | |
| | | | France – 2.6% | | | | | | | | | | | | |
| | | | | | |
| | 1,836 | | | Aeroports de Paris | | | | | | | | | | | 144,149 | |
| | | | | | |
| | 42,870 | | | Alstom | | | | | | | | | | | 1,596,393 | |
| | | | | | |
| | 125,267 | | | AXA | | | | | | | | | | | 2,014,788 | |
| | | | | | |
| | 95,584 | | | Carrefour | | | | | | | | | | | 2,528,962 | |
| | | | | | |
| | 27,469 | | | CFAO | | | | | | | | | | | 1,061,074 | |
| | | | | | |
| | 2,755 | | | Electricite de France | | | | | | | | | | | 82,451 | |
| | | | | | |
| | 24,696 | | | DANONE | | | | | | | | | | | 1,711,998 | |
| | | | | | |
| | 75,195 | | | Groupe Eurotunnel | | | | | | | | | | | 677,352 | |
| | | | | | |
| | 13,999 | | | L’oreal | | | | | | | | | | | 1,541,365 | |
| | | | | | |
| | 75 | | | Rubis | | | | | | | | | | | 4,262 | |
| | | | | | |
| | 68,703 | | | Total | | | | | | | | | | | 3,584,733 | |
| | | | Total France | | | | | | | | | | | 14,947,527 | |
| | | | Germany – 5.3% | | | | | | | | | | | | |
| | | | | | |
| | 66,448 | | | Adidas | | | | | | | | | | | 4,679,719 | |
| | | | | | |
| | 104,351 | | | Aixtron | | | | | | | | | | | 1,477,499 | |
| | | | | | |
| | 35,084 | | | Allianz | | | | | | | | | | | 3,903,521 | |
| | | | | | |
| | 8,551 | | | BASF | | | | | | | | | | | 624,188 | |
| | | | | | |
| | 29,907 | | | Bayer | | | | | | | | | | | 1,905,435 | |
| | | | | | |
| | 26,413 | | | BMW | | | | | | | | | | | 2,145,637 | |
| | | | | | |
| | 32,851 | | | Deutsche Boerse — | | | | | | | | | | | 1,810,543 | |
| | | | | | |
| | 139,860 | | | E.ON | | | | | | | | | | | 3,372,722 | |
| | | | | | |
| | 9,822 | | | Fraport Frankfurt Airport | | | | | | | | | | | 618,411 | |
| | | | | | |
| | 8,681 | | | Hamburger Hafen und Logistik | | | | | | | | | | | 266,900 | |
| | | | | | |
| | 28,376 | | | Henkel KGAA | | | | | | | | | | | 1,686,814 | |
| | | | | | |
| | 32,263 | | | SAP | | | | | | | | | | | 1,950,877 | |
| | | | | | | | | | | | | | | | |
| Shares | | | Description p | | | | | | | | | | Value | |
| | | | | | | | | | | | | | | | |
| | | | Germany (continued) | | | | | | | | | | | | |
| | | | | | |
| | 27,085 | | | Siemens | | | | | | | | | | $ | 2,839,074 | |
| | | | | | |
| | 80,590 | | | Symrise | | | | | | | | | | | 2,086,070 | |
| | | | | | |
| | 16,317 | | | Wacker Chemie | | | | | | | | | | | 1,642,300 | |
| | | | Total Germany | | | | | | | | | | | 31,009,710 | |
| | | | Hong Kong – 2.7% | | | | | | | | | | | | |
| | | | | | |
| | 130,923 | | | Beijing Capital International Airport, Class H | | | | | | | | | | | 58,791 | |
| | | | | | |
| | 31,158 | | | Beijing Enterprises Holdings | | | | | | | | | | | 172,425 | |
| | | | | | |
| | 154,975 | | | Cheung Kong Holdings | | | | | | | | | | | 1,921,059 | |
| | | | | | |
| | 139,053 | | | Cheung Kong Infrastructure Holdings | | | | | | | | | | | 744,868 | |
| | | | | | |
| | 755,109 | | | China Everbright International | | | | | | | | | | | 218,004 | |
| | | | | | |
| | 2,619,000 | | | China Longyuan Power, Class H | | | | | | | | | | | 2,174,891 | |
| | | | | | |
| | 100,937 | | | China Merchants Holdings International | | | | | | | | | | | 311,464 | |
| | | | | | |
| | 6,275 | | | China Resources Gas Group | | | | | | | | | | | 9,117 | |
| | | | | | |
| | 1,406,000 | | | China Resources Land | | | | | | | | | | | 2,057,957 | |
| | | | | | |
| | 1,068,000 | | | China Unicom | | | | | | | | | | | 2,147,338 | |
| | | | | | |
| | 33,972 | | | CLP Holdings | | | | | | | | | | | 302,627 | |
| | | | | | |
| | 52,475 | | | Cosco Pacific | | | | | | | | | | | 73,015 | |
| | | | | | |
| | 193,230 | | | Hong Kong & China Gas | | | | | | | | | | | 435,652 | |
| | | | | | |
| | 129,629 | | | Hopewell Highway Infrastructure | | | | | | | | | | | 71,501 | |
| | | | | | |
| | 2,458,000 | | | Huabao International Holdings | | | | | | | | | | | 1,561,464 | |
| | | | | | |
| | 1,162,000 | | | Li & Fung | | | | | | | | | | | 2,239,400 | |
| | | | | | |
| | 415,918 | | | Li Ning | | | | | | | | | | | 396,515 | |
| | | | | | |
| | 178,731 | | | MTR | | | | | | | | | | | 576,940 | |
| | | | | | |
| | 42,654 | | | Power Assets Holdings | | | | | | | | | | | 324,120 | |
| | | | | | |
| | 107,270 | | | Towngas China | | | | | | | | | | | 57,705 | |
| | | | Total Hong Kong | | | | | | | | | | | 15,854,853 | |
| | | | Hungary – 0.3% | | | | | | | | | | | | |
| | | | | | |
| | 96,008 | | | OTP Bank | | | | | | | | | | | 1,505,425 | |
| | | | India – 2.0% | | | | | | | | | | | | |
| | | | | | |
| | 172,631 | | | Bank of India | | | | | | | | | | | 1,173,888 | |
| | | | | | |
| | 352,945 | | | Bharat Heavy Electricals | | | | | | | | | | | 2,291,475 | |
| | | | | | |
| | 4,795 | | | GAIL India – GDR | | | | | | | | | | | 252,457 | |
| | | | | | |
| | 66,444 | | | HDFC Bank – ADR | | | | | | | | | | | 2,103,617 | |
| | | | | | |
| | 17,400 | | | Infosys Technologies – ADR | | | | | | | | | | | 1,019,466 | |
| | | | | | |
| | 158,123 | | | Jindal Steel & Power | | | | | | | | | | | 1,811,739 | |
| | | | | | |
| | 80,964 | | | Power Grid | | | | | | | | | | | 173,487 | |
| | | | | | |
| | 144,748 | | | Punjab National Bank | | | | | | | | | | | 2,886,724 | |
| | | | Total India | | | | | | | | | | | 11,712,853 | |
| | | | Indonesia – 1.6% | | | | | | | | | | | | |
| | | | | | |
| | 1,401,566 | | | Bank of Mandiri | | | | | | | | | | | 1,118,010 | |
| | | | | | |
| | 2,732,500 | | | Perusahaan Gas Negara | | | | | | | | | | | 901,336 | |
| | | | | | |
| | 1,415,300 | | | Semen Gresik Persero | | | | | | | | | | | 1,505,897 | |
| | | | | | |
| | 547,700 | | | Tambang Batubara Bukit Asam | | | | | | | | | | | 1,123,157 | |
| | | | | | |
| | 98,500 | | | Telekomunikasi Indonesia – ADR | | | | | | | | | | | 3,329,300 | |
| | | | | | |
| | 469,519 | | | United Tractors | | | | | | | | | | | 1,291,438 | |
| | | | Total Indonesia | | | | | | | | | | | 9,269,138 | |
Portfolio of Investments
Nuveen International Select Fund (continued)
October 31, 2011
| | | | | | | | | | | | | | | | |
| Shares | | | Description p | | | | | | | | | | Value | |
| | | | | | | | | | | | | | | | |
| | | | Ireland – 1.3% | | | | | | | | | | | | |
| | | | | | |
| | 85,940 | | | Covidien | | | | | | | | | | $ | 4,042,618 | |
| | | | | | |
| | 148,270 | | | CRH | | | | | | | | | | | 2,682,590 | |
| | | | | | |
| | 104,067 | | | WPP | | | | | | | | | | | 1,077,203 | |
| | | | Total Ireland | | | | | | | | | | | 7,802,411 | |
| | | | Israel – 0.5% | | | | | | | | | | | | |
| | | | | | |
| | 35,041 | | | NICE Systems – ADR — | | | | | | | | | | | 1,253,066 | |
| | | | | | |
| | 44,374 | | | Teva Pharmaceutical Industries – ADR | | | | | | | | | | | 1,812,678 | |
| | | | Total Israel | | | | | | | | | | | 3,065,744 | |
| | | | Italy – 1.2% | | | | | | | | | | | | |
| | | | | | |
| | 60,410 | | | Atlantia | | | | | | | | | | | 920,126 | |
| | | | | | |
| | 5,534 | | | Autostrada Torino-Milano | | | | | | | | | | | 57,879 | |
| | | | | | |
| | 189,940 | | | Enel Green Power | | | | | | | | | | | 896,156 | |
| | | | | | |
| | 126,290 | | | Hera | | | | | | | | | | | 206,495 | |
| | | | | | |
| | 15,095 | | | IREN | | | | | | | | | | | 18,258 | |
| | | | | | |
| | 350,700 | | | Prada — | | | | | | | | | | | 1,758,285 | |
| | | | | | |
| | 71,325 | | | Saipem | | | | | | | | | | | 3,186,975 | |
| | | | | | |
| | 11,083 | | | Societa Iniziative Autostradali e Servizi | | | | | | | | | | | 91,597 | |
| | | | | | |
| | 116 | | | Terna-Rete Elettrica Nationale | | | | | | | | | | | 446 | |
| | | | Total Italy | | | | | | | | | | | 7,136,217 | |
| | | | Japan – 10.5% | | | | | | | | | | | | |
| | | | | | |
| | 130,749 | | | AMADA | | | | | | | | | | | 867,413 | |
| | | | | | |
| | 129,246 | | | Canon | | | | | | | | | | | 5,867,485 | |
| | | | | | |
| | 15,800 | | | FANUC | | | | | | | | | | | 2,554,706 | |
| | | | | | |
| | 460 | | | INPEX | | | | | | | | | | | 3,036,958 | |
| | | | | | |
| | 20,534 | | | Japan Airport Terminal | | | | | | | | | | | 271,638 | |
| | | | | | |
| | 13,319 | | | Kamigumi | | | | | | | | | | | 116,300 | |
| | | | | | |
| | 6,915 | | | Keyence | | | | | | | | | | | 1,757,868 | |
| | | | | | |
| | 106,200 | | | KOMATSU | | | | | | | | | | | 2,625,775 | |
| | | | | | |
| | 170,186 | | | Mitsubishi | | | | | | | | | | | 3,500,209 | |
| | | | | | |
| | 108,564 | | | Mitsui Sumitomo Insurance Group | | | | | | | | | | | 2,126,373 | |
| | | | | | |
| | 161,000 | | | NGK Insulators | | | | | | | | | | | 1,856,000 | |
| | | | | | |
| | 20,675 | | | Nintendo | | | | | | | | | | | 3,119,250 | |
| | | | | | |
| | 101,198 | | | NKSJ Holdings | | | | | | | | | | | 2,023,940 | |
| | | | | | |
| | 64,011 | | | Nomura Research Institute | | | | | | | | | | | 1,439,613 | |
| | | | | | |
| | 2,450 | | | Rakuten | | | | | | | | | | | 2,685,776 | |
| | | | | | |
| | 49,738 | | | SECOM | | | | | | | | | | | 2,352,266 | |
| | | | | | |
| | 24,173 | | | SMC | | | | | | | | | | | 3,759,910 | |
| | | | | | |
| | 42,783 | | | Sugi Holdings | | | | | | | | | | | 1,116,533 | |
| | | | | | |
| | 141,592 | | | Sumitomo Metal Mining | | | | | | | | | | | 1,949,086 | |
| | | | | | |
| | 1,042,207 | | | Sumitomo Mitsui Trust | | | | | | | | | | | 3,566,562 | |
| | | | | | |
| | 195,730 | | | Suzuki Motor | | | | | | | | | | | 4,151,265 | |
| | | | | | |
| | 39,000 | | | TERUMO | | | | | | | | | | | 1,981,591 | |
| | | | | | |
| | 773,284 | | | The Bank of Yokohama | | | | | | | | | | | 3,540,416 | |
| | | | | | |
| | 64,849 | | | THK | | | | | | | | | | | 1,263,842 | |
| | | | | | |
| | 62,215 | | | TOKYO GAS | | | | | | | | | | | 267,918 | |
| | | | | | | | | | | | | | | | |
| Shares | | | Description p | | | | | | | | | | Value | |
| | | | | | | | | | | | | | | | |
| | | | Japan (continued) | | | | | | | | | | | | |
| | | | | | |
| | 97,100 | | | Toyota Motor | | | | | | | | | | $ | 3,223,796 | |
| | | | Total Japan | | | | | | | | | | | 61,022,489 | |
| | | | Lebanon – 0.1% | | | | | | | | | | | | |
| | | | | | |
| | 61,070 | | | Equatorial Energia | | | | | | | | | | | 399,462 | |
| | | | Luxembourg – 0.7% | | | | | | | | | | | | |
| | | | | | |
| | 21,539 | | | Millicom International Cellular | | | | | | | | | | | 2,375,460 | |
| | | | | | |
| | 27,255 | | | Oriflame Cosmetics – SDR | | | | | | | | | | | 1,084,359 | |
| | | | | | |
| | 14,869 | | | SES | | | | | | | | | | | 379,777 | |
| | | | Total Luxembourg | | | | | | | | | | | 3,839,596 | |
| | | | Malaysia – 0.3% | | | | | | | | | | | | |
| | | | | | |
| | 61,800 | | | British American Tobacco | | | | | | | | | | | 930,401 | |
| | | | | | |
| | 318,932 | | | Sime Darby Berhad | | | | | | | | | | | 920,016 | |
| | | | Total Malaysia | | | | | | | | | | | 1,850,417 | |
| | | | Mexico – 1.7% | | | | | | | | | | | | |
| | | | | | |
| | 90,400 | | | America Movil, Series L – ADR | | | | | | | | | | | 2,297,968 | |
| | | | | | |
| | 29,700 | | | Desarrolladora Homex – ADR — | | | | | | | | | | | 444,312 | |
| | | | | | |
| | 1,645 | | | Grupo Aeroportuario del Sureste – ADR | | | | | | | | | | | 94,752 | |
| | | | | | |
| | 919,353 | | | Grupo Mexico, Series B | | | | | | | | | | | 2,548,279 | |
| | | | | | |
| | 70,400 | | | Grupo Televisa – ADR | | | | | | | | | | | 1,501,632 | |
| | | | | | |
| | 182,700 | | | Kimberly-Clark de Mexico, Series A | | | | | | | | | | | 1,039,829 | |
| | | | | | |
| | 128,274 | | | OHL Mexico — | | | | | | | | | | | 199,336 | |
| | | | | | |
| | 71,951 | | | Wal-Mart de Mexico – ADR | | | | | | | | | | | 1,849,141 | |
| | | | Total Mexico | | | | | | | | | | | 9,975,249 | |
| | | | Netherlands – 0.8% | | | | | | | | | | | | |
| | | | | | |
| | 88,133 | | | Heineken | | | | | | | | | | | 4,281,652 | |
| | | | | | |
| | 9,289 | | | Koninklijke Vopak | | | | | | | | | | | 478,774 | |
| | | | Total Netherlands | | | | | | | | | | | 4,760,426 | |
| | | | New Zealand – 0.1% | | | | | | | | | | | | |
| | | | | | |
| | 59,830 | | | Auckland International Airport | | | | | | | | | | | 112,966 | |
| | | | | | |
| | 159,773 | | | Infratil | | | | | | | | | | | 237,876 | |
| | | | | | |
| | 49,175 | | | Port of Tauranga | | | | | | | | | | | 384,883 | |
| | | | Total New Zealand | | | | | | | | | | | 735,725 | |
| | | | Norway – 1.0% | | | | | | | | | | | | |
| | | | | | |
| | 9,437 | | | Hafslund, Class B | | | | | | | | | | | 96,385 | |
| | | | | | |
| | 373,710 | | | Norsk Hydro | | | | | | | | | | | 1,935,822 | |
| | | | | | |
| | 201,735 | | | Telenor ASA | | | | | | | | | | | 3,593,452 | |
| | | | Total Norway | | | | | | | | | | | 5,625,659 | |
| | | | Philippines – 0.6% | | | | | | | | | | | | |
| | | | | | |
| | 137,138 | | | International Container Terminal Services | | | | | | | | | | | 177,054 | |
| | | | | | |
| | 890,835 | | | Metro Pacific Investments | | | | | | | | | | | 67,747 | |
| | | | | | |
| | 59,600 | | | Philippine Long Distance Telephone – ADR | | | | | | | | | | | 3,310,184 | |
| | | | Total Philippines | | | | | | | | | | | 3,554,985 | |
| | | | Portugal – 0.2% | | | | | | | | | | | | |
| | | | | | |
| | 9,614 | | | Brisa Auto-Estradas de Portugal | | | | | | | | | | | 32,722 | |
Portfolio of Investments
Nuveen International Select Fund (continued)
October 31, 2011
| | | | | | | | | | | | | | | | |
| Shares | | | Description p | | | | | | | | | | Value | |
| | | | | | | | | | | | | | | | |
| | | | Portugal (continued) | | | | | | | | | | | | |
| | | | | | |
| | 403,981 | | | Energias de Portugal | | | | | | | | | | $ | 1,269,113 | |
| | | | Totla Portugal | | | | | | | | | | | 1,301,835 | |
| | | | Russia – 2.4% | | | | | | | | | | | | |
| | | | | | |
| | 189,961 | | | Gazprom – ADR | | | | | | | | | | | 2,205,447 | |
| | | | | | |
| | 176,187 | | | Gazprom OAO – ADR | | | | | | | | | | | 2,056,102 | |
| | | | | | |
| | 21,100 | | | LUKOIL – ADR | | | | | | | | | | | 1,222,137 | |
| | | | | | |
| | 43,971 | | | Magnit – GDR | | | | | | | | | | | 957,165 | |
| | | | | | |
| | 162,450 | | | Mobile TeleSystems – ADR | | | | | | | | | | | 2,321,411 | |
| | | | | | |
| | 825,980 | | | Sberbank | | | | | | | | | | | 2,316,874 | |
| | | | | | |
| | 408,336 | | | TNK-BP Holding | | | | | | | | | | | 1,116,787 | |
| | | | | | |
| | 36,824 | | | Uralkali – GDR, Class S | | | | | | | | | | | 1,586,815 | |
| | | | Total Russia | | | | | | | | | | | 13,782,738 | |
| | | | Singapore – 1.1% | | | | | | | | | | | | |
| | | | | | |
| | 477,013 | | | CitySpring Infrastructure Trust | | | | | | | | | | | 142,110 | |
| | | | | | |
| | 379,392 | | | ComfortDelGro | | | | | | | | | | | 420,390 | |
| | | | | | |
| | 207,870 | | | DBS Group Holdings | | | | | | | | | | | 2,030,426 | |
| | | | | | |
| | 3,309,836 | | | Golden Agri-Resources | | | | | | | | | | | 1,694,384 | |
| | | | | | |
| | 27,559 | | | Hyflux | | | | | | | | | | | 31,297 | |
| | | | | | |
| | 142,794 | | | Parkway Life – REIT | | | | | | | | | | | 203,771 | |
| | | | | | |
| | 102,027 | | | SembCorp Industries | | | | | | | | | | | 336,374 | |
| | | | | | |
| | 169,101 | | | Singapore Airport Terminal Services | | | | | | | | | | | 329,477 | |
| | | | | | |
| | 549,934 | | | Singapore Post | | | | | | | | | | | 447,813 | |
| | | | | | |
| | 50,129 | | | Singapore Telecommunications — | | | | | | | | | | | 126,742 | |
| | | | | | |
| | 325,498 | | | SMRT | | | | | | | | | | | 476,635 | |
| | | | Total Singapore | | | | | | | | | | | 6,239,419 | |
| | | | South Africa – 3.2% | | | | | | | | | | | | |
| | | | | | |
| | 104,097 | | | Bidvest Group | | | | | | | | | | | 2,058,464 | |
| | | | | | |
| | 29,021 | | | Kumba Iron Ore | | | | | | | | | | | 1,714,341 | |
| | | | | | |
| | 32,338 | | | Massmart Holdings | | | | | | | | | | | 643,859 | |
| | | | | | |
| | 163,940 | | | MTN Group | | | | | | | | | | | 2,849,409 | |
| | | | | | |
| | 291,390 | | | Murray & Roberts Holdings | | | | | | | | | | | 884,340 | |
| | | | | | |
| | 79,661 | | | Nedbank Group | | | | | | | | | | | 1,409,374 | |
| | | | | | |
| | 334,892 | | | Pretoria Portland Cement | | | | | | | | | | | 1,014,188 | |
| | | | | | |
| | 323,420 | | | Sanlam | | | | | | | | | | | 1,208,785 | |
| | | | | | |
| | 168,305 | | | Shoprite Holdings | | | | | | | | | | | 2,463,948 | |
| | | | | | |
| | 94,427 | | | Standard Bank Group | | | | | | | | | | | 1,159,500 | |
| | | | | | |
| | 55,870 | | | Tiger Brands | | | | | | | | | | | 1,603,198 | |
| | | | | | |
| | 185,636 | | | Truworths International | | | | | | | | | | | 1,868,082 | |
| | | | Total South Africa | | | | | | | | | | | 18,877,488 | |
| | | | South Korea – 4.0% | | | | | | | | | | | | |
| | | | | | |
| | 23,085 | | | Hite Jinro | | | | | | | | | | | 526,595 | |
| | | | | | |
| | 4,997 | | | Hyundai Mobis | | | | | | | | | | | 1,430,098 | |
| | | | | | |
| | 39,580 | | | KB Financial Group | | | | | | | | | | | 1,533,403 | |
| | | | | | |
| | 323,002 | | | Korea Life Insurance | | | | | | | | | | | 1,804,495 | |
| | | | | | |
| | 47,860 | | | KT&G | | | | | | | | | | | 2,993,931 | |
| | | | | | | | | | | | | | | | |
| Shares | | | Description p | | | | | | | | | | Value | |
| | | | | | | | | | | | | | | | |
| | | | South Korea (continued) | | | | | | | | | | | | |
| | | | | | |
| | 10,351 | | | NHN | | | | | | | | | | $ | 2,159,433 | |
| | | | | | |
| | 3,859 | | | Samsung Electronics – GDR | | | | | | | | | | | 3,322,063 | |
| | | | | | |
| | 8,236 | | | Samsung Electronics – GDR | | | | | | | | | | | 3,597,026 | |
| | | | | | |
| | 101,306 | | | Shinhan Financial Group – ADR | | | | | | | | | | | 4,035,741 | |
| | | | | | |
| | 52,357 | | | Woongjin Coway | | | | | | | | | | | 1,803,642 | |
| | | | Total South Korea | | | | | | | | | | | 23,206,427 | |
| | | | Spain – 0.7% | | | | | | | | | | | | |
| | | | | | |
| | 187,439 | | | Banco Santander — | | | | | | | | | | | 1,586,458 | |
| | | | | | |
| | 61,774 | | | Distribuidora International de Alimentacion — | | | | | | | | | | | 282,500 | |
| | | | | | |
| | 6,458 | | | Enagas | | | | | | | | | | | 126,987 | |
| | | | | | |
| | 10,638 | | | Ferrovial | | | | | | | | | | | 135,210 | |
| | | | | | |
| | 98,535 | | | Grifols | | | | | | | | | | | 1,832,010 | |
| | | | Total Spain | | | | | | | | | | | 3,963,165 | |
| | | | Sweden – 0.5% | | | | | | | | | | | | |
| | | | | | |
| | 267,293 | | | Ericsson | | | | | | | | | | | 2,786,136 | |
| | | | Switzerland – 5.8% | | | | | | | | | | | | |
| | | | | | |
| | 100,166 | | | ABB | | | | | | | | | | | 1,885,667 | |
| | | | | | |
| | 45,807 | | | Adecco | | | | | | | | | | | 2,199,983 | |
| | | | | | |
| | 37,197 | | | Compagnie Financiere Richemont | | | | | | | | | | | 2,118,913 | |
| | | | | | |
| | 414 | | | Flughafen Zuerich | | | | | | | | | | | 158,766 | |
| | | | | | |
| | 111,623 | | | Foster Wheeler | | | | | | | | | | | 2,379,802 | |
| | | | | | |
| | 35,142 | | | Holcim | | | | | | | | | | | 2,225,406 | |
| | | | | | |
| | 100,002 | | | Nestle | | | | | | | | | | | 5,783,885 | |
| | | | | | |
| | 111,110 | | | Noble | | | | | | | | | | | 3,993,293 | |
| | | | | | |
| | 51,587 | | | Novartis | | | | | | | | | | | 2,906,168 | |
| | | | | | |
| | 42,139 | | | Roche Holding | | | | | | | | | | | 6,913,721 | |
| | | | | | |
| | 94,696 | | | UBS | | | | | | | | | | | 1,196,788 | |
| | | | | | |
| | 133,006 | | | Xstrata | | | | | | | | | | | 2,215,418 | |
| | | | Total Switzerland | | | | | | | | | | | 33,977,810 | |
| | | | Taiwan – 1.5% | | | | | | | | | | | | |
| | | | | | |
| | 89,000 | | | Delta Electronics | | | | | | | | | | | 209,261 | |
| | | | | | |
| | 1,186,497 | | | Hon Hai Precision Industry | | | | | | | | | | | 3,252,637 | |
| | | | | | |
| | 75,706 | | | HTC | | | | | | | | | | | 1,701,374 | |
| | | | | | |
| | 122,150 | | | MediaTek | | | | | | | | | | | 1,281,875 | |
| | | | | | |
| | 975,961 | | | Taiwan Semiconductor Manufacturing | | | | | | | | | | | 2,378,297 | |
| | | | Total Taiwan | | | | | | | | | | | 8,823,444 | |
| | | | Thailand – 0.9% | | | | | | | | | | | | |
| | | | | | |
| | 88,000 | | | Banpu Public | | | | | | | | | | | 1,813,110 | |
| | | | | | |
| | 703,400 | | | CP ALL | | | | | | | | | | | 1,075,115 | |
| | | | | | |
| | 214,600 | | | Kasikornbank | | | | | | | | | | | 866,671 | |
| | | | | | |
| | 38,400 | | | PTT Exploration and Production Public Company | | | | | | | | | | | 208,546 | |
| | | | | | |
| | 98,200 | | | Siam Cement | | | | | | | | | | | 1,176,228 | |
| | | | Total Thailand | | | | | | | | | | | 5,139,670 | |
| | | | Turkey – 1.8% | | | | | | | | | | | | |
| | | | | | |
| | 377,681 | | | Akbank T.A.S. | | | | | | | | | | | 1,375,494 | |
Portfolio of Investments
Nuveen International Select Fund (continued)
October 31, 2011
| | | | | | | | | | | | | | | | |
| Shares | | | Description p | | | | | | | | | | Value | |
| | | | | | | | | | | | | | | | |
| | | | Turkey (continued) | | | | | | | | | | | | |
| | | | | | |
| | 413,264 | | | Koc Holding | | | | | | | | | | $ | 1,468,979 | |
| | | | | | |
| | 216,000 | | | Turkcell Iletisim Hizmetleri – ADR | | | | | | | | | | | 2,661,120 | |
| | | | | | |
| | 610,880 | | | Turkiye Garanti Bankasi | | | | | | | | | | | 2,143,315 | |
| | | | | | |
| | 1,170,650 | | | Turkiye Is Bankasi, Class C | | | | | | | | | | | 2,720,882 | |
| | | | Total Turkey | | | | | | | | | | | 10,369,790 | |
| | | | United Kingdom – 9.5% | | | | | | | | | | | | |
| | | | | | |
| | 117,832 | | | Anglo American | | | | | | | | | | | 4,319,772 | |
| | | | | | |
| | 190,093 | | | ARM Holdings | | | | | | | | | | | 1,783,618 | |
| | | | | | |
| | 120,170 | | | BG Group | | | | | | | | | | | 2,605,765 | |
| | | | | | |
| | 48,611 | | | BP – ADR | | | | | | | | | | | 2,147,634 | |
| | | | | | |
| | 154,106 | | | British Sky Broadcasting Group | | | | | | | | | | | 1,737,617 | |
| | | | | | |
| | 206,566 | | | Centrica | | | | | | | | | | | 983,376 | |
| | | | | | |
| | 224,723 | | | Diageo | | | | | | | | | | | 4,650,810 | |
| | | | | | |
| | 246,405 | | | GlaxoSmithKline | | | | | | | | | | | 5,529,903 | |
| | | | | | |
| | 47,816 | | | HSBC Holdings – ADR | | | | | | | | | | | 2,087,647 | |
| | | | | | |
| | 27,954 | | | National Grid – ADR | | | | | | | | | | | 1,399,657 | |
| | | | | | |
| | 7,847 | | | Pennon Group | | | | | | | | | | | 87,657 | |
| | | | | | |
| | 233,990 | | | Prudential | | | | | | | | | | | 2,416,906 | |
| | | | | | |
| | 402,827 | | | Reed Elsevier | | | | | | | | | | | 3,448,527 | |
| | | | | | |
| | 251,076 | | | Rolls-Royce Group | | | | | | | | | | | 2,826,226 | |
| | | | | | |
| | 70,514 | | | Schroders | | | | | | | | | | | 1,613,936 | |
| | | | | | |
| | 20,403 | | | Scottish & Southern Energy | | | | | | | | | | | 440,830 | |
| | | | | | |
| | 11,382 | | | Severn Trent | | | | | | | | | | | 277,044 | |
| | | | | | |
| | 139,782 | | | Standard Chartered | | | | | | | | | | | 3,261,715 | |
| | | | | | |
| | 390,706 | | | Tesco | | | | | | | | | | | 2,519,041 | |
| | | | | | |
| | 74,009 | | | United Utilities Group | | | | | | | | | | | 721,456 | |
| | | | | | |
| | 156,481 | | | Vedanta Resources | | | | | | | | | | | 3,193,936 | |
| | | | | | |
| | 129,493 | | | Vodafone Group – ADR | | | | | | | | | | | 3,605,085 | |
| | | | | | |
| | 106,307 | | | Willis Group Holdings | | | | | | | | | | | 3,860,007 | |
| | | | Total United Kingdom | | | | | | | | | | | 55,518,165 | |
| | | | United States – 2.8% | | | | | | | | | | | | |
| | | | | | |
| | 2,842 | | | American States Water | | | | | | | | | | | 99,299 | |
| | | | | | |
| | 27,807 | | | American Tower, Class A — | | | | | | | | | | | 1,532,166 | |
| | | | | | |
| | 2,919 | | | American Water Works | | | | | | | | | | | 89,117 | |
| | | | | | |
| | 36,590 | | | Brookfield Infrastructure Partners | | | | | | | | | | | 918,043 | |
| | | | | | |
| | 38,450 | | | Bunge | | | | | | | | | | | 2,375,056 | |
| | | | | | |
| | 57 | | | California Water Service Group | | | | | | | | | | | 1,058 | |
| | | | | | |
| | 8,749 | | | Chesapeake Utilities | | | | | | | | | | | 370,870 | |
| | | | | | |
| | 2,522 | | | Consolidated Edison | | | | | | | | | | | 145,948 | |
| | | | | | |
| | 20,879 | | | Crown Castle International — | | | | | | | | | | | 863,555 | |
| | | | | | |
| | 9,895 | | | Dominion Resources | | | | | | | | | | | 510,483 | |
| | | | | | |
| | 27,280 | | | El Paso | | | | | | | | | | | 682,273 | |
| | | | | | |
| | 2,493 | | | Exelon | | | | | | | | | | | 110,664 | |
| | | | | | |
| | 7,102 | | | ITC Holdings | | | | | | | | | | | 516,173 | |
| | | | | | |
| | 690 | | | Kinder Morgan | | | | | | | | | | | 19,734 | |
| | | | | | | | | | | | | | | | |
| Shares | | | Description p | | | | | | | | | | Value | |
| | | | | | | | | | | | | | | | |
| | | | United States (continued) | | | | | | | | | | | | |
| | | | | | |
| | 5,103 | | | NextEra Energy | | | | | | | | | | $ | 287,809 | |
| | | | | | |
| | 12,117 | | | NiSource | | | | | | | | | | | 267,665 | |
| | | | | | |
| | 4,328 | | | Northeast Utilities — | | | | | | | | | | | 149,619 | |
| | | | | | |
| | 2,863 | | | Northwest Natural Gas | | | | | | | | | | | 133,759 | |
| | | | | | |
| | 10,831 | | | OGE Energy | | | | | | | | | | | 560,396 | |
| | | | | | |
| | 33,699 | | | Philip Morris International | | | | | | | | | | | 2,354,549 | |
| | | | | | |
| | 7,416 | | | PPL | | | | | | | | | | | 217,808 | |
| | | | | | |
| | 39,500 | | | Questar | | | | | | | | | | | 761,165 | |
| | | | | | |
| | 1,378 | | | Republic Services | | | | | | | | | | | 39,218 | |
| | | | | | |
| | 8,100 | | | Schlumberger | | | | | | | | | | | 595,107 | |
| | | | | | |
| | 3,107 | | | Sempra Energy | | | | | | | | | | | 166,939 | |
| | | | | | |
| | 158 | | | SJW | | | | | | | | | | | 3,678 | |
| | | | | | |
| | 35,297 | | | Spectra Energy | | | | | | | | | | | 1,010,553 | |
| | | | | | |
| | 7,640 | | | Standard Parking — | | | | | | | | | | | 134,388 | |
| | | | | | |
| | 6,936 | | | UIL Holdings | | | | | | | | | | | 236,379 | |
| | | | | | |
| | 1,966 | | | Unitil | | | | | | | | | | | 52,433 | |
| | | | | | |
| | 13,558 | | | Waste Connections | | | | | | | | | | | 461,650 | |
| | | | | | |
| | 16,072 | | | Wisconsin Energy | | | | | | | | | | | 521,215 | |
| | | | | | |
| | 13,538 | | | Xcel Energy | | | | | | | | | | | 349,957 | |
| | | | Total United States | | | | | | | | | | | 16,538,726 | |
| | | | Total Common Stocks (cost $515,130,695) | | | | | | | | | | | 503,454,816 | |
| | | | EXCHANGE-TRADED FUNDS – 5.1% | | | | | | | | | | | | |
| | | | | | |
| | | | United States – 5.1% | | | | | | | | | | | | |
| | | | | | |
| | 1,311 | | | iShares MSCI Indonesia Investable Market Index Fund | | | | | | | | | | | 39,107 | |
| | | | | | |
| | 363,000 | | | iShares MSCI Malaysia Index Fund | | | | | | | | | | | 5,038,440 | |
| | | | | | |
| | 241,000 | | | Market Vectors Agribusiness | | | | | | | | | | | 12,057,230 | |
| | | | | | |
| | 120,000 | | | Market Vectors Gold Miners | | | | | | | | | | | 7,059,600 | |
| | | | | | |
| | 181,000 | | | Market Vectors Russia | | | | | | | | | | | 5,513,260 | |
| | | | Total Exchange-Traded Funds (cost $31,546,782) | | | | | | | | | | | 29,707,637 | |
| | | | RIGHTS – 0.0% | | | | | | | | | | | | |
| | | | | | |
| | | | Spain – 0.0% | | | | | | | | | | | | |
| | | | | | |
| | 187,439 | | | Banco Santander — | | | | | | | | | | | 32,420 | |
| | | | Total Rights (cost $–) | | | | | | | | | | | 32,420 | |
| | | | | | |
Shares/ Principal Amount (000) | | | Description p | | | | | | | | | | Value | |
| | | | SHORT-TERM INVESTMENTS – 8.5% | | | | | | | | | | | | |
| | | | Money Market Funds – 3.6% | | | | | | | | | | | | |
| | | | | | |
| | 21,253,411 | | | State Street Institutional Liquid Reserves Fund, 0.150% W | | | | | | | | | | $ | 21,253,411 | |
Portfolio of Investments
Nuveen International Select Fund (continued)
October 31, 2011
| | | | | | | | | | | | | | | | |
| | | | | | |
Shares/ Principal Amount (000) | | | Description p | | | | | | | | | | Value | |
| | | | | | | | | | | | | | | | |
| | | | | | |
| | | | U.S. Treasury Obligations – 4.9% | | | | | | | | | | | | |
| | | | | | |
| | | | U.S. Treasury Bills ¨ | | | | | | | | | | | | |
| | | | | | |
| $ | 24,750 | | | 0.022%, 03/01/2012 | | | | | | | | | | $ | 24,748,169 | |
| | | | | | |
| | 4,025 | | | 0.025%, 03/08/2012 | | | | | | | | | | | 4,024,642 | |
| | | | | | |
| | 28,775 | | | Total U.S. Treasury Obligations | | | | | | | | | | | 28,772,811 | |
| | | | Total Short-Term Investments (cost $50,026,407) | | | | | | | | | | | 50,026,222 | |
| | | | Total Investments (cost $596,703,884) – 99.9% | | | | | | | | | | | 583,221,095 | |
| | | | Other Assets Less Liabilities – 0.1% ¯ | | | | | | | | | | | 493,594 | |
| | | | Net Assets – 100.0% | | | | | | | | | | $ | 583,714,689 | |
Investments in Derivatives at October 31, 2011
Futures Contracts outstanding:
| | | | | | | | | | | | | | | | | | | | |
| Description | | Contract
Position | | | Number of
Contracts | | | Contract
Expiration | | | Value | | | Unrealized
Appreciation
(Depreciation) | |
Australian Dollar Currency | | | Short | | | | (135 | ) | | | 12/11 | | | $ | (14,216,850 | ) | | $ | (536,510 | ) |
British Pound Currency | | | Short | | | | (9 | ) | | | 12/11 | | | | (907,088 | ) | | | (44,416 | ) |
Dollar Index | | | Long | | | | 240 | | | | 12/11 | | | | 18,313,442 | | | | (257,398 | ) |
E-Mini MSCI EAFE | | | Long | | | | 103 | | | | 12/11 | | | | 7,626,635 | | | | 489,954 | |
E-Mini MSCI Emerging Market Index | | | Long | | | | 384 | | | | 12/11 | | | | 18,750,720 | | | | 452,302 | |
Euro FX Currency | | | Short | | | | (24 | ) | | | 12/11 | | | | (4,176,000 | ) | | | (143,296 | ) |
FTSE 100 Index | | | Long | | | | 356 | | | | 12/11 | | | | 31,703,021 | | | | 2,293,060 | |
FTSE JSE Top 40 | | | Short | | | | (441 | ) | | | 12/11 | | | | (16,197,879 | ) | | | (1,020,104 | ) |
H-Shares Index | | | Long | | | | 57 | | | | 11/11 | | | | 3,839,473 | | | | 275,946 | |
Mexican Bolsa Index | | | Short | | | | (65 | ) | | | 12/11 | | | | (1,764,808 | ) | | | (120,874 | ) |
Nasdaq 100 E-Mini | | | Short | | | | (446 | ) | | | 12/11 | | | | (21,015,520 | ) | | | (1,280,074 | ) |
Nikkei 225 Index | | | Long | | | | 479 | | | | 12/11 | | | | 21,291,550 | | | | 464,869 | |
OMXS 30 Index | | | Long | | | | 730 | | | | 11/11 | | | | 11,194,495 | | | | 445,228 | |
Russell 2000 Mini Index | | | Short | | | | (414 | ) | | | 12/11 | | | | (30,607,020 | ) | | | (1,949,319 | ) |
S&P 500 Index | | | Short | | | | (73 | ) | | | 12/11 | | | | (22,799,725 | ) | | | (1,266,842 | ) |
S&P TSX 60 | | | Long | | | | 171 | | | | 12/11 | | | | 23,904,831 | | | | (278,901 | ) |
SGX S&P CNX Nifty | | | Short | | | | (446 | ) | | | 11/11 | | | | (4,769,524 | ) | | | (209,620 | ) |
SPI 200 | | | Long | | | | 307 | | | | 12/11 | | | | 34,651,793 | | | | 1,503,163 | |
STOXX Euro Small 20 Index | | | Short | | | | (391 | ) | | | 12/11 | | | | (4,198,367 | ) | | | (284,304 | ) |
| | | | | | | | | | | | | | | | | | | $ | (1,467,136 | ) |
| | | | For Fund portfolio compliance purposes, the Fund’s industry classifications refer to any one or more of the industry sub-classifications used by one or more widely recognized market indexes or ratings group indexes, and/or as defined by Fund management. This definition may not apply for purposes of this report which may combine industry sub-classifications into sectors for reporting ease. |
| | p | | All percentages shown in the Portfolio of Investments are based on net assets. |
| | — | | Non-income producing; issuer has not declared a dividend within the past twelve months. |
| | | | Investment valued at fair value using methods determined in good faith by, or at the discretion of, the Board of Directors. For fair value measurement disclosure purposes, investment categorized as Level 3. See Notes to Financial Statements Footnote 1 – General Information and Significant Accounting Policies, Investment Valuation for more information. |
| | ¨ | | Investment, or portion of investment, segregated as collateral for investments in derivatives. Yield shown is the annualized effective yield as of October 31, 2011. |
| | W | | The rate shown is the annualized seven-day effective yield as of October 31, 2011. |
| | ¯ | | Other Assets Less Liabilities includes the net Unrealized Appreciation (Depreciation) of derivatives instruments as listed within Investments in Derivatives at October 31, 2011. |
| | ADR | | American Depositary Receipt |
| | BDR | | Brazilian Depositary Receipt |
| | GDR | | Global Depositary Receipt |
| | REIT | | Real Estate Investment Trust |
| | SDR | | Swedish Depositary Receipt |
See accompanying notes to financial statements.
Portfolio of Investments
Nuveen Quantitative Enhanced Core Equity Fund
(formerly known as Nuveen Quantitative Large Cap Core Fund and First American Quantitative Large Cap Core Fund)
October 31, 2011
| | | | | | | | | | | | | | | | |
| Shares | | | Description p | | | | | | | | | | Value | |
| | | | | | | | | | | | | | | | |
| | | | COMMON STOCKS – 98.0% | | | | | | | | | | | | |
| | | | | | |
| | | | Consumer Discretionary – 7.6% | | | | | | | | | | | | |
| | | | | | |
| | 2,160 | | | Amazon.com — q | | | | | | | | | | $ | 461,182 | |
| | | | | | |
| | 2,627 | | | Autoliv q | | | | | | | | | | | 151,762 | |
| | | | | | |
| | 2,329 | | | Bed Bath & Beyond — q | | | | | | | | | | | 144,025 | |
| | | | | | |
| | 11,281 | | | Carnival q | | | | | | | | | | | 397,204 | |
| | | | | | |
| | 5,919 | | | Coach | | | | | | | | | | | 385,149 | |
| | | | | | |
| | 14,954 | | | Comcast, Class A q | | | | | | | | | | | 350,671 | |
| | | | | | |
| | 996 | | | Foot Locker q | | | | | | | | | | | 21,772 | |
| | | | | | |
| | 9,373 | | | Gap q | | | | | | | | | | | 177,150 | |
| | | | | | |
| | 3,950 | | | Guess? | | | | | | | | | | | 130,310 | |
| | | | | | |
| | 8,762 | | | Home Depot q | | | | | | | | | | | 313,680 | |
| | | | | | |
| | 1,190 | | | J Crew Group Escrow Shares — n | | | | | | | | | | | — | |
| | | | | | |
| | 8,790 | | | Johnson Controls q | | | | | | | | | | | 289,455 | |
| | | | | | |
| | 285 | | | Kohl’s | | | | | | | | | | | 15,108 | |
| | | | | | |
| | 26,234 | | | Lowe’s q | | | | | | | | | | | 551,439 | |
| | | | | | |
| | 4,794 | | | Mattel q | | | | | | | | | | | 135,382 | |
| | | | | | |
| | 2,878 | | | McGraw-Hill | | | | | | | | | | | 122,315 | |
| | | | | | |
| | 17,037 | | | Newell Rubbermaid | | | | | | | | | | | 252,148 | |
| | | | | | |
| | 60,454 | | | News, Class A | | | | | | | | | | | 1,059,154 | |
| | | | | | |
| | 4,900 | | | Nike, Class B q | | | | | | | | | | | 472,115 | |
| | | | | | |
| | 1,640 | | | Nordstrom q | | | | | | | | | | | 83,132 | |
| | | | | | |
| | 2,782 | | | Omnicom Group q | | | | | | | | | | | 123,743 | |
| | | | | | |
| | 14,840 | | | Signet Jewelers | | | | | | | | | | | 639,752 | |
| | | | | | |
| | 4,260 | | | Stanley Black & Decker | | | | | | | | | | | 272,001 | |
| | | | | | |
| | 7,398 | | | Staples q | | | | | | | | | | | 110,674 | |
| | | | | | |
| | 2,907 | | | Target | | | | | | | | | | | 159,158 | |
| | | | | | |
| | 2,492 | | | TJX | | | | | | | | | | | 146,854 | |
| | | | | | |
| | 321 | | | TRW Automotive Holdings — | | | | | | | | | | | 13,514 | |
| | | | | | |
| | 1,427 | | | Tupperware | | | | | | | | | | | 80,683 | |
| | | | | | |
| | 10,930 | | | Viacom, Class B | | | | | | | | | | | 479,280 | |
| | | | | | |
| | 20,911 | | | Walt Disney q | | | | | | | | | | | 729,376 | |
| | | | Total Consumer Discretionary | | | | | | | | | | | 8,268,188 | |
| | | | Consumer Staples – 8.1% | | | | | | | | | | | | |
| | | | | | |
| | 9,656 | | | Altria Group q | | | | | | | | | | | 266,023 | |
| | | | | | |
| | 20,064 | | | Archer-Daniels-Midland q | | | | | | | | | | | 580,652 | |
| | | | | | |
| | 4,850 | | | Avon Products | | | | | | | | | | | 88,658 | |
| | | | | | |
| | 17,617 | | | Coca-Cola | | | | | | | | | | | 1,203,593 | |
| | | | | | |
| | 28,700 | | | Coca-Cola Enterprises | | | | | | | | | | | 769,734 | |
| | | | | | |
| | 1,469 | | | Colgate-Palmolive | | | | | | | | | | | 132,754 | |
| | | | | | |
| | 7,659 | | | ConAgra Foods | | | | | | | | | | | 194,002 | |
| | | | | | |
| | 6,552 | �� | | Corn Products International | | | | | | | | | | | 317,772 | |
| | | | | | |
| | 7,819 | | | CVS Caremark | | | | | | | | | | | 283,830 | |
| | | | | | |
| | 303 | | | General Mills | | | | | | | | | | | 11,675 | |
| | | | | | |
| | 303 | | | Hansen Natural — | | | | | | | | | | | 26,994 | |
| | | | | | |
| | 479 | | | JM Smucker | | | | | | | | | | | 36,893 | |
Portfolio of Investments
Nuveen Quantitative Enhanced Core Equity Fund (continued)
October 31, 2011
| | | | | | | | | | | | | | | | |
| Shares | | | Description p | | | | | | | | | | Value | |
| | | | | | | | | | | | | | | | |
| | | | Consumer Staples (continued) | | | | | | | | | | | | |
| | | | | | |
| | 4,326 | | | Molson Coors Brewing, Class B | | | | | | | | | | $ | 183,163 | |
| | | | | | |
| | 12,737 | | | PepsiCo | | | | | | | | | | | 801,794 | |
| | | | | | |
| | 12,774 | | | Philip Morris International | | | | | | | | | | | 892,519 | |
| | | | | | |
| | 23,384 | | | Procter & Gamble | | | | | | | | | | | 1,496,342 | |
| | | | | | |
| | 8,879 | | | Reynolds American q | | | | | | | | | | | 343,440 | |
| | | | | | |
| | 9,120 | | | Sysco | | | | | | | | | | | 252,806 | |
| | | | | | |
| | 9,655 | | | Walgreens | | | | | | | | | | | 320,546 | |
| | | | | | |
| | 9,062 | | | Wal-Mart Stores q | | | | | | | | | | | 513,997 | |
| | | | Total Consumer Staples | | | | | | | | | | | 8,717,187 | |
| | | | Energy – 15.0% | | | | | | | | | | | | |
| | | | | | |
| | 16,409 | | | Baker Hughes | | | | | | | | | | | 951,558 | |
| | | | | | |
| | 5,056 | | | Cameron International — q | | | | | | | | | | | 248,452 | |
| | | | | | |
| | 27,298 | | | Chevron q | | | | | | | | | | | 2,867,655 | |
| | | | | | |
| | 9,075 | | | ConocoPhillips | | | | | | | | | | | 632,074 | |
| | | | | | |
| | 55,616 | | | Exxon Mobil q | | | | | | | | | | | 4,343,053 | |
| | | | | | |
| | 22,653 | | | Halliburton | | | | | | | | | | | 846,316 | |
| | | | | | |
| | 8,086 | | | Helmerich & Payne q | | | | | | | | | | | 430,014 | |
| | | | | | |
| | 2,306 | | | HollyFrontier | | | | | | | | | | | 70,771 | |
| | | | | | |
| | 5,169 | | | Marathon Oil | | | | | | | | | | | 134,549 | |
| | | | | | |
| | 15,381 | | | Marathon Petroleum q | | | | | | | | | | | 552,178 | |
| | | | | | |
| | 17,876 | | | Nabors Industries — q | | | | | | | | | | | 327,667 | |
| | | | | | |
| | 12,330 | | | National Oilwell Varco q | | | | | | | | | | | 879,499 | |
| | | | | | |
| | 11,030 | | | Noble Energy q | | | | | | | | | | | 396,418 | |
| | | | | | |
| | 3,404 | | | Occidental Petroleum | | | | | | | | | | | 316,368 | |
| | | | | | |
| | 7,172 | | | Oceaneering International q | | | | | | | | | | | 300,005 | |
| | | | | | |
| | 4,292 | | | Oil States International — q | | | | | | | | | | | 298,766 | |
| | | | | | |
| | 12,094 | | | Patterson-UTI Energy | | | | | | | | | | | 245,750 | |
| | | | | | |
| | 3,376 | | | Rowan — q | | | | | | | | | | | 116,438 | |
| | | | | | |
| | 9,986 | | | RPC q | | | | | | | | | | | 185,440 | |
| | | | | | |
| | 20,017 | | | Schlumberger | | | | | | | | | | | 1,470,649 | |
| | | | | | |
| | 2,294 | | | Superior Energy Services — q | | | | | | | | | | | 64,507 | |
| | | | | | |
| | 19,820 | | | Valero Energy q | | | | | | | | | | | 487,572 | |
| | | | Total Energy | | | | | | | | | | | 16,165,699 | |
| | | | Financials – 18.9% | | | | | | | | | | | | |
| | | | | | |
| | 16,532 | | | ACE q | | | | | | | | | | | 1,192,784 | |
| | | | | | |
| | 11,365 | | | Aflac q | | | | | | | | | | | 512,448 | |
| | | | | | |
| | 16,998 | | | American Capital — q | | | | | | | | | | | 132,074 | |
| | | | | | |
| | 41,807 | | | American Capital Agency – REIT | | | | | | | | | | | 1,150,111 | |
| | | | | | |
| | 14,602 | | | Ameriprise Financial | | | | | | | | | | | 681,621 | |
| | | | | | |
| | 43,074 | | | Annaly Capital Management – REIT q | | | | | | | | | | | 725,797 | |
| | | | | | |
| | 5,114 | | | AON | | | | | | | | | | | 238,415 | |
| | | | | | |
| | 34,031 | | | Ares Capital | | | | | | | | | | | 526,460 | |
| | | | | | |
| | 2,680 | | | Arthur J. Gallagher | | | | | | | | | | | 82,812 | |
| | | | | | |
| | 8,053 | | | Assurant | | | | | | | | | | | 310,363 | |
| | | | | | |
| | 11,164 | | | Assured Guaranty | | | | | | | | | | | 142,229 | |
| | | | | | | | | | | | | | | | |
| Shares | | | Description p | | | | | | | | | | Value | |
| | | | | | | | | | | | | | | | |
| | | | Financials (continued) | | | | | | | | | | | | |
| | | | | | |
| | 32,057 | | | Bank of America | | | | | | | | | | $ | 218,949 | |
| | | | | | |
| | 22,654 | | | Bank of New York Mellon | | | | | | | | | | | 482,077 | |
| | | | | | |
| | 19,642 | | | Berkshire Hathaway, Class B — q | | | | | | | | | | | 1,529,326 | |
| | | | | | |
| | 2,315 | | | BlackRock | | | | | | | | | | | 365,284 | |
| | | | | | |
| | 11,105 | | | BOK Financial q | | | | | | | | | | | 579,903 | |
| | | | | | |
| | 556 | | | Brown & Brown | | | | | | | | | | | 12,276 | |
| | | | | | |
| | 1,138 | | | Capital One Financial q | | | | | | | | | | | 51,961 | |
| | | | | | |
| | 14,877 | | | Charles Schwab q | | | | | | | | | | | 182,690 | |
| | | | | | |
| | 10,698 | | | Chubb q | | | | | | | | | | | 717,301 | |
| | | | | | |
| | 4,510 | | | Citigroup | | | | | | | | | | | 142,471 | |
| | | | | | |
| | 566 | | | CME Group q | | | | | | | | | | | 155,967 | |
| | | | | | |
| | 10,265 | | | Discover Financial Services | | | | | | | | | | | 241,843 | |
| | | | | | |
| | 5,990 | | | East West Bancorp | | | | | | | | | | | 116,625 | |
| | | | | | |
| | 39,375 | | | First Niagara Financial Group q | | | | | | | | | | | 361,856 | |
| | | | | | |
| | 5,727 | | | Franklin Resources | | | | | | | | | | | 610,670 | |
| | | | | | |
| | 4,886 | | | Fulton Financial q | | | | | | | | | | | 46,124 | |
| | | | | | |
| | 2,300 | | | Hartford Financial Services Group q | | | | | | | | | | | 44,275 | |
| | | | | | |
| | 19,529 | | | HCC Insurance Holdings q | | | | | | | | | | | 519,667 | |
| | | | | | |
| | 32,042 | | | Huntington Bancshares q | | | | | | | | | | | 165,978 | |
| | | | | | |
| | 5,430 | | | Invesco | | | | | | | | | | | 108,980 | |
| | | | | | |
| | 33,488 | | | JPMorgan Chase | | | | | | | | | | | 1,164,043 | |
| | | | | | |
| | 511 | | | Kemper | | | | | | | | | | | 13,741 | |
| | | | | | |
| | 10,278 | | | Lincoln National q | | | | | | | | | | | 195,796 | |
| | | | | | |
| | 6,982 | | | Loew’s | | | | | | | | | | | 277,185 | |
| | | | | | |
| | 4,303 | | | M&T Bank | | | | | | | | | | | 327,501 | |
| | | | | | |
| | 2,961 | | | Marsh & McLennan | | | | | | | | | | | 90,666 | |
| | | | | | |
| | 2,737 | | | MetLife | | | | | | | | | | | 96,233 | |
| | | | | | |
| | 2,018 | | | NASDAQ OMX Group — | | | | | | | | | | | 50,551 | |
| | | | | | |
| | 2,644 | | | Northern Trust | | | | | | | | | | | 107,003 | |
| | | | | | |
| | 4,916 | | | NYSE Euronext | | | | | | | | | | | 130,618 | |
| | | | | | |
| | 6,908 | | | PNC Financial Services Group | | | | | | | | | | | 371,029 | |
| | | | | | |
| | 20,771 | | | Principal Financial Group | | | | | | | | | | | 535,476 | |
| | | | | | |
| | 27,485 | | �� | Progressive | | | | | | | | | | | 522,490 | |
| | | | | | |
| | 16,799 | | | Protective Life | | | | | | | | | | | 312,461 | |
| | | | | | |
| | 12,350 | | | Prudential Financial | | | | | | | | | | | 669,370 | |
| | | | | | |
| | 5,516 | | | Raymond James Financial | | | | | | | | | | | 167,521 | |
| | | | | | |
| | 1,654 | | | Reinsurance Group of America | | | | | | | | | | | 86,388 | |
| | | | | | |
| | 7,738 | | | State Street q | | | | | | | | | | | 312,538 | |
| | | | | | |
| | 6,037 | | | T. Rowe Price Group q | | | | | | | | | | | 318,995 | |
| | | | | | |
| | 8,534 | | | Travelers | | | | | | | | | | | 497,959 | |
| | | | | | |
| | 5,110 | | | Validus Holdings | | | | | | | | | | | 139,810 | |
| | | | | | |
| | 62,963 | | | Wells Fargo | | | | | | | | | | | 1,631,371 | |
| | | | Total Financials | | | | | | | | | | | 20,368,082 | |
| | | | Health Care – 12.0% | | | | | | | | | | | | |
| | | | | | |
| | 17,869 | | | Abbott Laboratories | | | | | | | | | | | 962,603 | |
Portfolio of Investments
Nuveen Quantitative Enhanced Core Equity Fund (continued)
October 31, 2011
| | | | | | | | | | | | | | | | |
| Shares | | | Description p | | | | | | | | | | Value | |
| | | | | | | | | | | | | | | | |
| | | | Health Care (continued) | | | | | | | | | | | | |
| | | | | | |
| | 14,108 | | | Aetna | | | | | | | | | | $ | 560,934 | |
| | | | | | |
| | 1,049 | | | AmerisourceBergen q | | | | | | | | | | | 42,799 | |
| | | | | | |
| | 10,155 | | | Amgen | | | | | | | | | | | 581,577 | |
| | | | | | |
| | 908 | | | Baxter International | | | | | | | | | | | 49,922 | |
| | | | | | |
| | 141 | | | Becton, Dickinson & Company | | | | | | | | | | | 11,030 | |
| | | | | | |
| | 18,137 | | | Bristol-Myers Squibb | | | | | | | | | | | 572,948 | |
| | | | | | |
| | 5,954 | | | Cardinal Health | | | | | | | | | | | 263,584 | |
| | | | | | |
| | 6,937 | | | CIGNA | | | | | | | | | | | 307,587 | |
| | | | | | |
| | 5,740 | | | Coventry Health Care — | | | | | | | | | | | 182,589 | |
| | | | | | |
| | 6,855 | | | Covidien q | | | | | | | | | | | 322,459 | |
| | | | | | |
| | 15,795 | | | Eli Lilly | | | | | | | | | | | 586,942 | |
| | | | | | |
| | 3,970 | | | Gilead Sciences — | | | | | | | | | | | 165,390 | |
| | | | | | |
| | 2,005 | | | Humana | | | | | | | | | | | 170,204 | |
| | | | | | |
| | 34,500 | | | Johnson & Johnson q | | | | | | | | | | | 2,221,455 | |
| | | | | | |
| | 794 | | | McKesson | | | | | | | | | | | 64,751 | |
| | | | | | |
| | 18,049 | | | Medtronic | | | | | | | | | | | 627,022 | |
| | | | | | |
| | 38,850 | | | Merck | | | | | | | | | | | 1,340,325 | |
| | | | | | |
| | 607 | | | PerkinElmer q | | | | | | | | | | | 12,547 | |
| | | | | | |
| | 114,788 | | | Pfizer | | | | | | | | | | | 2,210,817 | |
| | | | | | |
| | 3,557 | | | St. Jude Medical | | | | | | | | | | | 138,723 | |
| | | | | | |
| | 4,747 | | | Stryker q | | | | | | | | | | | 227,429 | |
| | | | | | |
| | 2,699 | | | Thermo Fisher Scientific — | | | | | | | | | | | 135,679 | |
| | | | | | |
| | 12,864 | | | UnitedHealth Group | | | | | | | | | | | 617,343 | |
| | | | | | |
| | 5,931 | | | WellPoint | | | | | | | | | | | 408,646 | |
| | | | | | |
| | 3,179 | | | Zimmer Holdings — q | | | | | | | | | | | 167,311 | |
| | | | Total Heath Care | | | | | | | | | | | 12,952,616 | |
| | | | Industrials – 8.2% | | | | | | | | | | | | |
| | | | | | |
| | 11,890 | | | 3M q | | | | | | | | | | | 939,548 | |
| | | | | | |
| | 1,524 | | | Carlisle Companies | | | | | | | | | | | 63,581 | |
| | | | | | |
| | 650 | | | Caterpillar | | | | | | | | | | | 61,399 | |
| | | | | | |
| | 1,644 | | | Crane | | | | | | | | | | | 72,517 | |
| | | | | | |
| | 18,919 | | | CSX | | | | | | | | | | | 420,191 | |
| | | | | | |
| | 3,845 | | | Cummins | | | | | | | | | | | 382,308 | |
| | | | | | |
| | 5,299 | | | Danaher q | | | | | | | | | | | 256,207 | |
| | | | | | |
| | 3,345 | | | Dover q | | | | | | | | | | | 185,748 | |
| | | | | | |
| | 13,405 | | | Eaton q | | | | | | | | | | | 600,812 | |
| | | | | | |
| | 7,137 | | | Emerson Electric q | | | | | | | | | | | 343,432 | |
| | | | | | |
| | 3,272 | | | Equifax | | | | | | | | | | | 115,011 | |
| | | | | | |
| | 1,229 | | | Fluor | | | | | | | | | | | 69,869 | |
| | | | | | |
| | 12,182 | | | General Dynamics | | | | | | | | | | | 781,963 | |
| | | | | | |
| | 55,979 | | | General Electric | | | | | | | | | | | 935,409 | |
| | | | | | |
| | 11,013 | | | Honeywell International | | | | | | | | | | | 577,081 | |
| | | | | | |
| | 1,412 | | | Hubbell, Class B | | | | | | | | | | | 84,423 | |
| | | | | | |
| | 3,526 | | | Illinois Tool Works q | | | | | | | | | | | 171,469 | |
| | | | | | |
| | 1,093 | | | KBR | | | | | | | | | | | 30,506 | |
| | | | | | | | | | | | | | | | |
| Shares | | | Description p | | | | | | | | | | Value | |
| | | | | | | | | | | | | | | | |
| | | | Industrials (continued) | | | | | | | | | | | | |
| | | | | | |
| | 6,582 | | | Norfolk Southern q | | | | | | | | | | $ | 487,002 | |
| | | | | | |
| | 3,837 | | | Paccar q | | | | | | | | | | | 165,912 | |
| | | | | | |
| | 5,065 | | | Parker Hannifin | | | | | | | | | | | 413,051 | |
| | | | | | |
| | 8,942 | | | Raytheon | | | | | | | | | | | 395,147 | |
| | | | | | |
| | 2,260 | | | Rockwell Automation q | | | | | | | | | | | 152,889 | |
| | | | | | |
| | 1,160 | | | Rockwell Collins q | | | | | | | | | | | 64,763 | |
| | | | | | |
| | 7,150 | | | Timken | | | | | | | | | | | 301,158 | |
| | | | | | |
| | 1,909 | | | Towers Watson, Class A q | | | | | | | | | | | 125,421 | |
| | | | | | |
| | 5,286 | | | Union Pacific | | | | | | | | | | | 526,327 | |
| | | | | | |
| | 2,166 | | | United Technologies q | | | | | | | | | | | 168,905 | |
| | | | Total Industrials | | | | | | | | | | | 8,892,049 | |
| | | | Information Technology – 17.5% | | | | | | | | | | | | |
| | | | | | |
| | 6,866 | | | Accenture, Class A q | | | | | | | | | | | 413,745 | |
| | | | | | |
| | 322 | | | Agilent Technologies — | | | | | | | | | | | 11,936 | |
| | | | | | |
| | 6,128 | | | Akamai Technologies — | | | | | | | | | | | 165,088 | |
| | | | | | |
| | 5,573 | | | Analog Devices q | | | | | | | | | | | 203,805 | |
| | | | | | |
| | 6,120 | | | Apple — | | | | | | | | | | | 2,477,254 | |
| | | | | | |
| | 11,443 | | | Applied Materials | | | | | | | | | | | 140,978 | |
| | | | | | |
| | 831 | | | Autodesk — | | | | | | | | | | | 28,753 | |
| | | | | | |
| | 19,982 | | | Automatic Data Processing q | | | | | | | | | | | 1,045,658 | |
| | | | | | |
| | 23,364 | | | AVX | | | | | | | | | | | 313,311 | |
| | | | | | |
| | 19,139 | | | Booz Allen Hamilton Holding — q | | | | | | | | | | | 302,588 | |
| | | | | | |
| | 838 | | | Broadcom, Class A | | | | | | | | | | | 30,243 | |
| | | | | | |
| | 51,274 | | | Cisco Systems | | | | | | | | | | | 950,107 | |
| | | | | | |
| | 2,795 | | | Cognizant Technology Solutions, Class A — | | | | | | | | | | | 203,336 | |
| | | | | | |
| | 16,227 | | | Computer Sciences q | | | | | | | | | | | 510,501 | |
| | | | | | |
| | 40,576 | | | Corning | | | | | | | | | | | 579,831 | |
| | | | | | |
| | 21,861 | | | eBay — | | | | | | | | | | | 695,836 | |
| | | | | | |
| | 3,079 | | | Google, Class A — | | | | | | | | | | | 1,824,738 | |
| | | | | | |
| | 35,688 | | | Hewlett-Packard | | | | | | | | | | | 949,658 | |
| | | | | | |
| | 5,782 | | | IBM q | | | | | | | | | | | 1,067,531 | |
| | | | | | |
| | 51,509 | | | Intel q | | | | | | | | | | | 1,264,031 | |
| | | | | | |
| | 685 | | | MasterCard, Class A | | | | | | | | | | | 237,859 | |
| | | | | | |
| | 108,373 | | | Microsoft | | | | | | | | | | | 2,885,973 | |
| | | | | | |
| | 30,452 | | | Oracle | | | | | | | | | | | 997,912 | |
| | | | | | |
| | 12,906 | | | QUALCOMM | | | | | | | | | | | 665,950 | |
| | | | | | |
| | 10,248 | | | Texas Instruments q | | | | | | | | | | | 314,921 | |
| | | | | | |
| | 4,111 | | | Visa, Class A q | | | | | | | | | | | 383,392 | |
| | | | | | |
| | 350 | | | Western Digital — | | | | | | | | | | | 9,324 | |
| | | | | | |
| | 615 | | | Western Union | | | | | | | | | | | 10,744 | |
| | | | | | |
| | 13,444 | | | Yahoo! — | | | | | | | | | | | 210,264 | |
| | | | Total Information Technology | | | | | | | | | | | 18,895,267 | |
| | | | Materials – 1.8% | | | | | | | | | | | | |
| | | | | | |
| | 607 | | | Albemarle | | | | | | | | | | | 32,347 | |
| | | | | | |
| | 1,168 | | | Ashland | | | | | | | | | | | 61,857 | |
Portfolio of Investments
Nuveen Quantitative Enhanced Core Equity Fund (continued)
October 31, 2011
| | | | | | | | | | | | | | | | |
| Shares | | | Description p | | | | | | | | | | Value | |
| | | | | | | | | | | | | | | | |
| | | | Materials (continued) | | | | | | | | | | | | |
| | | | | | |
| | 2,990 | | | Cabot Microelectronics | | | | | | | | | | $ | 90,238 | |
| | | | | | |
| | 4,394 | | | Cliffs Natural Resources q | | | | | | | | | | | 299,759 | |
| | | | | | |
| | 12,958 | | | Dow Chemical | | | | | | | | | | | 361,269 | |
| | | | | | |
| | 11,763 | | | E.I. Du Pont de Nemours q | | | | | | | | | | | 565,447 | |
| | | | | | |
| | 1,406 | | | Eastman Chemical | | | | | | | | | | | 55,242 | |
| | | | | | |
| | 197 | | | Monsanto | | | | | | | | | | | 14,332 | |
| | | | | | |
| | 1,840 | | | Mosaic | | | | | | | | | | | 107,750 | |
| | | | | | |
| | 4,859 | | | Sealed Air q | | | | | | | | | | | 86,490 | |
| | | | | | |
| | 4,679 | | | Southern Copper | | | | | | | | | | | 143,552 | |
| | | | | | |
| | 4,657 | | | Temple-Inland | | | | | | | | | | | 148,139 | |
| | | | Total Materials | | | | | | | | | | | 1,966,422 | |
| | | | Telecommunication Services – 3.3% | | | | | | | | | | | | |
| | | | | | |
| | 84,364 | | | AT&T q | | | | | | | | | | | 2,472,709 | |
| | | | | | |
| | 29,006 | | | Verizon Communications q | | | | | | | | | | | 1,072,642 | |
| | | | Total Telecommunication Services | | | | | | | | | | | 3,545,351 | |
| | | | Utilities – 5.6% | | | | | | | | | | | | |
| | | | | | |
| | 4,868 | | | Alliant Energy | | | | | | | | | | | 198,517 | |
| | | | | | |
| | 2,384 | | | American Electric Power | | | | | | | | | | | 93,643 | |
| | | | | | |
| | 1,863 | | | DTE Energy | | | | | | | | | | | 97,081 | |
| | | | | | |
| | 25,380 | | | Duke Energy q | | | | | | | | | | | 518,260 | |
| | | | | | |
| | 5,868 | | | NextEra Energy | | | | | | | | | | | 330,955 | |
| | | | | | |
| | 16,407 | | | NSTAR | | | | | | | | | | | 739,792 | |
| | | | | | |
| | 13,489 | | | OGE Energy | | | | | | | | | | | 697,921 | |
| | | | | | |
| | 12,752 | | | PG&E | | | | | | | | | | | 547,061 | |
| | | | | | |
| | 12,564 | | | Pinnacle West Capital | | | | | | | | | | | 572,667 | |
| | | | | | |
| | 32,704 | | | Public Service Enterprise Group q | | | | | | | | | | | 1,102,125 | |
| | | | | | |
| | 1,493 | | | SCANA | | | | | | | | | | | 63,124 | |
| | | | | | |
| | 3,204 | | | Sempra Energy | | | | | | | | | | | 172,151 | |
| | | | | | |
| | 6,192 | | | Southern | | | | | | | | | | | 267,494 | |
| | | | | | |
| | 3,305 | | | Vectren | | | | | | | | | | | 93,796 | |
| | | | | | |
| | 3,065 | | | Wisconsin Energy | | | | | | | | | | | 99,398 | |
| | | | | | |
| | 16,573 | | | Xcel Energy | | | | | | | | | | | 428,412 | |
| | | | Total Utilities | | | | | | | | | | | 6,022,397 | |
| | | | Total Common Stocks (cost $101,760,652) | | | | | | | | | | | 105,793,258 | |
| | | | | | |
| Shares | | | Description p | | | | | | | | | | Value | |
| | | | INVESTMENTS PURCHASED WITH COLLATERAL FROM SECURITIES LENDING – 39.8% | | | | | | | | | | | | |
| | | | | | |
| | | | Money Market Funds – 39.8% | | | | | | | | | | | | |
| | | | | | |
| | 42,978,792 | | | Mount Vernon Securities Lending Prime Portfolio, 0.200% W † | | | | | | | | | | $ | 42,978,792 | |
| | | | Total Investments Purchased with Collateral from Securities Lending (cost $42,978,792) | | | | | | | | | | | 42,978,792 | |
| | | | | | | | | | | | | | | | |
Shares/ Principal Amount (000) | | | Description p | | | | | | | | | | Value | |
| | | | | | | | | | | | | | | | |
| | | | SHORT-TERM INVESTMENTS – 2.3% | | | | | | | | | | | | |
| | | | | | |
| | | | Money Market Funds – 1.6% | | | | | | | | | | | | |
| | | | | | |
| | 1,766,122 | | | First American Treasury Obligations Fund, Class Z, 0.000% W | | | | | | | | | | $ | 1,766,122 | |
| | | | U.S. Treasury Obligations – 0.7% | | | | | | | | | | | | |
| | | | | | |
| | | | U.S. Treasury Bills ¨ | | | | | | | | | | | | |
| | | | | | |
| $ | 750 | | | 0.022%, 03/01/2012 | | | | | | | | | | | 749,944 | |
| | | | Total Short-Term Investments (cost $2,516,084) | | | | | | | | | | | 2,516,066 | |
| | | | Total Investments (cost $147,255,528) – 140.1% | | | | | | | | | | | 151,288,116 | |
| | | | Other Assets Less Liabilities – (40.1)% ¯ | | | | | | | | | | | (43,282,059) | |
| | | | Net Assets – 100.0% | | | | | | | | | | $ | 108,006,057 | |
Investments in Derivatives at October 31, 2011
Futures Contracts outstanding:
| | | | | | | | | | | | | | | | | | | | |
| Description | | Contract
Position | | | Number of
Contracts | | | Contract
Expiration | | | Value | | | Unrealized
Appreciation | |
S&P 500 Index | | | Long | | | | 7 | | | | 12/11 | | | $ | 2,186,275 | | | $ | 71,822 | |
| | | | For Fund portfolio compliance purposes, the Fund’s industry classifications refer to any one or more of the industry sub-classifications used by one or more widely recognized market indexes or ratings group indexes, and/or as defined by Fund management. This definition may not apply for purposes of this report which may combine industry sub-classifications into sectors for reporting ease. |
| | p | | All percentages shown in the Portfolio of Investments are based on net assets. |
| | q | | Investment, or a portion of investment, is out on loan for securities lending. |
| | — | | Non-income producing; issuer has not declared a dividend within the past twelve months. |
| | n | | Investment valued at fair value using methods determined in good faith by, or at the discretion of, the Board of Directors. For fair value measurement disclosure purposes, investment categorized as Level 3. See Notes to Financial Statements Footnote 1 – General Information and Significant Accounting Policies, Investment Valuation for more information. |
| | W | | The rate shown is the annualized seven-day effective yield as of October 31, 2011. |
| | ¨ | | Investment, or portion of investment, segregated as collateral for investments in derivatives. Yield shown is the annualized effective yield as of October 31, 2011. |
| | † | | The Fund may loan securities representing up to one third of the fair value of its total assets (which includes collateral for securities on loan) to broker dealers, banks, or other institutional borrowers of securities. The Fund maintains collateral equal to at least 102% of the fair value of the securities loaned. The adequacy of the collateral is monitored on a daily basis. The cash collateral received by the Fund is invested in this money market fund. |
| | ¯ | | Other Assets Less Liabilities includes the net Unrealized Appreciation (Depreciation) of derivatives instruments as listed within Investments in Derivatives at October 31, 2011. |
| | REIT | | Real Estate Investment Trust |
See accompanying notes to financial statements.
Portfolio of Investments
Nuveen Tactical Market Opportunities Fund
(formerly known as First American Tactical Opportunities Fund)
October 31, 2011
| | | | | | | | | | | | | | |
| Shares | | | Description p | | | | | | | | Value | |
| | | | EXCHANGE TRADED FUNDS – 25.2% | | | | | | | | | | |
| | | | | |
| | 49,000 | | | iShares Barclays 1-3 Year Credit Bond Fund | | | | | | | | $ | 5,130,790 | |
| | | | | |
| | 34,500 | | | iShares iBoxx High Yield Corporate Bond Fund | | | | | | | | | 3,080,160 | |
| | | | | |
| | 16,000 | | | iShares S&P U.S. Preferred Stock Index Fund | | | | | | | | | 596,960 | |
| | | | | |
| | 64,000 | | | Market Vectors Emerging Markets Local Currency Bond | | | | | | | | | 1,656,960 | |
| | | | | |
| | 48,000 | | | Market Vectors High Yield Municipal Index | | | | | | | | | 1,431,840 | |
| | | | | |
| | 31,000 | | | Market Vectors Russia | | | | | | | | | 944,260 | |
| | | | | |
| | 18,000 | | | PowerShares ETF Trust II Senior Loan Portfolio | | | | | | | | | 432,000 | |
| | | | | |
| | 1,200 | | | SPDR S&P Global Natural Resources | | | | | | | | | 63,036 | |
| | | | Total Exchange-Traded Funds (cost $13,386,978) | | | | | | | | | 13,336,006 | |
| | | | | |
Principal Amount (000) | | | Description p | | | | | | | | Value | |
| | | | CORPORATE BONDS – 9.8% | | | | | | | | | | |
| | | | | |
| | | | Sovereign – 9.8% | | | | | | | | | | |
| | | | | |
| $ | 4,900 | | | Australian Government, 5.750%, 04/15/2012 | | | | | | | | $ | 5,198,123 | |
| | | | Total Corporate Bonds (cost $5,005,166) | | | | | | | | | 5,198,123 | |
| | | | | |
| | | | U.S. GOVERNMENT AND AGENCY OBLIGATIONS – 9.2% | | | | | | | | | | |
| | | | | |
| | 3,900 | | | U.S. Treasury Bond, 4.500%, 08/15/2039 | | | | | | | | | 4,864,033 | |
| | | | Total U.S. Government and Agency Obligations (cost $4,139,381) | | | | | | | | | 4,864,033 | |
| | | | | |
Shares/ Principal Amount (000) | | | Description p | | | | | | | | Value | |
| | | | SHORT-TERM INVESTMENTS – 54.6% | | | | | | | | | | |
| | | | | |
| | | | Money Market Funds – 50.4% | | | | | | | | | | |
| | | | | |
| | 26,652,164 | | | First American Treasury Obligations Fund, 0.000% W | | | | | | | | $ | 26,652,164 | |
| | | | U.S. Treasury Obligations – 4.2% | | | | | | | | | | |
| | | | | |
| | | | U.S. Treasury Bills ¨ | | | | | | | | | | |
| | | | | |
| $ | 2,000 | | | 0.022%, 03/01/2012 | | | | | | | | $ | 1,999,852 | |
| | | | | |
| | 200 | | | 0.025%, 03/08/2012 | | | | | | | | | 199,982 | |
| $ | 2,200 | | | Total U.S. Treasury Obligations | | | | | | | | | 2,199,834 | |
| | | | Total Short-Term Investments (cost $28,852,023) | | | | | | | | | 28,851,998 | |
| | | | Total Investments (cost $51,383,548) – 98.8% | | | | | | | | | 52,250,160 | |
| | | | Other Assets Less Liabilities – 1.2% ¯ | | | | | | | | | 642,649 | |
| | | | Net Assets – 100.0% | | | | | | | | $ | 52,892,809 | |
Investments in Derivatives at October 31, 2011
Futures Contracts outstanding:
| | | | | | | | | | | | | | | | | | | | |
| Description | | Contract
Position | | | Number of
Contracts | | | Contract
Expiration | | | Value | | | Unrealized
Appreciation
(Depreciation) | |
Australian Dollar Currency | | | Short | | | | (50 | ) | | | 12/11 | | | $ | (5,265,500 | ) | | $ | (284,548 | ) |
Dollar Index | | | Long | | | | 29 | | | | 12/11 | | | | 2,212,874 | | | | (43,517 | ) |
H-Shares Index | | | Long | | | | 17 | | | | 11/11 | | | | 1,145,106 | | | | 82,300 | |
Mini MSCI Emerging Markets Index | | | Long | | | | 26 | | | | 12/11 | | | | 1,269,580 | | | | 8,428 | |
MSCI Taiwan Stock Index | | | Long | | | | 49 | | | | 11/11 | | | | 1,310,260 | | | | 4,350 | |
Nasdaq 100 E-Mini Index | | | Short | | | | (28 | ) | | | 12/11 | | | | (1,319,360 | ) | | | (41,557 | ) |
Nikkei 225 Index | | | Long | | | | 7 | | | | 12/11 | | | | 311,150 | | | | 6,794 | |
Russell 2000 Mini Index | | | Short | | | | (79 | ) | | | 12/11 | | | | (5,840,470 | ) | | | (364,791 | ) |
S&P 500 E-Mini Index | | | Long | | | | 112 | | | | 12/11 | | | | 6,996,080 | | | | 388,119 | |
SGX S&P CNX Nifty Index | | | Short | | | | (104 | ) | | | 11/11 | | | | (1,112,176 | ) | | | (48,880 | ) |
Swiss Market Index | | | Long | | | | 10 | | | | 12/11 | | | | 653,224 | | | | 41,541 | |
U.S. Treasury 2-Year Note | | | Short | | | | (79 | ) | | | 12/11 | | | | (17,402,220 | ) | | | 15,853 | |
| | | | | | | | | | | | | | | | | | | $ | (235,908 | ) |
| | | | For Fund portfolio compliance purposes, the Fund’s industry classifications refer to any one or more of the industry sub-classifications used by one or more widely recognized market indexes or ratings group indexes, and/or as defined by Fund management. This definition may not apply for purposes of this report which may combine industry sub-classifications into sectors for reporting ease. |
| | p | | All percentages shown in the Portfolio of Investments are based on net assets. |
| | W | | The rate shown is the annualized seven-day effective yield as of October 31, 2011. |
| | ¨ | | Investment, or portion of investment, segregated as collateral for investments in derivatives. Yield shown is the annualized effective yield as of October 31, 2011. |
| | ¯ | | Other Assets Less Liabilities includes the net Unrealized Appreciation (Depreciation) of derivatives instruments as listed within Investments in Derivatives at October 31, 2011. |
See accompanying notes to financial statements.
Statement of Assets & Liabilities (all dollars and shares are rounded to thousands (000), except for per share data)
October 31, 2011
| | | | | | | | | | | | | | | | |
| | | International | | | International
Select | | | Quantitative Enhanced
Core Equity | | | Tactical Market
Opportunities | |
Assets | | | | | | | | | | | | | | | | |
Investments, at value (cost $160,102, $546,678, $101,761 and $22,532, respectively) | | $ | 152,930 | | | $ | 533,195 | | | $ | 105,793 | | | $ | 23,398 | |
Investment purchased with collateral from securities lending (at cost, which approximates value) | | | — | | | | — | | | | 42,979 | | | | — | |
Short-term investments (cost $12,982, $50,026, $2,516 and $28,852, respectively) | | | 12,982 | | | | 50,026 | | | | 2,516 | | | | 28,852 | |
Cash denominated in foreign currencies (cost $5,158, $6,460, $– and $343, respectively) | | | 5,142 | | | | 6,490 | | | | — | | | | 347 | |
Receivables: | | | | | | | | | | | | | | | | |
Deposits with brokers for open futures contracts | | | 1,032 | | | | 4,025 | | | | — | | | | 200 | |
Dividends | | | 838 | | | | 977 | | | | 119 | | | | — | |
Due from broker | | | — | | | | — | | | | 3 | | | | — | |
From Adviser | | | — | | | | — | | | | — | | | | 3 | |
Interest | | | 1 | | | | 3 | | | | — | | | | 51 | |
Investments sold | | | 2,826 | | | | 7,186 | | | | — | | | | 361 | |
Reclaims | | | 764 | | | | 528 | | | | — | | | | — | |
Shares sold | | | 13 | | | | 354 | | | | — | | | | 1,140 | |
Other assets | | | 46 | | | | 36 | | | | 44 | | | | 27 | |
Total assets | | | 176,574 | | | | 602,820 | | | | 151,454 | | | | 54,379 | |
Liabilities | | | | | | | | | | | | | | | | |
Cash overdraft | | | 6,206 | | | | 9,583 | | | | — | | | | 328 | |
Payables: | | | | | | | | | | | | | | | | |
Collateral from securities lending program | | | — | | | | — | | | | 42,979 | | | | — | |
Investments purchased | | | 2,398 | | | | 5,983 | | | | — | | | | 1,079 | |
Shares redeemed | | | 108 | | | | 1,079 | | | | 212 | | | | — | |
Variation margin on futures contracts | | | 358 | | | | 1,325 | | | | 55 | | | | 28 | |
Accrued expenses: | | | | | | | | | | | | | | | | |
Management fees | | | 635 | | | | 726 | | | | 106 | | | | — | |
12b-1 distribution and service fees | | | 7 | | | | 1 | | | | — | | | | 1 | |
Other | | | 324 | | | | 408 | | | | 96 | | | | 50 | |
Total liabilities | | | 10,036 | | | | 19,105 | | | | 43,448 | | | | 1,486 | |
Net assets | | $ | 166,538 | | | $ | 583,715 | | | $ | 108,006 | | | $ | 52,893 | |
Class A Shares | | | | | | | | | | | | | | | | |
Net assets | | $ | 22,328 | | | $ | 4,388 | | | $ | 164 | | | $ | 3,558 | |
Shares outstanding | | | 2,008 | | | | 496 | | | | 8 | | | | 317 | |
Net asset value per share | | $ | 11.12 | | | $ | 8.85 | | | $ | 21.57 | | | $ | 11.22 | |
Offering price per share (net asset value per share plus maximum sales charge of 5.75% of offering price) | | $ | 11.80 | | | $ | 9.39 | | | $ | 21.57 | (2) | | $ | 11.90 | |
Class B Shares | | | | | | | | | | | | | | | | |
Net assets | | $ | 948 | | | | N/A | | | | N/A | | | | N/A | |
Shares outstanding | | | 94 | | | | N/A | | | | N/A | | | | N/A | |
Net asset value and offering price per share | | $ | 10.08 | | | | N/A | | | | N/A | | | | N/A | |
Class C Shares | | | | | | | | | | | | | | | | |
Net assets | | $ | 1,987 | | | $ | 717 | | | $ | 108 | | | $ | 475 | |
Shares outstanding | | | 189 | | | | 82 | | | | 5 | | | | 42 | |
Net asset value and offering price per share | | $ | 10.51 | | | $ | 8.72 | | | $ | 21.40 | | | $ | 11.17 | |
Class R3 Shares(1) | | | | | | | | | | | | | | | | |
Net assets | | $ | 11 | | | $ | 13 | | | | N/A | | | | N/A | |
Shares outstanding | | | 1 | | | | 2 | | | | N/A | | | | N/A | |
Net asset value and offering price per share | | $ | 11.11 | | | $ | 8.67 | | | | N/A | | | | N/A | |
Class I Shares(1) | | | | | | | | | | | | | | | | |
Net assets | | $ | 141,264 | | | $ | 578,597 | | | $ | 107,734 | | | $ | 48,860 | |
Shares outstanding | | | 12,557 | | | | 65,237 | | | | 4,978 | | | | 4,342 | |
Net asset value and offering price per share | | $ | 11.25 | | | $ | 8.87 | | | $ | 21.64 | | | $ | 11.25 | |
Net assets consist of: | | | | | | | | | | | | | | | | |
Capital paid-in | | $ | 148,757 | | | $ | 588,664 | | | $ | 101,412 | | | $ | 50,741 | |
Undistributed (Over-distribution of) net investment income | | | 6,115 | | | | 7,930 | | | | 1,945 | | | | 293 | |
Accumulated net realized gain (loss) | | | 17,385 | | | | 2,053 | | | | 545 | | | | 1,224 | |
Net unrealized appreciation (depreciation) | | | (5,719 | ) | | | (14,932 | ) | | | 4,104 | | | | 635 | |
Net assets | | $ | 166,538 | | | $ | 583,715 | | | $ | 108,006 | | | $ | 52,893 | |
Authorized shares | | | 2 billion | | | | 2 billion | | | | 2 billion | | | | 2 billion | |
Par value per share | | $ | 0.0001 | | | $ | 0.0001 | | | $ | 0.0001 | | | $ | 0.0001 | |
| N/A – | International Select does not offer Class B Shares. Quantitative Enhanced Core Equity and Tactical Market Opportunities do not offer Class B Shares or Class R3 Shares. |
| (1) – | Effective January 18, 2011, Class R Shares and Class Y Shares previously offered by FAF Advisors, Inc. were renamed Class R3 Shares and Class I Shares, respectively. |
| (2) – | Quantitative Enhanced Core Equity does not have a maximum sales charge. |
See accompanying notes to financial statements.
Statement of Operations (all dollars are rounded to thousands (000))
Year Ended October 31, 2011
| | | | | | | | | | | | | | | | |
| | | International | | | International
Select | | | Quantitative
Enhanced
Core Equity | | | Tactical
Market
Opportunities | |
Investment Income | | | | | | | | | | | | | | | | |
Dividend and interest income from unaffiliated investments (net of foreign tax withheld of $1,730, $1,856, $1 and $–, respectively) | | $ | 15,329 | | | $ | 18,570 | | | $ | 3,668 | | | $ | 684 | |
Interest income from affiliated investments(1) | | | — | | | | — | | | | — | | | | 1 | |
Securities lending income | | | — | | | | — | | | | 34 | | | | — | |
Total investment income | | | 15,329 | | | | 18,570 | | | | 3,702 | | | | 685 | |
Expenses | | | | | | | | | | | | | | | | |
Management fees | | | 6,607 | | | | 7,776 | | | | 795 | | | | 246 | |
12b-1 service fees – Class A(2) | | | 65 | | | | 13 | | | | — | | | | 1 | |
12b-1 distribution and service fees – Class B | | | 13 | | | | N/A | | | | N/A | | | | N/A | |
12b-1 distribution and service fees – Class C(2) | | | 24 | | | | 8 | | | | 1 | | | | 1 | |
Administration fees(1) | | | 267 | | | | 331 | | | | 78 | | | | 10 | |
Shareholders’ servicing agent fees and expenses | | | 172 | | | | 47 | | | | 22 | | | | 12 | |
Custodian’s fees and expenses | | | 524 | | | | 851 | | | | 55 | | | | 10 | |
Directors’ fees and expenses | | | 19 | | | | 20 | | | | 8 | | | | 5 | |
Professional fees | | | 33 | | | | 20 | | | | 31 | | | | 30 | |
Shareholders’ reports – printing and mailing expenses | | | 49 | | | | 70 | | | | 25 | | | | 5 | |
Federal and state registration fees | | | 81 | | | | 57 | | | | 67 | | | | 45 | |
Other expenses | | | 23 | | | | 35 | | | | 10 | | | | 7 | |
Total expenses before expense reimbursement | | | 7,877 | | | | 9,228 | | | | 1,092 | | | | 372 | |
Expense reimbursement | | | (1 | ) | | | — | | | | (311 | ) | | | (75 | ) |
Net expenses | | | 7,876 | | | | 9,228 | | | | 781 | | | | 297 | |
Net investment income (loss) | | | 7,453 | | | | 9,342 | | | | 2,921 | | | | 388 | |
Realized and Unrealized Gain (Loss) | | | | | | | | | | | | | | | | |
Net realized gain (loss) from: | | | | | | | | | | | | | | | | |
Investments and foreign currency | | | 79,230 | | | | 51,311 | | | | 11,480 | | | | 779 | |
Futures contracts | | | (3,657 | ) | | | (10,916 | ) | | | 152 | | | | 440 | |
Redemptions in-kind | | | — | | | | — | | | | 2,330 | | | | — | |
Change in net unrealized appreciation (depreciation) of: | | | | | | | | | | | | | | | | |
Investments and foreign currency | | | (121,678 | ) | | | (93,469 | ) | | | (4,840 | ) | | | 754 | |
Futures contracts | | | 8,604 | | | | 8,253 | | | | 72 | | | | (202 | ) |
Net realized and unrealized gain (loss) | | | (37,501 | ) | | | (44,821 | ) | | | 9,194 | | | | 1,771 | |
Net increase (decrease) in net assets from operations | | $ | (30,048 | ) | | $ | (35,479 | ) | | $ | 12,115 | | | $ | 2,159 | |
| N/A | – International Select, Quantitative Enhanced Core Equity and Tactical Market Opportunities do not offer Class B Shares. |
| (1) | – For the period November 1, 2010 through December 31, 2010. |
| (2) | – For the period February 24, 2011 (commencement of operations) through October 31, 2011. |
See accompanying notes to financial statements.
Statement of Changes in Net Assets (all dollars are rounded to thousands (000))
| | | | | | | | | | | | | | | | |
| | | International | | | International Select | |
| | | Year Ended
10/31/11 | | | Year Ended
10/31/10 | | | Year Ended
10/31/11 | | | Year Ended
10/31/10 | |
Operations | | | | | | | | | | | | | | | | |
Net investment income (loss) | | $ | 7,453 | | | $ | 5,972 | | | $ | 9,342 | | | $ | 7,381 | |
Net realized gain (loss) from: | | | | | | | | | | | | | | | | |
Investments and foreign currency | | | 79,230 | | | | 53,592 | | | | 51,311 | | | | 37,076 | |
Futures contracts | | | (3,657 | ) | | | (3,993 | ) | | | (10,916 | ) | | | (195 | ) |
Redemptions in-kind | | | — | | | | — | | | | — | | | | — | |
Change in net unrealized appreciation (depreciation) of: | | | | | | | | | | | | | | | | |
Investments and foreign currency | | | (121,678 | ) | | | 5,309 | | | | (93,469 | ) | | | 52,323 | |
Futures contracts | | | 8,604 | | | | (5,099 | ) | | | 8,253 | | | | (7,356 | ) |
Net increase (decrease) in net assets from operations | | | (30,048 | ) | | | 55,781 | | | | (35,479 | ) | | | 89,229 | |
Distributions to Shareholders | | | | | | | | | | | | | | | | |
From net investment income: | | | | | | | | | | | | | | | | |
Class A | | | (108 | ) | | | (112 | ) | | | (33 | ) | | | (7 | ) |
Class B | | | — | | | | — | | | | N/A | | | | N/A | |
Class C | | | — | | | | — | | | | (1 | ) | | | — | |
Class R3(1) | | | — | (2) | | | — | | | | — | | | | — | |
Class I(1) | | | (4,195 | ) | | | (4,307 | ) | | | (6,454 | ) | | | (2,439 | ) |
From accumulated net realized gains: | | | | | | | | | | | | | | | | |
Class A | | | — | | | | — | | | | — | | | | — | |
Class B | | | — | | | | — | | | | N/A | | | | N/A | |
Class C | | | — | | | | — | | | | — | | | | — | |
Class R3(1) | | | — | | | | — | | | | — | | | | — | |
Class I(1) | | | — | | | | — | | | | — | | | | — | |
Decrease in net assets from distributions to shareholders | | | (4,303 | ) | | | (4,419 | ) | | | (6,488 | ) | | | (2,446 | ) |
Fund Share Transactions | | | | | | | | | | | | | | | | |
Proceeds from sale of shares | | | 9,534 | | | | 31,093 | | | | 100,110 | | | | 331,375 | |
Proceeds from shares issued to shareholders due to reinvestment of distributions | | | 3,104 | | | | 3,022 | | | | 1,538 | | | | 709 | |
| | | 12,638 | | | | 34,115 | | | | 101,648 | | | | 332,084 | |
Cost of shares redeemed | | | (495,221 | ) | | | (115,559 | ) | | | (330,484 | ) | | | (152,308 | ) |
Cost of redemptions in-kind | | | — | | | | — | | | | — | | | | — | |
Net increase (decrease) in net assets from Fund share transactions | | | (482,583 | ) | | | (81,444 | ) | | | (228,836 | ) | | | 179,776 | |
Net increase (decrease) in net assets | | | (516,934 | ) | | | (30,082 | ) | | | (270,803 | ) | | | 266,559 | |
Net assets at the beginning of period | | | 683,472 | | | | 713,554 | | | | 854,518 | | | | 587,959 | |
Net assets at the end of period | | $ | 166,538 | | | $ | 683,472 | | | $ | 583,715 | | | $ | 854,518 | |
Undistributed (Over-distribution of) net investment income at the end of period | | $ | 6,115 | | | $ | 4,271 | | | $ | 7,930 | | | $ | 6,281 | |
See accompanying notes to financial statements.
| | | | | | | | | | | | | | | | |
| | | Quantitative
Enhanced Core Equity | | | Tactical
Market Opportunities | |
| | | Year Ended
10/31/11 | | | Year Ended
10/31/10 | | | Year Ended
10/31/11 | | | Year Ended
10/31/10 | |
Operations | | | | | | | | | | | | | | | | |
Net investment income (loss) | | $ | 2,921 | | | $ | 2,593 | | | $ | 388 | | | $ | 49 | |
Net realized gain (loss) from: | | | | | | | | | | | | | | | | |
Investments and foreign currency | | | 11,480 | | | | 18,592 | | | | 779 | | | | 86 | |
Futures contracts | | | 152 | | | | 88 | | | | 440 | | | | (22 | ) |
Redemptions in-kind | | | 2,330 | | | | — | | | | — | | | | — | |
Change in net unrealized appreciation (depreciation) of: | | | | | | | | | | | | | | | | |
Investments and foreign currency | | | (4,840 | ) | | | 2,535 | | | | 754 | | | | 117 | |
Futures contracts | | | 72 | | | | 234 | | | | (202 | ) | | | (34 | ) |
Net increase (decrease) in net assets from operations | | | 12,115 | | | | 24,042 | | | | 2,159 | | | | 196 | |
Distributions to Shareholders | | | | | | | | | | | | | | | | |
From net investment income: | | | | | | | | | | | | | | | | |
Class A(3) | | | (3 | ) | | | (3 | ) | | | — | | | | — | |
Class B | | | N/A | | | | N/A | | | | N/A | | | | N/A | |
Class C(3) | | | (1 | ) | | | — | | | | — | | | | — | |
Class R3(1) | | | N/A | | | | N/A | | | | N/A | | | | N/A | |
Class I(1) | | | (2,864 | ) | | | (2,274 | ) | | | (155 | ) | | | — | |
From accumulated net realized gains: | | | | | | | | | | | | | | | | |
Class A(3) | | | — | | | | — | | | | — | | | | — | |
Class B | | | N/A | | | | N/A | | | | N/A | | | | N/A | |
Class C(3) | | | — | | | | — | | | | — | | | | — | |
Class R3(1) | | | N/A | | | | N/A | | | | N/A | | | | N/A | |
Class I(1) | | | — | | | | — | | | | (47 | ) | | | — | |
Decrease in net assets from distributions to shareholders | | | (2,868 | ) | | | (2,277 | ) | | | (202 | ) | | | — | |
Fund Share Transactions | | | | | | | | | | | | | | | | |
Proceeds from sale of shares | | | 9,840 | | | | 76,687 | | | | 33,828 | | | | 27,104 | |
Proceeds from shares issued to shareholders due to reinvestment of distributions | | | 878 | | | | 901 | | | | 158 | | | | — | |
| | | 10,718 | | | | 77,588 | | | | 33,986 | | | | 27,104 | |
Cost of shares redeemed | | | (97,607 | ) | | | (42,197 | ) | | | (10,350 | ) | | | — | |
Cost of redemptions in-kind | | | (17,935 | ) | | | — | | | | — | | | | — | |
Net increase (decrease) in net assets from Fund share transactions | | | (104,824 | ) | | | 35,391 | | | | 23,636 | | | | 27,104 | |
Net increase (decrease) in net assets | | | (95,577 | ) | | | 57,156 | | | | 25,593 | | | | 27,300 | |
Net assets at the beginning of period | | | 203,583 | | | | 146,427 | | | | 27,300 | | | | — | |
Net assets at the end of period | | $ | 108,006 | | | $ | 203,583 | | | $ | 52,893 | | | $ | 27,300 | |
Undistributed (Over-distribution of) net investment income at the end of period | | $ | 1,945 | | | $ | 1,951 | | | $ | 293 | | | $ | 52 | |
| N/A – | International Select does not offer Class B Shares. Quantitative Enhanced Core Equity and Tactical Market Opportunities do not offer Class B Shares and Class R3 Shares. |
| (1) – | Effective January 18, 2011, Class R Shares and Class Y Shares previously offered by FAF Advisors, Inc. were renamed Class R3 Shares and Class I Shares, respectively. |
| (2) – | Amount rounds to less than $1,000. |
| (3) – | Tactical Market Opportunities did not offer Class A Shares and Class C Shares prior to February 24, 2011. |
See accompanying notes to financial statements.
Financial Highlights
| | | | | | | | | | | | | | | | | | | | | | | | | | | | | | | | |
| Selected data for a share outstanding throughout each period: | | | | |
| | | | | | |
| Class (Commencement Date) | | | | | | | | | | | | | | | | | | | |
| | | | | | Investment Operations | | | Less Distributions | | | | |
| | | | | |
| INTERNATIONAL | | | | | | | | | | | | | | | | |
Year Ended
October 31, | | Beginning
Net
Asset
Value | | | Net
Invest-
ment
Income
(Loss)(a) | | | Net
Realized/
Unrealized
Gain
(Loss) | | | Total | | | Net
Invest-
ment
Income | | | Capital
Gains(b) | | | Total | | | Ending
Net
Asset
Value | |
Class A (5/94) | | | | | | | | | | | | | | | | | | | | | | | | | | | | | | | | |
2011 | | $ | 11.62 | | | $ | .10 | | | $ | (.55 | ) | | $ | (.45 | ) | | $ | (.05 | ) | | $ | — | | | $ | (.05 | ) | | $ | 11.12 | |
2010 | | | 10.78 | | | | .07 | | | | .81 | | | | .88 | | | | (.04 | ) | | | — | | | | (.04 | ) | | | 11.62 | |
2009 | | | 8.68 | | | | .09 | | | | 2.09 | | | | 2.18 | | | | (.08 | ) | | | — | | | | (.08 | ) | | | 10.78 | |
2008 | | | 17.15 | | | | .26 | | | | (7.14 | ) | | | (6.88 | ) | | | (.14 | ) | | | (1.45 | ) | | | (1.59 | ) | | | 8.68 | |
2007 | | | 14.80 | | | | .15 | | | | 2.59 | | | | 2.74 | | | | (.13 | ) | | | (.26 | ) | | | (.39 | ) | | | 17.15 | |
Class B (3/95) | | | | | | | | | | | | | | | | | | | | | | | | | | | | | | | | |
2011 | | $ | 10.57 | | | $ | .01 | | | $ | (.50 | ) | | $ | (.49 | ) | | $ | — | | | $ | — | | | $ | — | | | $ | 10.08 | |
2010 | | | 9.84 | | | | (.02 | ) | | | .75 | | | | .73 | | | | — | | | | — | | | | — | | | | 10.57 | |
2009 | | | 7.92 | | | | .02 | | | | 1.90 | | | | 1.92 | | | | — | | | | — | | | | — | | | | 9.84 | |
2008 | | | 15.78 | | | | .14 | | | | (6.52 | ) | | | (6.38 | ) | | | (.03 | ) | | | (1.45 | ) | | | (1.48 | ) | | | 7.92 | |
2007 | | | 13.65 | | | | .03 | | | | 2.39 | | | | 2.42 | | | | (.03 | ) | | | (.26 | ) | | | (.29 | ) | | | 15.78 | |
Class C (9/01) | | | | | | | | | | | | | | | | | | | | | | | | | | | | | | | | |
2011 | | $ | 11.03 | | | $ | .01 | | | $ | (.53 | ) | | $ | (.52 | ) | | $ | — | | | $ | — | | | $ | — | | | $ | 10.51 | |
2010 | | | 10.26 | | | | (.02 | ) | | | .79 | | | | .77 | | | | — | | | | — | | | | — | | | | 11.03 | |
2009 | | | 8.25 | | | | .02 | | | | 1.99 | | | | 2.01 | | | | — | | | | — | | | | — | | | | 10.26 | |
2008 | | | 16.36 | | | | .15 | | | | (6.79 | ) | | | (6.64 | ) | | | (.02 | ) | | | (1.45 | ) | | | (1.47 | ) | | | 8.25 | |
2007 | | | 14.13 | | | | .03 | | | | 2.48 | | | | 2.51 | | | | (.02 | ) | | | (.26 | ) | | | (.28 | ) | | | 16.36 | |
Class R3 (4/94)(e) | | | | | | | | | | | | | | | | | | | | | | | | | | | | | | | | |
2011 | | $ | 11.61 | | | $ | .07 | | | $ | (.54 | ) | | $ | (.47 | ) | | $ | (.03 | ) | | $ | — | | | $ | (.03 | ) | | $ | 11.11 | |
2010 | | | 10.78 | | | | .04 | | | | .82 | | | | .86 | | | | (.03 | ) | | | — | | | | (.03 | ) | | | 11.61 | |
2009 | | | 8.67 | | | | .07 | | | | 2.11 | | | | 2.18 | | | | (.07 | ) | | | — | | | | (.07 | ) | | | 10.78 | |
2008 | | | 17.17 | | | | .19 | | | | (7.10 | ) | | | (6.91 | ) | | | (.14 | ) | | | (1.45 | ) | | | (1.59 | ) | | | 8.67 | |
2007 | | | 14.81 | | | | .10 | | | | 2.61 | | | | 2.71 | | | | (.09 | ) | | | (.26 | ) | | | (.35 | ) | | | 17.17 | |
Class I (4/94)(e) | | | | | | | | | | | | | | | | | | | | | | | | | | | | | | | | |
2011 | | $ | 11.78 | | | $ | .14 | | | $ | (.59 | ) | | $ | (.45 | ) | | $ | (.08 | ) | | $ | — | | | $ | (.08 | ) | | $ | 11.25 | |
2010 | | | 10.92 | | | | .10 | | | | .83 | | | | .93 | | | | (.07 | ) | | | — | | | | (.07 | ) | | | 11.78 | |
2009 | | | 8.81 | | | | .11 | | | | 2.12 | | | | 2.23 | | | | (.12 | ) | | | — | | | | (.12 | ) | | | 10.92 | |
2008 | | | 17.38 | | | | .30 | | | | (7.24 | ) | | | (6.94 | ) | | | (.18 | ) | | | (1.45 | ) | | | (1.63 | ) | | | 8.81 | |
2007 | | | 14.99 | | | | .19 | | | | 2.62 | | | | 2.81 | | | | (.16 | ) | | | (.26 | ) | | | (.42 | ) | | | 17.38 | |
| | | | | | | | | | | | | | | | | | | | | | | | | | |
| | | | | | | | | | | | | | | | | | | | |
| | | | |
| | | | | | | | | | | | | | |
| | | | Ratios/Supplemental Data | |
| | | | Ratios to Average
Net Assets Before
Reimbursement | | | Ratios to Average
Net Assets After
Reimbursement(d) | | | | |
Total
Return(c) | | | Ending
Net
Assets
(000) | | | Expenses | | | Net
Invest-
ment
Income
(Loss) | | | Expenses | | | Net
Invest-
ment
Income
(Loss) | | | Portfolio
Turnover
Rate | |
| | | | | | | | | | | | | | | | | | | | | | | | | | |
| | (3.93 | )% | | $ | 22,328 | | | | 1.46 | % | | | .84 | % | | | 1.46 | % | | | .84 | % | | | 72 | % |
| | 8.21 | | | | 26,698 | | | | 1.59 | | | | .51 | | | | 1.48 | | | | .62 | | | | 56 | |
| | 25.29 | | | | 27,995 | | | | 1.59 | | | | .90 | | | | 1.49 | | | | 1.00 | | | | 231 | |
| | (43.82 | ) | | | 25,342 | | | | 1.54 | | | | 1.87 | | | | 1.49 | | | | 1.92 | | | | 18 | |
| | 18.92 | | | | 56,705 | | | | 1.53 | | | | .93 | | | | 1.49 | | | | .97 | | | | 14 | |
| | | | | | | | | | | | | | | | | | | | | | | | | | |
| | (4.64 | )% | | $ | 948 | | | | 2.21 | % | | | .08 | % | | | 2.21 | % | | | .08 | % | | | 72 | % |
| | 7.42 | | | | 1,497 | | | | 2.34 | | | | (.26 | ) | | | 2.23 | | | | (.15 | ) | | | 56 | |
| | 24.24 | | | | 1,976 | | | | 2.34 | | | | .13 | | | | 2.24 | | | | .23 | | | | 231 | |
| | (44.19 | ) | | | 2,499 | | | | 2.29 | | | | 1.11 | | | | 2.24 | | | | 1.16 | | | | 18 | |
| | 18.05 | | | | 6,668 | | | | 2.28 | | | | .18 | | | | 2.24 | | | | .22 | | | | 14 | |
| | | | | | | | | | | | | | | | | | | | | | | | | | |
| | (4.71 | )% | | $ | 1,987 | | | | 2.21 | % | | | .10 | % | | | 2.21 | % | | | .10 | % | | | 72 | % |
| | 7.50 | | | | 2,607 | | | | 2.34 | | | | (.25 | ) | | | 2.23 | | | | (.14 | ) | | | 56 | |
| | 24.36 | | | | 3,269 | | | | 2.34 | | | | .14 | | | | 2.24 | | | | .24 | | | | 231 | |
| | (44.21 | ) | | | 3,232 | | | | 2.29 | | | | 1.15 | | | | 2.24 | | | | 1.20 | | | | 18 | |
| | 18.09 | | | | 7,173 | | | | 2.28 | | | | .16 | | | | 2.24 | | | | .20 | | | | 14 | |
| | | | | | | | | | | | | | | | | | | | | | | | | | |
| | (4.10 | )% | | $ | 11 | | | | 1.68 | % | | | .59 | % | | | 1.68 | % | | | .59 | % | | | 72 | % |
| | 7.94 | | | | 6 | | | | 1.84 | | | | .27 | | | | 1.73 | | | | .38 | | | | 56 | |
| | 25.39 | | | | 5 | | | | 1.84 | | | | .63 | | | | 1.74 | | | | .73 | | | | 231 | |
| | (43.94 | ) | | | 2 | | | | 1.79 | | | | 1.35 | | | | 1.74 | | | | 1.40 | | | | 18 | |
| | 18.66 | | | | 4 | | | | 1.78 | | | | .56 | | | | 1.74 | | | | .60 | | | | 14 | |
| | | | | | | | | | | | | | | | | | | | | | | | | | |
| | (3.90 | )% | | $ | 141,264 | | | | 1.21 | % | | | 1.17 | % | | | 1.21 | % | | | 1.17 | % | | | 72 | % |
| | 8.52 | | | | 652,664 | | | | 1.34 | | | | .76 | | | | 1.23 | | | | .87 | | | | 56 | |
| | 25.68 | | | | 680,309 | | | | 1.34 | | | | 1.15 | | | | 1.24 | | | | 1.25 | | | | 231 | |
| | (43.68 | ) | | | 658,276 | | | | 1.29 | | | | 2.14 | | | | 1.24 | | | | 2.19 | | | | 18 | |
| | 19.23 | | | | 1,670,810 | | | | 1.28 | | | | 1.17 | | | | 1.24 | | | | 1.21 | | | | 14 | |
| (a) | Per share Net Investment Income (Loss) is calculated using the average daily shares method. |
| (b) | Distributions from Capital Gains include short-term capital gains, if any. |
| (c) | Total return is the combination of changes in net asset value without any sales charge, reinvested dividend income at net asset value and reinvested capital gains distributions at net asset value, if any. Total returns are not annualized. |
| (d) | After expense reimbursement from the Adviser, where applicable. Ratios do not reflect the effect of custodian fee credits earned on the Fund’s net cash on deposit with the custodian bank, where applicable. |
| (e) | Effective January 18, 2011, Class R Shares and Class Y Shares previously offered by FAF Advisors, Inc. were renamed Class R3 Shares and Class I Shares, respectively. |
See accompanying notes to financial statements.
Financial Highlights (continued)
| | | | | | | | | | | | | | | | | | | | | | | | | | | | | | | | |
| Selected data for a share outstanding throughout each period: | | | | |
| | | | | | |
| Class (Commencement Date) | | | | | | | | | | | | | | | | | | | |
| | | | | | Investment Operations | | | Less Distributions | | | | |
| | | | | | |
| INTERNATIONAL SELECT | | | | | | | | | | | | | | | | | | | |
Year Ended
October 31, | | Beginning
Net
Asset
Value | | | Net
Invest-
ment
Income
(Loss)(a) | | | Net
Realized/
Unrealized
Gain
(Loss) | | | Total | | | Net
Invest-
ment
Income | | | Capital
Gains(b) | | | Total | | | Ending
Net
Asset
Value | |
Class A (12/06) | | | | | | | | | | | | | | | | | | | | | | | | | | | | | | | | |
2011 | | $ | 9.54 | | | $ | .09 | | | $ | (.72 | ) | | $ | (.63 | ) | | $ | (.06 | ) | | $ | — | | | $ | (.06 | ) | | $ | 8.85 | |
2010 | | | 8.48 | | | | .06 | | | | 1.02 | | | | 1.08 | | | | (.02 | ) | | | — | | | | (.02 | ) | | | 9.54 | |
2009 | | | 6.53 | | | | .07 | | | | 2.00 | | | | 2.07 | | | | (.12 | ) | | | — | | | | (.12 | ) | | | 8.48 | |
2008 | | | 12.15 | | | | .15 | | | | (5.52 | ) | | | (5.37 | ) | | | (.06 | ) | | | (.19 | ) | | | (.25 | ) | | | 6.53 | |
2007(f) | | | 10.00 | | | | .09 | | | | 2.07 | | | | 2.16 | | | | (.01 | ) | | | — | | | | (.01 | ) | | | 12.15 | |
Class C (12/06) | | | | | | | | | | | | | | | | | | | | | | | | | | | | | | | | |
2011 | | $ | 9.43 | | | $ | .02 | | | $ | (.72 | ) | | $ | (.70 | ) | | $ | (.01 | ) | | $ | — | | | $ | (.01 | ) | | $ | 8.72 | |
2010 | | | 8.42 | | | | .01 | | | | 1.00 | | | | 1.01 | | | | — | | | | — | | | | — | | | | 9.43 | |
2009 | | | 6.46 | | | | .03 | | | | 1.97 | | | | 2.00 | | | | (.04 | ) | | | — | | | | (.04 | ) | | | 8.42 | |
2008 | | | 12.07 | | | | .09 | | | | (5.48 | ) | | | (5.39 | ) | | | (.03 | ) | | | (.19 | ) | | | (.22 | ) | | | 6.46 | |
2007(f) | | | 10.00 | | | | .03 | | | | 2.04 | | | | 2.07 | | | | — | | | | — | | | | — | | | | 12.07 | |
Class R3 (12/06)(e) | | | | | | | | | | | | | | | | | | | | | | | | | | | | | | | | |
2011 | | $ | 9.48 | | | $ | .10 | | | $ | (.91 | ) | | $ | (.81 | ) | | $ | — | | | $ | — | | | $ | — | | | $ | 8.67 | |
2010 | | | 8.42 | | | | .05 | | | | 1.01 | | | | 1.06 | | | | — | | | | — | | | | — | | | | 9.48 | |
2009 | | | 6.52 | | | | .09 | | | | 1.94 | | | | 2.03 | | | | (.13 | ) | | | — | | | | (.13 | ) | | | 8.42 | |
2008 | | | 12.12 | | | | .08 | | | | (5.46 | ) | | | (5.38 | ) | | | (.03 | ) | | | (.19 | ) | | | (.22 | ) | | | 6.52 | |
2007(f) | | | 10.00 | | | | .07 | | | | 2.06 | | | | 2.13 | | | | (.01 | ) | | | — | | | | (.01 | ) | | | 12.12 | |
Class I (12/06)(e) | | | | | | | | | | | | | | | | | | | | | | | | | | | | | | | | |
2011 | | $ | 9.57 | | | $ | .12 | | | $ | (.74 | ) | | $ | (.62 | ) | | $ | (.08 | ) | | $ | — | | | $ | (.08 | ) | | $ | 8.87 | |
2010 | | | 8.49 | | | | .09 | | | | 1.02 | | | | 1.11 | | | | (.03 | ) | | | — | | | | (.03 | ) | | | 9.57 | |
2009 | | | 6.55 | | | | .08 | | | | 2.01 | | | | 2.09 | | | | (.15 | ) | | | — | | | | (.15 | ) | | | 8.49 | |
2008 | | | 12.17 | | | | .17 | | | | (5.52 | ) | | | (5.35 | ) | | | (.08 | ) | | | (.19 | ) | | | (.27 | ) | | | 6.55 | |
2007(f) | | | 10.00 | | | | .13 | | | | 2.05 | | | | 2.18 | | | | (.01 | ) | | | — | | | | (.01 | ) | | | 12.17 | |
| | | | | | | | | | | | | | | | | | | | | | | | | | |
| | | | | | | | | | | | | | | | | | | | |
| | | | |
| | | | | | | | | | | | | | |
| | | | Ratios/Supplemental Data | |
| | | | | | | Ratios to Average
Net Assets Before
Reimbursement | | | Ratios to Average
Net Assets After
Reimbursement(d) | | | | |
Total
Return(c) | | | Ending
Net
Assets
(000) | | | Expenses | | | Net
Invest-
ment
Income
(Loss) | | | Expenses | | | Net
Invest-
ment
Income
(Loss) | | | Portfolio
Turnover
Rate | |
| | | | | | | | | | | | | | | | | | | | | | | | | | |
| | (6.70 | )% | | $ | 4,388 | | | | 1.46 | % | | | .96 | % | | | 1.46 | % | | | .96 | % | | | 59 | % |
| | 12.72 | | | | 5,530 | | | | 1.62 | | | | .56 | | | | 1.49 | | | | .69 | | | | 47 | |
| | 32.32 | | | | 3,029 | | | | 1.76 | | | | .77 | | | | 1.49 | | | | 1.04 | | | | 64 | |
| | (45.00 | ) | | | 1,904 | | | | 1.70 | | | | 1.31 | | | | 1.49 | | | | 1.52 | | | | 63 | |
| | 21.58 | | | | 3,228 | | | | 1.89 | * | | | .55 | * | | | 1.49 | * | | | .95 | * | | | 45 | |
| | | | | | | | | | | | | | | | | | | | | | | | | | |
| | (7.45 | )% | | $ | 717 | | | | 2.21 | % | | | .21 | % | | | 2.21 | % | | | .21 | % | | | 59 | % |
| | 12.00 | | | | 816 | | | | 2.37 | | | | (.05 | ) | | | 2.24 | | | | .08 | | | | 47 | |
| | 31.43 | | | | 244 | | | | 2.51 | | | | .13 | | | | 2.24 | | | | .40 | | | | 64 | |
| | (45.39 | ) | | | 226 | | | | 2.45 | | | | .71 | | | | 2.24 | | | | .92 | | | | 63 | |
| | 20.75 | | | | 287 | | | | 2.64 | * | | | (.10 | )* | | | 2.24 | * | | | .30 | * | | | 45 | |
| | | | | | | | | | | | | | | | | | | | | | | | | | |
| | (8.54 | )% | | $ | 13 | | | | 1.67 | % | | | 1.02 | % | | | 1.67 | % | | | 1.02 | % | | | 59 | % |
| | 12.59 | | | | 7 | | | | 1.87 | | | | .40 | | | | 1.74 | | | | .53 | | | | 47 | |
| | 31.99 | | | | 19 | | | | 2.01 | | | | 1.03 | | | | 1.74 | | | | 1.30 | | | | 64 | |
| | (45.10 | ) | | | 48 | | | | 1.95 | | | | .69 | | | | 1.74 | | | | .90 | | | | 63 | |
| | 21.27 | | | | 17 | | | | 2.14 | * | | | .37 | * | | | 1.74 | * | | | .77 | * | | | 45 | |
| | | | | | | | | | | | | | | | | | | | | | | | | | |
| | (6.60 | )% | | $ | 578,597 | | | | 1.21 | % | | | 1.23 | % | | | 1.21 | % | | | 1.23 | % | | | 59 | % |
| | 13.14 | | | | 848,165 | | | | 1.37 | | | | .85 | | | | 1.24 | | | | .98 | | | | 47 | |
| | 32.68 | | | | 584,667 | | | | 1.51 | | | | .90 | | | | 1.24 | | | | 1.17 | | | | 64 | |
| | (44.86 | ) | | | 249,805 | | | | 1.45 | | | | 1.51 | | | | 1.24 | | | | 1.72 | | | | 63 | |
| | 21.78 | | | | 343,161 | | | | 1.64 | * | | | .96 | * | | | 1.24 | * | | | 1.36 | * | | | 45 | |
| (a) | Per share Net Investment Income (Loss) is calculated using the average daily shares method. |
| (b) | Distributions from Capital Gains include short-term capital gains, if any. |
| (c) | Total return is the combination of changes in net asset value without any sales charge, reinvested dividend income at net asset value and reinvested capital gains distributions at net asset value, if any. Total returns are not annualized. |
| (d) | After expense reimbursement from the Adviser, where applicable. Ratios do not reflect the effect of custodian fee credits earned on the Fund’s net cash on deposit with the custodian bank, where applicable. |
| (e) | Effective January 18, 2011, Class R Shares and Class Y Shares previously offered by FAF Advisors, Inc. were renamed Class R3 Shares and Class I Shares, respectively. |
| (f) | For the period December 21, 2006 (commencement of operations) through October 31, 2007. |
See accompanying notes to financial statements.
Financial Highlights (continued)
| | | | | | | | | | | | | | | | | | | | | | | | | | | | | | | | |
| Selected data for a share outstanding throughout each period: | | | | |
| | | | | | |
| Class (Commencement Date) | | | | | | | | | | | | | | | | | | | |
| | | | | | Investment Operations | | | Less Distributions | | | | |
| | | | | |
| QUANTITATIVE ENHANCED CORE EQUITY | | | | | | | | | | | | | | | | |
Year Ended
October 31, | | Beginning
Net
Asset
Value | | | Net
Invest-
ment
Income
(Loss)(a) | | | Net
Realized/
Unrealized
Gain
(Loss) | | | Total | | | Net
Invest-
ment
Income | | | Capital
Gains(b) | | | Total | | | Ending
Net
Asset
Value | |
Class A (7/07) | | | | | | | | | | | | | | | | | | | | | | | | | | | | | | | | |
2011 | | $ | 20.50 | | | $ | .31 | | | $ | 1.02 | | | $ | 1.33 | | | $ | (.26 | ) | | $ | — | | | $ | (.26 | ) | | $ | 21.57 | |
2010 | | | 18.01 | | | | .25 | | | | 2.48 | | | | 2.73 | | | | (.24 | ) | | | — | | | | (.24 | ) | | | 20.50 | |
2009 | | | 16.56 | | | | .31 | | | | 1.29 | | | | 1.60 | | | | (.15 | ) | | | — | | | | (.15 | ) | | | 18.01 | |
2008 | | | 26.90 | | | | .40 | | | | (10.21 | ) | | | (9.81 | ) | | | (.29 | ) | | | (.24 | ) | | | (.53 | ) | | | 16.56 | |
2007(f) | | | 25.00 | | | | .06 | | | | 1.91 | | | | 1.97 | | | | (.07 | ) | | | — | | | | (.07 | ) | | | 26.90 | |
Class C (7/07) | | | | | | | | | | | | | | | | | | | | | | | | | | | | | | | | |
2011 | | $ | 20.50 | | | $ | .12 | | | $ | 1.06 | | | $ | 1.18 | | | $ | (.28 | ) | | $ | — | | | $ | (.28 | ) | | $ | 21.40 | |
2010 | | | 17.91 | | | | .08 | | | | 2.51 | | | | 2.59 | | | | — | | | | — | | | | — | | | | 20.50 | |
2009 | | | 16.51 | | | | .24 | | | | 1.24 | | | | 1.48 | | | | (.08 | ) | | | — | | | | (.08 | ) | | | 17.91 | |
2008 | | | 26.88 | | | | .23 | | | | (10.20 | ) | | | (9.97 | ) | | | (.16 | ) | | | (.24 | ) | | | (.40 | ) | | | 16.51 | |
2007(f) | | | 25.00 | | | | .02 | | | | 1.90 | | | | 1.92 | | | | (.04 | ) | | | — | | | | (.04 | ) | | | 26.88 | |
Class I (7/07)(e) | | | | | | | | | | | | | | | | | | | | | | | | | | | | | | | | |
2011 | | $ | 20.57 | | | $ | .37 | | | $ | 1.03 | | | $ | 1.40 | | | $ | (.33 | ) | | $ | — | | | $ | (.33 | ) | | $ | 21.64 | |
2010 | | | 18.04 | | | | .29 | | | | 2.51 | | | | 2.80 | | | | (.27 | ) | | | — | | | | (.27 | ) | | | 20.57 | |
2009 | | | 16.57 | | | | .35 | | | | 1.29 | | | | 1.64 | | | | (.17 | ) | | | — | | | | (.17 | ) | | | 18.04 | |
2008 | | | 26.90 | | | | .44 | | | | (10.20 | ) | | | (9.76 | ) | | | (.33 | ) | | | (.24 | ) | | | (.57 | ) | | | 16.57 | |
2007(f) | | | 25.00 | | | | .11 | | | | 1.87 | | | | 1.98 | | | | (.08 | ) | | | — | | | | (.08 | ) | | | 26.90 | |
| | | | | | | | | | | | | | | | | | | | | | | | | | |
| | | | | | | | | | | | | | | | | | | | |
| | | | |
| | | | | | | | | | | | | | |
| | | | Ratios/Supplemental Data | |
| | | | | | | Ratios to Average
Net Assets Before
Reimbursement | | | Ratios to Average
Net Assets After
Reimbursement(d) | | | | |
Total
Return(c) | | | Ending
Net
Assets
(000) | | | Expenses | | | Net
Invest-
ment
Income
(Loss) | | | Expenses | | | Net
Invest-
ment
Income
(Loss) | | | Portfolio
Turnover
Rate | |
| | | | | | | | | | | | | | | | | | | | | | | | | | |
| | 6.50 | % | | $ | 164 | | | | .86 | % | | | 1.25 | % | | | .70 | % | | | 1.41 | % | | | 159 | % |
| | 15.24 | | | | 253 | | | | .93 | | | | 1.05 | | | | .70 | | | | 1.28 | | | | 142 | |
| | 9.87 | | | | 243 | | | | 1.01 | | | | 1.62 | | | | .69 | | | | 1.94 | | | | 75 | |
| | (37.08 | ) | | | 118 | | | | 1.18 | | | | 1.29 | | | | .70 | | | | 1.77 | | | | 153 | |
| | 7.89 | | | | 131 | | | | 1.40 | * | | | .21 | * | | | .70 | * | | | .91 | * | | | 55 | |
| | | | | | | | | | | | | | | | | | | | | | | | | | |
| | 5.76 | % | | $ | 108 | | | | 1.61 | % | | | .40 | % | | | 1.45 | % | | | .56 | % | | | 159 | % |
| | 14.46 | | | | 14 | | | | 1.68 | | | | .20 | | | | 1.45 | | | | .43 | | | | 142 | |
| | 9.05 | | | | 4 | | | | 1.76 | | | | 1.25 | | | | 1.44 | | | | 1.57 | | | | 75 | |
| | (37.58 | ) | | | 10 | | | | 1.93 | | | | .51 | | | | 1.45 | | | | .99 | | | | 153 | |
| | 7.69 | | | | 15 | | | | 2.15 | * | | | (.47 | )* | | | 1.45 | * | | | .23 | * | | | 55 | |
| | | | | | | | | | | | | | | | | | | | | | | | | | |
| | 6.79 | % | | $ | 107,734 | | | | .63 | % | | | 1.50 | % | | | .45 | % | | | 1.68 | % | | | 159 | % |
| | 15.61 | | | | 203,316 | | | | .68 | | | | 1.27 | | | | .45 | | | | 1.50 | | | | 142 | |
| | 10.13 | | | | 146,180 | | | | .76 | | | | 1.87 | | | | .44 | | | | 2.19 | | | | 75 | |
| | (36.93 | ) | | | 89,270 | | | | .93 | | | | 1.51 | | | | .45 | | | | 1.99 | | | | 153 | |
| | 7.93 | | | | 48,745 | | | | 1.15 | * | | | 1.03 | * | | | .45 | * | | | 1.73 | * | | | 55 | |
| (a) | Per share Net Investment Income (Loss) is calculated using the average daily shares method. |
| (b) | Distributions from Capital Gains include short-term capital gains, if any. |
| (c) | Total return is the combination of changes in net asset value, reinvested dividend income at net asset value and reinvested capital gains distributions at net asset value, if any. Total returns are not annualized. |
| (d) | After expense reimbursement from the Adviser, where applicable. Ratios do not reflect the effect of custodian fee credits earned on the Fund’s net cash on deposit with the custodian bank, where applicable. |
| (e) | Effective January 18, 2011, Class Y Shares previously offered by FAF Advisors, Inc. were renamed Class I Shares. |
| (f) | For the period July 31, 2007 (commencement of operations) through October 31, 2007. |
See accompanying notes to financial statements.
Financial Highlights (continued)
| | | | | | | | | | | | | | | | | | | | | | | | | | | | | | | | |
| Selected data for a share outstanding throughout each period: | | | | |
| | | | | | |
| Class (Commencement Date) | | | | | | | | | | | | | | | | | | | |
| | | | | | Investment Operations | | | Less Distributions | | | | |
| | | | | | | | |
| TACTICAL MARKET OPPORTUNITIES | | | | | | | | | | | | | | | | | | | | | | | | |
| Year Ended October 31, | | Beginning
Net
Asset
Value | | | Net
Invest-
ment
Income
(Loss)(a) | | | Net
Realized/
Unrealized
Gain
(Loss) | | | Total | | | Net
Invest-
ment
Income | | | Capital
Gains(b) | | | Total | | | Ending
Net
Asset
Value | |
Class A (2/11) | | | | | | | | | | | | | | | | | | | | | | | | | | | | | | | | |
2011(e) | | $ | 10.59 | | | $ | .04 | | | $ | .59 | | | $ | .63 | | | $ | — | | | $ | — | | | $ | — | | | $ | 11.22 | |
Class C (2/11) | | | | | | | | | | | | | | | | | | | | | | | | | | | | | | | | |
2011(e) | | $ | 10.59 | | | $ | — | * | | $ | .58 | | | $ | .58 | | | $ | — | | | $ | — | | | $ | — | | | $ | 11.17 | |
Class I (12/09)(f) | | | | | | | | | | | | | | | | | | | | | | | | | | | | | | | | |
2011 | | $ | 10.62 | | | $ | .14 | | | $ | .59 | | | $ | .73 | | | $ | (.08 | ) | | $ | (.02 | ) | | $ | (.10 | ) | | $ | 11.25 | |
2010(g) | | | 10.00 | | | | .02 | | | | .60 | | | | .62 | | | | — | | | | — | | | | — | | | | 10.62 | |
| | | | | | | | | | | | | | | | | | | | | | | | | | |
| | | | | | | | | | | | | | | | | | | | |
| | | | |
| | | | | | | | | | | | | | |
| | | | Ratios/Supplemental Data | |
| | | | | | | Ratios to Average
Net Assets Before
Reimbursement | | | Ratios to Average
Net Assets After
Reimbursement(d) | |
Total
Return(c) | | | Ending
Net
Assets
(000) | | | Expenses | | | Net
Invest-
ment
Income
(Loss) | | | Expenses | | | Net
Invest-
ment
Income
(Loss) | | | Portfolio
Turnover
Rate | |
| | | | | | | | | | | | | | | | | | | | | | | | | | |
| | 5.95 | % | | $ | 3,558 | | | | 1.67 | %** | | | .06 | %** | | | 1.19 | %** | | | .54 | %** | | | 177 | % |
| | | | | | | | | | | | | | | | | | | | | | | | | | |
| | 5.48 | % | | $ | 475 | | | | 2.31 | %** | | | (.37 | )%** | | | 1.94 | %** | | | — | %*** | | | 177 | % |
| | | | | | | | | | | | | | | | | | | | | | | | | | |
| | 6.95 | % | | $ | 48,860 | | | | 1.18 | % | | | 1.01 | % | | | .94 | % | | | 1.25 | % | | | 177 | % |
| | 6.20 | | | | 27,300 | | | | 4.14 | ** | | | (1.83 | )** | | | .92 | ** | | | 1.39 | ** | | | 156 | |
| (a) | Per share Net Investment Income (Loss) is calculated using the average daily shares method. |
| (b) | Distributions from Capital Gains include short-term capital gains, if any. |
| (c) | Total return is the combination of changes in net asset value without any sales charge, reinvested dividend income at net asset value and reinvested capital gains distributions at net asset value, if any. Total returns are not annualized. |
| (d) | After expense reimbursement from the Adviser, where applicable. Ratios do not reflect the effect of custodian fee credits earned on the Fund’s net cash on deposit with the custodian bank, where applicable. |
| (e) | For the period February 24, 2011 (commencement of operations) through October 31, 2011. |
| (f) | Effective January 18, 2011, Class Y Shares previously offered by FAF Advisors, Inc. were renamed Class I Shares. |
| (g) | For the period December 30, 2009 (commencement of operations) through October 31, 2010. |
| * | Rounds to less than $.01 per share. |
| *** | Annualized expense ratio rounds to less than .01%. |
See accompanying notes to financial statements.
Notes to Financial Statements (all dollars and shares are rounded to thousands (000))
1. General Information and Significant Accounting Policies
General Information
On July 28, 2010, U.S. Bancorp, the indirect parent company of FAF Advisors, Inc. (“FAF Advisors”) known as U.S. Bancorp Asset Management, Inc. (“USBAM”) effective January 1, 2011, entered into an agreement to sell a portion of FAF Advisors’ asset management business to Nuveen Investments, Inc. (“Nuveen”). Included in the sale was the part of FAF Advisors’ asset management business that advises the funds included in this report. The sale closed on December 31, 2010 (the “Sale”).
In connection with the Sale, the funds’ Board of Directors was asked to consider and approve new investment advisory agreements for the funds with Nuveen Asset Management, a wholly-owned subsidiary of Nuveen. The new investment advisory agreements for each fund were submitted to the funds’ shareholders for approval and took effect on January 1, 2011. Effective January 1, 2011, the funds’ adviser, Nuveen Asset Management, changed its name to Nuveen Fund Advisors, Inc. (“Nuveen Fund Advisors” or the “Adviser”). Concurrently, the Adviser formed a wholly-owned subsidiary, Nuveen Asset Management, LLC (the “Sub-Adviser”), to house its portfolio management capabilities and to serve as the funds’ sub-adviser, and the funds’ portfolio managers became employees of the Sub-Adviser. This allocation of responsibilities between the Adviser and the Sub-Adviser affects each of the funds. The Adviser will compensate the Sub-Adviser for the portfolio management services it provides to the fund from each fund’s management fee.
There was no change in the funds’ investment objectives or policies as a result of the Sale. The Sale did result in a change to each fund’s name effective January 1, 2011.
Effective January 18, 2011, Class R Shares and Class Y Shares previously offered by FAF Advisors were renamed Class R3 Shares and Class I Shares, respectively.
Effective May 15, 2011, Nuveen Quantitative Large Cap Core Fund is known as Nuveen Quantitative Enhanced Core Equity Fund.
The funds’ Board of Directors also approved new distribution agreements with Nuveen Investments, LLC, a wholly-owned subsidiary of Nuveen. Effective April 30, 2011, Nuveen Investments, LLC changed its name to Nuveen Securities, LLC.
First American Investment Funds, Inc., known as Nuveen Investment Funds, Inc. effective April 4, 2011 (the “Trust”), is an open-end investment company registered under the Investment Company Act of 1940, as amended. The Trust is comprised of Nuveen International Fund (“International”) formerly known as First American International Fund, Nuveen International Select Fund (“International Select”) formerly known as First American International Select Fund, Nuveen Quantitative Enhanced Core Equity Fund (“Quantitative Enhanced Core Equity”) formerly known as Nuveen Quantitative Large Cap Core Fund and First American Quantitative Large Cap Core Fund and Nuveen Tactical Market Opportunities Fund (“Tactical Market Opportunities”) formerly known as First American Tactical Market Opportunities Fund (each a “Fund” and collectively, the “Funds”), among others. The Trust was incorporated in the state of Maryland on August 20, 1987.
International’s investment objective is long-term growth of capital. Under normal market conditions, the Fund invests primarily in equity securities that trade in U.S. or foreign markets, depositary receipts representing shares of foreign issuers, and exchange traded funds and other investment companies that provide exposure to foreign issuers. Up to 15% of the Fund’s total assets may be invested in equity securities of emerging market issuers.
International Select’s investment objective is long-term growth of capital. Under normal market conditions, the Fund invests primarily in equity securities of foreign issuers that trade in U.S. or foreign markets, depositary receipts representing shares of foreign issuers, and exchange traded funds and other investment companies that provide exposure to foreign issuers.
Quantitative Enhanced Core Equity’s investment objective is to provide, over the long-term, a total return that exceeds the total return of the Standard & Poor’s 500 ® Index (“S&P 500 Index”). Under normal market conditions, the Fund invests at least 80% of net assets plus the amount of any borrowings for investment purposes in common stocks of large-capitalization companies within the same market capitalization range of companies in the S&P 500 Index. The Fund may also buy and sell stock index futures contracts.
Tactical Market Opportunities’ investment objective is to earn a positive total return over a reasonable period of time, regardless of market conditions. Under normal market conditions, the Fund will seek to outperform the Merrill Lynch 3 Month Treasury Bill Index (the “Treasury Bill Index”) by 400 basis points, or 4%, on an annualized basis. The Fund seeks to outperform the Treasury Bill Index over a reasonable period of time. The Fund seeks to achieve its objective by investing in U.S. international and emerging market equity and debt securities (including high yield debt securities), commodities, currencies, high quality, short-term debt securities and money market funds. The Fund also gains exposure to these assets classes by investing in exchange traded funds (“ETFs”) and derivative instruments such as options; futures contracts, including futures on equity and commodities indices, interest rate and currency futures; options on futures contracts; interest rate caps and floors; foreign currency contracts; options on foreign currencies; interest rate, total return, currency and credit default swaps; and options on the foregoing types of swap agreements.
Each Fund also may invest in options, futures contracts, options on futures contracts and forward foreign currency exchanges contracts (“derivatives”) to manage market or business risk, enhance its return or hedge against adverse movements in currency exchange rates.
Each Fund’s most recent prospectus provides further descriptions of each Fund’s investment objective, principal investment strategies and principal risks.
Significant Accounting Policies
The following is a summary of significant accounting policies followed by the Funds in the preparation of their financial statements in accordance with U.S. generally accepted accounting principles (“U.S. GAAP”).
Investment Valuation
Common stocks and other equity-type securities are valued at the last sales price on the securities exchange on which such securities are primarily traded and are generally classified as Level 1 for fair value measurement purposes. Securities primarily traded on the NASDAQ National Market (“NASDAQ”) are valued, except as indicated below, at the NASDAQ Official Closing Price and are generally classified as Level 1. However, securities traded on a securities exchange or NASDAQ for which there were no transactions on a given day or securities not listed on a securities exchange or NASDAQ are valued at the quoted bid price and are generally classified as Level 2. Prices of certain American Depositary Receipts (“ADR”) held by the Funds that trade in only limited volume in the United States are valued based on the last traded price, official closing price, or the most recent bid price of the underlying non-U.S.-traded stock, adjusted as appropriate for the underlying-to- ADR conversion ratio and foreign exchange rate, and from time-to-time may also be adjusted further to take into account material events that may take place after the close of the local non-U.S. market but before the close of the New York Stock Exchange, which generally represents a transfer from a Level 1 to a Level 2 security.
The Exchange-Traded Funds (“ETFs”) in which the Funds invests are valued at the last sales price on the securities exchange on which such securities are primarily traded and are generally classified as Level 1.
Investments in investment companies are valued at their respective net asset values on the valuation date. These investment vehicles are generally classified as Level 1.
Prices of fixed-income securities are provided by a pricing service approved by the Funds’ Board of Directors. These securities are generally classified as Level 2. When price quotes are not readily available, the pricing service establishes a security’s fair value using methods that may include consideration of the following: yields or prices of investments of comparable quality, type of issue, coupon, maturity and rating, market quotes or indications of value from security dealers, evaluations of anticipated cash flows or collateral, general market conditions and other information and analysis, including the obligor’s credit characteristics considered relevant. In pricing certain securities, particularly less liquid and lower quality securities, the pricing service may consider information about a security, its issuer, or market activity provided by the Adviser. These securities are generally classified as Level 2 or Level 3 depending on the priority of the significant inputs.
Futures contracts are valued using the closing settlement price or, in the absence of such a price, the last traded price. Futures contracts are generally classified as Level 1.
If significant market events occur between the time of determination of the closing price of a foreign security on an exchange and the time that the Funds’ net asset value (NAV) is determined, or if under the Funds’ procedures, the closing price of a foreign security is not deemed to be reliable, the security would be valued at fair value as determined in accordance with procedures established in good faith by the Fund’s Board of Directors. These securities are generally classified as Level 2 or Level 3.
Certain securities may not be able to be priced by the pre-established pricing methods as described above. Such securities may be valued by the Funds’ Board of Directors or its designee at fair value. These securities generally include, but are not limited to, restricted securities (securities which may not be publicly sold without registration under the Securities Act of 1933, as amended) for which a pricing service is unable to provide a market price; securities whose trading has been formally suspended; debt securities that have gone into default and for which there is no current market quotation; a security whose market price is not available from a pre-established pricing source; a security with respect to which an event has occurred that is likely to materially affect the value of the security after the market has closed but before the calculation of a Fund’s net asset value (as may be the case in non-U.S. markets on which the security is primarily traded) or make it difficult or impossible to obtain a reliable market quotation; and a security whose price, as provided by the pricing service, is not deemed to reflect the security’s fair value. As a general principle, the fair value of a security would appear to be the amount that the owner might reasonably expect to receive for it in a current sale. A variety of factors may be considered in determining the fair value of such securities, which may include consideration of the following: yields or prices of investments of comparable quality, type of issue, coupon, maturity and rating, market quotes or indications of value from security dealers, evaluations of anticipated cash flows or collateral, general market conditions and other information and analysis, including the obligor’s credit characteristics considered relevant. These securities are generally classified as Level 2 or Level 3 depending on the priority of the significant inputs. Regardless of the method employed to value a particular security, all valuations are subject to review by the Funds’ Board of Directors or its designee.
Refer to Footnote 2 – Fair Value Measurements for further details on the leveling of securities held by the Funds as of the end of the reporting period.
Investment Transactions
Investment transactions are recorded on a trade date basis. Realized gains and losses from investment transactions are determined on the specific identification method, which is the same basis used for federal income tax purposes.
Investment Income
Dividend income is recorded on the ex-dividend date or, for foreign securities, when information is available. Interest income, which reflects the amortization of premiums and includes accretion of discounts for financial reporting purposes is recorded on an accrual basis. Securities lending income is comprised of fees earned from borrowers and income earned on cash collateral investments, net of lending agent fees.
Notes to Financial Statements (all dollars and shares are rounded to thousands (000)) (continued)
Income Taxes
Each Fund is a separate taxpayer for federal income tax purposes. Each Fund intends to distribute substantially all of its net investment income and net capital gains to shareholders and to otherwise comply with the requirements of Subchapter M of the Internal Revenue Code applicable to regulated investment companies. Therefore, no federal income tax provision is required.
For all open tax years and all major taxing jurisdictions, management of the Funds has concluded that there are no significant uncertain tax positions that would require recognition in the financial statements. Open tax years are those that are open for examination by taxing authorities (i.e., generally the last four tax year ends and the interim tax period since then). Furthermore, management of the Funds is also not aware of any tax positions for which it is reasonably possible that the total amounts of unrecognized tax benefits will significantly change in the next twelve months.
Dividends and Distributions to Shareholders
Dividends from net investment income are declared and distributed to shareholders annually for each Fund. Dividends from net realized capital gains from investment transactions, if any, are declared and distributed to shareholders at least annually. Furthermore, capital gains are distributed only to the extent they exceed available capital loss carryforwards.
Distributions to shareholders are recorded on the ex-dividend date. The amount and timing of distributions are determined in accordance with federal income tax regulations, which may differ from U.S. GAAP.
Foreign Currency Transactions
Each Fund is authorized to engage in foreign currency exchange transactions, including foreign currency exchange contracts, futures, options and swap contracts. To the extent that the Funds invest in securities and/or contracts that are denominated in a currency other than U.S. dollars, the Funds will be subject to currency risk, which is the risk that an increase in the U.S. dollar relative to the foreign currency will reduce returns or portfolio value. Generally, when the U.S. dollar rises in value against a foreign currency, the Funds’ investments denominated in that currency will lose value because its currency is worth fewer U.S. dollars; the opposite effect occurs if the U.S. dollar falls in relative value. Investments and other assets and liabilities denominated in foreign currencies are converted into U.S. dollars on a spot (i.e. cash) basis at the spot rate prevailing in the foreign currency exchange market at the time of valuation. Purchases and sales of investments and income denominated in foreign currencies are translated into U.S. dollars on the respective dates of such transactions.
The books and records of the Funds are maintained in U.S. dollars. Foreign currencies, investments and other assets and liabilities are translated into U.S. dollars at 4:00 p.m. Eastern time. Investments, income and expenses are translated on the respective dates of such transactions. Net realized foreign currency gains and losses resulting from changes in exchange rates include foreign currency gains and losses between trade date and settlement date of the transactions, foreign currency transactions, and the difference between the amounts of interest and dividends recorded on the books of a Fund and the amounts actually received.
The realized gains and losses resulting from changes in foreign currency exchange rates and changes in foreign exchange rates associated with other assets and liabilities on investments, securities sold short, foreign currency exchange contracts, futures, options purchased, options written and swap contracts are recognized as a component of “Net realized gain (loss) from investments and foreign currency,” on the Statement of Operations, when applicable.
The unrealized gains and losses resulting from changes in foreign currency exchange rates and changes in foreign exchange rates associated with other assets and liabilities on investments are recognized as a component of “Change in net unrealized appreciation (depreciation) of investments and foreign currency,” on the Statement of Operations, when applicable. The unrealized gains and losses resulting from changes in foreign exchange rates associated with foreign currency exchange contracts, futures, options purchased, options written and swap contracts are recognized as a component of “Change in net unrealized appreciation (depreciation) of foreign currency exchange contracts, futures, options purchased, options written and swap contracts, respectively” on the Statement of Operations, when applicable.
Futures Contracts
Each Fund is subject to equity price risk, interest rate risk and foreign currency exchange rate risk in the normal course of pursuing its investment objectives and is authorized to invest in futures contracts in an attempt to manage such risk. Upon entering into a futures contract, a Fund is required to deposit with the broker an amount of cash or liquid securities equal to a specified percentage of the contract amount. This is known as the “initial margin.” Cash held by the broker to cover initial margin requirements on open futures contracts, if any, is recognized as “Deposits with brokers for open futures contracts” on the Statement of Assets and Liabilities. Subsequent payments (“variation margin”) are made or received by a Fund each day, depending on the daily fluctuation of the value of the contract. Variation margin is recognized as a receivable and/or payable for “Variation margin on futures contracts” on the Statement of Assets and Liabilities, when applicable.
During the period the futures contract is open, changes in the value of the contract are recognized as an unrealized gain or loss by “marking-to-market” on a daily basis to reflect the changes in market value of the contract, which is recognized as a component of “Change in net unrealized appreciation (depreciation) of futures contracts” on the Statement of Operations. When the contract is closed or expired, a Fund records a realized gain or loss equal to the difference between the value of the contract on the closing date and value of the contract when originally entered into, which is recognized as a component of “Net realized gain (loss) from futures contracts” on the Statement of Operations.
Risks of investments in futures contracts include the possible adverse movement in the price of the securities or indices underlying the contracts, the possibility that there may not be a liquid secondary market for the contracts and/or that a change in the value of the contract may not correlate with a change in the value of the underlying securities or indices.
During the fiscal year ended October 31, 2011, International and International Select invested in equity, fixed income and currency futures contracts, which were used as an overlay strategy to adjust the exposures created by the Funds’ multi-manager framework so that each Fund overall had the desired exposures to key markets. These Funds’ long and short futures contracts were used to implement various tactical market and hedging strategies. Quantitative Enhanced Core Equity invested in S&P 500 Index futures contracts, which were used to convert cash into the equivalent of an S&P 500 Index holding in order to minimize any tracking error to the Fund’s benchmark index resulting from cash flow activity and for tactical portfolio management positioning. Tactical Market Opportunities invested in equity, fixed income and currency futures contracts, which were used as part of the management of the Fund. This Fund’s long and short futures contracts were used to implement various absolute return, tactical market and hedging strategies.
The average number of futures contracts outstanding during the fiscal year ended October 31, 2011, for each Fund, were as follows:
| | | | | | | | | | | | | | | | |
| | | International | | | International
Select | | | Quantitative
Enhanced
Core Equity | | | Tactical
Market
Opportunities | |
Average number of futures contracts outstanding* | | | 5,367 | | | | 6,263 | | | | 6 | | | | 384 | |
| * | The average number of outstanding contracts is calculated based on the outstanding number of contracts at the beginning of the fiscal year and at the end of each fiscal quarter within the current fiscal year. |
Refer to Footnote 3 – Derivative Instruments and Hedging Activities for further details on futures contracts activity.
Market and Counterparty Credit Risk
In the normal course of business each Fund may invest in financial instruments and enter into financial transactions where risk of potential loss exists due to changes in the market (market risk) or failure of the other party to the transaction to perform (counterparty credit risk). The potential loss could exceed the value of the financial assets recorded on the financial statements. Financial assets, which potentially expose each Fund to counterparty credit risk, consist principally of cash due from counterparties on forward, option and swap transactions, when applicable. The extent of each Fund’s exposure to counterparty credit risk in respect to these financial assets approximates their carrying value as recorded on the Statement of Assets and Liabilities. Futures contracts, when applicable, expose a Fund to minimal counterparty credit risk as they are exchange traded and the exchange’s clearinghouse, which is counterparty to all exchange traded futures, guarantees the futures contracts against default.
Each Fund helps manage counterparty credit risk by entering into agreements only with counterparties the Adviser believes have the financial resources to honor their obligations and by having the Adviser monitor the financial stability of the counterparties. Additionally, counterparties may be required to pledge collateral daily (based on the daily valuation of the financial asset) on behalf of each Fund with a value approximately equal to the amount of any unrealized gain above a pre-determined threshold. Reciprocally, when each Fund has an unrealized loss, the Funds have instructed the custodian to pledge assets of the Funds as collateral with a value approximately equal to the amount of the unrealized loss above a pre-determined threshold. Collateral pledges are monitored and subsequently adjusted if and when the valuations fluctuate, either up or down, by at least the pre-determined threshold amount.
Multiclass Operations and Allocations
Income and expenses of the Funds that are not directly attributable to a specific class of shares are prorated among the classes based on the relative net assets of each class. Expenses directly attributable to a class of shares, which presently only include 12b-1 distribution fees and shareholder service fees, are recorded to the specific class.
Income, realized and unrealized capital gains and losses of the Funds are prorated among the classes based on the relative net assets of each class.
Interfund Lending Program
During the period November 1, 2010 through December 31, 2010, pursuant to an exemptive order issued by the Securities and Exchange Commission (“SEC”), the Funds, along with other registered investment companies in the First American Funds family, were allowed to participate in an interfund lending program. This program provided an alternative credit facility allowing the Funds to borrow from, or lend money to, other participating funds. The Funds did not have any interfund lending transactions during the period November 1, 2010 through December 31, 2010. The exemptive order terminated with respect to the Funds on December 31, 2010, in connection with the Sale.
Securities Lending
In order to generate additional income, each Fund may lend securities representing up to one-third of the value of its total assets (which includes collateral for securities on loan) to broker-dealers, banks, or other institutional borrowers of securities. Each Fund’s policy is to receive collateral from the borrower in the form of cash, U.S. government securities, or other high-grade debt obligations equal to at least 102% of the value of securities loaned, which is recognized as “Collateral from securities lending program” on the Statement of Assets and Liabilities. If the value of the securities on loan increases, [such that the level of collateralization falls below 102%], additional collateral is received from the borrower, which is recognized as “Due from broker” on the Statement of Assets and
Notes to Financial Statements (all dollars and shares are rounded to thousands (000)) (continued)
Liabilities, when applicable. As with other extensions of credit, there may be risks of delay in recovery of the securities or even loss of rights in the collateral should the borrower of the security fail financially.
U.S. Bank National Association (“U.S. Bank”) serves as the securities lending agent for the Funds in transactions involving the lending of portfolio securities on behalf of the Funds. U.S. Bank acts as the securities lending agent pursuant to, and subject to compliance with conditions contained in, an exemptive order issued by the SEC.
During the fiscal year ended October 31, 2011, U.S. Bank, as the securities lending agent, received fees that equaled up to 25% of each Fund’s net income from securities lending transactions through December 31, 2010, and 20% of such net income thereafter. U.S. Bank paid half of such fees to USBAM for certain securities lending services provided by USBAM. Collateral for securities on loan was invested in a money market fund administered by USBAM, which is recognized as “Investments purchased with collateral from securities lending” on the Statement of Assets and Liabilities. USBAM also received an administration fee equal to .02% of each Fund’s average daily net assets invested in the money market fund.
Income from securities lending, net of fees paid to U.S. Bank, is recognized on the Statement of Operations as “Securities lending income.” Securities lending fees paid to U.S. Bank by each Fund during the fiscal year ended October 31, 2011, were as follows:
| | | | | | | | | | | | | | | | |
| | | International | | | International
Select | | | Quantitative
Enhanced
Core Equity | | | Tactical
Market
Opportunities | |
Securities lending fees paid | | $ | — | | | $ | — | | | $ | 9 | | | $ | — | |
Indemnifications
Under the Trust’s organizational documents, its officers and directors are indemnified against certain liabilities arising out of the performance of their duties to the Trust. In addition, in the normal course of business, the Trust enters into contracts that provide general indemnifications to other parties. The Trust’s maximum exposure under these arrangements is unknown as this would involve future claims that may be made against the Trust that have not yet occurred. However, the Trust has not had prior claims or losses pursuant to these contracts and expects the risk of loss to be remote.
Use of Estimates
The preparation of financial statements in conformity with U.S. GAAP requires management to make estimates and assumptions that affect the reported amounts of assets and liabilities at the date of the financial statements and the reported amounts of increases and decreases in net assets from operations during the reporting period. Actual results may differ from those estimates.
2. Fair Value Measurements
Fair value is defined as the price that the Funds would receive upon selling an investment or transferring a liability in an orderly transaction to an independent buyer in the principal or most advantageous market for the investment. A three-tier hierarchy is used to maximize the use of observable market data and minimize the use of unobservable inputs and to establish classification of fair value measurements for disclosure purposes. Observable inputs reflect the assumptions market participants would use in pricing the asset or liability. Observable inputs are based on market data obtained from sources independent of the reporting entity. Unobservable inputs reflect the reporting entity’s own assumptions about the assumptions market participants would use in pricing the asset or liability. Unobservable inputs are based on the best information available in the circumstances. The three-tier hierarchy of inputs is summarized in the three broad levels listed below:
| | |
| Level 1 – | | Quoted prices in active markets for identical securities. |
| Level 2 – | | Other significant observable inputs (including quoted prices for similar securities, interest rates, prepayment speeds, credit risk, etc.). |
| Level 3 – | | Significant unobservable inputs (including management’s assumptions in determining the fair value of investments). |
The inputs or methodologies used for valuing securities are not an indication of the risk associated with investing in those securities. The following is a summary of each Fund’s fair value measurements as of October 31, 2011:
| | | | | | | | | | | | | | | | |
| | | | |
| International | | Level 1 | | | Level 2 | | | Level 3 | | | Total | |
Investments: | | | | | | | | | | | | | | | | |
Common Stocks | | $ | 146,223 | | | $ | — | | | $ | — | | | $ | 146,223 | |
Exchange-Traded Funds | | | 6,693 | | | | — | | | | — | | | | 6,693 | |
Rights | | | 14 | | | | — | | | | — | | | | 14 | |
Short-Term Investments | | | 4,511 | | | | 8,471 | | | | — | | | | 12,982 | |
Derivatives: | | | | | | | | | | | | | | | | |
Futures Contracts** | | | 1,428 | | | | — | | | | — | | | | 1,428 | |
Total | | $ | 158,869 | | | $ | 8,471 | | | $ | — | | | $ | 167,340 | |
| ** | Represents net unrealized appreciation (depreciation) as reported in the Fund’s Portfolio of Investments. |
| | | | | | | | | | | | | | | | |
| International Select | | Level 1 | | | Level 2 | | | Level 3 | | | Total | |
Investments: | | | | | | | | | | | | | | | | |
Common Stocks | | $ | 502,338 | | | $ | — | | | $ | 1,117 | | | $ | 503,455 | |
Exchange-Traded Funds | | | 29,708 | | | | — | | | | — | | | | 29,708 | |
Rights | | | 32 | | | | — | | | | — | | | | 32 | |
Short-Term Investments | | | 21,253 | | | | 28,773 | | | | — | | | | 50,026 | |
Derivatives: | | | | | | | | | | | | | | | | |
Futures Contracts** | | | (1,467 | ) | | | — | | | | — | | | | (1,467 | ) |
Total | | $ | 551,864 | | | $ | 28,773 | | | $ | 1,117 | | | $ | 581,754 | |
| | | | |
| Quantitative Enhanced Core Equity | | Level 1 | | | Level 2 | | | Level 3 | | | Total | |
Investments: | | | | | | | | | | | | | | | | |
Common Stocks | | $ | 105,793 | | | $ | — | | | $ | — | *** | | $ | 105,793 | |
Money Market Funds**** | | | 42,979 | | | | — | | | | — | | | | 42,979 | |
Short-Term Investments | | | 1,766 | | | | 750 | | | | — | | | | 2,516 | |
Derivatives: | | | | | | | | | | | | | | | | |
Futures Contracts** | | | 72 | | | | — | | | | — | | | | 72 | |
Total | | $ | 150,610 | | | $ | 750 | | | $ | — | *** | | $ | 151,360 | |
| | | | |
| Tactical Market Opportunities | | Level 1 | | | Level 2 | | | Level 3 | | | Total | |
Investments: | | | | | | | | | | | | | | | | |
Exchange-Traded Funds | | $ | 13,336 | | | $ | — | | | $ | — | | | $ | 13,336 | |
Corporate Bonds | | | — | | | | 5,198 | | | | — | | | | 5,198 | |
U.S. Government & Agency Obligations | | | — | | | | 4,864 | | | | — | | | | 4,864 | |
Short-Term Investments | | | 26,652 | | | | 2,200 | | | | — | | | | 28,852 | |
Derivatives: | | | | | | | | | | | | | | | | |
Futures Contracts** | | | (236 | ) | | | — | | | | — | | | | (236 | ) |
Total | | $ | 39,752 | | | $ | 12,262 | | | $ | — | | | $ | 52,014 | |
| ** | Represents net unrealized appreciation (depreciation) as reported in the Fund’s Portfolio of Investments. |
| *** | Level 3 security has a market value of zero. |
| **** | Represents the Fund’s investments purchased with collateral from securities lending. |
The following is a reconciliation of the Funds’ Level 3 investments held at the beginning and end of the measurement period:
| | | | | | | | |
| | | International
Select
Level 3
Common Stocks | | | Quantitative
Enhanced
Core Equity
Level 3
Common Stocks | |
Balance at the beginning of year | | $ | 1,507 | | | $ | — | *** |
Gains (losses): | | | | | | | | |
Net realized gains (losses) | | | 179 | | | | — | |
Net change in unrealized appreciation (depreciation) | | | (389 | ) | | | — | |
Purchases at cost | | | — | | | | — | |
Sales at proceeds | | | (340 | ) | | | — | |
Net discounts (premiums) | | | — | | | | — | |
Transfers in to | | | 1,117 | | | | — | |
Transfers out of | | | (957 | ) | | | — | |
Balance at the end of year | | $ | 1,117 | | | $ | — | *** |
Change in net unrealized appreciation (depreciation) during the year of Level 3 securities held as of October 31, 2011 | | $ | 159 | | | $ | — | *** |
| *** | Level 3 security has a market value of zero. |
During the fiscal year ended October 31, 2011, the Funds recognized no significant transfers to or from Level 1 or Level 2. Transfers in and/or out of Level 3 are shown using end of period values.
3. Derivative Instruments and Hedging Activities
The Funds record derivative instruments at fair value, with changes in fair value recognized on the Statement of Operations, when applicable. Even though the Funds’ investments in derivatives may represent economic hedges, they are not considered to be hedge transactions for financial reporting purposes. For additional information on the derivative instruments in which each Fund was invested during and at the end of the reporting period, refer to the Portfolios of Investments, Financial Statements and Footnote 1 – General Information and Significant Accounting Policies.
Notes to Financial Statements (all dollars and shares are rounded to thousands (000)) (continued)
The following tables present the fair value of all derivative instruments held by the Funds as of October 31, 2011, the location of these instruments on the Statement of Assets and Liabilities, and the primary underlying risk exposure.
| | | | | | | | | | | | | | |
| International | | | | | | | | | | |
| | | | | Location on the Statement of Assets and Liabilities | |
Underlying
Risk Exposure | | Derivative
Instrument | | Asset Derivative | | | Liability Derivatives | |
| | | Location | | Value | | | Location | | Value | |
Equity | | Futures
Contracts | | Deposits with brokers for open futures contracts and Receivable for variation margin on futures contracts* | | $ | 3,221 | | | Deposits with brokers for open futures contracts and Payable for variation margin on futures contracts* | | $ | 1,793 | |
| | | | | | | | | | | | | | |
| International Select | | | | | | | | | | | | |
| | | | | Location on the Statement of Assets and Liabilities | |
Underlying
Risk Exposure | | Derivative
Instrument | | Asset Derivative | | | Liability Derivatives | |
| | | Location | | Value | | | Location | | Value | |
Equity | | Futures
Contracts | | Deposits with brokers for open futures contracts and Receivable for variation margin on futures contracts* | | $ | 5,924 | | | Deposits with brokers for open futures contracts and Payable for variation margin on futures contracts* | | $ | 6,667 | |
Foreign Currency Exchange Rate | | Futures
Contracts | | Deposits with brokers for open futures contracts and Receivable for variation margin on futures contracts* | | | — | | | Deposits with brokers for open futures contracts and Payable for variation margin on futures contracts* | | | 724 | |
Total | | | | | | $ | 5,924 | | | | | $ | 7,391 | |
| | | | | | | | | | | | | | |
| Quantitative Enhanced Core Equity | | | | | | | | | | |
| | | | | Location on the Statement of Assets and Liabilities | |
Underlying
Risk Exposure | | Derivative
Instrument | | Asset Derivative | | | Liability Derivatives | |
| | | Location | | Value | | | Location | | Value | |
Equity | | Futures
Contracts | | Deposits with brokers for open futures contracts and Receivable for variation margin on futures contracts* | | $ | 72 | | | Deposits with brokers for open futures contracts and Payable for variation margin on futures contracts* | | $ | — | |
| | | | | | | | | | | | | | |
| Tactical Market Opportunities | | | | | | | | | | |
| | | | | Location on the Statement of Assets and Liabilities | |
Underlying
Risk Exposure | | Derivative
Instrument | | Asset Derivative | | | Liability Derivatives | |
| | | Location | | Value | | | Location | | Value | |
Equity | | Futures
Contracts | | Deposits with brokers for open futures contracts and Receivable for variation margin on futures contracts* | | $ | 531 | | | Deposits with brokers for open futures contracts and Payable for variation margin on futures contracts* | | $ | 498 | |
Foreign Currency Exchange Rate | | Futures
Contracts | | Deposits with brokers for open futures contracts and Receivable for variation margin on futures contracts* | | | — | | | Deposits with brokers for open futures contracts and Payable for variation margin on futures contracts* | | | 285 | |
Interest Rate | | Futures
Contracts | | Deposits with brokers for open futures contracts and Receivable for variation margin on futures contracts* | | | 16 | | | Deposits with brokers for open futures contracts and Payable for variation margin on futures contracts* | | | — | |
Total | | | | | | $ | 547 | | | | | $ | 783 | |
| * | Value represents cumulative gross unrealized appreciation (depreciation) of futures contracts as reported in the Portfolio of Investments and not the deposits with brokers, if any, or receivable or payable for variation margin on futures contracts presented on the Statement of Assets and Liabilities. |
The following tables present the amount of net realized gain (loss) and change in net unrealized appreciation (depreciation) recognized for the fiscal year ended October 31, 2011, on derivative instruments, as well as the primary risk exposure associated with each.
| | | | | | | | | | | | | | | | |
| Net Realized Gain (Loss) from Futures Contracts | | International | | | International
Select | | | Quantitative
Enhanced
Core Equity | | | Tactical
Market
Opportunities | |
Risk Exposure | | | | | | | | | | | | | | | | |
Equity | | $ | 7,354 | | | $ | (6,852 | ) | | $ | 152 | | | $ | 583 | |
Foreign Currency Exchange Rate | | | (4,303 | ) | | | (4,064 | ) | | | — | | | | (170 | ) |
Interest Rate | | | (6,708 | ) | | | — | | | | — | | | | 27 | |
Total | | $ | (3,657 | ) | | $ | (10,916 | ) | | $ | 152 | | | $ | 440 | |
| | | | | | | | | | | | | | | | |
Change in Net Unrealized Appreciation (Depreciation) of
Futures Contracts | | International | | | International
Select | | | Quantitative
Enhanced
Core Equity | | | Tactical
Market
Opportunities | |
Risk Exposure | | | | | | | | | | | | | | | | |
Equity | | $ | 4,799 | | | $ | 5,303 | | | $ | 72 | | | $ | 64 | |
Foreign Currency Exchange Rate | | | 3,805 | | | | 2,950 | | | | — | | | | (285 | ) |
Interest Rate | | | — | | | | — | | | | — | | | | 19 | |
Total | | $ | 8,604 | | | $ | 8,253 | | | $ | 72 | | | $ | (202 | ) |
4. Fund Shares
Transactions in Fund shares were as follows:
| | | | | | | | | | | | | | | | |
| | | International | |
| | | Year Ended
10/31/11 | | | Year Ended
10/31/10 | |
| | | Shares | | | Amount | | | Shares | | | Amount | |
Shares sold: | | | | | | | | | | | | | | | | |
Class A | | | 156 | | | $ | 1,889 | | | | 211 | | | $ | 2,352 | |
Class B | | | 1 | | | | 8 | | | | 6 | | | | 67 | |
Class C | | | 10 | | | | 108 | | | | 21 | | | | 235 | |
Class R3 (1) | | | — | | | | 5 | | | | 1 | | | | 1 | |
Class I (1) | | | 611 | | | | 7,524 | | | | 2,499 | | | | 28,438 | |
Shares issued to shareholders due to reinvestment of distributions: | | | | | | | | | | | | | | | | |
Class A | | | 8 | | | | 99 | | | | 9 | | | | 103 | |
Class B | | | — | | | | — | | | | — | | | | — | |
Class C | | | — | | | | — | | | | — | | | | — | |
Class R3 (1) | | | — | | | | — | | | | — | | | | — | |
Class I (1) | | | 245 | | | | 3,005 | | | | 251 | | | | 2,919 | |
| | | | 1,031 | | | | 12,638 | | | | 2,998 | | | | 34,115 | |
Shares redeemed: | | | | | | | | | | | | | | | | |
Class A | | | (453 | ) | | | (5,470 | ) | | | (520 | ) | | | (5,764 | ) |
Class B | | | (49 | ) | | | (534 | ) | | | (65 | ) | | | (667 | ) |
Class C | | | (57 | ) | | | (629 | ) | | | (104 | ) | | | (1,100 | ) |
Class R3 (1) | | | — | | | | — | | | | — | | | | — | |
Class I (1) | | | (43,703 | ) | | | (488,588 | ) | | | (9,647 | ) | | | (108,028 | ) |
| | | | (44,262 | ) | | | (495,221 | ) | | | (10,336 | ) | | | (115,559 | ) |
Net increase (decrease) | | | (43,231 | ) | | $ | (482,583 | ) | | | (7,338 | ) | | $ | (81,444 | ) |
| |
| | | International Select | |
| | | Year Ended
10/31/11 | | | Year Ended
10/31/10 | |
| | | Shares | | | Amount | | | Shares | | | Amount | |
Shares sold: | | | | | | | | | | | | | | | | |
Class A | | | 128 | | | $ | 1,262 | | | | 352 | | | $ | 3,042 | |
Class C | | | 10 | | | | 102 | | | | 62 | | | | 561 | |
Class R3 (1) | | | 2 | | | | 16 | | | | 1 | | | | 2 | |
Class I (1) | | | 10,212 | | | | 98,730 | | | | 36,745 | | | | 327,770 | |
Shares issued to shareholders due to reinvestment of distributions: | | | | | | | | | | | | | | | | |
Class A | | | 3 | | | | 28 | | | | 1 | | | | 5 | |
Class C | | | — | | | | 1 | | | | — | | | | — | |
Class R3 (1) | | | — | | | | — | | | | — | | | | — | |
Class I (1) | | | 152 | | | | 1,509 | | | | 78 | | | | 704 | |
| | | | 10,507 | | | | 101,648 | | | | 37,239 | | | | 332,084 | |
Shares redeemed: | | | | | | | | | | | | | | | | |
Class A | | | (214 | ) | | | (2,113 | ) | | | (131 | ) | | | (1,140 | ) |
Class C | | | (15 | ) | | | (145 | ) | | | (4 | ) | | | (38 | ) |
Class R3 (1) | | | (1 | ) | | | (8 | ) | | | (2 | ) | | | (15 | ) |
Class I (1) | | | (33,796 | ) | | | (328,218 | ) | | | (17,034 | ) | | | (151,115 | ) |
| | | | (34,026 | ) | | | (330,484 | ) | | | (17,171 | ) | | | (152,308 | ) |
Net increase (decrease) | | | (23,519 | ) | | $ | (228,836 | ) | | | 20,068 | | | $ | 179,776 | |
| (1) | Effective January 18, 2011, Class R Shares and Class Y Shares previously offered by FAF Advisors, Inc. were renamed Class R3 Shares and Class I Shares, respectively. |
Notes to Financial Statements (all dollars and shares are rounded to thousands (000)) (continued)
| | | | | | | | | | | | | | | | |
| | | Quantitative Enhanced Core Equity | |
| | | Year Ended
10/31/11 | | | Year Ended
10/31/10 | |
| | | Shares | | | Amount | | | Shares | | | Amount | |
Shares sold: | | | | | | | | | | | | | | | | |
Class A | | | 2 | | | $ | 47 | | | | 2 | | | $ | 52 | |
Class C | | | 4 | | | | 108 | | | | 1 | | | | 10 | |
Class I (1) | | | 441 | | | | 9,685 | | | | 3,897 | | | | 76,625 | |
Shares issued to shareholders due to reinvestment of distributions: | | | | | | | | | | | | | | | | |
Class A | | | — | | | | 2 | | | | — | | | | 2 | |
Class C | | | — | | | | 1 | | | | — | | | | — | |
Class I (1) | | | 40 | | | | 875 | | | | 46 | | | | 899 | |
| | | | 487 | | | | 10,718 | | | | 3,946 | | | | 77,588 | |
Shares redeemed: | | | | | | | | | | | | | | | | |
Class A | | | (6 | ) | | | (153 | ) | | | (4 | ) | | | (76 | ) |
Class C | | | — | | | | (12 | ) | | | — | | | | — | |
Class I (1) | | | (4,517 | ) | | | (97,442 | ) | | | (2,159 | ) | | | (42,121 | ) |
Class I (1) -in-kind | | | (871 | ) | | | (17,935 | ) | | | — | | | | — | |
| | | | (5,394 | ) | | | (115,542 | ) | | | (2,163 | ) | | | (42,197 | ) |
Net increase (decrease) | | | (4,907 | ) | | $ | (104,824 | ) | | | 1,783 | | | $ | 35,391 | |
| |
| | | Tactical Market Opportunities | |
| | | Year Ended
10/31/11 | | | Year Ended
10/31/10 | |
| | | Shares | | | Amount | | | Shares | | | Amount | |
Shares sold: | | | | | | | | | | | | | | | | |
Class A | | | 330 | | | $ | 3,676 | | | | — | | | $ | — | |
Class C | | | 42 | | | | 469 | | | | — | | | | — | |
Class I (1) | | | 2,710 | | | | 29,683 | | | | 2,571 | | | | 27,104 | |
Shares issued to shareholders due to reinvestment of distributions: | | | | | | | | | | | | | | | | |
Class A | | | — | | | | — | | | | — | | | | — | |
Class C | | | — | | | | — | | | | — | | | | — | |
Class I (1) | | | 15 | | | | 158 | | | | — | | | | — | |
| | | | 3,097 | | | | 33,986 | | | | 2,571 | | | | 27,104 | |
Shares redeemed: | | | | | | | | | | | | | | | | |
Class A | | | (13 | ) | | | (146 | ) | | | — | | | | — | |
Class C | | | — | | | | — | | | | — | | | | — | |
Class I (1) | | | (954 | ) | | | (10,204 | ) | | | — | | | | — | |
| | | | (967 | ) | | | (10,350 | ) | | | — | | | | — | |
Net increase (decrease) | | | 2,131 | | | $ | 23,636 | | | | 2,571 | | | $ | 27,104 | |
| (1) | Effective January 18, 2011, Class R Shares and Class Y Shares previously offered by FAF Advisors, Inc. were renamed Class R3 Shares and Class I Shares, respectively. |
Class B Shares that converted to Class A Shares (recognized as a component of Class A Shares sold and Class B Shares redeemed) during the fiscal years ended October 31, 2011 and October 31, 2010, were as follows:
| | | | | | | | |
| Fund | | Year Ended
10/31/11 | | | Year Ended
10/31/10 | |
International | | | 23 | | | | 39 | |
5. Investment Transactions
Purchases and sales (excluding short-term investments and derivative transactions, where applicable) during the fiscal year ended October 31, 2011, were as follows:
| | | | | | | | | | | | | | | | |
| | | International | | | International
Select | | | Quantitative
Enhanced
Core Equity | | | Tactical
Market
Opportunities | |
Purchases: | | | | | | | | | | | | | | | | |
Investment securities | | $ | 417,588 | | | $ | 409,824 | | | $ | 270,699 | | | $ | 27,017 | |
U.S. Government obligations | | | — | | | | — | | | | — | | | | 5,274 | |
| | | | |
Sales and maturities: | | | | | | | | | | | | | | | | |
Investment securities | | | 849,426 | | | | 629,468 | | | | 373,684 | | | | 24,049 | |
U.S. Government obligations | | | — | | | | — | | | | — | | | | 4,221 | |
6. Income Tax Information
The following information is presented on an income tax basis. Differences between amounts for financial statement and federal income tax purposes are primarily due to timing differences in recognizing certain gains and losses on investment transactions. To the extent that differences arise that are permanent in nature, such amounts are reclassified within the capital accounts as detailed below. Temporary differences do not require reclassification. Temporary and permanent differences do not impact the net asset values of the Funds.
At October 31, 2011, the cost and unrealized appreciation (depreciation) of investments (excluding investments in derivatives, where applicable), as determined on a federal income tax basis, were as follows:
| | | | | | | | | | | | | | | | |
| | | International | | | International
Select | | | Quantitative
Enhanced
Core Equity | | | Tactical
Market
Opportunities | |
Cost of investments | | $ | 173,638 | | | $ | 602,475 | | | $ | 148,220 | | | $ | 51,426 | |
Gross unrealized: | | | | | | | | | | | | | | | | |
Appreciation | | $ | 11,268 | | | $ | 43,505 | | | $ | 7,280 | | | $ | 1,166 | |
Depreciation | | | (18,994 | ) | | | (62,759 | ) | | | (4,212 | ) | | | (342 | ) |
Net unrealized appreciation (depreciation) of investments | | $ | (7,726 | ) | | $ | (19,254 | ) | | $ | 3,068 | | | $ | 824 | |
Permanent differences, primarily due to the redemption in-kind, tax equalization, REIT adjustments, foreign currency reclassifications and investments in passive foreign investment companies, resulted in reclassifications amount the Funds’ components of net assets at October 31, 2011, as follows:
| | | | | | | | | | | | | | | | |
| | | International | | | International
Select | | | Quantitative
Enhanced
Core Equity | | | Tactical
Market
Opportunities | |
Capital paid-in | | $ | 51,556 | | | $ | 6,812 | | | $ | 5,390 | | | $ | — | |
Undistributed (Over-distribution) of net investment income | | | (1,304 | ) | | | (1,205 | ) | | | (60 | ) | | | 7 | |
Accumulated net realized gain (loss) | | | (50,252 | ) | | | (5,607 | ) | | | (5,330 | ) | | | (7 | ) |
The tax components of undistributed net ordinary income and net long-term capital gains at October 31, 2011, the Funds’ tax year end, were as follows:
| | | | | | | | | | | | | | | | |
| | | International | | | International
Select | | | Quantitative
Enhanced
Core Equity | | | Tactical
Market
Opportunities | |
Undistributed net ordinary income* | | $ | 6,143 | | | $ | 7,993 | | | $ | 1,951 | | | $ | 1,123 | |
Undistributed net long-term capital gains | | | 19,357 | | | | 6,306 | | | | 1,581 | | | | 396 | |
| * | Net ordinary income consists of net taxable income derived from dividends, interest and net short-term capital gains, if any. |
Notes to Financial Statements (all dollars and shares are rounded to thousands (000)) (continued)
The tax character of distributions paid during the Funds’ tax years ended October 31, 2011 and October 31, 2010, was designated for purposes of the dividends paid deduction as follows:
| | | | | | | | | | | | | | | | |
| 2011 | | International | | | International
Select | | | Quantitative
Enhanced
Core Equity | | | Tactical
Market
Opportunities | |
Distributions from net ordinary income* | | $ | 4,303 | | | $ | 6,488 | | | $ | 2,868 | | | $ | 202 | |
Distributions from net long-term capital gains | | | — | | | | — | | | | — | | | | — | |
| | | | | | | | | | | | | | | | |
| 2010 | | International | | | International
Select | | | Quantitative
Enhanced
Core Equity | | | Tactical
Market
Opportunities | |
Distributions from net ordinary income* | | $ | 4,419 | | | $ | 2,446 | | | $ | 2,277 | | | $ | — | |
Distributions from net long-term capital gains | | | — | | | | — | | | | — | | | | — | |
| * | Net ordinary income consists of net taxable income derived from dividends, interest, net short-term capital gains and current year earnings and profits attributable to realized gains, if any. |
During the Funds’ tax year ended October 31, 2011, the following Funds utilized their capital loss carryforwards as follows:
| | | | | | | | | | | | |
| | | International | | | International
Select | | | Quantitative
Enhanced
Core Equity | |
Utilized capital loss carryforwards | | $ | 14,507 | | | $ | 38,754 | | | $ | 7,766 | |
7. Management Fees and Other Transactions with Affiliates
Investment Advisory Fees
During the period November 1, 2010 through December 31, 2010, pursuant to an investment advisory agreement (the “Agreement”), FAF Advisors managed each Fund’s assets and furnished related office facilities, equipment, research, and personnel. The Agreement required each Fund to pay FAF Advisors a monthly advisory fee, on an annual basis, equal to each Fund’s average daily net assets as follows:
| | | | |
| Fund | | Advisory Fee Rate | |
International | | | 1.00 | % |
International Select | | | 1.00 | |
Quantitative Enhanced Core Equity | | | .30 | |
Tactical Market Opportunities | | | .75 | |
Effective January 1, 2011, pursuant to a new investment advisory agreement (the “New Agreement”), the Funds’ new investment adviser is Nuveen Fund Advisors. Under the New Agreement, each Fund’s management fee consists of two components – a fund-level fee, based only on the amount of assets within each individual Fund, and a complex-level fee, based on the aggregate amount of all eligible fund assets managed by Nuveen Fund Advisors. This pricing structure enables each Fund’s shareholders to benefit from growth in the assets within their respective Fund as well as from growth in the amount of complex-wide assets managed by Nuveen Fund Advisors.
The annual fund-level fee for each Fund, payable monthly, is calculated according to the following schedule:
| | | | | | | | | | | | | | | | |
| Average Daily Net Assets | | International | | | International
Select | | | Quantitative
Enhanced
Core Equity | | | Tactical
Market
Opportunities | |
For the first $125 million | | | .8500 | % | | | .8500 | % | | | .3000 | % | | | .6000 | % |
For the next $125 million | | | .8375 | | | | .8375 | | | | .2875 | | | | .5875 | |
For the next $250 million | | | .8250 | | | | .8250 | | | | .2750 | | | | .5750 | |
For the next $500 million | | | .8125 | | | | .8125 | | | | .2625 | | | | .5625 | |
For the next $1 billion | | | .8000 | | | | .8000 | | | | .2500 | | | | .5500 | |
For net assets over $2 billion | | | .7750 | | | | .7750 | | | | .2250 | | | | .5250 | |
The annual complex-level fee for each Fund, payable monthly, is determined by taking the complex-level fee rate, which is based on the aggregate amount of “eligible assets” of all Nuveen funds as set forth in the schedule below, and making, as appropriate, an upward adjustment to that rate based upon the percentage of the particular fund’s assets that are not “eligible assets.” The complex-level fee schedule for each Fund is as follows:
| | | | |
| Complex-Level Asset Breakpoint Level* | | Effective Rate at Breakpoint Level | |
$55 billion | | | .2000 | % |
$56 billion | | | .1996 | |
$57 billion | | | .1989 | |
$60 billion | | | .1961 | |
$63 billion | | | .1931 | |
$66 billion | | | .1900 | |
$71 billion | | | .1851 | |
$76 billion | | | .1806 | |
$80 billion | | | .1773 | |
$91 billion | | | .1691 | |
$125 billion | | | .1599 | |
$200 billion | | | .1505 | |
$250 billion | | | .1469 | |
$300 billion | | | .1445 | |
| * | The complex-level fee is calculated based upon the aggregate daily “eligible assets” of all Nuveen funds. Eligible assets do not include assets attributable to investments in other Nuveen funds or assets in excess of $2 billion added to the Nuveen fund complex in connection with Nuveen Fund Advisors’ assumption of the management of the former First American Funds effective January 1, 2011. Eligible assets include closed-end fund assets managed by Nuveen Fund Advisors that are attributable to financial leverage. For these purposes, financial leverage includes the closed-end funds’ use of preferred stock and borrowings and investments in the residual interest certificates (also called inverse floating rate securities) in tender option bond (TOB) trusts, including the portion of assets held by the TOB trust that has been effectively financed by the trust’s issuance of floating rate securities, subject to an agreement by Nuveen Fund Advisors as to certain funds to limit the amount of such assets for determining eligible assets in certain circumstances. As of October 31, 2011, the complex-level fee rate for each Fund was as follows: |
| | | | |
| Fund | | Rate | |
International | | | .1759 | % |
International Select | | | .1759 | |
Quantitative Enhanced Core Equity | | | .2000 | |
Tactical Market Opportunities | | | .1843 | |
The management fee compensates Nuveen Fund Advisors for the overall investment advisory and administrative services and general office facilities it provides for the Funds. Nuveen Fund Advisors is responsible for each Funds overall strategy and asset allocation decisions. Effective January 1, 2011, Nuveen Fund Advisors has entered into a sub-advisory agreement with the Sub-Adviser, under which the Sub-Adviser manages the investment portfolios of the Funds. The Sub-Adviser will be compensated for its services to the Funds from the management fees paid to Nuveen Fund Advisors.
During the period November 1, 2010 through December 31, 2010, Altrinsic Global Advisors, LLC (“Altrinsic”) and Hansberger Global Investors, Inc. (“HGI”) served as sub-advisers to International and International Select pursuant to separate sub-advisory agreements with FAF Advisors. Effective January 1, 2011, Altrinsic, HGI, and Lazard Asset Management, LLC (“Lazard”) each continue to serve as investment sub-advisers to International and International Select pursuant to separate sub-advisory agreements with Nuveen Fund Advisors. Each sub-adviser had and continues to have discretion to select portfolio securities for its portion of the respective Fund. Altrinsic, HGI, and Lazard are compensated for their services to the Funds from the management fees paid to Nuveen Fund Advisors.
During the period November 1, 2010 through December 31, 2010, the Funds may have invested in related money market funds that were series of First American Funds, Inc., subject to certain limitations. In order to avoid the payment of duplicative investment advisory fees to FAF Advisors, which acted as the investment advisor to both the investing Funds and the related money market funds, FAF Advisors reimbursed each investing Fund an amount equal to that portion of FAF Advisors’ investment advisory fee received from the related money market funds that was attributable to the assets of the investing Funds. This reimbursement, if any, is recognized as a component of “Expense reimbursement” on the Statement of Operations, and terminated with respect to the Funds on December 31, 2010, in connection with the Sale.
Notes to Financial Statements (all dollars and shares are rounded to thousands (000)) (continued)
During the period November 1, 2010 through December 31, 2010, FAF Advisors agreed to waive fees and reimburse other Fund expenses through February 28, 2011 so that total annual Fund operating expenses, excluding indirect fees and expenses incurred through investment in exchange-traded funds and other investment companies, as a percentage of each Fund’s average daily net assets, did not exceed the following amounts:
| | | | | | | | | | | | | | | | |
| | | International | | | International
Select | | | Quantitative
Enhanced
Core Equity | | | Tactical Market
Opportunities | |
Class A Shares | | | 1.49 | % | | | 1.49 | % | | | .70 | % | | | N/A | |
Class B Shares | | | 2.24 | | | | N/A | | | | N/A | | | | N/A | |
Class C Shares | | | 2.24 | | | | 2.24 | | | | 1.45 | | | | N/A | |
Class R3 Shares (1) | | | 1.74 | | | | 1.74 | | | | N/A | | | | N/A | |
Class I Shares (1) | | | 1.24 | | | | 1.24 | | | | .45 | | | | .95 | % |
Expiration Date | | | February 28, 2011 | | | | February 28, 2011 | | | | February 28, 2011 | | | | February 28, 2011 | |
| N/A - | International Select does not offer Class B Shares. Quantitative Enhanced Core Equity and Tactical Market Opportunities do not offer Class B Shares and Class R3 Shares. Tactical Market Opportunities did not offer Class A Shares and Class C Shares until February 24, 2011. |
| (1) - | Effective January 18, 2011, Class R Shares and Class Y Shares previously offered by FAF Advisors, Inc. were renamed Class R3 Shares and Class I Shares, respectively. |
Effective January 1, 2011, Nuveen Fund Advisors contractually agreed to waive fees and reimburse other Fund expenses of each Fund so that total annual Fund operating expenses, after waivers and excluding any acquired Fund fees and expenses, do not exceed the average daily net assets of any class of Fund shares in the amounts and for the time periods stated in the following table:
| | | | | | | | | | | | | | | | |
| | | International | | | International
Select | | | Quantitative
Enhanced
Core Equity | | | Tactical
Market
Opportunities | |
Class A Shares | | | 1.49 | % | | | 1.49 | % | | | .70 | % | | | 1.20 | % |
Class B Shares | | | 2.24 | | | | N/A | | | | N/A | | | | N/A | |
Class C Shares | | | 2.24 | | | | 2.24 | | | | 1.45 | | | | 1.95 | |
Class R3 Shares (1) | | | 1.74 | | | | 1.74 | | | | N/A | | | | N/A | |
Class I Shares (1) | | | 1.24 | | | | 1.24 | | | | .45 | | | | .95 | |
Expiration Date | | | February 29, 2012 | | | | February 29, 2012 | | | | February 29, 2012 | | | | February 29, 2012 | |
| N/A - | Fund does not offer Class B Shares. Quantitative Enhanced Core Equity and Tactical Market Opportunities do not offer Class B Shares and Class R3 Shares. |
| (1) - | Effective January 18, 2011, Class R Shares and Class Y Shares previously offered by FAF Advisors, Inc. were renamed Class R3 Shares and Class I Shares, respectively. |
During the period November 1, 2010 through December 31, 2010, independent directors of the Funds may have participated and elected to defer receipt of part or all of their annual compensation under a deferred compensation plan (the “Plan”). Deferred amounts were treated as though equivalent dollar amounts had been invested in shares of selected open-end funds as designated by each director. All amounts in the Plan were 100% vested and accounts under the Plan were obligations of the Funds. Deferred amounts remain in the Funds until distributed in accordance with the Plan.
Effective January 1, 2011, independent directors may elect to defer receipt of all or a portion of the annual compensation they are entitled to receive from certain Funds advised by Nuveen Fund Advisors. Under the plan, deferred amounts are treated as though equal dollar amounts had been invested in shares of select Funds advised by Nuveen Fund Advisors.
Administration Fees
During the period November 1, 2010 through December 31, 2010, FAF Advisors served as the Funds’ administrator pursuant to an administration agreement between FAF Advisors and the Funds. U.S. Bancorp Fund Services, LLC (“USBFS”) served as sub-administrator pursuant to a sub-administration agreement between USBFS and FAF Advisors. FAF Advisors is a subsidiary of U.S. Bank. Both U.S. Bank and USBFS are direct subsidiaries of U.S. Bancorp. Under the administration agreement, FAF Advisors was compensated to provide, or compensated other entities to provide, services to the Funds. These services included various legal, oversight, and administrative and accounting services. The Funds paid FAF Advisors administration fees, which were calculated daily and paid monthly, equal to each Fund’s pro rata share of an amount equal, on an annual basis, to .25% of the aggregate average daily net assets of all open-end funds in the First American Funds family up to $8 billion, .235% on the next $17 billion of the aggregate average daily net assets, .22% on the next $25 billion of the aggregate average daily net assets and .20% of the aggregate average daily net assets in excess of $50 billion. All fees paid to the sub-administrator were paid from the administration fee. In addition to these fees, the Funds may have reimbursed FAF Advisors and the sub-administrator for any out-of-pocket expenses incurred in providing administration services. Effective January 1, 2011, FAF Advisors and USBFS no longer serve as the Funds’ administrator and sub-administrator, respectively, and the Funds have not entered into any new administration or sub-administration agreements.
Transfer Agent Fees
USBFS serves as the Funds’ transfer agent pursuant to a transfer agent agreement with the Trust. The Funds are charged transfer agent fees on a per shareholder account basis, subject to a minimum fee per share class. These fees are charged to each Fund based upon the number of accounts within each Fund. In addition to these fees, the Funds may reimburse USBFS for out-of-pocket expenses incurred in providing transfer agent services.
Custodian Fees
U.S. Bank serves as the custodian for each Fund other than International and International Select pursuant to a custodian agreement with the Trust. The custodian fee charged for each Fund is equal to an annual rate of 0.005% of average daily net assets. State Street Bank (“SSB”) serves as the custodian for International and International Select pursuant to an agreement with the Trust. International and International Select pay SSB various asset-based fees and transaction charges based on the issuer’s country. All fees are computed daily and paid monthly.
Interest earned on un-invested cash balances is used to reduce a portion of each Fund’s custodian expenses. These credits, if any, are recognized as “Custodian fee credit” on the Statement of Operations. Conversely, the custodian charges a fee for any cash overdrafts incurred, which increases the Funds’ custodian expenses.
Distribution and Shareholder Servicing (12b-1) Fees
During the period November 1, 2010 through December 31, 2010, Quasar Distributors, LLC (“Quasar”), a subsidiary of U.S. Bancorp, served as the distributor of the Funds pursuant to a distribution agreement with the Trust. Under the distribution agreement, and pursuant to a plan adopted by each Fund under Rule 12b-1 of the Investment Company Act, each Fund paid Quasar a monthly distribution and/or shareholder servicing fee equal to an annual rate of .25%, 1.00%, 1.00% and .50% of each Fund’s average daily net assets of Class A, Class B, Class C and Class R Shares (renamed Class R3 Shares), respectively. No distribution or shareholder servicing fees were paid by Class Y Shares (renamed Class I Shares). These fees may have been used by Quasar to provide compensation for sales support, distribution activities, and/or shareholder servicing activities. During the period November 1, 2010 through December 31, 2010, there were no distribution and shareholder servicing fees waived by Quasar.
Effective January 1, 2011, the Funds entered into a distribution agreement with Nuveen Securities LLC, who now serves as the Funds’ distributor. Under the new agreement, Class A Shares continue to incur a .25% annual 12b-1 service fee. Class B and Class C Shares continue to incur a .75% annual 12b-1 distribution fee and a .25% annual 12b-1 service fee. Class R3 Shares continue to incur a .25% annual 12b-1 distribution fee and a .25% annual 12b-1 service fee. Class I Shares will continue to not be subject to any sales charge or 12b-1 distribution or service fees. Annual distribution and service fees are based on average daily net assets.
During the fiscal year ended October 31, 2011, Quasar and/or Nuveen Securities, LLC. collected sales charges on purchases of Class A Shares, the majority of which were paid out as concessions to financial intermediaries as follows:
| | | | | | | | | | | | | | | | |
| | | International | | | International
Select | | | Quantitative
Enhanced
Core Equity | | | Tactical
Market
Opportunities | |
Sales charges collected (Unaudited) | | $ | 11 | | | $ | 6 | | | $ | — | | | $ | 7 | |
Paid to financial intermediaries (Unaudited) | | | 10 | | | | 5 | | | | — | | | | 6 | |
Quasar and/or Nuveen Securities, LLC. also received 12b-1 service fees on Class A Shares, substantially all of which were paid to compensate financial intermediaries for providing services to shareholders relating to their investments.
During the fiscal year ended October 31, 2011, Quasar and/or Nuveen Securities, LLC. compensated financial intermediaries directly with commission advances at the time of purchase as follows:
| | | | | | | | | | | | | | | | |
| | | International | | | International
Select | | | Quantitative
Enhanced
Core Equity | | | Tactical
Market
Opportunities | |
Commission advances (Unaudited) | | $ | 1 | | | $ | 1 | | | $ | 1 | | | $ | 3 | |
All 12b-1 service and distribution fees collected on Class B Shares and C Shares during the first year following a purchase were retained by Quasar and/or Nuveen Securities, LLC to compensate for commissions advanced to financial intermediaries. During the fiscal year ended October 31, 2011, Quasar and/or Nuveen Securities, LLC retained such 12b-1 fees as follows:
| | | | | | | | | | | | | | | | |
| | | International | | | International
Select | | | Quantitative
Enhanced
Core Equity | | | Tactical
Market
Opportunities | |
12b-1 fees retained (Unaudited) | | $ | 10 | | | $ | 3 | | | $ | 1 | | | $ | 1 | |
The remaining 12b-1 fees charged to the Funds were paid to compensate financial intermediaries for providing services to shareholders relating to their investments.
Other Fees and Expenses
In addition to the investment advisory fees, administration fees, transfer agent fees, custodian fees, and distribution and shareholder servicing fees, each Fund is responsible for paying other operating expenses, including: legal, auditing, registration fees, postage and printing of shareholder reports, fees and expenses of independent directors, insurance, and other miscellaneous expenses. During the period November 1, 2010 through December 31, 2010, legal fees and expenses of $4 were paid to a law firm of which an Assistant Secretary of the Funds was a partner.
Notes to Financial Statements (all dollars and shares are rounded to thousands (000)) (continued)
Contingent Deferred Sales Charges
During the period November 1, 2010 through January 17, 2011, Class A Shares of all the Funds, were sold with an up-front sales charge of 5.50%. Class B Shares were subject to a contingent deferred sales charge (“CDSC”) of up to 5% depending upon the length of time the shares were held by the investor (CDSC is reduced to 0% at the end of six years). Class B Shares automatically converted to Class A Shares eight years after purchase. Class C Shares were subject to a CDSC of 1% for twelve months. Class R Shares (renamed Class R3 Shares) and Class Y Shares (renamed Class I Shares) had no sales charge and were offered only to certain qualifying accounts and qualifying institutional investors, respectively.
Effective January 18, 2011, Class A Shares of the Funds are sold with an up-front sales charge of 5.75% with the exception of Quantitative Enhanced Core Equity. Quantitative Enhanced Core Equity only issues Class A Shares for purchase by certain retirement plans and by qualifying clients of investment advisers, financial planners or other financial intermediaries that charge periodic or asset-based fees for their service. Class A Shares of Quantitative Enhanced Core Equity are offered to these investors at their net asset value per share with no up-front sales charge. Class A Share purchases of the Funds continue to be subject to a CDSC of 1% if redeemed within twelve months of purchase. Class B Shares continue to be subject to a CDSC of up to 5% depending upon the length of time the shares are held by the investor (CDSC continues to be reduced to 0% at the end of six years). Class C Shares continue to be subject to a CDSC of 1% if redeemed within twelve months of purchase. Class R3 Shares and Class I Shares continue to have no sales charge and are offered only to certain qualifying accounts and qualifying institutional investors, respectively.
Quasar and/or Nuveen Securities, LLC also collected and retained CDSC on share redemptions during the fiscal year ended October 31, 2011, as follows:
| | | | | | | | | | | | | | | | |
| | | International | | | International
Select | | | Quantitative
Enhanced
Core Equity | | | Tactical
Market
Opportunities | |
CDSC retained (Unaudited) | | $ | 2 | | | $ | 1 | | | $ | — | | | $ | — | |
Affiliated Retirement Plan and Redemptions In-Kind
An affiliated 401(k) plan of FAF Advisors, (the “plan”) previously offered certain funds as investment options to plan participants. As a result of a decision to no longer offer such funds as investment options, certain fund shares held in the plan were redeemed in-kind on December 1, 2010, in the amounts as follows:
| | | | |
Quantitative Enhanced Core Equity | | $ | 17,935 | |
In this transaction, the Fund paid redemption proceeds by distributing a proportionate amount of securities in its respective portfolio. Remaining shareholders in the Fund did not recognize any capital gains from the transaction.
8. New Accounting Pronouncements
Fair Value Measurements and Disclosures
On May 12, 2011, the Financial Accounting Standards Board (“FASB”) issued Accounting Standards Update (“ASU”) No. 2011-04 (“ASU No. 2011-04”) modifying Topic 820, Fair Value Measurements and Disclosures. At the same time, the International Accounting Standards Board (“IASB”) issued International Financial Reporting Standard (“IFRS”) 13, Fair Value Measurement. The objective of the FASB and IASB is convergence of their guidance on fair value measurements and disclosures. Specifically, ASU No. 2011-04 requires reporting entities to disclose i) the amounts of any transfers between Level 1 and Level 2, the reasons for the transfers, ii) for Level 3 fair value measurements, a) quantitative information about significant unobservable inputs used, b) a description of the valuation processes used by the reporting entity and c) a narrative description of the sensitivity of the fair value measurement to changes in unobservable inputs if a change in those inputs might result in a significantly higher or lower fair value measurement. The effective date of ASU No. 2011-04 is for interim and annual periods beginning after December 15, 2011. At this time, management is evaluating the implications of this guidance and the impact it will have on the financial statement amounts and footnote disclosures, if any.
Trustees and Officers (Unaudited)
The management of the Funds, including general supervision of the duties performed for the Funds by the Adviser, is the responsibility of the Board of Trustees of the Funds. The number of trustees of the Funds is currently set at ten. None of the trustees who are not “interested” persons of the Funds (referred to herein as “independent trustees”) has ever been a director or employee of, or consultant to, Nuveen or its affiliates. The names and business addresses of the trustees and officers of the Funds, their principal occupations and other affiliations during the past five years, the number of portfolios each oversees and other directorships they hold are set forth below.
The Funds’ Statement of Additional Information (“SAI”) includes more information about the trustees. To request a free copy, call Nuveen Investments at (800) 257-8787 or visit the Funds’ website at www.nuveen.com.
| | | | | | | | |
Name, Birthdate and Address | | Position(s) Held with the Funds | | Year First Elected or Appointed (1) | | Principal Occupation(s) Including other Directorships During Past 5 Years | | Number of Portfolios in Fund Complex Overseen by Trustee |
| | |
| Independent Trustees: | | | | |
Robert P. Bremner (2) 8/22/40 333 W. Wacker Drive Chicago, IL 60606 | | Chairman of the Board and Trustee | | 1996 | | Private Investor and Management Consultant; Treasurer and Director, Humanities Council of Washington, D.C.; Board Member, Independent Directors Council affiliated with the Investment Company Institute. | | 241 |
Jack B. Evans 10/22/48 333 W. Wacker Drive Chicago, IL 60606 | | Trustee | | 1999 | | President, The Hall-Perrine Foundation, a private philanthropic corporation (since 1996); Director and Chairman, United Fire Group, a publicly held company; member of the Board of Regents for the State of Iowa University System; Director, Source Media Group; Life Trustee of Coe College and the Iowa College Foundation; formerly, Director, Alliant Energy; formerly, Director, Federal Reserve Bank of Chicago; formerly, President and Chief Operating Officer, SCI Financial Group, Inc., a regional financial services firm. | | 241 |
William C. Hunter 3/6/48 333 W. Wacker Drive Chicago, IL 60606 | | Trustee | | 2004 | | Dean, Tippie College of Business, University of Iowa (since 2006); Director (since 2004) of Xerox Corporation; Director (since 2005), Beta Gamma Sigma International Honor Society; Director of Wellmark, Inc. (since 2009); formerly, Dean and Distinguished Professor of Finance, School of Business at the University of Connecticut (2003-2006); previously, Senior Vice President and Director of Research at the Federal Reserve Bank of Chicago (1995-2003); formerly, Director (1997-2007), Credit Research Center at Georgetown University. | | 241 |
David J. Kundert (2) 10/28/42 333 W. Wacker Drive Chicago, IL 60606 | | Trustee | | 2005 | | Director, Northwestern Mutual Wealth Management Company; retired (since 2004) as Chairman, JPMorgan Fleming Asset Management, President and CEO, Banc One Investment Advisors Corporation, and President, One Group Mutual Funds; prior thereto, Executive Vice President, Banc One Corporation and Chairman and CEO, Banc One Investment Management Group; Member, Board of Regents, Luther College; member of the Wisconsin Bar Association; member of Board of Directors, Friends of Boerner Botanical Gardens; member of Board of Directors and Chair of Investment Committee, Greater Milwaukee Foundation. | | 241 |
William J. Schneider (2) 9/24/44 333 W. Wacker Drive Chicago, IL 60606 | | Trustee | | 1996 | | Chairman of Miller-Valentine Partners Ltd., a real estate investment company; formerly, Senior Partner and Chief Operating Officer (retired 2004) of Miller-Valentine Group; member, University of Dayton Business School Advisory Council; member, Mid-America Health System Board; formerly, member and chair, Dayton Philharmonic Orchestra Association; formerly, member, Business Advisory Council, Cleveland Federal Reserve Bank. | | 241 |
Judith M. Stockdale 12/29/47 333 W. Wacker Drive Chicago, IL 60606 | | Trustee | | 1997 | | Executive Director, Gaylord and Dorothy Donnelley Foundation (since 1994); prior thereto, Executive Director, Great Lakes Protection Fund (1990-1994). | | 241 |
Carole E. Stone (2) 6/28/47 333 W. Wacker Drive Chicago, IL 60606 | | Trustee | | 2007 | | Director, Chicago Board Options Exchange (since 2006); Director, C2 Options Exchange, Incorporated (since 2009); formerly, Commissioner, New York State Commission on Public Authority Reform (2005-2010); formerly, Chair, New York Racing Association Oversight Board (2005-2007). | | 241 |
Trustees and Officers (Unaudited) (continued)
| | | | | | | | |
Name, Birthdate and Address | | Position(s) Held with the Funds | | Year First Elected or Appointed (1) | | Principal Occupation(s) During Past Five Years | | Number of Portfolios in Fund Complex Overseen by Trustee |
Virginia L. Stringer 8/16/44 333 W. Wacker Drive Chicago, IL 60606 | | Trustee | | 2011 | | Board Member, Mutual Fund Directors Forum; Member, Governing Board, Investment Company Institute’s Independent Directors Council; governance consultant and non-profit board member; former Owner and President, Strategic Management Resources, Inc. a management consulting firm; previously, held several executive positions in general management, marketing and human resources at IBM and The Pillsbury Company; Independent Director, First American Fund Complex (1987-2010) and Chair (1997-2010). | | 241 |
Terence J. Toth (2) 9/29/59 333 W. Wacker Drive Chicago, IL 60606 | | Trustee | | 2008 | | Director, Legal & General Investment Management America, Inc. (since 2008); Managing Partner, Promus Capital (since 2008); formerly, CEO and President, Northern Trust Global Investments (2004-2007); Executive Vice President, Quantitative Management & Securities Lending (2000-2004); prior thereto, various positions with Northern Trust Company (since 1994); member: Goodman Theatre Board (since 2004), Chicago Fellowship Board (since 2005) and Catalyst Schools of Chicago Board (since 2008); formerly, member: Northern Trust Mutual Funds Board (2005-2007), Northern Trust Global Investments Board (2004-2007), Northern Trust Japan Board (2004-2007), Northern Trust Securities Inc. Board (2003-2007) and Northern Trust Hong Kong Board (1997-2004). | | 241 |
| | |
| Interested Trustee: | | | | |
John P. Amboian (3) 6/14/61 333 W. Wacker Drive Chicago, IL 60606 | | Trustee | | 2008 | | Chief Executive Officer and Chairman (since 2007), and Director (since 1999) of Nuveen Investments, Inc., formerly, President (1999-2007); Chief Executive Officer (since 2007) of Nuveen Investments Advisers Inc.; Director (since 1998) formerly, Chief Executive Officer (2007-2010) of Nuveen Fund Advisors, Inc. | | 241 |
Name, Birthdate and Address | | Position(s) Held with the Funds | | Year First Elected or Appointed (4) | | Principal Occupation(s) During Past 5 Years | | Number of Portfolios in Fund Complex Overseen by Officer |
| | |
| Officers of the Funds: | | | | |
Gifford R. Zimmerman 9/9/56 333 W. Wacker Drive Chicago, IL 60606 | | Chief Administrative Officer | | 1988 | | Managing Director (since 2002), Assistant Secretary and Associate General Counsel of Nuveen Securities, LLC; Managing Director (since 2004) and Assistant Secretary (since 1994) of Nuveen Investments, Inc.; Managing Director (since 2002), Assistant Secretary (since 1997) and Co-General Counsel (since 2011) of Nuveen Fund Advisors, Inc.; Managing Director, Assistant Secretary and Associate General Counsel of Nuveen Asset Management, LLC (since 2011); Managing Director, Associate General Counsel and Assistant Secretary of Symphony Asset Management LLC (since 2003); Vice President and Assistant Secretary of NWQ Investment Management Company, LLC (since 2002), Nuveen Investments Advisers Inc. (since 2002), Tradewinds Global Investors LLC, and Santa Barbara Asset Management, LLC (since 2006), Nuveen HydePark Group LLC and Nuveen Investment Solutions, Inc. (since 2007) and of Winslow Capital Management Inc. (since 2010); Chief Administrative Officer and Chief Compliance Officer (since 2006) of Nuveen Commodities Asset Management, LLC; Chartered Financial Analyst. | | 241 |
Margo L. Cook 4/11/64 333 W. Wacker Drive Chicago, IL 60606 | | Vice President | | 2009 | | Executive Vice President (since 2008) of Nuveen Investments, Inc. and of Nuveen Fund Advisors, Inc. (since 2011); Managing Director – Investment Services of Nuveen Commodities Asset Management, LLC (since August 2011); previously, Head of Institutional Asset Management (2007-2008) of Bear Stearns Asset Management; Head of Institutional Asset Management (1986-2007) of Bank of NY Mellon; Chartered Financial Analyst. | | 241 |
| | | | | | | | |
Name, Birthdate and Address | | Position(s) Held with the Funds | | Year First Elected or Appointed (4) | | Principal Occupation(s) During Past 5 Years | | Number of Portfolios in Fund Complex Overseen by Officer |
Lorna C. Ferguson 10/24/45 333 W. Wacker Drive Chicago, IL 60606 | | Vice President | | 1998 | | Managing Director (since 2005) of Nuveen Fund Advisors, Inc. and Nuveen Securities, LLC (since 2004). | | 241 |
Stephen D. Foy 5/31/54 333 W. Wacker Drive Chicago, IL 60606 | | Vice President and Controller | | 1998 | | Senior Vice President (since 2010), formerly, Vice President (2005-2010) and Funds Controller of Nuveen Securities, LLC; Vice President of Nuveen Fund Advisors, Inc.; Chief Financial Officer of Nuveen Commodities Asset Management, LLC (since 2010); Certified Public Accountant. | | 241 |
Scott S. Grace 8/20/70 333 W. Wacker Drive Chicago, IL 60606 | | Vice President and Treasurer | | 2009 | | Managing Director, Corporate Finance & Development, Treasurer (since 2009) of Nuveen Securities, LLC; Managing Director and Treasurer (since 2009) of Nuveen Fund Advisors, Inc., Nuveen Investment Solutions, Inc., Nuveen Investments Advisers, Inc., Nuveen Investments Holdings Inc. and (since (2011) Nuveen Asset Management, LLC; Vice President and Treasurer of NWQ Investment Management Company, LLC, Tradewinds Global Investors, LLC, Symphony Asset Management LLC and Winslow Capital Management, Inc.; Vice President of Santa Barbara Asset Management, LLC; formerly, Treasurer (2006-2009), Senior Vice President (2008-2009), previously, Vice President (2006-2008) of Janus Capital Group, Inc.; formerly, Senior Associate in Morgan Stanley’s Global Financial Services Group (2000-2003); Chartered Accountant Designation. | | 241 |
Walter M. Kelly 2/24/70 333 W. Wacker Drive Chicago, IL 60606 | | Chief Compliance Officer and Vice President | | 2003 | | Senior Vice President (since 2008) and Assistant Secretary (since 2003) of Nuveen Fund Advisors, Inc. | | 241 |
Tina M. Lazar 8/27/61 333 W. Wacker Drive Chicago, IL 60606 | | Vice President | | 2002 | | Senior Vice President (since 2010), formerly, Vice President (2005-2010) of Nuveen Fund Advisors, Inc. | | 241 |
Larry W. Martin 7/27/51 333 W. Wacker Drive Chicago, IL 60606 | | Vice President and Assistant Secretary | | 1997 | | Senior Vice President (since 2010), formerly, Vice President (1993-2010), Assistant Secretary and Assistant General Counsel of Nuveen Securities, LLC; Senior Vice President (since 2011) of Nuveen Asset Management, LLC: Senior Vice President (since 2010), formerly, Vice President (2005-2010), and Assistant Secretary of Nuveen Investments, Inc.; Senior Vice President (since 2010), formerly Vice President (2005-2010), and Assistant Secretary (since 1997) of Nuveen Fund Advisors, Inc.; Vice President and Assistant Secretary of Nuveen Investments Advisers, Inc. (since 2002), NWQ Investment Management Company, LLC, Symphony Asset Management LLC (since 2003), Tradewinds Global Investors, LLC, Santa Barbara Asset Management, LLC (since 2006), Nuveen HydePark Group, LLC and Nuveen Investment Solutions, Inc. (since 2007), and of Winslow Capital Management, Inc. (since 2010); Vice President and Assistant Secretary of Nuveen Commodities Asset Management, LLC (since 2010). | | 241 |
Trustees and Officers (Unaudited) (continued)
| | | | | | | | |
Name, Birthdate and Address | | Position(s) Held with the Funds | | Year First Elected or Appointed (4) | | Principal Occupation(s) Including other Directorships During Past 5 Years | | Number of Portfolios in Fund Complex Overseen by Officer |
Kevin J. McCarthy 3/26/66 333 W. Wacker Drive Chicago, IL 60606 | | Vice President and Secretary | | 2007 | | Managing Director (since 2008), formerly, Vice President (2007-2008), Nuveen Securities, LLC; Managing Director (since 2008), Assistant Secretary (since 2007) and Co-General Counsel (since 2011) of Nuveen Fund Advisors, Inc.; Managing Director, Assistant Secretary and Associate General Counsel (since 2011) of Nuveen Asset Management, LLC; Managing Director (since 2008), and Assistant Secretary, Nuveen Investment Holdings, Inc.; Vice President (since 2007) and Assistant Secretary of Nuveen Investments Advisers Inc., NWQ Investment Management Company, LLC, Tradewinds Global Investors LLC, NWQ Holdings, LLC, Symphony Asset Management LLC, Santa Barbara Asset Management, LLC, Nuveen HydePark Group, LLC, Nuveen Investment Solutions, Inc. (since 2007) and of Winslow Capital Management, Inc. (since 2010); Vice President and Secretary (since 2010) of Nuveen Commodities Asset Management, LLC; prior thereto, Partner, Bell, Boyd & Lloyd LLP (1997-2007). | | 241 |
Kathleen L. Prudhomme 3/30/53 901 Marquette Avenue Minneapolis, MN 55402 | | Vice President and Assistant Secretary | | 2011 | | Managing Director, Assistant Secretary and Co-General Counsel (since 2011) of Nuveen Fund Advisors, Inc.; Managing Director, Assistant Secretary and Associate General Counsel (since 2011) of Nuveen Asset Management, LLC; Managing Director and Assistant Secretary (since 2011) of Nuveen Securities, LLC; formerly, Deputy General Counsel, FAF Advisors, Inc. (2004-2010). | | 241 |
Jeffery M. Wilson 3/13/56 333 W. Wacker Drive Chicago, IL 60606 | | Vice President | | 2011 | | Senior Vice President of Nuveen Securities, LLC (since 2011), formerly, Senior Vice President of FAF Advisors, Inc. (2000-2010). | | 107 |
| (1) | Trustees serve an indefinite term until his/her successor is elected or appointed. The year first elected or appointed represents the year in which the trustee was first elected or appointed to any fund in the Nuveen Fund Complex. |
| (2) | Also serves as a trustee of the Nuveen Diversified Commodity Fund, an exchange-traded commodity pool managed by Nuveen Commodities Asset Management, LLC, an affiliate of the Adviser. |
| (3) | Mr. Amboian is an interested trustee because of his position with Nuveen Investments, Inc. and certain of its subsidiaries, which are affiliates of the Nuveen Funds. |
| (4) | Officers serve one year terms through August of each year. The year first elected or appointed represents the year in which the officer was first elected or appointed to any fund in the Nuveen Fund Complex. |
Annual Investment Management Agreement Approval Process
(Unaudited)
A. Background
Prior to January 1, 2011, FAF Advisors, Inc. (“FAF”), a wholly-owned subsidiary of U.S. Bank National Association (“U.S. Bank”), served as investment adviser to each Fund pursuant to an investment advisory agreement between First American Investment Funds, Inc. (the “Company”) and FAF (the “Prior Advisory Agreement”), and as administrator to each Fund pursuant to an administrative agreement between the Company and FAF (the “Prior Administrative Agreement”). On July 29, 2010, U.S. Bank and FAF entered into a definitive agreement with Nuveen Investments, Inc. (“Nuveen”), Nuveen Asset Management (“NAM”) and certain Nuveen affiliates, whereby NAM would acquire a portion of the asset management business of FAF (the “Transaction”). The acquired business included the assets of FAF used in providing investment advisory services, research, sales and distribution in connection with equity, fixed income, real estate, global infrastructure and asset allocation investment products (other than the money market business and closed-end funds advised by FAF), including the Funds. In connection with the Transaction, the Board of Directors (the “Prior Board”) serving the Funds as directors at that time (each a “Prior Director” and, collectively, the “Prior Directors”) considered a number of proposals designed to integrate the Funds into the Nuveen family of funds, including the appointment of NAM as investment adviser and Nuveen Investments, LLC as distributor to the Funds. The Prior Board also considered a proposal in connection with an internal restructuring of NAM (the “Restructuring”), for Nuveen Asset Management, LLC (“NAM LLC”), a wholly-owned subsidiary of NAM formed in anticipation of the Restructuring, to serve as sub-advisor for each Fund.
The Prior Board approved a new investment advisory agreement (the “New Advisory Agreement”) for each Fund with NAM and an investment sub-advisory agreement between NAM and NAM LLC (the “NAM Sub-Advisory Agreement”). In addition, for the Nuveen International Fund (formerly known as the International Fund) (the “International Fund”) and the Nuveen International Select Fund (formerly known as the International Select Fund) (the “International Select Fund”) (collectively, the “International Sub-Advised Funds”), the Prior Board approved new investment sub-advisory agreements (each, a “New International Sub-Advisory Agreement”) between NAM and the sub-advisors of such Funds (which included Altrinsic Global Advisors, LLC (for the International Fund and the International Select Fund), Hansberger Global Investors, Inc. (for the International Fund and the International Select Fund) and Lazard Asset Management LLC (for the International Select Fund) (collectively, the “International Fund Sub-Advisors”)), given that the investment sub-advisory agreements for such Funds (the “Prior International Sub-Advisory Agreements”) between FAF and the applicable International Fund Sub-Advisors would automatically terminate upon the completion of the Transaction. At a meeting of the Funds’ stockholders held on December 17, 2010, stockholders of each of the Funds approved the New Advisory Agreement and the NAM Sub-Advisory Agreement and stockholders of the International Sub-Advised Funds approved the applicable New International Sub-Advisory Agreements. In addition, stockholders of the Company’s funds (including the Funds) elected ten directors, including one Prior Director, to the board of directors of the Company (the “New Board”).
On December 31, 2010, the Transaction closed and the New Board (which replaced the Prior Board) took effect. On January 1, 2011, the New Advisory Agreement, the NAM Sub-Advisory Agreement and the New International Sub-Advisory Agreements became effective. In addition, in connection with the Restructuring, NAM has changed its name to Nuveen Fund Advisors, Inc. (“NFA”). The following is a summary of the considerations of the Prior Board, which were set forth in a proxy statement dated November 10, 2010 (the “Proxy Statement”), in approving the New Advisory Agreement and the NAM Sub-Advisory Agreement for all of the Funds and the New International Sub-Advisory Agreements for the International Sub-Advised Funds.
B. Prior Board Considerations
The New Advisory Agreement for each Fund was approved by the Prior Board after consideration of all factors determined to be relevant to its deliberations, including those discussed below. The Prior Board authorized the submission of the New Advisory Agreement for consideration by each Fund’s stockholders.
At meetings held in May and June of 2010, the Prior Board was apprised of the general terms of the Transaction and, as a result, began the process of considering the transition of services from FAF to NFA. In preparation for its September 21-23, 2010 meeting, the Prior Board received, in response to a written due diligence request prepared by the Prior Board and its independent legal counsel and provided to NFA and FAF, a significant amount of information covering a range of issues in advance of the meeting. To assist the Prior Board in its consideration of the New Advisory Agreement for each Fund, NFA provided materials and information about, among other things: (1) NFA and its affiliates, including their history and organizational structure, product lines, experience in providing investment advisory, administrative and other services, and financial condition, (2) the nature, extent and quality of services to be provided under the New Advisory Agreement, (3) proposed Fund fees and expenses and comparative information relating thereto, and (4) NFA’s compliance and risk management capabilities and processes. In addition, the Prior Board was provided with a memorandum from independent legal counsel outlining the legal duties of the Prior Board under the Investment Company Act of 1940, as amended (the “1940 Act”). In response to further requests from the Prior Board and its independent legal counsel, NFA and FAF provided additional information to the Prior Board following its September 21-23 meeting.
An additional in-person meeting of the Prior Board to consider the New Advisory Agreement was held on October 7, 2010, at which the members of the Prior Board in attendance, all of whom were not considered to be “interested persons” of the Company as defined in the 1940 Act (the “Independent Prior Directors”), approved the New Advisory Agreement with NFA for each Fund.
Annual Investment Management Agreement Approval Process
(Unaudited) (continued)
In considering the New Advisory Agreement for each Fund, the Prior Board, advised by independent legal counsel, reviewed and analyzed the factors it deemed relevant, including: (1) the nature, quality, and extent of services to be rendered to the Funds by NFA, (2) the cost of services to be provided, including Fund expense information, and (3) whether economies of scale may be realized as the Funds grow and whether fee levels are adjusted to enable Fund investors to share in these potential economies of scale.
In considering the New Advisory Agreement, the Prior Board did not identify any particular information that was all-important or controlling, and each Prior Director may have attributed different weights to the various factors discussed below. Where appropriate, the Prior Directors evaluated all information available to them regarding the Company’s funds on a fund-by-fund basis, and their determinations were made separately with respect to each such fund (including each of the Funds). The Prior Directors, all of whom were Independent Prior Directors, concluded that the terms of the New Advisory Agreement and the fee rates to be paid in light of the services to be provided to each Fund are in the best interests of each Fund, and that the New Advisory Agreement should be approved and recommended to stockholders for approval. In voting to approve the New Advisory Agreement with respect to each Fund, the Prior Board considered in particular the following factors:
Nature, Extent and Quality of Services. In considering approval of the New Advisory Agreement, the Prior Board considered the nature, extent and quality of services to be provided by NFA, including advisory services and administrative services. The Prior Board reviewed materials outlining, among other things, NFA’s organizational structure and business; the types of services that NFA or its affiliates are expected to provide to the Funds; the performance record of the applicable Fund (as described in further detail below); and fund product lines offered by NFA. The Prior Board considered that affiliation with a larger fund complex and well-recognized sponsor may result in a broader distribution network, potential economies of scale with respect to other services or fees and broader shareholder services including exchange options.
With respect to personnel, the Prior Board considered information regarding retention plans for current FAF employees who would be offered employment by NFA, and the background and experience of NFA employees who would become portfolio managers as of the closing of the Transaction. The Prior Board also reviewed information regarding portfolio manager compensation arrangements to evaluate NFA’s ability to attract and retain high quality investment personnel.
In evaluating the services of NFA, the Prior Board also considered NFA’s ability to supervise the Funds’ other service providers and, given the importance of compliance, NFA’s compliance program. Among other things, the Prior Board considered the report of NFA’s chief compliance officer regarding NFA’s compliance policies and procedures.
In addition to advisory services, the Prior Board considered the quality of administrative services expected to be provided by NFA and its affiliates including product management, fund administration, oversight of service providers, shareholder services, administration of Board relations, regulatory and portfolio compliance and legal support.
The Prior Board considered that, based on representations from FAF and NFA, the Transaction would allow stockholders to continue their investment in each of the Company’s funds with the same investment objective and principal strategies and, in most cases, the same portfolio management team. In light of the continuity of investment personnel in most cases (with respect to the Company’s funds in the aggregate), the Prior Board considered the historical investment performance of each of the Company’s funds (including each Fund) previously provided during the annual contract renewal process. The Prior Board also considered representations from NFA and FAF that no International Fund Sub-Advisor would change as a result of the Transaction.
Cost of Services Provided by NFA. In evaluating the costs of the services to be provided by NFA under the New Advisory Agreement, the Prior Board received a comparison of each Fund’s annual operating expenses as of June 30, 2010 under the Prior Advisory Agreement and under the New Advisory Agreement, in each case adjusted to reflect a decrease in net assets for certain of the Company’s funds from redemptions by the U.S. Bank 401(k) Plan expected to occur prior to the closing of the Transaction. The Prior Board considered, among other things, that the advisory fee rates and other expenses would change as a result of NFA serving as investment adviser to each Fund. The Prior Board noted that the services provided by NFA under the New Advisory Agreement would include certain administrative services, which services (along with other services) were provided pursuant to the Prior Administrative Agreement and were charged separately from the advisory fee. Accordingly, the Prior Board considered that the fee rates paid under the New Advisory Agreement include bundled investment advisory and administrative fees and thus are higher than the fee rates paid under the Prior Advisory Agreement for most of the Company’s funds, but lower than the combined fee rates paid under the Prior Advisory Agreement and the Prior Administrative Agreement. The Prior Board also noted that certain administrative services provided under the Prior Administrative Agreement would not be provided under the New Advisory Agreement and will be delegated to other service providers. Similarly, certain fees paid by FAF under the Prior Administrative Agreement will not be paid by NFA under the New Advisory Agreement and will be paid directly by the Funds. However, immediately following the closing of the Transaction, the net expense ratio of each Fund was expected to be the same or lower than the Fund’s net expense ratio as of June 30, 2010, adjusted (where applicable) to reflect a decrease in net assets resulting from redemptions by the U.S. Bank 401(k) Plan expected to occur prior to the closing of the Transaction, assuming the Fund’s net assets at the time of the closing of the Transaction were no lower than their adjusted June 30 level. In addition, the Prior Board noted that NFA has committed to certain undertakings to maintain current fee caps and/or to waive fees or reimburse expenses to maintain net management fees at certain levels and Nuveen has represented to the Prior Board that Nuveen and its affiliates will not take any action that imposes an “unfair burden” on any Fund as a result of the Transaction. The Prior Board also considered that fees payable under the New Advisory Agreement include both a fund-level fee and a complex-level fee, and that schedules for the fund-level and complex-level fees contain breakpoints that are based, respectively, on
Fund assets and Nuveen complex-wide assets. The Prior Board considered that breakpoints in the fund-level fee allow for the possibility that this portion of the advisory fee could decline in the future if Fund assets were to increase or increase in the future if Fund assets were to decline. The Prior Board also considered that breakpoints in the complex-level fee allow for the possibility that this portion of the advisory fee could decline in the future if complex-wide assets were to increase or increase in the future if complex-wide assets were to decline, regardless, in each case, of whether assets of the particular Fund had increased or decreased.
In considering the compensation to be paid to NFA, the Prior Board also reviewed fee information regarding NFA-sponsored funds, to the extent such funds had similar investment objectives and strategies to the Funds. The Prior Board reviewed information provided by NFA regarding similar funds managed by NFA and noted that the fee rates payable by these funds were generally comparable to the fee rates proposed for the Company’s funds. The Prior Board also compared proposed fee and expense information to the median fees and expenses of comparable funds, using information provided by an independent data service.
In evaluating the compensation, the Prior Board also considered other amounts expected to be paid to NFA by the Funds as well as any indirect benefits (such as soft dollar arrangements, if any) NFA and its affiliates are expected to receive, that are directly attributable to the management of the Funds.
The Prior Board also considered that the Funds would not bear any of the costs relating to the Transaction, including the costs of preparing, printing and mailing the Proxy Statement.
Economies of Scale. The Prior Board reviewed information regarding potential economies of scale or other efficiencies that might result from the Funds’ potential association with Nuveen. The Prior Board noted that the New Advisory Agreement provides for breakpoints in the Funds’ fund-level and complex-level management fee rates as the assets of the Funds and the assets held by the various registered investment companies sponsored by Nuveen increase, respectively. The Prior Board concluded that the structure of the investment management fee rates, with the breakpoints for the Funds under the New Advisory Agreement, reflected sharing of potential economies of scale with the Funds’ stockholders.
Conclusion. After deliberating in executive session, the members of the Prior Board in attendance, all of whom were Independent Prior Directors, approved the New Advisory Agreement with respect to each Fund, concluding that the New Advisory Agreement was in the best interests of each Fund.
NAM Sub-Advisory Agreement. The Prior Board also approved the NAM Sub-Advisory Agreement between NFA and NAM LLC as a result of the Restructuring expected to occur with NFA. The Prior Board considered that the services to be provided by NAM LLC under the NAM Sub-Advisory Agreement would not result in any material change in the nature or level of investment advisory services or administrative services provided to the Funds. In addition, the portfolio managers will continue to manage the Funds in their capacity as employees of NAM LLC. The Prior Board considered that NFA will pay a portion of the advisory fee it receives from each Fund to NAM LLC for its services as sub-advisor. The Prior Board concluded, based upon the conclusions that the Prior Board reached in connection with the approval of the New Advisory Agreement and after determining that it need not reconsider all of the factors that it had considered in connection with the approval of the New Advisory Agreement, to approve the NAM Sub-Advisory Agreement.
New International Sub-Advisory Agreements. At an in-person meeting held on October 7, 2010, the members of the Prior Board in attendance, all of whom were Independent Prior Directors, considered whether to approve the New International Sub-Advisory Agreements.
The Prior Board considered that completion of the Transaction would result in the termination of the Prior Advisory Agreement for each International Sub-Advised Fund, which would cause each Prior International Sub-Advisory Agreement to automatically terminate upon its terms. In anticipation of the termination of the Prior International Sub-Advisory Agreements, the Prior Board determined that the approval of New International Sub-Advisory Agreements was in the best interests of each International Sub-Advised Fund.
In determining whether to approve New International Sub-Advisory Agreements with respect to each International Sub-Advised Fund, the Prior Board considered representations of FAF and NFA that the Transaction was not expected to impact the nature, extent and quality of services to be provided by the International Fund Sub-Advisors. The Prior Board also considered that the terms of the New International Sub-Advisory Agreements, including the fees payable to the International Fund Sub-Advisors, would not change in any material respect in connection with the Transaction. They considered the sub-advisory fees in light of the changes to the advisory fee and expense structure discussed above, noting that the sub-advisory fee schedules include breakpoints. The Prior Board also considered that the International Sub-Advised Funds would not bear any of the costs relating to the Transaction, including the costs of preparing, printing and mailing the Proxy Statement to stockholders of the International Sub-Advised Funds and related solicitation expenses. The Prior Board considered that it had recently renewed the Prior International Sub-Advisory Agreements pursuant to an extensive annual renewal process that concluded at its June 2010 meeting. The Prior Board also determined that it was appropriate to take into consideration the extensive information received throughout the year regarding performance and operating results of the International Sub-Advised Funds, given the retention of the existing International Fund Sub-Advisors and the continuity of portfolio management expected following the Transaction. The Prior Board concluded, based upon all of these considerations, along with the conclusions the Prior Board reached with respect to the last renewal of each Prior International Sub-Advisory Agreement, that it need not reconsider all of the factors that it would typically consider in connection with an initial contract approval or contract renewal.
Annual Investment Management Agreement Approval Process
(Unaudited) (continued)
Based upon its evaluation of all information and factors it determined to be relevant to its deliberations, and assisted by the advice of independent legal counsel, the members of the Prior Board in attendance, all of whom were Independent Prior Directors, concluded that the New International Sub-Advisory Agreements between NAM (now NFA) and each International Sub-Advised Fund’s International Fund Sub-Advisors should be approved.
Notes
Notes
Notes
Glossary of Terms Used in this Report
Average Annual Total Return: This is a commonly used method to express an investment’s performance over a particular, usually multi-year time period. It expresses the return that would have been necessary each year to equal the investment’s actual cumulative performance (including change in NAV or offer price and reinvested dividends and capital gains distributions, if any) over the time period being considered.
Bank of America Merrill Lynch 3-Month U.S. Treasury Bill Index: The Bank of America Merrill Lynch 3-Month U.S. Treasury Bill Index is an unmanaged index that is comprised of a single U.S. Treasury issue with approximately three months to final maturity, purchased at the beginning of each month and held for one full month. The index returns assume reinvestment of dividends, but do not reflect any applicable sales charges. It is not possible to invest directly in an index.
Lipper International Large-Cap Growth Funds Classification Average: Represents the average annualized total return for all reporting funds in the Lipper International Large-Cap Growth Fund Classification. The Lipper International Large-Cap Growth Funds Classification Average contained 247, 181 and 113 funds for the 1-year, 5-year and 10-year periods, respectively, ended October 31, 2011. Lipper returns account for the effects of management fees and assume reinvestment of dividends but do not reflect any applicable sales charges. The Lipper average is not available for direct investment.
Lipper Large-Cap Core Funds Classification Average: Represents the average annualized total return for all reporting funds in the Lipper Large-Cap Core Fund Classification. The Lipper Large-Cap Core Funds Classification Average contained 1,081 and 831 funds for the 1-year and since inception periods, respectively, ended October 31, 2011. Lipper returns account for the effects of management fees and assume reinvestment of dividends but do not reflect any applicable sales charges. The Lipper average is not available for direct investment.
Lipper Flexible Portfolio Funds Classification Average: Represents the average annualized total return for all reporting funds in the Lipper Flexible Portfolio Funds Classification. Lipper Flexible Portfolio Funds Classification Average contained 178 and 137 funds for the 1-year and since inception periods, respectively, ended October 31, 2011. Lipper returns account for the effects of management fees and assume reinvestment of dividends but do not reflect any applicable sales charges. The Lipper average is not available for direct investment
MSCI EAFE Index: The MSCI (Morgan Stanley Capital International) EAFE (Europe, Australasia, Far East) Index is a free float-adjusted market capitalization weighted index designed to measure developed market equity performance, excluding the U.S. and Canada. The index returns assume reinvestment of dividends, but do not reflect any applicable sales charges. It is not possible to invest directly in an index.
MSCI All Country World Investable Market Index (ex US): The MSCI (Morgan Stanley Capital International) All Country World Investable Market Index (ex US) is a free float-adjusted market capitalization weighted index that is designed to measure the equity market performance of developed and emerging markets. The index consists of 45 country indexes comprising 24 developed and 21 emerging market countries. The index returns assume reinvestment of dividends, but do not reflect any applicable sales charges. It is not possible to invest directly in an index.
Net Asset Value (NAV): The net market value of all securities held in a portfolio.
Net Asset Value (NAV) Per Share: The market value of one share of a mutual fund or closed-end fund. For a Fund, the NAV is calculated daily by taking the Fund’s total assets (securities, cash, and accrued earnings), subtracting the Fund’s liabilities, and dividing by the number of shares outstanding.
S&P 500 Index: An unmanaged index generally considered representative of the U.S. stock market. The index returns assume reinvestment of dividends, but do not reflect any applicable sales charges. It is not possible to invest directly in an index.
Tax Equalization: The practice of treating a portion of the distribution made to a redeeming shareholder, which represents his proportionate part of undistributed net investment income and capital gain as a distribution for tax purposes. Such amounts are referred to as the equalization debits (or payments) and will be considered a distribution to the shareholder of net investment income and capital gain for calculation of the Fund’s dividends paid deduction.
Fund Information
Fund Manager
Nuveen Fund Advisors, Inc.
333 West Wacker Drive
Chicago, IL 60606
Sub-Advisers
Nuveen Asset Management, LLC
333 West Wacker Drive
Chicago, IL 60606
Altrinsic Global Advisors, LLC
100 First Stamford Place
Stamford, CT 06902
Hansberger Global Investors, Inc.
401 East Lasolas Blvd.
Suite 1700
Fort Lauderdale, FL 33301
Legal Counsel
Chapman and Cutler LLP
Chicago, IL
Independent Registered Public Accounting Firm
Ernst & Young LLP
Chicago, IL
Custodians
U.S. Bank National Association
St. Paul, MN
State Street Bank & Trust Company
Boston, MA
Transfer Agent and Shareholder Services
U.S. Bancorp Fund Services, LLC
615 East Michigan Street
Milwaukee, WI 53202
Distribution Information: The Funds hereby designate their percentages of dividends paid from net ordinary income as dividends qualifying for the 70% dividends received deduction (“DRD”) for corporations and their percentages as qualified dividend income (“QDI”) for individuals under Section 1 (h)(11) of the Internal Revenue Code as shown in the accompanying table. The actual qualified dividend income distributions will be reported to shareholders on Form 1099-DIV which will be sent to shareholders shortly after calendar year end.
| | | | | | | | |
| Fund | | % of DRD | | | % of QDI | |
Nuveen International Fund | | | 1.20% | | | | 100% | |
Nuveen International Select Fund | | | 1.26% | | | | 99.77% | |
Nuveen Quantitative Enhanced Core Equity Fund | | | 100% | | | | 100% | |
Nuveen Tactical Market Opportunities Fund | | | 0% | | | | 32.00% | |
Long Term Capital Gain Distributions: The following Funds designate as a long term capital gain dividend, pursuant to Internal Revenue Code Section 852 (b)(3), the amounts shown in the accompanying table, or if greater, the amount necessary to reduce earnings and profits of the Funds related to net capital gain to zero for the tax year ended October 31, 2011:
| | | | |
| Fund | | Long Term
Capital Gain
Dividend
(in thousands) | |
Nuveen International Fund | | $ | 32,097 | |
Nuveen International Select Fund | | | 6,812 | |
Nuveen Quantitative Enhanced Core Equity Fund | | | 3,070 | |
Foreign Taxes: Nuveen International Fund and Nuveen International Select Fund paid qualifying foreign taxes of $1,597 and $1,731, respectively (in thousands), and earned $14,623 and $18,525 of foreign source income, respectively (in thousands), during the fiscal year ended October 31, 2011. Pursuant to Section 853 of the Internal Revenue Code, Nuveen International Fund and Nuveen International Select Fund hereby designate $0.11 and $0.03 per share as foreign taxes paid, respectively, and $0.98 and $0.28 per share as income earned from foreign sources, respectively, for the fiscal year ended October 31, 2011. The actual foreign tax credit distribution will be reported to shareholders on Form 1099-DIV, which will be sent to shareholders shortly after calendar year end.
Quarterly Portfolio of Investments and Proxy Voting information: You may obtain (i) each Fund’s quarterly portfolio of investments, (ii) information regarding how the Funds voted proxies relating to portfolio securities held during the most recent twelve-month period ended June 30, and (iii) a description of the policies and procedures that the Funds used to determine how to vote proxies relating to portfolio securities without charge, upon request, by calling Nuveen Investments at (800) 257-8787 or on Nuveen’s website at www.nuveen.com.
You may also obtain this and other Fund information directly from the Securities and Exchange Commission (SEC). The SEC may charge a copying fee for this information. Visit the SEC on-line at http://www.sec.gov or in person at the SEC’s Public Reference Room in Washington, D.C. Call the SEC at (202) 942-8090 for room hours and operation. You may also request Fund information by sending an e-mail request to publicinfo@sec.gov or by writing to the SEC’s Public Reference Section at 100 F Street NE, Washington, D.C. 20549.
The Financial Industry Regulatory Authority (FINRA) provides a Public Disclosure Program which supplies certain information regarding the disciplinary history of FINRA members and their associated persons in response to either telephone inquiries at (800) 289-9999 or written inquiries at www.finra.org. FINRA also provides an investor brochure that includes information describing the Public Disclosure Program.
Nuveen Investments:
Serving Investors for Generations
Since 1898, financial advisors and their clients have relied on Nuveen Investments to provide dependable investment solutions through continued adherence to proven, long-term investing principles. Today, we offer a range of high quality equity and fixed-income solutions designed to be integral components of a well-diversified core portfolio.
Focused on meeting investor needs.
Nuveen Investments is a global investment management firm that seeks to help secure the long-term goals of institutions and high net worth investors as well as the consultants and financial advisors who serve them. We market our growing range of specialized investment solutions under the high-quality brands of NWQ, Nuveen Asset Management, Santa Barbara, Symphony, Tradewinds and Winslow Capital. In total, Nuveen Investments managed approximately $207 billion of assets as of October 31, 2011.
Find out how we can help you.
To learn more about how the products and services of Nuveen Investments may be able to help you meet your financial goals, talk to your financial advisor, or call us at (800) 257-8787. Please read the information provided carefully before you invest. Investors should consider the investment objective and policies, risk considerations, charges and expenses of any investment carefully. Where applicable, be sure to obtain a prospectus, which contains this and other relevant information. To obtain a prospectus, please contact your securities representative or Nuveen Investments, 333 W. Wacker Dr., Chicago, IL 60606. Please read the prospectus carefully before you invest or send money.
Learn more about Nuveen Funds at: www.nuveen.com/mf
| | |
Distributed by Nuveen Securities, LLC 333 West Wacker Drive Chicago, IL 60606 www.nuveen.com | | |
MAN-FQTII-1011D
ITEM 2. CODE OF ETHICS.
As of the end of the period covered by this report, the registrant has adopted a code of ethics that applies to the registrant’s principal executive officer, principal financial officer, principal accounting officer or controller, or persons performing similar functions. There were no amendments to or waivers from the code during the period covered by this report. The registrant has posted the code of ethics on its website at www.nuveen.com/mf. (To view the code, click on the Shareholder Resources drop down menu box, click on Fund Governance and then click on Code of Conduct.)
ITEM 3. AUDIT COMMITTEE FINANCIAL EXPERT.
The registrant’s Board of Trustees determined that the registrant has at least one “audit committee financial expert” (as defined in Item 3 of Form N-CSR) serving on its Audit Committee. The registrant’s audit committee financial expert is Carole E. Stone, who is “independent” for purposes of Item 3 of Form N-CSR.
Ms. Stone served for five years as Director of the New York State Division of the Budget. As part of her role as Director, Ms. Stone was actively involved in overseeing the development of the State’s operating, local assistance and capital budgets, its financial plan and related documents; overseeing the development of the State’s bond-related disclosure documents and certifying that they fairly presented the State’s financial position; reviewing audits of various State and local agencies and programs; and coordinating the State’s system of internal audit and control. Prior to serving as Director, Ms. Stone worked as a budget analyst/examiner with increasing levels of responsibility over a 30 year period, including approximately five years as Deputy Budget Director. Ms. Stone has also served as Chair of the New York State Racing Association Oversight Board, as Chair of the Public Authorities Control Board, as a Commissioner on the New York State Commission on Public Authority Reform and as a member of the Boards of Directors of several New York State public authorities. These positions have involved overseeing operations and finances of certain entities and assessing the adequacy of project/entity financing and financial reporting. Currently, Ms. Stone is on the Board of Directors of CBOE Holdings, Inc., of the Chicago Board Options Exchange, and of C2 Options Exchange. Ms. Stone’s position on the boards of these entities and as a member of both CBOE Holdings’ Audit Committee and its Finance Committee has involved, among other things, the oversight of audits, audit plans and preparation of financial statements.
ITEM 4. PRINCIPAL ACCOUNTANT FEES AND SERVICES.
The following tables show the amount of fees that Ernst and Young LLP, the Trust’s auditor, billed to the Trust during the Trust’s last two full fiscal years. The Audit Committee approved in advance all audit services and non-audit services that provided to the Trust, except for those non-audit services that were subject to the pre-approval exception under Rule 2-01 of Regulation S-X (the “pre-approval exception”). The pre-approval exception for services provided directly to the Trust waives the pre-approval requirement for services other than audit, review or attest services if: (A) the aggregate amount of all such services provided constitutes no more than 5% of the total amount of revenues paid by the Trust during the fiscal year in which the services are provided; (B) the Trust did not recognize the services as non-audit services at the time of the engagement; and (C) the services are promptly brought to the Audit Committee’s attention, and the Committee (or its delegate) approves the services before the audit is completed.
The Audit Committee has delegated certain pre-approval responsibilities to its Chairman (or, in his absence, any other member of the Audit Committee).
SERVICES THAT THE TRUST’S AUDITOR BILLED TO THE TRUST
| | | | | | | | | | | | | | | | |
Fiscal Year Ended October 31, 2011 5 | | Audit Fees Billed
to Funds 1 | | | Audit-Related Fees
Billed to Funds 2 | | | Tax Fees
Billed to Funds 3 | | | All Other Fees
Billed to Funds 4 | |
Name of Series | | | | | | | | | | | | | | | | |
Equity Income Fund | | | 21,875 | | | | 0 | | | | 1,056 | | | | 0 | |
Equity Index Fund | | | 20,000 | | | | 0 | | | | 1,056 | | | | 0 | |
Global Infrastructure Fund | | | 21,875 | | | | 0 | | | | 1,056 | | | | 0 | |
International Fund | | | 21,875 | | | | 0 | | | | 2,303 | | | | 0 | |
International Select Fund | | | 21,875 | | | | 0 | | | | 2,205 | | | | 0 | |
Large Cap Growth Opportunities Fund | | | 21,875 | | | | 0 | | | | 1,056 | | | | 0 | |
Large Cap Select Fund | | | 21,875 | | | | 0 | | | | 1,056 | | | | 0 | |
Large Cap Value Fund | | | 21,875 | | | | 0 | | | | 1,056 | | | | 0 | |
Mid Cap Growth Opportunities Fund | | | 21,875 | | | | 0 | | | | 1,056 | | | | 0 | |
Mid Cap Index Fund | | | 20,000 | | | | 0 | | | | 1,056 | | | | 0 | |
Mid Cap Select Fund | | | 21,875 | | | | 0 | | | | 1,056 | | | | 0 | |
Mid Cap Value Fund | | | 21,875 | | | | 0 | | | | 1,056 | | | | 0 | |
Quantitative Enhanced Core Equity Fund | | | 21,875 | | | | 0 | | | | 1,056 | | | | 0 | |
Real Estate Securities Fund | | | 21,875 | | | | 0 | | | | 1,056 | | | | 0 | |
Small Cap Growth Opportunities Fund | | | 21,875 | | | | 0 | | | | 1,056 | | | | 0 | |
Small Cap Index Fund | | | 20,000 | | | | 0 | | | | 1,056 | | | | 0 | |
Small Cap Select Fund | | | 21,875 | | | | 0 | | | | 0 | | | | 0 | |
Small Cap Value Fund | | | 21,875 | | | | 0 | | | | 1,056 | | | | 0 | |
Tactical Market Opportunities Fund | | | 21,875 | | | | 0 | | | | 1,056 | | | | 0 | |
| | | | | | | | | | | | | | | | |
Total | | $ | 410,000 | | | $ | 0 | | | $ | 21,404 | | | $ | 0 | |
| 1 | | “Audit Fees” are the aggregate fees billed for professional services for the audit of the Fund’s annual financial statements and services provided in connection with statutory and regulatory filings or engagements. |
| 2 | | “Audit Related Fees” are the aggregate fees billed for assurance and related services reasonably related to the performance of the audit or review of financial statements and are not reported under “Audit Fees”. |
| 3 | | “Tax Fees” are the aggregate fees billed for professional services for tax advice, tax compliance, and tax planning. |
| 4 | | “All Other Fees” are the aggregate fees billed for products and services other than “Audit Fees”, “Audit Related Fees”, and “Tax Fees”. |
| 5 | | The Funds were acquired on December 31, 2010. |
| | | | | | | | | | | | | | | | |
| | | Percentage Approved Pursuant to Pre-approval Exception | |
| | | Audit Fees Billed
to Funds | | | Audit-Related Fees
Billed to Funds | | | Tax Fees
Billed to Funds | | | All Other Fees
Billed to Funds | |
Name of Series | | | | | | | | | | | | | | | | |
Equity Income Fund | | | 0 | % | | | 0 | % | | | 0 | % | | | 0 | % |
Equity Index Fund | | | 0 | % | | | 0 | % | | | 0 | % | | | 0 | % |
Global Infrastructure Fund | | | 0 | % | | | 0 | % | | | 0 | % | | | 0 | % |
International Fund | | | 0 | % | | | 0 | % | | | 0 | % | | | 0 | % |
International Select Fund | | | 0 | % | | | 0 | % | | | 0 | % | | | 0 | % |
Large Cap Growth Opportunities Fund | | | 0 | % | | | 0 | % | | | 0 | % | | | 0 | % |
Large Cap Select Fund | | | 0 | % | | | 0 | % | | | 0 | % | | | 0 | % |
Large Cap Value Fund | | | 0 | % | | | 0 | % | | | 0 | % | | | 0 | % |
Mid Cap Growth Opportunities Fund | | | 0 | % | | | 0 | % | | | 0 | % | | | 0 | % |
Mid Cap Index Fund | | | 0 | % | | | 0 | % | | | 0 | % | | | 0 | % |
Mid Cap Select Fund | | | 0 | % | | | 0 | % | | | 0 | % | | | 0 | % |
Mid Cap Value Fund | | | 0 | % | | | 0 | % | | | 0 | % | | | 0 | % |
Quantitative Enhanced Core Equity Fund | | | 0 | % | | | 0 | % | | | 0 | % | | | 0 | % |
Real Estate Securities Fund | | | 0 | % | | | 0 | % | | | 0 | % | | | 0 | % |
Small Cap Growth Opportunities Fund | | | 0 | % | | | 0 | % | | | 0 | % | | | 0 | % |
Small Cap Index Fund | | | 0 | % | | | 0 | % | | | 0 | % | | | 0 | % |
Small Cap Select Fund | | | 0 | % | | | 0 | % | | | 0 | % | | | 0 | % |
Small Cap Value Fund | | | 0 | % | | | 0 | % | | | 0 | % | | | 0 | % |
Tactical Market Opportunities Fund | | | 0 | % | | | 0 | % | | | 0 | % | | | 0 | % |
| | | | |
Fiscal Year Ended October 31, 2010 | | Audit Fees Billed
to Funds 1 | | | Audit-Related Fees
Billed to Funds 2 | | | Tax Fees
Billed to Funds 3 | | | All Other Fees
Billed to Funds 4 | |
Name of Series | | | | | | | | | | | | | | | | |
Equity Income Fund | | | 61,758 | | | | 206 | | | | 12,512 | | | | 0 | |
Equity Index Fund | | | 61,758 | | | | 206 | | | | 12,512 | | | | 0 | |
Global Infrastructure Fund | | | 61,758 | | | | 206 | | | | 12,512 | | | | 0 | |
International Fund | | | 61,758 | | | | 206 | | | | 12,512 | | | | 0 | |
International Select Fund | | | 61,758 | | | | 206 | | | | 12,512 | | | | 0 | |
Large Cap Growth Opportunities Fund | | | 61,758 | | | | 206 | | | | 12,512 | | | | 0 | |
Large Cap Select Fund | | | 61,758 | | | | 206 | | | | 12,512 | | | | 0 | |
Large Cap Value Fund | | | 61,758 | | | | 206 | | | | 12,512 | | | | 0 | |
Mid Cap Growth Opportunities Fund | | | 61,758 | | | | 206 | | | | 12,512 | | | | 0 | |
Mid Cap Index Fund | | | 61,758 | | | | 206 | | | | 12,512 | | | | 0 | |
Mid Cap Select Fund | | | 61,758 | | | | 206 | | | | 12,512 | | | | 0 | |
Mid Cap Value Fund | | | 61,758 | | | | 206 | | | | 12,512 | | | | 0 | |
Quantitative Enhanced Core Equity Fund | | | 61,758 | | | | 206 | | | | 12,512 | | | | 0 | |
Real Estate Securities Fund | | | 61,758 | | | | 206 | | | | 12,512 | | | | 0 | |
Small Cap Growth Opportunities Fund | | | 61,758 | | | | 206 | | | | 12,512 | | | | 0 | |
Small Cap Index Fund | | | 61,758 | | | | 206 | | | | 12,512 | | | | 0 | |
Small Cap Select Fund | | | 61,758 | | | | 206 | | | | 12,512 | | | | 0 | |
Small Cap Value Fund | | | 61,758 | | | | 206 | | | | 12,512 | | | | 0 | |
Tactical Market Opportunities Fund | | | 61,758 | | | | 206 | | | | 12,512 | | | | 0 | |
| | | | | | | | | | | | | | | | |
Total | | $ | 1,173,402 | | | $ | 3,914 | | | $ | 237,728 | | | $ | 0 | |
| 1 | | “Audit Fees” are the aggregate fees billed for professional services for the audit of the Fund’s annual financial statements and services provided in connection with statutory and regulatory filings or engagements. |
| 2 | | “Audit Related Fees” are the aggregate fees billed for assurance and related services reasonably related to the performance of the audit or review of financial statements and are not reported under “Audit Fees”. |
| 3 | | “Tax Fees” are the aggregate fees billed for professional services for tax advice, tax compliance, and tax planning. |
| 4 | | “All Other Fees” are the aggregate fees billed for products and services other than “Audit Fees”, “Audit Related Fees”, and “Tax Fees”. |
| | | | | | | | | | | | | | | | |
| | | Percentage Approved Pursuant to Pre-approval Exception | |
| | | Audit Fees Billed
to Funds | | | Audit-Related Fees
Billed to Funds | | | Tax Fees
Billed to Funds | | | All Other Fees
Billed to Funds | |
Name of Series | | | | | | | | | | | | | | | | |
Equity Income Fund | | | 0 | % | | | 0 | % | | | 0 | % | | | 0 | % |
Equity Index Fund | | | 0 | % | | | 0 | % | | | 0 | % | | | 0 | % |
Global Infrastructure Fund | | | 0 | % | | | 0 | % | | | 0 | % | | | 0 | % |
International Fund | | | 0 | % | | | 0 | % | | | 0 | % | | | 0 | % |
International Select Fund | | | 0 | % | | | 0 | % | | | 0 | % | | | 0 | % |
Large Cap Growth Opportunities Fund | | | 0 | % | | | 0 | % | | | 0 | % | | | 0 | % |
Large Cap Select Fund | | | 0 | % | | | 0 | % | | | 0 | % | | | 0 | % |
Large Cap Value Fund | | | 0 | % | | | 0 | % | | | 0 | % | | | 0 | % |
Mid Cap Growth Opportunities Fund | | | 0 | % | | | 0 | % | | | 0 | % | | | 0 | % |
Mid Cap Index Fund | | | 0 | % | | | 0 | % | | | 0 | % | | | 0 | % |
Mid Cap Select Fund | | | 0 | % | | | 0 | % | | | 0 | % | | | 0 | % |
Mid Cap Value Fund | | | 0 | % | | | 0 | % | | | 0 | % | | | 0 | % |
Quantitative Enhanced Core Equity Fund | | | 0 | % | | | 0 | % | | | 0 | % | | | 0 | % |
Real Estate Securities Fund | | | 0 | % | | | 0 | % | | | 0 | % | | | 0 | % |
Small Cap Growth Opportunities Fund | | | 0 | % | | | 0 | % | | | 0 | % | | | 0 | % |
Small Cap Index Fund | | | 0 | % | | | 0 | % | | | 0 | % | | | 0 | % |
Small Cap Select Fund | | | 0 | % | | | 0 | % | | | 0 | % | | | 0 | % |
Small Cap Value Fund | | | 0 | % | | | 0 | % | | | 0 | % | | | 0 | % |
Tactical Market Opportunities Fund | | | 0 | % | | | 0 | % | | | 0 | % | | | 0 | % |
| | | | | | | | | | | | |
Fiscal Year Ended October 31, 2011 | | Audit-Related Fees
Billed to Adviser and
Affiliated Fund
Service Providers | | | Tax Fees Billed to
Adviser and
Affiliated Fund
Service Providers
| | | All Other Fees
Billed to Adviser
and Affiliated Fund
Service Providers | |
Nuveen Investment Funds, Inc. | | $ | 0 | | | $ | 0 | | | $ | 0 | |
| | | | | | | | | | | | |
| |
| | | Percentage Approved Pursuant to Pre-approval Exception | |
| | | Audit-Related Fees
Billed to Adviser and
Affiliated Fund
Service Providers | | | Tax Fees Billed to
Adviser and
Affiliated Fund
Service Providers | | | All Other Fees
Billed to Adviser
and Affiliated Fund
Service Providers | |
| | | 0 | % | | | 0 | % | | | 0 | % |
| | | |
Fiscal Year Ended October 31, 2010 | | Audit-Related Fees
Billed to Adviser and
Affiliated Fund
Service Providers | | | Tax Fees Billed to
Adviser and
Affiliated Fund
Service Providers
| | | All Other Fees
Billed to Adviser
and Affiliated Fund
Service Providers | |
Nuveen Investment Funds, Inc. | | $ | 0 | | | $ | 0 | | | $ | 0 | |
| |
| | | Percentage Approved Pursuant to Pre-approval Exception | |
| | | Audit-Related Fees
Billed to Adviser and
Affiliated Fund
Service Providers | | | Tax Fees Billed to
Adviser and
Affiliated Fund
Service Providers | | | All Other Fees
Billed to Adviser
and Affiliated Fund
Service Providers | |
| | | 0 | % | | | 0 | % | | | 0 | % |
| | | | | | | | | | | | | | | | |
Fiscal Year Ended October 31, 2011 1 | | Total Non-Audit Fees
Billed to Trust | | | Total Non-Audit Fees
billed to Adviser and
Affiliated Fund Service
Providers (engagements
related directly to the
operations and financial
reporting of the Trust) | | | Total Non-Audit Fees
billed to Adviser and
Affiliated Fund Service
Providers (all other
engagements) | | | Total | |
Name of Series | | | | | | | | | | | | | | | | |
Equity Income Fund | | | 1,056 | | | | 0 | | | | 0 | | | | 1,056 | |
Equity Index Fund | | | 1,056 | | | | 0 | | | | 0 | | | | 1,056 | |
Global Infrastructure Fund | | | 1,056 | | | | 0 | | | | 0 | | | | 1,056 | |
International Fund | | | 2,303 | | | | 0 | | | | 0 | | | | 2,303 | |
International Select Fund | | | 2,205 | | | | 0 | | | | 0 | | | | 2,205 | |
Large Cap Growth Opportunities Fund | | | 1,056 | | | | 0 | | | | 0 | | | | 1,056 | |
Large Cap Select Fund | | | 1,056 | | | | 0 | | | | 0 | | | | 1,056 | |
Large Cap Value Fund | | | 1,056 | | | | 0 | | | | 0 | | | | 1,056 | |
Mid Cap Growth Opportunities Fund | | | 1,056 | | | | 0 | | | | 0 | | | | 1,056 | |
Mid Cap Index Fund | | | 1,056 | | | | 0 | | | | 0 | | | | 1,056 | |
Mid Cap Select Fund | | | 1,056 | | | | 0 | | | | 0 | | | | 1,056 | |
Mid Cap Value Fund | | | 1,056 | | | | 0 | | | | 0 | | | | 1,056 | |
Quantitative Enhanced Core Equity Fund | | | 1,056 | | | | 0 | | | | 0 | | | | 1,056 | |
Real Estate Securities Fund | | | 1,056 | | | | 0 | | | | 0 | | | | 1,056 | |
Small Cap Growth Opportunities Fund | | | 1,056 | | | | 0 | | | | 0 | | | | 1,056 | |
Small Cap Index Fund | | | 1,056 | | | | 0 | | | | 0 | | | | 1,056 | |
Small Cap Select Fund | | | 0 | | | | 0 | | | | 0 | | | | 0 | |
Small Cap Value Fund | | | 1,056 | | | | 0 | | | | 0 | | | | 1,056 | |
Tactical Market Opportunities Fund | | | 1,056 | | | | 0 | | | | 0 | | | | 1,056 | |
| | | | | | | | | | | | | | | | |
Total | | $ | 21,404 | | | $ | 0 | | | $ | 0 | | | $ | 21,404 | |
“Non-Audit Fees Billed to Trust” represent “Tax Fees” and “All Other Fees” billed to each Fund in their respective amounts from the previous table.
| 1 | | The Funds were acquired on December 31, 2010. |
| | | | | | | | | | | | | | | | |
Fiscal Year Ended October 31, 2010 | | Total Non-Audit Fees
Billed to Trust | | | Total Non-Audit Fees
billed to Adviser and
Affiliated Fund Service
Providers (engagements
related directly to the
operations and financial
reporting of the Trust) | | | Total Non-Audit Fees
billed to Adviser and
Affiliated Fund Service
Providers (all other
engagements) | | | Total | |
Name of Series | | | | | | | | | | | | | | | | |
Equity Income Fund | | | 12,512 | | | | 0 | | | | 0 | | | | 12,512 | |
Equity Index Fund | | | 12,512 | | | | 0 | | | | 0 | | | | 12,512 | |
Global Infrastructure Fund | | | 12,512 | | | | 0 | | | | 0 | | | | 12,512 | |
International Fund | | | 12,512 | | | | 0 | | | | 0 | | | | 12,512 | |
International Select Fund | | | 12,512 | | | | 0 | | | | 0 | | | | 12,512 | |
Large Cap Growth Opportunities Fund | | | 12,512 | | | | 0 | | | | 0 | | | | 12,512 | |
Large Cap Select Fund | | | 12,512 | | | | 0 | | | | 0 | | | | 12,512 | |
Large Cap Value Fund | | | 12,512 | | | | 0 | | | | 0 | | | | 12,512 | |
Mid Cap Growth Opportunities Fund | | | 12,512 | | | | 0 | | | | 0 | | | | 12,512 | |
Mid Cap Index Fund | | | 12,512 | | | | 0 | | | | 0 | | | | 12,512 | |
Mid Cap Select Fund | | | 12,512 | | | | 0 | | | | 0 | | | | 12,512 | |
Mid Cap Value Fund | | | 12,512 | | | | 0 | | | | 0 | | | | 12,512 | |
Quantitative Enhanced Core Equity Fund | | | 12,512 | | | | 0 | | | | 0 | | | | 12,512 | |
Real Estate Securities Fund | | | 12,512 | | | | 0 | | | | 0 | | | | 12,512 | |
Small Cap Growth Opportunities Fund | | | 12,512 | | | | 0 | | | | 0 | | | | 12,512 | |
Small Cap Index Fund | | | 12,512 | | | | 0 | | | | 0 | | | | 12,512 | |
Small Cap Select Fund | | | 12,512 | | | | 0 | | | | 0 | | | | 12,512 | |
Small Cap Value Fund | | | 12,512 | | | | 0 | | | | 0 | | | | 12,512 | |
Tactical Market Opportunities Fund | | | 12,512 | | | | 0 | | | | 0 | | | | 12,512 | |
| | | | | | | | | | | | | | | | |
Total | | $ | 237,728 | | | $ | 0 | | | $ | 0 | | | $ | 237,728 | |
“Non-Audit Fees Billed to Trust” represent “Tax Fees” and “All Other Fees” billed to each Fund in their respective amounts from the previous table.
Audit Committee Pre-Approval Policies and Procedures. Generally, the Audit Committee must approve (i) all non-audit services to be performed for the Trust by the Trust’s independent accountants and (ii) all audit and non-audit services to be performed by the Trust’s independent accountants for the Affiliated Fund Service Providers with respect to the operations and financial reporting of the Trust. Regarding tax and research projects conducted by the independent accountants for the Trust and Affiliated Fund Service Providers (with respect to operations and financial reports of the Trust), such engagements will be (i) pre-approved by the Audit Committee if they are expected to be for amounts greater than $10,000; (ii) reported to the Audit Committee Chairman for his verbal approval prior to engagement if they are expected to be for amounts under $10,000 but greater than $5,000; and (iii) reported to the Audit Committee at the next Audit Committee meeting if they are expected to be for an amount under $5,000.
ITEM 5. AUDIT COMMITTEE OF LISTED REGISTRANTS
Not applicable to this registrant.
ITEM 6. SCHEDULE OF INVESTMENTS
| a) | | See Portfolio of Investments in Item 1. |
ITEM 7. DISCLOSURE OF PROXY VOTING POLICIES AND PROCEDURES FOR CLOSED-END
MANAGEMENT INVESTMENT COMPANIES
Not applicable to this registrant.
ITEM 8. PORTFOLIO MANAGERS OF CLOSED-END MANAGEMENT INVESTMENT COMPANIES
Not applicable to this registrant.
ITEM 9. PURCHASES OF EQUITY SECURITIES BY CLOSED-END MANAGEMENT INVESTMENT COMPANY AND AFFILIATED PURCHASERS
Not applicable to this registrant.
ITEM 10. SUBMISSION OF MATTERS TO A VOTE OF SECURITY HOLDERS
There have been no material changes to the procedures by which shareholders may recommend nominees to the registrant’s Board of Trustees implemented after the registrant last provided disclosure in response to this Item.
ITEM 11. CONTROLS AND PROCEDURES.
| | (a) | | The registrant’s principal executive and principal financial officers, or persons performing similar functions, have concluded that the registrant’s disclosure controls and procedures (as defined in Rule 30a-3(c) under the Investment Company Act of 1940, as amended (the “1940 Act”) (17 CFR 270.30a-3(c))) are effective, as of a date within 90 days of the filing date of this report that includes the disclosure required by this paragraph, based on their evaluation of the controls and procedures required by Rule 30a-3(b) under the 1940 Act (17 CFR 270.30a-3(b)) and Rules 13a-15(b) or 15d-15(b) under the Securities Exchange Act of 1934, as amended (the “Exchange Act”) (17 CFR 240.13a-15(b) or 240.15d-15(b)). |
| | (b) | | There were no changes in the registrant’s internal control over financial reporting (as defined in Rule 30a-3(d) under the 1940 Act (17 CFR 270.30a-3(d)) that occurred during the second fiscal quarter of the period covered by this report that has materially affected, or is reasonably likely to materially affect, the registrant’s internal control over financial reporting. |
ITEM 12. EXHIBITS
File the exhibits listed below as part of this Form.
| | |
| (a)(1) | | Any code of ethics, or amendment thereto, that is the subject of the disclosure required by Item 2, to the extent that the registrant intends to satisfy the Item 2 requirements through filing of an exhibit: Not applicable because the code is posted on registrant’s website at www.nuveen.com/mf and there were no amendments during the period covered by this report. (To view the code, click on the Shareholder Resources drop down menu box, click on Fund Governance and then Code of Conduct.) |
| |
| (a)(2) | | A separate certification for each principal executive officer and principal financial officer of the registrant as required by
Rule 30a-2(a) under the 1940 Act (17 CFR 270.30a-2(a)) in the exact form set forth below: See EX-99.CERT attached hereto. |
| |
| (a)(3) | | Any written solicitation to purchase securities under Rule 23c-1 under the 1940 Act (17 CFR 270.23c-1) sent or given during the period covered by the report by or on behalf of the registrant to 10 or more persons: Not applicable to this registrant. |
| |
| (b) | | If the report is filed under Section 13(a) or 15(d) of the Exchange Act, provide the certifications required by Rule 30a-2(b) under the 1940 Act (17 CFR 270.30a-2(b)), Rule 13a-14(b) or Rule 15d-14(b) under the Exchange Act (17 CFR 240.13a-14(b) or 240.15d-14(b)), and Section 1350 of Chapter 63 of Title 18 of the United States Code (18 U.S.C. 1350) as an Exhibit. A certification furnished pursuant to this paragraph will not be deemed “filed” for purposes of Section 18 of the Exchange Act (15 U.S.C. 78r), or otherwise subject to the liability of that section. Such certification will not be deemed to be incorporated by reference into any filing under the Securities Act of 1933 or the Exchange Act, except to the extent that the registration specifically incorporates it by reference: See EX-99.906 CERT attached hereto. |
SIGNATURES
Pursuant to the requirements of the Securities Exchange Act of 1934 and the Investment Company Act of 1940, the registrant has duly caused this report to be signed on its behalf by the undersigned, thereunto duly authorized.
(Registrant) Nuveen Investment Funds, Inc.
| | |
| |
By (Signature and Title) | | /s/ Kevin J. McCarthy |
| | Kevin J. McCarthy |
| | Vice President and Secretary |
Date February 8, 2012
Pursuant to the requirements of the Securities Exchange Act of 1934 and the Investment Company Act of 1940, this report has been signed below by the following persons on behalf of the registrant and in the capacities and on the dates indicated.
| | |
| |
By (Signature and Title) | | /s/ Gifford R. Zimmerman |
| | Gifford R. Zimmerman |
| | Chief Administrative Officer |
| | (principal executive officer) |
Date February 8, 2012
| | |
| |
| By (Signature and Title) | | /s/ Stephen D. Foy |
| | Stephen D. Foy |
| | Vice President and Controller |
| | (principal financial officer) |
Date February 8, 2012