UNITED STATES
SECURITIES AND EXCHANGE COMMISSION
Washington, D.C. 20549
FORM N-CSR
CERTIFIED SHAREHOLDER REPORT OF REGISTERED MANAGEMENT
INVESTMENT COMPANIES
Investment Company Act file number 811-05309
Nuveen Investment Funds, Inc.
(Exact name of registrant as specified in charter)
Nuveen Investments
333 West Wacker Drive, Chicago, IL 60606
(Address of principal executive offices) (Zip code)
Kevin J. McCarthy
Nuveen Investments
333 West Wacker Drive
Chicago, IL 60606
(Name and address of agent for service)
Registrant’s telephone number, including area code: (312) 917-7700
Date of fiscal year end: April 30
Date of reporting period: April 30, 2012
Form N-CSR is to be used by management investment companies to file reports with the Commission not later than 10 days after the transmission to stockholders of any report that is required to be transmitted to stockholders under Rule 30e-1 under the Investment Company Act of 1940 (17 CFR 270.30e-1). The Commission may use the information provided on Form N-CSR in its regulatory, disclosure review, inspection, and policy making roles.
A registrant is required to disclose the information specified by Form N-CSR, and the Commission will make this information public. A registrant is not required to respond to the collection of information contained in Form N-CSR unless the Form displays a currently valid Office of Management and Budget (“OMB”) control number. Please direct comments concerning the accuracy of the information collection burden estimate and any suggestions for reducing the burden to Secretary, Securities and Exchange Commission, 450 Fifth Street, NW, Washington, DC 20549-0609. The OMB has reviewed this collection of information under the clearance requirements of 44 U.S.C. ss.3507.
ITEM 1. REPORTS TO STOCKHOLDERS.

Mutual Funds
Nuveen Municipal Bond Funds
Dependable, tax-free income because it’s not what you earn, it’s what you keep.®
Annual Report
April 30, 2012
| | | | | | |
| | | Share Class / Ticker Symbol |
| | | |
| Fund Name | | Class A | | Class C | | Class I |
Nuveen Short Term Municipal Bond Fund | | FSHAX | | NSVCX | | FSHYX |
LIFE IS COMPLEX.
Nuveen makes things e-simple.
It only takes a minute to sign up for e-Reports. Once enrolled, you’ll receive an e-mail as soon as your Nuveen Fund information is ready. No more waiting for delivery by regular mail. Just click on the link within the e-mail to see the report and save it on your computer if you wish.
Free e-Reports right to your e-mail!
www.investordelivery.com
If you receive your Nuveen Fund distributions and statements from your financial advisor or brokerage account.
OR
www.nuveen.com/accountaccess
If you receive your Nuveen Fund distributions and statements directly from Nuveen.
| | | | | | |
| Must be preceded by or accompanied by a prospectus. | | NOT FDIC INSURED | | MAY LOSE VALUE | | NO BANK GUARANTEE |
Table of Contents
Chairman’s
Letter to Shareholders

Dear Shareholders,
Investors have many reasons to remain cautious. The challenges in the Euro area are casting a shadow over global economies and financial markets. The political support for addressing fiscal issues is eroding as the economic and social impacts become more visible. At the same time, member nations appear unwilling to provide adequate financial support or to surrender sufficient sovereignty to strengthen the banks or unify the Euro area financial system. The gains made in reducing deficits, and the hard-won progress on winning popular acceptance of the need for economic austerity, are at risk. To their credit, European political leaders press on to find compromise solutions, but there is increasing concern that time will begin to run out.
In the U.S., strong corporate earnings have enabled the equity markets to withstand much of the downward pressures coming from weakening job creation, slower economic growth and political uncertainty. The Fed remains committed to low interest rates but has refrained from predicting another program of quantitative easing unless economic growth were to weaken significantly or the threat of recession appears on the horizon. Pre-election maneuvering has added to the already highly partisan atmosphere in the Congress. The end of the Bush-era tax cuts and implementation of the spending restrictions of the Budget Control Act of 2011, both scheduled to take place at year-end, loom closer.
During the last year, U.S. based investors have experienced a sharp decline and a strong recovery in the equity markets. The experienced investment teams at Nuveen keep their eye on a longer time horizon and use their practiced investment disciplines to negotiate through market peaks and valleys to achieve long-term goals for investors. Experienced professionals pursue investments that will weather short-term volatility and at the same time, seek opportunities that are created by markets that overreact to negative developments. Monitoring this process is an important consideration for the Fund Board as it oversees your Nuveen funds on your behalf.
As always, I encourage you to contact your financial consultant if you have any questions about your investment in a Nuveen Fund. On behalf of the other members of your Fund Board, we look forward to continuing to earn your trust in the months and years ahead.
Sincerely,

Robert P. Bremner
Chairman of the Board
June 20, 2012
Portfolio Manager’s Comments
Certain statements in this report are forward-looking statements. Discussions of specific investments are for illustration only and are not intended as recommendations of individual investments. The forward-looking statements and other views expressed herein are those of the portfolio manager as of the date of this report. Actual future results or occurrences may differ significantly from those anticipated in any forward-looking statements, and the views expressed herein are subject to change at any time, due to numerous market and other factors. The Fund disclaims any obligation to update publicly or revise any forward-looking statements or views expressed herein.
Ratings shown are the highest rating given by one of the following national rating agencies: Standard & Poor’s Group, Moody’s Investors Service, Inc. or Fitch, Inc. Credit ratings are subject to change. AAA, AA, A, and BBB are investment grade ratings; BB, B, CCC, CC, C and D are below-investment grade ratings. Certain bonds backed by U.S. Government or agency securities are regarded as having an implied rating equal to the rating of such securities. Holdings designated N/R are not rated by a national rating agency.
This Fund features portfolio management by Nuveen Asset Management, LLC, an affiliate of Nuveen Investments. Chris Drahn, CFA, manages the Nuveen Short Term Municipal Bond Fund. He has 32 years of investment experience and has been managing the Fund since 2002.
Effective August 31, 2011, the Fund changed its name from Nuveen Short Tax Free Fund to Nuveen Short Term Municipal Bond Fund. There have been no changes in the Fund’s investment objectives, policies or portfolio management personnel.
What factors affected the U.S. economy and the national municipal bond market during the twelve-month reporting period ending April 30, 2012?
During this period, the U.S. economy’s progress toward recovery from recession remained modest. The Federal Reserve (Fed) maintained its efforts to improve the overall economic environment by continuing to hold the benchmark fed funds rate at the record low level of zero to 0.25% that it had established in December 2008. At its April 2012 meeting, the central bank reaffirmed its opinion that economic conditions would likely warrant keeping this rate at “exceptionally low levels” at least through late 2014. The Fed also stated that it would continue its program to extend the average maturity of its holdings of U.S. Treasury securities by purchasing $400 billion of these securities with maturities of six to thirty years and selling an equal amount of U.S. Treasury securities with maturities of three years or less. The goals of this program, which the Fed expects to complete by the end of June 2012, are to lower longer-term interest rates, support a stronger economic recovery, and help ensure that inflation remains at levels consistent with the Fed’s mandates of maximum employment and price stability.
In the first quarter of 2012, the U.S. economy, as measured by the U.S. gross domestic product (GDP), grew at an annualized rate of 1.9%, marking eleven consecutive quarters of positive growth. The Consumer Price Index (CPI) rose 2.3% year-over-year as of April 2012, the lowest 12-month rate of change since February 2011, while the core CPI (which excludes food and energy) also increased 2.3% during the period, edging above the Fed’s unofficial objective of 2.0% or lower for this inflation measure. Labor market conditions have shown some signs of improvement, as national unemployment stood at 8.1% in April 2012, the lowest level since January 2009, down from 9.0% in April 2011. However, some of this drop can be attributed to an increased number of discouraged workers leaving the labor market, rather than a significant gain in the number of new jobs. The housing market continued to be the major weak spot in the economy, beleaguered by a high level of distressed properties and difficult credit conditions. For the twelve months ended March 2012 (most recent data available at the time this report was
prepared), the average home price in the Standard & Poor’s (S&P)/Case-Shiller Index of 20 major metropolitan areas lost 2.6%, as housing prices hit their lowest levels since mid-2002, down approximately 35% from their 2006 peak. In addition, the U.S. economic picture continued to be clouded by concerns about the European debt crisis and efforts to reduce the federal deficit.
Municipal bond prices generally rallied during this period, amid strong demand and lower yields. Although the availability of tax-exempt supply improved in recent months, the pattern of new issuance remained light compared with long-term historical trends. This served as a key driver of performance, as tight supply and strong demand combined to create favorable market conditions for municipal bonds. Concurrent with rising prices, yields declined across most maturities, especially at the longer end of the municipal yield curve. The depressed level of municipal bond issuance was due in part to the continuing impact of the taxable Build America Bonds (BAB) program. Even though the BAB program expired at the end of 2010, issuers had made extensive use of its favorable terms to issue almost $190 billion in taxable BAB bonds during 2009 and 2010, representing approximately 25% of all municipal issuance during that period. Some borrowers accelerated issuance into 2010 in order to take advantage of the program before its termination, fulfilling their capital program borrowing needs well into 2011 and 2012. The low level of municipal issuance during this period also reflected the current political distaste for additional borrowing by state and local governments and the prevalent atmosphere of municipal budget austerity. In recent months, we have seen more borrowers come to market seeking to take advantage of the current rate environment by calling existing debt and refinancing at lower rates.
Over the twelve months ended April 30, 2012, municipal bond issuance nationwide totaled $345 billion, a decrease of 5% compared with issuance during the twelve-month period ended April 30, 2011. During this period, demand for municipal bonds remained very strong, especially from individual investors.
How did the Fund perform during the twelve-month period ended April 30, 2012?
The table in the Fund Performance and Expense Ratios section of this report provides total return performance information for the Fund’s Class A Shares at net asset value (NAV) for the one-year, five-year and since inception periods ended April 30, 2012. Over this period, the Fund outperformed both the S&P Municipal Bond Short Index (prior to November 2011, the Fund’s benchmark was the Barclays 3-Year Municipal Bond Index) and the Lipper Short Municipal Debt Funds Classification Average. A more detailed discussion of the Fund’s relative performance is provided later in this report.
What strategies were used to manage the Fund during the twelve-month reporting period ended April 30, 2012? How did these strategies influence performance?
The Fund enjoyed strong performance relative to its benchmark during the reporting period primarily due to favorable duration positioning, meaning the portfolio benefited
from being more sensitive than its benchmark to falling interest rates. Bonds with longer maturities tended to perform better than their shorter-dated counterparts. As compared to the benchmark, the Fund’s elevated exposure to bonds on the longer end of the short-term universe significantly helped the Fund’s performance. The Fund’s shortest dated bonds with maturities of less than one year modestly tempered the Fund’s results, but this was a minor impact in a period of otherwise positive performance overall.
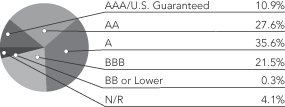
Credit rating positioning also helped the Fund to a lesser extent. Among bonds with shorter dated maturities, those with lower credit ratings tended to outperform higher rated bonds during the reporting period. This was due both to the higher income levels produced by lower rated bonds as well as investor willingness to pay somewhat higher prices in exchange for those bonds in the current low interest rate environment. This situation put the Fund in a favorable position given the overweight allocation to securities with credit ratings of BBB and A. In addition, we were underweight in the highest rated issues or bonds with credit ratings of AAA and AA, which did not perform as well. Accordingly, having more exposure to the better performing lower rated bonds while maintaining a lesser allocation to the lagging higher rated bonds was helpful.
Another source of outperformance was the Fund’s sector allocation. Similar to credit ratings, many sectors with an abundance of lower rated issuers enjoyed better performance than other groups, and the Fund had added exposure on a relative basis to several of these favorable sectors. For example, the Fund was overweight in health care bonds, especially bonds issued by hospitals, senior-housing facilities and continuing care retirement communities. These types of issuers tended to offer relatively high yields and thus benefited during the reporting period. Another advantage was the Fund’s limited exposure to pre-refunded bonds, which have short durations and high quality. Although they provided positive performance, these bonds trailed the S&P Index, so the Fund’s limited weighting was beneficial to performance.
New purchase activity focused on adding BBB-rated and A-rated bonds to the portfolio. As the Fund’s higher rated bonds matured, proceeds were frequently reinvested in these bonds at the lower end of the investment grade universe.
New purchases also incrementally reduced the Fund’s exposure to longer maturity bonds, with a subtle shift in emphasis in the portfolio away from four- to five-year bonds and toward bonds with maturities up to three years. Because of this focus on shorter maturity investments, the Fund regularly received a steady stream of cash to reinvest as holdings reached their maturity dates. In our view, this shift was prudent given the flattening yield curve, meaning that yields on longer maturity bonds had declined more than those on shorter dated issues. Slightly decreasing the Fund’s exposure to these longer bonds could make the portfolio somewhat less vulnerable to a potential increase in interest rates in the future.
At the end of the reporting period, the Fund remained underweight in AAA-rated and AA-rated issues while overweight in BBB-rated and A-rated bonds as compared to the S&P Index. The Fund was overweight in hospital bonds and also had higher allocations to higher education and airport bonds, sectors in which it was possible to get slightly higher yields in the low interest rate environment. The Fund remained underweight in pre-refunded and state general obligation bonds, two higher credit quality sectors that
tended to offer lower yields. Given the credit research capabilities of Nuveen, as well as the relatively limited duration risk of the short maturity bonds in the Fund’s diversified portfolio, we were comfortable increasing our focus on the lower end of the investment grade credit universe.
Risk Considerations
Mutual fund investing involves risk; principal loss is possible. Debt or fixed income securities such as those held by the Fund, are subject to market risk, credit risk, interest rate risk, call risk, tax risk, political and economic risk, and income risk. As interest rates rise, bond prices fall. Credit risk refers to an issuers ability to make interest and principal payments when due. Below investment grade or high yield debt securities are subject to liquidity risk and heightened credit risk. The Fund’s use of inverse floaters creates effective leverage. Leverage involves the risk that the Fund could lose more than its original investment and also increases the Fund’s exposure to volatility and interest rate risk.
Dividend Information
The Fund’s Class A and I Shares experienced an increase to their monthly dividend in May and August 2011. There were no dividend changes affecting the Fund’s Class C Shares.
The Fund seeks to pay dividends at a rate that reflects the past and projected performance of the Fund. To permit the Fund to maintain a more stable monthly dividend, the Fund may pay dividends at a rate that may be more or less than the amount of net investment income actually earned by the Fund during the period. If the Fund has cumulatively earned more than it has paid in dividends, it will hold the excess in reserve as undistributed net investment income (UNII) as part of the Fund’s net asset value. Conversely, if the Fund has cumulatively paid in dividends more than it has earned, the excess will constitute negative UNII that will likewise be reflected in the Fund’s net asset value. The Fund will, over time, pay all its net investment income as dividends to shareholders. As of April 30, 2012, the Fund had a positive UNII balance for both tax purposes and financial reporting purposes.
Fund Performance and Expense Ratios
The Fund Performance and Expense Ratios for the Fund are shown on the following two pages.
Returns quoted represent past performance, which is no guarantee of future results. Current performance may be higher or lower than the performance shown. Investment returns and principal value will fluctuate so that when shares are redeemed, they may be worth more or less than their original cost. Returns without sales charges would be lower if the sales charge were included. Returns do not reflect the deduction of taxes that a shareholder would pay on Fund distributions or the redemption of Fund shares. Income is generally exempt from regular federal income taxes. Some income may be subject to state and local income taxes and to the federal alternative minimum tax. Capital gains, if any, are subject to tax.
Returns may reflect a contractual agreement between the Fund and the investment adviser to waive certain fees and expenses; see Notes to Financial Statements, Footnote 7 — Management Fees and Other Transactions with Affiliates for more information. In addition, returns may reflect a voluntary expense limitation by the Fund’s investment adviser that may be modified or discontinued at any time without notice. For the most recent month-end performance visit www.nuveen.com or call (800) 257-8787.
Returns reflect differences in sales charges and expenses, which are primarily differences in distribution and service fees. Fund returns assume reinvestment of dividends and capital gains.
Comparative index and Lipper return information is provided for the Fund’s Class A Shares at net asset value (NAV) only.
The expense ratios shown reflect the Fund’s total operating expenses (before fee waivers or expense reimbursements, if any) as shown in the Fund’s most recent prospectus. The expense ratios include management fees and other fees and expenses.
Fund Performance and Expense Ratios (continued)
Nuveen Short Term Municipal Bond Fund
Refer to the first page of this Fund Performance and Expense Ratios section for further explanation of the information included within this page.
Fund Performance
Average Annual Total Returns as of April 30, 2012
| | | | | | | | | | | | |
| | | Average Annual | |
| | | |
| | | 1-Year | | | 5-Year | | | Since
Inception* | |
Class A Shares at NAV | | | 4.15% | | | | 3.27% | | | | 2.79% | |
Class A Shares at maximum Offering Price | | | 1.50% | | | | 2.75% | | | | 2.51% | |
Standard & Poor’s (S&P) Municipal Bond Short Index** | | | 2.45% | | | | 3.66% | | | | 3.07% | |
Barclays 3-Year Municipal Bond Index** | | | 3.24% | | | | 4.28% | | | | 3.56% | |
Lipper Short Municipal Debt Funds Classification Average** | | | 2.36% | | | | 2.43% | | | | 2.28% | |
| | | |
Class I Shares | | | 4.33% | | | | 3.43% | | | | 2.94% | |
| | | | |
| | | Cumulative | |
| |
| | | Since
Inception* | |
Class C Shares | | | 1.61% | |
Average Annual Total Returns as of March 31, 2012 (Most Recent Calendar Quarter)
| | | | | | | | | | | | |
| |
| | | Average Annual | |
| | | |
| | | 1-Year | | | 5-Year | | | Since
Inception* | |
Class A Shares at NAV | | | 4.45% | | | | 3.23% | | | | 2.77% | |
Class A Shares at maximum Offering Price | | | 1.88% | | | | 2.70% | | | | 2.49% | |
Class I Shares | | | 4.63% | | | | 3.39% | | | | 2.93% | |
| | | | |
| | | Cumulative | |
| |
| | | Since
Inception* | |
Class C Shares | | | 1.27% | |
Class A Shares have a maximum 2.50% sales charge (Offering Price). Class A Share purchases of $250,000 or more are sold at net asset value without an up-front sales charge but may be subject to a contingent deferred sales charge (CDSC), also known as a back-end sales charge, if redeemed within eighteen months of purchase. Class C Shares have a 1% CDSC for redemptions within less than twelve months, which is not reflected in the one-year total return. Class I Shares have no sales charge and may be purchased under limited circumstances or by specified classes of investors.
Expense Ratios as of Most Recent Prospectus
| | | | |
| |
| | | Expense
Ratios | |
Class A Shares | | | 0.71% | |
Class C Shares | | | 1.06% | |
Class I Shares | | | 0.51% | |
| * | Since inception returns for Class A Shares and I Shares, as well as for the comparative indexes and Lipper classification average, are from 10/25/02. Since inception returns for C Shares are from 8/31/11. |
| ** | Refer to the Glossary of Terms Used in the Report for definitions. Indexes and Lipper averages are not available for direct investment. |
Growth of an Assumed $10,000 Investment as of April 30, 2012
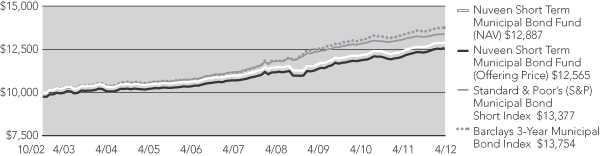
The graph does not reflect the deduction of taxes that a shareholder may pay on Fund distributions or the redemption of Fund shares.
Yields as of April 30, 2012
Dividend Yield is the most recent dividend per share (annualized) divided by the offering price per share.
The SEC 30-Day Yield is a standardized measure of a Fund’s yield that accounts for the future amortization of premiums or discounts of bonds held in the Fund’s portfolio. The SEC 30-Day Yield is computed under an SEC standardized formula and is based on the maximum offer price per share. Dividend Yield may differ from the SEC 30-Day Yield because the Fund may be paying out more or less than it is earning and it may not include the effect of amortization of bond premium.
The Taxable-Equivalent Yield represents the yield that must be earned on a fully taxable investment in order to equal the yield of the Fund on an after-tax basis at a specified tax rate. With respect to investments that generate qualified dividend income that is taxable at a maximum rate of 15%, the Taxable-Equivalent Yield is lower.
Nuveen Short Term Municipal Bond Fund
| | | | | | | | | | | | |
| | | |
| | | Dividend
Yield | | | SEC 30-Day
Yield | | | Taxable-
Equivalent
Yield1 | |
Class A Shares2 | | | 2.00% | | | | 0.82% | | | | 1.14% | |
Class C Shares | | | 1.65% | | | | 0.46% | | | | 0.64% | |
Class I Shares | | | 2.18% | | | | 1.04% | | | | 1.44% | |
| 1 | The Taxable-Equivalent Yield is based on the Fund’s 30-Day Yield on the indicated date and a combined federal and state income tax rate of 28.0%. |
| 2 | The SEC Yield for Class A shares quoted in the table reflects the maximum sales load. Investors paying a reduced load because of volume discounts, investors paying no load because they qualify for one of the several exclusions from the load, and existing shareholders who previously paid a load but would like to know the SEC Yield applicable to their shares on a going-forward basis, should understand that the SEC Yield effectively applicable to them would be higher than the figure quoted in the table. |
Holding Summaries as of April 30, 2012
This data relates to the securities held in the Fund’s portfolio of investments. It should not be construed as a measure of performance for the Fund itself.
Ratings shown are the highest rating given by one of the following national rating agencies: Standard & Poor’s Group, Moody’s Investors Service, Inc. or Fitch, Inc. Credit ratings are subject to change. AAA, AA, A, and BBB are investment grade ratings; BB, B, CCC, CC, C and D are below-investment grade ratings. Certain bonds backed by U.S. Government or agency securities are regarded as having an implied rating equal to the rating of such securities. Holdings designated N/R are not rated by a national rating agency.
Nuveen Short Term Municipal Bond Fund
Bond Credit Quality1
| | | | |
| Portfolio Composition1 | | | |
| Education and Civic Organizations | | | 22.0% | |
| Health Care | | | 21.7% | |
| Tax Obligation/Limited | | | 13.8% | |
| Tax Obligation/General | | | 12.8% | |
| Transportation | | | 8.9% | |
| Industrials | | | 7.1% | |
| Long-Term Care | | | 4.6% | |
| Other | | | 9.1% | |
| | | | |
| States/U.S. Territories1 | | | |
| California | | | 11.5% | |
| Florida | | | 8.8% | |
| Pennsylvania | | | 6.8% | |
| Texas | | | 6.2% | |
| Illinois | | | 4.9% | |
| New Jersey | | | 4.7% | |
| Arizona | | | 4.5% | |
| Virginia | | | 4.3% | |
| Michigan | | | 4.3% | |
| Colorado | | | 4.1% | |
| Minnesota | | | 3.4% | |
| Iowa | | | 3.4% | |
| New York | | | 3.2% | |
| Ohio | | | 2.5% | |
| Missouri | | | 2.4% | |
| Georgia | | | 2.3% | |
| Kansas | | | 1.6% | |
| Tennessee | | | 1.4% | |
| Other | | | 19.7% | |
| 1 | As a percentage of total investments (excluding money market funds) as of April 30, 2012. Holdings are subject to change. |
Expense Examples
As a shareholder of one or more of the Funds, you incur two types of costs: (1) transaction costs, including up-front and back-end sales charges (loads) or redemption fees, where applicable; and (2) ongoing costs, including management fees; distribution and service (12b-1) fees, where applicable; and other Fund expenses. The Examples below are intended to help you understand your ongoing costs (in dollars) of investing in the Funds and to compare these costs with the ongoing costs of investing in other mutual funds.
The Examples below are based on an investment of $1,000 invested at the beginning of the period and held for the period.
The information under “Actual Performance,” together with the amount you invested, allows you to estimate actual expenses incurred over the reporting period. Simply divide your account value by $1,000 (for example, an $8,600 account value divided by $1,000 = 8.60) and multiply the result by the cost shown for your share class, in the row entitled “Expenses Incurred During Period” to estimate the expenses incurred on your account during this period.
The information under “Hypothetical Performance,” provides information about hypothetical account values and hypothetical expenses based on the respective Fund’s actual expense ratio and an assumed rate of return of 5% per year before expenses, which is not the Fund’s actual return. The hypothetical account values and expenses may not be used to estimate the actual ending account balance or expense you incurred for the period. You may use this information to compare the ongoing costs of investing in the Fund and other Funds. To do so, compare this 5% hypothetical example with the 5% hypothetical examples that appear in the shareholder reports of the other funds.
Please note that the expenses shown in the table are meant to highlight your ongoing costs only and do not reflect any transaction costs. Therefore, the hypothetical information is useful in comparing ongoing costs only, and will not help you determine the relative total costs of owning different funds or share classes. In addition, if these transaction costs were included, your costs would have been higher.
Nuveen Short Term Municipal Bond Fund
| | | | | | | | | | | | | | | | | | | | | | | | | | |
| | | | | | | | | | | | | | Hypothetical Performance | |
| | | Actual Performance | | | | | (5% annualized return
before expenses) | |
| | | A Shares | | | C Shares | | | I Shares | | | | | A Shares | | | C Shares | | | I Shares | |
| Beginning Account Value (11/01/11) | | $ | 1,000.00 | | | $ | 1,000.00 | | | $ | 1,000.00 | | | | | $ | 1,000.00 | | | $ | 1,000.00 | | | $ | 1,000.00 | |
| Ending Account Value (4/30/12) | | $ | 1,021.10 | | | $ | 1,018.30 | | | $ | 1,022.00 | | | | | $ | 1,021.28 | | | $ | 1,019.69 | | | $ | 1,022.33 | |
| Expenses Incurred During Period | | $ | 3.62 | | | $ | 5.22 | | | $ | 2.56 | | | | | $ | 3.62 | | | $ | 5.22 | | | $ | 2.56 | |
For each class of the Fund, expenses are equal to the Fund’s annualized net expense ratio of .72%, 1.04% and .51% for Classes A, C and I, respectively, multiplied by the average account value over the period, multiplied by 182/366 (to reflect the one-half year period).
Report of
Independent Registered
Public Accounting Firm
To the Board of Directors and Shareholders of
Nuveen Investment Funds, Inc.:
In our opinion, the accompanying statement of assets and liabilities, including the portfolio of investments, and the related statements of operations, of changes in net assets and the financial highlights present fairly, in all material respects, the financial position of Nuveen Short Term Municipal Bond Fund (a series of the Nuveen Investment Funds, Inc., hereinafter referred to as the “Fund”) at April 30, 2012, the results of its operations, the changes in its net assets, and the financial highlights for the year ended April 30, 2012, in conformity with accounting principles generally accepted in the United States of America. These financial statements and financial highlights (hereafter referred to as “financial statements”) are the responsibility of the Fund’s management; our responsibility is to express an opinion on these financial statements based on our audit. We conducted our audit of these financial statements in accordance with the standards of the Public Company Accounting Oversight Board (United States). Those standards require that we plan and perform the audit to obtain reasonable assurance about whether the financial statements are free of material misstatement. An audit includes examining, on a test basis, evidence supporting the amounts and disclosures in the financial statements, assessing the accounting principles used and significant estimates made by management, and evaluating the overall financial statement presentation. We believe that our audit, which included confirmation of securities at April 30, 2012 by correspondence with the custodian and brokers, provides a reasonable basis for our opinion. The financial statements of Nuveen Short Term Municipal Bond Fund for the periods ended April 30, 2011 and prior were audited by other independent auditors whose report dated June 24, 2011 expressed an unqualified opinion on those statements.
PRICEWATERHOUSECOOPERS LLP
Chicago, IL
June 27, 2012
Portfolio of Investments
Nuveen Short Term Municipal Bond Fund (formerly Nuveen Short Tax Free Fund)
April 30, 2012
| | | | | | | | | | | | | | | | | | |
Principal
Amount (000) | | | Description (1) | | | | Optional Call
Provisions (2) | | | Ratings (3) | | | Value | |
| | | | | | | | | | | | | | | | | | |
| | | | MUNICIPAL BONDS – 94.0% | | | | | | | | | | | | | | |
| | | | | |
| | | | Alaska – 0.5% | | | | | | | | | | | | | | |
| | | | | |
| $ | 1,825 | | | Alaska Railroad Corporation, Capital Grant Receipts Bonds, Section 5307 and 5309 Formula Funds, Series 2007, 5.000%, 8/01/12 – NPFG Insured | | | | | No Opt. Call | | | | A+ | | | $ | 1,845,641 | |
| | | | Arizona – 3.0% | | | | | | | | | | | | | | |
| | | | | |
| | 1,545 | | | Glendale Industrial Development Authority, Arizona, Revenue Bonds, Midwestern University, Refunding Series 2010, 5.000%, 5/15/19 | | | | | No Opt. Call | | | | A+ | | | | 1,777,136 | |
| | | | | |
| | 1,045 | | | Maricopa County School District 31 Balsz, Arizona, General Obligation Bonds, School Improvement Project 2011 Series 2012, 2.000%, 7/01/14 – AGM Insured | | | | | No Opt. Call | | | | AA– | | | | 1,069,066 | |
| | | | | |
| | 5,000 | | | Phoenix Civic Improvement Corporation, Arizona, Junior Lien Airport Revenue Bonds, Series 2010A, 5.000%, 7/01/17 | | | | | No Opt. Call | | | | A+ | | | | 5,794,350 | |
| | | | | |
| | | | Phoenix Mesa Gateway Airport Authority, Arizona, Special Facility Revenue Bonds, Mesa Project, Series 2012: | | | | | | | | | | | | | | |
| | 200 | | | 3.000%, 7/01/14 (Alternative Minimum Tax) | | | | | No Opt. Call | | | | AA+ | | | | 206,834 | |
| | 130 | | | 3.000%, 7/01/15 (Alternative Minimum Tax) | | | | | No Opt. Call | | | | AA+ | | | | 134,479 | |
| | 300 | | | 3.000%, 7/01/16 (Alternative Minimum Tax) | | | | | No Opt. Call | | | | AA+ | | | | 310,293 | |
| | | | | |
| | 790 | | | Pinal County Electrical District 3, Arizona, Electric System Revenue Bonds, Refunding Series 2011, 2.500%, 7/01/15 | | | | | No Opt. Call | | | | A | | | | 815,225 | |
| | 9,010 | | | Total Arizona | | | | | | | | | | | | | 10,107,383 | |
| | | | Arkansas – 0.9% | | | | | | | | | | | | | | |
| | | | | |
| | 2,750 | | | North Little Rock Health Facilities Board, Arkansas, Healthcare Revenue Bonds, Baptist Health, Series 1996B, 5.375%, 12/01/19 | | | | | 12/18 at 100.00 | | | | A+ | | | | 3,186,590 | |
| | | | California – 10.5% | | | | | | | | | | | | | | |
| | | | | |
| | 870 | | | ABAG Finance Authority for Nonprofit Corporations, California, Revenue Bonds, Episcopal Senior Communities, Refunding Series 2011, 4.000%, 7/01/13 | | | | | No Opt. Call | | | | BBB+ | | | | 882,050 | |
| | | | | |
| | 4,000 | | | California Pollution Control Financing Authority, Solid Waste Disposal Revenue Bonds, Republic Services Inc., Refunding Series 2010B, 0.450%, 8/01/24 | | | | | No Opt. Call | | | | BBB | | | | 4,000,240 | |
| | | | | |
| | 8,000 | | | California Pollution Control Financing Authority, Solid Waste Disposal Revenue Bonds, Republic Services Inc., Series 2010A, 0.650%, 8/01/23 (Alternative Minimum Tax) | | | | | No Opt. Call | | | | BBB | | | | 8,001,440 | |
| | | | | |
| | 1,000 | | | California Pollution Control Financing Authority, Solid Waste Disposal Revenue Bonds, USA Waste Services Inc., Refunding Series 1998A, 2.625%, 6/01/18 (Mandatory put 6/02/14) (Alternative Minimum Tax) | | | | | No Opt. Call | | | | BBB | | | | 1,023,460 | |
| | | | | |
| | 2,330 | | | California State Public Works Board, Lease Revenue Bonds, Department of Corrections & Rehabilitation, Series 2011C, 4.000%, 10/01/15 | | | | | No Opt. Call | | | | A2 | | | | 2,534,830 | |
| | | | | |
| | 3,000 | | | California State Public Works Board, Lease Revenue Bonds, Various Capital Projects, Series 2011A, 4.000%, 10/01/15 | | | | | No Opt. Call | | | | A2 | | | | 3,263,730 | |
| | | | | |
| | 2,500 | | | California Statewide Communities Development Authority, Revenue Bonds, Adventist Health System West, Series 2005A, 5.000%, 3/01/16 | | | | | 3/15 at 100.00 | | | | A | | | | 2,757,075 | |
| | | | | |
| | 2,500 | | | Inland Valley Development Agency, California, Tax Allocation Bonds, Series 2011B, 4.250%, 3/01/41 (Mandatory put 3/01/15) | | | | | No Opt. Call | | | | A | | | | 2,616,900 | |
| | | | | |
| | 3,750 | | | Long Beach Community College District, California, General Obligation Bonds, Series 2010A, 9.850%, 1/15/13 | | | | | No Opt. Call | | | | Aa2 | | | | 3,999,713 | |
| | | | | |
| | 500 | | | Northern California Power Agency, Hydroelectric Project Number One Revenue Bonds, Refunding Series 2010A, 5.000%, 7/01/16 | | | | | No Opt. Call | | | | A | | | | 578,915 | |
| | | | | |
| | | | Pittsburg Infrastructure Financing Authority, California, Reassessment Revenue Refunding Bonds, Series 2011A: | | | | | | | | | | | | | | |
| | 200 | | | 2.000%, 9/02/13 – AGM Insured | | | | | No Opt. Call | | | | AA– | | | | 200,660 | |
| | 400 | | | 3.000%, 9/02/14 – AGM Insured | | | | | No Opt. Call | | | | AA– | | | | 408,424 | |
| | | | | |
| | 1,400 | | | Port of Oakland, California, Revenue Refunding Bonds, Series 2011-O, 4.000%, 5/01/13 (Alternative Minimum Tax) | | | | | No Opt. Call | | | | A+ | | | | 1,443,120 | |
| | | | | | | | | | | | | | | | | | |
Principal
Amount (000) | | | Description (1) | | | | Optional Call
Provisions (2) | | | Ratings (3) | | | Value | |
| | | | | | | | | | | | | | | | | | |
| | | | California (continued) | | | | | | | | | | | | | | |
| | | | | |
| $ | 475 | | | South Monterey County Joint Union High School District, Monterey and San Benito Counties, California, General Obligation Bonds, Series 2012, 2.000%, 8/01/12 | | | | | No Opt. Call | | | | BBB | | | $ | 476,173 | |
| | | | | |
| | 985 | | | Union City Community Redevelopment Agency, California, Tax Allocation Revenue Bonds, Redevelopment Project, Subordinate Lien Series 2011, 5.000%, 12/01/18 | | | | | No Opt. Call | | | | A | | | | 1,066,932 | |
| | | | | |
| | | | West Kern Water District, California, Certificates of Participation, Series 2011: | | | | | | | | | | | | | | |
| | 350 | | | 3.000%, 6/01/13 | | | | | No Opt. Call | | | | AA– | | | | 357,200 | |
| | 630 | | | 3.000%, 6/01/14 | | | | | No Opt. Call | | | | AA– | | | | 650,620 | |
| | 860 | | | 3.000%, 6/01/15 | | | | | No Opt. Call | | | | AA– | | | | 896,688 | |
| | 600 | | | 3.000%, 6/01/16 | | | | | No Opt. Call | | | | AA– | | | | 626,328 | |
| | 34,350 | | | Total California | | | | | | | | | | | | | 35,784,498 | |
| | | | Colorado – 3.5% | | | | | | | | | | | | | | |
| | | | | |
| | 3,345 | | | Colorado Health Facilities Authority, Colorado, Revenue Bonds, Catholic Health Initiatives, Series 2009A, 5.000%, 7/01/15 | | | | | No Opt. Call | | | | AA | | | | 3,782,091 | |
| | | | | |
| | 2,400 | | | Colorado Health Facilities Authority, Colorado, Revenue Bonds, Evangelical Lutheran Good Samaritan, Series 2009B, 5.000%, 6/01/39 (Mandatory put 12/01/14) | | | | | No Opt. Call | | | | A– | | | | 2,592,216 | |
| | | | | |
| | 1,000 | | | Colorado Health Facilities Authority, Colorado, Revenue Bonds, Yampa Valley Medical Center, Series 2007, 5.000%, 9/15/13 | | | | | No Opt. Call | | | | BBB | | | | 1,030,710 | |
| | | | | |
| | 1,010 | | | Colorado Health Facilities Authority, Hospital Improvement Revenue Bonds, NCMC Inc., Series 2003A, 5.000%, 5/15/13 – AGM Insured | | | | | No Opt. Call | | | | AA+ | | | | 1,052,844 | |
| | | | | |
| | | | Colorado Health Facilities Authority, Revenue Bonds, National Jewish Medical and Research Center, Series 2012: | | | | | | | | | | | | | | |
| | 300 | | | 3.000%, 1/01/13 | | | | | No Opt. Call | | | | BBB | | | | 302,010 | |
| | 350 | | | 4.000%, 1/01/14 | | | | | No Opt. Call | | | | BBB | | | | 360,700 | |
| | 505 | | | 4.000%, 1/01/15 | | | | | No Opt. Call | | | | BBB | | | | 527,962 | |
| | | | | |
| | | | Eagle County Air Terminal Corporation, Colorado, Airport Terminal Project Revenue Bonds, Refunding Series 2011A: | | | | | | | | | | | | | | |
| | 115 | | | 3.000%, 5/01/12 (Alternative Minimum Tax) | | | | | No Opt. Call | | | | Baa2 | | | | 115,005 | |
| | 125 | | | 3.000%, 5/01/13 (Alternative Minimum Tax) | | | | | No Opt. Call | | | | Baa2 | | | | 126,223 | |
| | 235 | | | 3.000%, 5/01/14 (Alternative Minimum Tax) | | | | | No Opt. Call | | | | Baa2 | | | | 237,834 | |
| | 345 | | | 3.500%, 5/01/15 (Alternative Minimum Tax) | | | | | No Opt. Call | | | | Baa2 | | | | 354,115 | |
| | | | | |
| | 1,240 | | | Meridian Metropolitan District, Douglas County, Colorado, General Obligation Refunding Bonds, Series 2011A, 3.000%, 12/01/15 | | | | | No Opt. Call | | | | A | | | | 1,308,659 | |
| | 10,970 | | | Total Colorado | | | | | | | | | | | | | 11,790,369 | |
| | | | Connecticut – 1.3% | | | | | | | | | | | | | | |
| | | | | |
| | 1,235 | | | Connecticut Development Authority, Pollution Control Revenue Bonds, Connecticut Light and Power Company, Refunding Series 2011B, 1.250%, 9/01/28 (Mandatory put 9/03/13) | | | | | No Opt. Call | | | | A | | | | 1,243,917 | |
| | | | | |
| | | | Connecticut Health and Educational Facilities Authority, Revenue Bonds, Sacred Heart University, Series 2011G: | | | | | | | | | | | | | | |
| | 505 | | | 2.250%, 7/01/14 | | | | | No Opt. Call | | | | BBB | | | | 511,262 | |
| | 765 | | | 4.000%, 7/01/15 | | | | | No Opt. Call | | | | BBB | | | | 807,274 | |
| | | | | |
| | | | Connecticut Health and Educational Facilities Authority, Revenue Bonds, Sacred Heart University, Series 2012H: | | | | | | | | | | | | | | |
| | 500 | | | 3.000%, 7/01/13 – AGM Insured | | | | | No Opt. Call | | | | AA– | | | | 512,540 | |
| | 1,150 | | | 4.000%, 7/01/14 – AGM Insured | | | | | No Opt. Call | | | | AA– | | | | 1,218,862 | |
| | 4,155 | | | Total Connecticut | | | | | | | | | | | | | 4,293,855 | |
| | | | Delaware – 0.9% | | | �� | | | | | | | | | | | |
| | | | | |
| | 3,000 | | | Wilmington, Delaware, Multifamily Rental Housing Revenue Bonds, Lincoln Towers Associates, LLC Project, Series 2011A and Series 2011B, 4.000%, 7/15/13 | | | | | No Opt. Call | | | | N/R | | | | 3,010,410 | |
Portfolio of Investments
Nuveen Short Term Municipal Bond Fund (continued)
April 30, 2012
| | | | | | | | | | | | | | | | | | |
Principal
Amount (000) | | | Description (1) | | | | Optional Call
Provisions (2) | | | Ratings (3) | | | Value | |
| | | | | | | | | | | | | | | | | | |
| | | | District of Columbia – 0.7% | | | | | | | | | | | | | | |
| | | | | |
| | | | District of Columbia, Revenue Bonds, Gallaudet University, Series 2011: | | | | | | | | | | | | | | |
| $ | 200 | | | 3.000%, 4/01/13 | | | | | No Opt. Call | | | | A+ | | | $ | 203,092 | |
| | 250 | | | 3.000%, 4/01/14 | | | | | No Opt. Call | | | | A+ | | | | 256,915 | |
| | | | | |
| | 1,740 | | | District of Columbia, Revenue Bonds, Georgetown University, Refunding Series 2009A, 5.000%, 4/01/14 | | | | | No Opt. Call | | | | A– | | | | 1,868,012 | |
| | 2,190 | | | Total District of Columbia | | | | | | | | | | | | | 2,328,019 | |
| | | | Florida – 8.8% | | | | | | | | | | | | | | |
| | | | | |
| | 1,250 | | | Broward County, Florida, Port Facilities Revenue Bonds, Refunding Series 2011B, 5.000%, 9/01/15 (Alternative Minimum Tax) | | | | | No Opt. Call | | | | A2 | | | | 1,376,700 | |
| | | | | |
| | 5,100 | | | Citizens Property Insurance Corporation, Florida, High-Risk Account Revenue Bonds, Coastal Account Senior Secured Series 2011A-1, 5.000%, 6/01/15 | | | | | No Opt. Call | | | | A+ | | | | 5,648,199 | |
| | | | | |
| | | | Citizens Property Insurance Corporation, Florida, High-Risk Account Senior Secured Bonds Series 2010A-1: | | | | | | | | | | | | | | |
| | 120 | | | 3.000%, 6/01/13 | | | | | No Opt. Call | | | | A+ | | | | 123,367 | |
| | 200 | | | 5.000%, 6/01/14 | | | | | No Opt. Call | | | | A+ | | | | 215,932 | |
| | | | | |
| | 650 | | | Cityplace Community Development District, Florida, Special Assessement and Revenue Bonds, Refunding Series 2012, 5.000%, 5/01/14 | | | | | No Opt. Call | | | | A | | | | 693,778 | |
| | | | | |
| | | | Florida Higher Educational Facilities Financing Authority, Revenue and Revenue Refunding Bonds, University of Tampa Project, Series 2012A: | | | | | | | �� | | | | | | | |
| | 250 | | | 3.000%, 4/01/13 | | | | | No Opt. Call | | | | BBB+ | | | | 254,248 | |
| | 300 | | | 4.000%, 4/01/14 | | | | | No Opt. Call | | | | BBB+ | | | | 313,977 | |
| | 300 | | | 4.000%, 4/01/15 | | | | | No Opt. Call | | | | BBB+ | | | | 318,024 | |
| | | | | |
| | 4,315 | | | Florida Hurricane Catastrophe Fund, Financial Corporation Revenue Bonds, Series 2006A, 5.250%, 7/01/12 | | | | | No Opt. Call | | | | AA | | | | 4,351,548 | |
| | | | | |
| | 1,000 | | | Highlands County Health Facilities Authority, Florida, Hospital Revenue Bonds, Adventist Health System/Sunbelt Obligated Group, Refunding Series 2009E, 5.000%, 11/15/15 | | | | | No Opt. Call | | | | AA– | | | | 1,132,230 | |
| | | | | |
| | 2,000 | | | Highlands County Health Facilities Authority, Florida, Hospital Revenue Bonds, Adventist Health System/Sunbelt Obligated Group, Variable Rate Demand Series 2005I, 5.000%, 11/15/16 | | | | | No Opt. Call | | | | AA– | | | | 2,306,500 | |
| | | | | |
| | 500 | | | Lakeland, Florida, Hospital System Revenue Bonds, Lakeland Regional Health, Refunding Series 2011, 3.000%, 11/15/12 | | | | | No Opt. Call | | | | A2 | | | | 505,605 | |
| | | | | |
| | 180 | | | Lee County, Florida, Airport Revenue Refunding Bonds, Series 2011A, 4.000%, 10/01/13 (Alternative Minimum Tax) | | | | | No Opt. Call | | | | A2 | | | | 185,557 | |
| | | | | |
| | 1,000 | | | Miami, Florida, Special Obligation Non-Ad Valorem Revenue Refunding Bonds, Series 2011A, 5.000%, 2/01/17 | | | | | No Opt. Call | | | | AA– | | | | 1,097,040 | |
| | | | | |
| | 500 | | | Miami-Dade County Industrial Development Authority, Florida, Solid Waste Revenue Bonds, Waste Management Inc. of Florida Project, Series 2008, 2.625%, 8/01/23 (Mandatory put 8/01/14) (Alternative Minimum Tax) | | | | | No Opt. Call | | | | BBB | | | | 507,860 | |
| | | | | |
| | | | Pinellas County Educational Facilities Authority, Florida, General Revenue Bonds, Barry University, Refunding Series 2011: | | | | | | | | | | | | | | |
| | 590 | | | 3.000%, 10/01/12 | | | | | No Opt. Call | | | | BBB | | | | 593,670 | |
| | 605 | | | 4.000%, 10/01/13 | | | | | No Opt. Call | | | | BBB | | | | 628,589 | |
| | 1,175 | | | 5.000%, 10/01/15 | | | | | No Opt. Call | | | | BBB | | | | 1,297,494 | |
| | 1,060 | | | 4.000%, 10/01/16 | | | | | No Opt. Call | | | | BBB | | | | 1,131,158 | |
| | | | | |
| | 305 | | | Pinellas County Educational Facilities Authority, Florida, General Revenue Bonds, Barry University, Refunding Series 2012, 4.000%, 10/01/15 | | | | | No Opt. Call | | | | BBB | | | | 324,956 | |
| | | | | |
| | 225 | | | Port Saint Lucie, Florida, Special Assessment Revenue Bonds, Water and Sewer Utility Service Area 3 & 4, Refunding Series 2011A, 1.250%, 9/01/12 – AGM Insured | | | | | No Opt. Call | | | | AA– | | | | 225,495 | |
| | | | | |
| | 2,000 | | | South Miami Health Facilities Authority, Florida, Hospital Revenue, Baptist Health System Obligation Group, Series 2007, 5.000%, 8/15/12 | | | | | No Opt. Call | | | | AA | | | | 2,027,220 | |
| | | | | |
| | 1,000 | | | Tallahassee, Florida, Energy System Revenue Bonds, Series 2007, 5.000%, 10/01/12 – NPFG Insured | | | | | No Opt. Call | | | | AA | | | | 1,019,020 | |
| | | | | | | | | | | | | | | | | | |
Principal
Amount (000) | | | Description (1) | | | | Optional Call
Provisions (2) | | | Ratings (3) | | | Value | |
| | | | | | | | | | | | | | | | | | |
| | | | Florida (continued) | | | | | | | | | | | | | | |
| | | | | |
| | | | Volusia County Educational Facilities Authority, Florida, Educational Facilities Revenue Bonds, Embry-Riddle Aeronautical University, Inc. Project, Refunding Series 2011: | | | | | | | | | | | | | | |
| $ | 2,380 | | | 2.000%, 10/15/14 – AGM Insured | | | | | No Opt. Call | | | | AA– | | | $ | 2,388,758 | |
| | 1,275 | | | 4.000%, 10/15/15 – AGM Insured | | | | | No Opt. Call | | | | AA– | | | | 1,361,509 | |
| | 28,280 | | | Total Florida | | | | | | | | | | | | | 30,028,434 | |
| | | | Georgia – 2.3% | | | | | | | | | | | | | | |
| | | | | |
| | 1,300 | | | Atlanta, Georgia, Airport General Revenue Refunding Bonds, Series 2011B, 5.000%, 1/01/14 | | | | | No Opt. Call | | | | A+ | | | | 1,387,542 | |
| | | | | |
| | 1,300 | | | Burke County Development Authority, Georgia, Pollution Control Revenue Bonds, Georgia Power Company, Ninth Series 1994, 1.200%, 10/01/32 (Mandatory put 4/01/14) | | | | | No Opt. Call | | | | A+ | | | | 1,308,593 | |
| | | | | |
| | 3,200 | | | DeKalb County Hospital Authority, Georgia, Anticipation Certificates Revenue Bonds, DeKalb Medical Center, Inc. Project, Series 2010, 4.000%, 9/01/15 | | | | | No Opt. Call | | | | BBB | | | | 3,327,104 | |
| | | | | |
| | | | Private Colleges and Universities Authority, Georgia, Revenue Bonds, Mercer University, Series Series 2012A: | | | | | | | | | | | | | | |
| | 755 | | | 4.000%, 10/01/12 | | | | | No Opt. Call | | | | Baa2 | | | | 764,438 | |
| | 585 | | | 4.000%, 10/01/14 | | | | | No Opt. Call | | | | Baa2 | | | | 614,905 | |
| | | | | |
| | 330 | | | Private Colleges and Universities Authority, Georgia, Revenue Bonds, Mercer University Project, Refunding Series 2012C, 4.000%, 10/01/14 (WI/DD, Settling 5/15/12) | | | | | No Opt. Call | | | | Baa2 | | | | 348,114 | |
| | 7,470 | | | Total Georgia | | | | | | | | | | | | | 7,750,696 | |
| | | | Hawaii – 0.4% | | | | | | | | | | | | | | |
| | | | | |
| | 1,500 | | | Hawaii Department of Budget and Finance, Special Purpose Senior Living Revenue Bonds, 15 Craigside Project, Series 2009C-1, 7.500%, 11/15/15 | | | | | 5/12 at 100.00 | | | | N/R | | | | 1,522,875 | |
| | | | Illinois – 4.9% | | | | | | | | | | | | | | |
| | | | | |
| | 700 | | | Board of Trustees of Southern Illinois University, Housing and Auxiliary Facilities System Revenue Bonds, Series 2011A, 3.000%, 4/01/13 | | | | | No Opt. Call | | | | A+ | | | | 712,327 | |
| | | | | |
| | 4,000 | | | Illinois Finance Authority, Revenue Bonds, Art Institute of Chicago, Refunding Series 2010A, 5.000%, 3/01/15 | | | | | No Opt. Call | | | | A+ | | | | 4,443,160 | |
| | | | | |
| | 500 | | | Illinois Finance Authority, Revenue Bonds, Illinois Institute of Technology, Series 2009, 6.250%, 2/01/19 | | | | | No Opt. Call | | | | Baa3 | | | | 517,730 | |
| | | | | |
| | | | Illinois Finance Authority, Revenue Bonds, Rush University Medical Center Obligated Group, Series 2009A: | | | | | | | | | | | | | | |
| | 1,655 | | | 5.000%, 11/01/13 | | | | | No Opt. Call | | | | A2 | | | | 1,738,925 | |
| | 1,105 | | | 5.000%, 11/01/14 | | | | | No Opt. Call | | | | A2 | | | | 1,192,030 | |
| | | | | |
| | 300 | | | Illinois Finance Authority, Revenue Bonds, The Clare at Water Tower Project, Capitol Appreciation Series 2010B, 0.000%, 5/15/50 (5) | | | | | 7/12 at 15.43 | | | | N/R | | | | 56,694 | |
| | | | | |
| | 700 | | | Illinois Finance Authority, Revenue Bonds, The Clare at Water Tower Project, Refunding Series 2010A, 5.100%, 5/15/14 (5) | | | | | No Opt. Call | | | | N/R | | | | 156,086 | |
| | | | | |
| | 305 | | | Illinois State, General Obligation Bonds, Refunding Series 2006, 5.000%, 1/01/15 | | | | | No Opt. Call | | | | A+ | | | | 332,950 | |
| | | | | |
| | 125 | | | Illinois State, General Obligation Bonds, Series 2006A, 5.000%, 6/01/15 | | | | | No Opt. Call | | | | A+ | | | | 137,758 | |
| | | | | |
| | 255 | | | Illinois State, General Obligation Bonds, Series 2006, 5.000%, 1/01/15 | | | | | No Opt. Call | | | | A+ | | | | 278,368 | |
| | | | | |
| | | | Illinois, General Obligation Bonds, Illinois FIRST Program, Series 2002: | | | | | | | | | | | | | | |
| | 125 | | | 5.500%, 4/01/13 – AGM Insured | | | | | No Opt. Call | | | | AA– | | | | 130,531 | |
| | 1,075 | | | 5.500%, 8/01/15 – SYNCORA GTY Insured | | | | | No Opt. Call | | | | A+ | | | | 1,205,817 | |
| | | | | |
| | | | Macon County School District 61 Decatur, Illinois, General Obligation Bonds, Series 2011A: | | | | | | | | | | | | | | |
| | 300 | | | 2.000%, 1/01/13 – AGM Insured | | | | | No Opt. Call | | | | Aa3 | | | | 302,145 | |
| | 320 | | | 2.000%, 1/01/15 – AGM Insured | | | | | No Opt. Call | | | | Aa3 | | | | 326,493 | |
| | | | | |
| | | | Waukegan, Illinois, General Obligation Bonds, Refunding Series 2012A: | | | | | | | | | | | | | | |
| | 1,200 | | | 3.000%, 12/30/13 – AGM Insured | | | | | No Opt. Call | | | | Aa3 | | | | 1,233,612 | |
Portfolio of Investments
Nuveen Short Term Municipal Bond Fund (continued)
April 30, 2012
| | | | | | | | | | | | | | | | | | |
Principal
Amount (000) | | | Description (1) | | | | Optional Call
Provisions (2) | | | Ratings (3) | | | Value | |
| | | | | | | | | | | | | | | | | | |
| | | | Illinois (continued) | | | | | | | | | | | | | | |
| $ | 1,145 | | | 4.000%, 12/30/14 – AGM Insured | | | | | No Opt. Call | | | | Aa3 | | | $ | 1,219,688 | |
| | 885 | | | 4.000%, 12/30/15 – AGM Insured | | | | | No Opt. Call | | | | Aa3 | | | | 955,570 | |
| | | | | |
| | 790 | | | Western Illinois University, Auxillary Facilities Revenue Bonds, Series 2012, 3.000%, 4/01/14 | | | | | No Opt. Call | | | | A | | | | 816,718 | |
| | | | | |
| | | | Williamson & Johnson Counties Community Unit School District 2, Marion, Illinois, General Obligation Bonds, Series 2011: | | | | | | | | | | | | | | |
| | 395 | | | 5.750%, 12/01/14 – AGM Insured | | | | | No Opt. Call | | | | AA– | | | | 430,763 | |
| | 450 | | | 5.750%, 12/01/15 – AGM Insured | | | | | No Opt. Call | | | | AA– | | | | 501,723 | |
| | 16,330 | | | Total Illinois | | | | | | | | | | | | | 16,689,088 | |
| | | | Indiana – 0.8% | | | | | | | | | | | | | | |
| | | | | |
| | 990 | | | Anderson, Indiana, Economic Development Revenue Bonds, Anderson University, Series 2007, 5.000%, 10/01/12 | | | | | No Opt. Call | | | | BB+ | | | | 988,901 | |
| | | | | |
| | 1,000 | | | Indiana Health and Educational Facilities Financing Authority, Revenue Bonds, Baptist Homes of Indiana, Series 2005, 5.000%, 11/15/13 | | | | | No Opt. Call | | | | A– | | | | 1,041,480 | |
| | | | | |
| | 610 | | | Knox County, Indiana, Economic Development Revenue and Refunding Bonds, Good Samaritan Hospital Project, Series 2012A, 3.000%, 4/01/15 (WI/DD, Settling 5/03/12) | | | | | No Opt. Call | | | | A3 | | | | 635,327 | |
| | 2,600 | | | Total Indiana | | | | | | | | | | | | | 2,665,708 | |
| | | | Iowa – 3.4% | | | | | | | | | | | | | | |
| | | | | |
| | | | Ames, Iowa, Hospital Revenue Bonds, Mary Greeley Medical Center, Series 2011: | | | | | | | | | | | | | | |
| | 100 | | | 3.000%, 6/15/13 | | | | | No Opt. Call | | | | A2 | | | | 102,034 | |
| | 230 | | | 4.000%, 6/15/14 | | | | | No Opt. Call | | | | A2 | | | | 243,703 | |
| | 500 | | | 4.000%, 6/15/15 | | | | | No Opt. Call | | | | A2 | | | | 536,145 | |
| | | | | |
| | | | Iowa Finance Authority, Healthcare Revenue Bonds, Gensisi Health System, Refunding Series 2010: | | | | | | | | | | | | | | |
| | 1,150 | | | 5.000%, 7/01/16 | | | | | No Opt. Call | | | | A1 | | | | 1,304,342 | |
| | 2,285 | | | 5.000%, 7/01/20 | | | | | No Opt. Call | | | | A1 | | | | 2,659,717 | |
| | | | | |
| | 220 | | | Iowa Higher Education Loan Authority, Private College Facility Revenue Bonds, University of Dubuque Project, Refunding Series 2011, 4.000%, 10/01/14 | | | | | No Opt. Call | | | | BBB– | | | | 226,235 | |
| | | | | |
| | | | Iowa Student Loan Liquidity Corporation Student Loan Revenue Bonds, Senior Lien Series 2011A-1: | | | | | | | | | | | | | | |
| | 375 | | | 2.600%, 12/01/13 (Alternative Minimum Tax) | | | | | No Opt. Call | | | | A | | | | 380,374 | |
| | 2,000 | | | 3.100%, 12/01/14 (Alternative Minimum Tax) | | | | | No Opt. Call | | | | A | | | | 2,058,640 | |
| | | | | |
| | 3,900 | | | Iowa Student Loan Liquidity Corporation, Student Loan Revenue Bonds, Refunding Series 2009-1, 5.000%, 12/01/13 | | | | | No Opt. Call | | | | A1 | | | | 4,136,574 | |
| | 10,760 | | | Total Iowa | | | | | | | | | | | | | 11,647,764 | |
| | | | Kansas – 1.6% | | | | | | | | | | | | | | |
| | | | | |
| | 1,000 | | | Kansas State Power Pool, Electric Utility Revenue Bonds, Dogwood Energy Facility, Series 2012A, 3.000%, 12/01/14 | | | | | No Opt. Call | | | | Baa1 | | | | 1,034,390 | |
| | | | | |
| | 1,150 | | | Olathe, Kansas, Health Facilities Revenue Bonds, Olathe Medical Center, Series 2008, 4.000%, 9/01/12 | | | | | No Opt. Call | | | | A+ | | | | 1,164,226 | |
| | | | | |
| | 1,000 | | | Wichita, Kansas, Hospital Facilities Revenue Bonds, Via Christi Health System, Inc., Refunding Series 2009X, 5.000%, 11/15/15 | | | | | No Opt. Call | | | | A+ | | | | 1,120,390 | |
| | | | | |
| | | | Wichita, Kansas, Hospital Facilities Revenue Refunding and Improvement Bonds, Via Christi Health System Inc., Series 2009A-III: | | | | | | | | | | | | | | |
| | 1,000 | | | 5.000%, 11/15/14 | | | | | No Opt. Call | | | | A+ | | | | 1,100,800 | |
| | 1,000 | | | 5.000%, 11/15/16 | | | | | No Opt. Call | | | | A+ | | | | 1,144,020 | |
| | 5,150 | | | Total Kansas | | | | | | | | | | | | | 5,563,826 | |
| | | | Kentucky – 1.1% | | | | | | | | | | | | | | |
| | | | | |
| | 3,000 | | | Pikeville, Kentucky, Educational Facilities Revenue Bond, Pikeville College of Osteopathic Medicine, Bond Anticipation Notes, Series 2011, 4.000%, 5/01/13 | | | | | No Opt. Call | | | | MIG2 | | | | 3,050,850 | |
| | | | | | | | | | | | | | | | | | |
Principal
Amount (000) | | | Description (1) | | | | Optional Call
Provisions (2) | | | Ratings (3) | | | Value | |
| | | | | | | | | | | | | | | | | | |
| | | | Kentucky (continued) | | | | | | | | | | | | | | |
| | | | | |
| $ | 750 | | | Pikeville, Kentucky, Hospital Revenue Bonds, Pikeville Medical Center, Inc. Project, Improvement and Refunding Series 2011, 4.000%, 3/01/13 | | | | | No Opt. Call | | | | A3 | | | $ | 764,138 | |
| | 3,750 | | | Total Kentucky | | | | | | | | | | | | | 3,814,988 | |
| | | | Louisiana – 1.0% | | | | | | | | | | | | | | |
| | | | | |
| | | | Calcasieu Parish Public Trust Authority, Louisiana, Student Lease Revenue Bonds, McNeese State Univeristy Student Housing-Cowboy Facilities, Inc. Project, Refunding Series 2011: | | | | | | | | | | | | | | |
| | 200 | | | 2.000%, 5/01/12 – AGM Insured | | | | | No Opt. Call | | | | Aa3 | | | | 200,008 | |
| | 535 | | | 2.000%, 5/01/13 – AGM Insured | | | | | No Opt. Call | | | | Aa3 | | | | 541,773 | |
| | 305 | | | 2.000%, 5/01/14 – AGM Insured | | | | | No Opt. Call | | | | Aa3 | | | | 310,453 | |
| | 315 | | | 3.000%, 5/01/15 – AGM Insured | | | | | No Opt. Call | | | | Aa3 | | | | 329,855 | |
| | 315 | | | 3.000%, 5/01/16 – AGM Insured | | | | | No Opt. Call | | | | Aa3 | | | | 329,225 | |
| | | | | |
| | | | Louisiana Citizens Property Insurance Corporation, Assessment Revenue Bonds, Refunding Series 2012: | | | | | | | | | | | | | | |
| | 260 | | | 2.000%, 6/01/13 | | | | | No Opt. Call | | | | A– | | | | 262,785 | |
| | 300 | | | 2.000%, 6/01/14 | | | | | No Opt. Call | | | | A– | | | | 304,176 | |
| | | | | |
| | 1,000 | | | Louisiana Citizens Property Insurance Corporation, Assessment Revenue Bonds, Series 2006B, 5.000%, 6/01/15 – AMBAC Insured | | | | | No Opt. Call | | | | A– | | | | 1,103,780 | |
| | 3,230 | | | Total Louisiana | | | | | | | | | | | | | 3,382,055 | |
| | | | Massachusetts – 1.2% | | | | | | | | | | | | | | |
| | | | | |
| | | | Massachusetts Development Finance Agency, Revenue Bonds, Lasell College, Series 2011: | | | | | | | | | | | | | | |
| | 220 | | | 2.000%, 7/01/12 | | | | | No Opt. Call | | | | BBB | | | | 220,198 | |
| | 600 | | | 2.250%, 7/01/13 | | | | | No Opt. Call | | | | BBB | | | | 604,320 | |
| | | | | |
| | 580 | | | Massachusetts Development Finance Agency, Senior Living Facility Revenue Bonds, The Groves in Lincoln Issue, Series 2009B-2, 6.250%, 6/01/14 | | | | | 7/12 at 100.00 | | | | N/R | | | | 580,070 | |
| | | | | |
| | 2,115 | | | Massachusetts Educational Financing Authority, Student Loan Revenue Bonds, Issue I Series 2010B, 4.500%, 1/01/16 (Alternative Minimum Tax) | | | | | No Opt. Call | | | | AA | | | | 2,257,382 | |
| | | | | |
| | 325 | | | Massachusetts Health and Educational Facilities Authority, Revenue Bonds, Springfield College, Series 2010, 4.000%, 10/15/13 | | | | | No Opt. Call | | | | Baa1 | | | | 334,568 | |
| | 3,840 | | | Total Massachusetts | | | | | | | | | | | | | 3,996,538 | |
| | | | Michigan – 4.3% | | | | | | | | | | | | | | |
| | | | | |
| | | | Bridgeport Spaulding Community School District, Saginaw County, Michigan, General Obligation Bonds, Refunding Series 2011: | | | | | | | | | | | | | | |
| | 675 | | | 2.500%, 5/01/14 – AGM Insured | | | | | No Opt. Call | | | | Aa2 | | | | 687,852 | |
| | 1,250 | | | 3.000%, 5/01/15 – AGM Insured | | | | | No Opt. Call | | | | Aa2 | | | | 1,293,613 | |
| | | | | |
| | | | Kalamazoo Hospital Finance Authority, Michigan, Hospital Revenue Bonds, Bronson Healthcare Group, Series 2011A: | | | | | | | | | | | | | | |
| | 175 | | | 3.000%, 5/15/13 | | | | | No Opt. Call | | | | A2 | | | | 177,737 | |
| | 430 | | | 4.000%, 5/15/15 | | | | | No Opt. Call | | | | A2 | | | | 455,357 | |
| | | | | |
| | 500 | | | Lake Superior State University Board of Trustees, Michigan, General Revenue Refunding Bonds, Series 2012, 2.000%, 11/15/14 – AGM Insured | | | | | No Opt. Call | | | | AA– | | | | 506,825 | |
| | | | | |
| | 2,030 | | | Michigan Hospital Finance Authority, Revenue Bonds, Ascension Health Group, Series 2010B, 5.000%, 11/15/16 | | | | | No Opt. Call | | | | AA+ | | | | 2,343,980 | |
| | | | | |
| | 4,455 | | | Walled Lake Consolidated School District, Oakland County, Michigan, General Obligation Bonds, Refunding Series 2011, 2.000%, 5/01/13 | | | | | No Opt. Call | | | | AAA | | | | 4,499,416 | |
| | | | | |
| | 1,200 | | | Warren Consolidated Schools, Counties of Macomb and Oakland, Michigan, General Obligation Bonds, Series 2003, 5.000%, 5/01/12 – NPFG Insured | | | | | No Opt. Call | | | | AA | | | | 1,200,156 | |
| | | | | |
| | 225 | | | Wayne County Airport Authority, Michigan, Revenue Bonds, Detroit Metropolitan Airport, Refunding Series 2010A, 5.000%, 12/01/16 (Alternative Minimum Tax) | | | | | No Opt. Call | | | | A | | | | 249,298 | |
| | | | | |
| | 1,315 | | | Wayne County Airport Authority, Michigan, Revenue Bonds, Detroit Metropolitan Wayne County Airport, Series 2005, 5.250%, 12/01/13 – NPFG Insured (Alternative Minimum Tax) | | | | | No Opt. Call | | | | A | | | | 1,392,927 | |
Portfolio of Investments
Nuveen Short Term Municipal Bond Fund (continued)
April 30, 2012
| | | | | | | | | | | | | | | | | | |
Principal
Amount (000) | | | Description (1) | | | | Optional Call
Provisions (2) | | | Ratings (3) | | | Value | |
| | | | | | | | | | | | | | | | | | |
| | | | Michigan (continued) | | | | | | | | | | | | | | |
| | | | | |
| | | | Williamston Community Schools School District, Ingham County, Michigan, General Obligation Bonds, Refunding Series 2011: | | | | | | | | | | | | | | |
| $ | 610 | | | 2.000%, 5/01/13 | | | | | No Opt. Call | | | | AA– | | | $ | 616,637 | |
| | 1,120 | | | 3.000%, 5/01/14 | | | | | No Opt. Call | | | | AA– | | | | 1,158,629 | |
| | 13,985 | | | Total Michigan | | | | | | | | | | | | | 14,582,427 | |
| | | | Minnesota – 3.5% | | | | | | | | | | | | | | |
| | | | | |
| | 2,500 | | | Minneapolis, Minnesota, Revenue Bonds, National Marrow Donor Program Project, Series 2010, 5.000%, 8/01/17 | | | | | No Opt. Call | | | | BBB | | | | 2,769,150 | |
| | | | | |
| | 1,000 | | | Minneapolis-St. Paul Housing and Redevelopment Authority, Minnesota, Revenue Bonds, HealthPartners Inc., Series 2003, 5.250%, 12/01/12 | | | | | No Opt. Call | | | | A3 | | | | 1,027,390 | |
| | | | | |
| | 2,500 | | | Minneapolis-St. Paul Metropolitan Airports Commission, Minnesota, Airport Revenue Bonds, Refunding Senior Lien Series 2009B, 5.000%, 1/01/15 (Alternative Minimum Tax) | | | | | No Opt. Call | | | | AA– | | | | 2,767,275 | |
| | | | | |
| | 1,335 | | | Minnesota Agricultural and Economic Development Board, Health Care Facilities Revenue Bonds, Essentia Health Obligated Group, Series 2008C-1, 5.000%, 2/15/15 – AGC Insured | | | | | No Opt. Call | | | | AA– | | | | 1,469,581 | |
| | | | | |
| | | | Minnesota Higher Education Facilities Authority, Revenue Bonds, Bethel University, Refunding Series 2007-6-R: | | | | | | | | | | | | | | |
| | 910 | | | 5.500%, 5/01/16 | | | | | No Opt. Call | | | | N/R | | | | 961,060 | |
| | 1,065 | | | 5.500%, 5/01/17 | | | | | No Opt. Call | | | | N/R | | | | 1,130,838 | |
| | | | | |
| | 500 | | | Minnesota Higher Education Facilities Authority, Revenue Bonds, Hamline University, Series 2011-7K1, 3.000%, 10/01/13 | | | | | No Opt. Call | | | | Baa2 | | | | 508,755 | |
| | | | | |
| | 1,000 | | | Saint Cloud, Minnesota, Health Care Revenue Bonds, CentraCare Health System Project, Series 2010A, 5.000%, 5/01/15 | | | | | No Opt. Call | | | | A+ | | | | 1,113,060 | |
| | 10,810 | | | Total Minnesota | | | | | | | | | | | | | 11,747,109 | |
| | | | Mississippi – 1.0% | | | | | | | | | | | | | | |
| | | | | |
| | 3,235 | | | Mississippi Development Bank, Special Obligation Bonds, Jackson County Limited Tax Note, Series 2009B-1, 4.000%, 7/01/15 – AGC Insured | | | | | No Opt. Call | | | | AA- | | | | 3,532,749 | |
| | | | Missouri – 2.4% | | | | | | | | | | | | | | |
| | | | | |
| | | | Joplin Industrial Development Authority, Missouri, Health Facilities Revenue Bonds, Freeman Health System, Series 2011: | | | | | | | | | | | | | | |
| | 250 | | | 2.500%, 2/15/13 | | | | | No Opt. Call | | | | BBB+ | | | | 250,753 | |
| | 360 | | | 2.750%, 2/15/14 | | | | | No Opt. Call | | | | BBB+ | | | | 361,296 | |
| | | | | |
| | 320 | | | Joplin Industrial Development Authority, Missouri, Revenue Bonds, Christian Homes Inc., Series 2007F, 5.500%, 5/15/17 | | | | | No Opt. Call | | | | BBB– | | | | 339,613 | |
| | | | | |
| | 2,020 | | | Missouri Development Finance Board, Independence, Infrastructure Facilities Revenue Bonds, Water System Improvement Projects, Series 2009E, 4.000%, 11/01/16 | | | | | 11/14 at 100.00 | | | | A– | | | | 2,114,354 | |
| | | | | |
| | 100 | | | Missouri Development Finance Board, Infrastructure Facilities Revenue Bonds, St. Joseph Sewer System Improvements Projects, Series 2011E, 2.000%, 5/01/12 | | | | | No Opt. Call | | | | N/R | | | | 100,003 | |
| | | | | |
| | 150 | | | Missouri Development Finance Board, Infrastructure Facilities Leasehold Revenue Bonds, City of Independence, Missouri, Annual Appropriation Electric System Revenue Bonds – Dogwood Project, Series 2012A, 2.000%, 6/01/13 | | | | | No Opt. Call | | | | A– | | | | 151,358 | |
| | | | | |
| | | | Missouri Health and Educational Facilities Authority, Revenue Bonds, Rockhurst University, Series 2011A: | | | | | | | | | | | | | | |
| | 460 | | | 3.000%, 10/01/12 | | | | | No Opt. Call | | | | BBB | | | | 463,013 | |
| | 475 | | | 3.000%, 10/01/13 | | | | | No Opt. Call | | | | BBB | | | | 484,225 | |
| | | | | |
| | 200 | | | Missouri Joint Municipal Electric Utility Commission, Plum Point Project, Revenue Bonds, Series 2006, 5.000%, 1/01/16 – NPFG Insured | | | | | No Opt. Call | | | | A– | | | | 220,040 | |
| | | | | |
| | 2,435 | | | Saint Louis, Missouri, Airport Revenue Bonds, Lambert-St. Louis International Airport, Refunding Series 2011B, 5.000%, 7/01/14 | | | | | No Opt. Call | | | | A– | �� | | | 2,598,924 | |
| | | | | | | | | | | | | | | | | | |
Principal
Amount (000) | | | Description (1) | | | | Optional Call
Provisions (2) | | | Ratings (3) | | | Value | |
| | | | | | | | | | | | | | | | | | |
| | | | Missouri (continued) | | | | | | | | | | | | | | |
| | | | | |
| $ | 950 | | | St. Louis, Missouri, Airport Revenue Bonds, Series 1970, 5.000%, 7/01/15 | | | | | No Opt. Call | | | | A– | | | $ | 1,039,680 | |
| | 7,720 | | | Total Missouri | | | | | | | | | | | | | 8,123,259 | |
| | | | Montana – 0.6% | | | | | | | | | | | | | | |
| | | | | |
| | 1,740 | | | Montana Facilities Finance Authority, Revenue Bonds, Sisters of Charity of Leavenworth Health Services Corporation, Camposite Deal Series 2010B, 5.000%, 1/01/19 | | | | | No Opt. Call | | | | AA | | | | 2,056,610 | |
| | | | Nebraska – 0.1% | | | | | | | | | | | | | | |
| | | | | |
| | 250 | | | Central Plains Energy Project, Nebraska, Gas Project 1 Revenue Bonds, Series 2007A, 5.250%, 12/01/21 | | | | | No Opt. Call | | | | A | | | | 270,900 | |
| | | | New Jersey – 4.7% | | | | | | | | | | | | | | |
| | | | | |
| | | | New Jersey Educational Facilities Authority, Revenue Bonds, Rider University, Series 2012A: | | | | | | | | | | | | | | |
| | 1,000 | | | 5.000%, 7/01/14 | | | | | No Opt. Call | | | | BBB+ | | | | 1,085,500 | |
| | 1,500 | | | 4.000%, 7/01/15 | | | | | No Opt. Call | | | | BBB+ | | | | 1,621,935 | |
| | | | | |
| | 1,000 | | | New Jersey Health Care Facilities Financing Authority, New Jersey, Revenue Bonds, Saint Peters University Hospital, Refunding Series 2011, 5.000%, 7/01/13 | | | | | No Opt. Call | | | | BBB– | | | | 1,032,770 | |
| | | | | |
| | 4,000 | | | New Jersey Health Care Facilities Financing Authority, Revenue Bonds, Saint Barnabas Health Care System, Refunding Series 2011A, 5.000%, 7/01/15 | | | | | No Opt. Call | | | | BBB | | | | 4,298,320 | |
| | | | | |
| | 4,000 | | | New Jersey Higher Education Assistance Authority, Student Loan Revenue Bonds, Series 2011-1, 5.000%, 12/01/14 (Alternative Minimum Tax) | | | | | No Opt. Call | | | | Aa3 | | | | 4,306,360 | |
| | | | | |
| | 3,100 | | | New Jersey Transportation Trust Fund Authority, Transportation System Bonds, Series 2010D, 5.000%, 12/15/18 | | | | | No Opt. Call | | | | A+ | | | | 3,706,360 | |
| | 14,600 | | | Total New Jersey | | | | | | | | | | | | | 16,051,245 | |
| | | | New Mexico – 0.7% | | | | | | | | | | | | | | |
| | | | | |
| | 2,050 | | | New Mexico Educational Assistance Foundation, Education Loan Bonds, Senior Lien Series 2009A, 3.900%, 9/01/14 (Alternative Minimum Tax) | | | | | No Opt. Call | | | | Aaa | | | | 2,158,527 | |
| | | | New York – 2.4% | | | | | | | | | | | | | | |
| | | | | |
| | 1,390 | | | Indian River Central School District, Philadephia, New York, General Obligation Bonds, Refunding Series 2012, 2.000%, 6/01/12 | | | | | No Opt. Call | | | | Aa3 | | | | 1,391,612 | |
| | | | | |
| | 500 | | | Long Island Power Authority, New York, Electric System Revenue Bonds, Series 2006F, 5.000%, 5/01/12 | | | �� | | No Opt. Call | | | | N/R | | | | 500,065 | |
| | | | | |
| | 830 | | | Nassau Health Care Corporation, New York, Revenue Anticipation Notes, Series 2012, 3.125%, 12/15/12 – AGC Insured | | | | | No Opt. Call | | | | AA– | | | | 842,309 | |
| | | | | |
| | 2,000 | | | New York State Energy Research and Development Authority, Pollution Control Revenue Bonds, New York State Electric and Gas Corporation, Series 2011A, 2.125%, 3/15/15 | | | | | No Opt. Call | | | | A– | | | | 2,034,060 | |
| | | | | |
| | 300 | | | Niagara Area Development Corporation, New York, Niagara University Project, Series 2012A, 3.000%, 5/01/13 (WI/DD, Settling 5/03/12) | | | | | No Opt. Call | | | | BBB+ | | | | 305,826 | |
| | | | | |
| | 1,265 | | | Yonkers, New York, General Obligation Bonds, Series 2005A, 5.000%, 8/01/13 – NPFG Insured | | | | | No Opt. Call | | | | BBB+ | | | | 1,321,343 | |
| | | | | |
| | 1,500 | | | Yonkers, New York, General Obligation Bonds, Series 2011A, 5.000%, 10/01/14 | | | | | No Opt. Call | | | | BBB+ | | | | 1,614,675 | |
| | 7,785 | | | Total New York | | | | | | | | | | | | | 8,009,890 | |
| | | | North Dakota – 1.1% | | | | | | | | | | | | | | |
| | | | | |
| | | | Burleigh County, North Dakota, Health Care Revenue Refunding Bonds, St. Alexius Medical Center Project, Series 2012A: | | | | | | | | | | | | | | |
| | 125 | | | 2.000%, 7/01/12 | | | | | No Opt. Call | | | | A– | | | | 125,121 | |
| | 225 | | | 2.500%, 7/01/13 | | | | | No Opt. Call | | | | A– | | | | 226,746 | |
| | 300 | | | 2.500%, 7/01/14 | | | | | No Opt. Call | | | | A– | | | | 303,324 | |
| | | | | |
| | 3,040 | | | Fargo, North Dakota, Health System Revenue Bonds, Sanford Health, Refunding Series 2011, 3.500%, 11/01/16 | | | | | No Opt. Call | | | | AA– | | | | 3,242,859 | |
| | 3,690 | | | Total North Dakota | | | | | | | | | | | | | 3,898,050 | |
Portfolio of Investments
Nuveen Short Term Municipal Bond Fund (continued)
April 30, 2012
| | | | | | | | | | | | | | | | | | |
Principal
Amount (000) | | | Description (1) | | | | Optional Call
Provisions (2) | | | Ratings (3) | | | Value | |
| | | | | | | | | | | | | | | | | | |
| | | | Ohio – 1.0% | | | | | | | | | | | | | | |
| | | | | |
| $ | 785 | | | Cleveland State University, Ohio, General Receipts Bonds, Series 2007A, 5.750%, 6/01/14 – FGIC Insured | | | | | No Opt. Call | | | | A+ | | | $ | 862,794 | |
| | | | | |
| | | | Cleveland, Ohio, Airport System Revenue Bonds, Series 2011A: | | | | | | | | | | | | | | |
| | 560 | | | 3.000%, 1/01/13 | | | | | No Opt. Call | | | | A– | | | | 566,866 | |
| | 1,000 | | | 3.000%, 1/01/14 | | | | | No Opt. Call | | | | A– | | | | 1,026,050 | |
| | | | | |
| | 1,000 | | | Ohio Air Quality Development Authority, Ohio, Air Quality Revenue Refunding Bonds, Ohio Power Company Project, Series 2010A, 3.250%, 6/01/41 (Mandatory put 6/02/14) | | | | | No Opt. Call | | | | Baa1 | | | | 1,024,260 | |
| | 3,345 | | | Total Ohio | | | | | | | | | | | | | 3,479,970 | |
| | | | Oklahoma – 1.0% | | | | | | | | | | | | | | |
| | | | | |
| | 2,000 | | | Cleveland County Public Facilities Authority, Oklahoma, Educational Facilities Lease Revenue Bonds, Norman Public Schools Project, Series 2010, 3.500%, 6/01/12 | | | | | No Opt. Call | | | | A+ | | | | 2,005,400 | |
| | | | | |
| | 1,125 | | | Tulsa County Industrial Authority, Oklahoma, Educational Facilities Lease Revenue Bonds, Jenks Public Schools Project, Series 2009, 5.000%, 9/01/14 | | | | | No Opt. Call | | | | AA– | | | | 1,239,683 | |
| | 3,125 | | | Total Oklahoma | | | | | | | | | | | | | 3,245,083 | |
| | | | Oregon – 1.0% | | | | | | | | | | | | | | |
| | | | | |
| | 2,850 | | | Medford Hospital Facilities Authority, Oregon, Hospital Revenue Bonds, Asante Health System, Refunding Series 2010, 5.000%, 8/15/15 – AGM Insured | | | | | No Opt. Call | | | | AA– | | | | 3,202,403 | |
| | | | Pennsylvania – 6.9% | | | | | | | | | | | | | | |
| | | | | |
| | 1,000 | | | Allegheny County Airport Authority, Pennsylvania, Airport Revenue Bonds, Pittsburgh International Airport, Refunding Series 2010A, 5.000%, 1/01/16 – AGM Insured (Alternative Minimum Tax) | | | | | No Opt. Call | | | | AA– | | | | 1,108,790 | |
| | | | | |
| | 3,000 | | | Pennsylvania Economic Development Financing Authority, Solid Waste Disposal Revenue Bonds, Republic Services Inc Project, Refunding Series 2010B, 0.450%, 12/01/30 (Mandatory put 7/01/12) | | | | | No Opt. Call | | | | BBB | | | | 3,000,120 | |
| | | | | |
| | 3,000 | | | Pennsylvania Economic Development Financing Authority, Solid Waste Disposal Revenue Bonds, Waste Management Inc., Project, Series 2011, 2.625%, 7/01/41 (Mandatory put 7/01/14) | | | | | No Opt. Call | | | | BBB | | | | 3,054,630 | |
| | | | | |
| | 725 | | | Pennsylvania Higher Educational Facilities Authority, Revenue Bonds, AICUP Financing Program-Mount Aloysius College Project, Series 2011R-1, 2.000%, 11/01/41 (Mandatory put 4/30/13) | | | | | 11/12 at 100.00 | | | | A– | | | | 727,197 | |
| | | | | |
| | | | Pennsylvania Higher Educational Facilities Authority, Revenue Bonds, Foundation for Student Housing at Indiana University, Project Series 2012A: | | | | | | | | | | | | | | |
| | 100 | | | 3.000%, 7/01/13 | | | | | No Opt. Call | | | | BBB+ | | | | 101,364 | |
| | 100 | | | 3.000%, 7/01/14 | | | | | No Opt. Call | | | | BBB+ | | | | 102,015 | |
| | 320 | | | 3.000%, 7/01/15 | | | | | No Opt. Call | | | | BBB+ | | | | 327,542 | |
| | | | | |
| | 110 | | | Philadelphia Gas Works, Pennsylvania, Revenue Bonds, General Ordinance, Fourth Series 1998, 5.000%, 8/01/12 – AGM Insured | | | | | No Opt. Call | | | | AA– | | | | 111,150 | |
| | | | | |
| | 1,780 | | | Philadelphia Gas Works, Pennsylvania, Revenue Bonds, Refunding Tenth Series 2011B, 4.000%, 7/01/13 | | | | | No Opt. Call | | | | BBB+ | | | | 1,839,167 | |
| | | | | |
| | 1,000 | | | Philadelphia Redevelopment Authority, Pennsylvania, Revenue Bonds, Philadelphia Neighborhood Transformation Initiative, Series 2012, 5.000%, 4/15/14 (WI/DD, Settling 5/01/12) | | | | | No Opt. Call | | | | A2 | | | | 1,075,170 | |
| | | | | |
| | 915 | | | Philadelphia School District, Pennsylvania, General Obligation Bonds, Series 2011B, 3.000%, 9/01/13 | | | | | No Opt. Call | | | | Aa2 | | | | 946,320 | |
| | | | | |
| | 920 | | | Philadelphia School District, Pennsylvania, General Obligation Bonds, Series 2011C, 3.000%, 9/01/13 | | | | | No Opt. Call | | | | Aa2 | | | | 951,492 | |
| | | | | |
| | 500 | | | Philadelphia, Pennsylvania, Airport Revenue Bonds, Refunding Series 2011A, 4.000%, 6/15/13 (Alternative Minimum Tax) | | | | | No Opt. Call | | | | A+ | | | | 516,575 | |
| | | | | |
| | 5,000 | | | Philadelphia, Pennsylvania, General Obligation Bonds, Refunding Series 2011, 5.000%, 8/01/14 | | | | | No Opt. Call | | | | A2 | | | | 5,377,900 | |
| | | | | | | | | | | | | | | | | | |
Principal
Amount (000) | | | Description (1) | | | | Optional Call
Provisions (2) | | | Ratings (3) | | | Value | |
| | | | | | | | | | | | | | | | | | |
| | | | Pennsylvania (continued) | | | | | | | | | | | | | | |
| | | | | |
| $ | 455 | | | Pittsburgh, Pennsylvania, General Obligation Bonds, Series 2012A, 3.000%, 9/01/14 | | | | | No Opt. Call | | | | A1 | | | $ | 473,755 | |
| | | | | |
| | | | Scranton, Pennsylvania, Sewer Authority Revenue Bonds, Series 2011A: | | | | | | | | | | | | | | |
| | 250 | | | 2.250%, 12/01/13 – AGM Insured | | | | | No Opt. Call | | | | AA– | | | | 253,768 | |
| | 540 | | | 3.500%, 12/01/14 – AGM Insured | | | | | No Opt. Call | | | | AA– | | | | 568,474 | |
| | | | | |
| | | | Union County Hospital Authority, Pennsylvania, Hospital Revenue Bonds, Evangelical Community Hospital Project, Refunding and Improvement Series 2011: | | | | | | | | | | | | | | |
| | 1,385 | | | 4.000%, 8/01/15 | | | | | No Opt. Call | | | | BBB+ | | | | 1,440,663 | |
| | 1,440 | | | 4.250%, 8/01/16 | | | | | No Opt. Call | | | | BBB+ | | | | 1,510,776 | |
| | 22,540 | | | Total Pennsylvania | | | | | | | | | | | | | 23,486,868 | |
| | | | Puerto Rico – 1.3% | | | | | | | | | | | | | | |
| | | | | |
| | 1,010 | | | Puerto Rico Government Development Bank, Senior Note Revenue Bonds, Series 2011C, 1.000%, 10/15/12 | | | | | 7/12 at 100.00 | | | | Baa1 | | | | 1,009,798 | |
| | | | | |
| | 2,500 | | | Puerto Rico Infrastructure Financing Authority, Revenue Bonds, Ports Authority Project, Series 2011C, 3.000%, 12/15/26 (Mandatory put 12/16/13) (Alternative Minimum Tax) | | | | | No Opt. Call | | | | Baa1 | | | | 2,518,175 | |
| | | | | |
| | 500 | | | Puerto Rico Municipal Finance Agency, Series 2005B, 5.000%, 7/01/14 – CIFG Insured | | | | | No Opt. Call | | | | Baa1 | | | | 534,000 | |
| | | | | |
| | 370 | | | Puerto Rico, General Obligation and Public Improvement Bonds, Series 2002A, 5.500%, 7/01/14 – NPFG Insured | | | | | No Opt. Call | | | | Baa1 | | | | 399,078 | |
| | 4,380 | | | Total Puerto Rico | | | | | | | | | | | | | 4,461,051 | |
| | | | South Carolina – 0.7% | | | | | | | | | | | | | | |
| | | | | |
| | 1,100 | | | Richland County, South Carolina, Environmental Improvement Revenue Bonds, International Paper Company Project, Series 2007, 4.600%, 9/01/12 | | | | | No Opt. Call | | | | BBB | | | | 1,112,320 | |
| | | | | |
| | 590 | | | South Carolina JOBS Economic Development Authority, Economic Development Revenue, Waste Management of South Carolina, Inc. Project, Series 2008, 2.875%, 2/01/15 | | | | | No Opt. Call | | | | BBB | | | | 599,635 | |
| | | | | |
| | 500 | | | South Carolina Jobs-Economic Development Authority, Hospital Revenue Bonds, Palmetto Health, Refunding & Improvement Series 2009, 5.000%, 8/01/15 | | | | | No Opt. Call | | | | BBB+ | | | | 547,490 | |
| | 2,190 | | | Total South Carolina | | | | | | | | | | | | | 2,259,445 | |
| | | | South Dakota – 0.5% | | | | | | | | | | | | | | |
| | | | | |
| | 325 | | | South Dakota Health and Educational Facilities Authority, Revenue Bonds, Vocational Education Program, Series 2012A, 0.500%, 8/01/12 | | | | | No Opt. Call | | | | Aa2 | | | | 325,091 | |
| | | | | |
| | 1,305 | | | South Dakota Health and Educational Facilities Authority, Revenue Bonds, Sanford Health, Series 2009, 4.500%, 11/01/15 | | | | | No Opt. Call | | | | AA– | | | | 1,451,578 | |
| | 1,630 | | | Total South Dakota | | | | | | | | | | | | | 1,776,669 | |
| | | | Tennessee – 1.4% | | | | | | | | | | | | | | |
| | | | | |
| | 1,000 | | | Memphis-Shelby County Airport Authority, Tennessee, Airport Revenue Bonds, Series 2010B, 5.000%, 7/01/16 (Alternative Minimum Tax) | | | | | No Opt. Call | | | | A+ | | | | 1,121,330 | |
| | | | | |
| | 1,270 | | | Memphis-Shelby County Sports Authority, Tennessee, Revenue Bonds, Memphis Arena, Refunding Series 2009B, 5.500%, 11/01/20 | | | | | 11/19 at 100.00 | | | | AA– | | | | 1,519,669 | |
| | | | | |
| | 1,800 | | | Metropolitan Nashville Airport Authority, Tennessee, Airport Revenue Bonds, Refunding & Improvement Series 2010A, 5.000%, 7/01/16 | | | | | No Opt. Call | | | | A | | | | 2,062,710 | |
| | 4,070 | | | Total Tennessee | | | | | | | | | | | | | 4,703,709 | |
| | | | Texas – 5.4% | | | | | | | | | | | | | | |
| | | | | |
| | 3,000 | | | BB&T Municipal Trust Pool, Texas, Series 2011, 1.120%, 4/30/12 | | | | | No Opt. Call | | | | AA | | | | 2,999,160 | |
| | | | | |
| | 1,000 | | | Dallas-Fort Worth International Airport, Texas, Joint Revenue Bonds, Refunding Series 2009A, 5.000%, 11/01/21 | | | | | 11/16 at 100.00 | | | | A+ | | | | 1,114,190 | |
Portfolio of Investments
Nuveen Short Term Municipal Bond Fund (continued)
April 30, 2012
| | | | | | | | | | | | | | | | | | |
Principal
Amount (000) | | | Description (1) | | | | Optional Call
Provisions (2) | | | Ratings (3) | | | Value | |
| | | | | | | | | | | | | | | | | | |
| | | | Texas (continued) | | | | | | | | | | | | | | |
| | | | | |
| $ | 1,000 | | | Harrison County Health Facilities Development Corporation, Texas, Hospital Revenue Bonds, Good Shepherd Health System, Refunding Series 2010, 4.000%, 7/01/15 | | | | | No Opt. Call | | | | BBB+ | | | $ | 1,027,390 | |
| | | | | |
| | 400 | | | Houston, Texas, First Lien Combined Utility System Revenue Bonds, Series 2009, 3.000%, 4/01/14 | | | | | No Opt. Call | | | | A+ | | | | 414,532 | |
| | | | | |
| | 1,100 | | | Houston, Texas, Hotel Occupancy Tax and Special Revenue Bonds, Convention and Entertainment Project, Refunding Series 2011A, 5.000%, 9/01/13 | | | | | No Opt. Call | | | | A2 | | | | 1,164,581 | |
| | | | | |
| | 1,000 | | | Houston, Texas, Subordinate Lien Airport System Revenue Refunding Bonds, Series 2011A, 5.000%, 7/01/13 (Alternative Minimum Tax) | | | | | No Opt. Call | | | | A+ | | | | 1,053,140 | |
| | | | | |
| | | | Lower Colorado River Authority, Texas, Revenue Refunding and Improvement Bonds, Series 2003: | | | | | | | | | | | | | | |
| | 70 | | | 5.000%, 5/15/12 – AMBAC Insured (ETM) | | | | | No Opt. Call | | | | A1 | (4) | | | 70,141 | |
| | 10 | | | 5.000%, 5/15/12 – AMBAC Insured (ETM) | | | | | No Opt. Call | | | | A1 | (4) | | | 10,020 | |
| | 10 | | | 5.000%, 5/15/12 – AMBAC Insured (ETM) | | | | | No Opt. Call | | | | A1 | (4) | | | 10,020 | |
| | | | | |
| | 5 | | | Lower Colorado River Authority, Texas, Revenue Refunding and Improvement Bonds, Series 2003, 5.000%, 5/15/12 – AMBAC Insured | | | | | No Opt. Call | | | | A1 | | | | 5,010 | |
| | | | | |
| | 55 | | | Lower Colorado River Authority, Texas, Revenue Refunding and Improvement Bonds, Series 2003, 5.000%, 5/15/12 – AMBAC Insured | | | | | No Opt. Call | | | | A1 | | | | 55,110 | |
| | | | | |
| | 2,005 | | | Midtown Redevelopment Authority, Texas, Tax Increment Contract Revenue, Refunding Series 2011, 4.000%, 1/01/15 | | | | | No Opt. Call | | | | A– | | | | 2,125,621 | |
| | | | | |
| | | | Tarrant County Cultural Education Facilities Finance Corporation, Texas, Hospital Revenue Bonds, Hendrick Medical Center, Series 2009A: | | | | | | | | | | | | | | |
| | 1,425 | | | 4.000%, 9/01/15 – AGC Insured | | | | | No Opt. Call | | | | AA– | | | | 1,544,116 | |
| | 1,070 | | | 4.000%, 9/01/16 – AGC Insured | | | | | No Opt. Call | | | | AA– | | | | 1,178,937 | |
| | 1,355 | | | 4.375%, 9/01/18 – AGC Insured | | | | | No Opt. Call | | | | AA– | | | | 1,550,621 | |
| | | | | |
| | 1,165 | | | Tarrant County Cultural Education Facilities Finance Corporation, Texas, Retirement Facility Revenue Bonds, Mirador Project, Temps 50,
Series 2010B-2, 6.250%, 11/15/14 | | | | | 7/12 at 100.00 | | | | N/R | | | | 1,164,930 | |
| | | | | |
| | 1,835 | | | Tarrant County Cultural Education Facilities Finance Corporation, Texas, Retirement Facility Revenue Bonds, The Stayton at Museum Way Senior Living Center, Inc. Project, Temps 50, Series 2009C-2, 6.500%, 11/15/14 | | | | | 7/12 at 100.00 | | | | N/R | | | | 1,835,844 | |
| | | | | |
| | 1,000 | | | Val Verde County, Texas, Pass-Through Toll Revenue and Limited Tax Bonds, Series 2011, 2.000%, 8/15/13 | | | | | No Opt. Call | | | | A | | | | 1,009,370 | |
| | 17,505 | | | Total Texas | | | | | | | | | | | | | 18,332,733 | |
| | | | Virgin Islands – 0.3% | | | | | | | | | | | | | | |
| | | | | |
| | 1,035 | | | Virgin Islands Public Finance Authority, Matching Fund Loan Notes Revenue Bonds, Series 2009B, 5.000%, 10/01/19 | | | | | No Opt. Call | | | | BBB+ | | | | 1,164,199 | |
| | | | Virginia – 4.3% | | | | | | | | | | | | | | |
| | | | | |
| | 1,000 | | | Louisa Industrial Development Authority, Virginia, Pollution Control Revenue Bonds, Virginia Electric and Power Company, Series 2008A, 5.375%, 11/01/35 (Mandatory put 12/02/13) | | | | | No Opt. Call | | | | A– | | | | 1,063,030 | |
| | | | | |
| | 7,000 | | | Virginia Housing Development Authority, Commonwealth Mortgage Bonds, Series 2006 D1, 4.300%, 1/01/14 (Alternative Minimum Tax) | | | | | No Opt. Call | | | | AAA | | | | 7,235,410 | |
| | | | | |
| | 6,000 | | | Virginia Public Building Authority, Public Facilities Revenue Bonds, Series 2004A, 5.000%, 8/01/14 | | | | | 8/13 at 100.00 | | | | AA+ | | | | 6,331,140 | |
| | 14,000 | | | Total Virginia | | | | | | | | | | | | | 14,629,580 | |
| | | | Washington – 1.2% | | | | | | | | | | | | | | |
| | | | | |
| | 1,000 | | | Port of Seattle, Washington, Revenue Bonds, Refunding Inter-Lien Series 2010C, 5.000%, 2/01/16 | | | | | No Opt. Call | | | | Aa3 | | | | 1,127,510 | |
| | | | | |
| | | | Washington Higher Education Facilities Authority Revenue Bonds, Whitworth University Project, Series 2012: | | | | | | | | | | | | | | |
| | 100 | | | 3.000%, 10/01/13 | | | | | No Opt. Call | | | | Baa1 | | | | 102,108 | |
| | 150 | | | 3.000%, 10/01/14 | | | | | No Opt. Call | | | | Baa1 | | | | 154,610 | |
| | 275 | | | 4.000%, 10/01/16 | | | | | No Opt. Call | | | | Baa1 | | | | 294,080 | |
| | | | | | | | | | | | | | | | | | |
Principal
Amount (000) | | | Description (1) | | | | Optional Call
Provisions (2) | | | Ratings (3) | | | Value | |
| | | | | | | | | | | | | | | | | | |
| | | | Washington (continued) | | | | | | | | | | | | | | |
| | | | | |
| | | | Washington State Health Care Facilities Authority, Revenue Bonds, Central Washington Health Services Association, Series 2009: | | | | | | | | | | | | | | |
| $ | 1,225 | | | 5.000%, 7/01/13 | | | | | No Opt. Call | | | | Baa2 | | | $ | 1,262,987 | |
| | 1,150 | | | 5.000%, 7/01/14 | | | | | No Opt. Call | | | | Baa2 | | | | 1,213,179 | |
| | 3,900 | | | Total Washington | | | | | | | | | | | | | 4,154,474 | |
| | | | West Virginia – 0.3% | | | | | | | | | | | | | | |
| | | | | |
| | 1,000 | | | Mason County, West Virginia, Pollution Control Revenue Bonds, Appalachian Power Company, Series 2003L, 2.000%, 10/01/22 (Mandatory put 10/01/14) | | | | | No Opt. Call | | | | Baa2 | | | | 1,004,830 | |
| | | | Wisconsin – 0.8% | | | | | | | | | | | | | | |
| | | | | |
| | 1,000 | | | Wisconsin Health and Educational Facilities Authority, Revenue Bonds, Aurora Health Care, Inc., Series 2010A, 5.000%, 4/15/16 | | | | | No Opt. Call | | | | A | | | | 1,120,750 | |
| | | | | |
| | 765 | | | Wisconsin Health and Educational Facilities Authority, Revenue Bonds, Gundersen Lutheran, Series 2011A, 2.500%, 10/15/13 | | | | | No Opt. Call | | | | A+ | | | | 780,912 | |
| | | | | |
| | | | Wisconsin Health and Educational Facilities Authority, Revenue Bonds, Howard Young Health Care, Inc., Refunding Series 2012: | | | | | | | | | | | | | | |
| | 130 | | | 2.500%, 8/15/12 (WI/DD, Settling 5/30/12) | | | | | No Opt. Call | | | | BBB+ | | | | 130,528 | |
| | 350 | | | 3.000%, 8/15/13 (WI/DD, Settling 5/30/12) | | | | | No Opt. Call | | | | BBB+ | | | | 357,002 | |
| | | | | |
| | 425 | | | Wisconsin Health and Educational Facilities Authority, Revenue Bonds, Ministry Health Care, Inc., Refunding 2012C, 2.500%, 8/15/13 (WI/DD, Settling 5/01/12) | | | | | No Opt. Call | | | | A+ | | | | 434,599 | |
| | 2,670 | | | Total Wisconsin | | | | | | | | | | | | | 2,823,791 | |
| | | | Wyoming – 0.3% | | | | | | | | | | | | | | |
| | | | | |
| | | | Natrona County, Wyoming, Hospital Revenue Bonds, Wyoming Medical Center Project, Series 2011: | | | | | | | | | | | | | | |
| | 200 | | | 4.000%, 9/15/14 | | | | | No Opt. Call | | | | A3 | | | | 210,430 | |
| | 530 | | | 4.000%, 9/15/15 | | | | | No Opt. Call | | | | A3 | | | | 564,236 | |
| | 300 | | | 4.000%, 9/15/16 | | | | | No Opt. Call | | | | A3 | | | | 320,740 | |
| | 1,030 | | | Total Wyoming | | | | | | | | | | | | | 1,095,406 | |
| $ | 302,295 | | | Total Municipal Bonds (cost $310,246,957) | | | | | | | | | | | | | 319,659,714 | |
| | | | | |
Shares/
Principal
Amount (000) | | | Description (1) | | | | | | | | | | Value | |
| | | | | | | | | | | | | | | | | | |
| | | | SHORT-TERM INVESTMENTS – 8.1% | | | | | | | | | | | | | | |
| | | | | |
| | | | Money Market Funds – 1.2% | | | | | | | | | | | | | | |
| | | | | |
| | 3,867,921 | | | First American Tax Free Obligations Fund, Class Z, 0.019% (6) | | | | | | | | | | | | $ | 3,867,921 | |
| | | | | |
Principal
Amount (000) | | | Description (1) | | | | Optional Call
Provisions (2) | | | Ratings (3) | | | Value | |
| | | | Variable Rate Demand Notes – 6.9% | | | | | | | | | | | | | | |
| | | | | |
| $ | 3,805 | | | California Municipal Finance Authority, Variable Rate Demand Obligations Revenue Bonds, Goodwill Industries of Orange County, Series 2008, 0.340%, 10/01/33 (7) | | | | | 7/12 at 100.00 | | | | F-1+ | | | $ | 3,805,000 | |
| | | | | |
| | 5,000 | | | Cleveland-Cuyahoga County Port Authority, Ohio, Revenue Bonds, Carnegie/89th Garage and Service Center LLC Project, Variable Rate Demand Obligation, Series 2007, 0.250%, 1/01/37 (7) | | | | | 12/12 at 100.00 | | | | VMIG-1 | | | | 5,000,000 | |
| | | | | |
| | 2,245 | | | Colorado Educational and Cultural Facilities Authority, Revenue Bonds, Denver Seminary Project, Variable Rate Demand Obligation Series 2004, 0.340%, 7/01/34 (7) | | | | | 8/12 at 100.00 | | | | A-1+ | | | | 2,245,000 | |
| | | | | |
| | 5,500 | | | Glendale Industrial Development Authority, Arizona, Senior Living Facility Revenue Bonds, Friendship Retirement Corporation, Senior Lien, Variable Rate Demand Obligation, Series 1997, 0.340%, 1/01/27 (7) | | | | | 8/12 at 100.00 | | | | A-1+ | | | | 5,500,000 | |
| | | | | |
| | 3,000 | | | Houston Higher Education Finance Corporation, Texas, Revenue Bonds, Rice University, Variable Rate Demand Obligations Series 2006,
0.240%, 11/15/29 (7) | | | | | 7/12 at 100.00 | | | | A-1 | | | | 3,000,000 | |
Portfolio of Investments
Nuveen Short Term Municipal Bond Fund (continued)
April 30, 2012
| | | | | | | | | | | | | | | | | | |
Principal
Amount (000) | | | Description (1) | | | | Optional Call
Provisions (2) | | | Ratings (3) | | | Value | |
| | | | | | | | | | | | | | | | | | |
| | | | Variable Rate Demand Notes (continued) | | | | | | | | | | | | | | |
| | | | | |
| $ | 1,000 | | | Indiana Finance Authority, Economic Development Revenue Bonds, Republic Service, Inc. Project, Variable Rate Demand Obligations, Refunding
Series 2010B, 0.450%, 5/01/28 (7) | | | | | No Opt. Call | | | | A-2 | | | $ | 1,000,000 | |
| | | | | |
| | 3,000 | | | New York State Environmental Facilities Corporation, Solid Waste Disposal Revenue Bonds, Waste Management Inc. Project, Variable Rate Demand Obligations, Refunding Series 2012, 0.700%, 5/01/30 (7) | | | | | No Opt. Call | | | | A-2 | | | | 3,000,000 | |
| $ | 23,550 | | | Total Variable Rate Demand Notes (cost $23,550,000) | | | | | | | | 23,550,000 | |
| | | | Total Short-Term Investments (cost $27,417,921) | | | | | | | | 27,417,921 | |
| | | | Total Investments (cost $337,664,878) – 102.1% | | | | | | | | | | | | | 347,077,635 | |
| | | | Other Assets Less Liabilities – (2.1)% | | | | | | | | | | | | | (7,149,535) | |
| | | | Net Assets – 100% | | | | | | | | | | | | $ | 339,928,100 | |
| | (1) | | All percentages shown in the Portfolio of Investments are based on net assets. |
| | (2) | | Optional Call Provisions (not covered by the report of independent registered public accounting firm): Dates (month and year) and prices of the earliest optional call or redemption. There may be other call provisions at varying prices at later dates. Certain mortgage-backed securities may be subject to periodic principal paydowns. |
| | (3) | | Ratings (not covered by the report of independent registered public accounting firm): Using the highest of Standard & Poor’s Group (“Standard & Poor’s”), Moody’s Investors Service, Inc. (“Moody’s”) or Fitch, Inc. (“Fitch”) rating. Ratings below BBB by Standard & Poor’s, Baa by Moody’s or BBB by Fitch are considered to be below investment grade. Holdings designated N/R are not rated by any of these national rating agencies. |
| | (4) | | Backed by an escrow or trust containing sufficient U.S. Government or U.S. Government agency securities, which ensure the timely payment of principal and interest. Bonds backed by U.S. Government or agency securities are regarded as having an implied rating equal to the rating of such securities. |
| | (5) | | During July 2010, the original issue for this security (1,000,000 par, 5.100% coupon and May 15, 2015 maturity) was restructured into two new securities. The first security, which is 30% of the original issue, has a 300,000 par, 0.000% coupon and May 15, 2050 maturity. The second security, which is the remaining 70% of the issue, has a 700,000 par, 5.100% coupon and May 15, 2014 maturity. During September 2011, the Adviser concluded this issue was not likely to meet its future interest payment obligations and directed the Fund’s custodian to cease accruing additional income on the Fund’s records. |
| | (6) | | The rate shown is the annualized seven-day effective yield as of April 30, 2012. |
| | (7) | | Investment has a maturity of more than one year, but has variable rate and demand features which qualify it as a short-term investment. The rate disclosed is that in effect at the end of the reporting period. This rate changes periodically based on market conditions or a specified market index. |
| | WI/DD | | Purchased on a when-issued or delayed delivery basis. |
| | (ETM) | | Escrowed to maturity. |
See accompanying notes to financial statements.
Statement of Assets and Liabilities
April 30, 2012
| | | | |
Assets | | | | |
Long-term investments, at value (cost $310,246,957) | | $ | 319,659,714 | |
Short-term investments (at cost, which approximates value) | | | 27,417,921 | |
Cash | | | 3,090 | |
Receivables: | | | | |
Interest | | | 3,888,108 | |
Shares sold | | | 2,264,251 | |
Other assets | | | 3,017 | |
Total assets | | | 353,236,101 | |
Liabilities | | | | |
Payables: | | | | |
Dividends | | | 515,363 | |
Investments purchased | | | 12,283,348 | |
Shares redeemed | | | 306,225 | |
Accrued expenses: | | | | |
Management fees | | | 147,479 | |
12b-1 distribution and service fees | | | 5,862 | |
Other | | | 49,724 | |
Total liabilities | | | 13,308,001 | |
Net assets | | $ | 339,928,100 | |
Class A Shares | | | | |
Net assets | | $ | 34,792,964 | |
Shares outstanding | | | 3,413,035 | |
Net asset value per share | | $ | 10.19 | |
Offering price per share (net asset value per share plus maximum sales charge of 2.50% of offering price) | | $ | 10.45 | |
Class C Shares | | | | |
Net assets | | $ | 1,026,141 | |
Shares outstanding | | | 100,769 | |
Net asset value and offering price per share | | $ | 10.18 | |
Class I Shares | | | | |
Net assets | | $ | 304,108,995 | |
Shares outstanding | | | 29,836,978 | |
Net asset value and offering price per share | | $ | 10.19 | |
Net assets consist of: | | | | |
Capital paid-in | | $ | 330,186,050 | |
Undistributed (Over-distribution of) net investment income | | | 787,168 | |
Accumulated net realized gain (loss) | | | (457,875 | ) |
Net unrealized appreciation (depreciation) | | | 9,412,757 | |
Net assets | | $ | 339,928,100 | |
Authorized shares | | | 2 billion | |
Par value per share | | $ | 0.0001 | |
See accompanying notes to financial statements.
Statement of Operations
Year Ended April 30, 2012
| | | | |
Investment Income | | $ | 8,677,476 | |
Expenses | | | | |
Management fees | | | 1,367,330 | |
12b-1 service fees – Class A | | | 36,729 | |
12b-1 distribution and service fees – Class C(1) | | | 781 | |
Shareholders’ servicing agent fees and expenses | | | 75,182 | |
Custodian’s fees and expenses | | | 69,114 | |
Directors’ fees and expenses | | | 8,456 | |
Professional fees | | | 33,176 | |
Shareholders’ reports – printing and mailing expenses | | | 23,440 | |
Federal and state registration fees | | | 40,772 | |
Other expenses | | | 21,326 | |
Total expenses | | | 1,676,306 | |
Net investment income (loss) | | | 7,001,170 | |
Realized and Unrealized Gain (Loss) | | | | |
Net realized gain (loss) from investments | | | 347,473 | |
Change in net unrealized appreciation (depreciation) of investments | | | 5,666,989 | |
Net realized and unrealized gain (loss) | | | 6,014,462 | |
Net increase (decrease) in net assets from operations | | $ | 13,015,632 | |
| (1) | For the period August 31, 2011 (commencement of operations) through April 30, 2012. |
See accompanying notes to financial statements.
Statement of Changes in Net Assets
| | | | | | | | | | | | |
| | | Year Ended
4/30/12 | | | Ten Months Ended
4/30/11 | | | Year Ended
6/30/10 | |
Operations | | | | | | | | | | | | |
Net investment income (loss) | | $ | 7,001,170 | | | $ | 5,268,114 | | | $ | 5,169,257 | |
Net realized gain (loss) from investments | | | 347,473 | | | | 630,537 | | | | 2,406,276 | |
Change in net unrealized appreciation (depreciation) of investments | | | 5,666,989 | | | | (1,305,264 | ) | | | 2,991,721 | |
Net increase (decrease) in net assets from operations | | | 13,015,632 | | | | 4,593,387 | | | | 10,567,254 | |
Distributions to Shareholders | | | | | | | | | | | | |
From net investment income: | | | | | | | | | | | | |
Class A | | | (363,371 | ) | | | (122,365 | ) | | | (115,881 | ) |
Class C | | | (2,244 | ) | | | N/A | | | | N/A | |
Class I | | | (6,362,952 | ) | | | (4,617,634 | ) | | | (5,052,188 | ) |
From accumulated net realized gains: | | | | | | | | | | | | |
Class A | | | — | | | | — | | | | — | |
Class C | | | — | | | | N/A | | | | N/A | |
Class I | | | — | | | | — | | | | — | |
Decrease in net assets from distributions to shareholders | | | (6,728,567 | ) | | | (4,739,999 | ) | | | (5,168,069 | ) |
Fund Share Transactions | | | | | | | | | | | | |
Proceeds from sale of shares | | | 208,239,858 | | | | 146,464,544 | | | | 260,316,833 | |
Proceeds from shares issued to shareholders due to reinvestment of distributions | | | 743,063 | | | | 338,031 | | | | 381,607 | |
| | | 208,982,921 | | | | 146,802,575 | | | | 260,698,440 | |
Cost of shares redeemed | | | (160,478,455 | ) | | | (179,470,534 | ) | | | (130,472,393 | ) |
Net increase (decrease) in net assets from Fund share transactions | | | 48,504,466 | | | | (32,667,959 | ) | | | 130,226,047 | |
Net increase (decrease) in net assets | | | 54,791,531 | | | | (32,814,571 | ) | | | 135,625,232 | |
Net assets at the beginning of period | | | 285,136,569 | | | | 317,951,140 | | | | 182,325,908 | |
Net assets at the end of period | | $ | 339,928,100 | | | $ | 285,136,569 | | | $ | 317,951,140 | |
Undistributed (Over-distribution of) net investment income at the end of period | | $ | 787,168 | | | $ | 522,627 | | | $ | (5,489 | ) |
| N/A | – The Fund did not offer Class C Shares prior to August 31, 2011. |
See accompanying notes to financial statements.
Financial Highlights
| | | | | | | | | | | | | | | | | | | | | | | | | | | | | | | | | | | | |
| Selected data for a share outstanding throughout each period: | | | | | | | |
| | | |
| Class (Commencement Date) | | | | | | | | | | |
| | | | | | Investment Operations | | | Less Distributions | | | | | | | |
| | | | | | | | |
| | | | | | | | | | | | | | | | | | | | | | | | | | |
| | | Beginning
Net
Asset
Value | | | Net
Invest-
ment
Income
(Loss)(a) | | | Net
Realized/
Unrealized
Gain
(Loss) | | | Total | | | Net
Invest-
ment
Income | | | Capital
Gains(b) | | | Total | | | Ending
Net
Asset
Value | | | Total
Return(c) | |
CLASS A (10/02) | | | | | | | | | | | | | | | | | | | | | | | | | | | | | | | | | |
Year Ended 4/30 | | | | | | | | | | | | | | | | | | | | | | | | | | | | | | | | | |
2012 | | $ | 9.98 | | | $ | .20 | | | $ | .21 | | | $ | .41 | | | $ | (.20 | ) | | $ | — | | | $ | (.20 | ) | | $ | 10.19 | | | | 4.15 | % |
2011(e) | | | 9.98 | | | | .16 | | | | (.02 | ) | | | .14 | | | | (.14 | ) | | | — | | | | (.14 | ) | | | 9.98 | | | | 1.41 | |
Year Ended 6/30 | | | | | | | | | | | | | | | | | | | | | | | | | | | | | | | | | |
2010 | | | 9.74 | | | | .20 | | | | .22 | | | | .42 | | | | (.18 | ) | | | — | | | | (.18 | ) | | | 9.98 | | | | 4.38 | |
2009 | | | 9.79 | | | | .28 | | | | (.07 | ) | | | .21 | | | | (.26 | ) | | | — | | | | (.26 | ) | | | 9.74 | | | | 2.17 | |
2008 | | | 9.70 | | | | .30 | | | | .10 | | | | .40 | | | | (.31 | ) | | | — | | | | (.31 | ) | | | 9.79 | | | | 4.17 | |
2007 | | | 9.68 | | | | .28 | | | | .03 | | | | .31 | | | | (.29 | ) | | | — | | | | (.29 | ) | | | 9.70 | | | | 3.22 | |
CLASS C (8/11) | | | | | | | | | | | | | | | | | | | | | | | | | | | | | | | | | |
Year Ended 4/30 | | | | | | | | | | | | | | | | | | | | | | | | | | | | | | | | | |
2012(f) | | | 10.13 | | | | .10 | | | | .06 | | | | .16 | | | | (.11 | ) | | | — | | | | (.11 | ) | | | 10.18 | | | | 1.61 | |
CLASS I (10/02) | | | | | | | | | | | | | | | | | | | | | | | | | | | | | | | | | |
Year Ended 4/30 | | | | | | | | | | | | | | | | | | | | | | | | | | | | | | | | | |
2012 | | | 9.98 | | | | .23 | | | | .20 | | | | .43 | | | | (.22 | ) | | | — | | | | (.22 | ) | | | 10.19 | | | | 4.33 | |
2011(e) | | | 9.98 | | | | .17 | | | | (.02 | ) | | | .15 | | | | (.15 | ) | | | — | | | | (.15 | ) | | | 9.98 | | | | 1.54 | |
Year Ended 6/30 | | | | | | | | | | | | | | | | | | | | | | | | | | | | | | | | | |
2010 | | | 9.74 | | | | .20 | | | | .24 | | | | .44 | | | | (.20 | ) | | | — | | | | (.20 | ) | | | 9.98 | | | | 4.53 | |
2009 | | | 9.79 | | | | .27 | | | | (.05 | ) | | | .22 | | | | (.27 | ) | | | — | | | | (.27 | ) | | | 9.74 | | | | 2.32 | |
2008 | | | 9.70 | | | | .31 | | | | .10 | | | | .41 | | | | (.32 | ) | | | — | | | | (.32 | ) | | | 9.79 | | | | 4.33 | |
2007 | | | 9.68 | | | | .31 | | | | .01 | | | | .32 | | | | (.30 | ) | | | — | | | | (.30 | ) | | | 9.70 | | | | 3.37 | |
| | | | | | | | | | | | | | | | | | | | | | |
| | |
|
| | |
| Ratios/Supplemental Data | |
| | | | Ratios to Average
Net Assets Before
Reimbursement | | | Ratios to Average
Net Assets After
Reimbursement(d) | | | | |
Ending
Net
Assets
(000) | | | Expenses | | | Net
Invest-
ment
Income
(Loss) | | | Expenses | | | Net
Invest-
ment
Income
(Loss) | | | Portfolio
Turnover
Rate | |
| | | | | | | | | | | | | | | | | | | | | | |
| | | | | | | | | | | | | | | | | | | | | | |
| $ | 34,793 | | | | .73 | % | | | 2.01 | % | | | .73 | % | | | 2.01 | % | | | 39 | % |
| | 7,790 | | | | .89 | * | | | 1.73 | * | | | .71 | * | | | 1.91 | * | | | 21 | |
| | | | | | | | | | | | | | | | | | | | | | |
| | 7,168 | | | | 1.06 | | | | 1.49 | | | | .74 | | | | 1.81 | | | | 45 | |
| | 3,376 | | | | 1.11 | | | | 2.35 | | | | .75 | | | | 2.71 | | | | 70 | |
| | 2,308 | | | | 1.11 | | | | 2.69 | | | | .75 | | | | 3.05 | | | | 58 | |
| | 2,410 | | | | 1.08 | | | | 2.61 | | | | .75 | | | | 2.94 | | | | 57 | |
| | | | | | | | | | | | | | | | | | | | | | |
| | | | | | | | | | | | | | | | | | | | | | |
| | 1,026 | | | | 1.07 | * | | | 1.49 | * | | | 1.07 | * | | | 1.49 | * | | | 39 | |
| | | | | | | | | | | | | | | | | | | | | | |
| | | | | | | | | | | | | | | | | | | | | | |
| | 304,109 | | | | .53 | | | | 2.27 | | | | .53 | | | | 2.27 | | | | 39 | |
| | 277,347 | | | | .67 | * | | | 1.94 | * | | | .55 | * | | | 2.06 | * | | | 21 | |
| | | | | | | | | | | | | | | | | | | | | | |
| | 310,783 | | | | .81 | | | | 1.74 | | | | .59 | | | | 1.96 | | | | 45 | |
| | 178,950 | | | | .86 | | | | 2.58 | | | | .60 | | | | 2.84 | | | | 70 | |
| | 143,985 | | | | .86 | | | | 2.94 | | | | .60 | | | | 3.20 | | | | 58 | |
| | 161,468 | | | | .83 | | | | 2.86 | | | | .60 | | | | 3.09 | | | | 57 | |
| (a) | Per share Net Investment Income (Loss) is calculated using the average daily shares method. |
| (b) | Distributions from Capital Gains include short-term capital gains, if any. |
| (c) | Total return is the combination of changes in net asset value without any sales charge, reinvested dividend income at net asset value and reinvested capital gains distributions at net asset value, if any. Total returns are not annualized. |
| (d) | After expense reimbursement from the Adviser, where applicable. Ratios do not reflect the effect of custodian fee credits earned on the Fund’s net cash on deposit with the custodian bank, where applicable. |
| (e) | For the ten months ended April 30, 2011. |
| (f) | For the period August 31, 2011 (commencement of operations) through April 30, 2012. |
See accompanying notes to financial statements.
Notes to Financial Statements
1. General Information and Significant Accounting Policies
General Information
Nuveen Investment Funds, Inc. (the “Trust”), is an open-end investment company registered under the Investment Company Act of 1940, as amended. The Trust is comprised of the Nuveen Short Term Municipal Bond Fund formerly known as Nuveen Short Tax Free Fund (the “Fund”), among others. The Trust was incorporated in the State of Maryland on August 20, 1987.
The Fund’s investment objective is to provide current income that is exempt from federal income tax to the extent consistent with preservation of capital.
Under normal market conditions, as a fundamental policy, the Fund invests at least 80% of its net assets (plus the amount of any borrowings for investment purposes) in municipal securities that pay interest that is exempt from federal income tax, including the federal alternative minimum tax. The Fund normally may invest up to 20% of its net assets in taxable obligations, including obligations the interest on which is subject to the federal alternative minimum tax. The Fund invests mainly in securities that, at the time of purchase, are either rated investment grade or are unrated and determined to be of comparable quality by the Fund’s sub-adviser, Nuveen Asset Management, LLC (the “Sub-Adviser”), a wholly-owned subsidiary of Nuveen Fund Advisers, Inc. (the “Adviser”), a wholly owned subsidiary of Nuveen Investments, Inc. (“Nuveen”). However, the Fund may invest up to 20% of its total assets in securities that, at the time of purchase, are rated lower than investment grade or are unrated and of comparable quality (securities commonly referred to as “high yield” securities or “junk bonds”). The Fund may invest up to 15% of its net assets in municipal securities whose interest payments vary inversely with changes in short-term tax-exempt interest rates (“inverse floaters”).
The Fund’s most recent prospectus provides further descriptions of the Fund’s investment objective, principal investment strategies and principal risks.
Effective August 31, 2011, the Fund changed its name to Nuveen Short Term Municipal Bond Fund from Nuveen Short Tax Free Fund. There were no changes in the Fund’s investment objectives, policies or portfolio management personnel.
During the prior fiscal period, the Fund’s Board of Directors approved a change in the Fund’s fiscal and tax year ends from June 30 to April 30.
Significant Accounting Policies
The following is a summary of significant accounting policies followed by the Fund in the preparation of its financial statements in accordance with U.S. generally accepted accounting principles (“U.S. GAAP”).
Investment Valuation
Prices of municipal bonds are provided by a pricing service approved by the Fund’s Board of Directors. These securities are generally classified as Level 2 for fair value measurement purposes. The pricing service establishes a security’s fair value using methods that may include consideration of the following: yields or prices of investments of comparable quality, type of issue, coupon, maturity and rating, market quotes or indications of value from security dealers, evaluations of anticipated cash flows or collateral, general market conditions and other information and analysis, including the obligor’s credit characteristics considered relevant. In pricing certain securities, particularly less liquid and lower quality securities, the pricing service may consider information about a security, its issuer, or market activity provided by the Adviser. These securities are generally classified as Level 2 or Level 3 depending on the priority of the significant inputs. Investments in open-end funds are valued at their respective net asset values on the valuation date. These investment vehicles are generally classified as Level 1.
Certain securities may not be able to be priced by the pre-established pricing methods as described above. Such securities may be valued by the Fund’s Board of Directors or its designee at fair value. These securities generally include, but are not limited to, restricted securities (securities which may not be publicly sold without registration under the Securities Act of 1933, as amended) for which a pricing service is unable to provide a market price; securities whose trading has been formally suspended; debt securities that have gone into default and for which there is no current market quotation; a security whose market price is not available from a pre-established pricing source; a security with respect to which an event has occurred that is likely to materially affect the value of the security after the market has closed but before the calculation of a Fund’s net asset value (as may be the case in non-U.S. markets on which the security is primarily traded) or make it difficult or impossible to obtain a reliable market quotation; and a security whose price, as provided by the pricing service, is not deemed to reflect the security’s fair value. As a general principle, the fair value of a security would appear to be the amount that the owner might reasonably expect to receive for it in a current sale. A variety of factors may be considered in determining the fair value of such securities, which may include consideration of the following: yields or prices of investments of comparable quality, type of issue, coupon, maturity and rating, market quotes or indications of value from security dealers, evaluations of anticipated cash flows or collateral, general market conditions and other information and analysis, including the obligor’s credit characteristics considered relevant. These securities are generally classified as Level 2 or Level 3 depending on the priority of the significant inputs. Regardless of the method employed to value a particular security, all valuations are subject to review by the Funds’ Board of Directors or its designee.
Refer to Footnote 2 – Fair Value Measurements for further details on the leveling of securities held by the Fund as of the end of the reporting period.
Investment Transactions
Investment transactions are recorded on a trade date basis. Realized gains and losses from investment transactions are determined on the specific identification method, which is the same basis used for federal income tax purposes. Investments purchased on a when-issued/delayed delivery basis may have extended settlement periods. Any investments so purchased are subject to market fluctuation during this period. The Fund has instructed the custodian to segregate assets with a current value at least equal to the amount of the when-issued/delayed delivery purchase commitments. At April 30, 2012, the Fund had outstanding when-issued/delayed delivery purchase commitments of $3,283,348.
Investment Income
Dividend income is recorded on the ex-dividend date. Investment income, which reflects the amortization of premiums and includes accretion of discounts for financial reporting purposes, is recorded on an accrual basis. Investment income also reflects paydown gains and losses, if any.
Income Taxes
The Fund intends to distribute substantially all of its net investment income and net capital gains to shareholders and to otherwise comply with the requirements of Subchapter M of the Internal Revenue Code applicable to regulated investment companies (“RICs”). Therefore, no federal income tax provision is required. Furthermore, the Fund intends to satisfy conditions that will enable interest from municipal securities, which is exempt from regular federal income tax, to retain such tax-exempt status when distributed to shareholders of the Fund. Net realized capital gains and ordinary income distributions paid by the Fund are subject to federal taxation.
For all open tax years and all major taxing jurisdictions, management of the Fund has concluded that there are no significant uncertain tax positions that would require recognition in the financial statements. Open tax years are those that are open for examination by taxing authorities (i.e., generally the last four tax year ends and the interim tax period since then). Furthermore, management of the Fund is also not aware of any tax positions for which it is reasonably possible that the total amounts of unrecognized tax benefits will significantly change in the next twelve months.
Dividends and Distributions to Shareholders
The Fund declares dividends from its net investment income daily and pay shareholders monthly. Fund shares begin to accrue dividends on the business day after the day when the monies used to purchase Fund shares are collected by the Fund’s transfer agent.
Net realized capital gains and/or market discount from investment transactions, if any, are declared and distributed to shareholders at least annually. Furthermore, capital gains are distributed only to the extent they exceed available capital loss carryforwards.
Distributions to shareholders of net investment income, net realized capital gains and/or market discount, if any, are recorded on the ex-dividend date. The amount and timing of distributions are determined in accordance with federal income tax regulations, which may differ from U.S. GAAP.
Flexible Sales Charge Program
Class A Shares are generally sold with an up-front sales charge of 2.50% and incur a .20% annual 12b-1 service fee. Class A Share purchases of $250,000 or more are sold at net asset value without an up-front sales but may be subject to a contingent deferred sales charge (“CDSC”) if redeemed within eighteen months of purchase. Class C Shares are sold without an up-front sales charge but incur a .35% annual 12b-1 distribution fee and a .20% annual 12b-1 service fee. Class C Shares are subject to a CDSC of 1% if redeemed within twelve months of purchase. Class I Shares are not subject to any sales charge or 12b-1 distribution or service fees.
Inverse Floating Rate Securities
The Fund is authorized to invest in inverse floating rate securities. An inverse floating rate security is created by depositing a municipal bond, typically with a fixed interest rate, into a special purpose trust created by a broker-dealer. In turn, this trust (a) issues floating rate certificates, in face amounts equal to some fraction of the deposited bond’s par amount or market value, that typically pay short-term tax-exempt interest rates to third parties, and (b) issues to a long-term investor (such as the Fund) an inverse floating rate certificate (sometimes referred to as an “inverse floater”) that represents all remaining or residual interest in the trust. The income received by the inverse floater holder varies inversely with the short-term rate paid to the floating rate certificates’ holders, and in most circumstances the inverse floater holder bears substantially all of the underlying bond’s downside investment risk and also benefits disproportionately from any potential appreciation of the underlying bond’s value. The price of an inverse floating rate security will be more volatile than that of the underlying bond because the interest rate is dependent on not only the fixed coupon rate of the underlying bond but also on the short-term interest paid on the floating rate certificates, and because the inverse floating rate security essentially bears the risk of loss of the greater face value of the underlying bond.
The Fund may purchase an inverse floating rate security in a secondary market transaction without first owning the underlying bond (referred to as an “externally-deposited inverse floater”), or instead by first selling a fixed-rate bond to a broker-dealer for deposit into the special purpose trust and receiving in turn the residual interest in the trust (referred to as a “self-deposited inverse floater”). The inverse floater held by the Fund gives the Fund the right (a) to cause the holders of the floating rate certificates to tender their notes
Notes to Financial Statements (continued)
at par, and (b) to have the broker transfer the fixed-rate bond held by the trust to the Fund, thereby collapsing the trust. An investment in an externally-deposited inverse floater is identified in the Portfolio of Investments as “(IF) – Inverse floating rate investment.” An investment in a self-deposited inverse floater is accounted for as a financing transaction. In such instances, a fixed-rate bond deposited into a special purpose trust is identified in the Portfolio of Investments as “(UB) – Underlying bond of an inverse floating rate trust reflected as a financing transaction,” with the Fund accounting for the short-term floating rate certificates issued by the trust as “Floating rate obligations” on the Statement of Assets and Liabilities. In addition, the Fund reflects in “Investment Income” the entire earnings of the underlying bond and recognizes the related interest paid to the holders of the short-term floating rate certificates as “Interest expense on floating rate obligations” on the Statement of Operations.
During the fiscal year ended April 30, 2012, the Fund did not invest in externally-deposited inverse floaters or self-deposited inverse floaters.
Derivative Financial Instruments
The Fund is authorized to invest in certain derivative instruments, including futures, forwards, options and swap contracts. Although the Fund is authorized to invest in such financial instruments, and may do so in the future, it did not make any such investments during the fiscal year ended April 30, 2012.
Market and Counterparty Credit Risk
In the normal course of business the Fund may invest in financial instruments and enter into financial transactions where risk of potential loss exists due to changes in the market (market risk) or failure of the other party to the transaction to perform (counterparty credit risk). The potential loss could exceed the value of the financial assets recorded on the financial statements. Financial assets, which potentially expose the Fund to counterparty credit risk, consist principally of cash due from counterparties on forward, option and swap transactions, when applicable. The extent of the Fund’s exposure to counterparty credit risk in respect to these financial assets approximates their carrying value as recorded on the Statement of Assets and Liabilities. Futures contracts, when applicable, expose a Fund to minimal counterparty credit risk as they are exchange traded and the exchange’s clearinghouse, which is counterparty to all exchange traded futures, guarantees the futures contracts against default.
The Fund helps manage counterparty credit risk by entering into agreements only with counterparties the Adviser believes have the financial resources to honor their obligations and by having the Adviser monitor the financial stability of the counterparties. Additionally, counterparties may be required to pledge collateral daily (based on the daily valuation of the financial asset) on behalf of the Fund with a value approximately equal to the amount of any unrealized gain above a pre-determined threshold. Reciprocally, when the Fund has an unrealized loss, the Fund has instructed the custodian to pledge assets of the Fund as collateral with a value approximately equal to the amount of the unrealized loss above a pre-determined threshold. Collateral pledges are monitored and subsequently adjusted if and when the valuations fluctuate, either up or down, by at least the pre-determined threshold amount.
Zero Coupon Securities
The Fund is authorized to invest in zero coupon securities. A zero coupon security does not pay a regular interest coupon to its holders during the life of the security. Tax-exempt income to the holder of the security comes from accretion of the difference between the original purchase price of the security at issuance and the par value of the security at maturity and is effectively paid at maturity. The market prices of zero coupon securities generally are more volatile than the market prices of securities that pay interest periodically.
Multiclass Operations and Allocations
Income and expenses of the Fund that are not directly attributable to a specific class of shares are prorated among the classes based on the relative settled shares of each class. Expenses directly attributable to a class of shares, which presently only include 12b-1 distribution fees and shareholder service fees, are recorded to the specific class.
Income, realized and unrealized capital gains and losses of the Fund are prorated among the classes based on the relative net assets of each class.
Indemnifications
Under the Trust’s organizational documents, its officers and directors are indemnified against certain liabilities arising out of the performance of their duties to the Trust. In addition, in the normal course of business, the Trust enters into contracts that provide general indemnifications to other parties. The Trust’s maximum exposure under these arrangements is unknown as this would involve future claims that may be made against the Trust that have not yet occurred. However, the Trust has not had prior claims or losses pursuant to these contracts and expects the risk of loss to be remote.
Use of Estimates
The preparation of financial statements in conformity with U.S. GAAP requires management to make estimates and assumptions that affect the reported amounts of assets and liabilities at the date of the financial statements and the reported amounts of increases and decreases in net assets from operations during the reporting period. Actual results may differ from those estimates.
2. Fair Value Measurements
Fair value is defined as the price that the Fund would receive upon selling an investment or transferring a liability in an orderly transaction to an independent buyer in the principal or most advantageous market for the investment. A three-tier hierarchy is used to maximize the use of observable market data and minimize the use of unobservable inputs and to establish classification of fair value
measurements for disclosure purposes. Observable inputs reflect the assumptions market participants would use in pricing the asset or liability. Observable inputs are based on market data obtained from sources independent of the reporting entity. Unobservable inputs reflect the reporting entity’s own assumptions about the assumptions market participants would use in pricing the asset or liability. Unobservable inputs are based on the best information available in the circumstances. The three-tier hierarchy of inputs is summarized in the three broad levels listed below:
| | |
| Level 1 – | | Quoted prices in active markets for identical securities. |
| Level 2 – | | Other significant observable inputs (including quoted prices for similar securities, interest rates, prepayment speeds, credit risk, etc.). |
| Level 3 – | | Significant unobservable inputs (including management’s assumptions in determining the fair value of investments). |
The inputs or methodologies used for valuing securities are not an indication of the risk associated with investing in those securities. The following is a summary of the Fund’s fair value measurements as of April 30, 2012:
| | | | | | | | | | | | | | | | |
| | | | |
| | | Level 1 | | | Level 2 | | | Level 3 | | | Total | |
Long-Term Investments: | | | | | | | | | | | | | | | | |
Municipal Bonds | | $ | — | | | $ | 319,659,714 | | | $ | — | | | $ | 319,659,714 | |
Short-Term Investments: | | | | | | | | | | | | | | | | |
Money Market Funds | | | 3,867,921 | | | | — | | | | — | | | | 3,867,921 | |
Variable Rate Demand Notes | | | — | | | | 23,550,000 | | | | — | | | | 23,550,000 | |
Total | | $ | 3,867,921 | | �� | $ | 343,209,714 | | | $ | — | | | $ | 347,077,635 | |
During the fiscal year ended April 30, 2012, the Fund recognized no significant transfers to or from Level 1, Level 2 or Level 3.
3. Derivative Instruments and Hedging Activities
The Fund records derivative instruments at fair value, with changes in fair value recognized on the Statement of Operations, when applicable. Even though the Fund’s investments in derivatives may represent economic hedges, they are not considered to be hedge transactions for financial reporting purposes. The Fund did not invest in derivative instruments during the fiscal year ended April 30, 2012.
4. Fund Shares
Transactions in Fund shares were as follows:
| | | | | | | | | | | | | | | | | | | | | | | | |
| | | Year Ended
4/30/12 | | | Ten Months Ended
4/30/11 | | | Year Ended
6/30/10 | |
| | | Shares | | | Amount | | | Shares | | | Amount | | | Shares | | | Amount | |
Shares sold: | | | | | | | | | | | | | | | | | | | | | | | | |
Class A | | | 3,089,516 | | | $ | 31,346,987 | | | | 421,279 | | | $ | 4,223,946 | | | | 413,958 | | | $ | 4,088,840 | |
Class C | | | 100,659 | | | | 1,023,985 | | | | N/A | | | | N/A | | | | N/A | | | | N/A | |
Class I | | | 17,366,166 | | | | 175,868,886 | | | | 14,222,873 | | | | 142,240,598 | | | | 25,824,027 | | | | 256,227,993 | |
Shares issued to shareholders due to reinvestment of distributions: | | | | | | | | | | | | | | | | | | | | | | | | |
Class A | | | 30,675 | | | | 311,311 | | | | 7,007 | | | | 70,025 | | | | 6,563 | | | | 56,353 | |
Class C | | | 193 | | | | 1,968 | | | | N/A | | | | N/A | | | | N/A | | | | N/A | |
Class I | | | 42,427 | | | | 429,784 | | | | 26,809 | | | | 268,006 | | | | 32,782 | | | | 325,254 | |
| | | | 20,629,636 | | | | 208,982,921 | | | | 14,677,968 | | | | 146,802,575 | | | | 26,277,330 | | | | 260,698,440 | |
Shares redeemed: | | | | | | | | | | | | | | | | | | | | | | | | |
Class A | | | (487,624 | ) | | | (4,954,870 | ) | | | (366,088 | ) | | | (3,638,389 | ) | | | (48,909 | ) | | | (486,511 | ) |
Class C | | | (83 | ) | | | (846 | ) | | | N/A | | | | N/A | | | | N/A | | | | N/A | |
Class I | | | (15,363,848 | ) | | | (155,522,739 | ) | | | (17,599,269 | ) | | | (175,832,145 | ) | | | (13,089,130 | ) | | | (129,985,882 | ) |
| | | | (15,851,555 | ) | | | (160,478,455 | ) | | | (17,965,357 | ) | | | (179,470,534 | ) | | | (13,138,039 | ) | | | (130,472,393 | ) |
Net increase (decrease) | | | 4,778,081 | | | $ | 48,504,466 | | | | (3,287,389 | ) | | $ | (32,667,959 | ) | | | 13,139,291 | | | $ | 130,226,047 | |
| N/A | – The Fund did not offer Class C Shares prior to August 31, 2011. |
5. Investment Transactions
Purchases and sales (including maturities but excluding short-term investments) during the fiscal year ended April 30, 2012, aggregated $180,557,682 and $117,970,746, respectively.
6. Income Tax Information
The following information is presented on an income tax basis. Differences between amounts for financial statement and federal income tax purposes are primarily due to timing differences in recognizing certain gains and losses on investment transactions. To the
Notes to Financial Statements (continued)
extent that differences arise that are permanent in nature, such amounts are reclassified within the capital accounts as detailed below. Temporary differences do not require reclassification. Temporary and permanent differences do not impact the net asset value of the Fund.
At April 30, 2012, the cost and unrealized appreciation (depreciation) of investments, as determined on a federal income tax basis, were as follows:
| | | | |
| | | | |
Cost of investments | | $ | 337,664,878 | |
Gross unrealized: | | | | |
Appreciation | | $ | 9,984,158 | |
Depreciation | | | (571,401 | ) |
Net unrealized appreciation (depreciation) of investments | | $ | 9,412,757 | |
Permanent differences, primarily due to federal taxes paid, resulted in reclassifications among the Fund’s components of net assets at April 30, 2012, the Fund’s tax year end, as follows:
| | | | |
| | | | |
Capital paid-in | | $ | 8,062 | |
Undistributed (Over-distribution of) net investment income | | | (8,062 | ) |
Accumulated net realized gain (loss) | | | — | |
The tax components of undistributed net tax-exempt income, net ordinary income and net long-term capital gains at April 30, 2012, the Fund’s tax year end, were as follows:
| | | | |
| | | | |
Undistributed net tax-exempt income* | | $ | 1,391,585 | |
Undistributed net ordinary income** | | | — | |
Undistributed net long-term capital gains | | | — | |
| * | Undistributed net tax exempt income (on a tax basis) has not been reduced for the dividends declared during the period April 1, 2012 through April 30, 2012 and paid on May 1, 2012. |
| ** | Net ordinary income consists of taxable market discount income and net short-term capital gains, if any. |
The tax character of distributions paid during the Fund’s tax years ended April 30, 2012, April 30, 2011 and June 30, 2010, was designated for purposes of the dividends paid deduction as follows:
| | | | |
| Tax Year ended April 30, 2012 | | | |
Distributions from net tax-exempt income*** | | $ | 6,583,563 | |
Distributions from net ordinary income** | | | 2 | |
Distributions from net long-term capital gains | | | — | |
| | | | |
| Ten months ended April 30, 2011 | | | |
Distributions from net tax-exempt income | | $ | 4,683,697 | |
Distributions from net ordinary income** | | | 36,861 | |
Distributions from net long-term capital gains | | | — | |
| |
| Tax year ended June 30, 2010 | | | |
Distributions from net tax-exempt income | | $ | 5,064,175 | |
Distributions from net ordinary income** | | | 17,356 | |
Distributions from net long-term gains | | | — | |
| ** | Net ordinary income consists of taxable market discount income and net short-term capital gains, if any. |
| *** | The Fund hereby designates this amount paid during the fiscal year ended April 30, 2012, as Exempt Interest Dividends. |
At April 30, 2012, the Fund’s tax year end, the Fund had unused capital loss carryforwards available for federal income tax purposes to be applied against future capital gains, if any. If not applied, the carryforwards will expire as follows:
| | | | |
| | | | |
Expiration: | | | | |
April 30, 2015 | | $ | 71,885 | |
April 30, 2017 | | | 312,109 | |
Total | | $ | 383,994 | |
During the Fund’s tax year ended April 30, 2012, the Fund utilized $347,473 of its capital loss carryforwards.
On December 22, 2010, the Regulated Investment Company Modernization Act of 2010 (the “Act”) was enacted, which changed various technical rules governing the tax treatment of RICs. The changes are generally effective for taxable years beginning after the date of enactment. One of the more prominent changes addresses capital loss carryforwards. Under the Act, the Fund will be permitted to carry forward capital losses incurred in taxable years beginning after the date of enactment for an unlimited period. However, any losses incurred during those future taxable years will be required to be utilized prior to the losses incurred in pre-enactment taxable years, which carry an expiration date. As a result of this ordering rule, pre-enactment capital loss carryforwards may be more likely to expire unused. Additionally, post-enactment capital loss carryforwards will retain their character as either short-term or long-term capital losses rather than being considered all short-term as permitted under previous regulation.
The Act also contains several provisions aimed at preserving the character of distributions made by a fiscal year RIC during the portion of its taxable year ending after October 31 or December 31, reducing the circumstances under which a RIC might be required to file amended Forms 1099 to restate previously reported distributions.
During the Fund’s tax year ended April 30, 2012, there were no post-enactment capital losses generated.
7. Management Fees and Other Transactions with Affiliates
The Fund’s management fee consists of two components – a fund-level fee, based only on the amount of assets within the Fund, and a complex-level fee, based on the aggregate amount of all eligible fund assets managed by the Adviser. This pricing structure enables Fund shareholders to benefit from growth in the assets within the Fund as well as from growth in the amount of complex-wide assets managed by the Adviser.
The annual fund-level fee, payable monthly, is calculated according to the following schedule:
| | | | |
| Average Daily Net Assets | | Fund-Level
Fee Rate | |
For the first $125 million | | | .2500 | % |
For the next $125 million | | | .2375 | |
For the next $250 million | | | .2250 | |
For the next $500 million | | | .2125 | |
For the next $1 billion | | | .2000 | |
For net assets over $2 billion | | | .1750 | |
The annual complex-level fee for the Fund, payable monthly, is determined by taking the complex-level fee rate, which is based on the aggregate amount of “eligible assets” of all Nuveen Funds as set forth in the schedule below, and making, as appropriate, an upward adjustment to that rate based upon the percentage of the particular fund’s assets that are not “eligible assets.” The complex-level fee schedule for the Fund is as follows:
| | | | |
| Complex-Level Asset Breakpoint Level* | | Effective Rate at Breakpoint Level | |
$55 billion | | | .2000 | % |
$56 billion | | | .1996 | |
$57 billion | | | .1989 | |
$60 billion | | | .1961 | |
$63 billion | | | .1931 | |
$66 billion | | | .1900 | |
$71 billion | | | .1851 | |
$76 billion | | | .1806 | |
$80 billion | | | .1773 | |
$91 billion | | | .1691 | |
$125 billion | | | .1599 | |
$200 billion | | | .1505 | |
$250 billion | | | .1469 | |
$300 billion | | | .1445 | |
| * | The complex-level fee is calculated based upon the aggregate daily “eligible assets” of all Nuveen Funds. Eligible assets do not include assets attributable to investments in other Nuveen Funds or assets in excess of $2 billion added to the Nuveen Fund complex in connection with the Adviser’s assumption of the management of the former First American Funds effective January 1, 2011. Eligible assets include closed-end fund assets managed by the Adviser that are attributable to financial leverage. For these purposes, financial leverage includes the closed-end funds’ use of preferred stock and borrowings and investments in the residual interest certificates (also called inverse floating rate securities) in tender option bond (TOB) trusts, including the portion of assets held by the TOB trust that has been effectively financed by the trust’s issuance of floating rate securities, subject to an agreement by the Adviser as to certain funds to limit the amount of such assets for determining eligible assets in certain circumstances. As of April 30, 2012, the complex-level fee rate for the Fund was .1954%. |
The management fee compensates the Adviser for overall investment advisory and administrative services and general office facilities. The Adviser is responsible for the Fund’s overall strategy and asset allocation decisions. The Adviser has entered into a sub-advisory agreement with the Sub-Adviser, under which the Sub-Adviser manages the investment portfolio of the Fund. The Sub-Adviser is compensated for its services to the Fund from the management fees paid to the Adviser.
Notes to Financial Statements (continued)
The Adviser has agreed to waive fees and/or reimburse expenses of the Fund so that total annual Fund operating expenses (excluding acquired Fund fees and expenses) do not exceed the percentage of the Fund’s average daily net assets, for each share class, as set forth in the following table:
| | | | |
| | | | |
Class A Shares | | | .80 | % |
Class C Shares | | | 1.15 | |
Class I Shares | | | .60 | |
Expiration date | | | August 31, 2012 | |
The Adviser may also voluntarily reimburse Fund expenses from time to time. Voluntary reimbursements may be terminated at any time at the Adviser’s discretion.
The Trust pays no compensation directly to those of its directors who are affiliated with the Adviser or to its officers, all of whom receive remuneration for their services to the Trust from the Adviser or its affiliates. The Board of Directors has adopted a deferred compensation plan for independent directors that enable directors to elect to defer receipt of all or a portion of the annual compensation they are entitled to receive from certain Nuveen-advised funds. Under the plan, deferred amounts are treated as though equal dollar amounts had been invested in shares of select Nuveen-advised funds.
During the fiscal year ended April 30, 2012, Nuveen Securities, LLC the Fund’s distributor, (the “Distributor”) collected sales charges on purchases of Class A Shares, the majority of which were paid out as concessions to financial intermediaries as follows:
| | | | |
| | | | |
Sales charges collected (Unaudited) | | $ | 88,589 | |
Paid to financial intermediaries (Unaudited) | | | 85,327 | |
The Distributor also received 12b-1 service fees on Class A Shares, substantially all of which were paid to compensate financial intermediaries for providing services to shareholders relating to their investments.
During the fiscal year ended April 30, 2012, the Distributor compensated financial intermediaries directly with commission advances at the time of purchase as follows:
| | | | |
| | | | |
Commission advances (Unaudited) | | $ | 74,651 | |
To compensate for commissions advanced to financial intermediaries, all 12b-1 service and distribution fees collected on Class C Shares during the first year following a purchase were retained by the Distributor to compensate for commissions advanced to financial intermediaries. During the fiscal year ended April 30, 2012, the Distributor retained such 12b-1 fees as follows:
| | | | |
| | | | |
12b-1 fees retained (Unaudited) | | $ | — | |
The remaining 12b-1 fees charged to the Fund was paid to compensate financial intermediaries for providing services to shareholders relating to their investments.
The Distributor also collected and retained CDSC on share redemptions during the fiscal year ended April 30, 2012, as follows:
| | | | |
| | | | |
CDSC retained (Unaudited) | | $ | 1,499 | |
8. New Accounting Pronouncements
Fair Value Measurements and Disclosures
On May 12, 2011, the Financial Accounting Standards Board (“FASB”) issued Accounting Standards Update (“ASU”) No. 2011-04 (“ASU No. 2011-04”) modifying Topic 820, Fair Value Measurements and Disclosures. At the same time, the International Accounting Standards Board (“IASB”) issued International Financial Reporting Standard (“IFRS”) 13, Fair Value Measurement. The objective of the FASB and IASB is convergence of their guidance on fair value measurements and disclosures. Specifically, ASU No. 2011-04 requires reporting entities to disclose i) the amounts of any transfers between Level 1 and Level 2 and the reasons for the transfers and ii) for Level 3 fair value measurements, a) quantitative information about significant unobservable inputs used, b) a description of the valuation processes used by the reporting entity and c) a narrative description of the sensitivity of the fair value measurement to changes in unobservable inputs if a change in those inputs might result in a significantly higher or lower fair value measurement. The effective date of the ASU No. 2011-04 is for interim and annual periods beginning after December 15, 2011. At this time, management is evaluating the implications of this guidance and the impact it will have to the financial statement amounts and footnote disclosures, if any.
Trustees and Officers (Unaudited)
The management of the Funds, including general supervision of the duties performed for the Funds by the Adviser, is the responsibility of the Board of Trustees of the Funds. The number of trustees of the Funds is currently set at ten. None of the trustees who are not “interested” persons of the Funds (referred to herein as “independent trustees”) has ever been a director or employee of, or consultant to, Nuveen or its affiliates. The names and business addresses of the trustees and officers of the Funds, their principal occupations and other affiliations during the past five years, the number of portfolios each oversees and other directorships they hold are set forth below.
The Funds’ Statement of Additional Information (“SAI”) includes more information about the trustees. To request a free copy, call Nuveen Investments at (800) 257-8787 or visit the Funds’ website at www.nuveen.com.
| | | | | | | | |
Name, Birthdate and Address | | Position(s) Held with the Funds | | Year First Elected or Appointed (1) | | Principal Occupation(s) Including other Directorships During Past 5 Years | | Number of Portfolios in Fund Complex Overseen by Trustee |
| | |
| Independent Trustees: | | | | |
Robert P. Bremner 8/22/40 333 W. Wacker Drive Chicago, IL 60606 | | Chairman of the Board and Trustee | | 1996 | | Private Investor and Management Consultant; Treasurer and Director, Humanities Council of Washington, D.C.; Board Member, Independent Directors Council affiliated with the Investment Company Institute. | | 232 |
Jack B. Evans 10/22/48 333 W. Wacker Drive Chicago, IL 60606 | | Trustee | | 1999 | | President, The Hall-Perrine Foundation, a private philanthropic corporation (since 1996); Director and Chairman, United Fire Group, a publicly held company; member of the Board of Regents for the State of Iowa University System; Director, Source Media Group; Life Trustee of Coe College and the Iowa College Foundation; formerly, Director, Alliant Energy; formerly, Director, Federal Reserve Bank of Chicago; formerly, President and Chief Operating Officer, SCI Financial Group, Inc., a regional financial services firm. | | 232 |
William C. Hunter 3/6/48 333 W. Wacker Drive Chicago, IL 60606 | | Trustee | | 2004 | | Dean, Tippie College of Business, University of Iowa (since 2006); Director (since 2004) of Xerox Corporation; Director (since 2005), Beta Gamma Sigma International Honor Society; Director of Wellmark, Inc. (since 2009); formerly, Dean and Distinguished Professor of Finance, School of Business at the University of Connecticut (2003-2006); previously, Senior Vice President and Director of Research at the Federal Reserve Bank of Chicago (1995-2003); formerly, Director (1997-2007), Credit Research Center at George Washington University. | | 232 |
David J. Kundert 10/28/42 333 W. Wacker Drive Chicago, IL 60606 | | Trustee | | 2005 | | Director, Northwestern Mutual Wealth Management Company; retired (since 2004) as Chairman, JPMorgan Fleming Asset Management, President and CEO, Banc One Investment Advisors Corporation, and President, One Group Mutual Funds; prior thereto, Executive Vice President, Banc One Corporation and Chairman and CEO, Banc One Investment Management Group; Member, Board of Regents, Luther College; member of the Wisconsin Bar Association; member of Board of Directors, Friends of Boerner Botanical Gardens; member of Board of Directors and Chair of Investment Committee, Greater Milwaukee Foundation. | | 232 |
William J. Schneider 9/24/44 333 W. Wacker Drive Chicago, IL 60606 | | Trustee | | 1996 | | Chairman of Miller-Valentine Partners Ltd., a real estate investment company; formerly, Senior Partner and Chief Operating Officer (retired 2004) of Miller-Valentine Group; member, University of Dayton Business School Advisory Council; member, Mid-America Health System Board; formerly, member and chair, Dayton Philharmonic Orchestra Association; formerly, member, Business Advisory Council, Cleveland Federal Reserve Bank. | | 232 |
Judith M. Stockdale 12/29/47 333 W. Wacker Drive Chicago, IL 60606 | | Trustee | | 1997 | | Executive Director, Gaylord and Dorothy Donnelley Foundation (since 1994); prior thereto, Executive Director, Great Lakes Protection Fund (1990-1994). | | 232 |
Carole E. Stone 6/28/47 333 W. Wacker Drive Chicago, IL 60606 | | Trustee | | 2007 | | Director, Chicago Board Options Exchange (since 2006); Director, C2 Options Exchange, Incorporated (since 2009); formerly, Commissioner, New York State Commission on Public Authority Reform (2005-2010); formerly, Chair, New York Racing Association Oversight Board (2005-2007). | | 232 |
Trustees and Officers (Unaudited) (continued)
| | | | | | | | |
Name, Birthdate and Address | | Position(s) Held with the Funds | | Year First Elected or Appointed (1) | | Principal Occupation(s) During Past Five Years | | Number of Portfolios in Fund Complex Overseen by Trustee |
Virginia L. Stringer 8/16/44 333 West Wacker Drive Chicago, IL 60606 | | Trustee | | 2011 | | Board Member, Mutual Fund Directors Forum; former governance consultant and non-profit board member; former Owner and President, Strategic Management Resources, Inc. a management consulting firm; former Member, Governing Board, Investment Company Institute’s Independent Directors Council; previously, held several executive positions in general management, marketing and human resources at IBM and The Pillsbury Company; Independent Director, First American Fund Complex (1987-2010) and Chair (1997-2010). | | 232 |
Terence J. Toth 9/29/59 333 W. Wacker Drive Chicago, IL 60606 | | Trustee | | 2008 | | Director, Legal & General Investment Management America, Inc. (since 2008); Managing Partner, Promus Capital (since 2008); formerly, CEO and President, Northern Trust Global Investments (2004-2007); Executive Vice President, Quantitative Management & Securities Lending (2000-2004); prior thereto, various positions with Northern Trust Company (since 1994); member: Goodman Theatre Board (since 2004), Chicago Fellowship Board (since 2005), Catalyst Schools of Chicago Board (since 2008); Mather Foundation Board (since 2012) and a member of its investment committee; formerly, member: Northern Trust Mutual Funds Board (2005-2007), Northern Trust Global Investments Board (2004-2007), Northern Trust Japan Board (2004-2007), Northern Trust Securities Inc. Board (2003-2007) and Northern Trust Hong Kong Board (1997-2004). | | 232 |
| | |
| Interested Trustee: | | | | |
John P. Amboian (2) 6/14/61 333 W. Wacker Drive Chicago, IL 60606 | | Trustee | | 2008 | | Chief Executive Officer and Chairman (since 2007) and Director (since 1999) of Nuveen Investments, Inc., formerly, President (1999-2007); Chief Executive Officer (since 2007) of Nuveen Investments Advisers Inc.; Director (since 1998) formerly, Chief Executive Officer (2007-2010) of Nuveen Fund Advisors, Inc. | | 232 |
Name, Birthdate and Address | | Position(s) Held with the Funds | | Year First Elected or Appointed (3) | | Principal Occupation(s) During Past 5 Years | | Number of Portfolios in Fund Complex Overseen by Officer |
| | |
| Officers of the Funds: | | | | |
Gifford R. Zimmerman 9/9/56 333 W. Wacker Drive Chicago, IL 60606 | | Chief Administrative Officer | | 1988 | | Managing Director (since 2002), Assistant Secretary of Nuveen Securities, LLC; Managing Director (since 2004) and Assistant Secretary (since 1994) of Nuveen Investments, Inc.; Managing Director (since 2002), Assistant Secretary (since 1997) and Co-General Counsel (since 2011) of Nuveen Fund Advisors, Inc.; Managing Director, Assistant Secretary and Associate General Counsel of Nuveen Asset Management, LLC (since 2011); Managing Director, Associate General Counsel and Assistant Secretary of Symphony Asset Management LLC (since 2003); Vice President and Assistant Secretary of NWQ Investment Management Company, LLC (since 2002), Nuveen Investments Advisers Inc. (since 2002), Santa Barbara Asset Management, LLC (since 2006) and of Winslow Capital Management Inc. (since 2010); Chief Administrative Officer and Chief Compliance Officer (since 2006) of Nuveen Commodities Asset Management, LLC; Chartered Financial Analyst. | | 232 |
Margo L. Cook 4/11/64 333 W. Wacker Drive Chicago, IL 60606 | | Vice President | | 2009 | | Executive Vice President (since 2008) of Nuveen Investments, Inc. and of Nuveen Fund Advisors, Inc. (since 2011); Managing Director – Investment Services of Nuveen Commodities Asset Management, LLC (since August 2011) previously, Head of Institutional Asset Management (2007-2008) of Bear Stearns Asset Management; Head of Institutional Asset Management (1986-2007) of Bank of NY Mellon; Chartered Financial Analyst. | | 232 |
| | | | | | | | |
Name, Birthdate and Address | | Position(s) Held with the Funds | | Year First Elected or Appointed (3) | | Principal Occupation(s) During Past 5 Years | | Number of Portfolios in Fund Complex Overseen by Officer |
Lorna C. Ferguson 10/24/45 333 W. Wacker Drive Chicago, IL 60606 | | Vice President | | 1998 | | Managing Director (since 2005) of Nuveen Fund Advisors, Inc. and Nuveen Securities, LLC (since 2004). | | 232 |
Stephen D. Foy 5/31/54 333 W. Wacker Drive Chicago, IL 60606 | | Vice President and Controller | | 1998 | | Senior Vice President (since 2010), formerly, Vice President (2005-2010) and Funds Controller of Nuveen Securities, LLC; Vice President of Nuveen Fund Advisors, Inc.; Chief Financial Officer of Nuveen Commodities Asset Management, LLC (since 2010); Certified Public Accountant. | | 232 |
Scott S. Grace 8/20/70 333 W. Wacker Drive Chicago, IL 60606 | | Vice President and Treasurer | | 2009 | | Managing Director, Corporate Finance & Development, Treasurer (since 2009) of Nuveen Securities, LLC; Managing Director and Treasurer (since 2009) of Nuveen Fund Advisors, Inc., Nuveen Investment Solutions, Inc., Nuveen Investments Advisers, Inc., Nuveen Investments Holdings Inc. and (since 2011) Nuveen Asset Management, LLC; Vice President and Treasurer of NWQ Investment Management Company, LLC, Tradewinds Global Investors, LLC, Symphony Asset Management LLC and Winslow Capital Management, Inc.; Vice President of Santa Barbara Asset Management, LLC; formerly, Treasurer (2006-2009), Senior Vice President (2008-2009), previously, Vice President (2006-2008) of Janus Capital Group, Inc.; formerly, Senior Associate in Morgan Stanley’s Global Financial Services Group (2000-2003); Chartered Accountant Designation. | | 232 |
Walter M. Kelly 2/24/70 333 W. Wacker Drive Chicago, IL 60606 | | Chief Compliance Officer and Vice President | | 2003 | | Senior Vice President (since 2008) and Assistant Secretary (since 2003) of Nuveen Fund Advisors, Inc; Senior Vice President (since 2008) of Nuveen Investments Holdings, Inc; formerly, Senior Vice President (2008-2011) of Nuveen Securities, LLC. | | 232 |
Tina M. Lazar 8/27/61 333 W. Wacker Drive Chicago, IL 60606 | | Vice President | | 2002 | | Senior Vice President (since 2010), formerly, Vice President (2005-2010) of Nuveen Fund Advisors, Inc. | | 232 |
Trustees and Officers (Unaudited) (continued)
| | | | | | | | |
Name, Birthdate and Address | | Position(s) Held with the Funds | | Year First Elected or Appointed (3) | | Principal Occupation(s) Including other Directorships During Past 5 Years | | Number of Portfolios in Fund Complex Overseen by Officer |
Kevin J. McCarthy 3/26/66 333 W. Wacker Drive Chicago, IL 60606 | | Vice President and Secretary | | 2007 | | Managing Director and Assistant Secretary (since 2008), formerly, Vice President (2007-2008), Nuveen Securities, LLC; Managing Director (since 2008), Assistant Secretary (since 2007) and Co-General Counsel (since 2011) of Nuveen Fund Advisors, Inc.; Managing Director, Assistant Secretary and Associate General Counsel (since 2011) of Nuveen Asset Management, LLC; Managing Director (since 2008), and Assistant Secretary, Nuveen Investment Holdings, Inc.; Vice President (since 2007) and Assistant Secretary of Nuveen Investments Advisers Inc., NWQ Investment Management Company, LLC, Tradewinds Global Investors LLC, NWQ Holdings, LLC, Symphony Asset Management LLC, Santa Barbara Asset Management, LLC, and of Winslow Capital Management, Inc. (since 2010); Vice President and Secretary (since 2010) of Nuveen Commodities Asset Management, LLC; prior thereto, Partner, Bell, Boyd & Lloyd LLP (1997-2007). | | 232 |
Kathleen L. Prudhomme 3/30/53 901 Marquette Avenue Minneapolis, MN 55402 | | Vice President and Assistant Secretary | | 2011 | | Managing Director, Assistant Secretary and Co-General Counsel (since 2011) of Nuveen Fund Advisors, Inc.; Managing Director, Assistant Secretary and Associate General Counsel (since 2011) of Nuveen Asset Management, LLC; Managing Director and Assistant Secretary (since 2011) of Nuveen Securities, LLC; formerly, Deputy General Counsel, FAF Advisors, Inc. (2004-2010). | | 232 |
Jeffery M. Wilson 3/13/56 333 West Wacker Drive Chicago, IL 60606 | | Vice President | | 2011 | | Senior Vice President of Nuveen Securities, LLC (since 2011); formerly, Senior Vice President of FAF Advisors, Inc. (2000-2010). | | 101 |
| (1) | Trustees serve an indefinite term until his/her successor is elected or appointed. The year first elected or appointed represents the year in which the trustee was first elected or appointed to any fund in the Nuveen Fund Complex. |
| (2) | Mr. Amboian is an interested trustee because of his position with Nuveen Investments, Inc. and certain of its subsidiaries, which are affiliates of the Nuveen Funds. |
| (3) | Officers serve one year terms through August of each year. The year first elected or appointed represents the year in which the officer was first elected or appointed to any fund in the Nuveen Fund Complex. |
Annual Investment Management Agreement Approval Process
(Unaudited)
A. Background
Prior to January 1, 2011, FAF Advisors, Inc. (“FAF”), a wholly-owned subsidiary of U.S. Bank National Association (“U.S. Bank”), served as investment adviser to the Fund pursuant to an investment advisory agreement between First American Investment Funds, Inc. (the “Company”) and FAF (the “Prior Advisory Agreement”), and as administrator to the Fund pursuant to an administrative agreement between the Company and FAF (the “Prior Administrative Agreement”). On July 29, 2010, U.S. Bank and FAF entered into a definitive agreement with Nuveen Investments, Inc. (“Nuveen”), Nuveen Asset Management (“NAM”) and certain Nuveen affiliates, whereby NAM would acquire a portion of the asset management business of FAF (the “Transaction”). The acquired business included the assets of FAF used in providing investment advisory services, research, sales and distribution in connection with equity, fixed income, real estate, global infrastructure and asset allocation investment products (other than the money market business and closed-end funds advised by FAF), including the Fund. In connection with the Transaction, the Board of Directors (the “Prior Board”) serving the Fund as directors at that time (each a “Prior Director” and, collectively, the “Prior Directors”) considered a number of proposals designed to integrate the Company’s funds (including the Fund) into the Nuveen family of funds, including the appointment of NAM as investment adviser and Nuveen Investments, LLC (currently known as Nuveen Securities, LLC), as distributor to the Fund. The Prior Board also considered a proposal in connection with an internal restructuring of NAM (the “Restructuring”), for Nuveen Asset Management, LLC (“NAM LLC”), a wholly-owned subsidiary of NAM formed in anticipation of the Restructuring, to serve as sub-advisor for the Fund.
The Prior Board approved a new investment advisory agreement (the “New Advisory Agreement”) for the Fund with NAM and an investment sub-advisory agreement between NAM and NAM LLC (the “NAM Sub-Advisory Agreement”). At a meeting of the Fund’s stockholders held on December 17, 2010, stockholders of the Fund approved the New Advisory Agreement and the NAM Sub-Advisory Agreement. In addition, stockholders of the Company’s funds (including the Fund) elected ten directors, including one Prior Director, to the board of directors of the Company (the “New Board”).
On December 31, 2010, the Transaction closed and the New Board (which replaced the Prior Board) took effect. On January 1, 2011, the New Advisory Agreement and the NAM Sub-Advisory Agreement became effective. In addition, in connection with the Restructuring, NAM has changed its name to Nuveen Fund Advisors, Inc. (“NFA”). The following is a summary of the considerations of the Prior Board, which were set forth in a proxy statement dated November 10, 2010 (the “Proxy Statement”), in approving the New Advisory Agreement and the NAM Sub-Advisory Agreement for the Fund.
B. Prior Board Considerations
The New Advisory Agreement for the Fund was approved by the Prior Board after consideration of all factors determined to be relevant to its deliberations, including those discussed below. The Prior Board authorized the submission of the New Advisory Agreement for consideration by the Fund’s stockholders.
At meetings held in May and June of 2010, the Prior Board was apprised of the general terms of the Transaction and, as a result, began the process of considering the transition of services from FAF to NFA. In preparation for its September 21-23, 2010 meeting, the Prior Board received, in response to a written due diligence request prepared by the Prior Board and its independent legal counsel and provided to NFA and FAF, a significant amount of information covering a range of issues in advance of the meeting. To assist the Prior Board in its consideration of the New Advisory Agreement for the Fund, NFA provided materials and information about, among other things: (1) NFA and its affiliates, including their history and organizational structure, product lines, experience in providing investment advisory, administrative and other services, and financial condition, (2) the nature, extent and quality of services to be provided under the New Advisory Agreement, (3) proposed Fund fees and expenses and comparative information relating thereto, and (4) NFA’s compliance and risk management capabilities and processes. In addition, the Prior Board was provided with a memorandum from independent legal counsel outlining the legal duties of the Prior Board under the Investment Company Act of 1940, as amended (the “1940 Act”). In response to further requests from the Prior Board and its independent legal counsel, NFA and FAF provided additional information to the Prior Board following its September 21-23 meeting.
An additional in-person meeting of the Prior Board to consider the New Advisory Agreement was held on October 7, 2010, at which the members of the Prior Board in attendance, all of whom were not considered to be “interested persons” of the Company as defined in the 1940 Act (the “Independent Prior Directors”), approved the New Advisory Agreement with NFA for the Fund.
In considering the New Advisory Agreement for the Fund, the Prior Board, advised by independent legal counsel, reviewed and analyzed the factors it deemed relevant, including: (1) the nature, quality, and extent of services to be rendered to the Fund by NFA, (2) the cost of services to be provided, including Fund expense information, and (3) whether economies of scale may be realized as the Fund grows and whether fee levels are adjusted to enable Fund investors to share in these potential economies of scale.
In considering the New Advisory Agreement, the Prior Board did not identify any particular information that was all-important or controlling, and each Prior Director may have attributed different weights to the various factors discussed below. Where appropriate, the Prior Directors evaluated all information available to them regarding the Company’s funds on a fund-by-fund basis, and their determinations were made separately with respect to each such fund (including the Fund). The Prior Directors, all of whom were Independent Prior Directors, concluded that the terms of the New Advisory Agreement and the fee rates to be paid in light of the
Annual Investment Management Agreement Approval Process
(Unaudited) (continued)
services to be provided to the Fund are in the best interests of the Fund, and that the New Advisory Agreement should be approved and recommended to stockholders for approval. In voting to approve the New Advisory Agreement with respect to the Fund, the Prior Board considered in particular the following factors:
Nature, Extent and Quality of Services. In considering approval of the New Advisory Agreement, the Prior Board considered the nature, extent and quality of services to be provided by NFA, including advisory services and administrative services. The Prior Board reviewed materials outlining, among other things, NFA’s organizational structure and business; the types of services that NFA or its affiliates are expected to provide to the Fund; the performance record of the Fund (as described in further detail below); and fund product lines offered by NFA. The Prior Board considered that affiliation with a larger fund complex and well-recognized sponsor may result in a broader distribution network, potential economies of scale with respect to other services or fees and broader shareholder services including exchange options.
With respect to personnel, the Prior Board considered information regarding retention plans for current FAF employees who would be offered employment by NFA, and the background and experience of NFA employees who would become portfolio managers as of the closing of the Transaction. The Prior Board also reviewed information regarding portfolio manager compensation arrangements to evaluate NFA’s ability to attract and retain high quality investment personnel.
In evaluating the services of NFA, the Prior Board also considered NFA’s ability to supervise the Fund’s other service providers and, given the importance of compliance, NFA’s compliance program. Among other things, the Prior Board considered the report of NFA’s chief compliance officer regarding NFA’s compliance policies and procedures.
In addition to advisory services, the Prior Board considered the quality of administrative services expected to be provided by NFA and its affiliates including product management, fund administration, oversight of service providers, shareholder services, administration of Board relations, regulatory and portfolio compliance and legal support.
The Prior Board considered that, based on representations from FAF and NFA, the Transaction would allow stockholders to continue their investment in each of the Company’s funds with the same investment objective and principal strategies. The Prior Board considered the historical investment performance of each of the Company’s funds (including the Fund) previously provided during the annual contract renewal process.
Cost of Services Provided by NFA. In evaluating the costs of the services to be provided by NFA under the New Advisory Agreement, the Prior Board received a comparison of the Fund’s annual operating expenses as of June 30, 2010 under the Prior Advisory Agreement and under the New Advisory Agreement, in each case adjusted to reflect a decrease in net assets for certain of the Company’s funds from redemptions by the U.S. Bank 401(k) Plan expected to occur prior to the closing of the Transaction. The Prior Board considered, among other things, that the advisory fee rates and other expenses would change as a result of NFA serving as investment adviser to the Fund. The Prior Board noted that the services provided by NFA under the New Advisory Agreement would include certain administrative services, which services (along with other services) were provided pursuant to the Prior Administrative Agreement and were charged separately from the advisory fee. Accordingly, the Prior Board considered that the fee rates paid under the New Advisory Agreement include bundled investment advisory and administrative fees and thus are higher than the fee rates paid under the Prior Advisory Agreement for most of the Company’s funds, but lower than the combined fee rates paid under the Prior Advisory Agreement and the Prior Administrative Agreement. The Prior Board also noted that certain administrative services provided under the Prior Administrative Agreement would not be provided under the New Advisory Agreement and will be delegated to other service providers. Similarly, certain fees paid by FAF under the Prior Administrative Agreement will not be paid by NFA under the New Advisory Agreement and will be paid directly by the Fund. However, immediately following the closing of the Transaction, the net expense ratio of each of the Company’s funds was expected to be the same or lower than the fund’s net expense ratio as of June 30, 2010, adjusted (where applicable) to reflect a decrease in net assets resulting from redemptions by the U.S. Bank 401(k) Plan expected to occur prior to the closing of the Transaction, assuming the fund’s net assets at the time of the closing of the Transaction were no lower than their adjusted June 30 level. In addition, the Prior Board noted that NFA has committed to certain undertakings to maintain current fee caps and/or to waive fees or reimburse expenses to maintain net management fees at certain levels and Nuveen has represented to the Prior Board that Nuveen and its affiliates will not take any action that imposes an “unfair burden” on the Fund as a result of the Transaction. The Prior Board also considered that fees payable under the New Advisory Agreement include both a fund-level fee and a complex-level fee, and that schedules for the fund-level and complex-level fees contain breakpoints that are based, respectively, on fund assets and Nuveen complex-wide assets. The Prior Board considered that breakpoints in the fund-level fee allow for the possibility that this portion of the advisory fee could decline in the future if Fund assets were to increase or increase in the future if Fund assets were to decline. The Prior Board also considered that breakpoints in the complex-level fee allow for the possibility that this portion of the advisory fee could decline in the future if complex-wide assets were to increase or increase in the future if complex-wide assets were to decline, regardless, in each case, of whether assets of a particular fund of the Company had increased or decreased.
In considering the compensation to be paid to NFA, the Prior Board also reviewed fee information regarding NFA-sponsored funds, to the extent such funds had similar investment objectives and strategies to the Company’s funds. The Prior Board reviewed information provided by NFA regarding similar funds managed by NFA and noted that the fee rates payable by these funds were generally
comparable to the fee rates proposed for the Company’s funds. The Prior Board also compared proposed fee and expense information to the median fees and expenses of comparable funds, using information provided by an independent data service.
In evaluating the compensation, the Prior Board also considered other amounts expected to be paid to NFA by the Fund as well as any indirect benefits (such as soft dollar arrangements, if any) NFA and its affiliates are expected to receive, that are directly attributable to the management of the Fund.
The Prior Board also considered that the Fund would not bear any of the costs relating to the Transaction, including the costs of preparing, printing and mailing the Proxy Statement.
Economies of Scale. The Prior Board reviewed information regarding potential economies of scale or other efficiencies that might result from the Fund’s potential association with Nuveen. The Prior Board noted that the New Advisory Agreement provides for breakpoints in the Fund’s fund-level and complex-level management fee rates as the assets of the Fund and the assets held by the various registered investment companies sponsored by Nuveen increase, respectively. The Prior Board concluded that the structure of the investment management fee rates, with the breakpoints for the Fund under the New Advisory Agreement, reflected sharing of potential economies of scale with the Fund’s stockholders.
Conclusion. After deliberating in executive session, the members of the Prior Board in attendance, all of whom were Independent Prior Directors, approved the New Advisory Agreement with respect to the Fund, concluding that the New Advisory Agreement was in the best interests of the Fund.
NAM Sub-Advisory Agreement. The Prior Board also approved the NAM Sub-Advisory Agreement between NFA and NAM LLC as a result of the Restructuring expected to occur with NFA. The Prior Board considered that the services to be provided by NAM LLC under the NAM Sub-Advisory Agreement would not result in any material change in the nature or level of investment advisory services or administrative services provided to the Fund. In addition, the portfolio managers will continue to manage the Fund in their capacity as employees of NAM LLC. The Prior Board considered that NFA will pay a portion of the advisory fee it receives from the Fund to NAM LLC for its services as sub-advisor. The Prior Board concluded, based upon the conclusions that the Prior Board reached in connection with the approval of the New Advisory Agreement and after determining that it need not reconsider all of the factors that it had considered in connection with the approval of the New Advisory Agreement, to approve the NAM Sub-Advisory Agreement.
Notes
Notes
Glossary of Terms Used in this Report
Auction Rate Bond: An auction rate bond is a security whose interest payments are adjusted periodically through an auction process, which process typically also serves as a means for buying and selling the bond. Auctions that fail to attract enough buyers for all the shares offered for sale are deemed to have “failed,” with current holders receiving a formula-based interest rate until the next scheduled auction.
Average Annual Total Return: This is a commonly used method to express an investment’s performance over a particular, usually multi-year time period. It expresses the return that would have been necessary each year to equal the investment’s actual cumulative performance (including change in NAV or offer price and reinvested distributions and capital gains, if any) over the time period being considered.
Average Effective Maturity: The market-value-weighted average of the effective maturity dates of the individual securities including cash. In the case of a bond that has been advance-refunded to a call date, the effective maturity is the date on which the bond is scheduled to be redeemed using the proceeds of an escrow account. In most other cases the effective maturity is the stated maturity date of the security.
Barclays 3-Year Municipal Bond Index: An unmanaged index comprised of fixed-rate, investment-grade tax-exempt bonds with remaining maturities between two and four years. Index returns assume reinvestment of distributions, but do not reflect any applicable sales charges or management fees.
Duration: Duration is a measure of the expected period over which a bond’s principal and interest will be paid, and consequently is a measure of the sensitivity of a bond’s (or bond fund’s) value to changes when market interest rates change. Generally, the longer a bond or Fund’s duration, the more the price of the bond or Fund will change as interest rates change.
Inverse Floating Rate Securities: Inverse floating rate securities, also known as inverse floaters or tender option bonds (TOBs), are created by depositing a municipal bond, typically with a fixed interest rate, into a special purpose trust created by a broker-dealer. This trust, in turn, (a) issues floating rate certificates typically paying short-term tax-exempt interest rates to third parties in amounts equal to some fraction of the deposited bond’s par amount or market value, and (b) issues an inverse floating rate certificate (sometimes referred to as an “inverse floater”) to an investor (such as a Fund) interested in gaining investment exposure to a long-term municipal bond. The income received by the holder of the inverse floater varies inversely with the short-term rate paid to the floating rate certificates’ holders, and in most circumstances the holder of the inverse floater bears substantially all of the underlying bond’s downside investment risk. The holder of the inverse floater typically also benefits disproportionately from any potential appreciation of the underlying bond’s value. Hence, an inverse floater essentially represents an investment in the underlying bond on a leveraged basis.
Lipper Short Municipal Debt Funds Classification Average: Represents the average annualized total return for all reporting funds in the Lipper Short Municipal Debt Funds Classification. Lipper returns account for the effects of management fees and assume reinvestment of distributions, but do not reflect any applicable sales charges.
Net Asset Value (NAV): The net market value of all securities held in a portfolio.
Net Asset Value (NAV) Per Share: The market value of one share of a mutual fund or closed-end fund. For a Fund, the NAV is calculated daily by taking the Fund’s total assets (securities, cash, and accrued earnings), subtracting the Funds’s liabilities, and dividing by the number of shares outstanding.
Pre-Refundings: Pre-Refundings, also known as advance refundings or refinancings, occur when an issuer sells new bonds and uses the proceeds to fund principal and interest payments of older existing bonds. This process often results in lower borrowing costs for bond issuers.
Standard & Poor’s (S&P) Municipal Bond Short Index: An unleveraged, market value-weighted index containing all of the bonds in the S&P Municipal Bond Index with maturities between 6 months and 3.999 years. Index returns assume reinvestment of distributions, but do not reflect any applicable sales charges or management fees.
Tax Equalization: The practice of treating a portion of the distribution made to a redeeming shareholder, which represents his proportionate part of undistributed net investment income and capital gain as a distribution for tax purposes. Such amounts are referred to as the equalization debits (or payments) and will be considered a distribution to the shareholder of net investment income and capital gain for calculation of the Fund’s dividends paid deduction.
Additional Fund Information
Fund Manager
Nuveen Fund Advisors, Inc.
333 West Wacker Drive
Chicago, IL 60606
Sub-Adviser
Nuveen Asset Management, LLC
333 West Wacker Drive
Chicago, IL 60606
Legal Counsel
Chapman and Cutler LLP
Chicago, IL
Independent Registered
Public Accounting Firm*
PricewaterhouseCoopers LLP
Chicago, IL
Custodian
U.S. Bank National Association
St. Paul, MN
Transfer Agent and
Shareholder Services
Boston Financial
Data Services, Inc.
Nuveen Investor Services
P.O. Box 8530
Boston, MA 02266-8530
(800) 257-8787
| * | The Board of Directors of the Fund, upon recommendation of the Audit Committee, engaged PricewaterhouseCoopers LLP as the Fund’s independent registered public accounting firm as of March 1, 2011. On December 30, 2011, Ernst & Young, LLP (“Ernst & Young”) completed its work on the October 31, 2011 audits and resigned as the independent registered public accounting firm of the Fund. |
| | Ernst & Young’s report on the Fund’s financial statements for the periods ended April 30, 2011 and June 30, 2010, contained no adverse opinion or disclaimer of opinion, and were not qualified or modified as to uncertainty, audit scope or accounting principles. For the periods ended April 30, 2011 and June 30, 2010, there were no disagreements with Ernst & Young on any matter of accounting principles, financial statement disclosure or auditing scope or procedures, which disagreements, if not resolved to the satisfaction of Ernst & Young, would have caused it to make reference to the subject matter of the disagreements in connection with its reports on the Fund’s financial statements. |
Quarterly Portfolio of Investments and Proxy Voting Information: You may obtain (i) the Fund’s quarterly portfolio of investments, (ii) information regarding how the Fund voted proxies relating to portfolio securities held during the most recent twelve-month period ended June 30, and (iii) a description of the policies and procedures that the Fund used to determine how to vote proxies relating to portfolio securities without charge, upon request, by calling Nuveen Investments at (800) 257-8787 or on Nuveen’s website at www.nuveen.com.
You may also obtain this and other Fund information directly from the Securities and Exchange Commission (SEC). The SEC may charge a copying fee for this information. Visit the SEC on-line at http://www.sec.gov or in person at the SEC’s Public Reference Room in Washington, D.C. Call the SEC at (202) 942-8090 for room hours and operation. You may also request Fund information by sending an e-mail request to publicinfo@sec.gov or by writing to the SEC’s Public Reference Section at 100 F Street NE, Washington, D.C. 20549.
The Financial Industry Regulatory Authority (FINRA) provides a Public Disclosure Program which supplies certain information regarding the disciplinary history of FINRA members and their associated persons in response to either telephone inquiries at (800) 289-9999 or written inquiries at www.finra.org. FINRA also provides an investor brochure that includes information describing the Public Disclosure Program.
Nuveen Investments:
Serving Investors for Generations
Since 1898, financial advisors and their clients have relied on Nuveen Investments to provide dependable investment solutions through continued adherence to proven, long-term investing principles. Today, we offer a range of high quality equity and fixed-income solutions designed to be integral components of a well-diversified core portfolio.
Focused on meeting investor needs.
Nuveen Investments provides high-quality investment services designed to help secure the longterm goals of institutional and individual investors as well as the consultants and financial advisors who serve them. Nuveen Investments markets a wide range of specialized investment solutions which provide investors access to capabilities of its high-quality boutique investment affiliates-Nuveen Asset Management, Symphony Asset Management, NWQ Investment Management Company, Santa Barbara Asset Management, Tradewinds Global Investors, Winslow Capital Management, and Gresham Investment Management. In total, Nuveen Investments managed approximately $227 billion as of March 31, 2012.
Find out how we can help you.
To learn more about how the products and services of Nuveen Investments may be able to help you meet your financial goals, talk to your financial advisor, or call us at (800) 257-8787. Please read the information provided carefully before you invest. Investors should consider the investment objective and policies, risk considerations, charges and expenses of any investment carefully. Where applicable, be sure to obtain a prospectus, which contains this and other relevant information. To obtain a prospectus, please contact your securities representative or Nuveen Investments, 333 W. Wacker Dr., Chicago, IL 60606. Please read the prospectus carefully before you invest or send money.
Learn more about Nuveen Funds at: www.nuveen.com/mf
| | |
Distributed by Nuveen Securities, LLC 333 West Wacker Drive Chicago, IL 60606 www.nuveen.com | | |
MAN-STMB-0412P
ITEM 2. CODE OF ETHICS.
As of the end of the period covered by this report, the registrant has adopted a code of ethics that applies to the registrant’s principal executive officer, principal financial officer, principal accounting officer or controller, or persons performing similar functions. There were no amendments to or waivers from the code during the period covered by this report. The registrant has posted the code of ethics on its website at www.nuveen.com/mf. (To view the code, click on the Shareholder Resources drop down menu box, click on Fund Governance and then click on Code of Conduct.)
ITEM 3. AUDIT COMMITTEE FINANCIAL EXPERT.
The registrant’s Board of Trustees determined that the registrant has at least one “audit committee financial expert” (as defined in Item 3 of Form N-CSR) serving on its Audit Committee. The registrant’s audit committee financial expert is Carole E. Stone, who is “independent” for purposes of Item 3 of Form N-CSR.
Ms. Stone served for five years as Director of the New York State Division of the Budget. As part of her role as Director, Ms. Stone was actively involved in overseeing the development of the State’s operating, local assistance and capital budgets, its financial plan and related documents; overseeing the development of the State’s bond-related disclosure documents and certifying that they fairly presented the State’s financial position; reviewing audits of various State and local agencies and programs; and coordinating the State’s system of internal audit and control. Prior to serving as Director, Ms Stone worked as a budget analyst/examiner with increasing levels of responsibility over a 30 year period, including approximately five years as Deputy Budget Director. Ms. Stone has also served as Chair of the New York State Racing Association Oversight Board, as Chair of the Public Authorities Control Board, as a Commissioner on the New York State Commission on Public Authority Reform and as a member of the Boards of Directors of several New York State public authorities. These positions have involved overseeing operations and finances of certain entities and assessing the adequacy of project/entity financing and financial reporting. Currently, Ms. Stone is on the Board of Directors of CBOE Holdings, Inc., of the Chicago Board Options Exchange, and of C2 Options Exchange. Ms. Stone’s position on the boards of these entities and as a member of both CBOE Holdings’ Audit Committee and its Finance Committee has involved, among other things, the oversight of audits, audit plans and preparation of financial statements.
ITEM 4. PRINCIPAL ACCOUNTANT FEES AND SERVICES.
The following tables show the amount of fees that PricewaterhouseCoopers LLP, the Trust’s auditor, billed to the Trust during the Trust’s last full fiscal year ending April 30, 2012 and the amount that Ernst & Young LLP, the Trust’s previous auditor, billed to the Trust during the Trust’s fiscal year ending April 30, 2011. The Audit Committee approved in advance all audit services and non-audit services that PricewaterhouseCoopers LLP and Ernst & Young LLP provided to the Trust, except for those non-audit services that were subject to the pre-approval exception under Rule 2-01 of Regulation S-X (the “pre-approval exception”). The pre-approval exception for services provided directly to the Trust waives the pre-approval requirement for services other than audit, review or attest services if: (A) the aggregate amount of all such services provided constitutes no more than 5% of the total amount of revenues paid by the Trust during the fiscal year in which the services are provided; (B) the Trust did not recognize the services as non-audit services at the time of the engagement; and (C) the services are promptly brought to the Audit Committee’s attention, and the Committee (or its delegate) approves the services before the audit is completed.
The Audit Committee has delegated certain pre-approval responsibilities to its Chairman (or, in his absence, any other member of the Audit Committee).
SERVICES THAT THE TRUST’S AUDITOR BILLED TO THE TRUST
| | | | | | | | | | | | | | | | |
Fiscal Year Ended April 30, 2012 | | Audit Fees Billed
to Funds 1 | | | Audit-Related Fees
Billed to Funds 2 | | | Tax Fees
Billed to Funds 3 | | | All Other Fees
Billed to Funds 4 | |
Name of Series | | | | | | | | | | | | | | | | |
Short Term Municipal Bond Fund 5 | | | 16,115 | | | | 0 | | | | 0 | | | | 0 | |
| | | | | | | | | | | | | | | | |
Total | | $ | 16,115 | | | $ | 0 | | | $ | 0 | | | $ | 0 | |
| 1 | | “Audit Fees” are the aggregate fees billed for professional services for the audit of the Fund’s annual financial statements and services provided in connection with statutory and regulatory filings or engagements. |
| 2 | | “Audit Related Fees” are the aggregate fees billed for assurance and related services reasonably related to the performance of the audit or review of financial statements and are not reported under “Audit Fees”. |
| 3 | | “Tax Fees” are the aggregate fees billed for professional services for tax advice, tax compliance, and tax planning. |
| 4 | | “All Other Fees” are the aggregate fees billed for products and services other than “Audit Fees”, “Audit Related Fees”, and “Tax Fees”. |
| 5 | | The Fund changed names from Short Tax Free Fund to Short Term Municipal Bond Fund. |
| | | | | | | | | | | | | | | | |
| | | Percentage Approved Pursuant to Pre-approval Exception | |
| | | Audit Fees Billed
to Funds | | | Audit-Related Fees
Billed to Funds | | | Tax Fees
Billed to Funds | | | All Other Fees
Billed to Funds | |
Name of Series | | | | | | | | | | | | | | | | |
Short Term Municipal Bond Fund | | | 0 | % | | | 0 | % | | | 0 | % | | | 0 | % |
| | | | | | | | | | | | | | | | |
Fiscal Year Ended April 30, 20115 | | Audit Fees Billed
to Funds 1 | | | Audit-Related Fees
Billed to Funds 2 | | | Tax Fees
Billed to Funds 3 | | | All Other Fees
Billed to Funds 4 | |
Name of Series | | | | | | | | | | | | | | | | |
Short Term Municipal Bond Fund | | | 19,091 | | | | 0 | | | | 1,348 | | | | 0 | |
| | | | | | | | | | | | | | | | |
Total | | $ | 19,091 | | | $ | 0 | | | $ | 1,348 | | | $ | 0 | |
| 1 | | “Audit Fees” are the aggregate fees billed for professional services for the audit of the Fund’s annual financial statements and services provided in connection with statutory and regulatory filings or engagements. |
| 2 | | “Audit Related Fees” are the aggregate fees billed for assurance and related services reasonably related to the performance of the audit or review of financial statements and are not reported under “Audit Fees”. |
| 3 | | “Tax Fees” are the aggregate fees billed for professional services for tax advice, tax compliance, and tax planning. |
| 4 | | “All Other Fees” are the aggregate fees billed for products and services other than “Audit Fees”, “Audit Related Fees”, and “Tax Fees”. |
| 5 | | The Fund was acquired on December 31, 2010 and changed fiscal year from June to April beginning in January, 2011. |
| | | | | | | | | | | | | | | | |
| | | Percentage Approved Pursuant to Pre-approval Exception | |
| | | Audit Fees Billed
to Funds | | | Audit-Related Fees
Billed to Funds | | | Tax Fees
Billed to Funds | | | All Other Fees
Billed to Funds | |
Name of Series | | | | | | | | | | | | | | | | |
Short Term Municipal Bond Fund | | | 0 | % | | | 0 | % | | | 0 | % | | | 0 | % |
| | | | | | | | | | | | |
Fiscal Year Ended April 30, 2012 | | Audit-Related Fees
Billed to Adviser and
Affiliated Fund
Service Providers | | | Tax Fees Billed to
Adviser and
Affiliated Fund
Service Providers | | | All Other Fees
Billed to Adviser
and Affiliated Fund
Service Providers | |
Nuveen Investment Funds, Inc. | | $ | 0 | | | $ | 0 | | | $ | 0 | |
| | | | | | | | | | | | |
| | | Percentage Approved Pursuant to Pre-approval Exception | |
| | | Audit-Related Fees
Billed to Adviser and
Affiliated Fund
Service Providers | | | Tax Fees Billed to
Adviser and
Affiliated Fund
Service Providers | | | All Other Fees
Billed to Adviser
and Affiliated Fund
Service Providers | |
| | | 0 | % | | | 0 | % | | | 0 | % |
| | | | | | | | | | | | |
Fiscal Year Ended April 30, 2011 | | Audit-Related Fees
Billed to Adviser and
Affiliated Fund
Service Providers | | | Tax Fees Billed to
Adviser and
Affiliated Fund
Service Providers | | | All Other Fees
Billed to Adviser
and Affiliated Fund
Service Providers | |
Nuveen Investment Funds, Inc. | | $ | 0 | | | $ | 0 | | | $ | 0 | |
| | | | | | | | | | | | |
| | | Percentage Approved Pursuant to Pre-approval Exception | |
| | | Audit-Related Fees
Billed to Adviser and
Affiliated Fund
Service Providers | | | Tax Fees Billed to
Adviser and
Affiliated Fund
Service Providers | | | All Other Fees
Billed to Adviser
and Affiliated Fund
Service Providers | |
| | | 0 | % | | | 0 | % | | | 0 | % |
| | | | | | | | | | | | | | | | |
Fiscal Year Ended April 30, 2012 | | Total Non-Audit Fees
Billed to Trust | | | Total Non-Audit Fees
billed to Adviser and
Affiliated Fund Service
Providers (engagements
related directly to the
operations and financial
reporting of the Trust) | | | Total Non-Audit Fees
billed to Adviser and
Affiliated Fund Service
Providers (all other
engagements) | | | Total | |
Name of Series | | | | | | | | | | | | | | | | |
Short Term Municipal Bond Fund 1 | | | 0 | | | | 0 | | | | 0 | | | | 0 | |
| | | | | | | | | | | | | | | | |
Total | | $ | 0 | | | $ | 0 | | | $ | 0 | | | $ | 0 | |
“Non-Audit Fees Billed to Trust” represent “Tax Fees” and “All Other Fees” billed to each Fund in their respective amounts from the previous table.
| 1 | | The Fund changed names from Short Tax Free Fund to Short Term Municipal Bond Fund. |
| | | | | | | | | | | | | | | | |
Fiscal Year Ended April 30, 20111 | | Total Non-Audit Fees
Billed to Trust | | | Total Non-Audit Fees
billed to Adviser and
Affiliated Fund Service
Providers (engagements
related directly to the
operations and financial
reporting of the Trust) | | | Total Non-Audit Fees
billed to Adviser and
Affiliated Fund Service
Providers (all other
engagements) | | | Total | |
Name of Series | | | | | | | | | | | | | | | | |
Short Term Municipal Bond Fund | | | 1,348 | | | | 0 | | | | 0 | | | | 1,348 | |
| | | | | | | | | | | | | | | | |
Total | | $ | 1,348 | | | $ | 0 | | | $ | 0 | | | $ | 1,348 | |
“Non-Audit Fees Billed to Trust” represent “Tax Fees” and “All Other Fees” billed to each Fund in their respective amounts from the previous table.
| 1 | | The Fund was acquired on December 31, 2010 and changed fiscal year from June to April beginning in January, 2011. |
Audit Committee Pre-Approval Policies and Procedures. Generally, the Audit Committee must approve (i) all non-audit services to be performed for the Trust by the Trust’s independent accountants and (ii) all audit and non-audit services to be performed by the Trust’s independent accountants for the Affiliated Fund Service Providers with respect to the operations and financial reporting of the Trust. Regarding tax and research projects conducted by the independent accountants for the Trust and Affiliated Fund Service Providers (with respect to operations and financial reports of the Trust), such engagements will be (i) pre-approved by the Audit Committee if they are expected to be for amounts greater than $10,000; (ii) reported to the Audit Committee Chairman for his verbal approval prior to engagement if they are expected to be for amounts under $10,000 but greater than $5,000; and (iii) reported to the Audit Committee at the next Audit Committee meeting if they are expected to be for an amount under $5,000.
ITEM 5. AUDIT COMMITTEE OF LISTED REGISTRANTS
Not applicable to this registrant.
ITEM 6. SCHEDULE OF INVESTMENTS
| a) | | See Portfolio of Investments in Item 1. |
ITEM 7. DISCLOSURE OF PROXY VOTING POLICIES AND PROCEDURES FOR CLOSED-END
MANAGEMENT INVESTMENT COMPANIES
Not applicable to this registrant.
ITEM 8. PORTFOLIO MANAGERS OF CLOSED-END MANAGEMENT INVESTMENT COMPANIES
Not applicable to this registrant.
ITEM 9. PURCHASES OF EQUITY SECURITIES BY CLOSED-END MANAGEMENT INVESTMENT COMPANY AND AFFILIATED PURCHASERS
Not applicable to this registrant.
ITEM 10. SUBMISSION OF MATTERS TO A VOTE OF SECURITY HOLDERS
There have been no material changes to the procedures by which shareholders may recommend nominees to the registrant’s Board of Trustees implemented after the registrant last provided disclosure in response to this Item.
ITEM 11. CONTROLS AND PROCEDURES.
| | (a) | | The registrant’s principal executive and principal financial officers, or persons performing similar functions, have concluded that the registrant’s disclosure controls and procedures (as defined in Rule 30a-3(c) under the Investment Company Act of 1940, as amended (the “1940 Act”) (17 CFR 270.30a-3(c))) are effective, as of a date within 90 days of the filing date of this report that includes the disclosure required by this paragraph, based on their evaluation of the controls and procedures required by Rule 30a-3(b) under the 1940 Act (17 CFR 270.30a-3(b)) and Rules 13a-15(b) or 15d-15(b) under the Securities Exchange Act of 1934, as amended (the “Exchange Act”) (17 CFR 240.13a-15(b) or 240.15d-15(b)). |
| | (b) | | There were no changes in the registrant’s internal control over financial reporting (as defined in Rule 30a-3(d) under the 1940 Act (17 CFR 270.30a-3(d)) that occurred during the second fiscal quarter of the period covered by this report that has materially affected, or is reasonably likely to materially affect, the registrant’s internal control over financial reporting. |
ITEM 12. EXHIBITS
File the exhibits listed below as part of this Form.
| | |
| (a)(1) | | Any code of ethics, or amendment thereto, that is the subject of the disclosure required by Item 2, to the extent that the registrant intends to satisfy the Item 2 requirements through filing of an exhibit: Not applicable because the code is posted on registrant’s website at www.nuveen.com/mf and there were no amendments during the period covered by this report. (To view the code, click on the Shareholder Resources drop down menu box, click on Fund Governance and then Code of Conduct.) |
| |
| (a)(2) | | A separate certification for each principal executive officer and principal financial officer of the registrant as required by Rule 30a-2(a) under the 1940 Act (17 CFR 270.30a-2(a)) in the exact form set forth below: See EX-99.CERT attached hereto. |
| |
| (a)(3) | | Any written solicitation to purchase securities under Rule 23c-1 under the 1940 Act (17 CFR 270.23c-1) sent or given during the period covered by the report by or on behalf of the registrant to 10 or more persons: Not applicable to this registrant. |
| |
| (b) | | If the report is filed under Section 13(a) or 15(d) of the Exchange Act, provide the certifications required by Rule 30a-2(b) under the 1940 Act (17 CFR 270.30a-2(b)), Rule 13a-14(b) or Rule 15d-14(b) under the Exchange Act (17 CFR 240.13a-14(b) or 240.15d-14(b)), and Section 1350 of Chapter 63 of Title 18 of the United States Code (18 U.S.C. 1350) as an Exhibit. A certification furnished pursuant to this paragraph will not be deemed “filed” for purposes of Section 18 of the Exchange Act (15 U.S.C. 78r), or otherwise subject to the liability of that section. Such certification will not be deemed to be incorporated by reference into any filing under the Securities Act of 1933 or the Exchange Act, except to the extent that the registration specifically incorporates it by reference: See EX-99.906 CERT attached hereto. |
SIGNATURES
Pursuant to the requirements of the Securities Exchange Act of 1934 and the Investment Company Act of 1940, the registrant has duly caused this report to be signed on its behalf by the undersigned, thereunto duly authorized.
(Registrant) Nuveen Investment Funds, Inc.
| | |
| |
By (Signature and Title) | | /s/ Kevin J. McCarthy |
| | Kevin J. McCarthy |
| | Vice President and Secretary |
Date: July 9, 2012
Pursuant to the requirements of the Securities Exchange Act of 1934 and the Investment Company Act of 1940, this report has been signed below by the following persons on behalf of the registrant and in the capacities and on the dates indicated.
| | |
| |
By (Signature and Title) | | /s/ Gifford R. Zimmerman |
| | Gifford R. Zimmerman |
| | Chief Administrative Officer |
| | (principal executive officer) |
Date: July 9, 2012
| | |
| |
| By (Signature and Title) | | /s/ Stephen D. Foy |
| | Stephen D. Foy |
| | Vice President and Controller |
| | (principal financial officer) |
Date: July 9, 2012