UNITED STATES
SECURITIES AND EXCHANGE COMMISSION
Washington, D.C. 20549
FORM N-CSR
CERTIFIED SHAREHOLDER REPORT OF REGISTERED MANAGEMENT
INVESTMENT COMPANIES
Investment Company Act file number 811-05309
Nuveen Investment Funds, Inc.
(Exact name of registrant as specified in charter)
Nuveen Investments
333 West Wacker Drive, Chicago, IL 60606
(Address of principal executive offices) (Zip code)
Kevin J. McCarthy
Nuveen Investments
333 West Wacker Drive
Chicago, IL 60606
(Name and address of agent for service)
Registrant’s telephone number, including area code: (312) 917-7700
Date of fiscal year end: June 30
Date of reporting period: June 30, 2012
Form N-CSR is to be used by management investment companies to file reports with the Commission not later than 10 days after the transmission to stockholders of any report that is required to be transmitted to stockholders under Rule 30e-1 under the Investment Company Act of 1940 (17 CFR 270.30e-1). The Commission may use the information provided on Form N-CSR in its regulatory, disclosure review, inspection, and policy making roles.
A registrant is required to disclose the information specified by Form N-CSR, and the Commission will make this information public. A registrant is not required to respond to the collection of information contained in Form N-CSR unless the Form displays a currently valid Office of Management and Budget (“OMB”) control number. Please direct comments concerning the accuracy of the information collection burden estimate and any suggestions for reducing the burden to Secretary, Securities and Exchange Commission, 450 Fifth Street, NW, Washington, DC 20549-0609. The OMB has reviewed this collection of information under the clearance requirements of 44 U.S.C. ss.3507.
ITEM 1. REPORTS TO STOCKHOLDERS.

Mutual Funds
Nuveen Income Funds
For investors seeking attractive monthly income and portfolio diversification potential.
Annual Report
June 30, 2012
| | | | | | | | | | |
| | | Share Class / Ticker Symbol |
| | | | | |
| Fund Name | | Class A | | Class B | | Class C | | Class R3 | | Class I |
Nuveen Core Plus Bond Fund
(formerly Nuveen Core Bond Fund) | | FAFIX | | FFIBX | | FFAIX | | FFISX | | FFIIX |
Nuveen High Income Bond Fund | | FJSIX | | FJSBX | | FCSIX | | FANSX | | FJSYX |
Nuveen Inflation Protected Securities Fund | | FAIPX | | — | | FCIPX | | FRIPX | | FYIPX |
Nuveen Intermediate Government Bond Fund | | FIGAX | | — | | FYGCX | | FYGRX | | FYGYX |
Nuveen Intermediate Term Bond Fund | | FAIIX | | — | | NTIBX | | — | | FINIX |
Nuveen Short Term Bond Fund | | FALTX | | — | | FBSCX | | NSSRX | | FLTIX |
Nuveen Strategic Income Fund
(formerly Nuveen Total Return Bond Fund) | | FCDDX | | FCBBX | | FCBCX | | FABSX | | FCBYX |
LIFE IS COMPLEX.
Nuveen makes things e-simple.
It only takes a minute to sign up for e-Reports. Once enrolled, you’ll receive an e-mail as soon as your Nuveen Fund information is ready. No more waiting for delivery by regular mail. Just click on the link within the e-mail to see the report and save it on your computer if you wish.
Free e-Reports right to your e-mail!
www.investordelivery.com
If you receive your Nuveen Fund distributions and statements from your financial advisor or brokerage account.
OR
www.nuveen.com/accountaccess
If you receive your Nuveen Fund distributions and statements directly from Nuveen.
| | | | | | |
| Must be preceded by or accompanied by a prospectus. | | NOT FDIC INSURED | | MAY LOSE VALUE | | NO BANK GUARANTEE |
Table of Contents
Chairman’s
Letter to Shareholders

Dear Shareholders,
Investors have many reasons to remain cautious. The challenges in the Euro area are casting a shadow over global economies and financial markets. The political support for addressing fiscal issues is eroding as the economic and social impacts become more visible. At the same time, member nations appear unwilling to provide adequate financial support or to surrender sufficient sovereignty to strengthen the banks or unify the Euro area financial system. The gains made in reducing deficits, and the hard-won progress on winning popular acceptance of the need for economic austerity, are at risk. To their credit, European political leaders press on to find compromise solutions, but there is increasing concern that time will begin to run out.
In the U.S., strong corporate earnings have enabled the equity markets to withstand much of the downward pressures coming from weakening job creation, slower economic growth and political uncertainty. The Fed remains committed to low interest rates but has refrained from predicting another program of quantitative easing unless economic growth were to weaken significantly or the threat of recession appears on the horizon. Pre-election maneuvering has added to the already highly partisan atmosphere in the Congress. The end of the Bush-era tax cuts and implementation of the spending restrictions of the Budget Control Act of 2011, both scheduled to take place at year-end, loom closer.
During the last year, U.S. based investors have experienced a sharp decline and a strong recovery in the equity markets. The experienced investment teams at Nuveen keep their eye on a longer time horizon and use their practiced investment disciplines to negotiate through market peaks and valleys to achieve long-term goals for investors. Experienced professionals pursue investments that will weather short-term volatility and at the same time, seek opportunities that are created by markets that overreact to negative developments. Monitoring this process is an important consideration for the Fund Board as it oversees your Nuveen Fund on your behalf.
As always, I encourage you to contact your financial consultant if you have any questions about your investment in a Nuveen Fund. On behalf of the other members of your Fund Board, we look forward to continuing to earn your trust in the months and years ahead.
Sincerely,

Robert P. Bremner
Chairman of the Board
August 23, 2012
Portfolio Managers’ Comments
Certain statements in this report are forward-looking statements. Discussions of specific investments are for illustration only and are not intended as recommendations of individual investments. The forward-looking statements and other views expressed herein are those of the portfolio managers as of the date of this report. Actual future results or occurrences may differ significantly from those anticipated in any forward-looking statements and the views expressed herein are subject to change at any time, due to numerous market and other factors. The Funds disclaim any obligation to update publicly or revise any forward-looking statements or views expressed herein.
Ratings shown are the highest rating given by one of the following national rating agencies: Standard & Poor’s Group, Moody’s Investors Service, Inc. or Fitch, Inc. Credit ratings are subject to change. AAA, AA, A and BBB are investment grade ratings; BB, B, CCC, CC, C and D are below-investment grade ratings. Certain bonds backed by U.S. Government or agency securities are regarded as having an implied rating equal to the rating of such securities. Holdings designated N/R are not rated by a national rating agency.
These Funds feature portfolio management by Nuveen Asset Management, LLC, an affiliate of Nuveen Investments. In this report, the various portfolio management teams for the Funds examine economic and market conditions, key investment strategies and the Funds’ performance during the twelve months ending June 30, 2012. These management teams include:
Nuveen Core Plus Bond Fund (formerly Nuveen Core Bond Fund)
Effective May 14, 2012, the Nuveen Core Bond Fund’s name changed to the Nuveen Core Plus Bond Fund. There were no changes to the Fund’s management team, investment objectives or policies. Chris Neuharth, CFA, who has 31 years of investment experience, has managed the Fund since 2006. Timothy Palmer, CFA, with 26 years of investment experience, Wan-Chong Kung, CFA, with 28 years of financial experience, and Jeffrey Ebert, with 21 years of financial experience, have been part of the management team for the Fund since 2003, 2001, and 2005, respectively.
Nuveen High Income Bond Fund
John Fruit, CFA, who has 24 years of investment experience, has managed the Fund since 2006. Jeffrey Schmitz, CFA, with 25 years of investment experience, has been part of the management team for the Fund since 2008.
Nuveen Inflation Protected Securities Fund
Wan-Chong Kung, CFA, has managed the Fund since its inception in 2004. Chad Kemper, who has 13 years of investment experience, joined the Fund as a co-portfolio manager in October 2010.
Nuveen Intermediate Government Bond Fund
Wan-Chong Kung, CFA, has managed the Fund since 2002. Chris Neuharth, CFA, and Jason O’Brien, CFA, who has 19 years of investment experience, have been on the Fund’s management team since 2009.
Nuveen Intermediate Term Bond Fund
Effective May 14, 2012, the Fund’s benchmark was changed to the Barclays Aggregate Bond Index to more closely reflect its investment universe. At the same time, Chris Neuharth, CFA, joined the Fund as a co-portfolio manager. Wan-Chong Kung, CFA, has managed the Fund since 2002 and Jeffrey Ebert since 2000.
Nuveen Short Term Bond Fund
Chris Neuharth, CFA, has been a co-portfolio manager of the Fund since 2004. Peter Agrimson, CFA, who has seven years of investment experience, joined the Fund as a co-portfolio manager on January 1, 2011.
Nuveen Strategic Income Fund (formerly Nuveen Total Return Bond Fund)
Effective May 14, 2012, the Nuveen Total Return Bond Fund’s name changed to the Nuveen Strategic Income Fund. In addition, the Fund’s investment objective and investment policies also changed; however, its management team remained the same. Please refer to the Fund’s prospectus for additional information regarding these changes. Timothy Palmer, CFA, has been the lead manager of the Fund since 2005. Jeffrey Ebert has been on the management team since 2000. Marie Newcome, CFA, who has 20 years of investment experience, joined the Fund as a co-portfolio manager in 2011.
What factors affected the U.S. economic and fixed-income market environments during the twelve-month reporting period ended June 30, 2012?
During the period, the U.S. economy’s progress toward recovery from recession remained sluggish. The Federal Reserve (Fed) maintained its efforts to improve the overall economic environment by continuing to hold the benchmark Fed Funds rate at the record low level of zero to 0.25% that it had established in December 2008. At its June 2012 meeting, the central bank affirmed its opinion that economic conditions would likely warrant keeping the rate at “exceptionally low levels” through at least late 2014. The Fed also announced that it would extend its so-called Operation Twist program, whereby it is lengthening the average maturity of its holdings of U.S. Treasury securities, through the end of December 2012. The goals of this program are to lower longer-term interest rates, make broader financial conditions more accommodating, support a stronger economic recovery and help ensure that inflation remains at levels consistent with the Fed’s mandates of maximum employment and price stability.
In the second quarter of 2012, the U.S. economy slowed to an annualized growth rate of 1.5%, according to initial estimates for U.S. gross domestic product (GDP). While this marked the twelfth consecutive quarter of positive growth, it was also a significant slowdown from the previous few quarters. The Consumer Price Index (CPI) rose 1.7% year-over-year as of June 2012, the same figure as May 2012, which was the lowest twelve-month rate of change since February 2011. Core CPI (which excludes food and energy) increased 2.2% during the period, remaining above the Fed’s unofficial objective of 2.0% or lower for this inflation measure. However, the number was slightly below the 2.3% figure reported in the previous three months. Labor market conditions continued to be slow to improve, with the national unemployment rate registering 8.2% in June 2012. While this figure was down from 9.1% one year ago, it was still a slight uptick from the 8.1% reading in April 2012. The housing market remained the major weak spot in the economy, beleaguered by a high level of distressed properties and difficult credit conditions. For the twelve months ended May 2012 (the most recent data available at the time this report was prepared), the average home price in the Standard & Poor’s
(S&P)/Case-Shiller Index of 20 major metropolitan areas lost 0.7%. Housing prices remained at the lowest levels since spring 2003, down more than one-third from their summer 2006 peak.
Throughout the fiscal year period, fixed-income markets were buffeted by concerns about the tepid U.S. economic recovery combined with the ballooning U.S. federal deficit, the seemingly unending European debt crisis and a broader slowdown in global growth, especially emerging markets. These macro events caused the financial markets to fluctuate between embracing risk and shunning risk several times during the period. In late summer of 2011, the markets experienced a massive flight to quality, leading U.S. Treasuries to outperform all risk assets, particularly equities, high yield and investment-grade corporate bonds. However, late fall brought about a renewed appetite for risk as the European crisis appeared to be on the mend and U.S. economic indicators strengthened. Risk premiums on non-government bonds contracted and asset classes such as high-yield corporates, emerging market debt and commercial mortgage-backed securities (CMBS) substantially outperformed Treasuries. In the final months of the reporting period, however, the situation reversed once again as a broad slowdown in global growth together with renewed political discord and sovereign funding pressures in Europe cast a malaise over the markets. Not surprisingly, risk premiums on non-government bonds widened once again as U.S. Treasuries renewed their safe haven status, outperforming other riskier asset classes.
When all was said and done, longer maturity Treasuries and Treasury Inflation-Protected Securities (TIPS) ended the one-year period as the top-performing asset classes in the taxable fixed-income market. While short Treasury rates remained at historically low levels throughout the fiscal year, dipping even lower midway through the period, intermediate and longer term Treasuries saw their rates fall fairly steadily throughout the period. For example, yields on five-year Treasuries dropped from 1.80% at the beginning of July 2011 to 0.72% as of June 30, 2012, while 30-year Treasuries started at 4.40% and ended at 2.69%. The prices of these securities move in the opposite direction of interest rates. Meanwhile, investment-grade corporates also turned in relatively strong results over the one-year period, outperforming other non-government bonds such as high-yield corporates, CMBS, mortgage-backed securities (MBS) and asset-backed securities, with a 9.54% return as measured by Barclays Corporate Investment Grade Index.
How did the Funds perform during the twelve-month period ended June 30, 2012?
The tables in the Fund Performance and Expense Ratios section of this report provide total return performance information for the one-year, five-year, ten-year and/or since inception periods ending June 30, 2012. Each Fund’s Class A Share total returns are compared with the performance of the appropriate Barclays Index and Lipper classification average.
What strategies were used to manage the Funds during the twelve-month reporting period? How did these strategies influence performance?
All of the Funds continued to employ the same fundamental investment strategies and tactics used previously, although implementation of those strategies depended on the
individual characteristics of the portfolios, as well as market conditions. The Funds’ management teams used a highly collaborative, research-driven approach that we believe offers the best opportunity to achieve consistent, superior long-term performance on a risk-adjusted basis across the full range of market environments. Going into the reporting period, we were generally comfortable with each Fund’s positioning and saw little need to make large-scale shifts to weightings. However, in the case of the Nuveen Intermediate Term Bond Fund, its benchmark was changed from the Barclays Intermediate Government/Credit Bond Index to the Barclays Aggregate Bond Index effective May 14, 2012. As a result, that Fund’s management team made several more significant changes to its composition which are discussed later in this report. In addition, all of the Funds invested in various derivative instruments during this reporting period, which are discussed in more detail later in this report.
Nuveen Core Plus Bond Fund (formerly Nuveen Core Bond Fund)
The Fund’s Class A Shares at net asset value (NAV) underperformed both the Barclays Aggregate Bond Index and the Lipper Intermediate Investment Grade Debt Funds Classification Average for the twelve-month period. The fixed income investing climate experienced dramatic shifts between “risk-off” and “risk-on” modes during the Fund’s fiscal year as macro events buffeted the markets. The Fund’s fiscal year began with a massive flight to quality late in the summer of 2011, as the markets reacted negatively to the European debt crisis, the seemingly endless U.S. debt ceiling debate and a global growth slowdown. U.S. Treasuries outperformed all other fixed income asset classes, particularly high yield and investment-grade corporate bonds during the first several months of the reporting period. The tide turned in late fall 2011 as markets embraced risk once again, emboldened by perceived stabilization in Europe and improving economic indicators. Fixed income risk premiums contracted as higher beta asset classes, such as high yield corporate bonds, emerging market (EM) debt and commercial mortgage-backed securities (CMBS), outpaced Treasuries by significant margins. The situation, however, was somewhat short lived as risk aversion resurfaced again in the final months of the reporting period due to slowdowns in U.S. and global growth combined with renewed political discord and sovereign funding pressures in Europe. Once again U.S. Treasuries were viewed as a safe haven with long-term rates falling significantly as investor demand for both duration and riskless assets seemed insatiable. Risk premiums on non-government bonds expanded, causing Treasuries to outperform spread sectors such as high yield corporate bonds and CMBS.
The Fund’s underperformance versus the benchmark and peers was mainly the result of our sector positioning. Specifically, we positioned the Fund with a broad-based underweight to Treasuries to reflect our strategic view that the long-term risk/reward profile of this sector was extremely overvalued and that investment-grade spread sectors offered more compelling value. Given the macro stresses, this view was not productive as U.S. Treasuries were the top-performing asset class over the one-year period. At the same time, the Fund had significant allocations to investment-grade credit as well as the non-government securitized sectors, including CMBS, mortgage-backed securities (MBS) and asset-backed securities (ABS). In the case of investment-grade credit, the segment overall turned in comparable results to Treasuries over the one-year period; however, our
portfolio had nearly twice as much exposure to financials versus that of the index. This overweight proved detrimental given the weaker performance of the financial sub-sector of the corporate market overall during the fiscal period. The Fund’s allocations in non-government securitized sectors also hindered performance as CMBS, MBS and ABS all posted lower returns than Treasuries during the fiscal year. Our interest rate strategy was tactical in nature and centered on trading market dislocations around a generally neutral stance. Several moves aimed at adjusting the Fund’s sensitivity to interest rate changes added marginally to investment performance, including our tactical move to lengthen duration after the rates market sold off significantly in March 2012, and our overweight to longer dated securities as rates fell late in the period.
While our investment themes remained largely intact, we did slightly moderate the active risk profile of the Fund toward the end of the reporting period out of respect for deteriorating macro fundamentals and heightened uncertainty. We reduced the Fund’s weightings to CMBS, ABS, investment-grade credit and high yield credit, while adding modestly to its Treasury and agency MBS positions as an offset. However, the Fund’s investment-grade corporate exposure still ended the fiscal year quite a bit higher than it was at the beginning. Earlier in the period, we had taken advantage of market volatility and new issue concessions to add a diversified array of corporate product at what we believed were extremely attractive levels on a long-term basis.
Nuveen High Income Bond Fund
The Fund’s Class A Shares at net asset value (NAV) underperformed both the Barclays High Yield 2% Issuer Capped Index and the Lipper High Current Yield Funds Classification Average for the twelve-month period. Much of the Fund’s underperformance during the fiscal year took place during the extreme “risk-off,” high volatility environment in late summer of 2011. During this dramatic flight to quality, our Fund suffered disproportionately due to its above average weighting in CCC rated securities, emerging market (EM) debt, non-rated securities and its corresponding underweight to securities in the BB sector. We made up much, but not all, of the performance shortfall in the “risk-on” months during the middle of the fiscal year as risk appetites improved and better liquidity returned to the markets. This helped the prices of some of our less liquid securities bounce back, as many of these were the same to sell off during the previous summer. We refer to much of this price fluctuation as “mark-to-market” risk because the underlying fundamentals were substantially unchanged, but the pricing of the securities became much more haphazard during bouts of illiquidity.
Overall credit fundamentals within the high yield asset class remained fairly strong; however, the default rate did inch up during the period as measured by Moody’s trailing 12-month global speculative grade corporate default rate, which rose to 2.7% by June 2012 after falling below the 2% level at the end of 2011. Credit impairment within the Fund was well contained, with two notable exceptions: domestic coal producer Patriot Coal and European oil refiner PetroPlus Holdings. While credit conditions remained generally favorable, both of these securities demonstrated how tightening lending standards can lead to bankruptcy risk. This is especially true in Europe where commercial banks are under even more pressure to protect precious capital and have become more conservative in extending credit.
In terms of sectors, the Fund’s overweight to metals/mining and energy caused some underperformance during the second half of the fiscal year. Both of these sectors are cyclical in nature; therefore, they were hurt by slowing worldwide economic indicators, especially in the United States and China, which contributed to lower commodity prices. However, this shortfall was partially offset by the Fund’s overweight in the housing and automotive industries, which were net positive contributors over the course of the fiscal year. The auto industry benefited from lower overall breakeven production levels and improving credit protection measures. Meanwhile, the housing market began to show signs of stabilization on a number of fronts.
Although the Fund’s exposure to EM bonds was a slight detractor to performance during the fiscal year’s risk-averse periods, these credits fared much better during spring 2012’s weakness than they did during the erratic market in late summer of 2011. While overall credit quality and fundamentals remained strong, the growing anxiety over China’s slowing growth rate caused weakness in certain commodity and base metals credits, most notably coal and steel. Default rates within the EM universe continued to run at a rate of less than 1% during the period, and therefore have perhaps nowhere to go but to possibly tick higher.
The Fund continued to maintain an allocation to out of index holdings, which included preferred/convertible securities focused in the U.S. financial and real estate investment trust (REIT) segments. U.S. financials began to perform much better during the period’s most recent rally, benefiting from their safe haven status compared to Europe. Indeed, the broader high yield financial sector has been the top performing area of the market year-to-date in 2012. The Fund also had small allocations in other specialized, income generating assets such as closed-end funds, exchange traded funds (ETFs) and high yielding equities. In addition to adding diversification to the Fund’s portfolio, we believe these out-of-index holdings will demonstrate less interest rate sensitivity than most high yield bonds and particularly other higher quality fixed income securities in the event that interest rates begin to rise.
In light of heightened volatility and slowing worldwide economic indicators, we made slight adjustments to the Fund’s composition over the course of the performance period. We added modestly to the Fund’s weighting in the BBB rating category in order to increase the portfolio’s liquidity. We believe this shift is prudent given some of the heightened macro risks. We ended the fiscal year positioned for moderate economic growth amid robust corporate profitability and balance sheets by maintaining a modest overweight in the CCC credit segment. We believe the extra yield that CCC-rated bonds provide over B and BB-rated credits is adequate compensation for accepting the segment’s higher risks. We also believe that CCCs will continue to perform well in light of sound credit fundamentals and the reasonable probability that the U.S. economy will avoid a recession in the next six to nine months. Perhaps even more important are the underlying technicals surrounding flows and issuance in high yield, which we believe will remain constructive for the market.
Other portfolio shifts included a reduction in the Fund’s exposure to the oil services sector due to profit taking and the lower commodity price environment. However, oil services
still remains an overweight in the Fund as we continue to find attractively priced issues that also carry security in the form of first liens on drilling rigs. In addition, we believe the sector should still benefit from overall strong energy prices as well as robust drilling activity. We also maintain an emphasis on home builders as we believe an uptick in housing sentiment and the policies surrounding home mortgage refinancing could help out the sector. We have lowered the Fund to a market weight position in the energy exploration and production sector due to continued low natural gas prices and the prospect for significant negative free cash flow and funding requirements for shale companies. At the same time, the Fund maintains an underweight in defensive sectors such as health care and utilities. Health care credits remain exposed to the risk of potential cuts in Medicare and Medicaid reimbursements while the utility sector is exposed to commodity risk in the form of low natural gas prices.
Nuveen Inflation Protected Securities Fund
The Fund’s Class A Shares at net asset value (NAV) outperformed the Lipper Treasury Inflation Protected Securities Funds Classification Average and performed in line with the Barclays U.S. TIPS Index for the twelve-month period. The annual reporting period was marked by dramatic shifts back and forth between “risk-off” and “risk-on” modes as investors reacted to a rapidly changing economic and investment backdrop. In the first several months of the fiscal year, fixed income markets experienced a massive flight to quality in reaction to the European debt crisis, slowing global growth and the U.S. debt ceiling debate. In this environment, nominal U.S. Treasuries outperformed all other fixed income asset classes, particularly high yield and investment-grade corporate bonds. Treasury inflation protected securities (TIPS) outperformed non-government securities, while falling short of nominal Treasuries due to lower inflation expectations and weaker growth. During this period, the Fund’s significant underweight to TIPS versus the index was helpful as breakeven spreads (the difference between the yields of nominal Treasuries and TIPS) tightened and TIPS underperformed nominal Treasuries. Our relative positioning along the TIPS yield curve also aided performance, especially the Fund’s underweight versus the index to securities at the short end of the maturity spectrum. The shortest maturity TIPS were the worst performing segment along the TIPS yield curve during the risk-averse period. However, the Fund’s small allocations to non-Treasury spread sectors, particularly high yield corporate bonds and commercial mortgage-backed securities (CMBS), partially offset these positives as these sectors underperformed both nominal Treasuries and TIPS.
In the middle six months of the reporting period, markets embraced risk once again, caused by perceived stabilization in Europe and improving economic indicators. Fixed income risk premiums contracted as higher beta asset classes, such as high yield corporate bonds, emerging market (EM) debt and CMBS, outpaced Treasuries by significant margins. Despite very low yields on TIPS, this segment experienced renewed investor interest, driven by relatively attractive breakeven spreads and anticipation over an improvement in seasonal Consumer Price Index (CPI) prints. Market speculation also increased regarding the prospects of another round of easing by the Federal Reserve, which could potentially increase inflation expectations. In almost a mirror image of the previous period, the Fund’s performance was enhanced by our allocation to non-U.S.
Treasury spread sectors, which produced significant excess returns. Beneficial positions included high yield corporate securities and CMBS, the two top-performing domestic fixed income sectors. However, the Fund was negatively impacted by its relative allocations along the TIPS yield curve. Specifically, the Fund’s underweight at the front end of the TIPS curve became detrimental as the shortest maturities were the best performers along the curve.
As the final months of the reporting period drew to a close, a broad slowdown in global growth coupled with renewed political discord and sovereign funding pressures in Europe caused risk aversion to resurface. U.S. Treasury securities remained a safe haven and were well bid, with long-term rates falling significantly as investor demand for both duration and riskless assets seemed insatiable. Risk premiums on non-government bonds once again expanded, causing Treasuries to outperform spread sectors such as high yield corporate bonds and CMBS. The flight to quality benefited nominal Treasuries more than TIPS, which were negatively impacted by the downgrades in economic growth and inflation outlooks. Investor interest in TIPS waned as persistently lower energy prices led to a softening of actual and forecasted CPI prints; however, TIPS still outpaced spread sectors during the final months. As was the case in the earlier “risk-off” environment, the Fund benefited from its significant underweight to TIPS, especially the shortest maturities, while our small allocations to spread sectors were detrimental. Performance was also enhanced by our longer duration than the benchmark during this period, which alters the Fund’s sensitivity to changing interest rates, as rates dropped substantially.
While our primary investment themes remained intact during the period, we made smaller scaled shifts on an ongoing basis to help improve the Fund’s profile in response to changing growth and inflation forecasts. Later in the reporting period, we increased the Fund’s underweight to TIPS as we began to see global growth conditions deteriorate. We also reduced the Fund’s exposure to non-Treasury spread sectors, as we tried to be cautious with the Fund’s risk allocation given the negative overall environment. This included lowering the Fund’s high yield exposure. In addition, we added duration, thereby increasing the Fund’s sensitivity to interest rates in order to benefit from the strong safe haven bid to Treasuries.
Nuveen Intermediate Government Bond Fund
The Fund’s Class A Shares at net asset value (NAV) underperformed both the Barclays Intermediate Government Bond Index and the Lipper Intermediate U.S. Government Funds Classification Average for the twelve-month period. As we entered the reporting period, we had positioned the Fund for a gradual economic recovery with a corresponding view that the fundamental and technical environment for non-U.S. Treasury securities would continue to support their valuations. In addition, we believed that European policymakers were making positive steps toward resolving the region’s sovereign debt crisis. However, fixed income markets experienced a massive flight to quality in August and September of 2011 sparked by the convergence of a number of negative factors, including a deterioration of progress in Europe, fears of a global growth slowdown and months of U.S. debt ceiling debate. Rates dropped and U.S. Treasuries rallied, outperforming all other non-government risk assets. The negative environment reversed midway through the period as progress was made on the European front and
various economic indicators experienced modest improvement. Non-government “spread” sectors outperformed Treasuries by substantial margins from December 2011 through the first quarter of 2012. However, risk aversion reappeared in the second quarter due to slowdowns in U.S. and global growth combined with renewed political discord and sovereign funding pressures in Europe. Once again U.S. Treasuries were viewed as a safe haven, which led to another round of underperformance for non-government securities.
With the uncertain nature of the markets as a backdrop, the Fund’s sector weightings were responsible for the majority of its underperformance versus the benchmark and classification average. The Fund’s underweight to U.S. Treasuries was the main negative contributor as all of the spread sectors underperformed for the year ended June 2012 as a whole. Our Fund’s sector overweight within the commercial mortgage-backed securities (CMBS) and mortgage-backed securities (MBS) sectors registered lower returns than intermediate maturity Treasuries during the fiscal year.
While our primary investment themes remained intact during the period, we made smaller scaled shifts on an ongoing basis that were geared toward improving the Fund’s profile in response to changing fundamental conditions and changes in relative valuations. During the first three months of the period, we increased the Fund’s CMBS and asset-backed security (ABS) exposure during the weakness in those sectors. As performance improved in early 2012, we reduced the Fund’s exposure to CMBS and ended the period with a lower weight in that sector. We also increased the Fund’s MBS weighting on weakness in April and May of 2012. These tactical moves helped offset some of the negative performance associated with the Fund’s overweight to spread product.
We also made several tactical yield curve positioning and duration moves during the period which included the use of interest rate futures, for overall risk management and to adjust the Fund’s sensitivity to interest rates. However, for most of the fiscal year, the Fund’s duration remained modestly short of the Barclays Index. While our tactical trades proved to be slight detractors to the Fund’s performance during the Treasury rally in the first half of the fiscal year, our overweight to longer, intermediate maturity securities helped offset some of this shortfall in the second half of the period.
Nuveen Intermediate Term Bond Fund
The Fund’s Class A Shares at net asset value (NAV) underperformed the Barclays Aggregate Bond Index and the Lipper Intermediate Investment Grade Debt Funds Classification Average for the twelve-month period. The fixed income investing climate experienced dramatic shifts between “risk-off” and “risk-on” modes during the Fund’s fiscal year as macro events buffeted the markets. The Fund’s fiscal year began with a massive flight to quality late in the summer of 2011, as the markets reacted negatively to the European debt crisis, the seemingly endless U.S. debt ceiling debate and a global growth slowdown. U.S. Treasuries outperformed all other fixed income asset classes, particularly high yield and investment-grade corporate bonds during the first several months of the reporting period. The tide turned in late fall 2011 as markets embraced risk once again, coupled with the perceived stabilization in Europe and improving economic indicators. Fixed income risk premiums contracted as higher beta asset classes, such as high yield corporate bonds, emerging market (EM) debt and commercial mortgage-backed securities (CMBS) outpaced Treasuries by significant margins. The situation,
however, was somewhat short lived as risk aversion resurfaced again in the final months of the reporting period due to slowdowns in U.S. and global growth combined with renewed political discord and sovereign funding pressures in Europe. Once again U.S. Treasuries were viewed as a safe haven and were well bid, with long-term rates falling significantly as investor demand for both duration and riskless assets seemed insatiable. Risk premiums on non-government bonds expanded, causing Treasuries to outperform spread sectors such as high yield corporate bonds and CMBS.
With the uncertain nature of the markets as a backdrop, the Fund’s underperformance versus the benchmark and peers was mainly the result of our sector positioning. Specifically, we positioned the Fund with a broad-based underweight to Treasuries to reflect our strategic view that the long-term risk/reward profile of this sector was extremely overvalued and that investment-grade spread sectors offered more compelling value. Given the macro stresses, this view was not productive as U.S. Treasuries were the top performing asset class over the one-year period. At the same time, the Fund had significant allocations to investment-grade credit as well as the non-government securitized sectors, including CMBS, mortgage-backed securities (MBS) and asset-backed securities (ABS). In the case of investment-grade credit, the segment overall turned in comparable results to Treasuries over the one-year period; however, our portfolio had nearly twice as much exposure to financials versus that of the index. This overweight proved detrimental given the weaker performance of the financial sub-sector of the corporate market overall during the fiscal period. The Fund’s allocations in non-government securitized sectors also hindered performance as CMBS, MBS and ABS all posted negative excess returns versus Treasuries during the fiscal year. Our duration policy, which indicates the Fund’s sensitivity to interest rate changes, was tactical in nature and centered on trading market dislocations around a generally neutral stance. The Fund’s results did modestly benefit from our tactical move to lengthen duration after the rates market sold off significantly in March 2012.
While our investment themes remained largely intact, we changed the composition of the Fund in mid-May in response to changes to its management philosophy and benchmark. The Fund is now managed to the Barclays Aggregate Bond Index, as opposed to the Barclays Intermediate Government/Credit Bond Index, and portfolio positioning has been modified to reflect this change. The rationale for the change was to recognize that the Fund provides shareholders with investment exposure similar to the broad fixed income market, as represented by the Fund’s new benchmark. The new benchmark, by encompassing the broad fixed income market, is less concentrated than the old benchmark, and provides a more accurate representation of the portfolio by including securitized products, an asset class that represents 35% of the strategy’s investments. The most significant effects of this change were a reduction in the Fund’s exposure to investment-grade credit, an increase in allocation to the U.S. MBS sector and a modest lengthening in the portfolio’s duration. As such, the change to the benchmark represents a moderate increase in the Fund’s risk profile. In addition, recognizing that the sovereign and bank funding crises in Europe may deteriorate further, we increased the Fund’s U.S. Treasury and agency holdings, while remaining underweight versus the benchmark.
Nuveen Short Term Bond Fund
The Fund’s Class A Shares at net asset value (NAV) outperformed the Barclays 1-3 Year Government/Credit Bond Index and fell short of the Lipper Short Investment Grade Debt Funds Classification Average for the twelve-month period. At the beginning of the reporting period, we viewed the long-term risk/reward for both high-grade and high yield corporate bonds as quite compelling. Along with our view that the global economy would expand and U.S. Treasury rates would remain extremely low, we believed domestic bottom-up credit fundamentals were very supportive and valuations on corporate bonds were at attractive levels. Therefore, we began the Fund’s fiscal year positioned with an overweight in both investment-grade and non-investment-grade corporate bonds. We also held a marginal weighting in higher quality securities from three securitized sectors not represented in the benchmark: commercial mortgage-backed securities (CMBS), mortgage backed securities (MBS) and asset-backed securities (ABS). At the same time, the Fund was substantially underweighted in U.S. Treasury and agency securities.
Although fixed income markets moved between “risk-off” and “risk-on” modes several times during the period, the Fund was able to outperform the Barclays benchmark due its well-diversified exposure across the corporate, MBS, ABS, and CMBS segments. In particular, our weights and security selection within the ABS and CMBS sectors were significant positive contributors for the Fund. We also positioned the Fund’s duration and yield curve exposure for a flattening curve, which benefited performance over the fiscal year. However, the Fund generally had a much shorter duration than most of its peers, which hurt it modestly as rates dropped sharply in the intermediate portion of the curve during the reporting period.
While we kept our main strategic emphasis on non-government sectors in place, we did make smaller scaled shifts to the Fund’s weightings that were geared toward improving its profile in response to changing fundamental conditions and significant changes in relative valuations. Over the course of the reporting period, we added slightly to the Fund’s investment-grade corporate exposure as our fundamental view on strong bottom-up credit metrics remained largely intact. We made offsetting reductions to the Fund’s weightings in the securitized sectors, including ABS, MBS and CMBS, which held their value much better than corporate securities during the reporting period. We continued to take a cautious approach toward managing risk in the Fund’s portfolio in response to deteriorating macro fundamentals and heightened uncertainty. For example, we slightly lowered the Fund’s already very small exposure to emerging market debt and non-dollar denominated bonds, while modestly increasing its cash weighting by period end.
Nuveen Strategic Income Fund (formerly Nuveen Total Return Bond Fund)
The Fund’s Class A Shares at net asset value (NAV) fell short of the Barclays Aggregate Bond Index, but outperformed the Lipper Multi-Sector Income Funds Classification Average, for the twelve-month period. Toward the beginning of the fiscal year (late summer 2011), financial markets experienced a massive flight to quality induced by the European sovereign debt crisis, the seemingly endless U.S. debt ceiling debate and a global growth slowdown. For the first several months of the reporting period, U.S. Treasuries significantly outpaced all other fixed income asset classes, especially high yield and investment-grade bonds. The financial sector performed particularly poorly, weighed
down by the stresses in Europe. However late in the fall of 2011, financial markets embraced risk once again as progress was made on the European front and economic results began to gain positive traction. Fixed income risk premiums contracted and risk assets such as high yield corporate bonds, emerging market (EM) debt and commercial mortgage-backed securities (CMBS) outperformed Treasuries by substantial margins. In the final months of the reporting period, risk aversion took hold of the markets yet again as the European situation reignited while economic indicators pointed to slowing growth both in the United States and overseas. Investors’ unquenchable thirst for income solutions and less risky assets caused them to flock to U.S. Treasuries, driving down long-term rates. In this environment, Treasuries again outperformed spread sectors as risk premiums on non-government bonds expanded.
Throughout the fiscal year, we positioned the Fund with an overweight to investment-grade credit sectors, along with positions in CMBS and EM debt. At the same time, we maintained an underweight to Treasuries and mortgage-backed securities (MBS) in the Fund’s portfolio. Given the macro stresses in the market, particularly early in the fiscal year, and underperformance by non-government sectors over the period as a whole, this positioning was not productive and drove the Fund’s shortfall versus the index. Although high yield bonds were similarly pressured, exposure to this sector had a minimal net impact on Fund performance due to our adjustments in weightings and the additional income these bonds generated during the period. On a credit selection basis, our emphasis on holdings in financials detracted significantly early in the period and economically sensitive industries underperformed later in the period. Meanwhile, the Fund’s foreign currency exposure, which was focused in several of the strongest performing countries such as Australia and Canada, had a roughly neutral impact on performance due to active changes in exposure, despite the U.S. dollar’s rise during the period. While our large underweight in U.S. government securities contributed to underperformance versus the benchmark index, the Fund did fare well compared to its peer group during the reporting period.
Our interest rate strategy was tactical in nature and centered on trading market dislocations around a generally neutral stance. Several moves aimed at adjusting the Fund’s sensitivity to interest rate changes added marginally to investment performance, including our beneficial duration underweight as interest rates rose earlier in 2012, and then our subsequent overweight to longer dated securities as rates fell late in the period. Our yield curve exposure was biased toward a flattening, which was beneficial to Fund performance during the year.
Although we kept our main strategic emphasis on non-government sectors in place, we did make smaller scaled shifts to the Fund’s weightings that were geared toward improving its profile in response to changing fundamental conditions and significant changes in relative valuations. Early in 2012, we increased the Fund’s weighting to investment-grade corporate bonds, particularly given attractive new issues coming to market. After reducing currency exposures in the spring of 2012, we opportunistically added to currency exposure as well as high yield credit toward the end of the reporting period, as valuations discounted significant negative potential outcomes and fundamental credit metrics remained intact. We funded increased weightings in investment-grade and
high yield credit largely by reducing holdings in the MBS sector, as well as smaller decreases in asset-backed securities (ABS) and CMBS. Within credit, we also continued to take advantage of the new issue calendar and secondary market conditions to reposition Fund holdings within the sector.
Investments in Derivatives
During the reporting period, each of the Funds held investments in derivatives. All of the Funds invested in interest rate futures contracts. The Funds used long and short U.S. Treasury note and bond futures to manage portfolio duration and yield curve exposure. For example, to increase the duration of the Fund’s portfolio, a long Treasury bond or Treasury note futures position would be acquired. To manage foreign currency exposure, the Inflation Protected Securities Fund and Strategic Income Fund also invested in foreign currency futures contracts. For example, to reduce unwanted currency exposure from the Fund’s portfolio, a short foreign currency future would be acquired. The funds no longer held these contracts at the end of the fiscal period.
The Core Plus Bond Fund, Inflation Protected Securities Fund, Intermediate Term Bond Fund, Short Term Bond Fund and Strategic Income Fund invested in credit default swap contracts to add diversified exposure to a broad segment of the credit markets, or to express a view on credit as part of an overall portfolio sector management strategy. For example, to increase the Fund’s credit exposure to the Investment Grade or High Yield Bond segment of the market, a long CDX Investment Grade Index swap and CDX High Yield Index swap, respectively, would be acquired. The Strategic Income Fund still held these contracts at the end of the fiscal year. These Funds also continued to be hedged against changes in interest rate spreads by taking a short interest rate swap position.
The Inflation Protected Securities Fund, Short Term Bond Fund and Strategic Income Fund utilized forward foreign currency exchange contracts to manage foreign currency exposure. For example, to reduce unwanted currency exposure from the Fund’s portfolio, a short foreign currency forward would be acquired.
The Strategic Income Fund purchased options on Treasury notes/bond futures as part of an overall portfolio interest rate strategy. For example, call options may be purchased to hedge the portfolio against adverse interest rate movements while limiting downside exposure to a portfolio. The Strategic Income Fund also wrote call and put options to manage its views on portfolio volatility, writing out-of-the-money calls and puts when implied volatility is high. The Fund no longer held these contracts as of the close of the fiscal period.
Risk Considerations
Mutual fund investing involves risk; principal loss is possible. Debt or fixed income securities such as those held by the Funds, are subject to market risk, credit risk, interest rate risk, call risk, derivatives risk, and income risk. The value of, and income generated by debt securities will decrease or increase based on changes in market interest rates. As interest rates rise, bond prices fall. Asset-backed and mortgage-backed securities are subject to additional risks such as prepayment risk, liquidity risk, default risk and adverse economic developments.
Below investment grade or high yield debt securities such as those held by the Core Plus Bond Fund, the High Income Bond Fund, the Inflation Protected Securities Fund, the Short Term Bond Fund and the Strategic Income Fund are subject to liquidity risk and heightened credit risk.
Foreign investments such as those held by the Core Plus Bond Fund, the High Income Bond Fund, the Inflation Protected Securities Fund, the Intermediate Term Bond Fund, the Short Term Bond Fund, and the Strategic Income Fund involve additional risks, including currency fluctuation, political and economic instability, lack of liquidity and differing legal and accounting standards. These risks are magnified in emerging markets.
For the Inflation Protected Securities Fund, the guarantee provided by the U.S. government to Treasury inflation protected securities (TIPS) relates only to the prompt payment of principal and interest and does not remove the market risks of investing in the Fund shares. The Fund’s investment in inflation protected securities has tax consequences that may result in income distributions to shareholders.
Fund Performance and Expense Ratios
The Fund Performance and Expense Ratios for each Fund are shown on the following fourteen pages.
Returns quoted represent past performance, which is no guarantee of future results. Current performance may be higher or lower than the performance shown. Investment returns and principal value will fluctuate so that when shares are redeemed, they may be worth more or less than their original cost. Returns without sales charges would be lower if the sales charge were included. Returns do not reflect the deduction of taxes that a shareholder would pay on Fund distributions or the redemption of Fund shares.
Returns may reflect a contractual agreement between certain Funds and the investment adviser to waive certain fees and expenses; see Notes to Financial Statements, Footnote 7 — Management Fees and Other Transactions with Affiliates for more information. In addition, returns may reflect a voluntary expense limitation by the Funds’ investment adviser that may be modified or discontinued at any time without notice. For the most recent month-end performance visit www.nuveen.com or call (800) 257-8787.
Returns reflect differences in sales charges and expenses, which are primarily differences in distribution and service fees. Fund returns assume reinvestment of dividends and capital gains.
Comparative index and Lipper return information is provided for the Funds’ Class A Shares at net asset value (NAV) only.
The expense ratios shown reflect the Funds’ total operating expenses (before fee waivers and/or expense reimbursements, if any) as shown in the Funds’ most recent prospectus. The expense ratios include management fees and other fees and expenses.
Fund Performance and Expense Ratios (continued)
Nuveen Core Plus Bond Fund
Refer to the first page of this Fund Performance and Expense Ratios section for further explanation of the information included within this page.
Fund Performance
Average Annual Total Returns as of June 30, 2012
| | | | | | | | | | | | |
| |
| | | Average Annual | |
| | | |
| | | 1-Year | | | 5-Year | | | 10-Year | |
Class A Shares at NAV | | | 5.52% | | | | 6.28% | | | | 5.05% | |
Class A Shares at maximum Offering Price | | | 1.01% | | | | 5.36% | | | | 4.60% | |
Barclays Aggregate Bond Index* | | | 7.47% | | | | 6.79% | | | | 5.63% | |
Lipper Intermediate Investment Grade Debt Funds Classification Average* | | | 6.97% | | | | 6.19% | | | | 5.19% | |
| | | |
Class B Shares w/o CDSC | | | 4.74% | | | | 5.52% | | | | 4.27% | |
Class B Shares w/CDSC | | | -0.26% | | | | 5.36% | | | | 4.27% | |
Class C Shares | | | 4.68% | | | | 5.50% | | | | 4.26% | |
Class R3 Shares | | | 5.27% | | | | 6.08% | | | | 4.87% | |
Class I Shares | | | 5.79% | | | | 6.57% | | | | 5.32% | �� |
Class A Shares have a maximum 4.25% sales charge (Offering Price). Class A Share purchases of $1 million or more are sold at net asset value without an up-front sales charge but may be subject to a contingent deferred sales charge (CDSC), also known as a back-end sales charge, if redeemed within eighteen months of purchase. Class B Shares have a CDSC that begins at 5% for redemptions during the first year and declines periodically until after six years when the charge becomes 0%. Class B Shares automatically convert to Class A Shares eight years after purchase. Class C Shares have a 1% CDSC for redemptions within less than twelve months, which is not reflected in the one-year total return. Class R3 Shares have no sales charge and are available to only certain retirement plans. Class I Shares have no sales charge and may be purchased under limited circumstances or by specified classes of investors.
Expense Ratios as of Most Recent Prospectus
| | | | |
| |
| | | Expense
Ratios | |
Class A Shares | | | 0.78% | |
Class B Shares | | | 1.53% | |
Class C Shares | | | 1.53% | |
Class R3 Shares | | | 1.03% | |
Class I Shares | | | 0.53% | |
| * | Refer to the Glossary of Terms Used in this Report for definitions. Indexes and Lipper averages are not available for direct investment. |
Growth of an Assumed $10,000 Investment as of June 30, 2012 – Class A Shares
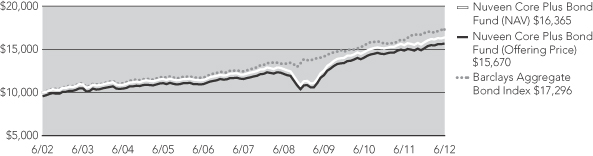
The graphs do not reflect the deduction of taxes that a shareholder may pay on Fund distributions or the redemption of Fund shares.
Fund Performance and Expense Ratios (continued)
Nuveen High Income Bond Fund
Refer to the first page of this Fund Performance and Expense Ratios section for further explanation of the information included within this page.
Fund Performance
Average Annual Total Returns as of June 30, 2012
| | | | | | | | | | | | |
| |
| | | Average Annual | |
| | | |
| | | 1-Year | | | 5-Year | | | 10-Year | |
Class A Shares at NAV | | | 3.76% | | | | 6.65% | | | | 8.42% | |
Class A Shares at maximum Offering Price | | | -1.16% | | | | 5.61% | | | | 7.90% | |
Barclays High Yield 2% Issuer Capped Index* | | | 7.21% | | | | 8.62% | | | | 10.10% | |
Lipper High Current Yield Funds Classification Average* | | | 5.15% | | | | 5.88% | | | | 8.14% | |
| | | |
Class B Shares w/o CDSC | | | 3.18% | | | | 5.86% | | | | 7.63% | |
Class B Shares w/CDSC | | | -1.60% | | | | 5.72% | | | | 7.63% | |
Class C Shares | | | 3.18% | | | | 5.90% | | | | 7.65% | |
Class R3 Shares | | | 3.46% | | | | 6.37% | | | | 8.19% | |
Class I Shares | | | 4.15% | | | | 6.92% | | | | 8.70% | |
Class A Shares have a maximum 4.75% sales charge (Offering Price). Class A Share purchases of $1 million or more are sold at net asset value without an up-front sales charge but may be subject to a contingent deferred sales charge (CDSC), also known as a back-end sales charge, if redeemed within eighteen months of purchase. Class B Shares have a CDSC that begins at 5% for redemptions during the first year and declines periodically until after six years when the charge becomes 0%. Class B Shares automatically convert to Class A Shares eight years after purchase. Class C Shares have a 1% CDSC for redemptions within less than twelve months, which is not reflected in the one-year total return. Class R3 Shares have no sales charge and are available to only certain retirement plans. Class I Shares have no sales charge and may be purchased under limited circumstances or by specified classes of investors.
Expense Ratios as of Most Recent Prospectus
| | | | |
| |
| | | Expense
Ratios | |
Class A Shares | | | 1.01% | |
Class B Shares | | | 1.76% | |
Class C Shares | | | 1.76% | |
Class R3 Shares | | | 1.26% | |
Class I Shares | | | 0.76% | |
| * | Refer to the Glossary of Terms Used in this Report for definitions. Indexes and Lipper averages are not available for direct investment. |
Growth of an Assumed $10,000 Investment as of June 30, 2012 – Class A Shares
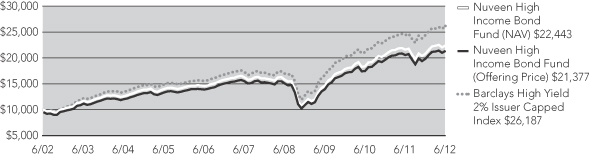
The graphs do not reflect the deduction of taxes that a shareholder may pay on Fund distributions or the redemption of Fund shares.
Fund Performance and Expense Ratios (continued)
Nuveen Inflation Protected Securities Fund
Refer to the first page of this Fund Performance and Expense Ratios section for further explanation of the information included within this page.
Fund Performance
Average Annual Total Returns as of June 30, 2012
| | | | | | | | | | | | |
| |
| | | Average Annual | |
| | | |
| | | 1-Year | | | 5-Year | | | Since
Inception* | |
Class A Shares at NAV | | | 11.44% | | | | 8.09% | | | | 5.90% | |
Class A Shares at maximum Offering Price | | | 6.67% | | | | 7.15% | | | | 5.31% | |
Barclays U.S. TIPs Index** | | | 11.66% | | | | 8.44% | | | | 6.46% | |
Lipper Treasury Inflation Protected Securities Funds Classification Average** | | | 9.21% | | | | 7.15% | | | | 5.82% | |
| | | |
Class C Shares | | | 10.62% | | | | 7.27% | | | | 5.09% | |
Class R3 Shares | | | 11.10% | | | | 7.65% | | | | 5.55% | |
Class I Shares | | | 11.62% | | | | 8.33% | | | | 6.14% | |
Class A Shares have a maximum 4.25% sales charge (Offering Price). Class A Share purchases of $1 million or more are sold at net asset value without an up-front sales charge but may be subject to a contingent deferred sales charge (CDSC), also known as a back-end sales charge, if redeemed within eighteen months of purchase. Class C Shares have a 1% CDSC for redemptions within less than twelve months, which is not reflected in the one-year total return. Class R3 Shares have no sales charge and are available to only certain retirement plans. Class I Shares have no sales charge and may be purchased under limited circumstances or by specified classes of investors.
Expense Ratios as of Most Recent Prospectus
| | | | | | | | |
| | |
| | | Gross
Expense
Ratios | | | Net
Expense
Ratios | |
Class A Shares | | | 0.88% | | | | 0.86% | |
Class C Shares | | | 1.63% | | | | 1.61% | |
Class R3 Shares | | | 1.13% | | | | 1.11% | |
Class I Shares | | | 0.63% | | | | 0.61% | |
The Fund’s investment adviser has contractually agreed to waive fees and/or reimburse other Fund expenses through October 31, 2013, so that total annual Fund operating expenses, after fee waivers and/or expense reimbursements and excluding acquired Fund fees and expenses, do not exceed 0.85%, 1.60%, 1.10% and 0.60% for Class A, Class C, Class R3 and Class I Shares, respectively. Fee waivers and/or expense reimbursements will not be terminated prior to that time without the approval of the Fund’s Board of Directors.
| * | Since inception returns are from 10/01/04. |
| ** | Refer to the Glossary of Terms Used in this Report for definitions. Indexes and Lipper averages are not available for direct investment. |
Growth of an Assumed $10,000 Investment as of June 30, 2012 – Class A Shares
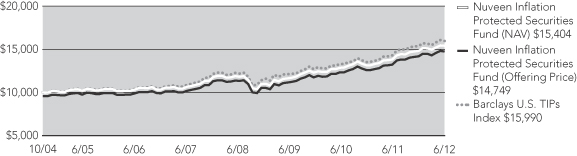
The graphs do not reflect the deduction of taxes that a shareholder may pay on Fund distributions or the redemption of Fund shares.
Fund Performance and Expense Ratios (continued)
Nuveen Intermediate Government Bond Fund
Refer to the first page of this Fund Performance and Expense Ratios section for further explanation of the information included within this page.
Fund Performance
Average Annual Total Returns as of June 30, 2012
| | | | | | | | | | | | |
| |
| | | Average Annual | |
| | | |
| | | 1-Year | | | 5-Year | | | Since
Inception* | |
Class A Shares at NAV | | | 4.24% | | | | 5.39% | | | | 3.87% | |
Class A Shares at maximum Offering Price | | | 1.15% | | | | 4.74% | | | | 3.54% | |
Barclays Intermediate Government Bond Index** | | | 5.01% | | | | 5.77% | | | | 4.38% | |
Lipper Intermediate U.S. Government Funds Classification Average** | | | 6.61% | | | | 5.90% | | | | 4.24% | |
| | | |
Class I Shares | | | 4.50% | | | | 5.57% | | | | 4.03% | |
| | | | | | | | |
| |
| | | Average Annual | |
| | |
| | | 1-Year | | | Since
Inception* | |
Class C Shares | | | 3.35% | | | | 3.25% | |
Class R3 Shares | | | 3.79% | | | | 3.70% | |
Class A Shares have a maximum 3.00% sales charge (Offering Price). Class A Share purchases of $1 million or more are sold at net asset value without an up-front sales charge but may be subject to a contingent deferred sales charge (CDSC), also known as a back-end sales charge, if redeemed within eighteen months of purchase. Class C Shares have a 1% CDSC for redemptions within less than twelve months, which is not reflected in the one-year total return. Class R3 Shares have no sales charge and are available to only certain retirement plans. Class I Shares have no sales charge and may be purchased under limited circumstances or by specified classes of investors.
Expense Ratios as of Most Recent Prospectus
| | | | | | | | |
| | |
| | | Gross
Expense
Ratios | | | Net
Expense
Ratios | |
Class A Shares | | | 0.89% | | | | 0.85% | |
Class C Shares | | | 1.64% | | | | 1.60% | |
Class R3 Shares | | | 1.14% | | | | 1.10% | |
Class I Shares | | | 0.64% | | | | 0.60% | |
The Fund’s investment adviser has contractually agreed to waive fees and/or reimburse other Fund expenses through October 31, 2013, so that total annual Fund operating expenses, after fee waivers and/or expense reimbursements and excluding acquired Fund fees and expenses, do not exceed 0.85%, 1.60%, 1.10% and 0.60% for Class A, Class C, Class R3 and Class I Shares, respectively. Fee waivers and/or expense reimbursements will not be terminated prior to that time without the approval of the Fund’s Board of Directors.
| * | Since inception returns for Class A and Class I Shares, and for the comparative index and Lipper average are from 10/25/02. Since inception returns for Class C and Class R3 Shares are from 10/28/09. |
| ** | Refer to the Glossary of Terms Used in this Report for definitions. Indexes and Lipper averages are not available for direct investment. |
Growth of an Assumed $10,000 Investment as of June 30, 2012 – Class A Shares
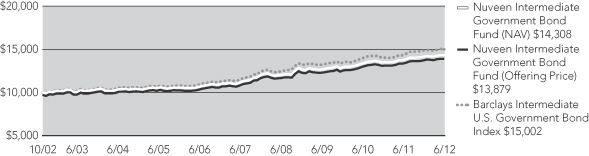
The graphs do not reflect the deduction of taxes that a shareholder may pay on Fund distributions or the redemption of Fund shares.
Fund Performance and Expense Ratios (continued)
Nuveen Intermediate Term Bond Fund
Refer to the first page of this Fund Performance and Expense Ratios section for further explanation of the information included within this page.
Fund Performance
Average Annual Total Returns as of June 30, 2012
| | | | | | | | | | | | |
| |
| | | Average Annual | |
| | | |
| | | 1-Year | | | 5-Year | | | 10-Year | |
Class A Shares at NAV | | | 4.93% | | | | 6.02% | | | | 4.75% | |
Class A Shares at maximum Offering Price | | | 1.82% | | | | 5.38% | | | | 4.44% | |
Barclays Aggregate Bond Index* | | | 7.47% | | | | 6.79% | | | | 5.63% | |
Lipper Intermediate Investment Grade Debt Funds Classification Average* | | | 6.97% | | | | 6.19% | | | | 5.19% | |
| | | |
Class I Shares | | | 5.18% | | | | 6.17% | | | | 4.91% | |
| | | | | | | | |
| |
| | | Average Annual | |
| | |
| | | 1-Year | | | Since
Inception** | |
Class C Shares | | | 3.97% | | | | 3.97% | |
Class A Shares have a maximum 3.00% sales charge (Offering Price). Class A Share purchases of $1 million or more are sold at net asset value without an up-front sales charge but may be subject to a contingent deferred sales charge (CDSC), also known as a back-end sales charge, if redeemed within eighteen months of purchase. Class C Shares have a 1% CDSC for redemptions within less than twelve months, which is not reflected in the one-year total return. Class I Shares have no sales charge and may be purchased under limited circumstances or by specified classes of investors.
Expense Ratios as of Most Recent Prospectus
| | | | |
| |
| | | Expense
Ratios | |
Class A Shares | | | 0.78% | |
Class C Shares | | | 1.53% | |
Class I Shares | | | 0.53% | |
| * | Refer to the Glossary of Terms Used in this Report for definitions. Indexes and Lipper averages are not available for direct investment. |
| ** | Since inception return for Class C Shares is from 1/18/11. |
Growth of an Assumed $10,000 Investment as of June 30, 2012 – Class A Shares
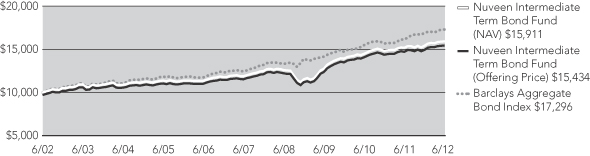
The graphs do not reflect the deduction of taxes that a shareholder may pay on Fund distributions or the redemption of Fund shares.
Fund Performance and Expense Ratios (continued)
Nuveen Short Term Bond Fund
Refer to the first page of this Fund Performance and Expense Ratios section for further explanation of the information included within this page.
Fund Performance
Average Annual Total Returns as of June 30, 2012
| | | | | | | | | | | | |
| |
| | | Average Annual | |
| | | |
| | | 1-Year | | | 5-Year | | | 10-Year | |
Class A Shares at NAV | | | 1.42% | | | | 3.52% | | | | 3.09% | |
Class A Shares at maximum Offering Price | | | -0.85% | | | | 3.05% | | | | 2.86% | |
Barclays 1-3 Year Government/Credit Bond Index* | | | 1.12% | | | | 3.67% | | | | 3.43% | |
Lipper Short Investment Grade Debt Funds Classification Average* | | | 1.72% | | | | 3.04% | | | | 3.13% | |
| | | |
Class I Shares | | | 1.51% | | | | 3.67% | | | | 3.25% | |
| | | | | | | | |
| |
| | | Average Annual | |
| | |
| | | 1-Year | | | Since
Inception** | |
Class C Shares | | | 0.50% | | | | 1.73% | |
| | | | |
| |
| | | Cumulative | |
| |
| | | Since
Inception** | |
Class R3 Shares | | | 2.92% | |
Class A Shares have a maximum 2.25% sales charge (Offering Price). Class A Share purchases of $250,000 or more are sold at net asset value without an up-front sales charge but may be subject to a contingent deferred sales charge (CDSC), also known as a back-end sales charge, if redeemed within eighteen months of purchase. Class C Shares have a 1% CDSC for redemptions within less than twelve months, which is not reflected in the one-year total return. Class R3 Shares have no sales charge and are available to only certain retirement plans. Class I Shares have no sales charge and may be purchased under limited circumstances or by specified classes of investors.
Expense Ratios as of Most Recent Prospectus
| | | | |
| |
| | | Expense
Ratios | |
Class A Shares | | | 0.73% | |
Class C Shares | | | 1.48% | |
Class R3 Shares | | | 0.98% | |
Class I Shares | | | 0.48% | |
| * | Refer to the Glossary of Terms Used in this Report for definitions. Indexes and Lipper averages are not available for direct investment. |
| ** | Since inception return for Class C Shares is from 10/28/09. Since inception return for Class R3 Shares is from 9/23/11. |
Growth of an Assumed $10,000 Investment as of June 30, 2012 – Class A Shares

The graphs do not reflect the deduction of taxes that a shareholder may pay on Fund distributions or the redemption of Fund shares.
Fund Performance and Expense Ratios (continued)
Nuveen Strategic Income Fund
Refer to the first page of this Fund Performance and Expense Ratios section for further explanation of the information included within this page.
Fund Performance
Average Annual Total Returns as of June 30, 2012
| | | | | | | | | | | | |
| |
| | | Average Annual | |
| | | |
| | | 1-Year | | | 5-Year | | | 10-Year | |
Class A Shares at NAV | | | 5.14% | | | | 7.74% | | | | 6.47% | |
Class A Shares at maximum Offering Price | | | 0.64% | | | | 6.80% | | | | 6.01% | |
Barclays Aggregate Bond Index* | | | 7.47% | | | | 6.79% | | | | 5.63% | |
Lipper Multi-Sector Income Classification Average* | | | 4.96% | | | | 6.22% | | | | 7.31% | |
| | | |
Class B Shares w/o CDSC | | | 4.32% | | | | 6.89% | | | | 5.66% | |
Class B Shares w/CDSC | | | -0.68% | | | | 6.73% | | | | 5.66% | |
Class C Shares | | | 4.32% | | | | 6.90% | | | | 5.67% | |
Class R3 Shares | | | 4.83% | | | | 7.40% | | | | 6.24% | |
Class I Shares | | | 5.35% | | | | 7.97% | | | | 6.73% | |
Class A Shares have a maximum 4.25% sales charge (Offering Price). Class A Share purchases of $1 million or more are sold at net asset value without an up-front sales charge but may be subject to a contingent deferred sales charge (CDSC), also known as a back-end sales charge, if redeemed within eighteen months of purchase. Class B Shares have a CDSC that begins at 5% for redemptions during the first year and declines periodically until after six years when the charge becomes 0%. Class B Shares automatically convert to Class A Shares eight years after purchase. Class C Shares have a 1% CDSC for redemptions within less than twelve months, which is not reflected in the one-year total return. Class R3 Shares have no sales charge and are available to only certain retirement plans. Class I Shares have no sales charge and may be purchased under limited circumstances or by specified classes of investors.
Expense Ratios as of Most Recent Prospectus
| | | | | | | | |
| | |
| | | Gross
Expense
Ratios | | | Net
Expense
Ratios | |
Class A Shares | | | 0.89% | | | | 0.86% | |
Class B Shares | | | 1.64% | | | | 1.61% | |
Class C Shares | | | 1.64% | | | | 1.61% | |
Class R3 Shares | | | 1.14% | | | | 1.11% | |
Class I Shares | | | 0.64% | | | | 0.61% | |
The Fund’s investment adviser has contractually agreed to waive fees and/or reimburse other Fund expenses through October 31, 2013, so that total annual Fund operating expenses, after fee waivers and/or expense reimbursements and excluding acquired Fund fees and expenses, do not exceed 0.84%, 1.59%, 1.59%, 1.09% and 0.59% for Class A, Class B, Class C, Class R3 and Class I Shares, respectively. Fee waivers and/or expense reimbursements will not be terminated prior to that time without the approval of the Fund’s Board of Directors.
| * | Refer to the Glossary of Terms Used in this Report for definitions. Indexes and Lipper averages are not available for direct investment. |
Growth of an Assumed $10,000 Investment as of June 30, 2012 – Class A Shares
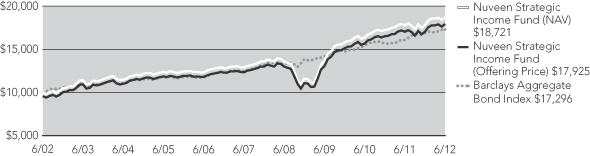
The graphs do not reflect the deduction of taxes that a shareholder may pay on Fund distributions or the redemption of Fund shares.
Yields as of June 30, 2012
Dividend Yield is the most recent dividend per share (annualized) divided by the offering price per share.
The SEC 30-Day Yield is a standardized measure of a Fund’s yield that accounts for the future amortization of premiums or discounts of bonds held in the Fund’s portfolio. The SEC 30-Day Yield is computed under an SEC standardized formula and is based on the maximum offer price per share. Dividend Yield may differ from the SEC 30-Day Yield because the Fund may be paying out more or less than it is earning and it may not include the effect of amortization of bond premium.
Nuveen Core Plus Bond Fund
| | | | | | | | |
| | |
| | | Dividend
Yield | | | SEC 30-Day
Yield | |
Class A Shares(1) | | | 3.45% | | | | 3.57% | |
Class B Shares | | | 2.86% | | | | 2.98% | |
Class C Shares | | | 2.90% | | | | 2.99% | |
Class R3 Shares | | | 3.38% | | | | 3.48% | |
Class I Shares | | | 3.87% | | | | 3.98% | |
Nuveen High Income Bond Fund
| | | | | | | | |
| | |
| | | Dividend
Yield | | | SEC 30-Day
Yield | |
Class A Shares(1) | | | 7.81% | | | | 8.13% | |
Class B Shares | | | 7.47% | | | | 7.80% | |
Class C Shares | | | 7.45% | | | | 7.80% | |
Class R3 Shares | | | 7.97% | | | | 8.30% | |
Class I Shares | | | 8.46% | | | | 8.80% | |
Nuveen Inflation Protected Securities Fund
| | | | | | | | |
| | |
| | | Dividend
Yield | | | SEC 30-Day
Yield | |
Class A Shares(1) | | | 1.95% | | | | 0.42% | |
Class C Shares | | | 1.28% | | | | -0.32% | |
Class R3 Shares | | | 1.79% | | | | 0.17% | |
Class I Shares | | | 2.29% | | | | 0.67% | |
Nuveen Intermediate Government Bond Fund
| | | | | | | | |
| | |
| | | Dividend
Yield | | | SEC 30-Day
Yield | |
Class A Shares(1) | | | 2.06% | | | | 1.30% | |
Class C Shares | | | 1.33% | | | | 0.61% | |
Class R3 Shares | | | 1.86% | | | | 1.09% | |
Class I Shares | | | 2.33% | | | | 1.59% | |
Nuveen Intermediate Term Bond Fund
| | | | | | | | |
| | |
| | | Dividend
Yield | | | SEC 30-Day
Yield | |
Class A Shares(1) | | | 2.62% | | | | 1.87% | |
Class C Shares | | | 1.92% | | | | 1.19% | |
Class I Shares | | | 2.88% | | | | 2.18% | |
| (1) | The SEC Yield for Class A Shares quoted in the table reflects the maximum sales load. Investors paying a reduced load because of volume discounts, investors paying no load because they qualify for one of the several exclusions from the load, and existing shareholders who previously paid a load but would like to know the SEC Yield applicable to their shares on a going-forward basis, should understand that the SEC Yield effectively applicable to them would be higher than the figure quoted in the table. |
Nuveen Short Term Bond Fund
| | | | | | | | |
| | |
| | | Dividend
Yield | | | SEC 30-Day
Yield | |
Class A Shares(1) | | | 2.36% | | | | 2.08% | |
Class C Shares | | | 1.62% | | | | 1.39% | |
Class R3 Shares | | | 2.11% | | | | 1.88% | |
Class I Shares | | | 2.65% | | | | 2.38% | |
Nuveen Strategic Income Fund
| | | | | | | | |
| | |
| | | Dividend
Yield | | | SEC 30-Day
Yield | |
Class A Shares(1) | | | 3.87% | | | | 4.29% | |
Class B Shares | | | 3.28% | | | | 3.79% | |
Class C Shares | | | 3.29% | | | | 3.75% | |
Class R3 Shares | | | 3.75% | | | | 4.32% | |
Class I Shares | | | 4.27% | | | | 4.89% | |
| (1) | The SEC Yield for Class A Shares quoted in the table reflects the maximum sales load. Investors paying a reduced load because of volume discounts, investors paying no load because they qualify for one of the several exclusions from the load, and existing shareholders who previously paid a load but would like to know the SEC Yield applicable to their shares on a going-forward basis, should understand that the SEC Yield effectively applicable to them would be higher than the figure quoted in the table. |
Holding Summaries as of June 30, 2012
This data relates to the securities held in each Fund’s portfolio of investments. It should not be construed as a measure of performance for the Fund itself.
Ratings shown are the highest rating given by one of the following national rating agencies: Standard & Poor’s Group, Moody’s Investors Service, Inc. or Fitch, Inc. Credit ratings are subject to change. AAA, AA, A and BBB are investment grade ratings; BB, B, CCC, CC, C and D are below investment grade ratings. Certain bonds backed by U.S. Government or agency securities are regarded as having an implied rating equal to the rating of such securities. Holdings designated N/R are not rated by a national rating agency.
Nuveen Core Plus Bond Fund
Portfolio Credit Quality1
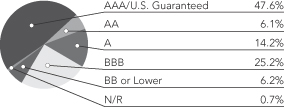
Nuveen High Income Bond Fund
Portfolio Credit Quality4
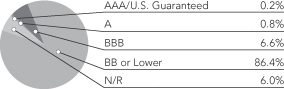
| | | | |
| Portfolio Allocation2 | | | |
| Asset-Backed and Mortgage-Backed Securities | | | 45.6% | |
| Corporate Bonds | | | 40.4% | |
| U.S. Government and Agency Obligations | | | 6.3% | |
| Capital Preferred Securities | | | 2.9% | |
| Short-Term Investments | | | 2.7% | |
| $25 Par (or similar) Preferred Securities | | | 1.3% | |
| Municipal Bonds | | | 0.8% | |
| | | | |
| Portfolio Allocation2 | | | |
| Corporate Bonds | | | 81.9% | |
| $25 Par (or similar) Preferred Securities | | | 5.9% | |
| Capital Preferred Securities | | | 3.3% | |
| Short-Term Investments | | | 2.7% | |
| Common Stock | | | 1.8% | |
| Exchange-Traded Funds | | | 1.4% | |
| Convertible Bonds | | | 0.9% | |
| Sovereign Debt | | | 0.9% | |
| Investment Companies | | | 0.9% | |
| U.S. Government and Agency Obligations | | | 0.2% | |
| Convertible Preferred Securities | | | 0.1% | |
| Warrants | | | —% | 5 |
| Asset-Backed and Mortgage-Backed Securities | | | —% | 5 |
| | | | |
| Corporate Debt: Industries3 | | | |
| Diversified Financial Services | | | 11.9% | |
| Oil, Gas & Consumable Fuels | | | 11.6% | |
| Metals & Mining | | | 10.1% | |
| Commercial Bank | | | 8.4% | |
| Capital Markets | | | 7.9% | |
| Media | | | 6.6% | |
| Insurance | | | 6.0% | |
| Diversified Telecommunication Services | | | 5.2% | |
| Energy Equipment & Services | | | 5.1% | |
| Chemicals | | | 3.3% | |
| Consumer Finance | | | 2.8% | |
| Electric Utilities | | | 2.6% | |
| Other | | | 18.5% | |
| | | | |
| Corporate Debt: Industries3 | | | |
| Oil, Gas & Consumable Fuels | | | 14.8% | |
| Metals & Mining | | | 7.1% | |
| Media | | | 5.2% | |
| Hotels, Restaurants & Leisure | | | 4.4% | |
| Diversified Telecommunication Services | | | 3.8% | |
| Chemicals | | | 3.8% | |
| Health Care Providers & Services | | | 3.7% | |
| Household Durables | | | 3.6% | |
| Commercial Services & Supplies | | | 3.4% | |
| Wireless Telecommunication Services | | | 3.2% | |
| Real Estate Management & Development | | | 3.2% | |
| Paper & Forest Products | | | 3.1% | |
| Energy Equipment & Services | | | 3.1% | |
| Food Products | | | 2.9% | |
| Building Products | | | 2.3% | |
| Machinery | | | 2.1% | |
| IT Services | | | 2.0% | |
| Diversified Financial Services | | | 2.0% | |
| Airlines | | | 1.9% | |
| Communications Equipment | | | 1.9% | |
| Capital Markets | | | 1.8% | |
| Multiline Retail | | | 1.8% | |
| Other | | | 18.9% | |
| 1 | As a percentage of total investments (excluding money market funds, investments in derivatives and investments purchased with collateral from securities lending) as of June 30, 2012. Holdings are subject to change. |
| 2 | As a percentage of total investments (excluding investments in derivatives and investments purchased with collateral from securities lending) as of June 30, 2012. Holdings are subject to change. |
| 3 | As a percentage of total corporate debt holdings as of June 30, 2012. Corporate debt holdings include corporate bonds (high-yield and investment grade rated), convertible bonds, and any other debt instruments issued by a corporation (or that references a corporation) held by the fund at the end of the reporting period. Holdings are subject to change. |
| 4 | As a percentage of total investments (excluding common stocks, exchange-traded funds, investment companies, warrants, money market funds, investments in derivatives and investments purchased with collateral from securities lending) as of June 30, 2012. Holdings are subject to change. |
| 5 | Rounds to less than 0.1%. |
Nuveen Inflation Protected Securities Fund
Portfolio Credit Quality1
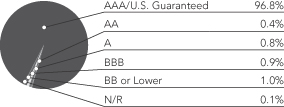
Nuveen Intermediate Government Bond
Portfolio Credit Quality4
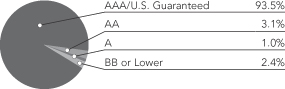
Nuveen Intermediate Term Bond Fund
Portfolio Credit Quality4
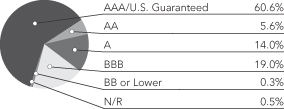
| | | | |
| Portfolio Allocation2 | | | |
| U.S. Government and Agency Obligations | | | 90.3% | |
| Short-Term Investments | | | 4.9% | |
| Asset-Backed and Mortgage-Backed Securities | | | 2.1% | |
| Corporate Bonds | | | 1.8% | |
| Municipal Bonds | | | 0.4% | |
| Sovereign Debt | | | 0.3% | |
| Investment Companies | | | 0.1% | |
| $25 Par (or similar) Preferred Securities | | | 0.1% | |
| | | | |
| Portfolio Allocation2 | | | |
| Asset-Backed and Mortgage-Backed Securities | | | 55.0% | |
| U.S. Government and Agency Obligations | | | 42.1% | |
| Short-Term Investments | | | 1.8% | |
| Municipal Bonds | | | 1.1% | |
| | | | |
| Portfolio Allocation2 | | | |
Asset-Backed and Mortgage-Backed Securities | | | 45.2% | |
Corporate Bonds | | | 31.3% | |
U.S. Government and Agency Obligations | | | 12.3% | |
Short-Term Investments | | | 9.2% | |
Municipal Bonds | | | 1.0% | |
Capital Preferred Securities | | | 0.8% | |
| Sovereign Debt | | | 0.2% | |
| | | | |
| Corporate Debt: Industries3 | | | |
| Metals & Mining | | | 30.8% | |
| Oil, Gas & Consumable Fuels | | | 10.0% | |
| Electric Utilities | | | 9.7% | |
| Commercial Banks | | | 7.5% | |
| Health Care Providers & Services | | | 6.3% | |
| Chemicals | | | 6.0% | |
| Food Products | | | 4.3% | |
| Commodity | | | 4.1% | |
| Energy Equipment & Services | | | 3.3% | |
| Other | | | 18.0% | |
| | | | |
| Corporate Debt: Industries3 | | | |
Diversified Financial Services | | | 14.9% | |
Media | | | 12.4% | |
Insurance | | | 10.2% | |
Metals & Mining | | | 10.0% | |
Commercial Banks | | | 8.4% | |
Oil, Gas & Consumable Fuels | | | 6.6% | |
Capital Markets | | | 6.5% | |
Diversified Telecommunication Services | | | 4.8% | |
Electric Utilities | | | 2.9% | |
Energy Equipment & Services | | | 2.9% | |
Tobacco | | | 2.5% | |
Other | | | 17.9% | |
| 1 | As a percentage of total investments (excluding investment companies, money market funds, investments in derivatives and investments purchased with collateral from securities lending) as of June 30, 2012. Holdings are subject to change. |
| 2 | As a percentage of total investments (excluding money market funds investments in derivatives and investments purchased with collateral from securities lending) as of June 30, 2012. Holdings are subject to change. |
| 3 | As a percentage of total corporate debt holdings as of June 30, 2012. Corporate debt holdings include corporate bonds (high-yield and investment grade rated), convertible bonds, and any other debt instruments issued by a corporation (or that references a corporation) held by the fund at the end of the reporting period. Holdings are subject to change. |
| 4 | As a percentage of total investments (excluding money market funds, investments in derivatives and investments purchased with collateral from securities lending) as of June 30, 2012. Holdings are subject to change. |
Holding Summaries (continued) as of June 30, 2012
Nuveen Short Term Bond Fund
Portfolio Credit Quality1
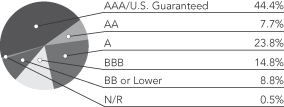
Nuveen Strategic Income Fund
Portfolio Credit Quality4
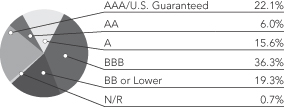
| | | | |
| Portfolio Allocation2 | | | |
| Corporate Bonds | | | 43.2% | |
| Asset-Backed and Mortgage-Backed Securities | | | 40.3% | |
| Short-Term Investments | | | 8.5% | |
| Municipal Bonds | | | 3.4% | |
| U.S. Government and Agency Obligations | | | 3.1% | |
| Sovereign Debt | | | 1.3% | |
| Structured Notes | | | 0.2% | |
| | | | |
| Portfolio Allocation2 | | | |
Corporate Bonds | | | 62.1% | |
Asset-Backed and Mortgage-Backed Securities | | | 24.7% | |
Capital Preferred Securities | | | 3.5% | |
Short-Term Investments | | | 3.1% | |
Sovereign Debt | | | 2.6% | |
$25 Par (or similar) Preferred Securities | | | 2.5% | |
Municipal Bonds | | | 0.7% | |
Convertible Bonds | | | 0.5% | |
Investment Companies | | | 0.2% | |
Structured Notes | | | 0.1% | |
| Common Stock | | | —% | 5 |
| | | | |
| Corporate Debt: Industries3 | | | |
Commercial Banks | | | 14.2% | |
Diversified Financial Services | | | 12.7% | |
Oil, Gas & Consumable Fuels | | | 10.2% | |
Capital Markets | | | 8.3% | |
Metals & Mining | | | 4.5% | |
Insurance | | | 4.3% | |
Diversified Telecommunication Services | | | 3.9% | |
Media | | | 3.5% | |
Real Estate Investment Trust | | | 3.5% | |
Consumer Finance | | | 3.1% | |
Health Care Providers & Services | | | 2.9% | |
Airlines | | | 2.6% | |
Chemicals | | | 2.3% | |
Energy Equipment & Services | | | 2.1% | |
Beverages | | | 2.0% | |
| Other | | | 19.9% | |
| | | | |
| Corporate Debt: Industries3 | | | |
Oil, Gas & Consumable Fuels | | | 10.8% | |
Diversified Financial Services | | | 9.9% | |
Metals & Mining | | | 9.9% | |
Capital Markets | | | 6.3% | |
Media | | | 5.9% | |
Insurance | | | 5.4% | |
Commercial Banks | | | 5.3% | |
Diversified Telecommunication Services | | | 4.2% | |
Chemicals | | | 3.8% | |
Electric Utilities | | | 3.0% | |
Energy Equipment & Services | | | 2.8% | |
Consumer Finance | | | 2.2% | |
Food Products | | | 2.2% | |
Airlines | | | 2.1% | |
Real Estate Investment Trust | | | 2.0% | |
Paper & Forest Products | | | 2.0% | |
Commercial Services & Supplies | | | 1.8% | |
| Tobacco | | | 1.8% | |
| Other | | | 18.6% | |
| 1 | As a percentage of total investments (excluding money market funds, investments in derivatives and investments purchased with collateral from securities lending) as of June 30, 2012. Holdings are subject to change. |
| 2 | As a percentage of total investments (excluding investments in derivatives and investments purchased with collateral from securities lending) as of June 30, 2012. Holdings are subject to change. |
| 3 | As a percentage of total corporate debt holdings as of June 30, 2012. Corporate debt holdings include corporate bonds (high-yield and investment grade rated), convertible bonds, and any other debt instruments issued by a corporation (or that references a corporation) held by the fund at the end of the reporting period. Holdings are subject to change. |
| 4 | As a percentage of total investments (excluding common stock, investment companies, money market funds, investments in derivatives and investments purchased with collateral from securities lending) as of June 30, 2012. Holdings are subject to change. |
| 5 | Rounds to less than 0.1%. |
Expense Examples
As a shareholder of one or more of the Funds, you incur two types of costs: (1) transaction costs, including up-front and back-end sales charges (loads) or redemption fees, where applicable; and (2) ongoing costs, including management fees; distribution and service (12b-1) fees, where applicable; and other Fund expenses. The Examples below are intended to help you understand your ongoing costs (in dollars) of investing in the Funds and to compare these costs with the ongoing costs of investing in other mutual funds.
The Examples below are based on an investment of $1,000 invested at the beginning of the period and held for the period.
The information under “Actual Performance,” together with the amount you invested, allows you to estimate actual expenses incurred over the reporting period. Simply divide your account value by $1,000 (for example, an $8,600 account value divided by $1,000 = 8.60) and multiply the result by the cost shown for your share class, in the row entitled “Expenses Incurred During Period” to estimate the expenses incurred on your account during this period.
The information under “Hypothetical Performance,” provides information about hypothetical account values and hypothetical expenses based on the respective Fund’s actual expense ratio and an assumed rate of return of 5% per year before expenses, which is not the Fund’s actual return. The hypothetical account values and expenses may not be used to estimate the actual ending account balance or expense you incurred for the period. You may use this information to compare the ongoing costs of investing in the Fund and other Funds. To do so, compare this 5% hypothetical example with the 5% hypothetical examples that appear in the shareholder reports of the other funds.
Please note that the expenses shown in the table are meant to highlight your ongoing costs only and do not reflect any transaction costs. Therefore, the hypothetical information is useful in comparing ongoing costs only, and will not help you determine the relative total costs of owning different funds or share classes. In addition, if these transaction costs were included, your costs would have been higher.
Nuveen Core Plus Bond Fund
| | | | | | | | | | | | | | | | | | | | | | | | | | | | | | | | | | | | | | | | | | |
| | | | | | | | Hypothetical Performance | |
| | | Actual Performance | | | | | (5% annualized return before expenses) | |
| | | A Shares | | | B Shares | | | C Shares | | | R3 Shares | | | I Shares | | | | | A Shares | | | B Shares | | | C Shares | | | R3 Shares | | | I Shares | |
| Beginning Account Value (1/01/12) | | $ | 1,000.00 | | | $ | 1,000.00 | | | $ | 1,000.00 | | | $ | 1,000.00 | | | $ | 1,000.00 | | | | | $ | 1,000.00 | | | $ | 1,000.00 | | | $ | 1,000.00 | | | $ | 1,000.00 | | | $ | 1,000.00 | |
| Ending Account Value (6/30/12) | | $ | 1,035.10 | | | $ | 1,032.30 | | | $ | 1,031.50 | | | $ | 1,034.70 | | | $ | 1,037.30 | | | | | $ | 1,020.39 | | | $ | 1,016.56 | | | $ | 1,016.66 | | | $ | 1,019.10 | | | $ | 1,021.58 | |
| Expenses Incurred During Period | | $ | 4.55 | | | $ | 8.44 | | | $ | 8.33 | | | $ | 5.87 | | | $ | 3.34 | | | | | $ | 4.52 | | | $ | 8.37 | | | $ | 8.27 | | | $ | 5.82 | | | $ | 3.32 | |
For each class of the Fund, expenses are equal to the Fund’s annualized net expense ratio of .90%, 1.67%, 1.65%, 1.16% and ..66% for Classes A, B, C, R3 and I, respectively, multiplied by the average account value over the period, multiplied by 182/366 (to reflect the one-half year period).
Nuveen High Income Bond Fund
| | | | | | | | | | | | | | | | | | | | | | | | | | | | | | | | | | | | | | | | | | |
| | | | | | | | Hypothetical Performance | |
| | | Actual Performance | | | | | (5% annualized return before expenses) | |
| | | A Shares | | | B Shares | | | C Shares | | | R3 Shares | | | I Shares | | | | | A Shares | | | B Shares | | | C Shares | | | R3 Shares | | | I Shares | |
| Beginning Account Value (1/01/12) | | $ | 1,000.00 | | | $ | 1,000.00 | | | $ | 1,000.00 | | | $ | 1,000.00 | | | $ | 1,000.00 | | | | | $ | 1,000.00 | | | $ | 1,000.00 | | | $ | 1,000.00 | | | $ | 1,000.00 | | | $ | 1,000.00 | |
| Ending Account Value (6/30/12) | | $ | 1,077.60 | | | $ | 1,074.00 | | | $ | 1,073.70 | | | $ | 1,074.30 | | | $ | 1,079.00 | | | | | $ | 1,019.84 | | | $ | 1,016.06 | | | $ | 1,016.11 | | | $ | 1,018.75 | | | $ | 1,021.08 | |
| Expenses Incurred During Period | | $ | 5.22 | | | $ | 9.13 | | | $ | 9.07 | | | $ | 6.34 | | | $ | 3.93 | | | | | $ | 5.07 | | | $ | 8.87 | | | $ | 8.82 | | | $ | 6.17 | | | $ | 3.82 | |
For each class of the Fund, expenses are equal to the Fund’s annualized net expense ratio of 1.01%, 1.77%, 1.76%, 1.23% and ..76% for Classes A, B, C, R3 and I, respectively, multiplied by the average account value over the period, multiplied by 182/366 (to reflect the one-half year period).
Expense Examples (continued)
Nuveen Inflation Protected Securities Fund
| | | | | | | | | | | | | | | | | | | | | | | | | | | | | | | | | | |
| | | | | | | | Hypothetical Performance | |
| | | Actual Performance | | | | | (5% annualized return before expenses) | |
| | | A Shares | | | C Shares | | | R3 Shares | | | I Shares | | | | | A Shares | | | C Shares | | | R3 Shares | | | I Shares | |
| Beginning Account Value (1/01/12) | | $ | 1,000.00 | | | $ | 1,000.00 | | | $ | 1,000.00 | | | $ | 1,000.00 | | | | | $ | 1,000.00 | | | $ | 1,000.00 | | | $ | 1,000.00 | | | $ | 1,000.00 | |
| Ending Account Value (6/30/12) | | $ | 1,039.30 | | | $ | 1,035.60 | | | $ | 1,037.30 | | | $ | 1,040.60 | | | | | $ | 1,020.74 | | | $ | 1,017.01 | | | $ | 1,019.49 | | | $ | 1,021.93 | |
| Expenses Incurred During Period | | $ | 4.21 | | | $ | 8.00 | | | $ | 5.47 | | | $ | 2.99 | | | | | $ | 4.17 | | | $ | 7.92 | | | $ | 5.42 | | | $ | 2.97 | |
For each class of the Fund, expenses are equal to the Fund’s annualized net expense ratio of .83%, 1.58%, 1.08% and .59% for Classes A, C, R3 and I, respectively, multiplied by the average account value over the period, multiplied by 182/366 (to reflect the one-half year period).
Nuveen Intermediate Government Bond Fund
| | | | | | | | | | | | | | | | | | | | | | | | | | | | | | | | | | |
| | | | | | | | Hypothetical Performance | |
| | | Actual Performance | | | | | (5% annualized return before expenses) | |
| | | A Shares | | | C Shares | | | R3 Shares | | | I Shares | | | | | A Shares | | | C Shares | | | R3 Shares | | | I Shares | |
| Beginning Account Value (1/01/12) | | $ | 1,000.00 | | | $ | 1,000.00 | | | $ | 1,000.00 | | | $ | 1,000.00 | | | | | $ | 1,000.00 | | | $ | 1,000.00 | | | $ | 1,000.00 | | | $ | 1,000.00 | |
| Ending Account Value (6/30/12) | | $ | 1,012.90 | | | $ | 1,008.70 | | | $ | 1,011.40 | | | $ | 1,014.80 | | | | | $ | 1,020.89 | | | $ | 1,016.91 | | | $ | 1,019.29 | | | $ | 1,021.88 | |
| Expenses Incurred During Period | | $ | 4.00 | | | $ | 7.99 | | | $ | 5.60 | | | $ | 3.01 | | | | | $ | 4.02 | | | $ | 8.02 | | | $ | 5.62 | | | $ | 3.02 | |
For each class of the Fund, expenses are equal to the Fund’s annualized net expense ratio of .80%, 1.60%, 1.12% and .60% for Classes A, C, R3 and I, respectively, multiplied by the average account value over the period, multiplied by 182/366 (to reflect the one-half year period).
Nuveen Intermediate Term Bond Fund
| | | | | | | | | | | | | | | | | | | | | | | | | | |
| | | | | | | | Hypothetical Performance | |
| | | Actual Performance | | | | | (5% annualized return before expenses) | |
| | | A Shares | | | C Shares | | | I Shares | | | | | A Shares | | | C Shares | | | I Shares | |
| Beginning Account Value (1/01/12) | | $ | 1,000.00 | | | $ | 1,000.00 | | | $ | 1,000.00 | | | | | $ | 1,000.00 | | | $ | 1,000.00 | | | $ | 1,000.00 | |
| Ending Account Value (6/30/12) | | $ | 1,033.90 | | | $ | 1,028.80 | | | $ | 1,034.70 | | | | | $ | 1,020.64 | | | $ | 1,016.75 | | | $ | 1,021.64 | |
| Expenses Incurred During Period | | $ | 4.35 | | | $ | 8.27 | | | $ | 3.34 | | | | | $ | 4.33 | | | $ | 8.25 | | | $ | 3.33 | |
For each class of the Fund, expenses are equal to the Fund’s annualized net expense ratio of .86%, 1.64% and .66% for classes A, C and I, respectively, multiplied by the average account value over the period, multiplied by 182/366 (to reflect the one-half year period).
Nuveen Short Term Bond Fund
| | | | | | | | | | | | | | | | | | | | | | | | | | | | | | | | | | |
| | | | | | | | Hypothetical Performance | |
| | | Actual Performance | | | | | (5% annualized return before expenses) | |
| | | A Shares | | | C Shares | | | R3 Shares | | | I Shares | | | | | A Shares | | | C Shares | | | R3 Shares | | | I Shares | |
| Beginning Account Value (1/01/12) | | $ | 1,000.00 | | | $ | 1,000.00 | | | $ | 1,000.00 | | | $ | 1,000.00 | | | | | $ | 1,000.00 | | | $ | 1,000.00 | | | $ | 1,000.00 | | | $ | 1,000.00 | |
| Ending Account Value (6/30/12) | | $ | 1,024.70 | | | $ | 1,020.60 | | | $ | 1,024.10 | | | $ | 1,025.70 | | | | | $ | 1,021.18 | | | $ | 1,017.11 | | | $ | 1,019.64 | | | $ | 1,022.23 | |
| Expenses Incurred During Period | | $ | 3.73 | | | $ | 7.84 | | | $ | 5.28 | | | $ | 2.67 | | | | | $ | 3.72 | | | $ | 7.82 | | | $ | 5.27 | | | $ | 2.66 | |
For each class of the Fund, expenses are equal to the Fund’s annualized net expense ratio of .74%, 1.56%, 1.05% and .53% for Classes A, C, R3 and I, respectively, multiplied by the average account value over the period, multiplied by 182/366 (to reflect the one-half year period).
Nuveen Strategic Income Fund
| | | | | | | | | | | | | | | | | | | | | | | | | | | | | | | | | | | | | | | | | | |
| | | | | | | | Hypothetical Performance | |
| | | Actual Performance | | | | | (5% annualized return before expenses) | |
| | | A Shares | | | B Shares | | | C Shares | | | R3 Shares | | | I Shares | | | | | A Shares | | | B Shares | | | C Shares | | | R3 Shares | | | I Shares | |
| Beginning Account Value (1/01/12) | | $ | 1,000.00 | | | $ | 1,000.00 | | | $ | 1,000.00 | | | $ | 1,000.00 | | | $ | 1,000.00 | | | | | $ | 1,000.00 | | | $ | 1,000.00 | | | $ | 1,000.00 | | | $ | 1,000.00 | | | $ | 1,000.00 | |
| Ending Account Value (6/30/12) | | $ | 1,050.30 | | | $ | 1,047.50 | | | $ | 1,046.50 | | | $ | 1,049.70 | | | $ | 1,052.50 | | | | | $ | 1,020.69 | | | $ | 1,016.94 | | | $ | 1,016.94 | | | $ | 1,019.54 | | | $ | 1,022.03 | |
| Expenses Incurred During Period | | $ | 4.28 | | | $ | 8.09 | | | $ | 8.09 | | | $ | 5.45 | | | $ | 2.91 | | | | | $ | 4.22 | | | $ | 7.97 | | | $ | 7.97 | | | $ | 5.37 | | | $ | 2.87 | |
For each class of the Fund, expenses are equal to the Fund’s annualized net expense ratio of .84%, 1.59%, 1.59%, 1.07% and ..57% for Classes A, B, C, R3 and I, respectively, multiplied by the average account value over the period, multiplied by 182/366 (to reflect the one-half year period).
Report of Independent Registered Public Accounting Firm
To the Board of Directors and Shareholders of
Nuveen Investment Funds, Inc.:
In our opinion, the accompanying statements of assets and liabilities, including the portfolios of investments, and the related statements of operations, of changes in net assets, and the financial highlights present fairly, in all material respects, the financial position of Nuveen Core Plus Bond Fund (formerly known as Nuveen Core Bond Fund), Nuveen High Income Bond Fund, Nuveen Inflation Protected Securities Fund, Nuveen Intermediate Government Bond Fund, Nuveen Intermediate Term Bond Fund, Nuveen Short Term Bond Fund, and Nuveen Strategic Income Fund (formerly known as Nuveen Total Return Bond Fund) (each a series of the Nuveen Investment Funds, Inc., hereinafter referred to as the “Funds”) at June 30, 2012, the results of each of their operations, the changes in each of their net assets and the financial highlights for the year ended June 30, 2012, in conformity with accounting principles generally accepted in the United States of America. These financial statements and financial highlights (hereafter referred to as “financial statements”) are the responsibility of the Funds’ management; our responsibility is to express an opinion on these financial statements based on our audits. We conducted our audits of these financial statements in accordance with the standards of the Public Company Accounting Oversight Board (United States). Those standards require that we plan and perform the audit to obtain reasonable assurance about whether the financial statements are free of material misstatement. An audit includes examining, on a test basis, evidence supporting the amounts and disclosures in the financial statements, assessing the accounting principles used and significant estimates made by management, and evaluating the overall financial statement presentation. We believe that our audits, which included confirmation of securities at June 30, 2012 by correspondence with the custodian and brokers, provides a reasonable basis for our opinion. The financial statements of Nuveen Core Plus Bond Fund (formerly known as Nuveen Core Bond Fund), Nuveen High Income Bond Fund, Nuveen Inflation Protected Securities Fund, Nuveen Intermediate Government Bond Fund, Nuveen Intermediate Term Bond Fund, Nuveen Short Term Bond Fund, and Nuveen Strategic Income Fund (formerly known as Nuveen Total Return Bond Fund) for the periods ended June 30, 2011 and prior were audited by other independent auditors whose report dated August 26, 2011 expressed an unqualified opinion on those statements.
PRICEWATERHOUSECOOPERS LLP
Chicago, IL
August 28, 2012
Portfolio of Investments
Nuveen Core Plus Bond Fund (formerly known as Nuveen Core Bond Fund)
June 30, 2012
| | | | | | | | | | | | | | | | | | | | |
| Shares | | | Description (1) | | Coupon | | | | | | Ratings (2) | | | Value | |
| | | | | | | | | | | | | | | | | | | | |
| | | | | | | | | | | | | | | | | | | | |
| | | | $25 PAR (OR SIMILAR) PREFERRED SECURITIES – 1.3% | | | | | | | | | | | | | | | | |
| | | | | |
| | | | Commercial Banks – 0.5% | | | | | | | | | | | | | | | | |
| | | | | |
| | 159,208 | | | PNC Financial Services | | | 0.000% | | | | | | | | BBB | | | $ | 4,195,131 | |
| | | | Insurance – 0.7% | | | | | | | | | | | | | | | | |
| | | | | |
| | 104,794 | | | Endurance Specialty Holdings Limited | | | 7.500% | | | | | | | | BBB– | | | | 2,757,130 | |
| | | | | |
| | 120,000 | | | Hartford Financial Services Group Inc. | | | 7.875% | | | | | | | | BB+ | | | | 3,244,800 | |
| | | | Total Insurance | | | | | | | | | | | | | | | 6,001,930 | |
| | | | Thrifts & Mortgage Finance – 0.1% | | | | | | | | | | | | | | | | |
| | | | | |
| | 218,000 | | | Federal National Mortgage Association | | | 4.691% | | | | | | | | Ca | | | | 355,340 | |
| | | | Total $25 Par (or similar) Preferred Securities (cost $14,773,150) | | | | | | | | | | | | | | | 10,552,401 | |
| | | | | |
Principal
Amount (000) | | | Description (1) | | Coupon | | | Maturity | | | Ratings (2) | | | Value | |
| | | | CORPORATE BONDS – 41.2% | | | | | | | | | | | | | | | | |
| | | | | |
| | | | Aerospace & Defense – 0.4% | | | | | | | | | | | | | | | | |
| | | | | |
| $ | 2,780 | | | Exelis, Inc., 144A | | | 5.550% | | | | 10/01/21 | | | | BBB+ | | | $ | 2,983,240 | |
| | | | Airlines – 0.3% | | | | | | | | | | | | | | | | |
| | | | | |
| | 1,948 | | | Northwest Airlines Trust Pass Through Certificates 2007-1 | | | 7.027% | | | | 11/01/19 | | | | BBB | | | | 2,064,650 | |
| | | | Automobiles – 0.3% | | | | | | | | | | | | | | | | |
| | | | | |
| | 2,500 | | | Chrysler GP/CG Company, (3) | | | 8.000% | | | | 6/15/19 | | | | B | | | | 2,568,750 | |
| | | | Beverages – 0.3% | | | | | | | | | | | | | | | | |
| | | | | |
| | 2,275 | | | Pernod-Ricard SA, 144A | | | 5.750% | | | | 4/07/21 | | | | BBB– | | | | 2,568,286 | |
| | | | Capital Markets – 3.2% | | | | | | | | | | | | | | | | |
| | | | | |
| | 4,640 | | | Goldman Sachs Group, Inc. | | | 6.000% | | | | 6/15/20 | | | | A | | | | 4,953,520 | |
| | | | | |
| | 2,495 | | | Goldman Sachs Group, Inc. | | | 5.250% | | | | 7/27/21 | | | | A | | | | 2,534,466 | |
| | | | | |
| | 3,685 | | | Goldman Sachs Group, Inc. | | | 6.750% | | | | 10/01/37 | | | | A– | | | | 3,611,495 | |
| | | | | |
| | 8,250 | | | Morgan Stanley | | | 6.625% | | | | 4/01/18 | | | | A | | | | 8,625,936 | |
| | | | | |
| | 6,500 | | | Morgan Stanley | | | 5.500% | | | | 7/28/21 | | | | A | | | | 6,404,171 | |
| | 25,570 | | | Total Capital Markets | | | | | | | | | | | | | | | 26,129,588 | |
| | | | Chemicals – 1.4% | | | | | | | | | | | | | | | | |
| | | | | |
| | 2,375 | | | Braskem Finance Limited, 144A, (3) | | | 5.750% | | | | 4/15/21 | | | | BBB– | | | | 2,440,313 | |
| | | | | |
| | 3,830 | | | Incitec Pivot Finance, 144A | | | 6.000% | | | | 12/10/19 | | | | BBB | | | | 4,199,434 | |
| | | | | |
| | 1,210 | | | Ineos Finance PLC, 144A, (3) | | | 7.500% | | | | 5/01/20 | | | | B+ | | | | 1,219,075 | |
| | | | | |
| | 2,050 | | | LyondellBasell Industries NV, 144A | | | 5.000% | | | | 4/15/19 | | | | BB+ | | | | 2,149,938 | |
| | | | | |
| | 1,000 | | | LyondellBasell Industries NV, 144A | | | 6.000% | | | | 11/15/21 | | | | BB+ | | | | 1,097,500 | |
| | 10,465 | | | Total Chemicals | | | | | | | | | | | | | | | 11,106,260 | |
| | | | Commercial Banks – 3.4% | | | | | | | | | | | | | | | | |
| | | | | |
| | 3,350 | | | Australia and New Zealand Banking Group Limited, 144A, (3) | | | 2.400% | | | | 11/23/16 | | | | Aaa | | | | 3,430,102 | |
| | | | | |
| | 1,910 | | | Banco Bradesco S.A. Grand Cayman, 144A | | | 4.125% | | | | 5/16/16 | | | | Baa1 | | | | 1,972,075 | |
| | | | | |
| | 2,900 | | | Bancolombia SA | | | 5.950% | | | | 6/03/21 | | | | Baa2 | | | | 3,095,750 | |
| | | | | |
| | 1,425 | | | BBVA Bancomer SA Texas, 144A | | | 4.500% | | | | 3/10/16 | | | | A2 | | | | 1,432,125 | |
| | | | | |
| | 984 | | | FNBC 1993-A Pass Through Trust Certificates | | | 8.080% | | | | 1/05/18 | | | | Aa1 | | | | 1,104,504 | |
| | | | | |
| | 1,890 | | | HSBC Holdings PLC | | | 6.800% | | | | 6/01/38 | | | | AA– | | | | 2,164,766 | |
| | | | | |
| | 1,660 | | | ING Bank NV, 144A | | | 3.750% | | | | 3/07/17 | | | | A+ | | | | 1,652,213 | |
| | | | | |
| | 4,250 | | | Lloyds TSB Bank | | | 4.875% | | | | 1/21/16 | | | | A | | | | 4,461,803 | |
| | | | | |
| | 4,450 | | | Rabobank Nederland | | | 3.875% | | | | 2/08/22 | | | | AA | | | | 4,526,687 | |
| | | | | |
| | 3,675 | | | Sovereign Bank | | | 8.750% | | | | 5/30/18 | | | | Baa1 | | | | 3,984,259 | |
| | 26,494 | | | Total Commercial Banks | | | | | | | | | | | | | | | 27,824,284 | |
| | | | | | | | | | | | | | | | | | | | |
Principal
Amount (000) | | | Description (1) | | Coupon | | | Maturity | | | Ratings (2) | | | Value | |
| | | | | | | | | | | | | | | | | | | | |
| | | | | | | | | | | | | | | | | | | | |
| | | | Commercial Services & Supplies – 0.5% | | | | | | | | | | | | | | | | |
| | | | | |
| $ | 1,990 | | | Donnelley & Son Company | | | 7.625% | | | | 6/15/20 | | | | BB+ | | | $ | 1,860,650 | |
| | | | | |
| | 2,000 | | | International Lease Finance Corporation | | | 5.875% | | | | 4/01/19 | | | | BBB– | | | | 2,001,938 | |
| | 3,990 | | | Total Commercial Services & Supplies | | | | | | | | | | | | | | | 3,862,588 | |
| | | | Computers & Peripherals – 0.2% | | | | | | | | | | | | | | | | |
| | | | | |
| | 1,935 | | | Hewlett Packard Company | | | 4.650% | | | | 12/09/21 | | | | A | | | | 2,028,275 | |
| | | | Consumer Finance – 1.1% | | | | | | | | | | | | | | | | |
| | | | | |
| | 1,650 | | | Ally Financial Inc., (3) | | | 7.500% | | | | 9/15/20 | | | | BB– | | | | 1,854,188 | |
| | | | | |
| | 2,790 | | | Capital One Bank | | | 8.800% | | | | 7/15/19 | | | | Baa1 | | | | 3,513,592 | |
| | | | | |
| | 3,690 | | | Discover Financial Services | | | 5.200% | | | | 4/27/22 | | | | BBB | | | | 3,860,020 | |
| | 8,130 | | | Total Consumer Finance | | | | | | | | | | | | | | | 9,227,800 | |
| | | | Diversified Financial Services – 4.9% | | | | | | | | | | | | | | | | |
| | | | | |
| | 1,910 | | | Bank of America Corporation | | | 3.750% | | | | 7/12/16 | | | | A | | | | 1,925,536 | |
| | | | | |
| | 2,845 | | | Bank of America Corporation | | | 5.875% | | | | 1/05/21 | | | | A | | | | 3,106,191 | |
| | | | | |
| | 3,725 | | | Bank of America Corporation | | | 5.750% | | | | 12/01/17 | | | | A | | | | 3,975,305 | |
| | | | | |
| | 5,000 | | | Citigroup Inc., (WI/DD) | | | 4.500% | | | | 1/14/22 | | | | A | | | | 5,164,270 | |
| | | | | |
| | 4,390 | | | Countrywide Financial Corporation, Convertible Bond | | | 6.250% | | | | 5/15/16 | | | | BBB+ | | | | 4,569,103 | |
| | | | | |
| | 2,915 | | | General Electric Capital Corporation | | | 6.875% | | | | 1/10/39 | | | | AA+ | | | | 3,760,735 | |
| | | | | |
| | 4,330 | | | JPMorgan Chase & Company | | | 4.400% | | | | 7/22/20 | | | | AA– | | | | 4,566,981 | |
| | | | | |
| | 2,750 | | | JPMorgan Chase & Company | | | 4.250% | | | | 10/15/20 | | | | AA– | | | | 2,888,914 | |
| | | | | |
| | 700 | | | JPMorgan Chase & Company | | | 4.350% | | | | 8/15/21 | | | | AA– | | | | 738,779 | |
| | | | | |
| | 5,845 | | | JPMorgan Chase & Company, (3) | | | 4.500% | | | | 1/24/22 | | | | AA– | | | | 6,296,339 | |
| | | | | |
| | 2,180 | | | JPMorgan Chase & Company, (3) | | | 6.400% | | | | 5/15/38 | | | | AA– | | | | 2,621,110 | |
| | 36,590 | | | Total Diversified Financial Services | | | | | | | | | | | | | | | 39,613,263 | |
| | | | Diversified Telecommunication Services – 2.1% | | | | | | | | | | | | | | | | |
| | | | | |
| | 2,970 | | | AT&T, Inc., (3) | | | 5.550% | | | | 8/15/41 | | | | A2 | | | | 3,540,112 | |
| | | | | |
| | 3,190 | | | CenturyLink Inc., (3) | | | 5.800% | | | | 3/15/22 | | | | Baa3 | | | | 3,175,661 | |
| | | | | |
| | 2,000 | | | Frontier Communications Corporation, (3) | | | 8.500% | | | | 4/15/20 | | | | BB+ | | | | 2,120,000 | |
| | | | | |
| | 1,730 | | | Sprint Nextel Corporation, (3) | | | 6.000% | | | | 12/01/16 | | | | B+ | | | | 1,656,475 | |
| | | | | |
| | 4,575 | | | Telefonica Emisiones SAU | | | 5.462% | | | | 2/16/21 | | | | Baa1 | | | | 3,983,878 | |
| | | | | |
| | 2,010 | | | Verizon Communications, (3) | | | 6.900% | | | | 4/15/38 | | | | A | | | | 2,765,597 | |
| | 16,475 | | | Total Diversified Telecommunication Services | | | | | | | | | | | | | | | 17,241,723 | |
| | | | Electric Utilities – 1.1% | | | | | | | | | | | | | | | | |
| | | | | |
| | 2,370 | | | Comision Federal de Electricidad of the United States of Mexcio, 144A, (3) | | | 4.875% | | | | 5/26/21 | | | | Baa1 | | | | 2,559,600 | |
| | | | | |
| | 3,690 | | | FirstEnergy Solutions Corporation, (3) | | | 6.050% | | | | 8/15/21 | | | | BBB | | | | 4,052,672 | |
| | | | | |
| | 1,685 | | | MidAmerican Energy Holdings Company | | | 6.125% | | | | 4/01/36 | | | | BBB+ | | | | 2,108,350 | |
| | 7,745 | | | Total Electric Utilities | | | | | | | | | | | | | | | 8,720,622 | |
| | | | Electronic Equipment & Instruments – 0.3% | | | | | | | | | | | | | | | | |
| | | | | |
| | 2,000 | | | Ingram Micro Inc. | | | 5.250% | | | | 9/01/17 | | | | BBB– | | | | 2,144,096 | |
| | | | Energy Equipment & Services – 2.1% | | | | | | | | | | | | | | | | |
| | | | | |
| | 3,280 | | | Diamond Offshore Drilling Inc., (3) | | | 5.700% | | | | 10/15/39 | | | | A– | | | | 3,902,147 | |
| | | | | |
| | 3,870 | | | Ensco PLC | | | 4.700% | | | | 3/15/21 | | | | BBB+ | | | | 4,215,355 | |
| | | | | |
| | 2,935 | | | Nabors Industries Inc. | | | 5.000% | | | | 9/15/20 | | | | BBB | | | | 3,131,839 | |
| | | | | |
| | 375 | | | NGPL PipeCo LLC, (3) | | | 7.119% | | | | 12/15/17 | | | | Ba3 | | | | 375,000 | |
| | | | | |
| | 3,000 | | | Weatherford International Limited Bermuda, (3) | | | 4.500% | | | | 4/15/22 | | | | BBB | | | | 3,074,712 | |
Portfolio of Investments
Nuveen Core Plus Bond Fund (continued)
June 30, 2012
| | | | | | | | | | | | | | | | | | | | |
Principal
Amount (000) | | | Description (1) | | Coupon | | | Maturity | | | Ratings (2) | | | Value | |
| | | | | | | | | | | | | | | | | | | | |
| | | | | | | | | | | | | | | | | | | | |
| | | | Energy Equipment & Services (continued) | | | | | | | | | | | | | | | | |
| | | | | |
| $ | 1,880 | | | Weatherford International Limited | | | 7.000% | | | | 3/15/38 | | | | BBB | | | $ | 2,146,960 | |
| | 15,340 | | | Total Energy Equipment & Services | | | | | | | | | | | | | | | 16,846,013 | |
| | | | Health Care Providers & Services – 0.7% | | | | | | | | | | | | | | | | |
| | | | | |
| | 2,400 | | | HCA Inc. | | | 7.250% | | | | 9/15/20 | | | | BB+ | | | | 2,640,000 | |
| | | | | |
| | 2,185 | | | UnitedHealth Group Incorporated | | | 6.875% | | | | 2/15/38 | | | | A– | | | | 3,037,412 | |
| | 4,585 | | | Total Health Care Providers & Services | | | | | | | | | | | | | | | 5,677,412 | |
| | | | Independent Power Producers & Energy Traders – 0.4% | | | | | | | | | | | | | | | | |
| | | | | |
| | 3,305 | | | Constellation Energy Group | | | 5.150% | | | | 12/01/20 | | | | BBB+ | | | | 3,658,440 | |
| | | | Industrial Conglomerates – 0.4% | | | | | | | | | | | | | | | | |
| | | | | |
| | 3,250 | | | Abengoa Finance SAU, 144A, (3) | | | 8.875% | | | | 11/01/17 | | | | BB | | | | 2,876,250 | |
| | | | Insurance – 2.5% | | | | | | | | | | | | | | | | |
| | | | | |
| | 3,975 | | | AFLAC Insurance, (3) | | | 6.450% | | | | 8/15/40 | | | | A– | | | | 4,602,235 | |
| | | | | |
| | 2,950 | | | Hartford Financial Services Group Inc., (3) | | | 6.000% | | | | 1/15/19 | | | | BBB | | | | 3,159,972 | |
| | | | | |
| | 3,015 | | | Liberty Mutual Group Inc., 144A | | | 5.000% | | | | 6/01/21 | | | | Baa2 | | | | 3,034,245 | |
| | | | | |
| | 2,295 | | | Lincoln National Corporation | | | 8.750% | | | | 7/01/19 | | | | A– | | | | 2,890,045 | |
| | | | | |
| | 1,640 | | | Pacific LifeCorp. | | | 6.000% | | | | 2/10/20 | | | | BBB+ | | | | 1,790,122 | |
| | | | | |
| | 4,000 | | | Prudential Holdings LLC, 144A | | | 7.245% | | | | 12/18/23 | | | | AA– | | | | 4,627,440 | |
| | 17,875 | | | Total Insurance | | | | | | | | | | | | | | | 20,104,059 | |
| | | | Media – 2.7% | | | | | | | | | | | | | | | | |
| | | | | |
| | 2,215 | | | DIRECTV Holdings LLC | | | 5.200% | | | | 3/15/20 | | | | BBB | | | | 2,451,219 | |
| | | | | |
| | 3,350 | | | DIRECTV Holdings LLC | | | 3.800% | | | | 3/15/22 | | | | BBB | | | | 3,387,832 | |
| | | | | |
| | 3,060 | | | NBC Universal Media LLC | | | 6.400% | | | | 4/30/40 | | | | BBB+ | | | | 3,738,356 | |
| | | | | |
| | 3,590 | | | News America Holdings Inc., (3) | | | 6.650% | | | | 11/15/37 | | | | BBB+ | | | | 4,190,643 | |
| | | | | |
| | 2,410 | | | Time Warner Cable Inc., (3) | | | 5.875% | | | | 11/15/40 | | | | BBB | | | | 2,697,238 | |
| | | | | |
| | 2,105 | | | Viacom Inc., (3) | | | 6.875% | | | | 4/30/36 | | | | BBB+ | | | | 2,725,419 | |
| | | | | |
| | 2,725 | | | Vivendi SA, 144A | | | 4.750% | | | | 4/12/22 | | | | BBB | | | | 2,689,213 | |
| | 19,455 | | | Total Media | | | | | | | | | | | | | | | 21,879,920 | |
| | | | Metals & Mining – 4.2% | | | | | | | | | | | | | | | | |
| | | | | |
| | 6,035 | | | Alcoa Inc., (3) | | | 5.400% | | | | 4/15/21 | | | | BBB– | | | | 6,009,472 | |
| | | | | |
| | 4,530 | | | Anglogold Holdings PLC | | | 6.500% | | | | 4/15/40 | | | | Baa2 | | | | 4,411,962 | |
| | | | | |
| | 1,155 | | | ArcelorMittal | | | 6.250% | | | | 2/25/22 | | | | BBB | | | | 1,131,216 | |
| | | | | |
| | 5,500 | | | ArcelorMittal | | | 7.000% | | | | 10/15/39 | | | | BBB | | | | 5,338,586 | |
| | | | | |
| | 1,535 | | | Freeport McMoRan Copper & Gold, Inc., (3) | | | 3.550% | | | | 3/01/22 | | | | BBB | | | | 1,510,253 | |
| | | | | |
| | 3,700 | | | Newmont Mining Corporation | | | 3.500% | | | | 3/15/22 | | | | BBB+ | | | | 3,651,893 | |
| | | | | |
| | 2,550 | | | Southern Copper Corporation | | | 7.500% | | | | 7/27/35 | | | | BBB | | | | 2,927,219 | |
| | | | | |
| | 1,440 | | | Teck Resources Limited | | | 6.250% | | | | 7/15/41 | | | | BBB | | | | 1,612,194 | |
| | | | | |
| | 3,895 | | | Vale Overseas Limited, (3) | | | 6.875% | | | | 11/10/39 | | | | A– | | | | 4,550,828 | |
| | | | | |
| | 2,340 | | | Xstrata Finance Canada Limited, 144A | | | 6.900% | | | | 11/15/37 | | | | BBB+ | | | | 2,593,729 | |
| | 32,680 | | | Total Metals & Mining | | | | | | | | | | | | | | | 33,737,352 | |
| | | | Multiline Retail – 0.3% | | | | | | | | | | | | | | | | |
| | | | | |
| | 2,585 | | | J.C. Penney Corporation Inc. | | | 5.650% | | | | 6/01/20 | | | | Ba1 | | | | 2,223,100 | |
| | | | Oil, Gas & Consumable Fuels – 4.8% | | | | | | | | | | | | | | | | |
| | | | | |
| | 3,230 | | | Anadarko Petroleum Corporation, (3) | | | 6.200% | | | | 3/15/40 | | | | BBB– | | | | 3,666,263 | |
| | | | | |
| | 2,000 | | | Canadian Oil Sands Trust | | | 7.750% | | | | 5/15/19 | | | | BBB | | | | 2,451,378 | |
| | | | | | | | | | | | | | | | | | | | |
Principal
Amount (000) | | | Description (1) | | Coupon | | | Maturity | | | Ratings (2) | | | Value | |
| | | | | | | | | | | | | | | | | | | | |
| | | | | | | | | | | | | | | | | | | | |
| | | | Oil, Gas & Consumable Fuels (continued) | | | | | | | | | | | | | | | | |
| | | | | |
| $ | 1,500 | | | Chesapeake Energy Corporation, (3) | | | 6.125% | | | | 2/15/21 | | | | BB | | | $ | 1,451,250 | |
| | | | | |
| | 1,800 | | | Everest Acquisition LLC Finance, (3) | | | 6.875% | | | | 5/01/19 | | | | BB– | | | | 1,881,000 | |
| | | | | |
| | 1,070 | | | Husky Energy Inc. | | | 7.250% | | | | 12/15/19 | | | | BBB+ | | | | 1,320,667 | |
| | | | | |
| | 690 | | | Kinder Morgan Energy Partners LP | | | 6.950% | | | | 1/15/38 | | | | BBB | | | | 816,024 | |
| | | | | |
| | 4,785 | | | Lukoil International Finance, 144A | | | 6.125% | | | | 11/09/20 | | | | Baa2 | | | | 5,018,030 | |
| | | | | |
| | 3,475 | | | Nexen Inc., (3) | | | 6.400% | | | | 5/15/37 | | | | BBB– | | | | 3,682,391 | |
| | | | | |
| | 1,500 | | | Noble Energy Inc. | | | 4.150% | | | | 12/15/21 | | | | BBB | | | | 1,577,318 | |
| | | | | |
| | 2,495 | | | Petrobras International Finance Company, (3) | | | 6.875% | | | | 1/20/40 | | | | A3 | | | | 2,967,860 | |
| | | | | |
| | 2,255 | | | Petro-Canada | | | 6.800% | | | | 5/15/38 | | | | BBB+ | | | | 2,814,615 | |
| | | | | |
| | 3,000 | | | Petroleos Mexicanos | | | 5.500% | | | | 1/21/21 | | | | Baa1 | | | | 3,390,000 | |
| | | | | |
| | 1,900 | | | Reliance Holdings USA Inc., 144A | | | 5.400% | | | | 2/14/22 | | | | BBB | | | | 1,899,884 | |
| | | | | |
| | 1,955 | | | Southwestern Energy Company, 144A | | | 4.100% | | | | 3/15/22 | | | | BBB– | | | | 1,981,469 | |
| | | | | |
| | 3,290 | | | Valero Energy Corporation | | | 6.125% | | | | 2/01/20 | | | | BBB | | | | 3,798,496 | |
| | | | | |
| | 34,945 | | | Total Oil, Gas & Consumable Fuels | | | | | | | | | | | | | | | 38,716,645 | |
| | | | Paper & Forest Products – 0.8% | | | | | | | | | | | | | | | | |
| | | | | |
| | 1,820 | | | Georgia-Pacific Corporation, 144A, (3) | | | 5.400% | | | | 11/01/20 | | | | A– | | | | 2,111,872 | |
| | | | | |
| | 3,015 | | | International Paper Company | | | 8.700% | | | | 6/15/38 | | | | BBB | | | | 4,255,184 | |
| | | | | |
| | 4,835 | | | Total Paper & Forest Products | | | | | | | | | | | | | | | 6,367,056 | |
| | | | Pharmaceuticals – 0.3% | | | | | | | | | | | | | | | | |
| | | | | |
| | 2,080 | | | Valeant Pharmaceuticals International, 144A | | | 6.875% | | | | 12/01/18 | | | | BB– | | | | 2,150,200 | |
| | | | Real Estate Investment Trust – 0.4% | | | | | | | | | | | | | | | | |
| | | | | |
| | 2,995 | | | Prologis Inc., (3) | | | 6.875% | | | | 3/15/20 | | | | Baa2 | | | | 3,582,149 | |
| | | | Real Estate Management & Development – 0.1% | | | | | | | | | | | | | | | | |
| | | | | |
| | 1,000 | | | Country Garden Holding Company, 144A, (3) | | | 11.125% | | | | 2/23/18 | | | | BB– | | | | 1,012,500 | |
| | | | Semiconductors & Equipment – 0.2% | | | | | | | | | | | | | | | | |
| | | | | |
| | 1,300 | | | Intel Corporation, (3) | | | 4.800% | | | | 10/01/41 | | | | A+ | | | | 1,488,803 | |
| | | | Thrifts & Mortgage Finance – 0.4% | | | | | | | | | | | | | | | | |
| | | | | |
| | 2,730 | | | WEA Finance LLC, 144A, (3) | | | 4.625% | | | | 5/10/21 | | | | A2 | | | | 2,885,142 | |
| | | | Tobacco – 0.5% | | | | | | | | | | | | | | | | |
| | | | | |
| | 3,350 | | | Lorillard Tobacco | | | 8.125% | | | | 6/23/19 | | | | Baa2 | | | | 4,157,590 | |
| | | | Transportation Infrastructure – 0.5% | | | | | | | | | | | | | | | | |
| | | | | |
| | 3,800 | | | Asciano Finance Limited, 144A, (3) | | | 5.000% | | | | 4/07/18 | | | | Baa2 | | | | 3,969,361 | |
| | | | Wireless Telecommunication Services – 0.4% | | | | | | | | | | | | | | | | |
| | | | | |
| | 2,980 | | | American Tower Company | | | 5.050% | | | | 9/01/20 | | | | Baa3 | | | | 3,130,117 | |
| $ | 307,987 | | | Total Corporate Bonds (cost $310,419,959) | | | | | | | | | | | | | | | 332,545,534 | |
| | | | | |
Principal
Amount (000) | | | Description (1) | | Coupon | | | Maturity | | | Ratings (2) | | | Value | |
| | | | CAPITAL PREFERRED SECURITIES – 3.0% | | | | | | | | | | | | | | | | |
| | | | | |
| | | | Capital Markets – 0.2% | | | | | | | | | | | | | | | | |
| | | | | |
| $ | 2,415 | | | Goldman Sachs Capital II | | | 4.000% | | | | 6/01/43 | | | | BB+ | | | $ | 1,635,003 | |
| | | | Commercial Banks – 0.8% | | | | | | | | | | | | | | | | |
| | | | | |
| | 3,500 | | | Wachovia Capital Trust III | | | 5.570% | | | | 3/15/42 | | | | BBB+ | | | | 3,342,500 | |
| | | | | |
| | 2,760 | | | Wells Fargo Capital Trust X, (3) | | | 5.950% | | | | 12/15/86 | | | | BBB+ | | | | 2,770,350 | |
| | | | | |
| | 6,260 | | | Total Commercial Banks | | | | | | | | | | | | | | | 6,112,850 | |
Portfolio of Investments
Nuveen Core Plus Bond Fund (continued)
June 30, 2012
| | | | | | | | | | | | | | | | | | | | |
Principal
Amount (000) | | | Description (1) | | Coupon | | | Maturity | | | Ratings (2) | | | Value | |
| | | | | | | | | | | | | | | | | | | | |
| | | | | | | | | | | | | | | | | | | | |
| | | | Diversified Financial Services – 1.0% | | | | | | | | | | | | | | | | |
| | | | | |
| $ | 3,720 | | | CitiGroup Capital XXI | | | 8.300% | | | | 12/21/77 | | | | BB+ | | | $ | 3,729,300 | |
| | | | | |
| | 4,000 | | | General Electric Capital Corporation, (3) | | | 0.000% | | | | 12/15/49 | | | | AA– | | | | 4,225,840 | |
| | | | | |
| | 7,720 | | | Total Diversified Financial Services | | | | | | | | | | | | | | | 7,955,140 | |
| | | | Insurance – 1.0% | | | | | | | | | | | | | | | | |
| | | | | |
| | 2,970 | | | Catlin Insurance Company Limited | | | 7.249% | | | | 1/19/17 | | | | BBB+ | | | | 2,613,600 | |
| | | | | |
| | 3,205 | | | Lincoln National Corporation | | | 6.050% | | | | 4/20/17 | | | | BBB | | | | 2,932,575 | |
| | | | | |
| | 2,755 | | | ZFS Finance USA Trust V | | | 6.500% | | | | 5/09/67 | | | | A | | | | 2,699,900 | |
| | | | | |
| | 8,930 | | | Total Insurance | | | | | | | | | | | | | | | 8,246,075 | |
| $ | 25,325 | | | Total Capital Preferred Securities (cost $23,727,840) | | | | | | | | | | | | | | | 23,949,068 | |
| | | | | |
Principal
Amount (000) | | | Description (1) | | | | | Optional Call
Provisions (4) | | | Ratings (2) | | | Value | |
| | | | MUNICIPAL BONDS – 0.8% | | | | | | | | | | | | | | | | |
| | | | | |
| | | | Illinois – 0.8% | | | | | | | | | | | | | | | | |
| | | | | |
| $ | 5,765 | | | Illinois State, General Obligation Bonds, Taxable Series 2011, 5.877%, 3/01/19 | | | | | | | No Opt. Call | | | | A+ | | | $ | 6,423,882 | |
| $ | 5,765 | | | Total Municipal Bonds (cost $5,765,000) | | | | | | | | | | | | | | | 6,423,882 | |
| | | | | |
Principal
Amount (000) | | | Description (1) | | Coupon | | | Maturity | | | Ratings (2) | | �� | Value | |
| | | | U.S. GOVERNMENT AND AGENCY OBLIGATIONS – 6.4% | | | | | | | | | | | | | | | | |
| | | | | |
| $ | 18,000 | | | Freddie Mac Notes | | | 0.000% | | | | 5/23/13 | | | | Aaa | | | $ | 17,969,184 | |
| | | | | |
| | 4,455 | | | U.S. Treasury Bonds, (7) | | | 4.250% | | | | 11/15/40 | | | | Aaa | | | | 5,827,697 | |
| | | | | |
| | 425 | | | U.S. Treasury Bonds | | | 4.750% | | | | 2/15/41 | | | | Aaa | | | | 600,313 | |
| | | | | |
| | 3,650 | | | U.S. Treasury Notes, (3) | | | 2.375% | | | | 2/28/15 | | | | Aaa | | | | 3,840,771 | |
| | | | | |
| | 8,985 | | | U.S. Treasury Notes, (3), (7) | | | 1.250% | | | | 8/31/15 | | | | Aaa | | | | 9,208,924 | |
| | | | | |
| | 1,385 | | | U.S. Treasury Notes, (3) | | | 3.625% | | | | 2/15/20 | | | | Aaa | | | | 1,629,214 | |
| | | | | |
| | 5,845 | | | U.S. Treasury Notes, (3) | | | 2.625% | | | | 8/15/20 | | | | Aaa | | | | 6,432,697 | |
| | | | | |
| | 2,020 | | | U.S. Treasury Notes | | | 2.000% | | | | 11/15/21 | | | | Aaa | | | | 2,094,330 | |
| | | | | |
| | 1,635 | | | U.S. Treasury Notes, (3) | | | 1.750% | | | | 5/15/22 | | | | Aaa | | | | 1,648,284 | |
| | | | | |
| | 2,065 | | | U.S. Treasury Notes | | | 3.875% | | | | 8/15/40 | | | | Aaa | | | | 2,542,209 | |
| $ | 48,465 | | | Total U.S. Government and Agency Obligations (cost $47,860,962) | | | | | | | | | | | | 51,793,623 | |
| | | | | |
Principal
Amount (000) | | | Description (1) | | Coupon | | | Maturity | | | Ratings (2) | | | Value | |
| | | | ASSET-BACKED AND MORTGAGE-BACKED SECURITIES – 46.5% | | | | | | | | | | | | | | | | |
| | | | | |
| $ | 4,546 | | | 321 Henderson Receivables LLC, Series 2010-3A | | | 3.820% | | | | 12/15/48 | | | | Aaa | | | $ | 4,631,371 | |
| | | | | |
| | 4,045 | | | American Home Mortgage Advance Trust, Revovling Pool Receivables, Series SART-3 | | | 3.720% | | | | 3/13/44 | | | | AAA | | | | 4,055,113 | |
| | | | | |
| | 2,090 | | | American Homes Mortgage Advance Trust, Series 2011-SART1 | | | 5.920% | | | | 5/10/43 | | | | BBB | | | | 2,095,225 | |
| | | | | |
| | 3,075 | | | AmeriCold LLC Trust, Series 2010 | | | 6.811% | | | | 1/14/29 | | | | A | | | | 3,517,376 | |
| | | | | |
| | 10 | | | Amresco Residential Securities Corporation, Mortgage Loan Pass-Through Certificates, Serioes 1997-3 | | | 6.960% | | | | 3/25/27 | | | | A1 | | | | 9,675 | |
| | | | | |
| | 5,480 | | | Arkle Master Issuer PLC, Mortgage Asset Backed Instrument, Series 2010-1A | | | 1.616% | | | | 5/17/60 | | | | AAA | | | | 5,489,174 | |
| | | | | |
| | 1,741 | | | Bank of America Auto Trust, Series 2010-2 | | | 1.310% | | | | 7/15/14 | | | | AAA | | | | 1,746,255 | |
| | | | | | | | | | | | | | | | | | | | |
Principal
Amount (000) | | | Description (1) | | Coupon | | | Maturity | | | Ratings (2) | | | Value | |
| | | | | | | | | | | | | | | | | | | | |
| | | | | | | | | | | | | | | | | | | | |
| | | | ASSET-BACKED AND MORTGAGE-BACKED SECURITIES (continued) | | | | | | | | | | | | | | | | |
| | | | | |
| $ | 1,247 | | | Bank of America Funding Trust, Mortgage Pass-Through Certificates, Series 2007-4 | | | 5.500% | | | | 6/25/37 | | | | CC | | | $ | 551,234 | |
| | | | | |
| | 1,250 | | | Bayview Financial Mortgage Pass-Through Trust, Mortgage Pass-Through Certificate Series 2005-D | | | 5.500% | | | | 12/28/35 | | | | AA– | | | | 929,056 | |
| | | | | |
| | 1,154 | | | Citigroup Commercial Mortgage Securities Trust, Commercial Mortgage Pass-Through Certificates, Series 2007-CD4, (3) | | | 5.205% | | | | 12/11/49 | | | | AAA | | | | 1,173,295 | |
| | | | | |
| | 4,225 | | | Commercial Mortgage Pass-Through Certificates, Series2006-CN2A | | | 5.449% | | | | 2/05/19 | | | | AAA | | | | 4,208,016 | |
| | | | | |
| | 250 | | | Countrywide Alternative Loan Trust, Mortgage Pass-Through Certificates, Series 2004-J1 | | | 6.000% | | | | 2/25/34 | | | | AAA | | | | 255,532 | |
| | | | | |
| | 1,789 | | | Countrywide Alternative Loan Trust, Mortgage Pass-Through Certificates, Series 2006-19CB | | | 6.000% | | | | 8/25/36 | | | | CCC | | | | 1,321,758 | |
| | | | | |
| | 1,376 | | | Countrywide Home Loan Mortgage Pass Through Trust, Series 2004-2 | | | 2.866% | | | | 2/25/34 | | | | BB | | | | 1,255,540 | |
| | | | | |
| | 539 | | | Countrywide Home Loans, Asset-Backed Certificates, Series 2003-SC1 | | | 2.489% | | | | 9/25/23 | | | | A+ | | | | 433,237 | |
| | | | | |
| | 3,526 | | | Credit Suisse First Boston Mortgage Securities Corporation, Mortgage-Backed Pass-Through Certificates, Series 2003-8 | | | 6.208% | | | | 4/25/33 | | | | AA+ | | | | 3,403,315 | |
| | | | | |
| | 2,550 | | | DBUBS Mortgage Trust, Commercial Mortgage Pass Through Certificates, Series 2011-LC3A | | | 3.642% | | | | 8/12/44 | | | | Aaa | | | | 2,748,691 | |
| | | | | |
| | 3,435 | | | Discover Card Master Trust I 2007-A | | | 5.650% | | | | 3/16/20 | | | | AAA | | | | 4,158,808 | |
| | | | | |
| | 3,195 | | | Extended Stay America Trust 2010-EHSA | | | 4.860% | | | | 11/05/27 | | | | A | | | | 3,230,075 | |
| | | | | |
| | 9,023 | | | Fannie Mae Mortgage Pool AB1959 | | | 4.000% | | | | 12/01/40 | | | | Aaa | | | | 9,699,795 | |
| | | | | |
| | 6,908 | | | Fannie Mae Mortgage Pool AC1877 | | | 4.500% | | | | 9/01/39 | | | | Aaa | | | | 7,412,964 | |
| | | | | |
| | 9,686 | | | Fannie Mae Mortgage Pool AD4375 | | | 5.000% | | | | 5/01/40 | | | | Aaa | �� | | | 10,533,555 | |
| | | | | |
| | 11,585 | | | Fannie Mae Mortgage Pool AE7265 | | | 4.000% | | | | 1/01/41 | | | | Aaa | | | | 12,349,300 | |
| | | | | |
| | 7,487 | | | Fannie Mae Mortgage Pool AE7723 | | | 4.000% | | | | 11/01/40 | | | | Aaa | | | | 7,981,172 | |
| | | | | |
| | 10,740 | | | Fannie Mae Mortgage Pool AH3804 | | | 4.000% | | | | 2/01/41 | | | | Aaa | | | | 11,448,314 | |
| | | | | |
| | 3,305 | | | Fannie Mae Mortgage Pool AL0160 | | | 4.500% | | | | 5/01/41 | | | | Aaa | | | | 3,556,710 | |
| | | | | |
| | 2,006 | | | Fannie Mae Mortgage Pool MA1028 | | | 4.000% | | | | 4/01/42 | | | | Aaa | | | | 2,149,399 | |
| | | | | |
| | 172 | | | Fannie Mae Mortgage Pool 250551 | | | 7.000% | | | | 5/01/26 | | | | Aaa | | | | 204,420 | |
| | | | | |
| | 751 | | | Fannie Mae Mortgage Pool 252255 | | | 6.500% | | | | 2/01/29 | | | | Aaa | | | | 863,729 | |
| | | | | |
| | 1,580 | | | Fannie Mae Mortgage Pool 254169 | | | 6.500% | | | | 12/01/31 | | | | Aaa | | | | 1,747,074 | |
| | | | | |
| | 1,191 | | | Fannie Mae Mortgage Pool 254379 | | | 7.000% | | | | 7/01/32 | | | | Aaa | | | | 1,389,560 | |
| | | | | |
| | 1,407 | | | Fannie Mae Mortgage Pool 254447 | | | 6.000% | | | | 9/01/32 | | | | Aaa | | | | 1,584,024 | |
| | | | | |
| | 1,241 | | | Fannie Mae Mortgage Pool 254513 | | | 6.000% | | | | 10/01/22 | | | | Aaa | | | | 1,370,689 | |
| | | | | |
| | 3,105 | | | Fannie Mae Mortgage Pool 255575 | | | 5.500% | | | | 1/01/25 | | | | Aaa | | | | 3,417,442 | |
| | | | | |
| | 902 | | | Fannie Mae Mortgage Pool 256845 | | | 6.500% | | | | 8/01/37 | | | | Aaa | | | | 1,018,762 | |
| | | | | |
| | 2,548 | | | Fannie Mae Mortgage Pool 256852 | | | 6.000% | | | | 8/01/27 | | | | Aaa | | | | 2,804,269 | |
| | | | | |
| | 1,642 | | | Fannie Mae Mortgage Pool 256890 | | | 6.000% | | | | 9/01/37 | | | | Aaa | | | | 1,796,175 | |
| | | | | |
| | 1,852 | | | Fannie Mae Mortgage Pool 257307 | | | 6.000% | | | | 8/01/38 | | | | Aaa | | | | 2,036,814 | |
| | | | | |
| | 85 | | | Fannie Mae Mortgage Pool 340798 | | | 7.000% | | | | 4/01/26 | | | | Aaa | | | | 100,570 | |
| | | | | |
| | 187 | | | Fannie Mae Mortgage Pool 440780 | | | 5.500% | | | | 2/01/14 | | | | Aaa | | | | 203,112 | |
| | | | | |
| | 56 | | | Fannie Mae Mortgage Pool 535206 | | | 7.000% | | | | 2/01/15 | | | | Aaa | | | | 58,067 | |
| | | | | |
| | 196 | | | Fannie Mae Mortgage Pool 545359 | | | 2.397% | | | | 3/01/31 | | | | Aaa | | | | 208,624 | |
| | | | | |
| | 473 | | | Fannie Mae Mortgage Pool 545813 | | | 7.000% | | | | 7/01/32 | | | | Aaa | | | | 562,321 | |
| | | | | |
| | 287 | | | Fannie Mae Mortgage Pool 545815 | | | 7.000% | | | | 7/01/32 | | | | Aaa | | | | 333,508 | |
| | | | | |
| | 2,003 | | | Fannie Mae Mortgage Pool 555798 | | | 6.500% | | | | 5/01/33 | | | | Aaa | | | | 2,292,345 | |
| | | | | |
| | 1,883 | | | Fannie Mae Mortgage Pool 555800 | | | 5.500% | | | | 10/01/33 | | | | Aaa | | | | 2,069,946 | |
Portfolio of Investments
Nuveen Core Plus Bond Fund (continued)
June 30, 2012
| | | | | | | | | | | | | | | | | | | | |
Principal
Amount (000) | | | Description (1) | | Coupon | | | Maturity | | | Ratings (2) | | | Value | |
| | | | | | | | | | | | | | | | | | | | |
| | | | | | | | | | | | | | | | | | | | |
| | | | ASSET-BACKED AND MORTGAGE-BACKED SECURITIES (continued) | | | | | | | | | | | | | | | | |
| | | | | |
| $ | 2,699 | | | Fannie Mae Mortgage Pool 555843 | | | 2.201% | | | | 8/01/30 | | | | Aaa | | | $ | 2,855,922 | |
| | | | | |
| | 153 | | | Fannie Mae Mortgage Pool 591038 | | | 7.000% | | | | 8/01/16 | | | | Aaa | | | | 164,631 | |
| | | | | |
| | 836 | | | Fannie Mae Mortgage Pool 673010 | | | 5.500% | | | | 12/01/17 | | | | Aaa | | | | 911,239 | |
| | | | | |
| | 2,684 | | | Fannie Mae Mortgage Pool 688330 | | | 6.000% | | | | 3/01/33 | | | | Aaa | | | | 3,022,044 | |
| | | | | |
| | 2,587 | | | Fannie Mae Mortgage Pool 694605 | | | 5.500% | | | | 4/01/33 | | | | Aaa | | | | 2,844,521 | |
| | | | | |
| | 4,811 | | | Fannie Mae Mortgage Pool 709446 | | | 5.500% | | | | 7/01/33 | | | | Aaa | | | | 5,344,597 | |
| | | | | |
| | 1,242 | | | Fannie Mae Mortgage Pool 725248 | | | 5.000% | | | | 3/01/34 | | | | Aaa | | | | 1,351,252 | |
| | | | | |
| | 2,207 | | | Fannie Mae Mortgage Pool 725250 | | | 5.000% | | | | 3/01/34 | | | | Aaa | | | | 2,401,168 | |
| | | | | |
| | 794 | | | Fannie Mae Mortgage Pool 725553 | | | 2.143% | | | | 9/01/33 | | | | Aaa | | | | 839,567 | |
| | | | | |
| | 3,527 | | | Fannie Mae Mortgage Pool 735054 | | | 5.198% | | | | 11/01/34 | | | | Aaa | | | | 3,795,825 | |
| | | | | |
| | 3,657 | | | Fannie Mae Mortgage Pool 735273 | | | 6.500% | | | | 6/01/34 | | | | Aaa | | | | 4,186,249 | |
| | | | | |
| | 2,487 | | | Fannie Mae Mortgage Pool 745101 | | | 6.000% | | | | 4/01/32 | | | | Aaa | | | | 2,710,758 | |
| | | | | |
| | 139 | | | Fannie Mae Mortgage Pool 772130 | | | 6.000% | | | | 11/01/33 | | | | Aaa | | | | 157,015 | |
| | | | | |
| | 404 | | | Fannie Mae Mortgage Pool 772256 | | | 6.000% | | | | 11/01/33 | | | | Aaa | | | | 454,515 | |
| | | | | |
| | 550 | | | Fannie Mae Mortgage Pool 781776 | | | 6.000% | | | | 10/01/34 | | | | Aaa | | | | 613,858 | |
| | | | | |
| | 1 | | | Fannie Mae Mortgage Pool 782909 | | | 5.000% | | | | 6/01/34 | | | | Aaa | | | | 670 | |
| | | | | |
| | 1,477 | | | Fannie Mae Mortgage Pool 885536 | | | 6.000% | | | | 8/01/36 | | | | Aaa | | | | 1,654,009 | |
| | | | | |
| | 8,297 | | | Fannie Mae Mortgage Pool 889618 | | | 5.500% | | | | 5/01/38 | | | | Aaa | | | | 9,053,951 | |
| | | | | |
| | 295 | | | Fannie Mae Mortgage Pool 889706 | | | 6.000% | | | | 6/01/38 | | | | Aaa | | | | 325,007 | |
| | | | | |
| | 2,730 | | | Fannie Mae Mortgage Pool 900555 | | | 6.000% | | | | 9/01/36 | | | | Aaa | | | | 3,056,763 | |
| | | | | |
| | 1,640 | | | Fannie Mae Mortgage Pool 932260 | | | 5.000% | | | | 12/01/39 | | | | Aaa | | | | 1,791,797 | |
| | | | | |
| | 5,821 | | | Fannie Mae Mortgage Pool 932323 | | | 4.500% | | | | 12/01/39 | | | | Aaa | | | | 6,246,455 | |
| | | | | |
| | 1,451 | | | Fannie Mae Mortgage Pool 944340 | | | 6.000% | | | | 6/01/37 | | | | Aaa | | | | 1,598,774 | |
| | | | | |
| | 9,746 | | | Fannie Mae Mortgage Pool 973241 | | | 5.000% | | | | 3/01/38 | | | | Aaa | | | | 10,550,072 | |
| | | | | |
| | 1 | | | Fannie Mae Mortgage Pool 983077 | | | 5.000% | | | | 5/01/38 | | | | Aaa | | | | 1,110 | |
| | | | | |
| | 1 | | | Fannie Mae Mortgage Pool 985344 | | | 5.500% | | | | 7/01/38 | | | | Aaa | | | | 1,040 | |
| | | | | |
| | 2,621 | | | Fannie Mae Mortgage Pool 993138 | | | 6.000% | | | | 10/01/38 | | | | Aaa | | | | 2,890,129 | |
| | | | | |
| | 6,106 | | | Fannie Mae Mortgage Pool 995112 | | | 5.500% | | | | 7/01/36 | | | | Aaa | | | | 6,708,542 | |
| | | | | |
| | 1,368 | | | Fannie Mae Real Estate Mortgage Investment Conduit, Pass Through Certificates 2003-30 AE | | | 3.900% | | | | 10/25/17 | | | | Aaa | | | | 1,378,023 | |
| | | | | |
| | 18 | | | Fannie Mae Real Estate Mortgage Investment Conduit, Pass Through Certificates 1988-24 G | | | 7.000% | | | | 10/25/18 | | | | Aaa | | | | 19,428 | |
| | | | | |
| | 17 | | | Fannie Mae Real Estate Mortgage Investment Conduit, Pass Through Certificates 1989-44 H | | | 9.000% | | | | 7/25/19 | | | | Aaa | | | | 19,507 | |
| | | | | |
| | 3 | | | Fannie Mae Real Estate Mortgage Investment Conduit, Pass Through Certificates 1989-90 E | | | 8.700% | | | | 12/25/19 | | | | Aaa | | | | 3,460 | |
| | | | | |
| | 11 | | | Fannie Mae Real Estate Mortgage Investment Conduit, Pass Through Certificates 1990-30 E | | | 6.500% | | | | 3/25/20 | | | | Aaa | | | | 12,071 | |
| | | | | |
| | 15 | | | Fannie Mae Real Estate Mortgage Investment Conduit, Pass Through Certificates 1990-61 H | | | 7.000% | | | | 6/25/20 | | | | Aaa | | | | 17,232 | |
| | | | | |
| | 14 | | | Fannie Mae Real Estate Mortgage Investment Conduit, Pass Through Certificates 1990-72 B | | | 9.000% | | | | 7/25/20 | | | | Aaa | | | | 15,630 | |
| | | | | |
| | 20 | | | Fannie Mae Real Estate Mortgage Investment Conduit, Pass Through Certificates 1990-102 J | | | 6.500% | | | | 8/25/20 | | | | Aaa | | | | 21,433 | |
| | | | | |
| | 152 | | | Fannie Mae Real Estate Mortgage Investment Conduit, Pass Through Certificates 1990-105 J | | | 6.500% | | | | 9/25/20 | | | | Aaa | | | | 166,623 | |
| | | | | |
| | 53 | | | Fannie Mae Real Estate Mortgage Investment Conduit, Pass Through Certificates 1991-56 M | | | 6.750% | | | | 6/25/21 | | | | Aaa | | | | 56,575 | |
| | | | | | | | | | | | | | | | | | | | |
Principal
Amount (000) | | | Description (1) | | Coupon | | | Maturity | | | Ratings (2) | | | Value | |
| | | | | | | | | | | | | | | | | | | | |
| | | | | | | | | | | | | | | | | | | | |
| | | | ASSET-BACKED AND MORTGAGE-BACKED SECURITIES (continued) | | | | | | | | | | | | | | | | |
| | | | | |
| $ | 101 | | | Fannie Mae Real Estate Mortgage Investment Conduit, Pass Through Certificates 1991-134 Z | | | 7.000% | | | | 10/25/21 | | | | Aaa | | | $ | 112,834 | |
| | | | | |
| | 16 | | | Fannie Mae Real Estate Mortgage Investment Conduit, Pass Through Certificates 1992-120 C | | | 6.500% | | | | 7/25/22 | | | | Aaa | | | | 17,149 | |
| | | | | |
| | 489 | | | Fannie Mae Real Estate Mortgage Investment Conduit, Pass Through Certificates 1996-35 Z | | | 7.000% | | | | 7/25/26 | | | | Aaa | | | | 566,655 | |
| | | | | |
| | 1,554 | | | Fannie Mae Real Estate Mortgage Investment Conduit, Pass Through Certificates 2005-62 JE | | | 5.000% | | | | 6/25/35 | | | | Aaa | | | | 1,753,059 | |
| | | | | |
| | 1,368 | | | Fannie Mae REMIC Pass-Through Certificates 2003-W1 B1 | | | 5.750% | | | | 12/25/42 | | | | B1 | | | | 532,492 | |
| | | | | |
| | 4,920 | | | Fannie Mae TBA Mortgage Pool (WI/DD) | | | 3.500% | | | | TBA | | | | Aaa | | | | 5,171,382 | |
| | | | | |
| | 14 | | | Federal Home Loan Mortgage Corporation, REMIC 1022 J | | | 6.000% | | | | 12/15/20 | | | | Aaa | | | | 15,385 | |
| | | | | |
| | 27 | | | Federal Home Loan Mortgage Corporation, REMIC 1118 Z | | | 8.250% | | | | 7/15/21 | | | | Aaa | | | | 30,592 | |
| | | | | |
| | 42 | | | Federal Home Loan Mortgage Corporation, REMIC 162 F | | | 7.000% | | | | 5/15/21 | | | | Aaa | | | | 47,196 | |
| | | | | |
| | 28 | | | Federal Home Loan Mortgage Corporation, REMIC 1790 A | | | 7.000% | | | | 4/15/22 | | | | Aaa | | | | 29,699 | |
| | | | | |
| | 91 | | | Federal Home Loan Mortgage Corporation, REMIC 188 H | | | 7.000% | | | | 9/15/21 | | | | Aaa | | | | 101,616 | |
| | | | | |
| | 1,859 | | | Federal Home Loan Mortgage Corporation, REMIC 2704 JF | | | 0.792% | | | | 5/15/23 | | | | Aaa | | | | 1,867,649 | |
| | | | | |
| | 1,013 | | | Federal Home Loan Mortgage Corporation, REMIC 2755 FN | | | 0.692% | | | | 4/15/32 | | | | Aaa | | | | 1,014,060 | |
| | | | | |
| | 5,000 | | | Federal Home Loan Mortgage Corporation, REMIC 2901 UB | | | 5.000% | | | | 3/15/33 | | | | Aaa | | | | 5,193,675 | |
| | | | | |
| | 2,837 | | | Federal Home Loan Mortgage Corporation, REMIC 3591 FP | | | 0.842% | | | | 6/15/39 | | | | Aaa | | | | 2,847,999 | |
| | | | | |
| | 9 | | | Federal Home Loan Mortgage Corporation, REMIC 6 C | | | 9.050% | | | | 6/15/19 | | | | Aaa | | | | 10,129 | |
| | | | | |
| | 3,778 | | | Fieldstone Mortgage Investment Trust, Mortgage Backed Notes, Series 2005-1 | | | 1.319% | | | | 3/25/35 | | | | A+ | | | | 3,346,271 | |
| | | | | |
| | 1,915 | | | Ford Credit Auto Lease Trust 2012-A A1 | | | 0.358% | | | | 3/15/13 | | | | AAA | | | | 1,916,780 | |
| | | | | |
| | 106 | | | Ford Credit Auto Lease Trust, Series 2011-B | | | 0.480% | | | | 11/15/12 | | | | A-1+ | | | | 106,031 | |
| | | | | |
| | 4,315 | | | Fosse Master Issuer PLC, Residential Mortgage Pool, Series 2011-1A | | | 1.866% | | | | 10/19/54 | | | | AAA | | | | 4,338,685 | |
| | | | | |
| | 3,321 | | | Freddie Mac Gold Pool 1G2163 | | | 5.655% | | | | 9/01/37 | | | | Aaa | | | | 3,525,482 | |
| | | | | |
| | 831 | | | Freddie Mac Gold Pool 847180 | | | 2.419% | | | | 3/01/30 | | | | Aaa | | | | 884,479 | |
| | | | | |
| | 628 | | | Freddie Mac Gold Pool 847190 | | | 2.289% | | | | 4/01/29 | | | | Aaa | | | | 668,356 | |
| | | | | |
| | 1,098 | | | Freddie Mac Gold Pool 847240 | | | 2.266% | | | | 7/01/30 | | | | Aaa | | | | 1,163,663 | |
| | | | | |
| | 450 | | | Freddie Mac Gold Pool 846984 | | | 1.903% | | | | 6/01/31 | | | | Aaa | | | | 468,074 | |
| | | | | |
| | 769 | | | Freddie Mac Mortgage Pool, Various P10023 | | | 4.500% | | | | 3/01/18 | | | | Aaa | | | | 799,147 | |
| | | | | |
| | 966 | | | Freddie Mac Mortgage Pool, Various A15521 | | | 6.000% | | | | 11/01/33 | | | | Aaa | | | | 1,083,608 | |
| | | | | |
| | 1,174 | | | Freddie Mac Mortgage Pool, Various A17212 | | | 6.500% | | | | 7/01/31 | | | | Aaa | | | | 1,342,958 | |
| | | | | |
| | 746 | | | Freddie Mac Mortgage Pool, Various C00676 | | | 6.500% | | | | 11/01/28 | | | | Aaa | | | | 854,001 | |
| | | | | |
| | 598 | | | Freddie Mac Mortgage Pool, Various C00689 | | | 6.500% | | | | 12/01/28 | | | | Aaa | | | | 684,368 | |
| | | | | |
| | 333 | | | Freddie Mac Mortgage Pool, Various C00742 | | | 6.500% | | | | 4/01/29 | | | | Aaa | | | | 380,799 | |
| | | | | |
| | 385 | | | Freddie Mac Mortgage Pool, Various G00876 | | | 6.500% | | | | 1/01/28 | | | | Aaa | | | | 438,936 | |
| | | | | |
| | 436 | | | Freddie Mac Mortgage Pool, Various H01292 | | | 7.000% | | | | 9/01/37 | | | | Aaa | | | | 495,615 | |
| | | | | |
| | 895 | | | Freddie Mac Mortgage Pool, Various H09059 | | | 7.000% | | | | 8/01/37 | | | | Aaa | | | | 1,016,940 | |
| | | | | |
| | 1,715 | | | Freddie Mac Mortgage Pool, Various P10032 | | | 4.500% | | | | 5/01/18 | | | | Aaa | | | | 1,785,264 | |
| | | | | |
| | 104 | | | Freddie Mac Non Gold Participation Certificates 846757 | | | 2.331% | | | | 5/01/25 | | | | Aaa | | | | 110,277 | |
| | | | | |
| | 5,750 | | | Ginnie Mae II Single Family 30 year TBA, (WI/DD) | | | 4.500% | | | | TBA | | | | Aaa | | | | 6,320,508 | |
| | | | | |
| | 611 | | | Goldman Sachs Mortgage Securities Corporation, Mortgage Pass-Through Certificates, Series 2003-1 | | | 6.717% | | | | 3/25/43 | | | | Ba3 | | | | 525,005 | |
| | | | | |
| | 738 | | | Goldman Sachs Mortgage Securities Corporation, Mortgage Pass-Through Certificates, Series 2005-RP2 1A2 | | | 7.500% | | | | 3/25/35 | | | | B1 | | | | 738,685 | |
Portfolio of Investments
Nuveen Core Plus Bond Fund (continued)
June 30, 2012
| | | | | | | | | | | | | | | | | | | | |
Principal
Amount (000) | | | Description (1) | | Coupon | | | Maturity | | | Ratings (2) | | | Value | |
| | | | | | | | | | | | | | | | | | | | |
| | | | | | | | | | | | | | | | | | | | |
| | | | ASSET-BACKED AND MORTGAGE-BACKED SECURITIES (continued) | | | | | | | | | | | | | | | | |
| | | | | |
| $ | 840 | | | Goldman Sachs Mortgage Securities Corporation, Mortgage Pass-Through Certificates, Series 2005-RP3 1A2 | | | 7.500% | | | | 9/25/35 | | | | Ba3 | | | $ | 872,297 | |
| | | | | |
| | 1 | | | Government National Mortgage Association Pool | | | 1.625% | | | | 8/20/23 | | | | Aaa | | | | 930 | |
| | | | | |
| | 201 | | | Government National Mortgage Association Pool | | | 7.500% | | | | 11/15/30 | | | | Aaa | | | | 245,262 | |
| | | | | |
| | 8,865 | | | Government National Mortgage Association Pool | | | 4.500% | | | | 2/20/41 | | | | Aaa | | | | 9,790,351 | |
| | | | | |
| | 167 | | | Green Tree Fiancial Manufactured Housing Loans, Series 2008-MH1 | | | 7.000% | | | | 4/25/38 | | | | AAA | | | | 166,848 | |
| | | | | |
| | 1,116 | | | IndyMac INDX Mortgage Loan Trust, Pass Through Certificates, Series 2005-AR1 | | | 2.748% | | | | 3/25/35 | | | | AAA | | | | 997,218 | |
| | | | | |
| | 74 | | | JPMorgan Mortage Trust, Mortgage Pass-Through Certtificates, Series 2006-A7 | | | 5.669% | | | | 1/25/37 | | | | C | | | | 1,767 | |
| | | | | |
| | 2,714 | | | JPMorgan Alternative Loan Trust, Mortgage Pass-Through Certificates, Series 2007-S1 | | | 0.525% | | | | 6/25/37 | | | | CCC | | | | 1,927,469 | |
| | | | | |
| | 7,488 | | | JPMorgan Chase Commercial Mortgage Securities Corporation, Commercial Mortgage Pass-Through Certificates, Series 2010-C1 | | | 3.853% | | | | 6/15/43 | | | | Aaa | | | | 7,957,297 | |
| | | | | |
| | 5,570 | | | JPMorgan Chase Commerical Mortgage Trust, Commerical Mortage Pass Through Certificates, Series 2011-C4 | | | 4.106% | | | | 7/17/46 | | | | AAA | | | | 6,049,165 | |
| | | | | |
| | 702 | | | LB-UBS Commercial Mortgage Trust, Commercial Mortgage Pass-Through Certificates, Series 2005-C7 | | | 5.103% | | | | 11/18/30 | | | | AAA | | | | 707,049 | |
| | | | | |
| | 6,000 | | | LB-UBS Commerical Mortgage Trust, Commercial Mortgage Pass-Through Certificates, Series 2004-C2 | | | 4.367% | | | | 3/15/36 | | | | AAA | | | | 6,273,474 | |
| | | | | |
| | 1,608 | | | Lehman Mortgage Trust, Mortgage Pass Through Certificates, Series 2008-6 | | | 5.792% | | | | 4/25/38 | | | | A | | | | 1,616,832 | |
| | | | | |
| | 1,733 | | | Mid-State Capital Corporation Trust Notes, Series 2005-1 | | | 5.745% | | | | 1/15/40 | | | | AAA | | | | 1,820,787 | |
| | | | | |
| | 920 | | | Mortgage Asset Securitization Transaction Inc., Alternative Loan Trust Mortgage Pass-Through Certificates Series 2004-1 | | | 7.000% | | | | 1/25/34 | | | | AAA | | | | 961,838 | |
| | | | | |
| | 3,830 | | | Mortgage Equity Conversion Asset Trust 2010-1A | | | 4.000% | | | | 7/25/60 | | | | AA | | | | 3,676,935 | |
| | | | | |
| | 4,185 | | | National Credit Union Adminstration Guaranteed Structured Collateral Notes | | | 2.900% | | | | 10/29/20 | | | | Aaa | | | | 4,462,256 | |
| | | | | |
| | 5,590 | | | OBP Depositor LLC Trust, Commercial Mortgage Pass Through Certificates, Series 2010-OBP | | | 4.646% | | | | 7/15/45 | | | | AAA | | | | 6,381,751 | |
| | | | | |
| | 3,545 | | | Ocwen Advance Receivables Backed Notes, Series 2009-3A | | | 4.140% | | | | 7/15/23 | | | | AAA | | | | 3,549,431 | |
| | | | | |
| | 414 | | | RBSSP Resecuritization Trust 2009-8 | | | 0.385% | | | | 3/26/37 | | | | Aaa | | | | 408,986 | |
| | | | | |
| | 259 | | | RBSSP Resecuritization Trust 2009-11 | | | 1.995% | | | | 12/26/37 | | | | Aa3 | | | | 258,648 | |
| | | | | |
| | 3,504 | | | RBSSP Resecuritization Trust 2010-10 | | | 0.375% | | | | 9/26/36 | | | | N/R | | | | 3,047,692 | |
| | | | | |
| | 2,446 | | | RBSSP Resecuritization Trust 2010-11 | | | 0.415% | | | | 3/26/37 | | | | A | | | | 2,402,115 | |
| | | | | |
| | 6,059 | | | RBSSP Resecuritization Trust 2010-4 | | | 0.355% | | | | 3/26/36 | | | | A | | | | 5,661,116 | |
| | | | | |
| | 1,556 | | | RBSSP Resecuritization Trust 2010-8 | | | 0.575% | | | | 7/26/36 | | | | N/R | | | | 1,474,269 | |
| | | | | |
| | 4,365 | | | Renaissance Home Equity Loan Trust I, Home Equity Loan Asset-Backed Notes, Series 2005-3 | | | 5.140% | | | | 11/25/35 | | | | AA+ | | | | 3,146,558 | |
| | | | | |
| | 2,605 | | | Sequoia Mortgage Trust, Mortgage Pass Through Certificates, Series 2011-1 | | | 4.125% | | | | 2/25/41 | | | | AAA | | | | 2,660,165 | |
| | | | | |
| | 4,138 | | | Springleaf Mortgage Loan Trust 2011-1 | | | 4.050% | | | | 1/25/58 | | | | AAA | | | | 4,196,667 | |
| | | | | |
| | 318 | | | Structured Adjustable Rate Mortgage Loan Trust, Mortgage Pass-Through Certificates, Series 2004-11 | | | 2.877% | | | | 8/25/34 | | | | Baa2 | | | | 302,542 | |
| | | | | |
| | 3,098 | | | U.S. Small Business Administration Guaranteed Participating Securities Participation Certificates, Series 2006-P10B | | | 5.681% | | | | 8/10/16 | | | | Aaa | | | | 3,394,142 | |
| | | | | |
| | 6,321 | | | U.S. Small Business Administration Guaranteed Participating Securities Participation Certificates, Series 2010-P10A | | | 4.108% | | | | 3/10/20 | | | | Aaa | | | | 6,644,215 | |
| | | | | |
| | 7,048 | | | United States Department of Veterans, Affairs, Guaranteed REMIC Pass-Through Certificates, Vendee Mortgage Trust, Series 2011-1 | | | 3.750% | | | | 2/15/35 | | | | Aaa | | | | 7,538,895 | |
| | | | | | | | | | | | | | | | | | | | |
Principal
Amount (000) | | | Description (1) | | Coupon | | | Maturity | | | Ratings (2) | | | Value | |
| | | | | | | | | | | | | | | | | | | | |
| | | | | | | | | | | | | | | | | | | | |
| | | | ASSET-BACKED AND MORTGAGE-BACKED SECURITIES (continued) | | | | | | | | | | | | | | | | |
| | | | | |
| $ | 1,331 | | | Vericrest Opportunity Loan Transferee, Series 2011-NL3A | | | 5.194% | | | | 9/25/51 | | | | N/R | | | $ | 1,333,469 | |
| | | | | |
| | 2,338 | | | Wachovia Bank Commercial Mortgage Trust, Commercial Mortgage Pass-Through Certificates, Series 2007-WHl8 | | | 0.322% | | | | 6/15/20 | | | | Aaa | | | | 2,175,518 | |
| | | | | |
| | 4,447 | | | Wachovia Mortgage Loan Trust LLC, Mortgage PasS-Through Certificates, Series 2005-B | | | 2.688% | | | | 10/20/35 | | | | CCC | | | | 3,150,224 | |
| | | | | |
| | 725 | | | Washington Mutual Mortgage Securities Corporation, Mortgage Pass-through Certificates, Series 2007-HY2 | | | 5.260% | | | | 9/25/36 | | | | C | | | | 28,316 | |
| | | | | |
| | 1,341 | | | Wells Fargo Mortagge Backed Securities Trust, Mortgage Pass_Through Certificate Series 2007-2 | | | 5.750% | | | | 3/25/37 | | | | Caa1 | | | | 1,225,019 | |
| | | | | |
| | 5,000 | | | Wells Fargo-RBS Commercial Mortgage Trust, Commercial Mortgage Pass-Through Certificates, Series 2011-C3 | | | 4.375% | | | | 3/17/44 | | | | Aaa | | | | 5,488,604 | |
| $ | 361,951 | | | Total Asset-Backed and Mortgage-Backed Securities (cost $359,812,882) | | | | | | | | | | | | 375,948,488 | |
| | | | | |
| Shares | | | Description (1) | | | | | | | | | | | Value | |
| | | | INVESTMENTS PURCHASED WITH COLLATERAL FROM SECURITIES LENDING – 14.0% | |
| | | | | |
| | | | Money Market Funds – 14.0% | | | | | | | | | | | | | | | | |
| | | | | |
| | 112,762,340 | | | Mount Vernon Securities Lending Prime Portfolio, 0.197% (5), (6) | | | | | | | | | | | | | | $ | 112,762,340 | |
| | | | Total Investments Purchased with Collateral from Securities Lending (cost $112,762,340) | | | | | | | | 112,762,340 | |
| | | | | |
Shares/
Principal
Amount (000) | | | Description (1) | | Coupon | | | Maturity | | | Ratings (2) | | | Value | |
| | | | SHORT-TERM INVESTMENTS – 2.7% | | | | | | | | | | | | | | | | |
| | | | | |
| | | | Money Market Funds – 2.3% | | | | | | | | | | | | | | | | |
| | | | | |
| | 18,425,992 | | | First American Treasury Obligations Fund, Class Z | | | 0.000% (5) | | | | N/A | | | | N/A | | | $ | 18,425,992 | |
| | | | U.S. Government and Agency Obligations – 0.4% | | | | | | | | | | | | | | | | |
| | | | | |
| $ | 1,170 | | | U.S. Treasury Bills, (7) | | | 0.330% | | | | 7/26/12 | | | | Aaa | | | | 1,169,971 | |
| | | | | |
| | 1,315 | | | U.S. Treasury Bills, (7) | | | 0.158% | | | | 2/07/13 | | | | Aaa | | | | 1,313,715 | |
| | | | | |
| | 1,270 | | | U.S. Treasury Bills, (7) | | | 0.158% | | | | 3/07/13 | | | | Aaa | | | | 1,268,580 | |
| | | | | |
| $ | 3,755 | | | Total U.S. Government and Agency Obligations | | | | | | | | | | | | | | | 3,752,266 | |
| | | | Total Short-Term Investments (cost $22,178,290) | | | | | | | | | | | | | | | 22,178,258 | |
| | | | Total Investments (cost $897,300,423) – 115.9% | | | | | | | | | | | | | | | 936,153,594 | |
| | | | Other Assets Less Liabilities – (15.9)% (8) | | | | | | | | | | | | | | | (128,448,301) | |
| | | | Net Assets – 100% | | | | | | | | | | | | | | $ | 807,705,293 | |
Investment in Derivatives at June 30, 2012
Interest Rate Swaps outstanding:
| | | | | | | | | | | | | | | | | | | | | | | | | | | | | | | | |
| Counterparty | | Notional
Amount | | | Fund
Pay/Receive
Floating Rate | | | Floating
Rate Index | | | Fixed Rate* | | | Fixed Rate
Payment
Frequency | | | Termination
Date | | | Value
| | | Unrealized
Appreciation
(Depreciation) (8) | |
JPMorgan | | $ | 8,000,000 | | | | Receive | | | | 3-Month USD-LIBOR | | | | 3.858 | % | | | Semi-Annually | | | | 1/19/20 | | | $ | (1,546,687 | ) | | $ | (1,546,687 | ) |
UBS | | | 14,000,000 | | | | Receive | | | | 3-Month USD-LIBOR | | | | 3.001 | | | | Semi-Annually | | | | 8/03/14 | | | | (876,818 | ) | | | (876,818 | ) |
| | | | | | | | | | | | | | | | | | | | | | | | | | | | | | | $ | (2,423,505 | ) |
Portfolio of Investments
Nuveen Core Plus Bond Fund (continued)
June 30, 2012
Investments in Derivatives at June 30, 2012 (continued)
Future Contracts outstanding:
| | | | | | | | | | | | | | | | | | | | |
| Type | | Contract
Position | | | Number of
Contracts | | | Contract
Expiration | | | Value
| | | Unrealized
Appreciation
(Depreciation)
| |
U.S. Treasury 2-Year Note | | | Long | | | | 319 | | | | 9/12 | | | $ | 70,239,813 | | | $ | (32,390 | ) |
U.S. Treasury 5-Year Note | | | Long | | | | 366 | | | | 9/12 | | | | 45,372,563 | | | | 82,436 | |
U.S. Treasury 10-Year Note | | | Short | | | | (1,029 | ) | | | 9/12 | | | | (137,242,875 | ) | | | (665,998 | ) |
U.S. Treasury Long Bond | | | Long | | | | 169 | | | | 9/12 | | | | 25,006,719 | | | | 140,880 | |
U.S. Treasury Ultra Bond | | | Short | | | | (45 | ) | | | 9/12 | | | | (7,507,969 | ) | | | (86,074 | ) |
| | | | | | | | | | | | | | | | | | | $ | (561,146 | ) |
| | | | For Fund portfolio compliance purposes, the Fund’s industry classifications refer to any one or more of the industry sub-classifications used by one or more widely recognized market indexes or ratings group indexes, and/or as defined by Fund management. This definition may not apply for purposes of this report, which may combine industry sub-classifications into sectors for reporting ease. |
| | (1) | | All Percentages shown in the Portfolio of Investments are based on net assets. |
| | (2) | | Ratings (not covered by the report of independent registered public accounting firm): Using the highest of Standard & Poor’s Group (“Standard & Poor’s”), Moody’s Investors Service, Inc. (“Moody’s”) or Fitch, Inc. (“Fitch”) rating. Ratings below BBB by Standard & Poor’s, Baa by Moody’s or BBB by Fitch are considered to be below investment grade. Holdings designated N/R are not rated by any of these national rating agencies. |
| | (3) | | Investment, or a portion of investment, is out on loan for securities lending. |
| | (4) | | Optional Call Provisions (not covered by the report of independent registered public accounting firm): Dates (month and year) and prices of the earliest optional call or redemption. There may be other call provisions at varying prices at later dates. |
| | (5) | | The rate shown is the annualized seven-day effective yield as of June 30, 2012. |
| | (6) | | The Fund may loan securities representing up to one third of the fair value of its total assets (which includes collateral for securities on loan) to broker-dealers, banks and other institutions. The Fund maintains collateral equal to at least 100% of the fair value of the securities loaned. The cash collateral received by the Fund is invested in this money market fund. See Notes to Financial Statements, Footnote 1 – General Information and Significant Accounting Policies, Securities Lending for more information. |
| | (7) | | Investment, or portion of investment, segregated as collateral for investments in derivatives. |
| | (8) | | Other Assets Less Liabilities includes the Unrealized Appreciation (Depreciation) of derivative instruments as noted within Investments in Derivatives at June 30, 2012. |
| | TBA | | To be announced. Maturity date not known prior to settlement of this transaction. |
| | WI/DD | | Investment, or portion of investment, purchased on a when-issued or delayed delivery basis. |
| | 144A | | Investment is exempt from registration under Rule 144A of the Securities Act of 1933, as amended. These investments may only be resold in transactions exempt from registration, which are normally those transactions with qualified institutional buyers. |
| | USD-LIBOR | | United States Dollar–London Inter-Bank Offered Rate. |
See accompanying notes to financial statements.
Portfolio of Investments
Nuveen High Income Bond Fund
June 30, 2012
| | | | | | | | | | | | | | |
| Shares | | | Description (1) | | | | | | | | Value | |
| | | | | | | | | | | | | | |
| | | | COMMON STOCKS – 1.8% | | | | | | | | | | |
| | | | | |
| | | | Airlines – 0.0% | | | | | | | | | | |
| | | | | |
| | 7,000 | | | Delta Air Lines, Inc., (2) | | | | | | | | $ | 76,650 | |
| | | | Building Products – 0.3% | | | | | | | | | | |
| | | | | |
| | 527 | | | Dayton Superior Class A, (3) | | | | | | | | | 30,195 | |
| | | | | |
| | 585 | | | Dayton Superior Class 1, (3) | | | | | | | | | 33,550 | |
| | | | | |
| | 35,871 | | | Nortek Inc., (2), (4) | | | | | | | | | 1,794,985 | |
| | | | Total Building Products | | | | | | | | | 1,858,730 | |
| | | | Capital Markets – 0.1% | | | | | | | | | | |
| | | | | |
| | 64,000 | | | Och-Ziff Capital Management Group, Class A Shares | | | | | | | | | 485,120 | |
| | | | Diversified Telecommunication Services – 0.1% | | | | | | | | | | |
| | | | | |
| | 53,006 | | | FairPoint Communications Inc., (2), (4) | | | | | | | | | 325,987 | |
| | | | Food Products – 0.1% | | | | | | | | | | |
| | | | | |
| | 17,306 | | | Archer-Daniels-Midland Company | | | | | | | | | 510,873 | |
| | | | Household Durables – 0.0% | | | | | | | | | | |
| | | | | |
| | 218,325 | | | William Lyon Homes Inc., (3) | | | | | | | | | 179,027 | |
| | | | Insurance – 0.1% | | | | | | | | | | |
| | | | | |
| | 23,500 | | | Protective Life Corporation, (4) | | | | | | | | | 691,135 | |
| | | | Machinery – 0.0% | | | | | | | | | | |
| | | | | |
| | 8,800 | | | Xylem Inc. | | | | | | | | | 221,496 | |
| | | | Multiline Retail – 0.0% | | | | | | | | | | |
| | | | | |
| | 4,800 | | | Target Corporation, (4) | | | | | | | | | 279,312 | |
| | | | Oil, Gas & Consumable Fuels – 0.3% | | | | | | | | | | |
| | | | | |
| | 12,900 | | | ConocoPhillips, (4) | | | | | | | | | 720,852 | |
| | | | | |
| | 16,575 | | | Pembina Pipeline Corporation | | | | | | | | | 424,486 | |
| | | | | |
| | 46,000 | | | Pengrowth Energy Corporation | | | | | | | | | 293,020 | |
| | | | | |
| | 11,450 | | | Phillips 66 | | | | | | | | | 380,598 | |
| | | | Total Oil, Gas & Consumable Fuels | | | | | | | | | 1,818,956 | |
| | | | Real Estate Investment Trust – 0.7% | | | | | | | | | | |
| | | | | |
| | 7,000 | | | Camden Property Trust | | | | | | | | | 473,690 | |
| | | | | |
| | 47,000 | | | Kite Realty Group Trust | | | | | | | | | 1,198,500 | |
| | | | | |
| | 18,400 | | | Mid-America Apartment Communities, (4) | | | | | | | | | 1,255,616 | |
| | | | | |
| | 40,000 | | | Summit Hotel Properties Inc., (4) | | | | | | | | | 1,040,800 | |
| | | | Total Real Estate Investment Trust | | | | | | | | | 3,968,606 | |
| | | | Wireless Telecommunication Services – 0.1% | | | | | | | | | | |
| | | | | |
| | 22,500 | | | Vodafone Group PLC, Sponsored ADR | | | | | | | | | 634,049 | |
| | | | Total Common Stocks (cost $10,041,832) | | | | | | | | | 11,049,941 | |
| | | | | |
| Shares | | | Description (1) | | | | | | | | Value | |
| | | | EXCHANGE-TRADED FUNDS – 1.4% | | | | | | | | | | |
| | | | | |
| | 50,000 | | | iShares I-Boxx High Yield Corporate Bond Fund | | | | | | | | $ | 4,561,000 | |
| | | | | |
| | 13,000 | | | iShares I-Boxx Investnment Grade Corporate Bond Fund | | | | | | | | | 1,529,580 | |
| | | | | |
| | 21,500 | | | Market Vectors International High Yield Bond Fund ETF | | | | | | | | | 516,430 | |
| | | | | |
| | 134,000 | | | Pioneer Floating Rate Trust | | | | | | | | | 1,695,100 | |
| | | | | |
| | 4,900 | | | SPDR DB International Government Inflation Protected Bond ETF | | | | | | | | | 288,512 | |
| | | | Total Exchange-Traded Funds (cost $8,427,206) | | | | | | | | | 8,590,622 | |
Portfolio of Investments
Nuveen High Income Bond Fund (continued)
June 30, 2012
| | | | | | | | | | | | | | | | | | |
| Shares | | | Description (1) | | Coupon | | | | | Ratings (5) | | | Value | |
| | | | | | | | | | | | | | | | | | |
| | | | CONVERTIBLE PREFERRED SECURITIES – 0.1% | | | | | | | | | | | | | | |
| | | | | |
| | | | Oil, Gas & Consumable Fuels – 0.1% | | | | | | | | | | | | | | |
| | | | | |
| | 6,123 | | | Chesapeake Energy Corporation, Convertible | | | 5.000% | | | | | | B+ | | | $ | 457,694 | |
| | | | Total Convertible Preferred Securities (cost $483,339) | | | | | | | | | | | | | 457,694 | |
| | | | | |
| Shares | | | Description (1) | | Coupon | | | | | Ratings (5) | | | Value | |
| | | | $25 PAR (OR SIMILAR) PREFERRED SECURITIES – 5.9% | | | | | | | | | | | | | | |
| | | | | |
| | | | Automobiles – 0.1% | | | | | | | | | | | | | | |
| | | | | |
| | 21,000 | | | General Motors Corporation, (4) | | | 4.750% | | | | | | B+ | | | $ | 697,200 | |
| | | | Capital Markets – 0.4% | | | | | | | | | | | | | | |
| | | | | |
| | 82,330 | | | Morgan Stanley, Series 2006A | | | 4.000% | | | | | | BB+ | | | | 1,383,144 | |
| | | | | |
| | 74,434 | | | UBS Preferred Funding Trust IV | | | 0.945% | | | | | | BBB– | | | | 1,138,840 | |
| | | | Total Capital Markets | | | | | | | | | | | | | 2,521,984 | |
| | | | Commercial Banks – 0.3% | | | | | | | | | | | | | | |
| | | | | |
| | 14,847 | | | First Naigara Finance Group | | | 8.625% | | | | | | BB+ | | | | 406,808 | |
| | | | | |
| | 2,785,000 | | | RBS Capital Trust, (6) | | | 5.512% | | | | | | BB | | | | 1,643,150 | |
| | | | Total Commercial Banks | | | | | | | | | | | | | 2,049,958 | |
| | | | Consumer Finance – 0.7% | | | | | | | | | | | | | | |
| | | | | |
| | 4,750 | | | Ally Financial Inc., (6) | | | 0.000% | | | | | | B3 | | | | 4,231,805 | |
| | | | Diversified Financial Services – 1.3% | | | | | | | | | | | | | | |
| | | | | |
| | 108,944 | | | Bank of America Corporation | | | 8.625% | | | | | | BB+ | | | | 2,824,918 | |
| | | | | |
| | 3,225 | | | Bank of America Corporation | | | 7.250% | | | | | | BB+ | | | | 3,144,375 | |
| | | | | |
| | 28,713 | | | Bank of America Corporation, (4) | | | 4.000% | | | | | | BB+ | | | | 559,042 | |
| | | | | |
| | 50,000 | | | Citigroup Capital Trust IX, (4) | | | 6.000% | | | | | | BB+ | | | | 1,224,500 | |
| | | | Total Diversified Financial Services | | | | | | | | | | | | | 7,752,835 | |
| | | | Household Durables – 0.2% | | | | | | | | | | | | | | |
| | | | | |
| | 61,541 | | | M-I Homes, (2) | | | 9.750% | | | | | | CCC | | | | 1,064,659 | |
| | | | Insurance – 1.0% | | | | | | | | | | | | | | |
| | | | | |
| | 30,000 | | | Aegon N.V | | | 8.000% | | | | | | Baa1 | | | | 791,700 | |
| | | | | |
| | 50,000 | | | Aspen Insurance Holdings Limited | | | 7.401% | | | | | | BBB– | | | | 1,284,500 | |
| | | | | |
| | 17,000 | | | Axis Capital Holdings Limited | | | 6.875% | | | | | | BBB | | | | 455,430 | |
| | | | | |
| | 51,131 | | | Endurance Specialty Holdings Limited | | | 7.500% | | | | | | BBB– | | | | 1,345,257 | |
| | | | | |
| | 75,000 | | | Hartford Financial Services Group Inc. | | | 7.875% | | | | | | BB+ | | | | 2,028,000 | |
| | | | Total Insurance | | | | | | | | | | | | | 5,904,887 | |
| | | | Marine – 0.1% | | | | | | | | | | | | | | |
| | | | | |
| | 29,338 | | | Seaspan Corporation | | | 9.500% | | | | | | N/R | | | | 797,994 | |
| | | | Real Estate Investment Trust – 1.8% | | | | | | | | | | | | | | |
| | | | | |
| | 51,900 | | | Ashford Hospitality Trust Inc. | | | 8.450% | | | | | | N/R | | | | 1,295,943 | |
| | | | | |
| | 40,000 | | | CommomWealth REIT | | | 7.250% | | | | | | Baa3 | | | | 1,085,600 | |
| | | | | |
| | 50,000 | | | Corporate Office Properties Trust, (2) | | | 0.000% | | | | | | N/R | | | | 1,262,000 | |
| | | | | |
| | 50,000 | | | Digital Realty Trust Inc. | | | 7.000% | | | | | | Baa3 | | | | 1,343,500 | |
| | | | | |
| | 65,000 | | | Dupont Fabros Technology | | | 7.875% | | | | | | Ba2 | | | | 1,700,400 | |
| | | | | |
| | 22,024 | | | First Potomac Realty Trust | | | 7.750% | | | | | | N/R | | | | 556,987 | |
| | | | | |
| | 30,000 | | | Hersha Hospitality Trust, (4) | | | 8.000% | | | | | | N/R | | | | 763,500 | |
| | | | | |
| | 50,000 | | | LaSalle Hotel Properties | | | 7.500% | | | | | | N/R | | | | 1,286,000 | |
| | | | | |
| | 50,000 | | | Pebblebrook Hotel Trust | | | 7.875% | | | | | | N/R | | | | 1,288,000 | |
| | | | Total Real Estate Investment Trust | | | | | | | | | | | | | 10,581,930 | |
| | | | | | | | | | | | | | | | | | | | |
| Shares | | | Description (1) | | Coupon | | | | | | Ratings (5) | | | Value | |
| | | | | | | | | | | | | | | | | | | | |
| | | | Thrifts & Mortgage Finance – 0.0% | | | | | | | | | | | | | | | | |
| | | | | |
| | 35,522 | | | Federal Home Loan Mortgage Corporation, (2) | | | 6.550% | | | | | | | | Ca | | | $ | 51,506 | |
| | | | Total $25 Par (or similar) Preferred Securities (cost $33,969,651) | | | | | | | | | | | | | | | 35,654,758 | |
| | | | | |
Principal
Amount (000) | | | Description (1) | | Coupon | | | Maturity | | | Ratings (5) | | | Value | |
| | | | CORPORATE BONDS – 81.8% | | | | | | | | | | | | | | | | |
| | | | | |
| | | | Aerospace & Defense – 0.5% | | | | | | | | | | | | | | | | |
| | | | | |
| $ | 900 | | | CHC Helicopter | | | 9.250% | | | | 10/15/20 | | | | B+ | | | $ | 879,750 | |
| | | | | |
| | 1,000 | | | Ducommun Inc. | | | 9.750% | | | | 7/15/18 | | | | B– | | | | 1,052,500 | |
| | | | | |
| | 1,000 | | | DynCorp International Inc. | | | 10.375% | | | | 7/01/17 | | | | B2 | | | | 855,000 | |
| | 2,900 | | | Total Aerospace & Defense | | | | | | | | | | | | | | | 2,787,250 | |
| | | | Airlines – 1.6% | | | | | | | | | | | | | | | | |
| | | | | |
| | 1,000 | | | Air Canada, 144A, (4) | | | 12.000% | | | | 2/01/16 | | | | B– | | | | 882,500 | |
| | | | | |
| | 3,513 | | | American Airlines Pass Through Certificates Trust, Series 2011-1 | | | 7.000% | | | | 1/31/18 | | | | B+ | | | | 3,477,806 | |
| | | | | |
| | 1,057 | | | Continental Airlines, inc. | | | 7.875% | | | | 7/02/18 | | | | Ba3 | | | | 1,062,759 | |
| | | | | |
| | 2,250 | | | Delta Air Lines Pass Through Certificates, Series 2012-1B, (WI/DD) | | | 6.875% | | | | 5/07/19 | | | | BB | | | | 2,272,500 | |
| | | | | |
| | 2,000 | | | US Airways Pass Through Trust 2012-1B | | | 8.000% | | | | 10/01/19 | | | | B+ | | | | 2,050,000 | |
| | 9,820 | | | Total Airlines | | | | | | | | | | | | | | | 9,745,565 | |
| | | | Auto Components – 1.0% | | | | | | | | | | | | | | | | |
| | | | | |
| | 1,800 | | | American & Axle Manufacturing Inc., (4) | | | 7.875% | | | | 3/01/17 | | | | B | | | | 1,858,500 | |
| | | | | |
| | 2,250 | | | American & Axle Manufacturing Inc., (4) | | | 7.750% | | | | 11/15/19 | | | | B1 | | | | 2,379,375 | |
| | | | | |
| | 2,065 | | | Pittsburgh Glass Works LLC, 144A | | | 8.500% | | | | 4/15/16 | | | | B+ | | | | 1,899,800 | |
| | 6,115 | | | Total Auto Components | | | | | | | | | | | | | | | 6,137,675 | |
| | | | Biotechnology – 0.4% | | | | | | | | | | | | | | | | |
| | | | | |
| | 2,105 | | | STHI Holding Corporation, 144A | | | 8.000% | | | | 3/15/18 | | | | B | | | | 2,226,038 | |
| | | | Building Products – 1.9% | | | | | | | | | | | | | | | | |
| | | | | |
| | 1,410 | | | Associated Materials Inc., (4) | | | 9.125% | | | | 11/01/17 | | | | B– | | | | 1,258,425 | |
| | | | | |
| | 3,097 | | | Corporativo Javer S.A. de C.V, 144A | | | 9.875% | | | | 4/06/21 | | | | B1 | | | | 2,911,180 | |
| | | | | |
| | 1,300 | | | Nortek Inc., (4) | | | 8.500% | | | | 4/15/21 | | | | B | | | | 1,270,750 | |
| | | | | |
| | 1,500 | | | Roofing Supply Group LLC Finance, 144A | | | 10.000% | | | | 6/01/20 | | | | B3 | | | | 1,567,500 | |
| | | | | |
| | 2,830 | | | Texas Industries Inc., (4) | | | 9.250% | | | | 8/15/20 | | | | B– | | | | 2,830,000 | |
| | | | | |
| | 1,600 | | | USG Corporation | | | 9.500% | | | | 1/15/18 | | | | B– | | | | 1,680,000 | |
| | 11,737 | | | Total Building Products | | | | | | | | | | | | | | | 11,517,855 | |
| | | | Capital Markets – 1.5% | | | | | | | | | | | | | | | | |
| | | | | |
| | 1,500 | | | Ace Cash Express Inc., 144A | | | 11.000% | | | | 2/01/19 | | | | B | | | | 1,321,875 | |
| | | | | |
| | 2,500 | | | Constellation Enterprises LLC, 144A | | | 10.625% | | | | 2/01/16 | | | | B | | | | 2,525,000 | |
| | | | | |
| | 2,300 | | | E Trade Financial Corporation | | | 6.750% | | | | 6/01/16 | | | | B2 | | | | 2,340,250 | |
| | | | | |
| | 3,000 | | | Morgan Stanley | | | 5.500% | | | | 7/28/21 | | | | A | | | | 2,955,771 | |
| | 9,300 | | | Total Capital Markets | | | | | | | | | | | | | | | 9,142,896 | |
| | | | Chemicals – 3.1% | | | | | | | | | | | | | | | | |
| | | | | |
| | 1,500 | | | Basell Finance Company BV, 144A | | | 8.100% | | | | 3/15/27 | | | | N/R | | | | 1,788,750 | |
| | | | | |
| | 3,000 | | | Celanese US Holdings LLC, (4) | | | 5.875% | | | | 6/15/21 | | | | BB– | | | | 3,217,500 | |
| | | | | |
| | 1,825 | | | Hexion US Finance Corporation | | | 9.000% | | | | 11/15/20 | | | | CCC+ | | | | 1,574,063 | |
| | | | | |
| | 2,000 | | | Hexion US Finance | | | 6.625% | | | | 4/15/20 | | | | Ba3 | | | | 2,050,000 | |
| | | | | |
| | 1,350 | | | Ineos Group Holdings PLC, 144A, (4) | | | 8.500% | | | | 2/15/16 | | | | B+ | | | | 1,238,625 | |
| | | | | |
| | 2,000 | | | LyondellBasell Industries NV, 144A | | | 5.000% | | | | 4/15/19 | | | | BB+ | | | | 2,097,500 | |
Portfolio of Investments
Nuveen High Income Bond Fund (continued)
June 30, 2012
| | | | | | | | | | | | | | | | | | | | |
Principal
Amount (000) | | | Description (1) | | Coupon | | | Maturity | | | Ratings (5) | | | Value | |
| | | | | | | | | | | | | | | | | | | | |
| | | | Chemicals (continued) | | | | | | | | | | | | | | | | |
| | | | | |
| $ | 2,000 | | | Momentive Performance Materials, 144A, (4) | | | 10.000% | | | | 10/15/20 | | | | B2 | | | $ | 2,005,000 | |
| | | | | |
| | 2,500 | | | Omonva Solutions Inc. | | | 7.875% | | | | 11/01/18 | | | | B2 | | | | 2,506,250 | |
| | | | | |
| | 2,550 | | | Taminco Global Chemical Corporation, 144A | | | 9.750% | | | | 3/31/20 | | | | B– | | | | 2,620,125 | |
| | 18,725 | | | Total Chemicals | | | | | | | | | | | | | | | 19,097,813 | |
| | | | Commercial Banks – 1.4% | | | | | | | | | | | | | | | | |
| | | | | |
| | 1,000 | | | PrivatBank Commercial Bank JSC | | | 8.750% | | | | 2/09/16 | | | | B2 | | | | 685,000 | |
| | | | | |
| | 3,000 | | | Regions Bank | | | 6.450% | | | | 6/26/37 | | | | BBB– | | | | 2,940,000 | |
| | | | | |
| | 2,500 | | | Russian Agricultural Bank, 144A | | | 5.298% | | | | 12/27/17 | | | | Baa1 | | | | 2,519,250 | |
| | | | | |
| | 1,500 | | | Sberbank of Russia Loan | | | 5.717% | | | | 6/16/21 | | | | A3 | | | | 1,529,895 | |
| | | | | |
| | 1,000 | | | Speedy Cash Inc,, 144A | | | 10.750% | | | | 5/15/18 | | | | B | | | | 1,032,500 | |
| | 9,000 | | | Total Commercial Banks | | | | | | | | | | | | | | | 8,706,645 | |
| | | | Commercial Services & Supplies – 2.8% | | | | | | | | | | | | | | | | |
| | | | | |
| | 915 | | | Casella Waste Systems Inc. | | | 7.750% | | | | 2/15/19 | | | | CCC+ | | | | 901,275 | |
| | | | | |
| | 1,250 | | | Ceridian Corporation, 144A, (WI/DD) | | | 8.875% | | | | 7/15/19 | | | | BB | | | | 1,290,625 | |
| | | | | |
| | 2,340 | | | Covanta Energy Corporation, Synthetic Letter of Credit, (4) | | | 6.375% | | | | 10/01/22 | | | | BB | | | | 2,473,366 | |
| | | | | |
| | 1,000 | | | Donnelley & Son Company | | | 7.625% | | | | 6/15/20 | | | | BB+ | | | | 935,000 | |
| | | | | |
| | 1,715 | | | EnergySolutions Inc. | | | 10.750% | | | | 8/15/18 | | | | B | | | | 1,432,025 | |
| | | | | |
| | 2,000 | | | GDR Holding II Corporation, 144A | | | 10.750% | | | | 6/01/19 | | | | B | | | | 1,980,000 | |
| | | | | |
| | 550 | | | Geo Group Inc. | | | 6.625% | | | | 2/15/21 | | | | B+ | | | | 567,875 | |
| | | | | |
| | 1,850 | | | Heckman Corporation | | | 9.875% | | | | 4/15/18 | | | | B– | | | | 1,757,500 | |
| | | | | |
| | 2,500 | | | International Lease Finance Corporation | | | 5.875% | | | | 4/01/19 | | | | BBB– | | | | 2,502,423 | |
| | | | | |
| | 1,300 | | | Liberty Tire Recycling, 144A | | | 11.000% | | | | 10/01/16 | | | | B | | | | 1,196,000 | |
| | | | | |
| | 500 | | | Monitronics International Inc., 144A, (4) | | | 9.125% | | | | 4/01/20 | | | | CCC+ | | | | 480,000 | |
| | | | | |
| | 2,000 | | | Suare Two Financial Corporation | | | 11.625% | | | | 4/01/17 | | | | B | | | | 1,785,000 | |
| | 17,920 | | | Total Commercial Services & Supplies | | | | | | | | | | | | | | | 17,301,089 | |
| | | | Commodity – 0.3% | | | | | | | | | | | | | | | | |
| | | | | |
| | 1,750 | | | Methanex Corporation | | | 5.250% | | | | 3/01/22 | | | | BBB– | | | | 1,815,643 | |
| | | | Communications Equipment – 1.5% | | | | | | | | | | | | | | | | |
| | | | | |
| | 1,900 | | | Goodman Networks Inc., 144A | | | 12.125% | | | | 7/01/18 | | | | B+ | | | | 1,957,000 | |
| | | | | |
| | 3,470 | | | IntelSat Jackson Holdings, (4) | | | 7.250% | | | | 4/01/19 | | | | B | | | | 3,643,500 | |
| | | | | |
| | 4,750 | | | Nokia Corporation, (4) | | | 5.375% | | | | 5/15/19 | | | | BB+ | | | | 3,740,625 | |
| | 10,120 | | | Total Communications Equipment | | | | | | | | | | | | | | | 9,341,125 | |
| | | | Construction & Engineering – 0.3% | | | | | | | | | | | | | | | | |
| | | | | |
| | 1,500 | | | Wyle Services Corporation, 144A | | | 10.500% | | | | 4/01/18 | | | | B– | | | | 1,620,000 | |
| | | | Construction Materials – 0.3% | | | | | | | | | | | | | | | | |
| | | | | |
| | 2,000 | | | Cemex SAB de CV, 144A, (4) | | | 9.000% | | | | 1/11/18 | | | | B+ | | | | 1,785,000 | |
| | | | Consumer Finance – 0.7% | | | | | | | | | | | | | | | | |
| | | | | |
| | 2,000 | | | Nationstar Mortgage LLC Capital Corporation, 144A | | | 7.625% | | | | 5/01/19 | | | | B+ | | | | 2,115,000 | |
| | | | | |
| | 2,850 | | | Springleaf Finance Corporation | | | 6.900% | | | | 12/15/17 | | | | Caa1 | | | | 2,274,642 | |
| | 4,850 | | | Total Consumer Finance | | | | | | | | | | | | | | | 4,389,642 | |
| | | | Containers & Packaging – 1.2% | | | | | | | | | | | | | | | | |
| | | | | |
| | 2,000 | | | Berry Plastics Corporation | | | 5.217% | | | | 2/15/15 | | | | B1 | | | | 1,997,500 | |
| | | | | |
| | 2,500 | | | Longview Fibre Paper & Packaging, 144A, (4) | | | 8.000% | | | | 6/01/16 | | | | B+ | | | | 2,500,000 | |
| | | | | |
| | 2,550 | | | Reynolds Group, 144A, (4) | | | 8.500% | | | | 5/15/18 | | | | B– | | | | 2,499,000 | |
| | 7,050 | | | Total Containers & Packaging | | | | | | | | | | | | | | | 6,996,500 | |
| | | | | | | | | | | | | | | | | | | | |
Principal
Amount (000) | | | Description (1) | | Coupon | | | Maturity | | | Ratings (5) | | | Value | |
| | | | | | | | | | | | | | | | | | | | |
| | | | Diversified Financial Services – 1.6% | | | | | | | | | | | | | | | | |
| | | | | |
| $ | 2,000 | | | CNG Holdings Inc., 144A, (4) | | | 9.375% | | | | 5/15/20 | | | | B | | | $ | 2,050,000 | |
| | | | | |
| | 1,825 | | | Community Choice Financial Inc., 144A | | | 10.750% | | | | 5/01/19 | | | | B– | | | | 1,806,750 | |
| | | | | |
| | 1,500 | | | Metalloinvest Finance Limited, 144A | | | 6.500% | | | | 7/21/16 | | | | Ba3 | | | | 1,488,750 | |
| | | | | |
| | 1,900 | | | SinOceanic II ASA | | | 10.000% | | | | 2/17/15 | | | | N/R | | | | 1,824,000 | |
| | | | | |
| | 2,800 | | | UPCB Finance III Limited, 144A, (4) | | | 6.625% | | | | 7/01/20 | | | | BB– | | | | 2,842,000 | |
| | 10,025 | | | Total Diversified Financial Services | | | | | | | | | | | | | | | 10,011,500 | |
| | | | Diversified Telecommunication Services – 2.9% | | | | | | | | | | | | | | | | |
| | | | | |
| | 1,850 | | | Axtel SAB de CV, 144A | | | 9.000% | | | | 9/22/19 | | | | B– | | | | 1,221,000 | |
| | | | | |
| | 1,043 | | | FairPoint Communications Inc., (4) | | | 13.125% | | | | 4/02/18 | | | | N/R | | | | 10,430 | |
| | | | | |
| | 2,550 | | | Frontier Communications Corporation, (4) | | | 8.500% | | | | 4/15/20 | | | | BB+ | | | | 2,703,000 | |
| | | | | |
| | 2,325 | | | Integra Telecom, 144A | | | 10.750% | | | | 4/15/16 | | | | B– | | | | 2,266,875 | |
| | | | | |
| | 2,750 | | | IntelSat Bermuda Limited | | | 11.250% | | | | 2/04/17 | | | | CCC+ | | | | 2,832,500 | |
| | | | | |
| | 3,500 | | | Level 3 Communications Inc. | | | 11.875% | | | | 2/01/19 | | | | B– | | | | 3,876,250 | |
| | | | | |
| | 1,500 | | | Sprint Nextel Corporation | | | 6.000% | | | | 12/01/16 | | | | B+ | | | | 1,436,250 | |
| | | | | |
| | 3,300 | | | Windstream Corporation | | | 7.875% | | | | 11/01/17 | | | | BB+ | | | | 3,597,000 | |
| | 18,818 | | | Total Diversified Telecommunication Services | | | | | | | | | | | | | | | 17,943,305 | |
| | | | Electric Utilities – 0.9% | | | | | | | | | | | | | | | | |
| | | | | |
| | 2,000 | | | Edison Mission Energy | | | 7.000% | | | | 5/15/17 | | | | CCC | | | | 1,120,000 | |
| | | | | |
| | 750 | | | Empresa Distribuidora y Comercializadora Norte S.A, 144A, (4) | | | 9.750% | | | | 10/25/22 | | | | B3 | | | | 266,250 | |
| | | | | |
| | 4,900 | | | Energy Future Holdings, (4) | | | 10.875% | | | | 11/01/17 | | | | CCC | | | | 4,152,750 | |
| | 7,650 | | | Total Electric Utilities | | | | | | | | | | | | | | | 5,539,000 | |
| | | | Energy Equipment & Services – 2.4% | | | | | | | | | | | | | | | | |
| | | | | |
| | 2,600 | | | Alta Mesa Holdngs Finance | | | 9.625% | | | | 10/15/18 | | | | B | | | | 2,567,500 | |
| | | | | |
| | 2,000 | | | Atwood Oceanics Inc., (4) | | | 6.500% | | | | 2/01/20 | | | | BB | | | | 2,090,000 | |
| | | | | |
| | 1,625 | | | Forbes Energy Services | | | 9.000% | | | | 6/15/19 | | | | B | | | | 1,535,625 | |
| | | | | |
| | 500 | | | Green Field Energy Services, 144A | | | 13.000% | | | | 11/15/16 | | | | CCC | | | | 430,000 | |
| | | | | |
| | 1,000 | | | Gulfmark Offshore Inc., 144A, (4) | | | 6.375% | | | | 3/15/22 | | | | BB– | | | | 1,010,000 | |
| | | | | |
| | 2,300 | | | Jasper Explorer Limited Cyprus | | | 13.500% | | | | 5/27/16 | | | | N/R | | | | 1,897,500 | |
| | | | | |
| | 2,000 | | | NGPL PipeCo LLC, (4) | | | 7.119% | | | | 12/15/17 | | | | Ba3 | | | | 2,000,000 | |
| | | | | |
| | 1,550 | | | Parker Drilling Company, 144A | | | 9.125% | | | | 4/01/18 | | | | B+ | | | | 1,639,125 | |
| | | | | |
| | 1,500 | | | Troll Drilling & Services Ltd. | | | 13.750% | | | | 8/19/16 | | | | N/R | | | | 1,530,450 | |
| | 15,075 | | | Total Energy Equipment & Services | | | | | | | | | | | | | | | 14,700,200 | |
| | | | Food & Staples Retailing – 1.1% | | | | | | | | | | | | | | | | |
| | | | | |
| | 1,750 | | | Harmony Foods Corporation, 144A | | | 10.000% | | | | 5/01/16 | | | | B– | | | | 1,815,625 | |
| | | | | |
| | 1,000 | | | Rite Aid Corporation | | | 10.250% | | | | 10/15/19 | | | | BB– | | | | 1,125,000 | |
| | | | | |
| | 3,625 | | | Supervalu Inc., (4) | | | 8.000% | | | | 5/01/16 | | | | B | | | | 3,670,313 | |
| | 6,375 | | | Total Food & Staples Retailing | | | | | | | | | | | | | | | 6,610,938 | |
| | | | Food Products – 2.4% | | | | | | | | | | | | | | | | |
| | | | | |
| | 2,050 | | | Fage Dairy Industry SA, 144A | | | 9.875% | | | | 2/01/20 | | | | B | | | | 1,804,000 | |
| | | | | |
| | 3,800 | | | JBS USA LLC, (4) | | | 7.250% | | | | 6/01/21 | | | | BB | | | | 3,534,000 | |
| | | | | |
| | 2,000 | | | Land O Lakes Capital Trust I | | | 7.450% | | | | 3/15/28 | | | | Ba1 | | | | 1,910,000 | |
| | | | | |
| | 1,400 | | | Marfrig Overseas Limited | | | 9.500% | | | | 5/04/20 | | | | B+ | | | | 1,092,000 | |
| | | | | |
| | 1,075 | | | MHP SA, 144A | | | 10.250% | | | | 4/29/15 | | | | B | | | | 1,036,042 | |
| | | | | |
| | 1,750 | | | Mriya Agro Holding PLC, 144A | | | 10.950% | | | | 3/30/16 | | | | B | | | | 1,491,875 | |
Portfolio of Investments
Nuveen High Income Bond Fund (continued)
June 30, 2012
| | | | | | | | | | | | | | | | | | | | |
Principal
Amount (000) | | | Description (1) | | Coupon | | | Maturity | | | Ratings (5) | | | Value | |
| | | | | | | | | | | | | | | | | | | | |
| | | | Food Products (continued) | | | | | | | | | | | | | | | | |
| | | | | |
| $ | 3,250 | | | Viterra Inc. | | | 5.950% | | | | 8/01/20 | | | | BBB– | | | $ | 3,559,452 | |
| | 15,325 | | | Total Food Products | | | | | | | | | | | | | | | 14,427,369 | |
| | | | Gas Utilities – 0.4% | | | | | | | | | | | | | | | | |
| | | | | |
| | 2,125 | | | AmeriGas Finance LLC, (4) | | | 6.750% | | | | 5/20/20 | | | | Ba2 | | | | 2,167,500 | |
| | | | Health Care Equipment & Supplies – 0.3% | | | | | | | | | | | | | | | | |
| | | | | |
| | 1,875 | | | Chiron Merger Sub Inc., 144A | | | 12.500% | | | | 11/01/19 | | | | CCC+ | | | | 1,696,875 | |
| | | | Health Care Providers & Services – 3.0% | | | | | | | | | | | | | | | | |
| | | | | |
| | 2,000 | | | Acadia Healthcare | | | 12.875% | | | | 11/01/18 | | | | B– | | | | 2,280,000 | |
| | | | | |
| | 2,865 | | | Community Health Systems, Inc., (4) | | | 8.000% | | | | 11/15/19 | | | | B | | | | 3,051,225 | |
| | | | | |
| | 4,135 | | | HCA Holdings Inc., (4) | | | 7.750% | | | | 5/15/21 | | | | B– | | | | 4,434,788 | |
| | | | | |
| | 900 | | | Health Management Associates, 144A, (4) | | | 7.375% | | | | 1/15/20 | | | | BB– | | | | 957,375 | |
| | | | | |
| | 2,735 | | | Kindred Healthcare Inc., Term Loan, (4) | | | 8.250% | | | | 6/01/19 | | | | B– | | | | 2,536,713 | |
| | | | | |
| | 1,250 | | | National Mentor Holdings, 144A | | | 12.500% | | | | 2/15/18 | | | | CCC+ | | | | 1,245,313 | |
| | | | | |
| | 2,000 | | | PSS World Medical Inc., 144A | | | 6.375% | | | | 3/01/22 | | | | BB– | | | | 2,050,000 | |
| | | | | |
| | 1,000 | | | Radiation Therapy Services Inc. | | | 9.875% | | | | 4/15/17 | | | | CCC+ | | | | 782,500 | |
| | | | | |
| | — | (7) | | Symbion Inc. | | | 11.000% | | | | 8/23/15 | | | | CCC+ | | | | 486 | |
| | | | | |
| | 1,000 | | | Wolverine Healthcare Analytics, 144A | | | 10.625% | | | | 6/01/20 | | | | CCC+ | | | | 1,040,000 | |
| | 17,885 | | | Total Health Care Providers & Services | | | | | | | | | | | | | | | 18,378,400 | |
| | | | Hotels, Restaurants & Leisure – 3.6% | | | | | | | | | | | | | | | | |
| | | | | |
| | 2,375 | | | Chukchansi Economic Development Authority, 144A | | | 9.750% | | | | 11/15/20 | | | | CCC+ | | | | 1,900,000 | |
| | | | | |
| | 1,584 | | | CKE Holdings, 144A, (4) | | | 10.500% | | | | 3/14/16 | | | | Caa1 | | | | 1,734,891 | |
| | | | | |
| | 2,043 | | | El Pollo Loco Inc., 144A | | | 12.500% | | | | 1/01/18 | | | | Caa2 | | | | 1,879,330 | |
| | | | | |
| | 1,000 | | | Fontainebleau Las Vegas | | | 10.250% | | | | 6/15/15 | | | | N/R | | | | 625 | |
| | | | | |
| | 30 | | | Greektown LLC, (3) | | | 10.750% | | | | 12/01/13 | | | | N/R | | | | 0 | |
| | | | | |
| | 2,000 | | | Harrah’s Operating Company, Inc., 144A, (4) | | | 12.750% | | | | 4/15/18 | | | | CCC | | | | 1,570,000 | |
| | | | | |
| | 2,000 | | | Harrah’s Operating Company, Inc. | | | 11.250% | | | | 6/01/17 | | | | B | | | | 2,182,500 | |
| | | | | |
| | 1,000 | | | Icon Health and Fitness Inc., 144A | | | 11.875% | | | | 10/15/16 | | | | B | | | | 872,500 | |
| | | | | |
| | 2,500 | | | MGM Resorts International Inc., (4) | | | 6.875% | | | | 4/01/16 | | | | B– | | | | 2,512,500 | |
| | | | | |
| | 1,850 | | | MGM Resorts International Inc., 144A | | | 8.625% | | | | 2/01/19 | | | | B– | | | | 1,979,500 | |
| | | | | |
| | 3,000 | | | Mohegan Tribal Gaming Authority, 144A, (4) | | | 11.000% | | | | 9/15/18 | | | | CCC | | | | 1,987,500 | |
| | | | | |
| | 2,500 | | | Rare Restaurant Group LLC, 144A | | | 15.000% | | | | 6/01/17 | | | | B– | | | | 2,543,750 | |
| | | | | |
| | 1,000 | | | Rivers Pittsburgh Borrowers LP, Finance Corporation, 144A | | | 9.500% | | | | 6/15/19 | | | | B | | | | 1,038,750 | |
| | | | | |
| | 1,650 | | | Wok Acquisition Group, 144A | | | 10.250% | | | | 6/30/20 | | | | Caa1 | | | | 1,699,500 | |
| | 24,532 | | | Total Hotels, Restaurants & Leisure | | | | | | | | | | | | | | | 21,901,346 | |
| | | | Household Durables – 3.0% | | | | | | | | | | | | | | | | |
| | | | | |
| | 750 | | | Agile Property Holdings Limited, (4) | | | 8.875% | | | | 4/28/17 | | | | BB | | | | 735,000 | |
| | | | | |
| | 2,250 | | | Beazer Homes USA, Inc., (4) | | | 9.125% | | | | 6/15/18 | | | | CCC | | | | 1,985,625 | |
| | | | | |
| | 1,910 | | | Desarrolla Homex S.A.B. de CV, 144A, (4) | | | 9.750% | | | | 3/25/20 | | | | Ba3 | | | | 2,005,500 | |
| | | | | |
| | 825 | | | K. Hovnanian Enterprises Inc. | | | 11.875% | | | | 10/15/15 | | | | Caa3 | | | | 695,063 | |
| | | | | |
| | 2,500 | | | K. Hovnanian Enterprises Inc., (4) | | | 10.625% | | | | 10/15/16 | | | | B3 | | | | 2,381,250 | |
| | | | | |
| | 1,760 | | | KB Home, (4) | | | 8.000% | | | | 3/15/20 | | | | B+ | | | | 1,795,200 | |
| | | | | |
| | 2,800 | | | Meritage Homes Corporation, 144A | | | 7.000% | | | | 4/01/22 | | | | BB– | | | | 2,884,000 | |
| | | | | |
| | 3,800 | | | Taylor Morrison Monarch Communities | | | 7.750% | | | | 4/15/20 | | | | BB– | | | | 3,971,000 | |
| | | | | |
| | 1,806 | | | William Lyon Homes Inc. | | | 12.000% | | | | 2/25/17 | | | | D | | | | 1,629,870 | |
| | 18,401 | | | Total Household Durables | | | | | | | | | | | | | | | 18,082,508 | |
| | | | | | | | | | | | | | | | | | | | |
Principal
Amount (000) | | | Description (1) | | Coupon | | | Maturity | | | Ratings (5) | | | Value | |
| | | | | | | | | | | | | | | | | | | | |
| | | | Household Products – 0.3% | | | | | | | | | | | | | | | | |
| | | | | |
| $ | 1,750 | | | Central Garden & Pet Compa | | | 8.250% | | | | 3/01/18 | | | | B | | | $ | 1,754,375 | |
| | | | Independent Power Producers & Energy Traders – 1.1% | | | | | | | | | | | | | | | | |
| | | | | |
| | 2,300 | | | AES Corporation | | | 9.750% | | | | 4/15/16 | | | | BB | | | | 2,725,500 | |
| | | | | |
| | 1,800 | | | Mirant Americas Generation LLC, (4) | | | 8.500% | | | | 10/01/21 | | | | BB | | | | 1,620,000 | |
| | | | | |
| | 2,440 | | | NRG Energy Inc., (4) | | | 8.500% | | | | 6/15/19 | | | | BB– | | | | 2,549,800 | |
| | 6,540 | | | Total Independent Power Producers & Energy Traders | | | | | | | | | | | | | | | 6,895,300 | |
| | | | Industrial Conglomerates – 0.5% | | | | | | | | | | | | | | | | |
| | | | | |
| | 2,000 | | | Abengoa Finance SAU, 144A, (4) | | | 8.875% | | | | 11/01/17 | | | | BB | | | | 1,770,000 | |
| | | | | |
| | 1,500 | | | J.B. Poindexter & Company, 144A | | | 9.000% | | | | 4/01/22 | | | | B | | | | 1,500,000 | |
| | 3,500 | | | Total Industrial Conglomerates | | | | | | | | | | | | | | | 3,270,000 | |
| | | | Internet Software & Services – 0.2% | | | | | | | | | | | | | | | | |
| | | | | |
| | 1,500 | | | Earthlink Inc., (4) | | | 8.875% | | | | 5/15/19 | | | | B2 | | | | 1,460,625 | |
| | | | IT Services – 1.7% | | | | | | | | | | | | | | | | |
| | | | | |
| | 5,475 | | | First Data Corporation, 144A, (4) | | | 8.750% | | | | 1/15/22 | | | | B– | | | | 5,516,063 | |
| | | | | |
| | 3,000 | | | First Data Corporation, (4) | | | 11.250% | | | | 3/31/16 | | | | CCC+ | | | | 2,827,500 | |
| | | | | |
| | 1,850 | | | Zayo Escrow Corporation, 144A | | | 8.125% | | | | 1/01/20 | | | | B1 | | | | 1,933,250 | |
| | 10,325 | | | Total IT Services | | | | | | | | | | | | | | | 10,276,813 | |
| | | | Machinery – 1.5% | | | | | | | | | | | | | | | | |
| | | | | |
| | 2,000 | | | Chloe Marine Corporation Limited | | | 12.000% | | | | 12/28/16 | | | | N/R | | | | 2,080,000 | |
| | | | | |
| | 2,250 | | | Commercial Vehicle Group | | | 7.875% | | | | 4/15/19 | | | | B | | | | 2,286,563 | |
| | | | | |
| | 1,800 | | | Navistar International Corporation, (4) | | | 8.250% | | | | 11/01/21 | | | | BB | | | | 1,725,750 | |
| | | | | |
| | 2,850 | | | Terex Corporation | | | 6.500% | | | | 4/01/20 | | | | BB– | | | | 2,885,625 | |
| | 8,900 | | | Total Machinery | | | | | | | | | | | | | | | 8,977,938 | |
| | | | Marine – 0.4% | | | | | | | | | | | | | | | | |
| | | | | |
| | 1,000 | | | Marquette Transportation Company Inc., (4) | | | 10.875% | | | | 1/15/17 | | | | B– | | | | 1,052,500 | |
| | | | | |
| | 1,725 | | | Navios Maritime Acquisition Corporation, (4) | | | 8.625% | | | | 11/01/17 | | | | B | | | | 1,604,250 | |
| | 2,725 | | | Total Marine | | | | | | | | | | | | | | | 2,656,750 | |
| | | | Media – 4.3% | | | | | | | | | | | | | | | | |
| | | | | |
| | 2,000 | | | American Media Inc., 144A, (4) | | | 13.500% | | | | 6/15/18 | | | | CCC+ | | | | 1,880,000 | |
| | | | | |
| | 2,500 | | | Belo Corporation, (4) | | | 7.750% | | | | 6/01/27 | | | | BB | | | | 2,450,000 | |
| | | | | |
| | 1,500 | | | Cengage Learning Acquisition Inc., 144A | | | 11.500% | | | | 4/15/20 | | | | B | | | | 1,552,500 | |
| | | | | |
| | 2,000 | | | Charter Communications, CCO Holdings LLC | | | 7.000% | | | | 1/15/19 | | | | BB– | | | | 2,160,000 | |
| | | | | |
| | 3,300 | | | Clear Channel Communications, Inc., (4) | | | 9.000% | | | | 3/01/21 | | | | CCC+ | | | | 2,871,000 | |
| | | | | |
| | 2,500 | | | Clear Channel Worldwide, (4) | | | 7.625% | | | | 3/15/20 | | | | B+ | | | | 2,443,750 | |
| | | | | |
| | 2,500 | | | CSC Holdings Inc., (4) | | | 7.875% | | | | 2/15/18 | | | | BB | | | | 2,806,250 | |
| | | | | |
| | 2,800 | | | Donnelley & Son Company | | | 8.250% | | | | 3/15/19 | | | | BB+ | | | | 2,744,000 | |
| | | | | |
| | 1,350 | | | Harron Coomunications Finance, 144A | | | 9.125% | | | | 4/01/20 | | | | B– | | | | 1,397,250 | |
| | | | | |
| | 2,600 | | | McClatchy Company | | | 11.500% | | | | 2/15/17 | | | | B1 | | | | 2,697,500 | |
| | | | | |
| | 1,400 | | | Media General Inc. | | | 11.750% | | | | 2/15/17 | | | | CCC+ | | | | 1,501,500 | |
| | | | | |
| | 2,000 | | | Nara Cable Funding Limited, 144A | | | 8.875% | | | | 12/01/18 | | | | B+ | | | | 1,720,000 | |
| | 26,450 | | | Total Media | | | | | | | | | | | | | | | 26,223,750 | |
| | | | Metals & Mining – 5.7% | | | | | | | | | | | | | | | | |
| | | | | |
| | 2,250 | | | AK Steel Corporation, (4) | | | 7.625% | | | | 5/15/20 | | | | B+ | | | | 1,901,250 | |
| | | | | |
| | 1,000 | | | Aleris International Inc. | | | 10.000% | | | | 12/15/16 | | | | N/R | | | | 100 | |
Portfolio of Investments
Nuveen High Income Bond Fund (continued)
June 30, 2012
| | | | | | | | | | | | | | | | | | | | |
Principal
Amount (000) | | | Description (1) | | Coupon | | | Maturity | | | Ratings (5) | | | Value | |
| | | | | | | | | | | | | | | | | | | | |
| | | | Metals & Mining (continued) | | | | | | | | | | | | | | | | |
| | | | | |
| $ | 1,000 | | | Alrosa Finance SA, 144A | | | 7.750% | | | | 11/03/20 | | | | BB– | | | $ | 1,047,270 | |
| | | | | |
| | 2,250 | | | APERAM, 144A, (4) | | | 7.750% | | | | 4/01/18 | | | | BB– | | | | 1,912,500 | |
| | | | | |
| | 1,500 | | | ArcelorMittal | | | 6.750% | | | | 3/01/41 | | | | BBB | | | | 1,400,087 | |
| | | | | |
| | 1,800 | | | Cliffs Natural Resources Inc. | | | 4.800% | | | | 10/01/20 | | | | BBB– | | | | 1,774,606 | |
| | | | | |
| | 2,900 | | | Evraz Group S.A, 144A | | | 7.400% | | | | 4/24/17 | | | | BB– | | | | 2,842,522 | |
| | | | | |
| | 2,750 | | | Fosun International Limited, 144A, (4) | | | 7.500% | | | | 5/12/16 | | | | BB+ | | | | 2,640,000 | |
| | | | | |
| | 2,500 | | | Glencore Finance Europe | | | 7.500% | | | | 1/06/61 | | | | BBB | | | | 2,593,750 | |
| | | | | |
| | 1,000 | | | Hidili Industry Internationl Development Limited, 144A | | | 8.625% | | | | 11/04/15 | | | | B+ | | | | 805,000 | |
| | | | | |
| | 1,195 | | | Inmet Mining Corporation, 144A | | | 8.750% | | | | 6/01/20 | | | | B+ | | | | 1,183,050 | |
| | | | | |
| | 1,490 | | | JMC Steel Group, 144A, (4) | | | 8.250% | | | | 3/15/18 | | | | B | | | | 1,478,825 | |
| | | | | |
| | 2,000 | | | Mirabela Nickel Limited, 144A | | | 8.750% | | | | 4/15/18 | | | | CCC+ | | | | 1,370,000 | |
| | | | | |
| | 1,400 | | | Northland Resources AB | | | 13.000% | | | | 3/06/17 | | | | B– | | | | 1,379,000 | |
| | | | | |
| | 2,100 | | | Patriot Coal Corporation, (4), (8) | | | 8.250% | | | | 4/30/18 | | | | CCC | | | | 750,750 | |
| | | | | |
| | 1,835 | | | Taseko Mines Limited | | | 7.750% | | | | 4/15/19 | | | | B | | | | 1,752,425 | |
| | | | | |
| | 2,000 | | | Tempel Steel Company, 144A | | | 12.000% | | | | 8/15/16 | | | | B | | | | 1,902,500 | |
| | | | | |
| | 3,115 | | | Thompson Creek Metals Company | | | 7.375% | | | | 6/01/18 | | | | CCC+ | | | | 2,499,788 | |
| | | | | |
| | 2,000 | | | United States Steel Corporation, (4) | | | 7.500% | | | | 3/15/22 | | | | BB | | | | 1,920,000 | |
| | | | | |
| | 2,000 | | | Vedanta Resources PLC, 144A, (4) | | | 8.250% | | | | 6/07/21 | | | | BB | | | | 1,865,000 | |
| | | | | |
| | 2,000 | | | WPE International Cooperatief U.A, 144A | | | 10.375% | | | | 9/30/20 | | | | B+ | | | | 1,580,000 | |
| | 40,085 | | | Total Metals & Mining | | | | | | | | | | | | | | | 34,598,423 | |
| | | | Multiline Retail – 1.5% | | | | | | | | | | | | | | | | |
| | | | | |
| | 3,000 | | | Bon-Ton Department Stores Inc. | | | 10.250% | | | | 3/15/14 | | | | CCC | | | | 2,535,000 | |
| | | | | |
| | 2,500 | | | Burlington Coat Factory | | | 10.000% | | | | 2/15/19 | | | | Caa1 | | | | 2,650,000 | |
| | | | | |
| | 2,070 | | | J.C. Penney Corporation Inc. | | | 5.650% | | | | 6/01/20 | | | | Ba1 | | | | 1,780,200 | |
| | | | | |
| | 2,000 | | | Macys Retail Holdings Inc. | | | 7.875% | | | | 8/15/36 | | | | BBB | | | | 2,147,346 | |
| | 9,570 | | | Total Multiline Retail | | | | | | | | | | | | | | | 9,112,546 | |
| | | | Oil, Gas & Consumable Fuels – 12.2% | | | | | | | | | | | | | | | | |
| | | | | |
| | 2,800 | | | Alpha Natural Resources Inc., (4) | | | 6.000% | | | | 6/01/19 | | | | BB– | | | | 2,387,000 | |
| | | | | |
| | 1,525 | | | Atlas Pipeline LP Finance | | | 8.750% | | | | 6/15/18 | | | | B | | | | 1,627,938 | |
| | | | | |
| | 2,500 | | | Bill Barrett Corporation | | | 7.000% | | | | 10/15/22 | | | | BB– | | | | 2,387,500 | |
| | | | | |
| | 1,900 | | | Black Elk Energy Offshore Operations LLC | | | 13.750% | | | | 12/01/15 | | | | B | | | | 1,909,500 | |
| | | | | |
| | 2,500 | | | Breitburn Energy Partners LP, 144A, (4) | | | 7.875% | | | | 4/15/22 | | | | B | | | | 2,500,000 | |
| | | | | |
| | 2,825 | | | Calumet Specialty Products | | | 9.375% | | | | 5/01/19 | | | | B | | | | 2,832,063 | |
| | | | | |
| | 1,000 | | | Chaparral Energy Inc., 144A, (4) | | | 7.625% | | | | 11/15/22 | | | | B– | | | | 1,020,000 | |
| | | | | |
| | 2,000 | | | Chesapeake Energy Corporation, (4) | | | 6.875% | | | | 11/15/20 | | | | BB | | | | 1,970,000 | |
| | | | | |
| | 1,975 | | | Deep Drilling 7 and 8 PT | | | 14.250% | | | | 3/05/15 | | | | N/R | | | | 1,955,685 | |
| | | | | |
| | 1,400 | | | Exco Resources Inc., (4) | | | 7.500% | | | | 9/15/18 | | | | B3 | | | | 1,211,000 | |
| | | | | |
| | 1,400 | | | Goden Close Marit Corporation | | | 11.000% | | | | 12/09/15 | | | | N/R | | | | 1,491,000 | |
| | | | | |
| | 1,500 | | | Halcon Resources Limited Liability Corporation, 144A, (WI/DD) | | | 9.750% | | | | 7/15/20 | | | | B3 | | | | 1,505,730 | |
| | | | | |
| | 2,515 | | | Holly Energy Partners LP, 144A | | | 6.500% | | | | 3/01/20 | | | | BB– | | | | 2,533,863 | |
| | | | | |
| | 2,220 | | | Inergy LP Finance | | | 7.000% | | | | 10/01/18 | | | | Ba3 | | | | 2,286,600 | |
| | | | | |
| | 1,500 | | | Kinder Morgan Finance Company ULC, (4) | | | 5.700% | | | | 1/05/16 | | | | Ba1 | | | | 1,578,750 | |
| | | | | |
| | 2,000 | | | Kodiak Oil and Gas Corporation, 144A, (4) | | | 8.125% | | | | 12/01/19 | | | | B– | | | | 2,060,000 | |
| | | | | |
| | 2,205 | | | Martin Mid-Stream Partners LP Finance | | | 8.875% | | | | 4/01/18 | | | | B | | | | 2,227,050 | |
| | | | | | | | | | | | | | | | | | | | |
Principal
Amount (000) | | | Description (1) | | Coupon | | | Maturity | | | Ratings (5) | | | Value | |
| | | | | | | | | | | | | | | | | | | | |
| | | | Oil, Gas & Consumable Fuels (continued) | | | | | | | | | | | | | | | | |
| | | | | |
| $ | 3,000 | | | Northern Oil and Gas Inc., 144A | | | 8.000% | | | | 6/01/20 | | | | B– | | | $ | 2,985,000 | |
| | | | | |
| | 1,800 | | | Ocean Rig UDW Inc. | | | 9.500% | | | | 4/27/16 | | | | CCC+ | | | | 1,737,000 | |
| | | | | |
| | 2,225 | | | PBF Holding Company LLC, 144A, (4) | | | 8.250% | | | | 2/15/20 | | | | BB+ | | | | 2,219,438 | |
| | | | | |
| | 2,500 | | | Peabody Energy Corporation, 144A, (4) | | | 6.000% | | | | 11/15/18 | | | | BB+ | | | | 2,487,500 | |
| | | | | |
| | 2,275 | | | PetroBakken Energy Limited, 144A, (4) | | | 8.625% | | | | 2/01/20 | | | | CCC+ | | | | 2,263,625 | |
| | | | | |
| | 2,000 | | | PetroPlus Finance Limited, 144A, (8) | | | 7.000% | | | | 5/01/17 | | | | C | | | | 230,000 | |
| | | | | |
| | 1,200 | | | PetroPlus Finance, (8) | | | 9.375% | | | | 9/15/19 | | | | C | | | | 138,000 | |
| | | | | |
| | 3,500 | | | Plains Exploration & Production Company, (4) | | | 6.125% | | | | 6/15/19 | | | | BB– | | | | 3,517,500 | |
| | | | | |
| | 2,300 | | | Polarcus Alima | | | 12.500% | | | | 10/29/15 | | | | N/R | | | | 2,323,000 | |
| | | | | |
| | 500 | | | Quicksilver Resources Incorporated | | | 11.750% | | | | 1/01/16 | | | | B2 | | | | 486,875 | |
| | | | | |
| | 4,002 | | | Sabine Pass LNG LP | | | 7.500% | | | | 11/30/16 | | | | BB+ | | | | 4,202,100 | |
| | | | | |
| | 1,900 | | | Samson Investment Company, 144A, (4) | | | 9.750% | | | | 2/15/20 | | | | B1 | | | | 1,890,500 | |
| | | | | |
| | 1,250 | | | Sandridge Energy Inc. | | | 7.500% | | | | 3/15/21 | | | | B3 | | | | 1,234,375 | |
| | | | | |
| | 2,000 | | | Sandridge Energy Inc. | | | 8.125% | | | | 10/15/22 | | | | B | | | | 2,020,000 | |
| | | | | |
| | 2,000 | | | Saratoga Resources Inc. | | | 12.500% | | | | 7/01/16 | | | | NA | | | | 1,990,000 | |
| | | | | |
| | 3,150 | | | SM Energy Company | | | 6.625% | | | | 2/15/19 | | | | BB | | | | 3,228,750 | |
| | | | | |
| | 1,650 | | | Stone Energy Corporation, (4) | | | 8.625% | | | | 2/01/17 | | | | B | | | | 1,674,750 | |
| | | | | |
| | 2,245 | | | United Refining Inc., 144A | | | 10.500% | | | | 2/28/18 | | | | B | | | | 2,301,125 | |
| | | | | |
| | 1,850 | | | Vanguard Natural Resources Finance, (4) | | | 7.875% | | | | 4/01/20 | | | | B– | | | | 1,850,000 | |
| | | | | |
| | 2,000 | | | Western Gas Partners LP | | | 4.000% | | | | 7/01/22 | | | | Baa3 | | | | 2,000,000 | |
| | 77,112 | | | Total Oil, Gas & Consumable Fuels | | | | | | | | | | | | | | | 74,263,217 | |
| | | | Paper & Forest Products – 2.5% | | | | | | | | | | | | | | | | |
| | | | | |
| | 1,985 | | | Abiti-Bowater Inc. | | | 10.250% | | | | 10/15/18 | | | | BB– | | | | 2,203,350 | |
| | | | | |
| | 250 | | | Consolidated Container Company Limited Liability
Corporation, 144A | | | 10.125% | | | | 7/15/20 | | | | Caa1 | | | | 257,500 | |
| | | | | |
| | 1,000 | | | Louisiana Pacific Corporation, 144A, (4) | | | 7.500% | | | | 6/01/20 | | | | BB | | | | 1,047,500 | |
| | | | | |
| | 2,500 | | | Millar Western Forest Products Ltd, (4) | | | 8.500% | | | | 4/01/21 | | | | B– | | | | 1,912,500 | |
| | | | | |
| | 1,800 | | | Sappi Papier Holding GMBH, 144A, (WI/DD) | | | 8.375% | | | | 6/15/19 | | | | N/R | | | | 1,802,250 | |
| | | | | |
| | 3,575 | | | Stora Enso Oyj | | | 7.250% | | | | 4/15/36 | | | | BB | | | | 3,163,875 | |
| | | | | |
| | 2,825 | | | Tembec Industries, Inc., (4) | | | 11.250% | | | | 12/15/18 | | | | B– | | | | 2,817,938 | |
| | | | | |
| | 2,000 | | | Verso Paper Holdings LLC, 144A, (4) | | | 11.750% | | | | 1/15/19 | | | | Ba2 | | | | 2,020,000 | |
| | | | | |
| | 500 | | | Verso Paper Holdings LLC | | | 8.750% | | | | 2/01/19 | | | | B3 | | | | 197,500 | |
| | 16,435 | | | Total Paper & Forest Products | | | | | | | | | | | | | | | 15,422,413 | |
| | | | Pharmaceuticals – 0.7% | | | | | | | | | | | | | | | | |
| | | | | |
| | 2,000 | | | BPA Laboratories Inc., 144A | | | 12.250% | | | | 4/01/17 | | | | N/R | | | | 1,920,000 | |
| | | | | |
| | 2,315 | | | Valeant Pharmaceuticals International, 144A | | | 6.875% | | | | 12/01/18 | | | | BB– | | | | 2,393,131 | |
| | 4,315 | | | Total Pharmaceuticals | | | | | | | | | | | | | | | 4,313,131 | |
| | | | Real Estate Investment Trust – 0.6% | | | | | | | | | | | | | | | | |
| | | | | |
| | 3,500 | | | First Industrial Realty Trust | | | 5.950% | | | | 5/15/17 | | | | BB | | | | 3,600,482 | |
| | | | Real Estate Management & Development – 2.6% | | | | | | | | | | | | | | | | |
| | | | | |
| | 1,650 | | | Agile Property Holdings Limited, 144A | | | 10.000% | | | | 11/14/16 | | | | BB | | | | 1,707,750 | |
| | | | | |
| | 2,500 | | | Central China Real Estate Limited, 144A, (4) | | | 12.250% | | | | 10/20/15 | | | | B+ | | | | 2,590,500 | |
| | | | | |
| | 2,950 | | | Country Garden Holding Company, 144A, (4) | | | 11.125% | | | | 2/23/18 | | | | BB– | | | | 2,986,875 | |
| | | | | |
| | 1,500 | | | Evergrande Real Estate Group Limited, (4) | | | 13.000% | | | | 1/27/15 | | | | BB | | | | 1,413,750 | |
| | | | | |
| | 1,500 | | | Longfor Properties Company Limited, 144A, (4) | | | 9.500% | | | | 4/07/16 | | | | BB | | | | 1,567,500 | |
Portfolio of Investments
Nuveen High Income Bond Fund (continued)
June 30, 2012
| | | | | | | | | | | | | | | | | | | | |
Principal
Amount (000) | | | Description (1) | | Coupon | | | Maturity | | | Ratings (5) | | | Value | |
| | | | | | | | | | | | | | | | | | | | |
| | | | Real Estate Management & Development (continued) | | | | | | | | | | | | | | | | |
| | | | | |
| $ | 1,375 | | | Realogy Corporation, 144A, (4) | | | 11.500% | | | | 4/15/17 | | | | Caa3 | | | $ | 1,302,813 | |
| | | | | |
| | 2,900 | | | Realogy Corporation, 144A, (4) | | | 9.000% | | | | 1/15/20 | | | | Caa1 | | | | 2,987,000 | |
| | | | | |
| | 1,500 | | | Shanghai Industrial Urban Development Group Limited, 144A | | | 9.750% | | | | 7/23/14 | | | | B2 | | | | 1,556,365 | |
| | 15,875 | | | Total Real Estate Management & Development | | | | | | | | | | | | | | | 16,112,553 | |
| | | | Road & Rail – 0.2% | | | | | | | | | | | | | | | | |
| | | | | |
| | 994 | | | Inversiones Alsacia SA, 144A | | | 8.000% | | | | 8/18/18 | | | | Ba2 | | | | 961,347 | |
| | | | Semiconductors & Equipment – 0.4% | | | | | | | | | | | | | | | | |
| | | | | |
| | 2,000 | | | Freescale Semiconductor Inc., 144A, (4) | | | 10.125% | | | | 3/15/18 | | | | B1 | | | | 2,185,000 | |
| | | | Specialty Retail – 1.0% | | | | | | | | | | | | | | | | |
| | | | | |
| | 1,500 | | | Office Depot Inc., (4) | | | 9.750% | | | | 3/15/19 | | | | B2 | | | | 1,458,750 | |
| | | | | |
| | 4,350 | | | Rite Aid Corporation, 144A | | | 9.250% | | | | 3/15/20 | | | | CCC | | | | 4,360,875 | |
| | 5,850 | | | Total Specialty Retail | | | | | | | | | | | | | | | 5,819,625 | |
| | | | Textiles, Apparel & Luxury Goods – 0.2% | | | | | | | | | | | | | | | | |
| | | | | |
| | 1,375 | | | Gymboree Corporation, Term Loan, (4) | | | 9.125% | | | | 12/01/18 | | | | CCC+ | | | | 1,275,313 | |
| | | | Tobacco – 0.2% | | | | | | | | | | | | | | | | |
| | | | | |
| | 1,000 | | | North Atlantic Trading Company, 144A | | | 19.000% | | | | 1/15/17 | | | | CCC | | | | 930,000 | |
| | | | Trading Companies & Distributors – 1.2% | | | | | | | | | | | | | | | | |
| | | | | |
| | 2,300 | | | Aircastle Limited | | | 6.750% | | | | 4/15/17 | | | | BB+ | | | | 2,323,000 | |
| | | | | |
| | 250 | | | Ashtead Capital Inc., 144A, (WI/DD) | | | 6.500% | | | | 7/15/22 | | | | B+ | | | | 249,999 | |
| | | | | |
| | 2,000 | | | Minerva Overseas II Limited, (4) | | | 10.875% | | | | 11/15/19 | | | | B+ | | | | 2,004,999 | |
| | | | | |
| | 2,600 | | | United Rentals North America Inc., (4) | | | 8.375% | | | | 9/15/20 | | | | B | | | | 2,736,499 | |
| | 7,150 | | | Total Trading Companies & Distributors | | | | | | | | | | | | | | | 7,314,497 | |
| | | | Wireless Telecommunication Services – 2.7% | | | | | | | | | | | | | | | | |
| | | | | |
| | 1,500 | | | Bakrie Telecom TPE Limited | | | 11.500% | | | | 5/07/15 | | | | B | | | | 877,499 | |
| | | | | |
| | 1,750 | | | Clearwire Corporation | | | 12.000% | | | | 12/01/15 | | | | B3 | | | | 1,592,499 | |
| | | | | |
| | 2,000 | | | Digicel Group, Limited, 144A, (4) | | | 8.875% | | | | 1/15/15 | | | | B– | | | | 2,019,999 | |
| | | | | |
| | 1,500 | | | Eileme 2 AB, 144A | | | 11.625% | | | | 1/31/20 | | | | B– | | | | 1,541,249 | |
| | | | | |
| | 2,000 | | | Nextel Communications, Inc. | | | 7.375% | | | | 8/01/15 | | | | B+ | | | | 2,002,499 | |
| | | | | |
| | 2,350 | | | NII Capital Corporation | | | 8.875% | | | | 12/15/19 | | | | B+ | | | | 2,129,687 | |
| | | | | |
| | 2,750 | | | Sprint Capital Corporation, (4) | | | 6.900% | | | | 5/01/19 | | | | B+ | | | | 2,584,999 | |
| | | | | |
| | 1,500 | | | Trilogy International Partners LLC, (4) | | | 10.250% | | | | 8/15/16 | | | | CCC+ | | | | 1,222,499 | |
| | | | | |
| | 2,625 | | | Wind Acquisition Finance SA, 144A | | | 7.250% | | | | 2/15/18 | | | | BB+ | | | | 2,296,874 | |
| | 17,975 | | | Total Wireless Telecommunication Services | | | | | | | | | | | | | | | 16,267,804 | |
| $ | 517,904 | | | Total Corporate Bonds (cost $506,246,361) | | | | | | | | | | | | | | | 497,761,579 | |
| | | | | |
Principal
Amount (000) | | | Description (1) | | Coupon | | | Maturity | | | Ratings (5) | | | Value | |
| | | | CONVERTIBLE BONDS – 0.9% | | | | | | | | | | | | | | | | |
| | | | | |
| | | | Computers & Peripherals – 0.2% | | | | | | | | | | | | | | | | |
| | | | | |
| $ | 1,238 | | | Hutchinson Technology Inc., Convertible Bond | | | 8.500% | | | | 1/15/26 | | | | N/R | | | $ | 837,198 | |
| | | | Diversified Telecommunication Services – 0.2% | | | | | | | | | | | | | | | | |
| | | | | |
| | 2,000 | | | Alaska Communications Systems Group Inc. | | | 6.250% | | | | 5/01/18 | | | | B+ | | | | 1,400,000 | |
| | | | Energy Equipment & Services – 0.1% | | | | | | | | | | | | | | | | |
| | | | | |
| | 1,500 | | | Evergreen Solar Inc. | | | 13.000% | | | | 4/15/15 | | | | N/R | | | | 710,625 | |
| | | | | | | | | | | | | | | | | | | | |
Principal
Amount (000) | | | Description (1) | | Coupon | | | Maturity | | | Ratings (5) | | | Value | |
| | | | | | | | | | | | | | | | | | | | |
| | | | Machinery – 0.2% | | | | | | | | | | | | | | | | |
| | | | | |
| $ | 1,500 | | | Navistar International Corporation, Convertible Bond, (4) | | | 3.000% | | | | 10/15/14 | | | | B1 | | | $ | 1,398,750 | |
| | | | Metals & Mining – 0.2% | | | | | | | | | | | | | | | | |
| | | | | |
| | 3,000 | | | Great Western Minerals Group | | | 8.000% | | | | 4/06/17 | | | | N/R | | | | 1,346,250 | |
| $ | 9,238 | | | Total Convertible Bonds (cost $6,247,611) | | | | | | | | | | | | | | | 5,692,823 | |
| | | | | |
Principal
Amount (000)/
Shares | | | Description (1) | | Coupon | | | Maturity | | | Ratings (5) | | | Value | |
| | | | CAPITAL PREFERRED SECURITIES – 3.3% | | | | | | | | | | | | | | | | |
| | | | | |
| | | | Capital Markets – 0.4% | | | | | | | | | | | | | | | | |
| | | | | |
| $ | 3,815 | | | Goldman Sachs Capital II | | | 4.000% | | | | 6/01/43 | | | | BB+ | | | $ | 2,582,831 | |
| | | | Commercial Banks – 0.5% | | | | | | | | | | | | | | | | |
| | | | | |
| | 3,500 | | | ABN AMRO North America Holding Capital, 144A | | | 6.523% | | | | 12/31/49 | | | | BB+ | | | | 3,093,125 | |
| | | | Consumer Finance – 0.2% | | | | | | | | | | | | | | | | |
| | | | | |
| | 2,000 | | | AFGC Capital Trust I, 144A | | | 6.000% | | | | 1/15/67 | | | | Caa3 | | | | 1,000,000 | |
| | | | Insurance – 1.4% | | | | | | | | | | | | | | | | |
| | | | | |
| | 2,700 | | | American International Group, Inc. | | | 6.250% | | | | 3/15/37 | | | | BBB | | | | 2,497,500 | |
| | | | | |
| | 3,000 | | | Glen Meadows Pass Through Trust | | | 6.505% | | | | 2/15/17 | | | | BB+ | | | | 2,160,000 | |
| | | | | |
| | 3,500 | | | Lincoln National Corporation | | | 7.000% | | | | 5/17/66 | | | | BBB | | | | 3,342,500 | |
| | | | | |
| | 1,000 | | | XL Capital Ltd | | | 6.500% | | | | 10/15/57 | | | | BBB– | | | | 812,500 | |
| | 10,200 | | | Total Insurance | | | | | | | | | | | | | | | 8,812,500 | |
| | | | Marine – 0.5% | | | | | | | | | | | | | | | | |
| | | | | |
| | 3,000 | | | OSX Leasing BV, 144A | | | 9.250% | | | | 3/20/15 | | | | N/R | | | | 2,995,500 | |
| | | | Oil, Gas & Consumable Fuels – 0.3% | | | | | | | | | | | | | | | | |
| | | | | |
| | 2,100 | | | Southern Union Company | | | 3.483% | | | | 11/01/66 | | | | Ba1 | | | | 1,708,875 | |
| $ | 24,615 | | | Total Capital Preferred Securities (cost $18,170,130) | | | | | | | | | | | | | | | 20,192,831 | |
| | | | | |
Principal
Amount (000) | | | Description (1) | | Coupon | | | Maturity | | | Ratings (5) | | | Value | |
| | | | U.S. GOVERNMENT AND AGENCY OBLIGATIONS – 0.2% | | | | | | | | | | | | | | | | |
| | | | | |
| $ | 155 | | | U.S. Treasury Notes | | | 3.375% | | | | 6/30/13 | | | | Aaa | | | $ | 159,789 | |
| | | | | |
| | 1,000 | | | U.S. Treasury Notes, (4) | | | 1.500% | | | | 12/31/13 | | | | Aaa | | | | 1,017,734 | |
| $ | 1,155 | | | Total U.S. Government and Agency Obligations (cost $1,157,786) | | | | | | | | | | | | 1,177,523 | |
| | | | | |
Principal
Amount (000) | | | Description (1) | | Coupon | | | Maturity | | | Ratings (5) | | | Value | |
| | | | ASSET BACKED-AND MORTGAGE-BACKED SECURITIES – 0.0% | | | | | | | | | | | | | |
| | | | | |
| $ | 3 | | | Green Tree Financial Corporation, Manufactured Housing Contract Pass Through Certificates, Series 1998-1 | | | 6.040% | | | | 11/01/29 | | | | A | | | $ | 3,665 | |
| $ | 3 | | | Total Asset-Backed and Mortgage-Backed Securities (cost $3,471) | | | | | | | | | | | | 3,665 | |
| | | | | |
| Shares | | | Description (1) | | | | | | | | | | | Value | |
| | | | INVESTMENT COMPANIES – 0.9% | | | | | | | | | | | | | | | | |
| | | | | |
| | 24,000 | | | Alliance National Municipal Inc. | | | | | | | | | | | | | | $ | 376,800 | |
| | | | | |
| | 169,000 | | | Blackrock Credit Allocation Income Trust IV | | | | | | | | | | | | | | | 2,239,250 | |
| | | | | |
| | 54,000 | | | First Trust Strategic High Income Fund II, (4) | | | | | | | | | | | | | | | 919,620 | |
Portfolio of Investments
Nuveen High Income Bond Fund (continued)
June 30, 2012
| | | | | | | | | | | | | | | | | | | | |
| Shares | | | Description (1) | | | | | | | | | | | Value | |
| | | | | | | | | | | | | | | | | | | | |
| | | | INVESTMENT COMPANIES (continued) | | | | | | | | | | | | | | | | |
| | | | | |
| | 28,500 | | | Gabelli Global Gold Natural Resources and Income Trust | | | | | | | | | | | | | | $ | 382,185 | |
| | | | | |
| | 107,500 | | | Pimco Income Strategy Fund | | | | | | | | | | | | | | | 1,283,550 | |
| | | | Total Investment Companies (cost $4,836,164) | | | | | | | | | | | | | | | 5,201,405 | |
| | | | | |
Principal
Amount (000) | | | Description (1) | | Coupon | | | Maturity | | | Ratings (5) | | | Value | |
| | | | SOVEREIGN DEBT – 0.9% | | | | | | | | | | | | | | | | |
| | | | | |
| | | | Argentina – 0.7% | | | | | | | | | | | | | | | | |
| | | | | |
| $ | 1,965 | | | Province of Buenos Aires, 144A | | | 10.875% | | | | 1/26/21 | | | | B | | | $ | 1,070,925 | |
| | | | | |
| | 1,000 | | | Provincia de Cordoba, 144A | | | 12.375% | | | | 8/17/17 | | | | B | | | | 573,330 | |
| | | | | |
| | 1,500 | | | Republic of Argentina | | | 7.000% | | | | 10/03/15 | | | | B | | | | 1,161,000 | |
| | | | | |
| | 1,250 | | | Republic of Argentina | | | 8.750% | | | | 6/02/17 | | | | B | | | | 1,075,000 | |
| | 5,715 | | | Total Argentina | | | | | | | | | | | | | | | 3,880,255 | |
| | | | Ukraine – 0.2% | | | | | | | | | | | | | | | | |
| | | | | |
| | 1,500 | | | Naftogaz Ukraine | | | 9.500% | | | | 9/30/14 | | | | B | | | | 1,438,125 | |
| $ | 7,215 | | | Total Sovereign Debt (cost $6,502,275) | | | | | | | | | | | | | | | 5,318,380 | |
| | | | | |
| Shares | | | Description (1) | | | | | | | | | | | Value | |
| | | | WARRANTS – 0.0% | | | | | | | | | | | | | | | | |
| | | | | |
| | 6,488 | | | FairPoint Communications Inc. | | | | | | | | | | | | | | $ | 973 | |
| | | | | |
| | 500 | | | Green Field Energy Services Warrants, (6) | | | | | | | | | | | | | | | 10,000 | |
| | | | Total Warrants (cost $19,604) | | | | | | | | | | | | | | | 10,973 | |
| | | | | |
| Shares | | | Description (1) | | | | | | | | | | | Value | |
| | | | INVESTMENTS PURCHASED WITH COLLATERAL FROM SECURITIES LENDING – 25.9% | | | | | | | | | |
| | | | | |
| | | | Money Market Funds – 25.9% | | | | | | | | | | | | | | | | |
| | | | | |
| | 157,452,505 | | | Mount Vernon Securities Lending Prime Portfolio, 0.197% (9), (10) | | | | | | | | | | | | | | $ | 157,452,505 | |
| | | | Total Investments Purchased with Collateral from Securities Lending (cost $157,452,505) | | | | | | | | 157,452,505 | |
| | | | | |
Shares/
Principal
Amount (000) | | | Description (1) | | Coupon | | | Maturity | | | Ratings (5) | | | Value | |
| | | | SHORT-TERM INVESTMENTS – 2.7% | | | | | | | | | | | | | | | | |
| | | | | |
| | | | Money Market Funds – 2.7% | | | | | | | | | | | | | | | | |
| | | | | |
| | 16,460,636 | | | First American Treasury Obligations Fund, Class Z | | | 0.000% (9) | | | | N/A | | | | N/A | | | $ | 16,460,636 | |
| | | | U.S. Government and Agency Obligations – 0.0% | | | | | | | | | | | | | | | | |
| | | | | |
| $ | 110 | | | U.S. Treasury Bills, (11) | | | 0.330% | | | | 7/26/12 | | | | Aaa | | | | 109,997 | |
| | | | Total Short-Term Investments (cost $16,570,634) | | | | | | | | | | | | | | | 16,570,633 | |
| | | | Total Investments (cost $770,128,569) – 125.8% | | | | | | | | | | | | | | | 765,135,332 | |
| | | | Other Assets Less Liabilities – (25.8)% | | | | | | | | | | | | | | | (156,692,747) | |
| | | | Net Assets – 100% | | | | | | | | | | | | | | $ | 608,442,585 | |
Investments in Derivatives at June 30, 2012
Futures Contracts outstanding:
| | | | | | | | | | | | | | | | | | | | |
| Type | | Contract
Position | | | Number of
Contracts | | | Contract
Expiration | | | Value | | | Unrealized
Appreciation
(Depreciation) | |
U.S. Treasury 10-Year Note | | | Long | | | | 64 | | | | 9/12 | | | $ | 8,536,000 | | | $ | 12,132 | |
| | | | For Fund portfolio compliance purposes, the Fund’s industry classifications refer to any one or more of the industry sub-classifications used by one or more widely recognized market indexes or ratings group indexes, and/or as defined by Fund management. This definition may not apply for purposes of this report, which may combine industry sub-classifications into sectors for reporting ease. |
| | (1) | | All percentages shown in the Portfolio of Investments are based on net assets. |
| | (2) | | Non-income producing; issuer has not declared a dividend within the past twelve months. |
| | (3) | | For fair value measurement disclosure purposes, investment categorized as Level 3. See Notes to Financial Statements, Footnote 1 – General Information and Significant Accounting Policies, Investment Valuation for more information. |
| | (4) | | Investment, or a portion of investment, is out on loan for securities lending. |
| | (5) | | Ratings (not covered by the report of independent registered public accounting firm): Using the highest of Standard & Poor’s Group (“Standard & Poor’s”), Moody’s Investors Service, Inc. (“Moody’s”) or Fitch, Inc. (“Fitch”) rating. Ratings below BBB by Standard & Poor’s, Baa by Moody’s or BBB by Fitch are considered to be below investment grade. Holdings designated N/R are not rated by any of these national rating agencies. |
| | (6) | | For fair value measurement disclosure purposes, $25 Par (or similar) Preferred Securities and warrants categorized as Level 2. See Notes to Financial Statements, Footnote 1 – General Information and Significant Accounting Policies, Investment Valuation for more information. |
| | (7) | | Principal Amount (000) rounds to less than $1,000. |
| | (8) | | At or subsequent to the end of the reporting period, this security is non-income producing. Non-income producing security, in the case of a bond, generally denotes that the issuer has (1) defaulted on the payment of principal or interest, (2) is under the protection of the Federal Bankruptcy Court or (3) the Fund’s Adviser has concluded that the issue is not likely to meet its future interest payment obligations and has directed the Fund’s custodian to cease accruing additional income on the Fund’s records. |
| | (9) | | The rate shown is the annualized seven-day effective yield as of June 30, 2012. |
| | (10) | | The Fund may loan securities representing up to one third of the fair value of its total assets (which includes collateral for securities on loan) to broker-dealers, banks and other institutions. The Fund maintains collateral equal to at least 100% of the fair value of the securities loaned. The cash collateral received by the Fund is invested in this money market fund. See Notes to Financial Statements, Footnote 1 – General Information and Significant Accounting Policies, Securities Lending for more information. |
| | (11) | | Investment, or portion of investment, segregated as collateral for investments in derivatives. |
| | WI/DD | | Investment, or portion of investment, purchased on a when-issued or delayed delivery basis. |
| | 144A | | Investment is exempt from registration under Rule 144A of the Securities Act of 1933, as amended. These investments may only be resold in transactions exempt from registration, which are normally those transactions with qualified institutional buyers. |
| | ADR | | American Depositary Receipt. |
| | REIT | | Real Estate Investment Trust. |
See accompanying notes to financial statements.
Portfolio of Investments
Nuveen Inflation Protected Securities Fund
June 30, 2012
| | | | | | | | | | | | | | | | | | | | |
| Shares | | | Description (1) | | Coupon | | | | | | Ratings (2) | | | Value | |
| | | | | | | | | | | | | | | | | | | | |
| | | | $25 PAR (OR SIMILAR) PREFERRED SECURITIES – 0.1% | | | | | | | | | | | | | | | | |
| | | | | |
| | | | Diversified Financial Services – 0.1% | | | | | | | | | | | | | | | | |
| | | | | |
| | 200 | | | Bank of America Corporation | | | 7.250% | | | | | | | | BB+ | | | $ | 195,000 | |
| | | | Thrifts & Mortgage Finance – 0.0% | | | | | | | | | | | | | | | | |
| | | | | |
| | 16,000 | | | Federal National Mortgage Association | | | 4.700% | | | | | | | | Ca | | | | 26,080 | |
| | | | Total $25 Par (or similar) Preferred Securities (cost $574,350) | | | | | | | | | | | | | | | 221,080 | |
| | | | | |
Principal
Amount (000) | | | Description (1) | | Coupon | | | Maturity | | | Ratings (2) | | | Value | |
| | | | CORPORATE BONDS – 1.8% | | | | | | | | | | | | | | | | |
| | | | | |
| | | | Auto Components – 0.0% | | | | | | | | | | | | | | | | |
| | | | | |
| $ | 175 | | | Dana Holding Corporation | | | 6.500% | | | | 2/15/19 | | | | BB | | | $ | 185,938 | |
| | | | Automobiles – 0.0% | | | | | | | | | | | | | | | | |
| | | | | |
| | 100 | | | Chrysler GP/CG Company, (3) | | | 8.000% | | | | 6/15/19 | | | | B | | | | 102,750 | |
| | | | Chemicals – 0.1% | | | | | | | | | | | | | | | | |
| | | | | |
| | 225 | | | Huntsman International LLC, (3) | | | 5.500% | | | | 6/30/16 | | | | BB– | | | | 225,000 | |
| | | | | |
| | 150 | | | Sinochem Overseas Capital Limited | | | 4.500% | | | | 11/12/20 | | | | Baa1 | | | | 150,928 | |
| | 375 | | | Total Chemicals | | | | | | | | | | | | | | | 375,928 | |
| | | | Commercial Banks – 0.1% | | | | | | | | | | | | | | | | |
| | | | | |
| | 200 | | | Banco do Nordeste do Brasil, 144A, (3) | | | 3.625% | | | | 11/09/15 | | | | BBB | | | | 202,000 | |
| | | | | |
| | 250 | | | Regions Financial Corporation, (3) | | | 7.750% | | | | 11/10/14 | | | | BBB– | | | | 270,000 | |
| | 450 | | | Total Commercial Banks | | | | | | | | | | | | | | | 472,000 | |
| | | | Commodity – 0.1% | | | | | | | | | | | | | | | | |
| | | | | |
| | 250 | | | Methanex Corporation | | | 5.250% | | | | 3/01/22 | | | | BBB– | | | | 259,378 | |
| | | | Containers & Packaging – 0.0% | | | | | | | | | | | | | | | | |
| | | | | |
| | 175 | | | Reynolds Group, 144A, (3) | | | 7.125% | | | | 4/15/19 | | | | BB– | | | | 183,313 | |
| | | | Electric Utilities – 0.2% | | | | | | | | | | | | | | | | |
| | | | | |
| | 570 | | | Comision Federal de Electricidad of the United States of Mexcio, 144A, (3) | | | 4.875% | | | | 5/26/21 | | | | Baa1 | | | | 615,600 | |
| | | | Energy Equipment & Services – 0.1% | | | | | | | | | | | | | | | | |
| | | | | |
| | 200 | | | Parker Drilling Company, 144A | | | 9.125% | | | | 4/01/18 | | | | B+ | | | | 211,500 | |
| | | | Food Products – 0.1% | | | | | | | | | | | | | | | | |
| | | | | |
| | 250 | | | Viterra Inc. | | | 5.950% | | | | 8/01/20 | | | | BBB– | | | | 273,804 | |
| | | | Health Care Providers & Services – 0.1% | | | | | | | | | | | | | | | | |
| | | | | |
| | 360 | | | HCA Inc. | | | 7.250% | | | | 9/15/20 | | | | BB+ | | | | 396,000 | |
| | | | Independent Power Producers & Energy Traders – 0.0% | | | | | | | | | | | | | | | | |
| | | | | |
| | 75 | | | Calpine Corporation, 144A | | | 7.875% | | | | 7/31/20 | | | | BB | | | | 82,688 | |
| | | | Machinery – 0.1% | | | | | | | | | | | | | | | | |
| | | | | |
| | 200 | | | Navistar International Corporation, (3) | | | 8.250% | | | | 11/01/21 | | | | BB | | | | 191,750 | |
| | | | Metals & Mining – 0.6% | | | | | | | | | | | | | | | | |
| | | | | |
| | 150 | | | Alrosa Finance SA, 144A | | | 7.750% | | | | 11/03/20 | | | | BB– | | | | 157,091 | |
| | | | | |
| | 200 | | | Evraz Group S.A, 144A | | | 7.400% | | | | 4/24/17 | | | | BB– | | | | 196,036 | |
| | | | | |
| | 1,000 | | | Southern Copper Corporation | | | 7.500% | | | | 7/27/35 | | | | BBB | | | | 1,147,929 | |
| | | | | |
| | 200 | | | Taseko Mines Limited | | | 7.750% | | | | 4/15/19 | | | | B | | | | 191,000 | |
| | | | | |
| | 250 | | | Vedanta Resources PLC, 144A, (3) | | | 9.500% | | | | 7/18/18 | | | | BB | | | | 251,250 | |
| | 1,800 | | | Total Metals & Mining | | | | | | | | | | | | | | | 1,943,306 | |
| | | | | | | | | | | | | | | | | | | | |
Principal
Amount (000) | | | Description (1) | | Coupon | | | Maturity | | | Ratings (2) | | | Value | |
| | | | | | | | | | | | | | | | | | | | |
| | | | Oil, Gas & Consumable Fuels – 0.2% | | | | | | | | | | | | | | | | |
| | | | | |
| $ | 250 | | | Holly Energy Partners LP, 144A | | | 6.500% | | | | 3/01/20 | | | | BB– | | | $ | 251,875 | |
| | | | | |
| | 200 | | | Seadrill Limited | | | 6.500% | | | | 10/05/15 | | | | N/R | | | | 199,000 | |
| | | | | |
| | 175 | | | SM Energy Company | | | 6.625% | | | | 2/15/19 | | | | BB | | | | 179,375 | |
| | 625 | | | Total Oil, Gas & Consumable Fuels | | | | | | | | | | | | | | | 630,250 | |
| | | | Real Estate Management & Development – 0.1% | | | | | | | | | | | | | | | | |
| | | | | |
| | 200 | | | Country Garden Holding Company, 144A | | | 11.125% | | | | 2/23/18 | | | | BB– | | | | 202,500 | |
| | | | Road & Rail – 0.0% | | | | | | | | | | | | | | | | |
| | | | | |
| | 175 | | | Hertz Corporation, (3) | | | 7.375% | | | | 1/15/21 | | | | BB– | | | | 187,247 | |
| $ | 5,980 | | | Total Corporate Bonds (cost $6,054,590) | | | | | | | | | | | | | | | 6,313,952 | |
| | | | | |
Principal
Amount (000) | | | Description (1) | | | | | Optional Call
Provisions (4) | | | Ratings (2) | | | Value | |
| | | | MUNICIPAL BONDS – 0.3% | | | | | | | | | | | | | | | | |
| | | | | |
| | | | Illinois – 0.3% | | | | | | | | | | | | | | | | |
| | | | | |
| $ | 1,130 | | | Illinois State, General Obligation Bonds, Taxable Series 2011, 5.877%, 3/01/19 | | | | | | | No Opt. Call | | | | A+ | | | $ | 1,259,148 | |
| $ | 1,130 | | | Total Municipal Bonds (cost $1,130,000) | | | | | | | | | | | | | | | 1,259,148 | |
| | | | | |
Principal
Amount (000) | | | Description (1) | | Coupon | | | Maturity | | | Ratings (2) | | | Value | |
| | | | U.S. GOVERNMENT AND AGENCY OBLIGATIONS – 90.5% | | | | | | | | | |
| | | | | |
| $ | 1,245 | | | Federal National Mortgage Association | | | 4.625% | | | | 5/01/13 | | | | Aa2 | | | $ | 1,289,277 | |
| | | | | |
| | 1,280 | | | Freddie Mac Reference Notes, (3) | | | 2.375% | | | | 1/13/22 | | | | Aaa | | | | 1,313,605 | |
| | | | | |
| | 1,055 | | | Tennessee Valley Authority, Series A | | | 3.875% | | | | 2/15/21 | | | | Aaa | | | | 1,218,872 | |
| | | | | |
| | 8,992 | | | U.S. Treasury Bonds | | | 3.875% | | | | 4/15/29 | | | | Aaa | | | | 14,529,798 | |
| | | | | |
| | 9,046 | | | U.S. Treasury Inflation Indexed Obligations | | | 0.625% | | | | 4/15/13 | | | | Aaa | | | | 9,060,778 | |
| | | | | |
| | 8,480 | | | U.S. Treasury Inflation Indexed Obligations | | | 2.000% | | | | 1/15/14 | | | | Aaa | | | | 8,804,569 | |
| | | | | |
| | 5,479 | | | U.S. Treasury Inflation Indexed Obligations | | | 1.250% | | | | 4/15/14 | | | | Aaa | | | | 5,657,092 | |
| | | | | |
| | 4,760 | | | U.S. Treasury Inflation Indexed Obligations | | | 2.000% | | | | 7/15/14 | | | | Aaa | | | | 5,044,223 | |
| | | | | |
| | 6,344 | | | U.S. Treasury Inflation Indexed Obligations | | | 1.625% | | | | 1/15/15 | | | | Aaa | | | | 6,741,723 | |
| | | | | |
| | 8,154 | | | U.S. Treasury Inflation Indexed Obligations | | | 0.500% | | | | 4/15/15 | | | | Aaa | | | | 8,466,140 | |
| | | | | |
| | 5,447 | | | U.S. Treasury Inflation Indexed Obligations | | | 1.875% | | | | 7/15/15 | | | | Aaa | | | | 5,923,889 | |
| | | | | |
| | 5,437 | | | U.S. Treasury Inflation Indexed Obligations | | | 2.000% | | | | 1/15/16 | | | | Aaa | | | | 6,015,399 | |
| | | | | |
| | 17,840 | | | U.S. Treasury Inflation Indexed Obligations | | | 0.125% | | | | 4/15/16 | | | | Aaa | | | | 18,569,293 | |
| | | | | |
| | 6,853 | | | U.S. Treasury Inflation Indexed Obligations | | | 2.500% | | | | 7/15/16 | | | | Aaa | | | | 7,845,024 | |
| | | | | |
| | 7,119 | | | U.S. Treasury Inflation Indexed Obligations | | | 2.375% | | | | 1/15/17 | | | | Aaa | | | | 8,216,233 | |
| | | | | |
| | 4,452 | | | U.S. Treasury Inflation Indexed Obligations | | | 0.125% | | | | 4/15/17 | | | | Aaa | | | | 4,699,831 | |
| | | | | |
| | 3,725 | | | U.S. Treasury Inflation Indexed Obligations, (3) | | | 2.625% | | | | 7/15/17 | | | | Aaa | | | | 4,424,069 | |
| | | | | |
| | 3,926 | | | U.S. Treasury Inflation Indexed Obligations | | | 1.625% | | | | 1/15/18 | | | | Aaa | | | | 4,480,336 | |
| | | | | |
| | 4,056 | | | U.S. Treasury Inflation Indexed Obligations | | | 2.125% | | | | 1/15/19 | | | | Aaa | | | | 4,853,218 | |
| | | | | |
| | 5,682 | | | U.S. Treasury Inflation Indexed Obligations | | | 1.375% | | | | 1/15/20 | | | | Aaa | | | | 6,605,932 | |
| | | | | |
| | 10,112 | | | U.S. Treasury Inflation Indexed Obligations | | | 1.250% | | | | 7/15/20 | | | | Aaa | | | | 11,741,408 | |
| | | | | |
| | 14,257 | | | U.S. Treasury Inflation Indexed Obligations | | | 1.125% | | | | 1/15/21 | | | | Aaa | | | | 16,406,856 | |
| | | | | |
| | 12,863 | | | U.S. Treasury Inflation Indexed Obligations, (3) | | | 0.625% | | | | 7/15/21 | | | | Aaa | | | | 14,325,984 | |
| | | | | |
| | 22,756 | | | U.S. Treasury Inflation Indexed Obligations | | | 0.125% | | | | 1/15/22 | | | | Aaa | | | | 24,076,769 | |
Portfolio of Investments
Nuveen Inflation Protected Securities Fund (continued)
June 30, 2012
| | | | | | | | | | | | | | | | | | | | |
Principal
Amount (000) | | | Description (1) | | Coupon | | | Maturity | | | Ratings (2) | | | Value | |
| | | | | | | | | | | | | | | | | | | | |
| | | | U.S. GOVERNMENT AND AGENCY OBLIGATIONS (continued) | | | | | | | | | |
| | | | | |
| $ | 11,498 | | | U.S. Treasury Inflation Indexed Obligations | | | 2.375% | | | | 1/15/25 | | | | Aaa | | | $ | 15,142,766 | |
| | | | | |
| | 6,637 | | | U.S. Treasury Inflation Indexed Obligations | | | 2.000% | | | | 1/15/26 | | | | Aaa | | | | 8,469,579 | |
| | | | | |
| | 5,191 | | | U.S. Treasury Inflation Indexed Obligations | | | 2.375% | | | | 1/15/27 | | | | Aaa | | | | 6,965,984 | |
| | | | | |
| | 6,397 | | | U.S. Treasury Inflation Indexed Obligations | | | 1.750% | | | | 1/15/28 | | | | Aaa | | | | 8,015,346 | |
| | | | | |
| | 8,358 | | | U.S. Treasury Inflation Indexed Obligations | | | 3.625% | | | | 4/15/28 | | | | Aaa | | | | 12,893,461 | |
| | | | | |
| | 4,410 | | | U.S. Treasury Inflation Indexed Obligations | | | 2.500% | | | | 1/15/29 | | | | Aaa | | | | 6,119,742 | |
| | | | | |
| | 6,882 | | | U.S. Treasury Inflation Indexed Obligations | | | 2.125% | | | | 2/15/40 | | | | Aaa | | | | 9,768,312 | |
| | | | | |
| | 8,095 | | | U.S. Treasury Inflation Indexed Obligations | | | 2.125% | | | | 2/15/41 | | | | Aaa | | | | 11,553,565 | |
| | | | | |
| | 7,667 | | | U.S. Treasury Inflation Indexed Obligations, (3) | | | 0.750% | | | | 2/15/42 | | | | Aaa | | | | 8,042,962 | |
| | | | | |
| | 7,600 | | | U.S. Treasury Notes, (3) | | | 1.875% | | | | 2/28/14 | | | | Aaa | | | | 7,795,046 | |
| | | | | |
| | 1,720 | | | U.S. Treasury Notes | | | 1.000% | | | | 9/30/16 | | | | Aaa | | | | 1,746,741 | |
| | | | | |
| | 3,782 | | | U.S. Treasury Notes | | | 1.375% | | | | 7/15/18 | | | | Aaa | | | | 4,318,234 | |
| | | | | |
| | 4,186 | | | U.S. Treasury Notes | | | 1.875% | | | | 7/15/19 | | | | Aaa | | | | 5,007,046 | |
| | | | | |
| | 10,880 | | | U.S. Treasury Notes | | | 2.000% | | | | 2/15/22 | | | | Aaa | | | | 11,246,351 | |
| $ | 272,663 | | | Total U.S. Government and Agency Obligations (cost $289,960,159) | | | | | | | | 317,395,453 | |
| | | | | |
Principal
Amount (000) | | | Description (1) | | Coupon | | | Maturity | | | Ratings (2) | | | Value | |
| | | | ASSET-BACKED AND MORTGAGE-BACKED SECURITIES – 2.1% | | | | | | | | | | | | | | | | |
| | | | | |
| $ | 730 | | | DBUBS Mortgage Trust, Commercial Mortgage Pass Through Certificates, Series 2011-LC3A | | | 3.642% | | | | 8/12/44 | | | | Aaa | | | $ | 786,880 | |
| | | | | |
| | 1,040 | | | Extended Stay America Trust 2010-EHSA | | | 4.860% | | | | 11/05/27 | | | | A | | | | 1,051,417 | |
| | | | | |
| | 977 | | | JPMorgan Chase Commercial Mortgage Securities Corporation, Commercial Mortgage Pass-Through Certificates, Series 2010-C1 | | | 3.853% | | | | 6/15/43 | | | | Aaa | | | | 1,038,572 | |
| | | | | |
| | 1,781 | | | Morgan Stanley Capital I Trust, Commercial Mortgage Pass-Through Certificates, Series 2011-C3 A1 | | | 2.178% | | | | 7/16/49 | | | | Aaa | | | | 1,823,576 | |
| | | | | |
| | 700 | | | OBP Depositor LLC Trust, Commercial Mortgage Pass Through Certificates, Series 2010-OBP | | | 4.646% | | | | 7/15/45 | | | | AAA | | | | 799,146 | |
| | | | | |
| | 501 | | | Sequoia Mortgage Trust, Mortgage Pass Through Certificates, Series 2011-1 | | | 4.125% | | | | 2/25/41 | | | | AAA | | | | 511,799 | |
| | | | | |
| | 1,260 | | | Wells Fargo-RBS Commercial Mortgage Trust, Commercial Mortgage Pass-Through Certificates, Series 2011-C3 | | | 4.375% | | | | 3/17/44 | | | | Aaa | | | | 1,383,129 | |
| $ | 6,989 | | | Total Asset-Backed and Mortgage-Backed Securities (cost $7,032,203) | | | | | | | | 7,394,519 | |
| | | | | |
Principal
Amount (000) (5) | | | Description (1) | | Coupon | | | Maturity | | | Ratings (2) | | | Value | |
| | | | SOVEREIGN DEBT – 0.3% | | | | | | | | | | | | | | | | |
| | | | | |
| | | | Canada – 0.2% | | | | | | | | | | | | | | | | |
| | | | | |
| | 750 | CAD | | Canadian Government Bond | | | 3.500% | | | | 6/01/20 | | | | AAA | | | $ | 843,151 | |
| | | | Poland – 0.1% | | | | | | | | | | | | | | | | |
| | | | | |
| | 250 | | | Republic of Poland, (3) | | | 6.375% | | | | 7/15/19 | | | | A2 | | | | 294,460 | |
| | | | Total Sovereign Debt (cost $1,013,016) | | | | | | | | | | | | | | | 1,137,611 | |
| | | | | |
| Shares | | | Description (1) | | | | | | | | | | | Value | |
| | | | INVESTMENT COMPANIES – 0.1% | | | | | | | | | | | | | | | | |
| | | | | |
| | 10,500 | | | Blackrock Credit Allocation Income Trust IV | | | | | | | | | | | | | | $ | 139,125 | |
| | | | | |
| | 11,000 | | | Pimco Income Strategy Fund, (3) | | | | | | | | | | | | | | | 131,340 | |
| | | | Total Investment Companies (cost $242,375) | | | | | | | | | | | | | | | 270,465 | |
| | | | | | | | | | | | | | | | | | | | |
| Shares | | | Description (1) | | | | | | | | | | | Value | |
| | | | | | | | | | | | | | | | | | | | |
| | | | INVESTMENTS PURCHASED WITH COLLATERAL FROM SECURITIES LENDING – 6.5% | |
| | | | | |
| | | | Money Market Funds – 6.5% | | | | | | | | | | | | | | | | |
| | | | | |
| | 22,654,387 | | | Mount Vernon Securities Lending Prime Portfolio, 0.197% (6), (7) | | | | | | | | | | | | | | $ | 22,654,387 | |
| | | | Total Investments Purchased with Collateral from Securities Lending (cost $22,654,387) | | | | | | | | 22,654,387 | |
| | | | | |
Shares/
Principal
Amount (000) | | | Description (1) | | Coupon | | | Maturity | | | Ratings (2) | | | Value | |
| | | | SHORT-TERM INVESTMENTS – 4.9% | | | | | | | | | | | | | | | | |
| | | | | |
| | | | Money Market Funds – 4.7% | | | | | | | | | | | | | | | | |
| | | | | |
| | 16,516,880 | | | First American Treasury Obligations Fund, Class Z | | | 0.000% (6) | | | | N/A | | | | N/A | | | $ | 16,516,880 | |
| | | | U.S. Government and Agency Obligations – 0.2% | | | | | | | | | | | | | | | | |
| | | | | |
| $ | 420 | | | U.S.Treasury Bills, (8) | | | 0.330% | | | | 7/26/12 | | | | Aaa | | | | 419,990 | |
| | | | | |
| | 320 | | | U.S.Treasury Bills, (8) | | | 0.158% | | | | 2/07/13 | | | | Aaa | | | | 319,687 | |
| | | | | |
| $ | 740 | | | Total U.S. Government and Agency Obligations | | | | | | | | | | | | | | | 739,677 | |
| | | | Total Short-Term Investments (cost $17,256,550) | | | | | | | | | | | | | | | 17,256,557 | |
| | | | Total Investments (cost $345,917,630) – 106.6% | | | | | | | | | | | | | | | 373,903,172 | |
| | | | Other Assets Less Liabilities – (6.6)% (9) | | | | | | | | | | | | | | | (23,311,452) | |
| | | | Net Assets – 100% | | | | | | | | | | | | | | $ | 350,591,720 | |
Investments in Derivatives at June 30, 2012
Forward Foreign Currency Exchange Contracts outstanding:
| | | | | | | | | | | | | | | | | | | | | | |
| Counterparty | | Currency Contracts to Deliver | | Amount
(Local Currency) | | | In Exchange For
Currency | | | Amount
(Local Currency) | | | Settlement
Date | | | Unrealized
Appreciation
(Depreciation)
(U.S. Dollars) (9) | |
Citigroup | | U.S. Dollar | | | 4,184,860 | | | | Canadian Dollar | | | | 4,150,000 | | | | 7/23/12 | | | $ | (110,837 | ) |
Interest Rate Swaps outstanding:
| | | | | | | | | | | | | | | | | | | | | | | | | | | | | | | | |
| Counterparty | | Notional
Amount | | | Fund
Pay/Receive
Floating Rate | | | Floating
Rate Index | | | Fixed
Rate* | | | Fixed Rate
Payment
Frequency | | | Termination
Date | | | Value | | | Unrealized
Appreciation
(Depreciation) (9) | |
JPMorgan | | $ | 8,000,000 | | | | Receive | | | | 3-Month USD-LIBOR | | | | 0.641 | % | | | Semi-Annually | | | | 1/12/14 | | | $ | (29,715 | ) | | $ | (29,715 | ) |
JPMorgan | | | 1,000,000 | | | | Receive | | | | 3-Month USD-LIBOR | | | | 3.858 | | | | Semi-Annually | | | | 1/19/20 | | | | (193,336 | ) | | | (193,336 | ) |
UBS | | | 2,000,000 | | | | Receive | | | | 3-Month USD-LIBOR | | | | 3.001 | | | | Semi-Annually | | | | 8/03/14 | | | | (125,260 | ) | | | (125,260 | ) |
| | | | | | | | | | | | | | | | | | | | | | | | | | | | | | | $ | (348,311 | ) |
Future Contracts outstanding:
| | | | | | | | | | | | | | | | | | | | |
| Type | | Contract
Position | | | Number of
Contracts | | | Contract
Expiration | | | Value | | | Unrealized
Appreciation
(Depreciation) | |
U.S. Treasury 2-Year Note | | | Long | | | | 48 | | | | 9/12 | | | $ | 10,569,000 | | | $ | (2,737 | ) |
U.S. Treasury 5-Year Note | | | Short | | | | (64 | ) | | | 9/12 | | | | (7,934,000 | ) | | | (7,611 | ) |
U.S. Treasury 10-Year Note | | | Long | | | | 42 | | | | 9/12 | | | | 5,601,750 | | | | 1,141 | |
U.S. Treasury Long Bond | | | Short | | | | (2 | ) | | | 9/12 | | | | (295,938 | ) | | | 1,558 | |
U.S. Treasury Ultra Bond | | | Long | | | | 7 | | | | 9/12 | | | | 1,167,906 | | | | 1,322 | |
| | | | | | | | | | | | | | | | | | | $ | (6,327 | ) |
Portfolio of Investments
Nuveen Inflation Protected Securities Fund (continued)
June 30, 2012
| | | | For Fund portfolio compliance purposes, the Fund’s industry classifications refer to any one or more of the industry sub-classifications used by one or more widely recognized market indexes or ratings group indexes, and/or as defined by Fund management. This definition may not apply for purposes of this report, which may combine industry sub-classifications into sectors for reporting ease. |
| | (1) | | All Percentages shown in the Portfolio of Investments are based on net assets. |
| | (2) | | Ratings (not covered by the report of independent registered public accounting firm): Using the highest of Standard & Poor’s Group (“Standard & Poor’s”), Moody’s Investors Service, Inc. (“Moody’s”) or Fitch, Inc. (“Fitch”) rating. Ratings below BBB by Standard & Poor’s, Baa by Moody’s or BBB by Fitch are considered to be below investment grade. Holdings designated N/R are not rated by any of these national rating agencies. |
| | (3) | | Investment, or a portion of investment, is out on loan for securities lending. |
| | (4) | | Optional Call Provisions (not covered by the report of independent registered public accounting firm): Dates (month and year) and prices of the earliest optional call or redemption. There may be other call provisions at varying prices at later dates. |
| | (5) | | Principal Amount (000) denominated in U.S. Dollars, unless otherwise noted. |
| | (6) | | The rate shown is the annualized seven-day effective yield as of June 30, 2012. |
| | (7) | | The Fund may loan securities representing up to one third of the fair value of its total assets (which includes collateral for securities on loan) to broker-dealers, banks and other institutions. The Fund maintains collateral equal to at least 100% of the fair value of the securities loaned. The cash collateral received by the Fund is invested in this money market fund. See Notes to Financial Statements, Footnote 1 – General Information and Significant Accounting Policies, Securities Lending for more information. |
| | (8) | | Investment, or portion of investment, segregated as collateral for investments in derivatives. |
| | (9) | | Other Assets Less Liabilities, includes the Unrealized Appreciation (Depreciation) of derivative instruments as noted within Investments in Derivatives at June 30, 2012. |
| | 144A | | Investment is exempt from registration under Rule 144A of the Securities Act of 1933, as amended. These investments may only be resold in transactions exempt from registration, which are normally transactions with qualified institutional buyers. |
| | USD-LIBOR | | United States Dollar–London Inter-Bank Offered Rate. |
See accompanying notes to financial statements.
Portfolio of Investments
Nuveen Intermediate Government Bond Fund
June 30, 2012
| | | | | | | | | | | | | | | | | | | | |
Principal
Amount (000) | | | Description (1) | | | | | Optional Call
Provisions (2) | | | Ratings (3) | | | Value | |
| | | | | | | | | | | | | | | | | | | | |
| | | | MUNICIPAL BONDS – 1.1% | | | | | | | | | | | | | | | | |
| | | | | |
| | | | Ohio – 1.1% | | | | | | | | | | | | | | | | |
| | | | | |
| $ | 845 | | | Ohio State, General Obligation Bonds, Higher Education, Build America Bond Series 2010E, 3.328%, 8/01/17 – AGM Insured | | | | | | | No Opt. Call | | | | AA+ | | | $ | 933,328 | |
| $ | 845 | | | Total Municipal Bonds (cost $936,732) | | | | | | | | | | | | | | | 933,328 | |
| | | | | |
Principal
Amount (000) | | | Description (1) | | Coupon | | | Maturity | | | Ratings (3) | | | Value | |
| | | | U.S. GOVERNMENT AND AGENCY OBLIGATIONS – 42.8% | | | | | | | | | | | | | | | | |
| | | | | |
| $ | 2,160 | | | Fannie Mae Notes | | | 1.050% | | | | 9/14/15 | | | | Aaa | | | $ | 2,162,730 | |
| | | | | |
| | 950 | | | Fannie Mae Notes | | | 1.125% | | | | 4/12/16 | | | | Aaa | | | | 952,100 | |
| | | | | |
| | 500 | | | Federal Farm Credit Banks, Consolidated Systemwide Notes | | | 2.100% | | | | 8/10/12 | | | | Aaa | | | | 501,071 | |
| | | | | |
| | 565 | | | Federal Farm Credit Banks, Consolidated Systemwide Notes | | | 4.500% | | | | 10/17/12 | | | | Aaa | | | | 572,129 | |
| | | | | |
| | 1,705 | | | Federal Farm Credit Banks, Consolidated Systemwide Notes | | | 1.375% | | | | 6/25/13 | | | | Aaa | | | | 1,723,965 | |
| | | | | |
| | 1,350 | | | Federal Farm Credit Banks, Consolidated Systemwide Notes, (4) | | | 3.875% | | | | 10/07/13 | | | | Aaa | | | | 1,410,386 | |
| | | | | |
| | 1,400 | | | Federal Farm Credit Banks, Consolidated Systemwide Notes | | | 2.625% | | | | 4/17/14 | | | | Aaa | | | | 1,456,732 | |
| | | | | |
| | 700 | | | Federal Farm Credit Banks, Consolidated Systemwide Notes, (4) | | | 3.000% | | | | 9/22/14 | | | | Aaa | | | | 740,603 | |
| | | | | |
| | 845 | | | Federal Farm Credit Banks, Consolidated Systemwide Notes, (4) | | | 1.500% | | | | 11/16/15 | | | | Aaa | | | | 870,456 | |
| | | | | |
| | 550 | | | Federal Farm Credit Banks, Consolidated Systemwide Notes | | | 1.230% | | | | 5/02/17 | | | | Aaa | | | | 551,055 | |
| | | | | |
| | 1,865 | | | Federal Home Loan Bank Bonds | | | 3.125% | | | | 12/13/13 | | | | Aaa | | | | 1,940,087 | |
| | | | | |
| | 1,000 | | | Federal Home Loan Bank Bonds | | | 0.875% | | | | 12/27/13 | | | | Aaa | | | | 1,007,935 | |
| | | | | |
| | 1,080 | | | Federal Home Loan Bank Bonds | | | 4.125% | | | | 3/13/20 | | | | Aaa | | | | 1,275,489 | |
| | | | | |
| | 365 | | | Federal Home Loan Mortgage Corporation, Notes, (4) | | | 3.750% | | | | 3/27/19 | | | | Aaa | | | | 421,586 | |
| | | | | |
| | 580 | | | Federal National Mortgage Association | | | 4.625% | | | | 5/01/13 | | | | Aa2 | | | | 600,627 | |
| | | | | |
| | 785 | | | Federal National Mortgage Association | | | 5.250% | | | | 8/01/12 | | | | Aa2 | | | | 788,149 | |
| | | | | |
| | 1,700 | | | Federal National Mortgage Association | | | 1.875% | | | | 10/15/15 | | | | Aaa | | | | 1,763,852 | |
| | | | | |
| | 1,065 | | | Freddie Mac Notes | | | 0.850% | | | | 2/24/16 | | | | Aaa | | | | 1,066,698 | |
| | | | | |
| | 1,000 | | | Freddie Mac Notes | | | 2.000% | | | | 2/27/17 | | | | Aaa | | | | 1,002,692 | |
| | | | | |
| | 1,315 | | | Freddie Mac Reference Notes | | | 0.450% | | | | 2/21/14 | | | | Aaa | | | | 1,316,228 | |
| | | | | |
| | 580 | | | Freddie Mac Reference Notes, (4) | | | 1.750% | | | | 9/10/15 | | | | Aaa | | | | 601,678 | |
| | | | | |
| | 1,140 | | | Freddie Mac Reference Notes, (4) | | | 1.500% | | | | 9/21/16 | | | | Aaa | | | | 1,142,345 | |
| | | | | |
| | 225 | | | Freddie Mac Reference Notes | | | 1.000% | | | | 6/29/17 | | | | Aaa | | | | 225,547 | |
| | | | | |
| | 1,000 | | | Freddie Mac Reference Notes | | | 1.000% | | | | 7/28/17 | | | | Aaa | | | | 999,481 | |
| | | | | |
| | 270 | | | Freddie Mac Reference Notes | | | 5.000% | | | | 12/14/18 | | | | Aa2 | | | | 306,595 | |
| | | | | |
| | 1,080 | | | Freddie Mac Reference Notes, (4) | | | 2.375% | | | | 1/13/22 | | | | Aaa | | | | 1,108,354 | |
| | | | | |
| | 505 | | | Private Export Funding | | | 4.550% | | | | 5/15/15 | | | | Aaa | | | | 562,695 | |
| | | | | |
| | 345 | | | Private Export Funding | | | 2.125% | | | | 7/15/16 | | | | Aaa | | | | 363,682 | |
| | | | | |
| | 2,725 | | | Tennessee Valley Authority | | | 6.000% | | | | 3/15/13 | | | | Aaa | | | | 2,835,537 | |
| | | | | |
| | 530 | | | Tennessee Valley Authority, Series A | | | 3.875% | | | | 2/15/21 | | | | Aaa | | | | 612,324 | |
| | | | | |
| | 1,105 | | | U.S. Treasury Bonds, (4) | | | 8.125% | | | | 8/15/19 | | | | Aaa | | | | 1,639,285 | |
| | | | | |
| | 430 | | | U.S. Treasury Bonds, (4) | | | 8.500% | | | | 2/15/20 | | | | Aaa | | | | 659,109 | |
| | | | | |
| | 325 | | | U.S. Treasury Bonds | | | 8.750% | | | | 8/15/20 | | | | Aaa | | | | 512,586 | |
| | | | | |
| | 160 | | | U.S. Treasury Notes | | | 1.375% | | | | 10/15/12 | | | | Aaa | | | | 160,563 | |
| | | | | |
| | 225 | | | U.S. Treasury Notes, (4) | | | 4.250% | | | | 11/15/14 | | | | Aaa | | | | 245,566 | |
| | | | | |
| | 2,005 | | | U.S. Treasury Notes | | | 2.000% | | | | 2/15/22 | | | | Aaa | | | | 2,072,514 | |
| $ | 34,130 | | | Total U.S. Government and Agency Obligations (cost $34,913,299) | | | | | | | | | | | | 36,172,431 | |
Portfolio of Investments
Nuveen Intermediate Government Bond Fund (continued)
June 30, 2012
| | | | | | | | | | | | | | | | | | | | |
Principal
Amount (000) | | | Description (1) | | Coupon | | | Maturity | | | Ratings (3) | | | Value | |
| | | | | | | | | | | | | | | | | | | | |
| | | | ASSET-BACKED AND MORTGAGE-BACKED SECURITIES – 56.0% | | | | | | | | | |
| | | | | |
| $ | 837 | | | 321 Henderson Receivables LLC, Series 2010-1A | | | 5.560% | | | | 7/15/59 | | | | Aaa | | | $ | 932,153 | |
| | | | | |
| | 776 | | | 321 Henderson Receivables LLC, Series 2010-3A | | | 3.820% | | | | 12/15/48 | | | | Aaa | | | | 790,504 | |
| | | | | |
| | 800 | | | Centerpoint Energy Transition Bond Company LLC | | | 0.901% | | | | 4/15/18 | | | | AAA | | | | 804,330 | |
| | | | | |
| | 280 | | | DBUBS Mortgage Trust, Commercial Mortgage Pass Through Certificates, Series 2011-LC3A | | | 3.642% | | | | 8/12/44 | | | | Aaa | | | | 301,817 | |
| | | | | |
| | 1,000 | | | Discover Card Master Trust I 2011-A3 A | | | 0.452% | | | | 3/15/17 | | | | AAA | | | | 1,001,775 | |
| | | | | |
| | 673 | | | Entergy Arkansas Restoration Funding LLC, Senior Secured Storm Recovery Bonds, Series 2010-A | | | 2.300% | | | | 8/01/21 | | | | AAA | | | | 698,608 | |
| | | | | |
| | 854 | | | Extended Stay America Trust 2010-EHSA | | | 2.951% | | | | 11/05/27 | | | | AAA | | | | 860,385 | |
| | | | | |
| | 930 | | | Fannie Mae Mortgage Pool AB1959 | | | 4.000% | | | | 12/01/40 | | | | Aaa | | | | 999,979 | |
| | | | | |
| | 1,331 | | | Fannie Mae Mortgage Pool AD0486 | | | 2.346% | | | | 4/01/34 | | | | Aaa | | | | 1,409,852 | |
| | | | | |
| | 299 | | | Fannie Mae Mortgage Pool AD0706 | | | 2.306% | | | | 3/01/38 | | | | Aaa | | | | 316,956 | |
| | | | | |
| | 943 | | | Fannie Mae Mortgage Pool AE4876 | | | 3.500% | | | | 10/01/40 | | | | Aaa | | | | 991,979 | |
| | | | | |
| | 929 | | | Fannie Mae Mortgage Pool AJ5303 | | | 4.000% | | | | 11/01/41 | | | | Aaa | | | | 991,067 | |
| | | | | |
| | 1,533 | | | Fannie Mae Mortgage Pool MA0583 | | | 4.000% | | | | 11/01/40 | | | | Aaa | | | | 1,634,482 | |
| | | | | |
| | 6 | | | Fannie Mae Mortgage Pool 251901 | | | 6.500% | | | | 8/01/13 | | | | Aaa | | | | 6,402 | |
| | | | | |
| | 12 | | | Fannie Mae Mortgage Pool 252799 | | | 7.000% | | | | 10/01/14 | | | | Aaa | | | | 12,194 | |
| | | | | |
| | 316 | | | Fannie Mae Mortgage Pool 254169 | | | 6.500% | | | | 12/01/31 | | | | Aaa | | | | 349,415 | |
| | | | | |
| | 203 | | | Fannie Mae Mortgage Pool 254179 | | | 6.000% | | | | 1/01/22 | | | | Aaa | | | | 223,686 | |
| | | | | |
| | 195 | | | Fannie Mae Mortgage Pool 254344 | | | 6.500% | | | | 6/01/22 | | | | Aaa | | | | 219,772 | |
| | | | | |
| | 225 | | | Fannie Mae Mortgage Pool 254373 | | | 6.500% | | | | 7/01/17 | | | | Aaa | | | | 244,904 | |
| | | | | |
| | 227 | | | Fannie Mae Mortgage Pool 254414 | | | 7.000% | | | | 7/01/17 | | | | Aaa | | | | 247,174 | |
| | | | | |
| | 384 | | | Fannie Mae Mortgage Pool 254720 | | | 4.500% | | | | 5/01/18 | | | | Aaa | | | | 413,596 | |
| | | | | |
| | 6 | | | Fannie Mae Mortgage Pool 425550 | | | 6.000% | | | | 4/01/13 | | | | Aaa | | | | 6,812 | |
| | | | | |
| | 1,835 | | | Fannie Mae Mortgage Pool 464158 | | | 3.120% | | | | 1/01/15 | | | | Aaa | | | | 1,919,693 | |
| | | | | |
| | 890 | | | Fannie Mae Mortgage Pool 467749 | | | 3.240% | | | | 4/01/16 | | | | Aaa | | | | 950,166 | |
| | | | | |
| | 13 | | | Fannie Mae Mortgage Pool 556195 | | | 6.000% | | | | 11/01/13 | | | | Aaa | | | | 12,659 | |
| | | | | |
| | 121 | | | Fannie Mae Mortgage Pool 580516 | | | 5.500% | | | | 4/01/16 | | | | Aaa | | | | 131,304 | |
| | | | | |
| | 252 | | | Fannie Mae Mortgage Pool 596680 | | | 7.000% | | | | 9/01/31 | | | | Aaa | | | | 281,637 | |
| | | | | |
| | 691 | | | Fannie Mae Mortgage Pool 596712 | | | 6.500% | | | | 6/01/32 | | | | Aaa | | | | 765,963 | |
| | | | | |
| | 122 | | | Fannie Mae Mortgage Pool 656269 | | | 6.000% | | | | 8/01/32 | | | | Aaa | | | | 133,295 | |
| | | | | |
| | 117 | | | Fannie Mae Mortgage Pool 673010 | | | 5.500% | | | | 12/01/17 | | | | Aaa | | | | 127,573 | |
| | | | | |
| | 192 | | | Fannie Mae Mortgage Pool 695765 | | | 5.500% | | | | 4/01/18 | | | | Aaa | | | | 208,397 | |
| | | | | |
| | 473 | | | Fannie Mae Mortgage Pool 725793 | | | 5.500% | | | | 9/01/19 | | | | Aaa | | | | 518,548 | |
| | | | | |
| | 776 | | | Fannie Mae Mortgage Pool 745101 | | | 6.000% | | | | 4/01/32 | | | | Aaa | | | | 846,189 | |
| | | | | |
| | 527 | | | Fannie Mae Mortgage Pool 819652 | | | 2.899% | | | | 3/01/35 | | | | Aaa | | | | 563,112 | |
| | | | | |
| | 185 | | | Fannie Mae Mortgage Pool 848390 | | | 1.944% | | | | 12/01/35 | | | | Aaa | | | | 192,064 | |
| | | | | |
| | 339 | | | Fannie Mae Mortgage Pool 886034 | | | 2.635% | | | | 7/01/36 | | | | Aaa | | | | 359,392 | |
| | | | | |
| | 438 | | | Fannie Mae Mortgage Pool 887017 | | | 6.500% | | | | 8/01/36 | | | | Aaa | | | | 494,174 | |
| | | | | |
| | 444 | | | Fannie Mae Mortgage Pool 913187 | | | 2.440% | | | | 4/01/37 | | | | Aaa | | | | 472,253 | |
| | | | | |
| | 736 | | | Fannie Mae Mortgage Pool 914224 | | | 2.844% | | | | 3/01/37 | | | | Aaa | | | | 785,981 | |
| | | | | |
| | 533 | | | Fannie Mae Mortgage Pool 928519 | | | 7.000% | | | | 6/01/37 | | | | Aaa | | | | 619,847 | |
| | | | | |
| | 262 | | | Fannie Mae Mortgage Pool 995949 | | | 2.468% | | | | 9/01/36 | | | | Aaa | | | | 276,310 | |
| | | | | |
| | 473 | | | Fannie Mae REMIC Pass-Through Certificates 2002-W1 2A | | | 7.055% | | | | 2/25/42 | | | | Aaa | | | | 555,618 | |
| | | | | |
| | 749 | | | Fannie Mae REMIC Pass-Through Certificates 2009-M1 A1 | | | 3.400% | | | | 7/25/19 | | | | Aaa | | | | 798,906 | |
| | | | | | | | | | | | | | | | | | | | |
Principal
Amount (000) | | | Description (1) | | Coupon | | | Maturity | | | Ratings (3) | | | Value | |
| | | | | | | | | | | | | | | | | | | | |
| | | | ASSET-BACKED AND MORTGAGE-BACKED SECURITIES (continued) | | | | | | | | | |
| | | | | |
| $ | 1,316 | | | Fannie Mae REMIC Pass-Through Certificates 2010-M4 A1 | | | 2.520% | | | | 6/25/20 | | | | Aaa | | | $ | 1,372,166 | |
| | | | | |
| | 940 | | | FDIC Structures Sale Guaranteed Notes, Series 2010-S1 | | | 3.250% | | | | 4/25/38 | | | | Aaa | | | | 961,891 | |
| | | | | |
| | 319 | | | FDIC Trust 2001-C1 | | | 1.840% | | | | 4/25/31 | | | | Aaa | | | | 322,745 | |
| | | | | |
| | 485 | | | FDIC Trust 2012-C1 | | | 0.841% | | | | 5/25/35 | | | | Aaa | | | | 484,880 | |
| | | | | |
| | 380 | | | Federal Home Loan Mortgage Corporation, REMIC 2629 BO | | | 3.250% | | | | 3/15/18 | | | | Aaa | | | | 391,231 | |
| | | | | |
| | 152 | | | Federal Home Loan Mortgage Corporation, REMIC 2843 BH | | | 4.000% | | | | 1/15/18 | | | | Aaa | | | | 153,430 | |
| | | | | |
| | 1,005 | | | Freddie Mac Gold Pool C09000, (WI/DD) | | | 3.500% | | | | 6/01/42 | | | | Aaa | | | | 1,055,499 | |
| | | | | |
| | 672 | | | Freddie Mac Gold Pool 1H1396 | | | 2.375% | | | | 5/01/37 | | | | Aaa | | | | 710,858 | |
| | | | | |
| | 764 | | | Freddie Mac Gold Pool 780836 | | | 2.343% | | | | 9/01/33 | | | | Aaa | | | | 794,230 | |
| | | | | |
| | 548 | | | Freddie Mac Gold Pool 848193 | | | 2.728% | | | | 3/01/36 | | | | Aaa | | | | 584,275 | |
| | | | | |
| | 24 | | | Freddie Mac Mortgage Pool, Various C35768 | | | 7.500% | | | | 1/01/30 | | | | Aaa | | | | 26,685 | |
| | | | | |
| | 16 | | | Freddie Mac Mortgage Pool, Various E00746 | | | 7.000% | | | | 9/01/14 | | | | Aaa | | | | 16,902 | |
| | | | | |
| | 10 | | | Freddie Mac Mortgage Pool, Various E72802 | | | 6.000% | | | | 10/01/13 | | | | Aaa | | | | 10,138 | |
| | | | | |
| | 123 | | | Freddie Mac Mortgage Pool, Various G00876 | | | 6.500% | | | | 1/01/28 | | | | Aaa | | | | 139,636 | |
| | | | | |
| | 253 | | | Freddie Mac Mortgage Pool, Various G01244 | | | 6.500% | | | | 3/01/31 | | | | Aaa | | | | 289,894 | |
| | | | | |
| | — | (5) | | Freddie Mac Mortgage Pool, Various G10735 | | | 7.500% | | | | 9/01/12 | | | | Aaa | | | | 355 | |
| | | | | |
| | 1,001 | | | Freddie Mac Multifamily Structured Pass Through Certificates, Series K010 A1 | | | 3.320% | | | | 7/25/20 | | | | Aaa | | | | 1,082,409 | |
| | | | | |
| | 1,142 | | | Freddie Mac Mulitfamily Strucured Pass Through Certificates, Series K701 | | | 2.776% | | | | 6/26/17 | | | | Aaa | | | | 1,193,803 | |
| | | | | |
| | 959 | | | Freddie Mac Structured Pass-Through Certificates, Series K008 | | | 2.746% | | | | 12/25/19 | | | | Aaa | | | | 1,017,830 | |
| | | | | |
| | 460 | | | Freddie Mac Structures Pass Through Certificates, Series K-501 | | | 1.655% | | | | 11/25/16 | | | | Aaa | | | | 468,722 | |
| | | | | |
| | 524 | | | Freddie Mac Structured Pass-Through Certificates Series T045 | | | 4.520% | | | | 8/27/12 | | | | Aaa | | | | 525,553 | |
| | | | | |
| | 719 | | | Goldman Sachs Mortgage Securities Corporation, Mortgage Pass-Through Certificates, Series 2003-1 | | | 6.717% | | | | 3/25/43 | | | | Ba3 | | | | 617,653 | |
| | | | | |
| | 1,194 | | | Goldman Sachs Mortgage Securities Corporation, Mortgage Pass-Through Certificates, Series 2005-4F | | | 5.779% | | | | 5/25/35 | | | | CC | | | | 755,961 | |
| | | | | |
| | 93 | | | Government National Mortgage Association Pool 3120 | | | 6.500% | | | | 8/20/31 | | | | Aaa | | | | 108,620 | |
| | | | | |
| | 43 | | | Government National Mortgage Association Pool 347332 | | | 7.500% | | | | 12/15/22 | | | | Aaa | | | | 44,927 | |
| | | | | |
| | 6 | | | Government National Mortgage Association Pool 455304 | | | 7.000% | | | | 9/15/27 | | | | Aaa | | | | 7,316 | |
| | | | | |
| | 904 | | | Government National Mortgage Association Pool 4946 | | | 4.500% | | | | 2/20/41 | | | | Aaa | | | | 998,285 | |
| | | | | |
| | 110 | | | Government National Mortgage Association Pool 570134 | | | 7.500% | | | | 12/15/31 | | | | Aaa | | | | 128,511 | |
| | | | | |
| | 871 | | | Government National Mortgage Association Pool 633605 | | | 6.000% | | | | 9/15/34 | | | | Aaa | | | | 991,831 | |
| | | | | |
| | 256 | | | Government National Mortgage Association Pool 780825 | | | 6.500% | | | | 7/15/28 | | | | Aaa | | | | 296,663 | |
| | | | | |
| | 27 | | | GRMT Mortgage Loan Trust 2001-1A | | | 8.272% | | | | 7/20/31 | | | | A | | | | 25,790 | |
| | | | | |
| | 344 | | | Impac Secured Assets Corporation, Mortgage Pass-Through Certificates,
Series 2000-3 | | | 8.000% | | | | 10/25/30 | | | | B | | | | 322,346 | |
| | | | | |
| | 883 | | | JPMorgan Chase Commercial Mortgage Securities Corporation, Commercial Mortgage Pass-Through Certificates, Series 2010-C2 A1 | | | 2.749% | | | | 11/15/43 | | | | AAA | | | | 912,829 | |
| | | | | |
| | 650 | | | Morgan Stanley Capital I Trust, Commercial Mortgage Pass-Through Certificates, Series 2011-C3 A1 | | | 2.178% | | | | 7/16/49 | | | | Aaa | | | | 665,175 | |
| | | | | |
| | 951 | | | National Credit Union Adminstration Guaranteed Structured Collateral Notes | | | 1.600% | | | | 10/29/20 | | | | Aaa | | | | 963,508 | |
| | | | | |
| | 743 | | | Origen Manufactured Housing Contract Trust Collaterlized Notes Series 2005B | | | 5.990% | | | | 1/15/37 | | | | A+ | | | | 785,438 | |
| | | | | |
| | 403 | | | Residential Accredit Loans Inc., Mortgage Asset-Backed Pass-Through Certificates, Series 2003-QS12 | | | 5.000% | | | | 6/25/18 | | | | CC | | | | 328,635 | |
Portfolio of Investments
Nuveen Intermediate Government Bond Fund (continued)
June 30, 2012
| | | | | | | | | | | | | | | | | | | | |
Principal
Amount (000) | | | Description (1) | | Coupon | | | Maturity | | | Ratings (3) | | | Value | |
| | | | | | | | | | | | | | | | | | | | |
| | | | ASSET-BACKED AND MORTGAGE-BACKED SECURITIES (continued) | | | | | | | | | |
| | | | | |
| $ | 265 | | | Sequoia Mortgage Trust, Mortgage Pass Through Certificates, Series 2011-1 | | | 4.125% | | | | 2/25/41 | | | | AAA | | | $ | 270,777 | |
| | | | | |
| | 215 | | | U.S. Small Business Administration Guaranteed Participating Securities, Participation Certificates Series 2005-P10A | | | 4.638% | | | | 2/10/15 | | | | Aaa | | | | 227,615 | |
| | | | | |
| | 154 | | | U.S. Small Business Administration Guaranteed Participating Securities Participation Certificates, Series 2005-10B | | | 4.940% | | | | 8/10/15 | | | | Aaa | | | | 166,670 | |
| | | | | |
| | 754 | | | U.S. Small Business Administration Guaranteed Participating Securities Participation Certificates, Series 2008-10A | | | 5.902% | | | | 2/10/18 | | | | Aaa | | | | 837,809 | |
| | | | | |
| | 903 | | | U.S. Small Business Administration Guaranteed Participating Securities Participation Certificates, Series 2010-P10A | | | 4.108% | | | | 3/10/20 | | | | Aaa | | | | 949,173 | |
| | | | | |
| | 725 | | | United States Department of Veterans, Affairs, Guaranteed REMIC Pass-Through Certificates, Vendee Mortgage Trust, Series 2011-1 | | | 3.750% | | | | 2/15/35 | | | | Aaa | | | | 775,768 | |
| $ | 45,233 | | | Total Asset-Backed and Mortgage-Backed Securities (cost $45,669,877) | | | | | | | | | | | | 47,255,355 | |
| | | | | |
| Shares | | | Description (1) | | | | | | | | | | | Value | |
| | | | | | | | | | | | | | | | | | | | |
| | | | INVESTMENTS PURCHASED WITH COLLATERAL FROM SECURITIES LENDING – 10.8% | | | | | | | | | |
| | | | | |
| | | | Money Market Funds – 10.8% | | | | | | | | | | | | | | | | |
| | | | | |
| | 9,126,144 | | | Mount Vernon Securities Lending Prime Portfolio, 0.197% (6), (7) | | | | | | | | | | | | | | $ | 9,126,144 | |
| | | | Total Investments Purchased with Collateral from Securities Lending (cost $9,126,144) | | | | | | | | 9,126,144 | |
| | | | | |
Shares/
Principal
Amount (000) | | | Description (1) | | Coupon | | | Maturity | | | Ratings (3) | | | Value | |
| | | | SHORT-TERM INVESTMENTS – 1.9% | | | | | | | | | |
| | | | | |
| | | | Money Market Funds – 1.6% | | | | | | | | | | | | | | | | |
| | | | | |
| | 1,289,203 | | | First American Treasury Obligations Fund, Class Z | | | 0.000% (6) | | | | N/A | | | | N/A | | | $ | 1,289,203 | |
| | | | U.S. Government and Agency Obligations – 0.3% | | | | | | | | | | | | | | | | |
| | | | | |
| $ | 275 | | | U.S. Treasury Bills, (8) | | | 0.330% | | | | 7/26/12 | | | | Aaa | | | | 274,993 | |
| | | | Total Short-Term Investments (cost $1,564,193) | | | | | | | | | | | | | | | 1,564,196 | |
| | | | Total Investments (cost $92,210,245) – 112.6% | | | | | | | | | | | | | | | 95,051,454 | |
| | | | Other Assets Less Liabilities – (12.6)% | | | | | | | | | | | | | | | (10,604,331) | |
| | | | Net Assets – 100% | | | | | | | | | | | | | | $ | 84,447,123 | |
Investments in Derivatives at June 30, 2012
Futures Contracts outstanding:
| | | | | | | | | | | | | | | | | | | | |
| Type | | Contract
Position | | | Number of
Contracts | | | Contract
Expiration | | | Value | | | Unrealized
Appreciation
(Depreciation) | |
U.S. Treasury 2-Year Note | | | Long | | | | 89 | | | | 9/12 | | | $ | 19,596,688 | | | $ | (7,900 | ) |
U.S. Treasury 5-Year Note | | | Long | | | | 85 | | | | 9/12 | | | | 10,537,344 | | | | 17,980 | |
U.S. Treasury 10-Year Note | | | Short | | | | (16 | ) | | | 9/12 | | | | (2,134,000 | ) | | | 2,213 | |
U.S. Treasury Long Bond | | | Long | | | | 1 | | | | 9/12 | | | | 147,969 | | | | (512 | ) |
| | | | | | | | | | | | | | | | | | | $ | 11,781 | |
| | | | For Fund portfolio compliance purposes, the Fund’s industry classifications refer to any one or more of the industry sub-classifications used by one or more widely recognized market indexes or ratings group indexes, and/or as defined by Fund management. This definition may not apply for purposes of this report, which may combine industry sub-classifications into sectors for reporting ease. |
| | (1) | | All Percentages shown in the Portfolio of Investments are based on net assets. |
| | (2) | | Optional Call Provisions (not covered by the report of independent registered public accounting firm): Dates (month and year) and prices of the earliest optional call or redemption. There may be other call provisions at varying prices at later dates. |
| | (3) | | Ratings (not covered by the report of independent registered public accounting firm): Using the highest of Standard & Poor’s Group (“Standard & Poor’s”), Moody’s Investors Service, Inc. (“Moody’s”) or Fitch, Inc. (“Fitch”) rating. Ratings below BBB by Standard & Poor’s, Baa by Moody’s or BBB by Fitch are considered to be below investment grade. Holdings designated N/R are not rated by any of these national rating agencies. |
| | (4) | | Investment, or a portion of investment, is out on loan for securities lending. |
| | (5) | | Principal Amount (000) rounds to less than $1,000. |
| | (6) | | The rate shown is the annualized seven-day effective yield as of June 30, 2012. |
| | (7) | | The Fund may loan securities representing up to one third of the fair value of its total assets (which includes collateral for securities on loan) to broker-dealers, banks and other institutions. The Fund maintains collateral equal to at least 100% of the fair value of the securities loaned. The cash collateral received by the Fund is invested in this money market fund. See Notes to Financial Statements, Footnote 1 – General Information and Significant Accounting Policies, Securities Lending for more information. |
| | (8) | | Investment, or portion of investment, segregated as collateral for investments in derivatives. |
| | WI/DD | | Investment, or portion of investment, purchased on a when-issued or delayed delivery basis. |
See accompanying notes to financial statements.
Portfolio of Investments
Nuveen Intermediate Term Bond Fund
June 30, 2012
| | | | | | | | | | | | | | | | | | | | |
Principal
Amount (000) | | | Description (1) | | Coupon | | | Maturity | | | Ratings (2) | | | Value | |
| | | | | | | | | | | | | | | | | | | | |
| | | | CORPORATE BONDS – 34.2% | | | | | | | | | | | | | | | | |
| | | | | |
| | | | Aerospace & Defense – 0.3% | | | | | | | | | | | | | | | | |
| | | | | |
| $ | 1,885 | | | Exelis, Inc., 144A | | | 5.550% | | | | 10/01/21 | | | | BBB+ | | | $ | 2,022,809 | |
| | | | Capital Markets – 2.2% | | | | | | | | | | | | | | | | |
| | | | | |
| | 2,845 | | | Goldman Sachs Group, Inc. | | | 6.150% | | | | 4/01/18 | | | | A | | | | 3,084,208 | |
| | | | | |
| | 3,125 | | | Goldman Sachs Group, Inc. | | | 6.000% | | | | 6/15/20 | | | | A | | | | 3,336,153 | |
| | | | | |
| | 1,605 | | | Goldman Sachs Group, Inc. | | | 5.250% | | | | 7/27/21 | | | | A | | | | 1,630,388 | |
| | | | | |
| | 2,250 | | | Morgan Stanley | | | 6.625% | | | | 4/01/18 | | | | A | | | | 2,352,528 | |
| | | | | |
| | 4,020 | | | Morgan Stanley, (3) | | | 5.500% | | | | 7/28/21 | | | | A | | | | 3,960,733 | |
| | 13,845 | | | Total Capital Markets | | | | | | | | | | | | | | | 14,364,010 | |
| | | | Chemicals – 0.4% | | | | | | | | | | | | | | | | |
| | | | | |
| | 2,255 | | | Incitec Pivot Finance, 144A | | | 6.000% | | | | 12/10/19 | | | | BBB | | | | 2,472,513 | |
| | | | Commercial Banks – 2.9% | | | | | | | | | | | | | | | | |
| | | | | |
| | 2,000 | | | Australia and New Zealand Banking Group Limited, 144A, (3) | | | 2.400% | | | | 11/23/16 | | | | Aaa | | | | 2,047,822 | |
| | | | | |
| | 1,245 | | | Banco Bradesco S.A. Grand Cayman, 144A | | | 4.125% | | | | 5/16/16 | | | | Baa1 | | | | 1,285,463 | |
| | | | | |
| | 1,910 | | | Bancolombia SA | | | 5.950% | | | | 6/03/21 | | | | Baa2 | | | | 2,038,925 | |
| | | | | |
| | 925 | | | BBVA Bancomer SA Texas, 144A | | | 4.500% | | | | 3/10/16 | | | | A2 | | | | 929,625 | |
| | | | | |
| | 2,220 | | | BNP Paribas, (3) | | | 3.600% | | | | 2/23/16 | | | | AA– | | | | 2,245,528 | |
| | | | | |
| | 1,160 | | | ING Bank NV, 144A | | | 3.750% | | | | 3/07/17 | | | | A+ | | | | 1,154,558 | |
| | | | | |
| | 2,500 | | | Lloyds TSB Bank | | | 4.875% | | | | 1/21/16 | | | | A | | | | 2,624,590 | |
| | | | | |
| | 2,805 | | | Rabobank Nederland | | | 3.875% | | | | 2/08/22 | | | | AA | | | | 2,853,339 | |
| | | | | |
| | 1,000 | | | Royal Bank of Scotland Group PLC, (3) | | | 6.400% | | | | 10/21/19 | | | | A | | | | 1,066,358 | |
| | | | | |
| | 2,040 | | | Sovereign Bank | | | 8.750% | | | | 5/30/18 | | | | Baa1 | | | | 2,211,670 | |
| | 17,805 | | | Total Commercial Banks | | | | | | | | | | | | | | | 18,457,878 | |
| | | | Commercial Services & Supplies – 0.2% | | | | | | | | | | | | | | | | |
| | | | | |
| | 1,195 | | | Donnelley & Son Company | | | 7.625% | | | | 6/15/20 | | | | BB+ | | | | 1,117,325 | |
| | | | Communications Equipment – 0.5% | | | | | | | | | | | | | | | | |
| | | | | |
| | 2,945 | | | Motorola, Inc. | | | 6.000% | | | | 11/15/17 | | | | BBB | | | | 3,344,884 | |
| | | | Construction & Engineering – 0.3% | | | | | | | | | | | | | | | | |
| | | | | |
| | 2,000 | | | ABB Finance USA Inc., (3) | | | 4.375% | | | | 5/08/42 | | | | A | | | | 2,149,226 | |
| | | | Consumer Finance – 0.3% | | | | | | | | | | | | | | | | |
| | | | | |
| | 1,700 | | | American Express Credit Corporation | | | 2.800% | | | | 9/19/16 | | | | A+ | | | | 1,773,381 | |
| | | | Diversified Financial Services – 5.1% | | | | | | | | | | | | | | | | |
| | | | | |
| | 2,500 | | | Bank of America Corporation | | | 5.750% | | | | 12/01/17 | | | | A | | | | 2,667,990 | |
| | | | | |
| | 3,270 | | | Bank of America Corporation | | | 5.875% | | | | 1/05/21 | | | | A | | | | 3,570,209 | |
| | | | | |
| | 2,000 | | | Citigroup Inc. | | | 4.587% | | | | 12/15/15 | | | | A | | | | 2,092,152 | |
| | | | | |
| | 2,090 | | | Citigroup Inc. | | | 6.125% | | | | 11/21/17 | | | | A | | | | 2,315,559 | |
| | | | | |
| | 2,000 | | | Citigroup Inc., (3) | | | 4.500% | | | | 1/14/22 | | | | A | | | | 2,065,708 | |
| | | | | |
| | 2,395 | | | Countrywide Financial Corporation, Convertible Bond | | | 6.250% | | | | 5/15/16 | | | | BBB+ | | | | 2,492,711 | |
| | | | | |
| | 5,720 | | | General Electric Capital Corporation, (3) | | | 5.625% | | | | 5/01/18 | | | | AA+ | | | | 6,575,369 | |
| | | | | |
| | 1,530 | | | General Electric Capital Corporation, (3) | | | 5.300% | | | | 2/11/21 | | | | AA | | | | 1,717,244 | |
| | | | | |
| | 6,935 | | | JPMorgan Chase & Company | | | 4.250% | | | | 10/15/20 | | | | AA– | | | | 7,285,315 | |
| | | | | |
| | 1,900 | | | JPMorgan Chase & Company, (3) | | | 4.500% | | | | 1/24/22 | | | | AA– | | | | 2,046,714 | |
| | 30,340 | | | Total Diversified Financial Services | | | | | | | | | | | | | | | 32,828,971 | |
| | | | | | | | | | | | | | | | | | | | |
Principal
Amount (000) | | | Description (1) | | Coupon | | | Maturity | | | Ratings (2) | | | Value | |
| | | | | | | | | | | | | | | | | | | | |
| | | | Diversified Telecommunication Services – 1.6% | | | | | | | | | | | | | | | | |
| | | | | |
| $ | 2,570 | | | Telecom Italia Capital S.p.A | | | 7.175% | | | | 6/18/19 | | | | BBB | | | $ | 2,557,150 | |
| | | | | |
| | 3,300 | | | Telefonica Emisiones SAU | | | 5.462% | | | | 2/16/21 | | | | Baa1 | | | | 2,873,617 | |
| | | | | |
| | 3,755 | | | Verizon Communications, (3) | | | 8.750% | | | | 11/01/18 | | | | A | | | | 5,161,413 | |
| | 9,625 | | | Total Diversified Telecommunication Services | | | | | | | | | | | | | | | 10,592,180 | |
| | | | Electric Utilities – 1.0% | | | | | | | | | | | | | | | | |
| | | | | |
| | 1,615 | | | Exelon Generation Co. LLC, 144A | | | 4.250% | | | | 6/15/22 | | | | Baa1 | | | | 1,620,181 | |
| | | | | |
| | 2,220 | | | FirstEnergy Solutions Corporation, (3) | | | 6.050% | | | | 8/15/21 | | | | BBB | | | | 2,438,193 | |
| | | | | |
| | 2,100 | | | Ohio Power Company | | | 6.000% | | | | 6/01/16 | | | | A– | | | | 2,431,076 | |
| | 5,935 | | | Total Electric Utilities | | | | | | | | | | | | | | | 6,489,450 | |
| | | | Electronic Equipment & Instruments – 0.2% | | | | | | | | | | | | | | | | |
| | | | | |
| | 1,205 | | | Ingram Micro Inc. | | | 5.250% | | | | 9/01/17 | | | | BBB– | | | | 1,291,818 | |
| | | | Energy Equipment & Services – 1.0% | | | | | | | | | | | | | | | | |
| | | | | |
| | 2,765 | | | Ensco PLC, (3) | | | 4.700% | | | | 3/15/21 | | | | BBB+ | | | | 3,011,746 | |
| | | | | |
| | 1,735 | | | Nabors Industries Inc., (3) | | | 5.000% | | | | 9/15/20 | | | | BBB | | | | 1,851,360 | |
| | | | | |
| | 1,505 | | | Weatherford International Limited Bermuda | | | 5.125% | | | | 9/15/20 | | | | BBB | | | | 1,615,691 | |
| | 6,005 | | | Total Energy Equipment & Services | | | | | | | | | | | | | | | 6,478,797 | |
| | | | Food Products – 0.2% | | | | | | | | | | | | | | | | |
| | | | | |
| | 1,225 | | | Kraft Foods Inc. | | | 6.500% | | | | 8/11/17 | | | | Baa2 | | | | 1,486,277 | |
| | | | Health Care Providers & Services – 0.2% | | | | | | | | | | | | | | | | |
| | | | | |
| | 1,295 | | | UnitedHealth Group Incorporated | | | 3.875% | | | | 10/15/20 | | | | A– | | | | 1,409,163 | |
| | | | Independent Power Producers & Energy Traders – 0.4% | | | | | | | | | | | | | | | | |
| | | | | |
| | 2,275 | | | Constellation Energy Group | | | 5.150% | | | | 12/01/20 | | | | BBB+ | | | | 2,518,291 | |
| | | | Insurance – 3.5% | | | | | | | | | | | | | | | | |
| | | | | |
| | 1,495 | | | AFLAC Insurance | | | 8.500% | | | | 5/15/19 | | | | A– | | | | 1,951,589 | |
| | | | | |
| | 2,860 | | | Allied World Assurance Holdings Limited | | | 7.500% | | | | 8/01/16 | | | | BBB+ | | | | 3,297,497 | |
| | | | | |
| | 3,000 | | | American International Group, Inc., (3) | | | 8.250% | | | | 8/15/18 | | | | A– | | | | 3,621,561 | |
| | | | | |
| | 2,000 | | | Berkshire Hathaway Inc. | | | 2.200% | | | | 8/15/16 | | | | AA+ | | | | 2,080,718 | |
| | | | | |
| | 3,055 | | | Hartford Financial Services Group Inc. | | | 6.000% | | | | 1/15/19 | | | | BBB | | | | 3,272,446 | |
| | | | | |
| | 1,985 | | | Liberty Mutual Group Inc., 144A | | | 5.000% | | | | 6/01/21 | | | | Baa2 | | | | 1,997,670 | |
| | | | | |
| | 1,545 | | | Lincoln National Corporation | | | 8.750% | | | | 7/01/19 | | | | A– | | | | 1,945,586 | |
| | | | | |
| | 4,250 | | | Prudential Covered Trust, 144A, (3) | | | 2.997% | | | | 9/30/15 | | | | A | | | | 4,317,295 | |
| | 20,190 | | | Total Insurance | | | | | | | | | | | | | | | 22,484,362 | |
| | | | Media – 4.2% | | | | | | | | | | | | | | | | |
| | | | | |
| | 1,845 | | | British Sky Broadcasting Group PLC | | | 6.100% | | | | 2/15/18 | | | | BBB+ | | | | 2,146,458 | |
| | | | | |
| | 1,625 | | | CBS Corporation, (3) | | | 5.750% | | | | 4/15/20 | | | | BBB | | | | 1,890,002 | |
| | | | | |
| | 1,850 | | | DIRECTV Holdings LLC | | | 3.550% | | | | 3/15/15 | | | | BBB | | | | 1,948,046 | |
| | | | | |
| | 1,640 | | | DIRECTV Holdings LLC | | | 5.200% | | | | 3/15/20 | | | | BBB | | | | 1,814,898 | |
| | | | | |
| | 1,460 | | | Discovery Communications Inc. | | | 5.050% | | | | 6/01/20 | | | | BBB | | | | 1,649,479 | |
| | | | | |
| | 5,825 | | | NBC Universal Media LLC | | | 4.375% | | | | 4/01/21 | | | | BBB+ | | | | 6,408,234 | |
| | | | | |
| | 3,000 | | | News America Holdings Inc., (3) | | | 6.650% | | | | 11/15/37 | | | | BBB+ | | | | 3,501,930 | |
| | | | | |
| | 2,025 | | | Time Warner Cable Inc., (3) | | | 6.750% | | | | 7/01/18 | | | | BBB | | | | 2,466,821 | |
| | | | | |
| | 3,000 | | | Time Warner Inc. | | | 4.700% | | | | 1/15/21 | | | | BBB | | | | 3,342,978 | |
| | | | | |
| | 2,075 | | | Vivendi SA, 144A | | | 4.750% | | | | 4/12/22 | | | | BBB | | | | 2,047,749 | |
| | 24,345 | | | Total Media | | | | | | | | | | | | | | | 27,216,595 | |
Portfolio of Investments
Nuveen Intermediate Term Bond Fund (continued)
June 30, 2012
| | | | | | | | | | | | | | | | | | | | |
Principal
Amount (000) | | | Description (1) | | Coupon | | | Maturity | | | Ratings (2) | | | Value | |
| | | | | | | | | | | | | | | | | | | | |
| | | | Metals & Mining – 3.4% | | | | | | | | | | | | | | | | |
| | | | | |
| $ | 3,835 | | | Alcoa Inc., (3) | | | 5.400% | | | | 4/15/21 | | | | BBB– | | | $ | 3,818,778 | |
| | | | | |
| | 3,260 | | | ArcelorMittal, (3) | | | 5.250% | | | | 8/05/20 | | | | BBB | | | | 3,125,140 | |
| | | | | |
| | 3,000 | | | BHP Billiton Finance Limited | | | 3.250% | | | | 11/21/21 | | | | A+ | | | | 3,130,770 | |
| | | | | |
| | 1,230 | | | Freeport McMoRan Copper & Gold, Inc., (3) | | | 3.550% | | | | 3/01/22 | | | | BBB | | | | 1,210,170 | |
| | | | | |
| | 2,625 | | | Newmont Mining Corporation | | | 3.500% | | | | 3/15/22 | | | | BBB+ | | | | 2,590,870 | |
| | | | | |
| | 1,970 | | | Rio Tinto Finance USA Limited, | | | 3.500% | | | | 11/02/20 | | | | A– | | | | 2,095,826 | |
| | | | | |
| | 2,000 | | | Southern Copper Corporation | | | 5.375% | | | | 4/16/20 | | | | Baa2 | | | | 2,216,022 | |
| | | | | |
| | 1,760 | | | Teck Resources Limited, (3) | | | 4.750% | | | | 1/15/22 | | | | BBB | | | | 1,891,132 | |
| | | | | |
| | 1,940 | | | Vale Overseas Limited | | | 4.625% | | | | 9/15/20 | | | | A– | | | | 2,029,426 | |
| | 21,620 | | | Total Metals & Mining | | | | | | | | | | | | | | | 22,108,134 | |
| | | | Oil, Gas & Consumable Fuels – 2.3% | | | | | | | | | | | | | | | | |
| | | | | |
| | 1,385 | | | Anadarko Petroleum Corporation | | | 6.375% | | | | 9/15/17 | | | | BBB– | | | | 1,608,863 | |
| | | | | |
| | 2,500 | | | EOG Resources Inc., (3) | | | 4.100% | | | | 2/01/21 | | | | A– | | | | 2,774,283 | |
| | | | | |
| | 1,460 | | | Husky Energy Inc. | | | 6.200% | | | | 9/15/17 | | | | BBB+ | | | | 1,725,377 | |
| | | | | |
| | 795 | | | Husky Energy Inc. | | | 7.250% | | | | 12/15/19 | | | | BBB+ | | | | 981,243 | |
| | | | | |
| | 1,685 | | | Marathon Petroleum Corporation, (3) | | | 6.500% | | | | 3/01/41 | | | | BBB | | | | 1,914,932 | |
| | | | | |
| | 2,385 | | | Petrobras International Finance Company | | | 5.375% | | | | 1/27/21 | | | | A3 | | | | 2,570,484 | |
| | | | | |
| | 1,455 | | | Southwestern Energy Company, 144A | | | 4.100% | | | | 3/15/22 | | | | BBB– | | | | 1,474,699 | |
| | | | | |
| | 1,275 | | | SunCor Energy Inc. | | | 6.100% | | | | 6/01/18 | | | | BBB+ | | | | 1,510,062 | |
| | 12,940 | | | Total Oil, Gas & Consumable Fuels | | | | | | | | | | | | | | | 14,559,943 | |
| | | | Paper & Forest Products – 0.3% | | | | | | | | | | | | | | | | |
| | | | | |
| | 2,000 | | | Celulosa Arauco Y Constitucion, (3) | | | 5.625% | | | | 4/20/15 | | | | BBB+ | | | | 2,155,476 | |
| | | | Pharmaceuticals – 0.3% | | | | | | | | | | | | | | | | |
| | | | | |
| | 1,830 | | | Merck & Company Inc., (3) | | | 2.250% | | | | 1/15/16 | | | | AA | | | | 1,910,976 | |
| | | | Real Estate Investment Trust – 0.4% | | | | | | | | | | | | | | | | |
| | | | | |
| | 1,885 | | | Prologis Inc., (3) | | | 6.875% | | | | 3/15/20 | | | | Baa2 | | | | 2,254,541 | |
| | | | Road & Rail – 0.3% | | | | | | | | | | | | | | | | |
| | | | | |
| | 1,500 | | | Union Pacific Corporation | | | 5.750% | | | | 11/15/17 | | | | A– | | | | 1,783,646 | |
| | | | Semiconductors & Equipment – 0.7% | | | | | | | | | | | | | | | | |
| | | | | |
| | 1,855 | | | Applied Materials Inc. | | | 4.300% | | | | 6/15/21 | | | | A– | | | | 2,066,021 | |
| | | | | |
| | 2,190 | | | Intel Corporation, (3) | | | 3.300% | | | | 10/01/21 | | | | A+ | | | | 2,341,147 | |
| | 4,045 | | | Total Semiconductors & Equipment | | | | | | | | | | | | | | | 4,407,168 | |
| | | | Thrifts & Mortgage Finance – 0.3% | | | | | | | | | | | | | | | | |
| | | | | |
| | 1,780 | | | WEA Finance LLC, 144A, (3) | | | 4.625% | | | | 5/10/21 | | | | A2 | | | | 1,881,155 | |
| | | | Tobacco – 0.9% | | | | | | | | | | | | | | | | |
| | | | | |
| | 1,300 | | | Altria Group Inc. | | | 9.700% | | | | 11/10/18 | | | | Baa1 | | | | 1,798,897 | |
| | | | | |
| | 1,365 | | | Altria Group Inc., (3) | | | 4.750% | | | | 5/05/21 | | | | Baa1 | | | | 1,547,972 | |
| | | | | |
| | 1,815 | | | Lorillard Tobacco | | | 8.125% | | | | 6/23/19 | | | | Baa2 | | | | 2,252,545 | |
| | 4,480 | | | Total Tobacco | | | | | | | | | | | | | | | 5,599,414 | |
| | | | Transportation Infrastructure – 0.4% | | | | | | | | | | | | | | | | |
| | | | | |
| | 2,450 | | | Asciano Finance Limited, 144A | | | 5.000% | | | | 4/07/18 | | | | Baa2 | | | | 2,559,193 | |
| | | | Wireless Telecommunication Services – 0.4% | | | | | | | | | | | | | | | | |
| | | | | |
| | 2,405 | | | American Tower Company | | | 5.050% | | | | 9/01/20 | | | | Baa3 | | | | 2,526,151 | |
| $ | 203,005 | | | Total Corporate Bonds (cost $207,573,771) | | | | | | | | | | | | | | | 220,243,727 | |
| | | | | | | | | | | | | | | | | | | | |
Principal
Amount (000) | | | Description (1) | | Coupon | | | Maturity | | | Ratings (2) | | | Value | |
| | | | | | | | | | | | | | | | | | | | |
| | | | CAPITAL PREFERRED SECURITIES – 0.9% | | | | | | | | | | | | | | | | |
| | | | | |
| | | | Capital Markets – 0.1% | | | | | | | | | | | | | | | | |
| | | | | |
| $ | 1,165 | | | Goldman Sachs Capital II | | | 4.000% | | | | 6/01/43 | | | | BB+ | | | $ | 788,728 | |
| | | | Commercial Banks – 0.3% | | | | | | | | | | | | | | | | |
| | | | | |
| | 2,220 | | | Wachovia Capital Trust III | | | 5.570% | | | | 3/15/42 | | | | BBB+ | | | | 2,120,100 | |
| | | | Insurance – 0.5% | | | | | | | | | | | | | | | | |
| | | | | |
| | 1,650 | | | Catlin Insurance Company Limited | | | 7.249% | | | | 1/19/17 | | | | BBB+ | | | | 1,452,000 | |
| | | | | |
| | 1,530 | | | ZFS Finance USA Trust V | | | 6.500% | | | | 5/09/67 | | | | A | | | | 1,499,400 | |
| | 3,180 | | | Total Insurance | | | | | | | | | | | | | | | 2,951,400 | |
| $ | 6,565 | | | Total Capital Preferred Securities (cost $5,973,426) | | | | | | | | | | | | | | | 5,860,228 | |
| | | | | |
Principal
Amount (000) | | | Description (1) | | | | | Optional Call
Provisions (4) | | | Ratings (2) | | | Value | |
| | | | MUNICIPAL BONDS – 1.1% | | | | | | | | | | | | | | | | |
| | | | | |
| | | | National – 0.4% | | | | | | | | | | | | | | | | |
| | | | | |
| $ | 2,500 | | | Las Vegas Valley Water District, Nevada, General Obligation Bonds, Refunding Taxable Series 2011B, 3.176%, 6/01/17 | | | | | | | No Opt. Call | | | | AA+ | | | $ | 2,636,050 | |
| | | | Illinois – 0.7% | | | | | | | | | | | | | | | | |
| | | | | |
| | 3,735 | | | Illinois State, General Obligation Bonds, Taxable Series 2011, 5.877%, 3/01/19 | | | | | | | No Opt. Call | | | | A+ | | | | 4,161,873 | |
| $ | 6,235 | | | Total Municipal Bonds (cost $6,235,000) | | | | | | | | | | | | | | | 6,797,923 | |
| | | | | |
Principal
Amount (000) | | | Description (1) | | Coupon | | | Maturity | | | Ratings (2) | | | Value | |
| | | | U.S. GOVERNMENT AND AGENCY OBLIGATIONS – 13.4% | | | | | | | | | | | | | | | | |
| | | | | |
| $ | 10,000 | | | Fannie Mae Notes | | | 0.750% | | | | 12/19/14 | | | | Aaa | | | $ | 10,072,060 | |
| | | | | |
| | 3,160 | | | Fannie Mae Notes | | | 1.250% | | | | 9/28/16 | | | | Aaa | | | | 3,215,180 | |
| | | | | |
| | 3,580 | | | Federal National Mortgage Association | | | 1.000% | | | | 9/23/13 | | | | Aaa | | | | 3,609,818 | |
| | | | | |
| | 4,595 | | | Federal National Mortgage Association, (3) | | | 2.375% | | | | 7/28/15 | | | | Aaa | | | | 4,848,653 | |
| | | | | |
| | 6,655 | | | Freddie Mac Reference Notes | | | 2.000% | | | | 8/25/16 | | | | Aaa | | | | 6,992,828 | |
| | | | | |
| | 2,055 | | | Freddie Mac Reference Notes | | | 5.000% | | | | 12/14/18 | | | | Aa2 | | | | 2,333,526 | |
| | | | | |
| | 60 | | | Freddie Mac Reference Notes | | | 1.750% | | | | 5/30/19 | | | | Aaa | | | | 61,369 | |
| | | | | |
| | 1,275 | | | U.S. Treasury Bonds | | | 4.750% | | | | 2/15/41 | | | | Aaa | | | | 1,800,938 | |
| | | | | |
| | 1,085 | | | U.S. Treasury Notes | | | 1.375% | | | | 1/15/13 | | | | Aaa | | | | 1,091,908 | |
| | | | | |
| | 100 | | | U.S. Treasury Notes | | | 4.250% | | | | 11/15/13 | | | | Aaa | | | | 105,395 | |
| | | | | |
| | 16,685 | | | U.S. Treasury Notes | | | 0.250% | | | | 2/28/14 | | | | Aaa | | | | 16,668,048 | |
| | | | | |
| | 475 | | | U.S. Treasury Notes, (3) | | | 4.250% | | | | 11/15/14 | | | | Aaa | | | | 518,418 | |
| | | | | |
| | 1,375 | | | U.S. Treasury Notes, (3) | | | 2.375% | | | | 2/28/15 | | | | Aaa | | | | 1,446,866 | |
| | | | | |
| | 2,160 | | | U.S. Treasury Notes, (3) | | | 1.250% | | | | 8/31/15 | | | | Aaa | | | | 2,213,832 | |
| | | | | |
| | 45 | | | U.S. Treasury Notes | | | 4.500% | | | | 2/15/16 | | | | Aaa | | | | 51,402 | |
| | | | | |
| | 1,215 | | | U.S. Treasury Notes, (3) | | | 3.250% | | | | 7/31/16 | | | | Aaa | | | | 1,344,758 | |
| | | | | |
| | 5,480 | | | U.S. Treasury Notes, (3) | | | 0.875% | | | | 11/30/16 | | | | Aaa | | | | 5,534,373 | |
| | | | | |
| | 135 | | | U.S. Treasury Notes | | | 0.875% | | | | 1/31/17 | | | | Aaa | | | | 136,171 | |
| | | | | |
| | 80 | | | U.S. Treasury Notes | | | 3.125% | | | | 5/15/19 | | | | Aaa | | | | 90,925 | |
| | | | | |
| | 6,065 | | | U.S. Treasury Notes, (3) | | | 2.625% | | | | 11/15/20 | | | | Aaa | | | | 6,666,290 | |
| | | | | |
| | 25 | | | U.S. Treasury Notes | | | 3.625% | | | | 2/15/21 | | | | Aaa | | | | 29,516 | |
| | | | | |
| | 5,140 | | | U.S. Treasury Notes | | | 3.125% | | | | 5/15/21 | | | | Aaa | | | | 5,851,571 | |
Portfolio of Investments
Nuveen Intermediate Term Bond Fund (continued)
June 30, 2012
| | | | | | | | | | | | | | | | | | | | |
Principal
Amount (000) | | | Description (1) | | Coupon | | | Maturity | | | Ratings (2) | | | Value | |
| | | | | | | | | | | | | | | | | | | | |
| | | | U.S. GOVERNMENT AND AGENCY OBLIGATIONS (continued) | | | | | | | | | | | | | | | | |
| | | | | |
| $ | 7,285 | | | U.S. Treasury Notes | | | 2.000% | | | | 11/15/21 | | | | Aaa | | | $ | 7,553,066 | |
| | | | | |
| | 3,000 | | | U.S. Treasury Notes | | | 2.000% | | | | 2/15/22 | | | | Aaa | | | | 3,101,016 | |
| | | | | |
| | 1,000 | | | U.S. Treasury Notes, (3) | | | 1.750% | | | | 5/15/22 | | | | Aaa | | | | 1,008,124 | |
| $ | 82,730 | | | Total U.S. Government and Agency Obligations (cost $83,080,692) | | | | | | | | | | | | | | | 86,346,051 | |
| | | | | |
Principal
Amount (000) | | | Description (1) | | Coupon | | | Maturity | | | Ratings (2) | | | Value | |
| | | | ASSET-BACKED AND MORTGAGE-BACKED SECURITIES – 49.3% | | | | | | | | | | | | | | | | |
| | | | | |
| $ | 1,982 | | | 321 Henderson Receivables LLC, Series 2010-3A | | | 3.820% | | | | 12/15/48 | | | | Aaa | | | $ | 2,018,688 | |
| | | | | |
| | 2,955 | | | American Home Mortgage Advance Trust, Revovling Pool Receivables, Series SART-3 | | | 3.720% | | | | 3/13/44 | | | | AAA | | | | 2,962,388 | |
| | | | | |
| | 4,041 | | | American Homes Mortgage Advance Trust, Series 2011-SART-1 A2 | | | 3.370% | | | | 5/10/43 | | | | AAA | | | | 4,088,280 | |
| | | | | |
| | 4,415 | | | AmeriCold LLC Trust, Series 2010 | | | 2.500% | | | | 1/17/29 | | | | AAA | | | | 4,466,271 | |
| | | | | |
| | 7 | | | Amresco Residential Securities Corporation, Mortgage Loan Pass-Through Certificates, Serioes 1997-3 | | | 6.960% | | | | 3/25/27 | | | | A1 | | | | 6,602 | |
| | | | | |
| | 3,570 | | | Arkle Master Issuer PLC, Mortgage Asset Backed Instrument, Series 2010-1A | | | 1.616% | | | | 5/17/60 | | | | AAA | | | | 3,575,976 | |
| | | | | |
| | 4,340 | | | Cabela’s Master Credit Card Trust, Series 2010-2A | | | 2.290% | | | | 9/17/18 | | | | AAA | | | | 4,515,652 | |
| | | | | |
| | 575 | | | Citigroup Commercial Mortgage Securities Trust, Commercial Mortgage Pass-Through Certificates, Series 2007-CD4, (3) | | | 5.205% | | | | 12/11/49 | | | | AAA | | | | 584,151 | |
| | | | | |
| | 2,430 | | | Commercial Mortgage Pass-Through Certificates, Series2006-CN2A | | | 5.449% | | | | 2/05/19 | | | | AAA | | | | 2,420,231 | |
| | | | | |
| | 4 | | | ContiMortgage Home Equity Loan Trust, Series 1997-2 | | | 7.090% | | | | 4/15/28 | | | | AAA | | | | 3,711 | |
| | | | | |
| | 476 | | | DT Auto Owner Trust 2011-2A | | | 0.960% | | | | 1/15/14 | | | | AAA | | | | 475,708 | |
| | | | | |
| | 7,080 | | | Extended Stay America Trust 2010-EHSA | | | 2.951% | | | | 11/05/27 | | | | AAA | | | | 7,132,394 | |
| | | | | |
| | 6,038 | | | Fannie Mae Mortgage Pool AB2085 | | | 4.000% | | | | 1/01/41 | | | | Aaa | | | | 6,436,888 | |
| | | | | |
| | 7,439 | | | Fannie Mae Mortgage Pool AB3194 | | | 4.500% | | | | 6/01/41 | | | | Aaa | | | | 8,019,675 | |
| | | | | |
| | 2,232 | | | Fannie Mae Mortgage Pool AD0706 | | | 2.306% | | | | 3/01/38 | | | | Aaa | | | | 2,366,363 | |
| | | | | |
| | 6,038 | | | Fannie Mae Mortgage Pool AD1593, (WI/DD) | | | 4.500% | | | | 2/01/40 | | | | Aaa | | | | 6,498,373 | |
| | | | | |
| | 2,618 | | | Fannie Mae Mortgage Pool AE0058 | | | 2.347% | | | | 7/01/36 | | | | Aaa | | | | 2,775,528 | |
| | | | | |
| | 9,446 | | | Fannie Mae Mortgage Pool AE0981 | | | 3.500% | | | | 3/01/41 | | | | Aaa | | | | 9,938,229 | |
| | | | | |
| | 2,052 | | | Fannie Mae Mortgage Pool AH3804 | | | 4.000% | | | | 2/01/41 | | | | Aaa | | | | 2,187,519 | |
| | | | | |
| | 6,092 | | | Fannie Mae Mortgage Pool AH5575 | | | 4.000% | | | | 2/01/41 | | | | Aaa | | | | 6,494,063 | |
| | | | | |
| | 2,796 | | | Fannie Mae Mortgage Pool AH5583, (WI/DD) | | | 4.500% | | | | 2/01/41 | | | | Aaa | | | | 3,014,686 | |
| | | | | |
| | 6,117 | | | Fannie Mae Mortgage Pool AH8954 | | | 4.000% | | | | 4/01/41 | | | | Aaa | | | | 6,522,303 | |
| | | | | |
| | 4,861 | | | Fannie Mae Mortgage Pool AJ4052 | | | 4.000% | | | | 10/01/41 | | | | Aaa | | | | 5,182,881 | |
| | | | | |
| | 9,583 | | | Fannie Mae Mortgage Pool AJ5303 | | | 4.000% | | | | 11/01/41 | | | | Aaa | | | | 10,218,238 | |
| | | | | |
| | 7,458 | | | Fannie Mae Mortgage Pool AJ7547 | | | 4.000% | | | | 1/01/42 | | | | Aaa | | | | 7,952,055 | |
| | | | | |
| | 3,310 | | | Fannie Mae Mortgage Pool AL0160, (WI/DD) | | | 4.500% | | | | 5/01/41 | | | | Aaa | | | | 3,562,242 | |
| | | | | |
| | 8,055 | | | Fannie Mae Mortgage Pool AL1597 | | | 6.000% | | | | 7/01/40 | | | | Aaa | | | | 8,876,348 | |
| | | | | |
| | 8,922 | | | Fannie Mae Mortgage Pool AO9636, (WI/DD) | | | 2.500% | | | | 7/01/27 | | | | Aaa | | | | 9,210,594 | |
| | | | | |
| | 6,274 | | | Fannie Mae Mortgage Pool MA1028 | | | 4.000% | | | | 4/01/42 | | | | Aaa | | | | 6,721,245 | |
| | | | | |
| | 5,749 | | | Fannie Mae Mortgage Pool 256101 | | | 5.500% | | | | 2/01/36 | | | | Aaa | | | | 6,305,858 | |
| | | | | |
| | 805 | | | Fannie Mae Mortgage Pool 725111 | | | 2.335% | | | | 9/01/33 | | | | Aaa | | | | 858,362 | |
| | | | | |
| | 2,900 | | | Fannie Mae Mortgage Pool 725205 | | | 5.000% | | | | 3/01/34 | | | | Aaa | | | | 3,155,264 | |
| | | | | |
| | 3,176 | | | Fannie Mae Mortgage Pool 725250 | | | 5.000% | | | | 3/01/34 | | | | Aaa | | | | 3,456,103 | |
| | | | | |
| | 5,180 | | | Fannie Mae Mortgage Pool 735402, (WI/DD) | | | 5.000% | | | | 4/01/35 | | | | Aaa | | | | 5,649,050 | |
| | | | | |
| | 3,504 | | | Fannie Mae Mortgage Pool 819652 | | | 2.899% | | | | 3/01/35 | | | | Aaa | | | | 3,742,911 | |
| | | | | | | | | | | | | | | | | | | | |
Principal
Amount (000) | | | Description (1) | | Coupon | | | Maturity | | | Ratings (2) | | | Value | |
| | | | | | | | | | | | | | | | | | | | |
| | | | ASSET-BACKED AND MORTGAGE-BACKED SECURITIES (continued) | | | | | | | | | |
| | | | | |
| $ | 494 | | | Fannie Mae Mortgage Pool 848390 | | | 1.944% | | | | 12/01/35 | | | | Aaa | | | $ | 512,170 | |
| | | | | |
| | 3,588 | | | Fannie Mae Mortgage Pool 879906 | | | 2.676% | | | | 10/01/33 | | | | Aaa | | | | 3,827,749 | |
| | | | | |
| | 1,205 | | | Fannie Mae Mortgage Pool 886034 | | | 2.635% | | | | 7/01/36 | | | | Aaa | | | | 1,278,367 | |
| | | | | |
| | 5,004 | | | Fannie Mae Mortgage Pool 960605, (WI/DD) | | | 5.000% | | | | 8/01/37 | | | | Aaa | | | | 5,442,257 | |
| | | | | |
| | 7,408 | | | Fannie Mae Mortgage Pool 995838 | | | 5.500% | | | | 5/01/39 | | | | Aaa | | | | 8,084,500 | |
| | | | | |
| | 1,001 | | | Fannie Mae Mortgage Pool 995949 | | | 2.468% | | | | 9/01/36 | | | | Aaa | | | | 1,054,622 | |
| | | | | |
| | 9 | | | Fannie Mae Real Estate Mortgage Investment Conduit, Pass Through Certificates 1990-89 K | | | 6.500% | | | | 7/25/20 | | | | Aaa | | | | 9,557 | |
| | | | | |
| | 822 | | | Fannie Mae Real Estate Mortgage Investment Conduit, Pass Through Certificates 2003-30 AE | | | 3.900% | | | | 10/25/17 | | | | Aaa | | | | 827,756 | |
| | | | | |
| | 2,151 | | | Fannie Mae Real Estate Mortgage Investment Conduit, Pass Through Certificates 2003-52 NF | | | 0.645% | | | | 6/25/23 | | | | Aaa | | | | 2,156,702 | |
| | | | | |
| | 1,920 | | | Fannie Mae TBA Mortgage Pool, (WI/DD) | | | 4.000% | | | | TBA | | | | Aaa | | | | 2,043,300 | |
| | | | | |
| | 1,040 | | | Fannie Mae TBA Mortgage Pool, (WI/DD) | | | 4.500% | | | | TBA | | | | Aaa | | | | 1,115,562 | |
| | | | | |
| | 6,100 | | | Fannie Mae TBA Mortgage Pool, (WI/DD) | | | 5.500% | | | | TBA | | | | Aaa | | | | 6,653,765 | |
| | | | | |
| | 9 | | | Federal Home Loan Mortgage Corporation, REMIC 1167 E | | | 7.500% | | | | 11/15/21 | | | | Aaa | | | | 10,719 | |
| | | | | |
| | 25 | | | Federal Home Loan Mortgage Corporation, REMIC 1286 A | | | 6.000% | | | | 5/15/22 | | | | Aaa | | | | 26,968 | |
| | | | | |
| | 2,994 | | | Federal Home Loan Mortgage Corporation, REMIC 2750 HE | | | 5.000% | | | | 2/15/19 | | | | Aaa | | | | 3,206,171 | |
| | | | | |
| | 140 | | | Federal Home Loan Mortgage Corporation, REMIC 2795 CL | | | 4.500% | | | | 7/15/17 | | | | Aaa | | | | 139,649 | |
| | | | | |
| | 1,437 | | | Federal Home Loan Mortgage Corporation, REMIC 2863 HF | | | 0.742% | | | | 2/15/19 | | | | Aaa | | | | 1,443,063 | |
| | | | | |
| | 1,334 | | | Federal Home Loan Mortgage Corporation, REMIC 2755 FO | | | 0.692% | | | | 4/15/32 | | | | Aaa | | | | 1,335,185 | |
| | | | | |
| | 1,386 | | | Federal Home Loan Mortgage Corporation, REMIC 3555 DA | | | 4.000% | | | | 12/15/14 | | | | Aaa | | | | 1,401,415 | |
| | | | | |
| | 982 | | | Federal Home Loan Mortgage Corporation, REMIC 3555 EA | | | 4.000% | | | | 12/15/14 | | | | Aaa | | | | 992,669 | |
| | | | | |
| | 2,465 | | | Fieldstone Mortgage Investment Trust, Mortgage Backed Notes, Series 2005-1 | | | 1.319% | | | | 3/25/35 | | | | A+ | | | | 2,183,647 | |
| | | | | |
| | 2,835 | | | Fosse Master Issuer PLC, Residential Mortgage Pool, Series 2011-1A | | | 1.866% | | | | 10/19/54 | | | | AAA | | | | 2,850,561 | |
| | | | | |
| | 6,160 | | | Freddie Mac Gold Pool C09000, (WI/DD) | | | 3.500% | | | | 6/01/42 | | | | Aaa | | | | 6,469,527 | |
| | | | | |
| | 5,775 | | | Freddie Mac Gold Pool G05852 | | | 5.500% | | | | 3/01/39 | | | | Aaa | | | | 6,278,210 | |
| | | | | |
| | 4,775 | | | Freddie Mac Gold Pool Q03085, (WI/DD) | | | 4.000% | | | | 9/01/41 | | | | Aaa | | | | 5,076,896 | |
| | | | | |
| | 539 | | | Freddie Mac Gold Pool 786281 | | | 2.489% | | | | 1/01/28 | | | | Aaa | | | | 576,029 | |
| | | | | |
| | 519 | | | Freddie Mac Gold Pool 847161 | | | 2.344% | | | | 5/01/31 | | | | Aaa | | | | 552,696 | |
| | | | | |
| | 588 | | | Freddie Mac Gold Pool 847190 | | | 2.289% | | | | 4/01/29 | | | | Aaa | | | | 625,510 | |
| | | | | |
| | 1,828 | | | Freddie Mac Gold Pool 847209 | | | 2.273% | | | | 10/01/30 | | | | Aaa | | | | 1,937,752 | |
| | | | | |
| | 1,406 | | | Freddie Mac Gold Pool 847210 | | | 2.333% | | | | 9/01/33 | | | | Aaa | | | | 1,495,345 | |
| | | | | |
| | 2,647 | | | Freddie Mac Gold Pool 848282 | | | 2.430% | | | | 6/01/38 | | | | Aaa | | | | 2,795,120 | |
| | | | | |
| | 3,224 | | | Freddie Mac Structured Pass-Through Certificates 2002 Series T-47 | | | 4.159% | | | | 8/27/12 | | | | Aaa | | | | 3,225,656 | |
| | | | | |
| | 1,581 | | | Goldman Sachs Mortgage Securities Corporation II, Commercial Mortgage Pass-Through Certificates, Series 2006-GG6 | | | 5.506% | | | | 4/10/38 | | | | AAA | | | | 1,586,725 | |
| | | | | |
| | 5,693 | | | Goldman Sachs Mortgage Securities Corporation II, Commercial Mortgage Pass-Through Certificates, Series 2010-C1 | | | 3.679% | | | | 8/12/43 | | | | Aaa | | | | 6,091,204 | |
| | | | | |
| | 6,000 | | | Government National Mortgage Association Pool AA5391, (WI/DD) | | | 3.500% | | | | 6/15/42 | | | | Aaa | | | | 6,427,661 | |
| | | | | |
| | 3,750 | | | GraceChurch Card PLC. Series 2012-1A. | | | 0.942% | | | | 2/15/17 | | | | AAA | | | | 3,749,014 | |
| | | | | |
| | 89 | | | Green Tree Fiancial Manufactured Housing Loans, Series 2008-MH1 | | | 7.000% | | | | 4/25/38 | | | | AAA | | | | 89,634 | |
| | | | | |
| | 30 | | | Green Tree Financial Corporation, Manufactured Housing Contract Pass Through Certificates, Series 1996-9 | | | 7.200% | | | | 8/15/27 | | | | AAA | | | | 31,358 | |
| | | | | |
| | 5,000 | | | Hertz Vehicle Financing LLC Series 2009 | | | 4.260% | | | | 3/25/14 | | | | Aaa | | | | 5,090,104 | |
| | | | | |
| | 3,672 | | | JPMorgan Chase Commercial Mortgage Securities Corporation, Commercial Mortgage Pass-Through Certificates,
Series 2010-C2 A1 | | | 2.749% | | | | 11/15/43 | | | | AAA | | | | 3,796,433 | |
Portfolio of Investments
Nuveen Intermediate Term Bond Fund (continued)
June 30, 2012
| | | | | | | | | | | | | | | | | | | | |
Principal
Amount (000) | | | Description (1) | | Coupon | | | Maturity | | | Ratings (2) | | | Value | |
| | | | | | | | | | | | | | | | | | | | |
| | | | ASSET-BACKED AND MORTGAGE-BACKED SECURITIES (continued) | | | | | | | | | |
| | | | | |
| $ | 2,462 | | | Mortgage Equity Conversion Asset Trust 2010-1A | | | 4.000% | | | | 7/25/60 | | | | AA | | | $ | 2,363,744 | |
| | | | | |
| | 3,200 | | | OBP Depositor LLC Trust, Commercial Mortgage Pass Through Certificates, Series 2010-OBP | | | 4.646% | | | | 7/15/45 | | | | AAA | | | | 3,653,238 | |
| | | | | |
| | 1,960 | | | Ocwen Advance Receivables Backed Notes, Series 2009-3A | | | 4.140% | | | | 7/15/23 | | | | AAA | | | | 1,962,450 | |
| | | | | |
| | 152 | | | RBSSP Resecuritization Trust 2009-11 | | | 1.995% | | | | 12/26/37 | | | | Aa3 | | | | 152,133 | |
| | | | | |
| | 227 | | | RBSSP Resecuritization Trust 2009-8 | | | 0.385% | | | | 3/26/37 | | | | Aaa | | | | 223,958 | |
| | | | | |
| | 2,075 | | | RBSSP Resecuritization Trust 2010-10 | | | 0.375% | | | | 9/26/36 | | | | N/R | | | | 1,804,911 | |
| | | | | |
| | 3,534 | | | RBSSP Resecuritization Trust 2010-4 | | | 0.355% | | | | 3/26/36 | | | | A | | | | 3,302,318 | |
| | | | | |
| | 1,681 | | | RBSSP Resecuritization Trust 2010-8 | | | 0.575% | | | | 7/26/36 | | | | N/R | | | | 1,592,258 | |
| | | | | |
| | 2,590 | | | Renaissance Home Equity Loan Trust I, Home Equity Loan Asset-Backed Notes, Series 2005-3 | | | 5.140% | | | | 11/25/35 | | | | AA+ | | | | 1,867,030 | |
| | | | | |
| | 1,733 | | | Sequoia Mortgage Trust, Mortgage Pass Through Certificates, Series 2011-1 | | | 4.125% | | | | 2/25/41 | | | | AAA | | | | 1,770,468 | |
| | | | | |
| | 6,134 | | | SMART Trust, Asset Backed Securities, Series 2011-1USA | | | 1.091% | | | | 10/14/14 | | | | Aaa | | | | 6,144,449 | |
| | | | | |
| | 220 | | | Structured Adjustable Rate Mortgage Loan Trust, Mortgage Pass-Through Certificates, Series 2004-11 | | | 2.877% | | | | 8/25/34 | | | | Baa2 | | | | 209,059 | |
| | | | | |
| | 1,229 | | | U.S. Small Business Administration Guaranteed Participating Securities Participation Certificates, Series 2006-10A | | | 5.408% | | | | 2/10/16 | | | | Aaa | | | | 1,333,810 | |
| | | | | |
| | 5,111 | | | U.S. Small Business Administration Guranteed Participating Securities, Partificpation Certificates, Series 2010-P10B | | | 3.215% | | | | 9/10/20 | | | | Aaa | | | | 5,269,082 | |
| | | | | |
| | 4,649 | | | United States Department of Veterans, Affairs, Guaranteed REMIC Pass-Through Certificates, Vendee Mortgage Trust, Series 2011-1 | | | 3.750% | | | | 2/15/35 | | | | Aaa | | | | 4,972,886 | |
| | | | | |
| | 381 | | | Vericrest Opportunity Loan Transferee, Series 2011-NL2A | | | 5.682% | | | | 6/25/51 | | | | Baa2 | | | | 381,556 | |
| | | | | |
| | 6,000 | | | Vornado DP LLC Commercial Mortgage Credit Tenant Lease Series 2010-VNO | | | 4.004% | | | | 9/13/28 | | | | AAA | | | | 6,533,976 | |
| | | | | |
| | 1,510 | | | Wachovia Bank Commercial Mortgage Trust, Commercial Mortgage Pass-Through Certificates, Series 2007-WHl8 | | | 0.322% | | | | 6/15/20 | | | | Aaa | | | | 1,405,465 | |
| | | | | |
| | 4,000 | | | Walter Investment Management Company Capital Trust, Series 2012-AA, (WI/DD) | | | 4.549% | | | | 10/15/50 | | | | BBB | | | | 4,008,750 | |
| | | | | |
| | 759 | | | Wells Fargo Mortgage Backed Securities Trust, Mortgage Pass-Through Certificate Series 2003-J | | | 4.434% | | | | 10/25/33 | | | | AAA | | | | 761,788 | |
| | | | | |
| | 3,220 | | | Wells Fargo-RBS Commercial Mortgage Trust, Commercial Mortgage Pass-Through Certificates, Series 2011-C3 | | | 4.375% | | | | 3/17/44 | | | | Aaa | | | | 3,534,663 | |
| $ | 302,972 | | | Total Asset-Backed and Mortgage-Backed Securities (cost $312,926,500) | | | | | | | | | | | | 317,134,050 | |
| | | | | |
Principal
Amount (000) | | | Description (1) | | Coupon | | | Maturity | | | Ratings (2) | | | Value | |
| | | | SOVEREIGN DEBT – 0.2% | | | | | | | | | | | | | | | | |
| | | | | |
| | | | Mexico – 0.2% | | | | | | | | | | | | | | | | |
| | | | | |
| $ | 1,400 | | | United Mexican States | | | 5.625% | | | | 1/15/17 | | | | Baa1 | | | $ | 1,629,250 | |
| $ | 1,400 | | | Total Sovereign Debt (cost $1,387,694) | | | | | | | | | | | | | | | 1,629,250 | |
| | | | | |
| Shares | | | Description (1) | | | | | | | | | | | Value | |
| | | | INVESTMENTS PURCHASED WITH COLLATERAL FROM SECURITIES LENDING – 11.5% | | | | | | | | | |
| | | | | |
| | | | Money Market Funds – 11.5% | | | | | | | | | | | | | | | | |
| | | | | |
| | 74,365,907 | | | Mount Vernon Securities Lending Prime Portfolio, 0.197% (5), (6) | | | | | | | | | | | | | | $ | 74,365,907 | |
| | | | Total Investments Purchased with Collateral from Securities Lending (cost $74,365,907) | | | | | | | | 74,365,907 | |
| | | | | | | | | | | | | | | | | | | | |
Shares/
Principal
Amount (000) | | | Description (1) | | Coupon | | | Maturity | | | Ratings (2) | | | Value | |
| | | | | | | | | | | | | | | | | | | | |
| | | | SHORT-TERM INVESTMENTS – 10.1% | | | | | | | | | | | | | | | | |
| | | | | |
| | | | Money Market Funds – 9.7% | | | | | | | | | | | | | | | | |
| | | | | |
| | 62,484,880 | | | First American Treasury Obligations Fund, Class Z | | | 0.000% (5) | | | | N/A | | | | N/A | | | $ | 62,484,880 | |
| | | | U.S. Government and Agency Obligations – 0.4% | | | | | | | | | | | | | | | | |
| | | | | |
| $ | 640 | | | U.S. Treasury Bills, (7) | | | 0.330% | | | | 7/26/12 | | | | Aaa | | | | 639,984 | |
| | | | | |
| | 845 | | | U.S. Treasury Bills, (7) | | | 0.158% | | | | 2/07/13 | | | | Aaa | | | | 844,174 | |
| | | | | |
| | 950 | | | U.S. Treasury Bills, (7) | | | 0.158% | | | | 3/07/13 | | | | Aaa | | | | 948,938 | |
| | | | | |
| $ | 2,435 | | | Total U.S. Government and Agency Obligations | | | | | | | | | | | | | | | 2,433,096 | |
| | | | Total Short-Term Investments (cost $64,917,997) | | | | | | | | | | | | | | | 64,917,976 | |
| | | | Total Investments (cost $756,460,987) – 120.7% | | | | | | | | | | | | | | | 777,295,112 | |
| | | | Other Assets Less Liabilities – (20.7)% (8) | | | | | | | | | | | | | | | (133,399,070) | |
| | | | Net Assets – 100% | | | | | | | | | | | | | | $ | 643,896,042 | |
Investments in Derivatives at June 30, 2012
Interest Rate Swaps outstanding:
| | | | | | | | | | | | | | | | | | | | | | | | | | | | | | | | |
| Counterparty | | Notional
Amount | | | Fund
Pay/Receive
Floating Rate | | | Floating
Rate Index | | | Fixed Rate* | | | Fixed Rate
Payment
Frequency | | | Termination
Date | | | Value | | | Unrealized
Appreciation
(Depreciation) (8) | |
JPMorgan | | $ | 17,000,000 | | | | Receive | | | | 3-Month USD-LIBOR | | | | 0.641 | % | | | Semi-Annually | | | | 1/12/14 | | | $ | (63,146 | ) | | $ | (63,146 | ) |
JPMorgan | | | 5,000,000 | | | | Receive | | | | 3-Month USD-LIBOR | | | | 3.858 | | | | Semi-Annually | | | | 1/19/20 | | | | (966,679 | ) | | | (966,679 | ) |
UBS | | | 8,000,000 | | | | Receive | | | | 3-Month USD-LIBOR | | | | 3.001 | | | | Semi-Annually | | | | 8/03/14 | | | | (501,039 | ) | | | (501,039 | ) |
| | | | | | | | | | | | | | | | | | | | | | | | | | | | | | | $ | (1,530,864 | ) |
Future Contracts outstanding:
| | | | | | | | | | | | | | | | | | | | |
| Type | | Contract
Position | | | Number of
Contracts | | | Contract
Expiration | | | Value | | | Unrealized
Appreciation
(Depreciation) | |
U.S. Treasury 2-Year Note | | | Long | | | | 557 | | | | 9/12 | | | $ | 122,644,438 | | | $ | (60,073 | ) |
U.S. Treasury 5-Year Note | | | Long | | | | 150 | | | | 9/12 | | | | 18,595,313 | | | | 2,778 | |
U.S. Treasury 10-Year Note | | | Short | | | | (38 | ) | | | 9/12 | | | | (5,068,250 | ) | | | 19,130 | |
U.S. Treasury Long Bond | | | Long | | | | 102 | | | | 9/12 | | | | 15,092,813 | | | | 43,905 | |
U.S. Treasury Ultra Bond | | | Long | | | | 38 | | | | 9/12 | | | | 6,340,063 | | | | (42,894 | ) |
| | | | | | | | | | | | | | | | | | | $ | (37,154 | ) |
Portfolio of Investments
Nuveen Intermediate Term Bond Fund (continued)
June 30, 2012
| | | | For Fund portfolio compliance purposes, the Fund’s industry classifications refer to any one or more of the industry sub-classifications used by one or more widely recognized market indexes or ratings group indexes, and/or as defined by Fund management. This definition may not apply for purposes of this report, which may combine industry sub-classifications into sectors for reporting ease. |
| | (1) | | All Percentages shown in the Portfolio of Investments are based on net assets. |
| | (2) | | Ratings (not covered by the report of independent registered public accounting firm): Using the highest of Standard & Poor’s Group (“Standard & Poor’s”), Moody’s Investors Service, Inc. (“Moody’s”) or Fitch, Inc. (“Fitch”) rating. Ratings below BBB by Standard & Poor’s, Baa by Moody’s or BBB by Fitch are considered to be below investment grade. Holdings designated N/R are not rated by any of these national rating agencies. |
| | (3) | | Investment, or a portion of investment, is out on loan for securities lending. |
| | (4) | | Optional Call Provisions (not covered by the report of independent registered public accounting firm): Dates (month and year) and prices of the earliest optional call or redemption. There may be other call provisions at varying prices at later dates. |
| | (5) | | The rate shown is the annualized seven-day effective yield as of June 30, 2012. |
| | (6) | | The Fund may loan securities representing up to one third of the fair value of its total assets (which includes collateral for securities on loan) to broker-dealers, banks and other institutions. The Fund maintains collateral equal to at least 100% of the fair value of the securities loaned. The cash collateral received by the Fund is invested in this money market fund. See Notes to Financial Statements, Footnote 1 – General Information and Significant Accounting Policies, Securities Lending for more information. |
| | (7) | | Investment, or portion of investment, segregated as collateral for investments in derivatives. |
| | (8) | | Other Assets Less Liabilities, includes the Unrealized Appreciation (Depreciation) of derivative instruments as noted within Investments in Derivatives at June 30, 2012. |
| | TBA | | To be announced. Maturity date not known prior to settlement of this transaction. |
| | WI/DD | | Investment, or portion of investment, purchased on a when-issued or delayed delivery basis. |
| | 144A | | Investment is exempt from registration under Rule 144A of the Securities Act of 1933, as amended. These investments may only be resold in transactions exempt from registration, which are normally those transactions with qualified institutional buyers. |
| | USD-LIBOR | | United States Dollar–London Inter-Bank Offered Rate. |
See accompanying notes to financial statements.
Portfolio of Investments
Nuveen Short Term Bond Fund
June 30, 2012
| | | | | | | | | | | | | | | | | | | | |
Principal
Amount (000) | | | Description (1) | | Coupon | | | Maturity | | | Ratings (2) | | | Value | |
| | | | | | | | | | | | | | | | | | | | |
| | | | CORPORATE BONDS – 46.9% | | | | | | | | | | | | | | | | |
| | | | | |
| | | | Airlines – 1.2% | | | | | | | | | | | | | | | | |
| | | | | |
| $ | 2,540 | | | Delta Air Lines Pass Through Certificates Series 2012-1A | | | 4.750% | | | | 5/07/20 | | | | A– | | | $ | 2,571,750 | |
| | | | | |
| | 2,509 | | | Delta Airlines, (3) | | | 5.300% | | | | 4/15/19 | | | | A– | | | | 2,678,157 | |
| | | | | |
| | 2,000 | | | JetBlue Airways Pass Through Trust, Series 2004-1 | | | 0.888% | | | | 3/15/14 | | | | BB+ | | | | 1,910,000 | |
| | | | | |
| | 1,998 | | | United Airlines Inc., 144A | | | 9.875% | | | | 8/01/13 | | | | BB | | | | 2,060,438 | |
| | | | | |
| | 1,562 | | | US Airways Pass Through Trust, Pass Through Certificates, Series 2001 | | | 7.076% | | | | 3/20/21 | | | | BB | | | | 1,596,841 | |
| | 10,609 | | | Total Airlines | | | | | | | | | | | | | | | 10,817,186 | |
| | | | Auto Components – 0.3% | | | | | | | | | | | | | | | | |
| | | | | |
| | 1,500 | | | Pittsburgh Glass Works LLC, 144A, (3) | | | 8.500% | | | | 4/15/16 | | | | B+ | | | | 1,380,000 | |
| | | | | |
| | 1,300 | | | TRW Automotive Inc., 144A | | | 8.875% | | | | 12/01/17 | | | | BBB– | | | | 1,433,250 | |
| | 2,800 | | | Total Auto Components | | | | | | | | | | | | | | | 2,813,250 | |
| | | | Automobiles – 0.8% | | | | | | | | | | | | | | | | |
| | | | | |
| | 400 | | | Chrysler GP/CG Company, (3) | | | 8.000% | | | | 6/15/19 | | | | B | | | | 411,000 | |
| | | | | |
| | 2,840 | | | Daimler Finance NA LLC, 144A | | | 2.300% | | | | 1/09/15 | | | | A– | | | | 2,897,618 | |
| | | | | |
| | 3,360 | | | Volkswagen International Finance NV, 144A | | | 1.625% | | | | 3/22/15 | | | | A– | | | | 3,371,639 | |
| | 6,600 | | | Total Automobiles | | | | | | | | | | | | | | | 6,680,257 | |
| | | | Beverages – 1.0% | | | | | | | | | | | | | | | | |
| | | | | |
| | 2,235 | | | Anheuser-Busch Companies Inc. | | | 5.050% | | | | 10/15/16 | | | | A | | | | 2,547,462 | |
| | | | | |
| | 1,500 | | | Constellation Brands Inc. | | | 8.375% | | | | 12/15/14 | | | | BB+ | | | | 1,702,500 | |
| | | | | |
| | 2,560 | | | Dr. Pepper Snapple Group Inc. | | | 2.900% | | | | 1/15/16 | | | | Baa1 | | | | 2,680,804 | |
| | | | | |
| | 1,445 | | | SABMiller Holdings Inc., 144A, (3) | | | 1.850% | | | | 1/15/15 | | | | BBB+ | | | | 1,465,637 | |
| | 7,740 | | | Total Beverages | | | | | | | | | | | | | | | 8,396,403 | |
| | | | Biotechnology – 0.2% | | | | | | | | | | | | | | | | |
| | | | | |
| | 2,000 | | | Genentech Inc. | | | 4.750% | | | | 7/15/15 | | | | AA– | | | | 2,210,234 | |
| | | | Building Products – 0.3% | | | | | | | | | | | | | | | | |
| | | | | |
| | 750 | | | Hanson Limted | | | 6.125% | | | | 8/15/16 | | | | BB | | | | 798,750 | |
| | | | | |
| | 2,000 | | | Masco Corporation, (3) | | | 6.125% | | | | 10/03/16 | | | | BBB– | | | | 2,134,400 | |
| | 2,750 | | | Total Building Products | | | | | | | | | | | | | | | 2,933,150 | |
| | | | Capital Markets – 3.9% | | | | | | | | | | | | | | | | |
| | | | | |
| | 1,225 | | | Credit Suisse New York, (3) | | | 5.500% | | | | 5/01/14 | | | | A+ | | | | 1,298,678 | |
| | | | | |
| | 920 | | | Deutsche Bank London | | | 4.875% | | | | 5/20/13 | | | | A+ | | | | 947,225 | |
| | | | | |
| | 2,000 | | | Deutsche Bank London | | | 3.875% | | | | 8/18/14 | | | | A+ | | | | 2,082,236 | |
| | | | | |
| | 2,000 | | | E Trade Financial Corporation | | | 6.750% | | | | 6/01/16 | | | | B2 | | | | 2,035,000 | |
| | | | | |
| | 4,640 | | | Goldman Sachs Group, Inc. | | | 1.527% | | | | 2/07/14 | | | | A | | | | 4,584,557 | |
| | | | | |
| | 9,125 | | | Goldman Sachs Group, Inc. | | | 3.700% | | | | 8/01/15 | | | | A | | | | 9,205,638 | |
| | | | | |
| | 4,000 | | | Morgan Stanley | | | 2.161% | | | | 1/24/14 | | | | A | | | | 3,887,880 | |
| | | | | |
| | 2,645 | | | Morgan Stanley | | | 4.100% | | | | 1/26/15 | | | | A | | | | 2,630,103 | |
| | | | | |
| | 2,650 | | | UBS AG Stamford | | | 2.250% | | | | 8/12/13 | | | | Aa3 | | | | 2,658,146 | |
| | | | | |
| | 3,875 | | | UBS AG Stamford | | | 1.553% | | | | 1/28/14 | | | | Aa3 | | | | 3,853,734 | |
| | | | | |
| | 1,000 | | | UBS AG Stamford | | | 3.875% | | | | 1/15/15 | | | | Aa3 | | | | 1,033,374 | |
| | 34,080 | | | Total Capital Markets | | | | | | | | | | | | | | | 34,216,571 | |
| | | | Chemicals – 1.1% | | | | | | | | | | | | | | | | |
| | | | | |
| | 2,000 | | | Dow Chemical Company, (3) | | | 2.500% | | | | 2/15/16 | | | | BBB | | | | 2,054,304 | |
| | | | | |
| | 3,275 | | | Huntsman International LLC, (3) | | | 5.500% | | | | 6/30/16 | | | | BB– | | | | 3,275,000 | |
Portfolio of Investments
Nuveen Short Term Bond Fund (continued)
June 30, 2012
| | | | | | | | | | | | | | | | | | | | |
Principal
Amount (000) | | | Description (1) | | Coupon | | | Maturity | | | Ratings (2) | | | Value | |
| | | | | | | | | | | | | | | | | | | | |
| | | | Chemicals (continued) | | | | | | | | | | | | | | | | |
| | | | | |
| $ | 2,000 | | | Ineos Finance PLC, 144A | | | 9.000% | | | | 5/15/15 | | | | B+ | | | $ | 2,110,000 | |
| | | | | |
| | 1,875 | | | Potash Corporation of Saskatchewan | | | 3.750% | | | | 9/30/15 | | | | A– | | | | 2,006,914 | |
| | 9,150 | | | Total Chemicals | | | | | | | | | | | | | | | 9,446,218 | |
| | | | Commercial Banks – 6.7% | | | | | | | | | | | | | | | | |
| | | | | |
| | 5,000 | | | Australia and New Zealand Banking Group Limited, 144A, (3) | | | 2.400% | | | | 11/23/16 | | | | Aaa | | | | 5,119,555 | |
| | | | | |
| | 800 | | | Banco do Nordeste do Brasil, 144A, (3) | | | 3.625% | | | | 11/09/15 | | | | BBB | | | | 808,000 | |
| | | | | |
| | 6,180 | | | Bank of Montreal, 144A, (3) | | | 1.300% | | | | 10/31/14 | | | | AAA | | | | 6,263,622 | |
| | | | | |
| | 3,615 | | | Barlcays Bank PLC | | | 5.000% | | | | 9/22/16 | | | | A+ | | | | 3,925,745 | |
| | | | | |
| | 2,315 | | | BB&T Corporation | | | 3.200% | | | | 3/15/16 | | | | A+ | | | | 2,450,321 | |
| | | | | |
| | 1,300 | | | BBVA Bancomer SA Texas, 144A | | | 4.500% | | | | 3/10/16 | | | | A2 | | | | 1,306,500 | |
| | | | | |
| | 2,780 | | | BNP Paribas, (3) | | | 3.600% | | | | 2/23/16 | | | | AA– | | | | 2,811,967 | |
| | | | | |
| | 2,000 | | | CIT Group Inc., 144A, (3) | | | 4.750% | | | | 2/15/15 | | | | BB– | | | | 2,047,500 | |
| | | | | |
| | 2,015 | | | Fifth Third Bancorp. | | | 6.250% | | | | 5/01/13 | | | | A– | | | | 2,098,685 | |
| | | | | |
| | 1,550 | | | Fifth Third Bancorp. | | | 3.625% | | | | 1/25/16 | | | | A– | | | | 1,634,870 | |
| | | | | |
| | 1,500 | | | ING Bank NV, 144A | | | 3.750% | | | | 3/07/17 | | | | A+ | | | | 1,492,964 | |
| | | | | |
| | 1,245 | | | Lloyds TSB Bank | | | 4.375% | | | | 1/12/15 | | | | A | | | | 1,285,746 | |
| | | | | |
| | 3,250 | | | Lloyds TSB Bank | | | 4.875% | | | | 1/21/16 | | | | A | | | | 3,411,967 | |
| | | | | |
| | 2,760 | | | National Australia Bank, 144A | | | 3.000% | | | | 7/27/16 | | | | Aa2 | | | | 2,827,890 | |
| | | | | |
| | 2,000 | | | Norea Bank AB, 144A | | | 2.125% | | | | 1/14/14 | | | | AA– | | | | 2,003,250 | |
| | | | | |
| | 1,000 | | | Rabobank Nederland Utrec | | | 3.375% | | | | 1/19/17 | | | | AA | | | | 1,029,187 | |
| | | | | |
| | 1,400 | | | Rabobank Nederland | | | 3.200% | | | | 3/11/15 | | | | AA | | | | 1,441,282 | |
| | | | | |
| | 2,500 | | | Regions Financial Corporation, (3) | | | 7.750% | | | | 11/10/14 | | | | BBB– | | | | 2,700,000 | |
| | | | | |
| | 2,330 | | | Royal Bank of Scotland Group PLC | | | 4.875% | | | | 8/25/14 | | | | A | | | | 2,395,569 | |
| | | | | |
| | 2,000 | | | Santander SA | | | 2.485% | | | | 1/18/13 | | | | A | | | | 1,959,410 | |
| | | | | |
| | 3,750 | | | Societe Generale, 144A, (3) | | | 2.500% | | | | 1/15/14 | | | | A1 | | | | 3,683,423 | |
| | | | | |
| | 2,000 | | | Wells Fargo & Company | | | 3.750% | | | | 10/01/14 | | | | AA– | | | | 2,111,574 | |
| | | | | |
| | 3,755 | | | Wells Fargo & Company | | | 3.676% | | | | 6/15/16 | | | | AA– | | | | 3,996,822 | |
| | 57,045 | | | Total Commercial Banks | | | | | | | | | | | | | | | 58,805,849 | |
| | | | Commercial Services & Supplies – 0.7% | | | | | | | | | | | | | | | | |
| | | | | |
| | 4,000 | | | International Lease Finance Corporation | | | 4.875% | | | | 4/01/15 | | | | BBB– | | | | 4,019,796 | |
| | | | | |
| | 1,815 | | | Waste Management Inc., (3) | | | 2.600% | | | | 9/01/16 | | | | BBB | | | | 1,862,506 | |
| | 5,815 | | | Total Commercial Services & Supplies | | | | | | | | | | | | | | | 5,882,302 | |
| | | | Computers & Peripherals – 0.7% | | | | | | | | | | | | | | | | |
| | | | | |
| | 2,760 | | | Hewlett Packard Company | | | 2.625% | | | | 12/09/14 | | | | A | | | | 2,826,684 | |
| | | | | |
| | 750 | | | Hewlett Packard Company | | | 3.000% | | | | 9/15/16 | | | | A | | | | 771,439 | |
| | | | | |
| | 2,000 | | | Seagate HDD Cayman, (3) | | | 7.750% | | | | 12/15/18 | | | | BB+ | | | | 2,212,500 | |
| | 5,510 | | | Total Computers & Peripherals | | | | | | | | | | | | | | | 5,810,623 | |
| | | | Construction & Engineering – 0.4% | | | | | | | | | | | | | | | | |
| | | | | |
| | 1,000 | | | ABB Finance USA Inc., (3) | | | 1.625% | | | | 5/08/17 | | | | A | | | | 1,004,830 | |
| | | | | |
| | 2,665 | | | Caterpillar Financial Services Corporation | | | 1.100% | | | | 5/29/15 | | | | A | | | | 2,679,913 | |
| | 3,665 | | | Total Construction & Engineering | | | | | | | | | | | | | | | 3,684,743 | |
| | | | Consumer Finance – 1.4% | | | | | | | | | | | | | | | | |
| | | | | |
| | 1,000 | | | Ally Financial Inc. | | | 4.625% | | | | 6/26/15 | | | | B1 | | | | 1,006,195 | |
| | | | | |
| | 505 | | | Ally Financial Inc., (3) | | | 5.500% | | | | 2/15/17 | | | | BB– | | | | 512,949 | |
| | | | | |
| | 2,980 | | | American Express Credit Corporation | | | 7.300% | | | | 8/20/13 | | | | A+ | | | | 3,186,097 | |
| | | | | |
| | 1,635 | | | American Express Credit Corporation | | | 1.750% | | | | 6/12/15 | | | | A2 | | | | 1,653,570 | |
| | | | | | | | | | | | | | | | | | | | |
Principal
Amount (000) | | | Description (1) | | Coupon | | | Maturity | | | Ratings (2) | | | Value | |
| | | | | | | | | | | | | | | | | | | | |
| | | | Consumer Finance (continued) | | | | | | | | | | | | | | | | |
| | | | | |
| $ | 2,000 | | | American Honda Finance Limited, 144A, (3) | | | 1.450% | | | | 2/27/15 | | | | A+ | | | $ | 2,007,556 | |
| | | | | |
| | 2,250 | | | Capital One Bank | | | 6.500% | | | | 6/13/13 | | | | Baa1 | | | | 2,358,131 | |
| | | | | |
| | 1,915 | | | Capital One Financial Corporation | | | 2.125% | | | | 7/15/14 | | | | A– | | | | 1,931,302 | |
| | 12,285 | | | Total Consumer Finance | | | | | | | | | | | | | | | 12,655,800 | |
| | | | Containers & Packaging – 0.5% | | | | | | | | | | | | | | | | |
| | | | | |
| | 2,000 | | | Berry Plastics Corporation, (3) | | | 8.250% | | | | 11/15/15 | | | | B1 | | | | 2,125,000 | |
| | | | | |
| | 2,000 | | | Reynolds Group Escrow, 144A | | | 8.750% | | | | 10/15/16 | | | | BB– | | | | 2,105,000 | |
| | 4,000 | | | Total Containers & Packaging | | | | | | | | | | | | | | | 4,230,000 | |
| | | | Diversified Financial Services – 5.9% | | | | | | | | | | | | | | | | |
| | | | | |
| | 3,000 | | | Bank of America Corporation, (3) | | | 1.973% | | | | 1/30/14 | | | | A | | | | 2,968,665 | |
| | | | | |
| | 10,010 | | | Bank of America Corporation | | | 4.500% | | | | 4/01/15 | | | | A | | | | 10,317,938 | |
| | | | | |
| | 12,390 | | | Citigroup Inc. | | | 4.587% | | | | 12/15/15 | | | | A | | | | 12,960,882 | |
| | | | | |
| | 2,000 | | | Ford Motor Credit Company, (3) | | | 2.750% | | | | 5/15/15 | | | | Baa3 | | | | 2,016,228 | |
| | | | | |
| | 4,500 | | | General Electric Capital Corporation | | | 2.100% | | | | 1/07/14 | | | | AA+ | | | | 4,569,989 | |
| | | | | |
| | 5,130 | | | General Electric Capital Corporation | | | 3.750% | | | | 11/14/14 | | | | AA+ | | | | 5,385,900 | |
| | | | | |
| | 1,675 | | | ING Bank NV, 144A | | | 4.000% | | | | 3/15/16 | | | | A+ | | | | 1,686,387 | |
| | | | | |
| | 2,500 | | | JPMorgan Chase & Company | | | 1.266% | | | | 1/24/14 | | | | AA– | | | | 2,506,483 | |
| | | | | |
| | 2,000 | | | JPMorgan Chase & Company | | | 3.700% | | | | 1/20/15 | | | | AA– | | | | 2,086,164 | |
| | | | | |
| | 4,500 | | | JPMorgan Chase & Company | | | 5.150% | | | | 10/01/15 | | | | A+ | | | | 4,828,824 | |
| | | | | |
| | 2,970 | | | National Rural Utilities Cooperative Finance Corporation | | | 1.900% | | | | 11/01/15 | | | | A+ | | | | 3,041,993 | |
| | 50,675 | | | Total Diversified Financial Services | | | | | | | | | | | | | | | 52,369,453 | |
| | | | Diversified Telecommunication Services – 1.8% | | | | | | | | | | | | | | | | |
| | | | | |
| | 2,250 | | | AT&T, Inc. | | | 2.500% | | | | 8/15/15 | | | | A2 | | | | 2,342,273 | |
| | | | | |
| | 2,500 | | | British Telecommunications PLC, (3) | | | 2.000% | | | | 6/22/15 | | | | BBB | | | | 2,534,353 | |
| | | | | |
| | 1,500 | | | Citizens Communications Company, (3) | | | 6.625% | | | | 3/15/15 | | | | BB+ | | | | 1,590,000 | |
| | | | | |
| | 2,000 | | | Qwest Corporation, (3) | | | 7.500% | | | | 10/01/14 | | | | BBB– | | | | 2,229,490 | |
| | | | | |
| | 500 | | | SBA Telecommunications Corporation | | | 8.000% | | | | 8/15/16 | | | | B+ | | | | 532,500 | |
| | | | | |
| | 1,540 | | | Telecom Italia Capital | | | 4.950% | | | | 9/30/14 | | | | BBB | | | | 1,528,450 | |
| | | | | |
| | 3,000 | | | Telefonica Emisiones SAU | | | 4.949% | | | | 1/15/15 | | | | Baa1 | | | | 2,836,221 | |
| | | | | |
| | 2,500 | | | Verizon Wireless Capital LLC | | | 5.550% | | | | 2/01/14 | | | | A2 | | | | 2,676,330 | |
| | 15,790 | | | Total Diversified Telecommunication Services | | | | | | | | | | | | | | | 16,269,617 | |
| | | | Electric Utilities – 0.2% | | | | | | | | | | | | | | | | |
| | | | | |
| | 1,640 | | | Commonwealth Edison Company, First Mortgage | | | 1.625% | | | | 1/15/14 | | | | A– | | | | 1,662,107 | |
| | | | | |
| | 200 | | | Exelon Generation Co. LLC | | | 5.350% | | | | 1/15/14 | | | | Baa1 | | | | 211,849 | |
| | 1,840 | | | Total Electric Utilities | | | | | | | | | | | | | | | 1,873,956 | |
| | | | Electronic Equipment & Instruments – 0.2% | | | | | | | | | | | | | | | | |
| | | | | |
| | 1,410 | | | Tyco Electronics Group. SA | | | 1.600% | | | | 2/03/15 | | | | BBB+ | | | | 1,415,898 | |
| | | | Energy Equipment & Services – 1.0% | | | | | | | | | | | | | | | | |
| | | | | |
| | 1,000 | | | Cameron International Corporation, Convertible Bonds | | | 1.600% | | | | 4/30/15 | | | | BBB+ | | | | 1,000,711 | |
| | | | | |
| | 3,000 | | | Ensco PLC | | | 3.250% | | | | 3/15/16 | | | | BBB+ | | | | 3,150,252 | |
| | | | | |
| | 375 | | | NGPL PipeCo LLC, (3) | | | 7.119% | | | | 12/15/17 | | | | Ba3 | | | | 375,000 | |
| | | | | |
| | 1,825 | | | Noble Holding International Limited | | | 3.450% | | | | 8/01/15 | | | | A– | | | | 1,921,088 | |
| | | | | |
| | 2,100 | | | Transocean Inc. | | | 4.950% | | | | 11/15/15 | | | | BBB– | | | | 2,261,013 | |
| | 8,300 | | | Total Energy Equipment & Services | | | | | | | | | | | | | | | 8,708,064 | |
Portfolio of Investments
Nuveen Short Term Bond Fund (continued)
June 30, 2012
| | | | | | | | | | | | | | | | | | | | |
Principal
Amount (000) | | | Description (1) | | Coupon | | | Maturity | | | Ratings (2) | | | Value | |
| | | | | | | | | | | | | | | | | | | | |
| | | | Food & Staples Retailing – 0.2% | | | | | | | | | | | | | | | | |
| | | | | |
| $ | 1,750 | | | Supervalu Inc., (3) | | | 8.000% | | | | 5/01/16 | | | | B | | | $ | 1,771,875 | |
| | | | Food Products – 0.6% | | | | | | | | | | | | | | | | |
| | | | | |
| | 2,000 | | | Kellogg Company, (3) | | | 1.125% | | | | 5/15/15 | | | | BBB+ | | | | 2,009,626 | |
| | | | | |
| | 3,000 | | | Sara Lee Corporation, (3) | | | 2.750% | | | | 9/15/15 | | | | BBB | | | | 3,072,618 | |
| | 5,000 | | | Total Food Products | | | | | | | | | | | | | | | 5,082,244 | |
| | | | Gas Utilities – 0.0% | | | | | | | | | | | | | | | | |
| | | | | |
| | 50 | | | Ferrellgas LP | | | 6.500% | | | | 5/01/21 | | | | B2 | | | | 45,625 | |
| | | | Health Care Equipment & Supplies – 0.3% | | | | | | | | | | | | | | | | |
| | | | | |
| | 2,000 | | | Boston Scientific Corporation | | | 6.250% | | | | 11/15/15 | | | | BBB– | | | | 2,239,994 | |
| | | | Health Care Providers & Services – 1.4% | | | | | | | | | | | | | | | | |
| | | | | |
| | 2,560 | | | Covidien International Finance SA, (3) | | | 1.350% | | | | 5/29/15 | | | | A | | | | 2,563,325 | |
| | | | | |
| | 3,500 | | | Express Scripts Holding Company, 144A | | | 3.500% | | | | 11/15/16 | | | | BBB+ | | | | 3,685,024 | |
| | | | | |
| | 2,000 | | | HCA Inc. | | | 6.375% | | | | 1/15/15 | | | | B– | | | | 2,125,000 | |
| | | | | |
| | 1,000 | | | HCA Inc., (3) | | | 8.500% | | | | 4/15/19 | | | | BB+ | | | | 1,120,000 | |
| | | | | |
| | 2,630 | | | Saint Jude Medical Inc. | | | 2.200% | | | | 9/15/13 | | | | A | | | | 2,673,164 | |
| | 11,690 | | | Total Health Care Providers & Services | | | | | | | | | | | | | | | 12,166,513 | |
| | | | Hotels, Restaurants & Leisure – 0.8% | | | | | | | | | | | | | | | | |
| | | | | |
| | 2,000 | | | Harrah’s Operating Company, Inc. | | | 11.250% | | | | 6/01/17 | | | | B | | | | 2,182,500 | |
| | | | | |
| | 2,600 | | | Wynn Las Vegas LLC Corporation, (3) | | | 7.875% | | | | 11/01/17 | | | | BBB– | | | | 2,860,000 | |
| | | | | |
| | 1,750 | | | Wynn Las Vegas LLC Corporation, (3) | | | 7.750% | | | | 8/15/20 | | | | BBB– | | | | 1,938,125 | |
| | 6,350 | | | Total Hotels, Restaurants & Leisure | | | | | | | | | | | | | | | 6,980,625 | |
| | | | Independent Power Producers & Energy Traders – 0.3% | | | | | | | | | | | | | | | | |
| | | | | |
| | 2,000 | | | AES Corporation | | | 9.750% | | | | 4/15/16 | | | | BB | | | | 2,370,000 | |
| | | | | |
| | 500 | | | RRI Energy Inc., (3) | | | 7.625% | | | | 6/15/14 | | | | BB– | | | | 510,000 | |
| | 2,500 | | | Total Independent Power Producers & Energy Traders | | | | | | | | | | | | | | | 2,880,000 | |
| | | | Insurance – 2.0% | | | | | | | | | | | | | | | | |
| | | | | |
| | 3,460 | | | AFLAC Insurance, (3) | | | 3.450% | | | | 8/15/15 | | | | A– | | | | 3,682,353 | |
| | | | | |
| | 1,450 | | | American International Group, Inc. | | | 3.650% | | | | 1/15/14 | | | | A– | | | | 1,481,059 | |
| | | | | |
| | 4,030 | | | American International Group, Inc., (3) | | | 4.250% | | | | 9/15/14 | | | | A– | | | | 4,176,410 | |
| | | | | |
| | 2,000 | | | Hartford Financial Services Group Inc. | | | 4.000% | | | | 3/30/15 | | | | BBB | | | | 2,097,536 | |
| | | | | |
| | 2,000 | | | Lincoln National Corporation | | | 4.300% | | | | 6/15/15 | | | | A– | | | | 2,107,148 | |
| | | | | |
| | 4,000 | | | Prudential Covered Trust, 144A | | | 2.997% | | | | 9/30/15 | | | | A | | | | 4,063,336 | |
| | 16,940 | | | Total Insurance | | | | | | | | | | | | | | | 17,607,842 | |
| | | | Life Sciences Tools & Services – 0.4% | | | | | | | | | | | | | | | | |
| | | | | |
| | 1,250 | | | Thermo Fischer Scientific Inc. | | | 3.200% | | | | 5/01/15 | | | | A | | | | 1,329,064 | |
| | | | | |
| | 1,745 | | | Thermo Fischer Scientific Inc. | | | 2.250% | | | | 8/15/16 | | | | A | | | | 1,804,681 | |
| | 2,995 | | | Total Life Sciences Tools & Services | | | | | | | | | | | | | | | 3,133,745 | |
| | | | Machinery – 0.1% | | | | | | | | | | | | | | | | |
| | | | | |
| | 1,000 | | | Case New Holland Inc. | | | 7.750% | | | | 9/01/13 | | | | BB+ | | | | 1,062,500 | |
| | | | Media – 1.6% | | | | | | | | | | | | | | | | |
| | | | | |
| | 1,570 | | | DIRECTV Holdings LLC | | | 3.550% | | | | 3/15/15 | | | | BBB | | | | 1,653,207 | |
| | | | | |
| | 2,000 | | | DIRECTV Holdings LLC | | | 3.125% | | | | 2/15/16 | | | | BBB | | | | 2,083,596 | |
| | | | | |
| | 4,000 | | | NBC Universal Media LLC | | | 3.650% | | | | 4/30/15 | | | | BBB+ | | | | 4,249,728 | |
| | | | | |
| | 1,000 | | | News America Holdings Inc., (3) | | | 5.300% | | | | 12/15/14 | | | | BBB+ | | | | 1,096,027 | |
| | | | | |
| | 250 | | | Sirius XM Radio Inc., 144A | | | 8.750% | | | | 4/01/15 | | | | BB | | | | 281,250 | |
| | | | | | | | | | | | | | | | | | | | |
Principal
Amount (000) | | | Description (1) | | Coupon | | | Maturity | | | Ratings (2) | | | Value | |
| | | | | | | | | | | | | | | | | | | | |
| | | | Media (continued) | | | | | | | | | | | | | | | | |
| | | | | |
| $ | 1,000 | | | TCM Sub LLC | | | 3.550% | | | | 1/15/15 | | | | A– | | | $ | 1,053,109 | |
| | | | | |
| | 1,025 | | | Time Warner Cable Inc. | | | 8.250% | | | | 2/14/14 | | | | BBB | | | | 1,141,217 | |
| | | | | |
| | 2,140 | | | Vivendi SA | | | 2.400% | | | | 4/10/15 | | | | BBB | | | | 2,118,805 | |
| | | | | |
| | 790 | | | XM Satellite Radio Inc., 144A | | | 7.625% | | | | 11/01/18 | | | | BB | | | | 849,250 | |
| | 13,775 | | | Total Media | | | | | | | | | | | | | | | 14,526,189 | |
| | | | Metals & Mining – 2.1% | | | | | | | | | | | | | | | | |
| | | | | |
| | 2,000 | | | APERAM, 144A | | | 7.375% | | | | 4/01/16 | | | | BB– | | | | 1,720,000 | |
| | | | | |
| | 3,680 | | | ArcelorMittal, (3) | | | 3.750% | | | | 3/01/16 | | | | BBB | | | | 3,654,693 | |
| | | | | |
| | 760 | | | BHP Billiton Finance Limited | | | 1.000% | | | | 2/24/15 | | | | A+ | | | | 761,301 | |
| | | | | |
| | 2,400 | | | Corporacion Nacional del Cobre, 144A | | | 5.500% | | | | 10/15/13 | | | | A1 | | | | 2,512,757 | |
| | | | | |
| | 1,500 | | | Evraz Group S.A, 144A | | | 8.250% | | | | 11/10/15 | | | | BB– | | | | 1,576,695 | |
| | | | | |
| | 2,155 | | | Freeport McMoRan Copper & Gold, Inc., (3) | | | 1.400% | | | | 2/13/15 | | | | BBB | | | | 2,147,643 | |
| | | | | |
| | 1,375 | | | Rio Tinto Finance USA Limited, | | | 8.950% | | | | 5/01/14 | | | | A– | | | | 1,570,080 | |
| | | | | |
| | 2,000 | | | United States Steel Corporation, (3) | | | 6.050% | | | | 6/01/17 | | | | BB | | | | 1,945,000 | |
| | | | | |
| | 2,500 | | | Xstrata Finance Canada Limited, 144A | | | 3.600% | | | | 1/15/17 | | | | BBB+ | | | | 2,574,690 | |
| | 18,370 | | | Total Metals & Mining | | | | | | | | | | | | | | | 18,462,859 | |
| | | | Multi-Utilities – 0.2% | | | | | | | | | | | | | | | | |
| | | | | |
| | 1,500 | | | Duke Energy Corporation | | | 3.950% | | | | 9/15/14 | | | | BBB+ | | | | 1,592,217 | |
| | | | Oil, Gas & Consumable Fuels – 4.8% | | | | | �� | | | | | | | | | | | |
| | | | | |
| | 1,000 | | | Anadarko Petroleum Corporation | | | 6.375% | | | | 9/15/17 | | | | BBB– | | | | 1,161,634 | |
| | | | | |
| | 1,500 | | | Atlas Pipeline LP Finance | | | 8.750% | | | | 6/15/18 | | | | B | | | | 1,601,250 | |
| | | | | |
| | 2,550 | | | BP Capital Markets PLC | | | 1.068% | | | | 3/11/14 | | | | A | | | | 2,567,659 | |
| | | | | |
| | 2,000 | | | Chesapeake Energy Corporation, (3) | | | 6.775% | | | | 3/15/19 | | | | BB | | | | 1,950,000 | |
| | | | | |
| | 2,000 | | | El Paso Pipeline Partners Operating Company LLC | | | 4.100% | | | | 11/15/15 | | | | BBB– | | | | 2,092,354 | |
| | | | | |
| | 2,680 | | | EnCana Corporation | | | 4.750% | | | | 10/15/13 | | | | BBB | | | | 2,789,213 | |
| | | | | |
| | 3,000 | | | Enterprise Products Operating LP | | | 5.600% | | | | 10/15/14 | | | | BBB | | | | 3,288,108 | |
| | | | | |
| | 1,500 | | | Inergy LP Finance | | | 7.000% | | | | 10/01/18 | | | | Ba3 | | | | 1,545,000 | |
| | | | | |
| | 1,500 | | | Kinder Morgan Finance Company ULC, (3) | | | 5.700% | | | | 1/05/16 | | | | Ba1 | | | | 1,578,750 | |
| | | | | |
| | 3,000 | | | Marathon Petroleum Corporation | | | 3.500% | | | | 3/01/16 | | | | BBB | | | | 3,144,720 | |
| | | | | |
| | 3,275 | | | MidAmerican Energy Company | | | 4.650% | | | | 10/01/14 | | | | A2 | | | | 3,537,743 | |
| | | | | |
| | 1,410 | | | Petrobras International Finance Company | | | 2.875% | | | | 2/06/15 | | | | A3 | | | | 1,431,150 | |
| | | | | |
| | 2,500 | | | Petrohawk Energy Corporation | | | 7.250% | | | | 8/15/18 | | | | A | | | | 2,811,435 | |
| | | | | |
| | 4,345 | | | Phillips 66, 144A | | | 2.950% | | | | 5/01/17 | | | | Baa1 | | | | 4,464,783 | |
| | | | | |
| | 2,000 | | | Plains Exploration & Production Company | | | 7.625% | | | | 6/01/18 | | | | BB– | | | | 2,125,000 | |
| | | | | |
| | 2,000 | | | Sabine Pass LNG LP | | | 7.500% | | | | 11/30/16 | | | | BB+ | | | | 2,100,000 | |
| | | | | |
| | 1,180 | | | Shell International Finance BV | | | 3.250% | | | | 9/22/15 | | | | Aa1 | | | | 1,266,334 | |
| | | | | |
| | 2,500 | | | Transcapitalinvest LP, 144A | | | 7.700% | | | | 8/07/13 | | | | Baa1 | | | | 2,648,740 | |
| | 39,940 | | | Total Oil, Gas & Consumable Fuels | | | | | | | | | | | | | | | 42,103,873 | |
| | | | Pharmaceuticals – 0.6% | | | | | | | | | | | | | | | | |
| | | | | |
| | 3,600 | | | Merck & Company Inc. | | | 2.250% | | | | 1/15/16 | | | | AA | | | | 3,759,296 | |
| | | | | |
| | 1,750 | | | Valeant Pharmaceuticals International, 144A, (3) | | | 6.500% | | | | 7/15/16 | | | | BB– | | | | 1,828,750 | |
| | 5,350 | | | Total Pharmaceuticals | | | | | | | | | | | | | | | 5,588,046 | |
| | | | Real Estate Investment Trust – 1.6% | | | | | | | | | | | | | | | | |
| | | | | |
| | 2,000 | | | DuPont Fabros Technology LP | | | 8.500% | | | | 12/15/17 | | | | Ba1 | | | | 2,199,999 | |
| | | | | |
| | 2,000 | | | First Industrial Realty Trust, (3) | | | 5.950% | | | | 5/15/17 | | | | BB | | | | 2,057,417 | |
Portfolio of Investments
Nuveen Short Term Bond Fund (continued)
June 30, 2012
| | | | | | | | | | | | | | | | | | | | |
Principal
Amount (000) | | | Description (1) | | Coupon | | | Maturity | | | Ratings (2) | | | Value | |
| | | | | | | | | | | | | | | | | | | | |
| | | | Real Estate Investment Trust (continued) | | | | | | | | | | | | | | | | |
| | | | | |
| $ | 2,385 | | | HCP Inc. | | | 2.700% | | | | 2/01/14 | | | | BBB+ | | | $ | 2,423,095 | |
| | | | | |
| | 3,395 | | | Health Care REIT Inc. | | | 3.625% | | | | 3/15/16 | | | | Baa2 | | | | 3,490,028 | |
| | | | | |
| | 2,000 | | | Simon Property Group, L.P. | | | 4.200% | | | | 2/01/15 | | | | A– | | | | 2,108,525 | |
| | | | | |
| | 2,000 | | | Ventas Realty LP, (3) | | | 3.125% | | | | 11/30/15 | | | | BBB+ | | | | 2,036,175 | |
| | 13,780 | | | Total Real Estate Investment Trust | | | | | | | | | | | | | | | 14,315,239 | |
| | | | Semiconductors & Equipment – 0.1% | | | | | | | | | | | | | | | | |
| | | | | |
| | 1,000 | | | National Semiconductor Corporation | | | 3.950% | | | | 4/15/15 | | | | A+ | | | | 1,083,361 | |
| | | | Specialty Retail – 0.3% | | | | | | | | | | | | | | | | |
| | | | | |
| | 2,440 | | | Home Depot, Inc., (3) | | | 5.400% | | | | 3/01/16 | | | | A– | | | | 2,812,891 | |
| | | | Tobacco – 0.2% | | | | | | | | | | | | | | | | |
| | | | | |
| | 2,000 | | | BAT International Finance PLC, 144A | | | 2.125% | | | | 6/07/17 | | | | BBB+ | | | | 1,997,366 | |
| | | | Trading Companies & Distributors – 0.1% | | | | | | | | | | | | | | | | |
| | | | | |
| | 1,000 | | | GATX Corporation | | | 4.750% | | | | 5/15/15 | | | | BBB | | | | 1,071,633 | |
| | | | Transportation Infrastructure – 0.2% | | | | | | | | | | | | | | | | |
| | | | | |
| | 2,000 | | | Penske Truck Leasing, 144A | | | 3.125% | | | | 5/11/15 | | | | BBB– | | | | 2,011,960 | |
| | | | Wireless Telecommunication Services – 0.7% | | | | | | | | | | | | | | | | |
| | | | | |
| | 2,000 | | | America Movil S.A. de C.V. | | | 2.375% | | | | 9/08/16 | | | | A2 | | | | 2,051,802 | |
| | | | | |
| | 2,000 | | | Crown Castle Towers LLC | | | 4.523% | | | | 1/15/15 | | | | A2 | | | | 2,096,298 | |
| | | | | |
| | 1,000 | | | Telefonica Moviles Chile SA, 144A | | | 2.875% | | | | 11/09/15 | | | | BBB+ | | | | 1,005,125 | |
| | | | | |
| | 750 | | | UPC Germany GmbH | | | 8.125% | | | | 12/01/17 | | | | BB– | | | | 806,250 | |
| | 5,750 | | | Total Wireless Telecommunication Services | | | | | | | | | | | | | | | 5,959,475 | |
| $ | 399,244 | | | Total Corporate Bonds (cost $407,933,688) | | | | | | | | | | | | | | | 413,715,646 | |
| | | | | |
Principal
Amount (000) | | | Description (1) | | Optional Call
Provisions (4) | | | | | | Ratings (2) | | | Value | |
| | | | MUNICIPAL BONDS – 3.7% | | | | | | | | | | | | | | | | |
| | | | | |
| | | | Arizona – 0.6% | | | | | | | | | | | | | | | | |
| | | | | |
| | | | Phoenix Civic Improvement Corporation, Arizona, Excise Tax Revenue Bonds, Taxable Series 2011: | | | | | | | | | | | | | | | | |
| $ | 2,800 | | | 2.302%, 7/01/14 | | | No Opt. Call | | | | | | | | AA | | | $ | 2,835,532 | |
| | 2,000 | | | 2.828%, 7/01/15 | | | No Opt. Call | | | | | | | | AA | | | | 2,049,840 | |
| | 4,800 | | | Total Arizona | | | | | | | | | | | | | | | 4,885,372 | |
| | | | California – 0.5% | | | | | | | | | | | | | | | | |
| | | | | |
| | 1,015 | | | California State, General Obligation Bonds, Various Purpose Build America Taxable Bond Series 2010, 5.750%, 3/01/17 | | | No Opt. Call | | | | | | | | A1 | | | | 1,172,995 | |
| | | | | |
| | | | San Francisco Airports Commission, California, Revenue Bonds, San Francisco International Airport, Refunding Taxable Second Series 2011E: | | | | | | | | | | | | | | | | |
| | 1,000 | | | 1.507%, 5/01/13 | | | No Opt. Call | | | | | | | | A+ | | | | 1,006,110 | |
| | 2,640 | | | 2.021%, 5/01/14 | | | No Opt. Call | | | | | | | | A+ | | | | 2,672,472 | |
| | 4,655 | | | Total California | | | | | | | | | | | | | | | 4,851,577 | |
| | | | Guam – 0.3% | | | | | | | | | | | | | | | | |
| | | | | |
| | | | Government of Guam, Business Privilege Tax Bonds, Taxable Series 2012B-2: | | | | | | | | | | | | | | | | |
| | 1,155 | | | 2.933%, 1/01/17 | | | No Opt. Call | | | | | | | | A | | | | 1,152,344 | |
| | 1,190 | | | 3.301%, 1/01/18 | | | No Opt. Call | | | | | | | | A | | | | 1,189,465 | |
| | 2,345 | | | Total Guam | | | | | | | | | | | | | | | 2,341,809 | |
| | | | | | | | | | | | | | | | | | | | |
Principal
Amount (000) | | | Description (1) | | Optional Call
Provisions (4) | | | | | | Ratings (2) | | | Value | |
| | | | | | | | | | | | | | | | | | | | |
| | | | Massachusetts – 0.4% | | | | | | | | | | | | | | | | |
| | | | | |
| | | | Massachusetts Port Authority, Special Facilities Revenue Bonds, ConRac Project Series 3011B: | | | | | | | | | | | | | | | | |
| $ | 3,260 | | | 1.910%, 7/01/14 | | | No Opt. Call | | | | | | | | A | | | $ | 3,283,472 | |
| | 400 | | | 3.230%, 7/01/15 | | | No Opt. Call | | | | | | | | A | | | | 407,820 | |
| | 3,660 | | | Total Massachusetts | | | | | | | | | | | | | | | 3,691,292 | |
| | | | Michigan – 0.2% | | | | | | | | | | | | | | | | |
| | | | | |
| | 2,100 | | | Wayne County, Michigan, General Obligation Bonds, Taxable Notes Series 2011, 5.000%, 9/15/13 | | | No Opt. Call | | | | | | | | BBB+ | | | | 2,107,350 | |
| | | | Minnesota – 0.5% | | | | | | | | | | | | | | | | |
| | | | | |
| | 4,000 | | | Tobacco Securitization Authority, Minnesota, Tobacco Settlement Revenue Bonds, Taxable Series 2011A, 2.643%, 3/01/14 | | | No Opt. Call | | | | | | | | A | | | | 4,059,960 | |
| | | | Nevada – 0.3% | | | | | | | | | | | | | | | | |
| | | | | |
| | 2,500 | | | Las Vegas Valley Water District, Nevada, General Obligation Bonds, Refunding Taxable Series 2011B, 3.176%, 6/01/17 | | | No Opt. Call | | | | | | | | AA+ | | | | 2,636,050 | |
| | | | Ohio – 0.2% | | | | | | | | | | | | | | | | |
| | | | | |
| | 1,470 | | | Ohio State, General Obligation Bonds, Higher Education, Build America Bond Series 2010E, 3.328%, 8/01/17 – AGM Insured | | | No Opt. Call | | | | | | | | AA+ | | | | 1,623,659 | |
| | | | Texas – 0.7% | | | | | | | | | | | | | | | | |
| | | | | |
| | 1,500 | | | Dallas Fort Worth International Airport Facility Improvement Corporation, Texas, Learjet Inc. Project, Revenue Bonds, Series 2001-A1, 6.150%, 1/01/16 (Alternative Minimum Tax) | | | 7/12 at 100.00 | | | | | | | | Ba2 | | | | 1,502,460 | |
| | | | | |
| | 5,000 | | | Dallas-Fort Worth International Airport, Texas, Joint Revenue Bonds, Refunding Taxable Series 2011E, 1.770%, 11/01/14 | | | No Opt. Call | | | | | | | | A+ | | | | 5,008,849 | |
| | 6,500 | | | Total Texas | | | | | | | | | | | | | | | 6,511,309 | |
| $ | 32,030 | | | Total Municipal Bonds (cost $32,293,229) | | | | | | | | | | | | | | | 32,708,378 | |
| | | | | |
Principal
Amount (000) | | | Description (1) | | Coupon | | | Maturity | | | Ratings (2) | | | Value | |
| | | | U.S. GOVERNMENT AND AGENCY OBLIGATIONS – 3.3% | | | | | | | | | |
| | | | | |
| $ | 5,400 | | | Federal Home Loan Bank Bonds, (3) | | | 1.500% | | | | 1/16/13 | | | | Aaa | | | $ | 5,436,029 | |
| | | | | |
| | 15,000 | | | Federal Home Loan Bank Bonds | | | 1.375% | | | | 5/28/14 | | | | Aaa | | | | 15,303,465 | |
| | | | | |
| | 5,000 | | | Federal Home Loan Banks, Discount Notes | | | 0.000% | | | | 7/19/12 | | | | Aaa | | | | 4,999,955 | |
| | | | | |
| | 250 | | | U.S. Treasury Notes | | | 4.125% | | | | 8/31/12 | | | | Aaa | | | | 251,631 | |
| | | | | |
| | 1,800 | | | U.S.Treasury Notes, (3), (5) | | | 1.375% | | | | 5/15/13 | | | | Aaa | | | | 1,817,719 | |
| | | | | |
| | 380 | | | U.S. Treasury Notes, (3) | | | 1.875% | | | | 2/28/14 | | | | Aaa | | | | 389,752 | |
| | | | | |
| | 1,310 | | | U.S. Treasury Notes | | | 1.500% | | | | 6/30/16 | | | | Aaa | | | | 1,357,079 | |
| | | | | |
| | 55 | | | U.S.Treasury Securities, STRIPS (P/O) | | | 0.000% | | | | 5/15/14 | | | | Aaa | | | | 54,650 | |
| $ | 29,195 | | | Total U.S. Government and Agency Obligations (cost $29,489,908) | | | | | | | | | | | | 29,610,280 | |
| | | | | |
Principal
Amount (000) | | | Description (1) | | Coupon | | | Maturity | | | Ratings (2) | | | Value | |
| | | | ASSET-BACKED AND MORTGAGE-BACKED SECURITIES – 43.6% | | | | | |
| | | | | |
| $ | 5,500 | | | Ally Auto Receivables Trust 2012-3 | | | 0.700% | | | | 1/15/15 | | | | AAA | | | $ | 5,505,143 | |
| | | | | |
| | 2,580 | | | Ally Auto Receivables Trust, Asset Bacnked Notes, Series 2010-1 | | | 2.300% | | | | 12/15/14 | | | | AAA | | | | 2,629,853 | |
| | | | | |
| | 2,400 | | | American Home Mortgage Advance Trust SART-1 Series 2012 | | | 2.230% | | | | 5/10/43 | | | | AAA | | | | 2,393,250 | |
| | | | | |
| | 3,575 | | | American Home Mortgage Advance Trust, Revovling Pool Receivables, Series SART-3 | | | 3.720% | | | | 3/13/44 | | | | AAA | | | | 3,583,938 | |
| | | | | |
| | 1,955 | | | American Homes Mortgage Advance Trust, Series 2011-SART1 | | | 5.920% | | | | 5/10/43 | | | | BBB | | | | 1,959,888 | |
| | | | | |
| | 4,770 | | | AmeriCold LLC Trust, Series 2010 | | | 2.500% | | | | 1/17/29 | | | | AAA | | | | 4,825,394 | |
Portfolio of Investments
Nuveen Short Term Bond Fund (continued)
June 30, 2012
| | | | | | | | | | | | | | | | | | | | |
Principal
Amount (000) | | | Description (1) | | Coupon | | | Maturity | | | Ratings (2) | | | Value | |
| | | | | | | | | | | | | | | | | | | | |
| | | | ASSET-BACKED AND MORTGAGE-BACKED SECURITIES (continued) | | | | | | | | | |
| | | | | |
| $ | 1,050 | | | AmeriCredit Automobile Receivables Trust, Series 2010-4 | | | 1.990% | | | | 10/08/15 | | | | Aaa | | | $ | 1,057,956 | |
| | | | | |
| | 944 | | | Ameriquest Mortgage Securities Inc., Asset-Backed Pass-Through Certificates, Series 2005-R9 | | | 0.475% | | | | 11/25/35 | | | | AAA | | | | 921,926 | |
| | | | | |
| | 5,200 | | | Arkle Master Issuer PLC, Mortgage Asset Backed Instrument, Series 2010-1A | | | 1.616% | | | | 5/17/60 | | | | AAA | | | | 5,208,705 | |
| | | | | |
| | 850 | | | Bank of America Commercial Mortgage Inc., Commercial Mortgage Pass-Through Certificates, Series 2005-4 | | | 4.933% | | | | 7/10/45 | | | | AAA | | | | 932,640 | |
| | | | | |
| | 4,970 | | | Cabela’s Master Credit Card Trust, Series 2010-1A | | | 1.692% | | | | 1/15/18 | | | | AAA | | | | 5,119,822 | |
| | | | | |
| | 4,290 | | | Cabela’s Master Credit Card Trust, Series 2010-2A | | | 2.290% | | | | 9/17/18 | | | | AAA | | | | 4,463,628 | |
| | | | | |
| | 575 | | | CarMax Auto Owner Trust 2010-3 | | | 2.000% | | | | 5/16/16 | | | | Aaa | | | | 581,170 | |
| | | | | |
| | 1,704 | | | CarNow Auto Receivables Trust 2012-1A | | | 2.090% | | | | 1/15/15 | | | | AA | | | | 1,704,283 | |
| | | | | |
| | 4,745 | | | CenterPoint Energy Restoration Bond Company LLC, Senior Secured System Restoration Bonds, Series 2009-1 | | | 1.833% | | | | 2/15/16 | | | | AAA | | | | 4,826,931 | |
| | | | | |
| | 190 | | | CenterPoint Energy Transition Bond Company II, LLC, Senior Secured Transition Bonds, Series 2005A | | | 4.970% | | | | 8/01/14 | | | | AAA | | | | 190,686 | |
| | | | | |
| | 2,440 | | | Centerpoint Energy Transition Bond Company LLC | | | 0.901% | | | | 4/15/18 | | | | AAA | | | | 2,453,207 | |
| | | | | |
| | 8,000 | | | Chase Issuance Trust 2012-A3 A3 | | | 0.790% | | | | 6/15/17 | | | | AAA | | | | 8,003,538 | |
| | | | | |
| | 18 | | | Chrysler Financial Auto Securitization Trust, Asset Backed Notes. Series 2009A | | | 2.820% | | | | 1/15/16 | | | | AAA | | | | 18,451 | |
| | | | | |
| | 872 | | | Chrysler Financial Auto Securtization Trust, Series 2010A | | | 1.650% | | | | 11/08/13 | | | | AA | | | | 874,972 | |
| | | | | |
| | 4,625 | | | Citibank Credit Card Issuance Trust 2008-A5 | | | 4.850% | | | | 4/22/15 | | | | AAA | | | | 4,787,128 | |
| | | | | |
| | 4,000 | | | CitiBank Credit Card Issuance Trust 2009-A4 | | | 4.900% | | | | 6/23/16 | | | | AAA | | | | 4,335,079 | |
| | | | | |
| | 4,278 | | | Citigroup Mortgage Loan Trust Inc., Mortgage Pass Through Certificates, Series 2010-10 | | | 4.778% | | | �� | 12/27/32 | | | | BBB | | | | 4,253,064 | |
| | | | | |
| | 45 | | | CNH Equipment Trust 2010-A | | | 1.540% | | | | 7/15/14 | | | | AAA | | | | 45,544 | |
| | | | | |
| | 3,406 | | | Countrywide ABS Asset-Backed Certificate Trust 2007-9 | | | 0.375% | | | | 6/25/47 | | | | BB+ | | | | 3,226,205 | |
| | | | | |
| | 1,008 | | | Countrywide Alternative Loan Trust, Mortgage Pass-Through Certificates, Series 2006-19CB | | | 6.000% | | | | 8/25/36 | | | | CCC | | | | 744,652 | |
| | | | | |
| | 571 | | | Countrywide Asset-Backed Certificates Trust, Series 2005-16 2AF2 | | | 5.326% | | | | 2/25/30 | | | | B3 | | | | 442,473 | |
| | | | | |
| | 2,725 | | | Countrywide Asset-Backed Certificates Trust, Series 2006-25 | | | 0.365% | | | | 6/25/47 | | | | AAA | | | | 2,684,791 | |
| | | | | |
| | 3,325 | | | Countrywide Hoen Loans, Asset Backed Certificates Series 2007-7 | | | 0.405% | | | | 10/25/47 | | | | AAA | | | | 3,060,273 | |
| | | | | |
| | 277 | | | Countrywide Home Loan Mortgage Pass Through Trust, Series 2004-2 | | | 2.866% | | | | 2/25/34 | | | | BB | | | | 252,685 | |
| | | | | |
| | 871 | | | Credit Suisse First Boston Mortgage Securities Corporation, Mortgage-Backed Pass-Through Certificates, Series 2003-23 | | | 5.750% | | | | 9/25/33 | | | | AAA | | | | 902,272 | |
| | | | | |
| | 924 | | | CS First Boston Mortgage Securities Corporation, Commercial Mortgage Pass-Through Certificates, Series 2004-C1 | | | 4.750% | | | | 1/15/37 | | | | AAA | | | | 964,536 | |
| | | | | |
| | 2,405 | | | DBUBS Mortgage Trust, Commercial Mortgage Pass Through Certificates, Series 2011-LC3A | | | 3.642% | | | | 8/12/44 | | | | Aaa | | | | 2,592,393 | |
| | | | | |
| | 700 | | | Developers Diversified Realty Corporation, Commercial Mortgage Pass Through Certificates Series 2009-DDR1 | | | 5.730% | | | | 10/17/22 | | | | AAA | | | | 752,664 | |
| | | | | |
| | 2,047 | | | DT Auto Owner Trust 2011-2A | | | 0.960% | | | | 1/15/14 | | | | AAA | | | | 2,046,988 | |
| | | | | |
| | 2,747 | | | DT Auto Owner Trust, Series 2011-3A | | | 1.400% | | | | 8/15/14 | | | | AAA | | | | 2,750,305 | |
| | | | | |
| | 3,507 | | | Energy Texas Restoration Funding LLC | | | 2.120% | | | | 2/01/16 | | | | AAA | | | | 3,574,407 | |
| | | | | |
| | 1,933 | | | Entergy Arkansas Restoration Funding LLC, Senior Secured Storm Recovery Bonds, Series 2010-A | | | 2.300% | | | | 8/01/21 | | | | AAA | | | | 2,005,681 | |
| | | | | |
| | 1,726 | | | Entergy Louisiana Investment Recovery Funding LLC, Series 2011-A | | | 2.040% | | | | 9/01/23 | | | | AAA | | | | 1,773,829 | |
| | | | | |
| | 87 | | | Equivantage Acceptance Corporation, Home Equity Loan Asset-Backed Certificates, Series 1996-4 | | | 7.250% | | | | 1/25/28 | | | | BBB+ | | | | 86,251 | |
| | | | | | | | | | | | | | | | | | | | |
Principal
Amount (000) | | | Description (1) | | Coupon | | | Maturity | | | Ratings (2) | | | Value | |
| | | | | | | | | | | | | | | | | | | | |
| | | | ASSET-BACKED AND MORTGAGE-BACKED SECURITIES (continued) | | | | | | | | | |
| | | | | |
| $ | 2,740 | | | Extended Stay America Trust 2010-EHSA | | | 4.860% | | | | 11/05/27 | | | | A | | | $ | 2,770,080 | |
| | | | | |
| | 1,941 | | | Extended Stay America Trust 2010-EHSA | | | 2.951% | | | | 11/05/27 | | | | AAA | | | | 1,955,420 | |
| | | | | |
| | 2,561 | | | Fannie Mae Mortgage Interest Strips 366 25 | | | 5.000% | | | | 10/01/35 | | | | Aaa | | | | 268,833 | |
| | | | | |
| | 1,365 | | | Fannie Mae Mortgage Pool AD0107 | | | 4.000% | | | | 5/01/20 | | | | Aaa | | | | 1,464,368 | |
| | | | | |
| | 2,119 | | | Fannie Mae Mortgage Pool AD0486 | | | 2.346% | | | | 4/01/34 | | | | Aaa | | | | 2,244,666 | |
| | | | | |
| | 1,513 | | | Fannie Mae Mortgage Pool AD0550 | | | 2.586% | | | | 8/01/37 | | | | Aaa | | | | 1,609,756 | |
| | | | | |
| | 1,591 | | | Fannie Mae Mortgage Pool AD0706 | | | 2.306% | | | | 3/01/38 | | | | Aaa | | | | 1,686,662 | |
| | | | | |
| | 2,568 | | | Fannie Mae Mortgage Pool AE0058 | | | 2.347% | | | | 7/01/36 | | | | Aaa | | | | 2,723,134 | |
| | | | | |
| | 12,500 | | | Fannie Mae Mortgage Pool AO9636, (WI/DD) | | | 2.500% | | | | 7/01/27 | | | | Aaa | | | | 12,903,960 | |
| | | | | |
| | 2,718 | | | Fannie Mae Mortgage Pool MA0648 | | | 3.500% | | | | 2/01/26 | | | | Aaa | | | | 2,874,770 | |
| | | | | |
| | 3,816 | | | Fannie Mae Mortgage Pool MA0771 | | | 3.500% | | | | 6/01/21 | | | | Aaa | | | | 4,035,614 | |
| | | | | |
| | 22 | | | Fannie Mae Mortgage Pool 254682 | | | 5.000% | | | | 3/01/13 | | | | Aaa | | | | 23,660 | |
| | | | | |
| | 334 | | | Fannie Mae Mortgage Pool 255039 | | | 4.000% | | | | 12/01/13 | | | | Aaa | | | | 351,245 | |
| | | | | |
| | 347 | | | Fannie Mae Mortgage Pool 433988 | | | 2.212% | | | | 11/01/25 | | | | Aaa | | | | 357,158 | |
| | | | | |
| | 951 | | | Fannie Mae Mortgage Pool 535363 | | | 5.081% | | | | 12/01/31 | | | | Aaa | | | | 1,021,289 | |
| | | | | |
| | 110 | | | Fannie Mae Mortgage Pool 545717 | | | 2.186% | | | | 5/01/32 | | | | Aaa | | | | 116,041 | |
| | | | | |
| | 19 | | | Fannie Mae Mortgage Pool 545791 | | | 2.325% | | | | 3/01/32 | | | | Aaa | | | | 19,846 | |
| | | | | |
| | 168 | | | Fannie Mae Mortgage Pool 555369 | | | 2.305% | | | | 8/01/36 | | | | Aaa | | | | 178,351 | |
| | | | | |
| | 190 | | | Fannie Mae Mortgage Pool 625338 | | | 2.223% | | | | 6/01/31 | | | | Aaa | | | | 200,810 | |
| | | | | |
| | 130 | | | Fannie Mae Mortgage Pool 634948 | | | 2.415% | | | | 5/01/32 | | | | Aaa | | | | 130,604 | |
| | | | | |
| | 26 | | | Fannie Mae Mortgage Pool 661645 | | | 2.346% | | | | 10/01/32 | | | | Aaa | | | | 27,767 | |
| | | | | |
| | 178 | | | Fannie Mae Mortgage Pool 671884 | | | 2.504% | | | | 12/01/32 | | | | Aaa | | | | 181,320 | |
| | | | | |
| | 2,081 | | | Fannie Mae Mortgage Pool 725721 | | | 2.762% | | | | 6/01/34 | | | | Aaa | | | | 2,223,430 | |
| | | | | |
| | 1,123 | | | Fannie Mae Mortgage Pool 745922 | | | 2.686% | | | | 7/01/35 | | | | Aaa | | | | 1,194,915 | |
| | | | | |
| | 139 | | | Fannie Mae Mortgage Pool 775389 | | | 2.508% | | | | 4/01/34 | | | | Aaa | | | | 142,010 | |
| | | | | |
| | 1,450 | | | Fannie Mae Mortgage Pool 795242 | | | 2.188% | | | | 7/01/34 | | | | Aaa | | | | 1,522,721 | |
| | | | | |
| | 1,124 | | | Fannie Mae Mortgage Pool 797182 | | | 2.322% | | | | 11/01/34 | | | | Aaa | | | | 1,189,087 | |
| | | | | |
| | 2,369 | | | Fannie Mae Mortgage Pool 819652 | | | 2.899% | | | | 3/01/35 | | | | Aaa | | | | 2,530,921 | |
| | | | | |
| | 124 | | | Fannie Mae Mortgage Pool 838948 | | | 2.260% | | | | 8/01/35 | | | | Aaa | | | | 131,707 | |
| | | | | |
| | 1,061 | | | Fannie Mae Mortgage Pool 838958 | | | 2.433% | | | | 8/01/35 | | | | Aaa | | | | 1,128,862 | |
| | | | | |
| | 1,393 | | | Fannie Mae Mortgage Pool 841068 | | | 2.485% | | | | 11/01/34 | | | | Aaa | | | | 1,486,333 | |
| | | | | |
| | 494 | | | Fannie Mae Mortgage Pool 848390 | | | 1.944% | | | | 12/01/35 | | | | Aaa | | | | 512,170 | |
| | | | | |
| | 696 | | | Fannie Mae Mortgage Pool 886034 | | | 2.635% | | | | 7/01/36 | | | | Aaa | | | | 738,388 | |
| | | | | |
| | 656 | | | Fannie Mae Mortgage Pool 995949 | | | 2.468% | | | | 9/01/36 | | | | Aaa | | | | 690,775 | |
| | | | | |
| | 1,775 | | | Fannie Mae Multifamily REMIC Trust 2010-M6, Guaranteed Pass Through Certificates | | | 2.210% | | | | 9/25/20 | | | | Aaa | | | | 1,840,800 | |
| | | | | |
| | 41 | | | Fannie Mae Real Estate Mortgage Investment Conduit, Pass Through Certificates 1992-150 M | | | 5.500% | | | | 9/25/22 | | | | Aaa | | | | 44,607 | |
| | | | | |
| | 724 | | | Fannie Mae Real Estate Mortgage Investment Conduit, Pass Through Certificates 2003-68 QP | | | 3.000% | | | | 7/25/22 | | | | Aaa | | | | 731,995 | |
| | | | | |
| | 2,115 | | | Fannie Mae Real Estate Mortgage Investment Conduit, Pass Through Certificates 2003-122 A | | | 4.500% | | | | 2/25/28 | | | | Aaa | | | | 2,148,832 | |
| | | | | |
| | 1,076 | | | Fannie Mae Real Estate Mortgage Investment Conduit, Pass Through Certificates 2004-90 GA | | | 4.350% | | | | 3/25/34 | | | | Aaa | | | | 1,114,935 | |
| | | | | |
| | 1,968 | | | Fannie Mae Real Estate Mortgage Investment Conduit, Pass Through Certificates 2004-90 GF | | | 0.545% | | | | 11/25/34 | | | | Aaa | | | | 1,968,699 | |
Portfolio of Investments
Nuveen Short Term Bond Fund (continued)
June 30, 2012
| | | | | | | | | | | | | | | | | | | | |
Principal
Amount (000) | | | Description (1) | | Coupon | | | Maturity | | | Ratings (2) | | | Value | |
| | | | | | | | | | | | | | | | | | | | |
| | | | ASSET-BACKED AND MORTGAGE-BACKED SECURITIES (continued) | | | | | | | | | |
| | | | | |
| $ | 1,798 | | | Fannie Mae REMIC Pass-Through Certificates 2010-M1 A1 | | | 3.305% | | | | 9/25/19 | | | | Aaa | | | $ | 1,916,172 | |
| | | | | |
| | 2,317 | | | Fannie Mae REMIC Pass-Through Certificates 2011-6 BA | | | 2.750% | | | | 6/25/20 | | | | Aaa | | | | 2,402,676 | |
| | | | | |
| | 7,500 | | | Fannie Mae TBA Mortgage Pool, (WI/DD) | | | 3.000% | | | | TBA | | | | Aaa | | | | 7,857,422 | |
| | | | | |
| | 3,692 | | | FDIC Structures Sale Guaranteed Notes, Series 2010-S1 | | | 3.250% | | | | 4/25/38 | | | | Aaa | | | | 3,779,343 | |
| | | | | |
| | 3,001 | | | FDIC Structures Sale Guaranteed Notes, Series 2010-S1 | | | 0.796% | | | | 2/25/48 | | | | Aaa | | | | 3,003,324 | |
| | | | | |
| | 2,902 | | | FDIC Trust 2001-C1 | | | 1.840% | | | | 4/25/31 | | | | Aaa | | | | 2,937,302 | |
| | | | | |
| | 4,849 | | | FDIC Trust 2012-C1 | | | 0.841% | | | | 5/25/35 | | | | Aaa | | | | 4,848,797 | |
| | | | | |
| | 14 | | | Federal Home Loan Mortgage Corporation, REMIC 1022 J | | | 6.000% | | | | 12/15/20 | | | | Aaa | | | | 15,178 | |
| | | | | |
| | 1,455 | | | Federal Home Loan Mortgage Corporation, REMIC 2629 BO | | | 3.250% | | | | 3/15/18 | | | | Aaa | | | | 1,496,457 | |
| | | | | |
| | 98 | | | Federal Home Loan Mortgage Corporation, REMIC 2795 CL | | | 4.500% | | | | 7/15/17 | | | | Aaa | | | | 97,499 | |
| | | | | |
| | 610 | | | Federal Home Loan Mortgage Corporation, REMIC 2843 BH | | | 4.000% | | | | 1/15/18 | | | | Aaa | | | | 613,721 | |
| | | | | |
| | 770 | | | Federal Home Loan Mortgage Corporation, REMIC 3555 DA | | | 4.000% | | | | 12/15/14 | | | | Aaa | | | | 778,863 | |
| | | | | |
| | 313 | | | Federal Home Loan Mortgage Corporation, REMIC 3555 EA | | | 4.000% | | | | 12/15/14 | | | | Aaa | | | | 316,217 | |
| | | | | |
| | 425 | | | Federal Home Loan Mortgage Corporation, REMIC 3591 NA | | | 1.250% | | | | 10/15/12 | | | | Aaa | | | | 424,747 | |
| | | | | |
| | 3,433 | | | Fieldstone Mortgage Investment Trust, Mortgage Backed Notes, Series 2005-1 | | | 1.319% | | | | 3/25/35 | | | | A+ | | | | 3,040,710 | |
| | | | | |
| | 710 | | | Ford Credit Auto Owner Trust 10A | | | 2.930% | | | | 11/15/15 | | | | AAA | | | | 735,354 | |
| | | | | |
| | 1,480 | | | Ford Credit Floorplan Master Owner Trust Series 2010-3 | | | 4.200% | | | | 2/15/17 | | | | AAA | | | | 1,597,626 | |
| | | | | |
| | 4,020 | | | Fosse Master Issuer PLC, Residential Mortgage Pool, Series 2011-1A | | | 1.866% | | | | 10/19/54 | | | | AAA | | | | 4,042,066 | |
| | | | | |
| | 512 | | | Freddie Mac Gold Pool 780456 | | | 2.347% | | | | 5/01/33 | | | | Aaa | | | | 544,019 | |
| | | | | |
| | 1,115 | | | Freddie Mac Gold Pool 780911 | | | 2.344% | | | | 10/01/33 | | | | Aaa | | | | 1,162,122 | |
| | | | | |
| | 1,211 | | | Freddie Mac Gold Pool 781296 | | | 2.355% | | | | 3/01/34 | | | | Aaa | | | | 1,284,945 | |
| | | | | |
| | 251 | | | Freddie Mac Gold Pool 786591 | | | 2.508% | | | | 12/01/26 | | | | Aaa | | | | 268,064 | |
| | | | | |
| | 228 | | | Freddie Mac Gold Pool 786853 | | | 2.260% | | | | 10/01/29 | | | | Aaa | | | | 237,044 | |
| | | | | |
| | 238 | | | Freddie Mac Gold Pool 846946 | | | 2.317% | | | | 1/01/29 | | | | Aaa | | | | 253,390 | |
| | | | | |
| | 140 | | | Freddie Mac Gold Pool 847014 | | | 1.879% | | | | 5/01/30 | | | | Aaa | | | | 142,681 | |
| | | | | |
| | 129 | | | Freddie Mac Gold Pool 847063 | | | 2.453% | | | | 10/01/32 | | | | Aaa | | | | 137,104 | |
| | | | | |
| | 1,083 | | | Freddie Mac Gold Pool 847241 | | | 2.302% | | | | 10/01/30 | | | | Aaa | | | | 1,148,080 | |
| | | | | |
| | 1,891 | | | Freddie Mac Gold Pool 847331 | | | 2.233% | | | | 8/01/32 | | | | Aaa | | | | 2,005,477 | |
| | | | | |
| | 127 | | | Freddie Mac Gold Pool 847367 | | | 2.201% | | | | 6/01/31 | | | | Aaa | | | | 133,631 | |
| | | | | |
| | 779 | | | Freddie Mac Gold Pool 847652 | | | 2.311% | | | | 9/01/32 | | | | Aaa | | | | 819,489 | |
| | | | | |
| | 2,204 | | | Freddie Mac Gold Pool 848193 | | | 2.728% | | | | 3/01/36 | | | | Aaa | | | | 2,349,234 | |
| | | | | |
| | 2,407 | | | Freddie Mac Gold Pool 848282 | | | 2.430% | | | | 6/01/38 | | | | Aaa | | | | 2,541,706 | |
| | | | | |
| | 239 | | | Freddie Mac Gold Pool 972055 | | | 3.877% | | | | 4/01/30 | | | | Aaa | | | | 253,752 | |
| | | | | |
| | 1,508 | | | Freddie Mac Mortgage Pool, Various G11618 | | | 4.500% | | | | 5/01/18 | | | | Aaa | | | | 1,614,103 | |
| | | | | |
| | 444 | | | Freddie Mac Mortgage Pool, Various M30035 | | | 4.500% | | | | 4/01/22 | | | | Aaa | | | | 466,783 | |
| | | | | |
| | 2,048 | �� | | Freddie Mac Multi-Class Certificates 3780 FE | | | 0.642% | | | | 12/15/20 | | | | Aaa | | | | 2,050,438 | |
| | | | | |
| | 2,408 | | | Freddie Mac Multifamily Structured Pass Through Certificates,
Series K703 | | | 1.873% | | | | 1/25/18 | | | | Aaa | | | | 2,469,527 | |
| | | | | |
| | 791 | | | Freddie Mac Non Gold Participation Certificates | | | 2.291% | | | | 8/01/36 | | | | Aaa | | | | 836,981 | |
| | | | | |
| | 2,230 | | | Freddie Mac Structured Pass-Through Certificates Series T045 | | | 4.520% | | | | 8/27/12 | | | | Aaa | | | | 2,237,355 | |
| | | | | |
| | 1,840 | | | General Electric Capital Credit Card Master Note Trust Series 2010-3 | | | 2.210% | | | | 6/15/16 | | | | Aaa | | | | 1,868,458 | |
| | | | | |
| | 6,998 | | | Goldman Sachs Mortgage Securities Corporation II, Commercial Mortgage Pass Through Certificates, Series 2001-ALF | | | 2.716% | | | | 2/12/21 | | | | AAA | | | | 7,110,511 | |
| | | | | |
| | 7,000 | | | Goldman Sachs Mortgage Securities Corporation II, Commercial Mortgage Pass-Through Certificates, Series 2007-GG10, (3) | | | 5.790% | | | | 8/10/45 | | | | AAA | | | | 7,768,698 | |
| | | | | | | | | | | | | | | | | | | | |
Principal
Amount (000) | | | Description (1) | | Coupon | | | Maturity | | | Ratings (2) | | | Value | |
| | | | | | | | | | | | | | | | | | | | |
| | | | ASSET-BACKED AND MORTGAGE-BACKED SECURITIES (continued) | | | | | | | | | |
| | | | | |
| $ | 5,589 | | | Goldman Sachs Mortgage Securities Corporation II, Commercial Mortgage Pass-Through Certificates, Series 2010-C1 | | | 3.679% | | | | 8/12/43 | | | | Aaa | | | $ | 5,980,629 | |
| | | | | |
| | 5,000 | | | Goldman Sachs Mortgage Securities Corporation II, Commercial Mortgage Pass Through Certificates, Series 2011-GC3 | | | 3.645% | | | | 3/11/44 | | | | Aaa | | | | 5,347,540 | |
| | | | | |
| | 2,130 | | | Goldman Sachs Mortgage Securities Corporation, Commercial Mortgage Pass-Through Certificates, Series 2011-GC5 | | | 2.999% | | | | 8/10/44 | | | | Aaa | | | | 2,245,559 | |
| | | | | |
| | 1,874 | | | Goldman Sachs Mortgage Securities Corporation, Mortgage Pass-Through Certificates, Series 2005-AR1 | | | 3.073% | | | | 1/25/35 | | | | CC | | | | 468,378 | |
| | | | | |
| | 652 | | | Government National Mortgage Assocation, Guaranteed REMIC Pass Through Securities and MX Securities Trust | | | 5.500% | | | | 6/20/28 | | | | Aaa | | | | 657,877 | |
| | | | | |
| | 1,084 | | | Government National Mortgage Assocation, Guaranteed REMIC Pass Through Securities and MX Securities Trust | | | 4.500% | | | | 5/16/38 | | | | Aaa | | | | 1,154,431 | |
| | | | | |
| | 44 | | | Government National Mortgage Association Pool | | | 6.500% | | | | 5/01/21 | | | | Aaa | | | | 45,648 | |
| | | | | |
| | 136 | | | Government National Mortgage Association Pool 8006 | | | 1.625% | | | | 7/20/22 | | | | Aaa | | | | 140,877 | |
| | | | | |
| | 23 | | | Government National Mortgage Association Pool 80106 | | | 1.625% | | | | 8/20/27 | | | | Aaa | | | | 23,441 | |
| | | | | |
| | 35 | | | Government National Mortgage Association Pool 80154 | | | 1.625% | | | | 1/20/28 | | | | Aaa | | | | 36,216 | |
| | | | | |
| | 93 | | | Government National Mortgage Association Pool 80283 | | | 2.375% | | | | 5/20/29 | | | | Aaa | | | | 96,939 | |
| | | | | |
| | 181 | | | Government National Mortgage Association Pool 80469 | | | 1.625% | | | | 11/20/30 | | | | Aaa | | | | 187,847 | |
| | | | | |
| | 57 | | | Government National Mortgage Association Pool 80507 | | | 2.375% | | | | 4/20/31 | | | | Aaa | | | | 59,268 | |
| | | | | |
| | 202 | | | Government National Mortgage Association Pool 80535 | | | 1.625% | | | | 8/20/31 | | | | Aaa | | | | 209,378 | |
| | | | | |
| | 78 | | | Government National Mortgage Association Pool 8699 | | | 1.625% | | | | 9/20/25 | | | | Aaa | | | | 81,014 | |
| | | | | |
| | 100 | | | Government National Mortgage Association Pool 8824 | | | 2.000% | | | | 8/20/21 | | | | Aaa | | | | 104,101 | |
| | | | | |
| | 62 | | | Government National Mortgage Association Pool 8847 | | | 2.375% | | | | 4/20/26 | | | | Aaa | | | | 64,657 | |
| | | | | |
| | 4,250 | | | GraceChurch Card PLC. Series 2012-1A. | | | 0.942% | | | | 2/15/17 | | | | AAA | | | | 4,248,882 | |
| | | | | |
| | 38 | | | Green Tree Fiancial Manufactured Housing Loans, Series 2008-MH1 | | | 7.000% | | | | 4/25/38 | | | | AAA | | | | 38,503 | |
| | | | | |
| | 1,990 | | | Greenwich Capital Commercial Funding Corporation, Commercial Mortgage Pass-Through Certificates, Series 2005-GG5 | | | 5.117% | | | | 4/10/37 | | | | AAA | | | | 1,997,480 | |
| | | | | |
| | 3,863 | | | Hertz Vehicle Financing LLC Series 2009 | | | 4.260% | | | | 3/25/14 | | | | Aaa | | | | 3,932,614 | |
| | | | | |
| | 3,750 | | | Holmes Master Issuer PLC, Residential Mortgage Pool, Series 2012-1A, 144A | | | 2.117% | | | | 10/15/54 | | | | AAA | | | | 3,778,628 | |
| | | | | |
| | 1,007 | | | IMC Home Mortgage Company, Home Equity Loan Pass-Through Certificates, Series 1998-3 | | | 6.687% | | | | 8/20/29 | | | | AA– | | | | 925,905 | |
| | | | | |
| | 392 | | | IndyMac INDX Mortgage Loan Trust, Pass Through Certificates, Series 2005-AR1 | | | 2.748% | | | | 3/25/35 | | | | AAA | | | | 350,516 | |
| | | | | |
| | 37 | | | JPMorgan Mortage Trust, Mortgage Pass-Through Certtificates, Series 2006-A7 | | | 5.669% | | | | 1/25/37 | | | | C | | | | 883 | |
| | | | | |
| | 4,125 | | | JPMorgan Chase Commercial Mortgage Securities Corporation, Commercial Mortgage Pass-Through Certificates, Series 2010-C1 | | | 3.853% | | | | 6/15/43 | | | | Aaa | | | | 4,383,386 | |
| | | | | |
| | 3,613 | | | JPMorgan Chase Commercial Mortgage Securities Corporation, Commercial Mortgage Pass-Through Certificates, Series 2010-C2 A1 | | | 2.749% | | | | 11/15/43 | | | | AAA | | | | 3,735,577 | |
| | | | | |
| | 6,855 | | | JPMorgan Chase Commerical Mortgage Trust, Commerical Mortage Pass Through Certificates, Series 2011-C4 | | | 1.525% | | | | 7/17/46 | | | | AAA | | | | 6,908,632 | |
| | | | | |
| | 2,618 | | | Merrill Lynch Mortgage Trust, Commercial Mortgage Pass-Through Certificates, Series 2006-C1 A2 | | | 5.614% | | | | 5/12/39 | | | | AAA | | | | 2,679,405 | |
| | | | | |
| | 1,642 | | | Morgan Stanley ABS Capital I Inc., Mortgage Pass-Through Certificates, Series 2007-NC2 | | | 0.355% | | | | 2/25/37 | | | | B3 | | | | 1,533,361 | |
| | | | | |
| | 1,609 | | | Morgan Stanley Capital I Inc Trust, Mortage Pass-Through Certificates, Series 2006-NC2 | | | 0.425% | | | | 2/25/36 | | | | B– | | | | 1,424,405 | |
| | | | | |
| | 3,839 | | | Morgan Stanley Capital I Trust, Commercial Mortgage Pass-Through Certificates, Series 2011-C1 | | | 2.602% | | | | 9/15/47 | | | | AAA | | | | 3,935,770 | |
Portfolio of Investments
Nuveen Short Term Bond Fund (continued)
June 30, 2012
| | | | | | | | | | | | | | | | | | | | |
Principal
Amount (000) | | | Description (1) | | Coupon | | | Maturity | | | Ratings (2) | | | Value | |
| | | | | | | | | | | | | | | | | | | | |
| | | | ASSET-BACKED AND MORTGAGE-BACKED SECURITIES (continued) | | | | | | | | | |
| | | | | |
| $ | 296 | | | Mortgage Asset Securitization Tranasction Inc., Alternative Loan Trust Mortgage Pass-Through Certificates, Series 2004-13 | | | 8.000% | | | | 1/25/35 | | | | A | | | $ | 307,372 | |
| | | | | |
| | 1,779 | | | Mortgage Asset Securitization Transaction Inc., Adjustable Rate Mortgage Pass-Through Certificates, Series 2003-5 | | | 2.315% | | | | 11/25/33 | | | | AAA | | | | 1,479,150 | |
| | | | | |
| | 2,371 | | | Mortgage Equity Conversion Asset Trust 2010-1A | | | 4.000% | | | | 7/25/60 | | | | AA | | | | 2,276,198 | |
| | | | | |
| | 1,411 | | | National Credit Union Administration, Guaranteed Notes Series 2011-R1 | | | 0.690% | | | | 1/08/20 | | | | Aaa | | | | 1,414,535 | |
| | | | | |
| | 1,042 | | | National Credit Union Adminstration Guaranteed Structured Collateral Notes | | | 2.900% | | | | 10/29/20 | | | | Aaa | | | | 1,111,033 | |
| | | | | |
| | 1,764 | | | National Credit Union Adminstration, Guaranteed Notes, Series 2010-R1 | | | 1.840% | | | | 10/07/20 | | | | Aaa | | | | 1,785,594 | |
| | | | | |
| | 2,244 | | | Newcastle Investment Trust, Manufactured Housing Contracts and Loans, Series 2010-MH1 | | | 4.500% | | | | 7/10/35 | | | | AAA | | | | 2,295,914 | |
| | | | | |
| | 3,512 | | | Newcastle Investment Trust, Manufactured Housing Loans, Series 2011-MH1 | | | 2.450% | | | | 12/10/33 | | | | AAA | | | | 3,518,235 | |
| | | | | |
| | 4,100 | | | Nissan Auto Lease Trust, Series 2011-B | | | 0.920% | | | | 2/16/15 | | | | Aaa | | | | 4,116,255 | |
| | | | | |
| | 30 | | | Nissan Auto Receivables Owner Trust, Series 2009-1 | | | 5.000% | | | | 9/15/14 | | | | AAA | | | | 30,402 | |
| | | | | |
| | 2,000 | | | Ocwen Advance Receivables Backed Notes, Series 2009-3A | | | 4.140% | | | | 7/15/23 | | | | AAA | | | | 2,002,500 | |
| | | | | |
| | 5,509 | | | Park Place Securities Inc., Asset Backed Pass Through Certificatess Series 2005- WCH1 | | | 0.765% | | | | 2/25/35 | | | | AA | | | | 5,118,972 | |
| | | | | |
| | 549 | | | PSE&G Transition Funding LLC Bonds, Series 2001-1 | | | 6.610% | | | | 6/15/15 | | | | AAA | | | | 568,407 | |
| | | | | |
| | 838 | | | RBSSP Resecuritization Trust 2009-10 | | | 0.345% | | | | 3/26/37 | | | | N/R | | | | 825,473 | |
| | | | | |
| | 92 | | | RBSSP Resecuritization Trust 2009-11 | | | 1.995% | | | | 12/26/37 | | | | Aa3 | | | | 91,854 | |
| | | | | |
| | 118 | | | RBSSP Resecuritization Trust 2009-8 | | | 0.385% | | | | 3/26/37 | | | | Aaa | | | | 116,502 | |
| | | | | |
| | 2,020 | | | RBSSP Resecuritization Trust 2010-10 | | | 0.375% | | | | 9/26/36 | | | | N/R | | | | 1,756,825 | |
| | | | | |
| | 1,526 | | | RBSSP Resecuritization Trust 2010-11 | | | 0.415% | | | | 3/26/37 | | | | A | | | | 1,498,730 | |
| | | | | |
| | 1,160 | | | RBSSP Resecuritization Trust 2010-8 | | | 0.575% | | | | 7/26/36 | | | | N/R | | | | 1,098,882 | |
| | | | | |
| | 2,425 | | | Renaissance Home Equity Loan Trust I, Home Equity Loan Asset-Backed Notes, Series 2005-3 | | | 5.140% | | | | 11/25/35 | | | | AA+ | | | | 1,748,088 | |
| | | | | |
| | 1,345 | | | Rialto Real Estate, Multipurpose Mortgage Loan Backed Pool, Series 2012 LT1A | | | 4.750% | | | | 2/15/25 | | | | Baa3 | | | | 1,347,555 | |
| | | | | |
| | 4,750 | | | Santander Drive Auto Receivables Trust, Series 2011-1 | | | 1.280% | | | | 1/15/15 | | | | Aaa | | | | 4,770,341 | |
| | | | | |
| | 521 | | | Sequoia Mortgage Trust, Mortgage Pass-Through Certificates, Series 2007-1 | | | 2.666% | | | | 2/20/47 | | | | CCC | | | | 403,703 | |
| | | | | |
| | 9,257 | | | SMART Trust, Asset Backed Securities, Series 2011-1USA | | | 1.091% | | | | 10/14/14 | | | | Aaa | | | | 9,273,520 | |
| | | | | |
| | 4,138 | | | Springleaf Mortgage Loan Trust 2011-1 | | | 4.050% | | | | 1/25/58 | | | | AAA | | | | 4,196,667 | |
| | | | | |
| | 173 | | | Structured Adjustable Rate Mortgage Loan Trust, Mortgage
Pass-Through Certificates, Series 2004-11 | | | 2.877% | | | | 8/25/34 | | | | Baa2 | | | | 164,873 | |
| | | | | |
| | 1,060 | | | Thornburg Mortgage Securities Trust, Mortgage Loan Pass-Through Certificates, Series 2007-4 | | | 7.750% | | | | 9/01/13 | | | | AAA | | | | 1,062,459 | |
| | | | | |
| | 2,058 | | | U.S. Small Business Administration Guaranteed Participating Securities, Participation Certificates, Series 2005-10B | | | 4.941% | | | | 9/10/15 | | | | Aaa | | | | 2,214,638 | |
| | | | | |
| | 1,899 | | | U.S. Small Business Administration Guaranteed Participating Securities Participation Certificates, Series 2005-10B | | | 4.940% | | | | 8/10/15 | | | | Aaa | | | | 2,061,513 | |
| | | | | |
| | 980 | | | U.S. Small Business Administration Guaranteed Participating Securities, Participation Certificates Series 2005-P10A | | | 4.638% | | | | 2/10/15 | | | | Aaa | | | | 1,039,359 | |
| | | | | |
| | 598 | | | U.S. Small Business Administration Guaranteed Participating Securities Participation Certificates, Series 2006-10A | | | 5.408% | | | | 2/10/16 | | | | Aaa | | | | 648,881 | |
| | | | | |
| | 319 | | | U.S. Small Business Administration Guaranteed Participating Securities, Participation Certificates, Series 2007-10A | | | 5.459% | | | | 2/10/17 | | | | Aaa | | | | 344,174 | |
| | | | | |
| | 5,000 | | | UBS-Barclays Commercial Mortgage Trust 2012-C2, (WI/DD) | | | 1.016% | | | | 5/10/63 | | | | Aaa | | | | 5,000,782 | |
| | | | | | | | | | | | | | | | | | | | |
Principal
Amount (000) | | | Description (1) | | Coupon | | | Maturity | | | Ratings (2) | | | Value | |
| | | | | | | | | | | | | | | | | | | | |
| | | | ASSET-BACKED AND MORTGAGE-BACKED SECURITIES (continued) | | | | | | | | | |
| | | | | |
| $ | 671 | | | Vericrest Opportunity Loan Transferee, Series 2011-NL1A | | | 5.926% | | | | 12/26/50 | | | | AAA | | | $ | 671,919 | |
| | | | | |
| | 444 | | | Vericrest Opportunity Loan Transferee, Series 2011-NL2A | | | 5.682% | | | | 6/25/51 | | | | Baa2 | | | | 445,148 | |
| | | | | |
| | 1,032 | | | Vericrest Opportunity Loan Transferee, Series 2011-NL3A | | | 5.194% | | | | 9/25/51 | | | | N/R | | | | 1,033,636 | |
| | | | | |
| | 4,642 | | | Vornado DP LLC Commercial Mortgage Credit Tenant Lease Series 2010-VNO | | | 2.970% | | | | 9/14/28 | | | | AAA | | | | 4,867,182 | |
| | | | | |
| | 2,135 | | | Wachovia Bank Commercial Mortgage Trust, Commercial
Mortgage Pass-Through Certificates, Series 2007-WHl8 | | | 0.322% | | | | 6/15/20 | | | | Aaa | | | | 1,986,548 | |
| | | | | |
| | 5,000 | | | Walter Investment Management Company Capital Trust, Series 2012-AA, (WI/DD) | | | 4.549% | | | | 10/15/50 | | | | BBB | | | | 5,010,938 | |
| | | | | |
| | 294 | | | Washington Mutual Mortgage Securities Corporation, Mortgage Pass-through Certificates, Series 2007-HY2 | | | 5.260% | | | | 9/25/36 | | | | C | | | | 11,469 | |
| | | | | |
| | 1,539 | | | Wells Fargo Mortgage Backed Securities Trust, Mortgage Pass-Through Certificate Series 2006-AR14 | | | 2.618% | | | | 10/25/36 | | | | Caa2 | | | | 1,146,850 | |
| | | | | |
| | 249 | | | Wells Fargo Mortgage Backed Securities Trust, Mortgage Pass-Through Certificate Series 2006-3 | | | 5.500% | | | | 3/25/36 | | | | B2 | | | | 248,046 | |
| | | | | |
| | 985 | | | Wells Fargo Mortagge Backed Securities Trust, Mortgage Pass-Through Certificate Series 2007-2 | | | 5.750% | | | | 3/25/37 | | | | Caa1 | | | | 899,648 | |
| | | | | |
| | 38 | | | Wells Fargo Mortgage Backed Securties, 2005-AR16 Class 3A2 | | | 2.630% | | | | 10/25/35 | | | | BBB– | | | | 37,219 | |
| | | | | |
| | 3,888 | | | Wells Fargo-RBS Commercial Mortgage Trust, Commercial Mortgage Pass-Through Certificates, Series 2011-C3 | | | 1.988% | | | | 3/17/44 | | | | Aaa | | | | 3,940,158 | |
| | | | | |
| | 3,829 | | | WF-RBS Commercial Mortage Trust, Commercial Mortgage Pass-Through Certificates, Series 2011-C2 | | | 2.501% | | | | 2/18/44 | | | | Aaa | | | | 3,908,787 | |
| | | | | |
| | 103 | | | World Omni Auto Receeivables Trust, Series 2010A | | | 1.340% | | | | 12/16/13 | | | | AAA | | | | 103,289 | |
| | | | | |
| | 1,175 | | | World Omni Auto Receivables Trust, Series 2010-A | | | 2.210% | | | | 5/15/15 | | | | AAA | | | | 1,191,704 | |
| $ | 383,235 | | | Total Asset-Backed and Mortgage-Backed Securities (cost $381,635,487) | | | | 384,599,882 | |
| | | | | |
Principal
Amount (000) (6) | | | Description (1) | | Coupon | | | Maturity | | | Ratings (2) | | | Value | |
| | | | SOVEREIGN DEBT – 1.4% | | | | | | | | | | | | | | | | |
| | | | | |
| | | | Canada – 0.9% | | | | | | | | | | | | | | | | |
| | | | | |
| | 8,000 | CAD | | Canadian Government Bond | | | 1.500% | | | | 12/01/12 | | | | AAA | | | $ | 7,873,254 | |
| | | | Mexico – 0.5% | | | | | | | | | | | | | | | | |
| | | | | |
| | 510 | MXN | | Mexican Bonos | | | 9.500% | | | | 12/18/14 | | | | A– | | | | 4,245,807 | |
| | | | Total Sovereign Debt (cost $12,920,511) | | | | | | | | | | | | | | | 12,119,061 | |
| | | | | |
Principal
Amount (000) | | | Description (1) | | Coupon | | | Maturity | | | Ratings (2) | | | Value | |
| | | | STRUCTURED NOTES – 0.2% | | | | | | | | | | | | | | | | |
| | | | | |
| $ | 1,750 | | | FDIC Structured Sales Guaranteed Notes, Series 2010-L1A | | | 0.000% | | | | 10/25/13 | | | | AAA | | | $ | 1,737,295 | |
| $ | 1,750 | | | Total Structured Notes (cost $1,700,335) | | | | | | | | | | | | | | | 1,737,295 | |
| | | | | |
| Shares | | | Description (1) | | | | | | | | | | | Value | |
| | | | INVESTMENTS PURCHASED WITH COLLATERAL FROM SECURITIES LENDING – 9.6% | | | | | | | | | |
| | | | | |
| | | | Money Market Funds – 9.6% | | | | | | | | | | | | | | | | |
| | | | | |
| | 85,229,787 | | | Mount Vernon Securities Lending Prime Portfolio, 0.197% (7), (8) | | | | | | | | | | | | | | $ | 85,229,787 | |
| | | | Total Investments Purchased with Collateral from Securities Lending (cost $85,229,787) | | | | 85,229,787 | |
Portfolio of Investments
Nuveen Short Term Bond Fund (continued)
June 30, 2012
| | | | | | | | | | | | | | | | | | | | |
Shares/
Principal
Amount (000) | | | Description (1) | | Coupon | | | Maturity | | | Ratings (2) | | | Value | |
| | | | | | | | | | | | | | | | | | | | |
| | | | SHORT-TERM INVESTMENTS – 9.2% | | | | | | | | | | | | | | | | |
| | | | | |
| | | | Money Market Funds – 8.9% | | | | | | | | | | | | | | | | |
| | | | | |
| | 78,112,244 | | | First American Treasury Obligations Fund, Class Z | | | 0.000% (7) | | | | N/A | | | | N/A | | | $ | 78,112,244 | |
| | | | U.S. Government and Agency Obligations – 0.3% | | | | | | | | | | | | | | | | |
| | | | | |
| $ | 1,180 | | | U.S. Treasury Bills, (5) | | | 0.330% | | | | 7/26/12 | | | | Aaa | | | | 1,179,971 | |
| | | | | |
| | 475 | | | U.S. Treasury Bills, (5) | | | 0.158% | | | | 2/07/13 | | | | Aaa | | | | 474,536 | |
| | | | | |
| | 1,185 | | | U.S. Treasury Bills, (5) | | | 0.158% | | | | 3/07/13 | | | | Aaa | | | | 1,183,675 | |
| $ | 2,840 | | | Total U.S. Government and Agency Obligations | | | | | | | | | | | | | | | 2,838,182 | |
| | | | Total Short-Term Investments (cost $80,950,448) | | | | | | | | | | | | | | | 80,950,426 | |
| | | | Total Investments (cost $1,032,153,393) – 117.9% | | | | | | | | | | | | | | | 1,040,670,755 | |
| | | | Other Assets Less Liabilities – (17.9)% (9) | | | | | | | | | | | | | | | (157,785,833) | |
| | | | Net Assets – 100% | | | | | | | | | | | | | | $ | 882,884,922 | |
Investments in Derivatives at June 30, 2012
Interest Rate Swaps outstanding:
| | | | | | | | | | | | | | | | | | | | | | | | | | | | | | | | |
| Counterparty | | Notional
Amount | | | Fund
Pay/Receive
Floating Rate | | | Floating
Rate Index | | | Fixed Rate* | | | Fixed Rate
Payment
Frequency | | | Termination
Date | | | Value | | | Unrealized
Appreciation
(Depreciation) (9) | |
JPMorgan | | $ | 20,000,000 | | | | Receive | | | | 3-Month USD-LIBOR | | | | 0.641 | % | | | Semi-Annually | | | | 1/12/14 | | | $ | (74,289 | ) | | $ | (74,289 | ) |
JPMorgan | | | 4,000,000 | | | | Receive | | | | 3-Month USD-LIBOR | | | | 3.858 | | | | Semi-Annually | | | | 1/19/20 | | | | (773,343 | ) | | | (773,343 | ) |
UBS | | | 4,000,000 | | | | Receive | | | | 3-Month USD-LIBOR | | | | 3.001 | | | | Semi-Annually | | | | 8/03/14 | | | | (250,520 | ) | | | (250,520 | ) |
| | | | | | | | | | | | | | | | | | | | | | | | | | | | | | | $ | (1,098,152 | ) |
Future Contracts outstanding:
| | | | | | | | | | | | | | | | | | | | |
| Type | | Contract
Position | | | Number of
Contracts | | | Contract
Expiration | | | Value
| | | Unrealized
Appreciation
(Depreciation) | |
U.S. Treasury 2-Year Note | | | Short | | | | (36 | ) | | | 9/12 | | | $ | (7,926,750 | ) | | $ | 3,854 | |
U.S. Treasury 5-Year Note | | | Short | | | | (396 | ) | | | 9/12 | | | | (49,091,625 | ) | | | (68,720 | ) |
U.S. Treasury 10-Year Note | | | Short | | | | (146 | ) | | | 9/12 | | | | (19,472,750 | ) | | | (102,139 | ) |
| | | | | | | | | | | | | | | | | | | $ | (167,005 | ) |
| | | | For Fund portfolio compliance purposes, the Fund’s industry classifications refer to any one or more of the industry sub-classifications used by one or more widely recognized market indexes or ratings group indexes, and/or as defined by Fund management. This definition may not apply for purposes of this report, which may combine industry sub-classifications into sectors for reporting ease. |
| | (1) | | All Percentages shown in the Portfolio of Investments are based on net assets. |
| | (2) | | Ratings (not covered by the report of independent registered public accounting firm): Using the highest of Standard & Poor’s Group (“Standard & Poor’s”), Moody’s Investors Service, Inc. (“Moody’s”) or Fitch, Inc. (“Fitch”) rating. Ratings below BBB by Standard & Poor’s, Baa by Moody’s or BBB by Fitch are considered to be below investment grade. Holdings designated N/R are not rated by any of these national rating agencies. |
| | (3) | | Investment, or a portion of investment, is out on loan for securities lending. |
| | (4) | | Optional Call Provisions (not covered by the report of independent registered public accounting firm): Dates (month and year) and prices of the earliest optional call or redemption. There may be other call provisions at varying prices at later dates. |
| | (5) | | Investment, or portion of investment, segregated as collateral for investments in derivatives. |
| | (6) | | Principal Amount (000) denominated in U.S. Dollars, unless otherwise noted. |
| | (7) | | The rate shown is the annualized seven-day effective yield as of June 30, 2012. |
| | (8) | | The Fund may loan securities representing up to one third of the fair value of its total assets (which includes collateral for securities on loan) to broker-dealers, banks and other institutions. The Fund maintains collateral equal to at least 100% of the fair value of the securities loaned. The cash collateral received by the Fund is invested in this money market fund. See Notes to Financial Statements, Footnote 1 – General Information and Significant Accounting Policies, Securities Lending for more information. |
| | (9) | | Other Assets Less Liabilities, includes the Unrealized Appreciation (Depreciation) of derivative instruments as noted within Investments in Derivatives at June 30, 2012. |
| | TBA | | To be announced. Maturity date not known prior to settlement of this transaction. |
| | WI/DD | | Investment, or portion of investment, purchased on a when-issued or delayed delivery basis. |
| | 144A | | Investment is exempt from registration under Rule 144A of the Securities Act of 1933, as amended. These investments may only be resold in transactions exempt from registration, which are normally those transactions with qualified institutional buyers. |
| | P/O | | Principal Only Security. |
| | USD-LIBOR | | United States Dollar–London Inter-Bank Offered Rate. |
See accompanying notes to financial statements.
Portfolio of Investments
Nuveen Strategic Income Fund (formerly known as Nuveen Total Return Bond Fund)
June 30, 2012
| | | | | | | | | | | | | | | | | | | | |
| Shares | | | Description (1) | | | | | | | | | | | Value | |
| | | | | | | | | | | | | | | | | | | | |
| | | | COMMON STOCKS – 0.0% | | | | | | | | | | | | | | | | |
| | | | | |
| | | | Building Products – 0.0% | | | | | | | | | | | | | | | | |
| | | | | |
| | 50 | | | Dayton Superior Class A, (2) | | | | | | | | | | | | | | $ | 2,839 | |
| | | | | |
| | 55 | | | Dayton Superior Class 1, (2) | | | | | | | | | | | | | | | 3,154 | |
| | | | Total Common Stocks (cost $20,079) | | | | | | | | | | | | | | | 5,993 | |
| | | | | |
| Shares | | | Description (1) | | Coupon | | | | | | Ratings (3) | | | Value | |
| | | | $25 PAR (OR SIMILAR) PREFERRED SECURITIES – 2.5% | | | | | | | | | | | | | | | | |
| | | | | |
| | | | Capital Markets – 0.1% | | | | | | | | | | | | | | | | |
| | | | | |
| | 47,500 | | | Goldman Sachs Group Inc., (4) | | | 1.216% | | | | | | | | BB+ | | | $ | 847,875 | |
| | | | Commercial Banks – 0.8% | | | | | | | | | | | | | | | | |
| | | | | |
| | 1,330,000 | | | Barclays Bank PLC (13) | | | 4.750% | | | | | | | | BBB | | | | 888,686 | |
| | | | | |
| | 118,392 | | | PNC Financial Services | | | 0.000% | | | | | | | | BBB | | | | 3,119,629 | |
| | | | | |
| | 1,000,000 | | | RBS Capital Trust (13) | | | 5.512% | | | | | | | | BB | | | | 590,000 | |
| | | | | |
| | 14,000 | | | Royal Bank of Scotland Group PLC, Series L | | | 5.750% | | | | | | | | BB | | | | 252,280 | |
| | | | Total Commercial Banks | | | | | | | | | | | | | | | 4,850,595 | |
| | | | Consumer Finance – 0.1% | | | | | | | | | | | | | | | | |
| | | | | |
| | 750 | | | Ally Financial Inc. (13) | | | 0.000% | | | | | | | | B3 | | | | 668,180 | |
| | | | Diversified Financial Services – 0.1% | | | | | | | | | | | | | | | | |
| | | | | |
| | 28,000 | | | Citigroup Capital Trust XI | | | 6.000% | | | | | | | | BB | | | | 681,800 | |
| | | | Insurance – 1.3% | | | | | | | | | | | | | | | | |
| | | | | |
| | 84,500 | | | Aspen Insurance Holdings Limited | | | 7.401% | | | | | | | | BBB– | | | | 2,170,805 | |
| | | | | |
| | 73,140 | | | Endurance Specialty Holdings Limited | | | 7.500% | | | | | | | | BBB– | | | | 1,924,313 | |
| | | | | |
| | 100,000 | | | Hartford Financial Services Group Inc. | | | 7.875% | | | | | | | | BB+ | | | | 2,704,000 | |
| | | | | |
| | 1,705,000 | | | Liberty Mutual Group, 144A, (4), (13) | | | 7.000% | | | | | | | | Baa3 | | | | 1,517,450 | |
| | | | Total Insurance | | | | | | | | | | | | | | | 8,316,568 | |
| | | | Thrifts & Mortgage Finance – 0.1% | | | | | | | | | | | | | | | | |
| | | | | |
| | 217,000 | | | Federal National Mortgage Association | | | 4.691% | | | | | | | | Ca | | | | 353,711 | |
| | | | Total $25 Par (or similar) Preferred Securities (cost $20,602,728) | | | | | | | | | | | | | | | 15,718,729 | |
| | | | | |
Principal
Amount (000) | | | Description (1) | | Coupon | | | Maturity | | | Ratings (3) | | | Value | |
| | | | CORPORATE BONDS – 62.6% | | | | | | | | | | | | | | | | |
| | | | | |
| | | | Aerospace & Defense – 0.9% | | | | | | | | | | | | | | | | |
| | | | | |
| $ | 2,140 | | | Exelis, Inc., 144A | | | 5.550% | | | | 10/01/21 | | | | BBB+ | | | $ | 2,296,451 | |
| | | | | |
| | 2,280 | | | Huntington Ingalls Industries Inc., (4) | | | 7.125% | | | | 3/15/21 | | | | BB | | | | 2,382,600 | |
| | | | | |
| | 850 | | | Martin Marietta Materials | | | 6.600% | | | | 4/15/18 | | | | BBB+ | | | | 937,436 | |
| | 5,270 | | | Total Aerospace & Defense | | | | | | | | | | | | | | | 5,616,487 | |
| | | | Airlines – 1.3% | | | | | | | | | | | | | | | | |
| | | | | |
| | 1,275 | | | Air Canada, 144A, (4) | | | 9.250% | | | | 8/01/15 | | | | B+ | | | | 1,246,313 | |
| | | | | |
| | 1,213 | | | American West Airlines Pass Through Certificates, Series 2001-1 | | | 8.057% | | | | 1/02/22 | | | | BBB | | | | 1,285,860 | |
| | | | | |
| | 1,760 | | | Delta Air Lines Pass Through Certificates Series 2012-1A | | | 4.750% | | | | 5/07/20 | | | | A– | | | | 1,782,000 | |
| | | | | |
| | 1,583 | | | Delta Airlines, (4) | | | 5.300% | | | | 4/15/19 | | | | A– | | | | 1,689,376 | |
| | | | | |
| | 1,021 | | | Northwest Airlines Trust Pass Through Certificates 2007-1 | | | 7.027% | | | | 11/01/19 | | | | BBB | | | | 1,082,391 | |
| | | | | |
| | 1,169 | | | United Airlines Pass Through Trust, Series 2007 | | | 6.636% | | | | 1/02/24 | | | | Baa3 | | | | 1,221,456 | |
| | 8,021 | | | Total Airlines | | | | | | | | | | | | | | | 8,307,396 | |
| | | | | | | | | | | | | | | | | | | | |
Principal
Amount (000) | | | Description (1) | | Coupon | | | Maturity | | | Ratings (3) | | | Value | |
| | | | | | | | | | | | | | | | | | | | |
| | | | Auto Components – 0.3% | | | | | | | | | | | | | | | | |
| | | | | |
| $ | 1,555 | | | Dana Holding Corporation | | | 6.500% | | | | 2/15/19 | | | | BB | | | $ | 1,652,188 | |
| | | | Automobiles – 0.5% | | | | | | | | | | | | | | | | |
| | | | | |
| | 2,920 | | | Chrysler GP/CG Company, (4) | | | 8.000% | | | | 6/15/19 | | | | B | | | | 3,000,300 | |
| | | | Beverages – 0.8% | | | | | | | | | | | | | | | | |
| | | | | |
| | 1,560 | | | Pernod-Ricard SA, 144A | | | 5.750% | | | | 4/07/21 | | | | BBB– | | | | 1,761,111 | |
| | | | | |
| | 3,280 | | | SABMiller Holdings Inc., 144A | | | 3.750% | | | | 1/15/22 | | | | BBB+ | | | | 3,488,126 | |
| | 4,840 | | | Total Beverages | | | | | | | | | | | | | | | 5,249,237 | |
| | | | Biotechnology – 0.6% | | | | | | | | | | | | | | | | |
| | | | | |
| | 1,845 | | | Sinopec Group Overseas Development 2012, 144A, (4) | | | 3.900% | | | | 5/17/22 | | | | Aa3 | | | | 1,923,293 | |
| | | | | |
| | 1,807 | | | STHI Holding Corporation, 144A | | | 8.000% | | | | 3/15/18 | | | | B | | | | 1,910,903 | |
| | 3,652 | | | Total Biotechnology | | | | | | | | | | | | | | | 3,834,196 | |
| | | | Building Products – 0.5% | | | | | | | | | | | | | | | | |
| | | | | |
| | 1,000 | | | Associated Materials Inc., (4) | | | 9.125% | | | | 11/01/17 | | | | B– | | | | 892,500 | |
| | | | | |
| | 2,000 | | | Nortek Inc., (4) | | | 8.500% | | | | 4/15/21 | | | | B | | | | 1,955,000 | |
| | 3,000 | | | Total Building Products | | | | | | | | | | | | | | | 2,847,500 | |
| | | | Capital Markets – 3.9% | | | | | | | | | | | | | | | | |
| | | | | |
| | 8,030 | | | Goldman Sachs Group, Inc. | | | 6.000% | | | | 6/15/20 | | | | A | | | | 8,572,579 | |
| | | | | |
| | 1,890 | | | Goldman Sachs Group, Inc. | | | 5.250% | | | | 7/27/21 | | | | A | | | | 1,919,896 | |
| | | | | |
| | 4,625 | | | Morgan Stanley | | | 6.625% | | | | 4/01/18 | | | | A | | | | 4,835,752 | |
| | | | | |
| | 7,405 | | | Morgan Stanley, (4) | | | 5.500% | | | | 7/28/21 | | | | A | | | | 7,295,828 | |
| | | | | |
| | 235 | | | State Street Corporation | | | 4.956% | | | | 3/15/18 | | | | A3 | | | | 251,674 | |
| | | | | |
| | 1,410 | | | UBS AG Stamford | | | 4.875% | | | | 8/04/20 | | | | Aa3 | | | | 1,506,475 | |
| | 23,595 | | | Total Capital Markets | | | | | | | | | | | | | | | 24,382,204 | |
| | | | Chemicals – 2.4% | | | | | | | | | | | | | | | | |
| | | | | |
| | 1,625 | | | Braskem Finance Limited, 144A, (4) | | | 5.750% | | | | 4/15/21 | | | | BBB– | | | | 1,669,688 | |
| | | | | |
| | 3,355 | | | Eastman Chemical Company, (4) | | | 3.600% | | | | 8/15/22 | | | | BBB | | | | 3,421,865 | |
| | | | | |
| | 1,125 | | | Ecolab Inc. | | | 4.350% | | | | 12/08/21 | | | | BBB+ | | | | 1,246,911 | |
| | | | | |
| | 1,350 | | | Georgia Gulf Corporation, (4) | | | 9.000% | | | | 1/15/17 | | | | BB | | | | 1,505,250 | |
| | | | | |
| | 1,915 | | | Incitec Pivot Finance, 144A | | | 6.000% | | | | 12/10/19 | | | | BBB | | | | 2,099,717 | |
| | | | | |
| | 1,500 | | | Ineos Finance PLC, 144A | | | 7.500% | | | | 5/01/20 | | | | B+ | | | | 1,511,250 | |
| | | | | |
| | 1,000 | | | Omonva Solutions Inc. | | | 7.875% | | | | 11/01/18 | | | | B2 | | | | 1,002,500 | |
| | | | | |
| | 225 | | | Rhodia SA, 144A | | | 6.875% | | | | 9/15/20 | | | | BBB+ | | | | 247,500 | |
| | | | | |
| | 750 | | | Sinochem Overseas Capital Limited | | | 4.500% | | | | 11/12/20 | | | | Baa1 | | | | 754,639 | |
| | | | | |
| | 1,175 | | | Taminco Global Chemical Corporation, 144A | | | 9.750% | | | | 3/31/20 | | | | B– | | | | 1,207,313 | |
| | 14,020 | | | Total Chemicals | | | | | | | | | | | | | | | 14,666,633 | |
| | | | Commercial Banks – 3.3% | | | | | | | | | | | | | | | | |
| | | | | |
| | 1,330 | | | Banco Bradesco S.A. Grand Cayman, 144A | | | 4.125% | | | | 5/16/16 | | | | Baa1 | | | | 1,373,225 | |
| | | | | |
| | 2,000 | | | Bancolombia SA | | | 5.950% | | | | 6/03/21 | | | | Baa2 | | | | 2,135,000 | |
| | | | | |
| | 1,000 | | | BBVA Bancomer SA Texas, 144A | | | 4.500% | | | | 3/10/16 | | | | A2 | | | | 1,005,000 | |
| | | | | |
| | 2,360 | | | HSBC Holdings PLC | | | 6.800% | | | | 6/01/38 | | | | AA– | | | | 2,703,094 | |
| | | | | |
| | 1,230 | | | ING Bank NV, 144A | | | 3.750% | | | | 3/07/17 | | | | A+ | | | | 1,224,230 | |
| | | | | |
| | 3,790 | | | Rabobank Nederland | | | 3.875% | | | | 2/08/22 | | | | AA | | | | 3,855,313 | |
| | | | | |
| | 2,100 | | | Royal Bank of Scotland Group PLC, (4) | | | 6.400% | | | | 10/21/19 | | | | A | | | | 2,239,352 | |
Portfolio of Investments
Nuveen Strategic Income Fund (continued)
June 30, 2012
| | | | | | | | | | | | | | | | | | | | |
Principal
Amount (000) | | | Description (1) | | Coupon | | | Maturity | | | Ratings (3) | | | Value | |
| | | | | | | | | | | | | | | | | | | | |
| | | | Commercial Banks (continued) | | | | | | | | | | | | | | | | |
| | | | | |
| $ | 2,120 | | | Russian Agricultural Bank, 144A | | | 7.750% | | | | 5/29/18 | | | | Baa1 | | | $ | 2,400,900 | |
| | | | | |
| | 2,350 | | | Sovereign Bank | | | 8.750% | | | | 5/30/18 | | | | Baa1 | | | | 2,547,757 | |
| | | | | |
| | 1,000 | | | VTB Bank Capital SA, 144A | | | 6.000% | | | | 4/12/17 | | | | BBB+ | | | | 1,015,000 | |
| | 19,280 | | | Total Commercial Banks | | | | | | | | | | | | | | | 20,498,871 | |
| | | | Commercial Services & Supplies – 1.2% | | | | | | | | | | | | | | | | |
| | | | | |
| | 635 | | | Ceridian Corporation, 144A, (WI/DD) | | | 8.875% | | | | 7/15/19 | | | | BB | | | | 655,638 | |
| | | | | |
| | 1,630 | | | Covanta Energy Corporation, Synthetic Letter of Credit, (4) | | | 6.375% | | | | 10/01/22 | | | | BB | | | | 1,722,900 | |
| | | | | |
| | 1,070 | | | Donnelley & Son Company | | | 7.625% | | | | 6/15/20 | | | | BB+ | | | | 1,000,450 | |
| | | | | |
| | 3,805 | | | International Lease Finance Corporation | | | 5.875% | | | | 4/01/19 | | | | BBB– | | | | 3,808,687 | |
| | 7,140 | | | Total Commercial Services & Supplies | | | | | | | | | | | | | | | 7,187,675 | |
| | | | Communications Equipment – 0.4% | | | | | | | | | | | | | | | | |
| | | | | |
| | 1,150 | | | Goodman Networks Inc., 144A | | | 12.125% | | | | 7/01/18 | | | | B+ | | | | 1,184,500 | |
| | | | | |
| | 1,500 | | | IntelSat Jackson Holdings, (4) | | | 7.250% | | | | 4/01/19 | | | | B | | | | 1,575,000 | |
| | 2,650 | | | Total Communications Equipment | | | | | | | | | | | | | | | 2,759,500 | |
| | | | Computers & Peripherals – 0.1% | | | | | | | | | | | | | | | | |
| | | | | |
| | 645 | | | Hewlett Packard Company | | | 4.650% | | | | 12/09/21 | | | | A | | | | 676,092 | |
| | | | Construction & Engineering – 0.2% | | | | | | | | | | | | | | | | |
| | | | | |
| | 1,100 | | | Odebrecht Finance Limited, 144A | | | 5.125% | | | | 6/26/22 | | | | BBB– | | | | 1,089,330 | |
| | | | Consumer Finance – 1.4% | | | | | | | | | | | | | | | | |
| | | | | |
| | 910 | | | Ally Financial Inc. | | | 7.500% | | | | 9/15/20 | | | | BB– | | | | 1,022,613 | |
| | | | | |
| | 1,615 | | | Capital One Bank | | | 8.800% | | | | 7/15/19 | | | | Baa1 | | | | 2,033,853 | |
| | | | | |
| | 3,755 | | | Discover Financial Services | | | 5.200% | | | | 4/27/22 | | | | BBB | | | | 3,928,015 | |
| | | | | |
| | 1,350 | | | Ford Motor Credit Company | | | 6.625% | | | | 8/15/17 | | | | Baa3 | | | | 1,535,590 | |
| | 7,630 | | | Total Consumer Finance | | | | | | | | | | | | | | | 8,520,071 | |
| | | | Containers & Packaging – 0.2% | | | | | | | | | | | | | | | | |
| | | | | |
| | 1,500 | | | Reynolds Group, 144A, (4) | | | 7.125% | | | | 4/15/19 | | | | BB– | | | | 1,571,250 | |
| | | | Diversified Financial Services – 6.2% | | | | | | | | | | | | | | | | |
| | | | | |
| | 2,115 | | | Bank of America Corporation | | | 5.750% | | | | 12/01/17 | | | | A | | | | 2,257,120 | |
| | | | | |
| | 9,000 | | | Bank of America Corporation | | | 5.875% | | | | 1/05/21 | | | | A | | | | 9,826,263 | |
| | | | | |
| | 2,765 | | | Citigroup Inc. | | | 6.125% | | | | 8/25/36 | | | | BBB+ | | | | 2,719,590 | |
| | | | | |
| | 300 | | | Citigroup Inc. | | | 6.875% | | | | 3/05/38 | | | | A | | | | 366,955 | |
| | | | | |
| | 975 | | | CNH Capital LLC, 144A | | | 6.250% | | | | 11/01/16 | | | | BB | | | | 1,043,250 | |
| | | | | |
| | 2,885 | | | Countrywide Financial Corporation, Convertible Bond | | | 6.250% | | | | 5/15/16 | | | | BBB+ | | | | 3,002,702 | |
| | | | | |
| | 1,000 | | | General Electric Capital Corporation | | | 5.300% | | | | 2/11/21 | | | | AA | | | | 1,122,382 | |
| | | | | |
| | 2,545 | | | General Electric Capital Corporation | | | 6.875% | | | | 1/10/39 | | | | AA+ | | | | 3,283,386 | |
| | | | | |
| | 1,280 | | | JPMorgan Chase & Company | | | 4.350% | | | | 8/15/21 | | | | AA– | | | | 1,350,909 | |
| | | | | |
| | 10,215 | | | JPMorgan Chase & Company, (4) | | | 4.500% | | | | 1/24/22 | | | | AA– | | | | 11,003,782 | |
| | | | | |
| | 2,280 | | | JPMorgan Chase & Company | | | 6.400% | | | | 5/15/38 | | | | AA– | | | | 2,741,344 | |
| | 35,360 | | | Total Diversified Financial Services | | | | | | | | | | | | | | | 38,717,683 | |
| | | | Diversified Telecommunication Services – 2.6% | | | | | | | | | | | | | | | | |
| | | | | |
| | 2,050 | | | AT&T, Inc., (4) | | | 5.550% | | | | 8/15/41 | | | | A2 | | | | 2,443,512 | |
| | | | | |
| | 2,780 | | | Brasil Telecom SA, 144A, (4) | | | 5.750% | | | | 2/10/22 | | | | Baa2 | | | | 2,832,820 | |
| | | | | |
| | 300 | | | CenturyLink Inc. | | | 6.150% | | | | 9/15/19 | | | | Baa3 | | | | 309,452 | |
| | | | | |
| | 2,360 | | | CenturyLink Inc., (4) | | | 5.800% | | | | 3/15/22 | | | | Baa3 | | | | 2,349,392 | |
| | | | | | | | | | | | | | | | | | | | |
Principal
Amount (000) | | | Description (1) | | Coupon | | | Maturity | | | Ratings (3) | | | Value | |
| | | | | | | | | | | | | | | | | | | | |
| | | | Diversified Telecommunication Services (continued) | | | | | | | | | | | | | | | | |
| | | | | |
| $ | 1,355 | | | Frontier Communications Corporation, (4) | | | 8.500% | | | | 4/15/20 | | | | BB+ | | | $ | 1,436,300 | |
| | | | | |
| | 2,250 | | | Telecom Italia Capital S.p.A | | | 7.175% | | | | 6/18/19 | | | | BBB | | | | 2,238,750 | |
| | | | | |
| | 5,270 | | | Telefonica Emisiones SAU | | | 5.462% | | | | 2/16/21 | | | | Baa1 | | | | 4,589,079 | |
| | 16,365 | | | Total Diversified Telecommunication Services | | | | | | | | | | | | | | | 16,199,305 | |
| | | | Electric Utilities – 1.9% | | | | | | | | | | | | | | | | |
| | | | | |
| | 1,485 | | | Comision Federal de Electricidad of the United States of Mexcio, 144A, (4) | | | 4.875% | | | | 5/26/21 | | | | Baa1 | | | | 1,603,800 | |
| | | | | |
| | 1,150 | | | Energy Future Intermediate Holding Company LLC | | | 10.000% | | | | 12/01/20 | | | | B | | | | 1,250,625 | |
| | | | | |
| | 3,145 | | | Exelon Generation Co. LLC, 144A | | | 4.250% | | | | 6/15/22 | | | | Baa1 | | | | 3,155,089 | |
| | | | | |
| | 2,230 | | | FirstEnergy Solutions Corporation, (4) | | | 6.050% | | | | 8/15/21 | | | | BBB | | | | 2,449,176 | |
| | | | | |
| | 2,630 | | | MidAmerican Energy Holdings Company | | | 6.125% | | | | 4/01/36 | | | | BBB+ | | | | 3,290,777 | |
| | 10,640 | | | Total Electric Utilities | | | | | | | | | | | | | | | 11,749,467 | |
| | | | Electronic Equipment & Instruments – 0.3% | | | | | | | | | | | | | | | | |
| | | | | |
| | 845 | | | Avnet Inc. | | | 5.875% | | | | 6/15/20 | | | | BBB– | | | | 931,350 | |
| | | | | |
| | 1,090 | | | Ingram Micro Inc. | | | 5.250% | | | | 9/01/17 | | | | BBB– | | | | 1,168,532 | |
| | 1,935 | | | Total Electronic Equipment & Instruments | | | | | | | | | | | | | | | 2,099,882 | |
| | | | Energy Equipment & Services – 1.7% | | | | | | | | | | | | | | | | |
| | | | | |
| | 1,985 | | | Diamond Offshore Drilling Inc., (4) | | | 5.700% | | | | 10/15/39 | | | | A– | | | | 2,361,513 | |
| | | | | |
| | 325 | | | Ensco PLC, (4) | | | 4.700% | | | | 3/15/21 | | | | BBB+ | | | | 354,003 | |
| | | | | |
| | 1,590 | | | Nabors Industries Inc., (4) | | | 5.000% | | | | 9/15/20 | | | | BBB | | | | 1,696,635 | |
| | | | | |
| | 1,550 | | | NGPL PipeCo LLC, (4) | | | 7.119% | | | | 12/15/17 | | | | Ba3 | | | | 1,550,000 | |
| | | | | |
| | 1,820 | | | Rowan Companies Inc. | | | 7.875% | | | | 8/01/19 | | | | BBB– | | | | 2,197,038 | |
| | | | | |
| | 1,000 | | | Transocean Inc. | | | 6.375% | | | | 12/15/21 | | | | BBB– | | | | 1,143,769 | |
| | | | | |
| | 1,385 | | | Weatherford International Limited | | | 7.000% | | | �� | 3/15/38 | | | | BBB | | | | 1,581,670 | |
| | 9,655 | | | Total Energy Equipment & Services | | | | | | | | | | | | | | | 10,884,628 | |
| | | | Food & Staples Retailing – 0.1% | | | | | | | | | | | | | | | | |
| | | | | |
| | 750 | | | Supervalu Inc., (4) | | | 8.000% | | | | 5/01/16 | | | | B | | | | 759,375 | |
| | | | Food Products – 1.4% | | | | | | | | | | | | | | | | |
| | | | | |
| | 1,300 | | | BRF Brasil Foods SA, 144A | | | 5.875% | | | | 6/06/22 | | | | BBB– | | | | 1,339,000 | |
| | | | | |
| | 3,410 | | | Bunge Limited Finance Company | | | 4.100% | | | | 3/15/16 | | | | Baa2 | | | | 3,555,791 | |
| | | | | |
| | 700 | | | MHP SA, 144A | | | 10.250% | | | | 4/29/15 | | | | B | | | | 674,632 | |
| | | | | |
| | 1,250 | | | Mriya Agro Holding PLC, 144A | | | 10.950% | | | | 3/30/16 | | | | B | | | | 1,065,625 | |
| | | | | |
| | 1,790 | | | Tyson Foods | | | 4.500% | | | | 6/15/22 | | | | BBB– | | | | 1,843,700 | |
| | 8,450 | | | Total Food Products | | | | | | | | | | | | | | | 8,478,748 | |
| | | | Gas Utilities – 0.3% | | | | | | | | | | | | | | | | |
| | | | | |
| | 1,527 | | | AmeriGas Finance LLC, (4) | | | 6.750% | | | | 5/20/20 | | | | Ba2 | | | | 1,557,540 | |
| | | | | |
| | 25 | | | Ferrellgas LP | | | 6.500% | | | | 5/01/21 | | | | B2 | | | | 22,813 | |
| | 1,552 | | | Total Gas Utilities | | | | | | | | | | | | | | | 1,580,353 | |
| | | | Health Care Providers & Services – 0.8% | | | | | | | | | | | | | | | | |
| | | | | |
| | 1,235 | | | Community Health Systems, Inc., (4) | | | 8.000% | | | | 11/15/19 | | | | B | | | | 1,315,275 | |
| | | | | |
| | 1,125 | | | HCA Holdings Inc., (4) | | | 7.750% | | | | 5/15/21 | | | | B– | | | | 1,206,563 | |
| | | | | |
| | 1,575 | | | UnitedHealth Group Incorporated | | | 6.875% | | | | 2/15/38 | | | | A– | | | | 2,189,439 | |
| | 3,935 | | | Total Health Care Providers & Services | | | | | | | | | | | | | | | 4,711,277 | |
Portfolio of Investments
Nuveen Strategic Income Fund (continued)
June 30, 2012
| | | | | | | | | | | | | | | | | | | | |
Principal
Amount (000) | | | Description (1) | | Coupon | | | Maturity | | | Ratings (3) | | | Value | |
| | | | | | | | | | | | | | | | | | | | |
| | | | Household Durables – 0.5% | | | | | | | | | | | | | | | | |
| | | | | |
| $ | 1,000 | | | Agile Property Holdings Limited, (4) | | | 8.875% | | | | 4/28/17 | | | | BB | | | $ | 980,000 | |
| | | | | |
| | 1,000 | | | Desarrolla Homex S.A.B. de CV, 144A, (4) | | | 9.750% | | | | 3/25/20 | | | | Ba3 | | | | 1,050,000 | |
| | | | | |
| | 1,000 | | | KB Home, (4) | | | 8.000% | | | | 3/15/20 | | | | B+ | | | | 1,020,000 | |
| | | | | |
| | 155 | | | MDC Holdings Inc. | | | 5.625% | | | | 2/01/20 | | | | Baa3 | | | | 154,568 | |
| | 3,155 | | | Total Household Durables | | | | | | | | | | | | | | | 3,204,568 | |
| | | | Independent Power Producers & Energy Traders – 0.7% | | | | | | | | | | | | | | | | |
| | | | | |
| | 2,010 | | | Constellation Energy Group | | | 5.150% | | | | 12/01/20 | | | | BBB+ | | | | 2,224,951 | |
| | | | | |
| | 1,000 | | | NRG Energy Inc., (4) | | | 8.500% | | | | 6/15/19 | | | | BB– | | | | 1,045,000 | |
| | | | | |
| | 1,200 | | | NRG Energy Inc. | | | 7.875% | | | | 5/15/21 | | | | BB | | | | 1,212,000 | |
| | 4,210 | | | Total Independent Power Producers & Energy Traders | | | | | | | | | | | | | | | 4,481,951 | |
| | | | Insurance – 3.4% | | | | | | | | | | | | | | | | |
| | | | | |
| | 2,475 | | | AFLAC Insurance, (4) | | | 6.450% | | | | 8/15/40 | | | | A– | | | | 2,865,543 | |
| | | | | |
| | 2,510 | | | Allied World Assurance Holdings Limited | | | 7.500% | | | | 8/01/16 | | | | BBB+ | | | | 2,893,957 | |
| | | | | |
| | 2,955 | | | Genworth Financial Inc. | | | 6.515% | | | | 5/22/18 | | | | BBB | | | | 2,831,729 | |
| | | | | |
| | 2,645 | | | Hartford Financial Services Group Inc. | | | 6.000% | | | | 1/15/19 | | | | BBB | | | | 2,833,263 | |
| | | | | |
| | 2,395 | | | Lincoln National Corporation | | | 8.750% | | | | 7/01/19 | | | | A– | | | | 3,015,973 | |
| | | | | |
| | 1,600 | | | MetLife Inc., (4) | | | 6.750% | | | | 6/01/16 | | | | A– | | | | 1,876,158 | |
| | | | | |
| | 840 | | | Pacific LifeCorp. | | | 6.000% | | | | 2/10/20 | | | | BBB+ | | | | 916,892 | |
| | | | | |
| | 1,650 | | | Prudential Financial Inc. | | | 5.500% | | | | 3/15/16 | | | | A | | | | 1,827,213 | |
| | | | | |
| | 1,830 | | | UnumProvident Corporation, (4) | | | 5.625% | | | | 9/15/20 | | | | BBB | | | | 1,968,363 | |
| | 18,900 | | | Total Insurance | | | | | | | | | | | | | | | 21,029,091 | |
| | | | IT Services ��� 0.3% | | | | | | | | | | | | | | | | |
| | | | | |
| | 150 | | | First Data Corporation, 144A, (4) | | | 8.750% | | | | 1/15/22 | | | | B– | | | | 151,125 | |
| | | | | |
| | 1,500 | | | Zayo Escrow Corporation, 144A | | | 8.125% | | | | 1/01/20 | | | | B1 | | | | 1,567,500 | |
| | 1,650 | | | Total IT Services | | | | | | | | | | | | | | | 1,718,625 | |
| | | | Machinery – 0.2% | | | | | | | | | | | | | | | | |
| | | | | |
| | 1,500 | | | Navistar International Corporation, (4) | | | 8.250% | | | | 11/01/21 | | | | BB | | | | 1,438,125 | |
| | | | Marine – 0.1% | | | | | | | | | | | | | | | | |
| | | | | |
| | 960 | | | Navios Maritime Acquisition Corporation, (4) | | | 8.625% | | | | 11/01/17 | | | | B | | | | 892,800 | |
| | | | Media – 3.7% | | | | | | | | | | | | | | | | |
| | | | | |
| | 1,975 | | | British Sky Broadcasting Group PLC | | | 6.100% | | | | 2/15/18 | | | | BBB+ | | | | 2,297,699 | |
| | | | | |
| | 1,790 | | | Comcast Corporation | | | 6.400% | | | | 5/15/38 | | | | BBB+ | | | | 2,182,033 | |
| | | | | |
| | 1,935 | | | DIRECTV Holdings LLC | | | 5.200% | | | | 3/15/20 | | | | BBB | | | | 2,141,358 | |
| | | | | |
| | 2,515 | | | NBC Universal Media LLC, (4) | | | 4.375% | | | | 4/01/21 | | | | BBB+ | | | | 2,766,817 | |
| | | | | |
| | 2,750 | | | News America Holdings Inc. | | | 6.650% | | | | 11/15/37 | | | | BBB+ | | | | 3,210,103 | |
| | | | | |
| | 870 | | | TCM Sub LLC | | | 3.550% | | | | 1/15/15 | | | | A– | | | | 916,205 | |
| | | | | |
| | 1,515 | | | Time Warner Cable Inc., (4) | | | 5.875% | | | | 11/15/40 | | | | BBB | | | | 1,695,567 | |
| | | | | |
| | 1,500 | | | Time Warner Inc. | | | 4.750% | | | | 3/29/21 | | | | BBB | | | | 1,678,284 | |
| | | | | |
| | 1,750 | | | Time Warner Inc. | | | 6.100% | | | | 7/15/40 | | | | BBB | | | | 2,013,195 | |
| | | | | |
| | 1,625 | | | Viacom Inc., (4) | | | 6.875% | | | | 4/30/36 | | | | BBB+ | | | | 2,103,946 | |
| | | | | |
| | 2,085 | | | Vivendi SA, 144A | | | 4.750% | | | | 4/12/22 | | | | BBB | | | | 2,057,618 | |
| | 20,310 | | | Total Media | | | | | | | | | | | | | | | 23,062,825 | |
| | | | Metals & Mining – 6.2% | | | | | | | | | | | | | | | | |
| | | | | |
| | 4,180 | | | Alcoa Inc., (4) | | | 5.400% | | | | 4/15/21 | | | | BBB– | | | | 4,162,319 | |
| | | | | | | | | | | | | | | | | | | | |
Principal
Amount (000) | | | Description (1) | | Coupon | | | Maturity | | | Ratings (3) | | | Value | |
| | | | | | | | | | | | | | | | | | | | |
| | | | Metals & Mining (continued) | | | | | | | | | | | | | | | | |
| | | | | |
| $ | 815 | | | Alrosa Finance SA, 144A | | | 7.750% | | | | 11/03/20 | | | | BB– | | | $ | 853,525 | |
| | | | | |
| | 2,690 | | | Anglogold Holdings PLC | | | 6.500% | | | | 4/15/40 | | | | Baa2 | | | | 2,619,907 | |
| | | | | |
| | 855 | | | ArcelorMittal | | | 6.250% | | | | 2/25/22 | | | | BBB | | | | 837,394 | |
| | | | | |
| | 3,450 | | | ArcelorMittal | | | 7.000% | | | | 10/15/39 | | | | BBB | | | | 3,348,749 | |
| | | | | |
| | 2,860 | | | Cliffs Natural Resources Inc. | | | 4.800% | | | | 10/01/20 | | | | BBB– | | | | 2,819,651 | |
| | | | | |
| | 1,200 | | | Evraz Group S.A, 144A | | | 7.400% | | | | 4/24/17 | | | | BB– | | | | 1,176,216 | |
| | | | | |
| | 950 | | | FMG Resources, 144A, (4) | | | 6.000% | | | | 4/01/17 | | | | BB+ | | | | 954,750 | |
| | | | | |
| | 1,500 | | | Fosun International Limited, 144A, (4) | | | 7.500% | | | | 5/12/16 | | | | BB+ | | | | 1,440,000 | |
| | | | | |
| | 1,165 | | | Freeport McMoRan Copper & Gold, Inc., (4) | | | 3.550% | | | | 3/01/22 | | | | BBB | | | | 1,146,218 | |
| | | | | |
| | 875 | | | Inmet Mining Corporation, 144A | | | 8.750% | | | | 6/01/20 | | | | B+ | | | | 866,250 | |
| | | | | |
| | 1,035 | | | JMC Steel Group, 144A, (4) | | | 8.250% | | | | 3/15/18 | | | | B | | | | 1,027,238 | |
| | | | | |
| | 2,610 | | | Newmont Mining Corporation | | | 3.500% | | | | 3/15/22 | | | | BBB+ | | | | 2,576,065 | |
| | | | | |
| | 1,515 | | | Southern Copper Corporation | | | 7.500% | | | | 7/27/35 | | | | BBB | | | | 1,739,112 | |
| | | | | |
| | 1,460 | | | Taseko Mines Limited | | | 7.750% | | | | 4/15/19 | | | | B | | | | 1,394,300 | |
| | | | | |
| | 1,775 | | | Teck Resources Limited | | | 6.125% | | | | 10/01/35 | | | | BBB | | | | 1,898,240 | |
| | | | | |
| | 1,140 | | | Teck Resources Limited | | | 6.250% | | | | 7/15/41 | | | | BBB | | | | 1,276,320 | |
| | | | | |
| | 1,500 | | | Thompson Creek Metals Company | | | 7.375% | | | | 6/01/18 | | | | CCC+ | | | | 1,203,750 | |
| | | | | |
| | 2,410 | | | Vale Overseas Limited, (4) | | | 6.875% | | | | 11/10/39 | | | | A– | | | | 2,815,789 | |
| | | | | |
| | 1,220 | | | Vedanta Resources PLC, 144A, (4) | | | 9.500% | | | | 7/18/18 | | | | BB | | | | 1,226,100 | |
| | | | | |
| | 1,465 | | | WPE International Cooperatief U.A, 144A | | | 10.375% | | | | 9/30/20 | | | | B+ | | | | 1,157,350 | |
| | | | | |
| | 1,765 | | | Xstrata Finance Canada Limited, 144A | | | 6.900% | | | | 11/15/37 | | | | BBB+ | | | | 1,956,381 | |
| | 38,435 | | | Total Metals & Mining | | | | | | | | | | | | | | | 38,495,624 | |
| | | | Multiline Retail – 0.5% | | | | | | | | | | | | | | | | |
| | | | | |
| | 1,425 | | | J.C. Penney Corporation Inc., (4) | | | 5.650% | | | | 6/01/20 | | | | Ba1 | | | | 1,225,500 | |
| | | | | |
| | 1,840 | | | Macys Retail Holdings Inc., (4) | | | 3.875% | | | | 1/15/22 | | | | BBB | | | | 1,934,526 | |
| | 3,265 | | | Total Multiline Retail | | | | | | | | | | | | | | | 3,160,026 | |
| | | | Oil, Gas & Consumable Fuels – 6.7% | | | | | | | | | | | | | | | | |
| | | | | |
| | 240 | | | Amerada Hess Corporation | | | 7.125% | | | | 3/15/33 | | | | BBB | | | | 297,865 | |
| | | | | |
| | 1,235 | | | Anadarko Petroleum Corporation | | | 6.375% | | | | 9/15/17 | | | | BBB– | | | | 1,434,618 | |
| | | | | |
| | 1,870 | | | Anadarko Petroleum Corporation | | | 6.200% | | | | 3/15/40 | | | | BBB– | | | | 2,122,573 | |
| | | | | |
| | 500 | | | Berau Coal Energy Tbk PT, 144A | | | 7.250% | | | | 3/13/17 | | | | BB– | | | | 486,250 | |
| | | | | |
| | 1,000 | | | Bill Barrett Corporation, (4) | | | 7.000% | | | | 10/15/22 | | | | BB– | | | | 955,000 | |
| | | | | |
| | 1,700 | | | Canadian Oil Sands Trust | | | 7.750% | | | | 5/15/19 | | | | BBB | | | | 2,083,671 | |
| | | | | |
| | 500 | | | Deep Drilling 7 and 8 PT | | | 14.250% | | | | 3/05/15 | | | | N/R | | | | 495,110 | |
| | | | | |
| | 195 | | | Enbridge Energy Partners LP | | | 5.200% | | | | 3/15/20 | | | | BBB | | | | 220,978 | |
| | | | | |
| | 1,285 | | | Exco Resources Inc., (4) | | | 7.500% | | | | 9/15/18 | | | | B3 | | | | 1,111,525 | |
| | | | | |
| | 1,375 | | | Husky Energy Inc. | | | 6.200% | | | | 9/15/17 | | | | BBB+ | | | | 1,624,927 | |
| | | | | |
| | 600 | | | Kinder Morgan Energy Partners LP | | | 6.950% | | | | 1/15/38 | | | | BBB | | | | 709,586 | |
| | | | | |
| | 1,500 | | | Kodiak Oil and Gas Corporation, 144A | | | 8.125% | | | | 12/01/19 | | | | B– | | | | 1,545,000 | |
| | | | | |
| | 2,625 | | | Lukoil International Finance, 144A | | | 6.125% | | | | 11/09/20 | | | | Baa2 | | | | 2,752,838 | |
| | | | | |
| | 1,006 | | | Martin Mid-Stream Partners LP Finance | | | 8.875% | | | | 4/01/18 | | | | B | | | | 1,016,060 | |
| | | | | |
| | 2,500 | | | Nexen Inc., (4) | | | 6.400% | | | | 5/15/37 | | | | BBB– | | | | 2,649,203 | |
| | | | | |
| | 1,120 | | | Noble Energy Inc. | | | 4.150% | | | | 12/15/21 | | | | BBB | | | | 1,177,730 | |
| | | | | |
| | 1,735 | | | OGX Petroleo e Gas Participacoes SA, 144A | | | 8.500% | | | | 6/01/18 | | | | B1 | | | | 1,544,150 | |
Portfolio of Investments
Nuveen Strategic Income Fund (continued)
June 30, 2012
| | | | | | | | | | | | | | | | | | | | |
Principal
Amount (000) | | | Description (1) | | Coupon | | | Maturity | | | Ratings (3) | | | Value | |
| | | | | | | | | | | | | | | | | | | | |
| | | | Oil, Gas & Consumable Fuels (continued) | | | | | | | | | | | | | | | | |
| | | | | |
| $ | 1,000 | | | PetroBakken Energy Limited, 144A | | | 8.625% | | | | 2/01/20 | | | | CCC+ | | | $ | 995,000 | |
| | | | | |
| | 1,770 | | | Petrobras International Finance Company, (4) | | | 6.875% | | | | 1/20/40 | | | | A3 | | | | 2,105,456 | |
| | | | | |
| | 1,275 | | | Petro-Canada | | | 6.800% | | | | 5/15/38 | | | | BBB+ | | | | 1,591,412 | |
| | | | | |
| | 1,500 | | | Plains Exploration & Production Company | | | 6.125% | | | | 6/15/19 | | | | BB– | | | | 1,507,500 | |
| | | | | |
| | 1,600 | | | Reliance Holdings USA Inc., 144A | | | 5.400% | | | | 2/14/22 | | | | BBB | | | | 1,599,902 | |
| | | | | |
| | 1,150 | | | Sabine Pass LNG LP | | | 7.500% | | | | 11/30/16 | | | | BB+ | | | | 1,207,500 | |
| | | | | |
| | 1,000 | | | Sandridge Energy Inc. | | | 8.125% | | | | 10/15/22 | | | | B | | | | 1,010,000 | |
| | | | | |
| | 1,300 | | | Seadrill Limited | | | 6.500% | | | | 10/05/15 | | | | N/R | | | | 1,293,500 | |
| | | | | |
| | 1,175 | | | SM Energy Company | | | 6.625% | | | | 2/15/19 | | | | BB | | | | 1,204,375 | |
| | | | | |
| | 1,445 | | | Southwestern Energy Company, 144A | | | 4.100% | | | | 3/15/22 | | | | BBB– | | | | 1,464,564 | |
| | | | | |
| | 100 | | | Stone Energy Corporation, (4) | | | 8.625% | | | | 2/01/17 | | | | B | | | | 101,500 | |
| | | | | |
| | 2,670 | | | Transcapitalinvest LP | | | 5.670% | | | | 3/05/14 | | | | Baa1 | | | | 2,810,843 | |
| | | | | |
| | 2,475 | | | Valero Energy Corporation | | | 6.125% | | | | 2/01/20 | | | | BBB | | | | 2,857,531 | |
| | 39,446 | | | Total Oil, Gas & Consumable Fuels | | | | | | | | | | | | | | | 41,976,167 | |
| | | | Paper & Forest Products – 1.3% | | | | | | | | | | | | | | | | |
| | | | | |
| | 1,860 | | | International Paper Company | | | 8.700% | | | | 6/15/38 | | | | BBB | | | | 2,625,089 | |
| | | | | |
| | 1,500 | | | Louisiana Pacific Corporation, 144A, (WI/DD) | | | 7.500% | | | | 6/01/20 | | | | BB | | | | 1,571,250 | |
| | | | | |
| | 1,500 | | | Sappi Papier Holding GMBH, 144A, (WI/DD) | | | 7.750% | | | | 7/15/17 | | | | Ba2 | | | | 1,518,750 | |
| | | | | |
| | 1,000 | | | Sappi Papier Holding GMBH, 144A | | | 8.375% | | | | 6/15/19 | | | | N/R | | | | 1,001,250 | |
| | | | | |
| | 1,150 | | | Tembec Industries, Inc., (4) | | | 11.250% | | | | 12/15/18 | | | | B– | | | | 1,147,125 | |
| | | | | |
| | 8 | | | Westvaco Corporation | | | 8.200% | | | | 1/15/30 | | | | BBB | | | | 9,497 | |
| | 7,018 | | | Total Paper & Forest Products | | | | | | | | | | | | | | | 7,872,961 | |
| | | | Pharmaceuticals – 0.4% | | | | | | | | | | | | | | | | |
| | | | | |
| | 2,580 | | | Valeant Pharmaceuticals International, 144A | | | 6.875% | | | | 12/01/18 | | | | BB– | | | | 2,667,075 | |
| | | | Real Estate Investment Trust – 1.3% | | | | | | | | | | | | | | | | |
| | | | | |
| | 1,820 | | | HCP Inc., (4) | | | 3.750% | | | | 2/01/19 | | | | BBB+ | | | | 1,816,806 | |
| | | | | |
| | 1,420 | | | Plum Creek Timberlands LP | | | 4.700% | | | | 3/15/21 | | | | BBB | | | | 1,475,384 | |
| | | | | |
| | 2,125 | | | Prologis Inc., (4) | | | 6.875% | | | | 3/15/20 | | | | Baa2 | | | | 2,541,591 | |
| | | | | |
| | 1,825 | | | Simon Property Group, L.P. | | | 5.650% | | | | 2/01/20 | | | | A– | | | | 2,128,859 | |
| | 7,190 | | | Total Real Estate Investment Trust | | | | | | | | | | | | | | | 7,962,640 | |
| | | | Real Estate Management & Development – 0.6% | | | | | | | | | | | | | | | | |
| | | | | |
| | 500 | | | Central China Real Estate Limited, 144A | | | 12.250% | | | | 10/20/15 | | | | B+ | | | | 518,100 | |
| | | | | |
| | 1,500 | | | Country Garden Holding Company, 144A, (4) | | | 11.125% | | | | 2/23/18 | | | | BB– | | | | 1,518,750 | |
| | | | | |
| | 1,500 | | | Realogy Corporation, 144A, (WI/DD) | | | 7.625% | | | | 1/15/20 | | | | B1 | | | | 1,556,250 | |
| | 3,500 | | | Total Real Estate Management & Development | | | | | | | | | | | | | | | 3,593,100 | |
| | | | Road & Rail – 0.2% | | | | | | | | | | | | | | | | |
| | | | | |
| | 1,000 | | | Hertz Corporation | | | 7.375% | | | | 1/15/21 | | | | BB– | | | | 1,070,000 | |
| | | | Semiconductors & Equipment – 0.2% | | | | | | | | | | | | | | | | |
| | | | | |
| | 840 | | | Intel Corporation, (4) | | | 4.800% | | | | 10/01/41 | | | | A+ | | | | 961,997 | |
| | | | Specialty Retail – 0.4% | | | | | | | | | | | | | | | | |
| | | | | |
| | 2,220 | | | O’Reilly Automotive Inc. | | | 4.875% | | | | 1/14/21 | | | | BBB | | | | 2,386,531 | |
| | | | Thrifts & Mortgage Finance – 0.3% | | | | | | | | | | | | | | | | |
| | | | | |
| | 1,855 | | | WEA Finance LLC, 144A, (4) | | | 4.625% | | | | 5/10/21 | | | | A2 | | | | 1,960,418 | |
| | | | | | | | | | | | | | | | | | | | |
Principal
Amount (000) | | | Description (1) | | Coupon | | | Maturity | | | Ratings (3) | | | Value | |
| | | | | | | | | | | | | | | | | | | | |
| | | | Tobacco – 1.1% | | | | | | | | | | | | | | | | |
| | | | | |
| $ | 3,125 | | | Altria Group Inc. | | | 9.950% | | | | 11/10/38 | | | | Baa1 | | | $ | 4,968,963 | |
| | | | | |
| | 1,590 | | | Lorillard Tobacco | | | 8.125% | | | | 6/23/19 | | | | Baa2 | | | | 1,973,304 | |
| | 4,715 | | | Total Tobacco | | | | | | | | | | | | | | | 6,942,267 | |
| | | | Transportation Infrastructure – 0.4% | | | | | | | | | | | | | | | | |
| | | | | |
| | 2,550 | | | Asciano Finance Limited, 144A, (4) | | | 5.000% | | | | 4/07/18 | | | | Baa2 | | | | 2,663,651 | |
| | | | Wireless Telecommunication Services – 0.8% | | | | | | | | | | | | | | | | |
| | | | | |
| | 2,195 | | | American Tower Company | | | 5.050% | | | | 9/01/20 | | | | Baa3 | | | | 2,305,568 | |
| | | | | |
| | 800 | | | Digicel Limited, 144A | | | 7.000% | | | | 2/15/20 | | | | B1 | | | | 774,000 | |
| | | | | |
| | 1,275 | | | NII Capital Corporation | | | 8.875% | | | | 12/15/19 | | | | B+ | | | | 1,155,466 | |
| | | | | |
| | 1,000 | | | Wind Acquisition Finance SA, 144A | | | 7.250% | | | | 2/15/18 | | | | BB+ | | | | 875,000 | |
| | 5,270 | | | Total Wireless Telecommunication Services | | | | | | | | | | | | | | | 5,110,034 | |
| $ | 366,029 | | | Total Corporate Bonds (cost $368,334,690) | | | | | | | | | | | | | | | 389,690,124 | |
| | | | | |
Principal
Amount (000) | | | Description (1) | | Coupon | | | Maturity | | | Ratings (3) | | | Value | |
| | | | CONVERTIBLE BONDS – 0.5% | | | | | | | | | | | | | | | | |
| | | | | |
| | | | Health Care Equipment & Supplies – 0.5% | | | | | | | | | | | | | | | | |
| | | | | |
| $ | 3,050 | | | Boston Properties Limited Partnership | | | 4.125% | | | | 5/15/21 | | | | A– | | | $ | 3,203,546 | |
| $ | 3,050 | | | Total Convertible Bonds (cost $3,055,390) | | | | | | | | | | | | | | | 3,203,546 | |
| | | | | |
Principal
Amount (000)/
Shares | | | Description (1) | | Coupon | | | Maturity | | | Ratings (3) | | | Value | |
| | | | CAPITAL PREFERRED SECURITIES – 3.5% | | | | | | | | | | | | | | | | |
| | | | | |
| | | | Capital Markets – 0.2% | | | | | | | | | | | | | | | | |
| | | | | |
| $ | 1,495 | | | Goldman Sachs Capital II | | | 4.000% | | | | 6/01/43 | | | | BB+ | | | $ | 1,012,145 | |
| | | | Commercial Banks – 0.9% | | | | | | | | | | | | | | | | |
| | | | | |
| | 5,585 | | | Wachovia Capital Trust III | | | 5.570% | | | | 3/15/42 | | | | BBB+ | | | | 5,333,675 | |
| | | | Consumer Finance – 0.0% | | | | | | | | | | | | | | | | |
| | | | | |
| | 235 | | | Capital One Capital III Corporation | | | 7.686% | | | | 8/01/66 | | | | Baa3 | | | | 236,763 | |
| | | | Diversified Financial Services – 1.3% | | | | | | | | | | | | | | | | |
| | | | | |
| | 3,075 | | | CitiGroup Capital XXI | | | 8.300% | | | | 12/21/77 | | | | BB+ | | | | 3,082,688 | |
| | | | | |
| | 5,000 | | | General Electric Capital Corporation, (4) | | | 0.000% | | | | 12/15/49 | | | | AA– | | | | 5,282,300 | |
| | 8,075 | | | Total Diversified Financial Services | | | | | | | | | | | | | | | 8,364,988 | |
| | | | Insurance – 0.8% | | | | | | | | | | | | | | | | |
| | | | | |
| | 2,050 | | | Catlin Insurance Company Limited | | | 7.249% | | | | 1/19/17 | | | | BBB+ | | | | 1,804,000 | |
| | | | | |
| | 1,620 | | | Lincoln National Corporation | | | 6.050% | | | | 4/20/17 | | | | BBB | | | | 1,482,300 | |
| | | | | |
| | 1,860 | | | ZFS Finance USA Trust V | | | 6.500% | | | | 5/09/67 | | | | A | | | | 1,822,800 | |
| | 5,530 | | | Total Insurance | | | | | | | | | | | | | | | 5,109,100 | |
| | | | Marine – 0.2% | | | | | | | | | | | | | | | | |
| | | | | |
| | 1,500 | | | OSX 3 Leasing BV, 144A | | | 9.250% | | | | 3/20/15 | | | | N/R | | | | 1,497,750 | |
| | | | Oil, Gas & Consumable Fuels – 0.1% | | | | | | | | | | | | | | | | |
| | | | | |
| | 545 | | | Southern Union Company | | | 3.483% | | | | 11/01/66 | | | | Ba1 | | | | 443,493 | |
| $ | 22,965 | | | Total Capital Preferred Securities (cost $21,778,290) | | | | | | | | | | | | | | | 21,997,914 | |
Portfolio of Investments
Nuveen Strategic Income Fund (continued)
June 30, 2012
| | | | | | | | | | | | | | | | | | | | |
Principal
Amount (000) | | | Description (1) | | Optional Call
Provisions (5) | | | | | | Ratings (3) | | | Value | |
| | | | | | | | | | | | | | | | | | | | |
| | | | MUNICIPAL BONDS – 0.7% | | | | | | | | | | | | | | | | |
| | | | | |
| | | | Illinois – 0.7% | | | | | | | | | | | | | | | | |
| | | | | |
| $ | 3,840 | | | Illinois State, General Obligation Bonds, Taxable Series 2011, 5.877%, 3/01/19 | | | No Opt. Call | | | | | | | | A+ | | | $ | 4,278,873 | |
| $ | 3,840 | | | Total Municipal Bonds (cost $3,840,000) | | | | | | | | | | | | | | | 4,278,873 | |
| | | | | |
Principal
Amount (000) | | | Description (1) | | Coupon | | | Maturity | | | Ratings (3) | | | Value | |
| | | | ASSET-BACKED AND MORTGAGE-BACKED SECURITIES – 24.9% | | | | | | | | | | | | | |
| | | | | |
| $ | 1,784 | | | 321 Henderson Receivables LLC, Series 2010-3A | | | 3.820% | | | | 12/15/48 | | | | Aaa | | | $ | 1,817,713 | |
| | | | | |
| | 2,925 | | | American Home Mortgage Advance Trust, Revovling Pool Receivables, Series SART-3 | | | 3.720% | | | | 3/13/44 | | | | AAA | | | | 2,932,313 | |
| | | | | |
| | 1,425 | | | American Homes Mortgage Advance Trust, Series 2011-SART1 | | | 5.920% | | | | 5/10/43 | | | | BBB | | | | 1,428,563 | |
| | | | | |
| | 2,270 | | | AmeriCold LLC Trust, Series 2010 | | | 6.811% | | | | 1/14/29 | | | | A | | | | 2,596,567 | |
| | | | | |
| | 3,714 | | | Master RePerforming Loan Trust 2005-1 | | | 7.500% | | | | 8/25/34 | | | | BB | | | | 3,872,402 | |
| | | | | |
| | 294 | | | Bank of America Alternative Loan Trust. Mortgage Pass-Through Certificates, Series 2007-1 | | | 6.403% | | | | 4/25/37 | | | | C | | | | 7,908 | |
| | | | | |
| | 64 | | | Bank of America Alternative Loan Trust, Series 2005-5 2 CB1 | | | 6.000% | | | | 6/25/35 | | | | Caa1 | | | | 49,966 | |
| | | | | |
| | 52 | | | Bank of America Auto Trust, Series 2010-1A | | | 1.390% | | | | 3/15/14 | | | | AAA | | | | 52,077 | |
| | | | | |
| | 350 | | | Bank of America Commercial Mortgage Inc., Commercial Mortgage Pass-Through Certificates, Series 2005-4 | | | 4.933% | | | | 7/10/45 | | | | AAA | | | | 384,028 | |
| | | | | |
| | 334 | | | Citigroup Commercial Mortgage Securities Trust, Commercial Mortgage Pass-Through Certificates, Series 2007-CD4, (4) | | | 5.205% | | | | 12/11/49 | | | | AAA | | | | 339,507 | |
| | | | | |
| | 19 | | | CNH Equipment Trust 2010-A | | | 1.540% | | | | 7/15/14 | | | | AAA | | | | 18,753 | |
| | | | | |
| | 1,805 | | | Commercial Mortgage Pass-Through Certificates, Series 2006-CN2A | | | 5.449% | | | | 2/05/19 | | | | AAA | | | | 1,797,744 | |
| | | | | |
| | 2,484 | | | Countrywide ABS Asset-Backed Certificate Trust 2007-9 | | | 0.375% | | | | 6/25/47 | | | | BB+ | | | | 2,352,913 | |
| | | | | |
| | 642 | | | Countrywide Alternative Loan Trust, Mortgage Pass-Through Certificates, Series 2004-24CB | | | 5.000% | | | | 11/25/19 | | | | BB+ | | | | 646,287 | |
| | | | | |
| | 941 | | | Countrywide Alternative Loan Trust, Mortgage Pass-Through Certificates, Series 2006-19CB | | | 6.000% | | | | 8/25/36 | | | | CCC | | | | 695,009 | |
| | | | | |
| | 1,270 | | | Countrywide Asset-Backed Certificates Trust, Series 2006-25 | | | 0.365% | | | | 6/25/47 | | | | AAA | | | | 1,250,621 | |
| | | | | |
| | 2,195 | | | Countrywide Hoen Loans, Asset Backed Certificates Series 2007-7 | | | 0.405% | | | | 10/25/47 | | | | AAA | | | | 2,020,241 | |
| | | | | |
| | 759 | | | Countrywide Home Loan Mortgage Pass Through Trust, Series 2004-2 | | | 2.866% | | | | 2/25/34 | | | | BB | | | | 692,356 | |
| | | | | |
| | 328 | | | Credit Suisse First Boston Mortgage Securities Corporation, Mortgage-Backed Pass-Through Certificates, Series 2003-23 | | | 5.750% | | | | 9/25/33 | | | | AAA | | | | 339,254 | |
| | | | | |
| | 497 | | | CS First Boston Mortgage Securities Corporation, Commercial Mortgage Pass- Through Certificates, Series 2004-C1 | | | 4.750% | | | | 1/15/37 | | | | AAA | | | | 518,568 | |
| | | | | |
| | 1,850 | | | DBUBS Mortgage Trust, Commercial Mortgage Pass Through Certificates, Series 2011-LC3A | | | 3.642% | | | | 8/12/44 | | | | Aaa | | | | 1,994,148 | |
| | | | | |
| | 2,225 | | | Extended Stay America Trust 2010-EHSA | | | 4.860% | | | | 11/05/27 | | | | A | | | | 2,249,426 | |
| | | | | |
| | 1,504 | | | Fannie Mae Mortgage Interest Strips 366 25 | | | 5.000% | | | | 10/01/35 | | | | Aaa | | | | 157,869 | |
| | | | | |
| | 1,303 | | | Fannie Mae Mortgage Pool AA0005 | | | 5.500% | | | | 11/01/38 | | | | Aaa | �� | | | 1,422,138 | |
| | | | | |
| | 1,820 | | | Fannie Mae Mortgage Pool AA0889 | | | 5.500% | | | | 12/01/38 | | | | Aaa | | | | 1,986,390 | |
| | | | | |
| | 4,879 | | | Fannie Mae Mortgage Pool AB1959 | | | 4.000% | | | | 12/01/40 | | | | Aaa | | | | 5,244,889 | |
| | | | | |
| | 4,863 | | | Fannie Mae Mortgage Pool AC1877 | | | 4.500% | | | | 9/01/39 | | | | Aaa | | | | 5,218,819 | |
| | | | | |
| | 2,605 | | | Fannie Mae Mortgage Pool AD0205 | | | 6.000% | | | | 9/01/39 | | | | Aaa | | | | 2,871,116 | |
| | | | | |
| | 1,192 | | | Fannie Mae Mortgage Pool AD8529 | | | 4.500% | | | | 8/01/40 | | | | Aaa | | | | 1,282,529 | |
| | | | | |
| | 5,610 | | | Fannie Mae Mortgage Pool AH1420, (6) | | | 4.000% | | | | 1/01/41 | | | | Aaa | | | | 5,979,690 | |
| | | | | |
| | 1,370 | | | Fannie Mae Mortgage Pool AL1187 | | | 5.500% | | | | 7/01/24 | | | | Aaa | | | | 1,488,743 | |
| | | | | | | | | | | | | | | | | | | | |
Principal
Amount (000) | | | Description (1) | | Coupon | | | Maturity | | | Ratings (3) | | | Value | |
| | | | | | | | | | | | | | | | | | | | |
| | | | ASSET-BACKED AND MORTGAGE-BACKED SECURITIES (continued) | | | | | | | | | | | | | | | | |
| | | | | |
| $ | 7,412 | | | Fannie Mae Mortgage Pool MA0583 | | | 4.000% | | | | 11/01/40 | | | | Aaa | | | $ | 7,900,624 | |
| | | | | |
| | 858 | | | Fannie Mae Mortgage Pool 255628 | | | 5.500% | | | | 2/01/25 | | | | Aaa | | | | 944,081 | |
| | | | | |
| | 3,176 | | | Fannie Mae Mortgage Pool 255956 | | | 5.500% | | | | 10/01/25 | | | | Aaa | | | | 3,483,805 | |
| | | | | |
| | 757 | | | Fannie Mae Mortgage Pool 256890 | | | 6.000% | | | | 9/01/37 | | | | Aaa | | | | 828,034 | |
| | | | | |
| | 849 | | | Fannie Mae Mortgage Pool 257307 | | | 6.000% | | | | 8/01/38 | | | | Aaa | | | | 934,191 | |
| | | | | |
| | 2,817 | | | Fannie Mae Mortgage Pool 725027 | | | 5.000% | | | | 11/01/33 | | | | Aaa | | | | 3,065,840 | |
| | | | | |
| | 433 | | | Fannie Mae Mortgage Pool 725205 | | | 5.000% | | | | 3/01/34 | | | | Aaa | | | | 470,672 | |
| | | | | |
| | 357 | | | Fannie Mae Mortgage Pool 725250 | | | 5.000% | | | | 3/01/34 | | | | Aaa | | | | 388,294 | |
| | | | | |
| | 166 | | | Fannie Mae Mortgage Pool 725553 | | | 2.143% | | | | 9/01/33 | | | | Aaa | | | | 175,461 | |
| | | | | |
| | 637 | | | Fannie Mae Mortgage Pool 725773 | | | 5.500% | | | | 9/01/34 | | �� | | Aaa | | | | 700,296 | |
| | | | | |
| | 236 | | | Fannie Mae Mortgage Pool 735060 | | | 6.000% | | | | 11/01/34 | | | | Aaa | | | | 262,969 | |
| | | | | |
| | 103 | | | Fannie Mae Mortgage Pool 735606 | | | 2.186% | | | | 5/01/35 | | | | Aaa | | | | 107,559 | |
| | | | | |
| | 236 | | | Fannie Mae Mortgage Pool 745101 | | | 6.000% | | | | 4/01/32 | | | | Aaa | | | | 257,717 | |
| | | | | |
| | 575 | | | Fannie Mae Mortgage Pool 745324 | | | 6.000% | | | | 3/01/34 | | | | Aaa | | | | 647,080 | |
| | | | | |
| | 511 | | | Fannie Mae Mortgage Pool 745548 | | | 2.289% | | | | 1/01/35 | | | | Aaa | | | | 541,136 | |
| | | | | |
| | 168 | | | Fannie Mae Mortgage Pool 824163 | | | 5.500% | | | | 4/01/35 | | | | Aaa | | | | 184,573 | |
| | | | | |
| | 550 | | | Fannie Mae Mortgage Pool 831377 | | | 6.500% | | | | 4/01/36 | | | | Aaa | | | | 625,202 | |
| | | | | |
| | 124 | | | Fannie Mae Mortgage Pool 838948 | | | 2.260% | | | | 8/01/35 | | | | Aaa | | | | 131,707 | |
| | | | | |
| | 435 | | | Fannie Mae Mortgage Pool 843435 | | | 5.500% | | | | 6/01/33 | | | | Aaa | | | | 478,802 | |
| | | | | |
| | 239 | | | Fannie Mae Mortgage Pool 852909 | | | 6.500% | | | | 4/01/36 | | | | Aaa | | | | 271,375 | |
| | | | | |
| | 1 | | | Fannie Mae Mortgage Pool 889618 | | | 5.500% | | | | 5/01/38 | | | | Aaa | | | | 905 | |
| | | | | |
| | 707 | | | Fannie Mae Mortgage Pool 893318 | | | 6.500% | | | | 8/01/36 | | | | Aaa | | | | 803,533 | |
| | | | | |
| | 1,277 | | | Fannie Mae Mortgage Pool 897129 | | | 6.500% | | | | 9/01/36 | | | | Aaa | | | | 1,449,636 | |
| | | | | |
| | 87 | | | Fannie Mae Mortgage Pool 905597 | | | 5.979% | | | | 12/01/36 | | | | Aaa | | | | 93,743 | |
| | | | | |
| | 463 | | | Fannie Mae Mortgage Pool 918883 | | | 5.500% | | | | 4/01/37 | | | | Aaa | | | | 505,188 | |
| | | | | |
| | 1,390 | | | Fannie Mae Mortgage Pool 932323 | | | 4.500% | | | | 12/01/39 | | | | Aaa | | | | 1,491,663 | |
| | | | | |
| | 619 | | | Fannie Mae Mortgage Pool 944340 | | | 6.000% | | | | 6/01/37 | | | | Aaa | | | | 682,404 | |
| | | | | |
| | 248 | | | Fannie Mae Mortgage Pool 946228 | | | 6.079% | | | | 9/01/37 | | | | Aaa | | | | 269,688 | |
| | | | | |
| | 1 | | | Fannie Mae Mortgage Pool 985344 | | | 5.500% | | | | 7/01/38 | | | | Aaa | | | | 814 | |
| | | | | |
| | 4,195 | | | Fannie Mae TBA Mortgage Pool (WI/DD) | | | 5.500% | | | | TBA | | | | Aaa | | | | 4,575,827 | |
| | | | | |
| | 4,810 | | | Fannie Mae TBA Mortgage Pool (WI/DD) | | | 4.500% | | | | TBA | | | | Aaa | | | | 5,159,476 | |
| | | | | |
| | 805 | | | Fannie Mae TBA Mortgage Pool (WI/DD) | | | 3.500% | | | | TBA | | | | Aaa | | | | 846,131 | |
| | | | | |
| | 2,464 | | | FDIC Structures Sale Guaranteed Notes, Series 2010-S1 | | | 0.796% | | | | 2/25/48 | | | | Aaa | | | | 2,465,600 | |
| | | | | |
| | 25 | | | Federal Home Loan Mortgage Corporation, Mortgage Pool 1B3220 | | | 2.664% | | | | 1/01/37 | | | | Aaa | | | | 26,858 | |
| | | | | |
| | 50 | | | Federal Home Loan Mortgage Corporation, Series 2376 | | | 5.500% | | | | 11/15/16 | | | | Aaa | | | | 53,851 | |
| | | | | |
| | 2,950 | | | Fosse Master Issuer PLC, Residential Mortgage Pool, Series 2011-1A | | | 1.866% | | | | 10/19/54 | | | | AAA | | | | 2,966,193 | |
| | | | | |
| | 563 | | | Freddie Mac Gold Pool 1L0117 | | | 2.650% | | | | 10/01/29 | | | | Aaa | | | | 576,977 | |
| | | | | |
| | 466 | | | Freddie Mac Gold Pool 847240 | | | 2.266% | | | | 7/01/30 | | | | Aaa | | | | 493,339 | |
| | | | | |
| | 311 | | | Freddie Mac Gold Pool 847411 | | | 2.143% | | | | 5/01/33 | | | | Aaa | | | | 328,883 | |
| | | | | |
| | 1,045 | | | Freddie Mac Gold Pool 1K1238 | | | 2.475% | | | | 7/01/36 | | | | Aaa | | | | 1,097,665 | |
| | | | | |
| | 2,324 | | | Freddie Mac Gold Pool 848289 | | | 2.379% | | | | 5/01/38 | | | | Aaa | | | | 2,464,346 | |
| | | | | |
| | 794 | | | Freddie Mac Mortgage Pool, Various A17212 | | | 6.500% | | | | 7/01/31 | | | | Aaa | | | | 908,651 | |
| | | | | |
| | 491 | | | Freddie Mac Mortgage Pool, Various H09059 | | | 7.000% | | | | 8/01/37 | | | | Aaa | | | | 557,538 | |
| | | | | |
| | 55 | | | Freddie Mac Non Gold Participation Certificates 847681 | | | 6.264% | | | | 12/01/36 | | | | Aaa | | | | 59,619 | |
Portfolio of Investments
Nuveen Strategic Income Fund (continued)
June 30, 2012
| | | | | | | | | | | | | | | | | | | | |
Principal
Amount (000) | | | Description (1) | | Coupon | | | Maturity | | | Ratings (3) | | | Value | |
| | | | | | | | | | | | | | | | | | | | |
| | | | ASSET-BACKED AND MORTGAGE-BACKED SECURITIES (continued) | | | | | | | | | | | | | | | | |
| | | | | |
| $ | 1,359 | | | Goldman Sachs Mortgage Securities Corporation II, Commercial Mortgage Pass-Through Certificates, Series 2006-GG6 | | | 5.506% | | | | 4/10/38 | | | | AAA | | | $ | 1,363,882 | |
| | | | | |
| | 1,390 | | | Goldman Sachs Mortgage Securities Corporation II, Commercial Mortgage Pass-Through Certificates, Series 2007-GG10, (4) | | | 5.790% | | | | 8/10/45 | | | | AAA | | | | 1,542,641 | |
| | | | | |
| | 3,135 | | | Goldman Sachs Mortgage Securities Corporation II, Commerical Mortgage Pass-Through Certificates, Series 2006-GG8 | | | 5.560% | | | | 11/14/39 | | | | Aaa | | | | 3,561,379 | |
| | | | | |
| | 2,170 | | | Goldman Sachs Mortgage Securities Corporation, Mortgage Pass-Through Certificates, Series 2003-1 | | | 6.717% | | | | 3/25/43 | | | | Ba3 | | | | 1,864,189 | |
| | | | | |
| | 1,990 | | | Goldman Sachs Mortgage Securities Corporation, Mortgage Pass-Through Certificates, Series 2005-4F | | | 5.779% | | | | 5/25/35 | | | | CC | | | | 1,259,934 | |
| | | | | |
| | 1,916 | | | Goldman Sachs Mortgage Securities Corporation, Mortgage Pass-Through Certificates, Series 2005-AR1 | | | 3.073% | | | | 1/25/35 | | | | CC | | | | 479,023 | |
| | | | | |
| | 453 | | | Government National Mortgage Assocation, Guaranteed REMIC Pass Through Securities and MX Securities Trust | | | 4.500% | | | | 5/16/38 | | | | Aaa | | | | 482,145 | |
| | | | | |
| | 119 | | | Green Tree Fiancial Manufactured Housing Loans, Series 2008-MH1 | | | 7.000% | | | | 4/25/38 | | | | AAA | | | | 119,029 | |
| | | | | |
| | 50 | | | Green Tree Financial Corporation, Manufactured Housing Contract Pass Through Certificates Series 1996-8 | | | 8.050% | | | | 11/15/26 | | | | AAA | | | | 51,136 | |
| | | | | |
| | 1,743 | | | Greenwich Capital Commercial Funding Corporation, Commercial Mortgage Pass- Through Certificates, Series 2005-GG5 | | | 5.117% | | | | 4/10/37 | | | | AAA | | | | 1,749,232 | |
| | | | | |
| | 650 | | | Greenwich Capital Commercial Funding Corporation, Commercial Mortgage Pass Through Certificates, Series 2007-GG11 | | | 5.736% | | | | 12/10/49 | | | | AAA | | | | 720,299 | |
| | | | | |
| | 82 | | | GRMT Mortgage Loan Trust 2001-1A | | | 8.272% | | | | 7/20/31 | | | | A | | | | 77,370 | |
| | | | | |
| | 19 | | | Hyundai Auto Receivables Trust 2009A | | | 2.030% | | | | 8/15/13 | | | | AAA | | | | 19,347 | |
| | | | | |
| | 2,002 | | | Impac Secured Assets Corporation, Mortgage Pass-Through Certificates, Series 2000-3 | | | 8.000% | | | | 10/25/30 | | | | B | | | | 1,874,905 | |
| | | | | |
| | 451 | | | IndyMac INDX Mortgage Loan Trust, Pass Through Certificates, Series 2005-AR1 | | | 2.748% | | | | 3/25/35 | | | | AAA | | | | 403,094 | |
| | | | | |
| | 131 | | | JPMorgan Mortage Trust, Mortgage Pass-Through Certtificates, Series 2006-A7 | | | 5.669% | | | | 1/25/37 | | | | C | | | | 3,153 | |
| | | | | |
| | 1,618 | | | JPMorgan Alternative Loan Trust, Mortgage Pass-Through Certificates, Series 2007-S1 | | | 0.525% | | | | 6/25/37 | | | | CCC | | | | 1,149,288 | |
| | | | | |
| | 3,991 | | | JPMorgan Chase Commercial Mortgage Securities Corporation, Commercial Mortgage Pass-Through Certificates, Series 2010-C1 | | | 3.853% | | | | 6/15/43 | | | | Aaa | | | | 4,240,837 | |
| | | | | |
| | 3,845 | | | JPMorgan Chase Commerical Mortgage Trust, Commerical Mortage Pass Through Certificates, Series 2011-C4 | | | 4.106% | | | | 7/17/46 | | | | AAA | | | | 4,175,770 | |
| | | | | |
| | 314 | | | LB-UBS Commercial Mortgage Trust, Commercial Mortgage Pass-Through Certificates, Series 2005-C7 | | | 5.103% | | | | 11/18/30 | | | | AAA | | | | 316,495 | |
| | | | | |
| | 1,697 | | | Lehman Mortgage Trust, Mortgage Pass Through Certificates, Series 2008-6 | | | 5.792% | | | | 4/25/38 | | | | A | | | | 1,706,528 | |
| | | | | |
| | 230 | | | Merrill Lynch Mortgage Investors Inc, Commercial Mortgage Pass-Through Certificates, Series 2006 | | | 5.204% | | | | 12/12/49 | | | | A1 | | | | 227,544 | |
| | | | | |
| | 4,570 | | | Morgan Stanley Capital I Trust, Commercial Mortgage Pass-Through Certificates, Series 2006-IQ12 | | | 5.332% | | | | 12/15/43 | | | | AAA | | | | 5,191,529 | |
| | | | | |
| | 508 | | | National Credit Union Adminstration Guaranteed Structured Collateral Notes | | | 2.900% | | | | 10/29/20 | | | | Aaa | | | | 541,655 | |
| | | | | |
| | 2,880 | | | OBP Depositor LLC Trust, Commercial Mortgage Pass Through Certificates, Series 2010-OBP | | | 4.646% | | | | 7/15/45 | | | | AAA | | | | 3,287,915 | |
| | | | | |
| | 1,745 | | | Ocwen Advance Receivables Backed Notes, Series 2009-3A | | | 4.140% | | | | 7/15/23 | | | | AAA | | | | 1,747,181 | |
| | | | | |
| | 1,370 | | | RBSSP Resecuritization Trust 2010-11 | | | 0.415% | | | | 3/26/37 | | | | A | | | | 1,345,476 | |
| | | | | |
| | 2,946 | | | RBSSP Resecuritization Trust 2010-4 | | | 0.355% | | | | 3/26/36 | | | | A | | | | 2,752,695 | |
| | | | | |
| | 2,495 | | | Renaissance Home Equity Loan Trust I, Home Equity Loan Asset-Backed Notes, Series 2005-3 | | | 5.140% | | | | 11/25/35 | | | | AA+ | | | | 1,798,548 | |
| | | | | | | | | | | | | | | | | | | | |
Principal
Amount (000) | | | Description (1) | | Coupon | | | Maturity | | | Ratings (3) | | | Value | |
| | | | | | | | | | | | | | | | | | | | |
| | | | ASSET-BACKED AND MORTGAGE-BACKED SECURITIES (continued) | | | | | | | | | | | | | |
| | | | | |
| $ | 219 | | | Residential Accredit Loans Inc., Mortgage Asset-Backed Pass-Through Certificates, Series 2005-QS12 | | | 5.500% | | | | 8/25/35 | | | | Caa2 | | | $ | 174,926 | |
| | | | | |
| | 1,786 | | | Sequoia Mortgage Trust, Mortgage Pass Through Certificates, Series 2011-1 | | | 4.125% | | | | 2/25/41 | | | | AAA | | | | 1,824,028 | |
| | | | | |
| | 724 | | | Wachovia Mortgage Loan Trust LLC, Mortgage PasS-Through Certificates, Series 2005-B | | | 2.688% | | | | 10/20/35 | | | | CCC | | | | 512,766 | |
| | | | | |
| | 676 | | | Washington Mutual Mortgage Securities Corporation, Mortgage Pass-Through Certificates, Series 2004-RA3 | | | 6.489% | | | | 8/25/38 | | | | AAA | | | | 718,561 | |
| | | | | |
| | 38 | | | Wells Fargo Mortgage Backed Securties, 2005-AR16 Class 3A2 | | | 2.630% | | | | 10/25/35 | | | | BBB– | | | | 37,523 | |
| | | | | |
| | 3,300 | | | Wells Fargo-RBS Commercial Mortgage Trust, Commercial Mortgage Pass-Through Certificates, Series 2011-C3 | | | 4.375% | | | | 3/17/44 | | | | Aaa | | | | 3,622,479 | |
| $ | 152,765 | | | Total Asset-Backed and Mortgage-Backed Securities (cost $150,460,632) | | | | | | | | 154,928,995 | |
| | | | | |
| Shares | | | Description (1) | | | | | | | | | | | Value | |
| | | | INVESTMENT COMPANIES – 0.2% | | | | | | | | | | | | | | | | |
| | | | | |
| | 36,000 | | | Blackrock Credit Allocation Income Trust IV | | | | | | | | | | | | | | $ | 477,000 | |
| | | | | |
| | 40,000 | | | CBRE Clarion Global Real Estate Income Fund | | | | | | | | | | | | | | | 316,800 | |
| | | | | |
| | 23,000 | | | NexPoint Credit Strategies Fund | | | | | | | | | | | | | | | 144,440 | |
| | | | | |
| | 16,000 | | | Pioneer Diversified High Income Trust | | | | | | | | | | | | | | | 322,400 | |
| | | | Total Investment Companies (cost $1,173,107) | | | | | | | | | | | | | | | 1,260,640 | |
| | | | | |
Principal
Amount (000) (7) | | | Description (1) | | Coupon | | | Maturity | | | Ratings (3) | | | Value | |
| | | | SOVEREIGN DEBT – 2.6% | | | | | | | | | | | | | | | | |
| | | | | |
| | | | Argentina – 0.4% | | | | | | | | | | | | | | | | |
| | | | | |
| $ | 1,200 | | | Province of Buenos Aires, 144A | | | 10.875% | | | | 1/26/21 | | | | B | | | $ | 654,000 | |
| | | | | |
| | 1,300 | | | Provincia de Cordoba | | | 12.375% | | | | 8/17/17 | | | | B | | | | 745,329 | |
| | | | | |
| | 1,400 | | | Republic of Argentina | | | 8.750% | | | | 6/02/17 | | | | B | | | | 1,204,000 | |
| | 3,900 | | | Total Argentina | | | | | | | | | | | | | | | 2,603,329 | |
| | | | Brazil – 0.2% | | | | | | | | | | | | | | | | |
| | | | | |
| | 870 | | | Federative Republic of Brazil, (4) | | | 4.875% | | | | 1/22/21 | | | | Baa2 | | | | 1,006,155 | |
| | | | Canada – 1.0% | | | | | | | | | | | | | | | | |
| | | | | |
| | 5,500 | CAD | | Canadian Government Bond | | | 3.750% | | | | 6/01/19 | | | | AAA | | | | 6,211,634 | |
| | | | Indonesia – 0.3% | | | | | | | | | | | | | | | | |
| | | | | |
| | 1,830 | | | Republic of Indonesia, 144A | | | 5.875% | | | | 3/13/20 | | | | Baa3 | | | | 2,109,075 | |
| | | | Poland – 0.1% | | | | | | | | | | | | | | | | |
| | | | | |
| | 350 | | | Republic of Poland | | | 5.000% | | | | 3/23/22 | | | | A2 | | | | 382,025 | |
| | | | South Africa – 0.4% | | | | | | | | | | | | | | | | |
| | | | | |
| | 18,500 | ZAR | | Republic of South Africa | | | 10.500% | | | | 12/21/26 | | | | A | | | | 2,747,521 | |
| | | | Ukraine – 0.2% | | | | | | | | | | | | | | | | |
| | | | | |
| | 1,250 | | | Republic of Ukraine, 144A, (4) | | | 7.750% | | | | 9/23/20 | | | | B+ | | | | 1,132,501 | |
| | | | Total Sovereign Debt (cost $16,516,283) | | | | | | | | | | | | | | | 16,192,240 | |
Portfolio of Investments
Nuveen Strategic Income Fund (continued)
June 30, 2012
| | | | | | | | | | | | | | | | | | | | |
Principal
Amount (000) | | | Description (1) | | Coupon | | | Maturity | | | Ratings (3) | | | Value | |
| | | | | | | | | | | | | | | | | | | | |
| | | | STRUCTURED NOTES – 0.1% | | | | | | | | | | | | | | | | |
| | | | | |
| $ | 650 | | | FDIC Structured Sales Guaranteed Notes, Series 2010-L1A | | | 0.000% | | | | 10/25/13 | | | | AAA | | | $ | 645,281 | |
| $ | 650 | | | Total Structured Notes (cost $631,553) | | | | | | | | | | | | | | | 645,281 | |
| | | | | |
| Shares | | | Description (1) | | | | | | | | | | | Value | |
| | | | INVESTMENTS PURCHASED WITH COLLATERAL FROM SECURITIES LENDING – 11.6% | | | | | |
| | | | | |
| | | | Money Market Funds – 11.6% | | | | | | | | | | | | | | | | |
| | | | | |
| | 71,979,473 | | | Mount Vernon Securities Lending Prime Portfolio, 0.197% (8), (9) | | | | | | | | | | | | | | $ | 71,979,473 | |
| | | | Total Investments Purchased with Collateral from Securities Lending (cost $71,979,473) | | | | 71,979,473 | |
| | | | | |
Shares/
Principal
Amount (000) | | | Description (1) | | Coupon | | | Maturity | | | Ratings (3) | | | Value | |
| | | | SHORT-TERM INVESTMENTS – 3.1% | | | | | | | | | | | | | | | | |
| | | | | |
| | | | Money Market Funds – 2.7% | | | | | | | | | | | | | | | | |
| | | | | |
| | 16,619,491 | | | First American Treasury Obligations Fund, Class Z | | | 0.000% (8) | | | | N/A | | | | N/A | | | $ | 16,619,491 | |
| | | | U.S. Government and Agency Obligations – 0.4% | | | | | | | | | | | | | | | | |
| | | | | |
| $ | 1,340 | | | U.S. Treasury Bills, (6) | | | 0.330% | | | | 7/26/12 | | | | Aaa | | | | 1,339,966 | |
| | | | | |
| | 1,160 | | | U.S. Treasury Bills, (6) | | | 0.158% | | | | 2/07/13 | | | | Aaa | | | | 1,158,867 | |
| | | | | |
| | 380 | | | U.S. Treasury Bills, (6) | | | 0.158% | | | | 3/07/13 | | | | Aaa | | | | 379,575 | |
| | | | |
| $ | 2,880 | | | Total U.S. Government and Agency Obligations | | | | | | | | | | | | 2,878,408 | |
| | | | Total Short-Term Investments (cost $19,497,865) | | | | | | | | | | | | | | | 19,497,899 | |
| | | | Total Investments (cost $677,890,090) – 112.3% | | | | | | | | | | | | | | | 699,399,707 | |
| | | | Other Assets Less Liabilities – (12.3)% (10) | | | | | | | | | | | | | | | (76,853,090) | |
| | | | Net Assets – 100% | | | | | | | | | | | | | | $ | 622,546,617 | |
Investments in Derivatives at June 30, 2012
Forward Foreign Currency Exchange Contracts outstanding:
| | | | | | | | | | | | | | | | | | | | | | |
| Counterparty | | Currency Contracts to Deliver | | Amount
(Local Currency) | | | In Exchange For
Currency | | | Amount
(Local Currency) | | | Settlement
Date | | | Unrealized
Appreciation
(Depreciation)
(U.S. Dollars) (10) | |
Citigroup | | Euro | | | 1,110,000 | | | | U.S. Dollar | | | | 1,411,618 | | | | 8/21/12 | | | $ | 6,202 | |
Citigroup | | U.S. Dollar | | | 6,469,700 | | | | South Korean Won | | | | 7,500,000,000 | | | | 7/13/12 | | | | 71,953 | |
Citigroup | | U.S. Dollar | | | 3,996,235 | | | | South Korean Won | | | | 4,670,000,000 | | | | 7/13/12 | | | | 77,035 | |
Citigroup | | U.S. Dollar | | | 12,050,380 | | | | Canadian Dollar | | | | 11,950,000 | | | | 7/23/12 | | | | (319,157 | ) |
Citigroup | | U.S. Dollar | | | 3,979,800 | | | | Mexican Peso | | | | 52,800,000 | | | | 7/23/12 | | | | (31,207 | ) |
Citigroup | | U.S. Dollar | | | 5,956,586 | | | | Swedish Krona | | | | 43,000,000 | | | | 8/07/12 | | | | 250,315 | |
Citigroup | | U.S. Dollar | | | 5,919,389 | | | | Turkish Lira | | | | 11,000,000 | | | | 8/07/12 | | | | 108,928 | |
Citigroup | | U.S. Dollar | | | 15,535,933 | | | | Australian Dollar | | | | 15,710,000 | | | | 8/20/12 | | | | 461,574 | |
JPMorgan | | South African Rand | | | 21,800,000 | | | | U.S. Dollar | | | | 2,606,623 | | | | 7/23/12 | | | | (50,157 | ) |
JPMorgan | | U.S. Dollar | | | 3,994,856 | | | | South Korean Won | | | | 4,660,000,000 | | | | 7/11/12 | | | | 70,268 | |
JPMorgan | | U.S. Dollar | | | 3,308,962 | | | | Mexican Peso | | | | 43,900,000 | | | | 7/23/12 | | | | (25,946 | ) |
JPMorgan | | U.S. Dollar | | | 6,953,426 | | | | Mexican Peso | | | | 95,700,000 | | | | 7/23/12 | | | | 203,399 | |
JPMorgan | | U.S. Dollar | | | 2,734,057 | | | | South African Rand | | | | 21,800,000 | | | | 7/23/12 | | | | (77,277 | ) |
JPMorgan | | U.S. Dollar | | | 1,737,877 | | | | South Korean Won | | | | 2,050,000,000 | | | | 8/03/12 | | | | 47,539 | |
JPMorgan | | U.S. Dollar | | | 5,964,420 | | | | New Zealand Dollar | | | | 7,700,000 | | | | 8/20/12 | | | | 176,669 | |
| | | | | | | | | | | | | | | | | | | | | $ | 970,138 | |
Credit Default Swaps outstanding:
| | | | | | | | | | | | | | | | | | | | | | | | | | | | | | |
| Counterparty | | Reference Entity | | Buy/Sell
Protection (11) | | | Current
Credit
Spread (12) | | | Notional
Amount
(U.S. Dollars) | | | Received
Fixed Rate* | | | Termination
Date | | | Value | | | Unrealized
Appreciation
(Depreciation) (10) | |
UBS | | Markit CDX NA HY18 Index | | | Sell | | | | 5.88 | % | | $ | 19,008,000 | | | | 5.000 | % | | | 6/20/17 | | | $ | (644,569 | ) | | $ | 405,979 | |
Interest Rate Swaps outstanding:
| | | | | | | | | | | | | | | | | | | | | | | | | | | | | | | | |
| Counterparty | | Notional
Amount | | | Fund
Pay/Receive
Floating Rate | | | Floating
Rate Index | | | Fixed Rate* | | | Fixed Rate
Payment Frequency | | | Termination
Date | | | Value
| | | Unrealized
Appreciation
(Depreciation) (10) | |
JPMorgan | | $ | 21,000,000 | | | | Receive | | | | 3-Month USD-LIBOR | | | | 2.113 | % | | | Semi-Annually | | | | 2/21/22 | | | $ | (917,705 | ) | | $ | (917,705 | ) |
UBS | | | 19,000,000 | | | | Receive | | | | 3-Month USD-LIBOR | | | | 2.056 | % | | | Semi-Annually | | | | 7/01/15 | | | | (982,146 | ) | | | (982,146 | ) |
| | | | | | | | | | | | | | | | | | | | | | | | | | | | | | | $ | (1,899,851 | ) |
Future Contracts outstanding:
| | | | | | | | | | | | | | | | | | | | |
| Type | | Contract
Position | | | Number of
Contracts | | | Contract
Expiration | | | Value
| | | Unrealized
Appreciation
(Depreciation) | |
U.S. Treasury 5-Year Note | | | Short | | | | (6 | ) | | | 9/12 | | | $ | (743,813 | ) | | $ | 1,486 | |
U.S. Treasury 10-Year Note | | | Short | | | | (671 | ) | | | 9/12 | | | | (89,494,625 | ) | | | (350,772 | ) |
U.S. Treasury Long Bond | | | Long | | | | 6 | | | | 9/12 | | | | 887,813 | | | | (9,764 | ) |
U.S. Treasury Ultra Bond | | | Long | | | | 19 | | | | 9/12 | | | | 3,170,031 | | | | 47,753 | |
| | | | | | | | | | | | | | | | | | | $ | (311,297 | ) |
Portfolio of Investments
Nuveen Strategic Income Fund (continued)
June 30, 2012
| | | | For Fund portfolio compliance purposes, the Fund’s industry classifications refer to any one or more of the industry sub-classifications used by one or more widely recognized market indexes or ratings group indexes, and/or as defined by Fund management. This definition may not apply for purposes of this report, which may combine industry sub-classifications into sectors for reporting ease. |
| | (1) | | All Percentages shown in the Portfolio of Investments are based on net assets. |
| | (2) | | Investment valued at fair value using methods determined in good faith by, or at the discretion of, the Board of Directors. For fair value measurement disclosure purposes, investment categorized as Level 3. See Notes to Financial Statements, Footnote 1 – General Information and Significant accounting Policies, Investment Valuation for more information. |
| | (3) | | Ratings (not covered by the report of independent registered public accounting firm): Using the highest of Standard & Poor’s Group (“Standard & Poor’s”), Moody’s Investors Service, Inc. (“Moody’s”) or Fitch, Inc. (“Fitch”) rating. Ratings below BBB by Standard & Poor’s, Baa by Moody’s or BBB by Fitch are considered to be below investment grade. Holdings designated N/R are not rated by any of these national rating agencies. |
| | (4) | | Investment, or a portion of investment, is out on loan for securities lending. |
| | (5) | | Optional Call Provisions (not covered by the report of independent registered public accounting firm): Dates (month and year) and prices of the earliest optional call or redemption. There may be other call provisions at varying prices at later dates. |
| | (6) | | Investment, or portion of investment, segregated as collateral for investments in derivatives. |
| | (7) | | Principal Amount (000) denominated in U.S. Dollars, unless otherwise noted. |
| | (8) | | The rate shown is the annualized seven-day effective yield as of June 30, 2012. |
| | (9) | | The Fund may loan securities representing up to one third of the fair value of its total assets (which includes collateral for securities on loan) to broker-dealers, banks and other institutions. The Fund maintains collateral equal to at least 100% of the fair value of the securities loaned. The cash collateral received by the Fund is invested in this money market fund. See Notes to Financial Statements, Footnote 1 – General Information and Significant Accounting Policies, Securities Lending for more information. |
| | (10) | | Other Assets Less Liabilities, includes the Unrealized Appreciation (Depreciation) of derivative instruments as noted within Investments in Derivatives at June 30, 2012. |
| | (11) | | The Fund entered into the credit default swaps to gain investment exposure to the referenced entity. Selling protection has a similar credit risk position to owning the referenced entity. Buying protection has a similar credit risk position to selling the referenced entity short. |
| | (12) | | The credit spread generally serves as an indication of the current status of the payment/performance risk and therefore the likelihood of default of the credit derivative. The credit spread also reflects the cost of buying/selling protection and may include upfront payments required to be made to enter into a credit default swap contract. Higher credit spreads are indicative of higher likelihood of performance by the seller of protection. |
| | WI/DD | | Investment, or portion of investment, purchased on a when-issued or delayed delivery basis. |
| | TBA | | To be announced. Maturity date not known prior to settlement of this transaction. |
| | 144A | | Investment is exempt from registration under Rule 144A of the Securities Act of 1933, as amended. These investments may only be resold in transactions exempt from registration, which are normally those transactions with qualified institutional buyers. |
| | USD-LIBOR | | United States Dollar–London Inter-Bank Offered Rate. |
Statement of Assets & Liabilities
June 30, 2012
| | | | | | | | | | | | |
| | | Core Plus
Bond | | | High
Income
Bond | | | Inflation
Protected
Securities | |
Assets | | | | | | | | | | | | |
Long-term investments, at value (cost $762,359,793, $596,105,430 and $306,006,693, respectively) | | $ | 801,212,996 | | | $ | 591,112,194 | | | $ | 333,992,228 | |
Investments purchased with collateral from securities lending (at cost, which approximates value) | | | 112,762,340 | | | | 157,452,505 | | | | 22,654,387 | |
Short-term investments (cost $22,178,290, $16,570,634 and $17,256,550, respectively) | | | 22,178,258 | | | | 16,570,633 | | | | 17,256,557 | |
Cash denominated in foreign currencies (cost $—, $— and $—, respectively) | | | — | | | | — | | | | — | |
Cash | | | 666 | | |
| 311,414
|
| | | — | |
Unrealized appreciation on: | | | | | | | | | | | | |
Credit default swaps | | | — | | | | — | | | | — | |
Forward foreign currency exchange contracts | | | — | | | | — | | | | — | |
Receivables: | | | | | | | | | | | | |
Dividends | | | 65,625 | | | | 289,930 | | | | 4,615 | |
Due from broker | | | 174,937 | | | | 54,229 | | | | 7,515 | |
Interest | | | 6,359,568 | | | | 11,209,007 | | | | 1,836,091 | |
Investments sold | | | 154,960 | | | | 4,449,050 | | | | 2,392,902 | |
Shares sold | | | 322,863 | | | | 880,551 | | | | 1,019,630 | |
Variation margin on futures contracts | | | 260,907 | | | | — | | | | — | |
Other assets | | | 8,940 | | | | 5,454 | | | | 2,305 | |
Total assets | | | 943,502,060 | | | | 782,334,967 | | | | 379,166,230 | |
Liabilities | | | | | | | | | | | | |
Cash overdraft denominated in foreign currencies (cost $—, $— and $—, respectively) | | | — | | | | — | | | | — | |
Credit default swap premiums received | | | — | | | | — | | | | — | |
Unrealized depreciation on: | | | | | | | | | | | | |
Forward foreign currency exchange contracts | | | — | | | | — | | | | 110,837 | |
Interest rate swaps | | | 2,423,505 | | | | — | | | | 348,311 | |
Payables: | | | | | | | | | | | | |
Collateral from securities lending program | | | 112,762,340 | | | | 157,452,505 | | | | 22,654,387 | |
Dividends | | | 1,744,697 | | | | 2,892,635 | | | | 555,672 | |
Investments purchased | | | 16,786,384 | | | | 11,984,205 | | | | 4,024,946 | |
Shares redeemed | | | 1,581,633 | | | | 936,987 | | | | 601,975 | |
Variation margin on futures contracts | | | — | | | | 35,000 | | | | 22,300 | |
Accrued expenses: | | | | | | | | | | | | |
Management fees | | | 242,317 | | | | 252,261 | | | | 128,165 | |
12b-1 distribution and service fees | | | 21,644 | | | | 58,334 | | | | 11,557 | |
Other | | | 234,247 | | | | 280,455 | | | | 116,360 | |
Total liabilities | | | 135,796,767 | | | | 173,892,382 | | | | 28,574,510 | |
Net assets | | $ | 807,705,293 | | | $ | 608,442,585 | | | $ | 350,591,720 | |
See accompanying notes to financial statements.
Statement of Assets & Liabilities (continued)
June 30, 2012
| | | | | | | | | | | | |
| | | Core Plus
Bond | | | High
Income
Bond | | | Inflation
Protected
Securities | |
Class A Shares | | | | | | | | | | | | |
Net assets | | $ | 83,264,457 | | | $ | 92,018,249 | | | $ | 19,330,349 | |
Shares outstanding | | | 7,150,913 | | | | 10,655,341 | | | | 1,638,795 | |
Net asset value per share | | $ | 11.64 | | | $ | 8.64 | | | $ | 11.80 | |
Offering price per share (net asset value per share plus maximum sales charge of 4.25%, 4.75% and 4.25%, respectively, of offering price) | | $ | 12.16 | | | $ | 9.07 | | | $ | 12.32 | |
Class B Shares | | | | | | | | | | | | |
Net assets | | $ | 1,019,001 | | | $ | 1,843,096 | | | | N/A | |
Shares outstanding | | | 88,333 | | | | 214,494 | | | | N/A | |
Net asset value and offering price per share | | $ | 11.54 | | | $ | 8.59 | | | | N/A | |
Class C Shares | | | | | | | | | | | | |
Net assets | | $ | 4,603,429 | | | $ | 48,666,954 | | | $ | 9,702,775 | |
Shares outstanding | | | 397,068 | | | | 5,646,375 | | | | 827,858 | |
Net asset value and offering price per share | | $ | 11.59 | | | $ | 8.62 | | | $ | 11.72 | |
Class R3 Shares | | | | | | | | | | | | |
Net assets | | $ | 312,925 | | | $ | 615,483 | | | $ | 172,688 | |
Shares outstanding | | | 26,743 | | | | 69,833 | | | | 14,712 | |
Net asset value and offering price per share | | $ | 11.70 | | | $ | 8.81 | | | $ | 11.74 | |
Class I Shares | | | | | | | | | | | | |
Net assets | | $ | 718,505,481 | | | $ | 465,298,803 | | | $ | 321,385,908 | |
Shares outstanding | | | 61,743,617 | | | | 53,774,062 | | | | 27,215,130 | |
Net asset value and offering price per share | | $ | 11.64 | | | $ | 8.65 | | | $ | 11.81 | |
Net assets consist of: | | | | | | | | | | | | |
Capital paid-in | | $ | 777,822,407 | | | $ | 629,704,205 | | | $ | 324,439,934 | |
Undistributed (Over-distribution of) net investment income | | | (257,304 | ) | | | 110,337 | | | | 1,461,219 | |
Accumulated net realized gain (loss) | | | (5,728,330 | ) | | | (16,390,854 | ) | | | (2,829,521 | ) |
Net unrealized appreciation (depreciation) | | | 35,868,520 | | | | (4,981,103 | ) | | | 27,520,088 | |
Net assets | | $ | 807,705,293 | | | $ | 608,442,585 | | | $ | 350,591,720 | |
Authorized shares – per class | | | 2 billion | | | | 2 billion | | | | 2 billion | |
Par value per share | | $ | 0.0001 | | | $ | 0.0001 | | | $ | 0.0001 | |
| N/A | – Inflation Protected Securities does not offer Class B Shares. |
See accompanying notes to financial statements.
| | | | | | | | | | | | | | | | |
| | | Intermediate
Government Bond | | | Intermediate
Term Bond | | | Short Term
Bond | | | Strategic Income | |
Assets | | | | | | | | | | | | | | | | |
Long-term investments, at value (cost $81,519,908, $617,177,083, $865,973,158 and $586,412,752, respectively) | | $ | 84,361,114 | | | $ | 638,011,229 | | | $ | 874,490,542 | | | $ | 607,922,335 | |
Investments purchased with collateral from securities lending (at cost, which approximates value) | | | 9,126,144 | | | | 74,365,907 | | | | 85,229,787 | | | | 71,979,473 | |
Short-term investments (cost $1,564,193, $64,917,997, $80,950,448 and $19,497,865, respectively) | | | 1,564,196 | | | | 64,917,976 | | | | 80,950,426 | | | | 19,497,899 | |
Cash denominated in foreign currencies (cost $—, $—, $422 and $—, respectively) | | | — | | | | — | | | | 312 | | | | — | |
Cash | | | 2,302 | | | | — | | | | — | | | | 960,077 | |
Unrealized appreciation on: | | | | | | | | | | | | | | | | |
Credit default swaps | | | — | | | | — | | | | — | | | | 405,979 | |
Forward foreign currency exchange contracts | | | — | | | | — | | | | — | | | | 1,473,882 | |
Receivables: | | | | | | | | | | | | | | | | |
Dividends | | | — | | | | — | | | | — | | | | 93,954 | |
Due from broker | | | 7,124 | | | | 11,399 | | | | 24,543 | | | | 24,835 | |
Interest | | | 440,007 | | | | 4,042,087 | | | | 5,717,936 | | | | 6,800,511 | |
Investments sold | | | 46,587 | | | | 24,803,608 | | | | 7,318,731 | | | | 31,008,332 | |
Shares sold | | | 4,917 | | | | 133,914 | | | | 997,043 | | | | 1,003,904 | |
Variation margin on futures contracts | | | — | | | | — | | | | 164,502 | | | | 303,535 | |
Other assets | | | 103 | | | | 6,176 | | | | 59,659 | | | | 93,178 | |
Total assets | | | 95,552,494 | | | | 806,292,296 | | | | 1,054,953,481 | | | | 741,567,894 | |
Liabilities | | | | | | | | | | | | | | | | |
Cash overdraft denominated in foreign currencies (cost $—, $—, $— and $605,111, respectively) | | | — | | | | — | | | | — | | | | 612,877 | |
Credit default swap premiums received | | | — | | | | — | | | | — | | | | 1,050,548 | |
Unrealized depreciation on: | | | | | | | | | | | | | | | | |
Forward foreign currency exchange contracts | | | — | | | | — | | | | — | | | | 503,744 | |
Interest rate swaps | | | — | | | | 1,530,864 | | | | 1,098,152 | | | | 1,899,851 | |
Payables: | | | | | | | | | | | | | | | | |
Collateral from securities lending program | | | 9,126,144 | | | | 74,365,907 | | | | 85,229,787 | | | | 71,979,473 | |
Dividends | | | 109,199 | | | | 992,922 | | | | 1,207,158 | | | | 1,518,481 | |
Investments purchased | | | 1,758,787 | | | | 84,657,556 | | | | 73,343,752 | | | | 40,114,254 | |
Shares redeemed | | | 13,540 | | | | 183,022 | | | | 10,618,971 | | | | 888,604 | |
Variation margin on futures contracts | | | 10,382 | | | | 282,818 | | | | — | | | | — | |
Accrued expenses: | | | | | | | | | | | | | | | | |
Management fees | | | 24,624 | | | | 225,705 | | | | 170,511 | | | | 125,850 | |
12b-1 distribution and service fees | | | 3,730 | | | | 5,583 | | | | 58,257 | | | | 37,962 | |
Other | | | 58,965 | | | | 151,877 | | | | 341,971 | | | | 289,633 | |
Total liabilities | | | 11,105,371 | | | | 162,396,254 | | | | 172,068,559 | | | | 119,021,277 | |
Net assets | | $ | 84,447,123 | | | $ | 643,896,042 | | | $ | 882,884,922 | | | $ | 622,546,617 | |
See accompanying notes to financial statements.
Statement of Assets & Liabilities (continued)
June 30, 2012
| | | | | | | | | | | | | | | | |
| | | Intermediate
Government Bond | | | Intermediate
Term Bond | | | Short Term
Bond | | | Strategic
Income | |
Class A Shares | | | | | | | | | | | | | | | | |
Net assets | | $ | 12,734,628 | | | $ | 21,262,206 | | | $ | 112,851,178 | | | $ | 52,802,373 | |
Shares outstanding | | | 1,411,121 | | | | 1,992,700 | | | | 11,340,866 | | | | 4,875,312 | |
Net asset value per share | | $ | 9.02 | | | $ | 10.67 | | | $ | 9.95 | | | $ | 10.83 | |
Offering price per share (net asset value per share plus maximum sales charge of 3.00%, 3.00%, 2.25% and 4.25%, respectively, of offering price) | | $ | 9.30 | | | $ | 11.00 | | | $ | 10.18 | | | $ | 11.31 | |
Class B Shares | | | | | | | | | | | | | | | | |
Net assets | | | N/A | | | | N/A | | | | N/A | | | $ | 2,148,327 | |
Shares outstanding | | | N/A | | | | N/A | | | | N/A | | | | 199,348 | |
Net asset value and offering price per share | | | N/A | | | | N/A | | | | N/A | | | $ | 10.78 | |
Class C Shares | | | | | | | | | | | | | | | | |
Net assets | | $ | 1,438,294 | | | $ | 1,567,858 | | | $ | 42,345,553 | | | $ | 31,084,844 | |
Shares outstanding | | | 159,212 | | | | 147,581 | | | | 4,246,395 | | | | 2,887,755 | |
Net asset value and offering price per share | | $ | 9.03 | | | $ | 10.62 | | | $ | 9.97 | | | $ | 10.76 | |
Class R3 Shares | | | | | | | | | | | | | | | | |
Net assets | | $ | 213,968 | | | | N/A | | | $ | 445,879 | | | $ | 1,902,622 | |
Shares outstanding | | | 23,743 | | | | N/A | | | | 44,779 | | | | 174,905 | |
Net asset value and offering price per share | | $ | 9.01 | | | | N/A | | | $ | 9.96 | | | $ | 10.88 | |
Class I Shares | | | | | | | | | | | | | | | | |
Net assets | | $ | 70,060,233 | | | $ | 621,065,978 | | | $ | 727,242,312 | | | $ | 534,608,451 | |
Shares outstanding | | | 7,759,879 | | | | 58,413,508 | | | | 73,077,742 | | | | 49,377,824 | |
Net asset value and offering price per share | | $ | 9.03 | | | $ | 10.63 | | | $ | 9.95 | | | $ | 10.83 | |
Net assets consist of: | | | | | | | | | | | | | | | | |
Capital paid-in | | $ | 89,214,961 | | | $ | 612,256,308 | | | $ | 904,954,381 | | | $ | 661,045,902 | |
Undistributed (Over-distribution of) net investment income | | | (13,772 | ) | | | (1,571,679 | ) | | | (96,445 | ) | | | 7,146,648 | |
Accumulated net realized gain (loss) | | | (7,607,056 | ) | | | 13,945,306 | | | | (29,224,278 | ) | | | (66,312,626 | ) |
Net unrealized appreciation (depreciation) | | | 2,852,990 | | | | 19,266,107 | | | | 7,251,264 | | | | 20,666,693 | |
Net assets | | $ | 84,447,123 | | | $ | 643,896,042 | | | $ | 882,884,922 | | | $ | 622,546,617 | |
Authorized shares – per class | | | 2 billion | | | | 2 billion | | | | 2 billion | | | | 2 billion | |
Par value per share | | $ | 0.0001 | | | $ | 0.0001 | | | $ | 0.0001 | | | $ | 0.0001 | |
| N/A | – Intermediate Government Bond and Short Term Bond do not offer Class B Shares. Intermediate Term Bond does not offer Class B Shares or Class R3 Shares. |
See accompanying notes to financial statements.
Statement of Operations
Year Ended June 30, 2012
| | | | | | | | | | | | |
| | | Core
Plus
Bond | | | High
Income
Bond | | | Inflation
Protected
Securities | |
Investment Income | | | | | | | | | | | | |
Dividend and interest income (net of foreign tax withheld of $—, $10,769 and $—, respectively) | | $ | 40,759,678 | | | $ | 48,887,986 | | | $ | 8,781,999 | |
Securities lending income | | | 187,658 | | | | 619,782 | | | | 134,177 | |
Total investment income | | | 40,947,336 | | | | 49,507,768 | | | | 8,916,176 | |
Expenses | | | | | | | | | | | | |
Management fees | | | 5,525,628 | | | | 3,789,261 | | | | 1,949,674 | |
12b-1 service fees – Class A | | | 209,171 | | | | 176,264 | | | | 36,397 | |
12b-1 distribution and service fees – Class B | | | 14,259 | | | | 17,952 | | | | N/A | |
12b-1 distribution and service fees – Class C | | | 40,134 | | | | 333,391 | | | | 79,863 | |
12b-1 distribution and service fees – Class R3 | | | 1,799 | | | | 2,153 | | | | 584 | |
Shareholders’ servicing agent fees and expenses | | | 464,801 | | | | 356,053 | | | | 217,145 | |
Custodian’s fees and expenses | | | 189,942 | | | | 138,120 | | | | 71,263 | |
Directors’ fees and expenses | | | 25,005 | | | | 17,000 | | | | 9,245 | |
Professional fees | | | 99,679 | | | | 43,488 | | | | 47,656 | |
Shareholders’ reports – printing and mailing expenses | | | 133,909 | | | | 112,630 | | | | 39,901 | |
Federal and state registration fees | | | 95,551 | | | | 93,008 | | | | 91,710 | |
Reorganization expense | | | — | | | | 19,000 | | | | — | |
Other expenses | | | 38,255 | | | | 10,380 | | | | 14,972 | |
Total expenses before expense reimbursement | | | 6,838,133 | | | | 5,108,700 | | | | 2,558,410 | |
Expense reimbursement | | | (369,998 | ) | | | (190,471 | ) | | | (528,613 | ) |
Net expenses | | | 6,468,135 | | | | 4,918,229 | | | | 2,029,797 | |
Net investment income (loss) | | | 34,479,201 | | | | 44,589,539 | | | | 6,886,379 | |
Realized and Unrealized Gain (Loss) | | | | | | | | | | | | |
Net realized gain (loss) from: | | | | | | | | | | | | |
Investments and foreign currency | | | 18,705,021 | | | | (13,744,653 | ) | | | 8,964,913 | |
Forward foreign currency exchange contracts | | | — | | | | — | | | | 167,168 | |
Futures contracts | | | (7,955,883 | ) | | | (67,967 | ) | | | 60,629 | |
Options purchased | | | — | | | | — | | | | — | |
Options written | | | — | | | | — | | | | — | |
Swaps | | | (1,725,955 | ) | | | — | | | | (127,943 | ) |
Change in net unrealized appreciation (depreciation) of: | | | | | | | | | | | | |
Investments and foreign currency | | | 9,052,404 | | | | (5,098,028 | ) | | | 18,437,020 | |
Forward foreign currency exchange contracts | | | — | | | | — | | | | (110,837 | ) |
Futures contracts | | | (1,449,836 | ) | | | 12,132 | | | | (82,693 | ) |
Options written | | | — | | | | — | | | | — | |
Swaps | | | 52,980 | | | | — | | | | (44,170 | ) |
Net realized and unrealized gain (loss) | | | 16,678,731 | | | | (18,898,516 | ) | | | 27,264,087 | |
Net increase (decrease) in net assets from operations | | $ | 51,157,932 | | | $ | 25,691,023 | | | $ | 34,150,466 | |
| N/A – | Inflation Protected Securities does not offer Class B Shares. |
See accompanying notes to financial statements.
Statement of Operations (continued)
Year Ended June 30, 2012
| | | | | | | | | | | | | | | | |
| | | Intermediate
Government
Bond | | | Intermediate
Term Bond | | | Short Term
Bond | | | Strategic
Income | |
Investment Income | | | | | | | | | | | | | | | | |
Dividend and interest income (net of foreign tax withheld of $—, $—, $— and $—, respectively) | | $ | 2,887,819 | | | $ | 23,099,397 | | | $ | 24,813,895 | | | $ | 31,580,404 | |
Securities lending income | | | 21,965 | | | | 172,074 | | | | 174,547 | | | | 157,841 | |
Total investment income | | | 2,909,784 | | | | 23,271,471 | | | | 24,988,442 | | | | 31,738,245 | |
Expenses | | | | | | | | | | | | | | | | |
Management fees | | | 664,767 | | | | 3,974,836 | | | | 3,586,821 | | | | 3,678,203 | |
12b-1 service fees – Class A | | | 34,041 | | | | 53,935 | | | | 260,019 | | | | 109,797 | |
12b-1 distribution and service fees – Class B | | | N/A | | | | N/A | | | | N/A | | | | 18,505 | |
12b-1 distribution and service fees – Class C | | | 12,716 | | | | 11,014 | | | | 302,310 | | | | 222,774 | |
12b-1 distribution and service fees – Class R3 | | | 2,277 | | | | N/A | | | | 1,362 | | | | 6,539 | |
Shareholders’ servicing agent fees and expenses | | | 67,810 | | | | 243,763 | | | | 250,721 | | | | 231,283 | |
Custodian’s fees and expenses | | | 34,843 | | | | 128,958 | | | | 181,495 | | | | 161,746 | |
Directors’ fees and expenses | | | 3,099 | | | | 18,066 | | | | 24,292 | | | | 20,235 | |
Professional fees | | | 38,147 | | | | 72,324 | | | | 110,689 | | | | 71,167 | |
Shareholders’ reports – printing and mailing expenses | | | 24,971 | | | | 38,399 | | | | 139,803 | | | | 79,231 | |
Federal and state registration fees | | | 60,554 | | | | 56,438 | | | | 76,636 | | | | 95,838 | |
Reorganization expense | | | — | | | | — | | | | 99,000 | | | | 121,000 | |
Other expenses | | | 12,474 | | | | 28,183 | | | | 38,151 | | | | 33,503 | |
Total expenses before expense reimbursement | | | 955,699 | | | | 4,625,916 | | | | 5,071,299 | | | | 4,849,821 | |
Expense reimbursement | | | (285,213 | ) | | | (130,767 | ) | | | (205,906 | ) | | | (431,342 | ) |
Net expenses | | | 670,486 | | | | 4,495,149 | | | | 4,865,393 | | | | 4,418,479 | |
Net investment income (loss) | | | 2,239,298 | | | | 18,776,322 | | | | 20,123,049 | | | | 27,319,766 | |
Realized and Unrealized Gain (Loss) | | | | | | | | | | | | | | | | |
Net realized gain (loss) from: | | | | | | | | | | | | | | | | |
Investments and foreign currency | | | 1,568,618 | | | | 19,955,520 | | | | 4,661,657 | | | | 12,429,444 | |
Forward foreign currency exchange contracts | | | — | | | | — | | | | (149,386 | ) | | | (102,811 | ) |
Futures contracts | | | 685,111 | | | | (1,294,926 | ) | | | (7,223,699 | ) | | | (7,719,289 | ) |
Options purchased | | | — | | | | — | | | | — | | | | (1,715,583 | ) |
Options written | | | — | | | | — | | | | — | | | | (321,084 | ) |
Swaps | | | — | | | | (767,968 | ) | | | (2,188,004 | ) | | | (883,712 | ) |
Change in net unrealized appreciation (depreciation) of: | | | | | | | | | | | | | | | | |
Investments and foreign currency | | | 108,077 | | | | (2,991,611 | ) | | | (3,980,585 | ) | | | 4,637,040 | |
Forward foreign currency exchange contracts | | | — | | | | — | | | | 92,822 | | | | 956,394 | |
Futures contracts | | | 22,105 | | | | (132,059 | ) | | | 458,809 | | | | (509,763 | ) |
Options written | | | — | | | | — | | | | — | | | | (113,961 | ) |
Swaps | | | — | | | | (72,804 | ) | | | (514,179 | ) | | | (491,079 | ) |
Net realized and unrealized gain (loss) | | | 2,383,911 | | | | 14,696,152 | | | | (8,842,565 | ) | | | 6,165,596 | |
Net increase (decrease) in net assets from operations | | $ | 4,623,209 | | | $ | 33,472,474 | | | $ | 11,280,484 | | | $ | 33,485,362 | |
| N/A | – Intermediate Government Bond and Short Term Bond do not offer Class B Shares. Intermediate Term Bond does not offer Class B Shares or Class R3 Shares. |
See accompanying notes to financial statements.
Statement of Changes in Net Assets
| | | | | | | | | | | | | | | | |
| | | | | | | |
| | | Core Plus Bond | | | High Income Bond | |
| | | Year Ended 6/30/12 | | | Year Ended
6/30/11 | | | Year Ended
6/30/12 | | | Year Ended
6/30/11 | |
Operations | | | | | | | | | | | | | | | | |
Net investment income (loss) | | $ | 34,479,201 | | | $ | 47,739,793 | | | $ | 44,589,539 | | | $ | 36,550,090 | |
Net realized gain (loss) from: | | | | | | | | | | | | | | | | |
Investments and foreign currency | | | 18,705,021 | | | | 54,185,668 | | | | (13,744,653 | ) | | | 24,993,013 | |
Forward foreign currency exchange contracts | | | — | | | | — | | | | — | | | | — | |
Futures contracts | | | (7,955,883 | ) | | | (8,856,879 | ) | | | (67,967 | ) | | | 439,344 | |
Options purchased | | | — | | | | — | | | | — | | | | — | |
Options written | | | — | | | | — | | | | — | | | | — | |
Swaps | | | (1,725,955 | ) | | | (2,009,429 | ) | | | — | | | | — | |
Change in net unrealized appreciation (depreciation) of: | | | | | | | | | | | | | | | | |
Investments and foreign currency | | | 9,052,404 | | | | (22,473,175 | ) | | | (5,098,028 | ) | | | 12,502,589 | |
Forward foreign currency exchange contracts | | | — | | | | — | | | | — | | | | — | |
Futures contracts | | | (1,449,836 | ) | | | 3,005,732 | | | | 12,132 | | | | (178,442 | ) |
Options written | | | — | | | | — | | | | — | | | | — | |
Swaps | | | 52,980 | | | | 62,340 | | | | — | | | | — | |
Net increase (decrease) in net assets from operations | | | 51,157,932 | | | | 71,654,050 | | | | 25,691,023 | | | | 74,306,594 | |
Distributions to Shareholders | | | | | | | | | | | | | | | | |
From net investment income: | | | | | | | | | | | | | | | | |
Class A | | | (3,053,035 | ) | | | (3,347,296 | ) | | | (5,735,501 | ) | | | (2,338,443 | ) |
Class B | | | (41,242 | ) | | | (75,877 | ) | | | (132,288 | ) | | | (103,717 | ) |
Class C | | | (117,724 | ) | | | (109,255 | ) | | | (2,477,744 | ) | | | (588,496 | ) |
Class R3 | | | (12,214 | ) | | | (17,140 | ) | | | (33,439 | ) | | | (26,632 | ) |
Class I | | | (32,189,815 | ) | | | (42,653,198 | ) | | | (36,583,834 | ) | | | (33,008,236 | ) |
From accumulated net realized gains: | | | | | | | | | | | | | | | | |
Class A | | | — | | | | — | | | | (298,280 | ) | | | — | |
Class B | | | — | | | | — | | | | (7,773 | ) | | | — | |
Class C | | | — | | | | — | | | | (148,234 | ) | | | — | |
Class R3 | | | — | | | | — | | | | (1,386 | ) | | | — | |
Class I | | | — | | | | — | | |
| (1,460,981
| )
| | | — | |
Decrease in net assets from distributions to shareholders | | | (35,414,030 | ) | | | (46,202,766 | ) | | | (46,879,460 | ) | | | (36,065,524 | ) |
Fund Share Transactions | | | | | | | | | | | | | | | | |
Fund reorganization | | | — | | | | — | | | | 104,870,978 | | | | — | |
Proceeds from sale of shares | | | 112,240,499 | | | | 157,991,764 | | | | 228,987,881 | | | | 226,022,874 | |
Proceeds from shares issued to shareholders due to reinvestment of distributions | | | 12,143,026 | | | | 16,255,878 | | | | 12,427,284 | | | | 5,754,839 | |
| | | 124,383,525 | | | | 174,247,642 | | | | 346,286,143 | | | | 231,777,713 | |
Cost of shares redeemed | | | (349,839,594 | ) | | | (462,890,776 | ) | | | (219,810,557 | ) | | | (155,401,477 | ) |
Net increase (decrease) in net assets from Fund share transactions | | | (225,456,069 | ) | | | (288,643,134 | ) | | | 126,475,586 | | | | 76,376,236 | |
Net increase (decrease) in net assets | | | (209,712,167 | ) | | | (263,191,850 | ) | | | 105,287,149 | | | | 114,617,306 | |
Net assets at the beginning of period | | | 1,017,417,460 | | | | 1,280,609,310 | | | | 503,155,436 | | | | 388,538,130 | |
Net assets at the end of period | | $ | 807,705,293 | | | $ | 1,017,417,460 | | | $ | 608,442,585 | | | $ | 503,155,436 | |
Undistributed (Over-distribution of) net investment income at the end of period | | $ | (257,304 | ) | | $ | 1,352,342 | | | $ | 110,337 | | | $ | 505,608 | |
See accompanying notes to financial statements.
Statement of Changes in Net Assets (continued)
| | | | | | | | | | | | | | | | |
| | | Inflation Protected Securities | | | Intermediate
Government Bond | |
| | | Year Ended
6/30/12 | | | Year Ended
6/30/11 | | | Year Ended
6/30/12 | | | Year Ended
6/30/11 | |
Operations | | | | | | | | | | | | | | | | |
Net investment income (loss) | | $ | 6,886,379 | | | $ | 7,901,160 | | | $ | 2,239,298 | | | $ | 3,253,134 | |
Net realized gain (loss) from: | | | | | | | | | | | | | | | | |
Investments and foreign currency | | | 8,964,913 | | | | 4,562,822 | | | | 1,568,618 | | | | 3,114,651 | |
Forward foreign currency exchange contracts | | | 167,168 | | | | (51,127 | ) | | | — | | | | — | |
Futures contracts | | | 60,629 | | | | (213,630 | ) | | | 685,111 | | | | 76,868 | |
Options purchased | | | — | | | | — | | | | — | | | | — | |
Options written | | | — | | | | — | | | | — | | | | — | |
Swaps | | | (127,943 | ) | | | (205,890 | ) | | | — | | | | — | |
Change in net unrealized appreciation (depreciation) of: | | | | | | | | | | | | | | | | |
Investments and foreign currency | | | 18,437,020 | | | | 4,335,598 | | | | 108,077 | | | | (1,948,456 | ) |
Forward foreign currency exchange contracts | | | (110,837 | ) | | | — | | | | — | | | | — | |
Futures contracts | | | (82,693 | ) | | | 210,169 | | | | 22,105 | | | | (68,702 | ) |
Options written | | | — | | | | — | | | | — | | | | — | |
Swaps | | | (44,170 | ) | | | 7,647 | | | | — | | | | — | |
Net increase (decrease) in net assets from operations | | | 34,150,466 | | | | 16,546,749 | | | | 4,623,209 | | | | 4,427,495 | |
Distributions to Shareholders | | | | | | | | | | | | | | | | |
From net investment income: | | | | | | | | | | | | | | | | |
Class A | | | (468,815 | ) | | | (125,517 | ) | | | (291,024 | ) | | | (383,252 | ) |
Class B | | | N/A | | | | N/A | | | | N/A | | | | N/A | |
Class C | | | (180,484 | ) | | | (48,340 | ) | | | (16,266 | ) | | | (24,042 | ) |
Class R3 | | | (3,148 | ) | | | (8,196 | ) | | | (8,188 | ) | | | (9,778 | ) |
Class I | | | (10,662,479 | ) | | | (2,852,540 | ) | | | (2,051,257 | ) | | | (2,876,058 | ) |
From accumulated net realized gains: | | | | | | | | | | | | | | | | |
Class A | | | — | | | | — | | | | — | | | | — | |
Class B | | | N/A | | | | N/A | | | | N/A | | | | N/A | |
Class C | | | — | | | | — | | | | — | | | | — | |
Class R3 | | | — | | | | — | | | | — | | | | — | |
Class I | | | — | | | | — | | | | — | | | | — | |
Decrease in net assets from distributions to shareholders | | | (11,314,926 | ) | | | (3,034,593 | ) | | | (2,366,735 | ) | | | (3,293,130 | ) |
Fund Share Transactions | | | | | | | | | | | | | | | | |
Fund reorganization | | | — | | | | — | | | | — | | | | — | |
Proceeds from sale of shares | | | 148,914,630 | | | | 153,222,275 | | | | 12,589,884 | | | | 33,044,146 | |
Proceeds from shares issued to shareholders due to reinvestment of distributions | | | 1,571,415 | | | | 487,382 | | | | 853,309 | | | | 1,416,540 | |
| | | 150,486,045 | | | | 153,709,657 | | | | 13,443,193 | | | | 34,460,686 | |
Cost of shares redeemed | | | (98,068,926 | ) | | | (64,764,465 | ) | | | (46,188,783 | ) | | | (94,342,196 | ) |
Net increase (decrease) in net assets from Fund share transactions | | | 52,417,119 | | | | 88,945,192 | | | | (32,745,590 | ) | | | (59,881,510 | ) |
Net increase (decrease) in net assets | | | 75,252,659 | | | | 102,457,348 | | | | (30,489,116 | ) | | | (58,747,145 | ) |
Net assets at the beginning of period | | | 275,339,061 | | | | 172,881,713 | | | | 114,936,239 | | | | 173,683,384 | |
Net assets at the end of period | | $ | 350,591,720 | | | $ | 275,339,061 | | | $ | 84,447,123 | | | $ | 114,936,239 | |
Undistributed (Over-distribution of) net investment income at the end of period | | $ | 1,461,219 | | | $ | 5,416,901 | | | $ | (13,772 | ) | | $ | (212 | ) |
| N/A | – Inflation Protected Securities and Intermediate Government Bond do not offer Class B Shares. |
See accompanying notes to financial statements.
| | | | | | | | | | | | | | | | |
| | | Intermediate Term Bond | | | Short Term Bond | |
| | | Year Ended
6/30/12 | | | Year Ended
6/30/11 | | | Year Ended
6/30/12 | | | Year Ended
6/30/11 | |
Operations | | | | | | | | | | | | | | | | |
Net investment income (loss) | | $ | 18,776,322 | | | $ | 25,116,673 | | | $ | 20,123,049 | | | $ | 20,010,214 | |
Net realized gain (loss) from: | | | | | | | | | | | | | | | | |
Investments and foreign currency | | | 19,955,520 | | | | 21,982,231 | | | | 4,661,657 | | | | 8,061,708 | |
Forward foreign currency exchange contracts | | | — | | | | — | | | | (149,386 | ) | | | (143,789 | ) |
Futures contracts | | | (1,294,926 | ) | | | (971,631 | ) | | | (7,223,699 | ) | | | (5,003,707 | ) |
Options purchased | | | — | | | | — | | | | — | | | | — | |
Options written | | | — | | | | — | | | | — | | | | — | |
Swaps | | | (767,968 | ) | | | (1,226,416 | ) | | | (2,188,004 | ) | | | 313,057 | |
Change in net unrealized appreciation (depreciation) of: | | | | | | | | | | | | | | | | |
Investments and foreign currency | | | (2,991,611 | ) | | | (9,945,282 | ) | | | (3,980,585 | ) | | | 390,332 | |
Forward foreign currency exchange contracts | | | — | | | | — | | | | 92,822 | | | | (92,822 | ) |
Futures contracts | | | (132,059 | ) | | | (165,227 | ) | | | 458,809 | | | | 693,795 | |
Options written | | | — | | | | — | | | | — | | | | — | |
Swaps | | | (72,804 | ) | | | 33,658 | | | | (514,179 | ) | | | 488,181 | |
Net increase (decrease) in net assets from operations | | | 33,472,474 | | | | 34,824,006 | | | | 11,280,484 | | | | 24,716,969 | |
Distributions to Shareholders | | | | | | | | | | | | | | | | |
From net investment income: | | | | | | | | | | | | | | | | |
Class A | | | (619,682 | ) | | | (786,192 | ) | | | (2,658,693 | ) | | | (1,859,321 | ) |
Class B | | | N/A | | | | N/A | | | | N/A | | | | N/A | |
Class C | | | (22,754 | ) | | | (2,096 | ) | | | (558,375 | ) | | | (58,239 | ) |
Class R3 | | | N/A | | | | N/A | | | | (6,394 | ) | | | N/A | |
Class I | | | (18,978,358 | ) | | | (24,001,414 | ) | | | (17,689,020 | ) | | | (16,480,508 | ) |
From accumulated net realized gains: | | | | | | | | | | | | | | | | |
Class A | | | (33,008 | ) | | | — | | | | — | | | | — | |
Class B | | | N/A | | | | N/A | | | | N/A | | | | N/A | |
Class C | | | (1,212 | ) | | | — | | | | — | | | | — | |
Class R3 | | | N/A | | | | N/A | | | | — | | | | N/A | |
Class I | | | (1,010,912 | ) | | | — | | | | — | | | | — | |
Decrease in net assets from distributions to shareholders | | | (20,665,926 | ) | | | (24,789,702 | ) | | | (20,912,482 | ) | | | (18,398,068 | ) |
Fund Share Transactions | | | | | | | | | | | | | | | | |
Fund reorganization | | | — | | | | — | | | | 153,886,513 | | | | — | |
Proceeds from sale of shares | | | 166,920,130 | | | | 149,971,859 | | | | 385,977,366 | | | | 524,865,968 | |
Proceeds from shares issued to shareholders due to reinvestment of distributions | | | 6,049,154 | | | | 6,310,928 | | | | 6,138,855 | | | | 4,910,267 | |
| | | 172,969,284 | | | | 156,282,787 | | | | 546,002,734 | | | | 529,776,235 | |
Cost of shares redeemed | | | (222,662,884 | ) | | | (246,799,023 | ) | | | (481,483,122 | ) | | | (427,990,718 | ) |
Net increase (decrease) in net assets from Fund share transactions | | | (49,693,600 | ) | | | (90,516,236 | ) | | | 64,519,612 | | | | 101,785,517 | |
Net increase (decrease) in net assets | | | (36,887,052 | ) | | | (80,481,932 | ) | | | 54,887,614 | | | | 108,104,418 | |
Net assets at the beginning of period | | | 680,783,094 | | | | 761,265,026 | | | | 827,997,308 | | | | 719,892,890 | |
Net assets at the end of period | | $ | 643,896,042 | | | $ | 680,783,094 | | | $ | 882,884,922 | | | $ | 827,997,308 | |
Undistributed (Over-distribution of) net investment income at the end of period | | $ | (1,571,679) | | | $ | (155,249 | ) | | $ | (96,445) | | | $ | 552,675 | |
| N/A | – Intermediate Term Bond does not offer Class B or Class R3 Shares. Short Term Bond does not offer Class B Shares and did not offer Class R3 Shares
prior to September 23, 2011. |
See accompanying notes to financial statements.
Statement of Changes in Net Assets (continued)
| | | | | | | | |
| | | Strategic Income | |
| | | Year Ended
6/30/12 | | | Year Ended
6/30/11 | |
Operations | | | | | | | | |
Net investment income (loss) | | $ | 27,319,766 | | | $ | 29,514,691 | |
Net realized gain (loss) from: | | | | | | | | |
Investments and foreign currency | | | 12,429,444 | | | | 34,568,431 | |
Forward foreign currency exchange contracts | | | (102,811 | ) | | | (70,957 | ) |
Futures contracts | | | (7,719,289 | ) | | | (7,380,309 | ) |
Options purchased | | | (1,715,583 | ) | | | — | |
Options written | | | (321,084 | ) | | | (189,057 | ) |
Swaps | | | (883,712 | ) | | | 2,289,011 | |
Change in net unrealized appreciation (depreciation) of: | | | | | | | | |
Investments and foreign currency | | | 4,637,040 | | | | (1,253,606 | ) |
Forward foreign currency exchange contracts | | | 956,394 | | | | 13,743 | |
Futures contracts | | | (509,763 | ) | | | 2,406,651 | |
Options written | | | (113,961 | ) | | | 113,961 | |
Swaps | | | (491,079 | ) | | | (715,210 | ) |
Net increase (decrease) in net assets from operations | | | 33,485,362 | | | | 59,297,349 | |
Distributions to Shareholders | | | | | | | | |
From net investment income: | | | | | | | | |
Class A | | | (1,766,560 | ) | | | (1,234,485 | ) |
Class B | | | (59,799 | ) | | | (43,626 | ) |
Class C | | | (721,977 | ) | | | (252,970 | ) |
Class R3 | | | (48,682 | ) | | | (36,575 | ) |
Class I | | | (24,363,476 | ) | | | (27,595,194 | ) |
From accumulated net realized gains: | | | | | | | | |
Class A | | | — | | | | — | |
Class B | | | — | | | | — | |
Class C | | | — | | | | — | |
Class R3 | | | — | | | | — | |
Class I | | | — | | | | — | |
Decrease in net assets from distributions to shareholders | | | (26,960,494 | ) | | | (29,162,850 | ) |
Fund Share Transactions | | | | | | | | |
Fund reorganization | | | 81,128,697 | | | | — | |
Proceeds from sale of shares | | | 120,219,679 | | | | 141,914,621 | |
Proceeds from shares issued to shareholders due to reinvestment of distributions | | | 8,306,341 | | | | 8,495,697 | |
| | | 209,654,717 | | | | 150,410,318 | |
Cost of shares redeemed | | | (244,013,153 | ) | | | (222,392,912 | ) |
Net increase (decrease) in net assets from Fund share transactions | | | (34,358,436 | ) | | | (71,982,594 | ) |
Net increase (decrease) in net assets | | | (27,833,568 | ) | | | (41,848,095 | ) |
Net assets at the beginning of period | | | 650,380,185 | | | | 692,228,280 | |
Net assets at the end of period | | $ | 622,546,617 | | | $ | 650,380,185 | |
Undistributed (Over-distribution of) net investment income at the end of period | | $ | 7,146,648 | | | $ | 4,397,063 | |
See accompanying notes to financial statements.
[THIS PAGE INTENTIONALLY LEFT BLANK]
Financial Highlights
| | | | | | | | | | | | | | | | | | | | | | | | | | | | | | | | | | | | |
| Selected data for a share outstanding throughout each period: | | | | |
| | | |
| Class (Commencement Date) | | | | | | | | | | |
| | | | | | Investment Operations | | | Less Distributions | | | | | | | |
| | | | | | | | |
| CORE PLUS BOND | | | | | | | | | | | | | | | | | | | | | | | | | |
Year Ended
June 30, | | Beginning
Net
Asset
Value | | | Net
Invest-
ment
Income
(Loss)(a) | | | Net
Realized/
Unrealized
Gain
(Loss) | | | Total | | | Net
Invest-
ment
Income | | | Capital
Gains(b) | | | Total | | | Ending
Net
Asset
Value | | | Total
Return(c) | |
Class A (12/87) | | | | | | | | | | | | | | | | | | | | | | | | | |
2012 | | $ | 11.44 | | | $ | .41 | | | $ | .21 | | | $ | .62 | | | $ | (.42 | ) | | $ | — | | | $ | (.42 | ) | | $ | 11.64 | | | | 5.52 | % |
2011 | | | 11.22 | | | | .43 | | | | .21 | | | | .64 | | | | (.42 | ) | | | — | | | | (.42 | ) | | | 11.44 | | | | 5.73 | |
2010 | | | 10.04 | | | | .51 | | | | 1.18 | | | | 1.69 | | | | (.51 | ) | | | — | | | | (.51 | ) | | | 11.22 | | | | 17.11 | |
2009 | | | 10.86 | | | | .61 | | | | (.81 | ) | | | (.20 | ) | | | (.62 | ) | | | — | | | | (.62 | ) | | | 10.04 | | | | (1.37 | ) |
2008 | | | 10.79 | | | | .51 | | | | .05 | | | | .56 | | | | (.49 | ) | | | — | | | | (.49 | ) | | | 10.86 | | | | 5.24 | |
Class B (8/94) | | | | | | | | | | | | | | | | | | | | | | | | | |
2012 | | | 11.34 | | | | .32 | | | | .21 | | | | .53 | | | | (.33 | ) | | | — | | | | (.33 | ) | | | 11.54 | | | | 4.74 | |
2011 | | | 11.12 | | | | .34 | | | | .21 | | | | .55 | | | | (.33 | ) | | | — | | | | (.33 | ) | | | 11.34 | | | | 4.97 | |
2010 | | | 9.95 | | | | .43 | | | | 1.17 | | | | 1.60 | | | | (.43 | ) | | | — | | | | (.43 | ) | | | 11.12 | | | | 16.31 | |
2009 | | | 10.77 | | | | .54 | | | | (.81 | ) | | | (.27 | ) | | | (.55 | ) | | | — | | | | (.55 | ) | | | 9.95 | | | | (2.12 | ) |
2008 | | | 10.70 | | | | .42 | | | | .06 | | | | .48 | | | | (.41 | ) | | | — | | | | (.41 | ) | | | 10.77 | | | | 4.50 | |
Class C (2/99) | | | | | | | | | | | | | | | | | | | | | | | | | |
2012 | | | 11.40 | | | | .32 | | | | .21 | | | | .53 | | | | (.34 | ) | | | — | | | | (.34 | ) | | | 11.59 | | | | 4.68 | |
2011 | | | 11.18 | | | | .34 | | | | .21 | | | | .55 | | | | (.33 | ) | | | — | | | | (.33 | ) | | | 11.40 | | | | 4.97 | |
2010 | | | 10.00 | | | | .42 | | | | 1.19 | | | | 1.61 | | | | (.43 | ) | | | — | | | | (.43 | ) | | | 11.18 | | | | 16.32 | |
2009 | | | 10.83 | | | | .54 | | | | (.82 | ) | | | (.28 | ) | | | (.55 | ) | | | — | | | | (.55 | ) | | | 10.00 | | | | (2.21 | ) |
2008 | | | 10.75 | | | | .43 | | | | .06 | | | | .49 | | | | (.41 | ) | | | — | | | | (.41 | ) | | | 10.83 | | | | 4.57 | |
Class R3 (9/01) | | | | | | | | | | | | | | | | | | | | | | | | | |
2012 | | | 11.50 | | | | .38 | | | | .22 | | | | .60 | | | | (.40 | ) | | | — | | | | (.40 | ) | | | 11.70 | | | | 5.27 | |
2011 | | | 11.27 | | | | .40 | | | | .22 | | | | .62 | | | | (.39 | ) | | | — | | | | (.39 | ) | | | 11.50 | | | | 5.54 | |
2010 | | | 10.09 | | | | .48 | | | | 1.19 | | | | 1.67 | | | | (.49 | ) | | | — | | | | (.49 | ) | | | 11.27 | | | | 16.74 | |
2009 | | | 10.89 | | | | .59 | | | | (.79 | ) | | | (.20 | ) | | | (.60 | ) | | | — | | | | (.60 | ) | | | 10.09 | | | | (1.43 | ) |
2008 | | | 10.81 | | | | .49 | | | | .05 | | | | .54 | | | | (.46 | ) | | | — | | | | (.46 | ) | | | 10.89 | | | | 5.06 | |
Class I (2/94) | | | | | | | | | | | | | | | | | | | | | | | | | |
2012 | | | 11.44 | | | | .44 | | | | .21 | | | | .65 | | | | (.45 | ) | | | — | | | | (.45 | ) | | | 11.64 | | | | 5.79 | |
2011 | | | 11.21 | | | | .46 | | | | .22 | | | | .68 | | | | (.45 | ) | | | — | | | | (.45 | ) | | | 11.44 | | | | 6.09 | |
2010 | | | 10.03 | | | | .54 | | | | 1.18 | | | | 1.72 | | | | (.54 | ) | | | — | | | | (.54 | ) | | | 11.21 | | | | 17.42 | |
2009 | | | 10.86 | | | | .64 | | | | (.82 | ) | | | (.18 | ) | | | (.65 | ) | | | — | | | | (.65 | ) | | | 10.03 | | | | (1.22 | ) |
2008 | | | 10.78 | | | | .54 | | | | .06 | | | | .60 | | | | (.52 | ) | | | — | | | | (.52 | ) | | | 10.86 | | | | 5.60 | |
| | | | | | | | | | | | | | | | | | | | | | |
| | | | | | | | | | | | | | | | | |
| | | | |
| | | | | | | | | | | | | | |
| Ratios/Supplemental Data | |
| | | | Ratios to Average
Net Assets Before
Reimbursement | | | Ratios to Average
Net Assets After
Reimbursement(d) | | | | |
Ending
Net
Assets
(000) | | | Expenses | | | Net
Invest-
ment
Income
(Loss) | | | Expenses | | | Net
Invest-
ment
Income
(Loss) | | | Portfolio
Turnover
Rate(e) | |
| | | | | | | | | | | | | | | | | | | | | | |
| $ | 83,264 | | | | .97 | % | | | 3.51 | % | | | .93 | % | | | 3.55 | % | | | 98 | % |
| | 85,980 | | | | .99 | | | | 3.72 | | | | .94 | | | | 3.77 | | | | 91 | |
| | 93,374 | | | | 1.02 | | | | 4.58 | | | | .95 | | | | 4.65 | | | | 83 | |
| | 82,373 | | | | 1.02 | | | | 6.27 | | | | .95 | | | | 6.34 | | | | 160 | |
| | 94,571 | | | | 1.01 | | | | 4.57 | | | | .95 | | | | 4.63 | | | | 131 | |
| | | | | | | | | | | | | | | | | | | | | | |
| | 1,019 | | | | 1.72 | | | | 2.78 | | | | 1.68 | | | | 2.82 | | | | 98 | |
| | 1,805 | | | | 1.74 | | | | 2.97 | | | | 1.69 | | | | 3.02 | | | | 91 | |
| | 3,607 | | | | 1.77 | | | | 3.90 | | | | 1.70 | | | | 3.97 | | | | 83 | |
| | 5,780 | | | | 1.77 | | | | 5.52 | | | | 1.70 | | | | 5.59 | | | | 160 | |
| | 7,733 | | | | 1.76 | | | | 3.81 | | | | 1.70 | | | | 3.87 | | | | 131 | |
| | | | | | | | | | | | | | | | | | | | | | |
| | 4,603 | | | | 1.72 | | | | 2.76 | | | | 1.67 | | | | 2.80 | | | | 98 | |
| | 3,711 | | | | 1.74 | | | | 2.97 | | | | 1.69 | | | | 3.02 | | | | 91 | |
| | 3,796 | | | | 1.77 | | | | 3.84 | | | | 1.70 | | | | 3.91 | | | | 83 | |
| | 3,693 | | | | 1.77 | | | | 5.52 | | | | 1.70 | | | | 5.59 | | | | 160 | |
| | 4,383 | | | | 1.76 | | | | 3.83 | | | | 1.70 | | | | 3.89 | | | | 131 | |
| | | | | | | | | | | | | | | | | | | | | | |
| | 313 | | | | 1.22 | | | | 3.24 | | | | 1.18 | | | | 3.27 | | | | 98 | |
| | 380 | | | | 1.23 | | | | 3.47 | | | | 1.19 | | | | 3.52 | | | | 91 | |
| | 379 | | | | 1.27 | | | | 4.35 | | | | 1.20 | | | | 4.42 | | | | 83 | |
| | 406 | | | | 1.27 | | | | 6.04 | | | | 1.20 | | | | 6.11 | | | | 160 | |
| | 289 | | | | 1.26 | | | | 4.36 | | | | 1.20 | | | | 4.42 | | | | 131 | |
| | | | | | | | | | | | | | | | | | | | | | |
| | 718,505 | | | | .72 | | | | 3.76 | | | | .68 | | | | 3.80 | | | | 98 | |
| | 925,541 | | | | .74 | | | | 3.97 | | | | .69 | | | | 4.02 | | | | 91 | |
| | 1,179,453 | | | | .77 | | | | 4.86 | | | | .70 | | | | 4.93 | | | | 83 | |
| | 1,279,489 | | | | .77 | | | | 6.50 | | | | .70 | | | | 6.57 | | | | 160 | |
| | 1,468,599 | | | | .76 | | | | 4.82 | | | | .70 | | | | 4.88 | | | | 131 | |
| (a) | Per share Net Investment Income (Loss) is calculated using the average daily shares method. |
| (b) | Distributions from Capital Gains include short-term capital gains, if any. |
| (c) | Total return is the combination of changes in net asset value without any sales charge, reinvested dividend income at net asset value and reinvested capital gains distributions at net asset value, if any. Total returns are not annualized. |
| (d) | After expense reimbursement from the Adviser, where applicable. |
| (e) | Excluding dollar roll transactions, where applicable. |
See accompanying notes to financial statements.
Financial Highlights (continued)
| | | | | | | | | | | | | | | | | | | | | | | | | | | | | | | | | | | | |
| Selected data for a share outstanding throughout each period: | | | | | | | | | | | | | | | | |
| | | | | | | | |
| Class (Commencement Date) | | | | | | | | | | | | | | | | | | | | | | | | | |
| | | | | | Investment Operations | | | Less Distributions | | | | | | | |
| | | | | | | | |
| HIGH INCOME BOND | | | | | | | | | | | | | | | | | | | | | | | | | |
Year Ended
June 30, | | Beginning
Net
Asset
Value | | | Net
Invest-
ment
Income
(Loss)(a) | | | Net
Realized/
Unrealized
Gain
(Loss) | | | Total | | | Net
Invest-
ment
Income | | | Capital
Gains(b) | | | Total | | | Ending
Net
Asset
Value | | | Total
Return(c) | |
Class A (8/01) | | | | | | | | | | | | | | | | | | | | | | | | | | | | | | | | | |
2012 | | $ | 9.05 | | | $ | .69 | | | $ | (.38 | ) | | $ | .31 | | | $ | (.69 | ) | | $ | (.03 | ) | | $ | (.72 | ) | | $ | 8.64 | | | | 3.76 | % |
2011 | | | 8.28 | | | | .67 | | | | .76 | | | | 1.43 | | | | (.66 | ) | | | — | | | | (.66 | ) | | | 9.05 | | | | 17.61 | |
2010 | | | 7.15 | | | | .67 | | | | 1.12 | | | | 1.79 | | | | (.66 | ) | | | — | | | | (.66 | ) | | | 8.28 | | | | 25.47 | |
2009 | | | 8.65 | | | | .73 | | | | (1.47 | ) | | | (.74 | ) | | | (.76 | ) | | | — | | | | (.76 | ) | | | 7.15 | | | | (7.26 | ) |
2008 | | | 9.61 | | | | .71 | | | | (.97 | ) | | | (.26 | ) | | | (.70 | ) | | | — | | | | (.70 | ) | | | 8.65 | | | | (2.84 | ) |
Class B (8/01) | | | | | | | | | | | | | | | | | | | | | | | | | | | | | | | | | |
2012 | | | 8.98 | | | | .62 | | | | (.36 | ) | | | .26 | | | | (.62 | ) | | | (.03 | ) | | | (.65 | ) | | | 8.59 | | | | 3.18 | |
2011 | | | 8.23 | | | | .60 | | | | .74 | | | | 1.34 | | | | (.59 | ) | | | — | | | | (.59 | ) | | | 8.98 | | | | 16.59 | |
2010 | | | 7.11 | | | | .60 | | | | 1.12 | | | | 1.72 | | | | (.60 | ) | | | — | | | | (.60 | ) | | | 8.23 | | | | 24.56 | |
2009 | | | 8.61 | | | | .68 | | | | (1.47 | ) | | | (.79 | ) | | | (.71 | ) | | | — | | | | (.71 | ) | | | 7.11 | | | | (7.99 | ) |
2008 | | | 9.57 | | | | .63 | | | | (.96 | ) | | | (.33 | ) | | | (.63 | ) | | | — | | | | (.63 | ) | | | 8.61 | | | | (3.57 | ) |
Class C (8/01) | | | | | | | | | | | | | | | | | | | | | | | | | | | | | | | | | |
2012 | | | 9.01 | | | | .63 | | | | (.37 | ) | | | .26 | | | | (.62 | ) | | | (.03 | ) | | | (.65 | ) | | | 8.62 | | | | 3.18 | |
2011 | | | 8.25 | | | | .60 | | | | .75 | | | | 1.35 | | | | (.59 | ) | | | — | | | | (.59 | ) | | | 9.01 | | | | 16.67 | |
2010 | | | 7.12 | | | | .60 | | | | 1.13 | | | | 1.73 | | | | (.60 | ) | | | — | | | | (.60 | ) | | | 8.25 | | | | 24.67 | |
2009 | | | 8.62 | | | | .68 | | | | (1.47 | ) | | | (.79 | ) | | | (.71 | ) | | | — | | | | (.71 | ) | | | 7.12 | | | | (7.98 | ) |
2008 | | | 9.58 | | | | .63 | | | | (.96 | ) | | | (.33 | ) | | | (.63 | ) | | | — | | | | (.63 | ) | | | 8.62 | | | | (3.57 | ) |
Class R3 (9/01) | | | | | | | | | | | | | | | | | | | | | | | | | | | | | | | | | |
2012 | | | 9.23 | | | | .67 | | | | (.38 | ) | | | .29 | | | | (.68 | ) | | | (.03 | ) | | | (.71 | ) | | | 8.81 | | | | 3.46 | |
2011 | | | 8.44 | | | | .66 | | | | .77 | | | | 1.43 | | | | (.64 | ) | | | — | | | | (.64 | ) | | | 9.23 | | | | 17.28 | |
2010 | | | 7.28 | | | | .66 | | | | 1.14 | | | | 1.80 | | | | (.64 | ) | | | — | | | | (.64 | ) | | | 8.44 | | | | 25.12 | |
2009 | | | 8.79 | | | | .73 | | | | (1.49 | ) | | | (.76 | ) | | | (.75 | ) | | | — | | | | (.75 | ) | | | 7.28 | | | | (7.49 | ) |
2008 | | | 9.75 | | | | .69 | | | | (.98 | ) | | | (.29 | ) | | | (.67 | ) | | | — | | | | (.67 | ) | | | 8.79 | | | | (3.04 | ) |
Class I (8/01) | | | | | | | | | | | | | | | | | | | | | | | | | | | | | | | | | |
2012 | | | 9.05 | | | | .71 | | | | (.37 | ) | | | .34 | | | | (.71 | ) | | | (.03 | ) | | | (.74 | ) | | | 8.65 | | | | 4.15 | |
2011 | | | 8.29 | | | | .69 | | | | .75 | | | | 1.44 | | | | (.68 | ) | | | — | | | | (.68 | ) | | | 9.05 | | | | 17.77 | |
2010 | | | 7.16 | | | | .69 | | | | 1.12 | | | | 1.81 | | | | (.68 | ) | | | — | | | | (.68 | ) | | | 8.29 | | | | 25.75 | |
2009 | | | 8.66 | | | | .75 | | | | (1.47 | ) | | | (.72 | ) | | | (.78 | ) | | | — | | | | (.78 | ) | | | 7.16 | | | | (7.01 | ) |
2008 | | | 9.62 | | | | .73 | | | | (.97 | ) | | | (.24 | ) | | | (.72 | ) | | | — | | | | (.72 | ) | | | 8.66 | | | | (2.59 | ) |
| | | | | | | | | | | | | | | | | | | | | | |
| | | | | | | | | | | | | | | | | |
| | | | |
| | | | | | | | | | | | | | |
| Ratios/Supplemental Data | |
| | | | Ratios to Average
Net Assets Before
Reimbursement | | | Ratios to Average
Net Assets After
Reimbursement(d) | | | | |
Ending
Net
Assets
(000) | | | Expenses | | | Net
Invest-
ment
Income
(Loss) | | | Expenses | | | Net
Invest-
ment
Income
(Loss) | | | Portfolio
Turnover
Rate | |
| | | | | | | | | | | | | | | | | | | | | | |
| $ | 92,018 | | | | 1.06 | % | | | 7.98 | % | | | 1.04 | % | | | 7.99 | % | | | 124 | % |
| | 30,984 | | | | 1.22 | | | | 7.38 | | | | 1.10 | | | | 7.50 | | | | 130 | |
| | 29,532 | | | | 1.29 | | | | 7.93 | | | | 1.10 | | | | 8.12 | | | | 132 | |
| | 25,696 | | | | 1.36 | | | | 10.53 | | | | 1.10 | | | | 10.79 | | | | 108 | |
| | 24,420 | | | | 1.31 | | | | 7.53 | | | | 1.10 | | | | 7.74 | | | | 100 | |
| | | | | | | | | | | | | | | | | | | | | | |
| | 1,843 | | | | 1.82 | | | | 7.23 | | | | 1.80 | | | | 7.26 | | | | 124 | |
| | 1,285 | | | | 1.98 | | | | 6.64 | | | | 1.85 | | | | 6.76 | | | | 130 | |
| | 1,628 | | | | 2.04 | | | | 7.28 | | | | 1.85 | | | | 7.47 | | | | 132 | |
| | 2,157 | | | | 2.11 | | | | 9.66 | | | | 1.85 | | | | 9.92 | | | | 108 | |
| | 3,496 | | | | 2.06 | | | | 6.76 | | | | 1.85 | | | | 6.97 | | | | 100 | |
| | | | | | | | | | | | | | | | | | | | | | |
| | 48,667 | | | | 1.80 | | | | 7.26 | | | | 1.79 | | | | 7.27 | | | | 124 | |
| | 9,792 | | | | 1.97 | | | | 6.64 | | | | 1.85 | | | | 6.76 | | | | 130 | |
| | 6,969 | | | | 2.04 | | | | 7.22 | | | | 1.85 | | | | 7.41 | | | | 132 | |
| | 5,038 | | | | 2.11 | | | | 9.72 | | | | 1.85 | | | | 9.98 | | | | 108 | |
| | 6,490 | | | | 2.06 | | | | 6.76 | | | | 1.85 | | | | 6.97 | | | | 100 | |
| | | | | | | | | | | | | | | | | | | | | | |
| | 615 | | | | 1.31 | | | | 7.66 | | | | 1.29 | | | | 7.68 | | | | 124 | |
| | 309 | | | | 1.47 | | | | 7.12 | | | | 1.35 | | | | 7.25 | | | | 130 | |
| | 343 | | | | 1.54 | | | | 7.73 | | | | 1.35 | | | | 7.92 | | | | 132 | |
| | 265 | | | | 1.61 | | | | 10.46 | | | | 1.35 | | | | 10.72 | | | | 108 | |
| | 185 | | | | 1.56 | | | | 7.16 | | | | 1.35 | | | | 7.37 | | | | 100 | |
| | | | | | | | | | | | | | | | | | | | | | |
| | 465,299 | | | | .84 | | | | 8.19 | | | | .80 | | | | 8.23 | | | | 124 | |
| | 460,785 | | | | .97 | | | | 7.63 | | | | .85 | | | | 7.75 | | | | 130 | |
| | 350,066 | | | | 1.04 | | | | 8.19 | | | | .85 | | | | 8.38 | | | | 132 | |
| | 182,051 | | | | 1.11 | | | | 10.67 | | | | .85 | | | | 10.93 | | | | 108 | |
| | 204,164 | | | | 1.06 | | | | 7.78 | | | | .85 | | | | 7.99 | | | | 100 | |
| (a) | Per share Net Investment Income (Loss) is calculated using the average daily shares method. |
| (b) | Distributions from Capital Gains include short-term capital gains, if any. |
| (c) | Total return is the combination of changes in net asset value without any sales charge, reinvested dividend income at net asset value and reinvested capital gains distributions at net asset value, if any. Total returns are not annualized. |
| (d) | After expense reimbursement from the Adviser, where applicable. |
See accompanying notes to financial statements.
Financial Highlights (continued)
| | | | | | | | | | | | | | | | | | | | | | | | | | | | | | | | | | | | | | | | |
| Selected data for a share outstanding throughout each period: | | | | | | | | | | | | | | | | | | | |
| | | | | | | | | |
| Class (Commencement Date) | | | | | | | | | | | | | | | | | | | | | | | | | | | | |
| | | | | | Investment Operations | | | Less Distributions | | | | | | | |
| | | | | | | | |
| INFLATION PROTECTED SECURITIES | | | | | | | | | | | | | | | | | | | | | | | | | |
Year Ended
June 30, | | Beginning
Net
Asset
Value | | | Net
Invest-
ment
Income
(Loss)(a) | | | Net
Realized/
Unrealized
Gain
(Loss) | | | Total | | | Net
Invest-
ment
Income | | | Capital
Gains(b) | | | Return
of
Capital | | | Total | | | Ending
Net
Asset
Value | | | Total
Return(c) | |
Class A (10/04) | | | | | | | | | | | | | | | | | | | | | | | | | | | | | | | | | | | | | |
2012 | | $ | 10.94 | | | $ | .23 | | | $ | 1.01 | | | $ | 1.24 | | | $ | (.38 | ) | | $ | — | | | $ | — | | | $ | (.38 | ) | | $ | 11.80 | | | | 11.44 | % |
2011 | | | 10.33 | | | | .35 | | | | .40 | | | | .75 | | | | (.14 | ) | | | — | | | | — | | | | (.14 | ) | | | 10.94 | | | | 7.30 | |
2010 | | | 9.59 | | | | .28 | | | | .73 | | | | 1.01 | | | | (.27 | ) | | | — | | | | — | | | | (.27 | ) | | | 10.33 | | | | 10.62 | |
2009 | | | 10.20 | | | | .14 | | | | (.37 | ) | | | (.23 | ) | | | (.26 | ) | | | — | | | | (.12 | ) | | | (.38 | ) | | | 9.59 | | | | (2.18 | ) |
2008 | | | 9.43 | | | | .54 | | | | .76 | | | | 1.30 | | | | (.53 | ) | | | — | | | | — | | | | (.53 | ) | | | 10.20 | | | | 14.01 | |
Class C (10/04) | | | | | | | | | | | | | | | | | | | | | | | | | | | | | | | | | | | | | |
2012 | | | 10.84 | | | | .14 | | | | 1.00 | | | | 1.14 | | | | (.26 | ) | | | — | | | | — | | | | (.26 | ) | | | 11.72 | | | | 10.62 | |
2011 | | | 10.24 | | | | .26 | | | | .41 | | | | .67 | | | | (.07 | ) | | | — | | | | — | | | | (.07 | ) | | | 10.84 | | | | 6.59 | |
2010 | | | 9.53 | | | | .18 | | | | .75 | | | | .93 | | | | (.22 | ) | | | — | | | | — | | | | (.22 | ) | | | 10.24 | | | | 9.76 | |
2009 | | | 10.18 | | | | .11 | | | | (.43 | ) | | | (.32 | ) | | | (.21 | ) | | | — | | | | (.12 | ) | | | (.33 | ) | | | 9.53 | | | | (3.03 | ) |
2008 | | | 9.41 | | | | .48 | | | | .75 | | | | 1.23 | | | | (.46 | ) | | | — | | | | — | | | | (.46 | ) | | | 10.18 | | | | 13.20 | |
Class R3 (10/04) | | | | | | | | | | | | | | | | | | | | | | | | | | | | | | | | | | | | | |
2012 | | | 10.84 | | | | .22 | | | | .97 | | | | 1.19 | | | | (.29 | ) | | | — | | | | — | | | | (.29 | ) | | | 11.74 | | | | 11.10 | |
2011 | | | 10.31 | | | | .11 | | | | .54 | | | | .65 | | | | (.12 | ) | | | — | | | | — | | | | (.12 | ) | | | 10.84 | | | | 6.31 | |
2010 | | | 9.58 | | | | .26 | | | | .72 | | | | .98 | | | | (.25 | ) | | | — | | | | — | | | | (.25 | ) | | | 10.31 | | | | 10.32 | |
2009 | | | 10.20 | | | | .13 | | | | (.39 | ) | | | (.26 | ) | | | (.24 | ) | | | — | | | | (.12 | ) | | | (.36 | ) | | | 9.58 | | | | (2.43 | ) |
2008 | | | 9.43 | | | | .52 | | | | .75 | | | | 1.27 | | | | (.50 | ) | | | — | | | | — | | | | (.50 | ) | | | 10.20 | | | | 13.73 | |
Class I (10/04) | | | | | | | | | | | | | | | | | | | | | | | | | | | | | | | | | | | | | |
2012 | | | 10.96 | | | | .25 | | | | 1.01 | | | | 1.26 | | | | (.41 | ) | | | — | | | | — | | | | (.41 | ) | | | 11.81 | | | | 11.62 | |
2011 | | | 10.34 | | | | .40 | | | | .38 | | | | .78 | | | | (.16 | ) | | | — | | | | — | | | | (.16 | ) | | | 10.96 | | | | 7.62 | |
2010 | | | 9.59 | | | | .33 | | | | .71 | | | | 1.04 | | | | (.29 | ) | | | — | | | | — | | | | (.29 | ) | | | 10.34 | | | | 10.92 | |
2009 | | | 10.20 | | | | .23 | | | | (.45 | ) | | | (.22 | ) | | | (.27 | ) | | | — | | | | (.12 | ) | | | (.39 | ) | | | 9.59 | | | | (2.03 | ) |
2008 | | | 9.43 | | | | .56 | | | | .76 | | | | 1.32 | | | | (.55 | ) | | | — | | | | — | | | | (.55 | ) | | | 10.20 | | | | 14.29 | |
| | | | | | | | | | | | | | | | | | | | | | |
| | | | | | | | | | | | | | | | | |
| | | | |
| | | | | | | | | | | | | | |
| Ratios/Supplemental Data | |
| | | | Ratios to Average
Net Assets Before
Reimbursement | | | Ratios to Average
Net Assets After
Reimbursement(d) | | | | |
Ending
Net
Assets
(000) | | | Expenses | | | Net
Invest-
ment
Income
(Loss) | | | Expenses | | | Net
Invest-
ment
Income
(Loss) | | | Portfolio
Turnover
Rate | |
| | | | | | | | | | | | | | | | | | | | | | |
| $ | 19,330 | | | | 1.00 | % | | | 1.81 | % | | | .84 | % | | | 1.97 | % | | | 47 | % |
| | 12,080 | | | | 1.09 | | | | 3.05 | | | | .85 | | | | 3.30 | | | | 45 | |
| | 7,894 | | | | 1.15 | | | | 2.46 | | | | .84 | | | | 2.77 | | | | 72 | |
| | 5,439 | | | | 1.10 | | | | 1.27 | | | | .85 | | | | 1.52 | | | | 24 | |
| | 3,294 | | | | 1.08 | | | | 5.17 | | | | .85 | | | | 5.40 | | | | 71 | |
| | | | | | | | | | | | | | | | | | | | | | |
| | 9,703 | | | | 1.75 | | | | 1.05 | | | | 1.59 | | | | 1.21 | | | | 47 | |
| | 8,043 | | | | 1.84 | | | | 2.19 | | | | 1.60 | | | | 2.44 | | | | 45 | |
| | 6,673 | | | | 1.91 | | | | 1.47 | | | | 1.60 | | | | 1.78 | | | | 72 | |
| | 1,406 | | | | 1.84 | | | | .94 | | | | 1.59 | | | | 1.19 | | | | 24 | |
| | 365 | | | | 1.83 | | | | 4.59 | | | | 1.60 | | | | 4.82 | | | | 71 | |
| | | | | | | | | | | | | | | | | | | | | | |
| | 173 | | | | 1.25 | | | | 1.72 | | | | 1.09 | | | | 1.88 | | | | 47 | |
| | 33 | | | | 1.38 | | | | .78 | | | | 1.10 | | | | 1.05 | | | | 45 | |
| | 1,332 | | | | 1.40 | | | | 2.33 | | | | 1.09 | | | | 2.64 | | | | 72 | |
| | 1,262 | | | | 1.35 | | | | 1.09 | | | | 1.10 | | | | 1.34 | | | | 24 | |
| | 1,175 | | | | 1.33 | | | | 4.98 | | | | 1.10 | | | | 5.21 | | | | 71 | |
| | | | | | | | | | | | | | | | | | | | | | |
| | 321,386 | | | | .75 | | | | 1.99 | | | | .59 | | | | 2.15 | | | | 47 | |
| | 255,183 | | | | .84 | | | | 3.49 | | | | .60 | | | | 3.74 | | | | 45 | |
| | 156,983 | | | | .90 | | | | 2.96 | | | | .59 | | | | 3.27 | | | | 72 | |
| | 167,501 | | | | .85 | | | | 2.23 | | | | .60 | | | | 2.48 | | | | 24 | |
| | 278,749 | | | | .83 | | | | 5.41 | | | | .60 | | | | 5.64 | | | | 71 | |
| (a) | Per share Net Investment Income (Loss) is calculated using the average daily shares method. |
| (b) | Distributions from Capital Gains include short-term capital gains, if any. |
| (c) | Total return is the combination of changes in net asset value without any sales charge, reinvested dividend income at net asset value and reinvested capital gains distributions at net asset value, if any. Total returns are not annualized. |
| (d) | After expense reimbursement from the Adviser, where applicable. |
See accompanying notes to financial statements.
Financial Highlights (continued)
| | | | | | | | | | | | | | | | | | | | | | | | | | | | | | | | | | | | | | | | |
| Selected data for a share outstanding throughout each period: | | | | |
| | | | | | | | |
| Class (Commencement Date) | | | | | | | | | | | | | | | | | | | | | | | | | |
| | | | | | Investment Operations | | | Less Distributions | | | | | | | |
| | | | | | | | |
| INTERMEDIATE GOVERNMENT BOND | | | | | | | | | | | | | | | | | | | | | | | | | |
Year Ended
June 30, | | Beginning
Net
Asset
Value | | | Net
Invest-
ment
Income
(Loss)(a) | | | Net
Realized/
Unrealized
Gain
(Loss) | | | Total | | | Net
Invest-
ment
Income | | | Capital
Gains(b) | | | Return
of
Capital | | | Total | | | Ending
Net
Asset
Value | | | Total
Return(c) | |
Class A (10/02) | | | | | | | | | | | | | | | | | | | | | | | | | | | | | | | | | |
2012 | | $ | 8.84 | | | $ | .18 | | | $ | .19 | | | $ | .37 | | | $ | (.19 | ) | | $ | — | | | $ | — | | | $ | (.19 | ) | | $ | 9.02 | | | | 4.24 | % |
2011 | | | 8.77 | | | | .20 | | | | .07 | | | | .27 | | | | (.20 | ) | | | — | | | | — | | | | (.20 | ) | | | 8.84 | | | | 3.10 | |
2010 | | | 8.67 | | | | .20 | | | | .27 | | | | .47 | | | | (.20 | ) | | | (.17 | ) | | | — | * | | | (.37 | ) | | | 8.77 | | | | 5.50 | |
2009 | | | 8.42 | | | | .19 | | | | .25 | | | | .44 | | | | (.19 | ) | | | — | | | | — | | | | (.19 | ) | | | 8.67 | | | | 5.30 | |
2008 | | | 8.00 | | | | .28 | | | | .43 | | | | .71 | | | | (.29 | ) | | | — | | | | — | | | | (.29 | ) | | | 8.42 | | | | 8.90 | |
Class C (10/09) | | | | | | | | | | | | | | | | | | | | | | | | | | | | | | | | | |
2012 | | | 8.85 | | | | .10 | | | | .20 | | | | .30 | | | | (.12 | ) | | | — | | | | — | | | | (.12 | ) | | | 9.03 | | | | 3.35 | |
2011 | | | 8.77 | | | | .12 | | | | .08 | | | | .20 | | | | (.12 | ) | | | — | | | | — | | | | (.12 | ) | | | 8.85 | | | | 2.32 | |
2010(e) | | | 8.76 | | | | .09 | | | | .17 | | | | .26 | | | | (.08 | ) | | | (.17 | ) | | | — | * | | | (.25 | ) | | | 8.77 | | | | 3.00 | |
Class R3 (10/09) | | | | | | | | | | | | | | | | | | | | | | | | | | | | | | | | | |
2012 | | | 8.84 | | | | .15 | | | | .18 | | | | .33 | | | | (.16 | ) | | | — | | | | — | | | | (.16 | ) | | | 9.01 | | | | 3.79 | |
2011 | | | 8.77 | | | | .16 | | | | .08 | | | | .24 | | | | (.17 | ) | | | — | | | | — | | | | (.17 | ) | | | 8.84 | | | | 2.75 | |
2010(e) | | | 8.76 | | | | .09 | | | | .20 | | | | .29 | | | | (.11 | ) | | | (.17 | ) | | | — | * | | | (.28 | ) | | | 8.77 | | | | 3.34 | |
Class I (10/02) | | | | | | | | | | | | | | | | | | | | | | | | | | | | | | | | | |
2012 | | | 8.84 | | | | .19 | | | | .21 | | | | .40 | | | | (.21 | ) | | | — | | | | — | | | | (.21 | ) | | | 9.03 | | | | 4.50 | |
2011 | | | 8.77 | | | | .21 | | | | .07 | | | | .28 | | | | (.21 | ) | | | — | | | | — | | | | (.21 | ) | | | 8.84 | | | | 3.25 | |
2010 | | | 8.67 | | | | .21 | | | | .27 | | | | .48 | | | | (.21 | ) | | | (.17 | ) | | | — | * | | | (.38 | ) | | | 8.77 | | | | 5.66 | |
2009 | | | 8.42 | | | | .21 | | | | .25 | | | | .46 | | | | (.21 | ) | | | — | | | | — | | | | (.21 | ) | | | 8.67 | | | | 5.46 | |
2008 | | | 8.00 | | | | .30 | | | | .42 | | | | .72 | | | | (.30 | ) | | | — | | | | — | | | | (.30 | ) | | | 8.42 | | | | 9.07 | |
| | | | | | | | | | | | | | | | | | | | | | |
| | | | | | | | | | | | | | | | | |
| | | | |
| | | | | | | | | | | | | | |
| Ratios/Supplemental Data | |
| | | | Ratios to Average
Net Assets Before
Reimbursement | | | Ratios to Average
Net Assets After
Reimbursement(d) | | | | |
Ending
Net
Assets
(000) | | | Expenses | | | Net
Invest-
ment
Income
(Loss) | | | Expenses | | | Net
Invest-
ment
Income
(Loss) | | | Portfolio
Turnover
Rate | |
| | | | | | | | | | | | | | | | | | | | | | |
| $ | 12,735 | | | | 1.11 | % | | | 1.65 | % | | | .77 | % | | | 1.99 | % | | | 72 | % |
| | 14,086 | | | | 1.10 | | | | 1.85 | | | | .73 | | | | 2.22 | | | | 58 | |
| | 19,003 | | | | 1.19 | | | | 1.89 | | | | .75 | | | | 2.33 | | | | 105 | |
| | 10,496 | | | | 1.15 | | | | 1.82 | | | | .75 | | | | 2.22 | | | | 133 | |
| | 6,504 | | | | 1.33 | | | | 2.74 | | | | .75 | | | | 3.32 | | | | 118 | |
| | | | | | | | | | | | | | | | | | | | | | |
| | 1,438 | | | | 1.86 | | | | .90 | | | | 1.60 | | | | 1.16 | | | | 72 | |
| | 1,417 | | | | 1.89 | | | | 1.05 | | | | 1.58 | | | | 1.37 | | | | 58 | |
| | 1,940 | | | | 1.94 | ** | | | 1.16 | ** | | | 1.60 | ** | | | 1.50 | ** | | | 105 | |
| | | | | | | | | | | | | | | | | | | | | | |
| | 214 | | | | 1.36 | | | | 1.39 | | | | 1.10 | | | | 1.66 | | | | 72 | |
| | 473 | | | | 1.39 | | | | 1.56 | | | | 1.08 | | | | 1.87 | | | | 58 | |
| | 652 | | | | 1.44 | ** | | | 1.44 | ** | | | 1.10 | ** | | | 1.78 | ** | | | 105 | |
| | | | | | | | | | | | | | | | | | | | | | |
| | 70,060 | | | | .86 | | | | 1.90 | | | | .60 | | | | 2.16 | | | | 72 | |
| | 98,960 | | | | .89 | | | | 2.05 | | | | .58 | | | | 2.36 | | | | 58 | |
| | 152,088 | | | | .94 | | | | 2.05 | | | | .60 | | | | 2.39 | | | | 105 | |
| | 101,253 | | | | .90 | | | | 2.11 | | | | .60 | | | | 2.41 | | | | 133 | |
| | 63,784 | | | | 1.08 | | | | 3.12 | | | | .60 | | | | 3.60 | | | | 118 | |
| (a) | Per share Net Investment Income (Loss) is calculated using the average daily shares method. |
| (b) | Distributions from Capital Gains include short-term capital gains, if any. |
| (c) | Total return is the combination of changes in net asset value without any sales charge, reinvested dividend income at net asset value and reinvested capital gains distributions at net asset value, if any. Total returns are not annualized. |
| (d) | After expense reimbursement from the Adviser, where applicable. |
| (e) | For the period October 28, 2009 (commencement of operations) through June 30, 2010. |
| * | Rounds to less than $.01 per share. |
See accompanying notes to financial statements.
Financial Highlights (continued)
| | | | | | | | | | | | | | | | | | | | | | | | | | | | | | | | | | | | |
| Selected data for a share outstanding throughout each period: | |
| | | | | | | |
| Class (Commencement Date) | | | | | | | | | | | | | | | | | | | | | | |
| | | | | | Investment Operations | | | Less Distributions | | | | | | | |
| | | | | | | |
| INTERMEDIATE TERM BOND | | | | | | | | | | | | | | | | | | | | | | |
Year Ended
June 30, | | Beginning
Net
Asset
Value | | | Net
Invest-
ment
Income
(Loss)(a) | | | Net
Realized/
Unrealized
Gain
(Loss) | | | Total | | | Net
Invest-
ment
Income | | | Capital
Gains(b) | | | Total | | | Ending
Net
Asset
Value | | | Total
Return(c) | |
Class A (1/95) | | | | | | | | | | | | | | | | | | | | | | | | | | | | | |
2012 | | $ | 10.47 | | | $ | .29 | | | $ | .23 | | | $ | .52 | | | $ | (.30 | ) | | $ | (.02 | ) | | $ | (.32 | ) | | $ | 10.67 | | | | 4.93 | % |
2011 | | | 10.33 | | | | .33 | | | | .14 | | | | .47 | | | | (.33 | ) | | | — | | | | (.33 | ) | | | 10.47 | | | | 4.70 | |
2010 | | | 9.47 | | | | .42 | | | | .86 | | | | 1.28 | | | | (.42 | ) | | | — | | | | (.42 | ) | | | 10.33 | | | | 13.64 | |
2009 | | | 9.90 | | | | .48 | | | | (.40 | ) | | | .08 | | | | (.51 | ) | | | — | | | | (.51 | ) | | | 9.47 | | | | 1.21 | |
2008 | | | 9.73 | | | | .44 | | | | .14 | | | | .58 | | | | (.41 | ) | | | — | | | | (.41 | ) | | | 9.90 | | | | 6.02 | |
Class C (1/11) | | | | | | | | | | | | | | | | | | | | | | | | | | | | | |
2012 | | | 10.44 | | | | .19 | | | | .22 | | | | .41 | | | | (.22 | ) | | | (.01 | ) | | | (.23 | ) | | | 10.62 | | | | 3.97 | |
2011(e) | | | 10.37 | | | | .12 | | | | .06 | | | | .18 | | | | (.11 | ) | | | — | | | | (.11 | ) | | | 10.44 | | | | 1.76 | |
Class I (1/93) | | | | | | | | | | | | | | | | | | | | | | | | | | | | | |
2012 | | | 10.43 | | | | .30 | | | | .23 | | | | .53 | | | | (.32 | ) | | | (.01 | ) | | | (.33 | ) | | | 10.63 | | | | 5.18 | |
2011 | | | 10.29 | | | | .35 | | | | .14 | | | | .49 | | | | (.35 | ) | | | — | | | | (.35 | ) | | | 10.43 | | | | 4.76 | |
2010 | | | 9.43 | | | | .43 | | | | .86 | | | | 1.29 | | | | (.43 | ) | | | — | | | | (.43 | ) | | | 10.29 | | | | 13.87 | |
2009 | | | 9.87 | | | | .49 | | | | (.40 | ) | | | .09 | | | | (.53 | ) | | | — | | | | (.53 | ) | | | 9.43 | | | | 1.26 | |
2008 | | | 9.70 | | | | .45 | | | | .15 | | | | .60 | | | | (.43 | ) | | | — | | | | (.43 | ) | | | 9.87 | | | | 6.20 | |
| | | | | | | | | | | | | | | | | | | | | | |
| | | | | | | | | | | | | | | | | |
| | | | |
| | | | | | | | | | | | | | |
| Ratios/Supplemental Data | |
| | | | Ratios to Average
Net Assets Before
Reimbursement | | | Ratios to Average
Net Assets After
Reimbursement(d) | | | | |
Ending
Net
Assets
(000) | | | Expenses | | | Net
Invest- ment
Income
(Loss) | | | Expenses | | | Net
Invest-
ment
Income
(Loss) | | | Portfolio
Turnover
Rate | |
| | | | | | | | | | | | | | | | | | | | | | |
| $ | 21,262 | | | | .95 | % | | | 2.61 | % | | | .85 | % | | | 2.70 | % | | | 75 | % |
| | 22,502 | | | | .94 | | | | 3.10 | | | | .85 | | | | 3.20 | | | | 58 | |
| | 26,341 | | | | 1.01 | | | | 3.96 | | | | .85 | | | | 4.12 | | | | 58 | |
| | 23,905 | | | | 1.01 | | | | 5.09 | | | | .85 | | | | 5.25 | | | | 41 | |
| | 28,364 | | | | 1.01 | | | | 4.22 | | | | .85 | | | | 4.38 | | | | 102 | |
| | | | | | | | | | | | | | | | | | | | | | |
| | 1,568 | | | | 1.69 | | | | 1.79 | | | | 1.67 | | | | 1.81 | | | | 75 | |
| | 1,152 | | | | 1.79 | * | | | 2.46 | * | | | 1.70 | * | | | 2.56 | * | | | 58 | |
| | | | | | | | | | | | | | | | | | | | | | |
| | 621,066 | | | | .70 | | | | 2.85 | | | | .68 | | | | 2.87 | | | | 75 | |
| | 657,129 | | | | .74 | | | | 3.30 | | | | .70 | | | | 3.35 | | | | 58 | |
| | 734,924 | | | | .76 | | | | 4.22 | | | | .70 | | | | 4.28 | | | | 58 | |
| | 724,531 | | | | .76 | | | | 5.33 | | | | .70 | | | | 5.39 | | | | 41 | |
| | 766,932 | | | | .76 | | | | 4.47 | | | | .70 | | | | 4.53 | | | | 102 | |
| (a) | Per share Net Investment Income (Loss) is calculated using the average daily shares method. |
| (b) | Distributions from Capital Gains include short-term capital gains, if any. |
| (c) | Total return is the combination of changes in net asset value without any sales charge, reinvested dividend income at net asset value and reinvested capital gains distributions at net asset value, if any. Total returns are not annualized. |
| (d) | After expense reimbursement from the Adviser, where applicable. |
| (e) | For the period January 18, 2011 (commencement of operations) through June 30, 2011. |
See accompanying notes to financial statements.
Financial Highlights (continued)
| | | | | | | | | | | | | | | | | | | | | | | | | | | | | | | | | | | | |
| Selected data for a share outstanding throughout each period: | |
| | | | | | | |
| Class (Commencement Date) | | | | | | | | | | | | | | | | | | | | | | |
| | | | | | Investment Operations | | | Less Distributions | | | | | | | |
| | | | | | | | |
| SHORT TERM BOND | | | | | | | | | | | | | | | | | | | | | | | | | |
Year Ended
June 30, | | Beginning
Net
Asset
Value | | | Net
Invest-
ment
Income
(Loss)(a) | | | Net
Realized/
Unrealized
Gain
(Loss) | | | Total | | | Net
Invest-
ment
Income | | | Capital
Gains(b) | | | Total | | | Ending
Net
Asset
Value | | | Total
Return(c) | |
Class A (12/92) | | | | | | | | | | | | | | | | | | | | | | | | | | | | | |
2012 | | $ | 10.06 | | | $ | .24 | | | $ | (.10 | ) | | $ | .14 | | | $ | (.25 | ) | | $ | — | | | $ | (.25 | ) | | $ | 9.95 | | | | 1.42 | % |
2011 | | | 9.98 | | | | .24 | | | | .06 | | | | .30 | | | | (.22 | ) | | | — | | | | (.22 | ) | | | 10.06 | | | | 3.00 | |
2010 | | | 9.66 | | | | .31 | | | | .34 | | | | .65 | | | | (.33 | ) | | | — | | | | (.33 | ) | | | 9.98 | | | | 6.77 | |
2009 | | | 9.89 | | | | .46 | | | | (.26 | ) | | | .20 | | | | (.43 | ) | | | — | | | | (.43 | ) | | | 9.66 | | | | 2.22 | |
2008 | | | 9.90 | | | | .45 | | | | (.03 | ) | | | .42 | | | | (.43 | ) | | | — | | | | (.43 | ) | | | 9.89 | | | | 4.30 | |
Class C (10/09) | | | | | | | | | | | | | | | | | | | | | | | | | | | | | |
2012 | | | 10.09 | | | | .16 | | | | (.11 | ) | | | .05 | | | | (.17 | ) | | | — | | | | (.17 | ) | | | 9.97 | | | | .50 | |
2011 | | | 10.00 | | | | .15 | | | | .07 | | | | .22 | | | | (.13 | ) | | | — | | | | (.13 | ) | | | 10.09 | | | | 2.22 | |
2010(e) | | | 9.95 | | | | .13 | | | | .06 | | | | .19 | | | | (.14 | ) | | | — | | | | (.14 | ) | | | 10.00 | | | | 1.90 | |
Class R3 (9/11) | | | | | | | | | | | | | | | | | | | | | | | | | | | | | |
2012(f) | | | 9.85 | | | | .16 | | | | .13 | | | | .29 | | | | (.18 | ) | | | — | | | | (.18 | ) | | | 9.96 | | | | 2.92 | |
Class I (2/94) | | | | | | | | | | | | | | | | | | | | | | | | | | | | | |
2012 | | | 10.07 | | | | .26 | | | | (.11 | ) | | | .15 | | | | (.27 | ) | | | — | | | | (.27 | ) | | | 9.95 | | | | 1.51 | |
2011 | | | 9.99 | | | | .25 | | | | .06 | | | | .31 | | | | (.23 | ) | | | — | | | | (.23 | ) | | | 10.07 | | | | 3.16 | |
2010 | | | 9.67 | | | | .32 | | | | .34 | | | | .66 | | | | (.34 | ) | | | — | | | | (.34 | ) | | | 9.99 | | | | 6.92 | |
2009 | | | 9.89 | | | | .48 | | | | (.25 | ) | | | .23 | | | | (.45 | ) | | | — | | | | (.45 | ) | | | 9.67 | | | | 2.48 | |
2008 | | | 9.91 | | | | .46 | | | | (.03 | ) | | | .43 | | | | (.45 | ) | | | — | | | | (.45 | ) | | | 9.89 | | | | 4.35 | |
| | | | | | | | | | | | | | | | | | | | | | |
| | | | | | | | | | | | | | | | | |
| | | | |
| | | | | | | | | | | | | | |
| Ratios/Supplemental Data | |
| | | | Ratios to Average
Net Assets Before
Reimbursement | | | Ratios to Average
Net Assets After
Reimbursement(d) | | | | |
Ending
Net
Assets
(000) | | | Expenses | | | Net
Invest-
ment
Income
(Loss) | | | Expenses | | | Net
Invest-
ment
Income
(Loss) | | | Portfolio
Turnover
Rate | |
| | | | | | | | | | | | | | | | | | | | | | |
| $ | 112,851 | | | | .82 | % | | | 2.33 | % | | | .73 | % | | | 2.42 | % | | | 56 | % |
| | 80,927 | | | | .87 | | | | 2.22 | | | | .73 | | | | 2.37 | | | | 58 | |
| | 87,631 | | | | 1.04 | | | | 2.88 | | | | .75 | | | | 3.17 | | | | 44 | |
| | 65,704 | | | | 1.06 | | | | 4.55 | | | | .74 | | | | 4.87 | | | | 54 | |
| | 59,933 | | | | 1.05 | | | | 4.17 | | | | .74 | | | | 4.48 | | | | 55 | |
| | | | | | | | | | | | | | | | | | | | | | |
| | 42,346 | | | | 1.56 | | | | 1.56 | | | | 1.55 | | | | 1.57 | | | | 56 | |
| | 5,101 | | | | 1.66 | | | | 1.45 | | | | 1.58 | | | | 1.53 | | | | 58 | |
| | 3,111 | | | | 1.79 | * | | | 1.76 | * | | | 1.60 | * | | | 1.95 | * | | | 44 | |
| | | | | | | | | | | | | | | | | | | | | | |
| | 446 | | | | 1.06 | * | | | 2.07 | * | | | 1.05 | * | | | 2.07 | * | | | 56 | |
| | | | | | | | | | | | | | | | | | | | | | |
| | 727,242 | | | | .57 | | | | 2.59 | | | | .55 | | | | 2.61 | | | | 56 | |
| | 741,969 | | | | .67 | | | | 2.43 | | | | .58 | | | | 2.52 | | | | 58 | |
| | 629,151 | | | | .79 | | | | 3.07 | | | | .60 | | | | 3.26 | | | | 44 | |
| | 315,024 | | | | .81 | | | | 4.80 | | | | .59 | | | | 5.02 | | | | 54 | |
| | 257,403 | | | | .80 | | | | 4.41 | | | | .59 | | | | 4.62 | | | | 55 | |
| (a) | Per share Net Investment Income (Loss) is calculated using the average daily shares method. |
| (b) | Distributions from Capital Gains include short-term capital gains, if any. |
| (c) | Total return is the combination of changes in net asset value without any sales charge, reinvested dividend income at net asset value and reinvested capital gains distributions at net asset value, if any. Total returns are not annualized. |
| (d) | After expense reimbursement from the Adviser, where applicable. |
| (e) | For the period October 28, 2009 (commencement of operations) through June 30, 2010. |
| (f) | For the period September 23, 2011 (commencement of operations) through June 30, 2012. |
See accompanying notes to financial statements.
Financial Highlights (continued)
| | | | | | | | | | | | | | | | | | | | | | | | | | | | | | | | | | | | |
| Selected data for a share outstanding throughout each period: | | | | | | | | | | | | | | | | |
| | | | | | | | |
| Class (Commencement Date) | | | | | | | | | | | | | | | | | | | | | | | | | |
| | | | | | Investment Operations | | | Less Distributions | | | | | | | |
| | | | | | | | |
| STRATEGIC INCOME | | | | | | | | | | | | | | | | | | | | | | | | | |
Year Ended
June 30, | | Beginning
Net
Asset
Value | | | Net
Invest-
ment
Income
(Loss)(a) | | | Net
Realized/
Unrealized
Gain
(Loss) | | | Total | | | Net
Invest-
ment
Income | | | Capital
Gains(b) | | | Total | | | Ending
Net
Asset
Value | | | Total
Return(c) | |
Class A (2/00) | | | | | | | | | | | | | | | | | | | | | | | | | | | | | | | | | |
2012 | | $ | 10.72 | | | $ | .44 | | | $ | .10 | | | $ | .54 | | | $ | (.43 | ) | | $ | — | | | $ | (.43 | ) | | $ | 10.83 | | | | 5.14 | % |
2011 | | | 10.27 | | | | .43 | | | | .45 | | | | .88 | | | | (.43 | ) | | | — | | | | (.43 | ) | | | 10.72 | | | | 8.69 | |
2010 | | | 9.01 | | | | .52 | | | | 1.28 | | | | 1.80 | | | | (.54 | ) | | | — | | | | (.54 | ) | | | 10.27 | | | | 20.21 | |
2009 | | | 9.90 | | | | .64 | | | | (.74 | ) | | | (.10 | ) | | | (.63 | ) | | | (.16 | ) | | | (.79 | ) | | | 9.01 | | | | .16 | |
2008 | | | 9.83 | | | | .49 | | | | .05 | | | | .54 | | | | (.47 | ) | | | — | | | | (.47 | ) | | | 9.90 | | | | 5.51 | |
Class B (2/00) | | | | | | | | | | | | | | | | | | | | | | | | | | | | | | | | | |
2012 | | | 10.67 | | | | .36 | | | | .09 | | | | .45 | | | | (.34 | ) | | | — | | | | (.34 | ) | | | 10.78 | | | | 4.32 | |
2011 | | | 10.22 | | | | .35 | | | | .44 | | | | .79 | | | | (.34 | ) | | | — | | | | (.34 | ) | | | 10.67 | | | | 7.84 | |
2010 | | | 8.97 | | | | .45 | | | | 1.26 | | | | 1.71 | | | | (.46 | ) | | | — | | | | (.46 | ) | | | 10.22 | | | | 19.22 | |
2009 | | | 9.86 | | | | .58 | | | | (.74 | ) | | | (.16 | ) | | | (.57 | ) | | | (.16 | ) | | | (.73 | ) | | | 8.97 | | | | (.58 | ) |
2008 | | | 9.80 | | | | .41 | | | | .05 | | | | .46 | | | | (.40 | ) | | | — | | | | (.40 | ) | | | 9.86 | | | | 4.65 | |
Class C (2/00) | | | | | | | | | | | | | | | | | | | | | | | | | | | | | | | | | |
2012 | | | 10.65 | | | | .36 | | | | .09 | | | | .45 | | | | (.34 | ) | | | — | | | | (.34 | ) | | | 10.76 | | | | 4.32 | |
2011 | | | 10.20 | | | | .35 | | | | .44 | | | | .79 | | | | (.34 | ) | | | — | | | | (.34 | ) | | | 10.65 | | | | 7.85 | |
2010 | | | 8.96 | | | | .43 | | | | 1.27 | | | | 1.70 | | | | (.46 | ) | | | — | | | | (.46 | ) | | | 10.20 | | | | 19.13 | |
2009 | | | 9.84 | | | | .58 | | | | (.73 | ) | | | (.15 | ) | | | (.57 | ) | | | (.16 | ) | | | (.73 | ) | | | 8.96 | | | | (.48 | ) |
2008 | | | 9.78 | | | | .42 | | | | .04 | | | | .46 | | | | (.40 | ) | | | — | | | | (.40 | ) | | | 9.84 | | | | 4.66 | |
Class R3 (9/01) | | | | | | | | | | | | | | | | | | | | | | | | | | | | | | | | | |
2012 | | | 10.77 | | | | .41 | | | | .10 | | | | .51 | | | | (.40 | ) | | | — | | | | (.40 | ) | | | 10.88 | | | | 4.83 | |
2011 | | | 10.31 | | | | .41 | | | | .45 | | | | .86 | | | | (.40 | ) | | | — | | | | (.40 | ) | | | 10.77 | | | | 8.40 | |
2010 | | | 9.07 | | | | .42 | | | | 1.32 | | | | 1.74 | | | | (.50 | ) | | | — | | | | (.50 | ) | | | 10.31 | | | | 19.47 | |
2009 | | | 9.95 | | | | .62 | | | | (.73 | ) | | | (.11 | ) | | | (.61 | ) | | | (.16 | ) | | | (.77 | ) | | | 9.07 | | | | .02 | |
2008 | | | 9.88 | | | | .47 | | | | .05 | | | | .52 | | | | (.45 | ) | | | — | | | | (.45 | ) | | | 9.95 | | | | 5.22 | |
Class I (2/00) | | | | | | | | | | | | | | | | | | | | | | | | | | | | | | | | | |
2012 | | | 10.71 | | | | .45 | | | | .12 | | | | .57 | | | | (.45 | ) | | | — | | | | (.45 | ) | | | 10.83 | | | | 5.35 | |
2011 | | | 10.26 | | | | .46 | | | | .44 | | | | .90 | | | | (.45 | ) | | | — | | | | (.45 | ) | | | 10.71 | | | | 8.99 | |
2010 | | | 9.01 | | | | .55 | | | | 1.25 | | | | 1.80 | | | | (.55 | ) | | | — | | | | (.55 | ) | | | 10.26 | | | | 20.31 | |
2009 | | | 9.89 | | | | .66 | | | | (.73 | ) | | | (.07 | ) | | | (.65 | ) | | | (.16 | ) | | | (.81 | ) | | | 9.01 | | | | .52 | |
2008 | | | 9.83 | | | | .52 | | | | .04 | | | | .56 | | | | (.50 | ) | | | — | | | | (.50 | ) | | | 9.89 | | | | 5.67 | |
| | | | | | | | | | | | | | | | | | | | | | |
| | | | | | | | | | | | | | | | | |
| | | | |
| | | | | | | | | | | | | | |
| Ratios/Supplemental Data | |
| | | | Ratios to Average
Net Assets Before
Reimbursement | | | Ratios to Average
Net Assets After
Reimbursement(d) | | | | |
Ending
Net
Assets
(000) | | | Expenses | | | Net
Invest-
ment
Income
(Loss) | | | Expenses | | | Net
Invest-
ment
Income
(Loss) | | | Portfolio
Turnover
Rate(e) | |
| | | | | | | | | | | | | | | | | | | | | | |
| $ | 52,802 | | | | .93 | % | | | 4.01 | % | | | .85 | % | | | 4.10 | % | | | 199 | % |
| | 25,045 | | | | 1.05 | | | | 3.93 | | | | .88 | | | | 4.10 | | | | 98 | |
| | 28,165 | | | | 1.13 | | | | 4.98 | | | | .92 | | | | 5.19 | | | | 96 | |
| | 13,948 | | | | 1.13 | | | | 7.45 | | | | 1.00 | | | | 7.58 | | | | 147 | |
| | 15,567 | | | | 1.11 | | | | 4.75 | | | | .99 | | | | 4.87 | | | | 124 | |
| | | | | | | | | | | | | | | | | | | | | | |
| | 2,148 | | | | 1.68 | | | | 3.27 | | | | 1.61 | | | | 3.33 | | | | 199 | |
| | 1,116 | | | | 1.80 | | | | 3.22 | | | | 1.73 | | | | 3.29 | | | | 98 | |
| | 1,413 | | | | 1.87 | | | | 4.35 | | | | 1.74 | | | | 4.48 | | | | 96 | |
| | 1,719 | | | | 1.88 | | | | 6.71 | | | | 1.75 | | | | 6.84 | | | | 147 | |
| | 2,384 | | | | 1.86 | | | | 4.01 | | | | 1.74 | | | | 4.13 | | | | 124 | |
| | | | | | | | | | | | | | | | | | | | | | |
| | 31,085 | | | | 1.67 | | | | 3.30 | | | | 1.60 | | | | 3.37 | | | | 199 | |
| | 8,092 | | | | 1.80 | | | | 3.22 | | | | 1.73 | | | | 3.29 | | | | 98 | |
| | 6,748 | | | | 1.88 | | | | 4.21 | | | | 1.75 | | | | 4.34 | | | | 96 | |
| | 2,778 | | | | 1.88 | | | | 6.64 | | | | 1.75 | | | | 6.77 | | | | 147 | |
| | 3,673 | | | | 1.86 | | | | 4.10 | | | | 1.74 | | | | 4.22 | | | | 124 | |
| | | | | | | | | | | | | | | | | | | | | | |
| | 1,903 | | | | 1.19 | | | | 3.73 | | | | 1.12 | | | | 3.80 | | | | 199 | |
| | 1,020 | | | | 1.29 | | | | 3.73 | | | | 1.23 | | | | 3.79 | | | | 98 | |
| | 601 | | | | 1.37 | | | | 4.06 | | | | 1.24 | | | | 4.19 | | | | 96 | |
| | 681 | | | | 1.38 | | | | 7.26 | | | | 1.25 | | | | 7.39 | | | | 147 | |
| | 293 | | | | 1.36 | | | | 4.54 | | | | 1.24 | | | | 4.66 | | | | 124 | |
| | | | | | | | | | | | | | | | | | | | | | |
| | 534,608 | | | | .69 | | | | 4.19 | | | | .63 | | | | 4.26 | | | | 199 | |
| | 615,107 | | | | .80 | | | | 4.22 | | | | .73 | | | | 4.29 | | | | 98 | |
| | 655,301 | | | | .87 | | | | 5.31 | | | | .74 | | | | 5.44 | | | | 96 | |
| | 633,108 | | | | .88 | | | | 7.64 | | | | .75 | | | | 7.77 | | | | 147 | |
| | 1,069,211 | | | | .86 | | | | 5.03 | | | | .74 | | | | 5.15 | | | | 124 | |
| (a) | Per share Net Investment Income (Loss) is calculated using the average daily shares method. |
| (b) | Distributions from Capital Gains include short-term capital gains, if any. |
| (c) | Total return is the combination of changes in net asset value without any sales charge, reinvested dividend income at net asset value and reinvested capital gains distributions at net asset value, if any. Total returns are not annualized. |
| (d) | After expense reimbursement from the Adviser, where applicable. |
| (e) | Excluding dollar roll transactions, where applicable. |
See accompanying notes to financial statements.
Notes to Financial Statements
1. General Information and Significant Accounting Policies
General Information
Nuveen Investment Funds, Inc. (the “Trust”), is an open-end investment company registered under the Investment Company Act of 1940, as amended. The Trust is comprised of the Nuveen Core Plus Bond Fund (“Core Plus Bond”) formerly known as Nuveen Core Bond Fund, Nuveen High Income Bond Fund (“High Income Bond”), Nuveen Inflation Protected Securities Fund (“Inflation Protected Securities”), Nuveen Intermediate Government Bond Fund (“Intermediate Government Bond”), Nuveen Intermediate Term Bond Fund (“Intermediate Term Bond”), Nuveen Short Term Bond Fund (“Short Term Bond”) and Nuveen Strategic Income Fund (“Strategic Income”) formerly known as Nuveen Total Return Bond Fund, (each a “Fund” and collectively, the “Funds”), among others. The Trust was incorporated in the State of Maryland on August 20, 1987.
During the current reporting period, Core Plus Bond changed its name from Nuveen Core Bond Fund and Strategic Income changed its name from Nuveen Total Return Bond Fund.
Core Plus Bond’s investment objective is to provide high current income consistent with limited risk to capital. Under normal market conditions, the Fund invests primarily (at least 80% of its net assets, plus the amount of any borrowings for investment purposes) in bonds such as U.S. government securities (securities issued or guaranteed by the U.S. government or its agencies or instrumentalities), including zero coupon securities, residential and commercial mortgage-backed securities, asset-backed securities and corporate debt obligations, including obligations issued by special-purpose entities that are backed by corporate debt obligations. Up to 10% of the Fund’s total assets may be invested collectively in bonds rated lower than investment grade or unrated securities of comparable quality as determined by Nuveen Asset Management, LLC (the “Sub-Adviser”), a wholly-owned subsidiary of Nuveen Fund Advisors, Inc. (the “Adviser”), a wholly-owned subsidiary of Nuveen Investments, Inc. (“Nuveen”), (securities commonly referred to as “high yield” or “junk bonds”), non-dollar denominated debt obligations of foreign corporations and governments and debt obligations issued by governmental and corporate issuers that are located in emerging market countries. The Fund may invest up to 25% of its total assets in U.S. dollar denominated debt obligations of foreign corporations and governments that are not located in emerging market countries. To generate additional income, the Fund may invest up to 25% of its total assets in dollar roll transactions.
High Income Bond’s investment objective is to provide a high level of current income. Under normal market conditions, the Fund invests primarily (at least 80% of its net assets, plus the amount of any borrowings for investment purposes) in bonds rated lower than investment grade at the time of purchase or in unrated bonds of comparable quality (securities commonly referred to as “high-yield” securities or “junk bonds”). The Fund may invest in exchange-traded funds, closed-end funds, and other investment companies (“investment companies”). The Fund may invest up to 25% of its total assets in dollar denominated debt obligations of foreign corporations and governments. Up to 20% of the Fund’s total assets may be invested in dollar denominated debt obligations issued by governmental and corporate issuers that are located in emerging market countries.
Inflation Protected Securities’, investment objective is to provide total return while providing protection against inflation. Under normal market conditions, the Fund invests primarily (at least 80% of its net assets, plus the amount of any borrowings for investment purposes) in inflation protected debt securities. These securities will be issued by the U.S. and non-U.S. governments, their agencies and instrumentalities, and domestic and foreign corporations. Up to 20% of the Fund’s assets may be invested in holdings that are not inflation protected. These holdings may include domestic and foreign corporate debt obligations, securities issued or guaranteed by the U.S. government or its agencies and instrumentalities, debt obligations of foreign governments, residential and commercial mortgage-backed securities and asset-backed securities. Up to 10% of the Fund’s net assets may be invested in securities that are rated lower than investment grade at the time of purchase or that are unrated and of comparable quality (securities commonly referred to as “high-yield” securities or “junk bonds”). The Fund may invest up to 20% of its net assets in non-dollar denominated securities, and may invest without limitation in U.S. dollar denominated securities of foreign corporations and governments.
Intermediate Government Bond’s investment objective is to provide current income to the extent consistent with the preservation of capital. Under normal market conditions, the Fund invests primarily (at least 80% of its net assets, plus the amount of any borrowings for investment purposes) in U.S. government bonds. The Fund may invest up to 20% of its total assets, collectively, in non-U.S. government debt obligations, including asset-backed securities, residential and commercial mortgage-backed securities, corporate debt obligations, and municipal securities. To generate additional income, the Fund may invest up to 10% of its total assets in dollar roll transactions.
Intermediate Term Bond’s investment objective is to provide current income to the extent consistent with preservation of capital. Under normal market conditions, the Fund invests primarily (at least 80% of its net assets, plus the amount of any borrowings for investment purposes) in bonds, such as U.S. government securities (securities issued or guaranteed by the U.S. government or its agencies or instrumentalities), including zero coupon securities, residential and commercial mortgage-backed securities, asset-backed securities, and corporate debt obligations, including obligations issued by special-purpose entities that are backed by corporate debt obligations. The Fund may invest up to 25% of its total assets in U.S. dollar denominated debt obligations of foreign corporations and governments. To generate additional income, the Fund may invest up to 25% of its total assets in dollar roll transactions.
Short Term Bond’s investment objective is to provide current income while maintaining a high degree of principal stability. Under normal market conditions, the Fund invests primarily (at least 80% of its net assets, plus the amount of any borrowings for investment
purposes) in bonds, such as residential and commercial mortgage-backed securities, asset-backed securities, corporate debt obligations, including obligations issued by special-purpose entities that are backed by corporate debt obligations, U.S. government securities, which are securities issued or guaranteed by the U.S. government or its agencies or instrumentalities and municipal securities. Up to 20% of the Fund’s total assets may be invested in securities rated lower than investment grade or unrated securities of comparable quality as determined by the Sub-Adviser (securities commonly referred to as “high yield” or “junk bonds”). The Fund may invest up to 35% of its total assets in debt obligations of foreign corporations and foreign governments. However, no more than 10% of the Fund’s total assets may be invested in debt obligations of corporations and governments that are located in emerging market countries.
For the period July 1, 2011 through May 14, 2012, Strategic Income’s investment objective was to provide a high level of current income consistent with prudent risk to capital. While the Fund may realize some capital appreciation, the Fund would primarily seek to achieve total return through preserving capital and generating income. Under normal market conditions, the Fund invested primarily (at least 80% of its net assets, plus the amount of any borrowings for investment purposes) in bonds such as U.S. government securities (securities issued or guaranteed by the U.S. government or its agencies or instrumentalities), residential and commercial mortgage-backed securities, asset-backed securities, domestic and foreign corporate debt obligations, including obligations issued by special-purpose entities that are backed by corporate debt obligations, and debt obligations of foreign governments. Up to 30% of the Fund’s total assets may have been invested collectively in debt securities, provided that the Fund would not invest more than 20% of its total assets in any single category such as securities rated lower than investment grade or unrated securities of comparable quality as determined by the Sub-Adviser (securities commonly referred to as “high yield” or “junk bonds”), non-dollar denominated debt obligations of foreign corporations and governments and debt obligations issued by governmental and corporate issuers that are located in emerging market countries. To generate additional income, the Fund may have invested up to 25% of its total assets in dollar roll transactions.
Effective May 15, 2012, Strategic Income’s investment objective is to provide total return. Under normal market conditions, the Fund continues to invest at least 80% of its net assets in debt securities, including U.S. government securities (securities issued or guaranteed by the U.S. government or its agencies or instrumentalities), residential and commercial mortgage-backed securities, asset-backed securities, domestic and foreign corporate debt obligations, including obligations issued by special-purpose entities that are backed by corporate debt obligations and debt obligations of foreign governments. The Fund may invest up to 30% of its total assets in non-dollar denominated debt obligations of foreign corporations and governments, including debt obligations issued by governmental and corporate issuers that are located in emerging market countries. (The Fund may invest without limitation in U.S. dollar denominated securities of foreign issuers.) The Fund may invest up to 50% of its total assets in securities rated lower than investment grade or unrated securities of comparable quality as determined by the Sub-Adviser (securities commonly referred to as “high yield” or “junk bonds”). The Fund will not invest in securities rated lower than CCC at the time of purchase or in unrated securities of equivalent quality. Unrated securities will not exceed 25% of the Fund’s total assets. To generate additional income, the Fund may continue to invest up to 25% of its total assets in dollar roll transactions.
The Funds may invest in derivative financial instruments in an attempt to manage market risk, credit risk and yield curve risk, to manage the effective maturity or duration of securities in the Funds’ portfolios or for speculative purposes in an effort to increase the Funds’ yield or to enhance returns. The Funds that may invest in non-dollar denominated securities may also use derivatives to gain exposure to non-dollar denominated securities markets to the extent they do not do so through direct investments.
The Funds’ most recent prospectus provides further descriptions of each Fund’s investment objective, principal investment strategies and principal risks.
On September 22, 2011, Short Term Bond began offering Class R3 Shares.
Significant Accounting Policies
The following is a summary of significant accounting policies followed by the Funds in the preparation of their financial statements in accordance with accounting principles generally accepted in the United States (“U.S. GAAP”).
Investment Valuation
Common stocks and other equity-type securities are valued at the last sales price on the securities exchange on which such securities are primarily traded and are generally classified as Level 1 for fair value measurement purposes. Securities primarily traded on the NASDAQ National Market (“NASDAQ”) are valued, except as indicated below, at the NASDAQ Official Closing Price and are generally classified as Level 1. However, securities traded on a securities exchange or NASDAQ for which there were no transactions on a given day or securities not listed on a securities exchange or NASDAQ are valued at the quoted bid price and are generally classified as Level 2. Prices of certain American Depositary Receipts (“ADR”) held by the Funds that trade in the United States are valued based on the last traded price, official closing price, or the most recent bid price of the underlying non-U.S.-traded stock, adjusted as appropriate for the underlying-to-ADR conversion ratio and foreign exchange rate, and from time-to-time may also be adjusted further to take into account material events that may take place after the close of the local non-U.S. market but before the close of the New York Stock Exchange. These securities may represent a transfer from a Level 1 to a Level 2 security.
Investments in the investment companies are valued at their respective net asset value on valuation date. These investment vehicles are generally classified Level 1.
Notes to Financial Statements (continued)
Prices of fixed-income securities, forward foreign currency exchange contracts and swap contracts are provided by a pricing service approved by the Funds’ Board of Directors. These securities are generally classified as Level 2. The pricing service establishes a security’s fair value using methods that may include consideration of the following: yields or prices of investments of comparable quality, type of issue, coupon, maturity and rating, market quotes or indications of value from security dealers, evaluations of anticipated cash flows or collateral, general market conditions and other information and analysis, including the obligor’s credit characteristics considered relevant. In pricing certain securities, particularly less liquid and lower quality securities, the pricing service may consider information about a security, its issuer, or market activity provided by the Adviser. These securities are generally classified as Level 2 or Level 3 depending on the priority of the significant inputs.
If significant market events occur between the time of determination of the closing price of a foreign security on an exchange and the time that the Funds’ net asset value (NAV) is determined, or if under the Funds’ procedures, the closing price of a foreign security is not deemed to be reliable, the security would be valued at fair value as determined in accordance with procedures established in good faith by the Funds’ Board of Directors. These securities are generally classified as Level 2 or Level 3 depending on the priority of the significant inputs.
The value of exchange-traded options are based on the mean of the closing bid and ask prices. Futures contracts are valued using the closing settlement price or, in the absence of such a price, the last traded price. Exchange-traded options and futures contracts are generally classified as Level 1. Options traded in the over-the counter market are valued using an evaluated mean price and are generally classified as Level 2.
Certain securities may not be able to be priced by the pre-established pricing methods as described above. Such securities may be valued by the Funds’ Board of Directors or its designee at fair value. These securities generally include, but are not limited to, restricted securities (securities which may not be publicly sold without registration under the Securities Act of 1933, as amended) for which a pricing service is unable to provide a market price; securities whose trading has been formally suspended; debt securities that have gone into default and for which there is no current market quotation; a security whose market price is not available from a pre-established pricing source; a security with respect to which an event has occurred that is likely to materially affect the value of the security after the market has closed but before the calculation of a Fund’s net asset value (as may be the case in non-U.S. markets on which the security is primarily traded) or make it difficult or impossible to obtain a reliable market quotation; and a security whose price, as provided by the pricing service, is not deemed to reflect the security’s fair value. As a general principle, the fair value of a security would appear to be the amount that the owner might reasonably expect to receive for it in a current sale. A variety of factors may be considered in determining the fair value of such securities, which may include consideration of the following: yields or prices of investments of comparable quality, type of issue, coupon, maturity and rating, market quotes or indications of value from security dealers, evaluations of anticipated cash flows or collateral, general market conditions and other information and analysis, including the obligor’s credit characteristics considered relevant. These securities are generally classified as Level 2 or Level 3 depending on the priority of the significant inputs. Regardless of the method employed to value a particular security, all valuations are subject to review by the Funds’ Board of Directors or its designee.
Refer to Footnote 2 – Fair Value Measurements for further details on the leveling of securities held by the Funds as of the end of the reporting period.
Investment Transactions
Investment transactions are recorded on a trade date basis. Realized gains and losses from investment transactions are determined on the specific identification method, which is the same basis used for federal income tax purposes. Investments purchased on a when-issued/ delayed delivery basis may have extended settlement periods. Any investments so purchased are subject to market fluctuation during this period. The Funds have instructed the custodian to earmark securities in the Fund’s portfolios with a current value at least equal to the amount of the when-issued/delayed delivery purchase commitments. At June 30, 2012, Core Plus Bond, High Income Bond, Intermediate Government Bond, Intermediate Term Bond, Short-Term Bond and Strategic Income had outstanding when issued/delayed delivery purchase commitments of $16,631,384, $7,117,855, $1,051,695, $84,580,009, $35,959,928 and $36,407,421, respectively. Inflation Protected Securities had no such outstanding purchase commitments.
Investment Income
Dividend income is recorded on the ex-dividend date or, for foreign securities, when information is available. Interest income, which reflects the amortization of premiums and includes accretion of discounts for financial reporting purposes, is recorded on an accrual basis. Interest income also reflects pay down gains and losses, if any. Securities lending income is comprised of fees earned from borrowers and income earned on cash collateral investments, net of lending agent fees.
Income Taxes
Each Fund is a separate taxpayer for federal income tax purposes. Each Fund intends to distribute substantially all of its net investment income and net capital gains to shareholders and to otherwise comply with the requirements of Subchapter M of the Internal Revenue Code applicable to regulated investment companies (“RICs”). Therefore, no federal income tax provision is required.
For all open tax years and all major taxing jurisdictions, management of the Funds has concluded that there are no significant uncertain tax positions that would require recognition in the financial statements. Open tax years are those that are open for examination by taxing authorities (i.e., generally the last four tax year ends and the interim tax period since then). Furthermore, management of the Funds is also not aware of any tax positions for which it is reasonably possible that the total amounts of unrecognized tax benefits will significantly change in the next twelve months.
Dividends and Distributions to Shareholders
The Funds declare dividends from their net investment income daily and pay shareholders monthly. Fund shares begin to accrue dividends on the business day after the day when the monies used to purchase Fund shares are collected by the Funds’ transfer agent.
Net realized capital gains from investment transactions, if any, are declared and distributed to shareholders at least annually. Furthermore, capital gains are distributed only to the extent they exceed available capital loss carry forwards.
Distributions to shareholders are recorded on the ex-dividend date. The amount and timing of distributions are determined in accordance with federal income tax regulations, which may differ from U.S. GAAP.
Flexible Sales Charge Program
Class A Shares are generally sold with an up-front sales charge and incur a .25% annual 12b-1 service fee. Class A Share purchases of the Funds, with the exception of Short Term Bond, of $1 million or more are sold at net asset value without an up-front sales charge. Class A Share purchases of Short Term Bond of $250,000 or more are sold at net asset value without an up-front sales charge. Class A Share purchases may be subject to a contingent deferred sales charge (“CDSC”) if redeemed within eighteen months of purchase. Core Plus Bond, High Income Bond and Strategic Income will issue Class B Shares upon the exchange of Class B Shares from another Nuveen mutual fund or for purposes of dividend reinvestment, but Class B Shares of the Funds are not available for new accounts or for additional investment into existing accounts. Class B Shares incur a .75% annual 12b-1 distribution fee and a .25% annual 12b-1 service fee. Class B Shares are subject to a CDSC of up to 5% depending upon the length of time the shares are held by the investor (CDSC is reduced to 0% at the end of six years). Class B Shares automatically convert to Class A Shares eight years after purchase. Class C Shares are sold without an up-front sales charge but incur a .75% annual 12b-1 distribution fee and a .25% annual 12b-1 service fee. Class C Shares are subject to a CDSC of 1% if redeemed within twelve months of purchase. Class R3 Shares are sold without an up-front sales charge but incur a .25% annual 12b-1 distribution fee and a .25% annual 12b-1 service fee. Class I Shares are not subject to any sales charge or 12b-1 distribution or service fees.
Dollar Roll Transactions
A dollar roll (“dollar rolls”) is a transaction in which a Fund purchases or sells mortgage-backed securities (“MBS”) for delivery in the future and simultaneously contracts to sell or repurchase substantially similar (same type, coupon, and maturity) MBS on a different specified future date. Dollar rolls are identified in a Fund’s Portfolio of Investments as “MDR”, when applicable. During the roll period, the Fund foregoes principal and interest paid on the MBS. The Fund is compensated by fee income or the difference between the current sales price and the lower forward price for the future purchase. Such compensation is amortized over the life of the dollar rolls, which is recognized as a component of “Interest income” on the Statement of Operations. Dollar rolls are valued daily.
Core Plus Bond and Strategic Income entered into dollar roll transactions during the fiscal year ended June 30, 2012.
Dollar rolls involve the risk that the market value of the MBS the Fund is obligated to repurchase under an agreement may decline below the repurchase price. These transactions also involve some risk to the Fund if the other party should default on its obligation and the Fund is delayed or prevented from completing the transaction. In the event that the buyer of securities under a dollar roll files for bankruptcy or becomes insolvent, the Fund’s use of proceeds of the dollar roll may be restricted pending a determination by the other party, or its trustee or receiver, whether to enforce the Fund’s obligation to repurchase the securities.
Foreign Currency Transactions
Each Fund with the exception of Intermediate Government Bond is authorized to engage in foreign currency exchange transactions, including forward foreign currency exchange contracts, futures, options and swap contracts. To the extent that the Funds invest in securities and/or contracts that are denominated in a currency other than U.S. dollars, the Funds will be subject to currency risk, which is the risk that an increase in the U.S. dollar relative to the foreign currency will reduce returns or portfolio value. Generally, when the U.S. dollar rises in value against a foreign currency, the Fund’s investments denominated in that currency will lose value because its currency is worth fewer U.S. dollars; the opposite effect occurs if the U.S. dollar falls in relative value. Investments and other assets and liabilities denominated in foreign currencies are converted into U.S. dollars on a spot (i.e. cash) basis at the spot rate prevailing in the foreign currency exchange market at the time of valuation. Purchases and sales of investments and income denominated in foreign currencies are translated into U.S. dollars on the respective dates of such transactions.
The books and records of the Funds are maintained in U.S. dollars. Foreign currencies, assets and liabilities are translated into U.S. dollars at 4:00 p.m. Eastern Time. Investment transactions, income and expenses are translated on the respective dates of such transactions. Net realized foreign currency gains and losses resulting from changes in exchange rates include foreign currency gains and losses between trade date and settlement date of the transactions, foreign currency transactions, and the difference between the amounts of interest and dividends recorded on the books of the Funds and the amounts actually received.
The realized gains and losses resulting from changes in foreign currency exchange rates and changes in foreign exchange rates associated with other assets and liabilities on investments, forward foreign currency exchange contracts, futures, options purchased, options written and swap contracts are recognized as a component of “Net realized gain (loss) from investments and foreign currency” on the Statement of Operations, when applicable.
The unrealized gains and losses resulting from changes in foreign currency exchange rates and changes in foreign exchange rates associated with other assets and liabilities on investments are recognized as a component of “Change in net unrealized appreciation (depreciation) of investments and foreign currency” on the Statement of Operations, when applicable. The unrealized gains and losses resulting from changes in foreign exchange rates associated with forward foreign currency exchange contracts, futures, options
Notes to Financial Statements (continued)
purchased, options written and swap contracts are recognized as a component of “Change in net unrealized appreciation (deprecation) of forward foreign currency exchange contracts, futures, options purchased, options written and swap contracts, respectively” on the Statement of Operations, when applicable.
Forward Foreign Currency Exchange Contracts
Each Fund that invests in non-dollar denominated securities is subject to foreign currency exchange rate risk in the normal course of pursuing its investment objectives and is authorized to enter into forward foreign currency exchange contracts in an attempt to manage such risk under two circumstances: (i) when a Fund enters into a contract for the purchase or sale of a security denominated in a foreign currency to “lock in” the U.S. exchange rate of the transaction, with such period being a short-dated contract covering the period between transaction date and settlement date; or (ii) when the Adviser, believes that the currency of a particular foreign country may experience a substantial movement against the U.S. dollar or against another foreign currency. Forward foreign currency exchange contracts are valued daily at the forward rate and are recognized as a component of “Unrealized appreciation or depreciation on forward foreign currency exchange contracts” on the Statement of Assets and Liabilities. The change in value of the contracts during the fiscal period is recognized as a component of “Change in net unrealized appreciation (depreciation) of forward foreign currency exchange contracts” on the Statement of Operations. When the contract is closed or offset with the same counterparty, the Fund recognizes the difference between the value of the contract at the time it was entered and the value at the time it was closed or offset as a component of “Net realized gain (loss) from forward foreign currency exchange contracts” on the Statement of Operations.
Forward foreign currency exchange contracts will generally not be entered into for terms greater than three months, but may have maturities of up to six months or more. The use of forward foreign currency exchange contracts does not eliminate fluctuations in the underlying prices of a Fund’s investment securities; however, it does establish a rate of exchange that can be achieved in the future. The use of forward foreign currency exchange contracts involves the risk that anticipated currency movements will not be accurately predicted. A forward foreign currency exchange contract would limit the risk of loss due to a decline in the value of a particular currency; however, it also would limit any potential gain that might result should the value of the currency increase instead of decrease. These contracts may involve market risk in excess of the unrealized gain or loss reflected on the Statement of Assets and Liabilities. Forward foreign currency exchange contracts are subject to counterparty risk if the counterparty fails to perform as specified in the contract due to financial impairment or other reason.
During the fiscal year ended June 30, 2012, Inflation Protected Securities, Short Term Bond and Strategic Income invested in forward foreign currency exchange contracts to manage foreign currency exposure. To reduce unwanted currency exposure from the Fund’s portfolio, the Fund would acquire a short foreign currency forward.
The average number of forward foreign currency exchange contracts outstanding during the fiscal year ended June 30, 2012, was as follows:
| | | | | | | | | | | | |
| | | Inflation
Protected
Securities | | | Short Term
Bond | | | Strategic
Income | |
Average number of forward foreign currency exchange contracts outstanding* | | | 2 | | | | 2 | | | | 14 | |
| * | The average number of outstanding contracts is calculated based on the outstanding contracts at the beginning of the fiscal year and at the end of each fiscal quarter within the current fiscal year. |
Refer to Footnote 3 – Derivative Instruments and Hedging Activities for further details on forward foreign currency exchange contract activity.
Futures Contracts
Each Fund is subject to equity price risk, interest rate risk and foreign currency exchange rate risk in the normal course of pursuing its investment objectives and is authorized to invest in futures contracts in attempt to manage such risk. Upon entering into a futures contract, a Fund is required to deposit with the broker an amount of cash or liquid securities equal to a specified percentage of the contract amount. This is known as the “initial margin.” Cash held by the broker to cover initial margin requirements on open futures contracts, if any, is recognized as “Deposits with brokers for open futures contracts” on the Statement of Assets and Liabilities. Subsequent payments (“variation margin”) are made or received by a Fund each day, depending on the daily fluctuation of the value of the contract. Variation margin is recognized as a receivable and/or payable for “Variation margin on futures contracts” on the Statement of Assets and Liabilities, when applicable.
During the period the futures contract is open, changes in the value of the contract are recognized as an unrealized gain or loss by “marking-to-market” on a daily basis to reflect the changes in market value of the contract, which is recognized as a component of “Change in net unrealized appreciation (depreciation) of futures contracts” on the Statement of Operations. When the contract is closed or expired, the Fund records a realized gain or loss equal to the difference between the value of the contract on the closing date and value of the contract when originally entered into, which is recognized as a component of “Net realized gain (loss) from futures contracts” on the Statement of Operations.
Risks of investments in futures contracts include the possible adverse movement in the price of the securities or indices underlying the contracts, the possibility that there may not be a liquid secondary market for the contracts and/or that a change in the value of the contract may not correlate with a change in the value of the underlying securities or indices.
During the fiscal year ended June 30, 2012, each of the Funds invested in interest rate futures contracts. The Funds used long and short U.S. Treasury note and bond futures to manage portfolio duration and yield curve exposure. For example, to increase the duration of the Fund’s portfolio, a long Treasury bond or Treasury note futures position would be acquired. Inflation Protected Securities and Strategic Income Fund also invested in foreign currency futures contracts to manage foreign currency exposure. To reduce unwanted currency exposure from the Fund’s portfolio, a short foreign currency future would be acquired.
The average number of futures contracts outstanding during the fiscal year ended June 30, 2012, was as follows:
| | | | | | | | | | | | |
| | | Core Plus
Bond | | | High Income
Bond | | | Inflation
Protected
Securities | |
Average number of futures contracts outstanding* | | | 1,541 | | | | 22 | | | | 131 | |
| | | | | | | | | | | | | | | | |
| | | Intermediate
Government
Bond | | | Intermediate
Term Bond | | | Short Term
Bond | | | Strategic Income | |
Average number of futures contracts outstanding* | | | 193 | | | | 836 | | | | 783 | | | | 726 | |
| * | The average number of outstanding contracts is calculated based on the outstanding contracts at the beginning of the fiscal year and at the end of each fiscal quarter within the current fiscal year. |
Refer to Footnote 3 – Derivative Instruments and Hedging Activities for further details on futures contract activity.
Options Transactions
Each Fund, with the exception of Intermediate Government Bond, is subject to interest rate risk and foreign currency risk in the normal course of pursuing its investment objectives and is authorized to purchase and write (sell) call and put options on securities, futures, swaps (“swaptions”) or currencies in an attempt to manage such risk. The purchase of options and/or swaptions involves the risk of loss of all or a part of the cash paid for the options (the premium). The market risk associated with purchasing options and/or swaptions is limited to the premium paid. The counterparty credit risk of purchasing options and/or swaptions, however, needs also to take into account the current value of the option, as this is the performance expected from the counterparty. When a Fund purchases an option and/or swaption, an amount equal to the premium paid (the premium plus commission) is recognized as a component of “Options and/or Swaptions purchased, at value” on the Statement of Assets and Liabilities. When a Fund writes an option and swaption, an amount equal to the net premium received (the premium less commission) is recognized as a component of “Options and/or Swaptions written, at value” on the Statement of Assets and Liabilities and is subsequently adjusted to reflect the current value of the written option and/or swaption until the option and/or swaption is exercised or expires or the Fund enters into a closing purchase transaction. The changes in the value of options and/or swaptions purchased during the fiscal period are recognized as a component of “Change in net unrealized appreciation (depreciation) of Options and/or Swaptions purchased” on the Statement of Operations. The changes in the value of options and/or swaptions written during the fiscal period are recognized as a component of “Change in net unrealized appreciation (depreciation) of Options and/or Swaptions written” on the Statement of Operations. When an option and/or swaption is exercised or expires or the Fund enters into a closing purchase transaction, the difference between the net premium received and any amount paid at expiration or on executing a closing purchase transaction, including commission, is recognized as a component of “Net realized gain (loss) from Options and/or Swaptions purchased and/or written” on the Statement of Operations. The Fund, as a writer of an option and/or swaption has no control over whether the underlying instrument may be sold (called) or purchased (put) and as a result bears the risk of an unfavorable change in the market value of the instrument underlying the written option and/or swaption. There is also the risk the Fund may not be able to enter into a closing transaction because of an illiquid market.
During the fiscal year ended June 30, 2012, Strategic Income purchased options on U.S. Treasury notes/bonds futures as part of an overall portfolio interest rate strategy; hedging the portfolio against adverse interest rate movements while limiting downside exposure to the portfolio.
The average number of purchased options contracts outstanding during the fiscal year ended June 30, 2012, was as follows:
| | | | |
| | | Strategic Income | |
Average number of purchased options contracts outstanding* | | | 82 | |
| * | The average number of option contracts is calculated based on the outstanding contracts at the beginning of the fiscal year and at the end of each fiscal quarter within the current fiscal year. |
During the fiscal year ended June 30, 2012, Strategic Income wrote call and put options to express views on volatility, writing out-of-the-money calls and puts when implied volatility was high.
Notes to Financial Statements (continued)
The average number of written options contracts outstanding during the fiscal year ended June 30, 2012, was as follows:
| | | | |
| | | Strategic
Income | |
Average number of options written contracts outstanding* | | | 182 | ** |
| * | The average number of outstanding contracts is calculated based on the outstanding contracts at the beginning of the fiscal year and at the end of each fiscal quarter within the current fiscal year. |
| ** | Includes both calls and puts. |
Refer to Footnote 3 – Derivative Instruments and Hedging Activities and Footnote 5 – Investment Transactions for further details on options contract activity.
Swap Contracts
Each Fund is authorized to enter into swap contracts consistent with their investment objectives and policies to reduce, increase or otherwise alter its risk profile or to alter its portfolio characteristics (i.e. duration, yield curve positioning and credit quality).
Interest Rate Swaps
Each Fund is subject to interest rate risk in the normal course of pursuing its investment objectives and policies in an attempt to obtain a desired return at a lower cost than if the Fund had invested directly in the asset that yielded the desired return. In connection with these contracts, securities in the Funds’ portfolios of investments may be identified as collateral in accordance with the terms of the respective swap contract. Interest rate swap contracts involve the exchange by a Fund with another party of their respective commitments to pay or receive interest (i.e., an exchange of floating rate payments for fixed rate payments with respect to a specified notional amount of principal). Interest rate swap contracts are valued daily. The Funds accrue daily the periodic payments expected to be paid and/or received on each interest rate swap contract and recognize the daily change in the market value of the Funds’ contractual rights and obligations under the contracts. The net amount recorded on these transactions for each counterparty is recognized on the Statement of Assets and Liabilities as a component of “Unrealized appreciation or depreciation on interest rate swaps (, net)” with the change during the fiscal period recognized on the Statement of Operations as a component of “Change in net unrealized appreciation (depreciation) of swaps” on the Statement of Operations. Income received or paid by the Funds is recognized as a component of “Net realized gain (loss) from swaps” on the Statement of Operations, in addition to the net realized gains or losses recognized upon the termination of an interest rate swap contract and are equal to the difference between the Funds’ basis in the interest rate swap and the proceeds from (or cost of) the closing transaction. The amount of the payment obligation is based on the notional amount of the interest rate swap contract. Payments received or made at the beginning of the measurement period are recognized as a component of “Interest rate swap premiums paid and/or received” on the Statement of Assets and Liabilities, when applicable. For tax purposes, periodic payments are treated as ordinary income or expense.
During the fiscal year ended June 30, 2012, Core Plus Bond, Inflation Protected Securities, Intermediate Term Bond, Short Term Bond and Strategic Income invested in interest rate swap contracts to hedge against changes in interest rate spreads by taking a short interest rate swap position. The average number of interest rate swap contracts outstanding during the fiscal year ended June 30, 2012, was as follows:
| | | | | | | | | | | | | | | | | | | | |
| | | Core Plus
Bond | | | Inflation
Protected
Securities | | | Intermediate
Term Bond | | | Short Term
Bond | | | Strategic
Income | |
Average number of interest rate swap contracts outstanding* | | | 4 | | | | 4 | | | | 4 | | | | 4 | | | | 3 | |
| * | The average number of outstanding contracts is calculated based on the outstanding contracts at the beginning of the fiscal year and at the end of each fiscal quarter within the current fiscal year. |
Credit Default Swaps
Each Fund is subject to credit risk in the normal course of pursuing its investment objectives. A Fund may enter into a credit default swap contract to seek to maintain a total return on a particular investment or portion of its portfolio, or to take an active long or short position with respect to the likelihood of a particular issuer’s default. Credit default swap contracts involve one party making a stream of payments to another party in exchange for the right to receive a specified return if/when there is a credit event by a third party. Generally, a credit event means bankruptcy, failure to pay, or restructuring. The specific credit events applicable for each credit default swap are stated in the terms of the particular swap agreement. As a purchaser of a credit default swap contract, the Fund pays to the counterparty a periodic interest fee based on the notional amount of the credit default swap. This interest fee is accrued daily and recognized with the daily change in the market value of the contract as a component of “Unrealized appreciation or depreciation on credit default swaps (, net)” on the Statement of Assets and Liabilities and is recorded as a realized loss upon payment. Upon occurrence of a specific credit event with respect to the underlying referenced entity, the Fund is obligated to deliver that security, or an equivalent amount of cash, to the counterparty in exchange for receipt of the notional amount from the counterparty. The difference between the value of the security delivered and the notional amount received is recorded as a realized gain. Payments received or made at the beginning of the measurement period are recognized as a component of “Credit default swap premiums paid and/or received” on the Statement of Assets and Liabilities, when applicable. As a seller of a credit default swap contract, the Fund generally receives from the counterparty a periodic interest fee based on the notional amount of the credit default swap. This interest fee is accrued daily as a component of unrealized appreciation or depreciation and is recorded as a realized gain upon payment. Upon
occurrence of a specific credit event with respect to the underlying referenced entity, the Fund will either receive that security, or an equivalent amount of cash, from the counterparty in exchange for payment of the notional amount to the counterparty, or pay a net settlement amount of the credit default swap contract less the recovery value of the referenced obligation or underlying securities comprising the referenced index. The difference between the value of the security received and the notional amount paid is recorded as a realized loss. Changes in the value of a credit default swap during the fiscal period are recognized as a component of “Change in net unrealized appreciation (depreciation) of swaps,” and realized gains and losses are recognized as a component of “Net realized gain (loss) from swaps” on the Statement of Operations. The maximum potential amount of future payments the Fund could incur as a seller of protection in a credit default swap contract is limited to the notional amount of the contract. The maximum potential amount would be offset by the recovery value, if any, of the respective referenced entity.
During the fiscal year ended June 30, 2012, Core Plus Bond, Inflation Protected Securities, Intermediate Term Bond, Short Term Bond and Strategic Income invested in credit default swap contacts to add diversified exposure to a broad segment of the credit markets, or to express a view on credit as part of an overall portfolio sector management strategy. To increase a Fund’s credit exposure to the investment grade or high yield segment of the market, a long CDX Investment Grade Index swap or long CDX High Yield Index swap, respectively, would be acquired.
The average number of credit default swap contracts outstanding during the fiscal year ended June 30, 2012, was as follows:
| | | | | | | | | | | | | | | | | | | | |
| | | Core Plus
Bond | | | Inflation
Protected
Securities | | | Intermediate
Term Bond | | | Short Term
Bond | | |
Strategic
Income | |
Average number of credit default swap contracts outstanding* | | | — | ** | | | 1 | | | | — | ** | | | 1 | | | | 2 | |
| * | The average number of outstanding contracts is calculated based on the outstanding contracts at the beginning of the fiscal year and at the end of each fiscal quarter within the current fiscal year. |
Refer to Footnote 3 – Derivative Instruments and Hedging Activities for further details on swap contract activity.
Market and Counterparty Credit Risk
In the normal course of business each Fund may invest in financial instruments and enter into financial transactions where risk of potential loss exists due to changes in the market (market risk) or failure of the other party to the transaction to perform (counterparty credit risk). The potential loss could exceed the value of the financial assets recorded on the financial statements. Financial assets, which potentially expose each Fund to counterparty credit risk, consist principally of cash due from counterparties on forward, option and swap transactions, when applicable. The extent of each Fund’s exposure to counterparty credit risk in respect to these financial assets approximates their carrying value as recorded on the Statement of Assets and Liabilities. Futures contracts, when applicable, expose a Fund to minimal counterparty credit risk as they are exchange traded and the exchange’s clearinghouse, which is counterparty to all exchange traded futures, guarantees the futures contracts against default.
Each Fund helps manage counterparty credit risk by entering into agreements only with counterparties the Adviser believes have the financial resources to honor their obligations and by having the Adviser monitor the financial stability of the counterparties. Additionally, counterparties may be required to pledge collateral daily (based on the daily valuation of the financial asset) on behalf of each Fund with a value approximately equal to the amount of any unrealized gain above a predetermined threshold. Reciprocally, when each Fund has an unrealized loss, the Funds have instructed the custodian to pledge assets of the Funds as collateral with a value approximately equal to the amount of the unrealized loss above a pre-determined threshold. Collateral pledges are monitored and subsequently adjusted if and when the valuations fluctuate, either up or down, by at least the pre-determined threshold amount.
Inflation-Indexed Bonds
Inflation-indexed bonds are fixed income securities whose principal value is periodically adjusted to the rate of inflation. The interest rate on these bonds is generally fixed at issuance at a rate lower than typical bonds. Over the life of an inflation-indexed bond however, interest will be paid based on a principal value which is adjusted for inflation. Any increase in the principal amount of an inflation-indexed bond is recognized as a component of “Interest income” on the Statement of Operations, even though investors do not receive their principal until maturity.
Zero Coupon Securities
Each Fund is authorized to invest in zero coupon securities. A zero coupon security does not pay a regular interest coupon to its holders during the life of the security. Income to the holder of the security comes from accretion of the difference between the original purchase price of the security at issuance and the par value of the security at maturity and is effectively paid at maturity. The market prices of zero coupon securities generally are more volatile than the market prices of securities that pay interest periodically.
Multiclass Operations and Allocations
Income and expenses of the Funds that are not directly attributable to a specific class of shares are prorated among the classes based on the relative settled shares of each class. Expenses directly attributable to a class of shares, which presently only include 12b-1 distribution and shareholder service fees, are recorded to the specific class.
Notes to Financial Statements (continued)
Realized and unrealized capital gains and losses of the Funds are prorated among the classes based on the relative net assets of each class.
Securities Lending
In order to generate additional income, each Fund may lend securities representing up to one-third of the value of its total assets (which includes collateral for securities on loan) to broker-dealers, banks or other institutions. Each Fund’s policy is to receive cash collateral equal to at least 102% of the value of securities loaned, which is recognized as “Collateral from securities lending program” on the Statement of Assets and Liabilities. The adequacy of the collateral is monitored on a daily basis. If the value of the securities on loan increases, such that the level of collateralization falls below 100%, additional collateral is received from the borrower, which is recognized as “Due from broker” on the Statement of Assets and Liabilities, when applicable. As with other extensions of credit, there may be risks of delay in recovery of the securities or even loss of rights in the collateral should the borrower of the security fail financially.
The Funds’ custodian serves as the securities lending agent for the Funds. Each Fund pays the custodian a fee based on the Fund’s proportional share of the custodian’s expense of operating its securities lending program. Collateral for securities on loan is invested in a money market fund, which is recognized as “Investments purchased with collateral from securities lending” on the Statement of Assets and Liabilities.
Income from securities lending, net of fees paid, is recognized on the Statement of Operations as “Securities lending income.” Securities lending fees paid by each Fund during the fiscal year ended June 30, 2012, were as follows:
| | | | | | | | | | | | | | | | |
| | | | | | Core Plus
Bond | | | High Income
Bond | | | Inflation
Protected
Securities | |
Securities lending fees paid | | | | | | $ | 34,318 | | | $ | 104,926 | | | $ | 19,703 | |
| | | | |
| | | Intermediate
Government
Bond | | | Intermediate
Term Bond | | | Short Term
Bond | | | Strategic
Income | |
Securities lending fees paid | | $ | 3,366 | | | $ | 26,665 | | | $ | 29,612 | | | $ | 26,471 | |
Indemnifications
Under the Trust’s organizational documents, its officers and directors are indemnified against certain liabilities arising out of the performance of their duties to the Trust. In addition, in the normal course of business, the Trust enters into contracts that provide general indemnifications to other parties. The Trust’s maximum exposure under these arrangements is unknown as this would involve future claims that may be made against the Trust that have not yet occurred. However, the Trust has not had prior claims or losses pursuant to these contracts and expects the risk of loss to be remote.
Use of Estimates
The preparation of financial statements in conformity with U.S. GAAP requires management to make estimates and assumptions that affect the reported amounts of assets and liabilities at the date of the financial statements and the reported amounts of increases and decreases in net assets from operations during the reporting period. Actual results may differ from those estimates.
2. Fair Value Measurements
Fair value is defined as the price that the Funds would receive upon selling an investment or transferring a liability in an orderly transaction to an independent buyer in the principal or most advantageous market for the investment. A three-tier hierarchy is used to maximize the use of observable market data and minimize the use of unobservable inputs and to establish classification of fair value measurements for disclosure purposes. Observable inputs reflect the assumptions market participants would use in pricing the asset or liability. Observable inputs are based on market data obtained from sources independent of the reporting entity. Unobservable inputs reflect the reporting entity’s own assumptions about the assumptions market participants would use in pricing the asset or liability. Unobservable inputs are based on the best information available in the circumstances. The following is a summary of the three-tiered hierarchy of valuation input levels.
| | |
| Level 1 – | | Inputs are unadjusted and prices are determined using quoted prices in active markets for identical securities. |
| Level 2 – | | Prices are determined using other significant observable inputs (including quoted prices for similar securities, interest rates, prepayment speeds, credit risk, etc.). |
| Level 3 – | | Prices are determined using significant unobservable inputs (including management’s assumptions in determining the fair value of investments). |
The inputs or methodologies used for valuing securities are not an indication of the risks associated with investing in those securities. The following is a summary of each Fund’s fair value measurements as of the end of the reporting period:
| | | | | | | | | | | | | | | | |
| Core Plus Bond | | Level 1 | | | Level 2 | | | Level 3 | | | Total | |
Long-Term Investments*: | | | | | | | | | | | | | | | | |
$25 Par (or similar) Preferred Securities | | $ | 10,552,401 | | | $ | — | | | $ | — | | | $ | 10,552,401 | |
Corporate Bonds | | | — | | | | 332,545,534 | | | | — | | | | 332,545,534 | |
Capital Preferred Securities | | | — | | | | 23,949,068 | �� | | | — | | | | 23,949,068 | |
Municipal Bonds | | | — | | | | 6,423,882 | | | | — | | | | 6,423,882 | |
U.S. Government and Agency Obligations | | | — | | | | 51,793,623 | | | | — | | | | 51,793,623 | |
Asset-Backed and Mortgage-Backed Securities | | | — | | | | 375,948,488 | | | | — | | | | 375,948,488 | |
Investments Purchased with Collateral from Securities Lending | | | 112,762,340 | | | | — | | | | — | | | | 112,762,340 | |
Short-Term Investments: | | | | | | | | | | | | | | | | |
Money-Market Funds | | | 18,425,992 | | | | — | | | | — | | | | 18,425,992 | |
U.S. Government and Agency Obligations | | | — | | | | 3,752,266 | | | | — | | | | 3,752,266 | |
Derivatives: | | | | | | | | | | | | | | | | |
Interest Rate Swaps** | | | — | | | | (2,423,505 | ) | | | — | | | | (2,423,505 | ) |
Futures Contracts** | | | (561,146 | ) | | | — | | | | — | | | | (561,146 | ) |
Total | | $ | 141,179,587 | | | $ | 791,989,356 | | | $ | — | | | $ | 933,168,943 | |
| | | | |
| High Income Bond | | Level 1 | | | Level 2 | | | Level 3 | | | Total | |
Long-Term Investments*: | | | | | | | | | | | | | | | | |
Common Stocks | | $ | 10,807,169 | | | $ | — | | | $ | 242,772 | | | $ | 11,049,941 | |
Exchange-Traded Funds | | | 8,590,622 | | | | — | | | | — | | | | 8,590,622 | |
Convertible Preferred Securities | | | 457,694 | | | | — | | | | — | | | | 457,694 | |
$25 Par (or similar) Preferred Securities | | | 29,779,803 | | | | 5,874,955 | | | | — | | | | 35,654,758 | |
Corporate Bonds | | | — | | | | 497,761,579 | | | | 0 | | | | 497,761,579 | |
Convertible Bonds | | | — | | | | 5,692,823 | | | | — | | | | 5,692,823 | |
Capital Preferred Securities | | | — | | | | 20,192,831 | | | | — | | | | 20,192,831 | |
U.S. Government and Agency Obligations | | | — | | | | 1,177,523 | | | | — | | | | 1,177,523 | |
Asset-Backed and Mortgage-Backed Securities | | | — | | | | 3,665 | | | | — | | | | 3,665 | |
Investment Companies | | | 5,201,405 | | | | — | | | | — | | | | 5,201,405 | |
Sovereign Debt | | | — | | | | 5,318,380 | | | | — | | | | 5,318,380 | |
Warrants | | | 973 | | | | 10,000 | | | | — | | | | 10,973 | |
Investments Purchased with Collateral from Securities Lending | | | 157,452,505 | | | | — | | | | — | | | | 157,452,505 | |
Short-Term Investments: | | | | | | | | | | | | | | | | |
Money-Market Funds | | | 16,460,636 | | | | — | | | | — | | | | 16,460,636 | |
U.S. Government and Agency Obligations | | | — | | | | 109,997 | | | | — | | | | 109,997 | |
Derivatives: | | | | | | | | | | | | | | | | |
Futures Contracts** | | | 12,132 | | | | — | | | | — | | | | 12,132 | |
Total | | $ | 228,762,939 | | | $ | 536,141,753 | | | $ | 242,772 | | | $ | 765,147,464 | |
| | | | |
| Inflation Protected Securities | | Level 1 | | | Level 2 | | | Level 3 | | | Total | |
Long-Term Investments*: | | | | | | | | | | | | | | | | |
$25 Par (or similar) Preferred Securities | | $ | 221,080 | | | $ | — | | | $ | — | | | $ | 221,080 | |
Corporate Bonds | | | — | | | | 6,313,952 | | | | — | | | | 6,313,952 | |
Municipal Bonds | | | — | | | | 1,259,148 | | | | — | | | | 1,259,148 | |
U.S. Government and Agency Obligations | | | — | | | | 317,395,453 | | | | — | | | | 317,395,453 | |
Asset-Backed and Mortgage-Backed Securities | | | — | | | | 7,394,519 | | | | — | | | | 7,394,519 | |
Sovereign Debt | | | — | | | | 1,137,611 | | | | — | | | | 1,137,611 | |
Investment Companies | | | 270,465 | | | | — | | | | — | | | | 270,465 | |
Investments Purchased with Collateral from Securities Lending | | | 22,654,387 | | | | — | | | | — | | | | 22,654,387 | |
Short-Term Investments: | | | | | | | | | | | | | | | | |
Money-Market Funds | | | 16,516,880 | | | | — | | | | — | | | | 16,516,880 | |
U.S. Government and Agency Obligations | | | — | | | | 739,677 | | | | — | | | | 739,677 | |
Derivatives: | | | | | | | | | | | | | | | | |
Forward Foreign Currency Exchange Contracts** | | | — | | | | (110,837 | ) | | | — | | | | (110,837 | ) |
Interest Rate Swaps** | | | — | | | | (348,311 | ) | | | — | | | | (348,311 | ) |
Futures Contracts** | | | (6,327 | ) | | | — | | | | — | | | | (6,327 | ) |
Total | | $ | 39,656,485 | | | $ | 333,781,212 | | | $ | — | | | $ | 373,437,697 | |
| * | Refer to the Fund’s Portfolio of Investments for industry classifications, a breakdown of securities classified as Level 3 and a breakdown of $25 Par (or similar) Preferred Securities and warrants classified as Level 2. |
| ** | Represents net unrealized appreciation (depreciation) as reported in the Fund’s Portfolio of Investments. |
Notes to Financial Statements (continued)
| | | | | | | | | | | | | | | | |
| Intermediate Government Bond | | Level 1 | | | Level 2 | | | Level 3 | | | Total | |
Long-Term Investments*: | | | | | | | | | | | | | | | | |
Municipal Bonds | | $ | — | | | $ | 933,328 | | | $ | — | | | $ | 933,328 | |
U.S. Government and Agency Obligations | | | — | | | | 36,172,431 | | | | — | | | | 36,172,431 | |
Asset-Backed and Mortgage-Backed Securities | | | — | | | | 47,255,355 | | | | — | | | | 47,255,355 | |
Investments Purchased with Collateral from Securities Lending | | | 9,126,144 | | | | — | | | | — | | | | 9,126,144 | |
Short-Term Investments: | | | | | | | | | | | | | | | | |
Money-Market Funds | | | 1,289,203 | | | | — | | | | — | | | | 1,289,203 | |
U.S. Government and Agency Obligations | | | — | | | | 274,993 | | | | — | | | | 274,993 | |
Derivatives: | | | | | | | | | | | | | | | | |
Futures Contracts** | | | 11,781 | | | | — | | | | — | | | | 11,781 | |
Total | | $ | 10,427,128 | | | $ | 84,636,107 | | | $ | — | | | $ | 95,063,235 | |
| | | | |
| Intermediate Term Bond | | Level 1 | | | Level 2 | | | Level 3 | | | Total | |
Long-Term Investments*: | | | | | | | | | | | | | | | | |
Corporate Bonds | | $ | — | | | $ | 220,243,727 | | | $ | — | | | $ | 220,243,727 | |
Capital Preferred Securities | | | — | | | | 5,860,228 | | | | — | | | | 5,860,228 | |
Municipal Bonds | | | — | | | | 6,797,923 | | | | — | | | | 6,797,923 | |
U.S. Government and Agency Obligations | | | — | | | | 86,346,051 | | | | — | | | | 86,346,051 | |
Asset-Backed and Mortgage-Backed Securities | | | — | | | | 317,134,050 | | | | — | | | | 317,134,050 | |
Sovereign Debt | | | — | | | | 1,629,250 | | | | — | | | | 1,629,250 | |
Investments Purchased with Collateral from Securities Lending | | | 74,365,907 | | | | — | | | | — | | | | 74,365,907 | |
Short-Term Investments: | | | | | | | | | | | | | | | | |
Money-Market Funds | | | 62,484,880 | | | | — | | | | — | | | | 62,484,880 | |
U.S. Government and Agency Obligations | | | — | | | | 2,433,096 | | | | — | | | | 2,433,096 | |
Derivatives: | | | | | | | | | | | | | | | | |
Interest Rate Swaps** | | | — | | | | (1,530,864 | ) | | | — | | | | (1,530,864 | ) |
Futures Contracts** | | | (37,154 | ) | | | — | | | | — | | | | (37,154 | ) |
Total | | $ | 136,813,633 | | | $ | 638,913,461 | | | $ | — | | | $ | 775,727,094 | |
| | | | |
| Short Term Bond | | Level 1 | | | Level 2 | | | Level 3 | | | Total | |
Long-Term Investments*: | | | | | | | | | | | | | | | | |
Corporate Bonds | | $ | — | | | $ | 413,715,646 | | | $ | — | | | $ | 413,715,646 | |
Municipal Bonds | | | — | | | | 32,708,378 | | | | — | | | | 32,708,378 | |
U.S. Government and Agency Obligations | | | — | | | | 29,610,280 | | | | — | | | | 29,610,280 | |
Asset-Backed and Mortgage-Backed Securities | | | — | | | | 384,599,882 | | | | — | | | | 384,599,882 | |
Sovereign Debt | | | — | | | | 12,119,061 | | | | — | | | | 12,119,061 | |
Structured Notes | | | — | | | | 1,737,295 | | | | — | | | | 1,737,295 | |
Investments Purchased with Collateral from Securities Lending | | | 85,229,787 | | | | — | | | | — | | | | 85,229,787 | |
Short-Term Investments: | | | | | | | | | | | | | | | | |
Money-Market Funds | | | 78,112,244 | | | | — | | | | — | | | | 78,112,244 | |
U.S. Government and Agency Obligations | | | — | | | | 2,838,182 | | | | — | | | | 2,838,182 | |
Derivatives: | | | | | | | | | | | | | | | | |
Interest Rate Swaps** | | | — | | | | (1,098,152 | ) | | | — | | | | (1,098,152 | ) |
Futures Contracts** | | | (167,005 | ) | | | — | | | | — | | | | (167,005 | ) |
Total | | $ | 163,175,026 | | | $ | 876,230,572 | | | $ | — | | | $ | 1,039,405,598 | |
| * | Refer to the Fund’s Portfolio of Investments for industry classifications. |
| ** | Represents net unrealized appreciation (depreciation) as reported in the Fund’s Portfolio of Investments. |
| | | | | | | | | | | | | | | | |
| Strategic Income | | Level 1 | | | Level 2 | | | Level 3 | | | Total | |
Long-Term Investments*: | | | | | | | | | | | | | | | | |
Common Stocks | | $ | — | | | $ | — | | | $ | 5,993 | | | $ | 5,993 | |
$25 Par (or similar) Preferred Securities | | | 12,054,413 | | | | 3,664,316 | | | | — | | | | 15,718,729 | |
Corporate Bonds | | | — | | | | 389,690,124 | | | | — | | | | 389,690,124 | |
Convertible Bonds | | | — | | | | 3,203,546 | | | | — | | | | 3,203,546 | |
Capital Preferred Securities | | | — | | | | 21,997,914 | | | | — | | | | 21,997,914 | |
Municipal Bonds | | | — | | | | 4,278,873 | | | | — | | | | 4,278,873 | |
Asset-Backed and Mortgage-Backed Securities | | | — | | | | 154,928,995 | | | | — | | | | 154,928,995 | |
Investment Companies | | | 1,260,640 | | | | — | | | | — | | | | 1,260,640 | |
Sovereign Debt | | | — | | | | 16,192,240 | | | | — | | | | 16,192,240 | |
Structured Notes | | | — | | | | 645,281 | | | | — | | | | 645,281 | |
Investments Purchased with Collateral from Securities Lending | | | 71,979,473 | | | | — | | | | — | | | | 71,979,473 | |
Short-Term Investments: | | | | | | | | | | | | | | | | |
Money-Market Funds | | | 16,619,491 | | | | — | | | | — | | | | 16,619,491 | |
U.S. Government and Agency Obligations | | | — | | | | 2,878,408 | | | | — | | | | 2,878,408 | |
Derivatives: | | | | | | | | | | | | | | | | |
Forward Foreign Currency Exchange Contracts** | | | — | | | | 970,138 | | | | — | | | | 970,138 | |
Credit Default Swaps** | | | — | | | | 405,979 | | | | — | | | | 405,979 | |
Interest Rate Swaps** | | | — | | | | (1,899,851 | ) | | | — | | | | (1,899,851 | ) |
Futures Contracts** | | | (311,297 | ) | | | — | | | | — | | | | (311,297 | ) |
Total | | $ | 101,602,720 | | | $ | 596,955,963 | | | $ | 5,993 | | | $ | 698,564,676 | |
| * | Refer to the Fund’s Portfolio of Investments for industry classifications and breakdown of securities classified as Level 3 and a breakdown of $25 Par (or similar) Preferred Securities classified as Level 2. |
| ** | Represents net unrealized appreciation (depreciation) as reported in the Fund’s Portfolio of Investments. |
The Nuveen funds’ Board of Directors/Trustees is responsible for the valuation process and has delegated the oversight of the daily valuation process to the Adviser’s Valuation Committee. The Valuation Committee, pursuant to the valuation policies and procedures adopted by the Board of Directors/Trustees, is responsible for making fair value determinations, evaluating the effectiveness of the funds’ pricing policies, and reporting to the Board of Directors/Trustees. The Valuation Committee is aided in its efforts by the Adviser’s dedicated Securities Valuation Team, which is responsible for administering the daily valuation process and applying fair value methodologies as approved by the Valuation Committee. When determining the reliability of independent pricing services for investments owned by the funds, the Valuation Committee, among other things, conducts due diligence reviews of the pricing services and monitors the quality of security prices received through various testing reports conducted by the Securities Valuation Team.
The Valuation Committee will consider pricing methodologies it deems relevant and appropriate when making fair value determinations. Examples of possible methodologies include, but are not limited to, multiple of earnings; discount from market of a similar freely traded security; discounted cash-flow analysis; book value or a multiple thereof; risk premium/yield analysis; yield to maturity; and/or fundamental investment analysis. The Valuation Committee will also consider factors it deems relevant and appropriate in light of the facts and circumstances. Examples of possible factors include, but are not limited to, the type of security; the issuer’s financial statements; the purchase price of the security; the discount from market value of unrestricted securities of the same class at the time of purchase; analysts’ research and observations from financial institutions; information regarding any transactions or offers with respect to the security; the existence of merger proposals or tender offers affecting the security; the price and extent of public trading in similar securities of the issuer or comparable companies; and the existence of a shelf registration for restricted securities.
For each portfolio security that has been fair valued pursuant to the policies adopted by the Board of Directors/Trustees, the fair value price is compared against the last available and next available market quotations. The Valuation Committee reviews the results of such testing and fair valuation occurrences are reported to the Board of Directors/Trustees.
3. Derivative Instruments and Hedging Activities
The Funds record derivative instruments at fair value, with changes in fair value recognized on the Statement of Operations, when applicable. Even though the Funds’ investments in derivatives may represent economic hedges, they are not considered to be hedge transactions for financial reporting purposes. For additional information on the derivative instruments in which each Fund was invested during and at the end of the reporting period, refer to the Portfolios of Investments, Financial Statements and Footnote 1 – General Information and Significant Accounting Policies.
Notes to Financial Statements (continued)
The following tables present the fair value of all derivative instruments held by the Funds as of June 30, 2012, the location of these instruments on the Statement of Assets and Liabilities, and the primary underlying risk exposure.
| | | | | | | | | | | | | | |
| Core Plus Bond | |
| | | | | Location on the Statements of Assets and Liabilities | |
Underlying
Risk Exposure | | Derivative Instrument | | Asset Derivatives | | | Liability Derivatives | |
| | | Location | | Value | | | Location | | Value | |
Interest Rate | | Futures
Contracts | | Deposits with brokers for open
futures contracts and
Receivable for variation margin
on futures contracts* | | $ | 223,316 | | | Deposits with brokers for open
futures contracts and
Receivable for variation margin
on futures contracts* | | $ | (784,462 | ) |
Interest Rate | | Swaps | | — | | | — | | | Unrealized depreciation on
interest rate swaps** | | | (2,423,505 | ) |
Total | | | | | | $ | 223,316 | | | | | $ | (3,207,967 | ) |
| | | | |
| High Income Bond | | | | | | | | | | |
| | | | | Location on the Statements of Assets and Liabilities | |
Underlying
Risk Exposure | | Derivative
Instrument | | Asset Derivatives | | | Liability Derivatives | |
| | | Location | | Value | | | Location | | Value | |
Interest Rate | | Futures
Contracts | | Deposits with brokers for open
futures contracts and
Payable for variation margin on
futures contracts* | | $ | 12,132 | | | — | | | $ — | |
| * | Value represents unrealized appreciation (depreciation) of futures contracts as reported in the Fund’s Portfolio of Investments, and not the deposits with brokers, if any, or the receivable or payable for variation margin presented on the Statement of Assets and Liabilities. |
| ** | Some swap contracts require a counterparty to pay or receive a premium, which is disclosed on the Statement of Assets and Liabilities but is not reflected in the unrealized appreciation (depreciation) presented above. |
| | | | | | | | | | | | | | |
|
| Inflation Protected Securities | |
| | | | | Location on the Statements of Assets and Liabilities | |
Underlying
Risk Exposure | | Derivative
Instrument | | Asset Derivatives | | | Liability Derivatives | |
| | | Location | | Value | | | Location | | Value | |
Foreign Currency
Exchange Rate | | Forward Foreign
Currency Exchange
Contracts | | — | | | $ — | | | Unrealized depreciation on
forward foreign currency
exchange contracts | | | $(110,837) | |
Interest Rate | | Futures
Contracts | | Deposits with brokers for
open futures contracts and
Payable for variation margin
on futures contracts* | | | 4,021 | | | Deposits with brokers for
open futures contracts and
Payable for variation margin
on futures contracts* | | | (10,348) | |
Interest Rate | | Swaps | | — | | | — | | | Unrealized depreciation on
interest rate swaps** | | | (348,311) | |
Total | | | | | | | $4,021 | | | | | | $(469,496) | |
|
| Intermediate Government Bond | |
| | | Location on the Statements of Assets and Liabilities | |
Underlying Risk Exposure | | Derivative
Instrument | | Asset Derivatives | | | Liability Derivatives | |
| | | Location | | Value | | | Location | | Value | |
Interest Rate | | Futures
Contracts | | Deposits with brokers for
open futures contracts and
Payable for variation margin
on futures contracts* | | | $20,193 | | | Deposits with brokers for
open futures contracts and
Payable for variation margin
on futures contracts* | | | $(8,412) | |
|
| Intermediate Term Bond | |
| | | Location on the Statements of Assets and Liabilities | |
| | | |
Underlying Risk Exposure | | Derivative Instrument | | Asset Derivatives | | | Liability Derivatives | |
| | | Location | | Value | | | Location | | Value | |
Interest Rate | | Futures
Contracts | | Deposits with brokers for
open futures contracts and
Payable for variation margin
on futures contracts* | | | $65,813 | | | Deposits with brokers for
open futures contracts and
Payable for variation margin
on futures contracts* | | | $ (102,967) | |
Interest Rate | | Swaps | | — | | | — | | | Unrealized depreciation on
interest rate swaps** | | | (1,530,864) | |
Total | | | | | | | $65,813 | | | | | | $(1,633,831) | |
| | | | | | | | | | | | | | |
|
| Short Term Bond | |
| | | | | Location on the Statements of Assets and Liabilities | |
| | | |
Underlying Risk Exposure | | Derivative Instrument | | Asset Derivatives | | | Liability Derivatives | |
| | | Location | | Value | | | Location | | Value | |
Interest Rate | | Futures
Contracts | | Deposits with brokers for open
futures contracts and
Receivable for variation margin
on futures contracts* | | | $3,854 | | | Deposits with brokers for
open futures contracts and
Receivable for variation margin
on futures contracts* | | | $ (170,859) | |
Interest Rate | | Swaps | | — | | | — | | | Unrealized depreciation on
interest rate swaps** | | | (1,098,152) | |
Total | | | | | | | $3,854 | | | | | | $(1,269,011) | |
| | | | | | | | | | | | | | |
| Strategic Income | |
| | | | | Location on the Statements of Assets Liabilities | |
Underlying
Risk Exposure | | Derivative
Instrument | | Asset Derivatives | | | Liability Derivatives | |
| | | Location | | Value | | | Location | | Value | |
Foreign Currency Exchange Rate | | Forward Foreign
Currency Exchange
Contracts | | Unrealized appreciation on
forward foreign currency
exchange contracts | | $ | 1,473,882 | | | Unrealized deppreciation on
forward foreign currency
exchange contracts | | | $ (503,744) | |
Interest Rate | | Futures
Contracts | | Deposits with brokers for open
futures contracts and
Receivable for variation margin
on futures contracts* | | | 49,239 | | | Deposits with brokers for
open futures contracts and
Receivable for variation margin
on futures contracts* | | | (360,536) | |
Credit | | Swaps | | Unrealized appreciation on
credit default swaps** | | | 405,979 | | | — | | | — | |
Interest Rate | | Swaps | | — | | | — | | | Unrealized depreciation on
interest rate swaps** | | | (1,899,851) | |
Total | | | | | | $ | 1,929,100 | | | | | | $(2,764,131) | |
| * | Value represents unrealized appreciation (depreciation) of futures contracts as reported in the Fund’s Portfolio of Investments, and not the deposits with brokers, if any, or the receivable or payable for variation margin presented on the Statement of Assets and Liabilities. |
| ** | Some swap contracts require a counterparty to pay or receive a premium, which is disclosed on the Statement of Assets and Liabilities but is not reflected in the unrealized appreciation (depreciation) presented above. |
The following tables present the amount of net realized gain (loss) and change in net unrealized appreciation (depreciation) recognized for the fiscal year ended June 30, 2012, on derivative instruments, as well as the primary risk exposure associated with each.
| | | | | | | | | | | | |
| Net Realized Gain (Loss) from Forward Foreign Currency Exchange Contracts | | Inflation
Protected
Securities | | | Short Term
Bond | | | Strategic
Income | |
Risk Exposure | | | | | | | | | | | | |
Foreign Currency Exchange Rate | | $ | 167,168 | | | $ | (149,386 | ) | | $ | (102,811 | ) |
| | | | | | | | | | | | | | | | | | | | | | | | | | | | |
| Net Realized Gain (Loss) from Futures Contracts | | Core Plus
Bond | | | High Income
Bond | | | Inflation
Protected
Securities | | | Intermediate
Government
Bond | | | Intermediate
Term Bond | | | Short Term
Bond | | | Strategic
Income | |
Risk Exposure | | | | | | | | | | | | | | | | | | | | | | | | | | | | |
Interest Rate | | $ | (7,955,883 | ) | | $ | (67,967 | ) | | $ | 87,346 | | | $ | 685,111 | | | $ | (1,294,926 | ) | | $ | (7,223,699 | ) | | $ | (7,783,002 | ) |
Foreign Currency Exchange Rate | | | — | | | | — | | | | (26,717 | ) | | | — | | | | — | | | | — | | | | 63,713 | |
Total | | $ | (7,955,883 | ) | | $ | (67,967 | ) | | $ | 60,629 | | | $ | 685,111 | | | $ | (1,294,926 | ) | | $ | (7,223,699 | ) | | $ | (7,719,289 | ) |
| | | | | | |
| Net Realized Gain (Loss) from Options Purchased | | | | Strategic
Income | |
Risk Exposure | | | | | | |
Interest Rate | | | | $ | (1,715,583 | ) |
| | | | | | | | |
| Net Realized Gain (Loss) from Options Written | | | | | | Strategic
Income | |
Risk Exposure | | | | | | | | |
Interest Rate | | | | | | $ | (321,084 | ) |
Notes to Financial Statements (continued)
| | | | | | | | | | | | | | | | | | | | |
| Net Realized Gain (Loss) from Swaps | | Core Plus
Bond | | | Inflation
Protected
Securities | | | Intermediate
Term Bond | | | Short Term
Bond | | | Strategic
Income | |
Risk Exposure | | | | | | | | | | | | | | | | | | | | |
Interest Rate | | $ | (1,507,818 | ) | | $ | (161,760 | ) | | $ | (859,380 | ) | | $ | (647,753 | ) | | $ | (1,482,779 | ) |
Credit | | | (218,137 | ) | | | 33,817 | | | | 91,412 | | | | (1,540,251 | ) | | | 599,067 | |
Total | | $ | (1,725,955 | ) | | $ | (127,943 | ) | | $ | (767,968 | ) | | $ | (2,188,004 | ) | | $ | (883,712 | ) |
| | | | | | | | | | | | |
Change in Net Unrealized Appreciation (Depreciation) of
Forward Foreign Currency Exchange Contracts | | Inflation
Protected
Securities | | | Short Term
Bond | | | Strategic
Income | |
Risk Exposure | | | | | | | | | | | | |
Foreign Currency Exchange Rate | | $ | (110,837 | ) | | $ | 92,822 | | | $ | 956,394 | |
| | | | | | | | | | | | | | | | | | | | | | | | | | | | |
Change in Net Unrealized Appreciation
(Depreciation) of Futures Contracts | | Core Plus
Bond | | | High Income
Bond | | | Inflation
Protected
Securities | | | Intermediate
Government
Bond | | | Intermediate
Term Bond | | | Short Term
Bond | | | Strategic
Income | |
Risk Exposure | | | | | | | | | | | | | | | | | | | | | | | | | | | | |
Interest Rate | | $ | (1,449,836 | ) | | $ | 12,132 | | | $ | (76,210 | ) | | $ | 22,105 | | | $ | (132,059 | ) | | $ | 458,809 | | | $ | (464,930 | ) |
Foreign Currency Exchange Rate | | | — | | | | — | | | | (6,483 | ) | | | — | | | | — | | | | — | | | | (44,833 | ) |
Total | | $ | (1,449,836 | ) | | $ | 12,132 | | | $ | (82,693 | ) | | $ | 22,105 | | | $ | (132,059 | ) | | $ | 458,809 | | | $ | (509,763 | ) |
| | | | |
| Change in Net Unrealized Appreciation (Depreciation) of Options Written | | Strategic
Income | |
Risk Exposure | | | | |
Interest Rate | | $ | (113,961 | ) |
| | | | | | | | | | | | | | | | | | | | |
| Change in Net Unrealized Appreciation (Depreciation) of Swaps | | Core Plus
Bond | | | Inflation
Protected
Securities | | | Intermediate
Term Bond | | | Short Term
Bond | | | Strategic
Income | |
Risk Exposure | | | | | | | | | | | | | | | | | | | | |
Interest Rate | | $ | 52,980 | | | $ | (44,170 | ) | | $ | (72,804 | ) | | $ | (60,869 | ) | | $ | (713,379 | ) |
Credit | | | — | | | | — | | | | — | | | | (453,310 | ) | | | 222,300 | |
Total | | $ | 52,980 | | | $ | (44,170 | ) | | $ | (72,804 | ) | | $ | (514,179 | ) | | $ | (491,079 | ) |
4. Fund Shares
Transactions in Fund shares were as follows:
| | | | | | | | | | | | | | | | |
| | | Core Plus Bond | |
| | | Year Ended
6/30/12 | | | Year Ended
6/30/11 | |
| | | Shares | | | Amount | | | Shares | | | Amount | |
Shares sold: | | | | | | | | | | | | | | | | |
Class A | | | 500,717 | | | $ | 5,733,104 | | | | 739,911 | | | $ | 8,441,382 | |
Class B | | | 12,619 | | | | 144,475 | | | | 17,982 | | | | 203,380 | |
Class C | | | 140,378 | | | | 1,609,370 | | | | 86,233 | | | | 978,077 | |
Class R3 | | | 16,239 | | | | 188,517 | | | | 27,321 | | | | 313,512 | |
Class I | | | 9,137,840 | | | | 104,565,033 | | | | 12,988,525 | | | | 148,055,413 | |
Shares issued to shareholders due to reinvestment of distributions: | | | | | | | | | | | | | | | | |
Class A | | | 220,659 | | | | 2,545,073 | | | | 225,186 | | | | 2,576,357 | |
Class B | | | 3,444 | | | | 39,316 | | | | 6,385 | | | | 72,353 | |
Class C | | | 8,389 | | | | 96,377 | | | | 7,578 | | | | 86,359 | |
Class R3 | | | 1,029 | | | | 11,916 | | | | 1,436 | | | | 16,511 | |
Class I | | | 820,154 | | | | 9,450,344 | | | | 1,180,846 | | | | 13,504,298 | |
| | | | 10,861,468 | | | | 124,383,525 | | | | 15,281,403 | | | | 174,247,642 | |
Shares redeemed: | | | | | | | | | | | | | | | | |
Class A | | | (1,083,218 | ) | | | (12,424,968 | ) | | | (1,775,546 | ) | | | (20,295,173 | ) |
Class B | | | (86,925 | ) | | | (993,749 | ) | | | (189,658 | ) | | | (2,141,012 | ) |
Class C | | | (77,268 | ) | | | (886,862 | ) | | | (107,908 | ) | | | (1,228,683 | ) |
Class R3 | | | (23,546 | ) | | | (273,326 | ) | | | (29,374 | ) | | | (338,082 | ) |
Class I | | | (29,122,019 | ) | | | (335,260,689 | ) | | | (38,436,240 | ) | | | (438,887,826 | ) |
| | | | (30,392,976 | ) | | | (349,839,594 | ) | | | (40,538,726 | ) | | | (462,890,776 | ) |
Net increase (decrease) | | | (19,531,508 | ) | | $ | (225,456,069 | ) | | | (25,257,323 | ) | | $ | (288,643,134 | ) |
| | | | | | | | | | | | | | | | |
| | | High Income Bond | |
| | | Year Ended
6/30/12 | | | Year Ended
6/30/11 | |
| | | Shares | | | Amount | | | Shares | | | Amount | |
Shares issued from reorganization(1) | | | | | | | | | | | | | | | | |
Class A | | | 4,133,109 | | | $ | 35,167,855 | | | | — | | | $ | — | |
Class B | | | 163,999 | | | | 1,387,561 | | | | — | | | | — | |
Class C | | | 4,108,173 | | | | 34,868,833 | | | | — | | | | — | |
Class R3 | | | 19,055 | | | | 165,597 | | | | — | | | | — | |
Class I | | | 3,904,626 | | | | 33,281,132 | | | | — | | | | — | |
Shares sold: | | | | | | | | | | | | | | | | |
Class A | | | 8,376,950 | | | | 71,391,195 | | | | 1,650,992 | | | | 14,838,874 | |
Class B | | | 5,088 | | | | 43,660 | | | | 19,049 | | | | 169,668 | |
Class C | | | 999,418 | | | | 8,595,927 | | | | 389,589 | | | | 3,433,409 | |
Class R3 | | | 135,756 | | | | 1,217,248 | | | | 13,462 | | | | 120,809 | |
Class I | | | 17,159,651 | | | | 147,739,851 | | | | 23,259,633 | | | | 207,460,114 | |
Shares issued to shareholders due to reinvestment of distributions: | | | | | | | | | | | | | | | | |
Class A | | | 523,508 | | | | 4,489,426 | | | | 176,972 | | | | 1,585,996 | |
Class B | | | 12,326 | | | | 104,932 | | | | 8,949 | | | | 79,362 | |
Class C | | | 207,228 | | | | 1,772,807 | | | | 34,726 | | | | 309,592 | |
Class R3 | | | 1,363 | | | | 11,950 | | | | 1,322 | | | | 12,042 | |
Class I | | | 704,977 | | | | 6,048,169 | | | | 418,652 | | | | 3,767,847 | |
| | | | 40,455,227 | | | | 346,286,143 | | | | 25,973,346 | | | | 231,777,713 | |
Shares redeemed: | | | | | | | | | | | | | | | | |
Class A | | | (5,802,411 | ) | | | (49,818,043 | ) | | | (1,968,596 | ) | | | (17,662,560 | ) |
Class B | | | (110,048 | ) | | | (938,652 | ) | | | (82,748 | ) | | | (738,327 | ) |
Class C | | | (755,495 | ) | | | (6,448,153 | ) | | | (182,453 | ) | | | (1,639,458 | ) |
Class R3 | | | (119,848 | ) | | | (1,075,705 | ) | | | (21,956 | ) | | | (199,270 | ) |
Class I | | | (18,907,106 | ) | | | (161,530,004 | ) | | | (15,012,748 | ) | | | (135,161,862 | ) |
| | | | (25,694,908 | ) | | | (219,810,557 | ) | | | (17,268,501 | ) | | | (155,401,477 | ) |
Net increase (decrease) | | | 14,760,319 | | | $ | 126,475,586 | | | | 8,704,845 | | | $ | 76,376,236 | |
| | | | | | | | | | | | | | | | |
| | | Inflation Protected Securities | |
| | | Year Ended
6/30/12 | | | Year Ended
6/30/11 | |
| | | Shares | | | Amount | | | Shares | | | Amount | |
Shares sold: | | | | | | | | | | | | | | | | |
Class A | | | 1,148,919 | | | $ | 13,357,415 | | | | 767,899 | | | $ | 8,151,301 | |
Class C | | | 308,270 | | | | 3,567,603 | | | | 361,379 | | | | 3,784,383 | |
Class R3 | | | 11,772 | | | | 134,949 | | | | 11,683 | | | | 120,988 | |
Class I | | | 11,421,540 | | | | 131,854,663 | | | | 13,307,322 | | | | 141,165,603 | |
Shares issued to shareholders due to reinvestment of distributions: | | | | | | | | | | | | | | | | |
Class A | | | 33,652 | | | | 389,254 | | | | 9,307 | | | | 98,001 | |
Class C | | | 11,715 | | | | 134,408 | | | | 3,791 | | | | 39,158 | |
Class R3 | | | 273 | | | | 3,148 | | | | 787 | | | | 8,126 | |
Class I | | | 90,217 | | | | 1,044,605 | | | | 32,413 | | | | 342,097 | |
| | | | 13,026,358 | | | | 150,486,045 | | | | 14,494,581 | | | | 153,709,657 | |
Shares redeemed: | | | | | | | | | | | | | | | | |
Class A | | | (648,265 | ) | | | (7,460,886 | ) | | | (437,134 | ) | | | (4,664,545 | ) |
Class C | | | (234,350 | ) | | | (2,658,785 | ) | | | (274,364 | ) | | | (2,898,304 | ) |
Class R3 | | | (359 | ) | | | (4,024 | ) | | | (138,661 | ) | | | (1,499,576 | ) |
Class I | | | (7,586,477 | ) | | | (87,945,231 | ) | | | (5,230,534 | ) | | | (55,702,040 | ) |
| | | | (8,469,451 | ) | | | (98,068,926 | ) | | | (6,080,693 | ) | | | (64,764,465 | ) |
Net increase (decrease) | | | 4,556,907 | | | $ | 52,417,119 | | | | 8,413,888 | | | $ | 88,945,192 | |
| (1) | Refer to Footnote 8 – Fund Reorganizations for further details. |
Notes to Financial Statements (continued)
| | | | | | | | | | | | | | | | |
| | | Intermediate Government Bond | |
| | | Year Ended
6/30/12 | | | Year Ended
6/30/11 | |
| | | Shares | | | Amount | | | Shares | | | Amount | |
Shares sold: | | | | | | | | | | | | | | | | |
Class A | | | 178,128 | | | $ | 1,591,327 | | | | 173,561 | | | $ | 1,525,111 | |
Class C | | | 38,907 | | | | 351,437 | | | | 12,516 | | | | 110,627 | |
Class R3 | | | 18,053 | | | | 162,281 | | | | 19,974 | | | | 176,060 | |
Class I | | | 1,166,929 | | | | 10,484,839 | | | | 3,520,661 | | | | 31,232,348 | |
Shares issued to shareholders due to reinvestment of distributions: | | | | | | | | | | | | | | | | |
Class A | | | 27,174 | | | | 244,409 | | | | 36,212 | | | | 319,580 | |
Class C | | | 1,554 | | | | 13,986 | | | | 1,965 | | | | 17,345 | |
Class R3 | | | 906 | | | | 8,138 | | | | 1,094 | | | | 9,648 | |
Class I | | | 65,224 | | | | 586,776 | | | | 120,943 | | | | 1,069,967 | |
| | | | 1,496,875 | | | | 13,443,193 | | | | 3,886,926 | | | | 34,460,686 | |
Shares redeemed: | | | | | | | | | | | | | | | | |
Class A | | | (387,337 | ) | | | (3,470,787 | ) | | | (783,079 | ) | | | (6,899,469 | ) |
Class C | | | (41,502 | ) | | | (372,466 | ) | | | (75,320 | ) | | | (662,950 | ) |
Class R3 | | | (48,768 | ) | | | (439,122 | ) | | | (41,853 | ) | | | (367,926 | ) |
Class I | | | (4,661,587 | ) | | | (41,906,408 | ) | | | (9,789,951 | ) | | | (86,411,851 | ) |
| | | | (5,139,194 | ) | | | (46,188,783 | ) | | | (10,690,203 | ) | | | (94,342,196 | ) |
Net increase (decrease) | | | (3,642,319 | ) | | $ | (32,745,590 | ) | | | (6,803,277 | ) | | $ | (59,881,510 | ) |
| | | | | | | | | | | | | | | | |
| |
| | | Intermediate Term Bond | |
| | | Year Ended
6/30/12 | | | Year Ended
6/30/11 | |
| | | Shares | | | Amount | | | Shares | | | Amount | |
Shares sold: | | | | | | | | | | | | | | | | |
Class A | | | 247,851 | | | $ | 2,354,945 | | | | 235,816 | | | $ | 2,473,051 | |
Class C | | | 124,652 | | | | 1,314,107 | | | | 110,331 | | | | 1,158,886 | |
Class I | | | 15,553,631 | | | | 163,251,078 | | | | 14,005,870 | | | | 146,339,922 | |
Shares issued to shareholders due to reinvestment of distributions: | | | | | | | | | | | | | | | | |
Class A | | | 52,085 | | | | 550,277 | | | | 60,797 | | | | 637,739 | |
Class C | | | 713 | | | | 7,546 | | | | 12 | | | | 124 | |
Class I | | | 521,026 | | | | 5,491,331 | | | | 542,928 | | | | 5,673,065 | |
| | | | 16,499,958 | | | | 172,969,284 | | | | 14,955,754 | | | | 156,282,787 | |
Shares redeemed: | | | | | | | | | | | | | | | | |
Class A | | | (455,381 | ) | | | (4,540,092 | ) | | | (697,452 | ) | | | (7,294,394 | ) |
Class C | | | (88,127 | ) | | | (933,248 | ) | | | — | | | | — | |
Class I | | | (20,647,842 | ) | | | (217,189,544 | ) | | | (22,971,286 | ) | | | (239,504,629 | ) |
| | | | (21,191,350 | ) | | | (222,662,884 | ) | | | (23,668,738 | ) | | | (246,799,023 | ) |
Net increase (decrease) | | | (4,691,392 | ) | | $ | (49,693,600 | ) | | | (8,712,984 | ) | | $ | (90,516,236 | ) |
| | | | | | | | | | | | | | | | |
| | | Short Term Bond | |
| | | Year Ended
6/30/12 | | | Year Ended
6/30/11 | |
| | | Shares | | | Amount | | | Shares | | | Amount | |
Shares issued from reorganization(1) | | | | | | | | | | | | | | | | |
Class A | | | 6,085,212 | | | $ | 59,925,259 | | | | — | | | $ | — | |
Class C | | | 4,652,150 | | | | 45,914,917 | | | | — | | | | — | |
Class R3 | | | 50,150 | | | | 494,189 | | | | — | | | | — | |
Class I | | | 4,827,535 | | | | 47,552,148 | | | | — | | | | — | |
Shares sold: | | | | | | | | | | | | | | | | |
Class A | | | 1,287,324 | | | | 12,810,199 | | | | 1,655,986 | | | | 16,621,982 | |
Class C | | | 576,630 | | | | 5,703,964 | | | | 372,306 | | | | 3,743,761 | |
Class R3 | | | 14,757 | | | | 146,434 | | | | — | | | | — | |
Class I | | | 36,919,806 | | | | 367,316,769 | | | | 50,235,884 | | | | 504,500,225 | |
Shares issued to shareholders due to reinvestment of distributions: | | | | | | | | | | | | | | | | |
Class A | | | 213,454 | | | | 2,119,111 | | | | 146,493 | | | | 1,472,256 | |
Class C | | | 42,037 | | | | 418,429 | | | | 4,431 | | | | 44,644 | |
Class I | | | 362,732 | | | | 3,601,315 | | | | 337,451 | | | | 3,393,367 | |
| | | | 55,031,787 | | | | 546,002,734 | | | | 52,752,551 | | | | 529,776,235 | |
Shares redeemed: | | | | | | | | | | | | | | | | |
Class A | | | (4,287,115 | ) | | | (42,534,725 | ) | | | (2,540,178 | ) | | | (25,519,931 | ) |
Class C | | | (1,530,200 | ) | | | (15,164,498 | ) | | | (181,937 | ) | | | (1,831,766 | ) |
Class R3 | | | (20,128 | ) | | | (198,825 | ) | | | — | | | | — | |
Class I | | | (42,737,411 | ) | | | (423,585,074 | ) | | | (39,873,032 | ) | | | (400,639,021 | ) |
| | | | (48,574,854 | ) | | | (481,483,122 | ) | | | (42,595,147 | ) | | | (427,990,718 | ) |
Net increase (decrease) | | | 6,456,933 | | | $ | 64,519,612 | | | | 10,157,404 | | | $ | 101,785,517 | |
| |
| | | Strategic Income | |
| | | Year Ended
6/30/12 | | | Year Ended
6/30/11 | |
| | | Shares | | | Amount | | | Shares | | | Amount | |
Shares issued from reorganization(1) | | | | | | | | | | | | | | | | |
Class A | | | 2,657,808 | | | $ | 28,166,954 | | | | — | | | $ | — | |
Class B | | | 147,656 | | | | 1,556,581 | | | | — | | | | — | |
Class C | | | 2,026,122 | | | | 21,334,881 | | | | — | | | | — | |
Class R3 | | | 7,780 | | | | 82,781 | | | | — | | | | — | |
Class I | | | 2,831,674 | | | | 29,987,500 | | | | — | | | | — | |
Shares sold: | | | | | | | | | | | | | | | | |
Class A | | | 1,254,225 | | | | 13,398,501 | | | | 1,109,596 | | | | 11,696,584 | |
Class B | | | 18,508 | | | | 197,468 | | | | 10,094 | | | | 106,218 | |
Class C | | | 644,248 | | | | 6,757,921 | | | | 254,294 | | | | 2,677,654 | |
Class R3 | | | 106,784 | | | | 1,136,998 | | | | 74,411 | | | | 795,061 | |
Class I | | | 9,257,272 | | | | 98,728,791 | | | | 11,952,101 | | | | 126,639,104 | |
Shares issued to shareholders due to reinvestment of distributions: | | | | | | | | | | | | | | | | |
Class A | | | 122,265 | | | | 1,308,933 | | | | 81,898 | | | | 871,022 | |
Class B | | | 4,902 | | | | 52,181 | | | | 3,730 | | | | 39,447 | |
Class C | | | 47,736 | | | | 508,435 | | | | 15,785 | | | | 166,894 | |
Class R3 | | | 4,511 | | | | 48,454 | | | | 3,372 | | | | 36,067 | |
Class I | | | 598,788 | | | | 6,388,338 | | | | 694,381 | | | | 7,382,267 | |
| | | | 19,730,279 | | | | 209,654,717 | | | | 14,199,662 | | | | 150,410,318 | |
Shares redeemed: | | | | | | | | | | | | | | | | |
Class A | | | (1,494,989 | ) | | | (16,025,373 | ) | | | (1,597,754 | ) | | | (17,009,324 | ) |
Class B | | | (76,386 | ) | | | (811,517 | ) | | | (47,459 | ) | | | (502,827 | ) |
Class C | | | (589,951 | ) | | | (6,176,624 | ) | | | (171,781 | ) | | | (1,812,198 | ) |
Class R3 | | | (38,862 | ) | | | (402,358 | ) | | | (41,363 | ) | | | (443,188 | ) |
Class I | | | (20,718,369 | ) | | | (220,597,281 | ) | | | (19,091,253 | ) | | | (202,625,375 | ) |
| | | | (22,918,557 | ) | | | (244,013,153 | ) | | | (20,949,610 | ) | | | (222,392,912 | ) |
Net increase (decrease) | | | (3,188,278 | ) | | $ | (34,358,436 | ) | | | (6,749,948 | ) | | $ | (71,982,594 | ) |
| (1) | Refer to Footnote 8 – Fund Reorganizations for further details. |
Notes to Financial Statements (continued)
Class B Shares converted to Class A Shares (recognized as a component of as Class A Shares sold and Class B Shares redeemed) during the fiscal years ended June 30, 2012 and June 30, 2011, as follows:
| | | | | | | | |
| Fund | | Year Ended
6/30/12 | | | Year Ended
6/30/11 | |
Core Plus Bond | | | 99,454 | | | | 134,013 | |
High Income Bond | | | 83,412 | | | | 65,846 | |
Strategic Income | | | 52,641 | | | | 35,392 | |
5. Investment Transactions
Purchases and sales (including maturities but excluding short-term investments, derivative and dollar roll transactions, where applicable) during the fiscal year ended June 30, 2012, were as follows:
| | | | | | | | | | | | |
| | | Core Plus
Bond | | | High Income
Bond | | | Inflation
Protected
Securities | |
Purchases: | | | | | | | | | | | | |
Investment securities | | $ | 246,915,847 | | | $ | 680,155,868 | | | $ | 7,395,109 | |
U.S. Government and agency obligations | | | 653,334,406 | | | | 10,106 | | | | 170,901,080 | |
Sales and maturities: | | | | | | | | | | | | |
Investment securities | | | 375,211,405 | | | | 658,770,575 | | | | 25,126,343 | |
U.S. Government and agency obligations | | | 840,386,125 | | | | 62,479 | | | | 121,465,493 | |
| | | | | | | | | | | | | | | | |
| | | Intermediate
Government
Bond | | | Intermediate
Term Bond | | | Short Term
Bond | | | Strategic
Income | |
Purchases: | | | | | | | | | | | | | | | | |
Investment securities | | $ | 6,260,408 | | | $ | 195,273,805 | | | $ | 382,280,960 | | | $ | 342,526,294 | |
U.S. Government and agency obligations | | | 67,500,556 | | | | 288,253,731 | | | | 51,394,375 | | | | 955,045,739 | |
Sales and maturities: | | | | | | | | | | | | | | | | |
Investment securities | | | 7,678,432 | | | | 331,631,047 | | | | 454,240,549 | | | | 343,423,193 | |
U.S. Government and agency obligations | | | 90,838,117 | | | | 177,327,605 | | | | 61,570,779 | | | | 1,069,116,128 | |
Transactions in options written for Strategic Income during the fiscal year ended June 30, 2012, were as follows:
| | | | | | | | |
| | | Strategic Income | |
| | | Number of
Contracts | | | Premiums
Received | |
Outstanding, beginning of period | | | 911 | | | $ | 410,821 | |
Options written | | | — | | | | — | |
Options terminated in closing purchase transactions | | | (650 | ) | | | (316,172 | ) |
Options expired | | | (261 | ) | | | (94,649 | ) |
Outstanding, end of period | | | — | | | $ | — | |
6. Income Tax Information
The following information is presented on an income tax basis. Differences between amounts for financial statement and federal income tax purposes are primarily due to timing differences in recognizing certain gains and losses on investment transactions. To the extent that differences arise that are permanent in nature, such amounts are reclassified within the capital accounts as detailed below. Temporary differences do not require reclassification. Temporary and permanent differences do not impact the net asset values of the Funds.
At June 30, 2012, the cost and unrealized appreciation (depreciation) of investments (excluding investments in derivatives, where applicable), as determined on a federal income tax basis, were as follows:
| | | | | | | | | | | | |
| | | Core Plus
Bond | | | High Income
Bond | | | Inflation
Protected
Securities | |
Cost of investments | | $ | 897,348,355 | | | $ | 771,574,926 | | | $ | 346,131,819 | |
Gross unrealized: | | | | | | | | | | | | |
Appreciation | | | 53,068,635 | | | | 15,661,341 | | | | 28,759,183 | |
Depreciation | | | (14,263,396 | ) | | | (22,100,935 | ) | | | (987,830 | ) |
Net unrealized appreciation (depreciation) of investments | | $ | 38,805,239 | | | $ | (6,439,594 | ) | | $ | 27,771,353 | |
| | | | | | | | | | | | | | | | |
| | | Intermediate
Government
Bond | | | Intermediate
Term Bond | | | Short Term
Bond | | | Strategic
Income | |
Cost of investments | | $ | 92,210,245 | | | $ | 756,460,987 | | | $ | 1,032,158,111 | | | $ | 677,893,925 | |
Gross unrealized: | | | | | | | | | | | | | | | | |
Appreciation | | | 3,434,194 | | | | 22,838,014 | | | | 14,410,969 | | | | 36,933,834 | |
Depreciation | | | (592,985 | ) | | | (2,003,889 | ) | | | (5,898,325 | ) | | | (15,428,052 | ) |
Net unrealized appreciation (depreciation) of investments | | $ | 2,841,209 | | | $ | 20,834,125 | | | $ | 8,512,644 | | | $ | 21,505,782 | |
Permanent differences, primarily due to tax equalization, treatment of notional principal contracts, paydown adjustments, nondeductible reorganization expenses, expiration of capital loss carryforwards, distribution reclasses, Real Estate Investment Trust (REIT) adjustments and foreign currency reclassifications resulted in reclassifications among the Funds’ components of net assets at June 30, 2012, the Funds’ tax year end, as follows:
| | | | | | | | | | | | | | | | |
| | | Core Plus
Bond | | | High Income
Bond | | | Inflation
Protected
Securities | | | Intermediate
Government
Bond | |
Capital paid-in | | $ | (9 | ) | | $ | 1,846,382 | | | $ | (9 | ) | | $ | (831,018 | ) |
Undistributed (Over-distribution of) net investment income | | | (674,817 | ) | | | (22,223 | ) | | | 472,865 | | | | 113,877 | |
Accumulated net realized gain (loss) | | | 674,826 | | | | (1,824,159 | ) | | | (472,856 | ) | | | 717,141 | |
| | | | | | | | | | | | |
| | | Intermediate Term
Bond | | | Short Term
Bond | | | Strategic
Income | |
Capital paid-in | | $ | (9 | ) | | $ | 2,339,726 | | | $ | 2,034,058 | |
Undistributed (Over-distribution of) net investment income | | | (571,958 | ) | | | 140,314 | | | | 2,390,312 | |
Accumulated net realized gain (loss) | | | 571,967 | | | | (2,480,040 | ) | | | (4,424,370 | ) |
The tax components of undistributed net ordinary income and net long-term capital gains at June 30, 2012, the Funds’ tax year end, were as follows:
| | | | | | | | | | | | | | | | |
| | | Core Plus
Bond | | | High Income
Bond | | | Inflation
Protected
Securities | | | Intermediate
Government
Bond | |
Undistributed net ordinary income* | | $ | 2,363,793 | | | $ | 4,277,910 | | | $ | 2,126,549 | | | $ | 166,383 | |
Undistributed net long-term capital gains | | | — | | | | — | | | | — | | | | — | |
| | | | | | | | | | | | |
| | | Intermediate Term
Bond | | | Short Term
Bond | | | Strategic
Income | |
Undistributed net ordinary income* | | $ | — | | | $ | 1,697,472 | | | $ | 11,092,460 | |
Undistributed net long-term capital gains | | | 14,617,394 | | | | — | | | | — | |
| * | Undistributed net ordinary income (on a tax basis) has not been reduced for the dividend declared during the period June 1, 2012 through June 30, 2012 and paid on July 2, 2012. Net ordinary income consists of net taxable income derived from dividends, interest and net short-term capital gains, if any. |
The tax character of distributions paid during the Funds’ tax years ended June 30, 2012 and June 30, 2011, was designated for purposes of the dividends paid deduction as follows:
| | | | | | | | | | | | | | | | |
| 2012 | | Core Plus
Bond | | | High Income
Bond | | | Inflation
Protected
Securities | | | Intermediate
Government
Bond | |
Distributions from net ordinary income* | | $ | 36,167,948 | | | $ | 43,906,949 | | | $ | 10,896,873 | | | $ | 2,413,551 | |
Distributions from net long-term capital gains** | | | — | | | | 1,916,654 | | | | — | | | | — | |
| | | | | | | | | | | | |
| 2012 | | Intermediate
Term Bond | | | Short Term
Bond | | | Strategic
Income | |
Distributions from net ordinary income* | | $ | 19,971,210 | | | $ | 20,732,280 | | | $ | 27,006,884 | |
Distributions from net long-term capital gains** | | | 1,045,132 | | | | — | | | | — | |
| | | | | | | | | | | | | | | | |
| 2011 | | Core Plus
Bond | | | High Income
Bond | | | Inflation
Protected
Securities | | | Intermediate
Government
Bond | |
Distributions from net ordinary income* | | $ | 45,495,506 | | | $ | 35,278,315 | | | $ | 3,515,936 | | | $ | 3,252,733 | |
Distributions from net long-term capital gains | | | — | | | | — | | | | — | | | | — | |
| | | | | | | | | | | | |
| 2011 | | Intermediate Term
Bond | | | Short Term
Bond | | | Strategic
Income | |
Distributions from net ordinary income* | | $ | 24,424,866 | | | $ | 17,805,924 | | | $ | 28,966,679 | |
Distributions from net long-term capital gains | | | — | | | | — | | | | — | |
| * | Net ordinary income consists of net taxable income derived from dividends, interest and net short-term capital gains, if any. |
| ** | The Fund hereby designates as long-term capital gain dividend, pursuant to the Internal Revenue Code Section 852 (b)(3), the amount necessary to reduce earnings and profits of the Fund related to net capital gain to zero for the tax year ended June 30, 2012. |
Notes to Financial Statements (continued)
At June 30, 2012, the Funds’ tax year end, the following Funds had unused capital loss carryforwards available for federal income tax purposes to be applied against future capital gains, if any. If not applied, the carryforwards will expire as follows:
| | | | | | | | | | | | | | | | | | | | |
| | | Core Plus
Bond | | | Inflation
Protected
Securities | | | Intermediate
Government
Bond* | | | Short Term
Bond | | | Strategic
Income | |
Expiration: | | | | | | | | | | | | | | | | | | | | |
June 30, 2013 | | $ | — | | | $ | — | | | $ | — | | | $ | 54,933 | | | $ | — | |
June 30, 2014 | | | — | | | | — | | | | 1,385,257 | | | | 7,386,527 | | | | — | |
June 30, 2015 | | | — | | | | — | | | | 2,446,535 | | | | 7,432,482 | | | | — | |
June 30, 2016 | | | — | | | | — | | | | 164,695 | | | | 48,855 | | | | — | |
June 30, 2017 | | | — | | | | — | | | | 3,538,398 | | | | 1,188,199 | | | | 20,481,259 | |
June 30, 2018 | | | 558,658 | | | | 2,034,554 | | | | — | | | | 4,103,631 | | | | 37,557,087 | |
Total | | $ | 558,658 | | | $ | 2,034,554 | | | $ | 7,534,885 | | | $ | 20,214,627 | | | $ | 58,038,346 | |
| * | A portion of Intermediate Governments Bond’s capital loss carryforward is subject to an annual limitation under Internal Revenue Code and related regulations. |
During the Funds’ tax year ended June 30, 2012, the following Funds utilized their capital loss carryforwards as follows:
| | | | | | | | | | | | | | | | |
| | | Core Plus
Bond | | | Inflation
Protected
Securities | | | Intermediate
Government
Bond | | | Intermediate
Term Bond | |
Utilized capital loss carryforwards | | $ | 7,891,170 | | | $ | 8,015,525 | | | $ | 2,091,369 | | | $ | 1,696,796 | |
On December 22, 2010, the Regulated Investment Company Modernization Act of 2010 (the “Act”) was enacted, which changed various technical rules governing the tax treatment of RICs. The changes are generally effective for taxable years beginning after the date of enactment. One of the more prominent changes addresses capital loss carryforwards. Under the Act, each Fund will be permitted to carry forward capital losses incurred in taxable years beginning after the date of enactment for an unlimited period. However, any losses incurred during those future taxable years will be required to be utilized prior to the losses incurred in pre-enactment taxable years, which carry an expiration date. As a result of this ordering rule, pre-enactment capital loss carryforwards may be more likely to expire unused. Additionally, post-enactment capital loss carryforwards will retain their character as either short-term or long-term capital losses rather than being considered all short-term as permitted under previous regulation.
Finally, the Act also contains several provisions aimed at preserving the character of distributions made by a fiscal year RIC during the portion of its taxable year ending after October 31 or December 31, reducing the circumstances under which a RIC might be required to file amended Forms 1099 to restate previously reported distributions.
Capital losses incurred that will be carried forward under the provisions of the Act are as follows:
| | | | | | | | | | | | |
| | | High Income Bond | | | Short Term Bond | | | Strategic Income | |
Post-enactment losses: | | | | | | | | | | | | |
Short-term | | $ | 7,979,498 | | | $ | 6,054,023 | | | $ | 1,170,056 | |
Long-term | | | 372,407 | | | | — | | | | 235,891 | |
The Funds have elected to defer losses incurred from November 1, 2011 through June 30, 2012, the Funds’ tax year end, in accordance with federal income tax rules. These losses are treated as having arisen on the first day of the following fiscal year. The Funds have elected to defer losses as follows:
| | | | | | | | |
| | | High Income Bond | | | Short Term Bond | |
Post-October capital losses | | $ | 6,606,723 | | | $ | 606,405 | |
Late-year ordinary losses | | | — | | | | — | |
7. Management Fees and Other Transactions with Affiliates
Each Fund’s management fee consists of two components – a fund-level fee, based only on the amount of assets within each individual Fund, and a complex-level fee, based on the aggregate amount of all eligible fund assets managed by the Adviser. This pricing structure enables Fund shareholders to benefit from growth in the assets within their respective Fund as well as from growth in the amount of complex-wide assets managed by the Adviser.
The annual fund-level fee for each Fund, payable monthly, was calculated according to the following schedule:
| | | | | | | | | | | | | | | | | | | | | | | | | | | | |
| Average Daily Net Assets | | Core Plus
Bond
Fund-Level
Fee Rate** | | | High Income
Bond Fund-Level
Fee Rate* | | | Inflation
Protected
Securities
Fund-Level
Fee Rate** | | | Intermediate
Government
Bond
Fund-Level
Fee Rate** | | | Intermediate
Term Bond
Fund-Level
Fee Rate** | | | Short Term
Bond
Fund-Level
Fee Rate* | | | Strategic
Income
Fund-Level
Fee Rate*
| |
For the first $125 million | | | .4500 | % | | | .6000 | % | | | .4500 | % | | | .4500 | % | | | .4500 | % | | | .3000 | % | | | .4500 | % |
For the next $125 million | | | .4375 | | | | .5875 | | | | .4375 | | | | .4375 | | | | .4375 | | | | .2875 | | | | .4375 | |
For the next $250 million | | | .4250 | | | | .5750 | | | | .4250 | | | | .4250 | | | | .4250 | | | | .2750 | | | | .4250 | |
For the next $500 million | | | .4125 | | | | .5625 | | | | .4125 | | | | .4125 | | | | .4125 | | | | .2625 | | | | .4125 | |
For the next $1 billion | | | .4000 | | | | .5500 | | | | .4000 | | | | .4000 | | | | .4000 | | | | .2500 | | | | .4000 | |
For net assets over $2 billion | | | .3750 | | | | .5250 | | | | .3750 | | | | .3750 | | | | .3750 | | | | .2250 | | | | .3750 | |
| * | Effective for the period July 1, 2011 through October 30, 2011. |
| ** | Effective for the period July 1, 2011 through May 14, 2012. |
Effective October 31, 2011, the annual fund-level for the following Funds, payable monthly, was calculated according to the following schedule:
| | | | | | | | | | | | |
| Average Daily Net Assets | | High Income
Bond Fund-Level
Fee Rate*** | | | Short Term
Bond
Fund-Level
Fee
Rate*** | | | Strategic
Income Fund-Level
Fee Rate*** | |
For the first $125 million | | | .5000 | % | | | .2800 | % | | | .3600 | % |
For the next $125 million | | | .4875 | | | | .2675 | | | | .3475 | |
For the next $250 million | | | .4750 | | | | .2550 | | | | .3350 | |
For the next $500 million | | | .4625 | | | | .2425 | | | | .3225 | |
For the next $1 billion | | | .4500 | | | | .2300 | | | | .3100 | |
For net assets over $2 billion | | | .4250 | | | | .2050 | | | | .2850 | |
| *** | Effective for the period October 31, 2011 through May 14, 2012. |
Effective May 15, 2012, the annual fund-level fee rate for each Fund, payable monthly, is calculated according to the following schedule:
| | | | | | | | | | | | | | | | | | | | | | | | | | | | |
| Average Daily Net Assets | | Core Plus
Bond
Fund-Level
Fee Rate | | | High Income
Bond
Fund-Level
Fee Rate | | | Inflation
Protected
Securities
Fund-Level
Fee Rate | | | Intermediate
Government
Bond
Fund-Level
Fee Rate | | | Intermediate
Term Bond
Fund-Level
Fee Rate | | | Short Term
Bond
Fund-Level
Fee Rate | | | Strategic
Income
Fund-Level
Fee Rate | |
For the first $125 million | | | .2800 | % | | | .4000 | % | | | .2500 | % | | | .2700 | % | | | .2700 | % | | | .2200 | % | | | .3600 | % |
For the next $125 million | | | .2675 | | | | .3875 | | | | .2375 | | | | .2575 | | | | .2575 | | | | .2075 | | | | .3475 | |
For the next $250 million | | | .2550 | | | | .3750 | | | | .2250 | | | | .2450 | | | | .2450 | | | | .1950 | | | | .3350 | |
For the next $500 million | | | .2425 | | | | .3625 | | | | .2125 | | | | .2325 | | | | .2325 | | | | .1825 | | | | .3225 | |
For the next $1 billion | | | .2300 | | | | .3500 | | | | .2000 | | | | .2200 | | | | .2200 | | | | .1700 | | | | .3100 | |
For net assets over $2 billion | | | .2050 | | | | .3250 | | | | .1750 | | | | .1950 | | | | .1950 | | | | .1450 | | | | .2850 | |
Notes to Financial Statements (continued)
The annual complex-level fee for each Fund, payable monthly, is determined by taking the complex-level fee rate, which is based on the aggregate amount of “eligible assets” of all Nuveen funds as set forth in the schedule below, and making, as appropriate, an upward adjustment to that rate based upon the percentage of the particular fund’s assets that are not “eligible assets.” The complex-level fee schedule for each Fund is as follows:
| | | | |
| Complex-Level Asset Breakpoint Level* | | Effective Rate at Breakpoint Level | |
$55 billion | | | .2000 | % |
$56 billion | | | .1996 | |
$57 billion | | | .1989 | |
$60 billion | | | .1961 | |
$63 billion | | | .1931 | |
$66 billion | | | .1900 | |
$71 billion | | | .1851 | |
$76 billion | | | .1806 | |
$80 billion | | | .1773 | |
$91 billion | | | .1691 | |
$125 billion | | | .1599 | |
$200 billion | | | .1505 | |
$250 billion | | | .1469 | |
$300 billion | | | .1445 | |
| * | The complex-level fee is calculated based upon the aggregate daily “eligible assets” of all Nuveen Funds. Eligible assets do not include assets attributable to investments in other Nuveen Funds or assets in excess of $2 billion added to the Nuveen Fund complex in connection with the Adviser’s assumption of the management of the former First American Funds effective January 1, 2011. Eligible assets include closed-end fund assets managed by the Adviser that are attributable to financial leverage. For these purposes, financial leverage includes the closed-end funds’ use of preferred stock and borrowings and investments in the residual interest certificates (also called inverse floating rate securities) in tender option bond (TOB) trusts, including the portion of assets held by the TOB trust that has been effectively financed by the trust’s issuance of floating rate securities, subject to an agreement by the Adviser as to certain funds to limit the amount of such assets for determining eligible assets in certain circumstances. As of June 30, 2012, the complex-level fee rate for each Fund was as follows: |
| | | | |
| Fund | | Complex-Level
Fee Rate | |
Core Plus Bond | | | .1998 | % |
High Income Bond | | | .1925 | |
Inflation Protected Securities | | | .1870 | |
Intermediate Government Bond | | | .1998 | |
Intermediate Term Bond | | | .1998 | |
Short Term Bond | | | .1947 | |
Strategic Income | | | .1991 | |
The management fee compensates the Adviser for overall investment advisory and administrative services and general office facilities. The Adviser is responsible for each Fund’s overall strategy and asset allocations decisions. The Adviser has entered into sub-advisory agreements with the Sub-Adviser under which the Sub-Adviser manages the investment portfolios of the Funds. The Sub-Adviser is compensated for its services to the Funds from the management fees paid to the Adviser.
During the period July 1, 2011 through October 30, 2011, the Adviser contractually agreed to waive fees and/or reimburse other Fund expenses of each Fund so that total annual Fund operating expenses, after fee waivers and/or expense reimbursements and excluding acquired Fund fees and expenses, did not exceed the average daily net assets of any class of Fund shares in the amounts and for the time periods stated in the following table:
| | | | | | | | | | | | | | | | | | | | | | | | | | | | |
| | | Core
Plus
Bond | | | High
Income
Bond | | | Inflation
Protected
Securities | | | Intermediate
Government
Bond | | | Intermediate
Term Bond | | | Short Term
Bond | | | Strategic
Income | |
Class A(1) | | | .95 | % | | | 1.10 | % | | | .85 | % | | | .75 | % | | | .85 | % | | | .75 | % | | | .89 | % |
Class B | | | 1.70 | | | | 1.85 | | | | N/A | | | | N/A | | | | N/A | | | | N/A | | | | 1.75 | |
Class C | | | 1.70 | | | | 1.85 | | | | 1.60 | | | | 1.60 | | | | 1.70 | | | | 1.60 | | | | 1.75 | |
Class R3(2) | | | 1.20 | | | | 1.35 | | | | 1.10 | | | | 1.10 | | | | N/A | | | | 1.10 | | | | 1.25 | |
Class I | | | .70 | | | | .85 | | | | .60 | | | | .60 | | | | .70 | | | | .60 | | | | .75 | |
| | |
N/A | | – Not applicable. |
(1) | | – The Funds’ distributor, Nuveen Securities, LLC, contractually agreed to limit Class A Share 12b-1 fees to 0.15% of average daily net assets through March 31, 2012, for Intermediate Government Bond, Intermediate Term Bond and Short Term Bond. |
(2) | | – Class R3 Shares of Short Term Bond commenced operations on September 23, 2011. |
During the period November 1, 2011 through May 14, 2012, the Adviser contractually agreed to waive fees and/or reimburse other Fund expenses of each Fund so that total annual Fund operating expenses, after fee waivers and/or expense reimbursements and excluding acquired Fund fees and expenses, do not exceed the average daily net assets of any Class of Fund shares in the amounts and for the time periods stated in the following table:
| | | | | | | | | | | | | | | | | | | | | | | | | | | | |
| | | Core
Plus
Bond | | | High Income Bond | | | Inflation Protected Securities | | | Intermediate Government Bond | | | Intermediate Term Bond | | | Short Term Bond | | | Strategic
Income | |
Class A(1) | | | .95 | % | | | 1.10 | % | | | .85 | % | | | .85 | % | | | .95 | % | | | .85 | % | | | .84 | % |
Class B | | | 1.70 | | | | 1.85 | | | | N/A | | | | N/A | | | | N/A | | | | N/A | | | | 1.59 | |
Class C | | | 1.70 | | | | 1.85 | | | | 1.60 | | | | 1.60 | | | | 1.70 | | | | 1.60 | | | | 1.59 | |
Class R3 | | | 1.20 | | | | 1.35 | | | | 1.10 | | | | 1.10 | | | | N/A | | | | 1.10 | | | | 1.09 | |
Class I | | | .70 | | | | .85 | | | | .60 | | | | .60 | | | | .70 | | | | .60 | | | | .59 | |
| | |
N/A | | – Not applicable. |
(1) | | – The Funds’ distributor, Nuveen Securities, LLC, contractually agreed to limit Class A Share 12b-1 fees to 0.15% of average daily net assets through March 31, 2012, for Intermediate Government Bond, Intermediate Term Bond and Short Term Bond. |
Effective May 15, 2012, the Adviser has contractually agreed to waive fees and/or reimburse other Fund expenses of the following Funds so that total annual Fund operating expenses, after fee waivers and/or expense reimbursements and excluding acquired Fund fees and expenses, do not exceed the average daily net assets of any Class of Fund shares in the amounts and for the time periods stated in the following table:
| | | | | | | | | | | | | | | | | | | | | | | | | | | | |
| | | Core Plus
Bond | | | High Income
Bond | | | Inflation
Protected Securities | | | Intermediate
Government
Bond | | | Intermediate
Term Bond | | | Short Term
Bond | | | Strategic
Income | |
Class A | | | .77 | % | | | .99 | % | | | .85 | % | | | .85 | % | | | .78 | % | | | .72 | % | | | .84 | % |
Class B | | | 1.52 | | | | 1.74 | | | | N/A | | | | N/A | | | | N/A | | | | N/A | | | | 1.59 | |
Class C | | | 1.52 | | | | 1.74 | | | | 1.60 | | | | 1.60 | | | | 1.53 | | | | 1.47 | | | | 1.59 | |
Class R3 | | | 1.02 | | | | 1.24 | | | | 1.10 | | | | 1.10 | | | | N/A | | | | .97 | | | | 1.09 | |
Class I | | | .52 | | | | .74 | | | | .60 | | | | .60 | | | | .53 | | | | .47 | | | | .59 | |
Expiration Date | | | October 31, 2013 | | | | October 31, 2013 | | | | October 31, 2013 | | | | October 31, 2013 | | | | October 31, 2013 | | | | October 31, 2013 | | | | October 31, 2013 | |
The Adviser may also voluntarily reimburse expenses from time to time in any of the Funds. Voluntarily reimbursements may be terminated at any time at the Adviser’s discretion.
The Trust pays no compensation directly to those of its directors who are affiliated with the Adviser or to its officers, all of whom receive remuneration for their services to the Trust from the Adviser or its affiliates. The Board of Directors has adopted a deferred compensation plan for independent directors that enable directors to elect to defer receipt of all or a portion of the annual compensation they are entitled to receive from certain Nuveen-advised funds. Under the plan, deferred amounts are treated as though equal dollar amounts had been invested in shares of select Nuveen-advised funds.
During the fiscal year ended June 30, 2012, Nuveen Securities, LLC. (the “Distributor”), a wholly-owned subsidiary of Nuveen, collected sales charges on purchases of Class A Shares, the majority of which were paid out as concessions to financial intermediaries as follows:
| | | | | | | | | | | | |
| | | Core Plus
Bond | | | High Income
Bond | | | Inflation
Protected
Securities | |
Sales charges collected (Unaudited) | | $ | 38,698 | | | $ | 298,375 | | | $ | 123,555 | |
Paid to financial intermediaries (Unaudited) | | | 34,186 | | | | 266,158 | | | | 109,051 | |
| | | | | | | | | | | | | | | | |
| | | Intermediate
Government
Bond | | | Intermediate
Term Bond | | | Short Term
Bond | | | Strategic
Income | |
Sales charges collected (Unaudited) | | $ | 14,605 | | | $ | 16,772 | | | $ | 31,105 | | | $ | 149,963 | |
Paid to financial intermediaries (Unaudited) | | | 11,801 | | | | 13,384 | | | | 26,432 | | | | 133,500 | |
The Distributor also received 12b-1 service fees on Class A Shares, substantially all of which were paid to compensate financial intermediaries for providing services to shareholders relating to their investments.
During the fiscal year ended June 30, 2012, the Distributor compensated financial intermediaries directly with commission advances at the time of purchase as follows:
| | | | | | | | | | | | |
| | | Core Plus
Bond | | | High Income
Bond | | | Inflation
Protected
Securities | |
Commission advances (Unaudited) | | $ | 6,803 | | | $ | 92,925 | | | $ | 36,877 | |
| | | | | | | | | | | | | | | | |
| | | Intermediate
Government
Bond | | | Intermediate
Term Bond | | | Short Term
Bond | | | Strategic
Income | |
Commission advances (Unaudited) | | $ | 3,288 | | | $ | 8,770 | | | $ | 29,805 | | | $ | 64,597 | |
Notes to Financial Statements (continued)
All 12b-1 service and distribution fees collected on Class B Shares and Class C Shares during the first year following a purchase were retained by the Distributor to compensate for commissions advanced to financial intermediaries. During the fiscal year ended June 30, 2012, the Distributor retained such 12b-1 fees as follows:
| | | | | | | | | | | | |
| | | Core Plus
Bond | | | High Income
Bond | | | Inflation
Protected
Securities | |
12b-1 fees retained (Unaudited) | | $ | 18,925 | | | $ | 60,945 | | | $ | 27,573 | |
| | | | | | | | | | | | | | | | |
| | | Intermediate
Government
Bond | | | Intermediate
Term Bond | | | Short Term
Bond | | | Strategic
Income | |
12b-1 fees retained (Unaudited) | | $ | 1,195 | | | $ | 5,912 | | | $ | 76,966 | | | $ | 74,301 | |
The remaining 12b-1 fees charged to the Funds were paid to compensate financial intermediaries for providing services to shareholders relating to their investments.
The Distributor also collected and retained CDSC on share redemptions during the fiscal year ended June 30, 2012, as follows:
| | | | | | | | | | | | |
| | | Core Plus
Bond | | | High Income
Bond | | | Inflation
Protected
Securities | |
CDSC retained (Unaudited) | | $ | 1,619 | | | $ | 10,949 | | | $ | 3,858 | |
| | | | | | | | | | | | | | | | |
| | | Intermediate
Government
Bond | | | Intermediate
Term Bond | | | Short Term
Bond | | | Strategic
Income | |
CDSC retained (Unaudited) | | $ | 2 | | | $ | 3,076 | | | $ | 13,840 | | | $ | 6,022 | |
8. Fund Reorganizations
During the current fiscal period, the following Nuveen open-end funds were reorganized into the following Funds included in this report as follows (each the “Reorganization” and collectively, the “Reorganizations”):
| | • | | Nuveen High Yield Bond Fund (“High Yield Bond”) into High Income Bond; |
| | • | | Nuveen Short Duration Bond Fund (“Short Duration Bond”) into Short Term Bond; and |
| | • | | Nuveen Multi-Strategy Core Bond Fund (“Multi-Strategy Core Bond”) into Strategic Income. |
High Yield Bond, Short Duration Bond and Multi-Strategy Core Bond are collectively the “Acquired Funds.” High Income Bond, Short Term Bond and Strategic Income are collectively the “Acquiring Funds.”
The Adviser proposed the Reorganizations of the Acquired Funds into the Acquiring Funds, as well as a number of other fund reorganizations between funds with similar investment objectives and policies, as part of an initiative to eliminate certain redundancies among the products it offers and in an effort to achieve certain operating efficiencies. The Acquired Funds’ Board of Trustees determined that the Reorganizations were in the best interest of the Acquired Funds and that the interests of existing shareholders would not be diluted as a result of the Reorganizations. A special meeting of the Acquired Funds’ shareholders was held on October 28, 2011, for the purpose of voting on the Reorganizations, at which time, each of the Reorganizations was approved. The Reorganizations were consummated at the close of business on November 4, 2011, for Multi-Strategy Core Bond and High Yield Bond and on November 18, 2011, for Short Duration Bond.
Upon consummation of each Fund’s Reorganization, the Acquired Funds transferred all of their assets and liabilities to the Acquiring Funds in exchange for the Acquiring Funds’ shares of equal value. The Acquiring Funds’ shares were then distributed to the Acquired Funds’ shareholders and the Acquired Funds were terminated. As a result of the Reorganizations, the Acquired Funds’ shareholders become shareholders of the Acquiring Funds and the Acquired Funds’ shareholders received the Acquiring Funds’ shares with a total value equal to the total value of their Acquired Funds’ shares immediately prior to the closing of their Reorganization.
The Reorganizations were structured to qualify as tax-free reorganizations under the Internal Revenue Code for federal income tax purposes, and the Acquired Funds’ shareholders will recognize no gain or loss for federal income tax purposes as a result of the Reorganizations. Prior to the closing of each of the Reorganizations, the Acquired Funds distributed all of their net investment income and capital gains, if any. Such a distribution may be taxable to the Acquired Funds’ shareholders for federal income tax purposes.
The cost, fair value and net unrealized appreciation (depreciation) of the investments of the Acquired Funds as of the date of their respective Reorganization were as follows:
| | | | | | | | | | | | |
| | | High Yield
Bond | | | Short Duration
Bond | | | Multi-Strategy
Core Bond | |
Cost of investments | | $ | 108,028,051 | | | $ | 153,827,932 | | | $ | 99,647,095 | |
Fair value of investments | | | 103,263,381 | | | | 152,771,723 | | | | 101,725,300 | |
Unrealized appreciation (depreciation) of investments | | | (4,764,670 | ) | | | (1,098,793 | ) | | | 2,084,055 | |
For financial statement purposes, assets received and shares issued by the Acquiring Funds were recorded at fair value; however, the cost basis of the investments received from the Acquired Funds were carried forward to align ongoing reporting of the Acquiring Funds’ realized and unrealized gains and losses with amounts distributable to shareholders for tax purposes.
For accounting and performance reporting purposes, the Acquiring Funds are the survivors. The shares outstanding, net assets and NAV per share immediately before and after the Reorganizations are as follows:
| | | | | | | | | | | | |
| Acquired Funds – Prior to Reorganizations | | Shares
Outstanding | | | Net Assets | | | NAV per
Share | |
High Yield Bond | | | | | | | | | | | | |
Class A | | | 2,089,814 | | | $ | 35,167,855 | | | $ | 16.83 | |
Class B | | | 82,525 | | | | 1,387,561 | | | | 16.81 | |
Class C | | | 2,076,855 | | | | 34,868,833 | | | | 16.79 | |
Class R3 | | | 9,844 | | | | 165,597 | | | | 16.82 | |
Class I | | | 1,979,661 | | | | 33,281,132 | | | | 16.81 | |
Short Duration Bond | | | | | | | | | | | | |
Class A | | | 3,128,950 | | | $ | 59,925,259 | | | $ | 19.15 | |
Class C | | | 2,393,643 | | | | 45,914,917 | | | | 19.18 | |
Class R3 | | | 25,826 | | | | 494,189 | | | | 19.14 | |
Class I | | | 2,488,562 | | | | 47,552,148 | | | | 19.11 | |
Multi-Strategy Core Bond | | | | | | | | | | | | |
Class A | | | 1,404,357 | | | $ | 28,166,954 | | | $ | 20.06 | |
Class B | | | 77,141 | | | | 1,556,581 | | | | 20.18 | |
Class C | | | 1,061,199 | | | | 21,334,881 | | | | 20.10 | |
Class R3 | | | 4,128 | | | | 82,781 | | | | 20.05 | |
Class I | | | 1,497,612 | | | | 29,987,500 | | | | 20.02 | |
| | | | | | | | | | | | |
| Acquiring Funds – Prior to Reorganizations | | Shares
Outstanding | | | Net Assets | | | NAV per
Share | |
High Income Bond | | | | | | | | | | | | |
Class A | | | 6,020,899 | | | $ | 51,230,447 | | | $ | 8.51 | |
Class B | | | 119,926 | | | | 1,014,664 | | | | 8.46 | |
Class C | | | 1,126,860 | | | | 9,564,452 | | | | 8.49 | |
Class R3 | | | 34,394 | | | | 298,898 | | | | 8.69 | |
Class I | | | 48,800,928 | | | | 415,952,708 | | | | 8.52 | |
Short Term Bond | | | | | | | | | | | | |
Class A | | | 7,472,373 | | | $ | 73,585,597 | | | $ | 9.85 | |
Class C | | | 503,552 | | | | 4,969,869 | | | | 9.87 | |
Class R3 | | | 2,575 | | | | 25,370 | | | | 9.85 | |
Class I | | | 64,885,839 | | | | 639,136,264 | | | | 9.85 | |
Strategic Income | | | | | | | | | | | | |
Class A | | | 2,390,123 | | | $ | 25,330,066 | | | $ | 10.60 | |
Class B | | | 92,424 | | | | 974,333 | | | | 10.54 | |
Class C | | | 763,287 | | | | 8,037,331 | | | | 10.53 | |
Class R3 | | | 109,533 | | | | 1,165,480 | | | | 10.64 | |
Class I | | | 55,458,511 | | | | 587,303,762 | | | | 10.59 | |
| Acquiring Funds – Post Reorganizations | | Shares
Outstanding | | | Net Assets | | | NAV per
Share | |
High Income Bond | | | | | | | | | | | | |
Class A | | | 10,154,009 | | | $ | 86,398,302 | | | $ | 8.51 | |
Class B | | | 283,925 | | | | 2,402,225 | | | | 8.46 | |
Class C | | | 5,235,033 | | | | 44,433,285 | | | | 8.49 | |
Class R3 | | | 53,449 | | | | 464,495 | | | | 8.69 | |
Class I | | | 52,705,553 | | | | 449,233,840 | | | | 8.52 | |
Short Term Bond | | | | | | | | | | | | |
Class A | | | 13,557,585 | | | $ | 133,510,856 | | | $ | 9.85 | |
Class C | | | 5,155,702 | | | | 50,884,786 | | | | 9.87 | |
Class R3 | | | 52,725 | | | | 519,559 | | | | 9.85 | |
Class I | | | 69,713,374 | | | | 686,688,412 | | | | 9.85 | |
Strategic Income | | | | | | | | | | | | |
Class A | | | 5,047,930 | | | $ | 53,497,020 | | | $ | 10.60 | |
Class B | | | 240,079 | | | | 2,530,914 | | | | 10.54 | |
Class C | | | 2,789,409 | | | | 29,372,212 | | | | 10.53 | |
Class R3 | | | 117,313 | | | | 1,248,261 | | | | 10.64 | |
Class I | | | 58,290,186 | | | | 617,291,262 | | | | 10.59 | |
Notes to Financial Statements (continued)
Assuming the Reorganizations had been completed on July 1, 2011, the beginning of the Acquiring Funds’ current fiscal period, the pro forma results of operations for the Acquired Funds for the fiscal year ended June 30, 2012, are as follows:
| | | | | | | | | | | | |
| | | High Yield
Bond | | | Short Duration
Bond | | | Multi-Strategy
Core Bond | |
Net investment income (loss) | | $ | 718,537 | | | $ | 598,060 | | | $ | 299,051 | |
Net realized and unrealized gains (losses) | | | (6,647,683 | ) | | | (1,337,736 | ) | | | 1,252,747 | |
Change in net assets resulting from operations | | | (5,090,939 | ) | | | (2,444,180 | ) | | | 47,660 | |
Because the combined investment portfolios for each Reorganization have been managed as a single integrated portfolio since each Reorganization was completed, it is not practicable to separate the amounts of revenue and earnings of the Acquired Funds that have been included in the Statement of Operations since November 4, 2011, for Multi-Strategy Core Bond and High Yield Bond and since November 18, 2011, for Short Duration Bond.
In connection with the reorganizations, each of the Acquiring Funds has accrued for certain associated costs and expenses. Such amounts are included as components of “Accrued other expense” on the Statement of Assets and Liabilities and “Reorganization expense” on the Statement of Operations.
9. New Accounting Pronouncements
Financial Accounting Standards Board (“FASB”) Balance Sheet (Topic 210): Disclosures about Offsetting Assets and Liabilities
In December 2011, the FASB issued Accounting Standards Update (“ASU”) No. 2011-11 (“ASU No. 2011-11”)to enhance disclosures about financial instruments and derivative instruments that are subject to offsetting (“netting”) on the Statement of Assets and Liabilities. This information will enable users of the entity’s financial statements to evaluate the effect or potential effect of netting arrangements on the entity’s financial position. ASU No. 2011-11 is effective prospectively during interim or annual periods beginning on or after January 1, 2013. At this time, management is evaluating the implications of this guidance and the impact it will have to the financial statements amounts and footnote disclosures, if any.
Trustees and Officers (Unaudited)
The management of the Funds, including general supervision of the duties performed for the Funds by the Adviser, is the responsibility of the Board of Trustees of the Funds. The number of trustees of the Funds is currently set at ten. None of the trustees who are not “interested” persons of the Funds (referred to herein as “independent trustees”) has ever been a director or employee of, or consultant to, Nuveen or its affiliates. The names and business addresses of the trustees and officers of the Funds, their principal occupations and other affiliations during the past five years, the number of portfolios each oversees and other directorships they hold are set forth below.
The Funds’ Statement of Additional Information (“SAI”) includes more information about the trustees. To request a free copy, call Nuveen Investments at (800) 257-8787 or visit the Funds’ website at www.nuveen.com.
| | | | | | | | |
Name, Birthdate and Address | | Position(s) Held with the Funds | | Year First Elected or Appointed (1) | | Principal Occupation(s) Including other Directorships During Past 5 Years | | Number of Portfolios in Fund Complex Overseen by Trustee |
| | |
| Independent Trustees: | | | | |
Robert P. Bremner 8/22/40 333 W. Wacker Drive Chicago, IL 60606 | | Chairman of the Board and Trustee | | 1996 | | Private Investor and Management Consultant; Treasurer and Director, Humanities Council of Washington, D.C.; Board Member, Independent Directors Council affiliated with the Investment Company Institute. | | 220 |
Jack B. Evans 10/22/48 333 W. Wacker Drive Chicago, IL 60606 | | Trustee | | 1999 | | President, The Hall-Perrine Foundation, a private philanthropic corporation (since 1996); Director and Chairman, United Fire Group, a publicly held company; member of the Board of Regents for the State of Iowa University System; Director, Source Media Group; Life Trustee of Coe College and the Iowa College Foundation; formerly, Director, Alliant Energy; formerly, Director, Federal Reserve Bank of Chicago; formerly, President and Chief Operating Officer, SCI Financial Group, Inc., a regional financial services firm. | | 220 |
William C. Hunter 3/6/48 333 W. Wacker Drive Chicago, IL 60606 | | Trustee | | 2004 | | Dean Emeritus (since June 30, 2012), formerly, Dean, Tippie College of Business, University of Iowa (2006-2012); Director (since 2004) of Xerox Corporation; Director (since 2005), and President (since July 2012) Beta Gamma Sigma International Honor Society; Director of Wellmark, Inc. (since 2009); formerly, Dean and Distinguished Professor of Finance, School of Business at the University of Connecticut (2003-2006); previously, Senior Vice President and Director of Research at the Federal Reserve Bank of Chicago (1995-2003); formerly, Director (1997-2007), Credit Research Center at George Washington University. | | 220 |
David J. Kundert 10/28/42 333 W. Wacker Drive Chicago, IL 60606 | | Trustee | | 2005 | | Director, Northwestern Mutual Wealth Management Company; retired (since 2004) as Chairman, JPMorgan Fleming Asset Management, President and CEO, Banc One Investment Advisors Corporation, and President, One Group Mutual Funds; prior thereto, Executive Vice President, Banc One Corporation and Chairman and CEO, Banc One Investment Management Group; Member, Board of Regents, Luther College; member of the Wisconsin Bar Association; member of Board of Directors, Friends of Boerner Botanical Gardens; member of Board of Directors and Chair of Investment Committee, Greater Milwaukee Foundation. | | 220 |
William J. Schneider 9/24/44 333 W. Wacker Drive Chicago, IL 60606 | | Trustee | | 1996 | | Chairman of Miller-Valentine Partners Ltd., a real estate investment company; formerly, Senior Partner and Chief Operating Officer (retired 2004) of Miller-Valentine Group; member, University of Dayton Business School Advisory Council; member, Mid-America Health System Board; formerly, member and chair, Dayton Philharmonic Orchestra Association; formerly, member, Business Advisory Council, Cleveland Federal Reserve Bank. | | 220 |
Judith M. Stockdale 12/29/47 333 W. Wacker Drive Chicago, IL 60606 | | Trustee | | 1997 | | Executive Director, Gaylord and Dorothy Donnelley Foundation (since 1994); prior thereto, Executive Director, Great Lakes Protection Fund (1990-1994). | | 220 |
Carole E. Stone 6/28/47 333 W. Wacker Drive Chicago, IL 60606 | | Trustee | | 2007 | | Director, Chicago Board Options Exchange (since 2006); Director, C2 Options Exchange, Incorporated (since 2009); formerly, Commissioner, New York State Commission on Public Authority Reform (2005-2010); formerly, Chair, New York Racing Association Oversight Board (2005-2007). | | 220 |
Trustees and Officers (Unaudited) (continued)
| | | | | | | | |
Name, Birthdate and Address | | Position(s) Held with the Funds | | Year First Elected or Appointed (1) | | Principal Occupation(s) During Past Five Years | | Number of Portfolios in Fund Complex Overseen by Trustee |
Virginia L. Stringer 8/16/44 333 West Wacker Drive Chicago, IL 60606 | | Trustee | | 2011 | | Board Member, Mutual Fund Directors Forum; former governance consultant and non-profit board member; former Owner and President, Strategic Management Resources, Inc. a management consulting firm; former Member, Governing Board, Investment Company Institute’s Independent Directors Council; previously, held several executive positions in general management, marketing and human resources at IBM and The Pillsbury Company; Independent Director, First American Fund Complex (1987-2010) and Chair (1997-2010). | | 220 |
Terence J. Toth 9/29/59 333 W. Wacker Drive Chicago, IL 60606 | | Trustee | | 2008 | | Director, Legal & General Investment Management America, Inc. (since 2008); Managing Partner, Promus Capital (since 2008); formerly, CEO and President, Northern Trust Global Investments (2004-2007); Executive Vice President, Quantitative Management & Securities Lending (2000-2004); prior thereto, various positions with Northern Trust Company (since 1994); member: Goodman Theatre Board (since 2004), Chicago Fellowship Board (since 2005), Catalyst Schools of Chicago Board (since 2008); Mather Foundation Board (since 2012) and a member of its investment committee; formerly, member: Northern Trust Mutual Funds Board (2005-2007), Northern Trust Global Investments Board (2004-2007), Northern Trust Japan Board (2004-2007), Northern Trust Securities Inc. Board (2003-2007) and Northern Trust Hong Kong Board (1997-2004). | | 220 |
| | |
| Interested Trustee: | | | | |
John P. Amboian (2) 6/14/61 333 W. Wacker Drive Chicago, IL 60606 | | Trustee | | 2008 | | Chief Executive Officer and Chairman (since 2007) and Director (since 1999) of Nuveen Investments, Inc., formerly, President (1999-2007); Chief Executive Officer (since 2007) of Nuveen Investments Advisers Inc.; Director (since 1998) formerly, Chief Executive Officer (2007-2010) of Nuveen Fund Advisors, Inc. | | 220 |
Name, Birthdate and Address | | Position(s) Held with the Funds | | Year First Elected or Appointed (3) | | Principal Occupation(s) During Past 5 Years | | Number of Portfolios in Fund Complex Overseen by Officer |
| | |
| Officers of the Funds: | | | | |
Gifford R. Zimmerman 9/9/56 333 W. Wacker Drive Chicago, IL 60606 | | Chief Administrative Officer | | 1988 | | Managing Director (since 2002), Assistant Secretary of Nuveen Securities, LLC; Managing Director (since 2004) and Assistant Secretary (since 1994) of Nuveen Investments, Inc.; Managing Director (since 2002), Assistant Secretary (since 1997) and Co-General Counsel (since 2011) of Nuveen Fund Advisors, Inc.; Managing Director, Assistant Secretary and Associate General Counsel of Nuveen Asset Management, LLC (since 2011); Managing Director, Associate General Counsel and Assistant Secretary of Symphony Asset Management LLC (since 2003); Vice President and Assistant Secretary of NWQ Investment Management Company, LLC (since 2002), Nuveen Investments Advisers Inc. (since 2002), Santa Barbara Asset Management, LLC (since 2006) and of Winslow Capital Management Inc. (since 2010); Chief Administrative Officer and Chief Compliance Officer (since 2006) of Nuveen Commodities Asset Management, LLC; Chartered Financial Analyst. | | 220 |
Margo L. Cook 4/11/64 333 W. Wacker Drive Chicago, IL 60606 | | Vice President | | 2009 | | Executive Vice President (since 2008) of Nuveen Investments, Inc. and of Nuveen Fund Advisors, Inc. (since 2011); Managing Director – Investment Services of Nuveen Commodities Asset Management, LLC (since August 2011) previously, Head of Institutional Asset Management (2007-2008) of Bear Stearns Asset Management; Head of Institutional Asset Management (1986-2007) of Bank of NY Mellon; Chartered Financial Analyst. | | 220 |
| | | | | | | | |
Name, Birthdate and Address | | Position(s) Held with the Funds | | Year First Elected or Appointed (3) | | Principal Occupation(s) During Past 5 Years | | Number of Portfolios in Fund Complex Overseen by Officer |
Lorna C. Ferguson 10/24/45 333 W. Wacker Drive Chicago, IL 60606 | | Vice President | | 1998 | | Managing Director (since 2005) of Nuveen Fund Advisors, Inc. and Nuveen Securities, LLC (since 2004). | | 220 |
Stephen D. Foy 5/31/54 333 W. Wacker Drive Chicago, IL 60606 | | Vice President and Controller | | 1998 | | Senior Vice President (since 2010), formerly, Vice President (2005-2010) and Funds Controller of Nuveen Securities, LLC; Vice President of Nuveen Fund Advisors, Inc.; Chief Financial Officer of Nuveen Commodities Asset Management, LLC (since 2010); Certified Public Accountant. | | 220 |
Scott S. Grace 8/20/70 333 W. Wacker Drive Chicago, IL 60606 | | Vice President and Treasurer | | 2009 | | Managing Director, Corporate Finance & Development, Treasurer (since 2009) of Nuveen Securities, LLC; Managing Director and Treasurer (since 2009) of Nuveen Fund Advisors, Inc., Nuveen Investments Advisers, Inc., Nuveen Investments Holdings Inc. and (since 2011) Nuveen Asset Management, LLC; Vice President and Treasurer of NWQ Investment Management Company, LLC, Tradewinds Global Investors, LLC, Symphony Asset Management LLC and Winslow Capital Management, Inc.; Vice President of Santa Barbara Asset Management, LLC; formerly, Treasurer (2006-2009), Senior Vice President (2008-2009), previously, Vice President (2006-2008) of Janus Capital Group, Inc.; formerly, Senior Associate in Morgan Stanley’s Global Financial Services Group (2000-2003); Chartered Accountant Designation. | | 220 |
Walter M. Kelly 2/24/70 333 W. Wacker Drive Chicago, IL 60606 | | Chief Compliance Officer and Vice President | | 2003 | | Senior Vice President (since 2008) and Assistant Secretary (since 2003) of Nuveen Fund Advisors, Inc; Senior Vice President (since 2008) of Nuveen Investments Holdings, Inc; formerly, Senior Vice President (2008-2011) of Nuveen Securities, LLC. | | 220 |
Tina M. Lazar 8/27/61 333 W. Wacker Drive Chicago, IL 60606 | | Vice President | | 2002 | | Senior Vice President (since 2010), formerly, Vice President (2005-2010) of Nuveen Fund Advisors, Inc. | | 220 |
Name, Birthdate and Address | | Position(s) Held with the Funds | | Year First Elected or Appointed (3) | | Principal Occupation(s) Including other Directorships During Past 5 Years | | Number of Portfolios in Fund Complex Overseen by Officer |
Kevin J. McCarthy 3/26/66 333 W. Wacker Drive Chicago, IL 60606 | | Vice President and Secretary | | 2007 | | Managing Director and Assistant Secretary (since 2008), formerly, Vice President (2007-2008), Nuveen Securities, LLC; Managing Director (since 2008), Assistant Secretary (since 2007) and Co-General Counsel (since 2011) of Nuveen Fund Advisors, Inc.; Managing Director, Assistant Secretary and Associate General Counsel (since 2011) of Nuveen Asset Management, LLC; Managing Director (since 2008), and Assistant Secretary, Nuveen Investment Holdings, Inc.; Vice President (since 2007) and Assistant Secretary of Nuveen Investments Advisers Inc., NWQ Investment Management Company, LLC, Tradewinds Global Investors LLC, NWQ Holdings, LLC, Symphony Asset Management LLC, Santa Barbara Asset Management, LLC, and of Winslow Capital Management, Inc. (since 2010); Vice President and Secretary (since 2010) of Nuveen Commodities Asset Management, LLC; prior thereto, Partner, Bell, Boyd & Lloyd LLP (1997-2007). | | 220 |
Kathleen L. Prudhomme 3/30/53 901 Marquette Avenue Minneapolis, MN 55402 | | Vice President and Assistant Secretary | | 2011 | | Managing Director, Assistant Secretary and Co-General Counsel (since 2011) of Nuveen Fund Advisors, Inc.; Managing Director, Assistant Secretary and Associate General Counsel (since 2011) of Nuveen Asset Management, LLC; Managing Director and Assistant Secretary (since 2011) of Nuveen Securities, LLC; formerly, Deputy General Counsel, FAF Advisors, Inc. (2004-2010). | | 220 |
Trustees and Officers (Unaudited) (continued)
| | | | | | | | |
Name, Birthdate and Address | | Position(s) Held with the Funds | | Year First Elected or Appointed (3) | | Principal Occupation(s) Including other Directorships During Past 5 Years | | Number of Portfolios in Fund Complex Overseen by Officer |
Jeffery M. Wilson 3/13/56 333 West Wacker Drive Chicago, IL 60606 | | Vice President | | 2011 | | Senior Vice President of Nuveen Securities, LLC (since 2011); formerly, Senior Vice President of FAF Advisors, Inc. (2000-2010). | | 102 |
| (1) | Trustees serve an indefinite term until his/her successor is elected or appointed. The year first elected or appointed represents the year in which the trustee was first elected or appointed to any fund in the Nuveen Fund Complex. |
| (2) | Mr. Amboian is an interested trustee because of his position with Nuveen Investments, Inc. and certain of its subsidiaries, which are affiliates of the Nuveen Funds. |
| (3) | Officers serve one year terms through August of each year. The year first elected or appointed represents the year in which the officer was first elected or appointed to any fund in the Nuveen Fund Complex. |
Annual Investment Management Agreement Approval Process
(Unaudited)
The Board of Trustees (each, a “Board” and each Trustee, a “Board Member”) of the Funds, including the Board Members who are not parties to the Funds’ advisory or sub-advisory agreements or “interested persons” of any such parties (the “Independent Board Members”), is responsible for approving the advisory agreements (each, an “Investment Management Agreement”) between each Fund and Nuveen Fund Advisors, Inc. (the “Advisor”) and the sub-advisory agreements (each, a “Sub-Advisory Agreement”) between the Advisor and Nuveen Asset Management, LLC (the “Sub-Advisor”) (the Investment Management Agreements and the Sub-Advisory Agreements are referred to collectively as the “Advisory Agreements”) and their periodic continuation. Pursuant to the Investment Company Act of 1940, as amended (the “1940 Act”), the Board is required to consider the continuation of the Advisory Agreements on an annual basis. Accordingly, at an in-person meeting held on May 21-23, 2012 (the “May Meeting”), the Board, including a majority of the Independent Board Members, considered and approved the continuation of the Advisory Agreements for the Funds for an additional one-year period.
In preparation for their considerations at the May Meeting, the Board requested and received extensive materials prepared in connection with the review of the Advisory Agreements. The materials provided a broad range of information regarding the Funds, the Advisor and the Sub-Advisor (the Advisor and the Sub-Advisor are collectively, the “Fund Advisers” and each, a “Fund Adviser”). As described in more detail below, the information provided included, among other things, a review of Fund performance, including Fund investment performance assessments against peer groups and appropriate benchmarks, a comparison of Fund fees and expenses relative to peers, a description and assessment of shareholder service levels for the Funds, a summary of the performance of certain service providers, a review of product initiatives and shareholder communications and an analysis of the Advisor’s profitability with comparisons to comparable peers in the managed fund business. As part of their annual review, the Board also held a separate meeting on April 18-19, 2012, to review the Funds’ investment performance and consider an analysis provided by the Advisor of the Sub-Advisor which generally evaluated the Sub-Advisor’s investment team, investment mandate, organizational structure and history, investment philosophy and process, performance of the applicable Fund, and significant changes to the foregoing. As a result of their review of the materials and discussions, the Board presented the Advisor with questions and the Advisor responded.
The materials and information prepared in connection with the annual review of the Advisory Agreements supplement the information and analysis provided to the Board during the year. In this regard, throughout the year, the Board, acting directly or through its committees, regularly reviews the performance and various services provided by the Advisor and the Sub-Advisor. The Board meets at least quarterly as well as at other times as the need arises. At its quarterly meetings, the Board reviews reports by the Advisor which include, among other things, Fund performance, a review of the investment teams and reports on compliance, regulatory matters and risk management. The Board also meets with key investment personnel managing the Fund portfolios during the year. In October 2011, the Board also created two new standing committees (the Open-end Fund Committee and the Closed-end Fund Committee) to assist the full Board in monitoring and gaining a deeper insight into the distinctive issues and business practices of open-end and closed-end funds.
In addition, the Board continues its program of seeking to have the Board Members or a subset thereof visit each sub-advisor to the Nuveen funds at least once over a multiple year rotation, meeting with key investment and business personnel. Further, an ad hoc committee of the Board visited the then-current transfer agents of the Nuveen funds in 2011 and the audit committee of the Board visited the various pricing agents for the Nuveen funds in January 2012.
The Board considers factors and information that are relevant to its annual consideration of the renewal of the Advisory Agreements at the meetings held throughout the year. Accordingly, the Board considers the information provided and knowledge gained at these meetings when performing its annual review of the Advisory Agreements. The Independent Board Members are assisted throughout the process by independent legal counsel who provided materials describing applicable law and the duties of directors or trustees in reviewing advisory contracts and met with the Independent Board Members in executive sessions without management present. In addition, it is important to recognize that the management arrangements for the Nuveen funds are the result of many years of review and discussion between the Independent Board Members and fund management and that the Board Members’ conclusions may be based, in part, on their consideration of fee arrangements and other factors developed in previous years.
The Board considered all factors it believed relevant with respect to each Fund, including among other factors: (a) the nature, extent and quality of the services provided by the Fund Advisers, (b) the investment performance of the Fund and Fund Advisers, (c) the advisory fees and costs of the services to be provided to the Funds and the profitability of the Fund Advisers, (d) the extent of any economies of scale, (e) any benefits derived by the Fund Advisers from the relationship with the Fund and (f) other factors. Each Board Member may have accorded different weight to the various factors in reaching his or her conclusions with respect to a Fund’s Advisory Agreements. The Independent Board Members did not identify any single factor as all important or controlling. The Independent Board Members’ considerations were instead based on a comprehensive consideration of all the information presented. The principal factors considered by the Board and its conclusions are described below.
A. Nature, Extent and Quality of Services
In considering renewal of the Advisory Agreements, the Independent Board Members considered the nature, extent and quality of the Fund Adviser’s services, including advisory services and the resulting Fund performance and administrative services. The Independent Board Members further considered the overall reputation and capabilities of the Advisor and its affiliates, the commitment of the Advisor to provide high quality service to the Funds, their overall confidence in the Advisor’s integrity and the Advisor’s
Annual Investment Management Agreement Approval Process
(Unaudited) (continued)
responsiveness to questions and concerns raised by them. The Independent Board Members reviewed materials outlining, among other things, the Fund Adviser’s organization and business; the types of services that the Fund Adviser or its affiliates provide to the Funds; the performance record of the applicable Fund (as described in further detail below); and any initiatives Nuveen had taken for the applicable fund product line.
In considering advisory services, the Board recognized that the Advisor provides various oversight, administrative, compliance and other services for the Funds and the Sub-Advisor generally provides the portfolio investment management services to the Funds. In reviewing the portfolio management services provided to each Fund, the Board reviewed the materials provided by the Nuveen Investment Services Oversight Team analyzing, among other things, the Sub-Advisor’s investment team and changes thereto, organization and history, assets under management, Fund objectives and mandate, the investment team’s philosophy and strategies in managing the Fund, developments affecting the Sub-Advisor or Fund and Fund performance. The Independent Board Members also reviewed portfolio manager compensation arrangements to evaluate each Fund Adviser’s ability to attract and retain high quality investment personnel, preserve stability, and reward performance but not provide an inappropriate incentive to take undue risks. In addition, the Board considered the Advisor’s execution of its oversight responsibilities over the Sub-Advisor. Given the importance of compliance, the Independent Board Members also considered Nuveen’s compliance program, including the report of the chief compliance officer regarding the Funds’ compliance policies and procedures; the resources dedicated to compliance; and the record of compliance with the policies and procedures.
In addition to advisory services, the Board considered the quality and extent of administrative and other non-investment advisory services the Advisor and its affiliates provide to the Funds, including product management, investment services (such as oversight of investment policies and procedures, risk management, and pricing), fund administration, oversight of service providers, shareholder services and communications, administration of Board relations, regulatory and portfolio compliance and legal support. The Board further recognized Nuveen’s additional investments in personnel, including in compliance and risk management. In reviewing the services provided, the Board also reviewed materials describing various notable initiatives and projects the Advisor performed in connection with the open-end fund product line. These initiatives included efforts to eliminate product overlap through mergers or liquidations; commencement of various new funds; elimination of insurance mandates for various funds; updates in investment policies or guidelines for several funds; and reductions in management fees and expense caps for certain funds.
Based on their review, the Independent Board Members found that, overall, the nature, extent and quality of services provided to the respective Funds under each applicable Advisory Agreement were satisfactory.
B. The Investment Performance of the Funds and Fund Advisers
The Board, including the Independent Board Members, reviewed and considered the performance history of each Fund over various time periods. The Board reviewed, among other things, each Fund’s historic investment performance as well as information comparing the Fund’s performance information with that of other funds (the “Performance Peer Group”) based on data compiled by Nuveen that was provided by an independent provider of mutual fund data and with recognized and/or customized benchmarks (i.e., benchmarks derived from multiple recognized benchmarks).
The Board reviewed reports, including a comprehensive analysis of the Funds’ performance and the applicable investment team. In this regard, the Board reviewed each Fund’s total return information compared to the returns of its Performance Peer Group and recognized and/or customized benchmarks for the quarter, one-, three- and five-year periods ending December 31, 2011, as well as performance information reflecting the first quarter of 2012.
In reviewing performance comparison information, the Independent Board Members recognized that the usefulness of the comparisons of the performance of certain funds with the performance of their respective Performance Peer Group may be limited because the Performance Peer Group may not adequately represent the objectives and strategies of the applicable funds or may be limited in size or number. The Independent Board Members also noted that the investment experience of a particular shareholder in the Nuveen funds will vary depending on when such shareholder invests in the applicable fund, the class held (if multiple classes are offered in a fund) and the performance of the fund (or respective class) during that shareholder’s investment period. In addition, although the performance below reflects the performance results for the time periods ending as of the most recent calendar year end (unless otherwise indicated), the Board also recognized that selecting a different ending time period may derive different results. Furthermore, while the Board is cognizant of the relevant performance of a fund’s peer set and/or benchmark(s), the Board evaluated fund performance in light of the respective fund’s investment objectives, investment parameters and guidelines and recognized that the objectives, investment parameters and guidelines of peers and/or benchmarks may differ to some extent, thereby resulting in differences in performance results. Nevertheless, with respect to any Nuveen funds that the Board considers to have underperformed their peers and/or benchmarks from time to time, the Board monitors such funds closely and considers any steps necessary or appropriate to address such issues.
In considering the results of the comparisons, the Independent Board Members observed, among other things, that the Nuveen Intermediate Term Bond Fund (the “Intermediate Term Bond Fund”) and the Nuveen Inflation Protected Securities Fund (the “Inflation Protected Securities Fund”) had demonstrated generally favorable performance in comparison to peers, performing in the first or second quartile over various periods. Further, they noted that the Nuveen High Income Bond Fund (the “High Income Bond Fund”), the Nuveen Short Term Bond Fund (the “Short Term Bond Fund”), the Nuveen Core Plus Bond Fund (the “Core Plus Bond
Fund”) and the Nuveen Strategic Income Fund (the “Strategic Income Fund”) lagged their peers somewhat in the short-term one-year period, but demonstrated more favorable performance in the longer three- and/or five-year periods. In this regard, the Independent Board Members recognized that recent modifications had been made to the objective and certain investment guidelines of the Strategic Income Fund. Finally, with respect to the Nuveen Intermediate Government Bond Fund (the “Intermediate Government Bond Fund”) the Independent Board Members noted that such Fund had lagged its peers and/or benchmarks over various periods. With respect to the Nuveen funds that have shown periods of underperformance, the Board considered the factors affecting performance and was satisfied with the process followed in seeking to address any performance issues in light of the fund’s investment strategy.
Based on their review, the Independent Board Members determined that each Fund’s investment performance had been satisfactory.
C. Fees, Expenses and Profitability
1. Fees and Expenses
The Board evaluated the management fees and expenses of each Fund reviewing, among other things, such Fund’s gross management fees, net management fees and net expense ratios in absolute terms as well as compared to the fee and expenses of a comparable universe of funds provided by an independent fund data provider (the “Peer Universe”) and to a more focused subset of funds in the Peer Universe (the “Peer Group”) and any expense limitations.
The Independent Board Members further reviewed the methodology regarding the construction of the applicable Peer Universe and Peer Group. In reviewing the comparisons of fee and expense information, the Independent Board Members took into account that in certain instances various factors such as: the limited size and particular composition of the Peer Universe or Peer Group (including the inclusion of other Nuveen funds in the peer set); expense anomalies; changes in the funds comprising the Peer Universe or Peer Group from year to year; levels of reimbursement or fee waivers; and the timing of information used may impact the comparative data, thereby limiting somewhat the ability to make a meaningful comparison with peers.
In reviewing the fee schedule for a Fund, the Independent Board Members also considered the fund-level and complex-wide breakpoint schedules (described in further detail below) and any fee waivers and reimbursements provided by Nuveen. In reviewing fees and expenses, the Board considered the expenses and fees to be higher if they were over 10 basis points higher, slightly higher if they were approximately 6 to 10 basis points higher, in line if they were within approximately 5 basis points higher than the peer average and below if they were below the peer average of the Peer Group. In reviewing the reports, the Board noted that the overwhelming majority of the Nuveen funds were at, close to or below their Peer Group or Peer Universe (if no separate Peer Group) average based on the net total expense ratio. The Independent Board Members noted that the High Income Bond Fund and the Intermediate Term Bond Fund each had net management fees slightly higher or higher than the peer average but net expense ratios below or in line with the peer average. In addition, the Independent Board Members noted that the Core Plus Bond Fund and the Strategic Income Fund each had higher net management fees than their peer average and a slightly higher net expense ratio compared to their peer average, although they recognized that the Strategic Income Fund was being repositioned into a more appropriate peer category. With respect to the Inflation Protected Securities Fund, the Intermediate Government Bond Fund and the Short Term Bond Fund, the Independent Board Members observed that such Funds had net management fees and net expense ratios (including fee waivers and expense reimbursements, if any) below or in line with their peer averages. Notwithstanding the foregoing, the Board recognized that the management fees and expense caps of the Inflation Protected Securities Fund, the Intermediate Government Bond Fund, the Intermediate Term Bond Fund and the Short Term Bond Fund were reduced effective May 15, 2012.
Based on their review of the fee and expense information provided, the Independent Board Members determined that each Fund’s management fees were reasonable in light of the nature, extent and quality of services provided to the Fund.
2. Comparisons with the Fees of Other Clients
The Independent Board Members further reviewed information regarding the nature of services and range of fees offered by the Advisor to other clients, including separately managed accounts (both retail and institutional accounts), collective trusts, foreign investment funds offered by Nuveen and funds that are not offered by Nuveen but are sub-advised by one of Nuveen’s investment management teams. In evaluating the comparisons of fees, the Independent Board Members noted that the fee rates charged to the Funds and other clients vary, among other things, because of the different services involved and the additional regulatory and compliance requirements associated with registered investment companies, such as the Funds. Accordingly, the Independent Board Members considered the differences in the product types, including, but not limited to, the services provided, the structure and operations, product distribution and costs thereof, portfolio investment policies, investor profiles, account sizes and regulatory requirements. The Independent Board Members noted, in particular, that the range of services provided to the Funds (as discussed above) is much more extensive than that provided to separately managed accounts. Given the inherent differences in the various products, particularly the extensive services provided to the Funds, the Independent Board Members believe such facts justify the different levels of fees.
In considering the fees of the Sub-Advisor, the Independent Board Members also considered the pricing schedule or fees that the Sub-Advisor charges for similar investment management services for other Nuveen funds, funds of other sponsors (if any), and other clients (such as retail and/or institutional managed accounts).
Annual Investment Management Agreement Approval Process
(Unaudited) (continued)
3. Profitability of Fund Advisers
In conjunction with its review of fees, the Independent Board Members also considered the profitability of Nuveen for its advisory activities and its financial condition. The Independent Board Members reviewed the revenues and expenses of Nuveen’s advisory activities for the last two calendar years, the allocation methodology used in preparing the profitability data and an analysis of the key drivers behind the changes in revenues and expenses that impacted profitability in 2011. The Independent Board Members noted this information supplemented the profitability information requested and received during the year to help keep them apprised of developments affecting profitability (such as changes in fee waivers and expense reimbursement commitments). In this regard, the Independent Board Members noted that they have an Independent Board Member serve as a point person to review and keep them apprised of changes to the profitability analysis and/or methodologies during the year. The Independent Board Members also considered Nuveen’s revenues for advisory activities, expenses, and profit margin compared to that of various unaffiliated management firms with comparable assets under management (based on asset size and asset composition).
In reviewing profitability, the Independent Board Members recognized the Advisor’s continued investment in its business to enhance its services, including capital improvements to investment technology, updated compliance systems, and additional personnel in compliance, risk management, and product development as well as its ability to allocate resources to various areas of the Advisor as the need arises. In addition, in evaluating profitability, the Independent Board Members also recognized the subjective nature of determining profitability which may be affected by numerous factors including the allocation of expenses. Further, the Independent Board Members recognized the difficulties in making comparisons as the profitability of other advisers generally is not publicly available and the profitability information that is available for certain advisers or management firms may not be representative of the industry and may be affected by, among other things, the adviser’s particular business mix, capital costs, types of funds managed and expense allocations. Notwithstanding the foregoing, the Independent Board Members reviewed Nuveen’s methodology and assumptions for allocating expenses across product lines to determine profitability. In reviewing profitability, the Independent Board Members recognized Nuveen’s investment in its fund business. Based on their review, the Independent Board Members concluded that the Advisor’s level of profitability for its advisory activities was reasonable in light of the services provided.
With respect to sub-advisers affiliated with Nuveen, including the Sub-Advisor, the Independent Board Members reviewed the sub-adviser’s revenues, expenses and profitability margins (pre- and post-tax) for its advisory activities and the methodology used for allocating expenses among the internal sub-advisers. Based on their review, the Independent Board Members were satisfied that the Sub-Advisor’s level of profitability was reasonable in light of the services provided.
In evaluating the reasonableness of the compensation, the Independent Board Members also considered other amounts paid to a Fund Adviser by the Funds as well as any indirect benefits (such as soft dollar arrangements, if any) the Fund Adviser and its affiliates receive, or are expected to receive, that are directly attributable to the management of the Funds, if any. See Section E below for additional information on indirect benefits a Fund Adviser may receive as a result of its relationship with the Funds. Based on their review of the overall fee arrangements of each Fund, the Independent Board Members determined that the advisory fees and expenses of the respective Fund were reasonable.
D. Economies of Scale and Whether Fee Levels Reflect These Economies of Scale
With respect to economies of scale, the Independent Board Members have recognized the potential benefits resulting from the costs of a fund being spread over a larger asset base, although economies of scale are difficult to measure and predict with precision, particularly on a fund-by-fund basis. One method to help ensure the shareholders share in these benefits is to include breakpoints in the advisory fee schedule. Generally, management fees for funds in the Nuveen complex are comprised of a fund-level component and a complex-level component, subject to certain exceptions. Accordingly, the Independent Board Members reviewed and considered the applicable fund-level breakpoints in the advisory fee schedules that reduce advisory fees as asset levels increase.
In addition to fund-level advisory fee breakpoints, the Board also considered the Funds’ complex-wide fee arrangement. Pursuant to the complex-wide fee arrangement, the fees of the funds in the Nuveen complex are generally reduced as the assets in the fund complex reach certain levels. The complex-wide fee arrangement seeks to provide the benefits of economies of scale to fund shareholders when total fund complex assets increase, even if assets of a particular fund are unchanged or have decreased. The approach reflects the notion that some of Nuveen’s costs are attributable to services provided to all its funds in the complex and therefore all funds benefit if these costs are spread over a larger asset base. In addition, with the acquisition of the funds previously advised by FAF Advisors, Inc., the Board noted that a portion of such funds’ assets at the time of acquisition were deemed eligible to be included in the complex-wide fee calculation in order to deliver fee savings to shareholders in the combined complex and such funds were subject to differing complex-level fee rates.
Based on their review, the Independent Board Members concluded that the breakpoint schedules and complex-wide fee arrangement were acceptable and reflect economies of scale to be shared with shareholders when assets under management increase.
E. Indirect Benefits
In evaluating fees, the Independent Board Members received and considered information regarding potential “fall out” or ancillary benefits the respective Fund Adviser or its affiliates may receive as a result of its relationship with each Fund. In this regard, the
Independent Board Members considered, among other things, any sales charges, distribution fees and shareholder services fees received and retained by the Funds’ principal underwriter, an affiliate of the Advisor, which includes fees received pursuant to any 12b-1 plan. The Independent Board Members, therefore, considered the 12b-1 fees retained by Nuveen during the last calendar year.
In addition to the above, the Independent Board Members considered whether the Fund Advisers received any benefits from soft dollar arrangements whereby a portion of the commissions paid by a Fund for brokerage may be used to acquire research that may be useful to the Fund Adviser in managing the assets of the Funds and other clients. The Independent Board Members recognized that each Fund Adviser has the authority to pay a higher commission in return for brokerage and research services if it determines in good faith that the commission paid is reasonable in relation to the value of the brokerage and research services provided and may benefit from such soft dollar arrangements. Similarly, the Board recognized that the research received pursuant to soft dollar arrangements by a Fund Adviser may also benefit a Fund and shareholders to the extent the research enhances the ability of the Fund Adviser to manage the Fund. The Independent Board Members noted that the Fund Advisers’ profitability may be somewhat lower if they did not receive the research services pursuant to the soft dollar arrangements and had to acquire such services directly.
Based on their review, the Independent Board Members concluded that any indirect benefits received by a Fund Adviser as a result of its relationship with the Funds were reasonable and within acceptable parameters.
F. Other Considerations
The Independent Board Members did not identify any single factor discussed previously as all-important or controlling. The Board Members, including the Independent Board Members, unanimously concluded that the terms of each Advisory Agreement are fair and reasonable, that the respective Fund Adviser’s fees are reasonable in light of the services provided to each Fund and that the Advisory Agreements be renewed.
Notes
Notes
Glossary of Terms Used in this Report
Asset-Backed Securities (ABS): Securities whose value and income payments are derived from and collateralized by a specific pool of underlying assets. The pool of assets typically is a group of small and/or illiquid assets that may be difficult to sell individually. The underlying pools of asset-backed securities often include payments from credit cards, auto loans or mortgage loans.
Average Annual Total Return: This is a commonly used method to express an investment’s performance over a particular, usually multi-year time period. It expresses the return that would have been necessary each year to equal the investment’s actual cumulative performance (including change in NAV or offer price and reinvested dividends and capital gains distributions, if any) over the time period being considered.
Barclays Aggregate Bond Index: An unmanaged index that includes all investment-grade, publicly issued, fixed-rate, dollar denominated, nonconvertible debt issues and commercial mortgage-backed securities with maturities of at least one year and out-standing par values of $150 million or more. Index returns assume reinvestment of distributions, but do not include the effects of any applicable sales charges or management fees.
Barclays High Yield 2% Issuer Capped Index: An issuer-constrained version of the U.S. Corporate High-Yield Index that covers the U.S. dollar denominated, non-investment grade, fixed-rate, taxable corporate bond market. Index returns assume reinvestment of distributions, but do not include the effects of any applicable sales charges or management fees.
Barclays Intermediate Government Bond Index: An unmanaged index that includes all publicly issued, U.S. Treasury securities that have a remaining maturity of greater than or equal to 1 year and less than 10 years, are rated investment grade, and have $250 million or more of outstanding face value. Index returns assume reinvestment of distributions, but do not include the effects of any applicable sales charges or management fees.
Barclays Intermediate Government/Credit Bond Index: An unmanaged index that measures the performance of U.S. dollar denominated U.S. Treasuries, government-rated and investment grade U.S. corporate fixed-rate, non-convertible securities having $250 million or more of outstanding face value and a remaining maturity of greater than or equal to 1 year and less than 10 years. Index returns assume reinvestment of distributions, but do not include the effects of any applicable sales charges or management fees.
Barclays U.S. TIPs Index: An unmanaged index that includes all publicly issued, U.S. Treasury inflation-protected securities that have at least one year remaining to maturity, are rated investment grade, and have $250 million or more of outstanding face value. Index returns assume reinvestment of distributions, but do not include the effects of any applicable sales charges or management fees.
Barclays 1-3 Year Government/Credit Bond Index: An unmanaged index that includes all medium and larger issues of U.S. government, investment-grade corporate, and investment-grade international dollar-denominated bonds that have maturities of between 1 and 3 years and are publicly issued. Index returns assume reinvestment of distributions, but do not include the effects of any applicable sales charges or management fees.
Commercial Mortgage-Backed Securities (CMBS): Commercial mortgage-backed securities are backed by cash flows of a mortgage or pool of mortgages on commercial real estate. CMBS generally are structured to provide protection to the senior class investors against potential losses on the underlying mortgage loans. CMBS are typically characterized by the following: i) loans on multi-family housing, non-residential property, ii) payments based on the amortization schedule of 25-30 years with a balloon payment due usually after 10 years, and iii) restrictions on prepayments.
Duration: A measure of the price sensitivity of a security or fund to changes in prevailing interest rates. The longer the duration, the more price sensitivity to interest rate movements in either direction.
Lipper High Current Yield Funds Classification Average: Represents the average annualized returns for all reporting funds in the Lipper High Current Yield Funds Classification. Lipper returns account for the effects of management fees and assume reinvestment of dividends, but do not reflect any applicable sales charge.
Lipper Intermediate Investment Grade Debt Funds Classification Average: Represents the average annualized returns for all reporting funds in the Lipper Intermediate Investment Grade Debt Funds Classification. Lipper returns account for the effects of management fees and assume reinvestment of distributions, but do not reflect any applicable sales charge.
Lipper Intermediate U.S. Government Funds Classification Average: Represents the average annualized returns for all reporting funds in the Lipper Intermediate U.S. Government Funds Classification. Lipper returns account for the effects of management fees and assume reinvestment of distributions, but do not reflect any applicable sales charge.
Lipper Multi-Sector Income Classification Average: Represents the average annualized returns for all reporting funds in the Lipper Multi-Sector Income Classification. Lipper returns account for the effects of management fees and assume reinvestment of distributions, but do not reflect any applicable sales charge.
Lipper Short Investment Grade Debt Funds Classification Average: Represents the average annualized returns for all reporting funds in the Lipper Short Investment Grade Debt Funds Classification. Lipper returns account for the effects of management fees and assume reinvestment of distributions, but do not reflect any applicable sales charge.
Lipper Treasury Inflation Protected Securities Funds Classification Average: Represents the average annualized returns for all reporting funds in the Lipper Treasury Inflation Protected Securities Funds Classification. The Lipper returns account for the effects of management fees and assume reinvestment of dividends, but do not reflect any applicable sales charge.
Mortgage-Backed Securities (MBS): Mortgage-backed securities (MBS) are bonds backed by pools of mortgages, usually with similar characteristics, and which return principal and interest in each payment. MBS are composed of residential mortgages (RMBS) or commercial mortgages (CMBS). RMBS are further divided into agency RMBS and non-agency RMBS, depending on the issuer.
Net Asset Value (NAV): The net market value of all securities held in a portfolio.
Net Asset Value (NAV) Per Share: The market value of one share of a mutual fund or closed-end fund. For a Fund, the NAV is calculated daily by taking the Fund’s total assets (securities, cash, and accrued earnings), subtracting the Fund’s liabilities, and dividing by the number of shares outstanding.
Tax Equalization: The practice of treating a portion of the distribution made to a redeeming shareholder, which represents his proportionate part of undistributed net investment income and capital gain as a distribution for tax purposes. Such amounts are referred to as the equalization debits (or payments) and will be considered a distribution to the shareholder of net investment income and capital gain for calculation of the Fund’s dividends paid deduction.
Additional Fund Information
Fund Manager
Nuveen Fund Advisors, Inc.
333 West Wacker Drive
Chicago, IL 60606
Sub-Adviser
Nuveen Asset Management, LLC
333 West Wacker Drive
Chicago, IL 60606
Legal Counsel
Chapman and Cutler LLP
Chicago, IL
Independent Registered Public Accounting Firm
PricewaterhouseCoopers LLP*
Chicago, IL
Custodian
State Street Bank & Trust Company
Boston, MA
Transfer Agent and Shareholder Services
Boston Financial
Data Services
Nuveen Investor Services
P.O. Box 8530
Boston, MA 02266-8530
(800) 257-8787
* The Board of Directors of the Funds, upon recommendation of the Audit Committee, engaged PricewaterhouseCoopers LLP as the Funds’ independent registered public accounting firm as of March 1, 2011. On December 30, 2011, Ernst & Young, LLP (“Ernst & Young”) completed its work on the October 31, 2011 audits and resigned as the independent registered public accounting firm of the Funds.
Ernst & Young’s report on the Funds’ financial statements for the most recent fiscal year contained no adverse opinion or disclaimer of opinion, and were not qualified or modified as to uncertainty, audit scope or accounting principles. For the most recent fiscal year and through March 1, 2011, there were no disagreements with Ernst & Young on any matter of accounting principles, financial statement disclosure or auditing scope or procedures, which disagreements, if not resolved to the satisfaction of Ernst & Young,
Distribution Information: The following Fund hereby designates its percentages of dividends paid from net ordinary income as dividends qualifying for the 70% dividends received deduction (“DRD”) for corporations and its percentages as qualified dividend income (“QDI”) for individuals under Section 1 (h)(11) of the Internal Revenue Code as shown in the accompanying table. The actual qualified dividend income distributions will be reported to shareholders on Form 1099-DIV which will be sent to shareholders shortly after calendar year end.
| | | | | | | | |
| Fund | | % of DRD | | % of QDI | |
High Income Bond | | 2.97% | | | 3.45 | % |
The following federal income tax information is provided with respect to the Funds’ distributions paid during the taxable year ended June 30, 2012: Nuveen Core Plus Bond Fund, Nuveen High Income Bond Fund, Nuveen Inflation Protected Securities Fund, Nuveen Intermediate Government Bond Fund, Nuveen Intermediate Term Bond Fund, Nuveen Short Term Bond Fund and Nuveen Strategic Income Fund hereby designate approximately 99.78%, 94.22%, 100%, 100.00%, 100.00%, 98.13% and 96.70%, respectively, (or the maximum amount eligible) of ordinary income distributions as Interest-Related Dividends as defined in Internal Revenue Code Section 871(k) for the taxable year ended June 30, 2012.
Funds’ Quarterly Portfolio of Investments and Proxy Voting information: You may obtain (i) each Fund’s quarterly portfolio of investments, (ii) information regarding how the Funds voted proxies relating to portfolio securities held during the most recent twelve-month period ended June 30, and (iii) a description of the policies and procedures that the Funds used to determine how to vote proxies relating to portfolio securities without charge, upon request, by calling Nuveen Investments at (800) 257-8787 or on Nuveen’s website at www.nuveen.com.
You may also obtain this and other Fund information directly from the Securities and Exchange Commission (SEC). The SEC may charge a copying fee for this information. Visit the SEC on-line at http://www.sec.gov or in person at the SEC’s Public Reference Room in Washington, D.C. Call the SEC at (202) 942-8090 for room hours and operation. You may also request Fund information by sending an e-mail request to publicinfo@sec.gov or by writing to the SEC’s Public Reference Section at 100 F Street NE, Washington, D.C. 20549.
The Financial Industry Regulatory Authority (FINRA) provides a Public Disclosure Program which supplies certain information regarding the disciplinary history of FINRA members and their associated persons in response to either telephone inquiries at (800) 289-9999 or written inquiries at www.finra.org. FINRA also provides an investor brochure that includes information describing the Public Disclosure Program.
Nuveen Investments:
Serving Investors for Generations
Since 1898, financial advisors and their clients have relied on Nuveen Investments to provide dependable investment solutions through continued adherence to proven, long-term investing principles. Today, we offer a range of high quality equity and fixed-income solutions designed to be integral components of a well-diversified core portfolio.
Focused on meeting investor needs.
Nuveen Investments provides high-quality investment services designed to help secure the long-term goals of institutional and individual investors as well as the consultants and financial advisors who serve them. Nuveen Investments markets a wide range of specialized investment solutions which provide investors access to capabilities of its high-quality boutique investment affiliates-Nuveen Asset Management, Symphony Asset Management, NWQ Investment Management Company, Santa Barbara Asset Management, Tradewinds Global Investors, Winslow Capital Management, and Gresham Investment Management. In total, Nuveen Investments managed $212 billion as of June 30, 2012.
Find out how we can help you.
To learn more about how the products and services of Nuveen Investments may be able to help you meet your financial goals, talk to your financial advisor, or call us at (800) 257-8787. Please read the information provided carefully before you invest. Investors should consider the investment objective and policies, risk considerations, charges and expenses of any investment carefully. Where applicable, be sure to obtain a prospectus, which contains this and other relevant information. To obtain a prospectus, please contact your securities representative or Nuveen Investments, 333 W. Wacker Dr., Chicago, IL 60606. Please read the prospectus carefully before you invest or send money.
Learn more about Nuveen Funds at: www.nuveen.com/mf
| | |
Distributed by Nuveen Securities, LLC 333 West Wacker Drive Chicago, IL 60606 www.nuveen.com | | |
MAN-FINC-0612D
ITEM 2. CODE OF ETHICS.
As of the end of the period covered by this report, the registrant has adopted a code of ethics that applies to the registrant’s principal executive officer, principal financial officer, principal accounting officer or controller, or persons performing similar functions. There were no amendments to or waivers from the code during the period covered by this report. The registrant has posted the code of ethics on its website at www.nuveen.com/mf. (To view the code, click on the Shareholder Resources drop down menu box, click on Fund Governance and then click on Code of Conduct.)
ITEM 3. AUDIT COMMITTEE FINANCIAL EXPERT.
The registrant’s Board of Trustees determined that the registrant has at least one “audit committee financial expert” (as defined in Item 3 of Form N-CSR) serving on its Audit Committee. The registrant’s audit committee financial expert is Carole E. Stone, who is “independent” for purposes of Item 3 of Form N-CSR.
Ms. Stone served for five years as Director of the New York State Division of the Budget. As part of her role as Director, Ms. Stone was actively involved in overseeing the development of the State’s operating, local assistance and capital budgets, its financial plan and related documents; overseeing the development of the State’s bond-related disclosure documents and certifying that they fairly presented the State’s financial position; reviewing audits of various State and local agencies and programs; and coordinating the State’s system of internal audit and control. Prior to serving as Director, Ms Stone worked as a budget analyst/examiner with increasing levels of responsibility over a 30 year period, including approximately five years as Deputy Budget Director. Ms. Stone has also served as Chair of the New York State Racing Association Oversight Board, as Chair of the Public Authorities Control Board, as a Commissioner on the New York State Commission on Public Authority Reform and as a member of the Boards of Directors of several New York State public authorities. These positions have involved overseeing operations and finances of certain entities and assessing the adequacy of project/entity financing and financial reporting. Currently, Ms. Stone is on the Board of Directors of CBOE Holdings, Inc., of the Chicago Board Options Exchange, and of C2 Options Exchange. Ms. Stone’s position on the boards of these entities and as a member of both CBOE Holdings’ Audit Committee and its Finance Committee has involved, among other things, the oversight of audits, audit plans and preparation of financial statements.
Item 4. Principal Accountant Fees and Services.
The following tables show the amount of fees that PricewaterhouseCoopers LLP, the Trust’s auditor, billed to the Trust during the Trust’s last full fiscal year ending June 30, 2012 and the amount that Ernst & Young LLP, the Trust’s previous auditor, billed to the Trust during the Trust’s full fiscal year ending June 30, 2011. The Audit Committee approved in advance all audit services and non-audit services that PricewaterhouseCoopers LLP and Ernst & Young LLP provided to the Trust, except for those non-audit services that were subject to the pre-approval exception under Rule 2-01 of Regulation S-X (the “pre-approval exception”). The preapproval exception for services provided directly to the Trust waives the pre-approval requirement for services other than audit, review or attest services if: (A) the aggregate amount of all such services provided constitutes no more than 5% of the total amount of revenues paid by the Trust during the fiscal year in which the services are provided; (B) the Trust did not recognize the services as non-audit services at the time of the engagement; and (C) the services are promptly brought to the Audit Committee’s attention, and the Committee (or its delegate) approves the services before the audit is completed.
| | | | | | | | | | | | | | | | |
Fiscal Year Ended June 30, 2012 | | Audit Fees Billed
to Funds 1 | | | Audit-Related Fees
Billed to Funds 2 | | | Tax Fees
Billed to Funds 3 | | | All Other Fees
Billed to Funds 4 | |
Name of Series | | | | | | | | | | | | | | | | |
Core Plus Bond Fund 5 | | | 38,841 | | | | 0 | | | | 0 | | | | 0 | |
High Income Bond Fund 6 | | | 17,335 | | | | 0 | | | | 1,500 | | | | 1,667 | |
Inflation Protected Securities Fund | | | 35,617 | | | | 0 | | | | 0 | | | | 0 | |
Intermediate Government Bond Fund | | | 35,235 | | | | 0 | | | | 0 | | | | 0 | |
Intermediate Term Bond Fund | | | 37,792 | | | | 0 | | | | 0 | | | | 0 | |
Short Term Bond Fund 7 | | | 38,557 | | | | 0 | | | | 0 | | | | 1,667 | |
Strategic Income Fund 8 | | | 38,110 | | | | 0 | | | | 0 | | | | 1,667 | |
| | | | | | | | | | | | | | | | |
Total | | $ | 241,487 | | | $ | 0 | | | $ | 1,500 | | | $ | 5,001 | |
| 1 | | “Audit Fees” are the aggregate fees billed for professional services for the audit of the Fund’s annual financial statements and services provided in connection with statutory and regulatory filings or engagements. |
| 2 | | “Audit Related Fees” are the aggregate fees billed for assurance and related services reasonably related to the performance of the audit or review of financial statements and are not reported under “Audit Fees”. |
| 3 | | “Tax Fees” are the aggregate fees billed for professional services for tax advice, tax compliance, and tax planning. |
| 4 | | “All Other Fees” are the aggregate fees billed for products and services other than “Audit Fees”, “Audit Related Fees”, and “Tax Fees”. |
| 5 | | The Fund changed names from Core Bond Fund to Core Plus Bond Fund on 05/14/2012. |
| 6 | | The Fund acquired the High Yield Bond Fund on 11/04/2011. |
| 7 | | The Fund acquired the Short Duration Bond Fund on 11/18/2011. |
| 8 | | The Fund acquired Multi-Strategy Core Bond Fund on 11/04/2011 and changed names from Total Return Bond Fund to Strategic Income Fund on 05/14/2012. |
| | | | | | | | | | | | | | | | |
| | | Percentage Approved Pursuant to Pre-approval Exception | |
| | | Audit Fees Billed
to Funds | | | Audit-Related Fees
Billed to Funds | | | Tax Fees
Billed to Funds | | | All Other Fees
Billed to Funds | |
Name of Series | | | | | | | | | | | | | | | | |
Core Plus Bond Fund | | | 0 | % | | | 0 | % | | | 0 | % | | | 0 | % |
High Income Bond Fund | | | 0 | % | | | 0 | % | | | 0 | % | | | 0 | % |
Inflation Protected Securities Fund | | | 0 | % | | | 0 | % | | | 0 | % | | | 0 | % |
Intermediate Government Bond Fund | | | 0 | % | | | 0 | % | | | 0 | % | | | 0 | % |
Intermediate Term Bond Fund | | | 0 | % | | | 0 | % | | | 0 | % | | | 0 | % |
Short Term Bond Fund | | | 0 | % | | | 0 | % | | | 0 | % | | | 0 | % |
Strategic Income Fund | | | 0 | % | | | 0 | % | | | 0 | % | | | 0 | % |
| | | | |
Fiscal Year Ended June 30, 2011 5 | | Audit Fees Billed
to Funds 1 | | | Audit-Related Fees
Billed to Funds 2 | | | Tax Fees
Billed to Funds 3 | | | All Other Fees
Billed to Funds 4 | |
Name of Series | | | | | | | | | | | | | | | | |
Core Plus Bond Fund | | | 24,428 | | | | 0 | | | | 4,557 | | | | 0 | |
High Income Bond Fund | | | 24,429 | | | | 0 | | | | 1,056 | | | | 0 | |
Inflation Protected Securities Fund | | | 24,429 | | | | 0 | | | | 3,681 | | | | 0 | |
Intermediate Government Bond Fund | | | 24,429 | | | | 0 | | | | 3,223 | | | | 0 | |
Intermediate Term Bond Fund | | | 24,428 | | | | 0 | | | | 2,513 | | | | 0 | |
Short Term Bond Fund | | | 24,428 | | | | 0 | | | | 4,265 | | | | 0 | |
Strategic Income Fund | | | 24,429 | | | | 0 | | | | 5,134 | | | | 0 | |
| | | | | | | | | | | | | | | | |
Total | | $ | 171,000 | | | $ | 0 | | | $ | 24,429 | | | $ | 0 | |
| 1 | | “Audit Fees” are the aggregate fees billed for professional services for the audit of the Fund’s annual financial statements and services provided in connection with statutory and regulatory filings or engagements. |
| 2 | | “Audit Related Fees” are the aggregate fees billed for assurance and related services reasonably related to the performance of the audit or review of financial statements and are not reported under “Audit Fees”. |
| 3 | | “Tax Fees” are the aggregate fees billed for professional services for tax advice, tax compliance, and tax planning. |
| 4 | | “All Other Fees” are the aggregate fees billed for products and services other than “Audit Fees”, “Audit Related Fees”, and “Tax Fees”. |
| 5 | | The Funds were acquired on December 31, 2010. |
| | | | | | | | | | | | | | | | |
| | | Percentage Approved Pursuant to Pre-approval Exception | |
| | | Audit Fees Billed
to Funds | | | Audit-Related Fees
Billed to Funds | | | Tax Fees
Billed to Funds | | | All Other Fees
Billed to Funds | |
Name of Series | | | | | | | | | | | | | | | | |
Core Plus Bond Fund | | | 0 | % | | | 0 | % | | | 0 | % | | | 0 | % |
High Income Bond Fund | | | 0 | % | | | 0 | % | | | 0 | % | | | 0 | % |
Inflation Protected Securities Fund | | | 0 | % | | | 0 | % | | | 0 | % | | | 0 | % |
Intermediate Government Bond Fund | | | 0 | % | | | 0 | % | | | 0 | % | | | 0 | % |
Intermediate Term Bond Fund | | | 0 | % | | | 0 | % | | | 0 | % | | | 0 | % |
Short Term Bond Fund | | | 0 | % | | | 0 | % | | | 0 | % | | | 0 | % |
Strategic Income Fund | | | 0 | % | | | 0 | % | | | 0 | % | | | 0 | % |
| | | | | | | | | | | | |
Fiscal Year Ended June 30, 2012 | | Audit-Related Fees
Billed to Adviser and
Affiliated Fund
Service Providers | | | Tax Fees Billed to
Adviser and
Affiliated Fund
Service Providers | | | All Other Fees
Billed to Adviser
and Affiliated Fund
Service Providers | |
Nuveen Investment Funds, Inc. | | $ | 0 | | | $ | 0 | | | $ | 0 | |
| |
| | | Percentage Approved Pursuant to Pre-approval Exception | |
| | | Audit-Related Fees
Billed to Adviser and
Affiliated Fund
Service Providers | | | Tax Fees Billed to
Adviser and
Affiliated Fund
Service Providers | | | All Other Fees
Billed to Adviser
and Affiliated Fund
Service Providers | |
| | | 0 | % | | | 0 | % | | | 0 | % |
| | | |
Fiscal Year Ended June 30, 2011 | | Audit-Related Fees
Billed to Adviser and
Affiliated Fund
Service Providers | | | Tax Fees Billed to
Adviser and
Affiliated Fund
Service Providers | | | All Other Fees
Billed to Adviser
and Affiliated Fund
Service Providers | |
Nuveen Investment Funds, Inc. | | $ | 0 | | | $ | 0 | | | $ | 0 | |
| |
| | | Percentage Approved Pursuant to Pre-approval Exception | |
| | | Audit-Related Fees
Billed to Adviser and
Affiliated Fund
Service Providers | | | Tax Fees Billed to
Adviser and
Affiliated Fund
Service Providers | | | All Other Fees
Billed to Adviser
and Affiliated Fund
Service Providers | |
| | | 0 | % | | | 0 | % | | | 0 | % |
| | | | | | | | | | | | | | | | |
Fiscal Year Ended June 30, 2012 | | Total Non-Audit Fees
Billed to Trust | | | Total Non-Audit Fees
billed to Adviser and
Affiliated Fund Service
Providers (engagements
related directly to the
operations and financial
reporting of the Trust) | | | Total Non-Audit Fees
billed to Adviser and
Affiliated Fund Service
Providers (all other
engagements) | | | Total | |
Name of Series | | | | | | | | | | | | | | | | |
Core Plus Bond Fund 1 | | | 0 | | | | 0 | | | | 0 | | | | 0 | |
High Income Bond Fund 2 | | | 3,167 | | | | 0 | | | | 0 | | | | 3,167 | |
Inflation Protected Securities Fund | | | 0 | | | | 0 | | | | 0 | | | | 0 | |
Intermediate Government Bond Fund | | | 0 | | | | 0 | | | | 0 | | | | 0 | |
Intermediate Term Bond Fund | | | 0 | | | | 0 | | | | 0 | | | | 0 | |
Short Term Bond Fund 3 | | | 1,667 | | | | 0 | | | | 0 | | | | 1,667 | |
Strategic Income Fund 4 | | | 1,667 | | | | 0 | | | | 0 | | | | 1,667 | |
| | | | | | | | | | | | | | | | |
Total | | $ | 6,501 | | | $ | 0 | | | $ | 0 | | | $ | 6,501 | |
“Non-Audit Fees Billed to Trust” represent “Tax Fees” and “All Other Fees” billed to each Fund in their respective amounts from the previous table.
| 1 | | The Fund changed names from Core Bond Fund to Core Plus Bond Fund on 05/14/2012. |
| 2 | | The Fund acquired the High Yield Bond Fund on 11/04/2011. |
| 3 | | The Fund acquired the Short Duration Bond Fund on 11/18/2011. |
| 4 | | The Fund acquired Multi-Strategy Core Bond Fund on 11/04/2011 and changed names from Total Return Bond Fund to Strategic Income Fund on 05/14/2012. |
| | | | | | | | | | | | | | | | |
Fiscal Year Ended June 30, 2011 1 | | Total Non-Audit Fees
Billed to Trust | | | Total Non-Audit Fees
billed to Adviser and
Affiliated Fund Service
Providers (engagements
related directly to the
operations and financial
reporting of the Trust) | | | Total Non-Audit Fees
billed to Adviser and
Affiliated Fund Service
Providers (all other
engagements) | | | Total | |
Name of Series | | | | | | | | | | | | | | | | |
Core Plus Bond Fund | | | 4,557 | | | | 0 | | | | 0 | | | | 4,557 | |
High Income Bond Fund | | | 1,056 | | | | 0 | | | | 0 | | | | 1,056 | |
Inflation Protected Securities Fund | | | 3,681 | | | | 0 | | | | 0 | | | | 3,681 | |
Intermediate Government Bond Fund | | | 3,223 | | | | 0 | | | | 0 | | | | 3,223 | |
Intermediate Term Bond Fund | | | 2,513 | | | | 0 | | | | 0 | | | | 2,513 | |
Short Term Bond Fund | | | 4,265 | | | | 0 | | | | 0 | | | | 4,265 | |
Strategic Income Fund | | | 5,134 | | | | 0 | | | | 0 | | | | 5,134 | |
| | | | | | | | | | | | | | | | |
Total | | $ | 24,429 | | | $ | 0 | | | $ | 0 | | | $ | 24,429 | |
“Non-Audit Fees Billed to Trust” represent “Tax Fees” and “All Other Fees” billed to each Fund in their respective amounts from the previous table.
| 1 | | The Funds were acquired on December 31, 2010. |
Audit Committee Pre-Approval Policies and Procedures. Generally, the Audit Committee must approve (i) all non-audit services to be performed for the Trust by the Trust’s independent accountants and (ii) all audit and non-audit services to be performed by the Trust’s independent accountants for the Affiliated Fund Service Providers with respect to the operations and financial reporting of the Trust. Regarding tax and research projects conducted by the independent accountants for the Trust and Affiliated Fund Service Providers (with respect to operations and financial reports of the Trust), such engagements will be (i) pre-approved by the Audit Committee if they are expected to be for amounts greater than $10,000; (ii) reported to the Audit Committee Chairman for his verbal approval prior to engagement if they are expected to be for amounts under $10,000 but greater than $5,000; and (iii) reported to the Audit Committee at the next Audit Committee meeting if they are expected to be for an amount under $5,000.
ITEM 5. AUDIT COMMITTEE OF LISTED REGISTRANTS.
Not applicable to this registrant.
ITEM 6. SCHEDULE OF INVESTMENTS.
| a) | | See Portfolio of Investments in Item 1. |
ITEM 7. DISCLOSURE OF PROXY VOTING POLICIES AND PROCEDURES FOR CLOSED-END
MANAGEMENT INVESTMENT COMPANIES.
Not applicable to this registrant.
ITEM 8. PORTFOLIO MANAGERS OF CLOSED-END MANAGEMENT INVESTMENT COMPANIES.
Not applicable to this registrant.
ITEM 9. PURCHASES OF EQUITY SECURITIES BY CLOSED-END MANAGEMENT INVESTMENT COMPANY AND AFFILIATED PURCHASERS.
Not applicable to this registrant.
ITEM 10. SUBMISSION OF MATTERS TO A VOTE OF SECURITY HOLDERS.
There have been no material changes to the procedures by which shareholders may recommend nominees to the registrant’s Board of Trustees implemented after the registrant last provided disclosure in response to this Item.
ITEM 11. CONTROLS AND PROCEDURES.
| | (a) | | The registrant’s principal executive and principal financial officers, or persons performing similar functions, have concluded that the registrant’s disclosure controls and procedures (as defined in Rule 30a-3(c) under the Investment Company Act of 1940, as amended (the “1940 Act”) (17 CFR 270.30a-3(c))) are effective, as of a date within 90 days of the filing date of this report that includes the disclosure required by this paragraph, based on their evaluation of the controls and procedures required by Rule 30a-3(b) under the 1940 Act (17 CFR 270.30a-3(b)) and Rules 13a-15(b) or 15d-15(b) under the Securities Exchange Act of 1934, as amended (the “Exchange Act”) (17 CFR 240.13a-15(b) or 240.15d-15(b)). |
| | (b) | | There were no changes in the registrant’s internal control over financial reporting (as defined in Rule 30a-3(d) under the 1940 Act (17 CFR 270.30a-3(d)) that occurred during the second fiscal quarter of the period covered by this report that has materially affected, or is reasonably likely to materially affect, the registrant’s internal control over financial reporting. |
ITEM 12. EXHIBITS.
File the exhibits listed below as part of this Form.
| | |
| (a)(1) | | Any code of ethics, or amendment thereto, that is the subject of the disclosure required by Item 2, to the extent that the registrant intends to satisfy the Item 2 requirements through filing of an exhibit: Not applicable because the code is posted on registrant’s website at www.nuveen.com/mf and there were no amendments during the period covered by this report. (To view the code, click on the Shareholder Resources drop down menu box, click on Fund Governance and then Code of Conduct.) |
| |
| (a)(2) | | A separate certification for each principal executive officer and principal financial officer of the registrant as required by Rule 30a-2(a) under the 1940 Act (17 CFR 270.30a-2(a)) in the exact form set forth below: See EX-99.CERT attached hereto. |
| |
| (a)(3) | | Any written solicitation to purchase securities under Rule 23c-1 under the 1940 Act (17 CFR 270.23c-1) sent or given during the period covered by the report by or on behalf of the registrant to 10 or more persons: Not applicable to this registrant. |
| |
| (b) | | If the report is filed under Section 13(a) or 15(d) of the Exchange Act, provide the certifications required by Rule 30a-2(b) under the 1940 Act (17 CFR 270.30a-2(b)), Rule 13a-14(b) or Rule 15d-14(b) under the Exchange Act (17 CFR 240.13a-14(b) or 240.15d-14(b)), and Section 1350 of Chapter 63 of Title 18 of the United States Code (18 U.S.C. 1350) as an Exhibit. A certification furnished pursuant to this paragraph will not be deemed “filed” for purposes of Section 18 of the Exchange Act (15 U.S.C. 78r), or otherwise subject to the liability of that section. Such certification will not be deemed to be incorporated by reference into any filing under the Securities Act of 1933 or the Exchange Act, except to the extent that the registration specifically incorporates it by reference: See EX-99.906 CERT attached hereto. |
SIGNATURES
Pursuant to the requirements of the Securities Exchange Act of 1934 and the Investment Company Act of 1940, the registrant has duly caused this report to be signed on its behalf by the undersigned, thereunto duly authorized.
(Registrant) Nuveen Investment Funds, Inc.
| | |
| |
By (Signature and Title) | | /s/ Kevin J. McCarthy |
| | Kevin J. McCarthy |
| | Vice President and Secretary |
Date: September 7, 2012
Pursuant to the requirements of the Securities Exchange Act of 1934 and the Investment Company Act of 1940, this report has been signed below by the following persons on behalf of the registrant and in the capacities and on the dates indicated.
| | |
| |
By (Signature and Title) | | /s/ Gifford R. Zimmerman |
| | Gifford R. Zimmerman |
| | Chief Administrative Officer |
| | (principal executive officer) |
Date: September 7, 2012
| | |
| |
| By (Signature and Title) | | /s/ Stephen D. Foy |
| | Stephen D. Foy |
| | Vice President and Controller |
| | (principal financial officer) |
Date: September 7, 2012