UNITED STATES
SECURITIES AND EXCHANGE COMMISSION
Washington, D.C. 20549
FORM N-CSR
CERTIFIED SHAREHOLDER REPORT OF REGISTERED MANAGEMENT
INVESTMENT COMPANIES
Investment Company Act file number 811-05309
Nuveen Investment Funds, Inc.
(Exact name of registrant as specified in charter)
Nuveen Investments
333 West Wacker Drive, Chicago, IL 60606
(Address of principal executive offices) (Zip code)
Kevin J. McCarthy
Nuveen Investments
333 West Wacker Drive
Chicago, IL 60606
(Name and address of agent for service)
Registrant’s telephone number, including area code: (312) 917-7700
Date of fiscal year end: May 31
Date of reporting period: May 31, 2012
Form N-CSR is to be used by management investment companies to file reports with the Commission not later than 10 days after the transmission to stockholders of any report that is required to be transmitted to stockholders under Rule 30e-1 under the Investment Company Act of 1940 (17 CFR 270.30e-1). The Commission may use the information provided on Form N-CSR in its regulatory, disclosure review, inspection, and policy making roles.
A registrant is required to disclose the information specified by Form N-CSR, and the Commission will make this information public. A registrant is not required to respond to the collection of information contained in Form N-CSR unless the Form displays a currently valid Office of Management and Budget (“OMB”) control number. Please direct comments concerning the accuracy of the information collection burden estimate and any suggestions for reducing the burden to Secretary, Securities and Exchange Commission, 450 Fifth Street, NW, Washington, DC 20549-0609. The OMB has reviewed this collection of information under the clearance requirements of 44 U.S.C. ss.3507.
ITEM 1. REPORTS TO STOCKHOLDERS.

Mutual Funds
Nuveen Municipal Bond Funds
Dependable, tax-free income because it’s not what you earn, it’s what you keep.®
Annual Report
May 31, 2012
| | | | | | | | |
| | | Share Class / Ticker Symbol |
| | | | |
| Fund Name | | Class A | | Class C | | Class C1 | | Class I |
Nuveen Minnesota Intermediate Municipal Bond Fund | | FAMAX | | NIBMX | | FACMX | | FAMTX |
Nuveen Minnesota Municipal Bond Fund | | FJMNX | | NMBCX | | FCMNX | | FYMNX |
Nuveen Nebraska Municipal Bond Fund | | FNTAX | | NCNBX | | FNTCX | | FNTYX |
Nuveen Oregon Intermediate Municipal Bond Fund | | FOTAX | | NIMOX | | — | | FORCX |
LIFE IS COMPLEX.
Nuveen makes things e-simple.
It only takes a minute to sign up for e-Reports. Once enrolled, you’ll receive an e-mail as soon as your Nuveen Fund information is ready. No more waiting for delivery by regular mail. Just click on the link within the e-mail to see the report and save it on your computer if you wish.
Free e-Reports right to your e-mail!
www.investordelivery.com
If you receive your Nuveen Fund distributions and statements from your financial advisor or brokerage account.
OR
www.nuveen.com/accountaccess
If you receive your Nuveen Fund distributions and statements directly from Nuveen.
| | | | | | |
| Must be preceded by or accompanied by a prospectus. | | NOT FDIC INSURED | | MAY LOSE VALUE | | NO BANK GUARANTEE |
Table of Contents
Chairman’s
Letter to Shareholders

Dear Shareholders,
Investors have many reasons to remain cautious. The challenges in the Euro area are casting a shadow over global economies and financial markets. The political support for addressing fiscal issues is eroding as the economic and social impacts become more visible. At the same time, member nations appear unwilling to provide adequate financial support or to surrender sufficient sovereignty to strengthen the banks or unify the Euro area financial system. The gains made in reducing deficits, and the hard-won progress on winning popular acceptance of the need for economic austerity, are at risk. To their credit, European political leaders press on to find compromise solutions, but there is increasing concern that time will begin to run out.
In the U.S., strong corporate earnings have enabled the equity markets to withstand much of the downward pressures coming from weakening job creation, slower economic growth and political uncertainty. The Fed remains committed to low interest rates but has refrained from predicting another program of quantitative easing unless economic growth were to weaken significantly or the threat of recession appears on the horizon. Pre-election maneuvering has added to the already highly partisan atmosphere in the Congress. The end of the Bush-era tax cuts and implementation of the spending restrictions of the Budget Control Act of 2011, both scheduled to take place at year-end, loom closer.
During the last year, U.S. based investors have experienced a sharp decline and a strong recovery in the equity markets. The experienced investment teams at Nuveen keep their eye on a longer time horizon and use their practiced investment disciplines to negotiate through market peaks and valleys to achieve long-term goals for investors. Experienced professionals pursue investments that will weather short-term volatility and at the same time, seek opportunities that are created by markets that overreact to negative developments. Monitoring this process is an important consideration for the Fund Board as it oversees your Nuveen Fund on your behalf.
As always, I encourage you to contact your financial consultant if you have any questions about your investment in a Nuveen Fund. On behalf of the other members of your Fund Board, we look forward to continuing to earn your trust in the months and years ahead.
Sincerely,

Robert P. Bremner
Chairman of the Board
July 20, 2012
Portfolio Managers’ Comments
Certain statements in this report are forward-looking statements. Discussions of specific investments are for illustration only and are not intended as recommendations of individual investments. The forward-looking statements and other views expressed herein are those of the portfolio managers as of the date of this report. Actual future results or occurrences may differ significantly from those anticipated in any forward-looking statements, and the views expressed herein are subject to change at any time, due to numerous market and other factors. The Funds disclaim any obligation to update publicly or revise any forward-looking statements or views expressed herein.
Ratings shown are the highest rating given by one of the following national rating agencies: Standard & Poor’s Group, Moody’s Investors Service, Inc. or Fitch, Inc. Credit ratings are subject to change. AAA, AA, A, and BBB are investment grade ratings; BB, B, CCC, CC, C and D are below-investment grade ratings. Certain bonds backed by U.S. Government or agency securities are regarded as having an implied rating equal to the rating of such securities. Holdings designated N/R are not rated by a national rating agency.
Portfolio managers Christopher Drahn, CFA, Michael Hamilton and Douglas White, CFA, review economic and municipal market conditions at the national and state levels, key investment strategies and the Funds’ performance during the twelve months ending May 31, 2012. Chris, with 32 years of investment experience, has managed the Nuveen Minnesota Intermediate Municipal Bond Fund since 2011. Doug, with 29 years of investment experience, has managed the Nuveen Minnesota Municipal Bond Fund and the Nuveen Nebraska Municipal Bond Fund since 2011. Michael, who has 23 years of investment experience, has managed the Nuveen Oregon Intermediate Municipal Bond Fund since 2011.
What factors affected the U.S. economy and the national municipal bond market during the twelve-month reporting period ending May 31, 2012?
During this period, the U.S. economy’s progress toward recovery from recession remained moderate. The Federal Reserve (Fed) maintained its efforts to improve the overall economic environment by continuing to hold the benchmark Fed Funds rate at the record low level of zero to 0.25% that it had established in December 2008. At its June 2012 meeting (following the end of this reporting period), the central bank affirmed its opinion that economic conditions would likely warrant keeping the Fed Funds rate at “exceptionally low levels” at least through late 2014. The Fed also announced that it would extend its program to lengthen the average maturity of its holdings of U.S. Treasury securities by purchasing another $267 billion of these securities (in addition to the $400 billion originally announced in September 2011) with remaining maturities of six to thirty years and selling an equal amount of U.S. Treasury securities with maturities of three years or less. The goals of this program, which the Fed has now extended through the end of December 2012, are to lower longer-term interest rates, make broader financial conditions more accommodating, support a stronger economic recovery and help ensure that inflation remains at levels consistent with the Fed’s mandates of maximum employment and price stability.
In the first quarter of 2012, the U.S. economy, as measured by the U.S. gross domestic product (GDP), grew at an annualized rate of 1.9%, marking eleven consecutive quarters of positive growth. The Consumer Price Index (CPI) rose 1.7% year-over-year as of May 2012, the lowest twelve-month rate of change since February 2011, while the core CPI (which excludes food and energy) increased 2.3% during the period, edging above the Fed’s unofficial objective of 2.0% or lower for this inflation measure. Labor market conditions continued to be slow to improve, with national unemployment registering 8.2% in May 2012, down from 9.0% in May 2011 but a slight uptick from the 8.1% reading in April 2012. The housing market remained the major weak spot in the economy,
beleaguered by a high level of distressed properties and difficult credit conditions. For the twelve months ended April 2012 (most recent data available at the time this report was prepared), the average home price in the Standard & Poor’s (S&P)/Case-Shiller Index of 20 major metropolitan areas lost 1.9%, as housing prices remained at the lowest levels since early 2003, down approximately 34% from their 2006 peak. In addition, the U.S. economic picture continued to be clouded by concerns about the European debt crisis and global financial markets in general and efforts to reduce the U.S. federal deficit.
Municipal bond prices generally rallied during this period, amid strong demand and tight supply. Although the availability of tax-exempt supply improved in recent months, the pattern of new issuance remained light compared with long-term historical trends. This served as a key driver of performance, as tight supply and strong demand combined to create favorable market conditions for municipal bonds. Concurrent with rising prices, yields declined across most maturities, especially at the longer end of the municipal yield curve. The depressed level of municipal bond issuance during the first part of this period was due in part to the lingering effects of the taxable Build America Bonds (BAB) program. Even though the BAB program expired at the end of 2010, issuers had made extensive use of its favorable terms to issue almost $190 billion in taxable BAB bonds during 2009 and 2010, representing approximately 25% of all municipal issuance during that period. Some borrowers accelerated issuance into 2010 in order to take advantage of the program before its termination, fulfilling their capital program borrowing needs well into 2011 and 2012. The low level of municipal issuance during this period also reflected the current political distaste for additional borrowing by state and local governments and the prevalent atmosphere of municipal budget austerity. In recent months, we have seen an increasing number of borrowers come to market seeking to take advantage of the current rate environment by calling existing debt and refinancing at lower rates.
Over the twelve months ended May 31, 2012, municipal bond issuance nationwide totaled $357.4 billion, an increase of 2.7% compared with issuance during the twelve-month period ended May 31, 2011. During this period, demand for municipal bonds remained very strong, especially from individual investors.
How were economic and market conditions in Minnesota, Nebraska and Oregon?
Due to some temporary setbacks, Minnesota’s pace of economic recovery, which had been fairly brisk going into the fourth quarter of 2011, has slightly lagged that of the nation as a whole. For 2011, the state’s economy expanded 1.2%, compared with the national rate of 1.5%, ranking Minnesota 23rd in terms of GDP growth by state. The shutdown of Minnesota’s state government for 20 days in July 2011 due to a budget dispute and higher crude oil prices presented obstacles to the state’s economic growth. However, recovery continued, as demonstrated by employment gains in most sectors of the state’s diverse economy, especially high-paying jobs in the professional and business services sector. Education, health care services and tourism also showed strong employment gains. In addition, Minnesota’s manufacturing firms reported strong production, investment, employment and export expectations, signaling continued expansion. Together, these four sectors account for almost 50% of the state’s jobs. As
of May 2012, Minnesota’s unemployment rate was 5.6%, down from 6.6% in May 2011 and well below the national average of 8.2%. Record-low mortgage rates have helped to boost demand for housing in some parts of the state, primarily Rochester, Duluth, and Minneapolis/St. Paul. According to the S&P/Case-Shiller Index of 20 major metropolitan areas, housing prices in Minneapolis rose 3.8% during the twelve months ending April 2012 (most recent data available at the time this report was prepared), bringing home prices in the area to 1999 levels. Minnesota enacted a $35.7 billion biennial budget for fiscal 2012 and 2013. As of May 2012, the state’s tax collections were reportedly running ahead of budget. The structural imbalance of Minnesota’s budget led S&P to downgrade the rating on the state’s general obligation bonds to AA+ from AAA in September 2011. Moody’s also revised its outlook for the state to negative from stable in August 2011, while maintaining its Aa1 rating. Despite these revisions, Minnesota retained a solid credit profile reflective of its well-balanced economy, above-average wealth levels, moderate debt burden and strong debt management. For the twelve months ended May 31, 2012, Minnesota issued $5.9 billion in municipal bonds, a decrease of 17% from the twelve months ended May 31, 2011.
While the impact of the recent economic recession was less severe in Nebraska than in many other states, the state’s recovery lost momentum in late 2011 as hiring slowed in most sectors of the Nebraska economy. For 2011, the state’s economy expanded at a rate of 0.1%, compared with the national growth rate of 1.5%, ranking Nebraska 42nd in terms of GDP growth by state. The chief exception to the hiring slowdown was the professional and business services sector, which accounted for 11% of jobs in Nebraska, while construction, finance and the government sector continued to be weaker. Nebraska’s economy remained less diverse than that in many other states, with a high dependence on agriculture and food processing. The state’s chief farm products were beef, pork, corn, soybeans and wheat, and Nebraska continued to rank as one of the nation’s top five exporters of corn and soybeans. Food production and manufacturing will likely remain a key strength in the state, while other manufacturing jobs were expected to decline. Nebraska gained ground as a transportation hub for the nation, with higher wages in rail and trucking transportation than the U.S. average. Overall, Nebraska regained more than two-thirds of the jobs lost in the state during the recession, compared with less than half for the nation as a whole. As of May 2012, Nebraska’s unemployment rate was 3.9%, the second lowest rate in the nation (behind North Dakota), down from 4.5% in May 2011. In May 2011, Nebraska enacted a two-year budget for fiscal 2012 and 2013 totaling approximately $7 billion over the biennium, with no new taxes. The budget for fiscal 2013 included a new University of Nebraska cancer research center, increased state spending on child welfare and child care services, and rolled back cuts in Medicaid payments to health care providers. As of May 2012, Nebraska held general obligation credit ratings of Aa2 from Moody’s and AA from S&P. For the twelve months ended May 31, 2012, Nebraska’s municipal bond issuance totaled $3.3 billion, up 19% from the twelve months ended May 31, 2011.
After a slow start, Oregon’s economic recovery has gained some momentum. In 2011, the state’s economy expanded at a rate of 4.7%, compared with the national growth rate of 1.5%, ranking Oregon second in terms of GDP growth by state. Computer and electronics manufacturing accounted for the majority of this growth, as the demand for
semiconductors increased, and Intel, with more than 15,000 employees, ranked as the state’s largest private employer. Education, health care, information services, construction and retail trade led the way in adding jobs during this period. At the same time, the government sector continued to shed jobs, as lawmakers looked for additional ways to cut spending. As of May 2012, the state’s unemployment rate was 8.4%, the lowest since October 2008, down from 9.5% in May 2011. In addition to the weaker government sector, one of the main problems on the Oregon economy continued to be the slow-to-recover housing market. According to the S&P/Case-Shiller Index of 20 major metropolitan areas, housing prices in Portland fell 0.9% during the twelve months ended April 2012 (most recent data available at the time this report was prepared), compared with a price decline of 1.9% nationally. In 2011, Oregon enacted a two-year budget for fiscal 2012 and 2013, closing an estimated $2.5 billion budget gap without adding new taxes. Budget solutions included transfers from the education stability fund to augment K-12 funding and a holdback of 3.5% of all appropriations except for K-12 education. The state also received approval from the federal government for a Medicaid waiver, which will allow the state to contain program costs. Oregon has no sales tax and personal income taxes make up a substantial percentage of the state’s revenues, accounting for 86% of general fund revenues in fiscal 2011. As of May 2012, Oregon’s general obligation bonds were rated Aa1 with a stable outlook from Moody’s and AA+ with a stable outlook by S&P. For the twelve months ended May 31, 2012, Oregon issued $2.8 billion in municipal bonds, a decline of 11% from the twelve months ended May 31, 2011.
How did the Funds perform during the twelve-month period ending May 31, 2012?
The tables in the Fund Performance and Expense Ratios section of this report provide Class A Share total returns for the Funds for the one-year, five-year and ten-year periods ending May 31, 2012. Each Fund’s total returns are compared with the performance of each Fund’s benchmark index and their appropriate Lipper classification average.
During the past twelve months, the Nuveen Minnesota Intermediate Municipal Bond Fund (Class A Shares at net asset value) outpaced its national benchmark, the Barclays 1-15 Year Blend Municipal Bond Index. The Nuveen Oregon Intermediate Municipal Bond Fund (Class A Shares at net asset value) very modestly trailed this same performance measure. Both Funds outpaced the Lipper Other States Intermediate Municipal Debt Funds Classification Average.
Meanwhile, the Nuveen Minnesota Municipal Bond Fund and the Nuveen Nebraska Municipal Bond Fund (both Funds’ Class A Shares at net asset value) significantly outpaced the Barclays Municipal Bond Index, as well as their respective Lipper averages, the Lipper Minnesota Municipal Debt Funds Classification Average and the Lipper Other States Municipal Debt Funds Classification Average.
What strategies were used to manage the Funds during the reporting period ended May 31, 2012? How did these strategies influence performance?
All of the Funds continued to employ the same fundamental investment strategies and tactics long relied upon by Nuveen, although our ability to implement those strategies
depended on the individual characteristics of the portfolios, as well as market conditions within each state. Nuveen’s municipal bond portfolios are managed with a value oriented approach and close input from Nuveen’s research team.
Nuveen Minnesota Intermediate Municipal Bond Fund
The Minnesota Intermediate Fund’s relative outperformance of the Barclays 1-15 Year Blend Municipal Bond Index was primarily the result of favorable credit quality positioning. Most notably, the Fund’s overweighting in BBB-rated and A-rated issues proved positive with the constructive backdrop for lower rated, higher yielding securities, as investors were increasingly willing throughout the year to take on added credit risk in exchange for increased income in the low interest rate environment. The Fund’s smaller allocation to the highest rated tax-exempt bonds in the Minnesota market also added to results, given those securities’ relative underperformance.
Another factor influencing the Fund’s results was a slightly longer duration, meaning its greater sensitivity to interest rate changes. Steadily falling interest rates during the past year, especially on longer dated issues, were favorable for the Fund, given the portfolio’s slightly increased duration compared with the overall municipal bond market, as measured by the benchmark. While the index features bonds with maturities ranging from about 1 to 17 years, the Fund had an even wider range, with bond maturities generally spanning from nearly zero to as long as 20 years. The Fund’s longer dated holdings provided a minor positive in relative terms, but our modest exposure to very short dated securities did not fare as well, as these bonds trailed the performance of their longer maturity counterparts.
New purchases for the portfolio were initiated along various points on the yield curve. We emphasized bonds with longer intermediate maturities, as bonds on the short end of the yield curve failed to offer much in the way of income relative to their credit risk. When we did add shorter maturities, they tended to be individual issues trading at attractive prices low enough to justify the relatively low yields.
Key additions included Minnesota Tobacco Securitization Authority bonds rated A- by S&P and BBB+ by Fitch. These bonds were issued in November 2011 to help the state’s budget deficit and we bought 20-year bonds in the offering. Later in the period, we turned to the secondary municipal bond market to add some shorter-intermediate bonds by the same issuer, with maturities ranging from 2018 to 2025.
Additional purchases included Wayzata Senior Housing Revenue Bonds for the Folkestone Senior Living Community, a retirement home owned and developed by Presbyterian Homes whose non-rated bonds offered a relatively high yield for what we believed to be a reasonable level of credit risk. We also added general obligation (GO) bonds from Moorhead, Minnesota, rated Aa3 by Moody’s. Funding for these and other purchases came predominantly from new shareholder investments in the portfolio, as well as the proceeds of bond calls and maturities.
Nuveen Minnesota Municipal Bond Fund
The Minnesota Municipal Bond Fund outperformed the Barclays Municipal Bond Index during the twelve-month reporting period. As interest rates declined throughout this span, the Fund’s longer duration, meaning its greater sensitivity to changing interest
rates, influenced performance the most relative to the index. As the yield curve flattened during the period, indicating that yields of longer bonds fell more than those of shorter bonds, the Fund was greatly helped by its larger allocation to longer dated bonds, specifically those with maturities of twelve years and longer. The portfolio’s underweighting of bonds with shorter maturities, which lagged the market, also added to results, though not to the same extent.
Credit quality allocation also contributed to the Fund’s performance. This was especially true of the lower rated bonds in the portfolio, which outperformed their higher rated counterparts. While all rating categories turned in positive results, the Fund’s elevated allocation to non-rated and BBB-rated issues, as well as to A-rated securities, was especially helpful, given investors’ willingness to assume greater credit risk in exchange for added income. In addition, we maintained underweighted positions in the highest credit rating categories, AAA-rated and AA-rated bonds, which further added to the Fund’s outperformance relative to the benchmark.
Although it was sometimes challenging to find appropriate Minnesota bonds to buy during the twelve months, we selectively added several longer maturity bonds to the portfolio, focusing when possible on issues with maturity dates ranging from 20 to 30 years and of mid investment grade quality. We favored revenue bonds in sectors such as education, housing and health care.
A noteworthy purchase established during the period was a position in Minnesota’s first issuance of tobacco securitization credits. These bonds, rated A- by S&P and BBB+ by Fitch, are funded by the revenue paid to the state from tobacco companies as part of a 1998 legal settlement. These securities increased the Fund’s allocation to the BBB credit rating category during the period. We continued to invest more heavily in these types of bonds, due to their higher level of income and what we saw as manageable credit risk. Simultaneously, the Fund’s allocation to AAA-rated issues declined. To finance our purchases, we used the proceeds of new shareholder investments into the Fund. In addition, we sold selected higher quality, intermediate maturity general obligation (GO) bonds as well as issues across various revenue sectors, whose value we believed was more limited than other securities available in the marketplace.
Nuveen Nebraska Municipal Bond Fund
The Nuveen Nebraska Municipal Bond Fund’s outperformance of the Barclays Municipal Bond Index was driven primarily by its favorable duration or interest rate positioning. The Fund’s composition enabled it to benefit to a greater extent than the benchmark did from falling interest rates, an advantageous situation for fixed-income securities. In fact, the Fund’s duration began the twelve-month period somewhat shorter, or less interest rate sensitive, than that of the benchmark. As the period progressed, however, the supply of Nebraska tax-exempt securities rose dramatically, nearly tripling in the first five months of 2012, compared to the same five months of 2011, and as a result we had multiple opportunities to lengthen the portfolio’s duration. The Fund’s subsequent increase in interest rate sensitivity was very helpful for performance relative to the benchmark, as we saw the best results from some of the longest duration securities in the portfolio, most notably, bonds with maturities of twelve years and longer. The Fund also
benefited in relative terms from its underweighting in bonds with shorter maturities, which resulted in less exposure to these lower returning issues.
A lesser but still meaningful factor lifting the Fund’s relative performance was credit quality positioning. While all of the Fund’s ratings categories provided positive performance, lower rated bonds did better than their higher rated counterparts. Accordingly, compared to its benchmark, the Fund was helped by its significant overweighting in non-rated and A-rated bonds. At the same time, the Fund had less exposure to AAA-rated and AA-rated bonds which further added to the Fund’s relative results.
In contrast, the Fund’s sector allocation and individual bond selection tempered the helpful effects of duration and credit related strategies. Specifically, the Fund was underweight in the strong performing corporate-backed industrial development revenue (IDR) bond sector, and several of our individual holdings in this group did not fare as well as we had hoped during the past twelve months. Although a small positive impact came from the Fund’s allocation to health care and leasing bonds, it was not enough to counterbalance the challenges from the portfolio’s IDR exposure.
As we mentioned, with ample supply of suitable Nebraska tax-exempt bonds to select from during the reporting period, we were successful in extending the Fund’s duration by purchasing a number of longer maturity bonds, which we generally saw as offering better value potential than comparable shorter dated issues. As a result of these new additions, we were able to extend the Fund’s average maturity by roughly 3.5 years. Our purchases consisted of a mix of general obligation (GO) and revenue bonds with high and mid-tier credit quality, including new portfolio additions in the health care and higher education sectors, among others.
To finance our purchases, we generally relied on the proceeds of new shareholder investments into the portfolio, which we were pleased to receive during a period of increased Nebraska bond supply because it meant that we did not need to sell many securities to fund our desired acquisitions. When we did liquidate positions in the portfolio, the sales typically involved higher quality, shorter duration bonds whose performance prospects were limited, or securities for which a buyer emerged who was willing to pay a competitive price, enabling us to apply the proceeds to another good value opportunity for our shareholders.
Early in the period, when the supply of Nebraska tax-exempt securities was scarce, we added some BBB rated Puerto Rico GO bonds to the Fund. Because bonds issued by U.S. territories are generally fully exempt from federal, state and local income taxes for residents of all 50 states, territorial debt is useful to own in a portfolio when we are unable to find suitable in-state bonds. We also later established a position in an A-rated Guam business tax revenue bond. Given falling interest rates throughout the period, these bonds’ relatively high yields made them attractive to us, and accordingly we maintained our positions while awaiting comparably desirable Nebraska securities.
Nuveen Oregon Intermediate Municipal Bond Fund
The Nuveen Oregon Intermediate Municipal Bond Fund (Class A Shares at net asset value) performed nearly in line with its benchmark, the Barclays 1-15 Year Blend Municipal
Bond Index. The primary factor supporting the Fund’s results was the portfolio’s helpful credit rating allocation. During the twelve-month period, bonds with lower credit ratings tended to outperform their higher rated counterparts. This situation was advantageous for the Fund, given that it was overweight in BBB-rated, BB-rated and non-rated bonds while underweight in bonds with AAA credit ratings. Compared with the national municipal bond market, the Fund did have more exposure to AA-rated bonds. Oregon and, by extension, the Fund had a great deal of AA-rated debt relative to other states, and these bonds were not among the better performers in an environment favoring lower rated bonds.
The Fund’s duration, or interest rate positioning, provided another positive impact on performance. As interest rates fell throughout the year, it was beneficial for the Fund to have a slightly longer than average duration, making the portfolio more sensitive to the favorable effects of declining rates. In contrast, the Fund’s results were hampered by unfortunate security selection on balance. Specifically, by an Oregon higher education bond issue that did not fare as well as this category of bonds did nationally.
Given significant shareholder investments into the portfolio during the twelve-month period, we were net buyers of bonds, taking advantage of a variety of opportunities that we, along with Nuveen’s research team, believed offered a good risk/reward trade-off for our shareholders. We invested across a variety of sectors, with an emphasis on health care and established a position in Tigard Water System bonds, which was a new name in the Oregon tax-exempt bond marketplace. In addition, we bought some U.S. territorial bonds, including those issued by the U.S. Virgin Islands, to keep the Fund fully invested in tax-exempt securities at times when suitable Oregon issues were limited. Most of our purchases during the period ranged from A to BBB in credit quality.
Funding for these purchases came primarily from bond calls as well as new investments from shareholders. In addition, we selectively sold a number of positions in the portfolio, including an Illinois continuing care retirement community bond whose credit quality we believed had deteriorated. We sold the position in the fourth quarter of 2011, and the sale enabled us to realize a capital loss that we used to reduce capital gains. Other sales included some AA-rated bank-eligible bonds, which we sold at a premium price and reinvested the proceeds in lower rated but higher yielding securities.
Risk Considerations
Mutual fund investing involves risk; principal loss is possible. Debt or fixed income securities such as those held by the Funds, are subject to market risk, credit risk, interest rate risk, call risk, state concentration risk, tax risk, and income risk. As interest rates rise, bond prices fall. Credit risk refers to an issuers ability to make interest and principal payments when due. Below investment grade or high yield debt securities are subject to liquidity risk and heightened credit risk. The Funds’ use of inverse floaters creates effective leverage. Leverage involves the risk that the Funds could lose more than their original investment and also increases the Funds’ exposure to volatility and interest rate risk.
Dividend Information
Throughout the twelve-month reporting period ending May 31, 2012 the monthly dividend for the Class A Shares of the Nuveen Minnesota Intermediate Municipal Bond Fund remained stable while the dividend for all other share classes experienced one increase. The monthly dividend for the Class A Shares of the Nuveen Minnesota Municipal Bond Fund had one increase, while all other share classes had two dividend increases. The Nuveen Nebraska Municipal Bond Fund’s Class A, C and I Shares all had one monthly dividend increase and decrease while the Class C1 Shares had one monthly dividend increase and two decreases. The Nuveen Oregon Intermediate Municipal Bond Fund’s Class A and I Shares had one monthly dividend increase and the Class C Shares had one monthly dividend increase and one decrease.
Each Fund seeks to pay dividends at a rate that reflects the past and projected performance of the Fund. To permit a Fund to maintain a more stable monthly dividend, the Fund may pay dividends at a rate that may be more or less than the amount of net investment income actually earned by the Fund during the period. If the Fund has cumulatively earned more than it has paid in dividends, it will hold the excess in reserve as undistributed net investment income (UNII) as part of the Fund’s net asset value. Conversely, if the Fund has cumulatively paid in dividends more than it has earned, the excess will constitute negative UNII that will likewise be reflected in the Fund’s net asset value. Each Fund will, over time, pay all its net investment income as dividends to shareholders. As of May 31, 2012, all four Funds had positive UNII balances for tax purposes. The Minnesota Intermediate, Minnesota and Oregon Intermediate Municipal Bond Funds had positive UNII balances and the Nebraska Municipal Bond Fund had a negative UNII balance for financial reporting purposes.
[THIS PAGE INTENTIONALLY LEFT BLANK]
Fund Performance and Expense Ratios
The Fund Performance and Expense Ratios for each Fund are shown on the following eight pages.
Returns quoted represent past performance, which is no guarantee of future results. Current performance may be higher or lower than the performance shown. Investment returns and principal value will fluctuate so that when shares are redeemed, they may be worth more or less than their original cost. Returns without sales charges would be lower if the sales charge were included. Returns do not reflect the deduction of taxes that a shareholder would pay on Fund distributions or the redemption of Fund shares. Income is generally exempt from regular federal income taxes. Some income may be subject to state and local income taxes and to the federal alternative minimum tax. Capital gains, if any, are subject to tax.
Returns may reflect a contractual agreement between certain Funds and the investment adviser to waive certain fees and expenses; see Notes to Financial Statements, Footnote 7 — Management Fees and Other Transactions with Affiliates for more information. In addition, returns may reflect a voluntary expense limitation by the Funds’ investment adviser that may be modified or discontinued at any time without notice. For the most recent month-end performance visit www.nuveen.com or call (800) 257-8787.
Returns reflect differences in sales charges and expenses, which are primarily differences in distribution and service fees. Fund returns assume reinvestment of dividends and capital gains.
Comparative index and Lipper return information is provided for the Funds’ Class A Shares at net asset value (NAV) only.
The expense ratios shown reflect the Funds’ total operating expenses (before fee waivers or expense reimbursements, if any) as shown in the Funds’ most recent prospectus. The expense ratios include management fees and other fees and expenses.
Fund Performance and Expense Ratios (continued)
Nuveen Minnesota Intermediate Municipal Bond Fund
Refer to the first page of this Fund Performance and Expense Ratios section for further explanation of the information included within this page.
Fund Performance
Average Annual Total Returns as of May 31, 2012
| | | | | | | | | | | | |
| | | Average Annual | |
| | | |
| | | 1-Year | | | 5-Year | | | 10-Year | |
Class A Shares at NAV | | | 8.32% | | | | 5.47% | | | | 4.59% | |
Class A Shares at maximum Offering Price | | | 5.03% | | | | 4.82% | | | | 4.28% | |
Barclays 1-15 Year Blend Municipal Bond Index* | | | 7.79% | | | | 5.85% | | | | 3.47% | |
Lipper Other States Intermediate Municipal Debt Funds Classification Average* | | | 7.10% | | | | 4.74% | | | | 4.03% | |
| | | |
Class I Shares | | | 8.60% | | | | 5.56% | | | | 4.71% | |
| | | | | | | | |
| |
| | | Average Annual | |
| | |
| | | 1-Year | | | Since
Inception** | |
Class C Shares | | | 7.79% | | | | 9.41% | |
Class C1 Shares | | | 7.81% | | | | 5.96% | |
Average Annual Total Returns as of June 30, 2012 (Most Recent Calendar Quarter)
| | | | | | | | | | | | |
| |
| | | Average Annual | |
| | | |
| | | 1-Year | | | 5-Year | | | 10-Year | |
Class A Shares at NAV | | | 7.91% | | | | 5.53% | | | | 4.49% | |
Class A Shares at maximum Offering Price | | | 4.63% | | | | 4.90% | | | | 4.17% | |
Class I Shares | | | 8.08% | | | | 5.62% | | | | 4.61% | |
| | | | | | | | |
| |
| | | Average Annual | |
| | |
| | | 1-Year | | | Since
Inception** | |
Class C Shares | | | 7.17% | | | | 8.66% | |
Class C1 Shares | | | 7.40% | | | | 5.72% | |
Class A Shares have a maximum 3.00% sales charge (Offering Price). Class A Share purchases of $1 million or more are sold at net asset value without an up-front sales charge but may be subject to a contingent deferred sales charge (CDSC), also known as a back-end sales charge, if redeemed within eighteen months of purchase. Class C Shares and Class C1 Shares have a 1% CDSC for redemptions within less than twelve months, which is not reflected in the one-year total return. Class I Shares have no sales charge and may be purchased under limited circumstances or by specified classes of investors.
Expense Ratios as of Most Recent Prospectus
| | | | |
| |
| | | Expense
Ratios | |
Class A Shares | | | 0.81% | |
Class C Shares | | | 1.36% | |
Class C1 Shares | | | 1.26% | |
Class I Shares | | | 0.61% | |
| * | Refer to the Glossary of Terms Used in this Report for definitions. Indexes and Lipper averages are not available for direct investment. |
| ** | Since inception returns for Class C and Class C1 Shares are from 1/18/11 and 10/28/09, respectively. |
Growth of an Assumed $10,000 Investment as of May 31, 2012 – Class A Shares
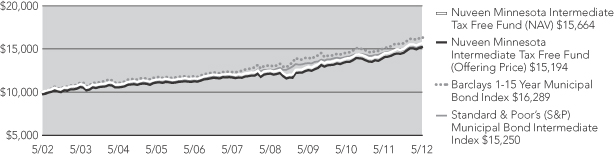
The graphs do not reflect the deduction of taxes, such as state and local income taxes or capital gains taxes, that a shareholder may pay on Fund distributions or the redemption of Fund shares.
Fund Performance and Expense Ratios (continued)
Nuveen Minnesota Municipal Bond Fund
Refer to the first page of this Fund Performance and Expense Ratios section for further explanation of the information included within this page.
Fund Performance
Average Annual Total Returns as of May 31, 2012
| | | | | | | | | | | | |
| | | Average Annual | |
| | | |
| | | 1-Year | | | 5-Year | | | 10-Year | |
Class A Shares at NAV | | | 14.03% | | | | 5.82% | | | | 5.26% | |
Class A Shares at maximum Offering Price | | | 9.29% | | | | 4.92% | | | | 4.81% | |
Barclays Municipal Bond Index* | | | 10.39% | | | | 5.86% | | | | 5.40% | |
Lipper Minnesota Municipal Debt Funds Classification Average* | | | 10.63% | | | | 4.80% | | | | 4.69% | |
| | | |
Class C1 Shares | | | 13.56% | | | | 5.33% | | | | 4.79% | |
Class I Shares | | | 14.23% | | | | 6.01% | | | | 5.48% | |
| | | | | | | | |
| |
| | | Average Annual | |
| | |
| | | 1-Year | | | Since
Inception** | |
Class C Shares | | | 13.48% | | | | 15.29% | |
Average Annual Total Returns as of June 30, 2012 (Most Recent Calendar Quarter)
| | | | | | | | | | | | |
| |
| | | Average Annual | |
| | | |
| | | 1-Year | | | 5-Year | | | 10-Year | |
Class A Shares at NAV | | | 13.23% | | | | 5.99% | | | | 5.18% | |
Class A Shares at maximum Offering Price | | | 8.45% | | | | 5.09% | | | | 4.73% | |
Class C1 Shares | | | 12.76% | | | | 5.48% | | | | 4.72% | |
Class I Shares | | | 13.33% | | | | 6.15% | | | | 5.39% | |
| | | | | | | | |
| |
| | | Average Annual | |
| | |
| | | 1-Year | | | Since
Inception** | |
Class C Shares | | | 12.49% | | | | 14.31% | |
Class A Shares have a maximum 4.20% sales charge (Offering Price). Class A Share purchases of $1 million or more are sold at net asset value without an up-front sales charge but may be subject to a contingent deferred sales charge (CDSC), also known as a back-end sales charge, if redeemed within eighteen months of purchase. Class C Shares and Class C1 Shares have a 1% CDSC for redemptions within less than twelve months, which is not reflected in the one-year total return. Class I Shares have no sales charge and may be purchased under limited circumstances or by specified classes of investors.
Expense Ratios as of Most Recent Prospectus
| | | | |
| |
| | | Expense
Ratios | |
Class A Shares | | | 0.86% | |
Class C Shares | | | 1.41% | |
Class C1 Shares | | | 1.31% | |
Class I Shares | | | 0.66% | |
| * | Refer to the Glossary of Terms Used in this Report for definitions. Indexes and Lipper averages are not available for direct investment. |
| ** | Since inception returns for Class C Shares are from 1/18/11. |
Growth of an Assumed $10,000 Investment as of May 31, 2012 – Class A Shares
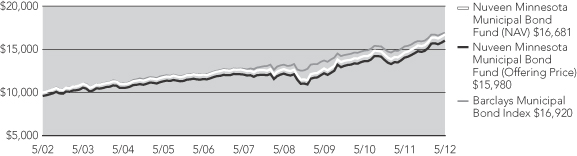
The graphs do not reflect the deduction of taxes, such as state and local income taxes or capital gains taxes, that a shareholder may pay on Fund distributions or the redemption of Fund shares.
Fund Performance and Expense Ratios (continued)
Nuveen Nebraska Municipal Bond Fund
Refer to the first page of this Fund Performance and Expense Ratios section for further explanation of the information included within this page.
Fund Performance
Average Annual Total Returns as of May 31, 2012
| | | | | | | | | | | | |
| |
| | | Average Annual | |
| | | |
| | | 1-Year | | | 5-Year | | | 10-Year | |
Class A Shares at NAV | | | 11.51% | | | | 5.49% | | | | 5.02% | |
Class A Shares at maximum Offering Price | | | 6.83% | | | | 4.58% | | | | 4.57% | |
Barclays Municipal Bond Index* | | | 10.39% | | | | 5.86% | | | | 5.40% | |
Lipper Other States Municipal Debt Funds Classification Average* | | | 10.01% | | | | 4.61% | | | | 4.52% | |
| | | |
Class C1 Shares | | | 11.08% | | | | 5.08% | | | | 4.60% | |
Class I Shares | | | 11.80% | | | | 5.75% | | | | 5.27% | |
| | | | | | | | |
| |
| | | Average Annual | |
| | |
| | | 1-Year | | | Since
Inception** | |
Class C Shares | | | 10.98% | | | | 12.41% | |
Average Annual Total Returns as of June 30, 2012 (Most Recent Calendar Quarter)
| | | | | | | | | | | | |
| |
| | | Average Annual | |
| | | |
| | | 1-Year | | | 5-Year | | | 10-Year | |
Class A Shares at NAV | | | 10.65% | | | | 5.57% | | | | 4.87% | |
Class A Shares at maximum Offering Price | | | 6.01% | | | | 4.67% | | | | 4.42% | |
Class C1 Shares | | | 10.11% | | | | 5.14% | | | | 4.45% | |
Class I Shares | | | 10.83% | | | | 5.81% | | | | 5.12% | |
| | | | | | | | |
| |
| | | Average Annual | |
| | |
| | | 1-Year | | | Since
Inception** | |
Class C Shares | | | 10.02% | | | | 11.37% | |
Class A Shares have a maximum 4.20% sales charge (Offering Price). Class A Share purchases of $1 million or more are sold at net asset value without an up-front sales charge but may be subject to a contingent deferred sales charge (CDSC), also known as a back-end sales charge, if redeemed within eighteen months of purchase. Class C Shares and Class C1 Shares have a 1% CDSC for redemptions within less than twelve months, which is not reflected in the one-year total return. Class I Shares have no sales charge and may be purchased under limited circumstances or by specified classes of investors.
Expense Ratios as of Most Recent Prospectus
| | | | | | | | |
| | |
| | | Gross
Expense
Ratios | | | Net
Expense
Ratios | |
Class A Shares | | | 0.95% | | | | 0.91% | |
Class C Shares | | | 1.50% | | | | 1.46% | |
Class C1 Shares | | | 1.40% | | | | 1.36% | |
Class I Shares | | | 0.75% | | | | 0.71% | |
The Fund’s adviser has contractually agreed to waive fees and/or reimburse other Fund expenses through March 31, 2013 so that annual Fund operating expenses, after fee waivers and/or expense reimbursements and excluding acquired Fund fees and expenses, do not exceed 0.90%, 1.45%, 1.35% and 0.70% for Class A, Class C, Class C1 and Class I Shares, respectively. Fee waivers and expense reimbursements will not be terminated prior to that time without the approval of the Fund’s Board of Directors.
| * | Refer to the Glossary of Terms Used in this Report for definitions. Indexes and Lipper averages are not available for direct investment. |
| ** | Since inception returns for Class C Shares are from 1/18/11. |
Growth of an Assumed $10,000 Investment as of May 31, 2012 – Class A Shares
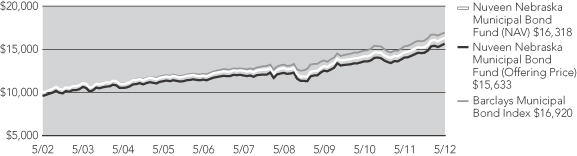
The graphs do not reflect the deduction of taxes, such as state and local income taxes or capital gains taxes, that a shareholder may pay on Fund distributions or the redemption of Fund shares.
Fund Performance and Expense Ratios (continued)
Nuveen Oregon Intermediate Municipal Bond Fund
Refer to the first page of this Fund Performance and Expense Ratios section for further explanation of the information included within this page.
Fund Performance
Average Annual Total Returns as of May 31, 2012
| | | | | | | | | | | | |
| | | Average Annual | |
| | | |
| | | 1-Year | | | 5-Year | | | 10-Year | |
Class A Shares at NAV | | | 7.71% | | | | 5.16% | | | | 4.32% | |
Class A Shares at maximum Offering Price | | | 4.53% | | | | 4.53% | | | | 4.00% | |
Barclays 1-15 Year Blend Municipal Bond Index* | | | 7.79% | | | | 5.85% | | | | 3.47% | |
Lipper Other States Intermediate Municipal Debt Funds Classification Average* | | | 7.10% | | | | 4.74% | | | | 4.03% | |
| | | |
Class I Shares | | | 7.90% | | | | 5.33% | | | | 4.48% | |
| | | | | | | | |
| |
| | | Average Annual | |
| | |
| | | 1-Year | | | Since
Inception** | |
Class C Shares | | | 6.98% | | | | 8.92% | |
Average Annual Total Returns as of June 30, 2012 (Most Recent Calendar Quarter)
| | | | | | | | | | | | |
| |
| | | Average Annual | |
| | | |
| | | 1-Year | | | 5-Year | | | 10-Year | |
Class A Shares at NAV | | | 7.21% | | | | 5.24% | | | | 4.21% | |
Class A Shares at maximum Offering Price | | | 4.04% | | | | 4.60% | | | | 3.90% | |
Class I Shares | | | 7.50% | | | | 5.40% | | | | 4.37% | |
| | | | | | | | |
| |
| | | Average Annual | |
| | |
| | | 1-Year | | | Since
Inception** | |
Class C Shares | | | 6.51% | | | | 8.28% | |
Class A Shares have a maximum 3.00% sales charge (Offering Price). Class A Share purchases of $1 million or more are sold at net asset value without an up-front sales charge but may be subject to a contingent deferred sales charge (CDSC), also known as a back-end sales charge, if redeemed within eighteen months of purchase. Class C Shares have a 1% CDSC for redemptions within less than twelve months, which is not reflected in the one-year total return. Class I Shares have no sales charge and may be purchased under limited circumstances or by specified classes of investors.
Expense Ratios as of Most Recent Prospectus
| | | | |
| |
| | | Expense
Ratios | |
Class A Shares | | | 0.83% | |
Class C Shares | | | 1.38% | |
Class I Shares | | | 0.63% | |
| * | Refer to the Glossary of Terms Used in this Report for definitions. Indexes and Lipper averages are not available for direct investment. |
| ** | Since inception returns for Class C Shares are from 1/18/11. |
Growth of an Assumed $10,000 Investment as of May 31, 2012 – Class A Shares
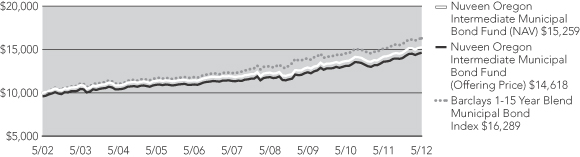
The graphs do not reflect the deduction of taxes, such as state and local income taxes or capital gains taxes, that a shareholder may pay on Fund distributions or the redemption of Fund shares.
Yields as of May 31, 2012
Dividend Yield is the most recent dividend per share (annualized) divided by the offering price per share.
The SEC 30-Day Yield is a standardized measure of a Fund’s yield that accounts for the future amortization of premiums or discounts of bonds held in the Fund’s portfolio. The SEC 30-Day Yield is computed under an SEC standardized formula and is based on the maximum offer price per share. Dividend Yield may differ from the SEC 30-Day Yield because the Fund may be paying out more or less than it is earning and it may not include the effect of amortization of bond premium.
The Taxable-Equivalent Yield represents the yield that must be earned on a fully taxable investment in order to equal the yield of the Fund on an after-tax basis at a specified tax rate. With respect to investments that generate qualified dividend income that is taxable at a maximum rate of 15%, the Taxable-Equivalent Yield is lower.
Nuveen Minnesota Intermediate Municipal Bond Fund
| | | | | | | | | | | | |
| | | |
| | | Dividend
Yield | | | SEC 30-Day
Yield | | | Taxable-
Equivalent
Yield1 | |
Class A Shares4 | | | 3.22% | | | | 1.50% | | | | 2.26% | |
Class C Shares | | | 2.71% | | | | 1.00% | | | | 1.51% | |
Class C1 Shares | | | 2.86% | | | | 1.11% | | | | 1.67% | |
Class I Shares | | | 3.45% | | | | 1.75% | | | | 2.64% | |
Nuveen Minnesota Municipal Bond Fund
| | | | | | | | | | | | |
| | | |
| | | Dividend
Yield | | | SEC 30-Day
Yield | | | Taxable-
Equivalent
Yield1 | |
Class A Shares4 | | | 3.73% | | | | 2.67% | | | | 4.03% | |
Class C Shares | | | 3.34% | | | | 2.28% | | | | 3.44% | |
Class C1 Shares | | | 3.45% | | | | 2.46% | | | | 3.71% | |
Class I Shares | | | 4.05% | | | | 3.09% | | | | 4.66% | |
Nuveen Nebraska Municipal Bond Fund
| | | | | | | | | | | | |
| | | |
| | | Dividend
Yield | | | SEC 30-Day
Yield | | | Taxable-
Equivalent
Yield2 | |
Class A Shares4 | | | 3.45% | | | | 2.38% | | | | 3.55% | |
Class C Shares | | | 3.05% | | | | 1.94% | | | | 2.89% | |
Class C1 Shares | | | 3.13% | | | | 2.04% | | | | 3.04% | |
Class I Shares | | | 3.76% | | | | 2.68% | | | | 3.99% | |
Nuveen Oregon Intermediate Municipal Bond Fund
| | | | | | | | | | | | |
| | | |
| | | Dividend
Yield | | | SEC 30-Day
Yield | | | Taxable-
Equivalent
Yield3 | |
Class A Shares4 | | | 3.13% | | | | 1.11% | | | | 1.71% | |
Class C Shares | | | 2.67% | | | | 0.58% | | | | 0.89% | |
Class I Shares | | | 3.40% | | | | 1.34% | | | | 2.06% | |
| 1 | The Taxable-Equivalent Yield is based on the Fund’s SEC 30-Day Yield on the indicated date and a combined federal and state income tax rate of 33.7%. |
| 2 | The Taxable-Equivalent Yield is based on the Fund’s SEC 30-Day Yield on the indicated date and a combined federal and state income tax rate of 32.9%. |
| 3 | The Taxable-Equivalent Yield is based on the Fund’s SEC 30-Day Yield on the indicated date and a combined federal and state income tax rate of 35.1%. |
| 4 | The SEC Yield for Class A shares quoted in the table reflects the maximum sales load. Investors paying a reduced load because of volume discounts, investors paying no load because they qualify for one of the several exclusions from the load, and existing shareholders who previously paid a load but would like to know the SEC Yield applicable to their shares on a going-forward basis, should understand that the SEC Yield effectively applicable to them would be higher than the figure quoted in the table. |
Holding Summaries as of May 31, 2012
This data relates to the securities held in each Fund’s portfolio of investments. It should not be construed as a measure of performance for the Fund itself.
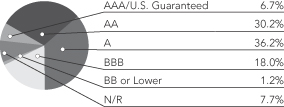
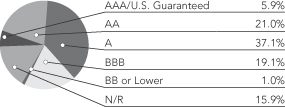
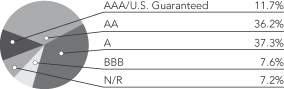
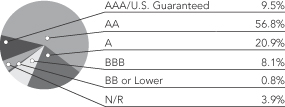
Ratings shown are the highest rating given by one of the following national rating agencies: Standard & Poor’s Group, Moody’s Investors Service, Inc. or Fitch, Inc. Credit ratings are subject to change. AAA, AA, A and BBB are investment grade ratings; BB, B, CCC, CC, C and D are below investment grade ratings. Certain bonds backed by U.S. Government or agency securities are regarded as having an implied rating equal to the rating of such securities. Holdings designated N/R are not rated by a national rating agency.
Nuveen Minnesota Intermediate Municipal Bond Fund
Bond Credit Quality1
Nuveen Minnesota Municipal Bond Fund
Bond Credit Quality1
Nuveen Nebraska Municipal Bond Fund
Bond Credit Quality1
| | | | |
| Portfolio Composition2 | | | |
| Health Care | | | 22.1% | |
| Education and Civic Organizations | | | 21.4% | |
| Tax Obligation/General | | | 18.0% | |
| Utilities | | | 9.6% | |
| Tax Obligation/Limited | | | 7.9% | |
| Transportation | | | 5.2% | |
| Short-Term Investments | | | 2.7% | |
| Other | | | 13.1% | |
| | | | |
| Portfolio Composition2 | | | |
| Health Care | | | 22.3% | |
| Utilities | | | 15.6% | |
| Education and Civic Organizations | | | 15.2% | |
| Tax Obligation/General | | | 8.7% | |
| Long-Term Care | | | 8.0% | |
| Transportation | | | 6.1% | |
| Consumer Staples | | | 5.1% | |
| Housing/Single Family | | | 4.4% | |
| Short-Term Investments | | | 3.6% | |
| Other | | | 11.0% | |
| | | | |
| Portfolio Composition2 | | | |
| Education and Civic Organizations | | | 23.3% | |
| Utilities | | | 21.7% | |
| Tax Obligation/General | | | 13.7% | |
| Tax Obligation/Limited | | | 13.2% | |
| Long-Term Care | | | 9.2% | |
| Health Care | | | 7.5% | |
| Short-Term Investments | | | 1.9% | |
| Other | | | 9.5% | |
| 1 | As a percentage of total investments (excluding money market funds) as of May 31, 2012. Holdings are subject to change. |
| 2 | As a percentage of total investments as of May 31, 2012. Holdings are subject to change. |
Holding Summaries (continued) as of May 31, 2012
Nuveen Oregon Intermediate Municipal Bond Fund
Bond Credit Quality1
| | | | |
| Portfolio Composition2 | | | |
| Tax Obligation/General | | | 41.7% | |
| Health Care | | | 12.8% | |
| Tax Obligation/Limited | | | 9.8% | |
| Water and Sewer | | | 9.5% | |
| Education and Civic Organizations | | | 8.1% | |
| Housing/Multifamily | | | 4.4% | |
| Short-Term Investments | | | 1.6% | |
| Other | | | 12.1% | |
| 1 | As a percentage of total investments (excluding money market funds) as of May 31, 2012. Holdings are subject to change. |
| 2 | As a percentage of total investments as of May 31, 2012. Holdings are subject to change. |
Expense Examples
As a shareholder of one or more of the Funds, you incur two types of costs: (1) transaction costs, including up-front and back-end sales charges (loads) or redemption fees, where applicable; and (2) ongoing costs, including management fees; distribution and service (12b-1) fees, where applicable; and other Fund expenses. The Examples below are intended to help you understand your ongoing costs (in dollars) of investing in the Funds and to compare these costs with the ongoing costs of investing in other mutual funds.
The Examples below are based on an investment of $1,000 invested at the beginning of the period and held for the period.
The information under “Actual Performance,” together with the amount you invested, allows you to estimate actual expenses incurred over the reporting period. Simply divide your account value by $1,000 (for example, an $8,600 account value divided by $1,000 = 8.60) and multiply the result by the cost shown for your share class, in the row entitled “Expenses Incurred During Period” to estimate the expenses incurred on your account during this period.
The information under “Hypothetical Performance,” provides information about hypothetical account values and hypothetical expenses based on the respective Fund’s actual expense ratio and an assumed rate of return of 5% per year before expenses, which is not the Fund’s actual return. The hypothetical account values and expenses may not be used to estimate the actual ending account balance or expense you incurred for the period. You may use this information to compare the ongoing costs of investing in the Fund and other Funds. To do so, compare this 5% hypothetical example with the 5% hypothetical examples that appear in the shareholder reports of the other funds.
Please note that the expenses shown in the table are meant to highlight your ongoing costs only and do not reflect any transaction costs. Therefore, the hypothetical information is useful in comparing ongoing costs only, and will not help you determine the relative total costs of owning different funds or share classes. In addition, if these transaction costs were included, your costs would have been higher.
Nuveen Minnesota Intermediate Municipal Bond Fund
| | | | | | | | | | | | | | | | | | | | | | | | | | | | | | | | | | |
| | | | | | | | | | | | | | | | | Hypothetical Performance | |
| | | Actual Performance | | | | | (5% annualized return before expenses) | |
| | | A Shares | | | C Shares | | | C1 Shares | | | I Shares | | | | | A Shares | | | C Shares | | | C1 Shares | | | I Shares | |
| Beginning Account Value (12/01/11) | | $ | 1,000.00 | | | $ | 1,000.00 | | | $ | 1,000.00 | | | $ | 1,000.00 | | | | | $ | 1,000.00 | | | $ | 1,000.00 | | | $ | 1,000.00 | | | $ | 1,000.00 | |
| Ending Account Value (5/31/12) | | $ | 1,046.50 | | | $ | 1,044.40 | | | $ | 1,045.00 | | | $ | 1,048.30 | | | | | $ | 1,021.10 | | | $ | 1,018.05 | | | $ | 1,018.50 | | | $ | 1,021.75 | |
| Expenses Incurred During Period | | $ | 3.99 | | | $ | 7.10 | | | $ | 6.65 | | | $ | 3.33 | | | | | $ | 3.94 | | | $ | 7.01 | | | $ | 6.56 | | | $ | 3.29 | |
For each class of the Fund, expenses are equal to the Fund’s annualized net expense ratio of .78%, 1.39%, 1.30% and .65% for Classes A, C, C1 and I, respectively, multiplied by the average account value over the period, multiplied by 183/366 (to reflect the one-half year period).
Nuveen Minnesota Municipal Bond Fund
| | | | | | | | | | | | | | | | | | | | | | | | | | | | | | | | | | |
| | | | | | | | | | | | | | | | | Hypothetical Performance | |
| | | Actual Performance | | | | | (5% annualized return before expenses) | |
| | | A Shares | | | C Shares | | | C1 Shares | | | I Shares | | | | | A Shares | | | C Shares | | | C1 Shares | | | I Shares | |
| Beginning Account Value (12/01/11) | | $ | 1,000.00 | | | $ | 1,000.00 | | | $ | 1,000.00 | | | $ | 1,000.00 | | | | | $ | 1,000.00 | | | $ | 1,000.00 | | | $ | 1,000.00 | | | $ | 1,000.00 | |
| Ending Account Value (5/31/12) | | $ | 1,078.50 | | | $ | 1,075.50 | | | $ | 1,076.40 | | | $ | 1,080.40 | | | | | $ | 1,020.70 | | | $ | 1,017.85 | | | $ | 1,018.25 | | | $ | 1,021.55 | |
| Expenses Incurred During Period | | $ | 4.47 | | | $ | 7.42 | | | $ | 7.01 | | | $ | 3.59 | | | | | $ | 4.34 | | | $ | 7.21 | | | $ | 6.81 | | | $ | 3.49 | |
For each class of the Fund, expenses are equal to the Fund’s annualized net expense ratio of .86%, 1.43%, 1.35% and .69% for Classes A, C, C1 and I, respectively, multiplied by the average account value over the period, multiplied by 183/366 (to reflect the one-half year period).
Nuveen Nebraska Municipal Bond Fund
| | | | | | | | | | | | | | | | | | | | | | | | | | | | | | | | | | |
| | | | | | | | | | | | | | | | | Hypothetical Performance | |
| | | Actual Performance | | | | | (5% annualized return before expenses) | |
| | | A Shares | | | C Shares | | | C1 Shares | | | I Shares | | | | | A Shares | | | C Shares | | | C1 Shares | | | I Shares | |
| Beginning Account Value (12/01/11) | | $ | 1,000.00 | | | $ | 1,000.00 | | | $ | 1,000.00 | | | $ | 1,000.00 | | | | | $ | 1,000.00 | | | $ | 1,000.00 | | | $ | 1,000.00 | | | $ | 1,000.00 | |
| Ending Account Value (5/31/12) | | $ | 1,071.80 | | | $ | 1,069.80 | | | $ | 1,070.90 | | | $ | 1,073.70 | | | | | $ | 1,020.55 | | | $ | 1,017.90 | | | $ | 1,018.30 | | | $ | 1,021.55 | |
| Expenses Incurred During Period | | $ | 4.61 | | | $ | 7.35 | | | $ | 6.94 | | | $ | 3.58 | | | | | $ | 4.50 | | | $ | 7.16 | | | $ | 6.76 | | | $ | 3.49 | |
For each class of the Fund, expenses are equal to the Fund’s annualized net expense ratio of .89%, 1.42%, 1.34% and .69% for Classes A, C, C1 and I, respectively, multiplied by the average account value over the period, mulitplied by 183/366 (to reflect the one-half year period).
Expense Examples (continued)
Nuveen Oregon Intermediate Municipal Bond Fund
| | | | | | | | | | | | | | | | | | | | | | | | | | |
| | | | | | | | Hypothetical Performance | |
| | | Actual Performance | | | | | (5% annualized return before expenses) | |
| | | A Shares | | | C Shares | | | I Shares | | | | | A Shares | | | C Shares | | | I Shares | |
| Beginning Account Value (12/01/11) | | $ | 1,000.00 | | | $ | 1,000.00 | | | $ | 1,000.00 | | | | | $ | 1,000.00 | | | $ | 1,000.00 | | | $ | 1,000.00 | |
| Ending Account Value (5/31/12) | | $ | 1,043.70 | | | $ | 1,038.90 | | | $ | 1,044.60 | | | | | $ | 1,020.80 | | | $ | 1,018.15 | | | $ | 1,021.80 | |
| Expenses Incurred During Period | | $ | 4.29 | | | $ | 6.98 | | | $ | 3.27 | | | | | $ | 4.24 | | | $ | 6.91 | | | $ | 3.23 | |
For each class of the Fund, expenses are equal to the Fund’s annualized net expense ratio of .84%, 1.37% and .64% for Classes A, C and I, respectively, multiplied by the average account value over the period, mulitplied by 183/366 (to reflect the one-half year period).
Report of
Independent Registered
Public Accounting Firm
To the Board of Directors and Shareholders of
Nuveen Investment Funds, Inc.:
In our opinion, the accompanying statements of assets and liabilities, including the portfolios of investments, and the related statements of operations, of changes in net assets, and the financial highlights present fairly, in all material respects, the financial position of Nuveen Minnesota Intermediate Municipal Bond Fund, Nuveen Minnesota Municipal Bond Fund, Nuveen Nebraska Municipal Bond Fund, and Nuveen Oregon Intermediate Municipal Bond Fund (each a series of the Nuveen Investment Funds, Inc., hereinafter referred to as the “Funds”) at May 31, 2012, the results of each of their operations for the year then ended, the changes in each of their net assets and the financial highlights for the year ended May 31, 2012, in conformity with accounting principles generally accepted in the United States of America. These financial statements and financial highlights (hereafter referred to as “financial statements”) are the responsibility of the Funds’ management; our responsibility is to express an opinion on these financial statements based on our audits. We conducted our audits of these financial statements in accordance with the standards of the Public Company Accounting Oversight Board (United States). Those standards require that we plan and perform the audit to obtain reasonable assurance about whether the financial statements are free of material misstatement. An audit includes examining, on a test basis, evidence supporting the amounts and disclosures in the financial statements, assessing the accounting principles used and significant estimates made by management, and evaluating the overall financial statement presentation. We believe that our audits, which included confirmation of securities at May 31, 2012 by correspondence with the custodian and brokers, provide a reasonable basis for our opinion. The financial statements of Nuveen Minnesota Intermediate Municipal Bond Fund, Nuveen Minnesota Municipal Bond Fund, Nuveen Nebraska Municipal Bond Fund, and Nuveen Oregon Intermediate Municipal Bond Fund for the periods ended May 31, 2011 and prior were audited by other independent auditors whose report dated July 28, 2011 expressed an unqualified opinion on those statements.
PRICEWATERHOUSECOOPERS LLP
Chicago, IL
July 26, 2012
Portfolio of Investments
Nuveen Minnesota Intermediate Municipal Bond Fund
May 31, 2012
| | | | | | | | | | | | | | | | | | |
Principal
Amount (000) | | | Description (1) | | | | Optional Call
Provisions (2) | | | Ratings (3) | | | Value | |
| | | | | | | | | | | | | | | | | | |
| | | | MUNICIPAL BONDS – 97.8% | | | | | | | | | | | | | | |
| | | | | |
| | | | Consumer Staples – 2.6% | | | | | | | | | | | | | | |
| | | | | |
| | | | Tobacco Securitization Authority, Minnesota, Tobacco Settlement Revenue Bonds, Tax-Exempt Series 2011B: | | | | | | | | | | | | | | |
| $ | 2,000 | | | 5.000%, 3/01/18 | | | | | No Opt. Call | | | | A | | | $ | 2,295,720 | |
| | 540 | | | 4.000%, 3/01/21 | | | | | No Opt. Call | | | | A | | | | 586,640 | |
| | 1,075 | | | 5.250%, 3/01/25 | | | | | 3/22 at 100.00 | | | | A– | | | | 1,230,832 | |
| | 2,370 | | | 5.250%, 3/01/31 | | | | | 3/22 at 100.00 | | | | A– | | | | 2,644,612 | |
| | 5,985 | | | Total Consumer Staples | | | | | | | | | | | | | 6,757,804 | |
| | | | Education and Civic Organizations – 21.5% | | | | | | | | | | | | | | |
| | | | | |
| | | | Itasca County, Minnesota, Revenue Bonds, Charles K. Blandin Foundation, Series 2010: | | | | | | | | | | | | | | |
| | 635 | | | 4.000%, 5/01/18 | | | | | No Opt. Call | | | | A3 | | | | 685,330 | |
| | 255 | | | 4.000%, 5/01/19 | | | | | No Opt. Call | | | | A3 | | | | 277,782 | |
| | | | | |
| | | | Minneapolis, Minnesota, Revenue Bonds, Blake School Project, Refundinjg Series 2010: | | | | | | | | | | | | | | |
| | 550 | | | 4.000%, 9/01/19 | | | | | No Opt. Call | | | | A2 | | | | 633,177 | |
| | 315 | | | 4.000%, 9/01/21 | | | | | 9/20 at 100.00 | | | | A2 | | | | 359,034 | |
| | | | | |
| | 3,025 | | | Minneapolis, Minnesota, Revenue Bonds, National Marrow Donor Program Project, Series 2010, 4.250%, 8/01/20 | | | | | 8/18 at 100.00 | | | | BBB | | | | 3,160,157 | |
| | | | | |
| | 815 | | | Minnesota Higher Education Facilities Authority, Revenue Bonds, Augsburg College, Refunding Series 2010-7-G, 4.000%, 10/01/21 | | | | | 10/18 at 100.00 | | | | Baa3 | | | | 856,043 | |
| | | | | |
| | 1,075 | | | Minnesota Higher Education Facilities Authority, Revenue Bonds, Augsburg College, Series 2005-6-C, 4.750%, 5/01/18 | | | | | 5/14 at 100.00 | | | | Baa3 | | | | 1,117,484 | |
| | | | | |
| | | | Minnesota Higher Education Facilities Authority, Revenue Bonds, Augsburg College, Series 2006-J-1: | | | | | | | | | | | | | | |
| | 320 | | | 5.000%, 5/01/13 | | | | | No Opt. Call | | | | Baa3 | | | | 329,923 | |
| | 375 | | | 5.000%, 5/01/16 | | | | | 5/15 at 100.00 | | | | Baa3 | | | | 405,030 | |
| | 1,295 | | | 5.000%, 5/01/20 | | | | | 5/15 at 100.00 | | | | Baa3 | | | | 1,366,601 | |
| | | | | |
| | | | Minnesota Higher Education Facilities Authority, Revenue Bonds, Bethel University, Refunding Series 2007-6-R: | | | | | | | | | | | | | | |
| | 1,125 | | | 5.500%, 5/01/18 | | | | | 5/17 at 100.00 | | | | N/R | | | | 1,211,040 | |
| | 1,185 | | | 5.500%, 5/01/19 | | | | | 5/17 at 100.00 | | | | N/R | | | | 1,272,880 | |
| | 1,050 | | | 5.500%, 5/01/24 | | | | | 5/17 at 100.00 | | | | N/R | | | | 1,108,601 | |
| | | | | |
| | 1,585 | | | Minnesota Higher Education Facilities Authority, Revenue Bonds, College of St. Benedict, Series 2008-V, 4.500%, 3/01/17 | | | | | No Opt. Call | | | | Baa1 | | | | 1,758,114 | |
| | | | | |
| | 300 | | | Minnesota Higher Education Facilities Authority, Revenue Bonds, College of St. Benedict, Series 2011-7M, 5.000%, 3/01/31 | | | | | 3/20 at 100.00 | | | | Baa1 | | | | 316,224 | |
| | | | | |
| | 150 | | | Minnesota Higher Education Facilities Authority, Revenue Bonds, College of St. Scholastica, Inc., Series 2011-7J , 6.000%, 12/01/28 | | | | | 12/19 at 100.00 | | | | Baa2 | | | | 170,471 | |
| | | | | |
| | | | Minnesota Higher Education Facilities Authority, Revenue Bonds, College of St. Scholastica, Series 2007-6S: | | | | | | | | | | | | | | |
| | 360 | | | 4.375%, 12/01/16 | | | | | No Opt. Call | | | | Baa2 | | | | 395,806 | |
| | 380 | | | 4.500%, 12/01/17 | | | | | No Opt. Call | | | | Baa2 | | | | 422,750 | |
| | | | | |
| | 750 | | | Minnesota Higher Education Facilities Authority, Revenue Bonds, College of St. Scholastica, Series 20107H, 5.125%, 12/01/30 | | | | | 12/19 at 100.00 | | | | Baa2 | | | | 811,020 | |
| | | | | |
| | | | Minnesota Higher Education Facilities Authority, Revenue Bonds, Gustavus Adolfus College, Series 2010-7-B: | | | | | | | | | | | | | | |
| | 1,500 | | | 5.000%, 10/01/18 | | | | | No Opt. Call | | | | A3 | | | | 1,787,745 | |
| | 1,040 | | | 5.000%, 10/01/23 | | | | | 10/19 at 100.00 | | | | A3 | | | | 1,188,096 | |
| | 150 | | | 4.250%, 10/01/24 | | | | | 10/19 at 100.00 | | | | A3 | | | | 162,461 | |
| | | | | |
| | | | Minnesota Higher Education Facilities Authority, Revenue Bonds, Hamline University of Minnesota, Refunding Series 2010E: | | | | | | | | | | | | | | |
| | 1,000 | | | 4.125%, 10/01/18 | | | | | No Opt. Call | | | | Baa2 | | | | 1,088,310 | |
| | 1,370 | | | 4.375%, 10/01/20 | | | | | No Opt. Call | | | | Baa2 | | | | 1,516,453 | |
| | 500 | | | 4.500%, 10/01/21 | | | | | 10/20 at 100.00 | | | | Baa2 | | | | 550,385 | |
| | 250 | | | 5.000%, 10/01/29 | | | | | 10/20 at 100.00 | | | | Baa2 | | | | 270,040 | |
| | | | | |
| | | | Minnesota Higher Education Facilities Authority, Revenue Bonds, Hamline University, Series 2011-7K1: | | | | | | | | | | | | | | |
| | 1,000 | | | 4.250%, 10/01/18 | | | | | No Opt. Call | | | | Baa2 | | | | 1,090,130 | |
| | 625 | | | 6.000%, 10/01/32 | | | | | 10/21 at 100.00 | | | | Baa2 | | | | 729,750 | |
| | | | | | | | | | | | | | | | | | |
Principal
Amount (000) | | | Description (1) | | | | Optional Call
Provisions (2) | | | Ratings (3) | | | Value | |
| | | | | | | | | | | | | | | | | | |
| | | | Education and Civic Organizations (continued) | | | | | | | | | | | | | | |
| | | | | |
| | | | Minnesota Higher Education Facilities Authority, Revenue Bonds, Minneapolis College of Art and Design, Refunding Series 2006-6-K: | | | | | | | | | | | | | | |
| $ | 310 | | | 5.000%, 5/01/13 | | | | | No Opt. Call | | | | Baa2 | | | $ | 319,613 | |
| | 320 | | | 5.000%, 5/01/14 | | | | | No Opt. Call | | | | Baa2 | | | | 339,590 | |
| | 340 | | | 5.000%, 5/01/15 | | | | | No Opt. Call | | | | Baa2 | | | | 370,389 | |
| | 355 | | | 5.000%, 5/01/16 | | | | | 5/15 at 100.00 | | | | Baa2 | | | | 385,633 | |
| | 370 | | | 5.000%, 5/01/17 | | | | | 5/15 at 100.00 | | | | Baa2 | | | | 399,859 | |
| | | | | |
| | 305 | | | Minnesota Higher Education Facilities Authority, Revenue Bonds, Minneapolis College of Art and Design, Series 2012-7N., 3.000%, 5/01/17 | | | | | No Opt. Call | | | | Baa2 | | | | 313,037 | |
| | | | | |
| | 500 | | | Minnesota Higher Education Facilities Authority, Revenue Bonds, Saint Olaf College, Refunding Series 2007-6O, 5.000%, 10/01/16 | | | | | No Opt. Call | | | | A1 | | | | 581,645 | |
| | | | | |
| | 500 | | | Minnesota Higher Education Facilities Authority, Revenue Bonds, St. Catherine College, Series 2002-5N1, 5.250%, 10/01/22 | | | | | 10/12 at 100.00 | | | | Baa1 | | | | 503,130 | |
| | | | | |
| | | | Minnesota Higher Education Facilities Authority, Revenue Bonds, University of Saint Thomas, Series 2009-6X: | | | | | | | | | | | | | | |
| | 500 | | | 4.500%, 4/01/21 | | | | | 4/17 at 100.00 | | | | A2 | | | | 553,970 | |
| | 1,250 | | | 5.000%, 4/01/24 | | | | | 4/17 at 100.00 | | | | A2 | | | | 1,384,075 | |
| | | | | |
| | | | Minnesota Higher Education Facilities Authority, Revenue Bonds, University of Saint Thomas, Series 2009-7A: | | | | | | | | | | | | | | |
| | 1,000 | | | 4.000%, 10/01/17 | | | | | No Opt. Call | | | | A2 | | | | 1,137,290 | |
| | 1,000 | | | 4.500%, 10/01/18 | | | | | No Opt. Call | | | | A2 | | | | 1,177,610 | |
| | 1,845 | | | 4.500%, 10/01/19 | | | | | No Opt. Call | | | | A2 | | | | 2,196,639 | |
| | | | | |
| | 1,045 | | | Minnesota Higher Education Facilities Authority, Revenue Bonds, University of St. Thomas, Series 2006-6I, 4.000%, 4/01/14 | | | | | No Opt. Call | | | | A2 | | | | 1,105,986 | |
| | | | | |
| | | | Minnesota Higher Education Facilities Authority, Saint John’s University Revenue Bonds, Series 2008-6U: | | | | | | | | | | | | | | |
| | 290 | | | 4.200%, 10/01/19 | | | | | 10/18 at 100.00 | | | | A2 | | | | 332,937 | |
| | 385 | | | 4.300%, 10/01/20 | | | | | 10/18 at 100.00 | | | | A2 | | | | 436,979 | |
| | 145 | | | 4.500%, 10/01/22 | | | | | 10/18 at 100.00 | | | | A2 | | | | 163,151 | |
| | | | | |
| | | | Minnesota State Colleges and University, General Fund Revenue Bonds,
Series 2009A: | | | | | | | | | | | | | | |
| | 985 | | | 4.000%, 10/01/22 | | | | | 10/19 at 100.00 | | | | Aa2 | | | | 1,114,567 | |
| | 1,755 | | | 4.000%, 10/01/23 | | | | | 10/19 at 100.00 | | | | Aa2 | | | | 1,960,879 | |
| | | | | |
| | | | Minnesota State Colleges and University, General Fund Revenue Bonds,
Series 2011A: | | | | | | | | | | | | | | |
| | 1,415 | | | 4.250%, 10/01/24 | | | | | 10/21 at 100.00 | | | | Aa2 | | | | 1,626,302 | |
| | 750 | | | 4.375%, 10/01/25 | | | | | 10/21 at 100.00 | | | | Aa2 | | | | 860,543 | |
| | 870 | | | 4.500%, 10/01/26 | | | | | 10/21 at 100.00 | | | | Aa2 | | | | 998,255 | |
| | | | | |
| | | | Moorhead, Minnesota, Educational Facilities Revenue Bonds, The Concordia College Corporation Project, Series 2005A: | | | | | | | | | | | | | | |
| | 500 | | | 4.100%, 12/15/14 | | | | | No Opt. Call | | | | A3 | | | | 529,795 | |
| | 880 | | | 4.200%, 12/15/15 | | | | | No Opt. Call | | | | A3 | | | | 951,773 | |
| | 925 | | | 4.300%, 12/15/16 | | | | | 12/15 at 100.00 | | | | A3 | | | | 1,000,591 | |
| | 1,005 | | | 5.000%, 12/15/18 | | | | | 12/15 at 100.00 | | | | A3 | | | | 1,100,907 | |
| | 1,060 | | | 5.000%, 12/15/19 | | | | | 12/15 at 100.00 | | | | A3 | | | | 1,151,754 | |
| | | | | |
| | 1,000 | | | Saint Paul Housing & Redevelopment Authority, Minnesota, Charter School Lease Revenue Bonds, Nova Classical Academy, Series 2011A, 5.700%, 9/01/21 | | | | | No Opt. Call | | | | BBB– | | | | 1,064,200 | |
| | | | | |
| | 2,395 | | | Saint Paul Housing and Redevelopment Authority, Minnesota, Revenue Bonds, Minnesota Public Radio Project, Refunding Series 2010, 5.000%, 12/01/25 | | | | | 12/20 at 100.00 | | | | A2 | | | | 2,716,481 | |
| | | | | |
| | 1,020 | | | University of Minnesota, General Revenue Bonds, Series 2009C, 5.000%, 12/01/19 | | | | | 6/19 at 100.00 | | | | Aa1 | | | | 1,271,501 | |
| | | | | |
| | 1,895 | | | University of Minnesota, Special Purpose Revenue Bonds, State Supported Biomedical Science Research Facilities Funding Program, Series 2011B, 5.000%, 8/01/23 | | | | | 8/21 at 100.00 | | | | AA | | | | 2,318,798 | |
| | 49,895 | | | Total Education and Civic Organizations | | | | | | | | | | | | | 55,408,716 | |
Portfolio of Investments
Nuveen Minnesota Intermediate Municipal Bond Fund (continued)
May 31, 2012
| | | | | | | | | | | | | | | | | | |
Principal
Amount (000) | | | Description (1) | | | | Optional Call
Provisions (2) | | | Ratings (3) | | | Value | |
| | | | | | | | | | | | | | | | | | |
| | | | Health Care – 22.2% | | | | | | | | | | | | | | |
| | | | | |
| $ | 735 | | | Aitkin, Minnesota Health Care Revenue Bonds, Riverwood Healthcare Center, Series 2006, 5.250%, 2/01/15 | | | | | No Opt. Call | | | | N/R | | | $ | 761,651 | |
| | | | | |
| | 1,340 | | | Cuyuna Range Hospital District, Minnesota, Health Care Facilities Gross Revenue Bonds, Refunding Series 2007, 5.000%, 6/01/17 | | | | | No Opt. Call | | | | N/R | | | | 1,430,195 | |
| | | | | |
| | | | Cuyuna Range Hospital District, Minnesota, Health Care Facilities Gross Revenue Bonds, Series 2005: | | | | | | | | | | | | | | |
| | 425 | | | 5.000%, 6/01/16 | | | | | 6/13 at 101.00 | | | | N/R | | | | 435,655 | |
| | 1,320 | | | 5.000%, 6/01/19 | | | | | 6/13 at 101.00 | | | | N/R | | | | 1,347,852 | |
| | | | | |
| | 400 | | | Fergus Falls, Minnesota, Health Care Facilities Revenue Bonds, Lake Region Healthcare Corporation Project, Series 2010, 4.750%, 8/01/25 | | | | | 8/17 at 100.00 | | | | BBB | | | | 416,036 | |
| | | | | |
| | | | Glencoe, Minnesota, Health Care Facilities Revenue Bonds, Glencoe Regional Health Services Project, Series 2005: | | | | | | | | | | | | | | |
| | 500 | | | 5.000%, 4/01/13 | | | | | No Opt. Call | | | | BBB | | | | 511,985 | |
| | 800 | | | 5.000%, 4/01/14 | | | | | 4/13 at 101.00 | | | | BBB | | | | 826,160 | |
| | 845 | | | 5.000%, 4/01/15 | | | | | 4/13 at 101.00 | | | | BBB | | | | 872,133 | |
| | 1,815 | | | 5.000%, 4/01/17 | | | | | 4/13 at 101.00 | | | | BBB | | | | 1,863,878 | |
| | | | | |
| | | | Maple Grove, Minnesota, Health Care Facilities Revenue Bonds, Maple Grove Hospital Corporation, Series 2007: | | | | | | | | | | | | | | |
| | 1,000 | | | 5.000%, 5/01/17 | | | | | No Opt. Call | | | | Baa1 | | | | 1,114,430 | |
| | 585 | | | 4.500%, 5/01/23 | | | | | 5/17 at 100.00 | | | | Baa1 | | | | 595,542 | |
| | | | | |
| | 1,730 | | | Maple Grove, Minnesota, Health Care Facility Revenue Bonds, North Memorial Health Care, Series 2005, 4.500%, 9/01/17 | | | | | 9/15 at 100.00 | | | | Baa1 | | | | 1,829,631 | |
| | | | | |
| | 1,155 | | | Marshall, Minnesota, Revenue Bonds, Avera Marshall Regional Medical Center, Series 2006, 4.750%, 11/01/20 | | | | | 11/15 at 100.00 | | | | BBB+ | | | | 1,296,430 | |
| | | | | |
| | 1,000 | | | Meeker County, Minnesota, Gross Revenue Hospital Facilities Bonds, Meeker County Memorial Hospital Project, Series 2007, 5.625%, 11/01/22 | | | | | 11/17 at 100.00 | | | | N/R | | | | 1,072,860 | |
| | | | | |
| | 4,000 | | | Minneapolis Health Care System, Minnesota, Revenue Bonds, Fairview Hospital and Healthcare Services, Series 2008A, 6.375%, 11/15/23 | | | | | 11/18 at 100.00 | | | | A | | | | 4,820,992 | |
| | | | | |
| | 1,000 | | | Minneapolis-Saint Paul Housing and Redevelopment Authority, Minnesota, Health Care Revenue Bonds, Children’s Health Care, Series 2010A, 5.250%, 8/15/25 | | | | | 8/20 at 100.00 | | | | A+ | | | | 1,158,120 | |
| | | | | |
| | 1,000 | | | Minnesota Agricultural and Economic Development Board, Health Care Facilities Revenue Bonds, Essentia Health Obligated Group, Series 2008C-1, 5.500%, 2/15/25 – AGC Insured | | | | | 2/20 at 100.00 | | | | AA– | | | | 1,173,890 | |
| | | | | |
| | | | Minnesota Agricultural and Economic Development Board, Healthcare System Revenue Bonds, Fairview Hospital and Healthcare Services, Series 1997A: | | | | | | | | | | | | | | |
| | 305 | | | 5.500%, 11/15/17 – NPFG Insured | | | | | 11/12 at 100.00 | | | | A | | | | 306,046 | |
| | 10 | | | 5.750%, 11/15/26 – NPFG Insured | | | | | 11/12 at 100.00 | | | | A | | | | 10,015 | |
| | | | | |
| | 2,320 | | | Monticello-Big Lake Community Hospital District, Minnesota, Gross Revenue Health Care Facilities Bonds, Series 2003C, 5.750%, 12/01/15 | | | | | 12/12 at 100.00 | | | | N/R | | | | 2,332,412 | |
| | | | | |
| | | | Northfield, Minnesota, Hospital Revenue Bonds, Refunding Series 2006: | | | | | | | | | | | | | | |
| | 920 | | | 5.000%, 11/01/14 | | | | | No Opt. Call | | | | BBB– | | | | 976,442 | |
| | 1,080 | | | 5.500%, 11/01/17 | | | | | 11/16 at 100.00 | | | | BBB– | | | | 1,199,902 | |
| | | | | |
| | 1,015 | | | Redwood Falls, Minnesota, Gross Revenue Hospital Facilities Bonds, Redwood Area Hospital Project, Series 2006, 5.000%, 12/01/21 | | | | | 12/16 at 100.00 | | | | N/R | | | | 1,058,970 | |
| | | | | |
| | 1,140 | | | Rochester, Minnesota, Health Care Facilities Revenue Bonds, Mayo Clinic, Series 2011C, 4.500%, 11/15/38 (Mandatory put 11/15/21) | | | | | No Opt. Call | | | | AA | | | | 1,371,249 | |
| | | | | |
| | 1,000 | | | Rochester, Minnesota, Health Care Facilities Revenue Bonds, Mayo Clinic, Series 2012, 4.000%, 11/15/41 | | | | | 5/22 at 100.00 | | | | AA | | | | 1,007,760 | |
| | | | | |
| | 1,000 | | | Rochester, Minnesota, Health Care Facilities Revenue Bonds, Olmsted Medical Center Project, Series 2010, 5.125%, 7/01/20 | | | | | No Opt. Call | | | | BBB | | | | 1,091,440 | |
| | | | | |
| | 1,000 | | | Saint Cloud, Minnesota, Health Care Revenue Bonds, CentraCare Health System Project, Series 2008D, 5.375%, 5/01/31 – AGC Insured | | | | | 5/19 at 100.00 | | | | Aa3 | | | | 1,111,350 | |
| | | | | |
| | 1,000 | | | Saint Cloud, Minnesota, Health Care Revenue Bonds, CentraCare Health System Project, Series 2010A, 4.250%, 5/01/21 | | | | | 5/20 at 100.00 | | | | A+ | | | | 1,121,080 | |
| | | | | | | | | | | | | | | | | | |
Principal
Amount (000) | | | Description (1) | | | | Optional Call
Provisions (2) | | | Ratings (3) | | | Value | |
| | | | | | | | | | | | | | | | | | |
| | | | Health Care (continued) | | | | | | | | | | | | | | |
| | | | | |
| $ | 2,500 | | | Saint Louis Park, Minnesota, Health Care Facilities Revenue Refunding Bonds, Park Nicollet Health Services, Series 2008C, 5.625%, 7/01/26 | | | | | 7/18 at 100.00 | | | | A | | | $ | 2,776,450 | |
| | | | | |
| | 1,325 | | | Saint Louis Park, Minnesota, Health Care Facilities Revenue Refunding Bonds, Park Nicollet Health Services, Series 2009, 5.500%, 7/01/29 | | | | | 7/19 at 100.00 | | | | A | | | | 1,465,861 | |
| | | | | |
| | | | Saint Paul Housing and Redevelopment Authority, Minnesota, Health Care Facility Revenue Bonds, HealthPartners Obligated Group, Series 2006: | | | | | | | | | | | | | | |
| | 250 | | | 5.000%, 5/15/15 | | | | | No Opt. Call | | | | A3 | | | | 271,703 | |
| | 1,350 | | | 5.250%, 5/15/19 | | | | | 11/16 at 100.00 | | | | A3 | | | | 1,482,692 | |
| | | | | |
| | 3,000 | | | Saint Paul Housing and Redevelopment Authority, Minnesota, Health Care Revenue Bonds, Allina Health System, Series 2009-A1, 5.000%, 11/15/24 | | | | | 11/19 at 100.00 | | | | AA– | | | | 3,321,840 | |
| | | | | |
| | 1,000 | | | Saint Paul Housing and Redevelopment Authority, Minnesota, Health Care Revenue Bonds, Gillette Children’s Specialty Healthcare Project,
Series 2009, 5.000%, 2/01/19 | | | | | No Opt. Call | | | | A– | | | | 1,133,620 | |
| | | | | |
| | | | Saint Paul Housing and Redevelopment Authority, Minnesota, Health Care Revenue Bonds, Gillette Children’s Specialty Healthcare Project,
Series 2010: | | | | | | | | | | | | | | |
| | 1,560 | | | 5.000%, 2/01/19 | | | | | 2/14 at 100.00 | | | | A– | | | | 1,621,090 | |
| | 500 | | | 5.000%, 2/01/20 | | | | | 2/14 at 100.00 | | | | A– | | | | 518,325 | |
| | | | | |
| | 1,785 | | | Shakopee, Minnesota, Health Care Facilities Revenue Bonds, Saint Francis Regional Medical Center, Series 2004, 5.000%, 9/01/17 | | | | | 9/14 at 100.00 | | | | A– | | | | 1,885,674 | |
| | | | | |
| | | | St. Paul Housing and Redevelopment Authority, Minnesota, Health Care Revenue Bonds, Allina Health System, Series 2007A: | | | | | | | | | | | | | | |
| | 100 | | | 5.000%, 11/15/14 – NPFG Insured | | | | | No Opt. Call | | | | AA– | | | | 110,567 | |
| | 720 | | | 5.000%, 11/15/15 – NPFG Insured | | | | | No Opt. Call | | | | AA– | | | | 819,684 | |
| | 1,200 | | | 5.000%, 11/15/19 – NPFG Insured | | | | | 11/17 at 100.00 | | | | AA– | | | | 1,400,232 | |
| | | | | |
| | 1,840 | | | St. Paul Housing and Redevelopment Authority, Minnesota, Revenue Bonds, Healtheast Inc., Series 2005, 5.150%, 11/15/20 | | | | | 11/15 at 100.00 | | | | BBB– | | | | 1,901,622 | |
| | | | | |
| | | | St. Paul Port Authority, Minnesota, Lease Revenue Bonds, HealthEast Midway Campus, Series 2005A: | | | | | | | | | | | | | | |
| | 940 | | | 5.250%, 5/01/15 | | | | | No Opt. Call | | | | BB | | | | 983,080 | |
| | 2,000 | | | 5.750%, 5/01/25 | | | | | 5/15 at 100.00 | | | | BB | | | | 2,058,720 | |
| | | | | |
| | 525 | | | Winona Health Care Facilities Revenue Bonds, Minnesota, Winona Health Obligated Group, Series 2004A, 5.300%, 7/01/17 | | | | | 7/12 at 102.00 | | |
| BBB–
|
| | | 536,802 | |
| | | | | |
| | 1,000 | | | Winona Health Care Facilities Revenue Refunding Bonds, Minnesota, Winona Health Obligated Group, Series 2007, 5.000%, 7/01/20 | | | | | 7/17 at 100.00 | | | | BBB– | | | | 1,088,700 | |
| | | | | |
| | | | Winona, Minnesota, Health Care Facilities Revenue Bonds, Winona Health Obligated Group, Refunding Series 2012: | | | | | | | | | | | | | | |
| | 485 | | | 4.500%, 7/01/24 | | | | | 7/21 at 100.00 | | | | BBB– | | | | 502,552 | |
| | 250 | | | 5.000%, 7/01/34 | | | | | 7/21 at 100.00 | | | | BBB– | | | | 255,390 | |
| | 52,770 | | | Total Health Care | | | | | | | | | | | | | 57,248,710 | |
| | | | Housing/Multifamily – 0.2% | | | | | | | | | | | | | | |
| | | | | |
| | 500 | | | Anoka Housing and Redevelopment Authority, Minnesota, Multifamily Housing Revenue Bonds, Woodland Park Apartments Project, Series 2011A,
5.000%, 4/01/27 | | | | | 4/19 at 100.00 | | | | Aaa | | | | 542,615 | |
| | | | Housing/Single Family – 1.2% | | | | | | | | | | | | | | |
| | | | | |
| | 1,055 | | | Dakota County Community Development Agency, Minnesota, Single Family Mortgage Revenue Bonds, Mortgage Backed Securities Program, Series 2011A, 4.400%, 12/01/26 | | | | | 12/20 at 100.00 | | | | AA+ | | | | 1,146,194 | |
| | | | | |
| | 1,000 | | | Minnesota Housing Finance Agency, Homeownership Finance Bonds, Mortgage-Backed Securities Program, Series 2011D, 4.375%, 7/01/26 | | | | | 7/21 at 100.00 | | | | Aaa | | | | 1,095,680 | |
| | | | | |
| | 650 | | | Minnesota Housing Finance Agency, Residential Housing Finance Bonds, Series 2012A, 3.750%, 7/01/22 (Alternative Minimum Tax) | | | | | 1/22 at 100.00 | | | | AA+ | | | | 680,661 | |
| | | | | |
| | 220 | | | Minnesota Housing Finance Agency, Residential Housing Finance Bonds, Series 2012C, 3.750%, 1/01/22 (Alternative Minimum Tax) | | | | | No Opt. Call | | | | AA+ | | | | 234,122 | |
| | 2,925 | | | Total Housing/Single Family | | | | | | | | | | | | | 3,156,657 | |
Portfolio of Investments
Nuveen Minnesota Intermediate Municipal Bond Fund (continued)
May 31, 2012
| | | | | | | | | | | | | | | | | | |
Principal
Amount (000) | | | Description (1) | | | | Optional Call
Provisions (2) | | | Ratings (3) | | | Value | |
| | | | | | | | | | | | | | | | | | |
| | | | Long-Term Care – 3.2% | | | | | | | | | | | | | | |
| | | | | |
| $ | 565 | | | Center City, Minnesota, Health Care Facilities Revenue Bonds, Hazelden Foundation Project, Series 2011, 4.550%, 11/01/26 | | | | | 11/19 at 100.00 | | | | A3 | | | $ | 600,708 | |
| | | | | |
| | 730 | | | Minnesota Agricultural and Economic Development Board, Revenue Bonds, Evangelical Lutheran Good Samaritan Society, Series 2002, 5.500%, 2/01/15 | | | | | 8/12 at 101.00 | | | | A– | | | | 739,877 | |
| | | | | |
| | 2,000 | | | Moorhead, Minnesota, Senior Housing Facility Revenue Bonds, Sheyenne Crossings Project, Series 2006, 5.600%, 4/01/25 | | | | | 4/14 at 101.00 | | | | N/R | | | | 2,027,180 | |
| | | | | |
| | 2,000 | | | Saint Paul Port Authority, Minnesota, Revenue Bonds, Amherst H. Wilder Foundation Project, Series 2010-3, 5.000%, 12/01/24 | | | | | 12/20 at 100.00 | | | | A1 | | | | 2,259,560 | |
| | | | | |
| | | | Wayzata, Minnesota, Senior Housing Revenue Bonds, Folkestone Senior Living Community, Series 2012A: | | | | | | | | | | | | | | |
| | 625 | | | 5.100%, 5/01/24 – AGM Insured | | | | | 5/19 at 102.00 | | | | N/R | | | | 627,731 | |
| | 310 | | | 5.300%, 5/01/27 | | | | | 5/19 at 102.00 | | | | N/R | | | | 311,429 | |
| | 500 | | | 5.300%, 11/01/27 | | | | | 5/19 at 102.00 | | | | N/R | | | | 502,305 | |
| | 515 | | | 5.500%, 11/01/32 | | | | | 5/19 at 102.00 | | | | N/R | | | | 515,690 | |
| | | | | |
| | 765 | | | Worthington, Minnesota, Housing Revenue Refunding Bonds, Meadows of Worthington Project, Series 2007A, 5.000%, 11/01/17 | | | | | 11/14 at 101.00 | | | | N/R | | | | 777,684 | |
| | 8,010 | | | Total Long-Term Care | | | | | | | | | | | | | 8,362,164 | |
| | | | Materials – 0.8% | | | | | | | | | | | | | | |
| | | | | |
| | 2,100 | | | Seaway Port Authority of Duluth, Minnesota, Industrial Development Dock and Wharf Revenue Refunding Bonds, Cargill, Inc Project, Series 2004, 4.200%, 5/01/13 | | | | | No Opt. Call | | | | A | | | | 2,160,606 | |
| | | | Tax Obligation/General – 18.1% | | | | | | | | | | | | | | |
| | | | | |
| | 610 | | | Anoka County, Minnesota, General Obligation Bonds, Capital Improvement, Series 2007A, 4.100%, 2/01/18 | | | | | 2/15 at 100.00 | | | | Aa1 | | | | 659,142 | |
| | | | | |
| | 500 | | | Anoka County, Minnesota, General Obligation Bonds, Capital Improvement, Series 2007D, 5.000%, 2/01/24 | | | | | 2/17 at 100.00 | | | | Aa1 | | | | 579,730 | |
| | | | | |
| | 1,000 | | | Anoka County, Minnesota, General Obligation Bonds, Capital Improvement, Series 2008A, 5.000%, 2/01/20 | | | | | 2/18 at 100.00 | | | | Aa1 | | | | 1,182,580 | |
| | | | | |
| | | | Anoka County, Minnesota, General Obligation Bonds, Capital Improvement, Series 2008C: | | | | | | | | | | | | | | |
| | 285 | | | 4.100%, 2/01/18 | | | | | No Opt. Call | | | | Aa1 | | | | 333,054 | |
| | 595 | | | 4.200%, 2/01/19 | | | | | 2/18 at 100.00 | | | | Aa1 | | | | 690,866 | |
| | | | | |
| | | | Bemidji, Minnesota, General Obligation Bonds, Refunding Sales Tax Series 2011: | | | | | | | | | | | | | | |
| | 635 | | | 5.500%, 2/01/23 | | | | | 2/21 at 100.00 | | | | Aa3 | | | | 797,681 | |
| | 750 | | | 5.500%, 2/01/24 | | | | | 2/21 at 100.00 | | | | Aa3 | | | | 934,380 | |
| | 875 | | | 5.500%, 2/01/25 | | | | | 2/21 at 100.00 | | | | Aa3 | | | | 1,081,596 | |
| | 1,010 | | | 5.500%, 2/01/26 | | | | | 2/21 at 100.00 | | | | Aa3 | | | | 1,240,684 | |
| | 1,150 | | | 5.500%, 2/01/27 | | | | | 2/21 at 100.00 | | | | Aa3 | | | | 1,406,646 | |
| | | | | |
| | 350 | | | Burnsville Independent School District 191, Dakota and Scott Counties, Minnesota, General Obligation Bonds, Series 2007A, 4.200%, 2/01/25 – AGM Insured | | | | | 2/17 at 100.00 | | | | Aa2 | | | | 374,770 | |
| | | | | |
| | 1,200 | | | Burnsville Independent School District 191, Dakota and Scott Counties, Minnesota, General Obligation Bonds, Series 2008A, 4.250%, 2/01/20 | | | | | 2/18 at 100.00 | | | | Aa2 | | | | 1,371,036 | |
| | | | | |
| | 1,000 | | | Chaska Independent School District 112, Carver County, Minnesota, General Obligation Bonds, Series 2007A, 4.250%, 2/01/19 – NPFG Insured | | | | | 2/17 at 100.00 | | | | Aa2 | | | | 1,130,910 | |
| | | | | |
| | 450 | | | Chatfield Independent School District 227, Olmstead County, Minnesota, General Obligation Bonds, Series 2007A, 4.000%, 2/01/18 – AGM Insured | | | | | No Opt. Call | | | | AA+ | | | | 520,988 | |
| | | | | |
| | | | Dakota County Community Agency, Minnesota, Governmental Housing Development General Obligation Bonds, Senior Housing Facilities,
Series 2007A: | | | | | | | | | | | | | | |
| | 510 | | | 4.375%, 1/01/19 | | | | | 7/17 at 100.00 | | | | AAA | | | | 583,787 | |
| | 215 | | | 4.500%, 1/01/20 | | | | | 7/17 at 100.00 | | | | AAA | | | | 244,588 | |
| | | | | |
| | 1,160 | | | Duluth Independent School District 709, Saint Louis County, Minnesota, General Obligation Bonds, Series 2008A, 4.250%, 2/01/22 – AGM Insured | | | | | 2/18 at 100.00 | | | | Aa2 | | | | 1,296,903 | |
| | | | | |
| | | | Duluth, Minnesota, General Obligation Bonds, DECC Improvement
Series 2008A: | | | | | | | | | | | | | | |
| | 1,160 | | | 4.500%, 2/01/21 | | | | | 2/18 at 100.00 | | | | Aa2 | | | | 1,325,033 | |
| | | | | | | | | | | | | | | | | | |
Principal
Amount (000) | | | Description (1) | | | | Optional Call
Provisions (2) | | | Ratings (3) | | | Value | |
| | | | | | | | | | | | | | | | | | |
| | | | Tax Obligation/General (continued) | | | | | | | | | | | | | | |
| | | | | |
| $ | 465 | | | 4.500%, 2/01/22 | | | | | 2/18 at 100.00 | | | | Aa2 | | | $ | 526,603 | |
| | 1,100 | | | 4.625%, 2/01/24 | | | | | 2/18 at 100.00 | | | | Aa2 | | | | 1,232,143 | |
| | | | | |
| | 455 | | | Greenway Independent School District 316, Itasca County, Minnesota, General Obligation Bonds, Alternate Facilities, Series 2011C, 4.250%, 2/01/25 | | | | | 2/19 at 100.00 | | | | AA+ | | | | 499,849 | |
| | | | | |
| | | | Independent School District 621, Mounds View, Minnesota, General Obligation Bonds, Crossover Refunding Series 2009A: | | | | | | | | | | | | | | |
| | 625 | | | 3.250%, 2/01/17 | | | | | No Opt. Call | | | | Aa2 | | | | 698,288 | |
| | 750 | | | 4.000%, 2/01/22 | | | | | 2/19 at 100.00 | | | | Aa2 | | | | 863,738 | |
| | | | | |
| | 2,000 | | | Independent School District 833, South Washington County, Minnesota, General Obligation Bonds, Crossover Refunding School Building
Series 2010A, 4.000%, 2/01/22 | | | | | 2/19 at 100.00 | | | | AA+ | | | | 2,265,260 | |
| | | | | |
| | | | Mankato, Minnesota, General Obligation Bonds, Improvement Series 2009A: | | | | | | | | | | | | | | |
| | 765 | | | 3.500%, 2/01/18 | | | | | No Opt. Call | | | | AA | | | | 870,731 | |
| | 775 | | | 3.500%, 2/01/19 | | | | | 2/18 at 100.00 | | | | AA | | | | 873,541 | |
| | | | | |
| | 1,135 | | | Minneapolis Special School District 1, Hennepin County, Minnesota, General Obligation Bonds, Series 2007, 4.000%, 2/01/18 | | | | | 2/15 at 100.00 | | | | AA+ | | | | 1,224,177 | |
| | | | | |
| | 1,000 | | | Minneapolis, Minnesota, Limited Tax Supported Development Revenue Bonds, Common Bond Fund Series 2007-2A, 5.125%, 6/01/22 (Alternative Minimum Tax) | | | | | 6/17 at 100.00 | | | | A+ | | | | 1,065,450 | |
| | | | | |
| | 1,440 | | | Minnesota State, General Obligation Bonds, Refunding Series 2008C,
5.000%, 8/01/19 | | | | | No Opt. Call | | | | AA+ | | | | 1,812,758 | |
| | | | | |
| | | | Moorhead, Minnesota, General Obligation Bonds, Flood Mitigation
Series 2012A: | | | | | | | | | | | | | | |
| | 625 | | | 3.000%, 2/01/23 – AMBAC Insured | | | | | 2/22 at 100.00 | | | | Aa3 | | | | 644,588 | |
| | 715 | | | 3.000%, 2/01/26 – AMBAC Insured | | | | | 2/22 at 100.00 | | | | Aa3 | | | | 710,538 | |
| | | | | |
| | 600 | | | Moorhead, Minnesota, General Obligation Bonds, Improvement Refunding Series 2012C, 3.000%, 2/01/20 – AMBAC Insured | | | | | No Opt. Call | | | | Aa3 | | | | 646,962 | |
| | | | | |
| | 1,180 | | | Osseo Independent School District 279 Hennepin County, Minnesota, General Obligation Bonds, Series 2010A, 4.000%, 2/01/21 | | | | | 8/18 at 100.00 | | | | AA+ | | | | 1,329,825 | |
| | | | | |
| | 620 | | | OtterTail County, Minnesota, General Obligation Bonds, Disposal System – Prairie Lakes Municipal Authority, Series 2011, 4.750%, 5/01/27 (Alternative Minimum Tax) | | | | | 5/21 at 100.00 | | | | AA+ | | | | 686,669 | |
| | | | | |
| | 1,335 | | | Puerto Rico Government Development Bank, Senior Note Revenue Bonds, Senior Lien, Series 2006B, 5.000%, 12/01/14 | | | | | No Opt. Call | | | | Baa1 | | | | 1,443,242 | |
| | | | | |
| | 1,605 | | | Puerto Rico, General Obligation and Public Improvement Bonds, Series 1998, 6.000%, 7/01/14 – NPFG Insured | | | | | No Opt. Call | | | | Baa1 | | | | 1,750,012 | |
| | | | | |
| | 1,000 | | | Puerto Rico, General Obligation and Public Improvement Bonds, Series 2002A, 5.500%, 7/01/17 – SYNCORA GTY Insured | | | | | No Opt. Call | | | | Baa1 | | | | 1,133,460 | |
| | | | | |
| | 1,000 | | | Puerto Rico, General Obligation Bonds, Public Improvement Refunding
Series 2007A, 5.500%, 7/01/18 | | | | | No Opt. Call | | | | Baa1 | | | | 1,134,770 | |
| | | | | |
| | 575 | | | Puerto Rico, General Obligation Bonds, Public Improvement Series 2008A, 5.500%, 7/01/18 | | | | | No Opt. Call | | | | Baa1 | | | | 652,493 | |
| | | | | |
| | 520 | | | Ramsey County, Minnesota, General Obligation Bonds, Capital Improvement, Refunding Series 2010A, 4.000%, 2/01/18 | | | | | No Opt. Call | | | | AAA | | | | 610,870 | |
| | | | | |
| | 1,040 | | | Ramsey, Minnesota, General Obligation Bonds, Capital Improvement Plan Series 2012A, 3.000%, 12/15/26 (WI/DD, Settling 6/07/12) | | | | | 12/21 at 100.00 | | | | AA+ | | | | 1,041,622 | |
| | | | | |
| | 500 | | | Robbinsdale Independent School District 281, Hennepin County, Minnesota, General Obligation Bonds, Series 2008B, 4.500%, 2/01/21 | | | | | 2/18 at 100.00 | | | | Aa2 | | | | 571,135 | |
| | | | | |
| | 1,140 | | | Rochester, Minnesota, General Obligation Waste Water Bonds, Series 2007A, 4.000%, 12/01/18 | | | | | 6/17 at 100.00 | | | | AAA | | | | 1,303,157 | |
| | | | | |
| | 1,000 | | | Saint Cloud, Minnesota, General Obligation Bonds, Library Sales Tax
Series 2006B, 4.000%, 2/01/18 – AGM Insured | | | | | 2/16 at 100.00 | | | | AA+ | | | | 1,104,340 | |
| | | | | |
| | | | Saint Peter, Minnesota, General Obligation Bonds, Hospital Crossover, Refunding Series 2010A: | | | | | | | | | | | | | | |
| | 550 | | | 3.000%, 9/01/18 – AGM Insured | | | | | No Opt. Call | | | | AA– | | | | 591,135 | |
| | 515 | | | 3.150%, 9/01/19 – AGM Insured | | | | | No Opt. Call | | | | AA– | | | | 559,311 | |
| | 585 | | | 3.300%, 9/01/20 – AGM Insured | | | | | 9/19 at 100.00 | | | | AA– | | | | 633,935 | |
Portfolio of Investments
Nuveen Minnesota Intermediate Municipal Bond Fund (continued)
May 31, 2012
| | | | | | | | | | | | | | | | | | |
Principal
Amount (000) | | | Description (1) | | | | Optional Call
Provisions (2) | | | Ratings (3) | | | Value | |
| | | | | | | | | | | | | | | | | | |
| | | | Tax Obligation/General (continued) | | | | | | | | | | | | | | |
| | | | | |
| $ | 400 | | | Todd, Morrison, Cass and Wadena Counties United Hospital District, Minnesota, General Obligation Bonds, Lakewood Health System, Series 2004, 4.000%, 12/01/13 | | | | | No Opt. Call | | | | A2 | | | $ | 420,884 | |
| | | | | |
| | | | Wadena-Deer Creek Independent School District2155, Wadena, Otter Tail, and Todd Counties, Minnesota, General Obligation bonds, Series 2010,: | | | | | | | | | | | | | | |
| | 430 | | | 4.000%, 2/01/18 | | | | | 2/17 at 100.00 | | | | AA+ | | | | 490,019 | |
| | 410 | | | 4.000%, 2/01/19 | | | | | 2/17 at 100.00 | | | | AA+ | | | | 463,058 | |
| | | | | |
| | 640 | | | Wright County, Minnesota, General Obligation Bonds, Jail Series 2007A, 4.500%, 12/01/20 | | | | | 12/17 at 100.00 | | | | AA+ | | | | 736,506 | |
| | | | | |
| | 200 | | | Zumbrota-Mazeppa Independent School District 2805, Wabasha County, Minnesota, General Obligation Bonds, Alternate Facilities Series 2008A, 4.000%, 2/01/19 | | | | | 2/18 at 100.00 | | | | AA+ | | | | 228,864 | |
| | 41,150 | | | Total Tax Obligation/General | | | | | | | | | | | | | 46,574,307 | |
| | | | Tax Obligation/Limited – 8.0% | | | | | | | | | | | | | | |
| | | | | |
| | 1,910 | | | Duluth Independent School District 709, Minnesota, Certificates of Participation, Series 2008B, 4.000%, 2/01/19 | | | | | No Opt. Call | | | | AA+ | | | | 2,226,850 | |
| | | | | |
| | 780 | | | Government of Guam, Business Privilege Tax Bonds, Series 2011A, 5.000%, 1/01/31 | | | | | 1/22 at 100.00 | | | | A | | | | 858,187 | |
| | | | | |
| | | | Hennepin County, Minnesota, Sales Tax Revenue Bonds, Ballpark Project, Second Lien Series 2008B: | | | | | | | | | | | | | | |
| | 585 | | | 4.375%, 12/15/22 | | | | | 12/17 at 100.00 | | | | AA+ | | | | 653,562 | |
| | 1,000 | | | 5.000%, 12/15/29 | | | | | 12/17 at 100.00 | | | | AA+ | | | | 1,141,610 | |
| | | | | |
| | | | Minneapolis, Minnesota, Limited Tax Supported Development Revenue Bonds, Common Bond Fund Series 2006-1A: | | | | | | | | | | | | | | |
| | 480 | | | 4.550%, 12/01/13 (Alternative Minimum Tax) | | | | | No Opt. Call | | | | A+ | | | | 499,944 | |
| | 505 | | | 4.625%, 12/01/14 (Alternative Minimum Tax) | | | | | No Opt. Call | | | | A+ | | | | 537,133 | |
| | | | | |
| | 2,000 | | | Minneapolis, Minnesota, Limited Tax Supported Development Revenue Bonds, Common Bond Fund Series 2010-2A, 4.625%, 12/01/20 | | | | | No Opt. Call | | | | A+ | | | | 2,249,760 | |
| | | | | |
| | 1,000 | | | Minneapolis, Minnesota, Tax Increment Revenue Bonds, Grant Park Project, Series 2006, 5.200%, 2/01/22 | | | | | 2/14 at 100.00 | | | | N/R | | | | 1,002,580 | |
| | | | | |
| | 1,040 | | | Minneapolis, Minnesota, Tax Increment Revenue Bonds, Village at St. Anthony Falls Project, Refunding Series 2004, 5.000%, 2/01/17 | | | | | 8/12 at 102.00 | | | | N/R | | | | 1,053,530 | |
| | | | | |
| | 570 | | | Minneapolis, Minnesota, Tax Increment Revenue Bonds, Village at St. Anthony Falls Project, Refunding Series 2005, 5.300%, 2/01/21 | | | | | 2/14 at 100.00 | | | | N/R | | | | 572,571 | |
| | | | | |
| | 1,185 | | | Minnesota Housing Finance Agency, Nonprofit Housing Bonds, State Appropriation Series 2011, 5.250%, 8/01/27 | | | | | 8/21 at 100.00 | | | | AA | | | | 1,366,957 | |
| | | | | |
| | 1,000 | | | Northeast Metropolitan Intermediate School District 916, White Bear Lake, Minnesota, Certificates of Particpation, Series 2004, 4.250%, 1/01/15 | | | | | 1/14 at 100.00 | | | | A2 | | | | 1,046,640 | |
| | | | | |
| | | | Pine County Housing and Redevelopment Authority, Minnesota, Public Project Revenue Bonds, Series 2005A: | | | | | | | | | | | | | | |
| | 465 | | | 4.500%, 2/01/16 | | | | | No Opt. Call | | | | BBB+ | | | | 507,924 | |
| | 385 | | | 4.500%, 2/01/17 | | | | | 2/16 at 100.00 | | | | BBB+ | | | | 418,872 | |
| | | | | |
| | 685 | | | Puerto Rico, Highway Revenue Bonds, Highway and Transportation Authority, Series 1993X, 5.500%, 7/01/13 – NPFG Insured | | | | | No Opt. Call | | | | A3 | | | | 709,619 | |
| | | | | |
| | 200 | | | Puerto Rico, Highway Revenue Bonds, Highway and Transportation Authority, Series 1993X, 5.500%, 7/01/13 – NPFG Insured | | | | | No Opt. Call | | | | A3 | | | | 204,896 | |
| | | | | |
| | | | Saint Paul Housing and Redevelopment Authority, Minnesota, Recreational Faility Lease Revenue Bonds, Jimmy Lee Recreational Center, Series 2008: | | | | | | | | | | | | | | |
| | 180 | | | 4.500%, 12/01/19 | | | | | 12/17 at 100.00 | | | | AA+ | | | | 205,290 | |
| | 290 | | | 4.500%, 12/01/20 | | | | | 12/17 at 100.00 | | | | AA+ | | | | 326,729 | |
| | | | | |
| | 2,415 | | | St. Paul Port Authority, Minnesota, Lease Revenue Bonds, Building at Cedar Street, Series 2002, 5.000%, 12/01/19 | | | | | 12/12 at 100.00 | | | | AA | | | | 2,466,584 | |
| | | | | |
| | | | Stevens County Housing and Redevelopment Authority, Minnesota, Public Project Revenue Bonds, Series 2009A: | | | | | | | | | | | | | | |
| | 315 | | | 4.000%, 2/01/18 | | | | | No Opt. Call | | | | A+ | | | | 350,765 | |
| | 325 | | | 4.000%, 2/01/19 | | | | | No Opt. Call | | | | A+ | | | | 363,630 | |
| | 340 | | | 4.100%, 2/01/20 | | | | | No Opt. Call | | | | A+ | | | | 384,237 | |
| | | | | | | | | | | | | | | | | | |
Principal
Amount (000) | | | Description (1) | | | | Optional Call
Provisions (2) | | | Ratings (3) | | | Value | |
| | | | | | | | | | | | | | | | | | |
| | | | Tax Obligation/Limited (continued) | | | | | | | | | | | | | | |
| | | | | |
| | | | Virgin Islands Public Finance Authority, Matching Fund Loan Notes Revenue Bonds, Senior Lien Series 2010A: | | | | | | | | | | | | | | |
| $ | 290 | | | 5.000%, 10/01/20 | | | | | No Opt. Call | | | | BBB+ | | | $ | 328,065 | |
| | 975 | | | 5.000%, 10/01/29 | | | | | 10/20 at 100.00 | | | | BBB+ | | | | 1,032,476 | |
| | 18,920 | | | Total Tax Obligation/Limited | | | | | | | | | | | | | 20,508,411 | |
| | | | Transportation – 5.3% | | | | | | | | | | | | | | |
| | | | | |
| | | | Minneapolis-St. Paul Metropolitan Airports Commission, Minnesota, Airport Revenue Bonds, Refunding Senior Lien Series 2009A: | | | | | | | | | | | | | | |
| | 1,000 | | | 4.000%, 1/01/19 | | | | | No Opt. Call | | | | AA– | | | | 1,139,660 | |
| | 1,000 | | | 5.000%, 1/01/20 | | | | | 1/19 at 100.00 | | | | AA– | | | | 1,189,950 | |
| | 500 | | | 5.000%, 1/01/21 | | | | | 1/19 at 100.00 | | | | AA– | | | | 588,205 | |
| | | | | |
| | 2,200 | | | Minneapolis-St. Paul Metropolitan Airports Commission, Minnesota, Airport Revenue Bonds, Series 2003A, 5.000%, 1/01/20 – NPFG Insured | | | | | 1/13 at 100.00 | | | | A | | | | 2,261,732 | |
| | | | | |
| | 2,125 | | | Minneapolis-St. Paul Metropolitan Airports Commission, Minnesota, Airport Revenue Bonds, Subordinate Lien Series 2005B, 5.000%, 1/01/20 – AMBAC Insured (Alternative Minimum Tax) | | | | | 1/15 at 100.00 | | | | A | | | | 2,248,569 | |
| | | | | |
| | 2,330 | | | Minneapolis-St. Paul Metropolitan Airports Commission, Minnesota, Airport Revenue Bonds, Subordinate Lien, Refunding Series 2011A,
5.000%, 1/01/25 | | | | | 1/21 at 100.00 | | | | A | | | | 2,681,224 | |
| | | | | |
| | | | St Paul Housing and Redevelopment Authority, Minnesota, Parking Revenue Bonds, Parking Facilities Project, Refunding Series 2010A: | | | | | | | | | | | | | | |
| | 805 | | | 4.000%, 8/01/21 | | | | | 8/18 at 102.00 | | | | A+ | | | | 888,817 | |
| | 895 | | | 4.125%, 8/01/23 | | | | | 8/18 at 102.00 | | | | A+ | | | | 979,085 | |
| | 935 | | | 4.250%, 8/01/24 | | | | | 8/18 at 102.00 | | | | A+ | | | | 1,018,879 | |
| | 575 | | | 4.250%, 8/01/25 | | | | | 8/18 at 102.00 | | | | A+ | | | | 621,213 | |
| | 12,365 | | | Total Transportation | | | | | | | | | | | | | 13,617,334 | |
| | | | U.S. Guaranteed – 4.8% (4) | | | | | | | | | | | | | | |
| | | | | |
| | | | Andover Economic Development Authority, Minnesota, Public Facility Lease Revenue Bonds, Andover Community Center, Series 2004: | | | | | | | | | | | | | | |
| | 730 | | | 5.000%, 2/01/19 (Pre-refunded 2/01/14) | | | | | 2/14 at 100.00 | | | | AA | (4) | | | 776,355 | |
| | 495 | | | 5.000%, 2/01/19 (Pre-refunded 2/01/14) | | | | | 2/14 at 100.00 | | | | AA | (4) | | | 526,433 | |
| | | | | |
| | | | Bemidji, Minnesota, Health Care Facilities First Mortgage Revenue Bonds, North Country Health Services, Refunding Series 2006: | | | | | | | | | | | | | | |
| | 500 | | | 5.000%, 9/01/17 (Pre-refunded 9/01/16) | | | | | 9/16 at 100.00 | | | | N/R | (4) | | | 586,610 | |
| | 1,050 | | | 5.000%, 9/01/18 (Pre-refunded 9/01/16) | | | | | 9/16 at 100.00 | | | | N/R | (4) | | | 1,231,881 | |
| | 1,110 | | | 5.000%, 9/01/19 (Pre-refunded 9/01/16) | | | | | 9/16 at 100.00 | | | | N/R | (4) | | | 1,302,274 | |
| | | | | |
| | | | Duluth Economic Development Authority, Minnesota, Healthcare Facilities Revenue Bonds, Benedictine Health System – St. Mary’s Duluth Clinic,
Series 2004: | | | | | | | | | | | | | | |
| | 2,045 | | | 5.375%, 2/15/22 (Pre-refunded 2/15/14) | | | | | 2/14 at 100.00 | | | | N/R | (4) | | | 2,216,105 | |
| | 45 | | | 5.250%, 2/15/28 (Pre-refunded 2/15/14) | | | | | 2/14 at 100.00 | | | | N/R | (4) | | | 48,669 | |
| | | | | |
| | 1,260 | | | Lakeville Independent School District 194, Dakota County, Minnesota, General Obligation Bonds, Series 2002A, 5.000%, 2/01/22 (Pre-refunded 2/01/13) – FGIC Insured | | | | | 2/13 at 100.00 | | | | Aa2 | (4) | | | 1,295,545 | |
| | | | | |
| | 345 | | | Marshall, Minnesota, Revenue Bonds, Avera Marshall Regional Medical Center, Series 2006, 4.500%, 11/01/13 (ETM) | | | | | No Opt. Call | | | | N/R | (4) | | | 363,219 | |
| | | | | |
| | | | Minneapolis, Minnesota, Health Care System Revenue Bonds, Allina Health System, Series 2002A: | | | | | | | | | | | | | | |
| | 2,500 | | | 6.000%, 11/15/23 (Pre-refunded 11/15/12) | | | | | 11/12 at 100.00 | | | | AA+ | (4) | | | 2,566,100 | |
| | 1,415 | | | 5.750%, 11/15/32 (Pre-refunded 11/15/12) | | | | | 11/12 at 100.00 | | | | AA+ | (4) | | | 1,450,800 | |
| | 11,495 | | | Total U.S. Guaranteed | | | | | | | | | | | | | 12,363,991 | |
| | | | Utilities – 9.6% | | | | | | | | | | | | | | |
| | | | | |
| | 775 | | | Central Minnesota Municipal Power Agency, Revenue Bonds, Brookings – Southeast Twin Cities Transmission Project, Series 2012, 5.000%, 1/01/20 (WI/DD, Settling 6/07/12) | | | | | No Opt. Call | | | | A– | | | | 918,530 | |
| | | | | |
| | 1,010 | | | Chaska, Minnesota, Electric Revenue Bonds, Generating Facility Project, Refunding Series 2005A, 4.200%, 10/01/15 | | | | | No Opt. Call | | | | A3 | | | | 1,108,768 | |
Portfolio of Investments
Nuveen Minnesota Intermediate Municipal Bond Fund (continued)
May 31, 2012
| | | | | | | | | | | | | | | | | | |
Principal
Amount (000) | | | Description (1) | | | | Optional Call
Provisions (2) | | | Ratings (3) | | | Value | |
| | | | | | | | | | | | | | | | | | |
| | | | Utilities (continued) | | | | | | | | | | | | | | |
| | | | | |
| $ | 2,230 | | | Cohasset, Minnesota, Pollution Control Revenue Bonds, Allete Inc., Series 2004, 4.950%, 7/01/22 – RAAI Insured | | | | | 7/14 at 100.00 | | | | A2 | | | $ | 2,322,367 | |
| | | | | |
| | 500 | | | Litchfield, Minnesota, Electric Utility Revenue Bonds, Series 2009C, 5.000%, 2/01/29 – AGC Insured | | | | | 2/18 at 100.00 | | | | AA– | | | | 552,420 | |
| | | | | |
| | | | Marshall, Minnesota, Public Utility Revenue Bonds, Series 2009A: | | | | | | | | | | | | | | |
| | 315 | | | 3.500%, 7/01/16 – AGC Insured | | | | | No Opt. Call | | | | AA– | | | | 343,652 | |
| | 275 | | | 3.500%, 7/01/17 – AGC Insured | | | | | No Opt. Call | | | | AA– | | | | 303,523 | |
| | 340 | | | 3.750%, 7/01/18 – AGC Insured | | | | | No Opt. Call | | | | AA– | | | | 382,211 | |
| | | | | |
| | | | Minnesota Municipal Power Agency, Electric Revenue Bonds, Refunding
Series 2007: | | | | | | | | | | | | | | |
| | 420 | | | 4.125%, 10/01/17 | | | | | No Opt. Call | | | | A3 | | | | 472,970 | |
| | 1,000 | | | 5.250%, 10/01/22 | | | | | 10/17 at 100.00 | | | | A3 | | | | 1,144,000 | |
| | | | | |
| | | | Northern Municipal Power Agency, Minnesota, Electric System Revenue Bonds, Refunding Series 2007A: | | | | | | | | | | | | | | |
| | 380 | | | 5.000%, 1/01/13 – AMBAC Insured | | | | | No Opt. Call | | | | A2 | | | | 389,891 | |
| | 460 | | | 5.000%, 1/01/17 – AMBAC Insured | | | | | No Opt. Call | | | | A2 | | | | 536,268 | |
| | 1,000 | | | 5.000%, 1/01/19 – AGC Insured | | | | | 1/18 at 100.00 | | | | AA– | | | | 1,182,360 | |
| | | | | |
| | 2,095 | | | Northern Municipal Power Agency, Minnesota, Electric System Revenue Bonds, Refunding Series 2008A, 5.000%, 1/01/21 – AGC Insured | | | | | 1/18 at 100.00 | | | | AA– | | | | 2,420,039 | |
| | | | | |
| | 2,830 | | | Northern Municipal Power Agency, Minnesota, Electric System Revenue Bonds, Series 2010A-1, 5.000%, 1/01/20 | | | | | No Opt. Call | | | | A2 | | | | 3,390,453 | |
| | | | | |
| | 295 | | | Shakopee Public Utilities Commission, Minnesota, Public Utilities Crossover Refunding Revenue Bonds, Series 2006A, 4.250%, 2/01/18 – AGM Insured | | | | | 2/15 at 100.00 | | | | Aa3 | | | | 317,529 | |
| | | | | |
| | | | Southern Minnesota Municipal Power Agency, Power Supply System Revenue Bonds, Series 1994A: | | | | | | | | | | | | | | |
| | 3,500 | | | 0.000%, 1/01/20 – NPFG Insured | | | | | No Opt. Call | | | | A+ | | | | 2,897,895 | |
| | 5,000 | | | 0.000%, 1/01/21 – NPFG Insured | | | | | No Opt. Call | | | | A+ | | | | 3,936,700 | |
| | | | | |
| | 2,020 | | | Southern Minnesota Municipal Power Agency, Power Supply System Revenue Bonds, Series 2002A, 5.250%, 1/01/14 – AMBAC Insured | | | | | No Opt. Call | | | | A+ | | | | 2,173,964 | |
| | 24,445 | | | Total Utilities | | | | | | | | | | | | | 24,793,540 | |
| | | | Water and Sewer – 0.3% | | | | | | | | | | | | | | |
| | | | | |
| | 500 | | | Puerto Rico Aqueduct and Sewerage Authority, Revenue Bonds, Senior Lien Series 2008A, 5.000%, 7/01/16 – AGC Insured | | | | | No Opt. Call | | | | AA– | | | | 563,340 | |
| | | | | |
| | 275 | | | Saint Paul, Minnesota, Sewer Revenue Bonds, Series 2012C, 3.000%, 12/01/23 | | | | | 6/20 at 100.00 | | | | AAA | | | | 284,347 | |
| | 775 | | | Total Water and Sewer | | | | | | | | | | | | | 847,687 | |
| $ | 231,335 | | | Total Municipal Bonds (cost $231,114,761) | | | | | | | | | | | | | 252,342,542 | |
| | | | | |
| Shares | | | Description (1) | | | | | | | | | | Value | |
| | | | SHORT-TERM INVESTMENTS – 2.8% | | | | | | | | | | | | | | |
| | | | | |
| | | | Money Market Funds – 2.8% | | | | | | | | | | | | | | |
| | | | | |
| | 7,105,303 | | | Federated Minnesota Municipal Cash Trust, 0.010% (5) | | | | | | | | | | | | $ | 7,105,303 | |
| | | | Total Short-Term Investments (cost $7,105,303) | | | | | | | | | | | | | 7,105,303 | |
| | | | Total Investments (cost $238,220,064) – 100.6% | | | | | | | | | | | | | 259,447,845 | |
| | | | Other Assets Less Liabilities – (0.6)% | | | | | | | | | | | | | (1,624,892) | |
| | | | Net Assets – 100% | | | | | | | | | | | | $ | 257,822,953 | |
| | (1) | | All percentages shown in the Portfolio of Investments are based on net assets. |
| | (2) | | Optional Call Provisions (not covered by the report of independent registered public accounting firm): Dates (month and year) and prices of the earliest optional call or redemption. There may be other call provisions at varying prices at later dates. Certain mortgage-backed securities may be subject to periodic principal paydowns. |
| | (3) | | Ratings (not covered by the report of independent registered public accounting firm): Using the highest of Standard & Poor’s Group (“Standard & Poor’s”), Moody’s Investors Service, Inc. (“Moody’s”) or Fitch, Inc. (“Fitch”) rating. Ratings below BBB by Standard & Poor’s, Baa by Moody’s or BBB by Fitch are considered to be below investment grade. Holdings designated N/R are not rated by any of these national rating agencies. |
| | (4) | | Backed by an escrow or trust containing sufficient U.S. Government or U.S. Government agency securities, which ensure the timely payment of principal and interest. Certain bonds backed by U.S. Government or agency securities are regarded as having an implied rating equal to the rating of such securities. |
| | (5) | | The rate shown is the annualized seven-day effective yield as of May 31, 2012. |
| | WI/DD | | Purchased on a when-issued or delayed delivery basis. |
| | (ETM) | | Escrowed to maturity. |
See accompanying notes to financial statements.
Portfolio of Investments
Nuveen Minnesota Municipal Bond Fund
May 31, 2012
| | | | | | | | | | | | | | | | | | |
Principal
Amount (000) | | | Description (1) | | | | Optional Call Provisions (2) | | | Ratings (3) | | | Value | |
| | | | | | | | | | | | | | | | | | |
| | | | MUNICIPAL BONDS – 95.9% | | | | | | | | | | | | | | |
| | | | | |
| | | | Consumer Staples – 5.1% | | | | | | | | | | | | | | |
| | | | | |
| $ | 1,800 | | | Moorhead, Minnesota, Recovery Zone Facility Revenue Bonds, American Crystal Sugar Company Project, Series 2010, 5.650%, 6/01/27 | | | | | 7/20 at 100.00 | | | | BBB+ | | | $ | 1,968,120 | |
| | | | | |
| | 7,025 | | | Tobacco Securitization Authority, Minnesota, Tobacco Settlement Revenue Bonds, Tax-Exempt Series 2011B, 5.250%, 3/01/31 | | | | | 3/22 at 100.00 | | | | A– | | | | 7,838,987 | |
| | 8,825 | | | Total Consumer Staples | | | | | | | | | | | | | 9,807,107 | |
| | | | Education and Civic Organizations – 15.1% | | | | | | | | | | | | | | |
| | | | | |
| | 1,500 | | | Baytown Township, Minnesota, Lease Revenue Bonds, Saint Croix Preparatory Academy Project, Series 2008A, 7.000%, 8/01/38 | | | | | 8/16 at 102.00 | | | | N/R | | | | 1,576,995 | |
| | | | | |
| | 800 | | | Chaska, Minnesota, Lease Revenue Bonds, World Learner School Project, Series, 8.000%, 12/01/43 | | | | | 12/21 at 100.00 | | | | BB+ | | | | 877,528 | |
| | | | | |
| | 1,750 | | | Duluth Housing & Redevelopment Authority, Minnesota, Lease Revenue Bonds, Duluth Public Schools Academy, Series 2010A, 5.600%, 11/01/30 | | | | | 11/18 at 102.00 | | | | BBB– | | | | 1,781,623 | |
| | | | | |
| | | | Minneapolis, Minnesota, Revenue Bonds, National Marrow Donor Program Project, Series 2010: | | | | | | | | | | | | | | |
| | 90 | | | 4.250%, 8/01/20 | | | | | 8/18 at 100.00 | | | | BBB | | | | 94,021 | |
| | 4,100 | | | 4.875%, 8/01/25 | | | | | 8/18 at 100.00 | | | | BBB | | | | 4,211,971 | |
| | | | | |
| | | | Minnesota Higher Education Facilities Authority, Revenue Bonds, Bethel University, Refunding Series 2007-6-R: | | | | | | | | | | | | | | |
| | 1,725 | | | 5.500%, 5/01/26 | | | | | 5/17 at 100.00 | | | | N/R | | | | 1,813,458 | |
| | 820 | | | 5.500%, 5/01/27 | | | | | 5/17 at 100.00 | | | | N/R | | | | 860,196 | |
| | 1,500 | | | 5.500%, 5/01/37 | | | | | 5/17 at 100.00 | | | | N/R | | | | 1,553,400 | |
| | | | | |
| | 275 | | | Minnesota Higher Education Facilities Authority, Revenue Bonds, College of St. Benedict, Series 2011-7M, 5.125%, 3/01/36 | | | | | 3/20 at 100.00 | | | | Baa1 | | | | 287,312 | |
| | | | | |
| | 1,835 | | | Minnesota Higher Education Facilities Authority, Revenue Bonds, College of St. Scholastica, Inc., Series 2011-7J , 6.300%, 12/01/40 | | | | | 12/19 at 100.00 | | | | Baa2 | | | | 2,085,147 | |
| | | | | |
| | 1,000 | | | Minnesota Higher Education Facilities Authority, Revenue Bonds, Gustavus Adolfus College, Series 2010-7-B, 5.000%, 10/01/31 | | | | | 10/19 at 100.00 | | | | A3 | | | | 1,097,250 | |
| | | | | |
| | | | Minnesota Higher Education Facilities Authority, Revenue Bonds, Hamline University, Series 2011-7K1: | | | | | | | | | | | | | | |
| | 625 | | | 6.000%, 10/01/32 | | | | | 10/21 at 100.00 | | | | Baa2 | | | | 729,750 | |
| | 2,000 | | | 6.000%, 10/01/40 | | | | | 10/21 at 100.00 | | | | Baa2 | | | | 2,277,960 | |
| | | | | |
| | 30 | | | Minnesota Higher Education Facilities Authority, Revenue Bonds, Minneapolis College of Art and Design, Refunding Series 2006-6-K, 5.000%, 5/01/26 | | | | | 5/15 at 100.00 | | | | Baa2 | | | | 31,112 | |
| | | | | |
| | 80 | | | Minnesota Higher Education Facilities Authority, Revenue Bonds, Vermillion Community College, Series 1993-3-T, 6.000%, 1/01/13 | | | | | 7/12 at 100.00 | | | | N/R | | | | 80,179 | |
| | | | | |
| | 1,760 | | | Moorhead, Minnesota, Golf Course Revenue Refunding Bonds, Series 1998B, 5.875%, 12/01/21 | | | | | 6/12 at 100.00 | | | | N/R | | | | 1,760,669 | |
| | | | | |
| | 1,500 | | | Saint Paul Housing & Redevelopment Authority, Minnesota, Charter School Lease Revenue Bonds, Nova Classical Academy, Series 2011A, 6.625%, 9/01/42 | | | | | 9/21 at 100.00 | | | | BBB– | | | | 1,605,405 | |
| | | | | |
| | 2,000 | | | Saint Paul Housing and Redevelopment Authority, Minnesota, Educational Facility Revenue Refunding Bonds, Saint Paul Academy and Summit School Project, Series 2007, 5.000%, 10/01/24 | | | | | 10/17 at 100.00 | | | | A3 | | | | 2,204,520 | |
| | | | | |
| | 2,550 | | | Saint Paul Housing and Redevelopment Authority, Minnesota, Lease Revenue Bonds, Community of Peace Academy Project, Series 2006A, 5.000%, 12/01/36 | | | | | 12/15 at 100.00 | | | | BBB– | | | | 2,347,403 | |
| | | | | |
| | 1,540 | | | University of Minnesota, General Revenue Bonds, Series 2011A, 5.250%, 12/01/29 | | | | | 12/20 at 100.00 | | | | Aa1 | | | | 1,867,096 | |
| | 27,480 | | | Total Education and Civic Organizations | | | | | | | | | | | | | 29,142,995 | |
| | | | Health Care – 22.1% | | | | | | | | | | | | | | |
| | | | | |
| | 2,470 | | | Chippewa County, Minnesota, Gross Revenue Hospital Bonds, Montevideo Hospital Project, Series 2007, 5.500%, 3/01/37 | | | | | 3/17 at 100.00 | | | | N/R | | | | 2,534,022 | |
| | | | | |
| | 2,000 | | | Glencoe, Minnesota, Health Care Facilities Revenue Bonds, Glencoe Regional Health Services Project, Series 2005, 5.000%, 4/01/31 | | | | | 4/14 at 100.00 | | | | BBB | | | | 2,027,980 | |
| | | | | | | | | | | | | | | | | | |
Principal
Amount (000) | | | Description (1) | | | | Optional Call Provisions (2) | | | Ratings (3) | | | Value | |
| | | | | | | | | | | | | | | | | | |
| | | | Health Care (continued) | | | | | | | | | | | | | | |
| | | | | |
| $ | 2,500 | | | Hawaii Department of Budget and Finance, Special Purpose Revenue Bonds, Hawaii Pacific Health Obligated Group, Series 2010B, 5.750%, 7/01/40 | | | | | 7/20 at 100.00 | | | | A3 | | | $ | 2,746,100 | |
| | | | | |
| | | | Maple Grove, Minnesota, Health Care Facilities Revenue Bonds, Maple Grove Hospital Corporation, Series 2007: | | | | | | | | | | | | | | |
| | 1,800 | | | 4.500%, 5/01/23 | | | | | 5/17 at 100.00 | | | | Baa1 | | | | 1,832,436 | |
| | 1,000 | | | 5.250%, 5/01/25 | | | | | 5/17 at 100.00 | | | | Baa1 | | | | 1,045,670 | |
| | 85 | | | 5.250%, 5/01/37 | | | | | 5/17 at 100.00 | | | | Baa1 | | | | 88,103 | |
| | | | | |
| | 250 | | | Maple Grove, Minnesota, Health Care Facility Revenue Bonds, North Memorial Health Care, Series 2005, 5.000%, 9/01/29 | | | | | 9/15 at 100.00 | | | | Baa1 | | | | 253,988 | |
| | | | | |
| | 3,000 | | | Minneapolis Health Care System, Minnesota, Revenue Bonds, Fairview Hospital and Healthcare Services, Series 2008A, 6.625%, 11/15/28 | | | | | 11/18 at 100.00 | | | | A | | | | 3,580,470 | |
| | | | | |
| | 2,400 | | | Minneapolis-Saint Paul Housing and Redevelopment Authority, Minnesota, Health Care Revenue Bonds, Children’s Health Care, Series 2010A, 5.250%, 8/15/35 | | | | | 8/20 at 100.00 | | | | A+ | | | | 2,699,928 | |
| | | | | |
| | 1,000 | | | Minnesota Agricultural and Economic Development Board, Health Care Facilities Revenue Bonds, Essentia Health Obligated Group, Series 2008C-1, 5.000%, 2/15/30 – AGC Insured | | | | | 2/20 at 100.00 | | | | AA– | | | | 1,099,430 | |
| | | | | |
| | 125 | | | Minnesota Agricultural and Economic Development Board, Healthcare System Revenue Bonds, Fairview Hospital and Healthcare Services, Series 2000A, 6.375%, 11/15/29 | | | | | 11/12 at 100.00 | | | | A | | | | 125,239 | |
| | | | | |
| | 1,000 | | | Monticello-Big Lake Community Hospital District, Minnesota, Gross Revenue Health Care Facilities Bonds, Series 2003C, 6.200%, 12/01/22 | | | | | 12/12 at 100.00 | | | | N/R | | | | 1,005,110 | |
| | | | | |
| | 1,700 | | | Rochester, Minnesota, Health Care Facilities Revenue Bonds, Olmsted Medical Center Project, Series 2010, 5.875%, 7/01/30 | | | | | 7/20 at 100.00 | | | | BBB | | | | 1,845,469 | |
| | | | | |
| | 40 | | | Saint Cloud, Minnesota, Health Care Revenue Bonds, CentraCare Health System Project, Series 2008D, 5.500%, 5/01/39 – AGC Insured | | | | | 5/19 at 100.00 | | | | Aa3 | | | | 43,927 | |
| | | | | |
| | 1,020 | | | Saint Cloud, Minnesota, Health Care Revenue Bonds, CentraCare Health System Project, Series 2010A, 5.125%, 5/01/30 | | | | | 5/20 at 100.00 | | | | A+ | | | | 1,114,901 | |
| | | | | |
| | 1,045 | | | Saint Louis Park, Minnesota, Health Care Facilities Revenue Refunding Bonds, Park Nicollet Health Services, Series 2008C, 5.750%, 7/01/30 | | | | | 7/18 at 100.00 | | | | A | | | | 1,164,621 | |
| | | | | |
| | 2,190 | | | Saint Louis Park, Minnesota, Health Care Facilities Revenue Refunding Bonds, Park Nicollet Health Services, Series 2009, 5.750%, 7/01/39 | | | | | 7/19 at 100.00 | | | | A | | | | 2,430,703 | |
| | | | | |
| | 2,060 | | | Saint Paul Housing and Redevelopment Authority, Minnesota, Health Care Facility Revenue Bonds, HealthPartners Obligated Group, Series 2006, 5.250%, 5/15/36 | | | | | 11/16 at 100.00 | | | | A3 | | | | 2,125,487 | |
| | | | | |
| | 3,050 | | | Saint Paul Housing and Redevelopment Authority, Minnesota, Health Care Revenue Bonds, Allina Health System, Series 2009-A1, 5.250%, 11/15/29 | | | | | 11/19 at 100.00 | | | | AA– | | | | 3,377,509 | |
| | | | | |
| | 2,060 | | | Saint Paul Housing and Redevelopment Authority, Minnesota, Health Care Revenue Bonds, Gillette Children’s Specialty Healthcare Project, Series 2009, 5.000%, 2/01/29 | | | | | 2/19 at 100.00 | | | | A– | | | | 2,181,252 | |
| | | | | |
| | 1,375 | | | Saint Paul Port Authority, Minnesota, Lease Revenue Bonds, Regions Hospital Parking Ramp Project, Series 2007-1, 5.000%, 8/01/36 | | | | | 8/16 at 100.00 | | | | N/R | | | | 1,383,374 | |
| | | | | |
| | 2,000 | | | Shakopee, Minnesota, Health Care Facilities Revenue Bonds, Saint Francis Regional Medical Center, Series 2004, 5.250%, 9/01/34 | | | | | 9/14 at 100.00 | | | | A– | | | | 2,035,260 | |
| | | | | |
| | 500 | | | St. Paul Housing and Redevelopment Authority, Minnesota, Healthcare Revenue Bonds, Regions Hospital, Series 1998, 5.250%, 5/15/18 | | | | | 11/12 at 100.00 | | | | A3 | | | | 501,070 | |
| | | | | |
| | 800 | | | St. Paul Housing and Redevelopment Authority, Minnesota, Revenue Bonds, Healtheast Inc., Series 2005, 6.000%, 11/15/30 | | | | | 11/15 at 100.00 | | | | BBB– | | | | 831,248 | |
| | | | | |
| | 900 | | | St. Paul Port Authority, Minnesota, Lease Revenue Bonds, HealthEast Midway Campus, Series 2005A, 5.875%, 5/01/30 | | | | | 5/15 at 100.00 | | | | BB | | | | 920,349 | |
| | | | | |
| | 1,800 | | | St. Paul Port Authority, Minnesota, Lease Revenue Bonds, HealthEast Midway Campus, Series 2005B, 6.000%, 5/01/30 | | | | | 5/15 at 100.00 | | | | N/R | | | | 1,848,204 | |
| | | | | |
| | | | Winona, Minnesota, Health Care Facilities Revenue Bonds, Winona Health Obligated Group, Refunding Series 2012: | | | | | | | | | | | | | | |
| | 1,270 | | | 4.500%, 7/01/24 | | | | | 7/21 at 100.00 | | | | BBB– | | | | 1,315,961 | |
| | 500 | | | 5.000%, 7/01/34 | | | | | 7/21 at 100.00 | | | | BBB– | | | | 510,780 | |
| | 39,940 | | | Total Health Care | | | | | | | | | | | | | 42,668,591 | |
Portfolio of Investments
Nuveen Minnesota Municipal Bond Fund (continued)
May 31, 2012
| | | | | | | | | | | | | | | | | | |
Principal
Amount (000) | | | Description (1) | | | | Optional Call Provisions (2) | | | Ratings (3) | | | Value | |
| | | | | | | | | | | | | | | | | | |
| | | | Housing/Multifamily – 3.2% | | | | | | | | | | | | | | |
| | | | | |
| $ | 1,955 | | | Dakota County Community Development Agency, Minnesota, GNMA Collateralized Mortgage Loan Multifamily Housing Revenue Bonds, Ebenezer Project, Series 2000, 5.900%, 4/20/42 | | | | | 10/12 at 101.00 | | | | Aaa | | | $ | 1,977,483 | |
| | | | | |
| | 2,000 | | | Maplewood, Minnesota, Mutifamily Housing Revenue Refunding Bonds, Carefree Cottages of Maplewood III Project, Series 2004, 4.800%, 4/15/34 (Mandatory put 4/15/19) (Alternative Minimum Tax) | | | | | 4/14 at 100.00 | | | | Aaa | | | | 2,071,620 | |
| | | | | |
| | 855 | | | Minneapolis, Minnesota, GNMA Collateralized Multifamily Housing Revenue Bonds, Vantage Flats Project, Series 2007, 5.200%, 10/20/48 (Alternative Minimum Tax) | | | | | 10/15 at 100.00 | | | | Aaa | | | | 877,504 | |
| | | | | |
| | 1,350 | | | Minneapolis, Minnesota, Multifamily Housing Revenue Bonds, Keeler Apartments, Series 2007A, 5.000%, 10/01/37 | | | | | 10/15 at 102.00 | | | | N/R | | | | 1,268,744 | |
| | 6,160 | | | Total Housing/Multifamily | | | | | | | | | | | | | 6,195,351 | |
| | | | Housing/Single Family – 4.4% | | | | | | | | | | | | | | |
| | | | | |
| | 200 | | | Minneapolis-Saint Paul Housing Finance Board, Minnesota, Single Family Mortgage Revenue Bonds, City Living Home Program, Market Series 2011B, 4.100%, 12/01/29 | | | | | 6/21 at 100.00 | | | | AA+ | | | | 211,732 | |
| | | | | |
| | 470 | | | Minneapolis-Saint Paul Housing Finance Board, Minnesota, Single Family Mortgage Revenue Bonds, City Living Series 2006A-4, 5.000%, 11/01/38 (Alternative Minimum Tax) | | | | | 7/16 at 100.00 | | | | AA+ | | | | 486,581 | |
| | | | | |
| | 1,425 | | | Minneapolis-Saint Paul Housing Finance Board, Minnesota, Single Family Mortgage Revenue Bonds, City Living Series 2007A-2, 5.520%, 3/01/41 (Alternative Minimum Tax) | | | | | 5/17 at 102.00 | | | | AA+ | | | | 1,531,619 | |
| | | | | |
| | 750 | | | Minnesota Housing Finance Agency, Homeownership Finance Bonds, Mortgage-Backed Securities Program, Series 2011D, 4.700%, 1/01/31 | | | | | 7/21 at 100.00 | | | | Aaa | | | | 823,163 | |
| | | | | |
| | 330 | | | Minnesota Housing Finance Agency, Residential Housing Finance Bonds, Series 2002B, 5.650%, 7/01/33 (Alternative Minimum Tax) | | | | | 7/12 at 100.00 | | | | AA+ | | | | 329,993 | |
| | | | | |
| | 3,305 | | | Minnesota Housing Finance Agency, Residential Housing Finance Bonds, Series 2007D, 4.700%, 7/01/27 (Alternative Minimum Tax) | | | | | 7/16 at 100.00 | | | | AA+ | | | | 3,404,447 | |
| | | | | |
| | 55 | | | Minnesota Housing Finance Agency, Residential Housing Finance Bonds, Series 2007-I, 4.850%, 7/01/38 (Alternative Minimum Tax) | | | | | 7/16 at 100.00 | | | | AA+ | | | | 56,007 | |
| | | | | |
| | 1,500 | | | Minnesota Housing Finance Agency, Residential Housing Finance Bonds, Series 2012C, 3.850%, 1/01/29 | | | | | 1/22 at 100.00 | | | | AA+ | | | | 1,557,015 | |
| | 8,035 | | | Total Housing/Single Family | | | | | | | | | | | | | 8,400,557 | |
| | | | Industrials – 0.1% | | | | | | | | | | | | | | |
| | | | | |
| | 170 | | | Little Canada, Minnesota, Commercial Development Revenue Refunding Bonds, RLF Minnesota Project, Series 1993, 5.000%, 4/01/13 | | | | | 10/12 at 100.00 | | | | N/R | | | | 171,020 | |
| | | | Long-Term Care – 7.9% | | | | | | | | | | | | | | |
| | | | | |
| | 1,500 | | | Anoka County Housing and Redevelopment Authority, Minnesota, Health Care Facility Care Center Project, Series 2010D, 6.750%, 11/01/36 | | | | | 11/15 at 102.00 | | | | N/R | | | | 1,574,370 | |
| | | | | |
| | 1,600 | | | Center City, Minnesota, Health Care Facilities Revenue Bonds, Hazelden Foundation Project, Series 2011, 5.000%, 11/01/41 | | | | | 11/19 at 100.00 | | | | A3 | | | | 1,704,400 | |
| | | | | |
| | 850 | | | Cottage Grove, Minnesota, Senior Housing Revenue Bonds, PHS/Cottage Grove, Inc., Project, Series 2006A, 5.000%, 12/01/31 | | | | | 12/14 at 100.00 | | | | N/R | | | | 842,682 | |
| | | | | |
| | 1,475 | | | Golden Valley, Minnesota, Revenue Bonds, Covenant Retirement Communities, Inc., Series 1999A, 5.500%, 12/01/29 | | | | | 6/12 at 100.00 | | | | BBB+ | | | | 1,475,561 | |
| | | | | |
| | 1,620 | | | Moorhead, Minnesota, Senior Housing Facility Revenue Bonds, Sheyenne Crossings Project, Series 2006, 5.650%, 4/01/41 | | | | | 4/14 at 101.00 | | | | N/R | | | | 1,594,048 | |
| | | | | |
| | 1,600 | | | New Hope, Minnesota, Housing and Health Care Facilities Revenue Bonds, Minnesota Masonic Home North Ridge Project, Series 1999, 5.750%, 3/01/15 | | | | | 9/12 at 100.00 | | | | N/R | | | | 1,601,504 | |
| | | | | |
| | 1,100 | | | Saint Paul Housing & Redevelopment Authority, Minnesota, Revenue Bonds, Rossy & Richard Shaller Family Sholom East Campus, Series 2007A, 5.250%, 10/01/42 | | | | | 10/17 at 100.00 | | | | N/R | | | | 1,073,820 | |
| | | | | | | | | | | | | | | | | | |
Principal
Amount (000) | | | Description (1) | | | | Optional Call Provisions (2) | | | Ratings (3) | | | Value | |
| | | | | | | | | | | | | | | | | | |
| | | | Long-Term Care (continued) | | | | | | | | | | | | | | |
| | | | | |
| $ | 2,140 | | | Saint Paul Housing and Redevelopment Authority, Minnesota, Nursing Home Revenue Bonds, Episcopal Homes of Minnesota, Series 2006, 5.630%, 10/01/33 | | | | | 4/17 at 100.00 | | | | N/R | | | $ | 2,149,799 | |
| | | | | |
| | | | Wayzata, Minnesota, Senior Housing Revenue Bonds, Folkestone Senior Living Community, Series 2012A: | | | | | | | | | | | | | | |
| | 260 | | | 5.000%, 5/01/23 | | | | | 5/19 at 102.00 | | | | N/R | | | | 260,731 | |
| | 680 | | | 5.000%, 11/01/23 | | | | | 5/19 at 102.00 | | | | N/R | | | | 681,911 | |
| | 700 | | | 5.500%, 11/01/32 | | | | | 5/19 at 102.00 | | | | N/R | | | | 700,938 | |
| | 330 | | | 6.000%, 5/01/47 | | | | | 5/19 at 102.00 | | | | N/R | | | | 337,986 | |
| | | | | |
| | 1,200 | | | West St. Paul, Minnesota, Health Care Facilities Revenue Bonds, Walker Thompson Hill LLC Project, Series 2011A, 7.000%, 9/01/46 | | | | | 9/19 at 100.00 | | | | N/R | | | | 1,271,724 | |
| | 15,055 | | | Total Long-Term Care | | | | | | | | | | | | | 15,269,474 | |
| | | | Materials – 0.6% | | | | | | | | | | | | | | |
| | | | | |
| | 1,130 | | | Seaway Port Authority of Duluth, Minnesota, Industrial Development Dock and Wharf Revenue Refunding Bonds, Cargill, Inc Project, Series 2004, 4.200%, 5/01/13 | | | | | No Opt. Call | | | | A | | | | 1,162,612 | |
| | | | Tax Obligation/General – 8.7% | | | | | | | | | | | | | | |
| | | | | |
| | 10,000 | | | Bemidji, Minnesota, General Obligation Bonds, Refunding Sales Tax Series 2011, 6.000%, 2/01/41 | | | | | 2/21 at 100.00 | | | | Aa3 | | | | 12,373,100 | |
| | | | | |
| | 1,430 | | | Burnsville Independent School District 191, Dakota and Scott Counties, Minnesota, General Obligation Bonds, Series 2008A, 4.500%, 2/01/22 | | | | | 2/18 at 100.00 | | | | Aa2 | | | | 1,619,446 | |
| | | | | |
| | 380 | | | Independent School District 625, St. Paul, Minnesota, General Obligation Bonds, School Building Series 2011A, 4.000%, 2/01/32 | | | | | 2/21 at 100.00 | | | | AA+ | | | | 407,151 | |
| | | | | |
| | 1,000 | | | Thief River Falls Independent School District 564, Minnesota, General Obligation Bonds, Series 2012A, 4.000%, 2/01/33 | | | | | 2/22 at 100.00 | | | | Aa2 | | | | 1,046,940 | |
| | | | | |
| | 1,250 | | | Willmar, Minnesota, General Obligation Revenue Refunding Bonds, Rice Memorial Hospital Project, Series 2012A, 3.000%, 2/01/29 | | | | | 2/21 at 100.00 | | | | Aa2 | | | | 1,233,150 | |
| | 14,060 | | | Total Tax Obligation/General | | | | | | | | | | | | | 16,679,787 | |
| | | | Tax Obligation/Limited – 3.6% | | | | | | | | | | | | | | |
| | | | | |
| | 2,000 | | | Duluth Independent School District 709, Minnesota, Certificates of Participation, Series 2008B, 4.000%, 2/01/19 | | | | | No Opt. Call | | | | AA+ | | | | 2,331,780 | |
| | | | | |
| | 585 | | | Lakeville Housing and Redevelopment Authority, Minnesota, Lease Revenue Bonds, Ice Arena Project, Series 2006, 4.625%, 2/01/32 | | | | | 2/17 at 100.00 | | | | Aa3 | | | | 620,223 | |
| | | | | |
| | 400 | | | Minneapolis, Minnesota, Tax Increment Revenue Bonds, Village at St. Anthony Falls Project, Refunding Series 2005, 5.650%, 2/01/27 | | | | | 2/14 at 100.00 | | | | N/R | | | | 400,784 | |
| | | | | |
| | | | Pine County Housing and Redevelopment Authority, Minnesota, Public Project Revenue Bonds, Series 2005A: | | | | | | | | | | | | | | |
| | 1,000 | | | 5.000%, 2/01/28 | | | | | 2/16 at 100.00 | | | | BBB+ | | | | 1,042,570 | |
| | 1,890 | | | 5.000%, 2/01/31 | | | | | 2/16 at 100.00 | | | | BBB+ | | | | 1,963,238 | |
| | | | | |
| | 500 | | | Saint Paul Housing and Redevelopment Authority, Minnesota, Recreational Faility Lease Revenue Bonds, Jimmy Lee Recreational Center, Series 2008, 4.750%, 12/01/26 | | | | | 12/17 at 100.00 | | | | AA+ | | | | 545,280 | |
| | 6,375 | | | Total Tax Obligation/Limited | | | | | | | | | | | | | 6,903,875 | |
| | | | Transportation – 6.1% | | | | | | | | | | | | | | |
| | | | | |
| | 1,000 | | | Minneapolis, Minnesota, Recovery Zone Facility Revenue Bonds, Mozaic Parking, LLC Project, Series 2010A, 8.500%, 1/01/41 | | | | | 1/21 at 100.00 | | | | N/R | | | | 1,072,220 | |
| | | | | |
| | 4,000 | | | Minneapolis-St. Paul Metropolitan Airports Commission, Minnesota, Airport Revenue Bonds, Refunding Senior Lien Series 2009B, 5.000%, 1/01/20 (Alternative Minimum Tax) | | | | | 1/19 at 100.00 | | | | AA– | | | | 4,639,000 | |
| | | | | |
| | 3,070 | | | Minneapolis-St. Paul Metropolitan Airports Commission, Minnesota, Airport Revenue Bonds, Series 2007B, 4.500%, 1/01/32 – NPFG Insured | | | | | 1/17 at 100.00 | | | | A | | | | 3,148,469 | |
| | | | | |
| | | | St Paul Housing and Redevelopment Authority, Minnesota, Parking Revenue Bonds, Parking Facilities Project, Refunding Series 2010A: | | | | | | | | | | | | | | |
| | 1,070 | | | 5.000%, 8/01/30 | | | | | 8/18 at 102.00 | | | | A+ | | | | 1,177,760 | |
| | 1,500 | | | 5.000%, 8/01/35 | | | | | 8/18 at 102.00 | | | | A+ | | | | 1,627,455 | |
| | 10,640 | | | Total Transportation | | | | | | | | | | | | | 11,664,904 | |
Portfolio of Investments
Nuveen Minnesota Municipal Bond Fund (continued)
May 31, 2012
| | | | | | | | | | | | | | | | | | |
Principal
Amount (000) | | | Description (1) | | | | Optional Call Provisions (2) | | | Ratings (3) | | | Value | |
| | | | | | | | | | | | | | | | | | |
| | | | U.S. Guaranteed – 2.7% (4) | | | | | | | | | | | | | | |
| | | | | |
| $ | 1,065 | | | Duluth Economic Development Authority, Minnesota, Healthcare Facilities Revenue Bonds, Benedictine Health System – St. Mary’s Duluth Clinic, Series 2004, 5.250%, 2/15/28 (Pre-refunded 2/15/14) | | | | | 2/14 at 100.00 | | | | N/R | (4) | | $ | 1,151,840 | |
| | | | | |
| | | | Marshall, Minnesota, Revenue Bonds, Weiner Memorial Medical Center, Series 2003A: | | | | | | | | | | | | | | |
| | 305 | | | 5.250%, 11/01/16 (Pre-refunded 11/01/13) | | | | | 11/13 at 100.00 | | | | N/R | (4) | | | 323,968 | |
| | 875 | | | 5.850%, 11/01/23 (Pre-refunded 11/01/13) | | | | | 11/13 at 100.00 | | | | N/R | (4) | | | 936,793 | |
| | | | | |
| | 2,000 | | | St. Louis Park, Minnesota, Revenue Bonds, Park Nicollet Health Services, Series 2003B, 5.500%, 7/01/25 (Pre-refunded 7/01/14) | | | | | 7/14 at 100.00 | | | | N/R | (4) | | | 2,210,300 | |
| | | | | |
| | 410 | | | Western Minnesota Municipal Power Agency, Power Supply Revenue Bonds, Series 1983A, 9.750%, 1/01/16 - NPFG Insured (ETM) | | | | | No Opt. Call | | | | Aaa | | | | 518,748 | |
| | 4,655 | | | Total U.S. Guaranteed | | | | | | | | | | | | | 5,141,649 | |
| | | | Utilities – 15.5% | | | | | | | | | | | | | | |
| | | | | |
| | 1,110 | | | Central Minnesota Municipal Power Agency, Revenue Bonds, Brookings – Southeast Twin Cities Transmission Project, Series 2012, 5.000%, 1/01/42 (WI/DD, Settling 6/07/12) | | | | | 1/22 at 100.00 | | | | A– | | | | 1,216,582 | |
| | | | | |
| | 45 | | | Chaska, Minnesota, Electric Revenue Bonds, Generating Facility Project, Series 2000A, 6.100%, 10/01/30 | | | | | 10/12 at 100.00 | | | | A3 | | | | 45,166 | |
| | | | | |
| | 5,000 | | | Minnesota Municipal Power Agency, Electric Revenue Bonds, Refunding Series 2010A, 5.000%, 10/01/30 | | | | | 10/20 at 100.00 | | | | A3 | | | | 5,551,200 | |
| | | | | |
| | 2,000 | | | Northern Municipal Power Agency, Minnesota, Electric System Revenue Bonds, Refunding Series 2007A, 5.000%, 1/01/26 – AMBAC Insured | | | | | 1/18 at 100.00 | | | | A2 | | | | 2,195,020 | |
| | | | | |
| | 2,000 | | | Puerto Rico Electric Power Authority, Power Revenue Bonds, Series 2005SS, 5.000%, 7/01/24 – NPFG Insured | | | | | 7/15 at 100.00 | | | | BBB+ | | | | 2,115,400 | |
| | | | | |
| | | | Southern Minnesota Municipal Power Agency, Power Supply System Revenue Bonds, Series 1994A: | | | | | | | | | | | | | | |
| | 1,450 | | | 0.000%, 1/01/19 – NPFG Insured | | | | | No Opt. Call | | | | A+ | | | | 1,250,176 | |
| | 1,765 | | | 0.000%, 1/01/21 – NPFG Insured | | | | | No Opt. Call | | | | A+ | | | | 1,389,655 | |
| | 3,000 | | | 0.000%, 1/01/23 – NPFG Insured | | | | | No Opt. Call | | | | A+ | | | | 2,145,030 | |
| | 10,500 | | | 0.000%, 1/01/24 – NPFG Insured | | | | | No Opt. Call | | | | A+ | | | | 7,150,080 | |
| | 4,770 | | | 0.000%, 1/01/25 – NPFG Insured | | | | | No Opt. Call | | | | A+ | | | | 3,092,057 | |
| | 6,100 | | | 0.000%, 1/01/26 – NPFG Insured | | | | | No Opt. Call | | | | A+ | | | | 3,759,552 | |
| | 37,740 | | | Total Utilities | | | | | | | | | | | | | 29,909,918 | |
| | | | Water and Sewer – 0.8% | | | | | | | | | | | | | | |
| | | | | |
| | 1,500 | | | Puerto Rico Aqueduct and Sewerage Authority, Revenue Bonds, Senior Lien Series 2008A, 6.000%, 7/01/38 | | | | | 7/18 at 100.00 | | | | Baa2 | | | | 1,602,480 | |
| $ | 181,765 | | | Total Municipal Bonds (cost $168,006,663) | | | | | | | | | | | | | 184,720,320 | |
| | | | | |
| Shares | | | Description (1) | | | | | | | | | | Value | |
| | | | SHORT-TERM INVESTMENTS – 3.6% | | | | | | | | | | | | | | |
| | | | | |
| | | | Money Market Funds – 3.6% | | | | | | | | | | | | | | |
| | | | | |
| | 6,910,130 | | | Federated Minnesota Municipal Cash Trust, 0.010% (5) | | | | | | | | | | | | $ | 6,910,130 | |
| | | | Total Short-Term Investments (cost $6,910,130) | | | | | | | | | | | | | 6,910,130 | |
| | | | Total Investments (cost $174,916,793) – 99.5% | | | | | | | | | | | | | 191,630,450 | |
| | | | Other Assets Less Liabilities – 0.5% | | | | | | | | | | | | | 950,179 | |
| | | | Net Assets – 100% | | | | | | | | | | | | $ | 192,580,629 | |
| | (1) | | All percentages shown in the Portfolio of Investments are based on net assets. |
| | (2) | | Optional Call Provisions (not covered by the report of independent registered public accounting firm): Dates (month and year) and prices of the earliest optional call or redemption. There may be other call provisions at varying prices at later dates. Certain mortgage-backed securities may be subject to periodic principal paydowns. |
| | (3) | | Ratings (not covered by the report of independent registered public accounting firm): Using the highest of Standard & Poor’s Group (“Standard & Poor’s”), Moody’s Investors Service, Inc. (“Moody’s”) or Fitch, Inc. (“Fitch”) rating. Ratings below BBB by Standard & Poor’s, Baa by Moody’s or BBB by Fitch are considered to be below investment grade. Holdings designated N/R are not rated by any of these national rating agencies. |
| | (4) | | Backed by an escrow or trust containing sufficient U.S. Government or U.S. Government agency securities, which ensure the timely payment of principal and interest. Certain bonds backed by U.S. Government or agency securities are regarded as having an implied rating equal to the rating of such securities. |
| | (5) | | The rate shown is the annualized seven-day effective yield as of May 31, 2012. |
| | WI/DD | | Purchased on a when-issued or delayed delivery basis. |
| | (ETM) | | Escrowed to maturity. |
See accompanying notes to financial statements.
Portfolio of Investments
Nuveen Nebraska Municipal Bond Fund
May 31, 2012
| | | | | | | | | | | | | | | | | | |
Principal
Amount (000) | | | Description (1) | | | | Optional Call
Provisions (2) | | | Ratings (3) | | | Value | |
| | | | | | | | | | | | | | | | | | |
| | | | MUNICIPAL BONDS – 100.4% | | | | | | | | | | | | | | |
| | | | | |
| | | | Education and Civic Organizations – 23.9% | | | | | | | | | | | | | | |
| | | | | |
| $ | 990 | | | Colorado Educational and Cultural Facilities Authority, Charter School Revenue Bonds, Academy of Charter Schools Project, Series 2008, 5.625%, 5/01/40 | | | | | 5/18 at 100.00 | | | | A | | | $ | 1,047,509 | |
| | | | | |
| | 1,000 | | | Douglas County Hospital Authority 2, Nebraska, Healthcare Revenue Bonds, Boys Town Project, Series 2008, 4.750%, 9/01/28 | | | | | 9/18 at 100.00 | | | | AA+ | | | | 1,088,010 | |
| | | | | |
| | | | Douglas County, Nebraska, Educational Facilities Revenue Bonds, Creighton University Projects, Refunding Series 2010A: | | | | | | | | | | | | | | |
| | 1,000 | | | 5.600%, 7/01/25 | | | | | 7/20 at 100.00 | | | | A3 | | | | 1,162,380 | |
| | 1,000 | | | 5.500%, 7/01/30 | | | | | 7/20 at 100.00 | | | | A3 | | | | 1,133,320 | |
| | | | | |
| | 665 | | | Douglas County, Nebraska, Zoo Facilities Revenue Bonds, O’Maha’s Henry Doory Zoo Project, Refunding Series 2005, 4.750%, 9/01/24 | | | | | 4/15 at 100.00 | | | | A– | | | | 695,317 | |
| | | | | |
| | | | Lincoln, Nebraska, Educational Facilities Revenue and Refunding Bonds, Nebraska Wesleyan University Project, Series 2012: | | | | | | | | | | | | | | |
| | 685 | | | 3.300%, 4/01/25 | | | | | 4/22 at 100.00 | | | | A– | | | | 686,411 | |
| | 410 | | | 4.000%, 4/01/32 | | | | | 4/22 at 100.00 | | | | A– | | | | 415,818 | |
| | | | | |
| | 500 | | | Missouri Health and Educational Facilities Authority, Revenue Bonds, Washington University, Series 2008A, 5.375%, 3/15/39 | | | | | 3/18 at 100.00 | | | | AAA | | | | 578,610 | |
| | | | | |
| | 525 | | | Nebraska Educational Finance Authority, Revenue Bonds, Clarkson College Project, Refunding Series 2011, 5.450%, 9/01/35 | | | | | 5/21 at 100.00 | | | | Aa3 | | | | 590,578 | |
| | | | | |
| | 2,690 | | | Nebraska Educational Finance Authority, Revenue Bonds, Concordia University Project, Refunding Series 2007, 5.000%, 10/01/37 | | | | | 10/15 at 100.00 | | | | N/R | | | | 2,666,915 | |
| | | | | |
| | 690 | | | Omaha, Nebraska, Special Tax Redevelopment Bonds, Refunding Series 2012, 4.000%, 2/01/28 | | | | | 2/22 at 100.00 | | | | AA+ | | | | 741,805 | |
| | | | | |
| | 1,120 | | | University of Nebraska, Revenue Bonds, Lincoln Student Fees and Facilities Refunding Series 2011, 5.000%, 7/01/42 | | | | | 1/22 at 100.00 | | | | Aa1 | | | | 1,268,915 | |
| | | | | |
| | 750 | | | University of Nebraska, Revenue Bonds, Lincoln Student Fees and Facilities, Series 2003, 5.000%, 7/01/22 | | | | | 1/13 at 100.00 | | | | Aa1 | | | | 769,073 | |
| | | | | |
| | 1,000 | | | University of Nebraska, Revenue Bonds, Omaha Health & Recreation Project, Series 2008, 5.000%, 5/15/33 | | | | | 5/18 at 100.00 | | | | Aa1 | | �� | | 1,106,310 | |
| | | | | |
| | 350 | | | University of Nebraska, Revenue Bonds, Omaha Student Facilities Project, Series 2007, 5.000%, 5/15/32 | | | | | 5/17 at 100.00 | | | | Aa1 | | | | 398,150 | |
| | | | | |
| | 500 | | | University of Nebraska, Revenue Bonds, Omaha Student Housing Project, Series 2003, 5.000%, 5/15/23 | | | | | 11/13 at 100.00 | | | | Aa1 | | | | 531,250 | |
| | 13,875 | | | Total Education and Civic Organizations | | | | | | | | | | | | | 14,880,371 | |
| | | | Health Care – 7.6% | | | | | | | | | | | | | | |
| | | | | |
| | 1,000 | | | Douglas County Hospital Authority 2, Nebraska, Health Facilities Revenue Refunding Bonds, Children’s Hospital Obligated Group, Series 2008B, 6.000%, 8/15/28 | | | | | 8/17 at 100.00 | | | | A2 | | | | 1,115,200 | |
| | | | | |
| | | | Douglas County Hospital Authority 3, Nebraska, Health Facilities Refunding and Revenue Bonds, Nebraska Methodist Health System, Series 2008: | | | | | | | | | | | | | | |
| | 275 | | | 5.750%, 11/01/28 | | | | | 11/18 at 100.00 | | | | BBB+ | | | | 300,930 | |
| | 1,010 | | | 5.500%, 11/01/38 | | | | | 11/18 at 100.00 | | | | BBB+ | | | | 1,067,722 | |
| | | | | |
| | 600 | | | Halifax Hospital Medical Center, Florida, Revenue Bonds, Series 2006, 5.000%, 6/01/38 | | | | | 6/16 at 100.00 | | | | A– | | | | 611,862 | |
| | | | | |
| | 600 | | | Indiana Health Facility Financing Authority, Hospital Revenue Bonds, Jackson County, Schneck Memorial Hospital, Series 2006A, 5.250%, 2/15/30 | | | | | 2/16 at 100.00 | | | | A | | | | 620,850 | |
| | | | | |
| | | | Nebraska Investment Finance Authority, Hospital Revenue Bonds, Great Plains Regional Medical Center Project, Series 2002: | | | | | | | | | | | | | | |
| | 250 | | | 5.200%, 11/15/16 – RAAI Insured | | | | | 11/12 at 100.00 | | | | A | | | | 250,733 | |
| | 805 | | | 5.300%, 11/15/17 – RAAI Insured | | | | | 11/12 at 100.00 | | | | A | | | | 807,270 | |
| | 4,540 | | | Total Health Care | | | | | | | | | | | | | 4,774,567 | |
| | | | | | | | | | | | | | | | | | |
Principal
Amount (000) | | | Description (1) | | | | Optional Call
Provisions (2) | | | Ratings (3) | | | Value | |
| | | | | | | | | | | | | | | | | | |
| | | | Housing/Multifamily – 0.8% | | | | | | | | | | | | | | |
| | | | | |
| $ | 480 | | | Omaha Housing Authority, Nebraska, Multifamily Housing Revenue Bonds, GNMA Mortgage Backed Securities Program – Timbercreek Apartments Project, Series 2001, 5.150%, 11/20/22 | | | | | 10/12 at 100.00 | | | | N/R | | | $ | 480,869 | |
| | | | Housing/Single Family – 4.4% | | | | | | | | | | | | | | |
| | | | | |
| | | | Nebraska Investment Finance Authority, Single Family Housing Revenue Bonds, Series 2010A: | | | | | | | | | | | | | | |
| | 2,000 | | | 5.700%, 9/01/31 | | | | | 9/20 at 100.00 | | | | AA+ | | | | 2,288,160 | |
| | 380 | | | 6.100%, 9/01/45 | | | | | 9/20 at 100.00 | | | | AA+ | | | | 433,515 | |
| | 2,380 | | | Total Housing/Single Family | | | | | | | | | | | | | 2,721,675 | |
| | | | Long-Term Care – 9.4% | | | | | | | | | | | | | | |
| | | | | |
| | 250 | | | Colorado Health Facilities Authority, Colorado, Revenue Bonds, Evangelical Lutheran Good Samaritan, Series 2009B, 5.000%, 6/01/39 (Mandatory put 12/01/14) | | | | | No Opt. Call | | | | A– | | | | 269,478 | |
| | | | | |
| | 100 | | | Colorado Health Facilities Authority, Revenue Bonds, Christian Living Communities Project, Series 2006A, 5.750%, 1/01/26 | | | | | 1/17 at 100.00 | | | | N/R | | | | 104,092 | |
| | | | | |
| | 900 | | | Douglas County Hospital Authority 2, Nebraska, Health Facilities Revenue Bonds, Immanuel Obligated Group, Refunding Series 2010, 5.625%, 1/01/40 | | | | | 1/20 at 100.00 | | | | A– | | | | 988,344 | |
| | | | | |
| | 200 | | | Illinois Finance Authority, Revenue Bonds, Three Crowns Park Plaza,
Series 2006A, 5.875%, 2/15/26 | | | | | 2/16 at 100.00 | | | | N/R | | | | 205,170 | |
| | | | | |
| | 3,385 | | | Lancaster County Hospital Authority 1, Nebraska, Health Facilities Revenue Bonds, Immanuel Obligated Group, Refunding Series 2010, 5.625%, 1/01/40 | | | | | 1/20 at 100.00 | | | | A– | | | | 3,717,272 | |
| | | | | |
| | 600 | | | South Dakota Health and Educational Facilities Authority, Revenue Bonds, Westhills Village Retirement Community Project, Series 2006, 5.000%, 9/01/25 | | | | | 9/14 at 100.00 | | | | A | | | | 610,188 | |
| | 5,435 | | | Total Long-Term Care | | | | | | | | | | | | | 5,894,544 | |
| | | | Materials – 0.5% | | | | | | | | | | | | | | |
| | | | | |
| | 300 | | | Washington County, Nebraska, Wastewater Facilities Revenue Bonds, Cargill Inc., Series 2002, 5.900%, 11/01/27 (Alternative Minimum Tax) | | | | | 11/12 at 101.00 | | | | A | | | | 305,589 | |
| | | | Tax Obligation/General – 14.0% | | | | | | | | | | | | | | |
| | | | | |
| | 195 | | | Buffalo County, Nebraska, General Obligation Bonds, Series 2008, 6.000%, 12/15/28 – AGC Insured | | | | | 11/13 at 102.00 | | | | AA– | | | | 215,257 | |
| | | | | |
| | 350 | | | Douglas County School District 059, Nebraska, General Obligation Bonds, School Building Series 2011B, 4.700%, 12/15/32 | | | | | 5/16 at 100.00 | | | | AA– | | | | 385,427 | |
| | | | | |
| | 2,000 | | | Douglas County School District 1, Nebraska, General Obligation Bonds, Refunding School Building Series 2012, 5.000%, 6/15/24 | | | | | No Opt. Call | | | | AAA | | | | 2,552,440 | |
| | | | | |
| | 500 | | | Douglas County School District 10 Elkhorn, Nebraska, General Obligation Bonds, Public Schools Series 2009, 6.000%, 6/15/28 | | | | | 1/14 at 100.00 | | | | AA– | | | | 545,790 | |
| | | | | |
| | | | Douglas County School District 10 Elkhorn, Nebraska, General Obligation Bonds, Public Schools Series 2012: | | | | | | | | | | | | | | |
| | 1,000 | | | 4.250%, 6/15/29 | | | | | 6/22 at 100.00 | | | | AA– | | | | 1,099,000 | |
| | 1,000 | | | 3.500%, 1/15/33 | | | | | 1/22 at 100.00 | | | | AA– | | | | 1,012,310 | |
| | | | | |
| | 450 | | | Omaha, Nebraska, General Obligation Bonds, Refunding Series 2008, 5.750%, 10/15/28 | | | | | 10/18 at 100.00 | | | | AAA | | | | 536,900 | |
| | | | | |
| | 1,000 | | | Puerto Rico, General Obligation Bonds, Public Improvement, Series 2011A, 5.750%, 7/01/41 | | | | | 7/21 at 100.00 | | | | Baa1 | | | | 1,074,180 | |
| | | | | |
| | 375 | | | Puerto Rico, General Obligation Bonds, Public Improvement Refunding
Series 2008A, 5.250%, 7/01/26 | | | | | 7/18 at 100.00 | | | | Baa1 | | | | 393,161 | |
| | | | | |
| | 250 | | | Puerto Rico, General Obligation Bonds, Refunding Series 2003C-7, 6.000%, 7/01/27 – NPFG Insured | | | | | 7/18 at 100.00 | | | | Baa1 | | | | 280,408 | |
| | | | | |
| | 650 | | | Saunders County, Nebraska, General Obligation Bonds, Series 2006, 5.000%, 11/01/30 – AGM Insured | | | | | 7/12 at 100.00 | | | | AA– | | | | 651,892 | |
| | 7,770 | | | Total Tax Obligation/General | | | | | | | | | | | | | 8,746,765 | |
Portfolio of Investments
Nuveen Nebraska Municipal Bond Fund (continued)
May 31, 2012
| | | | | | | | | | | | | | | | | | |
Principal
Amount (000) | | | Description (1) | | | | Optional Call
Provisions (2) | | | Ratings (3) | | | Value | |
| | | | | | | | | | | | | | | | | | |
| | | | Tax Obligation/Limited – 13.5% | | | | | | | | | | | | | | |
| | | | | |
| $ | 265 | | | Government of Guam, Business Privilege Tax Bonds, Series 2011A, 5.125%, 1/01/42 | | | | | 1/22 at 100.00 | | | | A | | | $ | 287,541 | |
| | | | | |
| | 1,600 | | | Government of Guam, Business Privilege Tax Bonds, Series 2012B-1, 5.000%, 1/01/37 (WI/DD, Settling 6/06/12) | | | | | 1/22 at 100.00 | | | | A | | | | 1,728,256 | |
| | | | | |
| | 2,500 | | | Lincoln- West Haymarket Joint Public Agency, Nebraska, General Obligation Facility Bonds, Series 2011, 5.000%, 12/15/42 | | | | | 12/21 at 100.00 | | | | AAA | | | | 2,864,050 | |
| | | | | |
| | 750 | | | Lincoln-Lancaster County, Nebraska, Public Building Commission Tax Supported Lease Rental Revenue Building Bonds, Refunding Series 2005, 4.500%, 10/15/26 | | | | | 4/15 at 100.00 | | | | Aaa | | | | 783,600 | |
| | | | | |
| | 915 | | | Omaha, Nebraska, Special Obligation Bonds, Riverfront Redevelopment Project, Refunding Series 2012, 3.500%, 2/01/32 | | | | | 2/22 at 100.00 | | | | AA+ | | | | 914,835 | |
| | | | | |
| | 650 | | | Omaha, Nebraska, Special Tax Redevelopment Bonds, Redevelopment 2008, 5.250%, 10/15/28 | | | | | 10/18 at 100.00 | | | | AA+ | | | | 739,278 | |
| | | | | |
| | 1,000 | | | Puerto Rico Sales Tax Financing Corporation, Sales Tax Revenue Bonds, First Subordinate Series 2011A-1, 5.250%, 8/01/40 | | | | | 8/21 at 100.00 | | | | Aa2 | | | | 1,108,440 | |
| | 7,680 | | | Total Tax Obligation/Limited | | | | | | | | | | | | | 8,426,000 | |
| | | | Utilities – 22.2% | | | | | | | | | | | | | | |
| | | | | |
| | 760 | | | Central Plains Energy Project, Nebraska, Gas Project 1 Revenue Bonds,
Series 2007A, 5.250%, 12/01/21 | | | | | No Opt. Call | | | | A | | | | 825,421 | |
| | | | | |
| | 2,000 | | | Central Plains Energy Project, Nebraska, Gas Project 3 Revenue Bonds,
Series 2012, 5.000%, 9/01/42 | | | | | 9/22 at 100.00 | | | | A1 | | | | 2,046,340 | |
| | | | | |
| | 585 | | | Forsyth, Rosebud County, Montana, Pollution Control Revenue Refunding Bonds, Northwestern Corporation Colstrip Project, Series 2006, 4.650%, 8/01/23 – AMBAC Insured | | | | | 8/16 at 100.00 | | | | A2 | | | | 628,220 | |
| | | | | |
| | 250 | | | Lincoln, Nebraska, Electric System Revenue Bonds, Refunding Series 2003, 5.000%, 9/01/26 | | | | | 9/13 at 100.00 | | | | AA | | | | 262,115 | |
| | | | | |
| | 210 | | | Municipal Energy Agency of Nebraska, Power Supply System Revenue and Refunding Bonds, Series 2009A, 5.375%, 4/01/39 – BHAC Insured | | | | | 4/19 at 100.00 | | | | AA+ | | | | 238,999 | |
| | | | | |
| | 50 | | | Municipal Energy Agency of Nebraska, Power Supply System Revenue Bonds, Refunding Series 2012A, 5.000%, 4/01/31 | | | | | 4/22 at 100.00 | | | | A | | | | 56,974 | |
| | | | | |
| | 500 | | | Nebraska Public Power District, General Revenue Bonds, Series 2008B, 5.000%, 1/01/33 | | | | | 1/18 at 100.00 | | | | A1 | | | | 541,550 | |
| | | | | |
| | 2,380 | | | Nebraska Public Power District, General Revenue Bonds, Series 2012A, 5.000%, 1/01/34 | | | | | 1/22 at 100.00 | | | | A1 | | | | 2,725,814 | |
| | | | | |
| | 100 | | | Nebraska Public Power District, Power Supply System Revenue Bonds, Series 2006A, 5.000%, 1/01/41 – FGIC Insured | | | | | 1/16 at 100.00 | | | | A1 | | | | 104,956 | |
| | | | | |
| | | | Omaha Public Power District, Nebraska, Electric System Revenue Bonds,
Series 2008A: | | | | | | | | | | | | | | |
| | 1,000 | | | 5.500%, 2/01/33 | | | | | 2/18 at 100.00 | | | | Aa1 | | | | 1,143,070 | |
| | 1,200 | | | 5.500%, 2/01/35 | | | | | 2/18 at 100.00 | | | | Aa1 | | | | 1,361,568 | |
| | | | | |
| | 10 | | | Omaha Public Power District, Nebraska, Electric System Revenue Bonds, Subordinate Lien Series 2005, 4.250%, 2/01/35 – BHAC Insured | | | | | 8/15 at 100.00 | | | | AA+ | | | | 10,272 | |
| | | | | |
| | 1,000 | | | Puerto Rico Electric Power Authority, Power Revenue Bonds, Series WW, 5.250%, 7/01/25 | | | | | 7/18 at 100.00 | | | | BBB+ | | | | 1,091,390 | |
| | | | | |
| | 1,500 | | | Southern Nebraska Public Power District, Electric System Revenue Bonds, Series 2008, 5.250%, 12/15/28 | | | | | 12/18 at 100.00 | | | | AA– | | | | 1,738,080 | |
| | | | | |
| | 1,000 | | | Twin Valleys Public Power District, Nebraska, Electric System Revenue Bonds, Series 2011, 5.000%, 9/15/35 | | | | | 6/16 at 100.00 | | | | N/R | | | | 1,055,220 | |
| | 12,545 | | | Total Utilities | | | | | | | | | | | | | 13,829,989 | |
| | | | Water and Sewer – 4.1% | | | | | | | | | | | | | | |
| | | | | |
| | 1,395 | | | Omaha, Nebraska, Sanitary Sewage System Revenue Bonds, Series 2011, 4.250%, 11/15/41 | | | | | 11/21 at 100.00 | | | | AA | | | | 1,468,823 | |
| | | | | | | | | | | | | | | | | | |
Principal
Amount (000) | | | Description (1) | | | | Optional Call
Provisions (2) | | | Ratings (3) | | | Value | |
| | | | | | | | | | | | | | | | | | |
| | | | Water and Sewer (continued) | | | | | | | | | | | | | | |
| | | | | |
| | | | Puerto Rico Aqueduct and Sewerage Authority, Revenue Bonds, Senior Lien Series 2008A: | | | | | | | | | | | | | | |
| $ | 500 | | | 5.000%, 7/01/25 – AGC Insured | | | | | 7/18 at 100.00 | | | | AA– | | | $ | 542,045 | |
| | 500 | | | 6.000%, 7/01/38 | | | | | 7/18 at 100.00 | | | | Baa2 | | | | 534,160 | |
| | 2,395 | | | Total Water and Sewer | | | | | | | | | | | | | 2,545,028 | |
| $ | 57,400 | | | Total Municipal Bonds (cost $58,084,645) | | | | | | | | | | | | | 62,605,397 | |
| | | | | |
| Shares | | | Description (1) | | | | | | | | | | Value | |
| | | | SHORT-TERM INVESTMENTS – 1.9% | | | | | | | | | | | | | | |
| | | | | |
| | | | Money Market Funds – 1.9% | | | | | | | | | | | | | | |
| | | | | |
| | 1,214,076 | | | First American Tax Free Obligations Fund, Class Z, 0.000% (4) | | | | | | | | | | | | $ | 1,214,076 | |
| | | | Total Short-Term Investments (cost $1,214,076) | | | | | | | | | | | | | 1,214,076 | |
| | | | Total Investments (cost $59,298,721) – 102.3% | | | | | | | | | | | | | 63,819,473 | |
| | | | Other Assets Less Liabilities – (2.3)% | | | | | | | | | | | | | (1,461,940) | |
| | | | Net Assets – 100% | | | | | | | | | | | | $ | 62,357,533 | |
| | (1) | | All percentages shown in the Portfolio of Investments are based on net assets. |
| | (2) | | Optional Call Provisions (not covered by the report of independent registered public accounting firm): Dates (month and year) and prices of the earliest optional call or redemption. There may be other call provisions at varying prices at later dates. Certain mortgage-backed securities may be subject to periodic principal paydowns. |
| | (3) | | Ratings (not covered by the report of independent registered public accounting firm): Using the highest of Standard & Poor’s Group (“Standard & Poor’s”), Moody’s Investors Service, Inc. (“Moody’s”) or Fitch, Inc. (“Fitch”) rating. Ratings below BBB by Standard & Poor’s, Baa by Moody’s or BBB by Fitch are considered to be below investment grade. Holdings designated N/R are not rated by any of these national rating agencies. |
| | (4) | | The rate shown is the annualized seven-day effective yield as of May 31, 2012. |
| | WI/DD | | Purchased on a when-issued or delayed delivery basis. |
See accompanying notes to financial statements.
Portfolio of Investments
Nuveen Oregon Intermediate Municipal Bond Fund
May 31, 2012
| | | | | | | | | | | | | | | | | | |
Principal
Amount (000) | | | Description (1) | | | | Optional Call
Provisions (2) | | | Ratings (3) | | | Value | |
| | | | | | | | | | | | | | | | | | |
| | | | MUNICIPAL BONDS – 97.2% | | | | | | | | | | | | | | |
| | | | | |
| | | | Education and Civic Organizations – 8.0% | | | | | | | | | | | | | | |
| | | | | |
| $ | 2,350 | | | Forest Grove, Oregon, Campus Improvement Revenue Bonds, Pacific University Project, Refunding Series 2005A, 5.000%, 5/01/22 – RAAI Insured | | | | | 5/15 at 100.00 | | | | BBB | | | $ | 2,423,156 | |
| | | | | |
| | 250 | | | Forest Grove, Oregon, Campus Improvement Revenue Bonds, Pacific University Project, Series 2009, 5.750%, 5/01/24 | | | | | 5/14 at 100.00 | | | | BBB | | | | 259,648 | |
| | | | | |
| | 1,140 | | | Oregon State Facilities Authority, Revenue Bonds, Concordia University Project, Series 2010A, 6.125%, 9/01/30 | | | | | 9/20 at 100.00 | | | | BB+ | | | | 1,220,951 | |
| | | | | |
| | | | Oregon State Facilities Authority, Revenue Bonds, Lewis & Clark College Project, Refunding Series 2011A: | | | | | | | | | | | | | | |
| | 625 | | | 4.000%, 10/01/17 | | | | | No Opt. Call | | | | A– | | | | 695,519 | |
| | 500 | | | 5.250%, 10/01/24 | | | | | 10/21 at 100.00 | | | | A– | | | | 581,460 | |
| | | | | |
| | 1,000 | | | Oregon State Facilities Authority, Revenue Bonds, Linfield College, Refunding Series 2005A, 5.000%, 10/01/25 | | | | | 10/15 at 100.00 | | | | Baa1 | | | | 1,053,040 | |
| | | | | |
| | 500 | | | Oregon State Facilities Authority, Revenue Bonds, Linfield College, Series 2010A, 4.750%, 10/01/28 | | | | | 10/20 at 100.00 | | | | Baa1 | | | | 538,260 | |
| | | | | |
| | 1,000 | | | Oregon State Facilities Authority, Revenue Bonds, Reed College, Refunding Series 2011A, 5.000%, 7/01/29 | | | | | 7/20 at 100.00 | | | | Aa2 | | | | 1,164,820 | |
| | | | | |
| | | | Oregon State Facilities Authority, Revenue Bonds, University of Portland Projects, Series 2007A: | | | | | | | | | | | | | | |
| | 1,000 | | | 4.250%, 4/01/14 | | | | | No Opt. Call | | | | BBB+ | | | | 1,047,490 | |
| | 250 | | | 5.000%, 4/01/17 | | | | | No Opt. Call | | | | BBB+ | | | | 285,410 | |
| | 2,000 | | | 4.500%, 4/01/21 | | | | | 4/18 at 100.00 | | | | BBB+ | | | | 2,188,280 | |
| | | | | |
| | 200 | | | Oregon State Facilities Authority, Revenue Bonds, Willamette University, Refunding Series 2010A, 4.000%, 10/01/24 | | | | | 4/20 at 100.00 | | | | A | | | | 215,922 | |
| | | | | |
| | 1,085 | | | Oregon State Facilities Authority, Revenue Bonds, Willamette University, Series 2007A, 4.300%, 10/01/21 | | | | | 10/17 at 100.00 | | | | A | | | | 1,173,634 | |
| | 11,900 | | | Total Education and Civic Organizations | | | | | | | | | | | | | 12,847,590 | |
| | | | Health Care – 12.6% | | | | | | | | | | | | | | |
| | | | | |
| | 1,000 | | | Clackamas County Hospital Facility Authority, Oregon, Revenue Bonds, Legacy Health System, Series 2009A, 5.000%, 7/15/21 | | | | | 7/19 at 100.00 | | | | A+ | | | | 1,110,300 | |
| | | | | |
| | 250 | | | Deschutes County Hospital Facility Authority, Oregon, Hospital Revenue Bonds, Cascade Healthcare Community, Inc., Series 2005B, 5.000%, 1/01/16 – AMBAC Insured | | | | | No Opt. Call | | | | A3 | | | | 271,335 | |
| | | | | |
| | 1,500 | | | Deschutes County Hospital Facility Authority, Oregon, Hospital Revenue Refunding Bonds, Cascade Healthcare Community, Inc., Series 2008, 7.375%, 1/01/23 | | | | | 1/19 at 100.00 | | | | A3 | | | | 1,877,640 | |
| | | | | |
| | 810 | | | Klamath Falls Intercommunity Hospital Authority, Oregon, Revenue Bonds, Merle West Medical Center Project, Series 2006, 4.750%, 9/01/20 – AGC Insured | | | | | 9/16 at 100.00 | | | | AA– | | | | 875,578 | |
| | | | | |
| | 1,900 | | | Medford Hospital Facilities Authority, Oregon, Hospital Revenue Bonds, Asante Health System, Refunding Series 2010, 5.500%, 8/15/28 – AGM Insured | | | | | 8/20 at 100.00 | | | | AA– | | | | 2,215,324 | |
| | | | | |
| | | | Multnomah County Hospital Facilities Authority, Oregon, Revenue Bonds, Adventist Health System/West, Series 2009A: | | | | | | | | | | | | | | |
| | 1,875 | | | 5.000%, 9/01/21 | | | | | 9/19 at 100.00 | | | | A | | | | 2,156,100 | |
| | 440 | | | 4.500%, 9/01/21 | | | | | 9/19 at 100.00 | | | | A | | | | 491,572 | |
| | | | | |
| | 1,000 | | | Multnomah County Hospital Facilities Authority, Oregon, Revenue Bonds, Sisters of Providence Health System, Series 2004, 5.250%, 10/01/22 | | | | | 10/14 at 100.00 | | | | AA | | | | 1,103,150 | |
| | | | | |
| | | | Oregon Health and Science University, Revenue Bonds, Series 2012A: | | | | | | | | | | | | | | |
| | 750 | | | 5.000%, 7/01/25 | | | | | 7/22 at 100.00 | | | | A+ | | | | 877,530 | |
| | 125 | | | 5.000%, 7/01/26 | | | | | 7/22 at 100.00 | | | | A+ | | | | 145,076 | |
| | | | | |
| | 1,000 | | | Oregon State Facilities Authority, Auction Rate Revenue Bonds, Peacehealth System, Refunding Series 2009A, 5.000%, 11/01/20 | | | | | 11/19 at 100.00 | | | | AA– | | | | 1,185,360 | |
| | | | | |
| | | | Oregon State Facilities Authority, Oregon, Revenue Bonds, Samaritan Health Services, Refunding Series 2010A: | | | | | | | | | | | | | | |
| | 1,250 | | | 5.000%, 10/01/19 | | | | | No Opt. Call | | | | A– | | | | 1,455,163 | |
| | 500 | | | 5.000%, 10/01/24 | | | | | 10/20 at 100.00 | | | | A– | | | | 556,150 | |
| | | | | | | | | | | | | | | | | | |
Principal
Amount (000) | | | Description (1) | | | | Optional Call
Provisions (2) | | | Ratings (3) | | | Value | |
| | | | | | | | | | | | | | | | | | |
| | | | Health Care (continued) | | | | | | | | | | | | | | |
| | | | | |
| | | | Oregon State Facilities Authority, Revenue Bonds, Legacy Health System, Refunding Series 2010A: | | | | | | | | | | | | | | |
| $ | 2,000 | | | 4.250%, 3/15/17 | | | | | No Opt. Call | | | | A+ | | | $ | 2,219,840 | |
| | 1,000 | | | 4.750%, 3/15/24 | | | | | 3/20 at 100.00 | | | | A+ | | | | 1,104,540 | |
| | | | | |
| | 375 | | | Oregon State Facilities Authority, Revenue Bonds, Providence Health & Services, Series 2011C, 5.000%, 10/01/20 | | | | | No Opt. Call | | | | AA | | | | 453,968 | |
| | | | | |
| | 450 | | | Salem Hospital Facility Authority, Oregon, Revenue Bonds, Salem Hospital Project, Series 2006A, 5.000%, 8/15/27 | | | | | 8/16 at 100.00 | | | | A+ | | | | 477,954 | |
| | | | | |
| | 1,510 | | | Salem Hospital Facility Authority, Oregon, Revenue Bonds, Salem Hospital Project, Series 2008A, 5.750%, 8/15/23 | | | | | 8/18 at 100.00 | | | | A+ | | | | 1,754,967 | |
| | 17,735 | | | Total Health Care | | | | | | | | | | | | | 20,331,547 | |
| | | | Housing/Multifamily – 4.4% | | | | | | | | | | | | | | |
| | | | | |
| | | | Oregon Housing and Community Services Department, Multifamily Housing Revenue Bonds, Refunding Series 2010A: | | | | | | | | | | | | | | |
| | 750 | | | 4.000%, 7/01/19 (Alternative Minimum Tax) | | | | | No Opt. Call | | | | Aaa | | | | 796,785 | |
| | 500 | | | 4.250%, 7/01/21 (Alternative Minimum Tax) | | | | | 1/20 at 100.00 | | | | Aaa | | | | 533,875 | |
| | | | | |
| | | | Oregon State Facilities Authority, Revenue Bonds, CHF Ashland Southern Oregon University Project Series 2012: | | | | | | | | | | | | | | |
| | 1,500 | | | 4.350%, 7/01/27 | | | | | 7/22 at 100.00 | | | | AA– | | | | 1,573,275 | |
| | 725 | | | 4.700%, 7/01/33 | | | | | 7/22 at 100.00 | | | | AA– | | | | 761,402 | |
| | | | | |
| | 705 | | | Portland Housing Authority, Oregon, Housing Revenue Refundign Bonds, Yards at Union Station Project, Series 2007, 4.750%, 5/01/22 (Alternative Minimum Tax) | | | | | 5/17 at 100.00 | | | | Aa2 | | | | 746,919 | |
| | | | | |
| | | | Portland, Oregon, Economic Development Revenue Refunding Bonds, Broadway Project, Series 2008A: | | | | | | | | | | | | | | |
| | 880 | | | 5.125%, 4/01/16 | | | | | No Opt. Call | | | | A+ | | | | 1,008,586 | |
| | 1,355 | | | 6.250%, 4/01/23 | | | | | 4/18 at 100.00 | | | | A+ | | | | 1,619,659 | |
| | 6,415 | | | Total Housing/Multifamily | | | | | | | | | | | | | 7,040,501 | |
| | | | Housing/Single Family – 0.9% | | | | | | | | | | | | | | |
| | | | | |
| | 230 | | | Oregon Housing and Community Services Department, Single Family Mortgage Revenue Bonds, Series 2004A, 4.050%, 1/01/18 | | | | | 7/13 at 100.00 | | | | Aa2 | | | | 235,074 | |
| | | | | |
| | 1,055 | | | Oregon Housing and Community Services Department, Single Family Mortgage Revenue Bonds, Series 2008D, 4.750%, 7/01/22 | | | | | 1/18 at 100.00 | | | | Aa2 | | | | 1,158,052 | |
| | 1,285 | | | Total Housing/Single Family | | | | | | | | | | | | | 1,393,126 | |
| | | | Long-Term Care – 2.4% | | | | | | | | | | | | | | |
| | | | | |
| | 1,000 | | | Clackamas County Hospital Facility Authority, Oregon, Revenue Refunding Bonds, Robison Jewish Home, DBA Cedar Sinia Park, Series 2005, 5.125%, 10/01/24 | | | | | 10/15 at 100.00 | | | | N/R | | | | 990,920 | |
| | | | | |
| | 1,900 | | | Multnomah County Hospital Facility Authority, Oregon, Revenue Bonds, Terwillger Plaza Project, Series 1999, 6.500%, 12/01/29 | | | | | 6/12 at 100.00 | | | | N/R | | | | 1,903,059 | |
| | | | | |
| | 1,000 | | | Multnomah County Hospital Facility Authority, Oregon, Revenue Bonds, Terwillger Plaza Project, Series 2006A, 5.250%, 12/01/26 | | | | | 12/16 at 100.00 | | | | N/R | | | | 1,036,840 | |
| | 3,900 | | | Total Long-Term Care | | | | | | | | | | | | | 3,930,819 | |
| | | | Tax Obligation/General – 41.2% | | | | | | | | | | | | | | |
| | | | | |
| | | | Beaverton School District 48J, Washington County, Oregon, General Obligation Bonds, Series 2004A: | | | | | | | | | | | | | | |
| | 1,600 | | | 5.000%, 6/01/14 – AGM Insured | | | | | No Opt. Call | | | | Aa1 | | | | 1,747,248 | |
| | 1,500 | | | 5.000%, 6/01/16 – AGM Insured | | | | | 12/14 at 100.00 | | | | Aa1 | | | | 1,662,810 | |
| | | | | |
| | | | Blue Mountain Hospital District, Grant County, Oregon, General Obligation Bonds, Refunding Series 2010: | | | | | | | | | | | | | | |
| | 605 | | | 4.250%, 2/01/19 | | | | | No Opt. Call | | | | Baa1 | | | | 680,220 | |
| | 655 | | | 4.500%, 2/01/20 | | | | | No Opt. Call | | | | Baa1 | | | | 749,648 | |
| | 280 | | | 5.000%, 2/01/21 | | | | | No Opt. Call | | | | Baa1 | | | | 329,339 | |
| | | | | |
| | | | Central Oregon Community College District, Crook, Jefferson, Deschutes, Klamath, Lake, and Wasco Counties, Oregon, General Obligation Bonds, Series 2010: | | | | | | | | | | | | | | |
| | 1,000 | | | 4.000%, 6/15/19 | | | | | No Opt. Call | | | | AA+ | | | | 1,185,630 | |
| | 800 | | | 4.500%, 6/15/20 | | | | | No Opt. Call | | | | AA+ | | | | 981,584 | |
Portfolio of Investments
Nuveen Oregon Intermediate Municipal Bond Fund (continued)
May 31, 2012
| | | | | | | | | | | | | | | | | | |
Principal
Amount (000) | | | Description (1) | | | | Optional Call
Provisions (2) | | | Ratings (3) | | | Value | |
| | | | | | | | | | | | | | | | | | |
| | | | Tax Obligation/General (continued) | | | | | | | | | | | | | | |
| | | | | |
| $ | 1,000 | | | Chemeketa Community College District, Oregon, General Obligation Bonds, Series 2008, 5.500%, 6/15/24 | | | | | 6/18 at 100.00 | | | | AA+ | | | $ | 1,218,550 | |
| | | | | |
| | | | City of The Dalles, Wasco County, Oregon, General Obligation Bonds, Series 2008: | | | | | | | | | | | | | | |
| | 130 | | | 4.000%, 6/01/17 | | | | | No Opt. Call | | | | A+ | | | | 146,952 | |
| | 140 | | | 4.000%, 6/01/18 | | | | | No Opt. Call | | | | A+ | | | | 160,366 | |
| | 75 | | | 4.000%, 6/01/19 | | | | | 6/18 at 100.00 | | | | A+ | | | | 85,232 | |
| | | | | |
| | 1,145 | | | Clackamas Community College District, Oregon, General Obligation Bonds, Series 2006, 5.000%, 5/01/19 – NPFG Insured | | | | | 5/16 at 100.00 | | | | AA | | | | 1,302,449 | |
| | | | | |
| | 1,975 | | | Clackamas County School District 115, Oregon, General Obligation Bond, Series 2006B, 4.500%, 6/15/21 – NPFG Insured | | | | | 6/16 at 100.00 | | | | AA+ | | | | 2,205,937 | |
| | | | | |
| | | | Clackamas County School District 12, North Clackamas, Oregon, General Obligation Bonds, Series 2007B: | | | | | | | | | | | | | | |
| | 685 | | | 5.000%, 6/15/19 – AGM Insured | | | | | 6/17 at 100.00 | | | | AA+ | | | | 811,574 | |
| | 3,665 | | | 5.000%, 6/15/21 – AGM Insured | | | | | 6/17 at 100.00 | | | | AA+ | | | | 4,324,512 | |
| | 3,135 | | | 5.000%, 6/15/22 – AGM Insured | | | | | 6/17 at 100.00 | | | | AA+ | | | | 3,689,080 | |
| | | | | |
| | 1,000 | | | Clackamas County School District 46 Oregon Trail, Oregon, General Obligation Bonds, Series 2009A, 5.000%, 6/15/24 | | | | | 6/19 at 100.00 | | | | AA+ | | | | 1,228,840 | |
| | | | | |
| | 525 | | | Clackamas County School District 86, Oregon, General Obligation Bonds, Refunding Series 2012A, 5.000%, 6/15/25 | | | | | 6/22 at 100.00 | | | | AA+ | | | | 641,981 | |
| | | | | |
| | | | Clackamas County School District 86, Oregon, General Obligation Bonds, Series 2005: | | | | | | | | | | | | | | |
| | 1,000 | | | 5.000%, 6/15/18 – AGM Insured | | | | | 6/15 at 100.00 | | | | AA+ | | | | 1,137,430 | |
| | 1,305 | | | 5.000%, 6/15/21 – AGM Insured | | | | | 6/15 at 100.00 | | | | AA+ | | | | 1,484,346 | |
| | | | | |
| | 1,755 | | | Deschutes County, Oregon, General Obligation Bonds, Series 2002, 5.000%, 12/01/14 – AGM Insured | | | | | 12/12 at 100.00 | | | | Aa2 | | | | 1,796,155 | |
| | | | | |
| | 3,030 | | | Deshutes and Jefferson Counties School District 2J Redmond, Oregon, General Obligation Bonds, Deffered Interest Series 2008, 0.000%, 6/15/22 | | | | | No Opt. Call | | | | Aa1 | | | | 2,338,766 | |
| | | | | |
| | 965 | | | Forest Grove School District 15, Washington County, Oregon, General Obligation Bonds, Series 2012B, 0.000%, 6/15/25 | | | | | No Opt. Call | | | | AA+ | | | | 643,742 | |
| | | | | |
| | 1,000 | | | Hillsboro School District 1J, Washington, Multnomah and Yamhill Counties, Oregon, General Obligation Refunding Bonds, Series 1998, 5.000%, 11/01/14 | | | | | No Opt. Call | | | | Aa2 | | | | 1,109,440 | |
| | | | | |
| | 1,000 | | | Josephine County Unit School District Three Rivers, Oregon, General Obligation Bonds, Refunding Series 2005, 5.000%, 12/15/19 – NPFG Insured | | | | | No Opt. Call | | | | Aa1 | | | | 1,252,730 | |
| | | | | |
| | 875 | | | Keizer, Oregon, General Obligation Assessment Bonds, Keizer Station Area A Local Improvement District, Series 2008, 5.200%, 6/01/31 | | | | | 6/18 at 100.00 | | | | A1 | | | | 955,815 | |
| | | | | |
| | 200 | | | Lake Oswego School District 7J, Clackamas County, Oregon, General Obligation Bonds, Refunding Series 2005, 5.250%, 6/01/25 – AGM Insured | | | | | No Opt. Call | | | | Aa1 | | | | 259,096 | |
| | | | | |
| | 1,305 | | | Marion-Clackamas Counties School District 4J, Oregon, General Obligation Bonds, Series 2007, 4.500%, 6/15/22 – NPFG Insured | | | | | 6/16 at 100.00 | | | | Aa1 | | | | 1,430,437 | |
| | | | | |
| | 1,000 | | | McMinnville School District 40, Yamhill County, Oregon, General Obligation Bonds, Series 2001, 5.500%, 6/15/13 – AGM Insured | | | | | No Opt. Call | | | | Aa3 | | | | 1,054,750 | |
| | | | | |
| | 1,000 | | | Metro, Oregon, General Obligation Bonds, Series 2002, 5.250%, 9/01/14 | | | | | 9/12 at 100.00 | | | | AAA | | | | 1,012,450 | |
| | | | | |
| | 1,635 | | | Metro, Oregon, General Obligation Bonds, Series 2007, 5.000%, 6/01/20 | | | | | 6/17 at 100.00 | | | | AAA | | | | 1,922,090 | |
| | | | | |
| | 1,000 | | | Multnomah-Clackamas Counties, Oregon, School District 10JT, General Obligation Bonds, Series 2005, 5.250%, 6/15/17 – AGM Insured | | | | | No Opt. Call | | | | AA+ | | | | 1,216,410 | |
| | | | | |
| | 125 | | | North Lincoln Fire and Rescue District 1, Oregon, General Obligation Bonds, Series 2007, 4.250%, 2/01/18 – AGM Insured | | | | | 2/17 at 100.00 | | | | AA- | | | | 141,849 | |
| | | | | |
| | 1,500 | | | Oregon Department of Administrative Services, General Obligation Bonds, Oregon Opportunity, Refunding Series 2010F, 5.000%, 12/01/20 | | | | | 6/20 at 100.00 | | | | AA+ | | | | 1,877,325 | |
| | | | | |
| | | | Oregon State, General Obligation Bonds, Alterrnative Energy Series 2011B: | | | | | | | | | | | | | | |
| | 540 | | | 5.000%, 1/01/20 (Alternative Minimum Tax) | | | | | No Opt. Call | | | | AA+ | | | | 641,536 | |
| | 560 | | | 5.000%, 1/01/21 (Alternative Minimum Tax) | | | | | No Opt. Call | | | | AA+ | | | | 668,254 | |
| | 100 | | | 5.000%, 1/01/23 (Alternative Minimum Tax) | | | | | 1/21 at 100.00 | | | | AA+ | | | | 116,722 | |
| | | | | |
| | 455 | | | Pacific City Joint Water-Sanitary Authority, Tilamook County, Oregon, General Obligation Bonds, Series 2007, 4.650%, 7/01/22 | | | | | 7/17 at 100.00 | | | | N/R | | | | 487,478 | |
| | | | | | | | | | | | | | | | | | |
Principal
Amount (000) | | | Description (1) | | | | Optional Call
Provisions (2) | | | Ratings (3) | | | Value | |
| | | | | | | | | | | | | | | | | | |
| | | | Tax Obligation/General (continued) | | | | | | | | | | | | | | |
| | | | | |
| $ | 1,000 | | | Puerto Rico Government Development Bank, Senior Note Revenue Bonds, Senior Lien, Series 2006B, 5.000%, 12/01/14 | | | | | No Opt. Call | | | | Baa1 | | | $ | 1,081,080 | |
| | | | | |
| | 1,250 | | | Redmond School District 2J, Deshutes and Jefferson Counties, Oregon, General Obligation Bonds, Series 2004A, 5.000%, 6/15/13 – NPFG Insured | | | | | No Opt. Call | | | | Aa1 | | | | 1,311,100 | |
| | | | | |
| | | | Redmond, Oregon, Full Faith and Credit Obligations, Terminal Expansion Project, Series 2009: | | | | | | | | | | | | | | |
| | 240 | | | 4.000%, 6/01/21 | | | | | 6/19 at 100.00 | | | | A1 | | | | 265,766 | |
| | 200 | | | 4.250%, 6/01/23 | | | | | 6/19 at 100.00 | | | | A1 | | | | 219,412 | |
| | 500 | | | 4.625%, 6/01/29 | | | | | 6/19 at 100.00 | | | | A1 | | | | 536,420 | |
| | | | | |
| | 340 | | | Redmond, Oregon, Full Faith and Credit Refunding Obligations, Series 2012A, 4.000%, 6/01/25 (WI/DD, Settling 6/05/12) | | | | | 6/22 at 100.00 | | | | A1 | | | | 368,696 | |
| | | | | |
| | 635 | | | Salem-Keizer School District 24J, Marion and Polk Counties, Oregon, General Obligation Bonds, Series 2009B, 0.000%, 6/15/22 | | | | | No Opt. Call | | | | AA+ | | | | 492,576 | |
| | | | | |
| | | | Sandy, Clackamas County, Oregon, General Obligation Bonds, Series 2010: | | | | | | | | | | | | | | |
| | 190 | | | 4.000%, 6/01/15 | | | | | 6/14 at 100.00 | | | | AA | | | | 202,137 | |
| | 150 | | | 4.000%, 6/01/16 | | | | | 6/14 at 100.00 | | | | AA | | | | 159,329 | |
| | 210 | | | 4.000%, 6/01/17 | | | | | 6/14 at 100.00 | | | | AA | | | | 222,453 | |
| | 240 | | | 4.000%, 6/01/18 | | | | | 6/14 at 100.00 | | | | AA | | | | 253,442 | |
| | 100 | | | 4.000%, 6/01/19 | | | | | 6/14 at 100.00 | | | | AA | | | | 105,301 | |
| | | | | |
| | 1,030 | | | Tigard-Tualatin School District 23J, Washington and Clackamas Counties, Oregon, General Obligation Bonds, Series 2000, 0.000%, 6/15/14 | | | | | No Opt. Call | | | | Aa3 | | | | 998,863 | |
| | | | | |
| | 1,000 | | | Tigard-Tualatin School District 23J, Washington and Clackamas Counties, Oregon, General Obligation Refunding Bonds, Series 2001, 5.500%, 6/01/13 – FGIC Insured | | | | | No Opt. Call | | | | Aa2 | | | | 1,052,390 | |
| | | | | |
| | 960 | | | Tualatin Hills Park and Recreation District, Oregon, General Obligation Bonds, Series 1998, 5.750%, 3/01/13 – NPFG Insured | | | | | No Opt. Call | | | | Aa1 | | | | 999,821 | |
| | | | | |
| | 1,540 | | | Umatilla County School District 016R Pendleton, Oregon, General Obligation Bonds, Series 1998, 5.250%, 7/01/14 – NPFG Insured | | | | | No Opt. Call | | | | Aa3 | | | | 1,679,278 | |
| | | | | |
| | 1,080 | | | Wasco County School District 012, Oregon, General Obligation Bonds, Series 2001 Refunding, 5.500%, 6/15/14 – AGM Insured | | | | | No Opt. Call | | | | AA- | | | | 1,192,180 | |
| | | | | |
| | 1,525 | | | Washington County, Oregon, General Obligation Bonds, Series 2006, 5.000%, 6/01/22 | | | | | 6/16 at 102.00 | | | | Aa1 | | | | 1,767,917 | |
| | | | | |
| | 2,490 | | | Washington Multnomah & Yamhill Counties School District 1J Hillsboro, Oregon, General Obligation Bonds, Series 2006, 5.000%, 6/15/19 – NPFG Insured | | | | | 6/17 at 100.00 | | | | Aa2 | | | | 2,912,877 | |
| | | | | |
| | | | West Valley Fire District, Oregon, General Obligation Bonds, Series 2010: | | | | | | | | | | | | | | |
| | 120 | | | 3.000%, 2/01/13 | | | | | No Opt. Call | | | | N/R | | | | 121,201 | |
| | 125 | | | 3.000%, 2/01/14 | | | | | No Opt. Call | | | | N/R | | | | 127,815 | |
| | 125 | | | 3.000%, 2/01/15 | | | | | No Opt. Call | | | | N/R | | | | 128,840 | |
| | 130 | | | 3.500%, 2/01/16 | | | | | No Opt. Call | | | | N/R | | | | 137,015 | |
| | 135 | | | 4.000%, 2/01/17 | | | | | No Opt. Call | | | | N/R | | | | 146,179 | |
| | 140 | | | 4.000%, 2/01/18 | | | | | No Opt. Call | | | | N/R | | | | 153,087 | |
| | 145 | | | 4.000%, 2/01/19 | | | | | No Opt. Call | | | | N/R | | | | 158,911 | |
| | | | | |
| | | | Yamhill County School District 29J Newberg, Oregon, General Obligation Bonds, Refunding Series 2005: | | | | | | | | | | | �� | | | |
| | 1,260 | | | 5.250%, 6/15/15 – FGIC Insured | | | | | No Opt. Call | | | | Aa1 | | | | 1,432,078 | |
| | 1,835 | | | 5.250%, 6/15/16 – FGIC Insured | | | | | No Opt. Call | | | | Aa1 | | | | 2,160,254 | |
| | | | | |
| | 1,005 | | | Yamhill County School District 40, McMinnville, Oregon, General Obligation Bonds, Series 2007, 5.000%, 6/15/23 – AGM Insured | | | | | 6/17 at 100.00 | | | | Aa1 | | | | 1,165,609 | |
| | 59,965 | | | Total Tax Obligation/General | | | | | | | | | | | | | 66,250,800 | |
| | | | Tax Obligation/Limited – 9.7% | | | | | | | | | | | | | | |
| | | | | |
| | 1,060 | | | Oregon Department of Administrative Services, Certificates of Participation, Series 2006A, 5.000%, 11/01/18 – NPFG Insured | | | | | 11/16 at 100.00 | | | | AA | | | | 1,228,052 | |
| | | | | |
| | 1,500 | | | Oregon Department of Administrative Services, Certificates of Participation, Series 2009A, 4.700%, 5/01/25 | | | | | 5/19 at 100.00 | | | | AA | | | | 1,687,785 | |
Portfolio of Investments
Nuveen Oregon Intermediate Municipal Bond Fund (continued)
May 31, 2012
| | | | | | | | | | | | | | | | | | |
Principal
Amount (000) | | | Description (1) | | | | Optional Call
Provisions (2) | | | Ratings (3) | | | Value | |
| | | | | | | | | | | | | | | | | | |
| | | | Tax Obligation/Limited (continued) | | | | | | | | | | | | | | |
| | | | | |
| $ | 1,055 | | | Oregon Department of Administrative Services, Certificates of Participation, Series 2009C, 5.000%, 11/01/25 | | | | | 11/19 at 100.00 | | | | AA | | | $ | 1,217,850 | |
| | | | | |
| | 700 | | | Oregon State Department of Transportation, Highway User Tax Revenue Bonds, Series 2005A, 5.000%, 11/15/24 | | | | | 11/14 at 100.00 | | | | AAA | | | | 764,260 | |
| | | | | |
| | 1,000 | | | Oregon State Department of Transportation, Highway User Tax Revenue Bonds, Series 2009A, 5.000%, 11/15/21 | | | | | 5/19 at 100.00 | | | | AAA | | | | 1,210,430 | |
| | | | | |
| | 2,655 | | | Portland, Oregon, Renewal and Redevelopment Revenue Bonds, North Macadam Series 2010B, 5.000%, 6/15/24 | | | | | 6/20 at 100.00 | | | | A1 | | | | 3,018,151 | |
| | | | | |
| | 2,030 | | | Portland, Oregon, South Park Blocks Urban Renewal and Redevelopment Bonds, Series 2008B, 5.000%, 6/15/21 | | | | | 6/18 at 101.00 | | | | Aa3 | | | | 2,335,941 | |
| | | | | |
| | 280 | | | Seaside Urban Renewal Agency, Clatsop County, Oregon, Greater Seaside Urban Renewal Area Revenue Bonds, Series 2006, 4.750%, 6/01/15 | | | | | No Opt. Call | | | | N/R | | | | 296,120 | |
| | | | | |
| | | | Tri-County Metropolitan Transportation District, Oregon, Capital Grant Receipt Revenue Bonds, Series 2011A: | | | | | | | | | | | | | | |
| | 1,000 | | | 5.000%, 10/01/25 | | | | | 10/21 at 100.00 | | | | A1 | | | | 1,192,880 | |
| | 1,435 | | | 5.000%, 10/01/26 | | | | | 10/21 at 100.00 | | | | A1 | | | | 1,699,399 | |
| | | | | |
| | 815 | | | Virgin Islands Public Finance Authority, Matching Fund Loan Notes Revenue Bonds, Senior Lien Series 2010A, 5.000%, 10/01/20 | | | | | No Opt. Call | | | | BBB+ | | | | 921,977 | |
| | 13,530 | | | Total Tax Obligation/Limited | | | | | | | | | | | | | 15,572,845 | |
| | | | Transportation – 3.5% | | | | | | | | | | | | | | |
| | | | | |
| | 1,000 | | | Port of Portland, Oregon, International Airport Revenue Bonds,
Series 2010-20C, 5.000%, 7/01/17 (Alternative Minimum Tax) | | | | | No Opt. Call | | | | AA– | | | | 1,166,140 | |
| | | | | |
| | 250 | | | Port of Portland, Oregon, International Airport Revenue Bonds,
Series 2011-21, 5.000%, 7/01/17 (Alternative Minimum Tax) | | | | | No Opt. Call | | | | AA– | | | | 296,453 | |
| | | | | |
| | 1,000 | | | Port of Portland, Oregon, International Airport Revenue Bonds, Series 2011, 5.000%, 7/01/23 (Alternative Minimum Tax) | | | | | 7/21 at 100.00 | | | | AA– | | | | 1,171,840 | |
| | | | | |
| | | | Port of Portland, Oregon, Portland International Airport Passenger Facility Charge Revenue Bonds, Series 2011A: | | | | | | | | | | | | | | |
| | 865 | | | 4.000%, 7/01/17 | | | | | No Opt. Call | | | | A | | | | 967,079 | |
| | 1,500 | | | 5.000%, 7/01/26 | | | | | 7/21 at 100.00 | | | | A | | | | 1,707,525 | |
| | | | | |
| | 215 | | | Redmond, Oregon, Airport Revenue Bonds, Series 2009, 5.500%, 6/01/24 | | | | | 6/19 at 100.00 | | | | Baa3 | | | | 234,657 | |
| | 4,830 | | | Total Transportation | | | | | | | | | | | | | 5,543,694 | |
| | | | U.S. Guaranteed – 4.0% (4) | | | | | | | | | | | | | | |
| | | | | |
| | 2,170 | | | Chemeketa Community College District, Oregon, General Obligation Bonds, Refunding Series 1998, 5.500%, 6/01/13 – FGIC Insured (ETM) | | | | | No Opt. Call | | | | N/R | (4) | | | 2,284,663 | |
| | | | | |
| | 1,000 | | | Linn County Community School District 9, Lebanon, Oregon, General Obligation Bonds, Series 2001, 5.550%, 6/15/21 (Pre-refunded 6/15/13) – FGIC Insured | | | | | 6/13 at 100.00 | | | | AA+ | (4) | | | 1,055,480 | |
| | | | | |
| | 1,010 | | | Medford Urban Renewal Agency, Jackson County, Oregon, Tax Revenue Bonds, Urban Redevelopment Refunding Series 2002, 4.500%, 6/01/13 (ETM) | | | | | 1/13 at 101.00 | | | | A– | (4) | | | 1,038,250 | |
| | | | | |
| | 1,010 | | | Oregon Health and Science University, Revenue Bonds, Series 2002A, 5.250%, 7/01/22 (Pre-refunded 1/01/13) – NPFG Insured | | | | | 1/13 at 100.00 | | | | A+ | (4) | | | 1,039,270 | |
| | | | | |
| | 1,000 | | | Oregon State Department of Transportation, Highway User Tax Revenue Bonds, Series 2002A, 5.500%, 11/15/16 (Pre-refunded 11/15/12) | | | | | 11/12 at 100.00 | | | | AAA | | | | 1,024,280 | |
| | 6,190 | | | Total U.S. Guaranteed | | | | | | | | | | | | | 6,441,943 | |
| | | | Utilities – 1.2% | | | | | | | | | | | | | | |
| | | | | |
| | 885 | | | Northern Wasco County Peoples Utility District, Wasco County, Oregon, McNary Dam Fishway Hydroelectric Project Revenue Bonds, Refunding Series 2012, 5.000%, 12/01/23 | | | | | No Opt. Call | | | | AA– | | | | 1,097,143 | |
| | | | | |
| | 800 | | | Puerto Rico Electric Power Authority, Power Revenue Bonds, Series WW, 5.375%, 7/01/23 | | | | | 7/18 at 100.00 | | | | BBB+ | | | | 899,472 | |
| | 1,685 | | | Total Utilities | | | | | | | | | | | | | 1,996,615 | |
| | | | | | | | | | | | | | | | | | |
Principal
Amount (000) | | | Description (1) | | | | Optional Call
Provisions (2) | | | Ratings (3) | | | Value | |
| | | | | | | | | | | | | | | | | | |
| | | | Water and Sewer – 9.3% | | | | | | | | | | | | | | |
| | | | | |
| $ | 820 | | | Lane County Metropolitan Wastewater Management Commission, Oregon, Wastewater Revenue Bonds, Series 2006, 5.000%, 11/01/21 – NPFG Insured | | | | | 11/16 at 100.00 | | | | AA | | | $ | 926,190 | |
| | | | | |
| | 1,500 | | | Lane County Metropolitan Wastewater Management Commission, Oregon, Wastewater Revenue Bonds, Series 2008, 5.000%, 11/01/22 | | | | | 11/18 at 100.00 | | | | AA | | | | 1,759,155 | |
| | | | | |
| | | | Lebanon, Oregon, Wastewater Revenue Bonds, Refunding Series 2010: | | | | | | | | | | | | | | |
| | 165 | | | 4.000%, 3/01/17 – AGM Insured | | | | | No Opt. Call | | | | AA– | | | | 186,283 | |
| | 435 | | | 4.000%, 3/01/18 – AGM Insured | | | | | No Opt. Call | | | | AA– | | | | 499,184 | |
| | | | | |
| | 1,000 | | | Portland, Oregon, Sewer System Revenue Bonds, Refunding First Lien Series 2008A, 4.750%, 6/15/24 | | | | | 6/18 at 100.00 | | | | AA | | | | 1,134,800 | |
| | | | | |
| | 1,175 | | | Portland, Oregon, Sewer System Revenue Bonds, Series 2006B, 5.000%, 6/15/23 – NPFG Insured | | | | | 6/16 at 100.00 | | | | AA | | | | 1,337,808 | |
| | | | | |
| | 2,000 | | | Portland, Oregon, Water System Revenue Bonds, Refunding Series 2010A, 5.000%, 5/01/15 | | | | | No Opt. Call | | | | Aaa | | | | 2,262,440 | |
| | | | | |
| | 500 | | | Portland, Oregon, Water System Revenue Bonds, Second Lien Series 2006A, 4.375%, 10/01/24 – NPFG Insured | | | | | 10/16 at 100.00 | | | | Aa1 | | | | 539,220 | |
| | | | | |
| | 1,500 | | | Puerto Rico Aqueduct and Sewerage Authority, Revenue Bonds, Senior Lien Series 2008A, 5.000%, 7/01/25 – AGC Insured | | | | | 7/18 at 100.00 | | | | AA– | | | | 1,626,135 | |
| | | | | |
| | 450 | | | Redmond, Oregon, Water Revenue Bonds, Series 2010, 4.500%, 6/01/25 | | | | | 6/20 at 100.00 | | | | A1 | | | | 512,478 | |
| | | | | |
| | 325 | | | The Dalles, Oregon, Water Revenue Bonds, Series 200, 4.250%, 6/01/20 – AMBAC Insured | | | | | 6/17 at 100.00 | | | | N/R | | | | 349,092 | |
| | | | | |
| | 1,435 | | | Tigard, Washington County, Oregon, Water System Revenue Bonds, Series 2012, 5.000%, 8/01/26 | | | | | 8/22 at 100.00 | | | | AA– | | | | 1,716,518 | |
| | | | | |
| | 1,000 | | | Washington County, Oregon, Clean Water Services Sewer Revenue Bonds, Senior Lien Series 2004, 5.000%, 10/01/14 – NPFG Insured | | | | | No Opt. Call | | | | AA | | | | 1,105,980 | |
| | | | | |
| | 900 | | | Woodburn, Marion County, Oregon, Wastewater Revenue Bonds, Refunding Series 2011A, 5.000%, 3/01/20 | | | | | No Opt. Call | | | | A2 | | | | 1,075,086 | |
| | 13,205 | | | Total Water and Sewer | | | | | | | | | | | | | 15,030,369 | |
| $ | 140,640 | | | Total Municipal Bonds (cost $142,975,423) | | | | | | | | | | | | | 156,379,849 | |
| | | | | |
| Shares | | | Description (1) | | | | | | | | | | Value | |
| | | | SHORT-TERM INVESTMENTS – 1.6% | | | | | | | | | | | | | | |
| | | | | |
| | | | Money Market Funds – 1.6% | | | | | | | | | | | | | | |
| | | | | |
| | 2,554,275 | | | First American Tax Free Obligations Fund, Class Z, 0.000% (5) | | | | | | | | | | | | $ | 2,554,275 | |
| | | | Total Short-Term Investments (cost $2,554,275) | | | | | | | | | | | | | 2,554,275 | |
| | | | Total Investments (cost $145,529,698) – 98.8% | | | | | | | | | | | | | 158,934,124 | |
| | | | Other Assets Less Liabilities – 1.2% | | | | | | | | | | | | | 1,937,895 | |
| | | | Net Assets – 100% | | | | | | | | | | | | $ | 160,872,019 | |
| | (1) | | All percentages shown in the Portfolio of Investments are based on net assets. |
| | (2) | | Optional Call Provisions (not covered by the report of independent registered public accounting firm): Dates (month and year) and prices of the earliest optional call or redemption. There may be other call provisions at varying prices at later dates. Certain mortgage-backed securities may be subject to periodic principal paydowns. |
| | (3) | | Ratings (not covered by the report of independent registered public accounting firm): Using the highest of Standard & Poor’s Group (“Standard & Poor’s”), Moody’s Investors Service, Inc. (“Moody’s”) or Fitch, Inc. (“Fitch”) rating. Ratings below BBB by Standard & Poor’s, Baa by Moody’s or BBB by Fitch are considered to be below investment grade. Holdings designated N/R are not rated by any of these national rating agencies. |
| | (4) | | Backed by an escrow or trust containing sufficient U.S. Government or U.S. Government agency securities, which ensure the timely payment of principal and interest. Certain bonds backed by U.S. Government or agency securities are regarded as having an implied rating equal to the rating of such securities. |
| | (5) | | The rate shown is the annualized seven-day effective yield as of May 31, 2012. |
| | WI/DD | | Purchased on a when-issued or delayed delivery basis. |
| | (ETM) | | Escrowed to maturity. |
See accompanying notes to financial statements.
Statement of Assets & Liabilities
May 31, 2012
| | | | | | | | | | | | | | | | |
| | | Minnesota
Intermediate | | | Minnesota | | | Nebraska | | | Oregon
Intermediate | |
Assets | | | | | | | | | | | | | | | | |
Investments, at value (cost $238,220,064, $174,916,793, $59,298,721 and $145,529,698, respectively) | | $ | 259,447,845 | | | $ | 191,630,450 | | | $ | 63,819,473 | | | $ | 158,934,124 | |
Receivables: | | | | | | | | | | | | | | | | |
Interest | | | 3,000,266 | | | | 2,192,203 | | | | 797,872 | | | | 2,261,349 | |
Shares sold | | | 496,218 | | | | 687,525 | | | | 134,059 | | | | 812,296 | |
Other assets | | | 255 | | | | 175 | | | | 46 | | | | 166 | |
Total assets | | | 262,944,584 | | | | 194,510,353 | | | | 64,751,450 | | | | 162,007,935 | |
Liabilities | | | | | | | | | | | | | | | | |
Payables: | | | | | | | | | | | | | | | | |
Dividends | | | 552,436 | | | | 251,398 | | | | 97,561 | | | | 321,435 | |
Investments purchased | | | 4,104,876 | | | | 1,267,035 | | | | 2,144,395 | | | | 369,155 | |
Shares redeemed | | | 225,959 | | | | 170,334 | | | | 83,305 | | | | 294,795 | |
Accrued expenses: | | | | | | | | | | | | | | | | |
Management fees | | | 143,325 | | | | 106,810 | | | | 24,944 | | | | 88,226 | |
12b-1 distribution and service fees | | | 13,841 | | | | 31,343 | | | | 7,101 | | | | 10,916 | |
Other | | | 81,194 | | | | 102,804 | | | | 36,611 | | | | 51,389 | |
Total liabilities | | | 5,121,631 | | | | 1,929,724 | | | | 2,393,917 | | | | 1,135,916 | |
Net assets | | $ | 257,822,953 | | | $ | 192,580,629 | | | $ | 62,357,533 | | | $ | 160,872,019 | |
Class A Shares | | | | | | | | | | | | | | | | |
Net assets | | $ | 52,039,047 | | | $ | 100,184,640 | | | $ | 19,020,523 | | | $ | 42,818,805 | |
Shares outstanding | | | 4,875,523 | | | | 8,436,978 | | | | 1,728,095 | | | | 4,039,684 | |
Net asset value per share | | $ | 10.67 | | | $ | 11.87 | | | $ | 11.01 | | | $ | 10.60 | |
Offering price per share (net asset value per share plus maximum sales charge of 3.00%, 4.20%, 4.20% and 3.00%, respectively, of offering price) | | $ | 11.00 | | | $ | 12.39 | | | $ | 11.49 | | | $ | 10.93 | |
Class C Shares | | | | | | | | | | | | | | | | |
Net assets | | $ | 3,768,137 | | | $ | 4,927,118 | | | $ | 2,799,645 | | | $ | 7,345,407 | |
Shares outstanding | | | 354,936 | | | | 415,186 | | | | 254,108 | | | | 695,347 | |
Net asset value and offering price per share | | $ | 10.62 | | | $ | 11.87 | | | $ | 11.02 | | | $ | 10.56 | |
Class C1 Shares | | | | | | | | | | | | | | | | |
Net assets | | $ | 5,447,979 | | | $ | 21,452,804 | | | $ | 4,131,762 | | | | N/A | |
Shares outstanding | | | 509,408 | | | | 1,815,059 | | | | 378,462 | | | | N/A | |
Net asset value and offering price per share | | $ | 10.69 | | | $ | 11.82 | | | $ | 10.92 | | | | N/A | |
Class I Shares | | | | | | | | | | | | | | | | |
Net assets | | $ | 196,567,790 | | | $ | 66,016,067 | | | $ | 36,405,603 | | | $ | 110,707,807 | |
Shares outstanding | | | 18,525,238 | | | | 5,567,278 | | | | 3,307,605 | | | | 10,443,049 | |
Net asset value and offering price per share | | $ | 10.61 | | | $ | 11.86 | | | $ | 11.01 | | | $ | 10.60 | |
Net assets consist of: | | | | | | | | | | | | | | | | |
Capital paid-in | | $ | 236,045,986 | | | $ | 174,844,766 | | | $ | 58,407,879 | | | $ | 147,873,238 | |
Undistributed (Over-distribution of) net investment income | | | 377,806 | | | | 803,077 | | | | (35,014 | ) | | | 35,439 | |
Accumulated net realized gain (loss) | | | 171,380 | | | | 219,129 | | | | (536,084 | ) | | | (441,084 | ) |
Net unrealized appreciation (depreciation) | | | 21,227,781 | | | | 16,713,657 | | | | 4,520,752 | | | | 13,404,426 | |
Net assets | | $ | 257,822,953 | | | $ | 192,580,629 | | | $ | 62,357,533 | | | $ | 160,872,019 | |
Authorized shares – per class | | | 2 billion | | | | 2 billion | | | | 2 billion | | | | 2 billion | |
Par value per share | | $ | 0.0001 | | | $ | 0.0001 | | | $ | 0.0001 | | | $ | 0.0001 | |
| N/A | – Oregon Intermediate does not offer Class C1 Shares. |
See accompanying notes to financial statements.
Statement of Operations
Year Ended May 31, 2012
| | | | | | | | | | | | | | | | |
| | | Minnesota
Intermediate | | | Minnesota | | | Nebraska | | | Oregon
Intermediate | |
Investment Income | | $ | 10,211,155 | | | $ | 8,415,805 | | | $ | 2,427,377 | | | $ | 6,103,701 | |
Expenses | | | | | | | | | | | | | | | | |
Management fees | | | 1,307,924 | | | | 919,359 | | | | 270,850 | | | | 824,655 | |
12b-1 service fees – Class A | | | 66,712 | | | | 178,919 | | | | 23,056 | | | | 70,680 | |
12b-1 distribution and service fees – Class C | | | 15,102 | | | | 16,278 | | | | 7,594 | | | | 19,006 | |
12b-1 distribution and service fees – Class C1 | | | 38,936 | | | | 140,621 | | | | 26,000 | | | | N/A | |
Shareholders’ servicing agent fees and expenses | | | 65,149 | | | | 82,983 | | | | 28,011 | | | | 31,791 | |
Custodian’s fees and expenses | | | 83,834 | | | | 41,988 | | | | 24,467 | | | | 50,118 | |
Directors’ fees and expenses | | | 6,564 | | | | 4,648 | | | | 1,485 | | | | 4,154 | |
Professional fees | | | 16,758 | | | | 13,719 | | | | 9,059 | | | | 13,192 | |
Shareholders’ reports – printing and mailing expenses | | | 42,640 | | | | 96,094 | | | | 21,127 | | | | 24,077 | |
Federal and state registration fees | | | 13,450 | | | | 15,992 | | | | 16,884 | | | | 9,608 | |
Other expenses | | | 20,823 | | | | 21,000 | | | | 14,236 | | | | 18,551 | |
Total expenses before expense reimbursement | | | 1,677,892 | | | | 1,531,601 | | | | 442,769 | | | | 1,065,832 | |
Expense reimbursement | | | (15,884 | ) | | | (53,281 | ) | | | (47,447 | ) | | | — | |
Net expenses | | | 1,662,008 | | | | 1,478,320 | | | | 395,322 | | | | 1,065,832 | |
Net investment income (loss) | | | 8,549,147 | | | | 6,937,485 | | | | 2,032,055 | | | | 5,037,869 | |
Realized and Unrealized Gain (Loss) | | | | | | | | | | | | | | | | |
Net realized gain (loss) from investments | | | 333,701 | | | | 1,170,450 | | | | 71,303 | | | | (106,713 | ) |
Change in net unrealized appreciation (depreciation) of investments | | | 10,866,921 | | | | 14,081,248 | | | | 3,427,173 | | | | 6,475,464 | |
Net realized and unrealized gain (loss) | | | 11,200,622 | | | | 15,251,698 | | | | 3,498,476 | | | | 6,368,751 | |
Net increase (decrease) in net assets from operations | | $ | 19,749,769 | | | $ | 22,189,183 | | | $ | 5,530,531 | | | $ | 11,406,620 | |
| N/A | – Oregon Intermediate does not offer Class C1 Shares. |
See accompanying notes to financial statements.
Statement of Changes in Net Assets
| | | | | | | | | | | | | | | | | | | | | | | | |
| | | Minnesota Intermediate | | | Minnesota | |
| | | Year Ended
5/31/12 | | | Eleven Months
Ended
5/31/11 | | | Year Ended
6/30/10 | | |
Year Ended
5/31/12 | | | Eleven Months
Ended
5/31/11 | | | Year Ended
6/30/10 | |
Operations | | | | | | | | | | | | | | | | | | | | | | | | |
Net investment income (loss) | | $ | 8,549,147 | | | $ | 7,915,953 | | | $ | 7,878,622 | | | $ | 6,937,485 | | | $ | 5,924,409 | | | $ | 6,285,717 | |
Net realized gain (loss) from: | | | | | | | | | | | | | | | | | | | | | | | | |
Investments | | | 333,701 | | | | 91,567 | | | | 41,859 | | | | 1,170,450 | | | | (720,786 | ) | | | 1,108,056 | |
Futures contracts | | | — | | | | — | | | | — | | | | — | | | | — | | | | — | |
Change in net unrealized appreciation (depreciation) of investments | | | 10,866,921 | | | | 887,720 | | | | 9,395,360 | | | | 14,081,248 | | | | (727,337 | ) | | | 12,393,582 | |
Net increase (decrease) in net assets from operations | | | 19,749,769 | | | | 8,895,240 | | | | 17,315,841 | | | | 22,189,183 | | | | 4,476,286 | | | | 19,787,355 | |
Distributions to Shareholders | | | | | | | | | | | | | | | | | | | | | | | | |
From net investment income: | | | | | | | | | | | | | | | | | | | | | | | | |
Class A | | | (1,421,044 | ) | | | (1,184,499 | ) | | | (1,021,562 | ) | | | (3,570,488 | ) | | | (2,869,927 | ) | | | (3,518,314 | ) |
Class C(1) | | | (54,947 | ) | | | (2,635 | ) | | | — | | | | (73,284 | ) | | | (3,180 | ) | | | — | |
Class C1(2) | | | (175,525 | ) | | | (156,046 | ) | | | (37,773 | ) | | | (762,021 | ) | | | (718,863 | ) | | | (817,765 | ) |
Class I | | | (6,770,838 | ) | | | (6,253,126 | ) | | | (6,807,179 | ) | | | (2,313,144 | ) | | | (1,771,724 | ) | | | (1,956,264 | ) |
From accumulated net realized gains: | | | | | | | | | | | | | | | | | | | | | | | | |
Class A | | | (42,285 | ) | | | — | | | | (13,581 | ) | | | — | | | | — | | | | (5,531 | ) |
Class C(1) | | | (2,118 | ) | | | — | | | | — | | | | — | | | | — | | | | — | |
Class C1(2) | | | (6,395 | ) | | | — | | | | (427 | ) | | | — | | | | — | | | | (1,460 | ) |
Class I | | | (202,389 | ) | | | — | | | | (90,474 | ) | | | — | | | | — | | | | (3,026 | ) |
Decrease in net assets from distributions to shareholders | | | (8,675,541 | ) | | | (7,596,306 | ) | | | (7,970,996 | ) | | | (6,718,937 | ) | | | (5,363,694 | ) | | | (6,302,360 | ) |
Fund Share Transactions | | | | | | | | | | | | | | | | | | | | | | | | |
Proceeds from sale of shares | | | 52,659,065 | | | | 52,792,857 | | | | 63,338,798 | | | | 38,182,780 | | | | 22,307,582 | | | | 35,123,786 | |
Proceeds from shares issued to shareholders due to reinvestment of distributions | | | 1,743,603 | | | | 1,206,532 | | | | 963,813 | | | | 3,529,303 | | | | 2,399,450 | | | | 2,892,852 | |
| | | 54,402,668 | | | | 53,999,389 | | | | 64,302,611 | | | | 41,712,083 | | | | 24,707,032 | | | | 38,016,638 | |
Cost of shares redeemed | | | (43,209,577 | ) | | | (52,107,519 | ) | | | (36,741,985 | ) | | | (23,708,233 | ) | | | (36,046,529 | ) | | | (29,968,334 | ) |
Net increase (decrease) in net assets from Fund share transactions | | | 11,193,091 | | | | 1,891,870 | | | | 27,560,626 | | | | 18,003,850 | | | | (11,339,497 | ) | | | 8,048,304 | |
Net increase (decrease) in net assets | | | 22,267,319 | | | | 3,190,804 | | | | 36,905,471 | | | | 33,474,096 | | | | (12,226,905 | ) | | | 21,533,299 | |
Net assets at the beginning of period | | | 235,555,634 | | | | 232,364,830 | | | | 195,459,359 | | | | 159,106,533 | | | | 171,333,438 | | | | 149,800,139 | |
Net assets at the end of period | | $ | 257,822,953 | | | $ | 235,555,634 | | | $ | 232,364,830 | | | $ | 192,580,629 | | | $ | 159,106,533 | | | $ | 171,333,438 | |
Undistributed (Over-distribution of) net investment income at the end of period | | $ | 377,806 | | | $ | 250,314 | | | $ | (69,333 | ) | | $ | 803,077 | | | $ | 584,529 | | | $ | 23,814 | |
| (1) | – Minnesota Intermediate and Minnesota did not offer Nuveen Class C Shares prior to January 18, 2011. |
| (2) | – Effective January 18, 2011, Class C Shares previously offered by FAF Advisors, Inc. were renamed Class C1 Shares. |
See accompanying notes to financial statements.
| | | | | | | | | | | | | | | | | | | | | | | | |
| | | Nebraska | | | Oregon Intermediate | |
| | | Year Ended
5/31/12 | | | Eleven Months
Ended
5/31/11 | | | Year Ended
6/30/10 | | | Year Ended
5/31/12 | | | Eleven Months
Ended
5/31/11 | | | Year Ended
6/30/10 | |
Operations | | | | | | | | | | | | | | | | | | | | | | | | |
Net investment income (loss) | | $ | 2,032,055 | | | $ | 1,647,958 | | | $ | 1,738,802 | | | $ | 5,037,869 | | | $ | 4,805,669 | | | $ | 5,287,402 | |
Net realized gain (loss) from: | | | | | | | | | | | | | | | | | | | | | | | | |
Investments | | | 71,303 | | | | 30,849 | | | | (18,952 | ) | | | (106,713 | ) | | | 191,648 | | | | 527,715 | |
Futures contracts | | | — | | | | — | | | | — | | | | — | | | | — | | | | (111,180 | ) |
Change in net unrealized appreciation (depreciation) of investments | | | 3,427,173 | | | | (323,461 | ) | | | 2,000,011 | | | | 6,475,464 | | | | 259,224 | | | | 4,378,981 | |
Net increase (decrease) in net assets from operations | | | 5,530,531 | | | | 1,355,346 | | | | 3,719,861 | | | | 11,406,620 | | | | 5,256,541 | | | | 10,082,918 | |
Distributions to Shareholders | | | | | | | | | | | | | | | | | | | | | | | | |
From net investment income: | | | | | | | | | | | | | | | | | | | | | | | | |
Class A | | | (460,396 | ) | | | (256,762 | ) | | | (243,849 | ) | | | (1,157,394 | ) | | | (939,800 | ) | | | (718,686 | ) |
Class C(1) | | | (34,015 | ) | | | (2,455 | ) | | | — | | | | (67,271 | ) | | | (4,354 | ) | | | — | |
Class C1(2) | | | (144,342 | ) | | | (150,008 | ) | | | (122,821 | ) | | | N/A | | | | N/A | | | | N/A | |
Class I | | | (1,403,358 | ) | | | (1,261,970 | ) | | | (1,332,846 | ) | | | (3,908,936 | ) | | | (3,701,690 | ) | | | (4,595,782 | ) |
From accumulated net realized gains: | | | | | | | | | | | | | | | | | | | | | | | | |
Class A | | | — | | | | — | | | | — | | | | (5,511 | ) | | | — | | | | — | |
Class C(1) | | | — | | | | — | | | | — | | | | (287 | ) | | | — | | | | — | |
Class C1(2) | | | — | | | | — | | | | — | | | | N/A | | | | N/A | | | | N/A | |
Class I | | | — | | | | — | | | | — | | | | (18,394 | ) | | | — | | | | — | |
Decrease in net assets from distributions to shareholders | | | (2,042,111 | ) | | | (1,671,195 | ) | | | (1,699,516 | ) | | | (5,157,793 | ) | | | (4,645,844 | ) | | | (5,314,468 | ) |
Fund Share Transactions | | | | | | | | | | | | | | | | | | | | | | | | |
Proceeds from sale of shares | | | 18,232,833 | | | | 6,583,881 | | | | 7,353,135 | | | | 37,599,507 | | | | 33,675,906 | | | | 66,046,028 | |
Proceeds from shares issued to shareholders due to reinvestment of distributions | | | 745,293 | | | | 434,974 | | | | 361,334 | | | | 1,205,284 | | | | 871,374 | | | | 644,489 | |
| | | 18,978,126 | | | | 7,018,855 | | | | 7,714,469 | | | | 38,804,791 | | | | 34,547,280 | | | | 66,690,517 | |
Cost of shares redeemed | | | (3,199,518 | ) | | | (5,883,757 | ) | | | (6,584,883 | ) | | | (30,039,440 | ) | | | (54,159,395 | ) | | | (37,521,557 | ) |
Net increase (decrease) in net assets from Fund share transactions | | | 15,778,608 | | | | 1,135,098 | | | | 1,129,586 | | | | 8,765,351 | | | | (19,612,115 | ) | | | 29,168,960 | |
Net increase (decrease) in net assets | | | 19,267,028 | | | | 819,249 | | | | 3,149,931 | | | | 15,014,178 | | | | (19,001,418 | ) | | | 33,937,410 | |
Net assets at the beginning of period | | | 43,090,505 | | | | 42,271,256 | | | | 39,121,325 | | | | 145,857,841 | | | | 164,859,259 | | | | 130,921,849 | |
Net assets at the end of period | | $ | 62,357,533 | | | $ | 43,090,505 | | | $ | 42,271,256 | | | $ | 160,872,019 | | | $ | 145,857,841 | | | $ | 164,859,259 | |
Undistributed (Over-distribution of) net investment income at the end of period | | $ | (35,014 | ) | | $ | (609 | ) | | $ | 22,628 | | | $ | 35,439 | | | $ | 131,170 | | | $ | (28,654 | ) |
| N/A | – Oregon Intermediate does not offer Class C1 Shares. |
| (1) | – Nebraska and Oregon Intermediate did not offer Nuveen Class C Shares prior to January 18, 2011. |
| (2) | – Effective January 18, 2011, Class C Shares previously offered by FAF Advisors, Inc. were renamed Class C1 Shares. |
See accompanying notes to financial statements.
Financial Highlights
| | | | | | | | | | | | | | | | | | | | | | | | | | | | | | | | | | | | |
| Selected data for a share outstanding throughout each period: | | | | | | | | | | | | | | | | | | | |
| | | | | | | | |
| Class (Commencement Date) | | | | | | | | | | | | | | | | | | | | | | | | | |
| | | | | | Investment Operations | | | Less Distributions | | | | | | | |
| | | | | | | | |
| MINNESOTA INTERMEDIATE | | | | | | | | | | | | | | | | | | | | | | | | | |
| | | Beginning
Net
Asset
Value | | | Net
Invest-
ment
Income
(Loss)(a) | | | Net
Realized/
Unrealized
Gain
(Loss) | | | Total | | | Net
Invest-
ment
Income | | | Capital
Gains(b) | | | Total | | | Ending
Net
Asset
Value | | | Total
Return(c) | |
Class A (2/94) | | | | | | | | | | | | | | | | | | | | | | | | | | | | | | | | | | | | |
Year Ended 5/31 | | | | | | | | | | | | | | | | | | | | | | | | | | | | | | | | | | | | |
2012 | | $ | 10.20 | | | $ | .36 | | | $ | .47 | | | $ | .83 | | | $ | (.35 | ) | | $ | (.01 | ) | | $ | (.36 | ) | | $ | 10.67 | | | | 8.32 | % |
2011(e) | | | 10.12 | | | | .33 | | | | .07 | | | | .40 | | | | (.32 | ) | | | — | | | | (.32 | ) | | | 10.20 | | | | 4.00 | |
Year Ended 6/30 | | | | | | | | | | | | | | | | | | | | | | | | | | | | | | | | | | | | |
2010 | | | 9.67 | | | | .36 | | | | .46 | | | | .82 | | | | (.36 | ) | | | (.01 | ) | | | (.37 | ) | | | 10.12 | | | | 8.51 | |
2009 | | | 9.75 | | | | .38 | | | | (.05 | ) | | | .33 | | | | (.38 | ) | | | (.03 | ) | | | (.41 | ) | | | 9.67 | | | | 3.53 | |
2008 | | | 9.83 | | | | .39 | | | | (.05 | ) | | | .34 | | | | (.39 | ) | | | (.03 | ) | | | (.42 | ) | | | 9.75 | | | | 3.53 | |
2007 | | | 9.88 | | | | .39 | | | | (.01 | ) | | | .38 | | | | (.38 | ) | | | (.05 | ) | | | (.43 | ) | | | 9.83 | | | | 3.87 | |
Class C (1/11) | | | | | | | | | | | | | | | | | | | | | | | | | | | | | | | | | | | | |
Year Ended 5/31 | | | | | | | | | | | | | | | | | | | | | | | | | | | | | | | | | | | | |
2012 | | | 10.14 | | | | .29 | | | | .49 | | | | .78 | | | | (.29 | ) | | | (.01 | ) | | | (.30 | ) | | | 10.62 | | | | 7.79 | |
2011(f) | | | 9.77 | | | | .11 | | | | .36 | | | | .47 | | | | (.10 | ) | | | — | | | | (.10 | ) | | | 10.14 | | | | 4.88 | |
Class C1 (10/09)(h) | | | | | | | | | | | | | | | | | | | | | | | | | | | | | | | | | | | | |
Year Ended 5/31 | | | | | | | | | | | | | | | | | | | | | | | | | | | | | | | | | | | | |
2012 | | | 10.22 | | | | .31 | | | | .48 | | | | .79 | | | | (.31 | ) | | | (.01 | ) | | | (.32 | ) | | | 10.69 | | | | 7.81 | |
2011(e) | | | 10.14 | | | | .28 | | | | .07 | | | | .35 | | | | (.27 | ) | | | — | | | | (.27 | ) | | | 10.22 | | | | 3.46 | |
Year Ended 6/30 | | | | | | | | | | | | | | | | | | | | | | | | | | | | | | | | | | | | |
2010(g) | | | 9.94 | | | | .21 | | | | .20 | | | | .41 | | | | (.20 | ) | | | (.01 | ) | | | (.21 | ) | | | 10.14 | | | | 4.15 | |
Class I (2/94)(h) | | | | | | | | | | | | | | | | | | | | | | | | | | | | | | | | | | | | |
Year Ended 5/31 | | | | | | | | | | | | | | | | | | | | | | | | | | | | | | | | | | | | |
2012 | | | 10.13 | | | | .37 | | | | .49 | | | | .86 | | | | (.37 | ) | | | (.01 | ) | | | (.38 | ) | | | 10.61 | | | | 8.60 | |
2011(e) | | | 10.06 | | | | .34 | | | | .06 | | | | .40 | | | | (.33 | ) | | | — | | | | (.33 | ) | | | 10.13 | | | | 4.00 | |
Year Ended 6/30 | | | | | | | | | | | | | | | | | | | | | | | | | | | | | | | | | | | | |
2010 | | | 9.62 | | | | .36 | | | | .45 | | | | .81 | | | | (.36 | ) | | | (.01 | ) | | | (.37 | ) | | | 10.06 | | | | 8.50 | |
2009 | | | 9.69 | | | | .39 | | | | (.04 | ) | | | .35 | | | | (.39 | ) | | | (.03 | ) | | | (.42 | ) | | | 9.62 | | | | 3.71 | |
2008 | | | 9.78 | | | | .39 | | | | (.05 | ) | | | .34 | | | | (.40 | ) | | | (.03 | ) | | | (.43 | ) | | | 9.69 | | | | 3.51 | |
2007 | | | 9.83 | | | | .40 | | | | — | | | | .40 | | | | (.40 | ) | | | (.05 | ) | | | (.45 | ) | | | 9.78 | | | | 4.05 | |
| | | | | | | | | | | | | | | | | | | | | | |
| | | | | |
| | | | | | | | | | | | | | | | | |
| Ratios/Supplemental Data | |
| | | |
| | | | Ratios to Average
Net Assets Before
Reimbursement | | | Ratios to Average
Net Assets After
Reimbursement(d) | | | | |
Ending
Net
Assets
(000) | | | Expenses | | | Net
Invest-
ment
Income
(Loss) | | | Expenses | | | Net
Invest-
ment
Income
(Loss) | | | Portfolio
Turnover
Rate | |
| | | | | | | | | | | | | | | | | | | | | | |
| | | | | | | | | | | | | | | | | | | | | | |
| $ | 52,039 | | | | .80 | % | | | 3.41 | % | | | .76 | % | | | 3.44 | % | | | 9 | % |
| | 37,175 | | | | .92 | * | | | 3.40 | * | | | .74 | * | | | 3.60 | * | | | 12 | |
| | | | | | | | | | | | | | | | | | | | | | |
| | 34,957 | | | | 1.08 | | | | 3.28 | | | | .75 | | | | 3.61 | | | | 9 | |
| | 23,019 | | | | 1.07 | | | | 3.68 | | | | .75 | | | | 4.00 | | | | 18 | |
| | 22,059 | | | | 1.07 | | | | 3.65 | | | | .77 | | | | 3.95 | | | | 15 | |
| | 21,153 | | | | 1.07 | | | | 3.64 | | | | .85 | | | | 3.86 | | | | 18 | |
| | | | | | | | | | | | | | | | | | | | | | |
| | | | | | | | | | | | | | | | | | | | | | |
| | 3,768 | | | | 1.40 | | | | 2.74 | | | | 1.40 | | | | 2.74 | | | | 9 | |
| | 623 | | | | 1.41 | * | | | 3.10 | * | | | 1.37 | * | | | 3.14 | * | | | 12 | |
| | | | | | | | | | | | | | | | | | | | | | |
| | | | | | | | | | | | | | | | | | | | | | |
| | 5,448 | | | | 1.29 | | | | 2.94 | | | | 1.29 | | | | 2.94 | | | | 9 | |
| | 6,242 | | | | 1.37 | * | | | 2.99 | * | | | 1.31 | * | | | 3.05 | * | | | 12 | |
| | | | | | | | | | | | | | | | | | | | | | |
| | 3,965 | | | | 1.48 | * | | | 2.87 | * | | | 1.35 | * | | | 3.00 | * | | | 9 | |
| | | | | | | | | | | | | | | | | | | | | | |
| | | | | | | | | | | | | | | | | | | | | | |
| | 196,568 | | | | .64 | | | | 3.58 | | | | .64 | | | | 3.58 | | | | 9 | |
| | 191,516 | | | | .72 | * | | | 3.60 | * | | | .66 | * | | | 3.67 | * | | | 12 | |
| | | | | | | | | | | | | | | | | | | | | | |
| | 193,443 | | | | .83 | | | | 3.53 | | | | .70 | | | | 3.66 | | | | 9 | |
| | 172,440 | | | | .82 | | | | 3.92 | | | | .70 | | | | 4.04 | | | | 18 | |
| | 175,681 | | | | .82 | | | | 3.90 | | | | .70 | | | | 4.02 | | | | 15 | |
| | 168,920 | | | | .82 | | | | 3.89 | | | | .70 | | | | 4.01 | | | | 18 | |
| (a) | Per share Net Investment Income (Loss) is calculated using the average daily shares method. |
| (b) | Distributions from Capital Gains include short-term capital gains, if any. |
| (c) | Total return is the combination of changes in net asset value without any sales charge, reinvested dividend income at net asset value and reinvested capital gains distributions at net asset value, if any. Total returns are not annualized. |
| (d) | After expense reimbursement from the Adviser, where applicable. |
| (e) | For the eleven months ended May 31, 2011. |
| (f) | For the period January 18, 2011 (commencement of operations) through May 31, 2011. |
| (g) | For the period October 28, 2009 (commencement of operations) through June 30, 2010. |
| (h) | Effective January 18, 2011, Class C Shares and Class Y Shares previously offered by FAF Advisors, Inc. were renamed Class C1 Shares and Class I Shares, respectively. |
See accompanying notes to financial statements.
Financial Highlights (continued)
| | | | | | | | | | | | | | | | | | | | | | | | | | | | | | | | | | | | |
| Selected data for a share outstanding throughout each period: | | | | | | | | | | | | | | | | | | | |
| | | | | | | | |
| Class (Commencement Date) | | | | | | | | | | | | | | | | | | | | | | | | | |
| | | | | | Investment Operations | | | Less Distributions | | | | | | | |
| | | | |
| MINNESOTA MUNICIPAL | | | | | | | | | | | | | |
| | | Beginning
Net
Asset
Value | | | Net
Invest-
ment
Income
(Loss)(a) | | | Net
Realized/
Unrealized
Gain
(Loss) | | | Total | | | Net
Invest-
ment
Income | | | Capital
Gains(b) | | | Total | | | Ending
Net
Asset
Value | | | Total
Return(c) | |
Class A (7/88) | | | | | | | | | | | | | | | | | | | | | | | | | | | | | | | | | |
Year Ended 5/31 | | | | | | | | | | | | | | | | | | | | | | | | | | | | | | | | | | | | |
2012 | | $ | 10.83 | | | $ | .47 | | | $ | 1.02 | | | $ | 1.49 | | | $ | (.45 | ) | | $ | — | | | $ | (.45 | ) | | $ | 11.87 | | | | 14.03 | % |
2011(e) | | | 10.87 | | | | .39 | | | | (.08 | ) | | | .31 | | | | (.35 | ) | | | — | | | | (.35 | ) | | | 10.83 | | | | 2.94 | |
Year Ended 6/30 | | | | | | | | | | | | | | | | | | | | | | | | | | | | | | | | | | | | |
2010 | | | 9.98 | | | | .41 | | | | .89 | | | | 1.30 | | | | (.41 | ) | | | — | | | | (.41 | ) | | | 10.87 | | | | 13.19 | |
2009 | | | 10.48 | | | | .43 | | | | (.44 | ) | | | (.01 | ) | | | (.43 | ) | | | (.06 | ) | | | (.49 | ) | | | 9.98 | | | | .07 | |
2008 | | | 10.93 | | | | .44 | | | | (.38 | ) | | | .06 | | | | (.45 | ) | | | (.06 | ) | | | (.51 | ) | | | 10.48 | | | | .54 | |
2007 | | | 10.97 | | | | .46 | | | | (.02 | ) | | | .44 | | | | (.45 | ) | | | (.03 | ) | | | (.48 | ) | | | 10.93 | | | | 4.05 | |
Class C (1/11) | | | | | | | | | | | | | | | | | | | | | | | | | | | | | | | | | |
Year Ended 5/31 | | | | | | | | | | | | | | | | | | | | | | | | | | | | | | | | | | | | |
2012 | | | 10.82 | | | | .39 | | | | 1.05 | | | | 1.44 | | | | (.39 | ) | | | — | | | | (.39 | ) | | | 11.87 | | | | 13.48 | |
2011(f) | | | 10.23 | | | | .15 | | | | .56 | | | | .71 | | | | (.12 | ) | | | — | | | | (.12 | ) | | | 10.82 | | | | 6.99 | |
Class C1 (2/99)(g) | | | | | | | | | | | | | | | | | | | | | | | | | | | | | | | | | |
Year Ended 5/31 | | | | | | | | | | | | | | | | | | | | | | | | | | | | | | | | | | | | |
2012 | | | 10.78 | | | | .41 | | | | 1.03 | | | | 1.44 | | | | (.40 | ) | | | — | | | | (.40 | ) | | | 11.82 | | | | 13.56 | |
2011(e) | | | 10.82 | | | | .34 | | | | (.08 | ) | | | .26 | | | | (.30 | ) | | | — | | | | (.30 | ) | | | 10.78 | | | | 2.48 | |
Year Ended 6/30 | | | | | | | | | | | | | | | | | | | | | | | | | | | | | | | | | | | | |
2010 | | | 9.94 | | | | .36 | | | | .88 | | | | 1.24 | | | | (.36 | ) | | | — | | | | (.36 | ) | | | 10.82 | | | | 12.58 | |
2009 | | | 10.44 | | | | .38 | | | | (.44 | ) | | | (.06 | ) | | | (.38 | ) | | | (.06 | ) | | | (.44 | ) | | | 9.94 | | | | (.42 | ) |
2008 | | | 10.89 | | | | .40 | | | | (.39 | ) | | | .01 | | | | (.40 | ) | | | (.06 | ) | | | (.46 | ) | | | 10.44 | | | | .06 | |
2007 | | | 10.93 | | | | .42 | | | | (.02 | ) | | | .40 | | | | (.41 | ) | | | (.03 | ) | | | (.44 | ) | | | 10.89 | | | | 3.65 | |
Class I (8/97)(g) | | | | | | | | | | | | | | | | | | | | | | | | | | | | | | | | | |
Year Ended 5/31 | | | | | | | | | | | | | | | | | | | | | | | | | | | | | | | | | | | | |
2012 | | | 10.82 | | | | .49 | | | | 1.02 | | | | 1.51 | | | | (.47 | ) | | | — | | | | (.47 | ) | | | 11.86 | | | | 14.23 | |
2011(e) | | | 10.86 | | | | .41 | | | | (.08 | ) | | | .33 | | | | (.37 | ) | | | — | | | | (.37 | ) | | | 10.82 | | | | 3.09 | |
Year Ended 6/30 | | | | | | | | | | | | | | | | | | | | | | | | | | | | | | | | | | | | |
2010 | | | 9.97 | | | | .42 | | | | .90 | | | | 1.32 | | | | (.43 | ) | | | — | | | | (.43 | ) | | | 10.86 | | | | 13.37 | |
2009 | | | 10.47 | | | | .44 | | | | (.44 | ) | | | — | | | | (.44 | ) | | | (.06 | ) | | | (.50 | ) | | | 9.97 | | | | .23 | |
2008 | | | 10.92 | | | | .46 | | | | (.38 | ) | | | .08 | | | | (.47 | ) | | | (.06 | ) | | | (.53 | ) | | | 10.47 | | | | .71 | |
2007 | | | 10.96 | | | | .48 | | | | (.01 | ) | | | .47 | | | | (.48 | ) | | | (.03 | ) | | | (.51 | ) | | | 10.92 | | | | 4.31 | |
| | | | | | | | | | | | | | | | | | | | | | |
| | | | | |
| | | | | | | | | | | | | | | | | |
| Ratios/Supplemental Data | |
| | | |
| | | | Ratios to Average
Net Assets Before
Reimbursement | | | Ratios to Average
Net Assets After
Reimbursement(d) | | | | |
Ending
Net
Assets
(000) | | | Expenses | | | Net
Invest
ment
Income
(Loss) | | | Expenses | | | Net
Invest
ment
Income
(Loss) | | | Portfolio
Turnover
Rate | |
| | | | | | | | | | | | | | | | | | | | | | |
| | | | | | | | | | | | | | | | | | | | | | |
| $ | 100,185 | | | | .90 | % | | | 4.06 | % | | | .86 | % | | | 4.11 | % | | | 17 | % |
| | 85,183 | | | | 1.00 | * | | | 3.77 | * | | | .85 | * | | | 3.94 | * | | | 25 | |
| | | | | | | | | | | | | | | | | | | | | | |
| | 91,922 | | | | 1.11 | | | | 3.60 | | | | .85 | | | | 3.86 | | | | 34 | |
| | 87,218 | | | | 1.11 | | | | 4.06 | | | | .85 | | | | 4.32 | | | | 28 | |
| | 102,089 | | | | 1.10 | | | | 3.91 | | | | .87 | | | | 4.14 | | | | 37 | |
| | 106,732 | | | | 1.10 | | | | 3.95 | | | | .95 | | | | 4.10 | | | | 20 | |
| | | | | | | | | | | | | | | | | | | | | | |
| | | | | | | | | | | | | | | | | | | | | | |
| | 4,927 | | | | 1.47 | | | | 3.37 | | | | 1.45 | | | | 3.39 | | | | 17 | |
| | 618 | | | | 1.50 | * | | | 3.91 | * | | | 1.43 | * | | | 3.98 | * | | | 25 | |
| | | | | | | | | | | | | | | | | | | | | | |
| | | | | | | | | | | | | | | | | | | | | | |
| | 21,453 | | | | 1.35 | | | | 3.63 | | | | 1.35 | | | | 3.64 | | | | 17 | |
| | 22,190 | | | | 1.43 | * | | | 3.33 | * | | | 1.33 | * | | | 3.43 | * | | | 25 | |
| | | | | | | | | | | | | | | | | | | | | | |
| | 26,772 | | | | 1.51 | | | | 3.19 | | | | 1.35 | | | | 3.35 | | | | 34 | |
| | 20,489 | | | | 1.51 | | | | 3.66 | | | | 1.35 | | | | 3.82 | | | | 28 | |
| | 20,061 | | | | 1.50 | | | | 3.48 | | | | 1.35 | | | | 3.63 | | | | 37 | |
| | 14,221 | | | | 1.58 | | | | 3.46 | | | | 1.35 | | | | 3.69 | | | | 20 | |
| | | | | | | | | | | | | | | | | | | | | | |
| | | | | | | | | | | | | | | | | | | | | | |
| | 66,016 | | | | .71 | | | | 4.26 | | | | .70 | | | | 4.27 | | | | 17 | |
| | 51,116 | | | | .77 | * | | | 4.01 | * | | | .68 | * | | | 4.11 | * | | | 25 | |
| | | | | | | | | | | | | | | | | | | | | | |
| | 52,639 | | | | .86 | | | | 3.84 | | | | .70 | | | | 4.00 | | | | 34 | |
| | 42,093 | | | | .86 | | | | 4.31 | | | | .70 | | | | 4.47 | | | | 28 | |
| | 44,993 | | | | .85 | | | | 4.17 | | | | .70 | | | | 4.32 | | | | 37 | |
| | 56,181 | | | | .85 | | | | 4.20 | | | | .70 | | | | 4.35 | | | | 20 | |
| (a) | Per share Net Investment Income (Loss) is calculated using the average daily shares method. |
| (b) | Distributions from Capital Gains include short-term capital gains, if any. |
| (c) | Total return is the combination of changes in net asset value without any sales charge, reinvested dividend income at net asset value and reinvested capital gains distributions at net asset value, if any. Total returns are not annualized. |
| (d) | After expense reimbursement from the Adviser, where applicable. |
| (e) | For the eleven months ended May 31, 2011. |
| (f) | For the period January 18, 2011 (commencement of operations) through May 31, 2011. |
| (g) | Effective January 18, 2011, Class C Shares and Class Y Shares previously offered by FAF Advisors, Inc. were renamed Class C1 Shares and Class I Shares, respectively. |
See accompanying notes to financial statements.
Financial Highlights (continued)
| | | | | | | | | | | | | | | | | | | | | | | | | | | | | | | | | | | | |
| Selected data for a share outstanding throughout each period: | | | | | | | | | | | | | | | | | | | |
| | | | | | | | |
| Class (Commencement Date) | | | | | | | | | | | | | | | | | | | | | | | | | |
| | | | | | Investment Operations | | | Less Distributions | | | | | | | |
| | | | | | | | |
| NEBRASKA | | | | | | | | | | | | | | | | | | | | | | | | | |
| | | Beginning
Net
Asset
Value | | | Net
Invest-
ment
Income
(Loss)(a) | | | Net
Realized/
Unrealized
Gain
(Loss) | | | Total | | | Net
Invest-
ment
Income | | | Capital
Gains(b) | | | Total | | | Ending
Net
Asset
Value | | | Total
Return(c) | |
CLASS A (2/01) | | | | | | | | | | | | | | | | | | | | | | | | | | | | | | | | | | | | |
Year Ended 5/31 | | | | | | | | | | | | | | | | | | | | | | | | | | | | | | | | | | | | |
2012 | | $ | 10.28 | | | $ | .41 | | | $ | .75 | | | $ | 1.16 | | | $ | (.43 | ) | | $ | — | | | $ | (.43 | ) | | $ | 11.01 | | | | 11.51 | % |
2011(e) | | | 10.34 | | | | .39 | | | | (.06 | ) | | | .33 | | | | (.39 | ) | | | — | | | | (.39 | ) | | | 10.28 | | | | 3.28 | |
Year Ended 6/30 | | | | | | | | | | | | | | | | | | | | | | | | | | | | | | | | | | | | |
2010 | | | 9.84 | | | | .41 | | | | .49 | | | | .90 | | | | (.40 | ) | | | — | | | | (.40 | ) | | | 10.34 | | | | 9.26 | |
2009 | | | 10.06 | | | | .43 | | | | (.21 | ) | | | .22 | | | | (.44 | ) | | | — | | | | (.44 | ) | | | 9.84 | | | | 2.33 | |
2008 | | | 10.30 | | | | .42 | | | | (.20 | ) | | | .22 | | | | (.41 | ) | | | (.05 | ) | | | (.46 | ) | | | 10.06 | | | | 2.19 | |
2007 | | | 10.33 | | | | .42 | | | | .02 | | | | .44 | | | | (.42 | ) | | | (.05 | ) | | | (.47 | ) | | | 10.30 | | | | 4.24 | |
CLASS C (1/11) | | | | | | | | | | | | | | | | | | | | | | | | | | | | | | | | | | | | |
Year Ended 5/31 | | | | | | | | | | | | | | | | | | | | | | | | | | | | | | | | | | | | |
2012 | | | 10.28 | | | | .34 | | | | .77 | | | | 1.11 | | | | (.37 | ) | | | — | | | | (.37 | ) | | | 11.02 | | | | 10.98 | |
2011(f) | | | 9.86 | | | | .14 | | | | .42 | | | | .56 | | | | (.14 | ) | | | — | | | | (.14 | ) | | | 10.28 | | | | 5.70 | |
CLASS C1 (2/01)(g) | | | | | | | | | | | | | | | | | | | | | | | | | | | | | | | | | | | | |
Year Ended 5/31 | | | | | | | | | | | | | | | | | | | | | | | | | | | | | | | | | | | | |
2012 | | | 10.19 | | | | .38 | | | | .73 | | | | 1.11 | | | | (.38 | ) | | | — | | | | (.38 | ) | | | 10.92 | | | | 11.08 | |
2011(e) | | | 10.26 | | | | .34 | | | | (.06 | ) | | | .28 | | | | (.35 | ) | | | — | | | | (.35 | ) | | | 10.19 | | | | 2.80 | |
Year Ended 6/30 | | | | | | | | | | | | | | | | | | | | | | | | | | | | | | | | | | | | |
2010 | | | 9.76 | | | | .38 | | | | .48 | | | | .86 | | | | (.36 | ) | | | — | | | | (.36 | ) | | | 10.26 | | | | 8.91 | |
2009 | | | 9.99 | | | | .39 | | | | (.22 | ) | | | .17 | | | | (.40 | ) | | | — | | | | (.40 | ) | | | 9.76 | | | | 1.84 | |
2008 | | | 10.23 | | | | .38 | | | | (.20 | ) | | | .18 | | | | (.37 | ) | | | (.05 | ) | | | (.42 | ) | | | 9.99 | | | | 1.81 | |
2007 | | | 10.26 | | | | .37 | | | | .02 | | | | .39 | | | | (.37 | ) | | | (.05 | ) | | | (.42 | ) | | | 10.23 | | | | 3.86 | |
CLASS I (2/01)(g) | | | | | | | | | | | | | | | | | | | | | | | | | | | | | | | | | | | | |
Year Ended 5/31 | | | | | | | | | | | | | | | | | | | | | | | | | | | | | | | | | | | | |
2012 | | | 10.27 | | | | .45 | | | | .74 | | | | 1.19 | | | | (.45 | ) | | | — | | | | (.45 | ) | | | 11.01 | | | | 11.80 | |
2011(e) | | | 10.34 | | | | .41 | | | | (.07 | ) | | | .34 | | | | (.41 | ) | | | — | | | | (.41 | ) | | | 10.27 | | | | 3.39 | |
Year Ended 6/30 | | | | | | | | | | | | | | | | | | | | | | | | | | | | | | | | | | | | |
2010 | | | 9.83 | | | | .44 | | | | .50 | | | | .94 | | | | (.43 | ) | | | — | | | | (.43 | ) | | | 10.34 | | | | 9.65 | |
2009 | | | 10.06 | | | | .45 | | | | (.22 | ) | | | .23 | | | | (.46 | ) | | | — | | | | (.46 | ) | | | 9.83 | | | | 2.48 | |
2008 | | | 10.30 | | | | .44 | | | | (.19 | ) | | | .25 | | | | (.44 | ) | | | (.05 | ) | | | (.49 | ) | | | 10.06 | | | | 2.45 | |
2007 | | | 10.33 | | | | .44 | | | | .02 | | | | .46 | | | | (.44 | ) | | | (.05 | ) | | | (.49 | ) | | | 10.30 | | | | 4.51 | |
| | | | | | | | | | | | | | | | | | | | | | |
| | | | | |
| | | | | | | | | | | | | | | | | |
| Ratios/Supplemental Data | |
| | | |
Ratios to Average
Net Assets Before
Reimbursement | | | Ratios to Average
Net Assets After
Reimbursement(d) | | | | |
Ending
Net
Assets
(000) | | | Expenses | | | Net
Invest-
ment
Income
(Loss) | | | Expenses | | | Net
Invest-
ment
Income
(Loss) | | | Portfolio
Turnover
Rate | |
| | | | | | | | | | | | | | | | | | | | | | |
| | | | | | | | | | | | | | | | | | | | | | |
| $ | 19,021 | | | | .97 | % | | | 3.79 | % | | | .88 | % | | | 3.88 | % | | | 25 | % |
| | 7,099 | | | | 1.21 | * | | | 3.62 | * | | | .72 | * | | | 4.11 | * | | | 21 | |
| | | | | | | | | | | | | | | | | | | | | | |
| | 6,333 | | | | 1.46 | | | | 3.30 | | | | .75 | | | | 4.01 | | | | 18 | |
| | 5,847 | | | | 1.50 | | | | 3.66 | | | | .75 | | | | 4.41 | | | | 34 | |
| | 5,689 | | | | 1.47 | | | | 3.34 | | | | .75 | | | | 4.06 | | | | 22 | |
| | 7,091 | | | | 1.44 | | | | 3.28 | | | | .75 | | | | 3.97 | | | | 39 | |
| | | | | | | | | | | | | | | | | | | | | | |
| | | | | | | | | | | | | | | | | | | | | | |
| | 2,800 | | | | 1.51 | | | | 3.10 | | | | 1.43 | | | | 3.19 | | | | 25 | |
| | 321 | | | | 1.60 | * | | | 3.37 | * | | | 1.24 | * | | | 3.73 | * | | | 21 | |
| | | | | | | | | | | | | | | | | | | | | | |
| | | | | | | | | | | | | | | | | | | | | | |
| | 4,132 | | | | 1.43 | | | | 3.49 | | | | 1.33 | | | | 3.59 | | | | 25 | |
| | 4,201 | | | | 1.64 | * | | | 3.19 | * | | | 1.14 | * | | | 3.69 | * | | | 21 | |
| | | | | | | | | | | | | | | | | | | | | | |
| | 4,181 | | | | 1.86 | | | | 2.91 | | | | 1.15 | | | | 3.62 | | | | 18 | |
| | 2,585 | | | | 1.90 | | | | 3.27 | | | | 1.15 | | | | 4.02 | | | | 34 | |
| | 1,798 | | | | 1.87 | | | | 2.93 | | | | 1.15 | | | | 3.65 | | | | 22 | |
| | 1,559 | | | | 1.92 | | | | 2.79 | | | | 1.15 | | | | 3.56 | | | | 39 | |
| | | | | | | | | | | | | | | | | | | | | | |
| | | | | | | | | | | | | | | | | | | | | | |
| | 36,406 | | | | .78 | | | | 4.13 | | | | .68 | | | | 4.23 | | | | 25 | |
| | 31,470 | | | | .99 | * | | | 3.83 | * | | | .49 | * | | | 4.34 | * | | | 21 | |
| | | | | | | | | | | | | | | | | | | | | | |
| | 31,757 | | | | 1.21 | | | | 3.55 | | | | .50 | | | | 4.26 | | | | 18 | |
| | 30,689 | | | | 1.25 | | | | 3.92 | | | | .50 | | | | 4.67 | | | | 34 | |
| | 29,533 | | | | 1.22 | | | | 3.59 | | | | .50 | | | | 4.31 | | | | 22 | |
| | 32,502 | | | | 1.19 | | | | 3.53 | | | | .50 | | | | 4.22 | | | | 39 | |
| (a) | Per share Net Investment Income (Loss) is calculated using the average daily shares method. |
| (b) | Distributions from Capital Gains include short-term capital gains, if any. |
| (c) | Total return is the combination of changes in net asset value without any sales charge, reinvested dividend income at net asset value and reinvested capital gains distributions at net asset value, if any. Total returns are not annualized. |
| (d) | After expense reimbursement from the Adviser, where applicable. |
| (e) | For the eleven months ended May 31, 2011. |
| (f) | For the period January 18, 2011 (commencement of operations) through May 31, 2011. |
| (g) | Effective January 18, 2011, Class C Shares and Class Y Shares previously offered by FAF Advisors, Inc. were renamed Class C1 Shares and Class I Shares, respectively. |
See accompanying notes to financial statements.
Financial Highlights (continued)
| | | | | | | | | | | | | | | | | | | | | | | | | | | | | | | | | | | | |
| Selected data for a share outstanding throughout each period: | | | | | | | | | | | | | | | | | | | |
| | | | | | | | |
| Class (Commencement Date) | | | | | | | | | | | | | | | | | | | | | | | | | |
| | | | | | Investment Operations | | | Less Distributions | | | | | | | |
| | | | | | | | |
| OREGON INTERMEDIATE | | | | | | | | | | | | | | | | | | | | | | | | | |
| | | Beginning
Net
Asset
Value | | | Net
Invest-
ment
Income
(Loss)(a) | | | Net
Realized/
Unrealized
Gain
(Loss) | | | Total | | | Net
Invest-
ment
Income | | | Capital
Gains(b) | | | Total | | | Ending
Net
Asset
Value | | | Total
Return(c) | |
Class A (2/99) | | | | | | | | | | | | | | | | | | | | | | | | | | | | | | | | | | | | |
Year Ended 5/31 | | | | | | | | | | | | | | | | | | | | | | | | | | | | | | | | | | | | |
2012 | | $ | 10.17 | | | $ | .33 | | | $ | .44 | | | $ | .77 | | | $ | (.34 | ) | | $ | — | ** | | $ | (.34 | ) | | $ | 10.60 | | | | 7.71 | % |
2011(e) | | | 10.11 | | | | .29 | | | | .05 | | | | .34 | | | | (.28 | ) | | | — | | | | (.28 | ) | | | 10.17 | | | | 3.46 | |
Year Ended 6/30 | | | | | | | | | | | | | | | | | | | | | | | | | | | | | | | | | | | | |
2010 | | | 9.77 | | | | .35 | | | | .33 | | | | .68 | | | | (.34 | ) | | | — | | | | (.34 | ) | | | 10.11 | | | | 7.05 | |
2009 | | | 9.68 | | | | .36 | | | | .09 | | | | .45 | | | | (.36 | ) | | | — | | | | (.36 | ) | | | 9.77 | | | | 4.77 | |
2008 | | | 9.72 | | | | .35 | | | | (.02 | ) | | | .33 | | | | (.36 | ) | | | (.01 | ) | | | (.37 | ) | | | 9.68 | | | | 3.39 | |
2007 | | | 9.78 | | | | .37 | | | | (.02 | ) | | | .35 | | | | (.37 | ) | | | (.04 | ) | | | (.41 | ) | | | 9.72 | | | | 3.54 | |
Class C (1/11) | | | | | | | | | | | | | | | | | | | | | | | | | | | | | | | | | | | | |
Year Ended 5/31 | | | | | | | | | | | | | | | | | | | | | | | | | | | | | | | | | | | | |
2012 | | | 10.15 | | | | .27 | | | | .43 | | | | .70 | | | | (.29 | ) | | | — | ** | | | (.29 | ) | | | 10.56 | | | | 6.98 | |
2011(f) | | | 9.78 | | | | .09 | | | | .40 | | | | .49 | | | | (.12 | ) | | | — | | | | (.12 | ) | | | 10.15 | | | | 5.04 | |
Class I (8/97)(g) | | | | | | | | | | | | | | | | | | | | | | | | | | | | | | | | | | | | |
Year Ended 5/31 | | | | | | | | | | | | | | | | | | | | | | | | | | | | | | | | | | | | |
2012 | | | 10.17 | | | | .35 | | | | .44 | | | | .79 | | | | (.36 | ) | | | — | ** | | | (.36 | ) | | | 10.60 | | | | 7.90 | |
2011(e) | | | 10.11 | | | | .31 | | | | .05 | | | | .36 | | | | (.30 | ) | | | — | | | | (.30 | ) | | | 10.17 | | | | 3.62 | |
Year Ended 6/30 | | | | | | | | | | | | | | | | | | | | | | | | | | | | | | | | | | | | |
2010 | | | 9.77 | | | | .35 | | | | .35 | | | | .70 | | | | (.36 | ) | | | — | | | | (.36 | ) | | | 10.11 | | | | 7.21 | |
2009 | | | 9.68 | | | | .37 | | | | .10 | | | | .47 | | | | (.38 | ) | | | — | | | | (.38 | ) | | | 9.77 | | | | 4.92 | |
2008 | | | 9.72 | | | | .37 | | | | (.03 | ) | | | .34 | | | | (.37 | ) | | | (.01 | ) | | | (.38 | ) | | | 9.68 | | | | 3.54 | |
2007 | | | 9.78 | | | | .38 | | | | (.02 | ) | | | .36 | | | | (.38 | ) | | | (.04 | ) | | | (.42 | ) | | | 9.72 | | | | 3.70 | |
| | | | | | | | | | | | | | | | | | | | | | |
| | | | | |
| | | | | | | | | | | | | | | | | |
| Ratios/Supplemental Data | |
| | | |
| | | | Ratios to Average
Net Assets Before
Reimbursement | | | Ratios to Average
Net Assets After
Reimbursement(d) | | | | |
Ending
Net
Assets
(000) | | | Expenses | | | Net
Invest-
ment
Income
(Loss) | | | Expenses | | | Net
Invest-
ment
Income
(Loss) | | | Portfolio
Turnover
Rate | |
| | | | | | | | | | | | | | | | | | | | | | |
| | | | | | | | | | | | | | | | | | | | | | |
| $ | 42,819 | | | | .85 | % | | | 3.18 | % | | | .85 | % | | | 3.18 | % | | | 9 | % |
| | 31,399 | | | | .97 | * | | | 3.04 | * | | | .82 | * | | | 3.18 | * | | | 12 | |
| | | | | | | | | | | | | | | | | | | | | | |
| | 31,043 | | | | 1.10 | | | | 3.12 | | | | .85 | | | | 3.37 | | | | 19 | |
| | 10,963 | | | | 1.12 | | | | 3.43 | | | | .85 | | | | 3.70 | | | | 19 | |
| | 5,967 | | | | 1.12 | | | | 3.37 | | | | .85 | | | | 3.64 | | | | 15 | |
| | 7,895 | | | | 1.12 | | | | 3.44 | | | | .85 | | | | 3.71 | | | | 43 | |
| | | | | | | | | | | | | | | | | | | | | | |
| | | | | | | | | | | | | | | | | | | | | | |
| | 7,345 | | | | 1.40 | | | | 2.58 | | | | 1.40 | | | | 2.58 | | | | 9 | |
| | 632 | | | | 1.40 | * | | | 2.50 | * | | | 1.36 | * | | | 2.53 | * | | | 12 | |
| | | | | | | | | | | | | | | | | | | | | | |
| | | | | | | | | | | | | | | | | | | | | | |
| | 110,708 | | | | .65 | | | | 3.40 | | | | .65 | | | | 3.40 | | | | 9 | |
| | 113,827 | | | | .74 | * | | | 3.26 | * | | | .65 | * | | | 3.35 | * | | | 12 | |
| | | | | | | | | | | | | | | | | | | | | | |
| | 133,816 | | | | .85 | | | | 3.37 | | | | .70 | | | | 3.52 | | | | 19 | |
| | 119,959 | | | | .87 | | | | 3.67 | | | | .70 | | | | 3.84 | | | | 19 | |
| | 120,800 | | | | .87 | | | | 3.61 | | | | .70 | | | | 3.78 | | | | 15 | |
| | 109,357 | | | | .87 | | | | 3.69 | | | | .70 | | | | 3.86 | | | | 43 | |
| (a) | Per share Net Investment Income (Loss) is calculated using the average daily shares method. |
| (b) | Distributions from Capital Gains include short-term capital gains, if any. |
| (c) | Total return is the combination of changes in net asset value without any sales charge, reinvested dividend income at net asset value and reinvested capital gains distributions at net asset value, if any. Total returns are not annualized. |
| (d) | After expense reimbursement from the Adviser, where applicable. |
| (e) | For the eleven months ended May 31, 2011. |
| (f) | For the period January 18, 2011 (commencement of operations) through May 31, 2011. |
| (g) | Effective January 18, 2011, Class Y Shares previously offered by FAF Advisors, Inc. were renamed Class I Shares. |
| ** | Rounds to less than $.01 per share. |
See accompanying notes to financial statements.
Notes to Financial Statements
1. General Information and Significant Accounting Policies
General Information
Nuveen Investment Funds, Inc. (the “Trust”), is an open-end investment company registered under the Investment Company Act of 1940, as amended. The Trust is comprised of the Nuveen Minnesota Intermediate Municipal Bond Fund (“Minnesota Intermediate”), Nuveen Minnesota Municipal Bond Fund (“Minnesota”), Nuveen Nebraska Municipal Bond Fund (“Nebraska”) and Nuveen Oregon Intermediate Municipal Bond Fund (“Oregon Intermediate”), (each a “Fund” and collectively, the “Funds”), among others. The Trust was incorporated in the State of Maryland on August 20, 1987.
The investment objective of each Fund is to provide maximum current income that is exempt from both federal income tax and its respective state income tax to the extent consistent with prudent investment risk.
Under normal market conditions, as a fundamental policy, each Fund invests at least 80% of its net assets (plus the amount of any borrowings for investment purposes) in municipal securities that pay interest that is exempt from federal and its respective state income tax, including the federal and state alternative minimum tax. Each Fund normally may invest up to 20% of its net assets in taxable obligations, including obligations the interest on which is subject to the federal and state, where applicable, alternative minimum tax. Each Fund invests mainly in securities that, at the time of purchase, are either rated investment grade or are unrated and determined to be of comparable quality by the Funds’ sub-adviser, Nuveen Asset Management, LLC (the “Sub-Adviser”), a wholly-owned subsidiary of Nuveen Fund Advisers, Inc. (the “Adviser”), a wholly-owned subsidiary of Nuveen Investments, Inc. (“Nuveen”). However, each Fund may invest up to 20% of its total assets in securities that, at the time of purchase, are rated lower than investment grade or are unrated and of comparable quality (securities commonly referred to as “high yield” securities or “junk bonds”). Each Fund may invest up to 15% of its net assets in municipal securities whose interest payments vary inversely with changes in short-term tax-exempt interest rates (“inverse floaters”).
The Funds’ most recent prospectus provides further descriptions of each Fund’s investment objective, principal investment strategies and principal risks.
During the prior fiscal period, the Funds’ Board of Directors approved a change in the Funds’ fiscal and tax year ends from June 30 to May 31.
Significant Accounting Policies
The following is a summary of significant accounting policies followed by the Funds in the preparation of their financial statements in accordance with accounting principles generally accepted in the United States (“U.S. GAAP”).
Investment Valuation
Prices of municipal bonds are provided by a pricing service approved by the Funds’ Board of Directors. These securities are generally classified as Level 2 for fair measurement purposes. The pricing service establishes a security’s fair value using methods that may include consideration of the following: yields or prices of investments of comparable quality, type of issue, coupon, maturity and rating, market quotes or indications of value from security dealers, evaluations of anticipated cash flows or collateral, general market conditions and other information and analysis, including the obligor’s credit characteristics considered relevant. In pricing certain securities, particularly less liquid and lower quality securities, the pricing service may consider information about a security, its issuer, or market activity provided by the Adviser. These securities are generally classified as Level 2 or Level 3 depending on the priority of the significant inputs.
Investments in open-end funds are valued at their respective net asset values on the valuation date. These investment vehicles are generally classified as Level 1. Futures contracts are valued using the closing settlement price or, in the absence of such a price, the last traded price. Futures contracts are generally classified as Level 1.
Certain securities may not be able to be priced by the pre-established pricing methods as described above. Such securities may be valued by the Funds’ Board of Directors or its designee at fair value. These securities generally include, but are not limited to, restricted securities (securities which may not be publicly sold without registration under the Securities Act of 1933, as amended) for which a pricing service is unable to provide a market price; securities whose trading has been formally suspended; debt securities that have gone into default and for which there is no current market quotation; a security whose market price is not available from a pre-established pricing source; a security with respect to which an event has occurred that is likely to materially affect the value of the security after the market has closed but before the calculation of a Fund’s net asset value (as may be the case in non-U.S. markets on which the security is primarily traded) or make it difficult or impossible to obtain a reliable market quotation; and a security whose price, as provided by the pricing service, is not deemed to reflect the security’s fair value. As a general principle, the fair value of a security would appear to be the amount that the owner might reasonably expect to receive for it in a current sale. A variety of factors may be considered in determining the fair value of such securities, which may include consideration of the following: yields or prices of investments of comparable quality, type of issue, coupon, maturity and rating, market quotes or indications of value from security dealers, evaluations of anticipated cash flows or collateral, general market conditions and other information and analysis, including the obligor’s credit characteristics considered relevant. These securities are generally classified as Level 2 or Level 3 depending on the priority of the significant inputs. Regardless of the method employed to value a particular security, all valuations are subject to review by the Funds’ Board of Directors or its designee.
Refer to Footnote 2 – Fair Value Measurements for further details on the leveling of securities held by the Funds as of the end of the reporting period.
Investment Transactions
Investment transactions are recorded on a trade date basis. Realized gains and losses from investment transactions are determined on the specific identification method, which is the same basis used for federal income tax purposes. Investments purchased on a when-issued/delayed delivery basis may have extended settlement periods. Any investments so purchased are subject to market fluctuation during this period. The Funds have instructed the custodian to earmark securities in the Funds’ portfolios with a current value at least equal to the amount of the when-issued/delayed delivery purchase commitments. At May 31, 2012, Minnesota Intermediate, Minnesota, Nebraska and Oregon Intermediate had outstanding when issued/delayed delivery purchase commitments of $1,938,423, $1,202,996, $1,709,056 and $369,155, respectively.
Investment Income
Dividend income is recorded on the ex-dividend date. Interest income, which reflects the amortization of premiums and includes accretion of discounts for financial reporting purposes, is recorded on an accrual basis. Interest income also reflects paydowns gains and losses, if any.
Income Taxes
Each Fund is a separate taxpayer for federal income tax purposes. Each Fund intends to distribute substantially all of its net investment income and net capital gains to shareholders and to otherwise comply with the requirements of Subchapter M of the Internal Revenue Code applicable to regulated investment companies (“RICs”). Therefore, no federal income tax provision is required. Furthermore, each Fund intends to satisfy conditions that will enable interest from municipal securities, which is exempt from regular federal and designated state income taxes, to retain such tax-exempt status when distributed to shareholders of the Funds. Net realized capital gains and ordinary income distributions paid by the Funds are subject to federal taxation.
For all open tax years and all major taxing jurisdictions, management of the Funds has concluded that there are no significant uncertain tax positions that would require recognition in the financial statements. Open tax years are those that are open for examination by taxing authorities (i.e., generally the last four tax year ends and the interim tax period since then). Furthermore, management of the Funds is also not aware of any tax positions for which it is reasonably possible that the total amounts of unrecognized tax benefits will significantly change in the next twelve months.
Dividends and Distributions to Shareholders
The Funds declare dividends from their net investment income daily and pay shareholders monthly. Fund shares begin to accrue dividends on the business day after the day when the monies used to purchase Fund shares are collected by the Funds’ transfer agent.
Net realized capital gains and/or market discount from investment transactions, if any, are declared and distributed to shareholders at least annually. Furthermore, capital gains are distributed only to the extent they exceed available capital loss carryforwards.
Distributions to shareholders of net investment income, net realized capital gains and/or market discount, if any, are recorded on the ex-dividend date. The amount and timing of distributions are determined in accordance with federal income tax regulations, which may differ from U.S. GAAP.
Flexible Sales Charge Program
Class A Shares are generally sold with an up-front sales charge and incur a .20% annual 12b-1 service fee. Class A Share purchases of $1 million or more are sold at net asset value without an up-front sales charge but may be subject to a contingent deferred sales charge (“CDSC”) if redeemed within eighteen months of purchase. Class C Shares are sold without an up-front sales charge but incur a .55% annual 12b-1 distribution fee and a .20% annual 12b-1 service fee. Class C1 Shares of the Funds (except for Oregon Intermediate, which does not offer Class C1 Shares) are not available for new accounts or for additional investment into existing accounts, but Class C1 Shares can be issued for purposes of dividend reinvestment. Class C1 Shares are sold without an up-front sales charge but incur a .40% annual 12b-1 distribution fee and a .25% annual 12b-1 service fee. Class C Shares and Class C1 Shares are subject to a CDSC of 1% if redeemed within twelve months of purchase. Class I Shares are not subject to any sales charge or 12b-1 distribution or service fees.
Inverse Floating Rate Securities
Each Fund is authorized to invest in inverse floating rate securities. An inverse floating rate security is created by depositing a municipal bond, typically with a fixed interest rate, into a special purpose trust created by a broker-dealer. In turn, this trust (a) issues floating rate certificates, in face amounts equal to some fraction of the deposited bond’s par amount or market value, that typically pay short-term tax-exempt interest rates to third parties, and (b) issues to a long-term investor (such as one of the Funds) an inverse floating rate certificate (sometimes referred to as an “inverse floater”) that represents all remaining or residual interest in the trust. The income received by the inverse floater holder varies inversely with the short-term rate paid to the floating rate certificates’ holders, and in most circumstances the inverse floater holder bears substantially all of the underlying bond’s downside investment risk and also benefits disproportionately from any potential appreciation of the underlying bond’s value. The price of an inverse floating rate security will be more volatile than that of the underlying bond because the interest rate is dependent on not only the fixed coupon rate of the underlying bond but also on the short-term interest paid on the floating rate certificates, and because the inverse floating rate security essentially bears the risk of loss of the greater face value of the underlying bond.
Notes to Financial Statements (continued)
A Fund may purchase an inverse floating rate security in a secondary market transaction without first owning the underlying bond (referred to as an “externally-deposited inverse floater”), or instead by first selling a fixed-rate bond to a broker-dealer for deposit into the special purpose trust and receiving in turn the residual interest in the trust (referred to as a “self-deposited inverse floater”). The inverse floater held by a Fund gives the Fund the right (a) to cause the holders of the floating rate certificates to tender their notes at par, and (b) to have the broker transfer the fixed-rate bond held by the trust to the Fund, thereby collapsing the trust. An investment in an externally-deposited inverse floater is identified in the Portfolio of Investments as “(IF) – Inverse floating rate investment.” An investment in a self-deposited inverse floater is accounted for as a financing transaction. In such instances, a fixed-rate bond deposited into a special purpose trust is identified in the Portfolio of Investments as “(UB) – Underlying bond of an inverse floating rate trust reflected as a financing transaction,” with the Fund accounting for the short-term floating rate certificates issued by the trust as “Floating rate obligations” on the Statement of Assets and Liabilities. In addition, the Fund reflects in “Investment Income” the entire earnings of the underlying bond and recognizes the related interest paid to the holders of the short-term floating rate certificates as “Interest expense” on the Statement of Operations.
During the fiscal year ended May 31, 2012, the Funds did not invest in externally-deposited inverse floaters or self-deposited inverse floaters.
Futures Contracts
Each Fund is subject to interest rate risk in the normal course of pursuing its investment objectives and is authorized to invest in futures contracts in an attempt to manage such risk. Upon entering into a futures contract, a Fund is required to deposit with the broker an amount of cash or liquid securities equal to a specified percentage of the contract amount. This is known as the “initial margin.” Cash held by the broker to cover initial margin requirements on open futures contracts, if any, is recognized as “Deposits with brokers for open futures contracts” on the Statement of Assets and Liabilities. Subsequent payments (“variation margin”) are made or received by a Fund each day, depending on the daily fluctuation of the value of the contract. Variation margin is recognized as a receivable and/or payable for “Variation margin on futures contracts” on the Statement of Assets and Liabilities, when applicable.
During the period the futures contract is open, changes in the value of the contract are recognized as an unrealized gain or loss by “marking-to-market” on a daily basis to reflect the changes in market value of the contract, which is recognized as a component of “Change in net unrealized appreciation (depreciation) of futures contracts” on the Statement of Operations. When the contract is closed or expired, a Fund records a realized gain or loss equal to the difference between the value of the contract on the closing date and value of the contract when originally entered into, which is recognized as a component of “Net realized gain (loss) from futures contracts” on the Statement of Operations.
Risks of investments in futures contracts include the possible adverse movement in the price of the securities or indices underlying the contracts, the possibility that there may not be a liquid secondary market for the contracts and/or that a change in the value of the contract may not correlate with a change in the value of the underlying securities or indices.
During the fiscal year ended May 31, 2012, none of the Funds invested in futures contracts.
Market and Counterparty Credit Risk
In the normal course of business each Fund may invest in financial instruments and enter into financial transactions where risk of potential loss exists due to changes in the market (market risk) or failure of the other party to the transaction to perform (counterparty credit risk). The potential loss could exceed the value of the financial assets recorded on the financial statements. Financial assets, which potentially expose each Fund to counterparty credit risk, consist principally of cash due from counterparties on forward, option and swap transactions, when applicable. The extent of each Fund’s exposure to counterparty credit risk in respect to these financial assets approximates their carrying value as recorded on the Statement of Assets and Liabilities. Futures contracts, when applicable, expose a Fund to minimal counterparty credit risk as they are exchange traded and the exchange’s clearinghouse, which is counterparty to all exchange traded futures, guarantees the futures contracts against default.
Each Fund helps manage counterparty credit risk by entering into agreements only with counterparties the Adviser believes have the financial resources to honor their obligations and by having the Adviser monitor the financial stability of the counterparties. Additionally, counterparties may be required to pledge collateral daily (based on the daily valuation of the financial asset) on behalf of each Fund with a value approximately equal to the amount of any unrealized gain above a pre-determined threshold. Reciprocally, when each Fund has an unrealized loss, the Funds have instructed the custodian to pledge assets of the Funds as collateral with a value approximately equal to the amount of the unrealized loss above a pre-determined threshold. Collateral pledges are monitored and subsequently adjusted if and when the valuations fluctuate, either up or down, by at least the pre-determined threshold amount.
Zero Coupon Securities
Each Fund is authorized to invest in zero coupon securities. A zero coupon security does not pay a regular interest coupon to its holders during the life of the security. Tax-exempt income to the holder of the security comes from accretion of the difference between the original purchase price of the security at issuance and the par value of the security at maturity and is effectively paid at maturity. The market prices of zero coupon securities generally are more volatile than the market prices of securities that pay interest periodically.
Multiclass Operations and Allocations
Income and expenses of the Funds that are not directly attributable to a specific class of shares are prorated among the classes based on the relative settled shares of each class. Expenses directly attributable to a class of shares, which presently only include 12b-1 distribution fees and shareholder service fees, are recorded to the specific class.
Realized and unrealized capital gains and losses of the Funds are prorated among the classes based on the relative net assets of each class.
Indemnifications
Under the Trust’s organizational documents, its officers and directors are indemnified against certain liabilities arising out of the performance of their duties to the Trust. In addition, in the normal course of business, the Trust enters into contracts that provide general indemnifications to other parties. The Trust’s maximum exposure under these arrangements is unknown as this would involve future claims that may be made against the Trust that have not yet occurred. However, the Trust has not had prior claims or losses pursuant to these contracts and expects the risk of loss to be remote.
Use of Estimates
The preparation of financial statements in conformity with U.S. GAAP requires management to make estimates and assumptions that affect the reported amounts of assets and liabilities at the date of the financial statements and the reported amounts of increases and decreases in net assets from operations during the reporting period. Actual results may differ from those estimates.
2. Fair Value Measurements
Fair value is defined as the price that the Funds would receive upon selling an investment or transferring a liability in an orderly transaction to an independent buyer in the principal or most advantageous market for the investment. A three-tier hierarchy is used to maximize the use of observable market data and minimize the use of unobservable inputs and to establish classification of fair value measurements for disclosure purposes. Observable inputs reflect the assumptions market participants would use in pricing the asset or liability. Observable inputs are based on market data obtained from sources independent of the reporting entity. Unobservable inputs reflect the reporting entity’s own assumptions about the assumptions market participants would use in pricing the asset or liability. Unobservable inputs are based on the best information available in the circumstances. The three-tier hierarchy of inputs is summarized in the three broad levels listed below:
| | |
| Level 1 – | | Quoted prices in active markets for identical securities. |
| Level 2 – | | Other significant observable inputs (including quoted prices for similar securities, interest rates, prepayment speeds, credit risk, etc.). |
| Level 3 – | | Significant unobservable inputs (including management’s assumptions in determining the fair value of investments). |
The inputs or methodologies used for valuing securities are not an indication of the risk associated with investing in those securities. The following is a summary of each Fund’s fair value measurements as of May 31, 2012:
| | | | | | | | | | | | | | | | |
| Minnesota Intermediate | | Level 1 | | | Level 2 | | | Level 3 | | | Total | |
Long-Term Investments: | | | | | | | | | | | | | | | | |
Municipal Bonds | | $ | — | | | $ | 252,342,542 | | | $ | — | | | $ | 252,342,542 | |
Short-Term Investments: | | | | | | | | | | | | | | | | |
Money Market Funds | | | 7,105,303 | | | | — | | | | — | | | | 7,105,303 | |
Total | | $ | 7,105,303 | | | $ | 252,342,542 | | | $ | — | | | $ | 259,447,845 | |
| | | | |
| Minnesota | | Level 1 | | | Level 2 | | | Level 3 | | | Total | |
Long-Term Investments: | | | | | | | | | | | | | | | | |
Municipal Bonds | | $ | — | | | $ | 184,720,320 | | | $ | — | | | $ | 184,720,320 | |
Short-Term Investments: | | | | | | | | | | | | | | | | |
Money Market Funds | | | 6,910,130 | | | | — | | | | — | | | | 6,910,130 | |
Total | | $ | 6,910,130 | | | $ | 184,720,320 | | | $ | — | | | $ | 191,630,450 | |
| | | | |
| Nebraska | | Level 1 | | | Level 2 | | | Level 3 | | | Total | |
Long-Term Investments: | | | | | | | | | | | | | | | | |
Municipal Bonds | | $ | — | | | $ | 62,605,397 | | | $ | — | | | $ | 62,605,397 | |
Short-Term Investments: | | | | | | | | | | | | | | | | |
Money Market Funds | | | 1,214,076 | | | | — | | | | — | | | | 1,214,076 | |
Total | | $ | 1,214,076 | | | $ | 62,605,397 | | | $ | — | | | $ | 63,819,473 | |
| | | | |
| Oregon Intermediate | | Level 1 | | | Level 2 | | | Level 3 | | | Total | |
Long-Term Investments: | | | | | | | | | | | | | | | | |
Municipal Bonds | | $ | — | | | $ | 156,379,849 | | | $ | — | | | $ | 156,379,849 | |
Short-Term Investments: | | | | | | | | | | | | | | | | |
Money Market Funds | | | 2,554,275 | | | | — | | | | — | | | | 2,554,275 | |
Total | | $ | 2,554,275 | | | $ | 156,379,849 | | | $ | — | | | $ | 158,934,124 | |
During the fiscal year ended May 31, 2012, the Funds recognized no significant transfers to or from Level 1, Level 2 or Level 3.
Notes to Financial Statements (continued)
3. Derivative Instruments and Hedging Activities
The Funds record derivative instruments at fair value, with changes in fair value recognized on the Statement of Operations, when applicable. Even though the Funds’ investments in derivatives may represent economic hedges, they are not considered to be hedge transactions for financial reporting purposes. The Funds did not invest in derivative instruments during the fiscal year ended May 31, 2012.
4. Fund Shares
Transactions in Fund shares were as follows:
| | | | | | | | | | | | | | | | | | | | | | | | |
| | | Minnesota Intermediate | |
| | | Year Ended
5/31/12 | | | Eleven Months Ended
5/31/11 | | | Year Ended
6/30/10 | |
| | | Shares | | | Amount | | | Shares | | | Amount | | | Shares | | | Amount | |
Shares sold: | | | | | | | | | | | | | | | | | | | | | | | | |
Class A | | | 1,762,984 | | | $ | 18,520,988 | | | | 1,134,480 | | | $ | 11,516,192 | | | | 1,406,871 | | | $ | 14,085,154 | |
Class C | | | 320,741 | | | | 3,341,075 | | | | 61,225 | | | | 610,012 | | | | N/A | | | | N/A | |
Class C1(1) | | | 481 | | | | 5,036 | | | | 411,712 | | | | 4,204,514 | | | | 424,207 | | | | 4,277,549 | |
Class I(1) | | | 2,951,840 | | | | 30,791,966 | | | | 3,616,746 | | | | 36,462,139 | | | | 4,529,540 | | | | 44,976,095 | |
Shares issued to shareholders due to reinvestment of distributions: | | | | | | | | | | | | | | | | | | | | | | | | |
Class A | | | 115,025 | | | | 1,204,654 | | | | 90,375 | | | | 914,438 | | | | 75,914 | | | | 761,342 | |
Class C | | | 4,910 | | | | 51,413 | | | | 208 | | | | 2,099 | | | | N/A | | | | N/A | |
Class C1(1) | | | 13,217 | | | | 138,387 | | | | 12,102 | | | | 122,497 | | | | 3,360 | | | | 33,923 | |
Class I(1) | | | 33,512 | | | | 349,149 | | | | 16,655 | | | | 167,498 | | | | 16,946 | | | | 168,548 | |
| | | | 5,202,710 | | | | 54,402,668 | | | | 5,343,503 | | | | 53,999,389 | | | | 6,456,838 | | | | 64,302,611 | |
Shares redeemed: | | | | | | | | | | | | | | | | | | | | | | | | |
Class A | | | (648,644 | ) | | | (6,789,668 | ) | | | (1,031,872 | ) | | | (10,363,389 | ) | | | (409,024 | ) | | | (4,091,061 | ) |
Class C | | | (32,148 | ) | | | (337,359 | ) | | | — | | | | — | | | | N/A | | | | N/A | |
Class C1(1) | | | (115,360 | ) | | | (1,213,113 | ) | | | (203,683 | ) | | | (2,039,624 | ) | | | (36,628 | ) | | | (369,617 | ) |
Class I(1) | | | (3,362,625 | ) | | | (34,869,437 | ) | | | (3,956,961 | ) | | | (39,704,506 | ) | | | (3,247,419 | ) | | | (32,281,307 | ) |
| | | | (4,158,777 | ) | | | (43,209,577 | ) | | | (5,192,516 | ) | | | (52,107,519 | ) | | | (3,693,071 | ) | | | (36,741,985 | ) |
Net increase (decrease) | | | 1,043,933 | | | $ | 11,193,091 | | | | 150,987 | | | $ | 1,891,870 | | | | 2,763,767 | | | $ | 27,560,626 | |
| | | | | | | | | | | | | | | | | | | | | | | | |
| | | Minnesota | |
| | | Year Ended
5/31/12 | | | Eleven Months Ended
5/31/11 | | | Year Ended
6/30/10 | |
| | | Shares | | | Amount | | | Shares | | | Amount | | | Shares | | | Amount | |
Shares sold: | | | | | | | | | | | | | | | | | | | | | | | | |
Class A | | | 1,290,772 | | | $ | 14,873,424 | | | | 775,664 | | | $ | 8,397,331 | | | | 1,217,843 | | | $ | 12,952,910 | |
Class C | | | 379,744 | | | | 4,380,042 | | | | 56,870 | | | | 600,797 | | | | N/A | | | | N/A | |
Class C1(1) | | | 4,691 | | | | 53,117 | | | | 335,534 | | | | 3,329,111 | | | | 638,292 | | | | 6,758,429 | |
Class I(1) | | | 1,641,557 | | | | 18,876,197 | | | | 921,830 | | | | 9,980,343 | | | | 1,442,585 | | | | 15,412,447 | |
Shares issued to shareholders due to reinvestment of distributions: | | | | | | | | | | | | | | | | | | | | | | | | |
Class A | | | 238,211 | | | | 2,726,168 | | | | 165,258 | | | | 1,786,868 | | | | 206,791 | | | | 2,205,625 | |
Class C | | | 4,914 | | | | 56,828 | | | | 241 | | | | 2,570 | | | | N/A | | | | N/A | |
Class C1(1) | | | 54,910 | | | | 623,840 | | | | 50,013 | | | | 538,676 | | | | 57,493 | | | | 611,059 | |
Class I(1) | | | 10,682 | | | | 122,467 | | | | 6,614 | | | | 71,336 | | | | 7,153 | | | | 76,168 | |
| | | | 3,625,481 | | | | 41,712,083 | | | | 2,312,024 | | | | 24,707,032 | | | | 3,570,157 | | | | 38,016,638 | |
Shares redeemed: | | | | | | | | | | | | | | | | | | | | | | | | |
Class A | | | (955,770 | ) | | | (10,817,559 | ) | | | (1,532,608 | ) | | | (16,489,035 | ) | | | (1,707,353 | ) | | | (18,154,374 | ) |
Class C | | | (26,575 | ) | | | (310,556 | ) | | | (8 | ) | | | (88 | ) | | | N/A | | | | N/A | |
Class C1(1) | | | (302,359 | ) | | | (3,401,378 | ) | | | (801,638 | ) | | | (8,182,403 | ) | | | (283,568 | ) | | | (3,009,021 | ) |
Class I(1) | | | (810,815 | ) | | | (9,178,740 | ) | | | (1,051,582 | ) | | | (11,375,003 | ) | | | (823,658 | ) | | | (8,804,939 | ) |
| | | | (2,095,519 | ) | | | (23,708,233 | ) | | | (3,385,836 | ) | | | (36,046,529 | ) | | | (2,814,579 | ) | | | (29,968,334 | ) |
Net increase (decrease) | | | 1,529,962 | | | $ | 18,003,850 | | | | (1,073,811 | ) | | $ | (11,339,497 | ) | | | 755,578 | | | $ | 8,048,304 | |
| (1) | – Effective January 18, 2011, Class C Shares and Class Y Shares previously offered by FAF Advisor, Inc. were renamed Class C1 Shares and Class I Shares, respectively. |
| N/A | – The Fund did not offer Class C Shares prior to January 18, 2011. |
| | | | | | | | | | | | | | | | | | | | | | | | |
| | | Nebraska | |
| | | Year Ended
5/31/12 | | | Eleven Months Ended
5/31/11 | | | Year Ended
6/30/10 | |
| | | Shares | | | Amount | | | Shares | | | Amount | | | Shares | | | Amount | |
Shares sold: | | | | | | | | | | | | | | | | | | | | | | | | |
Class A | | | 1,052,841 | | | $ | 11,246,926 | | | | 185,685 | | | $ | 1,921,548 | | | | 156,322 | | | $ | 1,600,396 | |
Class C | | | 228,712 | | | | 2,465,910 | | | | 31,046 | | | | 312,000 | | | | N/A | | | | N/A | |
Class C1(1) | | | 1,672 | | | | 17,925 | | | | 72,070 | | | | 730,404 | | | | 155,443 | | | | 1,574,720 | |
Class I(1) | | | 420,217 | | | | 4,502,072 | | | | 354,711 | | | | 3,619,929 | | | | 405,866 | | | | 4,178,019 | |
Shares issued to shareholders due to reinvestment of distributions: | | | | | | | | | | | | | | | | | | | | | | | | |
Class A | | | 29,951 | | | | 322,453 | | | | 14,265 | | | | 146,355 | | | | 14,916 | | | | 153,135 | |
Class C | | | 2,057 | | | | 22,187 | | | | 172 | | | | 1,752 | | | | N/A | | | | N/A | |
Class C1(1) | | | 11,568 | | | | 122,256 | | | | 9,310 | | | | 94,727 | | | | 7,300 | | | | 74,443 | |
Class I(1) | | | 26,107 | | | | 278,397 | | | | 18,756 | | | | 192,140 | | | | 13,015 | | | | 133,756 | |
| | | | 1,773,125 | | | | 18,978,126 | | | | 686,015 | | | | 7,018,855 | | | | 752,862 | | | | 7,714,469 | |
Shares redeemed: | | | | | | | | | | | | | | | | | | | | | | | | |
Class A | | | (45,380 | ) | | | (481,975 | ) | | | (121,482 | ) | | | (1,230,484 | ) | | | (153,421 | ) | | | (1,577,109 | ) |
Class C | | | (7,879 | ) | | | (84,950 | ) | | | — | | | | — | | | | N/A | | | | N/A | |
Class C1(1) | | | (46,994 | ) | | | (485,064 | ) | | | (76,658 | ) | | | (768,038 | ) | | | (20,083 | ) | | | (203,586 | ) |
Class I(1) | | | (202,940 | ) | | | (2,147,529 | ) | | | (380,978 | ) | | | (3,885,235 | ) | | | (468,148 | ) | | | (4,804,188 | ) |
| | | | (303,193 | ) | | | (3,199,518 | ) | | | (579,118 | ) | | | (5,883,757 | ) | | | (641,652 | ) | | | (6,584,883 | ) |
Net increase (decrease) | | | 1,469,932 | | | $ | 15,778,608 | | | | 106,897 | | | $ | 1,135,098 | | | | 111,210 | | | $ | 1,129,586 | |
| | | | | | | | | | | | | | | | | | | | | | | | |
| | | Oregon Intermediate | |
| | | Year Ended
5/31/12 | | | Eleven Months Ended
5/31/11 | | | Year Ended
6/30/10 | |
| | | Shares | | | Amount | | | Shares | | | Amount | | | Shares | | | Amount | |
Shares sold: | | | | | | | | | | | | | | | | | | | | | | | | |
Class A | | | 1,247,098 | | | $ | 13,048,451 | | | | 938,440 | | | $ | 9,517,448 | | | | 2,047,813 | | | $ | 20,541,193 | |
Class C | | | 653,076 | | | | 6,838,752 | | | | 61,865 | | | | 615,351 | | | | N/A | | | | N/A | |
Class I(1) | | | 1,704,340 | | | | 17,712,304 | | | | 2,355,223 | | | | 23,543,107 | | | | 4,536,476 | | | | 45,504,835 | |
Shares issued to shareholders due to reinvestment of distributions: | | | | | | | | | | | | | | | | | | | | | | | | |
Class A | | | 85,272 | | | | 889,463 | | | | 71,924 | | | | 726,653 | | | | 53,832 | | | | 541,594 | |
Class C | | | 5,512 | | | | 57,649 | | | | 372 | | | | 3,738 | | | | N/A | | | | N/A | |
Class I(1) | | | 24,797 | | | | 258,172 | | | | 13,965 | | | | 140,983 | | | | 10,324 | | | | 102,895 | |
| | | | 3,720,095 | | | | 38,804,791 | | | | 3,441,789 | | | | 34,547,280 | | | | 6,648,445 | | | | 66,690,517 | |
Shares redeemed: | | | | | | | | | | | | | | | | | | | | | | | | |
Class A | | | (379,765 | ) | | | (3,928,739 | ) | | | (992,803 | ) | | | (9,904,516 | ) | | | (154,474 | ) | | | (1,553,778 | ) |
Class C | | | (25,478 | ) | | | (265,350 | ) | | | — | | | | — | | | | N/A | | | | N/A | |
Class I(1) | | | (2,480,921 | ) | | | (25,845,351 | ) | | | (4,410,990 | ) | | | (44,254,879 | ) | | | (3,588,177 | ) | | | (35,967,779 | ) |
| | | | (2,886,164 | ) | | | (30,039,440 | ) | | | (5,403,793 | ) | | | (54,159,395 | ) | | | (3,742,651 | ) | | | (37,521,557 | ) |
Net increase (decrease) | | | 833,931 | | | $ | 8,765,351 | | | | (1,962,004 | ) | | $ | (19,612,115 | ) | | | 2,905,794 | | | $ | 29,168,960 | |
| (1) | – Effective January 18, 2011, Class C Shares and Class Y Shares previously offered by FAF Advisor, Inc. were renamed Class C1 Shares and Class I Shares, respectively. |
| N/A | – The Fund did not offer Class C Shares prior to January 18, 2011. |
5. Investment Transactions
Purchases and sales (including maturities but excluding short-term investments, where applicable) during the fiscal year ended May 31, 2012, were as follows:
| | | | | | | | | | | | | | | | |
| | | Minnesota
Intermediate | | | Minnesota | | | Nebraska
| | | Oregon
Intermediate | |
Purchases | | $ | 30,550,925 | | | $ | 39,068,764 | | | $ | 28,758,331 | | | $ | 19,445,270 | |
Sales and maturities | | | 21,315,267 | | | | 28,910,346 | | | | 12,276,869 | | | | 13,000,230 | |
6. Income Tax Information
The following information is presented on an income tax basis. Differences between amounts for financial statement and federal income tax purposes are primarily due to timing differences in recognizing certain gains and losses on investment transactions. To the extent that differences arise that are permanent in nature, such amounts are reclassified within the capital accounts as detailed below. Temporary differences do not require reclassification. Temporary and permanent differences do not impact the net asset values of the Funds.
Notes to Financial Statements (continued)
At May 31, 2012, the cost and unrealized appreciation (depreciation) of investments, as determined on a federal income tax basis, were as follows:
| | | | | | | | | | | | | | | | |
| | | Minnesota
Intermediate | | | Minnesota | | | Nebraska | | | Oregon
Intermediate | |
Cost of investments | | $ | 238,220,064 | | | $ | 174,916,793 | | | $ | 59,298,721 | | | $ | 145,529,698 | |
Gross unrealized: | | | | | | | | | | | | | | | | |
Appreciation | | $ | 21,232,243 | | | $ | 16,903,344 | | | $ | 4,520,752 | | | $ | 13,404,885 | |
Depreciation | | | (4,462 | ) | | | (189,687 | ) | | | — | | | | (459 | ) |
Net unrealized appreciation (depreciation) of investments | | $ | 21,227,781 | | | $ | 16,713,657 | | | $ | 4,520,752 | | | $ | 13,404,426 | |
Permanent differences, primarily due to federal taxes paid and distribution character reclassifications, resulted in reclassifications among the Funds’ components of net assets at May 31, 2012, the Funds’ tax year end, as follows:
| | | | | | | | | | | | | | | | |
| | | Minnesota
Intermediate | | | Minnesota | | | Nebraska | | | Oregon
Intermediate | |
Capital paid-in | | $ | (76 | ) | | $ | — | | | $ | 24,349 | | | $ | — | |
Undistributed (Over-distribution of) net investment income | | | 698 | | | | — | | | | (24,349 | ) | | | — | |
Accumulated net realized gain (loss) | | | (622 | ) | | | — | | | | — | | | | — | |
The tax components of undistributed net tax-exempt income, net ordinary income and net long-term capital gains at May 31, 2012, the Funds’ tax year end, were as follows:
| | | | | | | | | | | | | | | | |
| | | Minnesota
Intermediate | | | Minnesota | | | Nebraska | | | Oregon
Intermediate | |
Undistributed net tax-exempt income* | | $ | 1,065,705 | | | $ | 1,197,045 | | | $ | 49,763 | | | $ | 361,772 | |
Undistributed net ordinary income** | | | 9,197 | | | | — | | | | — | | | | 13,617 | |
Undistributed net long-term capital gains | | | 162,183 | | | | 384,230 | | | | — | | | | 648 | |
| * | Undistributed net tax exempt income (on a tax basis) has not been reduced for the dividends declared during the period May 1, 2012 through May 31, 2012 and paid on June 1, 2012. |
| ** | Net ordinary income consists of net taxable income derived from dividends, interest and net short-term capital gains, if any. |
The tax character of distributions paid during the Funds’ tax years ended May 31, 2012, May 31, 2011 and June 30, 2010, was designated for purposes of the dividends paid deduction as follows:
| | | | | | | | | | | | | | | | |
| Tax year ended May 31, 2012 | | Minnesota
Intermediate | | | Minnesota | | | Nebraska | | | Oregon
Intermediate | |
Distributions from net tax-exempt income*** | | $ | 8,364,048 | | | $ | 6,539,683 | | | $ | 2,002,803 | | | $ | 5,002,123 | |
Distributions from net ordinary income** | | | 29,652 | | | | 71,205 | | | | — | | | | 97,463 | |
Distributions from net long-term capital gains**** | | | 253,187 | | | | — | | | | — | | | | 24,192 | |
| | | | | | | | | | | | | | | | |
Eleven months ended May 31, 2011 | | Minnesota
Intermediate | | | Minnesota | | | Nebraska | | | Oregon
Intermediate | |
Distributions from net tax-exempt income | | $ | 7,479,058 | | | $ | 5,053,001 | | | $ | 1,620,490 | | | $ | 4,508,159 | |
Distributions from net ordinary income** | | | 15,260 | | | | 87,657 | | | | 13,041 | | | | 107,863 | |
Distributions from net long-term capital gains | | | — | | | | — | | | | — | | | | — | |
| | | | | | | | | | | | | | | | |
| Tax year ended June 30, 2010 | | Minnesota
Intermediate | | | Minnesota | | | Nebraska | | | Oregon
Intermediate | |
Distributions from net tax-exempt income | | $ | 7,780,380 | | | $ | 6,226,143 | | | $ | 1,703,096 | | | $ | 5,244,072 | |
Distributions from net ordinary income** | | | 36,603 | | | | 73,366 | | | | 6,899 | | | | 94,709 | |
Distributions from net long-term capital gains | | | 104,483 | | | | 10,017 | | | | — | | | | — | |
| ** | Net ordinary income consists of net taxable income derived from dividends, interest and net short-term capital gains, if any. |
| *** | The Funds hereby designate these amounts paid during the fiscal year ended May 31, 2012, as Exempt Interest Dividends. |
| **** | The Funds designate as long-term capital gain dividend, pursuant to the Internal Revenue Code Section 852(b)(3), the amount necessary to reduce earnings and profits of the Funds related to net capital gain to zero for the tax year ended May 31, 2012. |
At May 31, 2012, the Funds’ tax year end, the following Fund had unused capital loss carryforwards available for federal income tax purposes to be applied against future capital gains, if any. If not applied, the carryforwards will expire as follows:
| | | | |
| | | Nebraska | |
Expiration: | | | | |
May 31, 2017 | | $ | 199,025 | |
May 31, 2018 | | | 36,230 | |
Total | | $ | 235,255 | |
During the fiscal year ended May 31, 2012, the following Funds utilized their capital loss carryforwards as follows:
| | | | | | | | |
| | | Minnesota | | | Nebraska | |
Utilized capital loss carryforwards | | $ | 123,599 | | | $ | 128,711 | |
On December 22, 2010, the Regulated Investment Company Modernization Act of 2010 (the “Act”) was enacted, which changed various technical rules governing the tax treatment of RICs. The changes are generally effective for taxable years beginning after the date of enactment. One of the more prominent changes addresses capital loss carryforwards. Under the Act, each Fund will be permitted to carry forward capital losses incurred in taxable years beginning after the date of enactment for an unlimited period. However, any losses incurred during those future taxable years will be required to be utilized prior to the losses incurred in pre-enactment taxable years, which carry an expiration date. As a result of this ordering rule, pre-enactment capital loss carryforwards may be more likely to expire unused. Additionally, post-enactment capital loss carryforwards will retain their character as either short-term or long-term capital losses rather than being considered all short-term as permitted under previous regulation.
The Act also contains several provisions aimed at preserving the character of distributions made by a fiscal year RIC during the portion of its taxable year ending after October 31 or December 31, reducing the circumstances under which a RIC might be required to file amended Forms 1099 to restate previously reported distributions.
During the Funds’ tax year ended May 31, 2012, there were no post-enactment capital losses generated by any of the funds.
The Funds have elected to defer losses incurred from November 1, 2011 through May 31, 2012, the Funds’ tax year end, in accordance with federal income tax rules. These losses are treated as having arisen on the first day of the following fiscal year. The following Funds have elected to defer losses as follows:
| | | | | | | | |
| | | Nebraska | | | Oregon
Intermediate | |
Post-October capital losses | | $ | 60,100 | | | $ | 129,536 | |
Late-year ordinary losses | | | — | | | | — | |
7. Management Fees and Other Transactions with Affiliates
Each Fund’s management fee consists of two components – a fund-level fee, based only on the amount of assets within each individual Fund, and a complex-level fee, based on the aggregate amount of all eligible fund assets managed by the Adviser. This pricing structure enables each Fund’s shareholders to benefit from growth in the assets within their respective Fund as well as from growth in the amount of complex-wide assets managed by the Adviser.
The annual fund-level fee for each Fund, payable monthly, is calculated according to the following schedule:
| | | | | | | | | | | | | | | | |
| Average Daily Net Assets | | Minnesota
Intermediate
Fund-Level
Fee Rate | | | Minnesota
Fund-Level
Fee Rate | | | Nebraska
Fund-Level
Fee Rate | | | Oregon
Intermediate
Fund-Level
Fee Rate | |
For the first $125 million | | | .3500 | % | | | .3500 | % | | | .3500 | % | | | .3500 | % |
For the next $125 million | | | .3375 | | | | .3375 | | | | .3375 | | | | .3375 | |
For the next $250 million | | | .3250 | | | | .3250 | | | | .3250 | | | | .3250 | |
For the next $500 million | | | .3125 | | | | .3125 | | | | .3125 | | | | .3125 | |
For the next $1 billion | | | .3000 | | | | .3000 | | | | .3000 | | | | .3000 | |
For net assets over $2 billion | | | .2750 | | | | .2750 | | | | .2750 | | | | .2750 | |
Notes to Financial Statements (continued)
The annual complex-level fee for each Fund, payable monthly, is determined by taking the complex-level fee rate, which is based on the aggregate amount of “eligible assets” of all Nuveen funds as set forth in the schedule below, and making, as appropriate, an upward adjustment to that rate based upon the percentage of the particular fund’s assets that are not “eligible assets.” The complex-level fee schedule for each Fund is as follows:
| | | | |
| Complex-Level Asset Breakpoint Level* | | Effective Rate at Breakpoint Level | |
$55 billion | | | .2000 | % |
$56 billion | | | .1996 | |
$57 billion | | | .1989 | |
$60 billion | | | .1961 | |
$63 billion | | | .1931 | |
$66 billion | | | .1900 | |
$71 billion | | | .1851 | |
$76 billion | | | .1806 | |
$80 billion | | | .1773 | |
$91 billion | | | .1691 | |
$125 billion | | | .1599 | |
$200 billion | | | .1505 | |
$250 billion | | | .1469 | |
$300 billion | | | .1445 | |
| * | The complex-level fee is calculated based upon the aggregate daily “eligible assets” of all Nuveen Funds. Eligible assets do not include assets attributable to investments in other Nuveen Funds or assets in excess of $2 billion added to the Nuveen Fund complex in connection with Nuveen Fund Advisors’ assumption of the management of the former First American Funds effective January 1, 2011. Eligible assets include closed-end fund assets managed by the Adviser that are attributable to financial leverage. For these purposes, financial leverage includes the closed-end funds’ use of preferred stock and borrowings and investments in the residual interest certificates (also called inverse floating rate securities) in tender option bond (TOB) trusts, including the portion of assets held by the TOB trust that has been effectively financed by the trust’s issuance of floating rate securities, subject to an agreement by the Adviser as to certain funds to limit the amount of such assets for determining eligible assets in certain circumstances. As of May 31, 2012, the complex-level fee rate for each Fund was as follows: |
| | | | |
| Fund | | Complex-Level
Fee Rate | |
Minnesota Intermediate | | | .1947 | % |
Minnesota | | | .1932 | |
Nebraska | | | .1892 | |
Oregon Intermediate | | | .1958 | |
The management fee compensates the Adviser for overall investment advisory and administrative services and general office facilities. The Adviser is responsible for each Fund’s overall investment strategy and asset allocation decisions. The Adviser has entered into sub-advisory agreements with the Sub-Adviser, under which the Sub-Adviser manages the investment portfolios of the Funds. The Sub-Adviser is compensated for its services to the Funds from the management fees paid to the Adviser.
During the current fiscal period, the Advisor had contractually agreed to reimburse Class A Share 12b-1 fees through March 31, 2012, to the extent necessary so that total annual Fund operating expenses (after fee waivers and/or expense reimbursements and excluding acquired Fund fees and expenses) did not exceed 0.75% for Class A Shares of Minnesota Intermediate and 0.85% for Class A Shares of Minnesota and Oregon Intermediate. In addition, Nuveen Securities, LLC (the “Distributor”), a wholly-owned subsidiary of Nuveen, had contractually agreed to limit its Class A Share 12b-1 fees for Minnesota Intermediate to 0.15% of average daily net assets through March 31, 2012.
The Adviser has agreed to waive fees and/or reimburse expenses of each Fund so that total annual Fund operating expenses (excluding acquired Fund fees and expenses), do not exceed the average daily net assets of any class of Fund shares in the amounts and for the time periods stated in the following table.
| | | | | | | | | | | | | | | | |
| | | Minnesota
Intermediate | | | Minnesota | | | Nebraska | | | Oregon
Intermediate | |
Class A Shares | | | .75 | % | | | .85 | % | | | .70 | % | | | .85 | % |
Class C Shares | | | N/A | | | | N/A | | | | 1.25 | | | | N/A | |
Class C1 Shares | | | N/A | | | | N/A | | | | 1.15 | | | | N/A | |
Class I Shares | | | N/A | | | | N/A | | | | .50 | | | | N/A | |
First expiration date | | | March 31, 2012 | | | | March 31, 2012 | | | | June 30, 2011 | | | | March 31, 2012 | |
| | | | |
After first expiration date: | | | | | | | | | | | | | | | | |
Class A Shares | | | .90 | % | | | .90 | % | | | .90 | % | | | .90 | % |
Class C Shares | | | 1.45 | | | | 1.45 | | | | 1.45 | | | | 1.45 | |
Class C1 Shares | | | 1.35 | | | | 1.35 | | | | 1.35 | | | | N/A | |
Class I Shares | | | .70 | | | | .70 | | | | .70 | | | | .70 | |
Expiration date | | | March 31, 2013 | | | | March 31, 2013 | | | | March 31, 2013 | | | | March 31, 2013 | |
The Adviser may also voluntarily reimburse expenses from time to time in any of the Funds. Voluntary reimbursements may be terminated at any time at the Adviser’s discretion.
The Trust pays no compensation directly to those of its directors who are affiliated with the Adviser or to its officers, all of whom receive remuneration for their services to the Trust from the Adviser or its affiliates. The Board of Directors has adopted a deferred compensation plan for independent directors that enable directors to elect to defer receipt of all or a portion of the annual compensation they are entitled to receive from certain Nuveen-advised funds. Under the plan, deferred amounts are treated as though equal dollar amounts had been invested in shares of select Nuveen-advised funds.
During the fiscal year ended May 31, 2012, the Distributor collected sales charges on purchases of Class A Shares, the majority of which were paid out as concessions to financial intermediaries as follows:
| | | | | | | | | | | | | | | | | | |
| | | | | Minnesota
Intermediate | | | Minnesota | | | Nebraska | | | Oregon
Intermediate | |
Sales charges collected (Unaudited) | | | | $ | 107,341 | | | $ | 230,168 | | | $ | 273,727 | | | $ | 101,807 | |
Paid to financial intermediaries (Unaudited) | | | | | 92,480 | | | | 199,555 | | | | 237,731 | | | | 85,124 | |
The Distributor also received 12b-1 service fees on Class A Shares, substantially all of which were paid to compensate financial intermediaries for providing services to shareholders relating to their investments.
During the fiscal year ended May 31, 2012, the Distributor compensated financial intermediaries directly with commission advances at the time of purchase as follows:
| | | | | | | | | | | | | | | | | | |
| | | | | Minnesota
Intermediate | | | Minnesota | | | Nebraska | | | Oregon
Intermediate | |
Commission advances (Unaudited) | | | | $ | 37,088 | | | $ | 43,590 | | | $ | 26,704 | | | $ | 82,160 | |
To compensate for commissions advanced to financial intermediaries, all 12b-1 service and distribution fees collected on Class C Shares and Class C1 Shares during the first year following a purchase are retained by the Distributor. During the fiscal year ended May 31, 2012, the Distributor retained such 12b-1 fees as follows:
| | | | | | | | | | | | | | | | | | |
| | | | | Minnesota
Intermediate | | | Minnesota | | | Nebraska | | | Oregon
Intermediate | |
12b-1 fees retained (Unaudited) | | | | $ | 5,996 | | | $ | 8,659 | | | $ | 6,061 | | | $ | 18,515 | |
The remaining 12b-1 fees charged to the Funds were paid to compensate financial intermediaries for providing services to shareholders relating to their investments.
The Distributor also collected and retained CDSC on share redemptions during the fiscal year ended May 31, 2012, as follows:
| | | | | | | | | | | | | | | | | | |
| | | | | Minnesota
Intermediate | | | Minnesota | | | Nebraska | | | Oregon
Intermediate | |
CDSC retained (Unaudited) | | | | $ | — | | | $ | — | | | $ | 250 | | | $ | 1,586 | |
8. New Accounting Pronouncements
Fair Value Measurements and Disclosures
On May 12, 2011, the Financial Accounting Standards Board (“FASB”) issued Accounting Standards Update (“ASU”) No. 2011-04 (“ASU No. 2011-04”) modifying Topic 820, Fair Value Measurements and Disclosures. At the same time, the International Accounting Standards Board (“IASB”) issued International Financial Reporting Standard (“IFRS”) 13, Fair Value Measurement. The objective of the FASB and IASB is convergence of their guidance on fair value measurements and disclosures. Specifically, ASU No. 2011-04 requires reporting entities to disclose i) the amounts of any transfers between Level 1 and Level 2 and the reasons for the transfers and ii) for Level 3 fair value measurements, a) quantitative information about significant unobservable inputs used, b) a description of the valuation processes used by the reporting entity and c) a narrative description of the sensitivity of the fair value measurement to changes in unobservable inputs if a change in those inputs might result in a significantly higher or lower fair value measurement. The effective date of the ASU No. 2011-04 is for interim and annual periods beginning after December 15, 2011. At this time, management is evaluating the implications of this guidance and the impact it will have to the financial statement amounts and footnote disclosures, if any.
Trustees and Officers (Unaudited)
The management of the Funds, including general supervision of the duties performed for the Funds by the Adviser, is the responsibility of the Board of Trustees of the Funds. The number of trustees of the Funds is currently set at ten. None of the trustees who are not “interested” persons of the Funds (referred to herein as “independent trustees”) has ever been a director or employee of, or consultant to, Nuveen or its affiliates. The names and business addresses of the trustees and officers of the Funds, their principal occupations and other affiliations during the past five years, the number of portfolios each oversees and other directorships they hold are set forth below.
The Funds’ Statement of Additional Information (“SAI”) includes more information about the trustees. To request a free copy, call Nuveen Investments at (800) 257-8787 or visit the Funds’ website at www.nuveen.com.
| | | | | | | | |
Name, Birthdate and Address | | Position(s) Held with the Funds | | Year First Elected or Appointed (1) | | Principal Occupation(s) Including other Directorships During Past 5 Years | | Number of Portfolios in Fund Complex Overseen by Trustee |
| | |
| Independent Trustees: | | | | |
Robert P. Bremner 8/22/40 333 W. Wacker Drive Chicago, IL 60606 | | Chairman of the Board and Trustee | | 1996 | | Private Investor and Management Consultant; Treasurer and Director, Humanities Council of Washington, D.C.; Board Member, Independent Directors Council affiliated with the Investment Company Institute. | | 222 |
Jack B. Evans 10/22/48 333 W. Wacker Drive Chicago, IL 60606 | | Trustee | | 1999 | | President, The Hall-Perrine Foundation, a private philanthropic corporation (since 1996); Director and Chairman, United Fire Group, a publicly held company; member of the Board of Regents for the State of Iowa University System; Director, Source Media Group; Life Trustee of Coe College and the Iowa College Foundation; formerly, Director, Alliant Energy; formerly, Director, Federal Reserve Bank of Chicago; formerly, President and Chief Operating Officer, SCI Financial Group, Inc., a regional financial services firm. | | 222 |
William C. Hunter 3/6/48 333 W. Wacker Drive Chicago, IL 60606 | | Trustee | | 2004 | | Dean Emeritus (since June 30, 2012), formerly, Dean, Tippie College of Business, University of Iowa (2006-2012); Director (since 2004) of Xerox Corporation; Director (since 2005), Beta Gamma Sigma International Honor Society; Director of Wellmark, Inc. (since 2009); formerly, Dean and Distinguished Professor of Finance, School of Business at the University of Connecticut (2003-2006); previously, Senior Vice President and Director of Research at the Federal Reserve Bank of Chicago (1995-2003); formerly, Director (1997-2007), Credit Research Center at George Washington University. | | 222 |
David J. Kundert 10/28/42 333 W. Wacker Drive Chicago, IL 60606 | | Trustee | | 2005 | | Director, Northwestern Mutual Wealth Management Company; retired (since 2004) as Chairman, JPMorgan Fleming Asset Management, President and CEO, Banc One Investment Advisors Corporation, and President, One Group Mutual Funds; prior thereto, Executive Vice President, Banc One Corporation and Chairman and CEO, Banc One Investment Management Group; Member, Board of Regents, Luther College; member of the Wisconsin Bar Association; member of Board of Directors, Friends of Boerner Botanical Gardens; member of Board of Directors and Chair of Investment Committee, Greater Milwaukee Foundation. | | 222 |
William J. Schneider 9/24/44 333 W. Wacker Drive Chicago, IL 60606 | | Trustee | | 1996 | | Chairman of Miller-Valentine Partners Ltd., a real estate investment company; formerly, Senior Partner and Chief Operating Officer (retired 2004) of Miller-Valentine Group; member, University of Dayton Business School Advisory Council; member, Mid-America Health System Board; formerly, member and chair, Dayton Philharmonic Orchestra Association; formerly, member, Business Advisory Council, Cleveland Federal Reserve Bank. | | 222 |
Judith M. Stockdale 12/29/47 333 W. Wacker Drive Chicago, IL 60606 | | Trustee | | 1997 | | Executive Director, Gaylord and Dorothy Donnelley Foundation (since 1994); prior thereto, Executive Director, Great Lakes Protection Fund (1990-1994). | | 222 |
Carole E. Stone 6/28/47 333 W. Wacker Drive Chicago, IL 60606 | | Trustee | | 2007 | | Director, Chicago Board Options Exchange (since 2006); Director, C2 Options Exchange, Incorporated (since 2009); formerly, Commissioner, New York State Commission on Public Authority Reform (2005-2010); formerly, Chair, New York Racing Association Oversight Board (2005-2007). | | 222 |
| | | | | | | | |
Name, Birthdate and Address | | Position(s) Held with the Funds | | Year First Elected or Appointed (1) | | Principal Occupation(s) During Past Five Years | | Number of Portfolios in Fund Complex Overseen by Trustee |
Virginia L. Stringer 8/16/44 333 West Wacker Drive Chicago, IL 60606 | | Trustee | | 2011 | | Board Member, Mutual Fund Directors Forum; former governance consultant and non-profit board member; former Owner and President, Strategic Management Resources, Inc. a management consulting firm; former Member, Governing Board, Investment Company Institute’s Independent Directors Council; previously, held several executive positions in general management, marketing and human resources at IBM and The Pillsbury Company; Independent Director, First American Fund Complex (1987-2010) and Chair (1997-2010). | | 222 |
Terence J. Toth 9/29/59 333 W. Wacker Drive Chicago, IL 60606 | | Trustee | | 2008 | | Director, Legal & General Investment Management America, Inc. (since 2008); Managing Partner, Promus Capital (since 2008); formerly, CEO and President, Northern Trust Global Investments (2004-2007); Executive Vice President, Quantitative Management & Securities Lending (2000-2004); prior thereto, various positions with Northern Trust Company (since 1994); member: Goodman Theatre Board (since 2004), Chicago Fellowship Board (since 2005), Catalyst Schools of Chicago Board (since 2008); Mather Foundation Board (since 2012) and a member of its investment committee; formerly, member: Northern Trust Mutual Funds Board (2005-2007), Northern Trust Global Investments Board (2004-2007), Northern Trust Japan Board (2004-2007), Northern Trust Securities Inc. Board (2003-2007) and Northern Trust Hong Kong Board (1997-2004). | | 222 |
| | |
| Interested Trustee: | | | | |
John P. Amboian (2) 6/14/61 333 W. Wacker Drive Chicago, IL 60606 | | Trustee | | 2008 | | Chief Executive Officer and Chairman (since 2007) and Director (since 1999) of Nuveen Investments, Inc., formerly, President (1999-2007); Chief Executive Officer (since 2007) of Nuveen Investments Advisers Inc.; Director (since 1998) formerly, Chief Executive Officer (2007-2010) of Nuveen Fund Advisors, Inc. | | 222 |
Name, Birthdate and Address | | Position(s) Held with the Funds | | Year First Elected or Appointed (3) | | Principal Occupation(s) During Past 5 Years | | Number of Portfolios in Fund Complex Overseen by Officer |
| | |
| Officers of the Funds: | | | | |
Gifford R. Zimmerman 9/9/56 333 W. Wacker Drive Chicago, IL 60606 | | Chief Administrative Officer | | 1988 | | Managing Director (since 2002), Assistant Secretary of Nuveen Securities, LLC; Managing Director (since 2004) and Assistant Secretary (since 1994) of Nuveen Investments, Inc.; Managing Director (since 2002), Assistant Secretary (since 1997) and Co-General Counsel (since 2011) of Nuveen Fund Advisors, Inc.; Managing Director, Assistant Secretary and Associate General Counsel of Nuveen Asset Management, LLC (since 2011); Managing Director, Associate General Counsel and Assistant Secretary of Symphony Asset Management LLC (since 2003); Vice President and Assistant Secretary of NWQ Investment Management Company, LLC (since 2002), Nuveen Investments Advisers Inc. (since 2002), Santa Barbara Asset Management, LLC (since 2006) and of Winslow Capital Management Inc. (since 2010); Chief Administrative Officer and Chief Compliance Officer (since 2006) of Nuveen Commodities Asset Management, LLC; Chartered Financial Analyst. | | 222 |
Margo L. Cook 4/11/64 333 W. Wacker Drive Chicago, IL 60606 | | Vice President | | 2009 | | Executive Vice President (since 2008) of Nuveen Investments, Inc. and of Nuveen Fund Advisors, Inc. (since 2011); Managing Director – Investment Services of Nuveen Commodities Asset Management, LLC (since August 2011) previously, Head of Institutional Asset Management (2007-2008) of Bear Stearns Asset Management; Head of Institutional Asset Management (1986-2007) of Bank of NY Mellon; Chartered Financial Analyst. | | 222 |
Trustees and Officers (Unaudited) (continued)
| | | | | | | | |
Name, Birthdate and Address | | Position(s) Held with the Funds | | Year First Elected or Appointed (3) | | Principal Occupation(s) During Past 5 Years | | Number of Portfolios in Fund Complex Overseen by Officer |
Lorna C. Ferguson 10/24/45 333 W. Wacker Drive Chicago, IL 60606 | | Vice President | | 1998 | | Managing Director (since 2005) of Nuveen Fund Advisors, Inc. and Nuveen Securities, LLC (since 2004). | | 222 |
Stephen D. Foy 5/31/54 333 W. Wacker Drive Chicago, IL 60606 | | Vice President and Controller | | 1998 | | Senior Vice President (since 2010), formerly, Vice President (2005-2010) and Funds Controller of Nuveen Securities, LLC; Vice President of Nuveen Fund Advisors, Inc.; Chief Financial Officer of Nuveen Commodities Asset Management, LLC (since 2010); Certified Public Accountant. | | 222 |
Scott S. Grace 8/20/70 333 W. Wacker Drive Chicago, IL 60606 | | Vice President and Treasurer | | 2009 | | Managing Director, Corporate Finance & Development, Treasurer (since 2009) of Nuveen Securities, LLC; Managing Director and Treasurer (since 2009) of Nuveen Fund Advisors, Inc., Nuveen Investments Advisers, Inc., Nuveen Investments Holdings Inc. and (since 2011) Nuveen Asset Management, LLC; Vice President and Treasurer of NWQ Investment Management Company, LLC, Tradewinds Global Investors, LLC, Symphony Asset Management LLC and Winslow Capital Management, Inc.; Vice President of Santa Barbara Asset Management, LLC; formerly, Treasurer (2006-2009), Senior Vice President (2008-2009), previously, Vice President (2006-2008) of Janus Capital Group, Inc.; formerly, Senior Associate in Morgan Stanley’s Global Financial Services Group (2000-2003); Chartered Accountant Designation. | | 222 |
Walter M. Kelly 2/24/70 333 W. Wacker Drive Chicago, IL 60606 | | Chief Compliance Officer and Vice President | | 2003 | | Senior Vice President (since 2008) and Assistant Secretary (since 2003) of Nuveen Fund Advisors, Inc; Senior Vice President (since 2008) of Nuveen Investments Holdings, Inc; formerly, Senior Vice President (2008-2011) of Nuveen Securities, LLC. | | 222 |
Tina M. Lazar 8/27/61 333 W. Wacker Drive Chicago, IL 60606 | | Vice President | | 2002 | | Senior Vice President (since 2010), formerly, Vice President (2005-2010) of Nuveen Fund Advisors, Inc. | | 222 |
Name, Birthdate and Address | | Position(s) Held with the Funds | | Year First Elected or Appointed (3) | | Principal Occupation(s) Including other Directorships During Past 5 Years | | Number of Portfolios in Fund Complex Overseen by Officer |
Kevin J. McCarthy 3/26/66 333 W. Wacker Drive Chicago, IL 60606 | | Vice President and Secretary | | 2007 | | Managing Director and Assistant Secretary (since 2008), formerly, Vice President (2007-2008), Nuveen Securities, LLC; Managing Director (since 2008), Assistant Secretary (since 2007) and Co-General Counsel (since 2011) of Nuveen Fund Advisors, Inc.; Managing Director, Assistant Secretary and Associate General Counsel (since 2011) of Nuveen Asset Management, LLC; Managing Director (since 2008), and Assistant Secretary, Nuveen Investment Holdings, Inc.; Vice President (since 2007) and Assistant Secretary of Nuveen Investments Advisers Inc., NWQ Investment Management Company, LLC, Tradewinds Global Investors LLC, NWQ Holdings, LLC, Symphony Asset Management LLC, Santa Barbara Asset Management, LLC, and of Winslow Capital Management, Inc. (since 2010); Vice President and Secretary (since 2010) of Nuveen Commodities Asset Management, LLC; prior thereto, Partner, Bell, Boyd & Lloyd LLP (1997-2007). | | 222 |
Kathleen L. Prudhomme 3/30/53 901 Marquette Avenue Minneapolis, MN 55402 | | Vice President and Assistant Secretary | | 2011 | | Managing Director, Assistant Secretary and Co-General Counsel (since 2011) of Nuveen Fund Advisors, Inc.; Managing Director, Assistant Secretary and Associate General Counsel (since 2011) of Nuveen Asset Management, LLC; Managing Director and Assistant Secretary (since 2011) of Nuveen Securities, LLC; formerly, Deputy General Counsel, FAF Advisors, Inc. (2004-2010). | | 222 |
| | | | | | | | |
Name, Birthdate and Address | | Position(s) Held with the Funds | | Year First Elected or Appointed (3) | | Principal Occupation(s) Including other Directorships During Past 5 Years | | Number of Portfolios in Fund Complex Overseen by Officer |
Jeffery M. Wilson 3/13/56 333 West Wacker Drive Chicago, IL 60606 | | Vice President | | 2011 | | Senior Vice President of Nuveen Securities, LLC (since 2011); formerly, Senior Vice President of FAF Advisors, Inc. (2000-2010). | | 100 |
| (1) | Trustees serve an indefinite term until his/her successor is elected or appointed. The year first elected or appointed represents the year in which the trustee was first elected or appointed to any fund in the Nuveen Fund Complex. |
| (2) | Mr. Amboian is an interested trustee because of his position with Nuveen Investments, Inc. and certain of its subsidiaries, which are affiliates of the Nuveen Funds. |
| (3) | Officers serve one year terms through August of each year. The year first elected or appointed represents the year in which the officer was first elected or appointed to any fund in the Nuveen Fund Complex. |
Annual Investment Management Agreement Approval Process
(Unaudited)
The Board of Trustees (each, a “Board” and each Trustee, a “Board Member”) of the Funds, including the Board Members who are not parties to the Funds’ advisory or sub-advisory agreements or “interested persons” of any such parties (the “Independent Board Members”), is responsible for approving the advisory agreements (each, an “Investment Management Agreement”) between each Fund and Nuveen Fund Advisors, Inc. (the “Advisor”) and the sub-advisory agreements (each a “Sub-Advisory Agreement”) between the Advisor and Nuveen Asset Management, LLC (the “Sub-Advisor”) (the Investment Management Agreements and the Sub-Advisory Agreements are referred to collectively as the “Advisory Agreements”) and their periodic continuation. Pursuant to the Investment Company Act of 1940, as amended (the “1940 Act”), the Board is required to consider the continuation of the Advisory Agreements on an annual basis. Accordingly, at an in-person meeting held on May 21-23, 2012 (the “May Meeting”), the Board, including a majority of the Independent Board Members, considered and approved the continuation of the Advisory Agreements for the Funds for an additional one-year period.
In preparation for their considerations at the May Meeting, the Board requested and received extensive materials prepared in connection with the review of the Advisory Agreements. The materials provided a broad range of information regarding the Funds, the Advisor and the Sub-Advisor (the Advisor and the Sub-Advisor are collectively, the “Fund Advisers” and each, a “Fund Adviser”). As described in more detail below, the information provided included, among other things, a review of Fund performance, including Fund investment performance assessments against peer groups and appropriate benchmarks, a comparison of Fund fees and expenses relative to peers, a description and assessment of shareholder service levels for the Funds, a summary of the performance of certain service providers, a review of product initiatives and shareholder communications and an analysis of the Advisor’s profitability with comparisons to comparable peers in the managed fund business. As part of their annual review, the Board also held a separate meeting on April 18-19, 2012, to review the Funds’ investment performance and consider an analysis provided by the Advisor of the Sub-Advisor which generally evaluated the Sub-Advisor’s investment team, investment mandate, organizational structure and history, investment philosophy and process, performance of the applicable Fund, and significant changes to the foregoing. As a result of their review of the materials and discussions, the Board presented the Advisor with questions and the Advisor responded.
The materials and information prepared in connection with the annual review of the Advisory Agreements supplement the information and analysis provided to the Board during the year. In this regard, throughout the year, the Board, acting directly or through its committees, regularly reviews the performance and various services provided by the Advisor and the Sub-Advisor. The Board meets at least quarterly as well as at other times as the need arises. At its quarterly meetings, the Board reviews reports by the Advisor which include, among other things, Fund performance, a review of the investment teams and reports on compliance, regulatory matters and risk management. The Board also meets with key investment personnel managing the Fund portfolios during the year. In October 2011, the Board also created two new standing committees (the Open-end Fund Committee and the Closed-end Fund Committee) to assist the full Board in monitoring and gaining a deeper insight into the distinctive issues and business practices of open-end and closed-end funds.
In addition, the Board continues its program of seeking to have the Board Members or a subset thereof visit each sub-advisor to the Nuveen funds at least once over a multiple year rotation, meeting with key investment and business personnel. In this regard, the Board visited with the Sub-Advisor’s municipal team in Minneapolis in September 2011, and with the Sub-Advisor’s municipal team in Chicago in November 2011. Further, an ad hoc committee of the Board visited the then-current transfer agents of the Nuveen funds in 2011 and the audit committee of the Board visited the various pricing agents for the Nuveen funds in January 2012.
The Board considers factors and information that are relevant to its annual consideration of the renewal of the Advisory Agreements at the meetings held throughout the year. Accordingly, the Board considers the information provided and knowledge gained at these meetings when performing its annual review of the Advisory Agreements. The Independent Board Members are assisted throughout the process by independent legal counsel who provided materials describing applicable law and the duties of directors or trustees in reviewing advisory contracts and met with the Independent Board Members in executive sessions without management present. In addition, it is important to recognize that the management arrangements for the Nuveen funds are the result of many years of review and discussion between the Independent Board Members and fund management and that the Board Members’ conclusions may be based, in part, on their consideration of fee arrangements and other factors developed in previous years.
The Board considered all factors it believed relevant with respect to each Fund, including among other factors: (a) the nature, extent and quality of the services provided by the Fund Advisers, (b) the investment performance of the Fund and Fund Advisers, (c) the advisory fees and costs of the services to be provided to the Funds and the profitability of the Fund Advisers, (d) the extent of any economies of scale, (e) any benefits derived by the Fund Advisers from the relationship with the Fund and (f) other factors. Each Board Member may have accorded different weight to the various factors in reaching his or her conclusions with respect to a Fund’s Advisory Agreements. The Independent Board Members did not identify any single factor as all important or controlling. The Independent Board Members’ considerations were instead based on a comprehensive consideration of all the information presented. The principal factors considered by the Board and its conclusions are described below.
A. Nature, Extent and Quality of Services
In considering renewal of the Advisory Agreements, the Independent Board Members considered the nature, extent and quality of the Fund Adviser’s services, including advisory services and the resulting Fund performance and administrative services. The Independent Board Members further considered the overall reputation and capabilities of the Advisor and its affiliates, the commitment of the
Advisor to provide high quality service to the Funds, their overall confidence in the Advisor’s integrity and the Advisor’s responsiveness to questions and concerns raised by them. The Independent Board Members reviewed materials outlining, among other things, the Fund Adviser’s organization and business; the types of services that the Fund Adviser or its affiliates provide to the Funds; the performance record of the applicable Fund (as described in further detail below); and any initiatives Nuveen had taken for the applicable fund product line.
In considering advisory services, the Board recognized that the Advisor provides various oversight, administrative, compliance and other services for the Funds and the Sub-Advisor generally provides the portfolio investment management services to the Funds. In reviewing the portfolio management services provided to each Fund, the Board reviewed the materials provided by the Nuveen Investment Services Oversight Team analyzing, among other things, the Sub-Advisor’s investment team and changes thereto, organization and history, assets under management, Fund objectives and mandate, the investment team’s philosophy and strategies in managing the Fund, developments affecting the Sub-Advisor or Fund and Fund performance. The Independent Board Members also reviewed portfolio manager compensation arrangements to evaluate each Fund Adviser’s ability to attract and retain high quality investment personnel, preserve stability, and reward performance but not provide an inappropriate incentive to take undue risks. In addition, the Board considered the Advisor’s execution of its oversight responsibilities over the Sub-Advisor. Given the importance of compliance, the Independent Board Members also considered Nuveen’s compliance program, including the report of the chief compliance officer regarding the Funds’ compliance policies and procedures; the resources dedicated to compliance; and the record of compliance with the policies and procedures.
In addition to advisory services, the Board considered the quality and extent of administrative and other non-investment advisory services the Advisor and its affiliates provide to the Funds, including product management, investment services (such as oversight of investment policies and procedures, risk management, and pricing), fund administration, oversight of service providers, shareholder services and communications, administration of Board relations, regulatory and portfolio compliance and legal support. The Board further recognized Nuveen’s additional investments in personnel, including in compliance and risk management. In reviewing the services provided, the Board also reviewed materials describing various notable initiatives and projects the Advisor performed in connection with the open-end fund product line. These initiatives included efforts to eliminate product overlap through mergers or liquidations; commencement of various new funds; elimination of insurance mandates for various funds; updates in investment policies or guidelines for several funds; and reductions in management fees and expense caps for certain funds.
Based on their review, the Independent Board Members found that, overall, the nature, extent and quality of services provided to the respective Funds under each applicable Advisory Agreement were satisfactory.
B. The Investment Performance of the Funds and Fund Advisers
The Board, including the Independent Board Members, reviewed and considered the performance history of each Fund over various time periods. The Board reviewed, among other things, each Fund’s historic investment performance as well as information comparing the Fund’s performance information with that of other funds (the “Performance Peer Group”) based on data compiled by Nuveen that was provided by an independent provider of mutual fund data and with recognized and/or customized benchmarks (i.e., benchmarks derived from multiple recognized benchmarks).
The Board reviewed reports, including a comprehensive analysis of the Funds’ performance and the applicable investment team. In this regard, the Board reviewed each Fund’s total return information compared to its Performance Peer Group for the quarter, one-, three- and five-year periods ending December 31, 2011, as well as performance information reflecting the first quarter of 2012. In addition, the Board reviewed each Fund’s total return information compared to recognized and/or customized benchmarks for the quarter, one- and three-year periods ending December 31, 2011, as well as performance information reflecting the first quarter of 2012.
In reviewing performance comparison information, the Independent Board Members recognized that the usefulness of the comparisons of the performance of certain funds with the performance of their respective Performance Peer Group may be limited because the Performance Peer Group may not adequately represent the objectives and strategies of the applicable funds or may be limited in size or number. In this regard, the Independent Board Members noted that the Performance Peer Groups of the Nuveen Minnesota Intermediate Municipal Bond Fund (the “Minnesota Intermediate Fund”), the Nuveen Nebraska Municipal Bond Fund (the “Nebraska Fund”) and the Nuveen Oregon Intermediate Municipal Bond Fund (the “Oregon Fund”) were classified as having significant differences from such Funds based on various considerations such as special fund objectives, potential investable universe and the composition of the peer set (e.g., the number and size of competing funds and number of competing managers). The Independent Board Members also noted that the investment experience of a particular shareholder in the Nuveen funds will vary depending on when such shareholder invests in the applicable fund, the class held (if multiple classes are offered in a fund) and the performance of the fund (or respective class) during that shareholder’s investment period. In addition, although the performance below reflects the performance results for the time periods ending as of the most recent calendar year end (unless otherwise indicated), the Board also recognized that selecting a different ending time period may derive different results. Furthermore, while the Board is cognizant of the relevant performance of a fund’s peer set and/or benchmark(s), the Board evaluated fund performance in light of the respective fund’s investment objectives, investment parameters and guidelines and recognized that the objectives, investment parameters and guidelines of peers and/or benchmarks may differ to some extent, thereby resulting in differences in
Annual Investment Management Agreement Approval Process
(Unaudited) (continued)
performance results. Nevertheless, with respect to any Nuveen funds that the Board considers to have underperformed their peers and/or benchmarks from time to time, the Board monitors such funds closely and considers any steps necessary or appropriate to address such issues.
In considering the results of the comparisons, the Independent Board Members observed, among other things, that the Nuveen Minnesota Municipal Bond Fund (the “Minnesota Fund”) had demonstrated generally favorable performance in comparison to peers, performing in the first quartile over various periods. With respect to the other Funds which, as noted above, had significant differences with their Performance Peer Group, the Independent Board Members considered the performance of such Funds compared to their respective benchmarks and noted that each such Fund’s performance was similar to that of its benchmark for the one- and three-year periods.
Based on their review, the Independent Board Members determined that each Fund’s investment performance had been satisfactory.
C. Fees, Expenses and Profitability
1. Fees and Expenses
The Board evaluated the management fees and expenses of each Fund reviewing, among other things, such Fund’s gross management fees, net management fees and net expense ratios in absolute terms as well as compared to the fee and expenses of a comparable universe of funds provided by an independent fund data provider (the “Peer Universe”) and to a more focused subset of funds in the Peer Universe (the “Peer Group”) and any expense limitations.
The Independent Board Members further reviewed the methodology regarding the construction of the applicable Peer Universe and Peer Group. In reviewing the comparisons of fee and expense information, the Independent Board Members took into account that in certain instances various factors such as: the limited size and particular composition of the Peer Universe or Peer Group (including the inclusion of other Nuveen funds in the peer set); expense anomalies; changes in the funds comprising the Peer Universe or Peer Group from year to year; levels of reimbursement or fee waivers; the timing of information used; and differences in the states reflected in the Peer Universe or Peer Group may impact the comparative data, thereby limiting somewhat the ability to make a meaningful comparison with peers.
In reviewing the fee schedule for a Fund, the Independent Board Members also considered the fund-level and complex-wide breakpoint schedules (described in further detail below) and any fee waivers and reimbursements provided by Nuveen. In reviewing fees and expenses, the Board considered the expenses and fees to be higher if they were over 10 basis points higher, slightly higher if they were approximately 6 to 10 basis points higher, in line if they were within approximately 5 basis points higher than the peer average and below if they were below the peer average of the Peer Group. In reviewing the reports, the Board noted that the overwhelming majority of the Nuveen funds were at, close to or below their Peer Group or Peer Universe (if no separate Peer Group) average based on the net total expense ratio. The Independent Board Members noted that the Minnesota Intermediate Fund, the Minnesota Fund and the Oregon Fund each had net management fees slightly higher or higher than the peer average but net expense ratios below the peer average. They noted that the Nebraska Fund had net management fees and a net expense ratio (including fee waivers and expense reimbursements) in line with its peer average.
Based on their review of the fee and expense information provided, the Independent Board Members determined that each Fund’s management fees were reasonable in light of the nature, extent and quality of services provided to the Fund.
2. Comparisons with the Fees of Other Clients
The Independent Board Members further reviewed information regarding the nature of services and range of fees offered by the Advisor to other clients, including municipal separately managed accounts and passively managed exchange traded funds (ETFs) sub-advised by the Advisor. In evaluating the comparisons of fees, the Independent Board Members noted that the fee rates charged to the Funds and other clients vary, among other things, because of the different services involved and the additional regulatory and compliance requirements associated with registered investment companies, such as the Funds. Accordingly, the Independent Board Members considered the differences in the product types, including, but not limited to, the services provided, the structure and operations, product distribution and costs thereof, portfolio investment policies, investor profiles, account sizes and regulatory requirements. The Independent Board Members noted, in particular, that the range of services provided to the Funds (as discussed above) is much more extensive than that provided to separately managed accounts. Given the inherent differences in the various products, particularly the extensive services provided to the Funds, the Independent Board Members believe such facts justify the different levels of fees.
In considering the fees of the Sub-Advisor, the Independent Board Members also considered the pricing schedule or fees that the Sub-Advisor charges for similar investment management services for other Nuveen funds, funds of other sponsors (if any), and other clients (such as retail and/or institutional managed accounts).
3. Profitability of Fund Advisers
In conjunction with its review of fees, the Independent Board Members also considered the profitability of Nuveen for its advisory activities and its financial condition. The Independent Board Members reviewed the revenues and expenses of Nuveen’s advisory activities for the last two calendar years, the allocation methodology used in preparing the profitability data and an analysis of the
key drivers behind the changes in revenues and expenses that impacted profitability in 2011. The Independent Board Members noted this information supplemented the profitability information requested and received during the year to help keep them apprised of developments affecting profitability (such as changes in fee waivers and expense reimbursement commitments). In this regard, the Independent Board Members noted that they have an Independent Board Member serve as a point person to review and keep them apprised of changes to the profitability analysis and/or methodologies during the year. The Independent Board Members also considered Nuveen’s revenues for advisory activities, expenses, and profit margin compared to that of various unaffiliated management firms with comparable assets under management (based on asset size and asset composition).
In reviewing profitability, the Independent Board Members recognized the Advisor’s continued investment in its business to enhance its services, including capital improvements to investment technology, updated compliance systems, and additional personnel in compliance, risk management, and product development as well as its ability to allocate resources to various areas of the Advisor as the need arises. In addition, in evaluating profitability, the Independent Board Members also recognized the subjective nature of determining profitability which may be affected by numerous factors including the allocation of expenses. Further, the Independent Board Members recognized the difficulties in making comparisons as the profitability of other advisers generally is not publicly available and the profitability information that is available for certain advisers or management firms may not be representative of the industry and may be affected by, among other things, the adviser’s particular business mix, capital costs, types of funds managed and expense allocations. Notwithstanding the foregoing, the Independent Board Members reviewed Nuveen’s methodology and assumptions for allocating expenses across product lines to determine profitability. In reviewing profitability, the Independent Board Members recognized Nuveen’s investment in its fund business. Based on their review, the Independent Board Members concluded that the Advisor’s level of profitability for its advisory activities was reasonable in light of the services provided.
With respect to sub-advisers affiliated with Nuveen, including the Sub-Advisor, the Independent Board Members reviewed the sub-adviser’s revenues, expenses and profitability margins (pre- and post-tax) for its advisory activities and the methodology used for allocating expenses among the internal sub-advisers. Based on their review, the Independent Board Members were satisfied that the Sub-Advisor’s level of profitability was reasonable in light of the services provided.
In evaluating the reasonableness of the compensation, the Independent Board Members also considered other amounts paid to a Fund Adviser by the Funds as well as any indirect benefits (such as soft dollar arrangements, if any) the Fund Adviser and its affiliates receive, or are expected to receive, that are directly attributable to the management of the Funds, if any. See Section E below for additional information on indirect benefits a Fund Adviser may receive as a result of its relationship with the Funds. Based on their review of the overall fee arrangements of each Fund, the Independent Board Members determined that the advisory fees and expenses of the respective Fund were reasonable.
D. Economies of Scale and Whether Fee Levels Reflect These Economies of Scale
With respect to economies of scale, the Independent Board Members have recognized the potential benefits resulting from the costs of a fund being spread over a larger asset base, although economies of scale are difficult to measure and predict with precision, particularly on a fund-by-fund basis. One method to help ensure the shareholders share in these benefits is to include breakpoints in the advisory fee schedule. Generally, management fees for funds in the Nuveen complex are comprised of a fund-level component and a complex-level component, subject to certain exceptions. Accordingly, the Independent Board Members reviewed and considered the applicable fund-level breakpoints in the advisory fee schedules that reduce advisory fees as asset levels increase.
In addition to fund-level advisory fee breakpoints, the Board also considered the Funds’ complex-wide fee arrangement. Pursuant to the complex-wide fee arrangement, the fees of the funds in the Nuveen complex are generally reduced as the assets in the fund complex reach certain levels. The complex-wide fee arrangement seeks to provide the benefits of economies of scale to fund shareholders when total fund complex assets increase, even if assets of a particular fund are unchanged or have decreased. The approach reflects the notion that some of Nuveen’s costs are attributable to services provided to all its funds in the complex and therefore all funds benefit if these costs are spread over a larger asset base. In addition, with the acquisition of the funds previously advised by FAF Advisors, Inc., the Board noted that a portion of such funds’ assets at the time of acquisition were deemed eligible to be included in the complex-wide fee calculation in order to deliver fee savings to shareholders in the combined complex and such funds were subject to differing complex-level fee rates.
Based on their review, the Independent Board Members concluded that the breakpoint schedules and complex-wide fee arrangement were acceptable and reflect economies of scale to be shared with shareholders when assets under management increase.
E. Indirect Benefits
In evaluating fees, the Independent Board Members received and considered information regarding potential “fall out” or ancillary benefits the respective Fund Adviser or its affiliates may receive as a result of its relationship with each Fund. In this regard, the Independent Board Members considered, among other things, any sales charges, distribution fees and shareholder services fees received and retained by the Funds’ principal underwriter, an affiliate of the Advisor, which includes fees received pursuant to any 12b-1 plan. The Independent Board Members, therefore, considered the 12b-1 fees retained by Nuveen during the last calendar year.
Annual Investment Management Agreement Approval Process
(Unaudited) (continued)
In addition to the above, the Independent Board Members considered whether the Fund Advisers received any benefits from soft dollar arrangements whereby a portion of the commissions paid by a Fund for brokerage may be used to acquire research that may be useful to the Fund Adviser in managing the assets of the Funds and other clients. The Independent Board Members recognized that each Fund Adviser has the authority to pay a higher commission in return for brokerage and research services if it determines in good faith that the commission paid is reasonable in relation to the value of the brokerage and research services provided and may benefit from such soft dollar arrangements. Similarly, the Board recognized that the research received pursuant to soft dollar arrangements by a Fund Adviser may also benefit a Fund and shareholders to the extent the research enhances the ability of the Fund Adviser to manage the Fund. The Independent Board Members noted that the Fund Advisers’ profitability may be somewhat lower if they did not receive the research services pursuant to the soft dollar arrangements and had to acquire such services directly.
Based on their review, the Independent Board Members concluded that any indirect benefits received by a Fund Adviser as a result of its relationship with the Funds were reasonable and within acceptable parameters.
F. Other Considerations
The Independent Board Members did not identify any single factor discussed previously as all-important or controlling. The Board Members, including the Independent Board Members, unanimously concluded that the terms of each Advisory Agreement are fair and reasonable, that the respective Fund Adviser’s fees are reasonable in light of the services provided to each Fund and that the Advisory Agreements be renewed.
Notes
Notes
Notes
Glossary of Terms Used in this Report
Average Annual Total Return: This is a commonly used method to express an investment’s performance over a particular, usually multi-year time period. It expresses the return that would have been necessary each year to equal the investment’s actual cumulative performance (including change in NAV or offer price and reinvested dividends and capital gains distributions, if any) over the time period being considered.
Average Effective Maturity: The market-value-weighted average of the effective maturity dates of the individual securities including cash. In the case of a bond that has been advance-refunded to a call date, the effective maturity is the date on which the bond is scheduled to be redeemed using the proceeds of an escrow account. In most other cases the effective maturity is the stated maturity date of the security.
Barclays Municipal Bond Index: An unmanaged index comprised of fixed-rate, investment-grade tax-exempt bonds with remaining maturities of one year or more. Index returns assume reinvestment of distributions, but do not reflect any applicable sales charges or management fees.
Barclays 1-15 Year Blend Municipal Bond Index: An unmanaged index comprised of fixed-rate, investment-grade tax-exempt bonds with remaining maturities between 1 and 17 years. Index returns assume reinvestment of distributions, but do not reflect any applicable sales charges or management fees.
Duration: Duration is a measure of the expected period over which a bond’s principal and interest will be paid, and consequently is a measure of the sensitivity of a bond’s (or bond fund’s) value to changes when market interest rates change. Generally, the longer a bond or Fund’s duration, the more the price of the bond or Fund will change as interest rates change.
Gross Domestic Product (GDP): The total market value of all final goods and services produced in a country/region in a given year, equal to total consumer, investment and government spending, plus the value of exports, minus the value of imports.
Inverse Floating Rate Securities: Inverse floating rate securities, also known as inverse floaters or tender option bonds (TOBs), are created by depositing a municipal bond, typically with a fixed interest rate, into a special purpose trust created by a broker-dealer. This trust, in turn, (a) issues floating rate certificates typically paying short-term tax-exempt interest rates to third parties in amounts equal to some fraction of the deposited bond’s par amount or market value, and (b) issues an inverse floating rate certificate (sometimes referred to as an “inverse floater”) to an investor (such as a Fund) interested in gaining investment exposure to a long-term municipal bond. The income received by the holder of the inverse floater varies inversely with the short-term rate paid to the floating rate certificates’ holders, and in most circumstances the holder of the inverse floater bears substantially all of the underlying bond’s downside investment risk. The holder of the inverse floater typically also benefits disproportionately from any potential appreciation of the underlying bond’s value. Hence, an inverse floater essentially represents an investment in the underlying bond on a leveraged basis.
Leverage: Leverage is created whenever a fund has investment exposure (both reward and/or risk) equivalent to more than 100% of the investment capital.
Lipper Minnesota Municipal Debt Funds Classification Average: Represents the average annualized total return for all reporting funds in the Lipper Minnesota Municipal Debt Funds Classification. Lipper returns account for the effects of management fees and assume reinvestment of distributions, but do not reflect any applicable sales charge.
Lipper Other States Intermediate Municipal Debt Funds Classification Average: Represents the average annualized total return for all reporting funds in the Lipper Other States Intermediate Municipal Debt Funds Classification. Shareholders should note that the performance of the Lipper Other States Intermediate Municipal Debt Funds Classification Average represents the overall average of returns for funds from ten different states with a wide variety of municipal market conditions, making direct comparisons less meaningful. Lipper returns account for the effects of management fees and assume reinvestment of distributions, but do not reflect any applicable sales charge.
Lipper Other States Municipal Debt Funds Classification Average: Represents the average annualized total return for all reporting funds in the Lipper Other States Municipal Debt Funds Classification. Shareholders should note that the performance of the Lipper Other States Municipal Debt Funds Classification Average represents the overall average of returns for funds from ten different states with a wide variety of municipal market conditions, making direct comparisons less meaningful. Lipper returns account for the effects of management fees and assume reinvestment of distributions, but do not reflect any applicable sales charge.
Net Asset Value (NAV): The net market value of all securities held in a portfolio.
Net Asset Value (NAV) Per Share: The market value of one share of a mutual fund or closed-end fund. For a Fund, the NAV is calculated daily by taking the Fund’s total assets (securities, cash, and accrued earnings), subtracting the Funds’s liabilities, and dividing by the number of shares outstanding.
Pre-Refundings: Pre-Refundings, also known as advance refundings or refinancings, occur when an issuer sells new bonds and uses the proceeds to fund principal and interest payments of older existing bonds. This process often results in lower borrowing costs for bond issuers.
Zero Coupon Bond: A zero coupon bond does not pay a regular interest coupon to its holders during the life of the bond. Tax-exempt income to the holder of the bond comes from accretion of the difference between the original purchase price of the bond at issuance and the par value of the bond at maturity and is effectively paid at maturity. The market prices of zero coupon bonds generally are more volatile than the market prices of bonds that pay interest periodically.
Additional Fund Information
Fund Manager
Nuveen Fund Advisors, Inc.
333 West Wacker Drive
Chicago, IL 60606
Sub-Adviser
Nuveen Asset Management, LLC
333 West Wacker Drive
Chicago, IL 60606
Legal Counsel
Chapman and Cutler LLP
Chicago, IL
Independent Registered* Public Accounting Firm
PricewaterhouseCoopers LLP
Chicago, IL
Custodian
U.S. Bank National Association
St. Paul, MN
Transfer Agent and Shareholder Services
Boston Financial
Data Services, Inc.
Nuveen Investor Services
P.O. Box 8530
Boston, MA 02266-8530
(800) 257-8787
| * | The Board of Directors of the Funds, upon recommendation of the Audit Committee, engaged PricewaterhouseCoopers LLP as the Funds’ independent registered public accounting firm as of March 1, 2011. On December 30, 2011, Ernst & Young, LLP (“Ernst & Young”) completed its work on the October 31, 2011 audits and resigned as the independent registered public accounting firm of the Funds. Ernst & Young’s report on the Funds’ financial statements for the two most recent fiscal periods contained no adverse opinion or disclaimer of opinion, and were not qualified or modified as to uncertainty, audit scope or accounting principles. For the two most recent fiscal periods and through March 1, 2011, there were no disagreements with Ernst & Young on any matter of accounting principles. financial statement disclosure or auditing scope or procedures, which disagreements, if not resolved to the satisfaction of Ernst & Young, would have caused it to make reference to the subject matter of the disagreements in connection with its reports on the Funds’ financial statements. |
Quarterly Portfolio of Investments and Proxy Voting information: You may obtain (i) each Fund’s quarterly portfolio of investments, (ii) information regarding how the Funds voted proxies relating to portfolio securities held during the most recent twelve-month period ended June 30, and (iii) a description of the policies and procedures that the Funds used to determine how to vote proxies relating to portfolio securities without charge, upon request, by calling Nuveen Investments at (800) 257-8787 or on Nuveen’s website at www.nuveen.com.
You may also obtain this and other Fund information directly from the Securities and Exchange Commission (SEC). The SEC may charge a copying fee for this information. Visit the SEC on-line at http://www.sec.gov or in person at the SEC’s Public Reference Room in Washington, D.C. Call the SEC at (202) 942-8090 for room hours and operation. You may also request Fund information by sending an e-mail request to publicinfo@sec.gov or by writing to the SEC’s Public Reference Section at 100 F Street NE, Washington, D.C. 20549.
The Financial Industry Regulatory Authority (FINRA) provides a Public Disclosure Program which supplies certain information regarding the disciplinary history of FINRA members and their associated persons in response to either telephone inquiries at (800) 289-9999 or written inquiries at www.finra.org. FINRA also provides an investor brochure that includes information describing the Public Disclosure Program.
Nuveen Investments:
Serving Investors for Generations
Since 1898, financial advisors and their clients have relied on Nuveen Investments to provide dependable investment solutions through continued adherence to proven, long-term investing principles. Today, we offer a range of high quality equity and fixed-income solutions designed to be integral components of a well-diversified core portfolio.
Focused on meeting investor needs.
Nuveen Investments provides high-quality investment services designed to help secure the long-term goals of institutional and individual investors as well as the consultants and financial advisors who serve them. Nuveen Investments markets a wide range of specialized investment solutions which provide investors access to capabilities of its high-quality boutique investment affiliates-Nuveen Asset Management, Symphony Asset Management, NWQ Investment Management Company, Santa Barbara Asset Management, Tradewinds Global Investors, Winslow Capital Management, and Gresham Investment Management. In total, Nuveen Investments managed $227 billion as of March 31, 2012.
Find out how we can help you.
To learn more about how the products and services of Nuveen Investments may be able to help you meet your financial goals, talk to your financial advisor, or call us at (800) 257-8787. Please read the information provided carefully before you invest. Investors should consider the investment objective and policies, risk considerations, charges and expenses of any investment carefully. Where applicable, be sure to obtain a prospectus, which contains this and other relevant information. To obtain a prospectus, please contact your securities representative or Nuveen Investments, 333 W. Wacker Dr., Chicago, IL 60606. Please read the prospectus carefully before you invest or send money.
Learn more about Nuveen Funds at: www.nuveen.com/mf
| | |
Distributed by Nuveen Securities, LLC 333 West Wacker Drive Chicago, IL 60606 www.nuveen.com | | |
MAN-FTFI-0512D
ITEM 2. CODE OF ETHICS.
As of the end of the period covered by this report, the registrant has adopted a code of ethics that applies to the registrant’s principal executive officer, principal financial officer, principal accounting officer or controller, or persons performing similar functions. There were no amendments to or waivers from the code during the period covered by this report. The registrant has posted the code of ethics on its website at www.nuveen.com/mf. (To view the code, click on the Shareholder Resources drop down menu box, click on Fund Governance and then click on Code of Conduct.)
ITEM 3. AUDIT COMMITTEE FINANCIAL EXPERT.
The registrant’s Board of Trustees determined that the registrant has at least one “audit committee financial expert” (as defined in Item 3 of Form N-CSR) serving on its Audit Committee. The registrant’s audit committee financial expert is Carole E. Stone, who is “independent” for purposes of Item 3 of Form N-CSR.
Ms. Stone served for five years as Director of the New York State Division of the Budget. As part of her role as Director, Ms. Stone was actively involved in overseeing the development of the State’s operating, local assistance and capital budgets, its financial plan and related documents; overseeing the development of the State’s bond-related disclosure documents and certifying that they fairly presented the State’s financial position; reviewing audits of various State and local agencies and programs; and coordinating the State’s system of internal audit and control. Prior to serving as Director, Ms Stone worked as a budget analyst/examiner with increasing levels of responsibility over a 30 year period, including approximately five years as Deputy Budget Director. Ms. Stone has also served as Chair of the New York State Racing Association Oversight Board, as Chair of the Public Authorities Control Board, as a Commissioner on the New York State Commission on Public Authority Reform and as a member of the Boards of Directors of several New York State public authorities. These positions have involved overseeing operations and finances of certain entities and assessing the adequacy of project/entity financing and financial reporting. Currently, Ms. Stone is on the Board of Directors of CBOE Holdings, Inc., of the Chicago Board Options Exchange, and of C2 Options Exchange. Ms. Stone’s position on the boards of these entities and as a member of both CBOE Holdings’ Audit Committee and its Finance Committee has involved, among other things, the oversight of audits, audit plans and preparation of financial statements.
ITEM 4. PRINCIPAL ACCOUNTANT FEES AND SERVICES.
The following tables show the amount of fees that PricewaterhouseCoopers LLP, the Trust’s auditor, billed to the Trust during the Trust’s last full fiscal year ending May 31, 2012 and the amount that Ernst & Young LLP, the Trust’s previous auditor, billed to the Trust during the Trust’s full fiscal year ending May 31, 2011. The Audit Committee approved in advance all audit services and non-audit services that PricewaterhouseCoopers LLP and Ernst & Young LLP provided to the Trust, except for those non-audit services that were subject to the pre-approval exception under Rule 2-01 of Regulation S-X (the “pre-approval exception”). The preapproval exception for services provided directly to the Trust waives the pre-approval requirement for services other than audit, review or attest services if: (A) the aggregate amount of all such services provided constitutes no more than 5% of the total amount of revenues paid by the Trust during the fiscal year in which the services are provided; (B) the Trust did not recognize the services as non-audit services at the time of the engagement; and (C) the services are promptly brought to the Audit Committee’s attention, and the Committee (or its delegate) approves the services before the audit is completed.
The Audit Committee has delegated certain pre-approval responsibilities to its Chairman (or, in his absence, any other member of the Audit Committee).
SERVICES THAT THE TRUST’S AUDITOR BILLED TO THE TRUST
| | | | | | | | | | | | | | | | |
Fiscal Year Ended May 31, 2012 | | Audit Fees Billed
to Funds 1 | | | Audit-Related Fees
Billed to Funds 2 | | | Tax Fees
Billed to Funds 3 | | | All Other Fees
Billed to Funds 4 | |
Name of Series | | | | | | | | | | | | | | | | |
Minnesota Municipal Bond Fund | | | 15,415 | | | | 0 | | | | 0 | | | | 0 | |
Minnesota Intermediate Municipal Bond Fund | | | 15,739 | | | | 0 | | | | 0 | | | | 0 | |
Nebraska Municipal Bond Fund | | | 14,847 | | | | 0 | | | | 0 | | | | 0 | |
Oregon Intermediate Municipal Bond Fund | | | 15,308 | | | | 0 | | | | 0 | | | | 0 | |
| | | | | | | | | | | | | | | | |
Total | | $ | 61,309 | | | $ | 0 | | | $ | 0 | | | $ | 0 | |
| 1 | | “Audit Fees” are the aggregate fees billed for professional services for the audit of the Fund’s annual financial statements and services provided in connection with statutory and regulatory filings or engagements. |
| 2 | | “Audit Related Fees” are the aggregate fees billed for assurance and related services reasonably related to the performance of the audit or review of financial statements and are not reported under “Audit Fees”. |
| 3 | | “Tax Fees” are the aggregate fees billed for professional services for tax advice, tax compliance, and tax planning. |
| 4 | | “All Other Fees” are the aggregate fees billed for products and services other than “Audit Fees”, “Audit Related Fees”, and “Tax Fees”. |
| | | | | | | | | | | | | | | | |
| | | Percentage Approved Pursuant to Pre-approval Exception | |
| | | Audit Fees Billed
to Funds | | | Audit-Related Fees
Billed to Funds | | | Tax Fees
Billed to Funds | | | All Other Fees
Billed to Funds | |
Name of Series | | | | | | | | | | | | | | | | |
Minnesota Municipal Bond Fund | | | 0 | % | | | 0 | % | | | 0 | % | | | 0 | % |
Minnesota Intermediate Municipal Bond Fund | | | 0 | % | | | 0 | % | | | 0 | % | | | 0 | % |
Nebraska Municipal Bond Fund | | | 0 | % | | | 0 | % | | | 0 | % | | | 0 | % |
Oregon Intermediate Municipal Bond Fund | | | 0 | % | | | 0 | % | | | 0 | % | | | 0 | % |
| | | | |
Fiscal Year Ended May 31, 2011 5 | | Audit Fees Billed
to Funds 1 | | | Audit-Related Fees
Billed to Funds 2 | | | Tax Fees
Billed to Funds 3 | | | All Other Fees
Billed to Funds 4 | |
Name of Series | | | | | | | | | | | | | | | | |
Minnesota Municipal Bond Fund | | | 19,091 | | | | 0 | | | | 1,348 | | | | 0 | |
Minnesota Intermediate Municipal Bond Fund | | | 19,091 | | | | 0 | | | | 1,056 | | | | 0 | |
Nebraska Municipal Bond Fund | | | 19,090 | | | | 0 | | | | 1,348 | | | | 0 | |
Oregon Intermediate Municipal Bond Fund | | | 19,091 | | | | 0 | | | | 1,348 | | | | 0 | |
| | | | | | | | | | | | | | | | |
Total | | $ | 76,363 | | | $ | 0 | | | $ | 5,100 | | | $ | 0 | |
| 1 | | “Audit Fees” are the aggregate fees billed for professional services for the audit of the Fund’s annual financial statements and services provided in connection with statutory and regulatory filings or engagements. |
| 2 | | “Audit Related Fees” are the aggregate fees billed for assurance and related services reasonably related to the performance of the audit or review of financial statements and are not reported under “Audit Fees”. |
| 3 | | “Tax Fees” are the aggregate fees billed for professional services for tax advice, tax compliance, and tax planning. |
| 4 | | “All Other Fees” are the aggregate fees billed for products and services other than “Audit Fees”, “Audit Related Fees”, and “Tax Fees”. |
| 5 | | The Funds were acquired on December 31, 2010 and changed fiscal year from June to May beginning in January, 2011. |
| | | | | | | | | | | | | | | | |
| | | Percentage Approved Pursuant to Pre-approval Exception | |
| | | Audit Fees Billed
to Funds | | | Audit-Related Fees
Billed to Funds | | | Tax Fees
Billed to Funds | | | All Other Fees
Billed to Funds | |
Name of Series | | | | | | | | | | | | | | | | |
Minnesota Municipal Bond Fund | | | 0 | % | | | 0 | % | | | 0 | % | | | 0 | % |
Minnesota Intermediate Municipal Bond Fund | | | 0 | % | | | 0 | % | | | 0 | % | | | 0 | % |
Nebraska Municipal Bond Fund | | | 0 | % | | | 0 | % | | | 0 | % | | | 0 | % |
Oregon Intermediate Municipal Bond Fund | | | 0 | % | | | 0 | % | | | 0 | % | | | 0 | % |
| | | | | | | | | | | | |
Fiscal Year Ended May 31, 2012 | | Audit-Related Fees
Billed to Adviser and
Affiliated Fund
Service Providers | | | Tax Fees Billed to
Adviser and
Affiliated Fund
Service Providers | | | All Other Fees
Billed to Adviser
and Affiliated Fund
Service Providers | |
Nuveen Investment Funds, Inc. | | $ | 0 | | | $ | 0 | | | $ | 0 | |
| |
| | | Percentage Approved Pursuant to Pre-approval Exception | |
| | | Audit-Related Fees
Billed to Adviser and
Affiliated Fund
Service Providers | | | Tax Fees Billed to
Adviser and
Affiliated Fund
Service Providers | | | All Other Fees
Billed to Adviser
and Affiliated Fund
Service Providers | |
| | | 0 | % | | | 0 | % | | | 0 | % |
| | | |
Fiscal Year Ended May 31, 2011 | | Audit-Related Fees
Billed to Adviser and
Affiliated Fund
Service Providers | | | Tax Fees Billed to
Adviser and
Affiliated Fund
Service Providers | | | All Other Fees
Billed to Adviser
and Affiliated Fund
Service Providers | |
Nuveen Investment Funds, Inc. | | $ | 0 | | | $ | 0 | | | $ | 0 | |
| |
| | | Percentage Approved Pursuant to Pre-approval Exception | |
| | | Audit-Related Fees
Billed to Adviser and
Affiliated Fund
Service Providers | | | Tax Fees Billed to
Adviser and
Affiliated Fund
Service Providers | | | All Other Fees
Billed to Adviser
and Affiliated Fund
Service Providers | |
| | | 0 | % | | | 0 | % | | | 0 | % |
| | | | | | | | | | | | | | | | |
Fiscal Year Ended May 31, 2012 | | Total Non-Audit Fees
Billed to Trust | | | Total Non-Audit Fees
billed to Adviser and
Affiliated Fund Service
Providers (engagements
related directly to the
operations and financial
reporting of the Trust) | | | Total Non-Audit Fees
billed to Adviser and
Affiliated Fund Service
Providers (all other
engagements) | | | Total | |
Name of Series | | | | | | | | | | | | | | | | |
Minnesota Municipal Bond Fund | | | 0 | | | | 0 | | | | 0 | | | | 0 | |
Minnesota Intermediate Municipal Bond Fund | | | 0 | | | | 0 | | | | 0 | | | | 0 | |
Nebraska Municipal Bond Fund | | | 0 | | | | 0 | | | | 0 | | | | 0 | |
Oregon Intermediate Municipal Bond Fund | | | 0 | | | | 0 | | | | 0 | | | | 0 | |
| | | | | | | | | | | | | | | | |
Total | | $ | 0 | | | $ | 0 | | | $ | 0 | | | $ | 0 | |
“Non-Audit Fees Billed to Trust” represent “Tax Fees” and “All Other Fees” billed to each Fund in their respective amounts from the previous table.
| | | | | | | | | | | | | | | | |
Fiscal Year Ended May 31, 2011 1 | | Total Non-Audit Fees
Billed to Trust | | | Total Non-Audit Fees
billed to Adviser and
Affiliated Fund Service
Providers (engagements
related directly to the
operations and financial
reporting of the Trust) | | | Total Non-Audit Fees
billed to Adviser and
Affiliated Fund Service
Providers (all other
engagements) | | | Total | |
Name of Series | | | | | | | | | | | | | | | | |
Minnesota Municipal Bond Fund | | | 1,348 | | | | 0 | | | | 0 | | | | 1,348 | |
Minnesota Intermediate Municipal Bond Fund | | | 1,056 | | | | 0 | | | | 0 | | | | 1,056 | |
Nebraska Municipal Bond Fund | | | 1,348 | | | | 0 | | | | 0 | | | | 1,348 | |
Oregon Intermediate Municipal Bond Fund | | | 1,348 | | | | 0 | | | | 0 | | | | 1,348 | |
| | | | | | | | | | | | | | | | |
Total | | $ | 5,100 | | | $ | 0 | | | $ | 0 | | | $ | 5,100 | |
“Non-Audit Fees Billed to Trust” represent “Tax Fees” and “All Other Fees” billed to each Fund in their respective amounts from the previous table.
| 1 | | The Funds were acquired on December 31, 2010 and changed fiscal year from June to May beginning in January, 2011. |
Audit Committee Pre-Approval Policies and Procedures. Generally, the Audit Committee must approve (i) all non-audit services to be performed for the Trust by the Trust’s independent accountants and (ii) all audit and non-audit services to be performed by the Trust’s independent accountants for the Affiliated Fund Service Providers with respect to the operations and financial reporting of the Trust. Regarding tax and research projects conducted by the independent accountants for the Trust and Affiliated Fund Service Providers (with respect to operations and financial reports of the Trust), such engagements will be (i) pre-approved by the Audit Committee if they are expected to be for amounts greater than $10,000; (ii) reported to the Audit Committee Chairman for his verbal approval prior to engagement if they are expected to be for amounts under $10,000 but greater than $5,000; and (iii) reported to the Audit Committee at the next Audit Committee meeting if they are expected to be for an amount under $5,000.
ITEM 5. AUDIT COMMITTEE OF LISTED REGISTRANTS.
Not applicable to this registrant.
ITEM 6. SCHEDULE OF INVESTMENTS.
| a) | | See Portfolio of Investments in Item 1. |
ITEM 7. DISCLOSURE OF PROXY VOTING POLICIES AND PROCEDURES FOR CLOSED-END
MANAGEMENT INVESTMENT COMPANIES.
Not applicable to this registrant.
ITEM 8. PORTFOLIO MANAGERS OF CLOSED-END MANAGEMENT INVESTMENT COMPANIES.
Not applicable to this registrant.
ITEM 9. PURCHASES OF EQUITY SECURITIES BY CLOSED-END MANAGEMENT INVESTMENT COMPANY AND AFFILIATED PURCHASERS.
Not applicable to this registrant.
ITEM 10. SUBMISSION OF MATTERS TO A VOTE OF SECURITY HOLDERS.
There have been no material changes to the procedures by which shareholders may recommend nominees to the registrant’s Board of Trustees implemented after the registrant last provided disclosure in response to this Item.
ITEM 11. CONTROLS AND PROCEDURES.
| | (a) | | The registrant’s principal executive and principal financial officers, or persons performing similar functions, have concluded that the registrant’s disclosure controls and procedures (as defined in Rule 30a-3(c) under the Investment Company Act of 1940, as amended (the “1940 Act”) (17 CFR 270.30a-3(c))) are effective, as of a date within 90 days of the filing date of this report that includes the disclosure required by this paragraph, based on their evaluation of the controls and procedures required by Rule 30a-3(b) under the 1940 Act (17 CFR 270.30a-3(b)) and Rules 13a-15(b) or 15d-15(b) under the Securities Exchange Act of 1934, as amended (the “Exchange Act”) (17 CFR 240.13a-15(b) or 240.15d-15(b)). |
| | (b) | | There were no changes in the registrant’s internal control over financial reporting (as defined in Rule 30a-3(d) under the 1940 Act (17 CFR 270.30a-3(d)) that occurred during the second fiscal quarter of the period covered by this report that has materially affected, or is reasonably likely to materially affect, the registrant’s internal control over financial reporting. |
ITEM 12. EXHIBITS.
File the exhibits listed below as part of this Form.
| | |
| (a)(1) | | Any code of ethics, or amendment thereto, that is the subject of the disclosure required by Item 2, to the extent that the registrant intends to satisfy the Item 2 requirements through filing of an exhibit: Not applicable because the code is posted on registrant’s website at www.nuveen.com/mf and there were no amendments during the period covered by this report. (To view the code, click on the Shareholder Resources drop down menu box, click on Fund Governance and then Code of Conduct.) |
| |
| (a)(2) | | A separate certification for each principal executive officer and principal financial officer of the registrant as required by Rule 30a-2(a) under the 1940 Act (17 CFR 270.30a-2(a)) in the exact form set forth below: See EX-99.CERT attached hereto. |
| |
| (a)(3) | | Any written solicitation to purchase securities under Rule 23c-1 under the 1940 Act (17 CFR 270.23c-1) sent or given during the period covered by the report by or on behalf of the registrant to 10 or more persons: Not applicable to this registrant. |
| |
| (b) | | If the report is filed under Section 13(a) or 15(d) of the Exchange Act, provide the certifications required by Rule 30a-2(b) under the 1940 Act (17 CFR 270.30a-2(b)), Rule 13a-14(b) or Rule 15d-14(b) under the Exchange Act (17 CFR 240.13a-14(b) or 240.15d-14(b)), and Section 1350 of Chapter 63 of Title 18 of the United States Code (18 U.S.C. 1350) as an Exhibit. A certification furnished pursuant to this paragraph will not be deemed “filed” for purposes of Section 18 of the Exchange Act (15 U.S.C. 78r), or otherwise subject to the liability of that section. Such certification will not be deemed to be incorporated by reference into any filing under the Securities Act of 1933 or the Exchange Act, except to the extent that the registration specifically incorporates it by reference: See EX-99.906 CERT attached hereto. |
SIGNATURES
Pursuant to the requirements of the Securities Exchange Act of 1934 and the Investment Company Act of 1940, the registrant has duly caused this report to be signed on its behalf by the undersigned, thereunto duly authorized.
(Registrant) Nuveen Investment Funds, Inc.
| | |
| |
By (Signature and Title) | | /s/ Kevin J. McCarthy |
| | Kevin J. McCarthy |
| | Vice President and Secretary |
Date: August 8, 2012
Pursuant to the requirements of the Securities Exchange Act of 1934 and the Investment Company Act of 1940, this report has been signed below by the following persons on behalf of the registrant and in the capacities and on the dates indicated.
| | |
| |
By (Signature and Title) | | /s/ Gifford R. Zimmerman |
| | Gifford R. Zimmerman |
| | Chief Administrative Officer |
| | (principal executive officer) |
Date: August 8, 2012
| | |
| |
| By (Signature and Title) | | /s/ Stephen D. Foy |
| | Stephen D. Foy |
| | Vice President and Controller |
| | (principal financial officer) |
Date: August 8, 2012