UNITED STATES
SECURITIES AND EXCHANGE COMMISSION
Washington, D.C. 20549
FORM N-CSR
CERTIFIED SHAREHOLDER REPORT OF REGISTERED MANAGEMENT
INVESTMENT COMPANIES
Investment Company Act file number 811-05309
Nuveen Investment Funds, Inc.
(Exact name of registrant as specified in charter)
Nuveen Investments
333 West Wacker Drive, Chicago, IL 60606
(Address of principal executive offices) (Zip code)
Kevin J. McCarthy
Nuveen Investments
333 West Wacker Drive
Chicago, IL 60606
(Name and address of agent for service)
Registrant’s telephone number, including area code: (312) 917-7700
Date of fiscal year end: April 30
Date of reporting period: April 30, 2013
Form N-CSR is to be used by management investment companies to file reports with the Commission not later than 10 days after the transmission to stockholders of any report that is required to be transmitted to stockholders under Rule 30e-1 under the Investment Company Act of 1940 (17 CFR 270.30e-1). The Commission may use the information provided on Form N-CSR in its regulatory, disclosure review, inspection, and policy making roles.
A registrant is required to disclose the information specified by Form N-CSR, and the Commission will make this information public. A registrant is not required to respond to the collection of information contained in Form N-CSR unless the Form displays a currently valid Office of Management and Budget (“OMB”) control number. Please direct comments concerning the accuracy of the information collection burden estimate and any suggestions for reducing the burden to Secretary, Securities and Exchange Commission, 450 Fifth Street, NW, Washington, DC 20549-0609. The OMB has reviewed this collection of information under the clearance requirements of 44 U.S.C. ss.3507.
ITEM 1. REPORTS TO STOCKHOLDERS.

Mutual Funds
Nuveen Municipal Bond Funds
Dependable, tax-free income because it’s not what you earn, its what you keep.®
Annual Report
April 30, 2013
| | | | | | | | |
| | | Share Class / Ticker Symbol |
| | | | |
| Fund Name | | Class A | | Class B | | Class C | | Class I |
Nuveen All-American Municipal Bond Fund | | FLAAX | | FAAMX | | FAACX | | FAARX |
Nuveen High Yield Municipal Bond Fund | | NHMAX | | NHMBX | | NHMCX | | NHMRX |
Nuveen Inflation Protected Municipal Bond Fund | | NITAX | | — | | NIPCX | | NIPIX |
Nuveen Intermediate Duration Municipal Bond Fund | | NMBAX | | NUMBX | | NNSCX | | NUVBX |
Nuveen Limited Term Municipal Bond Fund | | FLTDX | | — | | FLTCX | | FLTRX |
Nuveen Short Duration High Yield Municipal Bond Fund | | NVHAX | | — | | NVHCX | | NVXIX |
Nuveen Short Term Municipal Bond Fund | | FSHAX | | — | | NSVCX | | FSHYX |
LIFE IS COMPLEX.
Nuveen makes things e-simple.
It only takes a minute to sign up for e-Reports. Once enrolled, you’ll receive an e-mail as soon as your Nuveen Fund information is ready. No more waiting for delivery by regular mail. Just click on the link within the e-mail to see the report and save it on your computer if you wish.
Free e-Reports right to your e-mail!
www.investordelivery.com
If you receive your Nuveen Fund distributions and statements from your financial advisor or brokerage account.
OR
www.nuveen.com/accountaccess
If you receive your Nuveen Fund distributions and statements directly from Nuveen.
| | | | | | |
| Must be preceded by or accompanied by a prospectus. | | NOT FDIC INSURED | | MAY LOSE VALUE | | NO BANK GUARANTEE |
Table of Contents
Chairman’s
Letter to Shareholders

Dear Shareholders,
After nine years of serving as lead director and independent chairman of the Nuveen Fund Board, my term of office is coming to an end. It has been a privilege to use this space to communicate with you on some of the broad economic trends in the U.S. and abroad and how they are impacting the investment environment in which your funds operate. In addition, I have enjoyed offering some perspective on how your Board views the various Nuveen investment teams as they apply their investment disciplines in that investment environment.
My term has coincided with a particularly challenging period for both mutual fund sponsors and investors. Since 2000 there have been three periods of unusually strong stock market growth and two major market declines. Recent years have been characterized by a search for yield in fixed income securities to compensate for an extended period of very low interest rates. Funds are investing more in foreign and emerging markets that require extensive research capabilities to overcome the more limited transparency and higher volatility in those markets. New fund concepts often incorporate derivative financial instruments that offer efficient ways to hedge investment risk or gain exposure to selected markets. Fund trading teams operate in many new domestic and international venues with quite different characteristics. Electronic trading and global communication networks mean that fund managers must be able to thrive in financial markets that react instantaneously to newsworthy events and are more interconnected than ever.
Nuveen has committed additional resources to respond to these changes in the fund industry environment. It has added IT and research resources to assemble and evaluate the increased flow of detailed information on economies, markets and individual companies. Based on its experience during the financial crisis of 2008-09, Nuveen has expanded its resources dedicated to valuing and trading portfolio securities with a particular focus on stressed financial market conditions. It has added systems and experienced risk management professionals to work with investment teams to better help evaluate whether their funds’ risk exposures are appropriate in view of the return targets. The investment teams have also reflected on recent experience to reaffirm or modify their investment disciplines. Finally, experienced professionals and IT resources have been added to address new regulatory requirements designed to better inform and protect investors. The Board has enthusiastically encouraged these initiatives.
The Nuveen Fund Board has always viewed itself as your representatives to assure that Nuveen brings together experienced people, proven technologies and effective processes designed to produce results that meet investor expectations. It is important to note that our activities are highlighted by the annual contract renewal process. Despite its somewhat formal language, I strongly encourage you to read the summary because it offers an insight into our oversight process. The report is included in the back of this or a subsequent shareholder report. The renewal process is very comprehensive and includes a number of evaluations and discussions between the Board and Nuveen during the year. The summary also describes what has been achieved across the Nuveen fund complex and at individual funds such as yours.
As I leave the chairmanship and resume my role as a member of the Board, please be assured that I and my fellow Board members will continue to hold your interests uppermost in our minds as we oversee the management of your funds and that we greatly appreciate your confidence in your Nuveen fund.
Very sincerely,

Robert P. Bremner
Chairman of the Board
June 21, 2013
Portfolio Managers’ Comments
Certain statements in this report are forward-looking statements. Discussions of specific investments are for illustration only and are not intended as recommendations of individual investments. The forward-looking statements and other views expressed herein are those of the portfolio managers as of the date of this report. Actual future results or occurrences may differ significantly from those anticipated in any forward-looking statements and the views expressed herein are subject to change at any time, due to numerous market and other factors. The Funds disclaim any obligation to update publicly or revise any forward-looking statements or views expressed herein.
Ratings shown are the highest rating given by one of the following national rating agencies: Standard & Poor’s, Moody’s Investors Service, Inc. or Fitch, Inc. Credit ratings are subject to change. AAA, AA, A and BBB are investment grade ratings; BB, B, CCC, CC, C and D are below investment grade ratings. Certain bonds backed by U.S. Government or agency securities are regarded as having an implied rating equal to the rating of such securities. Holdings designated N/R are not rated by these national rating agencies.
These Funds feature portfolio management by Nuveen Asset Management, LLC, an affiliate of Nuveen Investments. John Miller, CFA, and Doug White, CFA, manage the Nuveen All-American Municipal Bond Fund. John began managing the Fund in 2010 and Doug joined him as co-manager of the Fund in 2011. John has managed the Nuveen High Yield Municipal Bond Fund since 2000. John and his co-managers Timothy Ryan, CFA, and Steven Hlavin have managed the Nuveen Short Duration High Yield Municipal Bond Fund since its inception in February 2013. Dan Close, CFA, and Doug Baker, CFA, have managed the Nuveen Inflation Protected Municipal Bond Fund since its inception in 2011. Paul Brennan, CFA, has managed the Nuveen Intermediate Duration Municipal Bond Fund since 2007 and the Nuveen Limited Term Municipal Bond Fund since 2006. Chris Drahn, CFA, has managed the Nuveen Short Term Municipal Bond Fund since 2002.
Recently, the portfolio managers discussed the economic and municipal market conditions at the national level, key investment strategies and the Funds’ performance for the twelve-month period ended April 30, 2013.
What factors affected the U.S. economy and the national municipal bond market during the twelve-month reporting period ended April 30, 2013?
During this reporting period, the U.S. economy’s progress toward recovery from recession continued at a moderate pace. The Federal Reserve (Fed) maintained its efforts to improve the overall economic environment by holding the benchmark fed funds rate at the record low level of zero to 0.25% that it established in December 2008. At its May 2013 meeting, the central bank stated that it expected its “highly accommodative stance of monetary policy” would keep the fed funds rate in “this exceptionally low range” at least as long as the unemployment rate remained above 6.5% and the outlook for inflation one to two years ahead was no higher than 2.5%. The Fed also decided to continue its monthly purchases of $40 billion of mortgage-backed securities and $45 billion of longer-term Treasury securities in an open-ended effort to bolster growth. Taken together, the goals of these actions are to put downward pressure on longer-term interest rates, make broader financial conditions more accommodative, and support a stronger economic recovery as well as continued progress toward the Fed’s mandates of maximum employment and price stability.
In the first quarter of 2013, the U.S. economy, as measured by the U.S. gross domestic product (GDP), grew at an annualized rate of 2.5%, compared with 0.4% for the fourth quarter of 2012, continuing the pattern of positive economic growth for the 15th consecutive quarter. The Consumer Price Index (CPI) rose 1.1% year-over-year as of April 2013, while the core CPI (which excludes food and energy) increased 0.1% during the period, staying within the Fed’s unofficial objective of 2.0% or lower for this inflation
measure. Labor market conditions continued to slowly show signs of improvement. As of April 2013, the national unemployment rate was 7.5%, the lowest level since December 2008, down from 8.1% in April 2012. The housing market, long a major weak spot in the economic recovery, also delivered some good news, as the average home price in the S&P/Case-Shiller Index of 20 major metropolitan areas rose 10.9% for the twelve months ended March 2013 (most recent data available at the time this report was prepared). This marked the largest twelve-month percentage gain for the index since May 2006.
During this reporting period, the outlook for the U.S. economy was clouded by uncertainty about global financial markets and the outcome of the “fiscal cliff.” The tax consequences of the fiscal cliff situation, which had been scheduled to become effective in January 2013 were averted through a last-minute deal that raised payroll taxes but left in place a number of tax breaks. However, lawmakers postponed and then failed to reach a resolution on $1.2 trillion in spending cuts intended to address the federal budget deficit. As a result, automatic spending cuts (or sequestration) affecting both defense and non-defense programs (excluding Social Security and Medicaid) took effect March 1, 2013, with potential implications for economic growth over the next decade. In late March 2013, Congress passed legislation that established federal funding levels for the remainder of fiscal 2013, which ends on September 30, 2013, preventing a federal government shutdown. The proposed federal budget for fiscal 2014 remains under debate.
Municipal bond prices generally rallied nationally during this reporting period, as strong demand and tight supply combined to create favorable market conditions for municipal bonds. However, the market also encountered some additional volatility generated by the political environment, particularly the fiscal cliff at the end of 2012 and the approach of federal tax season. Although the total volume of tax-exempt supply improved over that of the same period a year earlier, the issuance pattern remained light compared with long-term historical trends and new money issuance was relatively flat. This supply/demand dynamic served as a key driver of performance. At the state level, state governments in aggregate appeared to have made good progress in dealing with budget issues. On the revenue side, state tax collections have grown for eleven straight quarters, exceeding pre-recession levels beginning in September 2011, while on the expense side, the states made headway in cutting and controlling costs. The current low level of municipal issuance reflects the current political distaste for additional borrowing by state and local governments facing fiscal constraints and the prevalent atmosphere of municipal budget austerity. During this period, we continued to see municipal yields remain relatively low. Borrowers seeking to take advantage of the low rate environment sparked an increase in refunding activity, with approximately two-thirds of municipal paper issued by borrowers that were calling existing debt and refinancing at lower rates.
Over the twelve months ended April 30, 2013, municipal bond issuance nationwide totaled $378 billion, an increase of 9.5% over the issuance for the twelve-month period ended April 30, 2012. During this period, demand for municipal bonds remained very strong, especially from individual investors, but also from mutual funds, banks and insurance companies.
How did the Funds perform during the twelve-month reporting period ended April 30, 2013?
The tables in the Fund Performance, Expense and Effective Leverage Ratios section of this report provide each Fund’s total return performance information for the Fund’s Class A Shares at net asset value (NAV) for the applicable one-year, five-year, ten-year and since-inception periods ending April 30, 2013. The tables also compare these returns to each Fund’s benchmark index and appropriate Lipper classification average.
Nuveen All-American Municipal Bond Fund
During the twelve-month period ended April 30, 2013, the Nuveen All-American Municipal Bond Fund’s Class A Shares at NAV significantly outperformed the S&P Municipal Bond Index and the Lipper General Municipal Debt Funds Classification Average.
For much of the reporting period, most bonds, especially those with longer maturity dates, experienced a decline in rates, while their prices simultaneously rose (bond yields and prices move in opposite directions). This environment provided a favorable backdrop for the Fund, which benefited primarily from the portfolio’s heightened sensitivity to interest rate changes, known as duration positioning. Because the Fund had a somewhat longer duration than the benchmark, the portfolio was well situated to take advantage of prevailing market conditions during the majority of the twelve-month time frame.
The Fund’s sector positioning also contributed to results on a relative basis, with health care securities providing a particularly notable impact. Because Nuveen brings substantial credit-research experience and resources to this part of the market, the health care sector is often an area in which we believe we can add significant value for investors, and, accordingly, we were active participants in this group. Also adding to the Fund’s relative performance were overweightings in corporate-backed industrial development revenue (IDR) and transportation bonds (especially toll roads), both of which were strong performing categories. At the same time, the Fund was helped by having less exposure to sectors whose performance was more subdued. General obligation (GO) bonds fit into this category, as did pre-refunded bonds, whose very short maturities and high credit quality were out of favor characteristics in a market where longer-dated, lower quality bonds tended to do the best.
A third positive factor was our credit quality allocation. With interest rates remaining extremely low by historical standards, investors were eager to buy lower rated bonds, which offered a higher degree of income to compensate investors for their added risk. The Fund’s significant overweighting in BBB-rated and non-rated issues added to results, given those securities’ solid performance. Meanwhile, the Fund maintained lesser exposure to the highest quality bonds, those rated AAA and AA, and this strategy proved additionally advantageous in light of those securities’ more modest gains.
Given the Fund’s favorable results, there were few particularly negative performance factors. The Fund was, however, modestly hampered by its holdings within the dedicated-tax bond sector. While the category as a whole fared well, the individual bonds we owned in this sector failed to keep pace, which limited the Fund’s upside. Another minor
disappointment was the Fund’s slight overweighting in water/sewer bonds, which lagged the broad municipal bond index.
Nuveen High Yield Municipal Bond Fund
During the twelve months ending April 30, 2013, the Nuveen High Yield Municipal Bond Fund’s Class A shares at NAV significantly outperformed the S&P Municipal Yield Index and the Lipper High Yield Municipal Debt Funds Classification Average. Please note that during the last fiscal reporting period, the Nuveen High Yield Municipal Bond Fund’s primary index was changed. Previously, the Fund used the S&P Municipal Bond High Yield Index as its benchmark. The Fund is now compared to the S&P Municipal Yield Index because it more closely reflects the Fund’s investment universe.
The environment for high yield municipal bonds was favorable during the period, as credit spreads narrowed (indicating lower-rated bond yields were falling more sharply than higher-rated bond yields). Demand for high yield securities was further bolstered by improved fiscal conditions, as states and municipalities generally enjoyed growth in tax revenue in response to the improving economy, which was being lifted in part by better conditions in the housing market. The Fund was well positioned to benefit from these trends, maintaining elevated exposure to corporate-backed industrial development revenue (IDR) municipal bonds and land-backed community district debt.
Regarding IDR bonds, the Fund was especially helped by its exposure to municipal bonds issued by the airline industry, which witnessed a number of positive developments during the period, including market consolidation that has strengthened the financial position of issuers. One particularly notable contributor to the Fund’s results was an unsecured bond issue for American Airlines that we initially purchased in the secondary municipal bond market early in the reporting period and added to that position at various points throughout the past twelve months. As the company made progress on its bankruptcy resolution, it improved its financial position much more than many investors expected a year ago. We began buying these securities in May 2012 at a very large discount to their face value; by the end of the reporting period, they traded at a healthy premium.
Another area of opportunity was land-backed community district debt, whose income stream is supplied by property tax revenues. The improving real estate market provided a tailwind for these types of securities, so the Fund’s overweighting was helpful for relative performance. In particular, the Fund benefited from non-rated bonds for the Tolomato Community Development District, which enjoyed solid performance, as the prospects for this development project near Jacksonville, Florida, regained momentum in response to better housing market conditions. While not a land-backed security, our position in Pennsylvania Economic Development Authority bonds for USG Corporation, a leading manufacturer of wallboard used in building and home construction, reflected healthier real estate market conditions, improved construction data and higher pricing for wallboard.
The health care sector remained an important area of investment. As hospitals prepare to implement the requirements of the Affordable Care Act, we saw an increase in merger activity, which was a generally positive trend for hospital bonds.
Another positive performance factor during the period was our use of leverage through inverse floating rate securities. These positions supported the Fund’s results, given that the yield curve remained steep and interest rates on high quality bonds maintained stable performance, enabling the Fund’s leveraged position to generate significant cash flow. (For more information on the Fund’s use of leverage, see “Impact of Nuveen High Yield Municipal Bond Fund’s Leveraging Strategy on Performance” later in this report.)
Even as the Fund enjoyed positive results, a few holdings did not meet our expectations. The largest individual detractor in the portfolio was an IDR bond issue for EnerTech Biosolids, a firm that provides electricity generation through the burning of solid waste. Unfortunately, the company was unable to fulfill the terms of its contract with Los Angeles and other Southern California communities. At period end, we were in the process of liquidating our position. Another challenging performer was a parking bond issue for Yankee Stadium, which we wrote about in our shareholder report six months ago. These bonds remained depressed in value because of the issuer’s high level of debt relative to revenues. However, we maintained our position in the bonds, believing that the issuer’s difficulties were already reflected in the bonds’ values and there could be opportunities for future price improvement. While both of these positions hindered performance, the portfolio’s broad diversification helped ensure that the losses had a minimal impact on the Fund’s overall results.
The Fund also continued to maintain several interest rate swaps that we used to reduce the duration of its portfolio. While these investments functioned exactly as planned, the overall impact on performance was mildly negative, given interest rates declined during the period in which the Fund had the highest exposure to these interest rate swap contracts. The Fund also used credit default swaps to manage credit risk. Using a credit default swap, the Fund purchased credit protection on a small set of issuers, which had a mildly negative impact on performance. Because the credit default swap contract was paired with specifics bonds, however, the same improvement in credit quality that led to negative performance on the credit default swap contract caused positive performance in the bonds it was hedging.
Impact of Nuveen High Yield Municipal Bond Fund’s Leveraging Strategy on Performance
One important factor impacting the returns of the Nuveen High Yield Municipal Bond Fund relative to its comparative benchmarks was the Fund’s use of substantial leverage through its investments in inverse floating rate securities, which represent leveraged investments in underlying bonds. The Fund uses leverage because the manager believes that our research as shown that, over time, leveraging provides opportunities for additional income and total return, particularly in the recent market environment where short-term market rates are at or near historical lows, meaning that the short-term rates the Fund has been paying on its leveraging instruments have been much lower than the interest the Fund has been earning on its portfolio of long-term bonds that it has bought with the proceeds of that leverage. However, use of leverage also can expose the Fund to additional volatility. For example, the value of an inverse floating rate security will increase or decrease in value by a multiple of the increase or decrease of the market value of the underlying bond due to changes in market interest rates or the bond’s creditworthiness.
Thus, when investing in an inverse floating rate security rather than directly in the underlying bond, the Fund will experience a greater increase in its net asset value if the underlying municipal bond increases in value, but it will also experience a correspondingly larger decline in its net asset value if the underlying bond declines in value, which will make the Fund’s net asset value more volatile, and its total return performance more variable over time. In addition, income on inverse floating rate securities will decrease when short term interest rates increase and increase when short term interest rates decrease. As a consequence, although investments in inverse floating rate securities offer the opportunity for higher income than the underlying bond at times of low short term market interest rates, those investments would serve to reduce the Fund’s income if short term interest rates rise such that they exceed the net income on the underlying bond.
The Fund’s use of leverage through inverse floating rate securities made a positive contribution to the performance of the Fund over this reporting period, largely because of the income differential between the higher rates earned on the Fund’s long term bond investments and the lower rates paid on its leveraging instruments.
Nuveen Inflation Protected Municipal Bond Fund
During the twelve-month period ending April 30, 2013, the Nuveen Inflation Protected Municipal Bond Fund’s Class A shares at NAV beat the results of the Barclays 1-10 Year Municipal Bond Index by a generous margin. The Fund also outpaced the Lipper Intermediate Municipal Debt Funds Classification Average.
The Fund’s performance is generally shaped by its two portfolio components, intermediate duration municipal bonds and inflation linked swaps, the latter of which are designed to hedge the Fund against changes in inflation expectations, which can influence municipal bond prices.
In this period of strong relative performance for the Fund, several factors lifted results. In particular, the portfolio was supported by its yield curve positioning. Specifically, the Fund’s underweighting of bonds at the shorter end of its investment universe proved helpful, as did our modest overweighting of longer dated securities. Both stances worked out well, given that longer dated bonds generally benefited from declining interest rates to a greater extent than their shorter maturity counterparts.
Also adding to results was the Fund’s credit quality mix. The portfolio maintained an overweighting in BBB-rated and A-rated securities, two categories that make up the lower half of the investment grade bond universe and represent our primary focus in the managing the portfolio. In an environment of low bond yields, investors generally preferred these lower rated securities for the additional income they provide, despite the extra credit risk. Also, the Fund was underweight in the highest rated credit quality segments, bonds rated AAA and AA, which made an additional positive impact, as these securities did not perform quite as well.
Another source of outperformance came from the Fund’s sector allocations. Specifically, our overweighting in health care, which as a whole fared better than the broad municipal bond market, contributed notably. The Fund was also underweighted in pre-refunded bonds, which are high quality, short duration securities. In a market environment where
the opposite characteristics were sought by investors, our lesser exposure to this group added to our results in relative terms. On the other hand, the Fund’s positioning within the corporate-backed industrial development revenue category was a modest detractor.
The Fund’s inflation-protection component achieved its goal of hedging the portfolio against fluctuating prices. During the period, however, this portion of the portfolio detracted from relative performance, as inflation expectations decreased, causing the Fund’s inflation-linked swaps to decline in value accordingly.
Nuveen Intermediate Duration Municipal Bond Fund
During the twelve-month period ending April 30, 2013, the Nuveen Intermediate Duration Municipal Bond Fund’s Class A Shares at NAV modestly outpaced the S&P Municipal Bond Intermediate Index, as well as the Lipper Intermediate Municipal Debt Funds Classification Average.
The most helpful factor behind the Fund’s outperformance of the S&P Index was good credit quality positioning. Specifically, the portfolio had more exposure to bonds with lower investment grade credit ratings, which made up more than half of the Fund’s net assets at period end and these lower rated issues outperformed their higher rated counterparts. Two key factors drove the results of these securities. First, the financial position of municipal bond issuers generally improved along with the recovering economy. Second, investors remained hungry for yield in the continued low interest rate environment, and one of the primary ways to obtain a higher level of income was by taking on more credit risk.
The Fund’s sector positioning also proved advantageous, given that we were well invested in certain areas that featured a significant amount of lower rated issuance. For example, our hospital and tobacco holdings continued to add value, as did a number of our corporate-backed industrial development revenue bond positions, which benefited from improving economic conditions. Another source of outperformance was our allocation to state-supported general obligation debt, led by our holdings in California and Illinois securities. California bonds were helped by the state’s progress in resolving its budget challenges, while, in Illinois, investors’ expectations that the economic situation could begin to improve in that financially troubled state lifted those bonds’ prices.
On the other hand, our yield curve positioning was, in retrospect, sub-optimal. To maintain our desired duration for the portfolio, we owned a combination of longer maturity bonds from within the Fund’s intermediate investment universe, balanced by some very short maturity issues. Because these latter securities were highly liquid, we thought they would be good sale candidates in the event of a sudden change in demand for municipal bonds. In addition, some of these shorter-maturity bonds were purchased years ago at higher yields than those available today, which has helped sustain the Fund’s income stream for its shareholders. During this reporting period, however, these bonds did not perform as well as longer dated bonds did, but we maintained this allocation because of these other factors.
Nuveen Limited Term Municipal Bond Fund
For the twelve-month period ending April 30, 2013, the Nuveen Limited Term Municipal Bond Fund’s Class A Shares at NAV outpaced the S&P Municipal Bond Short-Intermediate Index, to a modest degree. The Fund also surpassed the results of the Lipper Short-Intermediate Municipal Debt Funds Classification Average.
The Fund benefited from favorable credit quality positioning. As with the other Funds profiled in this report, we maintained higher relative exposure to bonds on the lower end of the credit quality spectrum, taking advantage of Nuveen’s credit research capabilities to find securities offering additional yield at what we believed was an acceptable level of credit risk. At period end, close to 40% of the portfolio’s net assets was invested in investment grade bonds rated A and BBB, which added to the Fund’s results on a relative basis. As mentioned earlier in this report, lower rated bonds generally outperformed higher rated issues.
On a related note, the Fund saw good results from its holdings in sectors that tend to offer more exposure to lower rated bonds. These included health care, tobacco and corporate-backed industrial development revenue bonds, all of which were supported by improving economic conditions and investors’ willingness to take on credit risk. Another boost came from our state general obligation debt and bonds issued by the State of Illinois, whose prospects for resolving its serious financial challenges appeared to improve a bit. At the same time, however, the Fund was hampered somewhat by its allocation to pre-refunded bonds, whose very short durations and high credit quality were out-of-favor characteristics.
In all, the Fund’s duration positioning had a slight positive impact on results during the twelve-month reporting period. While the Fund’s interest rate sensitivity was roughly equivalent to that of its benchmark, we got a lift from helpful yield curve positioning. We achieved our desired interest rate stance by balancing the Fund’s shorter dated issues with corresponding exposure on the long end of the yield curve. In particular, the Fund’s allocation to very short dated paper was modest, allowing the Fund to realize a benefit from its longer dated holdings.
Nuveen Short Duration High Yield Municipal Bond Fund
While this is an annual report, the Nuveen Short Duration High Yield Municipal Bond Fund’s performance discussion encompasses an abbreviated reporting period from inception on February 1, 2013 through April 30, 2013. During this period, the Fund’s Class A shares at NAV outpaced the S&P Municipal Bond Short Intermediate Index, as well as the Lipper High Yield Municipal Debt Funds Classification Average.
The Fund’s investment approach is to limit duration risk and take advantage of the relatively wider credit spreads generally available on shorter duration bonds. During the three months between the Fund’s inception date and period end, the Fund was well positioned to benefit from favorable market conditions, as yields declined on shorter dated municipal bonds, while their prices rose accordingly.
Nuveen Short Term Municipal Bond Fund
For the twelve-month period ending April 30, 2013, the Nuveen Short Term Municipal Bond Fund’s Class A Shares at NAV outpaced the S&P Municipal Bond Short Index. The Fund also surpassed the results of the Lipper Short Municipal Debt Funds Classification Average. Prior to November 2011, the Fund’s benchmark was the Barclays 3-Year Municipal Bond Index. The Fund is now compared to the S&P Municipal Bond Short Index because it more closely reflects the Fund’s investment universe.
The Fund’s outperformance relative to the S&P Index was shaped predominantly by the portfolio’s credit rating positioning. Specifically, the Fund’s overweighting in lower quality, investment grade bonds rated A and BBB was advantageous. With yields on high quality short term municipal bonds at or near record lows during the period, investors seeking income were compelled to turn to higher yielding segments of the municipal market. Given that, the Fund’s overweighting in the lower half of the investment grade bond universe and its corresponding underweighting in bonds rated AAA and AA proved beneficial.
The Fund’s sector weighting breakdown also boosted performance relative to its benchmark. The Fund was overweighted in the health care and higher education groups, both of which outpaced the index, as income-seeking investors sought opportunities among higher yielding bonds. Similarly, the Fund’s underweighting among higher-quality sectors, namely pre-refunded bonds and state general obligation debt, was helpful as neither kept pace with the index, somewhat due to their relatively lower income return component.
The maturity profile of the Fund further contributed to our positive results. Here, the Fund’s modest holdings in bonds with maturities exceeding four years, which, to achieve the Fund’s desired duration, are balanced with very short duration securities, enabled the Fund to capture some additional yield and benefit from the small amount of price appreciation these bonds enjoyed. The Fund’s holdings in short dated bonds with maturities of less than six months also modestly tempered the Fund’s results because they lagged the index, given their lower yields and minimal price performance.
What strategies were used to manage the Funds during the twelve-month reporting period ended April 30, 2013?
All of the Funds continued to employ the same fundamental investment strategies and tactics long relied upon by Nuveen Asset Management. Our municipal bond portfolios are managed with a value oriented approach and close input from Nuveen Asset Management’s experienced research team. Below, we highlight the specific factors influencing each Fund’s investment strategy, as well as how we managed each portfolio in light of recent market conditions.
Nuveen All-American Municipal Bond Fund
For much of the reporting period, investors were enthusiastic about the municipal bond market, which resulted in substantial new shareholder inflows for the Fund. In order to invest these assets, we were actively looking to purchase new municipal debt for the portfolio throughout the period. We generally emphasized lower-rated securities and
revenue bonds, which, despite their prior strong results, continued to offer relatively attractive yields. During the first half of the period, our purchases tended to focus on bonds with longer maturities, which we believed could continue to thrive in a low interest rate environment. By the second half of the period, however, our emphasis began to shift toward the intermediate portion of the yield curve. Because interest rates had declined more sharply on longer dated bonds, we believed that intermediate bonds had begun to offer better relative value. We made purchases across various revenue sectors, including health care, corporate-backed and “other revenue” bonds, a category that consists of securities backed by dedicated sales or use taxes and, therefore, we felt had the potential to do well in tandem with the improving economy.
Essential service bonds, such as water/sewer and public power revenue bonds, also provided attractive values. We found it appealing that these bonds offered a legally protected revenue stream dedicated to pay back bondholders. In selected instances, we also bought high-yield bonds. Before purchasing these below investment grade rated securities, we conducted thorough research to get comfortable with the financial quality of these issues and became confident that their reward potential fully compensated investors for their risk. Of course, the vast majority of this Fund’s assets were invested in investment grade rated securities, as mandated in the prospectus and the higher yielding, lower rated positions represented a modest portion of the portfolio.
Most of our new purchases were funded through the proceeds of bond calls or bond maturities, and to a lesser extent shareholder inflows. Selling activity, which was very limited, tended to focus on pre-refunded bonds, whose very short maturities and limited performance potential made them, in our view, good sale candidates. At period end, the Fund had a small number of Puerto Rico bond issues we believed were creditworthy and offered a good risk/reward trade-off for our shareholders. Puerto Rico bonds, like those issued by other U.S. territories, are generally fully tax-exempt for residents of all 50 states.
Nuveen High Yield Municipal Bond Fund
The Fund experienced substantial new shareholder inflows during the period, as investors actively searched for higher yield in an environment of continued low interest rates. Therefore, our primary emphasis during the period was to find suitable places to invest these new assets in order to keep the Fund fully invested.
With a significant amount of new cash available for investment, we bought bond issues across multiple economic sectors. One such area of activity was land-backed community development district deals, in which we have long been active participants because of our belief that they offered good value. With fewer mortgage defaults providing a more favorable environment for property development, the prospects for many community development district bond issuers was enhanced. Our purchases in this sector took place in multiple markets across the country, most notably buying special assessment bonds for the Grand Bay at Doral Community Development District, a facility outside Miami; adding to our position in special assessment bonds issued for the Tolomato Community Development District near Jacksonville, Florida; and purchasing special-tax bonds for Murrieta (California) Public Facilities Authority.
Another area of emphasis was corporate-backed IDR municipal bonds, many of which continued to benefit from the stabilizing economic backdrop but still offered what we believed was good value potential. New IDR purchases included tax-exempt bonds issued for chemical manufacturer Celanese and truck engine manufacturer Navistar International. Several times during the period, we also added to the Fund’s position in American Airlines bonds, which, as we mentioned, were extremely strong performers for the Fund. We found additional opportunities to add value among charter school bonds. In contrast, while health care is typically an active sector for Nuveen and we did periodically add to the Fund’s allocation, we were less involved here than usual. Because many health care bonds have performed relatively well in recent years, we identified better values in other parts of the market, such as those we mentioned earlier.
We also sought value potential by purchasing bonds backed by municipal bond insurer National Public Finance Guarantee (NPFG). In the wake of the financial crisis of 2008, most municipal bond insurers saw their credit ratings downgraded, and NPFG was no exception. In recent years, however, NPFG has settled its outstanding litigation, which, in our view, has increased its future viability as a legitimately highly rated entity. Although the company’s credibility has not yet been rebuilt with investors, a process we believe may take time, it has become possible to purchase municipal debt offering NPFG’s insurance wrapper without paying much in the way of a premium for this additional coverage. Accordingly, we looked for attractively valued NPFG-backed bonds that we believed were solid investments, paid only a modest amount for NPFG’s insurance policy and then anticipated the potential for capital appreciation if NPFG is successful in restoring its credibility with investors.
Selling activity was also very limited and tended to be concentrated around investment outflows in December 2012, as investors developed short-lived concerns about the perceived risk in the municipal bond market related to unrealized proposals out of Washington, D.C. to limit the tax-exemption of municipal bonds. When we sold securities in response to shareholder outflows, we generally unloaded higher coupon investment grade bonds priced to relatively short call dates. We believed these securities were not a key component of our long term investment strategy, offered less compelling long term value and could be most easily replaced in the portfolio.
Nuveen Inflation Protected Municipal Bond Fund
The Fund’s net assets more than doubled during the period due to a sizeable inflow of shareholder investments. As a result, our primary emphasis in managing the portfolio was to stay fully invested. To accomplish this goal, we were extremely active in making new purchases, via both the primary and secondary municipal bond markets and across a variety of sectors, buying suitable securities that we believed offered good value for our shareholders. In our opinion, the portfolio was well structured going into the period, so modest changes to the Fund’s credit quality and sector weightings reflected the composition of the new bonds we added, as opposed to the sale of specific securities from the portfolio. In fact, sales were almost non-existent during a period in which our main priority was to invest the portfolio’s growing assets.
While the average credit quality of the portfolio remained fairly consistent, we took advantage of selected opportunities among below investment grade rated bonds that, after conducting thorough credit research, we believed offered our shareholders a particularly favorable risk/reward trade-off. However, we found fewer of these opportunities as the period progressed. Notable sector activity included adding to the Fund’s allocation to general obligation, higher education and dedicated-tax bonds, reflecting where we believed we were finding good value. In contrast, the Fund’s health care, toll road and public power bond exposure remained significant but decreased modestly as a percentage of the portfolio’s assets, as we tended to favor securities from other sectors.
As the Fund grew, we added additional inflation-linked swap positions several times during the reporting period and monitored the portfolio regularly to help ensure appropriate inflation protection.
Nuveen Intermediate Duration Municipal Bond Fund
With new shareholder inflows coming into the Fund, our primary consideration was to keep the portfolio fully invested, a goal that influenced our management decisions throughout the period. On a duration basis, for example, we continued to identify desirable bonds across a wide spectrum of maturities. As the period progressed, we were finding the best values among bonds in our investment universe with maturities ranging from roughly six to fifteen years. In addition to providing our shareholders with what we believed was the best available risk/reward balance, this focus on the “belly” of the yield curve provided the Fund with sufficient interest rate sensitivity to keep duration in line with that of our target.
The Fund’s credit quality positioning also remained consistent. Even as credit spreads narrowed, indicating that investors were willing to take on more credit risk in exchange for a declining amount of yield, lower investment grade rated bonds continued to offer what we believed was good value, even if that value at period end was not quite as significant as it had been twelve months earlier. We worked closely with Nuveen’s credit research team to find those bonds that we believed offered the best risk/reward trade-off, especially as robust demand for municipal securities made it more important than ever to be selective about choosing appropriate bonds offering good value. We believe Nuveen’s credit research expertise makes us well positioned to capitalize on this situation, given the depth of our credit research experience and resources. While we continued to purchase lower-investment grade debt we found attractive, we were not looking to dramatically increase our exposure as a percentage of the portfolio’s net assets, believing that the Fund was already sufficiently represented in bonds with credit ratings below AA-rated.
During the first half of the period, we took advantage of several unique opportunities to buy unemployment compensation-backed bonds, a category that does not come to market very often. In the wake of the financial crisis of 2008, various states depleted their unemployment compensation funds, leading them to issue new state tax-exempt bonds to finance funds borrowed from the federal government. During the first half of the period, we purchased these generally high quality securities issued by Michigan, Illinois
and Pennsylvania. In our view, these bonds provided our shareholders with two important advantages, an adequate level of compensation and, because of their general scarcity, beneficial diversification to the portfolio.
To finance purchases for the Fund, we relied primarily on the proceeds from new shareholder investments and from bond calls and maturities. Selling activity was infrequent and tended to consist of bonds we saw as having limited performance prospects, and we typically initiated sales only during periods when we needed to generate cash for attractive purchase opportunities.
Nuveen Limited Term Municipal Bond Fund
The majority of our purchase activity was focused on keeping the portfolio’s healthy level of shareholder inflows invested, and therefore we had little need to sell securities to take advantage of attractive buying opportunities. Additional funds for our purchases came from the proceeds of bond calls and maturities. Because of this Fund’s emphasis on holdings with relatively short maturity dates, securities roll off the portfolio with a high degree of regularity. During the period, we were able to maintain the Fund’s duration positioning, which we believed was favorable, as the bulk of our new purchases focused on bonds with maturities ranging from roughly three to eight years. When it was possible to find lower-rated bonds providing a good risk/reward trade-off, we looked to this maturity range for new investments. That said, as these bonds continued to gain in price, it became more challenging to find limited-term issues providing what we saw as good value, and we found ourselves becoming more selective as the premium available for investing in lower rated bonds continued to narrow. One notable area in which we were able to find some good prospects was among public power bonds, which, as “essential service” projects, typify the kind of holding we regularly seek as a source of long term potential.
During the first half of the period, we took advantage of several unique opportunities to buy unemployment compensation-backed bonds, a category that does not come to market very often. In the wake of the financial crisis of 2008, various states depleted their unemployment compensation funds, leading them to issue new state tax-exempt bonds to finance funds borrowed from the federal government. During the first half of the period, we purchased these generally high quality securities issued by Michigan, Illinois and Pennsylvania. In our view, these bonds provided our shareholders with two important advantages, an adequate level of compensation and, because of their general scarcity, beneficial diversification to the portfolio.
Nuveen Short Duration High Yield Municipal Bond Fund
In seeking high current income exempt from regular federal income taxes, the Fund invests in predominantly lower rated municipal bonds while maintaining a weighted average effective portfolio duration of less than 4.5 years. When appropriate, the Fund may also use leverage in an opportunistic manner, through the use of inverse floating rate securities.
By design, the duration of the Fund is controlled to limit the impact of interest rate movements on performance, making this a potential option for investors who wish to add exposure to high yield municipal bonds to their portfolios, while limiting their interest rate risk.
In its initial three months of operation, the Fund experienced extremely large inflows, and thus our main priority was to invest those assets quickly. We were successful in promptly putting those funds to work in the lower-rated bonds that are our primary emphasis in this portfolio.
Our new purchases consisted of securities across a variety of sectors, including special-assessment, tobacco, corporate-backed industrial development revenue and health care bonds, all of which we believed offered good value to our investors. The Fund also had a small amount of exposure to bonds issued by Puerto Rico, as U.S. territorial bonds are generally fully income tax exempt for all U.S. residents. Our Puerto Rico allocation consisted of individually selected bonds with shorter maturities and, when possible, bonds backed by municipal insurers we believe to be creditworthy.
The majority of our purchases took place in the secondary municipal bond market, which can be a more challenging process than buying bonds in the primary market. However, it can also be a very good source of value, especially for investors such as Nuveen with substantial research and trading resources, as bonds in the secondary market are often less liquid and sometimes even trade by appointment.
We also sought value potential by purchasing bonds backed by municipal bond insurer National Public Finance Guarantee (NPFG). In the wake of the financial crisis of 2008, most municipal bond insurers saw their credit ratings downgraded, and NPFG was no exception. In recent years, however, NPFG has settled its outstanding litigation, which, in our view, has increased its future viability as a legitimately highly rated entity. Although the company’s credibility has not yet been rebuilt with investors, a process we believe may take time, it has become possible to purchase municipal debt offering NPFG’s insurance wrapper without paying much in the way of a premium for this additional coverage. Accordingly, we looked for attractively valued NPFG-backed bonds that we believed were solid investments, paid only a modest amount for NPFG’s insurance policy and then anticipated the potential for capital appreciation if NPFG is successful in restoring its credibility with investors. During the period, we bought NPFG-insured bonds that we thought were good investments in their own right, and further had the potential to see additional capital appreciation if NPFG regains its favor with investors, which we see as a distinct possibility over time.
Nuveen Short Term Municipal Bond Fund
At the end of 2012, the Fund experienced inflows during a period when the supply of new municipal bonds was comparatively light. At that time, our view was that tight supply had temporarily inflated municipal bond valuations, and that once issuers resumed bringing new bonds to the market in 2013, we would have more attractive points of entry. As expected, the supply of municipal bonds increased in early 2013, providing increased opportunities for us to invest at prices we believed were more attractive. As a result, we sold some very short dated holdings to make way for purchases of bonds in the three- to
four-year maturity range. Given our expectation that short-term interest rates were unlikely to rise much in the near term, we thought that bonds in the three- to four-year range provided attractive yield and total return potential.
Throughout much of the past twelve months, yields on bonds with maturities between one and four years were relatively stable. Because this lack of volatility limited opportunities to buy and sell mispriced bonds, we focused on finding securities that we felt offered the best combination of yield and credit risk. We generally saw the best prospects among bonds with A and BBB credit ratings reflecting the lower end of our investment grade bond universe and took advantage to add these types of securities to the portfolio when we found suitable opportunities to do so. As a result of this increasing emphasis on lower investment grade bonds, the Fund’s allocation to AAA-rated and AA-rated issues declined.
Low and stable yields also supported our ongoing focus on higher yielding investment grade sectors, leading us to emphasize hospital and higher education bonds. At the same time, we maintained more limited exposure to lower yielding sectors, including pre-refunded and state general obligation bonds. Adding diversification to the portfolio, we made new purchases during the period across a combination of sectors, including special-assessment bonds, student housing projects and higher education debt.
Risk Considerations
Nuveen All-American Municipal Bond Fund
Nuveen Intermediate Duration Municipal Bond Fund
Nuveen Limited Term Municipal Bond Fund
Nuveen Short Term Municipal Bond Fund
Mutual fund investing involves risk; principal loss is possible. Debt or fixed income securities such as those held by the Funds, are subject to market risk, credit risk, interest rate risk, call risk, tax risk, political and economic risk, and income risk. As interest rates rise, bond prices fall. Credit risk refers to an issuers ability to make interest and principal payments when due. Below investment grade or high yield debt securities are subject to liquidity risk and heightened credit risk. The Funds’ use of inverse floaters creates effective leverage. Leverage involves the risk that the Funds could lose more than their original investment and also increases the Funds’ exposure to volatility, interest rate risk and credit risk.
Nuveen High Yield Municipal Bond Fund
Mutual fund investing involves risk; principal loss is possible. Debt or fixed income securities such as those held by the Fund, are subject to market risk, credit risk, interest rate risk, call risk, tax risk, political and economic risk, and income risk. As interest rates rise, bond prices fall. Credit risk refers to an issuers ability to make interest and principal payments when due.
The Fund concentrates in non-investment-grade and unrated bonds with long maturities and durations which carry heightened credit risk, liquidity risk, and potential for default. In addition, the Fund oftentimes engages in a significant amount of portfolio leverage and in doing so, assumes a high level of risk in pursuit of its objectives. Leverage involves the risk that the Fund could lose more than its original investment and also increases the Fund’s exposure to volatility, interest rate risk and credit risk.
Nuveen Inflation Protected Municipal Bond Fund
Mutual fund investing involves risk; principal loss is possible. Debt or fixed income securities such as those held by the Fund, are subject to market risk, credit risk, interest rate risk, non-diversification risk, call risk, tax risk, political and economic risk, and income risk. As interest rates rise, bond prices fall. Credit risk refers to an issuer’s ability to make interest and principal payments when due. Below investment grade or high yield debt securities are subject to liquidity risk and heightened credit risk. The Fund’s use of derivative instruments may involve a small amount of cash investment relative to the total notional principal amount of the transaction, the magnitude of losses from derivatives may be greater than the amount originally invested. There can be no assurance that the Fund’s inflation hedging strategy will be successful or perform as expected.
Nuveen Short Duration High Yield Municipal Bond Fund
Mutual fund investing involves risk; principal loss is possible. Debt or fixed income securities such as those held by the Fund, are subject to market risk, credit risk, interest rate risk, call risk, tax risk, political and economic risk, and income risk. As interest rates rise, bond prices fall. Credit risk refers to an issuers ability to make interest and principal payments when due.
The Fund concentrates in non-investment-grade and unrated bonds with shorter maturities and durations which carry heightened credit risk, liquidity risk, and potential for default. In addition, the Fund may engage in a moderate amount of portfolio leverage and in doing so, assumes a higher level of risk in pursuit of its objectives. Leverage involves the risk that the Fund could lose more than its original investment and also increases the Fund’s exposure to volatility, interest rate risk and credit risk.
Dividend Information
Each Fund seeks to pay dividends at a rate that reflects the past and projected performance of the Fund. To permit a Fund to maintain a more stable monthly dividend, the Fund may pay dividends at a rate that may be more or less than the amount of net investment income actually earned by the Fund during the period. If the Fund has cumulatively earned more than it has paid in dividends, it will hold the excess in reserve as undistributed net investment income (UNII) as part of the Fund’s net asset value. Conversely, if the Fund has cumulatively paid in dividends more than it has earned, the excess will constitute a negative UNII that will likewise be reflected in the Fund’s net asset value. Each Fund will, over time, pay all its net investment income as dividends to shareholders. As of April 30, 2013, all the Funds in this report had positive UNII balance for tax purposes. As of April 30, 2013, the Nuveen Inflation Protected Municipal Bond Fund, Nuveen Limited Term Municipal Bond Fund and Nuveen Short Duration High Yield Municipal Bond Fund had negative UNII balances and the Nuveen All-American Municipal Bond Fund, Nuveen High Yield Municipal Bond Fund, Nuveen Intermediate Duration Municipal Bond Fund and Nuveen Short Term Municipal Bond Fund had positive UNII balances for financial reporting purposes.
Fund Performance, Expense and Effective Leverage Ratios
The Fund Performance, Expense and Effective Leverage Ratios for each Fund are shown on the following 14 pages.
Returns quoted represent past performance, which is no guarantee of future results. Current performance may be higher or lower than the performance shown. Investment returns and principal value will fluctuate so that when shares are redeemed, they may be worth more or less than their original cost. Returns without sales charges would be lower if the sales charge were included. Returns do not reflect the deduction of taxes that a shareholder would pay on Fund distributions or the redemption of Fund shares. Income is generally exempt from regular federal income taxes. Some income may be subject to state and local income taxes and to the federal alternative minimum tax. Capital gains, if any, are subject to tax.
Returns may reflect a contractual agreement between certain Funds and the investment adviser to waive certain fees and expenses; see Notes to Financial Statements, Footnote 7 — Management Fees and Other Transactions with Affiliates for more information. In addition, returns may reflect a voluntary expense limitation by the Funds’ investment adviser that may be modified or discontinued at any time without notice. For the most recent month-end performance visit www.nuveen.com or call (800) 257-8787.
Returns reflect differences in sales charges and expenses, which are primarily differences in distribution and service fees. Fund returns assume reinvestment of dividends and capital gains.
Comparative index and Lipper return information is provided for the Funds’ Class A Shares at net asset value (NAV) only.
The expense ratios shown reflect the Funds’ total operating expenses (before fee waivers and/or expense reimbursements, if any) as shown in the Funds’ most recent prospectus. The expense ratios include management fees and other fees and expenses.
Leverage is created whenever the Fund has investment exposure (both reward and/or risk) equivalent to more than 100% of the investment capital. The effective leverage ratio shown is the amount of investment exposure created either through borrowings or indirectly through inverse floaters, divided by the assets invested, including those assets that were purchased with the proceeds of the leverage, or referenced by the levered instrument.
Fund Performance, Expense and Effective Leverage Ratios (continued)
Nuveen All-American Municipal Bond Fund
Refer to the first page of this Fund Performance, Expense and Effective Leverage Ratios section for further explanation of the information included within this page.
Fund Performance
Average Annual Total Returns as of April 30, 2013
| | | | | | | | | | | | |
| |
| | | Average Annual | |
| | | |
| | | 1-Year | | | 5-Year | | | 10-Year | |
Class A Shares at NAV | | | 7.83% | | | | 7.46% | | | | 5.60% | |
Class A Shares at maximum Offering Price | | | 3.29% | | | | 6.54% | | | | 5.15% | |
S&P Municipal Bond Index* | | | 5.74% | | | | 6.08% | | | | 5.16% | |
Lipper General Municipal Debt Funds Classification Average* | | | 6.17% | | | | 5.67% | | | | 4.39% | |
| | | |
Class B Shares w/o CDSC | | | 7.05% | | | | 6.64% | | | | 4.98% | |
Class B Shares w/CDSC | | | 3.05% | | | | 6.49% | | | | 4.98% | |
Class C Shares | | | 7.17% | | | | 6.87% | | | | 5.03% | |
Class I Shares | | | 8.03% | | | | 7.64% | | | | 5.79% | |
Average Annual Total Returns as of March 31, 2013 (Most Recent Calendar Quarter)
| | | | | | | | | | | | |
| |
| | | Average Annual | |
| | | |
| | | 1-Year | | | 5-Year | | | 10-Year | |
Class A Shares at NAV | | | 8.04% | | | | 7.49% | | | | 5.57% | |
Class A Shares at maximum Offering Price | | | 3.52% | | | | 6.56% | | | | 5.12% | |
Class B Shares w/o CDSC | | | 7.16% | | | | 6.67% | | | | 4.95% | |
Class B Shares w/CDSC | | | 3.16% | | | | 6.52% | | | | 4.95% | |
Class C Shares | | | 7.47% | | | | 6.90% | | | | 5.00% | |
Class I Shares | | | 8.13% | | | | 7.67% | | | | 5.76% | |
Class A Shares have a maximum 4.20% sales charge (Offering Price). Class A Share purchases of $1 million or more are sold at net asset value without an up-front sales charge but may be subject to a contingent deferred sales charge (CDSC), also known as a back-end sales charge, if redeemed within eighteen months of purchase. Class B Shares have a CDSC that begins at 5% for redemptions during the first year and declines periodically until after six years when the charge becomes 0%. Class B Shares automatically convert to Class A Shares eight years after purchase. Class C Shares have a 1% CDSC for redemptions within less than twelve months, which is not reflected in the one-year total return. Class I Shares have no sales charge and may be purchased under limited circumstances or by specified classes of investors.
Expense Ratios as of Most Recent Prospectus
| | | | |
| |
| | | Expense
Ratios | |
Class A Shares | | | 0.77% | |
Class B Shares | | | 1.53% | |
Class C Shares | | | 1.32% | |
Class I Shares | | | 0.55% | |
Effective Leverage Ratio as of April 30, 2013
| | | | |
Effective Leverage Ratio | | | 5.34% | |
| * | Refer to the Glossary of Terms Used in this Report for definitions. Indexes and Lipper averages are not available for direct investment. |
Growth of an Assumed $10,000 Investment as of April 30, 2013 – Class A Shares
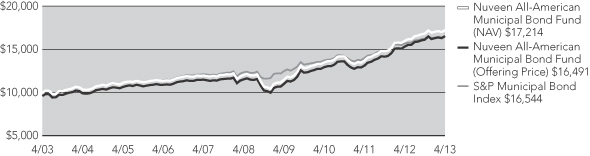
The graphs do not reflect the deduction of taxes that a shareholder may pay on Fund distributions or the redemption of Fund shares.
Fund Performance, Expense and Effective Leverage Ratios (continued)
Nuveen High Yield Municipal Bond Fund
Refer to the first page of this Fund Performance, Expense and Effective Leverage Ratios section for further explanation of the information included within this page.
Fund Performance
Average Annual Total Returns as of April 30, 2013
| | | | | | | | | | | | |
| |
| | | Average Annual | |
| | | |
| | | 1-Year | | | 5-Year | | | 10-Year | |
Class A Shares at NAV | | | 14.24% | | | | 5.17% | | | | 5.11% | |
Class A Shares at maximum Offering Price | | | 9.43% | | | | 4.27% | | | | 4.66% | |
S&P Municipal Yield Index* | | | 11.18% | | | | 7.12% | | | | N/A | |
S&P Municipal Bond High Yield Index* | | | 13.04% | | | | 7.66% | | | | 7.33% | |
Lipper High Yield Municipal Debt Funds Classification Average* | | | 9.60% | | | | 5.75% | | | | 4.95% | |
| | | |
Class B Shares w/o CDSC | | | 13.34% | | | | 4.38% | | | | 4.48% | |
Class B Shares w/CDSC | | | 9.34% | | | | 4.22% | | | | 4.48% | |
Class C Shares | | | 13.57% | | | | 4.58% | | | | 4.53% | |
Class I Shares | | | 14.44% | | | | 5.36% | | | | 5.31% | |
Average Annual Total Returns as of March 31, 2013 (Most Recent Calendar Quarter)
| | | | | | | | | | | | |
| |
| | | Average Annual | |
| | | |
| | | 1-Year | | | 5-Year | | | 10-Year | |
Class A Shares at NAV | | | 14.82% | | | | 5.03% | | | | 5.04% | |
Class A Shares at maximum Offering Price | | | 9.99% | | | | 4.13% | | | | 4.59% | |
Class B Shares w/o CDSC | | | 13.99% | | | | 4.25% | | | | 4.42% | |
Class B Shares w/CDSC | | | 9.99% | | | | 4.09% | | | | 4.42% | |
Class C Shares | | | 14.22% | | | | 4.45% | | | | 4.47% | |
Class I Shares | | | 15.10% | | | | 5.22% | | | | 5.24% | |
Class A Shares have a maximum 4.20% sales charge (Offering Price). Class A Share purchases of $1 million or more are sold at net asset value without an up-front sales charge but may be subject to a contingent deferred sales charge (CDSC), also known as a back-end sales charge, if redeemed within eighteen months of purchase. Class B Shares have a CDSC that begins at 5% for redemptions during the first year and declines periodically until after six years when the charge becomes 0%. Class B Shares automatically convert to Class A Shares eight years after purchase. Class C Shares have a 1% CDSC for redemptions within less than twelve months, which is not reflected in the one-year total return. Class I Shares have no sales charge and may be purchased under limited circumstances or by specified classes of investors.
Expense Ratios as of Most Recent Prospectus
| | | | |
| |
| | | Expense
Ratios | |
Class A Shares | | | 0.85% | |
Class B Shares | | | 1.61% | |
Class C Shares | | | 1.40% | |
Class I Shares | | | 0.65% | |
Effective Leverage Ratio as of April 30, 2013
| | | | |
Effective Leverage Ratio | | | 18.62% | |
| * | Refer to the Glossary of Terms Used in the Report for definitions. Indexes and Lipper averages are not available for direct investment. |
Growth of an Assumed $10,000 Investment as of April 30, 2013 – Class A Shares
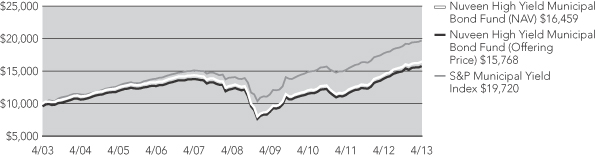
The graphs do not reflect the deduction of taxes that a shareholder may pay on Fund distributions or the redemption of Fund shares.
Fund Performance, Expense and Effective Leverage Ratios (continued)
Nuveen Inflation Protected Municipal Bond Fund
Refer to the first page of this Fund Performance, Expense and Effective Leverage Ratios section for further explanation of the information included within this page.
Fund Performance
Average Annual Total Returns as of April 30, 2013
| | | | | | | | |
| |
| | | Average Annual | |
| | |
| | | 1-Year | | | Since
Inception* | |
Class A Shares at NAV | | | 5.39% | | | | 8.89% | |
Class A Shares at maximum Offering Price | | | 2.23% | | | | 7.35% | |
Barclays 1-10 Year Municipal Bond Index** | | | 3.28% | | | | 5.37% | |
Lipper Intermediate Municipal Debt Funds Classification Average** | | | 3.98% | | | | 6.54% | |
| | |
Class C Shares | | | 4.81% | | | | 8.28% | |
Class I Shares | | | 5.65% | | | | 9.10% | |
Average Annual Total Returns as of March 31, 2013 (Most Recent Calendar Quarter)
| | | | | | | | |
| |
| | | Average Annual | |
| | |
| | | 1-Year | | | Since
Inception* | |
Class A Shares at NAV | | | 6.35% | | | | 9.16% | |
Class A Shares at maximum Offering Price | | | 3.16% | | | | 7.57% | |
Class C Shares | | | 5.77% | | | | 8.56% | |
Class I Shares | | | 6.51% | | | | 9.38% | |
Class A Shares have a maximum 3.00% sales charge (Offering Price). Class A Share purchases of $1 million or more are sold at net asset value without an up-front sales charge but may be subject to a contingent deferred sales charge (CDSC), also known as a back-end sales charge, if redeemed within eighteen months of purchase. Class C Shares have a 1% CDSC for redemptions within less than twelve months, which is not reflected in the one-year total return. Class I Shares have no sales charge and may be purchased under limited circumstances or by specified classes of investors.
Expense Ratios as of Most Recent Prospectus
| | | | | | | | |
| | |
| | | Gross
Expense
Ratios | | | Net
Expense
Ratios | |
Class A Shares | | | 1.45% | | | | 0.78% | |
Class C Shares | | | 2.02% | | | | 1.33% | |
Class I Shares | | | 1.21% | | | | 0.58% | |
The Fund’s investment adviser has agreed to waive fees and/or reimburse expenses through August 31, 2013 so that total annual Fund operating expenses (excluding 12b-1 distribution and service fees, interest expenses, taxes, fees incurred in acquiring and disposing of portfolio securities and extraordinary expenses) do not exceed 0.60% (1.05% after August 31, 2013) of the average daily net assets of any class of Fund shares. The expense limitation expiring August 31, 2013 may be terminated or modified prior to that date only with the approval of the Board of Trustees of the Fund. The expense limitation in effect thereafter may be terminated or modified only with the approval of shareholders of the Fund.
Effective Leverage Ratio as of April 30, 2013
| | | | |
Effective Leverage Ratio | | | 0% | |
| * | Since inception returns are from 3/08/11. |
| ** | Refer to the Glossary of Terms Used in the Report for definitions. Indexes and Lipper averages are not available for direct investment. |
Growth of an Assumed $10,000 Investment as of April 30, 2013 – Class A Shares
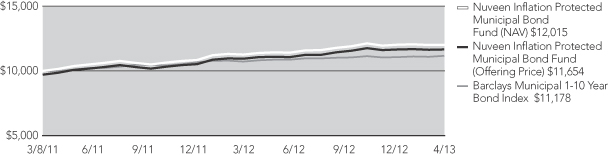
The graphs do not reflect the deduction of taxes that a shareholder may pay on Fund distributions or the redemption of Fund shares.
Fund Performance, Expense and Effective Leverage Ratios (continued)
Nuveen Intermediate Duration Municipal Bond Fund
Refer to the first page of this Fund Performance, Expense and Effective Leverage Ratios section for further explanation of the information included within this page.
Fund Performance
Average Annual Total Returns as of April 30, 2013
| | | | | | | | | | | | |
| |
| | | Average Annual | |
| | | |
| | | 1-Year | | | 5-Year | | | 10-Year | |
Class A Shares at NAV | | | 4.83% | | | | 5.18% | | | | 4.26% | |
Class A Shares at maximum Offering Price | | | 1.64% | | | | 4.55% | | | | 3.94% | |
S&P Municipal Bond Intermediate Index* | | | 4.71% | | | | 6.25% | | | | 5.12% | |
Lipper Intermediate Municipal Debt Funds Classification Average* | | | 3.98% | | | | 4.97% | | | | 3.91% | |
| | | |
Class B Shares w/o CDSC | | | 4.19% | | | | 4.40% | | | | 3.64% | |
Class B Shares w/CDSC | | | 0.19% | | | | 4.23% | | | | 3.64% | |
Class C Shares | | | 4.39% | | | | 4.63% | | | | 3.69% | |
Class I Shares | | | 5.13% | | | | 5.41% | | | | 4.47% | |
Average Annual Total Returns as of March 31, 2013 (Most Recent Calendar Quarter)
| | | | | | | | | | | | |
| |
| | | Average Annual | |
| | | |
| | | 1-Year | | | 5-Year | | | 10-Year | |
Class A Shares at NAV | | | 4.99% | | | | 5.11% | | | | 4.22% | |
Class A Shares at maximum Offering Price | | | 1.88% | | | | 4.47% | | | | 3.90% | |
Class B Shares w/o CDSC | | | 4.24% | | | | 4.32% | | | | 3.59% | |
Class B Shares w/CDSC | | | 0.24% | | | | 4.15% | | | | 3.59% | |
Class C Shares | | | 4.33% | | | | 4.53% | | | | 3.65% | |
Class I Shares | | | 5.18% | | | | 5.31% | | | | 4.42% | |
Class A Shares have a maximum 3.00% sales charge (Offering Price). Class A Share purchases of $1 million or more are sold at net asset value without an up-front sales charge but may be subject to a contingent deferred sales charge (CDSC), also known as a back-end sales charge, if redeemed within eighteen months of purchase. Class B Shares have a CDSC that begins at 5% for redemptions during the first year and declines periodically until after six years when the charge becomes 0%. Class B Shares automatically convert to Class A Shares eight years after purchase. Class C Shares have a 1% CDSC for redemptions within less than twelve months, which is not reflected in the one-year total return. Class I Shares have no sales charge and may be purchased under limited circumstances or by specified classes of investors.
Expense Ratios as of Most Recent Prospectus
| | | | |
| |
| | | Expense
Ratios | |
Class A Shares | | | 0.71% | |
Class B Shares | | | 1.46% | |
Class C Shares | | | 1.26% | |
Class I Shares | | | 0.51% | |
Effective Leverage Ratio as of April 30, 2013
| | | | |
Effective Leverage Ratio | | | 2.02% | |
| * | Refer to the Glossary of Terms Used in the Report for definitions. Indexes and Lipper averages are not available for direct investment. |
Growth of an Assumed $10,000 Investment as of April 30, 2013 – Class A Shares
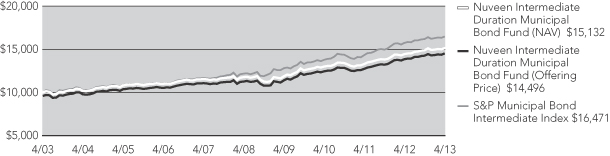
The graphs do not reflect the deduction of taxes that a shareholder may pay on Fund distributions or the redemption of Fund shares.
Fund Performance, Expense and Effective Leverage Ratios (continued)
Nuveen Limited Term Municipal Bond Fund
Refer to the first page of this Fund Performance, Expense and Effective Leverage Ratios section for further explanation of the information included within this page.
Fund Performance
Average Annual Total Returns as of April 30, 2013
| | | | | | | | | | | | |
| |
| | | Average Annual | |
| | | |
| | | 1-Year | | | 5-Year | | | 10-Year | |
Class A Shares at NAV | | | 2.79% | | | | 4.08% | | | | 3.53% | |
Class A Shares at maximum Offering Price | | | 0.20% | | | | 3.56% | | | | 3.27% | |
S&P Municipal Bond Short-Intermediate Index* | | | 2.64% | | | | 4.43% | | | | 3.94% | |
Lipper Short-Intermediate Municipal Debt Funds Classification Average* | | | 2.22% | | | | 3.53% | | | | 3.28% | |
| | | |
Class C Shares | | | 2.51% | | | | 3.72% | | | | 3.17% | |
Class I Shares | | | 3.07% | | | | 4.28% | | | | 3.73% | |
Average Annual Total Returns as of March 31, 2013 (Most Recent Calendar Quarter)
| | | | | | | | | | | | |
| |
| | | Average Annual | |
| | | |
| | | 1-Year | | | 5-Year | | | 10-Year | |
Class A Shares at NAV | | | 2.94% | | | | 4.00% | | | | 3.52% | |
Class A Shares at maximum Offering Price | | | 0.33% | | | | 3.48% | | | | 3.25% | |
Class C Shares | | | 2.57% | | | | 3.64% | | | | 3.16% | |
Class I Shares | | | 3.21% | | | | 4.22% | | | | 3.73% | |
Class A Shares have a maximum 2.50% sales charge (Offering Price). Class A Share purchases of $250,000 or more are sold at net asset value without an up-front sales charge but may be subject to a contingent deferred sales charge (CDSC), also known as a back-end sales charge, if redeemed within eighteen months of purchase. Class C Shares have a 1% CDSC for redemptions within less than twelve months, which is not reflected in the one-year total return. Class I Shares have no sales charge and may be purchased under limited circumstances or by specified classes of investors.
Expense Ratios as of Most Recent Prospectus
| | | | |
| |
| | | Expense
Ratios | |
Class A Shares | | | 0.65% | |
Class C Shares | | | 1.00% | |
Class I Shares | | | 0.45% | |
Effective Leverage Ratio as of April 30, 2013
| | | | |
Effective Leverage Ratio | | | 0% | |
| * | Refer to the Glossary of Terms Used in the Report for definitions. Indexes and Lipper averages are not available for direct investment. |
Growth of an Assumed $10,000 Investment as of April 30, 2013 – Class A Shares
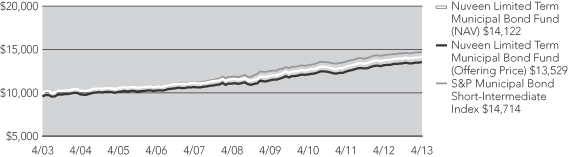
The graphs do not reflect the deduction of taxes that a shareholder may pay on Fund distributions or the redemption of Fund shares.
Fund Performance, Expense and Effective Leverage Ratios (continued)
Nuveen Short Duration High Yield Municipal Bond Fund
Refer to the first page of this Fund Performance, Expense and Effective Leverage Ratios section for further explanation of the information included within this page.
Fund Performance
Cumulative Total Returns as of April 30, 2013
| | | | |
| |
| | | Since
Inception* | |
Class A Shares at NAV | | | 1.72% | |
Class A Shares at maximum Offering Price | | | -0.82% | |
S&P Municipal Bond Short-Intermediate Index** | | | 0.77% | |
Lipper High Yield Municipal Debt Funds Classification Average** | | | 1.23% | |
| |
Class C Shares | | | 1.63% | |
Class I Shares | | | 1.75% | |
Cumulative Total Returns as of March 31, 2013 (Most Recent Calendar Quarter)
| | | | |
| |
| | | Since
Inception* | |
Class A Shares at NAV | | | 0.66% | |
Class A Shares at maximum Offering Price | | | -1.86% | |
Class C Shares | | | 0.62% | |
Class I Shares | | | 0.68% | |
Class A Shares have a maximum 2.50% sales charge (Offering Price). Class A Share purchases of $250,000 or more are sold at net asset value without an up-front sales charge but may be subject to a contingent deferred sales charge (CDSC), also known as a back-end sales charge, if redeemed within eighteen months of purchase. Class C Shares have a 1% CDSC for redemptions within less than twelve months, which is not reflected in the one-year total return. Class I Shares have no sales charge and may be purchased under limited circumstances or by specified classes of investors.
Expense Ratios as of Most Recent Prospectus
| | | | | | | | |
| | |
| | | Gross
Expense
Ratios | | | Net
Expense
Ratios | |
Class A Shares | | | 1.05% | | | | 0.85% | |
Class C Shares | | | 1.60% | | | | 1.40% | |
Class I Shares | | | 0.85% | | | | 0.65% | |
The Fund’s investment adviser has agreed to waive fees and/or reimburse expenses through April 30, 2016 so that total annual Fund operating expenses (excluding 12b-1 distribution and/or service fees, interest expenses, taxes, acquired fund fees and expenses, fees incurred in acquiring and disposing of portfolio securities and extraordinary expenses) do not exceed 0.65% of the average daily net assets of any class of Fund shares. The expense limitation expiring April 30, 2016 may be terminated or modified prior to that date only with the approval of the Board of Trustees of the Fund.
Effective Leverage Ratio as of April 30, 2013
| | | | |
Effective Leverage Ratio | | | 0.53% | |
| * | Since inception returns are from 2/01/13. |
| ** | Refer to the Glossary of Terms Used in the Report for definitions. Indexes and Lipper averages are not available for direct investment. |
Growth of an Assumed $10,000 Investment as of April 30, 2013 – Class A Shares
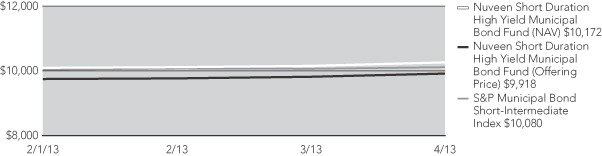
The graphs do not reflect the deduction of taxes that a shareholder may pay on Fund distributions or the redemption of Fund shares.
Fund Performance, Expense and Effective Leverage Ratios (continued)
Nuveen Short Term Municipal Bond Fund
Refer to the first page of this Fund Performance and Expense Ratios section for further explanation of the information included within this page.
Fund Performance
Average Annual Total Returns as of April 30, 2013
| | | | | | | | | | | | |
| |
| | | Average Annual | |
| | | |
| | | 1-Year | | | 5-Year | | | 10-Year | |
Class A Shares at NAV | | | 1.88% | | | | 2.78% | | | | 2.53% | |
Class A Shares at maximum Offering Price | | | -0.66% | | | | 2.27% | | | | 2.27% | |
S&P Municipal Bond Short Index** | | | 1.27% | | | | 2.81% | | | | 2.88% | |
Barclays 3-Year Municipal Bond Index** | | | 1.54% | | | | 5.39% | | | | 3.12% | |
Lipper Short Municipal Debt Funds Classification Average** | | | 1.14% | | | | 2.03% | | | | 2.10% | |
| | | |
Class I Shares | | | 2.06% | | | | 2.95% | | | | 2.69% | |
| | | |
| | | 1-Year | | | | | | Since
Inception* | |
Class C Shares | | | 1.42% | | | | | | | | 1.82% | |
Average Annual Total Returns as of March 31, 2013 (Most Recent Calendar Quarter)
| | | | | | | | | | | | |
| |
| | | Average Annual | |
| | | |
| | | 1-Year | | | 5-Year | | | 10-Year | |
Class A Shares at NAV | | | 2.13% | | | | 2.77% | | | | 2.55% | |
Class A Shares at maximum Offering Price | | | -0.42% | | | | 2.26% | | | | 2.29% | |
Class I Shares | | | 2.31% | | | | 2.94% | | | | 2.71% | |
| | | |
| | | 1-Year | | | | | | Since
Inception* | |
Class C Shares | | | 1.67% | | | | | | | | 1.86% | |
Class A Shares have a maximum 2.50% sales charge (Offering Price). Class A Share purchases of $250,000 or more are sold at net asset value without an up-front sales charge but may be subject to a contingent deferred sales charge (CDSC), also known as a back-end sales charge, if redeemed within eighteen months of purchase. Class C Shares have a 1% CDSC for redemptions within less than twelve months, which is not reflected in the one-year total return. Class I Shares have no sales charge and may be purchased under limited circumstances or by specified classes of investors.
Expense Ratios as of Most Recent Prospectus
| | | | |
| |
| | | Expense
Ratios | |
Class A Shares | | | 0.71% | |
Class C Shares | | | 1.05% | |
Class I Shares | | | 0.51% | |
Effective Leverage Ratio as of April 30, 2013
| | | | |
Effective Leverage Ratio | | | 0% | |
| * | Since inception returns for C Shares are from 8/31/11. |
| ** | Refer to the Glossary of Terms Used in this Report for definitions. Indexes and Lipper averages are not available for direct investment. |
Growth of an Assumed $10,000 Investment as of April 30, 2013 – Class A Shares
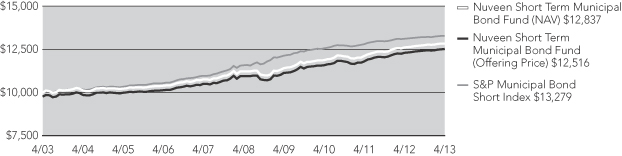
The graphs do not reflect the deduction of taxes that a shareholder may pay on Fund distributions or the redemption of Fund shares.
Yields as of April 30, 2013
Dividend Yield is the most recent dividend per share (annualized) divided by the offering price per share.
The SEC 30-Day Yield is a standardized measure of a Fund’s yield that accounts for the future amortization of premiums or discounts of bonds held in the Fund’s portfolio. The SEC 30-Day Yield is computed under an SEC standardized formula and is based on the maximum offer price per share. Dividend Yield may differ from the SEC 30-Day Yield because the Fund may be paying out more or less than it is earning and it may not include the effect of amortization of bond premium.
The Taxable-Equivalent Yield represents the yield that must be earned on a fully taxable investment in order to equal the yield of the Fund on an after-tax basis at a specified tax rate. With respect to investments that generate qualified dividend income that is taxable at a maximum rate of 15%, the Taxable-Equivalent Yield is lower.
Nuveen All-American Municipal Bond Fund
| | | | | | | | | | | | |
| | | |
| | | Dividend
Yield | | | SEC 30-Day
Yield | | | Taxable-
Equivalent
Yield1 | |
Class A Shares2 | | | 3.76% | | | | 2.40% | | | | 3.33% | |
Class B Shares | | | 3.21% | | | | 1.76% | | | | 2.44% | |
Class C Shares | | | 3.37% | | | | 1.96% | | | | 2.72% | |
Class I Shares | | | 4.12% | | | | 2.70% | | | | 3.75% | |
Nuveen High Yield Municipal Bond Fund
| | | | | | | | | | | | |
| | | |
| | | Dividend
Yield | | | SEC 30-Day
Yield | | | Taxable-
Equivalent
Yield1 | |
Class A Shares2 | | | 5.48% | | | | 4.49% | | | | 6.24% | |
Class B Shares | | | 4.97% | | | | 3.94% | | | | 5.47% | |
Class C Shares | | | 5.18% | | | | 4.14% | | | | 5.75% | |
Class I Shares | | | 5.89% | | | | 4.89% | | | | 6.79% | |
Nuveen Inflation Protected Municipal Bond Fund
| | | | | | | | | | | | |
| | | |
| | | Dividend
Yield | | | SEC 30-Day
Yield | | | Taxable-
Equivalent
Yield1 | |
Class A Shares2 | | | 2.01% | | | | 1.69% | | | | 2.35% | |
Class C Shares | | | 1.49% | | | | 1.19% | | | | 1.65% | |
Class I Shares | | | 2.23% | | | | 1.93% | | | | 2.68% | |
Nuveen Intermediate Duration Municipal Bond Fund
| | | | | | | | | | | | |
| | | |
| | | Dividend
Yield | | | SEC 30-Day
Yield | | | Taxable-
Equivalent
Yield1 | |
Class A Shares2 | | | 3.10% | | | | 1.30% | | | | 1.81% | |
Class B Shares | | | 2.49% | | | | 0.59% | | | | 0.82% | |
Class C Shares | | | 2.68% | | | | 0.79% | | | | 1.10% | |
Class I Shares | | | 3.38% | | | | 1.53% | | | | 2.13% | |
| 1 | TheTaxable-Equivalent Yield is based on the Fund’s SEC 30-Day Yield on the indicated date and a federal income tax rate of 28.0%. |
| 2 | The SEC Yield for Class A shares quoted in the table reflects the maximum sales load. Investors paying a reduced load because of volume discounts, investors paying no load because they qualify for one of the several exclusions from the load, and existing shareholders who previously paid a load but would like to know the SEC Yield applicable to their shares on a going-forward basis, should understand that the SEC Yield effectively applicable to them would be higher than the figure quoted in the table. |
Nuveen Limited Term Municipal Bond Fund
| | | | | | | | | | | | |
| | | |
| | | Dividend
Yield | | | SEC 30-Day
Yield | | | Taxable-
Equivalent
Yield1 | |
Class A Shares2 | | | 1.87% | | | | 0.61% | | | | 0.85% | |
Class C Shares | | | 1.55% | | | | 0.28% | | | | 0.39% | |
Class I Shares | | | 2.09% | | | | 0.83% | | | | 1.15% | |
Nuveen Short Duration High Yield Municipal Bond Fund
| | | | | | | | | | | | |
| | | |
| | | Dividend
Yield | | | SEC 30-Day
Yield | | | Taxable-
Equivalent
Yield1 | |
Class A Shares2 | | | 3.01% | | | | 2.43% | | | | 3.38% | |
Class C Shares | | | 2.55% | | | | 1.98% | | | | 2.75% | |
Class I Shares | | | 3.26% | | | | 2.77% | | | | 3.85% | |
Nuveen Short Term Municipal Bond Fund
| | | | | | | | | | | | |
| | | |
| | | Dividend
Yield | | | SEC 30-Day
Yield | | | Taxable-
Equivalent
Yield1 | |
Class A Shares2 | | | 1.43% | | | | 0.25% | | | | 0.35% | |
Class C Shares | | | 1.12% | | | | -0.10% | | | | -0.14% | |
Class I Shares | | | 1.65% | | | | 0.45% | | | | 0.61% | |
| 1 | TheTaxable-Equivalent Yield is based on the Fund’s SEC 30-Day Yield on the indicated date and a federal income tax rate of 28.0%. |
| 2 | The SEC Yield for Class A shares quoted in the table reflects the maximum sales load. Investors paying a reduced load because of volume discounts, investors paying no load because they qualify for one of the several exclusions from the load, and existing shareholders who previously paid a load but would like to know the SEC Yield applicable to their shares on a going-forward basis, should understand that the SEC Yield effectively applicable to them would be higher than the figure quoted in the table. |
Holding Summaries as of April 30, 2013
This data relates to the securities held in each Fund’s portfolio of investments. It should not be construed as a measure of performance for the Fund itself.
Ratings shown are the highest rating given by one of the following national rating agencies: Standard & Poor’s, Moody’s Investors Service, Inc. or Fitch, Inc. Credit ratings are subject to change. AAA, AA, A and BBB are investment grade ratings; BB, B, CCC, CC, C and D are below investment grade ratings. Certain bonds backed by U.S. Government or agency securities are regarded as having an implied rating equal to the rating of such securities. Holdings designated N/R are not rated by these national rating agencies.
Nuveen All-American Municipal Bond Fund
| | | | |
| Bond Credit Quality1,2,3,4 | | | |
| AAA/U.S. Guaranteed | | | 11.2% | |
| AA | | | 26.5% | |
| A | | | 28.0% | |
| BBB | | | 22.6% | |
| BB or Lower | | | 3.6% | |
| N/R | | | 6.3% | |
Nuveen High Yield Municipal Bond Fund
| | | | |
| Bond Credit Quality1,2,3,4 | | | |
| AAA/U.S. Guaranteed | | | 1.3% | |
| AA | | | 18.1% | |
| A | | | 13.3% | |
| BBB | | | 15.3% | |
| BB or Lower | | | 18.9% | |
| N/R | | | 30.8% | |
| | | | |
| Portfolio Composition1,5 | | | |
| Tax Obligation/Limited | | | 21.4% | |
| Health Care | | | 17.2% | |
| Transportation | | | 12.4% | |
| Tax Obligation/General | | | 10.9% | |
| Education and Civic Organizations | | | 9.6% | |
| Utilities | | | 9.0% | |
| Water and Sewer | | | 5.0% | |
| Other | | | 14.5% | |
| | | | |
| Portfolio Composition1,6 | | | |
| Tax Obligation/Limited | | | 25.5% | |
| Health Care | | | 15.1% | |
| Transportation | | | 11.8% | |
| Education and Civic Organizations | | | 10.3% | |
| Consumer Staples | | | 5.8% | |
| Utilities | | | 5.5% | |
| Long-Term Care | | | 5.2% | |
| Consumer Discretionary | | | 5.0% | |
| Industrials | | | 4.7% | |
| Other | | | 11.1% | |
| | | | |
| States/U.S. Territories1,5 | | | |
| California | | | 11.8% | |
| Texas | | | 9.5% | |
| Florida | | | 8.7% | |
| Illinois | | | 7.6% | |
| New York | | | 4.5% | |
| Pennsylvania | | | 4.1% | |
| Colorado | | | 3.6% | |
| Arizona | | | 3.3% | |
| Ohio | | | 3.1% | |
| Wisconsin | | | 3.1% | |
| Georgia | | | 2.9% | |
| Indiana | | | 2.9% | |
| Puerto Rico | | | 2.6% | |
| Washington | | | 2.6% | |
| Michigan | | | 2.3% | |
| New Jersey | | | 2.3% | |
| Kansas | | | 2.1% | |
| Louisiana | | | 1.9% | |
| Missouri | | | 1.7% | |
| Other | | | 19.4% | |
| | | | |
| States/U.S. Territories1,7 | | | |
| California | | | 17.9% | |
| Florida | | | 11.0% | |
| Illinois | | | 7.8% | |
| Texas | | | 7.5% | |
| Colorado | | | 6.3% | |
| Arizona | | | 4.1% | |
| Michigan | | | 3.6% | |
| Ohio | | | 3.3% | |
| New York | | | 3.0% | |
| Pennsylvania | | | 2.7% | |
| New Jersey | | | 2.6% | |
| Indiana | | | 2.4% | |
| Alabama | | | 2.0% | |
| Washington | | | 1.9% | |
| Georgia | | | 1.7% | |
| Virginia | | | 1.6% | |
| Iowa | | | 1.5% | |
| Other | | | 19.1% | |
| 1 | Holdings are subject to change. |
| 2 | Ratings shown are the highest rating given by one of the following national rating agencies: Standard & Poor’s Group, Moody’s Investors Service, Inc. or Fitch, Inc. Credit ratings are subject to change. AAA, AA, A and BBB are investment grade ratings; BB, B, CCC, CC, C and D are below-investment grade ratings. Certain bonds backed by U.S. Government or agency securities are regarded as having an implied rating equal to the rating of such securities. Holdings designated N/R are not rated by these national rating agencies. |
| 3 | Percentages may not add to 100% due to the exclusion of Other Assets Less Liabilities from the table. |
| 4 | As a percentage of total investment exposure. |
| 5 | As a percentage of total investments. |
| 6 | As a percentage of total investments (excluding investments in derivatives). |
| 7 | As a percentage of total municipal bonds and Las Vegas Monorail Company Corporate Bonds. |
Nuveen Inflation Protected Municipal Bond Fund
| | | | |
| Bond Credit Quality1,2,3,4 | | | |
| AAA/U.S. Guaranteed | | | 2.6% | |
| AA | | | 31.0% | |
| A | | | 28.9% | |
| BBB | | | 24.1% | |
| BB or Lower | | | 4.5% | |
| N/R | | | 5.2% | |
| | | | |
| Portfolio Composition1,5 | | | |
| Tax Obligation/Limited | | | 23.6% | |
| Transportation | | | 15.1% | |
| Tax Obligation/General | | | 14.3% | |
| Education and Civic Organizations | | | 12.8% | |
| Utilities | | | 12.2% | |
| Health Care | | | 10.2% | |
| Water and Sewer | | | 5.5% | |
| Other | | | 6.3% | |
| | | | |
| States/U.S. Territories1,5 | | | |
| Florida | | | 8.1% | |
| Illinois | | | 7.0% | |
| California | | | 6.5% | |
| Pennsylvania | | | 6.2% | |
| Colorado | | | 6.1% | |
| Texas | | | 5.8% | |
| Ohio | | | 5.6% | |
| North Carolina | | | 5.1% | |
| Michigan | | | 4.7% | |
| Kansas | | | 4.4% | |
| New York | | | 4.1% | |
| Louisiana | | | 3.9% | |
| Indiana | | | 3.8% | |
| Arizona | | | 3.0% | |
| New Jersey | | | 2.8% | |
| Georgia | | | 2.1% | |
| Washington | | | 2.1% | |
| Other | | | 18.7% | |
Nuveen Intermediate Duration Municipal Bond Fund
| | | | |
| Bond Credit Quality1,2,3,4 | | | |
| AAA/U.S. Guaranteed | | | 15.3% | |
| AA | | | 33.4% | |
| A | | | 32.5% | |
| BBB | | | 11.6% | |
| BB or Lower | | | 3.5% | |
| N/R | | | 2.0% | |
| | | | |
| Portfolio Composition1,6 | | | |
| Tax Obligation/Limited | | | 27.7% | |
| Tax Obligation/General | | | 19.6% | |
| Health Care | | | 14.9% | |
| Utilities | | | 9.7% | |
| Transportation | | | 7.5% | |
| U.S. Guaranteed | | | 6.4% | |
| Other | | | 14.2% | |
| | | | |
| States/U.S. Territories1,6 | | | |
| Illinois | | | 8.6% | |
| Texas | | | 8.3% | |
| California | | | 7.9% | |
| Florida | | | 6.1% | |
| New Jersey | | | 6.0% | |
| New York | | | 6.0% | |
| Michigan | | | 4.9% | |
| Arizona | | | 4.3% | |
| Pennsylvania | | | 4.0% | |
| Colorado | | | 3.4% | |
| Louisiana | | | 3.0% | |
| Ohio | | | 3.0% | |
| Massachusetts | | | 2.9% | |
| Missouri | | | 2.6% | |
| Wisconsin | | | 2.3% | |
| Washington | | | 2.1% | |
| Tennessee | | | 2.1% | |
| Nevada | | | 2.0% | |
| North Carolina | | | 1.4% | |
| Other | | | 19.1% | |
| 1 | Holdings are subject to change. |
| 2 | Ratings shown are the highest rating given by one of the following national rating agencies: Standard & Poor’s Group, Moody’s Investors Service, Inc. or Fitch, Inc. Credit ratings are subject to change. AAA, AA, A and BBB are investment grade ratings; BB, B, CCC, CC, C and D are below-investment grade ratings. Certain bonds backed by U.S. Government or agency securities are regarded as having an implied rating equal to the rating of such securities. Holdings designated N/R are not rated by these national rating agencies. |
| 3 | Percentages may not add to 100% due to the exclusion of Other Assets Less Liabilities from the table. |
| 4 | As a percentage of total investment exposure. |
| 5 | As a percentage of total investments (excluding investments in derivatives). |
| 6 | As a percentage of total investments. |
Holding Summaries as of April 30, 2013 (continued)
Nuveen Limited Term Municipal Bond Fund
| | | | |
| Bond Credit Quality1,2,3,4 | | | |
| AAA/U.S. Guaranteed | | | 22.6% | |
| AA | | | 38.2% | |
| A | | | 26.4% | |
| BBB | | | 8.5% | |
| BB or Lower | | | 1.6% | |
| N/R | | | 1.2% | |
| | | | |
| Portfolio Composition1,5 | | | |
| Tax Obligation/Limited | | | 26.8% | |
| Tax Obligation/General | | | 23.1% | |
| Utilities | | | 11.2% | |
| Health Care | | | 10.0% | |
| Education and Civic Organizations | | | 6.3% | |
| Transportation | | | 6.1% | |
| U.S. Guaranteed | | | 5.9% | |
| Other | | | 10.6% | |
| | | | |
States/U.S. Territories1,5 | | | |
| New York | | | 9.6% | |
| Illinois | | | 8.2% | |
| New Jersey | | | 6.5% | |
| Pennsylvania | | | 6.4% | |
| Florida | | | 5.9% | |
| Texas | | | 5.9% | |
| California | | | 5.1% | |
| Michigan | | | 4.7% | |
| Arizona | | | 4.1% | |
| Ohio | | | 3.9% | |
| Washington | | | 3.4% | |
| Georgia | | | 3.1% | |
| Indiana | | | 2.6% | |
| Massachusetts | | | 2.3% | |
| Colorado | | | 2.2% | |
| Louisiana | | | 1.9% | |
| Missouri | | | 1.8% | |
| Maryland | | | 1.8% | |
| Tennessee | | | 1.6% | |
| Other | | | 19.0% | |
Nuveen Short Duration High Yield Municipal Bond Fund
| | | | |
| Bond Credit Quality1,2,3,4 | | | |
| AA | | | 4.1% | |
| A | | | 17.8% | |
| BBB | | | 26.1% | |
| BB or Lower | | | 18.6% | |
| N/R | | | 13.7% | |
| | | | |
| Portfolio Composition1,5 | | | |
| Tax Obligation/Limited | | | 19.5% | |
| Education and Civic Organizations | | | 11.2% | |
| Transportation | | | 10.9% | |
| Tax Obligation/General | | | 10.7% | |
| Health Care | | | 10.6% | |
| Consumer Staples | | | 9.0% | |
| Utilities | | | 8.2% | |
| Long-Term Care | | | 7.0% | |
| Industrials | | | 5.0% | |
| Other | | | 7.9% | |
| | | | |
| States/U.S. Territories1,5 | | | |
| California | | | 13.6% | |
| Florida | | | 9.3% | |
| Texas | | | 7.8% | |
| Ohio | | | 6.5% | |
| New York | | | 5.7% | |
| Michigan | | | 5.0% | |
| Puerto Rico | | | 4.9% | |
| Arizona | | | 3.7% | |
| New Jersey | | | 3.6% | |
| Pennsylvania | | | 3.4% | |
| Illinois | | | 3.3% | |
| Guam | | | 3.1% | |
| Colorado | | | 3.0% | |
| Missouri | | | 2.8% | |
| Indiana | | | 2.8% | |
| Massachusetts | | | 2.6% | |
| Other | | | 18.9% | |
| 1 | Holdings are subject to change. |
| 2 | Ratings shown are the highest rating given by one of the following national rating agencies: Standard & Poor’s Group, Moody’s Investors Service, Inc. or Fitch, Inc. Credit ratings are subject to change. AAA, AA, A and BBB are investment grade ratings; BB, B, CCC, CC, C and D are below-investment grade ratings. Certain bonds backed by U.S. Government or agency securities are regarded as having an implied rating equal to the rating of such securities. Holdings designated N/R are not rated by these national rating agencies. |
| 3 | Percentages may not add to 100% due to the exclusion of Other Assets Less Liabilities from the table. |
| 4 | As a percentage of total investment exposure. |
| 5 | As a percentage of total investments. |
Nuveen Short Term Municipal Bond Fund
| | | | |
| Bond Credit Quality1,2,3 | | | |
| AAA/U.S. Guaranteed | | | 4.4% | |
| AA | | | 23.8% | |
| A | | | 40.7% | |
| BBB | | | 26.2% | |
| BB or Lower | | | 0.4% | |
| N/R | | | 4.5% | |
| | | | |
| Portfolio Composition1,4 | | | |
| Education and Civic Organizations | | | 19.1% | |
| Health Care | | | 18.7% | |
| Tax Obligation/Limited | | | 18.1% | |
| Tax Obligation/General | | | 13.7% | |
| Transportation | | | 9.0% | |
| Utilities | | | 7.2% | |
| Other | | | 14.2% | |
| | | | |
| States/U.S. Territories1,4 | | | |
| Florida | | | 8.3% | |
| Pennsylvania | | | 7.0% | |
| California | | | 6.6% | |
| Arizona | | | 5.9% | |
| Illinois | | | 5.6% | |
| New York | | | 5.2% | |
| Colorado | | | 5.1% | |
| Missouri | | | 5.0% | |
| Minnesota | | | 4.7% | |
| Texas | | | 4.6% | |
| New Jersey | | | 4.6% | |
| Virginia | | | 3.7% | |
| Michigan | | | 3.3% | |
| Iowa | | | 2.7% | |
| Ohio | | | 2.3% | |
| Georgia | | | 1.9% | |
| Virgin Islands | | | 1.8% | |
| Oregon | | | 1.8% | |
| Other | | | 19.9% | |
| 1 | Holdings are subject to change. |
| 2 | Ratings shown are the highest rating given by one of the following national rating agencies: Standard & Poor’s Group, Moody’s Investors Service, Inc. or Fitch, Inc. Credit ratings are subject to change. AAA, AA, A and BBB are investment grade ratings; BB, B, CCC, CC, C and D are below-investment grade ratings. Certain bonds backed by U.S. Government or agency securities are regarded as having an implied rating equal to the rating of such securities. Holdings designated N/R are not rated by these national rating agencies. |
| 3 | As a percentage of total investment exposure (excluding money market funds). |
| 4 | Percentages may not add to 100% due to the exclusion of Other Assets Less Liabilities from the table. |
| 5 | As a percentage of total investments (excluding money market funds). |
Expense Examples
As a shareholder of one or more of the Funds, you incur two types of costs: (1) transaction costs, including up-front and back-end sales charges (loads) or redemption fees, where applicable; and (2) ongoing costs, including management fees; distribution and service (12b-1) fees, where applicable; and other Fund expenses. The Examples below are intended to help you understand your ongoing costs (in dollars) of investing in the Funds and to compare these costs with the ongoing costs of investing in other mutual funds. Since the expense examples for Nuveen Short Duration High Yield Municipal Bond Fund reflect only the first 89 days of the Fund’s operations they may not provide a meaningful understanding of the Funds ongoing expense.
The Examples below are based on an investment of $1,000 invested at the beginning of the period and held through the end of the period.
The information under “Actual Performance,” together with the amount you invested, allows you to estimate actual expenses incurred over the reporting period. Simply divide your account value by $1,000 (for example, an $8,600 account value divided by $1,000 = 8.60) and multiply the result by the cost shown for your share class, in the row entitled “Expenses Incurred During Period” to estimate the expenses incurred on your account during this period.
The information under “Hypothetical Performance,” provides information about hypothetical account values and hypothetical expenses based on the respective Fund’s actual expense ratio and an assumed rate of return of 5% per year before expenses, which is not the Fund’s actual return. The hypothetical account values and expenses may not be used to estimate the actual ending account balance or expense you incurred for the period. You may use this information to compare the ongoing costs of investing in the Fund and other funds. To do so, compare this 5% hypothetical example with the 5% hypothetical examples that appear in the shareholder reports of the other funds.
Please note that the expenses shown in the table are meant to highlight your ongoing costs only and do not reflect any transaction costs. Therefore, the hypothetical information is useful in comparing ongoing costs only, and will not help you determine the relative total costs of owning different funds or share classes. In addition, if these transaction costs were included, your costs would have been higher.
Nuveen All-American Municipal Bond Fund
| | | | | | | | | | | | | | | | | | | | | | | | | | | | | | | | | | |
| | | | | | | | | | | | | | | | | Hypothetical Performance | |
| | | Actual Performance | | | | | (5% annualized return before expenses) | |
| | | A Shares | | | B Shares | | | C Shares | | | I Shares | | | | | A Shares | | | B Shares | | | C Shares | | | I Shares | |
| Beginning Account Value (11/01/12) | | $ | 1,000.00 | | | $ | 1,000.00 | | | $ | 1,000.00 | | | $ | 1,000.00 | | | | | $ | 1,000.00 | | | $ | 1,000.00 | | | $ | 1,000.00 | | | $ | 1,000.00 | |
| Ending Account Value (4/30/13) | | $ | 1,024.30 | | | $ | 1,020.70 | | | $ | 1,020.70 | | | $ | 1,025.30 | | | | | $ | 1,021.27 | | | $ | 1,017.55 | | | $ | 1,018.55 | | | $ | 1,022.27 | |
| Expenses Incurred During Period | | $ | 3.56 | | | $ | 7.31 | | | $ | 6.31 | | | $ | 2.56 | | | | | $ | 3.56 | | | $ | 7.30 | | | $ | 6.31 | | | $ | 2.56 | |
For each class of the Fund, expenses are equal to the Fund’s annualized net expense ratio of .71%, 1.46%, 1.26% and .51% for Classes A, B, C and I, respectively, multiplied by the average account value over the period, multiplied by 181/365 (to reflect the one-half year period).
Nuveen High Yield Municipal Bond Fund
| | | | | | | | | | | | | | | | | | | | | | | | | | | | | | | | | | |
| | | | | | | | | | | | | | | | | Hypothetical Performance | |
| | | Actual Performance | | | | | (5% annualized return before expenses) | |
| | | A Shares | | | B Shares | | | C Shares | | | I Shares | | | | | A Shares | | | B Shares | | | C Shares | | | I Shares | |
| Beginning Account Value (11/01/12) | | $ | 1,000.00 | | | $ | 1,000.00 | | | $ | 1,000.00 | | | $ | 1,000.00 | | | | | $ | 1,000.00 | | | $ | 1,000.00 | | | $ | 1,000.00 | | | $ | 1,000.00 | |
| Ending Account Value (4/30/13) | | $ | 1,052.90 | | | $ | 1,049.00 | | | $ | 1,050.10 | | | $ | 1,053.80 | | | | | $ | 1,020.68 | | | $ | 1,016.96 | | | $ | 1,017.95 | | | $ | 1,021.67 | |
| Expenses Incurred During Period | | $ | 4.22 | | | $ | 8.03 | | | $ | 7.01 | | | $ | 3.21 | | | | | $ | 4.16 | | | $ | 7.90 | | | $ | 6.90 | | | $ | 3.16 | |
For each class of the Fund, expenses are equal to the Fund’s annualized net expense ratio of .83%, 1.58%, 1.38% and .63% for Classes A, B, C and I, respectively, multiplied by the average account value over the period, multiplied by 181/365 (to reflect the one-half year period).
Nuveen Inflation Protected Municipal Bond Fund
| | | | | | | | | | | | | | | | | | | | | | | | | | |
| | | | | | | | | | | | | | Hypothetical Performance | |
| | | Actual Performance | | | | | (5% annualized return before expenses) | |
| | | A Shares | | | C Shares | | | I Shares | | | | | A Shares | | | C Shares | | | I Shares | |
| Beginning Account Value (11/01/12) | | $ | 1,000.00 | | | $ | 1,000.00 | | | $ | 1,000.00 | | | | | $ | 1,000.00 | | | $ | 1,000.00 | | | $ | 1,000.00 | |
| Ending Account Value (4/30/13) | | $ | 1,008.40 | | | $ | 1,005.50 | | | $ | 1,009.20 | | | | | $ | 1,020.98 | | | $ | 1,018.25 | | | $ | 1,021.97 | |
| Expenses Incurred During Period | | $ | 3.83 | | | $ | 6.56 | | | $ | 2.84 | | | | | $ | 3.86 | | | $ | 6.61 | | | $ | 2.86 | |
For each class of the Fund, expenses are equal to the Fund’s annualized net expense ratio of .77%, 1.32% and .57% for Classes A, C and I, respectively, multiplied by the average account value over the period, multiplied by 181/365 (to reflect the one-half year period).
Nuveen Intermediate Duration Municipal Bond Fund
| | | | | | | | | | | | | | | | | | | | | | | | | | | | | | | | | | |
| | | | | | | | | | | | | | | | | Hypothetical Performance | |
| | | Actual Performance | | | | | (5% annualized return before expenses) | |
| | | A Shares | | | B Shares | | | C Shares | | | I Shares | | | | | A Shares | | | B Shares | | | C Shares | | | I Shares | |
| Beginning Account Value (11/01/12) | | $ | 1,000.00 | | | $ | 1,000.00 | | | $ | 1,000.00 | | | $ | 1,000.00 | | | | | $ | 1,000.00 | | | $ | 1,000.00 | | | $ | 1,000.00 | | | $ | 1,000.00 | |
| Ending Account Value (4/30/13) | | $ | 1,017.40 | | | $ | 1,014.90 | | | $ | 1,015.90 | | | $ | 1,019.40 | | | | | $ | 1,021.32 | | | $ | 1,017.60 | | | $ | 1,018.65 | | | $ | 1,022.32 | |
| Expenses Incurred During Period | | $ | 3.50 | | | $ | 7.24 | | | $ | 6.20 | | | $ | 2.50 | | | | | $ | 3.51 | | | $ | 7.25 | | | $ | 6.21 | | | $ | 2.51 | |
For each class of the Fund, expenses are equal to the Fund’s annualized net expense ratio of .70%, 1.45%, 1.24% and .50% for Classes A, B, C and I, respectively, multiplied by the average account value over the period, multiplied by 181/365 (to reflect the one-half year period).
Nuveen Limited Term Municipal Bond Fund
| | | | | | | | | | | | | | | | | | | | | | | | | | |
| | | | | | | | | | | | | | Hypothetical Performance | |
| | | Actual Performance | | | | | (5% annualized return before expenses) | |
| | | A Shares | | | C Shares | | | I Shares | | | | | A Shares | | | C Shares | | | I Shares | |
| Beginning Account Value (11/01/12) | | $ | 1,000.00 | | | $ | 1,000.00 | | | $ | 1,000.00 | | | | | $ | 1,000.00 | | | $ | 1,000.00 | | | $ | 1,000.00 | |
| Ending Account Value (4/30/13) | | $ | 1,010.90 | | | $ | 1,010.00 | | | $ | 1,011.80 | | | | | $ | 1,021.57 | | | $ | 1,019.84 | | | $ | 1,022.56 | |
| Expenses Incurred During Period | | $ | 3.24 | | | $ | 4.98 | | | $ | 2.24 | | | | | $ | 3.26 | | | $ | 5.01 | | | $ | 2.26 | |
For each class of the Fund, expenses are equal to the Fund’s annualized net expense ratio of .65%, 1.00% and .45% for Classes A, C and I, respectively, multiplied by the average account value over the period, multiplied by 181/365 (to reflect the one-half year period).
Nuveen Short Duration High Yield Municipal Bond Fund
| | | | | | | | | | | | | | | | | | | | | | | | | | |
| | | | | | | | | | | | | | Hypothetical Performance | |
| | | Actual Performance | | | | | (5% annualized return before expenses) | |
| | | A Shares | | | C Shares | | | I Shares | | | | | A Shares | | | C Shares | | | I Shares | |
| Beginning Account Value (2/01/13) | | $ | 1,000.00 | | | $ | 1,000.00 | | | $ | 1,000.00 | | | | | $ | 1,000.00 | | | $ | 1,000.00 | | | $ | 1,000.00 | |
| Ending Account Value (4/30/13) | | $ | 1,017.20 | | | $ | 1,016.30 | | | $ | 1,017.50 | | | | | $ | 1,010.19 | | | $ | 1,008.85 | | | $ | 1,010.68 | |
| Expenses Incurred During Period | | $ | 2.02 | | | $ | 3.37 | | | $ | 1.53 | | | | | $ | 2.01 | | | $ | 3.36 | | | $ | 1.52 | |
For each class of the Fund, expenses are equal to the Fund’s annualized net expense ratio of .82%, 1.37% and .62% for Classes A, C and I, respectively, multiplied by the average account value over the period, multiplied by 89/365 (to reflect the 89 days in the period since the Fund’s commencement of operations).
Nuveen Short Term Municipal Bond Fund
| | | | | | | | | | | | | | | | | | | | | | | | | | |
| | | | | | | | | | | | | | Hypothetical Performance | |
| | | Actual Performance | | | | | (5% annualized return before expenses) | |
| | | A Shares | | | C Shares | | | I Shares | | | | | A Shares | | | C Shares | | | I Shares | |
| Beginning Account Value (11/01/12) | | $ | 1,000.00 | | | $ | 1,000.00 | | | $ | 1,000.00 | | | | | $ | 1,000.00 | | | $ | 1,000.00 | | | $ | 1,000.00 | |
| Ending Account Value (4/30/13) | | $ | 1,008.00 | | | $ | 1,005.20 | | | $ | 1,008.90 | | | | | $ | 1,021.12 | | | $ | 1,019.39 | | | $ | 1,022.12 | |
| Expenses Incurred During Period | | $ | 3.68 | | | $ | 5.42 | | | $ | 2.69 | | | | | $ | 3.71 | | | $ | 5.46 | | | $ | 2.71 | |
For each class of the Fund, expenses are equal to the Fund’s annualized net expense ratio of .74%, 1.09% and .54% for Classes A, C and I, respectively, multiplied by the average account value over the period, multiplied by 181/365 (to reflect the one-half year period).
Report of Independent Registered Public Accounting Firm
To the Board of Trustees/Directors and Shareholders of
Nuveen Municipal Trust and Nuveen Investment Funds, Inc.:
In our opinion, the accompanying statements of assets and liabilities, including the portfolios of investments, and the related statements of operations, of changes in net assets, and the financial highlights present fairly, in all material respects, the financial position of Nuveen All-American Municipal Bond Fund, Nuveen High Yield Municipal Bond Fund, Nuveen Inflation Protected Municipal Bond Fund, Nuveen Intermediate Duration Municipal Bond Fund, Nuveen Limited Term Municipal Bond Fund, Nuveen Short Duration High Yield Municipal Bond Fund, (each a series of the Nuveen Municipal Trust, collectively “Nuveen Municipal Trust”) and the Nuveen Short Term Municipal Bond Fund, (a series of the Nuveen Investment Funds, Inc.), (Nuveen Municipal Trust and Nuveen Short Term Municipal Bond Fund collectively, the “Funds”) at April 30, 2013, the results of each of their operations, the changes in each of their net assets and the financial highlights for each of the periods presented for each series of Nuveen Municipal Trust, and the results of its operations for the year then ended, the changes in its net assets and financial highlights for each of the two years in the period then ended for the Nuveen Short Term Municipal Bond Fund, in conformity with accounting principles generally accepted in the United States of America. These financial statements and financial highlights (hereafter referred to as “financial statements”) are the responsibility of the Funds’ management; our responsibility is to express an opinion on these financial statements based on our audits. We conducted our audits of these financial statements in accordance with the standards of the Public Company Accounting Oversight Board (United States). Those standards require that we plan and perform the audit to obtain reasonable assurance about whether the financial statements are free of material misstatement. An audit includes examining, on a test basis, evidence supporting the amounts and disclosures in the financial statements, assessing the accounting principles used and significant estimates made by management, and evaluating the overall financial statement presentation. We believe that our audits, which included confirmation of securities at April 30, 2013 by correspondence with the custodian and brokers, provide a reasonable basis for our opinion. The financial statements of the Nuveen Short Term Municipal Bond Fund for the periods ended April 30, 2011 and prior were audited by other independent auditors whose report dated June 24, 2011 expressed an unqualified opinion on those statements.
PRICEWATERHOUSECOOPERS LLP
Chicago, IL
June 27, 2013
Portfolio of Investments
Nuveen All-American Municipal Bond Fund
April 30, 2013
| | | | | | | | | | | | | | | | | | |
Principal
Amount (000) | | | Description (1) | | | | Optional Call
Provisions (2) | | | Ratings (3) | | | Value | |
| | | | MUNICIPAL BONDS – 98.5% | | | | | | | | | | | | | | |
| | | | | |
| | | | Alabama – 1.1% | | | | | | | | | | | | | | |
| | | | | |
| $ | 6,165 | | | Birmingham Special Care Facilities Financing Authority, Alabama, Revenue Bonds, Baptist Health System Inc., Series 2005A, 5.000%, 11/15/30 | | | | | 11/15 at 100.00 | | | | Baa2 | | | $ | 6,411,538 | |
| | | | | |
| | 350 | | | Camden Industrial Development Board, Alabama, Exempt Facilities Revenue Bonds, Weyerhaeuser Company Project, Series 2003B, 6.375%, 12/01/24 (Pre-refunded 12/01/13) (Alternative Minimum Tax) | | | | | 12/13 at 100.00 | | | | AA+ (4) | | | | 362,649 | |
| | | | | |
| | 2,750 | | | Courtland Industrial Development Board, Alabama, Solid Waste Revenue Bonds, International Paper Company Project, Series 2005A, 5.200%, 6/01/25 (Alternative Minimum Tax) | | | | | 6/15 at 100.00 | | | | BBB | | | | 2,892,478 | |
| | | | | |
| | | | Jefferson County, Alabama, Limited Obligation School Warrants, Education Tax Revenue Bonds, Series 2004A: | | | | | | | | | | | | | | |
| | 1,000 | | | 5.250%, 1/01/14 | | | | | No Opt. Call | | | | B | | | | 1,001,000 | |
| | 5,165 | | | 5.250%, 1/01/15 | | | | | 1/14 at 100.00 | | | | B | | | | 5,169,132 | |
| | 1,000 | | | 5.500%, 1/01/21 – AGM Insured | | | | | 1/14 at 100.00 | | | | AA– | | | | 1,005,370 | |
| | 1,000 | | | 5.500%, 1/01/22 | | | | | 1/14 at 100.00 | | | | B | | | | 1,001,640 | |
| | | | | |
| | 2,000 | | | Pell City, Alabama, Special Care Facilities Financing Authority, Revenue Bonds, Noland Health Services, Series 2007A, 5.250%, 12/01/34
(Pre-refunded 12/01/17) | | | | | 12/17 at 100.00 | | | | Aaa | | | | 2,404,380 | |
| | | | | |
| | 1,565 | | | Sheffield, Alabama, Electric Revenue Bonds, Series 2003, 5.500%, 7/01/29 (Pre-refunded 7/01/13) – AMBAC Insured | | | | | 7/13 at 100.00 | | | | Aa3 (4) | | | | 1,579,007 | |
| | | | | |
| | 435 | | | Sheffield, Alabama, Electric Revenue Bonds, Series 2003, 5.500%, 7/01/29 – AMBAC Insured | | | | | 1/14 at 100.00 | | | | Aa3 | | | | 436,657 | |
| | | | | |
| | 12,255 | | | Walker County, Alabama, General Obligation Bonds, Series 2002, 0.000%, 2/01/32 – NPFG Insured | | | | | 7/13 at 66.83 | | | | A | | | | 9,960,374 | |
| | 33,685 | | | Total Alabama | | | | | | | | | | | | | 32,224,225 | |
| | | | Alaska – 0.2% | | | | | | | | | | | | | | |
| | | | | |
| | 5,000 | | | Alaska State, International Airport System Revenue Bonds, Refunding Series 2010A, 5.000%, 10/01/27 (Alternative Minimum Tax) | | | | | 10/20 at 100.00 | | | | Aa3 | | | | 5,597,100 | |
| | | | | |
| | 2,000 | | | Northern Tobacco Securitization Corporation, Alaska, Tobacco Settlement Asset-Backed Bonds, Series 2006A, 5.000%, 6/01/32 | | | | | 6/14 at 100.00 | | | | B+ | | | | 1,871,420 | |
| | 7,000 | | | Total Alaska | | | | | | | | | | | | | 7,468,520 | |
| | | | Arizona – 3.2% | | | | | | | | | | | | | | |
| | | | | |
| | 4,550 | | | Apache County Industrial Development Authority, Arizona, Pollution Control Revenue Bonds, Tucson Electric Power Company, Series 20102A, 4.500%, 3/01/30 | | | | | 3/22 at 100.00 | | | | BBB | | | | 4,745,286 | |
| | | | | |
| | 140 | | | Arizona Board of Regents, Certificates of Participation, Northern Arizona University Research Projects, Series 2005, 5.000%, 9/01/23 (Pre-refunded 9/01/15) – AMBAC Insured | | | | | 9/15 at 100.00 | | | | A (4) | | | | 154,778 | |
| | | | | |
| | 6,500 | | | Arizona Health Facilities Authority, Hospital System Revenue Bonds, Phoenix Children’s Hospital, Refunding Series 2012A, 5.000%, 2/01/30 | | | | | 2/22 at 100.00 | | | | BBB+ | | | | 7,124,000 | |
| | | | | |
| | 2,733 | | | Arizona Health Facilities Authority, Revenue Bonds, American Baptist Estates – Terraces Project, Series 2003A, 7.500%, 11/15/23 (Pre-refunded 11/15/13) | | | | | 11/13 at 101.00 | | | | AAA | | | | 2,864,375 | |
| | | | | |
| | 500 | | | Arizona School Facilities Board, Certificates of Participation, Series 2008, 5.250%, 9/01/23 | | | | | 9/18 at 100.00 | | | | A+ | | | | 577,865 | |
| | | | | |
| | 5,325 | | | Arizona Sports and Tourism Authority, Senior Revenue Refunding Bonds, Multipurpose Stadium Facility Project, Series 2012A, 5.000%, 7/01/36 | | | | | 7/22 at 100.00 | | | | A1 | | | | 5,922,359 | |
| | | | | |
| | 200 | | | Arizona State University Nanotechnology LLC Lease Revenue Refunding Bonds, Arizona State University Project, Series 2006, 5.000%, 3/01/34 – AGC Insured | | | | | 3/19 at 100.00 | | | | AA– | | | | 220,304 | |
| | | | | |
| | 250 | | | Cottonwood, Arizona, Water Revenue Bonds, Series 2006, 5.000%, 7/01/17 – SYNCORA GTY Insured | | | | | 7/16 at 100.00 | | | | A | | | | 275,348 | |
| | | | | |
| | 6,630 | | | Gila County Unified School District 10 Payson, Arizona, General Obligation Bonds, Project of 2006, Series 2007A, 5.250%, 7/01/22 – AMBAC Insured | | | | | 7/17 at 100.00 | | | | Aa3 | | | | 7,627,086 | |
Portfolio of Investments
Nuveen All-American Municipal Bond Fund (continued)
April 30, 2013
| | | | | | | | | | | | | | | | | | |
Principal
Amount (000) | | | Description (1) | | | | Optional Call
Provisions (2) | | | Ratings (3) | | | Value | |
| | | | Arizona (continued) | | | | | | | | | | | | | | |
| | | | | |
| $ | 500 | | | Gilbert, Arizona, Public Facilities Municipal Property Corporation, Revenue Bonds, Series 2009, 5.500%, 7/01/27 | | | | | 7/19 at 100.00 | | | | AA | | | $ | 577,055 | |
| | | | | |
| | 3,430 | | | Glendale Industrial Development Authority, Arizona, Revenue Bonds, John C. Lincoln Health Network, Series 2007, 5.000%, 12/01/42 | | | | | 12/17 at 100.00 | | | | BBB+ | | | | 3,570,116 | |
| | | | | |
| | 595 | | | Glendale Industrial Development Authority, Arizona, Revenue Bonds, Midwestern University, Refunding Series 2007, 5.000%, 5/15/31 | | | | | 5/22 at 100.00 | | | | A– | | | | 660,004 | |
| | | | | |
| | 750 | | | Greater Arizona Development Authority, Infrastructure Revenue Bonds, Series 2004B, 5.250%, 8/01/26 | | | | | 8/14 at 100.00 | | | | A1 | | | | 787,335 | |
| | | | | |
| | 750 | | | Greater Arizona Development Authority, Infrastructure Revenue Bonds, Series 2006-1, 4.500%, 8/01/25 – NPFG Insured | | | | | 8/16 at 100.00 | | | | AA– | | | | 810,983 | |
| | | | | |
| | 500 | | | Maricopa County Industrial Development Authority, Arizona, Health Facility Revenue Bonds, Catholic Healthcare West, Series 2004A, 5.375%, 7/01/23 | | | | | 7/14 at 100.00 | | | | A | | | | 524,610 | |
| | | | | |
| | 225 | | | Maricopa County, Arizona, Hospital Revenue Bonds, Sun Health Corporation, Series 2005, 5.000%, 4/01/25 (Pre-refunded 4/01/24) | | | | | 4/24 at 100.00 | | | | N/R (4) | | | | 276,476 | |
| | | | | |
| | 750 | | | Northern Arizona University, System Revenue Bonds, Series 2012, 5.000%, 6/01/36 | | | | | 6/21 at 100.00 | | | | A+ | | | | 836,160 | |
| | | | | |
| | 310 | | | Peoria Municipal Development Authority, Arizona, Revenue Bonds, Series 2006, 5.000%, 7/01/15 | | | | | No Opt. Call | | | | AA+ | | | | 339,531 | |
| | | | | |
| | 465 | | | Peoria, Arizona, Improvement District 601, Improvement Bonds, Series 2007, 4.250%, 1/01/22 | | | | | 1/18 at 101.00 | | | | AA | | | | 518,628 | |
| | | | | |
| | 4,000 | | | Phoenix Civic Improvement Corporation, Arizona, Junior Lien Airport Revenue Bonds, Series 2010A, 5.000%, 7/01/31 | | | | | 7/20 at 100.00 | | | | A+ | | | | 4,516,600 | |
| | | | | |
| | 1,000 | | | Phoenix Industrial Development Authority, Arizona, Education Facility Revenue Bonds, Choice Academies Charter Schools Project, Series 2012, 4.875%, 9/01/22 | | | | | No Opt. Call | | | | BB+ | | | | 1,018,720 | |
| | | | | |
| | 1,000 | | | Phoenix Industrial Development Authority, Arizona, Education Revenue Bonds, Great Hearts Academies – Veritas Project, Series 2012, 6.400%, 7/01/47 | | | | | 7/21 at 100.00 | | | | BB | | | | 1,075,380 | |
| | | | | |
| | | | Phoenix, Arizona, Civic Improvement Revenue Bonds, Civic Plaza, Series 2005B: | | | | | | | | | | | | | | |
| | 1,650 | | | 0.000%, 7/01/31 – FGIC Insured | | | | | No Opt. Call | | | | AA | | | | 2,067,054 | |
| | 6,000 | | | 0.000%, 7/01/39 – FGIC Insured | | | | | No Opt. Call | | | | AA | | | | 7,539,240 | |
| | | | | |
| | | | Pima County Industrial Development Authority, Arizona, Education Facility Revenue and Refunding Bonds, Edkey Charter Schools Project, Series 2013: | | | | | | | | | | | | | | |
| | 2,115 | | | 6.000%, 7/01/33 | | | | | 7/20 at 102.00 | | | | BB+ | | | | 2,222,336 | |
| | 2,000 | | | 6.000%, 7/01/43 | | | | | 7/20 at 102.00 | | | | BB+ | | | | 2,031,260 | |
| | | | | |
| | 825 | | | Pima County Industrial Development Authority, Arizona, Education Revenue Bonds, Paradise Education Center Project, Series 2010, 6.000%, 6/01/40 | | | | | 6/19 at 100.00 | | | | BBB– | | | | 861,201 | |
| | | | | |
| | 730 | | | Pima County Unified School District 1, Tucson, Arizona, School Improvement Bonds, Series 2007C, 5.000%, 7/01/27 – FGIC Insured | | | | | 7/17 at 100.00 | | | | Aa2 | | | | 821,695 | |
| | | | | |
| | 270 | | | Pima County Unified School District 1, Tucson, Arizona, School Improvement Bonds, Series 2007C, 5.000%, 7/01/27 (Pre-refunded 7/01/17) – FGIC Insured | | | | | 7/17 at 100.00 | | | | Aa2 (4) | | | | 318,603 | |
| | | | | |
| | 3,705 | | | Pinal County Electrical District 3, Arizona, Electric System Revenue Bonds, Refunding Series 2011, 5.250%, 7/01/41 | | | | | 7/21 at 100.00 | | | | A | | | | 4,173,275 | |
| | | | | |
| | 1,000 | | | Pinal County Unified School District 1 Florence, Arizona, General Obligation Bonds, Series 2007A, 5.000%, 7/01/27 – FGIC Insured | | | | | 7/17 at 100.00 | | | | A | | | | 1,125,610 | |
| | | | | |
| | 300 | | | Queen Creek, Arizona, Improvement District 1 Improvement Bonds, Series 2006, 5.000%, 1/01/20 | | | | | 1/14 at 100.00 | | | | A3 | | | | 302,376 | |
| | | | | | | | | | | | | | | | | | |
Principal
Amount (000) | | | Description (1) | | | | Optional Call
Provisions (2) | | | Ratings (3) | | | Value | |
| | | | Arizona (continued) | | | | | | | | | | | | | | |
| | | | | |
| | | | Salt Verde Financial Corporation, Arizona, Senior Gas Revenue Bonds, Citigroup Energy Inc Prepay Contract Obligations, Series 2007: | | | | | | | | | | | | | | |
| $ | 1,500 | | | 5.250%, 12/01/19 | | | | | No Opt. Call | | | | A– | | | $ | 1,750,590 | |
| | 1,000 | | | 5.250%, 12/01/28 | | | | | No Opt. Call | | | | A– | | | | 1,178,360 | |
| | 10,250 | | | 5.000%, 12/01/37 | | | | | No Opt. Call | | | | A– | | | | 11,515,363 | |
| | | | | |
| | 1,000 | | | Scottsdale Industrial Development Authority, Arizona, Hospital Revenue Bonds, Scottsdale Healthcare, Series 2008A, 5.000%, 9/01/22 | | | | | 9/18 at 100.00 | | | | A2 | | | | 1,098,670 | |
| | | | | |
| | 500 | | | Scottsdale Municipal Property Corporation, Arizona, Excise Tax Revenue Bonds, Series 2005C, 0.000%, 7/01/21 – AMBAC Insured | | | | | 7/17 at 100.00 | | | | AAA | | | | 552,305 | |
| | | | | |
| | 4,300 | | | Scottsdale Municipal Property Corporation, Arizona, Excise Tax Revenue Bonds, Series 2008A, 5.000%, 7/01/21 | | | | | 7/18 at 100.00 | | | | AAA | | | | 5,110,937 | |
| | | | | |
| | | | Tempe Industrial Development Authority, Arizona, Revenue Bonds, Friendship Village of Tempe Project, Refunding Series 2012A: | | | | | | | | | | | | | | |
| | 2,390 | | | 6.000%, 12/01/27 | | | | | 12/21 at 100.00 | | | | N/R | | | | 2,646,471 | |
| | 430 | | | 6.000%, 12/01/32 | | | | | 12/21 at 100.00 | | | | N/R | | | | 467,831 | |
| | 1,100 | | | 6.250%, 12/01/42 | | | | | 12/21 at 100.00 | | | | N/R | | | | 1,202,608 | |
| | | | | |
| | 415 | | | Tempe Industrial Development Authority, Arizona, Senior Living Revenue Bonds, Friendship Village of Tempe Project, Refunding Series 2004A, 5.375%, 12/01/13 (ETM) | | | | | No Opt. Call | | | | N/R (4) | | | | 422,839 | |
| | | | | |
| | 250 | | | Tucson, Arizona, General Obligation Refunding Bonds, Series 1998, 5.500%, 7/01/18 | | | | | No Opt. Call | | | | Aa2 | | | | 305,765 | |
| | | | | |
| | 450 | | | University Medical Center Corporation, Arizona, Hospital Revenue Bonds, Refunding Series 2004, 5.000%, 7/01/24 | | | | | 7/14 at 100.00 | | | | BBB+ | | | | 462,794 | |
| | | | | |
| | 155 | | | University Medical Center Corporation, Arizona, Hospital Revenue Bonds, Series 2005, 5.000%, 7/01/16 | | | | | 7/15 at 100.00 | | | | BBB+ | | | | 164,229 | |
| | | | | |
| | 1,000 | | | University Medical Center Corporation, Tucson, Arizona, Hospital Revenue Bonds, Series 2011, 6.000%, 7/01/39 | | | | | 7/21 at 100.00 | | | | BBB+ | | | | 1,157,390 | |
| | | | | |
| | 953 | | | Watson Road Community Facilities District, Arizona, Special Assessment Revenue Bonds, Series 2005, 6.000%, 7/01/30 | | | | | 7/16 at 100.00 | | | | N/R | | | | 978,007 | |
| | | | | |
| | | | Yavapai County Industrial Development Authority, Arizona, Hospital Revenue Bonds, Yavapai Regional Medical Center, Series 2003A: | | | | | | | | | | | | | | |
| | 375 | | | 5.250%, 8/01/21 – RAAI Insured | | | | | 8/13 at 100.00 | | | | BBB+ | | | | 379,470 | |
| | 100 | | | 6.000%, 8/01/33 | | | | | 8/13 at 100.00 | | | | BBB+ | | | | 101,258 | |
| | | | | |
| | 400 | | | Yavapai County Industrial Development Authority, Arizona, Solid Waste Disposal Revenue Bonds, Waste Management Inc., Series 2003A-1, 4.900%, 3/01/28 (Alternative Minimum Tax) | | | | | 3/16 at 101.00 | | | | BBB | | | | 430,984 | |
| | | | | |
| | 365 | | | Yuma, Arizona, Improvement District 68 Improvement Bonds, Series 2006, 4.700%, 1/01/21 | | | | | 1/17 at 101.00 | | | | A+ | | | | 393,368 | |
| | 86,631 | | | Total Arizona | | | | | | | | | | | | | 96,804,888 | |
| | | | Arkansas – 0.1% | | | | | | | | | | | | | | |
| | | | | |
| | | | Benton County Public Facilities Board, Arkansas, Charter School Lease Revenue Bonds, BCCSO Project, Series 2010A: | | | | | | | | | | | | | | |
| | 500 | | | 5.750%, 6/01/30 | | | | | 6/20 at 100.00 | | | | BBB | | | | 562,865 | |
| | 1,000 | | | 6.000%, 6/01/40 | | | | | 6/20 at 100.00 | | | | BBB | | | | 1,145,870 | |
| | | | | |
| | 500 | | | Conway Health Facilities Board, Arkansas, Hospital Revenue Bond, Conway Regional Medical Center, Improvement Series 2012, 4.100%, 8/01/27 | | | | | 8/22 at 100.00 | | | | BBB+ | | | | 520,595 | |
| | | | | |
| | 2,000 | | | University of Arkansas, Fayetteville, Revenue Bonds, Medical Sciences Campus, Series 2004B, 5.000%, 11/01/26 – NPFG Insured | | | | | 11/14 at 100.00 | | | | Aa2 | | | | 2,123,620 | |
| | 4,000 | | | Total Arkansas | | | | | | | | | | | | | 4,352,950 | |
| | | | California – 11.6% | | | | | | | | | | | | | | |
| | | | | |
| | 2,400 | | | Alameda Corridor Transportation Authority, California, Revenue Bonds, Refunding Subordinate Lien Series 2004A, 0.000%, 10/01/20 – AMBAC Insured | | | | | No Opt. Call | | | | BBB+ | | | | 1,893,216 | |
| | | | | |
| | 1,000 | | | Bay Area Toll Authority, California, Revenue Bonds, San Francisco Bay Area Toll Bridge, Tender Option Bond Trust 2985, 17.305%, 4/01/34 (IF) | | | | | 4/18 at 100.00 | | | | AA | | | | 1,523,290 | |
Portfolio of Investments
Nuveen All-American Municipal Bond Fund (continued)
April 30, 2013
| | | | | | | | | | | | | | | | | | |
Principal
Amount (000) | | | Description (1) | | | | Optional Call
Provisions (2) | | | Ratings (3) | | | Value | |
| | | | California (continued) | | | | | | | | | | | | | | |
| | | | | |
| | | | California Department of Water Resources, Water System Revenue Bonds, Central Valley Project, Series 2005AC: | | | | | | | | | | | | | | |
| $ | 10 | | | 5.000%, 12/01/27 (Pre-refunded 12/01/14) – NPFG Insured | | | | | 12/14 at 100.00 | | | | AAA | | | $ | 10,736 | |
| | 55 | | | 5.000%, 12/01/27 (Pre-refunded 12/01/14) – NPFG Insured | | | | | 12/14 at 100.00 | | | | Aa1 (4) | | | | 59,047 | |
| | 935 | | | 5.000%, 12/01/27 (Pre-refunded 12/01/14) – NPFG Insured | | | | | 12/14 at 100.00 | | | | AAA | | | | 1,003,807 | |
| | | | | |
| | 2,000 | | | California Department of Water Resources, Water System Revenue Bonds, Central Valley Project, Series 2008AE, 5.000%, 12/01/21 | | | | | 6/18 at 100.00 | | | | AAA | | | | 2,391,820 | |
| | | | | |
| | 1,000 | | | California Educational Facilities Authority, Revenue Bonds, University of the Pacific, Series 2006, 5.000%, 11/01/30 | | | | | 11/15 at 100.00 | | | | A2 | | | | 1,079,960 | |
| | | | | |
| | 1,065 | | | California Educational Facilities Authority, Revenue Bonds, Woodbury University, Series 2006, 5.000%, 1/01/36 | | | | | 1/15 at 100.00 | | | | Baa3 | | | | 1,074,084 | |
| | | | | |
| | 1,000 | | | California Health Facilities Financing Authority, Revenue Bonds, Cedars-Sinai Medical Center, Series 2005, 5.000%, 11/15/27 | | | | | 11/15 at 100.00 | | | | A+ | | | | 1,081,360 | |
| | | | | |
| | 4,285 | | | California Health Facilities Financing Authority, Revenue Bonds, Kaiser Permanente System, Series 2006, 5.000%, 4/01/37 | | | | | 4/16 at 100.00 | | | | A+ | | | | 4,665,851 | |
| | | | | |
| | 2,000 | | | California Health Facilities Financing Authority, Revenue Bonds, Lucile Salter Packard Children’s Hospital, Series 2012A, 5.000%, 8/15/51 | | | | | 8/22 at 100.00 | | | | AA | | | | 2,248,780 | |
| | | | | |
| | 5,100 | | | California Health Facilities Financing Authority, Revenue Bonds, Providence Health & Services, Series 2009B, 5.500%, 10/01/39 | | | | | 10/19 at 100.00 | | | | AA | | | | 6,007,086 | |
| | | | | |
| | 3,470 | | | California Municipal Finance Authority, Mobile Home Park Revenue Bonds, Caritas Projects Series 2010A, 6.400%, 8/15/45 | | | | | 8/20 at 100.00 | | | | BBB | | | | 3,870,681 | |
| | | | | |
| | 14,500 | | | California Pollution Control Financing Authority, Solid Waste Disposal Revenue Bonds, Waste Management Inc., Series 2005C, 5.125%, 11/01/23 (Alternative Minimum Tax) | | | | | 11/15 at 101.00 | | | | BBB | | | | 15,635,060 | |
| | | | | |
| | 5,000 | | | California State Public Works Board, Lease Revenue Bonds, Department of General Services, Series 2002B, 5.000%, 3/01/27 – AMBAC Insured | | | | | 7/13 at 100.00 | | | | A2 | | | | 5,014,750 | |
| | | | | |
| | 1,000 | | | California State Public Works Board, Lease Revenue Bonds, Judicial Council of California, Various Projects Series 2011D, 5.000%, 12/01/20 | | | | | No Opt. Call | | | | A2 | | | | 1,231,120 | |
| | | | | |
| | 1,000 | | | California State Public Works Board, Lease Revenue Bonds, Various Capital Projects, Series 2010A-1, 5.750%, 3/01/30 | | | | | 3/20 at 100.00 | | | | A2 | | | | 1,183,360 | |
| | | | | |
| | 2,250 | | | California State University, Systemwide Revenue Bonds, Series 2005A, 5.000%, 11/01/25 – AMBAC Insured | | | | | 5/15 at 100.00 | | | | Aa2 | | | | 2,450,970 | |
| | | | | |
| | 4,500 | | | California State, General Obligation Bonds, Series 2004, 5.000%, 6/01/31 – AMBAC Insured | | | | | 12/14 at 100.00 | | | | A1 | | | | 4,763,790 | |
| | | | | |
| | 700 | | | California State, General Obligation Bonds, Tender Option Bond Trust 3162, 19.050%, 3/01/18 – AGM Insured (IF) | | | | | No Opt. Call | | | | AA– | | | | 1,185,352 | |
| | | | | |
| | 8,475 | | | California State, General Obligation Bonds, Various Purpose Series 2008, 5.000%, 4/01/38 | | | | | 4/18 at 100.00 | | | | A1 | | | | 9,271,057 | |
| | | | | |
| | 1,400 | | | California State, General Obligation Bonds, Various Purpose Series 2010, 5.250%, 3/01/30 | | | | | 3/20 at 100.00 | | | | A1 | | | | 1,646,750 | |
| | | | | |
| | 10,000 | | | California State, General Obligation Bonds, Various Purpose Series 2013, 5.000%, 4/01/43 | | | | | 4/23 at 100.00 | | | | A1 | | | | 11,296,900 | |
| | | | | |
| | 1,725 | | | California Statewide Communities Development Authority, Revenue Bonds, American Baptist Homes of the West, Series 2010, 5.750%, 10/01/25 | | | | | 10/19 at 100.00 | | | | BBB+ | | | | 1,956,978 | |
| | | | | |
| | 845 | | | California Statewide Community Development Authority, Health Facility Revenue Bonds, Catholic Healthcare West, Series 2008E, 5.500%, 7/01/31 | | | | | 7/17 at 100.00 | | | | A | | | | 956,760 | |
| | | | | |
| | 2,000 | | | California Statewide Community Development Authority, Revenue Bonds, Children’s Hospital of Los Angeles, Series 2007, 5.000%, 8/15/47 | | | | | 8/17 at 100.00 | | | | BBB+ | | | | 2,092,900 | |
| | | | | |
| | | | California Statewide Community Development Authority, Revenue Bonds, Daughters of Charity Health System, Series 2005A: | | | | | | | | | | | | | | |
| | 825 | | | 5.250%, 7/01/30 | | | | | 7/15 at 100.00 | | | | BBB– | | | | 868,742 | |
| | 5,300 | | | 5.250%, 7/01/35 | | | | | 7/15 at 100.00 | | | | BBB– | | | | 5,553,552 | |
| | 2,000 | | | 5.000%, 7/01/39 | | | | | 7/15 at 100.00 | | | | BBB– | | | | 2,075,000 | |
| | | | | | | | | | | | | | | | | | |
Principal
Amount (000) | | | Description (1) | | | | Optional Call
Provisions (2) | | | Ratings (3) | | | Value | |
| | | | California (continued) | | | | | | | | | | | | | | |
| | | | | |
| $ | 1,000 | | | California Statewide Community Development Authority, Revenue Bonds, St. Joseph Health System, Series 2007A, 5.750%, 7/01/47 – FGIC Insured | | | | | 7/18 at 100.00 | | | | AA– | | | $ | 1,156,930 | |
| | | | | |
| | 1,050 | | | California Statewide Community Development Authority, Revenue Bonds, St. Joseph Health System, Series 2007B, 5.450%, 7/01/26 – FGIC Insured | | | | | 7/18 at 100.00 | | | | AA– | | | | 1,232,805 | |
| | | | | |
| | 1,050 | | | California Statewide Community Development Authority, Revenue Bonds, St. Joseph Health System, Series 2007C, 5.450%, 7/01/26 – FGIC Insured | | | | | 7/18 at 100.00 | | | | AA– | | | | 1,232,805 | |
| | | | | |
| | 675 | | | California Statewide Community Development Authority, Revenue Bonds, Sutter Health, Tender Option Bond Trust 3048, 18.516%, 11/15/46 (IF) | | | | | 11/16 at 100.00 | | | | AA– | | | | 973,701 | |
| | | | | |
| | 500 | | | Chino Hill, California, Community Facilities District 10 Special Tax Bonds, Series 2010, 5.000%, 9/01/30 – AGM Insured | | | | | 9/20 at 100.00 | | | | AA– | | | | 552,045 | |
| | | | | |
| | | | Chino Public Financing Authority, California, Revenue Refunding Bonds, Series 2012: | | | | | | | | | | | | | | |
| | 1,775 | | | 4.000%, 9/01/20 | | | | | No Opt. Call | | | | N/R | | | | 1,829,599 | |
| | 1,650 | | | 4.000%, 9/01/21 | | | | | No Opt. Call | | | | N/R | | | | 1,693,511 | |
| | 1,065 | | | 5.000%, 9/01/23 | | | | | 9/22 at 100.00 | | | | N/R | | | | 1,160,232 | |
| | 1,110 | | | 5.000%, 9/01/24 | | | | | 9/22 at 100.00 | | | | N/R | | | | 1,203,817 | |
| | 785 | | | 5.000%, 9/01/25 | | | | | 9/22 at 100.00 | | | | N/R | | | | 847,525 | |
| | 780 | | | 5.000%, 9/01/34 | | | | | 9/22 at 100.00 | | | | N/R | | | | 812,432 | |
| | | | | |
| | 4,410 | | | Contra Costa Home Mortgage Finance Authority, California, Home Mortgage Revenue Bonds, Series 1984, 0.000%, 9/01/17 – NPFG Insured (ETM) | | | | | No Opt. Call | | | | Aaa | | | | 3,355,304 | |
| | | | | |
| | 1,575 | | | California Statewide Communities Development Authority, Revenue Bonds, Saint Joseph Health System, Trust 2554, 18.068%, 7/01/47 – AGM Insured (IF) | | | | | 7/18 at 100.00 | | | | AA– | | | | 2,457,630 | |
| | | | | |
| | 400 | | | Davis Redevelopment Agency, California, Tax Allocation Bonds, Davis Redevelopment Project, Subordinate Series 2011A, 7.000%, 12/01/36 | | | | | 12/21 at 100.00 | | | | A+ | | | | 502,528 | |
| | | | | |
| | 1,960 | | | Elk Grove Community Facilities District 2005-1, California, Special Tax Bonds, Series 2007, 5.250%, 9/01/37 | | | | | 9/15 at 102.00 | | | | N/R | | | | 1,797,065 | |
| | | | | |
| | 510 | | | Etiwanda School District, California, Coyote Canyon Community Facilities District 2004-1 Improvement Area 2 Special Tax Bonds, Series 2009, 6.500%, 9/01/32 | | | | | 9/19 at 100.00 | | | | N/R | | | | 561,520 | |
| | | | | |
| | 1,385 | | | Fullerton Public Financing Authority, California, Tax Allocation Revenue Bonds, Series 2005, 5.000%, 9/01/27 – AMBAC Insured | | | | | 9/15 at 100.00 | | | | A | | | | 1,456,009 | |
| | | | | |
| | | | Golden State Tobacco Securitization Corporation, California, Enhanced Tobacco Settlement Asset-Backed Revenue Bonds, Series 2005A: | | | | | | | | | | | | | | |
| | 6,000 | | | 5.000%, 6/01/35 – FGIC Insured | | | | | 6/15 at 100.00 | | | | A2 | | | | 6,299,820 | |
| | 1,300 | | | 5.000%, 6/01/35 – AGC Insured | | | | | 6/15 at 100.00 | | | | AA | | | | 1,367,938 | |
| | | | | |
| | | | Golden State Tobacco Securitization Corporation, California, Tobacco Settlement Asset-Backed Bonds, Series 2007A-1: | | | | | | | | | | | | | | |
| | 6,710 | | | 4.500%, 6/01/27 | | | | | 6/17 at 100.00 | | | | B | | | | 6,545,605 | |
| | 3,480 | | | 5.000%, 6/01/33 | | | | | 6/17 at 100.00 | | | | B | | | | 3,210,230 | |
| | 8,740 | | | 5.750%, 6/01/47 | | | | | 6/17 at 100.00 | | | | B | | | | 8,350,808 | |
| | | | | |
| | 1,525 | | | Hayward Redevelopment Agency, California, Downtown Redevelopment Project Tax Allocation Bonds, Series 2006, 5.000%, 3/01/36 – SYNCORA GTY Insured | | | | | 3/16 at 100.00 | | | | A– | | | | 1,545,603 | |
| | | | | |
| | 1,000 | | | Jurupa Public Financing Authority, California, Superior Lien Revenue Bonds, Series 2010A, 5.000%, 9/01/33 | | | | | 9/20 at 100.00 | | | | AA– | | | | 1,088,500 | |
| | | | | |
| | 1,980 | | | Kern Community College District, California, General Obligation Bonds, Series 2006, 0.000%, 11/01/23 – AGM Insured | | | | | No Opt. Call | | | | Aa2 | | | | 1,399,642 | |
| | | | | |
| | 1,500 | | | Loma Linda, California, Hospital Revenue Bonds, Loma Linda University Medical Center, Series 2008A, 8.250%, 12/01/38 | | | | | 12/17 at 100.00 | | | | BBB | | | | 1,742,460 | |
| | | | | |
| | 6,000 | | | Los Angeles Community Redevelopment Agency, California, Tax Allocation Bonds, Bunker Hill Project, Series 2004A, 5.000%, 12/01/24 – AGM Insured | | | | | 12/14 at 100.00 | | | | AA– | | | | 6,359,220 | |
Portfolio of Investments
Nuveen All-American Municipal Bond Fund (continued)
April 30, 2013
| | | | | | | | | | | | | | | | | | |
Principal
Amount (000) | | | Description (1) | | | | Optional Call
Provisions (2) | | | Ratings (3) | | | Value | |
| | | | California (continued) | | | | | | | | | | | | | | |
| | | | | |
| $ | 5,025 | | | Los Angeles County Sanitation Districts Financing Authority, California, Capital Projects Revenue Bonds, District 14, Series 2005, 5.000%, 10/01/26 – FGIC Insured | | | | | 10/15 at 100.00 | | | | AA– | | | $ | 5,493,481 | |
| | | | | |
| | 1,000 | | | Los Angeles Department of Harbors, California, Revenue Bonds, Series 2009B, 5.250%, 8/01/39 | | | | | 8/19 at 100.00 | | | | AA | | | | 1,173,080 | |
| | | | | |
| | 500 | | | Lynwood Redevelopment Agency, California, Project A Revenue Bonds, Subordinate Lien Series 2011A, 7.000%, 9/01/31 | | | | | 9/21 at 100.00 | | | | A– | | | | 603,045 | |
| | | | | |
| | 3,000 | | | Madera County, California, Certificates of Participation, Children’s Hospital Central California, Series 2010, 5.375%, 3/15/36 | | | | | 3/20 at 100.00 | | | | A+ | | | | 3,309,150 | |
| | | | | |
| | 1,000 | | | Manteca Financing Authority, California, Sewer Revenue Bonds, Series 2009, 5.750%, 12/01/36 | | | | | 12/19 at 100.00 | | | | AAA | | | | 1,191,850 | |
| | | | | |
| | 500 | | | Metropolitan Water District of Southern California, Water Revenue Bonds, Series 2006C, 5.000%, 7/01/29 | | | | | 7/16 at 100.00 | | | | AAA | | | | 557,750 | |
| | | | | |
| | 1,000 | | | Modesto Irrigation District, California, Electric System Revenue Bonds, Refunding Series 2011A, 5.000%, 7/01/26 | | | | | 7/21 at 100.00 | | | | A+ | | | | 1,171,970 | |
| | | | | |
| | | | M-S-R Energy Authority, California, Gas Revenue Bonds, Series 2009A: | | | | | | | | | | | | | | |
| | 2,700 | | | 7.000%, 11/01/34 | | | | | No Opt. Call | | | | A | | | | 3,816,207 | |
| | 2,500 | | | 6.500%, 11/01/39 | | | | | No Opt. Call | | | | A | | | | 3,418,000 | |
| | | | | |
| | 13,750 | | | Ontario Redevelopment Financing Authority, San Bernardino County, California, Revenue Bonds, Redevelopment Project 1, Series 1993, 5.800%, 8/01/23 – NPFG Insured (ETM) | | | | | 7/13 at 100.00 | | | | A (4) | | | | 16,393,988 | |
| | | | | |
| | 10,000 | | | Orange County Sanitation District, California, Certificates of Participation, Series 2003, 5.250%, 2/01/27 (Pre-refunded 8/01/13) – FGIC Insured | | | | | 8/13 at 100.00 | | | | AAA | | | | 10,124,500 | |
| | | | | |
| | 4,700 | | | Oxnard, California, Financing Authority, Wastewater Revenue Bonds, Redwood Trunk Sewer and Headworks Projects, Series 2004A, 5.250%, 6/01/34 – FGIC Insured | | | | | 6/14 at 100.00 | | | | BBB | | | | 4,796,115 | |
| | | | | |
| | 1,310 | | | Palm Drive Health Care District, Sonoma County, California, Certificates of Participation, Parcel Tax Secured Financing Program, Series 2010, 7.000%, 4/01/25 | | | | | 7/13 at 102.00 | | | | BB | | | | 1,342,331 | |
| | | | | |
| | 1,740 | | | Palmdale, California, Special Tax Bonds, Community Facilities District 2003-1, Anaverde Project, Series 2005A, 5.350%, 9/01/30 | | | | | 9/15 at 101.00 | | | | N/R | | | | 1,780,246 | |
| | | | | |
| | 3,000 | | | Palomar Pomerado Health Care District, California, Certificates of Participation, Series 2009, 6.625%, 11/01/29 | | | | | 11/19 at 100.00 | | | | Baa3 | | | | 3,416,640 | |
| | | | | |
| | 1,710 | | | Perris Public Financing Authority, California, Tax Allocation Revenue Bonds, Housing Loan Series 2010A, 6.125%, 10/01/40 | | | | | 10/20 at 100.00 | | | | A | | | | 1,970,262 | |
| | | | | |
| | 3,775 | | | Poway Unified School District, San Diego County, California, School Facilities Improvement District 2007-1 General Obligation Bonds, Series 2009A, 0.000%, 8/01/23 | | | | | No Opt. Call | | | | Aa2 | | | | 2,696,822 | |
| | | | | |
| | 5,000 | | | Poway Unified School District, San Diego County, California, School Facilities Improvement District 2007-1 General Obligation Bonds, Series 2011A, 0.000%, 8/01/41 | | | | | No Opt. Call | | | | Aa2 | | | | 1,283,700 | |
| | | | | |
| | 2,035 | | | Redding, California, Electric System Revenue Certificates of Participation, Series 2005, 5.000%, 6/01/30 – FGIC Insured | | | | | 6/15 at 100.00 | | | | A | | | | 2,100,181 | |
| | | | | |
| | 15,000 | | | Rialto Unified School District, San Bernardino County, California, General Obligation Bonds, Series 2011A, 0.000%, 8/01/41 – AGM Insured | | | | | 8/36 at 100.00 | | | | AA– | | | | 9,837,000 | |
| | | | | |
| | 4,000 | | | Ridgecrest Redevelopment Agency, California, Ridgecrest Redevelopment Project Tax Allocation Bonds, Refunding Series 2010, 6.125%, 6/30/37 | | | | | 6/20 at 100.00 | | | | A– | | | | 4,544,840 | |
| | | | | |
| | 1,250 | | | Riverside Unified School District Finance Authority, Riverside County, California, Revenue Bonds Series 2012A, 5.000%, 9/01/37 | | | | | 9/22 at 100.00 | | | | A– | | | | 1,354,125 | |
| | | | | |
| | 2,500 | | | Sacramento County Sanitation District Financing Authority, California, Revenue Bonds, Series 2005B, 4.750%, 12/01/21 – FGIC Insured | | | | | 12/15 at 100.00 | | | | AA | | | | 2,779,625 | |
| | | | | |
| | 2,000 | | | Sacramento Municipal Utility District Financing Authority, California, Consumnes Power Plant Project Revenue Bonds, Series 2006, 5.125%, 7/01/29 – NPFG Insured | | | | | 7/16 at 100.00 | | | | A3 | | | | 2,198,740 | |
| | | | | | | | | | | | | | | | | | |
Principal
Amount (000) | | | Description (1) | | | | Optional Call
Provisions (2) | | | Ratings (3) | | | Value | |
| | | | California (continued) | | | | | | | | | | | | | | |
| | | | | |
| $ | 925 | | | Sacramento, California, Community Facilities District 05-1, College Square Special Tax Bonds, Series 2007, 5.900%, 9/01/37 | | | | | 9/17 at 100.00 | | | | N/R | | | $ | 939,023 | |
| | | | | |
| | 1,000 | | | San Bernardino County Redevelopment Agency, California, Tax Allocation Bonds, Cedar Glen Disaster Recovery Project Area Series 2010, 5.750%, 9/01/30 | | | | | 9/18 at 100.00 | | | | BBB | | | | 1,039,890 | |
| | | | | |
| | | | San Diego County Regional Airport Authority, California, Airport Revenue Bonds, Senior Series 2013B: | | | | | | | | | | | | | | |
| | 1,225 | | | 5.000%, 7/01/20 (Alternative Minimum Tax) | | | | | No Opt. Call | | | | A+ | | | | 1,478,857 | |
| | 1,200 | | | 5.000%, 7/01/21 (Alternative Minimum Tax) | | | | | No Opt. Call | | | | A+ | | | | 1,455,996 | |
| | 1,150 | | | 5.000%, 7/01/22 (Alternative Minimum Tax) | | | | | No Opt. Call | | | | A+ | | | | 1,402,195 | |
| | 700 | | | 5.000%, 7/01/23 (Alternative Minimum Tax) | | | | | No Opt. Call | | | | A+ | | | | 853,825 | |
| | | | | |
| | 8,965 | | | San Diego County Water Authority, California, Water Revenue Certificates of Participation, Series 2004A, 5.000%, 5/01/30 (Pre-refunded 5/01/15) | | | | | 5/15 at 100.00 | | | | Aa2 (4) | | | | 9,793,456 | |
| | | | | |
| | 1,035 | | | San Diego County Water Authority, California, Water Revenue Certificates of Participation, Series 2004A, 5.000%, 5/01/30 | | | | | 5/15 at 100.00 | | | | AA+ | | | | 1,105,556 | |
| | | | | |
| | 1,660 | | | San Diego Redevelopment Agency, California, City Heights Redevelopment Project Tax Allocation Bonds, Series 2010A, 5.625%, 9/01/40 | | | | | 9/20 at 100.00 | | | | A– | | | | 1,779,221 | |
| | | | | |
| | 1,500 | | | San Diego Unified Port District, California, Revenue Bonds, Series 2004B, 5.000%, 9/01/29 – NPFG Insured | | | | | 9/14 at 100.00 | | | | A+ | | | | 1,579,590 | |
| | | | | |
| | 6,880 | | | San Francisco Airports Commission, California, Revenue Bonds, San Francisco International Airport, Governmental Purpose, Refunding Second Series 2012A, 5.000%, 5/01/29 (Alternative Minimum Tax) | | | | | 5/22 at 100.00 | | | | A+ | | | | 7,816,093 | |
| | | | | |
| | 2,000 | | | San Francisco Airports Commission, California, Revenue Bonds, San Francisco International Airport, Second Series A of 2009, 4.900%, 5/01/29 | | | | | 11/19 at 100.00 | | | | A+ | | | | 2,271,400 | |
| | | | | |
| | 670 | | | San Francisco Redevelopment Finance Authority, California, Tax Allocation Revenue Bonds, Mission Bay North Redevelopment Project, Series 2009C, 6.500%, 8/01/39 | | | | | 8/19 at 100.00 | | | | A– | | | | 792,067 | |
| | | | | |
| | | | San Francisco, California, Community Facilities District 6, Mission Bay South Public Improvements, Special Tax Refunding Bonds, Series 2013A: | | | | | | | | | | | | | | |
| | 1,335 | | | 5.000%, 8/01/27 | | | | | 8/22 at 100.00 | | | | N/R | | | | 1,470,956 | |
| | 580 | | | 5.000%, 8/01/28 | | | | | 8/22 at 100.00 | | | | N/R | | | | 636,683 | |
| | 1,000 | | | 5.000%, 8/01/30 | | | | | 8/22 at 100.00 | | | | N/R | | | | 1,089,560 | |
| | 235 | | | 5.000%, 8/01/33 | | | | | 8/22 at 100.00 | | | | N/R | | | | 253,010 | |
| | | | | |
| | 1,135 | | | San Francisco, California, Community Facilities District 6, Mission Bay South Public Improvements, Special Tax Refunding Bonds, Series 2013B, 5.000%, 8/01/29 | | | | | 8/22 at 100.00 | | | | N/R | | | | 1,242,201 | |
| | | | | |
| | | | San Joaquin Hills Transportation Corridor Agency, Orange County, California, Toll Road Revenue Refunding Bonds, Series 1997A: | | | | | | | | | | | | | | |
| | 8,390 | | | 0.000%, 1/15/24 – NPFG Insured | | | | | No Opt. Call | | | | Baa2 | | | | 5,091,052 | |
| | 51,000 | | | 0.000%, 1/15/31 – NPFG Insured | | | | | No Opt. Call | | | | Baa2 | | | | 21,565,827 | |
| | | | | |
| | 8,400 | | | San Jose Redevelopment Agency, California, Tax Allocation Bonds, Merged Area Redevelopment Project, Series 2006C, 4.250%, 8/01/30 – NPFG Insured | | | | | 8/17 at 100.00 | | | | BBB | | | | 8,218,476 | |
| | | | | |
| | 3,450 | | | San Jose Unified School District, Santa Clara County, California, General Obligation Bonds, Series 2005B, 5.000%, 8/01/26 (Pre-refunded 8/01/15) – FGIC Insured | | | | | 8/15 at 100.00 | | | | AA (4) | | | | 3,810,318 | |
| | | | | |
| | 440 | | | Santee Community Development Commission, California, Santee Redevelopment Project Tax Allocation Bonds, Series 2011A, 7.000%, 8/01/31 | | | | | 2/21 at 100.00 | | | | A | | | | 552,420 | |
| | | | | |
| | 2,050 | | | Semitrophic Improvement District of Semitrophic Water Storage District, Kern County, California, Revenue Bonds, Refunding Series 2009A, 5.000%, 12/01/38 | | | | | 12/19 at 100.00 | | | | AA– | | | | 2,292,679 | |
| | | | | |
| | 4,000 | | | Southern California Public Power Authority, Transmission Project Revenue Bonds, Southern Transmission Subordinate Lien Refunding Series 2008A, 5.000%, 7/01/20 | | | | | 7/18 at 100.00 | | | | AA– | | | | 4,726,600 | |
Portfolio of Investments
Nuveen All-American Municipal Bond Fund (continued)
April 30, 2013
| | | | | | | | | | | | | | | | | | |
Principal
Amount (000) | | | Description (1) | | | | Optional Call
Provisions (2) | | | Ratings (3) | | | Value | |
| | | | California (continued) | | | | | | | | | | | | | | |
| | | | | |
| $ | 500 | | | Temecula Redevelopment Agency, California, Redevelopment Project 1 Tax Allocation Housing Bonds Series 2011A, 6.750%, 8/01/31 | | | | | 8/21 at 100.00 | | | | A | | | $ | 625,960 | |
| | | | | |
| | | | Tustin Community Redevelopment Agency, California, MCAS Project Area Tax Allocation Bonds, Series 2010: | | | | | | | | | | | | | | |
| | 425 | | | 5.000%, 9/01/29 | | | | | 9/18 at 102.00 | | | | A | | | | 460,551 | |
| | 500 | | | 5.000%, 9/01/35 | | | | | 9/18 at 102.00 | | | | A | | | | 532,635 | |
| | | | | |
| | 920 | | | Tustin Community Redevelopment Agency, California, Tax Allocation Housing Bonds Series 2010, 5.000%, 9/01/30 – AGM Insured | | | | | 9/20 at 100.00 | | | | AA– | | | | 1,020,814 | |
| | | | | |
| | 2,120 | | | Upland, California, Special Tax Bonds, Community Facilities District 2003-2 Improvement Area 1 The Colonies at San Antonio, Series 2012, 4.000%, 9/01/26 | | | | | 9/22 at 100.00 | | | | BBB | | | | 2,163,015 | |
| | | | | |
| | 205 | | | Val Verde Unified School District, Riverside County, California, Certificates of Participation, Series 2009A, 5.125%, 3/01/36 – AGC Insured | | | | | 3/19 at 100.00 | | | | AA– | | | | 222,156 | |
| | | | | |
| | 1,000 | | | Ventura County Area Housing Authority, California, Multifamily Revenue Bonds, Mira Vista Senior Apartments Project, Series 2006A, 5.000%, 12/01/22 – AMBAC Insured (Alternative Minimum Tax) | | | | | 12/16 at 100.00 | | | | N/R | | | | 1,001,580 | |
| | | | | |
| | 5,000 | | | Victor Valley Union High School District, San Bernardino County, California, General Obligation Bonds, Series 2009A, 0.000%, 8/01/31 – AGC Insured | | | | | 8/26 at 100.00 | | | | AA– | | | | 4,214,850 | |
| | | | | |
| | 2,000 | | | Walnut Energy Center Authority, California, Electric Revenue Bonds, Turlock Irrigation District, Series 2004A, 5.000%, 1/01/34 – AMBAC Insured | | | | | 1/14 at 100.00 | | | | A+ | | | | 2,050,840 | |
| | | | | |
| | 5,000 | | | West Contra Costa Unified School District, Contra Costa County, California, General Obligation Bonds, Election 2010 Series 2011A, 5.000%, 8/01/41 | | | | | 8/21 at 100.00 | | | | Aa3 | | | | 5,704,450 | |
| | | | | |
| | 485 | | | West Sacramento Financing Authority, California, Special Tax Revenue Bonds, Refunding Series 1999F, 6.100%, 9/01/29 | | | | | 9/13 at 100.00 | | | | N/R | | | | 487,284 | |
| | | | | |
| | 1,500 | | | Western Placer Unified School District, Placer County, California, Certificates of Participation, Refunding Series 2009, 5.250%, 8/01/35 – AGM Insured | | | | | 8/19 at 100.00 | | | | AA– | | | | 1,644,870 | |
| | | | | |
| | | | Westminster School District, Orange County, California, General Obligation Bonds, Series 2009-A1: | | | | | | | | | | | | | | |
| | 2,485 | | | 0.000%, 8/01/26 – AGC Insured | | | | | No Opt. Call | | | | AA– | | | | 1,470,027 | |
| | 1,405 | | | 0.000%, 8/01/28 – AGC Insured | | | | | No Opt. Call | | | | AA– | | | | 739,213 | |
| | 2,920 | | | 0.000%, 8/01/29 – AGC Insured | | | | | No Opt. Call | | | | AA– | | | | 1,440,524 | |
| | 372,140 | | | Total California | | | | | | | | | | | | | 349,217,411 | |
| | | | Colorado – 3.5% | | | | | | | | | | | | | | |
| | | | | |
| | 1,000 | | | Arista Metropolitan District, Colorado, Special Revenue Bonds, Series 2008, 9.250%, 12/01/37 | | | | | 12/15 at 100.00 | | | | N/R | | | | 734,900 | |
| | | | | |
| | | | Baptist Road Rural Transportation Authority, Colorado, Sales and Use Tax Revenue Bonds, Series 2007: | | | | | | | | | | | | | | |
| | 580 | | | 4.800%, 12/01/17 | | | | | No Opt. Call | | | | N/R | | | | 566,416 | |
| | 905 | | | 5.000%, 12/01/26 | | | | | 12/17 at 100.00 | | | | N/R | | | | 722,787 | |
| | | | | |
| | | | Colorado Educational and Cultural Facilities Authority, Charter School Revenue Bonds, Bromley School, Series 2005: | | | | | | | | | | | | | | |
| | 1,245 | | | 5.125%, 9/15/25 – SYNCORA GTY Insured | | | | | 9/15 at 100.00 | | | | A | | | | 1,298,386 | |
| | 2,140 | | | 5.250%, 9/15/32 – SYNCORA GTY Insured | | | | | 9/15 at 100.00 | | | | A | | | | 2,204,585 | |
| | | | | |
| | 2,065 | | | Colorado Educational and Cultural Facilities Authority, Charter School Revenue Bonds, Community Leadership Academy Project, Series 2008, 6.500%, 7/01/38 | | | | | 7/18 at 100.00 | | | | N/R | | | | 2,100,022 | |
| | | | | |
| | 1,025 | | | Colorado Educational and Cultural Facilities Authority, Charter School Revenue Bonds, Crown Pointe Academy of Westminster Project, Chartered Through Adams County School District 50, Series 2009, 5.000%, 7/15/39 | | | | | 7/19 at 100.00 | | | | BBB | | | | 1,083,394 | |
| | | | | |
| | 1,000 | | | Colorado Educational and Cultural Facilities Authority, Charter School Revenue Bonds, Lincoln Academy Charter School Project, Series 2013, 5.000%, 3/01/43 | | | | | 3/23 at 100.00 | | | | A | | | | 1,059,730 | |
| | | | | | | | | | | | | | | | | | |
Principal
Amount (000) | | | Description (1) | | | | Optional Call
Provisions (2) | | | Ratings (3) | | | Value | |
| | | | Colorado (continued) | | | | | | | | | | | | | | |
| | | | | |
| $ | 2,500 | | | Colorado Educational and Cultural Facilities Authority, Charter School Revenue Bonds, Pinnacle Charter School, Inc. High School Project, Series 2010, 5.125%, 12/01/39 | | | | | 12/19 at 100.00 | | | | BBB | | | $ | 2,657,625 | |
| | | | | |
| | 960 | | | Colorado Educational and Cultural Facilities Authority, Revenue Bonds, Pikes Peak School of Expeditionary Learning Charter School, Series 2008, 6.625%, 6/01/38 | | | | | 6/18 at 102.00 | | | | N/R | | | | 1,013,549 | |
| | | | | |
| | 3,000 | | | Colorado Health Facilities Authority, Colorado, Hospital Improvement Revenue Bonds, NCMC Inc., Series 2003A, 5.500%, 5/15/30 – AGM Insured | | | | | 5/19 at 100.00 | | | | AA– | | | | 3,359,670 | |
| | | | | |
| | 710 | | | Colorado Health Facilities Authority, Colorado, Hospital Revenue Bonds, Boulder Community Hospital Project, Series 2012, 4.000%, 10/01/27 | | | | | 10/22 at 100.00 | | | | A | | | | 742,326 | |
| | | | | |
| | 1,500 | | | Colorado Health Facilities Authority, Colorado, Revenue Bonds, American Baptist Homes Project, Series 2009A, 7.750%, 8/01/29 | | | | | 8/19 at 100.00 | | | | N/R | | | | 1,696,155 | |
| | | | | |
| | 600 | | | Colorado Health Facilities Authority, Colorado, Revenue Bonds, Christian Living Communities Project, Series 2012, 5.125%, 1/01/30 | | | | | 1/22 at 100.00 | | | | N/R | | | | 645,816 | |
| | | | | |
| | | | Colorado Health Facilities Authority, Colorado, Revenue Bonds, Colorado Senior Residences Project, Series 2012: | | | | | | | | | | | | | | |
| | 1,295 | | | 5.625%, 6/01/22 | | | | | No Opt. Call | | | | N/R | | | | 1,382,451 | |
| | 1,370 | | | 7.000%, 6/01/42 | | | | | 6/22 at 100.00 | | | | N/R | | | | 1,487,779 | |
| | 1,375 | | | 7.125%, 6/01/47 | | | | | 6/22 at 100.00 | | | | N/R | | | | 1,501,418 | |
| | | | | |
| | 12,500 | | | Colorado Health Facilities Authority, Colorado, Revenue Bonds, Covenant Retirement Communities Inc., Refunding Series 2012A, 5.000%, 12/01/33 | | | | | 12/22 at 100.00 | | | | BBB+ | | | | 13,378,750 | |
| | | | | |
| | 1,425 | | | Colorado Health Facilities Authority, Colorado, Revenue Bonds, National Jewish Medical and Research Center, Series 2012, 5.000%, 1/01/25 | | | | | 1/22 at 100.00 | | | | BBB– | | | | 1,554,077 | |
| | | | | |
| | 100 | | | Colorado Health Facilities Authority, Colorado, Revenue Bonds, Poudre Valley Health System, Series 2005B, 5.250%, 3/01/36 – AGM Insured | | | | | 9/18 at 102.00 | | | | AA– | | | | 112,757 | |
| | | | | |
| | 3,000 | | | Colorado Health Facilities Authority, Colorado, Revenue Bonds, Sisters of Charity of Leavenworth Health Services Corporation, Refunding Composite Deal Series 2010B, 5.250%, 1/01/25 | | | | | 1/20 at 100.00 | | | | AA | | | | 3,476,850 | |
| | | | | |
| | 1,100 | | | Colorado Health Facilities Authority, Colorado, Revenue Bonds, Total Long-term Care National Obligated Group Project, Series 2010A, 6.250%, 11/15/40 | | | | | 11/20 at 100.00 | | | | BBB– | | | | 1,238,017 | |
| | | | | |
| | 2,000 | | | Colorado Health Facilities Authority, Revenue Bonds, Evangelical Lutheran Good Samaritan Society, Series 2005, 5.000%, 6/01/29 | | | | | 6/16 at 100.00 | | | | A– | | | | 2,089,660 | |
| | | | | |
| | 2,610 | | | Colorado Health Facilities Authority, Revenue Bonds, Evangelical Lutheran Good Samaritan Society, Series 2006, 5.250%, 6/01/36 | | | | | 6/16 at 100.00 | | | | A– | | | | 2,786,175 | |
| | | | | |
| | 1,590 | | | Colorado Housing and Finance Authority, Solid Waste Disposal Revenue Bonds, Waste Management Inc. Project, Series 2004, 5.700%, 7/01/18 (Alternative Minimum Tax) | | | | | No Opt. Call | | | | BBB | | | | 1,832,157 | |
| | | | | |
| | 1,200 | | | Commerce City Northern Infrastructure General Improvement District, Colorado, General Obligation Bonds, Series 2013, 4.000%, 12/01/38 – AGM Insured | | | | | 12/22 at 100.00 | | | | AA– | | | | 1,245,012 | |
| | | | | |
| | | | Compark Business Campus Metropolitan District, Colorado, General Obligation Limited Tax Bonds, Series 2007A: | | | | | | | | | | | | | | |
| | 540 | | | 5.750%, 12/01/27 – RAAI Insured | | | | | 12/17 at 100.00 | | | | N/R | | | | 546,685 | |
| | 395 | | | 5.600%, 12/01/34 – RAAI Insured | | | | | 12/17 at 100.00 | | | | N/R | | | | 387,226 | |
| | | | | |
| | 1,000 | | | Compark Business Campus Metropolitan District, Douglas County, Colorado, General Obligation Bonds, Series 2012A, 6.750%, 12/01/39 – RAAI Insured | | | | | 12/22 at 100.00 | | | | N/R | | | | 1,037,770 | |
| | | | | |
| | 1,995 | | | Concord Metropolitan District, Douglas County, Colorado, General Obligation Bonds, Refunding Series 2010, 5.375%, 12/01/40 | | | | | 12/20 at 100.00 | | | | BBB | | | | 2,219,098 | |
| | | | | |
| | 700 | | | Confluence Metropolitan District, Colorado, General Obligation Limited Tax Bonds, Series 2007, 5.250%, 12/01/17 | | | | | No Opt. Call | | | | N/R | | | | 692,118 | |
| | | | | |
| | 1,730 | | | Denver City and County, Colorado, Airport System Revenue Bonds, Refunding Series 2010A, 5.000%, 11/15/21 | | | | | 11/20 at 100.00 | | | | A+ | | | | 2,106,863 | |
Portfolio of Investments
Nuveen All-American Municipal Bond Fund (continued)
April 30, 2013
| | | | | | | | | | | | | | | | | | |
Principal
Amount (000) | | | Description (1) | | | | Optional Call
Provisions (2) | | | Ratings (3) | | | Value | |
| | | | Colorado (continued) | | | | | | | | | | | | | | |
| | | | | |
| $ | 1,000 | | | Denver City and County, Colorado, Airport System Revenue Bonds, Series 2012B, 5.000%, 11/15/21 | | | | | No Opt. Call | | | | A+ | | | $ | 1,239,140 | |
| | | | | |
| | 1,105 | | | Denver West Metropolitan District, Jefferson County, Colorado, General Obligation Refunding Bonds, Series 2012A, 4.000%, 12/01/32 – AGM Insured | | | | | 12/22 at 100.00 | | | | AA– | | | | 1,161,753 | |
| | | | | |
| | 11,555 | | | E-470 Public Highway Authority, Colorado, Senior Revenue Bonds, Series 1997B, 0.000%, 9/01/24 – NPFG Insured | | | | | No Opt. Call | | | | A | | | | 7,346,669 | |
| | | | | |
| | | | E-470 Public Highway Authority, Colorado, Senior Revenue Bonds, Series 2000B: | | | | | | | | | | | | | | |
| | 20 | | | 0.000%, 9/01/29 – NPFG Insured | | | | | No Opt. Call | | | | A | | | | 9,386 | |
| | 395 | | | 0.000%, 9/01/30 – NPFG Insured | | | | | No Opt. Call | | | | A | | | | 174,306 | |
| | 15,000 | | | 0.000%, 9/01/31 – NPFG Insured | | | | | No Opt. Call | | | | A | | | | 6,224,400 | |
| | 20 | | | 0.000%, 9/01/32 – NPFG Insured | | | | | No Opt. Call | | | | A | | | | 7,792 | |
| | 25 | | | 0.000%, 9/01/33 – NPFG Insured | | | | | No Opt. Call | | | | A | | | | 9,149 | |
| | | | | |
| | 9,890 | | | E-470 Public Highway Authority, Colorado, Toll Revenue Bonds, Series 2004A, 0.000%, 9/01/27 – NPFG Insured | | | | | No Opt. Call | | | | A | | | | 5,243,876 | |
| | | | | |
| | 500 | | | Eagle River Water and Sanitation District, Eagle County, Colorado, Enterprise Wastewater Revenue Bonds, Series 2012, 5.000%, 12/01/27 | | | | | No Opt. Call | | | | A+ | | | | 595,925 | |
| | | | | |
| | 2,145 | | | Fitzsimons Village Metropolitan District 1, Aurora, Arapahoe County, Colorado, Tax Increment Public Improvement Fee Supported Revenue Bonds, Series 2010A, 7.500%, 3/01/40 | | | | | 3/20 at 100.00 | | | | N/R | | | | 2,329,256 | |
| | | | | |
| | 775 | | | Fossil Ridge Metropolitan District 1, Lakewood, Colorado, Tax-Supported Revenue Bonds, Refunding Series 2010, 7.250%, 12/01/40 | | | | | 12/20 at 100.00 | | | | N/R | | | | 829,886 | |
| | | | | |
| | 2,025 | | | Park Creek Metropolitan District, Colorado, Senior Property Tax Supported Revenue Bonds, Series 2009, 6.375%, 12/01/37 – AGC Insured | | | | | 12/19 at 100.00 | | | | AA– | | | | 2,367,974 | |
| | | | | |
| | 700 | | | Pinery West Metropolitan District 2, Colorado, General Obligation Limited Tax Bonds, Series 2007, 5.000%, 12/01/27 – RAAI Insured | | | | | 12/17 at 100.00 | | | | N/R | | | | 712,299 | |
| | | | | |
| | 4,300 | | | Plaza Metropolitan District 1, Lakewood, Colorado, Tax Increment Revenue Bonds, Refunding Series 2013, 4.500%, 12/01/30 | | | | | 12/22 at 100.00 | | | | N/R | | | | 4,380,367 | |
| | | | | |
| | | | Public Authority for Colorado Energy, Natural Gas Purchase Revenue Bonds, Colorado Springs Utilities, Series 2008: | | | | | | | | | | | | | | |
| | 1,555 | | | 6.250%, 11/15/28 | | | | | No Opt. Call | | | | A | | | | 1,970,154 | |
| | 2,925 | | | 6.500%, 11/15/38 | | | | | No Opt. Call | | | | A | | | | 3,977,298 | |
| | | | | |
| | | | Regional Transportation District, Colorado, Denver Transit Partners Eagle P3 Project Private Activity Bonds, Series 2010: | | | | | | | | | | | | | | |
| | 1,025 | | | 5.250%, 7/15/24 | | | | | 7/20 at 100.00 | | | | Baa3 | | | | 1,176,075 | |
| | 4,265 | | | 6.000%, 1/15/41 | | | | | 7/20 at 100.00 | | | | Baa3 | | | | 4,978,662 | |
| | | | | |
| | 815 | | | Three Springs Metropolitan District 3, Durango, La Plata County, Colorado, Property Tax Supported Revenue Bonds, Series 2010, 7.750%, 12/01/39 | | | | | 12/20 at 100.00 | | | | N/R | | | | 867,315 | |
| | | | | |
| | 20 | | | University of Colorado, Enterprise System Revenue Bonds, Series 2005, 5.000%, 6/01/26 – FGIC Insured | | | | | 6/15 at 100.00 | | | | Aa2 | | | | 21,678 | |
| | | | | |
| | 1,175 | | | Willow Trace Metropolitan District, Arapahoe County, Colorado, General Obligation Bonds, Refunding Series 2006A, 4.450%, 12/01/35 – CIFG Insured | | | | | 12/15 at 100.00 | | | | AA– | | | | 1,198,688 | |
| | 116,390 | | | Total Colorado | | | | | | | | | | | | | 105,782,272 | |
| | | | Connecticut – 0.3% | | | | | | | | | | | | | | |
| | | | | |
| | 1,000 | | | Connecticut Health and Educational Facilities Authority, Revenue Bonds, Sacred Heart University, Series 2011G, 5.625%, 7/01/41 | | | | | 7/21 at 100.00 | | | | BBB | | | | 1,132,710 | |
| | | | | |
| | 1,000 | | | Connecticut Health and Educational Facilities Authority, Revenue Bonds, Yale University, Series 2007Z-2, Trust 1080, 17.958%, 7/01/15 (IF) (5) | | | | | No Opt. Call | | | | AAA | | | | 1,524,200 | |
| | | | | |
| | 2,125 | | | Connecticut, Special Tax Obligation Transportation Infrastructure Bonds, Series 2004A, 5.000%, 7/01/24 (Pre-refunded 7/01/15) – AMBAC Insured | | | | | 7/15 at 100.00 | | | | AA (4) | | | | 2,340,560 | |
| | | | | |
| | 933 | | | Harbor Point Infrastructure Improvement District, Connecticut, Special Obligation Revenue Bonds, Harbor Point Project, Series 2010A, 7.000%, 4/01/22 | | | | | 4/20 at 100.00 | | | | N/R | | | | 1,066,158 | |
| | | | | | | | | | | | | | | | | | |
Principal
Amount (000) | | | Description (1) | | | | Optional Call
Provisions (2) | | | Ratings (3) | | | Value | |
| | | | Connecticut (continued) | | | | | | | | | | | | | | |
| | | | | |
| $ | 1,800 | | | Stamford, Connecticut, Special Obligation Revenue Bonds, Mill River Corridor Project, Series 2011aA, 7.000%, 4/01/41 | | | | | 4/21 at 100.00 | | | | N/R | | | $ | 1,939,050 | |
| | 6,858 | | | Total Connecticut | | | | | | | | | | | | | 8,002,678 | |
| | | | Delaware – 0.3% | | | | | | | | | | | | | | |
| | | | | |
| | 1,000 | | | Delaware Economic Development Authority, Exempt Facility Revenue Bonds, Indian River Power LLC Project, Series 2010, 5.375%, 10/01/45 | | | | | 10/20 at 100.00 | | | | Baa3 | | | | 1,075,460 | |
| | | | | |
| | 5,000 | | | Delaware Transportation Authority, Transportation System Revenue Bonds, Senior Lien Series 2008, 5.000%, 7/01/19 | | | | | No Opt. Call | | | | AA+ | | | | 6,165,150 | |
| | | | | |
| | 1,605 | | | Wilmington, Delaware, Replacement Housing Factor Fund Securitization Revenue Bonds, Wilmington Housing Authority-Lincoln Towers Project, Series 2011, 5.750%, 7/15/16 | | | | | 7/13 at 100.00 | | | | N/R | | | | 1,605,803 | |
| | 7,605 | | | Total Delaware | | | | | | | | | | | | | 8,846,413 | |
| | | | District of Columbia – 0.3% | | | | | | | | | | | | | | |
| | | | | |
| | 4,365 | | | District of Columbia, Certificates of Participation, Series 2003, 5.500%, 1/01/18 – AMBAC Insured | | | | | 1/14 at 100.00 | | | | A+ | | | | 4,505,073 | |
| | | | | |
| | 1,000 | | | District of Columbia, Revenue Bonds, Friendship Public Charter School Inc., Series 2006, 5.000%, 6/01/26 – ACA Insured | | | | | 6/16 at 100.00 | | | | BBB | | | | 1,030,190 | |
| | | | | |
| | 3,745 | | | Metropolitan Washington Airports Authority, Virginia, Dulles Toll Road Revenue Bonds, Capital Appreciation Series 2009B-2, 0.000%, 10/01/31 – AGC Insured | | | | | No Opt. Call | | | | AA– | | | | 1,598,741 | |
| | | | | |
| | 2,000 | | | Metropolitan Washington D.C. Airports Authority, District of Columbia, Airport System Revenue Bonds, Refunding Bonds, Series 2011C, 5.000%, 10/01/26 (Alternative Minimum Tax) | | | | | 10/21 at 100.00 | | | | AA– | | | | 2,339,400 | |
| | 11,110 | | | Total District of Columbia | | | | | | | | | | | | | 9,473,404 | |
| | | | Florida – 8.6% | | | | | | | | | | | | | | |
| | | | | |
| | 1,200 | | | Atlantic Beach, Florida, Healthcare Facilities Revenue Refunding Bonds, Fleet Landing Project, Series 2013A, 5.000%, 11/15/28 | | | | | 11/23 at 100.00 | | | | BBB | | | | 1,325,748 | |
| | | | | |
| | 1,250 | | | Bay County, Florida, Educational Facilities Revenue Refunding Bonds, Bay Haven Charter Academy, Inc. Project, Series 2010A, 6.000%, 9/01/40 | | | | | 9/20 at 100.00 | | | | BBB– | | | | 1,364,338 | |
| | | | | |
| | 1,000 | | | Boynton Beach, Florida, Revenue Bonds, Charter Schools of Boynton Beach, Series 2012A, 6.800%, 6/01/42 – NPFG Insured | | | | | 6/22 at 100.00 | | | | BBB– | | | | 1,038,040 | |
| | | | | |
| | 520 | | | Boynton Village Community Development District, Florida, Special Assessment Bonds, Series 2007-A1, 5.750%, 5/01/37 | | | | | 5/17 at 100.00 | | | | N/R | | | | 463,694 | |
| | | | | |
| | | | Brevard County Health Facilities Authority, Florida, Revenue Bonds, Health First Inc. Project, Series 2005: | | | | | | | | | | | | | | |
| | 500 | | | 5.000%, 4/01/34 | | | | | 4/16 at 100.00 | | | | A– | | | | 519,855 | |
| | 750 | | | 5.000%, 4/01/36 | | | | | 4/16 at 100.00 | | | | A– | | | | 778,725 | |
| | | | | |
| | 855 | | | Brevard County Health Facilities Authority, Florida, Revenue Bonds, Health First Inc. Project, Series 2009B, 7.000%, 4/01/39 | | | | | 4/19 at 100.00 | | | | A– | | | | 1,050,393 | |
| | | | | |
| | 8,000 | | | Cape Coral, Florida, Water and Sewer Revenue Bonds, Refunding Series 2011, 5.000%, 10/01/41 – AGM Insured | | | | | 10/21 at 100.00 | | | | AA– | | | | 9,026,880 | |
| | | | | |
| | 1,035 | | | Century Gardens Community Development District, Miami-Dade County, Florida, Special Assessment Revenue Bonds, Series 2007, 5.050%, 5/01/37 | | | | | 5/17 at 100.00 | | | | N/R | | | | 1,038,343 | |
| | | | | |
| | 1,025 | | | Cityplace Community Development District, Florida, Special Assessment and Revenue Bonds, Refunding Series 2012, 5.000%, 5/01/26 | | | | | No Opt. Call | | | | A | | | | 1,186,263 | |
| | | | | |
| | 1,000 | | | Clearwater, Florida, Water and Sewer Revenue Bonds, Series 2009A, 5.250%, 12/01/39 – AGC Insured | | | | | 12/19 at 100.00 | | | | AA– | | | | 1,139,620 | |
| | | | | |
| | 3,080 | | | Collier County, Florida, Gas Tax Revenue Bonds, Refunding Series 2012, 5.000%, 6/01/20 | | | | | No Opt. Call | | | | AA– | | | | 3,695,292 | |
| | | | | |
| | 105 | | | Colonial Country Club Community Development District, Florida, Capital Improvement Revenue Bonds, Series 2003, 6.400%, 5/01/33 | | | | | 5/14 at 100.00 | | | | A | | | | 106,068 | |
Portfolio of Investments
Nuveen All-American Municipal Bond Fund (continued)
April 30, 2013
| | | | | | | | | | | | | | | | | | |
Principal
Amount (000) | | | Description (1) | | | | Optional Call
Provisions (2) | | | Ratings (3) | | | Value | |
| | | | Florida (continued) | | | | | | | | | | | | | | |
| | | | | |
| $ | 1,325 | | | Country Greens Community Development District, Florida, Special Assessment Bonds, Series 2003, 6.625%, 5/01/34 | | | | | 5/14 at 100.00 | | | | N/R | | | $ | 1,338,833 | |
| | | | | |
| | 218 | | | East Park Community Development District, Florida, Special Assessment Revenue Bonds, Series 2008, 7.500%, 5/01/15 (6) | | | | | No Opt. Call | | | | N/R | | | | 9,812 | |
| | | | | |
| | 4,710 | | | Florida Citizens Property Insurance Corporation, Personal and Commercial Lines Account Bonds, Senior Secured Series 2012A-1, 5.000%, 6/01/19 | | | | | No Opt. Call | | | | A+ | | | | 5,654,308 | |
| | | | | |
| | 5,000 | | | Florida Department of Environmental Protection, Florida Forever Revenue Bonds, Refunding Series 2012A, 5.000%, 7/01/23 | | | | | 7/22 at 100.00 | | | | AA– | | | | 6,098,700 | |
| | | | | |
| | 2,885 | | | Florida Development Finance Corporation, Educational Facilities Revenue Bonds, Bay Area Charter Foundation, LLC Projects, Series 2011A, 7.750%, 6/15/42 | | | | | 12/21 at 101.00 | | | | N/R | | | | 3,304,248 | |
| | | | | |
| | 1,000 | | | Florida Development Finance Corporation, Educational Facilities Revenue Bonds, Renaissance Charter School, Inc. Projects, Series 2010A, 6.000%, 9/15/30 | | | | | 9/20 at 100.00 | | | | BB+ | | | | 1,082,760 | |
| | | | | |
| | | | Florida Development Finance Corporation, Educational Facilities Revenue Bonds, Renaissance Charter School, Inc. Projects, Series 2012A: | | | | | | | | | | | | | | |
| | 1,000 | | | 5.500%, 6/15/22 | | | | | No Opt. Call | | | | N/R | | | | 1,009,930 | |
| | 500 | | | 6.000%, 6/15/32 | | | | | No Opt. Call | | | | N/R | | | | 503,800 | |
| | 1,100 | | | 6.125%, 6/15/43 | | | | | No Opt. Call | | | | N/R | | | | 1,103,333 | |
| | | | | |
| | 3,180 | | | Florida Development Finance Corporation, Revenue Bonds, Learning Gate Community Charter School Project, Series 2007A, 6.000%, 2/15/37 | | | | | 2/17 at 100.00 | | | | BBB– | | | | 3,275,050 | |
| | | | | |
| | | | Florida Higher Educational Facilities Financing Authority, Revenue Bonds, Nova Southeastern University Project, Refunding Series 2012A: | | | | | | | | | | | | | | |
| | 6,800 | | | 5.000%, 4/01/27 | | | | | 4/22 at 100.00 | | | | BBB+ | | | | 7,575,540 | |
| | 5,730 | | | 5.000%, 4/01/32 | | | | | 4/22 at 100.00 | | | | BBB+ | | | | 6,221,061 | |
| | | | | |
| | | | Florida Higher Educational Facilities Financing Authority, Revenue Bonds, Rollins College Project, Series 2012A: | | | | | | | | | | | | | | |
| | 1,210 | | | 5.000%, 12/01/30 | | | | | 12/22 at 100.00 | | | | A1 | | | | 1,400,999 | |
| | 1,000 | | | 5.000%, 12/01/31 | | | | | 12/22 at 100.00 | | | | A1 | | | | 1,151,570 | |
| | 1,400 | | | 5.000%, 12/01/32 | | | | | 12/22 at 100.00 | | | | A1 | | | | 1,599,752 | |
| | 3,000 | | | 5.000%, 12/01/37 | | | | | 12/22 at 100.00 | | | | A1 | | | | 3,393,720 | |
| | | | | |
| | 735 | | | Florida Housing Finance Agency, Housing Revenue Bonds, Brittany of Rosemont Apartments Phase II, Series 1995C-1, 6.875%, 8/01/26 – AMBAC Insured (Alternative Minimum Tax) | | | | | 8/13 at 100.00 | | | | N/R | | | | 736,139 | |
| | | | | |
| | 1,000 | | | Florida Housing Finance Agency, Housing Revenue Bonds, Stoddert Arms Apartments, Series 1996O, 6.300%, 9/01/36 – AMBAC Insured (Alternative Minimum Tax) | | | | | 9/13 at 100.00 | | | | N/R | | | | 1,001,030 | |
| | | | | |
| | 400 | | | Florida State Board of Education, Full Faith and Credit Public Education Capital Outlay Bonds, Series 1985, 9.125%, 6/01/14 | | | | | No Opt. Call | | | | AAA | | | | 403,024 | |
| | | | | |
| | 335 | | | Florida State Board of Education, Full Faith and Credit Public Education Capital Outlay Bonds, Series 1985, 9.125%, 6/01/14 (ETM) | | | | | No Opt. Call | | | | Aaa | | | | 362,969 | |
| | | | | |
| | 10,000 | | | Florida State Board of Education, Lottery Revenue Bonds, Refunding Series 2011A, 5.000%, 7/01/22 | | | | | 7/21 at 100.00 | | | | AAA | | | | 12,301,600 | |
| | | | | |
| | 400 | | | Florida, Full Faith and Credit General Obligation Bonds, Broward County Expressway Authority, Series 1984, 10.000%, 7/01/14 (ETM) | | | | | No Opt. Call | | | | Aaa | | | | 425,140 | |
| | | | | |
| | | | Halifax Hospital Medical Center, Florida, Revenue Bonds, Series 2006: | | | | | | | | | | | | | | |
| | 2,250 | | | 5.250%, 6/01/26 | | | | | 6/16 at 100.00 | | | | A– | | | | 2,397,983 | |
| | 375 | | | 5.000%, 6/01/38 | | | | | 6/16 at 100.00 | | | | A– | | | | 393,045 | |
| | | | | |
| | 1,900 | | | Hernando County, Florida, Revenue Bonds, Criminal Justice Complex Financing Program, Series 1986, 7.650%, 7/01/16 – FGIC Insured | | | | | No Opt. Call | | | | N/R | | | | 2,241,981 | |
| | | | | |
| | 2,000 | | | Hillsborough County Industrial Development Authority, Florida, Hospital Revenue Bonds, Tampa General Hospital, Series 2003B, 5.250%, 10/01/28 (Pre-refunded 10/01/13) | | | | | 10/13 at 100.00 | | | | A3 (4) | | | | 2,041,680 | |
| | | | | |
| | 7,640 | | | Jacksonville, Florida, Better Jacksonville Sales Tax Revenue Bonds, Refunding Series 2012A, 5.000%, 10/01/29 | | | | | 10/22 at 100.00 | | | | A1 | | | | 8,888,987 | |
| | | | | | | | | | | | | | | | | | |
Principal
Amount (000) | | | Description (1) | | | | Optional Call
Provisions (2) | | | Ratings (3) | | | Value | |
| | | | Florida (continued) | | | | | | | | | | | | | | |
| | | | | |
| $ | 6,000 | | | Jacksonville Port Authority, Florida, Revenue Bonds, Refunding Series 2012, 5.000%, 11/01/38 (Alternative Minimum Tax) | | | | | 11/22 at 100.00 | | | | A2 | | | $ | 6,537,300 | |
| | | | | |
| | 1,005 | | | JEA, Florida, Electric System Revenue Bonds, Series Three 2006A, 5.000%, 10/01/41 – AGM Insured | | | | | 4/15 at 100.00 | | | | Aa2 | | | | 1,069,240 | |
| | | | | |
| | 945 | | | Keys Cove Community Development District, Florida, Special Assessment Revenue Bonds, Series 2004, 5.875%, 5/01/35 | | | | | 5/15 at 101.00 | | | | N/R | | | | 1,015,724 | |
| | | | | |
| | 975 | | | Lake County School District, Florida, Sales Tax Revenue Bonds, Series 2004, 5.000%, 10/01/15 – AMBAC Insured | | | | | 10/14 at 100.00 | | | | A+ | | | | 1,035,752 | |
| | | | | |
| | 970 | | | Lakes by the Bay South Community Development District, Florida, Special Assessment Bonds, Series 2004A, 6.100%, 5/01/23 | | | | | 5/14 at 101.00 | | | | N/R | | | | 989,924 | |
| | | | | |
| | 1,000 | | | Lee County Industrial Development Authority, Florida, Charter School Revenue Bonds, Lee County Community Charter Schools, Series 2007A, 5.250%, 6/15/27 | | | | | 6/17 at 100.00 | | | | BB | | | | 1,019,220 | |
| | | | | |
| | | | Lee County Industrial Development Authority, Florida, Charter School Revenue Bonds, Lee County Community Charter Schools, Series 2012A: | | | | | | | | | | | | | | |
| | 875 | | | 5.500%, 6/15/32 | | | | | 6/22 at 100.00 | | | | BB | | | | 907,988 | |
| | 1,375 | | | 5.750%, 6/15/42 | | | | | 6/22 at 100.00 | | | | BB | | | | 1,432,338 | |
| | | | | |
| | 1,635 | | | Leesburg, Florida, Hospital Revenue Refunding Bonds, Leesburg Regional Medical Center Project, Series 2003, 5.000%, 7/01/17 | | | | | 7/13 at 100.00 | | | | BBB+ | | | | 1,641,900 | |
| | | | | |
| | 2,305 | | | Leesburg, Florida, Utilities Revenue Bonds, Series 2004, 5.000%, 10/01/22 – FGIC Insured | | | | | 10/14 at 100.00 | | | | Aa3 | | | | 2,450,676 | |
| | | | | |
| | 690 | | | Lexington Community Development District, Florida, Special Assessment Revenue Bonds, Series 2004, 6.125%, 5/01/34 | | | | | 5/14 at 101.00 | | | | A– | | | | 713,219 | |
| | | | | |
| | | | Martin County Industrial Development Authority, Florida, Industrial Development Revenue Refunding Bonds, Indiantown Cogeneration LP, Series 2013: | | | | | | | | | | | | | | |
| | 885 | | | 3.950%, 12/15/21 (Alternative Minimum Tax) | | | | | 6/20 at 100.00 | | | | BB | | | | 897,886 | |
| | 8,000 | | | 4.200%, 12/15/25 (Alternative Minimum Tax) | | | | | 6/20 at 100.00 | | | | BB | | | | 8,115,360 | |
| | | | | |
| | 2,000 | | | Miami Beach Health Facilities Authority, Florida, Hospital Revenue Bonds, Mount Sinai Medical Center of Florida Project, Refunding 2012, 5.000%, 11/15/29 | | | | | 11/22 at 100.00 | | | | Baa2 | | | | 2,201,480 | |
| | | | | |
| | 3,760 | | | Miami-Dade County Industrial Development Authority, Florida, Revenue Bonds, BAC Funding Corporation, Series 2000A, 5.375%, 10/01/30 –AMBAC Insured | | | | | 10/13 at 100.00 | | | | Aa3 | | | | 3,773,574 | |
| | | | | |
| | 12,500 | | | Miami-Dade County School Board, Florida, Certificates of Participation, Series 2013A, 5.000%, 5/01/31 (WI/DD, Settling 5/01/13) | | | | | 5/23 at 100.00 | | | | A1 | | | | 14,303,625 | |
| | | | | |
| | | | Miami-Dade County School Board, Florida, Certificates of Participation, Series 2013B: | | | | | | | | | | | | | | |
| | 4,490 | | | 5.000%, 2/01/29 (WI/DD, Settling 5/01/13) | | | | | 2/23 at 100.00 | | | | A1 | | | | 5,176,521 | |
| | 3,670 | | | 5.000%, 2/01/30 (WI/DD, Settling 5/01/13) | | | | | 2/23 at 100.00 | | | | A1 | | | | 4,207,912 | |
| | | | | |
| | | | Miami-Dade County, Florida, Aviation Revenue Bonds, Miami International Airport, Refunding Series 2012A: | | | | | | | | | | | | | | |
| | 4,000 | | | 5.000%, 10/01/18 (Alternative Minimum Tax) | | | | | No Opt. Call | | | | A | | | | 4,763,920 | |
| | 4,000 | | | 5.000%, 10/01/19 (Alternative Minimum Tax) | | | | | No Opt. Call | | | | A | | | | 4,793,440 | |
| | 1,825 | | | 5.000%, 10/01/20 (Alternative Minimum Tax) | | | | | No Opt. Call | | | | A | | | | 2,197,939 | |
| | 5,000 | | | 5.000%, 10/01/23 (Alternative Minimum Tax) | | | | | No Opt. Call | | | | A | | | | 5,987,500 | |
| | | | | |
| | 7,020 | | | Miami-Dade County, Florida, Aviation Revenue Bonds, Miami International Airport, Series 2004A, 5.000%, 10/01/30 – FGIC Insured (Alternative Minimum Tax) | | | | | 10/14 at 100.00 | | | | A | | | | 7,367,279 | |
| | | | | |
| | 1,585 | | | Miami-Dade County, Florida, Aviation Revenue Bonds, Miami International Airport, Series 2010A-1, 5.375%, 10/01/35 | | | | | 10/20 at 100.00 | | | | A | | | | 1,811,037 | |
| | | | | |
| | 2,000 | | | Miami-Dade County, Florida, Aviation Revenue Bonds, Series 2008A, 5.500%, 10/01/27 – AGC Insured (Alternative Minimum Tax) | | | | | 10/18 at 100.00 | | | | AA– | | | | 2,324,040 | |
| | | | | |
| | 10,000 | | | Miami-Dade County, Florida, General Obligation Bonds, Series 2005, 5.000%, 7/01/33 – AGM Insured | | | | | 7/15 at 100.00 | | | | Aa2 | | | | 10,732,000 | |
Portfolio of Investments
Nuveen All-American Municipal Bond Fund (continued)
April 30, 2013
| | | | | | | | | | | | | | | | | | |
Principal
Amount (000) | | | Description (1) | | | | Optional Call
Provisions (2) | | | Ratings (3) | | | Value | |
| | | | Florida (continued) | | | | | | | | | | | | | | |
| | | | | |
| $ | 1,040 | | | Miami-Dade County, Florida, Public Facilities Revenue Bonds, Jackson Health System, Series 2009, 5.625%, 6/01/34 – AGC Insured (UB) (5) | | | | | 6/19 at 100.00 | | | | AA– | | | $ | 1,155,648 | |
| | | | | |
| | 7,400 | | | Miami-Dade County, Florida, Transit System Sales Surtax Revenue Bonds, Series 2012, 5.000%, 7/01/37 | | | | | 7/22 at 100.00 | | | | AA | | | | 8,410,026 | |
| | | | | |
| | 1,000 | | | Northern Palm Beach County Improvement District, Florida, Revenue Bonds, Water Control and Improvement Development Unit 46B, Series 2007A, 5.350%, 8/01/41 | | | | | 8/17 at 100.00 | | | | N/R | | | | 1,006,710 | |
| | | | | |
| | 3,370 | | | Old Palm Community Development District, Florida, Special Assessment Bonds, Palm Beach Gardens, Series 2004A, 5.900%, 5/01/35 | | | | | 5/15 at 101.00 | | | | N/R | | | | 3,487,613 | |
| | | | | |
| | | | Orange County Health Facilities Authority, Florida, Revenue Bonds, Mayflower Retirement Center, Refunding Series 2012: | | | | | | | | | | | | | | |
| | 550 | | | 4.500%, 6/01/27 | | | | | 6/21 at 100.00 | | | | A– | | | | 565,631 | |
| | 450 | | | 5.000%, 6/01/32 | | | | | 6/21 at 100.00 | | | | A– | | | | 480,654 | |
| | 750 | | | 5.000%, 6/01/36 | | | | | 6/21 at 100.00 | | | | A– | | | | 796,298 | |
| | 750 | | | 5.125%, 6/01/42 | | | | | 6/21 at 100.00 | | | | A– | | | | 798,975 | |
| | | | | |
| | | | Orange County Health Facilities Authority, Florida, Revenue Bonds, Nemours Foundation, Series 2005: | | | | | | | | | | | | | | |
| | 295 | | | 5.000%, 1/01/21 (Pre-refunded 1/01/15) | | | | | 1/15 at 100.00 | | | | N/R (4) | | | | 317,942 | |
| | 275 | | | 5.000%, 1/01/22 (Pre-refunded 1/01/15) | | | | | 1/15 at 100.00 | | | | N/R (4) | | | | 296,387 | |
| | | | | |
| | 2,510 | | | Orange County Health Facilities Authority, Florida, Hospital Revenue Bonds, Orlando Health, Inc., Tender Option Bond Trust 1071, 16.778%, 10/01/42 (IF) (5) | | | | | 4/22 at 100.00 | | | | A | | | | 3,544,170 | |
| | | | | |
| | 145 | | | Orange County, Florida, Sales Tax Revenue Bonds, Series 1989, 6.125%, 1/01/19 – FGIC Insured (ETM) | | | | | 7/13 at 100.00 | | | | N/R (4) | | | | 180,867 | |
| | | | | |
| | 500 | | | Orlando Utilities Commission, Florida, Utility System Revenue Bonds, Series 2009A-1, 5.250%, 10/01/39 | | | | | 4/19 at 100.00 | | | | AA | | | | 579,010 | |
| | | | | |
| | | | Palm Beach County Health Facilities Authority, Florida, Hospital Revenue Refunding Bonds, BRCH Corporation Obligated Group, Series 2001: | | | | | | | | | | | | | | |
| | 20 | | | 5.500%, 12/01/21 | | | | | 6/13 at 100.00 | | | | BBB– | | | | 20,050 | |
| | 1,000 | | | 5.625%, 12/01/31 | | | | | 6/13 at 100.00 | | | | BBB– | | | | 1,001,680 | |
| | | | | |
| | 2,000 | | | Palm Beach County Health Facilities Authority, Florida, Retirement Community Revenue Bonds, Adult Communities Total Services Retirement Life, Series 2006A, 4.500%, 11/15/36 | | | | | 11/16 at 100.00 | | | | A– | | | | 2,019,200 | |
| | | | | |
| | 625 | | | Palm Beach County Housing Finance Authority, Florida, Multifamily Housing Revenue Bonds, Affordable Housing Guarantee Program, Windsor Park Apartments, Series 1998A, 5.900%, 6/01/38 (Alternative Minimum Tax) | | | | | 6/13 at 100.00 | | | | A– | | | | 625,669 | |
| | | | | |
| | 2,415 | | | Palm Beach County School Board, Florida, Certificates of Participation, Series 2007, 5.000%, 8/01/18 – FGIC Insured | | | | | 8/17 at 100.00 | | | | AA– | | | | 2,804,346 | |
| | | | | |
| | 1,500 | | | Palm Beach County Solid Waste Authority, Florida, Revenue Bonds, Series 2002B, 0.000%, 10/01/15 – AMBAC Insured | | | | | No Opt. Call | | | | AA+ | | | | 1,470,150 | |
| | | | | |
| | 1,000 | | | Palm Coast, Florida, Water Utility System Revenue Bonds, Series 2003, 5.000%, 10/01/33 – NPFG Insured | | | | | 10/13 at 100.00 | | | | A1 | | | | 1,016,200 | |
| | | | | |
| | 1,880 | | | Panther Trails Community Development District, Florida, Special Assessment Bonds, Series 2005, 5.600%, 5/01/36 | | | | | 5/15 at 100.00 | | | | A1 | | | | 1,902,673 | |
| | | | | |
| | 2,000 | | | Port Saint Lucie, Florida, Special Assessment Revenue Bonds, Southwest Annexation District 1B, Series 2007, 5.000%, 7/01/33 – NPFG Insured | | | | | 7/17 at 100.00 | | | | Baa2 | | | | 2,118,140 | |
| | | | | |
| | 650 | | | Reedy Creek Improvement District, Florida, Utility Revenue Bonds, Series 2005-1, 5.000%, 10/01/25 – AMBAC Insured | | | | | 10/15 at 100.00 | | | | A1 | | | | 711,744 | |
| | | | | |
| | 2,870 | | | Seminole Tribe of Florida, Special Obligation Bonds, Series 2007A, 144A, 5.250%, 10/01/27 | | | | | 10/17 at 100.00 | | | | BBB– | | | | 3,097,448 | |
| | | | | |
| | | | St. John’s County Industrial Development Authority, Florida, First Mortgage Revenue Bonds, Presbyterian Retirement Communities, Series 2004A: | | | | | | | | | | | | | | |
| | 1,130 | | | 5.850%, 8/01/24 | | | | | 8/14 at 101.00 | | | | A– | | | | 1,180,556 | |
| | 1,565 | | | 5.625%, 8/01/34 | | | | | 8/14 at 101.00 | | | | A– | | | | 1,616,645 | |
| | | | | | | | | | | | | | | | | | |
Principal
Amount (000) | | | Description (1) | | | | Optional Call
Provisions (2) | | | Ratings (3) | | | Value | |
| | | | Florida (continued) | | | | | | | | | | | | | | |
| | | | | |
| $ | 965 | | | Stoneybrook Venice Community Development District, Florida, Capital Improvement Revenue Bonds, Series 2007, 6.750%, 5/01/38 | | | | | 5/18 at 100.00 | | | | N/R | | | $ | 1,016,270 | |
| | | | | |
| | 535 | | | Sunrise, Florida, Utility System Revenue Refunding Bonds, Series 1998, 5.000%, 10/01/28 – AMBAC Insured | | | | | 10/18 at 100.00 | | | | AA– | | | | 588,842 | |
| | | | | |
| | 1,000 | | | Tallahassee, Florida, Consolidated Utility System Revenue Bonds, Series 2005, 5.000%, 10/01/25 – AMBAC Insured | | | | | 10/15 at 100.00 | | | | AA+ | | | | 1,108,460 | |
| | | | | |
| | 2,820 | | | Tallahassee, Florida, Energy System Revenue Bonds, Series 2005, 5.000%, 10/01/29 – NPFG Insured | | | | | 10/15 at 100.00 | | | | AA | | | | 3,070,162 | |
| | | | | |
| | 2,095 | | | Tallahassee, Florida, Health Facilities Revenue Bonds, Tallahassee Memorial Healthcare Inc., Series 2000, 6.375%, 12/01/30 | | | | | 6/13 at 100.00 | | | | Baa1 | | | | 2,127,808 | |
| | | | | |
| | 165 | | | Tolomato Community Development District, Florida, Special Assessment Bonds, Convertible, Capital Appreciation, Series 2012A-2, 0.000%, 5/01/39 | | | | | 5/17 at 100.00 | | | | N/R | | | | 126,184 | |
| | | | | |
| | 290 | | | Tolomato Community Development District, Florida, Special Assessment Bonds, Convertible, Capital Appreciation, Series 2012A-3, 0.000%, 5/01/40 | | | | | 5/19 at 100.00 | | | | N/R | | | | 181,540 | |
| | | | | |
| | 210 | | | Tolomato Community Development District, Florida, Special Assessment Bonds, Convertible, Capital Appreciation, Series 2012A-4, 0.000%, 5/01/40 | | | | | 5/22 at 100.00 | | | | N/R | | | | 97,860 | |
| | | | | |
| | 170 | | | Tolomato Community Development District, Florida, Special Assessment Bonds, Hope Note, Series 2007-3, 6.650%, 5/01/40 (6) | | | | | 5/18 at 100.00 | | | | N/R | | | | 2 | |
| | | | | |
| | 475 | | | Tolomato Community Development District, Florida, Special Assessment Bonds, Hope Note, Series 2007A-2, 5.250%, 5/01/39 (6) | | | | | 5/17 at 100.00 | | | | N/R | | | | 5 | |
| | | | | |
| | 25 | | | Tolomato Community Development District, Florida, Special Assessment Bonds, Non Performing Parcel Series 2007-1. RMKT, 6.650%, 5/01/40 (6) | | | | | 5/18 at 100.00 | | | | N/R | | | | 13,549 | |
| | | | | |
| | 215 | | | Tolomato Community Development District, Florida, Special Assessment Bonds, Non Performing Parcel Series 2007A-1. RMKT, 5.250%, 5/01/39 (6) | | | | | 5/17 at 100.00 | | | | N/R | | | | 117,349 | |
| | | | | |
| | | | Tolomato Community Development District, Florida, Special Assessment Bonds, Refunding Series 2012A-1: | | | | | | | | | | | | | | |
| | 95 | | | 5.250%, 5/01/39 | | | | | 5/17 at 100.00 | | | | N/R | | | | 93,517 | |
| | 305 | | | 6.650%, 5/01/40 | | | | | 5/17 at 100.00 | | | | N/R | | | | 313,445 | |
| | | | | |
| | 2,990 | | | Tolomato Community Development District, Florida, Special Assessment Bonds, Series 2006, 5.400%, 5/01/37 | | | | | 5/14 at 101.00 | | | | BB | | | | 2,991,405 | |
| | | | | |
| | 705 | | | Tolomato Community Development District, Florida, Special Assessment Bonds, Southern/Forbearance Parcel Series 2007-2, 6.650%, 5/01/40 (6) | | | | | 5/18 at 100.00 | | | | N/R | | | | 283,142 | |
| | | | | |
| | 605 | | | University Square Community Development District, Florida, Capital Improvement Revenue Bonds, Series 2007A-1, 5.875%, 5/01/38 | | | | | 5/17 at 100.00 | | | | N/R | | | | 621,565 | |
| | | | | |
| | 250 | | | Venetian Community Development District, Sarasota County, Florida, Capital Improvement Revenue Bonds, Series 2012-A1, 6.125%, 5/01/42 | | | | | 5/22 at 100.00 | | | | N/R | | | | 256,340 | |
| | | | | |
| | | | Venetian Community Development District, Sarasota County, Florida, Capital Improvement Revenue Bonds, Series 2012-A2: | | | | | | | | | | | | | | |
| | 465 | | | 5.000%, 5/01/23 | | | | | 5/22 at 100.00 | | | | N/R | | | | 490,082 | |
| | 1,500 | | | 5.500%, 5/01/34 | | | | | 5/22 at 100.00 | | | | N/R | | | | 1,552,740 | |
| | | | | |
| | 2,000 | | | Village Center Community Development District, Florida, Recreational Revenue Bonds, Series 2003A, 5.000%, 11/01/32 – NPFG Insured | | | | | 11/13 at 101.00 | | | | Baa2 | | | | 2,021,620 | |
| | | | | |
| | 485 | | | Waters Edge Community Development District, Florida, Capital Improvement Revenue Bonds, Series 2005, 5.300%, 5/01/36 | | | | | 5/15 at 101.00 | | | | N/R | | | | 486,198 | |
| | | | | |
| | | | Westchester Community Development District 1, Florida, Special Assessment Bonds, Series 2003: | | | | | | | | | | | | | | |
| | 525 | | | 6.000%, 5/01/23 | | | | | 5/14 at 100.00 | | | | N/R | | | | 530,901 | |
| | 3,750 | | | 6.125%, 5/01/35 | | | | | 5/14 at 100.00 | | | | N/R | | | | 3,790,950 | |
| | 236,253 | | | Total Florida | | | | | | | | | | | | | 259,201,415 | |
Portfolio of Investments
Nuveen All-American Municipal Bond Fund (continued)
April 30, 2013
| | | | | | | | | | | | | | | | | | |
Principal
Amount (000) | | | Description (1) | | | | Optional Call
Provisions (2) | | | Ratings (3) | | | Value | |
| | | | Georgia – 2.9% | | | | | | | | | | | | | | |
| | | | | |
| $ | 2,000 | | | Atlanta and Fulton County Recreation Authority, Georgia, Guaranteed Revenue Bonds, Park Improvement, Series 2005A, 5.000%, 12/01/30 – NPFG Insured | | | | | 12/15 at 100.00 | | | | Aa2 | | | $ | 2,164,220 | |
| | | | | |
| | 735 | | | Atlanta, Georgia, Tax Allocation Bonds, Beltline Project Series 2008A. Remarketed, 7.500%, 1/01/31 | | | | | 1/19 at 100.00 | | | | A2 | | | | 919,051 | |
| | | | | |
| | 1,735 | | | Atlanta, Georgia, Tax Allocation Bonds, Beltline Project Series 2008B. Remarketed, 6.750%, 1/01/20 | | | | | 1/19 at 100.00 | | | | A2 | | | | 2,209,557 | |
| | | | | |
| | 265 | | | Atlanta, Georgia, Tax Allocation Bonds, Eastside Project, Series 2005A, 5.625%, 1/01/16 (Alternative Minimum Tax) | | | | | 7/15 at 100.00 | | | | A– | | | | 286,287 | |
| | | | | |
| | 500 | | | Atlanta, Georgia, Tax Allocation Bonds, Eastside Project, Series 2005B, 5.400%, 1/01/20 | | | | | 7/15 at 100.00 | | | | A– | | | | 540,335 | |
| | | | | |
| | 495 | | | Atlanta, Georgia, Tax Allocation Bonds, Princeton Lakes Project, Series 2006, 5.500%, 1/01/31 | | | | | 1/16 at 100.00 | | | | BBB– | | | | 504,167 | |
| | | | | |
| | 7,000 | | | Atlanta, Georgia, Water and Wastewater Revenue Bonds, Series 2009B, 5.375%, 11/01/39 – AGM Insured | | | | | 11/19 at 100.00 | | | | AA– | | | | 7,986,650 | |
| | | | | |
| | 1,000 | | | Augusta, Georgia, Airport Revenue Bonds, General Series 2005C, 5.450%, 1/01/31 (Alternative Minimum Tax) | | | | | 1/15 at 100.00 | | | | Baa2 | | | | 1,020,860 | |
| | | | | |
| | 4,955 | | | Cobb County Development Authority, Georgia, University Facilities Revenue Bonds, Kennesaw State University Foundations, Student Housing Subordinate Lien Series 2004C, 5.250%, 7/15/24 – NPFG Insured | | | | | 7/14 at 100.00 | | | | A3 | | | | 5,199,975 | |
| | | | | |
| | 4,000 | | | DeKalb County Hospital Authority, Georgia, Anticipation Certificates Revenue Bonds, DeKalb Medical Center, Inc. Project, Series 2010, 6.000%, 9/01/30 | | | | | 9/20 at 100.00 | | | | BBB | | | | 4,728,400 | |
| | | | | |
| | 1,320 | | | Dekalb County Housing Authority, Georgia, Subordinate Multifamily Housing Revenue Bonds, Greens of Stonecrest Project, 2001B
Pass-Through Certificate Series 2001-8, 5.900%, 11/01/34 (Mandatory put 11/01/18) (Alternative Minimum Tax) | | | | | 7/13 at 100.00 | | | | N/R | | | | 1,320,898 | |
| | | | | |
| | 3,300 | | | Fulton County Development Authority, Georgia, Local District Cooling Authority Revenue Bonds, Maxon Atlantic Station LLC, Series 2005A, 5.125%, 3/01/26 (Mandatory put 3/01/15) (Alternative Minimum Tax) | | | | | 9/15 at 100.00 | | | | BBB | | | | 3,366,198 | |
| | | | | |
| | 10,000 | | | Fulton County Development Authority, Georgia, Revenue Bonds, Georgia Tech Athletic Association, Series 2011, 5.750%, 10/01/41 | | | | | 4/21 at 100.00 | | | | A+ | | | | 11,592,900 | |
| | | | | |
| | | | Fulton County Development Authority, Georgia, Revenue Bonds, Georgia Tech Molecular Science Building, Series 2004: | | | | | | | | | | | | | | |
| | 1,250 | | | 5.250%, 5/01/21 – NPFG Insured | | | | | 5/14 at 100.00 | | | | Aa3 | | | | 1,308,013 | |
| | 2,490 | | | 5.250%, 5/01/23 – NPFG Insured | | | | | 5/14 at 100.00 | | | | Aa3 | | | | 2,602,971 | |
| | 2,440 | | | 5.000%, 5/01/36 – NPFG Insured | | | | | 5/14 at 100.00 | | | | Aa3 | | | | 2,530,792 | |
| | | | | |
| | | | Fulton County Residential Care Facilities Elderly Authority, Georgia, Revenue Bonds, Canterbury Court, Refunding Series 2004A: | | | | | | | | | | | | | | |
| | 1,500 | | | 6.125%, 2/15/26 | | | | | 2/14 at 101.00 | | | | N/R | | | | 1,532,460 | |
| | 4,080 | | | 6.125%, 2/15/34 | | | | | 2/14 at 101.00 | | | | N/R | | | | 4,158,458 | |
| | | | | |
| | 5,025 | | | Georgia Local Governments, Certificates of Participation, Georgia Municipal Association, Series 1998A, 4.750%, 6/01/28 – NPFG Insured | | | | | No Opt. Call | | | | Baa2 | | | | 5,242,633 | |
| | | | | |
| | 1,100 | | | Georgia Municipal Electric Authority, Senior Lien General Power Revenue Bonds, Series 1993BB, 5.250%, 1/01/25 – NPFG Insured | | | | | No Opt. Call | | | | A1 | | | | 1,291,257 | |
| | | | | |
| | 10,000 | | | Georgia State, General Obligation Bonds, Series 2012A, 5.000%, 7/01/21 | | | | | No Opt. Call | | | | AAA | | | | 12,818,900 | |
| | | | | |
| | 1,000 | | | Lavonia Hospital Authority, Georgia, Revenue Anticipation Certificates, Ty Cobb Regional Medical Center , Series 2010, 6.000%, 12/01/40 – AGM Insured | | | | | 12/20 at 100.00 | | | | AA– | | | | 1,168,530 | |
| | | | | |
| | | | Main Street Natural Gas Inc., Georgia, Gas Project Revenue Bonds, Series 2007A: | | | | | | | | | | | | | | |
| | 900 | | | 5.000%, 3/15/22 | | | | | No Opt. Call | | | | A+ | | | | 1,039,950 | |
| | 1,000 | | | 5.500%, 9/15/28 | | | | | No Opt. Call | | | | A | | | | 1,224,420 | |
| | | | | | | | | | | | | | | | | | |
Principal
Amount (000) | | | Description (1) | | | | Optional Call
Provisions (2) | | | Ratings (3) | | | Value | |
| | | | Georgia (continued) | | | | | | | | | | | | | | |
| | | | | |
| $ | 5,500 | | | Medical Center Hospital Authority, Georgia, Revenue Anticipation Certificates, Columbus Regional Healthcare System, Inc. Project, Series 2010, 5.000%, 8/01/41 | | | | | 8/20 at 100.00 | | | | AA– | | | $ | 5,974,595 | |
| | | | | |
| | 1,590 | | | Private Colleges and Universities Authority, Georgia, Revenue Bonds, Mercer University, Series 2012A, 5.250%, 10/01/27 | | | | | 10/21 at 100.00 | | | | Baa2 | | | | 1,826,338 | |
| | | | | |
| | 1,000 | | | Richmond County Development Authority, Georgia, Revenue Bonds, Augusta State University, Jaguar Student Center Project, Series 2005A, 5.000%, 7/01/29 – SYNCORA GTY Insured | | | | | 7/15 at 100.00 | | | | A2 | | | | 1,034,100 | |
| | | | | |
| | 1,000 | | | Savannah Economic Development Authority, Georgia, Revenue Bonds, Armstrong Atlantic State University, Windward Commons LLC Project, Series 2009, 5.000%, 6/15/39 – AGC Insured | | | | | 6/19 at 100.00 | | | | AA– | | | | 1,090,360 | |
| | 77,180 | | | Total Georgia | | | | | | | | | | | | | 86,683,275 | |
| | | | Guam – 0.1% | | | | | | | | | | | | | | |
| | | | | |
| | 1,020 | | | Government of Guam, Business Privilege Tax Bonds, Series 2011A, 5.000%, 1/01/31 | | | | | 1/22 at 100.00 | | | | A | | | | 1,146,082 | |
| | | | | |
| | 2,000 | | | Guam Government Department of Education, Certificates of Participation, John F. Kennedy High School Project, Series 2010A, 6.625%, 12/01/30 | | | | | 12/20 at 100.00 | | | | B | | | | 2,212,620 | |
| | | | | |
| | 880 | | | Guam Government Waterworks Authority, Water and Wastewater System Revenue Bonds, Series 2010, 5.625%, 7/01/40 | | | | | 7/20 at 100.00 | | | | Ba2 | | | | 942,260 | |
| | 3,900 | | | Total Guam | | | | | | | | | | | | | 4,300,962 | |
| | | | Hawaii – 0.6% | | | | | | | | | | | | | | |
| | | | | |
| | 2,000 | | | Hawaii Department of Budget and Finance, Special Purpose Revenue Bonds, Kahala Nui Project, Series 2003A, 8.000%, 11/15/33
(Pre-refunded 11/15/13) | | | | | 11/13 at 102.00 | | | | AA+ (4) | | | | 2,122,980 | |
| | | | | |
| | | | Hawaii Department of Budget and Finance, Special Purpose Senior Living Revenue Bonds, 15 Craigside Project, Series 2009A: | | | | | | | | | | | | | | |
| | 1,000 | | | 8.750%, 11/15/29 | | | | | 11/19 at 100.00 | | | | N/R | | | | 1,207,240 | |
| | 1,250 | | | 9.000%, 11/15/44 | | | | | 11/19 at 100.00 | | | | N/R | | | | 1,509,738 | |
| | | | | |
| | 10,000 | | | Hawaii State, General Obligation Bonds, Series 2012EF, 5.000%, 11/01/21 | | | | | No Opt. Call | | | | AA | | | | 12,682,000 | |
| | 14,250 | | | Total Hawaii | | | | | | | | | | | | | 17,521,958 | |
| | | | Idaho – 0.2% | | | | | | | | | | | | | | |
| | | | | |
| | | | Idaho Health Facilities Authority, Revenue Bonds, Trinity Health Group, Refunding Series 2008B: | | | | | | | | | | | | | | |
| | 1,000 | | | 6.000%, 12/01/23 | | | | | 12/18 at 100.00 | | | | AA | | | | 1,219,560 | |
| | 760 | | | 6.250%, 12/01/33 | | | | | 12/18 at 100.00 | | | | AA | | | | 910,039 | |
| | | | | |
| | | | Idaho Housing and Finance Association, Grant and Revenue Anticipation Bonds, Federal Highway Trust Funds, Series 2006: | | | | | | | | | | | | | | |
| | 1,000 | | | 5.000%, 7/15/23 – NPFG Insured | | | | | 7/16 at 100.00 | | | | Aa3 | | | | 1,117,830 | |
| | 1,065 | | | 5.000%, 7/15/24 – NPFG Insured | | | | | 7/16 at 100.00 | | | | Aa3 | | | | 1,190,489 | |
| | | | | |
| | | | Idaho Water Resource Board, Water Resource Loan Program Revenue, Ground Water Rights Mitigation Series 2012A: | | | | | | | | | | | | | | |
| | 900 | | | 4.600%, 9/01/28 | | | | | 9/22 at 100.00 | | | | Baa1 | | | | 951,678 | |
| | 595 | | | 5.000%, 9/01/32 | | | | | 9/22 at 100.00 | | | | Baa1 | | | | 652,852 | |
| | 5,320 | | | Total Idaho | | | | | | | | | | | | | 6,042,448 | |
| | | | Illinois – 7.5% | | | | | | | | | | | | | | |
| | | | | |
| | 2,000 | | | Bensenville, Illinois, General Obligation Bonds, Series 2011A, 5.000%, 12/15/30 – AGM Insured | | | | | 12/21 at 100.00 | | | | AA– | | | | 2,235,020 | |
| | | | | |
| | 1,000 | | | Bryant, Illinois, Pollution Control Revenue Refunding Bonds, Central Illinois Light Company, Series 1993, 5.900%, 8/01/23 | | | | | 7/13 at 100.00 | | | | A– | | | | 1,002,220 | |
| | | | | |
| | 974 | | | Cary, Illinois, Special Service Area 1 Special Tax Bonds, Series 2006, 5.000%, 3/01/30 – RAAI Insured | | | | | 3/16 at 100.00 | | | | N/R | | | | 990,402 | |
| | | | | |
| | 3,320 | | | CenterPoint Intermodal Center Program, Illinois, Trust Series 2004 Class A Certificates, 3.730%, 6/15/23 | | | | | No Opt. Call | | | | N/R | | | | 3,320,465 | |
Portfolio of Investments
Nuveen All-American Municipal Bond Fund (continued)
April 30, 2013
| | | | | | | | | | | | | | | | | | |
Principal
Amount (000) | | | Description (1) | | | | Optional Call
Provisions (2) | | | Ratings (3) | | | Value | |
| | | | Illinois (continued) | | | | | | | | | | | | | | |
| | | | | |
| | | | Champaign, Illinois, General Obligation Sales Tax Bonds, Public Safety Series 1999: | | | | | | | | | | | | | | |
| $ | 1,140 | | | 8.250%, 1/01/21 – FGIC Insured | | | | | No Opt. Call | | | | N/R | | | $ | 1,639,696 | |
| | 1,275 | | | 8.250%, 1/01/22 – FGIC Insured | | | | | No Opt. Call | | | | N/R | | | | 1,845,027 | |
| | | | | |
| | 2,000 | | | Chicago Board of Education, Illinois, Unlimited Tax General Obligation Bonds, Dedicated Revenues, Series 2008C, 5.000%, 12/01/20 | | | | | 12/18 at 100.00 | | | | A+ | | | | 2,293,840 | |
| | | | | |
| | 3,335 | | | Chicago Metropolitan Water Reclamation District, Illinois, General Obligation Bonds, Tender Option Bonds Trust 1130, 13.426%, 6/01/14 (IF) | | | | | No Opt. Call | | | | AAA | | | | 4,618,608 | |
| | | | | |
| | 2,000 | | | Chicago Transit Authority, Illinois, Sales Tax Receipts Revenue Bonds, Series 2011, 5.250%, 12/01/40 | | | | | 12/21 at 100.00 | | | | AA | | | | 2,291,900 | |
| | | | | |
| | 3,280 | | | Chicago, Illinois, FNMA/GNMA Collateralized Single Family Mortgage Revenue Bonds, Series 2007-2G, 5.950%, 6/01/39 (Alternative Minimum Tax) | | | | | 6/17 at 104.00 | | | | Aaa | | | | 3,548,698 | |
| | | | | |
| | 2,000 | | | Chicago, Illinois, Motor Fuel Tax Revenue Bonds, Series 2003A, 5.000%, 1/01/33 – AMBAC Insured | | | | | 7/13 at 100.00 | | | | AA+ | | | | 2,006,560 | |
| | | | | |
| | 1,000 | | | Chicago, Illinois, Revenue Bonds, Midway Airport, Series 1996A, 5.500%, 1/01/29 – NPFG Insured | | | | | 7/13 at 100.00 | | | | A | | | | 1,003,810 | |
| | | | | |
| | 2,875 | | | Chicago, Illinois, Third Lien General Airport Revenue Bonds, O’Hare International Airport, Series 2005A, 5.250%, 1/01/24 – NPFG Insured | | | | | 1/16 at 100.00 | | | | A2 | | | | 3,153,243 | |
| | | | | |
| | 20,000 | | | Chicago, Illinois, Water Revenue Bonds, Refunding Second Lien Series 2012-2, 4.000%, 11/01/37 | | | | | 11/22 at 100.00 | | | | AA | | | | 20,794,200 | |
| | | | | |
| | 310 | | | Cicero, Cook County, Illinois, General Obligation Corporate Purpose Bonds, Series 1994A, 6.400%, 12/01/14 – NPFG Insured | | | | | 6/13 at 100.00 | | | | Baa2 | | | | 311,246 | |
| | | | | |
| | | | Community College District 523, Counties of DeKalb, Kane, LaSalle, Lee, Ogle, Winnebago, and Boone, Illinois, General Obligation Bonds, Kishwaukee Community College, Capital Appreciation, Series 2011B: | | | | | | | | | | | | | | |
| | 1,000 | | | 0.000%, 2/01/35 | | | | | 2/21 at 38.17 | | | | AA | | | | 287,990 | |
| | 750 | | | 0.000%, 2/01/36 | | | | | 2/21 at 35.47 | | | | AA | | | | 200,775 | |
| | | | | |
| | 4,440 | | | Cook County, Illinois, General Obligation Bonds, Refunding Series 2010A, 5.250%, 11/15/33 | | | | | 11/20 at 100.00 | | | | AA | | | | 5,063,110 | |
| | | | | |
| | 2,000 | | | Cook County, Illinois, Recovery Zone Facility Revenue Bonds, Navistar International Corporation Project, Series 2010, 6.500%, 10/15/40 | | | | | 10/20 at 100.00 | | | | B3 | | | | 2,192,620 | |
| | | | | |
| | 2,500 | | | Harvey, Cook County, Illinois, Tax Increment Allocation Revenue Bonds, Amended Center Street Redevelopment Project Area, Series 2010, 7.500%, 12/01/19 | | | | | No Opt. Call | | | | N/R | | | | 2,691,525 | |
| | | | | |
| | 5,000 | | | Illinois Development Finance Authority, Pollution Control Revenue Refunding Bonds – CIPS Debt, Series 1993C-2, 5.950%, 8/15/26 | | | | | 7/13 at 100.00 | | | | BBB | | | | 5,013,300 | |
| | | | | |
| | 1,375 | | | Illinois Finance Authority Revenue Bonds, Christian Homes, Inc. Obligated Group, Series 2007A, 5.750%, 5/15/31 | | | | | 5/17 at 100.00 | | | | BBB– | | | | 1,460,003 | |
| | | | | |
| | | | Illinois Finance Authority Revenue Bonds, Christian Homes, Inc., Refunding Series 2010: | | | | | | | | | | | | | | |
| | 900 | | | 6.125%, 5/15/27 | | | | | 5/15 at 100.00 | | | | BBB– | | | | 934,209 | |
| | 2,000 | | | 6.125%, 5/15/27 | | | | | 5/20 at 100.00 | | | | BBB– | | | | 2,237,420 | |
| | | | | |
| | 1,500 | | | Illinois Finance Authority, Charter School Revenue Bonds, Chicago Charter School Foundation, Series 2007, 5.000%, 12/01/36 | | | | | 12/16 at 100.00 | | | | BBB+ | | | | 1,549,095 | |
| | | | | |
| | 1,000 | | | Illinois Finance Authority, Charter School Revenue Bonds, Uno Charter School Network, Refunding and Improvement Series 2011A, 7.125%, 10/01/41 | | | | | 10/21 at 100.00 | | | | BBB– | | | | 1,180,120 | |
| | | | | |
| | 500 | | | Illinois Finance Authority, Revenue Bonds, Admiral at Lake Project, Series 2010A, 7.750%, 5/15/30 | | | | | 5/20 at 100.00 | | | | N/R | | | | 602,315 | |
| | | | | |
| | 1,000 | | | Illinois Finance Authority, Revenue Bonds, Admiral at Lake Project, Temps 65 Series 2010D-2, 6.375%, 5/15/17 | | | | | 6/13 at 100.00 | | | | N/R | | | | 1,001,970 | |
| | | | | |
| | 1,215 | | | Illinois Finance Authority, Revenue Bonds, Central DuPage Health, Series 2009, 5.250%, 11/01/39 | | | | | 11/19 at 100.00 | | | | AA | | | | 1,371,358 | |
| | | | | | | | | | | | | | | | | | |
Principal
Amount (000) | | | Description (1) | | | | Optional Call
Provisions (2) | | | Ratings (3) | | | Value | |
| | | | Illinois (continued) | | | | | | | | | | | | | | |
| | | | | |
| $ | 1,000 | | | Illinois Finance Authority, Revenue Bonds, Edward Health Services Corporation, Series 2008A, 5.500%, 2/01/40 – AMBAC Insured | | | | | 2/18 at 100.00 | | | | A+ | | | $ | 1,080,220 | |
| | | | | |
| | 4,050 | | | Illinois Finance Authority, Revenue Bonds, Illinois Institute of Technology, Series 2009, 7.125%, 2/01/34 | | | | | 2/19 at 100.00 | | | | Baa3 | | | | 4,485,902 | |
| | | | | |
| | | | Illinois Finance Authority, Revenue Bonds, Ingalls Health System, Series 2013: | | | | | | | | | | | | | | |
| | 4,000 | | | 4.000%, 5/15/33 | | | | | 5/22 at 100.00 | | | | Baa1 | | | | 3,937,560 | |
| | 4,520 | | | 4.250%, 5/15/43 | | | | | 5/22 at 100.00 | | | | Baa1 | | | | 4,521,627 | |
| | | | | |
| | 1,250 | | | Illinois Finance Authority, Revenue Bonds, Little Company of Mary Hospital and Health Care Centers, Series 2010, 5.375%, 8/15/40 | | | | | 8/15 at 105.00 | | | | A+ | | | | 1,353,138 | |
| | | | | |
| | 2,000 | | | Illinois Finance Authority, Revenue Bonds, Northwestern Memorial Hospital, Series 2009A, 5.375%, 8/15/24 | | | | | 8/19 at 100.00 | | | | AA+ | | | | 2,392,400 | |
| | | | | |
| | 2,545 | | | Illinois Finance Authority, Revenue Bonds, OSF Healthcare System, Refunding Series 2010A, 6.000%, 5/15/39 | | | | | 5/20 at 100.00 | | | | A | | | | 2,957,086 | |
| | | | | |
| | 500 | | | Illinois Finance Authority, Revenue Bonds, OSF Healthcare System, Series 2007A, 5.750%, 11/15/37 | | | | | 11/17 at 100.00 | | | | A | | | | 551,155 | |
| | | | | |
| | 1,500 | | | Illinois Finance Authority, Revenue Bonds, Palos Community Hospital, Series 2010C, 5.125%, 5/15/35 | | | | | 5/20 at 100.00 | | | | AA– | | | | 1,684,260 | |
| | | | | |
| | 2,900 | | | Illinois Finance Authority, Revenue Bonds, Provena Health, Series 2009A, 7.750%, 8/15/34 | | | | | 8/19 at 100.00 | | | | BBB+ | | | | 3,727,486 | |
| | | | | |
| | 3,680 | | | Illinois Finance Authority, Revenue Bonds, Rush University Medical Center Obligated Group, Series 2009A, 7.250%, 11/01/30 | | | | | 11/18 at 100.00 | | | | A | | | | 4,662,560 | |
| | | | | |
| | | | Illinois Finance Authority, Revenue Bonds, Rush University Medical Center Obligated Group, Series 2009C: | | | | | | | | | | | | | | |
| | 1,265 | | | 6.625%, 11/01/39 | | | | | 5/19 at 100.00 | | | | A | | | | 1,545,109 | |
| | 1,665 | | | 6.625%, 11/01/39 (UB) (5) | | | | | 5/19 at 100.00 | | | | A | | | | 2,033,681 | |
| | | | | |
| | 6,255 | | | Illinois Finance Authority, Revenue Bonds, Sherman Health Systems, Series 2007A, 5.500%, 8/01/37 | | | | | 8/17 at 100.00 | | | | BBB | | | | 6,844,596 | |
| | | | | |
| | 9,000 | | | Illinois Finance Authority, Revenue Bonds, Silver Cross Hospital and Medical Centers, Series 2009, 6.875%, 8/15/38 | | | | | 8/19 at 100.00 | | | | BBB+ | | | | 10,662,300 | |
| | | | | |
| | 925 | | | Illinois Finance Authority, Revenue Bonds, Southern Illinois Healthcare Enterprises, Inc., Series 2005 Remarketed, 5.250%, 3/01/30 – AGM Insured | | | | | 3/20 at 100.00 | | | | AA– | | | | 1,033,641 | |
| | | | | |
| | 4,000 | | | Illinois Finance Authority, Revenue Bonds, The Carle Foundation, Series 2011A, 6.000%, 8/15/41 | | | | | 8/21 at 100.00 | | | | AA– | | | | 4,808,200 | |
| | | | | |
| | 1,400 | | | Illinois Finance Authority, Revenue Bonds, The University of Chicago Medical Center, Series 2009B, 5.000%, 8/15/26 | | | | | 8/20 at 100.00 | | | | AA– | | | | 1,593,396 | |
| | | | | |
| | 1,500 | | | Illinois Finance Authority, Revenue Bonds, The University of Chicago Medical Center, Series 2011C, 5.500%, 8/15/41 | | | | | 2/21 at 100.00 | | | | AA– | | | | 1,707,900 | |
| | | | | |
| | 2,350 | | | Illinois Finance Authority, Revenue Bonds, Three Crowns Park Plaza, Series 2006A, 5.875%, 2/15/26 | | | | | 2/16 at 100.00 | | | | N/R | | | | 2,445,739 | |
| | | | | |
| | 3,485 | | | Illinois Finance Authority, Revenue Refunding Bonds, Silver Cross Hospital and Medical Centers, Series 2008A, 5.500%, 8/15/30 | | | | | 8/18 at 100.00 | | | | BBB+ | | | | 3,761,186 | |
| | | | | |
| | 3,915 | | | Illinois Finance Authority, Student Housing Revenue Bonds, Educational Advancement Fund Inc., Refunding Series 2007A, 5.250%, 5/01/34 | | | | | 5/17 at 100.00 | | | | BBB+ | | | | 4,137,372 | |
| | | | | |
| | 1,000 | | | Illinois Finance Authority, Water Facilities Revenue Bonds, American Water Capital Corp., Project, Series 2009, 5.250%, 10/01/39 | | | | | 10/19 at 100.00 | | | | BBB+ | | | | 1,062,850 | |
| | | | | |
| | | | Illinois Health Facilities Authority, Revenue Refunding Bonds, Elmhurst Memorial Healthcare, Series 2002: | | | | | | | | | | | | | | |
| | 4,040 | | | 5.500%, 1/01/22 | | | | | 7/13 at 100.00 | | | | Baa2 | | | | 4,054,382 | |
| | 1,000 | | | 5.625%, 1/01/28 | | | | | 7/13 at 100.00 | | | | Baa2 | | | | 1,003,370 | |
| | | | | |
| | 255 | | | Illinois Housing Development Authority, Housing Finance Bonds, Series 2006K, 4.600%, 7/01/23 | | | | | 7/16 at 100.00 | | | | AA | | | | 263,025 | |
Portfolio of Investments
Nuveen All-American Municipal Bond Fund (continued)
April 30, 2013
| | | | | | | | | | | | | | | | | | |
Principal
Amount (000) | | | Description (1) | | | | Optional Call
Provisions (2) | | | Ratings (3) | | | Value | |
| | | | Illinois (continued) | | | | | | | | | | | | | | |
| | | | | |
| $ | 4,000 | | | Illinois Housing Development Authority, Multifamily Housing Revenue Bonds, GNMA Collateralized- Lifelink Developments, Series 2006, 4.850%, 4/20/41 (Alternative Minimum Tax) (UB) (5) | | | | | 4/16 at 100.00 | | | | AA+ | | | $ | 4,131,160 | |
| | | | | |
| | | | Illinois State, General Obligation Bonds, Series 2012A: | | | | | | | | | | | | | | |
| | 5,500 | | | 5.000%, 3/01/25 | | | | | 3/22 at 100.00 | | | | A2 | | | | 6,228,695 | |
| | 5,000 | | | 4.000%, 1/01/26 | | | | | 1/22 at 100.00 | | | | A2 | | | | 5,187,250 | |
| | 4,000 | | | 5.000%, 3/01/26 | | | | | 3/22 at 100.00 | | | | A2 | | | | 4,488,040 | |
| | 500 | | | 5.000%, 3/01/27 | | | | | 3/22 at 100.00 | | | | A2 | | | | 555,760 | |
| | | | | |
| | 5,000 | | | Illinois State, Sales Tax Revenue Bonds, Build Illinois Series 2011, 5.000%, 6/15/28 | | | | | 6/21 at 100.00 | | | | AAA | | | | 5,851,700 | |
| | | | | |
| | 960 | | | Lombard Public Facilities Corporation, Illinois, First Tier Conference Center and Hotel Revenue Bonds, Series 2005A-1, 7.125%, 1/01/36 | | | | | 1/16 at 100.00 | | | | N/R | | | | 644,736 | |
| | | | | |
| | 3,000 | | | Lombard Public Facilities Corporation, Illinois, First Tier Conference Center and Hotel Revenue Bonds, Series 2005A-2, 5.500%, 1/01/30 – ACA Insured | | | | | 1/16 at 100.00 | | | | CCC | | | | 1,969,170 | |
| | | | | |
| | 1,630 | | | Lombard Public Facilities Corporation, Illinois, Second Tier Conference Center and Hotel Revenue Bonds, Series 2005B, 5.250%, 1/01/36 | | | | | 1/16 at 100.00 | | | | CCC | | | | 759,580 | |
| | | | | |
| | 1,260 | | | Markham, Illinois, Alternative Source Revenue Bonds, Series 2005A, 5.250%, 4/01/23 – RAAI Insured | | | | | 4/15 at 100.00 | | | | N/R | | | | 1,279,921 | |
| | | | | |
| | 2,500 | | | Metropolitan Pier and Exposition Authority, Illinois, McCormick Place Expansion Project Refunding Bonds, Series 2012A, 5.000%, 6/15/42 – NPFG Insured (Alternative Minimum Tax) | | | | | 6/22 at 100.00 | | | | AAA | | | | 2,795,850 | |
| | | | | |
| | 13,000 | | | Metropolitan Pier and Exposition Authority, Illinois, Revenue Bonds, McCormick Place Expansion Project, Capital Appreciation Refunding Series 2010B-1, 0.000%, 6/15/45 – AGM Insured | | | | | No Opt. Call | | | | AAA | | | | 2,715,050 | |
| | | | | |
| | 10,000 | | | Metropolitan Pier and Exposition Authority, Illinois, Revenue Bonds, McCormick Place Expansion Project, Series 2002A, 0.000%, 12/15/35 – AGM Insured | | | | | No Opt. Call | | | | AAA | | | | 3,633,600 | |
| | | | | |
| | 8,025 | | | Metropolitan Pier and Exposition Authority, Illinois, Revenue Refunding Bonds, McCormick Place Expansion Project, Series 1996A, 0.000%, 12/15/21 – NPFG Insured | | | | | No Opt. Call | | | | AA– | | | | 6,422,327 | |
| | | | | |
| | 845 | | | Quad Cities Regional Economic Development Authority, Illinois, Revenue Bonds, Augustana College, Series 2012, 4.750%, 10/01/29 | | | | | 10/22 at 100.00 | | | | Baa1 | | | | 916,749 | |
| | | | | |
| | | | Railsplitter Tobacco Settlement Authority, Illinois, Tobacco Settlement Revenue Bonds, Series 2010: | | | | | | | | | | | | | | |
| | 3,890 | | | 5.250%, 6/01/21 | | | | | No Opt. Call | | | | A | | | | 4,765,561 | |
| | 3,000 | | | 6.250%, 6/01/24 | | | | | 6/16 at 100.00 | | | | A– | | | | 3,376,230 | |
| | | | | |
| | 4,450 | | | Regional Transportation Authority, Cook, DuPage, Kane, Lake, McHenry and Will Counties, Illinois, General Obligation Bonds, Series 2001A, 6.000%, 7/01/27 – FGIC Insured | | | | | No Opt. Call | | | | AA | | | | 5,911,514 | |
| | | | | |
| | 5,780 | | | Schaumburg, Illinois, General Obligation Bonds, Series 2004B, 5.000%, 12/01/41 – AGM Insured | | | | | 12/14 at 100.00 | | | | Aaa | | | | 6,107,553 | |
| | | | | |
| | 1,000 | | | Springfield, Sangamon County, Illinois, Special Service Area, Legacy Pointe Ad Valorem Tax Bonds, Series 2010, 7.500%, 3/01/32 | | | | | 3/17 at 102.00 | | | | N/R | | | | 1,068,070 | |
| | | | | |
| | 1,645 | | | Warren Township School District 121, Lake County, Gurnee, Illinois, General Obligation Bonds, Series 2004C, 5.500%, 3/01/22 (Pre-refunded 3/01/14) – AMBAC Insured | | | | | 3/14 at 101.00 | | | | AA+ (4) | | | | 1,733,666 | |
| | 226,674 | | | Total Illinois | | | | | | | | | | | | | 225,693,068 | |
| | | | Indiana – 2.8% | | | | | | | | | | | | | | |
| | | | | |
| | 425 | | | Anderson, Indiana, Economic Development Revenue Bonds, Anderson University, Series 2007, 5.000%, 10/01/32 | | | | | 4/14 at 100.00 | | | | BB+ | | | | 393,601 | |
| | | | | |
| | | | Delaware County Hospital Authority, Indiana, Hospital Revenue Bonds, Cardinal Health System, Series 2006: | | | | | | | | | | | | | | |
| | 1,000 | | | 5.125%, 8/01/29 | | | | | 8/16 at 100.00 | | | | Baa2 | | | | 1,068,390 | |
| | 500 | | | 5.250%, 8/01/36 | | | | | 8/16 at 100.00 | | | | Baa2 | | | | 533,235 | |
| | | | | | | | | | | | | | | | | | |
Principal
Amount (000) | | | Description (1) | | | | Optional Call
Provisions (2) | | | Ratings (3) | | | Value | |
| | | | Indiana (continued) | | | | | | | | | | | | | | |
| | | | | |
| $ | 1,235 | | | Hendricks County Building Facilities Corporation, Indiana, First Mortgage Revenue Bonds, Series 2004, 5.500%, 7/15/24 (Pre-refunded 7/15/14) | | | | | 7/14 at 100.00 | | | | Aa2 (4) | | | $ | 1,312,916 | |
| | | | | |
| | | | Indiana Bond Bank, Special Program Gas Revenue Bonds, JPMorgan Ventures Energy Corporation Guaranteed, Series 2007A: | | | | | | | | | | | | | | |
| | 3,185 | | | 5.250%, 10/15/18 | | | | | No Opt. Call | | | | A2 | | | | 3,741,770 | |
| | 5,215 | | | 5.250%, 10/15/20 | | | | | No Opt. Call | | | | A2 | | | | 6,193,334 | |
| | | | | |
| | | | Indiana Finance Authority, Educational Facilities Refunding Revenue Bonds, Butler University Project, Series 2012B: | | | | | | | | | | | | | | |
| | 1,420 | | | 5.000%, 2/01/30 | | | | | 2/22 at 100.00 | | | | BBB+ | | | | 1,541,935 | |
| | 2,260 | | | 5.000%, 2/01/33 | | | | | 2/22 at 100.00 | | | | BBB+ | | | | 2,417,612 | |
| | | | | |
| | 1,400 | | | Indiana Finance Authority, Educational Facilities Revenue Bonds, Drexel Foundation For Educational Excellence, Inc., Series 2009A, 6.625%, 10/01/29 | | | | | 10/19 at 100.00 | | | | BB+ | | | | 1,544,732 | |
| | | | | |
| | 1,000 | | | Indiana Finance Authority, Hospital Revenue Bonds, Floyd Memorial Hospital and Health Services Project, Refunding Series 2010, 5.125%, 3/01/30 | | | | | 3/20 at 100.00 | | | | A– | | | | 1,081,880 | |
| | | | | |
| | 3,325 | | | Indiana Finance Authority, Hospital Revenue Bonds, King’s Daughters’ Hospital and Health Services, Series 2010, 5.000%, 8/15/20 | | | | | No Opt. Call | | | | BBB+ | | | | 3,710,201 | |
| | | | | |
| | 3,000 | | | Indiana Finance Authority, Hospital Revenue Bonds, Marion General Hospital Project, Series 2012A, 5.000%, 7/01/36 | | | | | 7/21 at 100.00 | | | | A+ | | | | 3,245,160 | |
| | | | | |
| | 9,000 | | | Indiana Finance Authority, Midwestern Disaster Relief Revenue Bonds, Ohio Valley Electric Corporation Project, Series 2012A, 5.000%, 6/01/32 – AGM Insured | | | | | 6/22 at 100.00 | | | | BBB– | | | | 9,676,170 | |
| | | | | |
| | 5,115 | | | Indiana Finance Authority, Private Activity Bonds, Ohio River Bridges East End Crossing Project, Series 2013A, 5.000%, 7/01/48 (Alternative Minimum Tax) | | | | | 7/23 at 100.00 | | | | BBB | | | | 5,381,287 | |
| | | | | |
| | 5,705 | | | Indiana Finance Authority, Private Activity Bonds, Ohio River Bridges East End Crossing Project, Series 2013B, 5.000%, 1/01/19 (Alternative Minimum Tax) | | | | | 1/17 at 100.00 | | | | BBB | | | | 6,356,739 | |
| | | | | |
| | 7,200 | | | Indiana Finance Authority, Wastewater Utility Revenue Bonds, CWA Authority Project, Series 2011B, 5.000%, 10/01/41 | | | | | 10/21 at 100.00 | | | | AA– | | | | 8,000,928 | |
| | | | | |
| | 2,830 | | | Indiana Health Facility Financing Authority, Revenue Bonds, Community Foundation of Northwest Indiana, Series 2007, 5.500%, 3/01/37 | | | | | 3/17 at 100.00 | | | | A– | | | | 3,083,908 | |
| | | | | |
| | 4,030 | | | Indiana Municipal Power Agency, Power Supply Revenue Bonds, Series 2007A, 5.000%, 1/01/42 – NPFG Insured | | | | | 1/17 at 100.00 | | | | A+ | | | | 4,390,484 | |
| | | | | |
| | 645 | | | Indiana Transportation Finance Authority, Highway Revenue Bonds, Series 1992A, 6.800%, 12/01/16 | | | | | No Opt. Call | | | | AA+ | | | | 718,543 | |
| | | | | |
| | 3,500 | | | Indianapolis Local Public Improvement Bond Bank, Indiana, Waterworks Project Series 2009A, 5.500%, 1/01/38 – AGC Insured | | | | | 1/19 at 100.00 | | | | AA– | | | | 3,961,685 | |
| | | | | |
| | 3,000 | | | Jasper County, Indiana Pollution Control (Northern Indiana Public Service) Commercial Paper, 5.600%, 11/01/16 – NPFG Insured | | | | | No Opt. Call | | | | Baa2 | | | | 3,377,310 | |
| | | | | |
| | | | Knox County, Indiana, Economic Development Revenue and Refunding Bonds, Good Samaritan Hospital Project, Series 2012A: | | | | | | | | | | | | | | |
| | 1,530 | | | 5.000%, 4/01/26 | | | | | 4/22 at 100.00 | | | | A3 | | | | 1,716,339 | |
| | 1,400 | | | 5.000%, 4/01/27 | | | | | 4/22 at 100.00 | | | | A3 | | | | 1,579,102 | |
| | 1,560 | | | 5.000%, 4/01/29 | | | | | 4/22 at 100.00 | | | | A3 | | | | 1,734,751 | |
| | | | | |
| | | | Portage, Indiana, Economic Development Revenue Bonds, Ameriplex Project, Series 2006: | | | | | | | | | | | | | | |
| | 1,000 | | | 5.000%, 7/15/23 | | | | | 7/16 at 100.00 | | | | A | | | | 1,056,610 | |
| | 775 | | | 5.000%, 1/15/27 | | | | | 7/16 at 100.00 | | | | A | | | | 808,992 | |
| | | | | |
| | 5,000 | | | Vigo County Hospital Authority, Indiana, Hospital Revenue Bonds, Union Hospital, Inc., Series 2011, 8.000%, 9/01/41 | | | | | 9/21 at 100.00 | | | | N/R | | | | 6,146,100 | |
| | 76,255 | | | Total Indiana | | | | | | | | | | | | | 84,773,714 | |
Portfolio of Investments
Nuveen All-American Municipal Bond Fund (continued)
April 30, 2013
| | | | | | | | | | | | | | | | | | |
Principal
Amount (000) | | | Description (1) | | | | Optional Call
Provisions (2) | | | Ratings (3) | | | Value | |
| | | | Iowa – 1.3% | | | | | | | | | | | | | | |
| | | | | |
| $ | 2,275 | | | Ames, Iowa, Hospital Revenue Bonds, Mary Greeley Medical Center, Series 2011, 5.250%, 6/15/36 | | | | | 6/20 at 100.00 | | | | A2 | | | $ | 2,494,742 | |
| | | | | |
| | 500 | | | Iowa Finance Authority, Health Facilities Revenue Bonds, Iowa Health System, Series 2008A, 5.250%, 8/15/29 – AGC Insured | | | | | 8/19 at 100.00 | | | | Aa3 | | | | 565,725 | |
| | | | | |
| | 1,490 | | | Iowa Finance Authority, Health Facility Revenue Bonds, Care Initiatives Project, Series 2006A, 5.500%, 7/01/25 | | | | | 7/16 at 100.00 | | | | BB+ | | | | 1,574,915 | |
| | | | | |
| | 5,865 | | | Iowa Finance Authority, Iowa, Midwestern Disaster Area Revenue Bonds, Alcoa Inc. Project, Series 2012, 4.750%, 8/01/42 | | | | | 8/22 at 100.00 | | | | BBB– | | | | 5,864,589 | |
| | | | | |
| | 7,500 | | | Iowa Higher Education Loan Authority, Private College Facility Revenue Bonds, Central College, Refunding Series 2012B, 5.000%, 10/01/38 | | | | | 10/21 at 100.00 | | | | Baa3 | | | | 8,059,125 | |
| | | | | |
| | | | Iowa Higher Education Loan Authority, Private College Facility Revenue Bonds, Upper Iowa University Project, Series 2012: | | | | | | | | | | | | | | |
| | 2,325 | | | 4.000%, 9/01/28 | | | | | 9/23 at 100.00 | | | | BBB | | | | 2,311,724 | |
| | 2,165 | | | 5.000%, 9/01/33 | | | | | 9/23 at 100.00 | | | | BBB | | | | 2,300,183 | |
| | 8,615 | | | 5.000%, 9/01/43 | | | | | 9/23 at 100.00 | | | | BBB | | | | 9,003,623 | |
| | | | | |
| | 5,000 | | | Iowa Student Loan Liquidity Corporation Student Loan Revenue Bonds, Senior Lien Series 2011A-2, 5.750%, 12/01/28 (Alternative Minimum Tax) | | | | | 12/19 at 102.00 | | | | A | | | | 5,732,850 | |
| | | | | |
| | 1,000 | | | Iowa Student Loan Liquidity Corporation, Student Loan Revenue Bonds, Refunding Series 2009-2, 5.500%, 12/01/25 | | | | | 12/19 at 100.00 | | | | A1 | | | | 1,065,200 | |
| | 36,735 | | | Total Iowa | | | | | | | | | | | | | 38,972,676 | |
| | | | Kansas – 2.1% | | | | | | | | | | | | | | |
| | | | | |
| | | | Kansas Department of Transportation, Highway Revenue Bonds, Refunding Series 2012B: | | | | | | | | | | | | | | |
| | 12,500 | | | 5.000%, 9/01/19 | | | | | No Opt. Call | | | | AAA | | | | 15,551,875 | |
| | 10,000 | | | 5.000%, 9/01/21 | | | | | No Opt. Call | | | | AAA | | | | 12,815,300 | |
| | | | | |
| | 500 | | | Kansas Department of Transportation, Highway Revenue Bonds, Series 2004B, 5.000%, 9/01/22 | | | | | 9/18 at 100.00 | | | | AAA | | | | 601,630 | |
| | | | | |
| | 4,500 | | | Kansas Development Finance Authority Hospital Revenue Bonds, Adventist Health System/Sunbelt Obligated Group, Series 2009C, 5.500%, 11/15/29 | | | | | 11/19 at 100.00 | | | | AA | | | | 5,281,830 | |
| | | | | |
| | 2,500 | | | Kansas Development Finance Authority, Health Facilities Revenue Bonds, Stormont-Vail Health Care Inc., Series 2011F, 5.250%, 11/15/30 | | | | | 11/19 at 100.00 | | | | A2 | | | | 2,765,325 | |
| | | | | |
| | 6,000 | | | Kansas Development Finance Authority, Revenue Bonds, Sisters of Charity of Leavenworth Health Services Corporation, Series 2010A, 5.000%, 1/01/40 (UB) (5) | | | | | 1/20 at 100.00 | | | | AA | | | | 6,555,180 | |
| | | | | |
| | 3,135 | | | Kansas Development Finance Authority, Revenue Bonds, State Projects, Series 2005H, 5.000%, 5/01/32 – NPFG Insured | | | | | 5/15 at 100.00 | | | | AA | | | | 3,332,693 | |
| | | | | |
| | | | Kansas State Power Pool, Electric Utility Revenue Bonds, Dogwood Energy Facility, Series 2012A: | | | | | | | | | | | | | | |
| | 1,650 | | | 5.000%, 12/01/25 | | | | | 12/22 at 100.00 | | | | Baa1 | | | | 1,848,363 | |
| | 3,475 | | | 5.000%, 12/01/27 | | | | | 12/22 at 100.00 | | | | Baa1 | | | | 3,865,347 | |
| | 1,000 | | | 5.000%, 12/01/31 | | | | | 12/20 at 100.00 | | | | Baa1 | | | | 1,078,070 | |
| | | | | |
| | 2,000 | | | Olathe, Kansas, Senior Living Facility Revenue Bonds, Catholic Care Campus Santa Marta, Series 2006A, 6.000%, 11/15/38 | | | | | 11/16 at 100.00 | | | | N/R | | | | 2,062,160 | |
| | | | | |
| | 2,685 | | | Overland Park Development Corporation, Kansas, Second Tier Revenue Bonds, Overland Park Convention Center, Series 2007B, 5.125%, 1/01/22 – AMBAC Insured | | | | | 1/17 at 100.00 | | | | BB+ | | | | 2,779,109 | |
| | | | | |
| | 1,200 | | | Overland Park Transportation Development District, Kansas, Sales Tax Revenue Bonds, Oak Park Mall Project, Series 2010, 5.900%, 4/01/32 | | | | | 4/20 at 100.00 | | | | BBB | | | | 1,346,988 | |
| | | | | |
| | 2,845 | | | Wyandotte County-Kansas City Unified Government, Kansas, Sales Tax Special Obligation Capital Appreciation Revenue Bonds Redevelopment Project Area B – Major Multi-Sport Athletic Complex Project, Subordinate Lien Series 2010B, 0.000%, 6/01/21 | | | | | No Opt. Call | | | | BBB+ | | | | 1,915,652 | |
| | | | | | | | | | | | | | | | | | |
Principal
Amount (000) | | | Description (1) | | | | Optional Call
Provisions (2) | | | Ratings (3) | | | Value | |
| | | | Kansas (continued) | | | | | | | | | | | | | | |
| | | | | |
| $ | 1,270 | | | Wyandotte County-Kansas City Unified Government, Kansas, Utility System Revenue Bonds, Refunding Series 2012A, 5.000%, 9/01/28 | | | | | 9/22 at 100.00 | | | | A+ | | | $ | 1,479,372 | |
| | 55,260 | | | Total Kansas | | | | | | | | | | | | | 63,278,894 | |
| | | | Kentucky – 0.8% | | | | | | | | | | | | | | |
| | | | | |
| | | | Kentucky Economic Development Finance Authority, Hospital Facilities Revenue Bonds, Owensboro Medical Health System, Series 2010A: | | | | | | | | | | | | | | |
| | 2,500 | | | 5.750%, 6/01/25 | | | | | 6/20 at 100.00 | | | | BBB+ | | | | 2,935,300 | |
| | 2,000 | | | 6.000%, 6/01/30 | | | | | 6/20 at 100.00 | | | | BBB+ | | | | 2,383,920 | |
| | | | | |
| | 1,500 | | | Kentucky Economic Development Finance Authority, Hospital Revenue Bonds, Baptist Healthcare System Obligated Group, Series 2009A, 5.375%, 8/15/24 | | | | | 8/19 at 100.00 | | | | AA– | | | | 1,759,050 | |
| | | | | |
| | 2,840 | | | Kentucky Economic Development Finance Authority, Hospital Revenue Bonds, Baptist Healthcare System Obligated Group, Tender Option Bond Trust 1068, 17.116%, 8/15/42 (IF) (5) | | | | | 8/21 at 100.00 | | | | AA– | | | | 3,871,573 | |
| | | | | |
| | 3,520 | | | Louisville and Jefferson County Metro Government, Kentucky, Health System Revenue Bonds, Norton Healthcare Inc, Series 2006, 5.250%, 10/01/36 | | | | | 10/16 at 100.00 | | | | A– | | | | 3,736,058 | |
| | | | | |
| | 1,405 | | | Louisville-Jefferson County Metropolitan Government, Kentucky, Health Facilities Revenue Bonds, Jewish Hospital & Saint Mary’s HealthCare Inc. Project, Series 2008, 6.125%, 2/01/37 (Pre-refunded 2/01/18) | | | | | 2/18 at 100.00 | | | | Aaa | | | | 1,758,723 | |
| | | | | |
| | 1,000 | | | Paducah, Kentucky, Electric Board Revenue Bonds, Series 2009A, 5.250%, 10/01/35 – AGC Insured | | | | | 4/19 at 100.00 | | | | A3 | | | | 1,112,290 | |
| | | | | |
| | 5,000 | | | Pikeville, Kentucky, Hospital Revenue Bonds, Pikeville Medical Center, Inc. Project, Improvement and Refunding Series 2011, 6.500%, 3/01/41 | | | | | 3/21 at 100.00 | | | | A3 | | | | 5,965,150 | |
| | 19,765 | | | Total Kentucky | | | | | | | | | | | | | 23,522,064 | |
| | | | Louisiana – 1.9% | | | | | | | | | | | | | | |
| | | | | |
| | 3,020 | | | Lafayette City and Parish, Louisiana, Utilities Revenue Bonds, Series 2004, 5.250%, 11/01/22 (Pre-refunded 11/01/14) – NPFG Insured | | | | | 11/14 at 100.00 | | | | A+ (4) | | | | 3,243,571 | |
| | | | | |
| | 1,000 | | | Louisiana Public Facilities Authority, Revenue Bonds, Belle Chasse Educational Foundation Project, Series 2011, 6.750%, 5/01/41 | | | | | 5/21 at 100.00 | | | | BBB | | | | 1,184,490 | |
| | | | | |
| | 3,605 | | | Louisiana Citizens Property Insurance Corporation, Assessment Revenue Bonds, Series 2006B, 5.000%, 6/01/21 – AMBAC Insured | | | | | 6/16 at 100.00 | | | | A– | | | | 3,950,720 | |
| | | | | |
| | 1,000 | | | Louisiana Local Government Environmental Facilities & Community Development Authority, Revenue Bonds, Westlake Chemical Corporation Project, Series 2007, 6.750%, 11/01/32 | | | | | 11/17 at 100.00 | | | | BBB– | | | | 1,144,610 | |
| | | | | |
| | 5,000 | | | Louisiana Local Government Environmental Facilities and Community Development Authority, Revenue Bonds, Southgate Suites Hotel LLC Project, Series 2007A, 6.750%, 12/15/37 (6) | | | | | 12/17 at 100.00 | | | | N/R | | | | 2,244,800 | |
| | | | | |
| | 2,000 | | | Louisiana Public Facilities Authority, Revenue Bonds, Christus Health, Refunding Series 2009A, 6.000%, 7/01/29 | | | | | 7/19 at 100.00 | | | | A+ | | | | 2,325,140 | |
| | | | | |
| | 1,365 | | | Louisiana Public Facilities Authority, Revenue Bonds, Christus Health, Series 2008B, 5.750%, 7/01/18 – AGC Insured | | | | | No Opt. Call | | | | AA– | | | | 1,460,414 | |
| | | | | |
| | 2,685 | | | Louisiana Public Facilities Authority, Hospital Revenue Bonds, Franciscan Missionaries of Our Lady Health System, Series 2005A, 5.250%, 8/15/31 | | | | | 8/15 at 100.00 | | | | A+ | | | | 2,787,164 | |
| | | | | |
| | 2,405 | | | Louisiana Public Facilities Authority, Revenue Bonds, Baton Rouge General Hospital, Series 2004, 5.250%, 7/01/24 (Pre-refunded 7/01/14) – NPFG Insured | | | | | 7/14 at 100.00 | | | | Baa2 (4) | | | | 2,536,722 | |
| | | | | |
| | 1,500 | | | Louisiana Public Facilities Authority, Revenue Bonds, Ochsner Clinic Foundation Project, Series 2007A, 5.250%, 5/15/38 | | | | | 5/17 at 100.00 | | | | Baa1 | | | | 1,579,320 | |
| | | | | |
| | 650 | | | Louisiana Stadium and Exposition District, Revenue Refunding Bonds, Senior Lien Series 2013A, 5.000%, 7/01/23 | | | | | No Opt. Call | | | | A | | | | 785,701 | |
| | | | | |
| | 10,000 | | | Louisiana State, Gasoline and Fuels Tax Revenue Bonds, Series 2006A, 4.750%, 5/01/39 – AGM Insured (UB) | | | | | 5/16 at 100.00 | | | | Aa1 | | | | 10,901,000 | |
| | | | | |
| | 10,000 | | | Louisiana State, General Obligation Bonds, Series 2012C, 5.000%, 7/15/21 | | | | | No Opt. Call | | | | AA | | | | 12,675,700 | |
Portfolio of Investments
Nuveen All-American Municipal Bond Fund (continued)
April 30, 2013
| | | | | | | | | | | | | | | | | | |
Principal
Amount (000) | | | Description (1) | | | | Optional Call
Provisions (2) | | | Ratings (3) | | | Value | |
| | | | Louisiana (continued) | | | | | | | | | | | | | | |
| | | | | |
| $ | 1,920 | | | Saint Charles Parish, Louisiana, Gulf Opportunity Zone Revenue Bonds, Valero Project, Series 2010, 4.000%, 12/01/40 (Mandatory put 6/01/22) | | | | | No Opt. Call | | | | BBB | | | $ | 2,126,419 | |
| | | | | |
| | 3,000 | | | St John Baptist Parish, Louisiana, Revenue Bonds, Marathon Oil Corporation, Series 2007A, 5.125%, 6/01/37 | | | | | 6/17 at 100.00 | | | | BBB | | | | 3,186,360 | |
| | | | | |
| | 4,135 | | | Tobacco Settlement Financing Corporation, Louisiana, Tobacco Settlement Asset-Backed Bonds, Series 2001B, 5.875%, 5/15/39 | | | | | 5/13 at 100.00 | | | | A– | | | | 4,157,784 | |
| | 53,285 | | | Total Louisiana | | | | | | | | | | | | | 56,289,915 | |
| | | | Maine – 0.7% | | | | | | | | | | | | | | |
| | | | | |
| | | | Maine Health and Higher Educational Facilities Authority, Revenue Bonds, Maine General Medical Center, Series 2011: | | | | | | | | | | | | | | |
| | 2,000 | | | 6.750%, 7/01/36 | | | | | 7/21 at 100.00 | | | | Baa3 | | | | 2,446,320 | |
| | 10,390 | | | 6.750%, 7/01/41 | | | | | 7/21 at 100.00 | | | | Baa3 | | | | 12,601,927 | |
| | | | | |
| | 1,665 | | | Maine Health and Higher Educational Facilities Authority, Revenue Bonds, Series 2010A, 5.000%, 7/01/40 | | | | | 7/20 at 100.00 | | | | AA | | | | 1,835,946 | |
| | | | | |
| | | | Portland, Maine, General Airport Revenue Bonds, Refunding Series 2013: | | | | | | | | | | | | | | |
| | 700 | | | 5.000%, 7/01/25 | | | | | 7/23 at 100.00 | | | | BBB+ | | | | 816,893 | |
| | 460 | | | 5.000%, 7/01/26 | | | | | 7/23 at 100.00 | | | | BBB+ | | | | 530,081 | |
| | 1,000 | | | 5.000%, 7/01/27 | | | | | 7/23 at 100.00 | | | | BBB+ | | | | 1,140,710 | |
| | 1,000 | | | 5.000%, 7/01/30 | | | | | 7/23 at 100.00 | | | | BBB+ | | | | 1,124,180 | |
| | 17,215 | | | Total Maine | | | | | | | | | | | | | 20,496,057 | |
| | | | Maryland – 1.2% | | | | | | | | | | | | | | |
| | | | | |
| | | | Baltimore, Maryland, Senior Lien Convention Center Hotel Revenue Bonds, Series 2006A: | | | | | | | | | | | | | | |
| | 1,050 | | | 5.250%, 9/01/27 – SYNCORA GTY Insured | | | | | 9/16 at 100.00 | | | | BB+ | | | | 1,082,445 | |
| | 1,750 | | | 5.250%, 9/01/28 – SYNCORA GTY Insured | | | | | 9/16 at 100.00 | | | | BB+ | | | | 1,798,580 | |
| | | | | |
| | 1,000 | | | Maryland Health and Higher Educational Facilities Authority, Revenue Bonds, Patterson Park Public Charter School Issue, Series 2010, 5.750%, 7/01/30 | | | | | 7/20 at 100.00 | | | | BBB– | | | | 1,063,300 | |
| | | | | |
| | | | Washington Suburban Sanitary District, Montgomery and Prince George’s Counties, Maryland, General Obligation Bonds, Consolidated Public Improvement, Series 2012: | | | | | | | | | | | | | | |
| | 12,500 | | | 5.000%, 6/01/19 | | | | | No Opt. Call | | | | AAA | | | | 15,502,250 | |
| | 12,500 | | | 5.000%, 6/01/20 | | | | | No Opt. Call | | | | AAA | | | | 15,793,375 | |
| | 28,800 | | | Total Maryland | | | | | | | | | | | | | 35,239,950 | |
| | | | Massachusetts – 1.4% | | | | | | | | | | | | | | |
| | | | | |
| | 275 | | | Massachusetts Development Finance Agency, Education Facility Revenue Bonds, Academy of the Pacific Rim Project, Series 2006A, 5.125%, 6/01/31 – ACA Insured | | | | | 6/16 at 100.00 | | | | N/R | | | | 277,288 | |
| | | | | |
| | 2,850 | | | Massachusetts Development Finance Agency, Health Care Facility Revenue Bonds, Adventcare Project, Series 2007A, 6.750%, 10/15/37 | | | | | 10/17 at 100.00 | | | | N/R | | | | 3,015,557 | |
| | | | | |
| | 6,750 | | | Massachusetts Development Finance Agency, Resource Recovery Revenue Refunding Bonds, Covanta Energy Project, Series 2012C, 5.250%, 11/01/42 (Alternative Minimum Tax) | | | | | 11/17 at 100.00 | | | | BB+ | | | | 6,990,435 | |
| | | | | |
| | 1,000 | | | Massachusetts Development Finance Agency, Senior Living Facility Revenue Bonds, The Groves in Lincoln Issue, Series 2009A, 7.875%, 6/01/44 (6) | | | | | 6/19 at 100.00 | | | | N/R | | | | 470,000 | |
| | | | | |
| | 260 | | | Massachusetts Development Finance Agency, Senior Living Facility Revenue Bonds, The Groves in Lincoln Issue, Series 2009B-2, 6.250%, 6/01/14 (6) | | | | | 6/13 at 100.00 | | | | N/R | | | | 130,000 | |
| | | | | |
| | 2,000 | | | Massachusetts Development Finance Authority, Revenue Bonds, 100 Cambridge Street Redevelopment, M/SRBC Project, Series 2002A, 5.125%, 2/01/34 – NPFG Insured | | | | | 7/13 at 100.00 | | | | A | | | | 2,000,220 | |
| | | | | |
| | 795 | | | Massachusetts Educational Financing Authority, Student Loan Revenue Bonds, Issue I Series 2010B, 5.500%, 1/01/23 | | | | | 1/20 at 100.00 | | | | AA | | | | 895,098 | |
| | | | | | | | | | | | | | | | | | |
Principal
Amount (000) | | | Description (1) | | | | Optional Call
Provisions (2) | | | Ratings (3) | | | Value | |
| | | | Massachusetts (continued) | | | | | | | | | | | | | | |
| | | | | |
| $ | 6,665 | | | Massachusetts Health and Education Facilities Authority, Revenue Bonds, Partners HealthCare System, Tender Option Bond Trust 3627, 13.576%, 7/01/29 (IF) | | | | | 7/19 at 100.00 | | | | AA | | | $ | 9,133,583 | |
| | | | | |
| | 4,700 | | | Massachusetts Health and Educational Facilities Authority Revenue Bonds, Quincy Medical Center Issue, Series 2008A, 6.250%, 1/15/28 (6) | | | | | 1/18 at 100.00 | | | | N/R | | | | 24,064 | |
| | | | | |
| | 500 | | | Massachusetts Health and Educational Facilities Authority, Revenue Bonds, Emerson Hospital, Series 2005E, 5.000%, 8/15/25 – RAAI Insured | | | | | 8/15 at 100.00 | | | | N/R | | | | 508,185 | |
| | | | | |
| | 1,000 | | | Massachusetts Health and Educational Facilities Authority, Revenue Bonds, UMass Memorial Health Care, Series 2005D, 5.000%, 7/01/33 | | | | | 7/15 at 100.00 | | | | A– | | | | 1,042,200 | |
| | | | | |
| | 4,550 | | | Massachusetts Health and Educational Facilities Authority, Revenue Refunding Bonds, Suffolk University Issue, Series 2009A, 5.750%, 7/01/39 | | | | | 7/19 at 100.00 | | | | BBB | | | | 5,147,097 | |
| | | | | |
| | | | Massachusetts Port Authority, Special Facilities Revenue Bonds, Delta Air Lines Inc., Series 2001A: | | | | | | | | | | | | | | |
| | 1,260 | | | 5.500%, 1/01/22 – AMBAC Insured (Alternative Minimum Tax) | | | | | 7/13 at 100.00 | | | | N/R | | | | 1,260,580 | |
| | 700 | | | 5.000%, 1/01/27 – AMBAC Insured (Alternative Minimum Tax) | | | | | 7/13 at 100.00 | | | | N/R | | | | 699,993 | |
| | | | | |
| | 8,000 | | | Massachusetts State, Special Obligation Dedicated Tax Revenue Bonds, Series 2004, 5.250%, 1/01/23 (Pre-refunded 1/01/14) – FGIC Insured | | | | | 1/14 at 100.00 | | | | A1 (4) | | | | 8,264,320 | |
| | | | | |
| | 2,335 | | | Massachusetts Water Pollution Abatement Trust, Pooled Loan Program Bonds, Tender Option Bond Trust 2989, 13.340%, 8/01/38 (IF) | | | | | 8/19 at 100.00 | | | | AAA | | | | 3,454,189 | |
| | 43,640 | | | Total Massachusetts | | | | | | | | | | | | | 43,312,809 | |
| | | | Michigan – 2.3% | | | | | | | | | | | | | | |
| | | | | |
| | 12,130 | | | Bay City, Bay County, Michigan, Unlimited Tax General Street Improvement Bonds, Series 1991, 0.000%, 6/01/21 – AMBAC Insured | | | | | No Opt. Call | | | | A+ | | | | 8,715,648 | |
| | | | | |
| | 8,575 | | | Charlotte Public School District, Easton County, Michigan, General Obligation Bonds, Series 2005, 5.000%, 5/01/29 – NPFG Insured | | | | | 5/15 at 100.00 | | | | Aa2 | | | | 9,184,768 | |
| | | | | |
| | 3,710 | | | Detroit Water and Sewerage Department, Michigan, Sewage Disposal System Revenue Bonds, Refunding Senior Lien Series 2012A, 5.250%, 7/01/39 | | | | | 7/22 at 100.00 | | | | A+ | | | | 4,055,401 | |
| | | | | |
| | 1,250 | | | Detroit, Michigan, Distributable State Aid General Obligation Bonds, Limited Tax Series 2010, 5.000%, 11/01/30 | | | | | 11/20 at 100.00 | | | | AA | | | | 1,386,263 | |
| | | | | |
| | 5,595 | | | Detroit, Michigan, Second Lien Sewerage Disposal System Revenue Bonds, Series 2005A, 5.000%, 7/01/35 – NPFG Insured | | | | | 7/15 at 100.00 | | | | A | | | | 5,658,224 | |
| | | | | |
| | 1,380 | | | HealthSource Saginaw, Inc., Saginaw County, Michigan, General Obligation Bonds, Refunding Series 2013, 4.000%, 5/01/29 | | | | | 5/22 at 100.00 | | | | Aa2 | | | | 1,453,057 | |
| | | | | |
| | 800 | | | Jackson County Hospital Finance Authority, Michigan, Hospital Revenue Bonds, W.A. Foote Memorial Hospital, Refunding Series 2006B-2, 5.000%, 6/01/27 – AGM Insured | | | | | 6/20 at 100.00 | | | | AA– | | | | 898,992 | |
| | | | | |
| | 7,665 | | | Kalamazoo Hospital Finance Authority, Michigan, Hospital Revenue Bonds, Bronson Methodist Hospital, Refunding Series 2003A, 5.000%, 5/15/26 – AGM Insured | | | | | 5/18 at 100.00 | | | | AA– | | | | 8,447,980 | |
| | | | | |
| | 3,040 | | | Kalkaska County Hospital Authority, Michigan, Hospital Revenue Bonds, Series 2007, 5.375%, 5/01/17 | | | | | No Opt. Call | | | | A– | | | | 3,361,176 | |
| | | | | |
| | 500 | | | Kent Hospital Finance Authority, Michigan, Revenue Bonds, Spectrum Health System, Series 2008A, 5.500%, 1/15/47 (Mandatory put 1/15/15) | | | | | No Opt. Call | | | | AA | | | | 543,210 | |
| | | | | |
| | | | Michigan Finance Authority, Public School Academy Limited Obligation Revenue and Refunding Bonds, Detroit Service Learning Academy Project, Series 2011: | | | | | | | | | | | | | | |
| | 750 | | | 6.000%, 10/01/21 | | | | | No Opt. Call | | | | BB+ | | | | 830,303 | |
| | 435 | | | 7.000%, 10/01/31 | | | | | 10/21 at 100.00 | | | | BB+ | | | | 502,577 | |
| | 1,000 | | | 7.000%, 10/01/36 | | | | | 10/21 at 100.00 | | | | BB+ | | | | 1,144,890 | |
| | | | | |
| | 915 | | | Michigan Finance Authority, Public School Academy Limited Obligation Revenue Bonds, Creative Montessori Academy Project, Series 2011, 6.125%, 5/01/21 | | | | | 5/18 at 100.00 | | | | BBB– | | | | 974,210 | |
| | | | | |
| | 2,000 | | | Michigan Finance Authority, Revenue Bonds, Oakwood Obligated Group, Refunding Series 2012, 5.000%, 11/01/32 | | | | | 11/22 at 100.00 | | | | A | | | | 2,231,320 | |
Portfolio of Investments
Nuveen All-American Municipal Bond Fund (continued)
April 30, 2013
| | | | | | | | | | | | | | | | | | |
Principal
Amount (000) | | | Description (1) | | | | Optional Call
Provisions (2) | | | Ratings (3) | | | Value | |
| | | | Michigan (continued) | | | | | | | | | | | | | | |
| | | | | |
| $ | 1,550 | | | Michigan Housing Development Authority, Rental Housing Revenue Bonds, Series 2010A, 5.000%, 10/01/35 | | | | | 10/20 at 100.00 | | | | AA | | | $ | 1,681,750 | |
| | | | | |
| | 1,250 | | | Michigan Public Educational Facilities Authority, Limited Obligation Revenue Bonds, Chandler Park Academy Project, Series 2008, 6.500%, 11/01/35 | | | | | 11/15 at 100.00 | | | | BBB | | | | 1,282,375 | |
| | | | | |
| | 1,370 | | | Michigan Public Educational Facilities Authority, Limited Obligation Revenue Bonds, David Ellis Academy-West Charter School Project, Series 2007, 5.875%, 6/01/37 | | | | | 6/17 at 100.00 | | | | N/R | | | | 1,385,508 | |
| | | | | |
| | | | Michigan State Building Authority, Revenue Refunding Bonds, Facilities Program, Series 2011-I-A: | | | | | | | | | | | | | | |
| | 750 | | | 5.375%, 10/15/41 | | | | | 10/21 at 100.00 | | | | Aa3 | | | | 864,930 | |
| | 2,000 | | | 5.500%, 10/15/45 | | | | | 10/21 at 100.00 | | | | Aa3 | | | | 2,320,000 | |
| | | | | |
| | | | Michigan State Hospital Finance Authority, Hospital Revenue Bonds, Henry Ford Health System, Refunding Series 2009: | | | | | | | | | | | | | | |
| | 500 | | | 5.625%, 11/15/29 | | | | | 11/19 at 100.00 | | | | A | | | | 578,230 | |
| | 1,480 | | | 5.750%, 11/15/39 | | | | | 11/19 at 100.00 | | | | A | | | | 1,688,488 | |
| | | | | |
| | 1,635 | | | Michigan State Hospital Finance Authority, Revenue Bonds, Trinity Health Care Group, Series 2006A, 5.000%, 12/01/31 | | | | | 12/16 at 100.00 | | | | AA | | | | 1,803,846 | |
| | | | | |
| | 370 | | | Michigan State Hospital Finance Authority, Revenue Bonds, Trinity Health Care Group, Series 2006A, 5.000%, 12/01/31 (Pre-refunded 12/01/16) | | | | | 12/16 at 100.00 | | | | Aa2 (4) | | | | 426,980 | |
| | | | | |
| | 6,010 | | | Royal Oak Hospital Finance Authority, Michigan, Hospital Revenue Bonds, William Beaumont Hospital, Refunding Series 2009V, 8.000%, 9/01/29 | | | | | 9/18 at 100.00 | | | | A1 | | | | 7,628,974 | |
| | 66,660 | | | Total Michigan | | | | | | | | | | | | | 69,049,100 | |
| | | | Minnesota – 1.2% | | | | | | | | | | | | | | |
| | | | | |
| | 1,000 | | | Duluth Housing & Redevelopment Authority, Minnesota, Lease Revenue Bonds, Duluth Public Schools Academy, Series 2010A, 5.875%, 11/01/40 | | | | | 11/20 at 100.00 | | | | BBB– | | | | 1,069,360 | |
| | | | | |
| | 1,000 | | | Faribault, Minnesota, Housing Revenue Bonds, Faribault Senior Living LLC Project, Series 2010, 7.000%, 5/01/45 | | | | | 5/18 at 102.00 | | | | N/R | | | | 1,074,160 | |
| | | | | |
| | 5,000 | | | Lakeville Independent School District 194, Dakota County, Minnesota, General Obligation Bonds, Refunding Series 2012D, 5.000%, 2/01/20 | | | | | No Opt. Call | | | | Aa2 | | | | 6,185,400 | |
| | | | | |
| | | | Minneapolis Health Care System, Minnesota, Revenue Bonds, Fairview Hospital and Healthcare Services, Series 2008A: | | | | | | | | | | | | | | |
| | 3,000 | | | 6.375%, 11/15/23 | | | | | 11/18 at 100.00 | | | | A | | | | 3,660,450 | |
| | 3,000 | | | 6.625%, 11/15/28 | | | | | 11/18 at 100.00 | | | | A | | | | 3,682,170 | |
| | | | | |
| | 3,000 | | | Minneapolis, Minnesota, Recovery Zone Facility Revenue Bonds, Mosaic Parking, LLC Project, Series 2010A, 8.500%, 1/01/41 | | | | | 1/21 at 100.00 | | | | N/R | | | | 3,249,240 | |
| | | | | |
| | 95 | | | Minnesota Agricultural and Economic Development Board, Healthcare System Revenue Bonds, Fairview Hospital and Healthcare Services, Series 2000A, 6.375%, 11/15/29 | | | | | 7/13 at 100.00 | | | | A | | | | 95,392 | |
| | | | | |
| | 2,995 | | | Monticello-Big Lake Community Hospital District, Minnesota, Gross Revenue Health Care Facilities Bonds, Series 2003C, 6.200%, 12/01/22 | | | | | 7/13 at 100.00 | | | | N/R | | | | 3,000,990 | |
| | | | | |
| | 1,000 | | | Shakopee, Minnesota, Health Care Facilities Revenue Bonds, Saint Francis Regional Medical Center, Series 2004, 5.250%, 9/01/34 | | | | | 9/14 at 100.00 | | | | A– | | | | 1,015,850 | |
| | | | | |
| | | | St. Paul Housing and Redevelopment Authority, Minnesota, Revenue Bonds, Healtheast Inc., Series 2005: | | | | | | | | | | | | | | |
| | 4,500 | | | 6.000%, 11/15/25 | | | | | 11/15 at 100.00 | | | | BBB– | | | | 4,870,125 | |
| | 4,000 | | | 6.000%, 11/15/30 | | | | | 11/15 at 100.00 | | | | BBB– | | | | 4,305,240 | |
| | 2,000 | | | 6.000%, 11/15/35 | | | | | 11/15 at 100.00 | | | | BBB– | | | | 2,146,000 | |
| | | | | |
| | 2,240 | | | Wayzata, Minnesota, Senior Housing Revenue Bonds, Folkestone Senior Living Community, Series 2012A, 6.000%, 5/01/47 | | | | | 5/19 at 102.00 | | | | N/R | | | | 2,474,282 | |
| | 32,830 | | | Total Minnesota | | | | | | | | | | | | | 36,828,659 | |
| | | | Mississippi – 0.2% | | | | | | | | | | | | | | |
| | | | | |
| | 975 | | | Mississippi Business Finance Corporation, Gulf Opportunity Zone Revenue Bonds, Roberts Hotel of Jackson, LLC Project, Series 2010, 8.500%, 2/01/30 (6) | | | | | 2/21 at 102.00 | | | | N/R | | | | 194,981 | |
| | | | | | | | | | | | | | | | | | |
Principal
Amount (000) | | | Description (1) | | | | Optional Call
Provisions (2) | | | Ratings (3) | | | Value | |
| | | | Mississippi (continued) | | | | | | | | | | | | | | |
| | | | | |
| $ | 1,000 | | | Mississippi Business Finance Corporation, Pollution Control Revenue Refunding Bonds, System Energy Resources Inc. Project, Series 1998, 5.875%, 4/01/22 | | | | | 10/13 at 100.00 | | | | BBB | | | $ | 1,003,130 | |
| | | | | |
| | 5,000 | | | Mississippi Development Bank, Special Obligation Bonds, Gulfport Water and Sewer System Project, Series 2005, 5.250%, 7/01/24 – AGM Insured | | | | | No Opt. Call | | | | AA– | | | | 5,892,700 | |
| | 6,975 | | | Total Mississippi | | | | | | | | | | | | | 7,090,811 | |
| | | | Missouri – 1.7% | | | | | | | | | | | | | | |
| | | | | |
| | 7,600 | | | Bi-State Development Agency of the Missouri-Illinois Metropolitan District, Mass Transit Sales Tax Appropriation Bonds, Metrolink Cross County Extension Project, Series 2002B, 5.000%, 10/01/23 – AGM Insured | | | | | 10/13 at 100.00 | | | | AA– | | | | 7,750,632 | |
| | | | | |
| | 3,185 | | | Bi-State Development Agency of the Missouri-Illinois Metropolitan District, Metro East Transit District of St. Clair County, Illinois, Metrolink Extension Project Refunding Revenue Bonds, Series 2006, 5.250%, 7/01/27 – AGM Insured | | | | | No Opt. Call | | | | AA– | | | | 4,051,639 | |
| | | | | |
| | 2,540 | | | Cole County Industrial Development Authority, Missouri, Revenue Bonds, Lutheran Senior Services – Heisinger Project, Series 2004, 5.500%, 2/01/35 | | | | | 2/14 at 100.00 | | | | BBB+ | | | | 2,566,772 | |
| | | | | |
| | 2,470 | | | Hanley Road Corridor Transportation Development District, Brentwood and Maplewood, Missouri, Transportation Sales Revenue Bonds, Refunding Series 2009A, 5.875%, 10/01/36 | | | | | 10/19 at 100.00 | | | | A– | | | | 2,754,989 | |
| | | | | |
| | 1,250 | | | Missouri Health and Educational Facilities Authority, Revenue Bonds, Lutheran Senior Services Projects, Series 2011, 6.000%, 2/01/41 | | | | | 2/21 at 100.00 | | | | BBB+ | | | | 1,421,838 | |
| | | | | |
| | 4,455 | | | Missouri Health and Educational Facilities Authority, Revenue Bonds, Washington University, Tender Option Bond Trust 3604, 13.781%, 5/15/17 (IF) | | | | | No Opt. Call | | | | AAA | | | | 6,934,430 | |
| | | | | |
| | | | Saint Louis Municipal Finance Corporation, Missouri, Leasehold Revenue Bonds, Convention Center, Series 2010A: | | | | | | | | | | | | | | |
| | 5,000 | | | 0.000%, 7/15/31 – AGC Insured | | | | | No Opt. Call | | | | AA– | | | | 2,285,900 | |
| | 7,000 | | | 0.000%, 7/15/32 – AGC Insured | | | | | No Opt. Call | | | | AA– | | | | 3,036,950 | |
| | 6,250 | | | 0.000%, 7/15/33 – AGC Insured | | | | | No Opt. Call | | | | AA– | | | | 2,575,750 | |
| | 7,000 | | | 0.000%, 7/15/34 – AGC Insured | | | | | No Opt. Call | | | | AA– | | | | 2,698,710 | |
| | 6,000 | | | 0.000%, 7/15/35 – AGC Insured | | | | | No Opt. Call | | | | AA– | | | | 2,192,400 | |
| | 2,000 | | | 0.000%, 7/15/36 – AGC Insured | | | | | No Opt. Call | | | | AA– | | | | 693,680 | |
| | | | | |
| | | | Saint Louis, Missouri, Airport Revenue Bonds, Lambert-St. Louis International Airport, Refunding Series 2012A: | | | | | | | | | | | | | | |
| | 1,000 | | | 4.250%, 7/01/27 – FGIC Insured (Alternative Minimum Tax) | | | | | 7/22 at 100.00 | | | | A– | | | | 1,038,850 | |
| | 1,610 | | | 5.000%, 7/01/28 – FGIC Insured (Alternative Minimum Tax) | | | | | 7/22 at 100.00 | | | | A– | | | | 1,774,703 | |
| | | | | |
| | 1,729 | | | Saint Louis, Missouri, Tax Increment Financing Revenue Bonds, Fashion Square Redevelopment Project, Series 2008A, 6.300%, 8/22/26 | | | | | 9/13 at 100.00 | | | | N/R | | | | 1,664,093 | |
| | | | | |
| | 1,437 | | | Saint Louis, Missouri, Tax Increment Financing Revenue Notes, Marquette Building Redevelopment Project, Series 2008-A, 6.500%, 1/23/28 | | | | | 7/13 at 100.00 | | | | N/R | | | | 1,072,764 | |
| | | | | |
| | 5,250 | | | Saint Louis County Industrial Development Authority, Missouri, Revenue Bonds, Friendship Village of Chesterfield, Series 2012, 5.000%, 9/01/42 | | | | | No Opt. Call | | | | BBB– | | | | 5,271,053 | |
| | 65,776 | | | Total Missouri | | | | | | | | | | | | | 49,785,153 | |
| | | | Montana – 0.2% | | | | | | | | | | | | | | |
| | | | | |
| | 2,500 | | | Forsyth, Rosebud County, Montana, Pollution Control Revenue Refunding Bonds, Northwestern Corporation Colstrip Project, Series 2006, 4.650%, 8/01/23 – AMBAC Insured | | | | | 8/16 at 100.00 | | | | A2 | | | | 2,736,525 | |
| | | | | |
| | 1,000 | | | Montana Board of Housing, Single Family Homeownership Bonds, Series 2012A-1, 3.400%, 12/01/27 | | | | | 6/22 at 100.00 | | | | Aa3 | | | | 1,020,240 | |
| | | | | |
| | 2,500 | | | Montana Facilities Finance Authority, Revenue Bonds, Saint John’s Lutheran Ministries Project, Series 2006A, 6.125%, 5/15/36 | | | | | 5/16 at 100.00 | | | | N/R | | | | 2,587,475 | |
| | 6,000 | | | Total Montana | | | | | | | | | | | | | 6,344,240 | |
Portfolio of Investments
Nuveen All-American Municipal Bond Fund (continued)
April 30, 2013
| | | | | | | | | | | | | | | | | | |
Principal
Amount (000) | | | Description (1) | | | | Optional Call
Provisions (2) | | | Ratings (3) | | | Value | |
| | | | Nebraska – 0.5% | | | | | | | | | | | | | | |
| | | | | |
| $ | 6,000 | | | Central Plains Energy Project, Nebraska, Gas Project 3 Revenue Bonds, Series 2012, 5.000%, 9/01/42 | | | | | 9/22 at 100.00 | | | | A | | | $ | 6,496,620 | |
| | | | | |
| | 1,320 | | | Municipal Energy Agency of Nebraska, Power Supply System Revenue Bonds, Refunding Series 2012A, 5.000%, 4/01/32 | | | | | 4/22 at 100.00 | | | | A | | | | 1,523,557 | |
| | | | | |
| | 3,000 | | | Municipal Energy Agency of Nebraska, Power Supply System Revenue Bonds, Refunding Series 2013A, 4.000%, 4/01/36 | | | | | 4/23 at 100.00 | | | | A | | | | 3,098,010 | |
| | | | | |
| | 2,750 | | | Nebraska Public Power District, General Revenue Bonds, Series 2008B, 5.000%, 1/01/20 | | | | | 1/18 at 100.00 | | | | A1 | | | | 3,188,488 | |
| | | | | |
| | 1,000 | | | Omaha, Nebraska, General Obligation Bonds, Refunding Series 2011, 4.125%, 11/15/31 | | | | | 11/21 at 100.00 | | | | AAA | | | | 1,109,250 | |
| | 14,070 | | | Total Nebraska | | | | | | | | | | | | | 15,415,925 | |
| | | | Nevada – 0.6% | | | | | | | | | | | | | | |
| | | | | |
| | 80 | | | Clark County, Nevada, Industrial Development Revenue Bonds, Southwest Gas Corporation, Senior Lien Series 2006A, 4.750%, 9/01/36 – FGIC Insured (Alternative Minimum Tax) | | | | | 9/16 at 100.00 | | | | A– | | | | 83,362 | |
| | | | | |
| | 2,000 | | | Clark County, Nevada, Passenger Facility Charge Revenue Bonds, Las Vegas-McCarran International Airport, Series 2010A, 5.000%, 7/01/30 | | | | | 1/20 at 100.00 | | | | A+ | | | | 2,257,480 | |
| | | | | |
| | 2,000 | | | Clark County, Nevada, Subordinate Lien Airport Revenue Bonds, Series 2004A-2, 5.125%, 7/01/25 – FGIC Insured | | | | | 7/14 at 100.00 | | | | A+ | | | | 2,096,980 | |
| | | | | |
| | 2,100 | | | Henderson Redevelopment Agency, Nevada, Senior Lien Tax Allocation Bonds, Series 2002A, 5.250%, 10/01/25 – AMBAC Insured | | | | | 10/13 at 100.00 | | | | BBB+ | | | | 2,107,938 | |
| | | | | |
| | | | Las Vegas Redevelopment Agency, Nevada, Tax Increment Revenue Bonds, Series 2009A: | | | | | | | | | | | | | | |
| | 2,000 | | | 7.500%, 6/15/23 | | | | | 6/19 at 100.00 | | | | BBB– | | | | 2,296,040 | |
| | 1,500 | | | 8.000%, 6/15/30 | | | | | 6/19 at 100.00 | | | | BBB– | | | | 1,719,465 | |
| | | | | |
| | 2,500 | | | Las Vegas Valley Water District, Nevada, Limited Tax General Obligation Bonds, Water & Refunding Series 2011C, 5.000%, 6/01/38 | | | | | 6/21 at 100.00 | | | | AA+ | | | | 2,811,675 | |
| | | | | |
| | | | Sparks Local Improvement District 3, Legends at Sparks Marina, Nevada, Limited Obligation Improvement Bonds, Series 2008: | | | | | | | | | | | | | | |
| | 1,105 | | | 6.500%, 9/01/20 | | | | | 9/18 at 100.00 | | | | N/R | | | | 1,178,505 | |
| | 1,900 | | | 6.750%, 9/01/27 | | | | | 9/18 at 100.00 | | | | N/R | | | | 1,982,517 | |
| | | | | |
| | 410 | | | Washoe County, Nevada, General Obligation Bonds, Reno-Sparks Convention & Visitors Authority, Refunding Series 2011, 5.000%, 7/01/32 | | | | | 7/21 at 100.00 | | | | AA | | | | 460,943 | |
| | 15,595 | | | Total Nevada | | | | | | | | | | | | | 16,994,905 | |
| | | | New Hampshire – 0.4% | | | | | | | | | | | | | | |
| | | | | |
| | 3,500 | | | New Hampshire Business Finance Authority, Solid Waste Disposal Revenue Bonds, Waste Management Inc. Project, Series 2002, 5.200%, 5/01/27 (Alternative Minimum Tax) | | | | | 5/16 at 101.00 | | | | BBB | | | | 3,825,535 | |
| | | | | |
| | 800 | | | New Hampshire Health and Education Facilities Authority, Hospital Revenue Bonds, Speare Memorial Hospital, Series 2004, 5.875%, 7/01/34 (Pre-refunded 7/01/15) | | | | | 7/15 at 100.00 | | | | BBB– (4) | | | | 892,752 | |
| | | | | |
| | 1,250 | | | New Hampshire Health and Education Facilities Authority, Revenue Bonds, Covenant Health Systems Obligated Group Issue, Series 2004, 5.375%, 7/01/24 | | | | | 7/14 at 100.00 | | | | A | | | | 1,282,938 | |
| | | | | |
| | 3,305 | | | New Hampshire Health and Education Facilities Authority, Revenue Bonds, Dartmouth College, Tender Option Bond Trust 09-7W, 14.388%, 6/01/39 (IF) (5) | | | | | 6/19 at 100.00 | | | | AA+ | | | | 5,008,728 | |
| | | | | |
| | 955 | | | New Hampshire Health and Education Facilities Authority, Revenue Bonds, Elliot Hospital, Refunding Series 2003B, 5.600%, 10/01/22 | | | | | 10/13 at 100.00 | | | | Baa1 | | | | 1,027,360 | |
| | 9,810 | | | Total New Hampshire | | | | | | | | | | | | | 12,037,313 | |
| | | | New Jersey – 2.3% | | | | | | | | | | | | | | |
| | | | | |
| | 1,335 | | | Manalapan-Englishtown Regional Board of Education, New Jersey, General Obligation Bonds, Series 2004, 5.750%, 12/01/21 – FGIC Insured | | | | | No Opt. Call | | | | Aa3 | | | | 1,782,412 | |
| | | | | | | | | | | | | | | | | | |
Principal
Amount (000) | | | Description (1) | | | | Optional Call
Provisions (2) | | | Ratings (3) | | | Value | |
| | | | New Jersey (continued) | | | | | | | | | | | | | | |
| | | | | |
| | | | New Jersey Economic Development Authority, Revenue Bonds, Motor Vehicle Surcharge, Series 2004A: | | | | | | | | | | | | | | |
| $ | 1,775 | | | 5.000%, 7/01/22 – NPFG Insured | | | | | 7/14 at 100.00 | | | | A | | | $ | 1,863,200 | |
| | 1,775 | | | 5.000%, 7/01/23 – NPFG Insured | | | | | 7/14 at 100.00 | | | | A | | | | 1,863,200 | |
| | | | | |
| | 1,000 | | | New Jersey Economic Development Authority, Special Facilities Revenue Bonds, Continental Airlines Inc., Series 1999, 5.125%, 9/15/23 (Alternative Minimum Tax) | | | | | 9/13 at 100.00 | | | | B | | | | 1,053,850 | |
| | | | | |
| | 1,650 | | | New Jersey Economic Development Authority, Special Facilities Revenue Bonds, Continental Airlines Inc., Series 1999, 5.250%, 9/15/29 (Alternative Minimum Tax) | | | | | 8/24 at 100.00 | | | | B | | | | 1,738,572 | |
| | | | | |
| | 835 | | | New Jersey Economic Development Authority, Student Housing Revenue Bonds, Provident Group-Montclair Properties LLC, Montclair State University Student Housing Project, Series 2010A, 5.750%, 6/01/31 | | | | | 6/20 at 100.00 | | | | Baa3 | | | | 956,200 | |
| | | | | |
| | | | New Jersey Educational Facilities Authority, Revenue Refunding Bonds, University of Medicine and Dentistry of New Jersey, Series 2009B: | | | | | | | | | | | | | | |
| | 2,010 | | | 6.250%, 12/01/18 | | | | | No Opt. Call | | | | A– | | | | 2,435,256 | |
| | 600 | | | 7.500%, 12/01/32 | | | | | 6/19 at 100.00 | | | | A– | | | | 747,456 | |
| | | | | |
| | 1,335 | | | New Jersey Higher Education Assistance Authority, Student Loan Revenue Bonds, Tender Option Bond Trust PA-4643, 19.910%, 6/01/30 (IF) (5) | | | | | 6/19 at 100.00 | | | | AA | | | | 2,019,054 | |
| | | | | |
| | | | New Jersey Transportation Trust Fund Authority, Transportation System Bonds, Refunding Series 2006A: | | | | | | | | | | | | | | |
| | 2,150 | | | 5.250%, 12/15/20 | | | | | No Opt. Call | | | | A+ | | | | 2,669,741 | |
| | 7,000 | | | 5.500%, 12/15/23 | | | | | No Opt. Call | | | | A+ | | | | 9,000,390 | |
| | | | | |
| | | | New Jersey Transportation Trust Fund Authority, Transportation System Bonds, Series 2013A: | | | | | | | | | | | | | | |
| | 7,000 | | | 5.000%, 12/15/19 | | | | | No Opt. Call | | | | A+ | | | | 8,525,440 | |
| | 11,000 | | | 5.000%, 6/15/20 | | | | | No Opt. Call | | | | A+ | | | | 13,382,820 | |
| | | | | |
| | | | New Jersey Turnpike Authority, Revenue Bonds, Series 2005A: | | | | | | | | | | | | | | |
| | 3,000 | | | 5.000%, 1/01/21 – AGM Insured | | | | | 1/15 at 100.00 | | | | AA– | | | | 3,220,230 | |
| | 3,315 | | | 5.000%, 1/01/25 – AGM Insured | | | | | 1/15 at 100.00 | | | | AA– | | | | 3,539,956 | |
| | 3,150 | | | 5.250%, 1/01/26 – AGM Insured | | | | | No Opt. Call | | | | AA– | | | | 4,001,067 | |
| | | | | |
| | 1,000 | | | Newark Housing Authority, New Jersey, City-Secured Police Facility Revenue Bonds, South Ward Police Facility, Series 2009A, 5.750%, 12/01/30 – AGC Insured | | | | | 12/19 at 100.00 | | | | A3 | | | | 1,175,290 | |
| | | | | |
| | 3,470 | | | North Hudson Sewerage Authority, New Jersey, Gross Revenue Senior Lien Lease Certificates, Series 2012A, 5.000%, 6/01/23 | | | | | 6/22 at 100.00 | | | | A | | | | 4,218,375 | |
| | | | | |
| | 2,000 | | | Passaic Valley Water Commission, New Jersey, Water System Revenue Bonds, Series 2003, 5.000%, 12/15/19 – AGM Insured | | | | | No Opt. Call | | | | AA– | | | | 2,441,480 | |
| | | | | |
| | | | Tobacco Settlement Financing Corporation, New Jersey, Tobacco Settlement Asset-Backed Bonds, Series 2007-1A: | | | | | | | | | | | | | | |
| | 805 | | | 4.625%, 6/01/26 | | | | | 6/17 at 100.00 | | | | B1 | | | | 783,845 | |
| | 2,000 | | | 4.750%, 6/01/34 | | | | | 6/17 at 100.00 | | | | B2 | | | | 1,761,780 | |
| | 58,205 | | | Total New Jersey | | | | | | | | | | | | | 69,179,614 | |
| | | | New Mexico – 0.5% | | | | | | | | | | | | | | |
| | | | | |
| | 4,790 | | | Clayton, New Mexico, Appropriation Debt, Jail Project, Series 2006, 4.650%, 11/01/29 – CIFG Insured | | | | | 11/16 at 100.00 | | | | BBB+ | | | | 4,864,341 | |
| | | | | |
| | 1,415 | | | New Mexico Hospital Equipment Loan Council, First Mortgage Revenue Bonds, Haverland Carter Lifestyle Group, Series 2013, 5.000%, 7/01/32 | | | | | 7/22 at 100.00 | | | | BBB– | | | | 1,456,870 | |
| | | | | |
| | 3,000 | | | New Mexico Hospital Equipment Loan Council, First Mortgage Revenue Bonds, La Vida Llena Project, Series 2010A, 5.875%, 7/01/30 | | | | | 7/20 at 100.00 | | | | BBB– | | | | 3,249,210 | |
| | | | | |
| | 955 | | | The Trails Public Improvement District, Albuquerque, New Mexico, Special Levy Revenue Bonds, Series 2008, 7.500%, 10/01/18 | | | | | No Opt. Call | | | | N/R | | | | 1,042,468 | |
| | | | | |
| | 4,230 | | | University of New Mexico, FHA-Insured Hospital Mortgage Revenue Bonds, University of Mexico Hospital Project, Series 2004, 5.000%, 7/01/23 – AGM Insured | | | | | 7/14 at 100.00 | | | | AA– | | | | 4,402,415 | |
| | 14,390 | | | Total New Mexico | | | | | | | | | | | | | 15,015,304 | |
Portfolio of Investments
Nuveen All-American Municipal Bond Fund (continued)
April 30, 2013
| | | | | | | | | | | | | | | | | | |
Principal
Amount (000) | | | Description (1) | | | | Optional Call
Provisions (2) | | | Ratings (3) | | | Value | |
| | | | New York – 4.4% | | | | | | | | | | | | | | |
| | | | | |
| | | | Brooklyn Arena Local Development Corporation, New York, Payment in Lieu of Taxes Revenue Bonds, Barclays Center Project, Series 2009: | | | | | | | | | | | | | | |
| $ | 1,100 | | | 6.000%, 7/15/30 | | | | | 1/20 at 100.00 | | | | BBB– | | | $ | 1,314,236 | |
| | 7,745 | | | 6.375%, 7/15/43 | | | | | 1/20 at 100.00 | | | | BBB– | | | | 9,267,125 | |
| | | | | |
| | 1,880 | | | Dormitory Authority of the State of New York, FHA-Insured Mortgage Revenue Bonds, Montefiore Hospital, Series 2004, 5.000%, 8/01/23 – FGIC Insured | | | | | 2/15 at 100.00 | | | | N/R | | | | 2,006,844 | |
| | | | | |
| | 4,955 | | | Dormitory Authority of the State of New York, Revenue Bonds, New School University, Series 2010, 5.500%, 7/01/43 – AGM Insured | | | | | 7/20 at 100.00 | | | | AA– | | | | 5,654,151 | |
| | | | | |
| | 10,000 | | | Dormitory Authority of the State of New York, State Personal Income Tax Revenue Bonds, General Purpose Series 2011C, 5.000%, 3/15/24 | | | | | 3/21 at 100.00 | | | | AAA | | | | 12,151,900 | |
| | | | | |
| | 1,665 | | | Dormitory Authority of the State of New York, State Personal Income Tax Revenue Bonds, Series 2005F, 5.000%, 3/15/24 – AMBAC Insured | | | | | 3/15 at 100.00 | | | | AAA | | | | 1,804,277 | |
| | | | | |
| | | | Dormitory Authority of the State of New York, State Personal Income Tax Revenue Bonds, Tender Option Bond Trust 3518: | | | | | | | | | | | | | | |
| | 2,000 | | | 13.366%, 2/15/33 (IF) | | | | | 2/19 at 100.00 | | | | AAA | | | | 2,906,900 | |
| | 2,335 | | | 13.355%, 2/15/33 (IF) | | | | | 2/19 at 100.00 | | | | AAA | | | | 3,392,825 | |
| | | | | |
| | 400 | | | Hudson Yards Infrastructure Corporation, New York, Revenue Bonds, Senior Fiscal 2012 Series 2011A, 5.750%, 2/15/47 | | | | | 2/21 at 100.00 | | | | A | | | | 475,664 | |
| | | | | |
| | 4,055 | | | Hudson Yards Infrastructure Corporation, New York, Revenue Bonds, Series 2006A, 4.500%, 2/15/47 – NPFG Insured | | | | | 2/17 at 100.00 | | | | A | | | | 4,196,479 | |
| | | | | |
| | 4,000 | | | Liberty Development Corporation, New York, Goldman Sachs Headquarter Revenue Bonds, Series 2005, 5.250%, 10/01/35 | | | | | No Opt. Call | | | | A | | | | 4,758,640 | |
| | | | | |
| | 3,000 | | | Long Island Power Authority, New York, Electric System Revenue Bonds, Series 2008A, 6.000%, 5/01/33 | | | | | 5/19 at 100.00 | | | | A | | | | 3,636,840 | |
| | | | | |
| | | | Long Island Power Authority, New York, Electric System Revenue Bonds, Series 2011A: | | | | | | | | | | | | | | |
| | 1,000 | | | 5.000%, 5/01/36 – AGM Insured | | | | | 5/21 at 100.00 | | | | AA– | | | | 1,118,340 | |
| | 1,980 | | | 5.000%, 5/01/38 | | | | | 5/21 at 100.00 | | | | A | | | | 2,180,653 | |
| | | | | |
| | 4,600 | | | Metropolitan Transportation Authority, New York, Transportation Revenue Bonds, Series 2005F, 5.000%, 11/15/30 | | | | | 11/15 at 100.00 | | | | A | | | | 4,962,894 | |
| | | | | |
| | 9,190 | | | Metropolitan Transportation Authority, New York, Transportation Revenue Bonds, Series 2012D, 4.000%, 11/15/32 | | | | | 11/22 at 100.00 | | | | A | | | | 9,544,734 | |
| | | | | |
| | | | New York City Industrial Development Agency, New York, Civic Facility Revenue Bonds, Bronx Parking Development Company, LLC Project, Series 2007: | | | | | | | | | | | | | | |
| | 3,000 | | | 5.750%, 10/01/37 (7) | | | | | 10/17 at 100.00 | | | | N/R | | | | 1,273,350 | |
| | 1,000 | | | 5.875%, 10/01/46 (8) | | | | | 10/17 at 102.00 | | | | N/R | | | | 424,370 | |
| | | | | |
| | 1,000 | | | New York City Industrial Development Agency, New York, Liberty Revenue Bonds, IAC/InterActiveCorp, Series 2005, 5.000%, 9/01/35 | | | | | 9/15 at 100.00 | | | | BBB | | | | 1,041,080 | |
| | | | | |
| | 715 | | | New York City Industrial Development Agency, New York, Revenue Bonds, Yankee Stadium Project PILOT, Series 2009A, 7.000%, 3/01/49 – AGC Insured | | | | | 3/19 at 100.00 | | | | AA– | | | | 882,775 | |
| | | | | |
| | 1,500 | | | New York City Industrial Development Agency, New York, Special Facilities Revenue Bonds, British Airways PLC, Series 1998, 5.250%, 12/01/32 (Alternative Minimum Tax) | | | | | 6/13 at 100.00 | | | | BB | | | | 1,500,030 | |
| | | | | |
| | 1,000 | | | New York City Municipal Water Finance Authority, New York, Water and Sewerage System Revenue Bonds, Tender Option Bond Trust 3484, 17.982%, 6/15/33 (IF) | | | | | 6/19 at 100.00 | | | | AA+ | | | | 1,524,240 | |
| | | | | |
| | 5,000 | | | New York City, New York, General Obligation Bonds, Fiscal Series 2005M, 5.000%, 4/01/26 – FGIC Insured | | | | | 4/15 at 100.00 | | | | AA | | | | 5,421,750 | |
| | | | | |
| | 5 | | | New York City, New York, General Obligation Bonds, Series 1991B, 7.000%, 2/01/18 – AMBAC Insured | | | | | 7/13 at 100.00 | | | | AA | | | | 5,029 | |
| | | | | | | | | | | | | | | | | | |
Principal
Amount (000) | | | Description (1) | | | | Optional Call
Provisions (2) | | | Ratings (3) | | | Value | |
| | | | New York (continued) | | | | | | | | | | | | | | |
| | | | | |
| | | | New York Liberty Development Corporation, Liberty Revenue Bonds, 4 World Trade Center Project, Series 2011: | | | | | | | | | | | | | | |
| $ | 1,665 | | | 5.000%, 11/15/31 | | | | | 11/21 at 100.00 | | | | A+ | | | $ | 1,908,173 | |
| | 11,560 | | | 5.000%, 11/15/44 | | | | | 11/21 at 100.00 | | | | A+ | | | | 12,727,444 | |
| | | | | |
| | 10,000 | | | New York State Environmental Facilities Corporation, State Clean Water and Drinking Water Revolving Funds Revenue Bonds, New York City Municipal Water Finance Authority Projects, Second Resolution Series 2012D, 5.000%, 6/15/22 | | | | | No Opt. Call | | | | AAA | | | | 12,847,000 | |
| | | | | |
| | 1,035 | | | New York State Thruway Authority, Highway and Bridge Trust Fund Bonds, Second General, Series 2005B, 5.000%, 4/01/24 – AMBAC Insured | | | | | 10/15 at 100.00 | | | | AA | | | | 1,137,506 | |
| | | | | |
| | 2,125 | | | New York State Urban Development Corporation, Special Project Revenue Bonds, University Facilities Grants, Series 1995, 5.500%, 1/01/19 | | | | | No Opt. Call | | | | AA– | | | | 2,541,585 | |
| | | | | |
| | | | New York State Urban Development Corporation, State Personal Income Tax Revenue Bonds, Series 2004A-1: | | | | | | | | | | | | | | |
| | 2,655 | | | 5.000%, 3/15/24 (Pre-refunded 3/15/14) – FGIC Insured | | | | | 3/14 at 100.00 | | | | AAA | | | | 2,762,501 | |
| | 1,515 | | | 5.000%, 3/15/25 (Pre-refunded 3/15/14) – FGIC Insured | | | | | 3/14 at 100.00 | | | | AAA | | | | 1,576,342 | |
| | 1,000 | | | 5.000%, 3/15/26 (Pre-refunded 3/15/14) – FGIC Insured | | | | | 3/14 at 100.00 | | | | AAA | | | | 1,040,490 | |
| | | | | |
| | 5,000 | | | New York State Urban Development Corporation, State Personal Income Tax Revenue Bonds, Series 2011A, 5.000%, 3/15/20 | | | | | No Opt. Call | | | | AAA | | | | 6,214,550 | |
| | | | | |
| | 3,500 | | | Niagara Area Development Corporation, New York, Solid Waste Disposal Facility Revenue Refunding Bonds, Covanta Energy Project, Series 2012A, 5.250%, 11/01/42 | | | | | No Opt. Call | | | | BB+ | | | | 3,642,800 | |
| | | | | |
| | 795 | | | Port Authority of New York and New Jersey, Special Project Bonds, JFK International Air Terminal LLC Project, Eighth Series 2010, 6.000%, 12/01/42 | | | | | 12/20 at 100.00 | | | | BBB– | | | | 933,155 | |
| | | | | |
| | 1,170 | | | Suffolk County Economic Development Corporation, New York, Revenue Refunding Bonds, Peconic Landing At Southold, Inc. Project, Series 2010, 5.875%, 12/01/30 | | | | | 12/20 at 100.00 | | | | BBB– | | | | 1,319,210 | |
| | | | | |
| | 560 | | | Tobacco Settlement Financing Corporation, New York, Asset-Backed Revenue Bonds, State Contingency Contract Secured, Series 2011B, 5.000%, 6/01/18 | | | | | No Opt. Call | | | | AA– | | | | 668,310 | |
| | | | | |
| | 1,400 | | | Troy Capital Resource Corporation, New York, Revenue Bonds, Rensselaer Polytechnic Institute, Series 2010B, 5.000%, 9/01/20 | | | | | No Opt. Call | | | | A– | | | | 1,701,336 | |
| | 117,105 | | | Total New York | | | | | | | | | | | | | 132,465,528 | |
| | | | North Carolina – 0.8% | | | | | | | | | | | | | | |
| | | | | |
| | 2,000 | | | Buncombe County, North Carolina, Project Development Financing Revenue Bonds, Woodfin Downtown Corridor Development, Series 2008, 6.750%, 8/01/24 | | | | | 8/18 at 100.00 | | | | N/R | | | | 1,993,500 | |
| | | | | |
| | 1,780 | | | Charlotte, North Carolina, Water and Sewer System Refunding Bonds, Tender Option Bond Trust 43W, 13.763%, 7/01/38 (IF) (5) | | | | | 7/20 at 100.00 | | | | AAA | | | | 2,584,631 | |
| | | | | |
| | 3,880 | | | Columbus County Industrial Facilities and Pollution Control Financing Authority, North Carolina, Environmental Improvement Revenue Bonds, International Paper Company Project, Series 2007A, 4.625%, 3/01/27 | | | | | 3/17 at 100.00 | | | | BBB | | | | 4,085,834 | |
| | | | | |
| | | | North Carolina Capital Facilities Financing Agency, Revenue Bonds, Duke University, Series 2008, Tender Option Bonds Trust 3248: | | | | | | | | | | | | | | |
| | 1,920 | | | 27.037%, 10/01/21 (IF) | | | | | 10/16 at 100.00 | | | | AA+ | | | | 4,163,098 | |
| | 585 | | | 27.253%, 10/01/34 (IF) | | | | | 10/15 at 100.00 | | | | AA+ | | | | 1,174,850 | |
| | | | | |
| | 1,000 | | | North Carolina Eastern Municipal Power Agency, Power System Revenue Bonds, Series 2008C, 6.750%, 1/01/24 | | | | | 1/19 at 100.00 | | | | A– | | | | 1,247,130 | |
| | | | | |
| | 1,000 | | | North Carolina Eastern Municipal Power Agency, Power System Revenue Refunding Bonds, Series 1993B, 6.000%, 1/01/22 – FGIC Insured | | | | | No Opt. Call | | | | Baa1 | | | | 1,302,540 | |
| | | | | |
| | | | North Carolina Medical Care Commission, Health Care Facilities Revenue Bonds, Lutheran Services for the Aging, Series 2012A: | | | | | | | | | | | | | | |
| | 1,000 | | | 5.000%, 3/01/37 | | | | | No Opt. Call | | | | N/R | | | | 1,022,520 | |
| | 1,000 | | | 5.000%, 3/01/42 | | | | | No Opt. Call | | | | N/R | | | | 1,019,610 | |
Portfolio of Investments
Nuveen All-American Municipal Bond Fund (continued)
April 30, 2013
| | | | | | | | | | | | | | | | | | |
Principal
Amount (000) | | | Description (1) | | | | Optional Call
Provisions (2) | | | Ratings (3) | | | Value | |
| | | | North Carolina (continued) | | | | | | | | | | | | | | |
| | | | | |
| $ | 1,580 | | | North Carolina Medical Care Commission, Health Care Facilities Revenue Bonds, Presbyterian Homes, Series 2006B, 5.200%, 10/01/21 | | | | | 10/16 at 100.00 | | | | N/R | | | $ | 1,668,685 | |
| | | | | |
| | 1,160 | | | North Carolina Medical Care Commission, Health Care Facilities Revenue Refunding Bonds, Cape Fear Valley Health System, Series 2012A, 5.000%, 10/01/24 | | | | | 10/22 at 100.00 | | | | A– | | | | 1,360,286 | |
| | | | | |
| | 2,000 | | | North Carolina Turnpike Authority, Triangle Expressway System Revenue Bonds, Series 2009A, 5.750%, 1/01/39 – AGC Insured | | | | | 1/19 at 100.00 | | | | AA– | | | | 2,314,600 | |
| | 18,905 | | | Total North Carolina | | | | | | | | | | | | | 23,937,284 | |
| | | | North Dakota – 0.7% | | | | | | | | | | | | | | |
| | | | | |
| | 2,585 | | | Burleigh County, North Dakota, Health Care Revenue Refunding Bonds, St. Alexius Medical Center Project, Series 2012A, 5.000%, 7/01/38 | | | | | 7/22 at 100.00 | | | | A– | | | | 2,815,841 | |
| | | | | |
| | 2,100 | | | Grand Forks, North Dakota, Health Care System Revenue Bonds, Altru Health System Obligated Group, Series 2012, 4.000%, 12/01/27 | | | | | 12/21 at 100.00 | | | | A– | | | | 2,186,205 | |
| | | | | |
| | 15,000 | | | Williston Parks and Recreation District, North Dakota, Sales Tax & Gross Revenue Bonds, Series 2012A, 4.000%, 3/01/32 | | | | | 3/21 at 100.00 | | | | A | | | | 15,608,700 | |
| | 19,685 | | | Total North Dakota | | | | | | | | | | | | | 20,610,746 | |
| | | | Ohio – 3.0% | | | | | | | | | | | | | | |
| | | | | |
| | 2,435 | | | American Municipal Power Ohio Inc., Genoa Village, Electric System Improvement Revenue Bonds, Series 2004, 5.250%, 2/15/24 – AGC Insured | | | | | 2/14 at 100.00 | | | | AA– | | | | 2,487,986 | |
| | | | | |
| | | | Buckeye Tobacco Settlement Financing Authority, Ohio, Tobacco Settlement Asset-Backed Revenue Bonds, Senior Lien, Series 2007A-2: | | | | | | | | | | | | | | |
| | 1,130 | | | 5.125%, 6/01/24 | | | | | 6/17 at 100.00 | | | | B– | | | | 1,048,979 | |
| | 1,420 | | | 5.875%, 6/01/30 | | | | | 6/17 at 100.00 | | | | B | | | | 1,273,839 | |
| | 3,990 | | | 5.750%, 6/01/34 | | | | | 6/17 at 100.00 | | | | B | | | | 3,499,829 | |
| | 4,145 | | | 5.875%, 6/01/47 | | | | | 6/17 at 100.00 | | | | B | | | | 3,703,433 | |
| | | | | |
| | | | Butler County, Ohio, Hospital Facilities Revenue Bonds, UC Health, Series 2010: | | | | | | | | | | | | | | |
| | 3,000 | | | 5.250%, 11/01/29 | | | | | 11/20 at 100.00 | | | | BBB+ | | | | 3,299,130 | |
| | 2,000 | | | 5.750%, 11/01/40 | | | | | 11/20 at 100.00 | | | | BBB+ | | | | 2,274,180 | |
| | | | | |
| | 1,000 | | | Cleveland Municipal School District, Cuyahoga County, Ohio, General Obligation Bonds, Series 2004, 5.250%, 12/01/23 (Pre-refunded 6/01/14) – AGM Insured | | | | | 6/14 at 100.00 | | | | AA (4) | | | | 1,054,100 | |
| | | | | |
| | 1,000 | | | Cleveland, Ohio, Airport System Revenue Bonds, Series 2012A, 5.000%, 1/01/31 | | | | | 1/22 at 100.00 | | | | A– | | | | 1,119,620 | |
| | | | | |
| | 2,500 | | | Columbus, Ohio, Tax Increment Financing Bonds, Easton Project, Series 2004A, 5.000%, 12/01/23 (Pre-refunded 6/01/14) – AMBAC Insured | | | | | 6/14 at 100.00 | | | | N/R (4) | | | | 2,624,825 | |
| | | | | |
| | 3,040 | | | Franklin County, Ohio, Healthcare Facilities Revenue Bonds, Ohio Presbyterian Retirement Services, Improvement Series 2010A, 5.625%, 7/01/26 | | | | | 7/21 at 100.00 | | | | BBB | | | | 3,412,552 | |
| | | | | |
| | 4,420 | | | Franklin County, Ohio, Hospital Revenue Bonds, Nationwide Children’s Hospital Project, Tender Option Bond Trust 4152, 17.838%, 5/01/20 (IF) (5) | | | | | No Opt. Call | | | | Aa2 | | | | 6,530,771 | |
| | | | | |
| | | | Hamilton County, Ohio, Sales Tax Bonds, Subordinate Lien, Series 2006A: | | | | | | | | | | | | | | |
| | 4,000 | | | 5.000%, 12/01/20 – AMBAC Insured | | | | | No Opt. Call | | | | A+ | | | | 4,544,760 | |
| | 8,505 | | | 4.250%, 12/01/32 – AMBAC Insured | | | | | 12/16 at 100.00 | | | | A+ | | | | 8,753,006 | |
| | | | | |
| | 3,250 | | | Lake County, Ohio, Hospital Facilities Revenue Bonds, Lake Hospital System, Inc., Refunding Series 2008C, 5.625%, 8/15/29 | | | | | 8/18 at 100.00 | | | | A3 | | | | 3,626,480 | |
| | | | | |
| | 700 | | | Lorain County Port Authority, Ohio, Recovery Zone Facility Economic Development Revenue Bonds, United State Steel Corporation Project, Series 2010, 6.750%, 12/01/40 | | | | | 12/20 at 100.00 | | | | BB | | | | 781,893 | |
| | | | | |
| | 5,765 | | | Lucas County, Ohio, Hospital Revenue Bonds, ProMedica Healthcare Obligated Group, Series 2011A, 6.000%, 11/15/41 | | | | | 11/21 at 100.00 | | | | AA | | | | 7,013,526 | |
| | | | | | | | | | | | | | | | | | |
Principal
Amount (000) | | | Description (1) | | | | Optional Call
Provisions (2) | | | Ratings (3) | | | Value | |
| | | | Ohio (continued) | | | | | | | | | | | | | | |
| | | | | |
| $ | 2,240 | | | Marysville Exempt Village School District, Union County, Ohio, General Obligation Bonds, Series 2005, 5.000%, 12/01/24 – AGM Insured | | | | | 12/15 at 100.00 | | | | AA– | | | $ | 2,460,394 | |
| | | | | |
| | 1,000 | | | Miami County, Ohio, Hospital Facilities Revenue Refunding Bonds, Upper Valley Medical Center Inc., Series 2006, 5.250%, 5/15/26 | | | | | 5/16 at 100.00 | | | | A2 | | | | 1,067,640 | |
| | | | | |
| | 1,500 | | | Middleburg Heights, Ohio, Hospital Facilities Revenue Bonds, Southwest General Health Center Project, Refunding Series 2011, 5.250%, 8/01/41 | | | | | 8/21 at 100.00 | | | | A2 | | | | 1,663,410 | |
| | | | | |
| | 3,500 | | | Montgomery County, Ohio, Health Care and Multifamily Housing Revenue Bonds, Saint Leonard, Refunding & improvement Series 2010, 6.375%, 4/01/30 | | | | | 4/20 at 100.00 | | | | BBB– | | | | 3,911,670 | |
| | | | | |
| | 2,270 | | | Ohio Air Quality Development Authority, Ohio, Revenue Bonds, Ohio Valley Electric Corporation Project, Series 2009E, 5.625%, 10/01/19 | | | | | No Opt. Call | | | | BBB– | | | | 2,695,670 | |
| | | | | |
| | 1,540 | | | Ohio State, Higher Educational Facility Revenue Bonds, Baldwin-Wallace College Project, Series 2004, 5.250%, 12/01/19 (Pre-refunded 6/01/14) | | | | | 6/14 at 100.00 | | | | A– (4) | | | | 1,622,790 | |
| | | | | |
| | 2,640 | | | Ross Local School District, Butler County, Ohio, General Obligation Bonds, Series 2003, 5.000%, 12/01/28 (Pre-refunded 12/01/13) – AGM Insured | | | | | 12/13 at 100.00 | | | | Aa2 (4) | | | | 2,714,474 | |
| | | | | |
| | | | Southeastern Ohio Port Authority, Hospital Facilities Revenue Bonds, Memorial Health System Obligated Group Project, Refunding and Improvement Series 2012: | | | | | | | | | | | | | | |
| | 2,370 | | | 5.000%, 12/01/17 | | | | | No Opt. Call | | | | N/R | | | | 2,557,917 | |
| | 1,250 | | | 5.000%, 12/01/22 | | | | | No Opt. Call | | | | N/R | | | | 1,370,588 | |
| | 3,000 | | | 5.750%, 12/01/32 | | | | | 12/22 at 100.00 | | | | N/R | | | | 3,311,370 | |
| | 2,000 | | | 6.000%, 12/01/42 | | | | | 12/22 at 100.00 | | | | N/R | | | | 2,229,760 | |
| | | | | |
| | 3,000 | | | Trumbull County, Ohio, Multifamily Housing Revenue Bonds, Royal Mall Apartments, Series 2007, 5.000%, 5/20/49 (Alternative Minimum Tax) | | | | | 11/17 at 102.00 | | | | Aaa | | | | 3,194,220 | |
| | | | | |
| | | | Wood County, Ohio, Hospital Facilities Refunding and Improvement Revenue Bonds, Wood County Hospital Project, Series 2012: | | | | | | | | | | | | | | |
| | 2,000 | | | 5.000%, 12/01/27 | | | | | No Opt. Call | | | | Baa2 | | | | 2,180,620 | |
| | 2,500 | | | 5.000%, 12/01/32 | | | | | No Opt. Call | | | | Baa2 | | | | 2,677,800 | |
| | 83,110 | | | Total Ohio | | | | | | | | | | | | | 90,707,232 | |
| | | | Oregon – 0.5% | | | | | | | | | | | | | | |
| | | | | |
| | 1,400 | | | Oregon Department of Administrative Services, Certificates of Participation, Series 2009A, 5.250%, 5/01/39 | | | | | 5/19 at 100.00 | | | | AA | | | | 1,555,218 | |
| | | | | |
| | 1,000 | | | Oregon Housing and Community Services Department, Multifamily Housing Revenue Bonds, Refunding Series 2010A, 5.150%, 7/01/42 (Alternative Minimum Tax) | | | | | 1/20 at 100.00 | | | | Aaa | | | | 1,067,290 | |
| | | | | |
| | 2,500 | | | Oregon State Department of Transportation, Highway User Tax Revenue Bonds, Series 2004A, 5.000%, 11/15/21 (Pre-refunded 11/15/14) | | | | | 11/14 at 100.00 | | | | AAA | | | | 2,680,175 | |
| | | | | |
| | 1,140 | | | Oregon State Facilities Authority, Revenue Bonds, Concordia University Project, Series 2010A, 6.125%, 9/01/30 | | | | | 9/20 at 100.00 | | | | BB+ | | | | 1,245,644 | |
| | | | | |
| | 7,155 | | | Port of Portland, Oregon, International Airport Revenue Bonds, Series 2010-20C, 5.000%, 7/01/27 (Alternative Minimum Tax) | | | | | 7/20 at 100.00 | | | | AA– | | | | 8,133,446 | |
| | | | | |
| | 835 | | | Portland, Oregon, River District Urban Renewal and Redevelopment Bonds, Series 2012C, 5.000%, 6/15/30 | | | | | 6/22 at 100.00 | | | | A1 | | | | 963,456 | |
| | 14,030 | | | Total Oregon | | | | | | | | | | | | | 15,645,229 | |
| | | | Pennsylvania – 4.0% | | | | | | | | | | | | | | |
| | | | | |
| | 1,125 | | | Allegheny County Higher Education Building Authority, Pennsylvania, Revenue Bonds, Carlow University, Series 2011, 6.750%, 11/01/31 | | | | | 11/21 at 100.00 | | | | BBB– | | | | 1,271,239 | |
| | | | | |
| | 1,000 | | | Bucks County Industrial Development Authority, Pennsylvania, Charter School Revenue Bonds, School Lane Charter School, Series 2007A, 5.000%, 3/15/37 | | | | | 3/17 at 100.00 | | | | BBB | | | | 1,020,400 | |
| | | | | |
| | 1,000 | | | Cumberland County Municipal Authority Revenue Bonds, Pennsylvania, Diakon Lutheran Social Ministries Project, Series 2009, 6.125%, 1/01/29 | | | | | 1/19 at 100.00 | | | | BBB+ | | | | 1,133,320 | |
| | | | | |
| | 2,000 | | | Delaware County Authority, Pennsylvania, Revenue Bonds, Neumann College, Series 2008, 6.125%, 10/01/34 | | | | | 10/18 at 100.00 | | | | BBB | | | | 2,197,760 | |
Portfolio of Investments
Nuveen All-American Municipal Bond Fund (continued)
April 30, 2013
| | | | | | | | | | | | | | | | | | |
Principal
Amount (000) | | | Description (1) | | | | Optional Call
Provisions (2) | | | Ratings (3) | | | Value | |
| | | | Pennsylvania (continued) | | | | | | | | | | | | | | |
| | | | | |
| $ | 1,350 | | | Erie County Industrial Development Authority, Pennsylvania, Environmental Improvement Revenue Bonds, International Paper Company Project, Refunding Series 2004A, 5.000%, 11/01/18 (Alternative Minimum Tax) | | | | | 11/14 at 100.00 | | | | BBB | | | $ | 1,375,421 | |
| | | | | |
| | 2,525 | | | Harrisburg Authority, Dauphin County, Pennsylvania, Water Revenue Refunding Bonds, Series 2004, 5.000%, 7/15/19 – AGM Insured | | | | | 7/14 at 100.00 | | | | AA– | | | | 2,570,652 | |
| | | | | |
| | | | Montgomery Count Industrial Development Authority, Pennsylvania, Revenue Refunding Bonds, ACTS Retirement-Life Communities, Inc. , Series 2012: | | | | | | | | | | | | | | |
| | 2,400 | | | 5.000%, 11/15/27 | | | | | 5/22 at 100.00 | | | | A– | | | | 2,692,248 | |
| | 1,450 | | | 5.000%, 11/15/28 | | | | | 5/22 at 100.00 | | | | A– | | | | 1,610,776 | |
| | 1,150 | | | 5.000%, 11/15/29 | | | | | 5/22 at 100.00 | | | | A– | | | | 1,253,362 | |
| | | | | |
| | 710 | | | Montgomery County Industrial Development Authority, Pennsylvania, FHA Insured Mortgage Revenue Bonds, New Regional Medical Center Project, Series 2010, 5.375%, 8/01/38 | | | | | 8/20 at 100.00 | | | | AA | | | | 819,390 | |
| | | | | |
| | 940 | | | Montgomery County Industrial Development Authority, Pennsylvania, FHA Insured Mortgage Revenue Bonds, New Regional Medical Center Project, Tender Option Bond Trust 62B, 17.841%, 8/01/38 (IF) (5) | | | | | 8/20 at 100.00 | | | | AA | | | | 1,548,039 | |
| | | | | |
| | 500 | | | Montgomery County Industrial Development Authority, Pennsylvania, First Mortgage Revenue Bonds, Whitemarsh Continuing Care, Series 2005, 6.250%, 2/01/35 | | | | | 2/15 at 100.00 | | | | N/R | | | | 508,430 | |
| | | | | |
| | 3,990 | | | Montgomery County Industrial Development Authority, Pennsylvania, Water Facilities Revenue Bonds, Aqua Pennsylvania, Inc. Project, Series 2007A, 5.250%, 7/01/42 | | | | | 7/18 at 100.00 | | | | AA– | | | | 4,330,148 | |
| | | | | |
| | 5,000 | | | Pennsylvania Economic Development Financing Authority, Exempt Facilities Revenue Bonds, Allegheny Energy Supply Company LLC., Senior Lien Series 2009, 7.000%, 7/15/39 | | | | | 7/19 at 100.00 | | | | BBB– | | | | 5,988,650 | |
| | | | | |
| | 3,115 | | | Pennsylvania Economic Development Financing Authority, Health System Revenue Bonds , Albert Einstein Healthcare, Series 2009A, 6.250%, 10/15/23 | | | | | 10/19 at 100.00 | | | | BBB+ | | | | 3,677,538 | |
| | | | | |
| | 1,200 | | | Pennsylvania Higher Educational Facilities Authority, Revenue Bonds, Edinboro University Foundation Student Housing Project, Series 2010, 5.800%, 7/01/30 | | | | | 7/20 at 100.00 | | | | Baa3 | | | | 1,350,120 | |
| | | | | |
| | 525 | | | Pennsylvania Housing Finance Agency, Single Family Mortgage Revenue Bonds, Series 2010-110A, 4.750%, 10/01/25 | | | | | 10/19 at 100.00 | | | | AA+ | | | | 559,162 | |
| | | | | |
| | 10,000 | | | Pennsylvania State, General Obligation Bonds, First Refunding Series 2012-1, 5.000%, 7/01/20 | | | | | No Opt. Call | | | | AA+ | | | | 12,528,900 | |
| | | | | |
| | 1,050 | | | Pennsylvania Turnpike Commission, Turnpike Revenue Bonds, Series 2006A, 5.000%, 12/01/26 – AMBAC Insured | | | | | 6/16 at 100.00 | | | | A+ | | | | 1,148,049 | |
| | | | | |
| | 15,000 | | | Pennsylvania Turnpike Commission, Turnpike Subordinate Revenue Bonds, Series 2009C, 0.000%, 6/01/33 – AGM Insured | | | | | 6/26 at 100.00 | | | | AA | | | | 16,139,850 | |
| | | | | |
| | 480 | | | Philadelphia Authority for Industrial Development, Pennsylvania, Revenue Bonds, Global Leadership Academy Project, Series 2010, 5.750%, 11/15/30 | | | | | 11/20 at 100.00 | | | | BBB– | | | | 505,147 | |
| | | | | |
| | 4,980 | | | Philadelphia Gas Works, Pennsylvania, Revenue Bonds, General Ordinance, Fifth Series 2004A-1, 5.000%, 9/01/23 – AGM Insured | | | | | 9/14 at 100.00 | | | | AA– | | | | 5,234,229 | |
| | | | | |
| | 2,000 | | | Philadelphia Gas Works, Pennsylvania, Revenue Bonds, Ninth Series, 2010, 5.000%, 8/01/30 | | | | | 8/20 at 100.00 | | | | BBB+ | | | | 2,173,900 | |
| | | | | |
| | 240 | | | Philadelphia Redevelopment Authority, Pennsylvania, Multifamily Housing Revenue Bonds, Pavilion Apartments, Series 2003A, 4.250%, 10/01/16 (Alternative Minimum Tax) | | | | | 10/13 at 100.00 | | | | A | | | | 241,786 | |
| | | | | |
| | 6,650 | | | Philadelphia, Pennsylvania, Airport Revenue Bonds, Series 2010A, 5.000%, 6/15/40 – AGM Insured | | | | | 6/20 at 100.00 | | | | AA– | | | | 7,395,798 | |
| | | | | |
| | 2,380 | | | Philadelphia, Pennsylvania, General Obligation Bonds, Refunding Series 2011, 6.500%, 8/01/41 | | | | | 8/20 at 100.00 | | | | A2 | | | | 2,895,817 | |
| | | | | | | | | | | | | | | | | | |
Principal
Amount (000) | | | Description (1) | | | | Optional Call
Provisions (2) | | | Ratings (3) | | | Value | |
| | | | Pennsylvania (continued) | | | | | | | | | | | | | | |
| | | | | |
| | | | Pittsburgh and Allegheny County Sports and Exhibition Authority, Pennsylvania, Hotel Room Excise Tax Revenue Bonds, Refunding Series 2010: | | | | | | | | | | | | | | |
| $ | 2,400 | | | 5.000%, 2/01/30 – AGM Insured | | | | | 8/20 at 100.00 | | | | AA– | | | $ | 2,671,776 | |
| | 1,500 | | | 5.000%, 2/01/35 – AGC Insured | | | | | 8/20 at 100.00 | | | | AA– | | | | 1,630,425 | |
| | | | | |
| | 2,430 | | | Pittsburgh, Pennsylvania, General Obligation Bonds, Series 2005A, 5.000%, 9/01/16 – NPFG Insured | | | | | 9/15 at 100.00 | | | | A1 | | | | 2,644,107 | |
| | | | | |
| | 5,200 | | | Radnor Township School District, Delaware County, Pennsylvania, General Obligation Bonds, Series 2005A, 5.000%, 11/15/28 – AGM Insured | | | | | 5/15 at 100.00 | | | | Aa2 | | | | 5,624,372 | |
| | | | | |
| | 3,000 | | | Southeastern Pennsylvania Transportation Authority, Capital Grant Receipts Bonds, Federal Transit Administration Section 5309 Fixed Guideway Modernization Formula Funds, Series 2011, 5.000%, 6/01/28 | | | | | 6/21 at 100.00 | | | | A+ | | | | 3,466,320 | |
| | | | | |
| | 1,600 | | | State Public School Building Authority, Pennsylvania, College Revenue Bonds, Delaware County Community College, Series 2008, 5.000%, 10/01/24 – AGM Insured | | | | | 4/18 at 100.00 | | | | A1 | | | | 1,796,656 | |
| | | | | |
| | 19,300 | | | Susquehanna Area Regional Airport Authority, Pennsylvania, Airport System Revenue Bonds, Series 2012B, 4.000%, 1/01/33 | | | | | No Opt. Call | | | | Baa3 | | | | 18,760,565 | |
| | | | | |
| | | | Westmoreland County Industrial Development Authority, Pennsylvania, Retirement Community Revenue Bonds, Redstone Presbyterian SeniorCare Obligated Group, Series 2005A: | | | | | | | | | | | | | | |
| | 1,200 | | | 5.750%, 1/01/26 | | | | | 1/16 at 100.00 | | | | N/R | | | | 1,238,616 | |
| | 1,400 | | | 5.875%, 1/01/32 | | | | | 1/16 at 100.00 | | | | N/R | | | | 1,437,352 | |
| | 110,790 | | | Total Pennsylvania | | | | | | | | | | | | | 121,440,320 | |
| | | | Puerto Rico – 2.6% | | | | | | | | | | | | | | |
| | | | | |
| | | | Puerto Rico Electric Power Authority, Power Revenue Bonds, Refunding Series 2012A: | | | | | | | | | | | | | | |
| | 4,000 | | | 5.000%, 7/01/29 | | | | | No Opt. Call | | | | BBB+ | | | | 3,988,760 | |
| | 12,275 | | | 5.050%, 7/01/42 | | | | | 7/22 at 100.00 | | | | BBB+ | | | | 11,882,937 | |
| | | | | |
| | 10,615 | | | Puerto Rico Electric Power Authority, Power Revenue Bonds, Series 2007VV, 5.250%, 7/01/29 – NPFG Insured | | | | | No Opt. Call | | | | BBB+ | | | | 10,829,211 | |
| | | | | |
| | 1,250 | | | Puerto Rico Highway and Transportation Authority, Highway Revenue Bonds, Series 2003G, 5.250%, 7/01/18 (Pre-refunded 7/01/13) – FGIC Insured | | | | | 7/13 at 100.00 | | | | BBB (4) | | | | 1,260,650 | |
| | | | | |
| | 1,030 | | | Puerto Rico Housing Finance Authority, Capital Fund Program Revenue Bonds, Series 2003, 5.000%, 12/01/20 | | | | | 12/13 at 100.00 | | | | AA– | | | | 1,054,545 | |
| | | | | |
| | 10,000 | | | Puerto Rico Infrastructure Financing Authority, Revenue Bonds, Ports Authority Project Bonds, Series 2011B, 5.250%, 12/15/26 | | | | | 12/21 at 100.00 | | | | BBB– | | | | 10,120,700 | |
| | | | | |
| | | | Puerto Rico Infrastructure Financing Authority, Special Tax Revenue Bonds, Series 2005C: | | | | | | | | | | | | | | |
| | 850 | | | 5.500%, 7/01/17 – AMBAC Insured | | | | | No Opt. Call | | | | BBB+ | | | | 907,732 | |
| | 420 | | | 5.500%, 7/01/23 – AMBAC Insured | | | | | No Opt. Call | | | | BBB+ | | | | 438,089 | |
| | 4,000 | | | 5.500%, 7/01/25 – AMBAC Insured | | | | | No Opt. Call | | | | BBB+ | | | | 4,158,160 | |
| | 1,000 | | | 5.500%, 7/01/27 – AMBAC Insured | | | | | No Opt. Call | | | | BBB+ | | | | 1,029,230 | |
| | | | | |
| | 3,750 | | | Puerto Rico Sales Tax Financing Corporation, Sales Tax Revenue Bonds, First Subordinate Series 2009A, 0.000%, 8/01/32 | | | | | 8/26 at 100.00 | | | | A+ | | | | 3,968,663 | |
| | | | | |
| | | | Puerto Rico Sales Tax Financing Corporation, Sales Tax Revenue Bonds, First Subordinate Series 2011A-1: | | | | | | | | | | | | | | |
| | 1,500 | | | 5.250%, 8/01/40 | | | | | 8/21 at 100.00 | | | | AA– | | | | 1,627,845 | |
| | 1,600 | | | 5.250%, 8/01/43 | | | | | 8/21 at 100.00 | | | | A+ | | | | 1,673,424 | |
| | | | | |
| | 5,400 | | | Puerto Rico Sales Tax Financing Corporation, Sales Tax Revenue Bonds, Senior Series 2011C, 0.000%, 8/01/41 | | | | | No Opt. Call | | | | AA– | | | | 1,142,100 | |
| | | | | |
| | 5,000 | | | Puerto Rico Sales Tax Financing Corporation, Sales Tax Revenue Bonds, Series 2007A, 0.000%, 8/01/46 – NPFG Insured | | | | | No Opt. Call | | | | AA– | | | | 769,700 | |
Portfolio of Investments
Nuveen All-American Municipal Bond Fund (continued)
April 30, 2013
| | | | | | | | | | | | | | | | | | |
Principal
Amount (000) | | | Description (1) | | | | Optional Call
Provisions (2) | | | Ratings (3) | | | Value | |
| | | | Puerto Rico (continued) | | | | | | | | | | | | | | |
| | | | | |
| | | | Puerto Rico, General Obligation and Public Improvement Bonds, Series 2001A: | | | | | | | | | | | | | | |
| $ | 2,550 | | | 5.500%, 7/01/16 – AGM Insured | | | | | No Opt. Call | | | | AA– | | | $ | 2,776,746 | |
| | 3,000 | | | 5.500%, 7/01/17 – AGM Insured | | | | | No Opt. Call | | | | AA– | | | | 3,312,840 | |
| | 3,440 | | | 5.500%, 7/01/18 – AGM Insured | | | | | No Opt. Call | | | | AA– | | | | 3,848,018 | |
| | 2,250 | | | 5.500%, 7/01/19 – AGM Insured | | | | | No Opt. Call | | | | AA– | | | | 2,542,298 | |
| | | | | |
| | | | Puerto Rico, General Obligation and Public Improvement Bonds, Series 2002A: | | | | | | | | | | | | | | |
| | 50 | | | 5.500%, 7/01/16 – NPFG Insured | | | | | No Opt. Call | | | | Baa2 | | | | 53,283 | |
| | 140 | | | 5.500%, 7/01/18 | | | | | No Opt. Call | | | | BBB– | | | | 150,899 | |
| | 1,355 | | | 5.500%, 7/01/19 – NPFG Insured | | | | | No Opt. Call | | | | Baa2 | | | | 1,463,170 | |
| | 100 | | | 5.500%, 7/01/20 – NPFG Insured | | | | | No Opt. Call | | | | Baa2 | | | | 107,172 | |
| | 50 | | | 5.500%, 7/01/21 – NPFG Insured | | | | | No Opt. Call | | | | Baa2 | | | | 52,773 | |
| | 125 | | | 5.500%, 7/01/29 | | | | | No Opt. Call | | | | BBB– | | | | 129,543 | |
| | | | | |
| | 130 | | | Puerto Rico, General Obligation and Public Improvement Refunding Bonds, Series 1999, 5.250%, 7/01/18 | | | | | No Opt. Call | | | | AA | | | | 138,610 | |
| | | | | |
| | 1,360 | | | Puerto Rico, General Obligation Bonds, Public Improvement Series 2002A, 5.500%, 7/01/19 – FGIC Insured | | | | | No Opt. Call | | | | BBB– | | | | 1,468,569 | |
| | | | | |
| | | | Puerto Rico, General Obligation Bonds, Public Improvement, Refunding Series 2012A: | | | | | | | | | | | | | | |
| | 3,620 | | | 5.000%, 7/01/21 | | | | | No Opt. Call | | | | BBB– | | | | 3,698,988 | |
| | 3,000 | | | 5.000%, 7/01/41 | | | | | 7/22 at 100.00 | | | | BBB– | | | | 2,858,340 | |
| | 83,860 | | | Total Puerto Rico | | | | | | | | | | | | | 77,452,995 | |
| | | | Rhode Island – 0.1% | | | | | | | | | | | | | | |
| | | | | |
| | 285 | | | Providence Housing Development Corporation, Rhode Island, FHA-Insured Section 8 Assisted Mortgage Revenue Refunding Bonds, Barbara Jordan Apartments, Series 1994A, 6.650%, 7/01/15 – NPFG Insured | | | | | 7/13 at 100.00 | | | | Baa2 | | | | 286,143 | |
| | | | | |
| | | | Rhode Island Tobacco Settlement Financing Corporation, Tobacco Settlement Asset-Backed Bonds, Series 2002A: | | | | | | | | | | | | | | |
| | 1,855 | | | 6.125%, 6/01/32 | | | | | 7/13 at 100.00 | | | | BBB+ | | | | 1,873,365 | |
| | 1,360 | | | 6.250%, 6/01/42 | | | | | 7/13 at 100.00 | | | | BBB– | | | | 1,392,314 | |
| | 3,500 | | | Total Rhode Island | | | | | | | | | | | | | 3,551,822 | |
| | | | South Carolina – 0.3% | | | | | | | | | | | | | | |
| | | | | |
| | 700 | | | Georgetown County, South Carolina, Environmental Improvement Revenue Bonds, International Paper Company, Senior Lien Series 2005A, 5.550%, 12/01/29 (Alternative Minimum Tax) | | | | | 12/15 at 100.00 | | | | BBB | | | | 746,235 | |
| | | | | |
| | 460 | | | Greenville, South Carolina, Hospital Facilities Revenue Bonds, Series 1990, 6.000%, 5/01/20 | | | | | No Opt. Call | | | | AA– | | | | 555,910 | |
| | | | | |
| | 2,105 | | | Medical University Hospital Authority, South Carolina, FHA-Insured Mortgage Revenue Bonds, Series 2004A, 5.250%, 8/15/23 (Pre-refunded 8/15/14) – NPFG Insured | | | | | 8/14 at 100.00 | | | | Baa2 (4) | | | | 2,234,752 | |
| | | | | |
| | 1,340 | | | South Carolina Housing Finance and Development Authority, Mortgage Revenue Bonds, Series 2006C-2, 5.500%, 7/01/37 – AGM Insured (Alternative Minimum Tax) | | | | | 7/16 at 101.00 | | | | Aa1 | | | | 1,426,564 | |
| | | | | |
| | 1,250 | | | South Carolina JOBS Economic Development Authority, Hospital Facilities Revenue Bonds, Palmetto Health Alliance, Series 2003A, 6.125%, 8/01/23 | | | | | 8/13 at 100.00 | | | | BBB+ | | | | 1,268,438 | |
| | | | | |
| | 135 | | | South Carolina JOBS Economic Development Authority, Hospital Refunding and Improvement Revenue Bonds, Palmetto Health Alliance, Series 2003C, 6.375%, 8/01/34 (Pre-refunded 8/01/13) | | | | | 8/13 at 100.00 | | | | BBB+ (4) | | | | 137,099 | |
| | | | | |
| | 2,000 | | | South Carolina Public Service Authority, Electric System Revenue Bonds, Santee Cooper, Series 2008A, 5.375%, 1/01/28 | | | | | 1/19 at 100.00 | | | | AA– | | | | 2,374,780 | |
| | 7,990 | | | Total South Carolina | | | | | | | | | | | | | 8,743,778 | |
| | | | | | | | | | | | | | | | | | |
Principal
Amount (000) | | | Description (1) | | | | Optional Call
Provisions (2) | | | Ratings (3) | | | Value | |
| | | | South Dakota – 0.8% | | | | | | | | | | | | | | |
| | | | | |
| $ | 2,500 | | | Rapid City, South Dakota, Airport Customer Facility Charge Revenue Bonds, Recovery Zone Facility Bond Series 2010B, 7.000%, 12/01/30 | | | | | 12/20 at 102.00 | | | | N/R | | | $ | 2,908,850 | |
| | | | | |
| | 1,000 | | | Rapid City, South Dakota, Airport Revenue Refunding Bonds, Passenger Facility Charge Supported, Series 2011A, 7.000%, 12/01/35 | | | | | 12/19 at 100.00 | | | | Baa2 | | | | 1,149,370 | |
| | | | | |
| | 2,255 | | | Rapid City, South Dakota, Sales Tax Revenue Bonds, Series 2013, 4.000%, 6/01/28 | | | | | No Opt. Call | | | | Aa3 | | | | 2,420,111 | |
| | | | | |
| | 1,400 | | | South Dakota Economic Development Finance Authority, Economic Development Revenue Bonds, Davis Family Sodak, LLC Wastewater Project, Pooled Loan Program, Series 2004A, 6.000%, 4/01/29 (Alternative Minimum Tax) | | | | | 4/14 at 100.00 | | | | A+ | | | | 1,459,108 | |
| | | | | |
| | 2,000 | | | South Dakota Economic Development Finance Authority, Economic Development Revenue Bonds, Spearfish Products Project, Pooled Loan Program, Series 2008A, 5.875%, 4/01/28 (Alternative Minimum Tax) | | | | | 4/16 at 100.00 | | | | A+ | | | | 2,228,480 | |
| | | | | |
| | 1,850 | | | South Dakota Health and Educational Facilities Authority, Revenue Bonds, Avera Health, Series 2012A, 5.000%, 7/01/42 | | | | | 7/21 at 100.00 | | | | A+ | | | | 2,016,093 | |
| | | | | |
| | 6,750 | | | South Dakota Health and Educational Facilities Authority, Revenue Bonds, Vocational Education Program, Series 2008, 5.500%, 8/01/38 – AGC Insured | | | | | 8/18 at 100.00 | | | | AA | | | | 7,746,705 | |
| | | | | |
| | 750 | | | South Dakota Health and Educational Facilities Authority, Revenue Bonds, Westhills Village Retirement Community Project, Series 2006, 5.000%, 9/01/31 | | | | | 9/14 at 100.00 | | | | A | | | | 758,798 | |
| | | | | |
| | | | South Dakota Health and Educational Facilities Authority, Revenue Bonds, Westhills Village Retirement Community, Series 2012: | | | | | | | | | | | | | | |
| | 330 | | | 4.000%, 9/01/24 | | | | | 9/20 at 100.00 | | | | A | | | | 347,827 | |
| | 1,500 | | | 5.000%, 9/01/32 | | | | | 9/20 at 100.00 | | | | A | | | | 1,594,965 | |
| | 20,335 | | | Total South Dakota | | | | | | | | | | | | | 22,630,307 | |
| | | | Tennessee – 0.9% | | | | | | | | | | | | | | |
| | | | | |
| | 3,550 | | | Blount County Public Building Authority, Tennessee, Local Government Public Improvement Loan Bonds, Washington County, Series 2007B-12-A, 4.375%, 6/01/35 – SYNCORA GTY Insured | | | | | 6/19 at 100.00 | | | | Aa2 | | | | 3,848,378 | |
| | | | | |
| | | | Chattanooga Health, Educational and Housing Facility Board, Tennessee, Hospital Revenue Bonds, Catholic Health Initiatives, Series 2008D: | | | | | | | | | | | | | | |
| | 500 | | | 6.000%, 10/01/23 | | | | | 10/18 at 100.00 | | | | AA– | | | | 607,715 | |
| | 1,500 | | | 6.125%, 10/01/28 | | | | | 10/18 at 100.00 | | | | AA– | | | | 1,792,215 | |
| | | | | |
| | 3,000 | | | Claiborne County, Tennessee, Industrial Development Board, Revenue Refunding Bonds, Lincoln Memorial University Project, Series 2009, 6.625%, 10/01/39 | | | | | 10/19 at 100.00 | | | | N/R | | | | 3,446,430 | |
| | | | | |
| | 1,000 | | | Clarksville Natural Gas Acquisition Corporation, Tennessee, Natural Gas Revenue Bonds, Series 2006, 5.000%, 12/15/17 – SYNCORA GTY Insured | | | | | No Opt. Call | | | | A | | | | 1,150,350 | |
| | | | | |
| | | | Johnson City Health and Educational Facilities Board, Tennessee, Revenue Bonds, Mountain States Health Alliance, Series 2006A: | | | | | | | | | | | | | | |
| | 720 | | | 5.000%, 7/01/16 | | | | | No Opt. Call | | | | BBB+ | | | | 799,474 | |
| | 755 | | | 5.000%, 7/01/17 | | | | | 7/16 at 100.00 | | | | BBB+ | | | | 834,011 | |
| | 4,680 | | | 5.500%, 7/01/36 | | | | | 7/16 at 100.00 | | | | BBB+ | | | | 4,951,768 | |
| | | | | |
| | 135 | | | Memphis Health, Educational and Housing Facilities Board, Tennessee, Multifamily Housing Revenue Bonds, Goodwill Village Apartments, Series 2010A, 5.500%, 12/01/30 | | | | | 12/20 at 100.00 | | | | A– | | | | 143,055 | |
| | | | | |
| | | | Metropolitan Government of Nashville-Davidson County Health and Educational Facilities Board, Tennessee, Revenue Bonds, Belmont University Project, Series 2012: | | | | | | | | | | | | | | |
| | 1,440 | | | 5.000%, 11/01/26 | | | | | 11/21 at 100.00 | | | | BBB+ | | | | 1,631,621 | |
| | 1,000 | | | 5.000%, 11/01/27 | | | | | 11/21 at 100.00 | | | | BBB+ | | | | 1,123,430 | |
| | 250 | | | 5.000%, 11/01/28 | | | | | 11/21 at 100.00 | | | | BBB+ | | | | 279,615 | |
| | 255 | | | 5.000%, 11/01/29 | | | | | 11/21 at 100.00 | | | | BBB+ | | | | 283,019 | |
| | 245 | | | 5.000%, 11/01/30 | | | | | 11/21 at 100.00 | | | | BBB+ | | | | 270,215 | |
| | 705 | | | 5.000%, 11/01/31 | | | | | 11/21 at 100.00 | | | | BBB+ | | | | 773,223 | |
Portfolio of Investments
Nuveen All-American Municipal Bond Fund (continued)
April 30, 2013
| | | | | | | | | | | | | | | | | | |
Principal
Amount (000) | | | Description (1) | | | | Optional Call
Provisions (2) | | | Ratings (3) | | | Value | |
| | | | Tennessee (continued) | | | | | | | | | | | | | | |
| | | | | |
| $ | 1,000 | | | Metropolitan Government of Nashville-Davidson County Health and Educational Facilities Board, Tennessee, Revenue Bonds, Vanderbilt University, Series 2009A, 5.000%, 10/01/39 | | | | | 10/19 at 100.00 | | | | AA+ | | | $ | 1,139,450 | |
| | | | | |
| | 800 | | | Shelby County, Tennessee, General Obligation Public Improvement and School Bonds, Refunding Series 2009A, 5.000%, 4/01/20 | | | | | 4/19 at 100.00 | | | | AA+ | | | | 975,504 | |
| | | | | |
| | 200 | | | Shelby County, Tennessee, General Obligation Public Improvement and School Bonds, Refunding Series 2009A, 5.000%, 4/01/20 (Pre-refunded 4/01/19) | | | | | 4/19 at 100.00 | | | | Aa1 (4) | | | | 246,910 | |
| | | | | |
| | 2,000 | | | South Blount County Utility District, Tennessee, Waterworks Revenue Bonds, Improvement and Refunding Series 2009, 5.250%, 12/01/39 – AGM Insured | | | | | 12/19 at 100.00 | | | | AA– | | | | 2,309,060 | |
| | | | | |
| | 1,000 | | | Sumner County Health, Educational, and Housing Facilities Board, Tennessee, Revenue Refunding Bonds, Sumner Regional Health System Inc., Series 2007, 5.500%, 11/01/37 (6) | | | | | 11/17 at 100.00 | | | | N/R | | | | 2,490 | |
| | | | | |
| | 1,000 | | | The Tennessee Energy Acquisition Corporation, Gas Revenue Bonds, Series 2006A, 5.250%, 9/01/21 | | | | | No Opt. Call | | | | A | | | | 1,170,870 | |
| | 25,735 | | | Total Tennessee | | | | | | | | | | | | | 27,778,803 | |
| | | | Texas – 9.4% | | | | | | | | | | | | | | |
| | | | | |
| | 5,280 | | | Bexar County, Texas, Venue Project Revenue Bonds, Refunding Series 2010, 5.500%, 8/15/49 – AGM Insured | | | | | 8/19 at 100.00 | | | | AA– | | | | 5,930,338 | |
| | | | | |
| | 1,385 | | | Board of Regents of the Texas Tech University System, Revenue Financing System Refunding and Improvement Bonds, Fourteenth Series 2012A, 5.000%, 8/15/37 | | | | | 8/21 at 100.00 | | | | AA+ | | | | 1,595,174 | |
| | | | | |
| | 3,635 | | | Brazos County Health Facilities Development Corporation, Texas, Franciscan Services Corporation Obligated Group-St Joseph Regional, Revenue Bonds, Series 2008, 5.000%, 1/01/23 | | | | | 7/18 at 100.00 | | | | A– | | | | 3,988,795 | |
| | | | | |
| | 2,315 | | | Brownsville, Texas, Utility System Revenue Bonds, Refunding Series 2008, 5.000%, 9/01/27 – AGM Insured | | | | | No Opt. Call | | | | AA– | | | | 2,631,113 | |
| | | | | |
| | 3,500 | | | Bryan, Brazos County, Texas, Electric System Revenue Bonds, Refunding Series 2010, 5.000%, 7/01/19 | | | | | 7/17 at 100.00 | | | | A+ | | | | 4,011,630 | |
| | | | | |
| | 1,745 | | | Central Texas Regional Mobility Authority, Revenue Bonds, Senior Lien Series 2010, 5.750%, 1/01/25 | | | | | 1/20 at 100.00 | | | | Baa2 | | | | 2,074,805 | |
| | | | | |
| | 3,400 | | | Central Texas Regional Mobility Authority, Revenue Bonds, Senior Lien Series 2011, 6.250%, 1/01/46 | | | | | 1/21 at 100.00 | | | | Baa2 | | | | 4,026,484 | |
| | | | | |
| | | | Clifton Higher Education Finance Corporation, Texas, Education Revenue Bonds, Idea Public Schools, Series 2012: | | | | | | | | | | | | | | |
| | 2,745 | | | 5.000%, 8/15/32 | | | | | 8/22 at 100.00 | | | | BBB | | | | 3,025,319 | |
| | 2,750 | | | 5.000%, 8/15/42 | | | | | 8/22 at 100.00 | | | | BBB | | | | 2,979,268 | |
| | | | | |
| | 2,100 | | | Clifton Higher Education Finance Corporation, Texas, Education Revenue Bonds, Tejano Center for Community Concerns, Inc.-Raul Yzaguirre School for Success, Refunding Series 2009A, 8.750%, 2/15/28 | | | | | 2/18 at 100.00 | | | | BBB– | | | | 2,425,332 | |
| | | | | |
| | | | Dallas-Fort Worth International Airport, Texas, Joint Revenue Bonds, Refunding Series 2011C: | | | | | | | | | | | | | | |
| | 3,500 | | | 5.000%, 11/01/24 | | | | | 11/20 at 100.00 | | | | A+ | | | | 4,109,140 | |
| | 1,500 | | | 5.000%, 11/01/25 | | | | | 11/20 at 100.00 | | | | A+ | | | | 1,748,580 | |
| | | | | |
| | | | Dallas-Fort Worth International Airport, Texas, Joint Revenue Bonds, Refunding Series 2012B: | | | | | | | | | | | | | | |
| | 1,775 | | | 5.000%, 11/01/18 | | | | | No Opt. Call | | | | A+ | | | | 2,128,048 | |
| | 4,355 | | | 5.000%, 11/01/35 | | | | | 11/20 at 100.00 | | | | A+ | | | | 4,829,739 | |
| | | | | |
| | 1,460 | | | Danbury Higher Education Authority Inc., Texas, Golden Rule Charter School Revenue Bonds, Series 2008A, 6.500%, 8/15/38 | | | | | 2/18 at 100.00 | | | | BB+ | | | | 1,514,400 | |
| | | | | |
| | 2,700 | | | Fort Bend County Industrial Development Corporation, Texas, Revenue Bonds, NRG Energy Inc. Project, Series 2012A. RMKT, 4.750%, 5/01/38 | | | | | 11/22 at 100.00 | | | | Baa3 | | | | 2,737,125 | |
| | | | | |
| | 4,425 | | | Fort Bend County Industrial Development Corporation, Texas, Revenue Bonds, NRG Energy Inc. Project, Series 2012B, 4.750%, 11/01/42 | | | | | 11/22 at 100.00 | | | | Baa3 | | | | 4,468,852 | |
| | | | | | | | | | | | | | | | | | |
Principal
Amount (000) | | | Description (1) | | | | Optional Call
Provisions (2) | | | Ratings (3) | | | Value | |
| | | | Texas (continued) | | | | | | | | | | | | | | |
| | | | | |
| $ | 500 | | | Fort Bend Independent School District, Fort Bend County, Texas, General Obligation Bonds, Refunding Series 1994, 5.000%, 2/15/14 (ETM) | | | | | No Opt. Call | | | | AAA | | | $ | 518,955 | |
| | | | | |
| | 6,500 | | | Gregg County Health Facilities Development Corporation, Texas, Hospital Revenue Bonds, Good Shepherd Health System, Series 2012C, 5.000%, 7/01/32 | | | | | 7/22 at 100.00 | | | | BBB+ | | | | 6,925,100 | |
| | | | | |
| | 1,075 | | | Gulf Coast Industrial Development Authority, Texas, Solid Waste Disposal Revenue Bonds, Citgo Petroleum Corporation Project, Series 1995, 4.875%, 5/01/25 (Alternative Minimum Tax) | | | | | 10/22 at 100.00 | | | | BB+ | | | | 1,116,345 | |
| | | | | |
| | 1,030 | | | Harris County Cultural Education Facilities Finance Corporation, Texas, Medical Facilities Revenue Refunding Bonds, Baylor College of Medicine, Series 2012A, 4.000%, 11/15/32 | | | | | 11/22 at 100.00 | | | | A– | | | | 1,060,066 | |
| | | | | |
| | 3,045 | | | Harris County Cultural Education Facilities Finance Corporation, Texas, Revenue Refunding Bonds, Young Men’s Christian Association of the Greater Houston Area, Series 2013A, 5.000%, 6/01/33 | | | | | 6/23 at 100.00 | | | | Baa3 | | | | 3,312,716 | |
| | | | | |
| | 2,000 | | | Harris County Health Facilities Development Corporation, Texas, Hospital Revenue Bonds, Memorial Hermann Healthcare System, Series 2008B, 7.250%, 12/01/35 (Pre-refunded 12/01/18) | | | | | 12/18 at 100.00 | | | | A+ (4) | | | | 2,678,180 | |
| | | | | |
| | 5,000 | | | Harris County Hospital District, Texas, Revenue Bonds, Series 2007A, 5.250%, 2/15/42 – NPFG Insured | | | | | 2/17 at 100.00 | | | | A | | | | 5,356,300 | |
| | | | | |
| | | | Harris County-Houston Sports Authority, Texas, Revenue Bonds, Senior Lien Series 2001G: | | | | | | | | | | | | | | |
| | 5,000 | | | 5.250%, 11/15/21 – NPFG Insured | | | | | 7/13 at 100.00 | | | | A | | | | 5,049,850 | |
| | 6,500 | | | 5.250%, 11/15/22 – NPFG Insured | | | | | 7/13 at 100.00 | | | | A | | | | 6,556,680 | |
| | 7,800 | | | 5.250%, 11/15/30 – NPFG Insured | | | | | 7/13 at 100.00 | | | | A | | | | 7,848,594 | |
| | 2,500 | | | 5.375%, 11/15/41 – NPFG Insured | | | | | 7/13 at 100.00 | | | | A | | | | 2,505,350 | |
| | | | | |
| | 3,000 | | | Harrison County Health Facilities Development Corporation, Texas, Hospital Revenue Bonds, Good Shepherd Health System, Refunding Series 2010, 5.250%, 7/01/28 | | | | | 7/20 at 100.00 | | | | BBB+ | | | | 3,333,210 | |
| | | | | |
| | 7,560 | | | Houston Community College System, Texas, General Obligation Bonds, Refunding Series 2011, 5.000%, 2/15/22 | | | | | 2/21 at 100.00 | | | | AA+ | | | | 9,392,015 | |
| | | | | |
| | 1,955 | | | Houston, Texas, Hotel Occupancy Tax and Special Revenue Bonds, Convention and Entertainment Facilities Department, Refunding Series 2011A, 5.250%, 9/01/28 | | | | | 9/21 at 100.00 | | | | A2 | | | | 2,180,216 | |
| | | | | |
| | 1,250 | | | Houston, Texas, Subordinate Lien Airport System Revenue Refunding Bonds, Series 2011A, 5.000%, 7/01/25 (Alternative Minimum Tax) | | | | | 7/21 at 100.00 | | | | A+ | | | | 1,445,088 | |
| | | | | |
| | 1,500 | | | Houston, Texas, Subordinate Lien Airport System Revenue Refunding Bonds, Series 2012B, 5.000%, 7/01/32 | | | | | 7/22 at 100.00 | | | | A+ | | | | 1,722,675 | |
| | | | | |
| | 2,635 | | | Humble Independent School District, Harris County, Texas, General Obligation Bonds, Series 2008A, 5.250%, 2/15/22 – AGC Insured | | | | | 2/18 at 100.00 | | | | Aa2 | | | | 3,103,898 | |
| | | | | |
| | 10,720 | | | Love Field Airport Modernization Corporation, Texas, Special Facilities Revenue Bonds, Southwest Airlines Company – Love Field Modernization Program Project, Series 2012, 5.000%, 11/01/28 (Alternative Minimum Tax) | | | | | 11/22 at 100.00 | | | | BBB– | | | | 11,755,981 | |
| | | | | |
| | | | Lubbock Educational Facilities Authority, Texas, Revenue Bonds, Lubbock Christian University, Refunding & Improvement Series 2007: | | | | | | | | | | | | | | |
| | 1,000 | | | 5.125%, 11/01/27 | | | | | 11/17 at 100.00 | | | | BBB | | | | 1,074,840 | |
| | 2,500 | | | 5.250%, 11/01/37 | | | | | 11/17 at 100.00 | | | | BBB | | | | 2,662,025 | |
| | | | | |
| | 1,190 | | | Mansfield, Texas, General Obligation Bonds, Series 2004A, 5.250%, 2/15/25 (Pre-refunded 2/15/14) – AMBAC Insured | | | | | 2/14 at 100.00 | | | | AA (4) | | | | 1,237,362 | |
| | | | | |
| | 1,000 | | | Mission Economic Development Corporation, Texas, Solid Waste Disposal Revenue Bonds, Waste Management Inc. Project, Series 2008, 6.000%, 8/01/20 (Mandatory put 8/01/13) | | | | | No Opt. Call | | | | BBB | | | | 1,012,350 | |
| | | | | |
| | 1,780 | | | North Fort Bend Water Authority, Texas, Water System Revenue Bonds, Series 2011, 5.000%, 12/15/36 – AGM Insured | | | | | 12/21 at 100.00 | | | | AA– | | | | 1,984,949 | |
| | | | | |
| | 10,000 | | | North Texas Municipal Water District, Water System Revenue Bonds, Refunding & Improvement Series 2012, 5.000%, 9/01/26 | | | | | 3/22 at 100.00 | | | | AAA | | | | 12,113,400 | |
Portfolio of Investments
Nuveen All-American Municipal Bond Fund (continued)
April 30, 2013
| | | | | | | | | | | | | | | | | | |
Principal
Amount (000) | | | Description (1) | | | | Optional Call
Provisions (2) | | | Ratings (3) | | | Value | |
| | | | Texas (continued) | | | | | | | | | | | | | | |
| | | | | |
| $ | 4,500 | | | North Texas Tollway Authority, First Tier System Revenue Refunding Bonds, Variable Rate Demand Series 2008-E3, 5.750%, 1/01/38 (Mandatory put 1/01/16) | | | | | No Opt. Call | | | | A2 | | | $ | 5,090,310 | |
| | | | | |
| | 2,000 | | | North Texas Tollway Authority, Second Tier System Revenue Refunding Bonds, Series 2008, 5.750%, 1/01/33 (UB) (5) | | | | | 1/18 at 100.00 | | | | A3 | | | | 2,252,280 | |
| | | | | |
| | | | North Texas Tollway Authority, Special Projects System Revenue Bonds, Current Interest Series 2011D: | | | | | | | | | | | | | | |
| | 10,000 | | | 5.250%, 9/01/27 | | | | | 9/21 at 100.00 | | | | AA | | | | 12,075,500 | |
| | 4,000 | | | 5.000%, 9/01/32 | | | | | 9/21 at 100.00 | | | | AA | | | | 4,632,360 | |
| | | | | |
| | | | North Texas Tollway Authority, Special Projects System Revenue Bonds, Series 2011A: | | | | | | | | | | | | | | |
| | 2,000 | | | 5.500%, 9/01/41 | | | | | 9/21 at 100.00 | | | | AA | | | | 2,381,720 | |
| | 10,880 | | | 0.000%, 9/01/45 | | | | | 9/31 at 100.00 | | | | AA | | | | 9,192,077 | |
| | | | | |
| | 8,000 | | | North Texas Tollway Authority, System First Tier Revenue Refunding Bonds, Series 2012C, 1.950%, 1/01/38 (Mandatory put 1/01/19) | | | | | No Opt. Call | | | | A2 | | | | 8,241,120 | |
| | | | | |
| | 3,000 | | | North Texas Tollway Authority, System Revenue Bonds, First Tier Series 2009A, 6.000%, 1/01/28 | | | | | 1/19 at 100.00 | | | | A2 | | | | 3,540,390 | |
| | | | | |
| | 2,000 | | | Port of Houston Authority, Harris County, Texas, General Obligation Bonds, Series 2010D-1, 5.000%, 10/01/30 | | | | | 10/20 at 100.00 | | | | AAA | | | | 2,394,240 | |
| | | | | |
| | 1,000 | | | Richardson Hospital Authority, Texas, Revenue Bonds, Richardson Regional Medical Center, Series 2004, 6.000%, 12/01/34 | | | | | 12/13 at 100.00 | | | | A+ | | | | 1,017,530 | |
| | | | | |
| | 525 | | | SA Energy Acquisition Public Facilities Corporation, Texas, Gas Supply Revenue Bonds, Series 2007, 5.500%, 8/01/27 | | | | | No Opt. Call | | | | A | | | | 631,019 | |
| | | | | |
| | 10,000 | | | San Antonio, Texas, Electric and Gas Revenue Bonds, Refunding Series 2009A, 5.250%, 2/01/25 | | | | | 2/19 at 100.00 | | | | Aa1 | | | | 12,055,400 | |
| | | | | |
| | 4,000 | | | San Antonio, Texas, Electric and Gas Revenue Bonds, Series 2008, 5.000%, 2/01/25 | | | | | 2/18 at 100.00 | | | | Aa1 | | | | 4,669,160 | |
| | | | | |
| | | | San Marcos, Texas, General Obligation Bonds, Series 2008: | | | | | | | | | | | | | | |
| | 1,000 | | | 5.000%, 8/15/25 – AGM Insured | | | | | 8/17 at 100.00 | | | | Aa2 | | | | 1,141,980 | |
| | 1,000 | | | 5.000%, 8/15/27 – AGM Insured | | | | | 8/17 at 100.00 | | | | Aa2 | | | | 1,129,590 | |
| | | | | |
| | 1,000 | | | San Marcos, Texas, Waterworks and Wastewater System Revenue Bonds, Series 2008, 5.000%, 8/15/26 – AGM Insured | | | | | 8/17 at 100.00 | | | | Aa2 | | | | 1,129,100 | |
| | | | | |
| | 9,030 | | | Southwest Higher Education Authority Inc, Texas, Revenue Bonds, Southern Methodist University, Series 2009, 5.000%, 10/01/36 | | | | | 10/19 at 100.00 | | | | AA– | | | | 10,335,106 | |
| | | | | |
| | 1,600 | | | Tarrant County Cultural and Educational Facilities Finance Corporation, Texas, Retirement Facility Revenue Bonds, Northwest Senior Housing-Edgemere Project, Series 2006A, 6.000%, 11/15/26 | | | | | 11/16 at 100.00 | | | | N/R | | | | 1,724,384 | |
| | | | | |
| | 940 | | | Tarrant County Cultural Education Facilities Finance Corporation, Texas, Hospital Revenue Bonds, Scott & White Healthcare Project, Series 2010, 5.500%, 8/15/45 | | | | | 8/20 at 100.00 | | | | AA– | | | | 1,080,558 | |
| | | | | |
| | 790 | | | Texas Municipal Gas Acquisition and Supply Corporation I, Gas Supply Revenue Bonds, Senior Lien Series 2008D, 5.625%, 12/15/17 | | | | | No Opt. Call | | | | A– | | | | 885,077 | |
| | | | | |
| | 5,000 | | | Texas Municipal Gas Acquisition and Supply Corporation III, Gas Supply Revenue Bonds, Series 2012, 5.000%, 12/15/32 | | | | | No Opt. Call | | | | A3 | | | | 5,361,350 | |
| | | | | |
| | 7,800 | | | Texas Private Activity Bond Surface Transportation Corporation, Senior Lien Revenue Bonds, LBJ Infrastructure Group LLC IH-635 Managed Lanes Project, Series 2010, 7.000%, 6/30/40 | | | | | 6/20 at 100.00 | | | | Baa3 | | | | 9,566,622 | |
| | | | | |
| | 845 | | | Texas Private Activity Bond Surface Transportation Corporation, Senior Lien Revenue Bonds, NTE Mobility Partners LLC North Tarrant Express Managed Lanes Project, Series 2009, 6.875%, 12/31/39 | | | | | 12/19 at 100.00 | | | | Baa2 | | | | 1,018,233 | |
| | | | | |
| | 1,000 | | | Texas Public Finance Authority, Charter School Finance Corporation Revenue Bonds, Idea Public School Project, Series 2007A, 5.000%, 8/15/37 – ACA Insured | | | | | 8/17 at 100.00 | | | | BBB | | | | 1,043,430 | |
| | | | | |
| | 1,750 | | | Texas State, General Obligation Bonds, Water Financial Assistance, Tender Option Bond Trust 3479, 17.540%, 2/01/17 (IF) | | | | | No Opt. Call | | | | Aaa | | | | 2,926,770 | |
| | | | | | | | | | | | | | | | | | |
Principal
Amount (000) | | | Description (1) | | | | Optional Call
Provisions (2) | | | Ratings (3) | | | Value | |
| | | | Texas (continued) | | | | | | | | | | | | | | |
| | | | | |
| $ | 20,000 | | | Texas Turnpike Authority, Central Texas Turnpike System Revenue Bonds, First Tier Series 2002A, 0.000%, 8/15/17 – AMBAC Insured | | | | | No Opt. Call | | | | A– | | | $ | 18,560,400 | |
| | | | | |
| | | | Travis County Health Facilities Development Corporation, Texas, Retirement Facility Revenue Bonds, Querencia Barton Creek, Series 2005: | | | | | | | | | | | | | | |
| | 1,300 | | | 5.500%, 11/15/25 | | | | | 11/15 at 100.00 | | | | N/R | | | | 1,353,677 | |
| | 4,100 | | | 5.650%, 11/15/35 | | | | | 11/15 at 100.00 | | | | N/R | | | | 4,233,414 | |
| | | | | |
| | 750 | | | Travis County Health Facilities Development Corporation, Texas, Revenue Bonds, Westminster Manor, Series 2010, 7.000%, 11/01/30 | | | | | 11/20 at 100.00 | | | | BB+ | | | | 901,058 | |
| | | | | |
| | 2,000 | | | Tyler Health Facilities Development Corporation, Texas, Hospital Revenue Bonds, Mother Frances Hospital Regional Healthcare Center, Series 2007, 5.000%, 7/01/33 | | | | | 7/17 at 100.00 | | | | Baa1 | | | | 2,134,160 | |
| | | | | |
| | 500 | | | Uptown Development Authority, Houston, Texas, Tax Increment Revenue Bonds, Infrastructure Improvement Facilities, Series 2009, 5.250%, 9/01/24 | | | | | 9/19 at 100.00 | | | | BBB | | | | 560,475 | |
| | 257,920 | | | Total Texas | | | | | | | | | | | | | 283,428,777 | |
| | | | Utah – 0.6% | | | | | | | | | | | | | | |
| | | | | |
| | | | Utah State Charter School Finance Authority Charter School Revenue Bonds, Vista at Entrada School of Performing Arts and Technology) Series 2012: | | | | | | | | | | | | | | |
| | 950 | | | 5.600%, 7/15/22 | | | | | No Opt. Call | | | | BB+ | | | | 1,005,955 | |
| | 850 | | | 6.300%, 7/15/32 | | | | | 7/22 at 100.00 | | | | BB+ | | | | 903,329 | |
| | | | | |
| | 1,000 | | | Utah State Charter School Finance Authority, Charter School Revenue Bonds, Navigator Pointe Academy Project, Series 2010A, 5.625%, 7/15/40 | | | | | 7/20 at 100.00 | | | | BBB | | | | 1,073,620 | |
| | | | | |
| | | | Utah State Charter School Finance Authority, Charter School Revenue Bonds, Noah Webster Academy, Series 2008A: | | | | | | | | | | | | | | |
| | 485 | | | 6.250%, 6/15/28 | | | | | 6/17 at 100.00 | | | | N/R | | | | 494,108 | |
| | 950 | | | 6.500%, 6/15/38 | | | | | 6/17 at 100.00 | | | | N/R | | | | 968,430 | |
| | | | | |
| | 1,250 | | | Utah State Charter School Finance Authority, Charter School Revenue Bonds, North Davis Preparatory Academy, Series 2010, 6.250%, 7/15/30 | | | | | 7/20 at 100.00 | | | | BBB– | | | | 1,366,400 | |
| | | | | |
| | 1,135 | | | Utah State Charter School Finance Authority, Charter School Revenue Bonds, Paradigm High School, Series 2010A, 6.375%, 7/15/40 | | | | | 7/20 at 100.00 | | | | BBB– | | | | 1,225,879 | |
| | | | | |
| | | | Utah State Charter School Finance Authority, Revenue Bonds, George Washington Academy Project, Series 2011A: | | | | | | | | | | | | | | |
| | 2,135 | | | 7.750%, 7/15/31 | | | | | 7/21 at 100.00 | | | | BB+ | | | | 2,446,368 | |
| | 3,520 | | | 8.000%, 7/15/41 | | | | | 7/21 at 100.00 | | | | BB+ | | | | 4,084,502 | |
| | | | | |
| | 6,830 | | | Utah Transit Authority, Sales Tax Revenue Bonds, Series 2007A, 0.000%, 6/15/29 – NPFG Insured | | | | | 6/17 at 55.29 | | | | A1 | | | | 3,304,559 | |
| | 19,105 | | | Total Utah | | | | | | | | | | | | | 16,873,150 | |
| | | | Vermont – 0.1% | | | | | | | | | | | | | | |
| | | | | |
| | 1,000 | | | Vermont Economic Development Authority, Mortgage Revenue Bonds, Wake Robin Corporation Project, Refunding Series 2006A, 5.250%, 5/01/26 | | | | | 5/16 at 100.00 | | | | N/R | | | | 1,027,340 | |
| | | | | |
| | | | Vermont Educational and Health Buildings Financing Agency, Revenue Bonds, Vermont Law School Project, Series 2011A: | | | | | | | | | | | | | | |
| | 1,815 | | | 6.125%, 1/01/28 | | | | | 1/21 at 100.00 | | | | Baa2 | | | | 2,105,146 | |
| | 1,000 | | | 6.250%, 1/01/33 | | | | | 1/21 at 100.00 | | | | Baa2 | | | | 1,147,280 | |
| | 3,815 | | | Total Vermont | | | | | | | | | | | | | 4,279,766 | |
| | | | Virgin Islands – 0.1% | | | | | | | | | | | | | | |
| | | | | |
| | 500 | | | Virgin Islands Public Finance Authority, Matching Fund Loan Notes Revenue Bonds, Subordinate Lien Series 2009A, 6.000%, 10/01/39 | | | | | 10/19 at 100.00 | | | | Baa3 | | | | 554,760 | |
| | | | | |
| | 2,480 | | | Virgin Islands Public Finance Authority, Matching Fund Revenue Loan Note – Diageo Project, Series 2009A, 6.750%, 10/01/37 | | | | | 10/19 at 100.00 | | | | BBB | | | | 2,917,125 | |
| | 2,980 | | | Total Virgin Islands | | | | | | | | | | | | | 3,471,885 | |
Portfolio of Investments
Nuveen All-American Municipal Bond Fund (continued)
April 30, 2013
| | | | | | | | | | | | | | | | | | |
Principal
Amount (000) | | | Description (1) | | | | Optional Call
Provisions (2) | | | Ratings (3) | | | Value | |
| | | | Virginia – 1.2% | | | | | | | | | | | | | | |
| | | | | |
| $ | 845 | | | Arlington County Industrial Development Authority, Virginia, Multifamily Housing Mortgage Revenue Bonds, Berkeley Apartments, Series 2000, 5.850%, 12/01/20 (Alternative Minimum Tax) | | | | | 11/13 at 100.00 | | | | AA+ | | | $ | 847,366 | |
| | | | | |
| | | | Chesapeake, Virginia, Transportation System Senior Toll Road Revenue Bonds, Series 2012A: | | | | | | | | | | | | | | |
| | 1,000 | | | 4.000%, 7/15/20 | | | | | No Opt. Call | | | | BBB | | | | 1,107,280 | |
| | 900 | | | 5.000%, 7/15/21 | | | | | No Opt. Call | | | | BBB | | | | 1,063,071 | |
| | 930 | | | 5.000%, 7/15/22 | | | | | No Opt. Call | | | | BBB | | | | 1,105,891 | |
| | 1,720 | | | 4.000%, 7/15/24 | | | | | 7/22 at 100.00 | | | | BBB | | | | 1,869,176 | |
| | | | | |
| | 4,000 | | | Tobacco Settlement Financing Corporation of Virginia, Tobacco Settlement Asset Backed Bonds, Series 2007B1, 5.000%, 6/01/47 | | | | | 6/17 at 100.00 | | | | B2 | | | | 3,386,520 | |
| | | | | |
| | 1,000 | | | Virginia Small Business Financing Authority, Revenue Bonds Hampton Roads Proton Beam Therapy Institute at Hampton University, LLC Project, Series 2009, 9.000%, 7/01/39 | | | | | 7/14 at 102.00 | | | | N/R | | | | 1,076,350 | |
| | | | | |
| | 7,000 | | | Virginia Small Business Financing Authority, Senior Lien Revenue Bonds, 95 Express Lanes LLC Project, Series 2012, 5.000%, 7/01/34 (Alternative Minimum Tax) | | | | | 1/22 at 100.00 | | | | BBB– | | | | 7,325,290 | |
| | | | | |
| | | | Virginia Small Business Financing Authority, Senior Lien Revenue Bonds, Elizabeth River Crossing, Opco LLC Project, Series 2012: | | | | | | | | | | | | | | |
| | 3,515 | | | 5.250%, 1/01/32 (Alternative Minimum Tax) | | | | | 7/22 at 100.00 | | | | BBB– | | | | 3,877,678 | |
| | 11,490 | | | 5.500%, 1/01/42 (Alternative Minimum Tax) | | | | | 7/22 at 100.00 | | | | BBB– | | | | 12,543,173 | |
| | 32,400 | | | Total Virginia | | | | | | | | | | | | | 34,201,795 | |
| | | | Washington – 2.5% | | | | | | | | | | | | | | |
| | | | | |
| | 6,220 | | | Clark County Public Utility District 1, Washington, Electric System Revenue Bonds, Refunding Series 2011, 5.250%, 1/01/31 | | | | | 1/21 at 100.00 | | | | A+ | | | | 7,064,987 | |
| | | | | |
| | 175 | | | Franklin County Public Utility District 1, Washington, Electric Revenue Refunding Bonds, Series 2002, 5.625%, 9/01/20 – NPFG Insured | | | | | 7/13 at 100.00 | | | | Aa3 | | | | 175,753 | |
| | | | | |
| | 960 | | | FYI Properties, Washington, Lease Revenue Bonds, Washington State Department of Information Services Project, Tender Option Bond Trust 2009-14A&B, 19.940%, 6/01/34 (IF) (5) | | | | | 6/19 at 100.00 | | | | AA | | | | 1,461,811 | |
| | | | | |
| | 2,450 | | | King County Public Hospital District 4, Washington, General Obligation Bonds, Snoqualmie Valley Hospital, Refunding Improvement Series 2011, 7.000%, 12/01/40 | | | | | 12/21 at 100.00 | | | | N/R | | | | 2,695,147 | |
| | | | | |
| | | | King County, Washington, General Obligation Sewer Bonds, Series 2005: | | | | | | | | | | | | | | |
| | 5,115 | | | 5.000%, 1/01/35 (Pre-refunded 1/01/15) – FGIC Insured | | | | | 1/15 at 100.00 | | | | Aa1 (4) | | | | 5,514,584 | |
| | 1,885 | | | 5.000%, 1/01/35 (Pre-refunded 1/01/15) – FGIC Insured | | | | | 1/15 at 100.00 | | | | AAA | | | | 2,030,277 | |
| | | | | |
| | 2,335 | | | King County, Washington, Sewer Revenue Bonds, Tender Option Bond Trust 3090, 13.406%, 7/01/32 – AGM Insured (IF) (5) | | | | | 7/17 at 100.00 | | | | AA+ | | | | 3,238,995 | |
| | | | | |
| | 1,540 | | | Ocean Shores, Washington, Local Improvement District 2007-01 Bonds, 2011, 7.250%, 2/01/31 | | | | | No Opt. Call | | | | BBB+ | | | | 1,991,174 | |
| | | | | |
| | 5,000 | | | Seattle, Washington, Municipal Light and Power Revenue Bonds, Refunding & Improvement Series 2012A, 5.000%, 6/01/22 | | | | | No Opt. Call | | | | Aa2 | | | | 6,357,250 | |
| | | | | |
| | 2,000 | | | Washington Health Care Facilities Authority, Revenue Bonds, Fred Hutchinson Cancer Research Center, Series 2011A, 5.625%, 1/01/35 | | | | | 1/21 at 100.00 | | | | A | | | | 2,245,700 | |
| | | | | |
| | 3,535 | | | Washington Health Care Facilities Authority, Revenue Bonds, Kadlec Regional Medical Center, Series 2010, 5.250%, 12/01/30 | | | | | 12/20 at 100.00 | | | | Baa3 | | | | 3,810,765 | |
| | | | | |
| | | | Washington Health Care Facilities Authority, Revenue Bonds, Kadlec Regional Medical Center, Series 2012: | | | | | | | | | | | | | | |
| | 2,775 | | | 5.000%, 12/01/27 | | | | | 12/21 at 100.00 | | | | Baa3 | | | | 2,982,542 | |
| | 1,745 | | | 5.000%, 12/01/32 | | | | | 12/21 at 100.00 | | | | Baa3 | | | | 1,838,916 | |
| | 2,435 | | | 5.000%, 12/01/42 | | | | | 12/21 at 100.00 | | | | Baa3 | | | | 2,537,562 | |
| | | | | |
| | 2,315 | | | Washington Health Care Facilities Authority, Revenue Bonds, Seattle Children’s Hospital, Tender Option Bond Trust 3295, 17.675%, 4/01/20 (IF) (5) | | | | | No Opt. Call | | | | AA | | | | 3,385,433 | |
| | | | | | | | | | | | | | | | | | |
Principal
Amount (000) | | | Description (1) | | | | Optional Call
Provisions (2) | | | Ratings (3) | | | Value | |
| | | | Washington (continued) | | | | | | | | | | | | | | |
| | | | | |
| $ | 1,000 | | | Washington Higher Education Facilities Authority Revenue Bonds, Whitworth University Project, Series 2012, 5.000%, 10/01/27 | | | | | 4/22 at 100.00 | | | | Baa1 | | | $ | 1,113,230 | |
| | | | | |
| | 600 | | | Washington Public Power Supply System, Revenue Refunding Bonds, Nuclear Project 3, Series 1989B, 7.125%, 7/01/16 | | | | | No Opt. Call | | | | Aa1 | | | | 724,938 | |
| | | | | |
| | | | Washington State Health Care Facilities Authority, Revenue Bonds, Central Washington Health Services Association, Series 2009: | | | | | | | | | | | | | | |
| | 2,000 | | | 6.250%, 7/01/24 | | | | | 7/19 at 100.00 | | | | Baa3 | | | | 2,295,540 | |
| | 2,000 | | | 7.000%, 7/01/39 | | | | | 7/19 at 100.00 | | | | Baa3 | | | | 2,319,680 | |
| | | | | |
| | 3,000 | | | Washington State Higher Education Facilities Authority, Revenue Bonds, Whitworth University, Series 2009, 5.375%, 10/01/29 | | | | | 10/19 at 100.00 | | | | Baa1 | | | | 3,330,810 | |
| | | | | |
| | | | Washington State Housing Finance Commission, Non-Profit Revenue Bonds, Emerald Heights Project, Refunding 2013: | | | | | | | | | | | | | | |
| | 1,100 | | | 5.000%, 7/01/28 | | | | | 7/23 at 100.00 | | | | A– | | | | 1,245,651 | |
| | 1,150 | | | 5.000%, 7/01/33 | | | | | 7/23 at 100.00 | | | | A– | | | | 1,286,551 | |
| | | | | |
| | 2,340 | | | Washington State Housing Finance Commission, Revenue Bonds, Riverview Retirement Community Refunding, Series 2012, 5.000%, 1/01/48 | | | | | No Opt. Call | | | | BBB– | | | | 2,357,690 | |
| | | | | |
| | | | Washington State Tobacco Settlement Authority, Tobacco Settlement Asset-Backed Revenue Bonds, Series 2002: | | | | | | | | | | | | | | |
| | 2,965 | | | 6.500%, 6/01/26 | | | | | 6/13 at 100.00 | | | | A3 | | | | 3,024,241 | |
| | 660 | | | 6.625%, 6/01/32 | | | | | 6/13 at 100.00 | | | | Baa1 | | | | 673,187 | |
| | | | | |
| | 5,000 | | | Washington State, Federal Highway Grant Anticipation Revenue Bonds, Garvee – SR 520 Corridor Program, Series 2012F, 5.000%, 9/01/24 | | | | | 9/22 at 100.00 | | | | AA | | | | 6,166,850 | |
| | | | | |
| | 3,335 | | | Washington State, General Obligation Bonds, Tender Option Bond Trust 1121, 13.445%, 7/01/14 – AGM Insured (IF) | | | | | No Opt. Call | | | | AA+ | | | | 4,763,481 | |
| | 65,635 | | | Total Washington | | | | | | | | | | | | | 76,632,745 | |
| | | | West Virginia – 0.1% | | | | | | | | | | | | | | |
| | | | | |
| | 500 | | | Ohio County Commission, West Virginia, Tax Increment Revenue Bonds, Fort Henry Centre Financing District, Series 2007A, 5.850%, 6/01/34 | | | | | 6/17 at 100.00 | | | | N/R | | | | 528,735 | |
| | | | | |
| | 1,000 | | | West Virginia Hospital Finance Authority , Hospital Revenue Bonds, Charleston Area Medical Center, Series 2009A, 5.625%, 9/01/32 | | | | | 9/19 at 100.00 | | | | A3 | | | | 1,123,700 | |
| | | | | |
| | 1,000 | | | West Virginia Hospital Finance Authority, Hospital Revenue Bonds, Thomas Health System, Inc., Series 2008, 6.500%, 10/01/28 | | | | | 10/18 at 100.00 | | | | N/R | | | | 1,069,410 | |
| | 2,500 | | | Total West Virginia | | | | | | | | | | | | | 2,721,845 | |
| | | | Wisconsin – 3.0% | | | | | | | | | | | | | | |
| | | | | |
| | 2,760 | | | Manitowoc, Wisconsin, Power System Revenue Bonds, Series 2004, 5.000%, 10/01/23 – FGIC Insured | | | | | 10/14 at 100.00 | | | | A1 | | | | 2,925,490 | |
| | | | | |
| | 3,665 | | | Milwaukee County, Wisconsin, Airport Revenue Bonds, Series 2006A, 5.000%, 12/01/31 – NPFG Insured (Alternative Minimum Tax) | | | | | 12/16 at 100.00 | | | | A1 | | | | 4,034,139 | |
| | | | | |
| | 5,000 | | | Oneida Tribe of Indians of Wisconsin, Retail Sales Revenue Bonds, Series 2010, 144A, 6.500%, 2/01/31 | | | | | 2/19 at 102.00 | | | | AA– | | | | 5,742,450 | |
| | | | | |
| | | | Public Finance Authority of Wisconsin, Educational Facility Revenue Bonds, Cottonwood Classical Preparatory School in Albuquerque, New Mexico, Series 2012A: | | | | | | | | | | | | | | |
| | 1,610 | | | 6.000%, 12/01/32 | | | | | No Opt. Call | | | | N/R | | | | 1,616,875 | |
| | 5,000 | | | 6.250%, 12/01/42 | | | | | No Opt. Call | | | | N/R | | | | 5,042,650 | |
| | | | | |
| | | | Public Finance Authority, Wisconsin, Charter School Revenue Bonds, Voyager Foundation Inc. of North Carolina, Series 2012A: | | | | | | | | | | | | | | |
| | 395 | | | 5.500%, 10/01/22 | | | | | No Opt. Call | | | | N/R | | | | 407,877 | |
| | 375 | | | 6.000%, 10/01/32 | | | | | 10/22 at 100.00 | | | | N/R | | | | 387,506 | |
| | | | | |
| | 2,000 | | | Superior, Wisconsin, Limited Obligation Revenue Refunding Bonds, Midwest Energy Resources Company, Series 1991E, 6.900%, 8/01/21 – FGIC Insured | | | | | No Opt. Call | | | | A1 | | | | 2,673,740 | |
Portfolio of Investments
Nuveen All-American Municipal Bond Fund (continued)
April 30, 2013
| | | | | | | | | | | | | | | | | | |
Principal
Amount (000) | | | Description (1) | | | | Optional Call
Provisions (2) | | | Ratings (3) | | | Value | |
| | | | Wisconsin (continued) | | | | | | | | | | | | | | |
| | | | | |
| $ | 1,930 | | | Wisconsin Health and Educational Facilities Authority, Revenue Bonds, Aurora Health Care, Inc., Series 2010A, 5.250%, 4/15/24 | | | | | 4/20 at 100.00 | | | | A | | | $ | 2,215,293 | |
| | | | | |
| | 2,000 | | | Wisconsin Health and Educational Facilities Authority, Revenue Bonds, Beaver Dam Community Hospitals Inc., Series 2004A, 6.750%, 8/15/34 | | | | | 8/14 at 100.00 | | | | N/R | | | | 2,048,100 | |
| | | | | |
| | 1,225 | | | Wisconsin Health and Educational Facilities Authority, Revenue Bonds, Beloit College, Series 2010A, 6.125%, 6/01/39 | | | | | 6/20 at 100.00 | | | | Baa2 | | | | 1,401,731 | |
| | | | | |
| | 3,000 | | | Wisconsin Health and Educational Facilities Authority, Revenue Bonds, Fort Healthcare Inc., Series 2004, 5.750%, 5/01/29 | | | | | 5/14 at 100.00 | | | | BBB+ | | | | 3,122,490 | |
| | | | | |
| | 13,940 | | | Wisconsin Health and Educational Facilities Authority, Revenue Bonds, Gundersen Lutheran, Series 2011A, 5.250%, 10/15/39 | | | | | 10/21 at 100.00 | | | | A+ | | | | 15,577,253 | |
| | | | | |
| | 1,490 | | | Wisconsin Health and Educational Facilities Authority, Revenue Bonds, Howard Young Health Care, Inc., Refunding Series 2012, 5.000%, 8/15/27 | | | | | 8/22 at 100.00 | | | | BBB+ | | | | 1,640,132 | |
| | | | | |
| | | | Wisconsin Health and Educational Facilities Authority, Revenue Bonds, Marshfield Clinic, Series 2012B: | | | | | | | | | | | | | | |
| | 1,000 | | | 4.250%, 2/15/32 | | | | | 2/22 at 100.00 | | | | A– | | | | 1,031,430 | |
| | 1,485 | | | 5.000%, 2/15/40 | | | | | 2/22 at 100.00 | | | | A– | | | | 1,610,690 | |
| | | | | |
| | 20,000 | | | Wisconsin Health and Educational Facilities Authority, Revenue Bonds, Mercy Alliance, Inc., Series 2012, 5.000%, 6/01/32 | | | | | 6/22 at 100.00 | | | | A2 | | | | 22,308,800 | |
| | | | | |
| | 7,000 | | | Wisconsin Health and Educational Facilities Authority, Revenue Bonds, Ministry Health Care, Inc., Refunding 2012C, 5.000%, 8/15/32 | | | | | 8/22 at 100.00 | | | | A+ | | | | 7,823,480 | |
| | | | | |
| | 595 | | | Wisconsin Health and Educational Facilities Authority, Revenue Bonds, ProHealth Care, Inc. Obligated Group, Series 2009, 6.625%, 2/15/39 | | | | | 2/19 at 100.00 | | | | A+ | | | | 697,286 | |
| | | | | |
| | 1,800 | | | Wisconsin Health and Educational Facilities Authority, Revenue Bonds, ProHealth Care, Inc. Obligated Group, Series 2009, 6.625%, 2/15/32 (Pre-refunded 2/18/14) | | | | | 2/14 at 100.00 | | | | A+ (4) | | | | 1,890,504 | |
| | | | | |
| | 2,500 | | | Wisconsin Health and Educational Facilities Authority, Revenue Bonds, Wheaton Franciscan Health, Tender Option Bond Trust 2113, 14.172%, 8/15/33 (IF) | | | | | 8/13 at 100.00 | | | | A– | | | | 2,598,600 | |
| | | | | |
| | 2,535 | | | Wisconsin Health and Educational Facilities Authority, Revenue Bonds, Wheaton Franciscan Services Inc., Series 2006B, 5.125%, 8/15/30 | | | | | 8/16 at 100.00 | | | | A– | | | | 2,684,159 | |
| | | | | |
| | 1,765 | | | Wisconsin Public Power Incorporated System, Power Supply System Revenue Bonds, Series 2005A, 5.000%, 7/01/30 – AMBAC Insured | | | | | 7/15 at 100.00 | | | | A1 | | | | 1,910,771 | |
| | 83,070 | | | Total Wisconsin | | | | | | | | | | | | | 91,391,446 | |
| | | | Wyoming – 0.8% | | | | | | | | | | | | | | |
| | | | | |
| | 2,000 | | | Campbell County, Wyoming Solid Waste Facilities Revenue Bonds, Basin Electric Power Cooperative – Dry Fork Station Facilities, Series 2009A, 5.750%, 7/15/39 | | | | | 7/19 at 100.00 | | | | A1 | | | | 2,290,440 | |
| | | | | |
| | 2,000 | | | Laramie County, Wyoming, Hospital Revenue Bonds, Cheyenne Regional Medical Center Project, Series 2012, 5.000%, 5/01/37 | | | | | 5/21 at 100.00 | | | | A+ | | | | 2,202,680 | |
| | | | | |
| | 4,500 | | | Natrona County, Wyoming, Hospital Revenue Bonds, Wyoming Medical Center Project, Series 2011, 6.350%, 9/15/31 | | | | | 3/21 at 100.00 | | | | A3 | | | | 5,323,185 | |
| | | | | |
| | 1,000 | | | Sweetwater County, Wyoming, Pollution Control Revenue Refunding Bonds, Idaho Power Company Project, Series 2006, 5.250%, 7/15/26 | | | | | 8/19 at 100.00 | | | | A2 | | | | 1,134,240 | |
| | | | | |
| | | | Teton County Hospital District, Wyoming, Hospital Revenue Bonds, St. John’s Medical Center Project, Series 2011B: | | | | | | | | | | | | | | |
| | 800 | | | 5.500%, 12/01/27 | | | | | 12/21 at 100.00 | | | | BBB | | | | 926,528 | |
| | 2,500 | | | 6.000%, 12/01/36 | | | | | 12/21 at 100.00 | | | | BBB | | | | 2,963,025 | |
| | | | | |
| | 3,650 | | | West Park Hospital District, Wyoming, Hospital Revenue Bonds, Series 2011A, 7.000%, 6/01/40 | | | | | 6/21 at 100.00 | | | | BBB | | | | 4,404,200 | |
| | | | | |
| | | | Wyoming Community Development Authority, Housing Revenue Bonds, 2013 Series 1: | | | | | | | | | | | | | | |
| | 700 | | | 1.875%, 12/01/17 (Alternative Minimum Tax) | | | | | No Opt. Call | | | | AA+ | | | | 705,810 | |
| | 1,330 | | | 2.050%, 12/01/18 (Alternative Minimum Tax) | | | | | No Opt. Call | | | | AA+ | | | | 1,340,746 | |
| | 1,185 | | | 2.400%, 12/01/19 (Alternative Minimum Tax) | | | | | No Opt. Call | | | | AA+ | | | | 1,199,386 | |
| | | | | | | | | | | | | | | | | | | | |
Principal
Amount (000) | | | Description (1) | | | | | Optional Call
Provisions (2) | | | Ratings (3) | | | Value | |
| | | | Wyoming (continued) | | | | | | | | | | | | | | | | |
| $ | 865 | | | 2.700%, 12/01/20 (Alternative Minimum Tax) | | | | | | | No Opt. Call | | | | AA+ | | | $ | 874,429 | |
| | 1,475 | | | 2.900%, 12/01/21 (Alternative Minimum Tax) | | | | | | | No Opt. Call | | | | AA+ | | | | 1,486,918 | |
| | 505 | | | 3.150%, 12/01/22 (Alternative Minimum Tax) | | | | | | | No Opt. Call | | | | AA+ | | | | 511,474 | |
| | 22,510 | | | Total Wyoming | | | | | | | | | | | | | | | 25,363,061 | |
| $ | 2,825,242 | | | Total Municipal Bonds (cost $2,703,067,406) | | | | | | | | | | | | | | | 2,968,571,504 | |
| | | | | |
Principal
Amount (000) | | | Description (1) | | Coupon | | | Maturity | | | Ratings (3) | | | Value | |
| | | | CORPORATE BONDS – 0.0% | | | | | | | | | | | | | | | | |
| | | | | |
| | | | Transportation – 0.0% | | | | | | | | | | | | | | | | |
| | | | | |
| $ | 126 | | | Las Vegas Monorail Company, Senior Interest Bonds (9), (10) | | | 5.500% | | | | 7/15/19 | | | | N/R | | | $ | 31,493 | |
| | | | | |
| | 37 | | | Las Vegas Monorail Company, Senior Interest Bonds (9), (10) | | | 3.000% | | | | 7/15/55 | | | | N/R | | | | 7,373 | |
| $ | 163 | | | Total Corporate Bonds (cost $3,097) | | | | | | | | | | | | | | | 38,866 | |
| | | | Total Investments (cost $2,703,070,503) – 98.5% | | | | | | | | | | | | 2,968,610,370 | |
| | | | Floating Rate Obligations – (0.6)% | | | | | | | | | | | | | | | (18,520,000) | |
| | | | Other Assets Less Liabilities – 2.1% | | | | | | | | | | | | | | | 63,124,453 | |
| | | | Net Assets – 100% | | | | | | | | | | | | | | $ | 3,013,214,823 | |
| | (1) | | All percentages shown in the Portfolio of Investments are based on net assets. |
| | (2) | | Optional Call Provisions (not covered by the report of independent registered public accounting firm): Dates (month and year) and prices of the earliest optional call or redemption. There may be other call provisions at varying prices at later dates. Certain mortgage-backed securities may be subject to periodic principal paydowns. |
| | (3) | | Ratings (not covered by the report of independent registered public accounting firm): Using the highest of Standard & Poor’s Group (“Standard & Poor’s”), Moody’s Investors Service, Inc. (“Moody’s”) or Fitch, Inc. (“Fitch”) rating. Ratings below BBB by Standard & Poor’s, Baa by Moody’s or BBB by Fitch are considered to be below investment grade. Holdings designated N/R are not rated by any of these national rating agencies. |
| | (4) | | Backed by an escrow or trust containing sufficient U.S. Government or U.S. Government agency securities, which ensure the timely payment of principal and interest. Certain bonds backed by U.S. Government or agency securities are regarded as having an implied rating equal to the rating of such securities. |
| | (5) | | Investment, or portion of investment, has been pledged to collateralize the net payment obligations for investments in inverse floating rate transactions. |
| | (6) | | At or subsequent to the end of the reporting period, this security is non-income producing. Non-income producing security, in the case of a fixed-income security, generally denotes that the issuer has (1) defaulted on the payment of principal or interest, (2) is under the protection of the Federal Bankruptcy Court or (3) the Fund’s Adviser has concluded that the issue is not likely to meet its future interest payment obligations and has directed the Fund’s custodian to cease accruing additional income on the Fund’s records. |
| | (7) | | On April 1, 2013, the Fund’s Adviser determined it was unlikely that this borrower would fulfill its entire obligation on this security, and therefore reduced the security’s interest rate of accrual from 5.750% to 2.300%. |
| | (8) | | On April 1, 2013, the Fund’s Adviser determined it was unlikely that this borrower would fulfill its entire obligation on this security, and therefore reduced the security’s interest rate of accrual from 5.875% to 2.350%. |
| | (9) | | Investment valued at fair value using methods determined in good faith by, or at the discretion of, the Board of Directors/Trustees. For fair value measurement disclosure purposes, investment classified as Level 3. See Notes to Financial Statements, Footnote 1 – General Information and Significant Accounting Policies, Investment Valuation for more information. |
| | (10) | | During January 2010, Las Vegas Monorail Company (“Las Vegas Monorail”) filed for federal bankruptcy protection. During March 2012, Las Vegas Monorail emerged from federal bankruptcy with the acceptance of a reorganization plan assigned by the Federal Bankruptcy Court. Under the reorganization plan, the Fund surrendered its Las Vegas Monorail Project Revenue Bonds, First Tier, Series 2000 and in turn received two senior interest corporate bonds: the first with an interest rate of 5.500% maturing on July 15, 2019 and the second with an interest rate of 3.000% (5.500% after December 31, 2015) maturing on July 15, 2055. The custodian is not accruing income on the Fund’s records for either senior interest corporate bond. |
| | WI/DD | | Investment, or portion of investment, purchased on a when-issued or delayed delivery basis. |
| | (ETM) | | Escrowed to maturity. |
| | (IF) | | Inverse floating rate investment. |
| | (UB) | | Underlying bond of an inverse floating rate trust reflected as a financing transaction. See Notes to Financial Statements, Footnote 1 – General Information and Significant Accounting Policies, Inverse Floating Rate Securities for more information. |
| | 144A | | Investment is exempt from registration under Rule 144A of the Securities Act of 1933, as amended. These investments may only be resold in transactions exempt from registration, which are normally those transactions with qualified institutional buyers. |
See accompanying notes to financial statements.
Portfolio of Investments
Nuveen High Yield Municipal Bond Fund
April 30, 2013
| | | | | | | | | | | | | | | | | | |
Principal
Amount (000) | | | Description (1) | | | | Optional Call
Provisions (2) | | | Ratings (3) | | | Value | |
| | | | MUNICIPAL BONDS – 99.7% | | | | | | | | | | | | | | |
| | | | | |
| | | | National – 0.5% | | | | | | | | | | | | | | |
| | | | | |
| $ | 19,725 | | | MuniMae Tax-Exempt Bond Subsidiary Redeemable Preferred Shares, Multifamily Housing Pool, Series 2013A-5, 5.000%, 1/31/28 (Mandatory put 1/31/18) (Alternative Minimum Tax) | | | | | 1/18 at 100.00 | | | | Ba1 | | | $ | 19,739,991 | |
| | | | | |
| | 17,000 | | | MuniMae Tax-Exempt Bond Subsidiary Redeemable Preferred Shares, Multifamily Housing Pool, Series 2000B, 5.750%, 6/30/50 (Mandatory put 9/30/19) (Alternative Minimum Tax) | | | | | 11/13 at 100.00 | | | | Ba2 | | | | 17,004,080 | |
| | | | | |
| | 5,000 | | | MuniMae Tax-Exempt Bond Subsidiary Redeemable Preferred Shares, Multifamily Housing Pool, Series 2005A-4, 5.125%, 6/30/50 (Mandatory put 9/30/15) (Alternative Minimum Tax) | | | | | No Opt. Call | | | | Ba1 | | | | 4,949,950 | |
| | | | | |
| | 3,000 | | | MuniMae Tax-Exempt Bond Subsidiary Redeemable Preferred Shares, Multifamily Housing Pool, Series 2004A-2, 4.900%, 7/31/49 (Mandatory put 9/30/14) (Alternative Minimum Tax) | | | | | 9/14 at 100.00 | | | | Ba1 | | | | 2,969,970 | |
| | 44,725 | | | Total National | | | | | | | | | | | | | 44,663,991 | |
| | | | Alabama – 2.0% | | | | | | | | | | | | | | |
| | | | | |
| | 16,000 | | | Adamsville Solid Waste Disposal Authority, Alabama, Solid Waste Disposal Revenue Bonds, Green Mountain Management LLC Project, Series 2010, 8.750%, 8/01/30 | | | | | 8/20 at 100.00 | | | | N/R | | | | 16,304,640 | |
| | | | | |
| | 7,010 | | | Alabama Industrial Development Authority, Solid Waste Disposal Revenue Bonds, Pine City Fiber Co. Project, Series 1993, 6.450%, 12/01/23 (Alternative Minimum Tax) | | | | | 7/13 at 100.00 | | | | B2 | | | | 7,045,611 | |
| | | | | |
| | 3,005 | | | Alabama Industrial Development Authority, Solid Waste Disposal Revenue Bonds, Pine City Fiber Co. Project, Series 1994, 6.450%, 12/01/23 (Alternative Minimum Tax) | | | | | 7/13 at 100.00 | | | | B2 | | | | 3,020,265 | |
| | | | | |
| | 15,055 | | | Bessemer, Alabama, General Obligation Warrants, Series 2007,
6.500%, 2/01/37 | | | | | 2/17 at 102.00 | | | | N/R | | | | 13,937,317 | |
| | | | | |
| | 4,000 | | | Fairfield Industrial Development Board, Alabama, Environmental Improvement Revenue Bonds, US Steel Corporation Project, Series 2011, 5.375%, 6/01/15 | | | | | No Opt. Call | | | | BB | | | | 4,126,280 | |
| | | | | |
| | | | Jefferson County Public Building Authority, Alabama, Lease Revenue Warrants, Series 2006: | | | | | | | | | | | | | | |
| | 3,425 | | | 5.125%, 4/01/17 – AMBAC Insured | | | | | 4/16 at 100.00 | | | | Ca | | | | 3,232,652 | |
| | 1,900 | | | 5.125%, 4/01/19 – AMBAC Insured | | | | | 4/16 at 100.00 | | | | Ca | | | | 1,718,094 | |
| | 140 | | | 5.125%, 4/01/20 – AMBAC Insured | | | | | 4/16 at 100.00 | | | | Ca | | | | 124,488 | |
| | 2,540 | | | 5.125%, 4/01/21 – AMBAC Insured | | | | | 4/16 at 100.00 | | | | Ca | | | | 2,232,889 | |
| | 2,275 | | | 5.000%, 4/01/26 – AMBAC Insured | | | | | 4/16 at 100.00 | | | | Ca | | | | 1,908,156 | |
| | | | | |
| | | | Jefferson County, Alabama, General Obligation Refunding Warrants,
Series 2003A: | | | | | | | | | | | | | | |
| | 4,100 | | | 5.000%, 4/01/22 – NPFG Insured | | | | | 7/13 at 100.00 | | | | Baa2 | | | | 4,044,486 | |
| | 10,900 | | | 5.000%, 4/01/23 – NPFG Insured | | | | | 7/13 at 100.00 | | | | Baa2 | | | | 10,760,480 | |
| | | | | |
| | | | Jefferson County, Alabama, General Obligation Warrants, Series 2004A: | | | | | | | | | | | | | | |
| | 655 | | | 5.000%, 4/01/21 – NPFG Insured | | | | | 4/14 at 100.00 | | | | Baa2 | | | | 642,601 | |
| | 1,500 | | | 5.000%, 4/01/22 – NPFG Insured | | | | | 4/14 at 100.00 | | | | Baa2 | | | | 1,472,340 | |
| | 1,000 | | | 5.000%, 4/01/23 – NPFG Insured | | | | | 4/14 at 100.00 | | | | Baa2 | | | | 981,950 | |
| | 7,990 | | | 5.000%, 4/01/24 – NPFG Insured | | | | | 4/14 at 100.00 | | | | A | | | | 7,849,296 | |
| | | | | |
| | | | Jefferson County, Alabama, Limited Obligation School Warrants, Education Tax Revenue Bonds, Series 2004A: | | | | | | | | | | | | | | |
| | 5,950 | | | 5.250%, 1/01/14 | | | | | No Opt. Call | | | | B | | | | 5,955,950 | |
| | 3,275 | | | 5.250%, 1/01/15 | | | | | 1/14 at 100.00 | | | | B | | | | 3,277,620 | |
| | 5,300 | | | 5.250%, 1/01/16 | | | | | 1/14 at 100.00 | | | | B | | | | 5,303,551 | |
| | 14,725 | | | 5.250%, 1/01/17 | | | | | 1/14 at 100.00 | | | | B | | | | 14,730,007 | |
| | 4,300 | | | 5.250%, 1/01/19 | | | | | 1/14 at 100.00 | | | | B | | | | 4,300,645 | |
| | 5,355 | | | 5.500%, 1/01/22 | | | | | 1/14 at 100.00 | | | | B | | | | 5,363,782 | |
| | 3,785 | | | 5.250%, 1/01/23 | | | | | 1/14 at 100.00 | | | | B | | | | 3,785,076 | |
| | 5,440 | | | 5.000%, 1/01/24 | | | | | 1/14 at 100.00 | | | | B | | | | 5,336,096 | |
| | 695 | | | 4.750%, 1/01/25 | | | | | 1/14 at 100.00 | | | | B | | | | 665,796 | |
| | | | | | | | | | | | | | | | | | |
Principal
Amount (000) | | | Description (1) | | | | Optional Call
Provisions (2) | | | Ratings (3) | | | Value | |
| | | | Alabama (continued) | | | | | | | | | | | | | | |
| $ | 655 | | | 4.750%, 1/01/25 – AMBAC Insured | | | | | 1/14 at 100.00 | | | | B | | | $ | 627,477 | |
| | 765 | | | 4.750%, 1/01/25 – AGM Insured | | | | | 1/14 at 100.00 | | | | AA– | | | | 769,108 | |
| | | | | |
| | 1,925 | | | Jefferson County, Alabama, Limited Obligation School Warrants, Series 2005A-1, 0.563%, 1/01/27 | | | | | 7/13 at 100.00 | | | | B | | | | 1,549,625 | |
| | | | | |
| | 2,625 | | | Jefferson County, Alabama, Limited Obligation School Warrants, Series 2005A-2, 0.555%, 1/01/27 – AMBAC Insured | | | | | 9/13 at 100.00 | | | | B | | | | 2,113,125 | |
| | | | | |
| | 2,175 | | | Jefferson County, Alabama, Limited Obligation School Warrants, Series 2005A-3, 0.560%, 1/01/27 – AMBAC Insured | | | | | 9/13 at 100.00 | | | | B | | | | 1,750,875 | |
| | | | | |
| | 700 | | | Jefferson County, Alabama, Limited Obligation School Warrants, Series 2005A-4, 0.556%, 1/01/27 | | | | | 6/13 at 100.00 | | | | B | | | | 563,500 | |
| | | | | |
| | | | Jefferson County, Alabama, Sewer Revenue Refunding Warrants, Series 1997A: | | | | | | | | | | | | | | |
| | 2,065 | | | 5.625%, 2/01/22 – FGIC Insured (4) | | | | | 7/13 at 100.00 | | | | Ca | | | | 1,603,493 | |
| | 5,835 | | | 5.375%, 2/01/27 – FGIC Insured (4) | | | | | 7/13 at 100.00 | | | | Ca | | | | 4,349,409 | |
| | | | | |
| | 300 | | | Jefferson County, Alabama, Sewer Revenue Refunding Warrants, Series 2003B, 5.250%, 2/01/16 – AGM Insured | | | | | 5/13 at 100.00 | | | | AA– | | | | 301,041 | |
| | | | | |
| | 14,025 | | | Jefferson County, Alabama, Sewer Revenue Warrants, Refunding Series 2003C-10, 0.000%, 2/01/42 – AGM Insured (4) | | | | | 6/13 at 100.00 | | | | AA– | | | | 10,518,750 | |
| | | | | |
| | 20,275 | | | Jefferson County, Alabama, Sewer Revenue Warrants, Refunding Series 2003C-9, 0.000%, 2/01/42 – AGM Insured (4) | | | | | 7/13 at 100.00 | | | | AA– | | | | 15,206,250 | |
| | | | | |
| | 3,525 | | | Jefferson County, Alabama, Sewer Revenue Warrants, Series 2003C-2, 0.548%, 2/01/42 – FGIC Insured | | | | | No Opt. Call | | | | Ca | | | | 2,538,000 | |
| | | | | |
| | 5,000 | | | Jefferson County, Alabama, Sewer Revenue Warrants, Series 2003C-5, 0.180%, 2/01/42 – FGIC Insured | | | | | No Opt. Call | | | | Ca | | | | 3,600,000 | |
| | | | | |
| | | | Rainbow City Special Healthcare Facilities Financing Authority, Alabama, First Mortgage Revenue Bonds, Regency Pointe, Series 2001A: | | | | | | | | | | | | | | |
| | 10 | | | 7.650%, 1/01/06 (4) | | | | | No Opt. Call | | | | N/R | | | | 4,451 | |
| | 2,365 | | | 8.125%, 1/01/21 (4) | | | | | 7/13 at 100.00 | | | | N/R | | | | 1,052,567 | |
| | 1,420 | | | 8.250%, 1/01/31 (4) | | | | | 7/13 at 100.00 | | | | N/R | | | | 631,985 | |
| | | | | |
| | 2,630 | | | Rainbow City Special Healthcare Facilities Financing Authority, Alabama, First Mortgage Revenue Bonds, Regency Pointe, Series 2001B, 7.250%, 1/01/06 (4) | | | | | No Opt. Call | | | | N/R | | | | 1,170,508 | |
| | | | | |
| | | | Sylacauga Health Care Authority, Alabama, Revenue Bonds, Coosa Valley Medical Center, Series 2005A: | | | | | | | | | | | | | | |
| | 2,000 | | | 6.000%, 8/01/25 | | | | | 8/15 at 100.00 | | | | N/R | | | | 2,050,500 | |
| | 7,045 | | | 6.000%, 8/01/35 | | | | | 8/15 at 100.00 | | | | N/R | | | | 7,152,225 | |
| | 205,660 | | | Total Alabama | | | | | | | | | | | | | 185,672,957 | |
| | | | Arizona – 4.1% | | | | | | | | | | | | | | |
| | | | | |
| | 3,825 | | | Apache County Industrial Development Authority, Arizona, Pollution Control Revenue Bonds, Tucson Electric Power Company, Series 20102A, 4.500%, 3/01/30 | | | | | 3/22 at 100.00 | | | | BBB | | | | 3,989,169 | |
| | | | | |
| | | | Arizona Health Facilities Authority, Hospital Revenue Bonds, Banner Health Systems, Tender Option Bond Trust 3256: | | | | | | | | | | | | | | |
| | 5,000 | | | 13.858%, 1/01/20 (IF) | | | | | No Opt. Call | | | | AA– | | | | 5,123,000 | |
| | 4,250 | | | 19.392%, 7/01/27 (IF) (5) | | | | | 1/18 at 100.00 | | | | AA– | | | | 6,235,770 | |
| | | | | |
| | 1,750 | | | Arizona Health Facilities Authority, Hospital Revenue Bonds, Banner Health Systems, Tender Option Bond Trust 4695, 18.529%, 1/01/31 (IF) (5) | | | | | 1/18 at 100.00 | | | | AA– | | | | 2,497,110 | |
| | | | | |
| | 6,605 | | | Arizona Health Facilities Authority, Hospital Revenue Bonds, Phoenix Children’s Hospital, Series 2013D, 5.000%, 2/01/43 | | | | | 2/23 at 100.00 | | | | BBB+ | | | | 7,081,221 | |
| | | | | |
| | 17,920 | | | Arizona Health Facilities Authority, Hospital System Revenue Bonds, Phoenix Children’s Hospital, Refunding Series 2012A, 5.000%, 2/01/42 | | | | | 2/22 at 100.00 | | | | BBB+ | | | | 19,306,829 | |
| | | | | |
| | | | Downtown Phoenix Hotel Corporation, Arizona, Senior Revenue Bonds, Series 2005A: | | | | | | | | | | | | | | |
| | 775 | | | 5.250%, 7/01/23 – FGIC Insured | | | | | 1/16 at 100.00 | | | | BB+ | | | | 805,225 | |
Portfolio of Investments
Nuveen High Yield Municipal Bond Fund (continued)
April 30, 2013
| | | | | | | | | | | | | | | | | | |
Principal
Amount (000) | | | Description (1) | | | | Optional Call
Provisions (2) | | | Ratings (3) | | | Value | |
| | | | Arizona (continued) | | | | | | | | | | | | | | |
| $ | 4,050 | | | 5.250%, 7/01/26 – FGIC Insured | | | | | 1/16 at 100.00 | | | | BB+ | | | $ | 4,187,133 | |
| | 39,260 | | | 5.000%, 7/01/36 – FGIC Insured | | | | | 1/16 at 100.00 | | | | BB+ | | | | 39,790,403 | |
| | 13,505 | | | 5.000%, 7/01/40 – FGIC Insured | | | | | 1/16 at 100.00 | | | | BB+ | | | | 13,684,481 | |
| | | | | |
| | 561 | | | Estrella Mountain Ranch Community Facilities District, Goodyear, Arizona, Special Assessment Lien Bonds, Series 2001A, 7.875%, 7/01/25 | | | | | 7/13 at 100.00 | | | | N/R | | | | 562,172 | |
| | | | | |
| | 3,250 | | | Florence Town Inc., Industrial Development Authority, Arizona, Education Revenue Bonds, Legacy Traditional School Project – Queen Creek and Casa Grande Campuses, Series 2013, 6.000%, 7/01/43 | | | | | 7/23 at 100.00 | | | | BB | | | | 3,329,203 | |
| | | | | |
| | 20,000 | | | Maricopa County Industrial Development Authority, Arizona, Multifamily Housing Revenue Bonds, Privado Park Apartments Project, Series 2006A, 5.750%, 11/01/46 (Mandatory put 11/01/15) (Alternative Minimum Tax) (4) | | | | | 7/13 at 100.00 | | | | N/R | | | | 15,997,000 | |
| | | | | |
| | 6,720 | | | Maricopa County Industrial Development Authority, Arizona, Senior Living Facility Revenue Bonds, Christian Care Mesa II Inc., Series 2004A, 6.625%, 1/01/34 (Alternative Minimum Tax) | | | | | 1/14 at 100.00 | | | | CC | | | | 5,332,790 | |
| | | | | |
| | 420 | | | Parkway Community Facilities District 1, Prescott Valley, Arizona, General Obligation Bonds, Series 2006, 5.300%, 7/15/25 | | | | | 7/16 at 100.00 | | | | N/R | | | | 411,835 | |
| | | | | |
| | 500 | | | Phoenix Industrial Development Authority, Arizona, Airport Facilities Refunding Bonds, America West Airlines, Inc. Project, Series 1998, 6.300%, 4/01/23 (WI/DD, Settling 5/01/13) (Alternative Minimum Tax) | | | | | 10/13 at 100.00 | | | | Caa2 | | | | 501,905 | |
| | | | | |
| | 13,165 | | | Phoenix Industrial Development Authority, Arizona, Education Facility Revenue Bonds, fbo Brighter Choice Foundation Charter Middle Schools Project, Albany, New York, Series 2012, 7.500%, 7/01/42 | | | | | 7/22 at 100.00 | | | | BB– | | | | 13,922,251 | |
| | | | | |
| | 5,365 | | | Phoenix Industrial Development Authority, Arizona, Education Revenue Bonds, Arizona School for the Arts, Series 2011A, 7.750%, 7/01/41 | | | | | 7/21 at 100.00 | | | | N/R | | | | 5,954,560 | |
| | | | | |
| | | | Phoenix Industrial Development Authority, Arizona, Education Revenue Bonds, Painted Rock Academy Charter School Project, Series 2012A: | | | | | | | | | | | | | | |
| | 2,410 | | | 7.250%, 7/01/32 | | | | | 7/20 at 100.00 | | | | N/R | | | | 2,549,394 | |
| | 3,725 | | | 7.500%, 7/01/42 | | | | | 7/20 at 100.00 | | | | N/R | | | | 3,954,982 | |
| | | | | |
| | | | Phoenix Industrial Development Authority, Arizona, Educational Revenue Bonds, Keystone Montessori School, Series 2004A: | | | | | | | | | | | | | | |
| | 55 | | | 6.375%, 11/01/13 | | | | | 7/13 at 100.00 | | | | N/R | | | | 55,309 | |
| | 790 | | | 7.250%, 11/01/23 | | | | | 11/16 at 100.00 | | | | N/R | | | | 818,243 | |
| | 1,710 | | | 7.500%, 11/01/33 | | | | | 11/16 at 100.00 | | | | N/R | | | | 1,771,098 | |
| | | | | |
| | 5,000 | | | Phoenix Industrial Development Authority, Arizona, Lease Revenue Bonds, Rowan University Project, Series 2012, 5.000%, 6/01/42 (UB) (5) | | | | | 6/22 at 100.00 | | | | A+ | | | | 5,419,200 | |
| | | | | |
| | | | Phoenix Industrial Development Authority, Arizona, Lease Revenue Bonds, Rowan University Project, Tender Option Bond Trust 1086: | | | | | | | | | | | | | | |
| | 2,080 | | | 17.928%, 6/01/34 – AGM Insured (IF) (5) | | | | | 6/22 at 100.00 | | | | A+ | | | | 3,026,941 | |
| | 775 | | | 16.953%, 6/01/42 – AGM Insured (IF) (5) | | | | | 6/22 at 100.00 | | | | A+ | | | | 1,034,478 | |
| | 375 | | | 16.979%, 6/01/42 – AGM Insured (IF) (5) | | | | | 6/22 at 100.00 | | | | A+ | | | | 500,760 | |
| | 2,515 | | | 16.979%, 6/01/42 – AGM Insured (IF) (5) | | | | | 6/22 at 100.00 | | | | A+ | | | | 3,358,430 | |
| | 1,500 | | | 16.999%, 6/01/42 – AGM Insured (IF) (5) | | | | | 6/22 at 100.00 | | | | A+ | | | | 2,003,040 | |
| | | | | |
| | 5,170 | | | Phoenix Industrial Development Authority, Arizona, Senior Living Revenue Bonds, Christian Care Manor I and Christian Care Manor II, Inc. Project, Series 2005A, 5.500%, 7/01/35 | | | | | 7/15 at 100.00 | | | | Baa2 | | | | 5,242,794 | |
| | | | | |
| | 3,760 | | | Pima County Industrial Development Authority, Arizona, Charter School Revenue Bonds, Cambridge Academy-East, Inc. Project, Series 2010, 6.625%, 4/01/40 | | | | | 4/20 at 100.00 | | | | BB– | | | | 3,972,290 | |
| | | | | |
| | 550 | | | Pima County Industrial Development Authority, Arizona, Charter School Revenue Bonds, Noah Webster Basic Schools Inc., Series 2004, 6.125%, 12/15/34 | | | | | 12/14 at 100.00 | | | | BBB– | | | | 558,817 | |
| | | | | |
| | | | Pima County Industrial Development Authority, Arizona, Choice Education and Development Charter School Revenue Bonds, Series 2006: | | | | | | | | | | | | | | |
| | 210 | | | 6.000%, 6/01/16 | | | | | No Opt. Call | | | | N/R | | | | 213,049 | |
| | 1,465 | | | 6.250%, 6/01/26 | | | | | 6/16 at 100.00 | | | | N/R | | | | 1,493,216 | |
| | 4,225 | | | 6.375%, 6/01/36 | | | | | 6/16 at 100.00 | | | | N/R | | | | 4,294,248 | |
| | | | | | | | | | | | | | | | | | |
Principal
Amount (000) | | | Description (1) | | | | Optional Call
Provisions (2) | | | Ratings (3) | | | Value | |
| | | | Arizona (continued) | | | | | | | | | | | | | | |
| | | | | |
| $ | 8,170 | | | Pima County Industrial Development Authority, Arizona, Education Revenue Bonds Legacy Traditional School Project, Series 2009, 8.500%, 7/01/39 | | | | | 7/19 at 100.00 | | | | N/R | | | $ | 9,418,213 | |
| | | | | |
| | | | Pima County Industrial Development Authority, Arizona, Education Revenue Bonds, Carden Traditional Schools Project, Series 2012: | | | | | | | | | | | | | | |
| | 4,275 | | | 7.375%, 1/01/32 | | | | | 1/22 at 100.00 | | | | B | | | | 4,493,410 | |
| | 6,695 | | | 7.500%, 1/01/42 | | | | | 1/22 at 100.00 | | | | B | | | | 7,068,983 | |
| | | | | |
| | | | Pima County Industrial Development Authority, Arizona, Education Revenue Bonds, Paradise Education Center Project, Series 2010: | | | | | | | | | | | | | | |
| | 1,195 | | | 6.000%, 6/01/40 | | | | | 6/19 at 100.00 | | | | BBB– | | | | 1,247,437 | |
| | 2,250 | | | 6.100%, 6/01/45 | | | | | 6/19 at 100.00 | | | | BBB– | | | | 2,351,993 | |
| | | | | |
| | | | Pima County Industrial Development Authority, Arizona, Educational Revenue Bonds, Paradise Education Center Charter School, Series 2006: | | | | | | | | | | | | | | |
| | 250 | | | 5.875%, 6/01/22 | | | | | 6/16 at 100.00 | | | | BBB– | | | | 259,790 | |
| | 1,475 | | | 6.000%, 6/01/36 | | | | | 6/16 at 100.00 | | | | BBB– | | | | 1,508,586 | |
| | | | | |
| | 2,815 | | | Pima County Industrial Development Authority, Arizona, Educational Revenue Bonds, Valley Academy Charter School Project, Series 2008, 6.500%, 7/01/38 | | | | | 7/18 at 100.00 | | | | Baa3 | | | | 3,011,628 | |
| | | | | |
| | 3,165 | | | Pima County Industrial Development Authority, Arizona, Lease Revenue Bonds, Clark County Detention Facility Project, Trust 2835, 15.798%, 3/01/16 (IF) (5) | | | | | No Opt. Call | | | | AA | | | | 4,359,756 | |
| | | | | |
| | 8,250 | | | Pima County Industrial Development Authority, Arizona, Revenue Bonds, Tucson Electric Power Company Project, Series 2013A, 4.000%, 9/01/29 | | | | | 3/23 at 100.00 | | | | BBB | | | | 8,316,495 | |
| | | | | |
| | 9,250 | | | Pima County Industrial Development Authority, Arizona, Revenue Bonds, Tucson Electric Power Company, Series 2010A, 5.250%, 10/01/40 | | | | | 10/20 at 100.00 | | | | BBB | | | | 10,153,633 | |
| | | | | |
| | 2,500 | | | Pronghorn Ranch Community Facilities District, Prescott Valley, Arizona, General Obligation Bonds, Series 2004, 6.400%, 7/15/29 | | | | | 7/14 at 100.00 | | | | N/R | | | | 2,533,275 | |
| | | | | |
| | | | Quechan Indian Tribe of the Fort Yuma Reservation, Arizona, Government Project Bonds, Series 2008: | | | | | | | | | | | | | | |
| | 2,000 | | | 6.625%, 12/01/17 | | | | | No Opt. Call | | | | CCC | | | | 1,988,640 | |
| | 14,060 | | | 7.000%, 12/01/27 | | | | | 12/17 at 102.00 | | | | CCC | | | | 12,512,556 | |
| | | | | |
| | 19,225 | | | Quechan Indian Tribe of the Fort Yuma Reservation, Arizona, Tribal Economic Development Bonds, Series 2012A, 9.750%, 5/01/25 | | | | | 5/22 at 100.00 | | | | N/R | | | | 20,768,575 | |
| | | | | |
| | | | Salt Verde Financial Corporation, Arizona, Senior Gas Revenue Bonds, Citigroup Energy Inc Prepay Contract Obligations, Series 2007: | | | | | | | | | | | | | | |
| | 60 | | | 5.250%, 12/01/22 | | | | | No Opt. Call | | | | A– | | | | 70,274 | |
| | 80 | | | 5.250%, 12/01/28 | | | | | No Opt. Call | | | | A– | | | | 94,269 | |
| | 11,670 | | | 5.000%, 12/01/32 | | | | | No Opt. Call | | | | A– | | | | 13,262,372 | |
| | 25,030 | | | 5.500%, 12/01/37 | | | | | No Opt. Call | | | | B– | | | | 25,418,466 | |
| | 20,280 | | | 5.000%, 12/01/37 | | | | | No Opt. Call | | | | A– | | | | 22,783,566 | |
| | | | | |
| | | | Surprise Municipal Property Corporation, Arizona, Wastewater System Revenue Bonds, Series 2007: | | | | | | | | | | | | | | |
| | 3,000 | | | 4.700%, 4/01/22 | | | | | 4/14 at 100.00 | | | | A– | | | | 3,035,430 | |
| | 4,425 | | | 4.900%, 4/01/32 | | | | | 4/17 at 100.00 | | | | A– | | | | 4,542,971 | |
| | | | | |
| | | | Tempe Industrial Development Authority, Arizona, Revenue Bonds, Friendship Village of Tempe Project, Refunding Series 2012A: | | | | | | | | | | | | | | |
| | 1,100 | | | 6.250%, 12/01/42 | | | | | 12/21 at 100.00 | | | | N/R | | | | 1,202,608 | |
| | 1,600 | | | 6.250%, 12/01/46 | | | | | 12/21 at 100.00 | | | | N/R | | | | 1,743,392 | |
| | | | | |
| | | | Tucson Industrial Development Authority, Arizona, Charter School Revenue Bonds, Arizona Agribusiness and Equine Center Charter School, Series 2004A: | | | | | | | | | | | | | | |
| | 1,620 | | | 5.850%, 9/01/24 | | | | | 9/14 at 100.00 | | | | BB+ | | | | 1,644,997 | |
| | 1,035 | | | 6.125%, 9/01/34 | | | | | 9/14 at 100.00 | | | | BB+ | | | | 1,048,051 | |
| | | | | |
| | | | Watson Road Community Facilities District, Arizona, Special Assessment Revenue Bonds, Series 2005: | | | | | | | | | | | | | | |
| | 100 | | | 5.200%, 7/01/13 | | | | | No Opt. Call | | | | N/R | | | | 100,436 | |
| | 1,457 | | | 5.400%, 7/01/15 | | | | | No Opt. Call | | | | N/R | | | | 1,513,036 | |
Portfolio of Investments
Nuveen High Yield Municipal Bond Fund (continued)
April 30, 2013
| | | | | | | | | | | | | | | | | | |
Principal
Amount (000) | | | Description (1) | | | | Optional Call
Provisions (2) | | | Ratings (3) | | | Value | |
| | | | Arizona (continued) | | | | | | | | | | | | | | |
| $ | 700 | | | 5.500%, 7/01/16 | | | | | No Opt. Call | | | | N/R | | | $ | 734,965 | |
| | 8,544 | | | 5.750%, 7/01/22 | | | | | 7/16 at 100.00 | | | | N/R | | | | 8,842,869 | |
| | 11,615 | | | 6.000%, 7/01/30 | | | | | 7/16 at 100.00 | | | | N/R | | | | 11,919,778 | |
| | | | | |
| | 2,340 | | | Yavapai County Industrial Development Authority, Arizona, Education Revenue Bonds, Arizona Agribusiness and Equine Center Charter Schools, Series 2012, 5.125%, 3/01/42 | | | | | No Opt. Call | | | | BB+ | | | | 2,306,889 | |
| | | | | |
| | | | Yavapai County Industrial Development Authority, Arizona, Charter School Revenue Bonds, Arizona Agribusiness and Equine Center Charter School, Series 2011: | | | | | | | | | | | | | | |
| | 3,530 | | | 7.625%, 3/01/31 | | | | | 3/21 at 100.00 | | | | BB+ | | | | 4,113,756 | |
| | 1,830 | | | 7.875%, 3/01/42 | | | | | 3/21 at 100.00 | | | | BB+ | | | | 2,156,106 | |
| | | | | |
| | 1,340 | | | Yuma County Industrial Development Authority, Arizona, Exempt Revenue Bonds, Far West Water & Sewer Inc. Refunding, Series 2007A, 6.375%, 12/01/37 (Alternative Minimum Tax) | | | | | 12/17 at 100.00 | | | | N/R | | | | 1,166,671 | |
| | 370,167 | | | Total Arizona | | | | | | | | | | | | | 386,672,218 | |
| | | | California – 17.9% | | | | | | | | | | | | | | |
| | | | | |
| | | | Anaheim Public Finance Authority, California, Subordinate Lease Revenue Bonds, Public Improvement Project, Series 1997C: | | | | | | | | | | | | | | |
| | 855 | | | 0.000%, 9/01/29 – AGM Insured | | | | | No Opt. Call | | | | AA– | | | | 400,610 | |
| | 4,310 | | | 0.000%, 9/01/35 – AGM Insured | | | | | No Opt. Call | | | | AA– | | | | 1,404,026 | |
| | | | | |
| | 9,465 | | | Atwater Public Financing Authority, California, Wastewater Revenue Bonds, Series 2010, 5.250%, 5/01/45 – AGM Insured | | | | | 5/19 at 100.00 | | | | AA– | | | | 9,900,579 | |
| | | | | |
| | 255 | | | Azusa Redevelopment Agency, California, Tax Allocation Refunding Bonds, Merged West End Development, Series 2007B, 5.300%, 8/01/36 | | | | | 8/17 at 100.00 | | | | N/R | | | | 238,932 | |
| | | | | |
| | | | Azusa, California, Special Tax Bonds, Community Facilities District 2005-1 Rosedale Improvement Area 1, Series 2007: | | | | | | | | | | | | | | |
| | 3,565 | | | 5.000%, 9/01/27 | | | | | 9/17 at 100.00 | | | | N/R | | | | 3,641,327 | |
| | 8,765 | | | 5.000%, 9/01/37 | | | | | 9/17 at 100.00 | | | | N/R | | | | 8,805,056 | |
| | | | | |
| | | | Bakersfield City School District, Kern County, California, General Obligation Bonds, Series 2012C: | | | | | | | | | | | | | | |
| | 1,700 | | | 0.000%, 5/01/42 | | | | | 5/40 at 100.00 | | | | Aa2 | | | | 661,011 | |
| | 9,860 | | | 0.000%, 5/01/47 | | | | | 5/40 at 100.00 | | | | Aa2 | | | | 3,762,576 | |
| | | | | |
| | | | Bay Area Toll Authority, California, Revenue Bonds, San Francisco Bay Area Toll Bridge, Tender Option Bond Trust 2985: | | | | | | | | | | | | | | |
| | 1,085 | | | 17.254%, 4/01/31 (IF) | | | | | 4/17 at 100.00 | | | | AA | | | | 1,818,818 | |
| | 325 | | | 17.184%, 4/01/34 (IF) | | | | | 4/18 at 100.00 | | | | AA | | | | 493,821 | |
| | 2,445 | | | 17.305%, 4/01/34 (IF) | | | | | 4/18 at 100.00 | | | | AA | | | | 3,724,444 | |
| | 1,250 | | | 17.311%, 4/01/34 (IF) | | | | | 4/18 at 100.00 | | | | AA | | | | 1,904,350 | |
| | 2,185 | | | 17.311%, 4/01/39 (IF) | | | | | 4/18 at 100.00 | | | | AA | | | | 3,293,407 | |
| | 500 | | | 17.311%, 4/01/39 (IF) | | | | | 4/18 at 100.00 | | | | AA | | | | 753,640 | |
| | 1,250 | | | 19.300%, 4/01/43 (IF) | | | | | 4/18 at 100.00 | | | | AA | | | | 1,992,650 | |
| | 1,075 | | | 17.253%, 4/01/47 (IF) | | | | | 4/18 at 100.00 | | | | AA | | | | 1,618,423 | |
| | 1,250 | | | 17.499%, 4/01/47 (IF) | | | | | 4/18 at 100.00 | | | | AA | | | | 1,933,350 | |
| | 1,000 | | | 17.808%, 4/01/47 (IF) | | | | | 4/18 at 100.00 | | | | AA | | | | 1,546,680 | |
| | | | | |
| | 1,035 | | | Beaumont Financing Authority, California, Local Agency Revenue Bonds, Improvement Area 17A, Series 2013B, 5.000%, 9/01/34 | | | | | 9/23 at 100.00 | | | | N/R | | | | 1,090,466 | |
| | | | | |
| | 1,050 | | | Beaumont Financing Authority, California, Local Agency Revenue Bonds, Improvement Area 19C, Series 2008A, 6.875%, 9/01/36 | | | | | 9/16 at 100.00 | | | | N/R | | | | 1,116,675 | |
| | | | | |
| | 1,000 | | | Beaumont Financing Authority, California, Local Agency Revenue Bonds, Improvement Area 20 Series 2012B, 5.950%, 9/01/35 | | | | | 9/22 at 100.00 | | | | N/R | | | | 1,052,570 | |
| | | | | |
| | 1,000 | | | Beaumont Financing Authority, California, Local Agency Revenue Bonds, Improvement Area 8C, Series 2007E, 6.250%, 9/01/38 | | | | | 7/13 at 100.00 | | | | N/R | | | | 1,010,840 | |
| | | | | |
| | | | Beaumont Financing Authority, California, Local Agency Revenue Bonds, Series 2004D: | | | | | | | | | | | | | | |
| | 1,455 | | | 5.500%, 9/01/24 | | | | | 9/14 at 102.00 | | | | N/R | | | | 1,505,794 | |
| | 1,875 | | | 5.800%, 9/01/35 | | | | | 9/14 at 102.00 | | | | N/R | | | | 1,933,781 | |
| | | | | | | | | | | | | | | | | | |
Principal
Amount (000) | | | Description (1) | | | | Optional Call
Provisions (2) | | | Ratings (3) | | | Value | |
| | | | California (continued) | | | | | | | | | | | | | | |
| | | | | |
| | | | Beaumont Financing Authority, California, Local Agency Revenue Bonds, Series 2005A: | | | | | | | | | | | | | | |
| $ | 830 | | | 5.600%, 9/01/25 | | | | | 9/15 at 102.00 | | | | N/R | | | $ | 870,994 | |
| | 2,315 | | | 5.650%, 9/01/30 | | | | | 9/15 at 102.00 | | | | N/R | | | | 2,418,133 | |
| | 2,500 | | | 5.700%, 9/01/35 | | | | | 9/15 at 102.00 | | | | N/R | | | | 2,599,850 | |
| | | | | |
| | | | Beaumont Financing Authority, California, Local Agency Revenue Bonds, Series 2005B: | | | | | | | | | | | | | | |
| | 930 | | | 5.350%, 9/01/28 | | | | | 9/15 at 102.00 | | | | N/R | | | | 965,145 | |
| | 1,390 | | | 5.400%, 9/01/35 | | | | | 9/15 at 102.00 | | | | N/R | | | | 1,426,682 | |
| | | | | |
| | | | Beaumont Financing Authority, California, Local Agency Revenue Bonds, Series 2005C: | | | | | | | | | | | | | | |
| | 855 | | | 5.500%, 9/01/29 | | | | | 9/14 at 102.00 | | | | N/R | | | | 882,223 | |
| | 2,065 | | | 5.500%, 9/01/35 | | | | | 9/14 at 102.00 | | | | N/R | | | | 2,111,483 | |
| | | | | |
| | | | Beaumont Financing Authority, California, Local Agency Revenue Bonds, Series 2006B: | | | | | | | | | | | | | | |
| | 685 | | | 5.000%, 9/01/27 | | | | | 9/13 at 100.50 | | | | N/R | | | | 687,939 | |
| | 1,000 | | | 5.050%, 9/01/37 | | | | | 9/13 at 100.50 | | | | N/R | | | | 994,380 | |
| | | | | |
| | 2,275 | | | Blythe Redevelopment Agency, California, Tax Allocation Bonds, Redevelopment Project 1, Series 2011, 9.750%, 5/01/38 | | | | | 5/21 at 100.00 | | | | N/R | | | | 2,708,797 | |
| | | | | |
| | 3,260 | | | Borrego Water District, California, Community Facilities District 2007-1 Montesoro, Special Tax Bonds, Series 2007, 5.750%, 8/01/32 (4) | | | | | 8/17 at 102.00 | | | | N/R | | | | 881,308 | |
| | | | | |
| | 4,065 | | | Brea Redevelopment Agency, Orange County, California, Tax Allocation Bonds, Project Area AB, Series 2003, 0.000%, 8/01/29 – AMBAC Insured | | | | | No Opt. Call | | | | AA– | | | | 1,912,013 | |
| | | | | |
| | 5,930 | | | Brentwood Infrastructure Financing Authority, Contra Costa County, California, CIFP 2006-1 Infrastructure Revenue Bonds, Series 2006, 5.200%, 9/02/36 | | | | | 7/13 at 100.00 | | | | N/R | | | | 5,835,061 | |
| | | | | |
| | 10,000 | | | California Enterprise Development Authority, Recovery Zone Facility Revenue Bonds, SunPower Corporation – Headquarters Project, Series 2010, 8.500%, 4/01/31 | | | | | 4/21 at 100.00 | | | | N/R | | | | 11,567,100 | |
| | | | | |
| | 1,000 | | | California County Tobacco Securitization Agency, Tobacco Settlement Asset-Backed Bonds, Merced County Tobacco Funding Corporation, Series 2005A, 5.125%, 6/01/38 | | | | | 6/15 at 100.00 | | | | BB– | | | | 921,200 | |
| | | | | |
| | 7,000 | | | California County Tobacco Securitization Agency, Tobacco Settlement Asset-Backed Bonds, Sonoma County Tobacco Securitization Corporation, Series 2005, 5.250%, 6/01/45 | | | | | 6/15 at 100.00 | | | | B– | | | | 6,361,740 | |
| | | | | |
| | 7,250 | | | California Health Facilities Financing Authority, Hospital Revenue Bonds, Adventist Health System West, Tender Option Bonds Trust 4699, 19.191%, 9/01/28 – NPFG Insured (IF) (5) | | | | | 9/18 at 100.00 | | | | N/R | | | | 10,379,608 | |
| | | | | |
| | | | California Health Facilities Financing Authority, Refunding Revenue Bonds, Stanford Hospital and Clinics, Tender Option Bond Trust 3267: | | | | | | | | | | | | | | |
| | 2,500 | | | 19.925%, 5/15/19 (IF) (5) | | | | | No Opt. Call | | | | AA– | | | | 4,565,400 | |
| | 4,000 | | | 18.919%, 5/15/31 (IF) (5) | | | | | 11/21 at 100.00 | | | | AA– | | | | 6,402,080 | |
| | 1,500 | | | 19.925%, 11/15/40 (IF) (5) | | | | | 11/21 at 100.00 | | | | AA– | | | | 2,739,240 | |
| | | | | |
| | | | California Health Facilities Financing Authority, Revenue Bonds, Lucile Salter Packard Children’s Hospital, Tender Option Trust 4726: | | | | | | | | | | | | | | |
| | 12,040 | | | 17.913%, 8/15/51 (IF) (5) | | | | | 8/22 at 100.00 | | | | AA | | | | 18,030,622 | |
| | 500 | | | 17.913%, 8/15/51 (IF) (5) | | | | | 8/22 at 100.00 | | | | AA | | | | 748,780 | |
| | | | | |
| | | | California Health Facilities Financing Authority, Revenue Bonds, Stanford Hospitals and Clinics, Tender Option Bond Trust 3294: | | | | | | | | | | | | | | |
| | 1,185 | | | 17.828%, 2/15/20 (IF) | | | | | No Opt. Call | | | | AA– | | | | 1,869,835 | |
| | 1,250 | | | 17.883%, 2/15/20 (IF) (5) | | | | | No Opt. Call | | | | AA– | | | | 1,974,700 | |
| | | | | |
| | | | California Health Facilities Financing Authority, Revenue Bonds, Sutter Health, Tender Option Bond Trust 11952: | | | | | | | | | | | | | | |
| | 2,500 | | | 21.908%, 8/15/18 (IF) | | | | | No Opt. Call | | | | AA– | | | | 4,889,300 | |
| | 2,000 | | | 21.908%, 8/15/18 (IF) | | | | | No Opt. Call | | | | AA– | | | | 3,911,440 | |
Portfolio of Investments
Nuveen High Yield Municipal Bond Fund (continued)
April 30, 2013
| | | | | | | | | | | | | | | | | | |
Principal
Amount (000) | | | Description (1) | | | | Optional Call
Provisions (2) | | | Ratings (3) | | | Value | |
| | | | California (continued) | | | | | | | | | | | | | | |
| | | | | |
| | | | California Health Facilities Financing Authority, Revenue Bonds, Sutter Health, Tender Option Bond Trust 3248: | | | | | | | | | | | | | | |
| $ | 2,500 | | | 21.908%, 8/15/18 (IF) (5) | | | | | No Opt. Call | | | | AA– | | | $ | 4,889,300 | |
| | 2,500 | | | 21.908%, 8/15/18 (IF) (5) | | | | | No Opt. Call | | | | AA– | | | | 4,889,300 | |
| | | | | |
| | 4,320 | | | California Housing Finance Agency, Home Mortgage Revenue Bonds, Tender Option Bond Trust 3206, 8.130%, 2/01/24 (Alternative Minimum Tax) (IF) | | | | | 2/17 at 100.00 | | | | BBB | | | | 4,365,230 | |
| | | | | |
| | 19,250 | | | California Municipal Finance Authority, Certificates of Participation, Community Hospitals of Central California Obligated Group, Series 2009, 5.500%, 2/01/39 | | | | | 2/19 at 100.00 | | | | BBB | | | | 20,806,748 | |
| | | | | |
| | 4,000 | | | California Municipal Finance Authority, Charter School Lease Revenue Bonds, Rocket ship 7 – Alma Academy Elementary School, Series 2012A, 6.250%, 6/01/43 | | | | | 12/21 at 101.00 | | | | N/R | | | | 4,088,680 | |
| | | | | |
| | 355 | | | California Municipal Finance Authority, Charter School Lease Revenue Bonds, Rocket ship 7 – Alma Academy Elementary School, Taxable Series 2012B, 8.500%, 6/01/16 | | | | | No Opt. Call | | | | N/R | | | | 354,766 | |
| | | | | |
| | | | California Municipal Finance Authority, Charter School Revenue Bonds, Partnerships to Uplift Communities Project, Series 2012A: | | | | | | | | | | | | | | |
| | 1,550 | | | 5.250%, 8/01/42 | | | | | No Opt. Call | | | | BB+ | | | | 1,593,338 | |
| | 675 | | | 5.300%, 8/01/47 | | | | | 8/22 at 100.00 | | | | BB+ | | | | 693,826 | |
| | | | | |
| | 2,600 | | | California Municipal Finance Authority, Education Revenue Bonds, American Heritage Education Foundation Project, Series 2006A, 5.250%, 6/01/36 | | | | | 6/16 at 100.00 | | | | BB– | | | | 2,466,646 | |
| | | | | |
| | | | California Municipal Finance Authority, Educational Facilities Revenue Bonds, OCEAA Project, Series 2008A: | | | | | | | | | | | | | | |
| | 1,000 | | | 6.750%, 10/01/28 | | | | | 10/18 at 100.00 | | | | N/R | | | | 1,004,640 | |
| | 1,000 | | | 7.000%, 10/01/39 | | | | | 10/18 at 100.00 | | | | N/R | | | | 1,008,410 | |
| | | | | |
| | 8,735 | | | California Municipal Finance Authority, Mobile Home Park Revenue Bonds, Caritas Projects Series 2010B, 7.250%, 8/15/45 | | | | | 8/20 at 100.00 | | | | N/R | | | | 9,304,871 | |
| | | | | |
| | 1,000 | | | California Municipal Finance Authority, Mobile Home Park Revenue Bonds, Caritas Projects Series 2012A, 5.500%, 8/15/47 | | | | | 8/22 at 100.00 | | | | BBB | | | | 1,072,040 | |
| | | | | |
| | 5,000 | | | California Municipal Finance Authority, Mobile Home Park Revenue Bonds, Caritas Projects Series 2012B, 7.250%, 8/15/47 | | | | | 8/22 at 100.00 | | | | A1 | | | | 5,309,750 | |
| | | | | |
| | | | California Municipal Finance Authority, Revenue Bonds, Goodwill Industries of Sacramento Valley & Northern Nevada Project, Series 2012A: | | | | | | | | | | | | | | |
| | 570 | | | 6.625%, 1/01/32 | | | | | 1/22 at 100.00 | | | | N/R | | | | 605,819 | |
| | 530 | | | 6.875%, 1/01/42 | | | | | 1/22 at 100.00 | | | | N/R | | | | 564,805 | |
| | | | | |
| | | | California Municipal Finance Authority, Revenue Bonds, Harbor Regional Center Project, Series 2009: | | | | | | | | | | | | | | |
| | 500 | | | 8.000%, 11/01/29 | | | | | 11/19 at 100.00 | | | | Baa1 | | | | 620,970 | |
| | 1,040 | | | 8.500%, 11/01/39 | | | | | 11/19 at 100.00 | | | | AA | | | | 1,304,295 | |
| | | | | |
| | | | California Municipal Financing Authority, Certificates of Participation, Community Hospitals of Central California, Series 2007: | | | | | | | | | | | | | | |
| | 1,000 | | | 5.000%, 2/01/21 | | | | | 2/17 at 100.00 | | | | BBB | | | | 1,086,610 | |
| | 2,500 | | | 5.250%, 2/01/27 | | | | | 2/17 at 100.00 | | | | BBB | | | | 2,655,475 | |
| | | | | |
| | | | California Pollution Control Financing Authority, Water Furnishing Revenue Bonds, Poseidon Resources Channelside Desalination Project, Series 2012: | | | | | | | | | | | | | | |
| | 10,965 | | | 5.000%, 7/01/37 (Alternative Minimum Tax) | | | | | No Opt. Call | | | | Baa3 | | | | 11,355,793 | |
| | 18,500 | | | 5.000%, 11/21/45 (Alternative Minimum Tax) | | | | | No Opt. Call | | | | Baa3 | | | | 19,034,835 | |
| | | | | |
| | 1,000 | | | California School Finance Authority, Charter School Revenue Bonds, Coastal Academy Project, Series 2013A, 5.000%, 10/01/42 | | | | | 10/22 at 100.00 | | | | BBB– | | | | 1,009,690 | |
| | | | | |
| | 12,100 | | | California School Finance Authority, Educational Facilities Revenue Bonds, Tri-Valley Learning Corporation, Series 2012A, 7.000%, 6/01/47 | | | | | 6/20 at 102.00 | | | | N/R | | | | 12,359,545 | |
| | | | | |
| | 4,500 | | | California State, General Obligation Bonds, Tender Option Bond Trust 3162, 19.050%, 3/01/18 – AGM Insured (IF) | | | | | No Opt. Call | | | | AA– | | | | 7,620,120 | |
| | | | | | | | | | | | | | | | | | |
Principal
Amount (000) | | | Description (1) | | | | Optional Call
Provisions (2) | | | Ratings (3) | | | Value | |
| | | | California (continued) | | | | | | | | | | | | | | |
| | | | | |
| $ | 1,500 | | | California Statewide Communities Development Authority, Charter School Revenue Bonds – Albert Einstein Academy for Letters, Arts, & Sciences Charter School Series 2012, 6.250%, 11/01/42 | | | | | No Opt. Call | | | | N/R | | | $ | 1,518,195 | |
| | | | | |
| | 1,950 | | | California Statewide Communities Development Authority, Community Facilities District 2012-01, Fancher Creek, Special Tax Bonds, Series 2013A, 5.700%, 9/01/43 | | | | | 9/23 at 100.00 | | | | N/R | | | | 1,955,421 | |
| | | | | |
| | 805 | | | California Statewide Communities Development Authority, Multifamily Housing Revenue Subordinate Bonds Stanford Arms Seniors Apartments Series 2001-P2, Pass-Through Certificates of Beneficial Ownership, 5.750%, 11/01/34 (Mandatory put 11/01/16) (Alternative Minimum Tax) | | | | | 7/13 at 100.00 | | | | N/R | | | | 805,403 | |
| | | | | |
| | 2,410 | | | California Statewide Communities Development Authority, Recovery Zone Facility Bonds, SunEdison Huntington Beach Solar Projects, Series 2010, 7.500%, 1/01/31 | | | | | 1/21 at 100.00 | | | | N/R | | | | 2,611,163 | |
| | | | | |
| | 1,415 | | | California Statewide Communities Development Authority, Recovery Zone Facility Bonds, SunEdison Irvine Unified School District Solar Projects, Series 2010, 7.500%, 7/01/30 | | | | | 1/20 at 100.00 | | | | N/R | | | | 1,520,531 | |
| | | | | |
| | 4,650 | | | California Statewide Communities Development Authority, Revenue Bonds, American Baptist Homes of the West, Series 2010, 6.250%, 10/01/39 | | | | | 10/19 at 100.00 | | | | BBB+ | | | | 5,289,143 | |
| | | | | |
| | 40,600 | | | California Statewide Communities Development Authority, Revenue Bonds, EnerTech Regional Biosolids Project, Series 2007A, 5.500%, 12/01/33 (Alternative Minimum Tax) (4) | | | | | No Opt. Call | | | | D | | | | 1,116,500 | |
| | | | | |
| | 875 | | | California Statewide Communities Development Authority, Revenue Bonds, Lancer Plaza Project, Series 2013, 5.875%, 11/01/43 | | | | | 11/23 at 100.00 | | | | N/R | | | | 878,063 | |
| | | | | |
| | 1,000 | | | California Statewide Communities Development Authority, Revenue Bonds, Terraces San Joaquin Gardens, Series 2012A, 5.625%, 10/01/32 | | | | | 10/22 at 100.00 | | | | N/R | | | | 1,073,250 | |
| | | | | |
| | 5,000 | | | California Statewide Communities Development Authority, Statewide Community Infrastructure Program Revenue Bonds, Series 2011A, 8.000%, 9/02/41 | | | | | 9/21 at 100.00 | | | | N/R | | | | 5,350,150 | |
| | | | | |
| | 2,220 | | | California Statewide Communities Development Authority, Charter School Revenue Bonds, Rocketship 4 – Mosaic Elementary Charter School, Series 2011A, 8.500%, 12/01/41 | | | | | 12/21 at 100.00 | | | | N/R | | | | 2,576,665 | |
| | | | | |
| | 515 | | | California Statewide Communities Development Authority, Charter School Revenue Bonds, Rocketship 4 – Mosaic Elementary Charter School, Taxable Series 2011B, 8.750%, 12/01/18 | | | | | No Opt. Call | | | | N/R | | | | 504,108 | |
| | | | | |
| | 1,100 | | | California Statewide Communities Development Authority, School Facility Revenue Bonds, Alliance College-Ready Public Schools, Series 2011A, 7.000%, 7/01/46 | | | | | 7/21 at 100.00 | | | | BBB– | | | | 1,243,605 | |
| | | | | |
| | 5,000 | | | California Statewide Community Development Authority, Charter School Revenue Bonds, Rocklin Academy Charter, Series 2011A, 8.250%, 6/01/41 | | | | | 6/21 at 100.00 | | | | BB+ | | | | 5,905,350 | |
| | | | | |
| | | | California Statewide Community Development Authority, Lancer Educational Student Housing Revenue Bonds, California Baptist University, Series 2007: | | | | | | | | | | | | | | |
| | 125 | | | 9.125%, 6/01/13 | | | | | No Opt. Call | | | | N/R | | | | 125,101 | |
| | 1,000 | | | 5.625%, 6/01/33 | | | | | 6/17 at 102.00 | | | | N/R | | | | 1,063,610 | |
| | | | | |
| | 2,000 | | | California Statewide Community Development Authority, Lancer Educational Student Housing Revenue Bonds, California Baptist University, Series 2010A, 7.500%, 6/01/42 | | | | | 6/19 at 100.00 | | | | N/R | | | | 2,348,780 | |
| | | | | |
| | 565 | | | California Statewide Community Development Authority, Multifamily Housing Revenue Bonds, Magnolia City Lights, Series 1999X, 6.650%, 7/01/39 | | | | | 7/13 at 100.00 | | | | N/R | | | | 565,316 | |
| | | | | |
| | 485 | | | California Statewide Community Development Authority, Revenue Bonds, Brentwood Infrastructure Program, Series 2005A, 5.200%, 9/02/25 | | | | | 7/13 at 100.00 | | | | N/R | | | | 500,253 | |
| | | | | |
| | | | California Statewide Community Development Authority, Revenue Bonds, California Baptist University, Series 2007A: | | | | | | | | | | | | | | |
| | 1,000 | | | 5.400%, 11/01/27 | | | | | 11/17 at 102.00 | | | | N/R | | | | 1,072,180 | |
| | 1,500 | | | 5.500%, 11/01/38 | | | | | 11/17 at 102.00 | | | | N/R | | | | 1,611,825 | |
Portfolio of Investments
Nuveen High Yield Municipal Bond Fund (continued)
April 30, 2013
| | | | | | | | | | | | | | | | | | |
Principal
Amount (000) | | | Description (1) | | | | Optional Call
Provisions (2) | | | Ratings (3) | | | Value | |
| | | | California (continued) | | | | | | | | | | | | | | |
| | | | | |
| | | | California Statewide Community Development Authority, Revenue Bonds, California Baptist University, Series 2011A: | | | | | | | | | | | | | | |
| $ | 1,250 | | | 7.250%, 11/01/31 | | | | | 11/21 at 100.00 | | | | N/R | | | $ | 1,548,525 | |
| | 2,250 | | | 7.500%, 11/01/41 | | | | | 11/21 at 100.00 | | | | N/R | | | | 2,827,688 | |
| | | | | |
| | 15,530 | | | California Statewide Community Development Authority, Revenue Bonds, Children’s Hospital of Los Angeles, Series 2007, 5.000%, 8/15/47 | | | | | 8/17 at 100.00 | | | | BBB+ | | | | 16,251,369 | |
| | | | | |
| | 750 | | | California Statewide Community Development Authority, Revenue Bonds, Drew School, Series 2007, 5.300%, 10/01/37 | | | | | 10/15 at 102.00 | | | | N/R | | | | 766,238 | |
| | | | | |
| | 2,870 | | | California Statewide Community Development Authority, Revenue Bonds, Epidaurus Project, Series 2004A, 7.750%, 3/01/34 | | | | | 3/14 at 102.00 | | | | N/R | | | | 2,974,784 | |
| | | | | |
| | | | California Statewide Community Development Authority, Revenue Bonds, International School of the Peninsula, Palo Alto, California, Series 2006: | | | | | | | | | | | | | | |
| | 1,300 | | | 5.000%, 11/01/25 | | | | | 11/16 at 100.00 | | | | N/R | | | | 1,332,266 | |
| | 800 | | | 5.000%, 11/01/29 | | | | | 11/16 at 100.00 | | | | N/R | | | | 813,608 | |
| | | | | |
| | | | California Statewide Community Development Authority, Revenue Bonds, Kaiser Permanente System, Tender Option Bond Trust 1065: | | | | | | | | | | | | | | |
| | 1,610 | | | 17.058%, 4/01/42 (IF) (5) | | | | | 4/22 at 100.00 | | | | A+ | | | | 2,335,579 | |
| | 2,500 | | | 17.081%, 4/01/42 (IF) (5) | | | | | 4/22 at 100.00 | | | | A+ | | | | 3,628,300 | |
| | | | | |
| | 4,290 | | | California Statewide Community Development Authority, Revenue Bonds, Montessori in Redlands School, Series 2007A, 5.125%, 12/01/36 | | | | | 12/16 at 100.00 | | | | N/R | | | | 4,322,604 | |
| | | | | |
| | 6,915 | | | California Statewide Community Development Authority, Revenue Bonds, Sutter Health, Tender Option Bond Trust 3048, 18.513%, 11/15/32 (IF) | | | | | 5/18 at 100.00 | | | | AA– | | | | 10,457,001 | |
| | | | | |
| | 6,555 | | | California Statewide Community Development Authority, Revenue Bonds, Sutter Health, Tender Option Bond Trust 3102, 18.606%, 11/15/48 (IF) (5) | | | | | 5/18 at 100.00 | | | | AA– | | | | 9,913,258 | |
| | | | | |
| | 1,010 | | | California Statewide Community Development Authority, Subordinate Lien Multifamily Housing Revenue Bonds, Corona Park Apartments, Series 2004I-S, 7.750%, 1/01/34 (Alternative Minimum Tax) | | | | | 1/14 at 100.00 | | | | N/R | | | | 1,015,080 | |
| | | | | |
| | 1,790 | | | Carlsbad, California, Limited Obligation Refunding Bonds, Reassessment District 12-1, Series 2013, 5.000%, 9/02/35 | | | | | 9/22 at 100.00 | | | | N/R | | | | 1,916,732 | |
| | | | | |
| | 1,000 | | | Carson Redevelopment Agency, California, Redevelopment Project Area 1 Tax Allocation Bonds, Series 2009A, 7.000%, 10/01/36 | | | | | 10/19 at 100.00 | | | | A– | | | | 1,198,680 | |
| | | | | |
| | 1,000 | | | Chino Public Financing Authority, California, Revenue Refunding Bonds, Series 2012, 5.000%, 9/01/30 | | | | | 9/22 at 100.00 | | | | N/R | | | | 1,058,040 | |
| | | | | |
| | | | Chino, California, Special Tax Bonds, Community Facilities District 03-3 Improvement Area 2, Series 2006: | | | | | | | | | | | | | | |
| | 1,000 | | | 5.000%, 9/01/26 | | | | | 3/16 at 100.00 | | | | N/R | | | | 1,012,850 | |
| | 4,310 | | | 5.000%, 9/01/31 | | | | | 3/16 at 100.00 | | | | N/R | | | | 4,336,851 | |
| | 2,000 | | | 5.000%, 9/01/36 | | | | | 3/16 at 100.00 | | | | N/R | | | | 2,001,440 | |
| | | | | |
| | 1,000 | | | Compton Community Redevelopment Agency, California, Tax Allocation Revenue Bonds, Redevelopment Projects, Housing Second Lien Series 2010A, 5.500%, 8/01/30 | | | | | 8/20 at 100.00 | | | | N/R | | | | 1,030,630 | |
| | | | | |
| | 4,025 | | | Corona, California, Special Tax Bonds, Community Facilities District 2002-1 Dos Lagos, Series 2005A, 5.050%, 9/01/34 | | | | | 9/15 at 100.00 | | | | N/R | | | | 3,887,063 | |
| | | | | |
| | | | Corona-Norco Unified School District Public Financing Authority, Riverside County, California, Special Tax Revenue Refunding Bonds, Junior Lien Series 2013B: | | | | | | | | | | | | | | |
| | 1,015 | | | 5.000%, 9/01/32 | | | | | 9/23 at 100.00 | | | | N/R | | | | 1,069,394 | |
| | 500 | | | 5.000%, 9/01/35 | | | | | 9/23 at 100.00 | | | | N/R | | | | 521,295 | |
| | | | | |
| | 2,800 | | | California Statewide Communities Development Authority, Revenue Bonds, Saint Joseph Health System, Trust 2554, 18.068%, 7/01/47 – AGM Insured (IF) | | | | | 7/18 at 100.00 | | | | AA– | | | | 4,369,120 | |
| | | | | |
| | | | Desert Hot Springs Redevelopment Agency, California, Merged Redevelopment Project Tax Allocation Bonds, Series 2008A-2: | | | | | | | | | | | | | | |
| | 1,000 | | | 5.000%, 9/01/23 | | | | | 9/18 at 100.00 | | | | CCC+ | | | | 795,190 | |
| | 2,000 | | | 5.250%, 9/01/28 | | | | | 9/18 at 100.00 | | | | CCC+ | | | | 1,596,260 | |
| | 2,000 | | | 5.750%, 9/01/38 | | | | | 9/18 at 100.00 | | | | CCC+ | | | | 1,603,460 | |
| | | | | | | | | | | | | | | | | | |
Principal
Amount (000) | | | Description (1) | | | | Optional Call
Provisions (2) | | | Ratings (3) | | | Value | |
| | | | California (continued) | | | | | | | | | | | | | | |
| | | | | |
| $ | 5,000 | | | East Side Union High School District, Santa Clara County, California, General Obligation Bonds, Tender Option Bond Trust 2010-3171, 17.673%, 8/01/33 – AGC Insured (IF) | | | | | 8/19 at 100.00 | | | | AA– | | | $ | 6,899,800 | |
| | | | | |
| | 340 | | | Eastern Municipal Water District, California, Special Tax Bonds, Community Facility District 2005-38 Improvement Area A, Series 2006, 5.200%, 9/01/36 | | | | | 9/13 at 102.00 | | | | N/R | | | | 347,276 | |
| | | | | |
| | 5,150 | | | El Dorado County, California, Special Tax Bonds, Blackstone Community Facilities District 2005-1, Series 2005, 5.250%, 9/01/35 | | | | | 9/14 at 102.00 | | | | N/R | | | | 5,017,491 | |
| | | | | |
| | | | Elk Grove Community Facilities District 2005-1, California, Special Tax Bonds, Series 2007: | | | | | | | | | | | | | | |
| | 7,120 | | | 5.200%, 9/01/27 | | | | | 9/15 at 102.00 | | | | N/R | | | | 6,834,488 | |
| | 15,470 | | | 5.250%, 9/01/37 | | | | | 9/15 at 102.00 | | | | N/R | | | | 14,183,979 | |
| | | | | |
| | 4,000 | | | Fairfield, California, Community Facilities District 2007-1 Special Tax Bonds, Fairfield Commons Project, Series 2008, 6.875%, 9/01/38 | | | | | 9/18 at 100.00 | | | | N/R | | | | 4,232,040 | |
| | | | | |
| | 1,500 | | | Fillmore Redevelopment Agency, Ventura County, California, Central City Redevelopment Project, Subordinate Lien Tax Allocation Bonds, Series 2006A, 5.375%, 5/01/31 | | | | | 11/16 at 100.00 | | | | N/R | | | | 1,212,090 | |
| | | | | |
| | 2,500 | | | Fontana Public Financing Authority, California, Tax Allocation Revenue Bonds, North Fontana Redevelopment Project, Tender Option Bonds Trust 1013, 18.128%, 9/01/32 – AMBAC Insured (IF) (5) | | | | | 7/13 at 100.00 | | | | A+ | | | | 2,684,200 | |
| | | | | |
| | | | Fontana, California, Special Tax Bonds, Community Facilities District 31 Citrus Heights North, Series 2006: | | | | | | | | | | | | | | |
| | 3,610 | | | 5.000%, 9/01/26 | | | | | 9/14 at 102.00 | | | | N/R | | | | 3,658,410 | |
| | 1,000 | | | 5.000%, 9/01/36 | | | | | 9/14 at 102.00 | | | | N/R | | | | 997,200 | |
| | | | | |
| | 21,000 | | | Foothill/Eastern Transportation Corridor Agency, California, Toll Road Revenue Bonds, Series 1995A, 5.000%, 1/01/35 – NPFG Insured | | | | | 7/13 at 100.00 | | | | Baa2 | | | | 21,000,840 | |
| | | | | |
| | | | Foothill/Eastern Transportation Corridor Agency, California, Toll Road Revenue Refunding Bonds, Series 1999: | | | | | | | | | | | | | | |
| | 18,000 | | | 0.000%, 1/15/25 – NPFG Insured | | | | | 7/13 at 50.50 | | | | Baa2 | | | | 8,992,260 | |
| | 1,880 | | | 5.875%, 1/15/29 – NPFG Insured | | | | | 1/14 at 101.00 | | | | Baa2 | | | | 1,912,524 | |
| | 1,000 | | | 0.000%, 1/15/30 – NPFG Insured | | | | | 7/13 at 37.39 | | | | Baa2 | | | | 369,520 | |
| | 12,150 | | | 0.000%, 1/15/31 – NPFG Insured | | | | | 7/13 at 35.14 | | | | Baa2 | | | | 4,222,490 | |
| | 20,400 | | | 0.000%, 1/15/32 – NPFG Insured | | | | | 7/13 at 33.04 | | | | Baa2 | | | | 6,666,312 | |
| | | | | |
| | 31,935 | | | Golden State Tobacco Securitization Corporation, California, Enhanced Tobacco Settlement Asset-Backed Revenue Bonds, Series 2005A, 5.000%, 6/01/45 – AMBAC Insured (UB) | | | | | 6/15 at 100.00 | | | | A2 | | | | 33,325,131 | |
| | | | | |
| | | | Golden State Tobacco Securitization Corporation, California, Enhanced Tobacco Settlement Asset-Backed Revenue Bonds, Tender Option Bond Trust 1011: | | | | | | | | | | | | | | |
| | 1,560 | | | 17.086%, 6/01/38 (IF) (5) | | | | | 6/15 at 100.00 | | | | A2 | | | | 1,858,522 | |
| | 750 | | | 17.099%, 6/01/38 – FGIC Insured (IF) (5) | | | | | 6/15 at 100.00 | | | | A2 | | | | 893,640 | |
| | 2,500 | | | 17.099%, 6/01/38 (IF) (5) | | | | | 6/15 at 100.00 | | | | A2 | | | | 2,978,800 | |
| | 2,500 | | | 17.099%, 6/01/38 (IF) (5) | | | | | 6/15 at 100.00 | | | | A2 | | | | 2,978,800 | |
| | 2,500 | | | 17.099%, 6/01/38 (IF) (5) | | | | | 6/15 at 100.00 | | | | A2 | | | | 2,978,800 | |
| | 370 | | | 16.933%, 6/01/45 (IF) (5) | | | | | 6/15 at 100.00 | | | | A2 | | | | 433,770 | |
| | 955 | | | 17.056%, 6/01/45 (IF) (5) | | | | | 6/15 at 100.00 | | | | A2 | | | | 1,120,845 | |
| | 980 | | | 17.078%, 6/01/45 (IF) (5) | | | | | 6/15 at 100.00 | | | | A2 | | | | 1,150,422 | |
| | 1,880 | | | 17.078%, 6/01/45 (IF) (5) | | | | | 6/15 at 100.00 | | | | A2 | | | | 2,206,913 | |
| | 1,750 | | | 17.099%, 6/01/45 (IF) (5) | | | | | 6/15 at 100.00 | | | | A2 | | | | 2,054,710 | |
| | 2,250 | | | 17.099%, 6/01/45 (IF) (5) | | | | | 6/15 at 100.00 | | | | A2 | | | | 2,641,770 | |
| | 7,500 | | | 17.099%, 6/01/45 (IF) (5) | | | | | 6/15 at 100.00 | | | | A2 | | | | 8,805,900 | |
| | 1,530 | | | 17.099%, 6/01/45 (IF) (5) | | | | | 6/15 at 100.00 | | | | A2 | | | | 1,796,404 | |
| | 1,250 | | | 17.099%, 6/01/45 (IF) (5) | | | | | 6/15 at 100.00 | | | | A2 | | | | 1,467,650 | |
| | | | | |
| | 7,575 | | | Goden State Tobacco Securitization Corporation, California, Enhanced Tobacco Settlement Asset-Backed Revenue Bonds, Tender Option Bonds Trust 3107, 17.403%, 6/01/45 – BHAC Insured (IF) | | | | | 6/15 at 100.00 | | | | AA+ | | | | 9,031,445 | |
Portfolio of Investments
Nuveen High Yield Municipal Bond Fund (continued)
April 30, 2013
| | | | | | | | | | | | | | | | | | |
Principal
Amount (000) | | | Description (1) | | | | Optional Call
Provisions (2) | | | Ratings (3) | | | Value | |
| | | | California (continued) | | | | | | | | | | | | | | |
| | | | | |
| | | | Golden State Tobacco Securitization Corporation, California, Enhanced Tobacco Settlement Asset-Backed Revenue Bonds, Tender Option Bonds Trust 4686: | | | | | | | | | | | | | | |
| $ | 5,500 | | | 8.825%, 6/01/45 – AGC Insured (IF) (5) | | | | | 6/15 at 100.00 | | | | AA– | | | $ | 6,006,220 | |
| | 550 | | | 8.825%, 6/01/45 – AGC Insured (IF) | | | | | 6/15 at 100.00 | | | | AA– | | | | 600,622 | |
| | | | | |
| | | | Golden State Tobacco Securitization Corporation, California, Tobacco Settlement Asset-Backed Bonds, Series 2007A-1: | | | | | | | | | | | | | | |
| | 40,770 | | | 5.000%, 6/01/33 | | | | | 6/17 at 100.00 | | | | B | | | | 37,609,510 | |
| | 46,845 | | | 5.750%, 6/01/47 | | | | | 6/17 at 100.00 | | | | B | | | | 44,758,992 | |
| | 46,080 | | | 5.125%, 6/01/47 | | | | | 6/17 at 100.00 | | | | B | | | | 40,133,837 | |
| | | | | |
| | 51,205 | | | Golden State Tobacco Securitization Corporation, California, Tobacco Settlement Asset-Backed Bonds, Series 2007A-2, 5.300%, 6/01/37 | | | | | 6/22 at 100.00 | | | | B | | | | 47,588,391 | |
| | | | | |
| | 1,535 | | | Gonzales Redevelopment Agency, Monterey County, California, Tax Allocation Refunding Bonds, Gonzalez Redevelopment Project, Series 2011, 8.000%, 12/01/44 | | | | | 12/21 at 100.00 | | | | BB+ | | | | 1,696,252 | |
| | | | | |
| | 1,875 | | | Grossmont Healthcare District, California, General Obligation Bonds, Tender Option Bond Trust 3253, 22.441%, 1/15/19 (IF) (5) | | | | | No Opt. Call | | | | Aa2 | | | | 3,647,100 | |
| | | | | |
| | | | Hawthorne, California, Special Tax Bonds, Community Facilities District 2006-1, Three Sixty Degrees @ South Bay, Series 2006: | | | | | | | | | | | | | | |
| | 1,000 | | | 4.600%, 9/01/21 | | | | | 9/16 at 102.00 | | | | N/R | | | | 1,020,620 | |
| | 2,000 | | | 5.000%, 9/01/30 | | | | | 9/16 at 102.00 | | | | N/R | | | | 2,017,560 | |
| | 2,000 | | | 5.000%, 9/01/36 | | | | | 9/16 at 102.00 | | | | N/R | | | | 1,980,840 | |
| | | | | |
| | 585 | | | Hemet Unified School District, California, Community Facilities District 2005-1 Special Tax Bonds, Series 2006, 5.125%, 9/01/36 | | | | | 9/13 at 100.00 | | | | N/R | | | | 586,135 | |
| | | | | |
| | | | Hercules Redevelopment Agency, California, Tax Allocation Bonds, Merged Project Area, Series 2005: | | | | | | | | | | | | | | |
| | 5,675 | | | 5.000%, 8/01/25 – AMBAC Insured | | | | | 8/15 at 100.00 | | | | CC | | | | 4,282,979 | |
| | 3,750 | | | 4.750%, 8/01/35 – AMBAC Insured | | | | | 8/15 at 100.00 | | | | CC | | | | 2,435,138 | |
| | | | | |
| | | | Hesperia Public Financing Authority, California, Redevelopment and Housing Projects Tax Allocation Bonds, Series 2007A: | | | | | | | | | | | | | | |
| | 3,250 | | | 5.500%, 9/01/22 – SYNCORA GTY Insured | | | | | 9/17 at 100.00 | | | | Ba1 | | | | 3,386,923 | |
| | 1,000 | | | 5.500%, 9/01/27 – SYNCORA GTY Insured | | | | | No Opt. Call | | | | Ba1 | | | | 1,027,430 | |
| | 4,245 | | | 5.000%, 9/01/37 – SYNCORA GTY Insured | | | | | 9/17 at 100.00 | | | | Ba1 | | | | 4,049,390 | |
| | | | | |
| | 2,500 | | | Hesperia Unified School District, San Bernardino County, California, Certificates of Participation, Series 2013A, 5.000%, 2/01/43 – BAM Insured | | | | | 2/23 at 100.00 | | | | AA | | | | 2,699,050 | |
| | | | | |
| | 2,935 | | | Imperial, California, Community Facilities District 2006-2 Savanna Ranch Special Tax Bonds, Improvement Area 1, Series 2006, 5.000%, 9/01/37 | | | | | 9/13 at 103.00 | | | | N/R | | | | 2,945,537 | |
| | | | | |
| | 1,000 | | | Independent Cities Finance Authority, California, Mobile Home Park Revenue Bonds, Rancho Vallecitos Mobile Home Park, Series 2013, 5.000%, 4/15/48 | | | | | 7/13 at 100.00 | | | | BBB | | | | 1,022,020 | |
| | | | | |
| | 1,500 | | | Independent Cities Finance Authority, California, Mobile Home Park Revenue Bonds, Augusta Communities Mobile Home Park, Series 2012A, 5.000%, 5/15/47 | | | | | 5/22 at 100.00 | | | | A– | | | | 1,563,825 | |
| | | | | |
| | 1,000 | | | Independent Cities Lease Finance Authority, California, Mobile Home Park Revenue Bonds, San Juan Mobile Estates Project, Series 2006A, 5.125%, 5/15/41 | | | | | 5/16 at 100.00 | | | | A | | | | 1,026,710 | |
| | | | | |
| | 2,500 | | | Independent Cities Lease Finance Authority, California, Revenue Bonds, El Granada Mobile Home Park, Series 2004A, 6.450%, 5/15/44 | | | | | 5/14 at 100.00 | | | | N/R | | | | 2,538,925 | |
| | | | | |
| | 3,345 | | | Independent Cities Lease Finance Authority, California, Second Senior Subordinate Lien Revenue Bonds, Caritas Affordable Housing Project Mobile Home Park, Series 2005C, 7.000%, 9/01/40 | | | | | 9/15 at 100.00 | | | | N/R | | | | 3,474,786 | |
| | | | | |
| | 1,010 | | | Indio Redevelopment Agency, California, Tax Allocation Bonds, Merged Area Redevelopment Project, Subordinate Lien Refunding Series 2008A, 5.250%, 8/15/28 | | | | | 8/18 at 100.00 | | | | BBB– | | | | 1,051,521 | |
| | | | | | | | | | | | | | | | | | |
Principal
Amount (000) | | | Description (1) | | | | Optional Call
Provisions (2) | | | Ratings (3) | | | Value | |
| | | | California (continued) | | | | | | | | | | | | | | |
| | | | | |
| | | | Indio, California, Special Tax Bonds, Community Facilities District 2004-3 Terra Lago, Improvement Area 1, Series 2005: | | | | | | | | | | | | | | |
| $ | 2,050 | | | 5.100%, 9/01/30 | | | | | 9/15 at 102.00 | | | | N/R | | | $ | 2,068,881 | |
| | 3,825 | | | 5.150%, 9/01/35 | | | | | 9/15 at 102.00 | | | | N/R | | | | 3,832,076 | |
| | | | | |
| | | | Indio, California, Special Tax Bonds, Community Facilities District 2006-1 Sonora Wells, Series 2006: | | | | | | | | | | | | | | |
| | 630 | | | 5.050%, 9/01/26 | | | | | 9/16 at 100.00 | | | | N/R | | | | 634,568 | |
| | 1,830 | | | 5.125%, 9/01/36 | | | | | 9/16 at 100.00 | | | | N/R | | | | 1,794,480 | |
| | | | | |
| | 1,500 | | | Jurupa Community Services District, California, Special Tax Bonds, Community Facilities District 34 Eastvale Area , Series 2010A, 6.500%, 9/01/40 | | | | | 9/20 at 100.00 | | | | N/R | | | | 1,552,050 | |
| | | | | |
| | 5,185 | | | King Community Development Agency, California, Tax Allocation Bonds, King City Redevelopment Project, Series 2011, 7.250%, 8/01/34 | | | | | 8/21 at 100.00 | | | | N/R | | | | 5,965,446 | |
| | | | | |
| | 3,750 | | | Lake Elsinore Public Finance Authority, California, Local Agency Revenue Refunding Bonds, Assessment District 93-1, Series 2012B, 5.125%, 9/01/30 | | | | | No Opt. Call | | | | N/R | | | | 3,767,700 | |
| | | | | |
| | 2,500 | | | Lake Elsinore Public Finance Authority, California, Local Agency Revenue Refunding Bonds, Series 2003H, 6.375%, 10/01/33 | | | | | 10/13 at 102.00 | | | | N/R | | | | 2,564,425 | |
| | | | | |
| | 1,000 | | | Lake Elsinore Public Financing Authority, California, Local Agency Revenue Bonds, Canyon Hills Improvement Area C, Series 2012C, 5.000%, 9/01/42 | | | | | No Opt. Call | | | | N/R | | | | 1,015,600 | |
| | | | | |
| | 1,205 | | | Lake Elsinore Public Financing Authority, California, Local Agency Revenue Bonds, Villages at Wasson Canyon, Refunding Series 2012A, 5.250%, 9/01/38 | | | | | 9/22 at 100.00 | | | | N/R | | | | 1,240,764 | |
| | | | | |
| | 1,200 | | | Lake Elsinore, California, Special Tax Bonds, Community Facilities District 2003-2 Improvement Area A, Canyon Hills, Series 2004A, 5.950%, 9/01/34 | | | | | 9/13 at 102.00 | | | | N/R | | | | 1,227,396 | |
| | | | | |
| | | | Lake Elsinore, California, Special Tax Bonds, Community Facilities District 2003-2, Canyon Hills Improvement Area B, Series 2006A: | | | | | | | | | | | | | | |
| | 3,000 | | | 5.100%, 9/01/26 | | | | | 9/14 at 100.00 | | | | N/R | | | | 3,029,100 | |
| | 6,750 | | | 5.150%, 9/01/36 | | | | | 9/14 at 100.00 | | | | N/R | | | | 6,779,768 | |
| | | | | |
| | | | Lake Elsinore, California, Special Tax Bonds, Community Facilities District 2004-3, Rosetta Canyon Improvement Area 1,Series 2005: | | | | | | | | | | | | | | |
| | 1,195 | | | 5.250%, 9/01/30 | | | | | 9/15 at 102.00 | | | | N/R | | | | 1,242,274 | |
| | 1,225 | | | 5.250%, 9/01/35 | | | | | 9/15 at 102.00 | | | | N/R | | | | 1,261,726 | |
| | | | | |
| | | | Lake Elsinore, California, Special Tax Bonds, Community Facilities District 2004-3, Rosetta Canyon Improvement Area 2, Series 2006: | | | | | | | | | | | | | | |
| | 910 | | | 5.200%, 9/01/26 | | | | | 9/14 at 100.00 | | | | N/R | | | | 919,955 | |
| | 8,660 | | | 5.250%, 9/01/37 | | | | | 9/14 at 100.00 | | | | N/R | | | | 8,751,536 | |
| | | | | |
| | | | Lake Elsinore, California, Special Tax Bonds, Community Facilities District 2005-1, Series 2006A: | | | | | | | | | | | | | | |
| | 980 | | | 5.200%, 9/01/26 | | | | | 9/14 at 100.00 | | | | N/R | | | | 1,001,295 | |
| | 1,505 | | | 5.350%, 9/01/36 | | | | | 9/14 at 100.00 | | | | N/R | | | | 1,537,433 | |
| | | | | |
| | 11,820 | | | Lake Elsinore, California, Special Tax Bonds, Community Facilities District 2005-2 Improvement Area A, Series 2005A, 5.450%, 9/01/36 | | | | | 9/14 at 100.00 | | | | N/R | | | | 11,863,734 | |
| | | | | |
| | 5,000 | | | Lake Tahoe Unified School District, El Dorado County, California, General Obligation Bonds, Series 2010, 0.000%, 8/01/45 – AGM Insured | | | | | No Opt. Call | | | | AA– | | | | 2,331,050 | |
| | | | | |
| | 4,000 | | | Lammersville Joint Unified School District, Special Tax Bonds, California, Community Facilities District 2002, Mountain House, Series 2013, 5.000%, 9/01/37 | | | | | 9/22 at 100.00 | | | | N/R | | | | 4,130,840 | |
| | | | | |
| | 1,000 | | | Lammersville School District, California, Special Tax Refunding Bonds, Community Facilities District 2002 Mountain House, Series 2012, 0.000%, 9/01/29 | | | | | 9/22 at 100.00 | | | | N/R | | | | 905,060 | |
| | | | | |
| | | | Lancaster Redevelopment Agency, California, Tax Allocation Bonds, Combined Redevelopment Project Areas Housing Programs, Series 2009: | | | | | | | | | | | | | | |
| | 2,000 | | | 6.875%, 8/01/34 | | | | | 8/19 at 100.00 | | | | BBB | | | | 2,319,060 | |
| | 2,445 | | | 6.875%, 8/01/39 | | | | | 8/19 at 100.00 | | | | BBB | | | | 2,820,674 | |
Portfolio of Investments
Nuveen High Yield Municipal Bond Fund (continued)
April 30, 2013
| | | | | | | | | | | | | | | | | | |
Principal
Amount (000) | | | Description (1) | | | | Optional Call
Provisions (2) | | | Ratings (3) | | | Value | |
| | | | California (continued) | | | | | | | | | | | | | | |
| | | | | |
| $ | 1,155 | | | Lancaster Redevelopment Agency, California, Tax Allocation Bonds, Combined Redevelopment Project Areas Housing Programs, Subordinate Refunding Series 2003, 4.750%, 8/01/33 – NPFG Insured | | | | | 8/15 at 102.00 | | | | BBB | | | $ | 1,159,077 | |
| | | | | |
| | 1,180 | | | Lathrop Financing Authority, California, Revenue Bonds, Water Supply Project Series 2003, 6.000%, 6/01/35 | | | | | 6/13 at 100.00 | | | | N/R | | | | 1,181,192 | |
| | | | | |
| | 4,050 | | | Lee Lake Water District, Riverside County, California, Special Tax Bonds, Community Facilities District 3, Series 2004, 5.950%, 9/01/34 | | | | | 9/13 at 102.00 | | | | N/R | | | | 4,150,319 | |
| | | | | |
| | 1,335 | | | Lemoore Redevelopment Agency, Kings County, California, Lemorre Redevelopment Project Tax Allocation Bonds, Series 2011, 7.250%, 8/01/31 | | | | | 8/16 at 100.00 | | | | A– | | | | 1,496,508 | |
| | | | | |
| | 630 | | | Lincoln, California, Community Facility District 2006-1 Area 2 Special Tax Bonds, Series 2006, 5.000%, 9/01/26 | | | | | 9/16 at 100.00 | | | | N/R | | | | 639,425 | |
| | | | | |
| | | | Long Beach Bond Finance Authority, California, Natural Gas Purchase Revenue Bonds, Series 2007A: | | | | | | | | | | | | | | |
| | 480 | | | 5.500%, 11/15/30 | | | | | No Opt. Call | | | | A | | | | 591,538 | |
| | 730 | | | 5.000%, 11/15/35 | | | | | No Opt. Call | | | | A | | | | 838,880 | |
| | 11,210 | | | 5.500%, 11/15/37 | | | | | No Opt. Call | | | | A | | | | 13,740,545 | |
| | | | | |
| | 1,765 | | | Los Alamitos Unified School District, Orange County, California, Certificates of Participation, Series 2012, 0.000%, 8/01/42 | | | | | 8/29 at 100.00 | | | | A+ | | | | 1,087,011 | |
| | | | | |
| | 6,530 | | | Los Angeles County, California, Multifamily Housing Revenue Bonds, HDR Preservation Apartment Project, Series 2007C, 6.250%, 7/01/42 | | | | | 7/22 at 100.00 | | | | N/R | | | | 6,652,372 | |
| | | | | |
| | | | Los Angeles Department of Airports, California, Revenue Bonds, Los Angeles International Airport, Tender Option Bond Trust 10-27B: | | | | | | | | | | | | | | |
| | 1,875 | | | 18.310%, 5/15/40 (IF) (5) | | | | | 5/20 at 100.00 | | | | AA | | | | 2,915,100 | |
| | 4,550 | | | 18.310%, 5/15/40 (IF) (5) | | | | | 5/20 at 100.00 | | | | AA | | | | 6,937,294 | |
| | | | | |
| | | | Los Angeles Department of Airports, California, Revenue Bonds, Los Angeles International Airport, Tender Option Bond Trust 2011-27B: | | | | | | | | | | | | | | |
| | 3,565 | | | 18.297%, 5/15/40 (IF) (5) | | | | | 5/20 at 100.00 | | | | AA | | | | 5,434,165 | |
| | 5,000 | | | 18.310%, 5/15/40 (IF) (5) | | | | | 5/20 at 100.00 | | | | AA | | | | 7,623,400 | |
| | | | | |
| | 585 | | | Los Angeles Regional Airports Improvement Corporation, California, Sublease Revenue Bonds, Los Angeles International Airport, American Airlines Inc. Terminal 4 Project, Series 2002B, 7.500%, 12/01/24 (Alternative Minimum Tax) | | | | | 12/13 at 101.00 | | | | C | | | | 596,337 | |
| | | | | |
| | 4,600 | | | Los Angeles Regional Airports Improvement Corporation, California, Sublease Revenue Bonds, Los Angeles International Airport, American Airlines Inc. Terminal 4 Project, Series 2002C, 7.500%, 12/01/24 (Alternative Minimum Tax) | | | | | 12/13 at 101.00 | | | | N/R | | | | 4,699,774 | |
| | | | | |
| | 2,500 | | | Los Angeles, California, Wastewater System Revenue Bonds, Tender Option Bond Trust 2009-2W, 20.944%, 6/01/34 (IF) (5) | | | | | 6/19 at 100.00 | | | | AA+ | | | | 4,635,400 | |
| | | | | |
| | 1,000 | | | Lynwood Redevelopment Agency, California, Project A Revenue Bonds, Subordinate Lien Series 2011A, 7.000%, 9/01/31 | | | | | 9/21 at 100.00 | | | | A– | | | | 1,206,090 | |
| | | | | |
| | | | March Joint Powers Redevelopment Agency, California, March Air Force Base Redevelopment Project Tax Allocation Revenue Bonds, Series 2011A: | | | | | | | | | | | | | | |
| | 1,185 | | | 7.000%, 8/01/26 | | | | | 8/21 at 100.00 | | | | BBB+ | | | | 1,430,840 | |
| | 2,650 | | | 7.250%, 8/01/31 | | | | | 8/21 at 100.00 | | | | BBB+ | | | | 3,179,894 | |
| | 10,010 | | | 7.500%, 8/01/41 | | | | | 8/21 at 100.00 | | | | BBB+ | | | | 11,945,834 | |
| | | | | |
| | 3,950 | | | March Joint Powers Redevelopment Agency, California, March Air Force Base Redevelopment Project Tax Allocation Revenue Bonds, Series 2011B, 7.500%, 8/01/41 | | | | | 8/21 at 100.00 | | | | BBB+ | | | | 4,713,891 | |
| | | | | |
| | 625 | | | Menifee Union School District, Riverside County, California, Special Tax Bonds, Community Facilities District 2004-5, Series 2006, 5.200%, 9/01/26 | | | | | 9/15 at 100.00 | | | | N/R | | | | 639,663 | |
| | | | | |
| | 1,500 | | | Merced, California, Redevelopment Agency, Tax Allocation Revenue Bonds, 6.250%, 9/01/29 | | | | | 9/19 at 100.00 | | | | N/R | | | | 1,567,425 | |
| | | | | | | | | | | | | | | | | | |
Principal
Amount (000) | | | Description (1) | | | | Optional Call
Provisions (2) | | | Ratings (3) | | | Value | |
| | | | California (continued) | | | | | | | | | | | | | | |
| | | | | |
| $ | 5 | | | Merced Irrigation District, California, Revenue Certificates of Participation, Electric System Project, Series 2003, 5.700%, 9/01/36 | | | | | 9/13 at 102.00 | | | | Baa2 | | | $ | 5,100 | |
| | | | | |
| | | | Merced, California, Community Facilities District 2005-1, Special Tax Bonds, Bellevue Ranch West, Series 2006: | | | | | | | | | | | | | | |
| | 1,270 | | | 5.250%, 9/01/26 | | | | | 9/14 at 103.00 | | | | N/R | | | | 923,735 | |
| | 1,245 | | | 5.300%, 9/01/36 | | | | | 9/13 at 103.00 | | | | N/R | | | | 802,739 | |
| | | | | |
| | | | Monrovia Redevelopment Agency, California, Central Project Area 1 Housing Tax Allocation Bonds, Series 2011: | | | | | | | | | | | | | | |
| | 1,540 | | | 6.500%, 5/01/26 | | | | | 5/21 at 100.00 | | | | BBB+ | | | | 1,890,827 | |
| | 1,075 | | | 6.900%, 5/01/36 | | | | | 5/21 at 100.00 | | | | BBB+ | | | | 1,292,827 | |
| | | | | |
| | 615 | | | Moreno Valley Unified School District, Riverside County, California, Special Tax Bonds, Community Facilities District 2004-5, Series 2006, 5.200%, 9/01/36 | | | | | 3/16 at 100.00 | | | | N/R | | | | 624,668 | |
| | | | | |
| | 2,335 | | | Moreno Valley Unified School District, Riverside County, California, Special Tax Bonds, Community Facilities District 2004-6, Series 2005, 5.200%, 9/01/36 | | | | | 9/13 at 102.00 | | | | N/R | | | | 2,375,909 | |
| | | | | |
| | 220 | | | Moreno Valley Unified School District, Riverside County, California, Special Tax Bonds, Community Facilities District 2005-2, Series 2006, 5.000%, 9/01/26 | | | | | 9/15 at 101.00 | | | | N/R | | | | 224,941 | |
| | | | | |
| | | | Moreno Valley, California, Special Tax Bonds, Community Facilities District 5, Series 2007: | | | | | | | | | | | | | | |
| | 1,010 | | | 5.000%, 9/01/27 | | | | | 9/17 at 100.00 | | | | N/R | | | | 1,029,230 | |
| | 1,325 | | | 5.000%, 9/01/37 | | | | | 9/17 at 100.00 | | | | N/R | | | | 1,327,981 | |
| | | | | |
| | 2,700 | | | M-S-R Energy Authority, California, Gas Revenue Bonds, Citigroup Prepay Contracts, Series 2009B, 6.500%, 11/01/39 | | | | | No Opt. Call | | | | A | | | | 3,691,440 | |
| | | | | |
| | | | M-S-R Energy Authority, California, Gas Revenue Bonds, Series 2009A: | | | | | | | | | | | | | | |
| | 3,700 | | | 7.000%, 11/01/34 | | | | | No Opt. Call | | | | A | | | | 5,229,617 | |
| | 20,050 | | | 6.500%, 11/01/39 | | | | | No Opt. Call | | | | A | | | | 27,412,360 | |
| | | | | |
| | | | M-S-R Energy Authority, California, Gas Revenue Bonds, Series 2009C: | | | | | | | | | | | | | | |
| | 3,300 | | | 7.000%, 11/01/34 | | | | | No Opt. Call | | | | A | | | | 4,664,253 | |
| | 4,000 | | | 6.500%, 11/01/39 | | | | | No Opt. Call | | | | A | | | | 5,468,800 | |
| | | | | |
| | 5,000 | | | Murrieta Public Finance Authority, California, Special Tax Revenue Bonds, Refunding Series 2012, 5.000%, 9/01/31 | | | | | 9/22 at 100.00 | | | | BBB– | | | | 5,440,950 | |
| | | | | |
| | 1,265 | | | Murrieta, California, Special Tax Bonds, Community Facilities District 2003-3, Creekside Village Improvement Area 1, Series 2005, 5.200%, 9/01/35 | | | | | 9/13 at 100.00 | | | | N/R | | | | 1,267,859 | |
| | | | | |
| | 2,355 | | | National City Community Development Commission, California, Tax Allocation Bonds, National City Redevelopment Project, Series 2011, 7.000%, 8/01/32 | | | | | 8/21 at 100.00 | | | | A– | | | | 2,984,727 | |
| | | | | |
| | 1,000 | | | Oxnard Financing Authority, California, Local Obligation Revenue Bonds, Special District Bond Refinancing, Subordinate Lien Series 2012B, 5.000%, 9/02/33 | | | | | 9/22 at 100.00 | | | | N/R | | | | 1,005,870 | |
| | | | | |
| | 8,805 | | | Oxnard Financing Authority, California, Wastewater Revenue Bonds, Redwood Trunk Sewer and Headworks Projects, Series 2004A, 5.250%, 6/01/34 – FGIC Insured | | | | | 6/14 at 100.00 | | | | BBB | | | | 8,985,062 | |
| | | | | |
| | 1,100 | | | Pacifica, California, Certificates of Participation, Series 2008, 5.375%, 1/01/37 – AMBAC Insured | | | | | 1/16 at 102.00 | | | | A– | | | | 1,172,127 | |
| | | | | |
| | 2,465 | | | Palm Desert Finance Authority, California, Tax Allocation Revenue Bonds, Project Area 3, Series 2006A, 4.750%, 4/01/36 – NPFG Insured | | | | | 4/16 at 100.00 | | | | BBB+ | | | | 2,497,735 | |
| | | | | |
| | 1,995 | | | Palm Desert Financing Authority, California, Tax Allocation Revenue Bonds, Project Area 1, Series 2003, 5.000%, 4/01/30 – NPFG Insured | | | | | No Opt. Call | | | | Baa2 | | | | 2,000,606 | |
| | | | | |
| | | | Palm Desert, California, Special Tax Bonds, Community Facilities District 2005-1 University Park, Series 2006: | | | | | | | | | | | | | | |
| | 2,335 | | | 5.250%, 9/01/26 | | | | | 9/13 at 103.00 | | | | N/R | | | | 2,293,133 | |
| | 5,100 | | | 5.450%, 9/01/32 | | | | | 9/16 at 100.00 | | | | N/R | | | | 5,067,054 | |
| | 6,150 | | | 5.500%, 9/01/36 | | | | | 9/16 at 100.00 | | | | N/R | | | | 6,030,690 | |
Portfolio of Investments
Nuveen High Yield Municipal Bond Fund (continued)
April 30, 2013
| | | | | | | | | | | | | | | | | | |
Principal
Amount (000) | | | Description (1) | | | | Optional Call
Provisions (2) | | | Ratings (3) | | | Value | |
| | | | California (continued) | | | | | | | | | | | | | | |
| | | | | |
| | | | Palm Desert, California, Special Tax Bonds, Community Facilities District 2005-1 University Park, Series 2007: | | | | | | | | | | | | | | |
| $ | 3,000 | | | 5.150%, 9/01/27 | | | | | 9/13 at 103.00 | | | | N/R | | | $ | 2,913,930 | |
| | 9,000 | | | 5.200%, 9/01/37 | | | | | 9/15 at 102.00 | | | | N/R | | | | 8,223,300 | |
| | | | | |
| | | | Palm Drive Health Care District, Sonoma County, California, Certificates of Participation, Parcel Tax Secured Financing Program, Series 2010: | | | | | | | | | | | | | | |
| | 1,120 | | | 7.000%, 4/01/25 | | | | | 7/13 at 102.00 | | | | BB | | | | 1,147,642 | |
| | 1,605 | | | 7.500%, 4/01/35 | | | | | 7/13 at 102.00 | | | | BB | | | | 1,645,253 | |
| | | | | |
| | 1,000 | | | Palm Springs Financing Authority, California, Lease Revenue Bonds, Downtown Revitalization Project, Series 2012B, 5.000%, 6/01/35 | | | | | No Opt. Call | | | | A | | | | 1,104,790 | |
| | | | | |
| | | | Palmdale Community Redevelopment Agency, California, Tax Allocation Bonds, Merged Redevelopment Project Areas, Series 2002: | | | | | | | | | | | | | | |
| | 1,230 | | | 0.000%, 12/01/31 – AMBAC Insured | | | | | No Opt. Call | | | | A– | | | | 487,228 | |
| | 1,225 | | | 0.000%, 12/01/32 – AMBAC Insured | | | | | No Opt. Call | | | | A– | | | | 462,548 | |
| | | | | |
| | | | Palmdale, California, Special Tax Bonds, Community Facilities District 2003-1, Anaverde Project, Series 2005A: | | | | | | | | | | | | | | |
| | 1,000 | | | 5.350%, 9/01/30 | | | | | 9/15 at 101.00 | | | | N/R | | | | 1,023,130 | |
| | 2,855 | | | 5.400%, 9/01/35 | | | | | 9/15 at 101.00 | | | | N/R | | | | 2,904,563 | |
| | | | | |
| | 5,265 | | | Palomar Pomerado Health Care District, California, Certificates of Participation, Series 2009, 6.750%, 11/01/39 | | | | | 11/19 at 100.00 | | | | Baa3 | | | | 5,966,087 | |
| | | | | |
| | 17,360 | | | Palomar Pomerado Health Care District, California, Certificates of Participation, Series 2010, 6.000%, 11/01/41 | | | | | 11/20 at 100.00 | | | | Baa3 | | | | 19,031,594 | |
| | | | | |
| | 3,000 | | | Palomar Pomerado Health, California, General Obligation Bonds, Series 2009A, 0.000%, 8/01/38 – AGC Insured | | | | | 8/29 at 100.00 | | | | AA– | | | | 2,698,140 | |
| | | | | |
| | 2,000 | | | Palomar Pomerado Health, California, General Obligation Bonds, Tender Option Bond Trust 11872, 17.869%, 2/01/16 – NPFG Insured (IF) | | | | | No Opt. Call | | | | A+ | | | | 2,918,640 | |
| | | | | |
| | | | Palomar Pomerado Health, California, General Obligation Bonds, Tender Option Bond Trust 4683: | | | | | | | | | | | | | | |
| | 3,750 | | | 17.398%, 8/01/37 – NPFG Insured (IF) (5) | | | | | 8/17 at 100.00 | | | | A+ | | | | 5,472,450 | |
| | 7,000 | | | 17.398%, 8/01/37 – NPFG Insured (IF) (5) | | | | | 8/17 at 100.00 | | | | A+ | | | | 10,215,240 | |
| | | | | |
| | 5,000 | | | Peralta Community College District, Alameda County, California, General Obligation Bonds, Series 2009, Trust 3019, 17.600%, 8/01/37 – AGM Insured (IF) (5) | | | | | 8/17 at 100.00 | | | | AA– | | | | 6,605,800 | |
| | | | | |
| | 555 | | | Perris, California, Special Tax Bonds, Community Facilities District 2001-1, Improvement Area 5-A, Series 2006, 5.000%, 9/01/26 | | | | | 9/13 at 100.50 | | | | N/R | | | | 559,240 | |
| | | | | |
| | | | Perris, California, Special Tax Bonds, Community Facilities District 2001-1, May Farms Improvement Area 4, Series 2005A: | | | | | | | | | | | | | | |
| | 1,290 | | | 5.100%, 9/01/30 | | | | | 9/15 at 102.00 | | | | N/R | | | | 1,320,612 | |
| | 2,475 | | | 5.150%, 9/01/35 | | | | | 9/15 at 102.00 | | | | N/R | | | | 2,515,169 | |
| | | | | |
| | | | Perris, California, Special Tax Bonds, Community Facilities District 2001-2, Villages of Avalon, Series 2005: | | | | | | | | | | | | | | |
| | 1,500 | | | 5.100%, 9/01/28 | | | | | 9/14 at 100.00 | | | | N/R | | | | 1,512,615 | |
| | 1,050 | | | 5.150%, 9/01/32 | | | | | 9/14 at 100.00 | | | | N/R | | | | 1,056,657 | |
| | | | | |
| | 1,365 | | | Perris, California, Special Tax Bonds, Community Facilities District 2004-3, Monument Ranch Improvement Area 2, Series 2005A, 5.300%, 9/01/35 | | | | | 9/15 at 102.00 | | | | N/R | | | | 1,395,303 | |
| | | | | |
| | 3,900 | | | Pico Rivera Water Authority, California, Water System Project, Revenue Refunding Bonds, Series 1999A, 5.500%, 5/01/29 – NPFG Insured | | | | | No Opt. Call | | | | Baa2 | | | | 4,233,489 | |
| | | | | |
| | 17,000 | | | Pittsburg Redevelopment Agency, California, Tax Allocation Bonds, Los Medanos Community Development Project, Refunding Series 2008A, 6.500%, 9/01/28 | | | | | 9/18 at 100.00 | | | | BBB– | | | | 18,663,280 | |
| | | | | |
| | 2,500 | | | Pittsburg Redevelopment Agency, California, Tax Allocation Bonds, Los Medanos Community Development Project, Series 1999,
0.000%, 8/01/28 – AMBAC Insured | | | | | No Opt. Call | | | | A | | | | 1,184,100 | |
| | | | | |
| | 4,360 | | | Pittsburg Redevelopment Agency, California, Tax Allocation Refunding Bonds, Los Medanos Community Development Project, Series 2006C, 4.250%, 9/01/34 – AMBAC Insured | | | | | 9/16 at 100.00 | | | | BBB– | | | | 3,965,725 | |
| | | | | | | | | | | | | | | | | | |
Principal
Amount (000) | | | Description (1) | | | | Optional Call
Provisions (2) | | | Ratings (3) | | | Value | |
| | | | California (continued) | | | | | | | | | | | | | | |
| | | | | |
| $ | 1,455 | | | Pomona Public Financing Authority, California, Merged Projects Revenue Bonds, Series 2007AX, 5.000%, 2/01/41 | | | | | 2/17 at 100.00 | | | | BBB– | | | $ | 1,450,548 | |
| | | | | |
| | 1,285 | | | Pomona Public Financing Authority, California, Merged Projects Revenue Bonds, Series 2007, 5.125%, 2/01/33 | | | | | 7/13 at 100.00 | | | | BBB– | | | | 1,285,810 | |
| | | | | |
| | 3,895 | | | Rancho Cardova, California, Special Tax Bonds, Sunridge Park Area Community Facilities District 2004-1, Series, 6.125%, 9/01/37 | | | | | 9/17 at 100.00 | | | | N/R | | | | 4,102,370 | |
| | | | | |
| | 1,000 | | | Rancho Cordova, California, Special Tax Bonds, Sunridge Anatolia Area Community Facilities District 2003-1, Series 2005, 5.500%, 9/01/37 | | | | | 9/13 at 102.00 | | | | N/R | | | | 1,010,380 | |
| | | | | |
| | 1,000 | | | Rancho Cordova, California, Sunridge Anatolia Community Facilities District 2003-1, Special Tax Refunding Bonds, Series 2012, 5.000%, 9/01/37 | | | | | No Opt. Call | | | | N/R | | | | 1,020,880 | |
| | | | | |
| | 3,920 | | | Rancho Cucamonga, California, Community Facilities District 2004-01 Special Tax Bonds, Rancho Etiwanda Estates, Series 2006, 5.375%, 9/01/36 | | | | | 9/13 at 103.00 | | | | N/R | | | | 3,982,406 | |
| | | | | |
| | 2,500 | | | Rancho Mirage Joint Powers Financing Authority, California, Revenue Bonds, Eisenhower Medical Center, Series 2007A, 5.000%, 7/01/38 | | | | | 7/17 at 100.00 | | | | Baa2 | | | | 2,565,525 | |
| | | | | |
| | | | Redwood City, California, Special Tax Bonds, Community Facilities District 2010-1 One Marina, Series 2011: | | | | | | | | | | | | | | |
| | 775 | | | 7.500%, 9/01/31 | | | | | 9/16 at 103.00 | | | | N/R | | | | 848,710 | |
| | 1,440 | | | 7.750%, 9/01/41 | | | | | 9/16 at 103.00 | | | | N/R | | | | 1,572,494 | |
| | | | | |
| | | | Richmond, California, Joint Powers Financing Agency Multifamily Housing Revenue Bonds, Westridge Hilltop Apartments, Series 2007: | | | | | | | | | | | | | | |
| | 1,000 | | | 5.000%, 12/15/26 | | | | | 12/13 at 100.00 | | | | Baa2 | | | | 994,090 | |
| | 1,750 | | | 5.000%, 12/15/33 | | | | | 12/13 at 100.00 | | | | Baa2 | | | | 1,695,173 | |
| | | | | |
| | 37,968 | | | River Rock Entertainment Authority, California, Revenue Bonds, Senior Notes Series 2011B, 8.000%, 11/01/18 | | | | | 11/15 at 104.00 | | | | N/R | | | | 36,403,252 | |
| | | | | |
| | 6,650 | | | Riverside County Public Financing Authority, California, Tax Allocation Bonds, Multiple Projects, Series 2004, 5.000%, 10/01/35 – SYNCORA GTY Insured | | | | | 10/14 at 100.00 | | | | BBB | | | | 6,605,379 | |
| | | | | |
| | | | Riverside County Redevelopment Agency, California, Interstate 215 Corridor Redevelopment Project Area, 2nd Lien Tax Allocation Bonds, Series 2001E: | | | | | | | | | | | | | | |
| | 7,100 | | | 0.000%, 12/01/41 | | | | | No Opt. Call | | | | BBB+ | | | | 1,076,218 | |
| | 7,075 | | | 0.000%, 12/01/42 | | | | | No Opt. Call | | | | BBB+ | | | | 1,003,943 | |
| | 7,050 | | | 0.000%, 12/01/43 | | | | | No Opt. Call | | | | BBB+ | | | | 936,452 | |
| | 5,600 | | | 0.000%, 12/01/44 | | | | | No Opt. Call | | | | BBB+ | | | | 696,360 | |
| | | | | |
| | 1,500 | | | Riverside County Redevelopment Agency, California, Desert Communities Redevelopment Project Area Tax Allocation Bonds, Series 2010D, 6.000%, 10/01/30 | | | | | 10/20 at 100.00 | | | | BBB | | | | 1,588,155 | |
| | | | | |
| | 5,000 | | | Riverside County Redevelopment Agency, California, Tax Allocation Bonds, Jurupa Valley Project Area, Series 2011B, 0.000%, 10/01/39 | | | | | No Opt. Call | | | | A– | | | | 1,232,950 | |
| | | | | |
| | 1,455 | | | Riverside County Redevelopment Agency, California, Tax Allocation Housing Bonds, Series 2004A, 5.000%, 10/01/37 – SYNCORA GTY Insured | | | | | 10/14 at 100.00 | | | | A– | | | | 1,458,201 | |
| | | | | |
| | 1,000 | | | Riverside County Redevelopment Agency, California, Tax Allocation Housing Bonds, Series 2011A, 7.125%, 10/01/42 | | | | | 10/21 at 100.00 | | | | A– | | | | 1,216,290 | |
| | | | | |
| | 5,855 | | | Riverside Public Financing Authority, California, Tax Allocation Bonds, University Corridor, Series 2007C, 4.500%, 8/01/30 – NPFG Insured | | | | | No Opt. Call | | | | BBB+ | | | | 5,949,792 | |
| | | | | |
| | 2,955 | | | Riverside Unified School District, Riverside County, California, General Obligation Bonds, Series 2009, Trust 3017, 17.136%, 9/01/25 – AGC Insured (IF) | | | | | 8/15 at 100.00 | | | | Aa2 | | | | 3,527,177 | |
| | | | | |
| | | | Riverside, California, Improvement Bond Act of 1915, Special Assessment Bonds, Hunter Park Assessment District, Series 2006: | | | | | | | | | | | | | | |
| | 2,000 | | | 5.100%, 9/02/26 | | | | | 9/16 at 101.00 | | | | N/R | | | | 2,067,140 | |
| | 1,500 | | | 5.200%, 9/02/36 | | | | | 9/16 at 101.00 | | | | N/R | | | | 1,531,410 | |
Portfolio of Investments
Nuveen High Yield Municipal Bond Fund (continued)
April 30, 2013
| | | | | | | | | | | | | | | | | | |
Principal
Amount (000) | | | Description (1) | | | | Optional Call
Provisions (2) | | | Ratings (3) | | | Value | |
| | | | California (continued) | | | | | | | | | | | | | | |
| | | | | |
| | | | Rocklin Unified School District, Placer County, California, Special Tax Bonds, Community Facilities District 2, Series 2007: | | | | | | | | | | | | | | |
| $ | 550 | | | 0.000%, 9/01/36 – NPFG Insured | | | | | No Opt. Call | | | | AA– | | | $ | 158,395 | |
| | 660 | | | 0.000%, 9/01/37 – NPFG Insured | | | | | No Opt. Call | | | | AA– | | | | 178,886 | |
| | | | | |
| | | | Roseville, California, Special Tax Bonds, Community Facilities District 1 – Westpark, Series 2005: | | | | | | | | | | | | | | |
| | 1,765 | | | 5.250%, 9/01/25 | | | | | 9/15 at 100.00 | | | | N/R | | | | 1,794,317 | |
| | 4,800 | | | 5.200%, 9/01/36 | | | | | 9/15 at 100.00 | | | | N/R | | | | 4,818,480 | |
| | | | | |
| | 1,000 | | | Roseville, California, Special Tax Bonds, Community Facilities District 1 Diamond Creek, Series 2007, 5.000%, 9/01/37 | | | | | 9/13 at 103.00 | | | | N/R | | | | 854,620 | |
| | | | | |
| | 2,370 | | | Roseville, California, Special Tax Bonds, Community Facilities District 1 Westpark, Series 2006, 5.200%, 9/01/26 | | | | | 9/16 at 100.00 | | | | N/R | | | | 2,428,089 | |
| | | | | |
| | 6,145 | | | Roseville, California, Special Tax Bonds, Community Facilities District 1, Fiddyment Ranch, Series 2005, 5.050%, 9/01/30 | | | | | 9/15 at 100.00 | | | | N/R | | | | 6,102,477 | |
| | | | | |
| | 7,085 | | | Roseville, California, Special Tax Bonds, Community Facilities District 1, Fiddyment Ranch, Series 2006, 5.250%, 9/01/36 | | | | | 9/16 at 100.00 | | | | N/R | | | | 7,133,957 | |
| | | | | |
| | 3,000 | | | Roseville, California, Special Tax Bonds, Community Facilities District 5 Stone Point, Series 2006, 5.250%, 9/01/36 | | | | | 9/13 at 103.00 | | | | N/R | | | | 2,604,150 | |
| | | | | |
| | | | Sacramento City Financing Authority California, Lease Revenue Bonds, Master Lease Program Facilities Projects, Tender Option Bond Trust 4698: | | | | | | | | | | | | | | |
| | 6,830 | | | 18.679%, 12/01/33 – AMBAC Insured (IF) (5) | | | | | No Opt. Call | | | | A | | | | 12,210,674 | |
| | 2,500 | | | 18.195%, 12/01/30 – AMBAC Insured (IF) (5) | | | | | No Opt. Call | | | | A | | | | 4,570,100 | |
| | 3,000 | | | 18.195%, 12/01/30 – AMBAC Insured (IF) (5) | | | | | No Opt. Call | | | | A | | | | 5,484,120 | |
| | | | | |
| | 3,540 | | | Sacramento City Financing Authority, California, Master Lease Program Facilities Revenue Bonds, Tender Option Bond Trust 1114, 18.202%, 12/01/30 – AMBAC Insured (IF) (5) | | | | | No Opt. Call | | | | A | | | | 6,468,146 | |
| | | | | |
| | 8,895 | | | Sacramento, California, Community Facilities District 05-1, College Square Special Tax Bonds, Series 2007, 5.900%, 9/01/37 | | | | | 9/17 at 100.00 | | | | N/R | | | | 9,029,848 | |
| | | | | |
| | 4,845 | | | San Bernardino County Financing Authority, California, Revenue Bonds, Courthouse Facilities Project, Series 2007, 5.500%, 6/01/37 – NPFG Insured | | | | | No Opt. Call | | | | Baa2 | | | | 5,062,201 | |
| | | | | |
| | | | San Buenaventura, California, Revenue Bonds, Community Memorial Health System, Series 2011: | | | | | | | | | | | | | | |
| | 4,000 | | | 8.000%, 12/01/31 | | | | | 12/21 at 100.00 | | | | BB | | | | 5,110,960 | |
| | 16,730 | | | 7.500%, 12/01/41 | | | | | 12/21 at 100.00 | | | | BB | | | | 20,599,816 | |
| | | | | |
| | 2,935 | | | San Diego Public Facilities Financing Authority, California, Water Utility Revenue Bonds, Tender Option Bond Trust 3504, 19.640%, 2/01/33 (IF) | | | | | 8/19 at 100.00 | | | | Aa2 | | | | 4,942,393 | |
| | | | | |
| | | | San Francisco Redevelopment Agency, California, Special Tax Bonds, Community Facilities District 6, Mission Bay South, Series 2005B: | | | | | | | | | | | | | | |
| | 1,375 | | | 0.000%, 8/01/30 | | | | | 8/15 at 100.00 | | | | N/R | | | | 502,563 | |
| | 3,020 | | | 0.000%, 8/01/34 | | | | | 8/15 at 100.00 | | | | N/R | | | | 849,133 | |
| | | | | |
| | 500 | | | San Francisco Redevelopment Finance Authority, California, Tax Allocation Revenue Bonds, Mission Bay North Redevelopment Project, Series 2009C, 6.500%, 8/01/39 | | | | | 8/19 at 100.00 | | | | A– | | | | 591,095 | |
| | | | | |
| | 900 | | | San Jacinto Unified School District, Riverside County, California, Community Facilities District 2006-1 Special Tax Bonds, Infrastructure Projects, Series 2006, 5.200%, 9/01/36 | | | | | 9/16 at 100.00 | | | | N/R | | | | 909,261 | |
| | | | | |
| | | | San Joaquin Hills Transportation Corridor Agency, Orange County, California, Toll Road Revenue Refunding Bonds, Series 1997A: | | | | | | | | | | | | | | |
| | 275 | | | 0.000%, 1/15/24 – NPFG Insured | | | | | No Opt. Call | | | | Baa2 | | | | 166,870 | |
| | 39,120 | | | 0.000%, 1/15/25 – NPFG Insured | | | | | No Opt. Call | | | | Baa2 | | | | 22,655,957 | |
| | 65,905 | | | 0.000%, 1/15/26 – NPFG Insured | | | | | No Opt. Call | | | | Baa2 | | | | 36,338,040 | |
| | 2,120 | | | 0.000%, 1/15/27 – NPFG Insured | | | | | No Opt. Call | | | | Baa2 | | | | 1,115,417 | |
| | 15,180 | | | 0.000%, 1/15/28 – NPFG Insured | | | | | No Opt. Call | | | | Baa2 | | | | 7,566,623 | |
| | 1,010 | | | 0.000%, 1/15/29 – NPFG Insured | | | | | No Opt. Call | | | | Baa2 | | | | 477,972 | |
| | | | | | | | | | | | | | | | | | |
Principal
Amount (000) | | | Description (1) | | | | Optional Call
Provisions (2) | | | Ratings (3) | | | Value | |
| | | | California (continued) | | | | | | | | | | | | | | |
| $ | 1,000 | | | 5.250%, 1/15/30 – NPFG Insured | | | | | 7/13 at 100.00 | | | | Baa2 | | | $ | 1,000,020 | |
| | 7,100 | | | 0.000%, 1/15/30 – NPFG Insured | | | | | No Opt. Call | | | | Baa2 | | | | 3,177,676 | |
| | 50,550 | | | 0.000%, 1/15/31 – NPFG Insured | | | | | No Opt. Call | | | | Baa2 | | | | 21,375,573 | |
| | 2,085 | | | 0.000%, 1/15/32 – NPFG Insured | | | | | No Opt. Call | | | | Baa2 | | | | 832,207 | |
| | 24,790 | | | 0.000%, 1/15/34 – NPFG Insured | | | | | No Opt. Call | | | | Baa2 | | | | 8,843,337 | |
| | 24,505 | | | 0.000%, 1/15/36 – NPFG Insured | | | | | No Opt. Call | | | | Baa2 | | | | 7,774,456 | |
| | | | | |
| | 3,300 | | | San Jose Redevelopment Agency, California, Tax Allocation Bonds, Merged Area Redevelopment Project, Series 2003,
4.900%, 8/01/33 – FGIC Insured | | | | | 8/13 at 100.00 | | | | BBB | | | | 3,301,452 | |
| | | | | |
| | | | San Jose Redevelopment Agency, California, Tax Allocation Bonds, Merged Area Redevelopment Project, Series 2006C: | | | | | | | | | | | | | | |
| | 4,500 | | | 3.750%, 8/01/28 – NPFG Insured | | | | | 8/17 at 100.00 | | | | BBB | | | | 4,158,360 | |
| | 1,090 | | | 4.250%, 8/01/30 – NPFG Insured | | | | | 8/17 at 100.00 | | | | BBB | | | | 1,066,445 | |
| | | | | |
| | | | San Jose Redevelopment Agency, California, Tax Allocation Bonds, Merged Area Redevelopment Project, Series 2006D: | | | | | | | | | | | | | | |
| | 6,625 | | | 5.000%, 8/01/21 – AMBAC Insured | | | | | 8/17 at 100.00 | | | | BBB | | | | 6,939,423 | |
| | 7,750 | | | 5.000%, 8/01/22 – AMBAC Insured | | | | | 8/17 at 100.00 | | | | BBB | | | | 8,074,493 | |
| | | | | |
| | 5,520 | | | San Jose Redevelopment Agency, California, Tax Allocation Bonds, Merged Area Redevelopment Project, Series 2007B,
4.250%, 8/01/36 – SYNCORA GTY Insured | | | | | 8/17 at 100.00 | | | | BBB | | | | 5,068,078 | |
| | | | | |
| | | | San Jose, California, Airport Revenue Bonds, Tender Option Bond Trust 3923: | | | | | | | | | | | | | | |
| | 470 | | | 17.163%, 9/01/30 – AMBAC Insured (IF) (5) | | | | | 3/17 at 100.00 | | | | AA– | | | | 580,478 | |
| | 1,500 | | | 17.250%, 3/01/31 – AGM Insured (IF) (5) | | | | | 3/17 at 100.00 | | | | AA– | | | | 1,854,480 | |
| | | | | |
| | 3,860 | | | San Luis Obispo County Financing Authority, California, Revenue Bonds, Nacimiento Water Project, Tender Option Bond Trust 3030, 17.207%, 9/01/38 – BHAC Insured (IF) | | | | | 9/17 at 100.00 | | | | AA+ | | | | 5,207,294 | |
| | | | | |
| | | | San Marcos Public Facilities Authority, California, Revenue Refunding Bonds, Series 2012B: | | | | | | | | | | | | | | |
| | 1,670 | | | 5.000%, 9/01/32 – AGM Insured | | | | | 9/22 at 100.00 | | | | BBB | | | | 1,759,679 | |
| | 2,170 | | | 5.000%, 9/01/35 – AGM Insured | | | | | 9/22 at 100.00 | | | | BBB | | | | 2,261,075 | |
| | | | | |
| | 5,070 | | | San Marcos Public Facilities Authority, California, Tax Allocation Bonds, Project Areas 1 and 3, Series 2005A, 5.000%, 8/01/34 – AMBAC Insured | | | | | 8/15 at 102.00 | | | | A | | | | 5,237,107 | |
| | | | | |
| | 5,350 | | | Santa Ana Unified School District (1999 Financing Project) Certificates of Participation (Orange County, California), 0.000%, 4/01/32 – AGM Insured | | | | | No Opt. Call | | | | AA– | | | | 2,134,971 | |
| | | | | |
| | | | Santa Ana Unified School District, Orange County, California, Special Tax Bonds, Community Facilities District 2004-1, Central Park Project, Series 2005: | | | | | | | | | | | | | | |
| | 1,180 | | | 4.950%, 9/01/25 | | | | | 9/15 at 100.00 | | | | N/R | | | | 1,164,070 | |
| | 1,050 | | | 5.050%, 9/01/30 | | | | | 9/15 at 100.00 | | | | N/R | | | | 1,013,471 | |
| | 2,320 | | | 5.100%, 9/01/35 | | | | | 9/15 at 100.00 | | | | N/R | | | | 2,173,005 | |
| | | | | |
| | 8,340 | | | Santa Clara County Housing Authority, California, Multifamily Housing Revenue Bonds, Blossom River Project, Series 1998A, 6.500%, 9/01/39 | | | | | 7/13 at 100.00 | | | | N/R | | | | 8,341,835 | |
| | | | | |
| | 13,105 | | | Santa Cruz County Redevelopment Agency, California, Tax Allocation Bonds, Live Oak-Sequel Community Development Project, Series 2005A,
5.000%, 9/01/32 – NPFG Insured | | | | | 9/15 at 100.00 | | | | A | | | | 13,436,425 | |
| | | | | |
| | 1,475 | | | Santa Rosa, California, Certificates of Participation, Building Acquisition Project, Series 2007, 4.750%, 7/01/37 – AMBAC Insured | | | | | No Opt. Call | | | | A+ | | | | 1,580,182 | |
| | | | | |
| | 3,250 | | | Santee Community Development Commission, California, Santee Redevelopment Project Tax Allocation Bonds, Series 2011A, 7.000%, 8/01/41 | | | | | 2/21 at 100.00 | | | | A | | | | 4,048,590 | |
| | | | | |
| | 2,500 | | | Saugus Union School District, Los Angeles County, California, Special Tax Bonds, Community Facilities District 2005-1, Series 2006, 5.300%, 9/01/36 | | | | | 3/15 at 103.00 | | | | N/R | | | | 2,509,825 | |
| | | | | |
| | 900 | | | Sierra Kings Health Care District, Fresno County, California, Revenue Bonds, Series 2006A, 5.750%, 12/01/36 (Pre-refunded 12/01/16) | | | | | 12/16 at 100.00 | | | | N/R (6) | | | | 1,052,460 | |
Portfolio of Investments
Nuveen High Yield Municipal Bond Fund (continued)
April 30, 2013
| | | | | | | | | | | | | | | | | | |
Principal
Amount (000) | | | Description (1) | | | | Optional Call
Provisions (2) | | | Ratings (3) | | | Value | |
| | | | California (continued) | | | | | | | | | | | | | | |
| | | | | |
| $ | 22,000 | | | Silicon Valley Tobacco Securitization Authority, California, Tobacco Settlement Asset-Backed Bonds, Santa Clara County Tobacco Securitization Corporation, Series 2007A, 0.000%, 6/01/36 | | | | | 6/17 at 34.85 | | | | BB+ | | | $ | 3,657,500 | |
| | | | | |
| | 1,500 | | | Solana Beach School District Public Financing Authority, California, Special Tax Revenue Bonds, Series 2012, 5.000%, 9/01/42 | | | | | 9/22 at 100.00 | | | | BBB | | | | 1,571,130 | |
| | | | | |
| | 2,155 | | | South Gate, California, Certificates of Participation, Series 2002A, 5.000%, 9/01/24 – AMBAC Insured | | | | | 9/13 at 101.00 | | | | BBB | | | | 2,177,606 | |
| | | | | |
| | 1,200 | | | Southern California Public Power Authority, Natural Gas Project 1 Revenue Bonds, Series 2007A, 5.000%, 11/01/33 | | | | | No Opt. Call | | | | Baa1 | | | | 1,354,200 | |
| | | | | |
| | | | Stockton Public Financing Authority, California, Lease Revenue Bonds, Refunding Series 2006A: | | | | | | | | | | | | | | |
| | 1,710 | | | 4.500%, 8/01/28 – NPFG Insured | | | | | 8/14 at 100.00 | | | | Baa2 | | | | 1,418,325 | |
| | 1,000 | | | 4.500%, 8/01/31 – NPFG Insured | | | | | 8/14 at 100.00 | | | | Baa2 | | | | 810,970 | |
| | | | | |
| | 305 | | | Stockton Redevelopment Agency, California, Revenue Bonds, Stockton Events Center Arena Project, Series 2004, 5.000%, 9/01/36 – FGIC Insured | | | | | 9/14 at 100.00 | | | | BB | | | | 285,828 | |
| | | | | |
| | | | Stockton, California, Community Facilities District 2006-3, Northbrook Woodside Improvement Area 1 Special Tax Bonds, Series 2007: | | | | | | | | | | | | | | |
| | 1,935 | | | 6.125%, 9/01/31 | | | | | 9/14 at 103.00 | | | | N/R | | | | 2,012,110 | |
| | 2,930 | | | 6.250%, 9/01/37 | | | | | 9/14 at 103.00 | | | | N/R | | | | 3,050,247 | |
| | | | | |
| | 7,500 | | | Stockton, California, Special Tax Bonds, Arch Road Community Facilities District 99-02, Refunding Series 2007, 5.875%, 9/01/37 | | | | | 9/17 at 102.00 | | | | N/R | | | | 7,734,825 | |
| | | | | |
| | 2,000 | | | Tejon Ranch Public Facilities Financing Authority, California, Community Facilities District 2008-1 Tejon Industrial Complex East 2012A, 5.250%, 9/01/40 | | | | | No Opt. Call | | | | N/R | | | | 1,996,960 | |
| | | | | |
| | 4,000 | | | Tejon Ranch Public Facilities Financing Authority, California, Community Facilities District 2008-1 Tejon Industrial Complex East 2012B, 5.250%, 9/01/42 | | | | | No Opt. Call | | | | N/R | | | | 3,993,760 | |
| | | | | |
| | 1,500 | | | Temecula Redevelopment Agency, California, Tax Allocation Revenue Bonds, Redevelopment Project 1, Series 2002, 5.250%, 8/01/36 – NPFG Insured | | | | | 7/13 at 100.00 | | | | A– | | | | 1,501,260 | |
| | | | | |
| | | | Tobacco Securitization Authority of Northern California, Tobacco Settlement Asset-Backed Bonds, Series 2005A-1: | | | | | | | | | | | | | | |
| | 11,185 | | | 5.375%, 6/01/38 | | | | | 6/15 at 100.00 | | | | B– | | | | 10,156,092 | |
| | 5,995 | | | 5.500%, 6/01/45 | | | | | 6/15 at 100.00 | | | | B– | | | | 5,444,000 | |
| | | | | |
| | | | Tobacco Securitization Authority of Southern California, Tobacco Settlement Asset-Backed Bonds, San Diego County Tobacco Asset Securitization Corporation, Senior Series 2001A: | | | | | | | | | | | | | | |
| | 3,740 | | | 5.000%, 6/01/37 | | | | | 6/14 at 100.00 | | | | BB+ | | | | 3,463,651 | |
| | 26,620 | | | 5.125%, 6/01/46 | | | | | 6/14 at 100.00 | | | | B+ | | | | 23,987,814 | |
| | | | | |
| | | | Tulare Local Health Care District, California, Revenue Bonds, Series 2007: | | | | | | | | | | | | | | |
| | 525 | | | 5.000%, 11/01/15 | | | | | No Opt. Call | | | | B+ | | | | 535,631 | |
| | 550 | | | 5.000%, 11/01/16 | | | | | No Opt. Call | | | | B+ | | | | 561,319 | |
| | 835 | | | 5.100%, 11/01/27 | | | | | 11/17 at 100.00 | | | | B+ | | | | 799,663 | |
| | 2,785 | | | 5.200%, 11/01/32 | | | | | 11/17 at 100.00 | | | | B+ | | | | 2,598,127 | |
| | | | | |
| | 1,210 | | | Turlock Public Financing Authority, California, Tax Allocation Revenue Bonds, Series 2011, 7.500%, 9/01/39 | | | | | 3/21 at 100.00 | | | | BBB+ | | | | 1,392,444 | |
| | | | | |
| | | | Twenty-nine Palms Redevelopment Agency, California, Tax Allocation Bonds, Four Corners Project Area, Series 2011A: | | | | | | | | | | | | | | |
| | 760 | | | 7.400%, 9/01/32 | | | | | 9/21 at 100.00 | | | | BBB+ | | | | 911,726 | |
| | 3,460 | | | 7.650%, 9/01/42 | | | | | 9/21 at 100.00 | | | | BBB+ | | | | 4,138,506 | |
| | | | | |
| | 2,500 | | | University of California, General Revenue Bonds, Tender Option Bond Trust 3318, 13.824%, 5/15/20 (IF) (5) | | | | | No Opt. Call | | | | Aa2 | | | | 3,208,625 | |
| | | | | |
| | 2,415 | | | Val Verde Unified School District Financing Authority, California, Special Tax Revenue, Junior Lien Refunding Series 2003, 6.250%, 10/01/28 | | | | | 10/13 at 102.00 | | | | N/R | | | | 2,476,607 | |
| | | | | | | | | | | | | | | | | | |
Principal
Amount (000) | | | Description (1) | | | | Optional Call
Provisions (2) | | | Ratings (3) | | | Value | |
| | | | California (continued) | | | | | | | | | | | | | | |
| | | | | |
| $ | 3,879 | | | Ventura County Area Housing Authority, California, Mira Vista Senior Apartments Project, Junior Subordinate Series 2006C, 6.500%, 12/01/39 (Mandatory put 7/01/16) (Alternative Minimum Tax) | | | | | No Opt. Call | | | | N/R | | | $ | 3,818,565 | |
| | | | | |
| | 600 | | | West Hollywood Community Development Commission, California, East Side Redevelopment Project Series 2011 Tax Allocation Bonds Series 2011A, 7.500%, 9/01/42 | | | | | 9/21 at 100.00 | | | | BBB | | | | 741,810 | |
| | | | | |
| | 1,000 | | | West Patterson Financing Authority, California, Special Tax Bonds, Community Facilities District 01-1, Refunding Series 2009A, 8.625%, 9/01/39 | | | | | 9/14 at 105.00 | | | | N/R | | | | 1,078,480 | |
| | | | | |
| | 2,565 | | | West Patterson Financing Authority, California, Special Tax Bonds, Community Facilities District 01-1, Refunding Series 2009B, 10.000%, 9/01/32 | | | | | 9/14 at 105.00 | | | | N/R | | | | 2,789,848 | |
| | | | | |
| | | | West Patterson Financing Authority, California, Special Tax Bonds, Community Facilities District 01-1, Series 2003B: | | | | | | | | | | | | | | |
| | 1,100 | | | 6.750%, 9/01/30 | | | | | 9/13 at 103.00 | | | | N/R | | | | 1,126,268 | |
| | 3,400 | | | 7.000%, 9/01/38 | | | | | 9/13 at 103.00 | | | | N/R | | | | 3,476,432 | |
| | | | | |
| | 7,500 | | | West Patterson Financing Authority, California, Special Tax Bonds, Community Facilities District 01-1, Series 2004B, 6.000%, 9/01/39 | | | | | 9/13 at 102.00 | | | | N/R | | | | 7,502,475 | |
| | | | | |
| | 3,900 | | | West Patterson Financing Authority, California, Special Tax Bonds, Community Facilities District 2001-1, Series 2004A, 6.125%, 9/01/39 | | | | | 9/13 at 103.00 | | | | N/R | | | | 3,911,778 | |
| | | | | |
| | 2,325 | | | West Sacramento Financing Authority, California, Special Tax Revenue Bonds, Refunding Series 1999F, 6.100%, 9/01/29 | | | | | 9/13 at 100.00 | | | | N/R | | | | 2,335,951 | |
| | | | | |
| | | | Western Hills Water District, Stanislaus County, California, Special Tax Bonds, Diablo Grande Community Facilities District 1, Series 2005: | | | | | | | | | | | | | | |
| | 1,000 | | | 5.625%, 9/01/24 | | | | | 9/13 at 102.00 | | | | N/R | | | | 858,390 | |
| | 3,755 | | | 5.800%, 9/01/31 | | | | | 9/13 at 102.00 | | | | N/R | | | | 3,059,837 | |
| | | | | |
| | | | Westminster Redevelopment Agency, California, Tax Allocation Bonds, Commercial Redevelopment Project 1, Subordinate Lien Series 2011A: | | | | | | | | | | | | | | |
| | 1,775 | | | 5.750%, 11/01/36 | | | | | 11/21 at 100.00 | | | | A | | | | 1,974,705 | |
| | 3,885 | | | 5.875%, 11/01/41 | | | | | 11/21 at 100.00 | | | | A | | | | 4,358,076 | |
| | 1,200 | | | 5.875%, 11/01/45 | | | | | 11/21 at 100.00 | | | | A | | | | 1,339,296 | |
| | | | | |
| | 700 | | | Westside Union School District, California, Special Tax Bonds, Community Facilities District 2005-3, Series 2006, 5.000%, 9/01/26 | | | | | 9/14 at 102.00 | | | | N/R | | | | 711,557 | |
| | | | | |
| | 4,600 | | | William S. Hart Union High School District, Los Angeles County, California, Special Tax Bonds, Community Facilities District 2005-1, Series 2006, 5.300%, 9/01/36 | | | | | 9/15 at 100.00 | | | | N/R | | | | 4,618,078 | |
| | | | | |
| | | | Yuba County, California, Special Tax Bonds, Community Facilities District 2004-1, Edgewater, Series 2005: | | | | | | | | | | | | | | |
| | 2,575 | | | 5.000%, 9/01/23 | | | | | 3/15 at 100.00 | | | | N/R | | | | 2,554,323 | |
| | 7,270 | | | 5.125%, 9/01/35 | | | | | 3/15 at 100.00 | | | | N/R | | | | 6,719,152 | |
| | 1,829,757 | | | Total California | | | | | | | | | | | | | 1,677,928,762 | |
| | | | Colorado – 6.3% | | | | | | | | | | | | | | |
| | | | | |
| | | | Adonea Metropolitan District 2, Colorado, General Obligation Limited Tax Bonds, Series 2005A: | | | | | | | | | | | | | | |
| | 3,000 | | | 6.125%, 12/01/25 (4) | | | | | 12/15 at 100.00 | | | | N/R | | | | 1,960,530 | |
| | 5,380 | | | 6.250%, 12/01/35 (4) | | | | | 12/15 at 100.00 | | | | N/R | | | | 3,510,880 | |
| | | | | |
| | 6,540 | | | Alpine Mountain Ranch Metropolitan District, Special Improvement District 1, Routt County, Colorado, Special Assessment Revenue Bonds, Series 2011, 9.000%, 12/01/30 | | | | | 12/20 at 100.00 | | | | N/R | | | | 7,250,440 | |
| | | | | |
| | 1,750 | | | Antelope Heights Metropolitan District, Colorado, Limited Tax General Obligation Bonds, Series 2007, 5.000%, 12/01/37 – RAAI Insured | | | | | 12/17 at 100.00 | | | | N/R | | | | 1,650,723 | |
| | | | | |
| | 19,254 | | | Arista Metropolitan District, Colorado, Special Revenue Bonds, Series 2005, 6.750%, 12/01/35 | | | | | 12/15 at 100.00 | | | | N/R | | | | 14,748,179 | |
| | | | | |
| | 3,500 | | | Arista Metropolitan District, Colorado, Special Revenue Bonds, Series 2008, 9.250%, 12/01/37 | | | | | 12/15 at 100.00 | | | | N/R | | | | 2,572,150 | |
Portfolio of Investments
Nuveen High Yield Municipal Bond Fund (continued)
April 30, 2013
| | | | | | | | | | | | | | | | | | |
Principal
Amount (000) | | | Description (1) | | | | Optional Call
Provisions (2) | | | Ratings (3) | | | Value | |
| | | | Colorado (continued) | | | | | | | | | | | | | | |
| | | | | |
| | | | Arkansas River Power Authority, Colorado, Power Revenue Bonds, Series 2006: | | | | | | | | | | | | | | |
| $ | 3,800 | | | 5.250%, 10/01/32 – SYNCORA GTY Insured | | | | | 10/16 at 100.00 | | | | BBB– | | | $ | 3,893,480 | |
| | 13,290 | | | 5.250%, 10/01/40 – SYNCORA GTY Insured | | | | | 10/16 at 100.00 | | | | BBB– | | | | 13,549,421 | |
| | | | | |
| | 1,675 | | | BNC Metropolitan District 1, Colorado, General Obligation Bonds, Series 2004, 8.050%, 12/01/34 | | | | | 12/14 at 101.00 | | | | N/R | | | | 1,717,595 | |
| | | | | |
| | 1,015 | | | Bradburn Metropolitan District 3, Westminster, Adams County, Colorado, General Obligation Limited Tax Refunding Bonds, Series 2010, 7.500%, 12/01/39 | | | | | 12/13 at 102.00 | | | | N/R | | | | 1,043,166 | |
| | | | | |
| | | | Bromley Park Metropolitan District 2, Brighton, Colorado, General Obligation Bonds, Refunding Series 2007A: | | | | | | | | | | | | | | |
| | 125 | | | 5.000%, 12/01/27 – RAAI Insured | | | | | 12/17 at 100.00 | | | | N/R | | | | 116,994 | |
| | 5,895 | | | 5.125%, 12/01/37 – RAAI Insured | | | | | 12/17 at 100.00 | | | | N/R | | | | 5,191,314 | |
| | | | | |
| | | | Bromley Park Metropolitan District 3, Brighton, Colorado, General Obligation Bonds, Refunding & Improvement Series 2007: | | | | | | | | | | | | | | |
| | 155 | | | 4.250%, 12/01/19 – RAAI Insured | | | | | 12/17 at 100.00 | | | | N/R | | | | 157,416 | |
| | 1,555 | | | 4.625%, 12/01/29 – RAAI Insured | | | | | 12/17 at 100.00 | | | | N/R | | | | 1,505,909 | |
| | 4,315 | | | 4.750%, 12/01/37 – RAAI Insured | | | | | 12/17 at 100.00 | | | | N/R | | | | 4,041,429 | |
| | | | | |
| | 1,495 | | | Buckhorn Valley Metropolitan District 2, Gypsum, Eagle County, Colorado, General Obligation Bonds, Series 2003, 7.000%, 12/01/23 | | | | | 12/13 at 100.00 | | | | N/R | | | | 1,218,739 | |
| | | | | |
| | 5,870 | | | Buckhorn Valley Metropolitan District 2, Gypsum, Eagle County, Colorado, General Obligation Limited Tax Refunding and Improvement Bonds, Series 2010, 8.500%, 12/01/39 | | | | | 12/19 at 100.00 | | | | N/R | | | | 4,475,288 | |
| | | | | |
| | 1,425 | | | Buckley Ranch Metropolitan District, Colorado, General Obligation Limited Tax Bonds, Series 2006, 6.000%, 12/01/35 | | | | | 12/16 at 100.00 | | | | N/R | | | | 1,051,679 | |
| | | | | |
| | 5 | | | Buffalo Ridge Metropolitan District, Colorado, Limited Obligation Assessment Bonds, Series 2003, 7.500%, 12/01/33 (Pre-refunded 12/01/13) | | | | | 12/13 at 101.00 | | | | N/R (6) | | | | 5,227 | |
| | | | | |
| | | | Castle Oaks Metropolitan District, Colorado, General Obligation Limited Tax Bonds, Series 2005: | | | | | | | | | | | | | | |
| | 606 | | | 6.000%, 12/01/25 (Pre-refunded 12/01/15) | | | | | 12/15 at 100.00 | | | | N/R (6) | | | | 685,544 | |
| | 1,428 | | | 6.125%, 12/01/35 (Pre-refunded 12/01/15) | | | | | 12/15 at 100.00 | | | | N/R (6) | | | | 1,619,995 | |
| | | | | |
| | 4,010 | | | Castle Oaks Metropolitan District, In the Town of Castle Rock, Douglas County, Colorado, General Obligation Bonds, Limited Tax Refunding and Improvement Series 2012, 5.500%, 12/01/22 | | | | | No Opt. Call | | | | N/R | | | | 4,038,872 | |
| | | | | |
| | 6,905 | | | Central Marksheffel Metropolitan District, Colorado, General Obligation Limited Tax Bonds, Series 2004, 7.250%, 12/01/29 | | | | | 12/14 at 100.00 | | | | N/R | | | | 6,983,372 | |
| | | | | |
| | 6,000 | | | Cimarron Metropolitan District, Arvada, Colorado, Limited Tax Revenue Bonds, Convertible to Unlimited Tax, Series 2012, 6.000%, 12/01/22 | | | | | 10/17 at 100.00 | | | | N/R | | | | 6,049,320 | |
| | | | | |
| | 4,330 | | | Colorado Educational and Cultural Facilities Authority, Charter School Revenue Bonds, Academy of Charter Schools Project, Series 2010B, 7.250%, 11/01/34 | | | | | 11/20 at 100.00 | | | | B– | | | | 4,825,872 | |
| | | | | |
| | 1,110 | | | Colorado Educational and Cultural Facilities Authority, Charter School Revenue Bonds, Carbon Valley Academy, Series 2006, 5.625%, 12/01/36 | | | | | 12/16 at 100.00 | | | | N/R | | | | 884,381 | |
| | | | | |
| | 3,360 | | | Colorado Educational and Cultural Facilities Authority, Charter School Revenue Bonds, Cesar Chavez Academy, Series 2003, 8.000%, 5/01/34 (4) | | | | | 5/14 at 101.00 | | | | N/R | | | | 2,351,563 | |
| | | | | |
| | 500 | | | Colorado Educational and Cultural Facilities Authority, Charter School Revenue Bonds, Community Leadership Academy Project, Series 2008, 6.500%, 7/01/38 | | | | | 7/18 at 100.00 | | | | N/R | | | | 508,480 | |
| | | | | |
| | | | Colorado Educational and Cultural Facilities Authority, Charter School Revenue Bonds, Elbert County Charter School, Series 2004: | | | | | | | | | | | | | | |
| | 100 | | | 6.750%, 3/01/14 | | | | | No Opt. Call | | | | N/R | | | | 100,140 | |
| | 730 | | | 7.250%, 3/01/24 | | | | | 3/14 at 100.00 | | | | N/R | | | | 713,882 | |
| | 1,570 | | | 7.375%, 3/01/35 | | | | | 3/14 at 100.00 | | | | N/R | | | | 1,500,308 | |
| | | | | | | | | | | | | | | | | | |
Principal
Amount (000) | | | Description (1) | | | | Optional Call
Provisions (2) | | | Ratings (3) | | | Value | |
| | | | Colorado (continued) | | | | | | | | | | | | | | |
| | | | | |
| $ | 4,360 | | | Colorado Educational and Cultural Facilities Authority, Charter School Revenue Bonds, Flagstaff Academy Project, Series 2008A, 7.000%, 8/01/38 | | | | | 8/18 at 100.00 | | | | N/R | | | $ | 4,903,518 | |
| | | | | |
| | | | Colorado Educational and Cultural Facilities Authority, Charter School Revenue Bonds, Jefferson County School District R-1 – Compass Montessori Secondary School, Series 2006: | | | | | | | | | | | | | | |
| | 2,350 | | | 5.500%, 2/15/26 | | | | | 2/16 at 101.00 | | | | N/R | | | | 2,253,956 | |
| | 2,370 | | | 5.625%, 2/15/36 | | | | | 2/16 at 101.00 | | | | N/R | | | | 2,218,296 | |
| | | | | |
| | 1,785 | | | Colorado Educational and Cultural Facilities Authority, Charter School Revenue Bonds, Knowledge Quest Academy Charter School, Series 2005, 6.500%, 5/01/36 | | | | | 5/15 at 100.00 | | | | N/R | | | | 1,785,946 | �� |
| | | | | |
| | 1,080 | | | Colorado Educational and Cultural Facilities Authority, Charter School Revenue Bonds, Littleton Preparatory Charter School, Series 2013, 5.000%, 12/01/42 | | | | | No Opt. Call | | | | BBB– | | | | 1,103,058 | |
| | | | | |
| | 3,870 | | | Colorado Educational and Cultural Facilities Authority, Charter School Revenue Bonds, Mountain Phoenix Community School, Series 2012, 7.000%, 10/01/42 | | | | | 10/22 at 100.00 | | | | N/R | | | | 3,850,573 | |
| | | | | |
| | 2,335 | | | Colorado Educational and Cultural Facilities Authority, Charter School Revenue Bonds, New Vision Charter School Series 2008A, 6.750%, 4/01/40 | | | | | 4/18 at 100.00 | | | | N/R | | | | 2,396,037 | |
| | | | | |
| | 965 | | | Colorado Educational and Cultural Facilities Authority, Charter School Revenue Bonds, Twin Peaks Charter Academy, Series 2011B, 7.500%, 3/15/35 | | | | | 3/21 at 100.00 | | | | BBB– | | | | 1,121,484 | |
| | | | | |
| | 1,705 | | | Colorado Educational and Cultural Facilities Authority, Charter School Revenue Bonds, Windsor Academy, Series 2007A, 5.700%, 5/01/37 | | | | | 5/17 at 100.00 | | | | BBB– | | | | 1,728,086 | |
| | | | | |
| | 3,965 | | | Colorado Educational and Cultural Facilities Authority, Revenue Bonds, Montessori Peaks Academy, Series 2006A, 5.500%, 5/01/36 | | | | | 5/16 at 102.00 | | | | N/R | | | | 3,719,408 | |
| | | | | |
| | 1,875 | | | Colorado Educational and Cultural Facilities Authority, Revenue Bonds, Montessori School of Evergreen, Series 2005A, 6.500%, 12/01/35 | | | | | 12/15 at 100.00 | | | | N/R | | | | 1,903,294 | |
| | | | | |
| | 2,880 | | | Colorado Educational and Cultural Facilities Authority, Revenue Bonds, Pikes Peak School of Expeditionary Learning Charter School, Series 2008, 6.625%, 6/01/38 | | | | | 6/18 at 102.00 | | | | N/R | | | | 3,040,646 | |
| | | | | |
| | 28,000 | | | Colorado Health Facilities Authority, Colorado, Revenue Bonds, American Baptist Homes Project, Series 2007A, 5.900%, 8/01/37 | | | | | 8/17 at 100.00 | | | | N/R | | | | 28,486,920 | |
| | | | | |
| | 4,900 | | | Colorado Health Facilities Authority, Colorado, Revenue Bonds, American Baptist Homes Project, Series 2009A, 7.750%, 8/01/39 | | | | | 8/19 at 100.00 | | | | N/R | | | | 5,489,813 | |
| | | | | |
| | | | Colorado Health Facilities Authority, Colorado, Revenue Bonds, Colorado Senior Residences Project, Series 2012: | | | | | | | | | | | | | | |
| | 1,800 | | | 6.750%, 6/01/32 | | | | | 6/22 at 100.00 | | | | N/R | | | | 1,941,750 | |
| | 3,630 | | | 7.000%, 6/01/42 | | | | | 6/22 at 100.00 | | | | N/R | | | | 3,942,071 | |
| | 4,125 | | | 7.125%, 6/01/47 | | | | | 6/22 at 100.00 | | | | N/R | | | | 4,504,253 | |
| | | | | |
| | | | Colorado Health Facilities Authority, Health Facilities Revenue Bonds, Sisters of Charity of Leavenworth Health Services Corporation, Tender Option Bond Trust 3702: | | | | | | | | | | | | | | |
| | 3,500 | | | 17.853%, 1/01/18 (IF) (5) | | | | | No Opt. Call | | | | AA | | | | 5,167,120 | |
| | 1,000 | | | 18.859%, 1/01/18 (IF) (5) | | | | | No Opt. Call | | | | AA | | | | 1,562,240 | |
| | 1,250 | | | 18.859%, 1/01/18 (IF) (5) | | | | | No Opt. Call | | | | AA | | | | 1,952,800 | |
| | | | | |
| | 8,720 | | | Colorado Health Facilities Authority, Revenue Bonds, Craig Hospital Project, Series 2012, 4.000%, 12/01/42 (UB) (5) | | | | | 12/22 at 100.00 | | | | AA– | | | | 8,771,622 | |
| | | | | |
| | 1,315 | | | Colorado Housing and Finance Authority, Multifamily Housing Revenue Senior Bonds, Castle Highlands Apartments Project, Series 2000A-1, 5.900%, 12/01/20 – AMBAC Insured (Alternative Minimum Tax) | | | | | 7/13 at 100.00 | | | | N/R | | | | 1,315,736 | |
| | | | | |
| | | | Colorado Housing and Finance Authority, Revenue Bonds, Confluence Energy LLC Project, Series 2007: | | | | | | | | | | | | | | |
| | 1,310 | | | 6.200%, 4/01/16 (Alternative Minimum Tax) | | | | | No Opt. Call | | | | N/R | | | | 1,310,092 | |
| | 279 | | | 5.000%, 9/01/16 (Alternative Minimum Tax) (7) | | | | | No Opt. Call | | | | N/R | | | | 200,517 | |
Portfolio of Investments
Nuveen High Yield Municipal Bond Fund (continued)
April 30, 2013
| | | | | | | | | | | | | | | | | | |
Principal
Amount (000) | | | Description (1) | | | | Optional Call
Provisions (2) | | | Ratings (3) | | | Value | |
| | | | Colorado (continued) | | | | | | | | | | | | | | |
| | | | | |
| $ | 3,000 | | | Colorado Housing and Finance Authority, Revenue Bonds, Confluence Energy LLC Project, Series 2013, 6.875%, 10/01/27 (Alternative Minimum Tax) | | | | | No Opt. Call | | | | N/R | | | $ | 3,010,650 | |
| | | | | |
| | | | Compark Business Campus Metropolitan District, Colorado, General Obligation Limited Tax Bonds, Series 2007A: | | | | | | | | | | | | | | |
| | 1,095 | | | 5.300%, 12/01/22 – RAAI Insured | | | | | 12/17 at 100.00 | | | | N/R | | | | 1,106,027 | |
| | 3,580 | | | 5.750%, 12/01/27 – RAAI Insured | | | | | 12/17 at 100.00 | | | | N/R | | | | 3,624,320 | |
| | 8,750 | | | 5.600%, 12/01/34 – RAAI Insured | | | | | 12/17 at 100.00 | | | | N/R | | | | 8,577,800 | |
| | | | | |
| | 5,915 | | | Compark Business Campus Metropolitan District, Douglas County, Colorado, General Obligation Bonds, Series 2012A,
6.750%, 12/01/39 – RAAI Insured | | | | | 12/22 at 100.00 | | | | N/R | | | | 6,138,410 | |
| | | | | |
| | 5,045 | | | Compark Business Campus Metropolitan District, Douglas County, Colorado, General Obligation Bonds, Taxable Series 2012B, 9.500%, 12/01/27 – RAAI Insured | | | | | 12/22 at 100.00 | | | | N/R | | | | 5,024,568 | |
| | | | | |
| | | | Confluence Metropolitan District, Colorado, General Obligation Limited Tax Bonds, Series 2007: | | | | | | | | | | | | | | |
| | 6,910 | | | 5.400%, 12/01/27 | | | | | 12/17 at 100.00 | | | | N/R | | | | 6,141,677 | |
| | 9,465 | | | 5.450%, 12/01/34 | | | | | 12/17 at 100.00 | | | | N/R | | | | 8,025,184 | |
| | | | | |
| | | | Conservatory Metropolitan District, Aurora, Arapahoe County, Colorado, General Obligation Bonds, Limited Tax Series 2007: | | | | | | | | | | | | | | |
| | 100 | | | 5.000%, 12/01/22 – RAAI Insured | | | | | 12/17 at 100.00 | | | | N/R | | | | 98,872 | |
| | 422 | | | 4.750%, 12/01/27 – RAAI Insured | | | | | 12/17 at 100.00 | | | | N/R | | | | 386,548 | |
| | 2,360 | | | 5.125%, 12/01/37 – RAAI Insured | | | | | 12/17 at 100.00 | | | | N/R | | | | 2,124,094 | |
| | 345 | | | 4.875%, 12/01/37 – RAAI Insured | | | | | 12/17 at 100.00 | | | | N/R | | | | 299,394 | |
| | | | | |
| | | | Copperleaf Metropolitan District 2, Colorado, General Obligation Limited Tax Bonds, Series 2006: | | | | | | | | | | | | | | |
| | 5,000 | | | 5.850%, 12/01/26 | | | | | 12/16 at 100.00 | | | | N/R | | | | 4,154,950 | |
| | 3,980 | | | 5.950%, 12/01/36 | | | | | 12/16 at 100.00 | | | | N/R | | | | 3,051,665 | |
| | | | | |
| | 5,200 | | | Cornerstone Metropolitan District 2, Montrose and Ouray Counties, Colorado, Limited Tax General Obligation Refunding Bonds, Series 2010A, 8.000%, 12/01/40 | | | | | 12/21 at 100.00 | | | | N/R | | | | 5,746,260 | |
| | | | | |
| | 4,126 | | | Crystal Crossing Metropolitan District, Colorado, General Obligation Limited Tax Bonds, Series 2006, 6.000%, 12/01/36 | | | | | 12/16 at 100.00 | | | | N/R | | | | 2,820,616 | |
| | | | | |
| | | | Denver City and County, Colorado, Special Facilities Airport Revenue Bonds, United Air Lines Corporation, Series 2007A: | | | | | | | | | | | | | | |
| | 3,500 | | | 5.750%, 10/01/32 (Alternative Minimum Tax) | | | | | 10/17 at 100.00 | | | | B | | | | 3,671,990 | |
| | 12,500 | | | 5.250%, 10/01/32 (Alternative Minimum Tax) | | | | | 10/17 at 100.00 | | | | B | | | | 12,816,125 | |
| | | | | |
| | 2,110 | | | Denver West Promenade Metropolitan District, Colorado, General Obligation Bonds, Series 2013, 5.375%, 12/01/42 | | | | | 6/23 at 100.00 | | | | N/R | | | | 2,141,080 | |
| | | | | |
| | | | E-470 Public Highway Authority, Colorado, Senior Revenue Bonds, Capital Appreciation Series 2010A: | | | | | | | | | | | | | | |
| | 22,000 | | | 0.000%, 9/01/35 | | | | | No Opt. Call | | | | Baa2 | | | | 7,140,540 | |
| | 7,500 | | | 0.000%, 9/01/39 | | | | | No Opt. Call | | | | Baa2 | | | | 1,994,175 | |
| | 2,495 | | | 0.000%, 9/01/41 | | | | | No Opt. Call | | | | Baa2 | | | | 596,604 | |
| | | | | |
| | 1,125 | | | E-470 Public Highway Authority, Colorado, Senior Revenue Bonds, Series 1997B, 0.000%, 9/01/26 – NPFG Insured | | | | | No Opt. Call | | | | Baa2 | | | | 633,600 | |
| | | | | |
| | | | E-470 Public Highway Authority, Colorado, Senior Revenue Bonds, Series 2000B: | | | | | | | | | | | | | | |
| | 47,245 | | | 0.000%, 9/01/29 – NPFG Insured | | | | | No Opt. Call | | | | Baa2 | | | | 22,172,079 | |
| | 5,285 | | | 0.000%, 9/01/30 – NPFG Insured | | | | | No Opt. Call | | | | Baa2 | | | | 2,332,165 | |
| | 500 | | | 0.000%, 9/01/31 – NPFG Insured | | | | | No Opt. Call | | | | Baa2 | | | | 207,480 | |
| | 10,950 | | | 0.000%, 9/01/32 – NPFG Insured | | | | | No Opt. Call | | | | Baa2 | | | | 4,266,011 | |
| | 500 | | | 0.000%, 9/01/33 – NPFG Insured | | | | | No Opt. Call | | | | Baa2 | | | | 182,970 | |
| | | | | |
| | | | E-470 Public Highway Authority, Colorado, Toll Revenue Bonds, Refunding Series 2006B: | | | | | | | | | | | | | | |
| | 21,100 | | | 0.000%, 9/01/35 – NPFG Insured | | | | | 9/26 at 63.78 | | | | Baa2 | | | | 6,828,804 | |
| | 18,960 | | | 0.000%, 9/01/37 – NPFG Insured | | | | | 9/26 at 57.65 | | | | Baa2 | | | | 5,468,254 | |
| | 30,000 | | | 0.000%, 9/01/39 – NPFG Insured | | | | | 9/26 at 52.09 | | | | Baa2 | | | | 7,725,000 | |
| | | | | | | | | | | | | | | | | | |
Principal
Amount (000) | | | Description (1) | | | | Optional Call
Provisions (2) | | | Ratings (3) | | | Value | |
| | | | Colorado (continued) | | | | | | | | | | | | | | |
| | | | | |
| | | | E-470 Public Highway Authority, Colorado, Toll Revenue Bonds, Series 2004A: | | | | | | | | | | | | | | |
| $ | 40,250 | | | 0.000%, 9/01/27 – NPFG Insured | | | | | No Opt. Call | | | | Baa2 | | | $ | 21,341,355 | |
| | 24,045 | | | 0.000%, 9/01/28 – NPFG Insured | | | | | No Opt. Call | | | | Baa2 | | | | 11,997,493 | |
| | 25,600 | | | 0.000%, 9/01/34 – NPFG Insured | | | | | No Opt. Call | | | | Baa2 | | | | 8,823,808 | |
| | | | | |
| | | | E-470 Public Highway Authority, Colorado, Toll Revenue Bonds, Series 2004B: | | | | | | | | | | | | | | |
| | 3,000 | | | 0.000%, 9/01/27 – NPFG Insured | | | | | 9/20 at 67.94 | | | | Baa2 | | | | 1,470,930 | |
| | 9,000 | | | 0.000%, 9/01/29 – NPFG Insured | | | | | 9/20 at 60.30 | | | | Baa2 | | | | 3,858,300 | |
| | 1,320 | | | 0.000%, 9/01/33 – NPFG Insured | | | | | 9/20 at 48.04 | | | | Baa2 | | | | 441,223 | |
| | | | | |
| | 20,000 | | | E-470 Public Highway Authority, Colorado, Toll Revenue Bonds, Series 2006A, 0.000%, 9/01/38 – NPFG Insured | | | | | 9/26 at 54.77 | | | | Baa2 | | | | 5,440,400 | |
| | | | | |
| | 665 | | | Eagle Ranch Metropolitan District, Eagle County, Colorado, General Obligation Refunding Bonds, Series 2011, 5.500%, 12/01/28 | | | | | 12/21 at 100.00 | | | | BBB+ | | | | 751,556 | |
| | | | | |
| | | | Ebert Metropolitan District, Colorado, Limited Tax General Obligation Bonds, Series 2007: | | | | | | | | | | | | | | |
| | 300 | | | 5.000%, 12/01/22 – RAAI Insured | | | | | 12/17 at 100.00 | | | | N/R | | | | 305,394 | |
| | 1,210 | | | 5.200%, 12/01/27 – RAAI Insured | | | | | 12/17 at 100.00 | | | | N/R | | | | 1,222,620 | |
| | 17,420 | | | 5.350%, 12/01/37 – RAAI Insured | | | | | 12/17 at 100.00 | | | | N/R | | | | 17,395,438 | |
| | | | | |
| | 3,493 | | | Elbert and Highway 86 Metropolitan District, Colorado, General Obligation Bonds, Series 2006, 5.750%, 12/01/36 | | | | | 12/16 at 100.00 | | | | N/R | | | | 2,546,467 | |
| | | | | |
| | 3,345 | | | Elkhorn Ranch Metropolitan District 1, Colorado, General Obligation Limited Tax Bonds, Series 2005, 6.375%, 12/01/35 | | | | | 12/15 at 100.00 | | | | N/R | | | | 3,134,365 | |
| | | | | |
| | 4,150 | | | Fallbrook Metropolitan District, Colorado, General Obligation Bonds, Series 2006, 5.625%, 12/01/26 | | | | | 12/16 at 100.00 | | | | N/R | | | | 3,783,431 | |
| | | | | |
| | 1,788 | | | Fallbrook Metropolitan District, Colorado, Limited Tax Bonds, Series 2007, 6.750%, 12/15/26 | | | | | 12/16 at 100.00 | | | | N/R | | | | 1,602,888 | |
| | | | | |
| | 5,570 | | | Fitzsimons Village Metropolitan District 1, Aurora, Arapahoe County, Colorado, Tax Increment Public Improvement Fee Supported Revenue Bonds, Series 2010A, 7.500%, 3/01/40 | | | | | 3/20 at 100.00 | | | | N/R | | | | 6,048,463 | |
| | | | | |
| | 775 | | | Fossil Ridge Metropolitan District 1, Lakewood, Colorado, Tax-Supported Revenue Bonds, Refunding Series 2010, 7.250%, 12/01/40 | | | | | 12/20 at 100.00 | | | | N/R | | | | 829,886 | |
| | | | | |
| | 6,329 | | | Granby Ranch Metropolitan District, Colorado, General Obligation Bonds, Series 2006, 6.750%, 12/01/36 | | | | | 12/15 at 100.00 | | | | N/R | | | | 6,460,390 | |
| | | | | |
| | 2,142 | | | Great Western Metropolitan District 5, Colorado, General Obligation Limited Tax Revenue Bonds, Series 2009A-1, 9.000%, 8/01/39 | | | | | 12/19 at 100.00 | | | | N/R | | | | 2,257,582 | |
| | | | | |
| | 2,780 | | | Great Western Metropolitan District 5, Colorado, General Obligation Limited Tax Revenue Bonds, Series 2009A-2, 9.000%, 8/01/39 | | | | | 12/19 at 100.00 | | | | N/R | | | | 2,930,009 | |
| | | | | |
| | 4,000 | | | Great Western Metropolitan District 5, Colorado, General Obligation Limited Tax Revenue Bonds, Series 2010, 9.000%, 11/01/40 | | | | | 12/20 at 100.00 | | | | N/R | | | | 4,189,760 | |
| | | | | |
| | 750 | | | Harvest Junction Metropolitan District, Longmont, Colorado, General Obligation Bonds, Refunding and Improvement Series 2012, 5.375%, 12/01/37 | | | | | 12/22 at 100.00 | | | | N/R | | | | 784,260 | |
| | | | | |
| | 6,847 | | | Heritage Todd Creek Metropolitan District, Colorado, General Obligation Bonds Limited Tax, Series 2007A, 5.500%, 12/01/37 | | | | | 12/17 at 100.00 | | | | N/R | | | | 5,608,378 | |
| | | | | |
| | 825 | | | High Point Metropolitan District, Colorado, General Obligation Limited Tax Bonds, Series 2006, 6.000%, 12/01/35 | | | | | 12/16 at 100.00 | | | | N/R | | | | 759,998 | |
| | | | | |
| | 716 | | | Horse Creek Metropolitan District, Colorado, Limited Tax General Obligation Bonds, Series 2006, 5.750%, 12/01/36 | | | | | 12/16 at 100.00 | | | | N/R | | | | 608,958 | |
| | | | | |
| | | | Huntington Trails Metropolitan District, Colorado, General Obligation Bonds, Series 2008: | | | | | | | | | | | | | | |
| | 1,000 | | | 6.250%, 12/01/36 | | | | | 12/16 at 100.00 | | | | N/R | | | | 1,034,220 | |
| | 1,695 | | | 8.250%, 12/01/37 | | | | | 12/16 at 100.00 | | | | N/R | | | | 1,723,544 | |
| | | | | |
| | 3,645 | | | Kit Carson County Health Service District, Colorado, Health Care Facility Revenue Bonds, Series 2007, 6.750%, 1/01/34 | | | | | 1/18 at 100.00 | | | | N/R | | | | 3,814,784 | |
Portfolio of Investments
Nuveen High Yield Municipal Bond Fund (continued)
April 30, 2013
| | | | | | | | | | | | | | | | | | |
Principal
Amount (000) | | | Description (1) | | | | Optional Call
Provisions (2) | | | Ratings (3) | | | Value | |
| | | | Colorado (continued) | | | | | | | | | | | | | | |
| | | | | |
| $ | 2,282 | | | Laredo Metropolitan District, Colorado, General Obligation Bonds, Series 2003, 7.500%, 12/01/33 | | | | | 12/13 at 101.00 | | | | N/R | | | $ | 1,858,780 | |
| | | | | |
| | 1,602 | | | Liberty Ranch Metropolitan District, Colorado, Limited Tax General Obligation Bonds, Series 2006, 6.250%, 12/01/36 | | | | | 12/16 at 100.00 | | | | N/R | | | | 1,433,678 | |
| | | | | |
| | 330 | | | Maher Ranch Metropolitan District 4, Colorado, General Obligation Limited Tax Bonds, Series 2007, 5.250%, 12/01/36 – RAAI Insured | | | | | 12/17 at 100.00 | | | | N/R | | | | 319,579 | |
| | | | | |
| | 2,640 | | | Mead Western Meadows Metropolitan District, Colorado, General Obligation Bonds, Series 2007, 5.750%, 12/01/36 | | | | | 12/17 at 100.00 | | | | N/R | | | | 2,759,460 | |
| | | | | |
| | | | Mountain Shadows Metropolitan District, Colorado, General Obligation Limited Tax Bonds, Series 2007: | | | | | | | | | | | | | | |
| | 1,250 | | | 5.500%, 12/01/27 | | | | | 12/16 at 100.00 | | | | N/R | | | | 1,068,313 | |
| | 2,300 | | | 5.625%, 12/01/37 | | | | | 12/16 at 100.00 | | | | N/R | | | | 1,896,488 | |
| | | | | |
| | 2,495 | | | Park Creek Metropolitan District, Colorado, Limited Tax Obligation Revenue Bonds, Series 2003CR-1, 7.875%, 12/01/32 | | | | | 12/13 at 100.00 | | | | N/R | | | | 2,549,965 | |
| | | | | |
| | 1,495 | | | Park Creek Metropolitan District, Colorado, Limited Tax Obligation Revenue Bonds, Series 2003CR-2, 7.875%, 12/01/32 (Mandatory put 12/01/13) | | | | | 12/13 at 100.00 | | | | N/R | | | | 1,523,943 | |
| | | | | |
| | 2,749 | | | Piney Creek Metropolitan District, Colorado, Limited Tax General Obligation Bonds, Series 2005, 5.500%, 12/01/35 | | | | | 12/15 at 100.00 | | | | N/R | | | | 2,772,531 | |
| | | | | |
| | 4,500 | | | Plaza Metropolitan District 1, Lakewood, Colorado, Tax Increment Revenue Bonds, Refunding Series 2013, 5.000%, 12/01/40 | | | | | 12/22 at 100.00 | | | | N/R | | | | 4,704,840 | |
| | | | | |
| | 1,000 | | | Poudre Tech Metro District, Colorado, Unlimited Property Tax Supported Revenue Bonds, Refunding & Improvement Series 2010A, 5.000%, 12/01/30 – AGM Insured | | | | | 12/20 at 100.00 | | | | AA– | | | | 990,150 | |
| | | | | |
| | | | Prairie Center Metropolitan District 3, Colorado, Limited Property Tax Revenue Bonds, Series 2006A: | | | | | | | | | | | | | | |
| | 4,705 | | | 5.250%, 12/15/21 | | | | | 12/16 at 100.00 | | | | N/R | | | | 4,783,809 | |
| | 10,930 | | | 5.400%, 12/15/31 | | | | | 12/16 at 100.00 | | | | N/R | | | | 10,989,896 | |
| | | | | |
| | | | Public Authority for Colorado Energy, Natural Gas Purchase Revenue Bonds, Colorado Springs Utilities, Series 2008: | | | | | | | | | | | | | | |
| | 630 | | | 6.250%, 11/15/28 | | | | | No Opt. Call | | | | A | | | | 798,197 | |
| | 21,170 | | | 6.500%, 11/15/38 | | | | | No Opt. Call | | | | A | | | | 28,786,119 | |
| | | | | |
| | | | Regional Transportation District, Colorado, Denver Transit Partners Eagle P3 Project Private Activity Bonds, Series 2010: | | | | | | | | | | | | | | |
| | 4,000 | | | 6.500%, 1/15/30 | | | | | 7/20 at 100.00 | | | | Baa3 | | | | 4,833,480 | |
| | 2,500 | | | 6.000%, 1/15/34 | | | | | 7/20 at 100.00 | | | | Baa3 | | | | 2,904,500 | |
| | | | | |
| | 3,000 | | | Rendezvous Residential Metropolitan District, Colorado, Limited Tax General Obligation Bonds, Refunding Series 2007, 5.375%, 12/01/21 | | | | | 12/17 at 100.00 | | | | N/R | | | | 2,854,200 | |
| | | | | |
| | 1,955 | | | River Oaks Metropolitan District, Colorado, General Obligation Limited Tax Bonds, Series 2006, 6.000%, 12/01/35 | | | | | 12/16 at 100.00 | | | | N/R | | | | 1,800,966 | |
| | | | | |
| | 1,214 | | | River Park Metropolitan District, New Castle, Garfield County, Colorado, Limited Tax General Obligation Bonds, Refunding Series 2009, 6.990%, 6/15/39 | | | | | 9/14 at 100.00 | | | | N/R | | | | 1,231,724 | |
| | | | | |
| | 2,301 | | | Silver Peaks Metropolitan District 2, Colorado, Limited Tax Obligation Bonds, Series 2006, 5.750%, 12/01/36 | | | | | 12/16 at 100.00 | | | | N/R | | | | 1,575,380 | |
| | | | | |
| | | | Southlands Metropolitan District 1, Colorado, Limited Tax General Obligation Bonds, Series 2007: | | | | | | | | | | | | | | |
| | 1,640 | | | 4.625%, 12/01/22 – RAAI Insured | | | | | 12/17 at 100.00 | | | | N/R | | | | 1,623,305 | |
| | 1,620 | | | 5.250%, 12/01/34 – RAAI Insured | | | | | 12/17 at 100.00 | | | | N/R | | | | 1,607,931 | |
| | | | | |
| | 2,295 | | | Southlands Metropolitan District 2, Aurora, Colorado, General Obligation Bonds, Series 2010, 7.375%, 12/01/35 | | | | | 12/20 at 100.00 | | | | N/R | | | | 2,517,087 | |
| | | | | |
| | 4,990 | | | Stetson Ridge Metropolitan District 3, Colorado, Limited Tax General Obligation Bonds, Series 2012, 7.125%, 12/01/42 | | | | | No Opt. Call | | | | N/R | | | | 5,007,914 | |
| | | | | |
| | 7,500 | | | Stone Ridge Metropolitan District 2, Colorado, General Obligation Bonds, Limited Tax Convertible to Unlimited, Series 2007, 7.250%, 12/01/31 | | | | | 12/17 at 100.00 | | | | N/R | | | | 1,938,450 | |
| | | | | | | | | | | | | | | | | | |
Principal
Amount (000) | | | Description (1) | | | | Optional Call
Provisions (2) | | | Ratings (3) | | | Value | |
| | | | Colorado (continued) | | | | | | | | | | | | | | |
| | | | | |
| $ | 1,303 | | | Stoneridge Metropolitan District, Colorado, General Obligation Bonds, Series 2007, 5.625%, 12/01/36 | | | | | 12/17 at 100.00 | | | | N/R | | | $ | 1,180,844 | |
| | | | | |
| | 2,550 | | | Tabernash Meadows Water and Sanitation District, Grand County, Colorado, General Obligation Refunding Bonds, Series 2010, 7.125%, 12/01/34 | | | | | 12/20 at 100.00 | | | | N/R | | | | 2,792,862 | |
| | | | | |
| | 1,040 | | | Tallyn’s Reach Metropolitan District 3, Aurora, Colorado, Limited Tax General Obligation Bonds, Series 2007, 5.100%, 12/01/26 | | | | | 12/16 at 100.00 | | | | N/R | | | | 1,067,685 | |
| | | | | |
| | 6,455 | | | Three Springs Metropolitan District 3, Durango, La Plata County, Colorado, Property Tax Supported Revenue Bonds, Series 2010, 7.750%, 12/01/39 | | | | | 12/20 at 100.00 | | | | N/R | | | | 6,869,346 | |
| | | | | |
| | 1,195 | | | Traditions Metropolitan District 2, Colorado, Limited Tax General Obligation Bonds, Series 2006, 5.750%, 12/01/36 | | | | | 12/16 at 100.00 | | | | N/R | | | | 1,182,763 | |
| | | | | |
| | 9,500 | | | Valagua Metropolitan District, Eagle County, Colorado, General Obligation Limited Tax Bonds, Series 2008, 7.750%, 12/01/37 | | | | | 12/18 at 100.00 | | | | N/R | | | | 6,308,190 | |
| | | | | |
| | 525 | | | Waterfront Metropolitan District, Loveland, Colorado, General Obligation Bonds, Refunding & Improvement Series 2007, 4.800%, 12/01/35 – RAAI Insured | | | | | 12/17 at 100.00 | | | | N/R | | | | 464,037 | |
| | | | | |
| | | | Wheatlands Metropolitan District 2, City of Aurora, Colorado, General Obligation Bonds, Subordinate Limited Tax Convertible to Unlimited Tax, Series 2008: | | | | | | | | | | | | | | |
| | 2,209 | | | 6.000%, 12/01/25 | | | | | 12/15 at 100.00 | | | | N/R | | | | 2,103,962 | |
| | 4,946 | | | 6.125%, 12/01/35 | | | | | 12/15 at 100.00 | | | | N/R | | | | 4,442,646 | |
| | 7,000 | | | 8.250%, 12/15/35 | | | | | 12/15 at 100.00 | | | | N/R | | | | 7,133,630 | |
| | | | | |
| | 2,059 | | | Wildgrass Metropolitan District, Colorado, General Obligation Bonds, Series 2007, 6.200%, 12/01/34 | | | | | 12/16 at 100.00 | | | | N/R | | | | 2,114,634 | |
| | | | | |
| | 1,300 | | | Winter Farm Metropolitan District 1, Colorado, Property Tax Supported Revenue Bonds, Series 2011, 144A, 7.500%, 12/01/39 (Pre-refunded 12/01/18) | | | | | 12/18 at 100.00 | | | | N/R (6) | | | | 1,753,388 | |
| | | | | |
| | | | Wyndham Hill Metropolitan District 2, Colorado, General Obligation Limited Tax Bonds, Series 2005: | | | | | | | | | | | | | | |
| | 500 | | | 6.250%, 12/01/25 | | | | | 12/15 at 100.00 | | | | N/R | | | | 495,165 | |
| | 1,393 | | | 6.375%, 12/01/35 | | | | | 12/15 at 100.00 | | | | N/R | | | | 1,365,962 | |
| | 778,853 | | | Total Colorado | | | | | | | | | | | | | 588,671,135 | |
| | | | Connecticut – 1.4% | | | | | | | | | | | | | | |
| | | | | |
| | 12,250 | | | Connecticut Development Authority, Airport Facilities Revenue Bonds, Learjet Inc., Series 2004, 7.950%, 4/01/26 (Alternative Minimum Tax) | | | | | 10/14 at 101.00 | | | | Ba2 | | | | 13,103,090 | |
| | | | | |
| | | | Hamden, Connecticut, Facility Revenue Bonds, Whitney Center Project, Series 2009A: | | | | | | | | | | | | | | |
| | 1,250 | | | 7.625%, 1/01/30 | | | | | 1/20 at 100.00 | | | | N/R | | | | 1,382,913 | |
| | 3,570 | | | 7.750%, 1/01/43 | | | | | 1/20 at 100.00 | | | | N/R | | | | 3,898,583 | |
| | | | | |
| | | | Harbor Point Infrastructure Improvement District, Connecticut, Special Obligation Revenue Bonds, Harbor Point Project, Series 2010A: | | | | | | | | | | | | | | |
| | 932 | | | 7.000%, 4/01/22 | | | | | 4/20 at 100.00 | | | | N/R | | | | 1,065,015 | |
| | 37,720 | | | 7.875%, 4/01/39 | | | | | 4/20 at 100.00 | | | | N/R | | | | 43,095,100 | |
| | | | | |
| | | | Mashantucket Western Pequot Tribe, Connecticut, Special Revenue Bonds, Subordinate Lien Series 1997B: | | | | | | | | | | | | | | |
| | 8,600 | | | 5.700%, 9/01/12 (4) | | | | | No Opt. Call | | | | N/R | | | | 3,999,000 | |
| | 29,000 | | | 5.750%, 9/01/18 (4) | | | | | 7/13 at 100.00 | | | | N/R | | | | 13,743,100 | |
| | 22,500 | | | 5.750%, 9/01/27 (4) | | | | | 7/13 at 100.00 | | | | N/R | | | | 10,607,850 | |
| | | | | |
| | 2,250 | | | Mashantucket Western Pequot Tribe, Connecticut, Special Revenue Bonds, Subordinate Lien Series 1999A, 5.500%, 9/01/28 (4) | | | | | 7/13 at 100.00 | | | | N/R | | | | 1,061,190 | |
| | | | | |
| | 26,125 | | | Mashantucket Western Pequot Tribe, Connecticut, Subordinate Special Revenue Bonds, Series 2006A, 5.500%, 9/01/36 (4) | | | | | 9/16 at 100.00 | | | | N/R | | | | 12,318,199 | |
| | | | | |
| | | | Mashantucket Western Pequot Tribe, Connecticut, Subordinate Special Revenue Bonds, Series 2007A: | | | | | | | | | | | | | | |
| | 13,750 | | | 6.500%, 9/01/31 (4) | | | | | 11/17 at 100.00 | | | | N/R | | | | 6,471,300 | |
| | 12,170 | | | 5.750%, 9/01/34 (4) | | | | | 11/17 at 100.00 | | | | N/R | | | | 5,735,478 | |
Portfolio of Investments
Nuveen High Yield Municipal Bond Fund (continued)
April 30, 2013
| | | | | | | | | | | | | | | | | | |
Principal
Amount (000) | | | Description (1) | | | | Optional Call
Provisions (2) | | | Ratings (3) | | | Value | |
| | | | Connecticut (continued) | | | | | | | | | | | | | | |
| | | | | |
| $ | 1,885 | | | Mohegan Tribe of Indians of Connecticut, Gaming Authority Priority Distribution Payment Public Improvement Bonds, Series 2001, 6.250%, 1/01/31 | | | | | 7/13 at 100.00 | | | | B | | | $ | 1,886,602 | |
| | | | | |
| | | | Mohegan Tribe of Indians of Connecticut, Gaming Authority Priority Distribution Payment Public Improvement Bonds, Series 2003: | | | | | | | | | | | | | | |
| | 500 | | | 5.125%, 1/01/23 | | | | | 1/14 at 100.00 | | | | B | | | | 500,550 | |
| | 10,600 | | | 5.250%, 1/01/33 | | | | | 1/14 at 100.00 | | | | B | | | | 10,602,650 | |
| | | | | |
| | 5,000 | | | Stamford, Connecticut, Special Obligation Revenue Bonds, Mill River Corridor Project, Series 2011aA, 7.000%, 4/01/41 | | | | | 4/21 at 100.00 | | | | N/R | | | | 5,386,250 | |
| | 188,102 | | | Total Connecticut | | | | | | | | | | | | | 134,856,870 | |
| | | | Delaware – 0.2% | | | | | | | | | | | | | | |
| | | | | |
| | 13,665 | | | Delaware Economic Development Authority, Exempt Facility Revenue Bonds, Indian River Power LLC Project, Series 2010, 5.375%, 10/01/45 | | | | | 10/20 at 100.00 | | | | Baa3 | | | | 14,696,161 | |
| | | | | |
| | 2,110 | | | Kent County, Delaware, Revenue Bonds, Charter School, Inc. Project, Refunding Series 2011, 7.375%, 5/01/37 | | | | | 5/21 at 100.00 | | | | BBB– | | �� | | 2,513,516 | |
| | | | | |
| | 1,430 | | | Wilmington, Delaware, Multifamily Rental Housing Revenue Bonds, Lincoln Towers Associates, LLC Project, Series 2011A and Series 2011B, 8.250%, 7/15/48 (Mandatory put 7/15/28) | | | | | 7/21 at 100.00 | | | | N/R | | | | 1,588,401 | |
| | 17,205 | | | Total Delaware | | | | | | | | | | | | | 18,798,078 | |
| | | | District of Columbia – 0.5% | | | | | | | | | | | | | | |
| | | | | |
| | 3,500 | | | District of Columbia Tobacco Settlement Corporation, Tobacco Settlement Asset-Backed Bonds, Series 2001, 6.750%, 5/15/40 | | | | | 5/13 at 100.00 | | | | Baa1 | | | | 3,596,180 | |
| | | | | |
| | | | District of Columbia, Hospital Revenue Bonds, Children’s Hospital Obligated Group, Tender Option Bond Trust 11839: | | | | | | | | | | | | | | |
| | 1,220 | | | 18.779%, 7/15/17 – AGM Insured (IF) | | | | | No Opt. Call | | | | AA– | | | | 1,704,303 | |
| | 2,425 | | | 18.880%, 7/15/17 – AGM Insured (IF) | | | | | No Opt. Call | | | | AA– | | | | 3,391,096 | |
| | | | | |
| | 2,050 | | | District of Columbia, Revenue Bonds, Center for Strategic and International Studies, Inc., Series 2011, 6.625%, 3/01/41 | | | | | 3/21 at 100.00 | | | | BBB– | | | | 2,246,226 | |
| | | | | |
| | | | District of Columbia, Revenue Bonds, Cesar Chavez Public Charter Schools for Public Policy, Series 2011: | | | | | | | | | | | | | | |
| | 2,590 | | | 7.125%, 11/15/26 | | | | | 11/20 at 100.00 | | | | BBB– | | | | 2,944,830 | |
| | 2,740 | | | 7.500%, 11/15/31 | | | | | 11/20 at 100.00 | | | | BBB– | | | | 3,169,632 | |
| | 1,000 | | | 7.875%, 11/15/40 | | | | | 11/20 at 100.00 | | | | BBB– | | | | 1,181,000 | |
| | | | | |
| | 175 | | | District of Columbia, Revenue Bonds, Friendship Public Charter School Inc., Series 2006, 5.000%, 6/01/26 – ACA Insured | | | | | 6/16 at 100.00 | | | | BBB | | | | 180,283 | |
| | | | | |
| | 2,500 | | | District of Columbia, Revenue Bonds, Howard University, Series 2011A, 6.500%, 10/01/41 (UB) (5) | | | | | 4/21 at 100.00 | | | | A– | | | | 3,029,200 | |
| | | | | |
| | | | District of Columbia, Revenue Bonds, Howard University, Tender Option Bond Trust 1006: | | | | | | | | | | | | | | |
| | 2,500 | | | 22.973%, 10/01/37 (IF) (5) | | | | | 4/21 at 100.00 | | | | A– | | | | 4,655,500 | |
| | 1,250 | | | 22.973%, 10/01/41 (IF) (5) | | | | | 4/21 at 100.00 | | | | A– | | | | 2,308,400 | |
| | 1,750 | | | 22.973%, 10/01/41 (IF) (5) | | | | | 4/21 at 100.00 | | | | A– | | | | 3,231,760 | |
| | 625 | | | 23.571%, 10/01/41 (IF) (5) | | | | | 4/21 at 100.00 | | | | A– | | | | 1,154,200 | |
| | | | | |
| | | | District of Columbia, Revenue Bonds, National Public Radio, Tender Option Bond Trust 3163: | | | | | | | | | | | | | | |
| | 3,000 | | | 17.620%, 4/01/33 (IF) | | | | | 4/15 at 100.00 | | | | AA– | | | | 3,767,040 | |
| | 2,375 | | | 17.620%, 4/01/33 (IF) | | | | | 4/15 at 100.00 | | | | AA– | | | | 2,982,240 | |
| | | | | |
| | | | Metropolitan Washington Airports Authority, District of Columbia, Dulles Toll Road Revenue Bonds, Capital Appreciation Series 2009B–2: | | | | | | | | | | | | | | |
| | 2,450 | | | 0.000%, 10/01/27 – AGC Insured | | | | | No Opt. Call | | | | AA– | | | | 1,323,809 | |
| | 1,400 | | | 0.000%, 10/01/29 – AGC Insured | | | | | No Opt. Call | | | | AA– | | | | 672,588 | |
| | 4,810 | | | 0.000%, 10/01/32 – AGC Insured | | | | | No Opt. Call | | | | AA– | | | | 1,927,608 | |
| | | | | |
| | 5,000 | | | Metropolitan Washington D.C. Airports Authority, District of Columbia, Airport System Revenue Bonds, Tender Option Bond Trust 11798, 17.375%, 4/01/31 – AGM Insured (Alternative Minimum Tax) (IF) | | | | | 10/16 at 100.00 | | | | AA– | | | | 6,153,400 | |
| | 43,360 | | | Total District of Columbia | | | | | | | | | | | | | 49,619,295 | |
| | | | | | | | | | | | | | | | | | |
Principal
Amount (000) | | | Description (1) | | | | Optional Call
Provisions (2) | | | Ratings (3) | | | Value | |
| | | | Florida – 10.9% | | | | | | | | | | | | | | |
| | | | | |
| | | | Alachua County Health Facilities Authority, Florida, Continuing Care Retirement Community Revenue Bonds, Oak Hammock Project, Series 2012A: | | | | | | | | | | | | | | |
| $ | 2,500 | | | 8.000%, 10/01/42 | | | | | 10/22 at 102.00 | | | | N/R | | | $ | 3,057,325 | |
| | 2,500 | | | 8.000%, 10/01/46 | | | | | 10/22 at 102.00 | | | | N/R | | | | 3,046,775 | |
| | | | | |
| | 5,000 | | | Alachua County Health Facilities Authority, Florida, Health Facilities Revenue Bonds, Terraces at Bonita Springs Project, Mandatory Paydown TEMP -80 Series 2011B-1, 7.375%, 11/15/19 | | | | | 11/14 at 100.00 | | | | N/R | | | | 5,081,600 | |
| | | | | |
| | | | Alachua County Health Facilities Authority, Florida, Health Facilities Revenue Bonds, Terraces at Bonita Springs Project, Series 2011A: | | | | | | | | | | | | | | |
| | 10,380 | | | 8.000%, 11/15/31 | | | | | 11/21 at 100.00 | | | | N/R | | | | 12,292,826 | |
| | 10,700 | | | 8.125%, 11/15/41 | | | | | 11/21 at 100.00 | | | | N/R | | | | 12,641,622 | |
| | | | | |
| | 3,860 | | | Amelia National Community Development District, Nassau County, Florida, Special Assessment Bonds, Series 2004A, 6.300%, 5/01/35 | | | | | 5/14 at 101.00 | | | | N/R | | | | 3,692,553 | |
| | | | | |
| | 3,125 | | | Amelia National Community Development District, Nassau County, Florida, Special Assessment Bonds, Series 2006A, 5.375%, 5/01/37 | | | | | 5/15 at 100.00 | | | | N/R | | | | 2,470,188 | |
| | | | | |
| | 2,400 | | | Anthem Park Community Development District, Florida, Capital Improvement Revenue Bonds, Series 2004, 5.800%, 5/01/36 (8) | | | | | 5/15 at 101.00 | | | | N/R | | | | 1,725,864 | |
| | | | | |
| | 1,300 | | | Atlantic Beach, Florida, Healthcare Facilities Revenue Refunding Bonds, Fleet Landing Project, Series 2013A, 5.000%, 11/15/37 | | | | | 11/23 at 100.00 | | | | BBB | | | | 1,394,120 | |
| | | | | |
| | 20,280 | | | Ave Maria Stewardship Community Development District, Florida, Capital Improvement Revenue Bonds, Series 2006A, 5.125%, 5/01/38 | | | | | 5/16 at 100.00 | | | | N/R | | | | 19,279,790 | |
| | | | | |
| | 24,830 | | | Ave Maria Stewardship Community District, Florida, Capital Improvement Revenue Bonds, Series 2012, 6.700%, 5/01/42 | | | | | 5/22 at 100.00 | | | | N/R | | | | 25,927,238 | |
| | | | | |
| | 15,405 | | | Bartram Park Community Development District, Florida, Special Assessment Bonds, Series 2005, 5.300%, 5/01/35 (4) | | | | | 5/15 at 101.00 | | | | N/R | | | | 15,455,837 | |
| | | | | |
| | 4,075 | | | Bartram Park Community Development District, Florida, Special Assessment Bonds, Series 2012-1, 0.000%, 5/01/37 | | | | | 5/22 at 100.00 | | | | N/R | | | | 3,559,513 | |
| | | | | |
| | 3,475 | | | Bartram Park Community Development District, Florida, Special Assessment Bonds, Series 2012-2, 5.400%, 5/01/37 | | | | | 5/22 at 100.00 | | | | N/R | | | | 3,587,486 | |
| | | | | |
| | 4,960 | | | Bartram Park Community Development District, Florida, Special Assessment Bonds, Series 2012-3, 0.000%, 5/01/37 | | | | | 5/22 at 100.00 | | | | N/R | | | | 3,761,664 | |
| | | | | |
| | 3,430 | | | Bartram Park Community Development District, Florida, Special Assessment Bonds, Series 2012-5, 0.000%, 5/01/37 | | | | | 5/22 at 100.00 | | | | N/R | | | | 2,429,778 | |
| | | | | |
| | 2,650 | | | Bay County, Florida, Educational Facilities Revenue Refunding Bonds, Bay Haven Charter Academy, Inc. Project, Series 2010A, 6.000%, 9/01/40 | | | | | 9/20 at 100.00 | | | | BBB– | | | | 2,892,396 | |
| | | | | |
| | | | Bay County, Florida, Educational Facilities Revenue Refunding Bonds, Bay Haven Charter Academy, Inc. Project, Series 2013A: | | | | | | | | | | | | | | |
| | 2,495 | | | 5.000%, 9/01/43 | | | | | 9/23 at 100.00 | | | | BBB– | | | | 2,510,843 | |
| | 1,035 | | | 5.000%, 9/01/45 | | | | | 9/23 at 100.00 | | | | BBB– | | | | 1,037,412 | |
| | 2,550 | | | 5.000%, 9/01/48 | | | | | 9/23 at 100.00 | | | | BBB– | | | | 2,541,432 | |
| | | | | |
| | 1,950 | | | Bay Laurel Center Community Development District, Marion County, Florida, Candler Hills Project, Special Assessment Bonds, Series 2006A, 5.450%, 5/01/37 | | | | | 5/16 at 100.00 | | | | N/R | | | | 1,942,239 | |
| | | | | |
| | 12,870 | | | Beacon Lakes Community Development District, Florida, Special Assessment Bonds, Series 2003A, 6.900%, 5/01/35 | | | | | 5/14 at 100.00 | | | | N/R | | | | 13,023,153 | |
| | | | | |
| | 9,360 | | | Beacon Lakes Community Development District, Florida, Special Assessment Bonds, Series 2007A, 6.000%, 5/01/38 | | | | | 5/17 at 100.00 | | | | N/R | | | | 9,865,534 | |
| | | | | |
| | 7,425 | | | Beacon Lakes Community Development District, Florida, Special Assessment Bonds, Subordinate Lien Series 2007B, 6.200%, 5/01/38 | | | | | 5/17 at 100.00 | | | | N/R | | | | 7,782,959 | |
| | | | | |
| | 3,080 | | | Beeline Community Development District, Palm Beach County, Florida, Special Assessment Bonds, Series 2008A, 7.000%, 5/01/37 | | | | | 5/18 at 100.00 | | | | N/R | | | | 3,360,773 | |
| | | | | |
| | 3,600 | | | Bella Vida Community Development District, Florida, Special Assessment Revenue Bonds, Series 2006, 5.375%, 5/01/37 | | | | | 5/16 at 100.00 | | | | N/R | | | | 3,122,856 | |
Portfolio of Investments
Nuveen High Yield Municipal Bond Fund (continued)
April 30, 2013
| | | | | | | | | | | | | | | | | | |
Principal
Amount (000) | | | Description (1) | | | | Optional Call
Provisions (2) | | | Ratings (3) | | | Value | |
| | | | Florida (continued) | | | | | | | | | | | | | | |
| | | | | |
| $ | 1,000 | | | Belmont Community Development District, Florida, Capital Improvement Revenue Bonds, Phase 1 Project, Series 2013A, 6.500%, 11/01/43 | | | | | 11/24 at 100.00 | | | | N/R | | | $ | 1,015,910 | |
| | | | | |
| | 1,965 | | | Bloomingdale Community Development District, Hillsborough County, Florida, Special Assessment Revenue Bonds, Series 2004, 5.875%, 5/01/36 (9) | | | | | 5/15 at 101.00 | | | | N/R | | | | 1,495,896 | |
| | | | | |
| | 5,680 | | | Boynton Beach, Florida, Revenue Bonds, Charter Schools of Boynton Beach, Series 2012A, 6.800%, 6/01/42 – NPFG Insured | | | | | 6/22 at 100.00 | | | | BBB– | | | | 5,896,067 | |
| | | | | |
| | 2,755 | | | Boynton Village Community Development District, Florida, Special Assessment Bonds, Series 2007-A1, 5.750%, 5/01/37 | | | | | 5/17 at 100.00 | | | | N/R | | | | 2,456,689 | |
| | | | | |
| | 5,680 | | | Boynton Village Community Development District, Florida, Special Assessment Bonds, Series 2007A2, 6.000%, 5/01/38 | | | | | 5/17 at 100.00 | | | | N/R | | | | 5,226,509 | |
| | | | | |
| | | | Capital Projects Finance Authority, Florida, Student Housing Revenue Bonds, Capital Projects Loan Program, Series 2001F-1: | | | | | | | | | | | | | | |
| | 660 | | | 5.125%, 10/01/21 – NPFG Insured | | | | | 10/13 at 100.00 | | | | Baa2 | | | | 659,749 | |
| | 11,810 | | | 5.000%, 10/01/31 – NPFG Insured | | | | | 7/13 at 101.00 | | | | Baa2 | | | | 11,753,194 | |
| | | | | |
| | 2,500 | | | Capital Trust Agency, Florida, Revenue Bonds, Miami Community Charter School Project, Series 2010A, 7.000%, 10/15/40 | | | | | 10/20 at 100.00 | | | | N/R | | | | 2,684,150 | |
| | | | | |
| | 1,390 | | | Caribe Palm Community Development District, Florida, Special Assessment Bonds, Series 2005A, 5.850%, 5/01/35 | | | | | 5/15 at 101.00 | | | | N/R | | | | 1,455,969 | |
| | | | | |
| | 2,975 | | | Cascades at Groveland Community Development District, Florida, Capital Improvement Revenue Bonds, Series 2006, 5.300%, 5/01/36 | | | | | 5/16 at 100.00 | | | | N/R | | | | 2,418,318 | |
| | | | | |
| | 3,000 | | | Century Gardens at Tamiami Community Development District, Miami-Dade County, Florida, Special Assessment Revenue Bonds, Series 2007A, 6.250%, 5/01/37 | | | | | 5/17 at 100.00 | | | | N/R | | | | 2,926,890 | |
| | | | | |
| | 3,630 | | | Coconut Cay Community Development District, Florida, Special Assessment Bonds, Series 2006, 5.375%, 5/01/36 | | | | | 5/15 at 100.00 | | | | N/R | | | | 3,777,197 | |
| | | | | |
| | 3,175 | | | Copper Oaks Community Development District, Florida, Special Assessment Bonds, Series 2005A, 5.450%, 5/01/35 | | | | | 5/15 at 100.00 | | | | N/R | | | | 2,884,075 | |
| | | | | |
| | 3,400 | | | Cordoba Ranch Community Development District, Hillsborough County, Florida, Special Assessment Revenue Bonds, Series 2006, 5.550%, 5/01/37 | | | | | 5/16 at 100.00 | | | | N/R | | | | 3,230,034 | |
| | | | | |
| | 2,785 | | | Country Greens Community Development District, Florida, Special Assessment Bonds, Series 2003, 6.625%, 5/01/34 | | | | | 5/14 at 100.00 | | | | N/R | | | | 2,814,075 | |
| | | | | |
| | 1,535 | | | Dade County Industrial Development Authority, Florida, Revenue Bonds, Miami Cerebral Palsy Residential Services Inc., Series 1995, 8.000%, 6/01/22 | | | | | 6/13 at 100.00 | | | | N/R | | | | 1,535,399 | |
| | | | | |
| | 6,065 | | | East Homestead Community Development District, Florida, Special Assessment Revenue Bonds, Series 2005, 5.450%, 5/01/36 | | | | | 5/15 at 101.00 | | | | N/R | | | | 6,227,906 | |
| | | | | |
| | 3,195 | | | East Homestead Community Development District, Florida, Special Assessment Revenue Bonds, Series 2006, 5.375%, 5/01/36 | | | | | 5/15 at 100.00 | | | | N/R | | | | 2,464,208 | |
| | | | | |
| | 6,010 | | | East Homestead Community Development District, Florida, Special Assessment Revenue Bonds, Series 2011B, 7.250%, 5/01/21 | | | | | No Opt. Call | | | | N/R | | | | 6,577,765 | |
| | | | | |
| | 4,520 | | | East Park Community Development District, Florida, Special Assessment Revenue Bonds, Series 2002, 6.850%, 5/01/33 (4) | | | | | 5/14 at 100.00 | | | | N/R | | | | 4,558,149 | |
| | | | | |
| | 391 | | | East Park Community Development District, Florida, Special Assessment Revenue Bonds, Series 2008, 7.500%, 5/01/15 (4) | | | | | No Opt. Call | | | | N/R | | | | 17,613 | |
| | | | | |
| | 1,405 | | | Enclave at Black Point Marina Community Development District, Florida, Special Assessment Bonds, Series 2007A, 5.400%, 5/01/37 | | | | | 5/17 at 100.00 | | | | N/R | | | | 1,440,813 | |
| | | | | |
| | 1,525 | | | Enclave at Black Point Marina Community Development District, Florida, Special Assessment Bonds, Series 2007B, 5.200%, 5/01/14 | | | | | No Opt. Call | | | | N/R | | | | 1,539,366 | |
| | | | | |
| | 1,955 | | | Flora Ridge Educational Facilities Benefit District, Florida, Capital Improvement Revenue Bonds, Series 2007, 5.300%, 5/01/37 | | | | | 5/17 at 100.00 | | | | N/R | | | | 1,786,733 | |
| | | | | | | | | | | | | | | | | | |
Principal
Amount (000) | | | Description (1) | | | | Optional Call
Provisions (2) | | | Ratings (3) | | | Value | |
| | | | Florida (continued) | | | | | | | | | | | | | | |
| | | | | |
| $ | 4,615 | | | Florida Development Finance Corporation, Educational Facilities Revenue Bonds, Bay Area Charter Foundation, LLC Projects, Series 2011A, 7.750%, 6/15/42 | | | | | 12/21 at 101.00 | | | | N/R | | | $ | 5,285,652 | |
| | | | | |
| | | | Florida Development Finance Corporation, Educational Facilities Revenue Bonds, Renaissance Charter School, Inc. Projects, Series 2010A: | | | | | | | | | | | | | | |
| | 1,500 | | | 6.000%, 9/15/30 | | | | | 9/20 at 100.00 | | | | BB+ | | | | 1,624,140 | |
| | 4,000 | | | 6.000%, 9/15/40 | | | | | 9/20 at 100.00 | | | | BB+ | | | | 4,282,120 | |
| | | | | |
| | | | Florida Development Finance Corporation, Educational Facilities Revenue Bonds, Renaissance Charter School, Inc. Projects, Series 2011A: | | | | | | | | | | | | | | |
| | 9,610 | | | 7.000%, 6/15/26 | | | | | 6/21 at 100.00 | | | | BB– | | | | 11,329,517 | |
| | 5,275 | | | 7.500%, 6/15/33 | | | | | 6/21 at 100.00 | | | | BB– | | | | 6,321,718 | |
| | 7,500 | | | 7.625%, 6/15/41 | | | | | 6/21 at 100.00 | | | | BB– | | | | 8,982,225 | |
| | | | | |
| | | | Florida Development Finance Corporation, Educational Facilities Revenue Bonds, Renaissance Charter School, Inc. Projects, Series 2012A: | | | | | | | | | | | | | | |
| | 1,500 | | | 6.000%, 6/15/32 | | | | | No Opt. Call | | | | N/R | | | | 1,511,400 | |
| | 3,300 | | | 6.125%, 6/15/43 | | | | | No Opt. Call | | | | N/R | | | | 3,309,999 | |
| | | | | |
| | 1,625 | | | Florida Development Finance Corporation, Revenue Bonds, Learning Gate Community Charter School Project, Series 2007A, 6.000%, 2/15/37 | | | | | 2/17 at 100.00 | | | | BBB– | | | | 1,673,571 | |
| | | | | |
| | | | Florida Housing Finance Agency, Housing Revenue Bonds, Brittany of Rosemont Apartments Phase II, Series 1995C-1: | | | | | | | | | | | | | | |
| | 1,320 | | | 6.875%, 8/01/26 – AMBAC Insured (Alternative Minimum Tax) | | | | | 8/13 at 100.00 | | | | N/R | | | | 1,322,046 | |
| | 3,295 | | | 7.000%, 2/01/35 – AMBAC Insured (Alternative Minimum Tax) | | | | | 7/13 at 100.00 | | | | N/R | | | | 3,300,239 | |
| | | | | |
| | 4,275 | | | Florida Housing Finance Corporation, Multifamily Mortgage Revenue Bonds, Crossroads Apartments, Series 2010A-2, 7.250%, 8/15/27 | | | | | 8/20 at 100.00 | | | | N/R | | | | 4,696,045 | |
| | | | | |
| | 850 | | | Fontainebleau Lakes Community Development District, Miami-Dade County, Florida, Special Assessment Revenue Bonds, Series 2007B, 6.000%, 5/01/15 | | | | | No Opt. Call | | | | N/R | | | | 877,294 | |
| | | | | |
| | 7,000 | | | Fort Pierce Redevelopment Agency, Florida, Revenue Bonds, Series 2006, 5.000%, 5/01/31 – SYNCORA GTY Insured | | | | | 5/16 at 100.00 | | | | A– | | | | 7,305,970 | |
| | | | | |
| | | | Grand Bay at Doral Community Development District, Miami-Dade County, Florida, Special Assessment Bonds, Doral Breeze Project Series 2012: | | | | | | | | | | | | | | |
| | 750 | | | 5.125%, 11/01/22 | | | | | No Opt. Call | | | | N/R | | | | 761,843 | |
| | 975 | | | 5.500%, 11/01/32 | | | | | 11/22 at 100.00 | | | | N/R | | | | 981,094 | |
| | 2,275 | | | 6.000%, 11/01/42 | | | | | 11/22 at 100.00 | | | | N/R | | | | 2,288,900 | |
| | | | | |
| | 2,580 | | | Grand Hampton Community Development District, Florida, Capital Improvement Revenue Bonds, Series 2003, 6.150%, 5/01/34 | | | | | 5/14 at 100.00 | | | | N/R | | | | 2,607,967 | |
| | | | | |
| | 995 | | | Habitat Community Development District, Florida, Capital Improvement Revenue Bonds, Series 2004, 5.850%, 5/01/35 | | | | | 5/14 at 101.00 | | | | N/R | | | | 1,023,964 | |
| | | | | |
| | 6,775 | | | Harmony Community Development District, Florida, Special Assessment Bonds, Series 2001, 7.250%, 5/01/32 | | | | | 5/14 at 103.25 | | | | N/R | | | | 7,132,720 | |
| | | | | |
| | 5,115 | | | Heritage park Community Development District, Florida, Special Assessment Revenue Bond, Series 2004A, 6.300%, 5/01/35 | | | | | 5/14 at 101.00 | | | | N/R | | | | 5,203,234 | |
| | | | | |
| | 4,005 | | | Heron Isles Community Development District, Florida, Capital Improvement Revenue Bonds, Series 2005, 5.750%, 5/01/36 | | | | | 5/15 at 101.00 | | | | N/R | | | | 3,866,427 | |
| | | | | |
| | 5,245 | | | Highlands County Health Facilities Authority, Florida, Hospital Revenue Bonds, Adventist Health System/Sunbelt Obligated Group, Tender Option Bond Trust 11797, 18.225%, 5/15/15 (IF) | | | | | No Opt. Call | | | | AA | | | | 7,468,513 | |
| | | | | |
| | 3,130 | | | Highlands County Health Facilities Authority, Florida, Hospital Revenue Bonds, Adventist Health System/Sunbelt Obligated Group, Tender Option Bond Trust 3187, 18.305%, 5/15/15 (IF) | | | | | No Opt. Call | | | | AA | | | | 4,455,649 | |
| | | | | |
| | 1,875 | | | Highlands County Health Facilities Authority, Florida, Hospital Revenue Bonds, Adventist Health System/Sunbelt Obligated Group, Tender Option Bond Trust 3251, 18.829%, 5/15/31 – BHAC Insured (IF) | | | | | 11/16 at 100.00 | | | | AA+ | | | | 2,718,300 | |
| | | | | |
| | 3,670 | | | Hillsborough County Industrial Development Authority, Florida, Charter School Revenue Bonds, Terrace Community Middle School, Series 2007A, 5.125%, 5/15/37 | | | | | 5/17 at 100.00 | | | | BBB– | | | | 3,677,193 | |
Portfolio of Investments
Nuveen High Yield Municipal Bond Fund (continued)
April 30, 2013
| | | | | | | | | | | | | | | | | | |
Principal
Amount (000) | | | Description (1) | | | | Optional Call
Provisions (2) | | | Ratings (3) | | | Value | |
| | | | Florida (continued) | | | | | | | | | | | | | | |
| | | | | |
| $ | 6,525 | | | Islands at Doral III Community Development District, Doral, Florida, Special Assessment Bonds, Series 2004A, 5.900%, 5/01/35 | | | | | 6/13 at 100.00 | | | | N/R | | | $ | 6,539,355 | |
| | | | | |
| | 2,315 | | | Islands at Doral Northeast Community Development District, Miami-Dade County, Florida, Special Assessment Bonds, Series 2004, 6.250%, 5/01/34 | | | | | 5/14 at 101.00 | | | | N/R | | | | 2,379,403 | |
| | | | | |
| | | | Jacksonville Health Facilities Authority, Florida, Health Facilities Revenue Bonds, Brooks Health System, Tender Option Bond Trust 1004: | | | | | | | | | | | | | | |
| | 5,810 | | | 18.193%, 11/01/32 (IF) (5) | | | | | 11/17 at 100.00 | | | | A | | | | 7,117,773 | |
| | 2,865 | | | 18.197%, 11/01/38 (IF) (5) | | | | | 11/17 at 100.00 | | | | A | | | | 3,404,050 | |
| | | | | |
| | 12,095 | | | Jacksonville, Florida, Economic Development Commission Health Care Facilities Revenue Bonds, Florida Proton Therapy Institute Project, Series 2007A, 6.250%, 9/01/27 | | | | | 9/17 at 100.00 | | | | N/R | | | | 13,603,005 | |
| | | | | |
| | 2,605 | | | Jacksonville, Florida, Special Revenue Bonds, Tender Option Bond Trust 3918, 17.625%, 4/01/35 (IF) (5) | | | | | 10/21 at 100.00 | | | | Aa2 | | | | 4,122,152 | |
| | | | | |
| | 3,395 | | | Keys Cove Community Development District, Florida, Special Assessment Revenue Bonds, Series 2004, 5.875%, 5/01/35 | | | | | 5/15 at 101.00 | | | | N/R | | | | 3,649,082 | |
| | | | | |
| | 10,425 | | | Keys Cove II Community Development District, Florida, Special Assessment Revenue Bonds, Series 2005, 5.500%, 5/01/36 | | | | | 5/15 at 100.00 | | | | N/R | | | | 10,429,066 | |
| | | | | |
| | | | Lake County, Florida, Industrial Development Revenue Bonds, Crane’s View Lodge Project, Series 2012A: | | | | | | | | | | | | | | |
| | 865 | | | 6.250%, 11/01/27 | | | | | 11/17 at 102.00 | | | | N/R | | | | 867,967 | |
| | 3,500 | | | 7.125%, 11/01/42 | | | | | No Opt. Call | | | | N/R | | | | 3,530,695 | |
| | | | | |
| | 2,125 | | | Lake Frances Community Development District, Florida, Special Assessment Bonds, Series 2007, 5.300%, 5/01/37 | | | | | 5/17 at 100.00 | | | | N/R | | | | 1,554,098 | |
| | | | | |
| | 1,385 | | | Lake Powell Residential Golf Community Development District, Bay County, Florida, Special Assessment Revenue Refunding Bonds, Series 2012, 5.750%, 11/01/32 | | | | | No Opt. Call | | | | N/R | | | | 1,475,482 | |
| | | | | |
| | 250 | | | Lakeland, Florida, Educational Facilities Revenue Bonds, Florida Southern College Project, Refunding Series 2012A, 5.000%, 9/01/37 | | | | | 9/22 at 100.00 | | | | BBB+ | | | | 272,048 | |
| | | | | |
| | | | Lakes by the Bay South Community Development District, Florida, Special Assessment Bonds, Series 2004A: | | | | | | | | | | | | | | |
| | 2,185 | | | 6.100%, 5/01/23 | | | | | 5/14 at 101.00 | | | | N/R | | | | 2,229,880 | |
| | 4,035 | | | 6.250%, 5/01/34 | | | | | 5/14 at 101.00 | | | | N/R | | | | 4,128,087 | |
| | | | | |
| | | | Lakes by the Bay South Community Development District, Florida, Special Assessment Bonds, Series 2012: | | | | | | | | | | | | | | |
| | 3,500 | | | 5.250%, 11/01/33 | | | | | 11/22 at 100.00 | | | | N/R | | | | 3,625,265 | |
| | 5,000 | | | 5.750%, 11/01/42 | | | | | 11/22 at 100.00 | | | | N/R | | | | 5,174,200 | |
| | | | | |
| | 675 | | | Lakeside Landings Community Development District, Florida, Special Assessment Bonds, Series 2007A, 5.500%, 5/01/38 (4) | | | | | 5/17 at 100.00 | | | | N/R | | | | 277,567 | |
| | | | | |
| | 2,390 | | | Lakeside Landings Community Development District, Florida, Special Assessment Bonds, Series 2007B, 5.250%, 5/01/13 (4) | | | | | No Opt. Call | | | | N/R | | | | 982,075 | |
| | | | | |
| | 1,860 | | | Lee County Housing Finance Authority, Florida, Multifamily Housing Revenue Bonds, Janies Garden Phase 2, Series 2010B, 7.250%, 9/15/47 (Mandatory put 9/15/27) | | | | | 9/20 at 100.00 | | | | N/R | | | | 2,009,395 | |
| | | | | |
| | | | Lee County Industrial Development Authority, Florida, Charter School Revenue Bonds, Lee County Community Charter Schools, Series 2007A: | | | | | | | | | | | | | | |
| | 10,435 | | | 5.250%, 6/15/27 | | | | | 6/17 at 100.00 | | | | BB | | | | 10,635,561 | |
| | 26,350 | | | 5.375%, 6/15/37 | | | | | 6/17 at 100.00 | | | | BB | | | | 26,595,319 | |
| | | | | |
| | | | Lee County Industrial Development Authority, Florida, Charter School Revenue Bonds, Lee County Community Charter Schools, Series 2012A: | | | | | | | | | | | | | | |
| | 2,625 | | | 5.500%, 6/15/32 | | | | | 6/22 at 100.00 | | | | BB | | | | 2,723,963 | �� |
| | 4,125 | | | 5.750%, 6/15/42 | | | | | 6/22 at 100.00 | | | | BB | | | | 4,297,013 | |
| | | | | |
| | 5,675 | | | Lee County Industrial Development Authority, Florida, Healthcare Facilities Refunding Revenue Bonds, Cypress Cove at HealthPark Florida, Inc. Project, Series 2012, 5.750%, 10/01/42 | | | | | No Opt. Call | | | | | | | | 6,030,823 | |
| | | | | | | | | | | | | | | | | | |
Principal
Amount (000) | | | Description (1) | | | | Optional Call
Provisions (2) | | | Ratings (3) | | | Value | |
| | | | Florida (continued) | | | | | | | | | | | | | | |
| | | | | |
| | | | Lee County Industrial Development Authority, Florida, Healthcare Facilities Revenue Bonds, Park Royal Psychiatric Hospital, Series 2010: | | | | | | | | | | | | | | |
| $ | 7,460 | | | 9.000%, 12/01/30 | | | | | 12/18 at 104.00 | | | | N/R | | | $ | 8,147,439 | |
| | 15,540 | | | 9.500%, 12/01/40 | | | | | 12/18 at 104.00 | | | | N/R | | | | 16,924,769 | |
| | | | | |
| | | | Lee Memorial Health System, Florida, Hospital Revenue Bonds, Series 2007A: | | | | | | | | | | | | | | |
| | 6,800 | | | 5.000%, 4/01/32 (UB) (5) | | | | | 4/17 at 100.00 | | | | A | | | | 7,220,308 | |
| | 23,920 | | | 5.000%, 4/01/37 (UB) (5) | | | | | 4/17 at 100.00 | | | | A | | | | 25,299,227 | |
| | | | | |
| | 12,775 | | | Lee Memorial Health System, Florida, Hospital Revenue Bonds, Series 2007A, 5.000%, 4/01/37 – AMBAC Insured (UB) (5) | | | | | 4/17 at 100.00 | | | | A | | | | 13,613,040 | |
| | | | | |
| | 289 | | | Lexington Community Development District, Florida, Special Assessment Revenue Bonds, Series 2007, 5.400%, 5/01/37 | | | | | 5/17 at 100.00 | | | | N/R | | | | 254,118 | |
| | | | | |
| | 10,115 | | | Madison County, Florida, First Mortgage Revenue Bonds, Twin Oaks Project, Series 2005A, 6.000%, 7/01/25 | | | | | 7/15 at 100.00 | | | | N/R | | | | 10,070,899 | |
| | | | | |
| | 4,250 | | | Magnolia Creek Community Development District, Florida, Capital Improvement Revenue Bonds, Series 2007B, 5.600%, 5/01/14 (4) | | | | | No Opt. Call | | | | N/R | | | | 1,488,053 | |
| | | | | |
| | 1,020 | | | Mediterra South Community Development District, Collier County, Florida, Capital Improvement Revenue Bonds, Refunding Series 2012, 5.100%, 5/01/31 | | | | | 5/22 at 100.00 | | | | BBB– | | | | 1,059,913 | |
| | | | | |
| | 1,275 | | | Mediterra South Community Development District, Collier County, Florida, Capital Improvement Revenue Bonds, Series 2003A, 6.375%, 5/01/34 | | | | | No Opt. Call | | | | N/R | | | | 1,293,500 | |
| | | | | |
| | 2,880 | | | Miami-Dade County, Florida, Aviation Revenue Bonds, Miami International Airport, Tender Option Bond Trust Series 1009,
18.598%, 10/01/41 (IF) (5) | | | | | 10/20 at 100.00 | | | | A | | | | 4,496,918 | |
| | | | | |
| | 3,500 | | | Miami-Dade County, Florida, Aviation Revenue Bonds, Series 2008, Trust 1145, 17.650%, 4/01/32 – AGC Insured (Alternative Minimum Tax) (IF) (5) | | | | | 10/18 at 100.00 | | | | AA– | | | | 5,212,480 | |
| | | | | |
| | 3,210 | | | Miami-Dade County, Florida, Public Facilities Revenue Bonds, Jackson Health System, Tender Option Bond Trust 3271, 20.699%, 6/01/17 – AGM Insured (IF) | | | | | No Opt. Call | | | | AA– | | | | 4,675,493 | |
| | | | | |
| | | | Miami-Dade County, Florida, Subordinate Special Obligation Bonds, Series 2005A: | | | | | | | | | | | | | | |
| | 900 | | | 0.000%, 10/01/33 – NPFG Insured | | | | | 10/15 at 39.62 | | | | A+ | | | | 319,473 | |
| | 700 | | | 0.000%, 10/01/35 – NPFG Insured | | | | | 10/15 at 35.68 | | | | A+ | | | | 223,328 | |
| | 3,785 | | | 0.000%, 10/01/37 – NPFG Insured | | | | | 10/15 at 32.05 | | | | A+ | | | | 1,081,337 | |
| | 9,675 | | | 0.000%, 10/01/38 – NPFG Insured | | | | | 10/15 at 30.36 | | | | A+ | | | | 2,618,152 | |
| | 10,680 | | | 0.000%, 10/01/39 – NPFG Insured | | | | | 10/15 at 28.76 | | | | A+ | | | | 2,737,070 | |
| | | | | |
| | | | Miami-Dade County, Florida, Subordinate Special Obligation Bonds, Series 2009: | | | | | | | | | | | | | | |
| | 24,650 | | | 0.000%, 10/01/39 | | | | | No Opt. Call | | | | A+ | | | | 6,820,902 | |
| | 1,000 | | | 0.000%, 10/01/41 | | | | | No Opt. Call | | | | A+ | | | | 247,660 | |
| | 4,200 | | | 0.000%, 10/01/42 | | | | | No Opt. Call | | | | A+ | | | | 990,948 | |
| | 280 | | | 0.000%, 10/01/44 | | | | | No Opt. Call | | | | A+ | | | | 60,197 | |
| | 4,810 | | | 0.000%, 10/01/45 | | | | | No Opt. Call | | | | A+ | | | | 981,673 | |
| | 22,300 | | | 0.000%, 10/01/47 | | | | | No Opt. Call | | | | A+ | | | | 4,057,708 | |
| | | | | |
| | | | Miami-Dade County, Florida, Water and Sewer System Revenue Bonds, Tender Option Bond Trust 11834: | | | | | | | | | | | | | | |
| | 3,750 | | | 17.375%, 10/01/33 – AGM Insured (IF) | | | | | 10/20 at 100.00 | | | | Aa2 | | | | 5,673,450 | |
| | 2,065 | | | 17.355%, 10/01/33 – AGM Insured (IF) | | | | | 10/20 at 100.00 | | | | Aa2 | | | | 3,122,879 | |
| | | | | |
| | | | Mid-Bay Bridge Authority, Florida, Springing Lien Revenue Bonds, Series 2011: | | | | | | | | | | | | | | |
| | 1,500 | | | 7.250%, 10/01/34 | | | | | 10/21 at 100.00 | | | | BBB | | | | 1,921,590 | |
| | 12,350 | | | 7.250%, 10/01/40 | | | | | 10/21 at 100.00 | | | | BBB | | | | 15,779,348 | |
| | | | | |
| | | | Midtown Miami Community Development District, Florida, Special Assessment Revenue Bonds, Parking Garage Project, Series 2004A: | | | | | | | | | | | | | | |
| | 305 | | | 6.000%, 5/01/24 | | | | | 5/14 at 100.00 | | | | N/R | | | | 309,108 | |
| | 14,250 | | | 6.250%, 5/01/37 | | | | | 5/14 at 100.00 | | | | N/R | | | | 14,476,433 | |
Portfolio of Investments
Nuveen High Yield Municipal Bond Fund (continued)
April 30, 2013
| | | | | | | | | | | | | | | | | | |
Principal
Amount (000) | | | Description (1) | | | | Optional Call
Provisions (2) | | | Ratings (3) | | | Value | |
| | | | Florida (continued) | | | | | | | | | | | | | | |
| | | | | |
| $ | 7,560 | | | Midtown Miami Community Development District, Florida, Special Assessment Revenue Bonds, Series 2004B, 6.500%, 5/01/37 | | | | | 5/14 at 100.00 | | | | N/R | | | $ | 7,698,424 | |
| | | | | |
| | 1,270 | | | Mira Lago West Community Development District, Florida, Capital Improvement Revenue Bonds, Series 2005, 5.375%, 5/01/36 | | | | | 5/15 at 101.00 | | | | N/R | | | | 1,306,271 | |
| | | | | |
| | | | Miromar Lakes Community Development District, Lee County, Florida, Capital Improvement Revenue Bonds, Refunding Series 2012: | | | | | | | | | | | | | | |
| | 1,715 | | | 4.875%, 5/01/22 | | | | | No Opt. Call | | | | N/R | | | | 1,731,807 | |
| | 3,695 | | | 5.375%, 5/01/32 | | | | | 5/23 at 100.00 | | | | N/R | | | | 3,766,277 | |
| | | | | |
| | 3,360 | | | Myrtle Creek Improvement District, Florida, Special Assessment Revenue Bonds, Series 2006A, 5.200%, 5/01/37 | | | | | 5/16 at 100.00 | | | | N/R | | | | 3,133,435 | |
| | | | | |
| | 1,265 | | | Naturewalk Community Development District, Florida, Capital Improvement Revenue Bonds, Series 2007A, 5.500%, 5/01/38 (4) | | | | | 5/17 at 100.00 | | | | N/R | | | | 634,967 | |
| | | | | |
| | 2,320 | | | Naturewalk Community Development District, Florida, Capital Improvement Revenue Bonds, Series 2007B, 5.300%, 5/01/16 (4) | | | | | No Opt. Call | | | | N/R | | | | 1,163,874 | |
| | | | | |
| | 1,955 | | | Northern Palm Beach County Improvement District, Florida, Revenue Bonds, Water Control and Improvement Development Unit 46B, Series 2007A, 5.350%, 8/01/41 | | | | | 8/17 at 100.00 | | | | N/R | | | | 1,968,118 | |
| | | | | |
| | | | Northern Palm Beach County Improvement District, Florida, Special Assessment Revenue Bonds, Water Control and Improvement Refunding Bonds, Development Unit 16, Series 2012: | | | | | | | | | | | | | | |
| | 2,870 | | | 5.125%, 8/01/22 | | | | | No Opt. Call | | | | N/R | | | | 3,019,871 | |
| | 2,755 | | | 5.750%, 8/01/32 | | | | | 8/22 at 100.00 | | | | N/R | | | | 2,937,877 | |
| | | | | |
| | 1,000 | | | Old Palm Community Development District, Florida, Special Assessment Bonds, Palm Beach Gardens, Series 2004A, 5.900%, 5/01/35 | | | | | 5/15 at 101.00 | | | | N/R | | | | 1,034,900 | |
| | | | | |
| | | | Orange County Health Facilities Authority, Florida, Hospital Revenue Bonds, Orlando Health, Inc., Tender Option Bond Trust 1071: | | | | | | | | | | | | | | |
| | 580 | | | 16.767%, 10/01/42 (IF) (5) | | | | | 4/22 at 100.00 | | | | A | | | | 818,815 | |
| | 885 | | | 16.779%, 10/01/42 (IF) (5) | | | | | 4/22 at 100.00 | | | | A | | | | 1,249,664 | |
| | 1,915 | | | 16.781%, 10/01/42 (IF) (5) | | | | | 4/22 at 100.00 | | | | A | | | | 2,704,172 | |
| | 945 | | | 16.781%, 10/01/42 (IF) (5) | | | | | 4/22 at 100.00 | | | | A | | | | 1,334,425 | |
| | 2,310 | | | 16.784%, 10/01/42 (IF) (5) | | | | | 4/22 at 100.00 | | | | A | | | | 3,262,159 | |
| | 500 | | | 16.802%, 10/01/42 (IF) (5) | | | | | 4/22 at 100.00 | | | | A | | | | 706,320 | |
| | 700 | | | 16.802%, 10/01/42 (IF) (5) | | | | | 4/22 at 100.00 | | | | A | | | | 988,848 | |
| | 625 | | | 16.802%, 10/01/42 (IF) (5) | | | | | 4/22 at 100.00 | | | | A | | | | 882,900 | |
| | 625 | | | 16.802%, 10/01/42 (IF) (5) | | | | | 4/22 at 100.00 | | | | A | | | | 882,900 | |
| | 1,750 | | | 16.822%, 10/01/42 (IF) (5) | | | | | 4/22 at 100.00 | | | | A | | | | 2,472,120 | |
| | 2,000 | | | 16.822%, 10/01/42 (IF) (5) | | | | | 4/22 at 100.00 | | | | A | | | | 2,825,280 | |
| | | | | |
| | 5,725 | | | Orchid Grove Community Development District, Florida, Special Assessment Bonds, Series 2005, 5.450%, 5/01/36 | | | | | 5/15 at 101.00 | | | | N/R | | | | 5,506,649 | |
| | | | | |
| | 595 | | | Palm Beach County Health Facilities Authority, Florida, Hospital Revenue Refunding Bonds, BRCH Corporation Obligated Group, Series 2001, 5.500%, 12/01/21 | | | | | 6/13 at 100.00 | | | | BBB– | | | | 596,488 | |
| | | | | |
| | 5,510 | | | Palm Glades Community Development District, Florida, Special Assessment Bonds, Series 2006A, 5.300%, 5/01/36 | | | | | 5/16 at 100.00 | | | | N/R | | | | 5,532,701 | |
| | | | | |
| | 2,150 | | | Panther Trails Community Development District, Florida, Special Assessment Bonds, Series 2011, 7.150%, 11/01/41 | | | | | 11/18 at 100.00 | | | | N/R | | | | 2,320,710 | |
| | | | | |
| | | | Pelican Marsh Community Development District, Florida, Special Assessment Revenue Bonds, Refunding Series 2012: | | | | | | | | | | | | | | |
| | 745 | | | 4.875%, 5/01/22 | | | | | No Opt. Call | | | | N/R | | | | 751,757 | |
| | 1,620 | | | 5.375%, 5/01/31 | | | | | 5/22 at 100.00 | | | | N/R | | | | 1,640,169 | |
| | | | | |
| | 14,085 | | | Pine Island Community Development District, Florida, Special Assessment Bonds, Bella Collina, Series 2004, 5.750%, 5/01/35 | | | | | 7/13 at 100.00 | | | | N/R | | | | 13,941,051 | |
| | | | | |
| | 2,675 | | | Pine Ridge Plantation Community Development District, Florida, Capital Improvement Revenue Bonds, Series 2006A, 5.400%, 5/01/37 | | | | | 5/15 at 100.00 | | | | N/R | | | | 1,800,997 | |
| | | | | |
| | 575 | | | Poinciana West Community Development District, Florida, Special Assessment Bonds, Series 2007, 6.000%, 5/01/37 | | | | | 5/17 at 100.00 | | | | N/R | | | | 581,095 | |
| | | | | | | | | | | | | | | | | | |
Principal
Amount (000) | | | Description (1) | | | | Optional Call
Provisions (2) | | | Ratings (3) | | | Value | |
| | | | Florida (continued) | | | | | | | | | | | | | | |
| | | | | |
| | | | Port Saint Lucie, Florida, Special Assessment Revenue Bonds, Southwest Annexation District 1B, Series 2007: | | | | | | | | | | | | | | |
| $ | 4,700 | | | 5.000%, 7/01/27 – NPFG Insured | | | | | 7/17 at 100.00 | | | | Baa2 | | | $ | 5,024,723 | |
| | 5,510 | | | 5.000%, 7/01/33 – NPFG Insured | | | | | 7/17 at 100.00 | | | | Baa2 | | | | 5,835,476 | |
| | 315 | | | 5.000%, 7/01/40 – NPFG Insured | | | | | 7/17 at 100.00 | | | | Baa2 | | | | 331,607 | |
| | | | | |
| | 2,635 | | | Punta Gorda Housing Authority, Florida, Gulf Breeze Apartments Multifamily Housing Revenue Bonds, Series 2007A, 6.125%, 1/01/45 (Mandatory put 11/01/24) (Alternative Minimum Tax) | | | | | 1/22 at 100.00 | | | | N/R | | | | 2,692,443 | |
| | | | | |
| | | | Randal Park Community Development District, Orlando, Florida, Special Assessment Revenue Bonds, Series 2012: | | | | | | | | | | | | | | |
| | 500 | | | 5.750%, 11/01/22 | | | | | No Opt. Call | | | | N/R | | | | 511,010 | |
| | 1,250 | | | 6.125%, 11/01/32 | | | | | No Opt. Call | | | | N/R | | | | 1,306,038 | |
| | 1,000 | | | 6.875%, 11/01/42 | | | | | 11/32 at 100.00 | | | | N/R | | | | 1,050,200 | |
| | | | | |
| | 4,445 | | | Renaissance Commons Community Development District, Florida, Special Assessment Bonds, Series 2005A, 5.600%, 5/01/36 | | | | | 5/15 at 100.00 | | | | N/R | | | | 3,831,812 | |
| | | | | |
| | | | Renaissance Community Development District, Lee County, Florida, Special Assessment Bonds, Refunding Series 2012: | | | | | | | | | | | | | | |
| | 1,665 | | | 4.900%, 5/01/22 | | | | | No Opt. Call | | | | N/R | | | | 1,708,024 | |
| | 3,250 | | | 5.550%, 5/01/33 | | | | | 5/22 at 100.00 | | | | N/R | | | | 3,318,543 | |
| | | | | |
| | | | Reunion East Community Development District, Osceola County, Florida, Special Assessment Bonds, Series 2002A: | | | | | | | | | | | | | | |
| | 3,500 | | | 7.375%, 5/01/33 (4) | | | | | 7/13 at 100.00 | | | | N/R | | | | 3,571,680 | |
| | 1,550 | | | 7.375%, 5/01/33 (4) | | | | | 7/13 at 100.00 | | | | N/R | | | | 852,578 | |
| | | | | |
| | 1,965 | | | Reunion East Community Development District, Osceola County, Florida, Special Assessment Bonds, Series 2005, 5.800%, 5/01/36 (4) | | | | | 7/13 at 100.00 | | | | N/R | | | | 1,080,848 | |
| | | | | |
| | 2,945 | | | Reunion West Community Development District, Florida, Special Assessment Bonds, Series 2004A-1, 6.250%, 5/01/36 | | | | | 5/22 at 100.00 | | | | N/R | | | | 2,849,553 | |
| | | | | |
| | 1,960 | | | Sail Harbor Community Development District, Florida, Special Assessment Revenue Bonds, Series 05A, 5.500%, 5/01/36 – RAAI Insured | | | | | 5/14 at 100.00 | | | | N/R | | | | 2,002,669 | |
| | | | | |
| | | | Saint Lucie West Services District, Florida, Utility Revenue Bonds, Series 2004: | | | | | | | | | | | | | | |
| | 2,140 | | | 5.250%, 10/01/34 – NPFG Insured | | | | | 10/14 at 101.00 | | | | Baa2 | | | | 2,219,736 | |
| | 455 | | | 5.000%, 10/01/38 – NPFG Insured | | | | | 10/14 at 101.00 | | | | Baa2 | | | | 470,133 | |
| | | | | |
| | | | Seminole Tribe of Florida, Special Obligation Bonds, Series 2007A, 144A: | | | | | | | | | | | | | | |
| | 3,225 | | | 5.750%, 10/01/22 | | | | | 10/17 at 100.00 | | | | BBB– | | | | 3,579,557 | |
| | 3,000 | | | 5.500%, 10/01/24 | | | | | 10/17 at 100.00 | | | | BBB– | | | | 3,288,660 | |
| | 21,150 | | | 5.250%, 10/01/27 | | | | | 10/17 at 100.00 | | | | BBB– | | | | 22,826,138 | |
| | | | | |
| | 8,335 | | | Somerset Community Development District, Florida, Capital Improvement Revenue Bonds, Series 2005, 5.300%, 5/01/37 | | | | | 5/15 at 101.00 | | | | N/R | | | | 7,218,193 | |
| | | | | |
| | 2,225 | | | South Kendall Community Development District, Miami-Dade County, Florida, Special Assessment Bonds, Series 2008A, 6.750%, 11/01/38 | | | | | 11/16 at 100.00 | | | | N/R | | | | 2,336,317 | |
| | | | | |
| | 8,850 | | | South Miami Health Facilities Authority, Florida, Revenue Bonds, Baptist Health Systems of South Florida, Tender Option Bond Trust 1117, 8.481%, 2/15/28 (IF) | | | | | 8/17 at 100.00 | | | | AA | | | | 9,805,977 | |
| | | | | |
| | | | South Miami Health Facilities Authority, Florida, Revenue Bonds, Baptist Health Systems of South Florida, Tender Option Bond Trust 2749: | | | | | | | | | | | | | | |
| | 750 | | | 17.046%, 8/15/23 (IF) | | | | | 8/17 at 100.00 | | | | AA | | | | 1,126,050 | |
| | 6,250 | | | 15.538%, 8/15/42 (IF) | | | | | 8/17 at 100.00 | | | | AA | | | | 7,795,750 | |
| | | | | |
| | | | South Miami Health Facilities Authority, Florida, Revenue Bonds, Baptist Health Systems of South Florida, Trust 1030: | | | | | | | | | | | | | | |
| | 2,130 | | | 15.651%, 8/15/15 (IF) (5) | | | | | No Opt. Call | | | | AA | | | | 3,197,002 | |
| | 3,835 | | | 15.669%, 8/15/15 (IF) (5) | | | | | No Opt. Call | | | | AA | | | | 5,710,277 | |
| | | | | |
| | 1,225 | | | South Village Community Development District, Clay County, Florida, Capital Improvement Revenue Bonds, Series 2005A, 5.700%, 5/01/35 | | | | | 7/13 at 100.00 | | | | N/R | | | | 1,139,507 | |
| | | | | |
| | 4,120 | | | South-Dade Venture Community Development District, Florida, Special Assessment Revenue Bonds, Refunding Series 2012, 5.125%, 5/01/33 | | | | | 5/22 at 100.00 | | | | BBB– | | | | 4,373,627 | |
Portfolio of Investments
Nuveen High Yield Municipal Bond Fund (continued)
April 30, 2013
| | | | | | | | | | | | | | | | | | |
Principal
Amount (000) | | | Description (1) | | | | Optional Call
Provisions (2) | | | Ratings (3) | | | Value | |
| | | | Florida (continued) | | | | | | | | | | | | | | |
| | | | | |
| $ | 8,500 | | | St. Johns County Industrial Development Authority, Florida, Health Care Revenue Bonds, Glenmoor at Saint Johns, Series 2006A, 5.375%, 1/01/40 (4) | | | | | 10/16 at 100.00 | | | | N/R | | | $ | 6,061,350 | |
| | | | | |
| | 945 | | | Stoenbrier Community Development District, Hillsborough County Florida, Special Assessment Bonds, Series 2006, 5.500%, 5/01/37 | | | | | 5/16 at 100.00 | | | | N/R | | | | 947,325 | |
| | | | | |
| | | | Terra Bella Community Development District, Pasco County, Florida, Special Assessment Bonds, Series 2011A: | | | | | | | | | | | | | | |
| | 510 | | | 6.750%, 11/01/27 | | | | | 11/18 at 100.00 | | | | N/R | | | | 544,400 | |
| | 2,505 | | | 7.850%, 11/01/41 | | | | | 11/18 at 100.00 | | | | N/R | | | | 2,713,391 | |
| | | | | |
| | 9,425 | | | Tolomato Community Development District, Florida, Special Assessment Bonds, Convertible, Capital Appreciation, Series 2012A-2, 0.000%, 5/01/39 | | | | | 5/17 at 100.00 | | | | N/R | | | | 7,207,769 | |
| | | | | |
| | 22,305 | | | Tolomato Community Development District, Florida, Special Assessment Bonds, Convertible, Capital Appreciation, Series 2012A-3, 0.000%, 5/01/40 | | | | | 5/19 at 100.00 | | | | N/R | | | | 13,962,930 | |
| | | | | |
| | 11,625 | | | Tolomato Community Development District, Florida, Special Assessment Bonds, Convertible, Capital Appreciation, Series 2012A-4, 0.000%, 5/01/40 | | | | | 5/22 at 100.00 | | | | N/R | | | | 5,417,250 | |
| | | | | |
| | | | Tolomato Community Development District, Florida, Special Assessment Bonds, Hope Note, Series 2007-3: | | | | | | | | | | | | | | |
| | 340 | | | 6.375%, 5/01/17 (4) | | | | | No Opt. Call | | | | N/R | | | | 3 | |
| | 1,560 | | | 6.450%, 5/01/23 (4) | | | | | 5/18 at 100.00 | | | | N/R | | | | 16 | |
| | 2,060 | | | 6.550%, 5/01/27 (4) | | | | | 5/18 at 100.00 | | | | N/R | | | | 21 | |
| | 10,065 | | | 6.650%, 5/01/40 (4) | | | | | 5/18 at 100.00 | | | | N/R | | | | 101 | |
| | | | | |
| | 12,095 | | | Tolomato Community Development District, Florida, Special Assessment Bonds, Hope Note, Series 2007A-2, 5.250%, 5/01/39 (4) | | | | | 5/17 at 100.00 | | | | N/R | | | | 121 | |
| | | | | |
| | | | Tolomato Community Development District, Florida, Special Assessment Bonds, Non Performing Parcel Series 2007-1. RMKT: | | | | | | | | | | | | | | |
| | 60 | | | 6.375%, 5/01/17 (4) | | | | | No Opt. Call | | | | N/R | | | | 34,502 | |
| | 205 | | | 6.450%, 5/01/23 (4) | | | | | 5/18 at 100.00 | | | | N/R | | | | 112,879 | |
| | 260 | | | 6.550%, 5/01/27 (4) | | | | | 5/18 at 100.00 | | | | N/R | | | | 142,090 | |
| | 1,280 | | | 6.650%, 5/01/40 (4) | | | | | 5/18 at 100.00 | | | | N/R | | | | 693,696 | |
| | | | | |
| | 5,460 | �� | | Tolomato Community Development District, Florida, Special Assessment Bonds, Non Performing Parcel Series 2007A-1. RMKT,
5.250%, 5/01/39 (4) | | | | | 5/17 at 100.00 | | | | N/R | | | | 2,980,123 | |
| | | | | |
| | | | Tolomato Community Development District, Florida, Special Assessment Bonds, Refunding Series 2012A-1: | | | | | | | | | | | | | | |
| | 580 | | | 6.375%, 5/01/17 | | | | | No Opt. Call | | | | N/R | | | | 568,893 | |
| | 2,655 | | | 6.450%, 5/01/23 | | | | | 5/17 at 100.00 | | | | N/R | | | | 2,623,698 | |
| | 3,460 | | | 6.550%, 5/01/27 | | | | | 5/17 at 100.00 | | | | N/R | | | | 3,433,739 | |
| | 2,350 | | | 5.250%, 5/01/39 | | | | | 5/17 at 100.00 | | | | N/R | | | | 2,313,317 | |
| | 16,805 | | | 6.650%, 5/01/40 | | | | | 5/17 at 100.00 | | | | N/R | | | | 17,270,330 | |
| | | | | |
| | 39,900 | | | Tolomato Community Development District, Florida, Special Assessment Bonds, Series 2006, 5.400%, 5/01/37 | | | | | 5/14 at 101.00 | | | | BB | | | | 39,918,753 | |
| | | | | |
| | | | Tolomato Community Development District, Florida, Special Assessment Bonds, Southern/Forbearance Parcel Series 2007-2: | | | | | | | | | | | | | | |
| | 1,970 | | | 6.375%, 5/01/17 (4) | | | | | No Opt. Call | | | | N/R | | | | 794,383 | |
| | 6,180 | | | 6.450%, 5/01/23 (4) | | | | | 5/18 at 100.00 | | | | N/R | | | | 2,484,298 | |
| | 8,045 | | | 6.550%, 5/01/27 (4) | | | | | 5/18 at 100.00 | | | | N/R | | | | 3,232,803 | |
| | 39,075 | | | 6.650%, 5/01/40 (4) | | | | | 5/18 at 100.00 | | | | N/R | | | | 15,693,302 | |
| | | | | |
| | 10,500 | | | Trails Community Development District, Florida, Special Assessment Bonds, Series 2007, 5.375%, 5/01/38 (4) | | | | | 5/16 at 100.00 | | | | N/R | | | | 7,122,150 | |
| | | | | |
| | | | Triple Creek Community Development District, Hillsborough County, Florida, Special Assessment Bonds, Series 2012: | | | | | | | | | | | | | | |
| | 750 | | | 6.750%, 11/01/32 – AGM Insured | | | | | No Opt. Call | | | | N/R | | | | 781,568 | |
| | 650 | | | 6.125%, 11/01/32 – AGM Insured | | | | | No Opt. Call | | | | N/R | | | | 683,053 | |
| | | | | | | | | | | | | | | | | | |
Principal
Amount (000) | | | Description (1) | | | | Optional Call
Provisions (2) | | | Ratings (3) | | | Value | |
| | | | Florida (continued) | | | | | | | | | | | | | | |
| | | | | |
| | | | Venetian Community Development District, Sarasota County, Florida, Capital Improvement Revenue Bonds, Series 2012-A1: | | | | | | | | | | | | | | |
| $ | 590 | | | 5.000%, 5/01/23 | | | | | 5/22 at 100.00 | | | | N/R | | | $ | 615,234 | |
| | 500 | | | 5.500%, 5/01/34 | | | | | 5/22 at 100.00 | | | | N/R | | | | 517,580 | |
| | 500 | | | 6.125%, 5/01/42 | | | | | 5/22 at 100.00 | | | | N/R | | | | 512,680 | |
| | | | | |
| | | | Venetian Community Development District, Sarasota County, Florida, Capital Improvement Revenue Bonds, Series 2012-A2: | | | | | | | | | | | | | | |
| | 1,630 | | | 5.000%, 5/01/23 | | | | | 5/22 at 100.00 | | | | N/R | | �� | | 1,717,922 | |
| | 1,000 | | | 5.500%, 5/01/34 | | | | | 5/22 at 100.00 | | | | N/R | | | | 1,035,160 | |
| | | | | |
| | 5,000 | | | Verandah West Community Development District, Florida, Capital Improvement Revenue Bonds, Refunding Series 2013, 5.000%, 5/01/33 | | | | | 5/23 at 100.00 | | | | N/R | | | | 5,031,300 | |
| | | | | |
| | | | Villa Vizcaya Community Development District, Florida, Special Assessment Revenue Bonds, Series 2007: | | | | | | | | | | | | | | |
| | 1,520 | | | 5.350%, 5/01/13 (4) | | | | | No Opt. Call | | | | N/R | | | | 767,463 | |
| | 1,000 | | | 5.350%, 5/01/17 (4) | | | | | No Opt. Call | | | | N/R | | | | 505,110 | |
| | 1,500 | | | 5.550%, 5/01/39 (4) | | | | | 5/17 at 100.00 | | | | N/R | | | | 758,055 | |
| | | | | |
| | 3,675 | | | Village Center Community Development District, Florida, Recreational Revenue Bonds, Series 2003A, 5.000%, 11/01/32 – NPFG Insured | | | | | 11/13 at 101.00 | | | | Baa2 | | | | 3,714,727 | |
| | | | | |
| | 1,875 | | | Village Center Community Development District, Florida, Recreational Revenue Bonds, Series 2004A, 5.125%, 11/01/36 – NPFG Insured | | | | | 11/14 at 101.00 | | | | Baa2 | | | | 1,927,013 | |
| | | | | |
| | 1,700 | | | Village Center Community Development District, Lake County, Florida, Recreational Revenue Bonds, Series 2001A, 5.200%, 11/01/25 – NPFG Insured | | | | | 7/13 at 100.00 | | | | Baa2 | | | | 1,709,350 | |
| | | | | |
| | 760 | | | Vizcaya in Kendall Community Development District, Florida, Special Assessment Revenue Bonds, Phase One Assessment Area, Refunding Series 2012A-1, 5.600%, 5/01/22 | | | | | No Opt. Call | | | | N/R | | | | 807,447 | |
| | | | | |
| | 3,035 | | | Waters Edge Community Development District, Florida, Capital Improvement Revenue Bonds, Series 2005, 5.300%, 5/01/36 | | | | | 5/15 at 101.00 | | | | N/R | | | | 3,042,496 | |
| | | | | |
| | | | Westchester Community Development District 1, Florida, Special Assessment Bonds, Series 2003: | | | | | | | | | | | | | | |
| | 9,115 | | | 6.000%, 5/01/23 | | | | | 5/14 at 100.00 | | | | N/R | | | | 9,217,453 | |
| | 27,845 | | | 6.125%, 5/01/35 | | | | | 5/14 at 100.00 | | | | N/R | | | | 28,149,067 | |
| | 1,135,070 | | | Total Florida | | | | | | | | | | | | | 1,025,180,407 | |
| | | | Georgia – 1.7% | | | | | | | | | | | | | | |
| | | | | |
| | | | Albany-Dougherty County Hospital Authority, Georgia, Revenue Bonds, Phoebe Putney Memorial Hospital, Tender Option Bond Trust 4732: | | | | | | | | | | | | | | |
| | 575 | | | 13.781%, 12/01/42 (IF) (5) | | | | | 12/22 at 100.00 | | | | AA– | | | | 621,598 | |
| | 1,495 | | | 13.828%, 12/01/37 (IF) (5) | | | | | 12/22 at 100.00 | | | | AA– | | | | 1,645,681 | |
| | 4,135 | | | 13.835%, 12/01/42 (IF) (5) | | | | | 12/22 at 100.00 | | | | AA– | | | | 4,471,465 | |
| | | | | |
| | 6,075 | | | Atlanta, Georgia, Tax Allocation Bonds, Beltline Project Series 2008A. Remarketed, 7.500%, 1/01/31 | | | | | 1/19 at 100.00 | | | | A2 | | | | 7,596,241 | |
| | | | | |
| | 3,000 | | | Atlanta, Georgia, Tax Allocation Bonds, Beltline Project Series 2008C. Remarketed, 7.500%, 1/01/31 | | | | | 1/19 at 100.00 | | | | A2 | | | | 3,751,230 | |
| | | | | |
| | 500 | | | Augusta, Georgia, Airport Revenue Bonds, Series 2005A, 5.150%, 1/01/35 | | | | | 1/15 at 100.00 | | | | Baa2 | | | | 513,355 | |
| | | | | |
| | | | Baldwin County Hospital Authority, Georgia, Revenue Bonds, Oconee Regional Medical Center, Series 1998: | | | | | | | | | | | | | | |
| | 890 | | | 5.250%, 12/01/22 | | | | | 7/13 at 100.00 | | | | B+ | | | | 853,083 | |
| | 95 | | | 5.375%, 12/01/28 | | | | | 6/13 at 100.00 | | | | B+ | | | | 88,400 | |
| | | | | |
| | 10,500 | | | Clayton County Development Authority, Georgia, Special Facilities Revenue Bonds, Delta Air Lines, Inc. Project, Series 2009A, 8.750%, 6/01/29 | | | | | 6/20 at 100.00 | | | | B– | | | | 13,334,895 | |
| | | | | |
| | 12,830 | | | Clayton County Development Authority, Georgia, Special Facilities Revenue Bonds, Delta Air Lines, Inc. Project, Series 2009B, 9.000%, 6/01/35 (Alternative Minimum Tax) | | | | | 6/15 at 100.00 | | | | B– | | | | 14,221,157 | |
Portfolio of Investments
Nuveen High Yield Municipal Bond Fund (continued)
April 30, 2013
| | | | | | | | | | | | | | | | | | |
Principal
Amount (000) | | | Description (1) | | | | Optional Call
Provisions (2) | | | Ratings (3) | | | Value | |
| | | | Georgia (continued) | | | | | | | | | | | | | | |
| | | | | |
| | | | Coffee County Hospital Authority, Georgia, Revenue Bonds, Coffee County Regional Medical Center, Series 2004: | | | | | | | | | | | | | | |
| $ | 3,490 | | | 5.250%, 12/01/22 | | | | | 12/14 at 100.00 | | | | BB– | | | $ | 3,550,098 | |
| | 3,310 | | | 5.000%, 12/01/26 | | | | | 12/14 at 100.00 | | | | BB– | | | | 3,343,762 | |
| | | | | |
| | | | Franklin County Industrial Building Authority, Georgia, Revenue Bonds, Ty Cobb Regional Medical Center Project, Series 2010: | | | | | | | | | | | | | | |
| | 5,300 | | | 7.625%, 12/01/30 | | | | | 12/20 at 100.00 | | | | N/R | | | | 5,979,142 | |
| | 5,200 | | | 8.000%, 12/01/40 | | | | | 12/20 at 100.00 | | | | N/R | | | | 5,839,444 | |
| | 3,500 | | | 8.125%, 12/01/45 | | | | | 12/20 at 100.00 | | | | N/R | | | | 3,925,040 | |
| | | | | |
| | 5,445 | | | Fulton County Development Authority, Georgia, Revenue Bonds, Amana Academy Project, Series 2013A, 6.500%, 4/01/43 | | | | | 4/23 at 100.00 | | | | | | | | 5,484,150 | |
| | | | | |
| | | | Fulton County Residential Care Facilities Authority, Georgia, Revenue Bonds, Elderly Care, Lenbrook Square Project, Series 2006A: | | | | | | | | | | | | | | |
| | 4,500 | | | 5.000%, 7/01/27 | | | | | 7/17 at 100.00 | | | | N/R | | | | 4,570,695 | |
| | 8,000 | | | 5.125%, 7/01/37 | | | | | 7/17 at 100.00 | | | | N/R | | | | 8,056,880 | |
| | 32,400 | | | 5.125%, 7/01/42 | | | | | 7/17 at 100.00 | | | | N/R | | | | 32,606,064 | |
| | | | | |
| | 4,000 | | | Fulton County Residential Care Facilities Authority, Georgia, Revenue Bonds, Elderly Care, Lenbrook Square Project, Series 2006B, 7.300%, 7/01/42 | | | | | 7/17 at 101.00 | | | | N/R | | | | 4,000,520 | |
| | | | | |
| | 1,335 | | | Fulton County Residential Care Facilities Authority, Georgia, Revenue Bonds, St. Anne’s Terrace, Series 2003, 7.625%, 12/01/33 | | | | | 12/13 at 102.00 | | | | N/R | | | | 1,379,696 | |
| | | | | |
| | 200 | | | Fulton County Residential Care Facilities Elderly Authority, Georgia, Revenue Bonds, Canterbury Court, Refunding Series 2004A, 6.125%, 2/15/34 | | | | | 2/14 at 101.00 | | | | N/R | | | | 203,846 | |
| | | | | |
| | 26,359 | | | Georgia Local Governments, Certificates of Participation, Georgia Municipal Association, Series 1998A, 4.750%, 6/01/28 – NPFG Insured | | | | | No Opt. Call | | | | Baa2 | | | | 27,500,608 | |
| | | | | |
| | 750 | | | Main Street Natural Gas Inc., Georgia, Gas Project Revenue Bonds, Series 2006B, 5.000%, 3/15/17 | | | | | No Opt. Call | | | | A | | | | 842,160 | |
| | | | | |
| | 6,195 | | | Main Street Natural Gas Inc., Georgia, Gas Project Revenue Bonds, Series 2007A, 5.500%, 9/15/28 | | | | | No Opt. Call | | | | A | | | | 7,585,282 | |
| | | | | |
| | 1,600 | | | Private Colleges and Universities Authority, Georgia, Revenue Bonds, Mercer University, Series 2012A, 5.000%, 10/01/32 | | | | | 10/21 at 100.00 | | | | Baa2 | | | | 1,758,352 | |
| | 151,679 | | | Total Georgia | | | | | | | | | | | | | 163,722,844 | |
| | | | Guam – 0.5% | | | | | | | | | | | | | | |
| | | | | |
| | | | Guam Government Department of Education, Certificates of Participation, John F. Kennedy High School Project, Series 2010A: | | | | | | | | | | | | | | |
| | 1,000 | | | 6.625%, 12/01/30 | | | | | 12/20 at 100.00 | | | | B | | | | 1,106,310 | |
| | 6,000 | | | 6.875%, 12/01/40 | | | | | 12/20 at 100.00 | | | | B | | | | 6,697,680 | |
| | | | | |
| | 500 | | | Guam Government Waterworks Authority, Water and Wastewater System Revenue Bonds, Series 2005, 5.875%, 7/01/35 | | | | | 7/15 at 100.00 | | | | Ba2 | | | | 518,105 | |
| | | | | |
| | 2,000 | | | Guam Government Waterworks Authority, Water and Wastewater System Revenue Bonds, Series 2010, 5.250%, 7/01/25 | | | | | 7/20 at 100.00 | | | | Ba2 | | | | 2,159,560 | |
| | | | | |
| | | | Guam Government, General Obligation Bonds, 2009 Series A: | | | | | | | | | | | | | | |
| | 6,000 | | | 6.750%, 11/15/29 | | | | | 11/19 at 100.00 | | | | B+ | | | | 6,779,280 | |
| | 29,930 | | | 7.000%, 11/15/39 | | | | | 11/19 at 100.00 | | | | B+ | | | | 34,056,150 | |
| | 45,430 | | | Total Guam | | | | | | | | | | | | | 51,317,085 | |
| | | | Hawaii – 0.3% | | | | | | | | | | | | | | |
| | | | | |
| | 4,001 | | | Hawaii Department of Budget and Finance, Private School Revenue Bonds, Montessori of Maui, Series 2007, 5.500%, 1/01/37 | | | | | 2/17 at 100.00 | | | | N/R | | | | 3,933,103 | |
| | | | | |
| | 5,205 | | | Hawaii Housing Finance and Development Corporation, Multifamily Housing Revenue Bonds, Wilikina Apartments Project, Series 2012A, 6.750%, 5/01/47 | | | | | 5/22 at 100.00 | | | | BBB– | | | | 5,824,811 | |
| | | | | |
| | 9,065 | | | Hawaii State Department of Transportation, Special Facility Revenue Bonds, Continental Airlines Inc., Series 1997, 5.625%, 11/15/27 | | | | | 7/13 at 100.00 | | | | B | | | | 9,065,000 | |
| | | | | | | | | | | | | | | | | | |
Principal
Amount (000) | | | Description (1) | | | | Optional Call
Provisions (2) | | | Ratings (3) | | | Value | |
| | | | Hawaii (continued) | | | | | | | | | | | | | | |
| | | | | |
| $ | 875 | | | Hawaii State Department of Transportation, Special Facility Revenue Bonds, Continental Airlines Inc., Series 2000, 7.000%, 6/01/20 (Alternative Minimum Tax) | | | | | 7/13 at 100.00 | | | | B | | | $ | 875,289 | |
| | | | | |
| | | | Kauai County, Hawaii, Special Tax Bonds, Community Facilities District 2008-1 Kukuiula Development Project, Series 2012: | | | | | | | | | | | | | | |
| | 1,100 | | | 5.625%, 5/15/33 | | | | | 5/22 at 100.00 | | | | N/R | | | | 1,149,082 | |
| | 3,000 | | | 5.750%, 5/15/42 | | | | | 5/22 at 100.00 | | | | N/R | | | | 3,133,140 | |
| | 23,246 | | | Total Hawaii | | | | | | | | | | | | | 23,980,425 | |
| | | | Idaho – 0.1% | | | | | | | | | | | | | | |
| | | | | |
| | 3,875 | | | Harris Ranch Community Infrastructure District 1, Boise, Idaho, Special Assessment Bonds, Assessment Area One, Series 2011, 9.000%, 9/01/40 | | | | | 9/21 at 100.00 | | | | N/R | | | | 4,375,883 | |
| | | | | |
| | 3,000 | | | Idaho Health Facilities Authority, Revenue Bonds, Saint Luke’s Health System Project, Tender Option Bond Trust 1102, 16.774%, 3/01/47 (IF) (5) | | | | | 3/22 at 100.00 | | | | AAA | | | | 4,132,110 | |
| | | | | |
| | 1,000 | | | Idaho Housing and Finance Association Nonprofit Facilities Revenue Bonds, Liberty Charter School, Inc, Series 2008A, 6.000%, 6/01/38 | | | | | 6/18 at 100.00 | | | | BBB | | | | 1,084,480 | |
| | 7,875 | | | Total Idaho | | | | | | | | | | | | | 9,592,473 | |
| | | | Illinois – 7.8% | | | | | | | | | | | | | | |
| | | | | |
| | 1,065 | | | Bellwood, Illinois, General Obligation Bonds, Series 2008, 7.000%, 12/01/29 | | | | | No Opt. Call | | | | N/R | | | | 1,089,026 | |
| | | | | |
| | 7,850 | | | Bolingbrook, Illinois, Sales Tax Revenue Bonds, Series 2005, 6.250%, 1/01/24 | | | | | 1/15 at 102.00 | | | | N/R | | | | 6,089,952 | |
| | | | | |
| | 4,000 | | | Bolingbrook, Illinois, Special Tax Bonds, Special Service Area 1, Forest City Project, Series 2005, 5.900%, 3/01/27 | | | | | 3/15 at 102.00 | | | | N/R | | | | 3,758,440 | |
| | | | | |
| | 3,725 | | | Bolingbrook, Will and DuPage Counties, Illinois, Wastewater Facilities Revenue Bonds, Crossroads Treatment LLC, Series 2005, 6.600%, 1/01/35 | | | | | 1/15 at 102.00 | | | | N/R | | | | 3,575,590 | |
| | | | | |
| | 2,790 | | | Bradley, Illinois, Tax Increment Bonds, Bradley Commons, Series 2007, 6.100%, 1/01/27 | | | | | 1/17 at 102.00 | | | | N/R | | | | 2,841,810 | |
| | | | | |
| | 926 | | | Cary, Illinois, Special Service Area 1 Special Tax Bonds, Series 2006, 5.000%, 3/01/30 – RAAI Insured | | | | | 3/16 at 100.00 | | | | N/R | | | | 941,594 | |
| | | | | |
| | 1,181 | | | Chicago, Illinois, Certificates of Participation Tax Increment Bonds, 35th and State Redevelopment Project, Series 2012, 6.100%, 1/15/29 | | | | | No Opt. Call | | | | N/R | | | | 1,188,579 | |
| | | | | |
| | 7,000 | | | Chicago, Illinois, Certificates of Participation, Tax Increment Allocation Revenue Bonds, Diversey-Narragansett Project, Series 2006, 7.460%, 2/15/26 | | | | | 7/13 at 100.00 | | | | N/R | | | | 5,662,930 | |
| | | | | |
| | 9,525 | | | Chicago, Illinois, Chicago O’Hare International Airport Special Facility Revenue Refunding Bonds, American Air Lines, Inc. Project, Series 2007, 5.500%, 12/01/30 (4) | | | | | 7/13 at 100.00 | | | | N/R | | | | 10,501,313 | |
| | | | | |
| | 335 | | | Chicago, Illinois, Tax Increment Allocation Bonds, Irving/Cicero Redevelopment Project, Series 1998, 7.000%, 1/01/14 | | | | | 7/13 at 100.00 | | | | N/R | | | | 335,911 | |
| | | | | |
| | 40,115 | | | Cook County, Illinois, Recovery Zone Facility Revenue Bonds, Navistar International Corporation Project, Series 2010, 6.500%, 10/15/40 | | | | | 10/20 at 100.00 | | | | B3 | | | | 43,978,476 | |
| | | | | |
| | 2,451 | | | Crystal Lake Special Service Area 46, Illinois, Limited Tax Obligation Bonds, Series 2007, 5.750%, 3/01/36 | | | | | 3/17 at 100.00 | | | | N/R | | | | 2,348,695 | �� |
| | | | | |
| | 355 | | | Deerfield, Illinois, Educational Facility Revenue Bonds, Chicagoland Jewish High School Project, Capital Appreciation Series 2011B, 0.000%, 10/01/31 | | | | | No Opt. Call | | | | N/R | | | | 80,507 | |
| | | | | |
| | 669 | | | Deerfield, Illinois, Educational Facility Revenue Bonds, Chicagoland Jewish High School Project, Series 2011A, 6.000%, 10/01/42 | | | | | 5/14 at 102.00 | | | | N/R | | | | 552,520 | |
| | | | | |
| | 1,800 | | | East Dundee, Illinois, Kane and Cook Counties, Illinois, Limited Obligation Tax Increment Revenue Bonds, Route 25 South Redevelopment Project, Series 2012, 5.250%, 12/01/22 | | | | | No Opt. Call | | | | N/R | | | | 1,816,506 | |
| | | | | |
| | | | Evanston, Illinois, Educational Facility Revenue Bonds, Roycemore School Project, Series 2011: | | | | | | | | | | | | | | |
| | 7,865 | | | 7.750%, 7/01/30 | | | | | 7/21 at 100.00 | | | | N/R | | | | 8,772,464 | |
| | 1,545 | | | 8.000%, 7/01/35 | | | | | 7/21 at 100.00 | | | | N/R | | | | 1,748,507 | |
| | 2,000 | | | 8.250%, 7/01/41 | | | | | 7/21 at 100.00 | | | | N/R | | | | 2,276,000 | |
Portfolio of Investments
Nuveen High Yield Municipal Bond Fund (continued)
April 30, 2013
| | | | | | | | | | | | | | | | | | |
Principal
Amount (000) | | | Description (1) | | | | Optional Call
Provisions (2) | | | Ratings (3) | | | Value | |
| | | | Illinois (continued) | | | | | | | | | | | | | | |
| | | | | |
| $ | 5,000 | | | Gilberts, Illinois. Special Service Area 19 Special Tax Bonds, The Conservancy Project, Series 2006-1, 5.375%, 3/01/16 (4) | | | | | No Opt. Call | | | | N/R | | | $ | 1,752,350 | |
| | | | | |
| | 2,500 | | | Harvey, Cook County, Illinois, Tax Increment Allocation Revenue Bonds, Amended Center Street Redevelopment Project Area, Series 2010, 7.500%, 12/01/19 | | | | | No Opt. Call | | | | N/R | | | | 2,691,525 | |
| | | | | |
| | 3,900 | | | Hillside, Cook County, Illinois, Senior Lien Tax Increment Revenue Bonds, Mannheim Redevelopment Project, Series 2008, 7.000%, 1/01/28 | | | | | 1/18 at 102.00 | | | | N/R | | | | 4,007,952 | |
| | | | | |
| | 790 | | | Illinois Development Finance Authority, Environmental Services Revenue Bonds, Citgo Petroleum Corporation Project, Series 2002, 8.000%, 6/01/32 (Alternative Minimum Tax) | | | | | 7/13 at 100.00 | | | | BB+ | | | | 791,288 | |
| | | | | |
| | 2,000 | | | Illinois Finance Authority Revenue Bonds, Christian Homes, Inc., Refunding Series 2010, 5.500%, 5/15/23 | | | | | 5/15 at 100.00 | | | | BBB– | | | | 2,056,400 | |
| | | | | |
| | 3,250 | | | Illinois Finance Authority, Charter School Revenue Bonds, Chicago Charter School Foundation, Series 2007, 5.000%, 12/01/36 | | | | | 12/16 at 100.00 | | | | BBB+ | | | | 3,356,373 | |
| | | | | |
| | 2,000 | | | Illinois Finance Authority, Charter School Revenue Bonds, Uno Charter School Network, Refunding and Improvement Series 2011A, 7.125%, 10/01/41 | | | | | 10/21 at 100.00 | | | | BBB– | | | | 2,360,240 | |
| | | | | |
| | 45,600 | | | Illinois Finance Authority, Recovery Zone Facility Revenue Bonds, Navistar International Corporation Project, Series 2010, 6.500%, 10/15/40 | | | | | 10/20 at 100.00 | | | | B3 | | | | 49,991,736 | |
| | | | | |
| | 200 | | | Illinois Finance Authority, Revenue and Refunding Bonds, Roosevelt University Project, Series 2009, 6.500%, 4/01/44 | | | | | 10/19 at 100.00 | | | | BBB | | | | 228,296 | |
| | | | | |
| | | | Illinois Finance Authority, Revenue Bonds, Centegra Health System, Tender Option Bond Trust 1122: | | | | | | | | | | | | | | |
| | 1,540 | | | 16.680%, 9/01/38 (IF) (5) | | | | | 9/22 at 100.00 | | | | A– | | | | 2,012,441 | |
| | 1,120 | | | 16.688%, 9/01/38 (IF) (5) | | | | | 9/22 at 100.00 | | | | A– | | | | 1,463,762 | |
| | 3,085 | | | 16.706%, 9/01/38 (IF) (5) | | | | | 9/22 at 100.00 | | | | A– | | | | 4,032,959 | |
| | | | | |
| | | | Illinois Finance Authority, Revenue Bonds, Admiral at Lake Project, Series 2010A: | | | | | | | | | | | | | | |
| | 3,410 | | | 7.750%, 5/15/30 | | | | | 5/20 at 100.00 | | | | N/R | | | | 4,107,788 | |
| | 10,000 | | | 8.000%, 5/15/40 | | | | | 5/20 at 100.00 | | | | N/R | | | | 12,071,900 | |
| | 10,625 | | | 8.000%, 5/15/46 | | | | | 5/20 at 100.00 | | | | N/R | | | | 12,826,394 | |
| | | | | |
| | | | Illinois Finance Authority, Revenue Bonds, Advocate Health Care Network, Tender Option Bonds Trust 1123: | | | | | | | | | | | | | | |
| | 910 | | | 17.781%, 6/01/42 (IF) (5) | | | | | 6/22 at 100.00 | | | | AA | | | | 1,324,232 | |
| | 785 | | | 13.736%, 6/01/47 (IF) (5) | | | | | 6/22 at 100.00 | | | | AA | | | | 726,525 | |
| | 2,500 | | | 13.778%, 6/01/47 (IF) (5) | | | | | 6/22 at 100.00 | | | | AA | | | | 2,313,200 | |
| | 1,500 | | | 13.778%, 6/01/47 (IF) (5) | | | | | 6/22 at 100.00 | | | | AA | | | | 1,387,920 | |
| | 3,765 | | | 13.786%, 6/01/47 (IF) (5) | | | | | 6/22 at 100.00 | | | | AA | | | | 3,483,491 | |
| | 1,810 | | | 13.796%, 6/01/47 (IF) (5) | | | | | 6/22 at 100.00 | | | | AA | | | | 1,674,558 | |
| | | | | |
| | 5,140 | | | Illinois Finance Authority, Revenue Bonds, Central Baptist Village, Series 2007, 5.375%, 11/15/39 | | | | | 11/17 at 100.00 | | | | N/R | | | | 5,109,314 | |
| | | | | |
| | | | Illinois Finance Authority, Revenue Bonds, Children’s Memorial Hospital, Tender Option Bond Trust 1098: | | | | | | | | | | | | | | |
| | 1,500 | | | 18.012%, 8/15/15 – AGC Insured (IF) (5) | | | | | No Opt. Call | | | | AA– | | | | 2,148,000 | |
| | 2,495 | | | 17.163%, 9/01/30 – AGC Insured (IF) (5) | | | | | 3/17 at 100.00 | | | | AA– | | | | 3,235,117 | |
| | 1,730 | | | 17.869%, 8/15/33 – AGC Insured (IF) (5) | | | | | 8/18 at 100.00 | | | | AA– | | | | 2,475,734 | |
| | 1,625 | | | 17.543%, 8/15/39 – AGC Insured (IF) (5) | | | | | 8/18 at 100.00 | | | | AA– | | | | 2,107,040 | |
| | 550 | | | 17.935%, 8/15/47 – AGC Insured (IF) (5) | | | | | 8/18 at 100.00 | | | | AA– | | | | 712,410 | |
| | 625 | | | 18.012%, 8/15/47 – AGC Insured (IF) (5) | | | | | 8/18 at 100.00 | | | | AA– | | | | 810,400 | |
| | | | | |
| | 935 | | | Illinois Finance Authority, Revenue Bonds, De Kalb Supportive Living Project, Series 2007, 6.100%, 12/01/41 (Alternative Minimum Tax) | | | | | 12/17 at 102.00 | | | | N/R | | | | 942,489 | |
| | | | | |
| | 1,000 | | | Illinois Finance Authority, Revenue Bonds, Elmhurst Memorial Healthcare, Series 2008A, 5.625%, 1/01/37 | | | | | 1/18 at 100.00 | | | | Baa2 | | | | 1,119,780 | |
| | | | | |
| | 5,500 | | | Illinois Finance Authority, Revenue Bonds, Friendship Village of Schaumburg, Series 2005A, 5.625%, 2/15/37 | | | | | 2/15 at 100.00 | | | | BB– | | | | 5,562,920 | |
| | | | | | | | | | | | | | | | | | |
Principal
Amount (000) | | | Description (1) | | | | Optional Call
Provisions (2) | | | Ratings (3) | | | Value | |
| | | | Illinois (continued) | | | | | | | | | | | | | | |
| | | | | |
| | | | Illinois Finance Authority, Revenue Bonds, Illinois Institute of Technology, Refunding Series 2006A: | | | | | | | | | | | | | | |
| $ | 11,170 | | | 5.000%, 4/01/31 | | | | | 4/16 at 100.00 | | | | Baa3 | | | $ | 11,199,601 | |
| | 14,250 | | | 5.000%, 4/01/36 | | | | | 4/16 at 100.00 | | | | Baa3 | | | | 14,249,430 | |
| | | | | |
| | 6,000 | | | Illinois Finance Authority, Revenue Bonds, Illinois Institute of Technology, Series 2009, 7.125%, 2/01/34 | | | | | 2/19 at 100.00 | | | | Baa3 | | | | 6,645,780 | |
| | | | | |
| | 2,920 | | | Illinois Finance Authority, Revenue Bonds, Lake Forest College, Series 2012A, 6.000%, 10/01/48 | | | | | 10/22 at 100.00 | | | | BBB– | | | | 3,257,435 | |
| | | | | |
| | 10,550 | | | Illinois Finance Authority, Revenue Bonds, Midwest Regional Medical Center Galena-Stauss Hospital, Series 2006, 6.750%, 10/01/46 | | | | | 10/16 at 100.00 | | | | N/R | | | | 9,443,516 | |
| | | | | |
| | | | Illinois Finance Authority, Revenue Bonds, Montgomery Place Project, Series 2006A: | | | | | | | | | | | | | | |
| | 215 | | | 5.250%, 5/15/15 | | | | | No Opt. Call | | | | N/R | | | | 225,402 | |
| | 2,900 | | | 5.500%, 5/15/26 | | | | | 5/17 at 100.00 | | | | N/R | | | | 3,040,940 | |
| | 11,750 | | | 5.750%, 5/15/38 | | | | | 5/17 at 100.00 | | | | N/R | | | | 12,234,100 | |
| | 350 | | | 5.400%, 5/15/38 | | | | | 7/13 at 100.00 | | | | N/R | | | | 350,193 | |
| | | | | |
| | 3,125 | | | Illinois Finance Authority, Revenue Bonds, Northshore University HealthSystem, Tender Option Bond Trust 3764, 17.853%, 5/01/26 (IF) (5) | | | | | 5/20 at 100.00 | | | | AA | | | | 4,630,625 | |
| | | | | |
| | 560 | | | Illinois Finance Authority, Revenue Bonds, Northwestern Memorial HealthCare, Tender Option Bond Trust 4285, 17.853%, 8/15/20 (IF) (5) | | | | | No Opt. Call | | | | AA+ | | | | 884,666 | |
| | | | | |
| | 34,500 | | | Illinois Finance Authority, Revenue Bonds, Northwestern University, Series 2006, 5.000%, 12/01/42 (UB) | | | | | 12/15 at 100.00 | | | | AAA | | | | 37,699,875 | |
| | | | | |
| | | | Illinois Finance Authority, Revenue Bonds, Northwestern University, Tender Option Bond Trust 11783: | | | | | | | | | | | | | | |
| | 490 | | | 19.678%, 2/15/19 (IF) | | | | | No Opt. Call | | | | AA– | | | | 767,399 | |
| | 625 | | | 19.678%, 2/15/31 (IF) | | | | | 8/19 at 100.00 | | | | AA– | | | | 1,053,475 | |
| | | | | |
| | 1,900 | | | Illinois Finance Authority, Revenue Bonds, OSF Healthcare System, Series 2007A, 5.750%, 11/15/37 (UB) (5) | | | | | 11/17 at 100.00 | | | | A | | | | 2,094,389 | |
| | | | | |
| | | | Illinois Finance Authority, Revenue Bonds, OSF Healthcare System, Tender Option Bond Trust 4702: | | | | | | | | | | | | | | |
| | 1,125 | | | 19.775%, 11/15/33 (IF) (5) | | | | | 11/17 at 100.00 | | | | A | | | | 1,598,861 | |
| | 4,740 | | | 20.797%, 5/15/39 (IF) (5) | | | | | 5/20 at 100.00 | | | | A | | | | 7,810,003 | |
| | 1,705 | | | 20.803%, 5/15/39 (IF) (5) | | | | | 5/20 at 100.00 | | | | A | | | | 2,806,055 | |
| | 4,260 | | | 20.823%, 5/15/39 (IF) (5) | | | | | 5/20 at 100.00 | | | | A | | | | 7,019,117 | |
| | | | | |
| | | | Illinois Finance Authority, Revenue Bonds, OSF Healthcare System, Tender Option Bonds Trust 1115: | | | | | | | | | | | | | | |
| | 6,190 | | | 14.083%, 5/15/41 (IF) (5) | | | | | 5/22 at 100.00 | | | | A | | | | 6,834,689 | |
| | 3,525 | | | 17.107%, 5/15/41 (IF) (5) | | | | | 5/22 at 100.00 | | | | A | | | | 4,848,849 | |
| | 2,500 | | | 17.107%, 5/15/41 (IF) (5) | | | | | 5/22 at 100.00 | | | | A | | | | 3,438,900 | |
| | | | | |
| | 14,545 | | | Illinois Finance Authority, Revenue Bonds, Proctor Hospital, Series 2006, 5.125%, 1/01/25 | | | | | 1/16 at 100.00 | | | | BB+ | | | | 14,380,496 | |
| | | | | |
| | 1,110 | | | Illinois Finance Authority, Revenue Bonds, Provena Health Series 2010A, 6.000%, 5/01/28 | | | | | 5/20 at 100.00 | | | | BBB+ | | | | 1,277,677 | |
| | | | | |
| | 8,120 | | | Illinois Finance Authority, Revenue Bonds, Provena Health, Series 2009A, 7.750%, 8/15/34 | | | | | 8/19 at 100.00 | | | | BBB+ | | | | 10,436,961 | |
| | | | | |
| | 10,505 | | | Illinois Finance Authority, Revenue Bonds, Rogers Park Montessori School, Series 2004, 7.125%, 11/01/34 | | | | | 11/14 at 102.00 | | | | N/R | | | | 10,912,699 | |
| | | | | |
| | 9,040 | | | Illinois Finance Authority, Revenue Bonds, Rush University Medical Center Obligated Group, Series 2009A, 7.250%, 11/01/38 (UB) (5) | | | | | 11/18 at 100.00 | | | | A2 | | | | 11,309,492 | |
| | | | | |
| | 2,450 | | | Illinois Finance Authority, Revenue Bonds, Rush University Medical Center Obligated Group, Series 2009B, 7.250%, 11/01/38 (UB) (5) | | | | | 11/18 at 100.00 | | | | A2 | | | | 3,065,073 | |
| | | | | |
| | 5,550 | | | Illinois Finance Authority, Revenue Bonds, Rush University Medical Center Obligated Group, Series 2009C, 6.625%, 11/01/39 (UB) (5) | | | | | 5/19 at 100.00 | | | | A2 | | | | 6,778,937 | |
Portfolio of Investments
Nuveen High Yield Municipal Bond Fund (continued)
April 30, 2013
| | | | | | | | | | | | | | | | | | |
Principal
Amount (000) | | | Description (1) | | | | Optional Call
Provisions (2) | | | Ratings (3) | | | Value | |
| | | | Illinois (continued) | | | | | | | | | | | | | | |
| | | | | |
| | | | Illinois Finance Authority, Revenue Bonds, Rush University Medical Center Obligated Group, Tender Option Bonds Trust 1017: | | | | | | | | | | | | | | |
| $ | 300 | | | 22.334%, 11/01/39 (IF) (5) | | | | | 5/19 at 100.00 | | | | A | | | $ | 557,328 | |
| | 315 | | | 23.161%, 11/01/39 (IF) (5) | | | | | 5/19 at 100.00 | | | | A | | | | 591,787 | |
| | 815 | | | 23.271%, 11/01/39 (IF) (5) | | | | | 5/19 at 100.00 | | | | A | | | | 1,534,645 | |
| | 1,065 | | | 23.287%, 11/01/39 (IF) (5) | | | | | 5/19 at 100.00 | | | | A | | | | 2,006,077 | |
| | 3,067 | | | 23.328%, 11/01/39 (IF) (5) | | | | | 5/19 at 100.00 | | | | A | | | | 5,781,970 | |
| | 250 | | | 23.340%, 11/01/39 (IF) (5) | | | | | 5/19 at 100.00 | | | | A | | | | 471,430 | |
| | | | | |
| | | | Illinois Finance Authority, Revenue Bonds, Silver Cross Hospital and Medical Centers, Series 2009: | | | | | | | | | | | | | | |
| | 650 | | | 6.875%, 8/15/38 | | | | | 8/19 at 100.00 | | | | BBB+ | | | | 770,055 | |
| | 23,000 | | | 7.000%, 8/15/44 | | | | | 8/19 at 100.00 | | | | BBB+ | | | | 27,373,220 | |
| | | | | |
| | | | Illinois Finance Authority, Revenue Bonds, Swedish American Hospital, Tender Option Bond Trust 1116: | | | | | | | | | | | | | | |
| | 2,500 | | | 13.998%, 11/15/39 (IF) (5) | | | | | 11/22 at 100.00 | | | | A | | | | 2,621,200 | |
| | 1,405 | | | 16.974%, 11/15/43 (IF) (5) | | | | | 11/22 at 100.00 | | | | A | | | | 1,866,683 | |
| | | | | |
| | | | Illinois Finance Authority, Revenue Bonds, The Carle Foundation, Tender Option Bond Trust 3908: | | | | | | | | | | | | | | |
| | 665 | | | 21.461%, 2/15/19 – AGM Insured (IF) (5) | | | | | No Opt. Call | | | | AA– | | | | 1,146,573 | |
| | 1,030 | | | 21.578%, 2/15/19 – AGM Insured (IF) (5) | | | | | No Opt. Call | | | | AA– | | | | 1,780,128 | |
| | | | | |
| | 2,285 | | | Illinois Finance Authority, Revenue Bonds, The University of Chicago Medical Center, Tender Option Bond Trust 11783-1,
19.678%, 2/15/31 (IF) | | | | | 8/19 at 100.00 | | | | AA– | | | | 3,851,505 | |
| | | | | |
| | | | Illinois Finance Authority, Revenue Bonds, The University of Chicago Medical Center, Tender Option Bond Trust 3907: | | | | | | | | | | | | | | |
| | 3,025 | | | 19.865%, 2/15/19 (IF) (5) | | | | | No Opt. Call | | | | AA– | | | | 4,702,060 | |
| | 4,250 | | | 19.865%, 2/15/35 (IF) (5) | | | | | 2/21 at 100.00 | | | | AA– | | | | 6,606,200 | |
| | | | | |
| | 3,035 | | | Illinois Finance Authority, Revenue Bonds, Three Crowns Park Plaza, Series 2013, 5.250%, 2/15/40 | | | | | 2/23 at 100.00 | | | | | | | | 3,049,750 | |
| | | | | |
| | 3,470 | | | Illinois Finance Authority, Student Housing Revenue Bonds, Educational Advancement Fund Inc., University Center Project, Series 2006B, 5.000%, 5/01/25 | | | | | 11/16 at 100.00 | | | | BBB+ | | | | 3,696,765 | |
| | | | | |
| | | | Illinois Finance Authority, Student Housing Revenue Bonds, MJH Education Assistance Illinois IV LLC, Fullerton Village Project, Series 2004A: | | | | | | | | | | | | | | |
| | 50 | | | 5.000%, 6/01/09 (4) | | | | | No Opt. Call | | | | Ca | | | | 42,994 | |
| | 1,115 | | | 5.000%, 6/01/11 (4) | | | | | No Opt. Call | | | | Ca | | | | 958,755 | |
| | 1,160 | | | 5.000%, 6/01/12 (4) | | | | | No Opt. Call | | | | Ca | | | | 997,449 | |
| | 1,060 | | | 5.000%, 6/01/13 (4) | | | | | No Opt. Call | | | | Ca | | | | 911,462 | |
| | 1,225 | | | 5.000%, 6/01/13 (4) | | | | | No Opt. Call | | | | Ca | | | | 1,053,341 | |
| | 1,290 | | | 5.000%, 6/01/14 (4) | | | | | No Opt. Call | | | | Ca | | | | 1,109,232 | |
| | 7,540 | | | 5.500%, 6/01/19 (4) | | | | | 6/14 at 100.00 | | | | Ca | | | | 6,483,420 | |
| | 6,905 | | | 5.000%, 6/01/24 (4) | | | | | 6/14 at 100.00 | | | | Ca | | | | 5,937,402 | |
| | 14,640 | | | 5.125%, 6/01/35 (4) | | | | | 6/14 at 100.00 | | | | Ca | | | | 12,588,497 | |
| | | | | |
| | 2,600 | | | Illinois Health Facilities Authority, Revenue Bonds, Smith Crossing, Series 2003A, 7.000%, 11/15/32 | | | | | 11/13 at 100.00 | | | | N/R | | | | 2,623,062 | |
| | | | | |
| | 2,030 | | | Illinois Housing Development Authority, Homeowner Mortgage Revenue Bonds, Tender Option Bond Trust 3721, 18.290%, 2/01/33 (IF) (5) | | | | | 8/18 at 100.00 | | | | AA | | | | 2,307,156 | |
| | | | | |
| | 22,010 | | | Illinois Housing Development Authority, Multifamily Housing Revenue Bonds, GNMA Collateralized – Lifelink Developments, Series 2006, 4.850%, 4/20/41 (Alternative Minimum Tax) (UB) (5) | | | | | 4/16 at 100.00 | | | | AA+ | | | | 22,731,708 | |
| | | | | |
| | | | Illinois State, General Obligation Bonds, Series 2012A: | | | | | | | | | | | | | | |
| | 1,700 | | | 5.000%, 3/01/36 | | | | | 3/22 at 100.00 | | | | A2 | | | | 1,822,128 | |
| | 1,600 | | | 5.000%, 3/01/37 | | | | | 3/22 at 100.00 | | | | A2 | | | | 1,710,032 | |
| | | | | |
| | 25,935 | | | Lombard Public Facilities Corporation, Illinois, First Tier Conference Center and Hotel Revenue Bonds, Series 2005A-1, 7.125%, 1/01/36 | | | | | 1/16 at 100.00 | | | | N/R | | | | 17,417,946 | |
| | | | | |
| | | | Lombard Public Facilities Corporation, Illinois, First Tier Conference Center and Hotel Revenue Bonds, Series 2005A-2: | | | | | | | | | | | | | | |
| | 5,260 | | | 5.500%, 1/01/25 – ACA Insured | | | | | 1/16 at 100.00 | | | | CCC | | | | 3,505,737 | |
| | | | | | | | | | | | | | | | | | |
Principal
Amount (000) | | | Description (1) | | | | Optional Call
Provisions (2) | | | Ratings (3) | | | Value | |
| | | | Illinois (continued) | | | | | | | | | | | | | | |
| $ | 3,000 | | | 5.500%, 1/01/30 – ACA Insured | | | | | 1/16 at 100.00 | | | | CCC | | | $ | 1,969,170 | |
| | 12,015 | | | 5.500%, 1/01/36 – ACA Insured | | | | | 1/16 at 100.00 | | | | CCC | | | | 7,888,208 | |
| | | | | |
| | | | Lombard Public Facilities Corporation, Illinois, Second Tier Conference Center and Hotel Revenue Bonds, Series 2005B: | | | | | | | | | | | | | | |
| | 1,595 | | | 5.250%, 1/01/25 | | | | | 1/16 at 100.00 | | | | CCC | | | | 762,091 | |
| | 3,675 | | | 5.250%, 1/01/30 | | | | | 1/16 at 100.00 | | | | CCC | | | | 1,730,888 | |
| | 5,420 | | | 5.250%, 1/01/36 | | | | | 1/16 at 100.00 | | | | CCC | | | | 2,525,720 | |
| | | | | |
| | 12,431 | | | Lombard Public Facilities Corporation, Illinois, Third Tier Conference Center and Hotel Revenue Bonds, Series 2005C-3, 12.000%, 1/01/36 (4) | | | | | 7/18 at 100.00 | | | | N/R | | | | 2,727,484 | |
| | | | | |
| | | | Metropolitan Pier and Exposition Authority, Illinois, McCormick Place Expansion Project Refunding Bonds, Tender Option Bond Trust 3297: | | | | | | | | | | | | | | |
| | 3,500 | | | 17.805%, 6/15/20 (Alternative Minimum Tax) (IF) (5) | | | | | No Opt. Call | | | | AAA | | | | 4,902,415 | |
| | 5,000 | | | 17.811%, 6/15/20 (Alternative Minimum Tax) (IF) (5) | | | | | No Opt. Call | | | | AAA | | | | 7,004,200 | |
| | | | | |
| | 625 | | | Metropolitan Pier and Exposition Authority, Illinois, McCormick Place Expansion Project Refunding Bonds, Tender Option Bond Trust 3861, 17.721%, 6/15/42 (IF) (5) | | | | | 6/22 at 100.00 | | | | AAA | | | | 920,850 | |
| | | | | |
| | 20,000 | | | Metropolitan Pier and Exposition Authority, Illinois, Revenue Bonds, McCormick Place Expansion Project, Series 2002A, 0.000%, 12/15/33 – NPFG Insured | | | | | No Opt. Call | | | | AAA | | | | 8,093,000 | |
| | | | | |
| | 9,300 | | | Metropolitan Pier and Exposition Authority, Illinois, Revenue Bonds, McCormick Place Expansion Project, Tender Option Bond Trust 3220, 18.611%, 6/15/42 (IF) (5) | | | | | 6/20 at 100.00 | | | | AAA | | | | 12,777,456 | |
| | | | | |
| | 3,181 | | | Minooka, Illinois, Special Assessment Bonds, Lakewood Trails Project, Series 2003, 6.625%, 3/01/33 | | | | | 3/15 at 100.00 | | | | N/R | | | | 3,247,197 | |
| | | | | |
| | 4,685 | | | Pingree Grove Village, Illinois, Charter School Revenue Bonds, Cambridge Lakes Learning Center, Series 2007, 6.000%, 6/01/36 | | | | | 6/16 at 102.00 | | | | N/R | | | | 4,343,464 | |
| | | | | |
| | 11,442 | | | Pingree Grove Village, Illinois, Special Service Area 7, Cambridge Lakes Project, Special Tax Bonds, Series 2006-1, 6.000%, 3/01/36 | | | | | 3/16 at 102.00 | | | | N/R | | | | 11,785,146 | |
| | | | | |
| | 7,118 | | | Pingree Grove Village, Illinois, Tax Assessment Bonds, Special Service Area 2 – Cambridge Lakes Project, Series 2005-2, 6.000%, 3/01/35 | | | | | 3/15 at 102.00 | | | | N/R | | | | 7,347,342 | |
| | | | | |
| | 2,106 | | | Plano Special Service Area 1, Illinois, Special Tax Bonds, Lakewood Springs Project, Series 2004A, 6.200%, 3/01/34 | | | | | 3/14 at 102.00 | | | | N/R | | | | 2,164,757 | |
| | | | | |
| | 4,291 | | | Plano Special Service Area 3, Illinois, Special Tax Bonds, Lakewood Springs Project, Series 2005A, 6.100%, 3/01/35 | | | | | 3/15 at 102.00 | | | | N/R | | | | 4,436,937 | |
| | | | | |
| | 3,570 | | | Quad Cities Regional Economic Development Authority, Illinois, Multifamily Housing Revenue Bonds, Heritage Woods of Moline SLF Project, Series 2006, 6.000%, 12/01/41 | | | | | 12/16 at 102.00 | | | | N/R | | | | 3,502,813 | |
| | | | | |
| | — | (10) | | Robbins, Illinois, Resource Recovery Revenue Bonds, Restructuring Project Guaranteed by Foster Wheeler Ltd., Series 1999C, 7.250%, 10/15/24 (Alternative Minimum Tax) | | | | | No Opt. Call | | | | N/R | | | | 194 | |
| | | | | |
| | 2,200 | | | Rosemont, Illinois, Tax Increment Bonds, River Road Hotel Partners Project, Series 2007, 5.100%, 12/30/23 | | | | | 7/13 at 100.00 | | | | N/R | | | | 1,987,458 | |
| | | | | |
| | | | Saint Charles, Kane and DuPage Counties, Illinois, Senior Lien Limited Incremental Sales Tax Revenue Bonds, Series 2008 Zylstra Project: | | | | | | | | | | | | | | |
| | 2,660 | | | 6.950%, 1/01/21 | | | | | 1/18 at 100.00 | | | | N/R | | | | 2,761,293 | |
| | 2,000 | | | 6.950%, 1/01/25 | | | | | 1/18 at 100.00 | | | | N/R | | | | 2,002,100 | |
| | | | | |
| | 3,390 | | | Southwestern Illinois Development Authority Local Government Program Revenue Bonds, Granite City Project, Series 2009C, 7.750%, 3/01/22 | | | | | 3/14 at 100.00 | | | | N/R | | | | 3,443,494 | |
| | | | | |
| | 5,000 | | | Southwestern Illinois Development Authority, Environmental Improvement Revenue Bonds, US Steel Corporation Project, Series 2012, 5.750%, 8/01/42 (Alternative Minimum Tax) | | | | | 8/22 at 100.00 | | | | BB | | | | 5,122,000 | |
| | | | | |
| | 3,050 | | | Southwestern Illinois Development Authority, Local Government Program Revenue Bonds, Granite City Project, Series 2009B, 7.750%, 3/01/22 | | | | | 3/14 at 100.00 | | | | N/R | | | | 3,098,129 | |
| | | | | |
| | 1,000 | | | Southwestern Illinois Development Authority, Revenue Bonds, Anderson Hospital, Series 2006, 5.125%, 8/15/36 | | | | | 2/17 at 100.00 | | | | BBB– | | | | 1,021,320 | |
Portfolio of Investments
Nuveen High Yield Municipal Bond Fund (continued)
April 30, 2013
| | | | | | | | | | | | | | | | | | |
Principal
Amount (000) | | | Description (1) | | | | Optional Call
Provisions (2) | | | Ratings (3) | | | Value | |
| | | | Illinois (continued) | | | | | | | | | | | | | | |
| | | | | |
| $ | 3,140 | | | Springfield, Illinois, Electric Revenue Bonds, Series 2006, 5.000%, 3/01/35 – NPFG Insured | | | | | 3/16 at 100.00 | | | | A | | | $ | 3,264,689 | |
| | | | | |
| | 3,000 | | | Springfield, Sangamon County, Illinois, Special Service Area, Legacy Pointe Ad Valorem Tax Bonds, Series 2010, 7.500%, 3/01/32 | | | | | 3/17 at 102.00 | | | | N/R | | | | 3,204,210 | |
| | | | | |
| | 1,750 | | | Springfield, Sangamon County, Illinois, Special Service Area, Legacy Pointe, Special Assessment Bonds, Series 2009, 7.875%, 3/01/32 | | | | | 3/17 at 102.00 | | | | N/R | | | | 1,891,330 | |
| | | | | |
| | 7,602 | | | Volo Village, Illinois, Special Service Area 3 Special Tax Bonds, Symphony Meadows Project 1, Series 2006, 6.000%, 3/01/36 | | | | | 3/16 at 102.00 | | | | N/R | | | | 6,868,559 | |
| | | | | |
| | 2,204 | | | Waukegan, Illinois, Special Assessment Improvement Bonds, Fountain Square, Series 2005, 6.125%, 3/01/30 | | | | | 3/15 at 102.00 | | | | N/R | | | | 2,018,820 | |
| | | | | |
| | 705 | | | Wayne Village, Illinois, Special Service Area 5 Assessment Bonds, Series 2007, 5.800%, 1/15/23 | | | | | 1/18 at 100.00 | | | | N/R | | | | 684,083 | |
| | | | | |
| | 3,000 | | | Wheeling, Illinois, Tax Increment Revenue Bonds, North Milwaukee/Lake-Cook TIF Project, Series 2005, 6.000%, 1/01/25 | | | | | 7/13 at 102.00 | | | | N/R | | | | 3,020,490 | |
| | | | | |
| | 3,445 | | | Wonder Lake Village, McHenry County, Illinois, Special Tax Bonds, Special Service Area 1 – Woods Creek, Series 2004, 6.750%, 3/01/34 | | | | | 3/14 at 102.00 | | | | N/R | | | | 3,545,525 | |
| | | | | |
| | 2,245 | | | Yorkville United City Business District, Illinois, Storm Water and Water Improvement Project Revenue Bonds, Series 2007, 6.000%, 1/01/26 | | | | | 1/17 at 102.00 | | | | N/R | | | | 1,610,002 | |
| | | | | |
| | 7,155 | | | Yorkville United City, Illinois, Special Service Area 2006-113 Cannoball & Beecher Special Tax Bonds, Series 2007, 5.750%, 3/01/28 | | | | | 3/17 at 102.00 | | | | N/R | | | | 7,303,466 | |
| | | | | |
| | 4,187 | | | Yorkville, Illinois, Special Service Area 2005-108 Assessment Bonds, Autumn Creek Project, Series 2006, 6.000%, 3/01/36 | | | | | 3/16 at 102.00 | | | | N/R | | | | 4,070,099 | |
| | 717,191 | | | Total Illinois | | | | | | | | | | | | | 732,392,085 | |
| | | | Indiana – 2.4% | | | | | | | | | | | | | | |
| | | | | |
| | 1,080 | | | Anderson, Indiana, Multifamily Housing Revenue Bonds, Cross Lakes and Giant Oaks Apartments, Series 2011A, 7.250%, 12/01/45 | | | | | 12/20 at 100.00 | | | | A– | | | | 1,223,413 | |
| | | | | |
| | 660 | | | Carmel Redevelopment District, Indiana, Tax Increment Revenue Bonds, Series 2004A, 6.650%, 7/15/14 | | | | | 7/13 at 101.50 | | | | N/R | | | | 672,830 | |
| | | | | |
| | | | Carmel, Indiana, Revenue Bonds, Barrington of Carmel Project, Series 2012A: | | | | | | | | | | | | | | |
| | 1,000 | | | 7.125%, 11/15/42 | | | | | No Opt. Call | | | | N/R | | | | 1,117,000 | |
| | 1,000 | | | 7.125%, 11/15/47 | | | | | No Opt. Call | | | | N/R | | | | 1,109,170 | |
| | | | | |
| | | | Delaware County Hospital Authority, Indiana, Hospital Revenue Bonds, Cardinal Health System, Series 2006: | | | | | | | | | | | | | | |
| | 5,910 | | | 5.125%, 8/01/29 | | | | | 8/16 at 100.00 | | | | Baa2 | | | | 6,314,185 | |
| | 125 | | | 5.250%, 8/01/36 | | | | | 8/16 at 100.00 | | | | Baa2 | | | | 133,309 | |
| | | | | |
| | 6,360 | | | East Chicago, Indiana, Solid Waste Disposal Revenue Bonds, USG Corporation, Series 1998, 5.500%, 9/01/28 (Alternative Minimum Tax) | | | | | No Opt. Call | | | | B– | | | | 6,272,105 | |
| | | | | |
| | 835 | | | East Chicago, Indiana, Solid Waste Disposal Revenue Bonds, USG Corporation, Series 1999, 6.375%, 8/01/29 | | | | | 7/13 at 100.00 | | | | B– | | | | 835,409 | |
| | | | | |
| | 1,595 | | | Indiana Bond Bank, Special Program Bonds, Hendricks Regional Health Project, Tender Option Bond Trust 10-77W, 19.050%, 4/01/30 – AMBAC Insured (IF) (5) | | | | | No Opt. Call | | | | AA | | | | 3,363,329 | |
| | | | | |
| | 3,750 | | | Indiana Bond Bank, Special Program Gas Revenue Bonds, JPMorgan Ventures Energy Corporation Guaranteed, Tender Option Bond Trust 2882, 17.790%, 4/15/17 (IF) (5) | | | | | No Opt. Call | | | | A2 | | | | 6,570,450 | |
| | | | | |
| | 5,855 | | | Indiana Finance Authority, Educational Facilities Revenue Bonds, 21st Century Charter School Project, Series 2013A, 6.250%, 3/01/43 | | | | | 3/23 at 100.00 | | | | BB– | | | | 5,884,275 | |
| | | | | |
| | 2,400 | | | Indiana Finance Authority, Educational Facilities Revenue Bonds, Drexel Foundation For Educational Excellence, Inc., Series 2009A, 7.000%, 10/01/39 | | | | | 10/19 at 100.00 | | | | BB+ | | | | 2,674,608 | |
| | | | | |
| | 6,560 | | | Indiana Finance Authority, Environmental Improvement Revenue Bonds, United States Steel Corporation Project, Refunding Series 2010, 6.000%, 12/01/26 | | | | | 6/20 at 100.00 | | | | BB | | | | 6,993,354 | |
| | | | | | | | | | | | | | | | | | |
Principal
Amount (000) | | | Description (1) | | | | Optional Call
Provisions (2) | | | Ratings (3) | | | Value | |
| | | | Indiana (continued) | | | | | | | | | | | | | | |
| | | | | |
| $ | 1,330 | | | Indiana Finance Authority, Environmental Improvement Revenue Bonds, United States Steel Corporation Project, Refunding Series 2011, 6.000%, 12/01/19 | | | | | No Opt. Call | | | | BB | | | $ | 1,467,655 | |
| | | | | |
| | 20,000 | | | Indiana Finance Authority, Environmental Improvement Revenue Bonds, United States Steel Corporation Project, Series 2012, 5.750%, 8/01/42 (Alternative Minimum Tax) | | | | | No Opt. Call | | | | BB | | | | 20,488,000 | |
| | | | | |
| | | | Indiana Finance Authority, Hospital Revenue Bonds, King’s Daughters’ Hospital and Health Services, Series 2010: | | | | | | | | | | | | | | |
| | 5,870 | | | 5.500%, 8/15/40 | | | | | 8/20 at 100.00 | | | | BBB+ | | | | 6,437,277 | |
| | 3,855 | | | 5.500%, 8/15/45 | | | | | 8/20 at 100.00 | | | | BBB+ | | | | 4,222,459 | |
| | | | | |
| | 6,000 | | | Indiana Finance Authority, Private Activity Bonds, Ohio River Bridges East End Crossing Project, Series 2013B, 5.000%, 7/01/40 (Alternative Minimum Tax) | | | | | 7/23 at 100.00 | | | | BBB | | | | 6,414,120 | |
| | | | | |
| | | | Indiana Finance Authority, Revenue Bonds, Trinity Health Care Group, Tender Option Bond Trust 3611: | | | | | | | | | | | | | | |
| | 1,250 | | | 18.691%, 6/01/17 (IF) (5) | | | | | No Opt. Call | | | | AA | | | | 1,956,800 | |
| | 3,085 | | | 18.718%, 6/01/17 (IF) (5) | | | | | No Opt. Call | | | | AA | | | | 4,828,673 | |
| | 1,460 | | | 18.783%, 6/01/17 (IF) (5) | | | | | No Opt. Call | | | | AA | | | | 2,284,827 | |
| | 5,000 | | | 15.543%, 12/01/32 (IF) (5) | | | | | 12/19 at 100.00 | | | | AA | | | | 7,827,200 | |
| | 330 | | | 18.691%, 12/01/32 (IF) (5) | | | | | 12/19 at 100.00 | | | | AA | | | | 516,595 | |
| | | | | |
| | | | Indiana Health and Educational Facilities Financing Authority, Revenue Bonds, Ascension Health, Tender Option Bond Trust 3301: | | | | | | | | | | | | | | |
| | 1,500 | | | 17.816%, 5/15/31 (IF) (5) | | | | | 11/16 at 100.00 | | | | AA+ | | | | 2,125,740 | |
| | 2,750 | | | 17.962%, 5/15/31 (IF) (5) | | | | | 11/16 at 100.00 | | | | AA+ | | | | 3,897,190 | |
| | | | | |
| | 1,450 | | | Indiana Health Facility Financing Authority, Revenue Bonds, Community Foundation of Northwest Indiana, Series 2007, 5.500%, 3/01/37 | | | | | 3/17 at 100.00 | | | | A– | | | | 1,580,094 | |
| | | | | |
| | 10,000 | | | Indianapolis Local Public Improvement Bond Bank, Indiana, Waterworks Project Series 2009A, 5.500%, 1/01/38 – AGC Insured (UB) | | | | | 1/19 at 100.00 | | | | AA– | | | | 11,319,100 | |
| | | | | |
| | | | Indianapolis Local Public Improvement Bond Bank, Indiana, Waterworks Project, Tender Option Bond Trust 11779: | | | | | | | | | | | | | | |
| | 310 | | | 19.018%, 1/01/17 – AGC Insured (IF) | | | | | No Opt. Call | | | | AA– | | | | 473,568 | |
| | 2,500 | | | 19.018%, 1/01/17 – AGC Insured (IF) | | | | | No Opt. Call | | | | AA– | | | | 3,819,100 | |
| | 6,250 | | | 19.018%, 1/01/32 – AGC Insured (IF) | | | | | 1/19 at 100.00 | | | | AA– | | | | 9,547,750 | |
| | 4,995 | | | 20.010%, 1/01/32 – AGC Insured (IF) | | | | | 1/19 at 100.00 | | | | AA– | | | | 7,820,222 | |
| | | | | |
| | 970 | | | Monroe County, Indiana, Multifamily Housing Revenue Bonds, Canterbury House Apartments Project, Series 2001B, Pass through Certificates Series 2002-1, 5.900%, 11/01/34 (Mandatory put 11/01/22) | | | | | 7/13 at 100.00 | | | | Baa1 | | | | 970,737 | |
| | | | | |
| | 1,550 | | | Portage, Indiana, Economic Development Revenue Bonds, Ameriplex Project, Series 2006, 5.000%, 1/15/27 | | | | | 7/16 at 100.00 | | | | A | | | | 1,617,983 | |
| | | | | |
| | 3,643 | | | Portage, Indiana, Special Improvement District Revenue Bonds, Marina Shores Project, Series 2005, 6.375%, 3/01/35 (4) | | | | | 3/15 at 102.00 | | | | N/R | | | | 1,276,361 | |
| | | | | |
| | 9,000 | | | Rockport, Indiana, Revenue Bonds, AK Steel Corporation, Series 2012, 7.000%, 6/01/28 (Alternative Minimum Tax) | | | | | 2/22 at 100.00 | | | | B– | | | | 9,507,600 | |
| | | | | |
| | | | St. Joseph County Hospital Authority, Indiana, Revenue Bonds, Madison Center Inc., Series 2005: | | | | | | | | | | | | | | |
| | 3,065 | | | 5.250%, 2/15/23 (4) | | | | | 2/15 at 100.00 | | | | N/R | | | | 342,912 | |
| | 2,500 | | | 5.375%, 2/15/34 (4) | | | | | 2/15 at 100.00 | | | | N/R | | | | 279,700 | |
| | | | | |
| | 2,155 | | | St. Joseph County, Indiana, Economic Development Revenue Bonds, Chicago Trail Village Apartments, Series 2005A, 7.500%, 7/01/35 | | | | | 7/15 at 103.00 | | | | N/R | | | | 2,297,639 | |
| | | | | |
| | 230 | | | St. Joseph County, Indiana, Economic Development Revenue Bonds, Holy Cross Village at Notre Dame, Series 2006A, 5.550%, 5/15/19 | | | | | 7/13 at 100.00 | | | | N/R | | | | 230,278 | |
| | | | | |
| | | | Vigo County Hospital Authority, Indiana, Hospital Revenue Bonds, Union Hospital, Inc., Series 2011: | | | | | | | | | | | | | | |
| | 5,000 | | | 7.750%, 9/01/31 | | | | | 9/21 at 100.00 | | | | N/R | | | | 6,187,450 | |
| | 5,000 | | | 8.000%, 9/01/41 | | | | | 9/21 at 100.00 | | | | N/R | | | | 6,146,100 | |
Portfolio of Investments
Nuveen High Yield Municipal Bond Fund (continued)
April 30, 2013
| | | | | | | | | | | | | | | | | | |
Principal
Amount (000) | | | Description (1) | | | | Optional Call
Provisions (2) | | | Ratings (3) | | | Value | |
| | | | Indiana (continued) | | | | | | | | | | | | | | |
| | | | | |
| | | | Vigo County Hospital Authority, Indiana, Revenue Bonds, Union Hospital, Series 2007: | | | | | | | | | | | | | | |
| $ | 3,000 | | | 5.700%, 9/01/37 | | | | | 9/17 at 100.00 | | | | N/R | | | $ | 3,139,950 | |
| | 15,000 | | | 5.750%, 9/01/42 | | | | | 9/17 at 100.00 | | | | N/R | | | | 15,682,050 | |
| | 32,500 | | | 5.800%, 9/01/47 | | | | | 9/17 at 100.00 | | | | N/R | | | | 34,043,750 | |
| | 198,678 | | | Total Indiana | | | | | | | | | | | | | 221,912,317 | |
| | | | Iowa – 1.5% | | | | | | | | | | | | | | |
| | | | | |
| | 7,000 | | | Iowa Finance Authority, Health Facility Revenue Bonds, Care Initiatives Project, Series 2006A, 5.500%, 7/01/25 | | | | | 7/16 at 100.00 | | | | BB+ | | | | 7,398,930 | |
| | | | | |
| | 91,415 | | | Iowa Finance Authority, Iowa, Midwestern Disaster Area Revenue Bonds, Alcoa Inc. Project, Series 2012, 4.750%, 8/01/42 | | | | | 8/22 at 100.00 | | | | BBB– | | | | 91,408,601 | |
| | | | | |
| | 5,355 | | | Iowa Finance Authority, Multifamily Housing Bonds, Series 2006A, 4.600%, 7/01/41 (UB) | | | | | 7/16 at 100.00 | | | | AA | | | | 5,518,328 | |
| | | | | |
| | 1,000 | | | Iowa Finance Authority, Senior Housing Revenue Bonds, Bethany Life Communities, Series 2006A, 5.550%, 11/01/41 | | | | | 11/13 at 100.00 | | | | N/R | | | | 1,005,070 | |
| | | | | |
| | 2,000 | | | Iowa Higher Education Loan Authority, Private College Facility Revenue Bonds, Upper Iowa University Project, Refunding Series 2010, 5.750%, 9/01/30 | | | | | 9/20 at 100.00 | | | | BBB | | | | 2,277,720 | |
| | | | | |
| | | | Iowa Tobacco Settlement Authority, Asset Backed Settlement Revenue Bonds, Series 2005C: | | | | | | | | | | | | | | |
| | 2,030 | | | 5.375%, 6/01/38 | | | | | 6/15 at 100.00 | | | | B+ | | | | 1,958,138 | |
| | 11,425 | | | 5.500%, 6/01/42 | | | | | 6/15 at 100.00 | | | | B+ | | | | 11,096,874 | |
| | 2,075 | | | 5.625%, 6/01/46 | | | | | 6/15 at 100.00 | | | | B+ | | | | 2,035,181 | |
| | | | | |
| | 9,850 | | | Iowa Tobacco Settlement Authority, Tobacco Asset-Backed Revenue Bonds, Series 2005B, 5.600%, 6/01/34 | | | | | 6/17 at 100.00 | | | | B+ | | | | 9,856,600 | |
| | | | | |
| | 1,490 | | | Pottawattamie County, Iowa, Revenue Bonds, Christian Homes, Inc. Obligated Group, Series 2007E, 5.750%, 5/15/31 | | | | | 5/17 at 100.00 | | | | BBB– | | | | 1,582,112 | |
| | | | | |
| | 2,250 | | | Scott County, Iowa, Revenue Bonds, Ridgecrest Village, Series 2006, 5.250%, 11/15/27 | | | | | 11/16 at 100.00 | | | | BBB– | | | | 2,303,888 | |
| | 135,890 | | | Total Iowa | | | | | | | | | | | | | 136,441,442 | |
| | | | Kansas – 0.6% | | | | | | | | | | | | | | |
| | | | | |
| | 5,405 | | | Fredonia, Kansas, Hospital Revenue Bonds, Series 2007, 6.125%, 8/15/37 | | | | | 8/17 at 100.00 | | | | N/R | | | | 5,545,530 | |
| | | | | |
| | | | Lenexa, Kansas, Health Care Facilities Revenue Bonds, Lakeview Village Inc, Refunding & Improvement Series 2007: | | | | | | | | | | | | | | |
| | 1,650 | | | 5.250%, 5/15/22 | | | | | 5/17 at 100.00 | | | | N/R | | | | 1,728,425 | |
| | 490 | | | 5.500%, 5/15/39 | | | | | 5/17 at 100.00 | | | | N/R | | | | 502,181 | |
| | | | | |
| | 1,000 | | | Manhattan Health Care Facility Revenue Bonds, Kansas, Meadowlarks Hills Retirement, Series 2007B, 5.125%, 5/15/42 | | | | | 5/14 at 103.00 | | | | N/R | | | | 1,002,960 | |
| | | | | |
| | | | Olathe, Kansas, Tax Increment Revenue Bonds, Gateway Area 1 Special Obligation Series 2006: | | | | | | | | | | | | | | |
| | 1,000 | | | 5.000%, 3/01/16 (4) | | | | | No Opt. Call | | | | N/R | | | | 520,310 | |
| | 4,780 | | | 5.000%, 3/01/26 (4) | | | | | 3/16 at 100.00 | | | | N/R | | | | 2,485,982 | |
| | | | | |
| | 2,790 | | | Olathe, Kansas, Transportation Development District Sales Tax Revenue Bonds, Gateway Project Area lA, Series 2006, 5.000%, 12/01/28 (4) | | | | | 12/16 at 100.00 | | | | N/R | | | | 1,118,093 | |
| | | | | |
| | | | Overland Park Development Corporation, Kansas, First Tier Revenue Bonds, Overland Park Convention Center, Series 2007A: | | | | | | | | | | | | | | |
| | 18,500 | | | 5.250%, 1/01/32 – AMBAC Insured | | | | | 1/17 at 100.00 | | | | BB+ | | | | 19,010,600 | |
| | 1,960 | | | 5.125%, 1/01/32 – AMBAC Insured | | | | | 1/17 at 100.00 | | | | BB+ | | | | 2,005,884 | |
| | | | | |
| | 5,000 | | | Overland Park Development Corporation, Kansas, Second Tier Revenue Bonds, Overland Park Convention Center, Series 2007B, 5.125%, 1/01/32 – AMBAC Insured | | | | | 1/17 at 100.00 | | | | BB+ | | | | 5,083,150 | |
| | | | | |
| | 8,910 | | | Overland Park, Kansas, Sales Tax Special Obligation Revenue Bonds, Prairiefire at Lionsgate Project, Series 2012, 6.000%, 12/15/32 | | | | | No Opt. Call | | | | N/R | | | | 8,935,126 | |
| | | | | | | | | | | | | | | | | | |
Principal
Amount (000) | | | Description (1) | | | | Optional Call
Provisions (2) | | | Ratings (3) | | | Value | |
| | | | Kansas (continued) | | | | | | | | | | | | | | |
| | | | | |
| $ | 4,053 | | | Wichita, Kansas, Multifamily Housing Revenue Bonds, Buttonwood Tree Apartments Project, Series 2002-I, 7.350%, 12/01/33 (Alternative Minimum Tax) | | | | | 6/13 at 100.00 | | | | N/R | | | $ | 4,336,096 | |
| | 55,538 | | | Total Kansas | | | | | | | | | | | | | 52,274,337 | |
| | | | Kentucky – 0.2% | | | | | | | | | | | | | | |
| | | | | |
| | 8,000 | | | Kentucky Economic Development Finance Authority, Hospital Facilities Revenue Bonds, Owensboro Medical Health System, Series 2010A, 6.375%, 6/01/40 | | | | | 6/20 at 100.00 | | | | BBB+ | | | | 9,590,320 | |
| | | | | |
| | 3,070 | | | Kentucky Economic Development Finance Authority, Hospital Revenue Bonds, Baptist Healthcare System Obligated Group, Tender Option Bond Trust 1068, 18.123%, 8/15/46 (IF) (5) | | | | | 8/21 at 100.00 | | | | AA– | | | | 4,448,461 | |
| | | | | |
| | 1,000 | | | Kentucky Economic Development Finance Authority, Louisville Arena Project Revenue Bonds, Louisville Arena Authority, Inc., Series 2008-A1, 6.000%, 12/01/33 – AGC Insured | | | | | 6/18 at 100.00 | | | | AA– | | | | 1,097,690 | |
| | | | | |
| | 1,000 | | | Louisville and Jefferson County Metropolitan Government, Kentucky, General Revenue Bonds, Bellarmine University, Series 2008A, 6.000%, 5/01/38 | | | | | 5/18 at 100.00 | | | | Baa3 | | | | 1,102,490 | |
| | | | | |
| | 2,190 | | | Rockcastle County, Kentucky, First Mortgage Revenue Bonds, Rockcastle Hospital and Respiratory Care Center Inc. Project, Series 2005, 5.550%, 6/01/30 | | | | | 6/15 at 100.00 | | | | BBB– | | | | 2,238,399 | |
| | 15,260 | | | Total Kentucky | | | | | | | | | | | | | 18,477,360 | |
| | | | Louisiana – 1.1% | | | | | | | | | | | | | | |
| | | | | |
| | 15,000 | | | Hodge, Louisiana, Combined Utility System Revenue Bonds, Smurfit-Stone Container Corporation, Series 2003, 7.450%, 3/01/24 (Alternative Minimum Tax) (7) | | | | | No Opt. Call | | | | N/R | | | | 1,500 | |
| | | | | |
| | | | Jefferson Parish Hospital Service District 2, Louisiana, Hospital Revenue Bonds, East Jefferson General Hospital, Refunding Series 2011: | | | | | | | | | | | | | | |
| | 4,540 | | | 6.250%, 7/01/31 | | | | | 7/21 at 100.00 | | | | BBB– | | | | 5,407,730 | |
| | 25,365 | | | 6.375%, 7/01/41 | | | | | 7/21 at 100.00 | | | | BBB– | | | | 29,787,134 | |
| | | | | |
| | 1,160 | | | Juban Parc Community Development District, Livingston Parish, Louisiana, Special Assessment Bonds, Series 2006, 5.150%, 10/01/14 (4) | | | | | No Opt. Call | | | | N/R | | | | 383,194 | |
| | | | | |
| | 6,938 | | | Lakeshore Villages Master Community Development District, Louisiana, Special Assessment Revenue Bonds, Series 2007, 5.250%, 7/01/17 (4) | | | | | No Opt. Call | | | | N/R | | | | 2,777,906 | |
| | | | | |
| | 1,000 | | | Louisiana Public Facilities Authority, Revenue Bonds, Belle Chasse Educational Foundation Project, Series 2011, 6.750%, 5/01/41 | | | | | 5/21 at 100.00 | | | | BBB | | | | 1,184,490 | |
| | | | | |
| | | | Louisiana Public Facilities Authority, Revenue Bonds, Lake Charles Charter Academy Foundation Project, Series 2011A: | | | | | | | | | | | | | | |
| | 505 | | | 7.750%, 12/15/31 | | | | | 12/21 at 100.00 | | | | N/R | | | | 567,761 | |
| | 7,425 | | | 8.000%, 12/15/41 | | | | | 12/21 at 100.00 | | | | N/R | | | | 8,396,784 | |
| | | | | |
| | 7,315 | | | Louisiana Local Government Environment Facilities and Community Development Authority, Revenue Bonds, Westlake Chemical Corporation Projects, Series 2009A, 6.500%, 8/01/29 | | | | | 8/20 at 100.00 | | | | BBB– | | | | 8,881,800 | |
| | | | | |
| | 750 | | | Louisiana Local Government Environment Facilities and Community Development Authority, Revenue Bonds, Westlake Chemical Corporation Projects, Series 2010A-2, 6.500%, 11/01/35 | | | | | 11/20 at 100.00 | | | | BBB– | | | | 901,725 | |
| | | | | |
| | 11,440 | | | Louisiana Local Government Environmental Facilities & Community Development Authority, Revenue Bonds, Westlake Chemical Corporation Project, Series 2007, 6.750%, 11/01/32 | | | | | 11/17 at 100.00 | | | | BBB– | | | | 13,094,338 | |
| | | | | |
| | 590 | | | Louisiana Local Government Environmental Facilities and Community Development Authority, Revenue Bonds, Capital Projects and Equipment Acquisition Program, Series 2000A, 6.300%, 7/01/30 – AMBAC Insured | | | | | No Opt. Call | | | | N/R | | | | 666,665 | |
| | | | | |
| | 9,535 | | | Louisiana Local Government Environmental Facilities and Community Development Authority, Revenue Bonds, CDF Healthcare of Louisiana LLC, Series 2006A, 7.000%, 6/01/36 | | | | | 6/16 at 101.00 | | | | N/R | | | | 9,776,617 | |
Portfolio of Investments
Nuveen High Yield Municipal Bond Fund (continued)
April 30, 2013
| | | | | | | | | | | | | | | | | | |
Principal
Amount (000) | | | Description (1) | | | | Optional Call
Provisions (2) | | | Ratings (3) | | | Value | |
| | | | Louisiana (continued) | | | | | | | | | | | | | | |
| | | | | |
| $ | 6,100 | | | Louisiana Local Government Environmental Facilities and Community Development Authority, Revenue Bonds, Southgate Suites Hotel LLC Project, Series 2007A, 6.750%, 12/15/37 (4) | | | | | 12/17 at 100.00 | | | | N/R | | | $ | 2,738,656 | |
| | | | | |
| | | | Louisiana Local Government Environmental Facilities and Community Development Authority, Revenue Bonds, Woman’s Hospital Foundation Project, Tender Option Bonds Trust 1012: | | | | | | | | | | | | | | |
| | 3,315 | | | 20.273%, 10/01/40 (IF) (5) | | | | | 10/20 at 100.00 | | | | A3 | | | | 5,567,808 | |
| | 1,375 | | | 20.285%, 10/01/40 (IF) (5) | | | | | 10/20 at 100.00 | | | | A3 | | | | 2,310,000 | |
| | | | | |
| | | | Louisiana Public Facilities Authority, Revenue Bonds, Ochsner Clinic Foundation Project, Series 2011: | | | | | | | | | | | | | | |
| | 2,000 | | | 6.500%, 5/15/37 | | | | | 5/21 at 100.00 | | | | Baa1 | | | | 2,397,960 | |
| | 600 | | | 6.750%, 5/15/41 | | | | | 5/21 at 100.00 | | | | Baa1 | | | | 725,580 | |
| | | | | |
| | 5,260 | | | Louisiana Public Facilities Authority, Solid Waste Disposal Facility Revenue Bonds, Louisiana Pellets Inc Project, Series 2013A, 9.750%, 8/01/14 (Alternative Minimum Tax) | | | | | 1/14 at 100.00 | | | | N/R | | | | 5,261,052 | |
| | | | | |
| | 1,940 | | | Orange Grove Community Development District, Louisiana, Special Assessment Revenue Bonds, Series 2006, 5.300%, 11/01/21 (4) | | | | | 7/13 at 100.00 | | | | N/R | | | | 602,060 | |
| | | | | |
| | 2,290 | | | Whispering Springs Community Development District, Livingston Parish, Louisiana, Special Assessment Bonds, Series 2006, 5.200%, 10/01/21 (4) | | | | | 7/13 at 100.00 | | | | N/R | | | | 504,579 | |
| | 114,443 | | | Total Louisiana | | | | | | | | | | | | | 101,935,339 | |
| | | | Maine – 0.2% | | | | | | | | | | | | | | |
| | | | | |
| | | | Maine Health and Higher Educational Facilities Authority, Revenue Bonds, MaineGeneral Medical Center, Series 2011: | | | | | | | | | | | | | | |
| | 2,300 | | | 6.950%, 7/01/36 | | | | | 7/21 at 100.00 | | | | Baa3 | | | | 2,845,606 | |
| | 6,500 | | | 7.000%, 7/01/41 | | | | | 7/21 at 100.00 | | | | Baa3 | | | | 7,997,405 | |
| | | | | |
| | 3,950 | | | Rumford, Maine, Solid Waste Disposal Revenue Bonds, Boise Cascade Corporation Project, Series 2001, 6.875%, 10/01/26 (Alternative Minimum Tax) | | | | | 7/13 at 100.00 | | | | B2 | | | | 3,970,066 | |
| | 12,750 | | | Total Maine | | | | | | | | | | | | | 14,813,077 | |
| | | | Maryland – 1.3% | | | | | | | | | | | | | | |
| | | | | |
| | 7,850 | | | Baltimore, Maryland, Senior Lien Convention Center Hotel Revenue Bonds, Series 2006A, 5.250%, 9/01/39 – SYNCORA GTY Insured | | | | | 9/16 at 100.00 | | | | BB+ | | | | 8,006,843 | |
| | | | | |
| | 500 | | | Baltimore, Maryland, Special Obligation Bonds, North Locust Point Project, Series 2005, 5.500%, 9/01/34 | | | | | 9/15 at 101.00 | | | | N/R | | | | 512,030 | |
| | | | | |
| | 19,255 | | | Baltimore, Maryland, Subordinate Lien Convention Center Hotel Revenue Bonds, Series 2006B, 5.875%, 9/01/39 | | | | | 9/16 at 100.00 | | | | Ba2 | | | | 19,827,836 | |
| | | | | |
| | | | Howard County, Maryland, Retirement Community Revenue Bonds, Vantage House, Series 2007A: | | | | | | | | | | | | | | |
| | 1,270 | | | 5.250%, 4/01/27 | | | | | 4/17 at 100.00 | | | | N/R | | | | 1,285,621 | |
| | 1,000 | | | 5.250%, 4/01/33 | | | | | 4/17 at 100.00 | | | | N/R | | | | 1,004,700 | |
| | | | | |
| | 4,780 | | | Maryland Community Development Administration, Department of Housing and Community Development, Housing Revenue Bonds, Tender Option Bond Trust 2849, 10.811%, 1/01/15 (Alternative Minimum Tax) (IF) | | | | | No Opt. Call | | | | AA+ | | | | 5,147,247 | |
| | | | | |
| | 675 | | | Maryland Community Development Administration, Department of Housing and Community Development, Housing Revenue Bonds, Tender Option Bond Trust 2849, 10.811%, 1/01/15 (Alternative Minimum Tax) (IF) | | | | | No Opt. Call | | | | AA+ | | | | 726,860 | |
| | | | | |
| | 7,335 | �� | | Maryland Community Development Administration, Department of Housing and Community Development, Residential Revenue Bonds, Series 2007A, 4.800%, 9/01/42 (Alternative Minimum Tax) (UB) | | | | | 9/16 at 100.00 | | | | Aa2 | | | | 7,593,852 | |
| | | | | |
| | | | Maryland Community Development Administration, Residential Revenue Bonds, Series 2007D, Trust 1023: | | | | | | | | | | | | | | |
| | 1,710 | | | 17.027%, 3/01/30 (Alternative Minimum Tax) (IF) (5) | | | | | 3/17 at 100.00 | | | | Aa2 | | | | 1,935,754 | |
| | 940 | | | 16.822%, 3/01/30 (Alternative Minimum Tax) (IF) (5) | | | | | 3/17 at 100.00 | | | | Aa2 | | | | 1,066,148 | |
| | | | | | | | | | | | | | | | | | |
Principal
Amount (000) | | | Description (1) | | | | Optional Call
Provisions (2) | | | Ratings (3) | | | Value | |
| | | | Maryland (continued) | | | | | | | | | | | | | | |
| | | | | |
| | | | Maryland Economic Development Corporation, Revenue Bonds, Chesapeake Bay Hyatt Conference Center, Series 2006A: | | | | | | | | | | | | | | |
| $ | 1,650 | | | 5.000%, 12/01/16 | | | | | No Opt. Call | | | | N/R | | | $ | 1,515,080 | |
| | 54,000 | | | 5.000%, 12/01/31 | | | | | 12/16 at 100.00 | | | | N/R | | | | 37,595,880 | |
| | | | | |
| | | | Maryland Economic Development Corporation, Senior Lien Student Housing Revenue Bonds, University of Maryland – Baltimore, Series 2003A: | | | | | | | | | | | | | | |
| | 820 | | | 5.625%, 10/01/23 | | | | | 10/13 at 100.00 | | | | B3 | | | | 820,066 | |
| | 10,640 | | | 5.750%, 10/01/33 | | | | | 10/13 at 100.00 | | | | B3 | | | | 10,601,483 | |
| | | | | |
| | 2,080 | | | Maryland Economic Development Corporation, Student Housing Revenue Bonds, Frostburg State University Project, Series 2002A , 6.250%, 10/01/33 | | | | | 10/13 at 100.00 | | | | Ba3 | | | | 2,088,736 | |
| | | | | |
| | | | Maryland Health and Higher Educational Facilities Authority, Private School Revenue Bonds, Washington Christian Academy, Series 2006: | | | | | | | | | | | | | | |
| | 750 | | | 5.250%, 7/01/18 (4) | | | | | 1/17 at 100.00 | | | | N/R | | | | 262,515 | |
| | 6,260 | | | 5.500%, 7/01/38 (4) | | | | | 1/17 at 100.00 | | | | N/R | | | | 2,191,125 | |
| | | | | |
| | 4,345 | | | Maryland Health and Higher Educational Facilities Authority, Revenue Bonds, King Farm Presbyterian Community, Series 2007A, 5.300%, 1/01/37 | | | | | 1/17 at 100.00 | | | | N/R | | | | 4,223,688 | |
| | | | | |
| | 1,500 | | | Maryland Health and Higher Educational Facilities Authority, Revenue Bonds, Patterson Park Public Charter School Issue, Series 2010, 6.125%, 7/01/45 | | | | | 7/20 at 100.00 | | | | BBB– | | | | 1,618,200 | |
| | | | | |
| | | | Prince George’s County, Maryland, Revenue Bonds, Dimensions Health Corporation, Series 1994: | | | | | | | | | | | | | | |
| | 260 | | | 5.375%, 7/01/14 | | | | | 7/13 at 100.00 | | | | B3 | | | | 260,086 | |
| | 15,475 | | | 5.300%, 7/01/24 | | | | | 7/13 at 100.00 | | | | B3 | | | | 15,289,145 | |
| | 143,095 | | | Total Maryland | | | | | | | | | | | | | 123,572,895 | |
| | | | Massachusetts – 1.2% | | | | | | | | | | | | | | |
| | | | | |
| | 12,275 | | | Boston Industrial Development Financing Authority, Massachusetts, Senior Revenue Bonds, Crosstown Center Project, Series 2002, 6.500%, 9/01/35 (Alternative Minimum Tax) | | | | | 9/13 at 101.00 | | | | Caa3 | | | | 9,720,695 | |
| | | | | |
| | 4,080 | | | Boston Industrial Development Financing Authority, Massachusetts, Subordinate Revenue Bonds, Crosstown Center Project, Series 2002, 8.000%, 9/01/35 (Alternative Minimum Tax) (4) | | | | | 9/13 at 101.00 | | | | N/R | | | | 1,396,094 | |
| | | | | |
| | 2,000 | | | Massachusetts Development Finance Agency, Education Facility Revenue Bonds, Academy of the Pacific Rim Project, Series 2006A, 5.125%, 6/01/31 – ACA Insured | | | | | 6/16 at 100.00 | | | | N/R | | | | 2,016,640 | |
| | | | | |
| | 300 | | | Massachusetts Development Finance Agency, Pioneer Valley Resource Recovery Revenue Bonds, Eco/Springfield LLC, Series 2000A, 8.375%, 7/01/14 (Alternative Minimum Tax) | | | | | No Opt. Call | | | | N/R | | | | 307,179 | |
| | | | | |
| | 1,315 | | | Massachusetts Development Finance Agency, Pioneer Valley Resource Recovery Revenue Bonds, Eco/Springfield LLC, Series 2006, 5.875%, 7/01/14 (Alternative Minimum Tax) | | | | | No Opt. Call | | | | N/R | | | | 1,310,555 | |
| | | | | |
| | 34,580 | | | Massachusetts Development Finance Agency, Resource Recovery Revenue Refunding Bonds, Covanta Energy Project, Series 2012B, 4.875%, 11/01/42 | | | | | 11/17 at 100.00 | | | | BB+ | | | | 35,103,195 | |
| | | | | |
| | 1,500 | | | Massachusetts Development Finance Agency, Resource Recovery Revenue Refunding Bonds, Covanta Energy Project, Series 2012C, 5.250%, 11/01/42 (Alternative Minimum Tax) | | | | | 11/17 at 100.00 | | | | BB+ | | | | 1,553,430 | |
| | | | | |
| | 4,960 | | | Massachusetts Development Finance Agency, Revenue Bonds, Boston Architectural College, Series 2006, 5.000%, 1/01/37 – ACA Insured | | | | | 1/17 at 100.00 | | | | N/R | | | | 4,858,518 | |
| | | | | |
| | 3,500 | | | Massachusetts Development Finance Agency, Revenue Bonds, The Sabis International Charter School, Series 2009A, 8.000%, 4/15/39 | | | | | 10/19 at 100.00 | | | | BBB | | | | 4,325,720 | |
| | | | | |
| | 10,000 | | | Massachusetts Development Finance Authority, Revenue Bonds, 100 Cambridge Street Redevelopment, M/SRBC Project, Series 2002A, 5.125%, 2/01/34 – NPFG Insured | | | | | 7/13 at 100.00 | | | | BBB | | | | 10,001,100 | |
Portfolio of Investments
Nuveen High Yield Municipal Bond Fund (continued)
April 30, 2013
| | | | | | | | | | | | | | | | | | |
Principal
Amount (000) | | | Description (1) | | | | Optional Call
Provisions (2) | | | Ratings (3) | | | Value | |
| | | | Massachusetts (continued) | | | | | | | | | | | | | | |
| | | | | |
| | | | Massachusetts Health and Educational Facilities Authority Revenue Bonds, Quincy Medical Center Issue, Series 2008A: | | | | | | | | | | | | | | |
| $ | 5,950 | | | 6.250%, 1/15/28 (4) | | | | | 1/18 at 100.00 | | | | N/R | | | $ | 30,464 | |
| | 5,300 | | | 6.500%, 1/15/38 (4) | | | | | 1/18 at 100.00 | | | | N/R | | | | 27,136 | |
| | | | | |
| | | | Massachusetts Health and Educational Facilities Authority, Revenue Bonds, Emerson Hospital, Series 2005E: | | | | | | | | | | | | | | |
| | 3,500 | | | 5.000%, 8/15/25 – RAAI Insured | | | | | 8/15 at 100.00 | | | | N/R | | | | 3,557,295 | |
| | 400 | | | 5.000%, 8/15/35 – RAAI Insured | | | | | 8/15 at 100.00 | | | | N/R | | | | 401,256 | |
| | | | | |
| | 2,750 | | | Massachusetts Health and Educational Facilities Authority, Revenue Bonds, Jordan Hospital, Series 1998D, 5.250%, 10/01/23 | | | | | 7/13 at 100.00 | | | | BB– | | | | 2,753,465 | |
| | | | | |
| | 2,000 | | | Massachusetts Health and Educational Facilities Authority, Revenue Bonds, Milford Regional Medical Center, Series 2007E, 5.000%, 7/15/37 | | | | | 7/17 at 100.00 | | | | BBB– | | | | 2,026,720 | |
| | | | | |
| | 4,000 | | | Massachusetts Health and Educational Facilities Authority, Revenue Bonds, Milton Hospital Project, Series 2005D, 5.500%, 7/01/40 | | | | | 7/15 at 100.00 | | | | BB– | | | | 4,111,520 | |
| | | | | |
| | 5,323 | | | Massachusetts Health and Educational Facilities Authority, Revenue Bonds, Northern Berkshire Community Services Inc., Series 2012A, 6.000%, 2/15/43 | | | | | 7/13 at 103.00 | | | | D | | | | 4,560,273 | |
| | | | | |
| | 4,162 | | | Massachusetts Health and Educational Facilities Authority, Revenue Bonds, Northern Berkshire Community Services Inc., Series 2012B, 6.375%, 2/15/43 | | | | | 7/13 at 103.00 | | | | D | | | | 415,945 | |
| | | | | |
| | 6,244 | | | Massachusetts Health and Educational Facilities Authority, Revenue Bonds, Northern Berkshire Community Services Inc., Series 2012C, 6.625%, 2/15/43 | | | | | 7/13 at 103.00 | | | | D | | | | 62 | |
| | | | | |
| | 2,500 | | | Massachusetts Housing Finance Agency, Housing Bonds, Tender Option Bond Trust 2010-64W., 20.149%, 6/01/41 (IF) (5) | | | | | 6/20 at 100.00 | | | | AA– | | | | 3,349,800 | |
| | | | | |
| | | | Massachusetts Port Authority, Special Facilities Revenue Bonds, Delta Air Lines Inc., Series 2001A: | | | | | | | | | | | | | | |
| | 1,605 | | | 5.200%, 1/01/20 – AMBAC Insured (Alternative Minimum Tax) | | | | | 7/13 at 100.00 | | | | N/R | | | | 1,605,674 | |
| | 1,505 | | | 5.000%, 1/01/21 – AMBAC Insured | | | | | 7/13 at 100.00 | | | | N/R | | | | 1,505,166 | |
| | 4,000 | | | 5.500%, 1/01/22 – AMBAC Insured (Alternative Minimum Tax) | | | | | 7/13 at 100.00 | | | | N/R | | | | 4,001,840 | |
| | 15,445 | | | 5.000%, 1/01/27 – AMBAC Insured (Alternative Minimum Tax) | | | | | 7/13 at 100.00 | | | | N/R | | | | 15,444,846 | |
| | 139,194 | | | Total Massachusetts | | | | | | | | | | | | | 114,384,588 | |
| | | | Michigan – 3.6% | | | | | | | | | | | | | | |
| | | | | |
| | | | Advanced Technology Academy, Michigan, Public School Academy Revenue Bonds, Series 2008: | | | | | | | | | | | | | | |
| | 3,995 | | | 6.000%, 11/01/28 | | | | | 11/18 at 100.00 | | | | BBB– | | | | 4,224,433 | |
| | 5,105 | | | 6.000%, 11/01/37 | | | | | 11/18 at 100.00 | | | | BBB– | | | | 5,335,491 | |
| | | | | |
| | 1,050 | | | Chandler Park Academy, Michigan, Public School Academy Charter School Revenue Bonds, Series 2005, 5.125%, 11/01/30 | | | | | 11/15 at 100.00 | | | | BBB | | | | 1,042,209 | |
| | | | | |
| | 1,955 | | | Concord Academy, Boyne City, Michigan, Certificates of Participation, Series 2007, 5.600%, 11/01/36 | | | | | 11/17 at 100.00 | | | | N/R | | | | 1,685,738 | |
| | | | | |
| | | | Conner Creek Academy East, Michigan, Public School Revenue Bonds, Series 2007: | | | | | | | | | | | | | | |
| | 5,695 | | | 5.000%, 11/01/26 | | | | | 11/16 at 100.00 | | | | BB– | | | | 5,163,258 | |
| | 3,750 | | | 5.250%, 11/01/31 | | | | | 11/16 at 100.00 | | | | BB– | | | | 3,353,475 | |
| | 3,090 | | | 5.250%, 11/01/36 | | | | | 11/16 at 100.00 | | | | BB– | | | | 2,691,452 | |
| | | | | |
| | 2,500 | | | Detroit City School District, Wayne County, Michigan, General Obligation Bonds, Tender Option Bond Trust 3317, 18.652%, 11/01/26 – AGM Insured (IF) (5) | | | | | No Opt. Call | | | | Aa2 | | | | 4,436,200 | |
| | | | | |
| | 4,710 | | | Detroit City School District, Wayne County, Michigan, General Obligation Bonds, Tender Option Bond Trust 4697, 17.870%, 5/01/29 – AGM Insured (IF) (5) | | | | | No Opt. Call | | | | Aa2 | | | | 8,273,162 | |
| | | | | |
| | 5,500 | | | Detroit City School District, Wayne County, Michigan, Unlimited Tax School Building and Site Improvement Bonds, Tender Option Bonds Trust 11784, 18.312%, 5/01/27 – AGM Insured (IF) | | | | | No Opt. Call | | | | Aa2 | | | | 9,443,720 | |
| | | | | | | | | | | | | | | | | | |
Principal
Amount (000) | | | Description (1) | | | | Optional Call
Provisions (2) | | | Ratings (3) | | | Value | |
| | | | Michigan (continued) | | | | | | | | | | | | | | |
| | | | | |
| | | | Detroit Community High School, Michigan, Public School Academy Revenue Bonds, Series 2005: | | | | | | | | | | | | | | |
| $ | 2,000 | | | 5.650%, 11/01/25 | | | | | 11/15 at 100.00 | | | | B+ | | | $ | 1,747,240 | |
| | 500 | | | 5.750%, 11/01/30 | | | | | 11/15 at 100.00 | | | | B+ | | | | 421,490 | |
| | 2,425 | | | 5.750%, 11/01/35 | | | | | 11/15 at 100.00 | | | | B+ | | | | 1,978,339 | |
| | | | | |
| | 6,550 | | | Detroit Local Development Finance Authority, Michigan, Tax Increment Bonds, Series 1998A, 5.500%, 5/01/21 | | | | | 11/13 at 100.00 | | | | B– | | | | 6,094,055 | |
| | | | | |
| | | | Detroit Water and Sewerage Department, Michigan, Sewage Disposal System Revenue Bonds, Refunding Senior Lien Series 2012A: | | | | | | | | | | | | | | |
| | 12,725 | | | 5.000%, 7/01/32 | | | | | 7/22 at 100.00 | | | | A+ | | | | 13,923,059 | |
| | 12,000 | | | 5.250%, 7/01/39 | | | | | 7/22 at 100.00 | | | | A+ | | | | 13,117,200 | |
| | 5,365 | | | 5.000%, 7/01/39 – AGM Insured | | | | | 7/22 at 100.00 | | | | AA– | | | | 5,833,257 | |
| | | | | |
| | 2,500 | | | Detroit Water Supply System, Michigan, Water Supply System Revenue Bonds, Tender Option Bond Trust 4068, 17.553%, 7/01/15 (IF) (5) | | | | | No Opt. Call | | | | AA+ | | | | 2,959,600 | |
| | | | | |
| | 6,555 | | | Detroit Water Supply System, Michigan, Water Supply System Revenue Refunding Second Lien Bonds, Series 2006C, 5.000%, 7/01/33 – AGM Insured | | | | | No Opt. Call | | | | AA– | | | | 6,682,429 | |
| | | | | |
| | | | Detroit, Michigan, Distributable State Aid General Obligation Bonds, Tender Option Bond Trust 3789: | | | | | | | | | | | | | | |
| | 2,500 | | | 18.169%, 5/01/18 (IF) (5) | | | | | No Opt. Call | | | | AA | | | | 3,552,200 | |
| | 1,750 | | | 18.169%, 5/01/18 (IF) (5) | | | | | No Opt. Call | | | | AA | | | | 2,486,540 | |
| | | | | |
| | | | Detroit, Michigan, General Obligation Bonds, Limited Tax Capital Improvement Series 2008-A1: | | | | | | | | | | | | | | |
| | 12,140 | | | 5.000%, 4/01/15 | | | | | No Opt. Call | | | | B | | | | 11,367,775 | |
| | 6,500 | | | 5.000%, 4/01/16 | | | | | No Opt. Call | | | | B | | | | 5,958,225 | |
| | | | | |
| | | | Detroit, Michigan, General Obligation Bonds, Series 2001A-1: | | | | | | | | | | | | | | |
| | 500 | | | 5.375%, 4/01/16 – NPFG Insured | | | | | 7/13 at 100.00 | | | | Baa2 | | | | 495,980 | |
| | 2,000 | | | 5.375%, 4/01/18 – NPFG Insured | | | | | 7/13 at 100.00 | | | | Baa2 | | | | 1,926,260 | |
| | | | | |
| | 1,000 | | | Detroit, Michigan, General Obligation Bonds, Series 2002,
5.125%, 4/01/22 – NPFG Insured | | | | | 10/13 at 100.00 | | | | Baa2 | | | | 926,040 | |
| | | | | |
| | | | Detroit, Michigan, General Obligation Bonds, Series 2003A: | | | | | | | | | | | | | | |
| | 3,000 | | | 5.250%, 4/01/22 – SYNCORA GTY Insured | | | | | 7/13 at 100.00 | | | | B | | | | 2,768,100 | |
| | 1,025 | | | 5.250%, 4/01/23 – SYNCORA GTY Insured | | | | | 7/13 at 100.00 | | | | B | | | | 935,835 | |
| | | | | |
| | 5,000 | | | Detroit, Michigan, General Obligation Bonds, Series 2005A, 5.000%, 4/01/21 – AGM Insured | | | | | No Opt. Call | | | | AA– | | | | 5,066,150 | |
| | | | | |
| | 2,090 | | | Detroit, Michigan, General Obligation Bonds, Unlimited Tax Series 2008A, 5.000%, 4/01/20 | | | | | No Opt. Call | | | | AA– | | | | 2,139,282 | |
| | | | | |
| | 6,845 | | | Detroit, Michigan, Second Lien Sewerage Disposal System Revenue Bonds, Second Lien Series 2005B, 5.500%, 7/01/22 – NPFG Insured | | | | | No Opt. Call | | | | A | | | | 8,060,604 | |
| | | | | |
| | | | Detroit, Michigan, Second Lien Sewerage Disposal System Revenue Bonds, Series 2005A: | | | | | | | | | | | | | | |
| | 5,670 | | | 5.000%, 7/01/35 – NPFG Insured | | | | | 7/15 at 100.00 | | | | A | | | | 5,734,071 | |
| | 1,630 | | | 4.500%, 7/01/35 – NPFG Insured | | | | | 7/15 at 100.00 | | | | A | | | | 1,582,029 | |
| | | | | |
| | 9,105 | | | Detroit, Michigan, Senior Lien Sewerage Disposal System Revenue Bonds, Series 2001B, 5.500%, 7/01/29 – FGIC Insured | | | | | No Opt. Call | | | | A | | | | 10,961,601 | |
| | | | | |
| | 1,435 | | | Detroit, Michigan, Senior Lien Water Supply System Revenue Bonds, Series 2003A, 5.000%, 7/01/34 – NPFG Insured | | | | | 7/13 at 100.00 | | | | A+ | | | | 1,435,086 | |
| | | | | |
| | 1,325 | | | Detroit, Michigan, Sewer Disposal System Revenue Bonds, Second Lien, Series 2006B, 4.625%, 7/01/34 – FGIC Insured | | | | | 7/16 at 100.00 | | | | A | | | | 1,341,284 | |
| | | | | |
| | 1,100 | | | Detroit, Michigan, Water Supply System Revenue Bonds, Senior Lien Series 2005A, 4.500%, 7/01/35 – FGIC Insured | | | | | 7/15 at 100.00 | | | | A+ | | | | 1,093,070 | |
| | | | | |
| | 9,770 | | | Detroit, Michigan, Water Supply System Revenue Bonds, Senior Lien Series 2011A, 5.250%, 7/01/41 | | | | | 7/21 at 100.00 | | | | A+ | | | | 10,609,829 | |
| | | | | |
| | 1,095 | | | Doctor Charles Drew Academy, Michigan Certificates of Participation, Series 2006, 5.700%, 11/01/36 | | | | | 11/16 at 102.00 | | | | N/R | | | | 804,486 | |
Portfolio of Investments
Nuveen High Yield Municipal Bond Fund (continued)
April 30, 2013
| | | | | | | | | | | | | | | | | | |
Principal
Amount (000) | | | Description (1) | | | | Optional Call
Provisions (2) | | | Ratings (3) | | | Value | |
| | | | Michigan (continued) | | | | | | | | | | | | | | |
| | | | | |
| $ | 3,500 | | | Flint International Academy, Michigan, Public School Academy Revenue Bonds, Series 2007, 5.750%, 10/01/37 | | | | | 10/17 at 100.00 | | | | BBB– | | | $ | 3,616,760 | |
| | | | | |
| | | | Garden City Hospital Finance Authority, Michigan, Revenue Bonds, Garden City Hospital Obligated Group, Series 2007A: | | | | | | | | | | | | | | |
| | 11,825 | | | 4.875%, 8/15/27 | | | | | 8/17 at 100.00 | | | | N/R | | | | 11,734,066 | |
| | 14,145 | | | 5.000%, 8/15/38 | | | | | 8/17 at 100.00 | | | | N/R | | | | 13,594,477 | |
| | | | | |
| | 1,000 | | | Gaylord Hospital Finance Authority, Michigan, Revenue Bonds, Otsego Memorial Hospital, Series 2004, 6.200%, 1/01/25 | | | | | 1/15 at 100.00 | | | | N/R | | | | 1,028,070 | |
| | | | | |
| | 2,700 | | | Kentwood Economic Development Corporation, Michigan, Limited Obligation Revenue Bonds, Holland Home Obligated Group, Refunding Series 2012, 5.625%, 11/15/41 | | | | | 5/22 at 100.00 | | | | BB+ | | | | 2,858,733 | |
| | | | | |
| | 1,000 | | | Merritt Academy, Michigan, Certificates of Participation, Series 2004, 7.250%, 12/01/24 | | | | | 12/14 at 102.00 | | | | N/R | | | | 1,034,030 | |
| | | | | |
| | 1,900 | | | Merritt Academy, Michigan, Certificates of Participation, Series 2006, 6.250%, 12/01/36 | | | | | 12/14 at 102.00 | | | | N/R | | | | 1,904,085 | |
| | | | | |
| | | | Michigan Finance Authority, Limited Obligation Revenue Bonds, Michigan Technical Academy, Series 2011: | | | | | | | | | | | | | | |
| | 1,990 | | | 5.700%, 10/01/21 | | | | | No Opt. Call | | | | N/R | | | | 2,109,937 | |
| | 2,140 | | | 7.100%, 10/01/31 | | | | | 10/21 at 100.00 | | | | N/R | | | | 2,277,110 | |
| | 7,000 | | | 7.450%, 10/01/41 | | | | | 10/21 at 100.00 | | | | N/R | | | | 7,484,890 | |
| | | | | |
| | 1,000 | | | Michigan Finance Authority, Public School Academy Limited Obligation Revenue and Refunding Bonds, Detroit Service Learning Academy Project, Series 2011, 7.000%, 10/01/36 | | | | | 10/21 at 100.00 | | | | BB+ | | | | 1,144,890 | |
| | | | | |
| | 1,495 | | | Michigan Finance Authority, Public School Academy Limited Obligation Revenue Bonds, Creative Montessori Academy Project, Series 2011, 7.000%, 5/01/31 | | | | | 5/18 at 100.00 | | | | BBB– | | | | 1,616,304 | |
| | | | | |
| | 1,170 | | | Michigan Finance Authority, Public School Academy Limited Obligation Revenue Bonds, Holly Academy Project, Refunding Series 2011, 8.000%, 10/01/40 | | | | | 10/21 at 100.00 | | | | BBB– | | | | 1,416,800 | |
| | | | | |
| | 6,325 | | | Michigan Finance Authority, Public School Academy Limited Obligation Revenue Bonds, Hope Academy Project, Series 2011, 8.125%, 4/01/41 | | | | | 4/21 at 100.00 | | | | BB | | | | 7,297,722 | |
| | | | | |
| | 400 | | | Michigan Finance Authority, Public School Academy Limited Obligation Revenue Bonds, Old Redford Academy Project, Series 2010A, 6.500%, 12/01/40 | | | | | 12/20 at 100.00 | | | | BB | | | | 430,936 | |
| | | | | |
| | | | Michigan Finance Authority, Public School Academy Limited Obligation Revenue Bonds, Voyageur Academy Project, Series 2011: | | | | | | | | | | | | | | |
| | 1,500 | | | 7.750%, 7/15/26 | | | | | 7/21 at 100.00 | | | | BB | | | | 1,618,590 | |
| | 9,000 | | | 8.000%, 7/15/41 | | | | | 7/21 at 100.00 | | | | BB | | | | 9,704,610 | |
| | | | | |
| | 4,760 | | | Michigan Housing Development Authority, Rental Housing Revenue Bonds, Series 2006D, 5.200%, 10/01/42 – AGM Insured (Alternative Minimum Tax) (UB) (5) | | | | | 7/15 at 100.00 | | | | AA | | | | 4,887,996 | |
| | | | | |
| | | | Michigan Municipal Bond Authority, Public School Academy Revenue Bonds, Detroit Academy of Arts and Sciences Charter School, Series 2001A: | | | | | | | | | | | | | | |
| | 2,900 | | | 7.900%, 10/01/21 | | | | | 10/13 at 100.00 | | | | Caa2 | | | | 2,580,623 | |
| | 10,550 | | | 8.000%, 10/01/31 | | | | | 10/13 at 100.00 | | | | Caa2 | | | | 9,388,129 | |
| | | | | |
| | 1,000 | | | Michigan Public Educational Facilities Authority, Charter School Revenue Bonds, American Montessori Academy, Series 2007, 6.500%, 12/01/37 | | | | | 12/17 at 100.00 | | | | N/R | | | | 1,012,540 | |
| | | | | |
| | 1,505 | | | Michigan Public Educational Facilities Authority, Limited Obligation Revenue Bonds, Chandler Park Academy Project, Series 2008, 6.500%, 11/01/35 | | | | | 11/15 at 100.00 | | | | BBB | | | | 1,543,980 | |
| | | | | |
| | 1,000 | | | Michigan Public Educational Facilities Authority, Limited Obligation Revenue Bonds, Richfield Public School Academy, Series 2007, 5.000%, 9/01/36 | | | | | 9/17 at 100.00 | | | | BBB– | | | | 983,700 | |
| | | | | | | | | | | | | | | | | | |
Principal
Amount (000) | | | Description (1) | | | | Optional Call
Provisions (2) | | | Ratings (3) | | | Value | |
| | | | Michigan (continued) | | | | | | | | | | | | | | |
| | | | | |
| $ | 3,585 | | | Michigan Public Educational Facilities Authority, Limited Obligation Revenue Bonds, David Ellis Academy-West Charter School Project, Series 2007, 5.875%, 6/01/37 | | | | | 6/17 at 100.00 | | | | N/R | | | $ | 3,625,582 | |
| | | | | |
| | | | Michigan Public Educational Facilities Authority, Limited Obligation Revenue Bonds, Dr. Joseph F. Pollack Academic Center of Excellence Project, Series 2010: | | | | | | | | | | | | | | |
| | 290 | | | 7.250%, 4/01/20 | | | | | No Opt. Call | | | | BB | | | | 319,302 | |
| | 1,140 | | | 8.000%, 4/01/30 | | | | | 4/20 at 100.00 | | | | BB | | | | 1,292,999 | |
| | 500 | | | 8.000%, 4/01/40 | | | | | 4/20 at 100.00 | | | | BB | | | | 564,355 | |
| | | | | |
| | 10,275 | | | Michigan State Hospital Finance Authority, Revenue Bonds, Hills and Dales General Hospital, Series 2005A, 6.750%, 11/15/38 | | | | | 11/15 at 102.00 | | | | N/R | | | | 10,837,248 | |
| | | | | |
| | | | Michigan State Hospital Finance Authority, Revenue Bonds, Presbyterian Villages of Michigan Obligated Group, Series 2005: | | | | | | | | | | | | | | |
| | 2,250 | | | 5.250%, 11/15/25 | | | | | 5/15 at 100.00 | | | | BB+ | | | | 2,282,085 | |
| | 11,200 | | | 5.500%, 11/15/35 | | | | | 5/15 at 100.00 | | | | BB+ | | | | 11,309,312 | |
| | | | | |
| | 570 | | | Michigan Strategic Fund, Limited Obligation Revenue Bonds, Ford Motor Company, Series 1992A, 6.550%, 10/01/22 | | | | | 7/13 at 100.00 | | | | Baa3 | | | | 571,237 | |
| | | | | |
| | 9,900 | | | Michigan Tobacco Settlement Finance Authority, Tobacco Settlement Asset-Backed Revenue Bonds, Series 2008A, 6.875%, 6/01/42 | | | | | 6/18 at 100.00 | | | | BB– | | | | 10,296,099 | |
| | | | | |
| | | | Renaissance Public School Academy, Michigan, Public School Academy Revenue Bonds, Series 2012A: | | | | | | | | | | | | | | |
| | 990 | | | 5.500%, 5/01/27 | | | | | 5/22 at 100.00 | | | | BBB– | | | | 1,013,998 | |
| | 1,315 | | | 6.000%, 5/01/37 | | | | | 5/22 at 100.00 | | | | BBB– | | | | 1,350,860 | |
| | | | | |
| | 1,500 | | | Saline Economic Development Corporation, Michigan, Limited Obligation Revenue and Refunding Bonds, Evangelical Homes of Michigan, Series 2012, 5.250%, 6/01/32 | | | | | 6/22 at 100.00 | | | | BB+ | | | | 1,522,665 | |
| | | | | |
| | | | Summit Academy North, Michigan, Revenue Bonds, Public School Academy Series 2005: | | | | | | | | | | | | | | |
| | 820 | | | 5.000%, 11/01/15 | | | | | No Opt. Call | | | | BB | | | | 825,740 | |
| | 1,705 | | | 5.250%, 11/01/20 | | | | | 11/15 at 100.00 | | | | BB | | | | 1,719,697 | |
| | 685 | | | 6.750%, 5/01/21 | | | | | No Opt. Call | | | | BB | | | | 749,801 | |
| | 4,795 | | | 5.350%, 11/01/25 | | | | | 11/15 at 100.00 | | | | BB | | | | 4,795,000 | |
| | 3,685 | | | 5.500%, 11/01/30 | | | | | 11/15 at 100.00 | | | | BB | | | | 3,644,207 | |
| | 1,615 | | | 7.750%, 5/01/31 | | | | | 5/21 at 100.00 | | | | BB | | | | 1,798,512 | |
| | 6,900 | | | 5.500%, 11/01/35 | | | | | 11/15 at 100.00 | | | | BB | | | | 6,709,215 | |
| | 3,460 | | | 8.000%, 5/01/41 | | | | | 5/21 at 100.00 | | | | BB | | | | 3,887,725 | |
| | | | | |
| | 2,295 | | | Summit Academy, Michigan, Revenue Bonds, Public School Academy Series 2005, 6.375%, 11/01/35 | | | | | 11/15 at 100.00 | | | | BB | | | | 2,335,736 | |
| | 322,730 | | | Total Michigan | | | | | | | | | | | | | 340,370,607 | |
| | | | Minnesota – 0.9% | | | | | | | | | | | | | | |
| | | | | |
| | 1,000 | | | Baytown Township, Minnesota, Lease Revenue Bonds, Saint Croix Preparatory Academy Project, Series 2008A, 7.000%, 8/01/38 | | | | | 8/16 at 102.00 | | | | BB | | | | 1,068,800 | |
| | | | | |
| | 12,970 | | | Bloomington Port Authority, Minnesota, Recovery Zone Facility Revenue Bonds, Radisson Blu MOA, LLC Project, Series 2010, 9.000%, 12/01/35 | | | | | 12/20 at 100.00 | | | | N/R | | | | 15,451,939 | |
| | | | | |
| | 1,940 | | | Chaska, Minnesota, Lease Revenue Bonds, World Learner School Project, Series, 8.000%, 12/01/43 | | | | | 12/21 at 100.00 | | | | BB+ | | | | 2,304,817 | |
| | | | | |
| | | | Falcon Heights, Minnesota, Lease Revenue Bonds, Kaleidoscope Charter School Revenue Bonds, Series 2007A: | | | | | | | | | | | | | | |
| | 425 | | | 6.000%, 11/01/27 | | | | | 11/15 at 100.00 | | | | N/R | | | | 440,644 | |
| | 1,550 | | | 6.000%, 11/01/37 | | | | | 11/15 at 100.00 | | | | N/R | | | | 1,598,903 | |
| | | | | |
| | 1,000 | | | Faribault, Minnesota, Housing Revenue Bonds, Faribault Senior Living LLC Project, Series 2010, 7.000%, 5/01/45 | | | | | 5/18 at 102.00 | | | | N/R | | | | 1,074,160 | |
| | | | | |
| | 2,260 | | | International Falls, Minnesota, Solid Waste Disposal Revenue Bonds, Boise Cascade Corporation Project, Refunding Series 1999, 6.850%, 12/01/29 (Alternative Minimum Tax) | | | | | 7/13 at 100.00 | | | | B2 | | | | 2,271,481 | |
Portfolio of Investments
Nuveen High Yield Municipal Bond Fund (continued)
April 30, 2013
| | | | | | | | | | | | | | | | | | |
Principal
Amount (000) | | | Description (1) | | | | Optional Call
Provisions (2) | | | Ratings (3) | | | Value | |
| | | | Minnesota (continued) | | | | | | | | | | | | | | |
| | | | | |
| | | | Minneapolis, Minnesota, Recovery Zone Facility Revenue Bonds, Mosaic Parking, LLC Project, Series 2010A: | | | | | | | | | | | | | | |
| $ | 1,000 | | | 7.750%, 1/01/33 | | | | | 1/21 at 100.00 | | | | N/R | | | $ | 1,051,280 | |
| | 1,000 | | | 8.500%, 1/01/41 | | | | | 1/21 at 100.00 | | | | N/R | | | | 1,083,080 | |
| | | | | |
| | 600 | | | Minneapolis, Minnesota, Tax Increment Revenue Bonds, Grant Park Project, Series 2006, 5.200%, 2/01/22 | | | | | 2/14 at 100.00 | | | | N/R | | | | 601,698 | |
| | | | | |
| | 1,500 | | | Oak Park Heights, Minnesota, Senior Housing Revenue Bonds, Oakgreen Commons Project, Series 2010, 7.000%, 8/01/45 | | | | | 8/20 at 100.00 | | | | N/R | | | | 1,645,110 | |
| | | | | |
| | 1,525 | | | Ramsey, Anoka County, Minnesota, Charter School Lease Revenue Bonds, PACT Charter School, Series 2004A, 6.750%, 12/01/33 | | | | | 6/14 at 102.00 | | | | N/R | | | | 1,576,515 | |
| | | | | |
| | 1,695 | | | Saint Paul Housing & Redevelopment Authority , Minnesota, Charter School Lease Revenue Bonds, Hmong Education Reform Company, Series 2012A, 5.500%, 9/01/43 | | | | | 9/20 at 101.00 | | | | BB+ | | | | 1,742,206 | |
| | | | | |
| | 2,400 | | | Saint Paul Housing and Redevelopment Authority, Minnesota, Lease Revenue Bonds, Higher Ground Academy Project, Series 2009, 8.500%, 12/01/38 | | | | | 6/14 at 102.00 | | | | N/R | | | | 2,521,800 | |
| | | | | |
| | 460 | | | Saint Paul Port Authority, Minnesota, Great Northern Project Tax Increment Revenue Bonds, Series 2, 6.000%, 3/01/30 | | | | | 3/16 at 100.00 | | | | N/R | | | | 468,459 | |
| | | | | |
| | 1,000 | | | Sauk Rapids, Minnesota, Health Care and Housing Facilities Revenue Bonds, Good Shepherd Lutheran Home, Refunding Series 2013, 5.125%, 1/01/39 | | | | | 1/23 at 100.00 | | | | N/R | | | | 1,019,410 | |
| | | | | |
| | 1,600 | | | St. Paul Housing and Redevelopment Authority, Minnesota, Charter School Revenue Bonds, Achieve Charter School, Series 2003A, 7.000%, 12/01/32 | | | | | 12/13 at 100.00 | | | | N/R | | | | 1,615,488 | |
| | | | | |
| | | | St. Paul Housing and Redevelopment Authority, Minnesota, Charter School Revenue Bonds, Higher Ground Academy Charter School, Series 2004A: | | | | | | | | | | | | | | |
| | 390 | | | 6.625%, 12/01/23 | | | | | 6/14 at 102.00 | | | | N/R | | | | 403,915 | |
| | 2,120 | | | 6.875%, 12/01/33 | | | | | 6/14 at 102.00 | | | | N/R | | | | 2,187,374 | |
| | | | | |
| | | | St. Paul Housing and Redevelopment Authority, Minnesota, Charter School Revenue Bonds, Hmong Academy, Series 2006A: | | | | | | | | | | | | | | |
| | 400 | | | 5.750%, 9/01/26 | | | | | 9/14 at 102.00 | | | | BB+ | | | | 410,936 | |
| | 500 | | | 6.000%, 9/01/36 | | | | | 9/14 at 102.00 | | | | BB+ | | | | 514,530 | |
| | | | | |
| | 1,300 | | | St. Paul Housing and Redevelopment Authority, Minnesota, Charter School Revenue Bonds, HOPE Community Academy Charter School, Series 2004A, 6.750%, 12/01/33 | | | | | 6/14 at 102.00 | | | | N/R | | | | 1,339,598 | |
| | | | | |
| | 2,185 | | | St. Paul Housing and Redevelopment Authority, Minnesota, Charter School Revenue Bonds, HOPE Community Academy Charter School, Series 2005A, 6.250%, 12/01/33 | | | | | 6/14 at 102.00 | | | | N/R | | | | 2,217,819 | |
| | | | | |
| | | | St. Paul Housing and Redevelopment Authority, Minnesota, Collateralized Multifamily Housing Revenue Bonds, Marian Center Project, Series 2007A: | | | | | | | | | | | | | | |
| | 845 | | | 5.300%, 11/01/30 | | | | | 5/14 at 101.00 | | | | N/R | | | | 848,304 | |
| | 1,225 | | | 5.375%, 5/01/43 | | | | | 5/14 at 101.00 | | | | N/R | | | | 1,227,242 | |
| | | | | |
| | 2,195 | | | St. Paul Housing and Redevelopment Authority, Minnesota, Revenue Bonds, Healtheast Inc., Series 2005, 6.000%, 11/15/25 | | | | | 11/15 at 100.00 | | | | BBB– | | | | 2,375,539 | |
| | | | | |
| | | | St. Paul Port Authority, Minnesota, Lease Revenue Bonds, HealthEast Midway Campus, Series 2005A: | | | | | | | | | | | | | | |
| | 2,700 | | | 5.750%, 5/01/25 | | | | | 5/15 at 100.00 | | | | BB+ | | | | 2,854,548 | |
| | 2,800 | | | 5.875%, 5/01/30 | | | | | 5/15 at 100.00 | | | | BB+ | | | | 2,955,064 | |
| | | | | |
| | 8,300 | | | St. Paul Port Authority, Minnesota, Lease Revenue Bonds, HealthEast Midway Campus, Series 2005B, 6.000%, 5/01/30 | | | | | 5/15 at 100.00 | | | | N/R | | | | 8,781,317 | |
| | | | | |
| | | | Stillwater, Minnesota, Multifamily Housing Revenue Bonds, Orleans Homes LP, Series 2007: | | | | | | | | | | | | | | |
| | 1,500 | | | 5.250%, 2/01/27 (Alternative Minimum Tax) | | | | | 2/15 at 102.00 | | | | N/R | | | | 1,486,830 | |
| | 800 | | | 5.500%, 2/01/42 (Alternative Minimum Tax) | | | | | 2/15 at 102.00 | | | | N/R | | | | 785,192 | |
| | | | | | | | | | | | | | | | | | |
Principal
Amount (000) | | | Description (1) | | | | Optional Call
Provisions (2) | | | Ratings (3) | | | Value | |
| | | | Minnesota (continued) | | | | | | | | | | | | | | |
| | | | | |
| | | | Wayzata, Minnesota, Senior Housing Revenue Bonds, Folkestone Senior Living Community, Series 2012A: | | | | | | | | | | | | | | |
| $ | 1,485 | | | 5.500%, 11/01/32 | | | | | 5/19 at 102.00 | | | | N/R | | | $ | 1,617,091 | |
| | 3,000 | | | 5.750%, 11/01/39 | | | | | 5/19 at 102.00 | | | | N/R | | | | 3,291,210 | |
| | 6,100 | | | 6.000%, 5/01/47 | | | | | 5/19 at 102.00 | | | | N/R | | | | 6,737,999 | |
| | | | | |
| | | | Winsted, Minnesota, Health Care Revenue Bonds, Saint Mary’s Care Center Project, Series 2010A: | | | | | | | | | | | | | | |
| | 1,000 | | | 6.250%, 9/01/30 | | | | | 9/17 at 100.00 | | | | N/R | | | | 1,054,280 | |
| | 3,250 | | | 6.875%, 9/01/42 | | | | | 9/17 at 100.00 | | | | N/R | | | | 3,469,635 | |
| | 76,020 | | | Total Minnesota | | | | | | | | | | | | | 82,094,213 | |
| | | | Mississippi – 0.0% | | | | | | | | | | | | | | |
| | | | | |
| | 4,865 | | | Mississippi Business Finance Corporation, Gulf Opportunity Zone Revenue Bonds, Roberts Hotel of Jackson, LLC Project, Series 2010, 8.500%, 2/01/30 (4) | | | | | 2/21 at 102.00 | | | | N/R | | | | 972,903 | |
| | | | | |
| | 1,624 | | | Mississippi Home Corporation, Multifamily Housing Revenue Bonds, Tupelo Personal Care Apartments, Series 2004-2, 6.125%, 9/01/34 (Alternative Minimum Tax) | | | | | 10/19 at 101.00 | | | | N/R | | | | 1,396,758 | |
| | 6,489 | | | Total Mississippi | | | | | | | | | | | | | 2,369,661 | |
| | | | Missouri – 0.9% | | | | | | | | | | | | | | |
| | | | | |
| | | | Belton, Missouri, Town Center Project Tax Increment Revenue Bonds, Series 2006: | | | | | | | | | | | | | | |
| | 250 | | | 5.500%, 3/01/20 | | | | | 3/16 at 100.00 | | | | N/R | | | | 252,853 | |
| | 600 | | | 5.625%, 3/01/25 | | | | | 3/16 at 100.00 | | | | N/R | | | | 597,642 | |
| | | | | |
| | | | Cottleville, Missouri, Certificates of Participation, Series 2006: | | | | | | | | | | | | | | |
| | 200 | | | 5.125%, 8/01/26 (Pre-refunded 8/01/14) | | | | | 8/14 at 100.00 | | | | N/R (6) | | | | 212,060 | |
| | 600 | | | 5.250%, 8/01/31 (Pre-refunded 8/01/14) | | | | | 8/14 at 100.00 | | | | N/R (6) | | | | 637,122 | |
| | | | | |
| | 600 | | | Franklin County Industrial Development Authority, Missouri, Sales Tax Refunding Revenue Bonds, Phoenix Center II Community Improvement District Project, Series 2013A, 5.000%, 11/01/37 | | | | | 11/20 at 100.00 | | | | N/R | | | | 604,290 | |
| | | | | |
| | | | Fulton, Missouri, Tax Increment Revenue Bonds, Fulton Commons Redevelopment Project, Series 2006: | | | | | | | | | | | | | | |
| | 590 | | | 5.000%, 6/01/20 | | | | | 6/16 at 100.00 | | | | N/R | | | | 570,501 | |
| | 3,000 | | | 5.000%, 6/01/28 | | | | | 6/16 at 100.00 | | | | N/R | | | | 2,610,420 | |
| | | | | |
| | 1,475 | | | Hanley Road Corridor Transportation Development District, Brentwood and Maplewood, Missouri, Transportation Sales Revenue Bonds, Refunding Series 2009A, 5.875%, 10/01/36 | | | | | 10/19 at 100.00 | | | | A– | | | | 1,645,186 | |
| | | | | |
| | 1,300 | | | Hanley/Eager Road Transportation Development District, Missouri, Revenue Bonds, Refunding Series 2012A, 6.000%, 3/01/42 | | | | | 3/16 at 101.00 | | | | N/R | | | | 1,334,736 | |
| | | | | |
| | 7,685 | | | Hawk Ridge Transportation Development District, Missouri, Transportation Sales Tax Revenue Bonds, Series 2006A, 5.000%, 2/01/30 | | | | | 2/17 at 100.00 | | | | N/R | | | | 4,829,561 | |
| | | | | |
| | | | Kansas City Tax Increment Financing Commission, Missouri, Tax Increment Revenue Bonds, Briarcliff West Project, Series 2006A: | | | | | | | | | | | | | | |
| | 1,580 | | | 5.150%, 6/01/16 | | | | | 6/14 at 102.00 | | | | N/R | | | | 1,648,856 | |
| | 3,000 | | | 5.400%, 6/01/24 | | | | | 6/14 at 102.00 | | | | N/R | | | | 3,114,630 | |
| | | | | |
| | 18,500 | | | Lakeside 370 Levee District, Saint Charles, Missouri, Levee District Improvement Bonds, Series 2008, 7.000%, 4/01/28 | | | | | 4/16 at 100.00 | | | | N/R | | | | 11,100,185 | |
| | | | | |
| | 1,500 | | | Lees Summit Industrial Development Authority, Missouri, Revenue Bonds, John Knox Village Obligated Group, Series 2007A, 5.125%, 8/15/26 | | | | | 8/17 at 100.00 | | | | BBB– | | | | 1,536,705 | |
| | | | | |
| | | | Lees Summit Industrial Development Authority, Missouri, Special Assessment and Sales Tax Revenue Bonds, Summit Fair Community Improvement District Project, Series 2012: | | | | | | | | | | | | | | |
| | 1,460 | | | 5.000%, 5/01/35 | | | | | 5/20 at 100.00 | | | | N/R | | | | 1,472,877 | |
| | 2,365 | | | 6.000%, 5/01/42 | | | | | 5/20 at 100.00 | | | | N/R | | | | 2,389,194 | |
| | | | | |
| | 500 | | | Missouri Development Finance Board. Infrastructure Facilities Revenue Bonds, City of Independence, Missouri – Events Center Project, Series 2009F, 6.250%, 4/01/38 (Pre-refunded 4/01/14) | | | | | 4/14 at 100.00 | | | | A– (6) | | | | 527,175 | |
Portfolio of Investments
Nuveen High Yield Municipal Bond Fund (continued)
April 30, 2013
| | | | | | | | | | | | | | | | | | |
Principal
Amount (000) | | | Description (1) | | | | Optional Call
Provisions (2) | | | Ratings (3) | | | Value | |
| | | | Missouri (continued) | | | | | | | | | | | | | | |
| | | | | |
| $ | 2,810 | | | Missouri Health and Educational Facilities Authority, Health Facilities Revenue Bonds, Mercy Health, Tender Option Bond Trust 4731, 13.540%, 11/15/42 (IF) (5) | | | | | 11/22 at 100.00 | | | | AA– | | | $ | 3,011,027 | |
| | | | | |
| | 550 | | | Missouri Health and Educational Facilities Authority, Revenue Bonds, Lutheran Senior Services, Series 2005, 5.375%, 2/01/35 | | | | | 2/15 at 100.00 | | | | BBB+ | | | | 560,819 | |
| | | | | |
| | 2,580 | | | Poplar Bluff Regional Transportation Development District, Missouri, Transportation Sales Tax Revenue Bonds, Series 2012, 4.750%, 12/01/42 | | | | | No Opt. Call | | | | BBB | | | | 2,648,886 | |
| | | | | |
| | | | Saint Louis Industrial Development Authority, Missouri, Confluence Academy Project, Series 2007A: | | | | | | | | | | | | | | |
| | 1,295 | | | 5.250%, 6/15/25 | | | | | 6/15 at 103.00 | | | | N/R | | | | 1,264,296 | |
| | 3,400 | | | 5.350%, 6/15/32 | | | | | 6/15 at 103.00 | | | | N/R | | | | 3,228,096 | |
| | | | | |
| | 5,365 | | | Saint Louis Industrial Development Authority, Missouri, Multifamily Housing Revenue Bonds, Councils Towers Apartments, Series 2010B, 7.250%, 12/15/13 | | | | | 6/13 at 100.00 | | | | N/R | | | | 5,376,642 | |
| | | | | |
| | 9,000 | | | Saint Louis Land Clearance for Redevelopment Authority, Missouri, Tax-Exempt Recovery Zone Facilities Improvement, Special Revenue Bonds, Kiel Opera House Project, Series 2010B, 7.000%, 9/01/35 | | | | | 9/20 at 100.00 | | | | N/R | | | | 9,410,670 | |
| | | | | |
| | 1,664 | | | Saint Louis, Missouri, Tax Increment Bonds, 410 North Jefferson Lofts Project, Series 2007, 5.500%, 9/01/27 | | | | | 9/13 at 100.00 | | | | N/R | | | | 1,470,460 | |
| | | | | |
| | 1,354 | | | Saint Louis, Missouri, Tax Increment Financing District Revenue Bonds, Gaslight Square East Project, Series 2006, 5.500%, 1/22/28 | | | | | 9/13 at 100.00 | | | | N/R | | | | 1,217,260 | |
| | | | | |
| | 2,205 | | | Saint Louis, Missouri, Tax Increment Financing District Revenue Bonds, Printers Lofts Project, Series 2006, 6.000%, 8/21/26 (11) | | | | | No Opt. Call | | | | N/R | | | | 1,345,866 | |
| | | | | |
| | 1,989 | | | Saint Louis, Missouri, Tax Increment Financing Revenue Bonds, City Hospital Tax Increment District, Series 2007, 6.000%, 8/23/26 | | | | | 7/13 at 100.00 | | | | N/R | | | | 1,862,400 | |
| | | | | |
| | 2,587 | | | Saint Louis, Missouri, Tax Increment Financing Revenue Notes, Marquette Building Redevelopment Project, Series 2008-A, 6.500%, 1/23/28 | | | | | 7/13 at 100.00 | | | | N/R | | | | 1,931,273 | |
| | | | | |
| | 1,356 | | | Saint Louis, Missouri, Tax-Exempt Revenue Notes, City Block 1859, Grand Avenue/Cozens/Evans Redevelopment Project, Series 2008-A, 6.500%, 12/11/29 | | | | | 7/13 at 100.00 | | | | N/R | | | | 1,110,578 | |
| | | | | |
| | | | St. Joseph Industrial Development Authority, Missouri, Tax Increment Bonds, Shoppes at North Village Project, Series 2005A: | | | | | | | | | | | | | | |
| | 500 | | | 5.100%, 11/01/19 | | | | | 11/14 at 100.00 | | | | N/R | | | | 503,765 | |
| | 1,000 | | | 5.375%, 11/01/24 | | | | | 11/14 at 100.00 | | | | N/R | | | | 1,006,220 | |
| | | | | |
| | 2,000 | | | St. Joseph Industrial Development Authority, Missouri, Tax Increment Bonds, Shoppes at North Village Project, Series 2005B, 5.375%, 11/01/23 | | | | | 11/14 at 100.00 | | | | N/R | | | | 2,014,760 | |
| | | | | |
| | 1,500 | | | St. Louis County Industrial Development Authority, Missouri, Revenue Bonds, Friendship Village of Chesterfield, Series 2012, 5.000%, 9/01/42 | | | | | No Opt. Call | | | | BBB– | | | | 1,506,015 | |
| | | | | |
| | 1,350 | | | Strother Interchange Transportation Development District, Missouri, Revenue Bonds, Lees Summit, Series 2006, 5.000%, 5/01/24 | | | | | 5/16 at 100.00 | | | | N/R | | | | 1,338,741 | |
| | | | | |
| | 1,500 | | | Sugar Creek, Missouri, Industrial Development Revenue Bonds, Lafarge North America Inc., Series 2003A, 5.650%, 6/01/37 (Alternative Minimum Tax) | | | | | 6/13 at 101.00 | | | | BB+ | | | | 1,521,765 | |
| | | | | |
| | | | University Place Transportation Development District, St. Louis County, Missouri, Transportation Sales Tax and Special Assessment Revenue Bonds, Series 2006: | | | | | | | | | | | | | | |
| | 1,000 | | | 5.000%, 3/01/26 | | | | | 3/15 at 100.00 | | | | N/R | | | | 949,900 | |
| | 2,500 | | | 5.000%, 3/01/32 | | | | | 3/15 at 100.00 | | | | N/R | | | | 2,259,150 | |
| | 92,710 | | | Total Missouri | | | | | | | | | | | | | 80,622,582 | |
| | | | | | | | | | | | | | | | | | |
Principal
Amount (000) | | | Description (1) | | | | Optional Call
Provisions (2) | | | Ratings (3) | | | Value | |
| | | | Montana – 0.1% | | | | | | | | | | | | | | |
| | | | | |
| | | | Billings, Montana, Tax Increment Urban Renewal Revenue Bonds, Expanded North 27th Street, Series 2013A: | | | | | | | | | | | | | | |
| $ | 910 | | | 5.000%, 7/01/33 | | | | | 1/23 at 100.00 | | | | N/R | | | $ | 951,478 | |
| | 2,100 | | | 5.000%, 7/01/38 | | | | | 1/23 at 100.00 | | | | N/R | | | | 2,150,820 | |
| | | | | |
| | 10,140 | | | Montana Board of Investments, Exempt Facility Revenue Bonds, Stillwater Mining Company, Series 2000, 8.000%, 7/01/20 (Alternative Minimum Tax) | | | | | 7/13 at 100.00 | | | | B | | | | 10,176,403 | |
| | 13,150 | | | Total Montana | | | | | | | | | | | | | 13,278,701 | |
| | | | Nebraska – 0.5% | | | | | | | | | | | | | | |
| | | | | |
| | | | Central Plains Energy Project, Nebraska, Gas Project 3 Revenue Bonds, Series 2012: | | | | | | | | | | | | | | |
| | 8,690 | | | 5.000%, 9/01/32 | | | | | 9/22 at 100.00 | | | | A | | | | 9,723,502 | |
| | 500 | | | 5.250%, 9/01/37 | | | | | No Opt. Call | | | | A | | | | 559,595 | |
| | 35,025 | | | 5.000%, 9/01/42 | | | | | 9/22 at 100.00 | | | | A | | | | 37,924,019 | |
| | 44,215 | | | Total Nebraska | | | | | | | | | | | | | 48,207,116 | |
| | | | Nevada – 1.0% | | | | | | | | | | | | | | |
| | | | | |
| | 4,250 | | | Clark County, Nevada, Airport Revenue Bonds, Tender Option Bond Trust Series 11823, 20.174%, 1/01/36 (IF) | | | | | 1/20 at 100.00 | | | | A+ | | | | 7,252,710 | |
| | | | | |
| | 1,035 | | | Clark County, Nevada, Passenger Facility Charge Revenue Bonds, Las Vegas-McCarran International Airport, Tender Option Bond Trust 11823, 18.100%, 1/01/18 (IF) | | | | | No Opt. Call | | | | A+ | | | | 1,548,267 | |
| | | | | |
| | 1,555 | | | Henderson Local Improvement Districts T-17, Nevada, Limited Obligation Improvement Bonds, Madeira Canyon Project, Series 2005, 5.000%, 9/01/25 | | | | | 3/18 at 100.00 | | | | N/R | | | | 1,576,210 | |
| | | | | |
| | 5,000 | | | Henderson Local Improvement Districts T-18, Nevada, Limited Obligation Improvement Bonds, Inspirada Series 2006, 5.300%, 9/01/35 | | | | | 9/13 at 102.00 | | | | N/R | | | | 3,904,400 | |
| | | | | |
| | 5,000 | | | Las Vegas Redevelopment Agency, Nevada, Tax Increment Revenue Bonds, Series 2009A, 8.000%, 6/15/30 | | | | | 6/19 at 100.00 | | | | BBB– | | | | 5,731,550 | |
| | | | | |
| | | | Las Vegas, Nevada, Local Improvement and Refunding Bonds, Special Improvement District 808 and 810 Summerlin Village 23B, Series 2007: | | | | | | | | | | | | | | |
| | 4,610 | | | 5.875%, 6/01/21 | | | | | 12/13 at 103.00 | | | | N/R | | | | 4,719,580 | |
| | 11,770 | | | 6.125%, 6/01/31 | | | | | 12/13 at 103.00 | | | | N/R | | | | 11,987,863 | |
| | | | | |
| | 3,060 | | | Las Vegas, Nevada, Local Improvement Bonds, District 607, Series 2004, 6.250%, 6/01/24 | | | | | 12/16 at 100.00 | | | | N/R | | | | 3,153,544 | |
| | | | | |
| | | | Mesquite Special Improvement District 07-01, Nevada, Anthem at Mesquite Local Improvement Bonds, Series 2007: | | | | | | | | | | | | | | |
| | 500 | | | 6.000%, 8/01/27 | | | | | 4/15 at 102.00 | | | | N/R | | | | 503,855 | |
| | 2,495 | | | 6.150%, 8/01/37 | | | | | 4/15 at 102.00 | | | | N/R | | | | 2,472,994 | |
| | | | | |
| | | | North Las Vegas, Nevada, General Obligation Bonds, Wastewater Reclamation System Series 2006: | | | | | | | | | | | | | | |
| | 2,860 | | | 4.625%, 10/01/31 – NPFG Insured | | | | | 10/16 at 100.00 | | | | A | | | | 2,881,479 | |
| | 4,900 | | | 4.500%, 10/01/36 – NPFG Insured | | | | | 10/16 at 100.00 | | | | A | | | | 4,953,214 | |
| | | | | |
| | 2,375 | | | Reno, Nevada, Redevelopment Agency Downtown Project Tax Allocation Bonds, Series 2007C, 5.400%, 6/01/27 | | | | | 6/17 at 100.00 | | | | N/R | | | | 1,306,559 | |
| | | | | |
| | | | Sparks Local Improvement District 3, Legends at Sparks Marina, Nevada, Limited Obligation Improvement Bonds, Series 2008: | | | | | | | | | | | | | | |
| | 1,980 | | | 6.500%, 9/01/20 | | | | | 9/18 at 100.00 | | | | N/R | | | | 2,111,710 | |
| | 2,000 | | | 6.750%, 9/01/27 | | | | | 9/18 at 100.00 | | | | N/R | | | | 2,086,860 | |
| | | | | |
| | | | Sparks Tourism Improvement District 1, Legends at Sparks Marina, Nevada, Senior Sales Tax Revenue Bonds Series 2008A: | | | | | | | | | | | | | | |
| | 6,580 | | | 6.500%, 6/15/20 | | | | | 6/18 at 100.00 | | | | B2 | | | | 6,881,825 | |
| | 25,590 | | | 6.750%, 6/15/28 | | | | | 6/18 at 100.00 | | | | B2 | | | | 26,492,048 | |
| | 85,560 | | | Total Nevada | | | | | | | | | | | | | 89,564,668 | |
Portfolio of Investments
Nuveen High Yield Municipal Bond Fund (continued)
April 30, 2013
| | | | | | | | | | | | | | | | | | |
Principal
Amount (000) | | | Description (1) | | | | Optional Call
Provisions (2) | | | Ratings (3) | | | Value | |
| | | | New Hampshire – 0.0% | | | | | | | | | | | | | | |
| | | | | |
| $ | 200 | | | New Hampshire Health and Education Facilities Authority, Revenue Bonds, The Memorial Hospital, Series 2006, 5.250%, 6/01/26 | | | | | 6/16 at 100.00 | | | | BBB | | | $ | 205,304 | |
| | | | New Jersey – 2.6% | | | | | | | | | | | | | | |
| | | | | |
| | 6,422 | | | Bayonne Medical Center Inc., New Jersey, Revenue Bonds, Bond Anticipation Notes, Series 2006, 8.050%, 12/31/49 (12) | | | | | No Opt. Call | | | | N/R | | | | 674,674 | |
| | | | | |
| | 8,255 | | | Bayonne Redevelopment Agency, New Jersey, Revenue Bonds, Royal Caribbean Cruises Project, Series 2006A, 5.375%, 11/01/35 (Alternative Minimum Tax) | | | | | 11/16 at 100.00 | | | | BB | | | | 8,318,811 | |
| | | | | |
| | 1,000 | | | Burlington County Bridge Commission, New Jersey, Economic Development Revenue Bonds, The Evergreens Project, Series 2007, 5.625%, 1/01/38 | | | | | 1/18 at 100.00 | | | | N/R | | | | 1,040,430 | |
| | | | | |
| | | | New Jersey Economic Development Authority, Charter School Revenue Bonds, Lady Liberty Academy Charter School Project, Series 2013A: | | | | | | | | | | | | | | |
| | 2,390 | | | 5.500%, 8/01/33 | | | | | 8/23 at 100.00 | | | | BB+ | | | | 2,402,810 | |
| | 4,120 | | | 5.650%, 8/01/43 | | | | | 8/23 at 100.00 | | | | BB+ | | | | 4,151,477 | |
| | 2,395 | | | 5.750%, 8/01/47 | | | | | 8/23 at 100.00 | | | | BB+ | | | | 2,411,358 | |
| | | | | |
| | 1,180 | | | New Jersey Economic Development Authority, Cigarette Tax Revenue Bonds, Series 2004, 5.750%, 6/15/34 (Pre-refunded 6/15/14) | | | | | 6/14 at 100.00 | | | | Aaa | | | | 1,251,992 | |
| | | | | |
| | 1,000 | | | New Jersey Economic Development Authority, Economic Development Revenue Bonds, Glimcher Properties LP, Series 1998, 6.000%, 11/01/28 (Alternative Minimum Tax) | | | | | 7/13 at 100.00 | | | | N/R | | | | 999,900 | |
| | | | | |
| | 10,015 | | | New Jersey Economic Development Authority, Revenue Bonds, American Airlines Inc., Series 1991, 7.100%, 11/01/31 (Alternative Minimum Tax) (4) | | | | | 11/13 at 100.00 | | | | N/R | | | | 10,014,900 | |
| | | | | |
| | 20,000 | | | New Jersey Economic Development Authority, Special Facilities Revenue Bonds, Continental Airlines Inc., Refunding Series 2012, 5.750%, 9/15/27 (Mandatory put 9/15/22) (Alternative Minimum Tax) | | | | | 7/13 at 100.00 | | | | B | | | | 20,686,600 | |
| | | | | |
| | 795 | | | New Jersey Economic Development Authority, Special Facilities Revenue Bonds, Continental Airlines Inc., Series 1998, 5.500%, 4/01/28 (Alternative Minimum Tax) | | | | | 7/13 at 100.00 | | | | B | | | | 797,989 | |
| | | | | |
| | 8,100 | | | New Jersey Economic Development Authority, Special Facilities Revenue Bonds, Continental Airlines Inc., Series 1999, 5.125%, 9/15/23 (Alternative Minimum Tax) | | | | | 9/13 at 100.00 | | | | B | | | | 8,536,185 | |
| | | | | |
| | 23,750 | | | New Jersey Economic Development Authority, Special Facilities Revenue Bonds, Continental Airlines Inc., Series 1999, 5.250%, 9/15/29 (Alternative Minimum Tax) | | | | | 9/22 at 101.00 | | | | B | | | | 25,024,900 | |
| | | | | |
| | | | New Jersey Economic Development Authority, Special Facilities Revenue Bonds, Continental Airlines Inc., Series 2000: | | | | | | | | | | | | | | |
| | 1,500 | | | 7.200%, 11/15/30 (Alternative Minimum Tax) | | | | | 7/13 at 100.00 | | | | B | | | | 1,505,700 | |
| | 5,210 | | | 7.000%, 11/15/30 (Alternative Minimum Tax) | | | | | 5/13 at 100.00 | | | | B | | | | 5,229,694 | |
| | | | | |
| | 7,510 | | | New Jersey Economic Development Authority, Special Facilities Revenue Bonds, Continental Airlines Inc., Series 2003, 9.000%, 6/01/33(Alternative Minimum Tax) | | | | | 7/13 at 100.00 | | | | B | | | | 7,735,150 | |
| | | | | |
| | 1,500 | | | New Jersey Economic Development Authority, Student Housing Revenue Bonds, Provident Group-Montclair Properties LLC, Montclair State University Student Housing Project, Series 2010A, 5.875%, 6/01/42 | | | | | 6/20 at 100.00 | | | | Baa3 | | | | 1,708,695 | |
| | | | | |
| | 2,400 | | | New Jersey Educational Facilities Authority, Revenue Refunding Bonds, University of Medicine and Dentistry of New Jersey, Series 2009B, 7.500%, 12/01/32 | | | | | 6/19 at 100.00 | | | | A– | | | | 2,989,824 | |
| | | | | |
| | | | New Jersey Health Care Facilities Financing Authority, Hospital Revenue Bonds, Virtual Health, Tender Option Bond Trust 3018: | | | | | | | | | | | | | | |
| | 1,575 | | | 18.599%, 7/01/38 – AGC Insured (IF) (5) | | | | | 1/14 at 100.00 | | | | AA– | | | | 1,678,824 | |
| | 1,815 | | | 19.077%, 7/01/38 – AGC Insured (IF) (5) | | | | | 7/19 at 100.00 | | | | AA– | | | | 2,632,059 | |
| | 5,000 | | | 19.102%, 7/01/38 – AGC Insured (IF) (5) | | | | | 7/19 at 100.00 | | | | AA– | | | | 7,254,000 | |
| | 1,250 | | | 19.102%, 7/01/38 – AGC Insured (IF) (5) | | | | | 7/19 at 100.00 | | | | AA– | | | | 1,813,500 | |
| | | | | | | | | | | | | | | | | | |
Principal
Amount (000) | | | Description (1) | | | | Optional Call
Provisions (2) | | | Ratings (3) | | | Value | |
| | | | New Jersey (continued) | | | | | | | | | | | | | | |
| | | | | |
| | | | New Jersey Health Care Facilities Financing Authority, New Jersey, Revenue Bonds, Saint Peters University Hospital, Refunding Series 2011: | | | | | | | | | | | | | | |
| $ | 4,450 | | | 6.000%, 7/01/26 | | | | | 7/21 at 100.00 | | | | BB+ | | | $ | 5,194,752 | |
| | 1,365 | | | 6.250%, 7/01/35 | | | | | 7/21 at 100.00 | | | | BB+ | | | | 1,605,759 | |
| | | | | |
| | 23,630 | | | New Jersey Health Care Facilities Financing Authority, New Jersey, Revenue Bonds, Saint Peters University Hospital, Series 2007, 5.750%, 7/01/37 | | | | | 7/18 at 100.00 | | | | BB+ | | | | 25,732,361 | |
| | | | | |
| | | | New Jersey Health Care Facilities Financing Authority, Revenue Bonds, Palisades Medical Center of New York Presbyterian Healthcare System, Series 2002: | | | | | | | | | | | | | | |
| | 1,320 | | | 6.500%, 7/01/21 | | | | | 7/13 at 100.00 | | | | BB+ | | | | 1,323,828 | |
| | 1,500 | | | 6.625%, 7/01/31 | | | | | 7/13 at 100.00 | | | | BB+ | | | | 1,502,730 | |
| | | | | |
| | 5,715 | | | New Jersey Health Care Facilities Financing Authority, Revenue Bonds, Saint Joseph’s Healthcare System Obligated Group Issue, Series 2008, 6.625%, 7/01/38 | | | | | 7/18 at 100.00 | | | | BBB– | | | | 6,600,711 | |
| | | | | |
| | 590 | | | New Jersey Health Care Facilities Financing Authority, Revenue Bonds, Somerset Medical Center, Series 2003, 5.500%, 7/01/23 | | | | | 7/13 at 100.00 | | | | Ba2 | | | | 592,307 | |
| | | | | |
| | 2,500 | | | New Jersey Higher Education Assistance Authority, Student Loan Revenue Bonds, Series 2012-1B, 5.750%, 12/01/39 (Alternative Minimum Tax) | | | | | 12/22 at 100.00 | | | | A | | | | 2,659,075 | |
| | | | | |
| | 1,535 | | | New Jersey Higher Education Assistance Authority, Student Loan Revenue Bonds, Tender Option Trust 11853, 21.551%, 6/01/16 (IF) | | | | | No Opt. Call | | | | AA– | | | | 2,208,589 | |
| | | | | |
| | 42,515 | | | New Jersey Higher Education Assistance Authority, Student Loan Revenue Bonds, Series 2008A, 6.125%, 6/01/30 – AGC Insured (Alternative Minimum Tax) (UB) | | | | | 6/18 at 100.00 | | | | AA– | | | | 47,180,596 | |
| | | | | |
| | 35,000 | | | Tobacco Settlement Financing Corporation, New Jersey, Tobacco Settlement Asset-Backed Bonds, Series 2007-1A, 4.750%, 6/01/34 | | | | | 6/17 at 100.00 | | | | B2 | | | | 30,831,150 | |
| | 237,302 | | | Total New Jersey | | | | | | | | | | | | | 244,291,330 | |
| | | | New Mexico – 0.3% | | | | | | | | | | | | | | |
| | | | | |
| | 1,000 | | | Bernalillo County, New Mexico, Multifamily Housing Revenue Bonds, Valencia Retirement Apartments Project, Series 2001A, 5.450%, 6/01/34 – AMBAC Insured (Alternative Minimum Tax) | | | | | 5/13 at 100.00 | | | | N/R | | | | 1,000,260 | |
| | | | | |
| | | | Cabezon Public Improvement District, Rio Rancho, New Mexico, Special Levy Revenue Bonds, Series 2005: | | | | | | | | | | | | | | |
| | 1,505 | | | 6.000%, 9/01/24 | | | | | 9/15 at 102.00 | | | | N/R | | | | 1,575,043 | |
| | 1,490 | | | 6.300%, 9/01/34 | | | | | 9/15 at 102.00 | | | | N/R | | | | 1,551,582 | |
| | | | | |
| | 4,000 | | | Farmington, New Mexico, Pollution Control Revenue Bonds, Public Service Company of New Mexico – San Juan Project, Series 2003B, 4.875%, 4/01/33 | | | | | 4/16 at 101.00 | | | | BBB | | | | 4,141,080 | |
| | | | | |
| | 3,000 | | | Jicarilla Apache Nation, New Mexico, Revenue Bonds, Series 2002A, 5.500%, 9/01/23 | | | | | No Opt. Call | | | | N/R | | | | 2,999,760 | |
| | | | | |
| | | | Mariposa East Public Improvement District, New Mexico, General Obligation Bonds, Series 2006: | | | | | | | | | | | | | | |
| | 1,210 | | | 5.500%, 9/01/16 | | | | | No Opt. Call | | | | N/R | | | | 1,043,226 | |
| | 1,655 | | | 5.750%, 9/01/21 | | | | | 9/16 at 100.00 | | | | N/R | | | | 1,415,422 | |
| | 9,050 | | | 6.000%, 9/01/32 | | | | | 9/16 at 100.00 | | | | N/R | | | | 7,719,741 | |
| | | | | |
| | 5,245 | | | New Mexico Hospital Equipment Loan Council, First Mortgage Revenue Bonds, Haverland Carter Lifestyle Group, Series 2013, 5.000%, 7/01/42 | | | | | 7/22 at 100.00 | | | | BBB– | | | | 5,298,447 | |
| | | | | |
| | | | The Trails Public Improvement District, Albuquerque, New Mexico, Special Levy Revenue Bonds, Series 2008: | | | | | | | | | | | | | | |
| | 1,190 | | | 7.625%, 10/01/23 | | | | | 10/18 at 100.00 | | | | N/R | | | | 1,252,868 | |
| | 3,400 | | | 7.750%, 10/01/38 | | | | | 10/18 at 100.00 | | | | N/R | | | | 3,487,720 | |
| | 32,745 | | | Total New Mexico | | | | | | | | | | | | | 31,485,149 | |
Portfolio of Investments
Nuveen High Yield Municipal Bond Fund (continued)
April 30, 2013
| | | | | | | | | | | | | | | | | | |
Principal
Amount (000) | | | Description (1) | | | | Optional Call
Provisions (2) | | | Ratings (3) | | | Value | |
| | | | New York – 3.0% | | | | | | | | | | | | | | |
| | | | | |
| $ | 750 | | | Albany Industrial Development Agency, New York, Revenue Bonds, Saint Peter’s Hospital, Series 2008A, 5.250%, 11/15/32 | | | | | 11/17 at 100.00 | | | | A3 | | | $ | 816,983 | |
| | | | | |
| | | | Brooklyn Arena Local Developme(nt Corporation, New York, Payment in Lieu of Taxes Revenue Bonds, Barclays Center Project, Series 2009: | | | | | | | | | | | | | | |
| | 12,430 | | | 0.000%, 7/15/32 | | | | | No Opt. Call | | | | BBB– | | | | 5,372,495 | |
| | 5,470 | | | 0.000%, 7/15/35 | | | | | No Opt. Call | | | | BBB– | | | | 1,977,186 | |
| | 10,750 | | | 6.375%, 7/15/43 | | | | | 1/20 at 100.00 | | | | BBB– | | | | 12,862,698 | |
| | | | | |
| | 1,125 | | | Buffalo and Erie County Industrial Land Development Corporation, New York, Revenue Bonds, Medaille College, Series 2012, 5.250%, 4/01/35 | | | | | 1/23 at 100.00 | | | | BB+ | | | | 1,169,899 | |
| | | | | |
| | 500 | | | Cattaraugus County Industrial Development Agency, New York, Revenue Bonds, St. Bonaventure University, Series 2006, 5.100%, 5/01/31 | | | | | 5/16 at 100.00 | | | | BBB– | | | | 513,425 | |
| | | | | |
| | 1,000 | | | Dormitory Authority of the State of New York, Insured Revenue Bonds, Pace University, Series 2013A, 5.000%, 5/01/38 | | | | | 5/23 at 100.00 | | | | BBB– | | | | 1,089,950 | |
| | | | | |
| | | | New York City Industrial Development Agency, New York, American Airlines-JFK International Airport Special Facility Revenue Bonds, Series 2005: | | | | | | | | | | | | | | |
| | 14,050 | | | 7.500%, 8/01/16 (Alternative Minimum Tax) | | | | | No Opt. Call | | | | N/R | | | | 14,805,154 | |
| | 9,960 | | | 7.625%, 8/01/25 (Alternative Minimum Tax) | | | | | 8/16 at 101.00 | | | | N/R | | | | 11,308,042 | |
| | 12,600 | | | 8.000%, 8/01/28 | | | | | 8/16 at 101.00 | | | | N/R | | | | 14,386,554 | |
| | 14,800 | | | 7.750%, 8/01/31 (Alternative Minimum Tax) | | | | | 8/16 at 101.00 | | | | N/R | | | | 16,905,526 | |
| | | | | |
| | | | New York City Industrial Development Agency, New York, Civic Facility Revenue Bonds, Bronx Parking Development Company, LLC Project, Series 2007: | | | | | | | | | | | | | | |
| | 2,425 | | | 5.625%, 10/01/17 (13) | | | | | No Opt. Call | | | | N/R | | | | 1,032,032 | |
| | 12,570 | | | 5.750%, 10/01/27 (14) | | | | | 10/17 at 100.00 | | | | N/R | | | | 5,336,468 | |
| | 28,560 | | | 5.750%, 10/01/37 (14) | | | | | 10/17 at 100.00 | | | | N/R | | | | 12,122,292 | |
| | 61,500 | | | 5.875%, 10/01/46 (15) | | | | | 10/17 at 102.00 | | | | N/R | | | | 26,098,755 | |
| | | | | |
| | 5,555 | | | New York City Industrial Development Agency, New York, Liberty Revenue Bonds, IAC/InterActiveCorp, Series 2005, 5.000%, 9/01/35 | | | | | 9/15 at 100.00 | | | | BBB | | | | 5,783,199 | |
| | | | | |
| | | | New York City Industrial Development Agency, New York, PILOT Revenue Bonds, Queens Baseball Stadium Project, Series 2006: | | | | | | | | | | | | | | |
| | 9,130 | | | 5.000%, 1/01/31 – AMBAC Insured | | | | | 1/17 at 100.00 | | | | Ba1 | | | | 9,485,614 | |
| | 10,090 | | | 5.000%, 1/01/36 – AMBAC Insured | | | | | 1/17 at 100.00 | | | | Ba1 | | | | 10,392,397 | |
| | | | | |
| | 4,275 | | | New York City Industrial Development Agency, New York, Revenue Bonds, Yankee Stadium Project PILOT, Series 2009A, 7.000%, 3/01/49 – AGC Insured | | | | | 3/19 at 100.00 | | | | AA– | | | | 5,278,129 | |
| | | | | |
| | | | New York City Industrial Development Agency, New York, Special Facilities Revenue Bonds, American Airlines Inc., Series 1990: | | | | | | | | | | | | | | |
| | 200 | | | 5.400%, 7/01/19 (Alternative Minimum Tax) (4) | | | | | 8/13 at 100.00 | | | | N/R | | | | 224,998 | |
| | 430 | | | 5.400%, 7/01/20 (Alternative Minimum Tax) (4) | | | | | 8/13 at 100.00 | | | | N/R | | | | 483,746 | |
| | | | | |
| | 2,305 | | | New York City Industrial Development Agency, New York, Special Facilities Revenue Bonds, American Airlines Inc., Series 1994, 6.900%, 8/01/24 (Alternative Minimum Tax) (4) | | | | | 7/13 at 100.00 | | | | N/R | | | | 2,581,577 | |
| | | | | |
| | 27,805 | | | New York City Industrial Development Agency, New York, Special Facilities Revenue Bonds, British Airways PLC, Series 1998, 5.250%, 12/01/32 (Alternative Minimum Tax) | | | | | 6/13 at 100.00 | | | | BB | | | | 27,805,556 | |
| | | | | |
| | 6,610 | | | New York City Industrial Development Agency, New York, Special Facilities Revenue Bonds, British Airways PLC, Series 2002, 7.625%, 12/01/32 (Alternative Minimum Tax) | | | | | 12/13 at 100.00 | | | | BB | | | | 6,742,068 | |
| | | | | |
| | 8,500 | | | New York City Industrial Development Agency, New York, Special Facilities Revenue Bonds, JFK Airport – American Airlines Inc., Series 2002B, 8.500%, 8/01/28 (Alternative Minimum Tax) | | | | | 8/13 at 100.50 | | | | N/R | | | | 9,392,245 | |
| | | | | |
| | | | New York City Industrial Development Agency, New York, Special Facility Revenue Bonds, JetBlue Airways Corporation Project, Series 2006: | | | | | | | | | | | | | | |
| | 2,085 | | | 5.000%, 5/15/20 (Alternative Minimum Tax) | | | | | 7/13 at 100.00 | | | | B– | | | | 2,085,000 | |
| | 5,370 | | | 5.125%, 5/15/30 (Alternative Minimum Tax) | | | | | 7/13 at 100.00 | | | | B– | | | | 5,369,624 | |
| | | | | | | | | | | | | | | | | | |
Principal
Amount (000) | | | Description (1) | | | | Optional Call
Provisions (2) | | | Ratings (3) | | | Value | |
| | | | New York (continued) | | | | | | | | | | | | | | |
| | | | | |
| | | | New York City Municipal Water Finance Authority, New York, Water and Sewerage System Revenue Bonds, Tender Option Bond Trust 3484: | | | | | | | | | | | | | | |
| $ | 1,290 | | | 17.949%, 6/15/15 (IF) | | | | | No Opt. Call | | | | AA+ | | | $ | 1,894,301 | |
| | 2,500 | | | 17.982%, 6/15/15 (IF) | | | | | No Opt. Call | | | | AA+ | | | | 3,673,400 | |
| | 375 | | | 17.983%, 6/15/15 (IF) | | | | | No Opt. Call | | | | AA+ | | | | 570,330 | |
| | 1,250 | | | 17.982%, 6/15/32 (IF) | | | | | 6/17 at 100.00 | | | | AA+ | | | | 1,830,650 | |
| | 7,500 | | | 17.982%, 6/15/33 (IF) | | | | | 6/19 at 100.00 | | | | AA+ | | | | 11,431,800 | |
| | 625 | | | 17.982%, 6/15/33 (IF) | | | | | 6/19 at 100.00 | | | | AA+ | | | | 952,650 | |
| | | | | |
| | 835 | | | New York Liberty Development Corporation, Liberty Revenue Bonds, 4 World Trade Center Project, Series 2011, 5.000%, 11/15/31 | | | | | 11/21 at 100.00 | | | | A+ | | | | 956,952 | |
| | | | | |
| | 9,860 | | | New York Liberty Development Corporation, Second Priority Liberty Revenue Refunding Bonds, Bank of America Tower at One Bryant Park Project, Series 2010, 6.375%, 7/15/49 | | | | | 1/20 at 100.00 | | | | A– | | | | 11,814,942 | |
| | | | | |
| | | | New York Liberty Development Corporation, Second Priority Liberty Revenue Refunding Bonds, Bank of America Tower at One Bryant Park Project, Tender Option Bond Trust PT4704: | | | | | | | | | | | | | | |
| | 1,000 | | | 18.206%, 1/15/44 (IF) (5) | | | | | 1/20 at 100.00 | | | | AA+ | | | | 1,488,320 | |
| | 1,875 | | | 18.206%, 1/15/44 (IF) (5) | | | | | 1/20 at 100.00 | | | | AA+ | | | | 2,790,600 | |
| | | | | |
| | 1,665 | | | Port Authority of New York and New Jersey, Consolidated Revenue Bonds, One Hundred Fifty Second Series 2009, 13.799%, 11/01/35 (Alternative Minimum Tax) (IF) | | | | | 5/18 at 100.00 | | | | AA– | | | | 2,177,887 | |
| | | | | |
| | 16,000 | | | Port Authority of New York and New Jersey, Consolidated Revenue Bonds, One Hundred Fifty Second Series 2008, 5.250%, 11/01/35 (Alternative Minimum Tax) (UB) | | | | | 5/18 at 100.00 | | | | AA– | | | | 17,641,280 | |
| | | | | |
| | | | Seneca Nation of Indians Capital Improvements Authority, New York, Special Obligation Bonds, Series 2007A: | | | | | | | | | | | | | | |
| | 4,695 | | | 5.250%, 12/01/16 | | | | | No Opt. Call | | | | BB | | | | 5,026,749 | |
| | 1,000 | | | 5.000%, 12/01/23 | | | | | 6/17 at 100.00 | | | | BB | | | | 1,056,620 | |
| | | | | |
| | 100 | | | Suffolk County Industrial Development Agency, New York, Revenue Bonds, Nissequogue Cogeneration Partners Facility, Series 1998, 5.500%, 1/01/23 (Alternative Minimum Tax) | | | | | 7/13 at 100.00 | | | | N/R | | | | 100,005 | |
| | | | | |
| | | | TSASC Inc., New York, Tobacco Asset-Backed Bonds, Series 2006: | | | | | | | | | | | | | | |
| | 1,000 | | | 5.000%, 6/01/26 | | | | | 6/16 at 100.00 | | | | BB– | | | | 989,550 | |
| | 3,230 | | | 5.000%, 6/01/34 | | | | | 6/16 at 100.00 | | | | B+ | | | | 2,932,356 | |
| | | | | |
| | 1,000 | | | Yonkers Industrial Development Agency, New York, Revenue Bonds, St. John’s Riverside Hospital, Series 2001A, 7.125%, 7/01/31 | | | | | 7/13 at 100.00 | | | | B+ | | | | 1,001,730 | |
| | 326,645 | | | Total New York | | | | | | | | | | | | | 279,751,734 | |
| | | | North Carolina – 0.4% | | | | | | | | | | | | | | |
| | | | | |
| | 1,500 | | | Albemarle Hospital Authority, North Carolina, Health Care Facilities Revenue Bonds, Series 2007, 5.250%, 10/01/38 | | | | | 10/17 at 100.00 | | | | N/R | | | | 1,531,620 | |
| | | | | |
| | | | Buncombe County, North Carolina, Project Development Financing Revenue Bonds, Woodfin Downtown Corridor Development, Series 2008: | | | | | | | | | | | | | | |
| | 750 | | | 6.750%, 8/01/24 | | | | | 8/18 at 100.00 | | | | N/R | | | | 747,563 | |
| | 3,470 | | | 7.250%, 8/01/34 | | | | | 8/18 at 100.00 | | | | N/R | | | | 3,441,615 | |
| | | | | |
| | 1,000 | | | Charlotte, North Carolina, Special Facility Refunding Revenue Bonds, Charlotte/Douglas International Airport, US Airways, Inc. Project, Series 1998, 5.600%, 7/01/27 (Alternative Minimum Tax) | | | | | 7/13 at 100.00 | | | | N/R | | | | 1,001,230 | |
| | | | | |
| | 1,565 | | | Charlotte-Mecklenberg Hospital Authority, North Carolina, Health Care Revenue Bonds, DBA Carolinas HealthCare System, Tender Option Bond Trust 11963, 18.853%, 1/15/19 (IF) | | | | | No Opt. Call | | | | AA– | | | | 2,467,880 | |
| | | | | |
| | | | Durham Housing Authority, North Carolina, Multifamily Housing Revenue Bonds, JFK Towers Project, Series 2012A: | | | | | | | | | | | | | | |
| | 1,900 | | | 5.000%, 12/01/35 | | | | | No Opt. Call | | | | A– | | | | 1,991,333 | |
| | 2,570 | | | 5.000%, 12/01/47 | | | | | No Opt. Call | | | | A– | | | | 2,613,125 | |
Portfolio of Investments
Nuveen High Yield Municipal Bond Fund (continued)
April 30, 2013
| | | | | | | | | | | | | | | | | | |
Principal
Amount (000) | | | Description (1) | | | | Optional Call
Provisions (2) | | | Ratings (3) | | | Value | |
| | | | North Carolina (continued) | | | | | | | | | | | | | | |
| | | | | |
| $ | 5,250 | | | North Carolina Capital Facilities Finance Agency, Solid Waste Facilities Revenue Bonds, Liberty Tire Services of North Carolina LLC, Series 2004A, 6.750%, 7/01/29 | | | | | 7/16 at 100.00 | | | | N/R | | | $ | 5,363,663 | |
| | | | | |
| | 1,000 | | | North Carolina Capital Facilities Financing Agency, Educational Facilities Revenue Bond, Meredith College, Series 2008A, 6.125%, 6/01/35 | | | | | 6/18 at 100.00 | | | | BBB | | | | 1,135,000 | |
| | | | | |
| | 5,000 | | | North Carolina Medical Care Commission, Health Care Facilities Revenue Bonds, Wake Forest Baptist Obligated Group, Tender Option Bond Trust 4278, 13.688%, 12/01/20 (IF) (5) | | | | | No Opt. Call | | | | AA– | | | | 5,007,400 | |
| | | | | |
| | | | North Carolina Medical Care Commission, Healthcare Facilities Revenue Bonds, Presbyterian Homes, Series 2006: | | | | | | | | | | | | | | |
| | 2,800 | | | 5.400%, 10/01/27 | | | | | 10/16 at 100.00 | | | | N/R | | | | 2,919,924 | |
| | 1,655 | | | 5.600%, 10/01/36 | | | | | 10/16 at 100.00 | | | | N/R | | | | 1,720,803 | |
| | | | | |
| | 2,790 | | | North Carolina Medical Care Commission, Healthcare Revenue Bonds, Novant Health Inc., Tender Option Bond Trust 1066, 17.224%, 11/01/34 (IF) (5) | | | | | 11/16 at 100.00 | | | | AA– | | | | 3,395,207 | |
| | 31,250 | | | Total North Carolina | | | | | | | | | | | | | 33,336,363 | |
| | | | Ohio – 3.2% | | | | | | | | | | | | | | |
| | | | | |
| | 1,140 | | | Blue Ash, Ohio, Tax Increment Financing Revenue Bonds, Duke Realty Ohio, Series 2006, 5.000%, 12/01/35 | | | | | 12/16 at 102.00 | | | | N/R | | | | 1,164,727 | |
| | | | | |
| | | | Buckeye Tobacco Settlement Financing Authority, Ohio, Tobacco Settlement Asset-Backed Revenue Bonds, Senior Lien, Series 2007A-2: | | | | | | | | | | | | | | |
| | 13,000 | | | 5.125%, 6/01/24 | | | | | 6/17 at 100.00 | | | | B– | | | | 12,067,900 | |
| | 74,465 | | | 5.875%, 6/01/30 | | | | | 6/17 at 100.00 | | | | B | | | | 66,800,318 | |
| | 56,150 | | | 5.750%, 6/01/34 | | | | | 6/17 at 100.00 | | | | B | | | | 49,251,973 | |
| | 15,455 | | | 6.000%, 6/01/42 | | | | | 6/17 at 100.00 | | | | BB+ | | | | 14,022,012 | |
| | 27,285 | | | 6.500%, 6/01/47 | | | | | 6/17 at 100.00 | | | | B | | | | 26,519,110 | |
| | | | | |
| | 14,970 | | | Buckeye Tobacco Settlement Financing Authority, Ohio, Tobacco Settlement Asset-Backed Revenue Bonds, Senior Lien, Series 2007A-3, 6.250%, 6/01/37 | | | | | 6/22 at 100.00 | | | | B | | | | 13,983,178 | |
| | | | | |
| | 2,650 | | | County of Greene, Ohio, Greene Town Center Improvement Revenue Bonds, Series 2009, 8.000%, 12/01/34 | | | | | 12/19 at 100.00 | | | | N/R | | | | 2,931,616 | |
| | | | | |
| | | | Jeffrey Place New Community Authority, Ohio, Jeffrey Place Redevelopment Bonds, Series 2007A: | | | | | | | | | | | | | | |
| | 800 | | | 5.000%, 12/01/22 | | | | | 12/16 at 100.00 | | | | N/R | | | | 817,328 | |
| | 1,000 | | | 5.000%, 12/01/32 | | | | | 12/16 at 100.00 | | | | N/R | | | | 977,970 | |
| | | | | |
| | 3,570 | | | Lorain County Port Authority, Ohio, Recovery Zone Facility Economic Development Revenue Bonds, United State Steel Corporation Project, Series 2010, 6.750%, 12/01/40 | | | | | 12/20 at 100.00 | | | | BB | | | | 3,987,654 | |
| | | | | |
| | 2,600 | | | Middleburg Heights, Ohio, Hospital Facilities Revenue Bonds, Southwest General Health Center Project, Tender Option Bonds Trust 1126, 12.977%, 8/01/47 (IF) (5) | | | | | 8/19 at 100.00 | | | | A2 | | | | 2,630,888 | |
| | | | | |
| | 2,500 | | | Montgomery County, Ohio, Health Care and Multifamily Housing Revenue Bonds, Saint Leonard, Refunding & improvement Series 2010, 6.625%, 4/01/40 | | | | | 4/20 at 100.00 | | | | BBB– | | | | 2,813,550 | |
| | | | | |
| | 1,745 | | | Montgomery County, Ohio, Revenue Bonds, Catholic Health Initiatives, Tender Option Bond Trust 3260, 19.835%, 5/01/29 (IF) | | | | | 5/19 at 100.00 | | | | AA– | | | | 2,951,493 | |
| | | | | |
| | 14,420 | | | Muskingum County, Ohio, Hospital Facilities Revenue Bonds, Genesis HealthCare System Obligated Group Project, Series 2013, 5.000%, 2/15/44 (WI/DD, Settling 5/09/13) | | | | | 2/23 at 100.00 | | | | BB+ | | | | 14,530,025 | |
| | | | | |
| | 17,820 | | | Ohio Air Quality Development Authority, Revenue Refunding Bonds, AK Steel Holding Corporation, Series 2012A, 6.750%, 6/01/24 (Alternative Minimum Tax) | | | | | 2/22 at 100.00 | | | | B– | | | | 18,588,220 | |
| | | | | |
| | | | Ohio State, Hospital Revenue Bonds, University Hospitals Health System, Inc., Tender Option Bond Trust 1092: | | | | | | | | | | | | | | |
| | 3,735 | | | 17.158%, 1/15/41 (IF) (5) | | | | | 1/22 at 100.00 | | | | A | | | | 5,104,849 | |
| | 2,250 | | | 17.158%, 1/15/41 (IF) (5) | | | | | 1/22 at 100.00 | | | | A | | | | 3,075,210 | |
| | | | | | | | | | | | | | | | | | |
Principal
Amount (000) | | | Description (1) | | | | Optional Call
Provisions (2) | | | Ratings (3) | | | Value | |
| | | | Ohio (continued) | | | | | | | | | | | | | | |
| | | | | |
| $ | 1,970 | | | Ohio State, Solid Waste Disposal Revenue Bonds, USG Corporation Project, Series 1998, 5.650%, 3/01/33 (Alternative Minimum Tax) | | | | | 7/13 at 100.00 | | | | B– | | | $ | 1,969,803 | |
| | | | | |
| | 552 | | | Ohio State, Solid Waste Disposal Revenue Bonds, USG Corporation Project, Series 1999, 6.050%, 8/01/34 (Alternative Minimum Tax) | | | | | 7/13 at 100.00 | | | | B– | | | | 552,121 | |
| | | | | |
| | 890 | | | Ohio, Environmental Facilities Revenue Bonds, Ford Motor Company, Series 1999, 5.950%, 9/01/29 (Alternative Minimum Tax) | | | | | 7/13 at 100.00 | | | | Baa3 | | | | 891,673 | |
| | | | | |
| | 1,785 | | | Ohio, Environmental Facilities Revenue Bonds, Ford Motor Company, Series 2000, 6.150%, 6/01/30 (Alternative Minimum Tax) | | | | | 7/13 at 100.00 | | | | Baa3 | | | | 1,788,570 | |
| | | | | |
| | 11,750 | | | Ohio, Environmental Facilities Revenue Bonds, Ford Motor Company, Series 2005, 5.750%, 4/01/35 (Alternative Minimum Tax) | | | | | 4/15 at 100.00 | | | | Baa3 | | | | 12,202,963 | |
| | | | | |
| | | | Port Authority of Columbiana County, Ohio, Solid Waste Facility Revenue Bonds, APEX Environmental LLC, Series 2004A: | | | | | | | | | | | | | | |
| | 3,240 | | | 7.125%, 8/01/25 (Alternative Minimum Tax) | | | | | 8/13 at 104.00 | | | | N/R | | | | 2,491,009 | |
| | 11,000 | | | 7.250%, 8/01/34 (Alternative Minimum Tax) | | | | | 8/16 at 100.00 | | | | N/R | | | | 8,436,340 | |
| | | | | |
| | 7,300 | | | Port Authority of Columbiana County, Ohio, Solid Waste Facility Revenue Bonds, Liberty Waste Transportation LLC, Series 2004A, 7.000%, 8/01/21 (Alternative Minimum Tax) | | | | | 8/16 at 100.00 | | | | N/R | | | | 4,920,857 | |
| | | | | |
| | 500 | | | Port of Greater Cincinnati Development Authority, Ohio, Economic Development Revenue Bonds, Sisters of Mercy of the Americas, Series 2006, 5.000%, 10/01/25 | | | | | 10/16 at 100.00 | | | | A+ | | | | 529,750 | |
| | | | | |
| | | | Southeastern Ohio Port Authority, Hospital Facilities Revenue Bonds, Memorial Health System Obligated Group Project, Refunding and Improvement Series 2012: | | | | | | | | | | | | | | |
| | 2,240 | | | 5.750%, 12/01/32 | | | | | 12/22 at 100.00 | | | | N/R | | | | 2,472,490 | |
| | 7,500 | | | 6.000%, 12/01/42 | | | | | 12/22 at 100.00 | | | | N/R | | | | 8,361,600 | |
| | | | | |
| | 11,300 | | | State of Ohio, Solid Waste Disposal Revenue Bonds (USG Corporation Project) Series 1997 Remarketed, 5.600%, 8/01/32 (Alternative Minimum Tax) | | | | | 8/13 at 100.00 | | | | B– | | | | 11,252,766 | |
| | | | | |
| | 1,805 | | | Summit County Port Authority, Ohio, Development Revenue Bonds, Garfield Heights Inc. Project, Series 2004A, 5.250%, 5/15/23 | | | | | 5/14 at 102.00 | | | | BBB+ | | | | 1,835,089 | |
| | | | | |
| | 505 | | | Toledo-Lucas County Port Authority, Ohio, Special Assessment Revenue Bonds, Crocker Park Project, Series 2003, 5.375%, 12/01/35 | | | | | 12/13 at 102.00 | | | | BB | | | | 519,130 | |
| | | | | |
| | | | Western Reserve Port Authority, Ohio, Solid Waste Facility Revenue Bonds, Central Waste Inc., Series 2007A: | | | | | | | | | | | | | | |
| | 11,750 | | | 6.100%, 7/01/17 (Alternative Minimum Tax) (4) | | | | | No Opt. Call | | | | N/R | | | | 1,649,818 | |
| | 18,400 | | | 6.350%, 7/01/27 (Alternative Minimum Tax) (4) | | | | | 7/17 at 102.00 | | | | N/R | | | | 2,583,544 | |
| | | | | |
| | 5,000 | | | Western Reserve Port Authority, Ohio, Solid Waste Facility Revenue Bonds, Central Waste Inc., Series 2007B, 7.250%, 7/01/27 (4) | | | | | 7/17 at 102.00 | | | | N/R | | | | 50 | |
| | 353,042 | | | Total Ohio | | | | | | | | | | | | | 304,675,594 | |
| | | | Oklahoma – 1.2% | | | | | | | | | | | | | | |
| | | | | |
| | 8,200 | | | Fort Sill Apache Tribe of Oklahoma Economic Development Authority, Gaming Enterprise Revenue Bonds, Fort Sill Apache Casino, Series 2011A, 8.500%, 8/25/26 | | | | | 8/21 at 100.00 | | | | N/R | | | | 9,056,900 | |
| | | | | |
| | 3,460 | | | Okeene Municipal Hospital and Schallmo Authority, Oklahoma, Revenue Bonds, Series 2006, 7.000%, 1/01/35 | | | | | 1/16 at 101.00 | | | | N/R | | | | 3,567,295 | |
| | | | | |
| | | | Sayre Memorial Hospital Authority, Oklahoma, Hospital and Sales Tax Revenue Bonds, Series 2007: | | | | | | | | | | | | | | |
| | 2,110 | | | 6.000%, 7/01/27 | | | | | 7/17 at 100.00 | | | | N/R | | | | 1,906,237 | |
| | 3,540 | | | 6.000%, 7/01/37 | | | | | 7/17 at 100.00 | | | | N/R | | | | 3,006,487 | |
| | | | | |
| | | | Tulsa County Industrial Authority, Oklahoma, Senior Living Community Revenue Bonds, Montereau, Inc Project, Series 2010A: | | | | | | | | | | | | | | |
| | 7,510 | | | 7.250%, 11/01/40 | | | | | 5/20 at 100.00 | | | | N/R | | | | 8,500,419 | |
| | 10,760 | | | 7.250%, 11/01/45 | | | | | 5/20 at 100.00 | | | | N/R | | | | 12,179,029 | |
| | | | | |
| | 56,977 | | | Tulsa Municipal Airport Trust, Oklahoma, Revenue Bonds, American Airlines Inc., Series 1995, 6.250%, 6/01/20 | | | | | 6/13 at 100.00 | | | | N/R | | | | 57,116,594 | |
Portfolio of Investments
Nuveen High Yield Municipal Bond Fund (continued)
April 30, 2013
| | | | | | | | | | | | | | | | | | |
Principal
Amount (000) | | | Description (1) | | | | Optional Call
Provisions (2) | | | Ratings (3) | | | Value | |
| | | | Oklahoma (continued) | | | | | | | | | | | | | | |
| | | | | |
| $ | 14,555 | | | Tulsa Municipal Airport Trust, Oklahoma, Revenue Refunding Bonds, American Airlines Inc., Series 2004A, 7.750%, 6/01/35 (Mandatory put 12/01/14) | | | | | No Opt. Call | | | | N/R | | | $ | 15,804,547 | |
| | | | | |
| | | | Weatherford Hospital Authority, Oklahoma, Sales Tax Revenue Bonds, Series 2006: | | | | | | | | | | | | | | |
| | 2,085 | | | 6.000%, 5/01/25 | | | | | 5/16 at 103.00 | | | | N/R | | | | 2,205,430 | |
| | 3,640 | | | 6.000%, 5/01/31 | | | | | 5/16 at 103.00 | | | | N/R | | | | 3,790,405 | |
| | 112,837 | | | Total Oklahoma | | | | | | | | | | | | | 117,133,343 | |
| | | | Oregon – 0.2% | | | | | | | | | | | | | | |
| | | | | |
| | 3,000 | | | Cow Creek Band of the Umpqua Tribe of Indians, Oregon, Revenue Bonds, Series 2006C, 5.625%, 10/01/26 | | | | | 10/16 at 100.00 | | | | N/R | | | | 2,831,970 | |
| | | | | |
| | | | Deschutes County Hospital Facility Authority, Oregon, Hospital Revenue Refunding Bonds, Cascade Healthcare Community, Inc., Series 2008: | | | | | | | | | | | | | | |
| | 900 | | | 8.000%, 1/01/28 | | | | | 1/19 at 100.00 | | | | A2 | | | | 1,147,239 | |
| | 2,670 | | | 8.250%, 1/01/38 | | | | | 1/19 at 100.00 | | | | A2 | | | | 3,415,678 | |
| | | | | |
| | | | Oregon Health, Housing, Educational and Cultural Facilities Authority, Revenue Bonds, Oregon Coast Aquarium Project, Series 2005A: | | | | | | | | | | | | | | |
| | 500 | | | 4.850%, 10/01/20 | | | | | 7/13 at 100.00 | | | | N/R | | | | 439,500 | |
| | 130 | | | 5.000%, 10/01/21 | | | | | 7/13 at 100.00 | | | | N/R | | | | 112,427 | |
| | 735 | | | 5.350%, 10/01/31 | | | | | 7/13 at 100.00 | | | | N/R | | | | 562,547 | |
| | | | | |
| | 1,600 | | | Oregon State Facilities Authority, Revenue Bonds, Concordia University Project, Series 2010A, 6.375%, 9/01/40 | | | | | 9/20 at 100.00 | | | | BB+ | | | | 1,769,776 | |
| | | | | |
| | 8,270 | | | Oregon State Solid Waste Disposal Facilities Economic Development Revenue Bonds, USG Corporation Project, Series 192 of 1999, 6.400%, 12/01/29 (Alternative Minimum Tax) | | | | | 7/13 at 100.00 | | | | B– | | | | 8,274,218 | |
| | | | | |
| | 1,000 | | | Port of Saint Helens, Oregon, Pollution Control Revenue Bonds, Boise Cascade Project, Series 1997, 5.650%, 12/01/27 | | | | | No Opt. Call | | | | N/R | | | | 999,970 | |
| | | | | |
| | 1,600 | | | Salem Hospital Facility Authority, Oregon, Revenue Bonds, Capital Manor, Inc., Refunding Series 2012, 6.000%, 5/15/42 | | | | | 5/22 at 100.00 | | | | N/R | | | | 1,739,456 | |
| | | | | |
| | 850 | | | Western Generation Agency, Oregon, Cogeneration Project Revenue Bonds, Series 2006C, 5.000%, 1/01/21 | | | | | No Opt. Call | | | | N/R | | | | 861,892 | |
| | 21,255 | | | Total Oregon | | | | | | | | | | | | | 22,154,673 | |
| | | | Pennsylvania – 2.7% | | | | | | | | | | | | | | |
| | | | | |
| | | | Allegheny Country Industrial Development Authority, Pennsylvania, Environmental Improvement Revenue Bonds, United States Steel Corporation Project, Refunding Series 2009: | | | | | | | | | | | | | | |
| | 7,915 | | | 6.750%, 11/01/24 | | | | | 11/19 at 100.00 | | | | BB | | | | 8,728,979 | |
| | 3,825 | | | 6.875%, 5/01/30 | | | | | 11/19 at 100.00 | | | | BB | | | | 4,244,717 | |
| | | | | |
| | 7,500 | | | Allegheny Country Industrial Development Authority, Pennsylvania, Environmental Improvement Revenue Bonds, United States Steel Corporation Project, Refunding Series 2011, 6.550%, 12/01/27 | | | | | 12/21 at 100.00 | | | | BB | | | | 8,366,850 | |
| | | | | |
| | 5,000 | | | Allegheny Country Industrial Development Authority, Pennsylvania, Environmental Improvement Revenue Bonds, United States Steel Corporation Project, Series 2012, 5.750%, 8/01/42 (Alternative Minimum Tax) | | | | | No Opt. Call | | | | BB | | | | 5,122,000 | |
| | | | | |
| | | | Allegheny County Higher Education Building Authority, Pennsylvania, Revenue Bonds, Carlow University, Series 2011: | | | | | | | | | | | | | | |
| | 500 | | | 6.750%, 11/01/31 | | | | | 11/21 at 100.00 | | | | BBB– | | | | 564,995 | |
| | 2,500 | | | 7.000%, 11/01/40 | | | | | 11/21 at 100.00 | | | | BBB– | | | | 2,850,325 | |
| | | | | |
| | 1,900 | | | Allegheny County Higher Education Building Authority, Pennsylvania, University Revenue Bonds, Robert Morris University, Series 2008A, 6.000%, 10/15/38 | | | | | 10/18 at 100.00 | | | | Baa3 | | | | 2,088,556 | |
| | | | | |
| | 4,785 | | | Allentown Area Hospital Authority, Pennsylvania, Revenue Bonds, Sacred Heart Hospital, Series 2005, 6.000%, 11/15/16 | | | | | No Opt. Call | | | | N/R | | | | 5,159,618 | |
| | | | | | | | | | | | | | | | | | |
Principal
Amount (000) | | | Description (1) | | | | Optional Call
Provisions (2) | | | Ratings (3) | | | Value | |
| | | | Pennsylvania (continued) | | | | | | | | | | | | | | |
| | | | | |
| $ | 8,000 | | | Allentown Neighborhood Improvement Zone Development Authority, Pennsylvania, Tax Revenue Bonds, Series 2012A, 5.000%, 5/01/42 | | | | | 5/22 at 100.00 | | | | Baa2 | | | $ | 8,562,320 | |
| | | | | |
| | 4,915 | | | Berks County Industrial Development Authority, Pennsylvania, First Mortgage Revenue Bonds, One Douglassville Properties Project, Series 2007A, 6.125%, 11/01/34 (Alternative Minimum Tax) | | | | | 11/17 at 101.00 | | | | N/R | | | | 5,003,224 | |
| | | | | |
| | | | Berks County Municipal Authority, Pennsylvania, Revenue Bonds, Reading Hospital and Medical Center Project, Tender Option Bond Trust 4727: | | | | | | | | | | | | | | |
| | 375 | | | 17.811%, 11/01/40 (IF) (5) | | | | | 5/22 at 100.00 | | | | AA | | | | 548,085 | |
| | 2,500 | | | 15.900%, 11/01/41 (IF) (5) | | | | | 5/22 at 100.00 | | | | AA | | | | 3,167,000 | |
| | 2,275 | | | 17.811%, 11/01/44 (IF) (5) | | | | | 5/22 at 100.00 | | | | AA | | | | 3,273,088 | |
| | | | | |
| | | | Bucks County Industrial Development Authority, Pennsylvania, Charter School Revenue Bonds, School Lane Charter School, Series 2007A: | | | | | | | | | | | | | | |
| | 1,295 | | | 4.875%, 3/15/27 | | | | | 3/17 at 100.00 | | | | BBB | | | | 1,327,297 | |
| | 1,000 | | | 5.000%, 3/15/37 | | | | | 3/17 at 100.00 | | | | BBB | | | | 1,020,400 | |
| | | | | |
| | | | Chester County Health and Education Facilities Authority, Pennsylvania, Revenue Bonds, Immaculata University, Series 2005: | | | | | | | | | | | | | | |
| | 1,355 | | | 5.125%, 10/15/15 | | | | | No Opt. Call | | | | N/R | | | | 1,388,089 | |
| | 4,925 | | | 5.500%, 10/15/25 | | | | | 10/15 at 102.00 | | | | N/R | | | | 5,129,929 | |
| | 12,180 | | | 5.750%, 10/15/37 | | | | | 10/15 at 102.00 | | | | N/R | | | | 12,579,991 | |
| | | | | |
| | 5,000 | | | Chester County Industrial Development Authority, Pennsylvania, Revenue Bonds, Collegium Charter School Project, Series 2012A, 5.375%, 10/15/42 | | | | | 10/22 at 100.00 | | | | BBB– | | | | 5,057,150 | |
| | | | | |
| | | | Chester County Industrial Development Authority, Pennsylvania, Student Housing Revenue Bonds, University Student Housing, LLC Project at West Chester University Series 2013A: | | | | | | | | | | | | | | |
| | 1,100 | | | 5.000%, 8/01/35 | | | | | 8/23 at 100.00 | | | | Baa3 | | | | 1,186,812 | |
| | 1,075 | | | 5.000%, 8/01/45 | | | | | 8/23 at 100.00 | | | | Baa3 | | | | 1,138,533 | |
| | | | | |
| | 5,000 | | | Dauphin County General Authority, Pennsylvania, Health System Revenue Bonds, Pinnacle Health System Project, Series 2012, 5.000%, 6/01/42 (UB) (5) | | | | | 6/22 at 100.00 | | | | A | | | | 5,399,350 | |
| | | | | |
| | | | Dauphin County General Authority, Pennsylvania, Health System Revenue Bonds, Pinnacle Health System Project, Tender Option Bond Trust 1111: | | | | | | | | | | | | | | |
| | 3,750 | | | 16.899%, 6/01/42 (IF) (5) | | | | | 6/22 at 100.00 | | | | A | | | | 4,948,050 | |
| | 1,525 | | | 16.859%, 6/01/42 (IF) (5) | | | | | 6/22 at 100.00 | | | | A | | | | 2,011,002 | |
| | | | | |
| | | | Fulton County, Pennsylvania, Industrial Development Authority Hospital Revenue Bonds, Fulton County Medical Center Project, Series 2006: | | | | | | | | | | | | | | |
| | 7,475 | | | 5.875%, 7/01/31 | | | | | 7/16 at 100.00 | | | | N/R | | | | 7,687,066 | |
| | 4,455 | | | 5.900%, 7/01/40 | | | | | 7/16 at 100.00 | | | | N/R | | | | 4,563,747 | |
| | | | | |
| | 2,500 | | | Harrisburg Authority, Dauphin County, Pennsylvania, Water Revenue Refunding Bonds, Series 2004, 5.000%, 7/15/19 – AGM Insured | | | | | 7/14 at 100.00 | | | | AA– | | | | 2,545,200 | |
| | | | | |
| | | | Lancaster County Hospital Authority, Pennsylvania, Health Center Revenue Bonds, Saint Anne’s Retirement Community, Inc. , Series 2012: | | | | | | | | | | | | | | |
| | 1,000 | | | 5.000%, 4/01/27 | | | | | 4/22 at 100.00 | | | | BB+ | | | | 1,041,590 | |
| | 1,125 | | | 5.000%, 4/01/33 | | | | | 4/22 at 100.00 | | | | BB+ | | | | 1,146,848 | |
| | | | | |
| | 4,125 | | | Latrobe Industrial Development Authority, Pennsylvania, College Revenue Bonds, Saint Vincent College Project, Series 2013, 5.000%, 5/01/43 | | | | | 5/23 at 100.00 | | | | Baa1 | | | | 4,323,536 | |
| | | | | |
| | 500 | | | Lebanon County Health Facilities Authority, Pennsylvania, Health Center Revenue Bonds, Pleasant View Retirement Community, Series 2005A, 5.300%, 12/15/26 | | | | | 12/14 at 100.00 | | | | N/R | | | | 507,160 | |
| | | | | |
| | 1,450 | | | Montgomery County Industrial Development Authority, Pennsylvania, FHA Insured Mortgage Revenue Bonds, New Regional Medical Center Project, Tender Option Bond Trust 62B, 19.356%, 8/01/38 (IF) (5) | | | | | 8/20 at 100.00 | | | | AA | | | | 2,343,606 | |
| | | | | |
| | | | Montgomery County Industrial Development Authority, Pennsylvania, First Mortgage Revenue Bonds, Whitemarsh Continuing Care, Series 2005: | | | | | | | | | | | | | | |
| | 750 | | | 6.000%, 2/01/21 | | | | | 2/15 at 100.00 | | | | N/R | | | | 766,478 | |
| | 10,500 | | | 6.250%, 2/01/35 | | | | | 2/15 at 100.00 | | | | N/R | | | | 10,677,030 | |
Portfolio of Investments
Nuveen High Yield Municipal Bond Fund (continued)
April 30, 2013
| | | | | | | | | | | | | | | | | | |
Principal
Amount (000) | | | Description (1) | | | | Optional Call
Provisions (2) | | | Ratings (3) | | | Value | |
| | | | Pennsylvania (continued) | | | | | | | | | | | | | | |
| | | | | |
| $ | 1,190 | | | Northampton County Industrial Development Authority, Pennsylvania, Recovery Revenue Bonds, Northampton Generating Project, Senior Lien Series 2013A0 & AE2, 5.000%, 12/01/23 | | | | | 5/13 at 100.00 | | | | N/R | | | $ | 1,087,131 | |
| | | | | |
| | 1,000 | | | Northampton County Industrial Development Authority, Pennsylvania, Revenue Bonds, Morningstar Senior Living, Inc., Series 2012, 5.000%, 7/01/36 | | | | | No Opt. Call | | | | BBB– | | | | 1,034,890 | |
| | | | | |
| | 965 | | | Northumberland County Industrial Development Authority, Pennsylvania, Facility Revenue Bonds, NHS Youth Services Inc., Series 2002, 7.500%, 2/15/29 | | | | | 2/15 at 100.00 | | | | N/R | | | | 720,083 | |
| | | | | |
| | 47,750 | | | Pennsylvania Economic Development Finance Authority, Solid Waste Disposal Revenue Bonds (USG Corporation Project) Series 1999, 6.000%, 6/01/31 (Alternative Minimum Tax) | | | | | 6/13 at 100.00 | | | | B– | | | | 47,943,865 | |
| | | | | |
| | 1,000 | | | Pennsylvania Economic Development Financing Authority, Sewage Sludge Disposal Revenue Bonds, Philadelphia Biosolids Facility Project, Series 2009, 6.250%, 1/01/32 | | | | | 1/20 at 100.00 | | | | BBB | | | | 1,152,300 | |
| | | | | |
| | 2,100 | | | Pennsylvania Economic Development Financing Authority, Special Facilities Revenue Bonds, US Airways Group Inc. Project, Series 2010B, 8.000%, 5/01/29 | | | | | 5/20 at 100.00 | | | | CCC+ | | | | 2,508,072 | |
| | | | | |
| | | | Pennsylvania Higher Educational Facilities Authority, Revenue Bonds, University of Pennsylvania Health System, Tender Option Bond Trust 3252: | | | | | | | | | | | | | | |
| | 1,205 | | | 21.281%, 2/15/19 (IF) | | | | | No Opt. Call | | | | AA– | | | | 2,132,404 | |
| | 750 | | | 20.775%, 2/15/19 (IF) | | | | | No Opt. Call | | | | AA– | | | | 1,300,065 | |
| | | | | |
| | 1,000 | | | Philadelphia Authority for Industrial Development, Pennsylvania, Multifamily Housing Revenue Bonds, PresbyHomes Germantown-Morrisville Project, Series 2005A, 5.625%, 7/01/35 | | | | | 5/15 at 102.00 | | | | Baa3 | | | | 1,018,290 | |
| | | | | |
| | 5,580 | | | Philadelphia Authority for Industrial Development, Pennsylvania, Revenue Bonds, Leadership Learning Partners, Series 2005A, 5.375%, 7/01/36 | | | | | 1/15 at 100.00 | | | | N/R | | | | 3,805,002 | |
| | | | | |
| | | | Philadelphia Authority for Industrial Development, Pennsylvania, Revenue Bonds, Richard Allen Preparatory Charter School, Series 2006: | | | | | | | | | | | | | | |
| | 440 | | | 5.800%, 5/01/16 | | | | | No Opt. Call | | | | BBB– | | | | 459,919 | |
| | 1,380 | | | 6.050%, 5/01/23 | | | | | 5/16 at 100.00 | | | | BBB– | | | | 1,437,877 | |
| | 985 | | | 6.250%, 5/01/33 | | | | | 5/16 at 100.00 | | | | BBB– | | | | 1,023,100 | |
| | | | | |
| | 31,355 | | | Philadelphia Hospitals and Higher Education Facilities Authority, Pennsylvania, Hospital Revenue Bonds, Temple University Health System Obligated Group, Series 2012A, 5.625%, 7/01/42 | | | | | 7/22 at 100.00 | | | | BBB– | | | | 34,102,012 | |
| | | | | |
| | 500 | | | Pottsville Hospital Authority, Pennsylvania, Hospital Revenue Bonds, Pottsville Hospital and Warne Clinic, Series 1998, 5.625%, 7/01/24 | | | | | 7/13 at 100.00 | | | | N/R | | | | 500,305 | |
| | | | | |
| | 90 | | | Scranton Parking Authority, Pennsylvania , Guaranteed Revenue Bonds, Series 2007, 5.000%, 6/01/22 – RAAI Insured | | | | | 6/17 at 100.00 | | | | N/R | | | | 85,698 | |
| | | | | |
| | 550 | | | Scranton Parking Authority, Pennsylvania, Guaranteed Parking Revenue Bonds, Series 2004, 5.000%, 9/15/33 – FGIC Insured | | | | | 9/13 at 100.00 | | | | N/R | | | | 525,927 | |
| | | | | |
| | 5,850 | | | Scranton, Pennsylvania, General Obligation Bonds, Series 2012A, 8.500%, 9/01/22 | | | | | No Opt. Call | | | | N/R | | | | 6,020,177 | |
| | | | | |
| | 7,750 | | | Scranton, Pennsylvania, General Obligation Bonds, Series 2012C, 7.250%, 9/01/22 | | | | | No Opt. Call | | | | N/R | | | | 7,562,295 | |
| | | | | |
| | 1,250 | | | Scranton, Pennsylvania, General Obligation Bonds, Series 2013A, 7.250%, 9/01/23 | | | | | No Opt. Call | | | | N/R | | | | 1,217,575 | |
| | | | | |
| | 1,470 | | | Scranton, Pennsylvania, General Obligation Notes, Series 2012B, 8.500%, 9/01/22 | | | | | No Opt. Call | | | | N/R | | | | 1,512,762 | |
| | | | | |
| | 465 | | | Union County Hospital Authority, Pennsylvania, Hospital Revenue Bonds, Evangelical Community Hospital Project, Refunding and Improvement Series 2011, 6.875%, 8/01/31 | | | | | 8/21 at 100.00 | | | | BBB+ | | | | 579,827 | |
| | 238,700 | | | Total Pennsylvania | | | | | | | | | | | | | 252,198,197 | |
| | | | | | | | | | | | | | | | | | |
Principal
Amount (000) | | | Description (1) | | | | Optional Call
Provisions (2) | | | Ratings (3) | | | Value | |
| | | | Puerto Rico – 0.5% | | | | | | | | | | | | | | |
| | | | | |
| $ | 1,115 | | | Puerto Rico Highway and Transportation Authority, Highway Revenue Bonds, Series 1998A, 4.750%, 7/01/38 – NPFG Insured | | | | | 7/18 at 100.00 | | | | Baa2 | | | $ | 1,086,947 | |
| | | | | |
| | 1,000 | | | Puerto Rico Industrial, Tourist, Educational, Medical and Environmental Control Facilities Financing Authority, Hospital Revenue Bonds, Auxilio Mutuo Hospital, Series 2011A, 6.000%, 7/01/33 | | | | | 7/21 at 100.00 | | | | A– | | | | 1,111,270 | |
| | | | | |
| | | | Puerto Rico Infrastructure Financing Authority, Special Tax Revenue Bonds, Series 2005A: | | | | | | | | | | | | | | |
| | 15,870 | | | 0.000%, 7/01/34 – AMBAC Insured | | | | | No Opt. Call | | | | BBB+ | | | | 4,215,707 | |
| | 3,115 | | | 0.000%, 7/01/44 – AMBAC Insured | | | | | No Opt. Call | | | | BBB+ | | | | 410,121 | |
| | | | | |
| | 14,885 | | | Puerto Rico Ports Authority, Special Facilities Revenue Bonds, American Airlines Inc., Series 1993A, 6.300%, 6/01/23 (Alternative Minimum Tax) (4) | | | | | 6/13 at 100.00 | | | | N/R | | | | 16,559,563 | |
| | | | | |
| | 4,780 | | | Puerto Rico Ports Authority, Special Facilities Revenue Bonds, American Airlines Inc., Series 1996A, 6.250%, 6/01/26 (Alternative Minimum Tax) (4) | | | | | 6/13 at 100.00 | | | | N/R | | | | 5,317,750 | |
| | | | | |
| | 7,000 | | | Puerto Rico Sales Tax Financing Corporation, Sales Tax Revenue Bonds, First Subordinate Series 2009A, 0.000%, 8/01/32 | | | | | 8/26 at 100.00 | | | | A+ | | | | 7,408,170 | |
| | | | | |
| | 27,000 | | | Puerto Rico Sales Tax Financing Corporation, Sales Tax Revenue Bonds, Series 2007A, 0.000%, 8/01/54 – AMBAC Insured | | | | | No Opt. Call | | | | AA– | | | | 2,339,010 | |
| | | | | |
| | | | Puerto Rico Sales Tax Financing Corporation, Sales Tax Revenue Bonds, Tender Option Bond Trust 1081: | | | | | | | | | | | | | | |
| | 1,250 | | | 18.949%, 8/01/57 (IF) (5) | | | | | 8/17 at 100.00 | | | | AA– | | | | 1,450,600 | |
| | 1,750 | | | 20.962%, 8/01/57 (IF) (5) | | | | | 8/19 at 100.00 | | | | AA– | | | | 2,345,560 | |
| | 2,000 | | | 20.962%, 8/01/57 (IF) (5) | | | | | 8/19 at 100.00 | | | | AA– | | | | 2,680,640 | |
| | 1,250 | | | 20.962%, 8/01/57 (IF) (5) | | | | | 8/19 at 100.00 | | | | AA– | | | | 1,675,400 | |
| | 2,000 | | | 20.962%, 8/01/57 (IF) (5) | | | | | 8/19 at 100.00 | | | | AA– | | | | 2,680,640 | |
| | | | | |
| | 30 | | | Puerto Rico, The Children’s Trust Fund, Tobacco Settlement Asset-Backed Refunding Bonds, Series 2002, 5.500%, 5/15/39 | | | | | 7/13 at 100.00 | | | | BBB | | | | 30,337 | |
| | 83,045 | | | Total Puerto Rico | | | | | | | | | | | | | 49,311,715 | |
| | | | Rhode Island – 0.3% | | | | | | | | | | | | | | |
| | | | | |
| | 6,850 | | | Rhode Island Health & Educational Building Corporation, Health Facilities Revenue Bonds, Tockwotton Home, Series 2011, 8.375%, 1/01/46 | | | | | 1/21 at 100.00 | | | | N/R | | | | 8,153,076 | |
| | | | | |
| | 8,020 | | | Rhode Island Health & Educational Building Corporation, Public Schools Financing Program Revenue Bonds, Pooled Series 2009E, 6.000%, 5/15/29 | | | | | 5/19 at 100.00 | | | | A3 | | | | 9,003,412 | |
| | | | | |
| | 2,290 | | | Rhode Island Housing & Mortgage Finance Corporation, Homeownership Opportunity Bond Program, Tender Option Bond Trust 3185, 18.848%, 10/01/42 (IF) | | | | | 4/17 at 100.00 | | | | AA+ | | | | 2,663,545 | |
| | | | | |
| | 2,450 | | | Rhode Island Housing & Mortgage Finance Corporation, Homeownership Opportunity Bond Program, Tender Option Bond Trust 3189, 17.868%, 10/01/26 (IF) | | | | | 10/16 at 100.00 | | | | AA+ | | | | 2,837,100 | |
| | | | | |
| | 1,550 | | | Rhode Island Student Loan Authority, Student Loan Program Revenue Bonds, Series 2008A, 6.750%, 12/01/28 (Alternative Minimum Tax) | | | | | 12/17 at 100.00 | | | | A | | | | 1,747,672 | |
| | | | | |
| | 1,280 | | | Rhode Island Tobacco Settlement Financing Corporation, Tobacco Settlement Asset-Backed Bonds, Series 2002A, 6.125%, 6/01/32 | | | | | 7/13 at 100.00 | | | | BBB+ | | | | 1,292,672 | |
| | | | | |
| | 1,850 | | | Tiverton, Rhode Island, Special Obligation Tax Increment Bonds, Village at Mount Hope Bay, Series 2002A, 6.875%, 5/01/22 | | | | | 11/13 at 101.00 | | | | N/R | | | | 1,869,092 | |
| | 24,290 | | | Total Rhode Island | | | | | | | | | | | | | 27,566,569 | |
| | | | South Carolina – 0.5% | | | | | | | | | | | | | | |
| | | | | |
| | 816 | | | Connector 2000 Association Inc., South Carolina, Senior Lien Toll Road Revenue Bonds, Series 2011A, 0.000%, 1/01/16 | | | | | No Opt. Call | | | | N/R | | | | 611,784 | |
| | | | | |
| | 5,229 | | | Lancaster County, South Carolina, Assessment Bonds, Edgewater II Improvement District, Series 2007A, 7.750%, 11/01/39 (4) | | | | | 11/17 at 100.00 | | | | N/R | | | | 2,624,121 | |
| | | | | |
| | 14,058 | | | Lancaster County, South Carolina, Special Assessment Bonds, Edgewater II Improvement District, Series 2007B, 7.700%, 11/01/17 (4) | | | | | No Opt. Call | | | | N/R | | | | 7,052,758 | |
Portfolio of Investments
Nuveen High Yield Municipal Bond Fund (continued)
April 30, 2013
| | | | | | | | | | | | | | | | | | |
Principal
Amount (000) | | | Description (1) | | | | Optional Call
Provisions (2) | | | Ratings (3) | | | Value | |
| | | | South Carolina (continued) | | | | | | | | | | | | | | |
| | | | | |
| $ | 3,895 | | | Lancaster County, South Carolina, Special Assessment Revenue Bonds, Sun City Carolina Lakes Improvement District, Series 2006, 5.450%, 12/01/37 | | | | | 12/15 at 100.00 | | | | N/R | | | $ | 3,907,815 | |
| | | | | |
| | 2,510 | | | Lancaster County, South Carolina, Special Source Revenue Bonds, Bailes Ridge Project, Series 2006, 5.750%, 5/01/20 | | | | | 5/16 at 101.00 | | | | N/R | | | | 2,517,982 | |
| | | | | |
| | | | Myrtle Beach, South Carolina, Tax Increment Bonds, Air Force Base Redevelopment Project, Series 2006: | | | | | | | | | | | | | | |
| | 2,670 | | | 5.250%, 10/01/26 | | | | | 11/16 at 100.00 | | | | N/R | | | | 2,501,096 | |
| | 4,465 | | | 5.300%, 10/01/35 | | | | | 11/16 at 100.00 | | | | N/R | | | | 4,061,811 | |
| | | | | |
| | | | South Carolina JOBS Economic Development Authority, First Mortgage Revenue Bonds, Lutheran Homes, Series 2007: | | | | | | | | | | | | | | |
| | 1,100 | | | 5.500%, 5/01/28 | | | | | 5/17 at 100.00 | | | | N/R | | | | 1,142,328 | |
| | 1,000 | | | 5.625%, 5/01/42 | | | | | 5/17 at 100.00 | | | | N/R | | | | 1,031,000 | |
| | | | | |
| | 70 | | | South Carolina JOBS Economic Development Authority, Hospital Facilities Revenue Bonds, Palmetto Health Alliance, Series 2003A, 6.125%, 8/01/23 | | | | | 8/13 at 100.00 | | | | BBB+ | | | | 71,033 | |
| | | | | |
| | 15,700 | | | South Carolina JOBS Economic Development Authority, Solid Waste Recycling Facilities Revenue Bonds, Viva Recycling of South Carolina, LLC Project, Series 2012, 8.125%, 1/01/28 (Alternative Minimum Tax) | | | | | 1/22 at 100.00 | | | | N/R | | | | 15,888,557 | |
| | | | | |
| | 3,000 | | | South Carolina Jobs-Economic Development Authority, Hospital Revenue Bonds, Palmetto Health, Refunding & Improvement Series 2009, 5.750%, 8/01/39 | | | | | 8/19 at 100.00 | | | | BBB+ | | | | 3,360,750 | |
| | | | | |
| | 1,250 | | | South Carolina Jobs-Economic Development Authority, Hospital Revenue Bonds, Palmetto Health, Refunding Series 2011A, 6.500%, 8/01/39 – AGM Insured | | | | | 8/21 at 100.00 | | | | AA– | | | | 1,528,238 | |
| | | | | |
| | 3,000 | | | York County, South Carolina, Celanese, Series 1994, 5.700%, 1/01/24 (Alternative Minimum Tax) | | | | | 7/13 at 100.00 | | | | BB– | | | | 3,000,330 | |
| | 58,763 | | | Total South Carolina | | | | | | | | | | | | | 49,299,603 | |
| | | | South Dakota – 0.1% | | | | | | | | | | | | | | |
| | | | | |
| | | | South Dakota Health and Educational Facilities Authority, Revenue Bonds, Sanford Health, Tender Option Bond Trust 1018: | | | | | | | | | | | | | | |
| | 2,905 | | | 19.006%, 11/01/40 (IF) (5) | | | | | 11/19 at 100.00 | | | | A+ | | | | 4,306,459 | |
| | 1,250 | | | 19.014%, 11/01/40 (IF) (5) | | | | | 11/19 at 100.00 | | | | A+ | | | | 1,853,300 | |
| | 250 | | | 19.014%, 11/01/40 (IF) (5) | | | | | 11/19 at 100.00 | | | | A+ | | | | 370,660 | |
| | 4,405 | | | Total South Dakota | | | | | | | | | | | | | 6,530,419 | |
| | | | Tennessee – 1.3% | | | | | | | | | | | | | | |
| | | | | |
| | | | Chattanooga Health, Educational, and Housing Facility Board, Tennessee, Revenue Refunding Bonds, CDFI Phase I, LLC Project, Series 2005A: | | | | | | | | | | | | | | |
| | 5,065 | | | 6.000%, 10/01/35 | | | | | 10/15 at 100.00 | | | | BB+ | | | | 5,315,312 | |
| | 2,000 | | | 5.125%, 10/01/35 | | | | | 10/15 at 100.00 | | | | BBB– | | | | 2,077,540 | |
| | | | | |
| | | | Johnson City Health and Educational Facilities Board, Tennessee, Hospital Revenue Bonds, Mountain States Health Alliance, Refunding Series 2010A: | | | | | | | | | | | | | | |
| | 10,000 | | | 6.500%, 7/01/38 | | | | | 7/20 at 100.00 | | | | BBB+ | | | | 12,031,200 | |
| | 4,605 | | | 6.000%, 7/01/38 | | | | | 7/20 at 100.00 | | | | BBB+ | | | | 5,394,389 | |
| | | | | |
| | 4,265 | | | Sullivan County Health Educational and Housing Facilities Board, Tennessee, Revenue Bonds, Wellmont Health System, Series 2006C, 5.250%, 9/01/36 | | | | | 9/16 at 100.00 | | | | BBB+ | | | | 4,555,404 | |
| | | | | |
| | | | Sumner County Health, Educational, and Housing Facilities Board, Tennessee, Revenue Refunding Bonds, Sumner Regional Health System Inc., Series 2007: | | | | | | | | | | | | | | |
| | 1,500 | | | 5.500%, 11/01/37 (4) | | | | | 11/17 at 100.00 | | | | N/R | | | | 3,735 | |
| | 19,500 | | | 5.500%, 11/01/46 (4) | | | | | 11/17 at 100.00 | | | | N/R | | | | 48,555 | |
| | | | | |
| | 70,300 | | | The Tennessee Energy Acquisition Corporation, Gas Revenue Bonds, Series 2006B, 5.625%, 9/01/26 | | | | | No Opt. Call | | | | BBB | | | | 82,093,528 | |
| | | | | | | | | | | | | | | | | | |
Principal
Amount (000) | | | Description (1) | | | | Optional Call
Provisions (2) | | | Ratings (3) | | | Value | |
| | | | Tennessee (continued) | | | | | | | | | | | | | | |
| | | | | |
| $ | 12,240 | | | Wilson County Health and Educational Facilities Board, Tennessee, Senior Living Revenue Bonds, Rutland Place, Series 2007A, 6.300%, 7/01/37 | | | | | 7/17 at 100.00 | | | | N/R | | | $ | 7,601,162 | |
| | 129,475 | | | Total Tennessee | | | | | | | | | | | | | 119,120,825 | |
| | | | Texas – 7.5% | | | | | | | | | | | | | | |
| | | | | |
| | 225 | | | Arlington Higher Education Finance Corporation, Texas, Education Revenue Bonds, Arlington Classics Academy, Series 2010A, 7.000%, 8/15/28 | | | | | 8/20 at 100.00 | | | | BB | | | | 245,306 | |
| | | | | |
| | | | Austin Convention Enterprises Inc., Texas, Convention Center Hotel Revenue Bonds, First Tier Series 2006A: | | | | | | | | | | | | | | |
| | 1,500 | | | 5.250%, 1/01/19 – SYNCORA GTY Insured | | | | | 1/17 at 100.00 | | | | BB+ | | | | 1,633,260 | |
| | 2,000 | | | 5.250%, 1/01/24 – SYNCORA GTY Insured | | | | | 1/17 at 100.00 | | | | BB+ | | | | 2,134,360 | |
| | 2,995 | | | 5.000%, 1/01/34 – SYNCORA GTY Insured | | | | | 1/17 at 100.00 | | | | BB+ | | | | 3,107,492 | |
| | | | | |
| | 26,850 | | | Austin Convention Enterprises Inc., Texas, Convention Center Hotel Revenue Bonds, Second Tier Series 2006B, 5.750%, 1/01/34 | | | | | 1/17 at 100.00 | | | | Ba2 | | | | 28,077,851 | |
| | | | | |
| | 7,705 | | | Austin Convention Enterprises Inc., Texas, Convention Center Hotel Revenue Bonds, Third Tier Series 2001C, 9.750%, 1/01/26 | | | | | 7/13 at 100.00 | | | | N/R | | | | 7,747,994 | |
| | | | | |
| | | | Beasley Higher Education Finance Corporation, Texas, Education Revenue Bonds, FOCUS Learning Academy Charter School, Series 2011: | | | | | | | | | | | | | | |
| | 1,565 | | | 7.500%, 8/15/31 | | | | | 8/21 at 100.00 | | | | BB+ | | | | 1,802,504 | |
| | 3,525 | | | 7.750%, 8/15/41 | | | | | 8/21 at 100.00 | | | | BB+ | | | | 4,096,720 | |
| | | | | |
| | | | Bexar County Housing Finance Corporation, Texas, Insured Multifamily Housing Revenue Bonds, Waters at Northern Hills Apartments Project, Series 2001A: | | | | | | | | | | | | | | |
| | 365 | | | 6.000%, 8/01/31 – NPFG Insured | | | | | 8/13 at 100.00 | | | | Baa2 | | | | 365,004 | |
| | 2,135 | | | 6.050%, 8/01/36 – NPFG Insured | | | | | 8/13 at 100.00 | | | | Baa2 | | | | 2,134,573 | |
| | | | | |
| | 9,545 | | | Bexar County Housing Finance Corporation, Texas, Multifamily Housing Revenue Bonds, Doral Club & Sutton House Apartments Project, Series 2001A, 5.550%, 10/01/36 – NPFG Insured | | | | | 10/13 at 100.00 | | | | Baa2 | | | | 9,629,951 | |
| | | | | |
| | 1,330 | | | Bexar County Housing Finance Corporation, Texas, Multifamily Housing Revenue Bonds, Dymaxion & Marbach Park Apartments, Series 2000A, 6.100%, 8/01/30 – NPFG Insured | | | | | 7/13 at 100.00 | | | | Baa2 | | | | 1,343,167 | |
| | | | | |
| | | | Bexar County Housing Finance Corporation, Texas, Multifamily Housing Revenue Bonds, Honey Creek Apartments Project, Series 2000A: | | | | | | | | | | | | | | |
| | 250 | | | 6.125%, 4/01/20 – NPFG Insured | | | | | 7/13 at 100.00 | | | | Baa2 | | | | 250,060 | |
| | 1,885 | | | 6.200%, 4/01/30 – NPFG Insured | | | | | 7/13 at 100.00 | | | | Baa2 | | | | 1,871,240 | |
| | | | | |
| | 6,080 | | | Brazos River Authority, Texas, Collateralized Pollution Control Revenue Bonds, Texas Utilities Electric Company, Series 2003B, 6.300%, 7/01/32 (Alternative Minimum Tax) | | | | | 7/13 at 101.00 | | | | CC | | | | 456,061 | |
| | | | | |
| | 3,400 | | | Brazos River Authority, Texas, Collateralized Pollution Control Revenue Bonds, Texas Utilities Electric Company, Series 2003D, 5.400%, 10/01/29 (Mandatory put 10/01/14) | | | | | No Opt. Call | | | | CC | | | | 476,000 | |
| | | | | |
| | 31,260 | | | Brazos River Authority, Texas, Pollution Control Revenue Bonds, TXU Electric Company Project, Series 1999A, 7.700%, 4/01/33 (Alternative Minimum Tax) | | | | | 4/14 at 100.00 | | | | CC | | | | 2,657,100 | |
| | | | | |
| | 12,725 | | | Brazos River Authority, Texas, Pollution Control Revenue Bonds, TXU Energy Company LLC Project, Series 2003C, 6.750%, 10/01/38 (Alternative Minimum Tax) | | | | | 10/13 at 101.00 | | | | CC | | | | 954,502 | |
| | | | | |
| | 8,350 | | | Brazos River Authority, Texas, Pollution Control Revenue Refunding Bonds, TXU Electric Company, Series 1999C, 7.700%, 3/01/32 (Alternative Minimum Tax) | | | | | 4/14 at 100.00 | | | | C | | | | 668,084 | |
| | | | | |
| | 55,305 | | | Brazos River Authority, Texas, Pollution Control Revenue Refunding Bonds, TXU Electric Company, Series 2001D, 8.250%, 5/01/33 (Alternative Minimum Tax) | | | | | 7/18 at 100.00 | | | | CCC | | | | 4,908,872 | |
| | | | | |
| | 4,500 | | | Brazos, Texas, River Authority, Electrical Utilities, Series 1975, 8.250%, 10/01/30 (Alternative Minimum Tax) | | | | | 7/18 at 100.00 | | | | CCC | | | | 399,420 | |
Portfolio of Investments
Nuveen High Yield Municipal Bond Fund (continued)
April 30, 2013
| | | | | | | | | | | | | | | | | | |
Principal
Amount (000) | | | Description (1) | | | | Optional Call
Provisions (2) | | | Ratings (3) | | | Value | |
| | | | Texas (continued) | | | | | | | | | | | | | | |
| | | | | |
| $ | 6,410 | | | Cameron Education Finance Corporation, Texas, Charter School Revenue Bonds, Faith Family Academy Charter School, Series 2006A, 5.250%, 8/15/36 – ACA Insured | | | | | 8/16 at 100.00 | | | | BBB– | | | $ | 6,442,114 | |
| | | | | |
| | | | Central Texas Regional Mobility Authority, Revenue Bonds, Senior Lien Series 2010: | | | | | | | | | | | | | | |
| | 2,225 | | | 0.000%, 1/01/28 | | | | | No Opt. Call | | | | Baa2 | | | | 1,127,964 | |
| | 4,000 | | | 0.000%, 1/01/29 | | | | | No Opt. Call | | | | Baa2 | | | | 1,917,040 | |
| | | | | |
| | 25,000 | | | Central Texas Regional Mobility Authority, Revenue Bonds, Senior Lien Series 2011, 6.750%, 1/01/41 | | | | | 1/21 at 100.00 | | | | Baa3 | | | | 29,410,250 | |
| | | | | |
| | 3,335 | | | Central Texas Regional Mobility Authority, Revenue Bonds, Subordinate Lien Refunding Series 2013, 5.000%, 1/01/42 (WI/DD, Settling 5/16/13) | | | | | 1/23 at 100.00 | | | | Baa3 | | | | 3,480,339 | |
| | | | | |
| | | | Clifton Higher Education Finance Corporation, Texas, Education Revenue Bonds, Tejano Center for Community Concerns, Inc.-Raul Yzaguirre School for Success, Refunding Series 2009A: | | | | | | | | | | | | | | |
| | 90 | | | 7.750%, 2/15/18 | | | | | No Opt. Call | | | | BBB– | | | | 98,003 | |
| | 7,500 | | | 9.000%, 2/15/38 | | | | | 2/18 at 100.00 | | | | BBB– | | | | 8,718,225 | |
| | | | | |
| | 8,685 | | | Dallas-Fort. Worth International Airport Facility Improvement Corporation, Texas, Revenue Bonds, American Airlines Inc., Series 2000-A2, 9.000%, 5/01/29 (Mandatory put 5/01/15) (Alternative Minimum Tax) | | | | | No Opt. Call | | | | N/R | | | | 9,727,287 | |
| | | | | |
| | 16,525 | | | Dallas-Ft. Worth International Airport Facility Improvement Corporation, Texas, Revenue Bonds, American Airlines Inc., Series 1995, 6.000%, 11/01/14 | | | | | 7/13 at 100.00 | | | | N/R | | | | 17,970,938 | |
| | | | | |
| | 50,715 | | | Dallas-Ft. Worth International Airport Facility Improvement Corporation, Texas, Revenue Bonds, American Airlines Inc., Series 1999, 6.375%, 5/01/35 (Alternative Minimum Tax) (4) | | | | | 11/13 at 100.00 | | | | N/R | | | | 54,518,625 | |
| | | | | |
| | 42,460 | | | Dallas-Ft. Worth International Airport Facility Improvement Corporation, Texas, Revenue Bonds, American Airlines Inc., Series 2000A-3, 9.125%, 5/01/29 (Alternative Minimum Tax) (4) | | | | | 5/15 at 101.00 | | | | N/R | | | | 47,236,750 | |
| | | | | |
| | 13,150 | | | Dallas-Ft. Worth International Airport Facility Improvement Corporation, Texas, Revenue Bonds, American Airlines Inc., Series 2007, 5.500%, 11/01/30 (Alternative Minimum Tax) (4) | | | | | 7/13 at 100.00 | | | | N/R | | | | 14,169,125 | |
| | | | | |
| | 2,430 | | | Danbury Higher Education Authority Inc., Texas, Golden Rule Charter School Revenue Bonds, Series 2008A, 6.500%, 8/15/38 | | | | | 2/18 at 100.00 | | | | BB+ | | | | 2,520,542 | |
| | | | | |
| | 8,760 | | | Decatur Hospital Authority, Texas, Revenue Bonds, Wise Regional Health System, Series 2004A, 7.125%, 9/01/34 | | | | | 9/14 at 100.00 | | | | N/R | | | | 9,171,545 | |
| | | | | |
| | | | Decatur Hospital Authority, Texas, Revenue Bonds, Wise Regional Health System, Series 2013A: | | | | | | | | | | | | | | |
| | 1,000 | | | 6.625%, 9/01/31 | | | | | 9/23 at 100.00 | | | | N/R | | | | 1,116,140 | |
| | 6,285 | | | 6.375%, 9/01/42 | | | | | 9/23 at 100.00 | | | | N/R | | | | 6,722,813 | |
| | | | | |
| | 6,800 | | | Fort Bend County Industrial Development Corporation, Texas, Revenue Bonds, NRG Energy Inc. Project, Series 2012A. RMKT, 4.750%, 5/01/38 | | | | | 11/22 at 100.00 | | | | Baa3 | | | | 6,893,500 | |
| | | | | |
| | 13,075 | | | Fort Bend County Industrial Development Corporation, Texas, Revenue Bonds, NRG Energy Inc. Project, Series 2012B, 4.750%, 11/01/42 | | | | | 11/22 at 100.00 | | | | Baa3 | | | | 13,204,573 | |
| | | | | |
| | 3,745 | | | Gulf Coast Industrial Development Authority, Texas, Solid Waste Disposal Revenue Bonds, Citgo Petroleum Corporation Project, Series 1995, 4.875%, 5/01/25 (Alternative Minimum Tax) | | | | | 10/22 at 100.00 | | | | BB+ | | | | 3,889,033 | |
| | | | | |
| | 2,530 | | | Gulf Coast Industrial Development Authority, Texas, Solid Waste Disposal Revenue Bonds, Citgo Petroleum Corporation Project, Series 1998, 8.000%, 4/01/28 (Alternative Minimum Tax) | | | | | 7/13 at 100.00 | | | | BB+ | | | | 2,534,554 | |
| | | | | |
| | | | Hackberry, Texas, Combination Special Assessment and Contract Revenue Road and Utility Bonds, Hidden Cove Improvements Series 2009-2A: | | | | | | | | | | | | | | |
| | 890 | | | 8.625%, 9/01/29 | | | | | 9/19 at 100.00 | | | | N/R | | | | 965,107 | |
| | 8,665 | | | 9.000%, 9/01/38 | | | | | 9/19 at 100.00 | | | | N/R | | | | 9,363,832 | |
| | | | | |
| | 4,078 | | | Harris County, Texas, Lease Purchase Agreement Bonds, Murworth Project II Series 2000, 6.750%, 5/01/20 | | | | | No Opt. Call | | | | N/R | | | | 4,080,645 | |
| | | | | | | | | | | | | | | | | | |
Principal
Amount (000) | | | Description (1) | | | | Optional Call
Provisions (2) | | | Ratings (3) | | | Value | |
| | | | Texas (continued) | | | | | | | | | | | | | | |
| | | | | |
| $ | 42,765 | | | Harris County-Houston Sports Authority, Texas, Junior Lien Revenue Refunding Bonds, Series 2001B, 5.250%, 11/15/40 – NPFG Insured | | | | | 5/13 at 100.00 | | | | Baa2 | | | $ | 42,856,517 | |
| | | | | |
| | 125 | | | Harris County-Houston Sports Authority, Texas, Junior Lien Special Revenue Bonds, Series 1998B, 0.000%, 11/15/22 – NPFG Insured | | | | | No Opt. Call | | | | Baa2 | | | | 74,504 | |
| | | | | |
| | | | Harris County-Houston Sports Authority, Texas, Revenue Bonds, Junior Lien Series 2001H: | | | | | | | | | | | | | | |
| | 1,525 | | | 0.000%, 11/15/23 – NPFG Insured | | | | | No Opt. Call | | | | Baa2 | | | | 891,317 | |
| | 11,180 | | | 0.000%, 11/15/24 – NPFG Insured | | | | | No Opt. Call | | | | Baa2 | | | | 6,195,844 | |
| | 16,030 | | | 0.000%, 11/15/25 – NPFG Insured | | | | | No Opt. Call | | | | Baa2 | | | | 8,430,498 | |
| | 4,920 | | | 0.000%, 11/15/26 | | | | | No Opt. Call | | | | Baa2 | | | | 2,458,278 | |
| | 5,000 | | | 0.000%, 11/15/27 – NPFG Insured | | | | | No Opt. Call | | | | Baa2 | | | | 2,366,750 | |
| | 12,075 | | | 0.000%, 11/15/28 – NPFG Insured | | | | | No Opt. Call | | | | Baa2 | | | | 5,380,016 | |
| | 10,525 | | | 0.000%, 11/15/29 – NPFG Insured | | | | | No Opt. Call | | | | Baa2 | | | | 4,408,923 | |
| | 2,725 | | | 0.000%, 11/15/30 – NPFG Insured | | | | | No Opt. Call | | | | Baa2 | | | | 1,071,961 | |
| | 5,000 | | | 0.000%, 11/15/31 – NPFG Insured | | | | | No Opt. Call | | | | Baa2 | | | | 1,858,300 | |
| | 1,205 | | | 0.000%, 11/15/32 – NPFG Insured | | | | | 11/31 at 94.05 | | | | Baa2 | | | | 418,171 | |
| | 180 | | | 0.000%, 11/15/33 | | | | | 11/31 at 88.44 | | | | Baa2 | | | | 58,525 | |
| | 2,075 | | | 0.000%, 11/15/34 – NPFG Insured | | | | | 11/31 at 83.17 | | | | Baa2 | | | | 632,170 | |
| | 35 | | | 0.000%, 11/15/35 | | | | | 11/31 at 78.18 | | | | Baa2 | | | | 10,005 | |
| | 4,160 | | | 0.000%, 11/15/36 – NPFG Insured | | | | | 11/31 at 73.51 | | | | Baa2 | | | | 1,116,253 | |
| | 1,525 | | | 0.000%, 11/15/37 – NPFG Insured | | | | | 11/31 at 69.08 | | | | Baa2 | | | | 382,470 | |
| | 1,930 | | | 0.000%, 11/15/38 – NPFG Insured | | | | | 11/31 at 64.91 | | | | Baa2 | | | | 454,805 | |
| | 1,005 | | | 0.000%, 11/15/39 – NPFG Insured | | | | | 11/31 at 60.98 | | | | Baa2 | | | | 221,673 | |
| | 9,300 | | | 0.000%, 11/15/40 – NPFG Insured | | | | | 11/31 at 57.27 | | | | Baa2 | | | | 1,926,588 | |
| | 4,140 | | | 0.000%, 11/15/41 – NPFG Insured | | | | | 11/31 at 53.78 | | | | Baa2 | | | | 805,396 | |
| | | | | |
| | | | Harris County-Houston Sports Authority, Texas, Revenue Bonds, Senior Lien Series 2001G: | | | | | | | | | | | | | | |
| | 95 | | | 5.250%, 11/15/22 – NPFG Insured | | | | | 7/13 at 100.00 | | | | BBB | | | | 95,828 | |
| | 4,465 | | | 5.250%, 11/15/30 – NPFG Insured | | | | | 7/13 at 100.00 | | | | BBB | | | | 4,492,817 | |
| | 1,605 | | | 5.375%, 11/15/41 – NPFG Insured | | | | | 7/13 at 100.00 | | | | BBB | | | | 1,608,435 | |
| | 300 | | | 0.000%, 11/15/41 – NPFG Insured | | | | | 11/31 at 53.78 | | | | BBB | | | | 63,075 | |
| | | | | |
| | | | Harris County-Houston Sports Authority, Texas, Revenue Bonds, Third Lien Series 2004A-3: | | | | | | | | | | | | | | |
| | 100 | | | 0.000%, 11/15/31 – NPFG Insured | | | | | 11/24 at 66.52 | | | | Baa2 | | | | 35,922 | |
| | 605 | | | 0.000%, 11/15/32 – NPFG Insured | | | | | 11/24 at 62.70 | | | | Baa2 | | | | 203,952 | |
| | 1,220 | | | 0.000%, 11/15/33 – NPFG Insured | | | | | 11/24 at 59.10 | | | | Baa2 | | | | 386,752 | |
| | 215 | | | 0.000%, 11/15/34 – NPFG Insured | | | | | 11/24 at 55.69 | | | | Baa2 | | | | 64,083 | |
| | 185 | | | 0.000%, 11/15/35 – NPFG Insured | | | | | 11/24 at 52.47 | | | | Baa2 | | | | 51,893 | |
| | 17,675 | | | 0.000%, 11/15/39 | | | | | 11/24 at 41.26 | | | | Baa2 | | | | 3,872,416 | |
| | | | | |
| | | | Harris County-Houston Sports Authority, Texas, Senior Lien Revenue Refunding Bonds, Series 2001A: | | | | | | | | | | | | | | |
| | 30 | | | 5.250%, 11/15/30 – NPFG Insured | | | | | 7/13 at 100.00 | | | | BBB | | | | 30,064 | |
| | 180 | | | 0.000%, 11/15/34 – NPFG Insured | | | | | 11/30 at 78.27 | | | | BBB | | | | 59,650 | |
| | 36,660 | | | 0.000%, 11/15/38 – NPFG Insured | | | | | 11/30 at 61.17 | | | | BBB | | | | 9,332,903 | |
| | 750 | | | 0.000%, 11/15/40 – NPFG Insured | | | | | 11/30 at 54.04 | | | | BBB | | | | 167,543 | |
| | | | | |
| | | | Harris County-Houston Sports Authority, Texas, Senior Lien Special Revenue Bonds, Series 1998A: | | | | | | | | | | | | | | |
| | 1,295 | | | 5.000%, 11/15/25 – NPFG Insured | | | | | 7/13 at 100.00 | | | | BBB | | | | 1,304,674 | |
| | 3,275 | | | 5.000%, 11/15/28 – NPFG Insured | | | | | 7/13 at 100.00 | | | | BBB | | | | 3,299,497 | |
| | | | | |
| | 3,685 | | | Health Facilities Development District of Central Texas, Revenue Bonds, Lutheran Social Services of the South Inc., Series 2004A, 6.875%, 2/15/32 | | | | | 2/14 at 100.00 | | | | N/R | | | | 3,728,446 | |
| | | | | |
| | 8,590 | | | Heart of Texas Education Finance Corporation, Texas, Gateway Charter Academy, Series 2006A, 6.000%, 2/15/36 | | | | | 8/16 at 100.00 | | | | N/R | | | | 8,706,824 | |
| | | | | |
| | 6,490 | | | Hidalgo Willacy Housing Finance Corporation, Texas, Multifamily Housing Revenue Bonds, Heritage Square Apartments Project, Series 2003A, 7.000%, 1/01/39 | | | | | 1/14 at 102.00 | | | | N/R | | | | 6,660,298 | |
| | | | | |
| | 4,350 | | | Houston, Texas, Airport System Special Facilities Revenue Bonds, Continental Air Lines Inc., Series 2001E, 7.000%, 7/01/29 | | | | | 7/13 at 100.00 | | | | B | | | | 4,370,141 | |
Portfolio of Investments
Nuveen High Yield Municipal Bond Fund (continued)
April 30, 2013
| | | | | | | | | | | | | | | | | | |
Principal
Amount (000) | | | Description (1) | | | | Optional Call
Provisions (2) | | | Ratings (3) | | | Value | |
| | | | Texas (continued) | | | | | | | | | | | | | | |
| | | | | |
| $ | 2,540 | | | Houston, Texas, Airport System Special Facilities Revenue Bonds, Continental Airlines Inc. – Airport Improvement Project, Series 1997C, 6.125%, 7/15/27 (Alternative Minimum Tax) | | | | | 7/13 at 100.00 | | | | B | | | $ | 2,549,982 | |
| | | | | |
| | 7,000 | | | Houston, Texas, Airport System Special Facilities Revenue Bonds, Continental Airlines Inc. – Terminal Improvement Project, Refunding Series 2011, 6.625%, 7/15/38 (Alternative Minimum Tax) | | | | | 7/21 at 100.00 | | | | B | | | | 7,928,690 | |
| | | | | |
| | 2,970 | | | Houston, Texas, Airport System Special Facilities Revenue Bonds, Continental Airlines Inc. – Terminal Improvement Project, Series 1997B, 6.125%, 7/15/27 (Alternative Minimum Tax) | | | | | 7/13 at 100.00 | | | | B | | | | 2,981,672 | |
| | | | | |
| | 11,375 | | | Jefferson County Industrial Development Corporation, Texas, Hurricane Ike Disaster Area Revenue Bonds, Port of Beaumont Petroleum Transload Terminal, LLC Project, Series 2012, 8.250%, 7/01/32 | | | | | 7/22 at 100.00 | | | | N/R | | | | 11,700,098 | |
| | | | | |
| | 4,680 | | | La Vernia Education Financing Corporation, Texas, Charter School Revenue Bonds, Riverwalk Education Foundation, Series 2007A, 5.450%, 8/15/36 | | | | | 7/13 at 100.00 | | | | N/R | | | | 4,364,334 | |
| | | | | |
| | 4,500 | | | La Vernia Higher Education Finance Corporation, Texas, Education Revenue Bonds, Cosmos Foundation Inc., Series 2008A, 7.125%, 2/15/38 | | | | | 2/17 at 100.00 | | | | BBB | | | | 5,189,985 | |
| | | | | |
| | 1,755 | | | Matagorda County Navigation District 1, Texas, Pollution Control Revenue Bonds, AEP Texas Central Company Project, Remarketing, Series 2005A, 4.400%, 5/01/30 – AMBAC Insured | | | | | No Opt. Call | | | | BBB | | | | 1,891,486 | |
| | | | | |
| | 1,500 | | | Newark Cultural Education Facilities Finance Corporation, Texas, Lease Revenue Bonds, A.W. Brown-Fellowship Leadership Academy, Series 2012A, 6.000%, 8/15/42 | | | | | 2/15 at 103.00 | | | | BBB– | | | | 1,573,965 | |
| | | | | |
| | 11,090 | | | North Texas Tollway Authority, Second Tier System Revenue Refunding Bonds, Tender Option Bond Trust 1015, 20.366%, 1/01/38 (IF) (5) | | | | | 1/18 at 100.00 | | | | A3 | | | | 18,391,656 | |
| | | | | |
| | 1,600 | | | North Texas Tollway Authority, System Revenue Bonds, First Tier Series 2009A, 6.250%, 1/01/39 | | | | | 1/19 at 100.00 | | | | A2 | | | | 1,864,640 | |
| | | | | |
| | 18,240 | | | Port Corpus Christi Authority, Nueces County, Texas, Pollution Control Revenue Bonds, Celanese Project, Refunding Series 2002B, 6.700%, 11/01/30 (Alternative Minimum Tax) | | | | | 5/14 at 100.00 | | | | BB– | | | | 18,427,142 | |
| | | | | |
| | 8,900 | | | Red River Authority, Texas, Pollution Control Revenue Bonds, Hoechst Celanese Corporation Project, Series 2002B, 6.700%, 11/01/30 (Alternative Minimum Tax) | | | | | 5/14 at 100.00 | | | | BB– | | | | 8,991,314 | |
| | | | | |
| | 9,375 | | | Red River Health Facilities Development Corporation, Texas, First Mortgage Revenue Bonds, Eden Home Inc., Series 2012, 7.250%, 12/15/47 | | | | | 12/21 at 100.00 | | | | N/R | | | | 9,954,750 | |
| | | | | |
| | 4,500 | | | Red River Health Facilities Development Corporation, Texas, Retirement Facility Revenue Bonds, MRC Crestview Project, Series 2011A, 8.000%, 11/15/46 | | | | | 11/21 at 100.00 | | | | N/R | | | | 5,241,780 | |
| | | | | |
| | 5,945 | | | Sabine River Authority, Texas, Pollution Control Revenue Bonds, TXU Electric Company, Series 2001C, 5.200%, 5/01/28 | | | | | 11/15 at 100.00 | | | | CCC | | | | 431,072 | |
| | | | | |
| | 1,000 | | | Sabine River Authority, Texas, Pollution Control Revenue Refunding Bonds, TXU Electric Company, Series 2003A, 5.800%, 7/01/22 | | | | | 7/13 at 101.00 | | | | CC | | | | 73,760 | |
| | | | | |
| | 2,900 | | | San Antonio Convention Center Hotel Finance Corporation, Texas, Contract Revenue Empowerment Zone Bonds, Series 2005A, 5.000%, 7/15/39 – AMBAC Insured (Alternative Minimum Tax) | | | | | 7/15 at 100.00 | | | | BBB | | | | 2,925,404 | |
| | | | | |
| | 2,075 | | | Tarrant County Cultural and Educational Facilities Finance Corporation, Texas, Retirement Facility Revenue Bonds, C.C. Young Memorial Home Project, Series 2009A, 8.000%, 2/15/38 | | | | | 2/20 at 100.00 | | | | N/R | | | | 2,386,997 | |
| | | | | |
| | 1,350 | | | Tarrant County Cultural Education Facilities Finance Corporation, Texas, Charter School Revenue Bonds, Trinity Basin Preparatory Project, Series 2009A, 7.750%, 6/01/39 | | | | | 12/19 at 100.00 | | | | BBB– | | | | 1,569,159 | |
| | | | | |
| | 11,685 | | | Texas Municipal Gas Acquisition and Supply Corporation I, Gas Supply Revenue Bonds, Senior Lien Series 2008D, 6.250%, 12/15/26 | | | | | No Opt. Call | | | | A– | | | | 14,724,736 | |
| | | | | |
| | 100 | | | Texas Municipal Gas Acquisition and Supply Corporation I, Gas Supply Revenue Bonds, Series 2006A, 5.250%, 12/15/22 | | | | | No Opt. Call | | | | A– | | | | 117,310 | |
| | | | | | | | | | | | | | | | | | |
Principal
Amount (000) | | | Description (1) | | | | Optional Call
Provisions (2) | | | Ratings (3) | | | Value | |
| | | | Texas (continued) | | | | | | | | | | | | | | |
| | | | | |
| | | | Texas Municipal Gas Acquisition and Supply Corporation III, Gas Supply Revenue Bonds, Series 2012: | | | | | | | | | | | | | | |
| $ | 3,500 | | | 5.000%, 12/15/28 | | | | | No Opt. Call | | | | A3 | | | $ | 3,811,080 | |
| | 6,350 | | | 5.000%, 12/15/30 | | | | | No Opt. Call | | | | A3 | | | | 6,861,366 | |
| | 25,500 | | | 5.000%, 12/15/31 | | | | | No Opt. Call | | | | A3 | | | | 27,447,945 | |
| | 24,150 | | | 5.000%, 12/15/32 | | | | | No Opt. Call | | | | A3 | | | | 25,895,321 | |
| | | | | |
| | | | Texas Private Activity Bond Surface Transportation Corporation, Senior Lien Revenue Bonds, LBJ Infrastructure Group LLC IH-635 Managed Lanes Project, Series 2010: | | | | | | | | | | | | | | |
| | 8,550 | | | 7.500%, 6/30/32 | | | | | 6/20 at 100.00 | | | | Baa3 | | | | 10,912,536 | |
| | 2,715 | | | 7.500%, 6/30/33 | | | | | 6/20 at 100.00 | | | | Baa3 | | | | 3,455,218 | |
| | 10,400 | | | 7.000%, 6/30/40 | | | | | 6/20 at 100.00 | | | | Baa3 | | | | 12,755,496 | |
| | | | | |
| | 1,900 | | | Texas Private Activity Bond Surface Transportation Corporation, Senior Lien Revenue Bonds, NTE Mobility Partners LLC North Tarrant Express Managed Lanes Project, Series 2009, 6.875%, 12/31/39 | | | | | 12/19 at 100.00 | | | | Baa2 | | | | 2,289,519 | |
| | | | | |
| | 3,515 | | | Texas Public Finance Authority Charter School Finance Corporation, Charter School Revenue Bonds, School of Excellence Education Project, Series 2004A, 7.000%, 12/01/34 | | | | | 12/14 at 100.00 | | | | BB+ | | | | 3,594,334 | |
| | | | | |
| | 850 | | | Texas Public Finance Authority Charter School Finance Corporation, Education Revenue Bonds, Uplift Education, Series 2007A, 5.875%, 12/01/36 | | | | | 12/17 at 100.00 | | | | BBB– | | | | 916,513 | |
| | | | | |
| | 1,000 | | | Texas Public Finance Authority, Charter School Finance Corporation Revenue Bonds, Idea Public School Project, Series 2007A, 5.000%, 8/15/37 – ACA Insured | | | | | 8/17 at 100.00 | | | | BBB | | | | 1,043,430 | |
| | | | | |
| | 5,500 | | | Travis County Health Facilities Development Corporation, Texas, Revenue Bonds, Westminster Manor, Series 2010, 7.125%, 11/01/40 | | | | | 11/20 at 100.00 | | | | BB+ | | | | 6,553,470 | |
| | | | | |
| | 980 | | | Trinity River Authority of Texas, Pollution Control Revenue Refunding Bonds, TXU Electric Company, Series 2003, 6.250%, 5/01/28 (Alternative Minimum Tax) | | | | | 11/13 at 101.00 | | | | CC | | | | 73,510 | |
| | | | | |
| | | | Tyler Health Facilities Development Corporation, Texas, Hospital Revenue Bonds, East Texas Medical Center Regional Healthcare System, Series 2007A: | | | | | | | | | | | | | | |
| | 1,405 | | | 5.250%, 11/01/27 | | | | | 11/17 at 100.00 | | | | Baa2 | | | | 1,532,167 | |
| | 3,610 | | | 5.250%, 11/01/32 | | | | | 11/17 at 100.00 | | | | Baa2 | | | | 3,893,710 | |
| | 5,400 | | | 5.375%, 11/01/37 | | | | | 11/17 at 100.00 | | | | Baa2 | | | | 5,812,614 | |
| | 871,448 | | | Total Texas | | | | | | | | | | | | | 700,920,803 | |
| | | | Utah – 0.6% | | | | | | | | | | | | | | |
| | | | | |
| | 610 | | | Bountiful, Davis County, Utah, Hospital Revenue Refunding Bonds, South Davis Community Hospital Project, Series 1998, 5.750%, 12/15/18 | | | | | 6/13 at 100.00 | | | | N/R | | | | 610,964 | |
| | | | | |
| | 2,500 | | | Carbon County, Utah, Solid Waste Disposal Facility Revenue Bonds, Sunnyside Cogeneration Associates, Series 1999A, 7.100%, 8/15/23 (Alternative Minimum Tax) | | | | | No Opt. Call | | | | N/R | | | | 2,873,550 | |
| | | | | |
| | 900 | | | Provo, Utah, Charter School Revenue Bonds, Freedom Academy Foundation, Series 2007, 5.500%, 6/15/37 | | | | | 6/17 at 100.00 | | | | N/R | | | | 897,552 | |
| | | | | |
| | | | Spanish Fork City, Utah, Charter School Revenue Bonds, American Leadership Academy, Series 2006: | | | | | | | | | | | | | | |
| | 2,605 | | | 5.550%, 11/15/21 | | | | | 11/16 at 100.00 | | | | N/R | | | | 2,699,614 | |
| | 1,145 | | | 5.550%, 11/15/26 | | | | | 11/16 at 100.00 | | | | N/R | | | | 1,167,041 | |
| | 8,195 | | | 5.700%, 11/15/36 | | | | | 11/16 at 100.00 | | | | N/R | | | | 8,328,415 | |
| | | | | |
| | 4,500 | | | Utah County, Utah, Charter School Revenue Bonds, Lakeview Academy, Series 2007A, 5.625%, 7/15/37 | | | | | 7/15 at 102.00 | | | | BBB– | | | | 4,676,040 | |
| | | | | |
| | 6,070 | | | Utah County, Utah, Charter School Revenue Bonds, Lincoln Academy, Series 2007A, 5.875%, 6/15/37 | | | | | 6/17 at 100.00 | | | | N/R | | | | 6,134,706 | |
| | | | | |
| | 2,000 | | | Utah State Charter School Finance Authority Charter School Revenue Bonds, Vista at Entrada School of Performing Arts and Technology) Series 2012, 6.550%, 7/15/42 | | | | | 7/22 at 100.00 | | | | BB+ | | | | 2,127,780 | |
Portfolio of Investments
Nuveen High Yield Municipal Bond Fund (continued)
April 30, 2013
| | | | | | | | | | | | | | | | | | |
Principal
Amount (000) | | | Description (1) | | | | Optional Call
Provisions (2) | | | Ratings (3) | | | Value | |
| | | | Utah (continued) | | | | | | | | | | | | | | |
| | | | | |
| | | | Utah State Charter School Finance Authority, Charter School Revenue Bonds, Noah Webster Academy, Series 2008A: | | | | | | | | | | | | | | |
| $ | 2,005 | | | 6.250%, 6/15/28 | | | | | 6/17 at 100.00 | | | | N/R | | | $ | 2,042,654 | |
| | 2,975 | | | 6.500%, 6/15/38 | | | | | 6/17 at 100.00 | | | | N/R | | | | 3,032,715 | |
| | | | | |
| | 2,690 | | | Utah State Charter School Finance Authority, Charter School Revenue Bonds, North Davis Preparatory Academy, Series 2010, 6.375%, 7/15/40 | | | | | 7/20 at 100.00 | | | | BBB– | | | | 2,939,363 | |
| | | | | |
| | | | Utah State Charter School Finance Authority, Charter School Revenue Bonds, Oquirrh Mountain Charter School, Series 2010: | | | | | | | | | | | | | | |
| | 2,110 | | | 8.000%, 7/15/30 | | | | | 7/18 at 102.00 | | | | N/R | | | | 2,372,526 | |
| | 3,910 | | | 8.000%, 7/15/41 | | | | | 7/18 at 102.00 | | | | N/R | | | | 4,379,474 | |
| | | | | |
| | 5,145 | | | Utah State Charter School Finance Authority, Charter School Revenue Bonds, Summit Academy High School, Series 2011A, 8.500%, 5/15/41 | | | | | 5/21 at 100.00 | | | | N/R | | | | 5,913,406 | |
| | | | | |
| | | | Utah State Charter School Finance Authority, Revenue Bonds, Channing Hall Project, Series 2007A: | | | | | | | | | | | | | | |
| | 1,490 | | | 5.750%, 7/15/22 | | | | | 7/15 at 102.00 | | | | N/R | | | | 1,517,103 | |
| | 1,530 | | | 5.875%, 7/15/27 | | | | | 7/15 at 102.00 | | | | N/R | | | | 1,546,004 | |
| | 3,475 | | | 6.000%, 7/15/37 | | | | | 7/15 at 102.00 | | | | N/R | | | | 3,502,835 | |
| | | | | |
| | 3,300 | | | Utah State Charter School Finance Authority, Revenue Bonds, Summit Academy Project, Series 2007A, 5.800%, 6/15/38 | | | | | 12/17 at 100.00 | | | | BBB– | | | | 3,417,216 | |
| | 57,155 | | | Total Utah | | | | | | | | | | | | | 60,178,958 | |
| | | | Virgin Islands – 0.2% | | | | | | | | | | | | | | |
| | | | | |
| | 3,500 | | | Virgin Islands Public Finance Authority, Gross Receipts Taxes Loan Note, Refunding Series 2012A, 5.000%, 10/01/32 | | | | | No Opt. Call | | | | BBB+ | | | | 3,919,580 | |
| | | | | |
| | 9,130 | | | Virgin Islands Public Finance Authority, Gross Receipts Taxes Loan Note, Series 2012C, 5.000%, 10/01/42 | | | | | No Opt. Call | | | | BBB+ | | | | 9,866,426 | |
| | | | | |
| | 1,240 | | | Virgin Islands Public Finance Authority, Matching Fund Revenue Loan Note – Diageo Project, Series 2009A, 6.750%, 10/01/37 | | | | | 10/19 at 100.00 | | | | BBB | | | | 1,458,562 | |
| | 13,870 | | | Total Virgin Islands | | | | | | | | | | | | | 15,244,568 | |
| | | | Virginia – 1.6% | | | | | | | | | | | | | | |
| | | | | |
| | 164 | | | Bell Creek Community Development Authority, Virginia, Special Assessment Bonds, Series 2003A, 6.750%, 3/01/22 | | | | | 3/14 at 100.00 | | | | N/R | | | | 165,806 | |
| | | | | |
| | | | Celebrate Virginia North Community Development Authority, Special Assessment Revenue Bonds, Series 2003B: | | | | | | | | | | | | | | |
| | 2,439 | | | 6.250%, 3/01/18 | | | | | 3/14 at 102.00 | | | | N/R | | | | 1,585,399 | |
| | 5,954 | | | 6.600%, 3/01/25 | | | | | 3/14 at 102.00 | | | | N/R | | | | 3,870,219 | |
| | 3,538 | | | 6.750%, 3/01/34 | | | | | 3/14 at 102.00 | | | | N/R | | | | 2,299,771 | |
| | | | | |
| | | | Chesterfield County Health Center Commission, Virginia, Mortgage Revenue Bonds, Lucy Corr Village, Series 2005: | | | | | | | | | | | | | | |
| | 3,750 | | | 5.375%, 12/01/28 | | | | | 12/15 at 100.00 | | | | N/R | | | | 3,379,313 | |
| | 11,500 | | | 5.625%, 12/01/39 | | | | | 12/15 at 100.00 | | | | N/R | | | | 9,761,085 | |
| | | | | |
| | 2,800 | | | Fairfax County Economic Development Authority, Virginia, Residential Care Facilities Revenue Bonds, Vinson Hall LLC, Series 2013A, 5.000%, 12/01/42 | | | | | 12/23 at 100.00 | | | | N/R | | | | 2,869,300 | |
| | | | | |
| | 260 | | | Giles County Industrial Development Authority, Virginia, Exempt Facility Revenue Bonds, Hoechst Celanese Corporation Project, Series 1995, 5.950%, 12/01/25 (Alternative Minimum Tax) | | | | | 6/13 at 100.00 | | | | BB– | | | | 259,984 | |
| | | | | |
| | 2,620 | | | Giles County Industrial Development Authority, Virginia, Exempt Facility Revenue Bonds, Hoechst Celanese Project, Series 1996, 6.450%, 5/01/26 | | | | | 7/13 at 100.00 | | | | BB– | | | | 2,622,122 | |
| | | | | |
| | 1,250 | | | Lexington Industrial Development Authority, Virginia, Residential Care Facilities Mortgage Revenue Bonds, Kendall at Lexington Retirement Community, Inc., Series 2007A, 5.500%, 1/01/37 | | | | | 1/17 at 100.00 | | | | N/R | | | | 1,276,925 | |
| | | | | |
| | 4,350 | | | Norfolk Economic Development Authority, Virginia, Empowerment Zone Facility Revenue Bonds, BBL Old Dominion University LLC Project, Series 2006A, 6.000%, 11/01/36 (Alternative Minimum Tax) | | | | | 11/16 at 102.00 | | | | N/R | | | | 3,428,844 | |
| | | | | | | | | | | | | | | | | | |
Principal
Amount (000) | | | Description (1) | | | | Optional Call
Provisions (2) | | | Ratings (3) | | | Value | |
| | | | Virginia (continued) | | | | | | | | | | | | | | |
| | | | | |
| | | | Peninsula Town Center Community Development Authority, Virginia, Special Obligation Bonds, Series 2007: | | | | | | | | | | | | | | |
| $ | 6,217 | | | 6.250%, 9/01/24 | | | | | 9/17 at 100.00 | | | | N/R | | | $ | 6,763,226 | |
| | 1,236 | | | 6.350%, 9/01/28 | | | | | 9/17 at 100.00 | | | | N/R | | | | 1,341,789 | |
| | 8,360 | | | 6.450%, 9/01/37 | | | | | 9/17 at 100.00 | | | | N/R | | | | 9,022,363 | |
| | | | | |
| | 725 | | | Suffolk Industrial Development Authority, Virginia, Retirement Facilities First Mortgage Revenue Bonds, Lake Prince Center, Series 2006, 5.150%, 9/01/24 | | | | | 9/16 at 100.00 | | | | N/R | | | | 753,862 | |
| | | | | |
| | 74,570 | | | Tobacco Settlement Financing Corporation of Virginia, Tobacco Settlement Asset Backed Bonds, Series 2007B1, 5.000%, 6/01/47 | | | | | 6/17 at 100.00 | | | | B2 | | | | 63,133,199 | |
| | | | | |
| | 17,000 | | | Virginia Small Business Financing Authority, Revenue Bonds Hampton Roads Proton Beam Therapy Institute at Hampton University, LLC Project, Series 2009, 9.000%, 7/01/39 | | | | | 7/14 at 102.00 | | | | N/R | | | | 18,297,950 | |
| | | | | |
| | | | Virginia Small Business Financing Authority, Senior Lien Revenue Bonds, Elizabeth River Crossing, Opco LLC Project, Series 2012: | | | | | | | | | | | | | | |
| | 5,000 | | | 6.000%, 1/01/37 (Alternative Minimum Tax) | | | | | 7/22 at 100.00 | | | | BBB– | | | | 5,773,000 | |
| | 9,000 | | | 5.500%, 1/01/42 (Alternative Minimum Tax) | | | | | 7/22 at 100.00 | | | | BBB– | | | | 9,824,940 | |
| | 160,733 | | | Total Virginia | | | | | | | | | | | | | 146,429,097 | |
| | | | Washington – 1.9% | | | | | | | | | | | | | | |
| | | | | |
| | 1,595 | | | FYI Properties, Washington, Lease Revenue Bonds, Washington State Department of Information Services Project, Series 2009, 5.500%, 6/01/34 (UB) (5) | | | | | 6/19 at 100.00 | | | | AA | | | | 1,803,435 | |
| | | | | |
| | | | FYI Properties, Washington, Lease Revenue Bonds, Washington State Department of Information Services Project, Tender Option Bond Trust 2009-14A&B: | | | | | | | | | | | | | | |
| | 2,500 | | | 19.700%, 6/01/39 (IF) (5) | | | | | 6/19 at 100.00 | | | | AA | | | | 3,777,200 | |
| | 750 | | | 19.700%, 6/01/39 (IF) (5) | | | | | 6/19 at 100.00 | | | | AA | | | | 1,133,160 | |
| | | | | |
| | 1,050 | | | King County Public Hospital District 4, Washington, General Obligation Bonds, Snoqualmie Valley Hospital, Refunding Improvement Series 2011, 7.000%, 12/01/40 | | | | | 12/21 at 100.00 | | | | N/R | | | | 1,155,063 | |
| | | | | |
| | | | Kitsap County Consolidated Housing Authority, Washington, Pooled Tax Credit Housing Revenue Bonds, Series 2007: | | | | | | | | | | | | | | |
| | 1,615 | | | 5.500%, 6/01/27 (Alternative Minimum Tax) | | | | | 6/17 at 100.00 | | | | N/R | | | | 1,547,735 | |
| | 2,310 | | | 5.600%, 6/01/37 (Alternative Minimum Tax) | | | | | 6/17 at 100.00 | | | | N/R | | | | 2,241,578 | |
| | | | | |
| | 2,315 | | | Ocean Shores, Washington, Local Improvement District 2007-01 Bonds, 2011, 7.250%, 2/01/31 | | | | | No Opt. Call | | | | BBB+ | | | | 2,993,226 | |
| | | | | |
| | 6,800 | | | Port of Seattle Industrial Development Corporation, Washington, Special Facilities Revenue Refunding Bonds, Delta Air Lines, Inc. Project, Series 2012, 5.000%, 4/01/30 (Alternative Minimum Tax) | | | | | 4/23 at 100.00 | | | | B+ | | | | 6,992,576 | |
| | | | | |
| | 2,065 | | | Snohomish County Housing Authority, Washington, Revenue Bonds, Westwood Crossing Apartments, Series 2007, 5.250%, 5/01/37 (Alternative Minimum Tax) | | | | | 5/17 at 100.00 | | | | N/R | | | | 1,949,422 | |
| | | | | |
| | 7,670 | | | Tacoma Consolidated Local Improvement District 65, Washington, Special Assessment Bonds, Series 2013, 5.750%, 4/01/43 | | | | | 4/14 at 100.00 | | | | N/R | | | | 7,673,605 | |
| | | | | |
| | | | Vancouver Downtown Redevelopment Authority, Washington, Revenue Bonds, Conference Center Project, Series 2003A: | | | | | | | | | | | | | | |
| | 1,655 | | | 6.000%, 1/01/28 – ACA Insured | | | | | 1/14 at 100.00 | | | | N/R | | | | 1,665,741 | |
| | 260 | | | 5.250%, 1/01/28 – ACA Insured | | | | | 1/14 at 100.00 | | | | N/R | | | | 260,421 | |
| | 6,590 | | | 6.000%, 1/01/34 – ACA Insured | | | | | 1/14 at 100.00 | | | | N/R | | | | 6,624,136 | |
| | | | | |
| | 750 | | | Washington Health Care Facilities Authority, Revenue Bonds, Kadlec Regional Medical Center, Series 2012, 5.000%, 12/01/32 | | | | | 12/21 at 100.00 | | | | Baa3 | | | | 790,365 | |
| | | | | |
| | | | Washington Health Care Facilities Authority, Revenue Bonds, Providence Health & Services, Tender Option Bond Trust 4728: | | | | | | | | | | | | | | |
| | 1,770 | | | 17.710%, 10/01/42 (IF) (5) | | | | | 10/22 at 100.00 | | | | AA | | | | 2,673,266 | |
| | 2,500 | | | 17.710%, 10/01/42 (IF) (5) | | | | | 10/22 at 100.00 | | | | AA | | | | 3,775,800 | |
| | 2,500 | | | 17.710%, 10/01/42 (IF) (5) | | | | | 10/22 at 100.00 | | | | AA | | | | 3,775,800 | |
Portfolio of Investments
Nuveen High Yield Municipal Bond Fund (continued)
April 30, 2013
| | | | | | | | | | | | | | | | | | |
Principal
Amount (000) | | | Description (1) | | | | Optional Call
Provisions (2) | | | Ratings (3) | | | Value | |
| | | | Washington (continued) | | | | | | | | | | | | | | |
| | | | | |
| $ | 4,440 | | | Washington Health Care Facilities Authority, Revenue Bonds, Providence Health & Services, Tender Option Bond Trust 4730, 14.701%, 10/01/40 (IF) (5) | | | | | 10/22 at 100.00 | | | | AA | | | $ | 5,131,574 | |
| | | | | |
| | | | Washington Health Care Facilities Authority, Revenue Bonds, Seattle Children’s Hospital, Tender Option Bond Trust 1180: | | | | | | | | | | | | | | |
| | 2,500 | | | 17.555%, 10/01/40 (IF) (5) | | | | | 10/20 at 100.00 | | | | AA | | | | 3,441,700 | |
| | 4,810 | | | 17.651%, 10/01/40 (IF) (5) | | | | | 10/20 at 100.00 | | | | AA | | | | 6,621,350 | |
| | | | | |
| | | | Washington Health Care Facilities Authority, Revenue Bonds, Seattle Children’s Hospital, Tender Option Bond Trust 3295: | | | | | | | | | | | | | | |
| | 2,310 | | | 17.675%, 4/01/20 (IF) (5) | | | | | No Opt. Call | | | | AA | | | | 3,378,121 | |
| | 7,500 | | | 17.610%, 10/01/42 (IF) | | | | | 10/22 at 100.00 | | | | AA | | | | 11,327,400 | |
| | | | | |
| | | | Washington State Health Care Facilities Authority, Revenue Bonds, Children’s Hospital and Regional Medical Center, Tender Option Bond Trust 1180: | | | | | | | | | | | | | | |
| | 3,545 | | | 19.545%, 4/01/16 (IF) (5) | | | | | No Opt. Call | | | | AA | | | | 5,665,052 | |
| | 2,500 | | | 17.655%, 10/01/40 (IF) (5) | | | | | 10/20 at 100.00 | | | | AA | | | | 3,441,700 | |
| | | | | |
| | | | Washington State Health Care Facilities Authority, Revenue Bonds, Group Health Cooperative of Puget Sound, Series 2006: | | | | | | | | | | | | | | |
| | 1,600 | | | 5.000%, 12/01/23 – RAAI Insured | | | | | 12/16 at 100.00 | | | | BBB– | | | | 1,660,896 | |
| | 1,810 | | | 5.000%, 12/01/25 – RAAI Insured | | | | | 12/16 at 100.00 | | | | BBB– | | | | 1,858,635 | |
| | 3,550 | | | 4.500%, 12/01/26 – RAAI Insured | | | | | 12/16 at 100.00 | | | | BBB– | | | | 3,563,668 | |
| | 27,180 | | | 4.750%, 12/01/31 – RAAI Insured | | | | | 12/16 at 100.00 | | | | BBB– | | | | 27,343,624 | |
| | 3,545 | | | 5.000%, 12/01/36 – RAAI Insured | | | | | 12/16 at 100.00 | | | | BBB– | | | | 3,588,320 | |
| | | | | |
| | | | Washington State Health Care Facilities Authority, Revenue Bonds, MultiCare Health System, Tender Option Bond Trust 1095: | | | | | | | | | | | | | | |
| | 1,000 | | | 17.319%, 8/15/42 (IF) (5) | | | | | 8/22 at 100.00 | | | | AA– | | | | 1,423,720 | |
| | 395 | | | 17.214%, 8/15/44 (IF) (5) | | | | | 8/22 at 100.00 | | | | AA– | | | | 562,610 | |
| | 6,515 | | | 17.309%, 8/15/44 (IF) (5) | | | | | 8/22 at 100.00 | | | | AA– | | | | 9,295,537 | |
| | | | | |
| | 3,465 | | | Washington State Health Care Facilities Authority, Revenue Bonds, MultiCare Health System, Tender Option Bond Trust 1146, 17.913%, 8/15/44 (IF) (5) | | | | | 8/22 at 100.00 | | | | AA– | | | | 4,944,694 | |
| | | | | |
| | | | Washington State Health Care Facilities Authority, Revenue Bonds, Providence Health & Services Project, Tender Option Bond Trust 4679: | | | | | | | | | | | | | | |
| | 1,875 | | | 18.736%, 10/01/39 (IF) (5) | | | | | 4/20 at 100.00 | | | | AA | | | | 2,736,150 | |
| | 1,520 | | | 18.935%, 10/01/39 (IF) (5) | | | | | 4/20 at 100.00 | | | | AA | | | | 2,217,528 | |
| | | | | |
| | 14,376 | | | Washington State Housing Finance Commission, Multifamily Revenue Bonds, Greentree Village Homes Project, Series 2008, 5.264%, 2/01/26 | | | | | No Opt. Call | | | | N/R | | | | 13,526,001 | |
| | | | | |
| | | | Washington State Housing Finance Commission, Non-Profit Housing Revenue Bonds, Mirabella Project, Series 2012A: | | | | | | | | | | | | | | |
| | 2,130 | | | 6.500%, 10/01/32 | | | | | No Opt. Call | | | | N/R | | | | 2,165,827 | |
| | 14,225 | | | 6.750%, 10/01/47 | | | | | No Opt. Call | | | | N/R | | | | 14,531,833 | |
| | | | | |
| | 2,660 | | | Washington State Housing Finance Commission, Revenue Bonds, Riverview Retirement Community Refunding, Series 2012, 5.000%, 1/01/48 | | | | | No Opt. Call | | | | BBB– | | | | 2,680,110 | |
| | 158,146 | | | Total Washington | | | | | | | | | | | | | 181,938,579 | |
| | | | West Virginia – 0.5% | | | | | | | | | | | | | | |
| | | | | |
| | 8,000 | | | Berkeley, Hardy and Jefferson Counties, West Virginia, as Joint Issuers, Commercial Development Revenue Bonds, Scattered Site Housing Projects, Series 2010, 5.750%, 12/01/44 (WI/DD, Settling 6/17/13) | | | | | 3/23 at 100.00 | | | | N/R | | | | 7,987,920 | |
| | | | | |
| | 365 | | | Ohio County Commission, West Virginia, Special District Excise Tax Revenue Bonds, Fort Henry Economic Development, Series 2006B, 5.625%, 3/01/36 | | | | | 3/16 at 100.00 | | | | BBB | | | | 381,980 | |
| | | | | |
| | 1,675 | | | Ohio County Commission, West Virginia, Tax Increment Revenue Bonds, Fort Henry Centre Tax Increment Financing District 1, The Highlands Project, Series 2008A, 6.500%, 6/01/34 | | | | | 6/18 at 100.00 | | | | N/R | | | | 1,841,663 | |
| | | | | | | | | | | | | | | | | | |
Principal
Amount (000) | | | Description (1) | | | | Optional Call
Provisions (2) | | | Ratings (3) | | | Value | |
| | | | West Virginia (continued) | | | | | | | | | | | | | | |
| | | | | |
| | | | West Virginia Hospital Finance Authority, Hospital Revenue Bonds, Thomas Health System, Inc., Series 2008: | | | | | | | | | | | | | | |
| $ | 15,165 | | | 6.500%, 10/01/38 | | | | | 10/18 at 100.00 | | | | N/R | | | $ | 15,982,545 | |
| | 22,275 | | | 6.750%, 10/01/43 | | | | | 10/18 at 100.00 | | | | N/R | | | | 23,734,904 | |
| | 47,480 | | | Total West Virginia | | | | | | | | | | | | | 49,929,012 | |
| | | | Wisconsin – 1.4% | | | | | | | | | | | | | | |
| | | | | |
| | 450 | | | Lac Courte Oreilles Band of Lake Superior Chippewa Indians, Wisconsin, Revenue Bonds, Series 2003A, 7.750%, 6/01/16 (Pre-refunded 12/01/14) | | | | | 12/14 at 101.00 | | | | N/R (6) | | | | 506,543 | |
| | | | | |
| | 8,990 | | | Lac Courte Oreilles Band of Lake Superior Chippewa Indians, Wisconsin, Revenue Bonds, Series 2006, 7.000%, 12/01/26 | | | | | 12/18 at 102.00 | | | | N/R | | | | 8,796,985 | |
| | | | | |
| | 300 | | | Milwaukee Redevelopment Authority, Wisconsin, Academy of Learning and Leadership Charter School, Series 2007A, 5.500%, 8/01/22 (4) | | | | | 8/15 at 102.00 | | | | N/R | | | | 89,946 | |
| | | | | |
| | | | Public Finance Authority of Wisconsin, Charter School Revenue Bonds, Thomas Jefferson Classical Academy of Mooresboro, North Carolina, Series 2011: | | | | | | | | | | | | | | |
| | 660 | | | 7.000%, 7/01/31 | | | | | 7/19 at 100.00 | | | | BBB– | | | | 730,745 | |
| | 500 | | | 7.125%, 7/01/42 | | | | | 7/19 at 100.00 | | | | BBB– | | | | 551,650 | |
| | | | | |
| | | | Public Finance Authority of Wisconsin, Revenue Bonds, Roseman University of Health Sciences, Series 2012: | | | | | | | | | | | | | | |
| | 2,475 | | | 5.500%, 4/01/32 | | | | | No Opt. Call | | | | BB+ | | | | 2,575,708 | |
| | 4,250 | | | 5.750%, 4/01/42 | | | | | No Opt. Call | | | | BB+ | | | | 4,439,593 | |
| | | | | |
| | 1,000 | | | Public Finance Authority, Wisconsin, Charter School Revenue Bonds, Explore Knowledge Foundation Las Vegas Project, Series 2012A, 6.000%, 7/15/42 | | | | | 7/22 at 100.00 | | | | BBB– | | | | 1,030,550 | |
| | | | | |
| | | | Public Finance Authority, Wisconsin, Charter School Revenue Bonds, Voyageur Foundation Inc. Detroit Project, Series 2012A: | | | | | | | | | | | | | | |
| | 1,100 | | | 6.000%, 10/01/32 | | | | | 10/22 at 100.00 | | | | N/R | | | | 1,136,685 | |
| | 3,275 | | | 6.200%, 10/01/42 | | | | | 10/22 at 100.00 | | | | N/R | | | | 3,397,714 | |
| | | | | |
| | 1,730 | | | University of Wisconsin Hospitals and Clinics Authority, Revenue Bonds, Tender Option Bond Trust 4287, 17.648%, 10/01/20 (IF) (5) | | | | | No Opt. Call | | | | Aa3 | | | | 2,611,868 | |
| | | | | |
| | 1,225 | | | Wisconsin Health and Educational Facilities Authority, Revenue Bonds, Beloit College, Series 2010A, 6.125%, 6/01/39 | | | | | 6/20 at 100.00 | | | | Baa2 | | | | 1,401,731 | |
| | | | | |
| | 2,750 | | | Wisconsin Health and Educational Facilities Authority, Revenue Bonds, Children’s Hospital of Wisconsin Inc., Tender Option Bond Trust 2009-15W, 19.551%, 8/15/37 (IF) (5) | | | | | 2/20 at 100.00 | | | | AA– | | | | 4,046,460 | |
| | | | | |
| | 955 | | | Wisconsin Health and Educational Facilities Authority, Revenue Bonds, Froedtert Community Health, Inc. Obligated Group, Tender Option Bond Trust 3592, 18.645%, 4/01/17 (IF) (5) | | | | | No Opt. Call | | | | AA– | | | | 1,379,593 | |
| | | | | |
| | | | Wisconsin Health and Educational Facilities Authority, Revenue Bonds, Meriter Hospital, Inc., Series 2011A: | | | | | | | | | | | | | | |
| | 1,000 | | | 5.750%, 5/01/35 | | | | | 5/21 at 100.00 | | | | A+ | | | | 1,177,620 | |
| | 3,925 | | | 6.000%, 5/01/41 | | | | | 5/21 at 100.00 | | | | A+ | | | | 4,654,422 | |
| | | | | |
| | 500 | | | Wisconsin Health and Educational Facilities Authority, Revenue Bonds, ThedaCare, Inc., Series 2009A, 5.500%, 12/15/38 | | | | | 12/19 at 100.00 | | | | AA– | | | | 555,685 | |
| | | | | |
| | | | Wisconsin Health and Educational Facilities Authority, Revenue Bonds, Wheaton Franciscan Health, Tender Option Bond Trust 2113: | | | | | | | | | | | | | | |
| | 1,335 | | | 14.172%, 8/15/26 (IF) | | | | | 8/16 at 100.00 | | | | A– | | | | 1,883,792 | |
| | 9,750 | | | 14.172%, 8/15/30 (IF) | | | | | 8/16 at 100.00 | | | | A– | | | | 12,044,760 | |
| | 3,535 | | | 14.665%, 8/15/31 (IF) | | | | | 8/16 at 100.00 | | | | A– | | | | 4,453,004 | |
| | 3,750 | | | 14.675%, 8/15/34 (IF) | | | | | 8/16 at 100.00 | | | | A– | | | | 4,681,050 | |
| | | | | |
| | 7,855 | | | Wisconsin Health and Educational Facilities Authority, Revenue Bonds, Wheaton Franciscan Services Inc., Series 2006B, 5.125%, 8/15/26 (UB) | | | | | 8/16 at 100.00 | | | | A– | | | | 8,662,258 | |
| | | | | |
| | 35,655 | | | Wisconsin Public Finance Authority, Revenue Bonds, SearStone Retirement Community of Cary North Carolina, Series 2012A, 8.625%, 6/01/47 | | | | | 6/22 at 100.00 | | | | N/R | | | | 38,786,222 | |
Portfolio of Investments
Nuveen High Yield Municipal Bond Fund (continued)
April 30, 2013
| | | | | | | | | | | | | | | | | | | | |
Principal
Amount (000) | | | Description (1) | | | | | Optional Call
Provisions (2) | | | Ratings (3) | | | Value | |
| | | | Wisconsin (continued) | | | | | | | | | | | | | | | | |
| | | | | |
| $ | 25,000 | | | Wisconsin Public Finance Authority, Revenue Bonds, SearStone Retirement Community of Cary North Carolina, Series 2012B, 8.375%, 6/01/20 | | | | | | | 12/13 at 100.00 | | | | N/R | | | $ | 25,223,500 | |
| | 121,965 | | | Total Wisconsin | | | | | | | | | | | | | | | 134,818,084 | |
| $ | 10,098,793 | | | Total Municipal Bonds (cost $8,599,231,864) | | | | | | | | | | | | | | | 9,359,907,447 | |
| | | | | |
| Shares | | | Description (1) | | | | | | | | | | | Value | |
| | | | Common Stocks – 0.0% | | | | | | | | | | | | | | | | |
| | | | | |
| | | | Containers & Packaging – 0.0% | | | | | | | | | | | | | | | | |
| | | | | |
| | 10,846 | | | Rock-Tenn Company (16) | | | | | | | | | | | | | | $ | 1,086,118 | |
| | | | Total Common Stocks (cost $–) | | | | | | | | | | | | | | | 1,086,118 | |
| | | | | |
Principal
Amount (000) | | | Description (1) | | Coupon | | | Maturity | | | Ratings (3) | | | Value | |
| | | | CORPORATE BONDS – 0.1% | | | | | | | | | | | | | | | | |
| | | | | |
| | | | Machinery – 0.1% | | | | | | | | | | | | | | | | |
| | | | | |
| $ | 7,000 | | | Navistar International Corporation | | | 8.250% | | | | 11/01/21 | | | | B3 | | | $ | 7,288,750 | |
| | | | Transportation – 0.0% | | | | | | | | | | | | | | | | |
| | | | | |
| | 62 | | | Las Vegas Monorail Company, Senior Interest Bonds (7), (17) | | | 5.500% | | | | 7/15/19 | | | | N/R | | | | 15,399 | |
| | | | | |
| | 18 | | | Las Vegas Monorail Company, Senior Interest Bonds (7), (17) | | | 3.000% | | | | 7/15/55 | | | | N/R | | | | 3,605 | |
| | 80 | | | Total Transportation | | | | | | | | | | | | | | | 19,004 | |
| $ | 7,080 | | | Total Corporate Bonds (cost $6,673,418) | | | | | | | | | | | | | | | 7,307,754 | |
| | | | Total Investments (cost $8,605,905,282) – 99.8% | | | | | | | | | | | | | | | 9,368,301,319 | |
| | | | Borrowings – (0.4)% (18) | | | | | | | | | | | | | | | (40,000,000) | |
| | | | Floating Rate Obligations – (2.0)% | | | | | | | | | | | | | | | (191,211,000) | |
| | | | Other Assets Less Liabilities – 2.6% (19) | | | | | | | | | | | | | | | 254,311,047 | |
| | | | Net Assets – 100% | | | | | | | | | | | | | | $ | 9,391,401,366 | |
Investments in Derivatives as of April 30, 2013
Credit Default Swaps outstanding:
| | | | | | | | | | | | | | | | | | | | |
| Counterparty | | Reference Entity | | Buy/Sell
Protection (20) | | Current
Credit
Spread (21) | | Notional
Amount | | | Fixed Rate
(Annualized) | | Termination
Date | | Value | | | Unrealized
Appreciation
(Depreciation) (19) |
Goldman Sachs | | Texas Competitive Electric
Holdings Company LLC | | Buy | | 160.45% | | $ | 2,000,000 | | | 5.000% | | 9/20/14 | | $ | 1,541,183 | | | $416,183 |
Forward Swaps outstanding:
| | | | | | | | | | | | | | | | | | | | | | | | |
| Counterparty | | Notional
Amount | | | Fund
Pay/Receive
Floating Rate | | | Floating Rate Index | | | Fixed Rate
(Annualized) | | Fixed Rate
Payment
Frequency | | | Effective
Date (22) | | Termination
Date | | Unrealized
Appreciation
(Depreciation) (19) |
Barclays PLC | | $ | 100,000,000 | | | | Receive | | | | 3-Month USD-LIBOR | | | 2.670% | | | Semi-Annually | | | 6/26/14 | | 6/26/42 | | $5,645,284 |
| | (1) | | All percentages shown in the Portfolio of Investments are based on net assets. |
| | (2) | | Optional Call Provisions (not covered by the report of independent registered public accounting firm): Dates (month and year) and prices of the earliest optional call or redemption. There may be other call provisions at varying prices at later dates. Certain mortgage-backed securities may be subject to periodic principal paydowns. |
| | (3) | | Ratings (not covered by the report of independent registered public accounting firm): Using the highest of Standard & Poor’s Group (“Standard & Poor’s”), Moody’s Investors Service, Inc. (“Moody’s”) or Fitch, Inc. (“Fitch”) rating. Ratings below BBB by Standard & Poor’s, Baa by Moody’s or BBB by Fitch are considered to be below investment grade. Holdings designated N/R are not rated by any of these national rating agencies. |
| | (4) | | At or subsequent to the end of the reporting period, this security is non-income producing. Non-income producing security, in the case of a fixed-income security, generally denotes that the issuer has (1) defaulted on the payment of principal or interest, (2) is under the protection of the Federal Bankruptcy Court or (3) the Fund’s Adviser has concluded that the issue is not likely to meet its future interest payment obligations and has directed the Fund’s custodian to cease accruing additional income on the Fund’s records. |
| | (5) | | Investment, or portion of investment, has been pledged to collateralize the net payment obligations for investments in derivatives and/or inverse floating rate transactions. |
| | (6) | | Backed by an escrow or trust containing sufficient U.S. Government or U.S. Government agency securities, which ensure the timely payment of principal and interest. Certain bonds backed by U.S. Government or agency securities are regarded as having an implied rating equal to the rating of such securities. |
| | (7) | | Investment valued at fair value using methods determined in good faith by, or at the discretion of, the Board of Directors/Trustees. For fair value measurement disclosure purposes, investment classified as Level 3. See Notes to Financial Statements, Footnote 1 – General Information and Significant Accounting Policies, Investment Valuation for more information. |
| | (8) | | On May 1, 2012, the Fund’s Adviser determined it was unlikely that this borrower would fulfill its entire obligation on this security, and therefore reduced the security’s interest rate of accrual from 5.80% to 4.35%. |
| | (9) | | On May 1, 2012, the Fund’s Adviser determined it was unlikely that this borrower would fulfill its entire obligation on this security, and therefore reduced the security’s interest rate of accrual from 5.875% to 4.700%. |
| | (10) | | Principal Amount (000) rounds to less than $1,000. |
| | (11) | | On February 8, 2011, the Fund’s Adviser directed the Fund’s custodian to cease accruing additional income and “write-off” any remaining recorded balances on the Fund’s records. Effective March 1, 2011, the Fund’s custodian resumed accruing income at an annual interest rate of 4.50%. |
| | (12) | | On March 5, 2007, Bayonne Medical Center (“Bayonne”) received an “event of default notice” resulting from their failure to pay a $5,000,000 bank line of credit. As senior creditors of Bayonne, the Adviser, on behalf of the Fund, issued an event of default notice to Bayonne on March 15, 2007, under default provisions of the debt agreements. Under such notice, Bayonne became obligated to increase the interest rate it paid on the debt from 8.050% annually to 10.750% annually and the Adviser had instructed the custodian to reflect such change in the Fund’s records. On April 30, 2007, the Adviser concluded that Bayonne was not likely able to meet its interest obligations and directed the Fund’s custodian to cease accruing additional income and to “write-off” any remaining recorded balances on the Fund’s records. |
| | (13) | | On April 1, 2013, the Fund’s Adviser determined it was unlikely that this borrower would fulfill its entire obligation on this security, and therefore reduced the security’s interest rate of accrual from 5.625% to 2.250%. |
Portfolio of Investments
Nuveen High Yield Municipal Bond Fund (continued)
April 30, 2013
| | (14) | | On April 1, 2013, the Fund’s Adviser determined it was unlikely that this borrower would fulfill its entire obligation on this security, and therefore reduced the security’s interest rate of accrual from 5.750% to 2.300%. |
| | (15) | | On April 1, 2013, the Fund’s Adviser determined it was unlikely that this borrower would fulfill its entire obligation on this security, and therefore reduced the security’s interest rate of accrual from 5.875% to 2.350%. |
| | (16) | | Common stock received as part of the bankruptcy settlement for Hodge, Louisiana, Combined Utility System Revenue Bonds,Smurfit-Stone Container Corporation, Series 2003, coupon 7.450%, Maturity 3/01/24. |
| | (17) | | During January 2010, Las Vegas Monorail Company (“Las Vegas Monorail”) filed for federal bankruptcy protection. During March 2012, Las Vegas Monorail emerged from federal bankruptcy with the acceptance of a reorganization plan assigned by the Federal Bankruptcy Court. Under the reorganization plan, the Fund surrendered its Las Vegas Monorail Project Revenue Bonds, First Tier, Series 2000 and in turn received two senior interest corporate bonds: the first with an interest rate of 5.500% maturing on July 15, 2019 and the second with an interest rate of 3.000% (5.500% after December 31, 2015) maturing on July 15, 2055. The custodian is not accruing income on the Fund’s records for either senior interest corporate bond. |
| | (18) | | Borrowings as a percentage of Total Investments is 0.4%. |
| | (19) | | Other Assets Less Liabilities includes the Unrealized Appreciation (Depreciation) of derivative instruments as listed within Investments in Derivatives as of the end of the reporting period. |
| | (20) | | The Fund entered into the credit default swaps to gain investment exposure to the referenced entity. Selling protection has a similar credit risk position to owning the referenced entity. Buying protection has a similar credit risk position to selling the referenced entity short. |
| | (21) | | The credit spread generally serves as an indication of the current status of the payment/performance risk and therefore the likelihood of default of the credit derivative. The credit spread also reflects the cost of buying/selling protection and may include upfront payments required to be made to enter into a credit default swap contract. Higher credit spreads are indicative of higher likelihood of performance by the seller of protection. |
| | (22) | | Effective date represents the date on which both the Fund and Counterparty commence interest payment accruals on each forward swap contract. |
| | WI/DD | | Investment, or portion of investment purchased on a when-issued or delayed delivery basis. |
| | (IF) | | Inverse floating rate investment. |
| | (UB) | | Underlying bond of an inverse floating rate trust reflected as a financing transaction. See Notes to Financial Statements, Footnote 1 – General Information and Significant Accounting Policies, Inverse Floating Rate Securities for more information. |
| | 144A | | Investment is exempt from registration under Rule 144A of the Securities Act of 1933, as amended. These investments may only be resold in transactions exempt from registration, which are normally those transactions with qualified institutional buyers. |
| | USD-LIBOR | | United States Dollar-London Inter-Bank Offered Rate. |
See accompanying notes to financial statements.
Portfolio of Investments
Nuveen Inflation Protected Municipal Bond Fund
April 30, 2013
| | | | | | | | | | | | | | | | | | |
Principal
Amount (000) | | | Description (1) | | | | Optional Call
Provisions (2) | | | Ratings (3) | | | Value | |
| | | | Alabama – 0.3% | | | | | | | | | | | | | | |
| | | | | |
| $ | 275 | | | Birmingham Airport Authority, Alabama, Airport Revenue Bonds, Series 2010, 6.000%, 7/01/23 – AGM Insured | | | | | 7/20 at 100.00 | | | | AA– | | | $ | 337,304 | |
| | | | Arizona – 2.9% | | | | | | | | | | | | | | |
| | | | | |
| | 250 | | | Apache County Industrial Development Authority, Arizona, Pollution Control Revenue Bonds, Tucson Electric Power Company, Series 20102A, 4.500%, 3/01/30 | | | | | 3/22 at 100.00 | | | | BBB | | | | 260,730 | |
| | | | | |
| | 500 | | | Arizona Health Facilities Authority, Hospital System Revenue Bonds, Phoenix Children’s Hospital, Refunding Series 2012A, 5.000%, 2/01/19 | | | | | No Opt. Call | | | | BBB+ | | | | 584,020 | |
| | | | | |
| | 345 | | | Arizona Sports and Tourism Authority, Senior Revenue Refunding Bonds, Multipurpose Stadium Facility Project, Series 2012A, 5.000%, 7/01/25 | | | | | 7/22 at 100.00 | | | | A1 | | | | 405,537 | |
| | | | | |
| | 130 | | | Arizona State, State Lottery Revenue Bonds, Series 2010A, 5.000%, 7/01/15 – AGM Insured | | | | | No Opt. Call | | | | AA | | | | 142,474 | |
| | | | | |
| | 1,110 | | | Pima County Industrial Development Authority, Arizona, Pollution Control Revenue Bonds, Tucson Electric Power Company, San Juan Project, Series 2009A, 4.950%, 10/01/20 | | | | | No Opt. Call | | | | BBB | | | | 1,264,079 | |
| | | | | |
| | 400 | | | Pima County, Arizona, Sewer System Revenue Obligations, Series 2012A, 5.000%, 7/01/21 | | | | | No Opt. Call | | | | AA– | | | | 491,216 | |
| | | | | |
| | 10 | | | Salt River Project Agricultural Improvement and Power District, Arizona, Electric System Revenue Bonds, Series 2003, 5.000%, 12/01/18 – NPFG Insured | | | | | 12/13 at 100.00 | | | | Aa2 | | | | 10,268 | |
| | | | | |
| | 75 | | | Salt Verde Financial Corporation, Arizona, Senior Gas Revenue Bonds, Citigroup Energy Inc Prepay Contract Obligations, Series 2007, 5.250%, 12/01/19 | | | | | No Opt. Call | | | | A– | | | | 87,530 | |
| | 2,820 | | | Total Arizona | | | | | | | | | | | | | 3,245,854 | |
| | | | Arkansas – 0.1% | | | | | | | | | | | | | | |
| | | | | |
| | 70 | | | North Little Rock, Arkansas, Electric Revenue Refunding Bonds, Series 1992A, 6.500%, 7/01/15 – NPFG Insured (ETM) | | | | | No Opt. Call | | | | A (4) | | | | 74,605 | |
| | | | California – 6.2% | | | | | | | | | | | | | | |
| | | | | |
| | 275 | | | Alameda Corridor Transportation Authority, California, Revenue Bonds, Refunding Subordinate Lien Series 2004A, 5.300%, 10/01/23 – AMBAC Insured | | | | | No Opt. Call | | | | BBB+ | | | | 309,969 | |
| | | | | |
| | 425 | | | California Department of Water Resources, Power Supply Revenue Bonds, Series 2010L, 5.000%, 5/01/16 | | | | | No Opt. Call | | | | AA | | | | 482,545 | |
| | | | | |
| | 185 | | | California Department of Water Resources, Power Supply Revenue Bonds, Series 2011N, 5.000%, 5/01/21 | | | | | No Opt. Call | | | | AA | | | | 236,898 | |
| | | | | |
| | 145 | | | California Health Facilities Financing Authority, Revenue Bonds, Catholic Healthcare West, Series 2008H, 5.125%, 7/01/22 | | | | | 7/15 at 100.00 | | | | A | | | | 158,575 | |
| | | | | |
| | 120 | | | California Health Facilities Financing Authority, Revenue Bonds, Children’s Hospital of Orange County, Series 2009A, 5.750%, 11/01/18 | | | | | No Opt. Call | | | | A | | | | 147,659 | |
| | | | | |
| | 850 | | | California Municipal Finance Authority, Revenue Bonds, University of San Diego, Refunding Series 2012A, 5.000%, 10/01/31 | | | | | No Opt. Call | | | | A2 | | | | 983,663 | |
| | | | | |
| | 45 | | | California State Public Works Board, Lease Revenue Bonds, Department of Corrections, Series 1993E, 5.500%, 6/01/15 | | | | | No Opt. Call | | | | A2 | | | | 46,850 | |
| | | | | |
| | 210 | | | California Statewide Communities Development Authority, Insured Revenue Refunding Bonds, Rady Children’s Hospital of San Diego, Series 2006A, 5.000%, 8/15/23 – NPFG Insured | | | | | 8/16 at 100.00 | | | | A+ | | | | 232,094 | |
| | | | | |
| | 175 | | | California Statewide Communities Development Authority, Revenue Bonds, State of California Proposition 1A Receivables Program, Series 2009, 5.000%, 6/15/13 | | | | | No Opt. Call | | | | A1 | | | | 176,059 | |
| | | | | |
| | 120 | | | California Statewide Community Development Authority, Revenue Bonds, Daughters of Charity Health System, Series 2005G, 5.000%, 7/01/22 | | | | | 7/15 at 100.00 | | | | BBB– | | | | 128,544 | |
| | | | | |
| | 1,000 | | | Chabot-Las Positas Community College District, California, General Obligation Bonds, 2016 Crossover Refunding Series 2013, 5.000%, 8/01/25 | | | | | 8/23 at 100.00 | | | | Aa3 | | | | 1,228,060 | |
Portfolio of Investments
Nuveen Inflation Protected Municipal Bond Fund (continued)
April 30, 2013
| | | | | | | | | | | | | | | | | | |
Principal
Amount (000) | | | Description (1) | | | | Optional Call
Provisions (2) | | | Ratings (3) | | | Value | |
| | | | California (continued) | | | | | | | | | | | | | | |
| | | | | |
| $ | 500 | | | El Camino Community College District, California, General Obligation Bonds, Election of 2002 Series 2012C, 0.000%, 8/01/21 | | | | | No Opt. Call | | | | Aa1 | | | $ | 414,515 | |
| | | | | |
| | 200 | | | Foothill/Eastern Transportation Corridor Agency, California, Toll Road Revenue Refunding Bonds, Series 1999, 5.750%, 1/15/40 – NPFG Insured | | | | | 7/13 at 100.00 | | | | Baa2 | | | | 200,124 | |
| | | | | |
| | 525 | | | Golden State Tobacco Securitization Corporation, California, Enhanced Tobacco Settlement Asset-Backed Bonds, Series 2013A, 5.000%, 6/01/21 | | | | | No Opt. Call | | | | A2 | | | | 642,422 | |
| | | | | |
| | 50 | | | Los Angeles Department of Airports, California, Revenue Bonds, Los Angeles International Airport, Senior Lien Series 2010A, 5.000%, 5/15/31 | | | | | 5/20 at 100.00 | | | | AA | | | | 57,374 | |
| | | | | |
| | 175 | | | Los Angeles Regional Airports Improvement Corporation, California, Lease Revenue Refunding Bonds, LAXFUEL Corporation at Los Angeles International Airport, Series 2012, 5.000%, 1/01/21 (Alternative Minimum Tax) | | | | | No Opt. Call | | | | A | | | | 208,926 | |
| | | | | |
| | 80 | | | Madera County, California, Certificates of Participation, Valley Children’s Hospital Project, Series 1995, 5.750%, 3/15/28 – NPFG Insured | | | | | 9/13 at 100.00 | | | | A3 | | | | 80,154 | |
| | | | | |
| | 100 | | | Port of Oakland, California, Revenue Refunding Bonds, Series 2011-O, 5.000%, 5/01/21 (Alternative Minimum Tax) | | | | | No Opt. Call | | | | A+ | | | | 121,170 | |
| | | | | |
| | 800 | | | San Francisco, California, Community Facilities District 6, Mission Bay South Public Improvements, Special Tax Refunding Bonds, Series 2013A, 5.000%, 8/01/25 | | | | | 8/22 at 100.00 | | | | N/R | | | | 882,792 | |
| | | | | |
| | 45 | | | San Joaquin Hills Transportation Corridor Agency, Orange County, California, Toll Road Revenue Refunding Bonds, Series 1997A, 0.000%, 1/15/26 – NPFG Insured | | | | | No Opt. Call | | | | Baa2 | | | | 24,812 | |
| | | | | |
| | 170 | | | Ventura County Public Financing Authority, California, Lease Revenue Bonds Series 2013A, 5.000%, 11/01/24 | | | | | 11/22 at 100.00 | | | | AA | | | | 205,323 | |
| | 6,195 | | | Total California | | | | | | | | | | | | | 6,968,528 | |
| | | | Colorado – 5.9% | | | | | | | | | | | | | | |
| | | | | |
| | 300 | | | Colorado State Board of Governors, Colorado State University Auxiliary Enterprise System Revenue Bonds, Refunding Series 2013A, 5.000%, 3/01/22 | | | | | No Opt. Call | | | | Aa2 | | | | 377,691 | |
| | | | | |
| | 500 | | | Denver City and County, Colorado, Airport System Revenue Bonds, Series 2012A, 5.000%, 11/15/22 (Alternative Minimum Tax) | | | | | No Opt. Call | | | | A+ | | | | 607,960 | |
| | | | | |
| | 150 | | | Denver Convention Center Hotel Authority, Colorado, Revenue Bonds, Convention Center Hotel, Senior Lien Series 2006, 5.250%, 12/01/22 – SYNCORA GTY Insured | | | | | 11/16 at 100.00 | | | | BBB– | | | | 162,093 | |
| | | | | |
| | 1,000 | | | Denver Urban Renewal Authority, Colorado, Tax Increment Revenue Bonds, Stapleton Senior Refunding Series 2013A-1, 5.000%, 12/01/23 | | | | | 12/22 at 100.00 | | | | A– | | | | 1,195,110 | |
| | | | | |
| | 1,000 | | | Denver West Metropolitan District, Jefferson County, Colorado, General Obligation Refunding Bonds, Series 2012A, 4.000%, 12/01/20 – AGM Insured | | | | | No Opt. Call | | | | AA– | | | | 1,139,280 | |
| | | | | |
| | | | E-470 Public Highway Authority, Colorado, Senior Revenue Bonds, Series 1997B: | | | | | | | | | | | | | | |
| | 480 | | | 0.000%, 9/01/21 – NPFG Insured | | | | | No Opt. Call | | | | Baa2 | | | | 360,173 | |
| | 10 | | | 0.000%, 9/01/26 – NPFG Insured | | | | | No Opt. Call | | | | Baa2 | | | | 5,632 | |
| | | | | |
| | 1,000 | | | E-470 Public Highway Authority, Colorado, Senior Revenue Bonds, Series 2000B, 0.000%, 9/01/20 – NPFG Insured | | | | | No Opt. Call | | | | Baa2 | | | | 789,840 | |
| | | | | |
| | 100 | | | E-470 Public Highway Authority, Colorado, Senior Revenue Bonds, Series 2007A-1, 5.250%, 9/01/16 – NPFG Insured | | | | | No Opt. Call | | | | Baa2 | | | | 110,286 | |
| | | | | |
| | 1,250 | | | Plaza Metropolitan District 1, Lakewood, Colorado, Tax Increment Revenue Bonds, Refunding Series 2013, 5.000%, 12/01/19 | | | | | No Opt. Call | | | | N/R | | | | 1,423,025 | |
| | | | | |
| | 395 | | | Regional Transportation District, Colorado, Denver Transit Partners Eagle P3 Project Private Activity Bonds, Series 2010, 5.250%, 7/15/24 | | | | | 7/20 at 100.00 | | | | Baa3 | | | | 453,219 | |
| | 6,185 | | | Total Colorado | | | | | | | | | | | | | 6,624,309 | |
| | | | | | | | | | | | | | | | | | |
Principal
Amount (000) | | | Description (1) | | | | Optional Call
Provisions (2) | | | Ratings (3) | | | Value | |
| | | | Connecticut – 0.2% | | | | | | | | | | | | | | |
| | | | | |
| $ | 190 | | | Connecticut Health and Educational Facilities Authority, Revenue Bonds, Ascension Health, Series 1999B, 1.550%, 11/15/29 (Mandatory put 2/01/17) | | | | | No Opt. Call | | | | AA+ | | | $ | 195,423 | |
| | | | District of Columbia – 1.8% | | | | | | | | | | | | | | |
| | | | | |
| | 1,250 | | | District of Columbia Student Dormitory Revenue Bonds, Provident Group – Howard Properties LLC Issue, Series 2013, 4.000%, 10/01/23 | | | | | 10/22 at 100.00 | | | | BBB– | | | | 1,279,563 | |
| | | | | |
| | 95 | | | District of Columbia Tobacco Settlement Corporation, Tobacco Settlement Asset-Backed Bonds, Series 2001, 6.500%, 5/15/33 | | | | | No Opt. Call | | | | Baa1 | | | | 113,743 | |
| | | | | |
| | 100 | | | District of Columbia, Income Tax Secured Revenue Bonds, Series 2009D, 5.000%, 12/01/16 | | | | | No Opt. Call | | | | AAA | | | | 115,799 | |
| | | | | |
| | 250 | | | District of Columbia, Revenue Bonds, The Association of American Medical Colleges Issue, Series 2011A, 5.000%, 10/01/24 | | | | | 10/23 at 100.00 | | | | A+ | | | | 300,590 | |
| | | | | |
| | 140 | | | Washington Convention Center Authority, District of Columbia, Dedicated Tax Revenue Bonds, Senior Lien Refunding Series 2007A, 5.000%, 10/01/16 – AMBAC Insured | | | | | No Opt. Call | | | | A1 | | | | 157,945 | |
| | 1,835 | | | Total District of Columbia | | | | | | | | | | | | | 1,967,640 | |
| | | | Florida – 7.8% | | | | | | | | | | | | | | |
| | | | | |
| | 100 | | | City of Tampa, Florida, Refunding and Capital Improvement Cigarette Tax Allocation Bonds, H. Lee Moffitt Cancer Center Project, Series 2012A, 5.000%, 9/01/21 | | | | | No Opt. Call | | | | A+ | | | | 121,371 | |
| | | | | |
| | 520 | | | Florida Citizens Property Insurance Corporation, Personal and Commercial Lines Account Bonds, Senior Secured Series 2012A-1, 5.000%, 6/01/22 | | | | | No Opt. Call | | | | A+ | | | | 633,818 | |
| | | | | |
| | 240 | | | Florida Hurricane Catastrophe Fund, Financial Corporation Revenue Bonds, Series 2010A, 5.000%, 7/01/15 | | | | | No Opt. Call | | | | AA | | | | 263,770 | |
| | | | | |
| | 2,000 | | | Greater Orlando Aviation Authority, Florida, Special Purpose Airport Facilities Revenue Bonds, JetBlue Airways Corporation, Series 2013, 5.000%, 11/15/26 (Alternative Minimum Tax) | | | | | 5/23 at 100.00 | | | | N/R | | | | 2,121,521 | |
| | | | | |
| | 95 | | | Halifax Hospital Medical Center, Florida, Revenue Bonds, Series 2006, 5.250%, 6/01/26 | | | | | 6/16 at 100.00 | | | | A– | | | | 101,248 | |
| | | | | |
| | 1,000 | | | Jacksonville, Florida, Capital Improvement Refunding Revenue Bonds, Series 2012, 4.000%, 10/01/19 | | | | | No Opt. Call | | | | AA | | | | 1,158,580 | |
| | | | | |
| | 500 | | | Jacksonville, Florida, Special Revenue Bonds, Series 20120C, 5.000%, 10/01/22 | | | | | No Opt. Call | | | | Aa2 | | | | 623,205 | |
| | | | | |
| | 15 | | | Lake County School District, Florida, Sales Tax Revenue Bonds, Series 2004, 5.000%, 10/01/15 – AMBAC Insured | | | | | 10/14 at 100.00 | | | | A+ | | | | 15,935 | |
| | | | | |
| | | | Martin County Industrial Development Authority, Florida, Industrial Development Revenue Refunding Bonds, Indiantown Cogeneration LP, Series 2013: | | | | | | | | | | | | | | |
| | 1,000 | | | 3.950%, 12/15/21 (Alternative Minimum Tax) | | | | | 6/20 at 100.00 | | | | BB | | | | 1,014,560 | |
| | 835 | | | 4.200%, 12/15/25 (Alternative Minimum Tax) | | | | | 6/20 at 100.00 | | | | BB | | | | 847,041 | |
| | | | | |
| | 450 | | | Miami, Florida, Limited Ad Valorem Tax Bonds, Homeland Defense / Neighborhood Capital Improvement Project, Series 2009, 5.000%, 1/01/19 | | | | | No Opt. Call | | | | A3 | | | | 495,473 | |
| | | | | |
| | 570 | | | Miami-Dade County, Florida, Transit System Sales Surtax Revenue Bonds, Series 2012, 5.000%, 7/01/22 | | | | | No Opt. Call | | | | AA | | | | 703,209 | |
| | | | | |
| | 500 | | | Saint Lucie County School Board, Florida, Refunding Certificates of Participation, Florida Master Lease Program, Series 2013A, 5.000%, 7/01/24 | | | | | 7/23 at 100.00 | | | | Aa3 | | | | 602,150 | |
| | 7,825 | | | Total Florida | | | | | | | | | | | | | 8,701,881 | |
| | | | Georgia – 2.0% | | | | | | | | | | | | | | |
| | | | | |
| | 150 | | | Atlanta, Georgia, Airport General Revenue Bonds, Series 2012C, 5.000%, 1/01/22 (Alternative Minimum Tax) | | | | | No Opt. Call | | | | A+ | | | | 181,860 | |
| | | | | |
| | 150 | | | Atlanta, Georgia, Tax Allocation Bonds Atlanta Station Project, Series 2007, 5.250%, 12/01/21 – AGC Insured | | | | | 12/17 at 100.00 | | | | AA– | | | | 166,164 | |
Portfolio of Investments
Nuveen Inflation Protected Municipal Bond Fund (continued)
April 30, 2013
| | | | | | | | | | | | | | | | | | |
Principal
Amount (000) | | | Description (1) | | | | Optional Call
Provisions (2) | | | Ratings (3) | | | Value | |
| | | | Georgia (continued) | | | | | | | | | | | | | | |
| | | | | |
| $ | 150 | | | Atlanta, Georgia, Tax Allocation Bonds, Beltline Project Series 2008C. Remarketed, 7.500%, 1/01/31 | | | | | 1/19 at 100.00 | | | | A2 | | | $ | 187,562 | |
| | | | | |
| | 35 | | | Atlanta, Georgia, Tax Allocation Bonds, Eastside Project, Series 2005A, 5.625%, 1/01/16 (Alternative Minimum Tax) | | | | | 7/15 at 100.00 | | | | A– | | | | 37,812 | |
| | | | | |
| | 500 | | | Burke County Development Authority, Georgia, Pollution Control Revenue Bonds, Georgia Power Company – Vogtle Plant, First Series 2012, 1.750%, 12/01/49 (Mandatory put 6/01/17) | | | | | No Opt. Call | | | | A | | | | 515,925 | |
| | | | | |
| | | | Cobb-Marietta Coliseum and Exhibit Hall Authority, Georgia, Revenue Refunding Bonds, Series 1993: | | | | | | | | | | | | | | |
| | 120 | | | 5.500%, 10/01/18 – NPFG Insured | | | | | No Opt. Call | | | | Baa2 | | | | 129,342 | |
| | 60 | | | 5.625%, 10/01/26 – NPFG Insured | | | | | 10/19 at 100.00 | | | | Baa2 | | | | 69,897 | |
| | | | | |
| | 55 | | | Coffee County Hospital Authority, Georgia, Revenue Bonds, Coffee County Regional Medical Center, Series 2004, 5.000%, 12/01/19 | | | | | 12/14 at 100.00 | | | | BB– | | | | 56,000 | |
| | | | | |
| | 200 | | | DeKalb County, Georgia, Water and Sewerage Revenue Bonds, Second Resolution Series 2011A, 5.250%, 10/01/41 | | | | | 10/21 at 100.00 | | | | Aa3 | | | | 232,692 | |
| | | | | |
| | 80 | | | Georgia Municipal Electric Authority, Senior Lien General Power Revenue Bonds, Series 1993Z, 5.500%, 1/01/20 – FGIC Insured | | | | | No Opt. Call | | | | A+ | | | | 87,538 | |
| | | | | |
| | 420 | | | Metropolitan Atlanta Rapid Transit Authority, Georgia, Sales Tax Revenue Refunding Bonds, Series 1992P, 6.250%, 7/01/20 – AMBAC Insured | | | | | No Opt. Call | | | | Aa2 | | | | 485,390 | |
| | | | | |
| | 100 | | | Private Colleges and Universities Authority, Georgia, Revenue Bonds, Mercer University, Series 2012A, 5.250%, 10/01/27 | | | | | 10/21 at 100.00 | | | | Baa2 | | | | 114,864 | |
| | 2,020 | | | Total Georgia | | | | | | | | | | | | | 2,265,046 | |
| | | | Guam – 0.7% | | | | | | | | | | | | | | |
| | | | | |
| | 640 | | | Guam Power Authority, Revenue Bonds, Series 2012A, 5.000%, 10/01/19 – AGM Insured | | | | | No Opt. Call | | | | AA– | | | | 769,216 | |
| | | | Idaho – 0.1% | | | | | | | | | | | | | | |
| | | | | |
| | 95 | | | Idaho Health Facilities Authority, Revenue Bonds, Trinity Health Group, Refunding Series 2008B, 6.000%, 12/01/23 | | | | | 12/18 at 100.00 | | | | AA | | | | 115,858 | |
| | | | Illinois – 6.7% | | | | | | | | | | | | | | |
| | | | | |
| | 285 | | | Chicago Public Building Commission, Illinois, General Obligation Lease Certificates, Chicago Board of Education, Series 1999B, 5.250%, 12/01/18 – FGIC Insured | | | | | No Opt. Call | | | | A2 | | | | 338,261 | |
| | | | | |
| | 65 | | | Chicago, Illinois, Revenue Bonds, Midway Airport, Series 2001A, 5.125%, 1/01/26 – AGM Insured (Alternative Minimum Tax) | | | | | 7/13 at 100.00 | | | | AA– | | | | 65,216 | |
| | | | | |
| | 280 | | | Chicago, Illinois, Second Lien Wastewater Transmission Revenue Bonds, Series 2001A, 5.500%, 1/01/30 – NPFG Insured | | | | | No Opt. Call | | | | Aa3 | | | | 344,285 | |
| | | | | |
| | 170 | | | Cook County, Illinois, General Obligation Bonds, Refunding Series 2009A, 5.000%, 11/15/17 | | | | | No Opt. Call | | | | AA | | | | 199,305 | |
| | | | | |
| | 500 | | | Illinois Finance Authority, Revenue Bonds, Centegra Health System, Series 2012, 5.000%, 9/01/21 | | | | | No Opt. Call | | | | A– | | | | 594,690 | |
| | | | | |
| | 325 | | | Illinois Finance Authority, Revenue Bonds, Art Institute of Chicago, Series 2012A, 5.000%, 3/01/22 | | | | | No Opt. Call | | | | A+ | | | | 397,378 | |
| | | | | |
| | 740 | | | Illinois Finance Authority, Revenue Bonds, Lake Forest College, Series 2012A, 5.000%, 10/01/22 | | | | | No Opt. Call | | | | BBB– | | | | 808,517 | |
| | | | | |
| | 100 | | | Illinois Finance Authority, Revenue Bonds, Trinity Health Credit Group, Series 2011-IL, 4.000%, 12/01/21 | | | | | No Opt. Call | | | | AA | | | | 115,010 | |
| | | | | |
| | 175 | | | Illinois Health Facilities Authority, Revenue Bonds, Sherman Health Systems, Series 1997, 5.250%, 8/01/27 – AMBAC Insured | | | | | 8/13 at 100.00 | | | | BBB | | | | 175,184 | |
| | | | | |
| | 110 | | | Illinois Health Facilities Authority, Revenue Refunding Bonds, Elmhurst Memorial Healthcare, Series 2002, 6.250%, 1/01/17 | | | | | 7/13 at 100.00 | | | | Baa2 | | | | 110,470 | |
| | | | | |
| | 500 | | | Illinois State Department of Employment Security, Unemployment Insurance Fund Building Receipts Revenue Bonds, Series 2012B, 5.000%, 12/15/17 | | | | | 12/16 at 100.00 | | | | AA+ | | | | 577,770 | |
| | | | | | | | | | | | | | | | | | |
Principal
Amount (000) | | | Description (1) | | | | Optional Call
Provisions (2) | | | Ratings (3) | | | Value | |
| | | | Illinois (continued) | | | | | | | | | | | | | | |
| | | | | |
| | | | Illinois State, General Obligation Bonds, Refunding Series 2012: | | | | | | | | | | | | | | |
| $ | 620 | | | 5.000%, 8/01/21 | | | | | No Opt. Call | | | | A2 | | | $ | 729,901 | |
| | 50 | | | 5.000%, 8/01/25 | | | | | 8/22 at 100.00 | | | | A2 | | | | 56,821 | |
| | | | | |
| | 130 | | | Illinois State, General Obligation Bonds, Series 2006, 5.000%, 1/01/17 | | | | | 1/16 at 100.00 | | | | A2 | | | | 142,128 | |
| | | | | |
| | 140 | | | Metropolitan Pier and Exposition Authority, Illinois, Revenue Bonds, McCormick Place Expansion Project, Series 1993A, 0.010%, 6/15/17 – FGIC Insured | | | | | No Opt. Call | | | | A3 | | | | 132,119 | |
| | | | | |
| | 100 | | | Metropolitan Pier and Exposition Authority, Illinois, Revenue Bonds, McCormick Place Expansion Project, Series 1993A, 0.000%, 6/15/17 – FGIC Insured (ETM) | | | | | No Opt. Call | | | | A (4) | | | | 96,763 | |
| | | | | |
| | 180 | | | Northern Illinois Municipal Power Agency, Power Project Revenue Bonds, Prairie State Project, Series 2007A, 5.000%, 1/01/19 – NPFG Insured | | | | | 1/18 at 100.00 | | | | A2 | | | | 206,509 | |
| | | | | |
| | 485 | | | Railsplitter Tobacco Settlement Authority, Illinois, Tobacco Settlement Revenue Bonds, Series 2010, 5.000%, 6/01/19 | | | | | No Opt. Call | | | | A | | | | 576,141 | |
| | | | | |
| | 210 | | | Regional Transportation Authority, Cook, DuPage, Kane, Lake, McHenry and Will Counties, Illinois, General Obligation Bonds, Series 2011A, 5.000%, 6/01/19 – AGM Insured | | | | | No Opt. Call | | | | AA | | | | 253,720 | |
| | | | | |
| | 1,000 | | | Southwestern Illinois Development Authority, Local Government Revenue Bonds, Edwardsville Community Unit School District 7 Project, Series 2007, 0.000%, 12/01/22 – AGM Insured | | | | | No Opt. Call | | | | AA– | | | | 734,490 | |
| | | | | |
| | 1,500 | | | Will County Community High School District 210 Lincoln-Way, Illinois, General Obligation Bonds, Series 2013B, 0.000%, 1/01/28 | | | | | No Opt. Call | | | | Aa2 | | | | 848,115 | |
| | 7,665 | | | Total Illinois | | | | | | | | | | | | | 7,502,793 | |
| | | | Indiana – 3.0% | | | | | | | | | | | | | | |
| | | | | |
| | 965 | | | Indiana Finance Authority, Educational Facilities Refunding Revenue Bonds, Butler University Project, Series 2012A, 5.000%, 2/01/26 | | | | | 2/22 at 100.00 | | | | BBB+ | | | | 1,088,192 | |
| | | | | |
| | 500 | | | Indiana Finance Authority, Hospital Revenue Bonds, Community Health Network Project, Series 2012A, 5.000%, 5/01/24 | | | | | 5/23 at 100.00 | | | | A | | | | 589,100 | |
| | | | | |
| | 290 | | | Indiana Finance Authority, Hospital Revenue Bonds, Indiana University Health Obligation Group, Series 2011N, 5.000%, 3/01/25 | | | | | 3/21 at 100.00 | | | | AA– | | | | 328,315 | |
| | | | | |
| | 500 | | | Indiana Finance Authority, Hospital Revenue Bonds, Parkview Health System Obligated Group, Series 2012A, 5.000%, 5/01/22 | | | | | No Opt. Call | | | | A+ | | | | 603,580 | |
| | | | | |
| | 460 | | | Indiana Finance Authority, Private Activity Bonds, Ohio River Bridges East End Crossing Project, Series 2013B, 5.000%, 1/01/19 (Alternative Minimum Tax) | | | | | 1/17 at 100.00 | | | | BBB | | | | 512,550 | |
| | | | | |
| | 100 | | | Indiana Finance Authority, Wastewater Utility Revenue Bonds, CWA Authority Project, Series 2011A, 5.250%, 10/01/23 | | | | | 10/21 at 100.00 | | | | AA | | | | 124,497 | |
| | | | | |
| | 100 | | | Indianapolis Local Public Improvement Bond Bank, Indiana, Waterworks Project, Refunding Series 2006, 5.500%, 1/01/20 – NPFG Insured | | | | | No Opt. Call | | | | A+ | | | | 122,624 | |
| | 2,915 | | | Total Indiana | | | | | | | | | | | | | 3,368,858 | |
| | | | Iowa – 1.6% | | | | | | | | | | | | | | |
| | | | | |
| | 500 | | | Iowa Higher Education Loan Authority, Private College Facility Revenue Bonds, Central College, Refunding Series 2012A, 5.000%, 10/01/31 | | | | | 10/21 at 100.00 | | | | Baa3 | | | | 547,775 | |
| | | | | |
| | 1,000 | | | Iowa Higher Education Loan Authority, Private College Facility Revenue Bonds, Wartburg College, Series 2005A, 5.000%, 10/01/23 | | | | | 10/13 at 100.00 | | | | BB | | | | 1,008,280 | |
| | | | | |
| | 190 | | | Iowa State, Special Obligation Bonds, I-Jobs Program, Series 2009A, 5.000%, 6/01/18 | | | | | No Opt. Call | | | | AA | | | | 228,086 | |
| | 1,690 | | | Total Iowa | | | | | | | | | | | | | 1,784,141 | |
| | | | Kansas – 3.2% | | | | | | | | | | | | | | |
| | | | | |
| | 75 | | | Kansas Development Finance Authority, Health Facilities Revenue Bonds, Stormont-Vail Health Care Inc., Series 2011F, 5.000%, 11/15/21 | | | | | No Opt. Call | | | | A2 | | | | 89,453 | |
| | | | | |
| | 600 | | | Kansas State Power Pool, Electric Utility Revenue Bonds, Dogwood Energy Facility, Series 2012A, 5.000%, 12/01/19 | | | | | No Opt. Call | | | | Baa1 | | | | 686,016 | |
Portfolio of Investments
Nuveen Inflation Protected Municipal Bond Fund (continued)
April 30, 2013
| | | | | | | | | | | | | | | | | | |
Principal
Amount (000) | | | Description (1) | | | | Optional Call
Provisions (2) | | | Ratings (3) | | | Value | |
| | | | Kansas (continued) | | | | | | | | | | | | | | |
| | | | | |
| $ | 500 | | | Kansas Turnpike Authority, Revenue Bonds, Series 2012A, 5.000%, 9/01/22 – AGM Insured | | | | | 9/20 at 100.00 | | | | AA– | | | $ | 607,755 | |
| | | | | |
| | 1,025 | | | Wyandotte County/Kansas City Unified Government Board of Utilities, Kansas, Utility System Revenue Bonds, Series 2012B, 5.000%, 9/01/23 | | | | | No Opt. Call | | | | A+ | | | | 1,242,700 | |
| | | | | |
| | 1,430 | | | Wyandotte County-Kansas City Unified Government, Kansas, Sales Tax Special Obligation Capital Appreciation Revenue Bonds Redevelopment Project Area B – Major Multi-Sport Athletic Complex Project, Subordinate Lien Series 2010B, 0.000%, 6/01/21 | | | | | No Opt. Call | | | | BBB+ | | | | 962,876 | |
| | 3,630 | | | Total Kansas | | | | | | | | | | | | | 3,588,800 | |
| | | | Kentucky – 1.6% | | | | | | | | | | | | | | |
| | | | | |
| | 125 | | | Kentucky Economic Development Finance Authority, Hospital Facilities Revenue Bonds, Owensboro Medical Health System, Series 2010A, 5.500%, 6/01/21 | | | | | 6/20 at 100.00 | | | | BBB+ | | | | 149,781 | |
| | | | | |
| | | | Kentucky Economic Development Finance Authority, Louisville Arena Project Revenue Bonds, Louisville Arena Authority, Inc., Series 2008-A1: | | | | | | | | | | | | | | |
| | 380 | | | 5.750%, 12/01/28 – AGC Insured | | | | | 6/18 at 100.00 | | | | AA– | | | | 417,187 | |
| | 525 | | | 6.000%, 12/01/33 – AGC Insured | | | | | 6/18 at 100.00 | | | | AA– | | | | 576,287 | |
| | | | | |
| | 100 | | | Kentucky Economic Development Finance Authority, Louisville Arena Project Revenue Bonds, Louisville Arena Authority, Inc., Series 2008-A2, 0.000%, 12/01/22 – AGC Insured | | | | | No Opt. Call | | | | AA– | | | | 69,152 | |
| | | | | |
| | 50 | | | Kentucky Housing Corporation, Housing Revenue Bonds, Series 2010A, 2.750%, 7/01/16 | | | | | No Opt. Call | | | | AAA | | | | 52,731 | |
| | | | | |
| | 200 | | | Kentucky Infrastructure Authority, Wastewater and Drinking Water Revolving Fund Revenue Bonds, Series 2012A, 5.000%, 2/01/27 | | | | | 2/22 at 100.00 | | | | AAA | | | | 241,600 | |
| | | | | |
| | 130 | | | Kentucky State Property and Buildings Commission, Revenue Bonds, Project 85, Series 2005, 5.000%, 8/01/15 – AGM Insured | | | | | No Opt. Call | | | | AA– | | | | 142,917 | |
| | | | | |
| | 150 | | | Louisville-Jefferson County Metropolitan Government, Kentucky, Environmental Facilities Revenue, Louisville Gas & Electric Company Project, Series 2007B, 1.600%, 6/01/33 (Mandatory put 6/01/17) | | | | | No Opt. Call | | | | A– | | | | 153,635 | |
| | | | | |
| | 50 | | | Owensboro, Kentucky, Electric Light and Power System Revenue Bonds, Series 1991B, 0.000%, 1/01/17 – AMBAC Insured | | | | | No Opt. Call | | | | A3 | | | | 46,793 | |
| | 1,710 | | | Total Kentucky | | | | | | | | | | | | | 1,850,083 | |
| | | | Louisiana – 3.7% | | | | | | | | | | | | | | |
| | | | | |
| | 25 | | | DeSoto Parish, Louisiana, Environmental Improvement Revenue Bonds, International Paper Company Project, Series 2004A, 5.000%, 11/01/18 (Alternative Minimum Tax) | | | | | 11/14 at 100.00 | | | | BBB | | | | 26,284 | |
| | | | | |
| | 100 | | | Jefferson Parish Hospital Service District 2, Louisiana, Hospital Revenue Bonds, East Jefferson General Hospital, Refunding Series 2011, 5.625%, 7/01/26 | | | | | 7/21 at 100.00 | | | | BBB– | | | | 114,408 | |
| | | | | |
| | 130 | | | Louisiana Local Government Environment Facilities and Community Development Authority, Revenue Bonds, Westlake Chemical Corporation Projects, Series 2009A, 6.500%, 8/01/29 | | | | | 8/20 at 100.00 | | | | BBB– | | | | 157,845 | |
| | | | | |
| | 200 | | | Louisiana Offshore Terminal Authority, Deepwater Port Revenue Refunding Bonds, LOOP Inc. Project, Series 2007B-1A, 1.375%, 10/01/37 (Mandatory put 10/01/16) | | | | | No Opt. Call | | | | A– | | | | 201,336 | |
| | | | | |
| | 1,000 | | | Louisiana Stadium and Exposition District, Revenue Refunding Bonds, Senior Lien Series 2013A, 5.000%, 7/01/23 | | | | | No Opt. Call | | | | A | | | | 1,208,770 | |
| | | | | |
| | 500 | | | New Orleans, Louisiana, General Obligation Refunding Bonds, Series 2012, 5.000%, 12/01/27 – AGM Insured | | | | | 12/22 at 100.00 | | | | AA– | | | | 577,200 | |
| | | | | |
| | 500 | | | Port New Orleans Board of Commissioners, Louisiana, Revenue Bonds, Port Facilities, Refunding Series 2013B, 5.000%, 4/01/29 (Alternative Minimum Tax) | | | | | 4/23 at 100.00 | | | | BBB+ | | | | 558,165 | |
| | | | | |
| | 1,000 | | | Regional Transit Authority, Louisiana, Sales Tax Revenue Bonds, Series 2010, 5.000%, 12/01/19 – AGM Insured | | | | | No Opt. Call | | | | AA– | | | | 1,213,620 | |
| | | | | | | | | | | | | | | | | | |
Principal
Amount (000) | | | Description (1) | | | | Optional Call
Provisions (2) | | | Ratings (3) | | | Value | |
| | | | Louisiana (continued) | | | | | | | | | | | | | | |
| | | | | |
| $ | 130 | | | Saint Charles Parish, Louisiana, Gulf Opportunity Zone Revenue Bonds, Valero Project, Series 2010, 4.000%, 12/01/40 (Mandatory put 6/01/22) | | | | | No Opt. Call | | | | BBB | | | $ | 143,976 | |
| | 3,585 | | | Total Louisiana | | | | | | | | | | | | | 4,201,604 | |
| | | | Maine – 0.6% | | | | | | | | | | | | | | |
| | | | | |
| | 250 | | | Maine Health and Higher Educational Facilities Authority Revenue Bonds, Eastern Maine Medical Center Obligated Group Issue, Series 2013, 5.000%, 7/01/25 | | | | | 7/23 at 100.00 | | | | Baa1 | | | | 285,873 | |
| | | | | |
| | 165 | | | Maine Turnpike Authority, Turnpike Revenue Bonds, Series 2012A, 5.000%, 7/01/37 | | | | | 7/22 at 100.00 | | | | AA– | | | | 191,780 | |
| | | | | |
| | 175 | | | Portland, Maine, General Airport Revenue Bonds, Refunding Series 2013, 5.000%, 7/01/23 | | | | | No Opt. Call | | | | BBB+ | | | | 209,291 | |
| | 590 | | | Total Maine | | | | | | | | | | | | | 686,944 | |
| | | | Massachusetts – 0.8% | | | | | | | | | | | | | | |
| | | | | |
| | 140 | | | Massachusetts Department of Transportation, Metropolitan Highway System Revenue Bonds, Senior Lien Series 2010B, 5.000%, 1/01/32 | | | | | 1/20 at 100.00 | | | | A+ | | | | 157,661 | |
| | | | | |
| | 100 | | | Massachusetts Development Finance Agency, Revenue Bonds, UMass Memorial Health, Series 2011H, 5.000%, 7/01/21 | | | | | No Opt. Call | | | | A– | | | | 117,843 | |
| | | | | |
| | | | Massachusetts Port Authority, Special Facilities Revenue Bonds, Delta Air Lines Inc., Series 2001A: | | | | | | | | | | | | | | |
| | 530 | | | 5.000%, 1/01/21 – AMBAC Insured | | | | | 7/13 at 100.00 | | | | N/R | | | | 530,058 | |
| | 110 | | | 5.000%, 1/01/27 – AMBAC Insured (Alternative Minimum Tax) | | | | | 7/13 at 100.00 | | | | N/R | | | | 109,999 | |
| | | | | |
| | 15 | | | Massachusetts Water Resources Authority, General Revenue Bonds, Series 1993C, 5.250%, 12/01/15 – NPFG Insured | | | | | No Opt. Call | | | | Aa1 | | | | 16,072 | |
| | 895 | | | Total Massachusetts | | | | | | | | | | | | | 931,633 | |
| | | | Michigan – 4.6% | | | | | | | | | | | | | | |
| | | | | |
| | 85 | | | Detroit City School District, Wayne County, Michigan, General Obligation Bonds, Series 2002A, 6.000%, 5/01/21 – FGIC Insured | | | | | No Opt. Call | | | | Aa2 | | | | 109,801 | |
| | | | | |
| | 1,000 | | | Detroit City School District, Wayne County, Michigan, General Obligation Bonds, Series 2005, 5.250%, 5/01/26 – AGM Insured | | | | | No Opt. Call | | | | Aa2 | | | | 1,175,270 | |
| | | | | |
| | 350 | | | Detroit Water Supply System, Michigan, Water Supply System Revenue Senior Lien Bonds, Series 2006A, 5.250%, 7/01/19 – NPFG Insured | | | | | 7/16 at 100.00 | | | | Baa2 | | | | 383,121 | |
| | | | | |
| | 505 | | | Detroit, Michigan, Second Lien Sewerage Disposal System Revenue Bonds, Series 2005A, 5.000%, 7/01/35 – NPFG Insured | | | | | 7/15 at 100.00 | | | | A | | | | 510,707 | |
| | | | | |
| | 500 | | | Detroit, Michigan, Senior Lien Sewerage Disposal System Revenue Bonds, Series 2001B, 5.500%, 7/01/29 – FGIC Insured | | | | | No Opt. Call | | | | A | | | | 601,955 | |
| | | | | |
| | 420 | | | Detroit, Michigan, Senior Lien Water Supply System Revenue Bonds, Series 1997A, 6.000%, 7/01/15 – NPFG Insured | | | | | No Opt. Call | | | | A+ | | | | 458,392 | |
| | | | | |
| | 115 | | | Detroit, Michigan, Sewerage Disposal System Revenue Bonds, Series 1999A, 0.000%, 7/01/21 – FGIC Insured | | | | | No Opt. Call | | | | A+ | | | | 85,342 | |
| | | | | |
| | | | Detroit-Wayne County Stadium Authority, Michigan, Wayne County Limited Tax General Obligation Bonds, Building Authority Stadium Refunding Series 2012: | | | | | | | | | | | | | | |
| | 200 | | | 5.000%, 10/01/17 | | | | | No Opt. Call | | | | BBB+ | | | | 220,354 | |
| | 500 | | | 5.000%, 10/01/19 – AGM Insured | | | | | No Opt. Call | | | | AA– | | | | 573,220 | |
| | 190 | | | 5.000%, 10/01/20 – AGM Insured | | | | | No Opt. Call | | | | AA– | | | | 219,441 | |
| | | | | |
| | 95 | | | Michigan Finance Authority, Public School Academy Limited Obligation Revenue and Refunding Bonds, Detroit Service Learning Academy Project, Series 2011, 6.000%, 10/01/21 | | | | | No Opt. Call | | | | BB+ | | | | 105,172 | |
| | | | | |
| | 110 | | | Michigan Finance Authority, Unemployment Obligation Assessment Revenue Bonds, Series 2012B, 5.000%, 7/01/22 | | | | | 7/16 at 100.00 | | | | AAA | | | | 124,583 | |
| | | | | |
| | 100 | | | Michigan State Hospital Finance Authority, Hospital Revenue Bonds, Henry Ford Health System, Refunding Series 2009, 5.000%, 11/15/20 | | | | | 11/19 at 100.00 | | | | A | | | | 119,171 | |
Portfolio of Investments
Nuveen Inflation Protected Municipal Bond Fund (continued)
April 30, 2013
| | | | | | | | | | | | | | | | | | |
Principal
Amount (000) | | | Description (1) | | | | Optional Call
Provisions (2) | | | Ratings (3) | | | Value | |
| | | | Michigan (continued) | | | | | | | | | | | | | | |
| | | | | |
| $ | 125 | | | Michigan State, General Obligation Refunding Bonds, Series 2002, 5.500%, 12/01/15 | | | | | No Opt. Call | | | | Aa2 | | | $ | 141,355 | |
| | | | | |
| | 50 | | | Rockford Public Schools, Kent County, Michigan, General Obligation Bonds, Refunding Series 2012, 5.000%, 5/01/19 | | | | | No Opt. Call | | | | AA– | | | | 60,807 | |
| | | | | |
| | 200 | | | Wayne Charter County, Michigan, General Obligation Bonds, Capital Improvements Series 2008A, 4.500%, 2/01/27 – AGM Insured | | | | | 2/18 at 100.00 | | | | AA– | | | | 212,862 | |
| | 4,545 | | | Total Michigan | | | | | | | | | | | | | 5,101,553 | |
| | | | Minnesota – 0.6% | | | | | | | | | | | | | | |
| | | | | |
| | 55 | | | Central Minnesota Municipal Power Agency, Revenue Bonds, Brookings – Southeast Twin Cities Transmission Project, Series 2012, 5.000%, 1/01/32 | | | | | 1/22 at 100.00 | | | | A– | | | | 63,047 | |
| | | | | |
| | 40 | | | Minnesota Higher Education Facilities Authority, St. John’s University Revenue Bonds, Series 2005-6G, 5.000%, 10/01/13 | | | | | No Opt. Call | | | | A2 | | | | 40,788 | |
| | | | | |
| | 135 | | | Minnesota State, General Obligation Bonds, Various Purpose, Refunding Series 2010D, 5.000%, 8/01/18 | | | | | No Opt. Call | | | | AA+ | | | | 164,290 | |
| | | | | |
| | 335 | | | Northern Municipal Power Agency, Minnesota, Electric System Revenue Bonds, Refunding Series 2009A, 5.000%, 1/01/15 – AGC Insured | | | | | No Opt. Call | | | | AA– | | | | 360,701 | |
| | 565 | | | Total Minnesota | | | | | | | | | | | | | 628,826 | |
| | | | Mississippi – 0.1% | | | | | | | | | | | | | | |
| | | | | |
| | 60 | | | Mississippi Business Finance Corporation, Pollution Control Revenue Refunding Bonds, System Energy Resources Inc. Project, Series 1998, 5.875%, 4/01/22 | | | | | 10/13 at 100.00 | | | | BBB | | | | 60,188 | |
| | | | Montana – 0.2% | | | | | | | | | | | | | | |
| | | | | |
| | 250 | | | Billings, Montana, Tax Increment Urban Renewal Revenue Bonds, Expanded North 27th Street, Series 2013A, 4.375%, 7/01/29 | | | | | 1/23 at 100.00 | | | | N/R | | | | 255,470 | |
| | | | Nebraska – 0.4% | | | | | | | | | | | | | | |
| | | | | |
| | 185 | | | Central Plains Energy Project, Nebraska, Gas Project 1 Revenue Bonds, Series 2007A, 5.000%, 12/01/14 | | | | | No Opt. Call | | | | A | | | | 195,168 | |
| | | | | |
| | 200 | | | Municipal Energy Agency of Nebraska, Power Supply System Revenue Bonds, Refunding Series 2012A, 5.000%, 4/01/24 | | | | | 4/22 at 100.00 | | | | A | | | | 243,184 | |
| | | | | |
| | 50 | | | Nebraska Public Power District, General Revenue Bonds, Series 2012A, 5.000%, 1/01/25 | | | | | 1/22 at 100.00 | | | | A1 | | | | 60,664 | |
| | 435 | | | Total Nebraska | | | | | | | | | | | | | 499,016 | |
| | | | Nevada – 0.6% | | | | | | | | | | | | | | |
| | | | | |
| | 365 | | | Clark County, Nevada, Airport Revenue Bonds, Subordinate Lien Series 2009C, 5.000%, 7/01/23 – AGM Insured | | | | | 7/19 at 100.00 | | | | AA– | | | | 430,101 | |
| | | | | |
| | 230 | | | Las Vegas Valley Water District, Nevada, General Obligation Bonds, Water Series 2012B, 5.000%, 6/01/25 | | | | | 6/22 at 100.00 | | | | AA+ | | | | 279,358 | |
| | 595 | | | Total Nevada | | | | | | | | | | | | | 709,459 | |
| | | | New Jersey – 2.6% | | | | | | | | | | | | | | |
| | | | | |
| | 50 | | | New Jersey Economic Development Authority, Cigarette Tax Revenue Bonds, Series 2004, 5.000%, 6/15/13 – FGIC Insured (ETM) | | | | | No Opt. Call | | | | Aaa | | | | 50,299 | |
| | | | | |
| | 55 | | | New Jersey Economic Development Authority, Cigarette Tax Revenue Refunding Bonds, Series 2012, 5.000%, 6/15/24 | | | | | 6/22 at 100.00 | | | | BBB+ | | | | 64,412 | |
| | | | | |
| | 500 | | | New Jersey Economic Development Authority, Special Facilities Revenue Bonds, Continental Airlines Inc., Series 1999, 6.250%, 9/15/19 (Alternative Minimum Tax) | | | | | No Opt. Call | | | | B | | | | 519,530 | |
| | | | | |
| | 1,000 | | | New Jersey Educational Facilities Authority, Revenue Bonds, Drew University, Series 2003C, 5.250%, 7/01/20 – FGIC Insured | | | | | No Opt. Call | | | | Baa1 | | | | 1,172,300 | |
| | | | | |
| | 90 | | | New Jersey Health Care Facilities Financing Authority, Revenue Bonds, Saint Joseph’s Healthcare System Obligated Group Issue, Series 2008, 6.000%, 7/01/18 | | | | | No Opt. Call | | | | BBB– | | | | 101,339 | |
| | | | | | | | | | | | | | | | | | |
Principal
Amount (000) | | | Description (1) | | | | Optional Call
Provisions (2) | | | Ratings (3) | | | Value | |
| | | | New Jersey (continued) | | | | | | | | | | | | | | |
| | | | | |
| $ | 155 | | | New Jersey Transportation Trust Fund Authority, Transportation System Bonds, Refunding Series 2006A, 5.500%, 12/15/23 | | | | | No Opt. Call | | | | A+ | | | $ | 199,294 | |
| | | | | |
| | 280 | | | New Jersey Transportation Trust Fund Authority, Transportation System Bonds, Series 2005B, 5.250%, 12/15/15 – AMBAC Insured | | | | | No Opt. Call | | | | A+ | | | | 314,642 | |
| | | | | |
| | 170 | | | New Jersey Turnpike Authority, Revenue Bonds, Series 1991C, 6.500%, 1/01/16 | | | | | No Opt. Call | | | | A3 | | | | 195,833 | |
| | | | | |
| | 45 | | | New Jersey Turnpike Authority, Revenue Bonds, Series 1991C, 6.500%, 1/01/16 (ETM) | | | | | No Opt. Call | | | | A3 (4) | | | | 52,275 | |
| | | | | |
| | 300 | | | Tobacco Settlement Financing Corporation, New Jersey, Tobacco Settlement Asset-Backed Bonds, Series 2007-1A, 4.500%, 6/01/23 | | | | | 6/17 at 100.00 | | | | B1 | | | | 300,210 | |
| | 2,645 | | | Total New Jersey | | | | | | | | | | | | | 2,970,134 | |
| | | | New York – 3.9% | | | | | | | | | | | | | | |
| | | | | |
| | 250 | | | Dormitory Authority of the State of New York, Insured Revenue Bonds, Pace University, Series 2013A, 5.000%, 5/01/23 | | | | | No Opt. Call | | | | BBB– | | | | 299,750 | |
| | | | | |
| | 300 | | | Dormitory Authority of the State of New York, Revenue Bonds, Culinary Institute of America, Series 2012, 5.000%, 7/01/21 | | | | | No Opt. Call | | | | Baa2 | | | | 354,015 | |
| | | | | |
| | 250 | | | Dormitory Authority of the State of New York, Rochester Institute of Technology Revenue Bond, Series 2012, 4.000%, 7/01/26 | | | | | No Opt. Call | | | | A1 | | | | 274,638 | |
| | | | | |
| | 70 | | | Long Island Power Authority, New York, Electric System General Revenue Bonds, Series 2006A, 5.000%, 12/01/23 – FGIC Insured | | | | | 6/16 at 100.00 | | | | A | | | | 77,627 | |
| | | | | |
| | 445 | | | Long Island Power Authority, New York, Electric System Revenue Bonds, Series 2006F, 5.000%, 5/01/18 – NPFG Insured | | | | | 11/16 at 100.00 | | | | A | | | | 503,197 | |
| | | | | |
| | 200 | | | Metropolitan Transportation Authority, New York, Transportation Revenue Bonds, Refunding Series 2012F, 5.000%, 11/15/19 | | | | | No Opt. Call | | | | A | | | | 243,794 | |
| | | | | |
| | 240 | | | Metropolitan Transportation Authority, New York, Transportation Revenue Bonds, Series 2005C, 5.250%, 11/15/14 | | | | | No Opt. Call | | | | A | | | | 258,463 | |
| | | | | |
| | 370 | | | Monroe County Industrial Development Corporation, New York, Revenue Bonds, St. John Fisher College, Series 2012A, 5.000%, 6/01/25 | | | | | 6/22 at 100.00 | | | | Aa3 | | | | 421,467 | |
| | | | | |
| | 5 | | | New York City, New York, General Obligation Bonds, Fiscal Series 2004E, 5.000%, 11/01/21 – AGM Insured | | | | | No Opt. Call | | | | AA | | | | 5,345 | |
| | | | | |
| | | | New York State Tobacco Settlement Financing Corporation, Tobacco Settlement Asset-Backed and State Contingency Contract-Backed Bonds, Series 2003B-1C: | | | | | | | | | | | | | | |
| | 45 | | | 5.500%, 6/01/19 | | | | | 6/13 at 100.00 | | | | AA– | | | | 45,204 | |
| | 50 | | | 5.500%, 6/01/21 | | | | | 6/13 at 100.00 | | | | AA– | | | | 50,229 | |
| | | | | |
| | 1,080 | | | New York State Urban Development Corporation, Service Contract Revenue Bonds, Refunding Series 2008D, 5.500%, 1/01/19 | | | | | No Opt. Call | | | | AA– | | | | 1,326,791 | |
| | | | | |
| | 280 | | | New York State Urban Development Corporation, State Personal Income Tax Revenue Bonds, Series 2009A-1, 5.000%, 12/15/16 (5) | | | | | No Opt. Call | | | | AAA | | | | 325,419 | |
| | | | | |
| | 100 | | | Onongada County Trust For Cultural Resources, New York, Revenue Bonds, Syracuse University Project, Series 2011, 5.000%, 12/01/21 | | | | | No Opt. Call | | | | Aa3 | | | | 123,617 | |
| | | | | |
| | 60 | | | Tobacco Settlement Financing Corporation, New York, Asset-Backed Revenue Bonds, State Contingency Contract Secured, Series 2011B, 5.000%, 6/01/18 | | | | | No Opt. Call | | | | AA– | | | | 71,605 | |
| | 3,745 | | | Total New York | | | | | | | | | | | | | 4,381,161 | |
| | | | North Carolina – 4.9% | | | | | | | | | | | | | | |
| | | | | |
| | 75 | | | Buncombe County, North Carolina, Project Development Financing Revenue Bonds, Woodfin Downtown Corridor Development, Series 2008, 6.750%, 8/01/24 | | | | | 8/18 at 100.00 | | | | N/R | | | | 74,756 | |
| | | | | |
| | 250 | | | Charlotte-Mecklenburg Hospital Authority, North Carolina, Health Care Revenue Bonds, DBA Carolinas HealthCare System, Refunding Series 2012A, 5.000%, 1/15/31 | | | | | 1/22 at 100.00 | | | | AA– | | | | 287,540 | |
Portfolio of Investments
Nuveen Inflation Protected Municipal Bond Fund (continued)
April 30, 2013
| | | | | | | | | | | | | | | | | | |
Principal
Amount (000) | | | Description (1) | | | | Optional Call
Provisions (2) | | | Ratings (3) | | | Value | |
| | | | North Carolina (continued) | | | | | | | | | | | | | | |
| | | | | |
| $ | 335 | | | North Carolina Agricultural & Technical State University, General Revenue Bonds, Series 2013, 4.000%, 10/01/21 | | | | | No Opt. Call | | | | A1 | | | $ | 381,317 | |
| | | | | |
| | 200 | | | North Carolina Capital Facilities Finance Agency, Revenue Bonds, The Methodist University, Series 2012, 5.000%, 3/01/19 | | | | | No Opt. Call | | | | BBB | | | | 231,338 | |
| | | | | |
| | | | North Carolina Eastern Municipal Power Agency, Power System Revenue Refunding Bonds, Series 1993B: | | | | | | | | | | | | | | |
| | 670 | | | 6.000%, 1/01/22 | | | | | No Opt. Call | | | | A– | | | | 872,702 | |
| | 50 | | | 6.000%, 1/01/22 – RAAI Insured | | | | | No Opt. Call | | | | Baa1 | | | | 65,127 | |
| | | | | |
| | 530 | | | North Carolina Medical Care Commission, Health Care Facilities Revenue and Refunding Revenue Bonds, Columbus Regional Healthcare System, Series 2013A, 4.000%, 10/01/18 | | | | | No Opt. Call | | | | BBB | | | | 604,794 | |
| | | | | |
| | 100 | | | North Carolina Medical Care Commission, Health Care Facilities Revenue Bonds, WakeMed, Series 2009A, 5.625%, 10/01/38 (Pre-refunded 10/01/14) – AGC Insured | | | | | 10/14 at 100.00 | | | | AA– (4) | | | | 107,574 | |
| | | | | |
| | 1,030 | | | North Carolina State, General Obligation Bonds, Series 2005B, 5.000%, 4/01/16 (5) | | | | | No Opt. Call | | | | AAA | | | | 1,167,052 | |
| | | | | |
| | 650 | | | North Carolina Turnpike Authority, Monroe Connector System State Appropriation Bonds, Series 2011, 5.000%, 7/01/21 | | | | | No Opt. Call | | | | AA | | | | 819,468 | |
| | | | | |
| | | | North Carolina Turnpike Authority, Triangle Expressway System Revenue Bonds, Series 2009A: | | | | | | | | | | | | | | |
| | 90 | | | 5.250%, 1/01/23 – AGC Insured | | | | | 1/19 at 100.00 | | | | AA– | | | | 104,527 | |
| | 20 | | | 5.250%, 1/01/25 – AGC Insured | | | | | No Opt. Call | | | | AA– | | | | 23,067 | |
| | 615 | | | 5.500%, 1/01/29 – AGC Insured | | | | | 1/19 at 100.00 | | | | AA– | | | | 708,252 | |
| | 4,615 | | | Total North Carolina | | | | | | | | | | | | | 5,447,514 | |
| | | | North Dakota – 0.4% | | | | | | | | | | | | | | |
| | | | | |
| | 400 | | | Grand Forks, North Dakota, Health Care System Revenue Bonds, Altru Health System Obligated Group, Series 2012, 4.000%, 12/01/21 | | | | | No Opt. Call | | | | A– | | | | 438,104 | |
| | | | Ohio – 5.4% | | | | | | | | | | | | | | |
| | | | | |
| | 100 | | | Akron, Ohio, Waterworks System Mortgage Revenue Improvement and Refunding Bonds, Series 2009, 5.000%, 3/01/17 – AGC Insured | | | | | No Opt. Call | | | | A3 | | | | 115,529 | |
| | | | | |
| | | | Buckeye Tobacco Settlement Financing Authority, Ohio, Tobacco Settlement Asset-Backed Revenue Bonds, Senior Lien, Series 2007A-1: | | | | | | | | | | | | | | |
| | 175 | | | 5.000%, 6/01/16 | | | | | No Opt. Call | | | | A1 | | | | 194,126 | |
| | 165 | | | 5.000%, 6/01/17 | | | | | No Opt. Call | | | | Baa1 | | | | 187,382 | |
| | | | | |
| | 500 | | | Buckeye Tobacco Settlement Financing Authority, Ohio, Tobacco Settlement Asset-Backed Revenue Bonds, Senior Lien, Series 2007A-2, 5.125%, 6/01/24 | | | | | 6/17 at 100.00 | | | | B– | | | | 464,150 | |
| | | | | |
| | 255 | | | Cleveland, Ohio, Waterworks First Mortgage Revenue Refunding and Improvement Bonds, Series 1993G, 5.500%, 1/01/21 – NPFG Insured | | | | | No Opt. Call | | | | Aa1 | | | | 311,643 | |
| | | | | |
| | 260 | | | Cuyhoga County, Ohio, Recovery Zone Facility Economic Development Revenue Bonds, Medical Mart- Convention Center Project, Series 2010F, 5.250%, 12/01/25 | | | | | 12/20 at 100.00 | | | | AA | | | | 310,279 | |
| | | | | |
| | 2,000 | | | Kings Local School District, Warren County, Ohio, General Obligation Bonds, School Improvement Series 2013A, 0.000%, 12/01/26 | | | | | No Opt. Call | | | | AA | | | | 1,283,740 | |
| | | | | |
| | | | New Albany Community Authority, Ohio, Community Facilities Revenue Refunding Bonds, Series 2012C: | | | | | | | | | | | | | | |
| | 1,000 | | | 5.000%, 10/01/22 | | | | | No Opt. Call | | | | A1 | | | | 1,218,480 | |
| | 140 | | | 5.000%, 10/01/24 | | | | | 10/22 at 100.00 | | | | A1 | | | | 166,716 | |
| | | | | |
| | 585 | | | Ohio Air Quality Development Authority, Ohio, Revenue Bonds, Ohio Valley Electric Corporation Project, Series 2009E, 5.625%, 10/01/19 | | | | | No Opt. Call | | | | BBB– | | | | 694,699 | |
| | | | | |
| | 40 | | | Ohio Municipal Electric Generation Agency, Beneficial Interest Certificates, Belleville Hydroelectric Project – Joint Venture 5, Series 2004, 5.000%, 2/15/22 – AMBAC Insured | | | | | 2/14 at 100.00 | | | | A1 | | | | 41,469 | |
| | | | | | | | | | | | | | | | | | |
Principal
Amount (000) | | | Description (1) | | | | Optional Call
Provisions (2) | | | Ratings (3) | | | Value | |
| | | | Ohio (continued) | | | | | | | | | | | | | | |
| | | | | |
| $ | 395 | | | Ohio Turnpike Commission, Revenue Refunding Bonds, Series 1998A, 5.500%, 2/15/18 – FGIC Insured | | | | | No Opt. Call | | | | AA | | | $ | 480,387 | |
| | | | | |
| | 500 | | | Springboro, Ohio, Sewer System Mortgage Revenue Bonds, Refunding Series 2012, 5.000%, 6/01/21 | | | | | No Opt. Call | | | | Aa3 | | | | 611,340 | |
| | 6,115 | | | Total Ohio | | | | | | | | | | | | | 6,079,940 | |
| | | | Oregon – 0.5% | | | | | | | | | | | | | | |
| | | | | |
| | 455 | | | Oregon Health and Science University, Revenue Bonds, Series 2012A, 5.000%, 7/01/22 | | | | | No Opt. Call | | | | A+ | | | | 564,964 | |
| | | | Pennsylvania – 6.0% | | | | | | | | | | | | | | |
| | | | | |
| | 745 | | | Delaware River Joint Toll Bridge Commission, Pennsylvania, Revenue Bonds, Refunding Series 2012A, 5.000%, 7/01/23 | | | | | 7/22 at 100.00 | | | | A2 | | | | 904,937 | |
| | | | | |
| | 840 | | | Delaware River Port Authority, Pennsylvania and New Jersey, Revenue Refunding Bonds, Port District Project, Series 2012, 5.000%, 1/01/24 | | | | | No Opt. Call | | | | BBB– | | | | 978,919 | |
| | | | | |
| | 590 | | | Pennsylvania Economic Development Financing Authority, Health System Revenue Bonds , Albert Einstein Healthcare, Series 2009A, 6.250%, 10/15/23 | | | | | 10/19 at 100.00 | | | | BBB+ | | | | 696,548 | |
| | | | | |
| | 175 | | | Pennsylvania Economic Development Financing Authority, Unemployment Compensation Revenue Bonds, Series 2012B, 5.000%, 1/01/21 | | | | | 1/19 at 100.00 | | | | Aaa | | | | 211,073 | |
| | | | | |
| | | | Pennsylvania Higher Educational Facilities Authority, Philadelphia University Refunding Revenue Bonds, Refunding Series 2013: | | | | | | | | | | | | | | |
| | 740 | | | 5.000%, 6/01/19 | | | | | No Opt. Call | | | | BBB | | | | 860,857 | |
| | 890 | | | 5.000%, 6/01/20 | | | | | No Opt. Call | | | | BBB | | | | 1,042,475 | |
| | 935 | | | 5.000%, 6/01/21 | | | | | No Opt. Call | | | | BBB | | | | 1,097,447 | |
| | | | | |
| | 100 | | | Pennsylvania Higher Educational Facilities Authority, Revenue Bonds, Slippery Rock University Foundation Inc., Series 2007A, 5.000%, 7/01/26 – SYNCORA GTY Insured | | | | | 7/17 at 100.00 | | | | BBB+ | | | | 105,887 | |
| | | | | |
| | 135 | | | Pennsylvania Turnpike Commission, Turnpike Revenue Bonds, Series 2006A, 5.000%, 12/01/24 – AMBAC Insured | | | | | 6/16 at 100.00 | | | | A+ | | | | 148,503 | |
| | | | | |
| | 230 | | | Pennsylvania, General Obligation Bonds, Refunding 3rd Series 2004, 5.375%, 7/01/16 – NPFG Insured | | | | | No Opt. Call | | | | AA+ | | | | 265,330 | |
| | | | | |
| | 200 | | | Pittsburgh, Pennsylvania, General Obligation Bonds, Series 2012B, 5.000%, 9/01/24 – AGM Insured | | | | | 9/22 at 100.00 | | | | A1 | | | | 239,094 | |
| | | | | |
| | 100 | | | Southeastern Pennsylvania Transportation Authority, Capital Grant Receipts Bonds, Federal Transit Administration Section 5309 Fixed Guideway Modernization Formula Funds, Series 2011, 5.000%, 6/01/21 | | | | | No Opt. Call | | | | A+ | | | | 122,268 | |
| | 5,680 | | | Total Pennsylvania | | | | | | | | | | | | | 6,673,338 | |
| | | | Puerto Rico – 0.2% | | | | | | | | | | | | | | |
| | | | | |
| | 215 | | | Puerto Rico, Highway Revenue Bonds, Highway and Transportation Authority, Series 2003AA, 5.500%, 7/01/16 – FGIC Insured (ETM) | | | | | No Opt. Call | | | | BBB+ (4) | | | | 249,166 | |
| | | | Rhode Island – 1.0% | | | | | | | | | | | | | | |
| | | | | |
| | 895 | | | Rhode Island Health and Educational Building Corporation, Higher Education Facility Revenue Bonds, Providence College, Refunding Series 2012B, 5.000%, 11/01/22 | | | | | No Opt. Call | | | | A | | | | 1,102,201 | |
| | | | South Carolina – 0.9% | | | | | | | | | | | | | | |
| | | | | |
| | 500 | | | Connector 2000 Association Inc., South Carolina, Senior Lien Toll Road Revenue Bonds, Series 2011A, 0.000%, 1/01/16 | | | | | No Opt. Call | | | | N/R | | | | 374,995 | |
| | | | | |
| | 585 | | | Piedmont Municipal Power Agency, South Carolina, Electric Revenue Bonds, Series 2012A, 5.000%, 1/01/25 | | | | | 1/22 at 100.00 | | | | A– | | | | 689,598 | |
| | 1,085 | | | Total South Carolina | | | | | | | | | | | | | 1,064,593 | |
| | | | South Dakota – 0.1% | | | | | | | | | | | | | | |
| | | | | |
| | 120 | | | South Dakota Educational Enhancement Funding Corporation, Tobacco Settlement Revenue Bonds Series 2013B, 5.000%, 6/01/24 | | | | | 6/23 at 100.00 | | | | A– | | | | 145,850 | |
Portfolio of Investments
Nuveen Inflation Protected Municipal Bond Fund (continued)
April 30, 2013
| | | | | | | | | | | | | | | | | | |
Principal
Amount (000) | | | Description (1) | | | | Optional Call
Provisions (2) | | | Ratings (3) | | | Value | |
| | | | Tennessee – 1.6% | | | | | | | | | | | | | | |
| | | | | |
| $ | 230 | | | Chattanooga-Hamilton County Hospital Authority, Tennessee, Hospital Revenue Bonds, Erlanger Health System, Refunding Series 2004, 5.000%, 10/01/18 – AGM Insured | | | | | No Opt. Call | | | | AA– | | | $ | 272,274 | |
| | | | | |
| | 60 | | | Metropolitan Government of Nashville-Davidson County Health and Educational Facilities Board, Tennessee, Revenue Bonds, Belmont University Project, Series 2012, 5.000%, 11/01/30 | | | | | 11/21 at 100.00 | | | | BBB+ | | | | 66,175 | |
| | | | | |
| | 150 | | | Shelby County Health, Educational and Housing Facilities Board, Tennessee, Revenue Bonds, Baptist Memorial Healthcare, Series 2004A, 5.000%, 9/01/15 | | | | | No Opt. Call | | | | AA– | | | | 165,341 | |
| | | | | |
| | 495 | | | Tennessee Housing Development Agency, Homeownership Program Bonds, Series 2012-1C, 3.650%, 7/01/29 | | | | | 1/22 at 100.00 | | | | AA+ | | | | 514,013 | |
| | | | | |
| | | | The Tennessee Energy Acquisition Corporation, Gas Revenue Bonds, Series 2006A: | | | | | | | | | | | | | | |
| | 100 | | | 5.000%, 9/01/13 | | | | | No Opt. Call | | | | A | | | | 101,619 | |
| | 200 | | | 5.250%, 9/01/26 | | | | | No Opt. Call | | | | A | | | | 236,596 | |
| | | | | |
| | 390 | | | West Tennessee Public Utility District, Weakley, Carroll and Benton Counties, Tennessee, Gas System Revenue Bonds, Refunding Series 2012, 4.000%, 3/01/22 | | | | | No Opt. Call | | | | A– | | | | 444,308 | |
| | 1,625 | | | Total Tennessee | | | | | | | | | | | | | 1,800,326 | |
| | | | Texas – 5.6% | | | | | | | | | | | | | | |
| | | | | |
| | 500 | | | Austin Convention Enterprises Inc., Texas, Convention Center Hotel Revenue Bonds, First Tier Series 2006A, 5.250%, 1/01/18 – SYNCORA GTY Insured | | | | | 1/17 at 100.00 | | | | BB+ | | | | 547,170 | |
| | | | | |
| | 1,150 | | | Brazoria County, Texas, Certificates of Obligation, Series 2012, 5.000%, 3/01/21 (5) | | | | | No Opt. Call | | | | AA+ | | | | 1,436,120 | |
| | | | | |
| | 75 | | | Central Texas Regional Mobility Authority, Revenue Bonds, Senior Lien Series 2010, 5.750%, 1/01/25 | | | | | 1/20 at 100.00 | | | | Baa2 | | | | 89,175 | |
| | | | | |
| | 500 | | | Central Texas Regional Mobility Authority, Revenue Bonds, Subordinate Lien Refunding Series 2013, 5.000%, 1/01/23 (WI/DD, Settling 5/16/13) | | | | | No Opt. Call | | | | Baa3 | | | | 563,240 | |
| | | | | |
| | 215 | | | Gulf Coast Industrial Development Authority, Texas, Solid Waste Disposal Revenue Bonds, Citgo Petroleum Corporation Project, Series 1995, 4.875%, 5/01/25 (Alternative Minimum Tax) | | | | | 10/22 at 100.00 | | | | BB+ | | | | 223,269 | |
| | | | | |
| | 125 | | | Harris County-Houston Sports Authority, Texas, Junior Lien Special Revenue Bonds, Series 1998B, 0.000%, 11/15/14 – NPFG Insured | | | | | 7/13 at 93.04 | | | | Baa2 | | | | 115,211 | |
| | | | | |
| | 785 | | | Harris County-Houston Sports Authority, Texas, Revenue Bonds, Junior Lien Series 2001H, 0.000%, 11/15/23 – NPFG Insured | | | | | No Opt. Call | | | | Baa2 | | | | 458,809 | |
| | | | | |
| | 230 | | | Harris County-Houston Sports Authority, Texas, Revenue Bonds, Third Lien Series 2004A-3, 0.000%, 11/15/31 – NPFG Insured | | | | | 11/24 at 66.52 | | | | Baa2 | | | | 82,621 | |
| | | | | |
| | 50 | | | Harris County-Houston Sports Authority, Texas, Senior Lien Revenue Refunding Bonds, Series 2001A, 0.000%, 11/15/20 – NPFG Insured | | | | | No Opt. Call | | | | BBB | | | | 34,861 | |
| | | | | |
| | 200 | | | Houston, Texas, General Obligation Bonds, Public Improvement Refunding Series 2009A, 5.000%, 3/01/20 | | | | | 3/19 at 100.00 | | | | AA | | | | 242,694 | |
| | | | | |
| | 120 | | | Houston, Texas, Subordinate Lien Airport System Revenue Refunding Bonds, Series 2011B, 5.000%, 7/01/25 | | | | | 7/21 at 100.00 | | | | A+ | | | | 142,381 | |
| | | | | |
| | 25 | | | Matagorda County Navigation District 1, Texas, Collateralized Revenue Refunding Bonds, Houston Light and Power Company, Series 1995, 4.000%, 10/15/15 – NPFG Insured | | | | | 10/13 at 101.00 | | | | A | | | | 25,568 | |
| | | | | |
| | 100 | | | Midtown Redevelopment Authority, Texas, Tax Increment Contract Revenue, Refunding Series 2011, 5.250%, 1/01/20 | | | | | No Opt. Call | | | | A– | | | | 117,296 | |
| | | | | |
| | 220 | | | Newark Cultural Education Facilities Finance Corporation, Texas, Lease Revenue Bonds, A.W. Brown-Fellowship Leadership Academy, Series 2012A, 6.000%, 8/15/32 | | | | | 2/15 at 103.00 | | | | BBB– | | | | 231,697 | |
| | | | | |
| | 200 | | | North Texas Tollway Authority, System First Tier Revenue Refunding Bonds, Series 2011B, 5.000%, 1/01/21 | | | | | No Opt. Call | | | | A– | | | | 241,906 | |
| | | | | | | | | | | | | | | | | | |
Principal
Amount (000) | | | Description (1) | | | | Optional Call
Provisions (2) | | | Ratings (3) | | | Value | |
| | | | Texas (continued) | | | | | | | | | | | | | | |
| | | | | |
| $ | 500 | | | Sam Rayburn Municipal Power Agency, Texas, Power Supply System Revenue Refunding Bonds, Series 2012, 5.000%, 10/01/18 | | | | | No Opt. Call | | | | BBB+ | | | $ | 585,710 | |
| | | | | |
| | 350 | | | Texas Municipal Gas Acquisition and Supply Corporation I, Gas Supply Revenue Bonds, Senior Lien Series 2008D, 6.250%, 12/15/26 | | | | | No Opt. Call | | | | A– | | | | 441,049 | |
| | | | | |
| | 150 | | | Texas Municipal Gas Acquisition and Supply Corporation I, Gas Supply Revenue Bonds, Series 2006A, 5.250%, 12/15/21 | | | | | No Opt. Call | | | | A– | | | | 174,984 | |
| | | | | |
| | 365 | | | Texas Municipal Gas Acquisition and Supply Corporation III, Gas Supply Revenue Bonds, Series 2012, 5.000%, 12/15/22 | | | | | No Opt. Call | | | | A3 | | | | 415,286 | |
| | | | | |
| | 50 | | | Tyler Health Facilities Development Corporation, Texas, Hospital Revenue Bonds, Mother Frances Hospital Regional Healthcare Center, Series 2011, 5.250%, 7/01/23 | | | | | 7/21 at 100.00 | | | | Baa1 | | | | 58,135 | |
| | 5,910 | | | Total Texas | | | | | | | | | 6,227,182 | |
| | | | Utah – 1.9% | | | | | | | | | | | | | | |
| | | | | |
| | 500 | | | Central Utah Water Conservancy District, Water Revenue Bonds, Series 2012C, 5.000%, 10/01/22 | | | | | 10/19 at 100.00 | | | | AA+ | | | | 606,610 | |
| | | | | |
| | 295 | | | Utah County, Utah, Hospital Revenue Bonds, IHC Health Services Inc., Series 2012, 5.000%, 5/15/23 | | | | | 5/21 at 100.00 | | | | AA+ | | | | 357,747 | |
| | | | | |
| | 925 | | | Utah Transit Authority, Sales Tax Revenue and Refunding Bonds, Series 2012, 5.000%, 6/15/22 | | | | | No Opt. Call | | | | A1 | | | | 1,134,587 | |
| | 1,720 | | | Total Utah | | | | | | | | | | | | | 2,098,944 | |
| | | | Virgin Islands – 0.1% | | | | | | | | | | | | | | |
| | | | | |
| | 60 | | | Virgin Islands Public Finance Authority, Matching Fund Loan Notes Revenue Bonds, Senior Lien Series 2010A, 5.000%, 10/01/29 | | | | | 10/20 at 100.00 | | | | BBB+ | | | | 66,725 | |
| | | | Virginia – 1.5% | | | | | | | | | | | | | | |
| | | | | |
| | 500 | | | Charles City County Industrial Development Authority, Virginia, Solid Waste Disposal Facility Revenue Bonds, Waste Management, Inc., Series 2002, 1.875%, 4/01/27 (Mandatory put 4/01/15) (Alternative Minimum Tax) | | | | | No Opt. Call | | | | BBB | | | | 509,205 | |
| | | | | |
| | 350 | | | Chesapeake, Virginia, Transportation System Senior Toll Road Revenue Bonds, Series 2012A, 5.000%, 7/15/22 | | | | | No Opt. Call | | | | BBB | | | | 416,196 | |
| | | | | |
| | | | Route 460 Funding Corporation, Virginia, Toll Road Revenue Bonds, Series 2012B: | | | | | | | | | | | | | | |
| | 200 | | | 0.000%, 7/01/25 | | | | | No Opt. Call | | | | BBB– | | | | 123,808 | |
| | 690 | | | 0.000%, 7/01/26 | | | | | No Opt. Call | | | | BBB– | | | | 400,683 | |
| | | | | |
| | 250 | | | Virginia Small Business Financing Authority, Senior Lien Revenue Bonds, Elizabeth River Crossing, Opco LLC Project, Series 2012, 5.250%, 1/01/32 (Alternative Minimum Tax) | | | | | 7/22 at 100.00 | | | | BBB– | | | | 275,795 | |
| | 1,990 | | | Total Virginia | | | | | | | | | | | | | 1,725,687 | |
| | | | Washington – 2.0% | | | | | | | | | | | | | | |
| | | | | |
| | 100 | | | Clark County Public Utility District 1, Washington, Electric System Revenue Bonds, Series 2007, 5.000%, 1/01/19 – FGIC Insured | | | | | 1/17 at 100.00 | | | | A | | | | 113,157 | |
| | | | | |
| | 250 | | | Port of Seattle, Washington, Revenue Bonds, Intermediate Lien Refunding Series 2012A, 5.000%, 8/01/26 | | | | | 8/22 at 100.00 | | | | Aa3 | | | | 300,495 | |
| | | | | |
| | 500 | | | Washington Health Care Facilities Authority, Revenue Bonds, Kadlec Regional Medical Center, Series 2012, 4.000%, 12/01/19 | | | | | No Opt. Call | | | | Baa3 | | | | 545,035 | |
| | | | | |
| | 1,000 | | | Washington State, General Obligation Refunding Bonds, Various Purpose Series 2013R-13C, 5.000%, 7/01/22 | | | | | No Opt. Call | | | | AA+ | | | | 1,272,770 | |
| | 1,850 | | | Total Washington | | | | | | | | | | | | | 2,231,457 | |
| | | | Wisconsin – 1.6% | | | | | | | | | | | | | | |
| | | | | |
| | 130 | | | University of Wisconsin Hospitals and Clinics Authority, Revenue Bonds, Refunding Series 2013A, 5.000%, 4/01/21 | | | | | No Opt. Call | | | | Aa3 | | | | 158,379 | |
| | | | | |
| | 1,000 | | | Wisconsin Health and Educational Facilities Authority, Revenue Bonds, Agnesian HealthCare, Inc., Series 2013B, 5.000%, 7/01/24 | | | | | 7/23 at 100.00 | | | | A– | | | | 1,175,100 | |
Portfolio of Investments
Nuveen Inflation Protected Municipal Bond Fund (continued)
April 30, 2013
| | | | | | | | | | | | | | | | | | |
Principal
Amount (000) | | | Description (1) | | | | Optional Call
Provisions (2) | | | Ratings (3) | | | Value | |
| | | | Wisconsin (continued) | | | | | | | | | | | | | | |
| | | | | |
| $ | 125 | | | Wisconsin Health and Educational Facilities Authority, Revenue Bonds, Wheaton Franciscan Healthcare System, Series 2006A, 5.250%, 8/15/18 | | | | | 8/16 at 100.00 | | | | A– | | | $ | 141,076 | |
| | | | | |
| | 175 | | | Wisconsin State, General Fund Annual Appropriation Revenue Bonds, Refunding Series 2009A, 5.250%, 5/01/20 | | | | | 5/19 at 100.00 | | | | AA– | | | | 213,570 | |
| | | | | |
| | 95 | | | Wisconsin State, General Obligation Bonds, Series 2005I, 5.000%, 5/01/16 – NPFG Insured | | | | | 5/15 at 100.00 | | | | AA | | | | 103,826 | |
| | 1,525 | | | Total Wisconsin | | | | | | | | | | | | | 1,791,951 | |
| | | | Wyoming – 0.2% | | | | | | | | | | | | | | |
| | | | | |
| | 180 | | | Teton County Hospital District, Wyoming, Hospital Revenue Bonds, St. John’s Medical Center Project, Series 2011B, 5.000%, 12/01/21 | | | | | No Opt. Call | | | | BBB | | | | 210,530 | |
| $ | 98,110 | | | Total Investments (cost $105,065,988) – 96.1% | | | | | | | | | | | | | 107,704,799 | |
| | | | Other Assets Less Liabilities – 3.9% (6) | | | | | | | | | | | | | 4,331,558 | |
| | | | Net Assets – 100% | | | | | | | | | | | | $ | 112,036,357 | |
Investments in Derivatives as of April 30, 2013
Consumer Price Index Swaps outstanding:
| | | | | | | | | | | | | | | | | | | | | | | | | | | | | | | | |
| Counterparty | | Notional
Amount | | | Fund
Pay/Receive
Floating Rate | | | Floating Rate Index | | | Fixed Rate
(Annualized) | | | Fixed Rate
Payment
Frequency | | | Effective
Date (7) | | | Termination
Date | | | Unrealized
Appreciation
(Depreciation) (6) | |
Barclays PLC | | $ | 4,000,000 | | | | Receive | | | | CPURNSA | | | | 2.560 | % | | | 12/31/18 | (8) | | | 12/28/12 | | | | 12/28/18 | | | $ | (68,954 | ) |
Barclays PLC | | | 4,500,000 | | | | Receive | | | | CPURNSA | | | | 2.645 | | | | 12/30/19 | (8) | | | 12/28/12 | | | | 12/28/19 | | | | (83,628 | ) |
Barclays PLC | | | 5,000,000 | | | | Receive | | | | CPURNSA | | | | 2.693 | | | | 2/03/20 | (8) | | | 2/01/13 | | | | 2/01/20 | | | | (83,447 | ) |
Barclays PLC | | | 5,000,000 | | | | Receive | | | | CPURNSA | | | | 2.600 | | | | 2/06/18 | (8) | | | 2/05/13 | | | | 2/05/18 | | | | (90,288 | ) |
Barclays PLC | | | 3,500,000 | | | | Receive | | | | CPURNSA | | | | 2.509 | | | | 2/11/19 | (8) | | | 2/08/13 | | | | 2/08/19 | | | | (27,330 | ) |
Barclays PLC | | | 8,000,000 | | | | Receive | | | | CPURNSA | | | | 2.777 | | | | 2/21/22 | (8) | | | 2/19/13 | | | | 2/19/22 | | | | (162,677 | ) |
Barclays PLC | | | 8,000,000 | | | | Receive | | | | CPURNSA | | | | 2.773 | | | | 4/04/23 | (8) | | | 4/03/13 | | | | 4/03/23 | | | | (122,172 | ) |
Barclays PLC | | | 3,800,000 | | | | Receive | | | | CPURNSA | | | | 2.480 | | | | 5/25/18 | (8) | | | 5/24/13 | | | | 5/24/18 | | | | (38,531 | ) |
Barclays PLC | | | 7,500,000 | | | | Receive | | | | CPURNSA | | | | 2.560 | | | | 8/10/20 | (8) | | | 8/07/13 | | | | 8/07/20 | | | | 1,322 | |
Barclays PLC | | | 5,500,000 | | | | Receive | | | | CPURNSA | | | | 2.645 | | | | 10/01/21 | (8) | | | 9/30/13 | | | | 9/30/21 | | | | (13,251 | ) |
JPMorgan | | | 5,000,000 | | | | Receive | | | | CPURNSA | | | | 2.350 | | | | 3/16/16 | (8) | | | 3/15/13 | | | | 3/15/16 | | | | (46,520 | ) |
JPMorgan | | | 5,000,000 | | | | Receive | | | | CPURNSA | | | | 2.655 | | | | 3/18/19 | (8) | | | 3/15/13 | | | | 3/15/19 | | | | (73,785 | ) |
JPMorgan | | | 4,000,000 | | | | Receive | | | | CPURNSA | | | | 2.600 | | | | 4/25/23 | (8) | | | 4/24/13 | | | | 4/24/23 | | | | 755 | |
Morgan Stanley | | | 5,500,000 | | | | Receive | | | | CPURNSA | | | | 2.130 | | | | 1/11/16 | (8) | | | 1/08/13 | | | | 1/08/16 | | | | (46,108 | ) |
Morgan Stanley | | | 6,000,000 | | | | Receive | | | | CPURNSA | | | | 2.714 | | | | 3/01/21 | (8) | | | 2/27/13 | | | | 2/27/21 | | | | (93,568 | ) |
Morgan Stanley | | | 4,000,000 | | | | Receive | | | | CPURNSA | | | | 2.700 | | | | 4/11/22 | (8) | | | 4/08/13 | | | | 4/08/22 | | | | (43,884 | ) |
Morgan Stanley | | | 3,000,000 | | | | Receive | | | | CPURNSA | | | | 2.650 | | | | 8/08/24 | (8) | | | 8/07/13 | | | | 8/07/24 | | | | 18,177 | |
Morgan Stanley | | | 3,750,000 | | | | Receive | | | | CPURNSA | | | | 2.440 | | | | 9/28/17 | (8) | | | 9/27/13 | | | | 9/27/17 | | | | (20,847 | ) |
Morgan Stanley | | | 3,800,000 | | | | Receive | | | | CPURNSA | | | | 2.595 | | | | 11/06/18 | (8) | | | 11/05/13 | | | | 11/05/18 | | | | (25,228 | ) |
Morgan Stanley | | | 3,000,000 | | | | Receive | | | | CPURNSA | | | | 2.468 | | | | 11/15/16 | (8) | | | 11/14/13 | | | | 11/14/16 | | | | (22,842 | ) |
Morgan Stanley | | | 9,750,000 | | | | Receive | | | | CPURNSA | | | | 2.275 | | | | 5/26/16 | (8) | | | 11/25/13 | | | | 5/25/16 | | | | (35,052 | ) |
| | | | | | | | | | | | | | | | | | | | | | | | | | | | | | | $ | (1,077,858 | ) |
| (1) | | All percentages shown in the Portfolio of Investments are based on net assets. |
| (2) | | Optional Call Provisions (not covered by the report of independent registered public accounting firm): Dates (month and year) and prices of the earliest optional call or redemption. There may be other call provisions at varying prices at later dates. Certain mortgage-backed securities may be subject to periodic principal paydowns. |
| (3) | | Ratings (not covered by the report of independent registered public accounting firm): Using the highest of Standard & Poor’s Group (“Standard & Poor’s”), Moody’s Investors Service, Inc. (“Moody’s”) or Fitch, Inc. (“Fitch”) rating. Ratings below BBB by Standard & Poor’s, Baa by Moody’s or BBB by Fitch are considered to be below investment grade. Holdings designated N/R are not rated by any of these national rating agencies. |
| (4) | | Backed by an escrow or trust containing sufficient U.S. Government or U.S. Government agency securities, which ensure the timely payment of principal and interest. Certain bonds backed by U.S. Government or agency securities are regarded as having an implied rating equal to the rating of such securities. |
| (5) | | Investment, or portion of investment, has been pledged to collateralize the net payment obligations for investments in derivatives transactions. |
| (6) | | Other Assets Less Liabilities includes the Unrealized Appreciation (Depreciation) of derivative instruments as listed within Investments in Derivatives as of the end of the reporting period. |
| (7) | | Effective date represents the date on which both the Fund and Counterparty commence interest payment accruals on each consumer price index swap contract. |
| (8) | | Fixed Rate Payment is due one business day after contract Termination Date. |
| WI/DD | | Investment, or portion of investment, purchased on a when-issued or delayed delivery basis. |
| (ETM) | | Escrowed to maturity. |
| CPURNSA | | US CPI Urban Consumers Non-Seasonally Adjusted. |
See accompanying notes to financial statements.
Portfolio of Investments
Nuveen Intermediate Duration Municipal Bond Fund
April 30, 2013
| | | | | | | | | | | | | | | | | | |
Principal
Amount (000) | | | Description (1) | | | | Optional Call
Provisions (2) | | | Ratings (3) | | | Value | |
| | | | MUNICIPAL BONDS – 98.2% | | | | | | | | | | | | | | |
| | | | | |
| | | | Alabama – 0.8% | | | | | | | | | | | | | | |
| | | | | |
| | | | Birmingham Special Care Facilities Financing Authority, Alabama, Revenue Bonds, Baptist Health System Inc., Series 2005A: | | | | | | | | | | | | | | |
| $ | 3,000 | | | 5.250%, 11/15/16 | | | | | 11/15 at 100.00 | | | | Baa2 | | | $ | 3,303,060 | |
| | 2,290 | | | 5.250%, 11/15/20 | | | | | 11/15 at 100.00 | | | | Baa2 | | | | 2,474,574 | |
| | | | | |
| | | | Health Care Authority for Baptist Health, Alabama, Revenue Bonds, Baptist Health, Series 2006D: | | | | | | | | | | | | | | |
| | 1,575 | | | 5.000%, 11/15/15 | | | | | No Opt. Call | | | | A3 | | | | 1,687,156 | |
| | 2,935 | | | 5.000%, 11/15/16 | | | | | 11/15 at 100.00 | | | | A3 | | | | 3,133,083 | |
| | | | | |
| | 1,130 | | | Huntsville, Alabama, Electric System Revenue Warrants, Refunding Series 2007, 4.000%, 12/01/18 – AGM Insured | | | | | 12/17 at 100.00 | | | | AA+ | | | | 1,277,058 | |
| | | | | |
| | 10,000 | | | Jefferson County, Alabama, Limited Obligation School Warrants, Education Tax Revenue Bonds, Series 2004A, 5.250%, 1/01/14 | | | | | No Opt. Call | | | | B | | | | 10,010,000 | |
| | | | | |
| | 2,000 | | | Mobile, Alabama, General Obligation Warrants, Improvement and Refunding Series 2008B, 5.000%, 2/15/20 | | | | | 2/18 at 100.00 | | | | Aa2 | | | | 2,329,900 | |
| | | | | |
| | 1,645 | | | Pell City, Alabama, Special Care Facilities Financing Authority, Revenue Bonds, Noland Health Services, Series 2007A, 5.000%, 12/01/14 (ETM) | | | | | No Opt. Call | | | | Aaa | | | | 1,765,562 | |
| | | | | |
| | | | University of Alabama, Birmingham, Hospital Revenue Bonds, Birmingham Hospital, Series 2008A: | | | | | | | | | | | | | | |
| | 1,500 | | | 5.000%, 9/01/18 | | | | | No Opt. Call | | | | A+ | | | | 1,784,760 | |
| | 4,000 | | | 5.750%, 9/01/22 | | | | | 9/18 at 100.00 | | | | A+ | | | | 4,721,040 | |
| | 30,075 | | | Total Alabama | | | | | | | | | | | | | 32,486,193 | |
| | | | Alaska – 0.2% | | | | | | | | | | | | | | |
| | | | | |
| | 3,000 | | | Alaska State, Sport Fishing Revenue Bonds, Series 2011, 5.000%, 4/01/21 | | | | | 4/20 at 100.00 | | | | A1 | | | | 3,540,660 | |
| | | | | |
| | 400 | | | Aleutians East Borough Project, Alaska, Revenue Bonds, Series 2006, 4.375%, 6/01/15 – ACA Insured | | | | | No Opt. Call | | | | N/R | | | | 403,920 | |
| | | | | |
| | 6,000 | | | Northern Tobacco Securitization Corporation, Alaska, Tobacco Settlement Asset-Backed Bonds, Series 2006A, 5.000%, 6/01/32 | | | | | 6/14 at 100.00 | | | | B+ | | | | 5,614,260 | |
| | 9,400 | | | Total Alaska | | | | | | | | | | | | | 9,558,840 | |
| | | | Arizona – 4.2% | | | | | | | | | | | | | | |
| | | | | |
| | 4,120 | | | Arizona Board of Regents, Certificates of Participation, University of Arizona Projects, Refunding Series 2007B, 4.500%, 6/01/18 – AMBAC Insured | | | | | 6/17 at 100.00 | | | | AA– | | | | 4,633,970 | |
| | | | | |
| | | | Arizona Health Facilities Authority, Hospital System Revenue Bonds, Phoenix Children’s Hospital, Refunding Series 2012A: | | | | | | | | | | | | | | |
| | 1,220 | | | 5.000%, 2/01/20 | | | | | No Opt. Call | | | | BBB+ | | | | 1,437,965 | |
| | 6,255 | | | 5.000%, 2/01/27 | | | | | 2/22 at 100.00 | | | | BBB+ | | | | 6,973,387 | |
| | | | | |
| | 2,817 | | | Arizona Health Facilities Authority, Revenue Bonds, American Baptist Estates – Terraces Project, Series 2003A, 7.500%, 11/15/23 (Pre-refunded 11/15/13) | | | | | 11/13 at 101.00 | | | | AAA | | | | 2,952,413 | |
| | | | | |
| | 1,000 | | | Arizona Health Facilities Authority, Revenue Bonds, Blood Systems Inc., Series 2004, 5.000%, 4/01/17 | | | | | 4/14 at 100.00 | | | | A | | | | 1,042,980 | |
| | | | | |
| | | | Arizona Sports and Tourism Authority, Senior Revenue Refunding Bonds, Multipurpose Stadium Facility Project, Series 2012A: | | | | | | | | | | | | | | |
| | 10,270 | | | 5.000%, 7/01/25 | | | | | 7/22 at 100.00 | | | | A1 | | | | 12,072,077 | |
| | 16,235 | | | 5.000%, 7/01/26 | | | | | 7/22 at 100.00 | | | | A1 | | | | 18,919,620 | |
| | 16,760 | | | 5.000%, 7/01/27 | | | | | 7/22 at 100.00 | | | | A1 | | | | 19,291,263 | |
| | | | | |
| | 150 | | | Arizona State Game and Fish Department and Commission, Beneficial Interest Certificates in Lease Purchase Agreement, AGF Administration Building Project, Series 2006, 4.500%, 7/01/15 | | | | | No Opt. Call | | | | A3 | | | | 161,238 | |
| | | | | |
| | 1,995 | | | Arizona State, Certificates of Participation, Series 2008A,
4.000%, 9/01/17 – AGM Insured | | | | | No Opt. Call | | | | AA– | | | | 2,225,063 | |
| | | | | |
| | | | Arizona State, State Lottery Revenue Bonds, Series 2010A: | | | | | | | | | | | | | | |
| | 30 | | | 5.000%, 7/01/17 – AGM Insured | | | | | No Opt. Call | | | | AA | | | | 34,835 | |
| | 15 | | | 5.000%, 7/01/18 – AGM Insured | | | | | No Opt. Call | | | | AA | | | | 17,828 | |
| | | | | | | | | | | | | | | | | | |
Principal
Amount (000) | | | Description (1) | | | | Optional Call
Provisions (2) | | | Ratings (3) | | | Value | |
| | | | Arizona (continued) | | | | | | | | | | | | | | |
| $ | 5,120 | | | 5.000%, 7/01/19 – AGM Insured | | | | | No Opt. Call | | | | AA | | | $ | 6,192,384 | |
| | 5,015 | | | 5.000%, 7/01/20 – AGM Insured | | | | | No Opt. Call | | | | AA | | | | 6,135,150 | |
| | 6,130 | | | 5.000%, 7/01/21 – AGM Insured | | | | | 1/20 at 100.00 | | | | AA | | | | 7,321,488 | |
| | 7,500 | | | 5.000%, 7/01/22 – AGM Insured | | | | | 1/20 at 100.00 | | | | AA | | | | 8,867,475 | |
| | | | | |
| | 6,000 | | | Arizona Tourism and Sports Authority, Tax Revenue Bonds, Multipurpose Stadium Facility Project, Series 2003A, 5.375%, 7/01/19 (Pre-refunded 7/01/13) – NPFG Insured | | | | | 7/13 at 100.00 | | | | N/R (4) | | | | 6,052,380 | |
| | | | | |
| | | | Gila County Unified School District 10 Payson, Arizona, General Obligation Bonds, Project of 2006, Series 2007A: | | | | | | | | | | | | | | |
| | 1,000 | | | 5.000%, 7/01/16 – AMBAC Insured | | | | | No Opt. Call | | | | Aa3 | | | | 1,120,810 | |
| | 1,050 | | | 5.000%, 7/01/17 – AMBAC Insured | | | | | No Opt. Call | | | | Aa3 | | | | 1,203,951 | |
| | | | | |
| | 6,000 | | | Gilbert, Arizona, Public Facilities Municipal Property Corporation, Revenue Bonds, Series 2009, 5.500%, 7/01/27 | | | | | 7/19 at 100.00 | | | | AA | | | | 6,924,660 | |
| | | | | |
| | 2,810 | | | Glendale Industrial Development Authority, Arizona, Revenue Bonds, John C. Lincoln Health Network, Series 2005B, 5.250%, 12/01/20 | | | | | 12/15 at 100.00 | | | | BBB+ | | | | 3,021,565 | |
| | | | | |
| | 2,000 | | | Glendale Industrial Development Authority, Arizona, Revenue Bonds, Midwestern University, Refunding Series 2007, 5.000%, 5/15/26 | | | | | 5/22 at 100.00 | | | | A– | | | | 2,269,580 | |
| | | | | |
| | 1,355 | | | Glendale Industrial Development Authority, Arizona, Revenue Bonds, Midwestern University, Refunding Series 2010, 5.000%, 5/15/21 | | | | | 5/20 at 100.00 | | | | A+ | | | | 1,549,280 | |
| | | | | |
| | 565 | | | Maricopa County Unified School District 48, Scottsdale, Arizona, General Obligation Bonds, Series 2006B, 4.750%, 7/01/18 – AGM Insured | | | | | 7/16 at 100.00 | | | | Aa1 | | | | 635,297 | |
| | | | | |
| | | | Maricopa County Unified School District 48, Scottsdale, Arizona, General Obligation Bonds, Series 2006B: | | | | | | | | | | | | | | |
| | 295 | | | 4.750%, 7/01/18 (Pre-refunded 7/01/16) – AGM Insured | | | | | 7/16 at 100.00 | | | | Aa1 (4) | | | | 335,123 | |
| | 290 | | | 4.750%, 7/01/18 (Pre-refunded 7/01/16) – AGM Insured | | | | | 7/16 at 100.00 | | | | Aa1 (4) | | | | 328,460 | |
| | | | | |
| | 2,740 | | | Maricopa County, Arizona, Hospital Revenue Bonds, Sun Health Corporation, Series 2005, 5.000%, 4/01/14 (ETM) | | | | | No Opt. Call | | | | N/R (4) | | | | 2,857,491 | |
| | | | | |
| | 3,250 | | | Mesa, Arizona, Excise Tax Revenue Bonds, Series 2013, 5.000%, 7/01/27 | | | | | 7/17 at 100.00 | | | | | | | | 3,674,970 | |
| | | | | |
| | | | Phoenix Civic Improvement Corporation, Arizona, Junior Lien Airport Revenue Bonds, Series 2010A: | | | | | | | | | | | | | | |
| | 2,000 | | | 5.000%, 7/01/22 | | | | | 7/20 at 100.00 | | | | A+ | | | | 2,400,380 | |
| | 10,370 | | | 5.000%, 7/01/40 | | | | | 7/20 at 100.00 | | | | A+ | | | | 11,393,104 | |
| | | | | |
| | 2,650 | | | Pima County Industrial Development Authority, Arizona, Revenue Bonds, Tucson Electric Power Company Project, Series 2013A, 4.000%, 9/01/29 | | | | | 3/23 at 100.00 | | | | BBB | | | | 2,671,359 | |
| | | | | |
| | 1,200 | | | Pima County Industrial Development Authority, Arizona, Revenue Bonds, Tucson Electric Power Company, Refunding Series 2008, 5.750%, 9/01/29 | | | | | 1/15 at 100.00 | | | | BBB– | | | | 1,265,088 | |
| | | | | |
| | | | Pima County Unified School District 1, Tucson, Arizona, School Improvement Bonds, Series 2007C: | | | | | | | | | | | | | | |
| | 1,000 | | | 4.375%, 7/01/18 – FGIC Insured | | | | | 7/17 at 100.00 | | | | Aa2 | | | | 1,126,140 | |
| | 1,000 | | | 4.500%, 7/01/19 – FGIC Insured | | | | | 7/17 at 100.00 | | | | Aa2 | | | | 1,121,670 | |
| | | | | |
| | 2,670 | | | Pima County, Arizona, Sewer Revenue Bonds, Series 2010, 5.000%, 7/01/24 – AGM Insured | | | | | 7/20 at 100.00 | | | | AA– | | | | 3,195,563 | |
| | | | | |
| | 11,000 | | | Salt River Project Agricultural Improvement and Power District, Arizona, Electric System Revenue Bonds, Series 2003, 5.000%, 12/01/14 – NPFG Insured | | | | | 12/13 at 100.00 | | | | Aa2 | | | | 11,302,940 | |
| | | | | |
| | 3,000 | | | Salt River Project Agricultural Improvement and Power District, Arizona, Electric System Revenue Bonds, Series 2009A, 5.000%, 1/01/25 | | | | | No Opt. Call | | | | Aa1 | | | | 3,523,110 | |
| | | | | |
| | 3,925 | | | Salt River Project Agricultural Improvement and Power District, Arizona, Electric System Revenue Bonds, Tender Option Bond Trust 3284,
13.473%, 6/01/19 (IF) | | | | | No Opt. Call | | | | Aa1 | | | | 6,780,869 | |
| | | | | |
| | 1,000 | | | Scottsdale Industrial Development Authority, Arizona, Hospital Revenue Bonds, Scottsdale Healthcare, Series 2008A, 5.000%, 9/01/20 | | | | | 9/18 at 100.00 | | | | A2 | | | | 1,126,690 | |
| | | | | |
| | 1,350 | | | Sedona-Oak Creek Joint Unified School District 9, Coconino and Yavapai Counties, Arizona, General Obligation Bonds, School Improvement Project 2007, Series 2009B., 5.375%, 7/01/28 | | | | | 7/19 at 100.00 | | | | Aa2 | | | | 1,547,708 | |
Portfolio of Investments
Nuveen Intermediate Duration Municipal Bond Fund (continued)
April 30, 2013
| | | | | | | | | | | | | | | | | | |
Principal
Amount (000) | | | Description (1) | | | | Optional Call
Provisions (2) | | | Ratings (3) | | | Value | |
| | | | Arizona (continued) | | | | | | | | | | | | | | |
| | | | | |
| $ | 359 | | | Tempe Industrial Development Authority, Arizona, Senior Living Revenue Bonds, Friendship Village of Tempe Project, Refunding Series 2004A, 5.375%, 12/01/13 (ETM) | | | | | No Opt. Call | | | | N/R (4) | | | $ | 365,782 | |
| | | | | |
| | 1,850 | | | Tucson Airport Authority Inc., Arizona, Revenue Bonds, Series 2003, 5.000%, 6/01/13 – AGM Insured | | | | | No Opt. Call | | | | AA– | | | | 1,857,511 | |
| | 155,361 | | | Total Arizona | | | | | | | | | | | | | 177,930,617 | |
| | | | Arkansas – 0.9% | | | | | | | | | | | | | | |
| | | | | |
| | 1,490 | | | Conway, Arkansas, Restaurant Gross Receipts Tax Revenue Bonds, Series 2007, 5.000%, 12/01/22 – AGM Insured | | | | | 12/15 at 100.00 | | | | AA– | | | | 1,646,271 | |
| | | | | |
| | | | Fayetteville, Arkansas, Sales and Use Tax Revenue Bonds, Series 2006A: | | | | | | | | | | | | | | |
| | 6,730 | | | 5.000%, 11/01/17 – AGM Insured | | | | | 11/16 at 100.00 | | | | AA– | | | | 7,690,573 | |
| | 6,740 | | | 4.500%, 11/01/19 – AGM Insured | | | | | 11/16 at 100.00 | | | | AA– | | | | 7,478,974 | |
| | | | | |
| | 3,685 | | | Fort Smith, Arkansas, Sales and Use Tax Revenue Bonds, Series 2006, 4.000%, 9/01/13 – FGIC Insured | | | | | No Opt. Call | | | | AA | | | | 3,732,389 | |
| | | | | |
| | | | Fort Smith, Arkansas, Water and Sewer Revenue Bonds, Series 2007: | | | | | | | | | | | | | | |
| | 1,235 | | | 5.000%, 10/01/19 – FGIC Insured | | | | | 10/17 at 100.00 | | | | A | | | | 1,431,340 | |
| | 1,000 | | | 5.000%, 10/01/21 – FGIC Insured | | | | | 10/17 at 100.00 | | | | A | | | | 1,162,680 | |
| | | | | |
| | 5,395 | | | Independence County, Arkansas, Pollution Control Revenue Bonds, Arkansas Power and Light Company Project, Series 2013, 2.375%, 1/01/21 | | | | | No Opt. Call | | | | A– | | | | 5,470,260 | |
| | | | | |
| | | | Magnolia, Arkansas, Sales and Use Tax Revenue Bonds, Series 2007: | | | | | | | | | | | | | | |
| | 575 | | | 5.000%, 8/01/21 – CIFG Insured | | | | | 8/17 at 100.00 | | | | N/R | | | | 641,079 | |
| | 1,130 | | | 5.000%, 8/01/22 – CIFG Insured | | | | | 8/17 at 100.00 | | | | N/R | | | | 1,251,204 | |
| | 1,185 | | | 5.000%, 8/01/23 – CIFG Insured | | | | | 8/17 at 100.00 | | | | N/R | | | | 1,307,304 | |
| | 1,245 | | | 5.000%, 8/01/24 – CIFG Insured | | | | | 8/17 at 100.00 | | | | N/R | | | | 1,363,599 | |
| | | | | |
| | 1,000 | | | North Little Rock Health Facilities Board, Arkansas, Healthcare Revenue Bonds, Baptist Health, Series 1996B, 5.750%, 12/01/21 | | | | | 12/18 at 100.00 | | | | A+ | | | | 1,174,890 | |
| | | | | |
| | 1,000 | | | University of Arkansas, Fayetteville, Various Facilities Revenue Bonds, Series 2005B, 4.500%, 11/01/16 – FGIC Insured | | | | | 11/15 at 100.00 | | | | Aa2 | | | | 1,096,550 | |
| | | | | |
| | | | Washington County, Arkansas, Hospital Revenue Bonds, Washington Regional Medical Center, Series 2005B: | | | | | | | | | | | | | | |
| | 1,270 | | | 5.000%, 2/01/14 | | | | | No Opt. Call | | | | Baa1 | | | | 1,309,434 | |
| | 1,000 | | | 5.000%, 2/01/17 | | | | | 2/15 at 100.00 | | | | Baa1 | | | | 1,059,420 | |
| | 1,165 | | | 5.000%, 2/01/18 | | | | | 2/15 at 100.00 | | | | Baa1 | | | | 1,231,813 | |
| | 35,845 | | | Total Arkansas | | | | | | | | | | | | | 39,047,780 | |
| | | | California – 7.7% | | | | | | | | | | | | | | |
| | | | | |
| | 1,215 | | | ABAG Finance Authority for Non-Profit Corporations, California, Cal-Mortgage Revenue Bonds, Elder Care Alliance of Union City, Series 2004, 5.000%, 8/15/17 | | | | | 8/14 at 100.00 | | | | A | | | | 1,272,433 | |
| | | | | |
| | 1,525 | | | ABAG Finance Authority for Non-Profit Corporations, California, Revenue Bonds, Children’s Hospital & Research Center at Oakland, Refunding Series 2007A, 4.500%, 12/01/18 | | | | | 12/17 at 100.00 | | | | A– | | | | 1,717,974 | |
| | | | | |
| | 1,565 | | | ABC Unified School District, Los Angeles County, California, General Obligation Bonds, Refunding Series 2003A, 4.900%, 2/01/20 – NPFG Insured | | | | | No Opt. Call | | | | A+ | | | | 1,835,416 | |
| | | | | |
| | | | Alameda Corridor Transportation Authority, California, Senior Lien Revenue Refunding Bonds, Series 2013A: | | | | | | | | | | | | | | |
| | 2,185 | | | 5.000%, 10/01/22 | | | | | No Opt. Call | | | | A | | | | 2,708,657 | |
| | 1,860 | | | 5.000%, 10/01/23 | | | | | No Opt. Call | | | | A | | | | 2,321,931 | |
| | 5,000 | | | 5.000%, 10/01/24 | | | | | 10/23 at 100.00 | | | | A | | | | 6,185,550 | |
| | | | | |
| | 2,000 | | | Alameda Corridor Transportation Authority, California, Subordinate Lien Revenue Bonds, Series 2004A, 0.000%, 10/01/14 – AMBAC Insured | | | | | No Opt. Call | | | | BBB+ | | | | 1,964,240 | |
| | | | | |
| | 920 | | | Apple Valley Redevelopment Agency, California, Tax Allocation Bonds, Project Area 2 Series 2007, 4.500%, 6/01/18 – AMBAC Insured | | | | | 6/17 at 100.00 | | | | BBB+ | | | | 972,311 | |
| | | | | | | | | | | | | | | | | | |
Principal
Amount (000) | | | Description (1) | | | | Optional Call
Provisions (2) | | | Ratings (3) | | | Value | |
| | | | California (continued) | | | | | | | | | | | | | | |
| | | | | |
| $ | 1,060 | | | California Department of Water Resources, Power Supply Revenue Bonds, Refunding Series 2008H, 5.000%, 5/01/22 – AGM Insured | | | | | 5/18 at 100.00 | | | | AA | | | $ | 1,264,834 | |
| | | | | |
| | 7,500 | | | California Department of Water Resources, Power Supply Revenue Bonds, Series 2010L, 5.000%, 5/01/17 | | | | | No Opt. Call | | | | AA | | | | 8,794,125 | |
| | | | | |
| | 2,645 | | | California Department of Water Resources, Power Supply Revenue Bonds, Series 2010M, 4.000%, 5/01/16 | | | | | No Opt. Call | | | | AA | | | | 2,926,005 | |
| | | | | |
| | 1,000 | | | California Educational Facilities Authority, Revenue Bonds, Lutheran University, Series 2004C, 5.000%, 10/01/24 | | | | | 10/14 at 100.00 | | | | Baa1 | | | | 1,036,730 | |
| | | | | |
| | 12,250 | | | California Educational Facilities Authority, Revenue Bonds, University of Southern California, Series 2007A, 4.500%, 10/01/33 | | | | | 10/17 at 100.00 | | | | Aa1 | | | | 13,547,275 | |
| | | | | |
| | 500 | | | California Health Facilities Financing Authority, Revenue Bonds, Adventist Health System/West, Series 2009C, 5.125%, 3/01/20 | | | | | 3/19 at 100.00 | | | | A | | | | 587,115 | |
| | | | | |
| | 6,290 | | | California Health Facilities Financing Authority, Revenue Bonds, Catholic Healthcare West, Series 2008H, 5.125%, 7/01/22 | | | | | 7/15 at 100.00 | | | | A | | | | 6,878,870 | |
| | | | | |
| | 3,160 | | | California Health Facilities Financing Authority, Revenue Bonds, Children’s Hospital of Orange County, Series 2009A, 5.750%, 11/01/18 | | | | | No Opt. Call | | | | A | | | | 3,888,348 | |
| | | | | |
| | 1,210 | | | California Health Facilities Financing Authority, Revenue Bonds, Lucile Salter Packard Children’s Hospital, Series 2008B, 1.450%, 8/15/33 (Mandatory put 3/15/17) | | | | | No Opt. Call | | | | AA | | | | 1,233,075 | |
| | | | | |
| | 1,440 | | | California Health Facilities Financing Authority, Revenue Bonds, Lucile Salter Packard Children’s Hospital, Series 2008C, 1.450%, 8/15/23 (Mandatory put 3/15/17) | | | | | No Opt. Call | | | | AA | | | | 1,467,461 | |
| | | | | |
| | 2,245 | | | California State Public Works Board, Lease Revenue Bonds, California State University Monterey Bay Campus Library Project, Series 2009D, 6.000%, 4/01/25 | | | | | 4/19 at 100.00 | | | | Aa3 | | | | 2,771,116 | |
| | | | | |
| | 1,400 | | | California State Public Works Board, Lease Revenue Bonds, California State University, Various University Projects, Series 2010B-1, 5.375%, 3/01/25 | | | | | 3/20 at 100.00 | | | | Aa3 | | | | 1,674,946 | |
| | | | | |
| | 8,075 | | | California State Public Works Board, Lease Revenue Bonds, Department of Corrections, Series 2003C, 5.500%, 6/01/14 | | | | | 12/13 at 100.00 | | | | A2 | | | | 8,320,884 | |
| | | | | |
| | 3,940 | | | California State Public Works Board, Lease Revenue Bonds, Department of Corrections, Series 2003C, 5.500%, 6/01/17 (Pre-refunded 12/01/13) | | | | | 12/13 at 100.00 | | | | AAA | | | | 4,059,106 | |
| | | | | |
| | 5,000 | | | California State Public Works Board, Lease Revenue Bonds, Various Capital Projects, Series 2009G-1, 5.250%, 10/01/24 | | | | | 10/19 at 100.00 | | | | A2 | | | | 5,938,700 | |
| | | | | |
| | | | California State, Economic Recovery Revenue Bonds, Refunding Series 2009A: | | | | | | | | | | | | | | |
| | 2,000 | | | 5.000%, 7/01/20 | | | | | 7/19 at 100.00 | | | | Aa3 | | | | 2,438,000 | |
| | 6,000 | | | 5.250%, 7/01/21 | | | | | 7/19 at 100.00 | | | | Aa3 | | | | 7,350,840 | |
| | | | | |
| | | | California State, Economic Recovery Revenue Bonds, Series 2004A: | | | | | | | | | | | | | | |
| | 10,175 | | | 5.250%, 7/01/13 | | | | | No Opt. Call | | | | Aa3 | | | | 10,262,098 | |
| | 5,945 | | | 5.250%, 7/01/14 | | | | | No Opt. Call | | | | Aa3 | | | | 6,290,761 | |
| | | | | |
| | 1,825 | | | California State, Economic Recovery Revenue Bonds, Series 2004A, 5.250%, 7/01/14 (ETM) | | | | | No Opt. Call | | | | Aaa | | | | 1,931,817 | |
| | | | | |
| | | | California State, General Obligation Bonds, Series 2003: | | | | | | | | | | | | | | |
| | 995 | | | 5.000%, 2/01/16 (Pre-refunded 8/01/13) | | | | | 8/13 at 100.00 | | | | Aaa | | | | 1,006,880 | |
| | 30 | | | 5.000%, 2/01/16 (Pre-refunded 8/01/13) | | | | | 8/13 at 100.00 | | | | Aaa | | | | 30,358 | |
| | 1,940 | | | 5.000%, 2/01/17 (Pre-refunded 8/01/13) | | | | | 8/13 at 100.00 | | | | Aaa | | | | 1,963,164 | |
| | 60 | | | 5.000%, 2/01/17 (Pre-refunded 8/01/13) | | | | | 8/13 at 100.00 | | | | Aaa | | | | 60,716 | |
| | | | | |
| | | | California State, General Obligation Bonds, Series 2004: | | | | | | | | | | | | | | |
| | 1,500 | | | 5.000%, 2/01/21 | | | | | 2/14 at 100.00 | | | | A1 | | | | 1,552,365 | |
| | 500 | | | 5.125%, 4/01/24 | | | | | 4/14 at 100.00 | | | | A1 | | | | 521,065 | |
| | | | | |
| | | | California State, General Obligation Bonds, Series 2007: | | | | | | | | | | | | | | |
| | 500 | | | 5.000%, 8/01/19 | | | | | 2/17 at 100.00 | | | | A1 | | | | 576,410 | |
| | 1,000 | | | 5.000%, 12/01/23 | | | | | 12/17 at 100.00 | | | | A1 | | | | 1,171,740 | |
| | | | | |
| | 15 | | | California State, General Obligation Bonds, Various Purpose Series 2001, 5.000%, 11/01/18 | | | | | 7/13 at 100.00 | | | | A1 | | | | 15,059 | |
Portfolio of Investments
Nuveen Intermediate Duration Municipal Bond Fund (continued)
April 30, 2013
| | | | | | | | | | | | | | | | | | |
Principal
Amount (000) | | | Description (1) | | | | Optional Call
Provisions (2) | | | Ratings (3) | | | Value | |
| | | | California (continued) | | | | | | | | | | | | | | |
| | | | | |
| $ | 500 | | | California Statewide Communities Development Authority, Pollution Control Revenue Bonds, Southern California Edison Company, Series 2006C, 4.250%, 11/01/33 (Mandatory put 11/01/16) – FGIC Insured | | | | | No Opt. Call | | | | A1 | | | $ | 549,890 | |
| | | | | |
| | 700 | | | California Statewide Communities Development Authority, Revenue Bonds, Adventist Health System West, Series 2005A, 5.000%, 3/01/30 | | | | | 3/15 at 100.00 | | | | A | | | | 743,701 | |
| | | | | |
| | 2,620 | | | California Statewide Communities Development Authority, Revenue Bonds, Kaiser Permanente, Series 2012E-1, 5.000%, 4/01/44 (Mandatory put 5/01/17) | | | | | No Opt. Call | | | | A+ | | | | 3,041,217 | |
| | | | | |
| | 1,000 | | | California Statewide Community Development Authority, Insured Health Facility Revenue Bonds, Henry Mayo Newhall Memorial Hospital, Series 2007B, 5.200%, 10/01/37 – AMBAC Insured | | | | | 10/18 at 100.00 | | | | A | | | | 1,107,200 | |
| | | | | |
| | | | California Statewide Community Development Authority, Revenue Bonds, Daughters of Charity Health System, Series 2005G: | | | | | | | | | | | | | | |
| | 750 | | | 5.250%, 7/01/13 | | | | | No Opt. Call | | | | BBB– | | | | 756,428 | |
| | 1,200 | | | 5.000%, 7/01/22 | | | | | 7/15 at 100.00 | | | | BBB– | | | | 1,285,440 | |
| | | | | |
| | 10,000 | | | California Statewide Community Development Authority, Revenue Bonds, Sutter Health, Series 2007C, 5.000%, 8/15/38 – AMBAC Insured | | | | | 8/17 at 100.00 | | | | AA– | | | | 11,017,400 | |
| | | | | |
| | 5,625 | | | Chula Vista, California, Industrial Development Revenue Bonds, San Diego Gas & Electric Company, Refunding Series 2006A, 1.650%, 7/01/18 | | | | | 9/15 at 100.00 | | | | Aa3 | | | | 5,740,088 | |
| | | | | |
| | 1,120 | | | Contra Costa County Public Financing Authority, California, Tax Allocation Revenue Bonds, Series 2003A, 5.500%, 8/01/23 – RAAI Insured | | | | | 8/13 at 100.00 | | | | BBB+ | | | | 1,123,427 | |
| | | | | |
| | | | Culver City Redevelopment Agency, California, Tax Allocation Revenue Bonds, Redevelopment Project, Capital Appreciation Series 2011A: | | | | | | | | | | | | | | |
| | 7,475 | | | 0.000%, 11/01/26 | | | | | 11/21 at 66.91 | | | | A | | | | 3,376,906 | |
| | 4,095 | | | 0.000%, 11/01/28 | | | | | 11/21 at 56.33 | | | | A | | | | 1,535,338 | |
| | | | | |
| | | | Delano, California, Certificates of Participation, Delano Regional Medical Center, Series 2012: | | | | | | | | | | | | | | |
| | 1,685 | | | 5.000%, 1/01/22 | | | | | No Opt. Call | | | | BBB– | | | | 1,895,996 | |
| | 1,530 | | | 5.000%, 1/01/23 | | | | | No Opt. Call | | | | BBB– | | | | 1,730,904 | |
| | 1,635 | | | 5.000%, 1/01/24 | | | | | No Opt. Call | | | | BBB– | | | | 1,835,353 | |
| | 1,325 | | | 5.000%, 1/01/25 | | | | | No Opt. Call | | | | BBB– | | | | 1,471,280 | |
| | | | | |
| | | | Desert Sands Unified School District, Riverside County, California, General Obligation Bonds, Election 2001, Series 2008: | | | | | | | | | | | | | | |
| | 500 | | | 5.250%, 8/01/23 | | | | | 8/18 at 100.00 | | | | Aa2 | | | | 593,465 | |
| | 2,025 | | | 5.000%, 8/01/24 | | | | | 8/18 at 100.00 | | | | Aa2 | | | | 2,331,524 | |
| | | | | |
| | 2,100 | | | Golden State Tobacco Securitization Corporation, California, Enhanced Tobacco Settlement Asset-Backed Revenue Bonds, Series 2005A, 4.550%, 6/01/22 – AGM Insured | | | | | 6/18 at 100.00 | | | | AA– | | | | 2,322,873 | |
| | | | | |
| | 620 | | | Golden State Tobacco Securitization Corporation, California, Tobacco Settlement Asset-Backed Bonds, Series 2003A-1, 6.250%, 6/01/33
(Pre-refunded 6/01/13) | | | | | 6/13 at 100.00 | | | | Aaa | | | | 623,199 | |
| | | | | |
| | | | Golden State Tobacco Securitization Corporation, California, Tobacco Settlement Asset-Backed Bonds, Series 2007A-1: | | | | | | | | | | | | | | |
| | 7,770 | | | 5.000%, 6/01/17 | | | | | No Opt. Call | | | | Baa1 | | | | 8,824,001 | |
| | 13,670 | | | 4.500%, 6/01/27 | | | | | 6/17 at 100.00 | | | | B | | | | 13,335,085 | |
| | | | | |
| | 1,300 | | | Grant Joint Union High School District, Sacramento County, California, General Obligation Bonds, Capital Appreciation Election 2006 Series 2008, 0.000%, 8/01/26 – AGM Insured | | | | | No Opt. Call | | | | A1 | | | | 748,345 | |
| | | | | |
| | 6,425 | | | Lake Elsinore Redevelopment Agency, California, Special Tax Bonds, Community Facilities District 90-2, Series 2007A, 4.500%, 10/01/24 – AGM Insured | | | | | 10/17 at 100.00 | | | | AA– | | | | 6,763,148 | |
| | | | | |
| | 2,015 | | | Las Virgenes Unified School District, Los Angeles County, California, General Obligation Bonds, 2006 Election, Series 2009B, 0.000%, 8/01/27 | | | | | No Opt. Call | | | | AA– | | | | 1,127,574 | |
| | | | | |
| | 3,775 | | | Long Beach Financing Authority, California, Revenue Bonds, Series 1992, 6.000%, 11/01/17 – AMBAC Insured | | | | | No Opt. Call | | | | N/R | | | | 3,984,286 | |
| | | | | | | | | | | | | | | | | | |
Principal
Amount (000) | | | Description (1) | | | | Optional Call
Provisions (2) | | | Ratings (3) | | | Value | |
| | | | California (continued) | | | | | | | | | | | | | | |
| | | | | |
| $ | 5,025 | | | Los Angeles Unified School District, California, General Obligation Bonds, Series 2003A, 5.250%, 7/01/19 (Pre-refunded 7/01/13) – AGM Insured | | | | | 7/13 at 100.00 | | | | Aa2 (4) | | | $ | 5,068,064 | |
| | | | | |
| | 6,000 | | | Los Angeles, California, Wastewater System Revenue Bonds, Series 2005A, 5.000%, 6/01/34 – NPFG Insured | | | | | No Opt. Call | | | | AA+ | | | | 6,471,120 | |
| | | | | |
| | | | Moulton Niguel Water District, California, Certificates of Participation, Refunding Series 2003: | | | | | | | | | | | | | | |
| | 2,220 | | | 5.000%, 9/01/21 – AMBAC Insured | | | | | 9/16 at 100.00 | | | | AAA | | | | 2,471,615 | |
| | 2,145 | | | 5.000%, 9/01/22 – AMBAC Insured | | | | | 9/16 at 100.00 | | | | AAA | | | | 2,388,114 | |
| | 2,000 | | | 5.000%, 9/01/23 – AMBAC Insured | | | | | 9/16 at 100.00 | | | | AAA | | | | 2,226,680 | |
| | | | | |
| | 10,000 | | | M-S-R Energy Authority, California, Gas Revenue Bonds, Series 2009A, 6.125%, 11/01/29 | | | | | No Opt. Call | | | | A | | | | 12,704,400 | |
| | | | | |
| | 10,000 | | | M-S-R Energy Authority, California, Gas Revenue Bonds, Series 2009C, 6.125%, 11/01/29 | | | | | No Opt. Call | | | | A | | | | 12,704,400 | |
| | | | | |
| | 1,000 | | | Northern Inyo County Local Hospital District, Inyo County, California, Revenue Bonds, Series 2010, 6.000%, 12/01/21 | | | | | 12/20 at 100.00 | | | | BBB– | | | | 1,156,190 | |
| | | | | |
| | 6,000 | | | Oakland State Building Authority, California, Lease Revenue Bonds, Elihu M. Harris State Office Building, Series 1998A, 5.000%, 4/01/23 – AMBAC Insured | | | | | 10/13 at 100.00 | | | | A2 | | | | 6,008,220 | |
| | | | | |
| | 8,000 | | | Palomar Pomerado Health, California, General Obligation Bonds, Convertible Capital Appreciation, Election 2004 Series 2010A, 0.000%, 8/01/40 | | | | | 8/30 at 100.00 | | | | A+ | | | | 6,578,080 | |
| | | | | |
| | | | Palomar Pomerado Health, California, General Obligation Bonds, Series 2009A: | | | | | | | | | | | | | | |
| | 1,815 | | | 0.000%, 8/01/21 – AGC Insured | | | | | No Opt. Call | | | | AA– | | | | 1,455,231 | |
| | 2,095 | | | 0.000%, 8/01/22 – AGC Insured | | | | | No Opt. Call | | | | AA– | | | | 1,572,465 | |
| | 4,085 | | | 0.000%, 8/01/23 – AGC Insured | | | | | No Opt. Call | | | | AA– | | | | 2,888,994 | |
| | | | | |
| | 7,000 | | | Placentia-Yorba Linda Unified School District, Orange County, California, Certificates of Participation, Series 2011, 0.000%, 10/01/25 – AGM Insured | | | | | 10/21 at 100.00 | | | | AA– | | | | 6,798,960 | |
| | | | | |
| | | | Port of Oakland, California, Revenue Refunding Bonds, Inter Lien, Series 2007B: | | | | | | | | | | | | | | |
| | 2,530 | | | 5.000%, 11/01/18 – NPFG Insured | | | | | 11/17 at 100.00 | | | | A | | | | 2,937,102 | |
| | 1,120 | | | 5.000%, 11/01/19 – NPFG Insured | | | | | 11/17 at 100.00 | | | | A | | | | 1,287,854 | |
| | | | | |
| | 5,350 | | | Poway Unified School District, San Diego County, California, School Facilities Improvement District 2007-1 General Obligation Bonds, Series 2011A, 0.000%, 8/01/34 | | | | | No Opt. Call | | | | Aa2 | | | | 2,058,466 | |
| | | | | |
| | | | Riverside County Redevelopment Agency, California, Tax Allocation Bonds, Jurupa Valley Project Area, Series 2011B: | | | | | | | | | | | | | | |
| | 2,115 | | | 0.000%, 10/01/34 | | | | | No Opt. Call | | | | A– | | | | 695,539 | |
| | 2,000 | | | 0.000%, 10/01/36 | | | | | No Opt. Call | | | | A– | | | | 587,480 | |
| | | | | |
| | 5,000 | | | Sacramento County, California, Airport System Revenue Bonds, Senior Lien Series 20010, 5.000%, 7/01/40 | | | | | 7/20 at 100.00 | | | | A | | | | 5,526,750 | |
| | | | | |
| | 1,000 | | | San Bernardino Community College District, California, General Obligation Bonds, Series 2008A, 6.500%, 8/01/27 (Pre-refunded 8/01/18) | | | | | 8/18 at 100.00 | | | | Aa2 (4) | | | | 1,290,190 | |
| | | | | |
| | 575 | | | San Bernardino County Redevelopment Agency, California, Tax Allocation Refunding Bonds, San Sevaine Project, Series 2005A, 5.000%, 9/01/16 – RAAI Insured | | | | | 9/15 at 100.00 | | | | BBB | | | | 605,475 | |
| | | | | |
| | 2,770 | | | San Jose Redevelopment Agency, California, Tax Allocation Bonds, Merged Area Redevelopment Project, Series 2006D, 5.000%, 8/01/23 – AMBAC Insured | | | | | 8/17 at 100.00 | | | | BBB | | | | 2,871,687 | |
| | | | | |
| | 1,000 | | | San Mateo Union High School District, San Mateo County, California, General Obligation Bonds, Election of 2000, Series 2002B, 0.000%, 9/01/17 – FGIC Insured | | | | | No Opt. Call | | | | Aa1 | | | | 951,560 | |
| | | | | |
| | 4,505 | | | Santa Ana Financing Authority, California, Lease Revenue Bonds, Police Administration and Housing Facility, Series 1994A, 6.250%, 7/01/24 – NPFG Insured | | | | | No Opt. Call | | | | Baa2 | | | | 5,282,653 | |
Portfolio of Investments
Nuveen Intermediate Duration Municipal Bond Fund (continued)
April 30, 2013
| | | | | | | | | | | | | | | | | | |
Principal
Amount (000) | | | Description (1) | | | | Optional Call
Provisions (2) | | | Ratings (3) | | | Value | |
| | | | California (continued) | | | | | | | | | | | | | | |
| | | | | |
| $ | 1,000 | | | Santa Ana Unified School District, Orange County, California, General Obligation Bonds, Series 2008A, 5.250%, 8/01/28 | | | | | 8/18 at 100.00 | | | | AA– | | | $ | 1,155,100 | |
| | | | | |
| | 2,000 | | | Santa Monica Community College District, Los Angeles County, California, General Obligation Bonds, Series 2005C, 0.000%, 8/01/16 – NPFG Insured | | | | | 8/15 at 95.72 | | | | Aa1 | | | | 1,887,220 | |
| | | | | |
| | | | Santa Paula Utility Authority, California, Water Enterprise Revenue Bonds, Series 2010: | | | | | | | | | | | | | | |
| | 2,510 | | | 5.000%, 2/01/28 | | | | | 2/20 at 100.00 | | | | A+ | | | | 2,856,606 | |
| | 2,630 | | | 5.000%, 2/01/29 | | | | | 2/20 at 100.00 | | | | A+ | | | | 2,981,052 | |
| | 2,765 | | | 5.000%, 2/01/30 | | | | | 2/20 at 100.00 | | | | A+ | | | | 3,123,178 | |
| | | | | |
| | | | South Bayside Waste Management Authority, California, Solid Waste Enterprise Revenue Bonds, Shoreway Environmental Center, Series 2009A: | | | | | | | | | | | | | | |
| | 2,500 | | | 5.250%, 9/01/24 | | | | | 9/19 at 100.00 | | | | A– | | | | 2,790,925 | |
| | 1,200 | | | 6.250%, 9/01/29 | | | | | 9/19 at 100.00 | | | | A– | | | | 1,398,240 | |
| | | | | |
| | | | Tulare Local Health Care District, California, General Obligation Bonds, Series 2009B-1: | | | | | | | | | | | | | | |
| | 1,180 | | | 6.000%, 8/01/22 | | | | | 8/19 at 100.00 | | | | Baa1 | | | | 1,426,762 | |
| | 1,410 | | | 6.125%, 8/01/23 | | | | | 8/19 at 100.00 | | | | Baa1 | | | | 1,700,263 | |
| | 1,585 | | | 6.250%, 8/01/24 | | | | | 8/19 at 100.00 | | | | Baa1 | | | | 1,908,261 | |
| | 1,265 | | | 6.375%, 8/01/25 | | | | | 8/19 at 100.00 | | | | Baa1 | | | | 1,525,375 | |
| | 500 | | | 6.500%, 8/01/26 | | | | | 8/19 at 100.00 | | | | Baa1 | | | | 605,470 | |
| | | | | |
| | 1,100 | | | Upland Community Redevelopment Agency, California, Tax Allocation Refunding Bonds, A Merged Project, Series 2006, 4.250%, 9/01/26 – AMBAC Insured | | | | | 9/16 at 100.00 | | | | A | | | | 1,111,022 | |
| | | | | |
| | 2,030 | | | Victor Elementary School District, San Bernardino County, California, General Obligation Bonds, Series 2002A, 0.000%, 8/01/23 – FGIC Insured | | | | | No Opt. Call | | | | Aa3 | | | | 1,421,264 | |
| | | | | |
| | 3,000 | | | Victor Valley Union High School District, San Bernardino County, California, General Obligation Bonds, Series 2009A, 0.000%, 8/01/31 – AGC Insured | | | | | 8/26 at 100.00 | | | | AA– | | | | 2,528,910 | |
| | | | | |
| | 2,500 | | | West Contra Costa Unified School District, Contra Costa County, California, General Obligation Bonds, Series 2008B, 6.000%, 8/01/25 | | | | | No Opt. Call | | | | Aa3 | | | | 3,288,750 | |
| | | | | |
| | 995 | | | Whittier Public Financing Authority, California, Tax Allocation Revenue Bonds, Whittier Redevelopment Agency, Series 2007A, 5.000%, 11/01/21 – AMBAC Insured | | | | | 11/17 at 100.00 | | | | A– | | | | 1,099,336 | |
| | | | | |
| | 815 | | | Woodland Finance Authority, California, Lease Revenue Bonds, Series 2002, 4.700%, 3/01/19 – SYNCORA GTY Insured | | | | | 7/13 at 102.00 | | | | A2 | | | | 833,338 | |
| | 314,265 | | | Total California | | | | | | | | | | | | | 324,630,804 | |
| | | | Colorado – 3.3% | | | | | | | | | | | | | | |
| | | | | |
| | 1,125 | | | Adams and Arapahoe Counties Joint School District 28J, Aurora, Colorado, General Obligation Bonds, Series 2008, 5.500%, 12/01/21 (Pre-refunded 12/01/18) | | | | | 12/18 at 100.00 | | | | Aa2 (4) | | | | 1,408,793 | |
| | | | | |
| | 5,000 | | | Adams County, Colorado, Pollution Control Refunding Revenue Bonds, Public Service Company of Colorado Projects, Senior Lien Series 2005A, 4.375%, 9/01/17 – NPFG Insured | | | | | 9/15 at 100.00 | | | | A | | | | 5,374,350 | |
| | | | | |
| | 175 | | | Colorado Educational and Cultural Facilities Authority, Charter School Revenue Bonds, Cheyenne Mountain Charter Academy, Series 2007A, 4.750%, 6/15/22 | | | | | 6/17 at 100.00 | | | | BBB– | | | | 182,100 | |
| | | | | |
| | 1,000 | | | Colorado Health Facilities Authority, Colorado, Hospital Improvement Revenue Bonds, NCMC Inc., Series 2003B, 6.000%, 5/15/26 – AGM Insured | | | | | 5/19 at 100.00 | | | | AA– | | | | 1,185,730 | |
| | | | | |
| | 16,830 | | | Colorado Health Facilities Authority, Colorado, Revenue Bonds, Catholic Health Initiatives, Series 2006A, 5.000%, 9/01/26 | | | | | 9/16 at 100.00 | | | | AA– | | | | 18,633,166 | |
| | | | | |
| | 725 | | | Colorado Health Facilities Authority, Colorado, Revenue Bonds, Catholic Health Initiatives, Series 2006C-7, 4.350%, 9/01/20 – AGM Insured | | | | | 5/18 at 100.00 | | | | AA– | | | | 815,335 | |
| | | | | | | | | | | | | | | | | | |
Principal
Amount (000) | | | Description (1) | | | | Optional Call
Provisions (2) | | | Ratings (3) | | | Value | |
| | | | Colorado (continued) | | | | | | | | | | | | | | |
| | | | | |
| $ | 1,500 | | | Colorado Health Facilities Authority, Colorado, Revenue Bonds, Catholic Health Initiatives, Series 2008D, 5.125%, 10/01/17 | | | | | No Opt. Call | | | | AA– | | | $ | 1,776,840 | |
| | | | | |
| | | | Colorado Health Facilities Authority, Colorado, Revenue Bonds, Christian Living Communities Project, Series 2006A: | | | | | | | | | | | | | | |
| | 600 | | | 5.250%, 1/01/14 | | | | | No Opt. Call | | | | N/R | | | | 609,576 | |
| | 620 | | | 5.250%, 1/01/15 | | | | | No Opt. Call | | | | N/R | | | | 643,343 | |
| | | | | |
| | 1,400 | | | Colorado Health Facilities Authority, Colorado, Revenue Bonds, Total Long-term Care National Obligated Group Project, Series 2010A, 5.250%, 11/15/20 | | | | | No Opt. Call | | | | BBB– | | | | 1,559,768 | |
| | | | | |
| | 405 | | | Colorado Health Facilities Authority, Colorado, Revenue Bonds, Valley View Hospital Association Project, Series 2006A, 5.000%, 5/15/13 – RAAI Insured | | | | | No Opt. Call | | | | BBB+ | | | | 405,587 | |
| | | | | |
| | 6,725 | | | Colorado Health Facilities Authority, Colorado, Revenue Bonds, Yampa Valley Medical Center, Series 2007, 5.000%, 9/15/22 | | | | | 9/17 at 100.00 | | | | BBB+ | | | | 7,142,623 | |
| | | | | |
| | 10,000 | | | Colorado Health Facilities Authority, Retirement Facilities Revenue Bonds, Liberty Heights, Series 1990B, 0.000%, 7/15/20 (ETM) | | | | | No Opt. Call | | | | AA+ (4) | | | | 8,892,600 | |
| | | | | |
| | 500 | | | Colorado Health Facilities Authority, Revenue Bonds, Covenant Retirement Communities Inc., Series 2005, 5.000%, 12/01/16 | | | | | 12/15 at 100.00 | | | | BBB+ | | | | 540,640 | |
| | | | | |
| | | | Colorado Health Facilities Authority, Revenue Bonds, Evangelical Lutheran Good Samaritan Society, Series 2006: | | | | | | | | | | | | | | |
| | 1,000 | | | 5.000%, 6/01/16 | | | | | No Opt. Call | | | | A– | | | | 1,115,530 | |
| | 1,000 | | | 5.250%, 6/01/18 | | | | | 6/16 at 100.00 | | | | A– | | | | 1,112,190 | |
| | | | | |
| | 1,250 | | | Colorado Health Facilities Authority, Revenue Bonds, Longmont United Hospital, Series 2007B, 4.250%, 12/01/15 – RAAI Insured | | | | | No Opt. Call | | | | Baa2 | | | | 1,313,363 | |
| | | | | |
| | 640 | | | Colorado Health Facilities Authority, Revenue Bonds, Parkview Medical Center, Series 2004, 5.000%, 9/01/16 | | | | | 9/13 at 100.00 | | | | A3 | | | | 648,506 | |
| | | | | |
| | 1,500 | | | Colorado State Higher Education Capital Construction Lease Purchase Financing Program Certificates of Participation, Series 2008, 5.250%, 11/01/23 | | | | | 11/18 at 100.00 | | | | Aa2 | | | | 1,790,175 | |
| | | | | |
| | | | Colorado State, Certificates of Participation, Colorado Penitentiary II Program, Refunding Series 2010: | | | | | | | | | | | | | | |
| | 150 | | | 0.000%, 3/01/14 | | | | | No Opt. Call | | | | AA– | | | | 149,673 | |
| | 1,390 | | | 4.000%, 3/01/15 | | | | | No Opt. Call | | | | Aa2 | | | | 1,482,115 | |
| | | | | |
| | 1,500 | | | Delta County Memorial Hospital District, Colorado, Enterprise Revenue Bonds, Refunding Series 2010, 5.500%, 9/01/25 | | | | | 3/20 at 100.00 | | | | BBB | | | | 1,593,525 | |
| | | | | |
| | 6,050 | | | Denver City and County, Colorado, Airport System Revenue Bonds, Refunding Series 2006A, 5.000%, 11/15/19 – FGIC Insured | | | | | 11/16 at 100.00 | | | | A+ | | | | 6,869,352 | |
| | | | | |
| | 4,025 | | | Denver City and County, Colorado, Airport System Revenue Bonds, Refunding Series 2006A, 5.000%, 11/15/19 (Pre-refunded 11/15/16) – FGIC Insured | | | | | 11/16 at 100.00 | | | | A1 (4) | | | | 4,646,983 | |
| | | | | |
| | 11,000 | | | Denver City and County, Colorado, Airport System Revenue Bonds, Series 2012B, 5.000%, 11/15/32 | | | | | 11/22 at 100.00 | | | | A+ | | | | 12,680,360 | |
| | | | | |
| | 5,775 | | | Denver Convention Center Hotel Authority, Colorado, Revenue Bonds, Convention Center Hotel, Senior Lien Series 2003A, 5.000%, 12/01/15 (Pre-refunded 12/01/13) – SYNCORA GTY Insured | | | | | 12/13 at 100.00 | | | | N/R (4) | | | | 5,932,715 | |
| | | | | |
| | | | Denver School District 1, Colorado, General Obligation Bonds, Series 2012B: | | | | | | | | | | | | | | |
| | 6,600 | | | 4.000%, 12/01/21 | | | | | No Opt. Call | | | | AA+ | | | | 7,834,860 | |
| | 6,445 | | | 4.000%, 12/01/22 | | | | | No Opt. Call | | | | AA+ | | | | 7,653,824 | |
| | | | | |
| | 5,000 | | | E-470 Public Highway Authority, Colorado, Senior Revenue Bonds, Series 2007B-1, 5.500%, 9/01/24 – NPFG Insured | | | | | 9/15 at 100.00 | | | | Baa2 | | | | 5,444,250 | |
| | | | | |
| | 10,000 | | | E-470 Public Highway Authority, Colorado, Toll Revenue Bonds, Series 2004B, 0.000%, 3/01/36 – NPFG Insured | | | | | 9/20 at 41.72 | | | | Baa2 | | | | 2,870,000 | |
| | | | | |
| | 1,500 | | | E-470 Public Highway Authority, Colorado, Toll Revenue Bonds, Series 2004C, 5.000%, 9/01/17 – NPFG Insured | | | | | No Opt. Call | | | | Baa2 | | | | 1,667,490 | |
Portfolio of Investments
Nuveen Intermediate Duration Municipal Bond Fund (continued)
April 30, 2013
| | | | | | | | | | | | | | | | | | |
Principal
Amount (000) | | | Description (1) | | | | Optional Call
Provisions (2) | | | Ratings (3) | | | Value | |
| | | | Colorado (continued) | | | | | | | | | | | | | | |
| | | | | |
| | | | El Paso County School District 20, Academy, Colorado, General Obligation Bonds, Refunding Series 2010: | | | | | | | | | | | | | | |
| $ | 1,500 | | | 5.000%, 12/15/20 | | | | | No Opt. Call | | | | Aa2 | | | $ | 1,887,000 | |
| | 2,215 | | | 5.000%, 12/15/21 | | | | | No Opt. Call | | | | Aa2 | | | | 2,813,537 | |
| | 1,530 | | | 5.000%, 12/15/22 | | | | | 12/21 at 100.00 | | | | Aa2 | | | | 1,916,738 | |
| | | | | |
| | 270 | | | High Plains Metropolitan District, Colorado, General Obligation Bonds, Series 2005B, 4.375%, 12/01/15 | | | | | No Opt. Call | | | | BBB– | | | | 279,734 | |
| | | | | |
| | 2,170 | | | Montrose, Colorado, Enterprise Revenue Bonds, Montrose Memorial Hospital, Series 2003, 5.700%, 12/01/17 | | | | | 12/13 at 102.00 | | | | BBB– | | | | 2,269,777 | |
| | | | | |
| | 1,000 | | | North Range Metropolitan District 1, Adams County, Colorado, Limited Tax General Obligation Bonds, Refunding Series 2007, 4.300%, 12/15/19 – ACA Insured | | | | | 12/16 at 100.00 | | | | N/R | | �� | | 1,027,670 | |
| | | | | |
| | 2,250 | | | Northwest Parkway Public Highway Authority, Colorado, Revenue Bonds, Senior Series 2001C, 5.250%, 6/15/15 – AMBAC Insured (ETM) | | | | | No Opt. Call | | | | N/R (4) | | | | 2,475,990 | |
| | | | | |
| | 725 | | | Platte River Power Authority, Colorado, Power Revenue Bonds, Refunding Series 2007GG, 4.500%, 6/01/17 – AGM Insured | | | | | No Opt. Call | | | | AA | | | | 834,678 | |
| | | | | |
| | | | Plaza Metropolitan District 1, Lakewood, Colorado, Tax Increment Revenue Bonds, Refunding Series 2013: | | | | | | | | | | | | | | |
| | 1,335 | | | 5.000%, 12/01/19 | | | | | No Opt. Call | | | | N/R | | | | 1,519,791 | |
| | 500 | | | 5.000%, 12/01/20 | | | | | No Opt. Call | | | | N/R | | | | 564,130 | |
| | | | | |
| | 1,000 | | | Pueblo County School District 60, Pueblo, Colorado, General Obligation Bonds, Refunding Series 2009, 5.000%, 12/15/22 | | | | | No Opt. Call | | | | Aa2 | | | | 1,279,610 | |
| | | | | |
| | 1,325 | | | Rangeview Library District, Adams County, Colorado, Certificates of Participation, Rangeview Library Projects, Series 2008,
4.500%, 12/15/20 – AGC Insured | | | | | 12/18 at 100.00 | | | | AA– | | | | 1,499,052 | |
| | | | | |
| | 975 | | | Regional Transportation District, Colorado, Denver Transit Partners Eagle P3 Project Private Activity Bonds, Series 2010, 6.000%, 1/15/41 | | | | | 7/20 at 100.00 | | | | Baa3 | | | | 1,138,147 | |
| | | | | |
| | | | Sand Creek Metropolitan District, Colorado, General Obligation Bonds, Refunding Series 2010A: | | | | | | | | | | | | | | |
| | 2,190 | | | 4.250%, 12/01/23 | | | | | 12/20 at 100.00 | | | | A | | | | 2,436,090 | |
| | 2,030 | | | 4.000%, 12/01/24 | | | | | 12/20 at 100.00 | | | | A | | | | 2,196,968 | |
| | | | | |
| | 1,000 | | | Walker Field Public Airport Authority, Colorado, Airport Revenue Bonds, Series 2007, 5.000%, 12/01/22 | | | | | 12/17 at 100.00 | | | | Baa2 | | | | 1,129,180 | |
| | 133,445 | | | Total Colorado | | | | | | | | | | | | | 139,243,454 | |
| | | | Connecticut – 0.6% | | | | | | | | | | | | | | |
| | | | | |
| | 1,000 | | | Connecticut Health and Educational Facilities Authority, Revenue Bonds, Griffin Hospital, Series 2005B, 5.000%, 7/01/14 – RAAI Insured | | | | | No Opt. Call | | | | N/R | | | | 1,039,100 | |
| | | | | |
| | 19,320 | | | Connecticut Health and Educational Facilities Authority, Revenue Bonds, Yale University, Series 2010A-3, 0.875%, 7/01/49 (Mandatory put 2/08/18) | | | | | No Opt. Call | | | | AAA | | | | 19,369,846 | |
| | | | | |
| | 3,470 | | | Eastern Connecticut Resource Recovery Authority, Solid Waste Revenue Bonds, Wheelabrator Lisbon Project, Series 1993A, 5.500%, 1/01/20 (Alternative Minimum Tax) | | | | | 7/13 at 100.00 | | | | BBB | | | | 3,483,741 | |
| | 23,790 | | | Total Connecticut | | | | | | | | | | | | | 23,892,687 | |
| | | | District of Columbia – 1.3% | | | | | | | | | | | | | | |
| | | | | |
| | 3,880 | | | District of Columbia Student Dormitory Revenue Bonds, Provident Group – Howard Properties LLC Issue, Series 2013, 5.000%, 10/01/30 | | | | | 10/22 at 100.00 | | | | BBB– | | | | 4,169,293 | |
| | | | | |
| | | | District of Columbia Tobacco Settlement Corporation, Tobacco Settlement Asset-Backed Bonds, Series 2001: | | | | | | | | | | | | | | |
| | 3,550 | | | 5.800%, 5/15/13 | | | | | No Opt. Call | | | | A1 | | | | 3,556,887 | |
| | 3,750 | | | 5.875%, 5/15/14 | | | | | 7/13 at 100.00 | | | | A1 | | | | 3,764,400 | |
| | 6,755 | | | 6.250%, 5/15/24 | | | | | 5/13 at 100.00 | | | | A1 | | | | 6,822,347 | |
| | 2,980 | | | 6.500%, 5/15/33 | | | | | No Opt. Call | | | | Baa1 | | | | 3,567,924 | |
| | | | | |
| | 10,165 | | | District of Columbia Water and Sewerage Authority, Public Utility Revenue Bonds, Series 1998, 5.500%, 10/01/18 – AGM Insured | | | | | No Opt. Call | | | | AA+ | | | | 12,584,168 | |
| | | | | | | | | | | | | | | | | | |
Principal
Amount (000) | | | Description (1) | | | | Optional Call
Provisions (2) | | | Ratings (3) | | | Value | |
| | | | District of Columbia (continued) | | | | | | | | | | | | | | |
| | | | | |
| $ | 11,530 | | | District of Columbia, General Obligation Bonds, Series 2003B, 5.000%, 6/01/15 (Pre-refunded 6/01/13) – AMBAC Insured | | | | | 6/13 at 100.00 | | | | Aa2 (4) | | | $ | 11,577,619 | |
| | | | | |
| | | | District of Columbia, Hospital Revenue Bonds, Sibley Memorial Hospital, Series 2009: | | | | | | | | | | | | | | |
| | 420 | | | 6.500%, 10/01/20 | | | | | 10/19 at 100.00 | | | | A | | | | 526,130 | |
| | 1,715 | | | 6.500%, 10/01/23 | | | | | 10/19 at 100.00 | | | | A | | | | 2,083,451 | |
| | 825 | | | 6.500%, 10/01/24 | | | | | 10/19 at 100.00 | | | | A | | | | 994,983 | |
| | | | | |
| | 3,485 | | | District of Columbia, Revenue Bonds, The Catholic University of America, Series 2010, 5.000%, 10/01/23 | | | | | 10/18 at 100.00 | | | | A | | | | 4,070,375 | |
| | 49,055 | | | Total District of Columbia | | | | | | | | | | | | | 53,717,577 | |
| | | | Florida – 6.0% | | | | | | | | | | | | | | |
| | | | | |
| | 5,000 | | | Broward County School Board, Florida, Certificates of Participation, Series 2003, 5.000%, 7/01/23 (Pre-refunded 7/01/13) – NPFG Insured | | | | | 7/13 at 100.00 | | | | Aa3 (4) | | | | 5,040,500 | |
| | | | | |
| | 1,615 | | | Citizens Property Insurance Corporation, Florida, High Risk Assessment Revenue, Senior Secured Bonds, Series 2009A-1, 5.500%, 6/01/17 | | | | | No Opt. Call | | | | A+ | | | | 1,897,350 | |
| | | | | |
| | | | Citizens Property Insurance Corporation, Florida, High-Risk Account Revenue Bonds, Coastal Account Senior Secured Series 2011A-1: | | | | | | | | | | | | | | |
| | 150 | | | 5.000%, 6/01/15 | | | | | No Opt. Call | | | | A+ | | | | 163,659 | |
| | 3,160 | | | 5.000%, 6/01/18 | | | | | No Opt. Call | | | | A+ | | | | 3,723,965 | |
| | 200 | | | 5.000%, 6/01/19 | | | | | No Opt. Call | | | | A+ | | | | 240,098 | |
| | | | | |
| | 120 | | | Citizens Property Insurance Corporation, Florida, High-Risk Account Senior Secured Bonds Series 2010A-1, 5.250%, 6/01/17 | | | | | No Opt. Call | | | | A+ | | | | 139,784 | |
| | | | | |
| | 1,020 | | | Citrus County Hospital Board, Florida, Revenue Bonds, Citrus Memorial Hospital, Refunding Series 2002, 6.250%, 8/15/23 | | | | | 8/13 at 100.00 | | | | BB– | | | | 1,022,907 | |
| | | | | |
| | | | City of Tampa, Florida, Refunding and Capital Improvement Cigarette Tax Allocation Bonds, H. Lee Moffitt Cancer Center Project, Series 2012A: | | | | | | | | | | | | | | |
| | 550 | | | 5.000%, 9/01/22 | | | | | No Opt. Call | | | | A+ | | | | 670,406 | |
| | 600 | | | 5.000%, 9/01/23 | | | | | 9/22 at 100.00 | | | | A+ | | | | 720,408 | |
| | 1,175 | | | 3.125%, 9/01/24 | | | | | 9/22 at 100.00 | | | | A+ | | | | 1,196,961 | |
| | 1,250 | | | 5.000%, 9/01/25 | | | | | 9/22 at 100.00 | | | | A+ | | | | 1,479,950 | |
| | 800 | | | 5.000%, 9/01/27 | | | | | 9/22 at 100.00 | | | | A+ | | | | 926,704 | |
| | | | | |
| | 2,205 | | | Clay County School Board, Florida, Certificates of Participation, Refunding Series 2005B, 5.000%, 7/01/18 – NPFG Insured | | | | | 7/15 at 100.00 | | | | A1 | | | | 2,350,530 | |
| | | | | |
| | | | Florida Citizens Property Insurance Corporation, High Risk Account Revenue Bonds, Series 2007A: | | | | | | | | | | | | | | |
| | 12,660 | | | 5.000%, 3/01/15 – NPFG Insured | | | | | No Opt. Call | | | | A+ | | | | 13,682,168 | |
| | 33,070 | | | 5.000%, 3/01/17 – NPFG Insured | | | | | No Opt. Call | | | | A+ | | | | 37,940,219 | |
| | | | | |
| | | | Florida Citizens Property Insurance Corporation, Personal and Commercial Lines Account Bonds, Senior Secured Series 2012A-1: | | | | | | | | | | | | | | |
| | 35 | | | 5.000%, 6/01/16 | | | | | No Opt. Call | | | | A+ | | | | 39,452 | |
| | 85 | | | 5.000%, 6/01/18 | | | | | No Opt. Call | | | | A+ | | | | 100,170 | |
| | 480 | | | 5.000%, 6/01/19 | | | | | No Opt. Call | | | | A+ | | | | 576,235 | |
| | 4,545 | | | 5.000%, 6/01/20 | | | | | No Opt. Call | | | | A+ | | | | 5,486,360 | |
| | | | | |
| | 3,275 | | | Florida Governmental Utility Authority, Utility Revenue Bonds, Lake Aqua Utility System, Series 2013A, 4.250%, 10/01/33 | | | | | 10/22 at 100.00 | | | | | | | | 3,317,313 | |
| | | | | |
| | 2,700 | | | Florida Governmental Utility Authority, Utility Revenue Bonds, Pasco Aqua Utility System, Series 2013A, 4.250%, 10/01/33 | | | | | 10/22 at 100.00 | | | | | | | | 2,736,234 | |
| | | | | |
| | 7,695 | | | Florida State Turnpike Authority, Turnpike Revenue Bonds, Department of Transportation, Series 2003A, 5.000%, 7/01/16 – AGM Insured | | | | | 7/13 at 101.00 | | | | AA– | | | | 7,834,203 | |
| | | | | |
| | 2,330 | | | Halifax Hospital Medical Center, Florida, Revenue Bonds, Series 2006, 5.250%, 6/01/26 | | | | | 6/16 at 100.00 | | | | A– | | | | 2,483,244 | |
| | | | | |
| | 2,000 | | | Highlands County Health Facilities Authority, Florida, Hospital Revenue Bonds, Adventist Health System/Sunbelt Obligated Group, Series 2008A, 6.500%, 11/15/38 (Mandatory put 11/17/15) | | | | | No Opt. Call | | | | AA | | | | 2,283,540 | |
Portfolio of Investments
Nuveen Intermediate Duration Municipal Bond Fund (continued)
April 30, 2013
| | | | | | | | | | | | | | | | | | |
Principal
Amount (000) | | | Description (1) | | | | Optional Call
Provisions (2) | | | Ratings (3) | | | Value | |
| | | | Florida (continued) | | | | | | | | | | | | | | |
| | | | | |
| $ | 7,215 | | | Hillsborough County, Florida, Capital Improvement Program Revenue Bonds, Junior Lien Refunding Series 2003, 5.000%, 8/01/13 – FGIC Insured (ETM) | | | | | No Opt. Call | | | | N/R (4) | | | $ | 7,301,147 | |
| | | | | |
| | | | Jacksonville, Florida, Capital Improvement Refunding Revenue Bonds, Series 2012: | | | | | | | | | | | | | | |
| | 2,240 | | | 5.000%, 10/01/20 | | | | | No Opt. Call | | | | AA | | | | 2,758,000 | |
| | 2,250 | | | 5.000%, 10/01/21 | | | | | No Opt. Call | | | | AA | | | | 2,796,233 | |
| | 4,605 | | | 5.000%, 10/01/27 | | | | | No Opt. Call | | | | AA | | | | 5,489,068 | |
| | | | | |
| | | | Jacksonville, Florida, Special Revenue Bonds, Series 20120C: | | | | | | | | | | | | | | |
| | 1,250 | | | 5.000%, 10/01/20 | | | | | No Opt. Call | | | | Aa2 | | | | 1,542,000 | |
| | 1,040 | | | 5.000%, 10/01/21 | | | | | No Opt. Call | | | | Aa2 | | | | 1,289,735 | |
| | 2,000 | | | 5.000%, 10/01/23 | | | | | No Opt. Call | | | | Aa2 | | | | 2,509,340 | |
| | 2,000 | | | 5.000%, 10/01/24 | | | | | No Opt. Call | | | | Aa2 | | | | 2,452,560 | |
| | | | | |
| | 4,040 | | | Martin County Industrial Development Authority, Florida, Industrial Development Revenue Refunding Bonds, Indiantown Cogeneration LP, Series 2013, 4.200%, 12/15/25 (Alternative Minimum Tax) | | | | | 6/20 at 100.00 | | | | BB | | | | 4,098,257 | |
| | | | | |
| | 2,520 | | | Miami-Dade County Educational Facilities Authority, Revenue Bonds, Florida University of Miami, Series 2008A, 5.150%, 4/01/23 | | | | | 4/16 at 100.00 | | | | A– | | | | 2,778,199 | |
| | | | | |
| | | | Miami-Dade County, Florida, Aviation Revenue Bonds, Miami International Airport, Refunding Series 2012A: | | | | | | | | | | | | | | |
| | 925 | | | 5.000%, 10/01/20 (Alternative Minimum Tax) | | | | | No Opt. Call | | | | A | | | | 1,114,024 | |
| | 3,000 | | | 5.000%, 10/01/21 (Alternative Minimum Tax) | | | | | No Opt. Call | | | | A | | | | 3,628,860 | |
| | 5,000 | | | 5.000%, 10/01/22 (Alternative Minimum Tax) | | | | | No Opt. Call | | | | A | | | | 6,074,800 | |
| | | | | |
| | 5,900 | | | Miami-Dade County, Florida, Aviation Revenue Bonds, Miami International Airport, Series 2010B, 5.000%, 10/01/41 | | | | | 10/20 at 100.00 | | | | A | | | | 6,610,773 | |
| | | | | |
| | 5,000 | | | Miami-Dade County, Florida, Public Facilities Revenue Bonds, Jackson Health System, Series 2005B, 5.000%, 6/01/25 – NPFG Insured | | | | | 6/15 at 100.00 | | | | Aa3 | | | | 5,346,500 | |
| | | | | |
| | | | Miami-Dade County, Florida, Special Obligation Bonds, Capital Asset Acquisition, Series 2010E: | | | | | | | | | | | | | | |
| | 1,575 | | | 4.000%, 4/01/16 | | | | | No Opt. Call | | | | Aa3 | | | | 1,713,821 | |
| | 1,975 | | | 5.000%, 4/01/21 | | | | | 4/20 at 100.00 | | | | Aa3 | | | | 2,338,242 | |
| | 5,015 | | | 5.250%, 4/01/30 | | | | | 4/20 at 100.00 | | | | Aa3 | | | | 5,696,789 | |
| | | | | |
| | 5,000 | | | Miami-Dade County, Florida, Subordinate Special Obligation Refunding Bonds Series 2012B, 5.000%, 10/01/35 | | | | | 10/22 at 100.00 | | | | A+ | | | | 5,569,650 | |
| | | | | |
| | 5,000 | | | Miami-Dade County, Florida, Water and Sewer System Revenue Bonds, Series 2010, 5.000%, 10/01/29 – AGM Insured | | | | | 10/20 at 100.00 | | | | Aa2 | | | | 5,737,650 | |
| | | | | |
| | 2,100 | | | North Brevard County Hospital District, Florida, Revenue Bonds, Parrish Medical Center Project, Refunding Series 2008, 5.500%, 10/01/28 | | | | | 10/18 at 100.00 | | | | A– | | | | 2,325,855 | |
| | | | | |
| | 3,400 | | | Orange County School Board, Florida, Certificates of Participation, Series 2005B, 5.000%, 8/01/25 – AMBAC Insured | | | | | 8/15 at 100.00 | | | | AA | | | | 3,719,634 | |
| | | | | |
| | 2,000 | | | Orlando Utilities Commission, Florida, Utility System Revenue Bonds, Refunding Series 2012A, 5.000%, 10/01/25 | | | | | No Opt. Call | | | | AA | | | | 2,604,380 | |
| | | | | |
| | 3,005 | | | Orlando-Orange County Expressway Authority, Florida, Expressway Revenue Bonds, Series 2012, 5.000%, 7/01/20 | | | | | No Opt. Call | | | | A | | | | 3,685,302 | |
| | | | | |
| | 1,400 | | | Palm Beach County Health Facilities Authority, Florida, Retirement Community Revenue Bonds, Abbey Delray South, Refunding Series 2003, 5.250%, 10/01/13 | | | | | No Opt. Call | | | | A | | | | 1,426,824 | |
| | | | | |
| | 10,000 | | | Palm Beach County Solid Waste Authority, Florida, Refunding Revenue Bonds, Series 2011, 5.000%, 10/01/25 | | | | | 10/21 at 100.00 | | | | AA+ | | | | 11,992,300 | |
| | | | | |
| | 7,540 | | | Palm Beach County, Florida, Airport System Revenue Bonds, Series 2002, 5.750%, 10/01/13 – NPFG Insured | | | | | No Opt. Call | | | | A | | | | 7,709,273 | |
| | | | | |
| | 10,300 | | | Port St. Lucie, Florida, Utility System Revenue Bonds, Series 2006A, 5.000%, 9/01/26 – NPFG Insured | | | | | 9/16 at 100.00 | | | | A1 | | | | 11,474,509 | |
| | | | | |
| | 22,930 | | | South Miami Health Facilities Authority, Florida, Hospital Revenue, Baptist Health System Obligation Group, Series 2007, 5.000%, 8/15/27 | | | | | 8/17 at 100.00 | | | | AA | | | | 25,804,276 | |
| | | | | | | | | | | | | | | | | | |
Principal
Amount (000) | | | Description (1) | | | | Optional Call
Provisions (2) | | | Ratings (3) | | | Value | |
| | | | Florida (continued) | | | | | | | | | | | | | | |
| | | | | |
| $ | 6,020 | | | Tampa Sports Authority, Hillsborough County, Florida, Local Option Sales Tax Payments Revenue Bonds, Stadium Project, Series 2005, 5.000%, 1/01/20 – AGM Insured | | | | | 1/15 at 100.00 | | | | AA+ | | | $ | 6,482,878 | |
| | | | | |
| | 350 | | | Vero Beach, Florida, Electric Refunding Revenue Bonds, Series 2003A, 4.000%, 12/01/19 – AGM Insured | | | | | 12/18 at 100.00 | | | | A1 | | | | 393,267 | |
| | 223,315 | | | Total Florida | | | | | | | | | | | | | 250,516,506 | |
| | | | Georgia – 1.0% | | | | | | | | | | | | | | |
| | | | | |
| | | | Atlanta, Georgia, Airport General Revenue Bonds, Series 2012B: | | | | | | | | | | | | | | |
| | 2,000 | | | 5.000%, 1/01/23 | | | | | No Opt. Call | | | | A+ | | | | 2,438,860 | |
| | 1,500 | | | 5.000%, 1/01/28 | | | | | No Opt. Call | | | | A+ | | | | 1,748,010 | |
| | | | | |
| | 2,000 | | | Atlanta, Georgia, Tax Allocation Bonds Atlanta Station Project, Series 2007, 4.375%, 12/01/18 – AGC Insured | | | | | 12/17 at 100.00 | | | | AA– | | | | 2,181,120 | |
| | | | | |
| | 2,220 | | | Atlanta, Georgia, Tax Allocation Bonds, Beltline Project Series 2008A. Remarketed, 7.500%, 1/01/31 | | | | | 1/19 at 100.00 | | | | A2 | | | | 2,775,910 | |
| | | | | |
| | | | Chatham County Hospital Authority, Georgia, Seven Mill Tax Pledge Refunding and Improvement Revenue Bonds, Memorial Health University Medical Center Inc., Series 2012A: | | | | | | | | | | | | | | |
| | 2,000 | | | 5.000%, 1/01/18 | | | | | No Opt. Call | | | | AA | | | | 2,360,540 | |
| | 3,325 | | | 5.000%, 1/01/23 | | | | | 1/22 at 100.00 | | | | AA | | | | 4,037,049 | |
| | 5,560 | | | 5.000%, 1/01/24 | | | | | 1/22 at 100.00 | | | | AA | | | | 6,649,148 | |
| | 8,990 | | | 5.000%, 1/01/25 | | | | | 1/22 at 100.00 | | | | AA | | | | 10,605,054 | |
| | | | | |
| | 1,000 | | | Coffee County Hospital Authority, Georgia, Revenue Bonds, Coffee County Regional Medical Center, Series 2004, 5.000%, 12/01/15 | | | | | 12/14 at 100.00 | | | | BB– | | | | 1,031,750 | |
| | | | | |
| | 1,250 | | | DeKalb County Hospital Authority, Georgia, Anticipation Certificates Revenue Bonds, DeKalb Medical Center, Inc. Project, Series 2010, 6.000%, 9/01/30 | | | | | 9/20 at 100.00 | | | | BBB | | | | 1,477,625 | |
| | | | | |
| | | | Fayette County School District, Georgia, General Obligation Bonds, Deferred Interest Series 2005: | | | | | | | | | | | | | | |
| | 675 | | | 4.150%, 3/01/14 – AGM Insured | | | | | No Opt. Call | | | | AA+ | | | | 696,809 | |
| | 265 | | | 4.250%, 3/01/15 – AGM Insured | | | | | No Opt. Call | | | | AA+ | | | | 283,486 | |
| | | | | |
| | 4,500 | | | Fulton County Residential Care Facilities Elderly Authority, Georgia, Revenue Bonds, Canterbury Court, Refunding Series 2004A, 5.800%, 2/15/18 | | | | | 7/13 at 100.00 | | | | N/R | | | | 4,507,245 | |
| | | | | |
| | 2,000 | | | Glynn-Brunswick Memorial Hospital Authority, Georgia, Anticipation Certificates Revenue Bonds, Southeast Georgia Health Systems, Series 2008A, 5.250%, 8/01/23 | | | | | 8/18 at 100.00 | | | | A2 | | | | 2,251,420 | |
| | 37,285 | | | Total Georgia | | | | | | | | | | | | | 43,044,026 | |
| | | | Hawaii – 0.2% | | | | | | | | | | | | | | |
| | | | | |
| | 5,000 | | | Hawaii Department of Budget and Finance, Special Purpose Revenue Bonds, Hawaii Pacific Health Obligated Group, Series 2010A, 5.250%, 7/01/30 | | | | | 7/20 at 100.00 | | | | A– | | | | 5,439,550 | |
| | | | | |
| | 1,025 | | | Hawaii Department of Budget and Finance, Special Purpose Revenue Bonds, Hawaii Pacific Health Obligated Group, Series 2010B, 5.625%, 7/01/30 | | | | | 7/20 at 100.00 | | | | A– | | | | 1,151,290 | |
| | | | | |
| | 2,670 | | | Hawaii Department of Budget and Finance, Special Purpose Senior Living Revenue Bonds, 15 Craigside Project, Series 2009C-1, 7.500%, 11/15/15 | | | | | 7/13 at 100.00 | | | | N/R | | | | 2,678,624 | |
| | 8,695 | | | Total Hawaii | | | | | | | | | | | | | 9,269,464 | |
| | | | Idaho – 0.2% | | | | | | | | | | | | | | |
| | | | | |
| | 3,000 | | | Idaho Health Facilities Authority, Revenue Bonds, Trinity Health Group, Refunding Series 2008B, 6.000%, 12/01/23 | | | | | 12/18 at 100.00 | | | | AA | | | | 3,658,680 | |
| | | | | |
| | | | Madison County, Idaho, Hospital Revenue Certificates of Participation, Madison Memorial Hospital, Series 2006: | | | | | | | | | | | | | | |
| | 450 | | | 5.250%, 9/01/16 | | | | | No Opt. Call | | | | BB+ | | | | 486,581 | |
| | 1,300 | | | 5.250%, 9/01/20 | | | | | 9/16 at 100.00 | | | | BB+ | | | | 1,377,363 | |
Portfolio of Investments
Nuveen Intermediate Duration Municipal Bond Fund (continued)
April 30, 2013
| | | | | | | | | | | | | | | | | | |
Principal
Amount (000) | | | Description (1) | | | | Optional Call
Provisions (2) | | | Ratings (3) | | | Value | |
| | | | Idaho (continued) | | | | | | | | | | | | | | |
| | | | | |
| $ | 1,000 | | | University of Idaho, General Revenue Bonds, Series 2007B, 4.500%, 4/01/41 (Mandatory put 4/01/18) – AGM Insured | | | | | No Opt. Call | | | | AA– | | | $ | 1,135,150 | |
| | 5,750 | | | Total Idaho | | | | | | | | | | | | | 6,657,774 | |
| | | | Illinois – 8.4% | | | | | | | | | | | | | | |
| | | | | |
| | 1,840 | | | Bolingbrook Park District, Illinois, General Obligation Bonds, Series 2007A, 4.500%, 1/01/17 – CIFG Insured | | | | | No Opt. Call | | | | Aa2 | | | | 2,062,603 | |
| | | | | |
| | 4,415 | | | Chicago Metropolitan Water Reclamation District, Illinois, General Obligation Bonds, Tender Option Bonds Trust 1130, 13.426%, 6/01/14 (IF) | | | | | No Opt. Call | | | | AAA | | | | 6,114,289 | |
| | | | | |
| | 5,545 | | | Chicago Park District, Illinois, General Obligation Bonds, Refunding Series 2005B, 5.000%, 1/01/20 – AMBAC Insured | | | | | 1/15 at 100.00 | | | | AAA | | | | 5,971,355 | |
| | | | | |
| | 2,300 | | | Chicago Park District, Illinois, General Obligation Bonds, Series 2010A, 4.500%, 1/01/23 | | | | | 7/20 at 100.00 | | | | AAA | | | | 2,649,853 | |
| | | | | |
| | | | Chicago Transit Authority, Illinois, Sales Tax Receipts Revenue Bonds, Series 2011: | | | | | | | | | | | | | | |
| | 3,380 | | | 5.250%, 12/01/25 | | | | | 12/21 at 100.00 | | | | AA | | | | 4,087,873 | |
| | 3,235 | | | 5.250%, 12/01/26 | | | | | 12/21 at 100.00 | | | | AA | | | | 3,878,862 | |
| | | | | |
| | 7,000 | | | Chicago, Illinois, General Obligation Bonds, City Colleges, Series 1999, 0.000%, 1/01/15 – FGIC Insured | | | | | No Opt. Call | | | | Aa3 | | | | 6,906,760 | |
| | | | | |
| | 2,000 | | | Chicago, Illinois, General Obligation Bonds, Series 2001A, 5.300%, 1/01/16 – NPFG Insured | | | | | No Opt. Call | | | | Aa3 | | | | 2,229,040 | |
| | | | | |
| | 1,350 | | | Chicago, Illinois, Revenue Bonds, Midway Airport, Series 1998C,
5.500%, 1/01/14 – NPFG Insured | | | | | No Opt. Call | | | | A | | | | 1,392,674 | |
| | | | | |
| | 1,000 | | | Cook County High School District 209, Proviso Township, Illinois, General Obligation Bonds, Series 2004, 5.000%, 12/01/16 – AGM Insured | | | | | No Opt. Call | | | | AA– | | | | 1,114,500 | |
| | | | | |
| | 2,440 | | | Cook County School District 102 La Grange, Illinois, General Obligation Bonds, Series 2001, 0.000%, 12/01/13 – FGIC Insured | | | | | No Opt. Call | | | | Aa2 | | | | 2,434,120 | |
| | | | | |
| | 2,250 | | | Cook County School District 123 Oak Lawn, Illinois, General Obligation Bonds, Series 2002, 0.000%, 12/01/15 – NPFG Insured | | | | | No Opt. Call | | | | A+ | | | | 2,177,100 | |
| | | | | |
| | 3,465 | | | Cook County School District 205 Thornton Township, Illinois, General Obligation Bonds, Series 2008, 5.250%, 12/01/21 – AGC Insured | | | | | 12/18 at 100.00 | | | | AA– | | | | 4,046,843 | |
| | | | | |
| | 1,175 | | | Cook County School District 88, Bellwood, Illinois, General Obligation Bonds, Refunding Series 2004B, 5.000%, 12/01/17 – AGM Insured | | | | | 12/14 at 100.00 | | | | A2 | | | | 1,261,116 | |
| | | | | |
| | 500 | | | Cook County School District 88, Bellwood, Illinois, General Obligation Bonds, Refunding Series 2004B, 5.000%, 12/01/17 (Pre-refunded 12/01/14) – AGM Insured | | | | | 12/14 at 100.00 | | | | A2 (4) | | | | 537,475 | |
| | | | | |
| | | | Cook County, Illinois, General Obligation Bonds, Refunding Series 2012C: | | | | | | | | | | | | | | |
| | 2,500 | | | 5.000%, 11/15/20 | | | | | No Opt. Call | | | | AA | | | | 3,059,125 | |
| | 2,730 | | | 5.000%, 11/15/21 | | | | | No Opt. Call | | | | AA | | | | 3,353,914 | |
| | 2,000 | | | 5.000%, 11/15/22 | | | | | No Opt. Call | | | | AA | | | | 2,469,440 | |
| | | | | |
| | 13,650 | | | Cook County, Illinois, General Obligation Bonds, Series 2004A,
5.000%, 11/15/17 – AMBAC Insured | | | | | 5/14 at 101.00 | | | | AA | | | | 14,441,700 | |
| | | | | |
| | 6,425 | | | Cook County, Illinois, General Obligation Bonds, Series 2004A, 5.000%, 11/15/17 (Pre-refunded 5/15/14) – AMBAC Insured | | | | | 5/14 at 101.00 | | | | Aa3 (4) | | | | 6,806,067 | |
| | | | | |
| | 1,000 | | | Elk Grove Village, Cook and DuPage Counties, Illinois, General Obligation Bonds, Improvement Series 2007, 4.125%, 1/01/19 (Pre-refunded 1/01/16) – NPFG Insured | | | | | 1/16 at 100.00 | | | | Aaa | | | | 1,096,980 | |
| | | | | |
| | | | Grundy and Will Counties Community Unit School District 1 Coal City, Illinois, General Obligation Bonds, Series 2008: | | | | | | | | | | | | | | |
| | 1,550 | | | 5.875%, 2/01/19 | | | | | 8/18 at 100.00 | | | | Aa3 | | | | 1,896,720 | |
| | 2,100 | | | 5.875%, 2/01/22 | | | | | 8/18 at 100.00 | | | | Aa3 | | | | 2,565,675 | |
| | 2,545 | | | 5.875%, 2/01/24 | | | | | 8/18 at 100.00 | | | | Aa3 | | | | 3,099,276 | |
| | | | | |
| | 2,750 | | | Illinois Development Finance Authority, Local Government Program Revenue Bonds, Kane, Cook and DuPage Counties School District U46 – Elgin, Series 2002, 0.000%, 1/01/18 – AGM Insured | | | | | No Opt. Call | | | | Aa3 | | | | 2,482,343 | |
| | | | | | | | | | | | | | | | | | |
Principal
Amount (000) | | | Description (1) | | | | Optional Call
Provisions (2) | | | Ratings (3) | | | Value | |
| | | | Illinois (continued) | | | | | | | | | | | | | | |
| | | | | |
| | | | Illinois Educational Facilities Authority, Revenue Bonds, Art Institute of Chicago, Series 1998A: | | | | | | | | | | | | | | |
| $ | 1,000 | | | 4.750%, 3/01/30 (Mandatory put 3/01/17) | | | | | No Opt. Call | | | | A+ | | | $ | 1,119,970 | |
| | 500 | | | 4.125%, 3/01/30 (Mandatory put 3/01/16) | | | | | No Opt. Call | | | | A+ | | | | 539,275 | |
| | | | | |
| | 1,525 | | | Illinois Finance Authority, Gas Supply Revenue Refunding Bonds, Peoples Gas, Light and Coke Company, Senior Lien Series 2005A, 4.300%, 6/01/35 (Mandatory put 6/01/16) – AMBAC Insured | | | | | No Opt. Call | | | | A1 | | | | 1,679,757 | |
| | | | | |
| | 4,000 | | | Illinois Finance Authority, Revenue and Refunding Bonds, Roosevelt University Project, Series 2009, 5.750%, 4/01/24 | | | | | 10/19 at 100.00 | | | | BBB | | | | 4,580,080 | |
| | | | | |
| | 13,685 | | | Illinois Finance Authority, Revenue Bonds, Centegra Health System, Series 2012, 5.000%, 9/01/27 | | | | | 9/22 at 100.00 | | | | A– | | | | 15,251,385 | |
| | | | | |
| | | | Illinois Finance Authority, Revenue Bonds, Edward Health Services Corporation, Series 2008A: | | | | | | | | | | | | | | |
| | 1,200 | | | 6.000%, 2/01/25 – AMBAC Insured | | | | | 2/18 at 100.00 | | | | A+ | | | | 1,356,780 | |
| | 1,280 | | | 6.000%, 2/01/26 – AMBAC Insured | | | | | 2/18 at 100.00 | | | | A+ | | | | 1,445,914 | |
| | 500 | | | 6.000%, 2/01/28 – AMBAC Insured | | | | | 2/18 at 100.00 | | | | A+ | | | | 560,660 | |
| | | | | |
| | 1,000 | | | Illinois Finance Authority, Revenue Bonds, Franciscan Communities Inc., Refunding Series 2007A, 5.500%, 5/15/27 | | | | | 5/17 at 100.00 | | | | BBB– | | | | 1,057,930 | |
| | | | | |
| | 910 | | | Illinois Finance Authority, Revenue Bonds, Friendship Village of Schaumburg, Series 2005A, 5.000%, 2/15/15 | | | | | No Opt. Call | | | | BB– | | | | 936,172 | |
| | | | | |
| | 1,000 | | | Illinois Finance Authority, Revenue Bonds, Illinois Institute of Technology, Series 2009, 6.500%, 2/01/23 | | | | | 2/19 at 100.00 | | | | Baa3 | | | | 1,097,640 | |
| | | | | |
| | 680 | | | Illinois Finance Authority, Revenue Bonds, Landing at Plymouth Place Project, Series 2005A, 5.250%, 5/15/14 | | | | | No Opt. Call | | | | N/R | | | | 681,040 | |
| | | | | |
| | 4,200 | | | Illinois Finance Authority, Revenue Bonds, OSF Healthcare System, Series 2009A, 7.000%, 11/15/29 | | | | | 5/19 at 100.00 | | | | A | | | | 5,238,996 | |
| | | | | |
| | 2,000 | | | Illinois Finance Authority, Revenue Bonds, Palos Community Hospital, Series 2007A, 5.000%, 5/15/21 – NPFG Insured | | | | | 5/17 at 100.00 | | | | AA– | | | | 2,239,120 | |
| | | | | |
| | | | Illinois Finance Authority, Revenue Bonds, Roosevelt University, Series 2007: | | | | | | | | | | | | | | |
| | 500 | | | 5.250%, 4/01/22 | | | | | 4/17 at 100.00 | | | | BBB | | | | 530,080 | |
| | 3,600 | | | 5.400%, 4/01/27 | | | | | 4/17 at 100.00 | | | | BBB | | | | 3,801,096 | |
| | | | | |
| | 2,000 | | | Illinois Finance Authority, Revenue Bonds, Rush University Medical Center Obligated Group, Series 2009A, 6.750%, 11/01/24 | | | | | 11/18 at 100.00 | | | | A | | | | 2,498,980 | |
| | | | | |
| | 1,500 | | | Illinois Finance Authority, Revenue Bonds, Rush University Medical Center Obligated Group, Series 2009C, 6.375%, 11/01/29 | | | | | 5/19 at 100.00 | | | | A | | | | 1,821,660 | |
| | | | | |
| | 5,000 | | | Illinois Finance Authority, Revenue Bonds, Silver Cross Hospital and Medical Centers, Series 2009, 6.875%, 8/15/38 | | | | | 8/19 at 100.00 | | | | BBB+ | | | | 5,923,500 | |
| | | | | |
| | 2,000 | | | Illinois Finance Authority, Revenue Bonds, The Carle Foundation, Series 2009A, 5.500%, 2/15/17 | | | | | No Opt. Call | | | | AA– | | | | 2,308,260 | |
| | | | | |
| | 600 | | | Illinois Finance Authority, Revenue Bonds, The Clare at Water Tower Project, Capitol Appreciation Series 2010B, 0.000%, 5/15/50 (6), (7) | | | | | 7/13 at 16.20 | | | | N/R | | | | 6 | |
| | | | | |
| | | | Illinois Finance Authority, Revenue Bonds, The Clare at Water Tower Project, Refunding Series 2010A: | | | | | | | | | | | | | | |
| | 700 | | | 5.400%, 5/15/17 (6) | | | | | 7/13 at 100.00 | | | | N/R | | | | 7 | |
| | 700 | | | 5.500%, 5/15/18 (7) | | | | | 7/13 at 100.00 | | | | N/R | | | | 7 | |
| | | | | |
| | 655 | | | Illinois Finance Authority, Revenue Bonds, Three Crowns Park Plaza, Series 2006A, 5.500%, 2/15/14 | | | | | No Opt. Call | | | | N/R | | | | 669,554 | |
| | | | | |
| | 3,510 | | | Illinois Finance Authority, Student Housing Revenue Bonds, Educational Advancement Fund Inc., University Center Project, Series 2006B, 5.000%, 5/01/25 | | | | | 11/16 at 100.00 | | | | BBB+ | | | | 3,739,379 | |
| | | | | |
| | 215 | | | Illinois Health Facilities Authority, Revenue Refunding Bonds, Series 1983 (Mercy Hospital and Medical Center), Chicago, Illinois, 10.000%, 1/01/15 (ETM) | | | | | No Opt. Call | | | | N/R (4) | | | | 237,261 | |
| | | | | |
| | 7,410 | | | Illinois Health Facilities Authority, Revenue Refunding Bonds, University of Chicago Hospitals, Series 2003, 5.000%, 8/15/14 – NPFG Insured | | | | | 8/13 at 100.00 | | | | AA– | | | | 7,508,108 | |
Portfolio of Investments
Nuveen Intermediate Duration Municipal Bond Fund (continued)
April 30, 2013
| | | | | | | | | | | | | | | | | | |
Principal
Amount (000) | | | Description (1) | | | | Optional Call
Provisions (2) | | | Ratings (3) | | | Value | |
| | | | Illinois (continued) | | | | | | | | | | | | | | |
| | | | | |
| | | | Illinois Sports Facility Authority, State Tax Supported Bonds, Series 2001: | | | | | | | | | | | | | | |
| $ | 1,405 | | | 4.750%, 6/15/13 – AMBAC Insured | | | | | No Opt. Call | | | | A | | | $ | 1,411,899 | |
| | 1,620 | | | 5.100%, 6/15/16 – AMBAC Insured | | | | | 6/15 at 101.00 | | | | A | | | | 1,770,109 | |
| | | | | |
| | | | Illinois State Department of Employment Security, Unemployment Insurance Fund Building Receipts Revenue Bonds, Series 2012B: | | | | | | | | | | | | | | |
| | 2,500 | | | 5.000%, 12/15/17 | | | | | 12/16 at 100.00 | | | | AA+ | | | | 2,888,850 | |
| | 2,500 | | | 5.000%, 6/15/18 | | | | | 12/16 at 100.00 | | | | AA+ | | | | 2,891,675 | |
| | 2,560 | | | 5.000%, 6/15/19 | | | | | 6/15 at 100.00 | | | | AA+ | | | | 2,810,573 | |
| | 1,705 | | | 5.000%, 12/15/19 | | | | | 6/15 at 100.00 | | | | AA+ | | | | 1,871,885 | |
| | | | | |
| | 1,000 | | | Illinois State, General Obligation Bonds, Refunding Series 2004B, 5.000%, 3/01/14 | | | | | No Opt. Call | | | | A2 | | | | 1,035,810 | |
| | | | | |
| | 555 | | | Illinois State, General Obligation Bonds, Refunding Series 2007B, 5.000%, 1/01/16 | | | | | No Opt. Call | | | | A2 | | | | 610,772 | |
| | | | | |
| | | | Illinois State, General Obligation Bonds, Refunding Series 2010: | | | | | | | | | | | | | | |
| | 510 | | | 5.000%, 1/01/16 | | | | | No Opt. Call | | | | A2 | | | | 561,250 | |
| | 520 | | | 5.000%, 1/01/17 | | | | | No Opt. Call | | | | A2 | | | | 586,222 | |
| | 1,590 | | | 5.000%, 1/01/18 | | | | | No Opt. Call | | | | A2 | | | | 1,820,312 | |
| | 6,040 | | | 5.000%, 1/01/19 – AGM Insured | | | | | No Opt. Call | | | | AA– | | | | 6,997,702 | |
| | 17,025 | | | 5.000%, 1/01/19 | | | | | No Opt. Call | | | | A2 | | | | 19,675,112 | |
| | | | | |
| | | | Illinois State, General Obligation Bonds, Refunding Series 2012: | | | | | | | | | | | | | | |
| | 7,735 | | | 5.000%, 8/01/20 | | | | | No Opt. Call | | | | A2 | | | | 9,069,829 | |
| | 6,320 | | | 5.000%, 8/01/21 | | | | | No Opt. Call | | | | A2 | | | | 7,440,283 | |
| | 2,450 | | | 5.000%, 8/01/22 | | | | | No Opt. Call | | | | A2 | | | | 2,888,599 | |
| | 2,730 | | | 5.000%, 8/01/23 | | | | | No Opt. Call | | | | A2 | | | | 3,197,758 | |
| | 1,055 | | | 5.000%, 8/01/24 | | | | | 8/22 at 100.00 | | | | A2 | | | | 1,209,262 | |
| | 270 | | | 5.000%, 8/01/25 | | | | | 8/22 at 100.00 | | | | A2 | | | | 306,831 | |
| | | | | |
| | | | Illinois State, General Obligation Bonds, Series 2004A: | | | | | | | | | | | | | | |
| | 2,590 | | | 5.000%, 3/01/18 | | | | | 3/14 at 100.00 | | | | A2 | | | | 2,680,495 | |
| | 805 | | | 5.000%, 3/01/22 | | | | | 3/14 at 100.00 | | | | A2 | | | | 831,750 | |
| | | | | |
| | 195 | | | Illinois State, General Obligation Bonds, Series 2004A, 5.000%, 3/01/22 (Pre-refunded 3/01/14) | | | | | 3/14 at 100.00 | | | | A2 (4) | | | | 202,617 | |
| | | | | |
| | | | Illinois State, General Obligation Bonds, Series 2006A: | | | | | | | | | | | | | | |
| | 850 | | | 5.000%, 6/01/16 | | | | | No Opt. Call | | | | A2 | | | | 946,356 | |
| | 1,075 | | | 5.000%, 6/01/17 | | | | | No Opt. Call | | | | A2 | | | | 1,224,156 | |
| | 10,000 | | | 5.000%, 6/01/18 | | | | | No Opt. Call | | | | A2 | | | | 11,524,200 | |
| | | | | |
| | 1,000 | | | Illinois State, General Obligation Bonds, Series 2006, 5.000%, 1/01/27 | | | | | 1/16 at 100.00 | | | | A2 | | | | 1,060,010 | |
| | | | | |
| | 1,000 | | | Illinois State, General Obligation Bonds, Series 2009A, 5.000%, 9/01/34 | | | | | 9/18 at 100.00 | | | | A2 | | | | 1,076,470 | |
| | | | | |
| | 20,290 | | | Illinois State, General Obligation Bonds, Series 2012A, 4.000%, 1/01/20 | | | | | No Opt. Call | | | | A2 | | | | 22,338,478 | |
| | | | | |
| | | | Kane County Community Unit School District 304 Geneva, Illinois, General Obligation Bonds, Series 2007A: | | | | | | | | | | | | | | |
| | 8,570 | | | 9.000%, 1/01/22 – AGM Insured | | | | | No Opt. Call | | | | AA+ | | | | 13,037,541 | |
| | 1,000 | | | 9.000%, 1/01/23 – AGM Insured | | | | | No Opt. Call | | | | AA+ | | | | 1,560,250 | |
| | 5,150 | | | 9.000%, 1/01/25 – AGM Insured | | | | | No Opt. Call | | | | AA+ | | | | 8,382,346 | |
| | | | | |
| | 2,100 | | | Madison and Jersey Counties Community Unit School District 11, Alton, Illinois, General Obligation Bonds, Series 2002, 0.000%, 12/01/19 – AGM Insured | | | | | No Opt. Call | | | | AA– | | | | 1,786,092 | |
| | | | | |
| | | | McCook, Illinois, General Obligation Bonds, Series 2008: | | | | | | | | | | | | | | |
| | 500 | | | 5.000%, 12/01/26 | | | | | 12/18 at 100.00 | | | | A– | | | | 586,260 | |
| | 1,000 | | | 5.100%, 12/01/28 | | | | | 12/18 at 100.00 | | | | A– | | | | 1,141,810 | |
| | | | | |
| | 1,000 | | | Metropolitan Pier and Exposition Authority, Illinois, Dedicated State Tax Revenue Bonds, Refunding Series 2002B, 5.200%, 6/15/17 – NPFG Insured | | | | | No Opt. Call | | | | AAA | | | | 1,172,550 | |
| | | | | |
| | 1,500 | | | Metropolitan Pier and Exposition Authority, Illinois, McCormick Place Expansion Project Refunding Bonds, Series 2012B, 5.000%, 12/15/22 | | | | | No Opt. Call | | | | | | | | 1,737,930 | |
| | | | | |
| | 2,270 | | | Peoria Public Building Commission, Illinois, School District Facility Revenue Bonds, Peoria County School District 150 Project, Series 2011., 0.000%, 12/01/24 | | | | | No Opt. Call | | | | A+ | | | | 1,503,217 | |
| | | | | | | | | | | | | | | | | | |
Principal
Amount (000) | | | Description (1) | | | | Optional Call
Provisions (2) | | | Ratings (3) | | | Value | |
| | | | Illinois (continued) | | | | | | | | | | | | | | |
| | | | | |
| | | | Quad Cities Regional Economic Development Authority, Illinois, Revenue Bonds, Augustana College, Series 2012: | | | | | | | | | | | | | | |
| $ | 295 | | | 5.000%, 10/01/23 | | | | | 10/22 at 100.00 | | | | Baa1 | | | $ | 345,472 | |
| | 275 | | | 5.000%, 10/01/24 | | | | | 10/22 at 100.00 | | | | Baa1 | | | | 317,573 | |
| | | | | |
| | | | Railsplitter Tobacco Settlement Authority, Illinois, Tobacco Settlement Revenue Bonds, Series 2010: | | | | | | | | | | | | | | |
| | 7,570 | | | 5.250%, 6/01/21 | | | | | No Opt. Call | | | | A | | | | 9,273,856 | |
| | 3,860 | | | 5.500%, 6/01/23 | | | | | 6/21 at 100.00 | | | | A– | | | | 4,725,682 | |
| | | | | |
| | 500 | | | Rockford School District 205, Winnebago and Boone Counties, Illinois, General Obligation Bonds, Series 2001, 5.000%, 2/01/14 – FGIC Insured | | | | | No Opt. Call | | | | A1 | | | | 516,465 | |
| | | | | |
| | | | Saint Clair County, Illinois, General Obligation Bonds, Alternative Revenue Source Refunding Series 2009: | | | | | | | | | | | | | | |
| | 1,000 | | | 4.500%, 10/01/20 | | | | | 10/19 at 100.00 | | | | AA | | | | 1,170,080 | |
| | 1,100 | | | 5.000%, 10/01/22 | | | | | 10/19 at 100.00 | | | | AA | | | | 1,293,336 | |
| | | | | |
| | 1,680 | | | School District 122, Winnebago County, Illinois, Capital Appreciation Bonds, Series 1998, 0.000%, 1/01/17 – AGM Insured | | | | | No Opt. Call | | | | A2 | | | | 1,592,388 | |
| | | | | |
| | 1,320 | | | School District 122, Winnebago County, Illinois, Capital Appreciation Bonds, Series 1998, 0.000%, 1/01/17 – AGM Insured (ETM) | | | | | No Opt. Call | | | | A2 (4) | | | | 1,284,466 | |
| | | | | |
| | 1,000 | | | Southwestern Illinois Development Authority, Local Government Revenue Bonds, Edwardsville Community Unit School District 7 Project, Series 2007, 5.000%, 12/01/17 – AGM Insured | | | | | No Opt. Call | | | | AA– | | | | 1,171,250 | |
| | | | | |
| | 2,000 | | | Southwestern Illinois Development Authority, Revenue Bonds, Anderson Hospital, Series 2006, 5.125%, 8/15/26 | | | | | 2/17 at 100.00 | | | | BBB– | | | | 2,058,020 | |
| | | | | |
| | 1,000 | | | Southwestern Illinois Development Authority, School Revenue Bonds, Triad School District 2, Madison County, Illinois, Series 2006, 5.000%, 10/01/18 – NPFG Insured | | | | | 10/16 at 100.00 | | | | A+ | | | | 1,104,420 | |
| | | | | |
| | | | Sterling, Whiteside County, Illinois, General Obligation Bonds, Alternate Revenue Source, Series 2012: | | | | | | | | | | | | | | |
| | 3,205 | | | 4.000%, 11/01/21 | | | | | No Opt. Call | | | | A+ | | | | 3,562,902 | |
| | 2,830 | | | 4.000%, 11/01/22 | | | | | No Opt. Call | | | | A+ | | | | 3,135,640 | |
| | | | | |
| | 5,675 | | | Will County Community High School District 210 Lincoln-Way, Illinois, General Obligation Bonds, Series 2013B, 0.000%, 1/01/30 | | | | | No Opt. Call | | | | Aa2 | | | | 2,860,881 | |
| | | | | |
| | 3,870 | | | Will County School District 86, Joliet, Illinois, General Obligation Bonds, Series 2002, 0.000%, 11/01/17 – AGM Insured | | | | | No Opt. Call | | | | AA– | | | | 3,573,132 | |
| | | | | |
| | | | Will, Grundy, Kendall, LaSalle, Kankakee, Livingston, and Cook Counties Community College District 525 Joliet Junior College, Illinois, General Obligation Bond, Series 2008: | | | | | | | | | | | | | | |
| | 535 | | | 6.250%, 6/01/24 | | | | | 6/18 at 100.00 | | | | AA | | | | 647,147 | |
| | 825 | | | 5.750%, 6/01/25 | | | | | 6/18 at 100.00 | | | | AA | | | | 973,640 | |
| | 225 | | | 5.750%, 6/01/26 | | | | | 6/18 at 100.00 | | | | AA | | | | 264,348 | |
| | | | | |
| | | | Will, Grundy, Kendall, LaSalle, Kankakee, Livingston, and Cook Counties Community College District 525 Joliet Junior College, Illinois, General Obligation Bond, Series 2008: | | | | | | | | | | | | | | |
| | 325 | | | 5.750%, 6/01/25 (Pre-refunded 6/01/18) | | | | | 6/18 at 100.00 | | | | N/R (4) | | | | 402,113 | |
| | 85 | | | 5.750%, 6/01/26 (Pre-refunded 6/01/18) | | | | | 6/18 at 100.00 | | | | N/R (4) | | | | 105,168 | |
| | | | | |
| | 10,080 | | | Williamson & Johnson Counties Community Unit School District 2, Marion, Illinois, Limited Tax General Obligation Lease Certificates, Series 2011, 7.000%, 10/15/22 | | | | | 10/19 at 103.00 | | | | BBB | | | | 11,563,978 | |
| | | | | |
| | | | Winnebago-Boone Counties School District 205, Illinois, General Obligation Bonds, Series 2013: | | | | | | | | | | | | | | |
| | 4,070 | | | 0.000%, 2/01/25 | | | | | No Opt. Call | | | | AA– | | | | 2,597,596 | |
| | 3,340 | | | 0.000%, 2/01/26 | | | | | No Opt. Call | | | | AA– | | | | 2,004,033 | |
| | 318,665 | | | Total Illinois | | | | | | | | | | | | | 353,339,167 | |
| | | | Indiana – 1.0% | | | | | | | | | | | | | | |
| | | | | |
| | 710 | | | Anderson, Indiana, Economic Development Revenue Bonds, Anderson University, Series 2007, 5.000%, 10/01/17 | | | | | 4/14 at 100.00 | | | | BB+ | | | | 722,603 | |
Portfolio of Investments
Nuveen Intermediate Duration Municipal Bond Fund (continued)
April 30, 2013
| | | | | | | | | | | | | | | | | | |
Principal
Amount (000) | | | Description (1) | | | | Optional Call
Provisions (2) | | | Ratings (3) | | | Value | |
| | | | Indiana (continued) | | | | | | | | | | | | | | |
| | | | | |
| $ | 1,000 | | | Avon Community School Building Corporation, Hendricks County, Indiana, First Mortgage Bonds, Refunding Series 2007, 4.500%, 7/15/20 – AMBAC Insured | | | | | 7/17 at 100.00 | | | | A | | | $ | 1,107,380 | |
| | | | | |
| | 5,550 | | | Indiana Finance Authority, Private Activity Bonds, Ohio River Bridges East End Crossing Project, Series 2013B, 5.000%, 1/01/19 (Alternative Minimum Tax) | | | | | 1/17 at 100.00 | | | | BBB | | | | 6,184,032 | |
| | | | | |
| | 3,000 | | | Indiana Health Facility Financing Authority, Hospital Revenue Bonds, Methodist Hospitals Inc., Series 2001, 5.375%, 9/15/22 | | | | | 9/13 at 100.00 | | | | BBB | | | | 3,004,950 | |
| | | | | |
| | 2,800 | | | Indianapolis Local Public Improvement Bond Bank, Indiana, Waterworks Project, Refunding Series 2006, 5.500%, 7/01/21 – NPFG Insured | | | | | No Opt. Call | | | | A+ | | | | 3,494,568 | |
| | | | | |
| | 5,000 | | | Indianapolis Local Public Improvement Bond Bank, Indiana, Waterworks Project, Series 2007B, 5.250%, 7/01/23 – NPFG Insured | | | | | No Opt. Call | | | | A+ | | | | 6,256,000 | |
| | | | | |
| | 2,985 | | | Jasper County, Indiana, Pollution Control Revenue Refunding Bonds, Northern Indiana Public Service Company Project, Series 1994A Remarketed, 5.850%, 4/01/19 – NPFG Insured | | | | | No Opt. Call | | | | Baa2 | | | | 3,531,942 | |
| | | | | |
| | | | Knox County, Indiana, Economic Development Revenue and Refunding Bonds, Good Samaritan Hospital Project, Series 2012A: | | | | | | | | | | | | | | |
| | 1,675 | | | 5.000%, 4/01/21 | | | | | No Opt. Call | | | | A3 | | | | 1,976,818 | |
| | 940 | | | 5.000%, 4/01/22 | | | | | No Opt. Call | | | | A3 | | | | 1,100,599 | |
| | 2,015 | | | 5.000%, 4/01/24 | | | | | 4/22 at 100.00 | | | | A3 | | | | 2,304,979 | |
| | | | | |
| | | | Lake County Building Corporation, Indiana, First Mortgage Bonds, Series 2012: | | | | | | | | | | | | | | |
| | 500 | | | 4.000%, 2/01/17 | | | | | No Opt. Call | | | | N/R | | | | 520,410 | |
| | 500 | | | 4.000%, 8/01/17 | | | | | No Opt. Call | | | | N/R | | | | 521,860 | |
| | 500 | | | 4.250%, 2/01/18 | | | | | No Opt. Call | | | | N/R | | | | 525,545 | |
| | 500 | | | 4.250%, 8/01/18 | | | | | No Opt. Call | | | | N/R | | | | 526,540 | |
| | 500 | | | 4.500%, 2/01/19 | | | | | No Opt. Call | | | | N/R | | | | 529,990 | |
| | 500 | | | 4.500%, 8/01/19 | | | | | No Opt. Call | | | | N/R | | | | 530,750 | |
| | 500 | | | 4.750%, 2/01/20 | | | | | No Opt. Call | | | | N/R | | | | 538,330 | |
| | 500 | | | 4.750%, 8/01/20 | | | | | No Opt. Call | | | | N/R | | | | 538,680 | |
| | 250 | | | 4.750%, 2/01/21 | | | | | No Opt. Call | | | | N/R | | | | 266,898 | |
| | 500 | | | 4.750%, 8/01/21 | | | | | No Opt. Call | | | | N/R | | | | 533,115 | |
| | 500 | | | 5.000%, 2/01/22 | | | | | No Opt. Call | | | | N/R | | | | 540,025 | |
| | 500 | | | 5.000%, 8/01/22 | | | | | No Opt. Call | | | | N/R | | | | 536,595 | |
| | 500 | | | 5.000%, 8/01/23 | | | | | 2/22 at 100.00 | | | | N/R | | | | 531,055 | |
| | 500 | | | 5.000%, 2/01/24 | | | | | 2/22 at 100.00 | | | | N/R | | | | 526,665 | |
| | | | | |
| | 1,250 | | | Portage Township Multi-School Building Corporation, Porter County, Indiana, First Mortgage Bonds, Series 2007, 4.000%, 7/15/18 – NPFG Insured | | | | | 7/17 at 100.00 | | | | AA+ | | | | 1,405,250 | |
| | | | | |
| | 1,485 | | | Southwind Housing Inc., Evansville, Indiana, First Mortgage Revenue Bonds, Series 1978A, 7.125%, 11/15/21 (ETM) | | | | | 11/13 at 100.00 | | | | N/R (4) | | | | 1,869,437 | |
| | | | | |
| | 5,210 | | | St. Joseph County Hospital Authority, Indiana, Revenue Bonds, Madison Center Inc., Series 2005, 5.000%, 2/15/17 (5) | | | | | 2/15 at 100.00 | | | | N/R | | | | 582,895 | |
| | | | | |
| | | | St. Joseph County, Indiana, Economic Development Revenue Bonds, Holy Cross Village at Notre Dame, Series 2006A: | | | | | | | | | | | | | | |
| | 450 | | | 5.750%, 5/15/16 | | | | | No Opt. Call | | | | N/R | | | | 479,970 | |
| | 230 | | | 5.550%, 5/15/19 | | | | | 7/13 at 100.00 | | | | N/R | | | | 230,278 | |
| | 41,050 | | | Total Indiana | | | | | | | | | | | | | 41,418,159 | |
| | | | Iowa – 0.9% | | | | | | | | | | | | | | |
| | | | | |
| | | | Ames, Iowa, Hospital Revenue Bonds, Mary Greeley Medical Center, Series 2011: | | | | | | | | | | | | | | |
| | 1,000 | | | 5.250%, 6/15/25 | | | | | 6/20 at 100.00 | | | | A2 | | | | 1,132,770 | |
| | 2,000 | | | 5.250%, 6/15/26 | | | | | 6/20 at 100.00 | | | | A2 | | | | 2,252,080 | |
| | 3,135 | | | 5.250%, 6/15/27 | | | | | 6/20 at 100.00 | | | | A2 | | | | 3,517,251 | |
| | 2,000 | | | 5.375%, 6/15/28 | | | | | 6/20 at 100.00 | | | | A2 | | | | 2,251,360 | |
| | 2,035 | | | 5.500%, 6/15/29 | | | | | 6/20 at 100.00 | | | | A2 | | | | 2,302,623 | |
| | | | | | | | | | | | | | | | | | |
Principal
Amount (000) | | | Description (1) | | | | Optional Call
Provisions (2) | | | Ratings (3) | | | Value | |
| | | | Iowa (continued) | | | | | | | | | | | | | | |
| | | | | |
| | | | Fort Dodge Community School District, Webster County, Iowa, School Infrastructure Sales, Services, and Use Tax Revenue Bonds, Series 2011: | | | | | | | | | | | | | | |
| $ | 1,830 | | | 5.000%, 1/01/23 – AGM Insured | | | | | 1/21 at 100.00 | | | | AA– | | | $ | 2,141,173 | |
| | 1,890 | | | 5.000%, 1/01/24 – AGM Insured | | | | | 1/21 at 100.00 | | | | AA– | | | | 2,194,214 | |
| | 1,520 | | | 5.000%, 1/01/25 – AGM Insured | | | | | 1/21 at 100.00 | | | | AA– | | | | 1,752,134 | |
| | 1,000 | | | 5.000%, 1/01/26 – AGM Insured | | | | | 1/21 at 100.00 | | | | AA– | | | | 1,144,550 | |
| | | | | |
| | | | Iowa Finance Authority, Health Facility Revenue Bonds, Care Initiatives Project, Series 2006A: | | | | | | | | | | | | | | |
| | 1,290 | | | 5.250%, 7/01/13 | | | | | No Opt. Call | | | | BB+ | | | | 1,297,095 | |
| | 2,235 | | | 5.250%, 7/01/14 | | | | | No Opt. Call | | | | BB+ | | | | 2,314,253 | |
| | 4,460 | | | 5.250%, 7/01/15 | | | | | No Opt. Call | | | | BB+ | | | | 4,730,900 | |
| | 2,000 | | | 5.250%, 7/01/16 | | | | | No Opt. Call | | | | BB+ | | | | 2,162,700 | |
| | 820 | | | 5.000%, 7/01/19 | | | | | 7/16 at 100.00 | | | | BB+ | | | | 867,035 | |
| | | | | |
| | 1,250 | | | Iowa Higher Education Loan Authority, Private College Facility Revenue Bonds, Upper Iowa University Project, Refunding Series 2010, 5.500%, 9/01/25 | | | | | 9/20 at 100.00 | | | | BBB | | | | 1,433,963 | |
| | | | | |
| | | | Iowa Higher Education Loan Authority, Private College Facility Revenue Bonds, Wartburg College, Series 2005A: | | | | | | | | | | | | | | |
| | 925 | | | 4.700%, 10/01/16 | | | | | 10/13 at 100.00 | | | | BB | | | | 935,277 | |
| | 1,100 | | | 4.750%, 10/01/17 | | | | | 10/13 at 100.00 | | | | BB | | | | 1,112,177 | |
| | 1,155 | | | 4.800%, 10/01/18 | | | | | 10/13 at 100.00 | | | | BB | | | | 1,167,728 | |
| | | | | |
| | 2,000 | | | Iowa State, Special Obligation Bonds, Prison Infrastructure Fund, Refunding Series 2010, 4.500%, 6/15/22 | | | | | 6/20 at 100.00 | | | | AA | | | | 2,356,700 | |
| | 33,645 | | | Total Iowa | | | | | | | | | | | | | 37,065,983 | |
| | | | Kansas – 1.4% | | | | | | | | | | | | | | |
| | | | | |
| | 20,000 | | | Burlington, Kansas, Environmental Improvement Revenue Refunding Bonds, Kansas City Power and Light Company Project, Series 1993, 2.950%, 12/01/23 | | | | | 4/23 at 101.00 | | | | A– | | | | 20,437,000 | |
| | | | | |
| | 2,000 | | | Johnson County Unified School District 512, Shawnee Mission, Kansas, General Obligation Refunding Bonds, Refunding Series 1996, 4.875%, 10/01/19 | | | | | No Opt. Call | | | | Aaa | | | | 2,319,280 | |
| | | | | |
| | 2,200 | | | Kansas Development Finance Authority Hospital Revenue Bonds, Adventist Health System/Sunbelt Obligated Group, Series 2009C, 5.500%, 11/15/23 | | | | | 11/19 at 100.00 | | | | AA | | | | 2,676,058 | |
| | | | | |
| | 1,405 | | | Kansas Development Finance Authority, Health Facilities Revenue Bonds, Hays Medical Center Inc., Series 2005L, 4.500%, 11/15/17 | | | | | 11/15 at 100.00 | | | | A2 | | | | 1,524,228 | |
| | | | | |
| | 1,850 | | | Kansas Development Finance Authority, Revenue Bonds, Kansas State Projects, Series 2007K, 4.500%, 11/01/19 – NPFG Insured | | | | | 11/17 at 100.00 | | | | AA | | | | 2,112,719 | |
| | | | | |
| | 1,000 | | | Olathe, Kansas, Health Facilities Revenue Bonds, Olathe Medical Center, Series 2008, 5.125%, 9/01/21 | | | | | 9/17 at 100.00 | | | | A+ | | | | 1,113,220 | |
| | | | | |
| | | | Olathe, Kansas, Senior Living Facility Revenue Bonds, Catholic Care Campus Santa Marta, Series 2006A: | | | | | | | | | | | | | | |
| | 700 | | | 5.750%, 11/15/13 | | | | | No Opt. Call | | | | N/R | | | | 711,487 | |
| | 765 | | | 5.750%, 11/15/14 | | | | | No Opt. Call | | | | N/R | | | | 797,099 | |
| | 820 | | | 5.750%, 11/15/15 | | | | | No Opt. Call | | | | N/R | | | | 870,537 | |
| | | | | |
| | 95 | | | Sedgwick and Shawnee Counties, Kansas, GNMA Mortgage-Backed Securities Program Single Family Revenue Bonds, Series 1997A-2, 6.700%, 6/01/29 | | | | | No Opt. Call | | | | Aaa | | | | 96,615 | |
| | | | | |
| | 10,000 | | | Wichita, Kansas, Hospital Facilities Revenue Refunding and Improvement Bonds, Via Christi Health System Inc., Series 2011A-IV, 5.000%, 11/15/29 | | | | | 11/21 at 100.00 | | | | AA– | | | | 11,444,400 | |
| | | | | |
| | 23,055 | | | Wyandotte County-Kansas City Unified Government, Kansas, Sales Tax Special Obligation Capital Appreciation Revenue Bonds Redevelopment Project Area B – Major Multi-Sport Athletic Complex Project, Subordinate Lien Series 2010B, 0.000%, 6/01/21 | | | | | No Opt. Call | | | | BBB+ | | | | 15,523,854 | |
| | 63,890 | | | Total Kansas | | | | | | | | | | | | | 59,626,497 | |
Portfolio of Investments
Nuveen Intermediate Duration Municipal Bond Fund (continued)
April 30, 2013
| | | | | | | | | | | | | | | | | | |
Principal
Amount (000) | | | Description (1) | | | | Optional Call
Provisions (2) | | | Ratings (3) | | | Value | |
| | | | Kentucky – 1.3% | | | | | | | | | | | | | | |
| | | | | |
| $ | 8,175 | | | Kentucky Economic Development Finance Authority, Louisville Arena Project Revenue Bonds, Louisville Arena Authority, Inc., Series 2008-A1, 5.750%, 12/01/28 – AGC Insured | | | | | 6/18 at 100.00 | | | | AA– | | | $ | 8,975,006 | |
| | | | | |
| | 20,670 | | | Kentucky State Property and Buildings Commission, Revenue Bonds, Project 83, Series 2004, 5.000%, 10/01/18 – AMBAC Insured | | | | | No Opt. Call | | | | Aa3 | | | | 24,869,524 | |
| | | | | |
| | 7,000 | | | Lexington-Fayette Urban County Government Public Facilities Corporation, Kentucky State Lease Revenue Bonds, Eastern State Hospital Project, Series 2011A, 5.250%, 6/01/28 | | | | | 6/21 at 100.00 | | | | Aa3 | | | | 8,241,450 | |
| | | | | |
| | 1,135 | | | Louisville and Jefferson County Metropolitan Government, Kentucky, General Revenue Bonds, Bellarmine University, Series 2008A, 6.000%, 5/01/28 | | | | | 5/18 at 100.00 | | | | Baa3 | | | | 1,267,216 | |
| | | | | |
| | 4,420 | | | Louisville-Jefferson County Metropolitan Government, Kentucky, Environmental Facilities Revenue, Louisville Gas & Electric Company Project, Series 2007B, 1.600%, 6/01/33 (Mandatory put 6/01/17) | | | | | No Opt. Call | | | | A– | | | | 4,527,097 | |
| | | | | |
| | 8,200 | | | Louisville-Jefferson County Metropolitan Government, Kentucky, Pollution Control Revenue Bonds, Louisville Gas and Electric Company Project, Series 2003A, 1.650%, 10/01/33 (Mandatory put 4/03/17) | | | | | No Opt. Call | | | | A+ | | | | 8,407,788 | |
| | 49,600 | | | Total Kentucky | | | | | | | | | | | | | 56,288,081 | |
| | | | Louisiana – 2.9% | | | | | | | | | | | | | | |
| | | | | |
| | | | Louisiana Citizens Property Insurance Corporation, Assessment Revenue Bonds, Series 2006B: | | | | | | | | | | | | | | |
| | 9,000 | | | 5.250%, 6/01/13 – AMBAC Insured | | | | | No Opt. Call | | | | A– | | | | 9,035,460 | |
| | 12,180 | | | 5.000%, 6/01/15 – AMBAC Insured | | | | | No Opt. Call | | | | A– | | | | 13,139,419 | |
| | | | | |
| | 10,255 | | | Louisiana Local Government Environmental Facilities and Community Development Authority, Multifamily Housing Revenue Bonds, Oakleigh Apartments, Series 2003A, 6.375%, 6/01/38 (Pre-refunded 6/01/13) | | | | | 6/13 at 102.00 | | | | Aaa | | | | 10,514,964 | |
| | | | | |
| | 2,000 | | | Louisiana Local Government Environmental Facilities and Community Development Authority, Revenue Bonds, Southgate Suites Hotel LLC Project, Series 2007A, 6.750%, 12/15/37 (5) | | | | | 12/17 at 100.00 | | | | N/R | | | | 897,920 | |
| | | | | |
| | | | Louisiana Public Facilities Authority, Revenue Bonds, Ochsner Clinic Foundation Project, Series 2007A: | | | | | | | | | | | | | | |
| | 2,015 | | | 5.000%, 5/15/16 | | | | | No Opt. Call | | | | Baa1 | | | | 2,219,986 | |
| | 5,155 | | | 5.000%, 5/15/20 | | | | | 5/17 at 100.00 | | | | Baa1 | | | | 5,663,695 | |
| | | | | |
| | | | Louisiana State, Gasoline and Fuels Tax Revenue Bonds, Series 2005A: | | | | | | | | | | | | | | |
| | 2,765 | | | 5.250%, 5/01/18 (Pre-refunded 5/01/15) – FGIC Insured | | | | | 5/15 at 100.00 | | | | Aa1 (4) | | | | 3,036,634 | |
| | 5,500 | | | 5.000%, 5/01/24 (Pre-refunded 5/01/15) – FGIC Insured | | | | | 5/15 at 100.00 | | | | Aa1 (4) | | | | 6,012,875 | |
| | 7,265 | | | 5.000%, 5/01/26 (Pre-refunded 5/01/15) – FGIC Insured | | | | | 5/15 at 100.00 | | | | Aa1 (4) | | | | 7,942,461 | |
| | | | | |
| | 22,115 | | | Louisiana State, General Obligation Bonds, Series 2012A, 5.000%, 8/01/26 | | | | | 8/22 at 100.00 | | | | Aa2 | | | | 27,134,220 | |
| | | | | |
| | | | New Orleans, Louisiana, General Obligation Refunding Bonds, Series 2012: | | | | | | | | | | | | | | |
| | 4,140 | | | 5.000%, 12/01/19 | | | | | No Opt. Call | | | | A3 | | | | 4,929,001 | |
| | 3,940 | | | 5.000%, 12/01/20 | | | | | No Opt. Call | | | | A3 | | | | 4,715,668 | |
| | 5,400 | | | 5.000%, 12/01/21 | | | | | No Opt. Call | | | | A3 | | | | 6,477,570 | |
| | | | | |
| | 500 | | | Port New Orleans Board of Commissioners, Louisiana, Revenue Bonds, Port Facilities, Refunding Series 2013B, 5.000%, 4/01/30 (Alternative Minimum Tax) | | | | | 4/23 at 100.00 | | | | BBB+ | | | | 554,200 | |
| | | | | |
| | 5,745 | | | Saint Charles Parish, Louisiana, Gulf Opportunity Zone Revenue Bonds, Valero Project, Series 2010, 4.000%, 12/01/40 (Mandatory put 6/01/22) | | | | | No Opt. Call | | | | BBB | | | | 6,362,645 | |
| | | | | |
| | 13,665 | | | Tobacco Settlement Financing Corporation, Louisiana, Tobacco Settlement Asset-Backed Bonds, Series 2001B, 5.875%, 5/15/39 | | | | | 5/13 at 100.00 | | | | A– | | | | 13,740,294 | |
| | 111,640 | | | Total Louisiana | | | | | | | | | | | | | 122,377,012 | |
| | | | Maine – 0.2% | | | | | | | | | | | | | | |
| | | | | |
| | 395 | | | Maine Health and Higher Educational Facilities Authority Revenue Bonds, Eastern Maine Medical Center Obligated Group Issue, Series 2013, 3.000%, 7/01/23 | | | | | No Opt. Call | | | | Baa1 | | | | 392,251 | |
| | | | | | | | | | | | | | | | | | |
Principal
Amount (000) | | | Description (1) | | | | Optional Call
Provisions (2) | | | Ratings (3) | | | Value | |
| | | | Maine (continued) | | | | | | | | | | | | | | |
| | | | | |
| | | | Maine Health and Higher Educational Facilities Authority, Revenue Bonds, MaineGeneral Medical Center, Series 2011: | | | | | | | | | | | | | | |
| $ | 1,000 | | | 6.750%, 7/01/36 | | | | | 7/21 at 100.00 | | | | Baa3 | | | $ | 1,223,160 | |
| | 3,850 | | | 6.750%, 7/01/41 | | | | | 7/21 at 100.00 | | | | Baa3 | | | | 4,669,627 | |
| | | | | |
| | 740 | | | Maine Health and Higher Educational Facilities Authority, Revenue Bonds, Series 2007B, 4.125%, 7/01/18 – FGIC Insured | | | | | 1/18 at 100.00 | | | | AA | | | | 820,926 | |
| | | | | |
| | | | Portland, Maine, General Airport Revenue Bonds, Refunding Series 2013: | | | | | | | | | | | | | | |
| | 500 | | | 4.000%, 7/01/18 | | | | | No Opt. Call | | | | BBB+ | | | | 557,205 | |
| | 225 | | | 4.000%, 7/01/20 | | | | | No Opt. Call | | | | BBB+ | | | | 252,997 | |
| | 290 | | | 5.000%, 7/01/22 | | | | | No Opt. Call | | | | BBB+ | | | | 347,635 | |
| | 7,000 | | | Total Maine | | | | | | | | | | | | | 8,263,801 | |
| | | | Maryland – 0.1% | | | | | | | | | | | | | | |
| | | | | |
| | 345 | | | Maryland Community Development Administration, Housing Revenue Bonds, Series 1996A, 5.875%, 7/01/16 | | | | | 7/13 at 100.00 | | | | Aa2 | | | | 346,056 | |
| | | | | |
| | 250 | | | Maryland Economic Development Corporation, Economic Development Revenue Bonds, Transportation Facilities Project, Series 2010A, 5.750%, 6/01/35 | | | | | 6/20 at 100.00 | | | | Baa3 | | | | 285,783 | |
| | | | | |
| | 2,000 | | | Maryland Health and Higher Educational Facilities Authority, Revenue Bonds, University of Maryland Medical System, Series 2010, 5.250%, 7/01/24 | | | | | 7/19 at 100.00 | | | | A2 | | | | 2,292,880 | |
| | | | | |
| | | | Westminster, Maryland, Educational Facilities Revenue Bonds, McDaniel College, Series 2006: | | | | | | | | | | | | | | |
| | 350 | | | 5.000%, 11/01/13 | | | | | No Opt. Call | | | | BBB+ | | | | 355,950 | |
| | 700 | | | 4.000%, 11/01/15 | | | | | No Opt. Call | | | | BBB+ | | | | 736,547 | |
| | 3,645 | | | Total Maryland | | | | | | | | | | | | | 4,017,216 | |
| | | | Massachusetts – 2.8% | | | | | | | | | | | | | | |
| | | | | |
| | 2,975 | | | Massachusetts Bay Transportation Authority, General Obligation Transportation System Bonds, Series 1991A, 7.000%, 3/01/21 – FGIC Insured | | | | | No Opt. Call | | | | AA+ | | | | 3,645,744 | |
| | | | | |
| | 10,000 | | | Massachusetts Bay Transportation Authority, Senior Lien Sales Tax Revenue Refunding Bonds, Series 2004B, 5.250%, 7/01/20 | | | | | No Opt. Call | | | | AAA | | | | 12,754,500 | |
| | | | | |
| | 2,500 | | | Massachusetts Development Finance Agency, Health Care Facility Revenue Bonds, Adventcare Project, Series 2007A, 6.650%, 10/15/28 | | | | | 10/17 at 100.00 | | | | N/R | | | | 2,665,125 | |
| | | | | |
| | | | Massachusetts Development Finance Agency, Revenue Bonds, Orchard Cove, Series 2007: | | | | | | | | | | | | | | |
| | 1,655 | | | 5.000%, 10/01/17 | | | | | No Opt. Call | | | | N/R | | | | 1,740,547 | |
| | 515 | | | 5.000%, 10/01/18 | | | | | 10/17 at 100.00 | | | | N/R | | | | 537,990 | |
| | | | | |
| | | | Massachusetts Development Finance Authority, Revenue Bonds, Suffolk University, Series 2010: | | | | | | | | | | | | | | |
| | 900 | | | 4.500%, 7/01/21 | | | | | 7/20 at 100.00 | | | | Baa2 | | | | 1,008,999 | |
| | 1,765 | | | 4.500%, 7/01/22 | | | | | 7/20 at 100.00 | | | | Baa2 | | | | 1,961,674 | |
| | 1,705 | | | 4.625%, 7/01/23 | | | | | 7/20 at 100.00 | | | | Baa2 | | | | 1,894,698 | |
| | | | | |
| | 1,230 | | | Massachusetts Educational Financing Authority, Student Loan Revenue Bonds, Issue I Series 2010B, 4.800%, 1/01/17 (Alternative Minimum Tax) | | | | | No Opt. Call | | | | AA | | | | 1,335,091 | |
| | | | | |
| | 2,000 | | | Massachusetts Health and Educational Facilities Authority, Revenue Bonds, Berkshire Health System, Series 2005F, 5.000%, 10/01/15 – AGC Insured | | | | | No Opt. Call | | | | AA– | | | | 2,174,160 | |
| | | | | |
| | | | Massachusetts Health and Educational Facilities Authority, Revenue Bonds, Springfield College, Series 2010: | | | | | | | | | | | | | | |
| | 500 | | | 5.125%, 10/15/22 | | | | | 10/19 at 100.00 | | | | Baa1 | | | | 569,835 | |
| | 2,595 | | | 5.500%, 10/15/26 | | | | | 10/19 at 100.00 | | | | Baa1 | | | | 2,919,972 | |
| | | | | |
| | 3,000 | | | Massachusetts Health and Educational Facilities Authority, Revenue Refunding Bonds, Suffolk University Issue, Series 2009A, 6.000%, 7/01/24 | | | | | 7/19 at 100.00 | | | | BBB | | | | 3,583,500 | |
| | | | | |
| | 740 | | | Massachusetts Port Authority, Revenue Bonds, Series 1982, 13.000%, 7/01/13 (ETM) | | | | | 6/13 at 100.00 | | | | Aaa | | | | 754,534 | |
Portfolio of Investments
Nuveen Intermediate Duration Municipal Bond Fund (continued)
April 30, 2013
| | | | | | | | | | | | | | | | | | |
Principal
Amount (000) | | | Description (1) | | | | Optional Call
Provisions (2) | | | Ratings (3) | | | Value | |
| | | | Massachusetts (continued) | | | | | | | | | | | | | | |
| | | | | |
| | | | Massachusetts Port Authority, Special Facilities Revenue Bonds, Delta Air Lines Inc., Series 2001A: | | | | | | | | | | | | | | |
| $ | 330 | | | 5.500%, 1/01/15 – AMBAC Insured (Alternative Minimum Tax) | | | | | 7/13 at 100.00 | | | | N/R | | | $ | 330,337 | |
| | 140 | | | 5.500%, 1/01/17 – AMBAC Insured (Alternative Minimum Tax) | | | | | 7/13 at 100.00 | | | | N/R | | | | 140,119 | |
| | 50 | | | 5.200%, 1/01/20 – AMBAC Insured (Alternative Minimum Tax) | | | | | 7/13 at 100.00 | | | | N/R | | | | 50,021 | |
| | 1,465 | | | 5.000%, 1/01/27 – AMBAC Insured (Alternative Minimum Tax) | | | | | 7/13 at 100.00 | | | | N/R | | | | 1,464,985 | |
| | | | | |
| | 10,000 | | | Massachusetts, General Obligation Bonds, Consolidated Loan, Series 2001D, 5.500%, 11/01/14 | | | | | No Opt. Call | | | | AA+ | | | | 10,794,600 | |
| | | | | |
| | 7,040 | | | Massachusetts, General Obligation Bonds, Consolidated Loan, Series 2003C, 5.000%, 8/01/21 (Pre-refunded 8/01/13) | | | | | 8/13 at 100.00 | | | | AA+ (4) | | | | 7,124,058 | |
| | | | | |
| | 10,000 | | | Massachusetts, General Obligation Bonds, Consolidated Loan, Series 2004D, 5.000%, 12/01/22 (Pre-refunded 12/01/14) – AGM Insured | | | | | 12/14 at 100.00 | | | | AA+ (4) | | | | 10,732,900 | |
| | | | | |
| | 29,340 | | | Massachusetts, General Obligation Bonds, Series 2004C,
5.500%, 12/01/16 – AGM Insured | | | | | No Opt. Call | | | | AA+ | | | | 34,577,777 | |
| | | | | |
| | 12,000 | | | Massachusetts, Special Obligation Refunding Notes, Federal Highway Grant Anticipation Note Program, Series 2003A, 5.000%, 12/15/13 – AGM Insured | | | | | No Opt. Call | | | | AAA | | | | 12,363,840 | |
| | | | | |
| | 1,000 | | | Massachusetts, Special Obligation Revenue Bonds, Series 1997A, 5.500%, 6/01/13 | | | | | No Opt. Call | | | | AAA | | | | 1,004,620 | |
| | | | | |
| | 1,400 | | | Springfield, Massachusetts, General Obligation Bonds, Refunding Series 2007, 4.500%, 8/01/20 – AGM Insured | | | | | 2/17 at 100.00 | | | | AA | | | | 1,563,366 | |
| | 104,845 | | | Total Massachusetts | | | | | | | | | | | | | 117,692,992 | |
| | | | Michigan – 4.8% | | | | | | | | | | | | | | |
| | | | | |
| | 790 | | | Algonac Community Schools, Saint Clair County, Michigan, General Obligation Bonds, School Building & Site Series 2008-I,
4.000%, 5/01/19 – AGM Insured | | | | | 5/18 at 100.00 | | | | Aa2 | | | | 894,991 | |
| | | | | |
| | 7,100 | | | Detroit Water and Sewerage Department, Michigan, Sewage Disposal System Revenue Bonds, Refunding Senior Lien Series 2012A, 5.000%, 7/01/32 | | | | | 7/22 at 100.00 | | | | A+ | | | | 7,768,465 | |
| | | | | |
| | 9,295 | | | Detroit Water Supply System, Michigan, Water Supply System Revenue Senior Lien Bonds, Series 2006A, 5.000%, 7/01/19 – AGM Insured | | | | | 7/16 at 100.00 | | | | AA– | | | | 9,975,115 | |
| | | | | |
| | | | Detroit, Michigan, Downtown Development Authority, Tax Increment Refunding Bonds, Development Area 1 Projects, Series 1996B: | | | | | | | | | | | | | | |
| | 3,050 | | | 0.000%, 7/01/22 | | | | | No Opt. Call | | | | A– | | | | 1,981,433 | |
| | 2,650 | | | 0.000%, 7/01/23 | | | | | No Opt. Call | | | | A– | | | | 1,622,198 | |
| | 2,880 | | | 0.000%, 7/01/24 | | | | | No Opt. Call | | | | A– | | | | 1,665,302 | |
| | | | | |
| | 7,780 | | | Detroit, Michigan, General Obligation Bonds, Series 2004B-1, 5.250%, 4/01/17 – AMBAC Insured | | | | | 4/14 at 100.00 | | | | B | | | | 7,512,757 | |
| | | | | |
| | 9,995 | | | Detroit, Michigan, Sewage Disposal System Revenue Bonds, Series 2001D-2, 0.250%, 7/01/32 (8) | | | | | 1/14 at 100.00 | | | | A | | | | 7,843,322 | |
| | | | | |
| | 7,050 | | | Dickinson County Economic Development Corporation, Michigan, Pollution Control Revenue Bonds, International Paper Company, Series 2004A, 4.800%, 11/01/18 | | | | | 11/14 at 100.00 | | | | BBB | | | | 7,359,002 | |
| | | | | |
| | 2,675 | | | Kalamazoo Hospital Finance Authority, Michigan, Hospital Revenue Bonds, Bronson Methodist Hospital, Refunding Series 2003A, 5.000%, 5/15/20 – AGM Insured | | | | | 5/18 at 100.00 | | | | AA– | | | | 3,094,467 | |
| | | | | |
| | 1,080 | | | Kent Hospital Finance Authority, Michigan, Revenue Bonds, Metropolitan Hospital, Series 2005A, 5.500%, 7/01/14 | | | | | No Opt. Call | | | | BB+ | | | | 1,134,205 | |
| | | | | |
| | 5,925 | | | Livonia Public Schools, Wayne County, Michigan, General Obligation Bonds, Series 2004A, 4.500%, 5/01/20 – NPFG Insured | | | | | 5/14 at 100.00 | | | | Aa3 | | | | 6,144,640 | |
| | | | | |
| | | | Michigan Finance Authority, Revenue Bonds, Detroit City School District, Series 2012: | | | | | | | | | | | | | | |
| | 1,535 | | | 5.000%, 6/01/17 | | | | | No Opt. Call | | | | A+ | | | | 1,728,287 | |
| | 800 | | | 4.000%, 6/01/17 | | | | | No Opt. Call | | | | A+ | | | | 870,344 | |
| | 2,220 | | | 5.000%, 6/01/18 | | | | | No Opt. Call | | | | A+ | | | | 2,542,832 | |
| | 1,900 | | | 5.000%, 6/01/19 | | | | | No Opt. Call | | | | A+ | | | | 2,225,071 | |
| | | | | | | | | | | | | | | | | | |
Principal
Amount (000) | | | Description (1) | | | | Optional Call
Provisions (2) | | | Ratings (3) | | | Value | |
| | | | Michigan (continued) | | | | | | | | | | | | | | |
| | | | | |
| | | | Michigan Finance Authority, Unemployment Obligation Assessment Revenue Bonds, Series 2012B: | | | | | | | | | | | | | | |
| $ | 15,250 | | | 5.000%, 7/01/21 | | | | | 7/18 at 100.00 | | | | AAA | | | $ | 18,201,943 | |
| | 17,575 | | | 5.000%, 7/01/22 | | | | | 7/16 at 100.00 | | | | AAA | | | | 19,904,918 | |
| | 11,090 | | | 5.000%, 1/01/23 | | | | | 1/16 at 100.00 | | | | AAA | | | | 12,337,958 | |
| | 6,850 | | | 5.000%, 7/01/23 | | | | | 7/14 at 100.00 | | | | AAA | | | | 7,218,462 | |
| | | | | |
| | 10,110 | | | Michigan Hospital Finance Authority, Refunding and Project Revenue Bonds, Ascension Health Senior Credit Group, Series 2010F-5, 1.500%, 11/15/47 (Mandatory put 3/15/17) | | | | | No Opt. Call | | | | AA+ | | | | 10,344,754 | |
| | | | | |
| | 3,540 | | | Michigan Hospital Finance Authority, Revenue Bonds, Ascension Health Group, Series 2010B, 5.000%, 11/15/23 | | | | | 11/19 at 100.00 | | | | AA+ | | | | 4,183,537 | |
| | | | | |
| | | | Michigan Hospital Financing Authority, Revenue Bonds, Oakwood Obligated Group, Series 2007A: | | | | | | | | | | | | | | |
| | 2,000 | | | 5.000%, 7/15/18 | | | | | 7/17 at 100.00 | | | | A | | | | 2,278,320 | |
| | 3,530 | | | 5.000%, 7/15/19 | | | | | 7/17 at 100.00 | | | | A | | | | 4,017,528 | |
| | | | | |
| | 1,850 | | | Michigan Municipal Bond Authority, AMBAC Insured Bonds, Series 2007B-A, 5.000%, 12/01/18 – AMBAC Insured | | | | | 6/17 at 100.00 | | | | N/R | | | | 1,982,405 | |
| | | | | |
| | 3,530 | | | Michigan State Building Authority, Revenue Refunding Bonds, Facilities Program, Series 2003I, 5.250%, 10/15/15 – AGM Insured | | | | | 10/13 at 100.00 | | | | AA– | | | | 3,611,155 | |
| | | | | |
| | 5,000 | | | Michigan State Building Authority, Revenue Refunding Bonds, Facilities Program, Series 2011-I-A, 5.000%, 10/15/28 | | | | | 10/21 at 100.00 | | | | Aa3 | | | | 5,813,050 | |
| | | | | |
| | 5,425 | | | Michigan State Building Authority, Revenue Refunding Bonds, Facilities Program, Series 2011-II-A, 5.000%, 10/15/28 | | | | | 10/21 at 100.00 | | | | Aa3 | | | | 6,307,159 | |
| | | | | |
| | 1,600 | | | Michigan State Trunk Line Fund Refunding Bonds, Series 2009, 5.000%, 11/01/23 | | | | | 11/19 at 100.00 | | | �� | AA+ | | | | 1,891,488 | |
| | | | | |
| | | | Monroe County Hospital Finance Authority, Michigan, Mercy Memorial Hospital Corporation Revenue Bonds, Series 2006: | | | | | | | | | | | | | | |
| | 1,080 | | | 5.000%, 6/01/14 | | | | | No Opt. Call | | | | BBB | | | | 1,127,401 | |
| | 1,260 | | | 5.500%, 6/01/17 | | | | | 6/16 at 100.00 | | | | BBB | | | | 1,420,965 | |
| | 1,330 | | | 5.500%, 6/01/18 | | | | | 6/16 at 100.00 | | | | BBB | | | | 1,499,509 | |
| | | | | |
| | 4,750 | | | Romulus Community Schools, Wayne County, Michigan, General Obligation Bonds, Refunding Series 2013, 5.000%, 5/01/22 | | | | | No Opt. Call | | | | Aa2 | | | | 5,671,928 | |
| | | | | |
| | 1,300 | | | Romulus Economic Development Corporation, Michigan, Limited Obligation Revenue Refunding Bonds, Romulus HIR LP Project, Series 1992, 7.000%, 11/01/15 (ETM) | | | | | 7/13 at 100.00 | | | | N/R (4) | | | | 1,503,944 | |
| | | | | |
| | | | Walled Lake Consolidated School District, Oakland County, Michigan, General Obligation Bonds, Refunding Series 2011: | | | | | | | | | | | | | | |
| | 4,885 | | | 5.000%, 5/01/20 | | | | | No Opt. Call | | | | Aa2 | | | | 5,890,870 | |
| | 4,845 | | | 5.000%, 5/01/21 | | | | | 11/20 at 100.00 | | | | Aa2 | | | | 5,830,085 | |
| | 3,845 | | | 5.000%, 5/01/22 | | | | | 11/20 at 100.00 | | | | Aa2 | | | | 4,578,664 | |
| | | | | |
| | 1,440 | | | Wayne Charter County, Michigan, General Obligation Bonds, Building Improvements, Series 2009A, 6.750%, 11/01/39 | | | | | 12/19 at 100.00 | | | | BBB+ | | | | 1,662,278 | |
| | | | | |
| | 8,000 | | | Wayne County Airport Authority, Michigan, Revenue Bonds, Detroit Metropolitan Airport, Refunding Series 2010C, 5.000%, 12/01/16 | | | | | No Opt. Call | | | | A | | | | 9,126,400 | |
| | | | | |
| | 1,300 | | | Western Michigan University, General Revenue Refunding Bonds, Series 2008, 5.000%, 11/15/23 – AGM Insured | | | | | 5/18 at 100.00 | | | | AA– | | | | 1,515,930 | |
| | 188,110 | | | Total Michigan | | | | | | | | | | | | | 202,283,082 | |
| | | | Minnesota – 0.6% | | | | | | | | | | | | | | |
| | | | | |
| | 1,590 | | | Aitkin, Minnesota Health Care Revenue Bonds, Riverwood Healthcare Center, Series 2006, 5.375%, 2/01/17 | | | | | 2/16 at 100.00 | | | | N/R | | | | 1,686,926 | |
| | | | | |
| | 1,710 | | | Cass Lake Independent School District 115, Minnesota, General Obligation Bonds, School Building Refunding Series 2010A, 5.000%, 2/01/27 | | | | | 2/20 at 100.00 | | | | AA+ | | | | 1,986,062 | |
| | | | | |
| | 160 | | | City of Minneapolis, Minnesota, Hospital Facilities Revenue Bonds (St. Mary’s Hospital and St. Mary’s Rehabilitation Center Projects), Series 1983, 10.000%, 6/01/13 (ETM) | | | | | No Opt. Call | | | | N/R (4) | | | | 161,192 | |
Portfolio of Investments
Nuveen Intermediate Duration Municipal Bond Fund (continued)
April 30, 2013
| | | | | | | | | | | | | | | | | | |
Principal
Amount (000) | | | Description (1) | | | | Optional Call
Provisions (2) | | | Ratings (3) | | | Value | |
| | | | Minnesota (continued) | | | | | | | | | | | | | | |
| | | | | |
| $ | 2,005 | | | Minneapolis Health Care System, Minnesota, Revenue Bonds, Fairview Hospital and Healthcare Services, Series 2008A, 6.375%, 11/15/23 | | | | | 11/18 at 100.00 | | | | A | | | $ | 2,446,401 | |
| | | | | |
| | | | Minneapolis, Minnesota, Revenue Bonds, National Marrow Donor Program Project, Series 2010: | | | | | | | | | | | | | | |
| | 2,650 | | | 5.000%, 8/01/18 | | | | | No Opt. Call | | | | BBB | | | | 2,988,750 | |
| | 1,240 | | | 4.250%, 8/01/20 | | | | | 8/18 at 100.00 | | | | BBB | | | | 1,321,381 | |
| | | | | |
| | | | Minnesota Higher Education Facilities Authority, Revenue Bonds, Bethel University, Refunding Series 2007-6-R: | | | | | | | | | | | | | | |
| | 1,255 | | | 5.500%, 5/01/20 | | | | | 5/17 at 100.00 | | | | N/R | | | | 1,344,607 | |
| | 815 | | | 5.500%, 5/01/21 | | | | | 5/17 at 100.00 | | | | N/R | | | | 870,681 | |
| | | | | |
| | 1,225 | | | Northern Municipal Power Agency, Minnesota, Electric System Revenue Bonds, Refunding Series 2009A, 5.000%, 1/01/15 – AGC Insured | | | | | No Opt. Call | | | | AA– | | | | 1,318,982 | |
| | | | | |
| | 650 | | | Rochester, Minnesota, Health Care Facilities Revenue Bonds, Olmsted Medical Center Project, Series 2013, 5.000%, 7/01/33 | | | | | 7/23 at 100.00 | | | | A– | | | | 743,262 | |
| | | | | |
| | 1,000 | | | Saint Paul Housing and Redevelopment Authority, Minnesota, Health Care Facility Revenue Bonds, HealthPartners Obligated Group, Series 2006, 5.250%, 5/15/21 | | | | | 11/16 at 100.00 | | | | A– | | | | 1,086,560 | |
| | | | | |
| | 1,000 | | | Saint Paul Housing and Redevelopment Authority, Minnesota, Health Care Revenue Bonds, Allina Health System, Series 2009A-1, 5.000%, 11/15/24 | | | | | 11/19 at 100.00 | | | | AA– | | | | 1,161,980 | |
| | | | | |
| | | | Saint Paul Housing and Redevelopment Authority, Minnesota, Health Care Revenue Bonds, Gillette Children’s Specialty Healthcare, Series 2005: | | | | | | | | | | | | | | |
| | 400 | | | 5.000%, 2/01/14 | | | | | No Opt. Call | | | | N/R | | | | 410,424 | |
| | 300 | | | 5.000%, 2/01/15 | | | | | No Opt. Call | | | | N/R | | | | 317,589 | |
| | | | | |
| | 475 | | | Saint Paul Port Authority, Minnesota, Lease Revenue Bonds, Regions Hospital Parking Ramp Project, Series 2007-1, 5.000%, 8/01/21 | | | | | 8/16 at 100.00 | | | | N/R | | | | 501,144 | |
| | | | | |
| | 2,670 | | | St. Paul Housing and Redevelopment Authority, Minnesota, Revenue Bonds, Healtheast Inc., Series 2005, 5.750%, 11/15/21 | | | | | 11/15 at 100.00 | | | | BBB– | | | | 2,917,429 | |
| | | | | |
| | 2,570 | | | St. Paul Port Authority, Minnesota, Lease Revenue Bonds, Office Building at Cedar Street, Series 2003, 5.000%, 12/01/13 | | | | | No Opt. Call | | | | AA | | | | 2,641,575 | |
| | 21,715 | | | Total Minnesota | | | | | | | | | | | | | 23,904,945 | |
| | | | Mississippi – 0.5% | | | | | | | | | | | | | | |
| | | | | |
| | 8,660 | | | Mississippi Business Finance Corporation, Pollution Control Revenue Refunding Bonds, System Energy Resources Inc. Project, Series 1998, 5.875%, 4/01/22 | | | | | 10/13 at 100.00 | | | | BBB | | | | 8,687,106 | |
| | | | | |
| | | | Mississippi Hospital Equipment and Facilities Authority, Revenue Refunding and Improvement Bonds, Mississippi Baptist Health System Inc., Series 2007A: | | | | | | | | | | | | | | |
| | 1,440 | | | 5.000%, 8/15/16 | | | | | No Opt. Call | | | | A– | | | | 1,618,200 | |
| | 10,140 | | | 5.000%, 8/15/20 | | | | | 8/17 at 100.00 | | | | A– | | | | 11,372,720 | |
| | 20,240 | | | Total Mississippi | | | | | | | | | | | | | 21,678,026 | |
| | | | Missouri – 2.5% | | | | | | | | | | | | | | |
| | | | | |
| | | | Cape Girardeau County Industrial Development Authority, Missouri, Health Facilities Revenue Bonds, Southeast Missouri Hospital Association, Series 2007: | | | | | | | | | | | | | | |
| | 1,245 | | | 5.000%, 6/01/18 | | | | | 6/17 at 100.00 | | | | BBB+ | | | | 1,367,969 | |
| | 3,030 | | | 5.000%, 6/01/20 | | | | | 6/17 at 100.00 | | | | BBB+ | | | | 3,267,794 | |
| | | | | |
| | 1,000 | | | Grundy County Industrial Development Authority, Missouri, Health Facility Revenue Bonds, Wright Memorial Hospital, Series 2009, 5.600%, 9/01/21 | | | | | 9/19 at 100.00 | | | | BBB– | | | | 1,107,240 | |
| | | | | |
| | | | Hannibal Industrial Development Authority, Missouri, Health Facilities Revenue Bonds, Hannibal Regional Hospital, Series 2006: | | | | | | | | | | | | | | |
| | 1,405 | | | 4.350%, 3/01/14 | | | | | No Opt. Call | | | | BBB+ | | | | 1,438,959 | |
| | 1,465 | | | 4.400%, 3/01/15 | | | | | No Opt. Call | | | | BBB+ | | | | 1,539,144 | |
| | 1,515 | | | 4.450%, 3/01/16 | | | | | No Opt. Call | | | | BBB+ | | | | 1,630,655 | |
| | | | | |
| | 6,020 | | | Joplin Industrial Development Authority, Missouri, Health Facilities Revenue Bonds, Freeman Health System, Series 2004, 5.500%, 2/15/19 | | | | | 2/15 at 102.00 | | | | BBB+ | | | | 6,471,982 | |
| | | | | | | | | | | | | | | | | | |
Principal
Amount (000) | | | Description (1) | | | | Optional Call
Provisions (2) | | | Ratings (3) | | | Value | |
| | | | Missouri (continued) | | | | | | | | | | | | | | |
| | | | | |
| $ | 1,800 | | | Kansas City Industrial Development Authority, Missouri, Retirement Center Revenue Refunding and Improvement Bonds, Kingswood Project, Series 1998A, 5.800%, 11/15/17 | | | | | 5/13 at 100.00 | | | | N/R | | | $ | 1,801,422 | |
| | | | | |
| | 13,180 | | | Kansas City, Missouri, Airport Revenue Bonds, General Improvement Projects, Series 2003B, 5.375%, 9/01/15 – FGIC Insured | | | | | 9/13 at 100.00 | | | | A+ | | | | 13,405,114 | |
| | | | | |
| | 505 | | | Kansas City, Missouri, Special Obligation Bonds, East Village Project, Series 2008B, 5.000%, 4/15/22 – AGC Insured | | | | | 4/18 at 100.00 | | | | AA– | | | | 590,123 | |
| | | | | |
| | 1,700 | | | Lees Summit Industrial Development Authority, Missouri, Revenue Bonds, John Knox Village Obligated Group, Series 2007A, 5.000%, 8/15/13 | | | | | No Opt. Call | | | | BBB– | | | | 1,714,246 | |
| | | | | |
| | 1,285 | | | Missouri Development Finance Board, Infrastructure Facilities Leasehold Revenue Bonds, Independence Electric System Projects, Series 2009D, 5.625%, 6/01/29 (Pre-refunded 6/01/14) | | | | | 6/14 at 100.00 | | | | A (4) | | | | 1,358,579 | |
| | | | | |
| | 2,000 | | | Missouri Development Finance Board, Infrastructure Facilities Revenue Bonds, City of Independence, Crackerneck Creek Project, Series 2008B, 5.125%, 3/01/22 | | | | | 3/18 at 100.00 | | | | A– | | | | 2,197,020 | |
| | | | | |
| | 1,130 | | | Missouri Development Finance Board, Research Facility Revenue Bonds, Midwest Research Institute Project, Series 2007, 5.000%, 11/01/16 | | | | | No Opt. Call | | | | Baa2 | | | | 1,253,554 | |
| | | | | |
| | 430 | | | Missouri Health and Educational Facilities Authority, Revenue Bonds, Lutheran Senior Services Projects, Series 2011, 4.400%, 2/01/19 | | | | | No Opt. Call | | | | BBB+ | | | | 476,118 | |
| | | | | |
| | | | Missouri Health and Educational Facilities Authority, Revenue Bonds, Lutheran Senior Services, Series 2005B: | | | | | | | | | | | | | | |
| | 850 | | | 4.350%, 2/01/15 | | | | | No Opt. Call | | | | BBB+ | | | | 889,117 | |
| | 930 | | | 4.375%, 2/01/16 | | | | | No Opt. Call | | | | BBB+ | | | | 994,961 | |
| | | | | |
| | 1,000 | | | Missouri Joint Municipal Electric Utility Commission, Plum Point Project, Revenue Bonds, Series 2006, 4.200%, 1/01/18 – NPFG Insured | | | | | 1/16 at 100.00 | | | | A– | | | | 1,055,680 | |
| | | | | |
| | 4,330 | | | Missouri Joint Municipal Electric Utility Commission, Prairie State Power Project Revenue Bonds, Series 2007A, 5.000%, 1/01/18 – AMBAC Insured | | | | | 1/17 at 100.00 | | | | A | | | | 4,965,081 | |
| | | | | |
| | 1,495 | | | Missouri State Board of Public Building, Special Obligation Bonds, Series 2003A, 5.000%, 10/15/16 | | | | | 10/13 at 100.00 | | | | AA+ | | | | 1,527,935 | |
| | | | | |
| | 12,885 | | | Missouri State Board of Public Building, Special Obligation Bonds, Series 2003A, 5.000%, 10/15/16 (Pre-refunded 10/15/13) | | | | | 10/13 at 100.00 | | | | Aa1 (4) | | | | 13,169,630 | |
| | | | | |
| | 1,060 | | | Osage Beach, Missouri, Tax Increment Revenue Bonds, Prewitts Point Transportation Development District, Series 2006, 4.800%, 5/01/16 | | | | | 7/13 at 100.00 | | | | N/R | | | | 1,050,025 | |
| | | | | |
| | 5,830 | | | Sikeston, Missouri, Electric System Revenue Refunding Bonds, Series 2012, 5.000%, 6/01/18 | | | | | No Opt. Call | | | | BBB+ | | | | 6,695,872 | |
| | | | | |
| | 500 | | | St. Joseph Industrial Development Authority, Missouri, Tax Increment Bonds, Shoppes at North Village Project, Series 2005A, 5.100%, 11/01/19 | | | | | 11/14 at 100.00 | | | | N/R | | | | 503,765 | |
| | | | | |
| | | | St. Louis, Missouri, Airport Revenue Bonds, Lambert-St. Louis International Airport, Series 2005: | | | | | | | | | | | | | | |
| | 11,500 | | | 5.500%, 7/01/17 – NPFG Insured | | | | | No Opt. Call | | | | A– | | | | 13,354,950 | |
| | 17,305 | | | 5.500%, 7/01/19 – NPFG Insured | | | | | No Opt. Call | | | | A– | | | | 20,977,121 | |
| | | | | |
| | 1,200 | | | St. Louis, Missouri, Airport Revenue Bonds, Lambert-St. Louis International Airport, Series 2007A, 5.000%, 7/01/25 – AGM Insured | | | | | No Opt. Call | | | | AA– | | | | 1,343,616 | |
| | 96,595 | | | Total Missouri | | | | | | | | | | | | | 106,147,672 | |
| | | | Montana – 0.2% | | | | | | | | | | | | | | |
| | | | | |
| | | | Montana Facilities Finance Authority, Revenue Bonds, Saint John’s Lutheran Ministries Project, Series 2006A: | | | | | | | | | | | | | | |
| | 1,385 | | | 5.750%, 5/15/16 | | | | | No Opt. Call | | | | N/R | | | | 1,483,446 | |
| | 1,675 | | | 6.000%, 5/15/25 | | | | | 5/16 at 100.00 | | | | N/R | | | | 1,750,961 | |
| | | | | |
| | 2,500 | | | Montana Facilities Finance Authority, Revenue Bonds, Sisters of Charity of Leavenworth Health Services Corporation, Composite Deal Series 2010B, 5.000%, 1/01/24 | | | | | 1/20 at 100.00 | | | | AA | | | | 2,885,825 | |
| | 5,560 | | | Total Montana | | | | | | | | | | | | | 6,120,232 | |
Portfolio of Investments
Nuveen Intermediate Duration Municipal Bond Fund (continued)
April 30, 2013
| | | | | | | | | | | | | | | | | | |
Principal
Amount (000) | | | Description (1) | | | | Optional Call
Provisions (2) | | | Ratings (3) | | | Value | |
| | | | Nebraska – 1.1% | | | | | | | | | | | | | | |
| | | | | |
| $ | 1,130 | | | Douglas County Hospital Authority 2, Nebraska, Health Facilities Revenue Bonds, Immanuel Obligated Group, Refunding Series 2010, 5.125%, 1/01/23 | | | | | 1/20 at 100.00 | | | | A– | | | $ | 1,270,855 | |
| | | | | |
| | 600 | | | Douglas County Hospital Authority 3, Nebraska, Health Facilities Refunding and Revenue Bonds, Nebraska Methodist Health System, Series 2008, 5.750%, 11/01/28 | | | | | 11/18 at 100.00 | | | | BBB+ | | | | 666,882 | |
| | | | | |
| | | | Douglas County School District 10 Elkhorn, Nebraska, General Obligation Bonds, Public Schools Series 2012: | | | | | | | | | | | | | | |
| | 665 | | | 4.000%, 6/15/23 | | | | | 6/22 at 100.00 | | | | AA– | | | | 763,387 | |
| | 1,830 | | | 4.000%, 6/15/24 | | | | | 6/22 at 100.00 | | | | AA– | | | | 2,080,234 | |
| | 1,265 | | | 4.000%, 6/15/25 | | | | | 6/22 at 100.00 | | | | AA– | | | | 1,419,684 | |
| | | | | |
| | | | Lancaster County Hospital Authority 1, Nebraska, Health Facilities Revenue Bonds, Immanuel Obligated Group, Refunding Series 2010: | | | | | | | | | | | | | | |
| | 735 | | | 4.750%, 1/01/19 | | | | | No Opt. Call | | | | A– | | | | 842,597 | |
| | 1,000 | | | 5.125%, 1/01/23 | | | | | 1/20 at 100.00 | | | | A– | | | | 1,132,390 | |
| | | | | |
| | 2,000 | | | Lancaster County Hospital Authority 1, Nebraska, Hospital Revenue Bonds, BryanLGH Medical Center Project, Refunding Series 2006, 4.000%, 6/01/18 | | | | | 6/16 at 100.00 | | | | A1 | | | | 2,156,200 | |
| | | | | |
| | 5,910 | | | Lincoln County Hospital Authority 1, Nebraska, Hospital Revenue and Refunding Bonds, Great Plains Regional Medical Center Project, Series 2012, 5.000%, 11/01/32 | | | | | No Opt. Call | | | | A– | | | | 6,531,909 | |
| | | | | |
| | | | Lincoln, Nebraska, Electric System Revenue Bonds, Refunding Series 2012: | | | | | | | | | | | | | | |
| | 5,510 | | | 5.000%, 9/01/22 | | | | | No Opt. Call | | | | AA | | | | 7,054,233 | |
| | 8,735 | | | 5.000%, 9/01/24 | | | | | 9/22 at 100.00 | | | | AA | | | | 10,932,377 | |
| | 3,380 | | | 5.000%, 9/01/25 | | | | | 9/22 at 100.00 | | | | AA | | | | 4,187,043 | |
| | 3,215 | | | 5.000%, 9/01/26 | | | | | 9/22 at 100.00 | | | | AA | | | | 3,931,913 | |
| | | | | |
| | | | Nebraska Public Power District, General Revenue Bonds, Series 2012A: | | | | | | | | | | | | | | |
| | 1,465 | | | 5.000%, 1/01/23 | | | | | 1/22 at 100.00 | | | | A1 | | | | 1,790,347 | |
| | 1,500 | | | 5.000%, 1/01/24 | | | | | 1/22 at 100.00 | | | | A1 | | | | 1,829,145 | |
| | 950 | | | 5.000%, 1/01/25 | | | | | 1/22 at 100.00 | | | | A1 | | | | 1,152,616 | |
| | 39,890 | | | Total Nebraska | | | | | | | | | | | | | 47,741,812 | |
| | | | Nevada – 2.0% | | | | | | | | | | | | | | |
| | | | | |
| | 3,000 | | | Clark County School District, Nevada, General Obligation Bonds, Series 2008A, 5.000%, 6/15/24 | | | | | No Opt. Call | | | | AA– | | | | 3,455,310 | |
| | | | | |
| | | | Clark County, Nevada, Airport Revenue Bonds, Jet Aviation Fuel Tax, Refunding Series 2013A: | | | | | | | | | | | | | | |
| | 2,000 | | | 5.000%, 7/01/22 (Alternative Minimum Tax) | | | | | No Opt. Call | | | | A | | | | 2,396,600 | |
| | 1,000 | | | 5.000%, 7/01/23 (Alternative Minimum Tax) | | | | | 1/23 at 100.00 | | | | A | | | | 1,183,830 | |
| | 1,905 | | | 5.000%, 7/01/24 (Alternative Minimum Tax) | | | | | 1/23 at 100.00 | | | | A | | | | 2,233,155 | |
| | | | | |
| | 16,000 | | | Clark County, Nevada, Airport Revenue Bonds, Subordinate Lien Series 2010B, 5.750%, 7/01/42 | | | | | 1/20 at 100.00 | | | | A+ | | | | 18,826,080 | |
| | | | | |
| | 1,885 | | | Henderson Local Improvement District T-4C, Nevada, Limited Obligation Refunding Bonds, Green Valley Properties, Series 1999A, 5.900%, 11/01/18 | | | | | 11/13 at 100.00 | | | | N/R | | | | 1,900,872 | |
| | | | | |
| | | | Las Vegas Valley Water District, Nevada, General Obligation Bonds, Water Series 2012B: | | | | | | | | | | | | | | |
| | 2,000 | | | 5.000%, 6/01/24 | | | | | 6/22 at 100.00 | | | | AA+ | | | | 2,450,420 | |
| | 1,500 | | | 5.000%, 6/01/25 | | | | | 6/22 at 100.00 | | | | AA+ | | | | 1,821,900 | |
| | 2,000 | | | 5.000%, 6/01/26 | | | | | 6/22 at 100.00 | | | | AA+ | | | | 2,405,320 | |
| | | | | |
| | | | Las Vegas Valley Water District, Nevada, Limited Tax General Obligation Bonds, Water & Refunding Series 2011C: | | | | | | | | | | | | | | |
| | 1,550 | | | 5.000%, 6/01/23 | | | | | 6/21 at 100.00 | | | | AA+ | | | | 1,880,321 | |
| | 1,000 | | | 5.000%, 6/01/24 | | | | | 6/21 at 100.00 | | | | AA+ | | | | 1,202,600 | |
| | 12,450 | | | 5.000%, 6/01/25 | | | | | 6/21 at 100.00 | | | | AA+ | | | | 14,734,077 | |
| | | | | |
| | 4,660 | | | Nevada State, General Obligation Bonds, Capital Improvement & Cultural Affairs, Refunding Series 2012B, 5.000%, 8/01/22 | | | | | No Opt. Call | | | | AA+ | | | | 5,875,514 | |
| | | | | | | | | | | | | | | | | | |
Principal
Amount (000) | | | Description (1) | | | | Optional Call
Provisions (2) | | | Ratings (3) | | | Value | |
| | | | Nevada (continued) | | | | | | | | | | | | | | |
| | | | | |
| $ | 11,105 | | | Nevada State, General Obligation Bonds, Capital Improvement & Cultural Affairs, Refunding Series 2013D-1, 5.000%, 3/01/22 | | | | | No Opt. Call | | | | AA+ | | | $ | 13,937,886 | |
| | | | | |
| | | | Washoe County, Nevada, General Obligation Bonds, Reno-Sparks Convention & Visitors Authority, Refunding Series 2011: | | | | | | | | | | | | | | |
| | 2,265 | | | 5.000%, 7/01/22 | | | | | 7/21 at 100.00 | | | | AA | | | | 2,736,845 | |
| | 4,710 | | | 5.000%, 7/01/23 | | | | | 7/21 at 100.00 | | | | AA | | | | 5,623,128 | |
| | 69,030 | | | Total Nevada | | | | | | | | | | | | | 82,663,858 | |
| | | | New Hampshire – 0.3% | | | | | | | | | | | | | | |
| | | | | |
| | | | New Hampshire Health and Education Facilities Authority, Hospital Revenue Bonds, Catholic Medical Center, Series 2006: | | | | | | | | | | | | | | |
| | 405 | | | 5.000%, 7/01/14 | | | | | No Opt. Call | | | | BBB+ | | | | 425,853 | |
| | 430 | | | 5.000%, 7/01/15 | | | | | No Opt. Call | | | | BBB+ | | | | 466,378 | |
| | 445 | | | 5.000%, 7/01/16 | | | | | No Opt. Call | | | | BBB+ | | | | 497,648 | |
| | | | | |
| | 1,000 | | | New Hampshire Health and Education Facilities Authority, Hospital Revenue Bonds, Speare Memorial Hospital, Series 2004, 5.500%, 7/01/25 (Pre-refunded 7/01/15) | | | | | 7/15 at 100.00 | | | | BBB– (4) | | | | 1,107,860 | |
| | | | | |
| | 1,250 | | | New Hampshire Health and Education Facilities Authority, Revenue Bonds, Covenant Health Systems Obligated Group Issue, Series 2004, 5.375%, 7/01/24 | | | | | 7/14 at 100.00 | | | | A | | | | 1,282,938 | |
| | | | | |
| | 5,660 | | | New Hampshire Health and Education Facilities Authority, Revenue Bonds, Dartmouth College, Series 2009, 5.250%, 6/01/39 | | | | | 6/19 at 100.00 | | | | AA+ | | | | 6,632,954 | |
| | | | | |
| | | | New Hampshire Health and Education Facilities Authority, Revenue Bonds, The Memorial Hospital, Series 2006: | | | | | | | | | | | | | | |
| | 415 | | | 5.250%, 6/01/13 | | | | | No Opt. Call | | | | BBB | | | | 416,179 | |
| | 1,000 | | | 5.250%, 6/01/21 | | | | | 6/16 at 100.00 | | | | BBB | | | | 1,049,650 | |
| | | | | |
| | 1,300 | | | New Hampshire Municipal Bond Bank, Non-State Guaranteed Bonds, Refunding Series 2007A, 4.500%, 2/15/20 – NPFG Insured | | | | | 8/17 at 100.00 | | | | AA | | | | 1,475,123 | |
| | 11,905 | | | Total New Hampshire | | | | | | | | | | | | | 13,354,583 | |
| | | | New Jersey – 5.9% | | | | | | | | | | | | | | |
| | | | | |
| | | | New Jersey Economic Development Authority, Cigarette Tax Revenue Bonds, Series 2004: | | | | | | | | | | | | | | |
| | 7,880 | | | 5.375%, 6/15/15 (ETM) | | | | | No Opt. Call | | | | Aaa | | | | 8,720,717 | |
| | 2,085 | | | 5.500%, 6/15/16 (ETM) | | | | | No Opt. Call | | | | Aaa | | | | 2,409,906 | |
| | 4,195 | | | 5.500%, 6/15/16 – RAAI Insured (ETM) | | | | | No Opt. Call | | | | Aaa | | | | 4,848,707 | |
| | | | | |
| | | | New Jersey Economic Development Authority, Cigarette Tax Revenue Refunding Bonds, Series 2012: | | | | | | | | | | | | | | |
| | 1,000 | | | 5.000%, 6/15/17 | | | | | No Opt. Call | | | | BBB+ | | | | 1,143,900 | |
| | 5,155 | | | 5.000%, 6/15/19 | | | | | No Opt. Call | | | | BBB+ | | | | 6,066,662 | |
| | 5,045 | | | 5.000%, 6/15/20 | | | | | No Opt. Call | | | | BBB+ | | | | 5,981,503 | |
| | 13,170 | | | 5.000%, 6/15/21 | | | | | No Opt. Call | | | | BBB+ | | | | 15,739,994 | |
| | 1,080 | | | 5.000%, 6/15/22 | | | | | No Opt. Call | | | | BBB+ | | | | 1,297,156 | |
| | 1,000 | | | 5.000%, 6/15/22 | | | | | No Opt. Call | | | | AA– | | | | 1,201,070 | |
| | 3,650 | | | 5.000%, 6/15/23 | | | | | 6/22 at 100.00 | | | | BBB+ | | | | 4,327,367 | |
| | 2,235 | | | 5.000%, 6/15/24 | | | | | 6/22 at 100.00 | | | | BBB+ | | | | 2,617,476 | |
| | 845 | | | 4.250%, 6/15/27 | | | | | 6/22 at 100.00 | | | | BBB+ | | | | 897,905 | |
| | | | | |
| | 25,000 | | | New Jersey Economic Development Authority, School Facilities Construction Financing Program Bonds, Refunding Series 2013NN, 5.000%, 3/01/21 | | | | | No Opt. Call | | | | A+ | | | | 30,581,000 | |
| | | | | |
| | 400 | | | New Jersey Health Care Facilities Financing Authority, Revenue Bonds, Children’s Specialized Hospital, Series 2005A, 5.000%, 7/01/18 | | | | | 7/15 at 100.00 | | | | BBB | | | | 419,896 | |
| | | | | |
| | 31,390 | | | New Jersey Transportation Trust Fund Authority, Transportation System Bonds, Series 2005B, 5.250%, 12/15/15 – AMBAC Insured | | | | | No Opt. Call | | | | A+ | | | | 35,273,571 | |
| | | | | |
| | 8,075 | | | New Jersey Transportation Trust Fund Authority, Transportation System Bonds, Series 2005B, 5.250%, 12/15/17 (Pre-refunded 12/15/15) – FGIC Insured | | | | | 12/15 at 100.00 | | | | A+ (4) | | | | 9,103,109 | |
| | | | | |
| | 1,340 | | | New Jersey Transportation Trust Fund Authority, Transportation System Bonds, Series 2006C, 0.000%, 12/15/31 – FGIC Insured | | | | | No Opt. Call | | | | A+ | | | | 599,556 | |
Portfolio of Investments
Nuveen Intermediate Duration Municipal Bond Fund (continued)
April 30, 2013
| | | | | | | | | | | | | | | | | | |
Principal
Amount (000) | | | Description (1) | | | | Optional Call
Provisions (2) | | | Ratings (3) | | | Value | |
| | | | New Jersey (continued) | | | | | | | | | | | | | | |
| | | | | |
| $ | 10,050 | | | New Jersey Transportation Trust Fund Authority, Transportation System Bonds, Series 2010D, 5.000%, 12/15/23 | | | | | No Opt. Call | | | | A+ | | | $ | 12,453,960 | |
| | | | | |
| | 3,670 | | | New Jersey Transportation Trust Fund Authority, Transportation System Bonds, Series 2011B, 5.500%, 6/15/31 | | | | | 6/21 at 100.00 | | | | A+ | | | | 4,360,547 | |
| | | | | |
| | | | New Jersey Transportation Trust Fund Authority, Transportation System Bonds, Series 2012AA: | | | | | | | | | | | | | | |
| | 20,200 | | | 5.000%, 6/15/21 | | | | | No Opt. Call | | | | A+ | | | | 24,641,172 | |
| | 14,000 | | | 5.000%, 6/15/22 | | | | | No Opt. Call | | | | A+ | | | | 17,211,040 | |
| | | | | |
| | 6,885 | | | New Jersey Turnpike Authority, Revenue Bonds, Series 2012B, 5.000%, 1/01/19 | | | | | No Opt. Call | | | | A+ | | | | 8,287,475 | |
| | | | | |
| | | | South Jersey Port Corporation, New Jersey, Marine Terminal Revenue Refunding Bonds, Series 2012Q: | | | | | | | | | | | | | | |
| | 4,965 | | | 3.000%, 1/01/20 | | | | | No Opt. Call | | | | A1 | | | | 5,275,064 | |
| | 2,950 | | | 3.000%, 1/01/21 | | | | | No Opt. Call | | | | A1 | | | | 3,097,559 | |
| | 2,500 | | | 3.000%, 1/01/22 | | | | | No Opt. Call | | | | A1 | | | | 2,591,900 | |
| | | | | |
| | | | Tobacco Settlement Financing Corporation, New Jersey, Tobacco Settlement Asset-Backed Bonds, Series 2007-1A: | | | | | | | | | | | | | | |
| | 20,255 | | | 4.500%, 6/01/23 | | | | | 6/17 at 100.00 | | | | B1 | | | | 20,269,179 | |
| | 515 | | | 4.625%, 6/01/26 | | | | | 6/17 at 100.00 | | | | B1 | | | | 501,466 | |
| | 20,000 | | | 5.000%, 6/01/29 | | | | | 6/17 at 100.00 | | | | B2 | | | | 19,104,800 | |
| | 219,535 | | | Total New Jersey | | | | | | | | | | | | | 249,023,657 | |
| | | | New Mexico – 0.9% | | | | | | | | | | | | | | |
| | | | | |
| | 30,000 | | | New Mexico Finance Authority, State Transportation Revenue Bonds, Senior Lien, Refunding Series 2012, 4.000%, 6/15/22 | | | | | No Opt. Call | | | | AAA | | | | 35,754,600 | |
| | | | New York – 5.9% | | | | | | | | | | | | | | |
| | | | | |
| | 4,055 | | | Brooklyn Arena Local Development Corporation, New York, Payment in Lieu of Taxes Revenue Bonds, Barclays Center Project, Series 2009, 6.000%, 7/15/30 | | | | | 1/20 at 100.00 | | | | BBB– | | | | 4,844,752 | |
| | | | | |
| | | | Dormitory Authority of the State of New York, Mortgage Insurance Fund Project Pool Bonds, State of New York Mortgage Agency – AIDS Long Term Health Care Facility, Series 2005: | | | | | | | | | | | | | | |
| | 1,450 | | | 5.000%, 11/01/13 | | | | | 7/13 at 100.00 | | | | Aa1 | | | | 1,455,757 | |
| | 720 | | | 5.000%, 11/01/14 | | | | | 7/13 at 100.00 | | | | Aa1 | | | | 722,851 | |
| | | | | |
| | 15,500 | | | Dormitory Authority of the State of New York, New York City, Lease Revenue Bonds, Court Facilities, Series 2003A, 5.500%, 5/15/18 (Pre-refunded 5/15/13) | | | | | 5/13 at 100.00 | | | | AA– (4) | | | | 15,506,557 | |
| | | | | |
| | 5,125 | | | Dormitory Authority of the State of New York, Revenue Bonds, Marymount Manhattan College, Series 2009, 5.000%, 7/01/24 | | | | | 7/19 at 100.00 | | | | Baa2 | | | | 5,625,559 | |
| | | | | |
| | 7,050 | | | Dormitory Authority of the State of New York, State and Local Appropriation Lease Bonds, Upstate Community Colleges, Series 2005A, 5.500%, 7/01/20 – FGIC Insured | | | | | No Opt. Call | | | | AA– | | | | 8,845,635 | |
| | | | | |
| | | | Dormitory Authority of the State of New York, Third General Resolution Revenue Bonds, State University Educational Facilities Issue, Series 2012A: | | | | | | | | | | | | | | |
| | 10,000 | | | 5.000%, 5/15/24 | | | | | 5/22 at 100.00 | | | | AA– | | | | 12,271,900 | |
| | 9,230 | | | 5.000%, 5/15/25 | | | | | 5/22 at 100.00 | | | | AA– | | | | 11,228,849 | |
| | | | | |
| | | | Long Island Power Authority, New York, Electric System General Revenue Bonds, Series 2000A: | | | | | | | | | | | | | | |
| | 85 | | | 0.000%, 6/01/17 – AGM Insured | | | | | No Opt. Call | | | | AA– | | | | 81,388 | |
| | 80 | | | 0.000%, 6/01/22 – AGM Insured | | | | | No Opt. Call | | | | AA– | | | | 65,079 | |
| | 150 | | | 0.000%, 6/01/23 – AGM Insured | | | | | No Opt. Call | | | | AA– | | | | 116,724 | |
| | | | | |
| | 11,500 | | | Long Island Power Authority, New York, Electric System General Revenue Bonds, Series 2003B, 5.250%, 12/01/13 | | | | | No Opt. Call | | | | A | | | | 11,834,190 | |
| | | | | |
| | | | Long Island Power Authority, New York, Electric System General Revenue Bonds, Series 2006A: | | | | | | | | | | | | | | |
| | 710 | | | 5.000%, 12/01/16 – AGM Insured | | | | | 6/16 at 100.00 | | | | AA– | | | | 798,565 | |
| | 180 | | | 4.000%, 12/01/16 – AGM Insured | | | | | No Opt. Call | | | | AA– | | | | 196,987 | |
| | | | | | | | | | | | | | | | | | |
Principal
Amount (000) | | | Description (1) | | | | Optional Call
Provisions (2) | | | Ratings (3) | | | Value | |
| | | | New York (continued) | | | | | | | | | | | | | | |
| $ | 970 | | | 5.000%, 12/01/19 – FGIC Insured | | | | | 6/16 at 100.00 | | | | A | | | $ | 1,078,174 | |
| | 340 | | | 5.250%, 12/01/20 – FGIC Insured | | | | | 6/16 at 100.00 | | | | A | | | | 379,603 | |
| | 345 | | | 5.000%, 12/01/23 – FGIC Insured | | | | | 6/16 at 100.00 | | | | A | | �� | | 382,588 | |
| | | | | |
| | 175 | | | Long Island Power Authority, New York, Electric System General Revenue Bonds, Series 2006B, 5.000%, 12/01/35 | | | | | 6/16 at 100.00 | | | | A | | | | 191,041 | |
| | | | | |
| | 25 | | | Long Island Power Authority, New York, Electric System General Revenue Bonds, Series 2006C, 5.000%, 9/01/35 – AGC Insured | | | | | 9/16 at 100.00 | | | | | | | | 27,512 | |
| | | | | |
| | | | Long Island Power Authority, New York, Electric System General Revenue Bonds, Series 2006E: | | | | | | | | | | | | | | |
| | 1,015 | | | 5.000%, 12/01/17 – FGIC Insured | | | | | 12/16 at 100.00 | | | | A | | | | 1,157,465 | |
| | 150 | | | 5.000%, 12/01/17 | | | | | 12/16 at 100.00 | | | | A | | | | 171,854 | |
| | 45 | | | 5.000%, 12/01/18 – FGIC Insured | | | | | 12/16 at 100.00 | | | | A | | | | 51,453 | |
| | 12,995 | | | 5.000%, 12/01/18 – NPFG Insured | | | | | 12/16 at 100.00 | | | | A | | | | 14,858,483 | |
| | 45 | | | 5.000%, 12/01/20 – NPFG Insured | | | | | 12/16 at 100.00 | | | | A | | | | 50,604 | |
| | 1,200 | | | 5.000%, 12/01/21 – FGIC Insured | | | | | 12/16 at 100.00 | | | | A | | | | 1,356,192 | |
| | 10 | | | 5.000%, 12/01/21 – NPFG Insured | | | | | 12/16 at 100.00 | | | | A | | | | 11,302 | |
| | 495 | | | 5.000%, 12/01/22 – FGIC Insured | | | | | 12/16 at 100.00 | | | | A | | | | 553,331 | |
| | 125 | | | 5.000%, 12/01/22 | | | | | 12/16 at 100.00 | | | | A | | | | 140,568 | |
| | | | | |
| | | | Long Island Power Authority, New York, Electric System Revenue Bonds, Refunding Series 2009A: | | | | | | | | | | | | | | |
| | 125 | | | 5.250%, 4/01/20 | | | | | 4/19 at 100.00 | | | | A | | | | 150,064 | |
| | 1,730 | | | 5.500%, 4/01/22 | | | | | 4/19 at 100.00 | | | | A | | | | 2,070,966 | |
| | | | | |
| | | | Long Island Power Authority, New York, Electric System Revenue Bonds, Series 2006F: | | | | | | | | | | | | | | |
| | 600 | | | 5.000%, 5/01/16 – NPFG Insured | | | | | No Opt. Call | | | | A | | | | 676,440 | |
| | 345 | | | 5.000%, 5/01/17 – NPFG Insured | | | | | No Opt. Call | | | | A | | | | 397,581 | |
| | 10,110 | | | 5.000%, 5/01/18 – NPFG Insured | | | | | 11/16 at 100.00 | | | | A | | | | 11,432,186 | |
| | 695 | | | 5.000%, 5/01/19 – NPFG Insured | | | | | 11/16 at 100.00 | | | | A | | | | 783,592 | |
| | 25 | | | 4.000%, 5/01/21 – NPFG Insured | | | | | 11/16 at 100.00 | | | | A | | | | 27,154 | |
| | | | | |
| | 15,310 | | | Metropolitan Transportation Authority, New York, Transportation Revenue Bonds, Series 2005B, 5.000%, 11/15/16 (Pre-refunded 11/15/15) – AMBAC Insured | | | | | 11/15 at 100.00 | | | | A (4) | | | | 17,063,301 | |
| | | | | |
| | 2,000 | | | New York City Industrial Development Agency, New York, American Airlines-JFK International Airport Special Facility Revenue Bonds, Series 2005, 7.750%, 8/01/31 (Alternative Minimum Tax) | | | | | 8/16 at 101.00 | | | | N/R | | | | 2,269,240 | |
| | | | | |
| | 410 | | | New York City Industrial Development Agency, New York, Civic Facility Revenue Bonds, Special Needs Facilities Pooled Program, Series 2008A-1, 5.700%, 7/01/13 | | | | | No Opt. Call | | | | N/R | | | | 410,947 | |
| | | | | |
| | 3,000 | | | New York City Municipal Water Finance Authority, New York, Water and Sewerage System Revenue Bonds, Fiscal Series 2005C, 5.000%, 6/15/30 | | | | | 6/15 at 100.00 | | | | AAA | | | | 3,248,640 | |
| | | | | |
| | 7,000 | | | New York City Sales Tax Asset Receivable Corporation, New York, Dedicated Revenue Bonds, Local Government Assistance Corporation, Series 2004A, 5.000%, 10/15/21 – NPFG Insured | | | | | 10/14 at 100.00 | | | | AAA | | | | 7,456,260 | |
| | | | | |
| | 10,095 | | | New York City Transitional Finance Authority, New York, Future Tax Secured Bonds, Fiscal Series 2007C-1, 5.000%, 11/01/16 | | | | | No Opt. Call | | | | AAA | | | | 11,659,523 | |
| | | | | |
| | 10 | | | New York City, New York, General Obligation Bonds, Fiscal Series 1998J, 5.375%, 8/01/13 | | | | | 7/13 at 100.00 | | | | AA | | | | 10,045 | |
| | | | | |
| | 100 | | | New York City, New York, General Obligation Bonds, Fiscal Series 2002A, 5.750%, 8/01/15 | | | | | 7/13 at 100.00 | | | | AA | | | | 100,471 | |
| | | | | |
| | 5,775 | | | New York City, New York, General Obligation Bonds, Fiscal Series 2004I, 5.000%, 8/01/17 – NPFG Insured | | | | | 8/14 at 100.00 | | | | AA | | | | 6,114,974 | |
| | | | | |
| | 2,620 | | | New York City, New York, General Obligation Bonds, Fiscal Series 2005H, 5.000%, 8/01/17 – NPFG Insured | | | | | 8/14 at 100.00 | | | | Aa2 | | | | 2,774,239 | |
| | | | | |
| | 2,380 | | | New York City, New York, General Obligation Bonds, Fiscal Series 2005H, 5.000%, 8/01/17 (Pre-refunded 8/01/14) – NPFG Insured | | | | | 8/14 at 100.00 | | | | Aa2 (4) | | | | 2,520,468 | |
| | | | | |
| | 21,235 | | | New York City, New York, General Obligation Bonds, Fiscal Series 2007C-1, 5.000%, 10/01/18 | | | | | 10/17 at 100.00 | | | | AA | | | | 25,034,154 | |
Portfolio of Investments
Nuveen Intermediate Duration Municipal Bond Fund (continued)
April 30, 2013
| | | | | | | | | | | | | | | | | | |
Principal
Amount (000) | | | Description (1) | | | | Optional Call
Provisions (2) | | | Ratings (3) | | | Value | |
| | | | New York (continued) | | | | | | | | | | | | | | |
| | | | | |
| | | | New York State Tobacco Settlement Financing Corporation, Tobacco Settlement Asset-Backed and State Contingency Contract-Backed Bonds, Series 2003A-1: | | | | | | | | | | | | | | |
| $ | 1,675 | | | 5.250%, 6/01/20 – AMBAC Insured | | | | | 6/13 at 100.00 | | | | AA– | | | $ | 1,682,169 | |
| | 5,520 | | | 5.250%, 6/01/21 – AMBAC Insured | | | | | 6/13 at 100.00 | | | | AA– | | | | 5,543,515 | |
| | | | | |
| | | | New York State Tobacco Settlement Financing Corporation, Tobacco Settlement Asset-Backed and State Contingency Contract-Backed Bonds, Series 2003B-1C: | | | | | | | | | | | | | | |
| | 1,115 | | | 5.500%, 6/01/18 | | | | | 5/13 at 100.00 | | | | AA– | | | | 1,119,917 | |
| | 5,205 | | | 5.500%, 6/01/19 | | | | | 6/13 at 100.00 | | | | AA– | | | | 5,228,579 | |
| | 1,200 | | | 5.500%, 6/01/20 | | | | | 6/13 at 100.00 | | | | AA– | | | | 1,205,412 | |
| | 5,725 | | | 5.500%, 6/01/21 | | | | | 6/13 at 100.00 | | | | AA– | | | | 5,751,221 | |
| | | | | |
| | 795 | | | Port Authority of New York and New Jersey, Special Project Bonds, JFK International Air Terminal LLC Project, Eighth Series 2010, 6.000%, 12/01/42 | | | | | 12/20 at 100.00 | | | | BBB– | | | | 933,155 | |
| | | | | |
| | | | Tobacco Settlement Financing Corporation, New York, Asset-Backed Revenue Bonds, State Contingency Contract Secured, Series 2011B: | | | | | | | | | | | | | | |
| | 8,000 | | | 5.000%, 6/01/16 | | | | | No Opt. Call | | | | AA– | | | | 9,077,120 | |
| | 8,040 | | | 5.000%, 6/01/17 | | | | | No Opt. Call | | | | AA– | | | | 9,370,459 | |
| | 9,015 | | | 5.000%, 6/01/18 | | | | | No Opt. Call | | | | AA– | | | | 10,758,591 | |
| | | | | |
| | 7,600 | | | Triborough Bridge and Tunnel Authority, New York, General Purpose Revenue Bonds, Refunding Series 2013B, 5.000%, 11/15/21 | | | | | No Opt. Call | | | | AA– | | | | 9,621,600 | |
| | 221,225 | | | Total New York | | | | | | | | | | | | | 248,496,946 | |
| | | | North Carolina – 1.4% | | | | | | | | | | | | | | |
| | | | | |
| | 900 | | | North Carolina Capital Facilities Financing Agency, Educational Facilities Revenue Bond, Meredith College, Series 2008A, 5.250%, 6/01/20 | | | | | 6/18 at 100.00 | | | | BBB | | | | 1,015,857 | |
| | | | | |
| | | | North Carolina Capital Facilities Finance Agency, Revenue Bonds, The Methodist University, Series 2012: | | | | | | | | | | | | | | |
| | 605 | | | 3.750%, 3/01/23 | | | | | 3/22 at 100.00 | | | | BBB | | | | 632,788 | |
| | 610 | | | 3.750%, 3/01/24 | | | | | 3/22 at 100.00 | | | | BBB | | | | 633,241 | |
| | | | | |
| | 2,000 | | | North Carolina Eastern Municipal Power Agency, Power System Revenue Bonds, Series 2009A, 5.500%, 1/01/26 | | | | | 1/19 at 100.00 | | | | A– | | | | 2,321,560 | |
| | | | | |
| | | | North Carolina Eastern Municipal Power Agency, Power System Revenue Bonds, Series 2012B: | | | | | | | | | | | | | | |
| | 5,000 | | | 5.000%, 1/01/20 | | | | | No Opt. Call | | | | A– | | | | 6,080,050 | |
| | 21,620 | | | 5.000%, 1/01/21 | | | | | No Opt. Call | | | | A– | | | | 26,476,717 | |
| | | | | |
| | 1,700 | | | North Carolina Eastern Municipal Power Agency, Power System Revenue Refunding Bonds, Series 2008A, 5.250%, 1/01/22 – AGC Insured | | | | | 1/18 at 100.00 | | | | AA– | | | | 1,962,735 | |
| | | | | |
| | | | North Carolina Medical Care Commission, Health Care Facilities Revenue Bonds, Presbyterian Homes, Series 2006B: | | | | | | | | | | | | | | |
| | 2,035 | | | 4.875%, 10/01/13 | | | | | No Opt. Call | | | | N/R | | | | 2,054,251 | |
| | 2,120 | | | 5.000%, 10/01/14 | | | | | No Opt. Call | | | | N/R | | | | 2,188,752 | |
| | 2,000 | | | North Carolina Medical Care Commission, Healthcare Facilities Revenue Bonds, Novant Health Obligated Group, Series 2003A, 5.000%, 11/01/17 | | | | | 11/13 at 100.00 | | | | AA– | | | | 2,047,080 | |
| | | | | |
| | 5,955 | | | North Carolina Municipal Power Agency 1, Catawba Electric Revenue Bonds, Refunding Series 2009A, 5.000%, 1/01/26 | | | | | 1/19 at 100.00 | | | | A | | | | 6,782,805 | |
| | | | | |
| | | | North Carolina Municipal Power Agency 1, Catawba Electric Revenue Bonds, Refunding Series 2012A: | | | | | | | | | | | | | | |
| | 5,250 | | | 5.000%, 1/01/19 | | | | | No Opt. Call | | | | A | | | | 6,338,588 | |
| | 425 | | | 5.000%, 1/01/20 | | | | | No Opt. Call | | | | A | | | | 519,516 | |
| | 520 | | | 4.000%, 1/01/20 | | | | | No Opt. Call | | | | A | | | | 602,742 | |
| | 50,740 | | | Total North Carolina | | | | | | | | | | | | | 59,656,682 | |
| | | | North Dakota – 0.2% | | | | | | | | | | | | | | |
| | | | | |
| | 2,750 | | | Fargo, North Dakota, Health System Revenue Bonds, Sanford Health, Refunding Series 2011, 6.250%, 11/01/31 | | | | | 11/21 at 100.00 | | | | A+ | | | | 3,443,358 | |
| | | | | | | | | | | | | | | | | | |
Principal
Amount (000) | | | Description (1) | | | | Optional Call
Provisions (2) | | | Ratings (3) | | | Value | |
| | | | North Dakota (continued) | | | | | | | | | | | | | | |
| | | | | |
| | | | Ward County Health Care, North Dakota, Revenue Bonds, Trinity Obligated Group, Series 2006: | | | | | | | | | | | | | | |
| $ | 1,180 | | | 5.000%, 7/01/14 | | | | | No Opt. Call | | | | BBB– | | | $ | 1,227,047 | |
| | 2,410 | | | 5.125%, 7/01/20 | | | | | 7/16 at 100.00 | | | | BBB– | | | | 2,572,314 | |
| | 6,340 | | | Total North Dakota | | | | | | | | | | | | | 7,242,719 | |
| | | | Ohio – 2.9% | | | | | | | | | | | | | | |
| | | | | |
| | 1,000 | | | Akron, Ohio, Certificates of Participation, Refunding Series 2005, 5.000%, 12/01/15 – AGC Insured | | | | | 6/15 at 100.00 | | | | AA– | | | | 1,079,950 | |
| | | | | |
| | 1,260 | | | Barberton City School District, Summit County, Ohio, General Obligation Bonds, School Improvement Series 2008, 4.750%, 12/01/21 | | | | | 6/18 at 100.00 | | | | AA | | | | 1,460,088 | |
| | | | | |
| | | | Buckeye Tobacco Settlement Financing Authority, Ohio, Tobacco Settlement Asset-Backed Revenue Bonds, Senior Lien, Series 2007A-1: | | | | | | | | | | | | | | |
| | 375 | | | 5.000%, 6/01/15 | | | | | No Opt. Call | | | | A1 | | | | 403,943 | |
| | 1,875 | | | 5.000%, 6/01/16 | | | | | No Opt. Call | | | | A1 | | | | 2,079,919 | |
| | 35 | | | 5.000%, 6/01/17 | | | | | No Opt. Call | | | | Baa1 | | | | 39,748 | |
| | | | | |
| | 37,910 | | | Buckeye Tobacco Settlement Financing Authority, Ohio, Tobacco Settlement Asset-Backed Revenue Bonds, Senior Lien, Series 2007A-2, 5.125%, 6/01/24 | | | | | 6/17 at 100.00 | | | | B– | | | | 35,191,853 | |
| | | | | |
| | 3,240 | | | Cleveland, Ohio, Airport System Revenue Bonds, Series 2009C, 5.000%, 1/01/21 – AGM Insured | | | | | 1/19 at 100.00 | | | | AA– | | | | 3,744,338 | |
| | | | | |
| | | | Cleveland, Ohio, General Obligation Bonds, Series 2011: | | | | | | | | | | | | | | |
| | 1,700 | | | 5.000%, 12/01/22 | | | | | 12/19 at 100.00 | | | | AA | | | | 1,980,772 | |
| | 1,780 | | | 5.000%, 12/01/23 | | | | | 12/19 at 100.00 | | | | AA | | | | 2,051,361 | |
| | | | | |
| | 4,740 | | | Columbus, Ohio, Sewerage System Revenue Bonds, Tender Option Bond Trust 2456, 17.366%, 12/01/15 (IF) | | | | | No Opt. Call | | | | AA+ | | | | 7,746,203 | |
| | | | | |
| | 2,905 | | | Lake County, Ohio, Hospital Facilities Revenue Bonds, Lake Hospital System, Inc., Refunding Series 2008C, 5.500%, 8/15/24 | | | | | 8/18 at 100.00 | | | | A3 | | | | 3,293,340 | |
| | | | | |
| | 1,095 | | | Mason City School District, Warren and Butler Counties, Ohio, General Obligation Bonds, Refunding Series 2007, 4.375%, 12/01/19 – AGM Insured | | | | | 12/16 at 100.00 | | | | Aaa | | | | 1,217,410 | |
| | | | | |
| | | | Miami County, Ohio, Hospital Facilities Revenue Refunding Bonds, Upper Valley Medical Center Inc., Series 2006: | | | | | | | | | | | | | | |
| | 1,970 | | | 5.250%, 5/15/15 | | | | | No Opt. Call | | | | A2 | | | | 2,146,985 | |
| | 750 | | | 5.250%, 5/15/16 | | | | | No Opt. Call | | | | A2 | | | | 846,653 | |
| | | | | |
| | 5,450 | | | Muskingum County, Ohio, Hospital Facilities Revenue Bonds, Genesis HealthCare System Obligated Group Project, Series 2013, 5.000%, 2/15/27 (WI/DD, Settling 5/09/13) | | | | | 2/23 at 100.00 | | | | BB+ | | | | 5,774,275 | |
| | | | | |
| | | | New Albany Community Authority, Ohio, Community Facilities Revenue Refunding Bonds, Series 2012C: | | | | | | | | | | | | | | |
| | 775 | | | 4.000%, 10/01/18 | | | | | No Opt. Call | | | | A1 | | | | 867,861 | |
| | 870 | | | 4.000%, 10/01/19 | | | | | No Opt. Call | | | | A1 | | | | 982,856 | |
| | 1,150 | | | 4.000%, 10/01/20 | | | | | No Opt. Call | | | | A1 | | | | 1,305,929 | |
| | 1,205 | | | 5.000%, 10/01/21 | | | | | No Opt. Call | | | | A1 | | | | 1,460,942 | |
| | 965 | | | 5.000%, 10/01/22 | | | | | No Opt. Call | | | | A1 | | | | 1,175,833 | |
| | | | | |
| | | | Ohio Higher Education Facilities Commission, Revenue Bonds, John Carroll University, Series 1997: | | | | | | | | | | | | | | |
| | 1,135 | | | 4.000%, 4/01/14 | | | | | No Opt. Call | | | | A3 | | | | 1,161,536 | |
| | 1,000 | | | 4.500%, 4/01/15 | | | | | No Opt. Call | | | | A3 | | | | 1,056,250 | |
| | | | | |
| | 11,015 | | | Ohio State, General Obligation Bonds, Common Schools Series 2007A, 5.000%, 6/15/15 | | | | | No Opt. Call | | | | AA+ | | | | 12,088,412 | |
| | | | | |
| | 6,960 | | | Ohio State, General Obligation Bonds, Refunding Common Schools Series 2011B, 4.000%, 9/15/21 | | | | | No Opt. Call | | | | AA+ | | | | 8,226,094 | |
| | | | | |
| | 8,160 | | | Ohio State, General Obligation Bonds, Refunding Higher Education Series 2012C, 5.000%, 8/01/21 | | | | | No Opt. Call | | | | AA+ | | | | 10,342,474 | |
| | | | | |
| | 8,000 | | | Ohio State, General Obligation Highway Capital Improvement Bonds, Series 2012Q, 5.000%, 5/01/21 | | | | | No Opt. Call | | | | AAA | | | | 10,103,280 | |
Portfolio of Investments
Nuveen Intermediate Duration Municipal Bond Fund (continued)
April 30, 2013
| | | | | | | | | | | | | | | | | | |
Principal
Amount (000) | | | Description (1) | | | | Optional Call
Provisions (2) | | | Ratings (3) | | | Value | |
| | | | Ohio (continued) | | | | | | | | | | | | | | |
| | | | | |
| $ | 500 | | | Richland County, Ohio, General Obligation Bonds, Correctional Facilities Improvement Refunding Series 2008, 5.875%, 12/01/24 – AGC Insured | | | | | 12/18 at 100.00 | | | | A2 | | | $ | 589,740 | |
| | | | | |
| | | | Richland County, Ohio, Hospital Revenue Bonds, MidCentral Health System Group, Series 2006: | | | | | | | | | | | | | | |
| | 735 | | | 5.000%, 11/15/14 | | | | | No Opt. Call | | | | A– | | | | 777,770 | |
| | 805 | | | 5.000%, 11/15/16 | | | | | No Opt. Call | | | | A– | | | | 902,936 | |
| | | | | |
| | 1,250 | | | Southeastern Ohio Port Authority, Hospital Facilities Revenue Bonds, Memorial Health System Obligated Group Project, Refunding and Improvement Series 2012, 5.000%, 12/01/22 | | | | | No Opt. Call | | | | N/R | | | | 1,370,588 | |
| | 110,610 | | | Total Ohio | | | | | | | | | | | | | 121,469,339 | |
| | | | Oklahoma – 0.8% | | | | | | | | | | | | | | |
| | | | | |
| | | | Canadian County Educational Facilities Authority, Oklahoma, Educational Facilities Lease Revenue Bonds, Mustang Public Schools Project, Series 2012: | | | | | | | | | | | | | | |
| | 2,290 | | | 4.500%, 9/01/21 | | | | | No Opt. Call | | | | A+ | | | | 2,653,469 | |
| | 1,415 | | | 4.000%, 9/01/23 | | | | | 9/21 at 100.00 | | | | A+ | | | | 1,542,789 | |
| | | | | |
| | 250 | | | McClain County Economic Development Authority, Oklahoma, Educational Facilities Lease Revenue Bonds, Newcastle Public Schools Project, Series 2006, 4.125%, 9/01/13 | | | | | No Opt. Call | | | | A– | | | | 252,925 | |
| | | | | |
| | 2,495 | | | Norman Regional Hospital Authority, Oklahoma, Hospital Revenue Bonds, Series 2005, 5.500%, 9/01/23 | | | | | 9/16 at 100.00 | | | | BB+ | | | | 2,657,998 | |
| | | | | |
| | 10,000 | | | Oklahoma Capitol Improvement Authority, State Facilities Revenue Bonds, Series 2005F, 5.000%, 7/01/27 – AMBAC Insured | | | | | 7/15 at 100.00 | | | | AA | | | | 10,857,400 | |
| | | | | |
| | 8,375 | | | Oklahoma State, General Obligation Bonds, Series 2003A, 5.000%, 7/15/17 (Pre-refunded 7/15/13) – FGIC Insured | | | | | 7/13 at 101.00 | | | | AA+ (4) | | | | 8,542,584 | |
| | | | | |
| | | | Stillwater Medical Center Authority, Oklahoma, Hospital Revenue Bonds, Series 2005: | | | | | | | | | | | | | | |
| | 700 | | | 5.250%, 5/15/13 | | | | | No Opt. Call | | | | BBB+ | | | | 701,358 | |
| | 790 | | | 5.250%, 5/15/14 | | | | | No Opt. Call | | | | BBB+ | | | | 824,460 | |
| | 1,050 | | | 5.250%, 5/15/15 | | | | | 5/14 at 100.00 | | | | BBB+ | | | | 1,093,082 | |
| | | | | |
| | 3,000 | | | Tulsa Airports Improvement Trust, Oklahoma, General Airport Revenue Bonds, Series 2009A, 5.375%, 6/01/24 | | | | | 6/15 at 100.00 | | | | A3 | | | | 3,190,410 | |
| | 30,365 | | | Total Oklahoma | | | | | | | | | | | | | 32,316,475 | |
| | | | Oregon – 0.6% | | | | | | | | | | | | | | |
| | | | | |
| | | | Beaverton School District 48J, Washington and Multnomah Counties, Oregon, General Obligation Refunding Bonds, Series 2012B: | | | | | | | | | | | | | | |
| | 4,050 | | | 4.000%, 6/15/21 | | | | | No Opt. Call | | | | AA+ | | | | 4,795,038 | |
| | 5,900 | | | 4.000%, 6/15/22 | | | | | No Opt. Call | | | | AA+ | | | | 6,998,934 | |
| | 4,540 | | | 4.000%, 6/15/23 | | | | | No Opt. Call | | | | AA+ | | | | 5,309,802 | |
| | | | | |
| | 4,120 | | | Clackamas Community College District, Oregon, General Obligation Bonds, Series 2007, 5.000%, 6/15/20 – FGIC Insured | | | | | No Opt. Call | | | | AA | | | | 5,159,723 | |
| | | | | |
| | 4,000 | | | Oregon State Department of Transportation, Highway User Tax Revenue Bonds, Series 2009A, 5.000%, 11/15/22 | | | | | 5/19 at 100.00 | | | | AAA | | | | 4,765,000 | |
| | 22,610 | | | Total Oregon | | | | | | | | | | | | | 27,028,497 | |
| | | | Pennsylvania – 4.0% | | | | | | | | | | | | | | |
| | | | | |
| | 2,015 | | | Allegheny County Hospital Development Authority, Pennsylvania, Revenue Bonds, University of Pittsburgh Medical Center System, Series 2008B, 5.000%, 6/15/18 | | | | | No Opt. Call | | | | Aa3 | | | | 2,410,242 | |
| | | | | |
| | 1,000 | | | Allegheny County, Pennsylvania, General Obligation Bonds, Series C69-C70 of 2012, 5.000%, 12/01/25 | | | | | 12/22 at 100.00 | | | | A+ | | | | 1,180,900 | |
| | | | | |
| | 26,315 | | | Beaver County Industrial Development Authority, Pennsylvania, Pollution Control Revenue Refunding Bonds, FirstEnergy Nuclear Generation Project, Series 2006B, 2.500%, 12/01/41 (Mandatory put 6/01/17) | | | | | No Opt. Call | | | | BBB– | | | | 26,642,359 | |
| | | | | | | | | | | | | | | | | | |
Principal
Amount (000) | | | Description (1) | | | | Optional Call
Provisions (2) | | | Ratings (3) | | | Value | |
| | | | Pennsylvania (continued) | | | | | | | | | | | | | | |
| | | | | |
| $ | 1,315 | | | Bethel Park School District, Allegheny County, Pennsylvania, General Obligation Bonds, Series 2009, 4.125%, 8/01/20 | | | | | 8/19 at 100.00 | | | | Aa2 | | | $ | 1,533,579 | |
| | | | | |
| | | | Delaware County Authority, Pennsylvania, Hospital Revenue Bonds, Crozer-Chester Medical Center, Refunding Series 2005: | | | | | | | | | | | | | | |
| | 1,275 | | | 5.000%, 12/15/15 – RAAI Insured | | | | | No Opt. Call | | | | BBB– | | | | 1,362,682 | |
| | 1,405 | | | 5.000%, 12/15/17 – RAAI Insured | | | | | 12/15 at 100.00 | | | | BBB– | | | | 1,486,687 | |
| | | | | |
| | | | Delaware County Authority, Pennsylvania, Revenue Bonds, Neumann College, Series 2008: | | | | | | | | | | | | | | |
| | 535 | | | 5.250%, 10/01/20 | | | | | 10/18 at 100.00 | | | | BBB | | | | 602,838 | |
| | 565 | | | 5.375%, 10/01/21 | | | | | 10/18 at 100.00 | | | | BBB | | | | 634,122 | |
| | | | | |
| | | | Delaware County Authority, Pennsylvania, Revenue Bonds, Neumann University, Series 2010: | | | | | | | | | | | | | | |
| | 1,000 | | | 5.000%, 10/01/21 | | | | | 10/20 at 100.00 | | | | BBB | | | | 1,128,050 | |
| | 1,050 | | | 5.000%, 10/01/25 | | | | | 10/20 at 100.00 | | | | BBB | | | | 1,149,771 | |
| | | | | |
| | 2,265 | | | Delaware County Industrial Development Authority, Pennsylvania, Resource Recovery Revenue Refunding Bonds, Series 1997A, 6.100%, 7/01/13 | | | | | 6/13 at 100.00 | | | | Ba1 | | | | 2,274,241 | |
| | | | | |
| | 3,140 | | | Luzerne County Industrial Development Authority, Pennsylvania, Guaranteed Lease Revenue Bonds, Series 2009, 7.750%, 12/15/27 | | | | | 12/19 at 100.00 | | | | N/R | | | | 3,310,785 | |
| | | | | |
| | 1,300 | | | Monroe County Hospital Authority, Pennsylvania, Hospital Revenue Bonds, Pocono Medical Center, Series 2007, 5.000%, 1/01/27 | | | | | 1/17 at 100.00 | | | | A | | | | 1,369,524 | |
| | | | | |
| | 1,000 | | | Montgomery County Industrial Development Authority, Pennsylvania, First Mortgage Revenue Bonds, Whitemarsh Continuing Care, Series 2005, 6.125%, 2/01/28 | | | | | 2/15 at 100.00 | | | | N/R | | | | 1,018,980 | |
| | | | | |
| | 1,220 | | | Pennsylvania Economic Development Financing Authority, Health System Revenue Bonds , Albert Einstein Healthcare, Series 2009A, 6.250%, 10/15/23 | | | | | 10/19 at 100.00 | | | | BBB+ | | | | 1,440,320 | |
| | | | | |
| | | | Pennsylvania Economic Development Financing Authority, Unemployment Compensation Revenue Bonds, Series 2012B: | | | | | | | | | | | | | | |
| | 24,575 | | | 5.000%, 7/01/20 | | | | | 7/19 at 100.00 | | | | Aaa | | | | 30,071,199 | |
| | 2,160 | | | 5.000%, 1/01/21 | | | | | 1/19 at 100.00 | | | | Aaa | | | | 2,605,241 | |
| | 9,575 | | | 5.000%, 7/01/21 | | | | | 1/18 at 100.00 | | | | Aaa | | | | 11,315,544 | |
| | 6,800 | | | 5.000%, 1/01/22 | | | | | 7/17 at 100.00 | | | | Aaa | | | | 7,915,880 | |
| | 6,665 | | | 5.000%, 7/01/22 | | | | | 7/16 at 100.00 | | | | Aaa | | | | 7,557,577 | |
| | | | | |
| | 15,020 | | | Pennsylvania Turnpike Commission, Turnpike Revenue Bonds, Capital Appreciation Series 2009E, 0.000%, 12/01/38 | | | | | 12/27 at 100.00 | | | | A– | | | | 15,414,726 | |
| | | | | |
| | 3,000 | | | Philadelphia Gas Works, Pennsylvania, Revenue Bonds, Ninth Series, 2010, 5.000%, 8/01/30 | | | | | 8/20 at 100.00 | | | | BBB+ | | | | 3,260,850 | |
| | | | | |
| | 10,000 | | | Philadelphia School District, Pennsylvania, General Obligation Bonds, Series 2005A, 5.000%, 8/01/19 – AMBAC Insured | | | | | 8/15 at 100.00 | | | | AA | | | | 10,902,400 | |
| | | | | |
| | 4,270 | | | Philadelphia School District, Pennsylvania, General Obligation Bonds, Series 2010A, 5.000%, 6/01/16 | | | | | No Opt. Call | | | | AA | | | | 4,813,144 | |
| | | | | |
| | 11,050 | | | Sayre Healthcare Facility Authority, Pennsylvania, Revenue Bonds, Guthrie Healthcare System, Series 2007, 0.972%, 12/01/24 | | | | | 12/17 at 100.00 | | | | AA– | | | | 10,338,049 | |
| | | | | |
| | | | Southcentral Pennsylvania General Authority, Revenue Bonds, Hanover Hospital Inc., Series 2013: | | | | | | | | | | | | | | |
| | 730 | | | 5.000%, 12/01/20 | | | | | No Opt. Call | | | | BBB– | | | | 831,207 | |
| | 1,105 | | | 5.000%, 12/01/21 | | | | | No Opt. Call | | | | BBB– | | | | 1,255,335 | |
| | 1,625 | | | 5.000%, 12/01/22 | | | | | No Opt. Call | | | | BBB– | | | | 1,841,808 | |
| | 1,705 | | | 5.000%, 12/01/23 | | | | | 6/23 at 100.00 | | | | BBB– | | | | 1,923,411 | |
| | 1,795 | | | 5.000%, 12/01/24 | | | | | 6/23 at 100.00 | | | | BBB– | | | | 2,009,000 | |
| | | | | |
| | 1,400 | | | Southcentral Pennsylvania General Authority, Revenue Bonds, Hanover Hospital Inc., Series 2013, 5.000%, 12/01/19 | | | | | No Opt. Call | | | | BBB– | | | | 1,592,304 | |
| | | | | |
| | 2,060 | | | Trinity Area School District, Washington County, Pennsylvania, General Obligation Bonds, Series 2012, 4.000%, 11/01/19 – AGM Insured | | | | | No Opt. Call | | | | A1 | | | | 2,359,812 | |
Portfolio of Investments
Nuveen Intermediate Duration Municipal Bond Fund (continued)
April 30, 2013
| | | | | | | | | | | | | | | | | | |
Principal
Amount (000) | | | Description (1) | | | | Optional Call
Provisions (2) | | | Ratings (3) | | | Value | |
| | | | Pennsylvania (continued) | | | | | | | | | | | | | | |
| | | | | |
| | | | Westmoreland County Industrial Development Authority, Pennsylvania, Retirement Community Revenue Bonds, Redstone Presbyterian SeniorCare Obligated Group, Series 2005A: | | | | | | | | | | | | | | |
| $ | 1,100 | | | 5.375%, 1/01/14 | | | | | No Opt. Call | | | | N/R | | | $ | 1,118,634 | |
| | 1,200 | | | 5.500%, 1/01/16 | | | | | No Opt. Call | | | | N/R | | | | 1,267,812 | |
| | 151,235 | | | Total Pennsylvania | | | | | | | | | | | | | 165,939,013 | |
| | | | Puerto Rico – 1.0% | | | | | | | | | | | | | | |
| | | | | |
| | 240 | | | Puerto Rico Aqueduct and Sewerage Authority, Revenue Bonds, Senior Lien Series 2012A, 4.250%, 7/01/25 | | | | | No Opt. Call | | | | BBB– | | | | 219,514 | |
| | | | | |
| | 3,000 | | | Puerto Rico Electric Power Authority, Power Revenue Bonds, Series 2007TT, 5.000%, 7/01/24 – NPFG Insured | | | | | 7/17 at 100.00 | | | | BBB+ | | | | 3,039,210 | |
| | | | | |
| | 11,355 | | | Puerto Rico Public Buildings Authority, Guaranteed Government Facilities Revenue Bonds, Series 2003H, 5.250%, 7/01/14 – FGIC Insured | | | | | No Opt. Call | | | | BBB– | | | | 11,713,023 | |
| | | | | |
| | 1,015 | | | Puerto Rico Public Buildings Authority, Guaranteed Government Facilities Revenue Bonds, Series 2007M, 5.500%, 7/01/35
(Mandatory put 7/01/17) – AMBAC Insured | | | | | 7/17 at 100.00 | | | | BBB– | | | | 1,077,697 | |
| | | | | |
| | 11,000 | | | Puerto Rico Sales Tax Financing Corporation, Sales Tax Revenue Bonds, First Subordinate Series 2009A, 0.000%, 8/01/32 | | | | | 8/26 at 100.00 | | | | A+ | | | | 11,641,410 | |
| | | | | |
| | 10,000 | | | Puerto Rico, General Obligation and Public Improvement Bonds, Series 2002A, 5.500%, 7/01/16 – NPFG Insured | | | | | No Opt. Call | | | | Baa2 | | | | 10,656,500 | |
| | | | | |
| | 4,000 | | | Puerto Rico, General Obligation Bonds, Public Improvement Refunding Series 2008A, 5.000%, 7/01/20 | | | | | 7/18 at 100.00 | | | | BBB– | | | | 4,123,680 | |
| | 40,610 | | | Total Puerto Rico | | | | | | | | | | | | | 42,471,034 | |
| | | | Rhode Island – 0.1% | | | | | | | | | | | | | | |
| | | | | |
| | | | Rhode Island Tobacco Settlement Financing Corporation, Tobacco Settlement Asset-Backed Bonds, Series 2002A: | | | | | | | | | | | | | | |
| | 3,055 | | | 6.000%, 6/01/23 | | | | | 7/13 at 100.00 | | | | Baa1 | | | | 3,095,998 | |
| | 315 | | | 6.125%, 6/01/32 | | | | | 7/13 at 100.00 | | | | BBB+ | | | | 318,119 | |
| | 3,370 | | | Total Rhode Island | | | | | | | | | | | | | 3,414,117 | |
| | | | South Carolina – 1.2% | | | | | | | | | | | | | | |
| | | | | |
| | 2,055 | | | Charleston Educational Excellence Financing Corporation, South Carolina, Installment Purchase Revenue Bonds, Charleston County School District, South Carolina Project, Series 2004, 5.000%, 12/01/13 | | | | | No Opt. Call | | | | AA | | | | 2,111,862 | |
| | | | | |
| | | | Columbia, South Carolina, Waterworks and Sewer System Revenue Bonds, Refunding Series 2012: | | | | | | | | | | | | | | |
| | 2,000 | | | 5.000%, 2/01/24 | | | | | 2/22 at 100.00 | | | | Aa1 | | | | 2,485,100 | |
| | 1,215 | | | 5.000%, 2/01/25 | | | | | 2/22 at 100.00 | | | | Aa1 | | | | 1,500,987 | |
| | | | | |
| | 5,200 | | | Greenville County School District, South Carolina, Installment Purchase Revenue Bonds, Series 2006, 5.000%, 12/01/24 | | | | | 12/16 at 100.00 | | | | AA | | | | 5,929,872 | |
| | | | | |
| | 2,000 | | | Lexington County Health Service District, South Carolina, Hospital Revenue Refunding and Improvement Bonds, Series 2003, 5.500%, 11/01/23 (Pre-refunded 11/01/13) | | | | | 11/13 at 100.00 | | | | AA– (4) | | | | 2,053,460 | |
| | | | | |
| | | | Newberry Investing in Children’s Education, South Carolina, Installment Purchase Revenue Bonds, Newberry County School District Project, Series 2005: | | | | | | | | | | | | | | |
| | 1,500 | | | 5.250%, 12/01/23 | | | | | 12/15 at 100.00 | | | | A2 | | | | 1,636,200 | |
| | 2,000 | | | 5.250%, 12/01/24 | | | | | 12/15 at 100.00 | | | | A2 | | | | 2,181,600 | |
| | | | | |
| | | | South Carolina JOBS Economic Development Authority, Hospital Revenue Bonds, Bon Secours Health System Obligated Group, Series 2012: | | | | | | | | | | | | | | |
| | 1,850 | | | 5.000%, 11/01/20 | | | | | No Opt. Call | | | | A– | | | | 2,258,147 | |
| | 7,500 | | | 5.000%, 11/01/27 | | | | | No Opt. Call | | | | A– | | | | 8,637,375 | |
| | 6,955 | | | 5.000%, 11/01/28 | | | | | No Opt. Call | | | | A– | | | | 7,946,296 | |
| | 1,225 | | | 5.000%, 11/01/29 | | | | | No Opt. Call | | | | A– | | | | 1,387,815 | |
| | | | | |
| | 235 | | | South Carolina JOBS Economic Development Authority, Hospital Facilities Revenue Bonds, Palmetto Health Alliance, Series 2003A, 6.000%, 8/01/13 | | | | | No Opt. Call | | | | BBB+ | | | | 238,370 | |
| | | | | | | | | | | | | | | | | | |
Principal
Amount (000) | | | Description (1) | | | | Optional Call
Provisions (2) | | | Ratings (3) | | | Value | |
| | | | South Carolina (continued) | | | | | | | | | | | | | | |
| | | | | |
| $ | 2,000 | | | South Carolina JOBS Economic Development Authority, Hospital Refunding and Improvement Revenue Bonds, Palmetto Health Alliance, Series 2003C, 6.000%, 8/01/13 | | | | | No Opt. Call | | | | BBB+ | | | $ | 2,028,680 | |
| | | | | |
| | 1,000 | | | South Carolina Jobs-Economic Development Authority, Hospital Revenue Bonds, Palmetto Health, Refunding & Improvement Series 2009, 5.000%, 8/01/18 | | | | | No Opt. Call | | | | BBB+ | | | | 1,167,050 | |
| | | | | |
| | 6,750 | | | South Carolina Transportation Infrastructure Bank, Revenue Bonds, Series 2004B, 5.250%, 10/01/16 – AMBAC Insured | | | | | No Opt. Call | | | | A1 | | | | 7,821,293 | |
| | | | | |
| | 1,520 | | | Spartanburg Regional Health Services District, Inc., South Carolina, Hospital Revenue Refunding Bonds, Series 2012A, 5.000%, 4/15/32 | | | | | 4/22 at 100.00 | | | | A1 | | | | 1,693,386 | |
| | 45,005 | | | Total South Carolina | | | | | | | | | | | | | 51,077,493 | |
| | | | South Dakota – 0.3% | | | | | | | | | | | | | | |
| | | | | |
| | 2,385 | | | Deadwood, South Dakota, Certificates of Participation, Crossover Refunding Series 2005, 5.000%, 11/01/18 – ACA Insured | | | | | 11/15 at 100.00 | | | | A | | | | 2,582,025 | |
| | | | | |
| | | | South Dakota Health and Educational Facilities Authority, Revenue Bonds, Huron Regional Medical Center, Series 2005: | | | | | | | | | | | | | | |
| | 760 | | | 5.000%, 4/01/17 | | | | | 7/13 at 100.00 | | | | A– | | | | 762,637 | |
| | 800 | | | 5.000%, 4/01/18 | | | | | 7/13 at 100.00 | | | | A– | | | | 802,704 | |
| | 840 | | | 5.000%, 4/01/19 | | | | | 7/13 at 100.00 | | | | A– | | | | 842,696 | |
| | 820 | | | 5.000%, 4/01/20 | | | | | 7/13 at 100.00 | | | | A– | | | | 822,485 | |
| | | | | |
| | 1,000 | | | South Dakota Health and Educational Facilities Authority, Revenue Bonds, Sanford Health, Series 2007, 5.000%, 11/01/19 | | | | | 5/17 at 100.00 | | | | A+ | | | | 1,125,100 | |
| | | | | |
| | 1,000 | | | South Dakota Health and Educational Facilities Authority, Revenue Bonds, Sanford Health, Series 2009, 5.000%, 11/01/24 | | | | | 11/19 at 100.00 | | | | A+ | | | | 1,130,170 | |
| | | | | |
| | 1,500 | | | South Dakota Health and Educational Facilities Authority, Revenue Bonds, Vocational Education Program, Series 2008, 5.125%, 8/01/28 – AGC Insured | | | | | 8/18 at 100.00 | | | | AA | | | | 1,696,815 | |
| | | | | |
| | | | South Dakota Health and Educational Facilities Authority, Revenue Bonds, Westhills Village Retirement Community Project, Series 2006: | | | | | | | | | | | | | | |
| | 300 | | | 4.550%, 9/01/14 | | | | | No Opt. Call | | | | A | | | | 311,667 | |
| | 1,770 | | | 5.000%, 9/01/25 | | | | | 9/14 at 100.00 | | | | A | | | | 1,797,824 | |
| | 11,175 | | | Total South Dakota | | | | | | | | | | | | | 11,874,123 | |
| | | | Tennessee – 2.0% | | | | | | | | | | | | | | |
| | | | | |
| | 2,265 | | | Chattanooga Health, Educational and Housing Facility Board, Tennessee, Hospital Revenue Bonds, Catholic Health Initiatives, Series 2008D, 6.125%, 10/01/28 | | | | | 10/18 at 100.00 | | | | AA– | | | | 2,706,245 | |
| | | | | |
| | 3,460 | | | Claiborne County, Tennessee, Industrial Development Board, Revenue Refunding Bonds, Lincoln Memorial University Project, Series 2009, 6.125%, 10/01/29 | | | | | 10/19 at 100.00 | | | | N/R | | | | 3,871,463 | |
| | | | | |
| | 3,650 | | | Jackson, Tennessee, Hospital Revenue Refunding Bonds, Jackson-Madison County General Hospital Project, Series 2008, 5.250%, 4/01/23 | | | | | 4/18 at 100.00 | | | | A+ | | | | 4,145,816 | |
| | | | | |
| | | | Johnson City Health and Educational Facilities Board, Tennessee, Revenue Bonds, Mountain States Health Alliance, Series 2006A: | | | | | | | | | | | | | | |
| | 715 | | | 5.000%, 7/01/15 | | | | | No Opt. Call | | | | BBB+ | | | | 771,635 | |
| | 750 | | | 5.000%, 7/01/18 | | | | | 7/16 at 100.00 | | | | BBB+ | | | | 824,948 | |
| | | | | |
| | 5,000 | | | Knox County Health Educational and Housing Facilities Board, Tennessee, Revenue Bonds, University Health System, Inc., Series 2007, 5.250%, 4/01/27 | | | | | 4/17 at 100.00 | | | | BBB+ | | | | 5,315,850 | |
| | | | | |
| | | | Knox County Health, Educational and Housing Facility Board, Tennessee, Hospital Revenue Refunding Bonds, Covenant Health, Series 2012A: | | | | | | | | | | | | | | |
| | 1,400 | | | 4.000%, 1/01/22 | | | | | No Opt. Call | | | | A | | | | 1,546,062 | |
| | 3,180 | | | 5.000%, 1/01/23 | | | | | No Opt. Call | | | | A | | | | 3,776,345 | |
| | 1,300 | | | 4.000%, 1/01/23 | | | | | No Opt. Call | | | | A | | | | 1,428,414 | |
| | 1,750 | | | 5.000%, 1/01/24 | | | | | No Opt. Call | | | | A | | | | 2,065,158 | |
Portfolio of Investments
Nuveen Intermediate Duration Municipal Bond Fund (continued)
April 30, 2013
| | | | | | | | | | | | | | | | | | |
Principal
Amount (000) | | | Description (1) | | | | Optional Call
Provisions (2) | | | Ratings (3) | | | Value | |
| | | | Tennessee (continued) | | | | | | | | | | | | | | |
| | | | | |
| | | | Memphis and Shelby County Port Commission, Tennessee, Port Development Revenue Bonds, Series 2011: | | | | | | | | | | | | | | |
| $ | 1,480 | | | 5.250%, 4/01/23 | | | | | 4/21 at 100.00 | | | | AA– | | | $ | 1,799,828 | |
| | 1,560 | | | 5.250%, 4/01/24 | | | | | 4/21 at 100.00 | | | | AA– | | | | 1,881,703 | |
| | 1,240 | | | 5.250%, 4/01/25 | | | | | 4/21 at 100.00 | | | | AA– | | | | 1,484,106 | |
| | | | | |
| | 1,000 | | | Memphis, Tennessee, General Improvement Bonds, Series 2005, 5.000%, 10/01/16 – NPFG Insured | | | | | No Opt. Call | | | | AA | | | | 1,151,820 | |
| | | | | |
| | 10,000 | | | Memphis, Tennessee, Subordinate Lien Electric System Revenue Bonds, Series 2003A, 5.000%, 12/01/15 (Pre-refunded 12/01/13) – NPFG Insured | | | | | 12/13 at 100.00 | | | | AA+ (4) | | | | 10,276,100 | |
| | | | | |
| | 12,155 | | | Memphis, Tennessee, Subordinate Lien Electric System Revenue Bonds, Series 2003A, 5.000%, 12/01/13 – NPFG Insured | | | | | No Opt. Call | | | | AA+ | | | | 12,502,755 | |
| | | | | |
| | 3,175 | | | Memphis-Shelby County Sports Authority, Tennessee, Revenue Bonds, Memphis Arena, Refunding Series 2007C, 5.000%, 11/01/17 – NPFG Insured | | | | | No Opt. Call | | | | AA– | | | | 3,640,900 | |
| | | | | |
| | 4,430 | | | Memphis-Shelby County Sports Authority, Tennessee, Revenue Bonds, Memphis Arena, Refunding Series 2009A, 5.125%, 11/01/24 | | | | | 11/19 at 100.00 | | | | AA– | | | | 5,095,209 | |
| | | | | |
| | | | Memphis-Shelby County Sports Authority, Tennessee, Revenue Bonds, Memphis Arena, Refunding Series 2009B: | | | | | | | | | | | | | | |
| | 1,000 | | | 5.500%, 11/01/20 | | | | | 11/19 at 100.00 | | | | AA– | | | | 1,231,480 | |
| | 1,860 | | | 5.250%, 11/01/25 | | | | | 11/19 at 100.00 | | | | AA– | | | | 2,129,384 | |
| | | | | |
| | 1,400 | | | Sullivan County Health Educational and Housing Facilities Board, Tennessee, Revenue Bonds, Wellmont Health System, Series 2006C, 5.000%, 9/01/19 | | | | | 9/16 at 100.00 | | | | BBB+ | | | | 1,553,762 | |
| | | | | |
| | 2,000 | | | Sullivan County Health, Educational and Housing Facilities Board, Tennessee, Hospital Revenue Bonds, Wellmont Health System, Series 2003, 5.000%, 9/01/16 – RAAI Insured | | | | | 9/13 at 100.00 | | | | BBB+ | | | | 2,028,140 | |
| | | | | |
| | 11,885 | | | The Tennessee Energy Acquisition Corporation, Gas Revenue Bonds, Series 2006A, 5.250%, 9/01/20 | | | | | No Opt. Call | | | | A | | | | 13,924,228 | |
| | 76,655 | | | Total Tennessee | | | | | | | | | | | | | 85,151,351 | |
| | | | Texas – 8.2% | | | | | | | | | | | | | | |
| | | | | |
| | 1,110 | | | Alvin Independent School District, Brazoria County, Texas, General Obligation Bonds, Refunding Series 2007, 4.125%, 2/15/19 | | | | | 2/16 at 100.00 | | | | AAA | | | | 1,200,620 | |
| | | | | |
| | 6,000 | | | Bexar County Housing Finance Corporation, Texas, FNMA Guaranteed Multifamily Housing Revenue Bonds, Villas Sonterra Apartments Project, Series 2007A, 4.700%, 10/01/15 (Alternative Minimum Tax) | | | | | No Opt. Call | | | | N/R | | | | 6,292,200 | |
| | | | | |
| | 2,125 | | | Brownsville, Texas, General Obligation Bonds, Refunding Series 2005, 5.000%, 2/15/17 – NPFG Insured | | | | | 2/15 at 100.00 | | | | AA– | | | | 2,279,828 | |
| | | | | |
| | 3,000 | | | Central Texas Regional Mobility Authority, Revenue Bonds, Senior Lien Refunding Series 2013A, 5.000%, 1/01/33 (WI/DD, Settling 5/16/13) | | | | | 1/23 at 100.00 | | | | BBB– | | | | 3,317,040 | |
| | | | | |
| | 3,380 | | | Central Texas Regional Mobility Authority, Revenue Bonds, Senior Lien Series 2011, 6.250%, 1/01/46 | | | | | 1/21 at 100.00 | | | | Baa2 | | | | 4,002,799 | |
| | | | | |
| | 8,000 | | | Conroe Independent School District, Montgomery County, Texas, General Obligation Bonds, School Building and Refunding Series 2012, 5.000%, 2/15/26 | | | | | 2/21 at 100.00 | | | | AAA | | | | 9,852,400 | |
| | | | | |
| | 1,180 | | | Corinth, Texas, Certificates of Obligation, Series 2007, 4.500%, 2/15/19 – NPFG Insured | | | | | 2/17 at 100.00 | | | | Aa2 | | | | 1,316,750 | |
| | | | | |
| | 5,715 | | | Dallas County Utility and Reclamation District, Texas, General Obligation Bonds, Refunding Series 2005A, 5.150%, 2/15/22 – AMBAC Insured | | | | | 2/17 at 100.00 | | | | A3 | | | | 6,390,056 | |
| | | | | |
| | 5,000 | | | Dallas, Texas, General Obligation Bonds, Refunding & Improvements Series 2007, 4.500%, 2/15/27 – NPFG Insured | | | | | 2/17 at 100.00 | | | | AA+ | | | | 5,528,400 | |
| | | | | |
| | 10,010 | | | Dallas, Texas, Waterworks and Sewer System Revenue Bonds, Refunding Series 2007, 5.000%, 10/01/15 – AMBAC Insured | | | | | No Opt. Call | | | | AAA | | | | 11,134,223 | |
| | | | | |
| | 2,440 | | | El Paso County, Texas, General Obligation Bonds, Refunding Series 2007, 5.000%, 2/15/18 – NPFG Insured | | | | | No Opt. Call | | | | AA | | | | 2,901,502 | |
| | | | | | | | | | | | | | | | | | |
Principal
Amount (000) | | | Description (1) | | | | Optional Call
Provisions (2) | | | Ratings (3) | | | Value | |
| | | | Texas (continued) | | | | | | | | | | | | | | |
| | | | | |
| $ | 650 | | | El Paso, Texas, Water and Sewer Revenue Bonds, Refunding Series 2006A, 4.000%, 3/01/18 – AGM Insured | | | | | 3/15 at 100.00 | | | | AA+ | | | $ | 688,103 | |
| | | | | |
| | 1,120 | | | Elgin Independent School District, Bastrop County, Texas, General Obligation Bonds, School Building Series 2007, 4.375%, 8/01/19 | | | | | 8/17 at 100.00 | | | | AAA | | | | 1,272,062 | |
| | | | | |
| | 2,000 | | | Fort Bend Independent School District, Fort Bend County, Texas, General Obligation Bonds, School Building Series 2009, 4.550%, 2/15/25 | | | | | 8/19 at 100.00 | | | | AA+ | | | | 2,271,920 | |
| | | | | |
| | 2,045 | | | Frisco, Collins and Denton Counties, Texas, Certificates of Obligation, Series 2007, 4.500%, 2/15/16 – AMBAC Insured | | | | | No Opt. Call | | | | Aa1 | | | | 2,268,928 | |
| | | | | |
| | 875 | | | Giddings Independent School District, Fayette, Lee, and Washington Counties, Texas, General Obligation Bonds, School Building Series 2007A, 4.250%, 2/15/19 | | | | | 2/17 at 100.00 | | | | Aaa | | | | 979,676 | |
| | | | | |
| | 635 | | | Grand Prairie Independent School District, Dallas County, Texas, General Obligation Bonds, Series 2007A, 4.500%, 2/15/18 | | | | | 2/17 at 100.00 | | | | AAA | | | | 722,986 | |
| | | | | |
| | 1,230 | | | Gregg County Health Facilities Development Corporation, Texas, Revenue Bonds, Good Shepherd Medical Center, Series 2006A, 5.000%, 10/01/13 | | | | | No Opt. Call | | | | BBB+ | | | | 1,250,184 | |
| | | | | |
| | | | Hale Center Education Facilities Corporation, Texas, Revenue Bonds, Wayland Baptist University Project, Improvement and Refunding Series 2010: | | | | | | | | | | | | | | |
| | 875 | | | 4.000%, 3/01/21 | | | | | No Opt. Call | | | | A– | | | | 950,469 | |
| | 500 | | | 4.000%, 3/01/22 | | | | | 3/21 at 100.00 | | | | A– | | | | 537,040 | |
| | 800 | | | 4.000%, 3/01/23 | | | | | 3/21 at 100.00 | | | | A– | | | | 850,024 | |
| | 440 | | | 4.250%, 3/01/25 | | | | | 3/21 at 100.00 | | | | A– | | | | 472,996 | |
| | | | | |
| | 1,000 | | | Harris County Health Facilities Development Corporation, Texas, Hospital Revenue Bonds, Memorial Hermann Healthcare System, Series 2004A, 5.250%, 12/01/13 | | | | | No Opt. Call | | | | A+ | | | | 1,028,810 | |
| | | | | |
| | 1,950 | | | Harris County Health Facilities Development Corporation, Texas, Hospital Revenue Bonds, Memorial Hermann Healthcare System, Series 2008B, 7.125%, 12/01/31 (Pre-refunded 12/01/18) | | | | | 12/18 at 100.00 | | | | A+ (4) | | | | 2,591,765 | |
| | | | | |
| | 6,930 | | | Harris County Health Facilities Development Corporation, Texas, Hospital Revenue Bonds, St. Luke’s Episcopal Hospital, Series 1991A, 6.750%, 2/15/21 (ETM) | | | | | 7/13 at 100.00 | | | | AA+ (4) | | | | 8,327,573 | |
| | | | | |
| | | | Harris County Metropolitan Transit Authority, Texas, Sales and Use Tax Revenue Bonds, Series 2009A: | | | | | | | | | | | | | | |
| | 5,120 | | | 5.000%, 11/01/22 | | | | | 11/19 at 100.00 | | | | AA | | | | 6,274,611 | |
| | 5,385 | | | 5.000%, 11/01/23 | | | | | 11/19 at 100.00 | | | | AA | | | | 6,569,377 | |
| | 5,660 | | | 5.000%, 11/01/24 | | | | | 11/19 at 100.00 | | | | AA | | | | 6,889,182 | |
| | | | | |
| | 2,320 | | | Harris County Metropolitan Transit Authority, Texas, Sales and Use Tax Revenue Bonds, Tender Option Bond Trust 1014, 13.633%, 11/01/41 (IF) | | | | | 11/21 at 100.00 | | | | AA | | | | 3,283,519 | |
| | | | | |
| | | | Harrison County Health Facilities Development Corporation, Texas, Hospital Revenue Bonds, Good Shepherd Health System, Refunding Series 2010: | | | | | | | | | | | | | | |
| | 2,270 | | | 5.000%, 7/01/19 | | | | | No Opt. Call | | | | BBB+ | | | | 2,636,900 | |
| | 2,380 | | | 5.000%, 7/01/20 | | | | | No Opt. Call | | | | BBB+ | | | | 2,779,316 | |
| | | | | |
| | 2,000 | | | Houston Health Facilities Development Corporation, Texas, Revenue Bonds, Buckingham Senior Living Community Inc., Series 2004A, 7.000%, 2/15/23 (Pre-refunded 2/15/14) | | | | | 2/14 at 101.00 | | | | AA+ (4) | | | | 2,125,900 | |
| | | | | |
| | 2,145 | | | Houston, Texas, First Lien Combined Utility System Revenue Bonds, Refunding Series 2012D, 5.000%, 11/15/24 | | | | | 11/22 at 100.00 | | | | AA | | | | 2,689,015 | |
| | | | | |
| | | | Houston, Texas, Hotel Occupancy Tax and Special Revenue Bonds, Convention and Entertainment Facilities Department, Refunding Series 2011B: | | | | | | | | | | | | | | |
| | 6,355 | | | 5.250%, 9/01/24 | | | | | 9/16 at 100.00 | | | | A2 | | | | 7,155,539 | |
| | 6,920 | | | 5.250%, 9/01/25 | | | | | 9/16 at 100.00 | | | | A2 | | | | 7,724,450 | |
| | 4,295 | | | 5.250%, 9/01/26 | | | | | 9/16 at 100.00 | | | | A2 | | | | 4,763,284 | |
Portfolio of Investments
Nuveen Intermediate Duration Municipal Bond Fund (continued)
April 30, 2013
| | | | | | | | | | | | | | | | | | |
Principal
Amount (000) | | | Description (1) | | | | Optional Call
Provisions (2) | | | Ratings (3) | | | Value | |
| | | | Texas (continued) | | | | | | | | | | | | | | |
| | | | | |
| | | | Houston, Texas, Hotel Occupancy Tax and Special Revenue Bonds, Convention and Entertainment Project, Series 2001B: | | | | | | | | | | | | | | |
| $ | 8,000 | | | 0.000%, 9/01/22 – AMBAC Insured | | | | | No Opt. Call | | | | A2 | | | $ | 5,688,960 | |
| | 3,810 | | | 0.000%, 9/01/23 – AMBAC Insured | | | | | No Opt. Call | | | | A2 | | | | 2,562,339 | |
| | | | | |
| | | | Houston, Texas, Subordinate Lien Airport System Revenue Refunding Bonds, Series 2011B: | | | | | | | | | | | | | | |
| | 1,900 | | | 5.000%, 7/01/25 | | | | | 7/21 at 100.00 | | | | A+ | �� | | | 2,254,369 | |
| | 2,025 | | | 5.000%, 7/01/26 | | | | | 7/21 at 100.00 | | | | A+ | | | | 2,381,380 | |
| | | | | |
| | | | Houston, Texas, Subordinate Lien Airport System Revenue Refunding Bonds, Series 2012B: | | | | | | | | | | | | | | |
| | 18,225 | | | 5.000%, 7/01/31 | | | | | 7/22 at 100.00 | | | | A+ | | | | 20,993,195 | |
| | 5,000 | | | 5.000%, 7/01/32 | | | | | 7/22 at 100.00 | | | | A+ | | | | 5,742,250 | |
| | | | | |
| | 715 | | | Howard County Junior College District, Texas, General Obligation Bonds, Series 2007, 4.250%, 2/15/18 – AMBAC Insured | | | | | 2/17 at 100.00 | | | | AA– | | | | 797,425 | |
| | | | | |
| | 1,595 | | | Kerrville Health Facilities Development Corporation, Texas, Revenue Bonds, Sid Peterson Memorial Hospital Project, Series 2005, 5.000%, 8/15/14 | | | | | No Opt. Call | | | | BBB– | | | | 1,655,770 | |
| | | | | |
| | 6,075 | | | Laredo, Texas, International Toll Bridge Revenue Bonds, Series 2005B, 5.000%, 10/01/18 – AGM Insured | | | | | 10/15 at 100.00 | | | | AA– | | | | 6,721,502 | |
| | | | | |
| | | | League City, Texas, Waterworks and Sewer System Revenue Bonds, Series 2008: | | | | | | | | | | | | | | |
| | 1,245 | | | 4.000%, 2/15/18 – AGM Insured | | | | | 2/17 at 100.00 | | | | AA | | | | 1,390,404 | |
| | 1,315 | | | 4.375%, 2/15/23 – AGM Insured | | | | | 2/17 at 100.00 | | | | AA | | | | 1,463,740 | |
| | | | | |
| | 2,000 | | | Love Field Airport Modernization Corporation, Texas, Special Facilities Revenue Bonds, Southwest Airlines Company, Series 2010, 5.250%, 11/01/40 | | | | | 11/20 at 100.00 | | | | BBB– | | | | 2,184,220 | |
| | | | | |
| | 1,000 | | | Lubbock Educational Facilities Authority, Texas, Revenue Bonds, Lubbock Christian University, Refunding & Improvement Series 2007, 5.000%, 11/01/16 | | | | | No Opt. Call | | | | BBB | | | | 1,116,260 | |
| | | | | |
| | 770 | | | Mansfield Independent School District, Tarrant County, Texas, General Obligation Bonds, Series 2006, 5.000%, 2/15/22 | | | | | 2/16 at 100.00 | | | | AAA | | | | 863,062 | |
| | | | | |
| | | | North Central Texas Health Facilities Development Corporation, Texas, Revenue Bonds, Children’s Medical Center Dallas Project, Series 2012: | | | | | | | | | | | | | | |
| | 4,340 | | | 5.000%, 8/15/24 | | | | | 8/22 at 100.00 | | | | AA | | | | 5,266,113 | |
| | 4,710 | | | 5.000%, 8/15/25 | | | | | 8/22 at 100.00 | | | | AA | | | | 5,644,605 | |
| | 3,920 | | | 5.000%, 8/15/26 | | | | | 8/22 at 100.00 | | | | AA | | | | 4,644,024 | |
| | 7,025 | | | 5.000%, 8/15/27 | | | | | 8/22 at 100.00 | | | | AA | | | | 8,254,656 | |
| | | | | |
| | 3,465 | | | North Harris County Regional Water Authority, Texas, Senior Water Revenue Bonds, Series 2003, 5.250%, 12/15/17 (Pre-refunded 12/15/13) – FGIC Insured | | | | | 12/13 at 100.00 | | | | A+ (4) | | | | 3,572,380 | |
| | | | | |
| | 2,500 | | | North Texas Tollway Authority, First Tier System Revenue Refunding Bonds, Series 2008A, 6.000%, 1/01/24 | | | | | 1/18 at 100.00 | | | | A2 | | | | 2,940,550 | |
| | | | | |
| | 3,050 | | | North Texas Tollway Authority, First Tier System Revenue Refunding Bonds, Variable Rate Demand Series 2008-E3, 5.750%, 1/01/38 (Mandatory put 1/01/16) | | | | | No Opt. Call | | | | A2 | | | | 3,450,099 | |
| | | | | |
| | | | North Texas Tollway Authority, Special Projects System Revenue Bonds, Current Interest Series 2011D: | | | | | | | | | | | | | | |
| | 8,565 | | | 5.250%, 9/01/25 | | | | | 9/21 at 100.00 | | | | AA | | | | 10,513,966 | |
| | 5,000 | | | 5.250%, 9/01/26 | | | | | 9/21 at 100.00 | | | | AA | | | | 6,084,000 | |
| | | | | |
| | | | North Texas Tollway Authority, Special Projects System Revenue Bonds, Series 2011A: | | | | | | | | | | | | | | |
| | 2,370 | | | 0.000%, 9/01/43 | | | | | 9/31 at 100.00 | | | | AA | | | | 1,835,518 | |
| | 9,130 | | | 0.000%, 9/01/45 | | | | | 9/31 at 100.00 | | | | AA | | | | 7,713,572 | |
| | | | | |
| | 1,000 | | | Northwest Independent School District, Denton County, Texas, General Obligation Bonds, Refunding Series 2006, 4.500%, 2/15/26 | | | | | 2/16 at 100.00 | | | | Aaa | | | | 1,086,980 | |
| | | | | |
| | 1,000 | | | Plano Independent School District, Collin County, Texas, General Obligation Bonds, Series 2008A, 5.000%, 2/15/25 | | | | | 2/18 at 100.00 | | | | Aaa | | | | 1,176,560 | |
| | | | | | | | | | | | | | | | | | |
Principal
Amount (000) | | | Description (1) | | | | Optional Call
Provisions (2) | | | Ratings (3) | | | Value | |
| | | | Texas (continued) | | | | | | | | | | | | | | |
| | | | | |
| $ | 875 | | | San Angelo, Texas, Certificates of Obligation Bonds, Tom Green County Series 2007A, 4.400%, 2/15/19 – NPFG Insured | | | | | 2/17 at 100.00 | | | | AA+ | | | $ | 981,689 | |
| | | | | |
| | 3,400 | | | San Antonio, Texas, Electric and Gas System Revenue Refunding Bonds, New Series 1992, 5.000%, 2/01/17 (ETM) | | | | | No Opt. Call | | | | AA+ (4) | | | | 3,704,980 | |
| | | | | |
| | | | San Antonio, Texas, General Obligation Bonds, Series 2006: | | | | | | | | | | | | | | |
| | 1,000 | | | 4.125%, 2/01/19 | | | | | 2/16 at 100.00 | | | | AAA | | | | 1,089,410 | |
| | 1,140 | | | 4.250%, 2/01/20 | | | | | 2/16 at 100.00 | | | | AAA | | | | 1,239,932 | |
| | | | | |
| | 575 | | | San Leanna Education Facilities Corporation, Texas, Higher Education Revenue Bonds, Saint Edward’s University Project, Series 2007, 5.000%, 6/01/19 | | | | | 6/17 at 100.00 | | | | BBB+ | | | | 635,801 | |
| | | | | |
| | 870 | | | Sunnyvale School District, Texas, General Obligation Bonds, School Building Series 2007, 4.400%, 2/15/20 | | | | | 2/17 at 100.00 | | | | AAA | | | | 972,721 | |
| | | | | |
| | 1,235 | | | Tarrant County Cultural and Educational Facilities Finance Corporation, Texas, Retirement Facility Revenue Bonds, Northwest Senior Housing-Edgemere Project, Series 2006A, 5.750%, 11/15/14 | | | | | No Opt. Call | | | | N/R | | | | 1,298,578 | |
| | | | | |
| | 4,825 | | | Tarrant County Cultural Education Facilities Finance Corporation, Texas, Hospital Revenue Bonds, Baylor Health Care System, Series 2011A, 5.000%, 11/15/30 | | | | | 11/21 at 100.00 | | | | AA– | | | | 5,529,691 | |
| | | | | |
| | 5,010 | | | Tarrant County Cultural Education Facilities Finance Corporation, Texas, Revenue Bonds, Texas Health Resources, Series 2007A, 5.000%, 2/15/19 | | | | | 2/17 at 100.00 | | | | AA– | | | | 5,715,558 | |
| | | | | |
| | 2,210 | | | Teague Independent School District, Freestone County, Texas, Unlimited Tax General Obligation Bonds, School Building Series 2008, 5.000%, 2/15/19 | | | | | 2/18 at 100.00 | | | | AAA | | | | 2,619,734 | |
| | | | | |
| | 5,000 | | | Texas Municipal Gas Acquisition and Supply Corporation III, Gas Supply Revenue Bonds, Series 2012, 5.000%, 12/15/21 | | | | | No Opt. Call | | | | A3 | | | | 5,709,200 | |
| | | | | |
| | 2,000 | | | Texas State Transportation Commission, Highway Fund Revenue Bonds, First Tier Series 2007, 5.000%, 4/01/17 | | | | | No Opt. Call | | | | AAA | | | | 2,337,440 | |
| | | | | |
| | 5,000 | | | Texas State Transportation Commission, Highway Fund Revenue Bonds, First Tier Tender Option Bond Trust 3216, 17.784%, 10/01/14 (IF) | | | | | No Opt. Call | | | | AAA | | | | 7,476,600 | |
| | | | | |
| | 4,645 | | | Texas State, General Obligation Bonds, Transportation Commission Mobility Fund, Series 2008, Trust 2568, 17.571%, 10/01/15 (IF) | | | | | No Opt. Call | | | | Aaa | | | | 7,639,306 | |
| | | | | |
| | 1,500 | | | Texas State, General Obligation Bonds, Water Financial Assistance, Refunding Series 2007A, 5.000%, 8/01/17 | | | | | No Opt. Call | | | | Aaa | | | | 1,775,670 | |
| | | | | |
| | | | Travis County Health Facilities Development Corporation, Texas, Retirement Facility Revenue Bonds, Querencia Barton Creek, Series 2005: | | | | | | | | | | | | | | |
| | 1,000 | | | 5.250%, 11/15/17 | | | | | 11/15 at 100.00 | | | | N/R | | | | 1,057,040 | |
| | 900 | | | 5.500%, 11/15/25 | | | | | 11/15 at 100.00 | | | | N/R | | | | 937,161 | |
| | | | | |
| | | | Tyler Health Facilities Development Corporation, Texas, Hospital Revenue Bonds, Mother Frances Hospital Regional Healthcare Center, Series 2007: | | | | | | | | | | | | | | |
| | 5,000 | | | 5.250%, 7/01/26 | | | | | 7/17 at 100.00 | | | | Baa1 | | | | 5,406,050 | |
| | 11,300 | | | 5.250%, 7/01/28 | | | | | 7/17 at 100.00 | | | | Baa1 | | | | 12,185,468 | |
| | | | | |
| | | | Val Verde County, Texas, Pass-Through Toll Revenue and Limited Tax Bonds, Series 2011: | | | | | | | | | | | | | | |
| | 2,675 | | | 3.500%, 8/15/18 | | | | | No Opt. Call | | | | A | | | | 2,874,154 | |
| | 2,900 | | | 4.000%, 8/15/19 | | | | | No Opt. Call | | | | A | | | | 3,214,157 | |
| | 3,015 | | | 4.000%, 8/15/20 | | | | | No Opt. Call | | | | A | | | | 3,344,208 | |
| | 3,135 | | | 4.000%, 8/15/21 | | | | | No Opt. Call | | | | A | | | | 3,479,066 | |
| | | | | |
| | 500 | | | Victoria Independent School District, Victoria County, Texas, General Obligation Bonds, Series 2007, 5.000%, 2/15/18 | | | | | 2/17 at 100.00 | | | | AAA | | | | 581,175 | |
| | | | | |
| | 1,000 | | | Victoria, Texas, Utility System Revenue Refunding Bonds, Series 2007, 4.400%, 12/01/19 – AMBAC Insured | | | | | 12/17 at 100.00 | | | | AA– | | | | 1,129,350 | |
| | | | | |
| | 8,830 | | | Williamson County, Texas, General Obligation Bonds, Limited Tax Refunding Series 2012, 5.000%, 2/15/26 | | | | | 2/22 at 100.00 | | | | AAA | | | | 10,822,048 | |
| | 303,150 | | | Total Texas | | | | | | | | | | | | | 343,073,533 | |
Portfolio of Investments
Nuveen Intermediate Duration Municipal Bond Fund (continued)
April 30, 2013
| | | | | | | | | | | | | | | | | | |
Principal
Amount (000) | | | Description (1) | | | | Optional Call
Provisions (2) | | | Ratings (3) | | | Value | |
| | | | Utah – 0.6% | | | | | | | | | | | | | | |
| | | | | |
| $ | 6,330 | | | Riverton, Utah, Hospital Revenue Bonds, IHC Health Services, Inc., Series 2009, 5.000%, 8/15/41 | | | | | 8/19 at 100.00 | | | | AA+ | | | $ | 7,127,580 | |
| | | | | |
| | | | Utah Associated Municipal Power Systems, Revenue Bonds, Horse Butte Wind Project, Series 2012A: | | | | | | | | | | | | | | |
| | 3,340 | | | 5.000%, 9/01/23 | | | | | 9/22 at 100.00 | | | | A– | | | | 4,059,737 | |
| | 2,000 | | | 5.000%, 9/01/25 | | | | | 9/22 at 100.00 | | | | A– | | | | 2,397,080 | |
| | 2,250 | | | 5.000%, 9/01/26 | | | | | 9/22 at 100.00 | | | | A– | | | | 2,670,705 | |
| | | | | |
| | | | Utah, General Obligation Bonds, Series 2009, Trust 2987: | | | | | | | | | | | | | | |
| | 1,250 | | | 17.510%, 7/01/21 (IF) | | | | | 7/18 at 100.00 | | | | AAA | | | | 2,362,500 | |
| | 2,500 | | | 17.510%, 7/01/22 (IF) | | | | | 7/18 at 100.00 | | | | AAA | | | | 4,725,000 | |
| | 17,670 | | | Total Utah | | | | | | | | | | | | | 23,342,602 | |
| | | | Virgin Islands – 0.2% | | | | | | | | | | | | | | |
| | | | | |
| | 1,580 | | | Virgin Islands Public Finance Authority, Matching Fund Loan Notes Revenue Bonds, Senior Lien Series 2010A, 5.000%, 10/01/29 | | | | | 10/20 at 100.00 | | | | BBB+ | | | | 1,757,102 | |
| | | | | |
| | 6,000 | | | Virgin Islands Public Finance Authority, Matching Fund Loan Notes Revenue Bonds, Series 2009B, 5.000%, 10/01/25 | | | | | 10/19 at 100.00 | | | | BBB+ | | | | 6,731,160 | |
| | 7,580 | | | Total Virgin Islands | | | | | | | | | | | | | 8,488,262 | |
| | | | Virginia – 0.1% | | | | | | | | | | | | | | |
| | | | | |
| | 2,370 | | | Chesapeake Hospital Authority, Virginia, Revenue Bonds, Chesapeake General Hospital, Series 2004A, 5.250%, 7/01/13 | | | | | No Opt. Call | | | | A2 | | | | 2,389,955 | |
| | | | | |
| | 1,260 | | | Virginia Small Business Financing Authority, Senior Lien Revenue Bonds, Elizabeth River Crossing, Opco LLC Project, Series 2012, 5.500%, 1/01/42 (Alternative Minimum Tax) | | | | | 7/22 at 100.00 | | | | BBB– | | | | 1,375,492 | |
| | 3,630 | | | Total Virginia | | | | | | | | | | | | | 3,765,447 | |
| | | | Washington – 2.1% | | | | | | | | | | | | | | |
| | | | | |
| | 5,690 | | | Central Valley School District 356 Spokane County, Washington, Unlimited Tax Deferred Interest General Obligation Bonds, Series 1998B, 0.000%, 12/01/14 – FGIC Insured | | | | | No Opt. Call | | | | Aa2 | | | | 5,646,756 | |
| | | | | |
| | 4,930 | | | Clark County Public Utility District 1, Washington, Electric System Revenue Bonds, Series 2007, 5.000%, 1/01/19 – FGIC Insured | | | | | 1/17 at 100.00 | | | | A | | | | 5,578,640 | |
| | | | | |
| | 1,515 | | | Clark County School District 37, Vancouver, Washington, General Obligation Bonds, Series 1998, 5.250%, 12/01/14 – AGM Insured | | | | | No Opt. Call | | | | Aa2 | | | | 1,632,397 | |
| | | | | |
| | 2,735 | | | Douglas County Public Utility District 1, Washington, Revenue Bonds, Wells Hydroelectric, Series 1963, 4.000%, 9/01/18 (ETM) | | | | | No Opt. Call | | | | AA (4) | | | | 2,983,694 | |
| | | | | |
| | 3,250 | | | Grant County Public Utility District 2, Washington, Electric System Revenue Bonds, Refunding Series 2011-I, 5.000%, 1/01/20 | | | | | No Opt. Call | | | | AA | | | | 3,958,923 | |
| | | | | |
| | 525 | | | King County School District 401, Highline, Washington, General Obligation Bonds, Series 2006, 5.250%, 12/01/25 (Pre-refunded 12/01/16) – AGM Insured | | | | | 12/16 at 100.00 | | | | AA+ (4) | | | | 613,142 | |
| | | | | |
| | 265 | | | King County School District 412 Shoreline, Washington, General Obligation Bonds, Series 2008, 5.750%, 12/01/21 | | | | | 12/18 at 100.00 | | | | AA+ | | | | 328,740 | |
| | | | | |
| | 5,055 | | | King County, Washington, General Obligation Bonds, Harborview Medical Center, Series 2004, 5.000%, 12/01/14 – AMBAC Insured | | | | | 6/14 at 100.00 | | | | AAA | | | | 5,316,091 | |
| | | | | |
| | 1,175 | | | Skagit County Public Hospital District 1, Washington, Revenue Bonds, Skagit Valley Hospital, Series 2005, 5.375%, 12/01/22 | | | | | 12/15 at 100.00 | | | | Baa2 | | | | 1,266,721 | |
| | | | | |
| | 1,000 | | | Spokane County School District 81, Spokane, Washington, General Obligation Bonds, Series 2005, 5.000%, 6/01/16
(Pre-refunded 6/01/15) – NPFG Insured | | | | | 6/15 at 100.00 | | | | Aa1 (4) | | | | 1,097,110 | |
| | | | | |
| | 8,900 | | | Tacoma, Washington, Electric System Revenue Bonds, Series 2004A, 5.250%, 1/01/16 – FGIC Insured | | | | | 7/14 at 100.00 | | | | AA | | | | 9,411,216 | |
| | | | | |
| | 6,000 | | | Washington Health Care Facilities Authority, Revenue Bonds, Fred Hutchinson Cancer Research Center, Series 2011A, 5.375%, 1/01/31 | | | | | 1/21 at 100.00 | | | | A | | | | 6,659,100 | |
| | | | | | | | | | | | | | | | | | |
Principal
Amount (000) | | | Description (1) | | | | Optional Call
Provisions (2) | | | Ratings (3) | | | Value | |
| | | | Washington (continued) | | | | | | | | | | | | | | |
| | | | | |
| | | | Washington State Health Care Facilities Authority, Revenue Bonds, Central Washington Health Services Association, Series 2009: | | | | | | | | | | | | | | |
| $ | 3,125 | | | 6.250%, 7/01/24 | | | | | 7/19 at 100.00 | | | | Baa3 | | | $ | 3,586,781 | |
| | 2,000 | | | 6.750%, 7/01/29 | | | | | 7/19 at 100.00 | | | | Baa3 | | | | 2,316,280 | |
| | | | | |
| | 3,250 | | | Washington State Higher Education Facilities Authority, Revenue Bonds, Whitworth University, Series 2009, 5.125%, 10/01/24 | | | | | 10/19 at 100.00 | | | | Baa1 | | | | 3,633,858 | |
| | | | | |
| | 4,790 | | | Washington State Tobacco Settlement Authority, Tobacco Settlement Asset-Backed Revenue Bonds, Series 2002, 6.500%, 6/01/26 | | | | | 6/13 at 100.00 | | | | A3 | | | | 4,885,704 | |
| | | | | |
| | 12,000 | | | Washington State, General Obligation Bonds, Series 1992B, 6.400%, 6/01/17 – NPFG Insured | | | | | No Opt. Call | | | | AA+ | | | | 13,711,440 | |
| | | | | |
| | 3,005 | | | Washington State, General Obligation Bonds, Series 2005A, 5.000%, 1/01/25 – AMBAC Insured | | | | | 1/15 at 100.00 | | | | AA+ | | | | 3,213,066 | |
| | | | | |
| | 3,005 | | | Washington State, General Obligation Motor Vehicle Fuel Tax Bonds, Series 2008, Trust 2599, 17.780%, 1/01/16 (IF) | | | | | No Opt. Call | | | | AA+ | | | | 5,152,914 | |
| | | | | |
| | 3,010 | | | Washington, General Obligation Bonds, Series 2000S-5, 0.000%, 1/01/16 – FGIC Insured | | | | | No Opt. Call | | | | AA+ | | | | 2,957,927 | |
| | | | | |
| | 2,275 | | | Washington, Various Purpose General Obligation Bonds, Series 1998C, 5.500%, 7/01/14 | | | | | No Opt. Call | | | | AA+ | | | | 2,415,345 | |
| | 77,500 | | | Total Washington | | | | | | | | | | | | | 86,365,845 | |
| | | | Wisconsin – 2.3% | | | | | | | | | | | | | | |
| | | | | |
| | 2,000 | | | Franklin, Wisconsin, Solid Waste Disposal Revenue Bonds, Waste Management of Wisconsin, Inc. Project, Series 2006A, 4.950%, 11/01/16 (Mandatory put 5/01/16) (Alternative Minimum Tax) | | | | | No Opt. Call | | | | BBB | | | | 2,216,800 | |
| | | | | |
| | | | University of Wisconsin Hospitals and Clinics Authority, Revenue Bonds, Refunding Series 2013A: | | | | | | | | | | | | | | |
| | 335 | | | 5.000%, 4/01/20 | | | | | No Opt. Call | | | | Aa3 | | | | 405,417 | |
| | 795 | | | 5.000%, 4/01/21 | | | | | No Opt. Call | | | | Aa3 | | | | 968,549 | |
| | 460 | | | 5.000%, 4/01/22 | | | | | No Opt. Call | | | | Aa3 | | | | 562,129 | |
| | | | | |
| | 1,020 | | | Wisconsin Health and Educational Facilities Authority, Revenue Bonds, Aurora Health Care, Inc., Series 2012A, 5.000%, 7/15/25 | | | | | 7/21 at 100.00 | | | | A | | | | 1,167,747 | |
| | | | | |
| | 2,060 | | | Wisconsin Health and Educational Facilities Authority, Revenue Bonds, Beloit College, Series 2010A, 6.000%, 6/01/30 | | | | | 6/15 at 100.00 | | | | Baa2 | | | | 2,389,064 | |
| | | | | |
| | | | Wisconsin Health and Educational Facilities Authority, Revenue Bonds, Children’s Hospital of Wisconsin Inc., Series 2008B: | | | | | | | | | | | | | | |
| | 1,400 | | | 4.350%, 8/15/19 | | | | | No Opt. Call | | | | AA– | | | | 1,645,154 | |
| | 8,670 | | | 5.500%, 8/15/29 | | | | | 2/20 at 100.00 | | | | AA– | | | | 10,001,105 | |
| | | | | |
| | 2,000 | | | Wisconsin Health and Educational Facilities Authority, Revenue Bonds, Divine Savior Healthcare, Series 2006, 5.000%, 5/01/23 | | | | | 5/16 at 100.00 | | | | BBB | | | | 2,095,580 | |
| | | | | |
| | 2,000 | | | Wisconsin Health and Educational Facilities Authority, Revenue Bonds, EastCastle Place Inc., Series, 5.750%, 12/01/19 | | | | | 7/13 at 100.00 | | | | N/R | | | | 1,448,320 | |
| | | | | |
| | 1,250 | | | Wisconsin Health and Educational Facilities Authority, Revenue Bonds, Fort Healthcare Inc., Series 2004, 5.375%, 5/01/18 | | | | | 5/14 at 100.00 | | | | BBB+ | | | | 1,301,713 | |
| | | | | |
| | | | Wisconsin Health and Educational Facilities Authority, Revenue Bonds, Franciscan Sisters of Christian Charity HealthCare Ministry, Series 2007: | | | | | | | | | | | | | | |
| | 2,275 | | | 5.000%, 9/01/20 | | | | | 9/17 at 100.00 | | | | BBB+ | | | | 2,484,573 | |
| | 2,505 | | | 5.000%, 9/01/22 | | | | | 9/17 at 100.00 | | | | BBB+ | | | | 2,676,142 | |
| | | | | |
| | 4,245 | | | Wisconsin Health and Educational Facilities Authority, Revenue Bonds, Mercy Alliance, Inc., Series 2010A, 5.000%, 6/01/19 | | | | | No Opt. Call | | | | A2 | | | | 4,477,796 | |
| | | | | |
| | 5,760 | | | Wisconsin Health and Educational Facilities Authority, Revenue Bonds, Meriter Hospital Inc., Series 1992A, 6.000%, 12/01/22 – FGIC Insured | | | | | No Opt. Call | | | | A1 | | | | 6,627,456 | |
| | | | | |
| | 1,500 | | | Wisconsin Health and Educational Facilities Authority, Revenue Bonds, Southwest Health Center Inc., Series 2004A, 6.125%, 4/01/24 (Pre-refunded 4/01/14) | | | | | 4/14 at 100.00 | | | | N/R (4) | | | | 1,576,365 | |
Portfolio of Investments
Nuveen Intermediate Duration Municipal Bond Fund (continued)
April 30, 2013
| | | | | | | | | | | | | | | | | | | | |
Principal
Amount (000) | | | Description (1) | | | | | Optional Call
Provisions (2) | | | Ratings (3) | | | Value | |
| | | | Wisconsin (continued) | | | | | | | | | | | | | | | | |
| | | | | |
| $ | 340 | | | Wisconsin Health and Educational Facilities Authority, Revenue Bonds, Vernon Memorial Healthcare Inc., Series 2005, 4.650%, 3/01/15 | | | | | | | No Opt. Call | | | | BBB | | | $ | 361,865 | |
| | | | | |
| | | | Wisconsin Health and Educational Facilities Authority, Revenue Bonds, Wheaton Franciscan Healthcare System, Series 2006A: | | | | | | | | | | | | | | | | |
| | 2,455 | | | 5.250%, 8/15/19 | | | | | | | 8/16 at 100.00 | | | | A– | | | | 2,764,796 | |
| | 11,955 | | | 5.250%, 8/15/20 | | | | | | | 8/16 at 100.00 | | | | A– | | | | 13,430,725 | |
| | | | | |
| | 10,050 | | | Wisconsin Health and Educational Facilities Authority, Revenue Bonds, Wheaton Franciscan Services Inc., Series 2006B, 5.125%, 8/15/21 | | | | | | | 8/16 at 100.00 | | | | A– | | | | 11,222,735 | |
| | | | | |
| | 1,110 | | | Wisconsin Housing and Economic Development Authority, Insured Mortgage Revenue Refunding Bonds, Series 1977A, 5.800%, 6/01/17 (ETM) | | | | | | | No Opt. Call | | | | N/R (4) | | | | 1,206,381 | |
| | | | | |
| | 9,000 | | | Wisconsin State, General Fund Annual Appropriation Revenue Bonds, Refunding Series 2009A, 6.000%, 5/01/27 | | | | | | | 5/19 at 100.00 | | | | AA– | | | | 11,115,720 | |
| | | | | |
| | 10,170 | | | Wisconsin State, General Obligation Bonds, Series 2005I, 5.000%, 5/01/16 – NPFG Insured | | | | | | | 5/15 at 100.00 | | | | AA | | | | 11,114,754 | |
| | | | | |
| | 1,450 | | | Wisconsin Health and Educational Facilities Authority, Revenue Bonds, The Medical College of Wisconsin, Inc., Series 2004A, 5.000%, 12/01/15 – NPFG Insured | | | | | | | 12/14 at 100.00 | | | | A+ | | | | 1,540,451 | |
| | 84,805 | | | Total Wisconsin | | | | | | | | | | | | | | | 94,801,337 | |
| | | | Wyoming – 0.1% | | | | | | | | | | | | | | | | |
| | | | | |
| | 2,250 | | | Lincoln County, Wyoming, Pollution Control Revenue Refunding Bonds, PacifiCorp Project, Series 1995, 0.000%, 11/01/25 (Alternative Minimum Tax) | | | | | | | No Opt. Call | | | | A2 | | | | 2,257,380 | |
| $ | 3,729,366 | | | Total Municipal Bonds (cost $3,836,699,425) | | | | | | | | | | | | | | | 4,116,989,292 | |
| | | | | |
Principal
Amount (000) | | | Description (1) | | Coupon | | | Maturity | | | Ratings (3) | | | Value | |
| | | | CORPORATE BONDS – 0.0% | | | | | | | | | | | | | | | | |
| | | | | |
| | | | Transportation – 0.0% | | | | | | | | | | | | | | | | |
| | | | | |
| $ | 194 | | | Las Vegas Monorail Company, Senior Interest Bonds (8), (9) | | | 5.500% | | | | 7/15/19 | | | | N/R | | | $ | 48,514 | |
| | 57 | | | Las Vegas Monorail Company, Senior Interest Bonds (8), (9) | | | 3.000% | | | | 7/15/55 | | | | N/R | | | | 11,357 | |
| $ | 251 | | | Total Corporate Bonds (cost $4,771) | | | | | | | | | | | | | | | 59,871 | |
| | | | Total Investments (cost $3,836,704,196) – 98.2% | | | | | | | | | | | | 4,117,049,163 | |
| | | | Other Assets Less Liabilities – 1.8% | | | | | | | | | | | | | | | 75,729,562 | |
| | | | Net Assets – 100% | | | | | | | | | | | | | | $ | 4,192,778,725 | |
| | (1) | | All percentages shown in the Portfolio of Investments are based on net assets. |
| | (2) | | Optional Call Provisions (not covered by the report of independent registered public accounting firm): Dates (month and year) and prices of the earliest optional call or redemption. There may be other call provisions at varying prices at later dates. Certain mortgage-backed securities may be subject to periodic principal paydowns. |
| | (3) | | Ratings (not covered by the report of independent registered public accounting firm): Using the highest of Standard & Poor’s Group (“Standard & Poor’s”), Moody’s Investors Service, Inc. (“Moody’s”) or Fitch, Inc. (“Fitch”) rating. Ratings below BBB by Standard & Poor’s, Baa by Moody’s or BBB by Fitch are considered to be below investment grade. Holdings designated N/R are not rated by any of these national rating agencies. |
| | (4) | | Backed by an escrow or trust containing sufficient U.S. Government or U.S. Government agency securities, which ensure the timely payment of principal and interest. Certain bonds backed by U.S. Government or agency securities are regarded as having an implied rating equal to the rating of such securities. |
| | (5) | | At or subsequent to the end of the reporting period, this security is non-income producing. Non-income producing security, in the case of a fixed-income security, generally denotes that the issuer has (1) defaulted on the payment of principal or interest, (2) is under the protection of the Federal Bankruptcy Court or (3) the Fund’s Adviser has concluded that the issue is not likely to meet its future interest payment obligations and has directed the Fund’s custodian to cease accruing additional income on the Fund’s records. |
| | (6) | | During July 2010, the original issue for this security (1,000,000 par, 5.400% coupon and May, 15, 2014 maturity) was restructured into two new securities. The first security, which is 30% of the original issue, has 300,000 par, 0.000% coupon and May 15, 2050 maturity. The second security, which is the remaining 70% of the issue, has a 700,000 par, 5.400% coupon and May 15, 2017 maturity. During September 2011, the Adviser concluded this issue is not likely to meet its future interest payment obligations and has directed the Fund’s custodian to cease accruing additional income on the Fund’s records. |
| | (7) | | During July 2010, the original issue for this security (1,000,000 par, 5.500% coupon and May, 15, 2015 maturity) was restructured into two new securities. The first security, which is 30% of the original issue, has 300,000 par, 0.000% coupon and May 15, 2050 maturity. The second security, which is the remaining 70% of the issue, has a 700,000 par, 5.500% coupon and May 15, 2018 maturity. During September 2011, the Adviser concluded this issue is not likely to meet its future interest payment obligations and has directed the Fund’s custodian to cease accruing additional income on the Fund’s records. |
| | (8) | | Investment valued at fair value using methods determined in good faith by, or at the discretion of, the Board of Trustees. For fair value measurement disclosure purposes, investment classified as Level 3. See Notes to Financial Statements, Footnote 1 – General Information and Significant Accounting Policies, Investment Valuation for more information. |
| | (9) | | During January 2010, Las Vegas Monorail Company (“Las Vegas Monorail”) filed for federal bankruptcy protection. During March 2012, Las Vegas Monorail emerged from federal bankruptcy with the acceptance of a reorganization plan assigned by the Federal Bankruptcy Court. Under the reorganization plan, the Fund surrendered its Las Vegas Monorail Project Revenue Bonds, First Tier, Series 2000 and in turn received two senior interest corporate bonds: the first with an interest rate of 5.500% maturing on July 15, 2019 and the second with an interest rate of 3.000% (5.500% after December 31, 2015) maturing on July 15, 2055. The custodian is not accruing income on the Fund’s records for either senior interest corporate bond. |
| | WI/DD | | Investment, or portion of investment, purchased on a when-issued or delayed delivery basis. |
| | (ETM) | | Escrowed to maturity. |
| | (IF) | | Inverse floating rate investment. |
See accompanying notes to financial statements.
Portfolio of Investments
Nuveen Limited Term Municipal Bond Fund
April 30, 2013
| | | | | | | | | | | | | | | | | | |
Principal
Amount (000) | | | Description (1) | | | | Optional Call
Provisions (2) | | | Ratings (3) | | | Value | |
| | | | MUNICIPAL BONDS – 95.2% | | | | | | | | | | | | | | |
| | | | | |
| | | | National – 0.1% | | | | | | | | | | | | | | |
| | | | | |
| $ | 5,074 | | | BB&T Various States Municipal Trust Pool, Class B Certificates, Series 2011, 0.340%, 9/01/14 | | | | | No Opt. Call | | | | AA– | | | $ | 5,073,705 | |
| | | | Alabama – 0.4% | | | | | | | | | | | | | | |
| | | | | |
| | | | Health Care Authority for Baptist Health, Alabama, Revenue Bonds, Baptist Health, Series 2006D: | | | | | | | | | | | | | | |
| | 1,000 | | | 5.000%, 11/15/13 | | | | | No Opt. Call | | | | A3 | | | | 1,017,210 | |
| | 1,000 | | | 5.000%, 11/15/14 | | | | | No Opt. Call | | | | A3 | | | | 1,044,920 | |
| | | | | |
| | 1,075 | | | Jefferson County, Alabama, Limited Obligation School Warrants, Education Tax Revenue Bonds, Series 2004A, 5.250%, 1/01/15 | | | | | 1/14 at 100.00 | | | | B | | | | 1,075,860 | |
| | | | | |
| | 5,000 | | | Mobile Industrial Development Board, Alabama, Pollution Control Revenue Refunding Bonds, Alabama Power Company Barry Plan, Series 2007A, 1.650%, 6/01/34 (Mandatory put 3/20/17) | | | | | No Opt. Call | | | | A+ | | | | 5,148,950 | |
| | | | | |
| | 570 | | | Pell City, Alabama, Special Care Facilities Financing Authority, Revenue Bonds, Noland Health Services, Series 2007A, 5.000%, 12/01/13 (ETM) | | | | | No Opt. Call | | | | Aaa | | | | 585,738 | |
| | | | | |
| | 4,890 | | | The Special Care Facilities Financing Authority of the City of Birmingham, Alabama, Medical Center East Health Care Facility Revenue Bonds, Series 1986 Refunding, 7.250%, 7/01/15 – NPFG Insured (ETM) | | | | | No Opt. Call | | | | A (4) | | | | 5,279,146 | |
| | 13,535 | | | Total Alabama | | | | | | | | | | | | | 14,151,824 | |
| | | | Alaska – 0.5% | | | | | | | | | | | | | | |
| | | | | |
| | | | Alaska State, Sport Fishing Revenue Bonds, Series 2011: | | | | | | | | | | | | | | |
| | 2,680 | | | 5.000%, 4/01/18 | | | | | No Opt. Call | | | | A1 | | | | 3,115,982 | |
| | 1,360 | | | 5.000%, 4/01/19 | | | | | No Opt. Call | | | | A1 | | | | 1,607,751 | |
| | | | | |
| | 7,745 | | | Anchorage, Alaska, General Obligation Bonds, Series 2003B, 5.000%, 9/01/19 (Pre-refunded 9/01/13) – FGIC Insured | | | | | 9/13 at 100.00 | | | | AA+ (4) | | | | 7,869,230 | |
| | | | | |
| | 7,530 | | | Northern Tobacco Securitization Corporation, Alaska, Tobacco Settlement Asset-Backed Bonds, Series 2006A, 4.625%, 6/01/23 | | | | | 6/14 at 100.00 | | | | Ba1 | | | | 7,558,991 | |
| | 19,315 | | | Total Alaska | | | | | | | | | | | | | 20,151,954 | |
| | | | Arizona – 4.0% | | | | | | | | | | | | | | |
| | | | | |
| | 1,000 | | | Arizona Board of Regents, Arizona State University System Revenue Bonds, Refunding Bonds, Series 2013A, 4.000%, 7/01/16 | | | | | No Opt. Call | | | | AA | | | | 1,108,580 | |
| | | | | |
| | 400 | | | Arizona Board of Regents, University of Arizona, System Revenue Refunding Bonds, Series 1992A, 6.200%, 6/01/16 | | | | | No Opt. Call | | | | AA | | | | 427,476 | |
| | | | | |
| | | | Arizona Health Facilities Authority, Hospital System Revenue Bonds, Phoenix Children’s Hospital, Refunding Series 2012A: | | | | | | | | | | | | | | |
| | 550 | | | 2.000%, 2/01/15 | | | | | No Opt. Call | | | | BBB+ | | | | 558,822 | |
| | 1,000 | | | 3.000%, 2/01/16 | | | | | No Opt. Call | | | | BBB+ | | | | 1,046,820 | |
| | 950 | | | 4.000%, 2/01/17 | | | | | No Opt. Call | | | | BBB+ | | | | 1,036,726 | |
| | 2,000 | | | 5.000%, 2/01/18 | | | | | No Opt. Call | | | | BBB+ | | | | 2,305,480 | |
| | | | | |
| | 2,955 | | | Arizona School Facilities Board, Certificates of Participation, Series 2008, 5.500%, 9/01/16 | | | | | No Opt. Call | | | | A+ | | | | 3,426,618 | |
| | | | | |
| | 895 | | | Arizona State University, System Revenue Bonds, Series 2005, 5.000%, 7/01/27 – AMBAC Insured | | | | | 7/15 at 100.00 | | | | Aa3 | | | | 969,724 | |
| | | | | |
| | | | Arizona State, Certificates of Participation, Department of Administration Series 2010B: | | | | | | | | | | | | | | |
| | 11,950 | | | 5.000%, 10/01/16 – AGC Insured | | | | | No Opt. Call | | | | AA– | | | | 13,570,062 | |
| | 760 | | | 5.000%, 10/01/17 – AGM Insured | | | | | No Opt. Call | | | | AA– | | | | 881,448 | |
| | | | | |
| | 7,760 | | | Arizona State, Certificates of Participation, Series 2008A, 5.000%, 9/01/21 – AGM Insured | | | | | 3/18 at 100.00 | | | | AA– | | | | 8,809,230 | |
| | | | | |
| | | | Arizona State, Certificates of Participation, Series 2010A: | | | | | | | | | | | | | | |
| | 4,700 | | | 5.000%, 10/01/16 – AGM Insured | | | | | No Opt. Call | | | | AA– | | | | 5,337,179 | |
| | 11,935 | | | 5.000%, 10/01/17 – AGM Insured | | | | | No Opt. Call | | | | AA– | | | | 13,842,213 | |
| | 2,960 | | | 5.000%, 10/01/19 – AGM Insured | | | | | No Opt. Call | | | | AA– | | | | 3,563,100 | |
| | | | | | | | | | | | | | | | | | |
Principal
Amount (000) | | | Description (1) | | | | Optional Call
Provisions (2) | | | Ratings (3) | | | Value | |
| | | | Arizona (continued) | | | | | | | | | | | | | | |
| | | | | |
| | | | Arizona State, State Lottery Revenue Bonds, Series 2010A: | | | | | | | | | | | | | | |
| $ | 4,105 | | | 5.000%, 7/01/15 – AGM Insured | | | | | No Opt. Call | | | | AA | | | $ | 4,498,875 | |
| | 1,890 | | | 5.000%, 7/01/16 – AGM Insured | | | | | No Opt. Call | | | | AA | | | | 2,137,930 | |
| | 2,335 | | | 5.000%, 7/01/17 – AGM Insured | | | | | No Opt. Call | | | | AA | | | | 2,711,332 | |
| | 5,100 | | | 5.000%, 7/01/18 – AGM Insured | | | | | No Opt. Call | | | | AA | | | | 6,061,554 | |
| | | | | |
| | | | City of Mesa, Arizona, General Obligation Refunding Bonds, Series 2012: | | | | | | | | | | | | | | |
| | 2,000 | | | 2.000%, 7/01/14 | | | | | No Opt. Call | | | | AA | | | | 2,038,840 | |
| | 1,855 | | | 3.000%, 7/01/17 – SYNCORA GTY Insured | | | | | No Opt. Call | | | | AA | | | | 2,010,505 | |
| | 1,425 | | | 4.000%, 7/01/20 | | | | | No Opt. Call | | | | AA | | | | 1,662,605 | |
| | 2,225 | | | 4.000%, 7/01/21 | | | | | No Opt. Call | | | | AA | | | | 2,601,804 | |
| | 2,055 | | | 4.000%, 7/01/22 | | | | | No Opt. Call | | | | AA | | | | 2,400,589 | |
| | | | | |
| | 2,205 | | | Greater Arizona Development Authority, Infrastructure Revenue Bonds, Series 2006A, 5.000%, 8/01/19 – NPFG Insured | | | | | 8/16 at 100.00 | | | | A1 | | | | 2,488,387 | |
| | | | | |
| | 3,000 | | | Maricopa County, Arizona, Hospital Revenue Bonds, Sun Health Corporation, Series 2005, 5.000%, 4/01/15 (ETM) | | | | | No Opt. Call | | | | N/R (4) | | | | 3,258,780 | |
| | | | | |
| | 3,550 | | | Mesa, Arizona, Excise Tax Revenue Bonds, Series 2013, 5.000%, 7/01/27 | | | | | 7/17 at 100.00 | | | | AA+ | | | | 4,014,198 | |
| | | | | |
| | | | Mesa, Arizona, Street and Highway User Revenue Refunding Bonds, Series 2012: | | | | | | | | | | | | | | |
| | 2,020 | | | 5.000%, 7/01/16 | | | | | No Opt. Call | | | | AA | | | | 2,289,387 | |
| | 2,040 | | | 5.000%, 7/01/21 | | | | | No Opt. Call | | | | AA | | | | 2,509,526 | |
| | 4,015 | | | 5.000%, 7/01/22 | | | | | No Opt. Call | | | | AA | | | | 4,962,701 | |
| | | | | |
| | | | Mesa, Arizona, Utility System Revenue Bonds, Refunding Series 2012: | | | | | | | | | | | | | | |
| | 5,370 | | | 5.000%, 7/01/20 | | | | | No Opt. Call | | | | Aa2 | | | | 6,610,202 | |
| | 6,115 | | | 5.000%, 7/01/21 | | | | | No Opt. Call | | | | Aa2 | | | | 7,582,355 | |
| | | | | |
| | 3,070 | | | Phoenix Civic Improvement Corporation, Arizona, Junior Lien Water System Revenue Bonds, Refunding Series 2011, 4.000%, 7/01/15 | | | | | No Opt. Call | | | | AAA | | | | 3,306,728 | |
| | | | | |
| | 1,625 | | | Pima County, Arizona, Sewer Revenue Bonds, Series 2011B, 4.000%, 7/01/13 | | | | | No Opt. Call | | | | AA– | | | | 1,635,530 | |
| | | | | |
| | 19,650 | | | Salt River Project Agricultural Improvement and Power District, Arizona, Electric System Revenue Bonds, Series 2009B, 4.000%, 1/01/18 | | | | | No Opt. Call | | | | Aa1 | | | | 22,492,176 | |
| | | | | |
| | 755 | | | Salt Verde Financial Corporation, Arizona, Senior Gas Revenue Bonds, Citigroup Energy Inc Prepay Contract Obligations, Series 2007, 5.000%, 12/01/16 | | | | | No Opt. Call | | | | A– | | | | 840,096 | |
| | | | | |
| | 300 | | | Surprise Municipal Property Corporation, Arizona, Wastewater System Revenue Bonds, Series 2007, 4.500%, 4/01/17 | | | | | 10/13 at 100.00 | | | | A– | | | | 302,592 | |
| | | | | |
| | 1,225 | | | Vistancia Community Facilities District, Peoria, Arizona, General Obligation Bonds, Series 2005, 5.000%, 7/15/14 | | | | | No Opt. Call | | | | A1 | | | | 1,267,973 | |
| | | | | |
| | 1,925 | | | Yuma County Industrial Development Authority, Arizona, Exempt Revenue Bonds, Far West Water & Sewer Inc. Refunding, Series 2007A, 6.500%, 12/01/17 (Alternative Minimum Tax) | | | | | No Opt. Call | | | | N/R | | | | 1,766,265 | |
| | 129,670 | | | Total Arizona | | | | | | | | | | | | | 148,334,408 | |
| | | | Arkansas – 0.1% | | | | | | | | | | | | | | |
| | | | | |
| | 3,000 | | | Jefferson County, Arkansas, Pollution Control Revenue Refunding Bonds, Entergy Arkansas, Inc. Project, Series 2013, 1.550%, 10/01/17 | | | | | No Opt. Call | | | | A– | | | | 3,041,490 | |
| | | | California – 5.0% | | | | | | | | | | | | | | |
| | | | | |
| | | | Alameda Corridor Transportation Authority, California, Senior Lien Revenue Refunding Bonds, Series 2013A: | | | | | | | | | | | | | | |
| | 1,040 | | | 5.000%, 10/01/19 | | | | | No Opt. Call | | | | A | | | | 1,262,851 | |
| | 1,755 | | | 5.000%, 10/01/20 | | | | | No Opt. Call | | | | A | | | | 2,144,399 | |
| | 2,300 | | | 5.000%, 10/01/21 | | | | | No Opt. Call | | | | A | | | | 2,832,174 | |
| | | | | |
| | | | California Department of Water Resources, Power Supply Revenue Bonds, Series 2010L: | | | | | | | | | | | | | | |
| | 3,600 | | | 5.000%, 5/01/16 | | | | | No Opt. Call | | | | AA | | | | 4,087,440 | |
| | 3,410 | | | 5.000%, 5/01/17 | | | | | No Opt. Call | | | | AA | | | | 3,998,396 | |
Portfolio of Investments
Nuveen Limited Term Municipal Bond Fund (continued)
April 30, 2013
| | | | | | | | | | | | | | | | | | |
Principal
Amount (000) | | | Description (1) | | | | Optional Call
Provisions (2) | | | Ratings (3) | | | Value | |
| | | | California (continued) | | | | | | | | | | | | | | |
| | | | | |
| $ | 3,805 | | | California Department of Water Resources, Power Supply Revenue Bonds, Series 2010M, 4.000%, 5/01/16 | | | | | No Opt. Call | | | | AA | | | $ | 4,209,243 | |
| | | | | |
| | 3,015 | | | California Health Facilities Financing Authority, Revenue Bonds, Catholic Healthcare West, Series 2009F, 5.000%, 7/01/27 (Mandatory put 7/01/14) | | | | | No Opt. Call | | | | A | | | | 3,172,443 | |
| | | | | |
| | 1,000 | | | California Health Facilities Financing Authority, Revenue Bonds, Cedars-Sinai Medical Center, Series 2005, 5.000%, 11/15/13 | | | | | No Opt. Call | | | | AAA | | | | 1,025,890 | |
| | | | | |
| | 1,875 | | | California Health Facilities Financing Authority, Revenue Bonds, Lucile Salter Packard Children’s Hospital, Series 2008A, 1.450%, 8/15/33 (Mandatory put 3/15/17) | | | | | No Opt. Call | | | | AA | | | | 1,910,756 | |
| | | | | |
| | 2,400 | | | California Health Facilities Financing Authority, Revenue Bonds, Lucile Salter Packard Children’s Hospital, Series 2012C, 1.450%, 8/15/23 (Mandatory put 3/15/17) | | | | | No Opt. Call | | | | AA | | | | 2,445,768 | |
| | | | | |
| | | | California State Public Works Board, Lease Revenue Bonds, Various Capital Projects, Series 2009-I: | | | | | | | | | | | | | | |
| | 4,440 | | | 5.000%, 11/01/16 | | | | | No Opt. Call | | | | A2 | | | | 5,086,153 | |
| | 3,675 | | | 5.000%, 11/01/17 | | | | | No Opt. Call | | | | A2 | | | | 4,328,011 | |
| | | | | |
| | | | California State, Economic Recovery Revenue Bonds, Refunding Series 2009A: | | | | | | | | | | | | | | |
| | 1,660 | | | 5.000%, 7/01/16 | | | | | No Opt. Call | | | | Aa3 | | | | 1,887,835 | |
| | 95 | | | 5.250%, 7/01/21 | | | | | 7/19 at 100.00 | | | | Aa3 | | | | 116,388 | |
| | | | | |
| | 4,185 | | | California State, Economic Recovery Revenue Bonds, Refunding Series 2009B, 5.000%, 7/01/23 (Mandatory put 7/01/14) | | | | | No Opt. Call | | | | Aa3 | | | | 4,411,660 | |
| | | | | |
| | 5,000 | | | California State, General Obligation Bonds, Various Purpose Series 2009, 5.000%, 10/01/16 | | | | | No Opt. Call | | | | A1 | | | | 5,736,600 | |
| | | | | |
| | | | California Statewide Communities Development Authority, Revenue Bonds, Kaiser Permanente, Series 2009A: | | | | | | | | | | | | | | |
| | 5,000 | | | 5.000%, 4/01/14 | | | | | No Opt. Call | | | | A+ | | | | 5,216,550 | |
| | 5,015 | | | 5.000%, 4/01/16 | | | | | No Opt. Call | | | | A+ | | | | 5,658,876 | |
| | | | | |
| | 1,955 | | | California Statewide Communities Development Authority, Revenue Bonds, Kaiser Permanente, Series 2009E-1, 5.000%, 4/01/44 (Mandatory put 5/01/17) | | | | | No Opt. Call | | | | A+ | | | | 2,269,305 | |
| | | | | |
| | 10,525 | | | California Statewide Communities Development Authority, Revenue Bonds, State of California Proposition 1A Receivables Program, Series 2009, 5.000%, 6/15/13 | | | | | No Opt. Call | | | | A1 | | | | 10,588,676 | |
| | | | | |
| | 1,000 | | | California Statewide Community Development Authority, Revenue Bonds, Daughters of Charity Health System, Series 2005G, 5.250%, 7/01/13 | | | | | No Opt. Call | | | | BBB– | | | | 1,008,570 | |
| | | | | |
| | 1,110 | | | California Statewide Community Development Authority, Revenue Bonds, Kaiser Permanente System, Series 2002C, 5.000%, 11/01/29 (Mandatory put 5/01/17) | | | | | No Opt. Call | | | | A+ | | | | 1,291,307 | |
| | | | | |
| | 9,375 | | | Chula Vista, California, Industrial Development Revenue Bonds, San Diego Gas & Electric Company, Refunding Series 2006A, 1.650%, 7/01/18 | | | | | 9/15 at 100.00 | | | | Aa3 | | | | 9,566,813 | |
| | | | | |
| | 1,000 | | | Del Mar Race Track Authority, California, Revenue Bonds, Series 2005, 5.000%, 8/15/13 | | | | | No Opt. Call | | | | BBB– | | | | 1,009,070 | |
| | | | | |
| | | | Delano, California, Certificates of Participation, Delano Regional Medical Center, Series 2012: | | | | | | | | | | | | | | |
| | 1,355 | | | 4.000%, 1/01/18 | | | | | No Opt. Call | | | | BBB– | | | | 1,469,227 | |
| | 1,410 | | | 5.000%, 1/01/19 | | | | | No Opt. Call | | | | BBB– | | | | 1,610,826 | |
| | 1,500 | | | 5.000%, 1/01/20 | | | | | No Opt. Call | | | | BBB– | | | | 1,709,715 | |
| | 1,595 | | | 5.000%, 1/01/21 | | | | | No Opt. Call | | | | BBB– | | | | 1,825,557 | |
| | | | | |
| | | | Golden State Tobacco Securitization Corporation, California, Tobacco Settlement Asset-Backed Bonds, Series 2003A-1: | | | | | | | | | | | | | | |
| | 16,487 | | | 6.250%, 6/01/33 (Pre-refunded 6/01/13) | | | | | 6/13 at 100.00 | | | | Aaa | | | | 16,572,073 | |
| | 7,430 | | | 6.750%, 6/01/39 (Pre-refunded 6/01/13) | | | | | 6/13 at 100.00 | | | | Aaa | | | | 7,471,534 | |
| | 1,115 | | | 6.625%, 6/01/40 (Pre-refunded 6/01/13) | | | | | 6/13 at 100.00 | | | | Aaa | | | | 1,121,110 | |
| | | | | | | | | | | | | | | | | | |
Principal
Amount (000) | | | Description (1) | | | | Optional Call
Provisions (2) | | | Ratings (3) | | | Value | |
| | | | California (continued) | | | | | | | | | | | | | | |
| | | | | |
| | | | Golden State Tobacco Securitization Corporation, California, Tobacco Settlement Asset-Backed Bonds, Series 2007A-1: | | | | | | | | | | | | | | |
| $ | 3,170 | | | 5.000%, 6/01/15 | | | | | No Opt. Call | | | | A1 | | | $ | 3,414,661 | |
| | 2,665 | | | 5.000%, 6/01/16 | | | | | No Opt. Call | | | | A2 | | | | 2,956,258 | |
| | 10,760 | | | 4.500%, 6/01/27 | | | | | 6/17 at 100.00 | | | | B | | | | 10,496,380 | |
| | 650 | | | 5.000%, 6/01/33 | | | | | 6/17 at 100.00 | | | | B | | | | 599,612 | |
| | | | | |
| | 12,000 | | | Inland Valley Development Agency, California, Tax Allocation Bonds, Series 2011C, 4.500%, 3/01/41 (Mandatory put 3/01/16) | | | | | No Opt. Call | | | | A | | | | 12,818,400 | |
| | | | | |
| | 1,785 | | | Los Angeles County Metropolitan Transportation Authority, California, Measure R Sales Tax Revenue Bonds, Senior Lien Series 2010B, 5.000%, 6/01/20 | | | | | No Opt. Call | | | | AAA | | | | 2,251,135 | |
| | | | | |
| | 965 | | | Los Angeles Harbors Department, California, Revenue Bonds, Series 1988, 7.600%, 10/01/18 (ETM) | | | | | No Opt. Call | | | | AA+ (4) | | | | 1,150,483 | |
| | | | | |
| | | | Moulton Niguel Water District, California, Certificates of Participation, Refunding Series 2003: | | | | | | | | | | | | | | |
| | 1,850 | | | 5.000%, 9/01/19 – AMBAC Insured | | | | | 9/16 at 100.00 | | | | AAA | | | | 2,058,070 | |
| | 2,255 | | | 5.000%, 9/01/20 – AMBAC Insured | | | | | 9/16 at 100.00 | | | | AAA | | | | 2,493,083 | |
| | | | | |
| | 6,160 | | | Mount San Antonio Community College District, Los Angeles County, California, General Obligation Bonds, Bond Anticipation Notes Series 2010, 0.000%, 5/01/15 | | | | | No Opt. Call | | | | AA | | | | 6,082,322 | |
| | | | | |
| | 6,250 | | | Palomar Pomerado Health Care District, California, Certificates of Participation, Series 2010, 5.250%, 11/01/21 | | | | | 11/20 at 100.00 | | | | Baa3 | | | | 6,997,500 | |
| | | | | |
| | 1,715 | | | Sacramento, California, Special Tax Bonds, North Natomas Community Facilities District 4, Series 2003C, 5.750%, 9/01/22 | | | | | 9/13 at 101.00 | | | | N/R | | | | 1,744,292 | |
| | | | | |
| | 170 | | | San Bernardino, California, GNMA Mortgage-Backed Securities Program Single Family Mortgage Revenue Refunding Bonds, Series 1990A, 7.500%, 5/01/23 (ETM) | | | | | No Opt. Call | | | | Aaa | | | | 223,383 | |
| | | | | |
| | | | San Diego County, California, Certificates of Participation, Burnham Institute, Series 2006: | | | | | | | | | | | | | | |
| | 1,420 | | | 5.000%, 9/01/14 | | | | | No Opt. Call | | | | Baa2 | | | | 1,482,437 | |
| | 1,500 | | | 5.000%, 9/01/15 | | | | | No Opt. Call | | | | Baa2 | | | | 1,605,705 | |
| | | | | |
| | 2,200 | | | San Francisco Public Utilities Commission, California, Wastewater Revenue Bonds, Series 2013A, 4.000%, 10/01/15 | | | | | No Opt. Call | | | | AA– | | | | 2,394,128 | |
| | | | | |
| | 750 | | | San Joaquin Hills Transportation Corridor Agency, Orange County, California, Senior Lien Toll Road Revenue Bonds, Series 1993, 0.000%, 1/01/14 (ETM) | | | | | No Opt. Call | | | | Aaa | | | | 749,025 | |
| | | | | |
| | 5,000 | | | San Jose Redevelopment Agency, California, Tax Allocation Bonds, Merged Area Redevelopment Project, Series 2004A, 4.250%, 8/01/15 – NPFG Insured | | | | | 8/14 at 100.00 | | | | BBB | | | | 5,037,100 | |
| | | | | |
| | 1,995 | | | Santa Ana Financing Authority, California, Lease Revenue Bonds, Police Administration and Housing Facility, Series 1994A, 6.250%, 7/01/15 – NPFG Insured | | | | | No Opt. Call | | | | Baa2 | | | | 2,181,652 | |
| | | | | |
| | | | Sierra View Local Health Care District, California, Revenue Bonds, Refunding Series 2010: | | | | | | | | | | | | | | |
| | 500 | | | 3.500%, 7/01/16 | | | | | No Opt. Call | | | | A | | | | 520,175 | |
| | 500 | | | 3.800%, 7/01/17 | | | | | No Opt. Call | | | | A | | | | 529,240 | |
| | | | | |
| | 1,415 | | | William S. Hart Union High School District, Los Angeles County, California, General Obligation Bonds, 2008 Election, Series 2013C, 2.000%, 8/01/14 | | | | | No Opt. Call | | | | Aa2 | | | | 1,447,036 | |
| | 174,802 | | | Total California | | | | | | | | | | | | | 186,277,293 | |
| | | | Colorado – 2.2% | | | | | | | | | | | | | | |
| | | | | |
| | 2,750 | | | Broomfield, Colorado, Sewer Activity Enterprise, Sewer and Wastewater Reclamation Revenue Bonds, Refunding Series 2012, 4.000%, 12/01/20 | | | | | No Opt. Call | | | | A2 | | | | 3,128,345 | |
| | | | | |
| | | | Colorado Health Facilities Authority, Revenue Bonds, Evangelical Lutheran Good Samaritan Society, Series 2006: | | | | | | | | | | | | | | |
| | 1,000 | | | 5.000%, 6/01/14 | | | | | No Opt. Call | | | | A– | | | | 1,045,970 | |
| | 2,320 | | | 5.250%, 6/01/17 | | | | | 6/16 at 100.00 | | | | A– | | | | 2,593,621 | |
Portfolio of Investments
Nuveen Limited Term Municipal Bond Fund (continued)
April 30, 2013
| | | | | | | | | | | | | | | | | | |
Principal
Amount (000) | | | Description (1) | | | | Optional Call
Provisions (2) | | | Ratings (3) | | | Value | |
| | | | Colorado (continued) | | | | | | | | | | | | | | |
| | | | | |
| $ | 1,120 | | | Colorado State Board of Community Colleges and Occupational Education, Systemwide Revenue Bonds, Series 2010C, 4.000%, 11/01/14 | | | | | No Opt. Call | | | | Aa3 | | | $ | 1,175,070 | |
| | | | | |
| | | | Colorado Water Resources and Power Development Authority, Clean Water Revolving Fund Revenue Bonds, Series 2004A: | | | | | | | | | | | | | | |
| | 80 | | | 5.000%, 9/01/23 (Pre-refunded 9/01/14) | | | | | 9/14 at 100.00 | | | | Aaa | | | | 85,041 | |
| | 3,840 | | | 5.000%, 9/01/23 (Pre-refunded 9/01/14) | | | | | 9/14 at 100.00 | | | | AAA | | | | 4,081,958 | |
| | | | | |
| | | | Denver School District 1, Colorado, General Obligation Bonds, Series 2012B: | | | | | | | | | | | | | | |
| | 7,000 | | | 4.000%, 12/01/18 | | | | | No Opt. Call | | | | AA+ | | | | 8,132,530 | |
| | 4,500 | | | 4.000%, 12/01/19 | | | | | No Opt. Call | | | | AA+ | | | | 5,285,655 | |
| | 7,120 | | | 4.000%, 12/01/20 | | | | | No Opt. Call | | | | AA+ | | | | 8,429,938 | |
| | | | | |
| | | | Denver Urban Renewal Authority, Colorado, Tax Increment Revenue Bonds, Stapleton Senior Refunding Series 2013A-1: | | | | | | | | | | | | | | |
| | 2,890 | | | 5.000%, 12/01/14 | | | | | No Opt. Call | | | | A– | | | | 3,093,485 | |
| | 1,850 | | | 5.000%, 12/01/15 | | | | | No Opt. Call | | | | A– | | | | 2,052,242 | |
| | | | | |
| | 15,955 | | | E-470 Public Highway Authority, Colorado, Senior Revenue Bonds, Series 2007C-2, 5.000%, 9/01/39 (Mandatory put 9/02/13) – NPFG Insured | | | | | No Opt. Call | | | | A | | | | 16,161,617 | |
| | | | | |
| | 4,500 | | | E-470 Public Highway Authority, Colorado, Toll Revenue Bonds, Series 2004C, 5.000%, 9/01/17 – NPFG Insured | | | | | No Opt. Call | | | | Baa2 | | | | 5,002,470 | |
| | | | | |
| | 2,550 | | | E-470 Public Highway Authority, Colorado, Toll Revenue Bonds, Series 2006A, 5.000%, 9/01/13 – NPFG Insured (ETM) | | | | | No Opt. Call | | | | A (4) | | | | 2,590,469 | |
| | | | | |
| | 2,665 | | | Eagle, Garfield and Routt Counties School District RE50J, Colorado, General Obligation Bonds, Series 2005, 5.000%, 12/01/15 – AGM Insured | | | | | No Opt. Call | | | | Aa2 | | | | 2,975,179 | |
| | | | | |
| | 955 | | | Kit Carson County Health Service District, Colorado, Health Care Facility Revenue Bonds, Series 2007, 6.100%, 1/01/17 | | | | | No Opt. Call | | | | N/R | | | | 1,002,597 | |
| | | | | |
| | 10,000 | | | Northwest Parkway Public Highway Authority, Colorado, Revenue Bonds, Senior Series 2001C, 5.800%, 6/15/25 (Pre-refunded 6/15/16) – AGM Insured | | | | | 6/16 at 100.00 | | | | AA– (4) | | | | 11,617,300 | |
| | | | | |
| | | | Plaza Metropolitan District 1, Lakewood, Colorado, Tax Increment Revenue Bonds, Refunding Series 2013: | | | | | | | | | | | | | | |
| | 1,200 | | | 4.000%, 12/01/15 | | | | | No Opt. Call | | | | N/R | | | | 1,267,656 | |
| | 1,000 | | | 5.000%, 12/01/17 | | | | | No Opt. Call | | | | N/R | | | | 1,115,020 | |
| | 1,000 | | | 5.000%, 12/01/18 | | | | | No Opt. Call | | | | N/R | | | | 1,130,120 | |
| | 74,295 | | | Total Colorado | | | | | | | | | | | | | 81,966,283 | |
| | | | Connecticut – 0.4% | | | | | | | | | | | | | | |
| | | | | |
| | 3,840 | | | Connecticut Health and Educational Facilities Authority, Revenue Bonds, Ascension Health, Series 1999B, 1.550%, 11/15/29 (Mandatory put 2/01/17) | | | | | No Opt. Call | | | | AA+ | | | | 3,949,594 | |
| | | | | |
| | 630 | | | Connecticut State Development Authority, Health Facilities Revenue Bonds, Alzheimer’s Resource Center of Connecticut, Inc., Series 2007, 5.200%, 8/15/17 | | | | | No Opt. Call | | | | N/R | | | | 682,277 | |
| | | | | |
| | 1,700 | | �� | Eastern Connecticut Resource Recovery Authority, Solid Waste Revenue Bonds, Wheelabrator Lisbon Project, Series 1993A, 5.500%, 1/01/20 (Alternative Minimum Tax) | | | | | 7/13 at 100.00 | | | | BBB | | | | 1,706,732 | |
| | | | | |
| | | | New Britain, Connecticut, General Obligation Bonds, Series 2012: | | | | | | | | | | | | | | |
| | 2,670 | | | 3.000%, 3/15/16 – AGM Insured | | | | | No Opt. Call | | | | A2 | | | | 2,828,972 | |
| | 2,670 | | | 3.000%, 3/15/17 – AGM Insured | | | | | No Opt. Call | | | | A2 | | | | 2,862,854 | |
| | | | | |
| | 1,915 | | | New Haven, Connecticut, General Obligation Bonds, Refunding Series 2010A-1, 5.000%, 2/01/14 | | | | | No Opt. Call | | | | A1 | | | | 1,981,853 | |
| | 13,425 | | | Total Connecticut | | | | | | | | | | | | | 14,012,282 | |
| | | | Delaware – 0.4% | | | | | | | | | | | | | | |
| | | | | |
| | 755 | | | Delaware Health Facilities Authority, Revenue Bonds, Beebe Medical Center, Series 2005A, 5.000%, 6/01/14 | | | | | No Opt. Call | | | | BBB– | | | | 778,254 | |
| | | | | |
| | 8,850 | | | Delaware State, General Obligation Bonds, Series 2013A, 5.000%, 8/01/17 | | | | | No Opt. Call | | | | AAA | | | | 10,496,985 | |
| | | | | | | | | | | | | | | | | | |
Principal
Amount (000) | | | Description (1) | | | | Optional Call
Provisions (2) | | | Ratings (3) | | | Value | |
| | | | Delaware (continued) | | | | | | | | | | | | | | |
| | | | | |
| $ | 5,000 | | | University of Delaware, Revenue Bonds, Series 2013C, 0.700%, 11/01/37 (Mandatory put 5/01/16) | | | | | No Opt. Call | | | | AA+ | | | $ | 5,009,600 | |
| | 14,605 | | | Total Delaware | | | | | | | | | | | | | 16,284,839 | |
| | | | District of Columbia – 0.1% | | | | | | | | | | | | | | |
| | | | | |
| | | | District of Columbia, Income Tax Secured Revenue Bonds, Series 2009D: | | | | | | | | | | | | | | |
| | 1,100 | | | 5.000%, 12/01/16 | | | | | No Opt. Call | | | | AAA | | | | 1,273,789 | |
| | 1,105 | | | 5.000%, 12/01/17 | | | | | No Opt. Call | | | | AAA | | | | 1,316,033 | |
| | 2,205 | | | Total District of Columbia | | | | | | | | | | | | | 2,589,822 | |
| | | | Florida – 5.8% | | | | | | | | | | | | | | |
| | | | | |
| | | | Citizens Property Insurance Corporation, Florida, High Risk Assessment Revenue, Senior Secured Bonds, Series 2009A-1: | | | | | | | | | | | | | | |
| | 35 | | | 5.500%, 6/01/14 | | | | | No Opt. Call | | | | A+ | | | | 36,975 | |
| | 7,255 | | | 6.000%, 6/01/16 | | | | | No Opt. Call | | | | A+ | | | | 8,393,672 | |
| | 275 | | | 5.375%, 6/01/16 | | | | | No Opt. Call | | | | A+ | | | | 313,115 | |
| | 1,850 | | | 5.500%, 6/01/17 | | | | | No Opt. Call | | | | A+ | | | | 2,173,436 | |
| | | | | |
| | | | Citizens Property Insurance Corporation, Florida, High-Risk Account Revenue Bonds, Coastal Account Senior Secured Series 2011A-1: | | | | | | | �� | | | | | | | |
| | 4,000 | | | 5.000%, 6/01/18 | | | | | No Opt. Call | | | | A+ | | | | 4,713,880 | |
| | 170 | | | 5.000%, 6/01/19 | | | | | No Opt. Call | | | | A+ | | | | 204,083 | |
| | | | | |
| | | | Citizens Property Insurance Corporation, Florida, High-Risk Account Senior Secured Bonds Series 2010A-1: | | | | | | | | | | | | | | |
| | 5,150 | | | 5.000%, 6/01/14 | | | | | No Opt. Call | | | | A+ | | | | 5,412,702 | |
| | 575 | | | 5.250%, 6/01/17 | | | | | No Opt. Call | | | | A+ | | | | 669,800 | |
| | | | | |
| | | | City of Tampa, Florida, Refunding and Capital Improvement Cigarette Tax Allocation Bonds, H. Lee Moffitt Cancer Center Project, Series 2012A: | | | | | | | | | | | | | | |
| | 250 | | | 3.000%, 9/01/14 | | | | | No Opt. Call | | | | A+ | | | | 257,740 | |
| | 400 | | | 3.000%, 9/01/15 | | | | | No Opt. Call | | | | A+ | | | | 419,672 | |
| | 400 | | | 4.000%, 9/01/17 | | | | | No Opt. Call | | | | A+ | | | | 444,816 | |
| | 815 | | | 5.000%, 9/01/18 | | | | | No Opt. Call | | | | A+ | | | | 961,113 | |
| | 660 | | | 5.000%, 9/01/19 | | | | | No Opt. Call | | | | A+ | | | | 789,479 | |
| | 700 | | | 5.000%, 9/01/20 | | | | | No Opt. Call | | | | A+ | | | | 842,681 | |
| | 575 | | | 5.000%, 9/01/21 | | | | | No Opt. Call | | | | A+ | | | | 697,883 | |
| | | | | |
| | 6,000 | | | Escambia County, Florida, Pollution Control Revenue Refunding Bonds, Gulf Power Company Project, Series 2003, 1.550%, 6/01/23 (Mandatory put 6/15/16) (Alternative Minimum Tax) | | | | | No Opt. Call | | | | A | | | | 6,112,500 | |
| | | | | |
| | 1,075 | | | Florida Board of Education, Lottery Revenue Bonds, Series 2008B, 4.000%, 7/01/13 | | | | | No Opt. Call | | | | AAA | | | | 1,082,020 | |
| | | | | |
| | | | Florida Citizens Property Insurance Corporation, High Risk Account Revenue Bonds, Series 2007A: | | | | | | | | | | | | | | |
| | 1,155 | | | 5.000%, 3/01/14 – NPFG Insured | | | | | No Opt. Call | | | | A+ | | | | 1,200,599 | |
| | 7,200 | | | 5.000%, 3/01/15 – NPFG Insured | | | | | No Opt. Call | | | | A+ | | | | 7,781,328 | |
| | 540 | | | 5.000%, 3/01/16 – NPFG Insured | | | | | No Opt. Call | | | | A+ | | | | 603,796 | |
| | 2,385 | | | 5.000%, 3/01/17 – NPFG Insured | | | | | No Opt. Call | | | | A+ | | | | 2,736,239 | |
| | | | | |
| | | | Florida Citizens Property Insurance Corporation, Personal and Commercial Lines Account Bonds, Senior Secured Series 2012A-1: | | | | | | | | | | | | | | |
| | 10,300 | | | 5.000%, 6/01/15 | | | | | No Opt. Call | | | | A+ | | | | 11,237,918 | |
| | 7,625 | | | 5.000%, 6/01/17 | | | | | No Opt. Call | | | | A+ | | | | 8,806,189 | |
| | | | | |
| | | | Florida Department of Environmental Protection, Florida Forever Revenue Bonds, Series 2007B: | | | | | | | | | | | | | | |
| | 4,480 | | | 5.000%, 7/01/17 – NPFG Insured | | | | | No Opt. Call | | | | AA– | | | | 5,234,029 | |
| | 6,575 | | | 5.000%, 7/01/19 – NPFG Insured | | | | | 7/17 at 101.00 | | | | AA– | | | | 7,609,839 | |
| | | | | |
| | 10,000 | | | Florida Hurricane Catastrophe Fund, Financial Corporation Revenue Bonds, Series 2010A, 5.000%, 7/01/15 | | | | | No Opt. Call | | | | AA | | | | 10,990,400 | |
| | | | | |
| | 2,580 | | | Florida Municipal Power Agency, Revenue Bonds, St. Lucie Project, Refunding Series 2011A, 5.000%, 10/01/20 | | | | | No Opt. Call | | | | A2 | | | | 3,150,438 | |
Portfolio of Investments
Nuveen Limited Term Municipal Bond Fund (continued)
April 30, 2013
| | | | | | | | | | | | | | | | | | |
Principal
Amount (000) | | | Description (1) | | | | Optional Call
Provisions (2) | | | Ratings (3) | | | Value | |
| | | | Florida (continued) | | | | | | | | | | | | | | |
| | | | | |
| $ | 500 | | | Florida Municipal Power Agency, Revenue Bonds, St. Lucie Project, Refunding Series 2012A, 4.000%, 10/01/15 | | | | | No Opt. Call | | | | A1 | | | $ | 539,860 | |
| | | | | |
| | | | Florida State Board of Education, Lottery Revenue Bonds, Series 2010A: | | | | | | | | | | | | | | |
| | 6,155 | | | 5.000%, 7/01/15 | | | | | No Opt. Call | | | | AAA | | | | 6,763,853 | |
| | 2,830 | | | 5.000%, 7/01/16 | | | | | No Opt. Call | | | | AAA | | | | 3,225,153 | |
| | 1,190 | | | 5.000%, 7/01/17 | | | | | No Opt. Call | | | | AAA | | | | 1,395,620 | |
| | | | | |
| | 8,035 | | | Florida State Division of Bond Finance, Preservation 2000 Revenue Bonds, Department of Environmental Protection, Series 1998A, 6.000%, 7/01/13 – AGM Insured | | | | | No Opt. Call | | | | AA– | | | | 8,114,225 | |
| | | | | |
| | 4,610 | | | Hernando County, Florida, Revenue Bonds, Criminal Justice Complex Financing Program, Series 1986, 7.650%, 7/01/16 – FGIC Insured | | | | | No Opt. Call | | | | N/R | | | | 5,439,754 | |
| | | | | |
| | 500 | | | Highlands County Health Facilities Authority, Florida, Hospital Revenue Bonds, Adventist Health System/Sunbelt Obligated Group, Series 2003D, 5.875%, 11/15/29 (Pre-refunded 11/15/13) | | | | | 11/13 at 100.00 | | | | N/R (4) | | | | 514,990 | |
| | | | | |
| | 1,650 | | | Hillsborough County Industrial Development Authority, Florida, Hospital Revenue Refunding Bonds, Tampa General Hospital, Series 2003A, 5.000%, 10/01/13 | | | | | No Opt. Call | | | | A3 | | | | 1,682,159 | |
| | | | | |
| | | | Jacksonville, Florida, Special Revenue Bonds, Series 20120C: | | | | | | | | | | | | | | |
| | 2,500 | | | 5.000%, 10/01/17 | | | | | No Opt. Call | | | | Aa2 | | | | 2,948,750 | |
| | 3,000 | | | 5.000%, 10/01/18 | | | | | No Opt. Call | | | | Aa2 | | | | 3,609,510 | |
| | 2,000 | | | 5.000%, 10/01/19 | | | | | No Opt. Call | | | | Aa2 | | | | 2,440,880 | |
| | 1,250 | | | 5.000%, 10/01/20 | | | | | No Opt. Call | | | | Aa2 | | | | 1,542,000 | |
| | | | | |
| | 900 | | | JEA, Florida, Electric System Revenue Bonds, Subordinate Series 2013B, 5.000%, 10/01/15 | | | | | No Opt. Call | | | | AA | | | | 997,848 | |
| | | | | |
| | | | Manatee County, Florida, Revenue Refunding and Improvement Bonds, Series 2013: | | | | | | | | | | | | | | |
| | 1,000 | | | 5.000%, 10/01/15 | | | | | No Opt. Call | | | | AA+ | | | | 1,108,720 | |
| | 2,500 | | | 5.000%, 10/01/20 | | | | | No Opt. Call | | | | AA+ | | | | 3,109,175 | |
| | | | | |
| | 1,540 | | | Marion County School Board, Florida, Certificates of Participation, Series 2007B, 5.000%, 6/01/18 – AMBAC Insured | | | | | 6/17 at 100.00 | | | | A1 | | | | 1,737,074 | |
| | | | | |
| | 355 | | | Martin County Industrial Development Authority, Florida, Industrial Development Revenue Refunding Bonds, Indiantown Cogeneration LP, Series 2013, 3.950%, 12/15/21 (Alternative Minimum Tax) | | | | | 6/20 at 100.00 | | | | BB | | | | 360,169 | |
| | | | | |
| | | | Miami-Dade County Industrial Development Authority, Florida, Solid Waste Revenue Bonds, Waste Management Inc. of Florida Projects 1&2, Series 2004: | | | | | | | | | | | | | | |
| | 3,725 | | | 3.750%, 12/01/18 | | | | | No Opt. Call | | | | BBB | | | | 4,066,843 | |
| | 4,000 | | | 3.750%, 12/01/18 | | | | | No Opt. Call | | | | BBB | | | | 4,367,080 | |
| | | | | |
| | | | Miami-Dade County, Florida, Special Obligation Bonds, Capital Asset Acquisition, Series 2010E: | | | | | | | | | | | | | | |
| | 1,515 | | | 4.000%, 4/01/15 | | | | | No Opt. Call | | | | Aa3 | | | | 1,610,915 | |
| | 1,640 | | | 4.000%, 4/01/17 | | | | | No Opt. Call | | | | Aa3 | | | | 1,806,870 | |
| | 1,705 | | | 5.000%, 4/01/18 | | | | | No Opt. Call | | | | Aa3 | | | | 1,989,206 | |
| | 1,790 | | | 5.000%, 4/01/19 | | | | | No Opt. Call | | | | Aa3 | | | | 2,121,615 | |
| | 1,880 | | | 5.000%, 4/01/20 | | | | | No Opt. Call | | | | Aa3 | | | | 2,250,811 | |
| | | | | |
| | 2,830 | | | Miami-Dade County, Florida, Water and Sewer System Revenue Bonds, Refunding Series 2008B, 5.250%, 10/01/17 – AGM Insured | | | | | No Opt. Call | | | | Aa2 | | | | 3,344,296 | |
| | | | | |
| | | | North Brevard County Hospital District, Florida, Revenue Bonds, Parrish Medical Center Project, Refunding Series 2008: | | | | | | | | | | | | | | |
| | 1,220 | | | 5.000%, 10/01/14 | | | | | No Opt. Call | | | | A– | | | | 1,284,599 | |
| | 1,145 | | | 5.125%, 10/01/16 | | | | | No Opt. Call | | | | A– | | | | 1,282,824 | |
| | | | | |
| | 12,035 | | | North Sumter County Utility Dependent District, Florida, Utility Revenue Bonds, Series 2010, 5.000%, 10/01/20 | | | | | No Opt. Call | | | | A | | | | 13,913,062 | |
| | | | | |
| | 5,075 | | | Orlando Utilities Commission, Florida, Water and Electric Revenue Bonds, Series 1996A, 3.750%, 10/01/23 (Pre-refunded 10/01/13) | | | | | 10/13 at 100.00 | | | | AA (4) | | | | 5,149,958 | |
| | | | | | | | | | | | | | | | | | |
Principal
Amount (000) | | | Description (1) | | | | Optional Call
Provisions (2) | | | Ratings (3) | | | Value | |
| | | | Florida (continued) | | | | | | | | | | | | | | |
| | | | | |
| | | | Orlando-Orange County Expressway Authority, Florida, Expressway Revenue Bonds, Series 2012: | | | | | | | | | | | | | | |
| $ | 2,500 | | | 5.000%, 7/01/18 | | | | | No Opt. Call | | | | A | | | $ | 2,982,425 | |
| | 2,000 | | | 5.000%, 7/01/19 | | | | | No Opt. Call | | | | A | | | | 2,424,160 | |
| | | | | |
| | 2,295 | | | Orlando-Orange County Expressway Authority, Florida, Senior Lien Revenue Bonds, Series 1988, 7.625%, 7/01/18 – AMBAC Insured (ETM) | | | | | No Opt. Call | | | | A (4) | | | | 2,879,169 | |
| | | | | |
| | | | Osceola County, Florida, Transportation Revenue Bonds, Osceola Parkway, Series 2004: | | | | | | | | | | | | | | |
| | 2,105 | | | 5.000%, 4/01/18 – NPFG Insured | | | | | 4/14 at 100.00 | | | | Aa3 | | | | 2,193,684 | |
| | 2,020 | | | 5.000%, 4/01/19 – NPFG Insured | | | | | 4/14 at 100.00 | | | | Aa3 | | | | 2,104,335 | |
| | | | | |
| | 5,000 | | | Palm Beach County Solid Waste Authority, Florida, Refunding Revenue Bonds, Series 2011, 5.000%, 10/01/25 | | | | | 10/21 at 100.00 | | | | AA+ | | | | 5,996,150 | |
| | | | | |
| | 7,425 | | | Port Everglades Authority, Florida, Port Facilities Revenue Bonds, Series 1986, 7.125%, 11/01/16 (ETM) | | | | | No Opt. Call | | | | Aaa | | | | 8,369,015 | |
| | | | | |
| | 2,250 | | | Putnam County Development Authority, Florida, Pollution Control Revenue Bonds, Seminole Electric Cooperative, Series 2007A, 5.350%, 3/15/42 (Mandatory put 5/01/18) – AMBAC Insured | | | | | No Opt. Call | | | | A– | | | | 2,658,173 | |
| | | | | |
| | 110 | | | Tolomato Community Development District, Florida, Special Assessment Bonds, Convertible, Capital Appreciation, Series 2012A-2, 0.000%, 5/01/39 | | | | | 5/17 at 100.00 | | | | N/R | | | | 84,123 | |
| | | | | |
| | 340 | | | Tolomato Community Development District, Florida, Special Assessment Bonds, Convertible, Capital Appreciation, Series 2012A-3, 0.000%, 5/01/40 | | | | | 5/19 at 100.00 | | | | N/R | | | | 212,840 | |
| | | | | |
| | 115 | | | Tolomato Community Development District, Florida, Special Assessment Bonds, Convertible, Capital Appreciation, Series 2012A-4, 0.000%, 5/01/40 | | | | | 5/22 at 100.00 | | | | N/R | | | | 53,590 | |
| | | | | |
| | 165 | | | Tolomato Community Development District, Florida, Special Assessment Bonds, Hope Note, Series 2007-3, 6.375%, 5/01/17 (5) | | | | | No Opt. Call | | | | N/R | | | | 2 | |
| | | | | |
| | 20 | | | Tolomato Community Development District, Florida, Special Assessment Bonds, Non Performing Parcel Series 2007-1. RMKT, 6.375%, 5/01/17 (5) | | | | | No Opt. Call | | | | N/R | | | | 11,501 | |
| | | | | |
| | 225 | | | Tolomato Community Development District, Florida, Special Assessment Bonds, Refunding Series 2012A-1, 6.375%, 5/01/17 | | | | | No Opt. Call | | | | N/R | | | | 220,691 | |
| | | | | |
| | 740 | | | Tolomato Community Development District, Florida, Special Assessment Bonds, Southern/Forbearance Parcel Series 2007-2, 6.375%, 5/01/17 (5) | | | | | No Opt. Call | | | | N/R | | | | 298,398 | |
| | | | | |
| | 3,110 | | | Volusia County School Board, Florida, Sales Tax Revenue Bonds, Series 2004, 5.250%, 10/01/16 – AGM Insured | | | | | No Opt. Call | | | | AA– | | | | 3,471,351 | |
| | 192,520 | | | Total Florida | | | | | | | | | | | | | 215,553,768 | |
| | | | Georgia – 2.6% | | | | | | | | | | | | | | |
| | | | | |
| | 5,900 | | | Burke County Development Authority, Georgia, Pollution Control Revenue Bonds, Georgia Power Company – Vogtle Plant, First Series 2012, 1.750%, 12/01/49 (Mandatory put 6/01/17) | | | | | No Opt. Call | | | | A | | | | 6,087,915 | |
| | | | | |
| | 9,000 | | | Burke County Development Authority, Georgia, Pollution Control Revenue Bonds, Georgia Power Company – Vogtle Plant, Second Series 2012, 1.750%, 12/01/49 (Mandatory put 6/01/17) | | | | | No Opt. Call | | | | A | | | | 9,242,820 | |
| | | | | |
| | 13,000 | | | Burke County Development Authority, Georgia, Pollution Control Revenue Bonds, Georgia Power Company – Vogtle Plant, Series 2008, 1.400%, 11/01/48 (Mandatory put 4/01/15) | | | | | No Opt. Call | | | | A+ | | | | 13,191,880 | |
| | | | | |
| | 5,000 | | | Burke County Development Authority, Georgia, Pollution Control Revenue Bonds, Georgia Power Company, Fourth Series 1994, 1.200%, 10/01/32 (Mandatory put 4/01/14) | | | | | No Opt. Call | | | | A+ | | | | 5,030,900 | |
| | | | | |
| | 3,700 | | | Burke County Development Authority, Georgia, Pollution Control Revenue Bonds, Georgia Power Company, Ninth Series 1994, 1.200%, 10/01/32 (Mandatory put 4/01/14) | | | | | No Opt. Call | | | | A+ | | | | 3,727,639 | |
Portfolio of Investments
Nuveen Limited Term Municipal Bond Fund (continued)
April 30, 2013
| | | | | | | | | | | | | | | | | | |
Principal
Amount (000) | | | Description (1) | | | | Optional Call
Provisions (2) | | | Ratings (3) | | | Value | |
| | | | Georgia (continued) | | | | | | | | | | | | | | |
| | | | | |
| $ | 3,345 | | | Cobb County Development Authority, Georgia, Solid Waste Disposal Revenue Bonds, Georgia Waste Management Project, Series 2004A, 2.000%, 4/01/33 (Mandatory put 10/01/14) | | | | | No Opt. Call | | | | BBB | | | $ | 3,415,145 | |
| | | | | |
| | | | Columbia County, Georgia, General Obligation Sales Tax Bonds, Series 2009: | | | | | | | | | | | | | | |
| | 1,310 | | | 5.000%, 4/01/15 | | | | | No Opt. Call | | | | AAA | | | | 1,427,219 | |
| | 1,450 | | | 5.000%, 4/01/17 | | | | | No Opt. Call | | | | AAA | | | | 1,694,644 | |
| | | | | |
| | | | DeKalb County, Georgia, Water and Sewerage Revenue Bonds, Second Resolution Series 2011A: | | | | | | | | | | | | | | |
| | 700 | | | 4.000%, 10/01/14 | | | | | No Opt. Call | | | | Aa3 | | | | 735,889 | |
| | 200 | | | 2.000%, 10/01/14 | | | | | No Opt. Call | | | | Aa3 | | | | 204,596 | |
| | 500 | | | 4.000%, 10/01/15 | | | | | No Opt. Call | | | | Aa3 | | | | 541,840 | |
| | | | | |
| | 1,000 | | | Fulton County Development Authority, Georgia, Revenue Bonds, Robert W. Woodruff Arts Center, Inc. Project, Refunding Series 2009B, 5.000%, 3/15/16 | | | | | No Opt. Call | | | | A2 | | | | 1,116,600 | |
| | | | | |
| | 280 | | | Georgia Municipal Electric Authority, General Power Revenue Bonds, Series 1991V, 6.600%, 1/01/18 – NPFG Insured | | | | | No Opt. Call | | | | A1 | | | | 317,335 | |
| | | | | |
| | 2,105 | | | Georgia State, General Obligation Bonds, Series 2009B, 4.000%, 1/01/21 | | | | | 1/19 at 100.00 | | | | AAA | | | | 2,428,960 | |
| | | | | |
| | 11,440 | | | Georgia State, General Obligation Bonds, Series 2009D, 5.000%, 5/01/20 | | | | | 5/19 at 100.00 | | | | AAA | | | | 14,063,650 | |
| | | | | |
| | 10,000 | | | Gwinnett County School District, Georgia, General Obligation Bonds, Sales Tax Series 2012A, 4.000%, 10/01/16 | | | | | No Opt. Call | | | | AAA | | | | 11,186,900 | |
| | | | | |
| | 3,300 | | | Henry County School District, Georgia, General Obligation Bonds, Refunding Series 2012, 2.000%, 12/01/14 | | | | | No Opt. Call | | | | AA+ | | | | 3,388,968 | |
| | | | | |
| | 170 | | | Metropolitan Atlanta Rapid Transit Authority, Georgia, Sales Tax Revenue Refunding Bonds, Series 1992N, 6.250%, 7/01/18 – NPFG Insured | | | | | No Opt. Call | | | | Aa2 | | | | 193,127 | |
| | | | | |
| | 1,000 | | | Municipal Electric Authority of Georgia, Combined Cycle Project Revenue Bonds, Series2012A, 4.000%, 11/01/14 | | | | | No Opt. Call | | | | A1 | | | | 1,054,320 | |
| | | | | |
| | 1,000 | | | Municipal Electric Authority of Georgia, Project One Revenue Bonds, Refunding Subordinate Lien Series 2011A, 4.000%, 1/01/15 | | | | | No Opt. Call | | | | A+ | | | | 1,058,890 | |
| | | | | |
| | 7,615 | | | Municipal Electric Authority of Georgia, Project One Subordinate Lien Revenue Bonds, Series 2008A, 5.250%, 1/01/18 | | | | | No Opt. Call | | | | A+ | | | | 9,074,339 | |
| | | | | |
| | | | Private Colleges and Universities Authority, Georgia, Revenue Bonds, Mercer University Project, Refunding Series 2012C: | | | | | | | | | | | | | | |
| | 500 | | | 5.000%, 10/01/17 | | | | | No Opt. Call | | | | Baa2 | | | | 560,660 | |
| | 580 | | | 5.000%, 10/01/20 | | | | | No Opt. Call | | | | Baa2 | | | | 671,982 | |
| | | | | |
| | | | Richmond County Board of Education, Georgia, General Obligation Bonds, Sales Tax Series 2012: | | | | | | | | | | | | | | |
| | 3,300 | | | 5.000%, 10/01/15 | | | | | No Opt. Call | | | | AA+ | | | | 3,665,541 | |
| | 2,000 | | | 3.000%, 10/01/15 | | | | | No Opt. Call | | | | AA+ | | | | 2,125,320 | |
| | 88,395 | | | Total Georgia | | | | | | | | | | | | | 96,207,079 | |
| | | | Hawaii – 1.5% | | | | | | | | | | | | | | |
| | | | | |
| | | | Hawaii State, General Obligation Bonds, Refunding Series 2011EA: | | | | | | | | | | | | | | |
| | 2,660 | | | 5.000%, 12/01/16 | | | | | No Opt. Call | | | | AA | | | | 3,079,216 | |
| | 7,500 | | | 5.000%, 12/01/17 | | | | | No Opt. Call | | | | AA | | | | 8,939,850 | |
| | | | | |
| | 15,000 | | | Hawaii State, General Obligation Bonds, Series 2008D-K, 5.000%, 5/01/16 | | | | | No Opt. Call | | | | AA | | | | 17,006,850 | |
| | | | | |
| | 6,385 | | | Hawaii State, General Obligation Bonds, Series 2011DZ, 5.000%, 12/01/18 | | | | | No Opt. Call | | | | AA | | | | 7,787,210 | |
| | | | | |
| | 4,500 | | | Hawaii State, General Obligation Bonds, Series 2012EE, 5.000%, 11/01/20 | | | | | No Opt. Call | | | | AA | | | | 5,657,760 | |
| | | | | |
| | 8,290 | | | Hawaii State, General Obligation Bonds, Series 2012EF, 5.000%, 11/01/20 | | | | | No Opt. Call | | | | AA | | | | 10,422,851 | |
| | | | | |
| | | | Hawaii State, Highway Revenue Bonds, Series 2011A: | | | | | | | | | | | | | | |
| | 405 | | | 4.000%, 1/01/15 | | | | | No Opt. Call | | | | AA+ | | | | 429,409 | |
| | 2,145 | | | 4.000%, 1/01/16 | | | | | No Opt. Call | | | | AA+ | | | | 2,341,117 | |
| | | | | |
| | 1,000 | | | Honolulu City and County, Hawaii, General Obligation Bonds, Series 2004B, 5.000%, 7/01/13 – NPFG Insured | | | | | No Opt. Call | | | | Aa1 | | | | 1,008,190 | |
| | 47,885 | | | Total Hawaii | | | | | | | | | | | | | 56,672,453 | |
| | | | | | | | | | | | | | | | | | |
Principal
Amount (000) | | | Description (1) | | | | Optional Call
Provisions (2) | | | Ratings (3) | | | Value | |
| | | | Illinois – 8.1% | | | | | | | | | | | | | | |
| | | | | |
| $ | 1,240 | | | Bourbonnais, Illinois, Industrial Project Revenue Bonds, Olivet Nazarene University Project, Series 2010, 5.000%, 11/01/20 | | | | | No Opt. Call | | | | BBB | | | $ | 1,444,265 | |
| | | | | |
| | 1,000 | | | Bourbonnais, Illinois, Revenue Bonds, Olivet Nazarene University, Refunding Series 2007, 5.000%, 11/01/15 – RAAI Insured | | | | | No Opt. Call | | | | BBB | | | | 1,086,160 | |
| | | | | |
| | 1,405 | | | Chicago Board of Education, Illinois, General Obligation Bonds, Series 1999A, 0.000%, 12/01/17 – FGIC Insured | | | | | No Opt. Call | | | | A+ | | | | 1,300,482 | |
| | | | | |
| | 4,020 | | | Chicago, Illinois, General Obligation Bonds, Modern Schools Across Chicago Program, Series 2007J, 5.000%, 12/01/21 – AMBAC Insured | | | | | 12/16 at 100.00 | | | | Aa3 | | | | 4,462,522 | |
| | | | | |
| | 2,000 | | | Community Unit School District 308, Oswego, in the Counties of Kendall, Kane, and Will, Illinois, General Obligation Bonds, Series 2004, 5.375%, 10/01/18 (Pre-refunded 10/01/14) – AGM Insured | | | | | 10/14 at 100.00 | | | | Aa2 (4) | | | | 2,144,400 | |
| | | | | |
| | 7,195 | | | Cook County, Illinois, General Obligation Bonds, Refunding Series 2009A, 5.000%, 11/15/17 | | | | | No Opt. Call | | | | AA | | | | 8,435,274 | |
| | | | | |
| | 3,500 | | | Cook County, Illinois, General Obligation Bonds, Refunding Series 2010A, 5.250%, 11/15/22 | | | | | 11/20 at 100.00 | | | | AA | | | | 4,223,940 | |
| | | | | |
| | 3,315 | | | Cook County, Illinois, General Obligation Bonds, Refunding Series 2011A, 5.000%, 11/15/18 | | | | | No Opt. Call | | | | AA | | | | 3,985,492 | |
| | | | | |
| | 1,930 | | | Glendale Heights, Illinois, Hospital Revenue Bonds, Glendale Heights Hospital, Series 1985B, 7.100%, 12/01/15 (ETM) | | | | | No Opt. Call | | | | Aaa | | | | 2,131,569 | |
| | | | | |
| | 920 | | | Huntley, Illinois, Special Service Area 10, Special Tax Bonds, Series 2007, 4.600%, 3/01/17 – AGC Insured | | | | | No Opt. Call | | | | AA– | | | | 978,530 | |
| | | | | |
| | 1,095 | | | Illinois Development Finance Authority, Revenue Bonds, Provena Health, Series 1998A, 5.750%, 5/15/14 – NPFG Insured | | | | | 7/13 at 100.00 | | | | Baa1 | | | | 1,100,081 | |
| | | | | |
| | 1,250 | | | Illinois Development Finance Authority, Revenue Bonds, St Vincent de Paul Center Project, Series 2013A, 1.875%, 11/15/39 (Mandatory put 3/01/19) | | | | | No Opt. Call | | | | AA+ | | | | 1,261,450 | |
| | | | | |
| | 1,175 | | | Illinois Educational Facilities Authority, Revenue Bonds, Art Institute of Chicago, Series 1998A, 5.000%, 3/01/30 (Mandatory put 3/01/17) | | | | | No Opt. Call | | | | A1 | | | | 1,315,671 | |
| | | | | |
| | 2,745 | | | Illinois Educational Facilities Authority, Revenue Bonds, University of Chicago, Series 1998B, 3.375%, 7/01/25 (Mandatory put 2/03/14) | | | | | No Opt. Call | | | | Aa1 | | | | 2,810,304 | |
| | | | | |
| | 8,000 | | | Illinois Educational Facilities Authority, Revenue Bonds, University of Chicago, Series 2004B2, 1.100%, 7/01/36 (Mandatory put 2/15/18) | | | | | No Opt. Call | | | | Aa1 | | | | 8,142,000 | |
| | | | | |
| | 11,300 | | | Illinois Finance Authority, Midwestern Disaster Area Industrial Development Revenue Bonds, Cargill, Incorporated Project, Series 2012, 1.550%, 11/01/38 (Mandatory put 11/01/17) | | | | | No Opt. Call | | | | A | | | | 11,397,519 | |
| | | | | |
| | 8,665 | | | Illinois Finance Authority, Revenue Bonds, Centegra Health System, Series 2012, 5.000%, 9/01/27 | | | | | 9/22 at 100.00 | | | | A– | | | | 9,656,796 | |
| | | | | |
| | 3,575 | | | Illinois Finance Authority, Revenue Bonds, Advocate Health Care Network, Refunding Series 2008C-3B, 4.375%, 11/01/38 (Mandatory put 7/01/14) | | | | | No Opt. Call | | | | AA | | | | 3,730,513 | |
| | | | | |
| | 3,000 | | | Illinois Finance Authority, Revenue Bonds, Ascension Health Alliance Senior Credit Group, Series 2012E-1, 5.000%, 11/15/42 (Mandatory put 5/01/15) | | | | | No Opt. Call | | | | AA+ | | | | 3,267,750 | |
| | | | | |
| | 2,000 | | | Illinois Finance Authority, Revenue Bonds, Children’s Memorial Hospital, Series 2008B, 5.500%, 8/15/21 | | | | | 8/18 at 100.00 | | | | AA– | | | | 2,310,920 | |
| | | | | |
| | 1,360 | | | Illinois Finance Authority, Revenue Bonds, OSF Healthcare System, Series 2007A, 4.750%, 11/15/14 | | | | | No Opt. Call | | | | A | | | | 1,444,796 | |
| | | | | |
| | 1,200 | | | Illinois Finance Authority, Revenue Bonds, Palos Community Hospital, Series 2010C, 5.000%, 5/15/17 | | | | | No Opt. Call | | | | AA– | | | | 1,385,688 | |
| | | | | |
| | | | Illinois Finance Authority, Revenue Bonds, Silver Cross Hospital and Medical Centers, Series 2005: | | | | | | | | | | | | | | |
| | 1,100 | | | 5.000%, 8/15/14 | | | | | No Opt. Call | | | | AA– | | | | 1,152,525 | |
| | 1,175 | | | 5.000%, 8/15/15 | | | | | No Opt. Call | | | | AA– | | | | 1,268,941 | |
| | 1,000 | | | 5.000%, 8/15/16 – AGC Insured | | | | | No Opt. Call | | | | AA– | | | | 1,112,760 | |
| | 875 | | | 5.000%, 8/15/18 | | | | | No Opt. Call | | | | AA– | | | | 1,011,421 | |
| | 355 | | | 5.250%, 8/15/19 | | | | | No Opt. Call | | | | AA– | | | | 421,616 | |
Portfolio of Investments
Nuveen Limited Term Municipal Bond Fund (continued)
April 30, 2013
| | | | | | | | | | | | | | | | | | |
Principal
Amount (000) | | | Description (1) | | | | Optional Call
Provisions (2) | | | Ratings (3) | | | Value | |
| | | | Illinois (continued) | | | | | | | | | | | | | | |
| | | | | |
| $ | 2,000 | | | Illinois Finance Authority, Revenue Bonds, The Carle Foundation, Series 2009A, 5.500%, 2/15/16 | | | | | No Opt. Call | | | | AA– | | | $ | 2,241,100 | |
| | | | | |
| | 5,000 | | | Illinois Finance Authority, Revenue Bonds, The University of Chicago, Series 2012A, 5.000%, 10/01/20 | | | | | No Opt. Call | | | | Aa1 | | | | 6,262,200 | |
| | | | | |
| | | | Illinois Finance Authority, Student Housing Revenue Bonds, Educational Advancement Fund Inc., University Center Project, Series 2006B: | | | | | | | | | | | | | | |
| | 1,000 | | | 5.000%, 5/01/13 | | | | | No Opt. Call | | | | BBB+ | | | | 1,000,100 | |
| | 2,510 | | | 5.000%, 5/01/25 | | | | | 11/16 at 100.00 | | | | BBB+ | | | | 2,674,029 | |
| | | | | |
| | 410 | | | Illinois Health Facilities Authority, Revenue Bonds, Silver Cross Hospital and Medical Centers, Series 1999, 5.500%, 8/15/19 | | | | | 7/13 at 100.00 | | | | BBB– | | | | 410,886 | |
| | | | | |
| | 3,000 | | | Illinois Municipal Electric Agency, Power Supply System Revenue Bonds, Series 2007A, 5.250%, 2/01/16 – FGIC Insured | | | | | No Opt. Call | | | | A+ | | | | 3,369,330 | |
| | | | | |
| | 2,080 | | | Illinois State Department of Employment Security, Unemployment Insurance Fund Building Receipts Revenue Bonds, Series 2012A, 5.000%, 6/15/14 | | | | | No Opt. Call | | | | AA+ | | | | 2,192,112 | |
| | | | | |
| | | | Illinois State Department of Employment Security, Unemployment Insurance Fund Building Receipts Revenue Bonds, Series 2012B: | | | | | | | | | | | | | | |
| | 2,525 | | | 5.000%, 6/15/18 | | | | | 12/16 at 100.00 | | | | AA+ | | | | 2,920,592 | |
| | 3,000 | | | 5.000%, 12/15/18 | | | | | 6/16 at 100.00 | | | | AA+ | | | | 3,407,580 | |
| | 1,705 | | | 5.000%, 6/15/19 | | | | | 6/15 at 100.00 | | | | AA+ | | | | 1,871,885 | |
| | 3,250 | | | 5.000%, 12/15/19 | | | | | 12/14 at 100.00 | | | | AA+ | | | | 3,501,680 | |
| | | | | |
| | 2,840 | | | Illinois State, General Obligation Bonds, Refunding Series 2004B, 5.000%, 3/01/14 | | | | | No Opt. Call | | | | A2 | | | | 2,941,700 | |
| | | | | |
| | | | Illinois State, General Obligation Bonds, Refunding Series 2006: | | | | | | | | | | | | | | |
| | 920 | | | 5.000%, 1/01/14 | | | | | No Opt. Call | | | | A2 | | | | 946,524 | |
| | 190 | | | 5.000%, 1/01/15 | | | | | No Opt. Call | | | | A2 | | | | 202,861 | |
| | 3,460 | | | 5.000%, 1/01/16 | | | | | No Opt. Call | | | | A2 | | | | 3,807,695 | |
| | | | | |
| | | | Illinois State, General Obligation Bonds, Refunding Series 2007B: | | | | | | | | | | | | | | |
| | 1,525 | | | 5.000%, 1/01/16 | | | | | No Opt. Call | | | | A2 | | | | 1,678,247 | |
| | 1,115 | | | 5.250%, 1/01/20 | | | | | No Opt. Call | | | | A2 | | | | 1,314,618 | |
| | | | | |
| | 235 | | | Illinois State, General Obligation Bonds, Refunding Series 2008, 4.250%, 4/01/16 | | | | | No Opt. Call | | | | A2 | | | | 255,412 | |
| | | | | |
| | | | Illinois State, General Obligation Bonds, Refunding Series 2010: | | | | | | | | | | | | | | |
| | 2,860 | | | 5.000%, 1/01/14 | | | | | No Opt. Call | | | | A2 | | | | 2,942,454 | |
| | 1,255 | | | 5.000%, 1/01/15 | | | | | No Opt. Call | | | | A2 | | | | 1,339,951 | |
| | 1,505 | | | 5.000%, 1/01/16 | | | | | No Opt. Call | | | | A2 | | | | 1,656,237 | |
| | 5,025 | | | 5.000%, 1/01/17 – AGM Insured | | | | | No Opt. Call | | | | AA– | | | | 5,674,582 | |
| | 425 | | | 5.000%, 1/01/17 | | | | | No Opt. Call | | | | A2 | | | | 479,124 | |
| | 4,960 | | | 5.000%, 1/01/18 – AGM Insured | | | | | No Opt. Call | | | | AA– | | | | 5,690,459 | |
| | 21,840 | | | 5.000%, 1/01/18 | | | | | No Opt. Call | | | | A2 | | | | 25,003,524 | |
| | 535 | | | 5.000%, 1/01/19 | | | | | No Opt. Call | | | | A2 | | | | 618,278 | |
| | | | | |
| | 885 | | | Illinois State, General Obligation Bonds, Refunding Series 2010, 5.000%, 1/01/14 (ETM) | | | | | No Opt. Call | | | | N/R (4) | | | | 913,063 | |
| | | | | |
| | | | Illinois State, General Obligation Bonds, Refunding Series 2012: | | | | | | | | | | | | | | |
| | 7,000 | | | 5.000%, 8/01/15 | | | | | No Opt. Call | | | | A2 | | | | 7,623,350 | |
| | 8,000 | | | 5.000%, 8/01/16 | | | | | No Opt. Call | | | | A2 | | | | 8,946,160 | |
| | 5,000 | | | 5.000%, 8/01/17 | | | | | No Opt. Call | | | | A2 | | | | 5,715,550 | |
| | 5,015 | | | 5.000%, 8/01/18 | | | | | No Opt. Call | | | | A2 | | | | 5,793,127 | |
| | 5,035 | | | 5.000%, 8/01/19 | | | | | No Opt. Call | | | | A2 | | | | 5,875,593 | |
| | 3,940 | | | 5.000%, 8/01/20 | | | | | No Opt. Call | | | | A2 | | | | 4,619,926 | |
| | | | | |
| | 6,975 | | | Illinois State, General Obligation Bonds, Series 2003A, 5.000%, 10/01/19 | | | | | 10/13 at 100.00 | | | | A2 | | | | 7,099,504 | |
| | | | | |
| | 560 | | | Illinois State, General Obligation Bonds, Series 2003, 5.000%, 6/01/19 – NPFG Insured | | | | | 6/13 at 100.00 | | | | A2 | | | | 562,055 | |
| | | | | |
| | 10 | | | Illinois State, General Obligation Bonds, Series 2004A, 5.000%, 3/01/22 | | | | | 3/14 at 100.00 | | | | A2 | | | | 10,332 | |
| | | | | |
| | | | Illinois State, General Obligation Bonds, Series 2004A: | | | | | | | | | | | | | | |
| | 1,840 | | | 5.000%, 3/01/16 (Pre-refunded 3/01/14) – NPFG Insured | | | | | 3/14 at 100.00 | | | | A2 (4) | | | | 1,912,662 | |
| | 5 | | | 5.000%, 3/01/22 (Pre-refunded 3/01/14) | | | | | 3/14 at 100.00 | | | | A2 (4) | | | | 5,195 | |
| | | | | | | | | | | | | | | | | | |
Principal
Amount (000) | | | Description (1) | | | | Optional Call
Provisions (2) | | | Ratings (3) | | | Value | |
| | | | Illinois (continued) | | | | | | | | | | | | | | |
| | | | | |
| | | | Illinois State, General Obligation Bonds, Series 2004: | | | | | | | | | | | | | | |
| $ | 860 | | | 5.000%, 11/01/13 – AMBAC Insured (ETM) | | | | | No Opt. Call | | | | A– (4) | | | $ | 880,391 | |
| | 940 | | | 5.000%, 9/01/14 – NPFG Insured (ETM) | | | | | No Opt. Call | | | | A (4) | | | | 999,229 | |
| | | | | |
| | | | Illinois State, General Obligation Bonds, Series 2005: | | | | | | | | | | | | | | |
| | 860 | | | 5.000%, 4/01/14 – AMBAC Insured | | | | | No Opt. Call | | | | A2 | | | | 893,772 | |
| | 2,000 | | | 5.000%, 9/01/16 – AGM Insured | | | | | 9/15 at 100.00 | | | | AA– | | | | 2,172,500 | |
| | | | | |
| | 1,010 | | | Illinois State, General Obligation Bonds, Series 2006A, 5.000%, 6/01/17 | | | | | No Opt. Call | | | | A2 | | | | 1,150,138 | |
| | | | | |
| | | | Illinois State, General Obligation Bonds, Series 2006: | | | | | | | | | | | | | | |
| | 4,060 | | | 5.000%, 1/01/16 | | | | | No Opt. Call | | | | A2 | | | | 4,467,989 | |
| | 1,005 | | | 5.000%, 1/01/17 | | | | | 1/16 at 100.00 | | | | A2 | | | | 1,098,756 | |
| | | | | |
| | 1,000 | | | Illinois State, General Obligation Bonds, Series 2007A, 5.000%, 6/01/22 – AGM Insured | | | | | 6/17 at 100.00 | | | | AA– | | | | 1,117,310 | |
| | | | | |
| | | | Illinois State, Sales Tax Revenue Bonds, Build Illinois Series 2010: | | | | | | | | | | | | | | |
| | 3,070 | | | 5.000%, 6/15/15 | | | | | No Opt. Call | | | | AAA | | | | 3,373,623 | |
| | 2,030 | | | 5.000%, 6/15/16 | | | | | No Opt. Call | | | | AAA | | | | 2,312,556 | |
| | | | | |
| | | | Illinois, General Obligation Bonds, Illinois FIRST Program, Series 2001: | | | | | | | | | | | | | | |
| | 415 | | | 5.500%, 5/01/15 – AGM Insured | | | | | No Opt. Call | | | | AA– | | | | 452,653 | |
| | 1,115 | | | 5.375%, 4/01/16 – NPFG Insured | | | | | No Opt. Call | | | | A2 | | | | 1,247,730 | |
| | | | | |
| | | | Illinois, General Obligation Bonds, Illinois FIRST Program, Series 2002: | | | | | | | | | | | | | | |
| | 1,165 | | | 5.500%, 8/01/13 – NPFG Insured | | | | | No Opt. Call | | | | A2 | | | | 1,179,749 | |
| | 625 | | | 5.500%, 8/01/14 – NPFG Insured | | | | | No Opt. Call | | | | A2 | | | | 661,938 | |
| | 620 | | | 5.500%, 8/01/15 – NPFG Insured | | | | | No Opt. Call | | | | A2 | | | | 682,099 | |
| | | | | |
| | 2,295 | | | Kane County School District 129, Aurora West, Illinois, General Obligation Bonds, Series 2005B, 5.000%, 2/01/19 – FGIC Insured | | | | | 2/15 at 100.00 | | | | A+ | | | | 2,458,152 | |
| | | | | |
| | | | Lake County Forest Preserve District, Illinois, General Obligation Bonds, Series 2007A: | | | | | | | | | | | | | | |
| | 875 | | | 0.538%, 12/15/13 | | | | | No Opt. Call | | | | AAA | | | | 875,018 | |
| | 2,000 | | | 0.638%, 12/15/16 | | | | | 12/14 at 100.00 | | | | AAA | | | | 1,990,560 | |
| | | | | |
| | 1,900 | | | Peoria Public Building Commission, Illinois, School District Facility Revenue Bonds, Peoria County School District 150 Project, Series 2009A, 0.000%, 12/01/22 – AGC Insured | | | | | 12/18 at 79.62 | | | | AA– | | | | 1,284,096 | |
| | | | | |
| | | | Railsplitter Tobacco Settlement Authority, Illinois, Tobacco Settlement Revenue Bonds, Series 2010: | | | | | | | | | | | | | | |
| | 255 | | | 5.000%, 6/01/15 | | | | | No Opt. Call | | | | A | | | | 275,604 | |
| | 5,115 | | | 5.000%, 6/01/16 | | | | | No Opt. Call | | | | A | | | | 5,705,936 | |
| | 7,300 | | | 5.000%, 6/01/17 | | | | | No Opt. Call | | | | A | | | | 8,368,063 | |
| | 5,140 | | | 5.000%, 6/01/18 | | | | | No Opt. Call | | | | A | | | | 6,012,052 | |
| | 9,585 | | | 5.000%, 6/01/19 | | | | | No Opt. Call | | | | A | | | | 11,386,213 | |
| | 5,185 | | | 5.250%, 6/01/20 | | | | | No Opt. Call | | | | A | | | | 6,301,693 | |
| | 20 | | | 5.250%, 6/01/21 | | | | | No Opt. Call | | | | A | | | | 24,502 | |
| | | | | |
| | 6,225 | | | Regional Transportation Authority, Cook, DuPage, Kane, Lake, McHenry and Will Counties, Illinois, General Obligation Bonds, Series 1990A, 7.200%, 11/01/20 – AMBAC Insured | | | | | No Opt. Call | | | | AA | | | | 7,486,372 | |
| | | | | |
| | 6,650 | | | Regional Transportation Authority, Cook, DuPage, Kane, Lake, McHenry and Will Counties, Illinois, General Obligation Bonds, Series 1994D, 7.750%, 6/01/19 – FGIC Insured | | | | | No Opt. Call | | | | AA | | | | 8,198,785 | |
| | | | | |
| | 200 | | | Winnebago-Boone Counties School District 205, Illinois, General Obligation Bonds, Series 2013, 4.000%, 2/01/15 | | | | | No Opt. Call | | | | AA– | | | | 211,565 | |
| | 269,350 | | | Total Illinois | | | | | | | | | | | | | 299,732,106 | |
| | | | Indiana – 2.6% | | | | | | | | | | | | | | |
| | | | | |
| | 5,245 | | | East Chicago Elementary School Building Corporation, Lake County, Indiana, First Mortgage Bonds, Series 1996 Refunding, 6.250%, 1/05/16 | | | | | No Opt. Call | | | | A | | | | 5,520,363 | |
| | | | | |
| | 695 | | | Indiana Finance Authority, Educational Facilities Revenue Bonds, Drexel Foundation For Educational Excellence, Inc., Series 2009A, 6.000%, 10/01/21 | | | | | 10/19 at 100.00 | | | | BB+ | | | | 759,413 | |
Portfolio of Investments
Nuveen Limited Term Municipal Bond Fund (continued)
April 30, 2013
| | | | | | | | | | | | | | | | | | |
Principal
Amount (000) | | | Description (1) | | | | Optional Call
Provisions (2) | | | Ratings (3) | | | Value | |
| | | | Indiana (continued) | | | | | | | | | | | | | | |
| | | | | |
| | | | Indiana Finance Authority, Hospital Revenue Bonds, Floyd Memorial Hospital and Health Services Project, Refunding Series 2010: | | | | | | | | | | | | | | |
| $ | 1,445 | | | 5.000%, 3/01/19 | | | | | No Opt. Call | | | | A– | | | $ | 1,661,186 | |
| | 2,115 | | | 5.000%, 3/01/20 | | | | | No Opt. Call | | | | A– | | | | 2,447,964 | |
| | | | | |
| | | | Indiana Finance Authority, Hospital Revenue Bonds, Parkview Health System Obligated Group, Series 2012A: | | | | | | | | | | | | | | |
| | 850 | | | 5.000%, 5/01/19 | | | | | No Opt. Call | | | | A+ | | | | 1,011,492 | |
| | 750 | | | 5.000%, 5/01/20 | | | | | No Opt. Call | | | | A+ | | | | 901,875 | |
| | 2,000 | | | 5.000%, 5/01/21 | | | | | No Opt. Call | | | | A+ | | | | 2,415,720 | |
| | | | | |
| | 5,725 | | | Indiana Finance Authority, Private Activity Bonds, Ohio River Bridges East End Crossing Project, Series 2013B, 5.000%, 1/01/19 (Alternative Minimum Tax) | | | | | 1/17 at 100.00 | | | | BBB | | | | 6,379,024 | |
| | | | | |
| | 12,020 | | | Indiana Finance Authority, Wastewater Utility Revenue Bonds, CWA Authority Project, Series 2011C, 3.000%, 10/01/16 | | | | | No Opt. Call | | | | AA– | | | | 12,831,350 | |
| | | | | |
| | 11,080 | | | Indiana Health and Educational Facilities Financing Authority, Revenue Bonds, Ascension Health, Series 2006B-7, 4.100%, 11/15/46 (Mandatory put 11/03/16) | | | | | No Opt. Call | | | | AA+ | | | | 12,356,305 | |
| | | | | |
| | 2,500 | | | Indiana Health Facility Financing Authority, Revenue Bonds, Ascension Health, Series 2005-A3, 1.700%, 11/01/27 (Mandatory put 9/01/14) | | | | | No Opt. Call | | | | AA | | | | 2,540,850 | |
| | | | | |
| | 3,000 | | | Indiana Health Facility Financing Authority, Revenue Bonds, Ascension Health, Series 2005A-5, 5.000%, 11/01/27 (Mandatory put 8/01/13) | | | | | No Opt. Call | | | | AA | | | | 3,033,660 | |
| | | | | |
| | 5,140 | | | Indiana Health Facility Financing Authority, Revenue Bonds, Ascension Health, Series 2012A-2, 1.600%, 11/15/36 (Mandatory put 2/01/17) | | | | | No Opt. Call | | | | AA+ | | | | 5,290,396 | |
| | | | | |
| | 3,500 | | | Indiana Transportation Finance Authority, Highway Revenue Bonds, Series 1993A, 0.000%, 12/01/15 – AMBAC Insured | | | | | No Opt. Call | | | | AA+ | | | | 3,442,985 | |
| | | | | |
| | 4,240 | | | Indianapolis Local Public Improvement Bond Bank, Indiana, Waterworks Project Series 2009A, 5.500%, 1/01/16 – AGC Insured | | | | | No Opt. Call | | | | AA– | | | | 4,768,219 | |
| | | | | |
| | | | Indianapolis Local Public Improvement Bond Bank, Indiana, Waterworks Project, Refunding Series 2006: | | | | | | | | | | | | | | |
| | 1,150 | | | 5.500%, 1/01/16 – NPFG Insured | | | | | No Opt. Call | | | | A+ | | | | 1,290,668 | |
| | 1,630 | | | 5.500%, 7/01/19 – NPFG Insured | | | | | No Opt. Call | | | | A+ | | | | 1,990,263 | |
| | 3,690 | | | 5.500%, 1/01/20 – NPFG Insured | | | | | No Opt. Call | | | | A+ | | | | 4,524,826 | |
| | | | | |
| | 4,080 | | | Jasper County, Indiana, Pollution Control Revenue Refunding Bonds, Northern Indiana Public Service Company Project, Series 1988A Remarketed, 5.600%, 11/01/16 – NPFG Insured | | | | | No Opt. Call | | | | Baa2 | | | | 4,593,142 | |
| | | | | |
| | 6,290 | | | Jasper County, Indiana, Pollution Control Revenue Refunding Bonds, Northern Indiana Public Service Company Project, Series 2003 Remarketed, 5.700%, 7/01/17 – AMBAC Insured | | | | | No Opt. Call | | | | Baa2 | | | | 7,171,858 | |
| | | | | |
| | | | Knox County, Indiana, Economic Development Revenue and Refunding Bonds, Good Samaritan Hospital Project, Series 2012A: | | | | | | | | | | | | | | |
| | 355 | | | 3.000%, 4/01/16 | | | | | No Opt. Call | | | | A3 | | | | 372,963 | |
| | 630 | | | 4.000%, 4/01/17 | | | | | No Opt. Call | | | | A3 | | | | 690,297 | |
| | 400 | | | 4.000%, 4/01/18 | | | | | No Opt. Call | | | | A3 | | | | 442,944 | |
| | 550 | | | 3.000%, 4/01/19 | | | | | No Opt. Call | | | | A3 | | | | 584,518 | |
| | | | | |
| | | | Lake County Building Corporation, Indiana, First Mortgage Bonds, Series 2012: | | | | | | | | | | | | | | |
| | 825 | | | 3.000%, 8/01/13 | | | | | No Opt. Call | | | | N/R | | | | 827,409 | |
| | 840 | | | 3.000%, 2/01/14 | | | | | No Opt. Call | | | | N/R | | | | 846,997 | |
| | 855 | | | 3.000%, 8/01/14 | | | | | No Opt. Call | | | | N/R | | | | 865,046 | |
| | 870 | | | 3.000%, 2/01/15 | | | | | No Opt. Call | | | | N/R | | | | 878,126 | |
| | 880 | | | 4.000%, 8/01/15 | | | | | No Opt. Call | | | | N/R | | | | 908,996 | |
| | 900 | | | 4.000%, 2/01/16 | | | | | No Opt. Call | | | | N/R | | | | 931,977 | |
| | 915 | | | 4.000%, 8/01/16 | | | | | No Opt. Call | | | | N/R | | | | 952,012 | |
| | | | | |
| | 2,795 | | | State of Indiana, Indiana Toll Road Commission, East-West Toll Road Revenue Bonds, 1980 Series, 9.000%, 1/01/15 (ETM) | | | | | No Opt. Call | | | | Aaa | | | | 3,075,227 | |
| | 87,960 | | | Total Indiana | | | | | | | | | | | | | 96,308,071 | |
| | | | | | | | | | | | | | | | | | |
Principal
Amount (000) | | | Description (1) | | | | Optional Call
Provisions (2) | | | Ratings (3) | | | Value | |
| | | | Iowa – 0.4% | | | | | | | | | | | | | | |
| | | | | |
| | | | Fort Dodge Community School District, Webster County, Iowa, School Infrastructure Sales, Services, and Use Tax Revenue Bonds, Series 2011: | | | | | | | | | | | | | | |
| $ | 1,150 | | | 4.000%, 1/01/18 – AGM Insured | | | | | No Opt. Call | | | | AA– | | | $ | 1,282,745 | |
| | 1,330 | | | 5.000%, 1/01/19 – AGM Insured | | | | | No Opt. Call | | | | AA– | | | | 1,565,836 | |
| | 1,380 | | | 5.000%, 1/01/20 – AGM Insured | | | | | No Opt. Call | | | | AA– | | | | 1,636,777 | |
| | 1,245 | | | 5.000%, 1/01/22 – AGM Insured | | | | | 1/21 at 100.00 | | | | AA– | | | | 1,470,955 | |
| | | | | |
| | 1,420 | | | Iowa City, Iowa, General Obligation Bonds, Capital Loan Notes, Refunding Series 2008B, 3.250%, 6/01/14 | | | | | No Opt. Call | | | | Aaa | | | | 1,465,880 | |
| | | | | |
| | | | Iowa State, Special Obligation Bonds, I-Jobs Program, Series 2009A: | | | | | | | | | | | | | | |
| | 1,930 | | | 5.000%, 6/01/17 | | | | | No Opt. Call | | | | AA | | | | 2,259,895 | |
| | 3,120 | | | 5.000%, 6/01/18 | | | | | No Opt. Call | | | | AA | | | | 3,745,404 | |
| | 11,575 | | | Total Iowa | | | | | | | | | | | | | 13,427,492 | |
| | | | Kansas – 0.7% | | | | | | | | | | | | | | |
| | | | | |
| | | | Kansas Department of Transportation, Highway Revenue Bonds, Refunding Series 2009A: | | | | | | | | | | | | | | |
| | 4,655 | | | 5.000%, 9/01/16 | | | | | No Opt. Call | | | | AAA | | | | 5,356,276 | |
| | 6,050 | | | 5.000%, 9/01/17 | | | | | No Opt. Call | | | | AAA | | | | 7,180,503 | |
| | | | | |
| | 650 | | | Kansas Development Finance Authority, Health Facilities Revenue Bonds, Hays Medical Center Inc., Series 2005L, 5.250%, 11/15/14 | | | | | No Opt. Call | | | | A2 | | | | 693,349 | |
| | | | | |
| | | | Kansas Development Finance Authority, Revenue Bonds, Sisters of Charity of Leavenworth Health Services Corporation, Series 2010A: | | | | | | | | | | | | | | |
| | 1,245 | | | 5.000%, 1/01/20 | | | | | No Opt. Call | | | | AA | | | | 1,513,061 | |
| | 1,475 | | | 5.000%, 1/01/23 | | | | | 1/20 at 100.00 | | | | AA | | | | 1,728,346 | |
| | | | | |
| | 12,040 | | | Wyandotte County-Kansas City Unified Government, Kansas, Sales Tax Special Obligation Capital Appreciation Revenue Bonds Redevelopment Project Area B – Major Multi-Sport Athletic Complex Project, Subordinate Lien Series 2010B, 0.000%, 6/01/21 | | | | | No Opt. Call | | | | BBB+ | | | | 8,107,014 | |
| | 26,115 | | | Total Kansas | | | | | | | | | | | | | 24,578,549 | |
| | | | Kentucky – 1.0% | | | | | | | | | | | | | | |
| | | | | |
| | 3,750 | | | Lexington-Fayette Urban County Government Public Facilities Corporation, Kentucky State Lease Revenue Bonds, Eastern State Hospital Project, Series 2011A, 5.000%, 6/01/18 | | | | | No Opt. Call | | | | Aa3 | | | | 4,480,538 | |
| | | | | |
| | 15,325 | | | Louisville and Jefferson County Metropolitan Sewer District, Kentucky, Sewer and Drainage System Revenue Bonds, Series 2009B, 5.000%, 5/15/17 | | | | | No Opt. Call | | | | AA | | | | 18,000,592 | |
| | | | | |
| | 3,580 | | | Louisville-Jefferson County Metropolitan Government, Kentucky, Environmental Facilities Revenue, Louisville Gas & Electric Company Project, Series 2007B, 1.600%, 6/01/33 (Mandatory put 6/01/17) | | | | | No Opt. Call | | | | A– | | | | 3,666,743 | |
| | | | | |
| | 11,480 | | | Louisville-Jefferson County Metropolitan Government, Kentucky, Pollution Control Revenue Bonds, Louisville Gas and Electric Company Project, Series 2003A, 1.650%, 10/01/33 (Mandatory put 4/03/17) | | | | | No Opt. Call | | | | A+ | | | | 11,770,903 | |
| | 34,135 | | | Total Kentucky | | | | | | | | | | | | | 37,918,776 | |
| | | | Louisiana – 1.9% | | | | | | | | | | | | | | |
| | | | | |
| | 5,000 | | | De Soto Parrish, Louisiana, Pollution Control Revenue Refunding Bonds, Southwestern Electric Power Company Project, Series 2010, 3.250%, 1/01/19 (Mandatory put 1/02/15) | | | | | No Opt. Call | | | | BBB | | | | 5,143,450 | |
| | | | | |
| | 380 | | | Louisiana Local Government Environmental Facilities and Community Development Authority, Multifamily Housing Revenue Bonds, Oakleigh Apartments, Series 2003A, 8.500%, 6/01/38 (Pre-refunded 6/01/13) | | | | | 6/13 at 102.00 | | | | Aaa | | | | 390,100 | |
| | | | | |
| | 1,065 | | | Louisiana Local Government Environmental Facilities and Community Development Authority, Revenue Bonds, Livingston Parish North Park Project, Series 2008, 6.100%, 10/01/19 | | | | | 10/18 at 100.00 | | | | A+ | | | | 1,268,340 | |
| | | | | |
| | 2,700 | �� | | Louisiana Local Government Environmental Facilities and Community Development Authority, Revenue Bonds, Southgate Suites Hotel LLC Project, Series 2007A, 6.500%, 12/15/15 (5) | | | | | No Opt. Call | | | | N/R | | | | 1,427,895 | |
Portfolio of Investments
Nuveen Limited Term Municipal Bond Fund (continued)
April 30, 2013
| | | | | | | | | | | | | | | | | | |
Principal
Amount (000) | | | Description (1) | | | | Optional Call
Provisions (2) | | | Ratings (3) | | | Value | |
| | | | Louisiana (continued) | | | | | | | | | | | | | | |
| | | | | |
| $ | 585 | | | Louisiana Public Facilities Authority, Revenue Bonds, Baton Rouge General Hospital, Series 2004, 5.000%, 1/01/14 – NPFG Insured (ETM) | | | | | No Opt. Call | | | | A (4) | | | $ | 603,153 | |
| | | | | |
| | 245 | | | Louisiana Public Facilities Authority, Revenue Bonds, Baton Rouge General Hospital, Series 2004, 5.250%, 7/01/24 (Pre-refunded 7/01/14) – NPFG Insured | | | | | 7/14 at 100.00 | | | | Baa2 (4) | | | | 258,419 | |
| | | | | |
| | | | Louisiana Stadium and Exposition District, Revenue Refunding Bonds, Senior Lien Series 2013A: | | | | | | | | | | | | | | |
| | 475 | | | 5.000%, 7/01/18 | | | | | No Opt. Call | | | | A | | | | 562,728 | |
| | 1,515 | | | 5.000%, 7/01/19 | | | | | No Opt. Call | | | | A | | | | 1,815,485 | |
| | | | | |
| | | | Louisiana State, Gasoline and Fuels Tax Revenue Bonds, Refunding Series 2012A-1: | | | | | | | | | | | | | | |
| | 2,250 | | | 5.000%, 5/01/19 | | | | | No Opt. Call | | | | Aa1 | | | | 2,757,240 | |
| | 2,500 | | | 5.000%, 5/01/20 | | | | | No Opt. Call | | | | Aa1 | | | | 3,113,825 | |
| | 3,605 | | | 5.000%, 5/01/21 | | | | | No Opt. Call | | | | Aa1 | | | | 4,531,161 | |
| | | | | |
| | 16,970 | | | Louisiana State, General Obligation Bonds, Series 2012A, 5.000%, 8/01/19 | | | | | No Opt. Call | | | | Aa2 | | | | 20,925,707 | |
| | | | | |
| | 7,120 | | | New Orleans, Louisiana, General Obligation Bonds, Series 1998, 5.500%, 12/01/21 – FGIC Insured | | | | | No Opt. Call | | | | A3 | | | | 8,400,461 | |
| | | | | |
| | | | New Orleans, Louisiana, General Obligation Refunding Bonds, Series 2012: | | | | | | | | | | | | | | |
| | 2,860 | | | 5.000%, 12/01/19 | | | | | No Opt. Call | | | | A3 | | | | 3,405,059 | |
| | 2,500 | | | 5.000%, 12/01/20 | | | | | No Opt. Call | | | | A3 | | | | 2,992,175 | |
| | 3,600 | | | 5.000%, 12/01/21 | | | | | No Opt. Call | | | | A3 | | | | 4,318,380 | |
| | | | | |
| | 40 | | | Saint Bernard Parish, Louisiana, Sales and Use Tax Revenue Bonds, Series 2004, 5.000%, 3/01/17 – AGM Insured | | | | | 3/14 at 101.00 | | | | AA– | | | | 41,953 | |
| | | | | |
| | 2,205 | | | Saint Bernard Parish, Louisiana, Sales and Use Tax Revenue Bonds, Series 2004, 5.000%, 3/01/17 (Pre-refunded 3/01/14) – AGM Insured | | | | | 3/14 at 101.00 | | | | AA– (4) | | | | 2,315,030 | |
| | | | | |
| | 5,745 | | | Saint Charles Parish, Louisiana, Gulf Opportunity Zone Revenue Bonds, Valero Project, Series 2010, 4.000%, 12/01/40 (Mandatory put 6/01/22) | | | | | No Opt. Call | | | | BBB | | | | 6,362,645 | |
| | 61,360 | | | Total Louisiana | | | | | | | | | | | | | 70,633,206 | |
| | | | Maine – 0.1% | | | | | | | | | | | | | | |
| | | | | |
| | 3,300 | | | Maine Finance Authority, Solid Waste Disposal Revenue Bonds, Waste Management Inc., Series 2004, 3.800%, 11/01/15 (Alternative Minimum Tax) | | | |
| No Opt. Call
|
| | | BBB | | | | 3,567,498 | |
| | | | Maryland – 1.7% | | | | | | | | | | | | | | |
| | | | | |
| | 1,095 | | | Anne Arundel County, Maryland, General Obligation Bonds, Consolidated General Improvement, Series 2012, 5.000%, 4/01/15 | | | | | No Opt. Call | | | | AAA | | | | 1,193,200 | |
| | | | | |
| | 6,235 | | | Baltimore County, Maryland, General Obligation Bonds, Consolidated Public Improvement Series 2009, 5.000%, 8/01/18 | | | | | No Opt. Call | | | | AAA | | | | 7,587,746 | |
| | | | | |
| | 1,000 | | | Baltimore, Maryland, General Obligation Bonds, Consolidated Public Improvements, Refunding Series 2013B, 5.000%, 10/15/15 | | | | | No Opt. Call | | | | Aa2 | | | | 1,113,250 | |
| | | | | |
| | 1,500 | | | Harford County, Maryland, General Obligation Bonds, Consolidated Public Improvement Series 2009, 3.000%, 6/01/15 | | | | | No Opt. Call | | | | Aaa | | | | 1,585,125 | |
| | | | | |
| | 375 | | | Maryland Transportation Authority, Revenue Refunding Bonds, Transportation Facilities Projects, First Series 1978, 6.800%, 7/01/16 – AMBAC Insured (ETM) | | | | | No Opt. Call | | | | Aaa | | | | 414,394 | |
| | | | | |
| | | | Maryland, General Obligation Bonds, State and Local Facilities Loan, Second Series 2008: | | | | | | | | | | | | | | |
| | 5,000 | | | 5.000%, 7/15/16 | | | | | No Opt. Call | | | | AAA | | | | 5,727,350 | |
| | 5,560 | | | 5.000%, 7/15/17 | | | | | No Opt. Call | | | | AAA | | | | 6,580,371 | |
| | 5,130 | | | 5.000%, 7/15/18 | | | | | No Opt. Call | | | | AAA | | | | 6,235,720 | |
| | | | | |
| | 13,535 | | | Maryland, General Obligation Bonds, State and Local Facilities Loan, Third Series 2009C, 5.000%, 11/01/17 | | | | | No Opt. Call | | | | AAA | | | | 16,166,610 | |
| | | | | |
| | 5,000 | | | Montgomery County, Maryland, Consolidated General Obligation Public Improvement Bonds, Refunding Series 2011A, 5.000%, 7/01/19 | | | | | No Opt. Call | | | | AAA | | | | 6,212,400 | |
| | | | | | | | | | | | | | | | | | |
Principal
Amount (000) | | | Description (1) | | | | Optional Call
Provisions (2) | | | Ratings (3) | | | Value | |
| | | | Maryland (continued) | | | | | | | | | | | | | | |
| | | | | |
| $ | 10,000 | | | Montgomery County, Maryland, Consolidated General Obligation Public Improvement Bonds, Series 2007A, 5.000%, 5/01/16 | | | | | No Opt. Call | | | | AAA | | | $ | 11,366,800 | |
| | 54,430 | | | Total Maryland | | | | | | | | | | | | | 64,182,966 | |
| | | | Massachusetts – 2.0% | | | | | | | | | | | | | | |
| | | | | |
| | 3,500 | | | Boston, Massachusetts, General Obligation Bonds, Refunding Series 2009C, 3.000%, 2/01/15 | | | | | No Opt. Call | | | | Aaa | | | | 3,667,580 | |
| | | | | |
| | 2,745 | | | Massachusetts Bay Transportation Authority, General Obligation Transportation System Refunding Bonds, Series 1992B, 6.200%, 3/01/16 – NPFG Insured | | | | | No Opt. Call | | | | AA+ | | | | 2,966,961 | |
| | | | | |
| | 780 | | | Massachusetts Development Finance Agency, Pioneer Valley Resource Recovery Revenue Bonds, Eco/Springfield LLC, Series 2006, 5.875%, 7/01/14 (Alternative Minimum Tax) | | | | | No Opt. Call | | | | N/R | | | | 777,364 | |
| | | | | |
| | 440 | | | Massachusetts Development Finance Agency, Revenue Bonds, Partners HealthCare System, Series 2012L, 5.000%, 7/01/15 | | | | | No Opt. Call | | | | AA | | | | 483,824 | |
| | | | | |
| | | | Massachusetts Health and Educational Facilities Authority, Revenue Bonds, Harvard University, Series 2009A: | | | | | | | | | | | | | | |
| | 2,000 | | | 5.000%, 11/15/15 | | | | | No Opt. Call | | | | AAA | | | | 2,237,280 | |
| | 2,075 | | | 5.000%, 11/15/16 | | | | | No Opt. Call | | | | AAA | | | | 2,407,145 | |
| | 1,510 | | | 5.000%, 11/15/17 | | | | | No Opt. Call | | | | AAA | | | | 1,807,244 | |
| | 1,000 | | | 5.000%, 11/15/18 | | | | | No Opt. Call | | | | AAA | | | | 1,227,380 | |
| | | | | |
| | 10,275 | | | Massachusetts Health and Educational Facilities Authority, Revenue Bonds, Massachusetts Institute of Technology, Series 2009O, 5.000%, 7/01/16 | | | | | No Opt. Call | | | | AAA | | | | 11,763,848 | |
| | | | | |
| | 100 | | | Massachusetts School Building Authority, Dedicated Sales Tax Revenue Bonds, Series 2005A, 5.000%, 8/15/16 – AGM Insured | | | | | 8/15 at 100.00 | | | | AA+ | | | | 110,568 | |
| | | | | |
| | 225 | | | Massachusetts School Building Authority, Dedicated Sales Tax Revenue Bonds, Series 2005A, 5.000%, 8/15/21 (Pre-refunded 8/15/15) – AGM Insured | | | | | 8/15 at 100.00 | | | | AA+ (4) | | | | 248,915 | |
| | | | | |
| | | | Massachusetts School Building Authority, Dedicated Sales Tax Revenue Bonds, Series 2005A: | | | | | | | | | | | | | | |
| | 55 | | | 5.000%, 8/15/17 (Pre-refunded 8/15/15) – AGM Insured | | | | | 8/15 at 100.00 | | | | AA+ (4) | | | | 60,846 | |
| | 3,960 | | | 5.000%, 8/15/18 (Pre-refunded 8/15/15) – AGM Insured | | | | | 8/15 at 100.00 | | | | AA+ (4) | | | | 4,380,908 | |
| | 35 | | | 5.000%, 8/15/19 (Pre-refunded 8/15/15) – NPFG Insured | | | | | 8/15 at 100.00 | | | | AA+ (4) | | | | 38,720 | |
| | 210 | | | 5.000%, 8/15/20 (Pre-refunded 8/15/15) – AGM Insured | | | | | 8/15 at 100.00 | | | | AA+ (4) | | | | 232,321 | |
| | 30 | | | 5.000%, 8/15/22 (Pre-refunded 8/15/15) – AGM Insured | | | | | 8/15 at 100.00 | | | | AA+ (4) | | | | 33,189 | |
| | 195 | | | 5.000%, 8/15/24 (Pre-refunded 8/15/15) – AGM Insured | | | | | 8/15 at 100.00 | | | | AA+ (4) | | | | 215,727 | |
| | 245 | | | 5.000%, 8/15/25 (Pre-refunded 8/15/15) – AGM Insured | | | | | 8/15 at 100.00 | | | | AA+ (4) | | | | 271,041 | |
| | 160 | | | 5.000%, 8/15/26 (Pre-refunded 8/15/15) – AGM Insured | | | | | 8/15 at 100.00 | | | | AA+ (4) | | | | 177,006 | |
| | 125 | | | 5.000%, 8/15/30 (Pre-refunded 8/15/15) – AGM Insured | | | | | 8/15 at 100.00 | | | | Aa1 (4) | | | | 138,286 | |
| | 885 | | | 5.000%, 8/15/30 (Pre-refunded 8/15/15) | | | | | 8/15 at 100.00 | | | | Aa1 (4) | | | | 979,067 | |
| | | | | |
| | 8,655 | | | Massachusetts State, Special Obligation Dedicated Tax Revenue Bonds, Series 2004, 5.000%, 1/01/34 (Pre-refunded 1/01/14) – FGIC Insured | | | | | 1/14 at 100.00 | | | | A1 (4) | | | | 8,926,507 | |
| | | | | |
| | 12,900 | | | Massachusetts, General Obligation Bonds, Consolidated Loan, Series 2002C, 5.500%, 11/01/17 – AGM Insured | | | | | No Opt. Call | | | | AA+ | | | | 15,693,108 | |
| | | | | |
| | 5,000 | | | Massachusetts, Special Obligation Refunding Notes, Federal Highway Grant Anticipation Note Program, Series 2003A, 5.000%, 12/15/13 – AGM Insured | | | | | No Opt. Call | | | | AAA | | | | 5,151,600 | |
| | | | | |
| | | | Norwood, Massachusetts, General Obligation Bonds, Municipal Purpose Loan Series 2009A: | | | | | | | | | | | | | | |
| | 2,420 | | | 4.000%, 8/15/15 | | | | | No Opt. Call | | | | AA | | | | 2,620,570 | |
| | 2,420 | | | 4.000%, 8/15/16 | | | | | No Opt. Call | | | | AA | | | | 2,696,195 | |
| | 2,420 | | | 4.000%, 8/15/17 | | | | | No Opt. Call | | | | AA | | | | 2,755,993 | |
| | 2,420 | | | 4.000%, 8/15/18 | | | | | No Opt. Call | | | | AA | | | | 2,803,812 | |
| | 66,785 | | | Total Massachusetts | | | | | | | | | | | | | 74,873,005 | |
Portfolio of Investments
Nuveen Limited Term Municipal Bond Fund (continued)
April 30, 2013
| | | | | | | | | | | | | | | | | | |
Principal
Amount (000) | | | Description (1) | | | | Optional Call
Provisions (2) | | | Ratings (3) | | | Value | |
| | | | Michigan – 4.6% | | | | | | | | | | | | | | |
| | | | | |
| | | | Detroit-Wayne County Stadium Authority, Michigan, Wayne County Limited Tax General Obligation Bonds, Building Authority Stadium Refunding Series 2012: | | | | | | | | | | | | | | |
| $ | 875 | | | 5.000%, 10/01/15 | | | | | No Opt. Call | | | | BBB+ | | | $ | 939,208 | |
| | 1,600 | | | 5.000%, 10/01/16 | | | | | No Opt. Call | | | | BBB+ | | | | 1,748,832 | |
| | 900 | | | 5.000%, 10/01/17 | | | | | No Opt. Call | | | | BBB+ | | | | 991,593 | |
| | 1,100 | | | 5.000%, 10/01/18 | | | | | No Opt. Call | | | | BBB+ | | | | 1,223,211 | |
| | 1,500 | | | 5.000%, 10/01/19 – AGM Insured | | | | | No Opt. Call | | | | AA– | | | | 1,719,660 | |
| | | | | |
| | | | Jackson Public Schools, Jackson County, Michigan, General Obligation School Building and Site Bonds, Series 2004: | | | | | | | | | | | | | | |
| | 2,265 | | | 5.000%, 5/01/21 (Pre-refunded 5/01/14) | | | | | 5/14 at 100.00 | | | | Aa2 (4) | | | | 2,373,108 | |
| | 185 | | | 5.000%, 5/01/21 (Pre-refunded 5/01/14) | | | | | 5/14 at 100.00 | | | | Aa2 (4) | | | | 193,793 | |
| | | | | |
| | | | Lake Orion Community School District, Oakland County, Michigan, General Obligation Bonds, Series 2012 Refunding: | | | | | | | | | | | | | | |
| | 500 | | | 3.000%, 5/01/13 | | | | | No Opt. Call | | | | N/R | | | | 500,040 | |
| | 1,200 | | | 5.000%, 5/01/14 | | | | | No Opt. Call | | | | AA– | | | | 1,255,044 | |
| | 750 | | | 4.000%, 5/01/15 | | | | | No Opt. Call | | | | AA– | | | | 800,408 | |
| | 1,000 | | | 5.000%, 5/01/16 | | | | | No Opt. Call | | | | AA– | | | | 1,126,860 | |
| | 1,000 | | | 4.000%, 5/01/17 | | | | | No Opt. Call | | | | AA– | | | | 1,124,780 | |
| | 1,780 | | | 4.000%, 5/01/18 | | | | | No Opt. Call | | | | AA– | | | | 2,036,089 | |
| | | | | |
| | | | Michigan Finance Authority, Revenue Bonds, Detroit City School District, Series 2012: | | | | | | | | | | | | | | |
| | 1,000 | | | 5.000%, 6/01/14 | | | | | No Opt. Call | | | | A+ | | | | 1,044,950 | |
| | 1,700 | | | 5.000%, 6/01/15 | | | | | No Opt. Call | | | | A+ | | | | 1,827,500 | |
| | 1,600 | | | 5.000%, 6/01/16 | | | | | No Opt. Call | | | | A+ | | | | 1,766,544 | |
| | | | | |
| | 1,700 | | | Michigan Finance Authority, State Revolving Fund Revenue Bonds, Clean Water Subordinate Refunding Series 2013, 5.000%, 10/01/15 | | | | | No Opt. Call | | | | AAA | | | | 1,890,927 | |
| | | | | |
| | | | Michigan Finance Authority, Unemployment Obligation Assessment Revenue Bonds, Series 2012A: | | | | | | | | | | | | | | |
| | 10,000 | | | 2.000%, 7/01/13 | | | | | No Opt. Call | | | | AAA | | | | 10,032,400 | |
| | 10,000 | | | 5.000%, 7/01/14 | | | | | No Opt. Call | | | | AAA | | | | 10,565,800 | |
| | 15,140 | | | 5.000%, 7/01/15 | | | | | No Opt. Call | | | | AAA | | | | 16,696,695 | |
| | | | | |
| | | | Michigan Finance Authority, Unemployment Obligation Assessment Revenue Bonds, Series 2012B: | | | | | | | | | | | | | | |
| | 8,765 | | | 5.000%, 7/01/21 | | | | | 7/18 at 100.00 | | | | AAA | | | | 10,461,641 | |
| | 13,475 | | | 5.000%, 7/01/22 | | | | | 7/16 at 100.00 | | | | AAA | | | | 15,261,381 | |
| | | | | |
| | 10,000 | | | Michigan Hospital Finance Authority, Refunding and Project Revenue Bonds, Ascension Health Senior Credit Group, Series 2010F-5, 1.500%, 11/15/47 (Mandatory put 3/15/17) | | | | | No Opt. Call | | | | AA+ | | | | 10,232,200 | |
| | | | | |
| | 3,155 | | | Michigan Hospital Finance Authority, Revenue Bonds, Ascension Health Group, Series 2010B, 5.000%, 11/15/17 | | | | | No Opt. Call | | | | AA+ | | | | 3,734,384 | |
| | | | | |
| | 18,530 | | | Michigan Hospital Finance Authority, Revenue Bonds, Ascension Health Senior Credit Group, Refunding Series 2010F-1, 2.000%, 11/15/47 (Mandatory put 5/30/18) | | | | | No Opt. Call | | | | AA+ | | | | 19,378,118 | |
| | | | | |
| | 4,825 | | | Michigan Housing Development Authority, Rental Housing Revenue Bonds, Series 2009B, 4.375%, 10/01/19 | | | | | 10/18 at 100.00 | | | | AA | | | | 5,024,128 | |
| | | | | |
| | 1,010 | | | Michigan State Building Authority, Revenue Bonds, State Police Communications System Project, Series 2004, 5.375%, 10/01/15 – NPFG Insured | | | | | 10/14 at 100.00 | | | | AA– | | | | 1,082,316 | |
| | | | | |
| | 6,255 | | | Michigan State Building Authority, Revenue Refunding Bonds, Facilities Program, Series 2003I, 5.250%, 10/15/13 – AGM Insured | | | | | No Opt. Call | | | | AA– | | | | 6,400,616 | |
| | | | | |
| | 6,025 | | | Michigan State Trunk Line Fund Refunding Bonds, Series 2009, 5.000%, 11/01/20 | | | | | 11/19 at 100.00 | | | | AA+ | | | | 7,328,087 | |
| | | | | |
| | 1,605 | | | Michigan State, General Obligation Bonds, Environmental Program, Series 2009A, 5.500%, 11/01/21 | | | | | 5/19 at 100.00 | | | | Aa2 | | | | 1,965,820 | |
| | | | | |
| | 2,000 | | | Michigan State, General Obligation Refunding Bonds, Series 2002, 5.500%, 12/01/15 | | | | | No Opt. Call | | | | Aa2 | | | | 2,261,680 | |
| | | | | | | | | | | | | | | | | | |
Principal
Amount (000) | | | Description (1) | | | | Optional Call
Provisions (2) | | | Ratings (3) | | | Value | |
| | | | Michigan (continued) | | | | | | | | | | | | | | |
| | | | | |
| $ | 7,000 | | | Michigan Strategic Fund, Limited Obligation Revenue Bonds, Detroit Edison Project, Refunding Series 2008, 5.250%, 8/01/29 (Mandatory put 8/01/14) | | | | | No Opt. Call | | | | A1 | | | $ | 7,417,550 | |
| | | | | |
| | 1,000 | | | Pinckney Community Schools, Livingston and Washtenaw Counties, Michigan, General Obligation Bonds, Series 2004, 5.000%, 5/01/19 – AGM Insured | | | | | 5/14 at 100.00 | | | | Aa2 | | | | 1,046,290 | |
| | | | | |
| | | | Plymouth-Canton Community School District, Wayne and Washtenaw Counties, Michigan, General Obligation Bonds, Refunding Series 2012A: | | | | | | | | | | | | | | |
| | 1,100 | | | 4.000%, 5/01/19 | | | | | No Opt. Call | | | | Aa2 | | | | 1,268,146 | |
| | 1,000 | | | 5.000%, 5/01/21 | | | | | No Opt. Call | | | | Aa2 | | | | 1,234,620 | |
| | | | | |
| | 1,370 | | | South Lyon Community Schools, Oakland, Washtenaw and Livingston Counties, Michigan, General Obligation Bonds, Series 2005, 5.000%, 5/01/19 (Pre-refunded 5/01/15) – AGM Insured | | | | | 5/15 at 100.00 | | | | Aa2 (4) | | | | 1,497,177 | |
| | | | | |
| | 1,025 | | | South Redford School District, Wayne County, Michigan, General Obligation Bonds, Series 2004, 5.000%, 5/01/22 – FGIC Insured | | | | | 11/14 at 100.00 | | | | Aa2 | | | | 1,094,106 | |
| | | | | |
| | 4,975 | | | Walled Lake Consolidated School District, Oakland County, Michigan, General Obligation Bonds, Refunding Series 2011, 5.000%, 5/01/19 | | | | | No Opt. Call | | | | Aa2 | | | | 5,934,926 | |
| | | | | |
| | 8,150 | | | Wayne County Airport Authority, Michigan, Revenue Bonds, Detroit Metropolitan Airport, Refunding Series 2010C, 5.000%, 12/01/16 | | | | | No Opt. Call | | | | A | | | | 9,297,520 | |
| | 157,060 | | | Total Michigan | | | | | | | | | | | | | 171,778,148 | |
| | | | Minnesota – 1.1% | | | | | | | | | | | | | | |
| | | | | |
| | | | Cass Lake Independent School District 115, Minnesota, General Obligation Bonds, School Building Refunding Series 2010A: | | | | | | | | | | | | | | |
| | 745 | | | 4.000%, 2/01/23 | | | | | 2/20 at 100.00 | | | | AA+ | | | | 841,083 | |
| | 1,615 | | | 5.000%, 2/01/25 | | | | | 2/20 at 100.00 | | | | AA+ | | | | 1,902,987 | |
| | 1,690 | | | 5.000%, 2/01/26 | | | | | 2/20 at 100.00 | | | | AA+ | | | | 1,974,207 | |
| | | | | |
| | 5,025 | | | Minneapolis, Minnesota, General Obligation Bonds, Various Purpose Refunding Series 2009B, 4.000%, 12/01/15 | | | | | No Opt. Call | | | | AAA | | | | 5,497,400 | |
| | | | | |
| | 1,422 | | | Minneapolis-Saint Paul Housing Finance Board, Minnesota, Single Family Mortgage Revenue Bonds, City Living Series 2006A-3, 5.700%, 4/01/27 | | | | | 2/16 at 100.00 | | | | AA+ | | | | 1,483,103 | |
| | | | | |
| | 1,500 | | | Minneapolis-St. Paul Metropolitan Airports Commission, Minnesota, Airport Revenue Bonds, Series 2005A, 5.000%, 1/01/18 – AMBAC Insured | | | | | 1/15 at 100.00 | | | | A | | | | 1,600,230 | |
| | | | | |
| | 1,250 | | | Minnesota Higher Education Facilities Authority, St. John’s University Revenue Bonds, Series 2005-6G, 5.000%, 10/01/13 | | | | | No Opt. Call | | | | A2 | | | | 1,274,638 | |
| | | | | |
| | | | Minnesota State, General Obligation Bonds, State Trunk Highway Series 2009E: | | | | | | | | | | | | | | |
| | 4,000 | | | 4.500%, 8/01/17 | | | | | No Opt. Call | | | | AA+ | | | | 4,656,800 | |
| | 4,000 | | | 4.500%, 8/01/18 | | | | | No Opt. Call | | | | AA+ | | | | 4,765,120 | |
| | | | | |
| | 6,000 | | | Minnesota State, General Obligation Bonds, Various Purpose, Refunding Series 2010D, 5.000%, 8/01/16 | | | | | No Opt. Call | | | | AA+ | | | | 6,883,620 | |
| | | | | |
| | | | Northern Municipal Power Agency, Minnesota, Electric System Revenue Bonds, Refunding Series 2009A: | | | | | | | | | | | | | | |
| | 1,000 | | | 5.000%, 1/01/14 – AGC Insured | | | | | No Opt. Call | | | | AA– | | | | 1,031,650 | |
| | 1,530 | | | 5.000%, 1/01/15 – AGC Insured | | | | | No Opt. Call | | | | AA– | | | | 1,647,382 | |
| | 5,500 | | | 5.000%, 1/01/16 – AGC Insured | | | | | No Opt. Call | | | | AA– | | | | 6,140,640 | |
| | 35,277 | | | Total Minnesota | | | | | | | | | | | | | 39,698,860 | |
| | | | Mississippi – 0.4% | | | | | | | | | | | | | | |
| | | | | |
| | 11,500 | | | Mississippi Business Finance Corporation, Revenue Bonds, Mississippi Power Company Project, First Series 2010, 1.625%, 12/01/40 (Mandatory put 1/12/18) | | | | | No Opt. Call | | | | A | | | | 11,659,620 | |
| | | | | |
| | 1,455 | | | Mississippi Hospital Equipment and Facilities Authority, Revenue Bonds, Baptist Memorial Healthcare, Series 2004B-1, 5.000%, 9/01/16 | | | | | 9/14 at 100.00 | | | | AA– | | | | 1,534,996 | |
| | 12,955 | | | Total Mississippi | | | | | | | | | | | | | 13,194,616 | |
Portfolio of Investments
Nuveen Limited Term Municipal Bond Fund (continued)
April 30, 2013
| | | | | | | | | | | | | | | | | | |
Principal
Amount (000) | | | Description (1) | | | | Optional Call
Provisions (2) | | | Ratings (3) | | | Value | |
| | | | Missouri – 1.5% | | | | | | | | | | | | | | |
| | | | | |
| | | | Kansas City Tax Increment Financing Commission, Missouri, Tax Increment Revenue Bonds, Shoal Creek Parkway Project, Series 2011: | | | | | | | | | | | | | | |
| $ | 120 | | | 5.000%, 6/01/21 | | | | | 6/16 at 100.00 | | | | N/R | | | $ | 125,219 | |
| | 2,000 | | | 5.625%, 6/01/23 | | | | | 6/16 at 100.00 | | | | N/R | | | | 2,079,260 | |
| | 100 | | | 6.500%, 6/01/25 | | | | | No Opt. Call | | | | N/R | | | | 103,888 | |
| | | | | |
| | | | Metropolitan St. Louis Sewerage District, Missouri, Wastewater System Revenue Bonds, Series 2011B: | | | | | | | | | | | | | | |
| | 2,520 | | | 4.000%, 5/01/23 | | | | | 5/21 at 100.00 | | | | AAA | | | | 2,910,877 | |
| | 2,695 | | | 4.000%, 5/01/24 | | | | | 5/21 at 100.00 | | | | AAA | | | | 3,093,591 | |
| | | | | |
| | | | Missouri Environmental Improvement and Energy Resources Authority, Water Pollution Control and Drinking Water Revenue Bonds, State Revolving Fund Program, Series 2010A: | | | | | | | | | | | | | | |
| | 3,595 | | | 5.000%, 1/01/17 | | | | | No Opt. Call | | | | Aaa | | | | 4,177,462 | |
| | 3,000 | | | 5.000%, 1/01/18 | | | | | No Opt. Call | | | | Aaa | | | | 3,589,290 | |
| | | | | |
| | 1,000 | | | Missouri Health and Educational Facilities Authority, Revenue Bonds, Lutheran Senior Services, Series 2007A, 4.875%, 2/01/19 | | | | | 2/17 at 100.00 | | | | BBB+ | | | | 1,089,680 | |
| | | | | |
| | 8,825 | | | Sikeston, Missouri, Electric System Revenue Refunding Bonds, Series 2012, 5.000%, 6/01/17 | | | | | No Opt. Call | | | | BBB+ | | | | 9,968,632 | |
| | | | | |
| | | | St. Louis, Missouri, Airport Revenue Bonds, Lambert-St. Louis International Airport, Series 2005: | | | | | | | | | | | | | | |
| | 8,155 | | | 5.500%, 7/01/17 – NPFG Insured | | | | | No Opt. Call | | | | A– | | | | 9,470,402 | |
| | 11,995 | | | 5.500%, 7/01/18 – NPFG Insured | | | | | No Opt. Call | | | | A– | | | | 14,254,618 | |
| | | | | |
| | 5,020 | | | St. Louis, Missouri, Airport Revenue Bonds, Lambert-St. Louis International Airport, Series 2007A, 5.000%, 7/01/14 – AGM Insured | | | | | No Opt. Call | | | | AA– | | | | 5,267,637 | |
| | 49,025 | | | Total Missouri | | | | | | | | | | | | | 56,130,556 | |
| | | | Nebraska – 0.6% | | | | | | | | | | | | | | |
| | | | | |
| | | | Douglas County School District 10 Elkhorn, Nebraska, General Obligation Bonds, Public Schools Series 2012: | | | | | | | | | | | | | | |
| | 375 | | | 4.000%, 6/15/15 | | | | | No Opt. Call | | | | AA– | | | | 401,794 | |
| | 500 | | | 4.000%, 6/15/16 | | | | | No Opt. Call | | | | AA– | | | | 550,055 | |
| | 750 | | | 4.000%, 6/15/17 | | | | | No Opt. Call | | | | AA– | | | | 842,978 | |
| | 600 | | | 4.000%, 6/15/18 | | | | | No Opt. Call | | | | AA– | | | | 685,230 | |
| | 800 | | | 5.000%, 6/15/19 | | | | | No Opt. Call | | | | AA– | | | | 970,168 | |
| | | | | |
| | | | Lancaster County School District 1, Lincoln, Nebraska, General Obligation Bonds, Series 2009: | | | | | | | | | | | | | | |
| | 1,915 | | | 3.000%, 1/15/16 | | | | | No Opt. Call | | | | AAA | | | | 2,043,765 | |
| | 3,475 | | | 3.000%, 1/15/17 | | | | | No Opt. Call | | | | AAA | | | | 3,776,491 | |
| | 3,220 | | | 3.000%, 1/15/18 | | | | | No Opt. Call | | | | AAA | | | | 3,535,657 | |
| | 2,520 | | | 3.000%, 1/15/19 | | | | | No Opt. Call | | | | AAA | | | | 2,791,379 | |
| | | | | |
| | 2,320 | | | Lincoln County Hospital Authority 1, Nebraska, Hospital Revenue and Refunding Bonds, Great Plains Regional Medical Center Project, Series 2012, 3.500%, 11/01/27 | | | | | No Opt. Call | | | | A– | | | | 2,311,718 | |
| | | | | |
| | 3,045 | | | Washington County, Nebraska, Wastewater and Solid Waste Disposal Facilities Revenue Bonds, Cargill Inc. Project, 1.375%, 9/01/30 (Mandatory put 9/01/15) (Alternative Minimum Tax) | | | | | No Opt. Call | | | | A | | | | 3,062,204 | |
| | 19,520 | | | Total Nebraska | | | | | | | | | | | | | 20,971,439 | |
| | | | Nevada – 0.7% | | | | | | | | | | | | | | |
| | | | | |
| | | | Clark County, Nevada, Airport Revenue Bonds, Jet Aviation Fuel Tax, Refunding Series 2013A: | | | | | | | | | | | | | | |
| | 1,000 | | | 5.000%, 7/01/20 (Alternative Minimum Tax) | | | | | No Opt. Call | | | | A | | | | 1,188,780 | |
| | 2,000 | | | 5.000%, 7/01/21 (Alternative Minimum Tax) | | | | | No Opt. Call | | | | A | | | | 2,388,580 | |
| | | | | |
| | 3,000 | | | Clark County, Nevada, General Obligation Airport Bonds, Series 2003B, 4.750%, 7/01/23 (Pre-refunded 7/01/13) – AMBAC Insured | | | | | 7/13 at 100.00 | | | | AA+ (4) | | | | 3,022,440 | |
| | | | | |
| | 1,610 | | | Clark County, Nevada, Limited Tax General Obligation Bank Bonds, Series 2006, 5.000%, 11/01/21 – AMBAC Insured | | | | | 11/16 at 100.00 | | | | AA+ | | | | 1,841,438 | |
| | | | | | | | | | | | | | | | | | |
Principal
Amount (000) | | | Description (1) | | | | Optional Call
Provisions (2) | | | Ratings (3) | | | Value | |
| | | | Nevada (continued) | | | | | | | | | | | | | | |
| | | | | |
| $ | 4,635 | | | Clark County, Nevada, Motor Vehicle Fuel Tax Highway Improvement Revenue Bonds, Refunding Series 2011, 5.000%, 7/01/14 | | | | | No Opt. Call | | | | AA– | | | $ | 4,884,919 | |
| | | | | |
| | 2,625 | | | Clark County, Nevada, Passenger Facility Charge Revenue Bonds, Las Vegas-McCarran International Airport, Refunding Series 2010F-1, 5.000%, 7/01/15 | | | | | No Opt. Call | | | | A+ | | | | 2,864,321 | |
| | | | | |
| | 5,000 | | | Las Vegas Valley Water District, Nevada, Limited Tax General Obligation Bonds, Water & Refunding Series 2011C, 5.000%, 6/01/24 | | | | | 6/21 at 100.00 | | | | AA+ | | | | 6,013,000 | |
| | | | | |
| | 2,825 | | | Nevada, Motor Vehicle Fuel Tax Highway Improvement Revenue Bonds, Series 2005, 5.000%, 12/01/15 – FGIC Insured | | | | | No Opt. Call | | | | AA+ | | | | 3,156,909 | |
| | 22,695 | | | Total Nevada | | | | | | | | | | | | | 25,360,387 | |
| | | | New Hampshire – 0.1% | | | | | | | | | | | | | | |
| | | | | |
| | 5,000 | | | New Hampshire Business Finance Authority, Pollution Control Revenue Bonds, United Illuminating Company, Series 2010A, 4.500%, 7/01/27 (Mandatory put 7/01/15) (Alternative Minimum Tax) | | | | | No Opt. Call | | | | BBB | | | | 5,295,200 | |
| | | | New Jersey – 6.4% | | | | | | | | | | | | | | |
| | | | | |
| | 960 | | | Bayonne Redevelopment Agency, New Jersey, Revenue Bonds, Royal Caribbean Cruises Project, Series 2006A, 4.750%, 11/01/16 (Alternative Minimum Tax) | | | | | No Opt. Call | | | | BB | | | | 974,688 | |
| | | | | |
| | 2,435 | | | Camden County Improvement Authority, New Jersey, Healthcare Revenue Bonds, Cooper Health System, Series 2005B, 5.000%, 2/15/15 | | | | | No Opt. Call | | | | BBB | | | | 2,608,055 | |
| | | | | |
| | 1,500 | | | Camden County Improvement Authority, New Jersey, Revenue Bonds, Cooper Health System, Series 2005A, 5.000%, 2/15/15 | | | | | No Opt. Call | | | | BBB | | | | 1,606,605 | |
| | | | | |
| | 3,890 | | | Casino Reinvestment Development Authority, New Jersey, Parking Revenue Bonds, Series 2005A, 5.250%, 6/01/20 – NPFG Insured | | | | | 6/15 at 100.00 | | | | A– | | | | 4,133,203 | |
| | | | | |
| | 3,205 | | | Mercer County, New Jersey, General Obligation Bonds, Series 2012, 2.000%, 2/01/16 | | | | | No Opt. Call | | | | AA+ | | | | 3,335,187 | |
| | | | | |
| | | | Millville, New Jersey, General Obligation Bonds, Improvement Series 2011: | | | | | | | | | | | | | | |
| | 140 | | | 5.000%, 11/01/13 – AGM Insured | | | | | No Opt. Call | | | | AA– | | | | 143,228 | |
| | 1,000 | | | 5.000%, 11/01/16 – AGM Insured | | | | | No Opt. Call | | | | AA– | | | | 1,139,880 | |
| | 1,445 | | | 5.000%, 11/01/19 – AGM Insured | | | | | No Opt. Call | | | | AA– | | | | 1,728,191 | |
| | 920 | | | 5.000%, 11/01/20 – AGM Insured | | | | | No Opt. Call | | | | AA– | | | | 1,106,410 | |
| | | | | |
| | 250 | | | Monmouth County Improvement Authority, New Jersey, Governmental Loan Revenue Bonds, Series 2005, 5.000%, 12/01/14 – AMBAC Insured | | | | | No Opt. Call | | | | N/R | | | | 263,680 | |
| | | | | |
| | 345 | | | Monmouth County Improvement Authority, New Jersey, Governmental Loan Revenue Bonds, Series 2007, 5.000%, 12/01/16 – AMBAC Insured | | | | | No Opt. Call | | | | N/R | | | | 381,963 | |
| | | | | |
| | 5 | | | Monmouth County Improvement Authority, New Jersey, Governmental Loan Revenue Bonds, Series 2007, 5.000%, 12/01/16 – AMBAC Insured (ETM) | | | | | No Opt. Call | | | | N/R (4) | | | | 5,784 | |
| | | | | |
| | | | New Jersey Economic Development Authority, Cigarette Tax Revenue Bonds, Series 2004: | | | | | | | | | | | | | | |
| | 8,670 | | | 5.000%, 6/15/13 – FGIC Insured (ETM) | | | | | No Opt. Call | | | | Aaa | | | | 8,721,847 | |
| | 4,410 | | | 5.375%, 6/15/14 (ETM) | | | | | No Opt. Call | | | | Aaa | | | | 4,663,090 | |
| | 650 | | | 5.375%, 6/15/15 (ETM) | | | | | No Opt. Call | | | | Aaa | | | | 719,349 | |
| | 995 | | | 5.375%, 6/15/15 – RAAI Insured (ETM) | | | | | No Opt. Call | | | | Aaa | | | | 1,101,157 | |
| | 1,335 | | | 5.500%, 6/15/16 (ETM) | | | | | No Opt. Call | | | | Aaa | | | | 1,543,033 | |
| | 2,235 | | | 5.500%, 6/15/16 – RAAI Insured (ETM) | | | | | No Opt. Call | | | | Aaa | | | | 2,583,280 | |
| | | | | |
| | | | New Jersey Economic Development Authority, Cigarette Tax Revenue Bonds, Series 2004: | | | | | | | | | | | | | | |
| | 3,505 | | | 5.750%, 6/15/29 (Pre-refunded 6/15/14) | | | | | 6/14 at 100.00 | | | | Aaa | | | | 3,718,840 | |
| | 75 | | | 5.750%, 6/15/29 (Pre-refunded 6/15/14) – AGC Insured | | | | | 6/14 at 100.00 | | | | Aaa | | | | 79,576 | |
| | 30 | | | 5.750%, 6/15/29 (Pre-refunded 6/15/14) – RAAI Insured | | | | | 6/14 at 100.00 | | | | Aaa | | | | 31,848 | |
| | 1,505 | | | 5.500%, 6/15/31 (Pre-refunded 6/15/14) | | | | | 6/14 at 100.00 | | | | Aaa | | | | 1,592,606 | |
| | 2,240 | | | 5.750%, 6/15/34 (Pre-refunded 6/15/14) | | | | | 6/14 at 100.00 | | | | Aaa | | | | 2,376,662 | |
| | | | | |
| | | | New Jersey Economic Development Authority, Cigarette Tax Revenue Refunding Bonds, Series 2012: | | | | | | | | | | | | | | |
| | 3,300 | | | 5.000%, 6/15/13 | | | | | No Opt. Call | | | | BBB+ | | | | 3,319,668 | |
Portfolio of Investments
Nuveen Limited Term Municipal Bond Fund (continued)
April 30, 2013
| | | | | | | | | | | | | | | | | | |
Principal
Amount (000) | | | Description (1) | | | | Optional Call
Provisions (2) | | | Ratings (3) | | | Value | |
| | | | New Jersey (continued) | | | | | | | | | | | | | | |
| $ | 3,900 | | | 5.000%, 6/15/14 | | | | | No Opt. Call | | | | BBB+ | | | $ | 4,093,557 | |
| | 2,595 | | | 5.000%, 6/15/15 | | | | | No Opt. Call | | | | BBB+ | | | | 2,819,078 | |
| | 3,670 | | | 5.000%, 6/15/16 | | | | | No Opt. Call | | | | BBB+ | | | | 4,110,914 | |
| | 5,630 | | | 5.000%, 6/15/17 | | | | | No Opt. Call | | | | BBB+ | | | | 6,440,157 | |
| | 8,510 | | | 5.000%, 6/15/18 | | | | | No Opt. Call | | | | BBB+ | | | | 9,907,682 | |
| | 3,200 | | | 5.000%, 6/15/19 | | | | | No Opt. Call | | | | BBB+ | | | | 3,765,920 | |
| | 160 | | | 4.000%, 6/15/19 | | | | | No Opt. Call | | | | BBB+ | | | | 179,747 | |
| | 2,690 | | | 5.000%, 6/15/20 | | | | | No Opt. Call | | | | BBB+ | | | | 3,189,345 | |
| | 6,410 | | | 5.000%, 6/15/21 | | | | | No Opt. Call | | | | BBB+ | | | | 7,660,847 | |
| | 475 | | | 5.000%, 6/15/22 | | | | | No Opt. Call | | | | AA– | | | | 570,508 | |
| | 685 | | | 4.250%, 6/15/27 | | | | | 6/22 at 100.00 | | | | BBB+ | | | | 727,888 | |
| | | | | |
| | 2,325 | | | New Jersey Economic Development Authority, School Facilities Construction Bonds, Series 2005P, 5.000%, 9/01/14 | | | | | No Opt. Call | | | | A+ | | | | 2,470,313 | |
| | | | | |
| | 2,000 | | | New Jersey Economic Development Authority, School Facilities Construction Bonds, Series 2005P, 5.000%, 9/01/13 (ETM) | | | | | No Opt. Call | | | | A+ (4) | | | | 2,031,740 | |
| | | | | |
| | 4,890 | | | New Jersey Economic Development Authority, School Facilities Construction Financing Program Bonds, Refunding Series 2011GG, 5.000%, 9/01/20 | | | | | No Opt. Call | | | | A+ | | | | 5,965,018 | |
| | | | | |
| | 3,710 | | | New Jersey Educational Facilities Authority, Revenue Bonds, Higher Education Capital Improvement Fund, Series 2004A, 5.250%, 9/01/14 – AGM Insured | | | | | No Opt. Call | | | | AA– | | | | 3,948,553 | |
| | | | | |
| | 3,990 | | | New Jersey Educational Facilities Authority, Revenue Bonds, Montclair State University Issue, Series 2007A, 5.250%, 7/01/21 – NPFG Insured | | | | | No Opt. Call | | | | AA– | | | | 4,475,583 | |
| | | | | |
| | 1,500 | | | New Jersey Environmental Infrastructure Trust, Environmental Infrastructure Bonds, Series 2004A, 5.000%, 9/01/22 (Pre-refunded 9/01/13) | | | | | 9/13 at 100.00 | | | | AAA | | | | 1,524,225 | |
| | | | | |
| | | | New Jersey Health Care Facilities Financing Authority, New Jersey, Revenue Bonds, Saint Peters University Hospital, Refunding Series 2011: | | | | | | | | | | | | | | |
| | 4,060 | | | 5.000%, 7/01/18 | | | | | No Opt. Call | | | | BB+ | | | | 4,634,937 | |
| | 4,260 | | | 5.000%, 7/01/19 | | | | | No Opt. Call | | | | BB+ | | | | 4,908,713 | |
| | | | | |
| | 1,290 | | | New Jersey Health Care Facilities Financing Authority, Revenue Bonds, South Jersey Hospital System, Refunding Series 2006, 5.000%, 7/01/13 | | | | | No Opt. Call | | | | A2 | | | | 1,300,114 | |
| | | | | |
| | 410 | | | New Jersey Highway Authority, Senior Revenue Bonds, Garden State Parkway, Series 1989, 6.000%, 1/01/19 – NPFG Insured (ETM) | | | | | No Opt. Call | | | | Aaa | | | | 502,676 | |
| | | | | |
| | 1,145 | | | New Jersey Housing & Mortgage Finance Agency, Single Family Home Mortgage Revenue Bonds, Series 2011A, 1.250%, 10/01/13 | | | | | No Opt. Call | | | | Aa1 | | | | 1,148,767 | |
| | | | | |
| | 1,400 | | | New Jersey Transit Corporation, Certificates of Participation Refunding, Series 2003, 5.500%, 10/01/14 – AGM Insured | | | | | No Opt. Call | | | | AA– | | | | 1,494,486 | |
| | | | | |
| | 5,000 | | | New Jersey Transportation Trust Fund Authority, Transportation System Bonds, Series 2005C, 5.250%, 6/15/15 – NPFG Insured (ETM) | | | | | No Opt. Call | | | | Aaa | | | | 5,522,450 | |
| | | | | |
| | | | New Jersey Transportation Trust Fund Authority, Transportation System Bonds, Series 2010D: | | | | | | | | | | | | | | |
| | 5,390 | | | 5.000%, 12/15/17 | | | | | No Opt. Call | | | | A+ | | | | 6,348,827 | |
| | 9,750 | | | 5.000%, 12/15/18 | | | | | No Opt. Call | | | | A+ | | | | 11,719,305 | |
| | | | | |
| | | | New Jersey Transportation Trust Fund Authority, Transportation System Bonds, Series 2011B: | | | | | | | | | | | | | | |
| | 2,000 | | | 5.000%, 6/15/14 | | | | | No Opt. Call | �� | | | A+ | | | | 2,105,680 | |
| | 1,500 | | | 5.000%, 6/15/15 | | | | | No Opt. Call | | | | A+ | | | | 1,644,525 | |
| | | | | |
| | | | New Jersey Transportation Trust Fund Authority, Transportation System Bonds, Series 2012AA: | | | | | | | | | | | | | | |
| | 11,500 | | | 5.000%, 6/15/19 | | | | | No Opt. Call | | | | A+ | | | | 13,867,045 | |
| | 13,675 | | | 5.000%, 6/15/20 | | | | | No Opt. Call | | | | A+ | | | | 16,637,279 | |
| | | | | |
| | 29 | | | New Jersey Turnpike Authority, Revenue and Improvement Bonds, First Series 1973, 5.700%, 5/01/13 (ETM) | | | | | No Opt. Call | | | | A3 (4) | | | | 29,004 | |
| | | | | |
| | 65 | | | New Jersey Turnpike Authority, Revenue Bonds, Series 1984, 7.000%, 1/01/14 (ETM) | | | | | No Opt. Call | | | | AA+ (4) | | | | 67,926 | |
| | | | | |
| | | | New Jersey Turnpike Authority, Revenue Bonds, Series 1991C: | | | | | | | | | | | | | | |
| | 2,225 | | | 6.500%, 1/01/16 | | | | | No Opt. Call | | | | A3 | | | | 2,563,111 | |
| | | | | | | | | | | | | | | | | | |
Principal
Amount (000) | | | Description (1) | | | | Optional Call
Provisions (2) | | | Ratings (3) | | | Value | |
| | | | New Jersey (continued) | | | | | | | | | | | | | | |
| $ | 5 | | | 6.500%, 1/01/16 – AMBAC Insured | | | | | No Opt. Call | | | | A3 | | | $ | 5,760 | |
| | 805 | | | 6.500%, 1/01/16 – NPFG Insured | | | | | No Opt. Call | | | | A+ | | | | 927,328 | |
| | | | | |
| | | | New Jersey Turnpike Authority, Revenue Bonds, Series 1991C: | | | | | | | | | | | | | | |
| | 1,425 | | | 6.500%, 1/01/16 (ETM) | | | | | No Opt. Call | | | | A3 (4) | | | | 1,655,366 | |
| | 5 | | | 6.500%, 1/01/16 – AMBAC Insured (ETM) | | | | | No Opt. Call | | | | A3 (4) | | | | 5,785 | |
| | 460 | | | 6.500%, 1/01/16 – NPFG Insured (ETM) | | | �� | | No Opt. Call | | | | A (4) | | | | 533,959 | |
| | 110 | | | 6.500%, 1/01/16 (ETM) | | | | | No Opt. Call | | | | AA+ (4) | | | | 127,783 | |
| | 235 | | | 6.500%, 1/01/16 – NPFG Insured (ETM) | | | | | No Opt. Call | | | | A+ (4) | | | | 272,990 | |
| | 1,925 | | | 6.500%, 1/01/16 – AGM Insured (ETM) | | | | | No Opt. Call | | | | AA– (4) | | | | 2,073,745 | |
| | 1,650 | | | 6.500%, 1/01/16 (ETM) | | | | | No Opt. Call | | | | AA+ (4) | | | | 1,777,496 | |
| | 85 | | | 6.500%, 1/01/16 – AMBAC Insured (ETM) | | | | | No Opt. Call | | | | A3 (4) | | | | 91,568 | |
| | 930 | | | 6.500%, 1/01/16 – NPFG Insured (ETM) | | | | | No Opt. Call | | | | A+ (4) | | | | 1,001,861 | |
| | | | | |
| | 235 | | | New Jersey Turnpike Authority, Revenue Bonds, Series 2000A, 6.000%, 1/01/14 – NPFG Insured (ETM) | | | | | No Opt. Call | | | | A+ (4) | | | | 244,057 | |
| | | | | |
| | 5,945 | | | New Jersey Turnpike Authority, Revenue Bonds, Series 2012B, 5.000%, 1/01/19 | | | | | No Opt. Call | | | | A+ | | | | 7,155,997 | |
| | | | | |
| | 205 | | �� | New Jersey Turnpike Authority, Revenue Refunding Bonds, First Series 1977, 6.000%, 1/01/14 (ETM) | | | | | 7/13 at 100.00 | | | | AAA | | | | 212,757 | |
| | | | | |
| | 1,125 | | | Parsippany-Troy Hills Township, New Jersey, General Obligation Bonds, Refunding Series 2012, 4.000%, 7/15/20 | | | | | No Opt. Call | | | | AA | | | | 1,307,644 | |
| | | | | |
| | 1,700 | | | Passaic Valley Sewage Commissioners, New Jersey, Sewer Revenue Bonds, Series 2010G, 5.750%, 12/01/22 | | | | | No Opt. Call | | | | A2 | | | | 2,155,855 | |
| | | | | |
| | | | South Jersey Port Corporation, New Jersey, Marine Terminal Revenue Refunding Bonds, Series 2012Q: | | | | | | | | | | | | | | |
| | 4,340 | | | 3.000%, 1/01/18 | | | | | No Opt. Call | | | | A1 | | | | 4,641,587 | |
| | 4,850 | | | 3.000%, 1/01/19 | | | | | No Opt. Call | | | | A1 | | | | 5,179,849 | |
| | | | | |
| | 2,840 | | | Tobacco Settlement Financing Corporation, New Jersey, Tobacco Settlement Asset-Backed Bonds, Series 2003, 6.375%, 6/01/32 (Pre-refunded 6/01/13) | | | | | 6/13 at 100.00 | | | | Aaa | | | | 2,855,080 | |
| | | | | |
| | | | Tobacco Settlement Financing Corporation, New Jersey, Tobacco Settlement Asset-Backed Bonds, Series 2007-1A: | | | | | | | | | | | | | | |
| | 4,160 | | | 5.000%, 6/01/14 | | | | | No Opt. Call | | | | A1 | | | | 4,337,882 | |
| | 5,660 | | | 5.000%, 6/01/15 | | | | | No Opt. Call | | | | A1 | | | | 6,096,839 | |
| | 50 | | | 5.000%, 6/01/17 | | | | | No Opt. Call | | | | A2 | | | | 56,783 | |
| | 7,775 | | | 4.500%, 6/01/23 | | | | | 6/17 at 100.00 | | | | B1 | | | | 7,780,443 | |
| | 211,604 | | | Total New Jersey | | | | | | | | | | | | | 236,752,164 | |
| | | | New Mexico – 0.1% | | | | | | | | | | | | | | |
| | | | | |
| | 2,720 | | | Clayton, New Mexico, Appropriation Debt, Jail Project, Series 2006, 5.000%, 11/01/13 – CIFG Insured | | | | | No Opt. Call | | | | BBB+ | | | | 2,766,022 | |
| | | | New York – 9.4% | | | | | | | | | | | | | | |
| | | | | |
| | 500 | | | Dormitory Authority of the State of New York, FHA-Insured Mortgage Revenue Bonds, Montefiore Hospital, Series 2004, 5.000%, 2/01/19 – FGIC Insured | | | | | 2/15 at 100.00 | | | | N/R | | | | 535,730 | |
| | | | | |
| | 1,585 | | | Dormitory Authority of the State of New York, Mental Health Services Facilities Improvement Revenue Bonds, Series 2010A, 5.000%, 8/15/19 | | | | | No Opt. Call | | | | AA– | | | | 1,928,739 | |
| | | | | |
| | 5 | | | Dormitory Authority of the State of New York, Mental Health Services Facilities Improvement Revenue Bonds, Series 2010A,
5.000%, 8/15/19 (ETM) | | | | | No Opt. Call | | | | N/R (4) | | | | 6,199 | |
| | | | | |
| | 1,250 | | | Dormitory Authority of the State of New York, Revenue Bonds, Memorial Sloan-Kettering Cancer Center, Series 2012-1, 5.000%, 7/01/23 | | | | | 1/22 at 100.00 | | | | AA | | | | 1,544,313 | |
| | | | | |
| | 1,785 | | | Dormitory Authority of the State of New York, Revenue Bonds, Rochester Institute of Technology, Series 2006A, 5.000%, 7/01/13 – AMBAC Insured | | | | | No Opt. Call | | | | A1 | | | | 1,798,727 | |
| | | | | |
| | 1,040 | | | Dormitory Authority of the State of New York, Revenue Bonds, Winthrop-South Nassau University Hospital Association, Series 2003A, 5.500%, 7/01/13 (ETM) | | | | | No Opt. Call | | | | Baa1 (4) | | | | 1,049,142 | |
Portfolio of Investments
Nuveen Limited Term Municipal Bond Fund (continued)
April 30, 2013
| | | | | | | | | | | | | | | | | | |
Principal
Amount (000) | | | Description (1) | | | | Optional Call
Provisions (2) | | | Ratings (3) | | | Value | |
| | | | New York (continued) | | | | | | | | | | | | | | |
| | | | | |
| $ | 12,195 | | | Dormitory Authority of the State of New York, State Personal Income Tax Revenue Bonds, General Purpose Series 2012A, 5.000%, 12/15/21 | | | | | No Opt. Call | | | | AAA | | | $ | 15,489,845 | |
| | | | | |
| | 5 | | | Dormitory Authority of the State of New York, State Personal Income Tax Revenue Bonds, General Purpose Series 2012A, 5.000%, 12/15/21 (ETM) | | | | | No Opt. Call | | | | N/R (4) | | | | 6,383 | |
| | | | | |
| | | | Long Island Power Authority, New York, Electric System General Revenue Bonds, Series 2000A: | | | | | | | | | | | | | | |
| | 600 | | | 0.000%, 6/01/16 – AGM Insured | | | | | No Opt. Call | | | | AA– | | | | 585,666 | |
| | 140 | | | 0.000%, 6/01/19 – AGM Insured | | | | | No Opt. Call | | | | AA– | | | | 127,574 | |
| | 350 | | | 0.000%, 6/01/21 – AGM Insured | | | | | No Opt. Call | | | | AA– | | | | 296,909 | |
| | 410 | | | 0.000%, 6/01/22 – AGM Insured | | | | | No Opt. Call | | | | AA– | | | | 333,531 | |
| | 1,065 | | | 0.000%, 6/01/23 – AGM Insured | | | | | No Opt. Call | | | | AA– | | | | 828,740 | |
| | | | | |
| | 2,205 | | | Long Island Power Authority, New York, Electric System General Revenue Bonds, Series 2003B, 5.250%, 12/01/14 | | | | | No Opt. Call | | | | A | | | | 2,369,206 | |
| | | | | |
| | | | Long Island Power Authority, New York, Electric System General Revenue Bonds, Series 2006A: | | | | | | | | | | | | | | |
| | 5,365 | | | 5.000%, 12/01/16 – AGM Insured | | | | | 6/16 at 100.00 | | | | AA– | | | | 6,034,230 | |
| | 675 | | | 4.250%, 12/01/16 – AGM Insured | | | | | No Opt. Call | | | | AA– | | | | 743,830 | |
| | 790 | | | 4.000%, 12/01/16 – AGM Insured | | | | | No Opt. Call | | | | AA– | | | | 864,552 | |
| | 490 | | | 5.000%, 12/01/19 – FGIC Insured | | | | | 6/16 at 100.00 | | | | A | | | | 544,645 | |
| | 270 | | | 5.250%, 12/01/20 – FGIC Insured | | | | | 6/16 at 100.00 | | | | A | | | | 301,450 | |
| | | | | |
| | 595 | | | Long Island Power Authority, New York, Electric System General Revenue Bonds, Series 2006D, 5.000%, 9/01/17 – NPFG Insured | | | | | 9/16 at 100.00 | | | | A | | | | 674,920 | |
| | | | | |
| | | | Long Island Power Authority, New York, Electric System General Revenue Bonds, Series 2006E: | | | | | | | | | | | | | | |
| | 880 | | | 5.000%, 12/01/17 – FGIC Insured | | | | | 12/16 at 100.00 | | | | A | | | | 1,003,517 | |
| | 255 | | | 5.000%, 12/01/17 | | | | | 12/16 at 100.00 | | | | A | | | | 292,151 | |
| | 150 | | | 5.000%, 12/01/18 – FGIC Insured | | | | | 12/16 at 100.00 | | | | A | | | | 171,510 | |
| | 12,110 | | | 5.000%, 12/01/18 – NPFG Insured | | | | | 12/16 at 100.00 | | | | A | | | | 13,846,574 | |
| | 200 | | | 5.000%, 12/01/21 – FGIC Insured | | | | | 12/16 at 100.00 | | | | A | | | | 226,032 | |
| | 450 | | | 5.000%, 12/01/21 – NPFG Insured | | | | | 12/16 at 100.00 | | | | A | | | | 508,572 | |
| | | | | |
| | | | Long Island Power Authority, New York, Electric System Revenue Bonds, Series 2006F: | | | | | | | | | | | | | | |
| | 2,315 | | | 5.000%, 5/01/15 – NPFG Insured | | | | | No Opt. Call | | | | A | | | | 2,517,910 | |
| | 645 | | | 5.000%, 5/01/16 – NPFG Insured | | | | | No Opt. Call | | | | A | | | | 727,173 | |
| | 625 | | | 5.000%, 5/01/17 – NPFG Insured | | | | | No Opt. Call | | | | A | | | | 720,256 | |
| | 755 | | | 5.000%, 5/01/18 – NPFG Insured | | | | | 11/16 at 100.00 | | | | A | | | | 853,739 | |
| | 285 | | | 5.000%, 5/01/19 – NPFG Insured | | | | | 11/16 at 100.00 | | | | A | | | | 321,329 | |
| | | | | |
| | 1,100 | | | Long Island Power Authority, New York, Electric System Revenue Bonds, Series 2011A, 5.000%, 5/01/16 | | | | | No Opt. Call | | | | A | | | | 1,240,140 | |
| | | | | |
| | 5,500 | | | Metropolitan Transportation Authority, New York, Dedicated Tax Fund Bonds, Refunding Series 2012A, 5.000%, 11/15/20 | | | | | No Opt. Call | | | | AA | | | | 6,839,580 | |
| | | | | |
| | | | Metropolitan Transportation Authority, New York, Transportation Revenue Bonds, Refunding Series 2012-B2: | | | | | | | | | | | | | | |
| | 3,985 | | | 5.000%, 11/15/21 | | | | | No Opt. Call | | | | A | | | | 4,920,319 | |
| | 2,000 | | | 5.000%, 11/15/22 | | | | | No Opt. Call | | | | A | | | | 2,483,760 | |
| | | | | |
| | | | Metropolitan Transportation Authority, New York, Transportation Revenue Bonds, Refunding Series 2012H: | | | | | | | | | | | | | | |
| | 5,135 | | | 5.000%, 11/15/20 | | | | | No Opt. Call | | | | A | | | | 6,287,499 | |
| | 3,090 | | | 4.000%, 11/15/21 | | | | | No Opt. Call | | | | A | | | | 3,573,709 | |
| | 5,790 | | | 4.000%, 11/15/22 | | | | | No Opt. Call | | | | A | | | | 6,683,339 | |
| | | | | |
| | 1,500 | | | Metropolitan Transportation Authority, New York, Transportation Revenue Bonds, Series 2005C, 5.250%, 11/15/14 | | | | | No Opt. Call | | | | A | | | | 1,615,395 | |
| | | | | |
| | | | Monroe County, New York, General Obligation Bonds, Refunding Series 2012: | | | | | | | | | | | | | | |
| | 1,500 | | | 5.000%, 3/01/14 | | | | | No Opt. Call | | | | A3 | | | | 1,557,825 | |
| | 1,000 | | | 5.000%, 3/01/15 | | | | | No Opt. Call | | | | A3 | | | | 1,078,820 | |
| | | | | | | | | | | | | | | | | | |
Principal
Amount (000) | | | Description (1) | | | | Optional Call
Provisions (2) | | | Ratings (3) | | | Value | |
| | | | New York (continued) | | | | | | | | | | | | | | |
| | | | | |
| $ | 730 | | | New York City Industrial Development Agency, New York, Civic Facility Revenue Bonds, Special Needs Facilities Pooled Program, Series 2008A-1, 5.700%, 7/01/13 | | | | | No Opt. Call | | | | N/R | | | $ | 731,686 | |
| | | | | |
| | 5,040 | | | New York City Municipal Water Finance Authority, New York, Water and Sewerage System Revenue Bonds, Fiscal Series 2005B, 5.000%, 6/15/20 (Pre-refunded 12/15/14) – AMBAC Insured | | | | | 12/14 at 100.00 | | | | Aa1 (4) | | | | 5,422,939 | |
| | | | | |
| | 6,425 | | | New York City Municipal Water Finance Authority, New York, Water and Sewerage System Revenue Bonds, Fiscal Series 2005B, 5.000%, 6/15/20 – AMBAC Insured | | | | | 12/14 at 100.00 | | | | AAA | | | | 6,898,651 | |
| | | | | |
| | 10,085 | | | New York City, New York, General Obligation Bonds, Fiscal 2010 Series C, 5.000%, 8/01/17 | | | | | No Opt. Call | | | | AA | | | | 11,864,095 | |
| | | | | |
| | 10,000 | | | New York City, New York, General Obligation Bonds, Fiscal 2012 Series I, 5.000%, 8/01/14 | | | | | No Opt. Call | | | | AA | | | | 10,594,400 | |
| | | | | |
| | 7,200 | | | New York State Energy Research and Development Authority, Pollution Control Revenue Bonds, Rochester Gas and Electric Corporation, Series 1997C, 5.000%, 8/01/32 (Mandatory put 8/01/16) – NPFG Insured | | | | | No Opt. Call | | | | A | | | | 7,947,360 | |
| | | | | |
| | 2,000 | | | New York State Energy Research and Development Authority, Pollution Control Revenue Bonds, Rochester Gas and Electric Corporation, Series 2004A, 4.750%, 5/15/32 (Mandatory put 7/01/16) – NPFG Insured | | | | | No Opt. Call | | | | A | | | | 2,187,740 | |
| | | | | |
| | 7,330 | | | New York State Energy Research and Development Authority, Pollution Control Revenue Refunding Bonds, New York State Electric and Gas Corporation, Remarketed Series 1994C, 3.000%, 6/01/29 (Mandatory put 6/03/13) (Pre-refunded 6/03/13) | | | | | 6/13 at 100.00 | | | | BBB+ (4) | | | | 7,346,712 | |
| | | | | |
| | 2,460 | | | New York State Thruway Authority, Highway and Bridge Trust Fund Bonds, Second General, Series 2005B, 5.000%, 4/01/19 – AMBAC Insured | | | | | 10/15 at 100.00 | | | | AA | | | | 2,725,557 | |
| | | | | |
| | | | New York State Thruway Authority, Local Highway and Bridge Service Contract Bonds, Series 2009: | | | | | | | | | | | | | | |
| | 5,000 | | | 4.000%, 4/01/16 | | | | | No Opt. Call | | | | AA– | | | | 5,505,000 | |
| | 5,000 | | | 4.000%, 4/01/17 | | | | | No Opt. Call | | | | AA– | | | | 5,633,750 | |
| | 6,845 | | | 5.000%, 4/01/18 | | | | | No Opt. Call | | | | AA– | | | | 8,188,057 | |
| | | | | |
| | | | New York State Tobacco Settlement Financing Corporation, Tobacco Settlement Asset-Backed and State Contingency Contract-Backed Bonds, Series 2003A-1C: | | | | | | | | | | | | | | |
| | 475 | | | 5.500%, 6/01/18 | | | | | 6/13 at 100.00 | | | | AA– | | | | 477,095 | |
| | 1,215 | | | 5.250%, 6/01/20 – AMBAC Insured | | | | | 6/13 at 100.00 | | | | AA– | | | | 1,220,200 | |
| | 820 | | | 5.250%, 6/01/21 – AMBAC Insured | | | | | 6/13 at 100.00 | | | | AA– | | | | 823,518 | |
| | 110 | | | 5.250%, 6/01/21 – AMBAC Insured | | | | | 6/13 at 100.00 | | | | AA+ | | | | 110,469 | |
| | | | | |
| | | | New York State Tobacco Settlement Financing Corporation, Tobacco Settlement Asset-Backed and State Contingency Contract-Backed Bonds, Series 2003A-1: | | | | | | | | | | | | | | |
| | 9,225 | | | 5.500%, 6/01/19 | | | | | 6/13 at 100.00 | | | | AA– | | | | 9,266,789 | |
| | 1,875 | | | 5.250%, 6/01/20 – AMBAC Insured | | | | | 6/13 at 100.00 | | | | AA– | | | | 1,883,025 | |
| | 11,245 | | | 5.250%, 6/01/21 – AMBAC Insured | | | | | 6/13 at 100.00 | | | | AA– | | | | 11,292,904 | |
| | 9,410 | | | 5.250%, 6/01/22 – AMBAC Insured | | | | | 6/13 at 100.00 | | | | AA– | | | | 9,449,710 | |
| | | | | |
| | | | New York State Tobacco Settlement Financing Corporation, Tobacco Settlement Asset-Backed and State Contingency Contract-Backed Bonds, Series 2003B-1C: | | | | | | | | | | | | | | |
| | 670 | | | 5.500%, 6/01/18 | | | | | 6/13 at 100.00 | | | | AA– | | | | 672,955 | |
| | 4,130 | | | 5.500%, 6/01/19 | | | | | 6/13 at 100.00 | | | | AA– | | | | 4,148,709 | |
| | 10,070 | | | 5.500%, 6/01/20 | | | | | 6/13 at 100.00 | | | | AA– | | | | 10,115,416 | |
| | 640 | | | 5.500%, 6/01/20 – FGIC Insured | | | | | 6/13 at 100.00 | | | | AA | | | | 642,918 | |
| | 14,020 | | | 5.500%, 6/01/21 | | | | | 6/13 at 100.00 | | | | AA– | | | | 14,084,212 | |
| | 5,205 | | | 5.500%, 6/01/22 | | | | | 6/13 at 100.00 | | | | AA– | | | | 5,228,214 | |
| | | | | |
| | 10,000 | | | New York State Urban Development Corporation, Service Contract Revenue Bonds, Refunding Series 2010A, 5.000%, 1/01/17 | | | | | No Opt. Call | | | | AA– | | | | 11,494,100 | |
Portfolio of Investments
Nuveen Limited Term Municipal Bond Fund (continued)
April 30, 2013
| | | | | | | | | | | | | | | | | | |
Principal
Amount (000) | | | Description (1) | | | | Optional Call
Provisions (2) | | | Ratings (3) | | | Value | |
| | | | New York (continued) | | | | | | | | | | | | | | |
| | | | | |
| | | | New York State Urban Development Corporation, State Personal Income Tax Revenue Bonds, Series 2009A-1: | | | | | | | | | | | | | | |
| $ | 3,105 | | | 5.000%, 12/15/16 | | | | | No Opt. Call | | | | AAA | | | $ | 3,608,662 | |
| | 1,000 | | | 5.000%, 12/15/17 | | | | | No Opt. Call | | | | AAA | | | | 1,196,280 | |
| | | | | |
| | 8,085 | | | New York State Urban Development Corporation, State Personal Income Tax Revenue Bonds, Series 2009C, 5.000%, 12/15/18 | | | | | No Opt. Call | | | | AAA | | | | 9,879,142 | |
| | | | | |
| | | | North Babylon Union Free School District, Suffolk County, New York, General Obligation Bonds, Refunding Series 2013: | | | | | | | | | | | | | | |
| | 3,080 | | | 3.000%, 1/15/14 | | | | | No Opt. Call | | | | Aa3 | | | | 3,141,261 | |
| | 3,080 | | | 3.000%, 1/15/15 | | | | | No Opt. Call | | | | Aa3 | | | | 3,218,323 | |
| | | | | |
| | 120 | | | Suffolk County Industrial Development Agency, New York, Civic Facility Revenue Bonds, Special Needs Facilities Pooled Program, Series 2008-B1, 5.700%, 7/01/13 | | | | | No Opt. Call | | | | N/R | | | | 120,277 | |
| | | | | |
| | | | Tobacco Settlement Financing Corporation, New York, Asset-Backed Revenue Bonds, State Contingency Contract Secured, Series 2011B: | | | | | | | | | | | | | | |
| | 7,800 | | | 5.000%, 6/01/15 | | | | | No Opt. Call | | | | AA– | | | | 8,548,956 | |
| | 5,500 | | | 5.000%, 6/01/16 | | | | | No Opt. Call | | | | AA– | | | | 6,240,520 | |
| | 3,600 | | | 5.000%, 6/01/17 | | | | | No Opt. Call | | | | AA– | | | | 4,195,728 | |
| | 2,800 | | | 5.000%, 6/01/18 | | | | | No Opt. Call | | | | AA– | | | | 3,341,548 | |
| | | | | |
| | | | Triborough Bridge and Tunnel Authority, New York, General Purpose Revenue Bonds, Refunding Series 2012B: | | | | | | | | | | | | | | |
| | 16,120 | | | 4.000%, 11/15/20 | | | | | No Opt. Call | | | | AA– | | | | 19,114,612 | |
| | 18,685 | | | 4.000%, 11/15/21 | | | | | No Opt. Call | | | | AA– | | | | 22,172,182 | |
| | | | | |
| | 5,150 | | | Triborough Bridge and Tunnel Authority, New York, General Purpose Revenue Bonds, Refunding Series 2013B, 4.000%, 11/15/19 | | | | | No Opt. Call | | | | AA– | | | | 6,072,417 | |
| | | | | |
| | 1,850 | | | Triborough Bridge and Tunnel Authority, New York, General Purpose Revenue Bonds, Refunding Subordinate Lien Series 2013A, 2.000%, 11/15/14 | | | | | No Opt. Call | | | | A+ | | | | 1,898,119 | |
| | | | | |
| | 1,815 | | | TSASC Inc., New York, Tobacco Asset-Backed Bonds, Series 2006, 4.750%, 6/01/22 | | | | | 6/16 at 100.00 | | | | BBB | | | | 1,822,169 | |
| | | | | |
| | 105 | | | Yonkers Industrial Development Agency, New York, Civic Facilities Revenue Bonds, Special Needs Facilities Pooled Program Bonds, Series 2008-C1, 5.700%, 7/01/13 | | | | | No Opt. Call | | | | N/R | | | | 105,243 | |
| | | | | |
| | | | Yonkers, New York, General Obligation Bonds, Series 2012C: | | | | | | | | | | | | | | |
| | 2,440 | | | 3.000%, 8/15/22 | | | | | No Opt. Call | | | | BBB+ | | | | 2,493,778 | |
| | 2,510 | | | 3.000%, 8/15/23 | | | | | No Opt. Call | | | | BBB+ | | | | 2,524,935 | |
| | 314,660 | | | Total New York | | | | | | | | | | | | | 349,183,813 | |
| | | | North Carolina – 1.4% | | | | | | | | | | | | | | |
| | | | | |
| | | | Fayetteville Public Works Commission, North Carolina, Revenue Bonds, Refunding Series 2009A: | | | | | | | | | | | | | | |
| | 3,000 | | | 5.000%, 3/01/16 | | | | | No Opt. Call | | | | AA | | | | 3,372,900 | |
| | 2,010 | | | 5.000%, 3/01/17 | | | | | No Opt. Call | | | | AA | | | | 2,333,711 | |
| | 2,075 | | | 5.000%, 3/01/18 | | | | | No Opt. Call | | | | AA | | | | 2,472,612 | |
| | | | | |
| | | | Mecklenburg County Public Facilities Corporation, North Carolina, Limited Obligation Bonds, Refunding Series 2009: | | | | | | | | | | | | | | |
| | 5,500 | | | 5.000%, 3/01/16 | | | | | No Opt. Call | | | | AA+ | | | | 6,195,255 | |
| | 3,000 | | | 5.000%, 3/01/18 | | | | | No Opt. Call | | | | AA+ | | | | 3,584,280 | |
| | | | | |
| | 3,570 | | | Mecklenburg County, North Carolina, General Obligation Bonds, Refunding Series 2013A, 4.000%, 12/01/16 | | | | | No Opt. Call | | | | AAA | | | | 4,016,893 | |
| | | | | |
| | | | New Hanover County, North Carolina, General Obligation Bonds, School Series 2009: | | | | | | | | | | | | | | |
| | 1,500 | | | 3.000%, 6/01/14 | | | | | No Opt. Call | | | | Aaa | | | | 1,545,570 | |
| | 1,500 | | | 3.000%, 6/01/15 | | | | | No Opt. Call | | | | Aaa | | | | 1,584,480 | |
| | 1,500 | | | 3.000%, 6/01/16 | | | | | No Opt. Call | | | | Aaa | | | | 1,618,530 | |
| | 765 | | | 3.000%, 6/01/17 | | | | | No Opt. Call | | | | Aaa | | | | 840,146 | |
| | | | | | | | | | | | | | | | | | |
Principal
Amount (000) | | | Description (1) | | | | Optional Call
Provisions (2) | | | Ratings (3) | | | Value | |
| | | | North Carolina (continued) | | | | | | | | | | | | | | |
| | | | | |
| | | | North Carolina Medical Care Commission, Hospital Revenue Bonds, CaroMont Health, Series 2008: | | | | | | | | | | | | | | |
| $ | 2,665 | | | 3.000%, 2/15/15 – AGC Insured | | | | | No Opt. Call | | | | AA– | | | $ | 2,768,349 | |
| | 3,200 | | | 3.500%, 2/15/16 – AGC Insured | | | | | No Opt. Call | | | | AA– | | | | 3,423,104 | |
| | 2,760 | | | 4.000%, 2/15/17 – AGC Insured | | | | | No Opt. Call | | | | AA– | | | | 3,055,486 | |
| | | | | |
| | 2,050 | | | North Carolina Municipal Power Agency 1, Catawba Electric Revenue Bonds, Refunding Series 2012A, 5.000%, 1/01/19 | | | | | No Opt. Call | | | | A | | | | 2,475,068 | |
| | | | | |
| | | | North Carolina State, Capital Improvement Limited Obligation Bonds, Series 2009A: | | | | | | | | | | | | | | |
| | 1,000 | | | 5.000%, 5/01/19 | | | | | No Opt. Call | | | | AA+ | | | | 1,224,140 | |
| | 5,195 | | | 5.000%, 5/01/20 | | | | | 5/19 at 100.00 | | | | AA+ | | | | 6,369,434 | |
| | 3,040 | | | 5.000%, 5/01/21 | | | | | 5/19 at 100.00 | | | | AA+ | | | | 3,693,752 | |
| | | | | |
| | 500 | | | University of North Carolina System, Pooled Revenue Bonds, East Carolina University, Series 2011A, 3.000%, 5/01/14 | | | | | No Opt. Call | | | | Aa2 | | | | 513,245 | |
| | | | | |
| | | | Wilmington, North Carolina, Limited Obligation Bonds, Refunding Series 2012: | | | | | | | | | | | | | | |
| | 350 | | | 2.000%, 6/01/14 – AGM Insured | | | | | No Opt. Call | | | | AA | | | | 356,300 | |
| | 420 | | | 3.000%, 6/01/15 – AGM Insured | | | | | No Opt. Call | | | | AA | | | | 441,701 | |
| | 855 | | | 4.000%, 6/01/17 – AGM Insured | | | | | No Opt. Call | | | | AA | | | | 966,800 | |
| | 800 | | | 4.000%, 6/01/18 – AGM Insured | | | | | No Opt. Call | | | | AA | | | | 918,584 | |
| | 47,255 | | | Total North Carolina | | | | | | | | | | | | | 53,770,340 | |
| | | | North Dakota – 0.2% | | | | | | | | | | | | | | |
| | | | | |
| | 800 | | | Fargo Public School District 1, County, North Dakota, General Obligation Bonds, Limited Tax School Building Series 2008, 4.000%, 5/01/14 | | | | | No Opt. Call | | | | Aa3 | | | | 828,784 | |
| | | | | |
| | 5,325 | | | Grand Forks, North Dakota, Healthcare System Revenue Bonds, Altru Health System, Series 2007, 5.500%, 12/01/17 | | | | | No Opt. Call | | | | A– | | | | 6,155,221 | |
| | | | | |
| | 1,000 | | | Ward County Health Care, North Dakota, Revenue Bonds, Trinity Obligated Group, Series 2006, 5.125%, 7/01/18 | | | | | 7/16 at 100.00 | | | | BBB– | | | | 1,083,140 | |
| | | | | |
| | 1,130 | | | West Fargo, North Dakota, General Obligation Bonds, Refunding & Improvement Series 2012C, 3.000%, 5/01/17 | | | | | No Opt. Call | | | | Aa3 | | | | 1,216,400 | |
| | 8,255 | | | Total North Dakota | | | | | | | | | | | | | 9,283,545 | |
| | | | Ohio – 3.6% | | | | | | | | | | | | | | |
| | | | | |
| | | | Akron, Bath and Copley Joint Township Hospital District, Ohio, Hospital Revenue Bonds, Children’s Hospital Medical Center, Improvement & Refunding Series 2012: | | | | | | | | | | | | | | |
| | 2,000 | | | 5.000%, 11/15/21 | | | | | No Opt. Call | | | | A1 | | | | 2,375,240 | |
| | 2,655 | | | 5.000%, 11/15/22 | | | | | 5/22 at 100.00 | | | | A1 | | | | 3,119,280 | |
| | | | | |
| | | | Akron, Ohio, Waterworks System Mortgage Revenue Improvement and Refunding Bonds, Series 2009: | | | | | | | | | | | | | | |
| | 2,220 | | | 5.000%, 3/01/15 – AGC Insured | | | | | No Opt. Call | | | | A3 | | | | 2,398,444 | |
| | 2,650 | | | 5.000%, 3/01/17 – AGC Insured | | | | | No Opt. Call | | | | A3 | | | | 3,061,519 | |
| | | | | |
| | | | Buckeye Tobacco Settlement Financing Authority, Ohio, Tobacco Settlement Asset-Backed Revenue Bonds, Senior Lien, Series 2007A-1: | | | | | | | | | | | | | | |
| | 5,825 | | | 5.000%, 6/01/14 | | | | | No Opt. Call | | | | A1 | | | | 6,074,077 | |
| | 9,515 | | | 5.000%, 6/01/15 | | | | | No Opt. Call | | | | A1 | | | | 10,249,368 | |
| | 6,630 | | | 5.000%, 6/01/16 | | | | | No Opt. Call | | | | A1 | | | | 7,354,593 | |
| | 3,415 | | | 5.000%, 6/01/17 | | | | | No Opt. Call | | | | Baa1 | | | | 3,878,245 | |
| | | | | |
| | 8,110 | | | Buckeye Tobacco Settlement Financing Authority, Ohio, Tobacco Settlement Asset-Backed Revenue Bonds, Senior Lien, Series 2007A-2, 5.125%, 6/01/24 | | | | | 6/17 at 100.00 | | | | B– | | | | 7,528,513 | |
| | | | | |
| | 2,020 | | | Cleveland, Ohio, Airport System Revenue Bonds, Series 2009C, 5.000%, 1/01/18 – AGM Insured | | | | | No Opt. Call | | | | AA– | | | | 2,345,079 | |
| | | | | |
| | | | Cleveland, Ohio, General Obligation Bonds, Series 2011: | | | | | | | | | | | | | | |
| | 1,470 | | | 5.000%, 12/01/19 | | | | | No Opt. Call | | | | AA | | | | 1,772,702 | |
| | 1,540 | | | 5.000%, 12/01/20 | | | | | 12/19 at 100.00 | | | | AA | | | | 1,838,313 | |
| | 1,620 | | | 5.000%, 12/01/21 | | | | | 12/19 at 100.00 | | | | AA | | | | 1,910,515 | |
Portfolio of Investments
Nuveen Limited Term Municipal Bond Fund (continued)
April 30, 2013
| | | | | | | | | | | | | | | | | | |
Principal
Amount (000) | | | Description (1) | | | | Optional Call
Provisions (2) | | | Ratings (3) | | | Value | |
| | | | Ohio (continued) | | | | | | | | | | | | | | |
| | | | | |
| $ | 2,175 | | | Marysville, Union County, Ohio, General Obligation Bonds, Limited Tax Series 2011, 5.000%, 12/01/20 – AMBAC Insured | | | | | No Opt. Call | | | | Aa3 | | | $ | 2,617,025 | |
| | | | | |
| | | | Muskingum County, Ohio, Hospital Facilities Revenue Bonds, Genesis HealthCare System Obligated Group Project, Series 2013: | | | | | | | | | | | | | | |
| | 1,000 | | | 5.000%, 2/15/16 (WI/DD, Settling 5/09/13) | | | | | No Opt. Call | | | | BB+ | | | | 1,072,850 | |
| | 1,630 | | | 5.000%, 2/15/18 (WI/DD, Settling 5/09/13) | | | | | No Opt. Call | | | | BB+ | | | | 1,787,393 | |
| | 1,000 | | | 5.000%, 2/15/19 (WI/DD, Settling 5/09/13) | | | | | No Opt. Call | | | | BB+ | | | | 1,102,210 | |
| | 270 | | | 5.000%, 2/15/20 (WI/DD, Settling 5/09/13) | | | | | No Opt. Call | | | | BB+ | | | | 297,861 | |
| | 2,000 | | | 5.000%, 2/15/21 (WI/DD, Settling 5/09/13) | | | | | No Opt. Call | | | | BB+ | | | | 2,195,780 | |
| | | | | |
| | 2,000 | | | Muskingum County, Ohio, Hospital Facilities Revenue Bonds, Genesis HealthCare System Obligated Group Project, Series 2013, 5.000%, 2/15/17 (WI/DD, Settling 5/09/13) | | | | | No Opt. Call | | | | BB+ | | | | 2,175,940 | |
| | | | | |
| | | | New Albany Community Authority, Ohio, Community Facilities Revenue Refunding Bonds, Series 2012C: | | | | | | | | | | | | | | |
| | 730 | | | 3.000%, 10/01/15 | | | | | No Opt. Call | | | | A1 | | | | 766,741 | |
| | 765 | | | 3.000%, 10/01/16 | | | | | No Opt. Call | | | | A1 | | | | 813,776 | |
| | 1,100 | | | 4.000%, 10/01/17 | | | | | No Opt. Call | | | | A1 | | | | 1,216,908 | |
| | | | | |
| | 5,650 | | | Ohio Air Quality Development Authority, Air Quality Revenue Refunding Bonds, Columbus Southern Power Company Project, Series 2009A, 3.875%, 12/01/38 (Mandatory put 6/01/14) | | | | | No Opt. Call | | | | Baa1 | | | | 5,807,070 | |
| | | | | |
| | 4,000 | | | Ohio Air Quality Development Authority, Ohio, Revenue Bonds, Ohio Valley Electric Corporation Project, Series 2009E, 5.625%, 10/01/19 | | | | | No Opt. Call | | | | BBB– | | | | 4,750,080 | |
| | | | | |
| | 3,260 | | | Ohio State, General Obligation Bonds, Infrastructure Improvement Series 2012A, 4.000%, 2/01/14 | | | | | No Opt. Call | | | | AA+ | | | | 3,354,344 | |
| | | | | |
| | 6,685 | | | Ohio State, General Obligation Bonds, Infrastructure Improvement Series 2013B, 5.000%, 8/01/21 | | | | | No Opt. Call | | | | AA+ | | | | 8,472,970 | |
| | | | | |
| | 12,625 | | | Ohio State, General Obligation Bonds, Refunding Common Schools Series 2011C, 5.000%, 9/15/20 | | | | | No Opt. Call | | | | AA+ | | | | 15,871,393 | |
| | | | | |
| | 2,640 | | | Ohio State, General Obligation Highway Capital Improvement Bonds, Series 2012Q, 5.000%, 5/01/18 | | | | | No Opt. Call | | | | AAA | | | | 3,176,765 | |
| | | | | |
| | | | Ohio State, Hospital Facility Revenue Refunding Bonds, Cleveland Clinic Health System Obligated Group, Series 2009B: | | | | | | | | | | | | | | |
| | 690 | | | 5.000%, 1/01/17 | | | | | No Opt. Call | | | | Aa2 | | | | 794,176 | |
| | 500 | | | 5.000%, 1/01/18 | | | | | No Opt. Call | | | | Aa2 | | | | 590,890 | |
| | | | | |
| | 110 | | | Ohio Water Development Authority, Loan Revenue Bonds, Pure Water Development, Series 1990I, 6.000%, 12/01/16 – AMBAC Insured (ETM) | | | | | No Opt. Call | | | | Aaa | | | | 119,618 | |
| | | | | |
| | 10,715 | | | Ohio Water Development Authority, Pollution Control Revenue Refunding Bonds, FirstEnergy Nuclear Generating Corporation Project, Series 2010B, 2.200%, 6/01/33 (Mandatory put 6/01/16) | | | | | No Opt. Call | | | | BBB– | | | | 10,836,615 | |
| | | | | |
| | 4,540 | | | Ohio, State Appropriation Lease Bonds, Mental Health Capital Facilities, Refunding Series 2012A, 5.000%, 6/01/17 – NPFG Insured | | | | | No Opt. Call | | | | AA | | | | 5,262,359 | |
| | | | | |
| | | | Southeastern Ohio Port Authority, Hospital Facilities Revenue Bonds, Memorial Health System Obligated Group Project, Refunding and Improvement Series 2012: | | | | | | | | | | | | | | |
| | 2,145 | | | 5.000%, 12/01/15 | | | | | No Opt. Call | | | | N/R | | | | 2,267,930 | |
| | 2,265 | | | 5.000%, 12/01/16 | | | | | No Opt. Call | | | | N/R | | | | 2,425,045 | |
| | | | | |
| | 2,230 | | | University of Toledo, Ohio, General Receipts Bonds, Series 2009, 4.000%, 6/01/18 | | | | | No Opt. Call | | | | A+ | | | | 2,528,753 | |
| | | | | |
| | 1,000 | | | Western Reserve Port Authority, Ohio, Solid Waste Facility Revenue Bonds, Central Waste Inc., Series 2007A, 6.100%, 7/01/17 (Alternative Minimum Tax) (5) | | | | | No Opt. Call | | | | N/R | | | | 140,410 | |
| | 121,395 | | | Total Ohio | | | | | | | | | | | | | 134,350,790 | |
| | | | | | | | | | | | | | | | | | |
Principal
Amount (000) | | | Description (1) | | | | Optional Call
Provisions (2) | | | Ratings (3) | | | Value | |
| | | | Oklahoma – 1.3% | | | | | | | | | | | | | | |
| | | | | |
| | | | Canadian County Educational Facilities Authority, Oklahoma, Educational Facilities Lease Revenue Bonds, Mustang Public Schools Project, Series 2012: | | | | | | | | | | | | | | |
| $ | 1,395 | | | 4.000%, 9/01/18 | | | | | No Opt. Call | | | | A+ | | | $ | 1,565,176 | |
| | 1,435 | | | 4.000%, 9/01/19 | | | | | No Opt. Call | | | | A+ | | | | 1,610,859 | |
| | 2,685 | | | 4.500%, 9/01/20 | | | | | No Opt. Call | | | | A+ | | | | 3,102,115 | |
| | | | | |
| | 4,845 | | | Cleveland County Public Facilities Authority, Oklahoma, Educational Facilities Lease Revenue Bonds, Norman Public Schools Project, Series 2010, 4.000%, 6/01/14 | | | | | No Opt. Call | | | | A+ | | | | 5,028,626 | |
| | | | | |
| | | | Oklahoma County Finance Authority, Oklahoma, Educational Facilities Lease Revenue Bonds, Midwest City-Del City Public Schools Project, Series 2012: | | | | | | | | | | | | | | |
| | 750 | | | 2.000%, 3/01/14 | | | | | No Opt. Call | | | | A+ | | | | 759,945 | |
| | 5,000 | | | 3.000%, 3/01/17 | | | | | No Opt. Call | | | | A+ | | | | 5,321,650 | |
| | 2,820 | | | 4.000%, 3/01/18 | | | | | No Opt. Call | | | | A+ | | | | 3,161,530 | |
| | | | | |
| | 4,585 | | | Tulsa, Oklahoma, Industrial Authority, Revenue and Refunding Bonds (The University of Tulsa), Series 1996A, 6.000%, 10/01/16 – NPFG Insured | | | | | No Opt. Call | | | | A3 | | | | 4,986,233 | |
| | | | | |
| | | | Tulsa Airports Improvement Trust, Oklahoma, General Airport Revenue Bonds, Series 2009A: | | | | | | | | | | | | | | |
| | 1,000 | | | 4.000%, 6/01/15 | | | | | No Opt. Call | | | | A3 | | | | 1,059,930 | |
| | 1,200 | | | 4.500%, 6/01/16 | | | | | 6/15 at 100.00 | | | | A3 | | | | 1,279,260 | |
| | | | | |
| | 8,505 | | | Tulsa Airports Improvement Trust, Oklahoma, General Airport Revenue Bonds, Tulsa International Airport, Series 1997B, 7.050%, 6/01/17 – NPFG Insured (ETM) | | | | | No Opt. Call | | | | A (4) | | | | 9,498,639 | |
| | | | | |
| | 7,425 | | | Tulsa County Industrial Authority, Oklahoma, Educational Facilities Lease Revenue Bonds, Broken Arrow Public Schools Project, Series 2011, 5.000%, 9/01/19 | | | | | No Opt. Call | | | | AA– | | | | 8,947,645 | |
| | | | | |
| | 1,250 | | | Tulsa County Industrial Authority, Oklahoma, Educational Facilities Lease Revenue Bonds, Broken Arrow Public Schools Project, Series 2012, 4.000%, 9/01/22 | | | | | No Opt. Call | | | | AA– | | | | 1,398,775 | |
| | 42,895 | | | Total Oklahoma | | | | | | | | | | | | | 47,720,383 | |
| | | | Oregon – 0.7% | | | | | | | | | | | | | | |
| | | | | |
| | 1,000 | | | Oregon State Department of Transportation, Highway User Tax Revenue Bonds, Series 2009A, 5.000%, 11/15/22 | | | | | 5/19 at 100.00 | | | | AAA | | | | 1,191,250 | |
| | | | | |
| | | | Portland Community College District, Multnomah County, Oregon, General Obligation Bonds, Series 2013: | | | | | | | | | | | | | | |
| | 3,795 | | | 5.000%, 6/15/14 | | | | | No Opt. Call | | | | Aa1 | | | | 3,999,968 | |
| | 5,655 | | | 5.000%, 6/15/15 | | | | | No Opt. Call | | | | Aa1 | | | | 6,211,113 | |
| | | | | |
| | 2,000 | | | Tri-County Metropolitan Transportation District, Oregon, Capital Grant Receipt Revenue Bonds, Series 2011A, 5.000%, 10/01/18 | | | | | No Opt. Call | | | | A | | | | 2,400,500 | |
| | | | | |
| | 10,000 | | | Tri-County Metropolitan Transportation District, Oregon, Revenue Bonds, Payroll Tax and Grant Receipt Series 2013, 3.000%, 11/01/16 | | | | | 5/15 at 100.00 | | | | Aa3 | | | | 10,496,500 | |
| | 22,450 | | | Total Oregon | | | | | | | | | | | | | 24,299,331 | |
| | | | Pennsylvania – 6.3% | | | | | | | | | | | | | | |
| | | | | |
| | 385 | | | Allegheny County Higher Education Building Authority, Pennsylvania, Revenue Bonds, Duquesne University, Series 2013A, 3.000%, 3/01/15 | | | | | No Opt. Call | | | | A2 | | | | 402,802 | |
| | | | | |
| | 1,480 | | | Allegheny County Higher Education Building Authority, Pennsylvania, Revenue Bonds, Robert Morris University, Series 2006A, 4.375%, 2/15/14 | | | | | No Opt. Call | | | | Baa3 | | | | 1,494,578 | |
| | | | | |
| | | | Allegheny County Hospital Development Authority, Pennsylvania, Revenue Bonds, Jefferson Regional Medical Center, Series 2006B: | | | | | | | | | | | | | | |
| | 1,800 | | | 5.000%, 5/01/13 | | | | | No Opt. Call | | | | Baa2 | | | | 1,800,144 | |
| | 1,865 | | | 5.000%, 5/01/14 | | | | | No Opt. Call | | | | Baa2 | | | | 1,913,210 | |
| | 1,985 | | | 5.000%, 5/01/15 | | | | | No Opt. Call | | | | Baa2 | | | | 2,078,851 | |
| | 1,620 | | | 5.000%, 5/01/16 | | | | | No Opt. Call | | | | Baa2 | | | | 1,723,567 | |
| | 1,285 | | | 5.000%, 5/01/18 | | | | | 5/16 at 100.00 | | | | Baa2 | | | | 1,351,846 | |
Portfolio of Investments
Nuveen Limited Term Municipal Bond Fund (continued)
April 30, 2013
| | | | | | | | | | | | | | | | | | |
Principal
Amount (000) | | | Description (1) | | | | Optional Call
Provisions (2) | | | Ratings (3) | | | Value | |
| | | | Pennsylvania (continued) | | | | | | | | | | | | | | |
| | | | | |
| $ | 5,000 | | | Allegheny County Hospital Development Authority, Pennsylvania, Revenue Bonds, University of Pittsburgh Medical Center System, Series 2008B, 5.000%, 6/15/18 | | | | | No Opt. Call | | | | Aa3 | | | $ | 5,980,750 | |
| | | | | |
| | | | Allegheny County Sanitary Authority, Pennsylvania, Sewerage Revenue Bonds, Refunding Series 2011: | | | | | | | | | | | | | | |
| | 6,550 | | | 5.000%, 12/01/17 – AGM Insured | | | | | No Opt. Call | | | | AA– | | | | 7,691,207 | |
| | 4,400 | | | 5.000%, 12/01/18 – AGM Insured | | | | | No Opt. Call | | | | AA– | | | | 5,276,524 | |
| | | | | |
| | 1,900 | | | Berks County, Pennsylvania, General Obligation Bonds, Series 2008, 5.000%, 11/15/21 | | | | | 11/18 at 100.00 | | | | Aa1 | | | | 2,279,107 | |
| | | | | |
| | 1,010 | | | Central Dauphin School District, Dauphin County, Pennsylvania, General Obligation Bonds, Series 2006, 5.250%, 2/01/14 – NPFG Insured (ETM) | | | | | No Opt. Call | | | | AA (4) | | | | 1,048,249 | |
| | | | | |
| | 1,120 | | | Centre County, Pennsylvania, General Obligation Bonds, Series 2012A, 3.000%, 7/01/19 | | | | | No Opt. Call | | | | AA | | | | 1,219,691 | |
| | | | | |
| | 2,295 | | | Coatesville Area School District, Chester County, Pennsylvania, General Obligation Bonds, Series 2009, 4.000%, 10/01/14 – AGM Insured | | | | | No Opt. Call | | | | AA– | | | | 2,406,950 | |
| | | | | |
| | | | Cumberland County Municipal Authority, Pennsylvania, Revenue Bonds, Presbyterian Homes Inc., Refunding Series 2005A: | | | | | | | | | | | | | | |
| | 440 | | | 5.000%, 12/01/15 – RAAI Insured | | | | | No Opt. Call | | | | BBB+ | | | | 472,388 | |
| | 20 | | | 4.250%, 12/01/17 – RAAI Insured | | | | | 12/15 at 100.00 | | | | BBB+ | | | | 20,942 | |
| | 210 | | | 5.000%, 12/01/19 – RAAI Insured | | | | | 12/15 at 100.00 | | | | BBB+ | | | | 221,775 | |
| | 75 | | | 5.000%, 12/01/21 – RAAI Insured | | | | | 12/15 at 100.00 | | | | BBB+ | | | | 78,197 | |
| | | | | |
| | | | Cumberland County Municipal Authority, Pennsylvania, Revenue Bonds, Presbyterian Homes Inc., Series 2003A: | | | | | | | | | | | | | | |
| | 500 | | | 4.750%, 12/01/19 – RAAI Insured | | | | | 6/13 at 100.00 | | | | BBB+ | | | | 500,815 | |
| | 50 | | | 5.000%, 12/01/26 – RAAI Insured | | | | | 6/13 at 100.00 | | | | BBB+ | | | | 50,036 | |
| | | | | |
| | | | Delaware County Authority, Pennsylvania, Revenue Bonds, Villanova University, Series 2010: | | | | | | | | | | | | | | |
| | 1,000 | | | 4.000%, 12/01/16 | | | | | No Opt. Call | | | | A+ | | | | 1,110,800 | |
| | 500 | | | 5.000%, 12/01/18 | | | | | No Opt. Call | | | | A+ | | | | 599,310 | |
| | | | | |
| | 1,305 | | | Delaware County Industrial Development Authority, Pennsylvania, Resource Recovery Revenue Refunding Bonds, Series 1997A, 6.100%, 7/01/13 | | | | | 6/13 at 100.00 | | | | Ba1 | | | | 1,310,324 | |
| | | | | |
| | 3,335 | | | Lancaster County, Pennsylvania, General Obligation Bonds, Series 2009A, 5.000%, 11/01/18 – AGM Insured | | | | | No Opt. Call | | | | A1 | | | | 4,004,234 | |
| | | | | |
| | 1,000 | | | Lebanon County Health Facilities Authority, Pennsylvania, Health Center Revenue Bonds, Pleasant View Retirement Community, Series 2005A, 5.125%, 12/15/20 | | | | | 12/14 at 100.00 | | | | N/R | | | | 1,019,700 | |
| | | | | |
| | 3,425 | | | Lebanon County Health Facilities Authority, Pennsylvania, Revenue Bonds, Good Samaritan Hospital Project, Refunding Series 2004, 5.000%, 11/15/18 | | | | | 11/13 at 100.00 | | | | Ba2 | | | | 3,410,204 | |
| | | | | |
| | 2,700 | | | Luzerne County Industrial Development Authority, Pennsylvania, Guaranteed Lease Revenue Bonds, Series 2009, 7.500%, 12/15/19 | | | | | No Opt. Call | | | | N/R | | | | 2,815,209 | |
| | | | | |
| | 2,165 | | | Lycoming County Authority, Pennsylvania, Health System Revenue Bonds, Susquehanna Health System Project, Series 2009A, 5.000%, 7/01/17 | | | | | No Opt. Call | | | | A– | | | | 2,427,225 | |
| | | | | |
| | 1,080 | | | Lycoming County Authority, Pennsylvania, Revenue Bonds, Pennsylvania College of Technology, Series 2012, 4.000%, 5/01/19 | | | | | No Opt. Call | | | | A | | | | 1,188,464 | |
| | | | | |
| | 560 | | | Northampton County Industrial Development Authority, Pennsylvania, Recovery Revenue Bonds, Northampton Generating Project, Senior Lien Series 2013A0 & AE2, 5.000%, 12/01/23 | | | | | 5/13 at 100.00 | | | | N/R | | | | 511,591 | |
| | | | | |
| | 1,210 | | | Pennsylvania Convention Center Authority, Revenue Bonds, Series 1989A, 6.700%, 9/01/16 – FGIC Insured (ETM) | | | | | No Opt. Call | | | | AA+ (4) | | | | 1,351,582 | |
| | | | | |
| | | | Pennsylvania Economic Development Financing Authority, Health System Revenue Bonds , Albert Einstein Healthcare, Series 2009A: | | | | | | | | | | | | | | |
| | 2,350 | | | 5.000%, 10/15/13 | | | | | No Opt. Call | | | | BBB+ | | | | 2,391,384 | |
| | 3,050 | | | 5.250%, 10/15/14 | | | | | No Opt. Call | | | | BBB+ | | | | 3,209,149 | |
| | 3,275 | | | 5.250%, 10/15/15 | | | | | No Opt. Call | | | | BBB+ | | | | 3,555,668 | |
| | | | | | | | | | | | | | | | | | |
Principal
Amount (000) | | | Description (1) | | | | Optional Call
Provisions (2) | | | Ratings (3) | | | Value | |
| | | | Pennsylvania (continued) | | | | | | | | | | | | | | |
| | | | | |
| $ | 2,700 | | | Pennsylvania Economic Development Financing Authority, Solid Waste Disposal Revenue Bonds, Waste Management Inc., Project, Series 2009, 1.750%, 12/01/33 (Mandatory put 12/01/15) | | | | | No Opt. Call | | | | BBB | | | $ | 2,758,887 | |
| | | | | |
| | 10,000 | | | Pennsylvania Economic Development Financing Authority, Solid Waste Disposal Revenue Bonds, Waste Management Inc., Project, Series 2011, 2.625%, 7/01/41 (Mandatory put 7/01/14) | | | | | No Opt. Call | | | | BBB | | | | 10,136,200 | |
| | | | | |
| | | | Pennsylvania Economic Development Financing Authority, Unemployment Compensation Revenue Bonds, Series 2012A: | | | | | | | | | | | | | | |
| | 2,500 | | | 5.000%, 7/01/15 | | | | | No Opt. Call | | | | Aaa | | | | 2,755,325 | |
| | 2,985 | | | 4.000%, 7/01/15 | | | | | No Opt. Call | | | | Aaa | | | | 3,225,322 | |
| | 3,900 | | | 5.000%, 7/01/16 | | | | | No Opt. Call | | | | Aaa | | | | 4,461,093 | |
| | 4,715 | | | 5.000%, 7/01/19 | | | | | No Opt. Call | | | | Aaa | | | | 5,826,420 | |
| | | | | |
| | | | Pennsylvania Economic Development Financing Authority, Unemployment Compensation Revenue Bonds, Series 2012B: | | | | | | | | | | | | | | |
| | 5,650 | | | 5.000%, 7/01/21 | | | | | 1/18 at 100.00 | | | | Aaa | | | | 6,677,057 | |
| | 19,950 | | | 5.000%, 1/01/22 | | | | | 7/17 at 100.00 | | | | Aaa | | | | 23,223,795 | |
| | 8,365 | | | 5.000%, 7/01/22 | | | | | 7/16 at 100.00 | | | | Aaa | | | | 9,485,241 | |
| | 15,750 | | | 5.000%, 1/01/23 | | | | | 1/16 at 100.00 | | | | Aaa | | | | 17,522,348 | |
| | 13,270 | | | 5.000%, 7/01/23 | | | | | 7/15 at 100.00 | | | | Aaa | | | | 14,540,204 | |
| | | | | |
| | 1,775 | | | Pennsylvania State Public School Building Authority, Lease Revenue Bonds, Philadelphia School District Project, Series 2006A, 4.500%, 6/01/15 – AGM Insured | | | | | No Opt. Call | | | | AA | | | | 1,900,990 | |
| | | | | |
| | | | Pennsylvania Turnpike Commission, Turnpike Subordinate Revenue Bonds, Series 2009B: | | | | | | | | | | | | | | |
| | 2,725 | | | 4.000%, 6/01/13 | | | | | No Opt. Call | | | | A– | | | | 2,733,911 | |
| | 4,000 | | | 5.000%, 6/01/14 | | | | | No Opt. Call | | | | A– | | | | 4,199,720 | |
| | 4,000 | | | 5.000%, 6/01/15 | | | | | No Opt. Call | | | | A– | | | | 4,359,520 | |
| | 4,000 | | | 5.000%, 6/01/16 | | | | | No Opt. Call | | | | A– | | | | 4,494,000 | |
| | | | | |
| | 16,030 | | | Pennsylvania, General Obligation Bonds, Refunding 3rd Series 2004, 5.375%, 7/01/16 – NPFG Insured | | | | | No Opt. Call | | | | AA+ | | | | 18,492,368 | |
| | | | | |
| | 2,860 | | | Philadelphia Gas Works, Pennsylvania, Revenue Bonds, Twelfth Series 1990B, 7.000%, 5/15/20 – NPFG Insured (ETM) | | | | | No Opt. Call | | | | A (4) | | | | 3,494,062 | |
| | | | | |
| | 10,000 | | | Philadelphia School District, Pennsylvania, General Obligation Bonds, Refunding Series 2010C, 5.000%, 9/01/16 | | | | | No Opt. Call | | | | AA | | | | 11,360,200 | |
| | | | | |
| | | | Philadelphia School District, Pennsylvania, General Obligation Bonds, Series 2011D: | | | | | | | | | | | | | | |
| | 1,795 | | | 5.000%, 9/01/17 | | | | | No Opt. Call | | | | AA | | | | 2,069,312 | |
| | 1,525 | | | 5.000%, 9/01/18 | | | | | No Opt. Call | | | | AA | | | | 1,790,137 | |
| | | | | |
| | | | Pittsburgh Water and Sewerage Authority, Pennsylvania, Water and Sewerage System Revenue Refunding Bonds, Series 1986: | | | | | | | | | | | | | | |
| | 1,139 | | | 7.250%, 9/01/14 – FGIC Insured (ETM) | | | | | No Opt. Call | | | | Aaa | | | | 1,199,116 | |
| | 620 | | | 6.000%, 9/01/16 – FGIC Insured (ETM) | | | | | No Opt. Call | | | | Aaa | | | | 706,936 | |
| | | | | |
| | | | Southcentral Pennsylvania General Authority, Revenue Bonds, Hanover Hospital Inc., Series 2013: | | | | | | | | | | | | | | |
| | 260 | | | 4.000%, 12/01/14 | | | | | No Opt. Call | | | | BBB– | | | | 271,157 | |
| | 1,205 | | | 4.000%, 12/01/16 | | | | | No Opt. Call | | | | BBB– | | | | 1,292,736 | |
| | | | | |
| | 1,250 | | | Union County Hospital Authority, Pennsylvania, Hospital Revenue Bonds, Evangelical Community Hospital Project, Refunding and Improvement Series 2011, 4.625%, 8/01/17 | | | | | No Opt. Call | | | | BBB+ | | | | 1,364,725 | |
| | | | | |
| | 2,500 | | | University of Pittsburgh of the Commonwealth System of Higher Education, Pennsylvania, University Capital Project Bonds, Series 2009B, 5.500%, 9/15/21 | | | | | 3/19 at 100.00 | | | | Aa1 | | | | 3,123,925 | |
| | | | | |
| | | | York County, Pennsylvania, General Obligation Bonds, Series 2013: | | | | | | | | | | | | | | |
| | 1,925 | | | 3.000%, 6/01/15 | | | | | No Opt. Call | | | | AA | | | | 2,023,233 | |
| | 1,320 | | | 3.000%, 6/01/16 | | | | | No Opt. Call | | | | AA | | | | 1,413,364 | |
| | 1,350 | | | 4.000%, 6/01/17 | | | | | No Opt. Call | | | | AA | | | | 1,520,141 | |
| | 211,009 | | | Total Pennsylvania | | | | | | | | | | | | | 235,337,918 | |
Portfolio of Investments
Nuveen Limited Term Municipal Bond Fund (continued)
April 30, 2013
| | | | | | | | | | | | | | | | | | |
Principal
Amount (000) | | | Description (1) | | | | Optional Call
Provisions (2) | | | Ratings (3) | | | Value | |
| | | | Puerto Rico – 0.2% | | | | | | | | | | | | | | |
| | | | | |
| $ | 1,525 | | | Puerto Rico Aqueduct and Sewerage Authority, Revenue Bonds, Senior Lien Series 2012A, 5.000%, 7/01/21 | | | | | No Opt. Call | | | | BBB– | | | $ | 1,527,440 | |
| | | | | |
| | 7,000 | | | Puerto Rico Electric Power Authority, Power Revenue Bonds, Series 2010ZZ, 5.250%, 7/01/24 | | | | | 7/20 at 100.00 | | | | BBB+ | | | | 7,253,120 | |
| | | | | |
| | 15 | | | Puerto Rico, General Obligation Bonds, Public Improvement, Refunding Series 2012A, 5.000%, 7/01/20 | | | | | No Opt. Call | | | | BBB– | | | | 15,618 | |
| | | | | |
| | 140 | | | Puerto Rico, Highway Revenue Bonds, Highway and Transportation Authority, Series 2003AA, 5.500%, 7/01/20 – NPFG Insured | | | | | No Opt. Call | | | | BBB+ | | | | 151,385 | |
| | 8,680 | | | Total Puerto Rico | | | | | | | | | | | | | 8,947,563 | |
| | | | Rhode Island – 0.1% | | | | | | | | | | | | | | |
| | | | | |
| | 2,000 | | | Rhode Island Industrial Facilities Corporation, Solid Waste Disposal Revenue Bonds, Waste Management Inc., Series 2004A, 4.625%, 4/01/16 (Alternative Minimum Tax) | | | | | No Opt. Call | | | | BBB | | | | 2,181,760 | |
| | | | | |
| | 2,805 | | | Rhode Island Tobacco Settlement Financing Corporation, Tobacco Settlement Asset-Backed Bonds, Series 2002A, 6.000%, 6/01/23 | | | | | 7/13 at 100.00 | | | | Baa1 | | | | 2,842,643 | |
| | 4,805 | | | Total Rhode Island | | | | | | | | | | | | | 5,024,403 | |
| | | | South Carolina – 1.0% | | | | | | | | | | | | | | |
| | | | | |
| | 3,065 | | | Cherokee County School District 1, South Carolina, General Obligation Bonds, Series 2013A, 4.000%, 3/01/15 | | | | | No Opt. Call | | | | Aa1 | | | | 3,273,573 | |
| | | | | |
| | | | Columbia, South Carolina, Waterworks and Sewer System Revenue Bonds, Refunding Series 2012: | | | | | | | | | | | | | | |
| | 1,500 | | | 3.500%, 2/01/20 | | | | | No Opt. Call | | | | Aa1 | | | | 1,714,890 | |
| | 1,000 | | | 4.500%, 2/01/21 | | | | | No Opt. Call | | | | Aa1 | | | | 1,222,300 | |
| | | | | |
| | 6,010 | | | Dorchester County School District 2, South Carolina, Installment Purchase Revenue Bonds, GROWTH, Series 2004, 5.250%, 12/01/19 | | | | | 12/14 at 100.00 | | | | AA– | | | | 6,464,536 | |
| | | | | |
| | 7,125 | | | Georgetown County, South Carolina, Environmental Improvement Revenue Refunding Bonds, International Paper Company, Series 2002A, 5.700%, 4/01/14 | | | | | No Opt. Call | | | | BBB | | | | 7,398,814 | |
| | | | | |
| | | | Greenville County School District, South Carolina, Installment Purchase Revenue Bonds, Building Equity Sooner Series 2012: | | | | | | | | | | | | | | |
| | 3,365 | | | 5.000%, 12/01/21 | | | | | No Opt. Call | | | | AA | | | | 4,183,705 | |
| | 4,910 | | | 5.000%, 12/01/22 | | | | | No Opt. Call | | | | AA | | | | 6,138,384 | |
| | | | | |
| | 510 | | | Lexington County Health Service District, South Carolina, Hospital Revenue Refunding and Improvement Bonds, Series 2003, 5.500%, 11/01/13 | | | | | No Opt. Call | | | | AA– | | | | 522,337 | |
| | | | | |
| | 1,330 | | | McCormick County, South Carolina, Hospital Facilities Revenue Refunding and Improvement Bonds, McCormick Health Care Center Project, Series 2006, 8.000%, 3/01/21 (ETM) | | | | | No Opt. Call | | | | N/R (4) | | | | 1,780,444 | |
| | | | | |
| | 555 | | | South Carolina JOBS Economic Development Authority, Hospital Facilities Revenue Bonds, Palmetto Health Alliance, Series 2003A, 6.000%, 8/01/13 | | | | | No Opt. Call | | | | BBB+ | | | | 562,959 | |
| | | | | |
| | 1,575 | | | South Carolina JOBS Economic Development Authority, Revenue Bonds, Waste Management of South Carolina, Inc. Project, Series 2008, 2.875%, 2/01/15 | | | | | No Opt. Call | | | | BBB | | | | 1,609,713 | |
| | | | | |
| | 820 | | | South Carolina JOBS-Economic Development Authority, Residential Care Facilities First Mortgage Revenue Bonds, South Carolina Episcopal Home at Still Hopes, Series 2004A, 6.000%, 5/15/17 | | | | | 7/13 at 100.00 | | | | N/R | | | | 822,460 | |
| | 31,765 | | | Total South Carolina | | | | | | | | | | | | | 35,694,115 | |
| | | | South Dakota – 0.1% | | | | | | | | | | | | | | |
| | | | | |
| | | | Deadwood, South Dakota, Certificates of Participation, Refunding Series 2012: | | | | | | | | | | | | | | |
| | 1,580 | | | 3.000%, 11/01/17 | | | | | No Opt. Call | | | | A | | | | 1,670,550 | |
| | 770 | | | 3.000%, 11/01/18 | | | | | No Opt. Call | | | | A | | | | 816,608 | |
| | | | | | | | | | | | | | | | | | |
Principal
Amount (000) | | | Description (1) | | | | Optional Call
Provisions (2) | | | Ratings (3) | | | Value | |
| | | | South Dakota (continued) | | | | | | | | | | | | | | |
| | | | | |
| $ | 1,920 | | | Heartland Consumers Power District, South Dakota, Electric System Revenue Bonds, Series 1977, 6.375%, 1/01/16 (ETM) | | | | | No Opt. Call | | | | Aaa | | | $ | 2,106,509 | |
| | 4,270 | | | Total South Dakota | | | | | | | | | | | | | 4,593,667 | |
| | | | Tennessee – 1.4% | | | | | | | | | | | | | | |
| | | | | |
| | | | First Utility District of Knox County, Tennessee, Water and Sewer Revenue Bonds, Series 2012A: | | | | | | | | | | | | | | |
| | 425 | | | 2.000%, 12/01/13 | | | | | No Opt. Call | | | | AA+ | | | | 429,373 | |
| | 425 | | | 2.000%, 12/01/14 | | | | | No Opt. Call | | | | AA+ | | | | 436,093 | |
| | 225 | | | 2.000%, 12/01/15 | | | | | No Opt. Call | | | | AA+ | | | | 233,631 | |
| | 225 | | | 2.000%, 12/01/16 | | | | | No Opt. Call | | | | AA+ | | | | 235,537 | |
| | 475 | | | 2.000%, 12/01/17 | | | | | No Opt. Call | | | | AA+ | | | | 498,109 | |
| | 710 | | | 4.000%, 12/01/20 | | | | | No Opt. Call | | | | AA+ | | | | 831,765 | |
| | 740 | | | 4.000%, 12/01/21 | | | | | No Opt. Call | | | | AA+ | | | | 871,269 | |
| | | | | |
| | | | Johnson City Health and Educational Facilities Board, Tennessee, Revenue Bonds, Mountain States Health Alliance, Series 2006A: | | | | | | | | | | | | | | |
| | 525 | | | 5.000%, 7/01/13 | | | | | No Opt. Call | | | | BBB+ | | | | 528,917 | |
| | 695 | | | 5.000%, 7/01/14 | | | | | No Opt. Call | | | | BBB+ | | | | 726,192 | |
| | | | | |
| | | | Knox County Health, Educational and Housing Facility Board, Tennessee, Hospital Revenue Refunding Bonds, Covenant Health, Series 2012A: | | | | | | | | | | | | | | |
| | 1,030 | | | 5.000%, 1/01/19 | | | | | No Opt. Call | | | | A | | | | 1,222,435 | |
| | 2,500 | | | 5.000%, 1/01/20 | | | | | No Opt. Call | | | | A | | | | 2,958,325 | |
| | 1,500 | | | 4.000%, 1/01/21 | | | | | No Opt. Call | | | | A | | | | 1,683,360 | |
| | | | | |
| | | | Metropolitan Government of Nashville-Davidson County Health and Educational Facilities Board, Tennessee, Revenue Bonds, Belmont University Project, Series 2012: | | | | | | | | | | | | | | |
| | 1,335 | | | 3.000%, 11/01/17 | | | | | No Opt. Call | | | | BBB+ | | | | 1,406,249 | |
| | 250 | | | 3.000%, 11/01/18 | | | | | No Opt. Call | | | | BBB+ | | | | 263,408 | |
| | 1,070 | | | 4.000%, 11/01/19 | | | | | No Opt. Call | | | | BBB+ | | | | 1,187,796 | |
| | 810 | | | 4.000%, 11/01/20 | | | | | No Opt. Call | | | | BBB+ | | | | 902,300 | |
| | 500 | | | 4.000%, 11/01/21 | | | | | No Opt. Call | | | | BBB+ | | | | 556,780 | |
| | 1,030 | | | 5.000%, 11/01/22 | | | | | 11/21 at 100.00 | | | | BBB+ | | | | 1,214,463 | |
| | | | | |
| | 1,000 | | | Metropolitan Government of Nashville-Davidson County, Tennessee, General Obligation Bonds, Refunding Series 2013, 3.000%, 7/01/15 | | | | | No Opt. Call | | | | Aa1 | | | | 1,058,670 | |
| | | | | |
| | | | Metropolitan Government of Nashville-Davidson County, Tennessee, Water and Sewerage Revenue Bonds, Subordinate Lien Refunding Series 2012: | | | | | | | | | | | | | | |
| | 1,050 | | | 5.000%, 7/01/16 | | | | | No Opt. Call | | | | A+ | | | | 1,194,470 | |
| | 2,570 | | | 5.000%, 7/01/21 | | | | | No Opt. Call | | | | A+ | | | | 3,180,118 | |
| | 1,320 | | | 5.000%, 7/01/22 | | | | | No Opt. Call | | | | A+ | | | | 1,650,264 | |
| | | | | |
| | | | Shelby County Health, Educational and Housing Facilities Board, Tennessee, Revenue Bonds, Baptist Memorial Healthcare, Series 2004A: | | | | | | | | | | | | | | |
| | 2,000 | | | 5.000%, 9/01/15 | | | | | No Opt. Call | | | | AA– | | | | 2,204,540 | |
| | 5,000 | | | 5.000%, 9/01/16 | | | | | No Opt. Call | | | | AA– | | | | 5,680,700 | |
| | 2,500 | | | 5.000%, 9/01/18 | | | | | No Opt. Call | | | | AA– | | | | 2,988,375 | |
| | | | | |
| | 7,530 | | | Tennessee State, General Obligation Bonds, Series 2009A, 5.000%, 5/01/17 | | | | | No Opt. Call | | | | Aaa | | | | 8,853,322 | |
| | | | | |
| | 1,000 | | | Tennessee State, General Obligation Bonds, Series 2009A, 5.000%, 5/01/19 (Pre-refunded 5/01/17) | | | | | 5/17 at 100.00 | | | | Aaa | | | | 1,175,880 | |
| | | | | |
| | | | The Tennessee Energy Acquisition Corporation, Gas Revenue Bonds, Series 2006A: | | | | | | | | | | | | | | |
| | 4,175 | | | 5.000%, 9/01/13 | | | | | No Opt. Call | | | | A | | | | 4,242,593 | |
| | 250 | | | 5.000%, 9/01/14 | | | | | No Opt. Call | | | | A | | | | 264,068 | |
| | 200 | | | 5.250%, 9/01/18 | | | | | No Opt. Call | | | | A | | | | 231,304 | |
| | | | | |
| | 1,395 | | | The Tennessee Energy Acquisition Corporation, Gas Revenue Bonds, Series 2006C, 5.000%, 2/01/17 | | | | | No Opt. Call | | | | A– | | | | 1,556,499 | |
| | 44,460 | | | Total Tennessee | | | | | | | | | | | | | 50,466,805 | |
Portfolio of Investments
Nuveen Limited Term Municipal Bond Fund (continued)
April 30, 2013
| | | | | | | | | | | | | | | | | | |
Principal
Amount (000) | | | Description (1) | | | | Optional Call
Provisions (2) | | | Ratings (3) | | | Value | |
| | | | Texas – 5.8% | | | | | | | | | | | | | | |
| | | | | |
| $ | 3,000 | | | Bexar County Housing Finance Corporation, Texas, FNMA Guaranteed Multifamily Housing Revenue Bonds, Villas Sonterra Apartments Project, Series 2007A, 4.700%, 10/01/15 (Alternative Minimum Tax) | | | | | No Opt. Call | | | | N/R | | | $ | 3,146,100 | |
| | | | | |
| | 7,095 | | | Board of Regents of the Texas Tech University System, Revenue Financing System Refunding and Improvement Bonds, Fourteenth Series 2012A, 2.000%, 8/15/13 | | | | | No Opt. Call | | | | AA+ | | | | 7,132,958 | |
| | | | | |
| | | | Board of Regents, University of Texas System, Financing System Revenue Bonds, Refunding Series 2012A: | | | | | | | | | | | | | | |
| | 5,000 | | | 4.000%, 8/15/14 | | | | | No Opt. Call | | | | AAA | | | | 5,240,150 | |
| | 20,350 | | | 5.000%, 8/15/23 | | | | | No Opt. Call | | | | AAA | | | | 26,520,934 | |
| | | | | |
| | | | Canadian River Municipal Water Authority, Texas, Contract Revenue Bonds, Conjunctive Use Groundwater Supply Project, Subordinate Lien Series 2011: | | | | | | | | | | | | | | |
| | 1,000 | | | 5.000%, 2/15/15 | | | | | No Opt. Call | | | | AA | | | | 1,082,600 | |
| | 1,000 | | | 5.000%, 2/15/16 | | | | | No Opt. Call | | | | AA | | | | 1,124,040 | |
| | | | | |
| | | | City of Houston, Texas, Sewer System Revenue Bonds, Series 1984: | | | | | | | | | | | | | | |
| | 745 | | | 9.375%, 10/01/13 – NPFG Insured (ETM) | | | | | 4/13 at 100.00 | | | | Aaa | | | | 772,774 | |
| | 30 | | | 9.375%, 10/01/13 – NPFG Insured (ETM) | | | | | 4/13 at 100.00 | | | | Aaa | | | | 31,118 | |
| | | | | |
| | | | Dallas, Texas, Waterworks and Sewer System Revenue Bonds, Refunding Series 2007: | | | | | | | | | | | | | | |
| | 5,100 | | | 5.000%, 10/01/13 – AMBAC Insured | | | | | No Opt. Call | | | | AAA | | | | 5,203,989 | |
| | 6,825 | | | 5.000%, 10/01/15 – AMBAC Insured | | | | | No Opt. Call | | | | AAA | | | | 7,591,516 | |
| | | | | |
| | | | Dallas-Fort Worth International Airport, Texas, Joint Revenue Bonds, Refunding Series 2012B: | | | | | | | | | | | | | | |
| | 2,595 | | | 5.000%, 11/01/20 | | | | | No Opt. Call | | | | A+ | | | | 3,171,869 | |
| | 5,000 | | | 5.000%, 11/01/21 | | | | | 11/20 at 100.00 | | | | A+ | | | | 6,035,600 | |
| | | | | |
| | 5,000 | | | Harris County Cultural Education Facilities Finance Corporation, Texas, Revenue Refunding Bonds, Methodist Hospital System, Series 2009B, 5.000%, 12/01/41 (Mandatory put 6/01/14) | | | | | No Opt. Call | | | | AA | | | | 5,020,250 | |
| | | | | |
| | 6,000 | | | Harris County, Texas, General Obligation Bonds, Refunding Road Series 2009A, 5.250%, 10/01/18 | | | | | No Opt. Call | | | | AAA | | | | 7,402,500 | |
| | | | | |
| | 1,500 | | | Houston Independent School District, Harris County, Texas, General Obligation Bonds, Schoolhouse Series 2013A, 4.000%, 2/15/16 | | | | | No Opt. Call | | | | AAA | | | | 1,648,770 | |
| | | | | |
| | 1,780 | | | Houston, Texas, First Lien Combined Utility System Revenue Bonds, Refunding Series 2012D, 5.000%, 11/15/21 | | | | | No Opt. Call | | | | AA | | | | 2,248,834 | |
| | | | | |
| | 11,520 | | | Houston, Texas, General Obligation Bonds, Public Improvement Refunding Series 2009A, 5.000%, 3/01/20 | | | | | 3/19 at 100.00 | | | | AA | | | | 13,979,174 | |
| | | | | |
| | 2,000 | | | Houston, Texas, Hotel Occupancy Tax and Special Revenue Bonds, Convention and Entertainment Facilities Department, Refunding Series 2011A, 5.000%, 9/01/14 | | | | | No Opt. Call | | | | A2 | | | | 2,124,820 | |
| | | | | |
| | | | Houston, Texas, Senior Lien Airport System Revenue Bonds, Refunding Series 2009A: | | | | | | | | | | | | | | |
| | 1,360 | | | 5.000%, 7/01/15 | | | | | No Opt. Call | | | | AA– | | | | 1,492,981 | |
| | 1,110 | | | 5.000%, 7/01/16 | | | | | No Opt. Call | | | | AA– | | | | 1,257,097 | |
| | | | | |
| | 2,250 | | | Houston, Texas, Subordinate Lien Airport System Revenue Refunding Bonds, Series 2011B, 5.000%, 7/01/20 | | | | | No Opt. Call | | | | A+ | | | | 2,735,618 | |
| | | | | |
| | | | Lubbock Health Facilities Development Corporation, Texas, Revenue Bonds, St. Joseph Health System, Refunding Series 2008B: | | | | | | | | | | | | | | |
| | 3,030 | | | 5.000%, 7/01/18 | | | | | No Opt. Call | | | | AA– | | | | 3,570,431 | |
| | 3,000 | | | 5.000%, 7/01/20 | | | | | No Opt. Call | | | | AA– | | | | 3,608,280 | |
| | | | | |
| | 5,660 | | | Mission Economic Development Corporation, Texas, Solid Waste Disposal Revenue Bonds, Waste Management Inc. Project, Series 2006, 3.750%, 12/01/18 (Mandatory put 6/01/15) | | | | | No Opt. Call | | | | BBB | | | | 5,978,715 | |
| | | | | |
| | 2,000 | | | Mission Economic Development Corporation, Texas, Solid Waste Disposal Revenue Bonds, Waste Management Inc. Project, Series 2008, 6.000%, 8/01/20 (Mandatory put 8/01/13) | | | | | No Opt. Call | | | | BBB | | | | 2,024,700 | |
| | | | | | | | | | | | | | | | | | |
Principal
Amount (000) | | | Description (1) | | | | Optional Call
Provisions (2) | | | Ratings (3) | | | Value | |
| | | | Texas (continued) | | | | | | | | | | | | | | |
| | | | | |
| | | | North Central Texas Health Facilities Development Corporation, Texas, Revenue Bonds, Children’s Medical Center Dallas Project, Series 2012: | | | | | | | | | | | | | | |
| $ | 1,670 | | | 5.000%, 8/15/19 | | | | | No Opt. Call | | | | AA | | | $ | 2,035,379 | |
| | 2,785 | | | 5.000%, 8/15/21 | | | | | No Opt. Call | | | | AA | | | | 3,422,793 | |
| | 2,000 | | | 5.000%, 8/15/22 | | | | | No Opt. Call | | | | AA | | | | 2,471,580 | |
| | 5,480 | | | 5.000%, 8/15/23 | | | | | 8/22 at 100.00 | | | | AA | | | | 6,691,738 | |
| | | | | |
| | 7,625 | | | North Texas Tollway Authority, Special Projects System Revenue Bonds, Current Interest Series 2011D, 5.000%, 9/01/24 | | | | | 9/21 at 100.00 | | | | AA | | | | 9,295,714 | |
| | | | | |
| | 10,000 | | | San Antonio Independent School District, Bexar County, Texas, General Obligation Bonds, Series 2005, 5.000%, 8/15/21 | | | | | 8/15 at 100.00 | | | | AAA | | | | 11,044,700 | |
| | | | | |
| | 3,425 | | | San Antonio, Texas, Electric and Gas System Revenue Refunding Bonds, New Series 1992, 5.000%, 2/01/17 (ETM) | | | | | No Opt. Call | | | | AA+ (4) | | | | 3,732,223 | |
| | | | | |
| | 15,000 | | | San Antonio, Texas, Electric and Gas System Revenue Refunding Bonds, Series 2012, 5.000%, 2/01/21 | | | | | No Opt. Call | | | | Aa1 | | | | 18,869,850 | |
| | | | | |
| | 8,420 | | | Texas A&M University, Financing System Revenue Bonds, Series 2008, 5.000%, 5/15/15 | | | | | No Opt. Call | | | | Aaa | | | | 9,224,531 | |
| | | | | |
| | 5,500 | | | Texas Municipal Gas Acquisition and Supply Corporation III, Gas Supply Revenue Bonds, Series 2012, 5.000%, 12/15/20 | | | | | No Opt. Call | | | | A3 | | | | 6,282,815 | |
| | | | | |
| | 6,520 | | | Texas State Transportation Commission, Highway Fund Revenue Bonds, First Tier Series 2007, 5.000%, 4/01/16 | | | | | No Opt. Call | | | | AAA | | | | 7,375,359 | |
| | | | | |
| | 2,250 | | | Texas State, Public Financing Authority, General Obligation Bonds, Series 2009A, 5.000%, 10/01/17 | | | | | No Opt. Call | | | | Aaa | | | | 2,677,320 | |
| | | | | |
| | | | Val Verde County, Texas, Pass-Through Toll Revenue and Limited Tax Bonds, Series 2011: | | | | | | | | | | | | | | |
| | 1,000 | | | 2.000%, 8/15/13 | | | | | No Opt. Call | | | | A | | | | 1,003,460 | |
| | 2,000 | | | 3.000%, 8/15/14 | | | | | No Opt. Call | | | | A | | | | 2,052,380 | |
| | 2,565 | | | 3.000%, 8/15/15 | | | | | No Opt. Call | | | | A | | | | 2,661,085 | |
| | 2,640 | | | 3.000%, 8/15/16 | | | | | No Opt. Call | | | | A | | | | 2,764,661 | |
| | 2,720 | | | 3.000%, 8/15/17 | | | | | No Opt. Call | | | | A | | | | 2,854,830 | |
| | 185,550 | | | Total Texas | | | | | | | | | | | | | 214,606,236 | |
| | | | Utah – 0.9% | | | | | | | | | | | | | | |
| | | | | |
| | | | Intermountain Power Agency, Utah, Subordinated Power Supply Revenue Refunding Bonds, Series 2013A: | | | | | | | | | | | | | | |
| | 20,040 | | | 2.000%, 7/01/14 | | | | | No Opt. Call | | | | AA– | | | | 20,460,038 | |
| | 4,000 | | | 3.000%, 7/01/15 | | | | | No Opt. Call | | | | AA– | | | | 4,226,680 | |
| | | | | |
| | | | Utah Associated Municipal Power Systems, Revenue Bonds, Horse Butte Wind Project, Series 2012A: | | | | | | | | | | | | | | |
| | 500 | | | 5.000%, 9/01/14 | | | | | No Opt. Call | | | | A– | | | | 529,055 | |
| | 550 | | | 5.000%, 9/01/15 | | | | | No Opt. Call | | | | A– | | | | 603,554 | |
| | 875 | | | 5.000%, 9/01/16 | | | | | No Opt. Call | | | | A– | | | | 989,284 | |
| | 500 | | | 5.000%, 9/01/17 | | | | | No Opt. Call | | | | A– | | | | 578,850 | |
| | 500 | | | 5.000%, 9/01/18 | | | | | No Opt. Call | | | | A– | | | | 591,615 | |
| | 625 | | | 5.000%, 9/01/19 | | | | | No Opt. Call | | | | A– | | | | 751,075 | |
| | 1,010 | | | 5.000%, 9/01/20 | | | | | No Opt. Call | | | | A– | | | | 1,204,728 | |
| | 2,040 | | | 5.000%, 9/01/21 | | | | | No Opt. Call | | | | A– | | | | 2,449,000 | |
| | 30,640 | | | Total Utah | | | | | | | | | | | | | 32,383,879 | |
| | | | Virgin Islands – 0.5% | | | | | | | | | | | | | | |
| | | | | |
| | | | Virgin Islands Public Finance Authority, Matching Fund Loan Notes Revenue Bonds, Series 2009B: | | | | | | | | | | | | | | |
| | 2,500 | | | 5.000%, 10/01/14 | | | | | No Opt. Call | | | | BBB+ | | | | 2,623,400 | |
| | 4,455 | | | 5.000%, 10/01/15 | | | | | No Opt. Call | | | | BBB+ | | | | 4,803,336 | |
| | 4,375 | | | 5.000%, 10/01/16 | | | | | No Opt. Call | | | | BBB+ | | | | 4,813,463 | |
| | 4,000 | | | 5.000%, 10/01/17 | | | | | No Opt. Call | | | | BBB+ | | | | 4,479,880 | |
| | 15,330 | | | Total Virgin Islands | | | | | | | | | | | | | 16,720,079 | |
Portfolio of Investments
Nuveen Limited Term Municipal Bond Fund (continued)
April 30, 2013
| | | | | | | | | | | | | | | | | | |
Principal
Amount (000) | | | Description (1) | | | | Optional Call
Provisions (2) | | | Ratings (3) | | | Value | |
| | | | Virginia – 0.4% | | | | | | | | | | | | | | |
| | | | | |
| | | | Amherst Industrial Development Authority, Virginia, Revenue Bonds, Sweet Briar College, Series 2006: | | | | | | | | | | | | | | |
| $ | 400 | | | 4.000%, 9/01/13 | | | | | No Opt. Call | | | | BBB | | | $ | 404,496 | |
| | 400 | | | 4.000%, 9/01/14 | | | | | No Opt. Call | | | | BBB | | | | 416,828 | |
| | 400 | | | 4.125%, 9/01/15 | | | | | No Opt. Call | | | | BBB | | | | 427,248 | |
| | | | | |
| | 1,825 | | | Caroline County Industrial Development Authority, Virginia, Public Facility Lease Revenue Bond, Anticipation Notes, Series 2011, 4.000%, 8/01/16 | | | | | 7/13 at 100.00 | | | | N/R | | | | 1,827,792 | |
| | | | | |
| | 1,000 | | | Hanover County, Virginia, General Obligation Bonds, Refunding & Public Improvement Series 2009, 5.000%, 7/15/19 | | | | | No Opt. Call | | | | AAA | | | | 1,239,460 | |
| | | | | |
| | | | Louisa Industrial Development Authority, Virginia, Pollution Control Revenue Bonds, Virginia Electric and Power Company, Series 2008c: | | | | | | | | | | | | | | |
| | 3,750 | | | 5.375%, 11/01/35 (Mandatory put 12/02/13) | | | | | No Opt. Call | | | | A– | | | | 3,863,100 | |
| | 2,500 | | | 1.500%, 11/01/35 (Mandatory put 12/01/14) | | | | | No Opt. Call | | | | A– | | | | 2,521,150 | |
| | | | | |
| | 3,250 | | | Peninsula Ports Authority, Virginia, Residential Care Facilities Revenue Bonds, Virginia Baptist Homes, Series 2003A, 7.375%, 12/01/32 (Pre-refunded 12/01/13) | | | | | 12/13 at 100.00 | | | | AA+ (4) | | | | 3,384,518 | |
| | | | | |
| | 1,750 | | | Virginia College Building Authority, Educational Facilities Revenue Refunding Bonds, Marymount University, Series 1998, 5.100%, 7/01/18 – RAAI Insured | | | | | 7/13 at 100.00 | | | | N/R | | | | 1,754,323 | |
| | 15,275 | | | Total Virginia | | | | | | | | | | | | | 15,838,915 | |
| | | | Washington – 2.8% | | | | | | | | | | | | | | |
| | | | | |
| | 1,700 | | | Central Washington University, Washington, System Revenue Bonds, Refunding Series 2013, 4.000%, 5/01/15 | | | | | No Opt. Call | | | | A1 | | | | 1,818,031 | |
| | | | | |
| | 4,090 | | | Seattle, Washington, Municipal Light and Power Revenue Bonds, Refunding & Improvement Series 2010B, 5.000%, 2/01/17 | | | | | No Opt. Call | | | | Aa2 | | | | 4,749,308 | |
| | | | | |
| | 5,000 | | | Seattle, Washington, Water System Revenue Bonds, Series 2003, 5.000%, 9/01/17 (Pre-refunded 9/01/13) – NPFG Insured | | | | | 9/13 at 100.00 | | | | Aa2 (4) | | | | 5,080,750 | |
| | | | | |
| | 3,000 | | | Washington Health Care Facilities Authority, Revenue Bonds, Fred Hutchinson Cancer Research Center, Series 2011A, 5.375%, 1/01/31 | | | | | 1/21 at 100.00 | | | | A | | | | 3,329,550 | |
| | | | | |
| | 10,000 | | | Washington Health Care Facilities Authority, Revenue Bonds, Providence Health & Services, Series 2012B, 4.000%, 10/01/42 (Mandatory put 10/01/21) | | | | | No Opt. Call | | | | AA | | | | 11,351,700 | |
| | | | | |
| | 10,580 | | | Washington Health Care Facilities Authority, Revenue Bonds, Seattle Children’s Hospital, Refunding Series 2012B, 5.000%, 10/01/42 (Mandatory put 10/01/21) | | | | | No Opt. Call | | | | AA | | | | 12,818,093 | |
| | | | | |
| | 5,570 | | | Washington State, General Obligation Bonds, Various Purpose Series 2013D, 4.000%, 2/01/15 | | | | | No Opt. Call | | | | AA+ | | | | 5,926,591 | |
| | | | | |
| | 10,380 | | | Washington State, General Obligation Motor Vehicle Fuel Tax Bonds, 2010 Series 2009B, 5.000%, 8/01/15 | | | | | No Opt. Call | | | | AA+ | | | | 11,454,226 | |
| | | | | |
| | 8,715 | | | Washington State, General Obligation Motor Vehicle Fuel Tax Bonds, Series 2008B, 5.000%, 7/01/19 | | | | | 7/18 at 100.00 | | | | AA+ | | | | 10,469,940 | |
| | | | | |
| | | | Washington State, General Obligation Refunding Bonds, Various Purpose Series 2013R-13C: | | | | | | | | | | | | | | |
| | 9,355 | | | 4.000%, 7/01/15 | | | | | No Opt. Call | | | | AA+ | | | | 10,087,029 | |
| | 20,070 | | | 5.000%, 7/01/21 | | | | | No Opt. Call | | | | AA+ | | | | 25,337,773 | |
| | | | | |
| | 1,190 | | | Washington, General Obligation Bonds, Series 1990A, 6.750%, 2/01/15 | | | | | No Opt. Call | | | | AA+ | | | | 1,280,297 | |
| | 89,650 | | | Total Washington | | | | | | | | | | | | | 103,703,288 | |
| | | | West Virginia – 0.5% | | | | | | | | | | | | | | |
| | | | | |
| | 2,000 | | | West Virginia Economic Development Authority, Pollution Control Revenue Bonds, Appalachian Power Company – Amos Project, Series 2008, 4.850%, 5/01/19 (Mandatory put 9/04/13) | | | | | No Opt. Call | | | | BBB | | | | 2,028,240 | |
| | | | | |
| | 5,000 | | | West Virginia Economic Development Authority, Solid Waste Disposal Facilities Revenue Bonds, Appalachian Power Company – Amos Project, Series 2011A, 2.250%, 1/01/41 (Mandatory put 9/01/16) (Alternative Minimum Tax) | | | | | No Opt. Call | | | | BBB | | | | 5,102,850 | |
| | | | | | | | | | | | | | | | | | |
Principal
Amount (000) | | | Description (1) | | | | Optional Call
Provisions (2) | | | Ratings (3) | | | Value | |
| | | | West Virginia (continued) | | | | | | | | | | | | | | |
| | | | | |
| $ | 7,000 | | | West Virginia Economic Development Authority, Solid Waste Disposal Facilities Revenue Bonds, Ohio Power Company – Amos Project, Series 2010A, 3.125%, 3/01/43 (Mandatory put 4/01/15) | | | | | No Opt. Call | | | | Baa1 | | | $ | 7,235,270 | |
| | | | | |
| | 530 | | | West Virginia State Building Commission, Lease Revenue Refunding Bonds, Regional Jail and Corrections Facility, Series 1998A, 5.375%, 7/01/18 – AMBAC Insured | | | | | No Opt. Call | | | | N/R | | | | 594,570 | |
| | | | | |
| | 2,480 | | | West Virginia University, Revenue Bonds, West Virginia University Projects, Series 2000A, 0.000%, 4/01/17 – AMBAC Insured | | | | | No Opt. Call | | | | Aa3 | | | | 2,348,758 | |
| | 17,010 | | | Total West Virginia | | | | | | | | | | | | | 17,309,688 | |
| | | | Wisconsin – 1.5% | | | | | | | | | | | | | | |
| | | | | |
| | 4,070 | | | Wisconsin Health and Educational Facilities Authority, Revenue Bonds, Aurora Health Care, Inc., Series 2009B, 4.750%, 8/15/25 (Mandatory put 8/15/14) | | | | | No Opt. Call | | | | A | | | | 4,249,202 | |
| | | | | |
| | | | Wisconsin Health and Educational Facilities Authority, Revenue Bonds, Aurora Health Care, Inc., Series 2010B: | | | | | | | | | | | | | | |
| | 5,000 | | | 5.000%, 7/15/17 | | | | | No Opt. Call | | | | A | | | | 5,726,000 | |
| | 5,000 | | | 5.000%, 7/15/18 | | | | | No Opt. Call | | | | A | | | | 5,830,050 | |
| | 5,680 | | | 5.000%, 7/15/19 | | | | | No Opt. Call | | | | A | | | | 6,707,171 | |
| | | | | |
| | | | Wisconsin Health and Educational Facilities Authority, Revenue Bonds, Hospital Sisters Services, Inc., Refunding Series 2012B: | | | | | | | | | | | | | | |
| | 540 | | | 4.000%, 8/15/17 | | | | | No Opt. Call | | | | AA– | | | | 607,586 | |
| | 1,105 | | | 5.000%, 8/15/18 | | | | | No Opt. Call | | | | AA– | | | | 1,319,271 | |
| | | | | |
| | | | Wisconsin Health and Educational Facilities Authority, Revenue Bonds, Marshfield Clinic, Series 2006A: | | | | | | | | | | | | | | |
| | 450 | | | 5.000%, 2/15/14 | | | | | No Opt. Call | | | | A– | | | | 465,876 | |
| | 500 | | | 5.000%, 2/15/15 | | | | | No Opt. Call | | | | A– | | | | 537,020 | |
| | | | | |
| | | | Wisconsin Health and Educational Facilities Authority, Revenue Bonds, Medical College of Wisconsin, Inc., Series 2010: | | | | | | | | | | | | | | |
| | 1,475 | | | 5.000%, 12/01/16 | | | | | No Opt. Call | | | | A+ | | | | 1,626,468 | |
| | 1,555 | | | 5.000%, 12/01/17 | | | | | No Opt. Call | | | | A+ | | | | 1,747,525 | |
| | 1,635 | | | 5.000%, 12/01/18 | | | | | No Opt. Call | | | | A+ | | | | 1,865,976 | |
| | 1,710 | | | 5.000%, 12/01/19 | | | | | No Opt. Call | | | | A+ | | | | 1,973,118 | |
| | | | | |
| | 8,485 | | | Wisconsin Health and Educational Facilities Authority, Revenue Bonds, Mercy Alliance, Inc., Series 2010A, 5.000%, 6/01/19 | | | | | No Opt. Call | | | | A2 | | | | 8,950,317 | |
| | | | | |
| | | | Wisconsin Health and Educational Facilities Authority, Revenue Bonds, Ministry Health Care, Inc., Refunding 2012C: | | | | | | | | | | | | | | |
| | 425 | | | 2.500%, 8/15/13 | | | | | No Opt. Call | | | | A+ | | | | 427,758 | |
| | 500 | | | 5.000%, 8/15/16 | | | | | No Opt. Call | | | | A+ | | | | 561,875 | |
| | 750 | | | 5.000%, 8/15/18 | | | | | No Opt. Call | | | | A+ | | | | 881,805 | |
| | 205 | | | 5.000%, 8/15/20 | | | | | No Opt. Call | | | | A+ | | | | 244,883 | |
| | 1,480 | | | 5.000%, 8/15/21 | | | | | No Opt. Call | | | | A+ | | | | 1,771,752 | |
| | | | | |
| | | | Wisconsin Health and Educational Facilities Authority, Revenue Bonds, Wheaton Franciscan Healthcare System, Series 2006A: | | | | | | | | | | | | | | |
| | 4,000 | | | 5.000%, 8/15/14 | | | | | No Opt. Call | | | | A– | | | | 4,208,520 | |
| | 2,000 | | | 5.250%, 8/15/18 | | | | | 8/16 at 100.00 | | | | A– | | | | 2,257,220 | |
| | | | | |
| | 480 | | | Wisconsin Health and Educational Facilities Authority, Revenue Bonds, Wheaton Franciscan Services Inc., Series 2003A, 5.000%, 8/15/13 | | | | | No Opt. Call | | | | A– | | | | 486,365 | |
| | | | | |
| | 2,160 | | | Wisconsin State, General Fund Annual Appropriation Revenue Bonds, Refunding Series 2009A, 5.250%, 5/01/20 | | | | | 5/19 at 100.00 | | | | AA– | | | | 2,636,064 | |
| | 49,205 | | | Total Wisconsin | | | | | | | | | | | | | 55,081,822 | |
| $ | 3,174,151 | | | Total Municipal Bonds (cost $3,378,671,146) | | | | | | | | | | | | | 3,531,802,841 | |
Portfolio of Investments
Nuveen Limited Term Municipal Bond Fund (continued)
April 30, 2013
| | | | | | | | | | | | | | | | | | | | |
Principal
Amount (000) | | | Description (1) | | Coupon | | | Maturity | | | Ratings (3) | | | Value | |
| | | | CORPORATE BONDS – 0.0% | | | | | | | | | | | | | | | | |
| | | | | |
| | | | Transportation – 0.0% | | | | | | | | | | | | | | | | |
| | | | | |
| $ | 120 | | | Las Vegas Monorail Company, Senior Interest Bonds (6), (7) | | | 5.500% | | | | 7/15/19 | | | | N/R | | | $ | 29,920 | |
| | 35 | | | Las Vegas Monorail Company, Senior Interest Bonds (6), (7) | | | 3.000% | | | | 7/15/55 | | | | N/R | | | | 7,003 | |
| $ | 155 | | | Total Corporate Bonds (cost $2,942) | | | | | | | | | | | | | | | 36,923 | |
| | | | Total Long-Term Investments (cost $3,378,674,088) – 95.2% | | | | | | | | | | | | | | | 3,531,839,764 | |
| | | | | |
Principal
Amount (000) | | | Description (1) | | | | | Optional Call
Provisions (2) | | | Ratings (3) | | | Value | |
| | | | SHORT-TERM INVESTMENTS – 3.3% | | | | | | | | | | | | | | | | |
| | | | | |
| | | | Connecticut – 0.3% | | | | | | | | | | | | | | | | |
| | | | | |
| $ | 4,250 | | | Connecticut Health and Educational Facilities Authority, Revenue Bonds, Choate Rosemary Hall, Variable Rate Demand Obligations, Series 2008D, 0.230%, 7/01/37 (8) | | | | | | | 8/13 at 100.00 | | | | VMIG-1 | | | $ | 4,250,000 | |
| | | | | |
| | 7,730 | | | Connecticut Health and Educational Facilities Authority, Revenue Bonds, Yale University, Variable Rate Demand Obligations, Trust 2862, 0.180%, 7/01/15 (8) | | | | | | | No Opt. Call | | | | A-1 | | | | 7,730,000 | |
| | 11,980 | | | Total Connecticut | | | | | | | | | | | | | | | 11,980,000 | |
| | | | Georgia – 0.4% | | | | | | | | | | | | | | | | |
| | | | | |
| | 5,000 | | | Forsyth County Water and Sewerage Authority, Georgia, Revenue Bonds, Variable Rate Demand Obligations, Tender Option Bond Trust 2253, 0.260%, 4/01/15 – AGM Insured (8) | | | | | | | No Opt. Call | | | | VMIG-1 | | | | 5,000,000 | |
| | | | | |
| | 12,020 | | | Georgia, General Obligation Bonds, Variable Rate Demand Obligations, Tender Option Bond Trust 1881, 0.220%, 4/01/27 (8) | | | | | | | 4/17 at 100.00 | | | | VMIG-1 | | | | 12,020,000 | |
| | 17,020 | | | Total Georgia | | | | | | | | | | | | | | | 17,020,000 | |
| | | | Iowa – 0.3% | | | | | | | | | | | | | | | | |
| | | | | |
| | 9,700 | | | Iowa State, Special Obligation Bonds, I-Jobs Program, Variable Rate Demand Obligations, Tender Option Bond Trust 13B-A REG D, 0.250%, 6/01/25 (8) | | | | | | | No Opt. Call | | | | A-1 | | | | 9,700,000 | |
| | | | | |
| | 1,500 | | | Iowa State, Special Obligation Bonds, I-Jobs Program,Variable Rate Demand Obligations, Tender Option Bond Trust 13B-B REG D, 0.250%, 6/01/26 (8) | | | | | | | 6/19 at 100.00 | | | | A-1 | | | | 1,500,000 | |
| | 11,200 | | | Total Iowa | | | | | | | | | | | | | | | 11,200,000 | |
| | | | Maine – 0.2% | | | | | | | | | | | | | | | | |
| | | | | |
| | 6,665 | | | Maine Health and Higher Educational Facilities Authority, Revenue Bonds, Bowdoin College, Variable Rate Demand Obligations, Tender Option Bond Trust 2009-5B, 0.250%, 7/01/39 (8) | | | | | | | 7/19 at 100.00 | | | | VMIG-1 | | | | 6,665,000 | |
| | | | Massachusetts – 0.3% | | | | | | | | | | | | | | | | |
| | | | | |
| | 10,000 | | | Massachusetts Health and Educational Facilities Authority, Revenue Bonds, Harvard University, Variable Rate Demand Obligations, Tender Option Bond Trust 3529, 0.340%, 6/01/15 (8) | | | | | | | No Opt. Call | | | | A-1 | | | | 10,000,000 | |
| | | | Michigan – 0.0% | | | | | | | | | | | | | | | | |
| | | | | |
| | 40 | | | Detroit City School District, Wayne County, Michigan, General Obligation Bonds, Variable Rate Demand Obligations, Tender Option Bonds Trust DCL-045, 0.450%, 5/01/30 (8) | | | | | | | No Opt. Call | | | | A-2 | | | | 40,000 | |
| | | | Missouri – 0.3% | | | | | | | | | | | | | | | | |
| | | | | |
| | 10,500 | | | St. Louis, Missouri, Airport Revenue Bonds, Lambert-St. Louis International Airport, Variable Rate Demand Obligations, Tender Option Bond Trust DCL-017, 0.600%, 7/01/22 (8) | | | | | | | No Opt. Call | | | | A-2 | | | | 10,500,000 | |
| | | | Ohio – 0.3% | | | | | | | | | | | | | | | | |
| | | | | |
| | 10,000 | | | Hamilton County, Ohio, Sales Tax Revenue Bonds, Variable Rate Demand Obligations, Tender Option Bond Trust 3766Z, 0.240%, 11/15/16 – AGM Insured (8) | | | | | | | No Opt. Call | | | | A-1 | | | | 10,000,000 | |
| | | | | | | | | | | | | | | | | | |
Principal
Amount (000) | | | Description (1) | | | | Optional Call
Provisions (2) | | | Ratings (3) | | | Value | |
| | | | Oregon – 0.2% | | | | | | | | | | | | | | |
| | | | | |
| $ | 5,880 | | | Eugene, Oregon, Electric Utility Revenue Bonds, Variable Rate Demand Obligations, Series 2003A, 0.230%, 8/01/22 – AGM Insured (8) | | | | | 8/13 at 100.00 | | | | A-1 | | | $ | 5,880,000 | |
| | | | Tennessee – 0.2% | | | | | | | | | | | | | | |
| | | | | |
| | 8,665 | | | Chattanooga, Tennessee, Electric System Enterprise Revenue Bonds, Variable Rate Demand Obligations, Tender Option Bond Trust 08-29, 0.220%, 3/01/16 (8) | | | | | No Opt. Call | | | | A-1 | | | | 8,665,000 | |
| | | | Virginia – 0.3% | | | | | | | | | | | | | | |
| | | | | |
| | 6,005 | | | The Rector and Visitors of the University of Virginia, General Revenue Bonds, Variable Rate Demand Obligations, Tender Option Bond Trust 2876, 0.240%, 6/01/13 (8) | | | | | No Opt. Call | | | | F-1 | | | | 6,005,000 | |
| | | | | |
| | 5,000 | | | Virginia Resources Authority, Clean Water State Revolving Fund Revenue Bonds, Variable Rate Demand Obligations, Series 2008, Trust 2917,
0.220%, 10/01/28 (8) | | | | | 10/18 at 100.00 | | | | A-1 | | | | 5,000,000 | |
| | 11,005 | | | Total Virginia | | | | | | | | | | | | | 11,005,000 | |
| | | | Washington – 0.5% | | | | | | | | | | | | | | |
| | | | | |
| | 4,480 | | | Bellingham, Washington, Water and Sewer Revenue Bonds, Variable Rate Demand Obligations, Tender Option Bond Trust 11981X,
0.370%, 8/01/19 (8) | | | | | No Opt. Call | | | | VMIG-2 | | | | 4,480,000 | |
| | | | | |
| | 15,000 | | | Central Puget Sound Regional Transit Authority, Washington, Sales and Use Tax Revenue Bonds, Variable Rate Demand Obligations, Tender Option Bond Trust 2007-1C, 0.210%, 11/01/32 – AGM Insured (8) | | | | | 11/17 at 100.00 | | | | VMIG-1 | | | | 15,000,000 | |
| | 19,480 | | | Total Washington | | | | | | | | | | | | | 19,480,000 | |
| $ | 122,435 | | | Total Short-Term Investments (cost $122,435,000) | | | | | | | | | | | | | 122,435,000 | |
| | | | Total Investments (cost $3,501,109,088) – 98.5% | | | | | | | | | | | | | 3,654,274,764 | |
| | | | Other Assets Less Liabilities – 1.5% | | | | | | | | | | | | | 54,914,236 | |
| | | | Net Assets – 100% | | | | | | | | | | | | $ | 3,709,189,000 | |
| | (1) | | All percentages shown in the Portfolio of Investments are based on net assets. |
| | (2) | | Optional Call Provisions (not covered by the report of independent registered public accounting firm): Dates (month and year) and prices of the earliest optional call or redemption. There may be other call provisions at varying prices at later dates. Certain mortgage-backed securities may be subject to periodic principal paydowns. |
| | (3) | | Ratings (not covered by the report of independent registered public accounting firm): Using the highest of Standard & Poor’s Group (“Standard & Poor’s”), Moody’s Investors Service, Inc. (“Moody’s”) or Fitch, Inc. (“Fitch”) rating. Ratings below BBB by Standard & Poor’s, Baa by Moody’s or BBB by Fitch are considered to be below investment grade. Holdings designated N/R are not rated by any of these national rating agencies. |
| | (4) | | Backed by an escrow or trust containing sufficient U.S. Government or U.S. Government agency securities, which ensure the timely payment of principal and interest. Certain bonds backed by U.S. Government or agency securities are regarded as having an implied rating equal to the rating of such securities. |
| | (5) | | At or subsequent to the end of the reporting period, this security is non-income producing. Non-income producing security, in the case of a fixed-income security, generally denotes that the issuer has (1) defaulted on the payment of principal or interest, (2) is under the protection of the Federal Bankruptcy Court or (3) the Fund’s Adviser has concluded that the issue is not likely to meet its future interest payment obligations and has directed the Fund’s custodian to cease accruing additional income on the Fund’s records. |
| | (6) | | Investment valued at fair value using methods determined in good faith by, or at the discretion of, the Board of Directors/Trustees. For fair value measurement disclosure purposes, investment classified as Level 3. See Notes to Financial Statements, Footnote 1 – General Information and Significant Accounting Policies, Investment Valuation for more information. |
| | (7) | | During January 2010, Las Vegas Monorail Company (“Las Vegas Monorail”) filed for federal bankruptcy protection. During March 2012, Las Vegas Monorail emerged from federal bankruptcy with the acceptance of a reorganization plan assigned by the Federal Bankruptcy Court. Under the reorganization plan, the Fund surrendered its Las Vegas Monorail Project Revenue Bonds, First Tier, Series 2000 and in turn received two senior interest corporate bonds: the first with an interest rate of 5.500% maturing on July 15, 2019 and the second with an interest rate of 3.000% (5.500% after December 31, 2015) maturing on July 15, 2055. The custodian is not accruing income on the Fund’s records for either senior interest corporate bond. |
| | (8) | | Investment has a maturity of more than one year, but has variable rate and demand features which qualify it as a short-term investment. The rate disclosed is that in effect at the end of the reporting period. This rate changes periodically based on market conditions or a specified market index. |
| | WI/DD | | Investment, or portion of investment, purchased on a when-issued or delayed delivery basis. |
| | (ETM) | | Escrowed to maturity. |
See accompanying notes to financial statements.
Portfolio of Investments
Nuveen Short Duration High Yield Municipal Bond Fund
April 30, 2013
| | | | | | | | | | | | | | | | | | |
Principal
Amount (000) | | | Description (1) | | | | Optional Call
Provisions (2) | | | Ratings (3) | | | Value | |
| | | | Alabama – 1.7% | | | | | | | | | | | | | | |
| | | | | |
| $ | 220 | | | Bessemer Governmental Utility Services Corporation, Alabama, Water Supply Revenue Bonds, Series 2008A, 3.750%, 6/01/17 | | | | | No Opt. Call | | | | A2 | | | $ | 233,873 | |
| | | | | |
| | 480 | | | Birmingham Special Care Facilities Financing Authority, Alabama, Revenue Bonds, Baptist Health System Inc., Series 2005A, 5.000%, 11/15/30 | | | | | 11/15 at 100.00 | | | | Baa2 | | | | 499,195 | |
| | | | | |
| | | | Jefferson County Public Building Authority, Alabama, Lease Revenue Warrants, Series 2006: | | | | | | | | | | | | | | |
| | 45 | | | 5.125%, 4/01/18 – AMBAC Insured | | | | | 4/16 at 100.00 | | | | Ca | | | | 41,584 | |
| | 100 | | | 5.125%, 4/01/21 – AMBAC Insured | | | | | 4/16 at 100.00 | | | | Ca | | | | 87,909 | |
| | | | | |
| | | | Jefferson County, Alabama, General Obligation Refunding Warrants, Series 2003A: | | | | | | | | | | | | | | |
| | 400 | | | 5.000%, 4/01/22 – NPFG Insured | | | | | 7/13 at 100.00 | | | | Baa2 | | | | 394,584 | |
| | 100 | | | 5.000%, 4/01/23 – NPFG Insured | | | | | 7/13 at 100.00 | | | | Baa2 | | | | 98,720 | |
| | | | | |
| | 500 | | | Jefferson County, Alabama, General Obligation Warrants, Series 2004A, 5.000%, 4/01/18 – NPFG Insured | | | | | 4/14 at 100.00 | | | | A | | | | 489,790 | |
| | | | | |
| | | | Jefferson County, Alabama, Limited Obligation School Warrants, Education Tax Revenue Bonds, Series 2004A: | | | | | | | | | | | | | | |
| | 40 | | | 5.250%, 1/01/14 | | | | | No Opt. Call | | | | B | | | | 40,040 | |
| | 140 | | | 5.250%, 1/01/15 | | | | | 1/14 at 100.00 | | | | B | | | | 140,112 | |
| | 275 | | | 5.250%, 1/01/18 – AGM Insured | | | | | 1/14 at 100.00 | | | | AA– | | | | 276,477 | |
| | 150 | | | 5.250%, 1/01/19 – AGM Insured | | | | | 1/14 at 100.00 | | | | AA | | | | 150,806 | |
| | 2,450 | | | Total Alabama | | | | | | | | | | | | | 2,453,090 | |
| | | | Alaska – 0.5% | | | | | | | | | | | | | | |
| | | | | |
| | | | Alaska Railroad Corporation, Capital Grant Receipts Bonds, Section 5307 and 5309 Formula Funds, Series 2007: | | | | | | | | | | | | | | |
| | 370 | | | 5.000%, 8/01/18 – FGIC Insured | | | | | 8/17 at 100.00 | | | | A+ | | | | 422,688 | |
| | 200 | | | 5.000%, 8/01/21 – FGIC Insured | | | | | 8/17 at 100.00 | | | | A+ | | | | 227,738 | |
| | 570 | | | Total Alaska | | | | | | | | | | | | | 650,426 | |
| | | | Arizona – 3.0% | | | | | | | | | | | | | | |
| | | | | |
| | 1,195 | | | Arizona Health Facilities Authority, Health Care Facilities Revenue Bonds, The Beatitudes Campus Project, Series 2006, 5.100%, 10/01/22 | | | | | 10/16 at 100.00 | | | | N/R | | | | 1,218,123 | |
| | | | | |
| | 75 | | | Downtown Phoenix Hotel Corporation, Arizona, Senior Revenue Bonds, Series 2005A, 5.250%, 7/01/23 – FGIC Insured | | | | | 1/16 at 100.00 | | | | BB+ | | | | 77,925 | |
| | | | | |
| | 350 | | | Florence Town Inc., Industrial Development Authority, Arizona, Education Revenue Bonds, Legacy Traditional School Project – Queen Creek and Casa Grande Campuses, Series 2013, 4.000%, 7/01/18 | | | | | No Opt. Call | | | | BB | | | | 350,473 | |
| | | | | |
| | 150 | | | Glendale Municipal Property Corporation, Arizona, Excise Tax Revenue Bonds, Senior Lien Series 2012A, 3.000%, 7/01/18 | | | | | No Opt. Call | | | | AA+ | | | | 158,886 | |
| | | | | |
| | 1,000 | | | Phoenix Industrial Development Authority, Arizona, Airport Facilities Refunding Bonds, America West Airlines, Inc. Project, Series 1998, 6.300%, 4/01/23 (WI/DD, Settling 5/01/13) (Alternative Minimum Tax) | | | | | 10/13 at 100.00 | | | | Caa2 | | | | 1,003,810 | |
| | | | | |
| | 360 | | | Phoenix Industrial Development Authority, Arizona, Education Revenue Bonds, Great Hearts Academies – Veritas Project, Series 2012, 5.200%, 7/01/22 | | | | | 7/21 at 100.00 | | | | BB | | | | 375,793 | |
| | | | | |
| | 1,000 | | | Watson Road Community Facilities District, Arizona, Special Assessment Revenue Bonds, Series 2005, 5.750%, 7/01/22 | | | | | 7/16 at 100.00 | | | | N/R | | | | 1,034,980 | |
| | 4,130 | | | Total Arizona | | | | | | | | | | | | | 4,219,990 | |
| | | | California – 10.9% | | | | | | | | | | | | | | |
| | | | | |
| | 450 | | | ABAG Finance Authority For Nonprofit Corporations, California, Revenue Bonds, Sharp HealthCare, Series 2009B, 6.375%, 8/01/34 | | | | | 8/14 at 100.00 | | | | A+ | | | | 480,294 | |
| | | | | |
| | 150 | | | Alameda Corridor Transportation Authority, California, Revenue Bonds, Refunding Subordinate Lien Series 2004A, 5.300%, 10/01/23 – AMBAC Insured | | | | | No Opt. Call | | | | BBB+ | | | | 169,074 | |
| | | | | |
| | 200 | | | Anaheim Redevelopment Agency, California, Tax Allocation Refunding Bonds, Merged Redevelopment Project Areas, Series 2007A, 5.000%, 2/01/16 – AGM Insured | | | | | No Opt. Call | | | | AA– | | | | 218,434 | |
| | | | | | | | | | | | | | | | | | |
Principal
Amount (000) | | | Description (1) | | | | Optional Call
Provisions (2) | | | Ratings (3) | | | Value | |
| | | | California (continued) | | | | | | | | | | | | | | |
| | | | | |
| $ | 315 | | | Beaumont Financing Authority, California, Local Agency Revenue Bonds, Improvement Area 17A, Series 2013B, 2.375%, 9/01/17 | | | | | No Opt. Call | | | | N/R | | | $ | 317,536 | |
| | | | | |
| | 1,395 | | | California County Tobacco Securitization Agency, Tobacco Settlement Asset-Backed Bonds, Los Angeles County Securitization Corporation, Series 2006A, 5.250%, 6/01/21 | | | | | 12/18 at 100.00 | | | | B2 | | | | 1,414,460 | |
| | | | | |
| | 150 | | | California Municipal Finance Authority, Certificates of Participation, Community Hospitals of Central California Obligated Group, Series 2009, 4.250%, 2/01/15 | | | | | No Opt. Call | | | | Baa2 | | | | 157,757 | |
| | | | | |
| | 50 | | | California Municipal Finance Authority, Revenue Bonds, Biola University, Refunding Series 2008A, 5.000%, 10/01/18 | | | | | No Opt. Call | | | | Baa1 | | | | 59,054 | |
| | | | | |
| | 165 | | | California Municipal Finance Authority, Revenue Bonds, Biola University, Series 2013, 5.000%, 10/01/22 | | | | | No Opt. Call | | | | Baa1 | | | | 196,753 | |
| | | | | |
| | 500 | | | California Municipal Finance Authority, Revenue Bonds, Eisenhower Medical Center, Series 2010A, 4.000%, 7/01/15 | | | | | No Opt. Call | | | | Baa2 | | | | 524,440 | |
| | | | | |
| | 300 | | | California Statewide Community Development Authority, Revenue Bonds, International School of the Peninsula, Palo Alto, California, Series 2006, 5.000%, 11/01/21 | | | | | 11/16 at 100.00 | | | | N/R | | | | 311,502 | |
| | | | | |
| | 500 | | | Foothill/Eastern Transportation Corridor Agency, California, Toll Road Revenue Bonds, Series 1995A, 5.000%, 1/01/35 – NPFG Insured | | | | | 7/13 at 100.00 | | | | Baa2 | | | | 500,020 | |
| | | | | |
| | | | Foothill/Eastern Transportation Corridor Agency, California, Toll Road Revenue Refunding Bonds, Series 1999: | | | | | | | | | | | | | | |
| | 100 | | | 5.375%, 1/15/14 – NPFG Insured | | | | | 7/13 at 100.00 | | | | Baa2 | | | | 100,189 | |
| | 75 | | | 5.000%, 1/15/16 – NPFG Insured | | | | | 5/13 at 100.00 | | | | Baa2 | | | | 75,113 | |
| | 380 | | | 0.000%, 1/15/31 – NPFG Insured | | | | | 7/13 at 35.18 | | | | Baa2 | | | | 132,061 | |
| | 250 | | | 0.000%, 1/15/33 | | | | | No Opt. Call | | | | BBB– | | | | 77,198 | |
| | | | | |
| | 100 | | | Fresno Unified School District, Fresno County, California, General Obligation Bonds, Series 2002A, 5.300%, 2/01/14 – NPFG Insured | | | | | No Opt. Call | | | | A+ | | | | 103,621 | |
| | | | | |
| | 750 | | | Golden State Tobacco Securitization Corporation, California, Tobacco Settlement Asset-Backed Bonds, Series 2007A-1, 4.500%, 6/01/27 | | | | | 6/17 at 100.00 | | | | B | | | | 731,625 | |
| | | | | |
| | | | Hesperia Public Financing Authority, California, Redevelopment and Housing Projects Tax Allocation Bonds, Series 2007A: | | | | | | | | | | | | | | |
| | 150 | | | 5.500%, 9/01/17 – SYNCORA GTY Insured | | | | | No Opt. Call | | | | Ba1 | | | | 165,327 | |
| | 590 | | | 5.000%, 9/01/22 – SYNCORA GTY Insured | | | | | 9/17 at 100.00 | | | | N/R | | | | 602,868 | |
| | | | | |
| | 1,000 | | | Independent Cities Finance Authority, California, Mobile Home Park Revenue Bonds, Rancho Vallecitos Mobile Home Park, Series 2013, 4.500%, 4/15/23 | | | | | No Opt. Call | | | | BBB | | | | 1,108,030 | |
| | | | | |
| | 100 | | | Indian Wells Redevelopment Agency, California, Tax Allocation Bonds, Consolidated Whitewater Project Area, Refunding Series 2003A, 4.000%, 9/01/16 – AMBAC Insured | | | | | No Opt. Call | | | | BBB– | | | | 104,939 | |
| | | | | |
| | 80 | | | Indio Redevelopment Agency, California, Tax Allocation Bonds, Merged Area Redevelopment Project, Subordinate Lien Refunding Series 2008A, 5.000%, 8/15/19 | | | | | 8/18 at 100.00 | | | | BBB– | | | | 85,987 | |
| | | | | |
| | 95 | | | Industry Public Facilities Authority, California, Tax Allocation Revenue Bonds Series 2007, 4.000%, 5/01/16 – NPFG Insured | | | | | 7/13 at 100.00 | | | | A | | | | 95,518 | |
| | | | | |
| | | | Inland Empire Tobacco Securitization Authority, California, Tobacco Settlement Asset-Backed Bonds, Series 2007: | | | | | | | | | | | | | | |
| | 185 | | | 5.000%, 6/01/21 | | | | | 6/17 at 100.00 | | | | B | | | | 186,282 | |
| | 200 | | | 4.625%, 6/01/21 | | | | | 6/17 at 100.00 | | | | B | | | | 197,538 | |
| | | | | |
| | | | Long Beach Bond Finance Authority, California, Natural Gas Purchase Revenue Bonds, Series 2007A: | | | | | | | | | | | | | | |
| | 300 | | | 5.250%, 11/15/19 | | | | | No Opt. Call | | | | A | | | | 349,359 | |
| | 500 | | | 5.250%, 11/15/21 | | | | | No Opt. Call | | | | A | | | | 584,060 | |
| | | | | |
| | 200 | | | Murrieta Valley Unified School District Public Finance Authority, Riverside County, California, Refunding Bonds Series 2013, 2.500%, 9/01/18 | | | | | No Opt. Call | | | | N/R | | | | 198,238 | |
Portfolio of Investments
Nuveen Short Duration High Yield Municipal Bond Fund (continued)
April 30, 2013
| | | | | | | | | | | | | | | | | | |
Principal
Amount (000) | | | Description (1) | | | | Optional Call
Provisions (2) | | | Ratings (3) | | | Value | |
| | | | California (continued) | | | | | | | | | | | | | | |
| | | | | |
| $ | 750 | | | Oak Valley Hospital District, Stanislaus County, California, General Obligation Bonds, Series 2005, 4.500%, 7/01/25 – FGIC Insured | | | | | 7/14 at 101.00 | | | | A2 | | | $ | 777,615 | |
| | | | | |
| | 650 | | | Palomar Pomerado Health Care District, California, Certificates of Participation, Series 2009, 5.500%, 11/01/19 | | | | | No Opt. Call | | | | Baa3 | | | | 752,343 | |
| | | | | |
| | 150 | | | Riverside County, California, Community Facilities District 05-8, Scott Road, Special Tax Bonds Series 2013, 4.000%, 9/01/21 | | | | | No Opt. Call | | | | N/R | | | | 153,956 | |
| | | | | |
| | | | Romoland School District, California, Special Tax Bonds, Community Facilities District 2004-1 Heritage Lake Improvement Area 3, Series 2013: | | | | | | | | | | | | | | |
| | 125 | | | 4.000%, 9/01/21 (WI/DD, Settling 5/09/13) | | | | | No Opt. Call | | | | N/R | | | | 131,981 | |
| | 125 | | | 4.000%, 9/01/22 (WI/DD, Settling 5/09/13) | | | | | No Opt. Call | | | | N/R | | | | 130,749 | |
| | 150 | | | 4.000%, 9/01/23 (WI/DD, Settling 5/09/13) | | | | | No Opt. Call | | | | N/R | | | | 155,792 | |
| | 175 | | | 4.000%, 9/01/24 (WI/DD, Settling 5/09/13) | | | | | 9/23 at 100.00 | | | | N/R | | | | 179,317 | |
| | | | | |
| | 50 | | | Roseville Natural Gas Financing Authority, California, Gas Revenue Bonds, Series 2007, 5.000%, 2/15/18 | | | | | No Opt. Call | | | | A | | | | 56,674 | |
| | | | | |
| | 100 | | | San Diego County, California, Certificates of Participation, Burnham Institute, Series 2006, 5.000%, 9/01/16 | | | | | 9/15 at 102.00 | | | | Baa2 | | | | 108,471 | |
| | | | | |
| | 105 | | | San Joaquin Hills Transportation Corridor Agency, Orange County, California, Toll Road Revenue Refunding Bonds, Series 1997A, 5.250%, 1/15/30 – NPFG Insured | | | | | 7/13 at 100.00 | | | | Baa2 | | | | 105,002 | |
| | | | | |
| | 65 | | | San Jose Redevelopment Agency, California, Tax Allocation Bonds, Merged Area Redevelopment Project, Series 1993, 6.000%, 8/01/15 – NPFG Insured | | | | | No Opt. Call | | | | A | | | | 70,682 | |
| | | | | |
| | 520 | | | San Jose Redevelopment Agency, California, Tax Allocation Bonds, Merged Area Redevelopment Project, Series 2005B, 5.000%, 8/01/14 – AMBAC Insured | | | | | No Opt. Call | | | | BBB | | | | 546,099 | |
| | | | | |
| | 100 | | | San Jose Redevelopment Agency, California, Tax Allocation Bonds, Merged Area Redevelopment Project, Series 2006D, 5.000%, 8/01/21 – AMBAC Insured | | | | | 8/17 at 100.00 | | | | BBB | | | | 104,746 | |
| | | | | |
| | 110 | | | San Jose, California, Airport Revenue Bonds, Refunding Series 2011A-1, 5.000%, 3/01/19 (Alternative Minimum Tax) | | | | | No Opt. Call | | | | A2 | | | | 129,565 | |
| | | | | |
| | 300 | | | Santa Fe Springs Community Development Commission, Los Angeles County, California, Consolidated Project Area Tax Allocation Refunding Bonds, Series 2007A, 4.500%, 9/01/21 – NPFG Insured | | | | | 9/17 at 100.00 | | | | A | | | | 317,802 | |
| | | | | |
| | 500 | | | Southern California Public Power Authority, Natural Gas Project 1 Revenue Bonds, Series 2007A, 5.000%, 11/01/13 | | | | | No Opt. Call | | | | Baa1 | | | | 511,400 | |
| | | | | |
| | 200 | | | Stockton Unified School District, San Joaquin County, California, General Obligation Bonds, Election 2008 Series 2008A, 4.000%, 8/01/19 | | | | | 8/16 at 102.00 | | | | AA– | | | | 216,580 | |
| | | | | |
| | 75 | | | Stockton Unified School District, San Joaquin County, California, General Obligation Bonds, Refunding Series 2011, 5.000%, 7/01/21 – AGM Insured | | | | | No Opt. Call | | | | AA– | | | | 88,686 | |
| | | | | |
| | 500 | | | Stockton Unified School District, San Joaquin County, California, General Obligation Bonds, Series 2007, 5.000%, 8/01/20 – AGM Insured | | | | | 8/17 at 100.00 | | | | AA– | | | | 562,495 | |
| | | | | |
| | 170 | | | Stockton, California, Revenue Certificates of Participation, Wastewater System Project, Series 1998A, 5.200%, 9/01/29 – NPFG Insured | | | | | 9/13 at 100.00 | | | | BBB+ | | | | 170,043 | |
| | | | | |
| | 100 | | | Stockton-East Water District, California, Certificates of Participation, Series 2002A Refunding, 5.000%, 4/01/20 – FGIC Insured | | | | | 5/13 at 100.00 | | | | N/R | | | | 100,136 | |
| | | | | |
| | 250 | | | Tobacco Securitization Authority of Northern California, Tobacco Settlement Asset-Backed Bonds, Series 2005A-1, 4.750%, 6/01/23 | | | | | 6/15 at 100.00 | | | | B+ | | | | 250,250 | |
| | | | | |
| | 605 | | | Vernon, California, Electric System Revenue Bonds, Series 2009A, 5.125%, 8/01/21 | | | | | 8/19 at 100.00 | | | | A– | | | | 692,265 | |
| | 15,105 | | | Total California | | | | | | | | | | | | | 15,559,926 | |
| | | | | | | | | | | | | | | | | | |
Principal
Amount (000) | | | Description (1) | | | | Optional Call
Provisions (2) | | | Ratings (3) | | | Value | |
| | | | Colorado – 2.4% | | | | | | | | | | | | | | |
| | | | | |
| | | | Colorado Educational and Cultural Facilities Authority, Charter School Revenue Bonds, Cheyenne Mountain Charter Academy, Series 2007A: | | | | | | | | | | | | | | |
| $ | 25 | | | 5.000%, 6/15/15 | | | | | No Opt. Call | | | | BBB– | | | $ | 26,490 | |
| | 75 | | | 5.000%, 6/15/16 | | | | | No Opt. Call | | | | BBB– | | | | 81,032 | |
| | | | | |
| | 500 | | | Colorado Educational and Cultural Facilities Authority, Charter School Revenue Bonds, Flagstaff Academy Project, Series 2008A, 6.750%, 8/01/28 | | | | | 8/18 at 100.00 | | | | N/R | | | | 563,185 | |
| | | | | |
| | 185 | | | Colorado Health Facilities Authority, Colorado, Revenue Bonds, Covenant Retirement Communities Inc., Refunding Series 2012C, 5.000%, 12/01/21 | | | | | No Opt. Call | | | | BBB+ | | | | 214,082 | |
| | | | | |
| | 50 | | | Compark Business Campus Metropolitan District, Colorado, General Obligation Limited Tax Bonds, Series 2007A, 5.000%, 12/01/18 – RAAI Insured | | | | | 12/17 at 100.00 | | | | N/R | | | | 51,546 | |
| | | | | |
| | 75 | | | Conservatory Metropolitan District, Aurora, Arapahoe County, Colorado, General Obligation Bonds, Limited Tax Series 2007, 4.000%, 12/01/13 – RAAI Insured | | | | | No Opt. Call | | | | N/R | | | | 75,249 | |
| | | | | |
| | 100 | | | E-470 Public Highway Authority, Colorado, Senior Revenue Bonds, Series 2007A-1, 5.250%, 9/01/16 – NPFG Insured | | | | | No Opt. Call | | | | Baa2 | | | | 110,286 | |
| | | | | |
| | 200 | | | E-470 Public Highway Authority, Colorado, Senior Revenue Bonds, Series 2007C-1, 5.500%, 9/01/24 – NPFG Insured | | | | | No Opt. Call | | | | Baa2 | | | | 217,770 | |
| | | | | |
| | 100 | | | Ebert Metropolitan District, Colorado, Limited Tax General Obligation Bonds, Series 2007, 5.000%, 12/01/22 – RAAI Insured | | | | | 12/17 at 100.00 | | | | N/R | | | | 101,798 | |
| | | | | |
| | 500 | | | Plaza Metropolitan District 1, Lakewood, Colorado, Tax Increment Revenue Bonds, Refunding Series 2013, 5.000%, 12/01/18 | | | | | No Opt. Call | | | | N/R | | | | 565,060 | |
| | | | | |
| | 100 | | | Poudre Tech Metro District, Colorado, Unlimited Property Tax Supported Revenue Bonds, Refunding & Improvement Series 2010B, 3.000%, 12/01/17 – AGM Insured | | | | | No Opt. Call | | | | AA– | | | | 100,642 | |
| | | | | |
| | 575 | | | Public Authority for Colorado Energy, Colorado, Natural Gas Purchase Revenue Bonds, Colorado Springs Utilities, Series 2008, 6.125%, 11/15/23 | | | | | No Opt. Call | | | | A | | | | 720,021 | |
| | | | | |
| | 500 | | | Rendezvous Residential Metropolitan District, Colorado, Limited Tax General Obligation Bonds, Refunding Series 2007, 5.200%, 12/01/17 | | | | | No Opt. Call | | | | N/R | | | | 487,455 | |
| | | | | |
| | 85 | | | Wyndham Hill Metropolitan District 2, Colorado, General Obligation Limited Tax Bonds, Series 2005, 6.250%, 12/01/25 | | | | | 12/15 at 100.00 | | | | N/R | | | | 84,178 | |
| | 3,070 | | | Total Colorado | | | | | | | | | | | | | 3,398,794 | |
| | | | Connecticut – 0.1% | | | | | | | | | | | | | | |
| | | | | |
| | 75 | | | Connecticut Health and Educational Facilities Authority, Revenue Bonds, Eastern Connecticut Health Network, Series 2005, 4.375%, 7/01/18 – RAAI Insured | | | | | 7/15 at 100.00 | | | | N/R | | | | 77,371 | |
| | | | Florida – 7.5% | | | | | | | | | | | | | | |
| | | | | |
| | 215 | | | Brevard County Health Facilities Authority, Florida, Health Facilities Revenue Refunding Bonds, Health First, Inc. Project, Series 2013A, 5.000%, 4/01/19 | | | | | No Opt. Call | | | | A– | | | | 254,162 | |
| | | | | |
| | | | Capital Projects Finance Authority, Florida, Student Housing Revenue Bonds, Capital Projects Loan Program, Series 2001F-1: | | | | | | | | | | | | | | |
| | 120 | | | 5.500%, 10/01/17 – NPFG Insured | | | | | 7/13 at 100.00 | | | | Baa2 | | | | 120,138 | |
| | 145 | | | 5.125%, 10/01/21 – NPFG Insured | | | | | 10/13 at 100.00 | | | | Baa2 | | | | 144,945 | |
| | 765 | | | 5.000%, 10/01/31 – NPFG Insured | | | | | 7/13 at 100.00 | | | | Baa2 | | | | 761,320 | |
| | | | | |
| | | | Citizens Property Insurance Corporation, Florida, High Risk Assessment Revenue, Senior Secured Bonds, Series 2009A-1: | | | | | | | | | | | | | | |
| | 65 | | | 6.000%, 6/01/16 | | | | | No Opt. Call | | | | A+ | | | | 75,202 | |
| | 60 | | | 5.500%, 6/01/16 – AGC Insured | | | | | No Opt. Call | | | | AA– | | | | 68,743 | |
| | | | | |
| | 25 | | | Citizens Property Insurance Corporation, Florida, High-Risk Account Revenue Bonds, Coastal Account Senior Secured Series 2011A-1, 4.000%, 6/01/16 | | | | | No Opt. Call | | | | A+ | | | | 27,420 | |
Portfolio of Investments
Nuveen Short Duration High Yield Municipal Bond Fund (continued)
April 30, 2013
| | | | | | | | | | | | | | | | | | |
Principal
Amount (000) | | | Description (1) | | | | Optional Call
Provisions (2) | | | Ratings (3) | | | Value | |
| | | | Florida (continued) | | | | | | | | | | | | | | |
| | | | | |
| | | | Citizens Property Insurance Corporation, Florida, High-Risk Account Senior Secured Bonds Series 2010A-1: | | | | | | | | | | | | | | |
| $ | 50 | | | 5.000%, 6/01/15 | | | | | No Opt. Call | | | | A+ | | | $ | 54,444 | |
| | 60 | | | 5.000%, 6/01/16 | | | | | No Opt. Call | | | | A+ | | | | 67,632 | |
| | 50 | | | 4.250%, 6/01/17 | | | | | No Opt. Call | | | | A+ | | | | 56,252 | |
| | 10 | | | 4.000%, 6/01/17 – AGM Insured | | | | | No Opt. Call | | | | AA– | | | | 11,190 | |
| | | | | |
| | 50 | | | Citrus County Hospital Board, Florida, Revenue Bonds, Citrus Memorial Hospital, Refunding Series 2002, 6.375%, 8/15/32 | | | | | 8/13 at 100.00 | | | | BB– | | | | 50,087 | |
| | | | | |
| | 50 | | | Florida Citizens Property Insurance Corporation, Personal and Commercial Lines Account Bonds, Senior Secured Series 2012A-1, 5.000%, 6/01/22 | | | | | No Opt. Call | | | | A+ | | | | 60,944 | |
| | | | | |
| | 500 | | | Florida Development Finance Corporation, Educational Facilities Revenue Bonds, Renaissance Charter School, Inc. Projects, Series 2011A, 6.500%, 6/15/21 | | | | | No Opt. Call | | | | BB– | | | | 584,065 | |
| | | | | |
| | 50 | | | Florida Higher Educational Facilities Financing Authority, Revenue Bonds, Nova Southeastern University, Refunding Series 2011, 4.250%, 4/01/17 | | | | | No Opt. Call | | | | BBB+ | | | | 54,695 | |
| | | | | |
| | 400 | | | Florida Municipal Loan Council, Infrastructure Improvement Revenue Bonds, 9B Design-Build-Finance Project, Series 2012, 1.750%, 8/15/16 | | | | | No Opt. Call | | | | A | | | | 401,000 | |
| | | | | |
| | 1,000 | | | Jacksonville, Florida, Economic Development Commission Health Care Facilities Revenue Bonds, Florida Proton Therapy Institute Project, Series 2007A, 6.250%, 9/01/27 | | | | | 9/17 at 100.00 | | | | N/R | | | | 1,124,680 | |
| | | | | |
| | 1,500 | | | Lee County Industrial Development Authority, Florida, Charter School Revenue Bonds, Lee County Community Charter Schools, Series 2007A, 5.250%, 6/15/27 | | | | | 6/17 at 100.00 | | | | BB | | | | 1,528,830 | |
| | | | | |
| | 700 | | | Manatee County School Board, Florida, Certificates of Participation, Series 2011A, 4.500%, 7/01/18 | | | | | No Opt. Call | | | | A2 | | | | 780,255 | |
| | | | | |
| | 1,375 | | | Orlando Community Redevelopment Agency, Florida, Tax Increment Revenue Bonds, Conroy Road District, Refunding Series 2012, 5.000%, 4/01/20 | | | | | No Opt. Call | | | | A– | | | | 1,601,363 | |
| | | | | |
| | 1,305 | | | Orlando Community Redevelopment Agency, Florida, Tax Increment Revenue Bonds, Conroy Road District, Refunding Series 2012, 5.000%, 4/01/19 | | | | | No Opt. Call | | | | A– | | | | 1,504,809 | |
| | | | | |
| | 750 | | | Palm Beach County Health Facilities Authority, Florida, Revenue Bonds, Jupiter Medical Center, Series 2013A, 5.000%, 11/01/21 (WI/DD, Settling 5/07/13) | | | | | No Opt. Call | | | | BBB+ | | | | 867,413 | |
| | | | | |
| | 10 | | | Seminole Tribe of Florida, Special Obligation Bonds, Series 2007A, 144A, 5.750%, 10/01/22 | | | | | 10/17 at 100.00 | | | | BBB– | | | | 11,099 | |
| | | | | |
| | 300 | | | Village Center Community Development District, Lake County, Florida, Recreational Revenue Bonds, Series 2001A, 5.200%, 11/01/25 – NPFG Insured | | | | | 7/13 at 100.00 | | | | Baa2 | | | | 301,650 | |
| | | | | |
| | 125 | | | Westchase East Community Development District, Florida, Special Assessment Bonds, Series 2007-2, 4.000%, 5/01/18 – NPFG Insured | | | | | 5/17 at 100.00 | | | | A | | | | 127,988 | |
| | 9,680 | | | Total Florida | | | | | | | | | | | | | 10,640,326 | |
| | | | Georgia – 1.8% | | | | | | | | | | | | | | |
| | | | | |
| | 450 | | | Coffee County Hospital Authority, Georgia, Revenue Bonds, Coffee County Regional Medical Center, Series 2004, 5.000%, 12/01/26 | | | | | 12/14 at 100.00 | | | | BB– | | | | 454,590 | |
| | | | | |
| | 560 | | | Fulton County Development Authority, Georgia, Revenue Bonds, Amana Academy Project, Series 2013A, 5.250%, 4/01/23 | | | | | No Opt. Call | | | | N/R | | | | 564,284 | |
| | | | | |
| | 500 | | | Fulton County Residential Care Facilities Authority, Georgia, Revenue Bonds, Elderly Care, Lenbrook Square Project, Series 2006A, 5.000%, 7/01/27 | | | | | 7/17 at 100.00 | | | | N/R | | | | 507,855 | |
| | | | | |
| | | | Main Street Natural Gas Inc., Georgia, Gas Project Revenue Bonds, Series 2006B: | | | | | | | | | | | | | | |
| | 95 | | | 5.000%, 3/15/14 | | | | | No Opt. Call | | | | A | | | | 98,506 | |
| | 275 | | | 5.000%, 3/15/20 | | | | | No Opt. Call | | | | A | | | | 314,606 | |
| | 100 | | | 5.000%, 3/15/21 | | | | | No Opt. Call | | | | A | | | | 114,937 | |
| | 265 | | | 5.000%, 3/15/22 | | | | | No Opt. Call | | | | A | | | | 307,919 | |
| | | | | | | | | | | | | | | | | | |
Principal
Amount (000) | | | Description (1) | | | | Optional Call
Provisions (2) | | | Ratings (3) | | | Value | |
| | | | Georgia (continued) | | | | | | | | | | | | | | |
| | | | | |
| $ | 125 | | | Private Colleges and Universities Authority, Georgia, Revenue Bonds, Mercer University, Series 2012A, 5.000%, 10/01/19 | | | | | No Opt. Call | | | | Baa2 | | | $ | 143,705 | |
| | | | | |
| | 67 | | | Savannah Economic Development Authority, Georgia, Pollution Control Revenue Bonds, International Paper Company Projects, Refunding Series 2003A, 5.100%, 8/01/14 | | | | | No Opt. Call | | | | BBB | | | | 69,480 | |
| | 2,437 | | | Total Georgia | | | | | | | | | | | | | 2,575,882 | |
| | | | Guam – 2.5% | | | | | | | | | | | | | | |
| | | | | |
| | | | Government of Guam, Hotel Occupancy Tax Revenue Bonds, Series 2011A: | | | | | | | | | | | | | | |
| | 750 | | | 4.125%, 11/01/15 | | | | | No Opt. Call | | | | BBB+ | | | | 792,203 | |
| | 500 | | | 5.000%, 11/01/16 | | | | | No Opt. Call | | | | BBB+ | | | | 550,255 | |
| | 500 | | | 5.000%, 11/01/17 | | | | | No Opt. Call | | | | BBB+ | | | | 556,180 | |
| | | | | |
| | 1,000 | | | Guam Government Department of Education, Certificates of Participation, John F. Kennedy High School Project, Series 2010A, 6.000%, 12/01/20 | | | | | No Opt. Call | | | | B | | | | 1,089,420 | |
| | | | | |
| | 500 | | | Guam Government, General Obligation Bonds, 2009 Series A, 6.750%, 11/15/29 | | | | | 11/19 at 100.00 | | | | B+ | | | | 564,940 | |
| | | | | |
| | 30 | | | Guam International Airport Authority, Revenue Bonds, Series 2003B, 5.250%, 10/01/14 – NPFG Insured | | | | | 10/13 at 100.00 | | | | A | | | | 30,503 | |
| | 3,280 | | | Total Guam | | | | | | | | | | | | | 3,583,501 | |
| | | | Hawaii – 0.2% | | | | | | | | | | | | | | |
| | | | | |
| | 250 | | | Hawaii Housing Finance and Development Corporation, Multifamily Housing Revenue Bonds, Wilikina Apartments Project, Series 2012A, 4.250%, 5/01/22 | | | | | No Opt. Call | | | | BBB– | | | | 273,235 | |
| | | | Illinois – 2.6% | | | | | | | | | | | | | | |
| | | | | |
| | 255 | | | Chicago Board of Education, Illinois, Unlimited Tax General Obligation Bonds, Dedicated Tax Revenues, Series 1999A, 5.250%, 12/01/17 – FGIC Insured | | | | | No Opt. Call | | | | A+ | | | | 296,463 | |
| | | | | |
| | 300 | | | Governors State University Board of Trustees, Illinois, Certificates of Participation, Capital Improvement Projects, Series 2008, 4.125%, 1/01/21 | | | | | No Opt. Call | | | | AA– | | | | 314,793 | |
| | | | | |
| | 25 | | | Illinois Development Finance Authority, Revenue Bonds, Provena Health, Series 1998A, 5.125%, 5/15/23 – NPFG Insured | | | | | 7/13 at 100.00 | | | | Baa1 | | | | 25,098 | |
| | | | | |
| | 15 | | | Illinois Finance Authority Revenue Bonds, Christian Homes, Inc., Refunding Series 2010, 6.125%, 5/15/27 | | | | | 5/20 at 100.00 | | | | BBB– | | | | 16,781 | |
| | | | | |
| | 300 | | | Illinois Finance Authority, Charter School Revenue Bonds, Chicago Charter School Foundation, Series 2007, 5.000%, 12/01/21 | | | | | 12/16 at 100.00 | | | | BBB+ | | | | 325,932 | |
| | | | | |
| | 150 | | | Illinois Finance Authority, Revenue Bonds, Admiral at Lake Project, Series 2010A, 7.250%, 5/15/20 | | | | | 5/15 at 100.00 | | | | N/R | | | | 157,926 | |
| | | | | |
| | 250 | | | Illinois Finance Authority, Revenue Bonds, Friendship Village of Schaumburg, Series 2005A, 5.000%, 2/15/15 | | | | | No Opt. Call | | | | BB– | | | | 257,190 | |
| | | | | |
| | 500 | | | Illinois Finance Authority, Revenue Bonds, Montgomery Place Project, Series 2006A, 5.500%, 5/15/26 | | | | | 5/17 at 100.00 | | | | N/R | | | | 524,300 | |
| | | | | |
| | 20 | | | Illinois Finance Authority, Revenue Refunding Bonds, Resurrection Health Care Corporation, Series 2009, 6.125%, 5/15/25 | | | | | 5/19 at 100.00 | | | | BBB+ | | | | 23,010 | |
| | | | | |
| | 510 | | | Illinois Finance Authority, Revenue Refunding Bonds, Swedish Covenant Hospital, Refunding Series 2010A, 5.000%, 8/15/17 | | | | | No Opt. Call | | | | BBB+ | | | | 570,690 | |
| | | | | |
| | 100 | | | Illinois State, General Obligation Bonds, Refunding Series 2010, 5.000%, 1/01/19 | | | | | No Opt. Call | | | | A2 | | | | 115,566 | |
| | | | | |
| | 510 | | | Illinois State, General Obligation Bonds, Refunding Series 2012, 5.000%, 8/01/20 | | | | | No Opt. Call | | | | AA– | | | | 599,867 | |
| | | | | |
| | 500 | | | Pingree Grove Village, Illinois, Tax Assessment Bonds, Special Service Area 2 – Cambridge Lakes Project, Series 2005-2, 6.000%, 3/01/35 | | | | | 3/15 at 102.00 | | | | N/R | | | | 516,110 | |
| | 3,435 | | | Total Illinois | | | | | | | | | | | | | 3,743,726 | |
Portfolio of Investments
Nuveen Short Duration High Yield Municipal Bond Fund (continued)
April 30, 2013
| | | | | | | | | | | | | | | | | | |
Principal
Amount (000) | | | Description (1) | | | | Optional Call
Provisions (2) | | | Ratings (3) | | | Value | |
| | | | Indiana – 2.2% | | | | | | | | | | | | | | |
| | | | | |
| $ | 500 | | | Carmel, Indiana, Revenue Bonds, Barrington of Carmel Project, Series 2012A, 6.000%, 11/15/22 | | | | | No Opt. Call | | | | N/R | | | $ | 547,895 | |
| | | | | |
| | 400 | | | Indiana Finance Authority, Educational Facilities Revenue Bonds, Drexel Foundation For Educational Excellence, Inc., Series 2009A, 6.000%, 10/01/21 | | | | | 10/19 at 100.00 | | | | BB+ | | | | 437,072 | |
| | | | | |
| | 330 | | | Indiana Finance Authority, Environmental Improvement Revenue Bonds, United States Steel Corporation Project, Refunding Series 2011, 6.000%, 12/01/19 | | | | | No Opt. Call | | | | BB | | | | 364,155 | |
| | | | | |
| | 435 | | | Indiana Finance Authority, Hospital Revenue Bonds, Marion General Hospital Project, Series 2012A, 3.000%, 7/01/19 | | | | | No Opt. Call | | | | A+ | | | | 467,329 | |
| | | | | |
| | 750 | | | Indiana Finance Authority, Private Activity Bonds, Ohio River Bridges East End Crossing Project, Series 2013B, 5.000%, 1/01/19 (Alternative Minimum Tax) | | | | | 1/17 at 100.00 | | | | BBB | | | | 835,680 | |
| | | | | |
| | 500 | | | Indiana Finance Authority, Revenue Bonds, Marquette Project, Series 2012, 5.000%, 3/01/19 | | | | | No Opt. Call | | | | BBB | | | | 552,645 | |
| | 2,915 | | | Total Indiana | | | | | | | | | | | | | 3,204,776 | |
| | | | Iowa – 0.4% | | | | | | | | | | | | | | |
| | | | | |
| | 400 | | | Iowa Finance Authority, Health Facility Revenue Bonds, Care Initiatives Project, Series 2006A, 5.500%, 7/01/25 | | | | | 7/16 at 100.00 | | | | BB+ | | | | 422,796 | |
| | | | | |
| | | | Iowa Higher Education Loan Authority, Private College Facility Revenue Bonds, Upper Iowa University Project, Series 2012: | | | | | | | | | | | | | | |
| | 125 | | | 3.000%, 9/01/16 | | | | | No Opt. Call | | | | BBB | | | | 130,025 | |
| | 60 | | | 4.000%, 9/01/17 | | | | | No Opt. Call | | | | BBB | | | | 64,622 | |
| | 585 | | | Total Iowa | | | | | | | | | | | | | 617,443 | |
| | | | Kansas – 0.4% | | | | | | | | | | | | | | |
| | | | | |
| | | | Kansas Power Pool, Electric Utility Revenue Bonds, Clay Center Projects, Series 2013A: | | | | | | | | | | | | | | |
| | 100 | | | 3.000%, 12/01/18 (WI/DD, Settling 5/15/13) | | | | | No Opt. Call | | | | Baa1 | | | | 105,762 | |
| | 310 | | | 4.000%, 12/01/20 (WI/DD, Settling 5/15/13) | | | | | No Opt. Call | | | | Baa1 | | | | 341,787 | |
| | | | | |
| | 30 | | | Overland Park Transportation Development District, Kansas, Sales Tax Revenue Bonds, Oak Park Mall Project, Series 2010, 5.200%, 4/01/20 | | | | | No Opt. Call | | | | BBB | | | | 34,488 | |
| | | | | |
| | 100 | | | Wichita, Kansas, Hospital Facilities Revenue Bonds, Via Christi Health System, Inc., Refunding Series 2009X, 4.750%, 11/15/24 | | | | | 11/19 at 100.00 | | | | AA– | | | | 111,884 | |
| | 540 | | | Total Kansas | | | | | | | | | | | | | 593,921 | |
| | | | Louisiana – 1.1% | | | | | | | | | | | | | | |
| | | | | |
| | 750 | | | Louisiana Local Government Environmental Facilities & Community Development Authority, Revenue Bonds, Westlake Chemical Corporation Project, Series 2007, 6.750%, 11/01/32 | | | | | 11/17 at 100.00 | | | | BBB– | | | | 858,458 | |
| | | | | |
| | 135 | | | Louisiana Public Facilities Authority, Revenue Bonds, Christus Health, Refunding Series 2009A, 5.000%, 7/01/19 | | | | | No Opt. Call | | | | A+ | | | | 160,377 | |
| | | | | |
| | 200 | | | Louisiana Public Facilities Authority, Revenue Bonds, The Oaks of Alexandria, L.L.C. – Louisiana State University at Alexandria Student housing Project, Series 2006, 4.000%, 10/01/17 – NPFG Insured | | | | | 10/16 at 100.00 | | | | A | | | | 210,080 | |
| | | | | |
| | 400 | | | Louisiana Public Facilities Authority, Solid Waste Disposal Facility Revenue Bonds, Louisiana Pellets Inc Project, Series 2013A, 9.750%, 8/01/14 (Alternative Minimum Tax) | | | | | 7/13 at 100.00 | | | | N/R | | | | 400,080 | |
| | 1,485 | | | Total Louisiana | | | | | | | | | | | | | 1,628,995 | |
| | | | Maryland – 0.7% | | | | | | | | | | | | | | |
| | | | | |
| | 1,000 | | | Maryland Economic Development Corporation, Senior Lien Student Housing Revenue Bonds, University of Maryland – Baltimore, Series 2003A, 5.625%, 10/01/23 | | | | | 10/13 at 100.00 | | | | B3 | | | | 1,000,080 | |
| | | | | | | | | | | | | | | | | | |
Principal
Amount (000) | | | Description (1) | | | | Optional Call
Provisions (2) | | | Ratings (3) | | | Value | |
| | | | Massachusetts – 2.1% | | | | | | | | | | | | | | |
| | | | | |
| $ | 750 | | | Massachusetts Development Finance Agency, Revenue Bonds, Boston Architectural College, Series 2006, 5.000%, 1/01/27 – ACA Insured | | | | | 1/17 at 100.00 | | | | N/R | | | $ | 750,945 | |
| | | | | |
| | 250 | | | Massachusetts Development Finance Authority, Revenue Bonds, Eastern Nazarene College, Series 1999, 5.625%, 4/01/29 | | | | | 7/13 at 100.00 | | | | BB+ | | | | 250,788 | |
| | | | | |
| | 1,150 | | | Massachusetts Health and Educational Facilities Authority, Revenue Bonds, Milton Hospital Project, Series 2005D, 5.250%, 7/01/30 | | | �� | | 7/15 at 100.00 | | | | BB– | | | | 1,187,019 | |
| | | | | |
| | | | Massachusetts Port Authority, Special Facilities Revenue Bonds, Delta Air Lines Inc., Series 2001A: | | | | | | | | | | | | | | |
| | 25 | | | 5.000%, 1/01/21 – AMBAC Insured | | | | | 7/13 at 100.00 | | | | N/R | | | | 25,003 | |
| | 785 | | | 5.000%, 1/01/27 – AMBAC Insured (Alternative Minimum Tax) | | | | | 7/13 at 100.00 | | | | N/R | | | | 784,992 | |
| | 2,960 | | | Total Massachusetts | | | | | | | | | | | | | 2,998,747 | |
| | | | Michigan – 4.1% | | | | | | | | | | | | | | |
| | | | | |
| | 630 | | | Detroit Water Supply System, Michigan, Water Supply System Revenue Bonds, Refunding Senior Lien Series 2006D, 5.000%, 7/01/23 – AGM Insured | | | | | No Opt. Call | | | | AA– | | | | 664,190 | |
| | | | | |
| | | | Detroit Water Supply System, Michigan, Water Supply System Revenue Senior Lien Bonds, Series 2006A: | | | | | | | | | | | | | | |
| | 70 | | | 5.250%, 7/01/19 – NPFG Insured | | | | | 7/16 at 100.00 | | | | Baa2 | | | | 76,624 | |
| | 365 | | | 5.250%, 7/01/22 – NPFG Insured | | | | | 7/16 at 100.00 | | | | Baa2 | | | | 395,452 | |
| | 65 | | | 5.250%, 7/01/23 – NPFG Insured | | | | | 7/16 at 100.00 | | | | Baa2 | | | | 70,216 | |
| | | | | |
| | 645 | | | Detroit, Michigan, Downtown Development Authority, Tax Increment Refunding Bonds, Development Area 1 Projects, Series 1998A, 4.750%, 7/01/25 – NPFG Insured | | | | | 7/13 at 100.00 | | | | A– | | | | 645,116 | |
| | | | | |
| | 250 | | | Detroit, Michigan, General Obligation Bonds, Limited Tax Capital Improvement Series 2008-A1, 5.000%, 4/01/15 | | | | | No Opt. Call | | | | B | | | | 234,098 | |
| | | | | |
| | 105 | | | Detroit, Michigan, Senior Lien Sewerage Disposal System Revenue Bonds, Remarketed Series 1998A, 5.250%, 7/01/23 – AGC Insured | | | | | 7/17 at 100.00 | | | | AA– | | | | 115,292 | |
| | | | | |
| | 250 | | | Detroit, Michigan, Senior Lien Water Supply System Revenue Bonds, Series 2001C, 5.750%, 7/01/21 – BHAC Insured | | | | | No Opt. Call | | | | AA+ | | | | 297,378 | |
| | | | | |
| | | | Detroit, Michigan, Senior Lien Water Supply System Revenue Bonds, Series 2003A: | | | | | | | | | | | | | | |
| | 55 | | | 5.000%, 7/01/26 – NPFG Insured | | | | | 7/13 at 100.00 | | | | A+ | | | | 55,212 | |
| | 750 | | | 5.000%, 7/01/34 – NPFG Insured | | | | | 7/13 at 100.00 | | | | A+ | | | | 750,045 | |
| | | | | |
| | 195 | | | Detroit, Michigan, Water Supply System Revenue Bonds, Series 2004B, 5.000%, 7/01/16 – NPFG Insured | | | | | No Opt. Call | | | | Baa2 | | | | 215,567 | |
| | | | | |
| | 235 | | | Michigan Finance Authority, Public School Academy Limited Obligation Revenue and Refunding Bonds, Detroit Service Learning Academy Project, Series 2011, 6.000%, 10/01/21 | | | | | No Opt. Call | | | | BB+ | | | | 260,161 | |
| | | | | |
| | 485 | | | Michigan Finance Authority, Public School Academy Limited Obligation Revenue Bonds, Old Redford Academy Project, Series 2010A, 5.250%, 12/01/20 | | | | | No Opt. Call | | | | BB | | | | 525,304 | |
| | | | | |
| | 250 | | | Summit Academy North, Michigan, Revenue Bonds, Public School Academy Series 2005, 5.000%, 11/01/15 | | | | | No Opt. Call | | | | BB | | | | 251,750 | |
| | | | | |
| | 175 | | | Taylor, Wayne County, Michigan, General Obligation Bonds, Refunding Series 2005, 5.000%, 9/01/14 – NPFG Insured | | | | | No Opt. Call | | | | BBB | | | | 183,271 | |
| | | | | |
| | 250 | | | Troy Downtown Development Authority, Michigan, Tax Increment Revenue Bonds, Development & Refunding Series 2001, 5.500%, 11/01/15 – NPFG Insured | | | | | 11/13 at 100.00 | | | | Baa2 | | | | 252,675 | |
| | | | | |
| | 790 | | | Wayne Charter County, Michigan, Limited Tax General Obligation Airport Hotel Revenue Bonds, Detroit Metropolitan Wayne County Airport, Series 2001A, 5.000%, 12/01/30 – NPFG Insured | | | | | 7/13 at 100.00 | | | | BBB+ | | | | 792,157 | |
| | 5,565 | | | Total Michigan | | | | | | | | | | | | | 5,784,508 | |
Portfolio of Investments
Nuveen Short Duration High Yield Municipal Bond Fund (continued)
April 30, 2013
| | | | | | | | | | | | | | | | | | |
Principal
Amount (000) | | | Description (1) | | | | Optional Call
Provisions (2) | | | Ratings (3) | | | Value | |
| | | | Minnesota – 0.1% | | | | | | | | | | | | | | |
| | | | | |
| $ | 150 | | | Minneapolis, Minnesota, Tax Increment Revenue Bonds, Village at St. Anthony Falls Project, Refunding Series 2004, 5.750%, 2/01/27 | | | | | 7/13 at 100.00 | | | | N/R | | | $ | 150,105 | |
| | | | Missouri – 2.3% | | | | | | | | | | | | | | |
| | | | | |
| | 500 | | | Kansas City Tax Increment Financing Commission, Missouri, Tax Increment Revenue Bonds, Briarcliff West Project, Series 2006A, 5.400%, 6/01/24 | | | | | 6/14 at 102.00 | | | | N/R | | | | 519,105 | |
| | | | | |
| | 1,000 | | | Saint Louis, Missouri, Parking Revenue Bonds, Series 2006A, 5.000%, 12/15/22 – NPFG Insured | | | | | 12/16 at 100.00 | | | | A | | | | 1,087,870 | |
| | | | | |
| | 500 | | | St. Joseph Industrial Development Authority, Missouri, Tax Increment Bonds, Shoppes at North Village Project, Series 2005B, 5.375%, 11/01/23 | | | | | 11/14 at 100.00 | | | | N/R | | | | 503,690 | |
| | | | | |
| | 1,000 | | | St. Louis, Missouri, Airport Revenue Bonds, Lambert-St. Louis International Airport, Refunding Series 2007B, 5.000%, 7/01/24 – AGM Insured (Alternative Minimum Tax) | | | | | 7/17 at 100.00 | | | | AA– | | | | 1,108,920 | |
| | 3,000 | | | Total Missouri | | | | | | | | | | | | | 3,219,585 | |
| | | | Nebraska – 0.1% | | | | | | | | | | | | | | |
| | | | | |
| | | | Central Plains Energy Project, Nebraska, Gas Project 1 Revenue Bonds, Series 2007A: | | | | | | | | | | | | | | |
| | 105 | | | 5.250%, 12/01/18 | | | | | No Opt. Call | | | | A | | | | 119,820 | |
| | 50 | | | 5.250%, 12/01/19 | | | | | No Opt. Call | | | | A | | | | 57,477 | |
| | 155 | | | Total Nebraska | | | | | | | | | | | | | 177,297 | |
| | | | Nevada – 1.4% | | | | | | | | | | | | | | |
| | | | | |
| | 100 | | | Henderson Local Improvement Districts T-18, Nevada, Limited Obligation Improvement Bonds, Inspirada Series 2006, 5.150%, 9/01/21 | | | | | 9/13 at 102.00 | | | | N/R | | | | 91,661 | |
| | | | | |
| | 100 | | | Henderson, Nevada, Local Improvement District T-13 Cornerstone, Limited Obligation Refunding Bonds, Series 2013, 4.000%, 3/01/17 | | | | | No Opt. Call | | | | N/R | | | | 102,456 | |
| | | | | |
| | 1,770 | | | North Las Vegas, Nevada, General Obligation Bonds, Series 2006, 5.000%, 5/01/27 – NPFG Insured | | | | | 5/16 at 100.00 | | | | A | | | | 1,844,977 | |
| | 1,970 | | | Total Nevada | | | | | | | | | | | | | 2,039,094 | |
| | | | New Hampshire – 0.2% | | | | | | | | | | | | | | |
| | | | | |
| | 200 | | | Manchester Housing and Redevelopment Authority, New Hampshire, Meals and Rooms Tax Revenue Bonds, Series 2000A, 6.750%, 1/01/14 – ACA Insured | | | | | 7/13 at 100.00 | | | | Caa1 | | | | 199,936 | |
| | | | | |
| | 130 | | | Manchester Housing and Redevelopment Authority, New Hampshire, Revenue Bonds, Series 2000B, 0.000%, 1/01/17 – ACA Insured | | | | | No Opt. Call | | | | Caa1 | | | | 100,888 | |
| | 330 | | | Total New Hampshire | | | | | | | | | | | | | 300,824 | |
| | | | New Jersey – 2.9% | | | | | | | | | | | | | | |
| | | | | |
| | 200 | | | Casino Reinvestment Development Authority, New Jersey, Parking Revenue Bonds, Series 2005A, 5.250%, 6/01/20 – NPFG Insured | | | | | 6/15 at 100.00 | | | | A– | | | | 212,504 | |
| | | | | |
| | 250 | | | New Jersey Economic Development Authority, School Facilities Construction Financing Program Bonds, Tender Option Bond Trust 1151, 2.769%, 9/01/25 (IF) (4) | | | | | 3/25 at 100.00 | | | | A+ | | | | 250,000 | |
| | | | | |
| | 100 | | | New Jersey Economic Development Authority, Transportation Sublease Revenue Bonds, Light Rail Transit System, Refunding Series 2008A, 5.000%, 5/01/19 | | | | | No Opt. Call | | | | A+ | | | | 120,565 | |
| | | | | |
| | 70 | | | New Jersey Health Care Facilities Financing Authority, Revenue Bonds, Palisades Medical Center of New York Presbyterian Healthcare System Obligated Group, Series 1999, 5.200%, 7/01/19 – ACA Insured | | | | | 7/13 at 100.00 | | | | BB+ | | | | 70,053 | |
| | | | | |
| | 500 | | | New Jersey State Higher Education Assistance Authority, Student Loan Revenue Bonds, Series 2011-1, 5.000%, 12/01/22 | | | | | 12/21 at 100.00 | | | | A | | | | 572,535 | |
| | | | | |
| | | | Tobacco Settlement Financing Corporation, New Jersey, Tobacco Settlement Asset-Backed Bonds, Series 2007-1A: | | | | | | | | | | | | | | |
| | 2,446 | | | 4.500%, 6/01/23 | | | | | 6/17 at 100.00 | | | | B1 | | | | 2,447,712 | |
| | 500 | | | 4.625%, 6/01/26 | | | | | 6/17 at 100.00 | | | | B1 | | | | 486,860 | |
| | 4,066 | | | Total New Jersey | | | | | | | | | | | | | 4,160,229 | |
| | | | | | | | | | | | | | | | | | |
Principal
Amount (000) | | | Description (1) | | | | Optional Call
Provisions (2) | | | Ratings (3) | | | Value | |
| | | | New Mexico – 1.1% | | | | | | | | | | | | | | |
| | | | | |
| $ | 1,500 | | | Bernalillo County, New Mexico, Multifamily Housing Revenue Bonds, Valencia Retirement Apartments Project, Series 2001A, 5.450%, 6/01/34 – AMBAC Insured (Alternative Minimum Tax) | | | | | 5/13 at 100.00 | | | | N/R | | | $ | 1,500,390 | |
| | | | New York – 4.6% | | | | | | | | | | | | | | |
| | | | | |
| | 100 | | | Buffalo and Erie County Industrial Land Development Corporation, New York, Tax-Exempt Revenue Bonds, Enterprise Charter School Project, Series 2011A, 6.000%, 12/01/19 | | | | | No Opt. Call | | | | BBB– | | | | 109,777 | |
| | | | | |
| | | | Build NYC Resource Corporation, New York, Revenue Bonds, Bronx Charter School for Excellence, Series 2013A: | | | | | | | | | | | | | | |
| | 485 | | | 4.000%, 4/01/19 | | | | | No Opt. Call | | | | BBB– | | | | 526,181 | |
| | 525 | | | 4.000%, 4/01/21 | | | | | No Opt. Call | | | | BBB– | | | | 567,908 | |
| | 545 | | | 4.000%, 4/01/22 | | | | | No Opt. Call | | | | BBB– | | | | 585,597 | |
| | | | | |
| | 1,000 | | | Essex County Industrial Development Agency, New York, Solid Waste Disposal Revenue Bonds, International Paper Company, Refunding Series 2005A, 5.200%, 12/01/23 (Alternative Minimum Tax) | | | | | 12/15 at 100.00 | | | | BBB | | | | 1,084,730 | |
| | | | | |
| | | | New York City Industrial Development Agency, New York, American Airlines-JFK International Airport Special Facility Revenue Bonds, Series 2005: | | | | | | | | | | | | | | |
| | 1,000 | | | 7.500%, 8/01/16 (Alternative Minimum Tax) | | | | | No Opt. Call | | | | N/R | | | | 1,067,680 | |
| | 150 | | | 7.625%, 8/01/25 (Alternative Minimum Tax) | | | | | 8/16 at 101.00 | | | | N/R | | | | 171,441 | |
| | | | | |
| | 150 | | | New York City Industrial Development Agency, New York, Civic Facility Revenue Bonds, Vaughn College of Aeronautics, Series 2006A, 5.000%, 12/01/16 | | | | | No Opt. Call | | | | BB+ | | | | 160,230 | |
| | | | | |
| | | | New York City Industrial Development Agency, New York, PILOT Revenue Bonds, Queens Baseball Stadium Project, Series 2006: | | | | | | | | | | | | | | |
| | 100 | | | 5.000%, 1/01/19 – AMBAC Insured | | | | | 1/17 at 100.00 | | | | Ba1 | | | | 109,409 | |
| | 75 | | | 5.000%, 1/01/20 – AMBAC Insured | | | | | 1/17 at 100.00 | | | | Ba1 | | | | 81,313 | |
| | 90 | | | 5.000%, 1/01/21 – AMBAC Insured | | | | | 1/17 at 100.00 | | | | Ba1 | | | | 97,182 | |
| | 105 | | | 5.000%, 1/01/22 – AMBAC Insured | | | | | 1/17 at 100.00 | | | | Ba1 | | | | 112,430 | |
| | 75 | | | 5.000%, 1/01/23 – AMBAC Insured | | | | | 1/17 at 100.00 | | | | Ba1 | | | | 79,850 | |
| | | | | |
| | | | Port Authority of New York and New Jersey, Special Project Bonds, JFK International Air Terminal LLC Project, Eighth Series 2010: | | | | | | | | | | | | | | |
| | 195 | | | 5.000%, 12/01/20 | | | | | No Opt. Call | | | | BBB– | | | | 224,853 | |
| | 200 | | | 6.500%, 12/01/28 | | | | | 12/15 at 100.00 | | | | BBB– | | | | 220,914 | |
| | | | | |
| | 75 | | | Port Authority of New York and New Jersey, Special Project Bonds, JFK International Air Terminal LLC, Sixth Series 1997, 5.750%, 12/01/22 – NPFG Insured (Alternative Minimum Tax) | | | | | 6/13 at 100.00 | | | | BBB– | | | | 75,290 | |
| | | | | |
| | 185 | | | Rockland County, New York, General Obligation Bonds, Various Purpose Series 2010B, 2.000%, 9/01/15 | | | | | No Opt. Call | | | | BBB– | | | | 189,440 | |
| | | | | |
| | 100 | | | Suffolk Tobacco Asset Securitization Corporation, New York, Tobacco Settlement Asset-Backed Bonds, Series 2008A, 5.000%, 6/01/18 | | | | | No Opt. Call | | | | BBB+ | | | | 104,764 | |
| | | | | |
| | 1,000 | | | TSASC Inc., New York, Tobacco Asset-Backed Bonds, Series 2006, 5.000%, 6/01/26 | | | | | 6/16 at 100.00 | | | | BB– | | | | 989,550 | |
| | 6,155 | | | Total New York | | | | | | | | | | | | | 6,558,539 | |
| | | | North Carolina – 0.3% | | | | | | | | | | | | | | |
| | | | | |
| | 450 | | | Charlotte, North Carolina, Special Facility Refunding Revenue Bonds, Charlotte/Douglas International Airport, US Airways, Inc. Project, Series 1998, 5.600%, 7/01/27 (Alternative Minimum Tax) | | | | | 7/13 at 100.00 | | | | N/R | | | | 450,554 | |
| | | | Ohio – 5.2% | | | | | | | | | | | | | | |
| | | | | |
| | | | Buckeye Tobacco Settlement Financing Authority, Ohio, Tobacco Settlement Asset-Backed Revenue Bonds, Senior Lien, Series 2007A-2: | | | | | | | | | | | | | | |
| | 1,395 | | | 5.375%, 6/01/24 | | | | | 6/17 at 100.00 | | | | B– | | | | 1,315,359 | |
| | 2,340 | | | 5.125%, 6/01/24 | | | | | 6/17 at 100.00 | | | | B– | | | | 2,172,222 | |
| | | | | |
| | 165 | | | Montgomery County, Ohio, Health Care and Multifamily Housing Revenue Bonds, Saint Leonard, Refunding & improvement Series 2010, 6.000%, 4/01/20 | | | | | No Opt. Call | | | | BBB– | | | | 190,177 | |
Portfolio of Investments
Nuveen Short Duration High Yield Municipal Bond Fund (continued)
April 30, 2013
| | | | | | | | | | | | | | | | | | |
Principal
Amount (000) | | | Description (1) | | | | Optional Call
Provisions (2) | | | Ratings (3) | | | Value | |
| | | | Ohio (continued) | | | | | | | | | | | | | | |
| | | | | |
| $ | 1,195 | | | Muskingum County, Ohio, Hospital Facilities Revenue Bonds, Genesis HealthCare System Obligated Group Project, Series 2013, 5.000%, 2/15/20 (WI/DD, Settling 5/09/13) | | | | | No Opt. Call | | | | BB+ | | | $ | 1,318,312 | |
| | | | | |
| | 1,075 | | | Toledo-Lucas County Port Authority, Ohio, Revenue Refunding Bonds, CSX Transportation Inc., Series 1992, 6.450%, 12/15/21 | | | | | No Opt. Call | | | | Baa2 | | | | 1,399,876 | |
| | | | | |
| | 1,000 | | | Youngstown, Ohio, General Obligation Bonds, Series 2005, 4.125%, 12/01/20 – NPFG Insured | | | | | 12/15 at 100.00 | | | | A | | | | 1,049,320 | |
| | 7,170 | | | Total Ohio | | | | | | | | | | | | | 7,445,266 | |
| | | | Oklahoma – 0.3% | | | | | | | | | | | | | | |
| | | | | |
| | 110 | | | Oklahoma Development Finance Authority, Hospital Revenue Bonds, Great Plains Regional Medical Center, Series 2007, 4.500%, 12/01/14 | | | | | No Opt. Call | | | | BB+ | | | | 113,655 | |
| | | | | |
| | 310 | | | Tulsa Municipal Airport Trust, Oklahoma, Revenue Bonds, American Airlines Inc., Series 1995, 6.250%, 6/01/20 | | | | | 6/13 at 100.00 | | | | N/R | | | | 310,760 | |
| | 420 | | | Total Oklahoma | | | | | | | | | | | | | 424,415 | |
| | | | Oregon – 0.4% | | | | | | | | | | | | | | |
| | | | | |
| | | | Medford Hospital Facilities Authority, Oregon, Hospital Revenue Bonds, Asante Health System, Refunding Series 2010: | | | | | | | | | | | | | | |
| | 260 | | | 5.000%, 8/15/19 – AGM Insured | | | | | No Opt. Call | | | | AA– | | | | 312,842 | |
| | 200 | | | 5.000%, 8/15/21 – AGM Insured | | | | | 8/20 at 100.00 | | | | AA– | | | | 240,394 | |
| | | | | |
| | 55 | | | Port of Saint Helens, Oregon, Pollution Control Revenue Bonds, Boise Cascade Project, Series 1997, 5.650%, 12/01/27 | | | | | No Opt. Call | | | | N/R | | | | 54,998 | |
| | 515 | | | Total Oregon | | | | | | | | | | | | | 608,234 | |
| | | | Pennsylvania – 2.7% | | | | | | | | | | | | | | |
| | | | | |
| | 215 | | | Allegheny Country Industrial Development Authority, Pennsylvania, Environmental Improvement Revenue Bonds, United States Steel Corporation Project, Refunding Series 2009, 6.500%, 5/01/17 | | | | | No Opt. Call | | | | BB | | | | 234,408 | |
| | | | | |
| | 120 | | | Allegheny County Industrial Development Authority, Pennsylvania, Pollution Control Revenue Refunding Bonds, Duquesne Light Company, Series 1999A, 4.350%, 12/01/13 – AMBAC Insured | | | | | No Opt. Call | | | | A2 | | | | 122,263 | |
| | | | | |
| | 680 | | | Allegheny County Industrial Development Authority, Pennsylvania, Revenue Bonds, United States Steel Corporation, Series 2005, 5.500%, 11/01/16 | | | | | No Opt. Call | | | | BB | | | | 712,239 | |
| | | | | |
| | 250 | | | Beaver County Industrial Development Authority, Pennsylvania, Pollution Control Revenue Refunding Bonds, Duquesne Light Company Project, Series 1999B, 4.750%, 8/01/20 (Mandatory put 5/01/18) | | | | | No Opt. Call | | | | A2 | | | | 283,453 | |
| | | | | |
| | 190 | | | Bucks County Industrial Development Authority, Pennsylvania, Charter School Revenue Bonds, School Lane Charter School, Series 2007A, 4.875%, 3/15/27 | | | | | 3/17 at 100.00 | | | | BBB | | | | 194,739 | |
| | | | | |
| | 515 | | | Doylestown Hospital Authority, Pennsylvania, Hospital Revenue Bonds, Series 2013A, 5.000%, 7/01/22 | | | | | No Opt. Call | | | | BBB | | | | 588,367 | |
| | | | | |
| | 400 | | | Lebanon County Health Facilities Authority, Pennsylvania, Revenue Bonds, Good Samaritan Hospital Project, Series 2002, 6.000%, 11/15/35 | | | | | 7/13 at 100.00 | | | | Ba2 | | | | 400,344 | |
| | | | | |
| | 200 | | | Pennsylvania Economic Development Financing Authority, Revenue Bonds, Northwestern Human Services Inc., Series 1998A, 5.250%, 6/01/28 | | | | | 6/13 at 100.00 | | | | N/R | | | | 200,192 | |
| | | | | |
| | 175 | | | Pennsylvania Higher Educational Facilities Authority, Revenue Bonds, AICUP Financing Program-Delaware Valley College of Science and Agriculture Project, Series 2012 LL1, 5.000%, 11/01/19 | | | | | No Opt. Call | | | | Baa3 | | | | 198,858 | |
| | | | | |
| | 40 | | | Pennsylvania Higher Educational Facilities Authority, Revenue Bonds, Allegheny Delaware Valley Obligated Group, Series 1996C, 5.875%, 11/15/16 – NPFG Insured | | | | | 7/13 at 100.00 | | | | Baa2 | | | | 40,048 | |
| | | | | |
| | 100 | | | Philadelphia School District, Pennsylvania, General Obligation Bonds, Series 2008F, 5.000%, 9/01/17 – BHAC Insured | | | | | No Opt. Call | | | | AA+ | | | | 114,902 | |
| | | | | |
| | 180 | | | Reading, Berks County, Pennsylvania, General Obligation Bonds, Refunding Series 2011A, 5.250%, 11/15/19 – AGM Insured | | | | | No Opt. Call | | | | A2 | | | | 211,720 | |
| | | | | | | | | | | | | | | | | | |
Principal
Amount (000) | | | Description (1) | | | | Optional Call
Provisions (2) | | | Ratings (3) | | | Value | |
| | | | Pennsylvania (continued) | | | | | | | | | | | | | | |
| | | | | |
| $ | 150 | | | Scranton Parking Authority, Pennsylvania, Guaranteed Parking Revenue Bonds, Series 2004, 4.250%, 9/15/18 – FGIC Insured | | | | | 9/13 at 100.00 | | | | N/R | | | $ | 145,745 | |
| | | | | |
| | 370 | | | Southcentral Pennsylvania General Authority, Revenue Bonds, Hanover Hospital Inc., Series 2013, 5.000%, 12/01/20 | | | | | No Opt. Call | | | | BBB– | | | | 421,297 | |
| | 3,585 | | | Total Pennsylvania | | | | | | | | | | | | | 3,868,575 | |
| | | | Puerto Rico – 3.9% | | | | | | | | | | | | | | |
| | | | | |
| | 60 | | | Puerto Rico Electric Power Authority, Power Revenue Bonds, Series 2002KK, 5.500%, 7/01/16 – NPFG Insured | | | | | No Opt. Call | | | | BBB+ | | | | 64,510 | |
| | | | | |
| | 200 | | | Puerto Rico Electric Power Authority, Power Revenue Bonds, Series 2005SS, 5.000%, 7/01/21 – NPFG Insured | | | | | 7/15 at 100.00 | | | | BBB+ | | | | 203,172 | |
| | | | | |
| | 620 | | | Puerto Rico Electric Power Authority, Power Revenue Refunding Bonds, Series 2002, 5.000%, 7/01/19 – NPFG Insured | | | | | No Opt. Call | | | | BBB+ | | | | 664,969 | |
| | | | | |
| | 500 | | | Puerto Rico Government Development Bank, Adjustable Refunding Bonds, Variable Rate Demand Obligations, Series 1985, 4.750%, 12/01/15 – NPFG Insured | | | | | 12/13 at 100.00 | | | | BBB– | | | | 507,055 | |
| | | | | |
| | | | Puerto Rico Government Development Bank, Senior Note Revenue Bonds, Senior Lien, Series 2006B: | | | | | | | | | | | | | | |
| | 440 | | | 5.000%, 12/01/15 | | | | | No Opt. Call | | | | BBB– | | | | 460,935 | |
| | 105 | | | 5.000%, 12/01/16 | | | | | No Opt. Call | | | | BBB– | | | | 110,759 | |
| | | | | |
| | 550 | | | Puerto Rico Industrial, Tourist, Educational, Medical and Environmental Control Facilities Financing Authority, Hospital Revenue Bonds, Auxilio Mutuo Hospital, Series 2011A, 5.000%, 7/01/21 | | | | | No Opt. Call | | | | | | | | 619,196 | |
| | | | | |
| | 300 | | | Puerto Rico Infrastructure Financing Authority, Special Tax Revenue Bonds, Series 2005A, 4.000%, 7/01/16 – FGIC Insured | | | | | No Opt. Call | | | | BBB+ | | | | 304,587 | |
| | | | | |
| | 270 | | | Puerto Rico Infrastructure Financing Authority, Special Tax Revenue Bonds, Series 2005C, 5.500%, 7/01/19 – FGIC Insured | | | | | No Opt. Call | | | | BBB+ | | | | 290,104 | |
| | | | | |
| | | | Puerto Rico, General Obligation and Public Improvement Bonds, Series 2002A: | | | | | | | | | | | | | | |
| | 300 | | | 5.500%, 7/01/15 – NPFG Insured | | | | | No Opt. Call | | | | Baa2 | | | | 315,954 | |
| | 175 | | | 5.500%, 7/01/16 – NPFG Insured | | | | | No Opt. Call | | | | Baa2 | | | | 186,489 | |
| | 1,055 | | | 5.500%, 7/01/18 – NPFG Insured (Alternative Minimum Tax) | | | | | No Opt. Call | | | | Baa2 | | | | 1,137,132 | |
| | | | | |
| | 500 | | | Puerto Rico, General Obligation Bonds, Public Improvement Refunding Series 2007A, 5.250%, 7/01/15 | | | | | No Opt. Call | | | | BBB– | | | | 523,985 | |
| | | | | |
| | 105 | | | University of Puerto Rico, University System Revenue Bonds, Series 2006P, 5.000%, 6/01/16 | | | | | No Opt. Call | | | | | | | | 107,965 | |
| | | | | |
| | 130 | | | University of Puerto Rico, University System Revenue Bonds, Series 2006Q, 5.000%, 6/01/21 | | | | | 6/16 at 100.00 | | | | BBB– | | | | 130,667 | |
| | 5,310 | | | Total Puerto Rico | | | | | | | | | | | | | 5,627,479 | |
| | | | Rhode Island – 0.1% | | | | | | | | | | | | | | |
| | | | | |
| | 100 | | | East Providence, Rhode Island, General Obligation Bonds, Series 2003, 4.000%, 5/15/21 – NPFG Insured | | | | | 5/13 at 100.00 | | | | A | | | | 100,058 | |
| | | | | |
| | 75 | | | Rhode Island Health & Educational Building Corporation, Public Schools Financing Program Revenue Bonds, Pooled Series 2009E, 5.000%, 5/15/17 | | | | | No Opt. Call | | | | A3 | | | | 82,860 | |
| | 175 | | | Total Rhode Island | | | | | | | | | | | | | 182,918 | |
| | | | South Carolina – 0.1% | | | | | | | | | | | | | | |
| | | | | |
| | 145 | | | South Carolina Jobs-Economic Authority, Student Housing Revenue Bonds, Coastal Housing Foundation, LLC Project, Series 2009A, 5.500%, 4/01/20 | | | | | No Opt. Call | | | | A | | | | 157,554 | |
| | | | | |
| | 20 | | | York County, South Carolina, Celanese, Series 1994, 5.700%, 1/01/24 (Alternative Minimum Tax) | | | | | 7/13 at 100.00 | | | | BB– | | | | 20,002 | |
| | 165 | | | Total South Carolina | | | | | | | | | | | | | 177,556 | |
Portfolio of Investments
Nuveen Short Duration High Yield Municipal Bond Fund (continued)
April 30, 2013
| | | | | | | | | | | | | | | | | | |
Principal
Amount (000) | | | Description (1) | | | | Optional Call
Provisions (2) | | | Ratings (3) | | | Value | |
| | | | South Dakota – 0.2% | | | | | | | | | | | | | | |
| | | | | |
| $ | 100 | | | Heartland Consumers Power District, South Dakota, Electric System Revenue Refunding Bonds, Series 1992, 6.000%, 1/01/17 – AGM Insured | | | | | No Opt. Call | | | | AA– | | | $ | 111,863 | |
| | | | | |
| | 160 | | | Rapid City, South Dakota, Airport Revenue Refunding Bonds, Passenger Facility Charge Supported, Series 2011A, 5.000%, 12/01/20 | | | | | 12/19 at 100.00 | | | | Baa2 | | | | 182,469 | |
| | 260 | | | Total South Dakota | | | | | | | | | | | | | 294,332 | |
| | | | Tennessee – 1.8% | | | | | | | | | | | | | | |
| | | | | |
| | 540 | | | Clarksville Natural Gas Acquisition Corporation, Tennessee, Natural Gas Revenue Bonds, Series 2006, 5.000%, 12/15/21 – SYNCORA GTY Insured | | | | | No Opt. Call | | | | A | | | | 626,092 | |
| | | | | |
| | | | The Tennessee Energy Acquisition Corporation, Gas Revenue Bonds, Series 2006A: | | | | | | | | | | | | | | |
| | 290 | | | 5.250%, 9/01/20 | | | | | No Opt. Call | | | | A | | | | 339,758 | |
| | 415 | | | 5.250%, 9/01/21 | | | | | No Opt. Call | | | | A | | | | 485,911 | |
| | 200 | | | 5.250%, 9/01/22 | | | | | No Opt. Call | | | | A | | | | 236,648 | |
| | 25 | | | 5.250%, 9/01/24 | | | | | No Opt. Call | | | | A | | | | 29,540 | |
| | | | | |
| | | | The Tennessee Energy Acquisition Corporation, Gas Revenue Bonds, Series 2006C: | | | | | | | | | | | | | | |
| | 20 | | | 5.000%, 2/01/17 | | | | | No Opt. Call | | | | A– | | | | 22,315 | |
| | 100 | | | 5.000%, 2/01/20 | | | | | No Opt. Call | | | | A– | | | | 114,413 | |
| | 650 | | | 5.000%, 2/01/22 | | | | | No Opt. Call | | | | A– | | | | 743,496 | |
| | 2,240 | | | Total Tennessee | | | | | | | | | | | | | 2,598,173 | |
| | | | Texas – 6.3% | | | | | | | | | | | | | | |
| | | | | |
| | 350 | | | Bexar County Health Facilities Development Corporation, Texas, Revenue Bonds, Army Retirement Residence Foundation Project, Series 2010, 4.250%, 7/01/15 | | | | | No Opt. Call | | | | BBB | | | | 368,732 | |
| | | | | |
| | 250 | | | Bexar County, Texas, Health Facilities Development Corporation Revenue Bonds, Army Retirement Residence, Series 2007, 5.000%, 7/01/27 | | | | | 7/17 at 100.00 | | | | BBB | | | | 263,775 | |
| | | | | |
| | 75 | | | Brazos River Authority, Texas, Collateralized Revenue Bonds, CenterPoint Energy Inc., Refunding Series 2004B, 4.250%, 12/01/17 – FGIC Insured | | | | | 6/14 at 100.00 | | | | A | | | | 77,969 | |
| | | | | |
| | 80 | | | Brazos River Authority, Texas, Revenue Refunding Bonds, Houston Industries Inc., Series 1998D, 4.900%, 10/01/15 – NPFG Insured | | | | | No Opt. Call | | | | BBB | | | | 86,150 | |
| | | | | |
| | 1,000 | | | Central Texas Regional Mobility Authority, Revenue Bonds, Senior Lien Refunding Series 2013A, 5.000%, 1/01/21 (WI/DD, Settling 5/16/13) | | | | | No Opt. Call | | | | BBB– | | | | 1,184,180 | |
| | | | | |
| | 65 | | | Central Texas Regional Mobility Authority, Revenue Bonds, Senior Lien Series 2010, 5.750%, 1/01/18 | | | | | No Opt. Call | | | | Baa2 | | | | 76,640 | |
| | | | | |
| | 750 | | | Central Texas Regional Mobility Authority, Revenue Bonds, Subordinate Lien Refunding Series 2013, 5.000%, 1/01/20 (WI/DD, Settling 5/16/13) | | | | | No Opt. Call | | | | Baa3 | | | | 851,183 | |
| | | | | |
| | 165 | | | Dallas-Ft. Worth International Airport Facility Improvement Corporation, Texas, Revenue Bonds, American Airlines Inc., Series 1995, 6.000%, 11/01/14 | | | | | 7/13 at 100.00 | | | | N/R | | | | 179,438 | |
| | | | | |
| | 105 | | | Harris County Cultural Education Facilities Finance Corporation, Texas, Revenue Refunding Bonds, Young Men’s Christian Association of the Greater Houston Area, Series 2013A, 5.000%, 6/01/18 | | | | | No Opt. Call | | | | Baa3 | | | | 119,642 | |
| | | | | |
| | 1,325 | | | Harris County-Houston Sports Authority, Texas, Junior Lien Revenue Refunding Bonds, Series 2001B, 5.250%, 11/15/40 – NPFG Insured | | | | | 5/13 at 100.00 | | | | Baa2 | | | | 1,327,836 | |
| | | | | |
| | 40 | | | Harris County-Houston Sports Authority, Texas, Junior Lien Special Revenue Bonds, Series 1998B, 0.000%, 11/15/17 – NPFG Insured | | | | | No Opt. Call | | | | Baa2 | | | | 31,343 | |
| | | | | |
| | 100 | | | Harris County-Houston Sports Authority, Texas, Senior Lien Revenue Refunding Bonds, Series 2001A, 5.250%, 11/15/30 – NPFG Insured | | | | | 7/13 at 100.00 | | | | BBB | | | | 100,214 | |
| | | | | |
| | | | Harris County-Houston Sports Authority, Texas, Senior Lien Special Revenue Bonds, Series 1998A: | | | | | | | | | | | | | | |
| | 100 | | | 5.000%, 11/15/25 – NPFG Insured | | | | | 7/13 at 100.00 | | | | BBB | | | | 100,747 | |
| | 95 | | | 5.000%, 11/15/28 – NPFG Insured | | | | | 7/13 at 100.00 | | | | BBB | | | | 95,711 | |
| | | | | |
| | 1,000 | | | Health Facilities Development District of Central Texas, Revenue Bonds, Legacy at Willow Bend Project, Series 2006A, 5.625%, 11/01/26 | | | | | 11/16 at 100.00 | | | | N/R | | | | 1,052,870 | |
| | | | | | | | | | | | | | | | | | |
Principal
Amount (000) | | | Description (1) | | | | Optional Call
Provisions (2) | | | Ratings (3) | | | Value | |
| | | | Texas (continued) | | | | | | | | | | | | | | |
| | | | | |
| $ | 400 | | | Houston, Texas, Airport System Special Facilities Revenue Bonds, Continental Air Lines Inc., Series 2001E, 6.750%, 7/01/29 (Alternative Minimum Tax) | | | | | 7/13 at 100.00 | | | | B | | | $ | 401,768 | |
| | | | | |
| | | | Lufkin Health Facilities Development Corporation, Texas, Health System Revenue Bonds, Memorial Health System of East Texas, Refunding Series 2009: | | | | | | | | | | | | | | |
| | 330 | | | 5.500%, 2/15/18 | | | | | No Opt. Call | | | | BBB– | | | | 376,999 | |
| | 255 | | | 5.750%, 2/15/19 | | | | | No Opt. Call | | | | BBB– | | | | 298,294 | |
| | | | | |
| | 1,030 | | | Red River Authority, Texas, Pollution Control Revenue Bonds, AEP Texas North Company, Public Service Company of Oklahoma and AEP Texas Central Company Oklaunion Project, Refunding Series 2007, 4.450%, 6/01/20 – NPFG Insured | | | | | No Opt. Call | | | | BBB | | | | 1,151,458 | |
| | | | | |
| | 425 | | | Texas Municipal Gas Acquisition and Supply Corporation I, Gas Supply Revenue Bonds, Senior Lien Series 2008D, 5.625%, 12/15/17 | | | | | No Opt. Call | | | | A– | | | | 476,149 | |
| | | | | |
| | | | Texas Municipal Gas Acquisition and Supply Corporation I, Gas Supply Revenue Bonds, Series 2006A: | | | | | | | | | | | | | | |
| | 80 | | | 5.250%, 12/15/18 | | | | | No Opt. Call | | | | A– | | | | 92,742 | |
| | 25 | | | 5.250%, 12/15/20 | | | | | No Opt. Call | | | | A– | | | | 29,117 | |
| | | | | |
| | 200 | | | Texas Municipal Gas Acquisition and Supply Corporation III, Gas Supply Revenue Bonds, Series 2012, 5.000%, 12/15/19 | | | | | No Opt. Call | | | | A3 | | | | 227,814 | |
| | 8,245 | | | Total Texas | | | | | | | | | | | | | 8,970,771 | |
| | | | Vermont – 0.4% | | | | | | | | | | | | | | |
| | | | | |
| | 500 | | | Vermont Economic Development Authority, Solid Waste Disposal Revenue Bonds, Casella Waste Systems, Inc. Project, Series 2013, 4.750%, 4/01/36 (Mandatory put 4/02/18) (Alternative Minimum Tax) | | | | | No Opt. Call | | | | B+ | | | | 503,470 | |
| | | | Virgin Islands – 0.9% | | | | | | | | | | | | | | |
| | | | | |
| | 1,000 | | | Virgin Islands Public Finance Authority, Gross Receipts Taxes Loan Note, Refunding Series 2012A, 4.000%, 10/01/22 | | | | | No Opt. Call | | | | BBB+ | | | | 1,078,270 | |
| | | | | |
| | 200 | | | Virgin Islands Public Finance Authority, Gross Receipts Taxes Loan Note, Series 2003, 5.000%, 10/01/33 – RAAI Insured | | | | | 10/14 at 100.00 | | | | BBB+ | | | | 207,224 | |
| | | | | |
| | 30 | | | Virgin Islands Public Finance Authority, Matching Fund Loan Notes Revenue Bonds, Subordinate Lien Series 2010B, 5.250%, 10/01/29 | | | | | 10/20 at 100.00 | | | | Baa2 | | | | 33,043 | |
| | 1,230 | | | Total Virgin Islands | | | | | | | | | | | | | 1,318,537 | |
| | | | Virginia – 0.3% | | | | | | | | | | | | | | |
| | | | | |
| | 400 | | | Peninsula Town Center Community Development Authority, Virginia, Special Obligation Bonds, Series 2007, 5.800%, 9/01/17 | | | | | No Opt. Call | | | | N/R | | | | 436,356 | |
| | | | Washington – 0.3% | | | | | | | | | | | | | | |
| | | | | |
| | 275 | | | Tacoma Consolidated Local Improvement District 65, Washington, Special Assessment Bonds, Series 2013, 5.750%, 4/01/43 | | | | | 4/14 at 100.00 | | | | N/R | | | | 275,129 | |
| | | | | |
| | 35 | | | Washington State Health Care Facilities Authority, Revenue Bonds, Central Washington Health Services Association, Series 2009, 6.250%, 7/01/24 | | | | | 7/19 at 100.00 | | | | Baa3 | | | | 40,172 | |
| | | | | |
| | 85 | | | Washington State Housing Finance Commission, Non-Profit Revenue Bonds, Emerald Heights Project, Refunding 2013, 4.000%, 7/01/18 | | | | | No Opt. Call | | | | A– | | | | 94,435 | |
| | 395 | | | Total Washington | | | | | | | | | | | | | 409,736 | |
| | | | Wisconsin – 0.1% | | | | | | | | | | | | | | |
| | | | | |
| | 40 | | | Green Bay Redevelopment Authority, Wisconsin, Industrial Development Revenue Bonds, Fort James Project, Series 1999, 5.600%, 5/01/19 (Alternative Minimum Tax) | | | | | No Opt. Call | | | | N/R | | | | 46,400 | |
| | | | | |
| | 25 | | | Wisconsin Health and Educational Facilities Authority, Revenue Bonds, Wheaton Franciscan Healthcare System, Series 2006A, 5.250%, 8/15/21 | | | | | 8/16 at 100.00 | | | | A– | | | | 28,017 | |
| | 65 | | | Total Wisconsin | | | | | | | | | | | | | 74,417 | |
| $ | 107,983 | | | Total Investments (cost $113,867,643) – 80.2% | | | | | | | | | | | | | 114,501,589 | |
| | | | Other Assets Less Liabilities – 19.8% | | | | | | | | | | | | | 28,283,119 | |
| | | | Net Assets – 100% | | | | | | | | | | | | $ | 142,784,708 | |
Portfolio of Investments
Nuveen Short Duration High Yield Municipal Bond Fund (continued)
April 30, 2013
| | (1) | | All percentages shown in the Portfolio of Investments are based on net assets. |
| | (2) | | Optional Call Provisions (not covered by the report of independent registered public accounting firm): Dates (month and year) and prices of the earliest optional call or redemption. There may be other call provisions at varying prices at later dates. Certain mortgage-backed securities may be subject to periodic principal paydowns. |
| | (3) | | Ratings (not covered by the report of independent registered public accounting firm): Using the highest of Standard & Poor’s Group (“Standard & Poor’s”), Moody’s Investors Service, Inc. (“Moody’s”) or Fitch, Inc. (“Fitch”) rating. Ratings below BBB by Standard & Poor’s, Baa by Moody’s or BBB by Fitch are considered to be below investment grade. Holdings designated N/R are not rated by any of these national rating agencies. |
| | (4) | | Investment, or portion of investment, has been pledged to collateralize the net payment obligations for investments in inverse floating rate transactions. |
| | WI/DD | | Investment, or portion of investment, purchased on a when-issued or delayed delivery basis. |
| | (IF) | | Inverse floating rate investment. |
| | 144A | | Investment is exempt from registration under Rule 144A of the Securities Act of 1933, as amended. These investments may only be resold in transactions exempt from registration, which are normally those transactions with qualified institutional buyers. |
See accompanying notes to financial statements.
Portfolio of Investments
Nuveen Short Term Municipal Bond Fund
April 30, 2013
| | | | | | | | | | | | | | | | | | |
Principal
Amount (000) | | | Description (1) | | | | Optional Call
Provisions (2) | | | Ratings (3) | | | Value | |
| | | | | | | | | | | | | | | | | | |
| | | | MUNICIPAL BONDS – 97.2% | | | | | | | | | | | | | | |
| | | | | |
| | | | National – 0.3% | | | | | | | | | | | | | | |
| | | | | |
| $ | 1,522 | | | BB&T Various States Municipal Trust Pool, Class B Certificates, Series 2011, 0.149%, 9/01/14 | | | | | No Opt. Call | | | | AA– | | | $ | 1,522,112 | |
| | | | Alabama – 0.1% | | | | | | | | | | | | | | |
| | | | | |
| | 650 | | | Camden Industrial Development Board, Alabama, Exempt Facilities Revenue Bonds, Weyerhaeuser Company Project, Series 2003B, 6.375%, 12/01/24 (Pre-refunded 12/01/13) (Alternative Minimum Tax) | | | | | 12/13 at 100.00 | | | | AA+ (4) | | | | 673,491 | |
| | | | Arizona – 4.8% | | | | | | | | | | | | | | |
| | | | | |
| | | | Arizona Sports and Tourism Authority, Subordinate Tax Revenue Refunding Bonds, Professional Baseball Training Facilities Project, Series 2013: | | | | | | | | | | | | | | |
| | 1,000 | | | 5.000%, 7/01/15 | | | | | No Opt. Call | | | | A3 | | | | 1,084,610 | |
| | 1,000 | | | 5.000%, 7/01/16 | | | | | No Opt. Call | | | | A3 | | | | 1,113,020 | |
| | | | | |
| | 1,545 | | | Glendale Industrial Development Authority, Arizona, Revenue Bonds, Midwestern University, Refunding Series 2010, 5.000%, 5/15/19 | | | | | No Opt. Call | | | | A+ | | | | 1,784,769 | |
| | | | | |
| | 1,045 | | | Maricopa County School District 31 Balsz, Arizona, General Obligation Bonds, School Improvement Project 2011 Series 2012,
2.000%, 7/01/14 – AGM Insured | | | | | No Opt. Call | | | | AA– | | | | 1,061,647 | |
| | | | | |
| | 5,000 | | | Navajo County Pollution Control Corporation, Arizona, Pollution Control Revenue Refunding Bonds, Arizona Public Service Company, Cholla Project, Series 2009A, 1.250%, 6/01/34 (Mandatory put 5/29/14) | | | | | No Opt. Call | | | | Baa1 | | | | 5,031,300 | |
| | | | | |
| | | | Phoenix Civic Improvement Corporation, Arizona, Junior Lien Airport Revenue Bonds, Series 2010A: | | | | | | | | | | | | | | |
| | 775 | | | 3.000%, 7/01/13 | | | | | No Opt. Call | | | | A+ | | | | 778,550 | |
| | 5,630 | | | 5.000%, 7/01/17 | | | | | No Opt. Call | | | | A+ | | | | 6,564,974 | |
| | | | | |
| | 1,270 | | | Phoenix Industrial Development Authority, Arizona, Single Family Mortgage Revenue Bonds, Series 1983, 0.000%, 12/01/14 (ETM) | | | | | No Opt. Call | | | | Aaa | | | | 1,263,040 | |
| | | | | |
| | | | Phoenix Mesa Gateway Airport Authority, Arizona, Special Facility Revenue Bonds, Mesa Project, Series 2012: | | | | | | | | | | | | | | |
| | 200 | | | 3.000%, 7/01/14 (Alternative Minimum Tax) | | | | | No Opt. Call | | | | AA+ | | | | 204,922 | |
| | 130 | | | 3.000%, 7/01/15 (Alternative Minimum Tax) | | | | | No Opt. Call | | | | AA+ | | | | 134,160 | |
| | 300 | | | 3.000%, 7/01/16 (Alternative Minimum Tax) | | | | | No Opt. Call | | | | AA+ | | | | 312,312 | |
| | | | | |
| | 500 | | | Pima County Unified School District 10 Amphitheater, Arizona, General Obligation Bonds, School Improvement Series 2011C, 3.000%, 7/01/13 | | | | | No Opt. Call | | | | Aa2 | | | | 501,930 | |
| | | | | |
| | 790 | | | Pinal County Electrical District 3, Arizona, Electric System Revenue Bonds, Refunding Series 2011, 2.500%, 7/01/15 | | | | | No Opt. Call | | | | A | | | | 814,593 | |
| | | | | |
| | 820 | | | Sun Devil Energy LLC, Arizona, Revenue Refunding Bonds, Arizona State University Project, Series 2008, 5.000%, 7/01/18 | | | | | No Opt. Call | | | | AA– | | | | 976,423 | |
| | | | | |
| | 2,000 | | | Yavapai County Industrial Development Authority, Arizona, Solid Waste Disposal Revenue Bonds, Waste Management Inc., Series 2003A-2, 0.850%, 3/01/28 (Alternative Minimum Tax) | | | | | No Opt. Call | | | | BBB | | | | 2,002,020 | |
| | 22,005 | | | Total Arizona | | | | | | | | | | | | | 23,628,270 | |
| | | | Arkansas – 0.7% | | | | | | | | | | | | | | |
| | | | | |
| | 2,805 | | | North Little Rock Health Facilities Board, Arkansas, Healthcare Revenue Bonds, Baptist Health, Series 1996B, 5.375%, 12/01/19 | | | | | 12/18 at 100.00 | | | | A+ | | | | 3,319,493 | |
| | | | California – 6.6% | | | | | | | | | | | | | | |
| | | | | |
| | 870 | | | ABAG Finance Authority for Nonprofit Corporations, California, Revenue Bonds, Episcopal Senior Communities, Refunding Series 2011, 4.000%, 7/01/13 | | | | | No Opt. Call | | | | BBB | | | | 874,942 | |
| | | | | |
| | | | Beaumont Financing Authority, California, Local Agency Revenue Bonds, Improvement Area 19C, Series 2013A: | | | | | | | | | | | | | | |
| | 475 | | | 2.000%, 9/01/14 | | | | | No Opt. Call | | | | N/R | | | | 477,736 | |
| | 495 | | | 2.250%, 9/01/15 | | | | | No Opt. Call | | | | N/R | | | | 497,465 | |
Portfolio of Investments
Nuveen Short Term Municipal Bond Fund (continued)
April 30, 2013
| | | | | | | | | | | | | | | | | | |
Principal
Amount (000) | | | Description (1) | | | | Optional Call
Provisions (2) | | | Ratings (3) | | | Value | |
| | | | | | | | | | | | | | | | | | |
| | | | California (continued) | | | | | | | | | | | | | | |
| | | | | |
| $ | 800 | | | California Health Facilities Financing Authority, Cal-Mortgage Insured Revenue Bonds, Northern California Retired Officers Community Corporation – Paradise Valley Estates, Refunding Series 2013, 3.000%, 1/01/17 | | | | | No Opt. Call | | | | A | | | $ | 850,496 | |
| | | | | |
| | | | California Health Facilities Financing Authority, Insured Refunding Revenue Bonds, Marshall Medical Center, Series 2012A: | | | | | | | | | | | | | | |
| | 300 | | | 3.000%, 11/01/13 | | | | | No Opt. Call | | | | A | | | | 304,059 | |
| | 495 | | | 4.000%, 11/01/14 | | | | | No Opt. Call | | | | A | | | | 520,557 | |
| | | | | |
| | 275 | | | California Municipal Finance Authority, Revenue Bonds, Centro De Salud De La Communidad De Ysidero, Inc., Series 2013, 3.000%, 3/01/16 | | | | | No Opt. Call | | | | A | | | | 290,804 | |
| | | | | |
| | 1,000 | | | California Pollution Control Financing Authority, Solid Waste Disposal Revenue Bonds, USA Waste Services Inc., Refunding Series 1998A, 2.625%, 6/01/18 (Mandatory put 6/02/14) (Alternative Minimum Tax) | | | | | No Opt. Call | | | | BBB | | | | 1,020,130 | |
| | | | | |
| | 2,330 | | | California State Public Works Board, Lease Revenue Bonds, Department of Corrections & Rehabilitation, Series 2011C, 4.000%, 10/01/15 | | | | | No Opt. Call | | | | A2 | | | | 2,524,089 | |
| | | | | |
| | 3,000 | | | California State Public Works Board, Lease Revenue Bonds, Various Capital Projects, Series 2011A, 4.000%, 10/01/15 | | | | | No Opt. Call | | | | A2 | | | | 3,249,900 | |
| | | | | |
| | 2,500 | | | California Statewide Communities Development Authority, Revenue Bonds, Adventist Health System West, Series 2005A, 5.000%, 3/01/16 | | | | | 3/15 at 100.00 | | | | A | | | | 2,699,025 | |
| | | | | |
| | | | Carlsbad, California, Limited Obligation Refunding Bonds, Reassessment District 12-1, Series 2013: | | | | | | | | | | | | | | |
| | 400 | | | 2.000%, 9/01/14 | | | | | No Opt. Call | | | | N/R | | | | 405,508 | |
| | 250 | | | 2.000%, 9/01/15 | | | | | No Opt. Call | | | | N/R | | | | 253,833 | |
| | | | | |
| | 550 | | | Corona-Norco Unified School District Public Financing Authority, Riverside County, California, Special Tax Revenue Refunding Bonds, Senior Lien Series 2013A, 2.000%, 9/01/15 | | | | | No Opt. Call | | | | BBB+ | | | | 556,914 | |
| | | | | |
| | 2,205 | | | Golden State Tobacco Securitization Corporation, California, Enhanced Tobacco Settlement Asset-Backed Bonds, Series 2013A, 5.000%, 6/01/17 | | | | | No Opt. Call | | | | A2 | | | | 2,556,146 | |
| | | | | |
| | 2,500 | | | Inland Valley Development Agency, California, Tax Allocation Bonds, Series 2011B, 4.250%, 3/01/41 (Mandatory put 3/01/15) | | | | | No Opt. Call | | | | A | | | | 2,608,875 | |
| | | | | |
| | 500 | | | Northern California Power Agency, Hydroelectric Project Number One Revenue Bonds, Refunding Series 2010A, 5.000%, 7/01/16 | | | | | No Opt. Call | | | | A+ | | | | 568,120 | |
| | | | | |
| | | | Orange City, California, Special Tax Bonds, Community Facilities District 91-2, Serrano Heights Public Improvements, Refunding Series 2013: | | | | | | | | | | | | | | |
| | 450 | | | 3.000%, 10/01/15 | | | | | No Opt. Call | | | | A | | | | 473,535 | |
| | 320 | | | 3.000%, 10/01/16 | | | | | No Opt. Call | | | | A | | | | 341,293 | |
| | 360 | | | 3.000%, 10/01/17 | | | | | No Opt. Call | | | | A | | | | 384,998 | |
| | 300 | | | 4.000%, 10/01/18 | | | | | No Opt. Call | | | | A | | | | 335,823 | |
| | | | | |
| | | | Pioneers Memorial Healthcare District, California, General Obligation Bonds, Refunding Series 2012: | | | | | | | | | | | | | | |
| | 450 | | | 3.000%, 10/01/13 | | | | | No Opt. Call | | | | BBB+ | | | | 454,734 | |
| | 675 | | | 3.000%, 10/01/14 | | | | | No Opt. Call | | | | BBB+ | | | | 693,441 | |
| | | | | |
| | | | Pittsburg Infrastructure Financing Authority, California, Reassessment Revenue Refunding Bonds, Series 2011A: | | | | | | | | | | | | | | |
| | 200 | | | 2.000%, 9/02/13 – AGM Insured | | | | | No Opt. Call | | | | AA– | | | | 201,038 | |
| | 400 | | | 3.000%, 9/02/14 – AGM Insured | | | | | No Opt. Call | | | | AA– | | | | 411,880 | |
| | | | | |
| | | | Sacramento City Financing Authority, California, Special Tax Revenue Bonds, Westlake and Regency Park, Refunding Series 2013A: | | | | | | | | | | | | | | |
| | 1,685 | | | 2.000%, 9/01/13 | | | | | No Opt. Call | | | | BBB+ | | | | 1,691,959 | |
| | 1,005 | | | 3.000%, 9/01/15 | | | | | No Opt. Call | | | | BBB+ | | | | 1,044,054 | |
| | 550 | | | 3.000%, 9/01/16 | | | | | No Opt. Call | | | | BBB+ | | | | 574,266 | |
| | | | | |
| | | | San Benito Health Care District, San Benito County, California, Revenue Bonds, Refunding Series 2013: | | | | | | | | | | | | | | |
| | 300 | | | 3.000%, 3/01/16 | | | | | No Opt. Call | | | | A | | | | 317,586 | |
| | 350 | | | 4.000%, 3/01/18 | | | | | No Opt. Call | | | | A | | | | 393,197 | |
| | | | | | | | | | | | | | | | | | |
Principal
Amount (000) | | | Description (1) | | | | Optional Call
Provisions (2) | | | Ratings (3) | | | Value | |
| | | | | | | | | | | | | | | | | | |
| | | | California (continued) | | | | | | | | | | | | | | |
| | | | | |
| $ | 1,000 | | | San Francisco Redevelopment Agency, California, Special Tax Bonds, Community Facilities District 6, Mission Bay South, Series 2002, 3.000%, 8/01/15 | | | | | No Opt. Call | | | | N/R | | | $ | 1,032,550 | |
| | | | | |
| | 430 | | | San Marcos Public Facilities Authority, California, Special Tax Revenue Bonds, Refunding Series 2012D, 2.000%, 9/01/13 | | | | | No Opt. Call | | | | N/R | | | | 431,707 | |
| | | | | |
| | 985 | | | Union City Community Redevelopment Agency, California, Tax Allocation Revenue Bonds, Redevelopment Project, Subordinate Lien Series 2011, 5.000%, 12/01/18 | | | | | No Opt. Call | | | | A | | | | 1,108,056 | |
| | | | | |
| | | | West Kern Water District, California, Certificates of Participation, Series 2011: | | | | | | | | | | | | | | |
| | 350 | | | 3.000%, 6/01/13 | | | | | No Opt. Call | | | | AA– | | | | 350,770 | |
| | 630 | | | 3.000%, 6/01/14 | | | | | No Opt. Call | | | | AA– | | | | 644,755 | |
| | 860 | | | 3.000%, 6/01/15 | | | | | No Opt. Call | | | | AA– | | | | 896,025 | |
| | 600 | | | 3.000%, 6/01/16 | | | | | No Opt. Call | | | | AA– | | | | 630,366 | |
| | 30,845 | | | Total California | | | | | | | | | | | | | 32,670,632 | |
| | | | Colorado – 4.7% | | | | | | | | | | | | | | |
| | | | | |
| | | | Colorado Educational and Cultural Facilities Authority, Charter School Refunding Revenue Bonds, Pinnacle Charter School, Inc. K-8 Facility Project, Series 2013: | | | | | | | | | | | | | | |
| | 175 | | | 3.000%, 6/01/15 | | | | | No Opt. Call | | | | A | | | | 181,097 | |
| | 250 | | | 3.000%, 6/01/16 | | | | | No Opt. Call | | | | A | | | | 261,260 | |
| | | | | |
| | | | Colorado Educational and Cultural Facilities Authority, Charter School Revenue Bonds, Douglas County School District RE-1 – DCS Montessori School, Refunding & Improvement Series 2012: | | | | | | | | | | | | | | |
| | 210 | | | 2.000%, 7/15/14 | | | | | No Opt. Call | | | | A | | | | 212,512 | |
| | 175 | | | 2.250%, 7/15/17 | | | | | No Opt. Call | | | | A | | | | 177,525 | |
| | | | | |
| | 500 | | | Colorado Educational and Cultural Facilities Authority, Charter School Revenue Bonds, Stargate Charter School, Series 2002, 6.125%, 5/01/33 (Pre-refunded 5/01/13) | | | | | 5/13 at 100.00 | | | | N/R (4) | | | | 500,080 | |
| | | | | |
| | 3,345 | | | Colorado Health Facilities Authority, Colorado, Revenue Bonds, Catholic Health Initiatives, Series 2009A, 5.000%, 7/01/15 | | | | | No Opt. Call | | | | AA– | | | | 3,675,118 | |
| | | | | |
| | 500 | | | Colorado Health Facilities Authority, Colorado, Revenue Bonds, Christian Living Communities Project, Series 2012, 4.000%, 1/01/15 | | | | | No Opt. Call | | | | N/R | | | | 508,720 | |
| | | | | |
| | 2,450 | | | Colorado Health Facilities Authority, Colorado, Revenue Bonds, Evangelical Lutheran Good Samaritan, Series 2009B, 5.000%, 6/01/39 (Mandatory put 12/01/14) | | | | | No Opt. Call | | | | A– | | | | 2,616,600 | |
| | | | | |
| | | | Colorado Health Facilities Authority, Colorado, Revenue Bonds, National Jewish Medical and Research Center, Series 2012: | | | | | | | | | | | | | | |
| | 350 | | | 4.000%, 1/01/14 | | | | | No Opt. Call | | | | BBB– | | | | 355,436 | |
| | 505 | | | 4.000%, 1/01/15 | | | | | No Opt. Call | | | | BBB– | | | | 523,478 | |
| | | | | |
| | 840 | | | Colorado Health Facilities Authority, Colorado, Revenue Bonds, Parkview Medical Center, Series 2012, 3.000%, 9/01/15 | | | | | No Opt. Call | | | | A3 | | | | 879,253 | |
| | | | | |
| | 1,000 | | | Colorado Health Facilities Authority, Colorado, Revenue Bonds, Yampa Valley Medical Center, Series 2007, 5.000%, 9/15/13 | | | | | No Opt. Call | | | | BBB+ | | | | 1,012,770 | |
| | | | | |
| | 1,610 | | | Colorado Springs, Colorado, Utilities System Revenue Bonds, Series 2012C-1, 3.000%, 11/15/13 | | | | | No Opt. Call | | | | AA | | | | 1,634,697 | |
| | | | | |
| | 360 | | | Colorado Water Resources and Power Development Authority, Water Resources Revenue Bonds, Parker Water and Sanitation District, Series 2004D, 4.000%, 9/01/14 – NPFG Insured | | | | | No Opt. Call | | | | Baa2 | | | | 374,580 | |
| | | | | |
| | | | Commerce City Northern Infrastructure General Improvement District, Colorado, General Obligation Bonds, Series 2013: | | | | | | | | | | | | | | |
| | 365 | | | 3.000%, 12/01/15 – AGM Insured | | | | | No Opt. Call | | | | AA– | | | | 385,936 | |
| | 600 | | | 4.000%, 12/01/16 – AGM Insured | | | | | No Opt. Call | | | | AA– | | | | 663,618 | |
| | | | | |
| | 1,850 | | | Denver Urban Renewal Authority, Colorado, Tax Increment Revenue Bonds, Stapleton Senior Refunding Series 2013A-1, 5.000%, 12/01/16 | | | | | No Opt. Call | | | | A– | | | | 2,110,998 | |
Portfolio of Investments
Nuveen Short Term Municipal Bond Fund (continued)
April 30, 2013
| | | | | | | | | | | | | | | | | | |
Principal
Amount (000) | | | Description (1) | | | | Optional Call
Provisions (2) | | | Ratings (3) | | | Value | |
| | | | | | | | | | | | | | | | | | |
| | | | Colorado (continued) | | | | | | | | | | | | | | |
| | | | | |
| $ | 220 | | | E-470 Public Highway Authority, Colorado, Senior Revenue Bonds, Series 1997B, 0.000%, 9/01/17 – NPFG Insured | | | | | No Opt. Call | | | | Baa2 | | | $ | 196,981 | |
| | | | | |
| | | | Eagle County Air Terminal Corporation, Colorado, Airport Terminal Project Revenue Bonds, Refunding Series 2011A: | | | | | | | | | | | | | | |
| | 125 | | | 3.000%, 5/01/13 (Alternative Minimum Tax) | | | | | No Opt. Call | | | | Baa2 | | | | 125,006 | |
| | 235 | | | 3.000%, 5/01/14 (Alternative Minimum Tax) | | | | | No Opt. Call | | | | Baa2 | | | | 238,715 | |
| | 345 | | | 3.500%, 5/01/15 (Alternative Minimum Tax) | | | | | No Opt. Call | | | | Baa2 | | | | 357,430 | |
| | | | | |
| | 1,240 | | | Meridian Metropolitan District, Douglas County, Colorado, General Obligation Refunding Bonds, Series 2011A, 3.000%, 12/01/15 | | | | | No Opt. Call | | | | A | | | | 1,302,360 | |
| | | | | |
| | 360 | | | Parker Water and Sanitation District, Douglas County, Colorado, Water and Sewer Enterprise Revenue Bonds, Refunding Series 2012, 2.000%, 11/01/13 – AGM Insured | | | | | No Opt. Call | | | | AA– | | | | 363,136 | |
| | | | | |
| | | | Plaza Metropolitan District 1, Lakewood, Colorado, Tax Increment Revenue Bonds, Refunding Series 2013: | | | | | | | | | | | | | | |
| | 730 | | | 4.000%, 12/01/15 | | | | | No Opt. Call | | | | N/R | | | | 771,157 | |
| | 1,015 | | | 4.000%, 12/01/16 | | | | | No Opt. Call | | | | N/R | | | | 1,085,258 | |
| | | | | |
| | | | Sand Creek Metropolitan District, Colorado, General Obligation Bonds, Refunding Series 2013B: | | | | | | | | | | | | | | |
| | 480 | | | 3.000%, 12/01/15 | | | | | No Opt. Call | | | | A | | | | 503,616 | |
| | 490 | | | 3.000%, 12/01/16 | | | | | No Opt. Call | | | | A | | | | 520,199 | |
| | 510 | | | 3.000%, 12/01/17 | | | | | No Opt. Call | | | | A | | | | 545,669 | |
| | | | | |
| | 235 | | | Tallyn’s Reach Metropolitan District 3, Aurora, Colorado, General Obligation Bonds, Refunding Series 2012, 3.000%, 12/01/15 | | | | | No Opt. Call | | | | BBB | | | | 243,476 | |
| | | | | |
| | | | Westminster Economic Development Authority, Colorado, Tax Increment Revenue Bonds, Mandalay Gardens Urban Renewal Project, Series 2012: | | | | | | | | | | | | | | |
| | 615 | | | 1.000%, 12/01/13 | | | | | No Opt. Call | | | | A | | | | 616,101 | |
| | 450 | | | 3.000%, 12/01/14 | | | | | No Opt. Call | | | | A | | | | 464,810 | |
| | 22,135 | | | Total Colorado | | | | | | | | | | | | | 23,407,592 | |
| | | | Connecticut – 0.9% | | | | | | | | | | | | | | |
| | | | | |
| | 1,235 | | | Connecticut Development Authority, Pollution Control Revenue Bonds, Connecticut Light and Power Company, Refunding Series 2011B, 1.250%, 9/01/28 (Mandatory put 9/03/13) | | | | | No Opt. Call | | | | A | | | | 1,239,224 | |
| | | | | |
| | | | Connecticut Health and Educational Facilities Authority, Revenue Bonds, Sacred Heart University, Series 2011G: | | | | | | | | | | | | | | |
| | 505 | | | 2.250%, 7/01/14 | | | | | No Opt. Call | | | | BBB | | | | 509,252 | |
| | 765 | | | 4.000%, 7/01/15 | | | | | No Opt. Call | | | | BBB | | | | 800,641 | |
| | | | | |
| | | | Connecticut Health and Educational Facilities Authority, Revenue Bonds, Sacred Heart University, Series 2012H: | | | | | | | | | | | | | | |
| | 500 | | | 3.000%, 7/01/13 – AGM Insured | | | | | No Opt. Call | | | | AA– | | | | 502,200 | |
| | 1,150 | | | 4.000%, 7/01/14 – AGM Insured | | | | | No Opt. Call | | | | AA– | | | | 1,194,609 | |
| | 4,155 | | | Total Connecticut | | | | | | | | | | | | | 4,245,926 | |
| | | | Delaware – 0.6% | | | | | | | | | | | | | | |
| | | | | |
| | 3,000 | | | Wilmington, Delaware, Multifamily Rental Housing Revenue Bonds, Lincoln Towers Associates, LLC Project, Series 2011A and Series 2011B, 4.000%, 7/15/13 | | | | | No Opt. Call | | | | N/R | | | | 3,002,220 | |
| | | | District of Columbia – 0.6% | | | | | | | | | | | | | | |
| | | | | |
| | 250 | | | District of Columbia, Revenue Bonds, Gallaudet University, Series 2011, 3.000%, 4/01/14 | | | | | No Opt. Call | | | | A+ | | | | 254,785 | |
| | | | | |
| | 1,740 | | | District of Columbia, Revenue Bonds, Georgetown University, Refunding Series 2009A, 5.000%, 4/01/14 | | | | | No Opt. Call | | | | A– | | | | 1,814,785 | |
| | | | | |
| | 325 | | | District of Columbia, Revenue Bonds, The Association of American Medical Colleges Issue, Series 2011A, 3.000%, 10/01/16 | | | | | No Opt. Call | | | | A+ | | | | 346,938 | |
| | | | | |
| | 595 | | | Washington Convention Center Authority, District of Columbia, Dedicated Tax Revenue Bonds, Senior Lien Refunding Series 2007A, 5.000%, 10/01/15 – AMBAC Insured | | | | | No Opt. Call | | | | A1 | | | | 651,823 | |
| | 2,910 | | | Total District of Columbia | | | | | | | | | | | | | 3,068,331 | |
| | | | | | | | | | | | | | | | | | |
Principal
Amount (000) | | | Description (1) | | | | Optional Call
Provisions (2) | | | Ratings (3) | | | Value | |
| | | | | | | | | | | | | | | | | | |
| | | | Florida – 8.3% | | | | | | | | | | | | | | |
| | | | | |
| | | | Atlantic Beach, Florida, Healthcare Facilities Revenue Refunding Bonds, Fleet Landing Project, Series 2013A: | | | | | | | | | | | | | | |
| $ | 300 | | | 3.000%, 11/15/16 | | | | | No Opt. Call | | | | BBB | | | $ | 313,008 | |
| | 600 | | | 4.000%, 11/15/17 | | | | | No Opt. Call | | | | BBB | | | | 651,612 | |
| | | | | |
| | 1,380 | | | Broward County, Florida, Port Facilities Revenue Bonds, Refunding Series 2011B, 5.000%, 9/01/15 (Alternative Minimum Tax) | | | | | No Opt. Call | | | | A2 | | | | 1,512,452 | |
| | | | | |
| | 475 | | | Citizens Property Insurance Corporation, Florida, High Risk Assessment Revenue, Senior Secured Bonds, Series 2009A-1, 5.000%, 6/01/16 – AGC Insured | | | | | No Opt. Call | | | | AA– | | | | 536,973 | |
| | | | | |
| | 5,250 | | | Citizens Property Insurance Corporation, Florida, High-Risk Account Revenue Bonds, Coastal Account Senior Secured Series 2011A-1, 5.000%, 6/01/15 | | | | | No Opt. Call | | | | A+ | | | | 5,728,065 | |
| | | | | |
| | | | Citizens Property Insurance Corporation, Florida, High-Risk Account Senior Secured Bonds Series 2010A-1: | | | | | | | | | | | | | | |
| | 170 | | | 3.000%, 6/01/13 | | | | | No Opt. Call | | | | A+ | | | | 170,413 | |
| | 300 | | | 5.000%, 6/01/14 | | | | | No Opt. Call | | | | A+ | | | | 315,303 | |
| | 595 | | | 5.000%, 6/01/15 – AGM Insured | | | | | No Opt. Call | | | | AA– | | | | 650,484 | |
| | | | | |
| | 305 | | | City of Tampa, Florida, Refunding and Capital Improvement Cigarette Tax Allocation Bonds, H. Lee Moffitt Cancer Center Project, Series 2012A, 3.000%, 9/01/14 | | | | | No Opt. Call | | | | A+ | | | | 314,443 | |
| | | | | |
| | 650 | | | Cityplace Community Development District, Florida, Special Assessment and Revenue Bonds, Refunding Series 2012, 5.000%, 5/01/14 | | | | | No Opt. Call | | | | A | | | | 676,117 | |
| | | | | |
| | 3,925 | | | Florida Citizens Property Insurance Corporation, Personal and Commercial Lines Account Bonds, Senior Secured Series 2012A-1, 5.000%, 6/01/16 | | | | | No Opt. Call | | | | A+ | | | | 4,424,260 | |
| | | | | |
| | | | Florida Higher Educational Facilities Financing Authority, Revenue and Revenue Refunding Bonds, University of Tampa Project, Series 2012A: | | | | | | | | | | | | | | |
| | 300 | | | 4.000%, 4/01/14 | | | | | No Opt. Call | | | | BBB+ | | | | 308,454 | |
| | 850 | | | 4.000%, 4/01/15 | | | | | No Opt. Call | | | | BBB+ | | | | 891,463 | |
| | | | | |
| | | | Florida Higher Educational Facilities Financing Authority, Revenue Bonds, Nova Southeastern University Project, Refunding Series 2012A: | | | | | | | | | | | | | | |
| | 220 | | | 4.000%, 4/01/15 | | | | | No Opt. Call | | | | BBB+ | | | | 230,516 | |
| | 435 | | | 4.000%, 4/01/16 | | | | | No Opt. Call | | | | BBB+ | | | | 464,467 | |
| | | | | |
| | 1,000 | | | Highlands County Health Facilities Authority, Florida, Hospital Revenue Bonds, Adventist Health System/Sunbelt Obligated Group, Refunding Series 2009E, 5.000%, 11/15/15 | | | | | No Opt. Call | | | | AA | | | | 1,112,170 | |
| | | | | |
| | 2,000 | | | Highlands County Health Facilities Authority, Florida, Hospital Revenue Bonds, Adventist Health System/Sunbelt Obligated Group, Variable Rate Demand Series 2005I, 5.000%, 11/15/16 | | | | | No Opt. Call | | | | AA | | | | 2,298,620 | |
| | | | | |
| | 1,000 | | | Hillsborough County Industrial Development Authority, Florida, Pollution Control Revenue Bonds, Tampa Electric Company Project, Series 2007B, 5.150%, 9/01/25 (Mandatory put 9/01/13) | | | | | No Opt. Call | | | | A3 | | | | 1,015,810 | |
| | | | | |
| | 180 | | | Lee County, Florida, Airport Revenue Refunding Bonds, Series 2011A, 4.000%, 10/01/13 (Alternative Minimum Tax) | | | | | No Opt. Call | | | | A2 | | | | 182,709 | |
| | | | | |
| | 1,000 | | | Miami, Florida, Special Obligation Non-Ad Valorem Revenue Refunding Bonds, Series 2011A, 5.000%, 2/01/17 | | | | | No Opt. Call | | | | AA– | | | | 1,108,280 | |
| | | | | |
| | 1,800 | | | Miami-Dade County Expressway Authority, Florida, Toll System Revenue Bonds, Refunding Series 2013A, 5.000%, 7/01/17 | | | | | No Opt. Call | | | | A– | | | | 2,091,708 | |
| | | | | |
| | 500 | | | Miami-Dade County Industrial Development Authority, Florida, Solid Waste Revenue Bonds, Waste Management Inc. of Florida Project, Series 2008, 2.625%, 8/01/23 (Mandatory put 8/01/14) (Alternative Minimum Tax) | | | | | No Opt. Call | | | | BBB | | | | 510,620 | |
| | | | | |
| | 3,200 | | | Miami-Dade County, Florida, Aviation Revenue Bonds, Miami International Airport, Refunding Series 2012B, 2.000%, 10/01/13 | | | | | No Opt. Call | | | | A | | | | 3,223,264 | |
| | | | | |
| | 2,000 | | | Okeechobee County, Florida, Solid Waste Disposal Revenue Bonds, Waste Management Inc., Series 2004A, 0.650%, 7/01/39 (Mandatory put 7/01/13) | | | | | No Opt. Call | | | | BBB | | | | 2,000,300 | |
| | | | | |
| | 2,330 | | | Osceola County, Florida, Tourist Development Tax Revenue Bonds, Refunding & Improvement Series 2012, 2.000%, 10/01/13 | | | | | No Opt. Call | | | | A1 | | | | 2,345,867 | |
Portfolio of Investments
Nuveen Short Term Municipal Bond Fund (continued)
April 30, 2013
| | | | | | | | | | | | | | | | | | |
Principal
Amount (000) | | | Description (1) | | | | Optional Call
Provisions (2) | | | Ratings (3) | | | Value | |
| | | | | | | | | | | | | | | | | | |
| | | | Florida (continued) | | | | | | | | | | | | | | |
| | | | | |
| $ | 730 | | | Palm Beach County Health Facilities Authority, Florida, Revenue Bonds, Jupiter Medical Center, Series 2013A, 4.000%, 11/01/15 (WI/DD, Settling 5/07/13) | | | | | No Opt. Call | | | | BBB+ | | | $ | 777,852 | |
| | | | | |
| | | | Pinellas County Educational Facilities Authority, Florida, General Revenue Bonds, Barry University, Refunding Series 2011: | | | | | | | | | | | | | | |
| | 905 | | | 4.000%, 10/01/13 | | | | | No Opt. Call | | | | BBB | | | | 918,077 | |
| | 1,175 | | | 5.000%, 10/01/15 | | | | | No Opt. Call | | | | BBB | | | | 1,282,031 | |
| | 1,060 | | | 4.000%, 10/01/16 | | | | | No Opt. Call | | | | BBB | | | | 1,148,542 | |
| | | | | |
| | 305 | | | Pinellas County Educational Facilities Authority, Florida, General Revenue Bonds, Barry University, Refunding Series 2012, 4.000%, 10/01/15 | | | | | No Opt. Call | | | | BBB | | | | 325,151 | |
| | | | | |
| | | | Volusia County Educational Facilities Authority, Florida, Educational Facilities Revenue Bonds, Embry-Riddle Aeronautical University, Inc. Project, Refunding Series 2011: | | | | | | | | | | | | | | |
| | 2,380 | | | 2.000%, 10/15/14 – AGM Insured | | | | | No Opt. Call | | | | AA– | | | | 2,407,989 | |
| | 1,275 | | | 4.000%, 10/15/15 – AGM Insured | | | | | No Opt. Call | | | | AA– | | | | 1,352,268 | |
| | 38,595 | | | Total Florida | | | | | | | | | | | | | 41,289,288 | |
| | | | Georgia – 1.9% | | | | | | | | | | | | | | |
| | | | | |
| | 1,300 | | | Atlanta, Georgia, Airport General Revenue Refunding Bonds, Series 2011B, 5.000%, 1/01/14 | | | | | No Opt. Call | | | | A+ | | | | 1,341,223 | |
| | | | | |
| | 1,300 | | | Burke County Development Authority, Georgia, Pollution Control Revenue Bonds, Georgia Power Company, Ninth Series 1994, 1.200%, 10/01/32 (Mandatory put 4/01/14) | | | | | No Opt. Call | | | | A+ | | | | 1,309,711 | |
| | | | | |
| | 1,500 | | | Carroll County School District, Georgia, General Obligation Bonds, Series 2011, 4.000%, 4/01/14 | | | | | No Opt. Call | | | | AA+ | | | | 1,551,690 | |
| | | | | |
| | 3,200 | | | DeKalb County Hospital Authority, Georgia, Anticipation Certificates Revenue Bonds, DeKalb Medical Center, Inc. Project, Series 2010, 4.000%, 9/01/15 | | | | | No Opt. Call | | | | BBB | | | | 3,341,440 | |
| | | | | |
| | 1,000 | | | Gwinnett County Development Authority, Georgia, Certificates of Participation, County Public Schools Project, Series 2004, 5.250%, 1/01/21 (Pre-refunded 1/01/14) – NPFG Insured | | | | | 1/14 at 100.00 | | | | AA+ (4) | | | | 1,033,390 | |
| | | | | |
| | 330 | | | Private Colleges and Universities Authority, Georgia, Revenue Bonds, Mercer University Project, Refunding Series 2012C, 4.000%, 10/01/14 | | | | | No Opt. Call | | | | Baa2 | | | | 341,930 | |
| | | | | |
| | 585 | | | Private Colleges and Universities Authority, Georgia, Revenue Bonds, Mercer University, Series 2012A, 4.000%, 10/01/14 | | | | | No Opt. Call | | | | Baa2 | | | | 606,148 | |
| | 9,215 | | | Total Georgia | | | | | | | | | | | | | 9,525,532 | |
| | | | Hawaii – 0.4% | | | | | | | | | | | | | | |
| | | | | |
| | 800 | | | Hawaii Department of Budget and Finance, Special Purpose Senior Living Revenue Bonds, 15 Craigside Project, Series 2009C-1, 7.500%, 11/15/15 | | | | | 7/13 at 100.00 | | | | N/R | | | | 802,584 | |
| | | | | |
| | 1,075 | | | Hawaii State, General Obligation Bonds, Series 2009D-Q, 4.000%, 6/01/14 | | | | | No Opt. Call | | | | AA | | | | 1,119,312 | |
| | 1,875 | | | Total Hawaii | | | | | | | | | | | | | 1,921,896 | |
| | | | Illinois – 5.7% | | | | | | | | | | | | | | |
| | | | | |
| | 2,000 | | | Chicago, Illinois, General Airport Revenue Bonds, O’Hare International Airport, Senior Lien Refunding Series 2012A, 5.000%, 1/01/15 (Alternative Minimum Tax) | | | | | No Opt. Call | | | | A2 | | | | 2,147,860 | |
| | | | | |
| | 1,120 | | | Chicago, Illinois, General Airport Revenue Bonds, O’Hare International Airport, Senior Lien Refunding Series 2012B, 4.000%, 1/01/15 (Alternative Minimum Tax) | | | | | No Opt. Call | | | | A2 | | | | 1,184,210 | |
| | | | | |
| | 1,070 | | | Decatur, Illinois, General Obligation Bonds, Refunding Series 2013, 3.000%, 3/01/16 | | | | | No Opt. Call | | | | Aa2 | | | | 1,130,658 | |
| | | | | |
| | 4,635 | | | Illinois Finance Authority, Revenue Bonds, Art Institute of Chicago, Refunding Series 2010A, 5.000%, 3/01/15 | | | | | No Opt. Call | | | | A+ | | | | 5,003,761 | |
| | | | | |
| | 500 | | | Illinois Finance Authority, Revenue Bonds, Illinois Institute of Technology, Series 2009, 6.250%, 2/01/19 | | | | | No Opt. Call | | | | Baa3 | | | | 545,460 | |
| | | | | | | | | | | | | | | | | | |
Principal
Amount (000) | | | Description (1) | | | | Optional Call
Provisions (2) | | | Ratings (3) | | | Value | |
| | | | | | | | | | | | | | | | | | |
| | | | Illinois (continued) | | | | | | | | | | | | | | |
| | | | | |
| | | | Illinois Finance Authority, Revenue Bonds, Rush University Medical Center Obligated Group, Series 2009A: | | | | | | | | | | | | | | |
| $ | 1,655 | | | 5.000%, 11/01/13 | | | | | No Opt. Call | | | | A | | | $ | 1,690,583 | |
| | 1,125 | | | 5.000%, 11/01/14 | | | | | No Opt. Call | | | | A | | | | 1,187,978 | |
| | | | | |
| | 300 | | | Illinois Finance Authority, Revenue Bonds, The Clare at Water Tower Project, Capitol Appreciation Series 2010B, 0.000%, 5/15/50 (5) | | | | | 7/13 at 100.00 | | | | N/R | | | | 3 | |
| | | | | |
| | 700 | | | Illinois Finance Authority, Revenue Bonds, The Clare at Water Tower Project, Refunding Series 2010A, 5.100%, 5/15/14 (5) | | | | | 7/13 at 100.00 | | | | N/R | | | | 7 | |
| | | | | |
| | 840 | | | Illinois State, General Obligation Bonds, Refunding Series 2006, 5.000%, 1/01/15 | | | | | No Opt. Call | | | | A2 | | | | 896,860 | |
| | | | | |
| | 1,065 | | | Illinois State, General Obligation Bonds, Refunding Series 2010, 5.000%, 1/01/15 – AGM Insured | | | | | No Opt. Call | | | | AA– | | | | 1,137,633 | |
| | | | | |
| | | | Illinois State, General Obligation Bonds, Refunding Series 2012: | | | | | | | | | | | | | | |
| | 1,450 | | | 4.000%, 8/01/14 | | | | | No Opt. Call | | | | A2 | | | | 1,508,624 | |
| | 1,340 | | | 5.000%, 8/01/17 | | | | | No Opt. Call | | | | A2 | | | | 1,531,767 | |
| | | | | |
| | 545 | | | Illinois State, General Obligation Bonds, Series 2006A, 5.000%, 6/01/15 | | | | | No Opt. Call | | | | A2 | | | | 590,279 | |
| | | | | |
| | 790 | | | Illinois State, General Obligation Bonds, Series 2006, 5.000%, 1/01/15 | | | | | No Opt. Call | | | | A2 | | | | 843,475 | |
| | | | | |
| | 1,420 | | | Illinois, General Obligation Bonds, Illinois FIRST Program, Series 2002, 5.500%, 8/01/15 – SYNCORA GTY Insured | | | | | No Opt. Call | | | | A2 | | | | 1,562,227 | |
| | | | | |
| | 320 | | | Macon County School District 61 Decatur, Illinois, General Obligation Bonds, Series 2011A, 2.000%, 1/01/15 – AGM Insured | | | | | No Opt. Call | | | | A1 | | | | 326,381 | |
| | | | | |
| | | | Quad Cities Regional Economic Development Authority, Illinois, Revenue Bonds, Augustana College, Series 2012: | | | | | | | | | | | | | | |
| | 250 | | | 2.000%, 10/01/13 | | | | | No Opt. Call | | | | Baa1 | | | | 251,038 | |
| | 200 | | | 3.000%, 10/01/16 | | | | | No Opt. Call | | | | Baa1 | | | | 208,770 | |
| | | | | |
| | | | St. Clair County, Illinois, Highway Revenue Bonds, Series 2013A: | | | | | | | | | | | | | | |
| | 250 | | | 5.000%, 1/01/16 | | | | | No Opt. Call | | | | AA– | | | | 274,985 | |
| | 310 | | | 5.000%, 1/01/17 | | | | | No Opt. Call | | | | AA– | | | | 349,717 | |
| | | | | |
| | 640 | | | University of Illinois, Auxiliary Facilities System Revenue Bonds, Series 2001A, 5.500%, 4/01/14 – AMBAC Insured | | | | | No Opt. Call | | | | Aa2 | | | | 669,952 | |
| | | | | |
| | | | Waukegan, Illinois, General Obligation Bonds, Refunding Series 2012A: | | | | | | | | | | | | | | |
| | 1,200 | | | 3.000%, 12/30/13 – AGM Insured | | | | | No Opt. Call | | | | A2 | | | | 1,217,952 | |
| | 1,100 | | | 4.000%, 12/30/14 – AGM Insured | | | | | No Opt. Call | | | | A2 | | | | 1,154,505 | |
| | 885 | | | 4.000%, 12/30/15 – AGM Insured | | | | | No Opt. Call | | | | A2 | | | | 946,826 | |
| | | | | |
| | 790 | | | Western Illinois University, Auxiliary Facilities Revenue Bonds, Series 2012, 3.000%, 4/01/14 | | | | | No Opt. Call | | | | A | | | | 806,369 | |
| | | | | |
| | | | Williamson & Johnson Counties Community Unit School District 2, Marion, Illinois, General Obligation Bonds, Series 2011: | | | | | | | | | | | | | | |
| | 395 | | | 5.750%, 12/01/14 – AGM Insured | | | | | No Opt. Call | | | | AA– | | | | 422,401 | |
| | 450 | | | 5.750%, 12/01/15 – AGM Insured | | | | | No Opt. Call | | | | AA– | | | | 497,300 | |
| | 27,345 | | | Total Illinois | | | | | | | | | | | | | 28,087,581 | |
| | | | Indiana – 0.8% | | | | | | | | | | | | | | |
| | | | | |
| | 300 | | | Indiana Finance Authority, Hospital Revenue Bonds, Marion General Hospital Project, Series 2012A, 2.000%, 7/01/13 | | | | | No Opt. Call | | | | A+ | | | | 300,882 | |
| | | | | |
| | 1,605 | | | Indiana Finance Authority, Private Activity Bonds, Ohio River Bridges East End Crossing Project, Series 2013B, 5.000%, 1/01/19 (Alternative Minimum Tax) | | | | | 1/17 at 100.00 | | | | BBB | | | | 1,788,355 | |
| | | | | |
| | 1,000 | | | Indiana Health and Educational Facilities Financing Authority, Revenue Bonds, Baptist Homes of Indiana, Series 2005, 5.000%, 11/15/13 | | | | | No Opt. Call | | | | A– | | | | 1,020,450 | |
| | | | | |
| | 610 | | | Knox County, Indiana, Economic Development Revenue and Refunding Bonds, Good Samaritan Hospital Project, Series 2012A, 3.000%, 4/01/15 | | | | | No Opt. Call | | | | A3 | | | | 632,899 | |
| | 3,515 | | | Total Indiana | | | | | | | | | | | | | 3,742,586 | |
Portfolio of Investments
Nuveen Short Term Municipal Bond Fund (continued)
April 30, 2013
| | | | | | | | | | | | | | | | | | |
Principal
Amount (000) | | | Description (1) | | | | Optional Call
Provisions (2) | | | Ratings (3) | | | Value | |
| | | | | | | | | | | | | | | | | | |
| | | | Iowa – 2.7% | | | | | | | | | | | | | | |
| | | | | |
| | | | Ames, Iowa, Hospital Revenue Bonds, Mary Greeley Medical Center, Series 2011: | | | | | | | | | | | | | | |
| $ | 100 | | | 3.000%, 6/15/13 | | | | | No Opt. Call | | | | A2 | | | $ | 100,339 | |
| | 230 | | | 4.000%, 6/15/14 | | | | | No Opt. Call | | | | A2 | | | | 239,241 | |
| | 500 | | | 4.000%, 6/15/15 | | | | | No Opt. Call | | | | A2 | | | | 531,995 | |
| | | | | |
| | | | Iowa Finance Authority, Healthcare Revenue Bonds, Genesis Health System, Refunding Series 2010: | | | | | | | | | | | | | | |
| | 310 | | | 5.000%, 7/01/13 | | | | | No Opt. Call | | | | A1 | | | | 312,424 | |
| | 1,150 | | | 5.000%, 7/01/16 | | | | | No Opt. Call | | | | A1 | | | | 1,295,636 | |
| | 2,430 | | | 5.000%, 7/01/20 | | | | | No Opt. Call | | | | A1 | | | | 2,902,975 | |
| | | | | |
| | 1,315 | | | Iowa Higher Education Loan Authority, Private College Facility Revenue Bonds, Central College, Refunding Series 2012A, 3.000%, 10/01/14 | | | | | No Opt. Call | | | | Baa3 | | | | 1,352,162 | |
| | | | | |
| | 220 | | | Iowa Higher Education Loan Authority, Private College Facility Revenue Bonds, University of Dubuque Project, Refunding Series 2011, 4.000%, 10/01/14 | | | | | No Opt. Call | | | | BBB– | | | | 224,077 | |
| | | | | |
| | | | Iowa Student Loan Liquidity Corporation Student Loan Revenue Bonds, Senior Lien Series 2011A-1: | | | | | | | | | | | | | | |
| | 375 | | | 2.600%, 12/01/13 (Alternative Minimum Tax) | | | | | No Opt. Call | | | | A | | | | 378,964 | |
| | 2,000 | | | 3.100%, 12/01/14 (Alternative Minimum Tax) | | | | | No Opt. Call | | | | A | | | | 2,063,940 | |
| | | | | |
| | 3,900 | | | Iowa Student Loan Liquidity Corporation, Student Loan Revenue Bonds, Refunding Series 2009-1, 5.000%, 12/01/13 | | | | | No Opt. Call | | | | A1 | | | | 3,985,605 | |
| | 12,530 | | | Total Iowa | | | | | | | | | | | | | 13,387,358 | |
| | | | Kansas – 1.1% | | | | | | | | | | | | | | |
| | | | | |
| | 745 | | | Dodge City, Kansas, General Obligation Bonds, Waterworks & Wastewater Utility Series 2012A, 2.000%, 9/01/13 | | | | | No Opt. Call | | | | A+ | | | | 748,881 | |
| | | | | |
| | 1,000 | | | Kansas State Power Pool, Electric Utility Revenue Bonds, Dogwood Energy Facility, Series 2012A, 3.000%, 12/01/14 | | | | | No Opt. Call | | | | Baa1 | | | | 1,030,270 | |
| | | | | |
| | 500 | | | Manhattan, Kansas, Hospital Revenue Bonds, Mercy Regional Health Center, Inc., Refunding Series 2013, 4.000%, 11/15/15 | | | | | No Opt. Call | | | | A | | | | 543,480 | |
| | | | | |
| | 1,000 | | | Wichita, Kansas, Hospital Facilities Revenue Bonds, Via Christi Health System, Inc., Refunding Series 2009X, 5.000%, 11/15/15 | | | | | No Opt. Call | | | | AA– | | | | 1,106,460 | |
| | | | | |
| | | | Wichita, Kansas, Hospital Facilities Revenue Refunding and Improvement Bonds, Via Christi Health System Inc., Series 2009A-III: | | | | | | | | | | | | | | |
| | 1,000 | | | 5.000%, 11/15/14 | | | | | No Opt. Call | | | | AA– | | | | 1,068,060 | |
| | 1,000 | | | 5.000%, 11/15/16 | | | | | No Opt. Call | | | | AA– | | | | 1,140,630 | |
| | 5,245 | | | Total Kansas | | | | | | | | | | | | | 5,637,781 | |
| | | | Kentucky – 0.7% | | | | | | | | | | | | | | |
| | | | | |
| | 3,000 | | | Pikeville, Kentucky, Educational Facilities Revenue Bond, Pikeville College of Osteopathic Medicine, Bond Anticipation Notes, Series 2011, 4.000%, 5/01/13 | | | | | | | | | N/R | | | | 3,000,270 | |
| | | | | |
| | 500 | | | Russell, Kentucky, Revenue Bonds, Bon Secours Health System, Series 2013, 4.000%, 11/01/15 | | | | | No Opt. Call | | | | A– | | | | 535,075 | |
| | 3,500 | | | Total Kentucky | | | | | | | | | | | | | 3,535,345 | |
| | | | Louisiana – 1.3% | | | | | | | | | | | | | | |
| | | | | |
| | | | Calcasieu Parish Public Trust Authority, Louisiana, Student Lease Revenue Bonds, McNeese State University Student Housing-Cowboy Facilities, Inc. Project, Refunding Series 2011: | | | | | | | | | | | | | | |
| | 535 | | | 2.000%, 5/01/13 – AGM Insured | | | | | No Opt. Call | | | | N/R | | | | 535,027 | |
| | 305 | | | 2.000%, 5/01/14 – AGM Insured | | | | | No Opt. Call | | | | A2 | | | | 309,435 | |
| | 315 | | | 3.000%, 5/01/15 – AGM Insured | | | | | No Opt. Call | | | | A2 | | | | 327,389 | |
| | 315 | | | 3.000%, 5/01/16 – AGM Insured | | | | | No Opt. Call | | | | A2 | | | | 330,167 | |
| | | | | |
| | | | Louisiana Citizens Property Insurance Corporation, Assessment Revenue Bonds, Refunding Series 2012: | | | | | | | | | | | | | | |
| | 260 | | | 2.000%, 6/01/13 | | | | | No Opt. Call | | | | A– | | | | 260,299 | |
| | 300 | | | 2.000%, 6/01/14 | | | | | No Opt. Call | | | | A– | | | | 303,702 | |
| | | | | | | | | | | | | | | | | | |
Principal
Amount (000) | | | Description (1) | | | | Optional Call
Provisions (2) | | | Ratings (3) | | | Value | |
| | | | | | | | | | | | | | | | | | |
| | | | Louisiana (continued) | | | | | | | | | | | | | | |
| | | | | |
| $ | 1,185 | | | Louisiana Citizens Property Insurance Corporation, Assessment Revenue Bonds, Series 2006B, 5.000%, 6/01/15 – AMBAC Insured | | | | | No Opt. Call | | | | A– | | | $ | 1,278,342 | |
| | | | | |
| | | | Louisiana Local Government Environmental Facilities and Community Development Authority, Revenue Refunding Bonds, Parking Faculties Corporation – Phase I Project, Series 2012: | | | | | | | | | | | | | | |
| | 500 | | | 3.000%, 10/01/14 – AGM Insured | | | | | No Opt. Call | | | | AA– | | | | 514,990 | |
| | 1,000 | | | 3.000%, 10/01/16 – AGM Insured | | | | | No Opt. Call | | | | AA– | | | | 1,049,210 | |
| | | | | |
| | 1,350 | | | New Orleans, Louisiana, General Obligation Refunding Bonds, Series 2012, 4.000%, 12/01/15 | | | | | No Opt. Call | | | | A3 | | | | 1,455,138 | |
| | 6,065 | | | Total Louisiana | | | | | | | | | | | | | 6,363,699 | |
| | | | Maine – 0.1% | | | | | | | | | | | | | | |
| | | | | |
| | | | Portland, Maine, General Airport Revenue Bonds, Refunding Series 2013: | | | | | | | | | | | | | | |
| | 175 | | | 3.000%, 7/01/16 | | | | | No Opt. Call | | | | BBB+ | | | | 185,525 | |
| | 350 | | | 3.000%, 7/01/17 | | | | | No Opt. Call | | | | BBB+ | | | | 372,680 | |
| | 525 | | | Total Maine | | | | | | | | | | | | | 558,205 | |
| | | | Maryland – 0.2% | | | | | | | | | | | | | | |
| | | | | |
| | 405 | | | Maryland Economic Development Corporation, Student Housing Revenue Bonds, Salisbury University Project, Series 2012, 3.000%, 6/01/15 | | | | | No Opt. Call | | | | Baa3 | | | | 414,149 | |
| | | | | |
| | | | Maryland Health and Higher Educational Facilities Authority, Revenue Bonds, Frederick Memorial Hospital Issue, Series 2012A: | | | | | | | | | | | | | | |
| | 150 | | | 3.000%, 7/01/14 | | | | | No Opt. Call | | | | Baa1 | | | | 154,197 | |
| | 220 | | | 3.000%, 7/01/15 | | | | | No Opt. Call | | | | Baa1 | | | | 229,539 | |
| | 775 | | | Total Maryland | | | | | | | | | | | | | 797,885 | |
| | | | Massachusetts – 1.2% | | | | | | | | | | | | | | |
| | | | | |
| | 600 | | | Massachusetts Development Finance Agency, Revenue Bonds, Lasell College, Series 2011, 2.250%, 7/01/13 | | | | | No Opt. Call | | | | BBB | | | | 601,590 | |
| | | | | |
| | 300 | | | Massachusetts Development Finance Agency, Revenue Bonds, Massachusetts College of Pharmacy and Allied Health Sciences, Series 2013F, 3.000%, 7/01/15 | | | | | No Opt. Call | | | | A | | | | 316,098 | |
| | | | | |
| | 525 | | | Massachusetts Development Finance Agency, Senior Living Facility Revenue Bonds, The Groves in Lincoln Issue, Series 2009B-2, 6.250%, 6/01/14 (6) | | | | | 7/13 at 100.00 | | | | N/R | | | | 262,500 | |
| | | | | |
| | 1,950 | | | Massachusetts Educational Financing Authority, Student Loan Revenue Bonds, Issue I Series 2010B, 4.500%, 1/01/16 (Alternative Minimum Tax) | | | | | No Opt. Call | | | | AA | | | | 2,073,182 | |
| | | | | |
| | 325 | | | Massachusetts Health and Educational Facilities Authority, Revenue Bonds, Springfield College, Series 2010, 4.000%, 10/15/13 | | | | | No Opt. Call | | | | Baa1 | | | | 329,573 | |
| | | | | |
| | 2,500 | | | Massachusetts Housing Finance Agency, Construction Loan Notes, Series 2012F, 0.650%, 12/01/14 | | | | | No Opt. Call | | | | A+ | | | | 2,503,350 | |
| | 6,200 | | | Total Massachusetts | | | | | | | | | | | | | 6,086,293 | |
| | | | Michigan – 3.4% | | | | | | | | | | | | | | |
| | | | | |
| | | | Bridgeport Spaulding Community School District, Saginaw County, Michigan, General Obligation Bonds, Refunding Series 2011: | | | | | | | | | | | | | | |
| | 675 | | | 2.500%, 5/01/14 – AGM Insured | | | | | No Opt. Call | | | | Aa2 | | | | 687,569 | |
| | 1,250 | | | 3.000%, 5/01/15 – AGM Insured | | | | | No Opt. Call | | | | Aa2 | | | | 1,305,688 | |
| | | | | |
| | 500 | | | Caledonia Community Schools, Kent, Allegan and Barry Counties, Michigan, General Obligation Bonds, Series 2013, 3.000%, 5/01/14 | | | | | No Opt. Call | | | | AA– | | | | 513,295 | |
| | | | | |
| | 800 | | | Dearborn School District, Wayne County, Michigan, General Obligation Bonds, Series 2007, 4.000%, 5/01/14 | | | | | No Opt. Call | | | | Aa2 | | | | 829,520 | |
| | | | | |
| | | | Detroit-Wayne County Stadium Authority, Michigan, Wayne County Limited Tax General Obligation Bonds, Building Authority Stadium Refunding Series 2012: | | | | | | | | | | | | | | |
| | 500 | | | 5.000%, 10/01/14 | | | | | No Opt. Call | | | | BBB+ | | | | 524,370 | |
| | 475 | | | 5.000%, 10/01/15 | | | | | No Opt. Call | | | | BBB+ | | | | 509,856 | |
| | | | | |
| | 800 | | | Grand Blanc Community Schools, Genesee County, Michigan, General Obligation Bonds, Refunding Series 2013, 4.000%, 5/01/17 | | | | | No Opt. Call | | | | AA– | | | | 894,344 | |
Portfolio of Investments
Nuveen Short Term Municipal Bond Fund (continued)
April 30, 2013
| | | | | | | | | | | | | | | | | | |
Principal
Amount (000) | | | Description (1) | | | | Optional Call
Provisions (2) | | | Ratings (3) | | | Value | |
| | | | | | | | | | | | | | | | | | |
| | | | Michigan (continued) | | | | | | | | | | | | | | |
| | | | | |
| | | | Kalamazoo Hospital Finance Authority, Michigan, Hospital Revenue Bonds, Bronson Healthcare Group, Series 2011A: | | | | | | | | | | | | | | |
| $ | 175 | | | 3.000%, 5/15/13 | | | | | No Opt. Call | | | | A2 | | | $ | 175,175 | |
| | 430 | | | 4.000%, 5/15/15 | | | | | No Opt. Call | | | | A2 | | | | 452,760 | |
| | | | | |
| | 500 | | | Lake Superior State University Board of Trustees, Michigan, General Revenue Refunding Bonds, Series 2012, 2.000%, 11/15/14 – AGM Insured | | | | | No Opt. Call | | | | AA– | | | | 507,755 | |
| | | | | |
| | | | Michigan Finance Authority, Revenue Bonds, Detroit City School District, Series 2012: | | | | | | | | | | | | | | |
| | 250 | | | 5.000%, 6/01/14 | | | | | No Opt. Call | | | | A+ | | | | 261,238 | |
| | 550 | | | 4.000%, 6/01/14 | | | | | No Opt. Call | | | | A+ | | | | 569,030 | |
| | | | | |
| | 2,030 | | | Michigan Hospital Finance Authority, Revenue Bonds, Ascension Health Group, Series 2010B, 5.000%, 11/15/16 | | | | | No Opt. Call | | | | AA+ | | | | 2,333,099 | |
| | | | | |
| | 250 | | | Michigan State Hospital Finance Authority, Hospital Revenue Bonds, Oakwood Obligated Group, Series 2003, 5.500%, 11/01/13 | | | | | No Opt. Call | | | | A | | | | 256,455 | |
| | | | | |
| | 700 | | | Romeo Community School District, Macomb and Oakland Counties, Michigan, General Obligation Bonds, School Building & Site Series 2013, 1.000%, 5/01/14 | | | | | No Opt. Call | | | | Aa2 | | | | 704,116 | |
| | | | | |
| | 1,000 | | | Warren Consolidated Schools, Macomb and Oakland Counties, Michigan, General Obligation Bonds, Refunding Series 2013, 4.000%, 5/01/16 | | | | | No Opt. Call | | | | AA– | | | | 1,091,900 | |
| | | | | |
| | 225 | | | Wayne County Airport Authority, Michigan, Revenue Bonds, Detroit Metropolitan Airport, Refunding Series 2010A, 5.000%, 12/01/16 (Alternative Minimum Tax) | | | | | No Opt. Call | | | | A | | | | 256,480 | |
| | | | | |
| | 415 | | | Wayne County Airport Authority, Michigan, Revenue Bonds, Detroit Metropolitan Airport, Refunding Series 2010C, 5.000%, 12/01/13 | | | | | No Opt. Call | | | | A | | | | 426,454 | |
| | | | | |
| | 1,405 | | | Wayne County Airport Authority, Michigan, Revenue Bonds, Detroit Metropolitan Wayne County Airport, Series 2005, 5.250%, 12/01/13 – NPFG Insured (Alternative Minimum Tax) | | | | | No Opt. Call | | | | A | | | | 1,444,747 | |
| | | | | |
| | 500 | | | Western Michigan University, General Revenue Refunding Bonds, Series 2008, 3.625%, 11/15/14 – AGM Insured | | | | | No Opt. Call | | | | AA– | | | | 522,445 | |
| | | | | |
| | 595 | | | Western Townships Utilities Authority, Michigan, Sewage Disposal System Bonds, Refunding Series 2012, 3.000%, 1/01/14 | | | | | No Opt. Call | | | | AA | | | | 605,151 | |
| | | | | |
| | | | Williamston Community Schools School District, Ingham County, Michigan, General Obligation Bonds, Refunding Series 2011 | | | | | | | | | | | | | | |
| | 610 | | | 2.000%, 5/01/13 | | | | | No Opt. Call | | | | N/R | | | | 610,024 | |
| | 1,120 | | | 3.000%, 5/01/14 | | | | | No Opt. Call | | | | AA– | | | | 1,146,443 | |
| | 15,755 | | | Total Michigan | | | | | | | | | | | | | 16,627,914 | |
| | | | Minnesota – 4.7% | | | | | | | | | | | | | | |
| | | | | |
| | 325 | | | Detroit Lakes, Minnesota, Housing and Health Facilities Revenue Bonds, Mankato Lutheran Home, Guaranteed by Ecumen Home Care Inc., Series 2004, 2.390%, 8/01/34 (Mandatory put 8/01/13) | | | | | 7/13 at 100.00 | | | | N/R | | | | 324,688 | |
| | | | | |
| | 2,155 | | | Farmington Independent School District 192, Dakota County, Minnesota, General Obligation Bonds, School Building Refunding Series 2012B, 3.000%, 2/01/14 | | | | | No Opt. Call | | | | Aa2 | | | | 2,199,501 | |
| | | | | |
| | 1,000 | | | Independent School District 194, Lakeville, Dakota County, Minnesota, General Obligation Bonds, School Building Refunding Series 2012C, 3.000%, 2/01/14 | | | | | No Opt. Call | | | | Aa2 | | | | 1,021,190 | |
| | | | | |
| | 2,500 | | | Minneapolis, Minnesota, Revenue Bonds, National Marrow Donor Program Project, Series 2010, 5.000%, 8/01/17 | | | | | No Opt. Call | | | | BBB | | | | 2,794,050 | |
| | | | | |
| | | | Minneapolis, Minnesota, Revenue Bonds, Walker Minneapolis Campus Project, Refunding Series 2012: | | | | | | | | | | | | | | |
| | 100 | | | 2.000%, 11/15/13 | | | | | No Opt. Call | | | | N/R | | | | 100,201 | |
| | 400 | | | 2.250%, 11/15/14 | | | | | No Opt. Call | | | | N/R | | | | 402,268 | |
| | 705 | | | 2.600%, 11/15/15 | | | | | No Opt. Call | | | | N/R | | | | 713,502 | |
| | | | | |
| | 2,500 | | | Minneapolis-St. Paul Metropolitan Airports Commission, Minnesota, Airport Revenue Bonds, Refunding Senior Lien Series 2009B, 5.000%, 1/01/15 (Alternative Minimum Tax) | | | | | No Opt. Call | | | | AA– | | | | 2,690,925 | |
| | | | | | | | | | | | | | | | | | |
Principal
Amount (000) | | | Description (1) | | | | Optional Call
Provisions (2) | | | Ratings (3) | | | Value | |
| | | | | | | | | | | | | | | | | | |
| | | | Minnesota (continued) | | | | | | | | | | | | | | |
| | | | | |
| $ | 1,335 | | | Minnesota Agricultural and Economic Development Board, Health Care Facilities Revenue Bonds, Essentia Health Obligated Group, Series 2008C-1, 5.000%, 2/15/15 – AGC Insured | | | | | No Opt. Call | | | | AA– | | | $ | 1,431,868 | |
| | | | | |
| | 500 | | | Minnesota Higher Education Facilities Authority, Revenue Bonds, Augsburg College, Refunding Series 2010-7-G, 3.000%, 10/01/14 | | | | | No Opt. Call | | | | Baa3 | | | | 508,930 | |
| | | | | |
| | | | Minnesota Higher Education Facilities Authority, Revenue Bonds, Bethel University, Refunding Series 2007-6-R: | | | | | | | | | | | | | | |
| | 910 | | | 5.500%, 5/01/16 | | | | | No Opt. Call | | | | N/R | | | | 959,586 | |
| | 1,065 | | | 5.500%, 5/01/17 | | | | | No Opt. Call | | | | N/R | | | | 1,138,166 | |
| | | | | |
| | | | Minnesota Higher Education Facilities Authority, Revenue Bonds, College of St. Scholastica, Inc., Series 2012-7R: | | | | | | | | | | | | | | |
| | 270 | | | 2.000%, 12/01/13 | | | | | No Opt. Call | | | | Baa2 | | | | 272,074 | |
| | 200 | | | 3.000%, 12/01/14 | | | | | No Opt. Call | | | | Baa2 | | | | 206,486 | |
| | 210 | | | 3.000%, 12/01/15 | | | | | No Opt. Call | | | | Baa2 | | | | 219,568 | |
| | | | | |
| | 500 | | | Minnesota Higher Education Facilities Authority, Revenue Bonds, Hamline University, Series 2011-7K1, 3.000%, 10/01/13 | | | | | No Opt. Call | | | | Baa2 | | | | 503,020 | |
| | | | | |
| | | | Minnesota Higher Education Facilities Authority, Revenue Bonds, Saint Catherine University, Series 2012-7Q: | | | | | | | | | | | | | | |
| | 325 | | | 3.000%, 10/01/13 | | | | | No Opt. Call | | | | Baa1 | | | | 327,948 | |
| | 500 | | | 3.000%, 10/01/14 | | | | | No Opt. Call | | | | Baa1 | | | | 514,380 | |
| | 450 | | | 4.000%, 10/01/15 | | | | | No Opt. Call | | | | Baa1 | | | | 479,345 | |
| | 650 | | | 4.000%, 10/01/16 | | | | | No Opt. Call | | | | Baa1 | | | | 706,225 | |
| | | | | |
| | 2,210 | | | Robbinsdale Independent School District 281, Hennepin County, Minnesota, General Obligation Bonds, School Building Refunding Series 2012B, 2.000%, 2/01/14 | | | | | No Opt. Call | | | | AA+ | | | | 2,239,371 | |
| | | | | |
| | 1,000 | | | Saint Cloud, Minnesota, Health Care Revenue Bonds, CentraCare Health System Project, Series 2010A, 5.000%, 5/01/15 | | | | | No Opt. Call | | | | A1 | | | | 1,086,320 | |
| | | | | |
| | 180 | | | Saint Paul Housing and Redevelopment Authority, Minnesota, Upper Landing Project Tax Increment Revenue Refunding Bonds, Series 2012, 5.000%, 3/01/14 | | | | | No Opt. Call | | | | N/R | | | | 184,390 | |
| | | | | |
| | | | Sauk Rapids, Minnesota, Health Care and Housing Facilities Revenue Bonds, Good Shepherd Lutheran Home, Refunding Series 2013: | | | | | | | | | | | | | | |
| | 235 | | | 4.000%, 1/01/15 | | | | | No Opt. Call | | | | N/R | | | | 242,320 | |
| | 300 | | | 4.000%, 1/01/16 | | | | | No Opt. Call | | | | N/R | | | | 312,807 | |
| | | | | |
| | 1,280 | | | Shakopee Independent School District 720, Scott County, Minnesota, General Obligation Bonds, Series 2013A, 3.000%, 2/01/17 | | | | | No Opt. Call | | | | Aa2 | | | | 1,389,082 | |
| | | | | |
| | 75 | | | St. Paul Housing and Redevelopment Authority, Minnesota, Performing Arts Facility Revenue Bonds, Ordway Center for the Performing Arts, Series 2012, 0.950%, 7/01/13 | | | | | No Opt. Call | | | | N/R | | | | 75,039 | |
| | | | | |
| | 350 | | | Wayzata, Minnesota, Senior Housing Entrance Deposit Revenue Bonds, Folkestone Senior Living Community, Series 2012B, 4.875%, 5/01/19 | | | | | 5/14 at 100.00 | | | | N/R | | | | 355,576 | |
| | 22,230 | | | Total Minnesota | | | | | | | | | | | | | 23,398,826 | |
| | | | Mississippi – 1.0% | | | | | | | | | | | | | | |
| | | | | |
| | 125 | | | D’Iberville, Mississippi, Tax Increment Limited Obligation Refunding Bonds, Gulf Coast Promenade Project, Series 2013, 2.000%, 4/01/14 | | | | | No Opt. Call | | | | BBB+ | | | | 126,141 | |
| | | | | |
| | 1,500 | | | Mississippi Business Finance Corporation, Gulf Opportunity Zone Revenue Bonds, Coast Electric Power Association, Series 2007C, 0.430%, 5/01/37 (Mandatory put 5/01/13) | | | | | 11/13 at 100.00 | | | | A | | | | 1,500,135 | |
| | | | | |
| | 3,235 | | | Mississippi Development Bank, Special Obligation Bonds, Jackson County Limited Tax Note, Series 2009B-1, 4.000%, 7/01/15 – AGC Insured | | | | | No Opt. Call | | | | AA– | | | | 3,460,447 | |
| | 4,860 | | | Total Mississippi | | | | | | | | | | | | | 5,086,723 | |
| | | | Missouri – 5.0% | | | | | | | | | | | | | | |
| | | | | |
| | | | Boone County, Missouri, Hospital Revenue Bonds, Boone Hospital Center, Refunding Series 2012: | | | | | | | | | | | | | | |
| | 250 | | | 3.000%, 8/01/14 | | | | | No Opt. Call | | | | A | | | | 256,795 | |
| | 1,000 | | | 3.000%, 8/01/15 | | | | | No Opt. Call | | | | A | | | | 1,042,870 | |
| | 1,000 | | | 4.000%, 8/01/17 | | | | | No Opt. Call | | | | A | | | | 1,105,910 | |
Portfolio of Investments
Nuveen Short Term Municipal Bond Fund (continued)
April 30, 2013
| | | | | | | | | | | | | | | | | | |
Principal
Amount (000) | | | Description (1) | | | | Optional Call
Provisions (2) | | | Ratings (3) | | | Value | |
| | | | | | | | | | | | | | | | | | |
| | | | Missouri (continued) | | | | | | | | | | | | | | |
| | | | | |
| $ | 1,000 | | | Cape Girardeau County Industrial Development Authority, Missouri, Health Facilities Revenue Bonds, Saint Francis Medical Center, Series 2013A, 4.000%, 6/01/17 (WI/DD, Settling 5/01/13) | | | | | No Opt. Call | | | | AA– | | | $ | 1,118,710 | |
| | | | | |
| | 360 | | | Joplin Industrial Development Authority, Missouri, Health Facilities Revenue Bonds, Freeman Health System, Series 2011, 2.750%, 2/15/14 | | | | | No Opt. Call | | | | BBB+ | | | | 362,736 | |
| | | | | |
| | 320 | | | Joplin Industrial Development Authority, Missouri, Revenue Bonds, Christian Homes Inc., Series 2007F, 5.500%, 5/15/17 | | | | | No Opt. Call | | | | BBB– | | | | 354,797 | |
| | | | | |
| | 2,020 | | | Missouri Development Finance Board, Independence, Infrastructure Facilities Revenue Bonds, Water System Improvement Projects, Series 2009E, 4.000%, 11/01/16 | | | | | 11/14 at 100.00 | | | | A– | | | | 2,107,022 | |
| | | | | |
| | 150 | | | Missouri Development Finance Board, Infrastructure Facilities Leasehold Revenue Bonds, City of Independence, Missouri, Annual Appropriation Electric System Revenue Bonds – Dogwood Project, Series 2012A, 2.000%, 6/01/13 | | | | | No Opt. Call | | | | A | | | | 150,170 | |
| | | | | |
| | 3,000 | | | Missouri Environmental Improvement and Energy Resources Authority, Revenue Bonds, Kansas City Power & Light Company Project, Series 1992, 1.250%, 7/01/17 | | | | | No Opt. Call | | | | A– | | | | 3,010,680 | |
| | | | | |
| | | | Missouri Health and Educational Facilities Authority, Educational Facilities Revenue Bonds, Southwest Baptist University Project, Series 2012: | | | | | | | | | | | | | | |
| | 240 | | | 3.000%, 10/01/13 | | | | | No Opt. Call | | | | BBB– | | | | 242,050 | |
| | 470 | | | 3.000%, 10/01/14 | | | | | No Opt. Call | | | | BBB– | | | | 482,037 | |
| | 480 | | | 3.000%, 10/01/15 | | | | | No Opt. Call | | | | BBB– | | | | 496,752 | |
| | 495 | | | 3.000%, 10/01/16 | | | | | No Opt. Call | | | | BBB– | | | | 512,023 | |
| | | | | |
| | 270 | | | Missouri Health and Educational Facilities Authority, Health Facilities Revenue Bonds, Capital Region Medical Center, Series 2011, 3.000%, 11/01/13 | | | | | No Opt. Call | | | | A3 | | | | 272,282 | |
| | | | | |
| | 700 | | | Missouri Health and Educational Facilities Authority, Health Facilities Revenue Bonds, St. Luke’s Episcopal and Presbyterian Hospitals, Series 2011, 5.000%, 12/01/13 | | | | | No Opt. Call | | | | A+ | | | | 719,173 | |
| | | | | |
| | 720 | | | Missouri Health and Educational Facilities Authority, Revenue Bonds, Lake Regional Health System, Series 2012, Reg S, 5.000%, 2/15/16 | | | | | No Opt. Call | | | | BBB+ | | | | 797,242 | |
| | | | | |
| | 675 | | | Missouri Health and Educational Facilities Authority, Revenue Bonds, Lake Regional Health System, Series 2012, 3.000%, 2/15/14 | | | | | No Opt. Call | | | | BBB+ | | | | 687,933 | |
| | | | | |
| | 475 | | | Missouri Health and Educational Facilities Authority, Revenue Bonds, Rockhurst University, Series 2011A, 3.000%, 10/01/13 | | | | | No Opt. Call | | | | BBB– | | | | 479,494 | |
| | | | | |
| | 1,435 | | | Missouri Health and Educational Facilities Authority, Revenue Bonds, Webster University, Series 2011, 4.000%, 4/01/17 | | | | | No Opt. Call | | | | A2 | | | | 1,588,402 | |
| | | | | |
| | 340 | | | Missouri Joint Municipal Electric Utility Commission, Plum Point Project, Revenue Bonds, Series 2006, 5.000%, 1/01/16 – NPFG Insured | | | | | No Opt. Call | | | | A– | | | | 369,291 | |
| | | | | |
| | 1,245 | | | Missouri State Health and Educational Facilities Authority, Health Facilities Revenue Bonds, Freeman Health System, Series 2012, 5.000%, 2/15/15 | | | | | No Opt. Call | | | | BBB+ | | | | 1,335,101 | |
| | | | | |
| | 300 | | | Northwest Missouri State University, Housing System Revenue Bonds, Refunding Series 2012, 0.700%, 6/01/14 | | | | | No Opt. Call | | | | A3 | | | | 300,786 | |
| | | | | |
| | 2,200 | | | Park Hill School District, Platte County, Missouri, General Obligation Bonds, Refunding Series 2013, 2.000%, 3/01/14 | | | | | No Opt. Call | | | | AA+ | | | | 2,233,462 | |
| | | | | |
| | 2,435 | | | Saint Louis, Missouri, Airport Revenue Bonds, Lambert-St. Louis International Airport, Refunding Series 2011B, 5.000%, 7/01/14 | | | | | No Opt. Call | | | | A– | | | | 2,555,119 | |
| | | | | |
| | 530 | | | St. Louis County Industrial Development Authority, Missouri, Revenue Bonds, Friendship Village of Sunset Hills, Series 2012, 5.000%, 9/01/17 | | | | | No Opt. Call | | | | A | | | | 600,941 | |
| | | | | |
| | 240 | | | St. Louis, Missouri, Airport Revenue Bonds, Lambert-St. Louis International Airport, Series 2007A, 5.000%, 7/01/14 – AGM Insured | | | | | No Opt. Call | | | | AA– | | | | 251,839 | |
| | | | | |
| | 950 | | | St. Louis, Missouri, Airport Revenue Bonds, Series 1970, 5.000%, 7/01/15 | | | | | No Opt. Call | | | | A– | | | | 1,031,339 | |
| | | | | |
| | 520 | | | Truman State University, Missouri, Housing System Revenue Bonds, Refunding Series 2013, 3.000%, 6/01/16 | | | | | No Opt. Call | | | | A1 | | | | 554,460 | |
| | 23,820 | | | Total Missouri | | | | | | | | | | | | | 25,019,416 | |
| | | | | | | | | | | | | | | | | | |
Principal
Amount (000) | | | Description (1) | | | | Optional Call
Provisions (2) | | | Ratings (3) | | | Value | |
| | | | | | | | | | | | | | | | | | |
| | | | Montana – 0.4% | | | | | | | | | | | | | | |
| | | | | |
| $ | 1,740 | | | Montana Facilities Finance Authority, Revenue Bonds, Sisters of Charity of Leavenworth Health Services Corporation, Composite Deal Series 2010B, 5.000%, 1/01/19 | | | | | No Opt. Call | | | | AA | | | $ | 2,084,955 | |
| | | | Nebraska – 0.4% | | | | | | | | | | | | | | |
| | | | | |
| | 250 | | | Central Plains Energy Project, Nebraska, Gas Project 1 Revenue Bonds, Series 2007A, 5.250%, 12/01/21 | | | | | No Opt. Call | | | | A | | | | 289,533 | |
| | | | | |
| | 505 | | | Lincoln County Hospital Authority 1, Nebraska, Hospital Revenue and Refunding Bonds, Great Plains Regional Medical Center Project, Series 2012, 4.000%, 11/01/15 | | | | | No Opt. Call | | | | A– | | | | 547,344 | |
| | | | | |
| | 1,125 | | | Washington County, Nebraska, Wastewater and Solid Waste Disposal Facilities Revenue Bonds, Cargill Inc. Project, Variable Rate Demand Series 2012, 1.375%, 9/01/30 (Mandatory put 9/01/15) (Alternative Minimum Tax) | | | | | No Opt. Call | | | | A | | | | 1,131,356 | |
| | 1,880 | | | Total Nebraska | | | | | | | | | | | | | 1,968,233 | |
| | | | Nevada – 0.6% | | | | | | | | | | | | | | |
| | | | | |
| | | | Carson City, Nevada, Hospital Revenue Refunding Bonds, Carson-Tahoe Regional Healthcare Project, Series 2012: | | | | | | | | | | | | | | |
| | 235 | | | 2.000%, 9/01/13 | | | | | No Opt. Call | | | | BBB+ | | | | 236,072 | |
| | 250 | | | 3.000%, 9/01/14 | | | | | No Opt. Call | | | | BBB+ | | | | 256,350 | |
| | | | | |
| | 650 | | | Clark County School District, Nevada, General Obligation Bonds, Limited Tax Series 2007C, 5.000%, 6/15/13 | | | | | No Opt. Call | | | | AA– | | | | 653,952 | |
| | | | | |
| | 1,830 | | | Clark County, Nevada, Local Improvement Refunding Bonds, Special Improvement District 142 Mountain’s Edge, Series 2012, 2.000%, 8/01/13 | | | | | No Opt. Call | | | | BBB– | | | | 1,833,440 | |
| | 2,965 | | | Total Nevada | | | | | | | | | | | | | 2,979,814 | |
| | | | New Jersey – 4.7% | | | | | | | | | | | | | | |
| | | | | |
| | | | New Jersey Educational Facilities Authority, Revenue Bonds, Rider University, Series 2012A: | | | | | | | | | | | | | | |
| | 1,000 | | | 5.000%, 7/01/14 | | | | | No Opt. Call | | | | BBB+ | | | | 1,053,010 | |
| | 2,615 | | | 4.000%, 7/01/15 | | | | | No Opt. Call | | | | BBB+ | | | | 2,787,015 | |
| | 3,450 | | | 2.000%, 7/01/16 | | | | | No Opt. Call | | | | BBB+ | | | | 3,533,939 | |
| | | | | |
| | 1,000 | | | New Jersey Health Care Facilities Financing Authority, New Jersey, Revenue Bonds, Saint Peters University Hospital, Refunding Series 2011, 5.000%, 7/01/13 | | | | | No Opt. Call | | | | BB+ | | | | 1,007,020 | |
| | | | | |
| | 4,000 | | | New Jersey Health Care Facilities Financing Authority, Revenue Bonds, Saint Barnabas Health Care System, Refunding Series 2011A, 5.000%, 7/01/15 | | | | | No Opt. Call | | | | BBB+ | | | | 4,337,520 | |
| | | | | |
| | 4,000 | | | New Jersey Higher Education Assistance Authority, Student Loan Revenue Bonds, Series 2011-1, 5.000%, 12/01/14 (Alternative Minimum Tax) | | | | | No Opt. Call | | | | Aa3 | | | | 4,267,920 | |
| | | | | |
| | | | New Jersey Higher Education Assistance Authority, Student Loan Revenue Bonds, Series 2012-1A: | | | | | | | | | | | | | | |
| | 975 | | | 3.000%, 12/01/13 (Alternative Minimum Tax) | | | | | No Opt. Call | | | | AA | | | | 989,401 | |
| | 1,285 | | | 4.000%, 12/01/14 (Alternative Minimum Tax) | | | | | No Opt. Call | | | | AA | | | | 1,350,856 | |
| | | | | |
| | 3,100 | | | New Jersey Transportation Trust Fund Authority, Transportation System Bonds, Series 2010D, 5.000%, 12/15/18 | | | | | No Opt. Call | | | | A+ | | | | 3,726,138 | |
| | 21,425 | | | Total New Jersey | | | | | | | | | | | | | 23,052,819 | |
| | | | New Mexico – 0.6% | | | | | | | | | | | | | | |
| | | | | |
| | 750 | | | Aztec Municipal School District 2, San Juan County, New Mexico, General Obligation Bonds, Refunding Series 2010B, 4.000%, 10/01/13 | | | | | No Opt. Call | | | | Aa1 | | | | 760,628 | |
| | | | | |
| | 2,050 | | | New Mexico Educational Assistance Foundation, Education Loan Bonds, Senior Lien Series 2009A, 3.900%, 9/01/14 (Alternative Minimum Tax) | | | | | No Opt. Call | | | | Aaa | | | | 2,129,192 | |
| | 2,800 | | | Total New Mexico | | | | | | | | | | | | | 2,889,820 | |
| | | | New York – 4.5% | | | | | | | | | | | | | | |
| | | | | |
| | 390 | | | Buffalo and Erie County Industrial Land Development Corporation, New York, Revenue Bonds, Medaille College, Series 2012, 2.125%, 4/01/15 | | | | | No Opt. Call | | | | BB+ | | | | 390,363 | |
Portfolio of Investments
Nuveen Short Term Municipal Bond Fund (continued)
April 30, 2013
| | | | | | | | | | | | | | | | | | |
Principal
Amount (000) | | | Description (1) | | | | Optional Call
Provisions (2) | | | Ratings (3) | | | Value | |
| | | | | | | | | | | | | | | | | | |
| | | | New York (continued) | | | | | | | | | | | | | | |
| | | | | |
| $ | 380 | | | Build NYC Resource Corporation, New York, Revenue Bonds, Bronx Charter School for Excellence, Series 2013A, 3.000%, 4/01/18 | | | | | No Opt. Call | | | | BBB– | | | $ | 393,737 | |
| | | | | |
| | 1,300 | | | Dormitory Authority of the State of New York, Insured Revenue Bonds, Pace University, Series 2013A, 4.000%, 5/01/16 | | | | | No Opt. Call | | | | BBB– | | | | 1,406,041 | |
| | | | | |
| | 670 | | | Long Island Power Authority, New York, Electric System General Revenue Bonds, Series 2000A, 0.000%, 6/01/16 – AGM Insured | | | | | No Opt. Call | | | | AA– | | | | 653,994 | |
| | | | | |
| | 150 | | | Long Island Power Authority, New York, Electric System Revenue Bonds, Refunding Series 2010A, 4.000%, 5/01/15 | | | | | No Opt. Call | | | | A | | | | 160,166 | |
| | | | | |
| | 300 | | | Niagara Area Development Corporation, New York, Niagara University Project, Series 2012A, 3.000%, 5/01/13 | | | | | No Opt. Call | | | | BBB+ | | | | 300,021 | |
| | | | | |
| | 1,545 | | | Metropolitan Transportation Authority, New York, Transportation Revenue Bonds, Series 2013A, 2.000%, 11/15/14 | | | | | No Opt. Call | | | | A | | | | 1,586,638 | |
| | | | | |
| | | | Monroe County Industrial Development Corporation, New York, Revenue Bonds, St. John Fisher College, Series 2012A: | | | | | | | | | | | | | | |
| | 325 | | | 3.000%, 6/01/13 | | | | | No Opt. Call | | | | Aa3 | | | | 325,705 | |
| | 815 | | | 3.000%, 6/01/14 | | | | | No Opt. Call | | | | Aa3 | | | | 833,778 | |
| | | | | |
| | 500 | | | Nassau County Local Economic Assistance Corporation, New York, Revenue Bonds, Winthrop-University Hospital Association, Series 2012, 3.000%, 7/01/13 | | | | | No Opt. Call | | | | Baa1 | | | | 502,020 | |
| | | | | |
| | 2,500 | | | Nassau Health Care Corporation, New York, Revenue Anticipation Notes, Series 2013A, 2.250%, 12/15/13 | | | | | No Opt. Call | | | | AA– | | | | 2,529,550 | |
| | | | | |
| | 1,035 | | | New York City, New York, General Obligation Bonds, Fiscal 2012 Series I, 5.000%, 8/01/14 | | | | | No Opt. Call | | | | AA | | | | 1,096,520 | |
| | | | | |
| | 175 | | | New York City, New York, General Obligation Bonds, Fiscal Series 2003J, 5.500%, 6/01/20 (Pre-refunded 6/01/13) | | | | | 6/13 at 100.00 | | | | AA (4) | | | | 175,798 | |
| | | | | |
| | 1,000 | | | New York City, New York, Industrial Development Agency, Senior Airport Facilities Revenue Refunding Bonds, Trips Obligated Group, Series 2012A, 5.000%, 7/01/13 (Alternative Minimum Tax) | | | | | No Opt. Call | | | | BBB– | | | | 1,005,920 | |
| | | | | |
| | 2,000 | | | New York State Energy Research and Development Authority, Pollution Control Revenue Bonds, New York State Electric and Gas Corporation, Series 2011A, 2.125%, 3/15/15 | | | | | No Opt. Call | | | | A– | | | | 2,037,360 | |
| | | | | |
| | 750 | | | New York State Thruway Authority, General Revenue Bonds, Series2012I, 4.000%, 1/01/15 | | | | | No Opt. Call | | | | A+ | | | | 793,133 | |
| | | | | |
| | 1,895 | | | Schenectady County Capital Resource Corporation, New York, FHA insured Mortgage Revenue Bonds, Ellis Hospital Project, Refunding Series 2012, 1.750%, 2/15/18 – AGM Insured | | | | | No Opt. Call | | | | AA+ | | | | 1,902,201 | |
| | | | | |
| | 1,450 | | | St. Lawrence County Industrial Development Agency Civic Development Corporation, New York, Revenue Bonds, Clarkson University Project, Series 2012B, 2.500%, 9/01/42 (Mandatory put 3/01/16) | | | | | No Opt. Call | | | | A3 | | | | 1,489,092 | |
| | | | | |
| | 450 | | | Westchester County Local Development Corporation, New York, Revenue Refunding Bonds, Kendal on Hudson Project, Series 2013, 2.000%, 1/01/16 | | | | | No Opt. Call | | | | N/R | | | | 453,681 | |
| | | | | |
| | 1,265 | | | Yonkers, New York, General Obligation Bonds, Series 2005A, 5.000%, 8/01/13 – NPFG Insured | | | | | No Opt. Call | | | | BBB+ | | | | 1,278,536 | |
| | | | | |
| | 1,500 | | | Yonkers, New York, General Obligation Bonds, Series 2011A, 5.000%, 10/01/14 | | | | | No Opt. Call | | | | BBB+ | | | | 1,588,410 | |
| | | | | |
| | 1,250 | | | Yonkers, New York, General Obligation Refunding Bonds, Series 2012A, 4.000%, 7/01/15 | | | | | No Opt. Call | | | | BBB+ | | | | 1,329,025 | |
| | 21,645 | | | Total New York | | | | | | | | | | | | | 22,231,689 | |
| | | | North Carolina – 0.2% | | | | | | | | | | | | | | |
| | | | | |
| | 985 | | | North Carolina Medical Care Commission, Health Care Facilities Revenue and Refunding Revenue Bonds, Columbus Regional Healthcare System, Series 2013A, 4.000%, 10/01/15 | | | | | No Opt. Call | | | | BBB | | | | 1,066,184 | |
| | | | | | | | | | | | | | | | | | |
Principal
Amount (000) | | | Description (1) | | | | Optional Call
Provisions (2) | | | Ratings (3) | | | Value | |
| | | | | | | | | | | | | | | | | | |
| | | | North Dakota – 0.9% | | | | | | | | | | | | | | |
| | | | | |
| | | | Burleigh County, North Dakota, Health Care Revenue Refunding Bonds, St. Alexius Medical Center Project, Series 2012A: | | | | | | | | | | | | | | |
| $ | 225 | | | 2.500%, 7/01/13 | | | | | No Opt. Call | | | | A– | | | $ | 225,617 | |
| | 300 | | | 2.500%, 7/01/14 | | | | | No Opt. Call | | | | A– | | | | 303,201 | |
| | | | | |
| | 3,040 | | | Fargo, North Dakota, Health System Revenue Bonds, Sanford Health, Refunding Series 2011, 3.500%, 11/01/16 | | | | | No Opt. Call | | | | A+ | | | | 3,291,621 | |
| | | | | |
| | | | Williston Parks and Recreation District, North Dakota, Sales Tax & Gross Revenue Bonds, Series 2012A: | | | | | | | | | | | | | | |
| | 200 | | | 1.150%, 3/01/14 | | | | | No Opt. Call | | | | A | | | | 200,598 | |
| | 600 | | | 2.000%, 3/01/15 | | | | | No Opt. Call | | | | A | | | | 609,078 | |
| | 4,365 | | | Total North Dakota | | | | | | | | | | | | | 4,630,115 | |
| | | | Ohio – 2.3% | | | | | | | | | | | | | | |
| | | | | |
| | 785 | | | Cleveland State University, Ohio, General Receipts Bonds, Series 2007A, 5.750%, 6/01/14 – FGIC Insured | | | | | No Opt. Call | | | | A+ | | | | 830,663 | |
| | | | | |
| | 1,000 | | | Cleveland, Ohio, Airport System Revenue Bonds, Series 2011A, 3.000%, 1/01/14 | | | | | No Opt. Call | | | | A– | | | | 1,017,600 | |
| | | | | |
| | 1,000 | | | Ohio Air Quality Development Authority, Ohio, Air Quality Revenue Refunding Bonds, Ohio Power Company Project, Series 2010A, 3.250%, 6/01/41 (Mandatory put 6/02/14) | | | | | No Opt. Call | | | | Baa1 | | | | 1,021,130 | |
| | | | | |
| | 4,005 | | | Ohio Air Quality Development Authority, Ohio, Pollution Control Revenue Refunding Bonds, FirstEnergy Generation Corp. Project, Series 2009D, 2.250%, 8/01/29 (Mandatory put 9/15/16) | | | | | No Opt. Call | | | | BBB– | | | | 4,061,070 | |
| | | | | |
| | 1,000 | | | Ohio State, Capital Facilities Lease-Appropriation Bonds, Administrative Building Fund Projects, Series 2013A, 5.000%, 10/01/17 | | | | | No Opt. Call | | | | AA | | | | 1,178,910 | |
| | | | | |
| | 1,700 | | | Ohio State, Capital Facilities Lease-Appropriation Bonds, Cultural & Sports Facilities Building Fund Projects, Series 2013B, 5.000%, 4/01/18 | | | | | No Opt. Call | | | | AA | | | | 2,024,751 | |
| | | | | |
| | 1,000 | | | Ohio State, Capital Facilities Lease-Appropriation Bonds, Parks & Recreation Improvement Fund Projects, Series 2013A, 3.000%, 8/01/17 | | | | | No Opt. Call | | | | AA | | | | 1,089,830 | |
| | 10,490 | | | Total Ohio | | | | | | | | | | | | | 11,223,954 | |
| | | | Oklahoma – 0.2% | | | | | | | | | | | | | | |
| | | | | |
| | 1,125 | | | Tulsa County Industrial Authority, Oklahoma, Educational Facilities Lease Revenue Bonds, Jenks Public Schools Project, Series 2009, 5.000%, 9/01/14 | | | | | No Opt. Call | | | | AA– | | | | 1,194,480 | |
| | | | Oregon – 1.8% | | | | | | | | | | | | | | |
| | | | | |
| | 2,000 | | | Gilliam County, Oregon, Solid Waste Disposal Revenue Bonds, Waste Management Inc., Variable Rate Demand Obligations, Series 2000A, 4.150%, 8/01/25 (Alternative Minimum Tax) | | | | | 12/13 at 100.00 | | | | N/R | | | | 2,000,140 | |
| | | | | |
| | 660 | | | Klamath Falls Intercommunity Hospital Authority, Oregon, Revenue Bonds, Sky Lakes Medical Center Project, Series 2012, 4.000%, 9/01/15 | | | | | No Opt. Call | | | | BBB+ | | | | 700,524 | |
| | | | | |
| | | | Local Oregon Capital Assets Program, Certificates of Participation, City of Cottage Grove, Oregon, Series 2013A: | | | | | | | | | | | | | | |
| | 860 | | | 3.000%, 9/15/14 | | | | | No Opt. Call | | | | Baa2 | | | | 882,635 | |
| | 880 | | | 4.000%, 9/15/15 | | | | | No Opt. Call | | | | Baa2 | | | | 933,020 | |
| | | | | |
| | 2,850 | | | Medford Hospital Facilities Authority, Oregon, Hospital Revenue Bonds, Asante Health System, Refunding Series 2010, 5.000%, 8/15/15 – AGM Insured | | | | | No Opt. Call | | | | AA– | | | | 3,123,486 | |
| | | | | |
| | 360 | | | Multnomah County Hospital Facilities Authority, Oregon, Revenue Refunding Bond, Terwilliger Plaza, Inc., Series 2012, 2.000%, 12/01/14 | | | | | No Opt. Call | | | | BBB | | | | 364,554 | |
| | | | | |
| | 770 | | | Portland, Oregon, Sewer System Revenue Bonds, Refunding Series 2007A, 5.000%, 6/01/14 – NPFG Insured | | | | | No Opt. Call | | | | AA | | | | 809,747 | |
| | 8,380 | | | Total Oregon | | | | | | | | | | | | | 8,814,106 | |
| | | | Pennsylvania – 7.0% | | | | | | | | | | | | | | |
| | | | | |
| | 1,240 | | | Allegheny County Airport Authority, Pennsylvania, Airport Revenue Bonds, Pittsburgh International Airport, Refunding Series 2010A, 5.000%, 1/01/16 – AGM Insured (Alternative Minimum Tax) | | | | | No Opt. Call | | | | AA– | | | | 1,381,633 | |
Portfolio of Investments
Nuveen Short Term Municipal Bond Fund (continued)
April 30, 2013
| | | | | | | | | | | | | | | | | | |
Principal
Amount (000) | | | Description (1) | | | | Optional Call
Provisions (2) | | | Ratings (3) | | | Value | |
| | | | | | | | | | | | | | | | | | |
| | | | Pennsylvania (continued) | | | | | | | | | | | | | | |
| | | | | |
| | | | Economy Municipal Authority, Pennsylvania, Sewer Revenue Bonds, Refunding Series 2013: | | | | | | | | | | | | | | |
| $ | 350 | | | 3.000%, 12/15/17 | | | | | No Opt. Call | | | | AA | | | $ | 377,122 | |
| | 300 | | | 3.000%, 12/15/18 | | | | | No Opt. Call | | | | AA | | | | 323,544 | |
| | | | | |
| | 655 | | | Lancaster County Hospital Authority, Pennsylvania, Health Center Revenue Bonds, Saint Anne’s Retirement Community, Inc. , Series 2012, 3.000%, 4/01/14 | | | | | No Opt. Call | | | | BB+ | | | | 656,880 | |
| | | | | |
| | 1,465 | | | Marion Center Area School District, Indiana County, Pennsylvania, General Obligation Bonds, Refunding Series 2013, 2.000%, 9/01/16 | | | | | No Opt. Call | | | | A | | | | 1,522,340 | |
| | | | | |
| | 2,340 | | | Penn Hills School District, Allegheny County, Pennsylvania, General Obligation Bonds, Series 2012A, 4.000%, 10/01/14 | | | | | No Opt. Call | | | | A1 | | | | 2,456,719 | |
| | | | | |
| | 220 | | | Pennsylvania Economic Development Financing Authority, Solid Waste Disposal Revenue Bonds, Waste Management Inc., Project, Series 2009, 1.750%, 12/01/33 (Mandatory put 12/01/15) | | | | | No Opt. Call | | | | BBB | | | | 224,798 | |
| | | | | |
| | 3,000 | | | Pennsylvania Economic Development Financing Authority, Solid Waste Disposal Revenue Bonds, Waste Management Inc., Project, Series 2011, 2.625%, 7/01/41 (Mandatory put 7/01/14) | | | | | No Opt. Call | | | | BBB | | | | 3,040,860 | |
| | | | | |
| | | | Pennsylvania Higher Educational Facilities Authority, Pennsylvania, Revenue Bonds, Saint Francis University, Series 2012-LL2: | | | | | | | | | | | | | | |
| | 130 | | | 2.000%, 5/01/13 | | | | | No Opt. Call | | | | N/R | | | | 130,004 | |
| | 165 | | | 2.000%, 11/01/13 | | | | | No Opt. Call | | | | BBB– | | | | 165,911 | |
| | | | | |
| | 840 | | | Pennsylvania Higher Educational Facilities Authority, Revenue Bonds, AICUP Financing Program-Delaware Valley College of Science and Agriculture Project, Series 2012 LL1, 4.000%, 11/01/16 | | | | | No Opt. Call | | | | Baa3 | | | | 892,164 | |
| | | | | |
| | 725 | | | Pennsylvania Higher Educational Facilities Authority, Revenue Bonds, AICUP Financing Program-Mount Aloysius College Project, Series 2011R-1, 0.650%, 11/01/41 (Mandatory put 11/01/14) | | | | | No Opt. Call | | | | A– | | | | 725,015 | |
| | | | | |
| | | | Pennsylvania Higher Educational Facilities Authority, Revenue Bonds, Association of Independent Colleges and Universities of Pennsylvania Financing Program-Messiah College Project, Series 2001-14: | | | | | | | | | | | | | | |
| | 3,000 | | | 0.450%, 11/01/31 (Mandatory put 5/01/14) | | | | | 11/13 at 100.00 | | | | A | | | | 3,000,000 | |
| | 2,000 | | | 0.625%, 11/01/31 (Mandatory put 11/01/13) | | | | | No Opt. Call | | | | A | | | | 2,000,900 | |
| | | | | |
| | | | Pennsylvania Higher Educational Facilities Authority, Revenue Bonds, Foundation for Student Housing at Indiana University, Project Series 2012A: | | | | | | | | | | | | | | |
| | 100 | | | 3.000%, 7/01/13 | | | | | No Opt. Call | | | | BBB+ | | | | 100,346 | |
| | 100 | | | 3.000%, 7/01/14 | | | | | No Opt. Call | | | | BBB+ | | | | 102,184 | |
| | 320 | | | 3.000%, 7/01/15 | | | | | No Opt. Call | | | | BBB+ | | | | 330,589 | |
| | | | | |
| | 2,510 | | | Pennsylvania Turnpike Commission, Motor License Fund-Enhanced Turnpike Subordinate Special Revenue, Series 2011B, 3.000%, 12/01/13 | | | | | No Opt. Call | | | | A– | | | | 2,550,838 | |
| | | | | |
| | 1,780 | | | Philadelphia Gas Works, Pennsylvania, Revenue Bonds, Refunding Tenth Series 2011B, 4.000%, 7/01/13 | | | | | No Opt. Call | | | | BBB+ | | | | 1,790,110 | |
| | | | | |
| | 1,000 | | | Philadelphia Redevelopment Authority, Pennsylvania, Revenue Bonds, Philadelphia Neighborhood Transformation Initiative, Series 2012, 5.000%, 4/15/14 | | | | | No Opt. Call | | | | A2 | | | | 1,042,450 | |
| | | | | |
| | 915 | | | Philadelphia School District, Pennsylvania, General Obligation Bonds, Series 2011B, 3.000%, 9/01/13 | | | | | No Opt. Call | | | | AA | | | | 923,693 | |
| | | | | |
| | 920 | | | Philadelphia School District, Pennsylvania, General Obligation Bonds, Series 2011C, 3.000%, 9/01/13 | | | | | No Opt. Call | | | | AA | | | | 928,740 | |
| | | | | |
| | 500 | | | Philadelphia, Pennsylvania, Airport Revenue Bonds, Refunding Series 2011A, 4.000%, 6/15/13 (Alternative Minimum Tax) | | | | | No Opt. Call | | | | A+ | | | | 502,330 | |
| | | | | |
| | 5,000 | | | Philadelphia, Pennsylvania, General Obligation Bonds, Refunding Series 2011, 5.000%, 8/01/14 | | | | | No Opt. Call | | | | A2 | | | | 5,257,100 | |
| | | | | |
| | 505 | | | Pittsburgh, Pennsylvania, General Obligation Bonds, Series 2012A, 3.000%, 9/01/14 | | | | | No Opt. Call | | | | A1 | | | | 520,357 | |
| | | | | | | | | | | | | | | | | | |
Principal
Amount (000) | | | Description (1) | | | | Optional Call
Provisions (2) | | | Ratings (3) | | | Value | |
| | | | | | | | | | | | | | | | | | |
| | | | Pennsylvania (continued) | | | | | | | | | | | | | | |
| | | | | |
| | | | Scranton, Pennsylvania, Sewer Authority Revenue Bonds, Series 2011A: | | | | | | | | | | | | | | |
| $ | 250 | | | 2.250%, 12/01/13 – AGM Insured | | | | | No Opt. Call | | | | AA– | | | $ | 252,173 | |
| | 540 | | | 3.500%, 12/01/14 – AGM Insured | | | | | No Opt. Call | | | | AA– | | | | 561,373 | |
| | | | | |
| | | | Union County Hospital Authority, Pennsylvania, Hospital Revenue Bonds, Evangelical Community Hospital Project, Refunding and Improvement Series 2011: | | | | | | | | | | | | | | |
| | 1,385 | | | 4.000%, 8/01/15 | | | | | No Opt. Call | | | | BBB+ | | | | 1,444,181 | |
| | 1,440 | | | 4.250%, 8/01/16 | | | | | No Opt. Call | | | | BBB+ | | | | 1,534,464 | |
| | 33,695 | | | Total Pennsylvania | | | | | | | | | | | | | 34,738,818 | |
| | | | Puerto Rico – 0.8% | | | | | | | | | | | | | | |
| | | | | |
| | 500 | | | Puerto Rico Industrial, Tourist, Educational, Medical and Environmental Control Facilities Financing Authority, Higher Education Revenue Bonds, Inter-American University of Puerto Rico Project, Refunding Series 2012, 4.000%, 10/01/14 | | | | | No Opt. Call | | | | A– | | | | 515,500 | |
| | | | | |
| | 2,500 | | | Puerto Rico Infrastructure Financing Authority, Revenue Bonds, Ports Authority Project, Series 2011C, 3.000%, 12/15/26 (Mandatory put 12/16/13) (Alternative Minimum Tax) | | | | | No Opt. Call | | | | BBB– | | | | 2,514,175 | |
| | | | | |
| | 500 | | | Puerto Rico Municipal Finance Agency, Series 2005B, 5.000%, 7/01/14 – CIFG Insured | | | | | No Opt. Call | | | | AA– | | | | 518,540 | |
| | | | | |
| | 370 | | | Puerto Rico, General Obligation and Public Improvement Bonds, Series 2002A, 5.500%, 7/01/14 – NPFG Insured | | | | | No Opt. Call | | | | Baa2 | | | | 383,009 | |
| | 3,870 | | | Total Puerto Rico | | | | | | | | | | | | | 3,931,224 | |
| | | | Rhode Island – 0.1% | | | | | | | | | | | | | | |
| | | | | |
| | 250 | | | Rhode Island Student Loan Authority, Student Loan Program Revenue Bonds, Senior Series 2013A, 4.000%, 12/01/15 (Alternative Minimum Tax) | | | | | No Opt. Call | | | | A+ | | | | 267,405 | |
| | | | South Carolina – 0.3% | | | | | | | | | | | | | | |
| | | | | |
| | 500 | | | South Carolina JOBS Economic Development Authority, Hospital Revenue Bonds, Bon Secours Health System Obligated Group, Series 2012, 4.000%, 11/01/15 | | | | | No Opt. Call | | | | A– | | | | 535,335 | |
| | | | | |
| | 590 | | | South Carolina JOBS Economic Development Authority, Revenue Bonds, Waste Management of South Carolina, Inc. Project, Series 2008, 2.875%, 2/01/15 | | | | | No Opt. Call | | | | BBB | | | | 603,004 | |
| | | | | |
| | 500 | | | South Carolina Jobs-Economic Development Authority, Hospital Revenue Bonds, Palmetto Health, Refunding & Improvement Series 2009, 5.000%, 8/01/15 | | | | | No Opt. Call | | | | BBB+ | | | | 543,400 | |
| | 1,590 | | | Total South Carolina | | | | | | | | | | | | | 1,681,739 | |
| | | | South Dakota – 0.9% | | | | | | | | | | | | | | |
| | | | | |
| | | | Rapid City, South Dakota, Sales Tax Revenue Bonds, Series 2013: | | | | | | | | | | | | | | |
| | 320 | | | 2.000%, 6/01/13 | | | | | No Opt. Call | | | | Aa3 | | | | 320,474 | |
| | 435 | | | 2.000%, 12/01/13 | | | | | No Opt. Call | | | | Aa3 | | | | 439,272 | |
| | | | | |
| | 1,305 | | | South Dakota Health and Educational Facilities Authority, Revenue Bonds, Sanford Health, Series 2009, 4.500%, 11/01/15 | | | | | No Opt. Call | | | | A+ | | | | 1,420,727 | |
| | | | | |
| | 730 | | | South Dakota Health and Educational Facilities Authority, Revenue Bonds, Westhills Village Retirement Community, Series 2012, 3.500%, 9/01/16 | | | | | No Opt. Call | | | | A | | | | 775,961 | |
| | | | | |
| | 1,700 | | | South Dakota Housing Development Authority, Multiple Purpose Revenue Bonds, Series 2013A, 1.600%, 5/01/18 | | | | | No Opt. Call | | | | Aa3 | | | | 1,705,474 | |
| | 4,490 | | | Total South Dakota | | | | | | | | | | | | | 4,661,908 | |
| | | | Tennessee – 1.7% | | | | | | | | | | | | | | |
| | | | | |
| | 1,000 | | | Memphis-Shelby County Airport Authority, Tennessee, Airport Revenue Bonds, Series 2010B, 5.000%, 7/01/16 (Alternative Minimum Tax) | | | | | No Opt. Call | | | | A2 | | | | 1,133,700 | |
| | | | | |
| | 1,290 | | | Memphis-Shelby County Sports Authority, Tennessee, Revenue Bonds, Memphis Arena, Refunding Series 2009B, 5.500%, 11/01/20 | | | | | 11/19 at 100.00 | | | | AA– | | | | 1,588,609 | |
Portfolio of Investments
Nuveen Short Term Municipal Bond Fund (continued)
April 30, 2013
| | | | | | | | | | | | | | | | | | |
Principal
Amount (000) | | | Description (1) | | | | Optional Call
Provisions (2) | | | Ratings (3) | | | Value | |
| | | | Tennessee (continued) | | | | | | | | | | | | | | |
| | | | | |
| | | | Metropolitan Government of Nashville-Davidson County Health and Educational Facilities Board, Tennessee, Revenue Bonds, Belmont University Project, Series 2012: | | | | | | | | | | | | | | |
| $ | 500 | | | 2.000%, 11/01/13 | | | | | No Opt. Call | | | | BBB+ | | | $ | 503,680 | |
| | 1,000 | | | 2.000%, 11/01/14 | | | | | No Opt. Call | | | | BBB+ | | | | 1,016,100 | |
| | 1,050 | | | 2.000%, 11/01/15 | | | | | No Opt. Call | | | | BBB+ | | | | 1,071,210 | |
| | 1,000 | | | 3.000%, 11/01/16 | | | | | No Opt. Call | | | | BBB+ | | | | 1,051,110 | |
| | | | | |
| | 1,800 | | | Metropolitan Nashville Airport Authority, Tennessee, Airport Revenue Bonds, Refunding & Improvement Series 2010A, 5.000%, 7/01/16 | | | | | No Opt. Call | | | | A | | | | 2,022,858 | |
| | 7,640 | | | Total Tennessee | | | | | | | | | | | | | 8,387,267 | |
| | | | Texas – 3.7% | | | | | | | | | | | | | | |
| | | | | |
| | 1,000 | | | Brazosport Independent School District, Brazoria County, Texas, General Obligation Bonds, Series 2004, 5.000%, 2/15/20 (Pre-refunded 2/15/14) | | | | | 2/14 at 100.00 | | | | Aaa | | | | 1,037,420 | |
| | | | | |
| | 1,000 | | | Dallas-Fort Worth International Airport, Texas, Joint Revenue Bonds, Refunding Series 2009A, 5.000%, 11/01/21 | | | | | 11/16 at 100.00 | | | | A+ | | | | 1,135,210 | |
| | | | | |
| | 800 | | | Harris County Cultural Education Facilities Finance Corporation, Texas, Revenue Refunding Bonds, Young Men’s Christian Association of the Greater Houston Area, Series 2013A, 5.000%, 6/01/17 | | | | | No Opt. Call | | | | Baa3 | | | | 899,072 | |
| | | | | |
| | 1,000 | | | Harrison County Health Facilities Development Corporation, Texas, Hospital Revenue Bonds, Good Shepherd Health System, Refunding Series 2010, 4.000%, 7/01/15 | | | | | No Opt. Call | | | | BBB+ | | | | 1,050,190 | |
| | | | | |
| | 455 | | | Houston, Texas, First Lien Combined Utility System Revenue Bonds, Series 2009, 3.000%, 4/01/14 | | | | | No Opt. Call | | | | A2 | | | | 464,541 | |
| | | | | |
| | 1,150 | | | Houston, Texas, Hotel Occupancy Tax and Special Revenue Bonds, Convention and Entertainment Project, Refunding Series 2011A, 5.000%, 9/01/13 | | | | | No Opt. Call | | | | A2 | | | | 1,168,653 | |
| | | | | |
| | 2,005 | | | Midtown Redevelopment Authority, Texas, Tax Increment Contract Revenue, Refunding Series 2011, 4.000%, 1/01/15 | | | | | No Opt. Call | | | | A– | | | | 2,093,240 | |
| | | | | |
| | 500 | | | Sabine Pass Independent School District, Jefferson County, Texas, General Obligation Bonds, Series 2003, 0.000%, 8/15/34 (Pre-refunded 8/15/13) | | | | | 8/13 at 32.33 | | | | AAA | | | | 161,575 | |
| | | | | |
| | 1,015 | | | Sam Rayburn Municipal Power Agency, Texas, Power Supply System Revenue Refunding Bonds, Series 2012, 5.000%, 10/01/14 | | | | | No Opt. Call | | | | BBB+ | | | | 1,076,083 | |
| | | | | |
| | | | Tarrant County Cultural Education Facilities Finance Corporation, Texas, Hospital Revenue Bonds, Hendrick Medical Center, Series 2009A: | | | | | | | | | | | | | | |
| | 1,425 | | | 4.000%, 9/01/15 – AGC Insured | | | | | No Opt. Call | | | | AA– | | | | 1,523,040 | |
| | 1,170 | | | 4.000%, 9/01/16 – AGC Insured | | | | | No Opt. Call | | | | AA– | | | | 1,279,138 | |
| | 1,405 | | | 4.375%, 9/01/18 – AGC Insured | | | | | No Opt. Call | | | | AA– | | | | 1,615,132 | |
| | | | | |
| | 300 | | | Tarrant County Cultural Education Facilities Finance Corporation, Texas, Hospital Revenue Bonds, Scott & White Healthcare Project, Series 2013A, 5.000%, 8/15/15 | | | | | No Opt. Call | | | | AA– | | | | 328,281 | |
| | | | | |
| | 3,000 | | | Texas Municipal Gas Acquisition and Supply Corporation III, Gas Supply Revenue Bonds, Series 2012, 5.000%, 12/15/16 | | | | | No Opt. Call | | | | A3 | | | | 3,294,660 | |
| | | | | |
| | 1,000 | | | Val Verde County, Texas, Pass-Through Toll Revenue and Limited Tax Bonds, Series 2011, 2.000%, 8/15/13 | | | | | No Opt. Call | | | | A | | | | 1,003,460 | |
| | 17,225 | | | Total Texas | | | | | | | | | | | | | 18,129,695 | |
| | | | Virgin Islands – 1.8% | | | | | | | | | | | | | | |
| | | | | |
| | 360 | | | Virgin Islands Public Finance Authority, Gross Receipts Taxes Loan Note, Series 2006, 5.000%, 10/01/15 – FGIC Insured | | | | | No Opt. Call | | | | BBB+ | | | | 388,148 | |
| | | | | |
| | 6,985 | | | Virgin Islands Public Finance Authority, Gross Receipts Taxes Loan Note, Series 2012C, 3.000%, 10/01/17 | | | | | No Opt. Call | | | | BBB+ | | | | 7,236,949 | |
| | | | | |
| | 1,035 | | | Virgin Islands Public Finance Authority, Matching Fund Loan Notes Revenue Bonds, Series 2009B, 5.000%, 10/01/19 | | | | | No Opt. Call | | | | BBB+ | | | | 1,190,043 | |
| | 8,380 | | | Total Virgin Islands | | | | | | | | | | | | | 8,815,140 | |
| | | | | | | | | | | | | | | | | | |
Principal
Amount (000) | | | Description (1) | | | | Optional Call
Provisions (2) | | | Ratings (3) | | | Value | |
| | | | Virginia – 3.7% | | | | | | | | | | | | | | |
| | | | | |
| $ | 1,100 | | | Dulles Town Center Community Development Authority, Loudon County, Virginia Special Assessment Refunding Bonds, Dulles Town Center Project, Series 2012, 3.000%, 3/01/16 | | | | | No Opt. Call | | | | N/R | | | $ | 1,109,471 | |
| | | | | |
| | 1,000 | | | Fredericksburg Economic Development Authority, Virginia, Hospital Facilities Revenue Bonds, MediCorp Health System, Series 2007, 5.000%, 6/15/17 | | | | | No Opt. Call | | | | Baa1 | | | | 1,140,010 | |
| | | | | |
| | 1,275 | | | Henrico County Economic Development Authority, Virginia, Revenue Bonds, Bon Secours Health System Obligated Group, Series 2013, 4.000%, 11/01/16 | | | | | No Opt. Call | | | | A– | | | | 1,395,462 | |
| | | | | |
| | 1,000 | | | Louisa Industrial Development Authority, Virginia, Pollution Control Revenue Bonds, Virginia Electric and Power Company, Series 2008c, 5.375%, 11/01/35 (Mandatory put 12/02/13) | | | | | No Opt. Call | | | | A– | | | | 1,030,160 | |
| | | | | |
| | 325 | | | Norfolk, Virginia, General Obligation Bonds, Bond Anticipation Notes Series 2011A, 2.000%, 1/01/14 | | | | | 7/13 at 100.00 | | | | AA | | | | 325,517 | |
| | | | | |
| | 310 | | | Virginia Beach, Virginia, General Obligation Public Improvement Bonds, Series 2003A, 5.500%, 5/01/13 | | | | | No Opt. Call | | | | AAA | | | | 310,047 | |
| | | | | |
| | 7,000 | | | Virginia Housing Development Authority, Commonwealth Mortgage Bonds, Series 2006D-1, 4.300%, 1/01/14 (Alternative Minimum Tax) | | | | | No Opt. Call | | | | AAA | | | | 7,131,600 | |
| | | | | |
| | 6,000 | | | Virginia Public Building Authority, Public Facilities Revenue Bonds, Series 2004A, 5.000%, 8/01/14 | | | | | 8/13 at 100.00 | | | | AA+ | | | | 6,071,580 | |
| | 18,010 | | | Total Virginia | | | | | | | | | | | | | 18,513,847 | |
| | | | Washington – 1.1% | | | | | | | | | | | | | | |
| | | | | |
| | 400 | | | King and Pierce Counties School District 408 Auburn, Washington, General Obligation Bonds, Refunding Series 2013, 3.000%, 12/01/14 | | | | | No Opt. Call | | | | Aa1 | | | | 416,784 | |
| | | | | |
| | 1,000 | | | Port of Seattle, Washington, Revenue Bonds, Refunding Inter-Lien Series 2010C, 5.000%, 2/01/16 | | | | | No Opt. Call | | | | Aa3 | | | | 1,116,700 | |
| | | | | |
| | 205 | | | Washington Health Care Facilities Authority, Revenue Bonds, Kadlec Regional Medical Center, Series 2012, 4.000%, 12/01/16 | | | | | No Opt. Call | | | | Baa3 | | | | 221,703 | |
| | | | | |
| | | | Washington Higher Education Facilities Authority Revenue Bonds, Whitworth University Project, Series 2012: | | | | | | | | | | | | | | |
| | 100 | | | 3.000%, 10/01/13 | | | | | No Opt. Call | | | | Baa1 | | | | 100,867 | |
| | 150 | | | 3.000%, 10/01/14 | | | | | No Opt. Call | | | | Baa1 | | | | 153,938 | |
| | 275 | | | 4.000%, 10/01/16 | | | | | No Opt. Call | | | | Baa1 | | | | 296,159 | |
| | | | | |
| | | | Washington State Health Care Facilities Authority, Revenue Bonds, Central Washington Health Services Association, Series 2009: | | | | | | | | | | | | | | |
| | 1,225 | | | 5.000%, 7/01/13 | | | | | No Opt. Call | | | | Baa3 | | | | 1,232,338 | |
| | 1,150 | | | 5.000%, 7/01/14 | | | | | No Opt. Call | | | | Baa3 | | | | 1,190,400 | |
| | | | | |
| | 500 | | | Washington State Housing Finance Commission, Non-Profit Revenue Bonds, Emerald Heights Project, Refunding 2013, 3.000%, 7/01/15 | | | | | No Opt. Call | | | | A– | | | | 520,580 | |
| | 5,005 | | | Total Washington | | | | | | | | | | | | | 5,249,469 | |
| | | | West Virginia – 0.5% | | | | | | | | | | | | | | |
| | | | | |
| | 1,000 | | | Mason County, West Virginia, Pollution Control Revenue Bonds, Appalachian Power Company, Series 2003L, 2.000%, 10/01/22 (Mandatory put 10/01/14) | | | | | No Opt. Call | | | | Baa2 | | | | 1,016,120 | |
| | | | | |
| | 1,500 | | | West Virginia Economic Development Authority, Solid Waste Disposal Facilities Revenue Bonds, Appalachian Power Company – Amos Project, Series 2011A, 2.250%, 1/01/41 (Mandatory put 9/01/16) (Alternative Minimum Tax) | | | | | No Opt. Call | | | | BBB | | | | 1,530,855 | |
| | 2,500 | | | Total West Virginia | | | | | | | | | | | | | 2,546,975 | |
| | | | Wisconsin – 1.0% | | | | | | | | | | | | | | |
| | | | | |
| | 130 | | | Appleton, Wisconsin, Storm Water System Revenue Bonds, Series 2012, 2.000%, 4/01/14 | | | | | No Opt. Call | | | | Aa2 | | | | 131,672 | |
| | | | | |
| | 600 | | | La Crosse, Wisconsin, General Obligation Bonds, Series 2012B, 2.000%, 12/01/13 | | | | | No Opt. Call | | | | AA | | | | 606,210 | |
Portfolio of Investments
Nuveen Short Term Municipal Bond Fund (continued)
April 30, 2013
| | | | | | | | | | | | | | | | | | |
Principal
Amount (000) | | | Description (1) | | | | Optional Call
Provisions (2) | | | Ratings (3) | | | Value | |
| | | | Wisconsin (continued) | | | | | | | | | | | | | | |
| | | | | |
| $ | 1,000 | | | Wisconsin Health and Educational Facilities Authority, Revenue Bonds, Aurora Health Care, Inc., Series 2010A, 5.000%, 4/15/16 | | | | | No Opt. Call | | | | A | | | $ | 1,112,780 | |
| | | | | |
| | 765 | | | Wisconsin Health and Educational Facilities Authority, Revenue Bonds, Gundersen Lutheran, Series 2011A, 2.500%, 10/15/13 | | | | | No Opt. Call | | | | A+ | | | | 772,528 | |
| | | | | |
| | 350 | | | Wisconsin Health and Educational Facilities Authority, Revenue Bonds, Howard Young Health Care, Inc., Refunding Series 2012, 3.000%, 8/15/13 | | | | | No Opt. Call | | | | BBB+ | | | | 352,237 | |
| | | | | |
| | 1,025 | | | Wisconsin Health and Educational Facilities Authority, Revenue Bonds, Ministry Health Care, Inc., Refunding 2012C, 2.500%, 8/15/13 | | | | | No Opt. Call | | | | A+ | | | | 1,031,652 | |
| | | | | |
| | 290 | | | Wisconsin Health and Educational Facilities Authority, Revenue Bonds, Ministry Health Care, Inc., Series 2010A, 5.000%, 8/15/15 | | | | | No Opt. Call | | | | A+ | | | | 315,453 | |
| | | | | |
| | 500 | | | Wisconsin Health and Educational Facilities Authority, Revenue Bonds, Watertown Regional Medical Center, Inc., Series 2012, 2.000%, 9/01/16 | | | | | No Opt. Call | | | | BBB+ | | | | 512,120 | |
| | 4,660 | | | Total Wisconsin | | | | | | | | | | | | | 4,834,652 | |
| | | | Wyoming – 0.2% | | | | | | | | | | | | | | |
| | | | | |
| | | | Natrona County, Wyoming, Hospital Revenue Bonds, Wyoming Medical Center Project, Series 2011: | | | | | | | | | | | | | | |
| | 200 | | | 4.000%, 9/15/14 | | | | | No Opt. Call | | | | A3 | | | | 207,142 | |
| | 530 | | | 4.000%, 9/15/15 | | | | | No Opt. Call | | | | A3 | | | | 561,519 | |
| | 300 | | | 4.000%, 9/15/16 | | | | | No Opt. Call | | | | A3 | | | | 323,433 | |
| | 1,030 | | | Total Wyoming | | | | | | | | | | | | | 1,092,094 | |
| $ | 458,222 | | | Total Municipal Bonds (cost $471,349,604) | | | | | | | | | | | | | 481,590,797 | |
| | | | | |
Shares/
Principal
Amount (000) | | | Description (1) | | | | Optional Call
Provisions (2) | | | Ratings (3) | | | Value | |
| | | | SHORT-TERM INVESTMENTS – 3.3% | | | | | | | | | | | | | | |
| | | | | |
| | | | Money Market Funds – 0.1% | | | | | | | | | | | | | | |
| | | | | |
| | 378,719 | | | Federated Minnesota Municipal Cash Trust, 0.010% (7) | | | | | N/A | | | | N/A | | | $ | 378,719 | |
| | | | MUNICIPAL BONDS – 3.2% | | | | | | | | | | | | | | |
| | | | | |
| | | | Arizona – 1.1% | | | | | | | | | | | | | | |
| | | | | |
| $ | 5,500 | | | Glendale Industrial Development Authority, Arizona, Senior Living Facility Revenue Bonds, Variable Rate Demand Obligations, Friendship Retirement Corporation, Senior Lien, Series 1997, 0.310%, 1/01/27 (8) | | | | | 8/13 at 100.00 | | | | A-1+ | | | | 5,500,000 | |
| | | | Colorado – 0.4% | | | | | | | | | | | | | | |
| | | | | |
| | 2,075 | | | Colorado Educational and Cultural Facilities Authority, Revenue Bonds, Denver Seminary Project, Variable Rate Demand Obligation Series 2004, 0.310%, 7/01/34 (8) | | | | | 8/13 at 100.00 | | | | A-1+ | | | | 2,075,000 | |
| | | | New York – 0.7% | | | | | | | | | | | | | | |
| | | | | |
| | 3,500 | | | New York State Environmental Facilities Corporation, Solid Waste Disposal Revenue Bonds, Waste Management Inc. Project, Variable Rate Demand Obligations, Refunding Series 2012, 0.550%, 5/01/30 (Mandatory put 8/01/13) (8) | | | | | No Opt. Call | | | | A-2 | | | | 3,500,000 | |
| | | | Texas – 1.0% | | | | | | | | | | | | | | |
| | | | | |
| | 5,000 | | | Mission Economic Development Corporation, Texas, Solid Waste Disposal Revenue Bonds, Republic Services Inc. Project, Variable Rate Demand Obligation Series 2012, 0.600%, 1/01/26 (Mandatory put 8/01/13) (Alternative Minimum Tax) (8) | | | | | No Opt. Call | | | | A-2 | | | | 5,000,000 | |
| $ | 16,075 | | | Total Municipal Bonds | | | | | | | | | | | | | 16,075,000 | |
| | | | Total Short-Term Investments (cost $16,453,719) | | | | | | | | | | | | | 16,453,719 | |
| | | | Total Investments (cost $487,803,323) – 100.5% | | | | | | | | | | | | | 498,044,516 | |
| | | | Other Assets Less Liabilities – (0.5)% | | | | | | | | | | | | | (2,251,124) | |
| | | | Net Assets – 100% | | | | | | | | | | | | $ | 495,793,392 | |
| | (1) | | All percentages shown in the Portfolio of Investments are based on net assets. |
| | (2) | | Optional Call Provisions (not covered by the report of independent registered public accounting firm): Dates (month and year) and prices of the earliest optional call or redemption. There may be other call provisions at varying prices at later dates. Certain mortgage-backed securities may be subject to periodic principal paydowns. |
| | (3) | | Ratings (not covered by the report of independent registered public accounting firm): Using the highest of Standard & Poor’s Group (“Standard & Poor’s”), Moody’s Investor Service, Inc. (“Moody’s”) or Fitch, Inc. (“Fitch”) rating. Ratings below BBB by Standard & Poor’s, Baa by Moody’s or BBB by Fitch are considered to be below investment grade. Holdings designated N/R are not rated by any of these national rating agencies. |
| | (4) | | Backed by an escrow or trust containing sufficient U.S. Government or U.S. Government agency securities, which ensure the timely payment of principal and interest. Certain bonds backed by U.S. Government or agency securities are regarded as having an implied rating equal to the rating of such securities. |
| | (5) | | During July 2010, the original issue for this security (1,000,000 par, 5.500% coupon and May, 15, 2015 maturity) was restructured into two new securities. The first security, which is 30% of the original issue, has 300,000 par, 0.000% coupon and May 15, 2050 maturity. The second security, which is the remaining 70% of the issue, has a 700,000 par, 5.500% coupon and May 15, 2018 maturity. During September 2011, the Adviser concluded this issue is not likely to meet its future interest payment obligations and has directed the Fund’s custodian to cease accruing additional income on the Fund’s records. |
| | (6) | | At or subsequent to the end of the reporting period, this security is non-income producing. Non-income producing security, in the case of a fixed-income security, generally denotes that the issuer has (1) defaulted on the payment of principal or interest, (2) is under the protection of the Federal Bankruptcy Court or (3) the Fund’s Adviser has concluded that the issue is not likely to meet its future interest payment obligations and has directed the Fund’s custodian to cease accruing additional income on the Fund’s records. |
| | (7) | | The rate shown is the annualized seven-day effective yield as of the end of the reporting period. |
| | (8) | | Investment has a maturity of more than one year, but has variable rate and demand features which qualify it as a short-term investment. The rate disclosed is that in effect as of the end of the reporting period. This rate changes periodically based on market conditions or a specified market index. |
| | WI/DD | | Investment, or a portion of investment purchased on a when-issued or delayed delivery basis. |
| | (ETM) | | Escrowed to maturity. |
| | Reg S | | Regulation S allows U.S. companies to sell securities to persons or entities located outside of the United States without registering those securities with the Securities and Exchange Commission. Specifically, Regulation S provides a safe harbor from the registration requirements of the Securities Act for the offers and sales of securities by both foreign and domestic issuers that are made outside the United States. |
See accompanying notes to financial statements.
Statement of Assets and Liabilities
April 30, 2013
| | | | | | | | | | | | |
| | | All-American | | | High Yield | | | Inflation Protected | |
Assets | | | | | | | | | | | | |
Investments, at value (cost $2,703,070,503, $8,605,905,282, and $105,065,988, respectively) | | $ | 2,968,610,370 | | | $ | 9,368,301,319 | | | $ | 107,704,799 | |
Cash | | | 11,188,739 | | | | 82,369,033 | | | | 2,766,924 | |
Unrealized appreciation on: | | | | | | | | | | | | |
Credit default swaps | | | — | | | | 416,183 | | | | — | |
Forward swaps | | | — | | |
| 5,645,284
|
| | | — | |
Credit default swaps premiums paid | | | — | | | | 1,125,000 | | | | — | |
Receivables: | | | | | | | | | | | | |
Interest | | | 42,931,779 | | | | 194,740,476 | | | | 1,121,367 | |
Investments sold | | | 36,902,567 | | | | 29,870,830 | | | | — | |
Shares sold | | | 6,736,048 | | | | 37,688,049 | | | | 2,561,638 | |
Other assets | | | 229,663 | | | | 658,333 | | | | 22 | |
Total assets | | | 3,066,599,166 | | | | 9,720,814,507 | | | | 114,154,750 | |
Liabilities | | | | | | | | | | | | |
Borrowings | | | — | | | | 40,000,000 | | | | — | |
Cash overdraft | | | — | | | | — | | | | — | |
Floating rate obligations | | | 18,520,000 | | | | 191,211,000 | | | | — | |
Unrealized depreciation on consumer price index swaps, net | | | — | | | | — | | | | 1,077,858 | |
Payables: | | | | | | | | | | | | |
Dividends | | | 3,251,616 | | | | 14,629,974 | | | | 14,084 | |
Investments purchased | | | 22,966,868 | | | | 45,092,738 | | | | 560,385 | |
Shares redeemed | | | 6,365,128 | | | | 30,779,147 | | | | 395,097 | |
Accrued expenses: | | | | | | | | | | | | |
Management fees | | | 1,034,566 | | | | 3,815,006 | | | | 27,453 | |
Directors/Trustees fees | | | 100,321 | | | | 418,998 | | | | 698 | |
12b-1 distribution and service fees | | | 507,540 | | | | 1,620,396 | | | | 18,874 | |
Other | | | 638,304 | | | | 1,845,882 | | | | 23,944 | |
Total liabilities | | | 53,384,343 | | | | 329,413,141 | | | | 2,118,393 | |
Net assets | | $ | 3,013,214,823 | | | $ | 9,391,401,366 | | | $ | 112,036,357 | |
Class A Shares | | | | | | | | | | | | |
Net assets | | $ | 1,230,355,976 | | | $ | 3,162,447,949 | | | $ | 61,926,092 | |
Shares outstanding | | | 104,663,108 | | | | 181,675,254 | | | | 5,474,010 | |
Net asset value per share | | $ | 11.76 | | | $ | 17.41 | | | $ | 11.31 | |
Offering price per share (net asset value per share plus maximum sales charge of 4.20%, 4.20% and 3.00%, respectively, of offering price) | | $ | 12.28 | | | $ | 18.17 | | | $ | 11.66 | |
Class B Shares | | | | | | | | | | | | |
Net assets | | $ | 4,451,813 | | | $ | 22,248,560 | | | | N/A | |
Shares outstanding | | | 378,066 | | | | 1,279,603 | | | | N/A | |
Net asset value and offering price per share | | $ | 11.78 | | | $ | 17.39 | | | | N/A | |
Class C Shares | | | | | | | | | | | | |
Net assets | | $ | 494,746,730 | | | $ | 1,780,580,820 | | | $ | 15,064,220 | |
Shares outstanding | | | 42,071,893 | | | | 102,401,021 | | | | 1,332,612 | |
Net asset value and offering price per share | | $ | 11.76 | | | $ | 17.39 | | | $ | 11.30 | |
Class I Shares | | | | | | | | | | | | |
Net assets | | $ | 1,283,660,304 | | | $ | 4,426,124,037 | | | $ | 35,046,045 | |
Shares outstanding | | | 108,803,286 | | | | 254,285,325 | | | | 3,094,911 | |
Net asset value and offering price per share | | $ | 11.80 | | | $ | 17.41 | | | $ | 11.32 | |
Net assets consist of: | | | | | | | | | | | | |
Capital paid-in | | $ | 2,791,220,218 | | | $ | 9,928,647,405 | | | $ | 110,681,553 | |
Undistributed (Over-distribution of) net investment income | | | 2,031,115 | | | | 7,131,601 | | | | (96,831 | ) |
Accumulated net realized gain (loss) | | | (45,576,377 | ) | | | (1,312,835,144 | ) | | | (109,318 | ) |
Net unrealized appreciation (depreciation) | | | 265,539,867 | | | | 768,457,504 | | | | 1,560,953 | |
Net assets | | $ | 3,013,214,823 | | | $ | 9,391,401,366 | | | $ | 112,036,357 | |
Authorized shares – per class | | | Unlimited | | | | Unlimited | | | | Unlimited | |
Par value per share | | $ | 0.01 | | | $ | 0.01 | | | $ | 0.01 | |
| N/A | – Inflation Protected is not authorized to issue Class B Shares. |
See accompanying notes to financial statements.
| | | | | | | | | | | | | | | | |
| | | Intermediate
Duration | | | Limited Term | | | Short Duration
High Yield | | | Short Term | |
Assets | | | | | | | | | | | | | | | | |
Investments, at value (cost $3,836,704,196, $3,501,109,088, $113,867,643 and $487,803,323, respectively) | | $ | 4,117,049,163 | | | $ | 3,654,274,764 | | | $ | 114,501,589 | | | $ | 498,044,516 | |
Cash | | | 7,860,434 | | | | 8,785,563 | | | | 5,245,984 | | | | — | |
Unrealized appreciation on: | | | | | | | | | | | | | | | | |
Credit default swaps | | | — | | | | — | | | | — | | | | — | |
Forward swaps | | | — | | | | — | | | | — | | | | — | |
Credit default swaps premiums paid | | | — | | | | — | | | | — | | | | — | |
Receivables: | | | | | | | | | | | | | �� | | | |
Interest | | | 57,046,686 | | | | 46,866,829 | | | | 1,618,823 | | | | 4,871,055 | |
Investments sold | | | 31,709,583 | | | | 4,971,903 | | | | — | | | | — | |
Shares sold | | | 8,142,987 | | | | 16,757,162 | | | | 36,340,092 | | | | 1,745,936 | |
Other assets | | | 383,345 | | | | 168,392 | | | | — | | | | 6,423 | |
Total assets | | | 4,222,192,198 | | | | 3,731,824,613 | | | | 157,706,488 | | | | 504,667,930 | |
Liabilities | | | | | | | | | | | | | | | | |
Borrowings | | | — | | | | — | | | | — | | | | — | |
Cash overdraft | | | — | | | | — | | | | — | | | | 874,834 | |
Floating rate obligations | | | — | | | | — | | | | — | | | | — | |
Unrealized depreciation on consumer price index swaps, net | | | — | | | | — | | | | — | | | | — | |
Payables: | | | | | | | | | | | | | | | | |
Dividends | | | 4,547,602 | | | | 1,961,467 | | | | 78,497 | | | | 452,573 | |
Investments purchased | | | 16,711,382 | | | | 9,860,891 | | | | 14,461,983 | | | | 6,479,570 | |
Shares redeemed | | | 5,361,583 | | | | 8,304,114 | | | | 316,681 | | | | 671,983 | |
Accrued expenses: | | | | | | | | | | | | | | | | |
Management fees | | | 1,465,789 | | | | 1,094,449 | | | | 22,671 | | | | 260,787 | |
Directors/Trustees fees | | | 396,311 | | | | 183,273 | | | | 294 | | | | 8,475 | |
12b-1 distribution and service fees | | | 189,855 | | | | 562,249 | | | | 8,266 | | | | 21,331 | |
Other | | | 740,951 | | | | 669,170 | | | | 33,388 | | | | 104,985 | |
Total liabilities | | | 29,413,473 | | | | 22,635,613 | | | | 14,921,780 | | | | 8,874,538 | |
Net assets | | $ | 4,192,778,725 | | | $ | 3,709,189,000 | | | $ | 142,784,708 | | | $ | 495,793,392 | |
Class A Shares | | | | | | | | | | | | | | | | |
Net assets | | $ | 512,138,970 | | | $ | 1,438,077,392 | | | $ | 66,923,912 | | | $ | 101,836,133 | |
Shares outstanding | | | 54,586,825 | | | | 127,636,524 | | | | 6,614,387 | | | | 9,987,842 | |
Net asset value per share | | $ | 9.38 | | | $ | 11.27 | | | $ | 10.12 | | | $ | 10.20 | |
Offering price per share (net asset value per share plus maximum sales charge of 3.00%, 2.50%, 2.50% and 2.50%, respectively, of offering price) | | $ | 9.67 | | | $ | 11.56 | | | $ | 10.38 | | | $ | 10.46 | |
Class B Shares | | | | | | | | | | | | | | | | |
Net assets | | $ | 1,939,783 | | | | N/A | | | | N/A | | | | N/A | |
Shares outstanding | | | 206,185 | | | | N/A | | | | N/A | | | | N/A | |
Net asset value and offering price per share | | $ | 9.41 | | | | N/A | | | | N/A | | | | N/A | |
Class C Shares | | | | | | | | | | | | | | | | |
Net assets | | $ | 158,004,017 | | | $ | 721,302,455 | | | $ | 4,844,206 | | | $ | 10,617,797 | |
Shares outstanding | | | 16,797,228 | | | | 64,258,094 | | | | 478,747 | | | | 1,042,572 | |
Net asset value and offering price per share | | $ | 9.41 | | | $ | 11.23 | | | $ | 10.12 | | | $ | 10.18 | |
Class I Shares | | | | | | | | | | | | | | | | |
Net assets | | $ | 3,520,695,955 | | | $ | 1,549,809,153 | | | $ | 71,016,590 | | | $ | 383,339,462 | |
Shares outstanding | | | 374,295,867 | | | | 138,261,413 | | | | 7,016,787 | | | | 37,598,330 | |
Net asset value and offering price per share | | $ | 9.41 | | | $ | 11.21 | | | $ | 10.12 | | | $ | 10.20 | |
Net assets consist of: | | | | | | | | | | | | | | | | |
Capital paid-in | | $ | 3,919,684,303 | | | $ | 3,577,746,560 | | | $ | 142,173,721 | | | $ | 485,927,180 | |
Undistributed (Over-distribution of) net investment income | | | 5,832,132 | | | | (632,441 | ) | | | (20,276 | ) | | | 5,952 | |
Accumulated net realized gain (loss) | | | (13,082,677 | ) | | | (21,090,795 | ) | | | (2,683 | ) | | | (380,933 | ) |
Net unrealized appreciation (depreciation) | | | 280,344,967 | | | | 153,165,676 | | | | 633,946 | | | | 10,241,193 | |
Net assets | | $ | 4,192,778,725 | | | $ | 3,709,189,000 | | | $ | 142,784,708 | | | $ | 495,793,392 | |
Authorized shares – per class | | | Unlimited | | | | Unlimited | | | | Unlimited | | | | 2 billion | |
Par value per share | | $ | 0.01 | | | $ | 0.01 | | | $ | 0.01 | | | $ | 0.0001 | |
| N/A | – Limited Term, Short Duration High Yield and Short Term are not authorized to issue Class B Shares. |
See accompanying notes to financial statements.
Statement of Operations
Year Ended April 30, 2013
| | | | | | | | | | | | |
| | | All-American | | | High Yield | | | Inflation Protected | |
Investment Income | | $ | 133,022,578 | | | $ | 561,479,741 | | | $ | 1,593,586 | |
Expenses | | | | | | | | | | | | |
Management fees | | | 11,921,414 | | | | 41,193,534 | | | | 257,475 | |
12b-1 service fees – Class A | | | 2,263,550 | | | | 5,758,645 | | | | 54,011 | |
12b-1 distribution and service fees – Class B | | | 58,789 | | | | 274,962 | | | | N/A | |
12b-1 distribution and service fees – Class C | | | 3,315,326 | | | | 12,140,123 | | | | 63,414 | |
Shareholder servicing agent fees and expenses | | | 1,216,902 | | | | 3,592,338 | | | | 26,191 | |
Interest expense | | | 128,829 | | | | 2,855,523 | | | | — | |
Custodian fees and expenses | | | 398,383 | | | | 1,110,738 | | | | 38,668 | |
Directors/Trustees fees and expenses | | | 71,461 | | | | 220,486 | | | | 1,633 | |
Professional fees | | | 113,389 | | | | 2,352,128 | | | | 28,316 | |
Shareholder reporting expenses | | | 305,405 | | | | 714,500 | | | | 15,171 | |
Federal and state registration fees | | | 450,563 | | | | 735,864 | | | | 75,232 | |
Other expenses | | | 112,790 | | | | 158,757 | | | | 5,528 | |
Total expenses before fee waiver/expense reimbursement | | | 20,356,801 | | | | 71,107,598 | | | | 565,639 | |
Fee waiver/expense reimbursement | | | — | | | | — | | | | (134,886 | ) |
Net expenses | | | 20,356,801 | | | | 71,107,598 | | | | 430,753 | |
Net investment income (loss) | | | 112,665,777 | | | | 490,372,143 | | | | 1,162,833 | |
Realized and Unrealized Gain (Loss) | | | | | | | | | | | | |
Net realized gain (loss) from: | | | | | | | | | | | | |
Investments | | | 4,466,708 | | | | (9,485,775 | ) | | | 40,975 | |
Swaps | | | — | | | | (85,585,217 | ) | | | (152,000 | ) |
Change in net unrealized appreciation (depreciation) of: | | | | | | | | | | | | |
Investments | | | 87,628,674 | | | | 573,041,707 | | | | 1,826,189 | |
Swaps | | | — | | | | 76,199,090 | | | | (1,001,260 | ) |
Net realized and unrealized gain (loss) | | | 92,095,382 | | | | 554,169,805 | | | | 713,904 | |
Net increase (decrease) in net assets from operations | | $ | 204,761,159 | | | $ | 1,044,541,948 | | | $ | 1,876,737 | |
| N/A | – Inflation Protected is not authorized to issue Class B Shares. |
See accompanying notes to financial statements.
| | | | | | | | | | | | | | | | |
| | | Intermediate
Duration | | | Limited Term | | | Short Duration
High Yield | | | Short Term | |
Investment Income | | $ | 154,381,040 | | | $ | 92,585,465 | | | $ | 253,752 | | | $ | 9,442,668 | |
Expenses | | | | | | | | | | | | | | | | |
Management fees | | | 16,345,401 | | | | 12,252,048 | | | | 47,584 | | | | 1,773,984 | |
12b-1 service fees – Class A | | | 953,255 | | | | 2,576,883 | | | | 7,210 | | | | 134,214 | |
12b-1 distribution and service fees – Class B | | | 22,874 | | | | N/A | | | | N/A | | | | N/A | |
12b-1 distribution and service fees – Class C | | | 1,099,821 | | | | 3,797,828 | | | | 3,183 | | | | 30,519 | |
Shareholder servicing agent fees and expenses | | | 1,756,436 | | | | 1,692,031 | | | | 373 | | | | 81,980 | |
Interest expense | | | — | | | | — | | | | — | | | | — | |
Custodian fees and expenses | | | 543,069 | | | | 452,381 | | | | 1,226 | | | | 152,008 | |
Directors/Trustees fees and expenses | | | 103,254 | | | | 87,004 | | | | 294 | | | | 10,890 | |
Professional fees | | | 185,184 | | | | 145,980 | | | | 51,513 | | | | 40,581 | |
Shareholder reporting expenses | | | 357,657 | | | | 313,853 | | | | 1,709 | | | | 72,102 | |
Federal and state registration fees | | | 225,444 | | | | 334,485 | | | | 6,984 | | | | 75,561 | |
Other expenses | | | 184,971 | | | | 87,113 | | | | 647 | | | | 11,162 | |
Total expenses before fee waiver/expense reimbursement | | | 21,777,366 | | | | 21,739,606 | | | | 120,723 | | | | 2,383,001 | |
Fee waiver/expense reimbursement | | | — | | | | — | | | | (58,514 | ) | | | — | |
Net expenses | | | 21,777,366 | | | | 21,739,606 | | | | 62,209 | | | | 2,383,001 | |
Net investment income (loss) | | | 132,603,674 | | | | 70,845,859 | | | | 191,543 | | | | 7,059,667 | |
Realized and Unrealized Gain (Loss) | | | | | | | | | | | | | | | | |
Net realized gain (loss) from: | | | | | | | | | | | | | | | | |
Investments | | | 4,892,455 | | | | (1,800,625 | ) | | | (2,683 | ) | | | 75,724 | |
Swaps | | | — | | | | — | | | | — | | | | — | |
Change in net unrealized appreciation
(depreciation) of: | | | | | | | | | | | | | | | | |
Investments | | | 53,292,933 | | | | 22,813,097 | | | | 633,946 | | | | 828,436 | |
Swaps | | | — | | | | — | | | | — | | | | — | |
Net realized and unrealized gain (loss) | | | 58,185,388 | | | | 21,012,472 | | | | 631,263 | | | | 904,160 | |
Net increase (decrease) in net assets from operations | | $ | 190,789,062 | | | $ | 91,858,331 | | | $ | 822,806 | | | $ | 7,963,827 | |
| N/A | – Limited Term, Short Duration High Yield and Short Term are not authorized to issue Class B Shares. |
See accompanying notes to financial statements.
Statement of Changes in Net Assets
| | | | | | | | | | | | | | | | |
| | | All-American | | | High Yield | |
| | | Year Ended
4/30/13 | | | Year Ended
4/30/12 | | | Year Ended
4/30/13 | | | Year Ended
4/30/12 | |
Operations | | | | | | | | | | | | | | | | |
Net investment income (loss) | | $ | 112,665,777 | | | $ | 38,821,606 | | | $ | 490,372,143 | | | $ | 380,137,142 | |
Net realized gain (loss) from: | | | | | | | | | | | | | | | | |
Investments | | | 4,466,708 | | | | 3,757,562 | | | | (9,485,775 | ) | | | (37,198,264 | ) |
Swaps | | | — | | | | — | | | | (85,585,217 | ) | | | (25,104,832 | ) |
Change in net unrealized appreciation (depreciation) of: | | | | | | | | | | | | | | | | |
Investments | | | 87,628,674 | | | | 77,163,841 | | | | 573,041,707 | | | | 796,774,447 | |
Swaps | | | — | | | | — | | | | 76,199,090 | | | | (56,488,314 | ) |
Net increase (decrease) in net assets from operations | | | 204,761,159 | | | | 119,743,009 | | | | 1,044,541,948 | | | | 1,058,120,179 | |
Distributions to Shareholders | | | | | | | | | | | | | | | | |
From net investment income: | | | | | | | | | | | | | | | | |
Class A | | | (46,205,698 | ) | | | (22,289,347 | ) | | | (171,001,738 | ) | | | (137,207,041 | ) |
Class B | | | (209,917 | ) | | | (199,319 | ) | | | (1,513,973 | ) | | | (2,584,434 | ) |
Class C | | | (15,687,070 | ) | | | (9,249,471 | ) | | | (87,403,077 | ) | | | (76,509,172 | ) |
Class I | | | (52,562,816 | ) | | | (8,042,102 | ) | | | (224,015,932 | ) | | | (154,226,585 | ) |
From accumulated net realized gains: | | | | | | | | | | | | | | | | |
Class A | | | — | | | | — | | | | — | | | | — | |
Class B | | | — | | | | — | | | | — | | | | — | |
Class C | | | — | | | | — | | | | — | | | | — | |
Class I | | | — | | | | — | | | | — | | | | — | |
Decrease in net assets from distributions to shareholders | | | (114,665,501 | ) | | | (39,780,239 | ) | | | (483,934,720 | ) | | | (370,527,232 | ) |
Fund Share Transactions | | | | | | | | | | | | | | | | |
Fund reorganization | | | — | | | | 1,423,036,439 | | | | — | | | | — | |
Proceeds from sale of shares | | | 936,248,087 | | | | 483,473,350 | | | | 4,715,783,350 | | | | 2,582,827,293 | |
Proceeds from shares issued to shareholders due to reinvestment of distributions | | | 76,014,158 | | | | 25,569,376 | | | | 323,290,149 | | | | 244,603,528 | |
| | | 1,012,262,245 | | | | 1,932,079,165 | | | | 5,039,073,499 | | | | 2,827,430,821 | |
Cost of shares redeemed | | | (549,407,373 | ) | | | (168,996,481 | ) | | | (2,668,557,714 | ) | | | (1,573,830,218 | ) |
Net increase (decrease) in net assets from Fund share transactions | | | 462,854,872 | | | | 1,763,082,684 | | | | 2,370,515,785 | | | | 1,253,600,603 | |
Net increase (decrease) in net assets | | | 552,950,530 | | | | 1,843,045,454 | | | | 2,931,123,013 | | | | 1,941,193,550 | |
Net assets at the beginning of period | | | 2,460,264,293 | | | | 617,218,839 | | | | 6,460,278,353 | | | | 4,519,084,803 | |
Net assets at the end of period | | $ | 3,013,214,823 | | | $ | 2,460,264,293 | | | $ | 9,391,401,366 | | | $ | 6,460,278,353 | |
Undistributed (Over-distribution of) net investment income at the end of period | | $ | 2,031,115 | | | $ | 4,007,698 | | | $ | 7,131,601 | | | $ | 1,463,181 | |
See accompanying notes to financial statements.
| | | | | | | | | | | | | | | | |
| | | Inflation Protected | | | Intermediate Duration | |
| | | Year Ended
4/30/13 | | | Year Ended
4/30/12 | | | Year Ended
4/30/13 | | | Year Ended
4/30/12 | |
Operations | | | | | | | | | | | | | | | | |
Net investment income (loss) | | $ | 1,162,833 | | | $ | 283,150 | | | $ | 132,603,674 | | | $ | 109,271,453 | |
Net realized gain (loss) from: | | | | | | | | | | | | | | | | |
Investments | | | 40,975 | | | | 37,913 | | | | 4,892,455 | | | | (7,763,209 | ) |
Swaps | | | (152,000 | ) | | | 7,500 | | | | — | | | | — | |
Change in net unrealized appreciation (depreciation) of: | | | | | | | | | | | | | | | | |
Investments | | | 1,826,189 | | | | 689,981 | | | | 53,292,933 | | | | 126,995,860 | |
Swaps | | | (1,001,260 | ) | | | (126,616 | ) | | | — | | | | — | |
Net increase (decrease) in net assets from operations | | | 1,876,737 | | | | 891,928 | | | | 190,789,062 | | | | 228,504,104 | |
Distributions to Shareholders | | | | | | | | | | | | | | | | |
From net investment income: | | | | | | | | | | | | | | | | |
Class A | | | (620,468 | ) | | | (131,224 | ) | | | (15,847,282 | ) | | | (15,014,228 | ) |
Class B | | | N/A | | | | N/A | | | | (63,171 | ) | | | (122,549 | ) |
Class C | | | (150,431 | ) | | | (62,818 | ) | | | (4,109,286 | ) | | | (3,937,448 | ) |
Class I | | | (491,789 | ) | | | (95,759 | ) | | | (115,311,143 | ) | | | (92,588,588 | ) |
From accumulated net realized gains: | | | | | | | | | | | | | | | | |
Class A | | | (22,063 | ) | | | — | | | | — | | | | — | |
Class B | | | N/A | | | | N/A | | | | — | | | | — | |
Class C | | | (7,575 | ) | | | — | | | | — | | | | — | |
Class I | | | (16,484 | ) | | | — | | | | — | | | | — | |
Decrease in net assets from distributions to shareholders | | | (1,308,810 | ) | | | (289,801 | ) | | | (135,330,882 | ) | | | (111,662,813 | ) |
Fund Share Transactions | | | | | | | | | | | | | | | | |
Fund reorganization | | | — | | | | — | | | | — | | | | 781,206,829 | |
Proceeds from sale of shares | | | 107,454,355 | | | | 13,656,522 | | | | 1,038,513,585 | | | | 573,100,813 | |
Proceeds from shares issued to shareholders due to reinvestment of distributions | | | 1,023,234 | | | | 77,945 | | | | 85,812,345 | | | | 80,429,039 | |
| | | 108,477,589 | | | | 13,734,467 | | | | 1,124,325,930 | | | | 1,434,736,681 | |
Cost of shares redeemed | | | (15,260,445 | ) | | | (1,340,279 | ) | | | (614,364,991 | ) | | | (426,491,995 | ) |
Net increase (decrease) in net assets from Fund share transactions | | | 93,217,144 | | | | 12,394,188 | | | | 509,960,939 | | | | 1,008,244,686 | |
Net increase (decrease) in net assets | | | 93,785,071 | | | | 12,996,315 | | | | 565,419,119 | | | | 1,125,085,977 | |
Net assets at the beginning of period | | | 18,251,286 | | | | 5,254,971 | | | | 3,627,359,606 | | | | 2,502,273,629 | |
Net assets at the end of period | | $ | 112,036,357 | | | $ | 18,251,286 | | | $ | 4,192,778,725 | | | $ | 3,627,359,606 | |
Undistributed (Over-distribution of) net investment income at the end of period | | $ | (96,831 | ) | | $ | 5,615 | | | $ | 5,832,132 | | | $ | 8,562,179 | |
| N/A | – Inflation Protected is not authorized to issue Class B Shares. |
See accompanying notes to financial statements.
Statement of Changes in Net Assets (continued)
| | | | | | | | | | | | |
| | | Limited Term | | | Short Duration
High Yield | |
| | | Year Ended
4/30/13 | | | Year Ended
4/30/12 | | | For the period 2/01/13
(commencement of
operations) through
4/30/13 | |
Operations | | | | | | | | | | | | |
Net investment income (loss) | | $ | 70,845,859 | | | $ | 68,110,688 | | | $ | 191,543 | |
Net realized gain (loss) from: | | | | | | | | | | | | |
Investments | | | (1,800,625 | ) | | | (6,476,130 | ) | | | (2,683 | ) |
Swaps | | | — | | | | — | | | | — | |
Change in net unrealized appreciation (depreciation) of: | | | | | | | | | | | | |
Investments | | | 22,813,097 | | | | 81,520,207 | | | | 633,946 | |
Swaps | | | — | | | | — | | | | — | |
Net increase (decrease) in net assets from operations | | | 91,858,331 | | | | 143,154,765 | | | | 822,806 | |
Distributions to Shareholders | | | | | | | | | | | | |
From net investment income: | | | | | | | | | | | | |
Class A | | | (27,306,390 | ) | | | (26,080,802 | ) | | | (100,495 | ) |
Class B | | | N/A | | | | N/A | | | | N/A | |
Class C | | | (12,158,830 | ) | | | (13,122,169 | ) | | | (10,048 | ) |
Class I | | | (31,433,207 | ) | | | (26,502,771 | ) | | | (111,669 | ) |
From accumulated net realized gains: | | | | | | | | | | | | |
Class A | | | — | | | | — | | | | — | |
Class B | | | N/A | | | | N/A | | | | N/A | |
Class C | | | — | | | | — | | | | — | |
Class I | | | — | | | | — | | | | — | |
Decrease in net assets from distributions to shareholders | | | (70,898,427 | ) | | | (65,705,742 | ) | | | (222,212 | ) |
Fund Share Transactions | | | | | | | | | | | | |
Fund reorganization | | | — | | | | — | | | | — | |
Proceeds from sale of shares | | | 1,649,178,808 | | | | 1,295,654,768 | | | | 142,743,232 | |
Proceeds from shares issued to shareholders due to reinvestment of distributions | | | 46,901,460 | | | | 39,275,909 | | | | 113,268 | |
| | | 1,696,080,268 | | | | 1,334,930,677 | | | | 142,856,500 | |
Cost of shares redeemed | | | (959,574,505 | ) | | | (793,001,408 | ) | | | (672,386 | ) |
Net increase (decrease) in net assets from Fund share transactions | | | 736,505,763 | | | | 541,929,269 | | | | 142,184,114 | |
Net increase (decrease) in net assets | | | 757,465,667 | | | | 619,378,292 | | | | 142,784,708 | |
Net assets at the beginning of period | | | 2,951,723,333 | | | | 2,332,345,041 | | | | — | |
Net assets at the end of period | | $ | 3,709,189,000 | | | $ | 2,951,723,333 | | | $ | 142,784,708 | |
Undistributed (Over-distribution of) net investment income at the end of period | | $ | (632,441 | ) | | $ | (341,438 | ) | | $ | (20,276 | ) |
| N/A – | Limited Term and Short Duration High Yield are not authorized to issue Class B Shares. |
See accompanying notes to financial statements.
| | | | | | | | |
| | | Short Term | |
| | | Year Ended
4/30/13 | | | Year Ended
4/30/12 | |
Operations | | | | | | | | |
Net investment income (loss) | | $ | 7,059,667 | | | $ | 7,001,170 | |
Net realized gain (loss) from: | | | | | | | | |
Investments | | | 75,724 | | | | 347,473 | |
Swaps | | | — | | | | — | |
Change in net unrealized appreciation (depreciation) of: | | | | | | | | |
Investments | | | 828,436 | | | | 5,666,989 | |
Swaps | | | — | | | | — | |
Net increase (decrease) in net assets from operations | | | 7,963,827 | | | | 13,015,632 | |
Distributions to Shareholders | | | | | | | | |
From net investment income: | | | | | | | | |
Class A | | | (1,139,066 | ) | | | (363,371 | ) |
Class B | | | N/A | | | | N/A | |
Class C | | | (72,558 | ) | | | (2,244 | ) |
Class I | | | (6,629,259 | ) | | | (6,362,952 | ) |
From accumulated net realized gains: | | | | | | | | |
Class A | | | — | | | | — | |
Class B | | | N/A | | | | N/A | |
Class C | | | — | | | | — | |
Class I | | | — | | | | — | |
Decrease in net assets from distributions to shareholders | | | (7,840,883 | ) | | | (6,728,567 | ) |
Fund Share Transactions | | | | | | | | |
Fund reorganization | | | — | | | | — | |
Proceeds from sale of shares | | | 433,812,513 | | | | 208,239,858 | |
Proceeds from shares issued to shareholders due to reinvestment of distributions | | | 1,969,999 | | | | 743,063 | |
| | | 435,782,512 | | | | 208,982,921 | |
Cost of shares redeemed | | | (280,040,164 | ) | | | (160,478,455 | ) |
Net increase (decrease) in net assets from Fund share transactions | | | 155,742,348 | | | | 48,504,466 | |
Net increase (decrease) in net assets | | | 155,865,292 | | | | 54,791,531 | |
Net assets at the beginning of period | | | 339,928,100 | | | | 285,136,569 | |
Net assets at the end of period | | $ | 495,793,392 | | | $ | 339,928,100 | |
Undistributed (Over-distribution of) net investment income at the end of period | | $ | 5,952 | | | $ | 787,168 | |
| N/A | – Short Term is not authorized to issue Class B Shares. |
See accompanying notes to financial statements.
Financial Highlights
| | | | | | | | | | | | | | | | | | | | | | | | | | | | | | | | |
| Selected data for a share outstanding throughout each period: | | | | | | | |
|
| Class (Commencement Date) | |
| | | | | | Investment Operations | | | Less Distributions | | | | |
| | | | | | | |
| ALL-AMERICAN | | | | | | | | | | | | | | | | | | | | | | |
| | | | | | | | |
Year Ended
April 30, | | Beginning
Net
Asset
Value | | | Net
Invest-
ment
Income
(Loss)(a) | | | Net
Realized/
Unrealized Gain
(Loss) | | | Total | | | From
Net
Invest-
ment
Income | | | From
Accumulated
Net Realized
Gains | | | Total | | | Ending
Net
Asset
Value | |
Class A (10/88) | | | | | | | | | | | | | | | | | | | | | | | | | | | | | |
2013 | | $ | 11.36 | | | $ | .47 | | | $ | .41 | | | $ | .88 | | | $ | (.48 | ) | | $ | — | | | $ | (.48 | ) | | $ | 11.76 | |
2012 | | | 10.24 | | | | .54 | | | | 1.13 | | | | 1.67 | | | | (.55 | ) | | | — | | | | (.55 | ) | | | 11.36 | |
2011 | | | 10.63 | | | | .56 | | | | (.40 | ) | | | .16 | | | | (.55 | ) | | | — | | | | (.55 | ) | | | 10.24 | |
2010 | | | 9.54 | | | | .56 | | | | 1.06 | | | | 1.62 | | | | (.53 | ) | | | — | | | | (.53 | ) | | | 10.63 | |
2009 | | | 10.50 | | | | .53 | | | | (1.00 | ) | | | (.47 | ) | | | (.49 | ) | | | — | | | | (.49 | ) | | | 9.54 | |
Class B (2/97) | | | | | | | | | | | | | | | | | | | | | | | | | | | | | |
2013 | | | 11.38 | | | | .38 | | | | .41 | | | | .79 | | | | (.39 | ) | | | — | | | | (.39 | ) | | | 11.78 | |
2012 | | | 10.27 | | | | .46 | | | | 1.12 | | | | 1.58 | | | | (.47 | ) | | | — | | | | (.47 | ) | | | 11.38 | |
2011 | | | 10.66 | | | | .48 | | | | (.39 | ) | | | .09 | | | | (.48 | ) | | | — | | | | (.48 | ) | | | 10.27 | |
2010 | | | 9.57 | | | | .49 | | | | 1.06 | | | | 1.55 | | | | (.46 | ) | | | — | | | | (.46 | ) | | | 10.66 | |
2009 | | | 10.53 | | | | .46 | | | | (1.01 | ) | | | (.55 | ) | | | (.41 | ) | | | — | | | | (.41 | ) | | | 9.57 | |
Class C (6/93) | | | | | | | | | | | | | | | | | | | | | | | | | | | | | |
2013 | | | 11.37 | | | | .40 | | | | .41 | | | | .81 | | | | (.42 | ) | | | — | | | | (.42 | ) | | | 11.76 | |
2012 | | | 10.24 | | | | .48 | | | | 1.14 | | | | 1.62 | | | | (.49 | ) | | | — | | | | (.49 | ) | | | 11.37 | |
2011 | | | 10.63 | | | | .50 | | | | (.39 | ) | | | .11 | | | | (.50 | ) | | | — | | | | (.50 | ) | | | 10.24 | |
2010 | | | 9.55 | | | | .50 | | | | 1.06 | | | | 1.56 | | | �� | (.48 | ) | | | — | | | | (.48 | ) | | | 10.63 | |
2009 | | | 10.50 | | | | .48 | | | | (1.00 | ) | | | (.52 | ) | | | (.43 | ) | | | — | | | | (.43 | ) | | | 9.55 | |
Class I (2/97) | | | | | | | | | | | | | | | | | | | | | | | | | | | | | |
2013 | | | 11.40 | | | | .49 | | | | .41 | | | | .90 | | | | (.50 | ) | | | — | | | | (.50 | ) | | | 11.80 | |
2012 | | | 10.28 | | | | .55 | | | | 1.14 | | | | 1.69 | | | | (.57 | ) | | | — | | | | (.57 | ) | | | 11.40 | |
2011 | | | 10.67 | | | | .58 | | | | (.39 | ) | | | .19 | | | | (.58 | ) | | | — | | | | (.58 | ) | | | 10.28 | |
2010 | | | 9.58 | | | | .58 | | | | 1.07 | | | | 1.65 | | | | (.56 | ) | | | — | | | | (.56 | ) | | | 10.67 | |
2009 | | | 10.54 | | | | .55 | | | | (1.00 | ) | | | (.45 | ) | | | (.51 | ) | | | — | | | | (.51 | ) | | | 9.58 | |
| | | | | | | | | | | | | | | | | | | | | | |
| | | | | |
| | | | | | | | | | | | | | | | | |
| | | | Ratios/Supplemental Data | |
| | | | | | | Ratios to Average
Net Assets | | | | |
| | | | | |
Total
Return(b) | | |
Ending
Net
Assets
(000) | | | Expenses
Including
Interest(c) | | | Expenses
Excluding
Interest | | | Net
Invest-
ment
Income
(Loss) | | | Portfolio
Turnover
Rate | |
| | | | | | | | | | | | | | | | | | | | | | |
| | 7.83 | % | | $ | 1,230,356 | | | | .72 | % | | | .72 | % | | | 4.01 | % | | | 17 | % |
| | 16.68 | | | | 969,745 | | | | .78 | | | | .77 | | | | 4.98 | | | | 18 | |
| | 1.53 | | | | 350,778 | | | | .78 | | | | .78 | | | | 5.34 | | | | 26 | |
| | 17.36 | | | | 352,666 | | | | .80 | | | | .80 | | | | 5.46 | | | | 33 | |
| | (4.41 | ) | | | 303,949 | | | | .83 | | | | .80 | | | | 5.48 | | | | 31 | |
| | | | | | | | | | | | | | | | | | | | | | |
| | 7.05 | | | | 4,452 | | | | 1.47 | | | | 1.47 | | | | 3.30 | | | | 17 | |
| | 15.70 | | | | 8,408 | | | | 1.54 | | | | 1.53 | | | | 4.29 | | | | 18 | |
| | .79 | | | | 5,273 | | | | 1.53 | | | | 1.53 | | | | 4.56 | | | | 26 | |
| | 16.49 | | | | 9,706 | | | | 1.55 | | | | 1.55 | | | | 4.73 | | | | 33 | |
| | (5.14 | ) | | | 12,342 | | | | 1.57 | | | | 1.54 | | | | 4.70 | | | | 31 | |
| | | | | | | | | | | | | | | | | | | | | | |
| | 7.17 | | | | 494,747 | | | | 1.27 | | | | 1.27 | | | | 3.45 | | | | 17 | |
| | 16.14 | | | | 361,364 | | | | 1.33 | | | | 1.32 | | | | 4.43 | | | | 18 | |
| | .99 | | | | 167,535 | | | | 1.33 | | | | 1.33 | | | | 4.78 | | | | 26 | |
| | 16.62 | | | | 151,025 | | | | 1.34 | | | | 1.34 | | | | 4.91 | | | | 33 | |
| | (4.88 | ) | | | 108,149 | | | | 1.38 | | | | 1.35 | | | | 4.95 | | | | 31 | |
| | | | | | | | | | | | | | | | | | | | | | |
| | 8.03 | | | | 1,283,660 | | | | .52 | | | | .52 | | | | 4.22 | | | | 17 | |
| | 16.71 | | | | 1,120,747 | | | | .56 | | | | .55 | | | | 5.13 | | | | 18 | |
| | 1.84 | | | | 93,633 | | | | .58 | | | | .58 | | | | 5.53 | | | | 26 | |
| | 17.52 | | | | 39,683 | | | | .59 | | | | .59 | | | | 5.64 | | | | 33 | |
| | (4.22 | ) | | | 12,027 | | | | .63 | | | | .60 | | | | 5.67 | | | | 31 | |
| (a) | Per share Net Investment Income (Loss) is calculated using the average daily shares method. |
| (b) | Total return is the combination of changes in net asset value without any sales charge, reinvested dividend income at net asset value and reinvested capital gains distributions at net asset value, if any. Total returns are not annualized. |
| (c) | The expense ratios reflect, among other things, the interest expense deemed to have been paid by the Fund on the floating rate certificates issued by the special purpose trusts for the self-deposited inverse floaters held by the Fund, where applicable, as described in Footnote 1 – General Information and Significant Accounting Policies, Inverse Floating Rate Securities. |
See accompanying notes to financial statements.
Financial Highlights (continued)
| | | | | | | | | | | | | | | | | | | | | | | | | | | | | | | | |
| Selected data for a share outstanding throughout each period: | |
| | | | | | |
| Class (Commencement Date) | | | | | | | | | | | | | | | | | | | |
| | | | | | Investment Operations | | | Less Distributions | | | | |
| | | | | | | |
| HIGH YIELD | | | | | | | | | | | | | | | | | | | | | | |
Year Ended
April 30, | | Beginning
Net
Asset
Value | | | Net
Invest-
ment
Income
(Loss)(a) | | | Net
Realized/
Unrealized
Gain
(Loss) | | | Total | | | From
Net
Invest-
ment
Income | | | From
Accumulated
Net Realized
Gains | | | Total | | | Ending
Net
Asset
Value | |
Class A (6/99) | | | | | | | | | | | | | | | | | | | | | | | | | | | | | |
2013 | | $ | 16.17 | | | $ | 1.02 | | | $ | 1.23 | | | $ | 2.25 | | | $ | (1.01 | ) | | $ | — | | | $ | (1.01 | ) | | $ | 17.41 | |
2012 | | | 14.22 | | | | 1.09 | | | | 1.92 | | | | 3.01 | | | | (1.06 | ) | | | — | | | | (1.06 | ) | | | 16.17 | |
2011 | | | 15.53 | | | | 1.08 | | | | (1.33 | ) | | | (.25 | ) | | | (1.06 | ) | | | — | | | | (1.06 | ) | | | 14.22 | |
2010 | | | 12.73 | | | | 1.06 | | | | 2.83 | | | | 3.89 | | | | (1.09 | ) | | | — | | | | (1.09 | ) | | | 15.53 | |
2009 | | | 19.26 | | | | 1.13 | | | | (6.52 | ) | | | (5.39 | ) | | | (1.14 | ) | | | — | | | | (1.14 | ) | | | 12.73 | |
Class B (6/99) | | | | | | | | | | | | | | | | | | | | | | | | | | | | | |
2013 | | | 16.16 | | | | .90 | | | | 1.21 | | | | 2.11 | | | | (.88 | ) | | | — | | | | (.88 | ) | | | 17.39 | |
2012 | | | 14.21 | | | | .98 | | | | 1.92 | | | | 2.90 | | | | (.95 | ) | | | — | | | | (.95 | ) | | | 16.16 | |
2011 | | | 15.51 | | | | .97 | | | | (1.33 | ) | | | (.36 | ) | | | (.94 | ) | | | — | | | | (.94 | ) | | | 14.21 | |
2010 | | | 12.72 | | | | .95 | | | | 2.83 | | | | 3.78 | | | | (.99 | ) | | | — | | | | (.99 | ) | | | 15.51 | |
2009 | | | 19.24 | | | | 1.01 | | | | (6.51 | ) | | | (5.50 | ) | | | (1.02 | ) | | | — | | | | (1.02 | ) | | | 12.72 | |
Class C (6/99) | | | | | | | | | | | | | | | | | | | | | | | | | | | | | |
2013 | | | 16.16 | | | | .93 | | | | 1.22 | | | | 2.15 | | | | (.92 | ) | | | — | | | | (.92 | ) | | | 17.39 | |
2012 | | | 14.21 | | | | 1.01 | | | | 1.93 | | | | 2.94 | | | | (.99 | ) | | | — | | | | (.99 | ) | | | 16.16 | |
2011 | | | 15.51 | | | | .99 | | | | (1.32 | ) | | | (.33 | ) | | | (.97 | ) | | | — | | | | (.97 | ) | | | 14.21 | |
2010 | | | 12.73 | | | | .98 | | | | 2.82 | | | | 3.80 | | | | (1.02 | ) | | | — | | | | (1.02 | ) | | | 15.51 | |
2009 | | | 19.25 | | | | 1.04 | | | | (6.50 | ) | | | (5.46 | ) | | | (1.06 | ) | | | — | | | | (1.06 | ) | | | 12.73 | |
Class I (6/99) | | | | | | | | | | | | | | | | | | | | | | | | | | | | | |
2013 | | | 16.17 | | | | 1.06 | | | | 1.22 | | | | 2.28 | | | | (1.04 | ) | | | — | | | | (1.04 | ) | | | 17.41 | |
2012 | | | 14.22 | | | | 1.12 | | | | 1.92 | | | | 3.04 | | | | (1.09 | ) | | | — | | | | (1.09 | ) | | | 16.17 | |
2011 | | | 15.52 | | | | 1.10 | | | | (1.31 | ) | | | (.21 | ) | | | (1.09 | ) | | | — | | | | (1.09 | ) | | | 14.22 | |
2010 | | | 12.73 | | | | 1.09 | | | | 2.82 | | | | 3.91 | | | | (1.12 | ) | | | — | | | | (1.12 | ) | | | 15.52 | |
2009 | | | 19.26 | | | | 1.16 | | | | (6.51 | ) | | | (5.35 | ) | | | (1.18 | ) | | | — | | | | (1.18 | ) | | | 12.73 | |
| | | | | | | | | | | | | | | | | | | | | | |
| | | | | |
| | | | | | | | | | | | | | | | | |
| | | |
Ratios/Supplemental Data | |
| | | | | | | Ratios to Average
Net Assets | | | | |
Total
Return(b) | | | Ending
Net
Assets
(000) | | | Expenses
Including
Interest(c)(d) | | | Expenses
Excluding
Interest | | | Net
Invest-
ment
Income
(Loss) | | | Portfolio
Turnover
Rate | |
| | | | | | | | | | | | | | | | | | | | | | |
| | 14.24 | % | | $ | 3,162,448 | | | | .85 | % | | | .82 | % | | | 6.01 | % | | | 13 | % |
| | 21.93 | | | | 2,382,456 | | | | .85 | | | | .83 | | | | 7.18 | | | | 16 | |
| | (1.78 | ) | | | 1,700,469 | | | | .88 | | | | .85 | | | | 7.12 | | | | 31 | |
| | 31.50 | | | | 2,158,475 | | | | .89 | | | | .86 | | | | 7.27 | | | | 11 | |
| | (28.45 | ) | | | 1,352,846 | | | | .97 | | | | .88 | | | | 7.20 | | | | 50 | |
| | | | | | | | | | | | | | | | | | | | | | |
| | 13.34 | | | | 22,249 | | | | 1.60 | | | | 1.57 | | | | 5.30 | | | | 13 | |
| | 21.07 | | | | 35,000 | | | | 1.61 | | | | 1.59 | | | | 6.49 | | | | 16 | |
| | (2.46 | ) | | | 47,700 | | | | 1.63 | | | | 1.60 | | | | 6.38 | | | | 31 | |
| | 30.40 | | | | 73,920 | | | | 1.64 | | | | 1.61 | | | | 6.58 | | | | 11 | |
| | (28.99 | ) | | | 73,287 | | | | 1.72 | | | | 1.63 | | | | 6.41 | | | | 50 | |
| | | | | | | | | | | | | | | | | | | | | | |
| | 13.57 | | | | 1,780,581 | | | | 1.40 | | | | 1.37 | | | | 5.46 | | | | 13 | |
| | 21.31 | | | | 1,376,916 | | | | 1.40 | | | | 1.38 | | | | 6.64 | | | | 16 | |
| | (2.33 | ) | | | 1,059,268 | | | | 1.43 | | | | 1.40 | | | | 6.59 | | | | 31 | |
| | 30.73 | | | | 1,166,535 | | | | 1.44 | | | | 1.41 | | | | 6.71 | | | | 11 | |
| | (28.87 | ) | | | 656,599 | | | | 1.52 | | | | 1.43 | | | | 6.63 | | | | 50 | |
| | | | | | | | | | | | | | | | | | | | | | |
| | 14.44 | | | | 4,426,124 | | | | .65 | | | | .62 | | | | 6.20 | | | | 13 | |
| | 22.17 | | | | 2,665,906 | | | | .65 | | | | .63 | | | | 7.38 | | | | 16 | |
| | (1.52 | ) | | | 1,711,647 | | | | .68 | | | | .65 | | | | 7.32 | | | | 31 | |
| | 31.66 | | | | 1,498,640 | | | | .69 | | | | .66 | | | | 7.43 | | | | 11 | |
| | (28.33 | ) | | | 655,390 | | | | .77 | | | | .68 | | | | 7.38 | | | | 50 | |
| (a) | Per share Net Investment Income (Loss) is calculated using the average daily shares method. |
| (b) | Total return is the combination of changes in net asset value without any sales charge, reinvested dividend income at net asset value and reinvested capital gains distributions at net asset value, if any. Total returns are not annualized. |
| (c) | The expense ratios reflect, among other things, the interest expense deemed to have been paid by the Fund on the floating rate certificates issued by the special purpose trusts for the self-deposited inverse floaters held by the Fund, where applicable, as described in Footnote 1 – General Information and Significant Accounting Policies, Inverse Floating Rate Securities and the interest expense and fees paid on borrowings, as described in Footnote 8 – Borrowing Arrangements. |
| (d) | Each Ratio of Expenses Including Interest to Average Net Assets includes the effect of the interest expense and fees paid on Fund borrowings for each share class as follows: |
| | | | |
Ratios of
Borrowings Expense
to Average Net Assets | |
Year Ended April 30: | |
2013 | | | .01 | % |
2012 | | | .01 | |
2011 | | | .01 | |
2010 | | | .01 | |
2009 | | | .01 | |
See accompanying notes to financial statements.
Financial Highlights (continued)
| | | | | | | | | | | | | | | | | | | | | | | | | | | | | | | | |
| Selected data for a share outstanding throughout each period: | | | | | | | | | | |
| | | | | | |
| Class (Commencement Date) | | | | | | | | | | | | | | | | | | | |
| | | | | | Investment Operations | | | Less Distributions | | | | |
| | | | | |
| INFLATION PROTECTED | | | | | | | | | | | | | | | | |
Year Ended
April 30, | | Beginning
Net
Asset
Value | | | Net
Invest-
ment
Income
(Loss)(a) | | | Net
Realized/
Unrealized
Gain
(Loss) | | | Total | | | From
Net
Invest-
ment
Income | | | From
Accumulated
Net Realized Gains | | | Total | | | Ending
Net
Asset
Value | |
Class A (3/11) | | | | | | | | | | | | | | | | | | | | | | | | | | | | | |
2013 | | $ | 11.01 | | | $ | .24 | | | $ | .35 | | | $ | .59 | | | $ | (.28 | ) | | $ | (.01 | ) | | $ | (.29 | ) | | $ | 11.31 | |
2012 | | | 10.36 | | | | .33 | | | | .66 | | | | .99 | | | | (.34 | ) | | | — | | | | (.34 | ) | | | 11.01 | |
2011(e) | | | 10.00 | | | | .04 | | | | .34 | | | | .38 | | | | (.02 | ) | | | — | | | | (.02 | ) | | | 10.36 | |
Class C (3/11) | | | | | | | | | | | | | | | | | | | | | | | | | | | | | |
2013 | | | 11.00 | | | | .18 | | | | .35 | | | | .53 | | | | (.22 | ) | | | (.01 | ) | | | (.23 | ) | | | 11.30 | |
2012 | | | 10.36 | | | | .27 | | | | .66 | | | | .93 | | | | (.29 | ) | | | — | | | | (.29 | ) | | | 11.00 | |
2011(e) | | | 10.00 | | | | .03 | | | | .35 | | | | .38 | | | | (.02 | ) | | | — | | | | (.02 | ) | | | 10.36 | |
Class I (3/11) | | | | | | | | | | | | | | | | | | | | | | | | | | | | | |
2013 | | | 11.01 | | | | .26 | | | | .36 | | | | .62 | | | | (.30 | ) | | | (.01 | ) | | | (.31 | ) | | | 11.32 | |
2012 | | | 10.37 | | | | .35 | | | | .65 | | | | 1.00 | | | | (.36 | ) | | | — | | | | (.36 | ) | | | 11.01 | |
2011(e) | | | 10.00 | | | | .05 | | | | .34 | | | | .39 | | | | (.02 | ) | | | — | | | | (.02 | ) | | | 10.37 | |
| | | | | | | | | | | | | | | | | | | | | | | | | | | | | | | | | | |
| | | | | | | | |
| | | | | | | | | | | | | | | | | | | | | | | | | | |
| | | |
Ratios/Supplemental Data | |
| | | | | | | Ratios to Average
Net Assets Before
Waiver/Reimbursement | | | Ratios to Average
Net Assets After
Waiver/Reimbursement(c) | | | | |
Total
Return(b) | | |
Ending
Net
Assets
(000) | | | Expenses
Including
Interest(d) | | | Expenses
Excluding
Interest | | | Net
Invest-
ment
Income (Loss) | | | Expenses
Including
Interest(d) | | | Expenses
Excluding
Interest | | | Net
Invest-
ment
Income
(Loss) | | | Portfolio
Turnover
Rate | |
| | | | | | | | | | | | | | | | | | | | | | | | | | | | | | | | | | |
| | 5.39 | % | | $ | 61,926 | | | | 1.01 | % | | | 1.01 | % | | | 1.87 | % | | | .77 | % | | | .77 | % | | | 2.11 | % | | | 9 | % |
| | 9.74 | | | | 7,339 | | | | 1.46 | | | | 1.46 | | | | 2.44 | | | | .78 | | | | .78 | | | | 3.13 | | | | 14 | |
| | 3.82 | | | | 1,801 | | | | 4.87 | * | | | 4.87 | * | | | (1.27 | )* | | | .78 | * | | | .78 | * | | | 2.83 | * | | | 6 | |
| | | | | | | | | | | | | | | | | | | | | | | | | | | | | | | | | | |
| | 4.81 | | | | 15,064 | | | | 1.57 | | | | 1.57 | | | | 1.33 | | | | 1.32 | | | | 1.32 | | | | 1.58 | | | | 9 | |
| | 9.07 | | | | 4,209 | | | | 2.03 | | | | 2.03 | | | | 1.87 | | | | 1.33 | | | | 1.33 | | | | 2.57 | | | | 14 | |
| | 3.78 | | | | 1,727 | | | | 5.44 | * | | | 5.44 | * | | | (1.82 | )* | | | 1.33 | * | | | 1.33 | * | | | 2.28 | * | | | 6 | |
| | | | | | | | | | | | | | | | | | | | | | | | | | | | | | | | | | |
| | 5.65 | | | | 35,046 | | | | .82 | | | | .82 | | | | 2.10 | | | | .57 | | | | .57 | | | | 2.35 | | | | 9 | |
| | 9.82 | | | | 6,704 | | | | 1.22 | | | | 1.22 | | | | 2.64 | | | | .58 | | | | .58 | | | | 3.28 | | | | 14 | |
| | 3.93 | | | | 1,728 | | | | 4.69 | * | | | 4.69 | * | | | (1.07 | )* | | | .58 | * | | | .58 | * | | | 3.03 | * | | | 6 | |
| (a) | Per share Net Investment Income (Loss) is calculated using the average daily shares method. |
| (b) | Total return is the combination of changes in net asset value without any sales charge, reinvested dividend income at net asset value and reinvested capital gains distributions at net asset value, if any. Total returns are not annualized. |
| (c) | After fee waiver and/or expense reimbursement from the Adviser, where applicable. |
| (d) | The expense ratios reflect, among other things, the interest expense deemed to have been paid by the Fund on the floating rate certificates issued by the special purpose trusts for the self-deposited inverse floaters held by the Fund, where applicable, as described in Footnote 1 – General Information and Significant Accounting Policies, Inverse Floating Rate Securities. |
| (e) | For the period March 8, 2011 (commencement of operations) through April 30, 2011. |
See accompanying notes to financial statements.
Financial Highlights (continued)
| | | | | | | | | | | | | | | | | | | | | | | | | | | | | | | | |
| Selected data for a share outstanding throughout each period: | | | | |
| | | | | | |
| Class (Commencement Date) | | | | | | | | | | | | | | | | | | | |
| | | | | | Investment Operations | | | Less Distributions | | | | |
| | | | | | |
| INTERMEDIATE DURATION | | | | | | | | | | | | | | | | | | | |
Year Ended
April 30, | | Beginning
Net
Asset
Value | | | Net
Invest-
ment
Income
(Loss)(a) | | | Net
Realized/
Unrealized
Gain
(Loss) | | | Total | | | From
Net
Invest-
ment
Income | | | From
Accumulated
Net Realized
Gains | | | Total | | | Ending
Net
Asset
Value | |
Class A (6/95) | | | | | | | | | | | | | | | | | | | | | | | | | | | | | |
2013 | | $ | 9.25 | | | $ | .30 | | | $ | .14 | | | $ | .44 | | | $ | (.31 | ) | | $ | — | | | $ | (.31 | ) | | $ | 9.38 | |
2012 | | | 8.84 | | | | .34 | | | | .42 | | | | .76 | | | | (.35 | ) | | | — | | | | (.35 | ) | | | 9.25 | |
2011 | | | 8.98 | | | | .34 | | | | (.14 | ) | | | .20 | | | | (.34 | ) | | | — | | | | (.34 | ) | | | 8.84 | |
2010 | | | 8.54 | | | | .35 | | | | .43 | | | | .78 | | | | (.34 | ) | | | — | | | | (.34 | ) | | | 8.98 | |
2009 | | | 8.78 | | | | .34 | | | | (.24 | ) | | | .10 | | | | (.34 | ) | | | — | | | | (.34 | ) | | | 8.54 | |
Class B (2/97) | | | | | | | | | | | | | | | | | | | | | | | | | | | | | |
2013 | | | 9.27 | | | | .24 | | | | .15 | | | | .39 | | | | (.25 | ) | | | — | | | | (.25 | ) | | | 9.41 | |
2012 | | | 8.87 | | | | .27 | | | | .41 | | | | .68 | | | | (.28 | ) | | | — | | | | (.28 | ) | | | 9.27 | |
2011 | | | 9.01 | | | | .27 | | | | (.14 | ) | | | .13 | | | | (.27 | ) | | | — | | | | (.27 | ) | | | 8.87 | |
2010 | | | 8.57 | | | | .28 | | | | .43 | | | | .71 | | | | (.27 | ) | | | — | | | | (.27 | ) | | | 9.01 | |
2009 | | | 8.81 | | | | .28 | | | | (.25 | ) | | | .03 | | | | (.27 | ) | | | — | | | | (.27 | ) | | | 8.57 | |
Class C (6/95) | | | | | | | | | | | | | | | | | | | | | | | | | | | | | |
2013 | | | 9.27 | | | | .25 | | | | .15 | | | | .40 | | | | (.26 | ) | | | — | | | | (.26 | ) | | | 9.41 | |
2012 | | | 8.87 | | | | .29 | | | | .41 | | | | .70 | | | | (.30 | ) | | | — | | | | (.30 | ) | | | 9.27 | |
2011 | | | 9.01 | | | | .29 | | | | (.14 | ) | | | .15 | | | | (.29 | ) | | | — | | | | (.29 | ) | | | 8.87 | |
2010 | | | 8.57 | | | | .30 | | | | .43 | | | | .73 | | | | (.29 | ) | | | — | | | | (.29 | ) | | | 9.01 | |
2009 | | | 8.80 | | | | .30 | | | | (.24 | ) | | | .06 | | | | (.29 | ) | | | — | | | | (.29 | ) | | | 8.57 | |
Class I (11/76) | | | | | | | | | | | | | | | | | | | | | | | | | | | | | |
2013 | | | 9.27 | | | | .32 | | | | .15 | | | | .47 | | | | (.33 | ) | | | — | | | | (.33 | ) | | | 9.41 | |
2012 | | | 8.86 | | | | .36 | | | | .41 | | | | .77 | | | | (.36 | ) | | | — | | | | (.36 | ) | | | 9.27 | |
2011 | | | 9.00 | | | | .36 | | | | (.15 | ) | | | .21 | | | | (.35 | ) | | | — | | | | (.35 | ) | | | 8.86 | |
2010 | | | 8.56 | | | | .36 | | | | .43 | | | | .79 | | | | (.35 | ) | | | — | | | | (.35 | ) | | | 9.00 | |
2009 | | | 8.79 | | | | .36 | | | | (.24 | ) | | | .12 | | | | (.35 | ) | | | — | | | | (.35 | ) | | | 8.56 | |
| | | | | | | | | | | | | | | | | | | | | | |
| | | | | |
| | | | | | | | | | | | | | | | | |
| |
| | | | Ratios/Supplemental Data | |
| | | |
| | | | | | | Ratios to Average
Net Assets(c) | | | | |
Total
Return(b) | | |
Ending
Net
Assets
(000) | | | Expenses
Including
Interest(d) | | | Expenses
Excluding
Interest | | | Net
Invest-
ment
Income
(Loss) | | | Portfolio
Turnover
Rate | |
| | | | | | | | | | | | | | | | | | | | | | |
| | 4.83 | % | | $ | 512,139 | | | | .70 | % | | | .70 | % | | | 3.24 | % | | | 15 | % |
| | 8.68 | | | | 450,036 | | | | .72 | | | | .72 | | | | 3.70 | | | | 10 | |
| | 2.21 | | | | 373,176 | | | | .74 | | | | .74 | | | | 3.82 | | | | 6 | |
| | 9.24 | | | | 374,528 | | | | .75 | | | | .75 | | | | 3.91 | | | | 5 | |
| | 1.22 | | | | 324,071 | | | | .76 | | | | .76 | | | | 4.03 | | | | 6 | |
| | | | | | | | | | | | | | | | | | | | | | |
| | 4.19 | | | | 1,940 | | | | 1.46 | | | | 1.46 | | | | 2.52 | | | | 15 | |
| | 7.75 | | | | 3,102 | | | | 1.47 | | | | 1.47 | | | | 2.95 | | | | 10 | |
| | 1.46 | | | | 5,283 | | | | 1.49 | | | | 1.49 | | | | 3.05 | | | | 6 | |
| | 8.40 | | | | 11,040 | | | | 1.50 | | | | 1.50 | | | | 3.16 | | | | 5 | |
| | .43 | | | | 14,204 | | | | 1.51 | | | | 1.51 | | | | 3.26 | | | | 6 | |
| | | | | | | | | | | | | | | | | | | | | | |
| | 4.39 | | | | 158,004 | | | | 1.25 | | | | 1.25 | | | | 2.69 | | | | 15 | |
| | 7.96 | | | | 134,478 | | | | 1.27 | | | | 1.27 | | | | 3.14 | | | | 10 | |
| | 1.66 | | | | 110,310 | | | | 1.29 | | | | 1.29 | | | | 3.27 | | | | 6 | |
| | 8.62 | | | | 100,047 | | | | 1.30 | | | | 1.30 | | | | 3.35 | | | | 5 | |
| | .76 | | | | 71,165 | | | | 1.31 | | | | 1.31 | | | | 3.48 | | | | 6 | |
| | | | | | | | | | | | | | | | | | | | | | |
| | 5.13 | | | | 3,520,696 | | | | .50 | | | | .50 | | | | 3.44 | | | | 15 | |
| | 8.87 | | | | 3,039,743 | | | | .52 | | | | .52 | | | | 3.91 | | | | 10 | |
| | 2.41 | | | | 2,013,504 | | | | .54 | | | | .54 | | | | 4.02 | | | | 6 | |
| | 9.41 | | | | 2,044,122 | | | | .55 | | | | .55 | | | | 4.11 | | | | 5 | |
| | 1.51 | | | | 1,916,368 | | | | .56 | | | | .56 | | | | 4.21 | | | | 6 | |
| (a) | Per share Net Investment Income (Loss) is calculated using the average daily shares method. |
| (b) | Total return is the combination of changes in net asset value without any sales charge, reinvested dividend income at net asset value and reinvested capital gains distributions at net asset value, if any. Total returns are not annualized. |
| (c) | The Fund has a contractural fee waiver/expense reimbursement agreement with the Adviser, but did not receive a fee waiver/expense reimbursement during the periods presented herein. |
| (d) | The expense ratios reflect, among other things, the interest expense deemed to have been paid by the Fund on the floating rate certificates issued by the special purpose trusts for the self-deposited inverse floaters held by the Fund, where applicable, as described in Footnote 1 – General Information and Significant Accounting Policies, Inverse Floating Rate Securities. |
See accompanying notes to financial statements.
Financial Highlights (continued)
| | | | | | | | | | | | | | | | | | | | | | | | | | | | | | | | |
| Selected data for a share outstanding throughout each period: | |
| | | | | | |
| Class (Commencement Date) | | | | | | | | | | | | | | | | | | | |
| | | | | | Investment Operations | | | Less Distributions | | | | |
| | | | | | |
| LIMITED TERM | | | | | | | | | | | | | | | | | | | |
Year Ended
April 30, | | Beginning
Net
Asset
Value
| | | Net
Invest-
ment
Income
(Loss)(a) | | | Net
Realized/
Unrealized
Gain
(Loss) | | | Total | | | From
Net
Invest-
ment
Income | | | From
Accumulated
Net Realized
Gains | | | Total | | | Ending
Net
Asset
Value | |
Class A (10/87) | | | | | | | | | | | | | | | | | | | | | | | | | | | | | |
2013 | | $ | 11.20 | | | $ | .24 | | | $ | .07 | | | $ | .31 | | | $ | (.24 | ) | | $ | — | | | $ | (.24 | ) | | $ | 11.27 | |
2012 | | | 10.85 | | | | .29 | | | | .34 | | | | .63 | | | | (.28 | ) | | | — | | | | (.28 | ) | | | 11.20 | |
2011 | | | 10.85 | | | | .30 | | | | (.01 | ) | | | .29 | | | | (.29 | ) | | | — | | | | (.29 | ) | | | 10.85 | |
2010 | | | 10.60 | | | | .32 | | | | .28 | | | | .60 | | | | (.35 | ) | | | — | | | | (.35 | ) | | | 10.85 | |
2009 | | | 10.63 | | | | .38 | | | | (.03 | ) | | | .35 | | | | (.38 | ) | | | — | | | | (.38 | ) | | | 10.60 | |
Class C (12/95) | | | | | | | | | | | | | | | | | | | | | | | | | | | | | |
2013 | | | 11.15 | | | | .20 | | | | .08 | | | | .28 | | | | (.20 | ) | | | — | | | | (.20 | ) | | | 11.23 | |
2012 | | | 10.81 | | | | .25 | | | | .34 | | | | .59 | | | | (.25 | ) | | | — | | | | (.25 | ) | | | 11.15 | |
2011 | | | 10.82 | | | | .26 | | | | (.02 | ) | | | .24 | | | | (.25 | ) | | | — | | | | (.25 | ) | | | 10.81 | |
2010 | | | 10.57 | | | | .28 | | | | .28 | | | | .56 | | | | (.31 | ) | | | — | | | | (.31 | ) | | | 10.82 | |
2009 | | | 10.60 | | | | .34 | | | | (.03 | ) | | | .31 | | | | (.34 | ) | | | — | | | | (.34 | ) | | | 10.57 | |
Class I (2/97) | | | | | | | | | | | | | | | | | | | | | | | | | | | | | |
2013 | | | 11.13 | | | | .26 | | | | .08 | | | | .34 | | | | (.26 | ) | | | — | | | | (.26 | ) | | | 11.21 | |
2012 | | | 10.79 | | | | .31 | | | | .33 | | | | .64 | | | | (.30 | ) | | | — | | | | (.30 | ) | | | 11.13 | |
2011 | | | 10.79 | | | | .32 | | | | (.01 | ) | | | .31 | | | | (.31 | ) | | | — | | | | (.31 | ) | | | 10.79 | |
2010 | | | 10.54 | | | | .34 | | | | .28 | | | | .62 | | | | (.37 | ) | | | — | | | | (.37 | ) | | | 10.79 | |
2009 | | | 10.57 | | | | .40 | | | | (.03 | ) | | | .37 | | | | (.40 | ) | | | — | | | | (.40 | ) | | | 10.54 | |
| | | | | | | | | | | | | | | | | | | | | | |
| | | | | | | | | | | | | | | | | |
| |
| | | | Ratios/Supplemental Data | |
| | | | | | | Ratios to Average
Net Assets | | | | |
Total
Return(b) | | | Ending
Net
Assets
(000) | | | Expenses
Including
Interest(c) | | | Expenses
Excluding
Interest | | | Net
Invest-
ment
Income
(Loss) | | | Portfolio
Turnover
Rate | |
| | | | | | | | | | | | | | | | | | | | | | |
| | 2.79 | % | | $ | 1,438,077 | | | | .66 | % | | | .66 | % | | | 2.10 | % | | | 12 | % |
| | 5.88 | | | | 1,113,802 | | | | .66 | | | | .66 | | | | 2.63 | | | | 12 | |
| | 2.68 | | | | 953,517 | | | | .68 | | | | .68 | | | | 2.72 | | | | 13 | |
| | 5.73 | | | | 1,001,241 | | | | .71 | | | | .71 | | | | 2.98 | | | | 10 | |
| | 3.38 | | | | 615,646 | | | | .72 | | | | .72 | | | | 3.59 | | | | 11 | |
| | | | | | | | | | | | | | | | | | | | | | |
| | 2.51 | | | | 721,302 | | | | 1.01 | | | | 1.01 | | | | 1.76 | | | | 12 | |
| | 5.45 | | | | 641,602 | | | | 1.01 | | | | 1.01 | | | | 2.29 | | | | 12 | |
| | 2.26 | | | | 566,098 | | | | 1.03 | | | | 1.03 | | | | 2.37 | | | | 13 | |
| | 5.39 | | | | 509,512 | | | | 1.06 | | | | 1.06 | | | | 2.63 | | | | 10 | |
| | 3.04 | | | | 282,951 | | | | 1.07 | | | | 1.07 | | | | 3.24 | | | | 11 | |
| | | | | | | | | | | | | | | | | | | | | | |
| | 3.07 | | | | 1,549,809 | | | | .46 | | | | .46 | | | | 2.31 | | | | 12 | |
| | 6.00 | | | | 1,196,319 | | | | .46 | | | | .46 | | | | 2.83 | | | | 12 | |
| | 2.87 | | | | 812,730 | | | | .48 | | | | .48 | | | | 2.92 | | | | 13 | |
| | 5.94 | | | | 694,430 | | | | .51 | | | | .51 | | | | 3.16 | | | | 10 | |
| | 3.59 | | | | 332,373 | | | | .52 | | | | .52 | | | | 3.78 | | | | 11 | |
| (a) | Per share Net Investment Income (Loss) is calculated using the average daily shares method. |
| (b) | Total return is the combination of changes in net asset value without any sales charge, reinvested dividend income at net asset value and reinvested capital gains distributions at net asset value, if any. Total returns are not annualized. |
| (c) | The expense ratios reflect, among other things, the interest expense deemed to have been paid by the Fund on the floating rate certificates issued by the special purpose trusts for the self-deposited inverse floaters held by the Fund, where applicable, as described in Footnote 1 – General Information and Significant Accounting Policies, Inverse Floating Rate Securities. |
See accompanying notes to financial statements.
Financial Highlights (continued)
| | | | | | | | | | | | | | | | | | | | | | | | | | | | | | | | |
| Selected data for a share outstanding throughout each period: | |
| | | | | | | |
| Class (Commencement Date) | | | | | | | | | | | | | | | | | | | | | | |
| | | | | | Investment Operations | | | Less Distributions | | | | |
| | | | | | |
| SHORT DURATION HIGH YIELD | | | | | | | | | | | | | | | | | | | |
Year Ended April 30, | | Beginning
Net Asset
Value | | | Net Invest-
ment
Income
(Loss)(a) | | | Net Realized/ Unrealized Gain
(Loss) | | | Total | | | From
Net Invest-
ment
Income | | | From
Accumulated
Net Realized
Gains | | | Total | | | Ending
Net
Asset
Value | |
Class A (2/13) | | | | | | | | | | | | | | | | | | | | | | | | | | | | | |
2013(d) | | $ | 10.00 | | | $ | .05 | | | $ | .12 | | | $ | .17 | | | $ | (.05 | ) | | $ | — | | | $ | (.05 | ) | | $ | 10.12 | |
Class C (2/13) | | | | | | | | | | | | | | | | | | | | | | | | | | | | | |
2013(d) | | | 10.00 | | | | .04 | | | | .12 | | | | .16 | | | | (.04 | ) | | | — | | | | (.04 | ) | | | 10.12 | |
Class I (2/13) | | | | | | | | | | | | | | | | | | | | | | | | | | | | | |
2013(d) | | | 10.00 | | | | .05 | | | | .13 | | | | .18 | | | | (.06 | ) | | | — | | | | (.06 | ) | | | 10.12 | |
| | | | | | | | | | | | | | | | | | | | | | | | | | |
| | | | | | | | | | | |
| | |
| | | | | | | | |
| | | | Ratios/Supplemental Data | |
| | | | | | |
Ratios to Average
Net Assets Before
Waiver/Reimbursement | | | Ratios to Average
Net Assets After
Waiver/Reimbursement(c) | | | | |
Total
Return(b) | | |
Ending
Net
Assets
(000) | | | Expenses | | | Net
Invest-
ment
Income
(Loss) | | | Expenses | | | Net
Invest-
ment
Income
(Loss) | | | Portfolio
Turnover
Rate | |
| | | | | | | | | | | | | | | | | | | | | | | | | | |
| | 1.72 | % | | $ | 66,924 | | | | 1.35 | %** | | | 1.76 | %** | | | .82 | %** | | | 2.30 | %** | | | 0 | %* |
| | | | | | | | | | | | | | | | | | | | | | | | | | |
| | 1.63 | | | | 4,844 | | | | 2.20 | ** | | | 1.07 | ** | | | 1.37 | ** | | | 1.90 | ** | | | 0 | * |
| | | | | | | | | | | | | | | | | | | | | | | | | | |
| | 1.75 | | | | 71,017 | | | | 1.43 | ** | | | 1.49 | ** | | | .62 | ** | | | 2.30 | ** | | | 0 | * |
| (a) | Per share Net Investment Income (Loss) is calculated using the average daily shares method. |
| (b) | Total return is the combination of changes in net asset value without any sales charge, reinvested dividend income at net asset value and reinvested capital gains distributions at net asset value, if any. Total returns are not annualized. |
| (c) | After fee waiver and/or expense reimbursement from the Adviser, where applicable. |
| (d) | For the period February 1, 2013 (commencement of operations) through April 30, 2013. |
See accompanying notes to financial statements.
Financial Highlights (continued)
| | | | | | | | | | | | | | | | | | | | | | | | | | | | | | | | |
| Selected data for a share outstanding throughout each period: | | | | |
| | |
| Class (Commencement Date) | | | | | | | |
| | | | | | Investment Operations | | | Less Distributions | | | | |
| | | | | | | |
| SHORT TERM | | | | | | | | | | | | | | | | | | | | | | |
| | | Beginning
Net
Asset
Value | | | Net
Invest-
ment
Income
(Loss)(a) | | | Net
Realized/
Unrealized
Gain
(Loss) | | | Total | | | From
Net
Invest-
ment
Income | | | From
Accumulated
Net Realized
Gains | | | Total | | | Ending
Net
Asset
Value | |
CLASS A (10/02) | | | | | | | | | | | | | | | | | | | | | | | | | | | | | |
Year Ended 4/30 | | | | | | | | | | | | | | | | | | | | | |
2013 | | $ | 10.19 | | | $ | .15 | | | $ | .04 | | | $ | .19 | | | $ | (.18 | ) | | $ | — | | | $ | (.18 | ) | | $ | 10.20 | |
2012 | | | 9.98 | | | | .20 | | | | .21 | | | | .41 | | | | (.20 | ) | | | — | | | | (.20 | ) | | | 10.19 | |
2011(d) | | | 9.98 | | | | .16 | | | | (.02 | ) | | | .14 | | | | (.14 | ) | | | — | | | | (.14 | ) | | | 9.98 | |
Year Ended 6/30 | | | | | | | | | | | | | | | | | | | | | | | | | | | | | |
2010 | | | 9.74 | | | | .20 | | | | .22 | | | | .42 | | | | (.18 | ) | | | — | | | | (.18 | ) | | | 9.98 | |
2009 | | | 9.79 | | | | .28 | | | | (.07 | ) | | | .21 | | | | (.26 | ) | | | — | | | | (.26 | ) | | | 9.74 | |
2008 | | | 9.70 | | | | .30 | | | | .10 | | | | .40 | | | | (.31 | ) | | | — | | | | (.31 | ) | | | 9.79 | |
CLASS C (8/11) | | | | | | | | | | | | | | | | | | | | | | | | | | | | | |
Year Ended 4/30 | | | | | | | | | | | | | | | | | | | | | | | | | |
2013 | | | 10.18 | | | | .11 | | | | .03 | | | | .14 | | | | (.14 | ) | | | — | | | | (.14 | ) | | | 10.18 | |
2012(e) | | | 10.13 | | | | .10 | | | | .06 | | | | .16 | | | | (.11 | ) | | �� | — | | | | (.11 | ) | | | 10.18 | |
CLASS I (10/02) | | | | | | | | | | | | | | | | | | | | | | | | | | | | | |
Year Ended 4/30 | | | | | | | | | | | | | | | | | | | | | | | | | |
2013 | | | 10.19 | | | | .18 | | | | .03 | | | | .21 | | | | (.20 | ) | | | — | | | | (.20 | ) | | | 10.20 | |
2012 | | | 9.98 | | | | .23 | | | | .20 | | | | .43 | | | | (.22 | ) | | | — | | | | (.22 | ) | | | 10.19 | |
2011(d) | | | 9.98 | | | | .17 | | | | (.02 | ) | | | .15 | | | | (.15 | ) | | | — | | | | (.15 | ) | | | 9.98 | |
Year Ended 6/30 | | | | | | | | | | | | | | | | | | | | | | | | | | | | | |
2010 | | | 9.74 | | | | .20 | | | | .24 | | | | .44 | | | | (.20 | ) | | | — | | | | (.20 | ) | | | 9.98 | |
2009 | | | 9.79 | | | | .27 | | | | (.05 | ) | | | .22 | | | | (.27 | ) | | | — | | | | (.27 | ) | | | 9.74 | |
2008 | | | 9.70 | | | | .31 | | | | .10 | | | | .41 | | | | (.32 | ) | | | — | | | | (.32 | ) | | | 9.79 | |
| | | | | | | | | | | | | | | | | | | | | | | | | | |
| | | | | |
| |
| | | | | |
| | | | Ratios/Supplemental Data | |
| | | | |
| | | | | | | Ratios to Average
Net Assets Before
Waiver/Reimbursement | | | Ratios to Average
Net Assets After
Waiver/Reimbursement(c) | | | | |
Total
Return(b) | | | Ending
Net
Assets
(000) | | | Expenses | | | Net
Invest-
ment
Income
(Loss) | | | Expenses | | | Net
Invest-
ment
Income
(Loss) | | | Portfolio
Turnover
Rate | |
| | | | | | | | | | | | | | | | | | | | | | | | | | |
| | | | | | | | | | | | | | | | | | | | | | | | | | |
| | 1.88 | % | | $ | 101,836 | | | | .73 | % | | | 1.49 | % | | | .73 | % | | | 1.49 | % | | | 30 | % |
| | 4.15 | | | | 34,793 | | | | .73 | | | | 2.01 | | | | .73 | | | | 2.01 | | | | 39 | |
| | 1.41 | | | | 7,790 | | | | .89 | * | | | 1.73 | * | | | .71 | * | | | 1.91 | * | | | 21 | |
| | | | | | | | | | | | | | | | | | | | | | | | | | |
| | 4.38 | | | | 7,168 | | | | 1.06 | | | | 1.49 | | | | .74 | | | | 1.81 | | | | 45 | |
| | 2.17 | | | | 3,376 | | | | 1.11 | | | | 2.35 | | | | .75 | | | | 2.71 | | | | 70 | |
| | 4.17 | | | | 2,308 | | | | 1.11 | | | | 2.69 | | | | .75 | | | | 3.05 | | | | 58 | |
| | | | | | | | | | | | | | | | | | | | | | | | | | |
| | | | | | | | | | | | | | | | | | | | | | | | | | |
| | 1.42 | | | | 10,618 | | | | 1.08 | | | | 1.10 | | | | 1.08 | | | | 1.10 | | | | 30 | |
| | 1.61 | | | | 1,026 | | | | 1.07 | * | | | 1.49 | * | | | 1.07 | * | | | 1.49 | * | | | 39 | |
| | | | | | | | | | | | | | | | | | | | | | | | | | |
| | | | | | | | | | | | | | | | | | | | | | | | | | |
| | 2.06 | | | | 383,339 | | | | .53 | | | | 1.74 | | | | .53 | | | | 1.74 | | | | 30 | |
| | 4.33 | | | | 304,109 | | | | .53 | | | | 2.27 | | | | .53 | | | | 2.27 | | | | 39 | |
| | 1.54 | | | | 277,347 | | | | .67 | * | | | 1.94 | * | | | .55 | * | | | 2.06 | * | | | 21 | |
| | | | | | | | | | | | | | | | | | | | | | | | | | |
| | 4.53 | | | | 310,783 | | | | .81 | | | | 1.74 | | | | .59 | | | | 1.96 | | | | 45 | |
| | 2.32 | | | | 178,950 | | | | .86 | | | | 2.58 | | | | .60 | | | | 2.84 | | | | 70 | |
| | 4.33 | | | | 143,985 | | | | .86 | | | | 2.94 | | | | .60 | | | | 3.20 | | | | 58 | |
| (a) | Per share Net Investment Income (Loss) is calculated using the average daily shares method. |
| (b) | Total return is the combination of changes in net asset value without any sales charge, reinvested dividend income at net asset value and reinvested capital gains distributions at net asset value, if any. Total returns are not annualized. |
| (c) | After fee waiver and/or expense reimbursement from the Adviser, where applicable. |
| (d) | For the ten months ended April 30, 2011. |
| (e) | For the period August 31, 2011 (commencement of operations) through April 30, 2012. |
See accompanying notes to financial statements.
Notes to Financial Statements
1. General Information and Significant Accounting Policies
General Information
The Nuveen Municipal Trust and the Nuveen Investment Funds, Inc. (each a “Trust” and collectively, the “Trusts”), are open-end investment companies registered under the Investment Company Act of 1940, as amended. The Nuveen Municipal Trust is comprised of the Nuveen All-American Municipal Bond Fund (“All-American”), Nuveen High Yield Municipal Bond Fund (”High Yield”), Nuveen Inflation Protected Municipal Bond Fund (“Inflation Protected”), Nuveen Intermediate Duration Municipal Bond Fund (“Intermediate Duration”), Nuveen Limited Term Municipal Bond Fund (“Limited Term”) and Nuveen Short Duration High Yield Municipal Bond Fund (“Short Duration High Yield”) and Nuveen Investment Funds, Inc is comprised of the Nuveen Short Term Municipal Bond Fund (“Short Term”) (each a “Fund” and collectively, the “Funds”), as diversified funds (non-diversified for Inflation Protected), among others. The Nuveen Municipal Trust was organized as a Massachusetts business trust on July 1, 1996. The Funds, with the exception of High Yield, Inflation Protected and Short Duration High Yield, were each organized as a series of predecessor trusts or corporations prior to that date. Nuveen Investment Funds, Inc. was incorporated in the State of Maryland on August 20, 1987.
On December 31, 2012, the Funds’ investment adviser converted from a Delaware corporation to a Delaware limited liability company. As a result, Nuveen Fund Advisors, Inc., a wholly-owned subsidiary of Nuveen Investments, Inc. (“Nuveen”), changed its name to Nuveen Fund Advisors, LLC (the “Adviser”). There were no changes to the identities or roles of any personnel as a result of the change.
All-American’s, Intermediate Duration’s and Limited Term’s investment objective is to provide as high a level of current interest income exempt from regular federal income taxes as is consistent with preservation of capital. Under normal market conditions, each Fund invests at least 80% of its net assets, plus the amount of any borrowings for investment purposes, in municipal bonds that pay interest that is exempt from regular federal personal income tax. Each Fund may invest without limit in securities that generate income subject to the alternative minimum tax. All American will generally maintain, under normal market conditions, an investment portfolio with an overall weighted average maturity of greater than 10 years. Intermediate Duration generally intends to maintain a weighted average portfolio duration within a defined range, currently between 4.5 and seven years. Limited Term generally invests in bonds with short- to intermediate-term maturities. Limited Term will attempt to maintain the weighted average maturity of its portfolio securities at three to seven years under normal market conditions. Each Fund invests at least 80% of its net assets in investment grade municipal bonds rated BBB/Baa or higher at the time of purchase by at least one independent rating agency, or, if unrated, judged by Nuveen Asset Management, LLC (the “Sub-Adviser”), a wholly-owned subsidiary of the Adviser, to be of comparable quality. Each Fund may invest up to 20% of its net assets in below investment grade municipal bonds, commonly referred to as “high yield” or “junk” bonds. Each Fund may invest up to 15% of its net assets in municipal securities whose interest payments vary inversely with changes in short-term tax-exempt interest rates (i.e., inverse floating rate securities).
High Yield’s and Short Duration High Yield’s investment objective is to provide high current income exempt from regular federal income taxes. Capital appreciation is a secondary objective when consistent with each Fund’s primary objective. Under normal market conditions, each Fund invests at least 80% of its net assets, plus the amount of any borrowings for investment purposes, in municipal bonds that pay interest that is exempt from regular federal personal income tax. Each Fund may invest without limit in securities that generate income subject to the alternative minimum tax. Under normal market conditions, each Fund invests at least 65% of its net assets in low- to medium-quality bonds rated BBB/Baa or lower by at least one independent rating agency, or if unrated, judged by the Sub-Adviser to be of comparable quality. Below investment grade municipal bonds are commonly referred to as “high yield” or “junk” bonds. Each Fund may invest up to 10% of its net assets in defaulted municipal bonds (i.e., bonds on which the issuer has not paid principal or interest on time). Each Fund may invest up to 15% of its net assets in municipal securities whose interest payments vary inversely with changes in short-term tax-exempt interest rates (i.e., inverse floating rate securities). Inverse floaters are derivative securities that provide leveraged exposure to underlying municipal bonds. Each Fund’s investments in inverse floaters are designed to increase each Fund’s income and returns through this leveraged exposure. These investments are speculative, however, and also create the possibility that income and returns will be diminished. High Yield is a long-term bond fund and, as such, will generally maintain, under normal market conditions, an investment portfolio with an overall weighted average maturity of greater than 10 years. The Fund invests significantly in lower-quality long-term municipal bonds and may employ effective leverage through investments in inverse floaters. The Fund may invest in inverse floating rate securities that create effective leverage of up to 30% of the Fund’s total investment exposure. Short Duration High Yield will maintain an investment portfolio with a weighted average effective duration of less than 4.5 years. The Fund invests significantly in lower-quality municipal bonds and may employ effective leverage through investments in inverse floaters.
Inflation Protected’s investment objective is to provide after-tax total return, protected from inflation, through a combination of federally tax-exempt income and inflation-linked investments. Under normal market conditions, the Fund invests at least 80% of its net assets, plus the amount of any borrowings for investment purposes, in municipal bonds that pay interest that is exempt from regular federal personal income tax. The Fund may invest without limit in securities that generate income subject to the alternative minimum tax. The Fund generally invests in intermediate and long-term bonds with a duration of between two and ten years, and generally intends to maintain the weighted average duration of its municipal bond portfolio within a defined intermediate-term range (currently, between four and seven years) over time. The Fund invests at least 80% of its net assets in investment grade quality municipal bonds rated BBB/Baa or higher at the time of purchase by at least one independent rating agency or, if unrated, judged by the Sub-Adviser to be of comparable quality. The Fund may invest up to 20% of its net assets in below-investment grade municipal bonds, commonly referred to as “high yield” or “junk” bonds.
Short Term’s investment objective is to provide current income that is exempt from federal income tax to the extent consistent with preservation of capital. Under normal market conditions, as a fundamental policy, the Fund invests at least 80% of its net assets, plus the amount of any borrowings for investment purposes, in municipal securities that pay interest that is exempt from federal income tax, including the federal alternative minimum tax. The Fund normally may invest up to 20% of its net assets in taxable obligations, including obligations the interest on which is subject to the federal alternative minimum tax. The Fund will attempt to maintain the weighted average maturity of its portfolio securities at three years or less under normal market conditions. The Fund invests mainly in securities that, at the time of purchase, are either rated investment grade or are unrated and determined to be of comparable quality by the Sub-Adviser. However, the Fund may invest up to 20% of its total assets in securities that, at the time of purchase, are rated lower than investment grade or are unrated and of comparable quality, commonly referred to as “high yield” or “junk” bonds. The Fund may invest up to 15% of its net assets in municipal securities whose interest payments vary inversely with changes in short-term tax-exempt interest rates (i.e., inverse floating rate securities).
Short Term may utilize futures contracts and options on futures contracts (“derivatives”) in an attempt to manage market risk, credit risk and yield curve risk, and to manage the effective maturity or duration of securities in the Fund’s portfolio. The Fund may not use such instruments to gain exposure to a security or type of security that it would be prohibited by its investment restrictions from purchasing directly.
The Funds’ most recent prospectus provides further descriptions of each Fund’s investment objective, principal investment strategies, and principal risks.
Significant Accounting Policies
The following is a summary of significant accounting policies followed by the Funds in the preparation of their financial statements in accordance with accounting principles generally accepted in the United States (“U.S. GAAP”).
Investment Valuation
Common stocks and other equity-type securities are valued at the last sales price on the securities exchange on which such securities are primarily traded and are generally classified as Level 1 for fair value measurement purposes. Securities primarily traded on the NASDAQ National Market (“NASDAQ”) are valued, except as indicated below, at the NASDAQ Official Closing Price and are generally classified as Level 1. However, securities traded on a securities exchange or NASDAQ for which there were no transactions on a given day or securities not listed on a securities exchange or NASDAQ are valued at the quoted bid price and are generally classified as Level 2.
Prices of municipal bonds, other fixed income securities and swap contracts are provided by a pricing service approved by the Funds’ Board of Directors/Trustees. These securities are generally classified as Level 2. The pricing service establishes a security’s fair value using methods that may include consideration of the following: yields or prices of investments of comparable quality, type of issue, coupon, maturity and rating, market quotes or indications of value from security dealers, evaluations of anticipated cash flows or collateral, general market conditions and other information and analysis, including the obligor’s credit characteristics considered relevant. In pricing certain securities, particularly less liquid and lower quality securities, the pricing service may consider information about a security, its issuer, or market activity, provided by the Adviser. These securities are generally classified as Level 2 or Level 3 depending on the priority of the significant inputs.
Investments in investment companies are valued at their respective net asset values on the valuation date. These investment vehicles are generally classified as Level 1.
Certain securities may not be able to be priced by the pre-established pricing methods as described above. Such securities may be valued by the Funds’ Board of Directors/Trustees or its designee at fair value. These securities generally include, but are not limited to, restricted securities (securities which may not be publicly sold without registration under the Securities Act of 1933, as amended) for which a pricing service is unable to provide a market price; securities whose trading has been formally suspended; debt securities that have gone into default and for which there is no current market quotation; a security whose market price is not available from a pre-established pricing source; a security with respect to which an event has occurred that is likely to materially affect the value of the security after the market has closed but before the calculation of a Fund’s net asset value (as may be the case in non-U.S. markets on which the security is primarily traded) or make it difficult or impossible to obtain a reliable market quotation; and a security whose price, as provided by the pricing service, is not deemed to reflect the security’s fair value. As a general principle, the fair value of a security would appear to be the amount that the owner might reasonably expect to receive for it in a current sale. A variety of factors may be considered in determining the fair value of such securities, which may include consideration of the following: yields or prices of investments of comparable quality, type of issue, coupon, maturity and rating, market quotes or indications of value from security dealers, evaluations of anticipated cash flows or collateral, general market conditions and other information and analysis, including the obligor’s credit characteristics considered relevant. These securities are generally classified as Level 2 or Level 3 depending on the priority of the significant inputs. Regardless of the method employed to value a particular security, all valuations are subject to review by the Funds’ Board of Directors/Trustees or its designee.
Refer to Footnote 2 – Fair Value Measurements for further details on the leveling of securities held by the Funds as of the end of the reporting period.
Notes to Financial Statements (continued)
Investment Transactions
Investment transactions are recorded on a trade date basis. Realized gains and losses from investment transactions are determined on the specific identification method, which is the same basis used for federal income tax purposes. Investments purchased on a when-issued/delayed delivery basis may have extended settlement periods. Any investments so purchased are subject to market fluctuation during this period. The Funds have instructed the custodian to earmark securities in the Funds’ portfolios with a current value at least equal to the amount of the when-issued/delayed delivery purchase commitments. As of April 30, 2013, All-American, High Yield, Inflation Protected, Intermediate Duration, Limited Term, Short Duration High Yield and Short-Term had outstanding when-issued/delayed delivery purchase commitments of $22,942,751, $26,034,275, $560,385, $8,938,201, $8,607,180, $6,254,038 and $1,893,518, respectively.
Investment Income
Dividend income is recorded on the ex-dividend date. Interest income, which reflects the amortization of premiums and includes accretion of discounts for financial reporting purposes, is recorded on an accrual basis. Interest income also reflects paydown gains and losses, if any.
Professional Fees
Professional fees presented on the Statement of Operations consist of legal fees incurred in the normal course of operations, audit fees, tax consulting fees and, in some cases, workout expenditures. Workout expenditures are incurred in an attempt to protect or enhance an investment, or to pursue other claims or legal actions on behalf of Fund shareholders. Legal fee refund presented on the Statement of Operations reflects a refund of workout expenditures paid in a prior reporting period, when applicable.
Income Taxes
Each Fund is a separate taxpayer for federal income tax purposes. Each Fund intends to distribute substantially all of its net investment income and net capital gains to shareholders and to otherwise comply with the requirements of Subchapter M of the Internal Revenue Code applicable to regulated investment companies. Therefore, no federal income tax provision is required. Furthermore, each Fund intends to satisfy conditions that will enable interest from municipal securities, which is exempt from regular federal income tax, to retain such tax-exempt status when distributed to shareholders of the Funds. Net realized capital gains and ordinary income distributions paid by the Funds are subject to federal taxation.
For all open tax years and all major taxing jurisdictions, management of the Funds has concluded that there are no significant uncertain tax positions that would require recognition in the financial statements. Open tax years are those that are open for examination by taxing authorities (i.e., generally the last four tax year ends and the interim tax period since then). Furthermore, management of the Funds is also not aware of any tax positions for which it is reasonably possible that the total amounts of unrecognized tax benefits will significantly change in the next twelve months.
Dividends and Distributions to Shareholders
The Funds declare dividends from their net investment income daily and pay shareholders monthly. Fund shares begin to accrue dividends on the business day after the day when the monies used to purchase Fund shares are collected by the Funds’ transfer agent.
Net realized capital gains and/or market discount from investment transactions, if any, are declared and distributed to shareholders at least annually. Furthermore, capital gains are distributed only to the extent they exceed available capital loss carryforwards.
Distributions to shareholders of net investment income, net realized capital gains and/or market discount, if any, are recorded on the ex-dividend date. The amount and timing of distributions are determined in accordance with federal income tax regulations, which may differ from U.S. GAAP.
Share Classes and Sales Charges
Class A Shares are generally sold with an up-front sales charge and incur a .20% annual 12b-1 service fee. Class A Share purchases of $1 million ($250,000 for Limited Term, Short Duration High Yield and Short Term) or more are sold at net asset value without an up-front sales charge but may be subject to a contingent deferred sales charge (“CDSC”) if redeemed within eighteen months of purchase. All-American, High Yield and Intermediate Duration will issue Class B Shares upon the exchange of Class B Shares from another Nuveen mutual fund or for purposes of dividend reinvestment, but Class B Shares are not available for new accounts or for additional investment into existing accounts. Class B Shares were sold without an up-front sales charge but incur a .75% annual 12b-1 distribution fee and a .20% annual 12b-1 service fee. Class B Shares are subject to a CDSC of up to 5% depending upon the length of time the shares are held by the investor (CDSC is reduced to 0% at the end of six years). Class B Shares automatically convert to Class A Shares eight years after purchase. Class C Shares are sold without an up-front sales charge but incur a .55% (.35% for Limited Term and Short Term) annual 12b-1 distribution fee and a .20% annual 12b-1 service fee. Class C Shares are subject to a CDSC of 1% if redeemed within twelve months of purchase. Class I Shares are not subject to any sales charge or 12b-1 distribution or service fees.
Inverse Floating Rate Securities
Each Fund (except Inflation Protected) is authorized to invest in inverse floating rate securities. An inverse floating rate security is created by depositing a municipal bond, typically with a fixed interest rate, into a special purpose trust created by a broker-dealer. In turn, this trust (a) issues floating rate certificates, in face amounts equal to some fraction of the deposited bond’s par amount or market value, that typically pay short-term tax-exempt interest rates to third parties, and (b) issues to a long-term investor (such as one
of the Funds) an inverse floating rate certificate (sometimes referred to as an “inverse floater”) that represents all remaining or residual interest in the trust. The income received by the inverse floater holder varies inversely with the short-term rate paid to the floating rate certificates’ holders, and in most circumstances the inverse floater holder bears substantially all of the underlying bond’s downside investment risk and also benefits disproportionately from any potential appreciation of the underlying bond’s value. The price of an inverse floating rate security will be more volatile than that of the underlying bond because the interest rate is dependent on not only the fixed coupon rate of the underlying bond but also on the short-term interest paid on the floating rate certificates, and because the inverse floating rate security essentially bears the risk of loss of the greater face value of the underlying bond.
A Fund may purchase an inverse floating rate security in a secondary market transaction without first owning the underlying bond (referred to as an “externally-deposited inverse floater”), or instead by first selling a fixed-rate bond to a broker-dealer for deposit into the special purpose trust and receiving in turn the residual interest in the trust (referred to as a “self-deposited inverse floater”). The inverse floater held by a Fund gives the Fund the right (a) to cause the holders of the floating rate certificates to tender their notes at par, and (b) to have the broker transfer the fixed-rate bond held by the trust to the Fund, thereby collapsing the trust. An investment in an externally-deposited inverse floater is identified in the Portfolio of Investments as “(IF) – Inverse floating rate investment.” An investment in a self-deposited inverse floater is accounted for as a financing transaction. In such instances, a fixed-rate bond deposited into a special purpose trust is identified in the Portfolio of Investments as “(UB) – Underlying bond of an inverse floating rate trust reflected as a financing transaction,” with the Fund accounting for the short-term floating rate certificates issued by the trust, at their liquidation value, as “Floating rate obligations” on the Statement of Assets and Liabilities. In addition, the Fund reflects in “Investment Income” the entire earnings of the underlying bond and related interest paid to the holders of the short-term floating rate certificates as a component of “Interest expense” on the Statement of Operations.
During the fiscal year ended April 30, 2013, each Fund, except for Inflation Protected, Limited Term and Short Term, invested in externally-deposited inverse floaters and/or self-deposited inverse floaters.
Each Fund may also enter into shortfall and forbearance agreements (sometimes referred to as a “recourse trust” or “credit recovery swap”) (such agreements referred to herein as “Recourse Trusts”) with a broker-dealer by which a Fund agrees to reimburse the broker-dealer, in certain circumstances, for the difference between the liquidation value of the fixed-rate bond held by the trust and the liquidation value of the floating rate certificates issued by the trust plus any shortfalls in interest cash flows. Under these agreements, a Fund’s potential exposure to losses related to or on inverse floaters may increase beyond the value of a Fund’s inverse floater investments as a Fund may potentially be liable to fulfill all amounts owed to holders of the floating rate certificates. At period end, any such shortfall is recognized as “Unrealized depreciation on Recourse Trusts” on the Statement of Assets and Liabilities.
As of April 30, 2013, each Fund’s maximum exposure to the floating rate obligations issued by externally-deposited Recourse Trusts was as follows:
| | | | | | | | | | | | | | | | |
| | | All-American | | | High Yield | | | Intermediate
Duration | | | Short Duration
High Yield | |
Maximum exposure to Recourse Trusts | | $ | 83,005,000 | | | $ | 1,844,463,000 | | | $ | 11,250,000 | | | $ | 750,000 | |
The average floating rate obligations outstanding and average annual interest rate and fees related to self-deposited inverse floaters for the following Funds during the fiscal year ended April 30, 2013, were as follows:
| | | | | | | | |
| | | All-American | | | High Yield | |
Average floating rate obligations outstanding | | $ | 19,376,849 | | | $ | 178,354,466 | |
Average annual interest rate and fees | | | 0.66 | % | | | 0.70 | % |
Swap Contracts
Each Fund (except Short Term) is authorized to enter into swap contracts consistent with their investment objectives and policies to reduce, increase or otherwise alter its risk profile or to alter its portfolio characteristics (i.e. duration, yield curve positioning and credit quality).
Forward Swaps
Each Fund’s use of forward interest rate swap transactions is intended to help the Fund manage its overall interest rate sensitivity, either shorter or longer, generally to more closely align the Fund’s interest rate sensitivity with that of the broader market. Forward interest rate swap transactions involve each Fund’s agreement with a counterparty to pay, in the future, a fixed or variable rate payment in exchange for the counterparty paying the Fund a variable or fixed rate payment, the accruals for which would begin at a specified date in the future (the “effective date”). The amount of the payment obligation is based on the notional amount of the swap contract and the termination date of the swap (which is akin to a bond’s maturity). The value of the Fund’s swap commitment would increase or decrease based primarily on the extent to which long-term interest rates for bonds having a maturity of the swap’s termination date increase or decrease. Forward interest rate swap contracts are valued daily. The net amount recorded on these transactions for each counterparty is recognized on the Statement of Assets and Liabilities as a component of “Unrealized appreciation or depreciation on forward swaps (,net)” with the change during the fiscal period recognized on the Statement of Operations as a component of “Change in net unrealized appreciation (depreciation) of swaps.”
Notes to Financial Statements (continued)
Each Fund may terminate a swap contract prior to the effective date, at which point a realized gain or loss is recognized. When a forward swap is terminated, it ordinarily does not involve the delivery of securities or other underlying assets or principal, but rather is settled in cash on a net basis. Net realized gains and losses during the fiscal period are recognized on the Statement of Operations as a component of “Net realized gain (loss) from swaps.” Each Fund intends, but is not obligated, to terminate its forward swaps before the effective date. Accordingly, the risk of loss with respect to the swap counterparty on such transactions is limited to the credit risk associated with a counterparty failing to honor its commitment to pay any realized gain to the Fund upon termination.
During the fiscal year ended April 30, 2013, High Yield entered into forward interest rate swap contracts to reduce the duration of its portfolio. The average notional amount of forward interest rate swap contracts outstanding during the fiscal year ended April 30, 2013, was as follows:
| | | | |
| | | High Yield | |
Average notional amount of forward interest rate swap contracts outstanding* | | $ | 124,600,000 | |
| * | The average notional amount is calculated based on the outstanding notional amount at the beginning of the fiscal year and at the end of each fiscal quarter within the current fiscal year. |
Credit Default Swaps
A Fund may enter into a credit default swap contract to seek to maintain a total return on a particular investment or portion of its portfolio, or to take an active long or short position with respect to the likelihood of a particular issuer’s default. Credit default swap contracts involve one party making a stream of payments to another party in exchange for the right to receive a specified return if/when there is a credit event by a third party. Generally, a credit event means bankruptcy, failure to pay, or restructuring. The specific credit events applicable for each credit default swap are stated in the terms of the particular swap agreement. As a purchaser of a credit default swap contract, the Fund pays to the counterparty a periodic interest fee based on the notional amount of the credit default swap. This interest fee is accrued daily and recognized with the daily change in the market value of the contract as a component of “Unrealized appreciation or depreciation on credit default swaps (,net)” on the Statement of Assets and Liabilities and is recorded as a realized loss upon payment. Upon occurrence of a specific credit event with respect to the underlying referenced entity, the Fund is obligated to deliver that security, or an equivalent amount of cash, to the counterparty in exchange for receipt of the notional amount from the counterparty. The difference between the value of the security delivered and the notional amount received is recorded as a realized gain. Payments received or made at the beginning of the measurement period are recognized as a component of “Credit default swap premiums paid and/or received” on the Statement of Assets and Liabilities, when applicable. As a seller of a credit default swap contract, the Fund generally receives from the counterparty a periodic interest fee based on the notional amount of the credit default swap. This interest fee is accrued daily as a component of unrealized appreciation or depreciation and is recorded as a realized gain upon payment. Upon occurrence of a specific credit event with respect to the underlying referenced entity, the Fund will either receive that security, or an equivalent amount of cash, from the counterparty in exchange for payment of the notional amount to the counterparty, or pay a net settlement amount of the credit default swap contract less the recovery value of the referenced obligation or underlying securities comprising the referenced index. The difference between the value of the security received and the notional amount paid is recorded as a realized loss. Changes in the value of a credit default swap during the fiscal period are recognized as a component of “Change in net unrealized appreciation (depreciation) of swaps,” and realized gains and losses are recognized as a component of “Net realized gain (loss) from swaps” on the Statement of Operations. The maximum potential amount of future payments the Fund could incur as a seller of protection in a credit default swap contract is limited to the notional amount of the contract. The maximum potential amount would be offset by the recovery value, if any, of the respective referenced entity.
During the fiscal year ended April 30, 2013, High Yield invested in credit default swap contacts to manage credit risk. The average notional amount of credit default swap contracts outstanding during the fiscal year ended April 30, 2013, was as follows:
| | | | |
| | | High Yield | |
Average notional amount of credit default swap contracts outstanding* | | $ | 2,091,000 | |
| * | The average notional amount is calculated based on the outstanding notional amount at the beginning of the fiscal year and at the end of each fiscal quarter within the current fiscal year. |
Consumer Price Index Swaps
Inflation Protected seeks to hedge inflation risk by investing inflation-linked instruments, such as Consumer Price Index (“CPI”) swaps, in amounts sufficient to approximate the duration characteristics of the Fund’s underlying municipal bond portfolio. A CPI swap is a fixed maturity, over-the-counter derivative in which the Fund pays to the counterparty a predetermined fixed annualized rate over the life of the CPI swap and receives in return the “realized” rate of inflation as measured by the Consumer Price Index for All Urban Consumers Non-Seasonally Adjusted over the life of the swap. The Fund will benefit from a CPI swap if actual inflation during the swap’s period is greater than the level of inflation expected for that period at the time the swap was entered into, and conversely the Fund will lose money on a CPI swap if actual inflation turns out to be less than expected.
Income accruals begin at a specified date in the future (the “effective date”). The amount of the payment obligation is based on the notional amount of the CPI swap contract and the termination date of the swap (which is akin to a bond’s maturity). CPI swap contracts are valued daily. The net amount recorded on these transactions, for each counterparty, is recognized on the Statement of Assets and
Liabilities as a component of “Unrealized appreciation or depreciation on consumer price index swaps (,net)” with the change during the fiscal period recognized on the Statement of Operations as a component of “Change in net unrealized appreciation (depreciation) of swaps.”
The Fund may terminate a swap contract prior to the effective date, at which point a realized gain or loss is recognized. When a CPI swap is terminated, it ordinarily does not involve the delivery of securities or other underlying assets or principal, but rather is settled in cash on a net basis. Net realized gains and losses during the fiscal period are recognized on the Statement of Operations as a component of “Net realized gain (loss) from swaps.” The Fund intends, but is not obligated, to terminate its CPI swaps before the effective date. Accordingly, the risk of loss with respect to the swap counterparty on such transactions is limited to the credit risk associated with a counterparty failing to honor its commitment to pay any realized gain to the Fund upon termination.
During the fiscal year ended April 30, 2013, Inflation Protected continued to invest in CPI swap contracts to hedge against unexpected increases in inflation. The average notional amount of CPI swap contracts outstanding during the fiscal year ended April 30, 2013, was as follows:
| | | | |
| | | Inflation
Protected | |
Average notional amount of forward interest rate swap contracts outstanding* | | $ | 52,530,000 | |
| * | The average notional amount is calculated based on the outstanding notional amount at the beginning of the fiscal year and at the end of each fiscal quarter within the current fiscal year. |
Refer to Footnote 3 – Derivative Instruments and Hedging Activities for further details on swap contract activity.
Market and Counterparty Credit Risk
In the normal course of business each Fund may invest in financial instruments and enter into financial transactions where risk of potential loss exists due to changes in the market (market risk) or failure of the other party to the transaction to perform (counterparty credit risk). The potential loss could exceed the value of the financial assets recorded on the financial statements. Financial assets, which potentially expose each Fund to counterparty credit risk, consist principally of cash due from counterparties on forward, option and swap transactions, when applicable. The extent of each Fund’s exposure to counterparty credit risk in respect to these financial assets approximates their carrying value as recorded on the Statement of Assets and Liabilities. Futures contracts, when applicable, expose a Fund to minimal counterparty credit risk as they are exchange traded and the exchange’s clearinghouse, which is counterparty to all exchange traded futures, guarantees the futures contracts against default.
Each Fund helps manage counterparty credit risk by entering into agreements only with counterparties the Adviser believes have the financial resources to honor their obligations and by having the Adviser monitor the financial stability of the counterparties. Additionally, counterparties may be required to pledge collateral daily (based on the daily valuation of the financial asset) on behalf of each Fund with a value approximately equal to the amount of any unrealized gain above a pre-determined threshold. Reciprocally, when each Fund has an unrealized loss, the Funds have instructed the custodian to pledge assets of the Funds as collateral with a value approximately equal to the amount of the unrealized loss above a pre-determined threshold. Collateral pledges are monitored and subsequently adjusted if and when the valuations fluctuate, either up or down, by at least the pre-determined threshold amount.
Zero Coupon Securities
Each Fund is authorized to invest in zero coupon securities. A zero coupon security does not pay a regular interest coupon to its holders during the life of the security. Income to the holder of the security comes from accretion of the difference between the original purchase price of the security at issuance and the par value of the security at maturity and is effectively paid at maturity. The market prices of zero coupon securities generally are more volatile than the market prices of securities that pay interest periodically.
Multiclass Operations and Allocations
Income and expenses of the Funds that are not directly attributable to a specific class of shares are prorated among the classes based on the relative settled shares of each class. Expenses directly attributable to a class of shares, which presently only include 12b-1 distribution and service fees, are recorded to the specific class.
Realized and unrealized capital gains and losses of the Funds are prorated among the classes based on the relative net assets of each class.
Indemnifications
Under each Trust’s organizational documents, its officers and trustees are indemnified against certain liabilities arising out of the performance of their duties to each Trust. In addition, in the normal course of business, each Trust enters into contracts that provide general indemnifications to other parties. Each Trust’s maximum exposure under these arrangements is unknown as this would involve future claims that may be made against each Trust that have not yet occurred. However, each Trust has not had prior claims or losses pursuant to these contracts and expects the risk of loss to be remote.
Use of Estimates
The preparation of financial statements in conformity with U.S. GAAP requires management to make estimates and assumptions that affect the reported amounts of assets and liabilities at the date of the financial statements and the reported amounts of increases and decreases in net assets from operations during the reporting period. Actual results may differ from those estimates.
Notes to Financial Statements (continued)
2. Fair Value Measurements
Fair value is defined as the price that the Funds would receive upon selling an investment or transferring a liability in an orderly transaction to an independent buyer in the principal or most advantageous market for the investment. A three-tier hierarchy is used to maximize the use of observable market data and minimize the use of unobservable inputs and to establish classification of fair value measurements for disclosure purposes. Observable inputs reflect the assumptions market participants would use in pricing the asset or liability. Observable inputs are based on market data obtained from sources independent of the reporting entity. Unobservable inputs reflect the reporting entity’s own assumptions about the assumptions market participants would use in pricing the asset or liability. Unobservable inputs are based on the best information available in the circumstances. The following is a summary of the three-tiered hierarchy of valuation input levels.
| | |
| Level 1 – | | Inputs are unadjusted and prices are determined using quoted prices in active markets for identical securities. |
| Level 2 – | | Prices are determined using other significant observable inputs (including quoted prices for similar securities, interest rates, prepayment speeds, credit risk, etc.). |
| Level 3 – | | Prices are determined using significant unobservable inputs (including management’s assumptions in determining the fair value of investments). |
The inputs or methodologies used for valuing securities are not an indication of the risks associated with investing in those securities. The following is a summary of each Fund’s fair value measurements as of the end of the reporting period:
| | | | | | | | | | | | | | | | |
| All-American | | Level 1 | | | Level 2 | | | Level 3 | | | Total | |
Long-Term Investments*: | | | | | | | | | | | | | | | | |
Municipal Bonds | | $ | — | | | $ | 2,968,571,504 | | | $ | — | | | $ | 2,968,571,504 | |
Corporate Bonds | | | — | | | | — | | | | 38,866 | | | | 38,866 | |
Total | | $ | — | | | $ | 2,968,571,504 | | | $ | 38,866 | | | $ | 2,968,610,370 | |
| | | | | | | | | | | | | | | | |
| High Yield | | Level 1 | | | Level 2 | | | Level 3 | | | Total | |
Long-Term Investments*: | | | | | | | | | | | | | | | | |
Municipal Bonds | | $ | — | | | $ | 9,359,705,430 | | | $ | 202,017 | | | $ | 9,359,907,447 | |
Common Stocks | | | 1,086,118 | | | | — | | | | — | | | | 1,086,118 | |
Corporate Bonds | | | — | | | | 7,288,750 | | | | 19,004 | | | | 7,307,754 | |
Derivatives: | | | | | | | | | | | | | | | | |
Credit Default Swaps** | | | — | | | | 416,183 | | | | — | | | | 416,183 | |
Forward Swaps** | | | — | | | | 5,645,284 | | | | — | | | | 5,645,284 | |
Total | | $ | 1,086,118 | | | $ | 9,373,055,647 | | | $ | 221,021 | | | $ | 9,374,362,786 | |
| | | | |
| Inflation Protected | | Level 1 | | | Level 2 | | | Level 3 | | | Total | |
Long-Term Investments*: | | | | | | | | | | | | | | | | |
Municipal Bonds | | $ | — | | | $ | 107,704,799 | | | $ | — | | | $ | 107,704,799 | |
Derivatives: | | | | | | | | | | | | | | | | |
Consumer Price Index Swaps** | | | — | | | | (1,077,858 | ) | | | — | | | | (1,077,858 | ) |
Total | | $ | — | | | $ | 106,626,941 | | | $ | — | | | $ | 106,626,941 | |
| | | | |
| Intermediate Duration | | Level 1 | | | Level 2 | | | Level 3 | | | Total | |
Long-Term Investments*: | | | | | | | | | | | | | | | | |
Municipal Bonds | | $ | — | | | $ | 4,109,145,970 | | | $ | 7,843,322 | | | $ | 4,116,989,292 | |
Corporate Bonds | | | — | | | | — | | | | 59,871 | | | | 59,871 | |
Total | | $ | — | | | $ | 4,109,145,970 | | | $ | 7,903,193 | | | $ | 4,117,049,163 | |
| | | | |
| Limited Term | | Level 1 | | | Level 2 | | | Level 3 | | | Total | |
Long-Term Investments*: | | | | | | | | | | | | | | | | |
Municipal Bonds | | $ | — | | | $ | 3,531,802,841 | | | $ | — | | | $ | 3,531,802,841 | |
Corporate Bonds | | | — | | | | — | | | | 36,923 | | | | 36,923 | |
Short-Term Investments*: | | | | | | | | | | | | | | | | |
Municipal Bonds | | | — | | | | 122,435,000 | | | | — | | | | 122,435,000 | |
Total | | $ | — | | | $ | 3,654,237,841 | | | $ | 36,923 | | | $ | 3,654,274,764 | |
| | | | |
| Short Duration High Yield | | Level 1 | | | Level 2 | | | Level 3 | | | Total | |
Long-Term Investments*: | | | | | | | | | | | | | | | | |
Municipal Bonds | | $ | — | | | $ | 114,501,589 | | | $ | — | | | $ | 114,501,589 | |
| | | | | | | | | | | | | | | | |
| Short Term | | Level 1 | | | Level 2 | | | Level 3 | | | Total | |
Long-Term Investments*: | | | | | | | | | | | | | | | | |
Municipal Bonds | | $ | — | | | $ | 481,590,797 | | | $ | — | | | $ | 481,590,797 | |
Short-Term Investments*: | | | | | | | | | | | | | | | | |
Money Market Funds | | | 378,719 | | | | — | | | | — | | | | 378,719 | |
Municipal Bonds | | | — | | | | 16,075,000 | | | | — | | | | 16,075,000 | |
Total | | $ | 378,719 | | | $ | 497,665,797 | | | $ | — | | | $ | 498,044,516 | |
| * | Refer to the Fund’s Portfolio of Investments for state classifications and breakdown of Municipal Bonds and Corporate Bonds classified as Level 3, where applicable. |
| ** | Represents net unrealized appreciation (depreciation) as reported in the Fund’s Portfolio of Investments. |
The Nuveen funds’ Board of Directors/Trustees is responsible for the valuation process and has delegated the oversight of the daily valuation process to the Adviser’s Valuation Committee. The Valuation Committee, pursuant to the valuation policies and procedures adopted by the Board of Directors/Trustees, is responsible for making fair value determinations, evaluating the effectiveness of the funds’ pricing policies, and reporting to the Board of Directors/Trustees. The Valuation Committee is aided in its efforts by the Adviser’s dedicated Securities Valuation Team, which is responsible for administering the daily valuation process and applying fair value methodologies as approved by the Valuation Committee. When determining the reliability of independent pricing services for investments owned by the funds, the Valuation Committee, among other things, conducts due diligence reviews of the pricing services and monitors the quality of security prices received through various testing reports conducted by the Securities Valuation Team.
The Valuation Committee will consider pricing methodologies it deems relevant and appropriate when making a fair value determination, based on the facts and circumstances specific to the portfolio instrument. Fair value determinations generally will be derived as follows, using public or private market information:
| | (i.) | If available, fair value determinations shall be derived by extrapolating from recent transactions or quoted prices for identical or comparable securities. |
| | (ii.) | If such information is not available, an analytical valuation methodology may be used based on other available information including, but not limited to: analyst appraisals, research reports, corporate action information, issuer financial statements and shelf registration statements. Such analytical valuation methodologies may include, but are not limited to: multiple of earnings, discount from market value of a similar freely-traded security, discounted cash flow analysis, book value or a multiple thereof, risk premium/yield analysis, yield to maturity and/or fundamental investment analysis. |
The purchase price of a portfolio instrument will be used to fair value the instrument only if no other valuation methodology is available or deemed appropriate, and it is determined that the purchase price fairly reflects the instrument’s current value.
For each portfolio security that has been fair valued pursuant to the policies adopted by the Board of Directors/Trustees, the fair value price is compared against the last available and next available market quotations. The Valuation Committee reviews the results of such testing and fair valuation occurrences are reported to the Board of Directors/Trustees.
3. Derivative Instruments and Hedging Activities
Each Fund is authorized to invest in certain derivative instruments, including futures, options and swap contracts. The Funds record derivative instruments at fair value, with changes in fair value recognized on the Statement of Operations, when applicable. Even though the Funds’ investments in derivatives may represent economic hedges, they are not considered to be hedge transactions for financial reporting purposes. For additional information on the derivative instruments in which each Fund was invested during and at the end of the reporting period, refer to the Portfolios of Investments, Financial Statements and Footnote 1 – General Information and Significant Accounting Policies.
The following tables present the fair value of all derivative instruments held by the Funds as of April 30, 2013, the location of these instruments on the Statement of Assets and Liabilities, and the primary underlying risk exposure.
| | | | | | | | | | | | | | |
| |
| High Yield | | | |
| | | | | Location on the Statement of Assets and Liabilities | |
Underlying
Risk Exposure | | Derivative
Instrument | | Asset Derivatives | | | Liability Derivatives | |
| | | Location | | Value | | | Location | | Value | |
Credit | | Swaps | | Unrealized appreciation on
credit default swaps* | | $ | 416,183 | | | — | | $ | — | |
Interest Rate | | Swaps | | Unrealized appreciation on
forward swaps | | | 5,645,284 | | | — | | | — | |
Total | | | | | | $ | 6,061,467 | | | | | $ | — | |
| * | Some swap contracts require a counterparty to pay or receive a premium, which is disclosed on the Statement of Assets and Liabilities but is not reflected in the unrealized appreciation (depreciation) presented above. |
Notes to Financial Statements (continued)
| | | | | | | | | | | | | | |
| |
| Inflation Protected | | | |
| | | | | Location on the Statement of Assets and Liabilities | |
Underlying
Risk Exposure | | Derivative
Instrument | | Asset Derivatives | | | Liability Derivatives | |
| | | Location | | Value | | | Location | | Value | |
Inflation | | Swaps | | — | | $ | — | | | Unrealized depreciation on
consumer price index
swaps, net | | $ | (1,077,858 | ) |
The following tables present the amount of net realized gain (loss) and change in net unrealized appreciation (depreciation) recognized for the fiscal year ended April 30, 2013, on derivative instruments, as well as the primary risk exposure associated with each.
| | | | | | | | |
| Net Realized Gain (Loss) from Swaps | | High Yield | | | Inflation
Protected | |
Risk Exposure | | | | | | | | |
Credit | | $ | 79,536 | | | $ | — | |
Interest Rate | | | (85,664,753 | ) | | | — | |
Inflation | | | — | | | | (152,000 | ) |
Total | | $ | (85,585,217 | ) | | $ | (152,000 | ) |
| | |
| Change in Net Unrealized Appreciation (Depreciation) of Swaps | | High Yield | | | Inflation
Protected | |
Risk Exposure | | | | | | | | |
Credit | | $ | (52,011 | ) | | $ | — | |
Interest Rate | | | 76,251,101 | | | | — | |
Inflation | | | — | | | | (1,001,260 | ) |
Total | | $ | 76,199,090 | | | $ | (1,001,260 | ) |
4. Fund Shares
Transactions in Fund shares were as follows:
| | | | | | | | | | | | | | | | |
| | | All-American | |
| | | Year Ended
4/30/13 | | | Year Ended
4/30/12 | |
| | | Shares | | | Amount | | | Shares | | | Amount | |
Shares issued from reorganization: | | | | | | | | | | | | | | | | |
Class A | | | — | | | $ | — | | | | 35,980,330 | | | $ | 408,027,129 | |
Class B | | | — | | | | — | | | | 395,872 | | | | 4,499,648 | |
Class C | | | — | | | | — | | | | 8,184,311 | | | | 92,803,541 | |
Class I | | | — | | | | — | | | | 80,552,353 | | | | 917,706,121 | |
Shares sold: | | | | | | | | | | | | | | | | |
Class A | | | 36,137,441 | | | | 422,123,272 | | | | 22,091,824 | | | | 242,252,943 | |
Class A – automatic conversion of Class B Shares | | | 88,230 | | | | 1,027,090 | | | | 79,973 | | | | 864,408 | |
Class B | | | 19,747 | | | | 230,819 | | | | 30,828 | | | | 332,007 | |
Class C | | | 14,765,759 | | | | 172,192,912 | | | | 9,413,510 | | | | 103,505,104 | |
Class I | | | 29,093,499 | | | | 340,673,994 | | | | 12,377,121 | | | | 136,518,888 | |
Shares issued to shareholders due to reinvestment of distributions: | | | | | | | | | | | | | | | | |
Class A | | | 3,031,020 | | | | 35,411,944 | | | | 1,341,013 | | | | 14,683,749 | |
Class B | | | 12,257 | | | | 143,124 | | | | 11,975 | | | | 130,615 | |
Class C | | | 856,156 | | | | 10,008,408 | | | | 450,253 | | | | 4,930,726 | |
Class I | | | 2,599,068 | | | | 30,450,682 | | | | 527,567 | | | | 5,824,286 | |
| | | | 86,603,177 | | | | 1,012,262,245 | | | | 171,436,930 | | | | 1,932,079,165 | |
Shares redeemed: | | | | | | | | | | | | | | | | |
Class A | | | (19,964,928 | ) | | | (233,633,614 | ) | | | (8,375,436 | ) | | | (91,659,689 | ) |
Class B | | | (304,556 | ) | | | (3,554,758 | ) | | | (133,765 | ) | | | (1,442,175 | ) |
Class B – automatic conversion to Class A Shares | | | (88,046 | ) | | | (1,027,090 | ) | | | (79,763 | ) | | | (864,408 | ) |
Class C | | | (5,344,245 | ) | | | (62,513,581 | ) | | | (2,611,773 | ) | | | (28,351,126 | ) |
Class I | | | (21,208,856 | ) | | | (248,678,330 | ) | | | (4,241,588 | ) | | | (46,679,083 | ) |
| | | | (46,910,631 | ) | | | (549,407,373 | ) | | | (15,442,325 | ) | | | (168,996,481 | ) |
Net increase (decrease) | | | 39,692,546 | | | $ | 462,854,872 | | | | 155,994,605 | | | $ | 1,763,082,684 | |
| | | | | | | | | | | | | | | | |
| | | High Yield | |
| | | Year Ended
4/30/13 | | | Year Ended
4/30/12 | |
| | | Shares | | | Amount | | | Shares | | | Amount | |
Shares sold: | | | | | | | | | | | | | | | | |
Class A | | | 83,227,749 | | | $ | 1,414,103,925 | | | | 58,867,393 | | | $ | 898,928,010 | |
Class A – automatic conversion of Class B Shares | | | 134,897 | | | | 2,280,367 | | | | 283,474 | | | | 4,292,207 | |
Class B | | | 16,943 | | | | 285,492 | | | | 25,770 | | | | 391,159 | |
Class C | | | 29,734,439 | | | | 504,278,019 | | | | 21,076,138 | | | | 322,695,197 | |
Class I | | | 164,318,215 | | | | 2,794,835,547 | | | | 89,276,195 | | | | 1,356,520,720 | |
Shares issued to shareholders due to reinvestment of distributions: | | | | | | | | | | | | | | | | |
Class A | | | 7,391,621 | | | | 126,114,340 | | | | 5,934,259 | | | | 90,492,225 | |
Class B | | | 70,136 | | | | 1,190,389 | | | | 116,361 | | | | 1,764,811 | |
Class C | | | 3,500,895 | | | | 59,654,894 | | | | 3,112,335 | | | | 47,397,757 | |
Class I | | | 7,990,918 | | | | 136,330,526 | | | | 6,890,054 | | | | 104,948,735 | |
| | | | 296,385,813 | | | | 5,039,073,499 | | | | 185,581,979 | | | | 2,827,430,821 | |
Shares redeemed: | | | | | | | | | | | | | | | | |
Class A | | | (56,382,324 | ) | | | (962,818,893 | ) | | | (37,330,244 | ) | | | (566,415,629 | ) |
Class B | | | (838,778 | ) | | | (14,222,250 | ) | | | (1,048,422 | ) | | | (15,809,002 | ) |
Class B – automatic conversion to Class A Shares | | | (135,059 | ) | | | (2,280,367 | ) | | | (283,790 | ) | | | (4,292,207 | ) |
Class C | | | (16,050,199 | ) | | | (273,672,024 | ) | | | (13,491,557 | ) | | | (204,163,093 | ) |
Class I | | | (82,899,202 | ) | | | (1,415,564,180 | ) | | | (51,658,794 | ) | | | (783,150,287 | ) |
| | | | (156,305,562 | ) | | | (2,668,557,714 | ) | | | (103,812,807 | ) | | | (1,573,830,218 | ) |
Net increase (decrease) | | | 140,080,251 | | | $ | 2,370,515,785 | | | | 81,769,172 | | | $ | 1,253,600,603 | |
| | | | | | | | | | | | | | | | |
| | | Inflation Protected | |
| | | Year Ended
4/30/13 | | | Year Ended
4/30/12 | |
| | | Shares | | | Amount | | | Shares | | | Amount | |
Shares sold: | | | | | | | | | | | | | | | | |
Class A | | | 5,232,725 | | | $ | 59,200,370 | | | | 599,121 | | | $ | 6,421,532 | |
Class C | | | 1,154,528 | | | | 13,014,423 | | | | 215,020 | | | | 2,323,724 | |
Class I | | | 3,120,247 | | | | 35,239,562 | | | | 454,115 | | | | 4,911,266 | |
Shares issued to shareholders due to reinvestment of distributions: | | | | | | | | | | | | | | | | |
Class A | | | 47,599 | | | | 538,687 | | | | 3,385 | | | | 36,472 | |
Class C | | | 11,011 | | | | 124,435 | | | | 1,199 | | | | 13,005 | |
Class I | | | 31,839 | | | | 360,112 | | | | 2,606 | | | | 28,468 | |
| | | | 9,597,949 | | | | 108,477,589 | | | | 1,275,446 | | | | 13,734,467 | |
Shares redeemed: | | | | | | | | | | | | | | | | |
Class A | | | (473,041 | ) | | | (5,305,991 | ) | | | (109,515 | ) | | | (1,182,821 | ) |
Class C | | | (215,629 | ) | | | (2,387,098 | ) | | | (184 | ) | | | (1,990 | ) |
Class I | | | (665,894 | ) | | | (7,567,356 | ) | | | (14,668 | ) | | | (155,468 | ) |
| | | | (1,354,564 | ) | | | (15,260,445 | ) | | | (124,367 | ) | | | (1,340,279 | ) |
Net increase (decrease) | | | 8,243,385 | | | $ | 93,217,144 | | | | 1,151,079 | | | $ | 12,394,188 | |
Notes to Financial Statements (continued)
| | | | | | | | | | | | | | | | |
| | | Intermediate Duration | |
| | | Year Ended
4/30/13 | | | Year Ended
4/30/12 | |
| | | Shares | | | Amount | | | Shares | | | Amount | |
Shares issued from reorganization: | | | | | | | | | | | | | | | | |
Class A | | | — | | | $ | — | | | | 7,230,971 | | | $ | 66,888,188 | |
Class B | | | — | | | | — | | | | — | | | | — | |
Class C | | | — | | | | — | | | | — | | | | — | |
Class I | | | — | | | | — | | | | 77,039,079 | | | | 714,318,641 | |
Shares sold: | | | | | | | | | | | | | | | | |
Class A | | | 14,955,830 | | | | 139,930,217 | | | | 10,156,879 | | | | 92,675,134 | |
Class A – automatic conversion of Class B Shares | | | 18,235 | | | | 169,460 | | | | 69,918 | | | | 631,465 | |
Class B | | | 7,073 | | | | 66,166 | | | | 41,119 | | | | 373,841 | |
Class C | | | 4,620,559 | | | | 43,326,884 | | | | 3,604,671 | | | | 32,896,367 | |
Class I | | | 91,216,978 | | | | 855,020,858 | | | | 48,744,931 | | | | 446,524,006 | |
Shares issued to shareholders due to reinvestment of distributions: | | | | | | | | | | | | | | | | |
Class A | | | 1,393,342 | | | | 13,028,844 | | | | 1,217,606 | | | | 11,083,192 | |
Class B | | | 4,210 | | | | 39,464 | | | | 8,200 | | | | 74,692 | |
Class C | | | 266,451 | | | | 2,498,523 | | | | 235,120 | | | | 2,145,889 | |
Class I | | | 7,496,009 | | | | 70,245,514 | | | | 7,360,832 | | | | 67,125,266 | |
| | | | 119,978,687 | | | | 1,124,325,930 | | | | 155,709,326 | | | | 1,434,736,681 | |
Shares redeemed: | | | | | | | | | | | | | | | | |
Class A | | | (10,455,595 | ) | | | (97,725,473 | ) | | | (12,210,661 | ) | | | (111,517,880 | ) |
Class B | | | (121,372 | ) | | | (1,137,338 | ) | | | (240,717 | ) | | | (2,185,157 | ) |
Class B – automatic conversion to Class A Shares | | | (18,178 | ) | | | (169,460 | ) | | | (69,762 | ) | | | (631,495 | ) |
Class C | | | (2,592,728 | ) | | | (24,303,565 | ) | | | (1,776,614 | ) | | | (16,190,024 | ) |
Class I | | | (52,392,176 | ) | | | (491,029,155 | ) | | | (32,395,696 | ) | | | (295,967,439 | ) |
| | | | (65,580,049 | ) | | | (614,364,991 | ) | | | (46,693,450 | ) | | | (426,491,995 | ) |
Net increase (decrease) | | | 54,398,638 | | | $ | 509,960,939 | | | | 109,015,876 | | | $ | 1,008,244,686 | |
| | | | | | | | | | | | | | | | |
| | | Limited Term | |
| | | Year Ended
4/30/13 | | | Year Ended
4/30/12 | |
| | | Shares | | | Amount | | | Shares | | | Amount | |
Shares sold: | | | | | | | | | | | | | | | | |
Class A | | | 55,858,576 | | | $ | 627,985,659 | | | | 41,699,811 | | | $ | 463,108,752 | |
Class C | | | 16,583,824 | | | | 185,750,383 | | | | 14,320,576 | | | | 158,503,222 | |
Class I | | | 74,687,116 | | | | 835,442,766 | | | | 61,012,287 | | | | 674,042,794 | |
Shares issued to shareholders due to reinvestment of distributions: | | | | | | | | | | | | | | | | |
Class A | | | 2,027,026 | | | | 22,803,105 | | | | 1,848,325 | | | | 20,523,739 | |
Class C | | | 735,318 | | | | 8,238,714 | | | | 717,338 | | | | 7,933,697 | |
Class I | | | 1,417,080 | | | | 15,859,641 | | | | 979,257 | | | | 10,818,473 | |
| | | | 151,308,940 | | | | 1,696,080,268 | | | | 120,577,594 | | | | 1,334,930,677 | |
Shares redeemed: | | | | | | | | | | | | | | | | |
Class A | | | (29,738,275 | ) | | | (334,355,453 | ) | | | (31,920,367 | ) | | | (354,520,690 | ) |
Class C | | | (10,594,753 | ) | | | (118,670,653 | ) | | | (9,858,868 | ) | | | (108,823,111 | ) |
Class I | | | (45,284,522 | ) | | | (506,548,399 | ) | | | (29,862,023 | ) | | | (329,657,607 | ) |
| | | | (85,617,550 | ) | | | (959,574,505 | ) | | | (71,641,258 | ) | | | (793,001,408 | ) |
Net increase (decrease) | | | 65,691,390 | | | $ | 736,505,763 | | | | 48,936,336 | | | $ | 541,929,269 | |
| | | | | | | | |
| | | Short Duration
High Yield | |
| | | For the period 2/01/13
(commencement of
operations) through
4/30/13 | |
| | | Shares | | | Amount | |
Shares sold: | | | | | | | | |
Class A | | | 6,630,023 | | | $ | 66,801,133 | |
Class C | | | 487,924 | | | | 4,905,230 | |
Class I | | | 7,047,337 | | | | 71,036,869 | |
Shares issued to shareholders due to reinvestment of distributions: | | | | | | | | |
Class A | | | 8,484 | | | | 85,736 | |
Class C | | | 878 | | | | 8,872 | |
Class I | | | 1,845 | | | | 18,660 | |
| | | | 14,176,491 | | | | 142,856,500 | |
Shares redeemed: | | | | | | | | |
Class A | | | (24,120 | ) | | | (243,114 | ) |
Class C | | | (10,055 | ) | | | (101,457 | ) |
Class I | | | (32,395 | ) | | | (327,815 | ) |
| | | | (66,570 | ) | | | (672,386 | ) |
Net increase (decrease) | | | 14,109,921 | | | $ | 142,184,114 | |
| | | | | | | | | | | | | | | | |
| | | Short Term | |
| | | Year Ended
4/30/13 | | | Year Ended
4/30/12 | |
| | | Shares | | | Amount | | | Shares | | | Amount | |
Shares sold: | | | | | | | | | | | | | | | | |
Class A | | | 10,803,399 | | | $ | 110,119,096 | | | | 3,089,516 | | | $ | 31,346,987 | |
Class C | | | 1,170,185 | | | | 11,914,696 | | | | 100,659 | | | | 1,023,985 | |
Class I | | | 30,582,797 | | | | 311,778,721 | | | | 17,366,166 | | | | 175,868,886 | |
Shares issued to shareholders due to reinvestment of distributions: | | | | | | | | | | | | | | | | |
Class A | | | 96,677 | | | | 985,725 | | | | 30,675 | | | | 311,311 | |
Class C | | | 7,034 | | | | 71,621 | | | | 193 | | | | 1,968 | |
Class I | | | 89,508 | | | | 912,653 | | | | 42,427 | | | | 429,784 | |
| | | | 42,749,600 | | | | 435,782,512 | | | | 20,629,636 | | | | 208,982,921 | |
Shares redeemed: | | | | | | | | | | | | | | | | |
Class A | | | (4,325,269 | ) | | | (44,088,273 | ) | | | (487,624 | ) | | | (4,954,870 | ) |
Class C | | | (235,416 | ) | | | (2,396,736 | ) | | | (83 | ) | | | (846 | ) |
Class I | | | (22,910,953 | ) | | | (233,555,155 | ) | | | (15,363,848 | ) | | | (155,522,739 | ) |
| | | | (27,471,638 | ) | | | (280,040,164 | ) | | | (15,851,555 | ) | | | (160,478,455 | ) |
Net increase (decrease) | | | 15,277,962 | | | $ | 155,742,348 | | | | 4,778,081 | | | $ | 48,504,466 | |
5. Investment Transactions
Purchases and sales (including maturities but excluding short-term investments and derivative transactions, where applicable) during the fiscal year ended April 30, 2013, were as follows:
| | | | | | | | | | | | | | | | | | | | | | | | | | | | |
| | | All-
American | | | High
Yield | | | Inflation
Protected | | | Intermediate
Duration | | | Limited
Term | | | Short Duration
High Yield | | | Short
Term | |
Purchases | | $ | 938,716,726 | | | $ | 3,332,859,656 | | | $ | 93,829,223 | | | $ | 1,090,153,340 | | | $ | 1,210,055,559 | | | $ | 113,993,595 | | | $ | 281,226,170 | |
Sales and maturities | | | 464,440,563 | | | | 1,106,025,919 | | | | 4,951,814 | | | | 583,711,881 | | | | 384,411,819 | | | | 50,376 | | | | 122,745,773 | |
6. Income Tax Information
The following information is presented on an income tax basis. Differences between amounts for financial statement and federal income tax purposes are primarily due to timing differences in recognizing taxable market discount, timing differences in recognizing certain gains and losses on investment transactions and the treatment of investments in inverse floating rate securities reflected as financing transactions, if any. To the extent that differences arise that are permanent in nature, such amounts are reclassified within the capital accounts as detailed below. Temporary differences do not require reclassification. Temporary and permanent differences do not impact the net asset values of the Funds.
Notes to Financial Statements (continued)
As of April 30, 2013, the cost and unrealized appreciation (depreciation) of investments (excluding investments in derivatives, where applicable), as determined on a federal income tax basis, were as follows:
| | | | | | | | | | | | | | | | | | | | | | | | | | | | |
| | | All-
American | | | High
Yield | | | Inflation
Protected | | | Intermediate
Duration | | | Limited
Term | | | Short Duration
High Yield | | | Short
Term | |
Cost of investments | | $ | 2,685,207,896 | | | $ | 8,378,885,740 | | | $ | 105,055,195 | | | $ | 3,833,995,835 | | | $ | 3,499,324,472 | | | $ | 113,864,613 | | | $ | 487,803,323 | |
Gross unrealized: | | | | | | | | | | | | | | | | | | | | | | | | | | | | |
Appreciation | | $ | 279,444,766 | | | $ | 1,103,192,219 | | | $ | 2,827,247 | | | $ | 296,373,851 | | | $ | 158,332,512 | | | $ | 679,038 | | | $ | 11,264,345 | |
Depreciation | | | (14,562,439 | ) | | | (304,986,784 | ) | | | (177,643 | ) | | | (13,320,523 | ) | | | (3,382,220 | ) | | | (42,062 | ) | | | (1,023,152 | ) |
Net unrealized appreciation (depreciation) of investments | | $ | 264,882,327 | | | $ | 798,205,435 | | | $ | 2,649,604 | | | $ | 283,053,328 | | | $ | 154,950,292 | | | $ | 636,976 | | | $ | 10,241,193 | |
Permanent differences, primarily due to federal taxes paid, taxable market discount, expiration of capital loss carryforwards, paydowns, treatment of notional principal contracts, nondeductible reorganizational expenses, nondeductible stock issuance costs and distribution reclasses, resulted in reclassifications among the Funds’ components of net assets as of April 30, 2013, the Funds’ tax year end, as follows:
| | | | | | | | | | | | | | | | | | | | | | | | | | | | |
| | | All-
American | | | High
Yield | | | Inflation
Protected | | | Intermediate
Duration | | | Limited
Term | | | Short Duration
High Yield | | | Short
Term | |
Capital paid-in | | $ | (55,192 | ) | | $ | — | | | $ | (361 | ) | | $ | (136,960 | ) | | $ | (149,326 | ) | | $ | (10,393 | ) | | $ | (1,218 | ) |
Undistributed (Over-distribution of) net investment income | | | 23,141 | | | | (769,004 | ) | | | (2,591 | ) | | | (2,839 | ) | | | (238,435 | ) | | | 10,393 | | | | — | |
Accumulated net realized gain (loss) | | | 32,051 | | | | 769,004 | | | | 2,952 | | | | 139,799 | | | | 387,761 | | | | — | | | | 1,218 | |
The tax components of undistributed net tax-exempt income, net ordinary income and net long-term capital gains as of April 30, 2013, the Funds’ tax year end, were as follows:
| | | | | | | | | | | | | | | | | | | | | | | | | | | | |
| | | All-
American | | | High
Yield | | | Inflation
Protected | | | Intermediate
Duration | | | Limited
Term | | | Short Duration
High Yield | | | Short
Term | |
Undistributed net tax-exempt income1 | | $ | 8,029,994 | | | $ | 9,509,652 | | | $ | 72,648 | | | $ | 13,865,480 | | | $ | 2,806,495 | | | $ | 149,735 | | | $ | 646,690 | |
Undistributed net ordinary income2 | | | 20,361 | | | | 2,747,455 | | | | — | | | | 453,495 | | | | 501,826 | | | | — | | | | — | |
Undistributed net long-term capital gains | | | — | | | | — | | | | — | | | | — | | | | — | | | | — | | | | — | |
| 1 | Undistributed net tax-exempt income (on a tax basis) has not been reduced for the dividends declared during the period April 1, 2013 through April 30, 2013, and paid on May 1, 2013. |
| 2 | Net ordinary income consists of taxable market discount income and net short-term capital gains, if any. |
The tax character of distributions paid during the Funds’ tax years ended April 30, 2013 and April 30, 2012, was designated for purposes of the dividends paid deduction as follows:
| | | | | | | | | | | | | | | | | | | | | | | | | | | | |
| 2013 | | All-
American | | | High
Yield | | | Inflation
Protected | | | Intermediate
Duration | | | Limited
Term | | | Short Duration
High Yield5 | | | Short
Term | |
Distributions from net tax-exempt income3 | | $ | 109,809,752 | | | $ | 472,225,182 | | | $ | 1,123,233 | | | $ | 134,244,774 | | | $ | 71,106,768 | | | $ | 49,171 | | | $ | 7,787,833 | |
Distributions from net ordinary income2 | | | 497,880 | | | | 1,997,075 | | | | 37,661 | | | | 845,011 | | | | — | | | | — | | | | — | |
Distributions from net long-term capital gains4 | | | — | | | | — | | | | 7,216 | | | | — | | | | — | | | | — | | | | — | |
| | | | | | | | | | | | | | | | | | | | | | | | |
| 2012 | | All-
American | | | High
Yield | | | Inflation
Protected | | | Intermediate
Duration | | | Limited
Term | | | Short
Term | |
Distributions from net tax-exempt income | | $ | 36,821,171 | | | $ | 356,818,555 | | | $ | 259,818 | | | $ | 105,851,283 | | | $ | 64,515,122 | | | $ | 6,583,563 | |
Distributions from net ordinary income2 | | | 209,633 | | | | 7,017,849 | | | | — | | | | 2,640,634 | | | | 118,046 | | | | 2 | |
Distributions from net long-term capital gains | | | — | | | | — | | | | — | | | | — | | | | — | | | | — | |
| 2 | Net ordinary income consists of taxable market discount income and net short-term capital gains, if any. |
| 3 | The Funds hereby designate these amounts paid during the fiscal year ended April 30, 2013, as Exempt Interest Dividends. |
| 4 | The Funds designate as long term capital gain dividend, pursuant to the Internal Revenue Code 852(b)(3), the amount necessary to reduce earnings and profits to the Funds related to net capital gain to zero for tax year ended April 30, 2013. |
| 5 | For the period February 1, 2013 (commencement of operations) through April 30, 2013. |
As of April 30, 2013, the Funds’ tax year end, the following Funds had unused capital loss carryforwards available for federal income tax purposes to be applied against future capital gains, if any. If not applied, the carryforwards will expire as shown in the following table. The losses not subject to expiration retain the character reflected and will be utilized first by a Fund, while the losses subject to expiration are considered short-term:
| | | | | | | | | | | | | | | | | | | | | | | | |
| | | All-
American6 | | | High
Yield | | | Inflation Protected
Securities | | | Intermediate
Duration6 | | | Limited
Term | | | Short
Term | |
Expiration: | | | | | | | | | | | | | | | | | | | | | | | | |
April 30, 2014 | | $ | — | | | $ | — | | | $ | — | | | $ | — | | | $ | 1,064,312 | | | $ | — | |
April 30, 2015 | | | 21,571 | | | | 273,441 | | | | — | | | | — | | | | 7,283,015 | | | | 11,893 | |
April 30, 2016 | | | 2,298,768 | | | | 25,595,622 | | | | — | | | | — | | | | 546,020 | | | | — | |
April 30, 2017 | | | 22,698,037 | | | | 277,191,907 | | | | — | | | | — | | | | 1,071,726 | | | | 312,109 | |
April 30, 2018 | | | 14,897,930 | | | | 755,760,482 | | | | — | | | | 9,207,679 | | | | 543,730 | | | | — | |
April 30, 2019 | | | 881,168 | | | | 36,220,059 | | | | — | | | | 1,043,786 | | | | 1,598,268 | | | | — | |
Not subject to expiration: | | | | | | | | | | | | | | | | | | | | | | | | |
Short-term losses | | | — | | | | — | | | | 32,143 | | | | — | | | | 906,756 | | | | — | |
Long-term losses | | | 590,494 | | | | 209,232,507 | | | | 38,611 | | | | 2,415,208 | | | | 7,562,532 | | | | — | |
Total | | $ | 41,387,968 | | | $ | 1,304,274,018 | | | $ | 70,754 | | | $ | 12,666,673 | | | $ | 20,576,359 | | | $ | 324,002 | |
| 6 | A portion of All-American’s and Intermediate Duration’s capital loss carryforward is subject to an annual limitation under Internal Revenue Code and related regulations. |
During the Funds’ tax year ended April 30, 2013, the following Funds utilized their capital loss carryforwards as follows:
| | | | | | | | | | | | |
| | | All-
American | | | High
Yield | | | Short
Term | |
Utilized capital loss carryforwards | | $ | 5,896,378 | | | $ | 2,563,115 | | | $ | 59,992 | |
As of April 30, 2013, the Funds’ tax year end, $169,527 of Limited Term’s capital loss carryforward expired.
The Funds have elected to defer late-year losses in accordance with federal income tax rules. These losses are treated as having arisen on the first day of the following fiscal year. The Funds have elected to defer losses as follows:
| | | | | | | | | | | | | | | | | | | | | | | | | | | | |
| | | All-
American | | | High
Yield | | | Inflation Protected
Securities | | | Intermediate
Duration | | | Limited
Term | | | Short Duration High Yield | | | Short
Term | |
Post-October capital losses7 | | $ | 1,283,158 | | | $ | 6,052,333 | | | $ | 37,587 | | | $ | 312,547 | | | $ | 363,136 | | | $ | 2,683 | | | $ | 56,932 | |
Late-year ordinary losses8 | | | — | | | | — | | | | — | | | | — | | | | — | | | | — | | | | — | |
| 7 | Capital losses incurred from November 1, 2012 through April 30, 2013, the Fund’s tax year end. |
| 8 | Ordinary losses incurred from January 1, 2013 through April 30, 2013 and specified losses incurred from November 1, 2012 through April 30, 2013. |
7. Management Fees and Other Transactions with Affiliates
Each Fund’s management fee consists of two components – a fund-level fee, based only on the amount of assets within each individual Fund, and a complex-level fee, based on the aggregate amount of all eligible fund assets managed by the Adviser. This pricing structure enables each Fund’s shareholders to benefit from growth in the assets within their respective Fund as well as from growth in the amount of complex-wide assets managed by the Adviser.
| | | | | | | | | | | | | | | | | | | | | | | | | | | | |
| Average Daily Net Assets | | All-
American
Fund-Level
Fee Rate | | | High Yield
Fund-Level
Fee Rate | | | Inflation
Protected
Fund-Level
Fee Rate | | | Intermediate
Duration
Fund-Level
Fee Rate | | | Limited
Term
Fund-Level
Fee Rate | | | Short Duration
High Yield
Fund-Level
Fee Rate | | | Short
Term
Fund-Level
Fee Rate | |
For the first $125 million | | | 0.3000 | % | | | 0.4000 | % | | | 0.3000 | % | | | 0.3000 | % | | | 0.2500 | % | | | 0.4000 | % | | | 0.2500 | % |
For the next $125 million | | | 0.2875 | | | | 0.3875 | | | | 0.2875 | | | | 0.2875 | | | | 0.2375 | | | | 0.3875 | | | | 0.2375 | |
For the next $250 million | | | 0.2750 | | | | 0.3750 | | | | 0.2750 | | | | 0.2750 | | | | 0.2250 | | | | 0.3750 | | | | 0.2250 | |
For the next $500 million | | | 0.2625 | | | | 0.3625 | | | | 0.2625 | | | | 0.2625 | | | | 0.2125 | | | | 0.3625 | | | | 0.2125 | |
For the next $1 billion | | | 0.2500 | | | | 0.3500 | | | | 0.2500 | | | | 0.2500 | | | | 0.2000 | | | | 0.3500 | | | | 0.2000 | |
For net assets over $2 billion | | | — | | | | 0.3250 | | | | 0.2250 | | | | — | | | | — | | | | 0.3250 | | | | 0.1750 | |
For the next $3 billion | | | 0.2250 | | | | — | | | | — | | | | 0.2250 | | | | 0.1750 | | | | — | | | | — | |
For net assets over $5 billion | | | 0.2125 | | | | — | | | | — | | | | 0.2125 | | | | 0.1625 | | | | — | | | | — | |
Notes to Financial Statements (continued)
The annual complex-level fee for the Funds, payable monthly, is determined by taking the complex-level fee rate, which is based on the aggregate amount of “eligible assets” of all Nuveen Funds as set forth in the schedule below, and for Short Term, making, as appropriate, an upward adjustment to that rate based upon the percentage of the Fund’s assets that are not “eligible assets.” The complex level fee schedule for the Funds is as follows:
| | | | |
| Complex-Level Asset Breakpoint Level* | | Effective Rate at Breakpoint Level | |
$55 billion | | | .2000 | % |
$56 billion | | | .1996 | |
$57 billion | | | .1989 | |
$60 billion | | | .1961 | |
$63 billion | | | .1931 | |
$66 billion | | | .1900 | |
$71 billion | | | .1851 | |
$76 billion | | | .1806 | |
$80 billion | | | .1773 | |
$91 billion | | | .1691 | |
$125 billion | | | .1599 | |
$200 billion | | | .1505 | |
$250 billion | | | .1469 | |
$300 billion | | | .1445 | |
| * | The complex-level fee is calculated based upon the aggregate daily “eligible assets” of all Nuveen Funds. Eligible assets do not include assets attributable to investments in other Nuveen Funds or assets in excess of $2 billion added to the Nuveen Fund complex in connection with the Adviser’s assumption of the management of the former First American Funds effective January 1, 2011. Eligible assets include closed-end fund assets managed by the Adviser that are attributable to financial leverage. For these purposes, financial leverage includes the closed-end funds’ use of preferred stock and borrowings and certain investments in the residual interest certificates (also called inverse floating rate securities) in tender option bond (TOB) trusts, including the portion of assets held by a TOB trust that has been effectively financed by the trust’s issuance of floating rate securities, subject to an agreement by the Adviser as to certain funds to limit the amount of such assets for determining eligible assets in certain circumstances. As of April 30, 2013, the complex-level fee rate for each of these Funds was as follows: |
| | | | |
| Fund | | Complex-Level Fee Rate | |
All-American | | | .1708 | % |
High Yield | | | .1661 | |
Inflation Protected | | | .1661 | |
Intermediate Duration | | | .1716 | |
Limited Term | | | .1661 | |
Short Duration High Yield | | | .1661 | |
Short Term | | | .1854 | |
The management fee compensates the Adviser for overall investment advisory and administrative services and general office facilities. The Adviser is responsible for each Fund’s overall investment strategy and asset allocation decisions. The Adviser has entered into sub-advisory agreements with the Sub-Adviser under which the Sub-Adviser manages the investment portfolios of the Funds. The Sub-Adviser is compensated for its services to the Funds from the management fees paid to the Adviser.
The Adviser has agreed to waive fees and/or reimburse expenses so that total annual Fund operating expenses (excluding 12b-1 distribution and service fees, interest expenses, taxes, fees incurred in acquiring and disposing of portfolio securities, acquired fund fees and expenses and extraordinary expenses) for Inflation Protected and Short term do not exceed .600% through August 31, 2013 (1.05% thereafter) and March 31, 2013, respectively, of the average daily net assets of any class of Fund shares.
The Adviser has contractually agreed to waive fees and/or reimburse expenses so that total annual Fund operating expenses (excluding 12b-1 distribution and service fees, interest expenses, taxes, fees incurred in acquiring and disposing of portfolio securities, acquired fund fees and expenses and extraordinary expenses) for Intermediate Duration do not exceed .750% of the average daily net assets of any class of Fund shares.
The Adviser has agreed to waive fees and/or reimburse expenses (“Expense Cap”) of the Funds so that total annual Fund operating expenses (excluding 12b-1 distribution and/or service fees, interest expenses, taxes, acquired fund fees and expenses, fees incurred in acquiring and disposing of portfolio securities and extraordinary expenses) do not exceed the average daily net assets of any class of Fund shares in the amounts and for the time periods stated in the following table.
| | | | | | | | | | | | |
| Fund | | Temporary
Expense Cap | | | Temporary
Expense Cap
Expiration Date | | | Permanent
Expense Cap | |
Inflation Protected | | | 0.60 | % | | | August 31, 2013 | | | | 1.05 | % |
Intermediate Duration | | | N/A | | | | N/A | | | | 0.75 | |
Short Duration High Yield | | | 0.65 | | | | April 30, 2016 | | | | N/A | |
Short Term | | | 0.60 | | | | March 31, 2013 | | | | N/A | |
N/A – Not applicable.
The Adviser may also voluntarily reimburse additional expenses from time to time in any of the Funds. Voluntary reimbursements may be terminated at any time at the Adviser’s discretion.
Neither Trust pays compensation directly to those of its trustees who are affiliated with the Adviser or to its officers, all of whom receive remuneration for their services to each Trust from the Adviser or its affiliates. The Board of Directors/Trustees has adopted a deferred compensation plan for independent trustees that enables trustees to elect to defer receipt of all or a portion of the annual compensation they are entitled to receive from certain Nuveen-advised funds. Under the plan, deferred amounts are treated as though equal dollar amounts had been invested in shares of select Nuveen-advised funds.
During the fiscal year ended April 30, 2013, Nuveen Securities, LLC, (the “Distributor”), a wholly-owned subsidiary of Nuveen, collected sales charges on purchases of Class A Shares, the majority of which were paid out as concessions to financial intermediaries as follows:
| | | | | | | | | | | | | | | | | | | | | | | | | | | | |
| | | All-
American | | | High
Yield | | | Inflation
Protected | | | Intermediate
Duration | | | Limited
Term | | | Short Duration
High Yield | | | Short
Term | |
Sales charges collected (Unaudited) | | $ | 5,630,919 | | | $ | 14,586,756 | | | $ | 261,927 | | | $ | 727,066 | | | $ | 2,410,503 | | | $ | 214,418 | | | $ | 331,325 | |
Paid to financial intermediaries (Unaudited) | | | 4,964,443 | | | | 12,998,842 | | | | 222,479 | | | | 628,697 | | | | 2,295,924 | | | | 210,845 | | | | 323,487 | |
The Distributor also received 12b-1 service fees on Class A Shares, substantially all of which were paid to compensate financial intermediaries for providing services to shareholders relating to their investments.
During the fiscal year ended April 30, 2013, the Distributor compensated financial intermediaries directly with commission advances at the time of purchase as follows:
| | | | | | | | | | | | | | | | | | | | | | | | | | | | |
| | | All-
American | | | High
Yield | | | Inflation
Protected | | | Intermediate
Duration | | | Limited
Term | | | Short Duration
High Yield | | | Short
Term | |
Commission advances (Unaudited) | | $ | 2,812,495 | | | $ | 8,730,909 | | | $ | 192,795 | | | $ | 602,050 | | | $ | 3,569,391 | | | $ | 231,729 | | | $ | 366,401 | |
To compensate for commissions advanced to financial intermediaries, all 12b-1 service fees collected on Class B Shares during the first year following a purchase, all 12b-1 distribution fees collected on Class B Shares, and all 12b-1 service and distribution fees collected on Class C Shares during the first year following a purchase are retained by the Distributor. During the fiscal year ended April 30, 2013, the Distributor retained such 12b-1 fees as follows:
| | | | | | | | | | | | | | | | | | | | | | | | | | | | |
| | | All-
American | | | High
Yield | | | Inflation
Protected | | | Intermediate
Duration | | | Limited
Term | | | Short Duration
High Yield | | | Short
Term | |
12b-1 fees retained (Unaudited) | | $ | 1,174,994 | | | $ | 3,508,477 | | | $ | 55,977 | | | $ | 263,202 | | | $ | 925,470 | | | $ | 2,578 | | | $ | 21,099 | |
The remaining 12b-1 fees charged to the Funds were paid to compensate financial intermediaries for providing services to shareholders relating to their investments.
The Distributor also collected and retained CDSC on share redemptions during the fiscal year ended April 30, 2013, as follows:
| | | | | | | | | | | | | | | | | | | | | | | | | | | | |
| | | All-
American | | | High
Yield | | | Inflation
Protected | | | Intermediate
Duration | | | Limited
Term | | | Short Duration
High Yield | | | Short
Term | |
CDSC retained (Unaudited) | | $ | 171,824 | | | $ | 582,859 | | | $ | — | | | $ | 41,140 | | | $ | 222,716 | | | $ | — | | | $ | 18,265 | |
As of April 30, 2013, Nuveen owned 5,000, 5,000 and 990,000 shares of Short Duration High Yield’s Class A, Class C and Class I, respectively.
8. Borrowing Arrangements
High Yield has entered into a committed 364-day unsecured line of credit (“Borrowings”) with its custodian bank to provide the Fund with a source of liquidity to meet temporary demands of the Fund. As of April 30, 2013, the maximum commitment amount on the Borrowings was $850 million.
Interest on the Borrowings is calculated at a rate per annum equal to the higher of (i) 1.25% plus the Federal Funds Rate as in effect on that day, or (ii) 1.25% plus the Overnight London Inter-Bank Offered Rate (LIBOR) as in effect on that day. The Fund also accrues a .12% per annum commitment fee on the unused portion of the Borrowings and incurred one-time closing fees of .02% on the maximum commitment amount, which will be expensed over the 364-day period.
On July 25, 2012, the Fund renewed the Borrowings with its custodian bank through July 24, 2013. The Fund also incurred one-time closing fees of .10% on the maximum commitment amount, which will be expensed over the 364-day period.
On November 27, 2012, the Fund increased its maximum commitment amount on the Borrowings from $650 million to $850 million and incurred a one-time closing fee of .07% on the increase to the maximum commitment amount, which will be expensed through July 24, 2013. All other terms of the Borrowings remained unchanged.
Notes to Financial Statements (continued)
Borrowings outstanding are recognized as “Borrowings” on the Statement of Assets and Liabilities. Interest expense and other fees incurred on the Borrowings are recognized as a component of “Interest expense” on the Statement of Operations.
As of April 30, 2013, the outstanding balance on these Borrowings was $40 million. During the fiscal year ended April 30, 2013, the Fund’s average daily loan balance outstanding on the Borrowings and corresponding weighted average annualized interest rate were $53,559,322 and 1.43%, respectively.
On May 22, 2013 (subsequent to the close of this reporting period), the Fund increased its Borrowings maximum commitment amount from $850 million to $1 billion. The Fund incurred one-time closing fees of .01% on the increase to the maximum commitment amount, which will be expensed through July 24, 2013. All other terms of the Borrowings remained unchanged.
9. New Accounting Pronouncements
Financial Accounting Standards Board (“FASB”) Balance Sheet (Topic 210): Disclosures about Offsetting Assets and Liabilities In January 2013, Accounting Standards Update (“ASU”) 2013-01, Clarifying the Scope of Disclosures about Offsetting Assets and Liabilities, replaced ASU 2011-11, Disclosures about Offsetting Assets and Liabilities. ASU 2013-01 is effective for fiscal years beginning on or after January 1, 2013. ASU 2011-11 was intended to enhance disclosure requirements on the offsetting of financial assets and liabilities. ASU 2013-01 limits the scope of the new balance sheet offsetting disclosures to derivatives, repurchase agreements and securities lending transactions to the extent that they are (1) offset in the financial statements or (2) subject to an enforceable master netting arrangement or similar agreement. Management is currently evaluating the application of ASU 2013-01 and its impact to the financial statements and footnote disclosures, if any.
Trustees and Officers (Unaudited)
The management of the Funds, including general supervision of the duties performed for the Funds by the Adviser, is the responsibility of the Board of Trustees of the Funds. The number of trustees of the Funds is currently set at ten. None of the trustees who are not “interested” persons of the Funds (referred to herein as “independent trustees”) has ever been a director or employee of, or consultant to, Nuveen or its affiliates. The names and business addresses of the trustees and officers of the Funds, their principal occupations and other affiliations during the past five years, the number of portfolios each oversees and other directorships they hold are set forth below.
The Funds’ Statement of Additional Information (“SAI”) includes more information about the trustees. To request a free copy, call Nuveen Investments at (800) 257-8787 or visit the Funds’ website at www.nuveen.com.
| | | | | | | | |
Name, Birthdate and Address | | Position(s) Held with the Funds | | Year First Elected or Appointed (1) | | Principal Occupation(s) Including other Directorships During Past 5 Years | | Number of Portfolios in Fund Complex Overseen by Trustee |
| | |
| Independent Trustees: | | | | |
Robert P. Bremner 8/22/40 333 W. Wacker Drive Chicago, IL 60606 | | Chairman of the Board and Trustee | | 1996 | | Private Investor and Management Consultant; Treasurer and Director, Humanities Council of Washington, D.C.; Board Member, Independent Directors Council affiliated with the Investment Company Institute. | | 210 |
Jack B. Evans 10/22/48 333 W. Wacker Drive Chicago, IL 60606 | | Trustee | | 1999 | | President, The Hall-Perrine Foundation, a private philanthropic corporation (since 1996); Chairman, United Fire Group, a publicly held company; formerly, President of the Board of Regents for the State of Iowa University System; Director, Source Media Group; Life Trustee of Coe College; formerly, Director, Alliant Energy; formerly, Director, Federal Reserve Bank of Chicago; formerly, President and Chief Operating Officer, SCI Financial Group, Inc., a regional financial services firm; Bachelor of Arts degree from Coe College and an MBA from the University of Iowa. | | 210 |
William C. Hunter 3/6/48 333 W. Wacker Drive Chicago, IL 60606 | | Trustee | | 2004 | | Dean Emeritus (since June 30, 2012), formerly, Dean, Tippie College of Business, University of Iowa (2006-2012); Director (since 2004) of Xerox Corporation; Director (since 2005), and President (since July 2012) Beta Gamma Sigma, Inc., The International Honor Society; Director of Wellmark, Inc. (since 2009); formerly, Dean and Distinguished Professor of Finance, School of Business at the University of Connecticut (2003-2006); previously, Senior Vice President and Director of Research at the Federal Reserve Bank of Chicago (1995-2003); formerly, Director (1997-2007), Credit Research Center at Georgetown University. | | 210 |
David J. Kundert 10/28/42 333 W. Wacker Drive Chicago, IL 60606 | | Trustee | | 2005 | | Formerly, Director, Northwestern Mutual Wealth Management Company; (2007-2013) retired (since 2004) as Chairman, JPMorgan Fleming Asset Management, President and CEO, Banc One Investment Advisors Corporation, and President, One Group Mutual Funds; prior thereto, Executive Vice President, Banc One Corporation and Chairman and CEO, Banc One Investment Management Group; Regent Emeritus, Member of Investment Committee, Luther College; member of the Wisconsin Bar Association; member of Board of Directors, Friends of Boerner Botanical Gardens; member of Board of Directors and Chair of Investment Committee, Greater Milwaukee Foundation; member of the Board of Directors (Milwaukee), College Possible. | | 210 |
William J. Schneider 9/24/44 333 W. Wacker Drive Chicago, IL 60606 | | Trustee | | 1996 | | Chairman of Miller-Valentine Partners Ltd., a real estate investment company; formerly, Senior Partner and Chief Operating Officer (retired 2004) of Miller-Valentine Group; Member of two Miller Valentine real estate LLC companies; member, University of Dayton Business School Advisory Council; member, Mid-America Health System Board; Board Member of Tech Town, Inc., a not-for-profit community development company; Board Member of WDPR Public Radio; formerly, member and chair, Dayton Philharmonic Orchestra Association; formerly, member, Business Advisory Council, Cleveland Federal Reserve Bank. | | 210 |
Judith M. Stockdale 12/29/47 333 W. Wacker Drive Chicago, IL 60606 | | Trustee | | 1997 | | Formerly, Executive Director (1994-2012), Gaylord and Dorothy Donnelley Foundation (since 1994); prior thereto, Executive Director, Great Lakes Protection Fund (1990-1994). | | 210 |
Trustees and Officers (continued)
| | | | | | | | |
Name, Birthdate and Address | | Position(s) Held with the Funds | | Year First Elected or Appointed (1) | | Principal Occupation(s) Including other Directorships During Past 5 Years | | Number��of Portfolios in Fund Complex Overseen by Trustee |
Carole E. Stone 6/28/47 333 W. Wacker Drive Chicago, IL 60606 | | Trustee | | 2007 | | Director, Chicago Board Options Exchange (since 2006); Director, C2 Options Exchange, Incorporated (since 2009); formerly, Commissioner, New York State Commission on Public Authority Reform (2005-2010); formerly, Chair, New York Racing Association Oversight Board (2005-2007). | | 210 |
Virginia L. Stringer 8/16/44 333 W. Wacker Drive Chicago, IL 60606 | | Trustee | | 2011 | | Board Member, Mutual Fund Directors Forum; former governance consultant and non-profit board member; former Owner and President, Strategic Management Resources, Inc. a management consulting firm; former Member, Governing Board, Investment Company Institute’s Independent Directors Council; previously, held several executive positions in general management, marketing and human resources at IBM and The Pillsbury Company; Independent Director, First American Fund Complex (1987-2010) and Chair (1997-2010). | | 210 |
Terence J. Toth 9/29/59 333 W. Wacker Drive Chicago, IL 60606 | | Trustee | | 2008 | | Managing Partner, Promus Capital (since 2008); Director, Fulcrum IT Service LLC (since 2010), Quality Control Corporation (since 2012) and LogicMark LLC (since 2012); formerly, Director, Legal & General Investment Management America, Inc. (2008-2013); formerly, CEO and President, Northern Trust Global Investments (2004-2007); Executive Vice President, Quantitative Management & Securities Lending (2000-2004); prior thereto, various positions with Northern Trust Company (since 1994); member: Chicago Fellowship Board (since 2005), Catalyst Schools of Chicago Board (since 2008) and Mather Foundation Board (since 2012), and a member of its investment committee; formerly, Member, Northern Trust Mutual Funds Board (2005-2007), Northern Trust Global Investments Board (2004-2007), Northern Trust Japan Board (2004-2007), Northern Trust Securities Inc. Board (2003-2007) and Northern Trust Hong Kong Board (1997-2004). | | 210 |
| | |
| Interested Trustee: | | | | |
John P. Amboian (2) 6/14/61 333 W. Wacker Drive Chicago, IL 60606 | | Trustee | | 2008 | | Chief Executive Officer and Chairman (since 2007) and Director (since 1999) of Nuveen Investments, Inc., formerly, President (1999-2007); Chief Executive Officer (since 2007) of Nuveen Investments Advisers Inc.; Director (since 1998) formerly, Chief Executive Officer (2007-2010) of Nuveen Fund Advisors, LLC. | | 210 |
Name, Birthdate and Address | | Position(s) Held with the Funds | | Year First Elected or Appointed (3) | | Principal Occupation(s) During Past 5 Years | | Number of Portfolios in Fund Complex Overseen by Officer |
| | |
| Officers of the Funds: | | | | |
Gifford R. Zimmerman 9/9/56 333 W. Wacker Drive Chicago, IL 60606 | | Chief Administrative Officer | | 1988 | | Managing Director (since 2002), and Assistant Secretary of Nuveen Securities, LLC; Managing Director (since 2004) and Assistant Secretary (since 1994) of Nuveen Investments, Inc.; Managing Director (since 2002), Assistant Secretary (since 1997) and Co-General Counsel (since 2011) of Nuveen Fund Advisors, LLC; Managing Director, Assistant Secretary and Associate General Counsel of Nuveen Asset Management, LLC (since 2011); Managing Director, Associate General Counsel and Assistant Secretary of Symphony Asset Management LLC (since 2003); Vice President and Assistant Secretary of NWQ Investment Management Company, LLC (since 2002), Nuveen Investments Advisers Inc. (since 2002), Santa Barbara Asset Management, LLC (since 2006) and of Winslow Capital Management, LLC, (since 2010); Vice President and Assistant Secretary (since 2013), formerly, Chief Administrative Officer and Chief Compliance Officer (2006-2013) of Nuveen Commodities Asset Management, LLC; Chartered Financial Analyst. | | 210 |
| | | | | | | | |
Name, Birthdate and Address | | Position(s) Held with the Funds | | Year First Elected or Appointed (3) | | Principal Occupation(s) During Past 5 Years | | Number of Portfolios in Fund Complex Overseen by Officer |
Margo L. Cook 4/11/64 333 W. Wacker Drive Chicago, IL 60606 | | Vice President | | 2009 | | Executive Vice President (since 2008) of Nuveen Investments, Inc. and of Nuveen Fund Advisors, LLC (since 2011); Managing Director – Investment Services of Nuveen Commodities Asset Management, LLC (since August 2011), previously, Head of Institutional Asset Management (2007-2008) of Bear Stearns Asset Management; Head of Institutional Asset Management (1986-2007) of Bank of NY Mellon; Chartered Financial Analyst. | | 210 |
Lorna C. Ferguson 10/24/45 333 W. Wacker Drive Chicago, IL 60606 | | Vice President | | 1998 | | Managing Director (since 2005) of Nuveen Fund Advisors, LLC and Nuveen Securities, LLC (since 2004). | | 210 |
Stephen D. Foy 5/31/54 333 W. Wacker Drive Chicago, IL 60606 | | Vice President and Controller | | 1998 | | Senior Vice President (since 2010), formerly, Vice President (2005-2010) and Funds Controller of Nuveen Securities, LLC; Vice President of Nuveen Fund Advisors, LLC; Chief Financial Officer of Nuveen Commodities Asset Management, LLC (since 2010); Certified Public Accountant. | | 210 |
Scott S. Grace 8/20/70 333 W. Wacker Drive Chicago, IL 60606 | | Vice President and Treasurer | | 2009 | | Managing Director, Corporate Finance & Development, Treasurer (since 2009) of Nuveen Securities, LLC; Managing Director and Treasurer (since 2009) of Nuveen Fund Advisors, LLC, Nuveen Investments Advisers, Inc., Nuveen Investments Holdings Inc. and (since 2011) Nuveen Asset Management, LLC; Vice President and Treasurer of NWQ Investment Management Company, LLC, Tradewinds Global Investors, LLC, Symphony Asset Management LLC and Winslow Capital Management, LLC.; Vice President of Santa Barbara Asset Management, LLC; formerly, Treasurer (2006-2009), Senior Vice President (2008-2009), previously, Vice President (2006-2008) of Janus Capital Group, Inc.; formerly, Senior Associate in Morgan Stanley’s Global Financial Services Group (2000-2003); Chartered Accountant Designation. | | 210 |
Walter M. Kelly 2/24/70 333 W. Wacker Drive Chicago, IL 60606 | | Chief Compliance Officer and Vice President | | 2003 | | Senior Vice President (since 2008) and Assistant Secretary (since 2003) of Nuveen Fund Advisors, LLC; Senior Vice President (since 2008) of Nuveen Investments Holdings, Inc; formerly, Senior Vice President (2008-2011) of Nuveen Securities, LLC. | | 210 |
Tina M. Lazar 8/27/61 333 W. Wacker Drive Chicago, IL 60606 | | Vice President | | 2002 | | Senior Vice President (since 2010), formerly, Vice President (2005-2010) of Nuveen Fund Advisors, LLC. | | 210 |
Name, Birthdate and Address | | Position(s) Held with the Funds | | Year First Elected or Appointed (3) | | Principal Occupation(s) Including other Directorships During Past 5 Years | | Number of Portfolios in Fund Complex Overseen by Officer |
Kevin J. McCarthy 3/26/66 333 W. Wacker Drive Chicago, IL 60606 | | Vice President and Secretary | | 2007 | | Managing Director and Assistant Secretary (since 2008), Nuveen Securities, LLC; Managing Director (since 2008), Assistant Secretary (since 2007) and Co-General Counsel (since 2011) of Nuveen Fund Advisors, LLC; Managing Director, Assistant Secretary and Associate General Counsel (since 2011) of Nuveen Asset Management, LLC; Managing Director (since 2008), and Assistant Secretary, Nuveen Investment Holdings, Inc.; Vice President (since 2007) and Assistant Secretary of Nuveen Investments Advisers Inc., NWQ Investment Management Company, LLC, Tradewinds Global Investors LLC, Symphony Asset Management LLC, Santa Barbara Asset Management, LLC, and of Winslow Capital Management, LLC. (since 2010); Vice President and Secretary (since 2010) of Nuveen Commodities Asset Management, LLC; prior thereto, Partner, Bell, Boyd & Lloyd LLP (1997-2007). | | 210 |
Trustees and Officers (continued)
| | | | | | | | |
Name, Birthdate and Address | | Position(s) Held with the Funds | | Year First Elected or Appointed (3) | | Principal Occupation(s) Including other Directorships During Past 5 Years | | Number of Portfolios in Fund Complex Overseen by Officer |
Kathleen L. Prudhomme 3/30/53 901 Marquette Avenue Minneapolis, MN 55402 | | Vice President and Assistant Secretary | | 2011 | | Managing Director, Assistant Secretary and Co-General Counsel (since 2011) of Nuveen Fund Advisors, LLC; Managing Director, Assistant Secretary and Associate General Counsel (since 2011) of Nuveen Asset Management, LLC; Managing Director and Assistant Secretary (since 2011) of Nuveen Securities, LLC; formerly, Deputy General Counsel, FAF Advisors, Inc. (2004-2010). | | 210 |
Jeffery M. Wilson 3/13/56 333 West Wacker Drive Chicago, IL 60606 | | Vice President | | 2011 | | Senior Vice President of Nuveen Securities, LLC (since 2011); formerly, Senior Vice President of FAF Advisors, Inc. (2000-2010). | | 107 |
| (1) | Trustees serve an indefinite term until his/her successor is elected or appointed. The year first elected or appointed represents the year in which the trustee was first elected or appointed to any fund in the Nuveen Fund Complex. |
| (2) | Mr. Amboian is an interested trustee because of his position with Nuveen Investments, Inc. and certain of its subsidiaries, which are affiliates of the Nuveen Funds. |
| (3) | Officers serve one year terms through August of each year. The year first elected or appointed represents the year in which the officer was first elected or appointed to any fund in the Nuveen Fund Complex. |
Annual Investment Management Agreement Approval Process
(Unaudited)
The Board of Trustees or Directors (as the case may be) (each, a “Board” and each Trustee or Director, a “Board Member”) of the Funds, including the Board Members who are not parties to the Funds’ advisory or sub-advisory agreements or “interested persons” of any such parties (the “Independent Board Members”), is responsible for approving the advisory agreements (each, an “Investment Management Agreement”) between each Fund and Nuveen Fund Advisors, LLC (formerly known as Nuveen Fund Advisors, Inc.) (the “Advisor”) and the sub-advisory agreements (each, a “Sub-Advisory Agreement”) between the Advisor and Nuveen Asset Management, LLC (the “Sub-Advisor”) (the Investment Management Agreements and the Sub-Advisory Agreements are referred to collectively as the “Advisory Agreements”) and their periodic continuation. Pursuant to the Investment Company Act of 1940, as amended (the “1940 Act”), after an initial term of up to two years, the Board is required to consider the continuation of the Advisory Agreements on an annual basis. Accordingly, at an in-person meeting held on May 21-23, 2012 (the “May Meeting”), the Board, including a majority of the Independent Board Members, considered and approved the continuation of the Advisory Agreements for the Nuveen All-American Municipal Bond Fund (the “All-American Fund”), the Nuveen High Yield Municipal Bond Fund (the “High Yield Fund”), the Nuveen Inflation Protected Municipal Bond Fund (the “Inflation Protected Fund”), the Nuveen Intermediate Duration Municipal Bond Fund (the “Intermediate Duration Fund”), the Nuveen Limited Term Municipal Bond Fund (the “Limited Term Fund”) and the Nuveen Short Term Municipal Bond Fund (the “Short Term Fund”) for an additional one-year period.
The Nuveen Short Duration High Yield Municipal Bond Fund (the “Short Duration High Yield Fund”) is new. The initial advisory agreement between the Advisor and the Short Duration High Yield Fund and the initial sub-advisory agreement between the Advisor and the Sub-Advisor, on behalf of such Fund, were approved separately at a meeting of the Board of such Fund held on January 16, 2013.
The discussion of the approvals for the All-American Fund, the High Yield Fund, the Inflation Protected Fund, the Intermediate Duration Fund, the Limited Term Fund and the Short Term Fund is set forth in Section I, followed by the discussion in Section II of the approvals for the Short Duration High Yield Fund.
I.
Nuveen All-American Municipal Bond Fund
Nuveen High Yield Municipal Bond Fund
Nuveen Inflation Protected Municipal Bond Fund
Nuveen Intermediate Duration Municipal Bond Fund
Nuveen Limited Term Municipal Bond Fund
Nuveen Short Term Municipal Bond Fund
With respect to the funds listed immediately above (for purposes of this Section I, the “Funds”), in preparation for its considerations at the May Meeting, the Board requested and received extensive materials prepared in connection with the review of the Funds’ Advisory Agreements. The materials provided a broad range of information regarding the Funds, the Advisor and the Sub-Advisor (for purposes of this Section I, the Advisor and the Sub-Advisor are collectively, the “Fund Advisers” and each, a “Fund Adviser”). As described in more detail below, the information provided included, among other things, a review of Fund performance, including Fund investment performance assessments against peer groups and appropriate benchmarks, a comparison of Fund fees and expenses relative to peers, a description and assessment of shareholder service levels for the Funds, a summary of the performance of certain service providers, a review of product initiatives and shareholder communications and an analysis of the Advisor’s profitability with comparisons to comparable peers in the managed fund business. As part of its annual review, the Board also held a separate meeting on April 18-19, 2012, to review the Funds’ investment performance and consider an analysis provided by the Advisor of the Sub-Advisor which generally evaluated the Sub-Advisor’s investment team, investment mandate, organizational structure and history, investment philosophy and process, performance of the applicable Fund, and significant changes to the foregoing. As a result of its review of the materials and discussions, the Board presented the Advisor with questions and the Advisor responded.
The materials and information prepared in connection with the annual review of the Advisory Agreements supplement the information and analysis provided to the Board during the year. In this regard, throughout the year, the Board, acting directly or through its committees, regularly reviews the performance and various services provided by the Advisor and the Sub-Advisor. The Board meets at least quarterly as well as at other times as the need arises. At its quarterly meetings, the Board reviews reports by the Advisor which include, among other things, Fund performance, a review of the investment teams and reports on compliance, regulatory matters and risk management. The Board also meets with key investment personnel managing the Fund portfolios during the year. In October 2011, the Board also created two new standing committees (the Open-end Fund Committee and the Closed-end Fund Committee) to assist the full Board in monitoring and gaining a deeper insight into the distinctive issues and business practices of open-end and closed-end funds.
In addition, the Board continues its program of seeking to have the Board Members or a subset thereof visit each sub-advisor to the Nuveen funds at least once over a multiple year rotation, meeting with key investment and business personnel. In this regard, the Board visited with the Sub-Advisor’s municipal team in Minneapolis in September 2011, and with the Sub-Advisor’s municipal team in
Annual Investment Management Agreement Approval Process
(Unaudited) (continued)
Chicago in November 2011. Further, an ad hoc committee of the Board visited the then-current transfer agents of the Nuveen funds in 2011 and the audit committee of the Board visited the various pricing agents for the Nuveen funds in January 2012.
The Board considers factors and information that are relevant to its annual consideration of the renewal of the Advisory Agreements at the meetings held throughout the year. Accordingly, the Board considers the information provided and knowledge gained at these meetings when performing its annual review of the Advisory Agreements. The Independent Board Members are assisted throughout the process by independent legal counsel who provided materials describing applicable law and the duties of directors or trustees in reviewing advisory contracts and met with the Independent Board Members in executive sessions without management present. In addition, it is important to recognize that the management arrangements for the Nuveen funds are the result of many years of review and discussion between the Independent Board Members and fund management and that the Board Members’ conclusions may be based, in part, on their consideration of fee arrangements and other factors developed in previous years.
The Board considered all factors it believed relevant with respect to each Fund, including among other factors: (a) the nature, extent and quality of the services provided by the Fund Advisers, (b) the investment performance of the Fund and Fund Advisers, (c) the advisory fees and costs of the services to be provided to the Fund and the profitability of the Fund Advisers, (d) the extent of any economies of scale, (e) any benefits derived by the Fund Advisers from the relationship with the Fund and (f) other factors. Each Board Member may have accorded different weight to the various factors in reaching his or her conclusions with respect to a Fund’s Advisory Agreements. The Independent Board Members did not identify any single factor as all important or controlling. The Independent Board Members’ considerations were instead based on a comprehensive consideration of all the information presented. The principal factors considered by the Board and its conclusions are described below.
A. Nature, Extent and Quality of Services
In considering renewal of the Advisory Agreements, the Independent Board Members considered the nature, extent and quality of the Fund Adviser’s services, including advisory services and the resulting Fund performance and administrative services. The Independent Board Members further considered the overall reputation and capabilities of the Advisor and its affiliates, the commitment of the Advisor to provide high quality service to the Funds, their overall confidence in the Advisor’s integrity and the Advisor’s responsiveness to questions and concerns raised by them. The Independent Board Members reviewed materials outlining, among other things, the Fund Adviser’s organization and business; the types of services that the Fund Adviser or its affiliates provide to the Funds; the performance record of the applicable Fund (as described in further detail below); and any initiatives Nuveen had taken for the applicable fund product line.
In considering advisory services, the Board recognized that the Advisor provides various oversight, administrative, compliance and other services for the Funds and the Sub-Advisor generally provides the portfolio investment management services to the Funds. In reviewing the portfolio management services provided to each Fund, the Board reviewed the materials provided by the Nuveen Investment Services Oversight Team analyzing, among other things, the Sub-Advisor’s investment team and changes thereto, organization and history, assets under management, Fund objectives and mandate, the investment team’s philosophy and strategies in managing the Fund, developments affecting the Sub-Advisor or Fund and Fund performance. The Independent Board Members also reviewed portfolio manager compensation arrangements to evaluate each Fund Adviser’s ability to attract and retain high quality investment personnel, preserve stability, and reward performance but not provide an inappropriate incentive to take undue risks. In addition, the Board considered the Advisor’s execution of its oversight responsibilities over the Sub-Advisor. Given the importance of compliance, the Independent Board Members also considered Nuveen’s compliance program, including the report of the chief compliance officer regarding the Funds’ compliance policies and procedures; the resources dedicated to compliance; and the record of compliance with the policies and procedures.
In addition to advisory services, the Board considered the quality and extent of administrative and other non-investment advisory services the Advisor and its affiliates provide to the Funds, including product management, investment services (such as oversight of investment policies and procedures, risk management, and pricing), fund administration, oversight of service providers, shareholder services and communications, administration of Board relations, regulatory and portfolio compliance and legal support. The Board further recognized Nuveen’s additional investments in personnel, including in compliance and risk management. In reviewing the services provided, the Board also reviewed materials describing various notable initiatives and projects the Advisor performed in connection with the open-end fund product line. These initiatives included efforts to eliminate product overlap through mergers or liquidations; commencement of various new funds; elimination of insurance mandates for various funds; updates in investment policies or guidelines for several funds; and reductions in management fees and expense caps for certain funds.
Based on their review, the Independent Board Members found that, overall, the nature, extent and quality of services provided to the respective Funds under each applicable Advisory Agreement were satisfactory.
B. The Investment Performance of the Funds and Fund Advisers
The Board, including the Independent Board Members, reviewed and considered the performance history of each Fund over various time periods. The Board reviewed, among other things, each Fund’s historic investment performance as well as information comparing the Fund’s performance information with that of other funds (the “Performance Peer Group”) based on data compiled by Nuveen that was provided by an independent provider of mutual fund data and with recognized and/or customized benchmarks (i.e., benchmarks derived from multiple recognized benchmarks).
The Board reviewed reports, including a comprehensive analysis of the Funds’ performance and the applicable investment team. In this regard, the Board reviewed each Fund’s total return information compared to its Performance Peer Group for the quarter, one-, three- and five-year periods ending December 31, 2011, as well as performance information reflecting the first quarter of 2012 (or for the periods available for the Inflation Protected Fund, which did not exist for part of the foregoing time frame). In addition, the Board reviewed each Fund’s total return information compared to recognized and/or customized benchmarks for the quarter, one- and three-year periods ending December 31, 2011, as well as performance information reflecting the first quarter of 2012 (or for the periods available for the Inflation Protected Fund, which did not exist for part of the foregoing time frame).
In reviewing performance comparison information, the Independent Board Members recognized that the usefulness of the comparisons of the performance of certain funds with the performance of their respective Performance Peer Group may be limited because the Performance Peer Group may not adequately represent the objectives and strategies of the applicable funds or may be limited in size or number. The Independent Board Members also noted that the investment experience of a particular shareholder in the Nuveen funds will vary depending on when such shareholder invests in the applicable fund, the class held (if multiple classes are offered in a fund) and the performance of the fund (or respective class) during that shareholder’s investment period. In addition, although the performance below reflects the performance results for the time periods ending as of the most recent calendar year end (unless otherwise indicated), the Board also recognized that selecting a different ending time period may derive different results. Furthermore, while the Board is cognizant of the relevant performance of a fund’s peer set and/or benchmark(s), the Board evaluated fund performance in light of the respective fund’s investment objectives, investment parameters and guidelines and recognized that the objectives, investment parameters and guidelines of peers and/or benchmarks may differ to some extent, thereby resulting in differences in performance results. Nevertheless, with respect to any Nuveen funds that the Board considers to have underperformed their peers and/or benchmarks from time to time, the Board monitors such funds closely and considers any steps necessary or appropriate to address such issues.
In considering the results of the comparisons, the Independent Board Members observed, among other things, that the All-American Fund, the Limited Term Fund and the Short Term Fund had demonstrated generally favorable performance in comparison to peers, performing in the first or second quartile over various periods. Although the Intermediate Duration Fund lagged its peers somewhat in the five-year period, it performed in the third and second quartiles for the one- and three-year periods, respectively. In addition, the Independent Board Members considered that the High Yield Fund lagged its peers somewhat in the longer five-year period, but that its performance had improved in the recent one- and three-year periods. In this regard, they recognized that the High Yield Fund also outperformed its benchmark in the one- and three-year periods and the first quarter of 2012. Finally, the Independent Board Members considered that the Inflation Protected Fund was new with limited performance history.
Based on their review, the Independent Board Members determined that each Fund’s investment performance had been satisfactory.
C. Fees, Expenses and Profitability
1. Fees and Expenses
The Board evaluated the management fees and expenses of each Fund reviewing, among other things, such Fund’s gross management fees, net management fees and net expense ratios in absolute terms as well as compared to the fee and expenses of a comparable universe of funds provided by an independent fund data provider (the “Peer Universe”) and to a more focused subset of funds in the Peer Universe (the “Peer Group”) and any expense limitations.
The Independent Board Members further reviewed the methodology regarding the construction of the applicable Peer Universe and Peer Group. In reviewing the comparisons of fee and expense information, the Independent Board Members took into account that in certain instances various factors such as: the limited size and particular composition of the Peer Universe or Peer Group (including the inclusion of other Nuveen funds in the peer set); expense anomalies; changes in the funds comprising the Peer Universe or Peer Group from year to year; levels of reimbursement or fee waivers; and the timing of information used may impact the comparative data, thereby limiting somewhat the ability to make a meaningful comparison with peers.
In reviewing the fee schedule for a Fund, the Independent Board Members also considered the fund-level and complex-wide breakpoint schedules (described in further detail below) and any fee waivers and reimbursements provided by Nuveen. In reviewing fees and expenses, the Board considered the expenses and fees to be higher if they were over 10 basis points higher, slightly higher if they were approximately 6 to 10 basis points higher, in line if they were within approximately 5 basis points higher than the peer average and below if they were below the peer average of the Peer Group. In reviewing the reports, the Board noted that the overwhelming majority of the Nuveen funds were at, close to or below their Peer Group or Peer Universe (if no separate Peer Group) average based on the net total expense ratio.
The Independent Board Members noted that the High Yield Fund and the Short Term Fund each had a net expense ratio slightly higher than the respective peer average, but net management fees in line with the respective peer average, while the All-American Fund, the Inflation Protected Fund, the Intermediate Duration Fund and the Limited Term Fund had net management fees and net expense ratios (including fee waivers and expense reimbursements) below or in line with their respective peer averages.
Based on their review of the fee and expense information provided, the Independent Board Members determined that each Fund’s management fees were reasonable in light of the nature, extent and quality of services provided to the Fund.
Annual Investment Management Agreement Approval Process
(Unaudited) (continued)
2. Comparisons with the Fees of Other Clients
The Independent Board Members further reviewed information regarding the nature of services and range of fees offered by the Advisor to other clients, including municipal separately managed accounts and passively managed exchange traded funds (ETFs) sub-advised by the Advisor. In evaluating the comparisons of fees, the Independent Board Members noted that the fee rates charged to the Funds and other clients vary, among other things, because of the different services involved and the additional regulatory and compliance requirements associated with registered investment companies, such as the Funds. Accordingly, the Independent Board Members considered the differences in the product types, including, but not limited to, the services provided, the structure and operations, product distribution and costs thereof, portfolio investment policies, investor profiles, account sizes and regulatory requirements. The Independent Board Members noted, in particular, that the range of services provided to the Funds (as discussed above) is much more extensive than that provided to separately managed accounts. Given the inherent differences in the various products, particularly the extensive services provided to the Funds, the Independent Board Members believe such facts justify the different levels of fees.
In considering the fees of the Sub-Advisor, the Independent Board Members also considered the pricing schedule or fees that the Sub-Advisor charges for similar investment management services for other Nuveen funds, funds of other sponsors (if any), and other clients (such as retail and/or institutional managed accounts).
3. Profitability of Fund Advisers
In conjunction with their review of fees, the Independent Board Members also considered the profitability of Nuveen for its advisory activities and its financial condition. The Independent Board Members reviewed the revenues and expenses of Nuveen’s advisory activities for the last two calendar years, the allocation methodology used in preparing the profitability data and an analysis of the key drivers behind the changes in revenues and expenses that impacted profitability in 2011. The Independent Board Members noted this information supplemented the profitability information requested and received during the year to help keep them apprised of developments affecting profitability (such as changes in fee waivers and expense reimbursement commitments). In this regard, the Independent Board Members noted that they have an Independent Board Member serve as a point person to review and keep them apprised of changes to the profitability analysis and/or methodologies during the year. The Independent Board Members also considered Nuveen’s revenues for advisory activities, expenses, and profit margin compared to that of various unaffiliated management firms with comparable assets under management (based on asset size and asset composition).
In reviewing profitability, the Independent Board Members recognized the Advisor’s continued investment in its business to enhance its services, including capital improvements to investment technology, updated compliance systems, and additional personnel in compliance, risk management, and product development as well as its ability to allocate resources to various areas of the Advisor as the need arises. In addition, in evaluating profitability, the Independent Board Members also recognized the subjective nature of determining profitability which may be affected by numerous factors including the allocation of expenses. Further, the Independent Board Members recognized the difficulties in making comparisons as the profitability of other advisers generally is not publicly available and the profitability information that is available for certain advisers or management firms may not be representative of the industry and may be affected by, among other things, the adviser’s particular business mix, capital costs, types of funds managed and expense allocations. Notwithstanding the foregoing, the Independent Board Members reviewed Nuveen’s methodology and assumptions for allocating expenses across product lines to determine profitability. In reviewing profitability, the Independent Board Members recognized Nuveen’s investment in its fund business. Based on their review, the Independent Board Members concluded that the Advisor’s level of profitability for its advisory activities was reasonable in light of the services provided.
With respect to sub-advisers affiliated with Nuveen, including the Sub-Advisor, the Independent Board Members reviewed the sub-adviser’s revenues, expenses and profitability margins (pre- and post-tax) for its advisory activities and the methodology used for allocating expenses among the internal sub-advisers. Based on their review, the Independent Board Members were satisfied that the Sub-Advisor’s level of profitability was reasonable in light of the services provided.
In evaluating the reasonableness of the compensation, the Independent Board Members also considered other amounts paid to a Fund Adviser by the Funds as well as any indirect benefits (such as soft dollar arrangements, if any) the Fund Adviser and its affiliates receive, or are expected to receive, that are directly attributable to the management of the Funds, if any. See Section E below for additional information on indirect benefits a Fund Adviser may receive as a result of its relationship with the Funds. Based on their review of the overall fee arrangements of each Fund, the Independent Board Members determined that the advisory fees and expenses of the respective Fund were reasonable.
D. Economies of Scale and Whether Fee Levels Reflect These Economies of Scale
With respect to economies of scale, the Independent Board Members have recognized the potential benefits resulting from the costs of a fund being spread over a larger asset base, although economies of scale are difficult to measure and predict with precision, particularly on a fund-by-fund basis. One method to help ensure the shareholders share in these benefits is to include breakpoints in the advisory fee schedule. Generally, management fees for funds in the Nuveen complex are comprised of a fund-level component
and a complex-level component, subject to certain exceptions. Accordingly, the Independent Board Members reviewed and considered the applicable fund-level breakpoints in the advisory fee schedules that reduce advisory fees as asset levels increase.
In addition to fund-level advisory fee breakpoints, the Board also considered the Funds’ complex-wide fee arrangement. Pursuant to the complex-wide fee arrangement, the fees of the funds in the Nuveen complex are generally reduced as the assets in the fund complex reach certain levels. The complex-wide fee arrangement seeks to provide the benefits of economies of scale to fund shareholders when total fund complex assets increase, even if assets of a particular fund are unchanged or have decreased. The approach reflects the notion that some of Nuveen’s costs are attributable to services provided to all its funds in the complex and therefore all funds benefit if these costs are spread over a larger asset base. In addition, with the acquisition of the funds previously advised by FAF Advisors, Inc., the Board noted that a portion of such funds’ assets at the time of acquisition were deemed eligible to be included in the complex-wide fee calculation in order to deliver fee savings to shareholders in the combined complex and such funds were subject to differing complex-level fee rates.
Based on their review, the Independent Board Members concluded that the breakpoint schedules and complex-wide fee arrangement were acceptable and reflect economies of scale to be shared with shareholders when assets under management increase.
E. Indirect Benefits
In evaluating fees, the Independent Board Members received and considered information regarding potential “fall out” or ancillary benefits the respective Fund Adviser or its affiliates may receive as a result of its relationship with each Fund. In this regard, the Independent Board Members considered, among other things, any sales charges, distribution fees and shareholder services fees received and retained by the Funds’ principal underwriter, an affiliate of the Advisor, which includes fees received pursuant to any 12b-1 plan. The Independent Board Members, therefore, considered the 12b-1 fees retained by Nuveen during the last calendar year.
In addition to the above, the Independent Board Members considered whether the Fund Advisers received any benefits from soft dollar arrangements whereby a portion of the commissions paid by a Fund for brokerage may be used to acquire research that may be useful to the Fund Adviser in managing the assets of the Funds and other clients. The Independent Board Members recognized that each Fund Adviser has the authority to pay a higher commission in return for brokerage and research services if it determines in good faith that the commission paid is reasonable in relation to the value of the brokerage and research services provided and may benefit from such soft dollar arrangements. Similarly, the Board recognized that the research received pursuant to soft dollar arrangements by a Fund Adviser may also benefit a Fund and shareholders to the extent the research enhances the ability of the Fund Adviser to manage the Fund. The Independent Board Members noted that the Fund Advisers’ profitability may be somewhat lower if they did not receive the research services pursuant to the soft dollar arrangements and had to acquire such services directly.
Based on their review, the Independent Board Members concluded that any indirect benefits received by a Fund Adviser as a result of its relationship with the Funds were reasonable and within acceptable parameters.
F. Other Considerations
The Independent Board Members did not identify any single factor discussed previously as all-important or controlling. The Board Members, including the Independent Board Members, unanimously concluded that the terms of each Advisory Agreement are fair and reasonable, that the respective Fund Adviser’s fees are reasonable in light of the services provided to each Fund and that the Advisory Agreements be renewed.
II.
Nuveen Short Duration High Yield Municipal Bond Fund
The Board is responsible for approving advisory arrangements for the fund listed immediately above (for purposes of this Section II, the “Fund”) and, at a meeting held on January 16, 2013 (for purposes of this Section II, the “Meeting”), was asked to approve the advisory arrangements for the Fund. At the Meeting, the Board Members, including the Independent Board Members, considered and approved the investment management agreement (for purposes of this Section II, the “Investment Management Agreement”) between the Fund and the Advisor, and the investment sub-advisory agreement (for purposes of this Section II, the “Sub-Advisory Agreement”) between the Advisor and the Sub-Advisor, on behalf of the Fund. For purposes of this Section II, the Advisor and the Sub-Advisor are each hereafter a “Fund Adviser” and the Investment Management Agreement and the Sub-Advisory Agreement are each hereafter an “Advisory Agreement.”
To assist the Board in its evaluation of an Advisory Agreement with a Fund Adviser at the Meeting, the Independent Board Members had received, in adequate time in advance of the Meeting or at prior meetings, materials which outlined, among other things:
| | • | | the nature, extent and quality of services expected to be provided by the Fund Adviser; |
| | • | | the organization of the Fund Adviser, including the responsibilities of various departments and key personnel; |
| | • | | the expertise and background of the Fund Adviser with respect to the Fund’s investment strategy; |
| | • | | certain performance-related information (as described below); |
Annual Investment Management Agreement Approval Process
(Unaudited) (continued)
| | • | | the profitability of Nuveen Investments, Inc. (“Nuveen”); |
| | • | | the proposed management fees of the Fund Adviser, including comparisons of such fees with the management fees of comparable funds; |
| | • | | the expected expenses of the Fund, including comparisons of the Fund’s expected expense ratio with the expense ratios of comparable funds; and |
| | • | | the soft dollar practices of the Fund Adviser, if any. |
At the Meeting, the Advisor made a presentation to and responded to questions from the Board of the Fund. During the Meeting, the Independent Board Members also met privately with their legal counsel to review the Board’s duties under the 1940 Act, the general principles of state law in reviewing and approving advisory contracts, the standards used by courts in determining whether investment company boards of directors have fulfilled their duties, factors to be considered in voting on advisory contracts and an adviser’s fiduciary duty with respect to advisory agreements and compensation. It is with this background that the Independent Board Members considered the Advisory Agreements. As outlined in more detail below, the Independent Board Members considered all factors they believed relevant with respect to the Fund, including the following: (a) the nature, extent and quality of the services to be provided by the Fund Advisers; (b) investment performance, as described below; (c) the advisory fees and costs of the services to be provided to the Fund and the profitability of the Fund Advisers; (d) the extent of any anticipated economies of scale; (e) any benefits expected to be derived by the Fund Advisers from their relationships with the Fund; and (f) other factors. Each Board Member may have accorded different weight to the various factors in reaching his or her conclusions with respect to the Fund’s Advisory Agreements.
A. Nature, Extent and Quality of Services
The Independent Board Members considered the nature, extent and quality of the respective Fund Adviser’s services, including advisory services and administrative services. As the Advisor and the Sub-Advisor already serve as adviser and sub-adviser, respectively, to other Nuveen funds overseen by the Board Members, the Board has a good understanding of each such Fund Adviser’s organization, operations and personnel. As the Independent Board Members meet regularly throughout the year to oversee the Nuveen funds, including funds currently advised by the Fund Advisers, the Independent Board Members have relied upon their knowledge from their meetings and any other interactions throughout the year of the respective Fund Adviser and its services in evaluating the Advisory Agreements.
At the Meeting and at prior meetings, the Independent Board Members reviewed materials outlining, among other things, the respective Fund Adviser’s organization and business; the types of services that such Fund Adviser or its affiliates provide to the Nuveen funds and are expected to provide to the Fund; and the experience of the respective Fund Adviser with applicable investment strategies. Further, the Independent Board Members have evaluated the background and experience of each Fund Adviser’s investment personnel.
In addition to advisory services, the Independent Board Members have considered the quality and extent of administrative and other non-investment advisory services to be provided. In this regard, the Advisor is expected to provide the Fund with such administrative and other services (exclusive of, and in addition to, any such services provided by others for the Fund) and officers and other personnel as are necessary for the operations of the Fund. In addition to investment management services, the Advisor and its affiliates will provide the Fund with a wide range of services, including, among other things, product management, investment services (such as oversight of investment policies and procedures, risk management, and pricing), fund administration, oversight of service providers, shareholder services and communications, administration of Board relations, regulatory and portfolio compliance and legal support. The Independent Board Members also recognized that the Advisor would oversee the Sub-Advisor.
In evaluating the services of the Sub-Advisor, the Independent Board Members noted that the Sub-Advisor was generally expected to supply portfolio investment management services to the Fund. In addition, the Board Members recognized the Sub-Advisor’s experience and investment process.
Based on their review, the Independent Board Members found that, overall, the nature, extent and quality of services expected to be provided to the Fund under each Advisory Agreement were satisfactory.
B. Investment Performance
The Fund was new and therefore did not have its own performance history. However, the Independent Board Members are familiar with the performance records of other Nuveen funds advised by the Advisor and sub-advised by the Sub-Advisor. The Independent Board Members recognized that the portfolio managers who were expected to manage the Fund served as portfolio managers to other high yield municipal bond funds in the Nuveen fund family, and that one of them had managed the High Yield Fund since December 2000. In that regard, the Independent Board Members reviewed certain performance information relating to the High Yield Fund, including trailing returns for the year-to-date, one-year, three-year, five-year and ten-year periods and calendar year returns for 2002 through 2011.
C. Fees, Expenses and Profitability
1. Fees and Expenses
In evaluating the management fees and expenses that the Fund was expected to bear, the Independent Board Members considered, among other things, the Fund’s proposed management fee structure, the rationale for its proposed fee levels, and its expected expense ratio in absolute terms as well as compared with the fees and expense ratios of comparable funds. In this regard, the Independent Board Members reviewed, among other things, comparative fee and expense structure data for the Lipper high yield municipal debt funds category. In addition, the Independent Board Members noted that the proposed management fees for the Fund were consistent with those of the High Yield Fund and considered the Sub-Advisor’s municipal expertise and reputation.
In addition, the Independent Board Members considered the fund-level breakpoint schedule and the complex-wide breakpoint schedule (described in further detail below) and any applicable fee waivers and expense reimbursements expected to be provided. Based on their review of the fee and expense information provided, the Independent Board Members determined that the Fund’s management fees were reasonable in light of the nature, extent and quality of services to be provided to the Fund.
2. Comparisons with the Fees of Other Clients
Due to their experience with other Nuveen funds, the Board Members were familiar with the nature of services and range of fees offered by the Advisor to other clients. Such other clients include municipal separately managed accounts and passively managed exchange-traded funds (ETFs) sub-advised by the Advisor. In evaluating the comparisons of fees, the Independent Board Members have noted, at the Meeting or at prior meetings, that the fee rates charged to a fund (such as the Fund) and charged to other clients vary, among other things, because of the different services involved and the additional regulatory and compliance requirements associated with registered investment companies, such as the Fund. Accordingly, the Independent Board Members have considered the differences in the product types, including, but not limited to, the services to be provided, the structure and operations, product distribution and costs thereof, portfolio investment policies, investor profiles, account sizes and regulatory requirements. The Independent Board Members have noted, in particular, that the range of services as described above to be provided to a fund (such as the Fund) is much more extensive than that provided to separately managed accounts. Given the inherent differences in the various products, particularly the extensive services to be provided to the Fund, the Independent Board Members believe such facts justify the different levels of fees.
In considering the fees of the Sub-Advisor, the Independent Board Members are familiar with the pricing schedule or fees that the Sub-Advisor charges for similar investment management services for other Nuveen funds, funds of other sponsors (if any), and other clients (such as retail and/or institutional managed accounts).
3. Profitability of Fund Advisers
In conjunction with their review of fees at prior meetings, the Independent Board Members have considered the profitability of Nuveen for its advisory activities and its financial condition. At the Meeting or prior meetings, the Independent Board Members reviewed the revenues and expenses of Nuveen’s advisory activities, the allocation methodology used in preparing the profitability data and an analysis of the key drivers behind the changes in revenues and expenses that impacted profitability. They also reviewed certain Nuveen business and financial information dated January 15, 2013, certain Nuveen financial information included in a report dated November 7, 2012, and Nuveen’s September 30, 2012 consolidated financial statements. The Independent Board Members have also considered, at the Meeting or at prior meetings, Nuveen’s revenues for advisory activities, expenses, and profit margin compared to that of various unaffiliated management firms with comparable assets under management (based on asset size and asset composition).
In reviewing profitability, the Independent Board Members have recognized the Advisor’s continued investment in its business to enhance its services, including capital improvements to investment technology, updated compliance systems, and additional personnel in compliance, risk management, and product development. In addition, in evaluating profitability, the Independent Board Members have also recognized the subjective nature of determining profitability which may be affected by numerous factors, including the allocation of expenses. Further, the Independent Board Members have recognized the difficulties in making comparisons as the profitability of other advisers generally is not publicly available and the profitability information that is available for certain advisers or management firms may not be representative of the industry and may be affected by, among other things, the adviser’s particular business mix, capital costs, types of funds managed and expense allocations. Notwithstanding the foregoing, the Independent Board Members have reviewed Nuveen’s methodology and assumptions for allocating expenses across product lines to determine profitability. In reviewing profitability, the Independent Board Members have recognized Nuveen’s investment in its fund business. Based on their review, the Independent Board Members concluded that the Advisor’s level of profitability for its advisory activities was reasonable in light of the services to be provided.
With respect to the Sub-Advisor, which is affiliated with Nuveen, the Independent Board Members have previously reviewed its revenues, expenses and profitability margins (pre- and post-tax) for its advisory activities and the methodology used for allocating expenses among the internal sub-advisers. Based on their review, the Independent Board Members were satisfied that the Sub-Advisor’s level of profitability was reasonable in light of the services to be provided to the Fund.
Annual Investment Management Agreement Approval Process
(Unaudited) (continued)
In evaluating the reasonableness of the compensation, the Independent Board Members also considered any other amounts expected to be paid to a Fund Adviser by the Fund as well as any indirect benefits (such as soft dollar arrangements, if any) the respective Fund Adviser and its affiliates are expected to receive that are directly attributable to the management of the Fund, if any. See Section E below for additional information on indirect benefits a Fund Adviser may receive as a result of its relationship with the Fund. Based on their review of the overall fee arrangements of the Fund, the Independent Board Members determined that the advisory fees and expected expenses of the Fund were reasonable.
D. Economies of Scale and Whether Fee Levels Reflect These Economies of Scale
With respect to economies of scale, the Independent Board Members have recognized the potential benefits resulting from the costs of a fund being spread over a larger asset base, although economies of scale are difficult to measure and predict with precision, particularly on a fund-by-fund basis. The Independent Board Members therefore considered whether the Fund could be expected to benefit from any economies of scale. One method to help ensure that the shareholders share in these benefits is to include breakpoints in the advisory fee schedule. Generally, management fees for funds in the Nuveen complex are comprised of a fund-level component and a complex-level component. Accordingly, the Independent Board Members received and reviewed the schedule of proposed advisory fees for the Fund, including fund-level breakpoints thereto.
In addition to fund-level advisory fee breakpoints, the Board also considered the Fund’s complex-wide fee arrangement. Pursuant to the complex-wide fee arrangement, the fees of the funds in the Nuveen complex, including the Fund, are generally reduced as the assets in the fund complex reach certain levels. In evaluating the complex-wide fee arrangement, the Independent Board Members have considered that the complex-wide fee arrangement seeks to provide the benefits of economies of scale to fund shareholders when total fund complex assets increase, even if assets of a particular fund are unchanged or have decreased. The approach reflects the notion that some of Nuveen’s costs are attributable to services provided to all its funds in the complex and therefore all funds benefit if these costs are spread over a larger asset base.
Based on their review, the Independent Board Members concluded that the breakpoint schedules and complex-wide fee arrangement were acceptable and reflect economies of scale to be shared with the Fund’s shareholders when assets under management increase.
E. Indirect Benefits
In evaluating fees, the Independent Board Members also considered information previously received regarding potential “fall out” or ancillary benefits that a Fund Adviser or its affiliates may receive as a result of its relationship with the Fund. In this regard, the Independent Board Members considered, among other things, any sales charges, distribution fees and shareholder services fees expected to be received and retained by the Fund’s principal underwriter, an affiliate of the Advisor, including fees to be received pursuant to any 12b-1 plan.
In addition to the above, the Independent Board Members considered whether the Fund Advisers will receive any benefits from soft dollar arrangements whereby a portion of the commissions paid by the Fund for brokerage may be used to acquire research that may be useful to a Fund Adviser in managing the assets of the Fund and other clients. The Independent Board Members recognized that each Fund Adviser has the authority to pay a higher commission in return for brokerage and research services if it determines in good faith that the commission paid is reasonable in relation to the value of the brokerage and research services provided and may benefit from such soft dollar arrangements. Similarly, the Board recognized that the research received pursuant to soft dollar arrangements by a Fund Adviser may also benefit the Fund and shareholders to the extent the research enhances the ability of the Fund Adviser to manage the Fund. The Independent Board Members noted that the Fund Advisers’ profitability may be somewhat lower if they did not receive the research services pursuant to the soft dollar arrangements and had to acquire such services directly.
Based on their review, the Independent Board Members concluded that any indirect benefits expected to be received by a Fund Adviser as a result of its relationship with the Fund were reasonable and within acceptable parameters.
F. Approval
The Independent Board Members did not identify any single factor discussed previously as all-important or controlling. The Board Members, including a majority of the Independent Board Members, concluded that the terms of the Investment Management Agreement and Sub-Advisory Agreement were fair and reasonable, that the respective Fund Adviser’s fees are reasonable in light of the services to be provided to the Fund and that the Investment Management Agreement and Sub-Advisory Agreement should be and were approved on behalf of the Fund.
Notes
Notes
Glossary of Terms Used in this Report
Average Annual Total Return: This is a commonly used method to express an investment’s performance over a particular, usually multi-year time period. It expresses the return that would have been necessary each year to equal the investment’s actual cumulative performance (including change in NAV or offer price and reinvested dividends and capital gains distributions, if any) over the time period being considered.
Barclays 1-10 Year Municipal Bond Index: An unmanaged index comprised of investment-grade municipal bonds with maturity dates of more than 1 year and less than 10 years. Index returns assume reinvestment of distributions, but do not reflect any applicable sales charges or management fees.
Barclays 3-Year Municipal Bond Index: An unmanaged index comprised of fixed-rate, investment-grade tax-exempt bonds with remaining maturities between 2 and 4 years. Index returns assume reinvestment of distributions, but do not reflect any applicable sales charges or management fees.
Duration: Duration is a measure of the expected period over which a bond’s principal and interest will be paid, and consequently is a measure of the sensitivity of a bond’s (or bond fund’s) value to changes when market interest rates change. Generally, the longer a bond or Fund’s duration, the more the price of the bond or Fund will change as interest rates change.
Effective Leverage (Effective Leverage Ratio): Effective leverage is investment exposure created either through borrowings or indirectly through inverse floaters, divided by the assets invested, including those assets that were purchased with the proceeds of the leverage, or referenced by the levered instrument.
Inflation Linked Swap: A contractual agreement between two counterparties under which one party agrees to make periodic interest payments to the other for an agreed period of time based on a fixed rate (alternatively, a floating rate based on an interest rate index), while the other party agrees to make periodic payments based on a floating rate of interest based on the Consumer Price Index.
Inverse Floating Rate Securities: Inverse floating rate securities, also known as inverse floaters or tender option bonds (TOBs), are created by depositing a municipal bond, typically with a fixed interest rate, into a special purpose trust created by a broker-dealer. This trust, in turn, (a) issues floating rate certificates typically paying short-term tax-exempt interest rates to third parties in amounts equal to some fraction of the deposited bond’s par amount or market value, and (b) issues an inverse floating rate certificate (sometimes referred to as an “inverse floater”) to an investor (such as a Fund) interested in gaining investment exposure to a long-term municipal bond. The income received by the holder of the inverse floater varies inversely with the short-term rate paid to the floating rate certificates’ holders, and in most circumstances the holder of the inverse floater bears substantially all of the underlying bond’s downside investment risk. The holder of the inverse floater typically also benefits disproportionately from any potential appreciation of the underlying bond’s value. Hence, an inverse floater essentially represents an investment in the underlying bond on a leveraged basis.
Leverage: Leverage is created whenever a fund has investment exposure (both reward and/or risk) equivalent to more than 100% of the investment capital.
Lipper General Municipal Debt Funds Classification Average: Represents the average annualized total return for all reporting funds in the Lipper General Municipal Debt Funds Classification. Lipper returns account for the effects of management fees and assume reinvestment of distributions, but do not reflect any applicable sales charge.
Lipper High Yield Municipal Debt Funds Classification Average: Represents the average annualized total return for all reporting funds in the Lipper High Yield Municipal Debt Funds Classification. Lipper returns account for the effects of management fees and assume reinvestment of distributions, but do not reflect any applicable sales charge.
Lipper Intermediate Municipal Debt Funds Classification Average: Represents the average annualized total return for all reporting funds in the Lipper Intermediate Municipal Debt Funds Classification. Lipper returns account for the effects of management fees and assume reinvestment of distributions, but do not reflect any applicable sales charge.
Lipper Short-Intermediate Municipal Debt Funds Classification Average: Represents the average annualized total return for all reporting funds in the Lipper Short-Intermediate Municipal Debt Funds Classification. Lipper returns account for the effects of management fees and assume reinvestment of distributions, but do not reflect any applicable sales charge.
Lipper Short Municipal Debt Funds Classification Average: Represents the average annualized total return for all reporting funds in the Lipper Short Municipal Debt Funds Classification. Lipper returns account for the effects of management fees and assume reinvestment of distributions, but do not reflect any applicable sales charges.
Net Asset Value (NAV): The net market value of all securities held in a portfolio.
Net Asset Value (NAV) Per Share: The market value of one share of a mutual fund or closed-end fund. For a Fund, the NAV is calculated daily by taking the Fund’s total assets (securities, cash, and accrued earnings), subtracting the Funds’s liabilities, and dividing by the number of shares outstanding.
Pre-Refundings: Pre-Refundings, also known as advance refundings or refinancings, occur when an issuer sells new bonds and uses the proceeds to fund principal and interest payments of older existing bonds. This process often results in lower borrowing costs for bond issuers.
S&P Municipal Bond High Yield Index: An unleveraged, market value-weighted index designed to measure the performance of the tax-exempt, investment-grade U.S. high yield municipal bond market. Index returns assume reinvestment of distributions but do not reflect any applicable sales charges or management fees.
S&P Municipal Bond Intermediate Index: Contains all bonds in the S&P Municipal Bond Index that mature between 3 and 14.999 years. Index returns assume reinvestment of dividends but do not reflect any applicable sales charges or management fees.
S&P Municipal Bond Index: An unleveraged, market value-weighted index designed to measure the performance of the tax-exempt, investment-grade U.S. municipal bond market. Index returns assume reinvestment of distributions, but do not reflect any applicable sales charges or management fees.
S&P Municipal Bond Short Index: An unleveraged, market value-weighted index containing all of the bonds in the S&P Municipal Bond Index with maturities between 6 months and 3.999 years. Index returns assume reinvestment of distributions, but do not reflect any applicable sales charges or management fees.
S&P Municipal Bond Short-Intermediate Index: Contains all bonds in the S&P Municipal Bond Index that mature between 1 and 7.999 years. Index returns assume reinvestment of distributions, but do not reflect any applicable sales charges or management fees.
S&P Municipal Yield Index: Contains all bonds in the S&P Municipal Bond Index that are non-rated or whose ratings are BB+ by S&P and BA-1 by Moody’s Investors Service, Inc. or lower. This index does not contain bonds that are pre-refunded or escrowed to maturity. Index returns assume reinvestment of distributions, but do not reflect any applicable sales charges or management fees.
Total Investment Exposure: Total investment exposure is a Fund’s assets managed by the Adviser that are attributable to financial leverage. For these purposes, financial leverage includes a Fund’s use of preferred stock and borrowings and investments in the residual interest certificates (also called inverse floating rate securities) in tender option bond (TOB) trusts, including the portion of assets held by a TOB trust that has been effectively financed by the trust’s issuance of floating rate securities.
Zero Coupon Bond: A zero coupon bond does not pay a regular interest coupon to its holders during the life of the bond. Tax-exempt income to the holder of the bond comes from accretion of the difference between the original purchase price of the bond at issuance and the par value of the bond at maturity and is effectively paid at maturity. The market prices of zero coupon bonds generally are more volatile than the market prices of bonds that pay interest periodically.
Additional Fund Information
Fund Manager
Nuveen Fund Advisors, LLC
333 West Wacker Drive
Chicago, IL 60606
Sub-Adviser
Nuveen Asset Management, LLC
333 West Wacker Drive
Chicago, IL 60606
Legal Counsel
Chapman and Cutler LLP
Chicago, IL
Independent Registered Public Accounting Firm
PricewaterhouseCoopers LLP
Chicago, IL
Custodians
State Street Bank & Trust Company
Boston, MA
U.S Bank National Association
Milwaukee, WI
Transfer Agent and Shareholder Services
Boston Financial
Data Services, Inc.
Nuveen Investor Services
P.O. Box 8530
Boston, MA 02266-8530
(800) 257-8787
Quarterly Form N-Q Portfolio of Investments Information
Each Fund is required to file its complete schedule of portfolio holdings with the Securities and Exchange Commission (SEC) for the first and third quarters of each fiscal year on Form N-Q. You may obtain this information directly from the SEC. Visit the SEC on-line at http://www.sec.gov or in person at the SEC’s Public Reference Room in Washington, D.C. Call the SEC toll-free at (800) SEC -0330 for room hours and operation.
Nuveen Funds’ Proxy Voting Information
You may obtain (i) information regarding how each Fund voted proxies relating to portfolio securities held during the most recent twelve-month period ended June 30, without charge, upon request, by calling Nuveen Investments toll-free at (800) 257-8787 or on Nuveen’s website at www.nuveen.com and (ii) a description of the policies and procedures that each Fund used to determine how to vote proxies relating to portfolio securities without charge, upon request, by calling Nuveen Investments toll-free at (800) 257-8787. You may also obtain this information directly from the SEC. Visit the SEC on-line at http://www.sec.gov.
The Financial Industry Regulatory Authority (FINRA) provides a Public Disclosure Program which supplies certain information regarding the disciplinary history of FINRA members and their associated persons in response to either telephone inquiries at (800) 289-9999 or written inquiries at www.finra.org. FINRA also provides an investor brochure that includes information describing the Public Disclosure Program.
Nuveen Investments:
Serving Investors for Generations
Since 1898, financial advisors and their clients have relied on Nuveen Investments to provide dependable investment solutions through continued adherence to proven, long-term investing principles. Today, we offer a range of high quality equity and fixed-income solutions designed to be integral components of a well-diversified core portfolio.
Focused on meeting investor needs.
Nuveen Investments provides high-quality investment services designed to help secure the longterm goals of institutional and individual investors as well as the consultants and financial advisors who serve them. Nuveen Investments markets a wide range of specialized investment solutions which provide investors access to capabilities of its high-quality boutique investment affiliates–Nuveen Asset Management, Symphony Asset Management, NWQ Investment Management Company, Santa Barbara Asset Management, Tradewinds Global Investors, Winslow Capital Management, and Gresham Investment Management. In total, Nuveen Investments managed $224 billion as of March 31, 2013.
Find out how we can help you.
To learn more about how the products and services of Nuveen Investments may be able to help you meet your financial goals, talk to your financial advisor, or call us at (800) 257-8787. Please read the information provided carefully before you invest. Investors should consider the investment objective and policies, risk considerations, charges and expenses of any investment carefully. Where applicable, be sure to obtain a prospectus, which contains this and other relevant information. To obtain a prospectus, please contact your securities representative or Nuveen Investments, 333 W. Wacker Dr., Chicago, IL 60606. Please read the prospectus carefully before you invest or send money.
Learn more about Nuveen Funds at: www.nuveen.com/mf
| | |
Distributed by Nuveen Securities, LLC 333 West Wacker Drive Chicago, IL 60606 www.nuveen.com | | |
MAN-NAT-0413D
ITEM 2. CODE OF ETHICS.
As of the end of the period covered by this report, the registrant has adopted a code of ethics that applies to the registrant’s principal executive officer, principal financial officer, principal accounting officer or controller, or persons performing similar functions. There were no amendments to or waivers from the code during the period covered by this report. The registrant has posted the code of ethics on its website at www.nuveen.com/MutualFunds/ShareholderResources/FundGovernance.aspx. (To view the code, click on Code of Conduct.)
ITEM 3. AUDIT COMMITTEE FINANCIAL EXPERT.
The registrant’s Board of Trustees determined that the registrant has at least one “audit committee financial expert” (as defined in Item 3 of Form N-CSR) serving on its Audit Committee. The registrant’s audit committee financial expert is Carole E. Stone, who is “independent” for purposes of Item 3 of Form N-CSR.
Ms. Stone served for five years as Director of the New York State Division of the Budget. As part of her role as Director, Ms. Stone was actively involved in overseeing the development of the State’s operating, local assistance and capital budgets, its financial plan and related documents; overseeing the development of the State’s bond-related disclosure documents and certifying that they fairly presented the State’s financial position; reviewing audits of various State and local agencies and programs; and coordinating the State’s system of internal audit and control. Prior to serving as Director, Ms. Stone worked as a budget analyst/examiner with increasing levels of responsibility over a 30 year period, including approximately five years as Deputy Budget Director. Ms. Stone has also served as Chair of the New York State Racing Association Oversight Board, as Chair of the Public Authorities Control Board, as a Commissioner on the New York State Commission on Public Authority Reform and as a member of the Boards of Directors of several New York State public authorities. These positions have involved overseeing operations and finances of certain entities and assessing the adequacy of project/entity financing and financial reporting. Currently, Ms. Stone is on the Board of Directors of CBOE Holdings, Inc., of the Chicago Board Options Exchange, and of C2 Options Exchange. Ms. Stone’s position on the boards of these entities and as a member of both CBOE Holdings’ Audit Committee and its Finance Committee has involved, among other things, the oversight of audits, audit plans and preparation of financial statements.
ITEM 4. PRINCIPAL ACCOUNTANT FEES AND SERVICES.
The following tables show the amount of fees that PricewaterhouseCoopers LLP, the Trust’s auditor, billed to the Trust during the Trust’s last two full fiscal years. The Audit Committee approved in advance all audit services and non-audit services that PricewaterhouseCoopers LLP provided to the Trust, except for those non-audit services that were subject to the pre-approval exception under Rule 2-01 of Regulation S-X (the “pre-approval exception”). The preapproval exception for services provided directly to the Trust waives the pre-approval requirement for services other than audit, review or attest services if: (A) the aggregate amount of all such services provided constitutes no more than 5% of the total amount of revenues paid by the Trust during the fiscal year in which the services are provided; (B) the Trust did not recognize the services as non-audit services at the time of the engagement; and (C) the services are promptly brought to the Audit Committee’s attention, and the Committee (or its delegate) approves the services before the audit is completed.
The Audit Committee has delegated certain pre-approval responsibilities to its Chairman (or, in his absence, any other member of the Audit Committee).
SERVICES THAT THE TRUST’S AUDITOR BILLED TO THE TRUST
| | | | | | | | | | | | | | | | |
Fiscal Year Ended April 30, 2013 | | Audit Fees Billed
to Funds 1 | | | Audit-Related Fees
Billed to Funds 2 | | | Tax Fees
Billed to Funds 3 | | | All Other Fees
Billed to Funds 4 | |
Fund Name | | | | | | | | | | | | | | | | |
Nuveen Short Term Municipal Bond Fund | | | 17,561 | | | | 0 | | | | 600 | | | | 0 | |
| | | | | | | | | | | | | | | | |
Total | | $ | 17,561 | | | $ | 0 | | | $ | 600 | | | $ | 0 | |
| 1 | | “Audit Fees” are the aggregate fees billed for professional services for the audit of the Fund’s annual financial statements and services provided in connection with statutory and regulatory filings or engagements. |
| 2 | | “Audit-Related Fees” are the aggregate fees billed for assurance and related services reasonably related to the performance of the audit or review of financial statements that are not reported under “Audit Fees”. These fees include offerings related to the Fund’s common shares and leverage. |
| 3 | | “Tax Fees” are the aggregate fees billed for professional services for tax advice, tax compliance, and tax planning. These fees include: all global withholding tax services; excise and state tax reviews; capital gain, tax equalization and taxable basis calculations performed by the principal accountant. |
| 4 | | “All Other Fees” are the aggregate fees billed for products and services other than “Audit Fees”, “Audit-Related Fees” and “Tax Fees”. These fees represent all “Agreed-Upon Procedures” engagements pertaining to the Fund’s use of leverage. |
| | | | | | | | | | | | | | | | |
| | | Percentage Approved Pursuant to Pre-approval Exception | |
| | | Audit Fees Billed
to Funds | | | Audit-Related Fees
Billed to Funds | | | Tax Fees
Billed to Funds | | | All Other Fees
Billed to Funds | |
Fund Name | | | | | | | | | | | | | | | | |
Nuveen Short Term Municipal Bond Fund | | | 0 | % | | | 0 | % | | | 0 | % | | | 0 | % |
| | | | |
Fiscal Year Ended April 30, 2012 | | Audit Fees Billed
to Funds 1 | | | Audit-Related Fees
Billed to Funds 2 | | | Tax Fees
Billed to Funds 3 | | | All Other Fees
Billed to Funds 4 | |
Fund Name | | | | | | | | | | | | | | | | |
Nuveen Short Term Municipal Bond Fund | | | 16,115 | | | | 0 | | | | — | | | | 0 | |
| | | | | | | | | | | | | | | | |
Total | | $ | 16,115 | | | $ | 0 | | | $ | — | | | $ | 0 | |
| 1 | | “Audit Fees” are the aggregate fees billed for professional services for the audit of the Fund’s annual financial statements and services provided in connection with statutory and regulatory filings or engagements. |
| 2 | | “Audit-Related Fees” are the aggregate fees billed for assurance and related services reasonably related to the performance of the audit or review of financial statements that are not reported under “Audit Fees”. These fees include offerings related to the Fund’s common shares and leverage. |
| 3 | | “Tax Fees” are the aggregate fees billed for professional services for tax advice, tax compliance, and tax planning. These fees include: all global withholding tax services; excise and state tax reviews; capital gain, tax equalization and taxable basis calculations performed by the principal accountant. |
| 4 | | “All Other Fees” are the aggregate fees billed for products and services other than “Audit Fees”, “Audit-Related Fees” and “Tax Fees”. These fees represent all “Agreed-Upon Procedures” engagements pertaining to the Fund’s use of leverage. |
| | | | | | | | | | | | | | | | |
| | | Percentage Approved Pursuant to Pre-approval Exception | |
| | | Audit Fees Billed
to Funds | | | Audit-Related Fees
Billed to Funds | | | Tax Fees
Billed to Funds | | | All Other Fees
Billed to Funds | |
Fund Name | | | | | | | | | | | | | | | | |
Nuveen Short Term Municipal Bond Fund | | | 0 | % | | | 0 | % | | | 0 | % | | | 0 | % |
| | | | | | | | | | | | |
Fiscal Year Ended April 30, 2013 | | Audit-Related Fees
Billed to Adviser and
Affiliated Fund
Service Providers | | | Tax Fees Billed to
Adviser and
Affiliated Fund
Service Providers | | | All Other Fees
Billed to Adviser
and Affiliated Fund
Service Providers | |
Nuveen Investment Funds, Inc. | | $ | 0 | | | $ | 0 | | | $ | 0 | |
| |
| | | Percentage Approved Pursuant to Pre-approval Exception | |
| | | Audit-Related Fees
Billed to Adviser and
Affiliated Fund
Service Providers | | | Tax Fees Billed to
Adviser and
Affiliated Fund
Service Providers | | | All Other Fees
Billed to Adviser
and Affiliated Fund
Service Providers | |
| | | 0 | % | | | 0 | % | | | 0 | % |
| | | |
Fiscal Year Ended April 30, 2012 | | Audit-Related Fees
Billed to Adviser and
Affiliated Fund
Service Providers | | | Tax Fees Billed to
Adviser and
Affiliated Fund
Service Providers | | | All Other Fees
Billed to Adviser
and Affiliated Fund
Service Providers | |
Nuveen Investment Funds, Inc. | | $ | 0 | | | $ | 0 | | | $ | 0 | |
| |
| | | Percentage Approved Pursuant to Pre-approval Exception | |
| | | Audit-Related Fees
Billed to Adviser and
Affiliated Fund
Service Providers | | | Tax Fees Billed to
Adviser and
Affiliated Fund
Service Providers | | | All Other Fees
Billed to Adviser
and Affiliated Fund
Service Providers | |
| | | 0 | % | | | 0 | % | | | 0 | % |
| | | | | | | | | | | | | | | | |
Fiscal Year Ended April 30, 2013 | | Total Non-Audit Fees
Billed to Trust | | | Total Non-Audit Fees
billed to Adviser and
Affiliated Fund Service
Providers (engagements
related directly to the
operations and financial
reporting of the Trust) | | | Total Non-Audit Fees
billed to Adviser and
Affiliated Fund Service
Providers (all other
engagements) | | | Total | |
Fund Name | | | | | | | | | | | | | | | | |
Nuveen Short Term Municipal Bond Fund | | | 600 | | | | 0 | | | | 0 | | | | 600 | |
| | | | | | | | | | | | | | | | |
Total | | $ | 600 | | | $ | 0 | | | $ | 0 | | | $ | 600 | |
“Non-Audit Fees billed to Fund” for both fiscal year ends represent “Tax Fees” and “All Other Fees” billed to Fund in their respective amounts from the previous table.
Less than 50 percent of the hours expended on the principal accountant’s engagement to audit the registrant’s financial statements for the most recent fiscal year were attributed to work performed by persons other than the principal accountant’s full-time, permanent employees.
| | | | | | | | | | | | | | | | |
Fiscal Year Ended April 30, 2012 | | Total Non-Audit Fees
Billed to Trust | | | Total Non-Audit Fees
billed to Adviser and
Affiliated Fund Service
Providers (engagements
related directly to the
operations and financial
reporting of the Trust) | | | Total Non-Audit Fees
billed to Adviser and
Affiliated Fund Service
Providers (all other
engagements) | | | Total | |
Fund Name | | | | | | | | | | | | | | | | |
Nuveen Short Term Municipal Bond Fund | | | 0 | | | | 0 | | | | 0 | | | | 0 | |
| | | | | | | | | | | | | | | | |
Total | | $ | 0 | | | $ | 0 | | | $ | 0 | | | $ | 0 | |
“Non-Audit Fees billed to Fund” for both fiscal year ends represent “Tax Fees” and “All Other Fees” billed to Fund in their respective amounts from the previous table.
Audit Committee Pre-Approval Policies and Procedures. Generally, the Audit Committee must approve (i) all non-audit services to be performed for the Trust by the Trust’s independent accountants and (ii) all audit and non-audit services to be performed by the Trust’s independent accountants for the Affiliated Fund Service Providers with respect to the operations and financial reporting of the Trust. Regarding tax and research projects conducted by the independent accountants for the Trust and Affiliated Fund Service Providers (with respect to operations and financial reports of the Trust), such engagements will be (i) pre-approved by the Audit Committee if they are expected to be for amounts greater than $10,000; (ii) reported to the Audit Committee Chairman for his verbal approval prior to engagement if they are expected to be for amounts under $10,000 but greater than $5,000; and (iii) reported to the Audit Committee at the next Audit Committee meeting if they are expected to be for an amount under $5,000.
ITEM 5. AUDIT COMMITTEE OF LISTED REGISTRANTS.
Not applicable to this registrant.
ITEM 6. SCHEDULE OF INVESTMENTS.
| a) | | See Portfolio of Investments in Item 1. |
ITEM 7. DISCLOSURE OF PROXY VOTING POLICIES AND PROCEDURES FOR CLOSED-END
MANAGEMENT INVESTMENT COMPANIES.
Not applicable to this registrant.
ITEM 8. PORTFOLIO MANAGERS OF CLOSED-END MANAGEMENT INVESTMENT COMPANIES.
Not applicable to this registrant.
ITEM 9. PURCHASES OF EQUITY SECURITIES BY CLOSED-END MANAGEMENT INVESTMENT COMPANY AND AFFILIATED PURCHASERS.
Not applicable to this registrant.
ITEM 10. SUBMISSION OF MATTERS TO A VOTE OF SECURITY HOLDERS.
There have been no material changes to the procedures by which shareholders may recommend nominees to the registrant’s Board of Trustees implemented after the registrant last provided disclosure in response to this Item.
ITEM 11. CONTROLS AND PROCEDURES.
| | (a) | | The registrant’s principal executive and principal financial officers, or persons performing similar functions, have concluded that the registrant’s disclosure controls and procedures (as defined in Rule 30a-3(c) under the Investment Company Act of 1940, as amended (the “1940 Act”) (17 CFR 270.30a-3(c))) are effective, as of a date within 90 days of the filing date of this report that includes the disclosure required by this paragraph, based on their evaluation of the controls and procedures required by Rule 30a-3(b) under the 1940 Act (17 CFR 270.30a-3(b)) and Rules 13a-15(b) or 15d-15(b) under the Securities Exchange Act of 1934, as amended (the “Exchange Act”) (17 CFR 240.13a-15(b) or 240.15d-15(b)). |
| | (b) | | There were no changes in the registrant’s internal control over financial reporting (as defined in Rule 30a-3(d) under the 1940 Act (17 CFR 270.30a-3(d)) that occurred during the second fiscal quarter of the period covered by this report that has materially affected, or is reasonably likely to materially affect, the registrant’s internal control over financial reporting. |
ITEM 12. EXHIBITS.
File the exhibits listed below as part of this Form.
| | |
| (a)(1) | | Any code of ethics, or amendment thereto, that is the subject of the disclosure required by Item 2, to the extent that the registrant intends to satisfy the Item 2 requirements through filing of an exhibit: Not applicable because the code is posted on registrant’s website at www.nuveen.com/MutualFunds/ShareholderResources/FundGovernance.aspx and there were no amendments during the period covered by this report. (To view the code, click on Code of Conduct.) |
| |
| (a)(2) | | A separate certification for each principal executive officer and principal financial officer of the registrant as required by Rule 30a-2(a) under the 1940 Act (17 CFR 270.30a-2(a)) in the exact form set forth below: See EX-99.CERT attached hereto. |
| |
| (a)(3) | | Any written solicitation to purchase securities under Rule 23c-1 under the 1940 Act (17 CFR 270.23c-1) sent or given during the period covered by the report by or on behalf of the registrant to 10 or more persons: Not applicable to this registrant. |
| |
| (b) | | If the report is filed under Section 13(a) or 15(d) of the Exchange Act, provide the certifications required by Rule 30a-2(b) under the 1940 Act (17 CFR 270.30a-2(b)), Rule 13a-14(b) or Rule 15d-14(b) under the Exchange Act (17 CFR 240.13a-14(b) or 240.15d-14(b)), and Section 1350 of Chapter 63 of Title 18 of the United States Code (18 U.S.C. 1350) as an Exhibit. A certification furnished pursuant to this paragraph will not be deemed “filed” for purposes of Section 18 of the Exchange Act (15 U.S.C. 78r), or otherwise subject to the liability of that section. Such certification will not be deemed to be incorporated by reference into any filing under the Securities Act of 1933 or the Exchange Act, except to the extent that the registration specifically incorporates it by reference: See EX-99.906 CERT attached hereto. |
SIGNATURES
Pursuant to the requirements of the Securities Exchange Act of 1934 and the Investment Company Act of 1940, the registrant has duly caused this report to be signed on its behalf by the undersigned, thereunto duly authorized.
(Registrant) Nuveen Investment Funds, Inc.
| | |
| |
By (Signature and Title) | | /s/ Kevin J. McCarthy |
| | Kevin J. McCarthy |
| | Vice President and Secretary |
Date: July 8, 2013
Pursuant to the requirements of the Securities Exchange Act of 1934 and the Investment Company Act of 1940, this report has been signed below by the following persons on behalf of the registrant and in the capacities and on the dates indicated.
| | |
| |
By (Signature and Title) | | /s/ Gifford R. Zimmerman |
| | Gifford R. Zimmerman |
| | Chief Administrative Officer |
| | (principal executive officer) |
Date: July 8, 2013
| | |
| |
| By (Signature and Title) | | /s/ Stephen D. Foy |
| | Stephen D. Foy |
| | Vice President and Controller |
| | (principal financial officer) |
Date: July 8, 2013