UNITED STATES
SECURITIES AND EXCHANGE COMMISSION
Washington, D.C. 20549
FORM N-CSR
CERTIFIED SHAREHOLDER REPORT OF REGISTERED MANAGEMENT
INVESTMENT COMPANIES
Investment Company Act file number 811-05309
Nuveen Investment Funds, Inc.
(Exact name of registrant as specified in charter)
Nuveen Investments
333 West Wacker Drive, Chicago, IL 60606
(Address of principal executive offices) (Zip code)
Christopher M. Rohrbachar
Vice President and Secretary
333 West Wacker Drive,
Chicago, IL 60606
(Name and address of agent for service)
Registrant’s telephone number, including area code: (312) 917-7700
Date of fiscal year end: June 30
Date of reporting period: June 30, 2018
Form N-CSR is to be used by management investment companies to file reports with the Commission not later than 10 days after the transmission to stockholders of any report that is required to be transmitted to stockholders under Rule 30e-1 under the Investment Company Act of 1940 (17 CFR 270.30e-1). The Commission may use the information provided on Form N-CSR in its regulatory, disclosure review, inspection, and policy making roles.
A registrant is required to disclose the information specified by Form N-CSR, and the Commission will make this information public. A registrant is not required to respond to the collection of information contained in Form N-CSR unless the Form displays a currently valid Office of Management and Budget (“OMB”) control number. Please direct comments concerning the accuracy of the information collection burden estimate and any suggestions for reducing the burden to Secretary, Securities and Exchange Commission, 450 Fifth Street, NW, Washington, DC 20549-0609. The OMB has reviewed this collection of information under the clearance requirements of 44 U.S.C. ss.3507.
ITEM 1. REPORTS TO STOCKHOLDERS.

Nuveen Income Funds
| | | | | | | | | | | | |
| Fund Name | | Class A | | Class C | | Class R3 | | Class R6 | | Class I | | Class T |
| Nuveen Core Bond Fund | | FAIIX | | NTIBX | | — | | NTIFX | | FINIX | | FIDTX |
| Nuveen Core Plus Bond Fund | | FAFIX | | FFAIX | | FFISX | | FPCFX | | FFIIX | | FFITX |
| Nuveen High Income Bond Fund | | FJSIX | | FCSIX | | FANSX | | — | | FJSYX | | FCPTX |
| Nuveen Inflation Protected Securities Fund | | FAIPX | | FCIPX | | FRIPX | | FISFX | | FYIPX | | FIFTX |
| Nuveen Short Term Bond Fund | | FALTX | | FBSCX | | NSSRX | | NSSFX | | FLTIX | | NSATX |
| Nuveen Strategic Income Fund | | FCDDX | | FCBCX | | FABSX | | FSFRX | | FCBYX | | FSFTX |
Annual Report
Life is Complex.
Nuveen makes things e-simple.
It only takes a minute to sign up for e-Reports. Once enrolled, you’ll receive an e-mail as soon as your Nuveen Fund information is ready. No more waiting for delivery by regular mail. Just click on the link within the e-mail to see the report and save it on your computer if you wish.
Free e-Reports right to your email!
www.investordelivery.com
If you receive your Nuveen Fund distributions and statements from your financial advisor or brokerage account.
or
www.nuveen.com/client-access
If you receive your Nuveen Fund distributions and statements directly from Nuveen.
Must be preceded by or accompanied by a prospectus.
NOT FDIC INSURED MAY LOSE VALUE NO BANK GUARANTEE
Table
of Contents
3
Chairman’s Letter to Shareholders
Dear Shareholders,
I am honored to serve as the new independent chairman of the Nuveen Fund Board, effective July 1, 2018. I’d like to gratefully acknowledge the stewardship of my predecessor William J. Schneider and, on behalf of my fellow Board members, reinforce our commitment to the legacy of strong, independent oversight of your Funds.
The increase in market volatility this year reflects greater uncertainty among investors. The global economic outlook is less clear cut than it was in 2017. U.S. growth is again decoupling from that of the rest of the world, and the U.S. dollar and interest rates have risen in response. Trade concern rhetoric and the imposition of tariffs between the U.S. and its major trading partners has recently dampened business sentiment and could pose a risk to growth expectations going forward. A host of other geopolitical concerns, including the ongoing Brexit and North American Free Trade Agreement negotiations, North Korea relations and rising populism around the world, remain on the horizon.
Despite these risks, global growth remains intact, albeit at a slower pace, providing support to corporate earnings. Fiscal stimulus, an easing regulatory environment and robust consumer spending recently helped boost the U.S. economy’s momentum. Subdued inflation pressures have kept central bank policy accommodative, even as Europe moves closer to winding down its monetary stimulus and the Federal Reserve remains on a moderate tightening course.
Headlines and political noise will continue to obscure underlying fundamentals at times and cause temporary bouts of volatility. We encourage you to work with your financial advisor to evaluate your goals, timeline and risk tolerance if short-term market fluctuations are a concern. On behalf of the other members of the Nuveen Fund Board, we look forward to continuing to earn your trust in the months and years ahead.
Sincerely,

Terence J. Toth
Chairman of the Board
August 24, 2018
4
Portfolio Managers’
Comments
Nuveen Core Bond Fund
Nuveen Core Plus Bond Fund
Nuveen High Income Bond Fund
Nuveen Inflation Protected Securities Fund
Nuveen Short Term Bond Fund
Nuveen Strategic Income Fund
These Funds feature portfolio management by Nuveen Asset Management, LLC (NAM), an affiliate of Nuveen, LLC. In this report, the various portfolio management teams for the Funds discuss the economy and financial markets, key investment strategies and the Funds’ performance for the twelve-month reporting period ended June 30, 2018.
The management teams include:
Nuveen Core Bond Fund
Jeffrey J. Ebert, Wan-Chong Kung, CFA, and Jason J. O’Brien, CFA, have been part of the management team for the Fund since 2000, 2002 and 2016, respectively. Portfolio manager Chris J. Neuharth retired from Nuveen Asset Management, LLC on June 1, 2018.
Nuveen Core Plus Bond Fund
Timothy A. Palmer, CFA, has managed the Fund since 2003. Wan-Chong Kung, CFA, Jeffrey J. Ebert and Douglas M. Baker, CFA, joined the Fund as portfolio managers in 2001, 2005 and 2016, respectively. Portfolio manager Chris J. Neuharth retired from Nuveen Asset Management, LLC on June 1, 2018.
Nuveen High Income Bond Fund
John T. Fruit, CFA, has managed the Fund since 2006. Jeffrey T. Schmitz, CFA, has been part of the management team for the Fund since 2008.
Nuveen Inflation Protected Securities Fund
Wan-Chong Kung, CFA, has managed the Fund since its inception in 2004 and Chad W. Kemper joined the Fund as a portfolio manager in 2010.
Nuveen Short Term Bond Fund
Peter L. Agrimson, CFA, Jason J. O’Brien, CFA, and Mackenzie S. Meyer have been on the management team since 2011, 2016 and 2016, respectively. Portfolio manager Chris J. Neuharth retired from Nuveen Asset Management, LLC on June 1, 2018.
This material is not intended to be a recommendation or investment advice, does not constitute a solicitation to buy or sell securities, and is not provided in a fiduciary capacity. The information provided does not take into account the specific objectives or circumstances of any particular investor, or suggest any specific course of action. Investment decisions should be made based on an investor’s objectives and circumstances and in consultation with his or her advisors.
Certain statements in this report are forward-looking statements. Discussions of specific investments are for illustration only and are not intended as recommendations of individual investments. The forward-looking statements and other views expressed herein are those of the portfolio managers as of the date of this report. Actual future results or occurrences may differ significantly from those anticipated in any forward-looking statements and the views expressed herein are subject to change at any time, due to numerous market and other factors. The Funds disclaim any obligation to update publicly or revise any forward-looking statements or views expressed herein.
For financial reporting purposes, the ratings disclosed are the highest rating given by one of the following national rating agencies: Standard & Poor’s (S&P), Moody’s Investors Service, Inc. (Moody’s) or Fitch, Inc. (Fitch). This treatment of split-rated securities may differ from that used for other purposes, such as for Fund investment policies. Credit ratings are subject to change. AAA, AA, A and BBB are investment grade ratings; BB, B, CCC, CC, C and D are below investment grade ratings. Holdings designated N/R are not rated by these national rating agencies.
Refer to the Glossary of Terms Used in this Report for further definition of the terms used within this section.
5
Portfolio Managers’ Comments (continued)
Nuveen Strategic Income Fund
Timothy A. Palmer, CFA, has managed the Fund since 2005. Jeffrey J. Ebert, Marie A. Newcome, CFA, and Douglas M. Baker, CFA, joined the Fund as co-portfolio managers in 2000, 2011 and 2016, respectively.
What factors affected the U.S. economy and financial markets during the twelve-month annual reporting period ended June 30, 2018?
After maintaining a moderate pace of growth for most of the twelve-month reporting period, the U.S. economy accelerated in the second quarter of 2018. In the April to June period, economic stimulus from tax cuts and deregulation helped lift the economy to its fastest pace since 2014. The “advance” estimate by the Bureau of Economic Analysis reported U.S. gross domestic product (GDP) grew at an annualized rate of 4.1% in the second quarter, up from 2.2% in the first quarter, 2.3% in the fourth quarter of 2017 and 2.8% in the third quarter of 2017. GDP is the value of goods and services produced by the nation’s economy less the value of the goods and services used up in production, adjusted for price changes. The boost in economic activity during the second quarter of 2018 was attributed to robust spending by consumers, businesses and the government, as well as a temporary increase in exports, as farmers rushed soybean shipments ahead of China’s retaliatory tariffs.
Consumer spending, the largest driver of the economy, remained well supported by low unemployment, wage gains and, in the second quarter, tax cuts. As reported by the Bureau of Labor Statistics, the unemployment rate fell to 4.0% in June 2018 from 4.3% in June 2017 and job gains averaged around 198,000 per month for the past twelve months. While the jobs market has continued to tighten, wage growth has remained lackluster during this economic recovery. Although the January jobs report revealed an unexpected pick-up in wages, the trend moderated in subsequent months. The Consumer Price Index (CPI) increased 2.9% over the twelve-month reporting period ended June 30, 2018 on a seasonally adjusted basis, as reported by the Bureau of Labor Statistics. The core CPI (which excludes food and energy) increased 2.3% during the same period, slightly above the Federal Reserve’s (Fed) unofficial longer term inflation objective of 2.0%.
Low mortgage rates and low inventory continued to drive home prices higher. Although mortgage rates have started to nudge higher, they remained relatively low by historical standards. The S&P CoreLogic Case-Shiller U.S. National Home Price Index, which covers all nine U.S. census divisions, recorded a 6.4% annual gain in May 2018 (most recent data available at the time this report was prepared). The 10-City and 20-City Composites reported year-over- year increases of 6.1% and 6.5%, respectively.
With the U.S. economy delivering a sustainable growth rate and employment strengthening, the Fed’s policy making committee continued to incrementally raise its main benchmark interest rate. The most recent increase, in June 2018, was the seventh rate hike since December 2015. Fed Chair Janet Yellen’s term expired in February 2018, and incoming Chairman Jerome Powell indicated he would likely maintain the Fed’s gradual pace of interest rate hikes. At the June meeting, the Fed increased its projection to four interest rate increases in 2018, from three increases projected at the March meeting, indicating its confidence in the economy’s health. In addition, in October 2017, the Fed began reducing its balance sheet by allowing a small amount of maturing Treasury and mortgage securities to roll off without reinvestment. The market expects the pace to remain moderate and predictable, with minimal market disruption.
The markets also continued to react to geopolitical news. Protectionist rhetoric had been garnering attention across Europe, as anti-European Union (EU) sentiment featured prominently (although did not win a majority) in the Dutch, French and German elections in 2017. Italy’s 2018 elections resulted in a hung parliament, and several months of negotiations resulted in a populist, euro-skeptic coalition government. The U.S. moved forward with tariffs on imported goods from China, as well as on steel and aluminum from Canada, Mexico and Europe. These countries announced retaliatory measures in kind, intensifying concerns about trade issues, although the U.S. and the Europe Union announced in July they would refrain from further tariffs while they negotiate trade terms. Meanwhile, in March the U.K. and EU agreed in principle to the Brexit transition terms, but political instability in the U.K. in July has clouded the outlook. The U.S. Treasury imposed additional sanctions on Russia in April, and re-imposed sanctions on Iran after President Trump decided to withdraw from the 2015 nuclear agreement. The threat of a nuclear North Korea eased somewhat as the leaders of South Korea and North Korea met during April and jointly announced a commitment toward peace, while the U.S.-North Korea summit yielded an agreement with few additional details.
6
What strategies were used to manage the Funds during the twelve-month reporting period and how did these strategies influence performance?
All of the Funds continued to employ the same fundamental investment strategies and tactics used previously, although implementation of those strategies depended on the individual characteristics of the portfolios, as well as market conditions. The Funds’ management teams use a highly collaborative, research-driven approach that we believe offers the best opportunity to achieve consistent, superior long-term performance on a risk-adjusted basis across the full range of market environments. During the reporting period, the Funds were generally positioned for an environment of continued moderate economic growth. Nonetheless, during the reporting period we made smaller scaled shifts on an ongoing basis that were geared toward improving each Fund’s profile in response to changing conditions and valuations. These strategic moves are discussed in more detail within each Fund’s section of this report.
Nuveen Core Bond Fund
The Fund’s Class A Shares at net asset value (NAV) underperformed both the Bloomberg Barclays U.S. Aggregate Bond Index and the Lipper Core Bond Funds Classification Average for the twelve-month reporting period. U.S. Treasury rates were broadly range-bound for the first few months of the reporting period, before moving sharply higher starting in December 2017 and through the first two months of 2018, responding to developments surrounding Fed policy and strength in the U.S. economy.
The U.S. Treasury yield curve flattened dramatically with the 30-year Treasury yield ending the reporting period only 14 basis points higher, while the two-year Treasury yield increased by 114 basis points, reaching its highest level of this cycle. The yield of the benchmark 10-year Treasury surpassed 3% in April and May 2018 before drifting lower to end the reporting period at 2.85%. During the reporting period, several catalysts contributed to the flatter yield curve, including stronger economic data, the Fed’s rate hikes, continued low inflation and a supply imbalance in the U.S. Treasury market caused by dramatically increased issuance of shorter maturity (two- and three-year) bonds.
Investment grade bonds enjoyed fairly strong performance in the first half of the reporting period as corporate earnings continued to exceed expectations, overall credit fundamentals were constructive and demand was strong, particularly from overseas investors searching for higher yields. Credit spreads continued to contract and reached their tightest levels since 2007 by early February 2018. Corporate bond issuance remained elevated with several industries taking advantage of tight spreads and low rates to fund merger and acquisition (M&A) activity and share buybacks. However, the tide turned for the sector in the latter part of the reporting period as protectionist U.S. trade policy, geopolitical concerns and rising interest rates fueled an increase in equity market volatility and risk asset underperformance. Spreads widened fairly significantly in the investment grade corporate sector, exacerbated by weakening overseas demand and heavy supply. Credit fundamentals remained very strong with top-line revenue, earnings growth and free cash flow paving the way for disciplined balance sheet action by companies.
In the mortgage-backed securities (MBS) sector, range-bound rates and relatively low levels of volatility in the first half of the reporting period provided a solid backdrop. In October 2017, the Fed began reducing its monthly reinvestments in MBS by $4 billion per month, but the runoff was easily absorbed by banks, real estate investment trusts (REITs) and foreign buyers. At the beginning of 2018, a spike in market volatility, higher rates and the Fed’s continued reduction combined to create a more difficult environment for the MBS segment. However, the market was able to modestly recover in the final months of the reporting period after volatility lessened and the segment experienced better-than-expected demand from banks and money managers.
Asset-backed securities (ABS) and commercial mortgage-backed securities (CMBS) outpaced Treasuries during the reporting period as solid credit performance and strong demand supported both segments. Issuance was modestly ahead of the previous year’s pace, but was easily absorbed by investors looking for high quality yield in shorter maturity securities. Improving economic conditions continued to support consumer balance sheets and commercial real estate fundamentals.
Throughout the reporting period, we maintained the Fund’s positioning with a broad overweight to non-government spread sectors and a bias toward income generation through diversified holdings in the investment grade credit and securitized sectors. The main drag on the Fund’s performance during the reporting period was its exposure to MBS. We continued to position the Fund with a modest underweight to these securities, which was detrimental since the sector outperformed the index. Also, security selection in
7
Portfolio Managers’ Comments (continued)
the MBS sector was a drag on performance because we targeted our underweight in the Government National Mortgage Association (Ginnie Mae) segment, which recovered and outperformed the broader index. However, the Fund’s remaining securitized exposures in CMBS and ABS each added incrementally to performance. In the ABS sector, we emphasized high quality, short maturity securities, which benefited from strong investor demand for yield at the short end of the yield curve for most of the reporting period. In the Fund’s CMBS exposure, our security selection was favorable because our non-AAA rated, investment grade CMBS outperformed the broader index.
For the reporting period as a whole, the Fund’s overweight to investment grade credit contributed positively to performance. The Fund was also aided by security selection within its investment grade corporate exposure. Results in the sector were driven by a meaningful overweight to BBB rated credits, as well as bottom-up credit selection within financials. The BBB overweight proved rewarding because lower quality issues led in excess returns until late in the reporting period, driven by favorable economic conditions and strong demand for yield from investors. Our financial positions in aggregate also outperformed the index.
In addition, our interest rate positioning benefited the Fund’s performance throughout the reporting period. As noted above, the yield curve flattened significantly as short-term rates rose much more than longer-term rates driven by steady economic data and the three Fed rate hikes. We had positioned the Fund with a shorter duration than the benchmark for the majority of the reporting period, which lessened its interest rate sensitivity, focused on the front of the yield curve. This shorter duration stance benefited the Fund’s performance given the higher rates. Our yield curve positioning also proved beneficial. We positioned the Fund for a flatter curve for much of the reporting period by underweighting securities at the front end of the curve out to ten years and overweighting securities with maturities longer than ten years.
Despite the spike in market volatility during the reporting period, we continued to manage the Fund with many of the same overarching investment themes, focusing on generating above-market income and managing credit risk. We invested primarily in securities from the investment grade corporate and securitized sectors, with an emphasis on bottom-up security selection. Although credit spreads widened from the tight levels reached in early 2018, the fundamental and technical backdrops for the sector remained positive. Therefore, as the reporting period concluded, we maintained the Fund’s overweight position in investment grade credit and more specifically an overweight in BBB rated credits versus the benchmark. We also stayed the course with the Fund’s overweight positions in the financial and industrial sectors.
High quality income from securitized sectors continued to play a role in the Fund’s positioning. Despite the year-to-date negative excess returns and wider spreads in the MBS area, we maintained our negative view regarding the sector. Volatility rose from the previous lows and the Fed continued to reduce its footprint in the mortgage market, both of which we believed would continue to pressure the sector. At the end of the reporting period, we were continuing to strategically position the Fund with a modest underweight to the MBS sector. Meanwhile, the CMBS sector has outperformed credit year-to-date in 2018 as spreads have not widened to the same degree. Fundamentals remain positive and supply in the sector is still manageable. That said, we did not believe valuations were all that compelling at the end of the reporting period, so we will be diligent when looking for spots to add to the Fund’s current CMBS overweight. In the ABS market, the widening in swap spreads provided a nice opportunity to add short-maturity, high quality ABS at attractive yield levels. Fundamentals remained solid and demand for bonds at the front end of the curve was strong. Valuations ended the reporting period at the tighter end of their recent range, despite higher volumes in the new issue market. Therefore, similar to the CMBS sector, we maintained the Fund’s overweight, but will continue to select our ABS investments carefully.
After shifting closer to a neutral duration partway through the reporting period, we moved the Fund back to a shorter duration versus the benchmark toward the end of the reporting period. We thought this was prudent with the Fed indicating a potentially faster pace of rate hikes and with economic data generally on the stronger side. We also continued to tactically trade securities along the yield curve with a bias toward a flatter curve. Although near term we could see a modest steepening in the curve, longer term we want the Fund to be positioned to benefit from a flatter curve.
In addition, we continued to use various derivative instruments in the Fund during the reporting period. We used U.S. Treasury note and bond futures as part of an overall construction strategy to manage the Fund’s duration and yield curve exposure. The effect of these activities during the reporting period was positive.
8
Nuveen Core Plus Bond Fund
The Fund’s Class A Shares at net asset value (NAV) underperformed both the Bloomberg Barclays U.S. Aggregate Bond Index and the Lipper Core Plus Bond Funds Classification Average for the twelve-month reporting period. U.S. Treasury rates were broadly range-bound for the first few months of the reporting period, before moving sharply higher starting in December and through the first two months of 2018, responding to developments surrounding Fed policy and strength in the U.S. economy.
The U.S. Treasury yield curve flattened dramatically with the 30-year Treasury yield ending the reporting period only 14 basis points higher, while the two-year Treasury yield increased by 114 basis points, reaching its highest level of this cycle. The yield of the benchmark 10-year Treasury surpassed 3% in April and May 2018 before drifting lower to end the reporting period at 2.85%. During the reporting period, several catalysts contributed to the flatter yield curve, including stronger economic data, the Fed’s rate hikes, continued low inflation and a supply imbalance in the U.S. Treasury market caused by dramatically increased issuance of shorter maturity (two- and three-year) bonds.
Investment grade bonds enjoyed fairly strong performance in the first half of the reporting period as corporate earnings continued to exceed expectations, overall credit fundamentals were constructive and demand was strong, particularly from overseas investors searching for higher yields. Credit spreads continued to contract and reached their tightest levels since 2007 by early February 2018. Corporate bond issuance remained elevated with several industries taking advantage of tight spreads and low rates to fund merger and acquisition (M&A) activity and share buybacks. However, the tide turned for the sector in the latter part of the reporting period as protectionist U.S. trade policy, geopolitical concerns and rising interest rates fueled an increase in equity market volatility and risk asset underperformance. Spreads widened fairly significantly in the investment grade corporate sector, exacerbated by weakening overseas demand and heavy supply. Credit fundamentals remained very strong with top-line revenue, earnings growth and free cash flow paving the way for disciplined balance sheet action by companies. In overseas markets, spreads for non-U.S. credit generally tracked the U.S. until late in the reporting period when European stress caused underperformance. Dollar-pay emerging market (EM) credit was strong early, before underperforming all other sectors in 2018 amid interest rate pressures, local policy missteps and investor outflows.
High yield credit also performed well in the first half of the reporting period with the segment continuing to benefit from low market volatility, accelerating global growth and double-digit corporate earnings growth. Funding and refinancing conditions also remained largely supportive of the segment, resulting in a high level of refinancing activity that helped to extend the current credit cycle. Despite a spike in early 2018 driven by a bout of risk aversion that spread from the technology sector in equities to risk assets more broadly, the sector continued to perform well given its income advantage and strong economic conditions. Low default levels and light net new issue activity were also supportive of the sector. For the reporting period as a whole, high yield spreads versus Treasuries narrowed despite continued rate hikes and persistent outflows from high yield mutual funds, although they did widen somewhat from the 10-year lows reached in April 2018. The segment outperformed the majority of fixed income alternatives during the reporting period.
In the mortgage-backed securities (MBS) sector, range-bound rates and relatively low levels of volatility in the first half of the reporting period provided a solid backdrop. In October 2017, the Fed began reducing its monthly reinvestments in MBS by $4 billion per month, but the runoff was easily absorbed by banks, real estate investment trusts (REITs) and foreign buyers. At the beginning of 2018, a spike in market volatility, higher rates and the Fed’s continued reduction combined to create a more difficult environment for the MBS segment. However, the market was able to modestly recover in the final months of the reporting period after volatility lessened and the segment experienced better-than-expected demand from banks and money managers.
Asset-backed securities (ABS) and commercial mortgage-backed securities (CMBS) outpaced Treasuries during the reporting period as solid credit performance and strong demand supported both segments. Issuance was modestly ahead of the previous year’s pace, but was easily absorbed by investors looking for high quality yield in shorter maturity securities. Improving economic conditions continued to support consumer balance sheets and commercial real estate fundamentals.
Emerging market debt began the reporting period on a strong note supported by the risk-on, low volatility market environment and robust investor flows into the segment. Through the end of December 2017, broad strength in both emerging and developed economies and higher commodity prices outweighed potential concerns from continued policy normalization and balance sheet
9
Portfolio Managers’ Comments (continued)
reduction from the Fed and other central banks. However, in the second half of the reporting period, the sector experienced broad-based repricing after concerns about the monetary policy normalization of major central banks, less synchronized global growth, trade tensions and slowing Chinese growth depressed risk appetites and led to significant outflows. Country specific political and policy risks in Argentina, Brazil and Turkey added to the negative global backdrop. Local EM markets were hurt by the strong U.S. dollar and elevated market volatility with bond yields, especially in higher yielding countries, rising due to heavy investor positioning and currency pressures. The Argentine peso and Turkish lira were the worst performing currencies.
With rates rising in the U.S., developed global bond markets generally outperformed, supported by moderating economic growth, continued low or declining inflation in many markets and ongoing capital flows. The ECB emphasized continued accommodation and promised to leave rates unchanged until at least late 2019, reassuring investors and driving outperformance in Europe. Canada increased interest rates three times, which removed the cuts made in 2015 in response to the oil collapse. The Bank of England raised rates in November for the first time in a decade, but then delayed a second planned hike in May 2018. With this backdrop, yield curves flattened significantly and developed markets generally outperformed the U.S. Peripheral European yield spreads spiked late in the reporting period due to uncertainties surrounding trade issues and the Italian government. The dollar declined for most of the reporting period, but reversed course late given ongoing rate hikes, strong U.S. growth and economic divergence versus most other economies. The U.S. Dollar Index ended the reporting period roughly 1% lower after declining by nearly 8% mid-period.
The Fund modestly underperformed both the Bloomberg Barclays U.S. Aggregate Bond Index and the Lipper Core Plus Bond Funds Classification Average during the reporting period. The performance shortfall occurred in the second half of the reporting period and was driven by the broad underperformance in investment grade corporates and preferred securities as spreads on these sectors moved wider amid market pressure. While we continued to make adjustments to the portfolio to manage risk and take advantage of opportunities, we maintained the Fund’s positioning with a broad overweight to credit sectors and a bias toward income generation through diversified holdings. In light of the ongoing constructive macroeconomic backdrop and solid fundamentals, we continued to see value in these sectors, particularly following recent spread widening. Likewise, we maintained the Fund’s large underweight in Treasuries, given our constructive economic view and the relatively unattractive duration and yield profile of that sector, as well as an underweight to MBS.
The most significant detractor from performance was the Fund’s overweight to preferred and contingent capital (CoCo) securities, which came under pressure later in the reporting period due to increased market volatility amid expected increases in interest rates and perceived increased risk to European banks from the Italian political turmoil. Early in the reporting period, the sector performed well on the back of strong bank fundamentals, attractive valuations and limited supply, factors we expect to benefit the sector again in the future. Nonetheless, this positioning hindered performance during the reporting period.
A reduced weight in high yield, along with hedges in the sector, resulted in a small negative impact on performance from the sector for the reporting period. Although fundamentals remained positive, we carried reduced positions and employed hedges during the reporting period due to richening valuations. On balance, these moves negatively impacted performance.
Our overall interest rate positioning had a marginally negative effect on performance. The Fund experienced some benefit from our slightly defensive duration stance, which lessened its sensitivity to rising short-term rates. However, the positive impact was more than offset by negative results from yield curve positioning. We were positioned with an overweight to intermediate maturities due to the issue selection and sector composition of our holdings. This was the segment of the yield curve where rates rose the most.
On the other hand, the largest positive contributor to the Fund’s performance during the reporting period was security selection within the Fund’s investment grade corporate exposure. Results in the sector were driven by a meaningful overweight to BBB rated credits, as well as bottom-up credit selection within industrials. This proved rewarding because lower-quality issues led in excess returns until late in the reporting period, driven by favorable economic conditions and strong demand for yield from investors. The Fund’s broader non-corporate sector exposures were also modestly beneficial. Specifically, positions in two securitized sectors, CMBS and ABS, each added incrementally to performance. Currency positioning was not a factor because positions were currency hedged and the impact from non-U.S. bonds was a small positive owing to positions in German government bonds.
We took advantage of market opportunities to add to sectors and issues at attractive valuations during the reporting period. We increased the Fund’s overweight to investment grade corporates after the sector suffered from issuance pressure and removed high
10
yield sector hedges after the sector cheapened significantly amid market volatility. We believed sound fundamentals, demand for income and continued risk appetite remained supportive for credit sectors, although valuations and uncertainty made it compelling for us to upgrade quality at the margin. We remained overweight in both CMBS and ABS, given solid fundamentals and the yield associated with these high-quality sectors. We added incrementally to CMBS, while reducing exposure to the MBS sector to fund purchases in other sectors. We maintained the Fund’s underweight in MBS given opportunities elsewhere and risks associated with reduced Fed investment.
With global interest rates remaining low and spreads to the U.S. somewhat stretched, we kept global bond positioning at the low end of the Fund’s range. We maintained a positioning in German Bunds given their liquidity, stability and currency-hedged yield. We continued to maintain the Fund’s large underweight in Treasuries given our constructive economic view and income focus. Because we expect modest upward pressure on Treasury yields, we further reduced the Fund’s duration, adding to our defensive interest rate posture. We continued to expect the U.S. dollar to remain supported, and therefore have a bias to hedge foreign currency exposure.
During the reporting period, we also continued to use various derivative instruments. We used Treasury note and bond futures as part of an overall construction strategy to manage the Fund’s duration and yield curve exposure. These derivative positions had a positive impact on performance during the reporting period.
We used forward foreign currency exchange contracts to manage the Fund’s foreign currency exposure. For example, the Fund may reduce unwanted currency exposure from the Fund’s bond portfolio, or may take long forward positions in select currencies in an attempt to benefit from the potential price appreciation. These positions had a negligible impact on performance during the reporting period.
The Fund also entered into credit default swaps to take on credit risk and earn a commensurate credit spread. The effect of these activities on performance was negative during the reporting period.
The Fund also purchased a small amount of call options on futures during the reporting period. The call options had a negligible impact on performance and these positions were terminated prior to the end of the reporting period.
Nuveen High Income Bond Fund
The Fund’s Class A Shares at net asset value (NAV) outperformed both the Bloomberg Barclays High Yield 2% Issuer Capped Index and the Lipper High Yield Funds Classification Average for the twelve-month reporting period. In the first half of the reporting period, the high yield segment continued to benefit from low market volatility, accelerating global growth and double-digit corporate earnings growth. Funding and refinancing conditions also remained largely supportive of the segment, resulting in a high level of refinancing activity that helped to extend the current credit cycle. However, despite this favorable macro backdrop in the first half of the reporting period, overall returns for the high yield market were kept in check by historically tight spreads versus Treasuries, outflows from the asset class and mixed effects from tax reform. The high yield sector also had disproportionate exposure to some of 2017’s more fundamentally and secularly challenged industries such as retail, auto rentals and hospitals.
At the start of 2018, a string of volatility-inducing episodes created headwinds for the high yield asset class. Concerns over an uptick in inflation and a swifter-than-expected lift-off in Treasury yields acted as the initial catalyst for the sell-off in risk assets. Next, headline risk stemming from the Trump administration’s restrictive trade policies and a sell-off among large-cap technology stocks helped exacerbate market volatility, the former of which seemed to pose a bigger concern for corporate fundamentals. Despite these headwinds, high yield bonds remained fairly resilient and recovered in the final months of the reporting period. The strengthening U.S. economy and solid global growth conditions helped keep fundamentals firm for the high yield asset class, while the segment continued to benefit from a strong technical backdrop, especially when compared to the investment grade market. Net new issuance for high yield bonds year-to-date through June 30th ran about 30% lower than 2017, and the excess amount of cash coming in the form of coupons, calls and maturities far outpaced the volume of new issuance. Although default activity increased modestly, much of that was due to the March bankruptcy filing of iHeart Communications (Clear Channel), a large index constituent that was stressed for some time. Without that episode, high yield defaults would be trending lower than the end of 2017.
Despite continued rate hikes and persistent outflows from high yield mutual funds, high yield spreads versus Treasuries were fairly resilient during the reporting period, narrowing slightly from 385 basis points over Treasuries to 381 basis points by June 30, 2018,
11
Portfolio Managers’ Comments (continued)
although they reached their tightest level in 10 years in mid-April of 335 basis points over Treasuries. The high yield segment outperformed the majority of other fixed income asset classes during the reporting period, returning 2.62% as measured by the benchmark Bloomberg Barclays High Yield 2% Issuer Capped Bond Index. Within the high yield market, spreads tightened the most for the lower rated securities based on improving fundamentals and less sensitivity to interest rates. The CCC rated segment outperformed with a 6.84% return for the reporting period and outpaced both single B rated securities (2.99%) and BBs (0.60%). Much of the strength in lower rated securities was due to the rebound in energy and commodity prices, which helped lead to outperformance in energy bonds (8.11%) and metals/mining bonds (3.95%). Elsewhere from a sector standpoint, the weak spots within U.S. high yield were communications, consumer cyclical and health care, most notably hospitals. Besides energy and basic materials, other strong performers were cyclical sectors such as transportation and industrials.
The Fund’s outperformance during the reporting period was mainly driven by the better environment for risk appetites that led to a significant improvement in market liquidity and the outperformance of lower quality credit. The Fund generally benefited from its broader down-in-quality positioning as well as relative strength in a number of industrial sectors. We maintained the Fund’s overweight to CCC rated securities throughout the reporting period, and corresponding underweight to BB rated securities, with a keen focus on bottom-up fundamental research. This positioning was the most significant contributor to performance because lower quality securities held up better as Treasury yields rose, but was even more important in the second half of the reporting period where the market saw little variation in the performance among sectors. The rate volatility the market experienced, particularly since February, continued to have a disproportionately negative effect on BB rated securities, given their longer durations. At the same time, the incremental yield provided by CCC rated securities better insulated them against the rise in Treasury rates. Strength among higher volatility energy names also helped CCC rated bonds outperform the overall index and single B rated securities in particular. We emphasized lower quality debt because we believed the segment would continue to perform well during an environment of strong credit conditions and potentially higher interest rates. Low volatility and a sideways-to-tighter move in spreads are consistent with an extension of the credit cycle. Long economic expansions are typically good news for credit because higher free cash flow from sustained economic growth improves company balance sheets and generally leads to credit rating upgrades.
In terms of sector exposures, the Fund’s performance was aided by our overweights to cyclical areas of the market that continued to perform well, including energy (oilfield services) and transportation services as well as security selection in consumer cyclical. Although the Fund’s overall energy exposure was roughly in line with the benchmark weighting, we benefited from our security selection and slight bias to lower-rated energy issues. Underweight positions in the technology and communications sectors were also positive contributors. The Fund maintained a small underweight to retail. Although retailers continued to have their challenges, the sector enjoyed a bit of a rebound later in the reporting period from previously oversold conditions.
On the negative side, the biggest detractor to the Fund’s performance was an overweight to the basic materials sector, and specifically to the commodity and metals/mining areas that are more exposed to the negative impacts from the recent trade issues and tariff issues. Despite the overall strength in cyclical areas, security selection in metals and mining detracted, including exposure to two distressed coal credits. The coal sector was pressured by environmental regulation and low natural gas prices. However, by the end of the reporting period, the Fund’s remaining exposure to troubled coal credits was very negligible because we had cut exposure to almost zero. Exposure to European financial preferred securities, which had been a source of outperformance earlier in the reporting period, also proved to be a drag due to volatility and downward pressure in the segment caused by political developments in Italy.
While we continued to overweight and find selective opportunities in improving CCC rated credits, we started to find long-term value in BB rated securities that had underperformed. CCCs have outperformed BBs rather meaningfully with the spread ratio, as measured by yield-to-worst, hitting three-year lows toward the end of the reporting period. Given the worries over escalating trade issues and other sources of external pressure on risk markets, it seemed reasonable to marginally upgrade overall portfolio quality while the opportunity cost of doing so wasn’t that significant.
One side effect benefit of the weakness in the BB rated segment was the growing supply of bonds trading at a discount to par. Typically, low dollar price bonds have better recovery prospects and potentially more limited downside than their higher coupon and higher dollar price counterparts. Therefore, toward the end of the reporting period, we took advantage of the opportunity to add some of these discounted BB rated bonds to the Fund’s portfolio. We continue to favor a barbell approach to credit risk because we believe the economy is still doing well enough to support valuations in select CCC rated securities. If risk aversion increases in the
12
market, then BBs should benefit and outperform. However, based on our current outlook, we still believe lower quality bonds could perform well because of the segment’s attractive incremental yield and potential for price gains.
We believe the continued global economic expansion should be constructive for cyclical sectors such as chemicals, paper, mining, energy, homebuilding and other consumer cyclicals. Therefore, we maintained the Fund’s overweights to those sectors at the end of the reporting period. Although the chemical, paper and mining segments underperformed later in the reporting period due to some weakness in Chinese macro data and the threat of escalating trade issues, our overall views on maintaining the Fund’s overweight in cyclicals has not changed. In the case of oilfield services, we believe higher crude prices and contracting drilling activity may lead to a more meaningful sector recovery in 2019-2020.
During the reporting period, we also continued to use various derivative instruments. We used U.S. Treasury note and bond futures as part of an overall portfolio construction strategy to manage the Fund’s duration and yield curve exposure. The effect of these activities during the reporting period was negligible.
We used foreign currency exchange contracts to manage the Fund’s foreign currency exposures. During the reporting period, these instruments were used primarily for hedging purposes to reduce unwanted currency exposure from the Fund’s bond portfolio. These positions had a negligible impact on performance during the reporting period.
Nuveen Inflation Protected Securities Fund
The Fund’s Class A Shares at net asset value (NAV) underperformed both the Bloomberg Barclays U.S. TIPS Index and the Lipper Inflation-Protected Bond Funds Classification Average for the twelve-month reporting period. U.S. Treasury rates were broadly range-bound for the first few months of the reporting period, before moving sharply higher starting in December and through the first two months of 2018, responding to developments surrounding Fed policy and strength in the U.S. economy.
The U.S. Treasury yield curve flattened dramatically with the 30-year Treasury yield ending the reporting period only 14 basis points higher, while the two-year Treasury yield increased by 114 basis points, reaching its highest level of this cycle. The yield of the benchmark 10-year Treasury surpassed 3% in April and May 2018 before drifting lower to end the reporting period at 2.85%. During the reporting period, several catalysts contributed to the flatter yield curve, including stronger economic data, the Fed’s rate hikes, continued low inflation and a supply imbalance in the U.S. Treasury market caused by dramatically increased issuance of shorter maturity (two- and three-year) bonds.
The Treasury inflation-protected securities (TIPS) market remained well supported as inflation readings came in near expectations to slightly stronger, the Fed made further upward revisions to its inflation forecasts, tariff war concerns escalated and energy prices rose. Despite some increase in U.S. inflation measures, however, broader inflation risk remained fairly benign. Real yields moved significantly higher (and therefore prices were lower) at the front end of the yield curve, while the long end of the TIPS curve traded in a narrow range causing the overall real yield curve to flatten during the reporting period. For five-year TIPS, real yields increased 44 basis points, ending the reporting period at 0.66%. Yields for 10-year TIPS began the reporting period at 0.68% and traded as low as 0.25% and as high as 0.94% before ending only modestly higher at 0.74%. Meanwhile, yields for 30-year TIPS fell 12 basis points to 0.87% by the end of June 2018.
Although flows into the TIPS asset class leveled off as the reporting period progressed, they remained supportive for the segment, helping breakeven spreads move wider (or improve) across the TIPS yield curve. (Breakeven spreads measure the difference between the yields of nominal Treasuries versus TIPS with the same maturity.) In fact, partway through the reporting period, breakeven spreads reached their widest level since 2014 for the 10-year part of the curve, indicating greater investor interest in inflation protection. Supported by higher inflation expectations and rising energy prices, the TIPS sector significantly outperformed nominal Treasuries producing a 2.11% return as measured by the Bloomberg Barclays U.S. TIPS Index, versus -0.65% for the Bloomberg Barclays U.S. Treasury Index.
Investment grade bonds enjoyed fairly strong performance in the first half of the reporting period as corporate earnings continued to exceed expectations, overall credit fundamentals were constructive and demand was strong, particularly from overseas investors searching for higher yields. Credit spreads continued to contract and reached their tightest levels since 2007 by early February 2018.
13
Portfolio Managers’ Comments (continued)
Corporate bond issuance remained elevated with several industries taking advantage of tight spreads and low rates to fund merger and acquisition (M&A) activity and share buybacks. However, the tide turned for the sector in the latter part of the reporting period as protectionist U.S. trade policy, geopolitical concerns and rising interest rates fueled an increase in equity market volatility and risk asset underperformance. Spreads widened fairly significantly in the investment grade corporate sector, exacerbated by weakening overseas demand and heavy supply. Credit fundamentals remained very strong with top-line revenue, earnings growth and free cash flow paving the way for disciplined balance sheet action by companies.
High yield credit also performed well in the first half of the reporting period with the segment continuing to benefit from low market volatility, accelerating global growth and double-digit corporate earnings growth. Funding and refinancing conditions also remained largely supportive of the segment, resulting in a high level of refinancing activity that helped to extend the current credit cycle. Despite a spike in early 2018 driven by a bout of risk aversion that spread from the technology sector in equities to risk assets more broadly, the sector continued to perform well given its income advantage and strong economic conditions. Low default levels and light net new issue activity were also supportive of the sector. For the reporting period as a whole, high yield spreads versus Treasuries narrowed despite continued rate hikes and persistent outflows from high yield mutual funds, although they did widen somewhat from the 10-year lows reached in April 2018. The segment outperformed the majority of fixed income alternatives during the reporting period.
In the mortgage-backed securities (MBS) sector, range-bound rates and relatively low levels of volatility in the first half of the reporting period provided a solid backdrop. In October, the Fed began reducing its monthly reinvestments in MBS by $4 billion per month, but the runoff was easily absorbed by banks, real estate investment trusts (REITs) and foreign buyers. At the beginning of 2018, a spike in market volatility, higher rates and the Fed’s continued reduction combined to create a more difficult environment for the MBS segment. However, the market was able to modestly recover in the final months of the reporting period after volatility lessened and the segment experienced better-than-expected demand from banks and money managers.
Asset-backed securities (ABS) and commercial mortgage-backed securities (CMBS) outpaced Treasuries during the reporting period as solid credit performance and strong demand supported both segments. Issuance was modestly ahead of the previous year’s pace, but was easily absorbed by investors looking for high-quality yield in shorter maturity securities. Improving economic conditions continued to support consumer balance sheets and commercial real estate fundamentals.
The Fund’s results during the reporting period were slightly hindered by our underweight position in TIPS and modest exposures to non-government spread sectors, including ABS, CMBS, high yield credit and investment grade credit. With the exception of high yield, the rest of these sectors underperformed the TIPS segment to varying degrees during the reporting period. Although we slightly increased the Fund’s TIPS exposure from approximately 85% of the Fund’s assets to more than 88% of the portfolio by June 30, 2018, our position still represented a significant underweight versus the index’s 100% TIPS exposure.
On the positive side, the Fund benefited from our interest rate positioning throughout the reporting period. As noted above, both the nominal and TIPS yield curves flattened during the reporting period as short-term rates rose fairly significantly while longer term rates in both segments were more range bound. We had positioned the Fund with a shorter duration than the benchmark throughout the reporting period and increased the short further as the fiscal year progressed. This shorter duration stance lessened the Fund’s interest rate sensitivity, which proved beneficial in light of the rising short-term rates. The Fund ended the reporting period with a duration of 7.06 years, which was shorter than the 7.59 year duration of the Bloomberg Barclays U.S. TIPS Index. Also, our yield curve positioning was biased toward the long end of the curve, which slightly aided the Fund’s results.
We slightly increased the Fund’s TIPS weighting throughout the reporting period and, in turn, lowered the Fund’s very modest nominal Treasury exposure to zero, given the relatively unattractive duration and yield profile of the Treasury sector. Although we believed that TIPS breakeven spreads were near fair value at the end of the reporting period, we remained underweight in inflation with a corresponding overweight to spread sectors in order to provide some diversification to the portfolio. The Fund’s non-government spread sector exposure continued to include modest weights in ABS, CMBS, MBS, high yield credit and investment grade credit. Within this portion of the Fund, we continued to use our bottom-up strategy to identify names where we believed the portfolio was being compensated accordingly for the risk. In terms of spread sector weightings, we slightly lowered the Fund’s exposure to corporate securities, both high yield and investment grade, during the reporting period. Although corporate and
14
consumer credit fundamentals were steady and benefiting from the economic backdrop, credit spread valuations compressed close to their tightest levels in years. While we did not see a catalyst for a large near-term widening, we believed these levels warranted a more balanced overall risk posture. We used the proceeds to slightly increase the Fund’s allocations across the MBS, CMBS and ABS segments, given solid fundamentals and the yield associated with these high quality sectors.
We positioned the portfolio with a short duration throughout the reporting period and increased the short further as the reporting period progressed and real rates retraced from their recent highs. We will continue to position the portfolio defensively, but will look to be opportunistic in managing duration as market conditions shift.
We also used U.S. Treasury note and bond futures as part of an overall portfolio construction strategy to manage the Fund’s duration and yield curve exposure. These derivative positions had a negligible impact on performance during the reporting period.
Nuveen Short Term Bond Fund
The Fund’s Class A Shares at net asset value (NAV) outperformed the Bloomberg Barclays 1-3 Year Government/Credit Bond Index and underperformed the Lipper Short Investment Grade Debt Funds Classification Average for the twelve-month reporting period. U.S. Treasury rates were broadly range-bound for the first few months of the reporting period, before moving sharply higher starting in December and through the first two months of 2018, responding to developments surrounding Fed policy and strength in the U.S. economy.
The U.S. Treasury yield curve flattened dramatically during the reporting period. At the long end of the yield curve, the 30-year Treasury yield ended the reporting period only 14 basis points higher at 2.98%. At the short end, the two-year Treasury yield increased by 114 basis points and reached 2.52%, its highest level of this cycle. The yield of the benchmark 10-year Treasury surpassed 3% in April and May 2018 before drifting lower to end the reporting period at 2.85%. During the reporting period, several catalysts contributed to the flatter yield curve, including stronger economic data, three rate hikes by the Fed, continued low inflation and a supply imbalance in the U.S. Treasury market caused by dramatically increased issuance of shorter maturity (two- and three-year) bonds. The return of the Fund’s shorter duration benchmark, the Bloomberg Barclays 1-3 Year Government/Credit Index, was 0.21%.
In the corporate market, investment grade bonds enjoyed fairly strong performance in the first half of the reporting period as corporate earnings continued to exceed expectations, overall credit fundamentals were constructive and demand was strong, particularly from overseas investors searching for higher yields. Credit spreads continued to contract and reached their tightest levels since 2007 by early February 2018. Corporate bond issuance remained elevated with several industries taking advantage of tight spreads and low rates to fund merger and acquisition (M&A) activity and share buybacks. However, the tide turned for the sector in the latter part of the reporting period as protectionist U.S. trade policy, geopolitical concerns and rising interest rates fueled an increase in equity market volatility and risk asset underperformance. Spreads widened fairly significantly in the investment grade corporate sector from the multi-year tight levels reached in early February, exacerbated by weakening overseas demand and heavy supply. However, in the final months of the reporting period, spreads moved modestly tighter once again. For the reporting period as a whole, short investment grade credit modestly outperformed Treasuries. That being said, credit fundamentals remained very strong with top-line revenue, earnings growth and free cash flow paving the way for disciplined balance sheet action by companies. Leverage, particularly for lower quality investment grade credit, continued to steadily decline.
In the securitized sectors, short-duration residential mortgage-backed securities (MBS) outperformed based on continued strong fundamentals and saw tighter spreads during the reporting period. Demand for the sector remained strong due to incremental spread and low correlation to broader markets. The commercial mortgage-backed securities (CMBS) sector performed well during the reporting period as heavy supply was met with strong investor demand. Traditional consumer asset-backed securities (ABS) provided stable performance during the reporting period. The liquid, high quality nature of the sector remained appealing to investors during periods of increased market volatility. In addition, floating rate exposure across the sectors proved beneficial during the reporting period as rates rose. Securitized sectors, in aggregate, posted positive excess returns versus Treasuries.
Generally speaking, the most significant driver of the Fund’s outperformance relative to the Bloomberg Barclays 1-3 Year Government/Credit Bond Index was its broad overweight to shorter maturity securities in the securitized sectors and a corresponding underweight to Treasuries. Typically around 45% of the Fund’s portfolio is allocated to securitized products, broadly diversified
15
Portfolio Managers’ Comments (continued)
across the residential MBS, CMBS and ABS sectors. Securitized sectors provided stable spreads during the uptick in volatility during February 2018, while providing incremental yield versus Treasuries during the reporting period. An overweight position in investment grade credit was also a slight benefit to performance as a result of tighter spreads during the first half of the reporting period.
The Fund also benefited significantly from our interest rate strategy. Throughout the reporting period, we maintained the Fund’s defensive positioning to limit its sensitivity to rising rates with a duration between 0.1 and 0.4 years shorter than the benchmark. As noted above, rates at the short end of the Treasury yield curve moved meaningfully higher during the reporting period, while longer-term rates remained range bound. Therefore, the Fund’s defensive duration stance relative to its benchmark had a favorable impact on performance. On the other hand, although the yield curve flattened during the reporting period, our yield curve positioning did not have a noticeable effect on performance.
Additionally, the Fund’s modest exposure to short-duration, high yield credit contributed to relative performance due primarily to the higher income levels of these securities. The Fund’s high yield exposure is focused on bonds rated BB and single-B with two- to four-year maturities.
Throughout the reporting period, we continued to focus our efforts on generating income by maintaining the Fund’s overweight to the investment grade credit sector. However, given the spread tightening in the market during the first half of the reporting period, we modestly lowered exposure to the sector. At the same time, we allowed the Fund’s high yield weighting to drift slightly lower through maturities and tenders. Because we expect the Fed’s tightening path to continue, we favored financials as well as higher quality securities over lower rated securities. We ended the reporting period with approximately 37% of the portfolio allocated to investment grade credit and 3% to high yield credit.
In aggregate, we slightly increased the Fund’s weightings in the securitized sectors, ending the reporting period at approximately 48% of the portfolio. In the ABS segment, we added incrementally to high quality, floating rate securities for their greater stability and return benefit in a rising rate environment. Toward the end of the reporting period, we also added incrementally to MBS exposure after we saw some spread widening that we viewed as technical in nature. As an offset, we slightly lowered the Fund’s CMBS weighting because we did not believe the risk/reward scenario was as compelling in that sector versus other short-duration sectors.
Short-term interest rates moved meaningfully higher after the Fed hiked three times during the reporting period. Given the strengthening economic growth throughout the reporting period and the Fed’s commitment to policy normalization, we maintained the Fund’s shorter duration than its benchmark. However, due to the magnitude of the increase in short-term rates, we covered a portion of the Fund’s short duration position relative to the benchmark. We targeted a portfolio duration that was around 1.5 to 1.8 years during the reporting period.
In addition, we used U.S. Treasury note futures as part of an overall portfolio construction strategy to manage the Fund’s duration and yield curve exposure. These derivative positions had a negative impact on performance during the reporting period.
Nuveen Strategic Income Fund
The Fund’s Class A Shares at net asset value (NAV) underperformed both the Bloomberg Barclays U.S. Aggregate Bond Index and the Lipper Multi-Sector Income Funds Classification Average for the twelve-month reporting period. U.S. Treasury rates were broadly range-bound for the first few months of the reporting period, before moving sharply higher starting in December and through the first two months of 2018, responding to developments surrounding Fed policy and strength in the U.S. economy.
The U.S. Treasury yield curve flattened dramatically with the 30-year Treasury yield ending the reporting period only 14 basis points higher, while the two-year Treasury yield increased by 114 basis points, reaching its highest level of this cycle. The yield of the benchmark 10-year Treasury surpassed 3% in April and May 2018 before drifting lower to end the reporting period at 2.85%. During the reporting period, several catalysts contributed to the flatter yield curve, including stronger economic data, the Fed’s rate hikes, continued low inflation and a supply imbalance in the U.S. Treasury market caused by dramatically increased issuance of shorter maturity (two- and three-year) bonds.
16
Investment grade bonds enjoyed fairly strong performance in the first half of the reporting period as corporate earnings continued to exceed expectations, overall credit fundamentals were constructive and demand was strong, particularly from overseas investors searching for higher yields. Credit spreads continued to contract and reached their tightest levels since 2007 by early February 2018. Corporate bond issuance remained elevated with several industries taking advantage of tight spreads and low rates to fund merger and acquisition (M&A) activity and share buybacks. However, the tide turned for the sector in the latter part of the reporting period as protectionist U.S. trade policy, geopolitical concerns and rising interest rates fueled an increase in equity market volatility and risk asset underperformance. Spreads widened fairly significantly in the investment grade corporate sector, exacerbated by weakening overseas demand and heavy supply. Credit fundamentals remained very strong with top-line revenue, earnings growth and free cash flow paving the way for disciplined balance sheet action by companies. In overseas markets, spreads for non-U.S. credit generally tracked the U.S. until late in the reporting period when European stress caused underperformance. Dollar-pay emerging market (EM) credit was strong early, before underperforming all other sectors in 2018 amid interest rate pressures, local policy missteps and investor outflows.
High yield credit also performed well in the first half of the reporting period with the segment continuing to benefit from low market volatility, accelerating global growth and double-digit corporate earnings growth. Funding and refinancing conditions also remained largely supportive of the segment, resulting in a high level of refinancing activity that helped to extend the current credit cycle. Despite a spike in early 2018 driven by a bout of risk aversion that spread from the technology sector in equities to risk assets more broadly, the sector continued to perform well given its income advantage and strong economic conditions. Low default levels and light net new issue activity were also supportive of the sector. For the reporting period as a whole, high yield spreads versus Treasuries narrowed despite continued rate hikes and persistent outflows from high yield mutual funds, although they did widen somewhat from the 10-year lows reached in April 2018. The segment outperformed the majority of fixed income alternatives during the reporting period.
In the mortgage-backed securities (MBS) sector, range-bound rates and relatively low levels of volatility in the first half of the reporting period provided a solid backdrop. In October 2017, the Fed began reducing its monthly reinvestments in MBS by $4 billion per month, but the runoff was easily absorbed by banks, real estate investment trusts (REITs) and foreign buyers. At the beginning of 2018, a spike in market volatility, higher rates and the Fed’s continued reduction combined to create a more difficult environment for the MBS segment. However, the market was able to modestly recover in the final months of the reporting period after volatility lessened and the segment experienced better-than-expected demand from banks and money managers.
Asset-backed securities (ABS) and commercial mortgage-backed securities (CMBS) outpaced Treasuries during the reporting period as solid credit performance and strong demand supported both segments. Issuance was modestly ahead of the previous year’s pace, but was easily absorbed by investors looking for high quality yield in shorter maturity securities. Improving economic conditions continued to support consumer balance sheets and commercial real estate fundamentals.
Emerging market debt began the reporting period on a strong note supported by the risk-on, low volatility market environment and robust investor flows into the segment. Through the end of December 2017, broad strength in both emerging and developed economies and higher commodity prices outweighed potential concerns from continued policy normalization and balance sheet reduction from the Fed and other central banks. However, in the second half of the reporting period, the sector experienced broad-based repricing after concerns about the monetary policy normalization of major central banks, less synchronized global growth, trade tensions and slowing Chinese growth depressed risk appetites and led to significant outflows. Country specific political and policy risks in Argentina, Brazil and Turkey added to the negative global backdrop. Local EM markets were hurt by the strong U.S. dollar and elevated market volatility with bond yields, especially in higher yielding countries, rising due to heavy investor positioning and currency pressures. The Argentine peso and Turkish lira were the worst performing currencies.
With rates rising in the U.S., developed global bond markets generally outperformed, supported by moderating economic growth, continued low or declining inflation in many markets and ongoing capital flows. The ECB emphasized continued accommodation and promised to leave rates unchanged until at least late 2019, reassuring investors and driving outperformance in Europe. The Bank of Canada increased interest rates three times, which removed the cuts made in 2015 in response to the oil collapse. The Bank of England raised rates in November 2017 for the first time in a decade, but then delayed a second planned hike in May 2018. With this backdrop, yield curves flattened significantly and developed markets generally outperformed the U.S. Peripheral European yield
17
Portfolio Managers’ Comments (continued)
spreads spiked late in the reporting period due to uncertainties surrounding trade issues and the Italian government. The dollar declined for most of the reporting period, but reversed course late given ongoing rate hikes, strong U.S. growth and economic divergence versus most other economies. The U.S. Dollar Index ended the reporting period roughly 1% lower after declining by nearly 8% mid-period.
The Fund’s performance shortfall occurred in the second half of the reporting period and was driven by the broad underperformance of preferred securities and investment grade corporates as spreads on these sectors moved wider amid market pressure. While we continued to make adjustments to the portfolio to manage risk and take advantage of opportunities, we maintained the Fund’s positioning with a broad overweight to credit sectors and a bias toward income generation through diversified holdings. In light of the ongoing constructive macroeconomic backdrop and solid fundamentals, we continued to see value in these sectors, particularly following recent spread widening. Likewise, we maintained the Fund’s large underweight in Treasuries, given our constructive economic view and the relatively unattractive duration and yield profile of that sector, as well as an underweight to MBS.
The most significant detractor from performance was the Fund’s overweight to preferred and contingent capital (CoCo) securities, which came under pressure later in the reporting period due to increased market volatility amid expected increases in interest rates and perceived increased risk to European banks from the Italian political turmoil. Early in the reporting period, the sector performed well on the back of strong bank fundamentals, attractive valuations and limited supply, factors we expect to benefit the sector again in the future. Nonetheless, this positioning hindered performance during this time frame.
Our overall interest rate positioning had a marginally negative effect on performance. The Fund experienced some benefit from our slightly defensive duration stance, which lessened its sensitivity to rising short-term rates. However, the positive impact was more than offset by negative results from yield curve positioning. We were positioned with an overweight to intermediate maturities due to the issue selection and sector composition of our holdings. This was the segment of the yield curve where rates rose the most.
The largest positive contributor to the Fund’s performance during the reporting period was positioning in non-dollar bonds, driven by the outperformance of German Bunds versus U.S. Treasuries. We took advantage of the sell-off in German bonds as U.S. rates rose, while both economic fundamentals and ECB policy remained constructive, despite prevailing market concerns. This position was currency hedged, given the firming U.S. dollar and the yield advantage associated with hedging. Other smaller non-U.S. positions also added value. Additionally, security selection within the Fund’s investment grade corporate exposure proved beneficial during the reporting period. Results in the sector were aided by a meaningful overweight to BBB rated credits, as well as bottom-up credit selection within industrials. This proved rewarding because lower quality issues led in excess returns until late in the reporting period, driven by favorable economic conditions and strong demand for yield from investors. The Fund’s broader non-corporate sector exposures were also modestly beneficial. Specifically, positions in two securitized sectors, CMBS and ABS, each added slightly to performance. High yield corporates added marginally to performance, driven by security selection. Currency positioning was a slight positive, owing to our positioning for a stronger dollar.
We took advantage of market opportunities to add to sectors and issues at attractive valuations during the reporting period. We added fairly substantially to the Fund’s high yield weighting later in the reporting period after the sector cheapened significantly amid market volatility by removing sector hedges and adding individual issues. We also increased the Fund’s overweight to investment grade corporates late in the reporting period after the sector suffered from issuance pressure, having previously taken profits in the sector earlier in the reporting period. We believed sound fundamentals, demand for income and continued risk appetite remained supportive for credit sectors, although valuations and uncertainty made it compelling for us to upgrade quality at the margin. We marginally reduced exposure to U.S. dollar-denominated EM sovereign bonds later in the reporting period given a deterioration in technical factors that was not yet reflected in valuations. We remained overweight in both CMBS and ABS, given solid fundamentals and the yield associated with these high quality sectors. We added incrementally to CMBS, while reducing exposure to the MBS sector to fund purchases in other sectors. We maintained the Fund’s underweight in MBS given opportunities elsewhere and risks associated with reduced Fed investment.
We remained overweight in German Bunds given their liquidity, stability and currency-hedged yield, although we reduced this position following its strong outperformance. We continued to maintain the Fund’s large underweight in Treasuries given our constructive
18
economic view and income focus. Because we expect modest upward pressure on Treasury yields, we further reduced the Fund’s duration, adding to our defensive interest rate posture. We continued to expect the U.S. dollar to remain supported, and therefore have a bias to hedge foreign currency exposure.
During the reporting period, we also continued to use various derivative instruments. We used foreign currency exchange forward contracts to manage the Fund’s foreign currency exposure. For example, the Fund may reduce unwanted currency exposure from the Fund’s portfolio, or may take long forward positions in select currencies in an attempt to benefit from the potential price appreciation. These positions had a negligible impact on performance during the reporting period.
We used U.S. Treasury futures and Eurodollar futures as part of an overall portfolio construction strategy to manage portfolio duration and yield curve exposure and selected foreign bond futures to actively manage exposure to those markets. These positions had a positive impact on performance during the reporting period.
In addition, we entered into credit default swaps as a way to assume and take on credit risk and earn credit spread. The effect of these activities on performance was negative during the reporting period.
The Fund also purchased a small amount of call options on futures during the reporting period. The call options had a negligible impact on performance and these positions were terminated prior to the end of the reporting period.
19
Risk Considerations
and Dividend Information
Risk Considerations
Nuveen Core Bond Fund
Mutual fund investing involves risk; principal loss is possible. Debt or fixed income securities such as those held by the Fund, are subject to market risk, credit risk, interest rate risk, call risk, derivatives risk, dollar roll transaction risk, and income risk. As interest rates rise, bond prices fall. Foreign investments involve additional risks, including currency fluctuation, political and economic instability, lack of liquidity, and differing legal and accounting standards. Asset-backed and mortgage-backed securities are subject to additional risks such as prepayment risk, liquidity risk, default risk and adverse economic developments.
Nuveen Core Plus Bond Fund
Mutual fund investing involves risk; principal loss is possible. Debt or fixed income securities such as those held by the Fund, are subject to market risk, credit risk, interest rate risk, call risk, derivatives risk, dollar roll transaction risk, and income risk. As interest rates rise, bond prices fall. Below investment grade or high yield debt securities are subject to liquidity risk and heightened credit risk. Foreign investments involve additional risks, including currency fluctuation, political and economic instability, lack of liquidity and differing legal and accounting standards. Asset-backed and mortgage-backed securities are subject to additional risks such as prepayment risk, liquidity risk, default risk and adverse economic developments.
Nuveen High Income Bond Fund
Mutual fund investing involves risk; principal loss is possible. Debt or fixed income securities such as those held by the Fund, are subject to market risk, credit risk, interest rate risk, call risk, derivatives risk, income risk, and other investment company risk. As interest rates rise, bond prices fall. Below investment grade or high yield debt securities are subject to liquidity risk and heightened credit risk. Foreign investments involve additional risks, including currency fluctuation, political and economic instability, lack of liquidity and differing legal and accounting standards.
Nuveen Inflation Protected Securities Fund
Mutual fund investing involves risk; principal loss is possible. Debt or fixed income securities such as those held by the Fund, are subject to market risk, credit risk, interest rate risk, call risk, derivatives risk, income risk, and index methodology risk. As interest rates rise, bond prices fall. Below investment grade or high yield debt securities are subject to liquidity risk and heightened credit risk. The guarantee provided by the U.S. government to treasury inflation protected securities (TIPS) relates only to the prompt payment of principal and interest and does not remove the market risks of investing in the Fund shares. Foreign investments involve additional risks, including currency fluctuation, political and economic instability, lack of liquidity and differing legal and accounting standards. Asset-backed and mortgage-backed securities are subject to additional risks such as prepayment risk, liquidity risk, default risk, and adverse economic developments. The Fund’s investment in inflation protected securities has tax consequences that may result in income distributions to shareholders.
Nuveen Short Term Bond Fund
Mutual fund investing involves risk; principal loss is possible. Debt or fixed income securities such as those held by the Fund, are subject to market risk, credit risk, interest rate risk, call risk, derivatives risk, and income risk. As interest rates rise, bond prices fall. Below investment grade or high yield debt securities are subject to liquidity risk and heightened credit risk. Foreign investments involve additional risks, including currency fluctuation, political and economic instability, lack of liquidity and differing legal and accounting standards. Asset-backed and mortgage-backed securities are subject to additional risks such as prepayment risk, liquidity risk, default risk and adverse economic developments.
20
Nuveen Strategic Income Fund
Mutual fund investing involves risk; principal loss is possible. Debt or fixed income securities such as those held by the Fund, are subject to market risk, credit risk, interest rate risk, call risk, derivatives risk, dollar roll transaction risk, and income risk. As interest rates rise, bond prices fall. Below investment grade or high yield debt securities are subject to liquidity risk and heightened credit risk. Foreign investments involve additional risks, including currency fluctuation, political and economic instability, lack of liquidity and differing legal and accounting standards. The Fund gains additional exposure to currency rates, and therefore to the risk of currency fluctuation, through investment in foreign currency contracts. The risks of foreign investments are magnified in emerging markets. Asset-backed and mortgage-backed securities are subject to additional risks such as prepayment risk, liquidity risk, default risk and adverse economic developments.
Dividend Information
Each Fund seeks to pay regular monthly dividends out of its net investment income at a rate that reflects its past and projected net income performance. To permit each Fund to maintain a more stable monthly dividend, the Fund may pay dividends at a rate that may be more or less than the amount of net income actually earned by the Fund during the period. If a Fund has cumulatively earned more than it has paid in dividends, it will hold the excess in reserve as undistributed net investment income (UNII) as part of the Fund’s net asset value. Conversely, if a Fund has cumulatively paid in dividends more than it has earned, the excess will constitute a negative UNII that will likewise be reflected in the Fund’s net asset value. Each Fund will, over time, pay all its net investment income as dividends to shareholders.
As of June 30, 2018, Nuveen Core Plus Bond Fund and Nuveen Strategic Income Fund had zero UNII balances while the other Funds in this report had positive UNII balances for tax purposes. Nuveen High Income Bond Fund and Nuveen Inflation Protected Securities Fund had positive UNII balances, while the other Funds in this report had negative UNII balances for financial reporting purposes.
All monthly dividends paid by each Fund during the current reporting period were paid from net investment income. If a portion of a Fund’s monthly distributions was sourced from or comprised of elements other than net investment income, including capital gains and/or a return of capital, shareholders would have received a notice to that effect. For financial reporting purposes, the composition and per share amounts of each Fund’s dividends for the reporting period are presented in this report’s Statement of Changes in Net Assets and Financial Highlights, respectively. For income tax purposes, distribution information for each Fund as of its most recent tax year end is presented in Note 6 – Income Tax Information within the Notes to Financial Statements of this report.
Special Dividend Information for Nuveen Core Plus Bond Fund and Nuveen Strategic Income Fund
Like the other Funds in this report, Nuveen Core Plus Bond Fund and Nuveen Strategic Income Fund seek to pay regular monthly distributions at a level rate that reflects past and projected net income of the Funds. Because these two Funds invest substantially in non-U.S. debt and fixed-income securities, in certain periods they can experience foreign currency exchange losses on those non-U.S. holdings. These Funds account for any such foreign currency losses (or gains) as capital items for financial reporting purposes, which do not impact the Funds’ net income and therefore are not taken into account in setting and paying monthly income dividends. However, under applicable tax rules, foreign currency exchange gains or losses are treated as income items. Consequently, if a Fund experiences a foreign currency exchange loss in a given fiscal period, that loss would offset and reduce net income. If such a circumstance were to occur for an entire calendar year the aggregate amount of the Fund’s distributions could exceed the amount of its net income for tax purposes, resulting in any over-distribution being reported on the Fund’s Form 1099 as a return of capital. For the fiscal year ended June 30, 2018, both of these Funds experienced realized foreign exchange losses resulting in a portion of the Fund’s dividends being characterized as a return of capital for tax purposes at fiscal year-end, which is identified in the tables below.
Nuveen Core Plus Bond Fund
| | | | | | | | | | | | | | | | | | | | |
| | | Share Class | |
| Fiscal Year Ended June 30, 2018 | | Class A | | | Class C | | | Class R3 | | | Class R6 | | | Class I | |
Regular monthly per share distribution | | | | | | | | | | | | | | | | | | | | |
From net investment income | | $ | 0.2669 | | | $ | 0.1829 | | | $ | 0.2429 | | | $ | 0.2909 | | | $ | 0.2909 | |
From net realized capital gains | | | — | | | | — | | | | — | | | | — | | | | — | |
Return of capital | | | 0.0651 | | | | 0.0651 | | | | 0.0651 | | | | 0.0651 | | | | 0.0651 | |
Total per share distribution | | $ | 0.3320 | | | $ | 0.2480 | | | $ | 0.3080 | | | $ | 0.3560 | | | $ | 0.3560 | |
21
Risk Considerations and Dividend Information (continued)
Nuveen Strategic Income Fund
| | | | | | | | | | | | | | | | | | | | | | | | |
| | | Share Class | |
| Fiscal Year Ended June 30, 2018 | | Class A | | | Class C | | | Class R3 | | | Class R6 | | | Class I | | | Class T | |
Regular monthly per share distribution | | | | | | | | | | | | | | | | | | | | | | | | |
From net investment income | | $ | 0.2151 | | | $ | 0.1321 | | | $ | 0.1911 | | | $ | 0.2391 | | | $ | 0.2391 | | | $ | 0.2151 | |
From net realized capital gains | | | — | | | | — | | | | — | | | | — | | | | — | | | | — | |
Return of capital | | | 0.1959 | | | | 0.1959 | | | | 0.1959 | | | | 0.1959 | | | | 0.1959 | | | | 0.1959 | |
Total per share distribution | | $ | 0.4110 | | | $ | 0.3280 | | | $ | 0.3870 | | | $ | 0.4350 | | | $ | 0.4350 | | | $ | 0.4110 | |
22
Fund Performance
and Expense Ratios
The Fund Performance and Expense Ratios for each Fund are shown within this section of the report.
Returns quoted represent past performance, which is no guarantee of future results. Investment returns and principal value will fluctuate so that when shares are redeemed, they may be worth more or less than their original cost. Current performance may be higher or lower than the performance shown. Total returns for a period of less than one year are not annualized. Returns at net asset value (NAV) would be lower if the sales charge were included. Returns assume reinvestment of dividends and capital gains. For performance current to the most recent month-end visit nuveen.com or call (800) 257-8787.
Returns do not reflect the deduction of taxes that a shareholder would pay on Fund distributions or the redemption of Fund shares.
Returns may reflect fee waivers and/or expense reimbursements by the investment adviser during the periods presented. If any such waivers and/or reimbursements had not been in place, returns would have been reduced. See Notes to Financial Statements, Note 7—Management Fees and Other Transactions with Affiliates for more information.
Returns reflect differences in sales charges and expenses, which are primarily differences in distribution and service fees, and assume reinvestment of dividends and capital gains.
Comparative index and Lipper return information is provided for Class A Shares at NAV only.
The expense ratios shown reflect total operating expenses (before fee waivers and/or expense reimbursements, if any) as shown in the most recent prospectus. The expense ratios include management fees and other fees and expenses.
Effective July 2018, subsequent to the close of the reporting period, Class C Shares will automatically convert to Class A Shares after 10 years. Conversions will occur during the month in which the 10-year anniversary of the purchase occurs. Class C Shares that have been held for longer than 10 years as of July 1, 2018 will also convert to Class A Shares in July 2018. The automatic conversion will be based on the relative net asset values of the two share classes without the imposition of a sales charge or fee. The automatic conversion of Class C Shares to Class A Shares will not apply to shares held through group retirement plan recordkeeping platforms of certain financial intermediaries who hold such shares in an omnibus account and do not track participant level share lot aging to facilitate such a conversion.
23
Fund Performance and Expense Ratios (continued)
Nuveen Core Bond Fund
Refer to the first page of this Fund Performance and Expense Ratios section for further explanation of the information included within this section. Refer to the Glossary of Terms Used in this Report for definitions of terms used within this section.
Fund Performance
Average Annual Total Returns as of June 30, 2018
| | | | | | | | | | | | |
| | | Average Annual | |
| | | 1-Year | | | 5-Year | | | 10-Year | |
Class A Shares at NAV | | | (0.76)% | | | | 1.81% | | | | 3.25% | |
Class A Shares at maximum Offering Price | | | (3.72)% | | | | 1.20% | | | | 2.93% | |
Bloomberg Barclays U.S. Aggregate Bond Index | | | (0.40)% | | | | 2.27% | | | | 3.72% | |
Lipper Core Bond Classification Average | | | (0.52)% | | | | 2.14% | | | | 3.67% | |
| | | |
Class I Shares | | | (0.51)% | | | | 2.07% | | | | 3.46% | |
| | | | | | | | | | | | |
| | | Average Annual | |
| | | 1-Year | | | 5-Year | | | Since
Inception | |
Class C Shares | | | (1.50)% | | | | 1.07% | | | | 1.32% | |
| | | | | | | | |
| | | Average Annual | |
| | | 1-Year | | | Since
Inception | |
Class R6 Shares | | | (0.51)% | | | | 0.61% | |
Since inception return for Class C Shares is from 1/18/11. Since inception return for Class R6 Shares is from 1/20/15. Indexes and Lipper averages are not available for direct investment.
Class A Shares have a maximum 3.00% sales charge (Offering Price). Class A Share purchases of $1 million or more are sold at net asset value without an up-front sales charge but may be subject to a contingent deferred sales charge (CDSC) of 1%, if redeemed within eighteen months of purchase. Class C Shares have a 1% CDSC for redemptions within less than twelve months, which is not reflected in the total returns. Class R6 Shares have no sales charge and are available only to certain limited categories as described in the prospectus. Class I Shares have no sales charge and may be purchased under limited circumstances or by specified classes of investors.
Expense Ratios as of Most Recent Prospectus
| | | | | | | | | | | | | | | | |
| | | Share Class | |
| | | Class A | | | Class C | | | Class R6 | | | Class I | |
Gross Expense Ratios | | | 0.93% | | | | 1.68% | | | | 0.61% | | | | 0.68% | |
Net Expense Ratios | | | 0.78% | | | | 1.53% | | | | 0.46% | | | | 0.53% | |
The Fund’s investment adviser has contractually agreed to waive fees and/or reimburse other Fund expenses through July 31, 2020 so that total annual Fund operating expenses (excluding 12b-1 distribution and/or service fees, interest expenses, taxes, acquired fund fees and expenses, fees incurred in acquiring and disposing of portfolio securities and extraordinary expenses) do not exceed 0.53% of the average daily net assets of any class of Fund shares. However, because Class R6 Shares are not subject to sub-transfer agent and similar fees, the total annual Fund operating expenses for the Class R6 Shares will be less than the expense limitation. Fee waivers and/or expense reimbursements will not be terminated prior to that time without the approval of the Board of Directors of the Fund.
24
Growth of an Assumed $10,000 Investment as of June 30, 2018 – Class A Shares
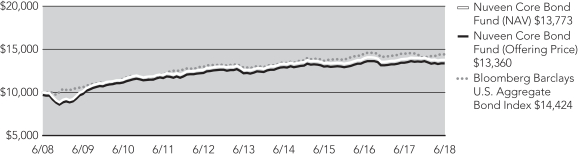
The graphs do not reflect the deduction of taxes that a shareholder may pay on Fund distributions or the redemption of Fund shares.
25
Fund Performance and Expense Ratios (continued)
Nuveen Core Plus Bond Fund
Refer to the first page of this Fund Performance and Expense Ratios section for further explanation of the information included within this section. Refer to the Glossary of Terms Used in this Report for definitions of terms used within this section.
Fund Performance
Average Annual Total Returns as of June 30, 2018
| | | | | | | | | | | | |
| | | Average Annual | |
| | | 1-Year | | | 5-Year | | | 10-Year | |
Class A Shares at NAV | | | (0.93)% | | | | 2.54% | | | | 4.11% | |
Class A Shares at maximum Offering Price | | | (5.14)% | | | | 1.65% | | | | 3.66% | |
Bloomberg Barclays U.S. Aggregate Bond Index | | | (0.40)% | | | | 2.27% | | | | 3.72% | |
Lipper Core Bond Plus Classification Average | | | (0.34)% | | | | 2.59% | | | | 4.47% | |
| | | |
Class C Shares | | | (1.61)% | | | | 1.78% | | | | 3.33% | |
Class R3 Shares | | | (1.14)% | | | | 2.32% | | | | 3.89% | |
Class I Shares | | | (0.62)% | | | | 2.81% | | | | 4.37% | |
| | | | | | | | |
| | | Average Annual | |
| | | 1-Year | | | Since
Inception | |
Class R6 Shares | | | (0.62)% | | | | 1.65% | |
Since inception return for Class R6 Shares is from 1/20/15. Indexes and Lipper averages are not available for direct investment.
Class A Shares have a maximum 4.25% sales charge (Offering Price). Class A Share purchases of $1 million or more are sold at net asset value without an up-front sales charge but may be subject to a contingent deferred sales charge (CDSC) of 1%, if redeemed within eighteen months of purchase. Class C Shares have a 1% CDSC for redemptions within less than twelve months, which is not reflected in the total returns. Class R3 Shares have no sales charge and are only available for purchase by eligible retirement plans. Class R6 Shares have no sales charge and are available only to certain limited categories as described in the prospectus. Class I Shares have no sales charge and may be purchased under limited circumstances or by specified classes of investors.
Expense Ratios as of Most Recent Prospectus
| | | | | | | | | | | | | | | | | | | | |
| | | Share Class | |
| | | Class A | | | Class C | | | Class R3 | | | Class R6 | | | Class I | |
Gross Expense Ratios | | | 0.89% | | | | 1.64% | | | | 1.14% | | | | 0.57% | | | | 0.64% | |
Net Expense Ratios | | | 0.77% | | | | 1.52% | | | | 1.02% | | | | 0.45% | | | | 0.52% | |
The Fund’s investment adviser has contractually agreed to waive fees and/or reimburse other Fund expenses through July 31, 2020 so that total annual Fund operating expenses (excluding 12b-1 distribution and/or service fees, interest expenses, taxes, acquired fund fees and expenses, fees incurred in acquiring and disposing of portfolio securities and extraordinary expenses) do not exceed 0.52% of the average daily net assets of any class of Fund shares. However, because Class R6 Shares are not subject to sub-transfer agent and similar fees, the total annual Fund operating expenses for the Class R6 Shares will be less than the expense limitation. Fee waivers and/or expense reimbursements will not be terminated prior to that time without the approval of the Board of Directors of the Fund.
26
Growth of an Assumed $10,000 Investment as of June 30, 2018 – Class A Shares
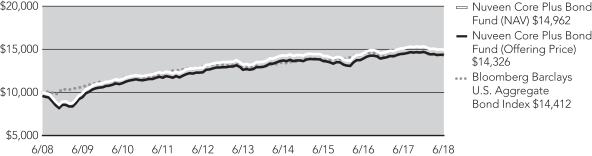
The graphs do not reflect the deduction of taxes that a shareholder may pay on Fund distributions or the redemption of Fund shares.
27
Fund Performance and Expense Ratios (continued)
Nuveen High Income Bond Fund
Refer to the first page of this Fund Performance and Expense Ratios section for further explanation of the information included within this section. Refer to the Glossary of Terms Used in this Report for definitions of terms used within this section.
Fund Performance
Average Annual Total Returns as of June 30, 2018
| | | | | | | | | | | | |
| | | Average Annual | |
| | | 1-Year | | | 5-Year | | | 10-Year | |
Class A Shares at NAV | | | 3.16% | | | | 3.93% | | | | 6.79% | |
Class A Shares at maximum Offering Price | | | (1.75)% | | | | 2.92% | | | | 6.27% | |
Bloomberg Barclays High Yield 2% Issuer Capped Index | | | 2.62% | | | | 5.52% | | | | 8.23% | |
Lipper High Current Yield Funds Classification Average | | | 2.02% | | | | 4.32% | | | | 6.52% | |
| | | |
Class C Shares | | | 2.37% | | | | 3.15% | | | | 6.03% | |
Class R3 Shares | | | 2.94% | | | | 3.68% | | | | 6.52% | |
Class I Shares | | | 3.52% | | | | 4.21% | | | | 7.08% | |
| | | | | | | | |
| | | Average Annual | |
| | | 1-Year | | | Since
Inception | |
Class T Shares* | | | 3.28% | | | | 2.48% | |
Class T Shares at maximum Offering Price* | | | 0.71% | | | | 0.15% | |
Since inception return for Class T Shares is from 5/31/17. Indexes and Lipper averages are not available for direct investment.
Class A Shares have a maximum 4.75% sales charge (Offering Price). Class A Share purchases of $1 million or more are sold at net asset value without an up-front sales charge but may be subject to a contingent deferred sales charge (CDSC) of 1%, if redeemed within eighteen months of purchase. Class C Shares have a 1% CDSC for redemptions within less than twelve months, which is not reflected in the total returns. Class R3 Shares have no sales charge and are only available for purchase by eligible retirement plans. Class I Shares have no sales charge and may be purchased under limited circumstances or by specified classes of investors. Class T Shares have a maximum 2.50% sales charge (Offering Price).
Expense Ratios as of Most Recent Prospectus
| | | | | | | | | | | | | | | | | | | | |
| | | Share Class | |
| | | Class A | | | Class C | | | Class R3 | | | Class I | | | Class T* | |
Expense Ratios | | | 1.07% | | | | 1.82% | | | | 1.32% | | | | 0.82% | | | | 1.07% | |
| * | Class T Shares are not available for public offering. |
28
Growth of an Assumed $10,000 Investment as of June 30, 2018 – Class A Shares
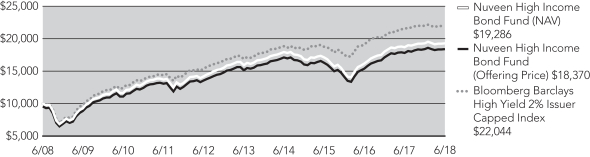
The graphs do not reflect the deduction of taxes that a shareholder may pay on Fund distributions or the redemption of Fund shares.
29
Fund Performance and Expense Ratios (continued)
Nuveen Inflation Protected Securities Fund
Refer to the first page of this Fund Performance and Expense Ratios section for further explanation of the information included within this section. Refer to the Glossary of Terms Used in this Report for definitions of terms used within this section.
Fund Performance
Average Annual Total Returns as of June 30, 2018
| | | | | | | | | | | | |
| | | Average Annual | |
| | | 1-Year | | | 5-Year | | | 10-Year | |
Class A Shares at NAV | | | 1.53% | | | | 1.13% | | | | 2.65% | |
Class A Shares at maximum Offering Price | | | (2.80)% | | | | 0.25% | | | | 2.21% | |
Bloomberg Barclays U.S. TIPS Index | | | 2.11% | | | | 1.68% | | | | 3.03% | |
Lipper Inflation-Protected Bond Funds Classification Average | | | 1.89% | | | | 1.02% | | | | 2.24% | |
| | | |
Class C Shares | | | 0.77% | | | | 0.41% | | | | 1.94% | |
Class R3 Shares | | | 1.26% | | | | 0.83% | | | | 2.32% | |
Class I Shares | | | 1.79% | | | | 1.42% | | | | 2.96% | |
| | | | | | | | |
| | | Average Annual | |
| | | 1-Year | | | Since
Inception | |
Class R6 Shares | | | 2.06% | | | | 1.01% | |
Since inception return for Class R6 Shares is from 1/20/15. Indexes and Lipper averages are not available for direct investment.
Class A Shares have a maximum 4.25% sales charge (Offering Price). Class A Share purchases of $1 million or more are sold at net asset value without an up-front sales charge but may be subject to a contingent deferred sales charge (CDSC) of 1%, if redeemed within eighteen months of purchase. Class C Shares have a 1% CDSC for redemptions within less than twelve months, which is not reflected in the total returns. Class R3 Shares have no sales charge and are only available for purchase by eligible retirement plans. Class R6 Shares have no sales charge and are available only to certain limited categories as described in the prospectus. Class I Shares have no sales charge and may be purchased under limited circumstances or by specified classes of investors.
Expense Ratios as of Most Recent Prospectus
| | | | | | | | | | | | | | | | | | | | |
| | | Share Class | |
| | | Class A | | | Class C | | | Class R3 | | | Class R6 | | | Class I | |
Gross Expense Ratios | | | 0.96% | | | | 1.71% | | | | 1.21% | | | | 0.48% | | | | 0.71% | |
Net Expense Ratios | | | 0.78% | | | | 1.53% | | | | 1.03% | | | | 0.30% | | | | 0.53% | |
The Fund’s investment adviser has contractually agreed to waive fees and/or reimburse other Fund expenses through July 31, 2020 so that total annual Fund operating expenses (excluding 12b-1 distribution and/or service fees, interest expenses, taxes, acquired fund fees and expenses, fees incurred in acquiring and disposing of portfolio securities and extraordinary expenses) do not exceed 0.56% of the average daily net assets of any class of Fund shares. However, because Class R6 Shares are not subject to sub-transfer agent and similar fees, the total annual Fund operating expenses for the Class R6 Shares will be less than the expense limitation. Fee waivers and/or expense reimbursements will not be terminated prior to that time without the approval of the Board of Directors of the Fund.
30
Growth of an Assumed $10,000 Investment as of June 30, 2018 – Class A Shares
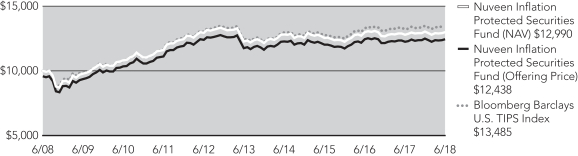
The graphs do not reflect the deduction of taxes that a shareholder may pay on Fund distributions or the redemption of Fund shares.
31
Fund Performance and Expense Ratios (continued)
Nuveen Short Term Bond Fund
Refer to the first page of this Fund Performance and Expense Ratios section for further explanation of the information included within this section. Refer to the Glossary of Terms Used in this Report for definitions of terms used within this section.
Fund Performance
Average Annual Total Returns as of June 30, 2018
| | | | | | | | | | | | |
| | | Average Annual | |
| | | 1-Year | | | 5-Year | | | 10-Year | |
Class A Shares at NAV | | | 0.30% | | | | 1.14% | | | | 2.13% | |
Class A Shares at maximum Offering Price | | | (1.99)% | | | | 0.68% | | | | 1.89% | |
Bloomberg Barclays 1-3 Year Government/Credit Bond Index | | | 0.21% | | | | 0.84% | | | | 1.65% | |
Lipper Short Investment Grade Debt Funds Classification Average | | | 0.58% | | | | 1.16% | | �� | | 2.04% | |
| | | |
Class I Shares | | | 0.54% | | | | 1.39% | | | | 2.35% | |
| | | | | | | | | | | | |
| | | Average Annual | |
| | | 1-Year | | | 5-Year | | | Since
Inception | |
Class C Shares | | | (0.40)% | | | | 0.39% | | | | 0.94% | |
Class R3 Shares | | | 0.09% | | | | 0.86% | | | | 1.37% | |
| | | | | | | | |
| | | Average Annual | |
| | | 1-Year | | | Since
Inception | |
Class R6 Shares | | | 0.64% | | | | 1.31% | |
Since inception return for Class C, Class R3 and Class R6 Shares are from 10/28/09, 9/22/11 and 1/20/15, respectively. Indexes and Lipper averages are not available for direct investment.
Class A Shares have a maximum 2.25% sales charge (Offering Price). Class A Share purchases of $250,000 or more are sold at net asset value without an up-front sales charge but may be subject to a contingent deferred sales charge (CDSC) of 0.75%, if redeemed within eighteen months (twelve months for shares purchased on or after March 27, 2018) of purchase. Class C Shares have a 1% CDSC for redemptions within less than twelve months, which is not reflected in the total returns. Class R3 Shares have no sales charge and are only available for purchase by eligible retirement plans. Class R6 Shares have no sales charge and are available only to certain limited categories as described in the prospectus. Class I Shares have no sales charge and may be purchased under limited circumstances or by specified classes of investors.
Expense Ratios as of Most Recent Prospectus
| | | | | | | | | | | | | | | | | | | | |
| | | Share Class | |
| | | Class A | | | Class C | | | Class R3 | | | Class R6 | | | Class I | |
Gross Expense Ratios | | | 0.77% | | | | 1.52% | | | | 1.02% | | | | 0.48% | | | | 0.52% | |
Net Expense Ratios | | | 0.72% | | | | 1.47% | | | | 0.97% | | | | 0.42% | | | | 0.47% | |
The Fund’s investment adviser has contractually agreed to waive fees and/or reimburse other Fund expenses through July 31, 2020 so that total annual fund operating expenses (excluding 12b-1 distribution and/or service fees, interest expenses, taxes, acquired fund fees and expenses, fees incurred in acquiring and disposing of portfolio securities and extraordinary expenses) do not exceed 0.47% of the average daily net assets of any class of Fund shares. However, because Class R6 Shares are not subject to sub-transfer agent and similar fees, the total annual Fund operating expenses for the Class R6 Shares will be less than the expense limitation. Fee waivers and/or expense reimbursements will not be terminated prior to that time without the approval of the Board of Directors of the Fund.
32
Growth of an Assumed $10,000 Investment as of June 30, 2018 – Class A Shares
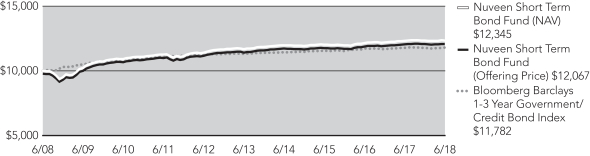
The graphs do not reflect the deduction of taxes that a shareholder may pay on Fund distributions or the redemption of Fund shares.
33
Fund Performance and Expense Ratios (continued)
Nuveen Strategic Income Fund
Refer to the first page of this Fund Performance and Expense Ratios section for further explanation of the information included within this section. Refer to the Glossary of Terms Used in this Report for definitions of terms used within this section.
Fund Performance
Average Annual Total Returns as of June 30, 2018
| | | | | | | | | | | | |
| | | Average Annual | |
| | | 1-Year | | | 5-Year | | | 10-Year | |
Class A Shares at NAV | | | (0.70)% | | | | 3.17% | | | | 5.50% | |
Class A Shares at maximum Offering Price | | | (4.90)% | | | | 2.28% | | | | 5.05% | |
Bloomberg Barclays U.S. Aggregate Bond Index | | | (0.40)% | | | | 2.27% | | | | 3.72% | |
Lipper Multi-Sector Income Funds Classification Average | | | 1.01% | | | | 3.29% | | | | 5.12% | |
| | | |
Class C Shares | | | (1.40)% | | | | 2.41% | | | | 4.72% | |
Class R3 Shares | | | (0.92)% | | | | 2.93% | | | | 5.21% | |
Class I Shares | | | (0.47)% | | | | 3.45% | | | | 5.76% | |
| | | | | | | | |
| | | Average Annual | |
| | | 1-Year | | | Since
Inception | |
Class R6 Shares | | | (0.38)% | | | | 2.18% | |
| | | | | | | | |
| | | Average Annual | |
| | | 1-Year | | | Since
Inception | |
Class T Shares* | | | (0.70)% | | | | (0.44)% | |
Class T Shares at maximum Offering Price* | | | (3.16)% | | | | (2.71)% | |
Since inception return for Class R6 Shares is from 1/20/15. Since inception return for Class T shares is from 5/31/17. Indexes and Lipper averages are not available for direct investment.
Class A Shares have a maximum 4.25% sales charge (Offering Price). Class A Share purchases of $1 million or more are sold at net asset value without an up-front sales charge but may be subject to a contingent deferred sales charge (CDSC) of 1%, if redeemed within eighteen months of purchase. Class C Shares have a 1% CDSC for redemptions within less than twelve months, which is not reflected in the total returns. Class R3 Shares have no sales charge and are only available for purchase by eligible retirement plans. Class R6 Shares have no sales charge and are available only to certain limited categories of investors as described in the prospectus. Class I Shares have no sales charge and may be purchased under limited circumstances or by specified classes of investors. Class T Shares have a maximum 2.50% sales change (Offering Price).
Expense Ratios as of Most Recent Prospectus
| | | | | | | | | | | | | | | | | | | | | | | | |
| | | Share Class | |
| | | Class A | | | Class C | | | Class R3 | | | Class R6 | | | Class I | | | Class T* | |
Gross Expense Ratios | | | 0.93% | | | | 1.68% | | | | 1.18% | | | | 0.60% | | | | 0.68% | | | | 0.93% | |
Net Expense Ratios | | | 0.83% | | | | 1.58% | | | | 1.08% | | | | 0.51% | | | | 0.58% | | | | 0.83% | |
The Fund’s investment adviser has contractually agreed to waive fees and/or reimburse other Fund expenses through July 31, 2020, so that total annual Fund operating expenses (excluding 12b-1 distribution and/or service fees, interest expenses, taxes, acquired fund fees and expenses, fees incurred in acquiring and disposing of portfolio securities and extraordinary expenses) do not exceed 0.59% of the average daily net assets of any class of Fund shares. However, because Class R6 shares are not subject to sub-transfer agent and similar fees, the total annual Fund operating expenses for the Class R6 shares will be less than the expense limitation. Fee waivers and/or expense reimbursements will not be terminated prior to that time without the approval of the Board of Directors of the Fund.
| * | Class T Shares are not available for public offering. |
34
Growth of an Assumed $10,000 Investment as of June 30, 2018 – Class A Shares
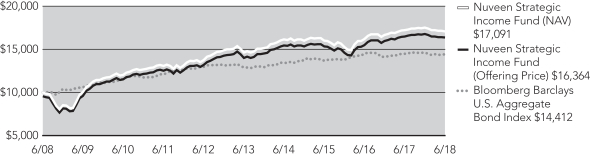
The graphs do not reflect the deduction of taxes that a shareholder may pay on Fund distributions or the redemption of Fund shares.
35
Yields as of June 30, 2018
Dividend Yield is the most recent dividend per share (annualized) divided by the offering price per share.
The SEC 30-Day Yield is a standardized measure of a fund’s yield that accounts for the future amortization of premiums or discounts of bonds held in the fund’s portfolio. The SEC 30-Day Yield is computed under an SEC standardized formula and is based on the maximum offer price per share. Subsidized yields reflect fee waivers and/or expense reimbursements from the investment adviser during the period. If any such waivers and/or reimbursements had not been in place, yields would have been reduced. Unsubsidized yields do not reflect waivers and/or reimbursements from the investment adviser during the period. If the fund did not receive a fee waiver/expense reimbursement during the period under its most recent agreement, subsidized and unsubsidized yields will equal. Refer to the Notes to Financial Statements, Note 7 – Management Fees and Other Transactions with Affiliates for further details on the investment adviser’s most recent agreement with the Fund to waive fees and/or reimburse expenses, where applicable. Dividend Yield may differ from the SEC 30-Day Yield because the fund may be paying out more or less than it is earning and it may not include the effect of amortization of bond premium.
Nuveen Core Bond Fund
| | | | | | | | | | | | | | | | |
| | | Share Class | |
| | | Class A1 | | | Class C | | | Class R6 | | | Class I | |
Dividend Yield | | | 2.34% | | | | 1.65% | | | | 2.67% | | | | 2.68% | |
SEC 30-Day Yield-Subsidized | | | 2.86% | | | | 2.20% | | | | 3.20% | | | | 3.20% | |
SEC 30-Day Yield-Unsubsidized | | | 2.70% | | | | 2.04% | | | | 3.09% | | | | 3.03% | |
Nuveen Core Plus Bond Fund
| | | | | | | | | | | | | | | | | | | | |
| | | Share Class | |
| | | Class A1 | | | Class C | | | Class R3 | | | Class R6 | | | Class I | |
Dividend Yield | | | 2.71% | | | | 2.05% | | | | 2.59% | | | | 3.05% | | | | 3.06% | |
SEC 30-Day Yield-Subsidized | | | 3.34% | | | | 2.74% | | | | 3.24% | | | | 3.79% | | | | 3.74% | |
SEC 30-Day Yield-Unsubsidized | | | 3.23% | | | | 2.62% | | | | 3.12% | | | | 3.68% | | | | 3.62% | |
Nuveen High Income Bond Fund
| | | | | | | | | | | | | | | | | | | | |
| | | Share Class | |
| | | Class A1 | | | Class C | | | Class R3 | | | Class I | | | Class T1 | |
Dividend Yield | | | 6.78% | | | | 6.32% | | | | 6.81% | | | | 7.32% | | | | 7.09% | |
SEC 30-Day Yield-Subsidized | | | 6.66% | | | | 6.23% | | | | 6.74% | | | | 7.24% | | | | 6.79% | |
SEC 30-Day Yield-Unsubsidized | | | 6.65% | | | | 6.22% | | | | 6.73% | | | | 7.24% | | | | 6.79% | |
Nuveen Inflation Protected Securities Fund
| | | | | | | | | | | | | | | | | | | | |
| | | Share Class | |
| | | Class A1 | | | Class C | | | Class R3 | | | Class R6 | | | Class I | |
Dividend Yield | | | 4.12% | | | | 3.53% | | | | 4.06% | | | | 4.54% | | | | 4.52% | |
SEC 30-Day Yield-Subsidized | | | 4.41% | | | | 3.86% | | | | 4.36% | | | | 5.05% | | | | 4.86% | |
SEC 30-Day Yield-Unsubsidized | | | 4.24% | | | | 3.70% | | | | 4.15% | | | | 4.91% | | | | 4.66% | |
36
Nuveen Short Term Bond Fund
| | | | | | | | | | | | | | | | | | | | |
| | | Share Class | |
| | | Class A1 | | | Class C | | | Class R3 | | | Class R6 | | | Class I | |
Dividend Yield | | | 1.75% | | | | 0.98% | | | | 1.48% | | | | 2.03% | | | | 2.03% | |
SEC 30-Day Yield-Subsidized | | | 2.32% | | | | 1.63% | | | | 2.12% | | | | 2.64% | | | | 2.63% | |
SEC 30-Day Yield-Unsubsidized | | | 2.26% | | | | 1.56% | | | | 2.06% | | | | 2.61% | | | | 2.56% | |
Nuveen Strategic Income Fund
| | | | | | | | | | | | | | | | | | | | | | | | |
| | | Share Class | |
| | | Class A1 | | | Class C | | | Class R3 | | | Class R6 | | | Class I | | | Class T1 | |
Dividend Yield | | | 3.38% | | | | 2.73% | | | | 3.23% | | | | 3.71% | | | | 3.72% | | | | 3.48% | |
SEC 30-Day Yield-Subsidized | | | 3.77% | | | | 3.18% | | | | 3.68% | | | | 4.25% | | | | 4.19% | | | | 3.84% | |
SEC 30-Day Yield-Unsubsidized | | | 3.68% | | | | 3.09% | | | | 3.59% | | | | 4.17% | | | | 4.10% | | | | 3.84% | |
| 1 | The SEC Yield for Class A Shares and Class T Shares quoted in the table reflects the maximum sales load. Investors paying a reduced load because of volume discounts, investors paying no load because they qualify for one of the several exclusions from the load, and existing shareholders who previously paid a load but would like to know the SEC Yield applicable to their shares on a going-forward basis, should understand that the SEC Yield effectively applicable to them would be higher than the figure quoted in the table. |
37
Holding Summaries as of June 30, 2018
This data relates to the securities held in each Fund’s portfolio of investments as of the end of this reporting period. It should not be construed as a measure of performance for the Fund itself. Holdings are subject to change
For financial reporting purposes, the ratings disclosed are the highest rating given by one of the following national rating agencies: Standard & Poor’s, Moody’s Investors Service, Inc. or Fitch, Inc. This treatment of split-rated securities may differ from that used for other purposes, such as for Fund investment policies. Credit ratings are subject to change. AAA, AA, A and BBB are investment grade ratings; BB, B, CCC, CC, C and D are below investment grade ratings. Holdings designated N/R are not rated by these national rating agencies.
Refer to the Glossary of Terms Used in this Report for further definition of the terms used within this section.
Nuveen Core Bond Fund
Fund Allocation
(% of net assets)
| | | | |
Corporate Bonds | | | 46.1% | |
Asset-Backed and Mortgage-Backed Securities | | | 45.7% | |
U.S. Government and Agency Obligations | | | 7.3% | |
$1,000 Par (or similar)
Institutional Preferred | | | 0.5% | |
Investments Purchased with
Collateral from Securities Lending | | | 0.4% | |
Money Market Funds | | | 0.6% | |
Other Assets Less Liabilities | | | (0.6)% | |
Net Assets | | | 100% | |
Corporate Bonds: Industries
(% of total corporate bonds)
| | | | |
Banks | | | 16.8% | |
Capital Markets | | | 11.1% | |
Insurance | | | 8.3% | |
Diversified Financial Services | | | 5.3% | |
Media | | | 5.1% | |
Oil, Gas & Consumable Fuels | | | 5.1% | |
Health Care Providers & Services | | | 4.4% | |
Diversified Telecommunication Services | | | 4.1% | |
Beverages | | | 2.8% | |
Consumer Finance | | | 2.8% | |
Biotechnology | | | 2.7% | |
Automobiles | | | 2.6% | |
Machinery | | | 2.3% | |
Semiconductors & Semiconductor Equipment | | | 2.2% | |
Food & Staples Retailing | | | 2.0% | |
Chemicals | | | 1.7% | |
Hotels, Restaurants & Leisure | | | 1.6% | |
Other | | | 19.1% | |
Total | | | 100% | |
Portfolio Credit Quality
(% of total long-term
investments)
| | | | |
U.S. Treasury/Agency | | | 33.0% | |
AAA | | | 12.0% | |
AA | | | 8.2% | |
A | | | 27.7% | |
BBB | �� | | 19.1% | |
Total | | | 100% | |
38
Nuveen Core Plus Bond Fund
Fund Allocation
(% of net assets)
| | | | |
Corporate Bonds | | | 44.7% | |
Asset-Backed and Mortgage-Backed Securities | | | 37.5% | |
$1,000 Par (or similar)
Institutional Preferred | | | 6.4% | |
Sovereign Debt | | | 4.4% | |
U.S. Government and Agency Obligations | | | 3.1% | |
Contingent Capital Securities | | | 2.7% | |
Municipal Bonds | | | 0.3% | |
Investments Purchased with Collateral from Securities Lending | | | 1.0% | |
Money Market Funds | | | 1.0% | |
Other Assets Less Liabilities | | | (1.1)% | |
Net Assets | | | 100% | |
Corporate Bonds: Industries
(% of total corporate bonds)
| | | | |
Banks | | | 17.9% | |
Capital Markets | | | 11.5% | |
Oil, Gas & Consumable Fuels | | | 8.5% | |
Insurance | | | 5.9% | |
Diversified Telecommunication Services | | | 4.1% | |
Diversified Financial Services | | | 3.3% | |
Health Care Providers & Services | | | 3.2% | |
Specialty Retail | | | 3.1% | |
Aerospace & Defense | | | 2.8% | |
Food Products | | | 2.7% | |
Airlines | | | 2.6% | |
Automobiles | | | 2.6% | |
Beverages | | | 2.4% | |
Media | | | 2.2% | |
Industrial Conglomerates | | | 2.1% | |
Chemicals | | | 2.0% | |
Consumer Finance | | | 2.0% | |
Equity Real Estate Investment Trusts | | | 2.0% | |
Other | | | 19.1% | |
Total | | | 100% | |
Portfolio Credit Quality
(% of total long-term
investments)
| | | | |
U.S. Treasury/Agency | | | 20.1% | |
AAA | | | 15.2% | |
AA | | | 4.6% | |
A | | | 25.3% | |
BBB | | | 26.8% | |
BB or Lower | | | 8.0% | |
Total | | | 100% | |
39
Holding Summaries as of June 30, 2018 (continued)
Nuveen High Income Bond Fund
Fund Allocation
(% of net assets)
| | | | |
Corporate Bonds | | | 84.9% | |
$1,000 Par (or similar)
Institutional Preferred | | | 3.8% | |
Common Stocks | | | 2.3% | |
Variable Rate Senior Loan
Interests | | | 2.1% | |
Contingent Capital Securities | | | 1.7% | |
$25 Par (or similar) Retail
Preferred | | | 1.5% | |
Investment Companies | | | 1.5% | |
Convertible Bonds | | | 0.0% | |
Warrants | | | 0.0% | |
Investments Purchased with Collateral from Securities Lending | | | 9.7% | |
Money Market Funds | | | 1.2% | |
Other Assets Less Liabilities | | | (8.7)% | |
Net Assets | | | 100% | |
Corporate Bonds: Industries
(% of total corporate bonds)
| | | | |
Oil, Gas & Consumable Fuels | | | 15.7% | |
Metals & Mining | | | 8.5% | |
Diversified Telecommunication Services | | | 6.8% | |
Chemicals | | | 6.3% | |
Diversified Financial Services | | | 5.8% | |
Hotels, Restaurants & Leisure | | | 4.2% | |
Media | | | 4.2% | |
Commercial Services & Supplies | | | 3.8% | |
Wireless Telecommunication Services | | | 3.7% | |
Food Products | | | 3.3% | |
Health Care Providers & Services | | | 3.1% | |
Independent Power & Renewable Electricity Producers | | | 3.0% | |
Food & Staples Retailing | | | 2.4% | |
Consumer Finance | | | 2.1% | |
Specialty Retail | | | 1.9% | |
Energy Equipment & Services | | | 1.8% | |
Tobacco | | | 1.8% | |
Household Durables | | | 1.7% | |
Other | | | 19.9% | |
Total | | | 100% | |
Portfolio Credit Quality
(% of total long-term fixed-income investments)
| | | | |
BBB | | | 4.9% | |
BB or Lower | | | 91.9% | |
N/R (not rated) | | | 3.2% | |
Total | | | 100% | |
40
Nuveen Inflation Protected Securities Fund
Fund Allocation
(% of net assets)
| | | | |
U.S. Government and Agency
Obligations | | | 88.6% | |
Asset-Backed and Mortgage-Backed Securities | | | 8.1% | |
Corporate Bonds | | | 1.9% | |
Sovereign Debt | | | 0.3% | |
Investments Purchased with Collateral from Securities Lending | | | 0.2% | |
Money Market Funds | | | 1.2% | |
Other Assets Less Liabilities | | | (0.3)% | |
Net Assets | | | 100% | |
Portfolio Credit Quality
(% of total long-term
investments)
| | | | |
U.S. Treasury/Agency | | | 89.6% | |
AAA | | | 3.0% | |
AA | | | 0.6% | |
BBB | | | 5.6% | |
BB or Lower | | | 1.2% | |
Total | | | 100% | |
41
Holding Summaries as of June 30, 2018 (continued)
Nuveen Short Term Bond Fund
Fund Allocation
(% of net assets)
| | | | |
Asset-Backed and Mortgage-Backed Securities | | | 48.0% | |
Corporate Bonds | | | 40.1% | |
U.S. Government and Agency Obligations | | | 10.9% | |
Investments Purchased with Collateral from Securities Lending | | | 1.1% | |
Money Market Funds | | | 0.9% | |
Other Assets Less Liabilities | | | (1.0)% | |
Net Assets | | | 100% | |
Corporate Bonds: Industries
(% of total corporate bonds)
| | | | |
Banks | | | 23.7% | |
Capital Markets | | | 9.0% | |
Diversified Telecommunication Services | | | 6.8% | |
Insurance | | | 6.7% | |
Consumer Finance | | | 6.6% | |
Oil, Gas & Consumable Fuels | | | 5.3% | |
Food Products | | | 4.3% | |
Automobiles | | | 4.2% | |
Media | | | 3.8% | |
Health Care Providers & Services | | | 2.8% | |
Diversified Financial Services | | | 2.4% | |
Wireless Telecommunication Services | | | 2.1% | |
Electric Utilities | | | 2.0% | |
Biotechnology | | | 2.0% | |
Other | | | 18.3% | |
Total | | | 100% | |
Portfolio Credit Quality
(% of total long-term investments)
| | | | |
U.S. Treasury/Agency | | | 14.8% | |
AAA | | | 30.1% | |
AA | | | 9.1% | |
A | | | 23.0% | |
BBB | | | 20.7% | |
BB or Lower | | | 2.3% | |
Total | | | 100% | |
42
Nuveen Strategic Income Fund
Fund Allocation
(% of net assets)
| | | | |
Corporate Bonds | | | 55.1% | |
Asset-Backed and Mortgage-Backed Securities | | | 20.0% | |
$1,000 Par (or similar) Institutional Preferred | | | 8.7% | |
Contingent Capital Securities | | | 6.7% | |
Sovereign Debt | | | 5.6% | |
U.S. Government and Agency Obligations | | | 1.5% | |
Variable Rate Senior Loan Interests | | | 0.7% | |
$25 Par (or similar) Retail Preferred | | | 0.6% | |
Municipal Bonds | | | 0.3% | |
Common Stocks | | | 0.0% | |
Investments Purchased with Collateral from Securities Lending | | | 2.7% | |
Money Market Funds | | | 0.6% | |
Other Assets Less Liabilities | | | (2.5)% | |
Net Assets | | | 100% | |
Corporate Bonds: Industries
(% of total corporate bonds)
| | | | |
Banks | | | 15.1% | |
Capital Markets | | | 10.9% | |
Oil, Gas & Consumable Fuels | | | 8.3% | |
Insurance | | | 5.9% | |
Diversified Telecommunication Services | | | 4.9% | |
Automobiles | | | 3.4% | |
Media | | | 3.1% | |
Beverages | | | 3.0% | |
Chemicals | | | 2.6% | |
Aerospace & Defense | | | 2.5% | |
Consumer Finance | | | 2.4% | |
Airlines | | | 2.4% | |
Metals & Mining | | | 2.4% | |
Industrial Conglomerates | | | 2.2% | |
Health Care Providers & Services | | | 2.2% | |
Diversified Financial Services | | | 2.1% | |
Specialty Retail | | | 2.0% | |
Equity Real Estate Investment Trusts | | | 1.7% | |
Household Durables | | | 1.6% | |
Food Products | | | 1.5% | |
Other | | | 19.8% | |
Total | | | 100% | |
Portfolio Credit Quality
(% of total long-term fixed-income investments)
| | | | |
U.S. Treasury/Agency | | | 4.1% | |
AAA | | | 13.3% | |
AA | | | 3.3% | |
A | | | 24.1% | |
BBB | | | 35.2% | |
BB or Lower | | | 20.0% | |
Total | | | 100% | |
43
Expense Examples
As a shareholder of one or more of the Funds, you incur two types of costs: (1) transaction costs, including up-front and back-end sales charges (loads) or redemption fees, where applicable; and (2) ongoing costs, including management fees; distribution and service (12b-1) fees, where applicable; and other Fund expenses. The Examples below are intended to help you understand your ongoing costs (in dollars) of investing in the Funds and to compare these costs with the ongoing costs of investing in other mutual funds.
The Examples below are based on an investment of $1,000 invested at the beginning of the period and held through the period ended June 30, 2018.
The beginning of the period for the funds is January 1, 2018.
The information under “Actual Performance,” together with the amount you invested, allows you to estimate actual expenses incurred over the reporting period. Simply divide your account value by $1,000 (for example, an $8,600 account value divided by $1,000 = 8.60) and multiply the result by the cost shown for your share class, in the row entitled “Expenses Incurred During Period” to estimate the expenses incurred on your account during this period.
The information under “Hypothetical Performance,” provides information about hypothetical account values and hypothetical expenses based on each Fund’s actual expense ratio and an assumed rate of return of 5% per year before expenses, which is not the Fund’s actual return. The hypothetical account values and expenses may not be used to estimate the actual ending account balance or expense you incurred for the period. You may use this information to compare the ongoing costs of investing in the Fund and other funds. To do so, compare this 5% hypothetical example with the 5% hypothetical examples that appear in the shareholder reports of the other funds.
Please note that the expenses shown in the tables are meant to highlight your ongoing costs only and do not reflect any transaction costs. Therefore, the hypothetical information is useful in comparing ongoing costs only, and will not help you determine the relative total costs of owning different funds or share classes. In addition, if these transaction costs were included, your costs would have been higher.
Nuveen Core Bond Fund
| | | | | | | | | | | | | | | | |
| | | Share Class | |
| | | Class A | | | Class C | | | Class R6 | | | Class I | |
Actual Performance | | | | | | | | | | | | | | | | |
Beginning Account Value | | $ | 1,000.00 | | | $ | 1,000.00 | | | $ | 1,000.00 | | | $ | 1,000.00 | |
Ending Account Value | | $ | 979.90 | | | $ | 976.20 | | | $ | 981.10 | | | $ | 981.10 | |
Expenses Incurred During the Period | | $ | 3.83 | | | $ | 7.50 | | | $ | 2.31 | | | $ | 2.60 | |
Hypothetical Performance (5% annualized return before expenses) | | | | | | | | | | | | | | | | |
Beginning Account Value | | $ | 1,000.00 | | | $ | 1,000.00 | | | $ | 1,000.00 | | | $ | 1,000.00 | |
Ending Account Value | | $ | 1,020.93 | | | $ | 1,017.21 | | | $ | 1,022.46 | | | $ | 1,022.17 | |
Expenses Incurred During the Period | | $ | 3.91 | | | $ | 7.65 | | | $ | 2.36 | | | $ | 2.66 | |
For each class of the Fund, expenses are equal to the Fund’s annualized net expense ratio of 0.78%, 1.53%, 0.47% and 0.53% for Classes A, C, R6 and I, respectively, multiplied by the average account value over the period, multiplied by 181/365 (to reflect the one-half year period).
44
Nuveen Core Plus Bond Fund
| | | | | | | | | | | | | | | | | | | | |
| | | Share Class | |
| | | Class A | | | Class C | | | Class R3 | | | Class R6 | | | Class I | |
Actual Performance | | | | | | | | | | | | | | | | | | | | |
Beginning Account Value | | $ | 1,000.00 | | | $ | 1,000.00 | | | $ | 1,000.00 | | | $ | 1,000.00 | | | $ | 1,000.00 | |
Ending Account Value | | $ | 975.80 | | | $ | 972.80 | | | $ | 974.80 | | | $ | 977.80 | | | $ | 976.90 | |
Expenses Incurred During the Period | | $ | 3.77 | | | $ | 7.44 | | | $ | 4.99 | | | $ | 2.26 | | | $ | 2.55 | |
Hypothetical Performance (5% annualized return before expenses) | | | | | | | | | �� | | | | | | | | | | | |
Beginning Account Value | | $ | 1,000.00 | | | $ | 1,000.00 | | | $ | 1,000.00 | | | $ | 1,000.00 | | | $ | 1,000.00 | |
Ending Account Value | | $ | 1,020.98 | | | $ | 1,017.26 | | | $ | 1,019.74 | | | $ | 1,022.51 | | | $ | 1,022.22 | |
Expenses Incurred During the Period | | $ | 3.86 | | | $ | 7.60 | | | $ | 5.11 | | | $ | 2.31 | | | $ | 2.61 | |
For each class of the Fund, expenses are equal to the Fund’s annualized net expense ratio of 0.77%, 1.52%, 1.02%, 0.46% and 0.52% for Classes A, C, R3, R6 and I, respectively, multiplied by the average account value over the period, multiplied by 181/365 (to reflect the one-half year period).
Nuveen High Income Bond Fund
| | | | | | | | | | | | | | | | | | | | |
| | | Share Class | |
| | | A Shares | | | C Shares | | | R3 Shares | | | I Shares | | | T Shares* | |
Actual Performance | | | | | | | | | | | | | | | | | | | | |
Beginning Account Value | | $ | 1,000.00 | | | $ | 1,000.00 | | | $ | 1,000.00 | | | $ | 1,000.00 | | | $ | 1,000.00 | |
Ending Account Value | | $ | 999.60 | | | $ | 995.70 | | | $ | 997.60 | | | $ | 1,000.80 | | | $ | 999.60 | |
Expenses Incurred During the Period | | $ | 4.96 | | | $ | 8.66 | | | $ | 6.19 | | | $ | 3.72 | | | $ | 4.96 | |
Hypothetical Performance | | | | | | | | | | | | | | | | | | | | |
Beginning Account Value | | $ | 1,000.00 | | | $ | 1,000.00 | | | $ | 1,000.00 | | | $ | 1,000.00 | | | $ | 1,000.00 | |
Ending Account Value | | $ | 1,019.84 | | | $ | 1,016.12 | | | $ | 1,018.60 | | | $ | 1,021.08 | | | $ | 1,019.84 | |
Expenses Incurred During the Period | | $ | 5.01 | | | $ | 8.75 | | | $ | 6.26 | | | $ | 3.76 | | | $ | 5.01 | |
For each class of the Fund, expenses are equal to the Fund’s annualized net expense ratio of 1.00%, 1.75%, 1.25%, 0.75% and 1.00% for Classes A, C, R3, I, and T respectively, multiplied by the average account value over the period, multiplied by 181/365 (to reflect the one-half year period).
| * | Class T Shares are not available for public offering. |
Nuveen Inflation Protected Securities Fund
| | | | | | | | | | | | | | | | | | | | |
| | | Share Class | |
| | | Class A | | | Class C | | | Class R3 | | | Class R6 | | | Class I | |
Actual Performance | | | | | | | | | | | | | | | | | | | | |
Beginning Account Value | | $ | 1,000.00 | | | $ | 1,000.00 | | | $ | 1,000.00 | | | $ | 1,000.00 | | | $ | 1,000.00 | |
Ending Account Value | | $ | 995.90 | | | $ | 992.80 | | | $ | 995.40 | | | $ | 999.30 | | | $ | 998.30 | |
Expenses Incurred During the Period | | $ | 3.86 | | | $ | 7.56 | | | $ | 5.10 | | | $ | 1.44 | | | $ | 2.63 | |
Hypothetical Performance (5% annualized return before expenses) | | | | | | | | | | | | | | | | | | | | |
Beginning Account Value | | $ | 1,000.00 | | | $ | 1,000.00 | | | $ | 1,000.00 | | | $ | 1,000.00 | | | $ | 1,000.00 | |
Ending Account Value | | $ | 1,020.98 | | | $ | 1,017.46 | | | $ | 1,019.64 | | | $ | 1,023.11 | | | $ | 1,022.17 | |
Expenses Incurred During the Period | | $ | 3.91 | | | $ | 7.65 | | | $ | 5.16 | | | $ | 1.45 | | | $ | 2.66 | |
For each class of the Fund, expenses are equal to the Fund’s annualized net expense ratio of 0.78%, 1.53%, 1.03%, 0.29% and 0.53% for Classes A, C, R3, R6 and I, respectively, multiplied by the average account value over the period, multiplied by 181/365 (to reflect the one-half year period).
45
Expense Examples (continued)
Nuveen Short Term Bond Fund
| | | | | | | | | | | | | | | | | | | | |
| | | Share Class | |
| | | Class A | | | Class C | | | Class R3 | | | Class R6 | | | Class I | |
Actual Performance | | | | | | | | | | | | | | | | | | | | |
Beginning Account Value | | $ | 1,000.00 | | | $ | 1,000.00 | | | $ | 1,000.00 | | | $ | 1,000.00 | | | $ | 1,000.00 | |
Ending Account Value | | $ | 1,000.10 | | | $ | 996.10 | | | $ | 998.60 | | | $ | 1,001.30 | | | $ | 1,001.30 | |
Expenses Incurred During the Period | | $ | 3.57 | | | $ | 7.28 | | | $ | 4.81 | | | $ | 2.13 | | | $ | 2.33 | |
Hypothetical Performance (5% annualized return before expenses) | | | | | | | | | | | | | | | | | | | | |
Beginning Account Value | | $ | 1,000.00 | | | $ | 1,000.00 | | | $ | 1,000.00 | | | $ | 1,000.00 | | | $ | 1,000.00 | |
Ending Account Value | | $ | 1,021.22 | | | $ | 1,017.50 | | | $ | 1,019.98 | | | $ | 1,022.66 | | | $ | 1,022.46 | |
Expenses Incurred During the Period | | $ | 3.61 | | | $ | 7.35 | | | $ | 4.86 | | | $ | 2.16 | | | $ | 2.36 | |
For each class of the Fund, expenses are equal to the Fund’s annualized net expense ratio of 0.72%, 1.47%, 0.97%, 0.43% and 0.47% for Classes A, C, R3, R6 and I, respectively, multiplied by the average account value over the period, multiplied by 181/365 (to reflect the one-half year period).
Nuveen Strategic Income Fund
| | | | | | | | | | | | | | | | | | | | | | | | |
| | | Share Class | |
| | | A Shares | | | C Shares | | | R3 Shares | | | R6 Shares | | | I Shares | | | T Shares* | |
Actual Performance | | | | | | | | | | | | | | | | | | | | | | | | |
Beginning Account Value | | $ | 1,000.00 | | | $ | 1,000.00 | | | $ | 1,000.00 | | | $ | 1,000.00 | | | $ | 1,000.00 | | | $ | 1,000.00 | |
Ending Account Value | | $ | 975.50 | | | $ | 972.40 | | | $ | 974.50 | | | $ | 977.60 | | | $ | 976.70 | | | $ | 975.50 | |
Expenses Incurred During the Period | | $ | 4.07 | | | $ | 7.73 | | | $ | 5.29 | | | $ | 2.45 | | | $ | 2.84 | | | $ | 4.07 | |
Hypothetical Performance (5% annualized return before expenses) | | | | | | | | | | | | | | | | | | | | | | | | |
Beginning Account Value | | $ | 1,000.00 | | | $ | 1,000.00 | | | $ | 1,000.00 | | | $ | 1,000.00 | | | $ | 1,000.00 | | | $ | 1,000.00 | |
Ending Account Value | | $ | 1,020.68 | | | $ | 1,016.96 | | | $ | 1,019.44 | | | $ | 1,022.32 | | | $ | 1,021.92 | | | $ | 1,020.68 | |
Expenses Incurred During the Period | | $ | 4.16 | | | $ | 7.90 | | | $ | 5.41 | | | $ | 2.51 | | | $ | 2.91 | | | $ | 4.16 | |
For each class of the Fund, expenses are equal to the Fund’s annualized net expense ratio of 0.83%, 1.58%, 1.08%, 0.50%, 0.58% and 0.83% for Classes A, C, R3, R6, I, and T respectively, multiplied by the average account value over the period, multiplied by 181/365 (to reflect the one-half year period).
| * | Class T Shares are not available for public offering. |
46
Report of Independent Registered Public Accounting Firm
To the Board of Directors of Nuveen Investment Funds, Inc. and Shareholders of
Nuveen Core Bond Fund, Nuveen Core Plus Bond Fund, Nuveen High Income Bond Fund, Nuveen Inflation Protected Securities Fund, Nuveen Short Term Bond Fund, and Nuveen Strategic Income Fund
Opinions on the Financial Statements
We have audited the accompanying statements of assets and liabilities, including the portfolios of investments, of Nuveen Core Bond Fund, Nuveen Core Plus Bond Fund, Nuveen High Income Bond Fund, Nuveen Inflation Protected Securities Fund, Nuveen Short Term Bond Fund, and Nuveen Strategic Income Fund (six of the Funds constituting Nuveen Investment Funds, Inc., hereafter collectively referred to as the “Funds”) as of June 30, 2018, the related statements of operations for the year ended June 30, 2018, the statements of changes in net assets for each of the two years in the period ended June 30, 2018, including the related notes, and the financial highlights for each of the periods indicated therein (collectively referred to as the “financial statements”). In our opinion, the financial statements present fairly, in all material respects, the financial position of each of the Funds as of June 30, 2018, the results of each of their operations for the year then ended, the changes in each of their net assets for each of the two years in the period ended June 30, 2018 and each of the financial highlights for each of the periods indicated therein in conformity with accounting principles generally accepted in the United States of America.
Basis for Opinions
These financial statements are the responsibility of the Funds’ management. Our responsibility is to express an opinion on the Funds’ financial statements based on our audits. We are a public accounting firm registered with the Public Company Accounting Oversight Board (United States) (“PCAOB”) and are required to be independent with respect to the Funds in accordance with the U.S. federal securities laws and the applicable rules and regulations of the Securities and Exchange Commission and the PCAOB.
We conducted our audits of these financial statements in accordance with the standards of the PCAOB. Those standards require that we plan and perform the audit to obtain reasonable assurance about whether the financial statements are free of material misstatement, whether due to error or fraud.
Our audits included performing procedures to assess the risks of material misstatement of the financial statements, whether due to error or fraud, and performing procedures that respond to those risks. Such procedures included examining, on a test basis, evidence regarding the amounts and disclosures in the financial statements. Our audits also included evaluating the accounting principles used and significant estimates made by management, as well as evaluating the overall presentation of the financial statements. Our procedures included confirmation of securities owned as of June 30, 2018 by correspondence with the custodian and brokers; when replies were not received from brokers, we performed other auditing procedures. We believe that our audits provide a reasonable basis for our opinions.
PricewaterhouseCoopers LLP
Chicago, Illinois
August 27, 2018
We have served as the auditor of one or more investment companies in Nuveen Funds since 2002.
47
Nuveen Core Bond Fund
Portfolio of Investments June 30, 2018
| | | | | | | | | | | | | | | | | | | | |
Principal
Amount (000) | | | Description (1) | | Coupon | | | Maturity | | | Ratings (2) | | | Value | |
| | | | | |
| | | | LONG-TERM INVESTMENTS – 99.6% | | | | | | | | | | | | | | | | |
| | | | | |
| | | | CORPORATE BONDS – 46.1% | | | | | | | | | | | | | | | | |
| | | | | |
| | | | Aerospace & Defense – 0.4% | | | | | | | | | | | | |
| | | | | |
| $ | 525 | | | Rockwell Collins Inc. | | | 3.500% | | | | 3/15/27 | | | | BBB | | | $ | 500,268 | |
| | | | | |
| | | | Airlines – 0.3% | | | | | | | | | | | | |
| | | | | |
| | 357 | | | American Airlines Inc., Pass Through Trust 2016-1A | | | 3.575% | | | | 1/15/28 | | | | AA+ | | | | 346,789 | |
| | | | | |
| | | | Auto Components – 0.3% | | | | | | | | | | | | |
| | | | | |
| | 355 | | | Lear Corporation | | | 5.375% | | | | 3/15/24 | | | | BBB– | | | | 368,208 | |
| | | | | |
| | | | Automobiles – 1.2% | | | | | | | | | | | | |
| | | | | |
| | 885 | | | BMW US Capital LLC, 144A | | | 3.450% | | | | 4/12/23 | | | | A+ | | | | 875,421 | |
| | | | | |
| | 750 | | | General Motors Corporation | | | 4.000% | | | | 4/01/25 | | | | BBB | | | | 727,641 | |
| | 1,635 | | | Total Automobiles | | | | | | | | | | | | | | | 1,603,062 | |
| | | | | |
| | | | Banks – 7.7% | | | | | | | | | | | | |
| | | | | |
| | 157 | | | Bank of America Corporation | | | 4.000% | | | | 4/01/24 | | | | A+ | | | | 158,313 | |
| | | | | |
| | 490 | | | Bank of America Corporation | | | 3.875% | | | | 8/01/25 | | | | A+ | | | | 487,397 | |
| | | | | |
| | 1,000 | | | Bank of America Corporation | | | 4.450% | | | | 3/03/26 | | | | A | | | | 1,002,141 | |
| | | | | |
| | 140 | | | Bank of America Corporation | | | 3.419% | | | | 12/20/28 | | | | A+ | | | | 131,782 | |
| | | | | |
| | 460 | | | Barclays Bank PLC | | | 3.650% | | | | 3/16/25 | | | | A | | | | 430,851 | |
| | | | | |
| | 645 | | | Citigroup Inc. | | | 4.500% | | | | 1/14/22 | | | | A | | | | 662,369 | |
| | | | | |
| | 650 | | | Citigroup Inc. | | | 3.300% | | | | 4/27/25 | | | | A | | | | 622,999 | |
| | | | | |
| | 365 | | | Citigroup Inc. | | | 4.300% | | | | 11/20/26 | | | | A– | | | | 356,040 | |
| | | | | |
| | 807 | | | Fifth Third Bancorp. | | | 3.500% | | | | 3/15/22 | | | | A– | | | | 807,247 | |
| | | | | |
| | 590 | | | HSBC Holdings PLC | | | 6.800% | | | | 6/01/38 | | | | A+ | | | | 709,655 | |
| | | | | |
| | 360 | | | Huntington Bancshares Inc./OH | | | 4.000% | | | | 5/15/25 | | | | A– | | | | 360,990 | |
| | | | | |
| | 400 | | | ING Groep N.V | | | 3.950% | | | | 3/29/27 | | | | A+ | | | | 391,705 | |
| | | | | |
| | 505 | | | JP Morgan Chase & Company | | | 3.200% | | | | 1/25/23 | | | | AA– | | | | 495,803 | |
| | | | | |
| | 695 | | | JP Morgan Chase & Company | | | 3.875% | | | | 9/10/24 | | | | A+ | | | | 688,266 | |
| | | | | |
| | 700 | | | JP Morgan Chase & Company | | | 4.260% | | | | 2/22/48 | | | | AA– | | | | 658,347 | |
| | | | | |
| | 810 | | | Santander UK PLC | | | 2.125% | | | | 11/03/20 | | | | Aa3 | | | | 786,258 | |
| | | | | |
| | 570 | | | SunTrust Banks Inc. | | | 2.450% | | | | 8/01/22 | | | | A– | | | | 546,877 | |
| | | | | |
| | 1,125 | | | Wells Fargo & Company | | | 3.550% | | | | 9/29/25 | | | | A+ | | | | 1,090,202 | |
| | 10,469 | | | Total Banks | | | | | | | | | | | | | | | 10,387,242 | |
| | | | | |
| | | | Beverages – 1.3% | | | | | | | | | | | | |
| | | | | |
| | 1,395 | | | Anheuser Busch InBev Financial Incorporated, Fixed Rate Note, Series 2016 | | | 3.650% | | | | 2/01/26 | | | | A– | | | | 1,366,107 | |
| | | | | |
| | 420 | | | Dr. Pepper Snapple Group Inc. | | | 2.550% | | | | 9/15/26 | | | | BBB | | | | 367,473 | |
| | 1,815 | | | Total Beverages | | | | | | | | | | | | | | | 1,733,580 | |
48
| | | | | | | | | | | | | | | | | | | | |
Principal
Amount (000) | | | Description (1) | | Coupon | | | Maturity | | | Ratings (2) | | | Value | |
| | | | | |
| | | | Biotechnology – 1.3% | | | | | | | | | | | | |
| | | | | |
| $ | 500 | | | Baxalta, Inc. | | | 4.000% | | | | 6/23/25 | | | | BBB– | | | $ | 489,339 | |
| | | | | |
| | 630 | | | Biogen Inc. | | | 3.625% | | | | 9/15/22 | | | | A– | | | | 628,813 | |
| | | | | |
| | 595 | | | Celgene Corporation, Convertible Notes | | | 3.625% | | | | 5/15/24 | | | | BBB+ | | | | 580,252 | |
| | 1,725 | | | Total Biotechnology | | | | | | | | | | | | | | | 1,698,404 | |
| | | | | |
| | | | Capital Markets – 5.1% | | | | | | | | | | | | |
| | | | | |
| | 665 | | | Charles Schwab Corporation | | | 3.000% | | | | 3/10/25 | | | | A | | | | 639,197 | |
| | | | | |
| | 1,280 | | | Goldman Sachs Group, Inc. | | | 5.750% | | | | 1/24/22 | | | | A | | | | 1,369,282 | |
| | | | | |
| | 800 | | | Goldman Sachs Group, Inc. | | | 6.750% | | | | 10/01/37 | | | | A– | | | | 950,311 | |
| | | | | |
| | 460 | | | Lazard Group LLC | | | 3.625% | | | | 3/01/27 | | | | A– | | | | 430,853 | |
| | | | | |
| | 1,740 | | | Morgan Stanley | | | 4.000% | | | | 7/23/25 | | | | A | | | | 1,734,178 | |
| | | | | |
| | 685 | | | Morgan Stanley | | | 3.950% | | | | 4/23/27 | | | | A– | | | | 652,765 | |
| | | | | |
| | 1,105 | | | State Street Corporation | | | 3.300% | | | | 12/16/24 | | | | AA– | | | | 1,083,717 | |
| | 6,735 | | | Total Capital Markets | | | | | | | | | | | | | | | 6,860,303 | |
| | | | | |
| | | | Chemicals – 0.8% | | | | | | | | | | | | |
| | | | | |
| | 500 | | | Agrium Inc. | | | 3.375% | | | | 3/15/25 | | | | BBB | | | | 470,482 | |
| | | | | |
| | 550 | | | LYB International Finance BV | | | 4.000% | | | | 7/15/23 | | | | BBB+ | | | | 551,008 | |
| | 1,050 | | | Total Chemicals | | | | | | | | | | | | | | | 1,021,490 | |
| | | | | |
| | | | Commercial Services & Supplies – 0.3% | | | | | | | | | | | | |
| | | | | |
| | 430 | | | AerCap Ireland Capital Limited / AerCap Global Aviation Trust | | | 3.950% | | | | 2/01/22 | | | | BBB– | | | | 427,355 | |
| | | | | |
| | | | Consumer Finance – 1.3% | | | | | | | | | | | | |
| | | | | |
| | 710 | | | American Express Company | | | 2.650% | | | | 12/02/22 | | | | A | | | | 681,563 | |
| | | | | |
| | 490 | | | Capital One Financial Corporation. | | | 3.750% | | | | 3/09/27 | | | | A– | | | | 463,848 | |
| | | | | |
| | 545 | | | Discover Financial Services | | | 5.200% | | | | 4/27/22 | | | | BBB+ | | | | 568,296 | |
| | 1,745 | | | Total Consumer Finance | | | | | | | | | | | | | | | 1,713,707 | |
| | | | | |
| | | | Containers & Packaging – 0.3% | | | | | | | | | | | | |
| | | | | |
| | 480 | | | Packaging Corporation of America | | | 3.650% | | | | 9/15/24 | | | | BBB | | | | 471,351 | |
| | | | | |
| | | | Diversified Financial Services – 2.4% | | | | | | | | | | | | |
| | | | | |
| | 990 | | | Berkshire Hathaway Inc. | | | 3.125% | | | | 3/15/26 | | | | AA | | | | 953,544 | |
| | | | | |
| | 525 | | | BNP Paribas, 144A | | | 4.375% | | | | 5/12/26 | | | | A | | | | 509,181 | |
| | | | | |
| | 365 | | | Jefferies Group Inc. | | | 4.850% | | | | 1/15/27 | | | | BBB | | | | 354,150 | |
| | | | | |
| | 995 | | | Rabobank Nederland | | | 3.875% | | | | 2/08/22 | | | | Aa3 | | | | 1,008,418 | |
| | | | | |
| | 500 | | | Voya Financial Inc. | | | 3.650% | | | | 6/15/26 | | | | BBB | | | | 472,800 | |
| | 3,375 | | | Total Diversified Financial Services | | | | | | | | | | | | | | | 3,298,093 | |
| | | | | |
| | | | Diversified Telecommunication Services – 1.9% | | | | | | | | | | | | |
| | | | | |
| | 360 | | | AT&T, Inc. | | | 3.800% | | | | 3/15/22 | | | | A– | | | | 360,519 | |
| | | | | |
| | 715 | | | AT&T, Inc. | | | 3.400% | | | | 5/15/25 | | | | A– | | | | 672,430 | |
| | | | | |
| | 365 | | | AT&T, Inc. | | | 4.750% | | | | 5/15/46 | | | | A– | | | | 325,800 | |
| | | | | |
| | 525 | | | Telefonica Emisiones SAU | | | 4.103% | | | | 3/08/27 | | | | BBB | | | | 507,536 | |
| | | | | |
| | 750 | | | Verizon Communications | | | 4.125% | | | | 8/15/46 | | | | A– | | | | 640,170 | |
| | 2,715 | | | Total Diversified Telecommunication Services | | | | | | | | | | | | | | | 2,506,455 | |
49
Nuveen Core Bond Fund (continued)
Portfolio of Investments June 30, 2018
| | | | | | | | | | | | | | | | | | | | |
Principal
Amount (000) | | | Description (1) | | Coupon | | | Maturity | | | Ratings (2) | | | Value | |
| | | | | |
| | | | Equity Real Estate Investment Trusts – 0.7% | | | | | | | | | | | | |
| | | | | |
| $ | 635 | | | American Tower Company | | | 5.000% | | | | 2/15/24 | | | | BBB | | | $ | 658,270 | |
| | | | | |
| | 380 | | | Crown Castle International Corporation | | | 3.700% | | | | 6/15/26 | | | | BBB– | | | | 358,188 | |
| | 1,015 | | | Total Equity Real Estate Investment Trusts | | | | | | | | | | | | | | | 1,016,458 | |
| | | | | |
| | | | Food & Staples Retailing – 0.9% | | | | | | | | | | | | |
| | | | | |
| | 730 | | | Sysco Corporation | | | 3.750% | | | | 10/01/25 | | | | A3 | | | | 720,073 | |
| | | | | |
| | 515 | | | Walgreen Company | | | 3.100% | | | | 9/15/22 | | | | BBB | | | | 504,073 | |
| | 1,245 | | | Total Food & Staples Retailing | | | | | | | | | | | | | | | 1,224,146 | |
| | | | | |
| | | | Food Products – 0.7% | | | | | | | | | | | | |
| | | | | |
| | 500 | | | Bunge Limited Finance Company | | | 3.250% | | | | 8/15/26 | | | | BBB | | | | 456,202 | |
| | | | | |
| | 525 | | | Kraft Heinz Foods Co | | | 3.000% | | | | 6/01/26 | | | | BBB | | | | 472,611 | |
| | 1,025 | | | Total Food Products | | | | | | | | | | | | | | | 928,813 | |
| | | | | |
| | | | Health Care Providers & Services – 2.0% | | | | | | | | | | | | |
| | | | | |
| | 630 | | | Anthem, Inc. | | | 3.125% | | | | 5/15/22 | | | | A | | | | 620,436 | |
| | | | | |
| | 930 | | | CVS Health Corporation. | | | 3.875% | | | | 7/20/25 | | | | Baa1 | | | | 909,078 | |
| | | | | |
| | 1,215 | | | UnitedHealth Group Incorporated | | | 2.875% | | | | 3/15/22 | | | | A+ | | | | 1,198,190 | |
| | 2,775 | | | Total Health Care Providers & Services | | | | | | | | | | | | | | | 2,727,704 | |
| | | | | |
| | | | Hotels, Restaurants & Leisure – 0.7% | | | | | | | | | | | | |
| | | | | |
| | 1,025 | | | Hyatt Hotels Corporation | | | 3.375% | | | | 7/15/23 | | | | BBB | | | | 1,008,484 | |
| | | | | |
| | | | Household Durables – 0.4% | | | | | | | | | | | | |
| | | | | |
| | 545 | | | Newell Brands Inc. | | | 4.200% | | | | 4/01/26 | | | | BBB– | | | | 526,328 | |
| | | | | |
| | | | Industrial Conglomerates – 0.5% | | | | | | | | | | | | |
| | | | | |
| | 635 | | | GE Capital International Funding CO | | | 4.418% | | | | 11/15/35 | | | | A | | | | 614,795 | |
| | | | | |
| | | | Insurance – 3.8% | | | | | | | | | | | | |
| | | | | |
| | 131 | | | AFLAC Insurance | | | 6.450% | | | | 8/15/40 | | | | A– | | | | 160,906 | |
| | | | | |
| | 620 | | | American International Group, Inc. | | | 3.750% | | | | 7/10/25 | | | | BBB+ | | | | 598,406 | |
| | | | | |
| | 375 | | | CNA Financial Corporation | | | 3.450% | | | | 8/15/27 | | | | BBB+ | | | | 347,283 | |
| | | | | |
| | 750 | | | Lincoln National Corporation | | | 4.000% | | | | 9/01/23 | | | | A– | | | | 755,887 | |
| | | | | |
| | 600 | | | MetLife Inc. | | | 3.000% | | | | 3/01/25 | | | | A– | | | | 569,203 | |
| | | | | |
| | 940 | | | Prudential Financial Inc. | | | 3.500% | | | | 5/15/24 | | | | A | | | | 931,583 | |
| | | | | |
| | 525 | | | Swiss Re Treasury US Corporation, 144A | | | 4.250% | | | | 12/06/42 | | | | AA– | | | | 525,576 | |
| | | | | |
| | 465 | | | Symetra Financial Corporation | | | 4.250% | | | | 7/15/24 | | | | Baa1 | | | | 459,874 | |
| | | | | |
| | 435 | | | Unum Group | | | 4.000% | | | | 3/15/24 | | | | BBB | | | | 431,460 | |
| | | | | |
| | 365 | | | Willis North America, Inc. | | | 3.600% | | | | 5/15/24 | | | | BBB | | | | 352,593 | |
| | 5,206 | | | Total Insurance | | | | | | | | | | | | | | | 5,132,771 | |
| | | | | |
| | | | Internet and Direct Marketing Retail – 0.4% | | | | | | | | | | | | |
| | | | | |
| | 560 | | | Amazon.com Incorporated. | | | 3.800% | | | | 12/05/24 | | | | AA– | | | | 571,122 | |
| | | | | |
| | | | Internet Software & Services – 0.5% | | | | | | | | | | | | |
| | | | | |
| | 655 | | | eBay Inc. | | | 3.800% | | | | 3/09/22 | | | | BBB+ | | | | 661,133 | |
50
| | | | | | | | | | | | | | | | | | | | |
Principal
Amount (000) | | | Description (1) | | Coupon | | | Maturity | | | Ratings (2) | | | Value | |
| | | | | |
| | | | IT Services – 0.7% | | | | | | | | | | | | |
| | | | | |
| $ | 955 | | | Visa Inc. | | | 3.150% | | | | 12/14/25 | | | | A+ | | | $ | 923,707 | |
| | | | | |
| | | | Machinery – 1.1% | | | | | | | | | | | | |
| | | | | |
| | 830 | | | Ingersoll-Rand Luxembourg Finance SA | | | 3.550% | | | | 11/01/24 | | | | BBB | | | | 815,856 | |
| | | | | |
| | 640 | | | John Deere Capital Corporation | | | 2.650% | | | | 6/24/24 | | | | A | | | | 609,414 | |
| | 1,470 | | | Total Machinery | | | | | | | | | | | | | | | 1,425,270 | |
| | | | | |
| | | | Media – 2.3% | | | | | | | | | | | | |
| | | | | |
| | 605 | | | 21st Century Fox America Inc. | | | 4.000% | | | | 10/01/23 | | | | BBB+ | | | | 612,687 | |
| | | | | |
| | 885 | | | Comcast Corporation | | | 6.400% | | | | 4/30/40 | | | | A– | | | | 1,042,378 | |
| | | | | |
| | 435 | | | Cox Communications Inc., 144A | | | 3.350% | | | | 9/15/26 | | | | BBB+ | | | | 402,033 | |
| | | | | |
| | 660 | | | Discovery Communications Inc. | | | 3.800% | | | | 3/13/24 | | | | BBB– | | | | 648,278 | |
| | | | | |
| | 520 | | | Viacom Inc. | | | 4.375% | | | | 3/15/43 | | | | BBB | | | | 431,684 | |
| | 3,105 | | | Total Media | | | | | | | | | | | | | | | 3,137,060 | |
| | | | | |
| | | | Metals & Mining – 0.4% | | | | | | | | | | | | |
| | | | | |
| | 495 | | | Nucor Corporation | | | 4.000% | | | | 8/01/23 | | | | A– | | | | 503,380 | |
| | | | | |
| | | | Multi-Utilities – 0.2% | | | | | | | | | | | | |
| | | | | |
| | 285 | | | Sempra Energy. | | | 3.400% | | | | 2/01/28 | | | | BBB+ | | | | 267,271 | |
| | | | | |
| | | | Oil, Gas & Consumable Fuels – 2.3% | | | | | | | | | | | | |
| | | | | |
| | 335 | | | BP Capital Markets PLC | | | 2.520% | | | | 9/19/22 | | | | A1 | | | | 323,073 | |
| | | | | |
| | 565 | | | Chevron Corporation. | | | 2.355% | | | | 12/05/22 | | | | Aa2 | | | | 539,987 | |
| | | | | |
| | 550 | | | EOG Resources Inc. | | | 4.100% | | | | 2/01/21 | | | | BBB+ | | | | 561,223 | |
| | | | | |
| | 340 | | | Occidental Petroleum Corporation | | | 3.400% | | | | 4/15/26 | | | | A | | | | 331,795 | |
| | | | | |
| | 270 | | | Sabine Pass Liquefaction LLC. | | | 5.875% | | | | 6/30/26 | | | | BBB– | | | | 289,485 | |
| | | | | |
| | 590 | | | Spectra Energy Partners LP | | | 4.750% | | | | 3/15/24 | | | | BBB+ | | | | 601,908 | |
| | | | | |
| | 540 | | | Valero Energy Corporation | | | 3.400% | | | | 9/15/26 | | | | BBB | | | | 511,109 | |
| | 3,190 | | | Total Oil, Gas & Consumable Fuels | | | | | | | | | | | | | | | 3,158,580 | |
| | | | | |
| | | | Pharmaceuticals – 0.7% | | | | | | | | | | | | |
| | | | | |
| | 995 | | | Merck & Company Inc. | | | 2.750% | | | | 2/10/25 | | | | AA | | | | 950,929 | |
| | | | | |
| | | | Road & Rail – 0.7% | | | | | | | | | | | | |
| | | | | |
| | 895 | | | Burlington Northern Santa Fe, LLC | | | 3.400% | | | | 9/01/24 | | | | A+ | | | | 886,356 | |
| |
| | | | Semiconductors & Semiconductor Equipment – 1.0% | |
| | | | | |
| | 740 | | | Applied Materials Inc. | | | 4.300% | | | | 6/15/21 | | | | A– | | | | 764,310 | |
| | | | | |
| | 630 | | | Intel Corporation | | | 3.150% | | | | 5/11/27 | | | | A+ | | | | 609,995 | |
| | 1,370 | | | Total Semiconductors & Semiconductor Equipment | | | | | | | | | | | | | | | 1,374,305 | |
| | | | | |
| | | | Specialty Retail – 0.7% | | | | | | | | | | | | |
| | | | | |
| | 520 | | | Home Depot, Inc. | | | 2.625% | | | | 6/01/22 | | | | A | | | | 509,865 | |
| | | | | |
| | 455 | | | Lowes Companies, Inc. | | | 3.100% | | | | 5/03/27 | | | | A– | | | | 429,857 | |
| | 975 | | | Total Specialty Retail | | | | | | | | | | | | | | | 939,722 | |
| | | | | |
| | | | Tobacco – 0.4% | | | | | | | | | | | | |
| | | | | |
| | 520 | | | Reynolds American Inc. | | | 3.250% | | | | 11/01/22 | | | | BBB+ | | | | 509,684 | |
51
Nuveen Core Bond Fund (continued)
Portfolio of Investments June 30, 2018
| | | | | | | | | | | | | | | | | | | | |
Principal
Amount (000) | | | Description (1) | | Coupon | | | Maturity | | | Ratings (2) | | | Value | |
| | | | | |
| | | | Wireless Telecommunication Services – 0.4% | | | | | | | | | | | | |
| | | | | |
| $ | 510 | | | Rogers Communications Inc. | | | 3.625% | | | | 12/15/25 | | | | BBB+ | | | $ | 498,531 | |
| $ | 62,862 | | | Total Corporate Bonds (cost $63,112,435) | | | | | | | | | | | | | | | 61,922,856 | |
| | | | | |
Principal
Amount (000) | | | Description (1) | | Coupon | | | Maturity | | | Ratings (2) | | | Value | |
| |
| | | | ASSET-BACKED AND MORTGAGED-BACKED SECURITIES – 45.7% | |
| | | | | |
| $ | 700 | | | American Credit Acceptance Receivables Trust 2016-1A, 144A | | | 5.550% | | | | 6/13/22 | | | | AA | | | $ | 710,420 | |
| | | | | |
| | 600 | | | AmeriCold LLC Trust, Series 2010, 144A | | | 6.031% | | | | 1/17/29 | | | | AA+ | | | | 628,630 | |
| | | | | |
| | 575 | | | Avid Automobile Receivables Trust 2018-1, 144A | | | 2.840% | | | | 8/15/23 | | | | A | | | | 571,993 | |
| | | | | |
| | 260 | | | Bank of America Commercial Mortgage Inc. , Commercial Mortgage Pass-Through Certificates, Series 2015-UBS7 | | | 4.507% | | | | 9/17/48 | | | | A– | | | | 253,604 | |
| | | | | |
| | 165 | | | Bank of America Commercial Mortgage Inc. , Commercial Mortgage Pass-Through Certificates, Series 2015-UBS7 | | | 3.167% | | | | 9/17/48 | | | | BBB– | | | | 133,375 | |
| | | | | |
| | 650 | | | BX TRUST BX 2018-MCSF A, 144A, (1-Month LIBOR reference rate + 0.577% spread), (4) | | | 2.650% | | | | 4/16/35 | | | | AAA | | | | 644,038 | |
| | | | | |
| | 457 | | | CarNow Auto Receivables Trust 2017-1A, 144A | | | 2.920% | | | | 9/15/22 | | | | A | | | | 454,310 | |
| | | | | |
| | 500 | | | Citigroup Commercial Mortgage Trust Series 2012-GC8 | | | 3.024% | | | | 9/12/45 | | | | Aaa | | | | 494,494 | |
| | | | | |
| | 725 | | | Cold Storage Trust, Commercial Mortgage Backed Securities, Series 2017-ICE3, 144A, (1-Month LIBOR reference rate + 1.000% spread), (4) | | | 3.073% | | | | 4/15/36 | | | | Aaa | | | | 727,711 | |
| | | | | |
| | 625 | | | Commercial Mortgage Pass-Through Certificates, Series 2015-CR26 | | | 4.642% | | | | 10/10/48 | | | | A– | | | | 606,650 | |
| | | | | |
| | 177 | | | Conns Receivables Funding Trust II, Series 2017-B, 144A | | | 2.730% | | | | 7/15/20 | | | | BBB | | | | 176,923 | |
| | | | | |
| | 445 | | | Countrywide Asset-Backed Securities Inc. , Asset-Backed Certificates Series 2003-BC3, 1-Month LIBOR reference rate + 0.620% spread), (4) | | | 2.711% | | | | 9/25/33 | | | | A | | | | 434,277 | |
| | | | | |
| | 368 | | | DB Master Finance LLC, Series 2015-1A, 144A | | | 3.980% | | | | 2/21/45 | | | | BBB | | | | 368,602 | |
| | | | | |
| | 586 | | | Domino’s Pizza Master Issuer LLC, 144A, 3-Month LIBOR reference rate + 1.250%), (4) | | | 3.610% | | | | 7/25/47 | | | | BBB+ | | | | 586,840 | |
| | | | | |
| | 565 | | | Fannie Mae, Connecticut Avenue Securities, Series 2017-C01, (1-Month LIBOR reference rate + 1.300% spread), (4) | | | 3.391% | | | | 7/25/29 | | | | BBB+ | | | | 568,922 | |
| | | | | |
| | 200 | | | Fannie Mae Grantor Trust, Series 2014-T1 | | | 2.898% | | | | 6/25/27 | | | | N/R | | | | 192,165 | |
| | | | | |
| | 1,870 | | | Fannie Mae Mortgage Pool FG G08687 | | | 4.000% | | | | 6/01/47 | | | | N/R | | | | 1,913,404 | |
| | | | | |
| | 516 | | | Fannie Mae Mortgage Pool FN 725205 | | | 5.000% | | | | 3/01/34 | | | | N/R | | | | 553,565 | |
| | | | | |
| | 826 | | | Fannie Mae Mortgage Pool FN 890310 | | | 5.000% | | | | 8/01/37 | | | | N/R | | | | 884,611 | |
| | | | | |
| | 984 | | | Fannie Mae Mortgage Pool FN 960605 | | | 4.500% | | | | 2/01/40 | | | | N/R | | | | 1,035,201 | |
| | | | | |
| | 1,318 | | | Fannie Mae Mortgage Pool FN AB2085 | | | 4.500% | | | | 8/01/40 | | | | N/R | | | | 1,386,588 | |
| | | | | |
| | 987 | | | Fannie Mae Mortgage Pool FN AB9659 | | | 4.500% | | | | 12/01/40 | | | | N/R | | | | 1,038,365 | |
| | | | | |
| | 1,569 | | | Fannie Mae Mortgage Pool FN AD1593 | | | 4.000% | | | | 1/01/41 | | | | N/R | | | | 1,611,652 | |
| | | | | |
| | 606 | | | Fannie Mae Mortgage Pool FN AE0217 | | | 4.000% | | | | 2/01/41 | | | | N/R | | | | 622,372 | |
| | | | | |
| | 1,610 | | | Fannie Mae Mortgage Pool FN AE0981 | | | 4.000% | | | | 2/01/41 | | | | N/R | | | | 1,653,876 | |
| | | | | |
| | 1,291 | | | Fannie Mae Mortgage Pool FN AH3804 | | | 3.500% | | | | 3/01/41 | | | | N/R | | | | 1,295,132 | |
| | | | | |
| | 1,441 | | | Fannie Mae Mortgage Pool FN AH5575 | | | 4.500% | | | | 4/01/41 | | | | N/R | | | | 1,516,361 | |
| | | | | |
| | 1,311 | | | Fannie Mae Mortgage Pool FN AH8954 | | | 4.000% | | | | 4/01/41 | | | | N/R | | | | 1,346,390 | |
| | | | | |
| | 747 | | | Fannie Mae Mortgage Pool FN AL0160 | | | 4.500% | | | | 5/01/41 | | | | N/R | | | | 785,918 | |
| | | | | |
| | 1,179 | | | Fannie Mae Mortgage Pool FN AL0215 | | | 4.000% | | | | 4/01/42 | | | | N/R | | | | 1,210,920 | |
52
| | | | | | | | | | | | | | | | | | | | |
Principal
Amount (000) | | | Description (1) | | Coupon | | | Maturity | | | Ratings (2) | | | Value | |
| |
| | | | ASSET-BACKED AND MORTGAGED-BACKED SECURITIES (continued) | |
| | | | | |
| $ | 2,354 | | | Fannie Mae Mortgage Pool FN AS6398 | | | 3.000% | | | | 6/01/43 | | | | N/R | | | $ | 2,300,555 | |
| | | | | |
| | 1,057 | | | Fannie Mae Mortgage Pool FN AU3353 | | | 3.000% | | | | 8/01/43 | | | | N/R | | | | 1,032,657 | |
| | | | | |
| | 1,314 | | | Fannie Mae Mortgage Pool FN BC0830 | | | 3.500% | | | | 12/01/45 | | | | N/R | | | | 1,311,451 | |
| | | | | |
| | 455 | | | Fannie Mae Mortgage Pool FN BE3671 | | | 3.500% | | | | 1/01/46 | | | | N/R | | | | 454,250 | |
| | | | | |
| | 751 | | | Fannie Mae Mortgage Pool FN BH7626 | | | 3.000% | | | | 4/01/46 | | | | N/R | | | | 728,534 | |
| | | | | |
| | 1,516 | | | Fannie Mae Mortgage Pool FN MA1028 | | | 4.000% | | | | 8/01/47 | | | | N/R | | | | 1,547,544 | |
| | | | | |
| | 1 | | | Fannie Mae Real Estate Mortgage Investment Conduit, Pass Through Certificates FNR 1990-89 K | | | 6.500% | | | | 7/25/20 | | | | N/R | | | | 1,130 | |
| | | | | |
| | 1,290 | | | Fannie Mae TBA, Mortgage Pool, (WI/DD) | | | 4.000% | | | | TBA | | | | N/R | | | | 1,315,044 | |
| | | | | |
| | 2 | | | Federal Home Loan Mortgage Corporation, REMIC FHR 1167 E | | | 7.500% | | | | 11/15/21 | | | | N/R | | | | 1,815 | |
| | | | | |
| | 3 | | | Federal Home Loan Mortgage Corporation, REMIC FHR 1286 A | | | 6.000% | | | | 5/15/22 | | | | N/R | | | | 3,249 | |
| | | | | |
| | 484 | | | Flagstar Mortgage Trust, Series 2017-2, 144A | | | 3.500% | | | | 10/25/47 | | | | Aaa | | | | 479,360 | |
| | | | | |
| | 510 | | | Focus Brands Funding LLC, Asset Backed Security FOCUS 2017-1A A2II, 144A | | | 5.093% | | | | 4/30/47 | | | | BBB | | | | 523,728 | |
| | | | | |
| | 546 | | | Freddie Mac Gold Pool FG G05852 | | | 5.500% | | | | 3/01/39 | | | | N/R | | | | 587,364 | |
| | | | | |
| | 1,265 | | | Freddie Mac Gold Pool FG Q54702 | | | 3.500% | | | | 3/01/48 | | | | N/R | | | | 1,258,749 | |
| | | | | |
| | 675 | | | Freddie Mac Structured Agency Credit Risk Debt Notes STACR 2018-SPI2 M1, 144A | | | 3.820% | | | | 5/25/48 | | | | BBB– | | | | 675,242 | |
| | | | | |
| | 705 | | | Ginnie Mae Mortgage Pool G2 MA2521 | | | 3.500% | | | | 1/20/45 | | | | N/R | | | | 709,010 | |
| | | | | |
| | 335 | | | GLS Auto Receivables Trust 2017-1A, 144A | | | 2.670% | | | | 4/15/21 | | | | A | | | | 334,506 | |
| | | | | |
| | 1,941 | | | Government National Mortgage Association Pool GN AA5391 | | | 3.500% | | | | 6/15/42 | | | | N/R | | | | 1,956,375 | |
| | | | | |
| | 780 | | | GS Mortgage Securities Corp Trust 2018-CHILL, 144A, (1-Month LIBOR reference rate + 0.750% spread), (4) | | | 2.823% | | | | 2/17/37 | | | | Aaa | | | | 779,795 | |
| | | | | |
| | 1,025 | | | Invitation Homes 2018-SFR1 Trust, 144A, (1-Month LIBOR reference rate + 0.700% spread), (4) | | | 2.785% | | | | 3/19/37 | | | | Aaa | | | | 1,022,255 | |
| | | | | |
| | 564 | | | Invitation Homes 2018-SFR2 Trust, 144A, (1-Month LIBOR reference rate + 0.900% spread), (4) | | | 2.973% | | | | 6/18/37 | | | | Aaa | | | | 563,519 | |
| | | | | |
| | 695 | | | Invitation Homes 2018-SFR3 Trust, 144A, (1-Month LIBOR reference rate + 1.000% spread), (4) | | | 3.000% | | | | 7/17/37 | | | | Aaa | | | | 695,870 | |
| | | | | |
| | 1,075 | | | Invitation Homes Trust 2015-SFR3, 144A, (1-Month LIBOR reference rate + 1.300% spread), (4) | | | 3.373% | | | | 8/19/32 | | | | N/R | | | | 1,076,752 | |
| | | | | |
| | 339 | | | Invitation Homes Trust 2017-SFR3, 144A, (1-Month LIBOR reference rate + 0.850% spread), (4) | | | 2.935% | | | | 12/19/36 | | | | Aaa | | | | 338,446 | |
| | | | | |
| | 690 | | | J.P. Morgan Chase Commercial Mortgage Securities Trust 2018-BCON, 144A | | | 3.735% | | | | 1/07/31 | | | | AAA | | | | 697,115 | |
| | | | | |
| | 496 | | | Jimmy Johns Funding LLC, 144A | | | 4.846% | | | | 7/30/47 | | | | BBB | | | | 497,664 | |
| | | | | |
| | 636 | | | JP Morgan Mortgage Trust 2018-4, 144A | | | 3.500% | | | | 10/25/48 | | | | Aaa | | | | 632,612 | |
| | | | | |
| | 853 | | | JP Morgan Mortgage Trust, Series 2016-A5, 144A | | | 3.500% | | | | 5/25/46 | | | | Aaa | | | | 846,257 | |
| | | | | |
| | 587 | | | JP Morgan Mortgage Trust, Series 2017-1, 144A | | | 3.500% | | | | 1/25/47 | | | | Aaa | | | | 583,973 | |
| | | | | |
| | 1,000 | | | JPMDB Commercial Mortgage Securities Trust, Series 2017-C7 | | | 3.409% | | | | 10/17/50 | | | | Aaa | | | | 974,031 | |
| | | | | |
| | 48 | | | Master Resecuritization Trust 2009-1, 144A | | | 6.000% | | | | 10/25/36 | | | | AAA | | | | 48,397 | |
| | | | | |
| | 624 | | | Mid-State Trust 2010-1, 144A | | | 7.000% | | | | 12/15/45 | | | | A | | | | 668,247 | |
| | | | | |
| | 750 | | | New Residential Advance Receivable Trust, Series 2016-T3, 144A | | | 2.833% | | | | 10/16/51 | | | | AAA | | | | 731,700 | |
| | | | | |
| | 775 | | | New Residential Advance Receivable Trust, Series 2017-T1, 144A | | | 3.214% | | | | 2/15/51 | | | | AAA | | | | 769,402 | |
53
Nuveen Core Bond Fund (continued)
Portfolio of Investments June 30, 2018
| | | | | | | | | | | | | | | | | | | | |
Principal
Amount (000) | | | Description (1) | | Coupon | | | Maturity | | | Ratings (2) | | | Value | |
| |
| | | | ASSET-BACKED AND MORTGAGED-BACKED SECURITIES (continued) | |
| | | | | |
| $ | 547 | | | New Residential Mortgage Loan Trust, Mortgage Pass-Through Certificates, Series 2017-3A, 144A | | | 4.000% | | | | 4/25/57 | | | | AA+ | | | $ | 552,167 | |
| | | | | |
| | 513 | | | New Residential Mortgage Loan Trust, Mortgage Pass-Through Certificates, Series 2017-6A, 144A | | | 4.000% | | | | 8/25/57 | | | | Aaa | | | | 517,868 | |
| | | | | |
| | 527 | | | New Residential Mortgage Loan Trust, Series 2017-1A, 144A | | | 4.000% | | | | 2/25/57 | | | | AA+ | | | | 531,277 | |
| | | | | |
| | 950 | | | OMART Receivables Trust, Series 2016-T1, 144A | | | 2.521% | | | | 8/17/48 | | | | AAA | | | | 950,655 | |
| | | | | |
| | 650 | | | OMART Receivables Trust, Series 2017-T1, 144A | | | 2.499% | | | | 9/15/48 | | | | AAA | | | | 649,226 | |
| | | | | |
| | 565 | | | OneMain Financial Issuance Trust, Series 2015-2A, 144A | | | 3.100% | | | | 7/18/25 | | | | AA+ | | | | 565,059 | |
| | | | | |
| | 433 | | | Sofi Professional Loan Program 2016-A LLC, 144A | | | 2.760% | | | | 12/26/36 | | | | Aaa | | | | 427,716 | |
| | | | | |
| | 394 | | | Sofi Professional Loan Program 2016-E LLC, 144A | | | 1.630% | | | | 1/25/36 | | | | Aaa | | | | 392,357 | |
| | | | | |
| | 615 | | | Sofi Professional Loan Program 2017-B LLC, 144A | | | 2.740% | | | | 5/25/40 | | | | Aaa | | | | 606,014 | |
| | | | | |
| | 535 | | | Tricon American Homes Trust, Series 2017-SFRI, 144A | | | 2.716% | | | | 9/19/34 | | | | Aaa | | | | 516,223 | |
| | | | | |
| | 1,267 | | | United States Department of Veterans, Affairs, Guaranteed REMIC Pass-Through Certificates, Vendee Mortgage Trust, Series 2011-1 | | | 3.750% | | | | 2/15/35 | | | | N/R | | | | 1,279,749 | |
| | | | | |
| | 624 | | | Wendys Funding LLC, Series 2015-1A, 144A | | | 4.080% | | | | 6/15/45 | | | | BBB | | | | 631,306 | |
| | | | | |
| | 858 | | | American Homes 4 Rent, Series 2014-SFR2, 144A | | | 3.786% | | | | 10/17/36 | | | | N/R | | | | 867,301 | |
| | | | | |
| | 500 | | | American Homes 4 Rent, Series 2015-SFR2, 144A | | | 5.036% | | | | 10/17/45 | | | | A2 | | | | 523,176 | |
| | | | | |
| | 818 | | | U.S. Small Business Administration Guaranteed Participating Securities, Participation Certificates, Series 2010-P10B | | | 3.215% | | | | 9/01/20 | | | | N/R | | | | 821,176 | |
| | | | | |
| | 942 | | | Atlantic City Electric Transition Funding LLC, Transition Bonds, Series 2002-1 | | | 5.550% | | | | 10/20/23 | | | | Aaa | | | | 982,772 | |
| $ | 60,732 | | | Total Asset-Backed and Mortgage-Backed Securities (cost $61,412,701) | | | | | | | | | | | | | | | 61,367,949 | |
| | | | | |
Principal
Amount (000) | | | Description (1) | | Coupon | | | Maturity | | | Ratings (2) | | | Value | |
| |
| | | | U.S. GOVERNMENT AND AGENCY OBLIGATIONS – 7.3% | |
| | | | | |
| $ | 240 | | | United States of America Treasury Bonds | | | 2.250% | | | | 8/15/46 | | | | Aaa | | | $ | 206,475 | |
| | | | | |
| | 1,655 | | | United States of America Treasury Bonds | | | 2.750% | | | | 8/15/47 | | | | Aaa | | | | 1,577,616 | |
| | | | | |
| | 1,925 | | | United States of America Treasury Bonds, (3) | | | 2.750% | | | | 11/15/47 | | | | Aaa | | | | 1,834,841 | |
| | | | | |
| | 2,390 | | | United States Treasury Note/Bond, (3) | | | 3.000% | | | | 2/15/48 | | | | Aaa | | | | 2,395,601 | |
| | | | | |
| | 1,050 | | | United States Treasury Note/Bond, (3) | | | 3.125% | | | | 5/15/48 | | | | Aaa | | | | 1,078,178 | |
| | | | | |
| | 2,760 | | | United States Treasury Notes | | | 2.875% | | | | 11/15/46 | | | | Aaa | | | | 2,699,733 | |
| $ | 10,020 | | | Total U.S. Government and Agency Obligations (cost $9,705,373) | | | | 9,792,444 | |
| | | | | |
Principal
Amount (000) | | | Description (1) | | Coupon | | | Maturity | | | Ratings (2) | | | Value | |
| |
| | | | $1,000 PAR (OR SIMILAR) INSTITUTIONAL PREFERRED – 0.5% | |
| | | | | |
| | | | Banks – 0.5% | | | | | | | | | | | | |
| | | | | |
| $ | 700 | | | Wachovia Capital Trust III | | | 5.570% | | | | N/A (5) | | | | Baa2 | | | $ | 693,000 | |
| $ | 700 | | | Total $1,000 Par (or similar) Institutional Preferred (cost $622,238) | | | | 693,000 | |
| | | | Total Long-Term Investments (cost $134,852,747) | | | | 133,776,249 | |
54
| | | | | | | | | | | | | | | | | | | | |
| Shares | | | Description (1) | | Coupon | | | | | | | | | Value | |
| |
| | | | INVESTMENTS PURCHASED WITH COLLATERAL FROM SECURITIES LENDING – 0.4% | |
| | | | | |
| | | | Money Market Funds – 0.4% | | | | | | | | | | | | |
| | | | | |
| | 582,295 | | | First American Government Obligations Fund, Class X, (6) | | | 1.806% (7) | | | | | | | | | | | $ | 582,295 | |
| | | | Total Investments Purchased with Collateral from Securities Lending (cost $582,295) | | | | 582,295 | |
| | | | | |
| Shares | | | Description (1) | | Coupon | | | | | | | | | Value | |
| | |
| | | | SHORT-TERM INVESTMENTS – 0.6% | | | | | |
| | | | | |
| | | | Money Market Funds – 0.6% | | | | | | | | | | | | |
| | | | | |
| | 861,862 | | | First American Treasury Obligations Fund, Class Z | | | 1.754% (7) | | | | | | | | | | | $ | 861,862 | |
| | | | Total Short-Term Investments (cost $861,862) | | | | | | | | | | | | 861,862 | |
| | | | Total Investments (cost $136,296,904) 100.6% | | | | | | | | | | | | | | | 135,220,406 | |
| | | | Other Assets Less Liabilities – (0.6)% (8) | | | | | | | | | | | | | | | (814,215) | |
| | | | Net Assets – 100% | | | | | | | | | | | | | | $ | 134,406,191 | |
Investments in Derivatives
Futures Contracts
| | | | | | | | | | | | | | | | | | | | | | | | | | | | |
| Description | | Contract
Position | | | Number of
Contracts | | | Expiration
Date | | | Notional
Amount* | | | Value | | | Unrealized
Appreciation
(Depreciation) | | | Variation
Margin
Receivable/
(Payable) | |
U.S. Treasury 2-Year Note | | | Short | | | | (34 | ) | | | 9/18 | | | $ | (7,207,236 | ) | | $ | (7,202,156 | ) | | $ | 5,080 | | | $ | 1,062 | |
U.S. Treasury 5-Year Note | | | Short | | | | (158 | ) | | | 9/18 | | | | (17,925,576 | ) | | | (17,951,516 | ) | | | (25,940 | ) | | | 3,703 | |
U.S. Treasury Long Bond | | | Long | | | | 12 | | | | 9/18 | | | | 1,720,870 | | | | 1,740,000 | | | | 19,130 | | | | 375 | |
U.S. Treasury Ultra 10-Year Note | | | Short | | | | (76 | ) | | | 9/18 | | | | (9,686,721 | ) | | | (9,745,813 | ) | | | (59,092 | ) | | | 360 | |
U.S. Treasury Ultra Bond | | | Long | | | | 49 | | | | 9/18 | | | | 7,682,194 | | | | 7,818,563 | | | | 136,369 | | | | (2,380 | ) |
Total | | | $ | (25,416,469 | ) | | $ | (25,340,922 | ) | | $ | 75,547 | | | $ | 3,120 | |
Total receivable for variation margin on futures contracts | | | $ | 5,500 | |
Total payable for variation margin on futures contracts | | | $ | (2,380 | ) |
| * | The aggregate notional amount of long and short positions is $9,403,064 and $(34,819,533), respectively. |
For Fund portfolio compliance purposes, the Fund’s industry classifications refer to any one or more of the industry sub-classifications used by one or more widely recognized market indexes or ratings group indexes, and/or as defined by Fund management. This definition may not apply for purposes of this report, which may combine industry sub-classifications into sectors for reporting ease.
| (1) | All percentages shown in the Portfolio of Investments are based on net assets. |
| (2) | For financial reporting purposes, the ratings disclosed are the highest of Standard & Poor’s Group (“Standard & Poor’s”), Moody’s Investors Service, Inc. (“Moody’s”) or Fitch, Inc. (“Fitch”) rating. This treatment of split-rated securities may differ from that used for other purposes, such as for Fund investment policies. Ratings below BBB by Standard & Poor’s, Baa by Moody’s or BBB by Fitch are considered to be below investment grade. Holdings designated N/R are not rated by any of these national rating agencies. Ratings are not covered by the report of independent registered public accounting firm. |
| (3) | Investment, or a portion of investment, is out on loan for securities lending. The total value of the securities out on loan as of the end of the reporting period was $565,082. |
| (4) | Variable rate security. The rate shown is the coupon as of the end of the reporting period. |
| (5) | Perpetual security. Maturity date is not applicable. |
| (6) | The Fund may loan securities representing up to one third of the fair value of its total assets (which includes collateral for securities on loan) to broker-dealers, banks and other institutions. The Fund maintains collateral equal to at least 100% of the fair value of the securities loaned. The cash collateral received by the Fund is invested in this money market fund. See Notes to Financial Statements, Note 3 – Portfolio Securities and Investments in Derivatives, Securities Lending for more information. |
| (7) | The rate shown is the annualized seven-day subsidized yield as of the end of the reporting period. |
| (8) | Other assets less liabilities includes the unrealized appreciation (depreciation) of certain over-the-counter (“OTC”) derivatives as presented on the Statement of Assets and Liabilities, when applicable. The unrealized appreciation (depreciation) of OTC cleared and exchange-traded derivatives is recognized as part of the cash collateral at brokers and/or receivable or payable for variation margin as presented on the Statement of Assets and Liabilities, when applicable. |
| 144A | Investment is exempt from registration under Rule 144A of the Securities Act of 1933, as amended. These investments may only be resold in transactions exempt from registration, which are normally those transactions with qualified institutional buyers. |
| LIBOR | London Inter-Bank Offered Rate |
| TBA | To be announced. Maturity date not known prior to the settlement of this transaction. |
| WI/DD | Investment, or portion of investment, purchased on a when-issued or delayed delivery basis. |
See accompanying notes to financial statements.
55
Nuveen Core Plus Bond Fund
Portfolio of Investments June 30, 2018
| | | | | | | | | | | | | | | | | | | | |
Principal
Amount (000) | | | Description (1) | | Coupon | | | Maturity | | | Ratings (2) | | | Value | |
| | | | | |
| | | | LONG-TERM INVESTMENTS – 99.1% | | | | | | | | | | | | | | | | |
| | | | | |
| | | | CORPORATE BONDS – 44.7% | | | | | | | | | | | | | | | | |
| | | |
| | | | Aerospace & Defense – 1.3% | | | | | | | |
| | | | | |
| $ | 1,530 | | | Airbus SE, 144A | | | 3.150% | | | | 4/10/27 | | | | A+ | | | $ | 1,462,361 | |
| | | | | |
| | 1,295 | | | BAE Systems Holdings, 144A | | | 3.850% | | | | 12/15/25 | | | | BBB | | | | 1,279,654 | |
| | | | | |
| | 1,625 | | | Rockwell Collins Inc. | | | 3.500% | | | | 3/15/27 | | | | BBB | | | | 1,548,447 | |
| | 4,450 | | | Total Aerospace & Defense | | | | | | | | | | | | | | | 4,290,462 | |
| | | | | |
| | | | Air Freight & Logistics – 0.3% | | | | | | | | | | | | | | | | |
| | | | | |
| | 1,095 | | | FedEx Corporation | | | 3.250% | | | | 4/01/26 | | | | BBB | | | | 1,048,132 | |
| | | | | |
| | | | Airlines – 1.1% | | | | | | | | | | | | |
| | | | | |
| | 1,211 | | | American Airlines Inc., Pass Through Trust 2016-1A | | | 3.575% | | | | 1/15/28 | | | | AA+ | | | | 1,175,479 | |
| | | | | |
| | 1,265 | | | British Airways 2018-1 Class AA Pass Through Trust, 144A | | | 3.800% | | | | 9/20/31 | | | | Aa2 | | | | 1,265,000 | |
| | | | | |
| | 1,362 | | | Northwest Airlines Trust Pass Through Certificates 2007-1 | | | 7.027% | | | | 11/01/19 | | | | A | | | | 1,422,478 | |
| | 3,838 | | | Total Airlines | | | | | | | | | | | | | | | 3,862,957 | |
| | | | | |
| | | | Automobiles – 1.2% | | | | | | | | | | | | |
| | | | | |
| | 3,000 | | | BMW US Capital LLC, 144A | | | 3.100% | | | | 4/12/21 | | | | A+ | | | | 2,981,280 | |
| | | | | |
| | 1,015 | | | BMW US Capital LLC, 144A | | | 3.450% | | | | 4/12/23 | | | | A+ | | | | 1,004,014 | |
| | 4,015 | | | Total Automobiles | | | | | | | | | | | | | | | 3,985,294 | |
| | | | | |
| | | | Banks – 8.0% | | | | | | | | | | | | |
| | | | | |
| | 1,105 | | | Banco Santander SA | | | 3.800% | | | | 2/23/28 | | | | A– | | | | 1,008,888 | |
| | | | | |
| | 792 | | | Bank of America Corporation | | | 4.000% | | | | 4/01/24 | | | | A+ | | | | 798,625 | |
| | | | | |
| | 2,250 | | | Bank of America Corporation | | | 4.250% | | | | 10/22/26 | | | | A | | | | 2,222,593 | |
| | | | | |
| | 2,322 | | | Bank of America Corporation | | | 3.419% | | | | 12/20/28 | | | | A+ | | | | 2,185,695 | |
| | | | | |
| | 1,815 | | | Barclays Bank PLC | | | 3.650% | | | | 3/16/25 | | | | A | | | | 1,699,987 | |
| | | | | |
| | 1,695 | | | Citigroup Inc. | | | 4.500% | | | | 1/14/22 | | | | A | | | | 1,740,644 | |
| | | | | |
| | 1,000 | | | Citigroup Inc. | | | 3.750% | | | | 6/16/24 | | | | A | | | | 987,898 | |
| | | | | |
| | 795 | | | Citigroup Inc. | | | 3.200% | | | | 10/21/26 | | | | A | | | | 739,714 | |
| | | | | |
| | 2,000 | | | Citigroup Inc. | | | 4.300% | | | | 11/20/26 | | | | A– | | | | 1,950,902 | |
| | | | | |
| | 1,080 | | | HSBC Holdings PLC. | | | 4.375% | | | | 11/23/26 | | | | A+ | | | | 1,063,128 | |
| | | | | |
| | 990 | | | Huntington Bancshares Inc./OH | | | 4.000% | | | | 5/15/25 | | | | A– | | | | 992,722 | |
| | | | | |
| | 1,000 | | | ING Groep N.V | | | 3.950% | | | | 3/29/27 | | | | A+ | | | | 979,263 | |
| | | | | |
| | 1,330 | | | JP Morgan Chase & Company | | | 4.500% | | | | 1/24/22 | | | | AA– | | | | 1,375,422 | |
| | | | | |
| | 965 | | | JP Morgan Chase & Company | | | 3.200% | | | | 1/25/23 | | | | AA– | | | | 947,426 | |
| | | | | |
| | 660 | | | JP Morgan Chase & Company | | | 3.900% | | | | 7/15/25 | | | | AA– | | | | 657,322 | |
| | | | | |
| | 1,250 | | | JP Morgan Chase & Company | | | 4.260% | | | | 2/22/48 | | | | AA– | | | | 1,175,620 | |
| | | | | |
| | 1,175 | | | Lloyds Banking Group PLC | | | 4.450% | | | | 5/08/25 | | | | A+ | | | | 1,180,992 | |
| | | | | |
| | 1,135 | | | PNC Financial Services Inc. | | | 3.150% | | | | 5/19/27 | | | | A+ | | | | 1,078,489 | |
| | | | | |
| | 1,200 | | | Royal Bank of Scotland Group PLC | | | 6.100% | | | | 6/10/23 | | | | BBB | | | | 1,263,427 | |
56
| | | | | | | | | | | | | | | | | | | | |
Principal
Amount (000) | | | Description (1) | | Coupon | | | Maturity | | | Ratings (2) | | | Value | |
| | | | | |
| | | | Banks (continued) | | | | | | | | | | | | |
| | | | | |
| $ | 1,445 | | | SunTrust Banks Inc. | | | 2.450% | | | | 8/01/22 | | | | A– | | | $ | 1,386,380 | |
| | | | | |
| | 1,680 | | | Wells Fargo & Company | | | 4.600% | | | | 4/01/21 | | | | A+ | | | | 1,733,586 | |
| | 27,684 | | | Total Banks | | | | | | | | | | | | | | | 27,168,723 | |
| | | | | |
| | | | Beverages – 1.1% | | | | | | | | | | | | |
| | | | | |
| | 1,600 | | | Anheuser Busch InBev Financial Incorporated, Fixed Rate Note, Series 2016 | | | 3.650% | | | | 2/01/26 | | | | A– | | | | 1,566,861 | |
| | | | | |
| | 1,085 | | | Heineken NV, 144A | | | 3.500% | | | | 1/29/28 | | | | BBB+ | | | | 1,043,730 | |
| | | | | |
| | 1,085 | | | Maple Escrow Subsidiary Inc., 144A | | | 4.417% | | | | 5/25/25 | | | | BBB | | | | 1,090,215 | |
| | 3,770 | | | Total Beverages | | | | | | | | | | | | | | | 3,700,806 | |
| | | | | |
| | | | Building Products – 0.5% | | | | | | | | | | | | |
| | | | | |
| | 425 | | | American Woodmark Corp, 144A | | | 4.875% | | | | 3/15/26 | | | | BB | | | | 402,687 | |
| | | | | |
| | 1,385 | | | Owens Corning Incorporated | | | 4.200% | | | | 12/15/22 | | | | BBB | | | | 1,387,979 | |
| | 1,810 | | | Total Building Products | | | | | | | | | | | | | | | 1,790,666 | |
| | | | | |
| | | | Capital Markets – 5.2% | | | | | | | | | | | | |
| | | | | |
| | 2,225 | | | Charles Schwab Corporation. | | | 2.650% | | | | 1/25/23 | | | | A | | | | 2,165,344 | |
| | | | | |
| | 1,665 | | | Deutsche Bank AG | | | 4.875% | | | | 12/01/32 | | | | BBB | | | | 1,424,441 | |
| | | | | |
| | 660 | | | Goldman Sachs Group, Inc. | | | 5.250% | | | | 7/27/21 | | | | A | | | | 693,560 | |
| | | | | |
| | 3,000 | | | Goldman Sachs Group, Inc. | | | 5.750% | | | | 1/24/22 | | | | A | | | | 3,209,255 | |
| | | | | |
| | 1,910 | | | Goldman Sachs Group, Inc. | | | 4.000% | | | | 3/03/24 | | | | A | | | | 1,910,597 | |
| | | | | |
| | 1,655 | | | Lazard Group LLC | | | 3.625% | | | | 3/01/27 | | | | A– | | | | 1,550,133 | |
| | | | | |
| | 3,250 | | | Morgan Stanley | | | 5.500% | | | | 7/28/21 | | | | A | | | | 3,438,829 | |
| | | | | |
| | 2,010 | | | Morgan Stanley | | | 3.950% | | | | 4/23/27 | | | | A– | | | | 1,915,412 | |
| | | | | |
| | 1,140 | | | Northern Trust Company | | | 3.950% | | | | 10/30/25 | | | | A+ | | | | 1,160,301 | |
| | 17,515 | | | Total Capital Markets | | | | | | | | | | | | | | | 17,467,872 | |
| | | | | |
| | | | Chemicals – 0.9% | | | | | | | | | | | | |
| | | | | |
| | 1,260 | | | Agrium Inc. | | | 3.375% | | | | 3/15/25 | | | | BBB | | | | 1,185,614 | |
| | | | | |
| | 450 | | | Chemours Co | | | 5.375% | | | | 5/15/27 | | | | BB– | | | | 435,375 | |
| | | | | |
| | 1,425 | | | LYB International Finance BV | | | 4.000% | | | | 7/15/23 | | | | BBB+ | | | | 1,427,613 | |
| | 3,135 | | | Total Chemicals | | | | | | | | | | | | | | | 3,048,602 | |
| | | | | |
| | | | Commercial Services & Supplies – 0.2% | | | | | | | | | | | | | | | | |
| | | | | |
| | 710 | | | Brinks Company, 144A | | | 4.625% | | | | 10/15/27 | | | | BB+ | | | | 656,750 | |
| | | | | |
| | | | Communications Equipment – 0.3% | | | | | | | | | | | | |
| | | | | |
| | 1,080 | | | Qualcomm, Inc. | | | 2.100% | | | | 5/20/20 | | | | A1 | | | | 1,079,077 | |
| | | | | |
| | | | Consumer Finance – 0.9% | | | | | | | | | | | | | | | | |
| | | | | |
| | 1,450 | | | Capital One Financial Corporation. | | | 3.750% | | | | 3/09/27 | | | | A– | | | | 1,372,611 | |
| | | | | |
| | 1,425 | | | Ford Motor Credit Company | | | 3.810% | | | | 1/09/24 | | | | BBB | | | | 1,382,699 | |
| | | | | |
| | 350 | | | Navient Corp | | | 6.750% | | | | 6/15/26 | | | | BB | | | | 342,020 | |
| | 3,225 | | | Total Consumer Finance | | | | | | | | | | | | | | | 3,097,330 | |
| | | | | |
| | | | Containers & Packaging – 0.3% | | | | | | | | | | | | | | | | |
| | | | | |
| | 840 | | | International Paper Company | | | 8.700% | | | | 6/15/38 | | | | BBB | | | | 1,171,360 | |
57
Nuveen Core Plus Bond Fund (continued)
Portfolio of Investments June 30, 2018
| | | | | | | | | | | | | | | | | | | | |
Principal
Amount (000) | | | Description (1) | | Coupon | | | Maturity | | | Ratings (2) | | | Value | |
| | | | | |
| | | | Diversified Financial Services – 1.5% | | | | | | | | | | | | |
| | | | | |
| $ | 1,720 | | | BNP Paribas, 144A | | | 4.375% | | | | 5/12/26 | | | | A | | | $ | 1,668,175 | |
| | | | | |
| | 935 | | | Jefferies Group Inc. | | | 4.850% | | | | 1/15/27 | | | | BBB | | | | 907,206 | |
| | | | | |
| | 555 | | | Quicken Loans Inc., 144A | | | 5.250% | | | | 1/15/28 | | | | Ba1 | | | | 511,876 | |
| | | | | |
| | 1,880 | | | Rabobank Nederland | | | 3.950% | | | | 11/09/22 | | | | A | | | | 1,861,249 | |
| | 5,090 | | | Total Diversified Financial Services | | | | | | | | | | | | | | | 4,948,506 | |
| | | | | |
| | | | Diversified Telecommunication Services – 1.8% | | | | | | | | | | | | |
| | | | | |
| | 2,270 | | | AT&T, Inc. | | | 3.800% | | | | 3/15/22 | | | | A– | | | | 2,273,273 | |
| | | | | |
| | 830 | | | Qwest Corporation | | | 6.750% | | | | 12/01/21 | | | | BBB– | | | | 883,131 | |
| | | | | |
| | 1,275 | | | Telefonica Emisiones SAU | | | 4.103% | | | | 3/08/27 | | | | BBB | | | | 1,232,588 | |
| | | | | |
| | 800 | | | Telenet Finance Luxembourg Notes Sarl, 144A | | | 5.500% | | | | 3/01/28 | | | | BB+ | | | | 726,944 | |
| | | | | |
| | 1,260 | | | Verizon Communications | | | 4.125% | | | | 8/15/46 | | | | A– | | | | 1,075,486 | |
| | 6,435 | | | Total Diversified Telecommunication Services | | | | | | | | | | | | | | | 6,191,422 | |
| | | | | |
| | | | Electrical Equipment – 0.2% | | | | | | | | | | | | | | | | |
| | | | | |
| | 710 | | | Park Aerospace Holdings Limited, 144A | | | 5.250% | | | | 8/15/22 | | | | BB | | | | 702,907 | |
| | | | | |
| | | | Energy Equipment & Services – 0.6% | | | | | | | | | | | | |
| | | | | |
| | 750 | | | Ensco PLC | | | 5.200% | | | | 3/15/25 | | | | BB– | | | | 622,500 | |
| | | | | |
| | 1,070 | | | Nabors Industries Inc., (3) | | | 5.500% | | | | 1/15/23 | | | | BB | | | | 1,022,920 | |
| | | | | |
| | 360 | | | Oceaneering International Inc. | | | 6.000% | | | | 2/01/28 | | | | BBB– | | | | 357,459 | |
| | 2,180 | | | Total Energy Equipment & Services | | | | | | | | | | | | | | | 2,002,879 | |
| | | | | |
| | | | Equity Real Estate Investment Trusts – 0.9% | | | | | | | | | | | | |
| | | | | |
| | 1,410 | | | American Tower Company | | | 5.000% | | | | 2/15/24 | | | | BBB | | | | 1,461,671 | |
| | | | | |
| | 785 | | | Crown Castle International Corporation | | | 3.700% | | | | 6/15/26 | | | | BBB– | | | | 739,941 | |
| | | | | |
| | 870 | | | Piedmont Operating Partnership LP | | | 4.450% | | | | 3/15/24 | | | | BBB | | | | 875,010 | |
| | 3,065 | | | Total Equity Real Estate Investment Trusts | | | | | | | | | | | | | | | 3,076,622 | |
| | | | | |
| | | | Food & Staples Retailing – 0.3% | | | | | | | | | | | | | | | | |
| | | | | |
| | 1,225 | | | Sysco Corporation | | | 3.300% | | | | 7/15/26 | | | | A3 | | | | 1,158,077 | |
| | | | | |
| | | | Food Products – 1.2% | | | | | | | | | | | | |
| | | | | |
| | 1,200 | | | Bunge Limited Finance Company | | | 3.250% | | | | 8/15/26 | | | | BBB | | | | 1,094,885 | |
| | | | | |
| | 1,045 | | | Kraft Heinz Foods Company | | | 4.375% | | | | 6/01/46 | | | | BBB | | | | 903,328 | |
| | | | | |
| | 1,045 | | | Smithfield Foods Inc., 144A | | | 4.250% | | | | 2/01/27 | | | | BBB | | | | 1,005,190 | |
| | | | | |
| | 1,025 | | | Tyson Foods | | | 3.950% | | | | 8/15/24 | | | | BBB | | | | 1,022,519 | |
| | 4,315 | | | Total Food Products | | | | | | | | | | | | | | | 4,025,922 | |
| | | | | |
| | | | Health Care Providers & Services – 1.4% | | | | | | | | | | | | |
| | | | | |
| | 695 | | | Centene Escrow I Corp, 144A | | | 5.375% | | | | 6/01/26 | | | | BB+ | | | | 704,125 | |
| | | | | |
| | 1,745 | | | CVS Health Corp | | | 4.300% | | | | 3/25/28 | | | | Baa1 | | | | 1,720,604 | |
| | | | | |
| | 740 | | | HCA Inc. | | | 5.500% | | | | 6/15/47 | | | | BBB– | | | | 678,950 | |
| | | | | |
| | 540 | | | Lifepoint Health Inc., (3) | | | 5.375% | | | | 5/01/24 | | | | Ba2 | | | | 519,750 | |
| | | | | |
| | 1,150 | | | UnitedHealth Group Incorporated | | | 4.750% | | | | 7/15/45 | | | | A+ | | | | 1,227,684 | |
| | 4,870 | | | Total Health Care Providers & Services | | | | | | | | | | | | | | | 4,851,113 | |
58
| | | | | | | | | | | | | | | | | | | | |
Principal
Amount (000) | | | Description (1) | | Coupon | | | Maturity | | | Ratings (2) | | | Value | |
| | | | | |
| | | | Hotels, Restaurants & Leisure – 0.5% | | | | | | | | | | | | |
| | | | | |
| $ | 345 | | | 1011778 BC ULC/New Red Finance Inc., 144A | | | 5.000% | | | | 10/15/25 | | | | B– | | | $ | 326,439 | |
| | | | | |
| | 525 | | | Hilton Domestic Operating Co Inc., 144A | | | 5.125% | | | | 5/01/26 | | | | BB+ | | | | 515,812 | |
| | | | | |
| | 715 | | | VOC Escrow Ltd, 144A | | | 5.000% | | | | 2/15/28 | | | | Ba2 | | | | 675,468 | |
| | 1,585 | | | Total Hotels, Restaurants & Leisure | | | | | | | | | | | | | | | 1,517,719 | |
| | | | | |
| | | | Household Durables – 0.3% | | | | | | | | | | | | |
| | | | | |
| | 875 | | | Harman International Industries, Inc. | | | 4.150% | | | | 5/15/25 | | | | BBB+ | | | | 871,942 | |
| | | | | |
| | 10 | | | Lennar Corporation | | | 4.750% | | | | 4/01/21 | | | | BB+ | | | | 10,143 | |
| | 885 | | | Total Household Durables | | | | | | | | | | | | | | | 882,085 | |
| | | | | |
| | | | Industrial Conglomerates – 0.9% | | | | | | | | | | | | |
| | | | | |
| | 1,700 | | | GE Capital International Funding CO | | | 4.418% | | | | 11/15/35 | | | | A | | | | 1,645,908 | |
| | | | | |
| | 1,550 | | | Siemens Financieringsmaatschappij NV, 144A | | | 3.400% | | | | 3/16/27 | | | | A+ | | | | 1,501,685 | |
| | 3,250 | | | Total Industrial Conglomerates | | | | | | | | | | | | | | | 3,147,593 | |
| | | | | |
| | | | Insurance – 2.6% | | | | | | | | | | | | |
| | | | | |
| | 385 | | | AFLAC Insurance | | | 6.450% | | | | 8/15/40 | | | | A– | | | | 472,893 | |
| | | | | |
| | 975 | | | CNA Financial Corporation | | | 3.450% | | | | 8/15/27 | | | | BBB+ | | | | 902,935 | |
| | | | | |
| | 585 | | | Genworth Holdings Inc. | | | 4.800% | | | | 2/15/24 | | | | B | | | | 507,488 | |
| | | | | |
| | 1,530 | | | Liberty Mutual Group Inc., 144A | | | 4.950% | | | | 5/01/22 | | | | BBB | | | | 1,589,431 | |
| | | | | |
| | 1,215 | | | Lincoln National Corporation | | | 4.000% | | | | 9/01/23 | | | | A– | | | | 1,224,537 | |
| | | | | |
| | 1,000 | | | Symetra Financial Corporation | | | 4.250% | | | | 7/15/24 | | | | Baa1 | | | | 988,976 | |
| | | | | |
| | 1,020 | | | Unum Group | | | 4.000% | | | | 3/15/24 | | | | BBB | | | | 1,011,700 | |
| | | | | |
| | 850 | | | Willis North America, Inc. | | | 3.600% | | | | 5/15/24 | | | | BBB | | | | 821,108 | |
| | | | | |
| | 1,440 | | | XLIT Limited | | | 4.450% | | | | 3/31/25 | | | | BBB | | | | 1,416,382 | |
| | 9,000 | | | Total Insurance | | | | | | | | | | | | | | | 8,935,450 | |
| | | | | |
| | | | Internet Software & Services – 0.4% | | | | | | | | | | | | | | | | |
| | | | | |
| | 1,370 | | | eBay Inc. | | | 3.800% | | | | 3/09/22 | | | | BBB+ | | | | 1,382,827 | |
| | | | | |
| | | | Machinery – 0.8% | | | | | | | | | | | | |
| | | | | |
| | 1,120 | | | Cummins Engine Inc. | | | 4.875% | | | | 10/01/43 | | | | A+ | | | | 1,211,663 | |
| | | | | |
| | 1,590 | | | John Deere Capital Corporation | | | 2.650% | | | | 6/24/24 | | | | A | | | | 1,514,014 | |
| | 2,710 | | | Total Machinery | | | | | | | | | | | | | | | 2,725,677 | |
| | | | | |
| | | | Media – 1.0% | | | | | | | | | | | | |
| | | | | |
| | 685 | | | Comcast Corporation | | | 6.400% | | | | 5/15/38 | | | | A– | | | | 811,291 | |
| | | | | |
| | 540 | | | Comcast Corporation | | | 6.400% | | | | 4/30/40 | | | | A– | | | | 636,027 | |
| | | | | |
| | 715 | | | SES SA, 144A | | | 3.600% | | | | 4/04/23 | | | | BBB | | | | 694,480 | |
| | | | | |
| | 1,290 | | | Time Warner Inc. | | | 3.875% | | | | 1/15/26 | | | | A– | | | | 1,238,434 | |
| | 3,230 | | | Total Media | | | | | | | | | | | | | | | 3,380,232 | |
| | | | | |
| | | | Metals & Mining – 0.4% | | | | | | | | | | | | |
| | | | | |
| | 1,080 | | | Glencore Funding LLC, 144A | | | 4.000% | | | | 3/27/27 | | | | BBB+ | | | | 1,019,069 | |
| | | | | |
| | 465 | | | United States Steel Corp | | | 6.250% | | | | 3/15/26 | | | | BB– | | | | 460,059 | |
| | 1,545 | | | Total Metals & Mining | | | | | | | | | | | | | | | 1,479,128 | |
59
Nuveen Core Plus Bond Fund (continued)
Portfolio of Investments June 30, 2018
| | | | | | | | | | | | | | | | | | | | |
Principal
Amount (000) | | | Description (1) | | Coupon | | | Maturity | | | Ratings (2) | | | Value | |
| | | | | |
| | | | Multi-Utilities – 0.2% | | | | | | | | | | | | | | | | |
| | | | | |
| $ | 795 | | | Sempra Energy. | | | 3.400% | | | | 2/01/28 | | | | BBB+ | | | $ | 745,547 | |
| | | | | |
| | | | Oil, Gas & Consumable Fuels – 3.8% | | | | | | | | | | | | |
| | | | | |
| | 1,110 | | | Baker Hughes a GE Co LLC / Baker Hughes Co-Obligor Inc. | | | 2.773% | | | | 12/15/22 | | | | A– | | | | 1,076,468 | |
| | | | | |
| | 1,087 | | | Berkshire Hathaway Energy Company | | | 6.125% | | | | 4/01/36 | | | | A– | | | | 1,338,913 | |
| | | | | |
| | 850 | | | BP Capital Markets PLC | | | 2.520% | | | | 9/19/22 | | | | A1 | | | | 819,737 | |
| | | | | |
| | 1,105 | | | Enterprise Products Operating LLC | | | 2.800% | | | | 2/15/21 | | | | BBB+ | | | | 1,090,792 | |
| | | | | |
| | 1,200 | | | Harvest Operations Corp, 144A | | | 4.200% | | | | 6/01/23 | | | | AA | | | | 1,212,722 | |
| | | | | |
| | 885 | | | Occidental Petroleum Corporation | | | 3.400% | | | | 4/15/26 | | | | A | | | | 863,644 | |
| | | | | |
| | 630 | | | Petro Canada | | | 6.800% | | | | 5/15/38 | | | | A– | | | | 802,461 | |
| | | | | |
| | 750 | | | Petroleos del Peru SA, 144A | | | 4.750% | | | | 6/19/32 | | | | BBB+ | | | | 717,750 | |
| | | | | |
| | 645 | | | Sabine Pass Liquefaction LLC. | | | 5.875% | | | | 6/30/26 | | | | BBB– | | | | 691,548 | |
| | | | | |
| | 895 | | | Sunoco Logistics Partners LP | | | 4.000% | | | | 10/01/27 | | | | BBB– | | | | 836,051 | |
| | | | | |
| | 495 | | | Targa Resources Inc. | | | 4.250% | | | | 11/15/23 | | | | BB– | | | | 475,200 | |
| | | | | |
| | 875 | | | Western Gas Partners LP | | | 4.500% | | | | 3/01/28 | | | | BBB– | | | | 841,736 | |
| | | | | |
| | 1,380 | | | Woodside Finance Limited, 144A | | | 3.650% | | | | 3/05/25 | | | | BBB+ | | | | 1,344,466 | |
| | | | | |
| | 695 | | | WPX Energy Inc. | | | 5.750% | | | | 6/01/26 | | | | BB– | | | | 695,000 | |
| | 12,602 | | | Total Oil, Gas & Consumable Fuels | | | | | | | | | | | | | | | 12,806,488 | |
| | | | | |
| | | | Paper & Forest Products – 0.3% | | | | | | | | | | | | | | | | |
| | | | | |
| | 975 | | | Domtar Corporation | | | 6.750% | | | | 2/15/44 | | | | BBB– | | | | 1,031,427 | |
| | | | | |
| | | | Personal Products – 0.1% | | | | | | | | | | | | |
| | | | | |
| | 520 | | | Coty Inc., 144A, (3) | | | 6.500% | | | | 4/15/26 | | | | BB | | | | 498,875 | |
| | | | | |
| | | | Pharmaceuticals – 0.4% | | | | | | | | | | | | |
| | | | | |
| | 645 | | | Endo Finance LLC, 144A | | | 5.375% | | | | 1/31/23 | | | | B3 | | | | 516,000 | |
| | | | | |
| | 690 | | | Teva Pharmaceutical Finance Netherlands III BV, (3) | | | 6.750% | | | | 3/01/28 | | | | BB | | | | 703,023 | |
| | 1,335 | | | Total Pharmaceuticals | | | | | | | | | | | | | | | 1,219,023 | |
| | | | | |
| | | | Road & Rail – 0.3% | | | | | | | | | | | | |
| | | | | |
| | 440 | | | The Hertz Corporation, 144A, (3) | | | 7.625% | | | | 6/01/22 | | | | BB– | | | | 422,400 | |
| | | | | |
| | 700 | | | Union Pacific Corp | | | 4.500% | | | | 9/10/48 | | | | A– | | | | 706,320 | |
| | 1,140 | | | Total Road & Rail | | | | | | | | | | | | | | | 1,128,720 | |
| | | | | |
| | | | Semiconductors & Semiconductor Equipment – 0.7% | | | | | | | | | | | | |
| | | | | |
| | 1,255 | | | Intel Corporation | | | 3.150% | | | | 5/11/27 | | | | A+ | | | | 1,215,148 | |
| | | | | |
| | 1,105 | | | Texas Instruments Incorporated | | | 2.900% | | | | 11/03/27 | | | | A+ | | | | 1,045,020 | |
| | 2,360 | | | Total Semiconductors & Semiconductor Equipment | | | | | | | | | | | | | | | 2,260,168 | |
| | | | | |
| | | | Software – 0.5% | | | | | | | | | | | | |
| | | | | |
| | 410 | | | CDK Global Inc. | | | 5.875% | | | | 6/15/26 | | | | BB+ | | | | 418,712 | |
| | | | | |
| | 1,165 | | | Microsoft Corporation | | | 3.300% | | | | 2/06/27 | | | | AAA | | | | 1,149,777 | |
| | 1,575 | | | Total Software | | | | | | | | | | | | | | | 1,568,489 | |
60
| | | | | | | | | | | | | | | | | | | | |
Principal
Amount (000) | | | Description (1) | | Coupon | | | Maturity | | | Ratings (2) | | | Value | |
| | | | | |
| | | | Specialty Retail – 1.4% | | | | | | | | | | | | |
| | | | | |
| $ | 1,005 | | | AutoNation Inc. | | | 4.500% | | | | 10/01/25 | | | | BBB– | | | $ | 997,858 | |
| | | | | |
| | 1,380 | | | Bed Bath and Beyond Incorporated | | | 5.165% | | | | 8/01/44 | | | | Baa2 | | | | 1,056,493 | |
| | | | | |
| | 1,145 | | | Lowes Companies, Inc. | | | 3.100% | | | | 5/03/27 | | | | A– | | | | 1,081,728 | |
| | | | | |
| | 1,515 | | | O’Reilly Automotive Inc. | | | 4.875% | | | | 1/14/21 | | | | Baa1 | | | | 1,564,622 | |
| | 5,045 | | | Total Specialty Retail | | | | | | | | | | | | | | | 4,700,701 | |
| | | | | |
| | | | Technology Hardware, Storage & Peripherals – 0.3% | | | | | | | | | | | | | | | | |
| | | | | |
| | 1,000 | | | Apple Inc. | | | 3.850% | | | | 5/04/43 | | | | AA+ | | | | 956,869 | |
| | | | | |
| | | | Trading Companies & Distributors – 0.1% | | | | | | | | | | | | | | | | |
| | | | | |
| | 245 | | | Ashtead Capital Inc., 144A | | | 4.125% | | | | 8/15/25 | | | | BBB– | | | | 228,463 | |
| | | | | |
| | | | Wireless Telecommunication Services – 0.5% | | | | | | | | | | | | |
| | | | | |
| | 470 | | | Millicom International Cellular SA, 144A | | | 5.125% | | | | 1/15/28 | | | | BB+ | | | | 431,695 | |
| | | | | |
| | 1,146 | | | Sprint Spectrum Co LLC / Sprint Spectrum Co II LLC / Sprint Spectrum Co III LLC, 144A | | | 3.360% | | | | 9/20/21 | | | | Baa2 | | | | 1,132,737 | |
| | 1,616 | | | Total Wireless Telecommunication Services | | | | | | | | | | | | | | | 1,564,432 | |
| $ | 153,840 | | | Total Corporate Bonds (cost $154,911,243) | | | | | | | | | | | | | | | 151,485,392 | |
| | | | | |
Principal
Amount (000) | | | Description (1) | | Coupon | | | Maturity | | | Ratings (2) | | | Value | |
| |
| | | | ASSET-BACKED AND MORTGAGED BACKED SECURITIES – 37.5% | |
| | | | | |
| $ | 2,420 | | | Ally Auto Receivables Trust, Series 2017-3 | | | 2.010% | | | | 3/15/22 | | | | Aaa | | | $ | 2,374,082 | |
| | | | | |
| | 2,590 | | | American Express Credit Card Master Trust, Series 2017-1 | | | 1.930% | | | | 9/15/22 | | | | Aaa | | | | 2,551,920 | |
| | | | | |
| | 1,529 | | | American Homes 4 Rent, Series 2014-SFR2, 144A | | | 3.786% | | | | 10/17/36 | | | | Aaa | | | | 1,545,029 | |
| | | | | |
| | 3,165 | | | AmeriCold LLC Trust, Series 2010, 144A | | | 6.811% | | | | 1/14/29 | | | | AA– | | | | 3,352,912 | |
| | | | | |
| | 2,165 | | | Bank 2017, Mortgage Series BNK4 | | | 3.625% | | | | 5/17/50 | | | | Aaa | | | | 2,147,959 | |
| | | | | |
| | 540 | | | Bank of America Commercial Mortgage Inc. , Commercial Mortgage Pass-Through Certificates, Series 2015-UBS7 | | | 4.507% | | | | 9/17/48 | | | | A– | | | | 526,716 | |
| | | | | |
| | 345 | | | Bank of America Commercial Mortgage Inc. , Commercial Mortgage Pass-Through Certificates, Series 2015-UBS7 | | | 3.167% | | | | 9/17/48 | | | | BBB– | | | | 278,875 | |
| | | | | |
| | 2,500 | | | Bank of America Credit Card Trust, Series 2017-A1 | | | 1.950% | | | | 8/15/22 | | | | Aaa | | | | 2,461,870 | |
| | | | | |
| | 63 | | | Bank of America Funding Trust, Mortgage Pass-Through Certificates, Series 2007-4 | | | 5.500% | | | | 6/25/37 | | | | C | | | | 5,934 | |
| | | | | |
| | 1,100 | | | Barclays Commercial Mortgage, Mortgage Pass-Through Certificates, Series 2015-STP, 144A | | | 4.427% | | | | 9/10/28 | | | | BBB– | | | | 1,092,529 | |
| | | | | |
| | 708 | | | Bayview Financial Mortgage Pass-Through Trust, Mortgage Pass-Through Certificate Series 2005-D | | | 5.500% | | | | 12/28/35 | | | | A+ | | | | 713,922 | |
| | | | | |
| | 1,510 | | | capital One Multi-Asset Execution Trust, Series 2016-A4 | | | 1.330% | | | | 6/15/22 | | | | AAA | | | | 1,486,344 | |
| | | | | |
| | 2,342 | | | CitiBank Credit Card Issuance Trust, Series 2014-A1 | | | 2.880% | | | | 1/23/23 | | | | Aaa | | | | 2,335,269 | |
| | | | | |
| | 2,360 | | | Citibank Credit Card Issuance Trust, Series 2014-A6. | | | 2.150% | | | | 7/15/21 | | | | Aaa | | | | 2,346,196 | |
| | | | | |
| | 2,040 | | | CitiBank Credit Card Issuance Trust, Series 2017-A8 | | | 1.860% | | | | 8/08/22 | | | | Aaa | | | | 1,992,283 | |
| | | | | |
| | 1,785 | | | Commercial Mortgage Pass-Through Certificates 2015-CR22 | | | 4.259% | | | | 3/12/48 | | | | A– | | | | 1,727,558 | |
| | | | | |
| | 1,485 | | | Commercial Mortgage Pass-Through Certificates, Series 2015-CR26 | | | 4.642% | | | | 10/10/48 | | | | A– | | | | 1,441,401 | |
| | | | | |
| | 1,795 | | | Commercial Mortgage Pass-Through Certificates, Series 2016-SAVA, 144A, (1-Month LIBOR reference rate + 2.300% spread), (4) | | | 4.373% | | | | 10/17/34 | | | | AA– | | | | 1,798,378 | |
61
Nuveen Core Plus Bond Fund (continued)
Portfolio of Investments June 30, 2018
| | | | | | | | | | | | | | | | | | | | |
| | | | | |
Principal
Amount (000) | | | Description (1) | | Coupon | | | Maturity | | | Ratings (2) | | | Value | |
| |
| | | | ASSET-BACKED AND MORTGAGED BACKED SECURITIES (continued) | |
| | | | | |
| $ | 1,762 | | | Credit Suisse First Boston Mortgage Securities Corporation, Mortgage-Backed Pass-Through Certificates, Series 2003-8 | | | 6.171% | | | | 4/25/33 | | | | Ba1 | | | $ | 1,752,664 | |
| | | | | |
| | 1,548 | | | DB Master Finance LLC, Series 2015-1A, 144A | | | 3.980% | | | | 2/21/45 | | | | N/R | | | | 1,552,009 | |
| | | | | |
| | 930 | | | Discover Card Execution Trust 2015-A2 | | | 1.900% | | | | 10/17/22 | | | | Aaa | | | | 913,595 | |
| | | | | |
| | 1,485 | | | Discover Card Execution Trust 2017-A2 | | | 2.390% | | | | 7/15/24 | | | | Aaa | | | | 1,450,239 | |
| | | | | |
| | 1,662 | | | Domino’s Pizza Master Issuer LLC, 144A, (3-Month LIBOR reference rate + 1.250% spread), (4) | | | 3.610% | | | | 7/25/47 | | | | BBB+ | | | | 1,666,028 | |
| | | | | |
| | 1,732 | | | Dominos Pizza Master Issuer LLC, Series 2017-1A, 144A | | | 3.082% | | | | 7/25/47 | | | | N/R | | | | 1,678,604 | |
| | | | | |
| | 38 | | | Fannie Mae Mortgage Pool FN 250551 | | | 7.000% | | | | 5/01/26 | | | | N/R | | | | 41,442 | |
| | | | | |
| | 179 | | | Fannie Mae Mortgage Pool FN 252255 | | | 6.500% | | | | 2/01/29 | | | | N/R | | | | 196,997 | |
| | | | | |
| | 359 | | | Fannie Mae Mortgage Pool FN 254169 | | | 6.500% | | | | 12/01/31 | | | | N/R | | �� | | 395,824 | |
| | | | | |
| | 351 | | | Fannie Mae Mortgage Pool FN 254379 | | | 7.000% | | | | 7/01/32 | | | | N/R | | | | 390,826 | |
| | | | | |
| | 192 | | | Fannie Mae Mortgage Pool FN 254513 | | | 6.000% | | | | 10/01/22 | | | | N/R | | | | 210,307 | |
| | | | | |
| | 612 | | | Fannie Mae Mortgage Pool FN 255575 | | | 5.500% | | | | 1/01/25 | | | | N/R | | | | 655,375 | |
| | | | | |
| | 108 | | | Fannie Mae Mortgage Pool FN 256845 | | | 6.500% | | | | 8/01/37 | | | | N/R | | | | 120,819 | |
| | | | | |
| | 419 | | | Fannie Mae Mortgage Pool FN 256852 | | | 6.000% | | | | 8/01/27 | | | | N/R | | | | 457,564 | |
| | | | | |
| | 81 | | | Fannie Mae Mortgage Pool FN 256890 | | | 6.000% | | | | 9/01/37 | | | | N/R | | | | 84,735 | |
| | | | | |
| | 26 | | | Fannie Mae Mortgage Pool FN 340798 | | | 7.000% | | | | 4/01/26 | | | | N/R | | | | 26,509 | |
| | | | | |
| | 120 | | | Fannie Mae Mortgage Pool FN 545813 | | | 7.000% | | | | 7/01/32 | | | | N/R | | | | 133,487 | |
| | | | | |
| | 83 | | | Fannie Mae Mortgage Pool FN 545815 | | | 7.000% | | | | 7/01/32 | | | | N/R | | | | 94,750 | |
| | | | | |
| | 454 | | | Fannie Mae Mortgage Pool FN 555798 | | | 6.500% | | | | 5/01/33 | | | | N/R | | | | 503,377 | |
| | | | | |
| | 594 | | | Fannie Mae Mortgage Pool FN 688330 | | | 6.000% | | | | 3/01/33 | | | | N/R | | | | 661,893 | |
| | | | | |
| | 1,221 | | | Fannie Mae Mortgage Pool FN 709446 | | | 5.500% | | | | 7/01/33 | | | | N/R | | | | 1,333,237 | |
| | | | | |
| | 925 | | | Fannie Mae Mortgage Pool FN 735273 | | | 6.500% | | | | 6/01/34 | | | | N/R | | | | 1,022,570 | |
| | | | | |
| | 445 | | | Fannie Mae Mortgage Pool FN 745101 | | | 6.000% | | | | 4/01/32 | | | | N/R | | | | 479,671 | |
| | | | | |
| | 94 | | | Fannie Mae Mortgage Pool FN 781776 | | | 6.000% | | | | 10/01/34 | | | | N/R | | | | 102,900 | |
| | | | | |
| | 254 | | | Fannie Mae Mortgage Pool FN 885536 | | | 6.000% | | | | 8/01/36 | | | | N/R | | | | 278,790 | |
| | | | | |
| | 393 | | | Fannie Mae Mortgage Pool FN 900555 | | | 6.000% | | | | 9/01/36 | | | | N/R | | | | 440,777 | |
| | | | | |
| | 1,276 | | | Fannie Mae Mortgage Pool FN 932323 | | | 4.500% | | | | 12/01/39 | | | | N/R | | | | 1,341,889 | |
| | | | | |
| | — | (5) | | Fannie Mae Mortgage Pool FN 983077 | | | 5.000% | | | | 5/01/38 | | | | N/R | | | | 126 | |
| | | | | |
| | — | (5) | | Fannie Mae Mortgage Pool FN 985344 | | | 5.500% | | | | 7/01/38 | | | | N/R | | | | 83 | |
| | | | | |
| | 1,515 | | | Fannie Mae Mortgage Pool FN AC1877 | | | 4.500% | | | | 9/01/39 | | | | N/R | | | | 1,592,967 | |
| | | | | |
| | 1,367 | | | Fannie Mae Mortgage Pool FN AD4375 | | | 5.000% | | | | 5/01/40 | | | | N/R | | | | 1,461,196 | |
| | | | | |
| | 2,794 | | | Fannie Mae Mortgage Pool FN AE7265 | | | 4.000% | | | | 1/01/41 | | | | N/R | | | | 2,869,540 | |
| | | | | |
| | 1,511 | | | Fannie Mae Mortgage Pool FN AS3907 | | | 4.000% | | | | 11/01/44 | | | | N/R | | | | 1,543,727 | |
| | | | | |
| | 3,447 | | | Fannie Mae Mortgage Pool FN AS6386 | | | 3.000% | | | | 12/01/45 | | | | N/R | | | | 3,343,650 | |
| | | | | |
| | 1,943 | | | Fannie Mae Mortgage Pool FN AS6652 | | | 3.500% | | | | 2/01/46 | | | | N/R | | | | 1,939,408 | |
| | | | | |
| | 2,111 | | | Fannie Mae Mortgage Pool FN AS6880 | | | 3.500% | | | | 3/01/46 | | | | N/R | | | | 2,107,050 | |
| | | | | |
| | 3,190 | | | Fannie Mae Mortgage Pool FN AS7544 | | | 3.500% | | | | 7/01/46 | | | | N/R | | | | 3,183,857 | |
| | | | | |
| | 2,599 | | | Fannie Mae Mortgage Pool FN AT2722 | | | 3.000% | | | | 5/01/43 | | | | N/R | | | | 2,538,526 | |
| | | | | |
| | 696 | | | Fannie Mae Mortgage Pool FN MA1028 | | | 4.000% | | | | 4/01/42 | | | | N/R | | | | 714,309 | |
62
| | | | | | | | | | | | | | | | | | | | |
| | | | | |
Principal
Amount (000) | | | Description (1) | | Coupon | | | Maturity | | | Ratings (2) | | | Value | |
| | | | |
| | | | ASSET-BACKED AND MORTGAGED BACKED SECURITIES (continued) | | | | | | | | | | |
| | | | | |
| $ | 1,438 | | | Fannie Mae Mortgage Pool FN MA2484 | | | 4.000% | | | | 12/01/45 | | | | N/R | | | $ | 1,466,985 | |
| | | | | |
| | 3,179 | | | Fannie Mae Mortgage Pool FN MA3058 | | | 4.000% | | | | 7/01/47 | | | | N/R | | | | 3,244,476 | |
| | | | | |
| | 3,571 | | | Fannie Mae Mortgage Pools FN BC0823 | | | 3.500% | | | | 4/01/46 | | | | N/R | | | | 3,564,706 | |
| | | | | |
| | — | (5) | | Fannie Mae Real Estate Mortgage Investment Conduit, Pass-Through Certificates FNR 1988-24 G | | | 7.000% | | | | 10/25/18 | | | | N/R | | | | 73 | |
| | | | | |
| | — | (5) | | Fannie Mae Real Estate Mortgage Investment Conduit, Pass-Through Certificates FNR 1989-44 H | | | 9.000% | | | | 7/25/19 | | | | N/R | | | | 152 | |
| | | | | |
| | — | (5) | | Fannie Mae Real Estate Mortgage Investment Conduit, Pass-Through Certificates FNR 1989-90 E | | | 8.700% | | | | 12/25/19 | | | | N/R | | | | 268 | |
| | | | | |
| | 3 | | | Fannie Mae Real Estate Mortgage Investment Conduit, Pass-Through Certificates FNR 1990-102 J | | | 6.500% | | | | 8/25/20 | | | | N/R | | | | 3,368 | |
| | | | | |
| | 21 | | | Fannie Mae Real Estate Mortgage Investment Conduit, Pass-Through Certificates FNR 1990-105 J | | | 6.500% | | | | 9/25/20 | | | | N/R | | | | 21,279 | |
| | | | | |
| | 1 | | | Fannie Mae Real Estate Mortgage Investment Conduit, Pass-Through Certificates FNR 1990-30 E | | | 6.500% | | | | 3/25/20 | | | | N/R | | | | 580 | |
| | | | | |
| | 2 | | | Fannie Mae Real Estate Mortgage Investment Conduit, Pass-Through Certificates FNR 1990-61 H | | | 7.000% | | | | 6/25/20 | | | | N/R | | | | 1,988 | |
| | | | | |
| | 2 | | | Fannie Mae Real Estate Mortgage Investment Conduit, Pass-Through Certificates FNR 1990-72 B | | | 9.000% | | | | 7/25/20 | | | | N/R | | | | 1,735 | |
| | | | | |
| | 18 | | | Fannie Mae Real Estate Mortgage Investment Conduit, Pass-Through Certificates FNR 1991-134 Z | | | 7.000% | | | | 10/25/21 | | | | N/R | | | | 18,162 | |
| | | | | |
| | 6 | | | Fannie Mae Real Estate Mortgage Investment Conduit, Pass-Through Certificates FNR 1991-56 M | | | 6.750% | | | | 6/25/21 | | | | N/R | | | | 6,429 | |
| | | | | |
| | 2 | | | Fannie Mae Real Estate Mortgage Investment Conduit, Pass-Through Certificates FNR 1992-120 C | | | 6.500% | | | | 7/25/22 | | | | N/R | | | | 1,739 | |
| | | | | |
| | 105 | | | Fannie Mae Real Estate Mortgage Investment Conduit, Pass-Through Certificates FNR 1996-35 Z | | | 7.000% | | | | 7/25/26 | | | | N/R | | | | 113,281 | |
| | | | | |
| | 608 | | | Fannie Mae Real Estate Mortgage Investment Conduit, Pass-Through Certificates FNR 2005-62 JE | | | 5.000% | | | | 6/25/35 | | | | N/R | | | | 624,985 | |
| | | | | |
| | 647 | | | Fannie Mae REMIC Pass-Through Certificates FNW 2003-W1 B1 | | | 3.623% | | | | 12/25/42 | | | | CCC | | | | 236,185 | |
| | | | | |
| | 1,000 | | | Fannie Mae TBA, Mortgage Pool, (WI/DD) | | | 5.000% | | | | TBA | | | | N/R | | | | 1,059,204 | |
| | | | | |
| | 360 | | | Fannie Mae TBA, Mortgage Pool, (WI/DD) | | | 4.500% | | | | TBA | | | | N/R | | | | 374,829 | |
| | | | | |
| | 7,690 | | | Fannie Mae TBA, Mortgage Pool, (WI/DD) | | | 3.500% | | | | TBA | | | | N/R | | | | 7,644,814 | |
| | | | | |
| | 2 | | | Federal Home Loan Mortgage Corporation, REMIC FHR 1022 J | | | 6.000% | | | | 12/15/20 | | | | N/R | | | | 1,762 | |
| | | | | |
| | 3 | | | Federal Home Loan Mortgage Corporation, REMIC FHR 1118 Z | | | 8.250% | | | | 7/15/21 | | | | N/R | | | | 3,349 | |
| | | | | |
| | 2 | | | Federal Home Loan Mortgage Corporation, REMIC FHR 162 F | | | 7.000% | | | | 5/15/21 | | | | N/R | | | | 2,374 | |
| | | | | |
| | 2 | | | Federal Home Loan Mortgage Corporation, REMIC FHR 1790 A | | | 7.000% | | | | 4/15/22 | | | | N/R | | | | 1,726 | |
| | | | | |
| | 14 | | | Federal Home Loan Mortgage Corporation, REMIC FHR 188 H | | | 7.000% | | | | 9/15/21 | | | | N/R | | | | 14,196 | |
| | | | | |
| | 183 | | | Federal Home Loan Mortgage Corporation, REMIC FHR 3591 FP, (1-Month LIBOR reference rate + 0.600% spread), (4) | | | 2.673% | | | | 6/15/39 | | | | N/R | | | | 183,793 | |
| | | | | |
| | 1,815 | | | Fifth Third Auto Trust, Series 2017-1 | | | 1.800% | | | | 2/15/22 | | | | Aaa | | | | 1,789,668 | |
| | | | | |
| | 1,580 | | | Flagstar Mortgage Trust 2018-4, 144A | | | 4.000% | | | | 7/25/48 | | | | Aaa | | | | 1,588,695 | |
| | | | | |
| | 1,356 | | | Focus Brands Funding LLC, Asset Backed Security FOCUS 2017-1A A2II, 144A | | | 5.093% | | | | 4/30/47 | | | | BBB | | | | 1,393,218 | |
| | | | | |
| | 148 | | | Freddie Mac Mortgage Pool, Various FG A15521 | | | 6.000% | | | | 11/01/33 | | | | N/R | | | | 162,270 | |
63
Nuveen Core Plus Bond Fund (continued)
Portfolio of Investments June 30, 2018
| | | | | | | | | | | | | | | | | | | | |
| | | | | |
Principal
Amount (000) | | | Description (1) | | Coupon | | | Maturity | | | Ratings (2) | | | Value | |
| |
| | | | ASSET-BACKED AND MORTGAGED BACKED SECURITIES (continued) | |
| | | | | |
| $ | 319 | | | Freddie Mac Mortgage Pool, Various FG A17212 | | | 6.500% | | | | 7/01/31 | | | | N/R | | | $ | 355,786 | |
| | | | | |
| | 189 | | | Freddie Mac Mortgage Pool, Various FG C00676 | | | 6.500% | | | | 11/01/28 | | | | N/R | | | | 209,906 | |
| | | | | |
| | 83 | | | Freddie Mac Mortgage Pool, Various FG H09059 | | | 7.000% | | | | 8/01/37 | | | | N/R | | | | 88,680 | |
| | | | | |
| | 373 | | | Goldman Sachs Mortgage Securities Corporation, Mortgage Pass-Through Certificates, Series 2005-RP2 1A2, 144A | | | 7.500% | | | | 3/25/35 | | | | B1 | | | | 400,639 | |
| | | | | |
| | 433 | | | Goldman Sachs Mortgage Securities Corporation, Mortgage Pass-Through Certificates, Series 2005-RP3 1A2, 144A | | | 7.500% | | | | 9/25/35 | | | | B3 | | | | 461,620 | |
| | | | | |
| | 1,175 | | | Goldman Sachs Mortgage Securities Trust, Mortgage Pass-Through Certificates, Series 2015-GC32 | | | 3.345% | | | | 7/10/48 | | | | BBB– | | | | 950,491 | |
| | | | | |
| | 1,932 | | | Government National Mortgage Association Pool G2 4946 | | | 4.500% | | | | 2/20/41 | | | | N/R | | | | 2,030,318 | |
| | | | | |
| | 72 | | | Government National Mortgage Association Pool GN 537699 | | | 7.500% | | | | 11/15/30 | | | | N/R | | | | 77,431 | |
| | | | | |
| | 1,547 | | | Invitation Homes 2018-SFR2 Trust, 144A, (1-Month LIBOR reference rate + 0.900% spread), (4) | | | 2.973% | | | | 6/18/37 | | | | Aaa | | | | 1,545,936 | |
| | | | | |
| | 851 | | | Invitation Homes Trust 2017-SFR3, 144A, (1-Month LIBOR reference rate + 0.850% spread), (4) | | | 2.935% | | | | 12/19/36 | | | | Aaa | | | | 851,093 | |
| | | | | |
| | 1,910 | | | JP Morgan Chase Commercial Mortgage Securities Corporation, Pass-Through Certificates Trust 2017-MAUI, 144A, (1-Month LIBOR reference rate + 0.830% spread), (4) | | | 2.876% | | | | 7/17/34 | | | | AAA | | | | 1,908,799 | |
| | | | | |
| | 2,055 | | | JP Morgan Chase Commercial Mortgage Securities Trust, Pass-Through Certificates 2017-JP5 | | | 3.723% | | | | 3/17/50 | | | | Aaa | | | | 2,050,982 | |
| | | | | |
| | 73 | | | Master Resecuritization Trust 2009-1, 144A | | | 6.000% | | | | 10/25/36 | | | | AAA | | | | 72,596 | |
| | | | | |
| | 1,282 | | | Mid-State Capital Corporation Trust Notes, Series 2005-1 | | | 5.745% | | | | 1/15/40 | | | | AA | | | | 1,381,330 | |
| | | | | |
| | 1,290 | | | Morgan Stanley Bank of America Merrill Lynch Trust, Series 2014-C16, 144A | | | 4.913% | | | | 6/17/47 | | | | BBB– | | | | 1,141,018 | |
| | | | | |
| | 895 | | | Morgan Stanley Bank of America Merrill Lynch Trust, Series 2015-C22, 144A | | | 4.382% | | | | 4/17/48 | | | | BBB– | | | | 761,948 | |
| | | | | |
| | 446 | | | Mortgage Asset Securitization Transaction Inc., Alternative Loan Trust Mortgage Pass-Through Certificates Series 2004-1 | | | 7.000% | | | | 1/25/34 | | | | BBB– | | | | 454,504 | |
| | | | | |
| | 1,455 | | | New Residential Advance Receivable Trust, Series 2017-T1, 144A | | | 4.002% | | | | 2/15/51 | | | | BBB | | | | 1,426,231 | |
| | | | | |
| | 1,360 | | | New Residential Mortgage Loan Trust, Mortgage Pass-Through Certificates, Series 2017-6A, 144A | | | 4.000% | | | | 8/25/57 | | | | Aaa | | | | 1,372,351 | |
| | | | | |
| | 1,915 | | | OMART Receivables Trust, Series 2016-T2, 144A | | | 4.446% | | | | 8/16/49 | | | | BBB | | | | 1,915,829 | |
| | | | | |
| | 1,907 | | | Shellpoint Co-Originator Trust, Series 2017-2, 144A | | | 3.500% | | | | 10/25/47 | | | | Aaa | | | | 1,886,476 | |
| | | | | |
| | 1,433 | | | Starwood Waypoint Homes Trust, 2017-1, 144A, (1-Month LIBOR + 0.950% spread), (4) | | | 3.035% | | | | 1/22/35 | | | | Aaa | | | | 1,438,838 | |
| | | | | |
| | 862 | | | Taco Bell Funding LLC, Series 2016-1A, 144A | | | 4.377% | | | | 5/25/46 | | | | BBB | | | | 874,329 | |
| | | | | |
| | 1,400 | | | Tricon American Homes Trust, Series 2017-SFRI, 144A | | | 2.716% | | | | 9/19/34 | | | | Aaa | | | | 1,350,863 | |
| | | | | |
| | 1,920 | | | United States Department of Veterans, Affairs, Guaranteed REMIC Pass-Through Certificates, Vendee Mortgage Trust, Series 2011-1 | | | 3.750% | | | | 2/15/35 | | | | N/R | | | | 1,940,100 | |
| | | | | |
| | 1,435 | | | Volkswagen Auto Loan Enhanced, (WI/DD) | | | 2.810% | | | | 7/20/21 | | | | AAA | | | | 1,434,988 | |
| | | | | |
| | 980 | | | Wachovia Mortgage Loan Trust LLC, Mortgage Pass-Through Certificates, Series 2005-B | | | 3.802% | | | | 10/20/35 | | | | D | | | | 960,134 | |
| | | | | |
| | 2,650 | | | Wells Fargo Commercial Mortgage Trust, Commercial Mortgage Pass-Through Certificates, Series 2015-C29 | | | 3.637% | | | | 6/17/48 | | | | Aaa | | | | 2,652,446 | |
| | | | | |
| | 920 | | | Wells Fargo Commercial Mortgage Trust, Commercial Mortgage Pass-Through Certificates, Series 2015-C30, 144A | | | 4.646% | | | | 9/17/58 | | | | BBB– | | | | 822,242 | |
| | | | | |
| | 1,240 | | | World Omni Auto Receivables Trust, Series 2016-B | | | 1.300% | | | | 2/15/22 | | | | AAA | | | | 1,224,320 | |
| $ | 127,118 | | | Total Asset-Backed and Mortgaged-Backed Securities (cost $126,985,341) | | | | | | | | 127,029,007 | |
64
| | | | | | | | | | | | | | | | | | | | |
| | | | | |
| Shares | | | Description (1) | | Coupon | | | Maturity | | | Ratings (2) | | | Value | |
| |
| | | | $1,000 PAR (OR SIMILAR) INSTITUTIONAL PREFERRED – 6.4% | |
| | | | | |
| | | | Automobiles – 0.1% | | | | | | | | | | | | |
| | | | | |
| | 155 | | | General Motors Financial Company Inc., (3) | | | 5.750% | | | | N/A (6) | | | | BB+ | | | $ | 148,606 | |
| | | | | |
| | | | Banks – 1.6% | | | | | | | | | | | | |
| | | | | |
| | 890 | | | Bank of America Corp | | | 5.875% | | | | N/A (6) | | | | BBB– | | | | 869,975 | |
| | | | | |
| | 835 | | | Bank of America Corporation | | | 6.300% | | | | N/A (6) | | | | BBB– | | | | 882,846 | |
| | | | | |
| | 1,500 | | | JP Morgan Chase & Company | | | 6.750% | | | | N/A (6) | | | | BBB | | | | 1,631,250 | |
| | | | | |
| | 1,100 | | | KeyCorp Convertible Preferred Stock | | | 5.000% | | | | N/A (6) | | | | Baa3 | | | | 1,070,300 | |
| | | | | |
| | 1,085 | | | SunTrust Bank Inc. | | | 5.050% | | | | N/A (6) | | | | Baa3 | | | | 1,064,602 | |
| | 5,410 | | | Total Banks | | | | | | | | | | | | | | | 5,518,973 | |
| | | | | |
| | | | Capital Markets – 0.7% | | | | | | | | | | | | | | | | |
| | | | | |
| | 755 | | | Bank of New York Mellon | | | 4.950% | | | | N/A (6) | | | | Baa1 | | | | 771,950 | |
| | | | | |
| | 780 | | | Goldman Sachs Group Inc. | | | 5.300% | | | | N/A (6) | | | | Ba1 | | | | 762,450 | |
| | | | | |
| | 625 | | | State Street Corporation | | | 5.250% | | | | N/A (6) | | | | Baa1 | | | | 642,031 | |
| | 2,160 | | | Total Capital Markets | | | | | | | | | | | | | | | 2,176,431 | |
| | | | | |
| | | | Commercial Services & Supplies – 0.2% | | | | | | | | | | | | | | | | |
| | | | | |
| | 770 | | | AerCap Global Aviation Trust, 144A | | | 6.500% | | | | 6/15/45 | | | | Ba1 | | | | 793,100 | |
| | | | | |
| | | | Consumer Finance – 0.7% | | | | | | | | | | | | |
| | | | | |
| | 985 | | | American Express Company | | | 5.200% | | | | N/A (6) | | | | Baa2 | | | | 998,544 | |
| | | | | |
| | 1,165 | | | Capital One Financial Corporation | | | 5.550% | | | | N/A (6) | | | | Baa3 | | | | 1,190,280 | |
| | 2,150 | | | Total Consumer Finance | | | | | | | | | | | | | | | 2,188,824 | |
| | | | | |
| | | | Food Products – 0.4% | | | | | | | | | | | | | | | | |
| | | | | |
| | 1,300 | | | Land O’ Lakes Incorporated, 144A | | | 8.000% | | | | N/A (6) | | | | BB | | | | 1,430,000 | |
| | | | | |
| | | | Industrial Conglomerates – 0.5% | | | | | | | | | | | | | | | | |
| | | | | |
| | 1,851 | | | General Electric Capital Corporation | | | 5.000% | | | | N/A (6) | | | | BBB+ | | | | 1,826,012 | |
| | | | | |
| | | | Insurance – 2.2% | | | | | | | | | | | | |
| | | | | |
| | 1,220 | | | Aegon NV | | | 5.500% | | | | | | | | Baa1 | | | | 1,171,246 | |
| | | | | |
| | 1,000 | | | Allstate Corporation | | | 5.750% | | | | 8/15/53 | | | | Baa1 | | | | 1,027,500 | |
| | | | | |
| | 1,220 | | | American International Group Inc. | | | 5.750% | | | | 4/01/48 | | | | Baa2 | | | | 1,201,700 | |
| | | | | |
| | 1,245 | | | MetLife Inc. | | | 5.250% | | | | N/A (6) | | | | BBB | | | | 1,266,538 | |
| | | | | |
| | 1,395 | | | Principal Financial Group | | | 4.700% | | | | 5/15/55 | | | | BBB | | | | 1,398,488 | |
| | | | | |
| | 1,500 | | | Prudential Financial Inc. | | | 5.200% | | | | 3/15/44 | | | | BBB+ | | | | 1,494,375 | |
| | 7,580 | | | Total Insurance | | | | | | | | | | | | | | | 7,559,847 | |
| $ | 21,376 | | | Total $1,000 Par (or similar) Institutional Preferred (cost $21,201,330) | | | | | | | | 21,641,793 | |
| | | | | |
Principal
Amount (000) (7) | | | Description (1) | | Coupon | | | Maturity | | | Ratings (2) | | | Value | |
| | | | | |
| | | | SOVEREIGN DEBT – 4.4% | | | | | | | | | | | | | | | | |
| | | | | |
| | | | Argentina – 0.3% | | | | | | | | | | | | |
| | | | | |
| $ | 1,100 | | | Republic of Argentina. | | | 6.875% | | | | 1/11/48 | | | | B+ | | | $ | 828,311 | |
65
Nuveen Core Plus Bond Fund (continued)
Portfolio of Investments June 30, 2018
| | | | | | | | | | | | | | | | | | | | |
| | | | | |
Principal
Amount (000) (7) | | | Description (1) | | Coupon | | | Maturity | | | Ratings (2) | | | Value | |
| | | | | |
| | | | Egypt – 0.3% | | | | | | | | | | | | |
| | | | | |
| $ | 1,200 | | | Egypt Government International Bond, 144A | | | 5.577% | | | | 2/21/23 | | | | B | | | $ | 1,137,000 | |
| | | | | |
| | | | Germany – 2.1% | | | | | | | | | | | | |
| | | | | |
| | 2,800 | EUR | | Bundesrepublik Deutschland Bundesanleihe, Reg S | | | 0.500% | | | | 2/15/28 | | | | Aaa | | | | 3,326,648 | |
| | | | | |
| | 3,100 | EUR | | Deutschland Republic, Reg S | | | 0.250% | | | | 2/15/27 | | | | Aaa | | | | 3,637,869 | |
| | | | Total Germany | | | | | | | | | | | | | | | 6,964,517 | |
| | | | | |
| | | | Honduras – 0.2% | | | | | | | | | | | | | | | | |
| | | | | |
| | 700 | | | Honduras Government, 144A | | | 8.750% | | | | 12/16/20 | | | | BB– | | | | 756,665 | |
| | | | | |
| | | | Oman – 0.4% | | | | | | | | | | | | |
| | | | | |
| | 1,250 | | | Oman Government International Bond, 144A | | | 5.625% | | | | 1/17/28 | | | | Baa3 | | | | 1,176,562 | |
| | | | | |
| | | | Saudi Arabia – 0.7% | | | | | | | | | | | | |
| | | | | |
| | 2,450 | | | Saudi Government International Bond, 144A | | | 4.000% | | | | 4/17/25 | | | | A1 | | | | 2,437,897 | |
| | | | | |
| | | | Sri Lanka – 0.4% | | | | | | | | | | | | |
| | | | | |
| | 700 | | | Republic of Sri Lanka, 144A | | | 6.125% | | | | 6/03/25 | | | | B+ | | | | 654,104 | |
| | | | | |
| | 850 | | | Sri Lanka Government International Bond, 144A | | | 6.750% | | | | 4/18/28 | | | | B1 | | | | 802,103 | |
| | | | Total Sri Lanka | | | | | | | | | | | | | | | 1,456,207 | |
| | | | Total Sovereign Debt (cost $15,111,410) | | | | | | | | | | | | | | | 14,757,159 | |
| | | | | |
Principal
Amount (000) | | | Description (1) | | Coupon | | | Maturity | | | Ratings (2) | | | Value | |
| | | |
| | | | U.S. GOVERNMENT AND AGENCY OBLIGATIONS – 3.1% | | | | | | | | | |
| | | | | |
| $ | 5,285 | | | United States of America Treasury Bonds | | | 2.750% | | | | 11/15/47 | | | | Aaa | | | $ | 5,037,472 | |
| | | | | |
| | 3,616 | | | United States Treasury Notes. | | | 0.500% | | | | 1/15/28 | | | | Aaa | | | | 3,537,052 | |
| | | | | |
| | 2,100 | | | United States Treasury Notes | | | 1.750% | | | | 9/30/22 | | | | Aaa | | | | 2,019,363 | |
| $ | 11,001 | | | Total U.S. Government and Agency Obligations (cost $10,708,049) | | | | | | | | | | | | | | | 10,593,887 | |
| | | | | |
Principal
Amount (000) | | | Description (1) | | Coupon | | | Maturity | | | Ratings (2) | | | Value | |
| | | |
| | | | CONTINGENT CAPITAL SECURITIES – 2.7% (8) | | | | | | | | | |
| | | | | |
| | | | Banks – 2.1% | | | | | | | | | | | | |
| | | | | |
| $ | 770 | | | Australia and New Zealand Banking Group Limited of the United Kingdom, 144A | | | 6.750% | | | | N/A (6) | | | | Baa2 | | | $ | 782,513 | |
| | | | | |
| | 2,270 | | | Credit Agricole SA, 144A | | | 7.875% | | | | N/A (6) | | | | BBB– | | | | 2,315,400 | |
| | | | | |
| | 1,525 | | | Nordea Bank AB, 144A | | | 6.125% | | | | N/A (6) | | | | BBB | | | | 1,488,781 | |
| | | | | |
| | 870 | | | Societe Generale SA, 144A | | | 6.750% | | | | N/A (6) | | | | BB+ | | | | 798,225 | |
| | | | | |
| | 590 | | | Standard Chartered PLC, 144A | | | 7.500% | | | | N/A (6) | | | | Ba1 | | | | 604,750 | |
| | | | | |
| | 1,230 | | | UniCredit SpA, Reg S | | | 8.000% | | | | N/A (6) | | | | B+ | | | | 1,152,820 | |
| | 7,255 | | | Total Banks | | | | | | | | | | | | | | | 7,142,489 | |
| | | | | |
| | | | Capital Markets – 0.3% | | | | | | | | | | | | | | | | |
| | | | | |
| | 925 | | | UBS Group AG, Reg S | | | 7.000% | | | | N/A (6) | | | | BBB– | | | | 937,719 | |
66
| | | | | | | | | | | | | | | | | | | | |
| | | | | |
Principal
Amount (000) | | | Description (1) | | Coupon | | | Maturity | | | Ratings (2) | | | Value | |
| | | | | |
| | | | Diversified Financial Services – 0.3% | | | | | | | | | | | | |
| | | | | |
| $ | 1,175 | | | BNP Paribas, 144A | | | 7.375% | | | | N/A (6) | | | | BBB– | | | $ | 1,201,437 | |
| $ | 9,355 | | | Total Contingent Capital Securities (cost $10,053,133) | | | | | | | | 9,281,645 | |
| | | | | |
Principal
Amount (000) | | | Description (1) | | Optional Call
Provisions (9) | | | | | | Ratings (2) | | | Value | |
| | | | | |
| | | | MUNICIPAL BONDS – 0.3% | | | | | | | | | | | | | | | | |
| | | | | |
| | | | Georgia – 0.3% | | | | | | | | | | | | |
| | | | | |
| $ | 750 | | | Georgia Municipal Electric Authority, Plant Vogtle Units 3 & 4 Project P Bonds, Refunding Taxable Build America Bonds Series 2010A, 7.055%, 4/01/57 | | | No Opt. Call | | | | | | | | A– | | | $ | 906,705 | |
| $ | 750 | | | Total Municipal Bonds (cost $815,869) | | | | | | | | | | | | | | | 906,705 | |
| | | | Total Long-Term Investments (cost $339,786,375) | | | | | | | | 335,695,588 | |
| | | | | |
| Shares | | | Description (1) | | Coupon | | | | | | | | | Value | |
| | |
| | | | INVESTMENTS PURCHASED WITH COLLATERAL FROM SECURITIES LENDING – 1.0% | | | | | |
| | | | | |
| | | | Money Market Funds – 1.0% | | | | | | | | | | | | |
| | | | | |
| | 3,480,585 | | | First American Government Obligations Fund, Class X, (10) | | | 1.806% (11) | | | | | | | | | | | $ | 3,480,585 | |
| | | | Total Investments Purchased with Collateral from Securities Lending (cost $3,480,585) | | | | | | | | | | | | 3,480,585 | |
| | | | | |
| Shares | | | Description (1) | | Coupon | | | | | | | | | Value | |
| | | | | |
| | | | SHORT-TERM INVESTMENTS – 1.0% | | | | | | | | | | | | | | | | |
| | | | | |
| | | | Money Market Funds – 1.0% | | | | | | | | | | | | |
| | | | | |
| | 3,373,159 | | | First American Treasury Obligations Fund, Class Z | | | 1.754% (11) | | | | | | | | | | | $ | 3,373,159 | |
| | | | Total Short-Term Investments (cost $3,373,159) | | | | | | | | 3,373,159 | |
| | | | Total Investments (cost $346,640,119) – 101.1% | | | | | | | | 342,549,332 | |
| | | | Other Assets Less Liabilities – (1.1)% (12) | | | | | | | | (3,824,968 | ) |
| | | | Net Assets – 100% | | | | | | | | | | | | | | $ | 338,724,364 | |
Investments in Derivatives
Forward Foreign Currency Contracts
| | | | | | | | | | | | | | | | | | | | | | |
| Currency Purchased | | Notional Amount
(Local Currency) | | Currency Sold | | | Notional Amount
(Local Currency) | | | Counterparty | | | Settlement
Date | | | Unrealized
Appreciation
(Depreciation) | |
| U.S. Dollar | | 3,400,122 | | | Euro | | | | 2,900,000 | | | | Bank of America, N.A. | | | | 8/08/18 | | | $ | 3,198 | |
| U.S. Dollar | | 3,593,976 | | | Euro | | | | 3,065,000 | | | | Bank of America, N.A. | | | | 8/08/18 | | | | 3,778 | |
Total | | | | | | | | | | | | | | | | | | | | $ | 6,976 | |
Total unrealized appreciation on forward foreign currency contracts | | | | | | | | | | | | | | | $ | 6,976 | |
Total unrealized depreciation on forward foreign currency contracts | | | | | | | | | | | | | | | $ | — | |
67
Nuveen Core Plus Bond Fund (continued)
Portfolio of Investments June 30, 2018
Futures Contracts
| | | | | | | | | | | | | | | | | | | | | | | | | | | | |
| Description | | Contract
Position | | | Number of
Contracts | | | Expiration
Date | | | Notional
Amount* | | | Value | | | Unrealized
Appreciation
(Depreciation) | | | Variation
Margin
Receivable/
(Payable) | |
Eurex Euro-Bund | | | Long | | | | 24 | | | | 9/18 | | | $ | 4,506,895 | | | $ | 4,555,827 | | | $ | 48,932 | | | $ | 2,523 | |
U.S. Treasury 5-Year Note | | | Long | | | | 63 | | | | 9/18 | | | | 7,142,400 | | | | 7,157,883 | | | | 15,483 | | | | (1,476 | ) |
U.S. Treasury 10-Year Note | | | Short | | | | (426 | ) | | | 9/18 | | | | (50,946,365 | ) | | | (51,199,875 | ) | | | (253,510 | ) | | | — | |
U.S. Treasury Long Bond | | | Long | | | | 84 | | | | 9/18 | | | | 12,028,904 | | | | 12,180,000 | | | | 151,096 | | | | 2,625 | |
U.S. Treasury Ultra 10-Year Note | | | Short | | | | (94 | ) | | | 9/18 | | | | (12,048,279 | ) | | | (12,054,031 | ) | | | (5,752 | ) | | | 406 | |
U.S. Treasury Ultra Bond | | | Long | | | | 69 | | | | 9/18 | | | | 10,779,186 | | | | 11,009,812 | | | | 230,626 | | | | (4,313 | ) |
Total | | | | | | | | | | | | | | $ | (28,537,259 | ) | | $ | (28,350,384 | ) | | $ | 186,875 | | | $ | (235 | ) |
Total receivable for variation margin on futures contracts | | | | | | | | | | | $ | 5,554 | |
Total payable for variation margin on futures contracts | | | | | | | | | | | $ | (5,789 | ) |
| * | The aggregate notional amount of long and short positions is $34,457,385 and $(62,994,644), respectively. |
For Fund portfolio compliance purposes, the Fund’s industry classifications refer to any one or more of the industry sub-classifications used by one or more widely recognized market indexes or ratings group indexes, and/or as defined by Fund management. This definition may not apply for purposes of this report, which may combine industry sub-classifications into sectors for reporting ease.
| (1) | All percentages shown in the Portfolio of Investments are based on net assets. |
| (2) | For financial reporting purposes, the ratings disclosed are the highest of Standard & Poor’s Group (“Standard & Poor’s”), Moody’s Investors Service, Inc. (“Moody’s”) or Fitch, Inc. (“Fitch”) rating. This treatment of split-rated securities may differ from that used for other purposes, such as for Fund investment policies. Ratings below BBB by Standard & Poor’s, Baa by Moody’s or BBB by Fitch are considered to be below investment grade. Holdings designated N/R are not rated by any of these national rating agencies. Ratings are not covered by the report of independent registered public accounting firm. |
| (3) | Investment, or a portion of investment, is out on loan for securities lending. The total value of the securities out on loan as of the end of the reporting period was $3,352,165. |
| (4) | Variable rate security. The rate shown is the coupon as of the end of the reporting period. |
| (5) | Principal Amount (000) rounds to less than $1,000. |
| (6) | Perpetual security. Maturity date is not applicable. |
| (7) | Principal Amount (000) denominated in U.S. Dollars, unless otherwise noted. |
| (8) | Contingent Capital Securities (“CoCos”) are hybrid securities with loss absorption characteristics built into the terms of the security for the benefit of the issuer. For example, the terms may specify an automatic write-down of principal or a mandatory conversion into the issuer’s common stock under certain adverse circumstances, such as the issuer’s capital ratio falling below a specified level. |
| (9) | Optional Call Provisions: Dates (month and year) and prices of the earliest optional call or redemption. There may be other call provisions at varying prices at later dates. Certain mortgagebacked securities may be subject to periodic principal paydowns. Optional Call Provisions are not covered by the report of independent registered public accounting firm. |
| (10) | The Fund may loan securities representing up to one third of the fair value of its total assets (which includes collateral for securities on loan) to broker-dealers, banks and other institutions. The Fund maintains collateral equal to at least 100% of the fair value of the securities loaned. The cash collateral received by the Fund is invested in this money market fund. See Notes to Financial Statements, Note 3 – Portfolio Securities and Investments in Derivatives, Securities Lending for more information. |
| (11) | The rate shown is the annualized seven-day subsidized yield as of the end of the reporting period. |
| (12) | Other assets less liabilities includes the unrealized appreciation (depreciation) of certain over-the-counter (“OTC”) derivatives as presented on the Statement of Assets and Liabilities, when applicable. The unrealized appreciation (depreciation) of OTC cleared and exchange-traded derivatives is recognized as part of the cash collateral at brokers and/or receivable or payable for variation margin as presented on the Statement of Assets and Liabilities, when applicable. |
| 144A | Investment is exempt from registration under Rule 144A of the Securities Act of 1933, as amended. These investments may only be resold in transactions exempt from registration, which are normally those transactions with qualified institutional buyers. |
| LIBOR | London Inter-Bank Offered Rate |
| Reg S | Regulation S allows U.S. companies to sell securities to persons or entities located outside of the United States without registering those securities with the Securities and Exchange Commission. Specifically, Regulation S provides a safe harbor from the registration requirements of the Securities Act for the offers and sales of securities by both foreign and domestic issuers that are made outside the United States. |
| TBA | To be announced. Maturity date not known prior to settlement of this transaction. |
| WI/DD | Investment, or portion of investment, purchased on a when-issued or delayed delivery basis. |
See accompanying notes to financial statements.
68
Nuveen High Income Bond Fund
Portfolio of Investments June 30, 2018
| | | | | | | | | | | | | | | | | | | | | | | | | | | | |
Principal
Amount (000) (1) | | | Description (2) | | Coupon | | | | | | | | | Maturity | | | Ratings (3) | | | Value | |
| | | | | | | |
| | | | LONG-TERM INVESTMENTS – 97.8% | | | | | | | | | | | | | | | | | | | | | | | | |
| | | | | | | |
| | | | CORPORATE BONDS – 84.9% | | | | | | | | | | | | | | | | | | | | | | | | |
| | | | | | | |
| | | | Aerospace & Defense – 0.3% | | | | | | | | | | | | | | | | | | |
| | | | | | | |
| $ | 1,000 | | | Arconic Inc. | | | 5.900% | | | | | | | | | | | | 2/01/27 | | | | BBB– | | | $ | 1,007,500 | |
| | | | | | | |
| | | | Airlines – 0.7% | | | | | | | | | | | | | | | | | | |
| | | | | | | |
| | 2,000 | | | Virgin Australia Holdings Limited, 144A | | | 7.875% | | | | | | | | | | | | 10/15/21 | | | | B– | | | | 1,990,000 | |
| | | | | | | |
| | | | Automobiles – 0.3% | | | | | | | | | | | | | | | | | | |
| | | | | | | |
| | 910 | | | Jaguar Land Rover Automotive PLC, 144A | | | 4.500% | | | | | | | | | | | | 10/01/27 | | | | BB+ | | | | 812,175 | |
| | | | | | | |
| | | | Banks – 0.5% | | | | | | | | | | | | | | | | | | |
| | | | | | | |
| | 1,300 | | | Curo Financial Technologies Corporation, 144A | | | 12.000% | | | | | | | | | | | | 3/01/22 | | | | B– | | | | 1,410,500 | |
| | | | | | | |
| | | | Building Products – 0.6% | | | | | | | | | | | | | | | | | | |
| | | | | | | |
| | 2,000 | | | Ashton Woods USA LLC / Ashton Woods Finance Company, 144A | | | 6.750% | | | | | | | | | | | | 8/01/25 | | | | B– | | | | 1,900,000 | |
| | | | | | | |
| | | | Capital Markets – 1.4% | | | | | | | | | | | | | | | | | | |
| | | | | | | |
| | 1,750 | | | DKT Finance ApS, 144A, (WI/DD) | | | 9.375% | | | | | | | | | | | | 6/17/23 | | | | B– | | | | 1,769,687 | |
| | | | | | | |
| | 2,325 | | | Donnelley Financial Solutions, Inc. | | | 8.250% | | | | | | | | | | | | 10/15/24 | | | | B | | | | 2,435,438 | |
| | | | Total Capital Markets | | | | | | | | | | | | | | | | | | | | | | | 4,205,125 | |
| | | | | | | |
| | | | Chemicals – 5.4% | | | | | | | | | | | | | | | | | | |
| | | | | | | |
| | 1,500 | | | CF Industries Inc. | | | 5.375% | | | | | | | | | | | | 3/15/44 | | | | BB+ | | | | 1,323,750 | |
| | | | | | | |
| | 1,077 | | | CVR Partners LP / CVR Nitrogen Finance Corp., 144A | | | 9.250% | | | | | | | | | | | | 6/15/23 | | | | B+ | | | | 1,109,310 | |
| | | | | | | |
| | 2,500 | | | FXI Holdings, Inc., 144A | | | 7.875% | | | | | | | | | | | | 11/01/24 | | | | B | | | | 2,443,750 | |
| | | | | | | |
| | 3,000 | | | Hexion Inc. | | | 6.625% | | | | | | | | | | | | 4/15/20 | | | | CCC+ | | | | 2,809,200 | |
| | | | | | | |
| | 2,000 | | | NOVA Chemicals Corporation, 144A | | | 5.250% | | | | | | | | | | | | 8/01/23 | | | | BBB– | | | | 1,995,000 | |
| | | | | | | |
| | 1,750 | | | OCI NV, 144A | | | 6.625% | | | | | | | | | | | | 4/15/23 | | | | BB– | | | | 1,777,475 | |
| | | | | | | |
| | 2,800 | | | Rayonier AM Products Inc., 144A, (4) | | | 5.500% | | | | | | | | | | | | 6/01/24 | | | | BB– | | | | 2,632,000 | |
| | | | | | | |
| | 2,500 | | | Tronox Inc., 144A | | | 6.500% | | | | | | | | | | | | 4/15/26 | | | | B– | | | | 2,484,375 | |
| | | | Total Chemicals | | | | | | | | | | | | | | | | | | | | | | | 16,574,860 | |
| | | | | | | |
| | | | Commercial Services & Supplies – 3.2% | | | | | | | | | | | | | | | | | | |
| | | | | | | |
| | 1,500 | | | ADT Corp/The | | | 4.125% | | | | | | | | | | | | 6/15/23 | | | | BB– | | | | 1,406,250 | |
| | | | | | | |
| | 825 | | | APX Group, Inc. | | | 7.875% | | | | | | | | | | | | 12/01/22 | | | | B1 | | | | 819,844 | |
| | | | | | | |
| | 2,000 | | | APX Group, Inc., (4) | | | 7.625% | | | | | | | | | | | | 9/01/23 | | | | CCC | | | | 1,775,000 | |
| | | | | | | |
| | 1,800 | | | Arch Merger Sub Inc., 144A, (4) | | | 8.500% | | | | | | | | | | | | 9/15/25 | | | | B– | | | | 1,678,500 | |
| | | | | | | |
| | 2,600 | | | Brinks Company, 144A | | | 4.625% | | | | | | | | | | | | 10/15/27 | | | | BB+ | | | | 2,405,000 | |
| | | | | | | |
| | 2,000 | | | Olympus Merger Sub, Inc., 144A | | | 8.500% | | | | | | | | | | | | 10/15/25 | | | | B3 | | | | 1,825,000 | |
| | | | Total Commercial Services & Supplies | | | | | | | | | | | | | | | | | | | | | | | 9,909,594 | |
| | | | | | | |
| | | | Construction & Engineering – 1.4% | | | | | | | | | | | | | | | | | | |
| | | | | | | |
| | 2,000 | | | HC2 Holdings, Inc., 144A | | | 11.000% | | | | | | | | | | | | 12/01/19 | | | | B– | | | | 2,030,000 | |
69
Nuveen High Income Bond Fund (continued)
Portfolio of Investments June 30, 2018
| | | | | | | | | | | | | | | | | | | | | | | | | | | | |
Principal
Amount (000) (1) | | | Description (2) | | Coupon | | | | | | | | | Maturity | | | Ratings (3) | | | Value | |
| | | | | | | |
| | | | Construction & Engineering (continued) | | | | | | | | | | | | | | | | | | |
| | | | | | | |
| $ | 1,500 | | | Michael Baker Holdings LLC Finance Corporation, 144A | | | 8.750% | | | | | | | | | | | | 3/01/23 | | | | Caa1 | | | $ | 1,462,500 | |
| | | | | | | |
| | 750 | | | New Enterprise Stone & Lime Co Inc., 144A | | | 6.250% | | | | | | | | | | | | 3/15/26 | | | | B+ | | | | 757,500 | |
| | | | Total Construction & Engineering | | | | | | | | | | | | | | | | | | | | | | | 4,250,000 | |
| | | | | | | |
| | | | Consumer Finance – 1.8% | | | | | | | | | | | | | | | | | | |
| | | | | | | |
| | 1,500 | | | Enova International, Inc., 144A | | | 8.500% | | | | | | | | | | | | 9/01/24 | | | | B– | | | | 1,552,500 | |
| | | | | | | |
| | 1,000 | | | Navient Corporation | | | 5.500% | | | | | | | | | | | | 1/25/23 | | | | BB | | | | 982,500 | |
| | | | | | | |
| | 3,000 | | | TMX Finance LLC / TitleMax Finance Corp, 144A | | | 11.125% | | | | | | | | | | | | 4/01/23 | | | | B– | | | | 3,045,000 | |
| | | | Total Consumer Finance | | | | | | | | | | | | | | | | | | | | | | | 5,580,000 | |
| | | | | | | |
| | | | Distributors – 0.7% | | | | | | | | | | | | | | | | | | |
| | | | | | | |
| | 2,250 | | | American Builders & Contractors Supply Co Inc., 144A | | | 5.875% | | | | | | | | | | | | 5/15/26 | | | | B+ | | | | 2,213,437 | |
| | | | | |
| | | | Diversified Financial Services – 4.9% | | | | | | | | | | | | | |
| | | | | | | |
| | 2,000 | | | Avation Capital SA, 144A | | | 6.500% | | | | | | | | | | | | 5/15/21 | | | | BB– | | | | 2,010,000 | |
| | | | | | | |
| | 2,470 | | | CNG Holdings Inc., 144A | | | 9.375% | | | | | | | | | | | | 5/15/20 | | | | CCC+ | | | | 2,451,475 | |
| | | | | | | |
| | 2,500 | | | Cometa Energia SA de CV, 144A | | | 6.375% | | | | | | | | | | | | 4/24/35 | | | | BBB | | | | 2,399,250 | |
| | | | | | | |
| | 1,750 | | | Jefferies Finance LLC Corporation, 144A | | | 7.250% | | | | | | | | | | | | 8/15/24 | | | | BB– | | | | 1,715,000 | |
| | | | | | | |
| | 2,750 | | | Park Aerospace Holdings Limited, 144A | | | 5.500% | | | | | | | | | | | | 2/15/24 | | | | BB | | | | 2,715,048 | |
| | | | | | | |
| | 1,500 | | | Quicken Loans Inc., 144A | | | 5.250% | | | | | | | | | | | | 1/15/28 | | | | Ba1 | | | | 1,383,450 | |
| | | | | | | |
| | 1,000 | | | Stoneway Capital Corporation, 144A | | | 10.000% | | | | | | | | | | | | 3/01/27 | | | | B | | | | 1,000,130 | |
| | | | | | | |
| | 1,500 | | | Ziggo Secured Finance BV, 144A | | | 5.500% | | | | | | | | | | | | 1/15/27 | | | | BB | | | | 1,401,150 | |
| | | | Total Diversified Financial Services | | | | | | | | | | | | | | | | | | | | | | | 15,075,503 | |
| | | | | |
| | | | Diversified Telecommunication Services – 5.8% | | | | | | | | | | | | | |
| | | | | | | |
| | 2,000 | | | Embarq Corporation | | | 7.995% | | | | | | | | | | | | 6/01/36 | | | | BB | | | | 1,887,500 | |
| | | | | | | |
| | 2,425 | | | GCI Inc. | | | 6.875% | | | | | | | | | | | | 4/15/25 | | | | B+ | | | | 2,510,603 | |
| | | | | | | |
| | 1,500 | | | IntelSat Jackson Holdings | | | 5.500% | | | | | | | | | | | | 8/01/23 | | | | CCC+ | | | | 1,345,800 | |
| | | | | | | |
| | 1,500 | | | IntelSat Limited | | | 8.125% | | | | | | | | | | | | 6/01/23 | | | | CCC– | | | | 1,211,250 | |
| | | | | | | |
| | 1,900 | | | Level 3 Financing Inc. | | | 5.250% | | | | | | | | | | | | 3/15/26 | | | | BB | | | | 1,807,090 | |
| | | | | | | |
| | 2,000 | | | Telecom Italia SpA, 144A | | | 5.303% | | | | | | | | | | | | 5/30/24 | | | | BBB– | | | | 1,972,500 | |
| | | | | | | |
| | 3,000 | | | Telenet Finance Luxembourg Notes Sarl, 144A | | | 5.500% | | | | | | | | | | | | 3/01/28 | | | | BB+ | | | | 2,726,040 | |
| | | | | | | |
| | 1,164 | | | Windstream Corporation, (4) | | | 7.750% | | | | | | | | | | | | 10/15/20 | | | | B | | | | 1,044,690 | |
| | | | | | | |
| | 3,174 | | | Xplornet Communications, Inc., 144A, (cash 9.625%, PIK 10.625%) | | | 9.625% | | | | | | | | | | | | 6/01/22 | | | | CCC | | | | 3,300,569 | |
| | | | Total Diversified Telecommunication Services | | | | | | | | | | | | | | | | | | | | | | | 17,806,042 | |
| | | | | | | |
| | | | Electric Utilities – 0.4% | | | | | | | | | | | | | | | | | | |
| | | | | | | |
| | 1,350 | | | ACWA Power Management And Investment One Ltd, 144A | | | 5.950% | | | | | | | | | | | | 12/15/39 | | | | BBB– | | | | 1,318,788 | |
| | | | | | | |
| | 1,000 | | | Texas Competitive Electric Holdings Co LLC / TCEH Finance, Inc., 144A | | | 11.500% | | | | | | | | | | | | 10/01/20 | | | | N/R | | | | 10 | |
| | | | Total Electric Utilities | | | | | | | | | | | | | | | | | | | | | | | 1,318,798 | |
| | | | | | | |
| | | | Energy Equipment & Services – 1.5% | | | | | | | | | | | | | | | | | | |
| | | | | | | |
| | 1,500 | | | Ensco PLC. | | | 7.750% | | | | | | | | | | | | 2/01/26 | | | | BB– | | | | 1,417,050 | |
70
| | | | | | | | | | | | | | | | | | | | | | | | | | | | |
Principal
Amount (000) (1) | | | Description (2) | | Coupon | | | | | | | | | Maturity | | | Ratings (3) | | | Value | |
| | | | |
| | | | Energy Equipment & Services (continued) | | | | | | | | | | |
| | | | | | | |
| $ | 771 | | | Murray Energy Corp, 144A | | | 11.250% | | | | | | | | | | | | 4/15/21 | | | | CCC | | | $ | 462,600 | |
| | | | | | | |
| | 1,170 | | | Pacific Drilling V Limited, 144A, (5) | | | 7.250% | | | | | | | | | | | | 12/01/18 | | | | N/R | | | | 585,000 | |
| | | | | | | |
| | 3,029 | | | Parker Drilling Company, (4) | | | 6.750% | | | | | | | | | | | | 7/15/22 | | | | B– | | | | 2,211,170 | |
| | | | Total Energy Equipment & Services | | | | | | | | | | | | | | | | | | | | | | | 4,675,820 | |
| | | | |
| | | | Equity Real Estate Investment Trusts – 1.0% | | | | | | | | | | |
| | | | | | | |
| | 2,000 | | | CBL & Associates LP, (4) | | | 5.950% | | | | | | | | | | | | 12/15/26 | | | | BBB– | | | | 1,683,830 | |
| | | | | | | |
| | 1,500 | | | Communications Sales & Leasing Inc. | | | 8.250% | | | | | | | | | | | | 10/15/23 | | | | BB– | | | | 1,432,800 | |
| | | | Total Equity Real Estate Investment Trusts | | | | | | | | | | | | 3,116,630 | |
| | | | | | | |
| | | | Food & Staples Retailing – 2.1% | | | | | | | | | | | | | | | | | | |
| | | | | | | |
| | 1,400 | | | Albertsons Cos LLC/Safeway Inc./New Albertron’s Inc./Albertson’s LLC, (4) | | | 6.625% | | | | | | | | | | | | 6/15/24 | | | | B+ | | | | 1,319,500 | |
| | | | | | | |
| | 1,819 | | | Albertson’s, Inc. | | | 7.450% | | | | | | | | | | | | 8/01/29 | | | | B– | | | | 1,473,390 | |
| | | | | | | |
| | 2,000 | | | Rite Aid Corporation, 144A | | | 6.125% | | | | | | | | | | | | 4/01/23 | | | | B | | | | 2,028,000 | |
| | | | | | | |
| | 1,500 | | | Supervalu Inc. | | | 7.750% | | | | | | | | | | | | 11/15/22 | | | | B | | | | 1,541,250 | |
| | | | Total Food & Staples Retailing | | | | | | | | | | | | | | | | | | | | | | | 6,362,140 | |
| | | | | | | |
| | | | Food Products – 2.8% | | | | | | | | | | | | | | | | | | |
| | | | | | | |
| | 1,500 | | | ESAL GmbH, 144A, (4) | | | 6.250% | | | | | | | | | | | | 2/05/23 | | | | BB– | | | | 1,396,875 | |
| | | | | | | |
| | 1,800 | | | Fage International SA/ FAGE USA Dairy Industry, Inc., 144A | | | 5.625% | | | | | | | | | | | | 8/15/26 | | | | BB– | | | | 1,656,000 | |
| | | | | | | |
| | 2,000 | | | JBS USA LUX SA / JBS USA Finance Inc. 144A | | | 6.750% | | | | | | | | | | | | 2/15/28 | | | | B+ | | | | 1,889,400 | |
| | | | | | | |
| | 2,000 | | | Minerva Luxembourg SA, 144A, (4) | | | 6.500% | | | | | | | | | | | | 9/20/26 | | | | BB– | | | | 1,832,500 | |
| | | | | | | |
| | 2,000 | | | Post Holdings Inc., 144A | | | 5.625% | | | | | | | | | | | | 1/15/28 | | | | B | | | | 1,875,000 | |
| | | | Total Food Products | | | | | | | | | | | | | | | | | | | | | | | 8,649,775 | |
| | | | | | | |
| | | | Gas Utilities – 0.5% | | | | | | | | | | | | | | | | | | |
| | | | | | | |
| | 1,500 | | | Superior Plus LP / Superior General Partner Inc. 144A | | | 7.000% | | | | | | | | | | | | 7/15/26 | | | | BB | | | | 1,511,250 | |
| | | | |
| | | | Health Care Providers & Services – 2.6% | | | | | | | | | | |
| | | | | | | |
| | 174 | | | CHS/Community Health Systems Inc., 144A, (4) | | | 8.125% | | | | | | | | | | | | 6/30/24 | | | | CCC– | | | | 143,767 | |
| | | | | | | |
| | 1,567 | | | Community Health Systems, Inc. | | | 6.875% | | | | | | | | | | | | 2/01/22 | | | | CCC– | | | | 799,170 | |
| | | | | | | |
| | 975 | | | Community Health Systems, Inc. | | | 6.250% | | | | | | | | | | | | 3/31/23 | | | | B | | | | 892,125 | |
| | | | | | | |
| | 1,775 | | | HCA Inc. | | | 5.250% | | | | | | | | | | | | 6/15/26 | | | | BBB– | | | | 1,762,930 | |
| | | | | | | |
| | 1,000 | | | Lifepoint Health Inc., (4) | | | 5.375% | | | | | | | | | | | | 5/01/24 | | | | Ba2 | | | | 962,500 | |
| | | | | | | |
| | 3,375 | | | Tenet Healthcare Corporation | | | 6.000% | | | | | | | | | | | | 10/01/20 | | | | BB– | | | | 3,467,812 | |
| | | | Total Health Care Providers & Services | | | | | | | | | | | | | | | | | | | | | | | 8,028,304 | |
| | | | | | | |
| | | | Health Care Technology – 0.8% | | | | | | | | | | | | | | | | | | |
| | | | | | | |
| | 2,500 | | | Exela Intermediate LLC / Exela Financial Inc., 144A | | | 10.000% | | | | | | | | | | | | 7/15/23 | | | | B | | | | 2,553,125 | |
| | | | | | | |
| | | | Hotels, Restaurants & Leisure – 3.5% | | | | | | | | | | | | | | | | | | |
| | | | | | | |
| | 2,250 | | | 1011778 BC ULC/New Red Finance Inc., 144A | | | 4.250% | | | | | | | | | | | | 5/15/24 | | | | Ba3 | | | | 2,137,500 | |
| | | | | | | |
| | 1,500 | | | Golden Nugget, Inc., 144A | | | 8.750% | | | | | | | | | | | | 10/01/25 | | | | CCC+ | | | | 1,540,815 | |
| | | | | | | |
| | 1,000 | | | Grupo Posadas SAB de CV, 144A | | | 7.875% | | | | | | | | | | | | 6/30/22 | | | | B+ | | | | 990,000 | |
71
Nuveen High Income Bond Fund (continued)
Portfolio of Investments June 30, 2018
| | | | | | | | | | | | | | | | | | | | | | | | | | | | |
Principal
Amount (000) (1) | | | Description (2) | | Coupon | | | | | | | | | Maturity | | | Ratings (3) | | | Value | |
| | | | | | | |
| | | | Hotels, Restaurants & Leisure (continued) | | | | | | | | | | | | | | | | | | |
| | | | | | | |
| $ | 1,500 | | | MGM Growth Properties Operating Partnership LP / MGP Finance Co-Issuer Inc. | | | 4.500% | | | | | | | | | | | | 1/15/28 | | | | BB– | | | $ | 1,361,250 | |
| | | | | | | |
| | 1,500 | | | Scientific Games International Inc., 144A | | | 5.000% | | | | | | | | | | | | 10/15/25 | | | | Ba3 | | | | 1,428,750 | |
| | | | | | | |
| | 1,500 | | | Stars Group Holdings BV / Stars Group US Co-Borrower LLC, 144A, (WI/DD) | | | 7.000% | | | | | | | | | | | | 7/15/26 | | | | B– | | | | 1,515,000 | |
| | | | | | | |
| | 2,000 | | | Wynn Las Vegas LLC / Wynn Las Vegas Capital Corp, 144A | | | 5.250% | | | | | | | | | | | | 5/15/27 | | | | BB– | | | | 1,870,000 | |
| | | | Total Hotels, Restaurants & Leisure | | | | | | | | | | | | | | | | | | | | | | | 10,843,315 | |
| | | | | | | |
| | | | Household Durables – 1.5% | | | | | | | | | | | | | | | | | | |
| | | | | | | |
| | 1,700 | | | Apex Tool Group LLC / BC Mountain Finance Inc., 144A, (4) | | | 9.000% | | | | | | | | | | | | 2/15/23 | | | | B– | | | | 1,644,750 | |
| | | | | | | |
| | 3,290 | | | Beazer Homes USA Inc. | | | 5.875% | | | | | | | | | | | | 10/15/27 | | | | B– | | | | 2,865,656 | |
| | | | Total Household Durables | | | | | | | | | | | | | | | | | | | | | | | 4,510,406 | |
| | | |
| | | | Independent Power & Renewable Electricity Producers – 2.5% | | | | | | | |
| | | | | | | |
| | 2,500 | | | Calpine Corporation, 144A | | | 5.250% | | | | | | | | | | | | 6/01/26 | | | | BB+ | | | | 2,356,250 | |
| | | | | | | |
| | 1,000 | | | GenOn Energy Inc., (5) | | | 9.500% | | | | | | | | | | | | 10/15/18 | | | | N/R | | | | 910,000 | |
| | | | | | | |
| | 3,350 | | | Talen Energy Supply LLC, (4) | | | 6.500% | | | | | | | | | | | | 6/01/25 | | | | B+ | | | | 2,554,375 | |
| | | | | | | |
| | 2,000 | | | TerraForm Power Operating LLC, 144A | | | 5.000% | | | | | | | | | | | | 1/31/28 | | | | BB | | | | 1,895,000 | |
| | | | Total Independent Power & Renewable Electricity Producers | | | | | | | | | | | | | | | | 7,715,625 | |
| | | | | | | |
| | | | Industrial Conglomerates – 0.4% | | | | | | | | | | | | | | | | | | |
| | | | | | | |
| | 1,250 | | | Techniplas, LLC, 144A | | | 10.000% | | | | | | | | | | | | 5/01/20 | | | | B– | | | | 1,112,500 | |
| | | | | | | |
| | | | Insurance – 0.9% | | | | | | | | | | | | | | | | | | |
| | | | | | | |
| | 2,000 | | | Genworth Holdings Inc. | | | 4.800% | | | | | | | | | | | | 2/15/24 | | | | B | | | | 1,735,000 | |
| | | | | | | |
| | 1,000 | | | Wand Merger Corp, 144A, (WI/DD) | | | 9.125% | | | | | | | | | | | | 7/15/26 | | | | B2 | | | | 1,010,000 | |
| | | | Total Insurance | | | | | | | | | | | | | | | | | | | | | | | 2,745,000 | |
| | | | | | | |
| | | | Internet and Direct Marketing Retail – 0.6% | | | | | | | | | | | | | | | | | | |
| | | | | | | |
| | 1,750 | | | Netflix Inc. 144A | | | 5.875% | | | | | | | | | | | | 11/15/28 | | | | Ba3 | | | | 1,766,975 | |
| | | | | | | |
| | | | Internet Software��& Services – 1.1% | | | | | | | | | | | | | | | | | | |
| | | | | | | |
| | 2,300 | | | Inception Merger Sub Inc. / Rackspace Hosting Inc., 144A, (4) | | | 8.625% | | | | | | | | | | | | 11/15/24 | | | | BB– | | | | 2,311,500 | |
| | | | | | | |
| | 2,000 | | | Sungard Availability Services Capital, Inc., 144A | | | 8.750% | | | | | | | | | | | | 4/01/22 | | | | Caa2 | | | | 1,180,000 | |
| | | | Total Internet Software & Services | | | | | | | | | | | | | | | | | | | | | | | 3,491,500 | |
| | | | | | | |
| | | | Leisure Products – 0.6% | | | | | | | | | | | | | | | | | | |
| | | | | | | |
| | 2,000 | | | Mattel Inc., 144A | | | 6.750% | | | | | | | | | | | | 12/31/25 | | | | BB | | | | 1,947,500 | |
| | | | | | | |
| | | | Machinery – 0.7% | | | | | | | | | | | | | | | | | | |
| | | | | | | |
| | 2,050 | | | Navistar International Corporation, 144A | | | 6.625% | | | | | | | | | | | | 11/01/25 | | | | B– | | | | 2,106,375 | |
| | | | | | | |
| | | | Marine – 1.4% | | | | | | | | | | | | | | | | | | |
| | | | | | | |
| | 2,000 | | | Eletson Holdings Inc., 144A | | | 9.625% | | | | | | | | | | | | 1/15/22 | | | | Caa2 | | | | 1,260,000 | |
| | | | | | | |
| | 1,500 | | | Navios Maritime Acquisition Corporation, 144A | | | 8.125% | | | | | | | | | | | | 11/15/21 | | | | B– | | | | 1,231,875 | |
| | | | | | | |
| | 2,000 | | | Navios Maritime Holdings Inc., 144A | | | 11.250% | | | | | | | | | | | | 8/15/22 | | | | B | | | | 1,900,000 | |
| | | | Total Marine | | | | | | | | | | | | | | | | | | | | | | | 4,391,875 | |
72
| | | | | | | | | | | | | | | | | | | | | | | | | | | | |
Principal
Amount (000) (1) | | | Description (2) | | Coupon | | | | | | | | | Maturity | | | Ratings (3) | | | Value | |
| | | | | | | |
| | | | Media – 3.6% | | | | | | | | | | | | | | | | | | |
| | | | | | | |
| $ | 1,500 | | | Altice S.A, 144A | | | 7.750% | | | | | | | | | | | | 5/15/22 | | | | B– | | | $ | 1,451,250 | |
| | | | | | | |
| | 1,000 | | | AMC Networks Inc. | | | 4.750% | | | | | | | | | | | | 8/01/25 | | | | BB | | | | 961,260 | |
| | | | | | | |
| | 2,000 | | | CBS Radio, Inc., 144A | | | 7.250% | | | | | | | | | | | | 11/01/24 | | | | B– | | | | 1,905,000 | |
| | | | | | | |
| | 1,000 | | | CSC Holdings Inc., 144A | | | 5.375% | | | | | | | | | | | | 2/01/28 | | | | Ba2 | | | | 925,000 | |
| | | | | | | |
| | 950 | | | iHeartCommunications, Inc., (5) | | | 7.250% | | | | | | | | | | | | 10/15/27 | | | | C | | | | 232,750 | |
| | | | | | | |
| | 2,200 | | | McGraw-Hill Global Education Holdings, 144A | | | 7.875% | | | | | | | | | | | | 5/15/24 | | | | BB+ | | | | 2,035,000 | |
| | | | | | | |
| | 2,000 | | | Meredith Corporation, 144A | | | 6.875% | | | | | | | | | | | | 2/01/26 | | | | B | | | | 1,972,500 | |
| | | | | | | |
| | 1,975 | CAD | | Videotron Limited, 144A | | | 5.625% | | | | | | | | | | | | 6/15/25 | | | | BB | | | | 1,564,782 | |
| | | | Total Media | | | | | | | | | | | | | | | | | | | | | | | 11,047,542 | |
| | | | | | | |
| | | | Metals & Mining – 7.2% | | | | | | | | | | | | | | | | | | |
| | | | | | | |
| | 2,000 | | | AK Steel Corporation, (4) | | | 7.000% | | | | | | | | | | | | 3/15/27 | | | | B– | | | | 1,900,000 | |
| | | | | | | |
| | 2,000 | | | Aleris International Inc., 144A, (4) | | | 10.750% | | | | | | | | | | | | 7/15/23 | | | | CCC+ | | | | 2,012,500 | |
| | | | | | | |
| | 1,200 | | | Commercial Metals Co, 144A | | | 5.750% | | | | | | | | | | | | 4/15/26 | | | | BB+ | | | | 1,158,000 | |
| | | | | | | |
| | 2,000 | | | FMG Resources, 144A, (4) | | | 5.125% | | | | | | | | | | | | 5/15/24 | | | | BB+ | | | | 1,902,500 | |
| | | | | | | |
| | 1,652 | | | Freeport-McMoRan Inc. | | | 5.400% | | | | | | | | | | | | 11/14/34 | | | | BB+ | | | | 1,499,190 | |
| | | | | | | |
| | 2,045 | | | Hudbay Minerals, Inc., 144A | | | 7.250% | | | | | | | | | | | | 1/15/23 | | | | B+ | | | | 2,106,350 | |
| | | | | | | |
| | 3,504 | | | Northland Resources AB, 144A, Reg S, (5) | | | 15.000% | | | | | | | | | | | | 7/15/19 | | | | N/R | | | | 35,044 | |
| | | | | | | |
| | 1,583 | | | Northland Resources AB, 144A, Reg S, (5) | | | 4.000% | | | | | | | | | | | | 10/15/20 | | | | N/R | | | | 16 | |
| | | | | | | |
| | 2,000 | | | Northwest Acquisition/Dominion Finco Inc. , 144A | | | 7.125% | | | | | | | | | | | | 11/01/22 | | | | BB | | | | 1,995,000 | |
| | | | | | | |
| | 1,500 | | | Novelis Corp, 144A | | | 6.250% | | | | | | | | | | | | 8/15/24 | | | | B+ | | | | 1,500,000 | |
| | | | | | | |
| | 1,500 | | | SunCoke Energy Partners LP / SunCoke Energy Partners Finance Corp., 144A | | | 7.500% | | | | | | | | | | | | 6/15/25 | | | | BB– | | | | 1,526,250 | |
| | | | | | | |
| | 2,630 | | | Taseko Mines Limited, 144A | | | 8.750% | | | | | | | | | | | | 6/15/22 | | | | B | | | | 2,682,600 | |
| | | | | | | |
| | 2,000 | | | United States Steel Corporation | | | 6.875% | | | | | | | | | | | | 8/15/25 | | | | BB– | | | | 2,011,900 | |
| | | | | | | |
| | 1,750 | | | Warrior Met Coal LLC, 144A | | | 8.000% | | | | | | | | | | | | 11/01/24 | | | | BB– | | | | 1,806,875 | |
| | | | Total Metals & Mining | | | | | | | | | | | | | | | | | | | | | | | 22,136,225 | |
| | | | | | | |
| | | | Multiline Retail – 0.6% | | | | | | | | | | | | | | | | | | |
| | | | | | | |
| | 1,000 | | | J.C. Penney Company Inc. | | | 7.400% | | | | | | | | | | | | 4/01/37 | | | | B+ | | | | 580,000 | |
| | | | | | | |
| | 1,500 | | | JC Penney Corp Inc., 144A | | | 8.625% | | | | | | | | | | | | 3/15/25 | | | | BB– | | | | 1,271,250 | |
| | | | Total Multiline Retail | | | | | | | | | | | | | | | | | | | | | | | 1,851,250 | |
| | | |
| | | | Oil, Gas & Consumable Fuels – 13.3% | | | | | | | |
| | | | | | | |
| | 2,834 | | | Armstrong Energy Inc., (5) | | | 11.750% | | | | | | | | | | | | 12/15/19 | | | | N/R | | | | 14,170 | |
| | | | | | | |
| | 2,125 | | | Ascent Resources – Utica LLC / AEU Finance Corporation, 144A | | | 10.000% | | | | | | | | | | | | 4/01/22 | | | | B– | | | | 2,337,500 | |
| | | | | | | |
| | 1,500 | | | Calfrac Holdings LP, 144A | | | 8.500% | | | | | | | | | | | | 6/15/26 | | | | B– | | | | 1,507,500 | |
| | | | | | | |
| | 1,150 | | | California Resources Corporation, 144A, (4) | | | 8.000% | | | | | | | | | | | | 12/15/22 | | | | CCC+ | | | | 1,043,625 | |
| | | | | | | |
| | 1,000 | | | CGG Holding US Inc. 144A | | | 9.000% | | | | | | | | | | | | 5/01/23 | | | | B | | | | 1,032,500 | |
| | | | | | | |
| | 2,500 | | | Chesapeake Energy Corp, (4) | | | 8.000% | | | | | | | | | | | | 6/15/27 | | | | CCC+ | | | | 2,543,750 | |
| | | | | | | |
| | 2,000 | | | Denbury Resources Incorporated | | | 4.625% | | | | | | | | | | | | 7/15/23 | | | | CCC– | | | | 1,745,600 | |
| | | | | | | |
| | 2,000 | | | DOF Subsea AS, 144A, Reg S | | | 9.500% | | | | | | | | | | | | 3/14/22 | | | | N/R | | | | 1,899,540 | |
73
Nuveen High Income Bond Fund (continued)
Portfolio of Investments June 30, 2018
| | | | | | | | | | | | | | | | | | | | | | | | | | | | |
Principal
Amount (000) (1) | | | Description (2) | | Coupon | | | | | | | | | Maturity | | | Ratings (3) | | | Value | |
| | | | | | | |
| | | | Oil, Gas & Consumable Fuels (continued) | | | | | | | | | | | | | | | | | | |
| | | | | | | |
| $ | 1,675 | | | EP Energy LLC and Everest Acquisition Finance, Inc., 144A | | | 9.375% | | | | | | | | | | | | 5/01/24 | | | | Caa2 | | | $ | 1,373,500 | |
| | | | | | | |
| | 1,500 | | | EP Energy LLC and Everest Acquisition Finance, Inc., 144A | | | 8.000% | | | | | | | | | | | | 2/15/25 | | | | Caa2 | | | | 1,162,500 | |
| | | | | | | |
| | 2,900 | | | Genesis Energy LP | | | 6.500% | | | | | | | | | | | | 10/01/25 | | | | BB– | | | | 2,784,000 | |
| | | | | | | |
| | 856 | | | Golden Close Maritime Corporation Limited, 144A, Reg S, (5) | | | 8.000% | | | | | | | | | | | | 3/29/22 | | | | N/R | | | | 645,934 | |
| | | | | | | |
| | 2,220 | | | MEG Energy Corporation, 144A | | | 6.375% | | | | | | | | | | | | 1/30/23 | | | | BB– | | | | 2,072,925 | |
| | | | | | | |
| | 2,704 | | | Metro Exploration Holding Inc., (5) | | | 11.500% | | | | | | | | | | | | 2/16/20 | | | | N/R | | | | 270 | |
| | | | | | | |
| | 3,000 | | | Moss Creek Resources Holdings, 144A | | | 7.500% | | | | | | | | | | | | 1/15/26 | | | | B+ | | | | 2,931,480 | |
| | | | | | | |
| | 1,000 | | | PBF Holding Company LLC. | | | 7.250% | | | | | | | | | | | | 6/15/25 | | | | BB | | | | 1,051,250 | |
| | | | | | | |
| | 3,000 | | | Peabody Energy Corporation, (5), (6) | | | 6.500% | | | | | | | | | | | | 9/15/20 | | | | NA | | | | — | |
| | | | | | | |
| | 1,750 | | | Petrobras Global Finance BV | | | 7.375% | | | | | | | | | | | | 1/17/27 | | | | Ba2 | | | | 1,747,813 | |
| | | | | | | |
| | 2,000 | | | Point Resources AS | | | 8.500% | | | | | | | | | | | | 9/20/24 | | | | N/R | | | | 1,988,970 | |
| | | | | | | |
| | 3,000 | | | Shelf Drilling Holdings Ltd, 144A | | | 8.250% | | | | | | | | | | | | 2/15/25 | | | | B2 | | | | 3,022,500 | |
| | | | | | | |
| | 2,800 | | | Southwestern Energy Company | | | 7.500% | | | | | | | | | | | | 4/01/26 | | | | BB | | | | 2,898,000 | |
| | | | | | | |
| | 2,000 | | | Sunoco LP / Sunoco Finance Corp, 144A | | | 4.875% | | | | | | | | | | | | 1/15/23 | | | | BB | | | | 1,920,000 | |
| | | | | | | |
| | 1,500 | | | Targa Resources Partners LP / Targa Resources Partners Finance Corp, 144A | | | 5.875% | | | | | | | | | | | | 4/15/26 | | | | BB– | | | | 1,511,250 | |
| | | | | | | |
| | 2,500 | | | Ultra Resources, Inc., 144A, (4) | | | 7.125% | | | | | | | | | | | | 4/15/25 | | | | BB | | | | 1,756,250 | |
| | | | | | | |
| | 2,098 | | | W&T Offshore, Inc. | | | 8.500% | | | | | | | | | | | | 6/15/19 | | | | CC | | | | 2,071,775 | |
| | | | Total Oil, Gas & Consumable Fuels | | | | | | | | | | | | | | | | | | | | | | | 41,062,602 | |
| | | | | | | |
| | | | Personal Products – 0.6% | | | | | | | | | | | | | | | | | | |
| | | | | | | |
| | 2,000 | | | Coty Inc., 144A, (4) | | | 6.500% | | | | | | | | | | | | 4/15/26 | | | | BB | | | | 1,918,750 | |
| | | | | | | |
| | | | Pharmaceuticals – 0.4% | | | | | | | | | | | | | | | | | | |
| | | | | | | |
| | 1,500 | | | Endo Finance LLC, 144A | | | 5.375% | | | | | | | | | | | | 1/31/23 | | | | B3 | | | | 1,200,000 | |
| | | |
| | | | Real Estate Management & Development – 0.5% | | | | | | | |
| | | | | | | |
| | 1,500 | | | Hunt Cos Inc., 144A | | | 6.250% | | | | | | | | | | | | 2/15/26 | | | | BB– | | | | 1,398,750 | |
| | | | | | | |
| | | | Road & Rail – 0.5% | | | | | | | | | | | | | | | | | | |
| | | | | | | |
| | 750 | | | The Hertz Corporation, 144A, (4) | | | 7.625% | | | | | | | | | | | | 6/01/22 | | | | BB– | | | | 720,000 | |
| | | | | | | |
| | 1,000 | | | United Rentals North America Inc. | | | 4.875% | | | | | | | | | | | | 1/15/28 | | | | BB | | | | 928,750 | |
| | | | Total Road & Rail | | | | | | | | | | | | | | | | | | | | | | | 1,648,750 | |
| | | | | | | |
| | | | Specialty Retail – 1.6% | | | | | | | | | | | | | | | | | | |
| | | | | | | |
| | 2,000 | | | goeasy Ltd, 144A | | | 7.875% | | | | | | | | | | | | 11/01/22 | | | | BB– | | | | 2,115,000 | |
| | | | | | | |
| | 2,000 | | | L Brands, Inc. | | | 6.875% | | | | | | | | | | | | 11/01/35 | | | | BB+ | | | | 1,780,000 | |
| | | | | | | |
| | 1,646 | | | Neiman Marcus Group Inc., 144A | | | 8.750% | | | | | | | | | | | | 10/15/21 | | | | Caa3 | | | | 1,094,513 | |
| | | | Total Specialty Retail | | | | | | | | | | | | | | | | | | | | | | | 4,989,513 | |
| | | | | | | |
| | | | Tobacco – 1.5% | | | | | | | | | | | | | | | | | | |
| | | | | | | |
| | 2,500 | | | Alliance One International Inc. | | | 9.875% | | | | | | | | | | | | 7/15/21 | | | | CCC | | | | 2,287,500 | |
| | | | | | | |
| | 2,500 | | | Vector Group Limited, 144A | | | 6.125% | | | | | | | | | | | | 2/01/25 | | | | BB– | | | | 2,415,625 | |
| | | | Total Tobacco | | | | | | | | | | | | | | | | | | | | | | | 4,703,125 | |
74
| | | | | | | | | | | | | | | | | | | | | | | | | | | | |
Principal
Amount (000) (1) | | | Description (2) | | Coupon | | | | | | | | | Maturity | | | Ratings (3) | | | Value | |
| | | |
| | | | Wireless Telecommunication Services – 3.2% | | | | | | | |
| | | | | | | |
| $ | 1,900 | | | C&W SR Financing Designated Activity Co, 144A | | | 6.875% | | | | | | | | | | | | 9/15/27 | | | | BB– | | | $ | 1,821,625 | |
| | | | | | | |
| | 2,000 | | | Digicel Limited, 144A | | | 6.000% | | | | | | | | | | | | 4/15/21 | | | | B1 | | | | 1,805,000 | |
| | | | | | | |
| | 3,150 | | | Sprint Capital Corporation | | | 6.875% | | | | | | | | | | | | 11/15/28 | | | | B+ | | | | 3,024,000 | |
| | | | | | | |
| | 1,000 | | | Sprint Corp | | | 7.625% | | | | | | | | | | | | 3/01/26 | | | | B+ | | | | 1,018,750 | |
| | | | | | | |
| | 2,250 | | | UPC Holding BV, 144A | | | 5.500% | | | | | | | | | | | | 1/15/28 | | | | B | | | | 2,025,000 | |
| | | | Total Wireless Telecommunication Services | | | | | | | | | | | | | | | | | | | | | | | 9,694,375 | |
| | | | Total Corporate Bonds (cost $279,103,564) | | | | | | | | | | | | | | | | | | | | | | | 261,232,531 | |
| | | | | | | |
Principal
Amount (000) | | | Description (2) | | Coupon | | | | | | | | | Maturity | | | Ratings (3) | | | Value | |
| | | |
| | | | $1,000 PAR (OR SIMILAR) INSTITUTIONAL PREFERRED – 3.8% | | | | | | | | | |
| | | | | | | |
| | | | Banks – 0.5% | | | | | | | | | | | | | | | | | | |
| | | | | | | |
| $ | 1,500 | | | BBVA Bancomer Texas, 144A | | | 7.250% | | | | | | | | | | | | 4/22/20 | | | | Ba1 | | | $ | 1,567,500 | |
| | | | | | | |
| | | | Commercial Services & Supplies – 0.9% | | | | | | | | | | | | | | | | | | |
| | | | | | | |
| | 2,500 | | | AerCap Global Aviation Trust, 144A | | | 6.500% | | | | | | | | | | | | 6/15/45 | | | | Ba1 | | | | 2,575,000 | |
| | | | | | | |
| | | | Food Products – 1.4% | | | | | | | | | | | | | | | | | | |
| | | | | | | |
| | 2,000 | | | Dairy Farmers of America Inc., 144A | | | 7.125% | | | | | | | | | | | | N/A (7) | | | | Baa3 | | | | 2,145,000 | |
| | | | | | | |
| | 2,000 | | | Land O’ Lakes Incorporated, 144A | | | 7.250% | | | | | | | | | | | | N/A (7) | | | | BB | | | | 2,180,000 | |
| | 4,000 | | | Total Food Products | | | | | | | | | | | | | | | | | | | | | | | 4,325,000 | |
| | | | | | | |
| | | | Oil, Gas & Consumable Fuels – 1.0% | | | | | | | | | | | | | | | | | | |
| | | | | | | |
| | 2,000 | | | Buckeye Partners LP. | | | 6.375% | | | | | | | | | | | | 1/22/78 | | | | Ba1 | | | | 1,782,957 | |
| | | | | | | |
| | 1,500 | | | Plains All American Pipeline L.P | | | 6.125% | | | | | | | | | | | | N/A (7) | | | | BB | | | | 1,410,000 | |
| | 3,500 | | | Total Oil, Gas & Consumable Fuels | | | | | | | | | | | | | | | | | | | | | | | 3,192,957 | |
| $ | 11,500 | | | Total $1,000 Par (or similar) Institutional Preferred (cost $11,665,478) | | | | | | | | | | | | | | | | 11,660,457 | |
| | | | | | | |
| Shares | | | Description (2) | | | | | | | | | | | | | | | | | Value | |
| | | | | | | |
| | | | COMMON STOCKS – 2.3% | | | | | | | | | | | | | | | | | | | | | | | | |
| | | | | | | |
| | | | Building Products – 0.0% | | | | | | | | | | | | | | | | | | |
| | | | | | | |
| | 527 | | | Dayton Superior Corporation, (6), (8) | | | | | | | | | | | | | | | | | | | | | | $ | 5 | |
| | | | | | | |
| | 585 | | | Dayton Superior, (6) | | | | | | | | | | | | | | | | | | | | | | | 6 | |
| | | | Total Building Products | | | | | | | | | | | | | | | | | | | | | | | 11 | |
| | | | | | | |
| | | | Capital Markets – 0.0% | | | | | | | | | | | | | | | | | | |
| | | | | | | |
| | 2,292 | | | Adamas Finance Asia Limited, (8) | | | | | | | | | | | | | | | | | | | | | | | 1,387 | |
| | | | | | | |
| | | | Electric Utilities – 0.6% | | | | | | | | | | | | | | | | | | |
| | | | | | | |
| | 40,000 | | | Exelon Corporation | | | | | | | | | | | | | | | | | | | | | | | 1,704,000 | |
| | | | | | | |
| | | | Energy Equipment & Services – 0.0% | | | | | | | | | | | | | | | | | | |
| | | | | | | |
| | 1 | | | Key Energy Services, (8) | | | | | | | | | | | | | | | | | | | | | | | 7 | |
| | | | | | | |
| | 71 | | | SAExploration Holdings Inc., (6), (8) | | | | | | | | | | | | | | | | | | | | | | | — | |
| | | | Total Energy Equipment & Services | | | | | | | | | | | | | | | | | | | | | | | 7 | |
75
Nuveen High Income Bond Fund (continued)
Portfolio of Investments June 30, 2018
| | | | | | | | | | | | | | | | | | | | | | | | | | | | |
| | | | | | | |
| Shares | | | Description (2) | | | | | | | | | | | | | | | | | Value | |
| |
| | | | Independent Power & Renewable Electricity Producers – 0.6% | |
| | | | | | | |
| | 72,121 | | | Vistra Energy Corporation, (8) | | | | | | | | | | | | | | | | | | | | | | $ | 1,706,383 | |
| | | |
| | | | Metals & Mining – 0.0% | | | | | | | |
| | | | | | | |
| | 499,059 | | | Northland Resources SA, (6), (8) | | | | | | | | | | | | | | | | | | | | | | | 1,497 | |
| | | | | | | |
| | | | Multi-Utilities – 0.2% | | | | | | | | | | | | | | | | | | |
| | | | | | | |
| | 10,000 | | | Dominion Resources, Inc. | | | | | | | | | | | | | | | | | | | | | | | 681,787 | |
| | | | |
| | | | Oil, Gas & Consumable Fuels – 0.9% | | | | | | | | | | |
| | | | | | | |
| | 10,000 | | | Arch Coal Inc., Class A | | | | | | | | | | | | | | | | | | | | | | | 784,300 | |
| | | | | | | |
| | 46,000 | | | Cenovus Energy Inc. | | | | | | | | | | | | | | | | | | | | | | | 477,480 | |
| | | | | | | |
| | 50,119 | | | Connacher Oil and Gas Limited, (6), (8) | | | | | | | | | | | | | | | | | | | | | | | 100 | |
| | | | | | | |
| | 19,121 | | | Golden Close Maritime Corporation Limited, (8), (9) | | | | | | | | | | | | | | | | | | | | | | | 46,956 | |
| | | | | | | |
| | 27,000 | | | Peabody Energy Corporation | | | | | | | | | | | | | | | | | | | | | | | 1,227,960 | |
| | | | | | | |
| | 4,145 | | | Penn Virginia Corporation, (8) | | | | | | | | | | | | | | | | | | | | | | | 351,890 | |
| | | | Total Oil, Gas & Consumable Fuels | | | | | | | | 2,888,686 | |
| | | | Total Common Stocks (cost $7,157,840) | | | | | | | | | | | | | | | | 6,983,758 | |
| | | | | | | |
Principal
Amount (000) | | | Description (2) | | Coupon (10) | | | Reference
Rate (10) | | | Spread (10) | | | Maturity (11) | | | Ratings (3) | | | Value | |
| | | |
| | | | VARIABLE RATE SENIOR LOAN INTERESTS – 2.1% (10) | | | | | | | | | |
| | | | | |
| | | | Diversified Financial Services – 0.6% | | | | | | | | | | | | | |
| | | | | | | |
| $ | 1,739 | | | Jill Acquisition LLC, First Lien Term Loan B | | | 7.360% | | | | 3-Month LIBOR | | | | 5.000% | | | | 5/08/22 | | | | B | | | $ | 1,719,646 | |
| | | | | | | |
| | | | IT Services – 0.1% | | | | | | | | | | | | | | | | | | |
| | | | | | | |
| | 500 | | | Optiv Security Inc., Second Lien Term Loan | | | 8.250% | | | | 3-Month LIBOR | | | | 7.250% | | | | 1/13/25 | | | | Caa1 | | | | 485,313 | |
| | | |
| | | | Paper & Forest Products – 0.4% | | | | | | | |
| | | | | | | |
| | 1,000 | | | Packaging Coordinators Inc., Second Lien Term Loan | | | 11.090% | | | | 3-Month LIBOR | | | | 8.750% | | | | 6/30/24 | | | | CCC+ | | | | 1,000,000 | |
| | | | | | | |
| | 385 | | | Verso Paper Holdings LLC, First Lien Term Loan | | | 13.125% | | | | 3-Month LIBOR | | | | 11.000% | | | | 10/14/21 | | | | BB | | | | 397,190 | |
| | 1,385 | | | Total Paper & Forest Products | | | | | | | | 1,397,190 | |
| | | | | |
| | | | Professional Services – 1.0% | | | | | | | | | | | | | |
| | | | | | | |
| | 3,000 | | | Sedgwick Claims Management Service Inc., Second Lien Term Loan | | | 7.843% | | | | 3-Month LIBOR | | | | 5.750% | | | | 2/28/22 | | | | CCC+ | | | | 3,020,640 | |
| $ | 6,624 | | | Total Variable Rate Senior Loan Interests (cost $6,576,666) | | | | | | | | | | | | 6,622,789 | |
| | | | | | | |
Principal
Amount (000) | | | Description (2) | | Coupon | | | | | | | | | Maturity | | | Ratings (3) | | | Value | |
| | | | | |
| | | | CONTINGENT CAPITAL SECURITIES – 1.7% (12) | | | | | | | | | | | | | | | | | |
| | | | | |
| | | | Banks – 1.1% | | | | | | | | | | | | | |
| | | | | | | |
| $ | 1,200 | | | Banco Bilbao Vizcaya Argentaria S.A, (4) | | | 6.125% | | | | | | | | | | | | N/A (7) | | | | Ba2 | | | $ | 1,059,000 | |
76
| | | | | | | | | | | | | | | | | | | | | | | | | | | | |
| | | | | | | |
Principal
Amount (000) | | | Description (2) | | Coupon | | | | | | | | | Maturity | | | Ratings (3) | | | Value | |
| | | | | |
| | | | Banks (continued) | | | | | | | | | | | | | |
| | | | | | | |
| $ | 1,000 | | | Intesa Sanpaolo SpA, 144A | | | 7.700% | | | | | | | | | | | | N/A (7) | | | | BB– | | | $ | 934,000 | |
| | | | | | | |
| | 1,500 | | | UniCredit SpA, Reg S | | | 8.000% | | | | | | | | | | | | N/A (7) | | | | B+ | | | | 1,405,878 | |
| | 3,700 | | | Total Banks | | | | | | | | | | | | | | | | | | | | | | | 3,398,878 | |
| | | | | | | |
| | | | Capital Markets – 0.6% | | | | | | | | | | | | | | | | | | |
| | | | | | | |
| | 2,000 | | | Deutsche Bank AG, Reg S | | | 6.250% | | | | | | | | | | | | N/A (7) | | | | BB– | | | | 1,770,816 | |
| $ | 5,700 | | | Total Contingent Capital Securities (cost $5,275,582) | | | | | | | | | | | | | | | | 5,169,694 | |
| | | | | | | |
| Shares | | | Description (2) | | Coupon | | | | | | | | | | | | Ratings (3) | | | Value | |
| | | | | |
| | | | $25 PAR (OR SIMILAR) RETAIL PREFERRED – 1.5% | | | | | | | | | | | | | | | | | |
| | | | | |
| | | | Equity Real Estate Investment Trusts – 0.6% | | | | | | | | | | | | | |
| | | | | | | |
| | 30,000 | | | Colony Capital Inc. | | | 7.500% | | | | | | | | | | | | | | | | N/R | | | $ | 727,500 | |
| | | | | | | |
| | 50,960 | | | Colony Capital Inc., (4) | | | 7.125% | | | | | | | | | | | | | | | | N/R | | | | 1,177,686 | |
| | | | Total Equity Real Estate Investment Trusts | | | | | | | | | | | | | | | | | | | | | | | 1,905,186 | |
| | | | | | | |
| | | | Food Products – 0.3% | | | | | | | | | | | | | | | | | | |
| | | | | | | |
| | 34,685 | | | CHS Inc. | | | 6.750% | | | | | | | | | | | | | | | | N/R | | | | 917,765 | |
| | | | | | | |
| | | | Insurance – 0.1% | | | | | | | | | | | | | | | | | | |
| | | | | | | |
| | 21,485 | | | AmTrust Financial Services Inc. | | | 7.250% | | | | | | | | | | | | | | | | N/R | | | | 426,047 | |
| | | | | | | |
| | | | Oil, Gas & Consumable Fuels – 0.5% | | | | | | | | | | | | | | | | | | |
| | | | | | | |
| | 60,000 | | | Nustar Energy LP | | | 8.500% | | | | | | | | | | | | | | | | B1 | | | | 1,405,800 | |
| | | | Total $25 Par (or similar) Preferred Securities (cost $4,720,765) | | | | | | | | | | | | | | | | 4,654,798 | |
| | | | | | | |
| Shares | | | Description (2), (13) | | | | | | | | | | | | | | | | | Value | |
| | | | | | | |
| | | | INVESTMENT COMPANIES – 1.5% | | | | | | | | | | | | | | | | | | |
| | | | | | | |
| | 17,000 | | | Adams Natural Resources Fund Inc. | | | | | | | | | | | | | | | | | | | | | | $ | 341,530 | |
| | | | | | | |
| | 65,000 | | | Blackrock Credit Allocation Income Trust IV | | | | | | | | | | | | | | | | | | | | | | | 785,200 | |
| | | | | | | |
| | 26,535 | | | First Trust Strategic High Income Fund II | | | | | | | | | | | | | | | | | | | | | | | 390,860 | |
| | | | | | | |
| | 7,000 | | | Gabelli Global Gold Natural Resources and Income Trust | | | | | | | | | | | | | | | | | | | | | | | 35,980 | |
| | | | | | | |
| | 85,500 | | | Invesco Dynamic Credit Opportunities Fund | | | | | | | | | | | | | | | | | | | | | | | 993,510 | |
| | | | | | | |
| | 59,500 | | | Pimco Income Strategy Fund | | | | | | | | | | | | | | | | | | | | | | | 705,075 | |
| | | | | | | |
| | 54,000 | | | Pioneer Floating Rate Trust | | | | | | | | | | | | | | | | | | | | | | | 603,720 | |
| | | | | | | |
| | 22,421 | | | Western Asset Emerging Market Debt Fund Incorporated | | | | | | | | | | | | | | | | | | | | | | | 297,527 | |
| | | | | | | |
| | 29,351 | | | WhiteHorse Finance Incorporated | | | | | | | | | | | | | | | | | | | | | | | 425,883 | |
| | | | Total Investment Companies (cost $4,307,987) | | | | | | | | | | | | 4,579,285 | |
| | | | | | | |
Principal
Amount (000) | | | Description (2) | | Coupon | | | | | | | | | Maturity | | | Ratings (3) | | | Value | |
| | | | | | | |
| | | | CONVERTIBLE BONDS – 0.0% | | | | | | | | | | | | | | | | | | | | | | | | |
| | | | | | | |
| | | | Oil, Gas & Consumable Fuels – 0.0% | | | | | | | | | | | | | | | | | | |
| | | | | | | |
| $ | — | (14) | | Golden Close Maritime Corporation Limited | | | 0.000% | | | | | | | | | | | | 3/29/22 | | | | N/R | | | $ | 22 | |
| | | | Total Convertible Bonds (cost $46) | | | | | | | | | | | | | | | | | | | | | | | 22 | |
77
Nuveen High Income Bond Fund (continued)
Portfolio of Investments June 30, 2018
| | | | | | | | | | | | | | | | | | | | | | | | | | | | |
| | | | | | | |
| Shares | | | Description (2) | | | | | | | | | | | | | | | | | Value | |
| | | | | | | |
| | | | WARRANTS – 0.0% | | | | | | | | | | | | | | | | | | | | | | | | |
| | | | | | | |
| | | | Energy – 0.0% | | | | | | | | | | | | | | | | | | |
| | | | | | | |
| | 336,891 | | | Iona Energy Inc., (6) | | | | | | | | | | | | | | | | | | | | | | $ | — | |
| | | | | | | |
| | | | Energy Equipment & Services – 0.0% | | | | | | | | | | | | | | | | | | |
| | | | | | | |
| | 28 | | | SA Exploration Holdings, Inc., (6), (8) | | | | | | | | | | | | | | | | | | | | | | | — | |
| | | | | | | |
| | | | Transportation – 0.0% | | | | | | | | | | | | | | | | | | |
| | | | | | | |
| | 8,907 | | | Jack Cooper Enterprises, 144A, (6) | | | | | | | | | | | | | | | | | | | | | | | — | |
| | | | Total Warrants (cost $223) | | | | | | | | | | | | | | | | | | | | | | | — | |
| | | | Total Long-Term Investments (cost $318,808,151) | | | | | | | | | | | | | | | | | | | | | | | 300,903,334 | |
| | | | | | | |
| Shares | | | Description (2) | | Coupon | | | | | | | | | | | | | | | Value | |
| | |
| | | | INVESTMENTS PURCHASED WITH COLLATERAL FROM SECURITIES LENDING – 9.7% | | | | | |
| | | | | | | |
| | | | Money Market Funds – 9.7% | | | | | | | | | | | | | | | | | | |
| | | | | | | |
| | 29,812,893 | | | First American Government Obligations Fund, Class X, (15) | | | 1.806% (16) | | | | | | | | | | | | | | | | | | | $ | 29,812,893 | |
| | | | Total Investments Purchased with Collateral from Securities Lending (cost $29,812,893) | | | | | | | | 29,812,893 | |
| | | | | | | |
| Shares | | | Description (2) | | Coupon | | | | | | | | | | | | | | | Value | |
| | | | | |
| | | | SHORT-TERM INVESTMENTS – 1.2% | | | | | | | | | | | | | | | | | |
| | | | | | | |
| | | | Money Market Funds – 1.2% | | | | | | | | | | | | | | | | | | |
| | | | | | | |
| | 3,715,556 | | | First American Treasury Obligations Fund, Class Z | | | 1.754% (16) | | | | | | | | | | | | | | | | | | | $ | 3,715,556 | |
| | | | Total Short-Term Investments (cost $3,715,556) | | | | | | | | | | | | | | | | | | | | | | | 3,715,556 | |
| | | | Total Investments (cost $352,336,600) – 108.7% | | | | | | | | | | | | | | | | | | | | | | | 334,431,783 | |
| | | | Other Assets Less Liabilities – (8.7)% (17) | | | | | | | | | | | | | | | | | | | | | | | (26,661,055 | ) |
| | | | Net Assets – 100% | | | | | | | | | | | | | | | | | | | | | | $ | 307,770,728 | |
Investments in Derivatives
Forward Foreign Currency Contracts
| | | | | | | | | | | | | | | | | | | | | | |
| Currency Purchased | | Notional Amount
(Local Currency) | | Currency Sold | | | Notional Amount
(Local Currency) | | | Counterparty | | | Settlement
Date | | | Unrealized
Appreciation
(Depreciation) | |
Canadian Dollar | | 84,000 | | | U.S. Dollar | | | | 63,151 | | | | Goldman Sachs Bank USA | | | | 8/17/18 | | | | 800 | |
Canadian Dollar | | 41,000 | | | U.S. Dollar | | | | 31,207 | | | | Goldman Sachs Bank USA | | | | 8/17/18 | | | | 7 | |
U.S. Dollar | | 1,641,888 | | | Canadian Dollar | | | | 2,163,000 | | | | Goldman Sachs Bank USA | | | | 8/17/18 | | | | (4,851 | ) |
Total | | | | | | | | | | | | | | | | | | | | $ | (4,044 | ) |
Total unrealized appreciation on forward foreign currency contracts | | | | | | | | | | | | | | | $ | 807 | |
Total unrealized depreciation on forward foreign currency contracts | | | | | | | | | | | | | | | $ | (4,851 | ) |
Futures Contracts
| | | | | | | | | | | | | | | | | | | | | | | | | | | | |
| Description | | Contract
Position | | | Number of
Contracts | | | Expiration
Date | | | Notional
Amount | | | Value | | | Unrealized
Appreciation
(Depreciation) | | | Variation
Margin
Receivable/
(Payable) | |
| U.S. Treasury 10-Year Note | | | Long | | | | 16 | | | | 9/18 | | | $ | 1,913,290 | | | $ | 1,923,000 | | | $ | 9,710 | | | $ | — | |
78
For Fund portfolio compliance purposes, the Fund’s industry classifications refer to any one or more of the industry sub-classifications used by one or more widely recognized market indexes or ratings group indexes, and/or as defined by Fund management. This definition may not apply for purposes of this report, which may combine industry sub-classifications into sectors for reporting ease.
| (1) | Principal Amount (000) denominated in U.S. Dollars, unless otherwise noted. |
| (2) | All percentages shown in the Portfolio of Investments are based on net assets. |
| (3) | For financial reporting purposes, the ratings disclosed are the highest of Standard & Poor’s Group (“Standard & Poor’s”), Moody’s Investors Service, Inc. (“Moody’s”) or Fitch, Inc. (“Fitch”) rating. This treatment of split-rated securities may differ from that used for other purposes, such as for Fund investment policies. Ratings below BBB by Standard & Poor’s, Baa by Moody’s or BBB by Fitch are considered to be below investment grade. Holdings designated N/R are not rated by any of these national rating agencies. Ratings are not covered by the report of independent registered public accounting firm. |
| (4) | Investment, or a portion of investment, is out on loan for securities lending. The total value of the securities out on loan as of the end of the reporting period was $28,699,626. |
| (5) | As of, or subsequent to, the end of the reporting period, this security is non-income producing. Non-income producing, in the case of a fixed-income security, generally denotes that the issuer has (1) defaulted on the payment of principal or interest, (2) is under the protection of the Federal Bankruptcy Court or (3) the Fund’s Adviser has concluded that the issue is not likely to meet its future interest payment obligations and has ceased accruing additional income on the Fund’s records. |
| (6) | Investment valued at fair value using methods determined in good faith by, or at the discretion, of the Board. For fair value measurement disclosure purposes, investment classified as Level 3. See Notes to Financial Statements, Note 2 – Investment Valuation and Fair Value Measurements for more information. |
| (7) | Perpetual security. Maturity date is not applicable. |
| (8) | Non-income producing; issuer has not declared a dividend within the past twelve months. |
| (9) | For fair value measurement disclosure purposes, investment classified as Level 2. See Notes to Financial Statements, Note 2 – Investment Valuation and Fair Value Measurements for more information. |
| (10) | Senior loans generally pay interest at rates which are periodically adjusted by reference to a base short-term, floating lending rate (Reference Rate) plus an assigned fixed rate (Spread). These floating lending rates are generally (i) the lending rate referenced by the London Inter-Bank Offered Rate (“LIBOR”), or (ii) the prime rate offered by one or more major United States banks. Senior loans may be considered restricted in that the Fund ordinarily is contractually obligated to receive approval from the agent bank and/or borrower prior to the disposition of a senior loan. The rate shown is the coupon as of the end of the reporting period. |
| (11) | Senior loans generally are subject to mandatory and/or optional prepayment. Because of these mandatory prepayment conditions and because there may be significant economic incentives for a borrower to prepay, prepayments of senior loans may occur. As a result, the actual remaining maturity of senior loans held may be substantially less than the stated maturities shown. |
| (12) | Contingent Capital Securities (“CoCos”) are hybrid securities with loss absorption characteristics built into the terms of the security for the benefit of the issuer. For example, the terms may specify an automatic write-down of principal or a mandatory conversion into the issuer’s common stock under certain adverse circumstances, such as the issuer’s capital ratio falling below a specified level. |
| (13) | A copy of the most recent financial statements for these investment companies can be obtained directly from the Securities and Exchange Commission on its website at http://www.sec.gov. |
| (14) | Principal Amount (000) rounds to less than $1,000. |
| (15) | The Fund may loan securities representing up to one third of the fair value of its total assets (which includes collateral for securities on loan) to broker-dealers, banks and other institutions. The Fund maintains collateral equal to at least 100% of the fair value of the securities loaned. The cash collateral received by the Fund is invested in this money market fund. See Notes to Financial Statements, Note 3 – Portfolio Securities and Investments in Derivatives, Securities Lending for more information. |
| (16) | The rate shown is the annualized seven-day subsidized yield as of the end of the reporting period. |
| (17) | Other assets less liabilities includes the unrealized appreciation (depreciation) of certain over-the-counter (“OTC”) derivatives as presented on the Statement of Assets and Liabilities, when applicable. The unrealized appreciation (depreciation) of OTC cleared and exchange-traded derivatives is recognized as part of the cash collateral at brokers and/or receivable or payable for variation margin as presented on the Statement of Assets and Liabilities, when applicable. |
| 144A | Investment is exempt from registration under Rule 144A of the Securities Act of 1933, as amended. These investments may only be resold in transactions exempt from registration, which are normally those transactions with qualified institutional buyers. |
| LIBOR | London Inter-Bank Offered Rate |
| PIK | Payment-in-kind (“PIK”) security. Depending on the terms of the security, income may be received in the form of cash, securities, or a combination of both. The PIK rate shown, where applicable, represents the annualized rate of the last PIK payment made by the issuer as of the end of the reporting period. |
| Reg S | Regulation S allows U.S. companies to sell securities to persons or entities located outside of the United States without registering those securities with the Securities and Exchange Commission. Specifically, Regulation S provides a safe harbor from the registration requirements of the Securities Act for the offers and sales of securities by both foreign and domestic issuers that are made outside the United States. |
| WI/DD | Investment, or portion of investment, purchased on a when-issued or delayed delivery basis. |
See accompanying notes to financial statements.
79
Nuveen Inflation Protected Securities Fund
Portfolio of Investments June 30, 2018
| | | | | | | | | | | | | | | | | | | | |
Principal
Amount (000) | | | Description (1) | | Coupon | | | Maturity | | | Ratings (2) | | | Value | |
| |
| | | | LONG-TERM INVESTMENTS – 98.9% | |
| |
| | | | U.S. GOVERNMENT AND AGENCY OBLIGATIONS – 88.6% | |
| | | | | |
| $ | 3,924 | | | U.S. Treasury Bonds | | | 3.875% | | | | 4/15/29 | | | | Aaa | | | $ | 5,172,702 | |
| | | | | |
| | 5,428 | | | U.S. Treasury Bonds | | | 0.875% | | | | 2/15/47 | | | | Aaa | | | | 5,426,713 | |
| | | | | |
| | 31,883 | | | U.S. Treasury Inflation Indexed Obligations | | | 0.125% | | | | 4/15/20 | | | | Aaa | | | | 31,543,396 | |
| | | | | |
| | 29,893 | | | U.S. Treasury Inflation Indexed Obligations | | | 1.125% | | | | 1/15/21 | | | | Aaa | | | | 30,282,905 | |
| | | | | |
| | 35,773 | | | U.S. Treasury Inflation Indexed Obligations | | | 0.125% | | | | 4/15/21 | | | | Aaa | | | | 35,220,277 | |
| | | | | |
| | 26,567 | | | U.S. Treasury Inflation Indexed Obligations | | | 0.125% | | | | 1/15/22 | | | | Aaa | | | | 26,115,003 | |
| | | | | |
| | 20,888 | | | U.S. Treasury Inflation Indexed Obligations | | | 0.125% | | | | 4/15/22 | | | | Aaa | | | | 20,460,328 | |
| | | | | |
| | 18,130 | | | U.S. Treasury Inflation Indexed Obligations | | | 0.125% | | | | 7/15/22 | | | | Aaa | | | | 17,829,057 | |
| | | | | |
| | 32,580 | | | U.S. Treasury Inflation Indexed Obligations | | | 0.125% | | | | 1/15/23 | | | | Aaa | | | | 31,849,684 | |
| | | | | |
| | 17,010 | | | U.S. Treasury Inflation Indexed Obligations | | | 0.375% | | | | 7/15/23 | | | | Aaa | | | | 16,856,032 | |
| | | | | |
| | 35,939 | | | U.S. Treasury Inflation Indexed Obligations | | | 0.625% | | | | 1/15/24 | | | | Aaa | | | | 35,892,316 | |
| | | | | |
| | 11,850 | | | U.S. Treasury Inflation Indexed Obligations | | | 0.125% | | | | 7/15/24 | | | | Aaa | | | | 11,518,634 | |
| | | | | |
| | 54,810 | | | U.S. Treasury Inflation Indexed Obligations | | | 0.250% | | | | 1/15/25 | | | | Aaa | | | | 53,309,609 | |
| | | | | |
| | 4,462 | | | U.S. Treasury Inflation Indexed Obligations | | | 2.000% | | | | 1/15/26 | | | | Aaa | | | | 4,889,001 | |
| | | | | |
| | 51,757 | | | U.S. Treasury Inflation Indexed Obligations | | | 0.625% | | | | 1/15/26 | | | | Aaa | | | | 51,469,421 | |
| | | | | |
| | 16,494 | | | U.S. Treasury Inflation Indexed Obligations | | | 0.125% | | | | 7/15/26 | | | | Aaa | | | | 15,799,259 | |
| | | | | |
| | 2,795 | | | U.S. Treasury Inflation Indexed Obligations | | | 2.375% | | | | 1/15/27 | | | | Aaa | | | | 3,178,923 | |
| | | | | |
| | 16,336 | | | U.S. Treasury Inflation Indexed Obligations | | | 0.375% | | | | 1/15/27 | | | | Aaa | | | | 15,869,404 | |
| | | | | |
| | 8,266 | | | U.S. Treasury Inflation Indexed Obligations | | | 0.375% | | | | 7/15/27 | | | | Aaa | | | | 8,039,994 | |
| | | | | |
| | 1,788 | | | U.S. Treasury Inflation Indexed Obligations | | | 1.750% | | | | 1/15/28 | | | | Aaa | | | | 1,953,254 | |
| | | | | |
| | 1,201 | | | U.S. Treasury Inflation Indexed Obligations | | | 3.625% | | | | 4/15/28 | | | | Aaa | | | | 1,523,747 | |
| | | | | |
| | 2,445 | | | U.S. Treasury Inflation Indexed Obligations | | | 2.500% | | | | 1/15/29 | | | | Aaa | | | | 2,872,183 | |
| | | | | |
| | 3,536 | | | U.S. Treasury Inflation Indexed Obligations | | | 2.125% | | | | 2/15/40 | | | | Aaa | | | | 4,442,577 | |
| | | | | |
| | 4,513 | | | U.S. Treasury Inflation Indexed Obligations | | | 2.125% | | | | 2/15/41 | | | | Aaa | | | | 5,712,248 | |
| | | | | |
| | 20,380 | | | U.S. Treasury Inflation Indexed Obligations | | | 0.750% | | | | 2/15/42 | | | | Aaa | | | | 19,887,332 | |
| | | | | |
| | 21,926 | | | U.S. Treasury Inflation Indexed Obligations | | | 0.625% | | | | 2/15/43 | | | | Aaa | | | | 20,739,932 | |
| | | | | |
| | 5,037 | | | U.S. Treasury Inflation Indexed Obligations | | | 1.375% | | | | 2/15/44 | | | | Aaa | | | | 5,620,080 | |
| | | | | |
| | 16,763 | | | U.S. Treasury Inflation Indexed Obligations | | | 0.750% | | | | 2/15/45 | | | | Aaa | | | | 16,253,713 | |
| | | | | |
| | 504 | | | U.S. Treasury Inflation Indexed Bonds | | | 0.625% | | | | 4/15/23 | | | | Aaa | | | | 503,455 | |
| | | | | |
| | 3,708 | | | U.S. Treasury Inflation Indexed Bonds | | | 1.000% | | | | 2/15/48 | | | | Aaa | | | | 3,832,020 | |
| | | | | |
| | 17,987 | | | U.S. Treasury Notes | | | 0.375% | | | | 7/15/25 | | | | Aaa | | | | 17,668,316 | |
| | | | | |
| | 26,409 | | | U.S. Treasury Notes | | | 0.500% | | | | 1/15/28 | | | | Aaa | | | | 25,832,401 | |
| $ | 550,982 | | | Total U.S. Government and Agency Obligations (cost $552,124,225) | | | | 547,563,916 | |
80
| | | | | | | | | | | | | | | | | | | | |
Principal
Amount (000) | | | Description (1) | | Coupon | | | Maturity | | | Ratings (2) | | | Value | |
| |
| | | | ASSET-BACKED AND MORTGAGE-BACKED SECURITIES – 8.1% | |
| | | | | |
| $ | 3,000 | | | Bank of America Commercial Mortgage Inc., Commercial Mortgage Pass-Through Certificates, Series 2015-UBS7 | | | 3.167% | | | | 9/17/48 | | | | BBB– | | | $ | 2,425,001 | |
| | | | | |
| | 2,000 | | | Cabela’s Master Credit Card Trust, Series 2013-2A A2, 144A | | | 2.170% | | | | 8/16/21 | | | | AAA | | | | 1,999,204 | |
| | | | | |
| | 474 | | | Carmax Auto Owners Trust, Series 2016-4 | | | 1.210% | | | | 11/15/19 | | | | Aaa | | | | 473,849 | |
| | | | | |
| | 890 | | | Commercial Mortgage Pass Through Certificates Series 2012-CR4 | | | 1.801% | | | | 10/17/45 | | | | AAA | | | | 871,532 | |
| | | | | |
| | 2,806 | | | DB Master Finance LLC, Series 2015-1A, 144A | | | 3.980% | | | | 2/21/45 | | | | BBB | | | | 2,813,017 | |
| | | | | |
| | 2,953 | | | Dominos Pizza Master Issuer LLC, Series 2017-1A, 144A | | | 3.082% | | | | 7/25/47 | | | | BBB+ | | | | 2,861,804 | |
| | | | | |
| | 2,873 | | | Domino’s Pizza Master Issuer LLC, 144A, (3-Month LIBOR reference rate + 1.250% spread), (3) | | | 3.610% | | | | 7/25/47 | | | | BBB+ | | | | 2,879,494 | |
| | | | | |
| | 2,194 | | | Driven Brands Funding LLC, HONK 2015-1A, 144A | | | 5.216% | | | | 7/20/45 | | | | BBB– | | | | 2,263,731 | |
| | | | | |
| | 1,550 | | | Finance of America Structured Security Trust, Series 2017-HB1, 144A | | | 3.624% | | | | 11/25/27 | | | | Baa2 | | | | 1,542,777 | |
| | | | | |
| | 2,550 | | | Flagstar Mortgage Trust, Series 2017-2, 144A | | | 3.500% | | | | 10/25/47 | | | | Aaa | | | | 2,525,201 | |
| | | | | |
| | 2,346 | | | Focus Brands Funding LLC, Asset Backed Security, 144A | | | 5.093% | | | | 4/30/47 | | | | BBB | | | | 2,410,166 | |
| | | | | |
| | 2,050 | | | Goldman Sachs Mortgage Securities Trust, Mortgage Pass Through Certificates, Series 2015-GC32 | | | 3.345% | | | | 7/10/48 | | | | BBB– | | | | 1,658,303 | |
| | | | | |
| | 227 | | | Honor Automobile Trust, Series 2016-1A, 144A | | | 2.940% | | | | 11/15/19 | | | | A | | | | 226,794 | |
| | | | | |
| | 3,075 | | | Invitation Homes 2018-SFR1 Trust, 144A, (1-Month LIBOR reference rate + 0.700% spread), (3) | | | 2.785% | | | | 3/19/37 | | | | Aaa | | | | 3,066,765 | |
| | | | | |
| | 1,428 | | | Invitation Homes Trust 2017-SFR3, 144A, (1-Month LIBOR reference rate + 0.850% spread), (3) | | | 2.935% | | | | 12/19/36 | | | | Aaa | | | | 1,428,442 | |
| | | | | |
| | 2,729 | | | Jimmy Johns Funding LLC, Series 2017-1A, 144A | | | 3.610% | | | | 7/30/47 | | | | BBB | | | | 2,711,470 | |
| | | | | |
| | 2,230 | | | Morgan Stanley Bank of America Merrill Lynch Trust, Series 2014-C16, 144A | | | 4.913% | | | | 6/17/47 | | | | BBB– | | | | 1,972,457 | |
| | | | | |
| | 2,000 | | | Morgan Stanley Bank of America Merrill Lynch Trust, Series 2015-C22, 144A | | | 4.382% | | | | 4/17/48 | | | | BBB– | | | | 1,702,678 | |
| | | | | |
| | 1,500 | | | Morgan Stanley Bank of America Merrill Lynch Trust, Series 2015-C25 | | | 3.068% | | | | 10/19/48 | | | | BBB– | | | | 1,237,256 | |
| | | | | |
| | 1,000 | | | New Residential Advance Receivable Trust Series 2016-T2, 144A | | | 4.005% | | | | 10/15/49 | | | | BBB | | | | 987,329 | |
| | | | | |
| | 2,565 | | | New Residential Advance Receivable Trust, Series 2017-T1, 144A | | | 4.002% | | | | 2/15/51 | | | | BBB | | | | 2,514,283 | |
| | | | | |
| | 2,284 | | | New Residential Mortgage Loan Trust, Mortgage Pass Through Certificates, Series 2017-6A, 144A | | | 4.000% | | | | 8/25/57 | | | | Aaa | | | | 2,304,514 | |
| | | | | |
| | 8 | | | OneMain Direct Auto Receivables Trust, Series 2016-1, 144A | | | 2.040% | | | | 1/15/21 | | | | AAA | | | | 7,993 | |
| | | | | |
| | 1,174 | | | Sequoia Mortgage Trust, Mortgage Pass Through Certificates, Series 2017-CH2, 144A | | | 4.000% | | | | 12/25/47 | | | | Aaa | | | | 1,183,478 | |
| | | | | |
| | 3,052 | | | Shellpoint Co-Originator Trust, Series 2017-2, 144A | | | 3.500% | | | | 10/25/47 | | | | Aaa | | | | 3,019,286 | |
| | | | | |
| | 1,798 | | | TCF Auto Receivables Owner trust, Series 2015-2A, 144A | | | 2.550% | | | | 4/15/21 | | | | AAA | | | | 1,794,269 | |
| | | | | |
| | 1,580 | | | Wells Fargo Commercial Mortgage Trust, Commercial Mortgage Pass-Through Certificates, Series 2015-C30, 144A | | | 4.646% | | | | 9/17/58 | | | | BBB– | | | | 1,412,112 | |
| $ | 52,336 | | | Total Asset-Backed and Mortgage-Backed Securities (cost $50,371,376) | | | | 50,293,205 | |
| | | | | |
Principal
Amount (000) | | | Description (1) | | Coupon | | | Maturity | | | Ratings (2) | | | Value | |
| | | | | |
| | | | CORPORATE BONDS – 1.9% | | | | | | | | | | | | | | | | |
| | | | | |
| | | | Airlines – 0.1% | | | | | | | | | | | | |
| | | | | |
| $ | 335 | | | American Airlines Inc., Pass Through Trust 2013-2B, 144A | | | 5.600% | | | | 7/15/20 | | | | BBB– | | | $ | 341,727 | |
81
Nuveen Inflation Protected Securities Fund (continued)
Portfolio of Investments June 30, 2018
| | | | | | | | | | | | | | | | | | | | |
Principal
Amount (000) | | | Description (1) | | Coupon | | | Maturity | | | Ratings (2) | | | Value | |
| | | | | |
| | | | Auto Components – 0.1% | | | | | | | | | | | | |
| | | | | |
| $ | 300 | | | American & Axle Manufacturing Inc. | | | 6.625% | | | | 10/15/22 | | | | BB– | | | $ | 307,875 | |
| | | | | |
| | 300 | | | Tenneco Inc. | | | 5.375% | | | | 12/15/24 | | | | BB– | | | | 285,750 | |
| | 600 | | | Total Auto Components | | | | | | | | | | | | | | | 593,625 | |
| | | | | |
| | | | Automobiles – 0.1% | | | | | | | | | | | | |
| | | | | |
| | 465 | | | General Motors Corporation | | | 4.000% | | | | 4/01/25 | | | | BBB | | | | 451,137 | |
| | | | | |
| | | | Banks – 0.0% | | | | | | | | | | | | |
| | | | | |
| | 170 | | | CIT Group Inc. | | | 5.000% | | | | 8/01/23 | | | | BB+ | | | | 171,972 | |
| | | | | |
| | | | Building Products – 0.0% | | | | | | | | | | | | |
| | | | | |
| | 250 | | | Owens Corning Incorporated | | | 4.200% | | | | 12/15/22 | | | | BBB | | | | 250,538 | |
| | | | | |
| | | | Chemicals – 0.1% | | | | | | | | | | | | |
| | | | | |
| | 515 | | | CF Industries Inc., (4) | | | 3.450% | | | | 6/01/23 | | | | BB+ | | | | 487,314 | |
| | | | | |
| | 250 | | | NOVA Chemicals Corporation, 144A | | | 5.250% | | | | 8/01/23 | | | | BBB– | | | | 249,375 | |
| | 765 | | | Total Chemicals | | | | | | | | | | | | | | | 736,689 | |
| | | | | |
| | | | Commercial Services & Supplies – 0.2% | | | | | | | | | | | | |
| | | | | |
| | 512 | | | Covanta Energy Corporation, Synthetic Letter of Credit | | | 6.375% | | | | 10/01/22 | | | | B1 | | | | 522,880 | |
| | | | | |
| | 400 | | | R.R. Donnelley & Sons Company, (4) | | | 7.875% | | | | 3/15/21 | | | | B | | | | 406,000 | |
| | 912 | | | Total Commercial Services & Supplies | | | | | | | | | | | | | | | 928,880 | |
| | | | | |
| | | | Construction Materials – 0.0% | | | | | | | | | | | | |
| | | | | |
| | 300 | | | Cemex SAB de CV, 144A | | | 5.700% | | | | 1/11/25 | | | | BB | | | | 296,550 | |
| | | | | |
| | | | Containers & Packaging – 0.0% | | | | | | | | | | | | |
| | | | | |
| | 175 | | | Graphic Packaging International Inc. | | | 4.875% | | | | 11/15/22 | | | | BB+ | | | | 175,656 | |
| | | | | |
| | | | Diversified Telecommunication Services – 0.2% | | | | | | | | | | | | |
| | | | | |
| | 400 | | | CenturyLink Inc., (4) | | | 5.625% | | | | 4/01/20 | | | | BB | | | | 404,500 | |
| | | | | |
| | 200 | | | CenturyLink Inc., (4) | | | 6.750% | | | | 12/01/23 | | | | BB | | | | 201,000 | |
| | | | | |
| | 400 | | | Telecom Italia SpA, 144A | | | 5.303% | | | | 5/30/24 | | | | BBB– | | | | 394,500 | |
| | 1,000 | | | Total Diversified Telecommunication Services | | | | | | | | | | | | | | | 1,000,000 | |
| | | | | |
| | | | Equity Real Estate Investment Trusts – 0.1% | | | | | | | | | | | | |
| | | | | |
| | 200 | | | Realogy Group LLC / Realogy Co-Issuer Corporation, 144A | | | 5.250% | | | | 12/01/21 | | | | B1 | | | | 199,500 | |
| | | | | |
| | 400 | | | Vereit Operating Partnership LP | | | 3.000% | | | | 2/06/19 | | | | BBB– | | | | 399,818 | |
| | 600 | | | Total Equity Real Estate Investment Trusts | | | | | | | | | | | | | | | 599,318 | |
| | | | | |
| | | | Health Care Providers & Services – 0.4% | | | | | | | | | | | | |
| | | | | |
| | 200 | | | Community Health Systems, Inc., (4) | | | 5.125% | | | | 8/01/21 | | | | B | | | | 185,000 | |
| | | | | |
| | 500 | | | HCA Inc. | | | 4.250% | | | | 10/15/19 | | | | BBB– | | | | 503,750 | |
| | | | | |
| | 1,715 | | | Mayo Clinic Rochester | | | 3.774% | | | | 11/15/43 | | | | AA | | | | 1,667,504 | |
| | 2,415 | | | Total Health Care Providers & Services | | | | | | | | | | | | | | | 2,356,254 | |
| | | | | |
| | | | Hotels, Restaurants & Leisure – 0.1% | | | | | | | | | | | | |
| | | | | |
| | 475 | | | 1011778 BC ULC/New Red Finance Inc., 144A | | | 4.250% | | | | 5/15/24 | | | | Ba3 | | | | 451,250 | |
82
| | | | | | | | | | | | | | | | | | | | |
Principal
Amount (000) | | | Description (1) | | Coupon | | | Maturity | | | Ratings (2) | | | Value | |
| | | | | |
| | | | Media – 0.1% | | | | | | | | | | | | |
| | | | | |
| $ | 200 | | | Charter Communications, CCO Holdings LLC | | | 5.125% | | | | 2/15/23 | | | | BB+ | | | $ | 197,938 | |
| | | | | |
| | 200 | | | SFR Group SA, 144A | | | 6.000% | | | | 5/15/22 | | | | B1 | | | | 201,250 | |
| | 400 | | | Total Media | | | | | | | | | | | | | | | 399,188 | |
| | | | | |
| | | | Metals & Mining – 0.2% | | | | | | | | | | | | |
| | | | | |
| | 470 | | | Freeport McMoRan, Inc. | | | 3.875% | | | | 3/15/23 | | | | BB+ | | | | 444,150 | |
| | | | | |
| | 550 | | | Hudbay Minerals, Inc., 144A | | | 7.250% | | | | 1/15/23 | | | | B+ | | | | 566,500 | |
| | 1,020 | | | Total Metals & Mining | | | | | | | | | | | | | | | 1,010,650 | |
| |
| | | | Mortgage Real Estate Investment Trusts – 0.1% | |
| | | | | |
| | 475 | | | Starwood Property Trust | | | 5.000% | | | | 12/15/21 | | | | BB– | | | | 478,562 | |
| | | | | |
| | | | Oil, Gas & Consumable Fuels – 0.0% | | | | | | | | | | | | |
| | | | | |
| | 150 | | | Targa Resources Inc. | | | 4.250% | | | | 11/15/23 | | | | BB– | | | | 144,000 | |
| | | | | |
| | | | Paper & Forest Products – 0.0% | | | | | | | | | | | | |
| | | | | |
| | 130 | | | Norbord Inc., 144A | | | 5.375% | | | | 12/01/20 | | | | BB+ | | | | 132,925 | |
| | | | | |
| | | | Road & Rail – 0.0% | | | | | | | | | | | | |
| | | | | |
| | 255 | | | The Hertz Corporation, 144A | | | 7.625% | | | | 6/01/22 | | | | BB– | | | | 244,800 | |
| |
| | | | Technology Hardware, Storage & Peripherals – 0.1% | |
| | | | | |
| | 500 | | | NCR Corporation | | | 5.000% | | | | 7/15/22 | | | | BB | | | | 495,000 | |
| |
| | | | Wireless Telecommunication Services – 0.0% | |
| | | | | |
| | 200 | | | Sprint Communications Inc., 144A | | | 7.000% | | | | 3/01/20 | | | | BB | | | | 207,500 | |
| $ | 11,592 | | | Total Corporate Bonds (cost $11,669,254) | | | | | | | | | | | | | | | 11,466,221 | |
| | | | | |
Principal
Amount (000) | | | Description (1) | | Coupon | | | Maturity | | | Ratings (2) | | | Value | |
| | | | | |
| | | | SOVEREIGN DEBT – 0.3% | | | | | | | | | | | | | | | | |
| | | | | |
| | | | Canada – 0.3% | | | | | | | | | | | | |
| | | | | |
| $ | 1,500 | | | Quebec Province | | | 7.500% | | | | 7/15/23 | | | | Aa2 | | | $ | 1,790,369 | |
| $ | 1,500 | | | Total Sovereign Debt (cost $1,810,900) | | | | | | | | | | | | | | | 1,790,369 | |
| | | | Total Long-Term Investments (cost $615,975,755) | | | | 611,113,711 | |
| | | | | |
| Shares | | | Description (1) | | | | | Coupon | | | | | | Value | |
| |
| | | | INVESTMENTS PURCHASED WITH COLLATERAL FROM SECURITIES LENDING – 0.2% | |
| | | | | |
| | | | Money Market Funds – 0.2% | | | | | | | | | | | | |
| | | | | |
| | 1,278,083 | | | First American Government Obligations Fund, Class X, (5) | | | | | | | 1.806% (6) | | | | | | | $ | 1,278,083 | |
| | | | Total Investments Purchased with Collateral from Securities Lending (cost $1,278,083) | | | | 1,278,083 | |
83
Nuveen Inflation Protected Securities Fund (continued)
Portfolio of Investments June 30, 2018
| | | | | | | | | | | | | | | | | | | | |
| Shares | | | Description (1) | | | | | Coupon | | | | | | Value | |
| | | | | |
| | | | SHORT-TERM INVESTMENTS – 1.2% | | | | | | | | | | | | | | | | |
| | | | | |
| | | | Money Market Funds – 1.2% | | | | | | | | | | | | |
| | | | | |
| | 7,365,188 | | | First American Treasury Obligations Fund, Class Z | | | | | | | 1.754% (6) | | | | | | | $ | 7,365,188 | |
| | | | Total Short-Term Investments (cost $7,365,188) | | | | | | | | | | | | | | | 7,365,188 | |
| | | | Total Investments (cost $624,619,026) – 100.3% | | | | | | | | | | | | | | | 619,756,982 | |
| | | | Other Assets Less Liabilities – (0.3)% (7) | | | | | | | | | | | | | | | (2,028,260) | |
| | | | Net Assets – 100% | | | | | | | | | | | | | | $ | 617,728,722 | |
Investments in Derivatives
Futures Contracts
| | | | | | | | | | | | | | | | | | | | | | | | | | | | |
| Description | | Contract
Position | | | Number of
Contracts | | | Expiration
Date | | | Notional
Amount* | | | Value | | | Unrealized
Appreciation
(Depreciation) | | | Variation
Margin
Receivable/
(Payable) | |
U.S. Treasury 2-Year Note | | | Short | | | | (291 | ) | | | 9/18 | | | $ | (61,667,258 | ) | | $ | (61,641,985 | ) | | $ | 25,273 | | | $ | 9,094 | |
U.S. Treasury 5-Year Note | | | Short | | | | (246 | ) | | | 9/18 | | | | (27,928,679 | ) | | | (27,949,828 | ) | | | (21,149 | ) | | | 5,766 | |
U.S. Treasury 10-Year Note | | | Short | | | | (1 | ) | | | 9/18 | | | | (119,857 | ) | | | (120,188 | ) | | | (331 | ) | | | 419 | |
U.S. Treasury Ultra 10-Year Note | | | Short | | | | (59 | ) | | | 9/18 | | | | (7,505,985 | ) | | | (7,565,828 | ) | | | (59,843 | ) | | | — | |
U.S. Treasury Ultra Bond | | | Long | | | | 62 | | | | 9/18 | | | | 9,716,689 | | | | 9,892,875 | | | | 176,186 | | | | (4,448 | ) |
| Total | | | $ | (87,505,090 | ) | | $ | (87,384,954 | ) | | $ | 120,136 | | | $ | 10,831 | |
| Total receivable for variation margin on futures contracts | | | $ | 15,279 | |
Total payable for variation margin on futures contracts | | | $ | (4,448 | ) |
| * | The aggregate notional amount of long and short-positions is $9,716,689 and $(97,221,779), respectively. |
For Fund portfolio compliance purposes, the Fund’s industry classifications refer to any one or more of the industry sub-classifications used by one or more widely recognized market indexes or ratings group indexes, and/or as defined by Fund management. This definition may not apply for purposes of this report, which may combine industry sub-classifications into sectors for reporting ease.
| (1) | All percentages shown in the Portfolio of Investments are based on net assets. |
| (2) | For financial reporting purposes, the ratings disclosed are the highest of Standard & Poor’s Group (“Standard & Poor’s”), Moody’s Investors Service, Inc. (“Moody’s”) or Fitch, Inc. (“Fitch”) rating. This treatment of split-rated securities may differ from that used for other purposes, such as for Fund investment policies. Ratings below BBB by Standard & Poor’s, Baa by Moody’s or BBB by Fitch are considered to be below investment grade. Holdings designated N/R are not rated by any of these national rating agencies. Ratings are not covered by the report of independent registered public accounting firm. |
| (3) | Variable rate security. The rate shown is the coupon as of the end of the reporting period. |
| (4) | Investment, or a portion of investment, is out on loan for securities lending. The total value of the securities out on loan as of the end of the reporting period was $1,239,354. |
| (5) | The Fund may loan securities representing up to one third of the fair value of its total assets (which includes collateral for securities on loan) to broker-dealers, banks and other institutions. The Fund maintains collateral equal to at least 100% of the fair value of the securities loaned. The cash collateral received by the Fund is invested in this money market fund. See Notes to Financial Statements, Note 3 – Portfolio Securities and Investments in Derivatives, Securities Lending for more information. |
| (6) | The rate shown is the annualized seven-day subsidized yield as of the end of the reporting period. |
| (7) | Other assets less liabilities includes the unrealized appreciation (depreciation) of certain over-the-counter (“OTC”) derivatives as presented on the Statement of Assets and Liabilities, when applicable. The unrealized appreciation (depreciation) of OTC cleared and exchange-traded derivatives is recognized as part of the cash collateral at brokers and/or receivable or payable for variation margin as presented on the Statement of Assets and Liabilities, when applicable. |
| 144A | Investment is exempt from registration under Rule 144A of the Securities Act of 1933, as amended. These investments may only be resold in transactions exempt from registration, which are normally those transactions with qualified institutional buyers. |
| LIBOR | London Inter-Bank Offered Rate |
See accompanying notes to financial statements.
84
Nuveen Short Term Bond Fund
Portfolio of Investments June 30, 2018
| | | | | | | | | | | | | | | | | | | | |
Principal
Amount (000) | | | Description (1) | | Coupon | | | Maturity | | | Ratings (2) | | | Value | |
| |
| | | | LONG-TERM INVESTMENTS – 99.0% | |
| |
| | | | ASSET-BACKED AND MORTGAGE-BACKED SECURITIES – 48.0% | |
| | | | | |
| $ | 1,767 | | | 321 Henderson Receivables LLC, Series 2005-1A, 144A, (1-Month LIBOR reference rate + 0.230% spread), (3) | | | 2.303% | | | | 11/15/40 | | | | AAA | | | $ | 1,682,657 | |
| | | | | |
| | 1,374 | | | 321 Henderson Receivables LLC, Series 2006-4A, 144A, (1-Month LIBOR reference rate + 0.200% spread), (3) | | | 2.273% | | | | 12/15/41 | | | | AAA | | | | 1,346,567 | |
| | | | | |
| | 417 | | | ACE Securities Corporation, Manufactured Housing Trust Series 2003-MH1, 144A | | | 6.500% | | | | 5/15/29 | | | | AA | | | | 450,893 | |
| | | | | |
| | 2,639 | | | American Credit Acceptance Receivables Trust 2016-1A, 144A | | | 5.550% | | | | 6/13/22 | | | | AA | | | | 2,678,284 | |
| | | | | |
| | 4,198 | | | American Express Credit Account Master Trust, Series 2013-1, (1-Month LIBOR reference rate + 0.420% spread), (3) | | | 2.493% | | | | 2/16/21 | | | | Aaa | | | | 4,198,396 | |
| | | | | |
| | 1,766 | | | American Express Credit Account Master Trust, Series 2014-4, (1-Month LIBOR reference rate + 0.370% spread), (3) | | | 2.443% | | | | 12/15/21 | | | | AAA | | | | 1,770,414 | |
| | | | | |
| | 2,649 | | | AmeriCold LLC Trust, Series 2010, 144A, (1-Month LIBOR reference rate + 1.500% spread), (3) | | | 3.557% | | | | 1/17/29 | | | | AAA | | | | 2,648,135 | |
| | | | | |
| | 2,521 | | | Asset Backed Securities Corp Home Equity Loan Trust, Series 2002-HE1, (1-Month LIBOR reference rate + 1.650% spread), (3) | | | 3.723% | | | | 3/15/32 | | | | BBB | | | | 2,506,448 | |
| | | | | |
| | 2,202 | | | Avid Automobile Receivables Trust 2018-1, 144A | | | 2.840% | | | | 8/15/23 | | | | A | | | | 2,189,351 | |
| | | | | |
| | 2,915 | | | Bank of the West Auto Trust, Series 2017-1, 144A | | | 2.110% | | | | 1/15/23 | | | | AAA | | | | 2,864,071 | |
| | | | | |
| | 3,000 | | | Barclays Commercial Mortgage, Mortgage Pass-Through Certificates, Series 2015-STP, 144A | | | 4.427% | | | | 9/10/28 | | | | A– | | | | 3,016,596 | |
| | | | | |
| | 2,375 | | | Cabela’s Master Credit Card Trust, Series 2014-2, (1-Month LIBOR reference rate + 0.450% spread), (3) | | | 2.523% | | | | 7/15/22 | | | | AAA | | | | 2,380,892 | |
| | | | | |
| | 1,808 | | | California Republic Auto Receivables Trust 2015-2 | | | 1.750% | | | | 1/15/21 | | | | AAA | | | | 1,797,866 | |
| | | | | |
| | 1,317 | | | California Republic Auto Receivables Trust, Series 2014-4 | | | 1.840% | | | | 6/15/20 | | | | AAA | | | | 1,313,947 | |
| | | | | |
| | 4,155 | | | Capital One Multi Asset Execution Trust, Series 2014-A3, (1-Month LIBOR reference rate + 0.380% spread), (3) | | | 2.453% | | | | 1/18/22 | | | | AAA | | | | 4,163,246 | |
| | | | | |
| | 2,678 | | | Capital One Multi Asset Execution Trust, Series 2015-A5 | | | 1.600% | | | | 5/17/21 | | | | AAA | | | | 2,676,602 | |
| | | | | |
| | 2,930 | | | Capital One Multi Asset Execution Trust, Series 2016-A1, (1-Month LIBOR reference rate + 0.450% spread), (3) | | | 2.523% | | | | 2/15/22 | | | | AAA | | | | 2,937,804 | |
| | | | | |
| | 2,500 | | | Capital One Multi-Asset Execution Trust, Series 2016-A2, (1-Month LIBOR reference rate + 0.630% spread), (3) | | | 2.703% | | | | 2/15/24 | | | | AAA | | | | 2,526,069 | |
| | | | | |
| | 538 | | | CarMax Auto Owner Trust, Series 2017-1 A2 | | | 1.540% | | | | 2/18/20 | | | | Aaa | | | | 537,332 | |
| | | | | |
| | 2,152 | | | CarNow Auto Receivables Trust 2017-1A, 144A | | | 2.920% | | | | 9/15/22 | | | | A | | | | 2,141,749 | |
| | | | | |
| | 1,000 | | | Cascade Funding Mortgage Trust, 144A, (WI/DD) | | | 4.580% | | | | 6/25/48 | | | | N/R | | | | 999,987 | |
| | | | | |
| | 2,379 | | | Chase Issuance Trust, Series 2013-A9, (1-Month LIBOR reference rate + 0.420% spread), (3) | | | 2.493% | | | | 11/16/20 | | | | AAA | | | | 2,382,005 | |
| | | | | |
| | 2,365 | | | Chase Issuance Trust, Series 2016-A1, (1-Month LIBOR reference rate + 0.410% spread), (3) | | | 2.483% | | | | 5/17/21 | | | | AAA | | | | 2,371,308 | |
| | | | | |
| | 4,000 | | | Chase Issuance Trust, Series 2016-A3, (1-Month LIBOR reference rate + 0.550% spread), (3) | | | 2.623% | | | | 6/15/23 | | | | AAA | | | | 4,041,694 | |
| | | | | |
| | 2,011 | | | CIG Auto Receivables Trust, Series 2017- 1A, 144A | | | 2.710% | | | | 5/15/23 | | | | A3 | | �� | | 1,997,985 | |
| | | | | |
| | 2,000 | | | Citibank Credit Card Issuance Trust, (1-Month LIBOR reference rate + 0.220% spread), (3) | | | 2.245% | | | | 4/7/22 | | | | AAA | | | | 2,002,194 | |
85
Nuveen Short Term Bond Fund (continued)
Portfolio of Investments June 30, 2018
| | | | | | | | | | | | | | | | | | | | |
Principal
Amount (000) | | | Description (1) | | Coupon | | | Maturity | | | Ratings (2) | | | Value | |
| |
| | | | ASSET-BACKED AND MORTGAGE-BACKED SECURITIES (continued) | |
| | | | | |
| $ | 78 | | | Citicorp Mortgage Securities Inc., REMIC Pass-Through Certificates, Series 2006-1 5A1 | | | 5.500% | | | | 2/25/26 | | | | Ba2 | | | $ | 78,831 | |
| | | | | |
| | 2,000 | | | Cold Storage Trust, Commercial Mortgage Backed Securities, Series 2017-ICE3, 144A, (1-Month LIBOR reference rate + 1.000% spread), (3) | | | 3.073% | | | | 4/15/36 | | | | AAA | | | | 2,007,479 | |
| | | | | |
| | 2,960 | | | Colony American Homes Trust 2015-1A, 144A, (1-Month LIBOR reference rate + 1.950% spread), (3) | | | 3.996% | | | | 7/17/32 | | | | Aa2 | | | | 2,965,967 | |
| | | | | |
| | 1,683 | | | Colony American Homes Trust 2015-1A, 144A, (1-Month LIBOR reference rate + 1.200% spread), (3) | | | 3.246% | | | | 7/19/32 | | | | Aaa | | | | 1,681,893 | |
| | | | | |
| | 2,000 | | | Colony Starwood Homes, Series 2016-1A, 144A, (1-Month LIBOR reference rate + 3.100% spread), (3) | | | 5.185% | | | | 7/19/33 | | | | Baa2 | | | | 2,006,609 | |
| | | | | |
| | 1,645 | | | Commercial Mortgage Pass-Through Certificates, Series 2016-SAVA, 144A, (1-Month LIBOR reference rate + 2.300% spread), (3) | | | 4.373% | | | | 10/17/34 | | | | AA– | | | | 1,648,095 | |
| | | | | |
| | 699 | | | Conns Receivables Funding Trust II, Series 2017-B, 144A | | | 2.730% | | | | 7/15/20 | | | | BBB | | | | 698,846 | |
| | | | | |
| | 1,750 | | | CPS Auto Trust, 144A | | | 5.540% | | | | 11/15/19 | | | | AAA | | | | 1,757,939 | |
| | | | | |
| | 301 | | | Credit Suisse First Boston Mortgage Securities Corporation, Mortgage-Backed Pass-Through Certificates, Series 2003-23 | | | 5.750% | | | | 9/25/33 | | | | AA+ | | | | 314,131 | |
| | | | | |
| | 2,439 | | | Credit Suisse Mortgage Trust 2017-HL2, 144A | | | 3.500% | | | | 10/25/47 | | | | AAA | | | | 2,421,756 | |
| | | | | |
| | 1,599 | | | Credit-Based Asset Servicing and Securitization Pool 2007-SP1, 144A | | | 5.634% | | | | 12/25/37 | | | | AA | | | | 1,629,609 | |
| | | | | |
| | 2,061 | | | DB Master Finance LLC, Series 2015-1A, 144A | | | 3.980% | | | | 2/21/45 | | | | BBB | | | | 2,066,112 | |
| | | | | |
| | 2,481 | | | Domino’s Pizza Master Issuer LLC, 144A, (3-Month LIBOR reference rate + 1.250% spread), (3) | | | 3.610% | | | | 7/25/47 | | | | BBB+ | | | | 2,486,610 | |
| | | | | |
| | 199 | | | Fannie Mae Connecticut Avenue Securities , Series 2016-C03, (1-Month LIBOR reference rate + 2.200% spread), (3) | | | 4.291% | | | | 10/25/28 | | | | A | | | | 199,742 | |
| | | | | |
| | 131 | | | Fannie Mae Mortgage Interest Strips | | | 5.000% | | | | 9/1/24 | | | | N/R | | | | 5,211 | |
| | | | | |
| | 2,329 | | | Fannie Mae Mortgage Pool | | | 2.500% | | | | 1/1/27 | | | | N/R | | | | 2,294,072 | |
| | | | | |
| | 2,738 | | | Fannie Mae Mortgage Pool | | | 2.500% | | | | 12/1/27 | | | | N/R | | | | 2,692,446 | |
| | | | | |
| | 8 | | | Fannie Mae Real Estate Mortgage Investment Conduit, Pass-Through Certificates | | | 5.500% | | | | 9/25/22 | | | | N/R | | | | 8,370 | |
| | | | | |
| | 121 | | | Fannie Mae Real Estate Mortgage Investment Conduit, Pass-Through Certificates, (1-Month LIBOR reference rate + 0.300% spread), (3) | | | 2.391% | | | | 11/25/34 | | | | N/R | | | | 121,226 | |
| | | | | |
| | 31 | | | Fannie Mae REMIC Pass-Through Certificates | | | 2.750% | | | | 6/25/20 | | | | N/R | | | | 31,618 | |
| | | | | |
| | 886 | | | Fannie Mae, Connecticut Avenue Securities, Series 2016-C07, (1-Month LIBOR reference rate + 1.300% spread), (3) | | | 3.391% | | | | 5/25/29 | | | | BBB | | | | 889,153 | |
| | | | | |
| | 2 | | | Federal Home Loan Mortgage Corporation, REMIC | | | 6.000% | | | | 12/15/20 | | | | N/R | | | | 1,739 | |
| | | | | |
| | 1,170 | | | Fifth Third Auto Trust, Series 2017-1 | | | 1.800% | | | | 2/15/22 | | | | AAA | | | | 1,153,670 | |
| | | | | |
| | 2,170 | | | Flagstar Mortgage Trust 2018-4 | | | 4.000% | | | | 7/25/48 | | | | Aaa | | | | 2,181,942 | |
| | | | | |
| | 1,333 | | | Flagstar Mortgage Trust, Series 2017-1, 144A | | | 3.500% | | | | 3/25/47 | | | | Aaa | | | | 1,315,871 | |
| | | | | |
| | 2,252 | | | Flagstar Mortgage Trust, Series 2017-2, 144A | | | 3.500% | | | | 10/25/47 | | | | Aaa | | | | 2,229,881 | |
| | | | | |
| | 990 | | | Focus Brands Funding LLC, Asset Backed Security, 144A | | | 3.857% | | | | 4/30/47 | | | | BBB | | | | 989,723 | |
| | | | | |
| | 2,775 | | | Ford Credit Auto Owner Trust 2017-C | | | 2.010% | | | | 3/15/22 | | | | AAA | | | | 2,735,901 | |
| | | | | |
| | 25 | | | Freddie Mac Mortgage Pool, Various | | | 4.500% | | | | 4/1/22 | | | | N/R | | | | 25,728 | |
| | | | | |
| | 2,000 | | | Freddie Mac Mortgage Trust, Multifamily Mortgage Pass-Through Certificates, Series 2013-K712, 144A | | | 3.477% | | | | 5/25/45 | | | | AA | | | | 1,999,143 | |
| | | | | |
| | 1,995 | | | Freddie Mac Mortgage Trust, Structured Pass-Through Certificates, Series 2012- K707, 144A | | | 4.020% | | | | 1/25/47 | | | | Aa2 | | | | 1,997,691 | |
86
| | | | | | | | | | | | | | | | | | | | |
Principal
Amount (000) | | | Description (1) | | Coupon | | | Maturity | | | Ratings (2) | | | Value | |
| |
| | | | ASSET-BACKED AND MORTGAGE-BACKED SECURITIES (continued) | |
| | | | | |
| $ | 174 | | | Freddie Mac Multi-Class Certificates, (1-Month LIBOR reference rate + 0.400% spread), (3) | | | 2.473% | | | | 12/15/20 | | | | N/R | | | $ | 174,674 | |
| | | | | |
| | 3,030 | | | Freddie Mac Multifamily Mortgage Trust, Series 2011-K704, 144A | | | 4.634% | | | | 10/25/30 | | | | A1 | | | | 3,027,403 | |
| | | | | |
| | 1,300 | | | Freddie Mac MultiFamily Mortgage Trust, Structured Pass-Through Certificates, Series 2012-K710, 144A | | | 3.942% | | | | 6/25/47 | | | | AA | | | | 1,309,067 | |
| | | | | |
| | 2,362 | | | Freddie Mac MultiFamily Mortgage Trust, Structured Pass-Through Certificates, Series 2016-K722 | | | 2.183% | | | | 5/25/22 | | | | AAA | | | | 2,304,574 | |
| | | | | |
| | 1,738 | | | Freddie Mac Multifamily Structured Pass- Through Certificates FHMS K029 | | | 2.839% | | | | 10/25/22 | | | | Aaa | | | | 1,734,024 | |
| | | | | |
| | 1,680 | | | Freddie Mac Multifamily Structured Pass- Through Certificates FHMS K068, (1-Month LIBOR reference rate + 0.200% spread), (3) | | | 2.201% | | | | 10/25/19 | | | | N/R | | | | 1,680,002 | |
| | | | | |
| | 1,474 | | | Freddie Mac Multifamily Structured Pass-Through Certificates, Series K034 | | | 2.669% | | | | 2/25/23 | | | | Aaa | | | | 1,465,960 | |
| | | | | |
| | 2,869 | | | Freddie Mac Multifamily Structured Pass-Through Certificates, Series K052 | | | 2.598% | | | | 1/25/25 | | | | Aaa | | | | 2,821,993 | |
| | | | | |
| | 2,235 | | | Freddie Mac Multifamily Structured Pass-Through Certificates, Series KLH1, (1-Month LIBOR reference rate + 0.700% spread), (3) | | | 2.701% | | | | 11/25/22 | | | | N/R | | | | 2,243,073 | |
| | | | | |
| | 2,163 | | | Freddie Mac Multifamily Structured Pass-Through Certificates, FHMS K726 | | | 2.596% | | | | 8/25/23 | | | | AAA | | | | 2,141,705 | |
| | | | | |
| | 1,935 | | | Freddie Mac Structured Agency Credit Risk Debt Notes, 144A | | | 3.746% | | | | 2/25/48 | | | | BBB– | | | | 1,929,214 | |
| | | | | |
| | 495 | | | GAHR Commercial Mortgage Trust, Commercial Mortgage Pass-Through Certificates, Series 2015-NRF, 144A, (1-Month LIBOR reference rate + 1.300% spread), (3) | | | 3.469% | | | | 12/15/34 | | | | AAA | | | | 495,448 | |
| | | | | |
| | 1,341 | | | GLS Auto Receivables Trust 2017-1A, 144A | | | 2.670% | | | | 4/15/21 | | | | A | | | | 1,338,023 | |
| | | | | |
| | 1,918 | | | GLS Auto Receivables Trust 2018-1, 144A | | | 2.820% | | | | 7/15/22 | | | | A | | | | 1,907,094 | |
| | | | | |
| | 631 | | | Goldman Sachs Mortgage Securities Corporation II, Commercial Mortgage Pass-Through Certificates, Series 2010-C1, 144A | | | 3.679% | | | | 8/12/43 | | | | Aaa | | | | 634,316 | |
| | | | | |
| | 1,000 | | | GS Mortgage Securities Corp Trust 2018-CHILL, 144A, (1-Month LIBOR reference rate + 1.650% spread), (3) | | | 3.723% | | | | 2/17/37 | | | | Baa3 | | | | 998,849 | |
| | | | | |
| | 376 | | | Honor Automobile Trust, Series 2016-1A, 144A | | | 2.940% | | | | 11/15/19 | | | | A | | | | 376,212 | |
| | | | | |
| | 530 | | | IMC Home Mortgage Company, Home Equity Loan Pass-Through Certificates, Series 1998-3 | | | 6.720% | | | | 8/20/29 | | | | AA | | | | 527,554 | |
| | | | | |
| | 3,254 | | | Invitation Homes 2018-SFR1 Trust, 144A, (1-Month LIBOR reference rate + 0.700% spread), (3) | | | 2.785% | | | | 3/19/37 | | | | Aaa | | | | 3,245,411 | |
| | | | | |
| | 2,171 | | | Invitation Homes 2018-SFR2 Trust, 144A, (1-Month LIBOR reference rate + 0.900% spread), (3) | | | 2.973% | | | | 6/18/37 | | | | Aaa | | | | 2,169,298 | |
| | | | | |
| | 2,735 | | | Invitation Homes 2018-SFR3 Trust, 144A, (1-Month LIBOR reference rate + 1.000% spread), (3) | | | 3.000% | | | | 7/17/37 | | | | Aaa | | | | 2,738,425 | |
| | | | | |
| | 2,441 | | | Invitation Homes Trust 2015-SFR3, 144A, (1-Month LIBOR reference rate + 1.300% spread), (3) | | | 3.373% | | | | 8/19/32 | | | | Aaa | | | | 2,443,758 | |
| | | | | |
| | 1,314 | | | Invitation Homes Trust 2017-SFR3, 144A, (1-Month LIBOR reference rate + 0.850% spread), (3) | | | 2.935% | | | | 12/19/36 | | | | Aaa | | | | 1,313,968 | |
| | | | | |
| | 2,605 | | | J.P. Morgan Chase Commercial Mortgage Securities Trust 2018-BCON, 144A | | | 3.735% | | | | 1/7/31 | | | | AAA | | | | 2,631,862 | |
| | | | | |
| | 2,675 | | | Jimmy Johns Funding LLC, Series 2017-1A, 144A | | | 3.610% | | | | 7/30/47 | | | | BBB | | | | 2,657,241 | |
| | | | | |
| | 3,693 | | | JP Morgan Chase Commercial Mortgage Securities Corporation, Commercial Mortgage Pass-Through Certificates, Series 2010-C2 A3, 144A | | | 4.070% | | | | 11/15/43 | | | | AAA | | | | 3,747,384 | |
| | | | | |
| | 2,113 | | | JP Morgan Chase Commercial Mortgage Securities Corporation, Commercial Mortgage Pass-Through Certificates, Series 2011-C3 A1, 144A | | | 4.717% | | | | 2/16/46 | | | | AAA | | | | 2,179,906 | |
| | | | | |
| | 2,970 | | | JP Morgan Chase Commercial Mortgage Securities Corporation, Pass-Through Certificates Trust 2017-MAUI, 144A, (1-Month LIBOR reference rate + 0.830% spread), (3) | | | 2.876% | | | | 7/17/34 | | | | AAA | | | | 2,968,132 | |
87
Nuveen Short Term Bond Fund (continued)
Portfolio of Investments June 30, 2018
| | | | | | | | | | | | | | | | | | | | |
Principal
Amount (000) | | | Description (1) | | Coupon | | | Maturity | | | Ratings (2) | | | Value | |
| |
| | | | ASSET-BACKED AND MORTGAGE-BACKED SECURITIES (continued) | |
| | | | | |
| $ | 2,406 | | | JP Morgan Mortgage Trust 2018-4, 144A | | | 3.500% | | | | 10/25/48 | | | | AAA | | | $ | 2,394,193 | |
| | | | | |
| | 2,410 | | | JP Morgan Mortgage Trust, Series 2017-2, 144A | | | 3.500% | | | | 5/25/47 | | | | Aaa | | | | 2,381,321 | |
| | | | | |
| | 145 | | | Master Resecuritization Trust 2009-1, 144A | | | 6.000% | | | | 10/25/36 | | | | AAA | | | | 145,192 | |
| | | | | |
| | 2,288 | | | Mid-State Trust 2010-1, 144A | | | 7.000% | | | | 12/15/45 | | | | A | | | | 2,450,237 | |
| | | | | |
| | 2,430 | | | New Residential Advance Receivable Trust, Series 2016-T3, 144A | | | 2.833% | | | | 10/16/51 | | | | AAA | | | | 2,370,708 | |
| | | | | |
| | 970 | | | New Residential Advance Receivable Trust, Series 2017-T1, 144A | | | 3.214% | | | | 2/15/51 | | | | AAA | | | | 962,993 | |
| | | | | |
| | 2,155 | | | New Residential Mortgage LLC, 144A | | | 4.690% | | | | 5/25/23 | | | | N/R | | | | 2,153,759 | |
| | | | | |
| | 1,598 | | | New Residential Mortgage Loan Trust, Mortgage Pass-Through Certificates, Series 2014-2A, 144A | | | 3.750% | | | | 5/25/54 | | | | AAA | | | | 1,604,815 | |
| | | | | |
| | 951 | | | New Residential Mortgage Loan Trust, Mortgage Pass-Through Certificates, Series 2014-3A, 144A | | | 3.750% | | | | 11/25/54 | | | | AA | | | | 949,536 | |
| | | | | |
| | 1,585 | | | New Residential Mortgage Loan Trust, Mortgage Pass-Through Certificates, Series 2015-A1, 144A | | | 3.750% | | | | 5/28/52 | | | | Aaa | | | | 1,590,234 | |
| | | | | |
| | 1,789 | | | New Residential Mortgage Loan Trust, Mortgage Pass-Through Certificates, Series 2016-1A, 144A | | | 3.750% | | | | 3/25/56 | | | | AAA | | | | 1,791,449 | |
| | | | | |
| | 2,547 | | | New Residential Mortgage Loan Trust, Mortgage Pass-Through Certificates, Series 2017-6A, 144A | | | 4.000% | | | | 12/25/57 | | | | AA– | | | | 2,563,526 | |
| | | | | |
| | 2,012 | | | New Residential Mortgage Loan Trust, Series 2017-1A, 144A | | | 4.000% | | | | 2/25/57 | | | | AA+ | | | | 2,028,186 | |
| | | | | |
| | 3,185 | | | OMART Receivables Trust, Series 2016-T2, 144A | | | 2.722% | | | | 8/16/49 | | | | AAA | | | | 3,168,081 | |
| | | | | |
| | 2,600 | | | OMART Receivables Trust, Series 2017-T1, 144A | | | 2.499% | | | | 9/15/48 | | | | AAA | | | | 2,596,904 | |
| | | | | |
| | 20 | | | OneMain Direct Auto Receivables Trust, Series 2016-1, 144A | | | 2.040% | | | | 1/15/21 | | | | AAA | | | | 19,902 | |
| | | | | |
| | 500 | | | OneMain Financial Issuance Trust 2015-1, 144A | | | 3.850% | | | | 3/18/26 | | | | AA | | | | 503,297 | |
| | | | | |
| | 1,219 | | | OWS Structured Asset Trust, Series 2016-NPL1, 144A | | | 3.750% | | | | 7/25/56 | | | | N/R | | | | 1,225,524 | |
| | | | | |
| | 2,213 | | | Progress Residential Trust, Series 2017 -SFRI, 144A | | | 2.768% | | | | 8/17/34 | | | | Aaa | | | | 2,140,203 | |
| | | | | |
| | 310 | | | RBSSP Resecuritization Trust 2009-10, 144A, (1-Month LIBOR reference rate + 0.100% spread), (3) | | | 2.060% | | | | 3/26/37 | | | | N/R | | | | 151,977 | |
| | | | | |
| | 1,034 | | | Sequoia Mortgage Trust, Mortgage Pass-Through Certificates, Series 2017-CH2, 144A | | | 4.000% | | | | 12/25/47 | | | | Aaa | | | | 1,042,401 | |
| | | | | |
| | 561 | | | Sofi Professional Loan Program 2016-E LLC, 144A | | | 1.630% | | | | 1/25/36 | | | | Aaa | | | | 558,160 | |
| | | | | |
| | 3,000 | | | STACR Trust 2018-DNA2, 144A, (1-Month LIBOR reference rate + 0.800% spread), (3) | | | 2.857% | | | | 12/26/30 | | | | BBB+ | | | | 2,999,996 | |
| | | | | |
| | 2,293 | | | Structured Agency Credit Risk Notes, Series 2017-HQA2, (1-Month LIBOR reference rate + 0.800% spread), (3) | | | 2.891% | | | | 12/26/29 | | | | BBB– | | | | 2,297,270 | |
| | | | | |
| | 1,176 | | | Sunset Mortgage Loan Company, Series 2017-NPL1, 144A | | | 3.500% | | | | 6/18/47 | | | | N/R | | | | 1,168,334 | |
| | | | | |
| | 3,080 | | | Synchrony Credit Card Master Note Trust, Series 2015-3 | | | 1.740% | | | | 9/15/21 | | | | AAA | | | | 3,074,872 | |
| | | | | |
| | 2,750 | | | Synchrony Credit Card Master Note Trust, Series 2016-1 | | | 2.040% | | | | 3/15/22 | | | | Aaa | | | | 2,741,464 | |
| | | | | |
| | 3,103 | | | Taco Bell Funding LLC, Series 2016-1A, 144A | | | 3.832% | | | | 5/25/46 | | | | BBB | | | | 3,106,473 | |
| | | | | |
| | 2,205 | | | TCF Auto Receivables Owner Trust, Series 2016-1A, 144A | | | 1.710% | | | | 4/15/21 | | | | AAA | | | | 2,194,286 | |
| | | | | |
| | 1,996 | | | Tesla Auto Lease Trust 2018-A, 144A | | | 2.320% | | | | 12/20/19 | | | | Aaa | | | | 1,989,388 | |
| | | | | |
| | 3,000 | | | Toyota Auto Receivables Owner Trust, Series 2017-B | | | 2.050% | | | | 9/15/22 | | | | AAA | | | | 2,941,561 | |
| | | | | |
| | 2,170 | | | Tricon American Homes Trust, Series 2017-SFRI, 144A | | | 2.716% | | | | 9/19/34 | | | | Aaa | | | | 2,093,837 | |
| | | | | |
| | 1,085 | | | Vericrest Opportunity Loan Transferee, Series 2017-NP12, 144A | | | 3.875% | | | | 9/25/45 | | | | N/R | | | | 1,085,124 | |
| | | | | |
| | 1,277 | | | Veros Auto Receivables Trust 2017-1, 144A | | | 2.840% | | | | 4/17/23 | | | | N/R | | | | 1,271,867 | |
| | | | | |
| | 1,565 | | | VNO Mortgage Trust, Series 2013-PENN, 144A | | | 3.808% | | | | 12/13/29 | | | | AAA | | | | 1,581,842 | |
88
| | | | | | | | | | | | | | | | | | | | |
Principal
Amount (000) | | | Description (1) | | Coupon | | | Maturity | | | Ratings (2) | | | Value | |
| |
| | | | ASSET-BACKED AND MORTGAGE-BACKED SECURITIES (continued) | |
| | | | | |
| $ | 9 | | | Wells Fargo Mortgage Backed Securities, 2005-AR16 Class 3A2 | | | 3.892% | | | | 2/25/35 | | | | AA+ | | | $ | 9,552 | |
| | | | | |
| | 1,945 | | | Wendys Funding LLC, Series 2015-1A, 144A | | | 4.080% | | | | 6/15/45 | | | | BBB | | | | 1,966,687 | |
| | | | | |
| | 1,493 | | | World Omni Auto Receivables Trust, Series 2017-A | | | 1.680% | | | | 12/16/19 | | | | Aaa | | | | 1,487,672 | |
| $ | 222,804 | | | Total Asset-Backed and Mortgage-Backed Securities (cost $224,187,655) | | | | 222,266,889 | |
| | | | | |
Principal
Amount (000) | | | Description (1) | | Coupon | | | Maturity | | | Ratings (2) | | | Value | |
| | | | | |
| | | | CORPORATE BONDS – 40.1% | | | | | | | | | | | | | | | | |
| | | | | |
| | | | Aerospace & Defense – 0.6% | | | | | | | | | | | | |
| | | | | |
| $ | 1,250 | | | Alcoa Inc. | | | 6.150% | | | | 8/15/20 | | | | BBB– | | | $ | 1,300,000 | |
| | | | | |
| | 1,580 | | | L-3 Communications Corporation | | | 4.950% | | | | 2/15/21 | | | | BBB– | | | | 1,619,603 | |
| | 2,830 | | | Total Aerospace & Defense | | | | | | | | | | | | | | | 2,919,603 | |
| | | | | |
| | | | Airlines – 0.5% | | | | | | | | | | | | |
| | | | | |
| | 839 | | | Delta Air Lines Pass Through Certificates, Series 2012-1B, 144A | | | 6.875% | | | | 5/07/19 | | | | BBB | | | | 856,073 | |
| | | | | |
| | 228 | | | Delta Airlines | | | 5.300% | | | | 4/15/19 | | | | A1 | | | | 231,472 | |
| | | | | |
| | 833 | | | Northwest Airlines Trust Pass Through Certificates 2007-1 | | | 7.027% | | | | 11/01/19 | | | | A | | | | 869,913 | |
| | | | | |
| | 342 | | | US Airways Pass Through Trust | | | 7.076% | | | | 3/20/21 | | | | A | | | | 362,404 | |
| | 2,242 | | | Total Airlines | | | | | | | | | | | | | | | 2,319,862 | |
| | | | | |
| | | | Auto Components – 0.3% | | | | | | | | | | | | |
| | | | | |
| | 853 | | | American & Axle Manufacturing Inc. | | | 6.625% | | | | 10/15/22 | | | | BB– | | | | 875,391 | |
| | | | | |
| | | | Automobiles – 1.7% | | | | | | | | | | | | |
| | | | | |
| | 1,540 | | | American Honda Finance Corp | | | 2.650% | | | | 2/12/21 | | | | A+ | | | | 1,527,489 | |
| | | | | |
| | 2,460 | | | BMW US Capital LLC, 144A | | | 3.100% | | | | 4/12/21 | | | | A+ | | | | 2,444,650 | |
| | | | | |
| | 1,950 | | | Daimler Finance North America LLC, 144A | | | 3.700% | | | | 5/04/23 | | | | A | | | | 1,939,912 | |
| | | | | |
| | 2,000 | | | General Motors Financial Company Inc. | | | 3.200% | | | | 7/13/20 | | | | BBB | | | | 1,990,622 | |
| | 7,950 | | | Total Automobiles | | | | | | | | | | | | | | | 7,902,673 | |
| | | | | |
| | | | Banks – 9.5% | | | | | | | | | | | | |
| | | | | |
| | 8,540 | | | Bank of America Corporation | | | 2.250% | | | | 4/21/20 | | | | A+ | | | | 8,422,521 | |
| | | | | |
| | 2,870 | | | Barclays PLC | | | 2.750% | | | | 11/08/19 | | | | A | | | | 2,847,181 | |
| | | | | |
| | 3,280 | | | BB&T Corporation. | | | 2.450% | | | | 1/15/20 | | | | A+ | | | | 3,247,855 | |
| | | | | |
| | 4,000 | | | Citigroup Inc. | | | 2.650% | | | | 10/26/20 | | | | A | | | | 3,937,704 | |
| | | | | |
| | 1,720 | | | Citigroup Inc. | | | 4.500% | | | | 1/14/22 | | | | A | | | | 1,766,318 | |
| | | | | |
| | 1,900 | | | Fifth Third Bancorp. | | | 2.875% | | | | 7/27/20 | | | | A– | | | | 1,888,964 | |
| | | | | |
| | 1,975 | | | HSBC USA Inc. | | | 2.750% | | | | 8/07/20 | | | | AA– | | | | 1,959,678 | |
| | | | | |
| | 1,445 | | | JP Morgan Chase & Company | | | 2.250% | | | | 1/23/20 | | | | AA– | | | | 1,426,578 | |
| | | | | |
| | 5,780 | | | JP Morgan Chase & Company | | | 4.625% | | | | 5/10/21 | | | | AA– | | | | 5,982,611 | |
| | | | | |
| | 1,945 | | | PNC Bank NA. | | | 2.500% | | | | 1/22/21 | | | | A+ | | | | 1,909,364 | |
| | | | | |
| | 2,160 | | | Santander UK PLC | | | 2.125% | | | | 11/03/20 | | | | Aa3 | | | | 2,096,687 | |
| | | | | |
| | 2,000 | | | Societe Generale, 144A | | | 2.500% | | | | 4/08/21 | | | | A1 | | | | 1,946,624 | |
| | | | | |
| | 1,720 | | | SunTrust Banks Inc. | | | 2.900% | | | | 3/03/21 | | | | A– | | | | 1,698,829 | |
89
Nuveen Short Term Bond Fund (continued)
Portfolio of Investments June 30, 2018
| | | | | | | | | | | | | | | | | | | | |
Principal
Amount (000) | | | Description (1) | | Coupon | | | Maturity | | | Ratings (2) | | | Value | |
| | | | | |
| | | | Banks (continued) | | | | | | | | | | | | |
| | | | | |
| $ | 4,995 | | | Wells Fargo & Company | | | 2.125% | | | | 4/22/19 | | | | A+ | | | $ | 4,966,455 | |
| | 44,330 | | | Total Banks | | | | | | | | | | | | | | | 44,097,369 | |
| | | | | |
| | | | Biotechnology – 0.8% | | | | | | | | | | | | |
| | | | | |
| | 1,375 | | | Biogen Inc. | | | 2.900% | | | | 9/15/20 | | | | A– | | | | 1,368,991 | |
| | | | | |
| | 2,285 | | | Celgene Corporation | | | 2.875% | | | | 8/15/20 | | | | BBB+ | | | | 2,269,285 | |
| | 3,660 | | | Total Biotechnology | | | | | | | | | | | | | | | 3,638,276 | |
| | | | | |
| | | | Capital Markets – 3.6% | | | | | | | | | | | | |
| | | | | |
| | 2,075 | | | Charles Schwab Corp/The | | | 3.250% | | | | 5/21/21 | | | | A | | | | 2,083,140 | |
| | | | | |
| | 1,300 | | | Deutsche Bank AG. | | | 3.150% | | | | 1/22/21 | | | | BBB+ | | | | 1,257,604 | |
| | | | | |
| | 1,870 | | | Goldman Sachs Group, Inc. | | | 2.750% | | | | 9/15/20 | | | | A | | | | 1,846,576 | |
| | | | | |
| | 4,000 | | | Goldman Sachs Group, Inc. | | | 2.875% | | | | 2/25/21 | | | | A | | | | 3,947,694 | |
| | | | | |
| | 1,570 | | | Lazard Group LLC | | | 4.250% | | | | 11/14/20 | | | | A– | | | | 1,600,662 | |
| | | | | |
| | 5,995 | | | Morgan Stanley | | | 2.650% | | | | 1/27/20 | | | | A | | | | 5,951,275 | |
| | 16,810 | | | Total Capital Markets | | | | | | | | | | | | | | | 16,686,951 | |
| | | | | |
| | | | Chemicals – 0.7% | | | | | | | | | | | | |
| | | | | |
| | 1,165 | | | Eastman Chemical Company | | | 2.700% | | | | 1/15/20 | | | | BBB | | | | 1,157,998 | |
| | | | | |
| | 1,935 | | | LyondellBasell Industries NV | | | 5.000% | | | | 4/15/19 | | | | BBB+ | | | | 1,954,144 | |
| | 3,100 | | | Total Chemicals | | | | | | | | | | | | | | | 3,112,142 | |
| | | | | |
| | | | Commercial Services & Supplies – 0.4% | | | | | | | | | | | | |
| | | | | |
| | 2,000 | | | AerCap Ireland Capital Limited / AerCap Global Aviation Trust | | | 3.950% | | | | 2/01/22 | | | | BBB– | | | | 1,987,696 | |
| | | | | |
| | | | Consumer Finance – 2.6% | | | | | | | | | | | | |
| | | | | |
| | 1,200 | | | Ally Financial Inc. | | | 8.000% | | | | 12/31/18 | | | | BB | | | | 1,222,500 | |
| | | | | |
| | 2,750 | | | American Express Credit Corporation | | | 2.375% | | | | 5/26/20 | | | | A2 | | | | 2,709,984 | |
| | | | | |
| | 845 | | | Capital One Financial Corporation | | | 2.500% | | | | 5/12/20 | | | | A– | | | | 832,985 | |
| | | | | |
| | 1,355 | | | Capital One Financial Corporation | | | 4.750% | | | | 7/15/21 | | | | A– | | | | 1,400,326 | |
| | | | | |
| | 1,555 | | | Discover Bank. | | | 3.200% | | | | 8/09/21 | | | | BBB+ | | | | 1,537,171 | |
| | | | | |
| | 2,000 | | | Ford Motor Credit Company | | | 2.597% | | | | 11/04/19 | | | | BBB | | | | 1,984,362 | |
| | | | | |
| | 1,250 | | | Navient Corporation | | | 5.000% | | | | 10/26/20 | | | | BB | | | | 1,246,875 | |
| | | | | |
| | 1,280 | | | Synchrony Financial | | | 3.000% | | | | 8/15/19 | | | | BBB– | | | | 1,277,475 | |
| | 12,235 | | | Total Consumer Finance | | | | | | | | | | | | | | | 12,211,678 | |
| | | | | |
| | | | Containers & Packaging – 0.3% | | | | | | | | | | | | |
| | | | | |
| | 1,240 | | | Packaging Corporation of America. | | | 2.450% | | | | 12/15/20 | | | | BBB | | | | 1,213,183 | |
| | | | | |
| | | | Diversified Financial Services – 1.0% | | | | | | | | | | | | |
| | | | | |
| | 2,760 | | | Berkshire Hathaway Finance Corporation | | | 4.250% | | | | 1/15/21 | | | | AA | | | | 2,854,861 | |
| | | | | |
| | 1,645 | | | BNP Paribas | | | 2.375% | | | | 5/21/20 | | | | Aa3 | | | | 1,620,487 | |
| | 4,405 | | | Total Diversified Financial Services | | | | | | | | | | | | | | | 4,475,348 | |
| | | | | |
| | | | Diversified Telecommunication Services – 2.7% | | | | | | | | | | | | |
| | | | | |
| | 4,440 | | | AT&T Inc. | | | 2.800% | | | | 2/17/21 | | | | A– | | | | 4,369,003 | |
| | | | | |
| | 1,500 | | | CenturyLink Inc., (4) | | | 5.625% | | | | 4/01/20 | | | | BB | | | | 1,516,875 | |
90
| | | | | | | | | | | | | | | | | | | | |
Principal
Amount (000) | | | Description (1) | | Coupon | | | Maturity | | | Ratings (2) | | | Value | |
| | | | | |
| | | | Diversified Telecommunication Services (continued) | | | | | | | | | | | | |
| | | | | |
| $ | 2,000 | | | Deutsche Telekom International Finance BV | | | 6.000% | | | | 7/08/19 | | | | BBB+ | | | $ | 2,060,370 | |
| | | | | |
| | 1,250 | | | Frontier Communications Corporation, (4) | | | 8.125% | | | | 10/01/18 | | | | B | | | | 1,256,250 | |
| | | | | |
| | 1,665 | | | Orange SA | | | 1.625% | | | | 11/03/19 | | | | BBB+ | | | | 1,634,050 | |
| | | | | |
| | 1,815 | | | Verizon Communications | | | 3.450% | | | | 3/15/21 | | | | A– | | | | 1,826,431 | |
| | 12,670 | | | Total Diversified Telecommunication Services | | | | | | | | | | | | | | | 12,662,979 | |
| | | | | |
| | | | Electric Utilities – 0.8% | | | | | | | | | | | | |
| | | | | |
| | 1,825 | | | Berkshire Hathaway Energy Co | | | 2.375% | | | | 1/15/21 | | | | A– | | | | 1,786,870 | |
| | | | | |
| | 2,000 | | | Exelon Generation Co. LLC | | | 2.950% | | | | 1/15/20 | | | | BBB | | | | 1,991,732 | |
| | 3,825 | | | Total Electric Utilities | | | | | | | | | | | | | | | 3,778,602 | |
| | | | | |
| | | | Food & Staples Retailing – 0.6% | | | | | | | | | | | | |
| | | | | |
| | 1,245 | | | Sysco Corporation | | | 2.600% | | | | 10/01/20 | | | | A3 | | | | 1,231,256 | |
| | | | | |
| | 1,535 | | | Walgreens Boots Alliance, Inc. | | | 2.700% | | | | 11/18/19 | | | | BBB | | | | 1,528,522 | |
| | 2,780 | | | Total Food & Staples Retailing | | | | | | | | | | | | | | | 2,759,778 | |
| | | | | |
| | | | Food Products – 1.7% | | | | | | | | | | | | |
| | | | | |
| | 2,175 | | | Bunge Limited Finance Company | | | 3.500% | | | | 11/24/20 | | | | BBB | | | | 2,173,956 | |
| | | | | |
| | 2,910 | | | General Mills Inc. | | | 3.200% | | | | 4/16/21 | | | | BBB | | | | 2,894,696 | |
| | | | | |
| | 1,635 | | | Kraft Heinz Foods Co | | | 2.800% | | | | 7/02/20 | | | | BBB | | | | 1,621,920 | |
| | | | | |
| | 1,405 | | | Tyson Foods | | | 2.650% | | | | 8/15/19 | | | | BBB | | | | 1,399,336 | |
| | 8,125 | | | Total Food Products | | | | | | | | | | | | | | | 8,089,908 | |
| | | | | |
| | | | Health Care Equipment & Supplies – 0.2% | | | | | | | | | | | | |
| | | | | |
| | 1,120 | | | Abbott Laboratories | | | 2.900% | | | | 11/30/21 | | | | BBB | | | | 1,102,595 | |
| | | | | |
| | | | Health Care Providers & Services – 1.1% | | | | | | | | | | | | |
| | | | | |
| | 2,000 | | | CVS Health Corporation | | | 2.800% | | | | 7/20/20 | | | | Baa1 | | | | 1,983,042 | |
| | | | | |
| | 1,500 | | | HCA Inc. | | | 4.250% | | | | 10/15/19 | | | | BBB– | | | | 1,511,250 | |
| | | | | |
| | 1,765 | | | UnitedHealth Group Incorporated | | | 3.875% | | | | 10/15/20 | | | | A+ | | | | 1,793,155 | |
| | 5,265 | | | Total Health Care Providers & Services | | | | | | | | | | | | | | | 5,287,447 | |
| | | | | |
| | | | Hotels, Restaurants & Leisure – 0.3% | | | | | | | | | | | | |
| | | | | |
| | 1,250 | | | MGM Resorts International Inc. | | | 6.750% | | | | 10/01/20 | | | | BB | | | | 1,309,375 | |
| | | | | |
| | | | Household Durables – 0.3% | | | | | | | | | | | | |
| | | | | |
| | 1,470 | | | Newell Brands Inc. | | | 3.150% | | | | 4/01/21 | | | | BBB– | | | | 1,456,254 | |
| | | | | |
| | | | Industrial Conglomerates – 0.4% | | | | | | | | | | | | |
| | | | | |
| | 2,020 | | | General Electric Capital Corporation | | | 4.625% | | | | 1/07/21 | | | | A | | | | 2,082,115 | |
| | | | | |
| | | | Insurance – 2.7% | | | | | | | | | | | | |
| | | | | |
| | 2,000 | | | AFLAC Insurance | | | 2.400% | | | | 3/16/20 | | | | A– | | | | 1,977,670 | |
| | | | | |
| | 2,415 | | | American International Group, Inc. | | | 3.375% | | | | 8/15/20 | | | | BBB+ | | | | 2,419,499 | |
| | | | | |
| | 1,500 | | | Hartford Financial Services Group Inc. | | | 5.500% | | | | 3/30/20 | | | | BBB+ | | | | 1,558,076 | |
| | | | | |
| | 2,025 | | | Marsh & McLennan Companies | | | 2.350% | | | | 3/06/20 | | | | A | | | | 1,996,919 | |
| | | | | |
| | 1,500 | | | Met Life Global Funding I, 144A | | | 2.000% | | | | 4/14/20 | | | | AA– | | | | 1,468,849 | |
| | | | | |
| | 1,570 | | | Prudential Financial Inc. | | | 4.500% | | | | 11/15/20 | | | | A | | | | 1,616,163 | |
91
Nuveen Short Term Bond Fund (continued)
Portfolio of Investments June 30, 2018
| | | | | | | | | | | | | | | | | | | | |
Principal
Amount (000) | | | Description (1) | | Coupon | | | Maturity | | | Ratings (2) | | | Value | |
| | | | | |
| | | | Insurance (continued) | | | | | | | | | | | | |
| | | | | |
| $ | 1,440 | | | Unum Group | | | 3.000% | | | | 5/15/21 | | | | BBB | | | $ | 1,417,806 | |
| | 12,450 | | | Total Insurance | | | | | | | | | | | | | | | 12,454,982 | |
| | | | | |
| | | | Internet Software & Services – 0.3% | | | | | | | | | | | | |
| | | | | |
| | 1,175 | | | eBay Inc. | | | 2.200% | | | | 8/01/19 | | | | BBB+ | | | | 1,165,400 | |
| | | | | |
| | | | Leisure Products – 0.4% | | | | | | | | | | | | |
| | | | | |
| | 1,980 | | | Carnival Corporation | | | 3.950% | | | | 10/15/20 | | | | A– | | | | 2,011,455 | |
| | | | | |
| | | | Machinery – 0.3% | | | | | | | | | | | | |
| | | | | |
| | 1,365 | | | Ingersoll-Rand Luxembourg Finance SA | | | 2.625% | | | | 5/01/20 | | | | BBB | | | | 1,353,423 | |
| | | | | |
| | | | Media – 1.5% | | | | | | | | | | | | |
| | | | | |
| | 1,735 | | | 21st Century Fox America Inc. | | | 4.500% | | | | 2/15/21 | | | | BBB+ | | | | 1,782,001 | |
| | | | | |
| | 1,660 | | | CBS Corporation. | | | 2.300% | | | | 8/15/19 | | | | BBB | | | | 1,644,668 | |
| | | | | |
| | 2,000 | | | Charter Communications Operating LLC/ Charter Communications Operating Capital Corporation | | | 3.579% | | | | 7/23/20 | | | | BBB– | | | | 1,999,703 | |
| | | | | |
| | 1,600 | | | Discovery Communications Inc. | | | 5.050% | | | | 6/01/20 | | | | BBB– | | | | 1,652,808 | |
| | 6,995 | | | Total Media | | | | | | | | | | | | | | | 7,079,180 | |
| | | | | |
| | | | Mortgage Real Estate Investment Trusts – 0.3% | | | | | | | | | | | | |
| | | | | |
| | 750 | | | Starwood Property Trust | | | 5.000% | | | | 12/15/21 | | | | BB– | | | | 755,625 | |
| | | | | |
| | | | Multi-Utilities – 0.3% | | | | | | | | | | | | |
| | | | | |
| | 1,635 | | | Sempra Energy. | | | 2.900% | | | | 2/01/23 | | | | BBB+ | | | | 1,586,718 | |
| | | | | |
| | | | Oil, Gas & Consumable Fuels – 2.1% | | | | | | | | | | | | |
| | | | | |
| | 1,700 | | | BP Capital Markets PLC. | | | 2.521% | | | | 1/15/20 | | | | A1 | | | | 1,689,258 | |
| | | | | |
| | 645 | | | Calumet Specialty Products | | | 6.500% | | | | 4/15/21 | | | | B– | | | | 641,775 | |
| | | | | |
| | 1,550 | | | Enterprise Products Operating LLC | | | 2.800% | | | | 2/15/21 | | | | BBB+ | | | | 1,530,070 | |
| | | | | |
| | 1,290 | | | Occidental Petroleum Corporation | | | 4.100% | | | | 2/01/21 | | | | A | | | | 1,320,361 | |
| | | | | |
| | 750 | | | Sabine Pass Liquefaction LLC | | | 5.625% | | | | 2/01/21 | | | | BBB– | | | | 784,356 | |
| | | | | |
| | 1,595 | | | Schlumberger Holdings Corporation, 144A | | | 3.000% | | | | 12/21/20 | | | | AA– | | | | 1,585,357 | |
| | | | | |
| | 1,000 | | | Southwestern Energy Company, (4) | | | 5.800% | | | | 1/23/20 | | | | BB | | | | 1,015,000 | |
| | | | | |
| | 1,300 | | | Valero Energy Corporation | | | 6.125% | | | | 2/01/20 | | | | BBB | | | | 1,357,857 | |
| | 9,830 | | | Total Oil, Gas, & Consumable Fuels | | | | | | | | | | | | | | | 9,924,034 | |
| | | | | |
| | | | Software – 0.3% | | | | | | | | | | | | |
| | | | | |
| | 1,000 | | | Microsoft Corporation | | | 1.850% | | | | 2/06/20 | | | | AAA | | | | 987,190 | |
| |
| | | | Technology Hardware, Storage & Peripherals – 0.4% | |
| | | | | |
| | 1,420 | | | Apple Inc. | | | 2.250% | | | | 2/23/21 | | | | AA+ | | | | 1,395,200 | |
| | | | | |
| | 500 | | | Dell Inc. | | | 5.875% | | | | 6/15/19 | | | | Ba2 | | | | 509,130 | |
| | 1,920 | | | Total Technology Hardware, Storage & Peripherals | | | | | | | | | | | | | | | 1,904,330 | |
| | | | | |
| | | | Tobacco – 0.3% | | | | | | | | | | | | |
| | | | | |
| | 1,465 | | | Reynolds American Inc. | | | 3.250% | | | | 6/12/20 | | | | BBB+ | | | | 1,462,055 | |
| | | | | |
| | | | Trading Companies & Distributors – 0.3% | | | | | | | | | | | | |
| | | | | |
| | 1,500 | | | Air Lease Corporation | | | 3.375% | | | | 6/01/21 | | | | BBB | | | | 1,491,826 | |
92
| | | | | | | | | | | | | | | | | | | | |
Principal
Amount (000) | | | Description (1) | | Coupon | | | Maturity | | | Ratings (2) | | | Value | |
| | | | | |
| | | | Wireless Telecommunication Services – 0.8% | | | | | | | | | | | | |
| | | | | |
| $ | 1,570 | | | America Movil S.A. de C.V. | | | 5.000% | | | | 3/30/20 | | | | A– | | | $ | 1,613,307 | |
| | | | | |
| | 2,205 | | | Vodafone Group PLC | | | 4.375% | | | | 3/16/21 | | | | BBB+ | | | | 2,263,343 | |
| | 3,775 | | | Total Wireless Telecommunication Services | | | | | | | | | | | | | | | 3,876,650 | |
| $ | 186,020 | | | Total Corporate Bonds (cost $188,447,155) | | | | | | | | | | | | | | | 186,022,093 | |
| | | | | |
Principal
Amount (000) | | | Description (1) | | Coupon | | | Maturity | | | Ratings (2) | | | Value | |
| | |
| | | | U.S. GOVERNMENT AND AGENCY OBLIGATIONS – 10.9% | | | | | |
| | | | | |
| $ | 13,000 | | | Federal National Mortgage Association | | | 1.000% | | | | 2/26/19 | | | | Aaa | | | $ | 12,894,102 | |
| | | | | |
| | 5,500 | | | Freddie Mac Notes | | | 1.500% | | | | 1/17/20 | | | | Aaa | | | | 5,415,404 | |
| | | | | |
| | 4,500 | | | U.S. Treasury Inflation Indexed Obligations | | | 1.000% | | | | 10/15/19 | | | | Aaa | | | | 4,418,086 | |
| | | | | |
| | 10,500 | | | U.S. Treasury Notes | | | 1.000% | | | | 8/15/18 | | | | Aaa | | | | 10,488,832 | |
| | | | | |
| | 6,000 | | | U.S. Treasury Notes | | | 1.250% | | | | 11/30/18 | | | | Aaa | | | | 5,979,141 | |
| | | | | |
| | 2,500 | | | U.S. Treasury Notes, (4) | | | 1.000% | | | | 8/31/19 | | | | Aaa | | | | 2,459,473 | |
| | | | | |
| | 5,000 | | | U.S. Treasury Notes | | | 0.875% | | | | 9/15/19 | | | | Aaa | | | | 4,908,398 | |
| | | | | |
| | 4,000 | | | U.S. Treasury Notes | | | 1.750% | | | | 11/30/19 | | | | Aaa | | | | 3,959,688 | |
| $ | 51,000 | | | Total U.S. Government and Agency Obligations (cost $50,843,125) | | | | 50,523,124 | |
| | | | Total Long-Term Investments (cost $463,477,935) | | | | 458,812,106 | |
| | | | | |
| Shares | | | Description (1) | | Coupon | | | | | | | | | Value | |
| |
| | | | INVESTMENTS PURCHASED WITH COLLATERAL FROM SECURITIES LENDING – 1.1% | |
| | | | | |
| | | | Money Market Funds – 1.1% | | | | | | | | | | | | |
| | | | | |
| | 5,228,027 | | | First American Government Obligations Fund, Class X, (5) | | | 1.806% (6) | | | | | | | | | | | $ | 5,228,027 | |
| | | | Total Investments Purchased with Collateral from Securities Lending (cost $5,228,027) | | | | 5,228,027 | |
| | | | | |
| Shares | | | Description (1) | | Coupon | | | | | | | | | Value | |
| | |
| | | | SHORT-TERM INVESTMENTS – 0.9% | | | | | |
| | | | | |
| | | | Money Market Funds – 0.9% | | | | | | | | | | | | |
| | | | | |
| | 3,966,394 | | | First American Treasury Obligations Fund, Class Z | | | 1.754% (6) | | | | | | | | | | | $ | 3,966,394 | |
| | | | Total Short-Term Investments (cost $3,966,394) | | | | | | | | | | | | 3,966,394 | |
| | | | Total Investments (cost $472,672,356) – 101.0% | | | | | | | | | | | | | | | 468,006,527 | |
| | | | Other Assets Less Liabilities – (1.0)% (7) | | | | | | | | | | | | | | | (4,536,510) | |
| | | | Net Assets – 100% | | | | | | | | | | | | | | $ | 463,470,017 | |
93
Nuveen Short Term Bond Fund (continued)
Portfolio of Investments June 30, 2018
Investments in Derivatives
Futures Contracts
| | | | | | | | | | | | | | | | | | | | | | | | | | | | |
| Description | | Contract
Position | | | Number of
Contracts | | | Expiration
Date | | | Notional
Amount | | | Value | | | Unrealized
Appreciation
(Depreciation) | | | Variation
Margin
Receivable/
(Payable) | |
U.S. Treasury 2-Year Note | | | Long | | | | 168 | | | | 9/18 | | | $ | 35,590,148 | | | $ | 35,587,125 | | | $ | (3,023 | ) | | $ | (5,250 | ) |
U.S. Treasury 5-Year Note | | | Long | | | | 35 | | | | 9/18 | | | | 3,975,280 | | | | 3,976,602 | | | | 1,322 | | | | (821 | ) |
Total | | | $ | 39,565,428 | | | $ | 39,563,727 | | | $ | (1,701 | ) | | $ | (6,071 | ) |
Total receivable for variation margin on futures contracts | | | | | | | | | | | | | | | | | | | $ | — | |
Total payable for variation margin on futures contracts | | | | | | | | | | | | | | | | | | | $ | (6,071 | ) |
For Fund portfolio compliance purposes, the Fund’s industry classifications refer to any one or more of the industry sub-classifications used by one or more widely recognized market indexes or ratings group indexes, and/or as defined by Fund management. This definition may not apply for purposes of this report, which may combine industry sub-classifications into sectors for reporting ease.
| (1) | All percentages shown in the Portfolio of Investments are based on net assets. |
| (2) | For financial reporting purposes, the ratings disclosed are the highest of Standard & Poor’s Group (“Standard & Poor’s”), Moody’s Investors Service, Inc. (“Moody’s”) or Fitch, Inc. (“Fitch”) rating. This treatment of split-rated securities may differ from that used for other purposes, such as for Fund investment policies. Ratings below BBB by Standard & Poor’s, Baa by Moody’s or BBB by Fitch are considered to be below investment grade. Holdings designated N/R are not rated by any of these national rating agencies. Ratings are not covered by the report of independent registered public accounting firm. |
| (3) | Variable rate security. The rate shown is the coupon as of the end of the reporting period. |
| (4) | Investment, or a portion of investment, is out on loan for securities lending. The total value of the securities out on loan as of the end of the reporting period was $5,066,974. |
| (5) | The Fund may loan securities representing up to one third of the fair value of its total assets (which includes collateral for securities on loan) to broker-dealers, banks and other institutions. The Fund maintains collateral equal to at least 100% of the fair value of the securities loaned. The cash collateral received by the Fund is invested in this money market fund. See Notes to Financial Statements, Note 3 – Portfolio Securities and Investments in Derivatives, Securities Lending for more information. |
| (6) | The rate shown is the annualized seven-day subsidized yield as of the end of the reporting period. |
| (7) | Other assets less liabilities includes the unrealized appreciation (depreciation) of certain over-the-counter (“OTC”) derivatives as presented on the Statement of Assets and Liabilities, when applicable. The unrealized appreciation (depreciation) of OTC cleared and exchange-traded derivatives is recognized as part of the cash collateral at brokers and/or receivable or payable for variation margin as presented on the Statement of Assets and Liabilities, when applicable. |
| 144A | Investment is exempt from registration under Rule 144A of the Securities Act of 1933, as amended. These investments may only be resold in transactions exempt from registration, which are normally those transactions with qualified institutional buyers. |
| LIBOR | London Inter-Bank Offered Rate |
| WI/DD | Investment , or portion of investment, purchased on a when-issued or delayed delivery basis. |
See accompanying notes to financial statements.
94
Nuveen Strategic Income Fund
Portfolio of Investments June 30, 2018
| | | | | | | | | | | | | | | | | | | | | | | | | | | | |
Principal
Amount (000) (1) | | | Description (2) | | Coupon | | | | | | | | | Maturity | | | Ratings (3) | | | Value | |
| | | | | | | |
| | | | LONG-TERM INVESTMENTS – 99.2% | | | | | | | | | | | | | | | | | | | | | | | | |
| | | | | | | |
| | | | CORPORATE BONDS – 55.1% | | | | | | | | | | | | | | | | | | | | | | | | |
| | | |
| | | | Aerospace & Defense – 1.4% | | | | | | | |
| | | | | | | |
| $ | 2,785 | | | BAE Systems Holdings, 144A | | | 3.850% | | | | | | | | | | | | 12/15/25 | | | | BBB | | | $ | 2,751,997 | |
| | | | | | | |
| | 930 | | | Bombardier Inc., 144A | | | 7.500% | | | | | | | | | | | | 3/15/25 | | | | B | | | | 968,362 | |
| | | | | | | |
| | 3,000 | | | General Dynamics Corporation | | | 2.625% | | | | | | | | | | | | 11/15/27 | | | | A+ | | | | 2,758,708 | |
| | | | | | | |
| | 3,380 | | | Rockwell Collins Inc. | | | 3.500% | | | | | | | | | | | | 3/15/27 | | | | BBB | | | | 3,220,771 | |
| | | | Total Aerospace & Defense | | | | | | | | | | | | | | | | | | | | | | | 9,699,838 | |
| | | | | | | |
| | | | Air Freight & Logistics – 0.3% | | | | | | | | | | | | | | | | | | | | | | | | |
| | | | | | | |
| | 2,280 | | | FedEx Corporation | | | 3.300% | | | | | | | | | | | | 3/15/27 | | | | BBB | | | | 2,161,338 | |
| | | | | | | |
| | | | Airlines – 1.3% | | | | | | | | | | | | | | | | | | |
| | | | | | | |
| | 2,000 | | | American Airlines Group Inc., 144A | | | 4.625% | | | | | | | | | | | | 3/01/20 | | | | BB– | | | | 1,990,000 | |
| | | | | | | |
| | 1,316 | | | American Airlines Inc., Pass Through Trust 2013-2B, 144A | | | 5.600% | | | | | | | | | | | | 7/15/20 | | | | BBB– | | | | 1,342,988 | |
| | | | | | | |
| | 928 | | | American Airlines Inc., Pass Through Trust 2016-1A | | | 3.575% | | | | | | | | | | | | 1/15/28 | | | | AA+ | | | | 900,750 | |
| | | | | | | |
| | 2,805 | | | British Airways 2018-1 Class AA Pass Through Trust, 144A | | | 3.800% | | | | | | | | | | | | 9/20/31 | | | | Aa2 | | | | 2,805,000 | |
| | | | | | | |
| | 2,444 | | | Northwest Airlines Trust Pass Through Certificates 2007-1 | | | 7.027% | | | | | | | | | | | | 11/01/19 | | | | A | | | | 2,552,576 | |
| | | | Total Airlines | | | | | | | | | | | | | | | | | | | | | | | 9,591,314 | |
| | | | | | | |
| | | | Auto Components – 0.6% | | | | | | | | | | | | | | | | | | |
| | | | | | | |
| | 1,180 | | | American & Axle Manufacturing Inc. | | | 6.625% | | | | | | | | | | | | 10/15/22 | | | | BB– | | | | 1,210,975 | |
| | | | | | | |
| | 750 | | | American Axle & Manufacturing Inc., (4) | | | 6.250% | | | | | | | | | | | | 4/01/25 | | | | BB– | | | | 744,375 | |
| | | | | | | |
| | 2,000 | | | Lear Corporation | | | 5.375% | | | | | | | | | | | | 3/15/24 | | | | BBB– | | | | 2,074,409 | |
| | | | Total Auto Components | | | | | | | | | | | | | | | | | | | | | | | 4,029,759 | |
| | | | | | | |
| | | | Automobiles – 1.9% | | | | | | | | | | | | | | | | | | |
| | | | | | | |
| | 5,000 | | | BMW US Capital LLC, 144A | | | 3.100% | | | | | | | | | | | | 4/12/21 | | | | A+ | | | | 4,968,800 | |
| | | | | | | |
| | 2,230 | | | BMW US Capital LLC, 144A | | | 3.450% | | | | | | | | | | | | 4/12/23 | | | | A+ | | | | 2,205,862 | |
| | | | | | | |
| | 5,680 | | | General Motors Corporation | | | 4.000% | | | | | | | | | | | | 4/01/25 | | | | BBB | | | | 5,510,667 | |
| | | | | | | |
| | 520 | | | Jaguar Land Rover Automotive PLC, 144A | | | 4.500% | | | | | | | | | | | | 10/01/27 | | | | BB+ | | | | 464,100 | |
| | | | Total Automobiles | | | | | | | | | | | | | | | | | | | | | | | 13,149,429 | |
| | | | | | | |
| | | | Banks – 8.2% | | | | | | | | | | | | | | | | | | |
| | | | | | | |
| | 2,435 | | | Banco Santander SA | | | 3.800% | | | | | | | | | | | | 2/23/28 | | | | A– | | | | 2,223,206 | |
| | | | | | | |
| | 1,064 | | | Bank of America Corporation | | | 4.000% | | | | | | | | | | | | 4/01/24 | | | | A+ | | | | 1,072,901 | |
| | | | | | | |
| | 1,105 | | | Bank of America Corporation | | | 3.248% | | | | | | | | | | | | 10/21/27 | | | | A+ | | | | 1,029,420 | |
| | | | | | | |
| | 3,662 | | | Bank of America Corporation | | | 3.419% | | | | | | | | | | | | 12/20/28 | | | | A+ | | | | 3,447,035 | |
| | | | | | | |
| | 3,800 | | | Barclays Bank PLC | | | 3.650% | | | | | | | | | | | | 3/16/25 | | | | A | | | | 3,559,202 | |
| | | | | | | |
| | 1,405 | | | Citigroup Inc. | | | 4.500% | | | | | | | | | | | | 1/14/22 | | | | A | | | | 1,442,835 | |
| | | | | | | |
| | 6,495 | | | Citigroup Inc. | | | 3.750% | | | | | | | | | | | | 6/16/24 | | | | A | | | | 6,416,398 | |
| | | | | | | |
| | 3,155 | | | Citigroup Inc. | | | 3.200% | | | | | | | | | | | | 10/21/26 | | | | A | | | | 2,935,594 | |
| | | | | | | |
| | 2,995 | | | Citigroup Inc. | | | 4.300% | | | | | | | | | | | | 11/20/26 | | | | A– | | | | 2,921,476 | |
95
Nuveen Strategic Income Fund (continued)
Portfolio of Investments June 30, 2018
| | | | | | | | | | | | | | | | | | | | | | | | | | | | |
Principal
Amount (000) (1) | | | Description (2) | | Coupon | | | | | | | | | Maturity | | | Ratings (3) | | | Value | |
| | | | | | | |
| | | | Banks (continued) | | | | | | | | | | | | | | | | | | |
| | | | | | | |
| $ | 2,375 | | | HSBC Holdings PLC. | | | 4.375% | | | | | | | | | | | | 11/23/26 | | | | A+ | | | $ | 2,337,897 | |
| | | | | | | |
| | 2,100 | | | ING Groep N.V | | | 3.950% | | | | | | | | | | | | 3/29/27 | | | | A+ | | | | 2,056,452 | |
| | | | | | | |
| | 1,400 | | | JP Morgan Chase & Company | | | 4.500% | | | | | | | | | | | | 1/24/22 | | | | AA– | | | | 1,447,812 | |
| | | | | | | |
| | 9,750 | | | JP Morgan Chase & Company | | | 3.200% | | | | | | | | | | | | 1/25/23 | | | | AA– | | | | 9,572,438 | |
| | | | | | | |
| | 1,100 | | | JP Morgan Chase & Company | | | 3.875% | | | | | | | | | | | | 9/10/24 | | | | A+ | | | | 1,089,342 | |
| | | | | | | |
| | 2,715 | | | JP Morgan Chase & Company | | | 4.260% | | | | | | | | | | | | 2/22/48 | | | | AA– | | | | 2,553,447 | |
| | | | | | | |
| | 2,560 | | | Lloyds Banking Group PLC | | | 4.450% | | | | | | | | | | | | 5/08/25 | | | | A+ | | | | 2,573,055 | |
| | | | | | | |
| | 2,425 | | | PNC Financial Services Inc. | | | 3.150% | | | | | | | | | | | | 5/19/27 | | | | A+ | | | | 2,304,260 | |
| | | | | | | |
| | 1,220 | | | Royal Bank of Scotland Group PLC, (4) | | | 6.100% | | | | | | | | | | | | 6/10/23 | | | | BBB | | | | 1,284,484 | |
| | | | | | | |
| | 3,335 | | | Santander UK PLC, 144A | | | 5.000% | | | | | | | | | | | | 11/07/23 | | | | A– | | | | 3,385,649 | |
| | | | | | | |
| | 3,090 | | | SunTrust Banks Inc. | | | 2.450% | | | | | | | | | | | | 8/01/22 | | | | A– | | | | 2,964,647 | |
| | | | | | | |
| | 2,505 | | | Wells Fargo & Company | | | 4.600% | | | | | | | | | | | | 4/01/21 | | | | A+ | | | | 2,584,901 | |
| | | | Total Banks | | | | | | | | | | | | | | | | | | | | | | | 59,202,451 | |
| | | | | | | |
| | | | Beverages – 1.6% | | | | | | | | | | | | | | | | | | |
| | | | | | | |
| | 5,785 | | | Anheuser Busch InBev Financial Incorporated, Fixed Rate Note, Series 2016 | | | 3.650% | | | | | | | | | | | | 2/01/26 | | | | A– | | | | 5,665,180 | |
| | | | | | | |
| | 3,870 | | | Heineken NV, 144A | | | 3.500% | | | | | | | | | | | | 1/29/28 | | | | BBB+ | | | | 3,722,798 | |
| | | | | | | |
| | 2,340 | | | Maple Escrow Subsidiary Inc., 144A | | | 4.417% | | | | | | | | | | | | 5/25/25 | | | | BBB | | | | 2,351,248 | |
| | | | Total Beverages | | | | | | | | | | | | | | | | | | | | | | | 11,739,226 | |
| | | | | | | |
| | | | Building Products – 0.5% | | | | | | | | | | | | | | | | | | |
| | | | | | | |
| | 930 | | | American Woodmark Corp, 144A | | | 4.875% | | | | | | | | | | | | 3/15/26 | | | | BB | | | | 881,175 | |
| | | | | | | |
| | 2,740 | | | Owens Corning Incorporated | | | 4.200% | | | | | | | | | | | | 12/15/22 | | | | BBB | | | | 2,745,893 | |
| | | | Total Building Products | | | | | | | | | | | | | | | | | | | | | | | 3,627,068 | |
| | | | | | | |
| | | | Capital Markets – 6.0% | | | | | | | | | | | | | | | | | | |
| | | | | | | |
| | 4,845 | | | Charles Schwab Corporation. | | | 2.650% | | | | | | | | | | | | 1/25/23 | | | | A | | | | 4,715,098 | |
| | | | | | | |
| | 3,630 | | | Deutsche Bank AG | | | 4.875% | | | | | | | | | | | | 12/01/32 | | | | BBB | | | | 3,105,538 | |
| | | | | | | |
| | 1,250 | | | Donnelley Financial Solutions, Inc. | | | 8.250% | | | | | | | | | | | | 10/15/24 | | | | B | | | | 1,309,375 | |
| | | | | | | |
| | 1,375 | | | Goldman Sachs Group, Inc. | | | 5.250% | | | | | | | | | | | | 7/27/21 | | | | A | | | | 1,444,916 | |
| | | | | | | |
| | 900 | | | Goldman Sachs Group, Inc. | | | 5.750% | | | | | | | | | | | | 1/24/22 | | | | A | | | | 962,776 | |
| | | | | | | |
| | 10,550 | | | Goldman Sachs Group, Inc. | | | 4.000% | | | | | | | | | | | | 3/03/24 | | | | A | | | | 10,553,296 | |
| | | | | | | |
| | 2,295 | | | Goldman Sachs Group, Inc. | | | 4.250% | | | | | | | | | | | | 10/21/25 | | | | A– | | | | 2,260,648 | |
| | | | | | | |
| | 4,915 | | | Lazard Group LLC | | | 3.625% | | | | | | | | | | | | 3/01/27 | | | | A– | | | | 4,603,567 | |
| | | | | | | |
| | 3,070 | | | Morgan Stanley | | | 4.000% | | | | | | | | | | | | 7/23/25 | | | | A | | | | 3,059,727 | |
| | | | | | | |
| | 8,500 | | | Morgan Stanley | | | 3.950% | | | | | | | | | | | | 4/23/27 | | | | A– | | | | 8,100,000 | |
| | | | | | | |
| | 2,415 | | | Northern Trust Company | | | 3.950% | | | | | | | | | | | | 10/30/25 | | | | A+ | | | | 2,458,007 | |
| | | | Total Capital Markets | | | | | | | | | | | | | | | | | | | | | | | 42,572,948 | |
| | | | | | | |
| | | | Chemicals – 1.4% | | | | | | | | | | | | | | | | | | |
| | | | | | | |
| | 3,000 | | | Agrium Inc. | | | 3.375% | | | | | | | | | | | | 3/15/25 | | | | BBB | | | | 2,822,890 | |
| | | | | | | |
| | 995 | | | Chemours Co | | | 5.375% | | | | | | | | | | | | 5/15/27 | | | | BB– | | | | 962,662 | |
| | | | | | | |
| | 1,000 | | | FXI Holdings, Inc., 144A | | | 7.875% | | | | | | | | | | | | 11/01/24 | | | | B | | | | 977,500 | |
96
| | | | | | | | | | | | | | | | | | | | | | | | | | | | |
Principal
Amount (000) (1) | | | Description (2) | | Coupon | | | | | | | | | Maturity | | | Ratings (3) | | | Value | |
| | | | | | | |
| | | | Chemicals (continued) | | | | | | | | | | | | | | | | | | |
| | | | | | | |
| $ | 1,950 | | | Hexion Inc. | | | 6.625% | | | | | | | | | | | | 4/15/20 | | | | CCC+ | | | $ | 1,825,980 | |
| | | | | | | |
| | 1,500 | | | NOVA Chemicals Corporation, 144A | | | 5.250% | | | | | | | | | | | | 8/01/23 | | | | BBB– | | | | 1,496,250 | |
| | | | | | | |
| | 1,350 | | | NOVA Chemicals Corporation, 144A | | | 5.000% | | | | | | | | | | | | 5/01/25 | | | | BBB– | | | | 1,279,125 | |
| | | | | | | |
| | 750 | | | Tronox Inc., 144A | | | 6.500% | | | | | | | | | | | | 4/15/26 | | | | B– | | | | 745,312 | |
| | | | Total Chemicals | | | | | | | | | | | | | | | | | | | | | | | 10,109,719 | |
| | | | | | | |
| | | | Commercial Services & Supplies – 0.6% | | | | | | | | | | | | | | | | | | |
| | | | | | | |
| | 2,105 | | | AerCap Ireland Capital Limited / AerCap Global Aviation Trust | | | 3.950% | | | | | | | | | | | | 2/01/22 | | | | BBB– | | | | 2,092,050 | |
| | | | | | | |
| | 800 | | | Arch Merger Sub Inc., 144A, (4) | | | 8.500% | | | | | | | | | | | | 9/15/25 | | | | B– | | | | 746,000 | |
| | | | | | | |
| | 1,529 | | | Brinks Company., 144A | | | 4.625% | | | | | | | | | | | | 10/15/27 | | | | BB+ | | | | 1,414,325 | |
| | | | Total Commercial Services & Supplies | | | | | | | | | | | | | | | | | | | | | | | 4,252,375 | |
| | | | | | | |
| | | | Communications Equipment – 0.3% | | | | | | | | | | | | | | | | | | |
| | | | | | | |
| | 2,300 | | | Qualcomm, Inc. | | | 2.100% | | | | | | | | | | | | 5/20/20 | | | | A1 | | | | 2,298,033 | |
| | | | | | | |
| | | | Construction & Engineering – 0.1% | | | | | | | | | | | | | | | | | | | | | | | | |
| | | | | | | |
| | 750 | | | New Enterprise Stone & Lime Co Inc., 144A | | | 6.250% | | | | | | | | | | | | 3/15/26 | | | | B+ | | | | 757,500 | |
| | | | | | | |
| | | | Consumer Finance – 1.4% | | | | | | | | | | | | | | | | | | |
| | | | | | | |
| | 3,280 | | | Capital One Financial Corporation. | | | 3.750% | | | | | | | | | | | | 3/09/27 | | | | A– | | | | 3,104,940 | |
| | | | | | | |
| | 750 | | | Credit Acceptance Corporation | | | 7.375% | | | | | | | | | | | | 3/15/23 | | | | BB | | | | 774,375 | |
| | | | | | | |
| | 1,750 | | | Discover Bank | | | 4.250% | | | | | | | | | | | | 3/13/26 | | | | BBB+ | | | | 1,710,032 | |
| | | | | | | |
| | 3,405 | | | Ford Motor Credit Company | | | 3.810% | | | | | | | | | | | | 1/09/24 | | | | BBB | | | | 3,303,924 | |
| | | | | | | |
| | 745 | | | Navient Corp | | | 6.750% | | | | | | | | | | | | 6/15/26 | | | | BB | | | | 728,014 | |
| | | | Total Consumer Finance | | | | | | | | | | | | | | | | | | | | | | | 9,621,285 | |
| | | | | | | |
| | | | Containers & Packaging – 0.3% | | | | | | | | | | | | | | | | | | | | | | | | |
| | | | | | | |
| | 1,740 | | | International Paper Company | | | 8.700% | | | | | | | | | | | | 6/15/38 | | | | BBB | | | | 2,426,389 | |
| | | | | | | |
| | | | Diversified Financial Services – 1.1% | | | | | | | | | | | | | | | | | | |
| | | | | | | |
| | 3,510 | | | BNP Paribas, 144A | | | 4.375% | | | | | | | | | | | | 5/12/26 | | | | A | | | | 3,404,241 | |
| | | | | | | |
| | 1,000 | | | Cometa Energia SA de CV, 144A | | | 6.375% | | | | | | | | | | | | 4/24/35 | | | | BBB | | | | 959,700 | |
| | | | | | | |
| | 1,955 | | | Jefferies Group Inc. | | | 4.850% | | | | | | | | | | | | 1/15/27 | | | | BBB | | | | 1,896,885 | |
| | | | | | | |
| | 2,000 | | | Quicken Loans Inc., 144A | | | 5.250% | | | | | | | | | | | | 1/15/28 | | | | Ba1 | | | | 1,844,600 | |
| | | | Total Diversified Financial Services | | | | | | | | | | | | | | | | | | | | | | | 8,105,426 | |
| | | | | | | |
| | | | Diversified Telecommunication Services – 2.7% | | | | | | | | | | | | | | | | | | |
| | | | | | | |
| | 2,335 | | | AT&T, Inc. | | | 3.800% | | | | | | | | | | | | 3/15/22 | | | | A– | | | | 2,338,367 | |
| | | | | | | |
| | 4,215 | | | AT&T, Inc. | | | 3.400% | | | | | | | | | | | | 5/15/25 | | | | A– | | | | 3,964,048 | |
| | | | | | | |
| | 883 | | | Frontier Communications Corporation, (4) | | | 8.500% | | | | | | | | | | | | 4/15/20 | | | | B | | | | 902,329 | |
| | | | | | | |
| | 500 | | | Frontier Communications Corporation | | | 11.000% | | | | | | | | | | | | 9/15/25 | | | | B | | | | 399,850 | |
| | | | | | | |
| | 1,175 | | | GCI Inc. | | | 6.875% | | | | | | | | | | | | 4/15/25 | | | | B+ | | | | 1,216,478 | |
| | | | | | | |
| | 500 | | | IntelSat Jackson Holdings | | | 5.500% | | | | | | | | | | | | 8/01/23 | | | | CCC+ | | | | 448,600 | |
| | | | | | | |
| | 1,000 | | | IntelSat Limited | | | 8.125% | | | | | | | | | | | | 6/01/23 | | | | CCC– | | | | 807,500 | |
| | | | | | | |
| | 2,360 | | | Qwest Corporation | | | 6.750% | | | | | | | | | | | | 12/01/21 | | | | BBB– | | | | 2,511,070 | |
| | | | | | | |
| | 1,350 | | | Telecom Italia SpA, 144A | | | 5.303% | | | | | | | | | | | | 5/30/24 | | | | BBB– | | | | 1,331,438 | |
97
Nuveen Strategic Income Fund (continued)
Portfolio of Investments June 30, 2018
| | | | | | | | | | | | | | | | | | | | | | | | | | | | |
Principal
Amount (000) (1) | | | Description (2) | | Coupon | | | | | | | | | Maturity | | | Ratings (3) | | | Value | |
| |
| | | | Diversified Telecommunication Services (continued) | |
| | | | | | | |
| $ | 2,650 | | | Telefonica Emisiones SAU | | | 4.103% | | | | | | | | | | | | 3/08/27 | | | | BBB | | | $ | 2,561,849 | |
| | | | | | | |
| | 3,215 | | | Verizon Communications | | | 4.125% | | | | | | | | | | | | 8/15/46 | | | | A– | | | | 2,744,197 | |
| | | | Total Diversified Telecommunication Services | | | | | | | | | | | | 19,225,726 | |
| | | | | | | |
| | | | Electric Utilities – 0.2% | | | | | | | | | | | | | | | | | | | | | | | | |
| | | | | | | |
| | 1,115 | | | FirstEnergy Transmission LLC, 144A | | | 4.350% | | | | | | | | | | | | 1/15/25 | | | | Baa2 | | | | 1,123,243 | |
| | | | | | | |
| | | | Electrical Equipment – 0.2% | | | | | | | | | | | | | | | | | | |
| | | | | | | |
| | 1,540 | | | Park Aerospace Holdings Limited, 144A | | | 5.250% | | | | | | | | | | | | 8/15/22 | | | | BB | | | | 1,524,615 | |
| | | | |
| | | | Energy Equipment & Services – 0.5% | | | | | | | | | | |
| | | | | | | |
| | 1,500 | | | Ensco PLC, (4) | | | 5.200% | | | | | | | | | | | | 3/15/25 | | | | BB– | | | | 1,245,000 | |
| | | | | | | |
| | 1,165 | | | Oceaneering International Inc. | | | 6.000% | | | | | | | | | | | | 2/01/28 | | | | BBB– | | | | 1,156,777 | |
| | | | | | | |
| | 1,000 | | | Precision Drilling Corporation, 144A, (4) | | | 7.125% | | | | | | | | | | | | 1/15/26 | | | | BB | | | | 1,027,000 | |
| | | | Total Energy Equipment & Services | | | | | | | | | | | | | | | | | | | | | | | 3,428,777 | |
| | | | |
| | | | Equity Real Estate Investment Trusts – 0.9% | | | | | | | | | | |
| | | | | | | |
| | 3,070 | | | American Tower Company | | | 5.000% | | | | | | | | | | | | 2/15/24 | | | | BBB | | | | 3,182,503 | |
| | | | | | | |
| | 2,080 | | | Piedmont Operating Partnership LP | | | 4.450% | | | | | | | | | | | | 3/15/24 | | | | BBB | | | | 2,091,978 | |
| | | | | | | |
| | 1,420 | | | Plum Creek Timberlands LP | | | 4.700% | | | | | | | | | | | | 3/15/21 | | | | BBB | | | | 1,466,624 | |
| | | | Total Equity Real Estate Investment Trusts | | | | | | | | | | | | | | | | | | | | | | | 6,741,105 | |
| | | | | | | |
| | | | Food & Staples Retailing – 0.8% | | | | | | | | | | | | | | | | | | |
| | | | | | | |
| | 1,000 | | | Rite Aid Corporation, 144A | | | 6.125% | | | | | | | | | | | | 4/01/23 | | | | B | | | | 1,014,000 | |
| | | | | | | |
| | 2,975 | | | Sysco Corporation | | | 3.300% | | | | | | | | | | | | 7/15/26 | | | | A3 | | | | 2,812,472 | |
| | | | | | | |
| | 2,000 | | | Walgreens Boots Alliance, Inc. | | | 3.800% | | | | | | | | | | | | 11/18/24 | | | | BBB | | | | 1,963,474 | |
| | | | Total Food & Staples Retailing | | | | | | | | | | | | | | | | | | | | | | | 5,789,946 | |
| | | | | | | |
| | | | Food Products – 0.8% | | | | | | | | | | | | | | | | | | |
| | | | | | | |
| | 2,460 | | | Bunge Limited Finance Company | | | 3.250% | | | | | | | | | | | | 8/15/26 | | | | BBB | | | | 2,244,515 | |
| | | | | | | |
| | 1,000 | | | JBS USA LUX SA / JBS USA Finance Inc., 144A | | | 6.750% | | | | | | | | | | | | 2/15/28 | | | | B+ | | | | 944,700 | |
| | | | | | | |
| | 2,235 | | | Kraft Heinz Foods Company | | | 4.375% | | | | | | | | | | | | 6/01/46 | | | | BBB | | | | 1,931,998 | |
| | | | | | | |
| | 800 | | | Post Holdings Inc., 144A | | | 5.625% | | | | | | | | | | | | 1/15/28 | | | | B | | | | 750,000 | |
| | | | Total Food Products | | | | | | | | | | | | | | | | | | | | | | | 5,871,213 | |
| | | | | | | |
| | | | Gas Utilities – 0.2% | | | | | | | | | | | | | | | | | | | | | | | | |
| | | | | | | |
| | 1,250 | | | Suburban Propane Partners LP | | | 5.500% | | | | | | | | | | | | 6/01/24 | | | | BB– | | | | 1,212,500 | |
| | | | |
| | | | Health Care Equipment & Supplies – 0.1% | | | | | | | | | | |
| | | | | | | |
| | 400 | EUR | | Synlab Bondco PLC, 144A | | | 6.250% | | | | | | | | | | | | 7/01/22 | | | | B+ | | | | 479,962 | |
| | | | |
| | | | Health Care Providers & Services – 1.2% | | | | | | | | | | |
| | | | | | | |
| | 1,515 | | | Centene Escrow I Corp, 144A | | | 5.375% | | | | | | | | | | | | 6/01/26 | | | | BB+ | | | | 1,534,892 | |
| | | | | | | |
| | 96 | | | CHS/Community Health Systems Inc., 144A, (4) | | | 8.125% | | | | | | | | | | | | 6/30/24 | | | | CCC– | | | | 79,320 | |
| | | | | | | |
| | 871 | | | Community Health Systems, Inc. | | | 6.875% | | | | | | | | | | | | 2/01/22 | | | | CCC– | | | | 444,210 | |
| | | | | | | |
| | 740 | | | Community Health Systems, Inc. | | | 6.250% | | | | | | | | | | | | 3/31/23 | | | | B | | | | 677,100 | |
| | | | | | | |
| | 3,815 | | | CVS Health Corp | | | 4.300% | | | | | | | | | | | | 3/25/28 | | | | Baa1 | | | | 3,761,665 | |
| | | | | | | |
| | 1,580 | | | HCA Inc. | | | 5.500% | | | | | | | | | | | | 6/15/47 | | | | BBB– | | | | 1,449,650 | |
98
| | | | | | | | | | | | | | | | | | | | | | | | | | | | |
Principal
Amount (000) (1) | | | Description (2) | | Coupon | | | | | | | | | Maturity | | | Ratings (3) | | | Value | |
| | | |
| | | | Health Care Providers & Services (continued) | | | | | | | |
| | | | | | | |
| $ | 500 | | | Kindred Healthcare Inc. | | | 6.375% | | | | | | | | | | | | 4/15/22 | | | | B– | | | $ | 515,000 | |
| | | | Total Health Care Providers & Services | | | | | | | | | | | | | | | | | | | | | | | 8,461,837 | |
| | | | | | | |
| | | | Hotels, Restaurants & Leisure – 0.5% | | | | | | | | | | | | | | | | | | |
| | | | | | | |
| | 720 | | | 1011778 BC ULC/New Red Finance Inc., 144A | | | 5.000% | | | | | | | | | | | | 10/15/25 | | | | B– | | | | 681,264 | |
| | | | | | | |
| | 1,230 | | | Hilton Domestic Operating Co Inc., 144A | | | 5.125% | | | | | | | | | | | | 5/01/26 | | | | BB+ | | | | 1,208,475 | |
| | | | | | | |
| | 1,550 | | | VOC Escrow Ltd, 144A | | | 5.000% | | | | | | | | | | | | 2/15/28 | | | | Ba2 | | | | 1,464,301 | |
| | | | Total Hotels, Restaurants & Leisure | | | | | | | | | | | | | | | | | | | | | | | 3,354,040 | |
| | | | | | | |
| | | | Household Durables – 0.9% | | | | | | | | | | | | | | | | | | |
| | | | | | | |
| | 1,000 | | | Apex Tool Group LLC / BC Mountain Finance Inc., 144A, (4) | | | 9.000% | | | | | | | | | | | | 2/15/23 | | | | B– | | | | 967,500 | |
| | | | | | | |
| | 2,940 | | | Harman International Industries, Inc. | | | 4.150% | | | | | | | | | | | | 5/15/25 | | | | BBB+ | | | | 2,929,724 | |
| | | | | | | |
| | 2,505 | | | Newell Brands Inc. | | | 4.200% | | | | | | | | | | | | 4/01/26 | | | | BBB– | | | | 2,419,177 | |
| | | | Total Household Durables | | | | | | | | | | | | | | | | | | | | | | | 6,316,401 | |
| | | | | | | |
| | | | Household Products – 0.2% | | | | | | | | | | | | | | | | | | | | | | | | |
| | | | | | | |
| | 1,300 | | | Kimberly-Clark de Mexico, S.A.B. de C.V, 144A | | | 3.250% | | | | | | | | | | | | 3/12/25 | | | | A | | | | 1,207,083 | |
| | | |
| | | | Independent Power & Renewable Electricity Producers – 0.2% | | | | | | | |
| | | | | | | |
| | 1,000 | | | Calpine Corporation., 144A | | | 5.250% | | | | | | | | | | | | 6/01/26 | | | | BB+ | | | | 942,500 | |
| | | | | | | |
| | 1,000 | | | Talen Energy Supply LLC, (4) | | | 6.500% | | | | | | | | | | | | 6/01/25 | | | | B+ | | | | 762,500 | |
| | | | Total Independent Power & Renewable Electricity Producers | | | | | | | | | | | | 1,705,000 | |
| | | | | | | |
| | | | Industrial Conglomerates – 1.2% | | | | | | | | | | | | | | | | | | |
| | | | | | | |
| | 1,000 | | | Alfa SAB de CV, 144A | | | 5.250% | | | | | | | | | | | | 3/25/24 | | | | BBB– | | | | 1,008,750 | |
| | | | | | | |
| | 3,740 | | | GE Capital International Funding CO | | | 4.418% | | | | | | | | | | | | 11/15/35 | | | | A | | | | 3,620,998 | |
| | | | | | | |
| | 3,200 | | | Siemens Financieringsmaatschappij NV, 144A | | | 3.400% | | | | | | | | | | | | 3/16/27 | | | | A+ | | | | 3,100,253 | |
| | | | | | | |
| | 1,000 | | | Stena International SA, 144A | | | 5.750% | | | | | | | | | | | | 3/01/24 | | | | BB– | | | | 917,500 | |
| | | | Total Industrial Conglomerates | | | | | | | | | | | | | | | | | | | | | | | 8,647,501 | |
| | | | | | | |
| | | | Insurance – 3.3% | | | | | | | | | | | | | | | | | | |
| | | | | | | |
| | 646 | | | AFLAC Insurance | | | 6.450% | | | | | | | | | | | | 8/15/40 | | | | A– | | | | 793,478 | |
| | | | | | | |
| | 3,000 | | | Fairfax US Inc., 144A | | | 4.875% | | | | | | | | | | | | 8/13/24 | | | | BBB– | | | | 3,063,930 | |
| | | | | | | |
| | 1,230 | | | Genworth Holdings Inc. | | | 4.800% | | | | | | | | | | | | 2/15/24 | | | | B | | | | 1,067,025 | |
| | | | | | | |
| | 3,370 | | | Liberty Mutual Group Inc., 144A | | | 4.950% | | | | | | | | | | | | 5/01/22 | | | | BBB | | | | 3,500,905 | |
| | | | | | | |
| | 2,535 | | | Lincoln National Corporation | | | 4.000% | | | | | | | | | | | | 9/01/23 | | | | A– | | | | 2,554,899 | |
| | | | | | | |
| | 3,015 | | | Symetra Financial Corporation | | | 4.250% | | | | | | | | | | | | 7/15/24 | | | | Baa1 | | | | 2,981,762 | |
| | | | | | | |
| | 2,075 | | | Unum Group | | | 4.000% | | | | | | | | | | | | 3/15/24 | | | | BBB | | | | 2,058,115 | |
| | | | | | | |
| | 750 | | | Wand Merger Corp, 144A, (WI/DD) | | | 8.125% | | | | | | | | | | | | 7/15/23 | | | | B2 | | | | 760,313 | |
| | | | | | | |
| | 1,805 | | | Willis North America, Inc. | | | 3.600% | | | | | | | | | | | | 5/15/24 | | | | BBB | | | | 1,743,647 | |
| | | | | | | |
| | 4,790 | | | XLIT Limited | | | 4.450% | | | | | | | | | | | | 3/31/25 | | | | BBB | | | | 4,711,438 | |
| | | | Total Insurance | | | | | | | | | | | | | | | | | | | | | | | 23,235,512 | |
| | | | | | | |
| | | | Internet Software & Services – 0.4% | | | | | | | | | | | | | | | | | | | | | | | | |
| | | | | | | |
| | 2,865 | | | eBay Inc. | | | 3.800% | | | | | | | | | | | | 3/09/22 | | | | BBB+ | | | | 2,891,825 | |
99
Nuveen Strategic Income Fund (continued)
Portfolio of Investments June 30, 2018
| | | | | | | | | | | | | | | | | | | | | | | | | | | | |
Principal
Amount (000) (1) | | | Description (2) | | Coupon | | | | | | | | | Maturity | | | Ratings (3) | | | Value | |
| | | | | | | |
| | | | Leisure Products – 0.1% | | | | | | | | | | | | | | | | | | |
| | | | | | | |
| $ | 750 | | | Mattel Inc., 144A, (4) | | | 6.750% | | | | | | | | | | | | 12/31/25 | | | | BB | | | $ | 730,313 | |
| | | | | | | |
| | | | Machinery – 0.6% | | | | | | | | | | | | | | | | | | |
| | | | | | | |
| | 3,370 | | | John Deere Capital Corporation | | | 2.650% | | | | | | | | | | | | 6/24/24 | | | | A | | | | 3,208,948 | |
| | | | | | | |
| | 1,000 | | | Navistar International Corporation, 144A, (4) | | | 6.625% | | | | | | | | | | | | 11/01/25 | | | | B– | | | | 1,027,500 | |
| | | | Total Machinery | | | | | | | | | | | | | | | | | | | | | | | 4,236,448 | |
| | | | | | | |
| | | | Marine – 0.3% | | | | | | | | | | | | | | | | | | |
| | | | | | | |
| | 1,595 | | | Eletson Holdings Inc., 144A | | | 9.625% | | | | | | | | | | | | 1/15/22 | | | | Caa2 | | | | 1,004,850 | |
| | | | | | | |
| | 500 | | | Navios Maritime Acquisition Corporation, 144A, (4) | | | 8.125% | | | | | | | | | | | | 11/15/21 | | | | B– | | | | 410,625 | |
| | | | | | | |
| | 1,000 | | | Navios Maritime Holdings Inc., 144A | | | 11.250% | | | | | | | | | | | | 8/15/22 | | | | B | | | | 950,000 | |
| | | | Total Marine | | | | | | | | | | | | | | | | | | | | | | | 2,365,475 | |
| | | | | | | |
| | | | Media – 1.7% | | | | | | | | | | | | | | | | | | |
| | | | | | | |
| | 2,260 | | | CBS Corporation | | | 4.000% | | | | | | | | | | | | 1/15/26 | | | | BBB | | | | 2,191,046 | |
| | | | | | | |
| | 1,790 | | | Comcast Corporation | | | 6.400% | | | | | | | | | | | | 5/15/38 | | | | A– | | | | 2,120,016 | |
| | | | | | | |
| | 1,000 | | | Meredith Corporation., 144A | | | 6.875% | | | | | | | | | | | | 2/01/26 | | | | B | | | | 986,250 | |
| | | | | | | |
| | 2,200 | | | Telenet Finance Luxembourg, 144A | | | 5.500% | | | | | | | | | | | | 3/01/28 | | | | BB | | | | 1,999,096 | |
| | | | | | | |
| | 1,805 | | | Time Warner Inc. | | | 3.875% | | | | | | | | | | | | 1/15/26 | | | | A– | | | | 1,732,847 | |
| | | | | | | |
| | 1,750 | CAD | | Videotron Limited, 144A | | | 5.625% | | | | | | | | | | | | 6/15/25 | | | | BB | | | | 1,386,515 | |
| | | | | | | |
| | 1,600 | | | VTR Finance BV, 144A | | | 6.875% | | | | | | | | | | | | 1/15/24 | | | | BB– | | | | 1,607,520 | |
| | | | Total Media | | | | | | | | | | | | | | | | | | | | | | | 12,023,290 | |
| | | | | | | |
| | | | Metals & Mining – 1.3% | | | | | | | | | | | | | | | | | | |
| | | | | | | |
| | 600 | | | Commercial Metals Co, 144A | | | 5.750% | | | | | | | | | | | | 4/15/26 | | | | BB+ | | | | 579,000 | |
| | | | | | | |
| | 1,000 | | | First Quantum Minerals Ltd, 144A | | | 6.500% | | | | | | | | | | | | 3/01/24 | | | | B | | | | 965,000 | |
| | | | | | | |
| | 2,350 | | | Glencore Funding LLC, 144A | | | 4.000% | | | | | | | | | | | | 3/27/27 | | | | BBB+ | | | | 2,217,418 | |
| | | | | | | |
| | 1,520 | | | Hudbay Minerals, Inc., 144A | | | 7.250% | | | | | | | | | | | | 1/15/23 | | | | B+ | | | | 1,565,600 | |
| | | | | | | |
| | 1,000 | | | Northwest Acquisition/Dominion Finco Inc. , 144A | | | 7.125% | | | | | | | | | | | | 11/01/22 | | | | BB | | | | 997,500 | |
| | | | | | | |
| | 1,000 | | | Novelis Corp, 144A | | | 6.250% | | | | | | | | | | | | 8/15/24 | | | | B+ | | | | 1,000,000 | |
| | | | | | | |
| | 1,000 | | | SunCoke Energy Partners LP / SunCoke Energy Partners Finance Corp., 144A | | | 7.500% | | | | | | | | | | | | 6/15/25 | | | | BB– | | | | 1,017,500 | |
| | | | | | | |
| | 1,045 | | | United States Steel Corp | | | 6.250% | | | | | | | | | | | | 3/15/26 | | | | BB– | | | | 1,033,897 | |
| | | | Total Metals & Mining | | | | | | | | | | | | | | | | | | | | | | | 9,375,915 | |
| | | | | | | |
| | | | Multi-Utilities – 0.2% | | | | | | | | | | | | | | | | | | | | | | | | |
| | | | | | | |
| | 1,750 | | | Sempra Energy. | | | 3.400% | | | | | | | | | | | | 2/01/28 | | | | BBB+ | | | | 1,641,140 | |
| | | | |
| | | | Oil, Gas & Consumable Fuels – 4.6% | | | | | | | | | | |
| | | | | | | |
| | 2,000 | | | Abu Dhabi Crude Oil Pipeline LLC, 144A | | | 4.600% | | | | | | | | | | | | 11/02/47 | | | | AA | | | | 1,832,000 | |
| | | | | | | |
| | 2,435 | | | Baker Hughes a GE Co LLC / Baker Hughes Co-Obligor Inc. | | | 2.773% | | | | | | | | | | | | 12/15/22 | | | | A– | | | | 2,361,440 | |
| | | | | | | |
| | 1,262 | | | Berkshire Hathaway Energy Company | | | 6.125% | | | | | | | | | | | | 4/01/36 | | | | A– | | | | 1,554,470 | |
| | | | | | | |
| | 2,405 | | | Enterprise Products Operating LLC | | | 2.800% | | | | | | | | | | | | 2/15/21 | | | | BBB+ | | | | 2,374,077 | |
| | | | | | | |
| | 1,000 | | | EP Energy LLC and Everest Acquisition Finance, Inc., 144A | | | 9.375% | | | | | | | | | | | | 5/01/24 | | | | Caa2 | | | | 820,000 | |
| | | | | | | |
| | 1,500 | | | MEG Energy Corporation, 144A | | | 6.375% | | | | | | | | | | | | 1/30/23 | | | | BB– | | | | 1,400,625 | |
100
| | | | | | | | | | | | | | | | | | | | | | | | | | | | |
Principal
Amount (000) (1) | | | Description (2) | | Coupon | | | | | | | | | Maturity | | | Ratings (3) | | | Value | |
| | | | | | | |
| | | | Oil, Gas & Consumable Fuels (continued) | | | | | | | | | | | | | | | | | | |
| | | | | | | |
| $ | 2,700 | | | MPLX LP | | | 4.875% | | | | | | | | | | | | 6/01/25 | | | | BBB | | | $ | 2,775,272 | |
| | | | | | | |
| | 1,880 | | | Occidental Petroleum Corporation | | | 3.400% | | | | | | | | | | | | 4/15/26 | | | | A | | | | 1,834,633 | |
| | | | | | | |
| | 1,000 | | | PBF Holding Company LLC. | | | 7.250% | | | | | | | | | | | | 6/15/25 | | | | BB | | | | 1,051,250 | |
| | | | | | | |
| | 1,275 | | | Petro Canada | | | 6.800% | | | | | | | | | | | | 5/15/38 | | | | A– | | | | 1,624,027 | |
| | | | | | | |
| | 1,000 | | | Petrobras Global Finance BV | | | 7.375% | | | | | | | | | | | | 1/17/27 | | | | Ba2 | | | | 998,750 | |
| | | | | | | |
| | 1,575 | | | Petroleos del Peru SA, 144A | | | 4.750% | | | | | | | | | | | | 6/19/32 | | | | BBB+ | | | | 1,507,275 | |
| | | | | | | |
| | 1,345 | | | Sabine Pass Liquefaction LLC. | | | 5.875% | | | | | | | | | | | | 6/30/26 | | | | BBB– | | | | 1,442,065 | |
| | | | | | | |
| | 1,250 | | | Shelf Drilling Holdings Ltd, 144A | | | 8.250% | | | | | | | | | | | | 2/15/25 | | | | B2 | | | | 1,259,375 | |
| | | | | | | |
| | 1,910 | | | Sunoco Logistics Partners LP | | | 4.000% | | | | | | | | | | | | 10/01/27 | | | | BBB– | | | | 1,784,199 | |
| | | | | | | |
| | 1,000 | | | Sunoco LP / Sunoco Finance Corp., 144A | | | 4.875% | | | | | | | | | | | | 1/15/23 | | | | BB | | | | 960,000 | |
| | | | | | | |
| | 670 | | | Targa Resources Inc. | | | 4.250% | | | | | | | | | | | | 11/15/23 | | | | BB– | | | | 643,200 | |
| | | | | | | |
| | 1,915 | | | Western Gas Partners LP | | | 4.500% | | | | | | | | | | | | 3/01/28 | | | | BBB– | | | | 1,842,199 | |
| | | | | | | |
| | 2,875 | | | Woodside Finance Limited, 144A | | | 3.650% | | | | | | | | | | | | 3/05/25 | | | | BBB+ | | | | 2,800,971 | |
| | | | | | | |
| | 1,515 | | | WPX Energy Inc. | | | 5.750% | | | | | | | | | | | | 6/01/26 | | | | BB– | | | | 1,515,000 | |
| | | | Total Oil, Gas & Consumable Fuels | | | | | | | | | | | | | | | | | | | | | | | 32,380,828 | |
| | | | | | | |
| | | | Paper & Forest Products – 0.3% | | | | | | | | | | | | | | | | | | | | | | | | |
| | | | | | | |
| | 2,100 | | | Domtar Corporation | | | 6.750% | | | | | | | | | | | | 2/15/44 | | | | BBB– | | | | 2,221,535 | |
| | | | | | | |
| | | | Personal Products – 0.2% | | | | | | | | | | | | | | | | | | |
| | | | | | | |
| | 1,145 | | | Coty Inc., 144A, (4) | | | 6.500% | | | | | | | | | | | | 4/15/26 | | | | BB | | | | 1,098,484 | |
| | | | | | | |
| | | | Pharmaceuticals – 0.4% | | | | | | | | | | | | | | | | | | | | | | | | |
| | | | | | | |
| | 1,635 | | | Endo Finance LLC, 144A | | | 5.375% | | | | | | | | | | | | 1/31/23 | | | | B3 | | | | 1,308,000 | |
| | | | | | | |
| | 1,515 | | | Teva Pharmaceutical Finance Netherlands III BV, (4) | | | 6.750% | | | | | | | | | | | | 3/01/28 | | | | BB | | | | 1,543,594 | |
| | | | Total Pharmaceuticals | | | | | | | | | | | | | | | | | | | | | | | 2,851,594 | |
| | | | | | | |
| | | | Real Estate Management & Development – 0.2% | | | | | | | | | | | | | | | | | | | | | | | | |
| | | | | | | |
| | 1,500 | | | Hunt Cos Inc., 144A | | | 6.250% | | | | | | | | | | | | 2/15/26 | | | | BB– | | | | 1,398,750 | |
| | | | | | | |
| | | | Road & Rail – 0.4% | | | | | | | | | | | | | | | | | | |
| | | | | | | |
| | 750 | | | The Hertz Corporation, 144A, (4) | | | 7.625% | | | | | | | | | | | | 6/01/22 | | | | BB– | | | | 720,000 | |
| | | | | | | |
| | 1,500 | | | Union Pacific Corp | | | 4.500% | | | | | | | | | | | | 9/10/48 | | | | A– | | | | 1,513,543 | |
| | | | | | | |
| | 1,000 | | | United Rentals North America Inc. | | | 4.875% | | | | | | | | | | | | 1/15/28 | | | | BB | | | | 928,750 | |
| | | | Total Road & Rail | | | | | | | | | | | | | | | | | | | | | | | 3,162,293 | |
| | | | | | | |
| | | | Semiconductors & Semiconductor Equipment – 0.7% | | | | | | | | | | | | | | | | | | |
| | | | | | | |
| | 2,655 | | | Intel Corporation | | | 3.150% | | | | | | | | | | | | 5/11/27 | | | | A+ | | | | 2,570,692 | |
| | | | | | | |
| | 2,425 | | | Texas Instruments Incorporated, (4) | | | 2.900% | | | | | | | | | | | | 11/03/27 | | | | A+ | | | | 2,293,370 | |
| | | | Total Semiconductors & Semiconductor Equipment | | | | | | | | | | | | | | | | | | | | | | | 4,864,062 | |
| | | | | | | |
| | | | Software – 0.5% | | | | | | | | | | | | | | | | | | |
| | | | | | | |
| | 875 | | | CDK Global Inc. | | | 5.875% | | | | | | | | | | | | 6/15/26 | | | | BB+ | | | | 893,594 | |
| | | | | | | |
| | 2,450 | | | Microsoft Corporation | | | 3.300% | | | | | | | | | | | | 2/06/27 | | | | AAA | | | | 2,417,986 | |
| | | | Total Software | | | | | | | | | | | | | | | | | | | | | | | 3,311,580 | |
101
Nuveen Strategic Income Fund (continued)
Portfolio of Investments June 30, 2018
| | | | | | | | | | | | | | | | | | | | | | | | | | | | |
Principal
Amount (000) (1) | | | Description (2) | | Coupon | | | | | | | | | Maturity | | | Ratings (3) | | | Value | |
| | | | | | | |
| | | | Specialty Retail – 1.1% | | | | | | | | | | | | | | | | | | |
| | | | | | | |
| $ | 2,000 | | | AutoNation Inc. | | | 4.500% | | | | | | | | | | | | 10/01/25 | | | | BBB– | | | $ | 1,985,787 | |
| | | | | | | |
| | 2,900 | | | Bed Bath and Beyond Incorporated | | | 5.165% | | | | | | | | | | | | 8/01/44 | | | | Baa2 | | | | 2,220,166 | |
| | | | | | | |
| | 1,500 | | | L Brands, Inc. | | | 6.875% | | | | | | | | | | | | 11/01/35 | | | | BB+ | | | | 1,335,000 | |
| | | | | | | |
| | 2,405 | | | Lowes Companies, Inc. | | | 3.100% | | | | | | | | | | | | 5/03/27 | | | | A– | | | | 2,272,101 | |
| | | | Total Specialty Retail | | | | | | | | | | | | | | | | | | | | | | | 7,813,054 | |
| | | | | | | |
| | | | Tobacco – 0.2% | | | | | | | | | | | | | | | | | | | | | | | | |
| | | | | | | |
| | 1,410 | | | Vector Group Limited, 144A | | | 6.125% | | | | | | | | | | | | 2/01/25 | | | | BB– | | | | 1,362,413 | |
| | | | | | | |
| | | | Trading Companies & Distributors – 0.4% | | | | | | | | | | | | | | | | | | |
| | | | | | | |
| | 1,995 | | | Air Lease Corporation | | | 3.875% | | | | | | | | | | | | 4/01/21 | | | | BBB | | | | 2,009,490 | |
| | | | | | | |
| | 515 | | | Ashtead Capital Inc., 144A | | | 4.125% | | | | | | | | | | | | 8/15/25 | | | | BBB– | | | | 480,238 | |
| | | | Total Trading Companies & Distributors | | | | | | | | | | | | | | | | | | | | | | | 2,489,728 | |
| | | | |
| | | | Wireless Telecommunication Services – 0.6% | | | | | | | | | | |
| | | | | | | |
| | 1,000 | | | Hughes Satellite Systems Corporation | | | 6.625% | | | | | | | | | | | | 8/01/26 | | | | BB– | | | | 925,000 | |
| | | | | | | |
| | 1,040 | | | Millicom International Cellular SA, 144A | | | 5.125% | | | | | | | | | | | | 1/15/28 | | | | BB+ | | | | 955,240 | |
| | | | | | | |
| | 500 | | | Sprint Capital Corporation | | | 6.875% | | | | | | | | | | | | 11/15/28 | | | | B+ | | | | 480,000 | |
| | | | | | | |
| | 1,848 | | | Sprint Spectrum Co LLC / Sprint Spectrum Co II LLC / Sprint Spectrum Co III LLC, 144A | | | 3.360% | | | | | | | | | | | | 9/20/21 | | | | Baa2 | | | | 1,827,643 | |
| | | | Total Wireless Telecommunication Services | | | | | | | | | | | | | | | | | | | | | | | 4,187,883 | |
| | | | Total Corporate Bonds (cost $402,256,018) | | | | | | | | | | | | | | | | | | | | | | | 392,075,169 | |
| | | | | | | |
Principal
Amount (000) | | | Description (2) | | Coupon | | | | | | | | | Maturity | | | Ratings (3) | | | Value | |
| | | |
| | | | ASSET-BACKED AND MORTGAGE-BACKED SECURITIES – 20.0% | | | | | | | | | |
| | | | | | | |
| $ | 5,075 | | | Ally Auto Receivables Trust, Series 2017-3 | | | 2.010% | | | | | | | | | | | | 3/15/22 | | | | AAA | | | $ | 4,978,706 | |
| | | | | | | |
| | 2,350 | | | American Express Credit Card Master Trust, Series 2017-1 | | | 1.930% | | | | | | | | | | | | 9/15/22 | | | | Aaa | | | | 2,315,449 | |
| | | | | | | |
| | 2,260 | | | American Homes 4 Rent, Series 2014-SFR2 | | | 3.786% | | | | | | | | | | | | 10/17/36 | | | | Aaa | | | | 2,284,368 | |
| | | | | | | |
| | 2,270 | | | AmeriCold LLC Trust, Series 2010, 144A | | | 6.811% | | | | | | | | | | | | 1/14/29 | | | | AA– | | | | 2,404,774 | |
| | | | | | | |
| | 21 | | | Bank of America Alternative Loan Trust, Series 2005-5 2 CB1 | | | 6.000% | | | | | | | | | | | | 6/25/35 | | | | Caa1 | | | | 20,120 | |
| | | | | | | |
| | 1,200 | | | Bank of America Commercial Mortgage Inc. , Commercial Mortgage Pass-Through Certificates, Series 2015-UBS7 | | | 4.507% | | | | | | | | | | | | 9/17/48 | | | | A– | | | | 1,170,480 | |
| | | | | | | |
| | 770 | | | Bank of America Commercial Mortgage Inc. , Commercial Mortgage Pass-Through Certificates, Series 2015-UBS7 | | | 3.167% | | | | | | | | | | | | 9/17/48 | | | | BBB– | | | | 622,417 | |
| | | | | | | |
| | 5,155 | | | Bank of America Credit Card Trust, Series 2017-A1 | | | 1.950% | | | | | | | | | | | | 8/15/22 | | | | Aaa | | | | 5,076,375 | |
| | | | | | | |
| | 2,400 | | | Barclays Commercial Mortgage, Mortgage Pass-Through Certificates, Series 2015-STP, 144A | | | 4.427% | | | | | | | | | | | | 9/10/28 | | | | BBB– | | | | 2,383,700 | |
| | | | | | | |
| | 4,900 | | | Citibank Credit Card Issuance Trust, Series 2014-A6. | | | 2.150% | | | | | | | | | | | | 7/15/21 | | | | Aaa | | | | 4,871,340 | |
| | | | | | | |
| | 3,000 | | | Cold Storage Trust, Commercial Mortgage Backed Securities, Series 2017-ICE3, 144A, (1-Month LIBOR reference rate + 1.000% spread), (5) | | | 3.073% | | | | | | | | | | | | 4/15/36 | | | | AAA | | | | 3,011,219 | |
| | | | | | | |
| | 3,940 | | | Commercial Mortgage Pass-Through Certificates 2015-CR22 | | | 4.259% | | | | | | | | | | | | 3/12/48 | | | | A– | | | | 3,813,208 | |
102
| | | | | | | | | | | | | | | | | | | | | | | | | | | | |
| | | | | | | |
Principal
Amount (000) | | | Description (2) | | Coupon | | | | | | | | | Maturity | | | Ratings (3) | | | Value | |
| | | |
| | | | ASSET-BACKED AND MORTGAGE-BACKED SECURITIES (continued) | | | | | | | |
| | | | | | | |
| $ | 3,260 | | | Commercial Mortgage Pass-Through Certificates, Series 2015-CR26 | | | 4.642% | | | | | | | | | | | | 10/10/48 | | | | A– | | | $ | 3,164,287 | |
| | | | | | | |
| | 1,610 | | | Commercial Mortgage Pass-Through Certificates, Series 2016-SAVA, 144A, (1-Month LIBOR reference rate + 2.300% spread), (5) | | | 4.373% | | | | | | | | | | | | 10/17/34 | | | | AA– | | | | 1,613,030 | |
| | | | | | | |
| | 53 | | | Countrywide Alternative Loan Trust, Mortgage Pass-Through Certificates, Series 2004-24CB | | | 5.000% | | | | | | | | | | | | 11/25/19 | | | | BB+ | | | | 52,502 | |
| | | | | | | |
| | 644 | | | Countrywide Home Loans Mortgage, Series 2005-27 | | | 5.500% | | | | | | | | | | | | 1/25/23 | | | | Caa1 | | | | 634,592 | |
| | | | | | | |
| | 113 | | | Credit Suisse First Boston Mortgage Securities Corporation, Mortgage-Backed Pass-Through Certificates, Series 2003-23 | | | 5.750% | | | | | | | | | | | | 9/25/33 | | | | AA+ | | | | 118,113 | |
| | | | | | | |
| | 3,246 | | | DB Master Finance LLC, Series 2015-1A, 144A | | | 3.980% | | | | | | | | | | | | 2/21/45 | | | | BBB | | | | 3,254,370 | |
| | | | | | | |
| | 1,950 | | | Discover Card Execution Trust 2015-A2 | | | 1.900% | | | | | | | | | | | | 10/17/22 | | | | AAA | | | | 1,915,601 | |
| | | | | | | |
| | 3,504 | | | Domino’s Pizza Master Issuer LLC, 144A, (3-Month LIBOR reference rate + 1.250% spread), (5) | | | 3.610% | | | | | | | | | | | | 7/25/47 | | | | BBB+ | | | | 3,511,093 | |
| | | | | | | |
| | 3,652 | | | Dominos Pizza Master Issuer LLC, Series 2017-1A, 144A | | | 3.082% | | | | | | | | | | | | 7/25/47 | | | | BBB+ | | | | 3,539,979 | |
| | | | | | | |
| | 77 | | | Fannie Mae Mortgage Interest Strips | | | 5.000% | | | | | | | | | | | | 9/01/24 | | | | N/R | | | | 3,060 | |
| | | | | | | |
| | 37 | | | Fannie Mae Mortgage Pool FN 255956 | | | 6.000% | | | | | | | | | | | | 9/01/37 | | | | N/R | | | | 39,063 | |
| | | | | | | |
| | 42 | | | Fannie Mae Mortgage Pool FN 256890 | | | 6.000% | | | | | | | | | | | | 6/01/37 | | | | N/R | | | | 46,462 | |
| | | | | | | |
| | 43 | | | Fannie Mae Mortgage Pool FN 725205 | | | 6.000% | | | | | | | | | | | | 11/01/34 | | | | N/R | | | | 46,957 | |
| | | | | | | |
| | 42 | | | Fannie Mae Mortgage Pool FN 725773 | | | 6.000% | | | | | | | | | | | | 4/01/32 | | | | N/R | | | | 45,603 | |
| | | | | | | |
| | 181 | | | Fannie Mae Mortgage Pool FN 735060 | | | 6.000% | | | | | | | | | | | | 3/01/34 | | | | N/R | | | | 194,004 | |
| | | | | | | |
| | 77 | | | Fannie Mae Mortgage Pool FN 745101 | | | 5.000% | | | | | | | | | | | | 3/01/34 | | | | N/R | | | | 82,576 | |
| | | | | | | |
| | 107 | | | Fannie Mae Mortgage Pool FN 745324 | | | 5.500% | | | | | | | | | | | | 9/01/34 | | | | N/R | | | | 116,341 | |
| | | | | | | |
| | 31 | | | Fannie Mae Mortgage Pool FN 824163 | | | 5.500% | | | | | | | | | | | | 4/01/35 | | | | N/R | | | | 33,794 | |
| | | | | | | |
| | 41 | | | Fannie Mae Mortgage Pool FN 831377 | | | 6.500% | | | | | | | | | | | | 4/01/36 | | | | N/R | | | | 45,246 | |
| | | | | | | |
| | 18 | | | Fannie Mae Mortgage Pool FN 852909 | | | 6.500% | | | | | | | | | | | | 4/01/36 | | | | N/R | | | | 19,583 | |
| | | | | | | |
| | — | (6) | | Fannie Mae Mortgage Pool FN 889618 | | | 5.500% | | | | | | | | | | | | 7/01/38 | | | | N/R | | | | 65 | |
| | | | | | | |
| | — | (6) | | Fannie Mae Mortgage Pool FN 893318 | | | 5.500% | | | | | | | | | | | | 5/01/38 | | | | N/R | | | | 103 | |
| | | | | | | |
| | 41 | | | Fannie Mae Mortgage Pool FN 905597 | | | 6.500% | | | | | | | | | | | | 8/01/36 | | | | N/R | | | | 44,733 | |
| | | | | | | |
| | 7 | | | Fannie Mae Mortgage Pool FN 944340, (12-Month LIBOR reference rate + 1.890% spread), (5) | | | 3.510% | | | | | | | | | | | | 12/01/36 | | | | N/R | | | | 7,199 | |
| | | | | | | |
| | 29 | | | Fannie Mae Mortgage Pool FN 946228, (12-Month LIBOR reference rate + 1.590% spread), (5) | | | 3.524% | | | | | | | | | | | | 9/01/37 | | | | N/R | | | | 30,234 | |
| | | | | | | |
| | 191 | | | Fannie Mae Mortgage Pool FN 985344 | | | 5.500% | | | | | | | | | | | | 11/01/38 | | | | N/R | | | | 206,796 | |
| | | | | | | |
| | 112 | | | Fannie Mae Mortgage Pool FN AA0005 | | | 5.500% | | | | | | | | | | | | 12/01/38 | | | | N/R | | | | 119,756 | |
| | | | | | | |
| | 3 | | | Fannie Mae Mortgage Pool FN AA0889 | | | 5.500% | | | | | | | | | | | | 7/01/24 | | | | N/R | | | | 2,727 | |
| | | | | | | |
| | 580 | | | Fannie Mae Mortgage Pool FN AL1187 | | | 5.500% | | | | | | | | | | | | 10/01/25 | | | | N/R | | | | 621,258 | |
| | | | | | | |
| | 1,430 | | | Fannie Mae TBA, (WI/DD) | | | 4.500% | | | | | | | | | | | | TBA | | | | N/R | | | | 1,488,904 | |
| | | | | | | |
| | 755 | | | Fannie Mae TBA, (WI/DD) | | | 4.000% | | | | | | | | | | | | TBA | | | | N/R | | | | 769,658 | |
| | | | | | | |
| | 14,150 | | | Fannie Mae TBA, (WI/DD) | | | 3.500% | | | | | | | | | | | | TBA | | | | N/R | | | | 14,066,855 | |
| | | | | | | |
| | 2,000 | | | Fifth Third Auto Trust, Series 2017-1 | | | 1.800% | | | | | | | | | | | | 2/15/22 | | | | AAA | | | | 1,972,086 | |
| | | | | | | |
| | 2,050 | | | Finance of America Structured Security Trust, Series 2017-HB1, 144A | | | 3.624% | | | | | | | | | | | | 11/25/27 | | | | Baa2 | | | | 2,040,447 | |
103
Nuveen Strategic Income Fund (continued)
Portfolio of Investments June 30, 2018
| | | | | | | | | | | | | | | | | | | | | | | | | | | | |
| | | | | | | |
Principal
Amount (000) | | | Description (2) | | Coupon | | | | | | | | | Maturity | | | Ratings (3) | | | Value | |
| | | |
| | | | ASSET-BACKED AND MORTGAGE-BACKED SECURITIES (continued) | | | | | | | |
| | | | | | | |
| $ | 3,315 | | | Flagstar Mortgage Trust 2018-4 | | | 4.000% | | | | | | | | | | | | 7/25/48 | | | | Aaa | | | $ | 3,333,244 | |
| | | | | | | |
| | 3,371 | | | Flagstar Mortgage Trust, Series 2017-2, 144A | | | 3.500% | | | | | | | | | | | | 10/25/47 | | | | Aaa | | | | 3,338,402 | |
| | | | | | | |
| | 2,980 | | | Focus Brands Funding LLC, Asset Backed Security, 144A | | | 5.093% | | | | | | | | | | | | 4/30/47 | | | | BBB | | | | 3,061,013 | |
| | | | | | | |
| | 216 | | | Freddie Mac Mortgage Pool, Various | | | 6.500% | | | | | | | | | | | | 7/01/31 | | | | N/R | | | | 240,726 | |
| | | | | | | |
| | 45 | | | Freddie Mac Mortgage Pool, Various | | | 7.000% | | | | | | | | | | | | 8/01/37 | | | | N/R | | | | 48,619 | |
| | | | | | | |
| | 2,465 | | | Goldman Sachs Mortgage Securities Trust, Mortgage Pass-Through Certificates, Series 2015-GC32 | | | 3.345% | | | | | | | | | | | | 7/10/48 | | | | BBB– | | | | 1,994,008 | |
| | | | | | | |
| | 3,000 | | | Honda Auto Receivables Owner Trust 2017-2 | | | 1.870% | | | | | | | | | | | | 9/15/23 | | | | AAA | | | | 2,924,803 | |
| | | | | | | |
| | 1,069 | | | Impact Secured Assets Corporation, Mortgage Pass-Through Certificates, Series 2000-3 | | | 8.000% | | | | | | | | | | | | 10/25/30 | | | | CCC | | | | 975,176 | |
| | | | | | | |
| | 1,871 | | | Invitation Homes Trust 2017-SFR3, 144A, (1-Month LIBOR reference rate + 0.850% spread), (5) | | | 2.935% | | | | | | | | | | | | 12/19/36 | | | | Aaa | | | | 1,871,409 | |
| | | | | | | |
| | 3,956 | | | Invitation Homes Trust 2018-SFR1, 144A, (1-Month LIBOR reference rate + 0.700% spread), (5) | | | 2.785% | | | | | | | | | | | | 3/19/37 | | | | Aaa | | | | 3,945,110 | |
| | | | | | | |
| | 3,393 | | | Invitation Homes Trust 2018-SFR2, 144A, (1-Month LIBOR reference rate + 0.900% spread), (5) | | | 2.973% | | | | | | | | | | | | 6/18/37 | | | | Aaa | | | | 3,391,086 | |
| | | | | | | |
| | 3,550 | | | Invitation Homes Trust 2018-SFR3, 144A, (1-Month LIBOR reference rate + 1.000% spread), (5) | | | 3.000% | | | | | | | | | | | | 7/17/37 | | | | Aaa | | | | 3,554,446 | |
| | | | | | | |
| | 571 | | | JP Morgan Alternative Loan Trust, Mortgage Pass-Through Certificates, Series 2007-S1, (1-Month LIBOR reference rate + 0.280% spread), (5) | | | 2.371% | | | | | | | | | | | | 6/25/37 | | | | Caa1 | | | | 561,512 | |
| | | | | | | |
| | 5,000 | | | JP Morgan Chase Commercial Mortgage Securities Corporation, Pass-Through Certificates Trust 2017-MAUI, 144A, (1-Month LIBOR reference rate + 0.830% spread), (5) | | | 2.876% | | | | | | | | | | | | 7/17/34 | | | | AAA | | | | 4,996,856 | |
| | | | | | | |
| | 1,500 | | | JP Morgan Chase Commercial Mortgage Securities Trust, Pass-Through Certificates 2017-JP5 | | | 3.723% | | | | | | | | | | | | 3/17/50 | | | | Aaa | | | | 1,497,067 | |
| | | | | | | |
| | 2,095 | | | Master RePerforming Loan Trust 2005-1, 144A | | | 7.500% | | | | | | | | | | | | 8/25/34 | | | | B3 | | | | 2,125,216 | |
| | | | | | | |
| | 2,750 | | | Morgan Stanley Bank of America Merrill Lynch Trust, Series 2014-C16, 144A | | | 4.913% | | | | | | | | | | | | 6/17/47 | | | | BBB– | | | | 2,432,402 | |
| | | | | | | |
| | 1,955 | | | Morgan Stanley Bank of America Merrill Lynch Trust, Series 2015-C22, 144A | | | 4.382% | | | | | | | | | | | | 4/17/48 | | | | BBB– | | | | 1,664,367 | |
| | | | | | | |
| | 3,100 | | | New Residential Advance Receivable Trust, Series 2017-T1, 144A | | | 4.002% | | | | | | | | | | | | 2/15/51 | | | | BBB | | | | 3,038,705 | |
| | | | | | | |
| | 2,986 | | | New Residential Mortgage Loan Trust, Mortgage Pass-Through Certificates, Series 2017-6A, 144A | | | 4.000% | | | | | | | | | | | | 8/25/57 | | | | Aaa | | | | 3,012,268 | |
| | | | | | | |
| | 3,900 | | | OMART Receivables Trust, Series 2016-T2, 144A | | | 4.446% | | | | | | | | | | | | 8/16/49 | | | | BBB | | | | 3,901,689 | |
| | | | | | | |
| | 76 | | | Residential Accredit Loans Inc., Mortgage Asset-Backed Pass-Through Certificates, Series 2005-QS12 | | | 5.500% | | | | | | | | | | | | 8/25/35 | | | | Caa2 | | | | 73,160 | |
| | | | | | | |
| | 1,348 | | | Sequoia Mortgage Trust, Mortgage Pass-Through Certificates, Series 2017-CH2, 144A | | | 4.000% | | | | | | | | | | | | 12/25/47 | | | | Aaa | | | | 1,359,824 | |
| | | | | | | |
| | 4,211 | | | Shellpoint Co-Originator Trust, Series 2017-2, 144A | | | 3.500% | | | | | | | | | | | | 10/25/47 | | | | Aaa | | | | 4,165,967 | |
| | | | | | | |
| | 3,140 | | | Starwood Waypoint Homes Trust, 2017-1, 144A, (1-Month LIBOR reference rate + 0.950% spread), (5) | | | 3.035% | | | | | | | | | | | | 1/22/35 | | | | Aaa | | | | 3,152,454 | |
| | | | | | | |
| | 1,822 | | | Taco Bell Funding LLC, Series 2016-1A, 144A | | | 4.377% | | | | | | | | | | | | 5/25/46 | | | | BBB | | | | 1,848,582 | |
| | | | | | | |
| | 3,000 | | | Volkswagen Auto Loan Enhanced, (WI/DD) | | | 2.810% | | | | | | | | | | | | 7/20/21 | | | | AAA | | | | 2,999,975 | |
104
| | | | | | | | | | | | | | | | | | | | | | | | | | | | |
| | | | | | | |
Principal
Amount (000) | | | Description (2) | | Coupon | | | | | | | | | Maturity | | | Ratings (3) | | | Value | |
| | | |
| | | | ASSET-BACKED AND MORTGAGE-BACKED SECURITIES (continued) | | | | | | | |
| | | | | | | |
| $ | 160 | | | Wachovia Mortgage Loan Trust LLC, Mortgage Pass-Through Certificates, Series 2005-B | | | 3.802% | | | | | | | | | | | | 10/20/35 | | | | D | | | $ | 156,282 | |
| | | | | | | |
| | 153 | | | Washington Mutual Mortgage Securities Corporation, Mortgage Pass-Through Certificates, Series 2004-RA3 | | | 6.263% | | | | | | | | | | | | 8/25/38 | | | | AA | | | | 160,347 | |
| | | | | | | |
| | 1,635 | | | Wells Fargo Commercial Mortgage Trust, Commercial Mortgage Pass-Through Certificates, Series 2015-C30, 144A | | | 4.646% | | | | | | | | | | | | 9/17/58 | | | | BBB– | | | | 1,461,268 | |
| | | | | | | |
| | 10 | | | Wells Fargo Mortgage Backed Securities, 2005-AR16 Class 3A2 | | | 3.892% | | | | | | | | | | | | 2/25/35 | | | | AA+ | | | | 9,630 | |
| | | | | | | |
| | 2,580 | | | World Omni Auto Receivables Trust, Series 2016-B | | | 1.300% | | | | | | | | | | | | 2/15/22 | | | | AAA | | | | 2,547,376 | |
| $ | 144,640 | | | Total Asset-Backed and Mortgage-Backed Securities (cost $143,155,564) | | | | 142,642,222 | |
| | | | | | | |
Principal
Amount (000) | | | Description (2) | | Coupon | | | | | | | | | Maturity | | | Ratings (3) | | | Value | |
| | | |
| | | | $1,000 PAR (OR SIMILAR) INSTITUTIONAL PREFERRED – 8.7% | | | | | | | | | |
| | | | | | | |
| | | | Automobiles – 0.3% | | | | | | | | | | | | | | | | | | |
| | | | | | | |
| $ | 2,470 | | | General Motors Financial Company Inc., (4) | | | 5.750% | | | | | | | | | | | | N/A (7) | | | | BB+ | | | $ | 2,368,113 | |
| | | | | | | |
| | | | Banks – 3.1% | | | | | | | | | | | | | | | | | | |
| | | | | | | |
| | 3,865 | | | Bank of America Corp | | | 5.875% | | | | | | | | | | | | N/A (7) | | | | BBB– | | | | 3,778,037 | |
| | | | | | | |
| | 2,695 | | | Bank of America Corporation | | | 6.300% | | | | | | | | | | | | N/A (7) | | | | BBB– | | | | 2,849,424 | |
| | | | | | | |
| | 2,000 | | | Cobank Agricultural Credit Bank | | | 6.250% | | | | | | | | | | | | N/A (7) | | | | BBB+ | | | | 2,080,000 | |
| | | | | | | |
| | 4,000 | | | JP Morgan Chase & Company | | | 6.750% | | | | | | | | | | | | N/A (7) | | | | BBB | | | | 4,350,000 | |
| | | | | | | |
| | 2,797 | | | KeyCorp Convertible Preferred Stock | | | 5.000% | | | | | | | | | | | | N/A (7) | | | | Baa3 | | | | 2,721,481 | |
| | | | | | | |
| | 1,000 | | | M&T Bank Corporation | | | 5.125% | | | | | | | | | | | | N/A (7) | | | | Baa2 | | | | 993,750 | |
| | | | | | | |
| | 4,570 | | | SunTrust Bank Inc. | | | 5.050% | | | | | | | | | | | | N/A (7) | | | | Baa3 | | | | 4,484,084 | |
| | | | | | | |
| | 1,000 | | | Wachovia Capital Trust III | | | 5.570% | | | | | | | | | | | | N/A (7) | | | | Baa2 | | | | 990,000 | |
| | 21,927 | | | Total Banks
| | | | | | | | | | | | | | | | | | | | | | | 22,246,776 | |
| | | | | | | |
| | | | Capital Markets – 1.1% | | | | | | | | | | | | | | | | | | |
| | | | | | | |
| | 2,325 | | | Bank of New York Mellon | | | 4.950% | | | | | | | | | | | | N/A (7) | | | | Baa1 | | | | 2,377,196 | |
| | | | | | | |
| | 3,005 | | | Goldman Sachs Group Inc., (4) | | | 5.300% | | | | | | | | | | | | N/A (7) | | | | Ba1 | | | | 2,937,388 | |
| | | | | | | |
| | 1,000 | | | Morgan Stanley | | | 5.550% | | | | | | | | | | | | N/A (7) | | | | BB+ | | | | 1,030,700 | |
| | | | | | | |
| | 1,605 | | | State Street Corporation | | | 5.250% | | | | | | | | | | | | N/A (7) | | | | Baa1 | | | | 1,648,736 | |
| | 7,935 | | | Total Capital Markets | | | | | | | | | | | | | | | | | | | | | | | 7,994,020 | |
| | | | | | | |
| | | | Commercial Services & Supplies – 0.2% | | | | | | | | | | | | | | | | | | |
| | | | | | | |
| | 1,550 | | | AerCap Global Aviation Trust, 144A | | | 6.500% | | | | | | | | | | | | 6/15/45 | | | | Ba1 | | | | 1,596,500 | |
| | | | | | | |
| | | | Consumer Finance – 0.9% | | | | | | | | | | | | | | | | | | |
| | | | | | | |
| | 2,020 | | | American Express Company | | | 5.200% | | | | | | | | | | | | N/A (7) | | | | Baa2 | | | | 2,047,775 | |
| | | | | | | |
| | 3,920 | | | Capital One Financial Corporation | | | 5.550% | | | | | | | | | | | | N/A (7) | | | | Baa3 | | | | 4,005,064 | |
| | 5,940 | | | Total Consumer Finance | | | | | | | | | | | | | | | | | | | | | | | 6,052,839 | |
| | | | | | | |
| | | | Food Products – 0.4% | | | | | | | | | | | | | | | | | | |
| | | | | | | |
| | 2,780 | | | Land O’ Lakes Incorporated, 144A | | | 8.000% | | | | | | | | | | | | N/A (7) | | | | BB | | | | 3,058,000 | |
105
Nuveen Strategic Income Fund (continued)
Portfolio of Investments June 30, 2018
| | | | | | | | | | | | | | | | | | | | | | | | | | | | |
| | | | | | | |
Principal
Amount (000) | | | Description (2) | | Coupon | | | | | | | | | Maturity | | | Ratings (3) | | | Value | |
| | | | | | | |
| | | | Industrial Conglomerates – 0.6% | | | | | | | | | | | | | | | | | | |
| | | | | | | |
| $ | 4,086 | | | General Electric Capital Corporation | | | 5.000% | | | | | | | | | | | | N/A (7) | | | | BBB+ | | | $ | 4,030,839 | |
| | | | | | | |
| | | | Insurance – 1.9% | | | | | | | | | | | | | | | | | | |
| | | | | | | |
| | 3,770 | | | Aegon NV | | | 5.500% | | | | | | | | | | | | 4/11/48 | | | | Baa1 | | | | 3,619,342 | |
| | | | | | | |
| | 2,000 | | | Allstate Corporation | | | 5.750% | | | | | | | | | | | | 8/18/23 | | | | Baa1 | | | | 2,055,000 | |
| | | | | | | |
| | 3,870 | | | American International Group Inc. | | | 5.750% | | | | | | | | | | | | 4/01/48 | | | | Baa2 | | | | 3,811,950 | |
| | | | | | | |
| | 3,730 | | | MetLife Inc. | | | 5.250% | | | | | | | | | | | | N/A (7) | | | | BBB | | | | 3,794,529 | |
| | 13,370 | | | Total Insurance | | | | | | | | | | | | | | | | | | | | | | | 13,280,821 | |
| | | | | | | |
| | | | Oil, Gas & Consumable Fuels – 0.2% | | | | | | | | | | | | | | | | | | |
| | | | | | | |
| | 1,000 | | | Buckeye Partners LP. | | | 6.375% | | | | | | | | | | | | 1/22/78 | | | | Ba1 | | | | 891,478 | |
| | | | | | | |
| | 750 | | | Plains All American Pipeline L.P | | | 6.125% | | | | | | | | | | | | N/A (7) | | | | BB | | | | 705,000 | |
| | 1,750 | | | Total Oil, Gas & Consumable Fuels | | | | | | | | | | | | | | | | | | | | | | | 1,596,478 | |
| $ | 61,808 | | | Total $1,000 Par (or similar) Institutional Preferred (cost $62,174,413) | | | | | | | | | | | | 62,224,386 | |
| | | | | | | |
Principal
Amount (000) | | | Description (2) | | Coupon | | | | | | | | | Maturity | | | Ratings (3) | | | Value | |
| | | | | | | |
| | | | CONTINGENT CAPITAL SECURITIES – 6.7% (8) | | | | | | | | | | | | | | | | | | | | | | | | |
| | | | | | | |
| | | | Banks – 5.6% | | | | | | | | | | | | | | | | | | |
| | | | | | | |
| $ | 1,590 | | | Australia and New Zealand Banking Group Limited of the United Kingdom, 144A | | | 6.750% | | | | | | | | | | | | N/A (7) | | | | Baa2 | | | $ | 1,615,837 | |
| | | | | | | |
| | 1,400 | | | Banco Bilbao Vizcaya Argentaria S.A, (4) | | | 6.125% | | | | | | | | | | | | N/A (7) | | | | Ba2 | | | | 1,235,500 | |
| | | | | | | |
| | 1,300 | | | Banco Mercantil del Norte, 144A | | | 7.625% | | | | | | | | | | | | N/A (7) | | | | BB | | | | 1,283,750 | |
| | | | | | | |
| | 2,000 | | | Credit Agricole SA, 144A | | | 8.125% | | | | | | | | | | | | N/A (7) | | | | BBB– | | | | 2,117,500 | |
| | | | | | | |
| | 8,905 | | | Credit Agricole SA, 144A | | | 7.875% | | | | | | | | | | | | N/A (7) | | | | BBB– | | | | 9,083,100 | |
| | | | | | | |
| | 2,500 | | | HSBC Holdings PLC | | | 6.375% | | | | | | | | | | | | N/A (7) | | | | BBB | | | | 2,453,125 | |
| | | | | | | |
| | 2,000 | | | ING Groep N.V | | | 6.500% | | | | | | | | | | | | N/A (7) | | | | BBB– | | | | 1,934,600 | |
| | | | | | | |
| | 2,300 | | | Intesa Sanpaolo SpA, 144A | | | 7.700% | | | | | | | | | | | | N/A (7) | | | | BB– | | | | 2,148,200 | |
| | | | | | | |
| | 3,000 | | | Lloyds Banking Group PLC | | | 7.500% | | | | | | | | | | | | N/A (7) | | | | Baa3 | | | | 3,046,500 | |
| | | | | | | |
| | 1,600 | | | Nordea Bank AB, 144A | | | 6.125% | | | | | | | | | | | | N/A (7) | | | | BBB | | | | 1,562,000 | |
| | | | | | | |
| | 3,134 | | | Royal Bank of Scotland Group PLC | | | 7.500% | | | | | | | | | | | | N/A (7) | | | | Ba3 | | | | 3,195,113 | |
| | | | | | | |
| | 3,020 | | | Societe Generale SA, 144A | | | 6.750% | | | | | | | | | | | | N/A (7) | | | | BB+ | | | | 2,770,850 | |
| | | | | | | |
| | 1,880 | | | Standard Chartered PLC, 144A | | | 7.500% | | | | | | | | | | | | N/A (7) | | | | Ba1 | | | | 1,927,000 | |
| | | | | | | |
| | 5,575 | | | UniCredit SpA, Reg S | | | 8.000% | | | | | | | | | | | | N/A (X) | | | | B+ | | | | 5,225,180 | |
| | 40,204 | | | Total Banks | | | | | | | | | | | | | | | | | | | | | | | 39,598,255 | |
| | | | | | | |
| | | | Capital Markets – 0.8% | | | | | | | | | | | | | | | | | | |
| | | | | | | |
| | 2,000 | | | Credit Suisse Group AG, 144A | | | 7.500% | | | | | | | | | | | | N/A (7) | | | | BB | | | | 2,065,000 | |
| | | | | | | |
| | 2,000 | | | Macquarie Bank Limited, 144A | | | 6.125% | | | | | | | | | | | | N/A (7) | | | | Ba1 | | | | 1,795,000 | |
| | | | | | | |
| | 2,005 | | | UBS Group AG, Reg S | | | 7.000% | | | | | | | | | | | | 12/29/49 | | | | BBB– | | | | 2,032,569 | |
| | 6,005 | | | Total Capital Markets | | | | | | | | | | | | | | | | | | | | | | | 5,892,569 | |
| | | | | | | |
| | | | Diversified Financial Services – 0.3% | | | | | | | | | | | | | | | | | | |
| | | | | | | |
| | 2,330 | | | BNP Paribas, 144A | | | 7.375% | | | | | | | | | | | | N/A (7) | | | | BBB– | | | | 2,382,425 | |
| $ | 48,539 | | | Total Contingent Capital Securities (cost $51,579,404) | | | | | | | | | | | | | | | | | | | | | | | 47,873,249 | |
106
| | | | | | | | | | | | | | | | | | | | | | | | | | | | |
| | | | | | | |
Principal
Amount (000) (1) | | | Description (2) | | Coupon | | | | | | | | | Maturity | | | Ratings (3) | | | Value | |
| | | | |
| | | | SOVEREIGN DEBT – 5.6% | | | | | | | | | | | | | |
| | | | | | | |
| | | | Argentina – 0.6% | | | | | | | | | | | | | | | | | | |
| | | | | | | |
| $ | 5,250 | | | Republic of Argentina. | | | 6.875% | | | | | | | | | | | | 1/11/48 | | | | B+ | | | $ | 3,953,302 | |
| | | | | | | |
| | | | Egypt – 0.6% | | | | | | | | | | | | | | | | | | |
| | | | | | | |
| | 4,400 | | | Egypt Government International Bond, 144A | | | 5.577% | | | | | | | | | | | | 2/21/23 | | | | B | | | | 4,169,000 | |
| | | | | | | |
| | | | Germany – 2.7% | | | | | | | | | | | | | | | | | | |
| | | | | | | |
| | 6,000 | EUR | | Bundesrepublik Deutschland Bundesanleihe, Reg S | | | 0.500% | �� | | | | | | | | | | | 2/15/28 | | | | Aaa | | | | 7,128,531 | |
| | | | | | | |
| | 10,300 | EUR | | Deutschland Republic, Reg S | | | 0.250% | | | | | | | | | | | | 2/15/27 | | | | Aaa | | | | 12,087,113 | |
| | | | Total Germany | | | | | | | | | | | | | | | | | | | | | | | 19,215,644 | |
| | | | | | | |
| | | | Honduras – 0.4% | | | | | | | | | | | | | | | | | | |
| | | | | | | |
| | 2,800 | | | Republic of Honduras, 144A | | | 8.750% | | | | | | | | | | | | 12/16/20 | | | | BB– | | | | 3,026,660 | |
| | | | | | | |
| | | | Oman – 0.3% | | | | | | | | | | | | | | | | | | |
| | | | | | | |
| | 2,000 | | | Oman Government International Bond, 144A | | | 6.750% | | | | | | | | | | | | 1/17/48 | | | | Baa3 | | | | 1,810,000 | |
| | | | | | | |
| | | | Saudi Arabia – 0.6% | | | | | | | | | | | | | | | | | | |
| | | | | | | |
| | 4,350 | | | Saudi Government International Bond, 144A | | | 4.000% | | | | | | | | | | | | 4/17/25 | | | | A1 | | | | 4,328,511 | |
| | | | | | | |
| | | | Sri Lanka – 0.4% | | | | | | | | | | | | | | | | | | |
| | | | | | | |
| | 3,400 | | | Sri Lanka Government International Bond, 144A | | | 6.750% | | | | | | | | | | | | 4/18/28 | | | | B1 | | | | 3,208,413 | |
| | | | Total Sovereign Debt (cost $40,811,574) | | | | | | | | | | | | 39,711,530 | |
| | | | | | | |
Principal
Amount (000) | | | Description (2) | | Coupon | | | | | | | | | Maturity | | | Ratings (3) | | | Value | |
| | | |
| | | | U.S. GOVERNMENT AND AGENCY OBLIGATIONS – 1.5% | | | | | | | | | |
| | | | | | | |
| $ | 7,515 | | | United States of America Treasury Bonds | | | 2.750% | | | | | | | | | | | | 11/15/47 | | | | Aaa | | | $ | 7,163,028 | |
| | | | | | | |
| | 3,865 | | | United States Treasury Notes | | | 0.500% | | | | | | | | | | | | 1/15/28 | | | | Aaa | | | | 3,780,472 | |
| $ | 11,380 | | | Total U.S. Government and Agency Obligations (cost $11,001,401) | | | | 10,943,500 | |
| | | | | | | |
Principal
Amount (000) | | | Description (2) | | Coupon (9) | | | Reference
Rate (9) | | | Spread (9) | | | Maturity (10) | | | Ratings (3) | | | Value | |
| | | | |
| | | | VARIABLE RATE SENIOR LOAN INTERESTS – 0.7% (9) | | | | | | | | | | | | | |
| |
| | | | Containers & Packaging – 0.3% | |
| | | | | | | |
| $ | 1,000 | | | Packaging Coordinators Inc., Second Lien Term Loan | | | 10.810% | | | | 3-Month LIBOR | | | | 8.750% | | | | 6/30/24 | | | | CCC+ | | | $ | 1,000,000 | |
| | | | | | | |
| | 980 | | | Packaging Coordinators Inc., First Lien Term Loan | | | 6.060% | | | | 3-Month LIBOR | | | | 4.000% | | | | 6/29/23 | | | | B | | | | 982,455 | |
| | 1,980 | | | Total Containers & Packaging | | | | | | | | | | | | 1,982,455 | |
| | | | | |
| | | | Diversified Financial Services – 0.1% | | | | | | | | | | | | | |
| | | | | | | |
| | 870 | | | Jill Acquisition LLC, First Lien Term Loan B | | | 7.360% | | | | 3-Month LIBOR | | | | 5.000% | | | | 5/08/22 | | | | B | | | | 859,823 | |
107
Nuveen Strategic Income Fund (continued)
Portfolio of Investments June 30, 2018
| | | | | | | | | | | | | | | | | | | | | | | | | | | | |
| | | | | | | |
Principal
Amount (000) | | | Description (2) | | Coupon (9) | | | Reference
Rate (9) | | | Spread (9) | | | Maturity (10) | | | Ratings (3) | | | Value | |
| | | | | | |
| | | | Professional Services – 0.3% | | | | | | | | | | | | | | | | |
| | | | | | | |
| $ | 2,000 | | | Sedgwick Claims Management Service Inc., Second Lien Term Loan | | | 7.651% | | | | 3-Month LIBOR | | | | 5.750% | | | | 2/28/22 | | | | CCC+ | | | $ | 2,013,760 | |
| $ | 4,850 | | | Total Variable Rate Senior Loan Interests (cost $4,804,421) | | | | | | | | 4,856,038 | |
| | | | | | | |
| Shares | | | Description (2) | | Coupon | | | | | | | | | | | | Ratings (3) | | | Value | |
| | | | |
| | | | $25 PAR (OR SIMILAR) RETIAL PREFERRED – 0.6% | | | | | | | | | | | | | |
| | | | | |
| | | | Banks – 0.3% | | | | | | | | | | | | | |
| | | | | | | |
| | 20,600 | | | AgriBank FCB, (11) | | | 6.875% | | | | | | | | | | | | | | | | BBB+ | | | $ | 2,204,200 | |
| | | | | | | |
| | | | Insurance – 0.3% | | | | | | | | | | | | | | | | | | |
| | | | | | | |
| | 70,000 | | | Enstar Group Ltd (11) | | | 7.000% | | | | | | | | | | | | | | | | BB+ | | | | 1,771,000 | |
| | | | Total $25 Par (or similar) Retail Preferred (cost $3,810,000) | | | | | | | $ | 3,975,200 | |
| | | | | | | |
Principal
Amount (000) | | | Description (2) | | | | | Optional Call
Provisions (12) | | | | | | | | | Ratings (3) | | | Value | |
| | | |
| | | | MUNICIPAL BONDS – 0.3% | | | | | | | | | |
| | | | | | | |
| | | | Georgia – 0.3% | | | | | | | | | | | | | | | | | | |
| | | | | | | |
| $ | 1,549 | | | Georgia Municipal Electric Authority, Plant Vogtle Units 3 & 4 Project P Bonds, Refunding Taxable Build America Bonds Series 2010A, 7.055%, 4/01/57 | | | | | | | No Opt. Call | | | | | | | | | | | | A– | | | $ | 1,872,648 | |
| $ | 1,549 | | | Total Municipal Bonds (cost $1,685,042) | | | | | | | | | | | | 1,872,648 | |
| | | | | | | |
| Shares | | | Description (2) | | | | | | | | | | | | | | | | | Value | |
| | | |
| | | | COMMON STOCKS – 0.0% | | | | | | | | | |
| | | | | | |
| | | | Building Products – 0.0% | | | | | | | | | | | | | | | | |
| | | | | | | |
| | 49 | | | Dayton Superior Class A, (13), (14) | | | | | | | | | | | | | | | | | | | | | | $ | 1 | |
| | | | | | | |
| | 55 | | | Dayton Superior Class 1, (14) | | | | | | | | | | | | | | | | | | | | | | | 1 | |
| | | | Total Building Products | | | | | | | | | | | | | | | | | | | | | | | 2 | |
| | | |
| | | | Independent Power & Renewable Electricity Producers – 0.0% | | | | | | | |
| | | | | | | |
| | 5,257 | | | Vistra Energy Corporation | | | | | | | | | | | | | | | | | | | | | | | 124,380 | |
| | | | Total Common Stocks (cost $270,029) | | | | | | | | 124,382 | |
| | | | Total Long-Term Investments (cost $721,547,866) | | | | | | | | | | | | 706,298,324 | |
| | | | | | | |
| Shares | | | Description (2) | | Coupon | | | | | | | | | | | | | | | Value | |
| | |
| | | | INVESTMENTS PURCHASED WITH COLLATERAL FROM SECURITIES LENDING – 2.7% | | | | | |
| | | |
| | | | Money Market Funds – 2.7% | | | | | | | |
| | | | | | | |
| | 19,390,513 | | | First American Government Obligations Fund, Class X, (15) | | | 1.806% | (16) | | | | | | | | | | | | | | | | | | $ | 19,390,513 | |
| | | | Total Investments Purchased with Collateral from Securities Lending (cost $19,390,513) | | | | 19,390,513 | |
108
| | | | | | | | | | | | | | | | | | | | | | | | | | | | |
| | | | | | | |
| Shares | | | Description (2) | | Coupon | | | | | | | | | | | | | | | Value | |
| | | | | | | |
| | | | SHORT-TERM INVESTMENTS – 0.6% | | | | | | | | | | | | | | | | | | | | | | | | |
| | | | | | | |
| | | | Money Market Funds – 0.6% | | | | | | | | | | | | | | | | | | |
| | | | | | | |
| $ | 4,044,545 | | | First American Treasury Obligations Fund, Class Z | | | 1.754% (16) | | | | | | | | | | | | | | | | | | | $ | 4,044,545 | |
| | | | Total Short-Term Investments (cost $4,044,545) | | | | | | | | | | | | | | | | | | | | | | | 4,044,545 | |
| | | | Total Investments (cost $744,982,924) – 102.5% | | | | | | | | | | | | | | | | | | | | | | | 729,733,382 | |
| | | | Other Assets Less Liabilities – (2.5)% (17) | | | | | | | | | | | | | | | | | | | | | | | (17,737,411 | ) |
| | | | Net Assets – 100% | | | | | | | | | | | | | | | | | | | | | | $ | 711,995,971 | |
Investments in Derivatives
Forward Foreign Currency Contracts
| | | | | | | | | | | | | | | | | | | | | | |
| Currency Purchased | | Notional Amount
(Local Currency) | | Currency Sold | | | Notional Amount
(Local Currency) | | | Counterparty | | | Settlement
Date | | | Unrealized
Appreciation
(Depreciation)
(U.S. Dollars) | |
| Japanese Yen | | $815,000,000 | | | U.S. Dollar | | | $ | 7,402,207 | | | | Goldman Sachs Bank USA | | | | 8/17/18 | | | $ | (15,607 | ) |
| U.S. Dollar | | 6,795,450 | | | Australian Dollar | | | | 9,000,000 | | | | Goldman Sachs Bank USA | | | | 8/20/18 | | | | 133,845 | |
| U.S. Dollar | | 1,395,946 | | | Canadian Dollar | | | | 1,839,000 | | | | Goldman Sachs Bank USA | | | | 8/17/18 | | | | (4,125 | ) |
| U.S. Dollar | | 7,163,706 | | | Euro | | | | 6,110,000 | | | | Bank of America, N.A. | | | | 8/08/18 | | | | 6,737 | |
| U.S. Dollar | | 19,418,024 | | | Euro | | | | 16,560,000 | | | | Bank of America, N.A. | | | | 8/08/18 | | | | 20,412 | |
| U.S. Dollar | | 15,019,121 | | | Euro | | | | 12,700,000 | | | | Goldman Sachs Bank USA | | | | 8/17/18 | | | | 132,314 | |
Total | | | | | | | | | | | | | | | | | | | | $ | 273,576 | |
Total unrealized appreciation on forward foreign currency contracts | | | | | | | | | | | | | | | $ | 293,308 | |
Total unrealized depreciation on forward foreign currency contracts | | | | | | | | | | | | | | | $ | (19,732 | ) |
Futures Contracts
| | | | | | | | | | | | | | | | | | | | | | | | | | |
| Description | | Contract
Position | | Number of
Contracts | | | Expiration
Date | | | Notional
Amount* | | | Value | | | Unrealized
Appreciation
(Depreciation) | | | Variation
Margin
Receivable/
(Payable) | |
| Eurex Euro-Bond | | Long | | | 196 | | | | 9/18 | | | $ | 36,815,998 | | | $ | 37,205,918 | | | $ | 389,920 | | | $ | 23,086 | |
| U.S. Treasury 5-Year Note | | Short | | | (225 | ) | | | 9/18 | | | | (25,576,213 | ) | | | (25,563,867 | ) | | | 12,346 | | | | 5,273 | |
| U.S. Treasury 10-Year Note | | Short | | | (678 | ) | | | 9/18 | | | | (81,297,657 | ) | | | (81,487,125 | ) | | | (189,468 | ) | | | (355 | ) |
| U.S. Treasury Long Bond | | Long | | | 247 | | | | 9/18 | | | | 35,420,598 | | | | 35,815,000 | | | | 394,402 | | | | 7,719 | |
| U.S. Treasury Ultra 10-Year Note | | Short | | | (438 | ) | | | 9/18 | | | | (55,880,924 | ) | | | (56,166,656 | ) | | | (285,732 | ) | | | (5,066 | ) |
| U.S. Treasury Ultra Bond | | Long | | | 246 | | | | 9/18 | | | | 38,522,570 | | | | 39,252,375 | | | | 729,805 | | | | (21,690 | ) |
Total | | | | | | | | | | | | $ | (51,995,628 | ) | | $ | (50,944,355 | ) | | $ | 1,051,273 | | | $ | 8,967 | |
Total receivable for variation margin on futures contracts | | | | | | | | | | | | | | | | | | | $ | 36,078 | |
Total payable for variation margin on futures contracts | | | | | | | | | | | | | | | | | | | $ | (27,111 | ) |
| * | Total aggregate notional amount of long and short positions is $110,759,166 and $(162,754,794), respectively. |
Interest Rate Swaps – OTC Cleared
| | | | | | | | | | | | | | | | | | | | | | | | | | | | | | | | |
Notional
Amount | | | Fund
Pay/Receive
Floating Rate | | Floating Rate
Index | | Fixed Rate
(Annualized) | | | Fixed Rate
Payment
Frequency | | Effective
Date (18) | | | Maturity
Date | | | Value | | | Unrealized
Appreciation
(Depreciation) | | | Variation
Margin
Receivable/
(Payable) | |
| | $60,000,000 | | | Receive | | 3-Month LIBOR | | | 3.032 | % | | Semi-Annually | | | 6/22/18 | | | | 6/22/28 | | | $ | (549,030 | ) | | $ | (549,030 | ) | | $ | (95,015 | ) |
109
Nuveen Strategic Income Fund (continued)
Portfolio of Investments June 30, 2018
For Fund portfolio compliance purposes, the Fund’s industry classifications refer to any one or more of the industry sub-classifications used by one or more widely recognized market indexes or ratings group indexes, and/or as defined by Fund management. This definition may not apply for purposes of this report, which may combine industry sub-classifications into sectors for reporting ease.
| (1) | Principal Amount (000) denominated in U.S. Dollars, unless otherwise noted. |
| (2) | All percentages shown in the Portfolio of Investments are based on net assets. |
| (3) | For financial reporting purposes, the ratings disclosed are the highest of Standard & Poor’s Group (“Standard & Poor’s”), Moody’s Investors Service, Inc. (“Moody’s”) or Fitch, Inc. (“Fitch”) rating. This treatment of split-rated securities may differ from that used for other purposes, such as for Fund investment policies. Ratings below BBB by Standard & Poor’s, Baa by Moody’s or BBB by Fitch are considered to be below investment grade. Holdings designated N/R are not rated by any of these national rating agencies. Ratings are not covered by the report of independent registered public accounting firm. |
| (4) | Investment, or a portion of investment, is out on loan for securities lending. The total value of the securities out on loan as of the end of the reporting period was $18,728,162. |
| (5) | Variable rate security. The rate shown is the coupon as of the end of the reporting period. |
| (6) | Principal Amount (000) rounds to less than $1,000. |
| (7) | Perpetual security. Maturity date is not applicable. |
| (8) | Contingent Capital Securities (“CoCos”) are hybrid securities with loss absorption characteristics built into the terms of the security for the benefit of the issuer. For example, the terms may specify an automatic write-down of principal or a mandatory conversion into the issuer’s common stock under certain adverse circumstances, such as the issuer’s capital ratio falling below a specified level. |
| (9) | Senior Loans generally pay interest at rates which are periodically adjusted by reference to a base short-term, floating lending rate (Reference Rate) plus an assigned fixed rate (Spread). These floating lending rates are generally (i) the lending rate referenced by the London Inter-Bank Offered Rate (“LIBOR”), or (ii) the prime rate offered by one or more major United States banks. Senior loans may be considered restricted in that the Fund ordinarily is contractually obligated to receive approval from the agent bank and/or borrower prior to the disposition of a senior loan. The rate shown is the coupon as of the end of the reporting period. |
| (10) | Senior loans generally are subject to mandatory and/or optional prepayment. Because of these mandatory prepayment conditions and because there may be significant economic incentives for a borrower to prepay, prepayments of senior loans may occur. As a result, the actual remaining maturity of senior loans held may be substantially less than the stated maturities shown. |
| (11) | For fair value measurement purposes, investment classified as Level 2. See Notes to Financial Statements, Note 2 – Investment Valuation and Fair Value Measurements for more information. |
| (12) | Optional Call Provisions: Dates (month and year) and prices of the earliest optional call or redemption. There may be other call provisions at varying prices at later dates. Certain mortgagebacked securities may be subject to periodic principal paydowns. Optional Call Provisions are not covered by the report of independent registered public accounting firm. |
| (13) | Non-income producing; issuer has not declared a dividend within the past twelve months. |
| (14) | Investment valued at fair value using methods determined in good faith by, or at the discretion of, the Board. For fair value measurement disclosure purposes, investment classified as Level 3. See Notes to Financial Statements, Note 2 – Investment Valuation and Fair Value Measurements for more information. |
| (15) | The Fund may loan securities representing up to one third of the fair value of its total assets (which includes collateral for securities on loan) to broker-dealers, banks and other institutions. The Fund maintains collateral equal to at least 100% of the fair value of the securities loaned. The cash collateral received by the Fund is invested in this money market fund. See Notes to Financial Statements, Note 3 – Portfolio Securities and Investments in Derivatives, Securities Lending for more information. |
| (16) | The rate shown is the annualized seven-day subsidized yield as of the end of the reporting period. |
| (17) | Other assets less liabilities includes the unrealized appreciation (depreciation) of certain over-the-counter (“OTC”) derivatives as presented on the Statement of Assets and Liabilities, when applicable. The unrealized appreciation (depreciation) of OTC cleared and exchange-traded derivatives is recognized as part of the cash collateral at brokers and/or receivable or payable for variation margin as presented on the Statement of Assets and Liabilities, when applicable. |
| (18) | Effective date represents the date on which both the Fund and counterparty commence interest payment accruals on each contract. |
| 144A | Investment is exempt from registration under Rule 144A of the Securities Act of 1933, as amended. These investments may only be resold in transactions exempt from registration, which are normally those transactions with qualified institutional buyers. |
| LIBOR | London Inter-Bank Offered Rate |
| Reg S | Regulation S allows U.S. companies to sell securities to persons or entities located outside of the United States without registering those securities with the Securities and Exchange Commission. Specifically, Regulation S provides a safe harbor from the registration requirements of the Securities Act for the offers and sales of securities by both foreign and domestic issuers that are made outside the United States. |
| TBA | To be announced. Maturity date not know prior to settlement of this transaction. |
| WI/DD | Investment, or portion of investment, purchased on a when-issued or delayed delivery basis. |
See accompanying notes to financial statements.
110
Statement of Assets and Liabilities
June 30, 2018
| | | | | | | | | | | | |
| | | Core
Bond | | | Core Plus
Bond | | | High Income
Bond | |
Assets | | | | | | | | | | | | |
Long-term investments, at value (cost $134,852,747, $339,786,375 and $318,808,151, respectively) | | $ | 133,776,249 | | | $ | 335,695,588 | | | $ | 300,903,334 | |
Investments purchased with collateral from securities lending, at value (cost approximates value) | | | 582,295 | | | | 3,480,585 | | | | 29,812,893 | |
Short-term investments, at value (cost approximates value) | | | 861,862 | | | | 3,373,159 | | | | 3,715,556 | |
Cash collateral at brokers for investments in futures contracts(1) | | | 75,000 | | | | 290,000 | | | | 17,000 | |
Cash collateral at brokers for investments in swaps(1) | | | — | | | | — | | | | — | |
Unrealized appreciation on forward foreign currency contracts | | | — | | | | 6,976 | | | | 807 | |
Receivable for: | | | | | | | | | | | | |
Dividends | | | — | | | | — | | | | 32,649 | |
Due from broker | | | 539 | | | | 3,326 | | | | 36,378 | |
Interest | | | 902,926 | | | | 2,715,165 | | | | 5,349,993 | |
Investments sold | | | 392,641 | | | | 9,637,933 | | | | 7,786,335 | |
Reclaims | | | — | | | | 31,127 | | | | — | |
Shares sold | | | 38,707 | | | | 164,073 | | | | 451,061 | |
Variation margin on futures contracts | | | 5,500 | | | | 5,554 | | | | — | |
Other assets | | | 45,752 | | | | 70,299 | | | | 73,519 | |
Total assets | | | 136,681,471 | | | | 355,473,785 | | | | 348,179,525 | |
Liabilities | | | | | | | | | | | | |
Unrealized depreciation on forward foreign currency contracts | | | — | | | | — | | | | 4,851 | |
Payable for: | | | | | | | | | | | | |
Collateral from securities lending program | | | 582,295 | | | | 3,480,585 | | | | 29,812,893 | |
Dividends | | | 94,872 | | | | 358,383 | | | | 242,859 | |
Investments purchased | | | 1,310,559 | | | | 12,162,810 | | | | 6,383,613 | |
Shares redeemed | | | 123,733 | | | | 387,180 | | | | 3,529,387 | |
Variation margin on futures contracts | | | 2,380 | | | | 5,789 | | | | — | |
Variation margin on swap contracts | | | — | | | | — | | | | — | |
Accrued expenses: | | | | | | | | | | | | |
Management fees | | | 36,657 | | | | 96,689 | | | | 151,982 | |
Directors fees | | | 21,116 | | | | 36,119 | | | | 37,094 | |
Shareholder servicing agent fees | | | 18,580 | | | | 82,050 | | | | 67,613 | |
12b-1 distribution and service fees | | | 3,969 | | | | 15,830 | | | | 61,230 | |
Other | | | 81,119 | | | | 123,986 | | | | 117,275 | |
Total liabilities | | | 2,275,280 | | | | 16,749,421 | | | | 40,408,797 | |
Net assets | | $ | 134,406,191 | | | $ | 338,724,364 | | | $ | 307,770,728 | |
| (1) | Cash pledged to collateralize the net payment obligations for investments in derivatives. |
See accompanying notes to financial statements.
111
Statement of Assets and Liabilities (continued)
| | | | | | | | | | | | |
| | | Inflation
Protected
Securities | | | Short Term
Bond | | | Strategic
Income | |
Assets | | | | | | | | | | | | |
Long-term investments, at value (cost $615,975,755, $463,477,935 and $721,547,866, respectively) | | $ | 611,113,711 | | | $ | 458,812,106 | | | $ | 706,298,324 | |
Investments purchased with collateral from securities lending, at value (cost approximates value) | | | 1,278,083 | | | | 5,228,027 | | | | 19,390,513 | |
Short-term investments, at value (cost approximates value) | | | 7,365,188 | | | | 3,966,394 | | | | 4,044,545 | |
Cash collateral at brokers for investments in futures contracts(1) | | | 340,200 | | | | 130,000 | | | | 1,635,000 | |
Cash collateral at brokers for investments in swaps(1) | | | — | | | | — | | | | 1,804,875 | |
Unrealized appreciation on forward foreign currency contracts | | | — | | | | — | | | | 293,308 | |
Receivable for: | | | | | | | | | | | | |
Dividends | | | — | | | | — | | | | 35,407 | |
Due from broker | | | 719 | | | | 1,835 | | | | 13,288 | |
Interest | | | 1,553,552 | | | | 2,469,478 | | | | 7,214,775 | |
Investments sold | | | 116,013 | | | | — | | | | 19,042,209 | |
Reclaims | | | — | | | | — | | | | — | |
Shares sold | | | 903,735 | | | | 513,774 | | | | 639,650 | |
Variation margin on futures contracts | | | 15,279 | | | | — | | | | 36,078 | |
Other assets | | | 55,276 | | | | 77,356 | | | | 80,297 | |
Total assets | | | 622,741,756 | | | | 471,198,970 | | | | 760,528,269 | |
Liabilities | | | | | | | | | | | | |
Unrealized depreciation on forward foreign currency contracts | | | — | | | | — | | | | 19,732 | |
Payable for: | | | | | | | | | | | | |
Collateral from securities lending program | | | 1,278,083 | | | | 5,228,027 | | | | 19,390,513 | |
Dividends | | | 1,401,649 | | | | 384,185 | | | | 825,671 | |
Investments purchased | | | — | | | | 999,987 | | | | 24,224,680 | |
Shares redeemed | | | 1,631,651 | | | | 701,429 | | | | 3,191,984 | |
Variation margin on futures contracts | | | 4,448 | | | | 6,071 | | | | 27,111 | |
Variation margin on swap contracts | | | — | | | | — | | | | 95,015 | |
Accrued expenses: | | | | | | | | | | | | |
Management fees | | | 108,160 | | | | 133,144 | | | | 263,308 | |
Directors fees | | | 31,632 | | | | 48,623 | | | | 52,741 | |
Shareholder servicing agent fees | | | 386,892 | | | | 71,242 | | | | 175,429 | |
12b-1 distribution and service fees | | | 30,517 | | | | 30,389 | | | | 75,509 | |
Other | | | 140,002 | | | | 125,856 | | | | 190,605 | |
Total liabilities | | | 5,013,034 | | | | 7,728,953 | | | | 48,532,298 | |
Net assets | | $ | 617,728,722 | | | $ | 463,470,017 | | | $ | 711,995,971 | |
| (1) | Cash pledged to collateralize the net payment obligations for investments in derivatives. |
See accompanying notes to financial statements.
112
| | | | | | | | | | | | |
| | | Core
Bond | | | Core Plus
Bond | | | High Income
Bond | |
Class A Shares | | | | | | | | | | | | |
Net assets | | $ | 12,576,889 | | | $ | 52,125,597 | | | $ | 126,376,343 | |
Shares outstanding | | | 1,329,842 | | | | 4,914,457 | | | | 16,823,599 | |
Net asset value (“NAV”) per share | | $ | 9.46 | | | $ | 10.61 | | | $ | 7.51 | |
Offering price per share (NAV per share plus maximum sales charge of 3.00%, 4.25% and 4.75%, respectively, of offering price) | | $ | 9.75 | | | $ | 11.08 | | | $ | 7.88 | |
Class C Shares | | | | | | | | | | | | |
Net assets | | $ | 1,709,438 | | | $ | 5,484,144 | | | $ | 41,120,511 | |
Shares outstanding | | | 181,317 | | | | 519,428 | | | | 5,480,685 | |
NAV and offering price per share | | $ | 9.43 | | | $ | 10.56 | | | $ | 7.50 | |
Class R3 Shares | | | | | | | | | | | | |
Net assets | | $ | — | | | $ | 1,265,222 | | | $ | 473,091 | |
Shares outstanding | | | — | | | | 118,688 | | | | 61,665 | |
NAV and offering price per share | | $ | — | | | $ | 10.66 | | | $ | 7.67 | |
Class R6 Shares | | | | | | | | | | | | |
Net assets | | $ | 64,538,853 | | | $ | 23,377,097 | | | $ | — | |
Shares outstanding | | | 6,836,631 | | | | 2,203,290 | | | | — | |
NAV and offering price per share | | $ | 9.44 | | | $ | 10.61 | | | $ | — | |
Class I Shares | | | | | | | | | | | | |
Net assets | | $ | 55,581,011 | | | $ | 256,472,304 | | | $ | 139,776,969 | |
Shares outstanding | | | 5,901,782 | | | | 24,222,852 | | | | 18,545,199 | |
NAV and offering price per share | | $ | 9.42 | | | $ | 10.59 | | | $ | 7.54 | |
Class T Shares(1) | | | | | | | | | | | | |
Net assets | | $ | — | | | $ | — | | | $ | 23,814 | |
Shares outstanding | | | — | | | | — | | | | 3,161 | |
NAV per share | | $ | — | | | $ | — | | | $ | 7.53 | |
Offering price per share (NAV per share plus maximum sales charge of —%, —% and 2.50%, respectively, of offering price) | | $ | — | | | $ | — | | | $ | 7.72 | |
Net assets consist of: | | | | | | | | | | | | |
Capital paid-in | | $ | 138,297,446 | | | $ | 348,936,305 | | | $ | 431,558,282 | |
Undistributed (Over-distribution of) net investment income | | | (112,911 | ) | | | (854,673 | ) | | | 445,111 | |
Accumulated net realized gain (loss) | | | (2,777,393 | ) | | | (5,454,669 | ) | | | (106,333,212 | ) |
Net unrealized appreciation (depreciation) | | | (1,000,951 | ) | | | (3,902,599 | ) | | | (17,899,453 | ) |
Net assets | | | 134,406,191 | | | | 338,724,364 | | | | 307,770,728 | |
Authorized shares – per class | | | 2 billion | | | | 2 billion | | | | 2 billion | |
Par value per share | | | 0.0001 | | | | 0.0001 | | | | 0.0001 | |
| (1) | Class T Shares are not available for public offering. |
See accompanying notes to financial statements.
113
Statement of Assets and Liabilities (continued)
| | | | | | | | | | | | |
| | | Inflation
Protected
Securities | | | Short Term
Bond | | | Strategic
Income | |
Class A Shares | | | | | | | | | | | | |
Net assets | | $ | 98,003,464 | | | $ | 78,314,848 | | | $ | 106,805,228 | |
Shares outstanding | | | 8,998,614 | | | | 8,044,809 | | | | 10,501,671 | |
Net asset value (“NAV”) per share | | $ | 10.89 | | | $ | 9.73 | | | $ | 10.17 | |
Offering price per share (NAV per share plus maximum sales charge of 4.25%, 2.25% and 4.25%, respectively, of offering price) | | $ | 11.37 | | | $ | 9.95 | | | $ | 10.62 | |
Class C Shares | | | | | | | | | | | | |
Net assets | | $ | 9,327,882 | | | $ | 16,766,579 | | | $ | 59,611,590 | |
Shares outstanding | | | 870,960 | | | | 1,714,228 | | | | 5,891,447 | |
NAV and offering price per share | | $ | 10.71 | | | $ | 9.78 | | | $ | 10.12 | |
Class R3 Shares | | | | | | | | | | | | |
Net assets | | $ | 5,697,273 | | | $ | 204,199 | | | $ | 5,869,075 | |
Shares outstanding | | | 527,936 | | | | 20,913 | | | | 574,965 | |
NAV and offering price per share | | $ | 10.79 | | | $ | 9.76 | | | $ | 10.21 | |
Class R6 Shares | | | | | | | | | | | | |
Net assets | | $ | 62,118,882 | | | $ | 77,312,789 | | | $ | 46,587,856 | |
Shares outstanding | | | 5,598,341 | | | | 7,918,752 | | | | 4,567,971 | |
NAV and offering price per share | | $ | 11.10 | | | $ | 9.76 | | | $ | 10.20 | |
Class I Shares | | | | | | | | | | | | |
Net assets | | $ | 442,581,221 | | | $ | 290,871,602 | | | $ | 493,098,394 | |
Shares outstanding | | | 40,169,708 | | | | 29,848,768 | | | | 48,494,128 | |
NAV and offering price per share | | $ | 11.02 | | | $ | 9.74 | | | $ | 10.17 | |
Class T Shares(1) | | | | | | | | | | | | |
Net assets | | $ | — | | | $ | — | | | $ | 23,828 | |
Shares outstanding | | | — | | | | — | | | | 2,343 | |
NAV per share | | $ | — | | | $ | — | | | $ | 10.17 | |
Offering price per share (NAV per share plus maximum sales charge of —%, —% and 2.50%, respectively, of offering price) | | $ | — | | | $ | — | | | $ | 10.43 | |
Net assets consist of: | | | | | | | | | | | | |
Capital paid-in | | $ | 624,494,796 | | | $ | 478,294,543 | | | $ | 781,217,864 | |
Undistributed (Over-distribution of) net investment income | | | 2,270,435 | | | | (224,987 | ) | | | (2,198,975 | ) |
Accumulated net realized gain (loss) | | | (4,294,601 | ) | | | (9,932,009 | ) | | | (52,547,905 | ) |
Net unrealized appreciation (depreciation) | | | (4,741,908 | ) | | | (4,667,530 | ) | | | (14,475,013 | ) |
Net assets | | | 617,728,722 | | | | 463,470,017 | | | | 711,995,971 | |
Authorized shares – per class | | | 2 billion | | | | 2 billion | | | | 2 billion | |
Par value per share | | | 0.0001 | | | | 0.0001 | | | | 0.0001 | |
| (1) | Class T Shares are not available for public offering. |
See accompanying notes to financial statements.
114
Statement of Operations
Year Ended June 30, 2018
| | | | | | | | | | | | |
| | | Core
Bond | | | Core Plus
Bond | | | High Income
Bond | |
Investment Income | | | | | | | | | | | | |
Dividend income | | $ | — | | | $ | — | | | $ | 776,494 | |
Interest income | | | 4,461,832 | | | | 13,498,319 | | | | 25,391,894 | |
Securities lending income | | | 4,407 | | | | 41,366 | | | | 397,744 | |
Total investment income | | $ | 4,466,239 | | | $ | 13,539,685 | | | $ | 26,566,132 | |
Expenses | | | | | | | | | | | | |
Management fees | | | 640,864 | | | | 1,686,213 | | | | 2,028,179 | |
12b-1 service fees – Class A Shares | | | 33,062 | | | | 138,246 | | | | 323,389 | |
12b-1 distribution and service fees – Class C Shares | | | 17,468 | | | | 64,501 | | | | 465,763 | |
12b-1 distribution and service fees – Class R3 Shares | | | — | | | | 6,359 | | | | 3,112 | |
12b-1 service fees – Class T Shares(1) | | | — | | | | — | | | | 61 | |
Shareholder servicing agent fees | | | 60,110 | | | | 254,467 | | | | 257,566 | |
Custodian fees | | | 73,455 | | | | 132,159 | | | | 119,299 | |
Directors fees | | | 3,997 | | | | 10,719 | | | | 10,131 | |
Professional fees | | | 56,220 | | | | 71,828 | | | | 65,573 | |
Shareholder reporting expenses | | | 20,264 | | | | 52,538 | | | | 64,189 | |
Federal and state registration fees | | | 67,378 | | | | 88,274 | | | | 111,067 | |
Other | | | 10,300 | | | | 16,146 | | | | 75,631 | |
Total expenses before fee waiver/expense reimbursement | | | 983,118 | | | | 2,521,450 | | | | 3,523,960 | |
Fee waiver/expense reimbursement | | | (246,886 | ) | | | (453,674 | ) | | | (140,655 | ) |
Net expenses | | | 736,232 | | | | 2,067,776 | | | | 3,383,305 | |
Net investment income (loss) | | | 3,730,007 | | | | 11,471,909 | | | | 23,182,827 | |
Realized and Unrealized Gain (Loss) | | | | | | | | | | | | |
Net realized gain (loss) from: | | | | | | | | | | | | |
Investments and foreign currency | | | 295,683 | | | | 2,136,849 | | | | (11,134,618 | ) |
Forward foreign currency contracts | | | — | | | | 260,603 | | | | (180,664 | ) |
Futures contracts | | | 384,629 | | | | (140,795 | ) | | | (84,799 | ) |
Options purchased | | | — | | | | (16,404 | ) | | | — | |
Swaps | | | — | | | | (196,673 | ) | | | (78,738 | ) |
Change in net unrealized appreciation (depreciation) of: | | | | | | | | | | | | |
Investments and foreign currency | | | (4,953,976 | ) | | | (16,352,314 | ) | | | (1,990,985 | ) |
Forward foreign currency contracts | | | — | | | | 201,767 | | | | 178,031 | |
Futures contracts | | | (116,123 | ) | | | (25,668 | ) | | | 12,573 | |
Options purchased | | | — | | | | 13,451 | | | | — | |
Swaps | | | — | | | | 3,126 | | | | — | |
Net realized and unrealized gain (loss) | | | (4,389,787 | ) | | | (14,116,058 | ) | | | (13,279,200 | ) |
Net increase (decrease) in net assets from operations | | $ | (659,780 | ) | | $ | (2,644,149 | ) | | $ | 9,903,627 | |
| (1) | Class T Shares are not available for public offering. |
See accompanying notes to financial statements.
115
Statement of Operations (continued)
| | | | | | | | | | | | |
| | | Inflation
Protected
Securities | | | Short Term
Bond | | | Strategic
Income | |
Investment Income | | | | | | | | | | | | |
Dividend income | | $ | 7,250 | | | $ | — | | | $ | 183,755 | |
Interest income | | | 17,934,695 | | | | 12,690,570 | | | | 32,856,730 | |
Securities lending income | | | 14,945 | | | | 30,374 | | | | 134,947 | |
Total investment income | | | 17,956,890 | | | | 12,720,944 | | | | 33,175,432 | |
Expenses | | | | | | | | | | | | |
Management fees | | | 2,469,019 | | | | 2,101,569 | | | | 4,119,552 | |
12b-1 service fees – Class A Shares | | | 257,665 | | | | 215,822 | | | | 317,062 | |
12b-1 distribution and service fees – Class C Shares | | | 99,833 | | | | 214,614 | | | | 703,033 | |
12b-1 distribution and service fees – Class R3 Shares | | | 27,702 | | | | 1,944 | | | | 33,669 | |
12b-1 service fees – Class T Shares(1) | | | — | | | | — | | | | 61 | |
Shareholder servicing agent fees | | | 1,429,041 | | | | 240,682 | | | | 630,237 | |
Custodian fees | | | 93,050 | | | | 136,250 | | | | 196,091 | |
Directors fees | | | 21,945 | | | | 15,508 | | | | 23,481 | |
Professional fees | | | 88,037 | | | | 83,632 | | | | 99,682 | |
Shareholder reporting expenses | | | 106,008 | | | | 52,786 | | | | 116,859 | |
Federal and state registration fees | | | 89,808 | | | | 97,839 | | | | 91,798 | |
Other | | | 9,558 | | | | 16,082 | | | | 19,432 | |
Total expenses before fee waiver/expense reimbursement | | | 4,691,666 | | | | 3,176,728 | | | | 6,350,957 | |
Fee waiver/expense reimbursement | | | (1,155,265 | ) | | | (337,301 | ) | | | (790,284 | ) |
Net expenses | | | 3,536,401 | | | | 2,839,427 | | | | 5,560,673 | |
Net investment income (loss) | | | 14,420,489 | | | | 9,881,517 | | | | 27,614,759 | |
Realized and Unrealized Gain (Loss) | | | | | | | | | | | | |
Net realized gain (loss) from: | | | | | | | | | | | | |
Investments and foreign currency | | | 101,938 | | | | (681,127 | ) | | | (312,181 | ) |
Forward foreign currency contracts | | | — | | | | — | | | | 281,199 | |
Futures contracts | | | 787,375 | | | | (703,560 | ) | | | 2,768,614 | |
Options purchased | | | — | | | | — | | | | (174,197 | ) |
Swaps | | | — | | | | — | | | | (2,912,985 | ) |
Change in net unrealized appreciation (depreciation) of: | | | | | | | | | | | | |
Investments and foreign currency | | | (5,093,673 | ) | | | (5,638,530 | ) | | | (33,436,656 | ) |
Forward foreign currency contracts | | | — | | | | — | | | | 1,217,587 | |
Futures contracts | | | (129,279 | ) | | | (31,944 | ) | | | 33,519 | |
Options purchased | | | — | | | | — | | | | 58,501 | |
Swaps | | | — | | | | — | | | | (8,602 | ) |
Net realized and unrealized gain (loss) | | | (4,333,639 | ) | | | (7,055,161 | ) | | | (32,485,201 | ) |
Net increase (decrease) in net assets from operations | | $ | 10,086,850 | | | $ | 2,826,356 | | | $ | (4,870,442 | ) |
| (1) | Class T Shares are not available for public offering. |
See accompanying notes to financial statements.
116
Statement of Changes in Net Assets
| | | | | | | | | | | | | | | | | | | | |
| | | Core Bond | | | | | | Core Plus Bond | |
| | | Year Ended
6/30/18 | | | Year Ended
6/30/17 | | | | | | Year Ended
6/30/18 | | | Year Ended
6/30/17 | |
Operations | | | | | | | | | | | | | | | | | | | | |
Net investment income (loss) | | $ | 3,730,007 | | | $ | 3,957,122 | | | | | | | $ | 11,471,909 | | | $ | 13,462,247 | |
Net realized gain (loss) from: | | | | | | | | | | | | | | | | | | | | |
Investments and foreign currency | | | 295,683 | | | | 1,094,016 | | | | | | | | 2,136,849 | | | | 3,481,669 | |
Forward foreign currency contracts | | | — | | | | — | | | | | | | | 260,603 | | | | (377,450 | ) |
Futures contracts | | | 384,629 | | | | (1,099,892 | ) | | | | | | | (140,795 | ) | | | 117,343 | |
Options purchased | | | — | | | | — | | | | | | | | (16,404 | ) | | | (189,915 | ) |
Swaps | | | — | | | | — | | | | | | | | (196,673 | ) | | | (2,414,363 | ) |
Change in net unrealized appreciation (depreciation) of: | | | | | | | | | | | | | | | | | | | | |
Investments and foreign currency | | | (4,953,976 | ) | | | (4,983,483 | ) | | | | | | | (16,352,314 | ) | | | (1,417,518 | ) |
Forward foreign currency contracts | | | — | | | | — | | | | | | | | 201,767 | | | | 154,851 | |
Futures contracts | | | (116,123 | ) | | | 215,835 | | | | | | | | (25,668 | ) | | | 62,649 | |
Options purchased | | | — | | | | — | | | | | | | | 13,451 | | | | (13,451 | ) |
Swaps | | | — | | | | — | | | | | | | | 3,126 | | | | 2,131,286 | |
Net increase (decrease) in net assets from operations | | | (659,780 | ) | | | (816,402 | ) | | | | | | | (2,644,149 | ) | | | 14,997,348 | |
Distributions to Shareholders | | | | | | | | | | | | | | | | | | | | |
From net investment income: | | | | | | | | | | | | | | | | | | | | |
Class A Shares | | | (312,195 | ) | | | (306,135 | ) | | | | | | | (1,354,695 | ) | | | (1,420,028 | ) |
Class C Shares | | | (28,258 | ) | | | (27,096 | ) | | | | | | | (109,438 | ) | | | (132,502 | ) |
Class R3 Shares | | | — | | | | — | | | | | | | | (28,053 | ) | | | (214,891 | ) |
Class R6 Shares | | | (1,566,207 | ) | | | (1,414,133 | ) | | | | | | | (642,684 | ) | | | (635,081 | ) |
Class I Shares | | | (1,616,402 | ) | | | (2,106,287 | ) | | | | | | | (7,299,961 | ) | | | (7,238,587 | ) |
Class T Shares(1) | | | — | | | | — | | | | | | | | — | | | | — | |
From accumulated net realized gains: | | | | | | | | | | | | | | | | | | | | |
Class A Shares | | | — | | | | — | | | | | | | | — | | | | — | |
Class C Shares | | | — | | | | — | | | | | | | | — | | | | — | |
Class R3 Shares | | | — | | | | — | | | | | | | | — | | | | — | |
Class R6 Shares | | | — | | | | — | | | | | | | | — | | | | — | |
Class I Shares | | | — | | | | — | | | | | | | | — | | | | — | |
Class T Shares(1) | | | — | | | | — | | | | | | | | — | | | | — | |
Return of capital: | | | | | | | | | | | | | | | | | | | | |
Class A Shares | | | — | | | | (24,751 | ) | | | | | | | (330,228 | ) | | | (796,441 | ) |
Class C Shares | | | — | | | | (3,373 | ) | | | | | | | (38,518 | ) | | | (107,897 | ) |
Class R3 Shares | | | — | | | | — | | | | | | | | (7,596 | ) | | | (126,056 | ) |
Class R6 Shares | | | — | | | | (102,536 | ) | | | | | | | (143,924 | ) | | | (320,604 | ) |
Class I Shares | | | — | | | | (152,775 | ) | | | | | | | (1,631,224 | ) | | | (3,651,042 | ) |
Class T Shares(1) | | | — | | | | — | | | | | | | | — | | | | — | |
Decrease in net assets from distributions to shareholders | | | (3,523,062 | ) | | | (4,137,086 | ) | | | | | | | (11,586,321 | ) | | | (14,643,129 | ) |
Fund Share Transactions | | | | | | | | | | | | | | | | | | | | |
Proceeds from sale of shares | | | 24,109,504 | | | | 17,939,062 | | | | | | | | 75,164,167 | | | | 64,405,698 | |
Proceeds from shares issued to shareholders due to reinvestment of distributions | | | 2,291,497 | | | | 2,509,337 | | | | | | | | 6,815,299 | | | | 8,528,468 | |
| | | 26,401,001 | | | | 20,448,399 | | | | | | | | 81,979,466 | | | | 72,934,166 | |
Cost of shares redeemed | | | (30,787,295 | ) | | | (55,410,123 | ) | | | | | | | (88,847,869 | ) | | | (107,070,562 | ) |
Net increase (decrease) in net assets from Fund share transactions | | | (4,386,294 | ) | | | (34,961,724 | ) | | | | | | | (6,868,403 | ) | | | (34,136,396 | ) |
Net increase (decrease) in net assets | | | (8,569,136 | ) | | | (39,915,212 | ) | | | | | | | (21,098,873 | ) | | | (33,782,177 | ) |
Net assets at the beginning of period | | | 142,975,327 | | | | 182,890,539 | | | | | | | | 359,823,237 | | | | 393,605,414 | |
Net assets at the end of period | | | 134,406,191 | | | $ | 142,975,327 | | | | | | | | 338,724,364 | | | $ | 359,823,237 | |
Undistributed (Over-distribution of) net investment income at the end of period | | $ | (112,911 | ) | | $ | (319,856 | ) | | | | | | $ | (854,673 | ) | | $ | (2,578,372 | ) |
| (1) | Class T Shares are not available for public offering. |
See accompanying notes to financial statements.
117
Statement of Changes in Net Assets (continued)
| | | | | | | | | | | | | | | | | | | | |
| | | High Income Bond | | | | | | Inflation Protected Securities | |
| | | Year Ended
6/30/18 | | | Year Ended
6/30/17 | | | | | | Year Ended
6/30/18 | | | Year Ended
6/30/17 | |
Operations | | | | | | | | | | | | | | | | | | | | |
Net investment income (loss) | | $ | 23,182,827 | | | $ | 31,041,673 | | | | | | | $ | 14,420,489 | | | $ | 11,146,193 | |
Net realized gain (loss) from: | | | | | | | | | | | | | | | | | | | | |
Investments and foreign currency | | | (11,134,618 | ) | | | (1,337,739 | ) | | | | | | | 101,938 | | | | 1,334,814 | |
Forward foreign currency contracts | | | (180,664 | ) | | | 210,744 | | | | | | | | — | | | | — | |
Futures contracts | | | (84,799 | ) | | | (137,663 | ) | | | | | | | 787,375 | | | | (3,448,952 | ) |
Options purchased | | | — | | | | — | | | | | | | | — | | | | — | |
Swaps | | | (78,738 | ) | | | (30,036 | ) | | | | | | | — | | | | — | |
Change in net unrealized appreciation (depreciation) of: | | | | | | | | | | | | | | | | | | | | |
Investments and foreign currency | | | (1,990,985 | ) | | | 32,917,584 | | | | | | | | (5,093,673 | ) | | | (16,784,072 | ) |
Forward foreign currency contracts | | | 178,031 | | | | (114,776 | ) | | | | | | | — | | | | — | |
Futures contracts | | | 12,573 | | | | (275,326 | ) | | | | | | | (129,279 | ) | | | (295,008 | ) |
Options purchased | | | — | | | | — | | | | | | | | — | | | | — | |
Swaps | | | — | | | | — | | | | | | | | — | | | | — | |
Net increase (decrease) in net assets from operations | | | 9,903,627 | | | | 62,274,461 | | | | | | | | 10,086,850 | | | | (8,047,025 | ) |
Distributions to Shareholders | | | | | | | | | | | | | | | | | | | | |
From net investment income: | | | | | | | | | | | | | | | | | | | | |
Class A Shares | | | (8,890,635 | ) | | | (11,349,409 | ) | | | | | | | (2,671,390 | ) | | | (1,153,307 | ) |
Class C Shares | | | (2,854,928 | ) | | | (2,883,575 | ) | | | | | | | (182,575 | ) | | | (63,715 | ) |
Class R3 Shares | | | (40,945 | ) | | | (52,021 | ) | | | | | | | (131,482 | ) | | | (87,641 | ) |
Class R6 Shares | | | — | | | | — | | | | | | | | (1,448,758 | ) | | | (243,084 | ) |
Class I Shares | | | (11,881,293 | ) | | | (16,098,152 | ) | | | | | | | (12,804,131 | ) | | | (5,866,832 | ) |
Class T Shares(1) | | | (1,688 | ) | | | (141 | ) | | | | | | | — | | | | — | |
From accumulated net realized gains: | | | | | | | | | | | | | | | | | | | | |
Class A Shares | | | — | | | | — | | | | | | | | — | | | | — | |
Class C Shares | | | — | | | | — | | | | | | | | — | | | | — | |
Class R3 Shares | | | — | | | | — | | | | | | | | — | | | | — | |
Class R6 Shares | | | — | | | | — | | | | | | | | — | | | | — | |
Class I Shares | | | — | | | | — | | | | | | | | — | | | | — | |
Class T Shares(1) | | | — | | | | — | | | | | | | | — | | | | — | |
Return of capital: | | | | | | | | | | | | | | | | | | | | |
Class A Shares | | | — | | | | — | | | | | | | | — | | | | — | |
Class C Shares | | | — | | | | — | | | | | | | | — | | | | — | |
Class R3 Shares | | | — | | | | — | | | | | | | | — | | | | — | |
Class R6 Shares | | | — | | | | — | | | | | | | | — | | | | — | |
Class I Shares | | | — | | | | — | | | | | | | | — | | | | — | |
Class T Shares(1) | | | — | | | | — | | | | | | | | — | | | | — | |
Decrease in net assets from distributions to shareholders | | | (23,669,489 | ) | | | (30,383,298 | ) | | | | | | | (17,238,336 | ) | | | (7,414,579 | ) |
Fund Share Transactions | | | | | | | | | | | | | | | | | | | | |
Proceeds from sale of shares | | | 320,649,681 | | | | 527,158,862 | | | | | | | | 215,916,601 | | | | 327,307,816 | |
Proceeds from shares issued to shareholders due to reinvestment of distributions | | | 20,124,847 | | | | 23,319,008 | | | | | | | | 6,651,234 | | | | 3,010,711 | |
| | | 340,774,528 | | | | 550,477,870 | | | | | | | | 222,567,835 | | | | 330,318,527 | |
Cost of shares redeemed | | | (405,002,409 | ) | | | (561,646,868 | ) | | | | | | | (201,038,600 | ) | | | (239,408,167 | ) |
Net increase (decrease) in net assets from Fund share transactions | | | (64,227,881 | ) | | | (11,168,998 | ) | | | | | | | 21,529,235 | | | | 90,910,360 | |
Net increase (decrease) in net assets | | | (77,993,743 | ) | | | 20,722,165 | | | | | | | | 14,377,749 | | | | 75,448,756 | |
Net assets at the beginning of period | | | 385,764,471 | | | | 365,042,306 | | | | | | | | 603,350,973 | | | | 527,902,217 | |
Net assets at the end of period | | | 307,770,728 | | | $ | 385,764,471 | | | | | | | | 617,728,722 | | | $ | 603,350,973 | |
Undistributed (Over-distribution of) net investment income at the end of period | | $ | 445,111 | | | $ | 1,125,810 | | | | | | | $ | 2,270,435 | | | $ | 5,088,282 | |
| (1) | Class T Shares are not available for public offering. |
See accompanying notes to financial statements.
118
| | | | | | | | | | | | | | | | | | | | |
| | | Short Term Bond | | | | | | Strategic Income | |
| | | Year Ended
6/30/18 | | | Year Ended
6/30/17 | | | | | | Year Ended
6/30/18 | | | Year Ended
6/30/17 | |
Operations | | | | | | | | | | | | | | | | | | | | |
Net investment income (loss) | | $ | 9,881,517 | | | $ | 10,231,004 | | | | | | | $ | 27,614,759 | | | $ | 32,606,064 | |
Net realized gain (loss) from: | | | | | | | | | | | | | | | | | | | | |
Investments and foreign currency | | | (681,127 | ) | | | 729,844 | | | | | | | | (312,181 | ) | | | (1,535,971 | ) |
Forward foreign currency contracts | | | — | | | | — | | | | | | | | 281,199 | | | | (2,742,500 | ) |
Futures contracts | | | (703,560 | ) | | | (326,015 | ) | | | | | | | 2,768,614 | | | | 243,580 | |
Options purchased | | | — | | | | — | | | | | | | | (174,197 | ) | | | (830,201 | ) |
Swaps | | | — | | | | — | | | | | | | | (2,912,985 | ) | | | (5,806,488 | ) |
Change in net unrealized appreciation (depreciation) of: | | | | | | | | | | | | | | | | | | | | |
Investments and foreign currency | | | (5,638,530 | ) | | | (2,250,536 | ) | | | | | | | (33,436,656 | ) | | | 23,950,852 | |
Forward foreign currency contracts | | | — | | | | — | | | | | | | | 1,217,587 | | | | (216,207 | ) |
Futures contracts | | | (31,944 | ) | | | 475,812 | | | | | | | | 33,519 | | | | 1,173,900 | |
Options purchased | | | — | | | | — | | | | | | | | 58,501 | | | | (58,501 | ) |
Swaps | | | — | | | | — | | | | | | | | (8,602 | ) | | | 2,651,990 | |
Net increase (decrease) in net assets from operations | | | 2,826,356 | | | | 8,860,109 | | | | | | | | (4,870,442 | ) | | | 49,436,518 | |
Distributions to Shareholders | | | | | | | | | | | | | | | | | | | | |
From net investment income: | | | | | | | | | | | | | | | | | | | | |
Class A Shares | | | (1,393,789 | ) | | | (1,440,422 | ) | | | | | | | (2,624,560 | ) | | | (4,700,078 | ) |
Class C Shares | | | (175,019 | ) | | | (206,915 | ) | | | | | | | (911,063 | ) | | | (1,697,178 | ) |
Class R3 Shares | | | (5,046 | ) | | | (4,210 | ) | | | | | | | (122,444 | ) | | | (189,836 | ) |
Class R6 Shares | | | (1,691,840 | ) | | | (1,266,480 | ) | | | | | | | (833,771 | ) | | | (888,278 | ) |
Class I Shares | | | (5,977,163 | ) | | | (6,537,353 | ) | | | | | | | (12,250,306 | ) | | | (14,906,062 | ) |
Class T Shares(1) | | | — | | | | — | | | | | | | | (504 | ) | | | — | |
From accumulated net realized gains: | | | | | | | | | | | | | | | | | | | | |
Class A Shares | | | — | | | | — | | | | | | | | — | | | | — | |
Class C Shares | | | — | | | | — | | | | | | | | — | | | | — | |
Class R3 Shares | | | — | | | | — | | | | | | | | — | | | | — | |
Class R6 Shares | | | — | | | | — | | | | | | | | — | | | | — | |
Class I Shares | | | — | | | | — | | | | | | | | — | | | | — | |
Class T Shares(1) | | | — | | | | — | | | | | | | | — | | | | — | |
Return of capital: | | | | | | | | | | | | | | | | | | | | |
Class A Shares | | | — | | | | (96,946 | ) | | | | | | | (2,364,360 | ) | | | (3,734,095 | ) |
Class C Shares | | | — | | | | (29,934 | ) | | | | | | | (1,310,645 | ) | | | (1,850,649 | ) |
Class R3 Shares | | | — | | | | (357 | ) | | | | | | | (125,534 | ) | | | (164,969 | ) |
Class R6 Shares | | | — | | | | (73,173 | ) | | | | | | | (728,959 | ) | | | (655,316 | ) |
Class I Shares | | | — | | | | (378,818 | ) | | | | | | | (10,039,433 | ) | | | (10,925,506 | ) |
Class T Shares(1) | | | — | | | | — | | | | | | | | (459 | ) | | | (104 | ) |
Decrease in net assets from distributions to shareholders | | | (9,242,857 | ) | | | (10,034,608 | ) | | | | | | | (31,312,038 | ) | | | (39,712,071 | ) |
Fund Share Transactions | | | | | | | | | | | | | | | | | | | | |
Proceeds from sale of shares | | | 161,733,139 | | | | 253,678,451 | | | | | | | | 234,165,148 | | | | 244,895,885 | |
Proceeds from shares issued to shareholders due to reinvestment of distributions | | | 4,722,287 | | | | 4,633,178 | | | | | | | | 18,990,554 | | | | 23,514,671 | |
| | | 166,455,426 | | | | 258,311,629 | | | | | | | | 253,155,702 | | | | 268,410,556 | |
Cost of shares redeemed | | | (258,266,815 | ) | | | (305,880,953 | ) | | | | | | | (275,270,261 | ) | | | (300,622,459 | ) |
Net increase (decrease) in net assets from Fund share transactions | | | (91,811,389 | ) | | | (47,569,324 | ) | | | | | | | (22,114,559 | ) | | | (32,211,903 | ) |
Net increase (decrease) in net assets | | | (98,227,890 | ) | | | (48,743,823 | ) | | | | | | | (58,297,039 | ) | | | (22,487,456 | ) |
Net assets at the beginning of period | | | 561,697,907 | | | | 610,441,730 | | | | | | | | 770,293,010 | | | | 792,780,466 | |
Net assets at the end of period | | | 463,470,017 | | | $ | 561,697,907 | | | | | | | | 711,995,971 | | | $ | 770,293,010 | |
Undistributed (Over-distribution of) net investment income at the end of period | | $ | (224,987 | ) | | $ | (863,647 | ) | | | | | | $ | (2,198,975 | ) | | $ | (9,533,183 | ) |
| (1) | Class T Shares are not available for public offering. |
See accompanying notes to financial statements.
119
Financial Highlights
Core Bond
Selected data for a share outstanding throughout each period:
| | | | | | | | | | | | | | | | | | | | | | | | | | | | | | | | | | | | | | | | |
| | | | | |
| | | | | | Investment Operations | | | | | | Less Distributions | | | | |
| | | | | | | | | | |
Class (Commencement Date) Year Ended June 30, | | Beginning
NAV | | | Net
Investment
Income
(Loss)(a) | | | Net
Realized/
Unrealized
Gain (Loss) | | | Total | | | | | | From
Net
Investment
Income | | | From
Accumulated
Net Realized
Gains | | | Return
of
Capital | | | Total | | | Ending
NAV | |
Class A (1/95) | | | | | | | | | | | | | | | | | | | | | | | | | | | | | | | | | |
2018 | | $ | 9.76 | | | $ | 0.24 | | | $ | (0.31 | ) | | $ | (0.07 | ) | | | | | | $ | (0.23 | ) | | $ | — | | | $ | — | | | $ | (0.23 | ) | | $ | 9.46 | |
2017 | | | 10.05 | | | | 0.22 | | | | (0.28 | ) | | | (0.06 | ) | | | | | | | (0.21 | ) | | | — | | | | (0.02 | ) | | | (0.23 | ) | | | 9.76 | |
2016 | | | 9.97 | | | | 0.23 | | | | 0.17 | | | | 0.40 | | | | | | | | (0.22 | ) | | | (0.06 | ) | | | (0.04 | ) | | | (0.32 | ) | | | 10.05 | |
2015 | | | 10.36 | | | | 0.25 | | | | (0.19 | ) | | | 0.06 | | | | | | | | (0.28 | ) | | | (0.17 | ) | | | — | | | | (0.45 | ) | | | 9.97 | |
2014 | | | 10.13 | | | | 0.24 | | | | 0.35 | | | | 0.59 | | | | | | | | (0.22 | ) | | | (0.14 | ) | | | — | | | | (0.36 | ) | | | 10.36 | |
Class C (1/11) | | | | | | | | | | | | | | | | | | | | | | | | | | | | | | | | | |
2018 | | | 9.73 | | | | 0.17 | | | | (0.31 | ) | | | (0.14 | ) | | | | | | | (0.16 | ) | | | — | | | | — | | | | (0.16 | ) | | | 9.43 | |
2017 | | | 10.02 | | | | 0.15 | | | | (0.28 | ) | | | (0.13 | ) | | | | | | | (0.14 | ) | | | — | | | | (0.02 | ) | | | (0.16 | ) | | | 9.73 | |
2016 | | | 9.94 | | | | 0.15 | | | | 0.17 | | | | 0.32 | | | | | | | | (0.14 | ) | | | (0.06 | ) | | | (0.04 | ) | | | (0.24 | ) | | | 10.02 | |
2015 | | | 10.32 | | | | 0.17 | | | | (0.19 | ) | | | (0.02 | ) | | | | | | | (0.19 | ) | | | (0.17 | ) | | | — | | | | (0.36 | ) | | | 9.94 | |
2014 | | | 10.08 | | | | 0.16 | | | | 0.36 | | | | 0.52 | | | | | | | | (0.14 | ) | | | (0.14 | ) | | | — | | | | (0.28 | ) | | | 10.32 | |
Class R6 (1/15) | | | | | | | | | | | | | | | | | | | | | | | | | | | | | | | | | |
2018 | | | 9.74 | | | | 0.27 | | | | (0.32 | ) | | | (0.05 | ) | | | | | | | (0.25 | ) | | | — | | | | — | | | | (0.25 | ) | | | 9.44 | |
2017 | | | 10.02 | | | | 0.25 | | | | (0.27 | ) | | | (0.02 | ) | | | | | | | (0.24 | ) | | | — | | | | (0.02 | ) | | | (0.26 | ) | | | 9.74 | |
2016 | | | 9.94 | | | | 0.26 | | | | 0.16 | | | | 0.42 | | | | | | | | (0.24 | ) | | | (0.06 | ) | | | (0.04 | ) | | | (0.34 | ) | | | 10.02 | |
2015(e) | | | 10.22 | | | | 0.12 | | | | (0.27 | ) | | | (0.15 | ) | | | | | | | (0.13 | ) | | | — | | | | — | | | | (0.13 | ) | | | 9.94 | |
Class I (1/93) | | | | | | | | | | | | | | | | | | | | | | | | | | | | | | | | | |
2018 | | | 9.72 | | | | 0.26 | | | | (0.31 | ) | | | (0.05 | ) | | | | | | | (0.25 | ) | | | — | | | | — | | | | (0.25 | ) | | | 9.42 | |
2017 | | | 10.01 | | | | 0.24 | | | | (0.27 | ) | | | (0.03 | ) | | | | | | | (0.24 | ) | | | — | | | | (0.02 | ) | | | (0.26 | ) | | | 9.72 | |
2016 | | | 9.93 | | | | 0.25 | | | | 0.17 | | | | 0.42 | | | | | | | | (0.24 | ) | | | (0.06 | ) | | | (0.04 | ) | | | (0.34 | ) | | | 10.01 | |
2015 | | | 10.32 | | | | 0.27 | | | | (0.19 | ) | | | 0.08 | | | | | | | | (0.30 | ) | | | (0.17 | ) | | | — | | | | (0.47 | ) | | | 9.93 | |
2014 | | | 10.09 | | | | 0.26 | | | | 0.22 | | | | 0.48 | | | | | | | | (0.11 | ) | | | (0.14 | ) | | | — | | | | (0.25 | ) | | | 10.32 | |
120
| | | | | | | | | | | | | | | | | | | | | | | | | | | | | | | | | | |
| | | | Ratios/Supplemental Data | |
| | | | | | | | | | Ratios to Average
Net Assets Before
Waiver/Reimbursement | | | | | | Ratios to Average
Net Assets After
Waiver/Reimbursement(c) | | | | |
| | | | | | | | |
Total
Return(b) | | | Ending
Net
Assets
(000) | | | | | | Expenses | | | Net
Investment
Income
(Loss) | | | | | | Expenses | | | Net
Investment
Income
(Loss) | | | Portfolio
Turnover
Rate(d) | |
| | | | | | | | | | | | | | | | | | | | | | | | | | | | | | | | | | |
| | (0.76 | )% | | $ | 12,577 | | | | | | | | 0.96 | % | | | 2.31 | % | | | | | | | 0.78 | % | | | 2.49 | % | | | 47 | % |
| | (0.56 | ) | | | 13,182 | | | | | | | | 0.93 | | | | 2.09 | | | | | | | | 0.78 | | | | 2.24 | | | | 85 | |
| | 4.12 | | | | 15,185 | | | | | | | | 0.87 | | | | 2.21 | | | | | | | | 0.78 | | | | 2.30 | | | | 75 | |
| | 0.52 | | | | 14,448 | | | | | | | | 0.85 | | | | 2.34 | | | | | | | | 0.78 | | | | 2.40 | | | | 44 | |
| | 5.94 | | | | 14,857 | | | | | | | | 0.81 | | | | 2.29 | | | | | | | | 0.78 | | | | 2.32 | | | | 49 | |
| | | | | | | | | | | | | | | | | | | | | | | | | | | | | | | | | | |
| | (1.50 | ) | | | 1,709 | | | | | | | | 1.71 | | | | 1.55 | | | | | | | | 1.53 | | | | 1.73 | | | | 47 | |
| | (1.33 | ) | | | 1,720 | | | | | | | | 1.68 | | | | 1.34 | | | | | | | | 1.53 | | | | 1.49 | | | | 85 | |
| | 3.31 | | | | 1,767 | | | | | | | | 1.63 | | | | 1.46 | | | | | | | | 1.53 | | | | 1.55 | | | | 75 | |
| | (0.20 | ) | | | 971 | | | | | | | | 1.61 | | | | 1.59 | | | | | | | | 1.53 | | | | 1.67 | | | | 44 | |
| | 5.24 | | | | 514 | | | | | | | | 1.56 | | | | 1.54 | | | | | | | | 1.53 | | | | 1.57 | | | | 49 | |
| | | | | | | | | | | | | | | | | | | | | | | | | | | | | | | | | | |
| | (0.51 | ) | | | 64,539 | | | | | | | | 0.65 | | | | 2.63 | | | | | | | | 0.47 | | | | 2.81 | | | | 47 | |
| | (0.22 | ) | | | 58,545 | | | | | | | | 0.61 | | | | 2.41 | | | | | | | | 0.46 | | | | 2.56 | | | | 85 | |
| | 4.38 | | | | 58,699 | | | | | | | | 0.57 | | | | 2.51 | | | | | | | | 0.48 | | | | 2.60 | | | | 75 | |
| | (1.46 | ) | | | 45,145 | | | | | | | | 0.56 | * | | | 2.60 | * | | | | | | | 0.48 | * | | | 2.68 | * | | | 44 | |
| | | | | | | | | | | | | | | | | | | | | | | | | | | | | | | | | | |
| | (0.51 | ) | | | 55,581 | | | | | | | | 0.71 | | | | 2.55 | | | | | | | | 0.53 | | | | 2.73 | | | | 47 | |
| | (0.32 | ) | | | 69,528 | | | | | | | | 0.68 | | | | 2.32 | | | | | | | | 0.53 | | | | 2.47 | | | | 85 | |
| | 4.39 | | | | 107,240 | | | | | | | | 0.62 | | | | 2.46 | | | | | | | | 0.53 | | | | 2.55 | | | | 75 | |
| | 0.78 | | | | 176,468 | | | | | | | | 0.59 | | | | 2.59 | | | | | | | | 0.53 | | | | 2.65 | | | | 44 | |
| | 6.21 | | | | 329,901 | | | | | | | | 0.56 | | | | 2.53 | | | | | | | | 0.53 | | | | 2.56 | | | | 49 | |
| (a) | Per share Net Investment Income (Loss) is calculated using the average daily shares method. | |
| (b) | Total return is the combination of changes in NAV without any sales charge, reinvested dividend income at NAV and reinvested capital gains distributions at NAV, if any. Total returns are not annualized. | |
| (c) | After fee waiver and/or expense reimbursement from the Adviser, where applicable. See Note 7 – Management Fees and Other Transactions with Affiliates, Management Fees for more information. | |
| (d) | Portfolio Turnover Rate is calculated based on the lesser of long-term purchases or sales (as disclosed in Note 5 – Investment Transactions) divided by the average long-term market value during the period. | |
| (e) | For the period January 20, 2015 (commencement of operations) through June 30, 2015. | |
See accompanying notes to financial statements.
121
Financial Highlights (continued)
Core Plus Bond
Selected data for a share outstanding throughout each period:
| | | | | | | | | | | | | | | | | | | | | | | | | | | | | | | | | | | | | | | | |
| | | | | |
| | | | | | Investment Operations | | | | | | Less Distributions | | | | |
| | | | | | | | | | |
Class (Commencement Date) Year Ended June 30, | | Beginning
NAV | | | Net
Investment
Income
(Loss)(a) | | | Net
Realized/
Unrealized
Gain (Loss) | | | Total | | | | | | From
Net
Investment
Income | | | From
Accumulated
Net Realized
Gains | | | Return
of
Capital | | | Total | | | Ending
NAV | |
Class A (12/87) | | | | | | | | | | | | | | | | | | | | | | | | | | | | | |
2018 | | $ | 11.04 | | | $ | 0.33 | | | $ | (0.43 | ) | | $ | (0.10 | ) | | | | | | $ | (0.26 | ) | | $ | — | | | $ | (0.07 | ) | | $ | (0.33 | ) | | $ | 10.61 | |
2017 | | | 11.01 | | | | 0.37 | | | | 0.07 | | | | 0.44 | | | | | | | | (0.26 | ) | | | — | | | | (0.15 | ) | | | (0.41 | ) | | | 11.04 | |
2016 | | | 11.25 | | | | 0.44 | | | | (0.22 | ) | | | 0.22 | | | | | | | | (0.44 | ) | | | (0.02 | ) | | | — | | | | (0.46 | ) | | | 11.01 | |
2015 | | | 11.75 | | | | 0.45 | | | | (0.49 | ) | | | (0.04 | ) | | | | | | | (0.44 | ) | | | (0.02 | ) | | | — | | | | (0.46 | ) | | | 11.25 | |
2014 | | | 11.46 | | | | 0.46 | | | | 0.45 | | | | 0.91 | | | | | | | | (0.43 | ) | | | (0.19 | ) | | | — | | | | (0.62 | ) | | | 11.75 | |
Class C (2/99) | | | | | | | | | | | | | | | | | | | | | | | | | | | | | |
2018 | | | 10.98 | | | | 0.24 | | | | (0.41 | ) | | | (0.17 | ) | | | | | | | (0.18 | ) | | | — | | | | (0.07 | ) | | | (0.25 | ) | | | 10.56 | |
2017 | | | 10.96 | | | | 0.29 | | | | 0.05 | | | | 0.34 | | | | | | | | (0.17 | ) | | | — | | | | (0.15 | ) | | | (0.32 | ) | | | 10.98 | |
2016 | | | 11.20 | | | | 0.35 | | | | (0.22 | ) | | | 0.13 | | | | | | | | (0.35 | ) | | | (0.02 | ) | | | — | | | | (0.37 | ) | | | 10.96 | |
2015 | | | 11.69 | | | | 0.36 | | | | (0.48 | ) | | | (0.12 | ) | | | | | | | (0.35 | ) | | | (0.02 | ) | | | — | | | | (0.37 | ) | | | 11.20 | |
2014 | | | 11.40 | | | | 0.37 | | | | 0.45 | | | | 0.82 | | | | | | | | (0.34 | ) | | | (0.19 | ) | | | — | | | | (0.53 | ) | | | 11.69 | |
Class R3 (9/01) | | | | | | | | | | | | | | | | | | | | | | | | | | | | | |
2018 | | | 11.09 | | | | 0.30 | | | | (0.42 | ) | | | (0.12 | ) | | | | | | | (0.24 | ) | | | — | | | | (0.07 | ) | | | (0.31 | ) | | | 10.66 | |
2017 | | | 11.05 | | | | 0.36 | | | | 0.06 | | | | 0.42 | | | | | | | | (0.23 | ) | | | — | | | | (0.15 | ) | | | (0.38 | ) | | | 11.09 | |
2016 | | | 11.29 | | | | 0.41 | | | | (0.22 | ) | | | 0.19 | | | | | | | | (0.41 | ) | | | (0.02 | ) | | | — | | | | (0.43 | ) | | | 11.05 | |
2015 | | | 11.80 | | | | 0.42 | | | | (0.50 | ) | | | (0.08 | ) | | | | | | | (0.41 | ) | | | (0.02 | ) | | | — | | | | (0.43 | ) | | | 11.29 | |
2014 | | | 11.51 | | | | 0.43 | | | | 0.46 | | | | 0.89 | | | | | | | | (0.41 | ) | | | (0.19 | ) | | | — | | | | (0.60 | ) | | | 11.80 | |
Class R6 (1/15) | | | | | | | | | | | | | | | | | | | | | | | | | | | | | |
2018 | | | 11.03 | | | | 0.36 | | | | (0.42 | ) | | | (0.06 | ) | | | | | | | (0.29 | ) | | | — | | | | (0.07 | ) | | | (0.36 | ) | | | 10.61 | |
2017 | | | 11.00 | | | | 0.41 | | | | 0.05 | | | | 0.46 | | | | | | | | (0.28 | ) | | | — | | | | (0.15 | ) | | | (0.43 | ) | | | 11.03 | |
2016 | | | 11.23 | | | | 0.47 | | | | (0.21 | ) | | | 0.26 | | | | | | | | (0.47 | ) | | | (0.02 | ) | | | — | | | | (0.49 | ) | | | 11.00 | |
2015(e) | | | 11.48 | | | | 0.22 | | | | (0.26 | ) | | | (0.04 | ) | | | | | | | (0.21 | ) | | | — | | | | — | | | | (0.21 | ) | | | 11.23 | |
Class I (2/94) | | | | | | | | | | | | | | | | | | | | | | | | | | | | | |
2018 | | | 11.01 | | | | 0.35 | | | | (0.41 | ) | | | (0.06 | ) | | | | | | | (0.29 | ) | | | — | | | | (0.07 | ) | | | (0.36 | ) | | | 10.59 | |
2017 | | | 10.99 | | | | 0.40 | | | | 0.05 | | | | 0.45 | | | | | | | | (0.28 | ) | | | — | | | | (0.15 | ) | | | (0.43 | ) | | | 11.01 | |
2016 | | | 11.24 | | | | 0.46 | | | | (0.22 | ) | | | 0.24 | | | | | | | | (0.47 | ) | | | (0.02 | ) | | | — | | | | (0.49 | ) | | | 10.99 | |
2015 | | | 11.74 | | | | 0.48 | | | | (0.49 | ) | | | (0.01 | ) | | | | | | | (0.47 | ) | | | (0.02 | ) | | | — | | | | (0.49 | ) | | | 11.24 | |
2014 | | | 11.44 | | | | 0.49 | | | | 0.46 | | | | 0.95 | | | | | | | | (0.46 | ) | | | (0.19 | ) | | | — | | | | (0.65 | ) | | | 11.74 | |
122
| | | | | | | | | | | | | | | | | | | | | | | | | | | | | | | | | | |
| | | | Ratios/Supplemental Data | |
| | | | | | | | | | Ratios to Average
Net Assets Before
Waiver/Reimbursement | | | | | | Ratios to Average
Net Assets After
Waiver/Reimbursement(c) | | | | |
| | | | | | | | |
Total
Return(b) | | | Ending
Net
Assets
(000) | | | | | | Expenses | | | Net
Investment
Income
(Loss) | | | | | | Expenses | | | Net
Investment
Income
(Loss) | | | Portfolio
Turnover
Rate(d) | |
| | | | | | | | | | | | | | | | | | | | | | | | | | | | | | | | | | |
| | (0.93 | )% | | $ | 52,126 | | | | | | | | 0.90 | % | | | 2.86 | % | | | | | | | 0.77 | % | | | 2.99 | % | | | 97 | % |
| | 4.03 | | | | 57,299 | | | | | | | | 0.89 | | | | 3.27 | | | | | | | | 0.77 | | | | 3.39 | | | | 131 | |
| | 2.07 | | | | 61,769 | | | | | | | | 0.87 | | | | 3.91 | | | | | | | | 0.77 | | | | 4.00 | | | | 79 | |
| | (0.41 | ) | | | 69,968 | | | | | | | | 0.85 | | | | 3.80 | | | | | | | | 0.77 | | | | 3.88 | | | | 44 | |
| | 8.23 | | | | 68,728 | | | | | | | | 0.84 | | | | 3.89 | | | | | | | | 0.77 | | | | 3.97 | | | | 50 | |
| | | | | | | | | | | | | | | | | | | | | | | | | | | | | | | | | | |
| | (1.61 | ) | | | 5,484 | | | | | | | | 1.65 | | | | 2.11 | | | | | | | | 1.52 | | | | 2.24 | | | | 97 | |
| | 3.16 | | | | 6,985 | | | | | | | | 1.64 | | | | 2.52 | | | | | | | | 1.52 | | | | 2.64 | | | | 131 | |
| | 1.29 | | | | 8,387 | | | | | | | | 1.62 | | | | 3.15 | | | | | | | | 1.52 | | | | 3.25 | | | | 79 | |
| | (1.10 | ) | | | 8,580 | | | | | | | | 1.60 | | | | 3.06 | | | | | | | | 1.52 | | | | 3.15 | | | | 44 | |
| | 7.43 | | | | 7,696 | | | | | | | | 1.59 | | | | 3.13 | | | | | | | | 1.52 | | | | 3.20 | | | | 50 | |
| | | | | | | | | | | | | | | | | | | | | | | | | | | | | | | | | | |
| | (1.14 | ) | | | 1,265 | | | | | | | | 1.15 | | | | 2.61 | | | | | | | | 1.02 | | | | 2.74 | | | | 97 | |
| | 3.88 | | | | 1,205 | | | | | | | | 1.14 | | | | 3.08 | | | | | | | | 1.02 | | | | 3.19 | | | | 131 | |
| | 1.83 | | | | 14,871 | | | | | | | | 1.12 | | | | 3.64 | | | | | | | | 1.02 | | | | 3.74 | | | | 79 | |
| | (0.70 | ) | | | 3,751 | | | | | | | | 1.10 | | | | 3.57 | | | | | | | | 1.02 | | | | 3.65 | | | | 44 | |
| | 7.97 | | | | 638 | | | | | | | | 1.10 | | | | 3.65 | | | | | | | | 1.02 | | | | 3.73 | | | | 50 | |
| | | | | | | | | | | | | | | | | | | | | | | | | | | | | | | | | | |
| | (0.62 | ) | | | 23,377 | | | | | | | | 0.59 | | | | 3.18 | | | | | | | | 0.46 | | | | 3.30 | | | | 97 | |
| | 4.30 | | | | 23,798 | | | | | | | | 0.57 | | | | 3.58 | | | | | | | | 0.45 | | | | 3.70 | | | | 131 | |
| | 2.35 | | | | 24,899 | | | | | | | | 0.56 | | | | 4.21 | | | | | | | | 0.46 | | | | 4.31 | | | | 79 | |
| | (0.29 | ) | | | 43,680 | | | | | | | | 0.54 | * | | | 4.14 | * | | | | | | | 0.46 | * | | | 4.22 | * | | | 44 | |
| | | | | | | | | | | | | | | | | | | | | | | | | | | | | | | | | | |
| | (0.62 | ) | | | 256,472 | | | | | | | | 0.65 | | | | 3.11 | | | | | | | | 0.52 | | | | 3.24 | | | | 97 | |
| | 4.21 | | | | 270,536 | | | | | | | | 0.64 | | | | 3.52 | | | | | | | | 0.52 | | | | 3.63 | | | | 131 | |
| | 2.26 | | | | 283,680 | | | | | | | | 0.62 | | | | 4.16 | | | | | | | | 0.52 | | | | 4.25 | | | | 79 | |
| | (0.15 | ) | | | 440,499 | | | | | | | | 0.60 | | | | 4.04 | | | | | | | | 0.52 | | | | 4.12 | | | | 44 | |
| | 8.64 | | | | 514,961 | | | | | | | | 0.60 | | | | 4.17 | | | | | | | | 0.52 | | | | 4.24 | | | | 50 | |
| (a) | Per share Net Investment Income (Loss) is calculated using the average daily shares method. | |
| (b) | Total return is the combination of changes in NAV without any sales charge, reinvested dividend income at NAV and reinvested capital gains distributions at NAV, if any. Total returns are not annualized. | |
| (c) | After fee waiver and/or expense reimbursement from the Adviser, where applicable. See Note 7 – Management Fees and Other Transactions with Affiliates, Management Fees for more information. | |
| (d) | Portfolio Turnover Rate is calculated based on the lesser of long-term purchases or sales (as disclosed in Note 5 – Investment Transactions) divided by the average long-term market value during the period. | |
| (e) | For the period January 20, 2015 (commencement of operations) through June 30, 2015. | |
See accompanying notes to financial statements.
123
Financial Highlights (continued)
High Income Bond
Selected data for a share outstanding throughout each period:
| | | | | | | | | | | | | | | | | | | | | | | | | | | | | | | | | | | | |
| | | | | |
| | | | | | Investment Operations | | | | | | Less Distributions | | | | |
| | | | | | | | | |
| Year Ended June 30, | | Beginning
NAV | | | Net
Investment
Income
(Loss)(a) | | | Net
Realized/
Unrealized
Gain (Loss) | | | Total | | | | | | Net
Investment
Income | | | From
Accumulated
Net Realized
Gains | | | Total | | | Ending
Net
Asset
Value | |
Class A (8/01) | | | | | | | | | | | | | | | | | | | | | | | | | | | | | | | | | | | | |
2018 | | $ | 7.80 | | | $ | 0.52 | | | $ | (0.28 | ) | | $ | 0.24 | | | | | | | $ | (0.53 | ) | | $ | — | | | $ | (0.53 | ) | | $ | 7.51 | |
2017 | | | 7.22 | | | | 0.54 | | | | 0.57 | | | | 1.11 | | | | | | | | (0.53 | ) | | | — | | | | (0.53 | ) | | | 7.80 | |
2016 | | | 8.23 | | | | 0.57 | | | | (1.05 | ) | | | (0.48 | ) | | | | | | | (0.53 | ) | | | — | | | | (0.53 | ) | | | 7.22 | |
2015 | | | 9.29 | | | | 0.55 | | | | (1.00 | ) | | | (0.45 | ) | | | | | | | (0.54 | ) | | | (0.07 | ) | | | (0.61 | ) | | | 8.23 | |
2014 | | | 8.99 | | | | 0.58 | | | | 0.53 | | | | 1.11 | | | | | | | | (0.61 | ) | | | (0.20 | ) | | | (0.81 | ) | | | 9.29 | |
Class C (8/01) | | | | | | | | | | | | | | | | | | | | | | | | | | | | | | | | | | | | |
2018 | | | 7.79 | | | | 0.46 | | | | (0.28 | ) | | | 0.18 | | | | | | | | (0.47 | ) | | | — | | | | (0.47 | ) | | | 7.50 | |
2017 | | | 7.21 | | | | 0.49 | | | | 0.57 | | | | 1.06 | | | | | | | | (0.48 | ) | | | — | | | | (0.48 | ) | | | 7.79 | |
2016 | | | 8.22 | | | | 0.53 | | | | (1.07 | ) | | | (0.54 | ) | | | | | | | (0.47 | ) | | | — | | | | (0.47 | ) | | | 7.21 | |
2015 | | | 9.27 | | | | 0.49 | | | | (0.99 | ) | | | (0.50 | ) | | | | | | | (0.48 | ) | | | (0.07 | ) | | | (0.55 | ) | | | 8.22 | |
2014 | | | 8.98 | | | | 0.51 | | | | 0.52 | | | | 1.03 | | | | | | | | (0.54 | ) | | | (0.20 | ) | | | (0.74 | ) | | | 9.27 | |
Class R3 (9/01) | | | | | | | | | | | | | | | | | | | | | | | | | | | | | | | | | | | | |
2018 | | | 7.96 | | | | 0.52 | | | | (0.29 | ) | | | 0.23 | | | | | | | | (0.52 | ) | | | — | | | | (0.52 | ) | | | 7.67 | |
2017 | | | 7.37 | | | | 0.54 | | | | 0.58 | | | | 1.12 | | | | | | | | (0.53 | ) | | | — | | | | (0.53 | ) | | | 7.96 | |
2016 | | | 8.40 | | | | 0.57 | | | | (1.08 | ) | | | (0.51 | ) | | | | | | | (0.52 | ) | | | — | | | | (0.52 | ) | | | 7.37 | |
2015 | | | 9.48 | | | | 0.53 | | | | (1.01 | ) | | | (0.48 | ) | | | | | | | (0.53 | ) | | | (0.07 | ) | | | (0.60 | ) | | | 8.40 | |
2014 | | | 9.17 | | | | 0.57 | | | | 0.54 | | | | 1.11 | | | | | | | | (0.60 | ) | | | (0.20 | ) | | | (0.80 | ) | | | 9.48 | |
Class I (8/01) | | | | | | | | | | | | | | | | | | | | | | | | | | | | | | | | | | | | |
2018 | | | 7.82 | | | | 0.54 | | | | (0.27 | ) | | | 0.27 | | | | | | | | (0.55 | ) | | | — | | | | (0.55 | ) | | | 7.54 | |
2017 | | | 7.24 | | | | 0.56 | | | | 0.57 | | | | 1.13 | | | | | | | | (0.55 | ) | | | — | | | | (0.55 | ) | | | 7.82 | |
2016 | | | 8.26 | | | | 0.60 | | | | (1.07 | ) | | | (0.47 | ) | | | | | | | (0.55 | ) | | | — | | | | (0.55 | ) | | | 7.24 | |
2015 | | | 9.31 | | | | 0.57 | | | | (0.98 | ) | | | (0.41 | ) | | | | | | | (0.57 | ) | | | (0.07 | ) | | | (0.64 | ) | | | 8.26 | |
2014 | | | 9.01 | | | | 0.60 | | | | 0.53 | | | | 1.13 | | | | | | | | (0.63 | ) | | | (0.20 | ) | | | (0.83 | ) | | | 9.31 | |
Class T (5/17)(e) | | | | | | | | | | | | | | | | | | | | | | | | | | | | | | | | | | | | |
2018 | | | 7.82 | | | | 0.52 | | | | (0.28 | ) | | | 0.24 | | | | | | | | (0.53 | ) | | | — | | | | (0.53 | ) | | | 7.53 | |
2017(f) | | | 7.91 | | | | 0.05 | | | | (0.10 | ) | | | (0.05 | ) | | | | | | | (0.04 | ) | | | — | | | | (0.04 | ) | | | 7.82 | |
124
| | | | | | | | | | | | | | | | | | | | | | | | | | | | | | | | | | |
| | | | Ratios/Supplemental Data | |
| | | | | | | | | | Ratios to Average
Net Assets Before
Waiver/Reimbursement | | | | | | Ratios to Average
Net Assets After
Waiver/Reimbursement(c) | | | | |
| | | | | | | | |
Total
Return(b) | | | Ending
Net
Assets
(000) | | | | | | Expenses | | | Net
Investment
Income
(Losss) | | | | | | Expenses | | | Net
Investment
Income
(Losss) | | | Portfolio
Turnover
Rate(d) | |
| | | | | | | | | | | | | | | | | | | | | | | | | | | | | | | | | | |
| | 3.16 | % | | $ | 126,376 | | | | | | | | 1.04 | % | | | 6.66 | % | | | | | | | 1.00 | % | | | 6.70 | % | | | 126 | % |
| | 15.75 | | | | 136,977 | | | | | | | | 1.01 | | | | 7.03 | | | | | | | | 1.01 | | | | 7.03 | | | | 155 | |
| | 5.48 | | | | 114,537 | | | | | | | | 1.03 | | | | 7.99 | | | | | | | | 1.03 | | | | 7.99 | | | | 91 | |
| | (4.82 | ) | | | 119,535 | | | | | | | | 0.97 | | | | 6.31 | | | | | | | | 0.97 | | | | 6.31 | | | | 80 | |
| | 12.88 | | | | 209,830 | | | | | | | | 0.95 | | | | 6.37 | | | | | | | | 0.95 | | | | 6.37 | | | | 85 | |
| | | | | | | | | | | | | | | | | | | | | | | | | | | | | | | | | | |
| | 2.37 | | | | 41,121 | | | | | | | | 1.80 | | | | 5.96 | | | | | | | | 1.75 | | | | 6.00 | | | | 126 | |
| | 14.93 | | | | 47,698 | | | | | | | | 1.76 | | | | 6.32 | | | | | | | | 1.76 | | | | 6.32 | | | | 155 | |
| | (6.27 | ) | | | 41,663 | | | | | | | | 1.79 | | | | 7.26 | | | | | | | | 1.79 | | | | 7.26 | | | | 91 | |
| | (5.45 | ) | | | 55,409 | | | | | | | | 1.72 | | | | 5.62 | | | | | | | | 1.72 | | | | 5.62 | | | | 80 | |
| | 11.98 | | | | 71,974 | | | | | | | | 1.70 | | | | 5.64 | | | | | | | | 1.70 | | | | 5.64 | | | | 85 | |
| | | | | | | | | | | | | | | | | | | | | | | | | | | | | | | | | | |
| | 2.94 | | | | 473 | | | | | | | | 1.30 | | | | 6.48 | | | | | | | | 1.25 | | | | 6.52 | | | | 126 | |
| | 15.46 | | | | 756 | | | | | | | | 1.26 | | | | 6.80 | | | | | | | | 1.26 | | | | 6.81 | | | | 155 | |
| | (5.76 | ) | | | 834 | | | | | | | | 1.29 | | | | 7.78 | | | | | | | | 1.29 | | | | 7.78 | | | | 91 | |
| | (5.07 | ) | | | 995 | | | | | | | | 1.21 | | | | 6.03 | | | | | | | | 1.21 | | | | 6.03 | | | | 80 | |
| | 12.65 | | | | 1,099 | | | | | | | | 1.20 | | | | 6.09 | | | | | | | | 1.20 | | | | 6.09 | | | | 85 | |
| | | | | | | | | | | | | | | | | | | | | | | | | | | | | | | | | | |
| | 3.52 | | | | 139,777 | | | | | | | | 0.79 | | | | 6.91 | | | | | | | | 0.75 | | | | 6.95 | | | | 126 | |
| | 15.97 | | | | 200,310 | | | | | | | | 0.75 | | | | 7.31 | | | | | | | | 0.76 | | | | 7.31 | | | | 155 | |
| | (5.21 | ) | | | 208,009 | | | | | | | | 0.78 | | | | 8.12 | | | | | | | | 0.78 | | | | 8.12 | | | | 91 | |
| | (4.55 | ) | | | 446,406 | | | | | | | | 0.72 | | | | 6.56 | | | | | | | | 0.72 | | | | 6.56 | | | | 80 | |
| | 13.15 | | | | 719,640 | | | | | | | | 0.71 | | | | 6.61 | | | | | | | | 0.71 | | | | 6.61 | | | | 85 | |
| | | | | | | | | | | | | | | | | | | | | | | | | | | | | | | | | | |
| | 3.28 | | | | 24 | | | | | | | | 1.04 | | | | 6.72 | | | | | | | | 1.00 | | | | 6.76 | | | | 126 | |
| | (0.58 | ) | | | 25 | | | | | | | | 0.98 | * | | | 7.78 | * | | | | | | | 1.00 | * | | | 7.78 | * | | | 155 | |
| (a) | Per share Net Investment Income (Loss) is calculated using the average daily shares method. | |
| (b) | Total return is the combination of changes in NAV without any sales charge, reinvested dividend income at NAV and reinvested capital gains distributions at NAV, if any. Total returns are not annualized. | |
| (c) | After fee waiver and/or expense reimbursement from the Adviser, where applicable. See Note 7 – Management Fees and Other Transactions with Affiliates, Management Fees for more information. For the period October 31, 2014 through June 29, 2016, the Adviser did not reimburse the Fund for any fees and expenses. | |
| (d) | Portfolio Turnover Rate is calculated based on the lesser of long-term purchases or sales (as disclosed in Note 5 – Investment Transactions) divided by the average long-term market value during the period. | |
| (e) | Class T Shares are not available for public offering. | |
| (f) | For the period May 31, 2017 (commencement of operations) through June 30, 2017. | |
See accompanying notes to financial statements.
125
Financial Highlights (continued)
Inflation Protected Securities
Selected data for a share outstanding throughout each period:
| | | | | | | | | | | | | | | | | | | | | | | | | | | | | | | | | | | | | | | | |
| | | | | |
| | | | | | Investment Operations | | | | | | Less Distributions | | | | |
| | | | | | | | | | |
Class (Commencement Date) Year Ended June 30, | | Beginning
NAV | | | Net
Investment
Income
(Loss)(a) | | | Net
Realized/
Unrealized
Gain (Loss) | | | Total | | | | | | From
Net
Investment
Income | | | From
Accumulated
Net Realized
Gains | | | Return
of
Capital | | | Total | | | Ending
NAV | |
Class A (10/04) | | | | | | | | | | | | | | | | | | | | | | | | | | | | | | | | | | | | | |
2018 | | $ | 11.01 | | | $ | 0.23 | | | $ | (0.06 | ) | | $ | 0.17 | | | | | | | $ | (0.29 | ) | | $ | — | | | $ | — | | | $ | (0.29 | ) | | $ | 10.89 | |
2017 | | | 11.30 | | | | 0.18 | | | | (0.35 | ) | | | (0.17 | ) | | | | | | | (0.12 | ) | | | — | | | | — | | | | (0.12 | ) | | | 11.01 | |
2016 | | | 10.92 | | | | 0.06 | | | | 0.32 | | | | 0.38 | | | | | | | | — | | | | — | | | | — | | | | — | | | | 11.30 | |
2015 | | | 11.26 | | | | (0.03 | ) | | | (0.20 | ) | | | (0.23 | ) | | | | | | | (0.07 | ) | | | — | | | | (0.04 | ) | | | (0.11 | ) | | | 10.92 | |
2014 | | | 11.08 | | | | 0.15 | | | | 0.32 | | | | 0.47 | | | | | | | | (0.09 | ) | | | (0.20 | ) | | | — | | | | (0.29 | ) | | | 11.26 | |
Class C (10/04) | | | | | | | | | | | | | | | | | | | | | | | | | | | | | | | | | | | | | |
2018 | | | 10.83 | | | | 0.14 | | | | (0.06 | ) | | | 0.08 | | | | | | | | (0.20 | ) | | | — | | | | — | | | | (0.20 | ) | | | 10.71 | |
2017 | | | 11.14 | | | | 0.10 | | | | (0.36 | ) | | | (0.26 | ) | | | | | | | (0.05 | ) | | | — | | | | — | | | | (0.05 | ) | | | 10.83 | |
2016 | | | 10.84 | | | | (0.05 | ) | | | 0.35 | | | | 0.30 | | | | | | | | — | | | | — | | | | — | | | | — | | | | 11.14 | |
2015 | | | 11.21 | | | | (0.11 | ) | | | (0.20 | ) | | | (0.31 | ) | | | | | | | (0.02 | ) | | | — | | | | (0.04 | ) | | | (0.06 | ) | | | 10.84 | |
2014 | | | 11.03 | | | | 0.06 | | | | 0.35 | | | | 0.41 | | | | | | | | (0.03 | ) | | | (0.20 | ) | | | — | | | | (0.23 | ) | | | 11.21 | |
Class R3 (10/04) | | | | | | | | | | | | | | | | | | | | | | | | | | | | | | | | | | | | | |
2018 | | | 10.91 | | | | 0.21 | | | | (0.07 | ) | | | 0.14 | | | | | | | | (0.26 | ) | | | — | | | | — | | | | (0.26 | ) | | | 10.79 | |
2017 | | | 11.21 | | | | 0.15 | | | | (0.36 | ) | | | (0.21 | ) | | | | | | | (0.09 | ) | | | — | | | | — | | | | (0.09 | ) | | | 10.91 | |
2016 | | | 10.85 | | | | 0.01 | | | | 0.35 | | | | 0.36 | | | | | | | | — | | | | — | | | | — | | | | — | | | | 11.21 | |
2015 | | | 11.21 | | | | (0.11 | ) | | | (0.16 | ) | | | (0.27 | ) | | | | | | | (0.05 | ) | | | — | | | | (0.04 | ) | | | (0.09 | ) | | | 10.85 | |
2014 | | | 11.05 | | | | 0.29 | | | | 0.14 | | | | 0.43 | | | | | | | | (0.07 | ) | | | (0.20 | ) | | | — | | | | (0.27 | ) | | | 11.21 | |
Class R6 (1/15) | | | | | | | | | | | | | | | | | | | | | | | | | | | | | | | | | | | | | |
2018 | | | 11.19 | | | | 0.33 | | | | (0.10 | ) | | | 0.23 | | | | | | | | (0.32 | ) | | | — | | | | — | | | | (0.32 | ) | | | 11.10 | |
2017 | | | 11.46 | | | | 0.26 | | | | (0.39 | ) | | | (0.13 | ) | | | | | | | (0.14 | ) | | | — | | | | — | | | | (0.14 | ) | | | 11.19 | |
2016 | | | 11.02 | | | | 0.09 | | | | 0.35 | | | | 0.44 | | | | | | | | — | | | | — | | | | — | | | | — | | | | 11.46 | |
2015(e) | | | 11.18 | | | | — | * | | | (0.16 | ) | | | (0.16 | ) | | | | | | | — | | | | — | | | | — | * | | | — | | | | 11.02 | |
Class I (10/04) | | | | | | | | | | | | | | | | | | | | | | | | | | | | | | | | | | | | | |
2018 | | | 11.14 | | | | 0.26 | | | | (0.06 | ) | | | 0.20 | | | | | | | | (0.32 | ) | | | — | | | | — | | | | (0.32 | ) | | | 11.02 | |
2017 | | | 11.43 | | | | 0.22 | | | | (0.37 | ) | | | (0.15 | ) | | | | | | | (0.14 | ) | | | — | | | | — | | | | (0.14 | ) | | | 11.14 | |
2016 | | | 11.02 | | | | 0.08 | | | | 0.33 | | | | 0.41 | | | | | | | | — | | | | — | | | | — | | | | — | | | | 11.43 | |
2015 | | | 11.35 | | | | (0.01 | ) | | | (0.19 | ) | | | (0.20 | ) | | | | | | | (0.09 | ) | | | — | | | | (0.04 | ) | | | (0.13 | ) | | | 11.02 | |
2014 | | | 11.14 | | | | 0.19 | | | | 0.33 | | | | 0.52 | | | | | | | | (0.11 | ) | | | (0.20 | ) | | | — | | | | (0.31 | ) | | | 11.35 | |
126
| | | | | | | | | | | | | | | | | | | | | | | | | | | | | | | | | | |
| | | | Ratios/Supplemental Data | |
| | | | | | | | | | Ratios to Average
Net Assets Before
Waiver/Reimbursement | | | | | | Ratios to Average
Net Assets After
Waiver/Reimbursement(c) | | | | |
| | | | | | | | |
Total
Return(b) | | | Ending
Net
Assets
(000) | | | | | | Expenses | | | Net
Investment
Income
(Loss) | | | | | | Expenses | | | Net
Investment
Income
(Loss) | | | Portfolio
Turnover
Rate(d) | |
| | | | | | | | | | | | | | | | | | | | | | | | | | | | | | | | | | |
| | 1.53 | % | | $ | 98,003 | | | | | | | | 0.97 | % | | | 1.93 | % | | | | | | | 0.78 | % | | | 2.12 | % | | | 24 | % |
| | (1.53 | ) | | | 104,588 | | | | | | | | 0.96 | | | | 1.47 | | | | | | | | 0.79 | | | | 1.65 | | | | 49 | |
| | 3.48 | | | | 93,104 | | | | | | | | 0.96 | | | | 0.45 | | | | | | | | 0.83 | | | | 0.58 | | | | 26 | |
| | (2.04 | ) | | | 42,341 | | | | | | | | 0.92 | | | | (0.38 | ) | | | | | | | 0.83 | | | | (0.29 | ) | | | 34 | |
| | 4.35 | | | | 24,020 | | | | | | | | 0.86 | | | | 1.30 | | | | | | | | 0.83 | | | | 1.33 | | | | 48 | |
| | | | | | | | | | | | | | | | | | | | | | | | | | | | | | | | | | |
| | 0.77 | | | | 9,328 | | | | | | | | 1.72 | | | | 1.15 | | | | | | | | 1.53 | | | | 1.34 | | | | 24 | |
| | (2.33 | ) | | | 10,639 | | | | | | | | 1.71 | | | | 0.75 | | | | | | | | 1.54 | | | | 0.93 | | | | 49 | |
| | 2.77 | | | | 13,131 | | | | | | | | 1.71 | | | | (0.61 | ) | | | | | | | 1.58 | | | | (0.47 | ) | | | 26 | |
| | (2.75 | ) | | | 9,366 | | | | | | | | 1.66 | | | | (1.06 | ) | | | | | | | 1.58 | | | | (0.98 | ) | | | 34 | |
| | 3.76 | | | | 6,954 | | | | | | | | 1.61 | | | | 0.50 | | | | | | | | 1.58 | | | | 0.52 | | | | 48 | |
| | | | | | | | | | | | | | | | | | | | | | | | | | | | | | | | | | |
| | 1.26 | | | | 5,697 | | | | | | | | 1.22 | | | | 1.76 | | | | | | | | 1.03 | | | | 1.94 | | | | 24 | |
| | (1.86 | ) | | | 5,618 | | | | | | | | 1.21 | | | | 1.21 | | | | | | | | 1.04 | | | | 1.38 | | | | 49 | |
| | 3.32 | | | | 13,094 | | | | | | | | 1.22 | | | | (0.05 | ) | | | | | | | 1.08 | | | | 0.08 | | | | 26 | |
| | (2.38 | ) | | | 3,693 | | | | | | | | 1.15 | | | | (1.05 | ) | | | | | | | 1.08 | | | | (0.98 | ) | | | 34 | |
| | 3.97 | | | | 3,447 | | | | | | | | 1.13 | | | | 2.63 | | | | | | | | 1.08 | | | | 2.68 | | | | 48 | |
| | | | | | | | | | | | | | | | | | | | | | | | | | | | | | | | | | |
| | 2.06 | | | | 62,119 | | | | | | | | 0.48 | | | | 2.76 | | | | | | | | 0.28 | | | | 2.95 | | | | 24 | |
| | (1.10 | ) | | | 23,654 | | | | | | | | 0.48 | | | | 1.12 | | | | | | | | 0.30 | | | | 2.30 | | | | 49 | |
| | 3.99 | | | | 3,773 | | | | | | | | 0.50 | | | | 0.71 | | | | | | | | 0.37 | | | | 0.84 | | | | 26 | |
| | (1.39 | ) | | | 3,074 | | | | | | | | 0.52 | ** | | | (0.12 | )** | | | | | | | 0.41 | ** | | | (0.01 | )** | | | 34 | |
| | | | | | | | | | | | | | | | | | | | | | | | | | | | | | | | | | |
| | 1.79 | | | | 442,581 | | | | | | | | 0.72 | | | | 2.18 | | | | | | | | 0.53 | | | | 2.36 | | | | 24 | |
| | (1.27 | ) | | | 458,852 | | | | | | | | 0.71 | | | | 1.76 | | | | | | | | 0.54 | | | | 1.93 | | | | 49 | |
| | 3.72 | | | | 404,801 | | | | | | | | 0.71 | | | | 0.57 | | | | | | | | 0.58 | | | | 0.70 | | | | 26 | |
| | (1.78 | ) | | | 331,707 | | | | | | | | 0.66 | | | | (0.13 | ) | | | | | | | 0.58 | | | | (0.05 | ) | | | 34 | |
| | 4.82 | | | | 321,472 | | | | | | | | 0.61 | | | | 1.65 | | | | | | | | 0.58 | | | | 1.68 | | | | 48 | |
| (a) | Per share Net Investment Income (Loss) is calculated using the average daily shares method. | |
| (b) | Total return is the combination of changes in NAV without any sales charge, reinvested dividend income at NAV and reinvested capital gains distributions at NAV, if any. Total returns are not annualized. | |
| (c) | After fee waiver and/or expense reimbursement from the Adviser, where applicable. See Note 7 – Management Fees and Other Transactions with Affiliates, Management Fees for more information. | |
| (d) | Portfolio Turnover Rate is calculated based on the lesser of long-term purchases or sales (as disclosed in Note 5 – Investment Transactions) divided by the average long-term market value during the period. | |
| (e) | For the period January 20, 2015 (commencement of operations) through June 30, 2015. | |
| * | Rounds to less than $0.01 per share. | |
See accompanying notes to financial statements.
127
Financial Highlights (continued)
Short Term Bond
Selected data for a share outstanding throughout each period:
| | | | | | | | | | | | | | | | | | | | | | | | | | | | | | | | | | | | | | | | |
| | | | | |
| | | | | | Investment Operations | | | | | | Less Distributions | | | | |
| | | | | | | | | | |
Class (Commencement Date) Year Ended June 30, | | Beginning
NAV | | | Net
Investment
Income
(Loss)(a) | | | Net
Realized/
Unrealized
Gain (Loss) | | | Total | | | | | | From
Net
Investment
Income | | | From
Accumulated
Net Realized
Gains | | | Return
of
Capital | | | Total | | | Ending
NAV | |
Class A (12/92) | | | | | | | | | | | | | | | | | | | | | | | | | | | | | |
2018 | | $ | 9.86 | | | $ | 0.17 | | | $ | (0.14 | ) | | $ | 0.03 | | | | | | | $ | (0.16 | ) | | $ | — | | | $ | — | | | $ | (0.16 | ) | | $ | 9.73 | |
2017 | | | 9.88 | | | | 0.16 | | | | (0.02 | ) | | | 0.14 | | | | | | | | (0.15 | ) | | | — | | | | (0.01 | ) | | | (0.16 | ) | | | 9.86 | |
2016 | | | 9.93 | | | | 0.16 | | | | (0.06 | ) | | | 0.10 | | | | | | | | (0.15 | ) | | | — | | | | — | | | | (0.15 | ) | | | 9.88 | |
2015 | | | 10.05 | | | | 0.16 | | | | (0.13 | ) | | | 0.03 | | | | | | | | (0.15 | ) | | | — | | | | — | | | | (0.15 | ) | | | 9.93 | |
2014 | | | 9.97 | | | | 0.19 | | | | 0.08 | | | | 0.27 | | | | | | | | (0.19 | ) | | | — | | | | — | | | | (0.19 | ) | | | 10.05 | |
Class C (10/09) | | | | | | | | | | | | | | | | | | | | | | | | | | | | | |
2018 | | | 9.90 | | | | 0.10 | | | | (0.14 | ) | | | (0.04 | ) | | | | | | | (0.08 | ) | | | — | | | | — | | | | (0.08 | ) | | | 9.78 | |
2017 | | | 9.92 | | | | 0.08 | | | | (0.02 | ) | | | 0.06 | | | | | | | | (0.07 | ) | | | — | | | | (0.01 | ) | | | (0.08 | ) | | | 9.90 | |
2016 | | | 9.97 | | | | 0.09 | | | | (0.07 | ) | | | 0.02 | | | | | | | | (0.07 | ) | | | — | | | | — | | | | (0.07 | ) | | | 9.92 | |
2015 | | | 10.08 | | | | 0.08 | | | | (0.12 | ) | | | (0.04 | ) | | | | | | | (0.07 | ) | | | — | | | | — | | | | (0.07 | ) | | | 9.97 | |
2014 | | | 10.00 | | | | 0.11 | | | | 0.08 | | | | 0.19 | | | | | | | | (0.11 | ) | | | — | | | | — | | | | (0.11 | ) | | | 10.08 | |
Class R3 (9/11) | | | | | | | | | | | | | | | | | | | | | | | | | | | | | |
2018 | | | 9.88 | | | | 0.14 | | | | (0.13 | ) | | | 0.01 | | | | | | | | (0.13 | ) | | | — | | | | — | | | | (0.13 | ) | | | 9.76 | |
2017 | | | 9.90 | | | | 0.13 | | | | (0.02 | ) | | | 0.11 | | | | | | | | (0.12 | ) | | | — | | | | (0.01 | ) | | | (0.13 | ) | | | 9.88 | |
2016 | | | 9.95 | | | | 0.14 | | | | (0.07 | ) | | | 0.07 | | | | | | | | (0.12 | ) | | | — | | | | — | | | | (0.12 | ) | | | 9.90 | |
2015 | | | 10.07 | | | | 0.13 | | | | (0.13 | ) | | | — | | | | | | | | (0.12 | ) | | | — | | | | — | | | | (0.12 | ) | | | 9.95 | |
2014 | | | 9.99 | | | | 0.16 | | | | 0.08 | | | | 0.24 | | | | | | | | (0.16 | ) | | | — | | | | — | | | | (0.16 | ) | | | 10.07 | |
Class R6 (1/15) | | | | | | | | | | | | | | | | | | | | | | | | | | | | | |
2018 | | | 9.88 | | | | 0.20 | | | | (0.14 | ) | | | 0.06 | | | | | | |
| (0.18
| )
| | | — | | | | — | | | | (0.18 | ) | | | 9.76 | |
2017 | | | 9.90 | | | | 0.19 | | | | (0.03 | ) | | | 0.16 | | | | | | | | (0.17 | ) | | | — | | | | (0.01 | ) | | | (0.18 | ) | | | 9.88 | |
2016 | | | 9.95 | | | | 0.19 | | | | (0.06 | ) | | | 0.13 | | | | | | | | (0.18 | ) | | | — | | | | — | | | | (0.18 | ) | | | 9.90 | |
2015(e) | | | 9.93 | | | | 0.09 | | | | — | * | | | 0.09 | | | | | | | | (0.07 | ) | | | — | | | | — | | | | (0.07 | ) | | | 9.95 | |
Class I (2/94) | | | | | | | | | | | | | | | | | | | | | | | | | | | | | |
2018 | | | 9.87 | | | | 0.19 | | | | (0.14 | ) | | | 0.05 | | | | | | | | (0.18 | ) | | | — | | | | — | | | | (0.18 | ) | | | 9.74 | |
2017 | | | 9.89 | | | | 0.18 | | | | (0.02 | ) | | | 0.16 | | | | | | | | (0.17 | ) | | | — | | | | (0.01 | ) | | | (0.18 | ) | | | 9.87 | |
2016 | | | 9.94 | | | | 0.19 | | | | (0.06 | ) | | | 0.13 | | | | | | | | (0.18 | ) | | | — | | | | — | | | | (0.18 | ) | | | 9.89 | |
2015 | | | 10.06 | | | | 0.18 | | | | (0.12 | ) | | | 0.06 | | | | | | | | (0.18 | ) | | | — | | | | — | | | | (0.18 | ) | | | 9.94 | |
2014 | | | 9.98 | | | | 0.21 | | | | 0.08 | | | | 0.29 | | | | | | | | (0.21 | ) | | | — | | | | — | | | | (0.21 | ) | | | 10.06 | |
128
| | | | | | | | | | | | | | | | | | | | | | | | | | | | | | | | | | |
| | | | Ratios/Supplemental Data | |
| | | | | | | | | | Ratios to Average
Net Assets Before
Waiver/Reimbursement | | | | | | Ratios to Average
Net Assets After
Waiver/Reimbursement(c) | | | | |
| | | | | | | | |
Total
Return(b) | | | Ending
Net
Assets
(000) | | | | | | Expenses | | | Net
Investment
Income
(Loss) | | | | | | Expenses | | | Net
Investment
Income
(Loss) | | | Portfolio
Turnover
Rate(d) | |
| | | | | | | | | | | | | | | | | | | | | | | | | | | | | | | | | | |
| | 0.30 | % | | $ | 78,315 | | | | | | | | 0.78 | % | | | 1.66 | % | | | | | | | 0.72 | % | | | 1.72 | % | | | 60 | % |
| | 1.39 | | | | 92,967 | | | | | | | | 0.77 | | | | 1.54 | | | | | | | | 0.72 | | | | 1.59 | | | | 50 | |
| | 1.04 | | | | 96,201 | | | | | | | | 0.76 | | | | 1.60 | | | | | | | | 0.72 | | | | 1.64 | | | | 43 | |
| | 0.32 | | | | 100,544 | | | | | | | | 0.73 | | | | 1.56 | | | | | | | | 0.71 | | | | 1.58 | | | | 43 | |
| | 2.69 | | | | 116,365 | | | | | | | | 0.73 | | | | 1.84 | | | | | | | | 0.71 | | | | 1.86 | | | | 43 | |
| | | | | | | | | | | | | | | | | | | | | | | | | | | | | | | | | | |
| | (0.40 | ) | | | 16,767 | | | | | | | | 1.54 | | | | 0.90 | | | | | | | | 1.47 | | | | 0.97 | | | | 60 | |
| | 0.59 | | | | 25,326 | | | | | | | | 1.52 | | | | 0.79 | | | | | | | | 1.47 | | | | 0.85 | | | | 50 | |
| | 0.25 | | | | 30,495 | | | | | | | | 1.51 | | | | 0.86 | | | | | | | | 1.47 | | | | 0.90 | | | | 43 | |
| | (0.36 | ) | | | 33,547 | | | | | | | | 1.48 | | | | 0.81 | | | | | | | | 1.46 | | | | 0.83 | | | | 43 | |
| | 1.89 | | | | 39,347 | | | | | | | | 1.48 | | | | 1.11 | | | | | | | | 1.46 | | | | 1.13 | | | | 43 | |
| | | | | | | | | | | | | | | | | | | | | | | | | | | | | | | | | | |
| | 0.09 | | | | 204 | | | | | | | | 1.03 | | | | 1.40 | | | | | | | | 0.97 | | | | 1.46 | | | | 60 | |
| | 1.08 | | | | 436 | | | | | | | | 1.02 | | | | 1.30 | | | | | | | | 0.97 | | | | 1.35 | | | | 50 | |
| | 0.74 | | | | 285 | | | | | | | | 1.01 | | | | 1.34 | | | | | | | | 0.97 | | | | 1.38 | | | | 43 | |
| | 0.02 | | | | 131 | | | | | | | | 0.98 | | | | 1.29 | | | | | | | | 0.96 | | | | 1.31 | | | | 43 | |
| | 2.38 | | | | 1,049 | | | | | | | | 0.98 | | | | 1.59 | | | | | | | | 0.96 | | | | 1.61 | | | | 43 | |
| | | | | | | | | | | | | | | | | | | | | | | | | | | | | | | | | | |
| | 0.64 | | | | 77,313 | | | | | | | | 0.49 | | | | 1.95 | | | | | | | | 0.42 | | | | 2.02 | | | | 60 | |
| | 1.63 | | | | 95,754 | | | | | | | | 0.48 | | | | 1.87 | | | | | | | | 0.42 | | | | 1.92 | | | | 50 | |
| | 1.29 | | | | 66,836 | | | | | | | | 0.47 | | | | 1.91 | | | | | | | | 0.43 | | | | 1.95 | | | | 43 | |
| | 0.96 | | | | 27,475 | | | | | | | | 0.46 | ** | | | 1.95 | ** | | | | | | | 0.43 | ** | | | 1.98 | ** | | | 43 | |
| | | | | | | | | | | | | | | | | | | | | | | | | | | | | | | | | | |
| | 0.54 | | | | 290,872 | | | | | | | | 0.53 | | | | 1.91 | | | | | | | | 0.47 | | | | 1.97 | | | | 60 | |
| | 1.63 | | | | 347,215 | | | | | | | | 0.52 | | | | 1.79 | | | | | | | | 0.47 | | | | 1.84 | | | | 50 | |
| | 1.29 | | | | 416,624 | | | | | | | | 0.51 | | | | 1.85 | | | | | | | | 0.47 | | | | 1.89 | | | | 43 | |
| | 0.57 | | | | 529,027 | | | | | | | | 0.48 | | | | 1.80 | | | | | | | | 0.46 | | | | 1.82 | | | | 43 | |
| | 2.93 | | | | 915,119 | | | | | | | | 0.48 | | | | 2.09 | | | | | | | | 0.46 | | | | 2.11 | | | | 43 | |
| (a) | Per share Net Investment Income (Loss) is calculated using the average daily shares method. | |
| (b) | Total return is the combination of changes in NAV without any sales charge, reinvested dividend income at NAV and reinvested capital gains distributions at NAV, if any. Total returns are not annualized. | |
| (c) | After fee waiver and/or expense reimbursement from the Adviser, where applicable. See Note 7 – Management Fees and Other Transactions with Affiliates, Management Fees for more information. | |
| (d) | Portfolio Turnover Rate is calculated based on the lesser of long-term purchases or sales (as disclosed in Note 5 – Investment Transactions) divided by the average long-term market value during the period. | |
| (e) | For the period January 20, 2015 (commencement of operations) through June 30, 2015. | |
| * | Rounds to less than $0.01 per share. | |
See accompanying notes to financial statements.
129
Financial Highlights (continued)
Strategic Income
Selected data for a share outstanding throughout each period:
| | | | | | | | | | | | | | | | | | | | | | | | | | | | | | | | | | | | | | | | |
| | | | | |
| | | | | | Investment Operations | | | | | | Less Distributions | | | | |
| | | | | | | | | | |
Class (Commencement Date) Year Ended June 30, | | Beginning
NAV | | | Net
Investment
Income
(Loss)(a) | | | Net
Realized/
Unrealized
Gain (Loss) | | | Total | | | | | | Net
Investment
Income | | | From
Accumulated
Net Realized
Gains | | | Return
of
Capital | | | Total | | | Ending
NAV | |
Class A (2/00) | | | | | | | | | | | | | | | | | | | | | | | | | | | | | | | | | | | | | | | | |
2018 | | $ | 10.65 | | | $ | 0.36 | | | $ | (0.43 | ) | | $ | (0.07 | ) | | | | | | $ | (0.21 | ) | | $ | — | | | $ | (0.20 | ) | | $ | (0.41 | ) | | $ | 10.17 | |
2017 | | | 10.52 | | | | 0.44 | | | | 0.22 | | | | 0.66 | | | | | | | | (0.29 | ) | | | — | | | | (0.24 | ) | | | (0.53 | ) | | | 10.65 | |
2016 | | | 10.97 | | | | 0.50 | | | | (0.42 | ) | | | 0.08 | | | | | | | | (0.53 | ) | | | — | | | | — | | | | (0.53 | ) | | | 10.52 | |
2015 | | | 11.60 | | | | 0.49 | | | | (0.58 | ) | | | (0.09 | ) | | | | | | | (0.54 | ) | | | — | | | | — | | | | (0.54 | ) | | | 10.97 | |
| 2014 | | | 11.02 | | | | 0.53 | | | | 0.59 | | | | 1.12 | | | | | | | | (0.54 | ) | | | — | | | | — | | | | (0.54 | ) | | | 11.60 | |
Class C (2/00) | | | | | | | | | | | | | | | | | | | | | | | | | | | | | | | | | | | | | | | | |
2018 | | | 10.59 | | | | 0.28 | | | | (0.42 | ) | | | (0.14 | ) | | | | | | | (0.13 | ) | | | — | | | | (0.20 | ) | | | (0.33 | ) | | | 10.12 | |
2017 | | | 10.46 | | | | 0.35 | | | | 0.23 | | | | 0.58 | | | | | | | | (0.21 | ) | | | — | | | | (0.24 | ) | | | (0.45 | ) | | | 10.59 | |
2016 | | | 10.90 | | | | 0.42 | | | | (0.41 | ) | | | 0.01 | | | | | | | | (0.45 | ) | | | — | | | | — | | | | (0.45 | ) | | | 10.46 | |
2015 | | | 11.52 | | | | 0.40 | | | | (0.57 | ) | | | (0.17 | ) | | | | | | | (0.45 | ) | | | — | | | | — | | | | (0.45 | ) | | | 10.90 | |
| 2014 | | | 10.94 | | | | 0.44 | | | | 0.60 | | | | 1.04 | | | | | | | | (0.46 | ) | | | — | | | | — | | | | (0.46 | ) | | | 11.52 | |
Class R3 (9/01) | | | | | | | | | | | | | | | | | | | | | | | | | | | | | | | | | | | | | | | | |
2018 | | | 10.69 | | | | 0.33 | | | | (0.42 | ) | | | (0.09 | ) | | | | | | | (0.19 | ) | | | — | | | | (0.20 | ) | | | (0.39 | ) | | | 10.21 | |
2017 | | | 10.56 | | | | 0.41 | | | | 0.23 | | | | 0.64 | | | | | | | | (0.27 | ) | | | — | | | | (0.24 | ) | | | (0.51 | ) | | | 10.69 | |
2016 | | | 11.01 | | | | 0.48 | | | | (0.42 | ) | | | 0.06 | | | | | | | | (0.51 | ) | | | — | | | | — | | | | (0.51 | ) | | | 10.56 | |
2015 | | | 11.64 | | | | 0.46 | | | | (0.57 | ) | | | (0.11 | ) | | | | | | | (0.52 | ) | | | — | | | | — | | | | (0.52 | ) | | | 11.01 | |
| 2014 | | | 11.05 | | | | 0.51 | | | | 0.60 | | | | 1.11 | | | | | | | | (0.52 | ) | | | — | | | | — | | | | (0.52 | ) | | | 11.64 | |
Class R6 (1/15) | | | | | | | | | | | | | | | | | | | | | | | | | | | | | | | | | | | | | | | | |
2018 | | | 10.67 | | | | 0.39 | | | | (0.42 | ) | | | (0.03 | ) | | | | | | | (0.24 | ) | | | — | | | | (0.20 | ) | | | (0.44 | ) | | | 10.20 | |
2017 | | | 10.52 | | | | 0.48 | | | | 0.23 | | | | 0.71 | | | | | | | | (0.32 | ) | | | — | | | | (0.24 | ) | | | (0.56 | ) | | | 10.67 | |
2016 | | | 10.96 | | | | 0.53 | | | | (0.41 | ) | | | 0.12 | | | | | | | | (0.56 | ) | | | — | | | | — | | | | (0.56 | ) | | | 10.52 | |
2015(e) | | | 11.22 | | | | 0.24 | | | | (0.25 | ) | | | (0.01 | ) | | | | | | | (0.25 | ) | | | — | | | | — | | | | (0.25 | ) | | | 10.96 | |
Class I (2/00) | | | | | | | | | | | | | | | | | | | | | | | | | | | | | | | | | | | | | | | | |
2018 | | | 10.65 | | | | 0.38 | | | | (0.42 | ) | | | (0.04 | ) | | | | | | | (0.24 | ) | | | — | | | | (0.20 | ) | | | (0.44 | ) | | | 10.17 | |
2017 | | | 10.51 | | | | 0.46 | | | | 0.24 | | | | 0.70 | | | | | | | | (0.32 | ) | | | — | | | | (0.24 | ) | | | (0.56 | ) | | | 10.65 | |
2016 | | | 10.96 | | | | 0.53 | | | | (0.42 | ) | | | 0.11 | | | | | | | | (0.56 | ) | | | — | | | | — | | | | (0.56 | ) | | | 10.51 | |
2015 | | | 11.59 | | | | 0.52 | | | | (0.58 | ) | | | (0.06 | ) | | | | | | | (0.57 | ) | | | — | | | | — | | | | (0.57 | ) | | | 10.96 | |
| 2014 | | | 11.01 | | | | 0.56 | | | | 0.59 | | | | 1.15 | | | | | | | | (0.57 | ) | | | — | | | | — | | | | (0.57 | ) | | | 11.59 | |
Class T (5/17)(f) | | | | | | | | | | | | | | | | | | | | | | | | | | | | | | | | | | | | | | | | |
2018 | | | 10.65 | | | | 0.36 | | | | (0.43 | ) | | | (0.07 | ) | | | | | | | (0.21 | ) | | | — | | | | (0.20 | ) | | | (0.41 | ) | | | 10.17 | |
2017(g) | | | 10.67 | | | | 0.03 | | | | (0.01 | ) | | | 0.02 | | | | | | | | — | | | | — | | | | (0.04 | ) | | | (0.04 | ) | | | 10.65 | |
130
| | | | | | | | | | | | | | | | | | | | | | | | | | | | | | | | | | |
| | | | Ratios/Supplemental Data | |
| | | | | | | | | | Ratios to Average
Net Assets Before
Waive/Reimbursement | | | | | | Ratios to Average
Net Assets After
Waive/Reimbursement(c) | | | | |
| | | | | | | | |
Total
Return(b) | | | Ending
Net
Assets
(000) | | | | | | Expenses | | | Net
Investment
Income
(Loss) | | | | | | Expenses | | | Net
Investment
Income
(Loss) | | | Portfolio
Turnover
Rate(d) | |
| | | | | | | | | | | | | | | | | | | | | | | | | | | | | | | | | | |
| | (0.70 | )% | | $ | 106,805 | | | | | | | | 0.93 | % | | | 3.31 | % | | | | | | | 0.83 | % | | | 3.41 | % | | | 124 | % |
| | 6.43 | | | | 137,072 | | | | | | | | 0.93 | | | | 4.02 | | | | | | | | 0.83 | | �� | | 4.12 | | | | 135 | |
| | 0.94 | | | | 187,052 | | | | | | | | 0.92 | | | | 4.71 | | | | | | | | 0.83 | | | | 4.80 | | | | 56 | |
| | (0.80 | ) | | | 288,080 | | | | | | | | 0.92 | | | | 4.25 | | | | | | | | 0.82 | | | | 4.34 | | | | 47 | |
| | 10.46 | | | | 128,189 | | | | | | | | 0.91 | | | | 4.65 | | | | | | | | 0.84 | | | | 4.73 | | | | 50 | |
| | | | | | | | | | | | | | | | | | | | | | | | | | | | | | | | | | |
| | (1.40 | ) | | | 59,612 | | | | | | | | 1.68 | | | | 2.56 | | | | | | | | 1.58 | | | | 2.66 | | | | 124 | |
| | 5.63 | | | | 76,513 | | | | | | | | 1.68 | | | | 3.25 | | | | | | | | 1.58 | | | | 3.35 | | | | 135 | |
| | 0.20 | | | | 89,173 | | | | | | | | 1.67 | | | | 3.97 | | | | | | | | 1.58 | | | | 4.06 | | | | 56 | |
| | (1.50 | ) | | | 110,660 | | | | | | | | 1.67 | | | | 3.51 | | | | | | | | 1.57 | | | | 3.60 | | | | 47 | |
| | 9.59 | | | | 48,335 | | | | | | | | 1.66 | | | | 3.91 | | | | | | | | 1.59 | | | | 3.98 | | | | 50 | |
| | | | | | | | | | | | | | | | | | | | | | | | | | | | | | | | | | |
| | (0.92 | ) | | | 5,869 | | | | | | | | 1.18 | | | | 3.06 | | | | | | | | 1.08 | | | | 3.16 | | | | 124 | |
| | 6.17 | | | | 7,320 | | | | | | | | 1.18 | | | | 3.74 | | | | | | | | 1.08 | | | | 3.83 | | | | 135 | |
| | 0.70 | | | | 7,647 | | | | | | | | 1.17 | | | | 4.44 | | | | | | | | 1.08 | | | | 4.54 | | | | 56 | |
| | (1.01 | ) | | | 12,272 | | | | | | | | 1.17 | | | | 4.00 | | | | | | | | 1.07 | | | | 4.09 | | | | 47 | |
| | 10.19 | | | | 5,321 | | | | | | | | 1.16 | | | | 4.41 | | | | | | | | 1.09 | | | | 4.48 | | | | 50 | |
| | | | | | | | | | | | | | | | | | | | | | | | | | | | | | | | | | |
| | (0.38 | ) | | | 46,588 | | | | | | | | 0.60 | | | | 3.65 | | | | | | | | 0.50 | | | | 3.75 | | | | 124 | |
| | 6.86 | | | | 8,995 | | | | | | | | 0.60 | | | | 4.35 | | | | | | | | 0.51 | | | | 4.45 | | | | 135 | |
| | 1.28 | | | | 33,372 | | | | | | | | 0.60 | | | | 5.07 | | | | | | | | 0.50 | | | | 5.17 | | | | 56 | |
| | (0.10 | ) | | | 20,498 | | | | | | | | 0.61 | * | | | 4.70 | * | | | | | | | 0.50 | * | | | 4.81 | * | | | 47 | |
| | | | | | | | | | | | | | | | | | | | | | | | | | | | | | | | | | |
| | (0.47 | ) | | | 493,098 | | | | | | | | 0.68 | | | | 3.56 | | | | | | | | 0.58 | | | | 3.67 | | | | 124 | |
| | 6.77 | | | | 540,368 | | | | | | | | 0.68 | | | | 4.22 | | | | | | | | 0.58 | | | | 4.32 | | | | 135 | |
| | 1.19 | | | | 475,536 | | | | | | | | 0.67 | | | | 4.95 | | | | | | | | 0.58 | | | | 5.05 | | | | 56 | |
| | (0.54 | ) | | | 773,719 | | | | | | | | 0.67 | | | | 4.48 | | | | | | | | 0.57 | | | | 4.57 | | | | 47 | |
| | 10.77 | | | | 612,214 | | | | | | | | 0.66 | | | | 4.92 | | | | | | | | 0.59 | | | | 5.00 | | | | 50 | |
| | | | | | | | | | | | | | | | | | | | | | | | | | | | | | | | | | |
| | (0.70 | ) | | | 24 | | | | | | | | 0.91 | | | | 3.35 | | | | | | | | 0.83 | | | | 3.43 | | | | 124 | |
| | 0.23 | | | | 25 | | | | | | | | 0.92 | * | | | 3.40 | * | | | | | | | 0.83 | * | | | 3.50 | * | | | 135 | |
| (a) | Per share Net Investment Income (Loss) is calculated using the average daily shares method. | |
| (b) | Total return is the combination of changes in NAV without any sales charge, reinvested dividend income at NAV and reinvested capital gains distributions at NAV, if any. Total returns are not annualized. | |
| (c) | After fee waiver and/or expense reimbursement from the Adviser, where applicable. See Note 7 – Management Fees and Other Transactions with Affiliates, Management Fees for more information. | |
| (d) | Portfolio Turnover Rate is calculated based on the lesser of long-term purchases or sales (as disclosed in Note 5 – Investment Transactions) divided by the average long-term market value during the period. | |
| (e) | For the period January 20, 2015 (commencement of operations) through June 30, 2015. | |
| (f) | Class T Shares are not available for public offering. | |
| (g) | For the period May 31, 2017 (commencement of operations) through June 30, 2017. | |
See accompanying notes to financial statements.
131
Notes to Financial Statements
1. General Information and Significant Accounting Policies
General Information
Trust and Fund Information
Nuveen Investment Funds, Inc. (the “Trust”) is an open-end management investment company registered under the Investment Company Act of 1940, as amended. The Trust is comprised of Nuveen Core Bond Fund (“Core Bond”), Nuveen Core Plus Bond Fund (“Core Plus Bond”), Nuveen High Income Bond Fund (“High Income Bond”), Nuveen Inflation Protected Securities Fund (“Inflation Protected Securities”), Nuveen Short Term Bond Fund (“Short Term Bond”) and Nuveen Strategic Income Fund (“Strategic Income”) (each a “Fund” and collectively, the “Funds”), as diversified funds, among others. The Trust was incorporated in the State of Maryland on August 20, 1987.
The end of the reporting period for the Funds is June 30, 2018, and the period covered by these Notes to Financial Statements is the fiscal year ended June 30, 2018 (the “current fiscal period”).
Investment Adviser
The Funds’ investment adviser is Nuveen Fund Advisors, LLC (the “Adviser”), a subsidiary of Nuveen, LLC (“Nuveen”). Nuveen is the investment management arm of Teachers Insurance and Annuity Association of America (TIAA). The Adviser has overall responsibility for management of the Funds, overseas the management of the Funds’ portfolios, manages the Funds’ business affairs and provides certain clerical, bookkeeping and other administrative services, and, if necessary, asset allocation decisions. The Adviser has entered into sub-advisory agreements with Nuveen Asset Management, LLC (the “Sub-Adviser”), a subsidiary of the Adviser, under which the Sub-Adviser manages the investment portfolios of the Funds.
Investment Objectives
Core Bond’s investment objective is to provide investors with current income to the extent consistent with preservation of capital. Core Plus Bond’s investment objective is to provide investors with high current income consistent with limited risk to capital. High Income Bond’s investment objective is to provide investors with a high level of current income. Inflation Protected Securities’ investment objective is to provide investors with total return while providing protection against inflation. Short Term Bond’s investment objective is to provide investors with current income while maintaining a high degree of principal stability. Strategic Income’s investment objective is to provide investors with total return.
The Funds’ most recent prospectus provides further descriptions of each Fund’s investment objective, principal investment strategies and principal risks.
Significant Accounting Policies
Each Fund is an investment company and follows accounting and reporting guidance under Financial Accounting Standards Board (“FASB”) Accounting Standards Codification (ASC) Topic 946 “Financial Services – Investment Companies.” The following is a summary of significant accounting policies followed by the Funds in the preparation of their financial statements in accordance with accounting principles generally accepted in the United States of America (“U.S. GAAP”).
Investment Transactions
Investment transactions are recorded on a trade date basis. Realized gains and losses from investment transactions are determined on the specific identification method, which is the same basis used for federal income tax purposes. Investments purchased on a when-issued/delayed delivery basis may have extended settlement periods. Any investments so purchased are subject to market fluctuation during this period. The Funds have earmarked securities in their portfolios with a current value at least equal to the amount of the when-issued/delayed delivery purchase commitments.
As of the end of the reporting period, the following Funds’ outstanding when-issued/delayed delivery purchase commitments were as follows:
| | | | | | | | | | | | | | | | | | | | |
| | | Core
Bond | | | Core Plus
Bond | | | High Income
Bond | | | Short Term
Bond | | | Strategic
Income | |
| Outstanding when-issued/delayed delivery purchase commitments | | $ | 1,310,559 | | | $ | 10,511,823 | | | $ | 4,275,000 | | | $ | 999,987 | | | $ | 24,224,704 | |
Investment Income
Dividend income is recorded on the ex-dividend date or, for foreign securities, when information is available. Interest income, which reflects the amortization of premiums and includes accretion of discounts for financial reporting purposes, is recorded on an accrual basis. Interest income also reflects payment-in-kind (“PIK”) interest and paydown gains and losses, if any. PIK interest represents income received in the form of securities in lieu of cash. Securities lending income is comprised of fees earned from borrowers and income earned on cash collateral investments.
132
Professional Fees
Professional fees presented on the Statement of Operations consist of legal fees incurred in the normal course of operations, audit fees, tax consulting fees and, in some cases, workout expenditures. Workout expenditures are incurred in an attempt to protect or enhance an investment or to pursue other claims or legal actions on behalf of Fund shareholders. If a refund is received for workout expenditures paid in a prior reporting period, such amounts will be recognized as “Legal fee refund” on the Statement of Operations.
Dividends and Distributions to Shareholders
Dividends from net investment income, if any, are declared daily and distributed to shareholders monthly. Fund shares begin to accrue dividends on the business day after the day when the monies used to purchase Fund shares are collected by the transfer agent.
Net realized capital gains from investment transactions, if any, are declared and distributed to shareholders at least annually. Furthermore, capital gains are distributed only to the extent they exceed available capital loss carryforwards.
Distributions to shareholders are recorded on the ex-dividend date. The amount and timing of distributions are determined in accordance with federal income tax regulations, which may differ from U.S. GAAP.
Share Classes and Sales Charges
Class A Shares are generally sold with an up-front sales charge and incur a 0.25% annual 12b-1 service fee. Class A Share purchases of the Funds, with the exception of Short Term Bond, of $1 million or more are sold at net asset value (“NAV”) without an up-front sales charge. Class A Share purchases of Short Term Bond of $250,000 or more are sold at NAV without an up-front sales charge. Class A Share purchases may be subject to a contingent deferred sales charge (“CDSC”) equal to 1% (0.75% for Short Term Bond) if redeemed within eighteen months (twelve months for shares of Short Term Bond purchased on or after March 27, 2018) of purchase. Class C Shares are sold without an up-front sales charge but incur a 0.75% annual 12b-1 distribution fee and a 0.25% annual 12b-1 service fee. Class C Shares are subject to a CDSC of 1% if redeemed within twelve months of purchase. Class R3 Shares are sold without an up-front sales charge but incur a 0.25% annual 12b-1 distribution fee and a 0.25% annual 12b-1 service fee. Class R6 Shares and Class I Shares are not subject to any sales charge or 12b-1 distribution or service fees. Class T Shares are generally sold with an up-front sales charge and incur a 0.25% annual 12b-1 service fee.
Multiclass Operations and Allocations
Income and expenses of the Funds that are not directly attributable to a specific class of shares are prorated among the classes based on the relative settled shares of each class. Expenses directly attributable to a class of shares are recorded to the specific class. Currently, the only expenses that are allocated on a class-specific basis are 12b-1 distribution and service fees.
Sub-transfer agent fees and similar fees, which are recognized as a component of “Shareholder servicing agent fees” on the Statement of Operations, are not charged to Class R6 Shares and are prorated among the other classes based on their relative net assets.
Realized and unrealized capital gains and losses of the Funds are prorated among the classes based on the relative net assets of each class.
Compensation
The Fund pays no compensation directly to those of its trustees who are affiliated with the Adviser or to its officers, all of whom receive remuneration for their services to the Trust from the Adviser or its affiliates. The Funds’ Board of Directors (the “Board”) has adopted a deferred compensation plan for independent directors that enables directors to elect to defer receipt of all or a portion of the annual compensation they are entitled to receive from certain Nuveen-advised funds. Under the plan, deferred amounts are treated as though equal dollar amounts had been invested in shares of select Nuveen-advised funds.
Indemnifications
Under the Trust’s organizational documents, its officers and directors are indemnified against certain liabilities arising out of the performance of their duties to the Trust. In addition, in the normal course of business, the Trust enters into contracts that provide general indemnifications to other parties. The Trust’s maximum exposure under these arrangements is unknown as this would involve future claims that may be made against the Trust that have not yet occurred. However, the Trust has not had prior claims or losses pursuant to these contracts and expects the risk of loss to be remote.
Netting Agreements
In the ordinary course of business, the Funds may enter into transactions subject to enforceable International Swaps and Derivative Association, Inc. (ISDA) master agreements or other similar arrangements (“netting agreements”). Generally, the right to offset in netting agreements allows each Fund to offset certain securities and derivatives with a specific counterparty, when applicable, as well as any collateral received or delivered to that counterparty based on the terms of the agreements. Generally, each Fund manages its cash collateral and securities collateral on a counterparty basis.
The Funds’ investments subject to netting agreements as of the end of the reporting period, if any, are further described in Note 3 – Portfolio Securities and Investments in Derivatives.
133
Notes to Financial Statements (continued)
Use of Estimates
The preparation of financial statements in conformity with U.S. GAAP requires management to make estimates and assumptions that affect the reported amounts of assets and liabilities at the date of the financial statements and the reported amounts of increases and decreases in net assets from operations during the current fiscal period. Actual results may differ from those estimates.
2. Investment Valuation and Fair Value Measurements
The fair valuation input levels as described below are for fair value measurement purposes.
Fair value is defined as the price that would be received upon selling an investment or transferring a liability in an orderly transaction to an independent buyer in the principal or most advantageous market for the investment. A three-tier hierarchy is used to maximize the use of observable market data and minimize the use of unobservable inputs and to establish classification of fair value measurements for disclosure purposes. Observable inputs reflect the assumptions market participants would use in pricing the asset or liability. Observable inputs are based on market data obtained from sources independent of the reporting entity. Unobservable inputs reflect the reporting entity’s own assumptions about the assumptions market participants would use in pricing the asset or liability. Unobservable inputs are based on the best information available in the circumstances. The following is a summary of the three-tiered hierarchy of valuation input levels.
| | |
| Level 1 – | | Inputs are unadjusted and prices are determined using quoted prices in active markets for identical securities. |
| Level 2 – | | Prices are determined using other significant observable inputs (including quoted prices for similar securities, interest rates, prepayment speeds, credit risk, etc.). |
| Level 3 – | | Prices are determined using significant unobservable inputs (including management’s assumptions in determining the fair value of investments). |
Common stocks and other equity-type securities are valued at the last sales price on the securities exchange on which such securities are primarily traded and are generally classified as Level 1. Securities primarily traded on the Nasdaq National Market (“Nasdaq”) are valued at the Nasdaq Official Closing Price and are generally classified as Level 1. However, securities traded on a securities exchange or Nasdaq for which there were no transactions on a given day or securities not listed on a securities exchange or Nasdaq are valued at the quoted bid price and are generally classified as Level 2.
Investments in investment companies are valued at their respective NAVs on the valuation date and are generally classified as Level 1.
Prices of fixed-income securities are provided by an independent pricing service (“pricing service”) approved by the Board. The pricing service establishes a security’s fair value using methods that may include consideration of the following: yields or prices of investments of comparable quality, type of issue, coupon, maturity and rating, market quotes or indications of value from security dealers, evaluations of anticipated cash flows or collateral, general market conditions and other information and analysis, including the obligor’s credit characteristics considered relevant. These securities are generally classified as Level 2. In pricing certain securities, particularly less liquid and lower quality securities, the pricing service may consider information about a security, its issuer or market activity, provided by the Adviser. These securities are generally classified as Level 2 or Level 3 depending on the observability of the significant inputs.
Like most fixed-income securities, the senior and subordinated loans in which the Fund invests are not listed on an organized exchange. The secondary market of such investments may be less liquid relative to markets for other fixed-income securities. Consequently, the value of senior and subordinated loans, determined as described above, may differ significantly from the value that would have been determined had there been an active market for that senior loan. These securities are generally classified as Level 2.
Prices of forward foreign currency contracts and swap contracts are also provided by a pricing service approved by the Board using the same methods as described above and are generally classified as Level 2.
Futures contracts are valued using the closing settlement price or, in the absence of such a price, the last traded price and are generally classified as Level 1.
Investments initially valued in currencies other than the U.S. dollar are converted to the U.S. dollar using exchange rates obtained from pricing services. As a result, the NAV of the Funds’ shares may be affected by changes in the value of currencies in relation to the U.S. dollar. The value of securities traded in markets outside the United States or denominated in currencies other than the U.S. dollar may be affected significantly on a day that the New York Stock Exchange is closed and an investor is not able to purchase, redeem or exchange shares. If significant market events occur between the time of determination of the closing price of a foreign security on an exchange and the time that the Funds’ NAV is determined, or if under the Funds’ procedures, the closing price of a foreign security is not deemed to be reliable, the security would be valued at fair value as determined in accordance with procedures established in good faith by the Board. These securities are generally classified as Level 2 or Level 3 depending on the observability of the significant inputs.
Certain securities may not be able to be priced by the pre-established pricing methods as described above. Such securities may be valued by the Board and/or its appointee at fair value. These securities generally include, but are not limited to, restricted securities (securities which may not be publicly sold without registration under the Securities Act of 1933, as amended) for which a pricing service is unable to provide a market price; securities whose trading has been formally suspended; debt securities that have gone into default and for which there is no current market quotation; a security whose market price is not available from a pre-established pricing source; a security with respect to which an event has occurred that is likely to materially affect the value of the security after the market has closed but before the calculation of a Fund’s NAV (as may be the case in non-U.S.
134
markets on which the security is primarily traded) or make it difficult or impossible to obtain a reliable market quotation; and a security whose price, as provided by the pricing service, is not deemed to reflect the security’s fair value. As a general principle, the fair value of a security would appear to be the amount that the owner might reasonably expect to receive for it in a current sale. A variety of factors may be considered in determining the fair value of such securities, which may include consideration of the following: yields or prices of investments of comparable quality, type of issue, coupon, maturity and rating, market quotes or indications of value from security dealers, evaluations of anticipated cash flows or collateral, general market conditions and other information and analysis, including the obligor’s credit characteristics considered relevant. These securities are generally classified as Level 2 or Level 3 depending on the observability of the significant inputs. Regardless of the method employed to value a particular security, all valuations are subject to review by the Board and/or its appointee.
The inputs or methodologies used for valuing securities are not an indication of the risks associated with investing in those securities. The following is a summary of each Fund’s fair value measurements as of the end of the reporting period:
| | | | | | | | | | | | | | | | |
| Core Bond | | Level 1 | | | Level 2 | | | Level 3 | | | Total | |
Long-Term Investments*: | | | | | | | | | | | | | | | | |
Corporate Bonds | | $ | — | | | $ | 61,922,856 | | | $ | — | | | $ | 61,922,856 | |
Asset-Backed and Mortgage-Backed Securities | | | — | | | | 61,367,949 | | | | — | | | | 61,367,949 | |
U.S Government and Agency Obligations | | | — | | | | 9,792,444 | | | | — | | | | 9,792,444 | |
$1,000 Par (or similar) Institutional Preferred | | | — | | | | 693,000 | | | | — | | | | 693,000 | |
Investments Purchased with Collateral from Securities Lending | | | 582,295 | | | | — | | | | — | | | | 582,295 | |
Short-Term Investments: | | | | | | | | | | | | | | | | |
Money Market Funds | | | 861,862 | | | | — | | | | — | | | | 861,862 | |
Investments in Derivatives: | | | | | | | | | | | | | | | | |
Futures Contracts** | | | 75,547 | | | | — | | | | — | | | | 75,547 | |
Total | | $ | 1,519,704 | | | $ | 133,776,249 | | | $ | — | | | $ | 135,295,953 | |
| | | | |
| Core Plus Bond | | | | | | | | | | | | |
Long-Term Investments*: | | | | | | | | | | | | | | | | |
Corporate Bonds | | $ | — | | | $ | 151,485,392 | | | $ | — | | | $ | 151,485,392 | |
Asset-Backed and Mortgage-Backed Securities | | | — | | | | 127,029,007 | | | | — | | | | 127,029,007 | |
$1,000 Par (or similar) Institutional Preferred | | | — | | | | 21,641,793 | | | | — | | | | 21,641,793 | |
Sovereign Debt | | | — | | | | 14,757,159 | | | | — | | | | 14,757,159 | |
U.S. Government and Agency Obligations | | | — | | | | 10,593,887 | | | | — | | | | 10,593,887 | |
Contingent Capital Securities | | | — | | | | 9,281,645 | | | | — | | | | 9,281,645 | |
Municipal Bonds | | | — | | | | 906,705 | | | | — | | | | 906,705 | |
Investments Purchased with Collateral from Securities Lending | | | 3,480,585 | | | | — | | | | — | | | | 3,480,585 | |
Short-Term Investments: | | | | | | | | | | | | | | | | |
Money Market Funds | | | 3,373,159 | | | | — | | | | — | | | | 3,373,159 | |
Investments in Derivatives: | | | | | | | | | | | | | | | | |
Forward Foreign Currency Contracts** | | | — | | | | 6,976 | | | | — | | | | 6,976 | |
Futures Contracts** | | | 186,875 | | | | — | | | | — | | | | 186,875 | |
Total | | $ | 7,040,619 | | | $ | 335,702,564 | | | $ | — | | | $ | 342,743,183 | |
| | | | |
| High Income Bond | | | | | | | | | | | | |
| Long-Term Investments*: | | | | | | | | | | | | | | | | |
Corporate Bonds | | $ | — | | | $ | 261,232,531 | | | $ | — | **** | | $ | 261,232,531 | |
$1,000 Par (or similar) Institutional Preferred | | | — | | | | 11,660,457 | | | | — | | | | 11,660,457 | |
Common Stocks | | | 6,935,194 | | | | 46,956 | *** | | | 1,608 | *** | | | 6,983,758 | |
Variable Rate Senior Loans Interests | | | — | | | | 6,622,789 | | | | — | | | | 6,622,789 | |
Contingent Capital Securities | | | — | | | | 5,169,694 | | | | — | | | | 5,169,694 | |
$25 Par (or similar) Retail Preferred | | | 4,654,798 | | | | — | | | | — | | | | 4,654,798 | |
Investment Companies | | | 4,579,285 | | | | — | | | | — | | | | 4,579,285 | |
Convertible Bonds | | | — | | | | 22 | | | | — | | | | 22 | |
Warrants | | | — | | | | — | | | | — | **** | | | — | |
| Investments Purchased with Collateral from Securities Lending | | | 29,812,893 | | | | — | | | | — | | | | 29,812,893 | |
| Short-Term Investments: | | | | | | | | | | | | | | | | |
Money Market Funds | | | 3,715,556 | | | | — | | | | — | | | | 3,715,556 | |
| Investments in Derivatives: | | | | | | | | | | | | | | | | |
Forward Foreign Currency Contracts** | | | — | | | | (4,044 | ) | | | — | | | | (4,044 | ) |
Futures Contracts** | | | 9,710 | | | | — | | | | — | | | | 9,710 | |
| Total | | $ | 49,707,436 | | | $ | 284,728,405 | | | $ | 1,608 | | | $ | 334,437,449 | |
| * | Refer to the Fund’s Portfolio of Investments for industry, state and country classifications, where applicable. |
| ** | Represents net unrealized appreciation (depreciation) as reported in the Fund’s Portfolio of Investments. |
| *** | Refer to the Fund’s Portfolio of Investments for securities classified as Level 2 and/or Level 3. |
| **** | Refer to the Fund’s Portfolio of Investments for securities classified as Level 3. Value equals zero as of the end of the reporting period. |
135
Notes to Financial Statements (continued)
| | | | | | | | | | | | | | | | |
| Inflation Protected Securities | | Level 1 | | | Level 2 | | | Level 3 | | | Total | |
| Long-Term Investments*: | | | | | | | | | | | | | | | | |
U.S. Government and Agency Obligations | | $ | — | | | $ | 547,563,916 | | | $ | — | | | $ | 547,563,916 | |
Asset-Backed and Mortgage-Backed Securities | | | — | | | | 50,293,205 | | | | — | | | | 50,293,205 | |
Corporate Bonds | | | — | | | | 11,466,221 | | | | — | | | | 11,466,221 | |
Municipal Bonds | | | — | | | | 1,790,369 | | | | — | | | | 1,790,369 | |
| Investments Purchased with Collateral from Securities Lending | | | 1,278,083 | | | | — | | | | — | | | | 1,278,083 | |
| Short-Term Investments: | | | | | | | | | | | | | | | | |
Money Market Funds | | | 7,365,188 | | | | — | | | | — | | | | 7,365,188 | |
| Investments in Derivatives: | | | | | | | | | | | | | | | | |
Futures Contracts** | | | 120,136 | | | | — | | | | — | | | | 120,136 | |
| Total | | $ | 8,763,407 | | | $ | 611,113,711 | | | $ | — | | | $ | 619,877,118 | |
| | | | |
| Short Term Bond | | | | | | | | | | | | |
| Long-Term Investments*: | | | | | | | | | | | | | | | | |
Asset-Backed and Mortgage-Backed Securities | | $ | — | | | $ | 222,266,889 | | | $ | — | | | $ | 222,266,889 | |
Corporate Bonds | | | — | | | | 186,022,093 | | | | — | | | | 186,022,093 | |
U.S. Government and Agency Obligations | | | — | | | | 50,523,124 | | | | — | | | | 50,523,124 | |
| Investments Purchased with Collateral from Securities Lending | | | 5,228,027 | | | | — | | | | — | | | | 5,228,027 | |
| Short-Term Investments: | | | | | | | | | | | | | | | | |
Money Market Funds | | | 3,966,394 | | | | — | | | | — | | | | 3,966,394 | |
| Investments in Derivatives: | | | | | | | | | | | | | | | | |
Futures Contracts** | | | (1,701 | ) | | | — | | | | — | | | | (1,701 | ) |
| Total | | $ | 9,192,720 | | | $ | 458,812,106 | | | $ | — | | | $ | 468,004,826 | |
| | | | |
| Strategic Income | | | | | | | | | | | | |
| Long-Term Investments*: | | | | | | | | | | | | | | | | |
Corporate Bonds | | $ | — | | | $ | 392,075,169 | | | $ | — | | | $ | 392,075,169 | |
Asset-Backed and Mortgage-Backed Securities | | | — | | | | 142,642,222 | | | | — | | | | 142,642,222 | |
$1,000 Par (or similar) Institutional Preferred | | | — | | | | 62,224,386 | | | | — | | | | 62,224,386 | |
Contingent Capital Securities | | | — | | | | 47,873,249 | | | | — | | | | 47,873,249 | |
Sovereign Debt | | | — | | | | 39,711,530 | | | | — | | | | 39,711,530 | |
U.S. Government and Agency Obligations | | | — | | | | 10,943,500 | | | | — | | | | 10,943,500 | |
Variable Rate Senior Loan Interests | | | — | | | | 4,856,038 | | | | — | | | | 4,856,038 | |
$25 Par (or similar) Retail Preferred | | | — | | | | 3,975,200 | *** | | | — | | | | 3,975,200 | |
Municipal Bonds | | | — | | | | 1,872,648 | | | | — | | | | 1,872,648 | |
Common Stocks | | | 124,380 | | | | — | | | | 2 | *** | | | 124,382 | |
| Investments Purchased with Collateral from Securities Lending | | | 19,390,513 | | | | — | | | | — | | | | 19,390,513 | |
| Short-Term Investments: | | | | | | | | | | | | | | | | |
Money Market Funds | | | 4,044,545 | | | | — | | | | — | | | | 4,044,545 | |
| Investments in Derivatives: | | | | | | | | | | | | | | | | |
Forward Foreign Currency Contracts** | | | — | | | | 273,576 | | | | — | | | | 273,576 | |
Futures Contracts** | | | 1,051,273 | | | | — | | | | — | | | | 1,051,273 | |
Interest Rate Swaps** | | | — | | | | (549,030 | ) | | | — | | | | (549,030 | ) |
| Total | | $ | 24,610,711 | | | $ | 705,898,488 | | | $ | 2 | | | $ | 730,509,201 | |
| * | Refer to the Fund’s Portfolio of Investments for industry, state and country classifications, where applicable. |
| ** | Represents net unrealized appreciation (depreciation) as reported in the Fund’s Portfolio of Investments. |
| *** | Refer to the Fund’s Portfolio of Investments for securities classified as Level 2 and/or Level 3. |
The Board is responsible for the valuation process and has appointed the oversight of the daily valuation process to the Adviser’s Valuation Committee. The Valuation Committee, pursuant to the valuation policies and procedures adopted by the Board, is responsible for making fair value determinations, evaluating the effectiveness of the Funds’ pricing policies and reporting to the Board. The Valuation Committee is aided in its efforts by the Adviser’s dedicated Securities Valuation Team, which is responsible for administering the daily valuation process and applying fair value methodologies as approved by the Valuation Committee. When determining the reliability of independent pricing services for investments owned by the Funds, the Valuation Committee, among other things, conducts due diligence reviews of the pricing services and monitors the quality of security prices received through various testing reports conducted by the Securities Valuation Team.
136
The Valuation Committee will consider pricing methodologies it deems relevant and appropriate when making a fair value determination, based on the facts and circumstances specific to the portfolio instrument. Fair value determinations generally will be derived as follows, using public or private market information:
| | (i) | If available, fair value determinations shall be derived by extrapolating from recent transactions or quoted prices for identical or comparable securities. |
| | (ii) | If such information is not available, an analytical valuation methodology may be used based on other available information including, but not limited to: analyst appraisals, research reports, corporate action information, issuer financial statements and shelf registration statements. Such analytical valuation methodologies may include, but are not limited to: multiple of earnings, discount from market value of a similar freely-traded security, discounted cash flow analysis, book value or a multiple thereof, risk premium/yield analysis, yield to maturity and/or fundamental investment analysis. |
The purchase price of a portfolio instrument will be used to fair value the instrument only if no other valuation methodology is available or deemed appropriate, and it is determined that the purchase price fairly reflects the instrument’s current value.
For each portfolio security that has been fair valued pursuant to the policies adopted by the Board, the fair value price is compared against the last available and next available market quotations. The Valuation Committee reviews the results of such testing and fair valuation occurrences are reported to the Board.
3. Portfolio Securities and Investments in Derivatives
Portfolio Securities
Foreign Currency Transactions
To the extent that the Funds may invest in securities and/or contracts that are denominated in a currency other than U.S. dollars, the Funds will be subject to currency risk, which is the risk that an increase in the U.S. dollar relative to the foreign currency will reduce returns or portfolio value. Generally, when the U.S. dollar rises in value against a foreign currency, the Funds’ investments denominated in that currency will lose value because their currency is worth fewer U.S. dollars; the opposite effect occurs if the U.S. dollar falls in relative value. Investments and other assets and liabilities denominated in foreign currencies are converted into U.S. dollars on a spot (i.e. cash) basis at the spot rate prevailing in the foreign currency exchange market at the time of valuation. Purchases and sales of investments and income denominated in foreign currencies are translated into U.S. dollars on the respective dates of such transactions.
The books and records of the Funds are maintained in U.S. dollars. Foreign currencies, assets and liabilities are translated into U.S. dollars at 4:00 p.m. Eastern Time. Investment transactions, income and expenses are translated on the respective dates of such transactions. Net realized foreign currency gains and losses resulting from changes in exchange rates include foreign currency gains and losses between trade date and settlement date of the transactions, foreign currency transactions and the difference between the amounts of interest and dividends recorded on the books of the Funds and the amounts actually received.
The realized gains and losses resulting from changes in foreign currency exchange rates and changes in foreign exchange rates associated with (i) foreign currency, (ii) investments, (iii) investments in derivatives and (iv) other assets and liabilities are recognized as a component of “Net realized gain (loss) from investments and foreign currency” on the Statement of Operations, when applicable.
The unrealized gains and losses resulting from changes in foreign currency exchange rates and changes in foreign exchange rates associated with (i) investments and (ii) other assets and liabilities are recognized as a component of “Change in net unrealized appreciation (depreciation) of investments and foreign currency” on the Statement of Operations, when applicable. The unrealized gains and losses resulting from changes in foreign exchange rates associated with investments in derivatives are recognized as a component of the respective derivative’s related “Change in net unrealized appreciation (depreciation)” on the Statement of Operations, when applicable.
Inflation-Indexed Bonds
Inflation-indexed bonds are fixed-income securities whose principal value is periodically adjusted to the rate of inflation. The interest rate on these bonds is generally fixed at issuance at a rate lower than typical bonds. Over the life of an inflation-indexed bond however, interest will be paid based on a principal value which is adjusted for inflation. Any increase in the principal amount of an inflation-indexed bond is recognized as a component of “Interest income” on the Statement of Operations, even though investors do not receive their principal until maturity.
Securities Lending
In order to generate additional income, each Fund may lend securities representing up to one-third of the value of its total assets (which includes collateral for securities on loan) to broker-dealers, banks or other institutions. When loaning securities, the Funds retain the benefits of owning the securities, including the economic equivalent of dividends or interest generated by the security. The Funds also have the ability to recall the securities on loan at any time.
137
Notes to Financial Statements (continued)
Each Fund’s policy is to receive, at the inception of a loan, cash collateral equal to at least 102% of the value of securities loaned, which is recognized as “Payable for collateral from securities lending program” on the Statement of Assets and Liabilities. Collateral for securities on loan is invested in a money market fund, which is recognized as “Investments purchased with collateral from securities lending, at value” on the Statement of Assets and Liabilities. The market value of the securities loaned is determined at the close of each business day in order to determine the adequacy of the collateral. If the value of the securities on loan increases such that the level of collateralization falls below 100%, additional collateral is received from the borrower on the next business day, which is recognized as “Due from broker” on the Statement of Assets and Liabilities.
Securities out on loan are subject to termination at any time at the option of the borrower or the Fund. Upon termination, the borrower is required to return to the Fund securities identical to the securities loaned. Generally, in the event the borrower defaults on its obligation to return the loaned securities, the Fund has the right to use the collateral to acquire identical securities. In the event the Fund is delayed or prevented from exercising its right to dispose of the collateral, there may be a loss to the Fund. Under each Fund’s securities lending agreement, however, the securities lending agent has indemnified the Fund against losses resulting from borrower default, except to the extent that those losses result from a decrease in the value of the collateral due to its investment by the Fund. The Fund bears the risk of loss with respect to the investment of collateral.
The Funds’ custodian, U.S. Bank National Association, serves as its securities lending agent. Income earned from the securities lending program is paid to the Funds. Income from securities lending is recognized as “Securities lending income” on the Statement of Operations.
The following table presents the securities out on loan for the Funds, and the collateral delivered related to those securities, as of the end of the reporting period.
| | | | | | | | | | | | | | |
| Fund | | Asset Class out on Loan | | Long-Term Investments, at Value | | | Collateral Pledged (From) Counterparty* | | | Net Exposure | |
| Core Bond | | | | | | | | | | | | | | |
| | | U.S. Government and Agency Obligations | | $ | 565,082 | | | $ | (565,082 | ) | | $ | — | |
| Core Plus Bond | | | | | | | | | | | | | | |
| | Corporate Bonds | | $ | 3,203,559 | | | $ | (3,203,559 | ) | | $ | — | |
| | | $1,000 Par (or Similar) Institutional Preferred | | | 148,606 | | | | (148,606 | ) | | | — | |
Total | | | | $ | 3,352,165 | | | $ | (3,352,165 | ) | | $ | — | |
| High Income Bond | | | | | | | | | | | | | | |
| | Corporate Bonds | | $ | 27,639,586 | | | $ | (27,639,586 | ) | | $ | — | |
| | Contingent Capital Securities | | | 1,059,000 | | | | (1,059,000 | ) | | | — | |
| | | $25 Par (or Similar) Retail Preferred | | | 1,040 | | | | (1,040 | ) | | | — | |
Total | | | | $ | 28,699,626 | | | $ | (28,699,626 | ) | | $ | — | |
| Inflation Procted Securities | | | | | | | | | | | | | | |
| | | Corporate Bonds | | $ | 1,239,354 | | | $ | (1,239,354 | ) | | $ | — | |
| Short Term Bond | | | | | | | | | | | | | | |
| | Corporate Bonds | | $ | 2,607,501 | | | $ | (2,607,501 | ) | | $ | — | |
| | | U.S. Government and Agency Obligations | | | 2,459,473 | | | | (2,459,473 | ) | | | — | |
Total | | | | $ | 5,066,974 | | | $ | (5,066,974 | ) | | $ | — | |
| Strategic Income | | | | | | | | | | | | | | |
| | Corporate Bonds | | $ | 12,192,050 | | | $ | (12,192,050 | ) | | $ | — | |
| | $1,000 Par (or Similar) Institutional Preferred | | | 5,300,612 | | | | (5,300,612 | ) | | | — | |
| | | Contingent Capital Securities | | | 1,235,500 | | | | (1,235,500 | ) | | | — | |
Total | | | | $ | 18,728,162 | | | $ | (18,728,162 | ) | | $ | — | |
| * | As of the end of the reporting period, the value of the collateral pledged from the counterparty exceeded the value of the securities out on loan. Refer to the Fund's Portfolio of Investments for details on the securities out on loan. |
Zero Coupon Securities
A zero coupon security does not pay a regular interest coupon to its holders during the life of the security. Income to the holder of the security comes from accretion of the difference between the original purchase price of the security at issuance and the par value of the security at maturity and is effectively paid at maturity. The market prices of zero coupon securities generally are more volatile than the market prices of securities that pay interest periodically.
Investments in Derivatives
Each Fund is authorized to invest in certain derivative instruments. The Funds record derivative instruments at fair value, with changes in fair value recognized on the Statement of Operations, when applicable. Even though the Funds’ investments in derivatives may represent economic hedges, they are not considered to be hedge transactions for financial reporting purposes.
138
Forward Foreign Currency Contracts
Each Fund is authorized to enter into forward foreign currency contracts (“forward contracts”) under two circumstances: (i) when a Fund enters into a contract for the purchase or sale of a security denominated in a foreign currency to “lock in” the U.S. exchange rate of the transaction, with such period being a short-dated contract covering the period between transaction date and settlement date; or (ii) when the Sub-Adviser believes that the currency of a particular foreign country may experience a substantial movement against the U.S. dollar or against another foreign currency.
A forward contract is an agreement between two parties to purchase or sell a specified quantity of a currency at or before a specified date in the future at a specified price. Forward contracts are typically traded in the OTC markets and all details of the contract are negotiated between the counterparties to the agreement. Accordingly, the forward contracts are valued by reference to the contracts traded in the OTC markets. The contractual obligations of a buyer or seller may generally be satisfied by taking or making physical delivery of the underlying currency, establishing an opposite position in the contract and recognizing the profit or loss on both positions simultaneously on the delivery date or, in some instances, paying a cash settlement before the designated date of delivery.
Forward contracts are valued daily at the forward rate. The net amount recorded on these transactions for each counterparty is recognized as a component of “Unrealized appreciation and/or depreciation on forward foreign currency contracts” on the Statement of Assets and Liabilities. The change in value of the forward contracts during the reporting period is recognized as a component of “Change in net unrealized appreciation (depreciation) of forward foreign currency contracts” on the Statement of Operations. When the contract is closed or offset with the same counterparty, a Fund recognizes the difference between the value of the contract at the time it was entered and the value at the time it was closed or offset as a component of “Net realized gain (loss) from forward foreign currency contracts” on the Statement of Operations.
Forward contracts will generally not be entered into for terms greater than three months, but may have maturities of up to six months or more. The use of forward contracts does not eliminate fluctuations in the underlying prices of a Fund’s investment securities; however, it does establish a rate of exchange that can be achieved in the future. The use of forward contracts involves the risk that anticipated currency movements will not be accurately predicted. A forward contract would limit the risk of loss due to a decline in the value of a particular currency; however, it also would limit any potential gain that might result should the value of the currency increase instead of decrease. These contracts may involve market risk in excess of the unrealized appreciation or depreciation reflected on the Statement of Assets and Liabilities. Forward contracts are subject to counterparty risk if the counterparty fails to perform as specified in the contract due to financial impairment or other reason.
During the current fiscal period, Core Plus Bond, High Income Bond and Strategic Income invested in forward foreign currency contracts to manage foreign currency exposure. For example, the Fund may reduce unwanted currency exposure from its bond portfolio, or it may take long forward positions in select currencies in an attempt to benefit from the potential price appreciation.
The average notional amount of forward foreign currency contracts outstanding during the current fiscal period was as follows:
| | | | | | | | | | | | |
| | | Core Plus
Bond | | | High Income
Bond | | | Strategic
Income | |
| Average notional amount of forward foreign currency contracts outstanding* | | $ | 8,756,574 | | | $ | 3,326,048 | | | $ | 65,067,399 | |
| * | The average notional amount is calculated based on the outstanding notional at the beginning of the current fiscal period and at the end of each fiscal quarter within the current fiscal period. |
The following table presents the fair value of forward foreign currency contracts held by the Funds as of the end of the reporting period, the location of these instruments on the Statement of Assets and Liabilities and the primary underlying risk exposure.
| | | | | | | | | | | | | | |
| | | | | Location on the Statement of Assets and Liabilities | |
| | | | | Asset Derivatives | | | (Liability) Derivatives | |
Underlying
Risk Exposure | | Derivative Instrument | | Location | | Value | | | Location | | Value | |
Core Plus Bond | | | | | | | | | | | | | | |
| | | | | |
Foreign currency exchange rate | | Forward contracts | | Unrealized appreciation on forward foreign currency contracts | | $ | 6,976 | | | — | | $ | — | |
High Income Bond | | | | | | | | | | | | | | |
| | | | | |
Foreign currency exchange rate | | Forward contracts | | Unrealized appreciation on forward foreign currency contracts | | $ | 807 | | | Unrealized depreciation on
forward foreign currency
contracts | | $ | (4,851 | ) |
| | | | | |
Strategic Income | | | | | | | | | | | | | | |
| | | | | |
Foreign currency exchange rate | | Forward contracts | | Unrealized appreciation on forward foreign currency contracts | | $ | 293,308 | | | Unrealized depreciation on
forward foreign currency
contracts | | $ | (19,732 | ) |
139
Notes to Financial Statements (continued)
The following table presents the forward foreign currency contracts subject to netting agreements and the collateral delivered related to those forward foreign currency contracts as of the end of the reporting period.
| | | | | | | | | | | | | | | | | | | | | | |
| Fund | | Counterparty | | Gross
Unrealized
Appreciation on
Forward Foreign
Currency Contracts* | | | Gross
Unrealized
(Depreciation) on
Forward Foreign
Currency Contracts* | | | Net Unrealized
Appreciation
(Depreciation) on
Forward Foreign
Currency Contracts | | | Collateral
Pledged
to (from)
Counterparty | | | Net
Exposure | |
| Core Plus Bond | | | | | | | | | | | | | | | | | | | | | | |
| | | Bank of America, N.A. | | $ | 6,976 | | | $ | — | | | $ | 6,976 | | | $ | (6,976 | ) | | $ | — | |
| High Income Bond | | | | | | | | | | | | | | | | | | | | | | |
| | | Goldman Sachs Bank USA | | $ | 807 | | | | (4,851 | ) | | $ | (4,044 | ) | | $ | — | | | $ | (4,044 | ) |
| Strategic Income | | | | | | | | | | | | | | | | | | | | | | |
| | Bank of America, N.A. | | $ | 27,149 | | | $ | — | | | $ | 27,149 | | | $ | (10,000 | ) | | $ | 17,149 | |
| | | Goldman Sachs Bank USA | | | 266,159 | | | | (19,732 | ) | | | 246,427 | | | | (246,427 | ) | | | — | |
Total | | | | $ | 293,308 | | | $ | (19,732 | ) | | $ | 273,576 | | | $ | (256,427 | ) | | $ | 17,149 | |
| * | Represents gross unrealized appreciation (depreciation) for the counterparty as reported in the Fund’s Portfolio of Investments. |
The following table presents the amount of net realized gain (loss) and change in net unrealized appreciation (depreciation) recognized on forward foreign currency contracts on the Statement of Operations during the current fiscal period, and the primary underlying risk exposure.
| | | | | | | | | | | | |
| Fund | | Underlying
Risk Exposure | | Derivative
Instrument | | Net Realized
Gain (Loss) from
Forward Foreign
Currency Contracts | | | Change in Net Unrealized
Appreciation (Depreciation) of
Forward Foreign Currency Contracts | |
| Core Plus Bond | | Foreign currency exchange rate | | Forward contracts | | $ | 260,603 | | | $ | 201,767 | |
| High Income Bond | | Foreign currency exchange rate | | Forward contracts | | | (180,664 | ) | | | 178,031 | |
| Strategic Income | | Foreign currency exchange rate | | Forward contracts | | | 281,199 | | | | 1,217,587 | |
Futures Contracts
Upon execution of a futures contract, a Fund is obligated to deposit cash or eligible securities, also known as “initial margin,” into an account at its clearing broker equal to a specified percentage of the contract amount. Cash held by the broker to cover initial margin requirements on open futures contracts, if any, is recognized as “Cash collateral at brokers for investments in futures contracts” on the Statement of Assets and Liabilities. Investments in futures contracts obligate a Fund and the clearing broker to settle monies on a daily basis representing changes in the prior days “mark-to-market” of the open contracts. If a Fund has unrealized appreciation the clearing broker would credit the Fund’s account with an amount equal to appreciation and conversely if a Fund has unrealized depreciation the clearing broker would debit the Fund’s account with an amount equal to depreciation. These daily cash settlements are also known as “variation margin.” Variation margin is recognized as a receivable and/or payable for “Variation margin on futures contracts” on the Statement of Assets and Liabilities.
During the period the futures contract is open, changes in the value of the contract are recognized as an unrealized gain or loss by “marking-to-market” on a daily basis to reflect the changes in market value of the contract, which is recognized as a component of “Change in net unrealized appreciation (depreciation) of futures contracts” on the Statement of Operations. When the contract is closed or expired, a Fund records a realized gain or loss equal to the difference between the value of the contract on the closing date and value of the contract when originally entered into, which is recognized as a component of “Net realized gain (loss) from futures contracts” on the Statement of Operations.
Risks of investments in futures contracts include the possible adverse movement in the price of the securities or indices underlying the contracts, the possibility that there may not be a liquid secondary market for the contracts and/or that a change in the value of the contract may not correlate with a change in the value of the underlying securities or indices.
During the current fiscal period, each Fund used U.S. Treasury futures as part of their overall portfolio construction strategy to manage portfolio duration and yield curve exposure. Strategic Income also used Eurodollar futures; selecting foreign bond futures to actively manage exposure to those markets.
The average notional amount of futures contracts outstanding during the current fiscal period was as follows:
| | | | | | | | | | | | | | | | | | | | | | | | |
| | | Core
Bond | | | Core Plus
Bond | | | High Income
Bond | | | Inflation
Protected
Securities | | | Short Term
Bond | | | Strategic
Income | |
| Average notional amount of futures contracts outstanding* | | $ | 32,007,360 | | | $ | 56,292,029 | | | $ | 2,224,141 | | | $ | 67,501,834 | | | $ | 82,777,807 | | | $ | 287,532,930 | |
| * | The average notional amount is calculated based on the absolute aggregate notional amount of contracts outstanding at the beginning of the current fiscal period and at the end of each fiscal quarter within the current fiscal period. |
140
The following table presents the fair value of all futures contracts held by the Funds as of the end of the reporting period, the location of these instruments on the Statement of Assets and Liabilities and the primary underlying risk exposure.
| | | | | | | | | | | | | | |
| | | | | Location on the Statement of Assets and Liabilities | |
| | | | | Asset Derivatives | | | (Liability) Derivatives | |
Underlying
Risk Exposure | | Derivative Instrument | | Location | | Value | | | Location | | Value | |
Core Bond | | | | | | | | | | | | | | |
| | | | | |
Interest rate | | Futures contracts | | Receivable for variation margin on futures contracts* | | $ | 24,210 | | | Payable for variation margin
on futures contracts* | | $ | 136,369 | |
| | | | | Receivable for variation margin on futures contracts* | | | (85,032 | ) | | — | | | — | |
Total | | | | | | $ | (60,822 | ) | | | | $ | 136,369 | |
| | | | | |
Core Plus Bond | | | | | | | | | | | | | | |
| | | | | |
Interest rate | | Futures contracts | | Receivable for variation margin on futures contracts* | | $ | 200,028 | | | Payable for variation margin
on futures contract* | | $ | 246,109 | |
| | | | | Receivable for variation margin on futures contracts* | | | (259,262 | ) | | — | | | — | |
Total | | | | | | $ | (59,234 | ) | | | | $ | 246,109 | |
| | | | | |
High Income Bond | | | | | | | | | | | | | | |
| | | | | |
Interest Rate | | Futures contracts | | Receivable for variation margin on futures contracts* | | $ | 9,710 | | | — | | $ | — | |
| | | | | |
Inflation Protected Securities | | | | | | | | | | | | | | |
| | | | | |
Interest rate | | Futures contracts | | Receivable for variation margin on futures contracts* | | $ | 25,273 | | | Payable for variation margin
on futures contracts* | | $ | 176,186 | |
| | | | | Receivable for variation margin on futures contracts* | | | (81,323 | ) | | — | | | — | |
Total | | | | | | $ | (56,050 | ) | | | | $ | 176,186 | |
| | | | | |
Short Term Bond | | | | | | | | | | | | | | |
| | | | | |
Interest rate | | Futures contracts | | — | | $ | — | | | Payable for variation margin
on futures contracts* | | $ | 1,322 | |
| | | | | — | | | — | | | Payable for variation margin
on futures contracts* | | | (3,023 | ) |
Total | | | | | | | — | | | | | $ | (1,701 | ) |
| | | | | |
Strategic Income | | | | | | | | | | | | | | |
| | | | | |
Interest Rate | | Futures contracts | | Receivable for variation margin on futures contracts* | | $ | 796,668 | | | Payable for variation margin
on futures contracts* | | $ | 729,805 | |
| | | | | — | | | — | | | Payable for variation margin
on futures contracts* | | | (475,200 | ) |
Total | | | �� | | | $ | 796,668 | | | | | $ | 254,605 | |
| * | Value represents unrealized appreciation (depreciation) of futures contracts as reported in the Fund’s Portfolio of Investments and not the asset and/or liability derivatives location as described in the table above. |
The following table presents the amount of net realized gain (loss) and change in net unrealized appreciation (depreciation) recognized on futures contracts on the Statement of Operations during the current fiscal period, and the primary underlying risk exposure.
| | | | | | | | | | | | |
| Fund | | Underlying
Risk Exposure | | Derivative
Instrument | | Net Realized
Gain (Loss) from
Futures Contracts | | | Change in Net Unrealized
Appreciation (Depreciation) of
Futures Contracts | |
| Core Bond | | Interest rate | | Futures contracts | | $ | 384,629 | | | $ | (116,123 | ) |
| Core Plus Bond | | Interest rate | | Futures contracts | | | (140,795 | ) | | | (25,668 | ) |
| High Income Bond | | Interest rate | | Futures contracts | | | (84,799 | ) | | | 12,573 | |
| Inflation Protected Securities | | Interest rate | | Futures contracts | | | 787,375 | | | | (129,279 | ) |
| Short Term Bond | | Interest rate | | Futures contracts | | | (703,560 | ) | | | (31,944 | ) |
| Strategic Income | | Interest rate | | Futures contracts | | | 2,768,614 | | | | 33,519 | |
141
Notes to Financial Statements (continued)
Interest Rate Swap Contracts
Interest rate swap contracts involve a Fund’s agreement with the counterparty to pay or receive a fixed rate payment in exchange for the counterparty receiving or paying a variable rate payment. Forward interest rate swap contracts involve a Fund’s agreement with a counterparty to pay, in the future, a fixed or variable rate payment in exchange for the counterparty paying the Fund a variable or fixed rate payment, the accruals for which begin at a specified date in the future (the “effective date”).
The amount of the payment obligation for an interest rate swap is based on the notional amount and the termination date of the contract. Interest rate swap contracts do not involve the delivery of securities or other underlying assets or principal. Accordingly, the risk of loss with respect to the swap counterparty on such transactions is limited to the net amount of interest payments that the Fund is to receive.
Interest rate swap contracts are valued daily. Upon entering into an interest rate swap contract (and beginning on the effective date for a forward interest rate swap contract), the Fund accrues the fixed rate payment expected to be paid or received and the variable rate payment expected to be received or paid on the interest rate swap contracts on a daily basis, and recognizes the daily change in the fair value of the Fund’s contractual rights and obligations under the contracts. For an over-the-counter (“OTC”) swap that is not cleared through a clearing house (“OTC Uncleared”), the amount recorded on these transactions is recognized on the Statement of Assets and Liabilities as a component of “Unrealized appreciation or depreciation on interest rate swaps.”
Upon the execution of an OTC swap cleared through a clearing house (“OTC Cleared”), the Fund is obligated to deposit cash or eligible securities, also known as “initial margin,” into an account at its clearing broker equal to a specified percentage of the contract amount. Cash deposited by the Fund to cover initial margin requirements on open swap contracts, if any, is recognized as a component of “Cash collateral at brokers for investments in swaps” on the Statement of Assets and Liabilities. Investments in OTC Cleared swaps obligate the Fund and the clearing broker to settle monies on a daily basis representing changes in the prior day’s “mark-to-market” of the swap contract. If the Fund has unrealized appreciation, the clearing broker will credit the Fund’s account with an amount equal to the appreciation. Conversely, if the Fund has unrealized depreciation, the clearing broker will debit the Fund’s account with an amount equal to the depreciation. These daily cash settlements are also known as “variation margin.” Variation margin for OTC Cleared swaps is recognized as a receivable and/or payable for “Variation margin on swap contracts” on the Statement of Assets and Liabilities. Upon the execution of an OTC Uncleared swap, neither the Fund nor the counterparty is required to deposit initial margin as the trades are recorded bilaterally between both parties to the swap contract, and the terms of the variation margin are subject to a predetermined threshold negotiated by the Fund and the counterparty. Variation margin for OTC Uncleared swaps is recognized as a component of “Unrealized appreciation or depreciation on interest rate swaps” as described in the preceding paragraph.
The net amount of periodic payments settled in cash are recognized as a component of “Net realized gain (loss) from swaps” on the Statement of
Operations, in addition to the net realized gain or loss recorded upon the termination of the swap contract. For tax purposes, payments expected to be received or paid on the swap contracts are treated as ordinary income or expense, respectively. Changes in the value of the swap contracts during the fiscal period are recognized as a component of “Change in net unrealized appreciation (depreciation) of swaps” on the Statement of Operations. In certain instances, payments are made or received upon entering into the swap contract to compensate for differences between the stated terms of the swap agreements and prevailing market conditions (credit spreads, currency exchange rates, interest rates, and other relevant factors). Payments received or made at the beginning of the measurement period, if any, are recognized as “Interest rate swaps premiums paid and/or received” on the Statement of Assets and Liabilities.
During the current fiscal period, Strategic Income used interest rate swap contracts as part of an overall portfolio construction strategy to manage portfolio duration.
The average notional amount of interest rate swap contracts outstanding during the current fiscal period was as follows:
| | | | |
| | | Strategic
Income | |
| Average notional amount of interest rate swap contracts outstanding* | | $ | 12,000,000 | |
| * | The average notional amount is calculated based on the outstanding notional at the beginning of the current fiscal period and at the end of each fiscal quarter within the current fiscal period. |
Credit Default Swap Contracts
A Fund may enter into a credit default swap contract to seek to maintain a total return on a particular investment or portion of its portfolio, or to take an active long or short position with respect to the likelihood of a particular issuer’s default. Credit default swap contracts involve one party making a stream of payments to another party in exchange for the right to receive a specified return if/when there is a credit event by a third party. Generally, a credit event means bankruptcy, failure to pay, or restructuring. The specific credit events applicable for each credit default swap are stated in the terms of the particular swap agreement. When a Fund has bought (sold) protection in a credit default swap upon occurrence of a specific credit event with respect to the underlying referenced entity, the Fund will either (i) deliver (receive) that security, or an equivalent amount of cash, from the counterparty in exchange for receipt (payment) of the notional amount to the counterparty, or (ii) receive (pay) a net settlement amount of the credit default swap contract less the recovery value of the referenced obligation or underlying securities comprising the referenced index. The difference between the
142
value of the security received (delivered) and the notional amount delivered (received) is recorded as a realized gain or loss. Payments paid (received) at the beginning of the measurement period are recognized as a component of “Credit default swaps premiums paid and/or received” on the Statement of Assets and Liabilities, when applicable.
Credit default swap contracts are valued daily. Changes in the value of a credit default swap during the fiscal period are recognized as a component of “Change in net unrealized appreciation (depreciation) of swaps” and realized gains and losses are recognized as a component of “Net realized gain (loss) from swaps” on the Statement of Operations.
For OTC swaps not cleared through a clearing house (“OTC Uncleared”), the daily change in the market value of the swap contract, along with any daily interest fees accrued, are recognized as components of “Unrealized appreciation or depreciation on credit default swaps” on the Statement of Assets and Liabilities.
Upon the execution of an OTC swap cleared through a clearing house (“OTC Cleared”), a Fund is obligated to deposit cash or eligible securities, also known as “initial margin,” into an account at its clearing broker equal to a specified percentage of the contract amount. Cash held by the broker to cover initial margin requirements on open swap contracts, if any, is recognized as “Cash collateral at brokers for investments in swaps” on the Statement of Assets and Liabilities. Investments in OTC Cleared swaps obligate a Fund and the clearing broker to settle monies on a daily basis representing changes in the prior day’s “mark-to-market” of the swap. If a Fund has unrealized appreciation, the clearing broker would credit the Fund’s account with an amount equal to the appreciation and conversely if a Fund has unrealized depreciation, the clearing broker will debit a Fund’s account with an amount equal to the depreciation. These daily cash settlements are also known as “variation margin.” Variation margin for OTC Cleared swaps is recognized as a receivable and/or payable for “Variation margin on swap contracts” on the Statement of Assets and Liabilities. Upon the execution of an OTC Uncleared swap, neither the Fund nor the counterparty is required to deposit initial margin as the trades are recorded bilaterally between both parties to the swap contract, and the terms of the variation margin are subject to a predetermined threshold negotiated by the Fund and the counterparty. Variation margin for OTC Uncleared swaps is recognized as a component of “Unrealized appreciation or depreciation on credit default swaps” as described in the preceding paragraph. The maximum potential amount of future payments the Fund could incur as a buyer or seller of protection in a credit default swap contract is limited to the notional amount of the contract. The maximum potential amount would be offset by the recovery value, if any, of the respective referenced entity.
During the current fiscal period, Core Plus Bond entered into credit default swaps to take on credit risk and earn a commensurate credit spread. High Income used to hedge a portion of the Fund’s high yield credit exposure. Strategic Income used high yield credit default swaps as a way to take on credit risk and earn credit spread.
The average notional amount of credit default swap contracts outstanding during the current fiscal period was as follows:
| | | | | | | | |
| | | Core Plus
Bond | | | Strategic
Income | |
| Average notional amount of credit default swap contracts outstanding* | | $ | 4,684,000 | | | $ | 47,240,000 | |
| * | The average notional amount is calculated based on the outstanding notional at the beginning of the current fiscal period and at the end of each fiscal quarter within the current fiscal period. |
The following table presents the fair value of all swap contracts held by the Funds as of the end of the reporting period, the location of these instruments on the Statement of Assets and Liabilities and the primary underlying risk exposure.
| | | | | | | | | | | | | | |
| | | | | Location on the Statement of Assets and Liabilities | |
| | | | | Asset Derivatives | | | (Liability) Derivatives | |
Underlying
Risk Exposure | | Derivative Instrument | | Location | | Value | | | Location | | Value | |
Strategic Income | | | | | | | | | | | | | | |
| | | | | |
Interest Rate | | Swaps (OTC Cleared) | | — | | $ | — | | | Payable for variation margin
on swap contracts* | | $ | (549,030 | ) |
| * | Value represents unrealized appreciation (depreciation) of swaps as reported in the Fund’s Portfolio of Investments and not the asset and/or liability amount as described in the table above. |
The following table presents the amount of net realized gain (loss) and change in net unrealized appreciation (depreciation) recognized on swap contracts on the Statement of Operations during the current fiscal period, and the primary underlying risk exposure.
| | | | | | | | | | | | |
| Fund | | Underlying
Risk Exposure | | Derivative
Instrument | | Net Realized
Gain (Loss)
from Swaps | | | Change in Net
Unrealized Appreciation
(Depreciation) of
Swaps | |
| Core Plus Bond | | Credit | | Swaps | | $ | (196,673 | ) | | $ | 3,126 | |
| High Income Bond | | Credit | | Swaps | | $ | (78,738 | ) | | $ | — | |
| Strategic Income | | Credit | | Swaps | | $ | (2,912,985 | ) | | $ | 540,428 | |
| | | Interest Rate | | Swaps | | | — | | | | (549,030 | ) |
| Total | | | | | | $ | (2,912,985 | ) | | $ | (8,602 | ) |
143
Notes to Financial Statements (continued)
Options Transactions
The purchase of options involves the risk of loss of all or a part of the cash paid for the options (the premium). The market risk associated with purchasing options is limited to the premium paid. The counterparty credit risk of purchasing options, however, needs to take into account the current value of the option, as this is the performance expected from the counterparty. When a Fund purchases an option, an amount equal to the premium paid (the premium plus commission) is recognized as a component of “Options purchased, at value” on the Statement of Asset and Liabilities. When a Fund writes an option, an amount equal to the net premium received (the premium less commission) is recognized as a component of “Options written, at value” on the Statement of Assets and Liabilities and is subsequently adjusted to reflect the current value of the written option until the option is exercised or expires or the Fund enters into a closing purchase transaction. The changes in the value of options purchased and/or written during the fiscal period are recognized as a component of “Change in net unrealized appreciation (depreciation) of options purchased and/or written” on the Statement of Operations. When an option is exercised or expires or a Fund enters into a closing purchase transaction, the difference between the net premium received, and any amount paid at expiration or on executing a closing purchase transaction, including commission, is recognized as a component of “Net realized gain (loss) from options purchased and/or written” on the Statement of Operations. The Fund, as writer of an option, has no control over whether the underlying instrument may be sold (called) or purchased (put) and as a result bears the risk of an unfavorable change in the market value of the instrument underlying the written option. There is also the risk the Fund may not be able to enter into a closing transaction because of an illiquid market.
During the current fiscal period, Core Plus Bond and Strategic Income purchased a small amount of call options on futures as part of its overwrite strategy.
The average notional amount of outstanding options purchased during the current fiscal period, was as follows:
| | | | | | | | |
| | | Core Plus
Bond | | | Strategic
Income | |
| Average notional amount of outstanding call options purchased* | | $ | 160,650 | | | $ | 698,700 | |
| * | The average notional amount is calculated based on the outstanding notional at the beginning of the current fiscal period and at the end of each fiscal quarter within the current fiscal period. The Fund did not have any outstanding call options purchased at the end of the current fiscal period. |
The following table presents the amount of net realized gain (loss) and change in net unrealized appreciation (depreciation) recognized on options purchased on the Statement of Operations during the current fiscal period, and the primary underlying risk exposure.
| | | | | | | | | | | | |
| Fund | | Underlying
Risk Exposure | | Derivative
Instrument | | Net Realized
Gain (Loss) from
Options Purchased | | | Change in Net
Unrealized
Appreciation
(Depreciation) of
Options Purchased | |
| Core Plus Bond | | Interest Rate | | Options | | $ | (16,404 | ) | | $ | 13,451 | |
| Strategic Income | | Interest Rate | | Options | | | (174,197 | ) | | | 58,501 | |
Market and Counterparty Credit Risk
In the normal course of business each Fund may invest in financial instruments and enter into financial transactions where risk of potential loss exists due to changes in the market (market risk) or failure of the other party to the transaction to perform (counterparty credit risk). The potential loss could exceed the value of the financial assets recorded on the financial statements. Financial assets, which potentially expose each Fund to counterparty credit risk, consist principally of cash due from counterparties on forward, option and swap transactions, when applicable. The extent of each Fund’s exposure to counterparty credit risk in respect to these financial assets approximates their carrying value as recorded on the Statement of Assets and Liabilities.
Each Fund helps manage counterparty credit risk by entering into agreements only with counterparties the Adviser believes have the financial resources to honor their obligations and by having the Adviser monitor the financial stability of the counterparties. Additionally, counterparties may be required to pledge collateral daily (based on the daily valuation of the financial asset) on behalf of each Fund with a value approximately equal to the amount of any unrealized gain above a pre-determined threshold. Reciprocally, when each Fund has an unrealized loss, the Funds have instructed the custodian to pledge assets of the Funds as collateral with a value approximately equal to the amount of the unrealized loss above a pre-determined threshold. Collateral pledges are monitored and subsequently adjusted if and when the valuations fluctuate, either up or down, by at least the pre-determined threshold amount.
144
4. Fund Shares
The Funds have an effective registration statement on file with the Securities and Exchange Commission (SEC) to issue Class T Shares, which were not yet available for public offering at the time this report was issued.
High Income Bond and Strategic Income have issued Class T Shares, however, these shares are not available for public offering.
Transactions in Fund shares during the current and prior fiscal period were as follows:
| | | | | | | | | | | | | | | | |
| | | Year Ended
6/30/18 | | | Year Ended
6/30/17 | |
| Core Bond | | Shares | | | Amount | | | Shares | | | Amount | |
| Shares sold: | | | | | | | | | | | | | | | | |
Class A | | | 259,345 | | | $ | 2,518,647 | | | | 348,602 | | | $ | 3,417,164 | |
Class C | | | 92,882 | | | | 896,333 | | | | 60,753 | | | | 599,236 | |
Class R6 | | | 1,251,363 | | | | 11,846,000 | | | | 43,750 | | | | 420,000 | |
Class I | | | 921,394 | | | | 8,848,524 | | | | 1,378,169 | | | | 13,502,662 | |
| Shares issued to shareholders due to reinvestment of distributions: | | | | | | | | | | | | | | | | |
Class A | | | 29,818 | | | | 287,696 | | | | 31,200 | | | | 306,317 | |
Class C | | | 2,395 | | | | 23,040 | | | | 2,394 | | | | 23,407 | |
Class R6 | | | 162,775 | | | | 1,566,207 | | | | 155,004 | | | | 1,516,669 | |
Class I | | | 43,111 | | | | 414,554 | | | | 67,626 | | | | 662,944 | |
| | | | 2,763,083 | | | | 26,401,001 | | | | 2,087,498 | | | | 20,448,399 | |
| Shares redeemed: | | | | | | | | | | | | | | | | |
Class A | | | (309,837 | ) | | | (2,984,976 | ) | | | (540,191 | ) | | | (5,290,739 | ) |
Class C | | | (90,717 | ) | | | (871,749 | ) | | | (62,735 | ) | | | (609,443 | ) |
Class R6 | | | (590,417 | ) | | | (5,610,000 | ) | | | (44,334 | ) | | | (425,000 | ) |
Class I | | | (2,215,128 | ) | | | (21,320,570 | ) | | | (5,006,267 | ) | | | (49,084,941 | ) |
| | | | (3,206,099 | ) | | | (30,787,295 | ) | | | (5,653,527 | ) | | | (55,410,123 | ) |
| Net increase (decrease) | | | (443,016 | ) | | $ | (4,386,294 | ) | | | (3,566,029 | ) | | $ | (34,961,724 | ) |
| | |
| | | Year Ended
6/30/18 | | | Year Ended
6/30/17 | |
| Core Plus Bond | | Shares | | | Amount | | | Shares | | | Amount | |
| Shares sold: | | | | | | | | | | | | | | | | |
Class A | | | 653,617 | | | $ | 7,139,307 | | | | 611,527 | | | $ | 6,726,114 | |
Class C | | | 121,329 | | | | 1,320,640 | | | | 171,637 | | | | 1,886,831 | |
Class R3 | | | 35,518 | | | | 389,435 | | | | 615,172 | | | | 6,844,174 | |
Class R6 | | | 184,131 | | | | 2,015,451 | | | | 90,528 | | | | 1,011,000 | |
Class I | | | 5,892,420 | | | | 64,299,334 | | | | 4,377,518 | | | | 47,937,579 | |
| Shares issued to shareholders due to reinvestment of distributions: | | | | | | | | | | | | | | | | |
Class A | | | 146,671 | | | | 1,599,806 | | | | 190,198 | | | | 2,095,816 | |
Class C | | | 12,592 | | | | 136,838 | | | | 16,235 | | | | 178,033 | |
Class R3 | | | 3,246 | | | | 35,566 | | | | 27,701 | | | | 307,667 | |
Class R6 | | | 68,518 | | | | 747,034 | | | | 84,172 | | | | 926,719 | |
Class I | | | 394,669 | | | | 4,296,055 | | | | 456,635 | | | | 5,020,233 | |
| | | | 7,512,711 | | | | 81,979,466 | | | | 6,641,323 | | | | 72,934,166 | |
| Shares redeemed: | | | | | | | | | | | | | | | | |
Class A | | | (1,077,905 | ) | | | (11,759,625 | ) | | | (1,217,937 | ) | | | (13,357,088 | ) |
Class C | | | (250,350 | ) | | | (2,716,787 | ) | | | (317,074 | ) | | | (3,464,656 | ) |
Class R3 | | | (28,732 | ) | | | (314,331 | ) | | | (1,879,685 | ) | | | (20,475,673 | ) |
Class R6 | | | (207,082 | ) | | | (2,236,563 | ) | | | (280,316 | ) | | | (3,090,000 | ) |
Class I | | | (6,627,192 | ) | | | (71,820,563 | ) | | | (6,073,915 | ) | | | (66,683,145 | ) |
| | | | (8,191,261 | ) | | | (88,847,869 | ) | | | (9,768,927 | ) | | | (107,070,562 | ) |
| Net increase (decrease) | | | (678,550 | ) | | $ | (6,868,403 | ) | | | (3,127,604 | ) | | $ | (34,136,396) | |
145
Notes to Financial Statements (continued)
| | | | | | | | | | | | | | | | |
| | |
| | | Year Ended
6/30/18 | | | Year Ended
6/30/17 | |
| High Income Bond | | Shares | | | Amount | | | Shares | | | Amount | |
| Shares sold: | | | | | | | | | | | | | | | | |
Class A | | | 17,652,996 | | | $ | 136,868,692 | | | | 32,470,739 | | | $ | 247,533,207 | |
Class C | | | 1,187,622 | | | | 9,211,820 | | | | 1,736,460 | | | | 13,348,306 | |
Class R3 | | | 10,132 | | | | 80,205 | | | | 45,050 | | | | 357,086 | |
Class I | | | 22,389,571 | | | | 174,488,964 | | | | 34,781,812 | | | | 265,895,263 | |
Class T | | | — | | | | — | | | | 3,161 | | | | 25,000 | |
| Shares issued to shareholders due to reinvestment of distributions: | | | | | | | | | | | | | | | | |
Class A | | | 1,074,495 | | | | 8,295,860 | | | | 1,340,981 | | | | 10,363,650 | |
Class C | | | 341,483 | | | | 2,633,531 | | | | 328,045 | | | | 2,530,015 | |
Class R3 | | | 4,177 | | | | 32,969 | | | | 4,906 | | | | 38,622 | |
Class I | | | 1,181,098 | | | | 9,162,487 | | | | 1,340,352 | | | | 10,386,721 | |
Class T | | | — | | | | — | | | | — | | | | — | |
| | | | 43,841,574 | | | | 340,774,528 | | | | 72,051,506 | | | | 550,477,870 | |
| Shares redeemed: | | | | | | | | | | | | | | | | |
Class A | | | (19,461,487 | ) | | | (150,787,002 | ) | | | (32,124,546 | ) | | | (247,025,407 | ) |
Class C | | | (2,170,940 | ) | | | (16,699,860 | ) | | | (1,721,578 | ) | | | (13,270,661 | ) |
Class R3 | | | (47,517 | ) | | | (377,065 | ) | | | (68,232 | ) | | | (534,057 | ) |
Class I | | | (30,624,226 | ) | | | (237,138,482 | ) | | | (39,271,277 | ) | | | (300,816,743 | ) |
Class T | | | — | | | | — | | | | — | | | | — | |
| | | | (52,304,170 | ) | | | (405,002,409 | ) | | | (73,185,633 | ) | | | (561,646,868 | ) |
| Net increase (decrease) | | | (8,462,596 | ) | | $ | (64,227,881 | ) | | | (1,134,127 | ) | | $ | (11,168,998 | ) |
| | |
| | | Year Ended
6/30/18 | | | Year Ended
6/30/17 | |
| Inflation Protected Securities | | Shares | | | Amount | | | Shares | | | Amount | |
| Shares sold: | | | | | | | | | | | | | | | | |
Class A | | | 3,233,346 | | | $ | 35,523,517 | | | | 6,040,554 | | | $ | 67,321,139 | |
Class C | | | 297,232 | | | | 3,212,789 | | | | 412,282 | | | | 4,524,060 | |
Class R3 | | | 258,480 | | | | 2,805,217 | | | | 603,269 | | | | 6,671,387 | |
Class R6 | | | 3,953,501 | | | | 44,478,129 | | | | 1,955,128 | | | | 21,949,504 | |
Class I | | | 11,698,956 | | | | 129,896,949 | | | | 20,142,393 | | | | 226,841,726 | |
| Shares issued to shareholders due to reinvestment of distributions: | | | | | | | | | | | | | | | | |
Class A | | | 109,290 | | | | 1,198,844 | | | | 59,660 | | | | 657,631 | |
Class C | | | 15,109 | | | | 162,888 | | | | 3,967 | | | | 42,609 | |
Class R3 | | | 4,822 | | | | 52,499 | | | | 2,149 | | | | 23,519 | |
Class R6 | | | 129,890 | | | | 1,448,758 | | | | 21,770 | | | | 243,084 | |
Class I | | | 341,197 | | | | 3,788,245 | | | | 182,980 | | | | 2,043,868 | |
| | | | 20,041,823 | | | | 222,567,835 | | | | 29,424,152 | | | | 330,318,527 | |
| Shares redeemed: | | | | | | | | | | | | | | | | |
Class A | | | (3,840,052 | ) | | | (42,159,326 | ) | | | (4,841,254 | ) | | | (53,604,295 | ) |
Class C | | | (423,472 | ) | | | (4,581,504 | ) | | | (613,289 | ) | | | (6,691,782 | ) |
Class R3 | | | (250,151 | ) | | | (2,721,323 | ) | | | (1,259,181 | ) | | | (13,919,416 | ) |
Class R6 | | | (598,621 | ) | | | (6,673,921 | ) | | | (192,582 | ) | | | (2,168,933 | ) |
Class I | | | (13,054,886 | ) | | | (144,902,526 | ) | | | (14,549,158 | ) | | | (163,023,741 | ) |
| | | | (18,167,182 | ) | | | (201,038,600 | ) | | | (21,455,464 | ) | | | (239,408,167 | ) |
| Net increase (decrease) | | | 1,874,641 | | | $ | 21,529,235 | | | | 7,968,688 | | | $ | 90,910,360 | |
146
| | | | | | | | | | | | | | | | |
| | | Year Ended
6/30/18 | | | Year Ended
6/30/17 | |
| Short Term Bond | | Shares | | | Amount | | | Shares | | | Amount | |
| Shares sold: | | | | | | | | | | | | | | | | |
Class A | | | 4,324,695 | | | $ | 42,456,234 | | | | 5,353,264 | | | $ | 52,756,422 | |
Class C | | | 336,335 | | | | 3,320,950 | | | | 1,329,379 | | | | 13,158,495 | |
Class R3 | | | 4,869 | | | | 47,861 | | | | 23,856 | | | | 235,874 | |
Class R6 | | | 281,692 | | | | 2,760,199 | | | | 5,437,604 | | | | 53,642,505 | |
Class I | | | 11,527,164 | | | | 113,147,895 | | | | 13,570,545 | | | | 133,885,155 | |
| Shares issued to shareholders due to reinvestment of distributions: | | | | | | | | | | | | | | | | |
Class A | | | 130,903 | | | | 1,282,714 | | | | 140,246 | | | | 1,383,223 | |
Class C | | | 13,707 | | | | 134,968 | | | | 18,098 | | | | 179,200 | |
Class R3 | | | 33 | | | | 326 | | | | 60 | | | | 589 | |
Class R6 | | | 128,556 | | | | 1,263,607 | | | | 90,268 | | | | 892,379 | |
Class I | | | 208,038 | | | | 2,040,672 | | | | 220,618 | | | | 2,177,787 | |
| | | | 16,955,992 | | | | 166,455,426 | | | | 26,183,938 | | | | 258,311,629 | |
| Shares redeemed: | | | | | | | | | | | | | | | | |
Class A | | | (5,841,694 | ) | | | (57,321,805 | ) | | | (5,799,396 | ) | | | (57,151,517 | ) |
Class C | | | (1,194,316 | ) | | | (11,763,288 | ) | | | (1,863,891 | ) | | | (18,443,917 | ) |
Class R3 | | | (28,101 | ) | | | (274,800 | ) | | | (8,633 | ) | | | (85,228 | ) |
Class R6 | | | (2,182,449 | ) | | | (21,345,719 | ) | | | (2,587,822 | ) | | | (25,570,087 | ) |
Class I | | | (17,075,957 | ) | | | (167,561,203 | ) | | | (20,733,177 | ) | | | (204,630,204 | ) |
| | | | (26,322,517 | ) | | | (258,266,815 | ) | | | (30,992,919 | ) | | | (305,880,953 | ) |
| Net increase (decrease) | | | (9,366,525 | ) | | $ | (91,811,389 | ) | | | (4,808,981 | ) | | $ | (47,569,324) | |
| | |
| | | Year Ended
6/30/18 | | | Year Ended
6/30/17 | |
| Strategic Income | | Shares | | | Amount | | | Shares | | | Amount | |
| Shares sold: | | | | | | | | | | | | | | | | |
Class A | | | 2,683,588 | | | $ | 28,377,306 | | | | 3,757,905 | | | $ | 39,980,395 | |
Class C | | | 803,487 | | | | 8,466,196 | | | | 1,087,361 | | | | 11,507,310 | |
Class R3 | | | 206,541 | | | | 2,172,121 | | | | 201,763 | | | | 2,155,820 | |
Class R6 | | | 4,457,391 | | | | 47,737,747 | | | | 16,930 | | | | 180,760 | |
Class I | | | 14,005,431 | | | | 147,411,778 | | | | 18,017,028 | | | | 191,046,600 | |
Class T | | | — | | | | — | | | | 2,343 | | | | 25,000 | |
| Shares issued to shareholders due to reinvestment of distributions: | | | | | | | | | | | | | | | | |
Class A | | | 416,049 | | | | 4,374,046 | | | | 719,575 | | | | 7,667,521 | |
Class C | | | 184,713 | | | | 1,932,280 | | | | 276,325 | | | | 2,927,905 | |
Class R3 | | | 12,106 | | | | 127,754 | | | | 17,683 | | | | 189,082 | |
Class R6 | | | 132,372 | | | | 1,386,723 | | | | 124,648 | | | | 1,328,825 | |
Class I | | | 1,063,993 | | | | 11,169,751 | | | | 1,071,000 | | | | 11,401,338 | |
Class T | | | — | | | | — | | | | — | | | | — | |
| | | | 23,965,671 | | | | 253,155,702 | | | | 25,292,561 | | | | 268,410,556 | |
| Shares redeemed: | | | | | | | | | | | | | | | | |
Class A | | | (5,467,652 | ) | | | (57,434,163 | ) | | | (9,384,268 | ) | | | (99,319,492 | ) |
Class C | | | (2,319,234 | ) | | | (24,188,687 | ) | | | (2,664,036 | ) | | | (28,194,589 | ) |
Class R3 | | | (328,430 | ) | | | (3,453,562 | ) | | | (258,707 | ) | | | (2,763,808 | ) |
Class R6 | | | (865,131 | ) | | | (9,161,916 | ) | | | (2,469,686 | ) | | | (26,308,349 | ) |
Class I | | | (17,331,712 | ) | | | (181,031,933 | ) | | | (13,558,767 | ) | | | (144,036,221 | ) |
Class T | | | — | | | | — | | | | — | | | | — | |
| | | | (26,312,159 | ) | | | (275,270,261 | ) | | | (28,335,464 | ) | | | (300,622,459 | ) |
| Net increase (decrease) | | | (2,346,488 | ) | | $ | (22,114,559 | ) | | | (3,042,903 | ) | | $ | (32,211,903 | ) |
147
Notes to Financial Statements (continued)
5. Investment Transactions
Long-term purchases and sales (including maturities but excluding investments purchased with collateral from securities lending and derivative transactions) during the current fiscal period were as follows:
| | | | | | | | | | | | | | | | | | | | | | | | |
| | | Core
Bond | | | Core Plus
Bond | | | High Income
Bond | | | Inflation
Protected
Securities | | | Short Term
Bond | | | Strategic
Income | |
| Purchases: | | | | | | | | | | | | | | | | | | | | | | | | |
Investment securities | | $ | 43,388,240 | | | $ | 155,359,984 | | | $ | 411,778,416 | | | $ | 32,382,998 | | | $ | 302,579,806 | | | $ | 449,897,185 | |
U.S. Government and agency obligations | | | 35,448,758 | | | | 204,158,960 | | | | 1,950,000 | | | | 138,309,024 | | | | 22,332,656 | | | | 515,633,371 | |
| Sales and maturities: | | | | | | | | | | | | | | | | | | | | | | | | |
Investment securities | | | 29,254,099 | | | | 155,437,077 | | | | 465,823,514 | | | | 15,304,591 | | | | 282,373,257 | | | | 401,615,403 | |
U.S. Government and agency obligations | | | 34,002,126 | | | | 187,980,419 | | | | — | | | | 131,776,088 | | | | 21,045,000 | | | | 549,557,244 | |
6. Income Tax Information
Each Fund is a separate taxpayer for federal income tax purposes. Each Fund intends to distribute substantially all of its net investment income and net capital gains to shareholders and to otherwise comply with the requirements of Subchapter M of the Internal Revenue Code applicable to regulated investment companies. Therefore, no federal income tax provision is required.
For all open tax years and all major taxing jurisdictions, management of the Funds has concluded that there are no significant uncertain tax positions that would require recognition in the financial statements. Open tax years are those that are open for examination by taxing authorities (i.e., generally the last four tax year ends and the interim tax period since then). Furthermore, management of the Funds is also not aware of any tax positions for which it is reasonably possible that the total amounts of unrecognized tax benefits will significantly change in the next twelve months.
The following information is presented on an income tax basis. Differences between amounts for financial statement and federal income tax purposes are primarily due to timing differences in recognizing certain gains and losses on investment transactions. To the extent that differences arise that are permanent in nature, such amounts are reclassified within the capital accounts as detailed below. Temporary differences do not require reclassification. Temporary and permanent differences do not impact the NAVs of the Funds.
The tables below present the cost and unrealized appreciation (depreciation) of each Fund’s investment portfolio, as determined on a federal income tax basis, as of June 30, 2018.
For purposes of this disclosure, derivative tax cost is generally the sum of any upfront fees or premiums exchanged and any amounts unrealized for income statement reporting but realized in income and/or capital gains for tax reporting. If a particular derivative category does not disclose any tax unrealized appreciation or depreciation, the change in value of those derivatives have generally been fully realized for tax purposes.
| | | | | | | | | | | | | | | | | | | | | | | | |
| | | Core
Bond | | | Core Plus
Bond | | | High Income
Bond | | | Inflation
Protected
Securities | | | Short Term
Bond | | | Strategic
Income | |
| Tax cost of investments | | $ | 136,368,396 | | | $ | 346,440,216 | | | $ | 353,005,560 | | | $ | 625,315,137 | | | $ | 472,679,847 | | | $ | 744,058,839 | |
| Gross unrealized: | | | | | | | | | | | | | | | | | | | | | | | | |
Appreciation | | $ | 1,007,369 | | | | 4,540,715 | | | $ | 5,347,163 | | | $ | 3,696,892 | | | $ | 232,362 | | | $ | 6,300,034 | |
Depreciation | | | (2,155,359 | ) | | | (8,431,599 | ) | | | (23,920,940 | ) | | | (9,255,047 | ) | | | (4,905,682 | ) | | | (20,625,491 | ) |
| Net unrealized appreciation (depreciation) of investments | | $ | (1,147,990 | ) | | $ | (3,890,884 | ) | | $ | (18,573,777 | ) | | $ | (5,558,155 | ) | | $ | (4,673,320 | ) | | $ | (14,325,457 | ) |
| | | | | | | | | | | | |
| | | Core Plus
Bond | | | High Income
Bond | | | Strategic
Income | |
| Tax cost of forward contracts | | $ | 6,976 | | | $ | (4,044 | ) | | $ | 273,576 | |
| Net unrealized appreciation (depreciation) of forward contracts | | | — | | | | — | | | | — | |
| | | | | | | | | | | | | | | | | | | | | | | | |
| | | Core
Bond | | | Core Plus
Bond | | | High Income
Bond | | | Inflation
Protected
Securities | | | Short Term
Bond | | | Strategic
Income | |
| Tax cost of futures contracts | | $ | 75,547 | | | $ | 186,875 | | | $ | 9,710 | | | $ | 120,136 | | | $ | (1,701 | ) | | $ | 1,051,273 | |
| Net unrealized appreciation (depreciation) of futures contracts | | | — | | | | — | | | | — | | | | — | | | | — | | | | — | |
| | | | |
| | | Strategic
Income | |
| Tax cost of swaps | | $ | — | |
| Net unrealized appreciation (depreciation) of swaps | | | (549,030 | ) |
148
Permanent differences, primarily due to expiration of capital loss carryforwards, foreign currency transactions, Sec. 305(c) adjustments, complex security character adjustments, investments in partnerships, treatment of notional principal contracts and amortization of mark-to-market adjustments on Sec. 311(e) assets, resulted in reclassifications among the Funds’ components of net assets as of June 30, 2018, the Funds’ tax year end, as follows:
| | | | | | | | | | | | | | | | | | | | | | | | |
| | | Core
Bond | | | Core Plus
Bond | | | High Income
Bond | | | Inflation
Protected
Securities | | | Short Term
Bond | | | Strategic
Income | |
| Capital paid-in | | $ | — | | | $ | — | | | $ | 9 | | | $ | — | | | $ | (4,103,631 | ) | | $ | (35,110,018 | ) |
| Undistributed (Over-distribution of) net investment income | | | — | | | | (313,379 | ) | | | (194,037 | ) | | | — | | | | — | | | | (3,537,903 | ) |
| Accumulated net realized gain (loss) | | | — | | | | 313,379 | | | | 194,028 | | | | — | | | | 4,103,631 | | | | 38,647,921 | |
The tax components of undistributed net ordinary income and net long-term capital gains as of June 30, 2018, the Funds’ tax year end, were as follows:
| | | | | | | | | | | | | | | | | | | | | | | | |
| | | Core
Bond | | | Core Plus
Bond | | | High Income
Bond | | | Inflation
Protected
Securities | | | Short Term
Bond | | | Strategic
Income | |
| Undistributed net ordinary income1 | | $ | 204,197 | | | $ | — | | | $ | 2,368,041 | | | $ | 4,942,480 | | | $ | 581,224 | | | $ | — | |
| Undistributed net long-term capital gains | | | — | | | | — | | | | — | | | | — | | | | — | | | | — | |
| 1 | Undistributed net ordinary income (on a tax basis) has not been reduced for the dividend declared during the period June 1, 2018 through June 29, 2018 and paid on July 2, 2018. Net ordinary income consists of net taxable income derived from dividends, interest and net short-term capital gains, if any. |
The tax character of distributions paid during the Funds’ tax years ended June 30, 2018 and June 30, 2017, was designated for purposes of the dividends paid deduction as follows:
| | | | | | | | | | | | | | | | | | | | | | | | |
| 2018 | | Core
Bond | | | Core Plus
Bond | | | High Income
Bond | | | Inflation
Protected
Securities | | | Short-Term
Bond | | | Strategic
Income | |
| Distributions from net ordinary income2 | | $ | 3,529,829 | | | $ | 9,611,001 | | | $ | 24,114,668 | | | $ | 15,363,092 | | | $ | 9,310,746 | | | $ | 17,866,927 | |
| Distributions from net long-term capital gains | | | — | | | | — | | | | — | | | | — | | | | — | | | | — | |
| Return of capital | | | — | | | | 2,151,490 | | | | — | | | | — | | | | — | | | | 14,569,390 | |
| | | | | | | | | | | | | | | | | | | | | | | | |
2017 | | Core
Bond | | | Core Plus
Bond | | | High Income
Bond | | | Inflation
Protected
Securities | | | Short Term
Bond | | | Strategic
Income | |
| Distributions from net ordinary income2 | | $ | 3,957,392 | | | $ | 9,981,541 | | | $ | 30,659,613 | | | $ | 6,987,083 | | | $ | 9,517,470 | | | $ | 22,549,140 | |
| Distributions from net long-term capital gains | | | — | | | | — | | | | — | | | | — | | | | — | | | | — | |
| Return of capital | | | 283,435 | | | | 5,002,040 | | | | — | | | | — | | | | 579,228 | | | | 17,330,639 | |
| 2 | Net ordinary income consists of net taxable income derived from dividends, interest and net short-term capital gains, if any. |
As of June 30, 2018, the Funds’ tax year end, the Funds had unused capital losses carrying forward available for federal income tax purposes to be applied against future capital gains, if any. The capital losses are not subject to expiration.
| | | | | | | | | | | | | | | | | | | | | | | | |
| | | Core
Bond | | | Core Plus
Bond | | | High Income
Bond | | | Inflation
Protected
Securities | | | Short Term
Bond | | | Strategic
Income | |
| Not subject to expiration: | | | | | | | | | | | | | | | | | | | | | | | | |
Short-term | | $ | 593,246 | | | $ | 3,833,985 | | | $ | 37,745,091 | | | $ | 3,026,514 | | | $ | 4,590,051 | | | $ | 23,964,735 | |
Long-term | | | 1,871,671 | | | | 910,732 | | | | 67,932,575 | | | | 157,834 | | | | 5,335,996 | | | | 27,514,278 | |
| Total | | $ | 2,464,917 | | | $ | 4,744,717 | | | $ | 105,677,666 | | | $ | 3,184,348 | | | $ | 9,926,047 | | | $ | 51,479,013 | |
During the Funds’ tax year ended June 30, 2018, the following Funds utilized capital loss carryforwards as follows:
| | | | | | | | | | | | | | | | |
| | | Core
Bond | | | Core Plus Bond | | | Inflation
Protected
Securities | | | Strategic
Income | |
| Utilized capital loss carryforwards | | $ | 453,035 | | | $ | 2,033,287 | | | $ | 626,831 | | | $ | 3,243,237 | |
As of June 30, 2018, the Funds’ tax year end, the following Fund’s capital loss carryforwards expired as follows:
| | | | | | | | |
| | | Short Term
Bond | | | Strategic
Income | |
| Expired capital loss carryforwards | | $ | 4,103,631 | | | $ | 35,110,018 | |
149
Notes to Financial Statements (continued)
7. Management Fees and Other Transactions with Affiliates
Management Fees
Each Fund’s management fee compensates the Adviser for the overall investment advisory and administrative services and general office facilities. The Sub-Adviser is compensated for its services to the Funds from the management fees paid to the Adviser.
Each Fund’s management fee consists of two components – a fund-level fee, based only on the amount of assets within each individual Fund, and a complex-level fee, based on the aggregate amount of all eligible fund assets managed by the Adviser. This pricing structure enables each Fund’s shareholders to benefit from growth in the assets within their respective Fund as well as from growth in the amount of complex-wide assets managed by the Adviser.
For the period July 1, 2017 through July 31, 2017, the annual fund-level fee, payable monthly, for each Fund was calculated according to the following schedule:
| | | | | | | | | | | | | | | | | | | | | | | | |
| Average Daily Net Assets | | Core Bond | | | Core Plus Bond | | | High Income Bond | | | Inflation
Protected
Securities | | | Short Term
Bond | | | Strategic
Income | |
| For the first $125 million | | | 0.2700 | % | | | 0.2800 | % | | | 0.4000 | % | | | 0.2500 | % | | | 0.2200 | % | | | 0.3600 | % |
| For the next $125 million | | | 0.2575 | | | | 0.2675 | | | | 0.3875 | | | | 0.2375 | | | | 0.2075 | | | | 0.3475 | |
| For the next $250 million | | | 0.2450 | | | | 0.2550 | | | | 0.3750 | | | | 0.2250 | | | | 0.1950 | | | | 0.3350 | |
| For the next $500 million | | | 0.2325 | | | | 0.2425 | | | | 0.3625 | | | | 0.2125 | | | | 0.1825 | | | | 0.3225 | |
| For the next $1 billion | | | 0.2200 | | | | 0.2300 | | | | 0.3500 | | | | 0.2000 | | | | 0.1700 | | | | 0.3100 | |
| For net assets over $2 billion | | | 0.1950 | | | | 0.2050 | | | | 0.3250 | | | | 0.1750 | | | | 0.1450 | | | | 0.2850 | |
Effective August 1, 2017, the annual fund-level fee, payable monthly, for each Fund is calculated according to the following schedule:
| | | | | | | | | | | | | | | | | | | | | | | | |
| Average Daily Net Assets | | Core Bond | | | Core Plus Bond | | | High Income Bond | | | Inflation Protected Securities | | | Short Term Bond | | | Strategic Income | |
| For the first $125 million | | | 0.2700 | % | | | 0.2800 | % | | | 0.4000 | % | | | 0.2500 | % | | | 0.2200 | % | | | 0.3600 | % |
| For the next $125 million | | | 0.2575 | | | | 0.2675 | | | | 0.3875 | | | | 0.2375 | | | | 0.2075 | | | | 0.3475 | |
| For the next $250 million | | | 0.2450 | | | | 0.2550 | | | | 0.3750 | | | | 0.2250 | | | | 0.1950 | | | | 0.3350 | |
| For the next $500 million | | | 0.2325 | | | | 0.2425 | | | | 0.3625 | | | | 0.2125 | | | | 0.1825 | | | | 0.3225 | |
| For the next $1 billion | | | 0.2200 | | | | 0.2300 | | | | 0.3500 | | | | 0.2000 | | | | 0.1700 | | | | 0.3100 | |
| For the next $3 billion | | | 0.1950 | | | | 0.2050 | | | | 0.3250 | | | | 0.1750 | | | | 0.1450 | | | | 0.2850 | |
| For the next $5 billion | | | 0.1700 | | | | 0.1800 | | | | 0.3000 | | | | 0.1500 | | | | 0.1200 | | | | 0.2600 | |
| For net assets over $10 billion | | | 0.1575 | | | | 0.1675 | | | | 0.2875 | | | | 0.1375 | | | | 0.1075 | | | | 0.2475 | |
The annual complex-level fee, payable monthly, for each Fund is determined by taking the complex-level fee rate, which is based on the aggregate amount of “eligible assets” of all Nuveen funds as set forth in the schedule below, and making, as appropriate, an upward adjustment to that rate based upon the percentage of the particular fund’s assets that are not “eligible assets.” The complex-level fee schedule for each Fund is as follows:
| | | | |
| Complex-Level Eligible Asset Breakpoint Level* | | Effective Complex-Level Fee Rate at Breakpoint Level | |
| $55 billion | | | 0.2000 | % |
| $56 billion | | | 0.1996 | |
| $57 billion | | | 0.1989 | |
| $60 billion | | | 0.1961 | |
| $63 billion | | | 0.1931 | |
| $66 billion | | | 0.1900 | |
| $71 billion | | | 0.1851 | |
| $76 billion | | | 0.1806 | |
| $80 billion | | | 0.1773 | |
| $91 billion | | | 0.1691 | |
| $125 billion | | | 0.1599 | |
| $200 billion | | | 0.1505 | |
| $250 billion | | | 0.1469 | |
| $300 billion | | | 0.1445 | |
| * | The complex-level fee is calculated based upon the aggregate daily “eligible assets” of all Nuveen open-end and closed-end funds. Eligible assets do not include assets attributable to investments in other Nuveen funds or assets in excess of a determined amount (originally $2 billion) added to the Nuveen fund complex in connection with the Adviser’s assumption of the management of the former First American Funds effective January 1, 2011. Eligible assets include closed-end fund assets managed by the Adviser that are attributable to certain types of leverage. For these purposes, leverage includes the closed-end funds’ use of preferred stock and borrowings and certain investments in the residual interest certificates (also called inverse floating rate securities) in tender option bond (TOB) trusts, including the portion of assets held by the TOB trust that has been effectively financed by the trust’s issuance of floating rate securities, subject to an agreement by the Adviser as to certain funds to limit the amount of such assets for determining eligible assets in certain circumstances. As of June 30, 2018, the complex-level fee for each Fund was as follows: |
150
| | | | |
| Fund | | Complex-Level Fee | |
| Core Bond | | | 0.2000 | % |
| Core Plus Bond | | | 0.2000 | |
| High Income Bond | | | 0.2000 | |
| Inflation Protected Securities | | | 0.1708 | |
| Short Term Bond | | | 0.2000 | |
| Strategic Income | | | 0.1935 | |
The Adviser has agreed to waive fees and/or reimburse expenses (“Expense Cap”) of each Fund so that total annual Fund operating expenses (excluding 12b-1 distribution and/or service fees, interest expenses, taxes, acquired fund fees and expenses, fees occurred in acquiring and disposing of portfolio securities and extraordinary expenses) do not exceed the average daily net assets of any class of Fund shares in the amounts and for the time periods stated in the following table. However, because Class R6 Shares are not subject to sub-transfer agent and similar fees, the total annual Fund operating expenses for the Class R6 Shares will be less than the expense limitation. The expense limitation in effect thereafter may be terminated or modified only with the approval of the Board.
| | | | | | |
| Fund | | Expense Cap | | | Expense Cap
Expiration Date |
| Core Bond | | | 0.53 | % | | July 31, 2020 |
| Core Plus Bond | | | 0.52 | | | July 31, 2020 |
| High Income Bond | | | 0.75 | | | July 31, 2020 |
| Inflation Protected Securities | | | 0.56 | | | July 31, 2020 |
| Short Term Bond | | | 0.47 | | | July 31, 2020 |
| Strategic Income | | | 0.59 | | | July 31, 2020 |
Other Transactions with Affiliates
During the current fiscal period, Nuveen Securities, LLC, (the “Distributor”), a wholly-owned subsidiary of Nuveen, collected sales charges on purchases of Class A Shares, the majority of which were paid out as concessions to financial intermediaries as follows:
| | | | | | | | | | | | | | | | | | | | | | | | |
| | | Core
Bond | | | Core Plus
Bond | | | High Income
Bond | | | Inflation
Protected
Securities | | | Short Term
Bond | | | Strategic
Income | |
| Sales charges collected (Unaudited) | | $ | 15,946 | | | $ | 56,492 | | | $ | 510,586 | | | $ | 27,973 | | | $ | 213,196 | | | $ | 116,269 | |
| Paid to financial intermediaries (Unaudited) | | | 13,610 | | | | 49,896 | | | | 456,143 | | | | 24,812 | | | | 207,280 | | | | 104,580 | |
The Distributor also received 12b-1 service fees on Class A Shares, substantially all of which were paid to compensate financial intermediaries for providing services to shareholders relating to their investments.
During the current fiscal period, the Distributor compensated financial intermediaries directly with commission advances at the time of purchase as follows:
| | | | | | | | | | | | | | | | | | | | | | | | |
| | | Core
Bond | | | Core Plus
Bond | | | High Income
Bond | | | Inflation
Protected
Securities | | | Short Term
Bond | | | Strategic
Income | |
| Commission advances (Unaudited) | | $ | 9,936 | | | $ | 12,936 | | | $ | 135,848 | | | $ | 24,603 | | | $ | 182,383 | | | $ | 93,448 | |
To compensate for commissions advanced to financial intermediaries, all 12b-1 service and distribution fees collected on Class C Shares during the first year following a purchase are retained by the Distributor. During the current fiscal period, the Distributor retained such 12b-1 fees as follows:
| | | | | | | | | | | | | | | | | | | | | | | | |
| | | Core
Bond | | | Core Plus
Bond | | | High Income
Bond | | | Inflation
Protected
Securities | | | Short Term
Bond | | | Strategic
Income | |
| 12b-1 fees retained (Unaudited) | | $ | 4,210 | | | $ | 13,489 | | | $ | 89,366 | | | $ | 21,058 | | | $ | 13,119 | | | $ | 82,214 | |
The remaining 12b-1 fees charged to the Funds were paid to compensate financial intermediaries for providing services to shareholders relating to their investments.
The Distributor also collected and retained CDSC on share redemptions during the current fiscal period, as follows:
| | | | | | | | | | | | | | | | | | | | | | | | |
| | | Core
Bond | | | Core Plus
Bond | | | High Income
Bond | | | Inflation
Protected
Securities | | | Short Term
Bond | | | Strategic
Income | |
| CDSC retained (Unaudited) | | $ | 8 | | | $ | 2,989 | | | $ | 26,125 | | | $ | 2,099 | | | $ | 14,592 | | | $ | 19,154 | |
151
Notes to Financial Statements (continued)
8. Borrowing Arrangements
Uncommitted Line of Credit
During the current fiscal period, the Funds participated in an unsecured bank line of credit (“Unsecured Credit Line”) under which outstanding balances would bear interest at a variable rate. Although the Funds participated in the Unsecured Credit Line, they did not have any outstanding balances during the current fiscal period.
The Unsecured Credit Line was not renewed after its scheduled termination date of July 27, 2017.
Committed Line of Credit
The Funds, along with certain other funds managed by the Adviser (“Participating Funds”), have established a 364-day, approximately $3 billion standby credit facility with a group of lenders, under which the Participating Funds may borrow for various purposes other than leveraging for investment purposes. A large portion of this facility’s capacity (and its associated costs as described below) is currently dedicated for use by a small number of Participating Funds, which does not include any of the Funds covered by this shareholder report. The remaining capacity under the facility (and the corresponding portion of the facility’s annual costs) is separately dedicated to most of the other open-end funds in the Nuveen fund family, including all of the Funds covered by this shareholder report, along with a number of Nuveen closed-end funds. The credit facility expires in July 2018 unless extended or renewed.
The credit facility has the following terms: a fee of 0.15% per annum on unused commitment amounts, and interest at a rate equal to the higher of (a) one-month LIBOR (London Inter-Bank Offered Rate) plus 1.00% (1.25% prior to July 27, 2017) per annum or (b) the Fed Funds rate plus 1.00% (1.25% prior to July 27, 2017) per annum on amounts borrowed. Participating Funds paid administration, legal and arrangement fees, which are recognized as a component of “Other expenses” on the Statement of Operations, and along with commitment fees, have been allocated among such Participating Funds based upon the relative proportions of the facility’s aggregate capacity reserved for them and other factors deemed relevant by the Adviser and the Board of each Participating Fund.
During the current fiscal period, High Income Bond utilized this facility. The Fund’s average daily balance outstanding and average annual interest rate during the utilization period was $11,228,571 and 2.29%, respectively. The Fund’s maximum outstanding daily balance during the utilization period was $17,100,000. Borrowings outstanding as of the end of the reporting period are recognized as “Borrowings” on the Statement of Assets and Liabilities. None of the other Funds utilized this facility during the current fiscal period.
9. New Accounting Pronouncements
FASB Accounting Standards Update (“ASU”) 2017-08 (“ASU 2017-08”) Premium Amortization on Purchased Callable Debt Securities
The FASB has issued ASU 2017-08, which shortens the premium amortization period for purchased non-contingently callable debt securities. ASU 2017-08 specifies that the premium amortization period ends at the earliest call date, for purchased non-contingently callable debt securities. ASU 2017-08 is effective for fiscal years, and interim periods within those fiscal years, beginning after December 15, 2018. Management is currently evaluating the implications of ASU 2017-08, if any.
10. Subsequent Events
Borrowing Arrangements
On July 11, 2018, the Funds renewed the standby credit facility through July 2019. In conjunction with this renewal, the amount of the facility decreased to $2.65 billion, while all other terms remained unchanged.
Share Classes and Sales Charges
Effective July 2018, Class C Shares will automatically convert to Class A Shares after 10 years. Conversions will occur during the month in which the 10-year anniversary of the purchase occurs. Class C Shares that have been held for longer than 10 years as of July 1, 2018 will also convert to Class A Shares in July 2018. The automatic conversion will be based on the relative net asset values of each share class without the imposition of a sales charge or fee. The automatic conversion of Class C Shares to Class A Shares will not apply to shares held through group retirement plan recordkeeping platforms of certain financial intermediaries who hold such shares in an omnibus account and do not track participant level share lot aging to facilitate such a conversion.
152
Additional
Fund Information
(Unaudited)
| | | | | | | | | | |
| | | | | |
| | Fund Manager Nuveen Fund Advisors, LLC 333 West Wacker Drive Chicago, IL 60606 Sub-Adviser Nuveen Asset Management, LLC 333 West Wacker Drive Chicago, IL 60606 | | Independent Registered
Public Accounting Firm PricewaterhouseCoopers LLP One North Wacker Drive Chicago, IL 60606 Custodian U.S. Bank National Association 1555 North RiverCenter Drive Suite 302 Milwaukee, WI 53202 | | Legal Counsel Chapman and Cutler LLP Chicago, IL 60603 | | Transfer Agent and
Shareholder Services DST Asset Manager
Solutions, Inc. (DST) P.O. Box 219140 Kansas City, MO 64121-9140 (800) 257-8787 | | |
| | | | | | | | | | | | | | | | |
| | | | | | |
| | | | | | | | | | | | |
| | |
| | Distribution Information: The Funds hereby designate their percentages of dividends paid from net ordinary income as dividends qualifying as Interest-Related Dividends and/or short-term capital gain dividends as defined in Internal Revenue Code Section 871(k) for the taxable year ended June 30, 2018: | | |
| | | | | | | | |
| | | | | Core Bond | | Core Plus Bond | | High Income Bond | | Inflation Protected Securities | | Short Term Bond | | Strategic Income | | |
| | % of Interest-Related Dividends | | 100.0% | | 96.5% | | 77.3% | | 92.7% | | 100.0% | | 100.0% | | |
| | |
| | Distribution Information: The following Fund hereby designates its percentage of dividends paid from net ordinary income as dividends qualifying for the 70% dividends received deduction (“DRD”) for corporations and its percentage as qualified dividend income (“QDI”) for individuals under Section 1(h)(11) of the Internal Revenue Code as shown in the accompanying table. The actual qualified dividend income distributions will be reported to shareholders on Form 1099-DIV which will be sent to shareholders shortly after calendar year end. | | |
| | | | | | | | |
| | | | | | | | | | | | | | | High Income Bond | | |
| | % QDI | | | | | | | | | | | | 3.1% | | |
| | % DRD | | | | | | | | | | | | 3.1% | | |
| | | |
| | | | | | |
| | |
| | Quarterly Form N-Q Portfolio of Investments Information: Each Fund is required to file its complete schedule of portfolio holdings with the Securities and Exchange Commission (SEC) for the first and third quarters of each fiscal year on Form N-Q. You may obtain this information directly from the SEC. Visit the SEC on-line at http://www.sec.gov or in person at the SEC’s Public Reference Room in Washington, D.C. Call the SEC toll-free at (800) SEC-0330 for room hours and operation. | | |
| | | |
| | | | | | |
| | |
| | Nuveen Funds’ Proxy Voting Information: You may obtain (i) information regarding how each fund voted proxies relating to portfolio securities held during the most recent twelve-month period ended June 30, without charge, upon request, by calling Nuveen toll-free at (800) 257-8787 or on Nuveen’s website at www.nuveen.com and (ii) a description of the policies and procedures that each fund used to determine how to vote proxies relating to portfolio securities without charge, upon request, by calling Nuveen toll-free at (800) 257-8787. You may also obtain this information directly from the SEC. Visit the SEC on-line at http://www.sec.gov. | | |
| | | |
| | | | | | |
| | |
| | FINRA BrokerCheck: The Financial Industry Regulatory Authority (FINRA) provides information regarding the disciplinary history of FINRA member firms and associated investment professionals. This information as well as an investor brochure describing FINRA BrokerCheck is available to the public by calling the FINRA BrokerCheck Hotline number at (800) 289-9999 or by visiting www.FINRA.org. | | |
153
Glossary of Terms
Used in this Report
(Unaudited)
Asset-Backed Securities (ABS): Securities whose value and income payments are derived from and collateralized by a specific pool of underlying assets. The pool of assets typically is a group of small and/or illiquid assets that may be difficult to sell individually. The underlying pools of asset-backed securities often include payments from credit cards, auto loans or mortgage loans.
Average Annual Total Return: This is a commonly used method to express an investment’s performance over a particular, usually multi-year time period. It expresses the return that would have been necessary each year to equal the investment’s actual cumulative performance (including change in NAV or offer price and reinvested dividends and capital gains distributions, if any) over the time period being considered.
Basis Point: One one-hundredth of one percentage point, or 0.01%. For example, 25 basis points equals 0.25%.
Beta: A measure of the variability of the change in the share price for a fund in relation to a change in the value of the fund’s market benchmark. Securities with betas higher than 1.0 have been, and are expected to be, more volatile than the benchmark; securities with betas lower than 1.0 have been, and are expected to be, less volatile than the benchmark.
Bloomberg Barclays U.S. Aggregate Bond Index: An unmanaged index that includes all investment-grade, publicly issued, fixed-rate, dollar denominated, nonconvertible debt issues and commercial mortgage-backed securities with maturities of at least one year and outstanding par values of $150 million or more. Index returns assume reinvestment of distributions, but do not include the effects of any applicable sales charges or management fees.
Bloomberg Barclays High Yield 2% Issuer Capped Index: An issuer-constrained version of the U.S. Corporate High-Yield Index that covers the U.S. dollar denominated, non-investment grade, fixed-rate, taxable corporate bond market. Index returns assume reinvestment of distributions, but do not include the effects of any applicable sales charges or management fees.
Bloomberg Barclays U.S. TIPS Index: An unmanaged index that includes all publicly issued, U.S. Treasury inflation-protected securities that have at least one year remaining to maturity, are rated investment grade, and have $250 million or more of outstanding face value. Index returns assume reinvestment of distributions, but do not include the effects of any applicable sales charges or management fees.
Bloomberg Barclays 1-3 Year Government/Credit Bond Index: An unmanaged index that includes all medium and larger issues of U.S. government, investment-grade corporate, and investment-grade international dollar-denominated bonds that have maturities of between 1 and 3 years and are publicly issued. Index returns assume reinvestment of distributions, but do not include the effects of any applicable sales charges or management fees.
Commercial Mortgage-Backed Securities (CMBS): Commercial mortgage-backed securities are backed by cash flows of a mortgage or pool of mortgages on commercial real estate. CMBS generally are structured to provide protection to the senior class investors against potential losses on the underlying mortgage loans. CMBS are typically characterized by the following: i) loans on multi-family housing, non-residential property, ii) payments based on the amortization schedule of 25-30 years with a balloon payment due usually after 10 years, and iii) restrictions on prepayments.
Contingent Capital Securities (CoCos): CoCos are debt or capital securities of primarily non-U.S. issuers with loss absorption contingency mechanisms built into the terms of the security, for example a mandatory conversion into common stock of the issuer, or a principal write-down, which if triggered would likely cause the CoCo investment to lose value. Loss absorption mechanisms would become effective upon the occurrence of a specified contingency event, or at the discretion of a regulatory body. Specified contingency events, as identified in the CoCo’s governing documents,
154
usually reference a decline in the issuer’s capital below a specified threshold level, and/or certain regulatory events. A loss absorption contingency event for CoCos would likely be the result of, or related to, the deterioration of the issuer’s financial condition and/or its status as a going concern. In such a case, with respect to CoCos that provide for conversion into common stock upon the occurrence of the contingency event, the market price of the issuer’s common stock received by the Acquiring Fund will have likely declined, perhaps substantially, and may continue to decline after conversion. CoCos rated below investment grade should be considered high yield securities, or “junk,” but often are issued by entities whose more senior securities are rated investment grade. CoCos are a relatively new type of security; and there is a risk that CoCo security issuers may suffer the sort of future financial distress that could materially increase the likelihood (or the market’s perception of the likelihood) that an automatic write-down or conversion event on those issuers’ CoCos will occur. Additionally, the trading behavior of a given issuer’s CoCo may be strongly impacted by the trading behavior of other issuers’ CoCos, such that negative information from an unrelated CoCo security may cause a decline in value of one or more CoCos held by the Fund. Accordingly, the trading behavior of CoCos may not follow the trading behavior of other types of debt and preferred securities. Despite these concerns, the prospective reward vs. risk characteristics of at least certain CoCos may be very attractive relative to other fixed-income alternatives.
Duration: Duration is a measure of the expected period over which a bond’s principal and interest will be paid, and consequently is a measure of the sensitivity of a bond’s or bond fund’s value to changes when market interest rates change. Generally, the longer a bond’s or fund’s duration, the more the price of the bond or fund will change as interest rates change.
Gross Domestic Product (GDP): The total market value of all final goods and services produced in a country/region in a given year, equal to total consumer, investment and government spending, plus the value of exports, minus the value of imports.
Lipper Core Bond Classification Average: Represents the average annualized returns for all reporting funds in the Lipper Core Bond Classification. Lipper returns account for the effects of management fees and assume reinvestment of distributions, but do not reflect any applicable sales charge.
Lipper Core Bond Plus Classification Average: Represents the average annualized returns for all reporting funds in the Lipper Core Bond Plus Classification. Lipper returns account for the effects of management fees and assume reinvestment of distributions, but do not reflect any applicable sales charge.
Lipper High Current Yield Funds Classification Average: Represents the average annualized returns for all reporting funds in the Lipper High Current Yield Funds Classification. Lipper returns account for the effects of management fees and assume reinvestment of distributions, but do not reflect any applicable sales charge.
Lipper Inflation-Protected Bond Funds Classification Average: Represents the average annualized returns for all reporting funds in the Lipper Inflation-Protected Bond Funds Classification. The Lipper returns account for the effects of management fees and assume reinvestment of distributions, but do not reflect any applicable sales charge.
Lipper Multi-Sector Income Funds Classification Average: Represents the average annualized returns for all reporting funds in the Lipper Multi-Sector Income Funds Classification. Lipper returns account for the effects of management fees and assume reinvestment of distributions, but do not reflect any applicable sales charge.
Lipper Short Investment Grade Debt Funds Classification Average: Represents the average annualized returns for all reporting funds in the Lipper Short Investment Grade Debt Funds Classification. Lipper returns account for the effects of management fees and assume reinvestment of distributions, but do not reflect any applicable sales charge.
Mortgage-Backed Securities (MBS): Mortgage-backed securities (MBS) are bonds backed by pools of mortgages, usually with similar characteristics, and which return principal and interest in each payment. MBS are composed of residential mortgages (RMBS) or commercial mortgages (CMBS). RMBS are further divided into agency RMBS and non-agency RMBS, depending on the issuer.
155
Glossary of Terms Used in this Report (Unaudited) (continued)
Net Asset Value (NAV) Per Share: A fund’s Net Assets is equal to its total assets (securities, cash and accrued earnings) less its total liabilities. For funds with multiple classes, Net Assets are determined separately for each share class. NAV per share is equal to the fund’s (or share class’) Net Assets divided by its number of shares outstanding.
Residential Mortgage-Backed Securities (RMBS): Residential mortgage-backed securities are securities the payments on which depend primarily on the cash flow from residential mortgage loans made to borrowers that are secured by residential real estate. RMBS consist of agency and non-agency RMBS. Agency RMBS have agency guarantees that assure investors that they will receive timely payment of interest and principal, regardless of delinquency or default rates on the underlying loans. Agency RMBS include securities issued by the Government National Mortgage Association, the Federal National Mortgage Association and the Federal Home Loan Mortgage Corporation, and other federal agencies, or issues guaranteed by them. Non-agency RMBS do not have agency guarantees. Non-agency RMBS have credit enhancement built into the structure to shield investors from borrower delinquencies. The spectrum of non-agency residential mortgage loans includes traditional jumbo loans (prime), alternative-A loans (Alt-A), and home equity loans (sub-prime).
Tax Equalization: The practice of treating a portion of the distribution made to a redeeming shareholder, which represents his proportionate part of undistributed net investment income and capital gain as a distribution for tax purposes. Such amounts are referred to as the equalization debits (or payments) and will be considered a distribution to the shareholder of net investment income and capital gain for calculation of the fund’s dividends paid deduction.
156
Annual Investment Management Agreement Approval Process
(Unaudited)
At a meeting held on May 22-24, 2018 (the “May Meeting”), the Board of Directors (the “Board,” and each Director, a “Board Member”) of the Funds, including the Board Members who are not “interested persons” (as defined under the Investment Company Act of 1940 (the “1940 Act”)) (the “Independent Board Members”), approved, for each Fund, the renewal of the management agreement (the “Investment Management Agreement”) with Nuveen Fund Advisors, LLC (the “Adviser”) pursuant to which the Adviser serves as investment adviser to such Fund and the sub-advisory agreement (the “Sub-Advisory Agreement”) with Nuveen Asset Management, LLC (the “Sub-Adviser”) pursuant to which the Sub-Adviser serves as investment sub-adviser to such Fund. Following an initial two-year period, the Board, including the Independent Board Members, is required under the 1940 Act to review and approve each Investment Management Agreement and Sub-Advisory Agreement on behalf of the applicable Fund on an annual basis. The Investment Management Agreements and Sub-Advisory Agreements are collectively referred to as the “Advisory Agreements” and the Adviser and the Sub-Adviser are collectively, the “Fund Advisers” and each, a “Fund Adviser.”
In response to a request on behalf of the Independent Board Members by independent legal counsel, the Board received and reviewed prior to the May Meeting extensive materials specifically prepared for the annual review of Advisory Agreements by the Adviser as well as by Broadridge Financial Solutions, Inc. (“Broadridge” or “Lipper”), an independent provider of investment company data. The materials provided in connection with the annual review covered a breadth of subject matter including, but not limited to, a description of the nature, extent and quality of services provided by each Fund Adviser; a review of the Sub-Adviser and the applicable investment team(s); an analysis of fund performance in absolute terms and as compared to the performance of certain peer funds and benchmarks with a focus on any performance outliers; an analysis of the fees and expense ratios of the Nuveen funds in absolute terms and as compared to those of certain peer funds with a focus on any expense outliers; a description of portfolio manager compensation; a review of the performance of various service providers; a description of various initiatives Nuveen had undertaken or continued during the year for the benefit of particular Nuveen fund(s) and/or the complex; a description of the profitability or financial data of Nuveen and the various sub-advisers to the Nuveen funds; and a description of indirect benefits received by the Fund Advisers as a result of their relationships with the Nuveen funds. The Independent Board Members also received a memorandum from independent legal counsel outlining their fiduciary duties and legal standards in reviewing the Advisory Agreements. The Board Members held an in-person meeting on April 10-11, 2018 (the “April Meeting”), in part, to review and discuss the performance of the Nuveen funds and the Adviser’s evaluation of the various sub-advisers to the Nuveen funds. Prior to the May Meeting, the Board Members also received and reviewed supplemental information provided in response to questions posed by the Board Members.
The information prepared specifically for the annual review of the Advisory Agreements supplemented the information provided to the Board and its committees throughout the year. The Board and its committees met regularly during the year and the information provided and topics discussed were relevant to the review of the Advisory Agreements. Some of these reports and other data included, among other things, materials that outlined the investment performance of the Nuveen funds; strategic plans of the Adviser which may impact the services it provides to the Nuveen funds; the review of the Nuveen funds and applicable investment teams; compliance, regulatory and risk management matters; the trading practices of the various sub-advisers; valuation of securities; fund expenses; payments to financial intermediaries, including 12b-1 fees and sub-transfer agency fees; and overall market and regulatory developments. The Board further continued its practice of seeking to meet periodically with the various sub-advisers to the Nuveen funds and their investment teams, when feasible. As a result, the Independent Board Members considered the review of the Advisory Agreements to be an ongoing process and employed the accumulated information, knowledge, and experience the Board Members had gained during their tenure on the boards governing the Nuveen funds and working with the Fund Advisers in their review of the Advisory Agreements. Throughout the year and during the annual review of Advisory Agreements, the Independent Board Members met in executive sessions with independent legal counsel and had the benefit of counsel’s advice.
In deciding to renew the Advisory Agreements, the Independent Board Members did not identify a particular factor as determinative, but rather the decision reflected the comprehensive consideration of all the information provided, and each Board Member may have attributed different levels of importance to the various factors and information considered in connection with the approval process. The following summarizes the principal factors, but not all the factors, the Board considered in deciding to renew the Advisory Agreements and its conclusions.
A. Nature, Extent and Quality of Services
In evaluating the renewal of the Advisory Agreements, the Independent Board Members received and considered information regarding the nature, extent and quality of the applicable Fund Adviser’s services provided to the respective Fund and the resulting performance of each Fund. With respect to the Adviser, the Board recognized the comprehensive set of management, oversight and administrative services the Adviser and its affiliates provided to manage and operate the Nuveen funds in a highly regulated industry. As illustrative, these services included, but were not limited to, product management; investment oversight, risk management and securities valuation services; fund accounting and administration services; board support and administration services; compliance and regulatory oversight services; and legal support.
157
Annual Investment Management Agreement Approval Process (Unaudited) (continued)
In addition to the services necessary to operate and maintain the Nuveen funds, the Board recognized the Adviser’s continued program of improvements and innovations to make the Nuveen fund complex more relevant and attractive to existing and new investors and to accommodate the new and changing regulatory requirements in an increasingly complex regulatory environment. The Board noted that some of the initiatives the Adviser had taken over recent years to benefit the complex and particular Nuveen funds included, among other things:
| | • | | Fund Rationalizations – continuing efforts to rationalize the product line through mergers, liquidations and repositionings in seeking to enhance shareholder value over the years through increased efficiency, reduced costs, improved performance and revised investment approaches more relevant to current shareholder needs; |
| | • | | Product Innovations – developing product innovations and launching new products that will help the Nuveen fund complex offer a variety of products that will attract new investors and retain existing investors, such as launching the target term funds, exchange-traded funds (“ETFs”) and multi-asset class funds; |
| | • | | Risk Management Enhancements – continuing efforts to enhance risk management, including enhancing reporting to increase the efficiency of risk monitoring, implementing programs to strengthen the ability to detect and mitigate operational risks, dedicating resources and staffing necessary to create standards to help ensure compliance with new liquidity requirements, and implementing a price verification system; |
| | • | | Additional Compliance Services – the continuing investment of significant resources, time and additional staffing to meet the various new regulatory requirements affecting the Nuveen funds over the past several years, the further implementation of unified compliance policies and processes, the development of additional compliance training modules, and the reorganization of the compliance team adding further depth to its senior leadership; and |
| | • | | Expanded Dividend Management Services – as the Nuveen fund complex has grown, the additional services necessary to manage the distributions of the varied funds offered and investing in automated systems to assist in this process. |
In addition to the services provided by the Adviser, the Board also noted the business related risks the Adviser incurred in managing the Nuveen funds, including entrepreneurial, legal and litigation risks.
The Board further considered the division of responsibilities between the Adviser and the Sub-Adviser and the investment and compliance oversight over the Sub-Adviser provided by the Adviser. The Board recognized that the Sub-Adviser generally provided the portfolio advisory services for the Funds. The Board reviewed the Adviser’s analysis of the Sub-Adviser which evaluated, among other things, the investment team, the members’ experience and any changes to the team during the year, the team’s assets under management, the stability and history of the organization, the team’s investment approach and the performance of the Funds over various periods. The Board noted that the Adviser recommended the renewal of the Sub-Advisory Agreements.
Based on its review, the Board determined, in the exercise of its reasonable business judgment, that it was satisfied with the nature, extent and quality of services provided to the respective Funds under each applicable Advisory Agreement.
B. The Investment Performance of the Funds and Fund Advisers
As part of its evaluation of the services provided by the Fund Advisers, the Board considered the investment performance of each Fund. In this regard, the Board reviewed fund performance over the quarter, one-, three- and five-year periods ending December 31, 2017 as well as performance data for the first quarter of 2018 ending March 31, 2018. For open-end Nuveen funds with multiple classes, the performance data was based on Class A shares and the performance of other classes should be substantially similar as they invest in the same portfolio of securities and differences in performance among the classes would be principally attributed to the variations in the expense structures of the classes. The Independent Board Members noted that they reviewed and discussed fund performance over various time periods with management at their quarterly meetings throughout the year and their review and analysis of performance during the annual review of Advisory Agreements incorporated such discussions.
The Board reviewed performance on an absolute basis and in comparison to the performance of peer funds (the “Performance Peer Group”) and recognized and/or customized benchmarks (i.e., generally benchmarks derived from multiple recognized benchmarks). The Board considered the Adviser’s analysis of each Nuveen fund’s performance, including, in particular, an analysis of the Nuveen funds determined to be performance outliers and the factors contributing to their underperformance.
In reviewing performance data, the Independent Board Members appreciated some of the inherent limitations of such data. In this regard, the Independent Board Members recognized that there may be limitations with the comparative data of certain peer groups or benchmarks as they may pursue objective(s), strategies or have other characteristics that are different from the respective Nuveen fund and therefore the performance results necessarily are different and limit the value of the comparisons. As an example, some funds may utilize leverage which may add to or detract from performance compared to an unlevered benchmark. The Independent Board Members also noted that management had ranked the relevancy of the peer group as low, medium or high to help the Board evaluate the value of the comparative peer performance data. The Board was aware that the performance data was measured as of a specific date and a different time period may reflect significantly different results and a period of
158
underperformance can significantly impact long-term performance figures. The Board further recognized that a shareholder’s experience in a Fund depends on his or her own holding period which may differ from that reviewed by the Independent Board Members.
In their review of performance, the Independent Board Members focused, in particular, on the Adviser’s analysis of Nuveen funds determined to be underperforming performance outliers. The Independent Board Members noted that only a limited number of the Nuveen funds appeared to be underperforming performance outliers at the end of 2017 and considered the factors contributing to the respective fund’s performance and whether there were any performance concerns that needed to be addressed. The Board recognized that some periods of underperformance may only be temporary while other periods of underperformance may indicate a broader issue that may require a corrective action.
Accordingly, with respect to any Nuveen funds for which the Board had identified performance issues, the Board monitors such funds closely until performance improves, discusses with the Adviser the reasons for such results, considers whether any steps are necessary or appropriate to address such issues, and reviews the results of any efforts undertaken.
For Nuveen Inflation Protected Securities Fund, the Board noted that although the Fund’s performance was below its benchmark in the one-, three- and five-year periods, the Fund ranked in the second quartile of its Performance Peer Group in the one-year period and the third quartile in the three- and five-year periods. The Board was satisfied with the Fund’s overall performance.
For Nuveen Short Term Bond Fund, the Board noted that the Fund ranked in the third quartile of its Performance Peer Group in the one- and three-year periods and the second quartile in the five-year period. The Fund also outperformed its benchmark over such periods. The Board was satisfied with the Fund’s overall performance.
For Nuveen Core Bond Fund, the Board noted that although the Fund ranked in the fourth quartile of its Performance Peer Group and underperformed its benchmark in the three- and five-year periods, the Fund ranked in the second quartile and outperformed its benchmark in the one-year period. The Board was satisfied with the Fund’s overall performance.
For Nuveen Core Plus Bond Fund, the Board noted that the Fund ranked in the second quartile of its Performance Peer Group in the one- and five-year periods and the third quartile in the three-year period. The Fund also outperformed its benchmark in the one-, three- and five-year periods. The Board was satisfied with the Fund’s overall performance.
For Nuveen Strategic Income Fund, the Board noted that although the Fund ranked in the fourth quartile of its Performance Peer Group in the one- and three-year periods, the Fund ranked in the third quartile in the five-year period and outperformed its benchmark in the one-, three- and five-year periods. The Board considered and had an active discussion with the Adviser regarding the factors that contributed to the Fund’s lower relative performance compared to peers and noted that a reduction in exposure to high yield corporate securities and foreign currencies implemented to add downside protection and reduce risk, respectively, also detracted from performance. The Board was satisfied with the Adviser’s explanation of the Fund’s performance.
For Nuveen High Income Bond Fund, the Board noted that although the Fund’s performance was below its benchmark in the one-, three- and five-year periods, the Fund ranked in the second quartile of its Performance Peer Group in the one-year period and third quartile in the three- and five-year periods. The Board was satisfied with the Fund’s overall performance.
C. Fees, Expenses and Profitability
1. Fees and Expenses
In its annual review, the Board considered the fees paid to the Fund Advisers and the total operating expense ratio of each Fund, before and after any undertaking by Nuveen to limit the Fund’s total annual operating expenses to certain levels. More specifically, the Independent Board Members reviewed, among other things, each Fund’s gross and net management fee rates (i.e., before and after expense reimbursements and/or fee waivers, if any) and net total expense ratio in relation to those of a comparable universe of funds (the “Peer Universe”) and to a more focused subset of comparable funds (the “Peer Group”) established by Broadridge. The Independent Board Members reviewed the methodology Broadridge employed to establish its Peer Universe and Peer Group and recognized that differences between the applicable fund and its respective Peer Universe and/or Peer Group may limit some of the value of the comparative data. The Independent Board Members also considered a fund’s operating expense ratio as it more directly reflected the shareholder’s costs in investing in the respective fund. In their review, the Independent Board Members considered, in particular, each fund with a net expense ratio of six basis points or higher compared to that of its peer average (each an “Expense Outlier Fund”). The Board noted that the number of Nuveen funds classified as an Expense Outlier Fund pursuant to the foregoing criteria had decreased over the past few years with only a limited number of the Nuveen funds identified as Expense Outlier Funds in 2017. The Independent Board Members reviewed an analysis as to the factors contributing to each such fund’s higher relative net expense ratio. Accordingly, in reviewing the comparative data between a fund and its peers, the Board generally considered the fund’s net expense ratio and fees to be higher if they were over 10 basis points higher, slightly higher if they were 6 to 10 basis points higher, in line if they were within approximately 5 basis points higher than the peer average and below if they were below the peer average of the Peer Group.
159
Annual Investment Management Agreement Approval Process (Unaudited) (continued)
In their review of the fee arrangements for the Nuveen funds, the Independent Board Members considered the management fee schedules, including the complex-wide and fund-level breakpoint schedules, and the expense reimbursements and/or fee waivers provided by Nuveen for each fund, as applicable. The Independent Board Members noted that the management fees and/or expense caps of various open-end funds had been reduced in 2016 and the fund-level breakpoint schedules also had been revised in 2017 for certain open-end funds resulting in the addition of more breakpoints in the management fee schedules of such funds. The Board considered that across the Nuveen fund complex, the complex-wide fee breakpoints reduced fees by $47.4 million and fund-level breakpoints reduced fees by $54.6 million in 2017. Further, fee caps and waivers for all applicable Nuveen funds saved an additional $16.7 million in fees for shareholders in 2017.
The Board considered the sub-advisory fees paid to the Sub-Adviser, including any breakpoint schedule, and as described below, comparative data of the fees the Sub-Adviser charges to other clients.
The Independent Board Members noted that each Fund had a net management fee and a net expense ratio below the respective peer averages.
Based on their review of the information provided, the Board determined that each Fund’s management fees (as applicable) to a Fund Adviser were reasonable in light of the nature, extent and quality of services provided to the Fund.
2. Comparisons with the Fees of Other Clients
In determining the appropriateness of fees, the Board also reviewed information regarding the fee rates the respective Fund Advisers charged for certain other types of clients and the type of services provided to these other clients. With respect to the Adviser and/or the Sub-Adviser, such other clients may include retail and institutional managed accounts, investment companies outside the Nuveen family, foreign investment companies offered by Nuveen, and collective investment trusts. The Board further noted that the Adviser also advised certain ETFs sponsored by Nuveen.
The Board recognized that each Fund had an affiliated sub-adviser and reviewed, among other things, the range of fees assessed for managed accounts and foreign investment companies. The Board also reviewed the fee range and average fee rate of certain selected investment strategies offered in retail and institutional managed accounts by the Sub-Adviser and of the non-Nuveen investment companies sub-advised by affiliated sub-advisers. In addition to the comparative fee data, the Board also reviewed, among other things, a description of the different levels of services provided to other clients compared to the services provided to the Nuveen funds as well as the differences in portfolio investment policies, investor profiles, account sizes and regulatory requirements, all of which contribute to the variations in the fee schedules. With respect to ETFs, the Board considered the differences in the passive management of Nuveen’s Nushares ETFs compared to the active management of other Nuveen funds which also contributed to differing management fee levels compared to the other Nuveen funds. In general, the Board noted that the higher fee levels reflect higher levels of services provided by Nuveen, increased investment management complexity, greater product management requirements and higher levels of business risk or some combination of these factors. The Board further considered that the Sub-Adviser’s fee is essentially for portfolio management services and therefore more comparable to the fees it receives for retail wrap accounts and other external sub-advisory mandates. The Board concluded the varying levels of fees were justified given, among other things, the inherent differences in the products and the level of services provided to the Nuveen funds versus other clients, the differing regulatory requirements and legal liabilities and the entrepreneurial risks incurred in sponsoring and advising a registered investment company.
3. Profitability of Fund Advisers
In conjunction with their review of fees, the Independent Board Members considered Nuveen’s level of profitability for its advisory services to the Nuveen funds for the calendar years 2017 and 2016. In considering profitability, the Independent Board Members reviewed the level of profitability realized by Nuveen including and excluding any distribution expenses incurred by Nuveen from its own resources. The Independent Board Members also reviewed a description of the expense allocation methodology employed to develop the financial information and a summary of the history of changes to the methodology over the years. For comparability purposes, the Board recognized that a prior year’s profitability would be restated to reflect any refinements to the methodology. The Independent Board Members were aware of the inherent limitations in calculating profitability as the use of different reasonable allocation methodologies may lead to significantly different results and in reviewing profitability margins over extended periods given the refinements to the methodology over time. The Board noted that two Independent Board Members, along with independent counsel, serve as the Board’s liaisons to review and discuss any proposed changes to the methodology prior to the full Board’s review.
In their review, the Independent Board Members evaluated, among other things, Nuveen’s adjusted operating margins, gross and net revenue margins (pre-tax and after-tax) for advisory activities for the Nuveen funds, and the revenues, expenses, and net income (pre-tax and after-tax and before distribution) of Nuveen for fund advisory services for each of the last two calendar years. The Independent Board Members also reviewed an analysis of the key drivers behind the changes in revenues and expenses that impacted profitability in 2017 versus 2016. The Board noted that Nuveen recently launched its ETF product line in 2016 and reviewed the revenues, expenses and operating margin from this product line.
In addition to reviewing Nuveen’s profitability in absolute terms, the Independent Board Members also examined comparative profitability data reviewing, among other things, the revenues, expenses and adjusted total company margins of other advisory firms that had publicly available information and comparable assets under management (based on asset size and asset composition) for 2017 and as compared to their adjusted
160
operating margins for 2016. The Independent Board Members, however, recognized the difficulty in comparing the profitability of various fund managers given the limited public information available and the subjective nature of calculating profitability which may be affected by numerous factors including the fund manager’s organizational structure, types of funds, other lines of business, methodology used to allocate expenses and cost of capital. Nevertheless, considering such limitations and based on the information provided, the Board noted that Nuveen’s adjusted operating margins appeared reasonable when compared to the adjusted margins of the peers.
Aside from Nuveen’s profitability, the Board recognized that the Adviser is a subsidiary of Nuveen, LLC, the investment management arm of Teachers Insurance and Annuity Association of America (“TIAA”). As such, the Board also reviewed a balance sheet for TIAA reflecting its assets, liabilities and capital and contingency reserves for the 2017 and 2016 calendar years to consider the financial strength of TIAA.
In reviewing profitability, the Independent Board Members also considered the profitability of the various sub-advisers from their relationships with the respective Nuveen fund(s). The Independent Board Members reviewed the Sub-Adviser’s revenues, expenses and revenue margins (pre- and post-tax) for its advisory activities for the calendar year ended December 31, 2017. The Independent Board Members also reviewed a profitability analysis reflecting the revenues, expenses and revenue margin (pre- and post-tax) by asset type for the Sub-Adviser for the calendar year ending December 31, 2017 and the pre- and post-tax revenue margin from 2017 and 2016.
In evaluating the reasonableness of the compensation, the Independent Board Members also considered any other ancillary benefits derived by the respective Fund Adviser from its relationship with the Nuveen funds as discussed in further detail below.
Based on a consideration of all the information provided, the Board noted that Nuveen’s and the Sub-Adviser’s level of profitability was acceptable and not unreasonable in light of the services provided.
D. Economies of Scale and Whether Fee Levels Reflect These Economies of Scale
The Independent Board Members considered the extent to which economies of scale may be achieved as a Fund grows and whether these economies of scale have been shared with shareholders. Although the Board recognized that economies of scale are difficult to measure, the Independent Board Members noted that there are several methods that may be used in seeking to share economies of scale, including through breakpoints in the management fee schedule reducing the fee rates as asset levels grow, fee waivers and/or expense limitation agreements and the Adviser’s investment in its business which can enhance the services provided to the Nuveen funds. With respect to breakpoint schedules, because the Board had previously recognized that economies of scale may occur not only when the assets of a particular fund grow but also when the assets in the complex grow, the Nuveen funds generally pay the Adviser a management fee comprised of a fund-level component and a complex-level component each with its own breakpoint schedule, subject to certain exceptions. In general terms, the breakpoint schedule at the fund level reduces fees as assets in the particular fund pass certain thresholds and the breakpoint schedule at the complex level reduces fees on certain funds as the eligible assets in the complex pass certain thresholds. Subject to exceptions for certain Nuveen funds, the Independent Board Members reviewed the fund-level and complex-level fee schedules and any resulting savings in fees. The Board also recognized that the fund-level breakpoint schedule for certain Nuveen funds had been revised in 2016.
Aside from the breakpoint schedules, the Independent Board Members also reviewed the temporary and/or permanent expense caps applicable to certain Nuveen funds (including, for each Fund, its temporary expense cap), which may also serve as a means to share economies of scale. Based on the information provided, the Independent Board Members noted that the combination of fund-level breakpoints, complex-level breakpoints and fund-specific fee waivers reflected a total of $118.6 million in fee reductions in 2017. In addition, the Independent Board Members recognized the Adviser’s continued reinvestment in its business through, among other things, improvements in technology, additional staffing, product innovations and other organizational changes designed to expand or enhance the services provided to the benefit of all of the Nuveen funds.
Based on its review, the Board concluded that the current fee arrangements together with the Adviser’s reinvestment in its business appropriately shared any economies of scale with shareholders.
E. Indirect Benefits
The Independent Board Members received and considered information regarding other benefits the respective Fund Adviser or its affiliates may receive as a result of their relationship with the Nuveen funds. The Independent Board Members reviewed the revenues that an affiliate of the Adviser received in 2017 as a result of serving as principal underwriter to the open-end funds from 12b-1 distribution and shareholder servicing fees (except for Nuveen’s Nushares ETFs which currently do not incur 12b-1 fees).
In addition to the above, the Independent Board Members considered whether the Sub-Adviser uses commissions paid by the Funds on portfolio transactions to obtain research products and other services (“soft dollar transactions”). The Board recognized that the Sub-Adviser may benefit from research received from broker-dealers that execute Fund portfolio transactions. The Board, however, noted that the benefits for sub-advisers transacting in fixed-income securities may be more limited as such securities generally trade on a principal basis and therefore do not generate brokerage commissions. Further, the Board noted that although the Sub-Adviser may benefit from the receipt of research and other services that it may otherwise have to pay for out of its own resources, the research may also benefit the Funds to the extent it enhances the ability of the Sub-Adviser to manage the Funds or is acquired through the commissions paid on portfolio transactions of other funds or clients.
161
Annual Investment Management Agreement Approval Process (Unaudited) (continued)
Based on their review, the Board concluded that any indirect benefits received by a Fund Adviser as a result of its relationship with the Funds were reasonable and within acceptable parameters.
F. Other Considerations
The Board Members did not identify any single factor discussed previously as all-important or controlling. The Board Members, including the Independent Board Members, concluded that the terms of each Advisory Agreement were fair and reasonable, that the respective Fund Adviser’s fees were reasonable in light of the services provided to each Fund and that the Advisory Agreements be renewed.
162
Directors and Officers
(Unaudited)
The management of the Funds, including general supervision of the duties performed for the Funds by the Adviser, is the responsibility of the Board of Directors of the Funds. The number of Directors of the Funds is currently set at eleven. None of the Directors who are not “interested” persons of the Funds (referred to herein as “independent Directors”) has ever been a Director or employee of, or consultant to, Nuveen or its affiliates. The names and business addresses of the Directors and officers of the Funds, their principal occupations and other affiliations during the past five years, the number of portfolios each oversees and other directorships they hold are set forth below.
The Funds’ Statement of Additional Information (“SAI”) includes more information about the Directors. To request a free copy, call Nuveen Investments at (800) 257-8787 or visit the Funds’ website at www.nuveen.com.
| | | | | | | | |
Name,
Year of Birth
& Address | | Position(s)
Held with
the Funds | | Year First
Elected or
Appointed (1) | | Principal Occupation(s)
Including other Directorships
During Past 5 Years | | Number of
Portfolios in
Fund Complex
Overseen by
Director |
| |
| Independent Directors: |
Terence J. Toth 1959 333 W. Wacker Drive Chicago, IL 60606 | | Chairman and Director | | 2008 | | Formerly, a Co-Founding Partner, Promus Capital (2008-2017); Director, Fulcrum IT Service LLC (since 2010) and Quality Control Corporation (since 2012); member: Catalyst Schools of Chicago Board (since 2008) and Mather Foundation Board (since 2012), and chair of its investment committee; formerly, Director, Legal & General Investment Management America, Inc. (2008-2013); formerly, CEO and President, Northern Trust Global Investments (2004-2007); Executive Vice President, Quantitative Management & Securities Lending (2000-2004); prior thereto, various positions with Northern Trust Company (since 1994); formerly, Member, Northern Trust Mutual Funds Board (2005-2007), Northern Trust Global Investments Board (2004-2007), Northern Trust Japan Board (2004-2007), Northern Trust Securities Inc. Board (2003-2007) and Northern Trust Hong Kong Board (1997-2004). | | 170 |
Jack B. Evans 1948 333 W. Wacker Drive Chicago, IL 60606 | | Director | | 1999 | | President, The Hall-Perrine Foundation, a private philanthropic corporation (since 1996); Director and Chairman, United Fire Group, a publicly held company; Director, Public member, American Board of Orthopaedic Surgery (since 2015); Life Trustee of Coe College and the Iowa College Foundation; formerly, President Pro-Tem of the Board of Regents for the State of Iowa University System; formerly, Director, Alliant Energy and The Gazette Company; formerly, Director, Federal Reserve Bank of Chicago; formerly, President and Chief Operating Officer, SCI Financial Group, Inc., a regional financial services firm. | | 170 |
William C. Hunter 1948 333 W. Wacker Drive Chicago, IL 60606 | | Director | | 2003 | | Dean Emeritus, formerly, Dean, Tippie College of Business, University of Iowa (2006-2012); Director of Wellmark, Inc. (since 2009); past Director (2005-2015), and past President (2010-2014) Beta Gamma Sigma, Inc., The International Business Honor Society; formerly, Director (2004-2018) of Xerox Corporation; Dean and Distinguished Professor of Finance, School of Business at the University of Connecticut (2003-2006); previously, Senior Vice President and Director of Research at the Federal Reserve Bank of Chicago (1995-2003); formerly, Director (1997-2007), Credit Research Center at Georgetown University. | | 170 |
163
Directors and Officers (Unaudited) (continued)
| | | | | | | | |
Name,
Year of Birth
& Address | | Position(s)
Held with
the Funds | | Year First
Elected or
Appointed (1) | | Principal Occupation(s)
Including other Directorships
During Past 5 Years | | Number of
Portfolios in
Fund Complex
Overseen by
Director |
Albin F. Moschner 1952 333 W. Wacker Drive Chicago, IL 60606 | | Director | | 2016 | | Founder and Chief Executive Officer, Northcroft Partners, LLC, a management consulting firm (since 2012); Director, USA Technologies, Inc., a provider of solutions and services to facilitate electronic payment transactions (since 2012); formerly, Director, Wintrust Financial Corporation (1996-2016); previously, held positions at Leap Wireless International, Inc., including Consultant (2011-2012), Chief Operating Officer (2008-2011), and Chief Marketing Officer (2004-2008); formerly, President, Verizon Card Services division of Verizon Communications, Inc. (2000-2003); formerly, President, One Point Services at One Point Communications (1999-2000); formerly, Vice Chairman of the Board, Diba, Incorporated (1996-1997); formerly, various executive positions with Zenith Electronics Corporation (1991-1996). | | 170 |
John K. Nelson 1962 333 W. Wacker Drive Chicago, IL 60606 | | Director | | 2013 | | Member of Board of Directors of Core12 LLC (since 2008), a private firm which develops branding, marketing and communications strategies for clients; Director of The Curran Center for Catholic American Studies (since 2009) and The President’s Council, Fordham University (since 2010); formerly senior external advisor to the financial services practice of Deloitte Consulting LLP (2012-2014); formerly, Chairman of the Board of Trustees of Marian University (2010 as trustee, 2011-2014 as Chairman); formerly, Chief Executive Officer of ABN AMRO N.V. North America, and Global Head of its Financial Markets Division (2007-2008); prior senior positions held at ABN AMRO include Corporate Executive Vice President and Head of Global Markets-the Americas (2006-2007), CEO of Wholesale Banking-North America and Global Head of Foreign Exchange and Futures Markets (2001-2006), and Regional Commercial Treasurer and Senior Vice President Trading-North America (1996-2001); formerly, Trustee at St. Edmund Preparatory School in New York City. | | 170 |
William J. Schneider 1944 333 W. Wacker Drive Chicago, IL 60606 | | Director | | 1996 | | Chairman of Miller-Valentine Partners, a real estate investment company; Board Member of WDPR Public Radio station; formerly, Senior Partner and Chief Operating Officer (retired (2004) of Miller-Valentine Group; formerly, Board member, Business Advisory Council of the Cleveland Federal Reserve Bank and University of Dayton Business School Advisory Council; past Chair and Director, Dayton Development Coalition. | | 170 |
Judith M. Stockdale 1947 333 W. Wacker Drive Chicago, IL 60606 | | Director | | 1997 | | Board Member, Land Trust Alliance (since 2013) and U.S. Endowment for Forestry and Communities (since 2013); formerly, Executive Director (1994-2012), Gaylord and Dorothy Donnelley Foundation; prior thereto, Executive Director, Great Lakes Protection Fund (1990-1994). | | 170 |
Carole E. Stone 1947 333 W. Wacker Drive Chicago, IL 60606 | | Director | | 2007 | | Former Director, Chicago Board Options Exchange (2006-2017), and C2 Options Exchange, Incorporated (2009-2017); Director, CBOE Global Markets, Inc., formerly, CBOE Holdings, Inc. (since 2010); formerly, Commissioner, New York State Commission on Public Authority Reform (2005-2010). | | 170 |
164
| | | | | | | | |
Name,
Year of Birth
& Address | | Position(s)
Held with
the Funds | | Year First
Elected or
Appointed (1) | | Principal Occupation(s)
Including other Directorships
During Past 5 Years | | Number of
Portfolios in
Fund Complex
Overseen by
Director |
Margaret L. Wolff 1955 333 W. Wacker Drive Chicago, IL 60606 | | Director | | 2016 | | Formerly, member of the Board of Directors (2013-2017) of Travelers Insurance Company of Canada and The Dominion of Canada General Insurance Company (each, a part of Travelers Canada, the Canadian operation of The Travelers Companies, Inc.); formerly, Of Counsel, Skadden, Arps, Slate, Meagher & Flom LLP (Mergers & Acquisitions Group) (2005-2014); Member of the Board of Trustees of New York-Presbyterian Hospital (since 2005); Member (since 2004) and Chair (since 2015) of the Board of Trustees of The John A. Hartford Foundation (a philanthropy dedicated to improving the care of older adults); formerly, Member (2005-2015) and Vice Chair (2011-2015) of the Board of Trustees of Mt. Holyoke College. | | 170 |
Robert L. Young(2) 1963 333 W. Wacker Drive Chicago, IL 60606 | | Director | | 2017 | | Formerly, Chief Operating Officer and Director, J.P. Morgan Investment Management Inc. (2010-2016); formerly, President and Principal Executive Officer (2013-2016), and Senior Vice President and Chief Operating Officer (2005-2010), of J.P. Morgan Funds; formerly, Director and various officer positions for J.P. Morgan Investment Management Inc. (formerly, JPMorgan Funds Management, Inc. and formerly, One Group Administrative Services) and JPMorgan Distribution Services, Inc. (formerly, One Group Dealer Services, Inc.) (1999-2017). | | 168 |
| |
| Interested Director: |
Margo L. Cook(3) 1964 333 W. Wacker Drive Chicago, IL 60606 | | Director | | 2016 | | President (since April 2017), formerly, Co-Chief Executive Officer and Co-President (2016-2017), formerly, Senior Executive Vice President of Nuveen Investments, Inc; Executive Vice President (since February 2017) of Nuveen, LLC; President, Global Products and Solutions (since July 2017), and Co-Chief Executive Officer (since 2015), formerly, Executive Vice President (2013-2015) of Nuveen Securities, LLC; President (since August 2017), formerly, Co-President (October 2016-August 2017), formerly Senior Executive Vice President (2015-2016) of Nuveen Fund Advisors, LLC (Executive Vice President 2011-2015); President (since 2017), Nuveen Alternative Investments, LLC; Chartered Financial Analyst. | | 170 |
| | | | | | | | |
Name,
Year of Birth
& Address | | Position(s)
Held with
the Funds | | Year First
Elected or
Appointed (4) | | Principal Occupation(s)
During Past 5 Years | | Number of
Portfolios in
Fund Complex
Overseen by
Officer |
| |
| Officers of the Funds: |
Greg A. Bottjer 1971 333 W. Wacker Drive Chicago, IL 60606 | | Chief Administrative Officer | | 2016 | | Senior (since 2017) Managing Director (since 2011), formerly, Senior Vice President (2007-2010) of Nuveen; Senior (since 2017) Managing Director (since October 2016) of Nuveen Fund Advisors, LLC; Chartered Financial Analyst. | | 84 |
Mark J. Czarniecki 1979 901 Marquette Avenue Minneapolis, MN 55402 | | Vice President and Assistant Secretary | | 2013 | | Vice President and Assistant Secretary of Nuveen Securities, LLC (since 2016) and Nuveen Fund Advisors (since 2017); Vice President and Associate General Counsel of Nuveen (since 2013) and Vice President, Assistant Secretary and Associate General Counsel of Nuveen Asset Management (since March 2018). | | 170 |
Stephen D. Foy 1954 333 W. Wacker Drive Chicago, IL 60606 | | Vice President and Controller | | 1998 | | Managing Director (since 2014), formerly, Senior Vice President (2013-2014) and Vice President (2005-2013) of Nuveen Fund Advisors, LLC; Managing Director (since 2016) of Nuveen Securities, LLC; Managing Director (since 2016) of Nuveen Alternative Investments, LLC; Certified Public Accountant. | | 170 |
165
Directors and Officers (Unaudited) (continued)
| | | | | | | | |
Name,
Year of Birth
& Address | | Position(s)
Held with
the Funds | | Year First
Elected or
Appointed (4) | | Principal Occupation(s)
During Past 5 Years | | Number of
Portfolios in
Fund Complex
Overseen by
Officer |
Diana R. Gonzalez 1978 333 West Wacker Drive Chicago, IL 60606 | | Vice President and Assistant Secretary | | 2017 | | Vice President and Assistant Secretary of Nuveen Fund Advisors (since 2017); Vice President and Associate General Counsel of Nuveen (since 2017); Associate General Counsel of Jackson National Asset Management (May 2012-April 2017). | | 170 |
Nathaniel T. Jones 1979 333 W. Wacker Drive Chicago, IL 60606 | | Vice President and Treasurer | | 2016 | | Managing Director (since January 2017), formerly, Senior Vice President (2016-2017), formerly, Vice President (2011-2016) of Nuveen; Chartered Financial Analyst. | | 170 |
Walter M. Kelly 1970 333 W. Wacker Drive Chicago, IL 60606 | | Chief Compliance Officer and Vice President | | 2003 | | Managing Director (since January 2017), formerly, Senior Vice President (2008-2017) of Nuveen Investments Holdings, Inc. | | 170 |
Tina M. Lazar 1961 333 W. Wacker Drive Chicago, IL 60606 | | Vice President | | 2002 | | Managing Director (since January 2017), formerly, Senior Vice President (2014-2017) of Nuveen Securities, LLC. | | 170 |
Kevin J. McCarthy 1966 333 W. Wacker Drive Chicago, IL 60606 | | Vice President and Assistant Secretary | | 2007 | | Senior Managing Director (since February 2017) and Secretary and General Counsel (since 2016) of Nuveen Investments, Inc., formerly, Executive Vice President (2016-2017) and Managing Director and Assistant Secretary (2008-2016); Senior Managing Director (since January 2017) and Assistant Secretary (since 2008) of Nuveen Securities, LLC, formerly Executive Vice President (2016-2017) and Managing Director (2008-2016); Senior Managing Director (since February 2017), Secretary (since 2016) and Co-General Counsel (since 2011) of Nuveen Fund Advisors, LLC, formerly, Executive Vice President (2016-2017), Managing Director (2008-2016) and Assistant Secretary (2007-2016); Senior Managing Director (since February 2017), Secretary (since 2016) and Associate General Counsel (since 2011 of Nuveen Asset Management, LLC, formerly Executive Vice President (2016-2017) and Managing Director and Assistant Secretary (2011-2016); Senior Managing Director (since February 2017) and Secretary (since 2016) of Nuveen Investments Advisers, LLC, formerly Executive Vice President (2016-2017); Vice President (since 2007) and Secretary (since 2016), formerly, Assistant Secretary, of NWQ Investment Management Company, LLC, Symphony Asset Management LLC Santa Barbara Asset Management, LLC and Winslow Capital Management, LLC (since 2010). Senior Managing Director (since 2017) and Secretary (since 2016) of Nuveen Alternative Investments, LLC. | | 170 |
Christopher M. Rohrbacher 1971 333 W. Wacker Drive Chicago, IL 60606 | | Vice President and Secretary | | 2008 | | Managing Director (since January 2017) of Nuveen Securities, LLC; Managing Director (Since January 2017), formerly, Senior Vice President (2016-2017) and Assistant Secretary (since October 2016) of Nuveen Fund Advisors, LLC. | | 170 |
William A. Siffermann 1975 333 W. Wacker Drive Chicago, IL 60606 | | Vice President | | 2017 | | Managing Director (Since February 2017), formerly Senior Vice President (2016-2017) and Vice President (2011-2016) of Nuveen. | | 170 |
Joel T. Slager 1978 333 W. Wacker Drive Chicago, IL 60606 | | Vice President and Assistant Secretary | | 2013 | | Fund Tax Director for Nuveen Funds (since 2013); previously, Vice President of Morgan Stanley Investment Management, Inc., Assistant Treasurer of the Morgan Stanley Funds (from 2010 to 2013). | | 170 |
166
| | | | | | | | |
Name,
Year of Birth
& Address | | Position(s)
Held with
the Funds | | Year First
Elected or
Appointed (4) | | Principal Occupation(s)
During Past 5 Years | | Number of
Portfolios in
Fund Complex
Overseen by
Officer |
Gifford R. Zimmerman 1956 333 W. Wacker Drive Chicago, IL 60606 | | Vice President and Assistant Secretary | | 1988 | | Managing Director (since 2002), and Assistant Secretary of Nuveen Securities, LLC; Managing Director (since 2004) and Assistant Secretary (since 1994) of Nuveen Investments, Inc.; Managing Director (since 2002), Assistant Secretary (since 1997) and Co-General Counsel (since 2011) of Nuveen Fund Advisors, LLC; Managing Director, Assistant Secretary and Associate General Counsel of Nuveen Asset Management, LLC (since 2011); Vice President (since February 2017), formerly, Managing Director (2003-2017) and Assistant Secretary (since 2003) of Symphony Asset Management LLC ; Managing Director and Assistant Secretary (since 2002) of Nuveen Investments Advisers, LLC; Vice President and Assistant Secretary of NWQ Investment Management Company, LLC (since 2002), Santa Barbara Asset Management, LLC (since 2006) and of Winslow Capital Management, LLC, (since 2010); Chartered Financial Analyst. | | 170 |
| (1) | Directors serve an indefinite term until his/her successor is elected or appointed. The year first elected or appointed represents the year in which the director was first elected or appointed to any fund in the Nuveen Fund Complex. |
| (2) | On May 25, 2017, Mr. Young was appointed as a Board Member, effective July 1, 2017. He is a Board Member of each of the Nuveen Funds, except Nuveen Diversified Dividend and Income Fund and Nuveen Real Estate Income Fund. |
| (3) | “Interested person” of the Trust, as defined in the 1940 Act, by reason of her position with Nuveen, LLC. and certain of its subsidiaries. |
| (4) | Officers serve one year terms through August of each year. The year first elected or appointed represents the year in which the officer was first elected or appointed to any fund in the Nuveen Fund Complex. |
167
Nuveen:
Serving Investors for Generations
Since 1898, financial advisors and their clients have relied on Nuveen to provide dependable investment solutions through continued adherence to proven, long-term investing principles. Today, we offer a range of high quality solutions designed to be integral components of a well-diversified core portfolio.
Focused on meeting investor needs.
Nuveen is the investment manager of TIAA. We have grown into one of the world’s premier global asset managers, with specialist knowledge across all major asset classes and particular strength in solutions that provide income for investors and that draw on our expertise in alternatives and responsible investing. Nuveen is driven not only by the independent investment processes across the firm, but also the insights, risk management, analytics and other tools and resources that a truly world-class platform provides. As a global asset manager, our mission is to work in partnership with our clients to create solutions which help them secure their financial future.
Find out how we can help you.
To learn more about how the products and services of Nuveen may be able to help you meet your financial goals, talk to your financial advisor, or call us at (800) 257-8787. Please read the information
provided carefully before you invest. Investors should consider the investment objective and policies, risk considerations, charges and expenses of any investment carefully. Where applicable, be sure to obtain a prospectus, which contains this and other relevant information. To obtain a prospectus, please contact your securities representative or Nuveen, 333 W. Wacker Dr., Chicago, IL 60606. Please read the prospectus carefully before you invest or send money.
Learn more about Nuveen Funds at: www.nuveen.com/mutual-funds
| | |
Securities offered through Nuveen Securities, LLC, member FINRA and SIPC |
333 West Wacker Drive | Chicago, IL 60606 | www.nuveen.com | | MAN-FINC-0618D 569735-INV-Y-08/19 |
ITEM 2. CODE OF ETHICS.
As of the end of the period covered by this report, the registrant has adopted a code of ethics that applies to the registrant’s principal executive officer, principal financial officer, principal accounting officer or controller, or persons performing similar functions. There were no amendments to or waivers from the code during the period covered by this report. The registrant has posted the code of ethics on its website at www.nuveen.com/MutualFunds/ShareholderResources/FundGovernance.aspx. (To view the code, click on Code of Conduct.)
ITEM 3. AUDIT COMMITTEE FINANCIAL EXPERT.
As of the end of the period covered by this report, the registrant’s Board of Directors or Trustees (“Board”) determined that the registrant has at least one “audit committee financial expert” (as defined in Item 3 of Form N-CSR) serving on its Audit Committee. The registrant’s audit committee financial experts are Carole E. Stone, Jack B. Evans and William C. Hunter, who are “independent” for purposes of Item 3 of Form N-CSR.
Ms. Stone served for five years as Director of the New York State Division of the Budget. As part of her role as Director, Ms. Stone was actively involved in overseeing the development of the State’s operating, local assistance and capital budgets, its financial plan and related documents; overseeing the development of the State’s bond-related disclosure documents and certifying that they fairly presented the State’s financial position; reviewing audits of various State and local agencies and programs; and coordinating the State’s system of internal audit and control. Prior to serving as Director, Ms. Stone worked as a budget analyst/examiner with increasing levels of responsibility over a 30 year period, including approximately five years as Deputy Budget Director. Ms. Stone has also served as Chair of the New York State Racing Association Oversight Board, as Chair of the Public Authorities Control Board, as a Commissioner on the New York State Commission on Public Authority Reform and as a member of the Boards of Directors of several New York State public authorities. These positions have involved overseeing operations and finances of certain entities and assessing the adequacy of project/entity financing and financial reporting. Currently, Ms. Stone is on the Board of Directors of CBOE Holdings, Inc., of the Chicago Board Options Exchange, and of C2 Options Exchange. Ms. Stone’s position on the boards of these entities and as a member of both CBOE Holdings’ Audit Committee and its Finance Committee has involved, among other things, the oversight of audits, audit plans and preparation of financial statements.
Mr. Evans was formerly President and Chief Operating Officer of SCI Financial Group, Inc., a full service registered broker-dealer and registered investment adviser (“SCI”). As part of his role as President and Chief Operating Officer, Mr. Evans actively supervised the Chief Financial Officer (the “CFO”) and actively supervised the CFO’s preparation of financial statements and other filings with various regulatory authorities. In such capacity, Mr. Evans was actively involved in the preparation of SCI’s financial statements and the resolution of issues raised in connection therewith. Mr. Evans has also served on the audit committee of various reporting companies. At such companies, Mr. Evans was involved in the oversight of audits, audit plans, and the preparation of financial statements. Mr. Evans also formerly chaired the audit committee of the Federal Reserve Bank of Chicago.
Mr. Hunter was formerly a Senior Vice President at the Federal Reserve Bank of Chicago. As part of his role as Senior Vice President, Mr. Hunter was the senior officer responsible for all operations of each of the Economic Research, Statistics, and Community and Consumer Affairs units at the Federal Reserve Bank of Chicago. In such capacity, Mr. Hunter oversaw the subunits of the Statistics and Community and Consumer Affairs divisions responsible for the analysis and evaluation of bank and bank holding company financial statements and financial filings. Prior to serving as Senior Vice President at the Federal Reserve Bank of Chicago, Mr. Hunter was the Vice President of the Financial Markets unit at the Federal Reserve Bank of Atlanta where he supervised financial staff and bank holding company analysts who analyzed and evaluated bank and bank holding company financial statements. Mr. Hunter also currently serves on the Boards of Directors of Xerox Corporation and Wellmark, Inc. as well as on the Audit Committees of such Boards. As an Audit Committee member, Mr. Hunter’s responsibilities include, among other things, reviewing financial statements, internal audits and internal controls over financial reporting. Mr. Hunter also formerly was a Professor of Finance at the University of Connecticut School of Business and has authored numerous scholarly articles on the topics of finance, accounting and economics.
ITEM 4. PRINCIPAL ACCOUNTANT FEES AND SERVICES.
The following tables show the amount of fees that PricewaterhouseCoopers LLP, the Funds’ auditor, billed to the Funds’ during the Funds’ last two full fiscal years. The Audit Committee approved in advance all audit services and non-audit services that PricewaterhouseCoopers LLP, provided to the Funds, except for those non-audit services that were subject to the pre-approval exception under Rule 2-01 of Regulation S-X (the “pre-approval exception”). The preapproval exception for services provided directly to the Funds waives the pre-approval requirement for services other than audit, review or attest services if: (A) the aggregate amount of all such services provided constitutes no more than 5% of the total amount of revenues paid by the Funds during the fiscal year in which the services are provided; (B) the Funds did not recognize the services as non-audit services at the time of the engagement; and (C) the services are promptly brought to the Audit Committee’s attention, and the Committee (or its delegate) approves the services before the audit is completed.
The Audit Committee has delegated certain pre-approval responsibilities to its Chairman (or, in his absence, any other member of the Audit Committee).
| | | | | | | | | | | | | | | | |
Fiscal Year Ended June 30, 2018 | | Audit Fees Billed
to Funds 1 | | | Audit-Related Fees
Billed to Funds 2 | | | Tax Fees Billed
to Funds 3 | | | All Other Fees
Billed to Funds 4 | |
Fund Name | | | | | | | | | | | | | | | | |
Nuveen Core Plus Bond Fund | | | 44,698 | | | | - | | | | 0 | | | | 0 | |
Nuveen High Income Bond Fund | | | 34,825 | | | | - | | | | 0 | | | | 0 | |
Nuveen Inflation Protected Securities Fund | | | 44,983 | | | | - | | | | 0 | | | | 0 | |
Nuveen Core Bond Fund | | | 43,748 | | | | - | | | | 0 | | | | 0 | |
Nuveen Short Term Bond Fund | | | 45,649 | | | | - | | | | 0 | | | | 0 | |
Nuveen Strategic Income Fund | | | 46,864 | | | | - | | | | 0 | | | | 0 | |
| | | | | | | | | | | | | | | | |
Total | | $ | 260,767 | | | $ | - | | | $ | 0 | | | $ | 0 | |
| 1 | | “Audit Fees” are the aggregate fees billed for professional services for the audit of the Fund’s annual financial statements and services provided in connection with statutory and regulatory filings or engagements. |
| 2 | | “Audit-Related Fees” are the aggregate fees billed for assurance and related services reasonably related to the performance of the audit or review of financial statements that are not reported under “Audit Fees”. These fees include offerings related to the Fund’s common shares and leverage. |
| 3 | | “Tax Fees” are the aggregate fees billed for professional services for tax advice, tax compliance, and tax planning. These fees include: all global withholding tax services; excise and state tax reviews; capital gain, tax equalization and taxable basis calculations performed by the principal accountant. |
| 4 | | “All Other Fees” are the aggregate fees billed for products and services other than “Audit Fees”, “Audit-Related Fees” and “Tax Fees”. These fees represent all “Agreed-Upon Procedures” engagements pertaining to the Fund’s use of leverage. |
| | | | | | | | | | | | | | | | |
| | | Percentage Approved Pursuant to Pre-approval Exception | |
| | | Audit Fees Billed
to Funds | | | Audit-Related Fees
Billed to Funds | | | Tax Fees
Billed to Funds | | | All Other Fees
Billed to Funds | |
Fund Name | | | | | | | | | | | | | | | | |
Nuveen Core Plus Bond Fund | | | 0 | % | | | 0 | % | | | 0 | % | | | 0 | % |
Nuveen High Income Bond Fund | | | 0 | % | | | 0 | % | | | 0 | % | | | 0 | % |
Nuveen Inflation Protected Securities Fund | | | 0 | % | | | 0 | % | | | 0 | % | | | 0 | % |
Nuveen Core Bond Fund | | | 0 | % | | | 0 | % | | | 0 | % | | | 0 | % |
Nuveen Short Term Bond Fund | | | 0 | % | | | 0 | % | | | 0 | % | | | 0 | % |
Nuveen Strategic Income Fund | | | 0 | % | | | 0 | % | | | 0 | % | | | 0 | % |
| | | | |
Fiscal Year Ended June 30, 2017 | | Audit Fees Billed
to Funds 1 | | | Audit-Related Fees
Billed to Funds 2 | | | Tax Fees
Billed to Funds 3 | | | All Other Fees
Billed to Funds 4 | |
Fund Name | | | | | | | | | | | | | | | | |
Nuveen Core Plus Bond Fund | | | 43,501 | | | | 1,629 | | | | 0 | | | | 0 | |
Nuveen High Income Bond Fund | | | 34,610 | | | | 1,629 | | | | 0 | | | | 0 | |
Nuveen Inflation Protected Securities Fund | | | 43,891 | | | | 1,629 | | | | 2,270 | | | | 0 | |
Nuveen Core Bond Fund | | | 42,542 | | | | 1,629 | | | | 0 | | | | 0 | |
Nuveen Short Term Bond Fund | | | 44,856 | | | | 1,629 | | | | 3,350 | | | | 0 | |
Nuveen Strategic Income Fund | | | 45,664 | | | | 1,629 | | | | 3,350 | | | | 0 | |
| | | | | | | | | | | | | | | | |
Total | | $ | 255,064 | | | $ | 9,776 | | | $ | 8,970 | | | $ | 0 | |
| 1 | | “Audit Fees” are the aggregate fees billed for professional services for the audit of the Fund’s annual financial statements and services provided in connection with statutory and regulatory filings or engagements. |
| 2 | | “Audit-Related Fees” are the aggregate fees billed for assurance and related services reasonably related to the performance of the audit or review of financial statements that are not reported under “Audit Fees”. These fees include offerings related to the Fund’s common shares and leverage. |
| 3 | | “Tax Fees” are the aggregate fees billed for professional services for tax advice, tax compliance, and tax planning. These fees include: all global withholding tax services; excise and state tax reviews; capital gain, tax equalization and taxable basis calculations performed by the principal accountant. |
| 4 | | “All Other Fees” are the aggregate fees billed for products and services other than “Audit Fees”, “Audit-Related Fees” and “Tax Fees”. These fees represent all “Agreed-Upon Procedures” engagements pertaining to the Fund’s use of leverage. |
| | | | | | | | | | | | | | | | |
| | | Percentage Approved Pursuant to Pre-approval Exception | |
| | | Audit Fees Billed
to Funds | | | Audit-Related Fees
Billed to Funds | | | Tax Fees
Billed to Funds | | | All Other Fees
Billed to Funds | |
Fund Name | | | | | | | | | | | | | | | | |
Nuveen Core Plus Bond Fund | | | 0 | % | | | 0 | % | | | 0 | % | | | 0 | % |
Nuveen High Income Bond Fund | | | 0 | % | | | 0 | % | | | 0 | % | | | 0 | % |
Nuveen Inflation Protected Securities Fund | | | 0 | % | | | 0 | % | | | 0 | % | | | 0 | % |
Nuveen Core Bond Fund | | | 0 | % | | | 0 | % | | | 0 | % | | | 0 | % |
Nuveen Short Term Bond Fund | | | 0 | % | | | 0 | % | | | 0 | % | | | 0 | % |
Nuveen Strategic Income Fund | | | 0 | % | | | 0 | % | | | 0 | % | | | 0 | % |
| | | | | | | | | | | | |
Fiscal Year Ended June 30, 2018 | | Audit-Related Fees
Billed to Adviser and
Affiliated Fund
Service Providers | | | Tax Fees Billed to
Adviser and
Affiliated Fund
Service Providers | | | All Other Fees
Billed to Adviser
and Affiliated Fund
Service Providers | |
Nuveen Investment Funds, Inc. | | $ | 0 | | | $ | 0 | | | $ | 0 | |
| |
| | | Percentage Approved Pursuant to Pre-approval Exception | |
| | | Audit-Related Fees
Billed to Adviser and
Affiliated Fund
Service Providers | | | Tax Fees Billed to
Adviser and
Affiliated Fund
Service Providers | | | All Other Fees
Billed to Adviser
and Affiliated Fund
Service Providers | |
| | | 0 | % | | | 0 | % | | | 0 | % |
| | | |
Fiscal Year Ended June 30, 2017 | | Audit-Related Fees
Billed to Adviser and
Affiliated Fund
Service Providers | | | Tax Fees Billed to
Adviser and
Affiliated Fund
Service Providers | | | All Other Fees
Billed to Adviser
and Affiliated Fund
Service Providers | |
Nuveen Investment Funds, Inc. | | $ | 0 | | | $ | 0 | | | $ | 0 | |
| |
| | | Percentage Approved Pursuant to Pre-approval Exception | |
| | | Audit-Related Fees
Billed to Adviser and
Affiliated Fund
Service Providers | | | Tax Fees Billed to
Adviser and
Affiliated Fund
Service Providers | | | All Other Fees
Billed to Adviser
and Affiliated Fund
Service Providers | |
| | | 0 | % | | | 0 | % | | | 0 | % |
| | | | | | | | | | | | | | | | |
Fiscal Year Ended June 30, 2018 | | Total Non-Audit Fees
Billed to Trust | | | Total Non-Audit Fees
billed to Adviser and
Affiliated Fund Service
Providers (engagements
related directly to the
operations and financial
reporting of the Trust) | | | Total Non-Audit Fees
billed to Adviser and
Affiliated Fund Service
Providers (all other
engagements) | | | Total | |
Fund Name | | | | | | | | | | | | | | | | |
Nuveen Core Plus Bond Fund | | | 0 | | | | 0 | | | | 0 | | | | 0 | |
Nuveen High Income Bond Fund | | | 0 | | | | 0 | | | | 0 | | | | 0 | |
Nuveen Inflation Protected Securities Fund | | | 0 | | | | 0 | | | | 0 | | | | 0 | |
Nuveen Core Bond Fund | | | 0 | | | | 0 | | | | 0 | | | | 0 | |
Nuveen Short Term Bond Fund | | | 0 | | | | 0 | | | | 0 | | | | 0 | |
Nuveen Strategic Income Fund | | | 0 | | | | 0 | | | | 0 | | | | 0 | |
| | | | | | | | | | | | | | | | |
Total | | $ | 0 | | | $ | 0 | | | $ | 0 | | | $ | 0 | |
“Non-Audit Fees billed to Fund” for both fiscal year ends represent “Tax Fees” and “All Other Fees” billed to Fund in their respective amounts from the previous table.
Less than 50 percent of the hours expended on the principal accountant’s engagement to audit the registrant’s financial statements for the most recent fiscal year were attributed to work performed by persons other than the principal accountant’s full-time, permanent employees.
| | | | | | | | | | | | | | | | |
Fiscal Year Ended June 30, 2017 | | Total Non-Audit Fees
Billed to Trust | | | Total Non-Audit Fees
billed to Adviser and
Affiliated Fund Service
Providers (engagements
related directly to the
operations and financial
reporting of the Trust) | | | Total Non-Audit Fees
billed to Adviser and
Affiliated Fund Service
Providers (all other
engagements) | | | Total | |
Fund Name | | | | | | | | | | | | | | | | |
Nuveen Core Plus Bond Fund | | | 0 | | �� | | 0 | | | | 0 | | | | 0 | |
Nuveen High Income Bond Fund | | | 0 | | | | 0 | | | | 0 | | | | 0 | |
Nuveen Inflation Protected Securities Fund | | | 2,270 | | | | 0 | | | | 0 | | | | 2,270 | |
Nuveen Core Bond Fund | | | 0 | | | | 0 | | | | 0 | | | | 0 | |
Nuveen Short Term Bond Fund | | | 3,350 | | | | 0 | | | | 0 | | | | 3,350 | |
Nuveen Strategic Income Fund | | | 3,350 | | | | 0 | | | | 0 | | | | 3,350 | |
| | | | | | | | | | | | | | | | |
Total | | $ | 8,970 | | | $ | 0 | | | $ | 0 | | | $ | 8,970 | |
“Non-Audit Fees billed to Fund” for both fiscal year ends represent “Tax Fees” and “All Other Fees” billed to Fund in their respective amounts from the previous table.
Audit Committee Pre-Approval Policies and Procedures. Generally, the Audit Committee must approve (i) all non-audit services to be performed for the Funds by the Funds’ independent accountant and (ii) all audit and non-audit services to be performed by the Funds’ independent accountant for the Affiliated Fund Service Providers with respect to the operations and financial reporting of the Funds. Regarding tax and research projects conducted by the independent accountant for the Funds and Affiliated Fund Service Providers (with respect to operations and financial reports of the Trust), such engagements will be (i) pre-approved by the Audit Committee if they are expected to be for amounts greater than $10,000; (ii) reported to the Audit Committee Chairman for his verbal approval prior to engagement if they are expected to be for amounts under $10,000 but greater than $5,000; and (iii) reported to the Audit Committee at the next Audit Committee meeting if they are expected to be for an amount under $5,000.
ITEM 5. AUDIT COMMITTEE OF LISTED REGISTRANTS.
Not applicable to this registrant.
ITEM 6. SCHEDULE OF INVESTMENTS.
| a) | | See Portfolio of Investments in Item 1. |
ITEM 7. DISCLOSURE OF PROXY VOTING POLICIES AND PROCEDURES FOR CLOSED-END
MANAGEMENT INVESTMENT COMPANIES.
Not applicable to this registrant.
ITEM 8. PORTFOLIO MANAGERS OF CLOSED-END MANAGEMENT INVESTMENT COMPANIES.
Not applicable to this registrant.
ITEM 9. PURCHASES OF EQUITY SECURITIES BY CLOSED-END MANAGEMENT INVESTMENT COMPANY AND AFFILIATED PURCHASERS.
Not applicable to this registrant.
ITEM 10. SUBMISSION OF MATTERS TO A VOTE OF SECURITY HOLDERS.
There have been no material changes to the procedures by which shareholders may recommend nominees to the registrant’s Board of Trustees implemented after the registrant last provided disclosure in response to this Item.
ITEM 11. CONTROLS AND PROCEDURES.
| | (a) | | The registrant’s principal executive and principal financial officers, or persons performing similar functions, have concluded that the registrant’s disclosure controls and procedures (as defined in Rule 30a-3(c) under the Investment Company Act of 1940, as amended (the “1940 Act”) (17 CFR 270.30a-3(c))) are effective, as of a date within 90 days of the filing date of this report that includes the disclosure required by this paragraph, based on their evaluation of the controls and procedures required by Rule 30a-3(b) under the 1940 Act (17 CFR 270.30a-3(b)) and Rules 13a-15(b) or 15d-15(b) under the Securities Exchange Act of 1934, as amended (the “Exchange Act”) (17 CFR 240.13a-15(b) or 240.15d-15(b)). |
| | (b) | | There were no changes in the registrant’s internal control over financial reporting (as defined in Rule 30a-3(d) under the 1940 Act (17 CFR 270.30a-3(d)) that occurred during the second fiscal quarter of the period covered by this report that has materially affected, or is reasonably likely to materially affect, the registrant’s internal control over financial reporting. |
ITEM 12. DISCLOSURE OF SECURITIES LENDING ACTIVITIES FOR CLOSED-END MANAGEMENT INVESTMENT COMPANIES.
Not applicable.
ITEM 13. EXHIBITS.
File the exhibits listed below as part of this Form.
| | |
| (a)(1) | | Any code of ethics, or amendment thereto, that is the subject of the disclosure required by Item 2, to the extent that the registrant intends to satisfy the Item 2 requirements through filing of an exhibit: Not applicable because the code is posted on registrant’s website at www.nuveen.com/MutualFunds/ShareholderResources/FundGovernance.aspx and there were no amendments during the period covered by this report. (To view the code, click on Code of Conduct.) |
| |
| (a)(2) | | A separate certification for each principal executive officer and principal financial officer of the registrant as required by Rule 30a-2(a) under the 1940 Act (17 CFR 270.30a-2(a)) in the exact form set forth below: See EX-99.CERT attached hereto. |
| |
| (a)(3) | | Any written solicitation to purchase securities under Rule 23c-1 under the 1940 Act (17 CFR 270.23c-1) sent or given during the period covered by the report by or on behalf of the registrant to 10 or more persons: Not applicable to this registrant. |
| |
| (b) | | If the report is filed under Section 13(a) or 15(d) of the Exchange Act, provide the certifications required by Rule 30a-2(b) under the 1940 Act (17 CFR 270.30a-2(b)), Rule 13a-14(b) or Rule 15d-14(b) under the Exchange Act (17 CFR 240.13a-14(b) or 240.15d-14(b)), and Section 1350 of Chapter 63 of Title 18 of the United States Code (18 U.S.C. 1350) as an Exhibit. A certification furnished pursuant to this paragraph will not be deemed “filed” for purposes of Section 18 of the Exchange Act (15 U.S.C. 78r), or otherwise subject to the liability of that section. Such certification will not be deemed to be incorporated by reference into any filing under the Securities Act of 1933 or the Exchange Act, except to the extent that the registration specifically incorporates it by reference: See EX-99.906 CERT attached hereto. |
SIGNATURES
Pursuant to the requirements of the Securities Exchange Act of 1934 and the Investment Company Act of 1940, the registrant has duly caused this report to be signed on its behalf by the undersigned, thereunto duly authorized.
(Registrant) Nuveen Investment Funds, Inc.
| | |
| |
| By (Signature and Title) | | /s/ Christopher M. Rohrbacher |
| | Christopher M. Rohrbacher |
| | Vice President and Secretary |
Date: September 6, 2018
Pursuant to the requirements of the Securities Exchange Act of 1934 and the Investment Company Act of 1940, this report has been signed below by the following persons on behalf of the registrant and in the capacities and on the dates indicated.
| | |
| |
| By (Signature and Title) | | /s/ Greg A. Bottjer |
| | Greg A. Bottjer |
| | Chief Administrative Officer |
| | (principal executive officer) |
Date: September 6, 2018
| | |
| |
| By (Signature and Title) | | /s/ Stephen D. Foy |
| | Stephen D. Foy |
| | Vice President and Controller |
| | (principal financial officer) |
Date: September 6, 2018