UNITED STATES
SECURITIES AND EXCHANGE COMMISSION
Washington, D.C. 20549
FORM N-CSR
CERTIFIED SHAREHOLDER REPORT OF REGISTERED MANAGEMENT
INVESTMENT COMPANIES
Investment Company Act file number 811-05309
Nuveen Investment Funds, Inc.
(Exact name of registrant as specified in charter)
Nuveen Investments
333 West Wacker Drive, Chicago, IL 60606
(Address of principal executive offices) (Zip code)
Kathleen L. Prudhomme
Vice President and Secretary
901 Marquette Avenue
Minneapolis, Minnesota 55402
(Name and address of agent for service)
Registrant’s telephone number, including area code: (312) 917-7700
Date of fiscal year end: December 31
Date of reporting period: December 31, 2017
Form N-CSR is to be used by management investment companies to file reports with the Commission not later than 10 days after the transmission to stockholders of any report that is required to be transmitted to stockholders under Rule 30e-1 under the Investment Company Act of 1940 (17 CFR 270.30e-1). The Commission may use the information provided on Form N-CSR in its regulatory, disclosure review, inspection, and policy making roles.
A registrant is required to disclose the information specified by Form N-CSR, and the Commission will make this information public. A registrant is not required to respond to the collection of information contained in Form N-CSR unless the Form displays a currently valid Office of Management and Budget (“OMB”) control number. Please direct comments concerning the accuracy of the information collection burden estimate and any suggestions for reducing the burden to Secretary, Securities and Exchange Commission, 450 Fifth Street, NW, Washington, DC 20549-0609. The OMB has reviewed this collection of information under the clearance requirements of 44 U.S.C. ss.3507.
ITEM 1. REPORTS TO STOCKHOLDERS.
| | |
| | |  |
| Mutual Funds | |
| | | | | | |
| | | | | | | Annual Report December 31, 2017 |
| | | | | | | | | | | | | | | | | | |
| | | | | | | Class / Ticker Symbol | | | | |
| | | Fund Name | | | | Class A | | Class C | | Class R3 | | Class R6 | | Class I | | Class T | | |
| | |
| | Nuveen Global Infrastructure Fund | | | | FGIAX | | FGNCX | | FGNRX | | FGIWX | | FGIYX | | FGNTX | | |
| | Nuveen Real Asset Income Fund | | | | NRIAX | | NRICX | | — | | NRIFX | | NRIIX | | NRITX | | |
| | Nuveen Real Estate Securities Fund | | | | FREAX | | FRLCX | | FRSSX | | FREGX | | FARCX | | FRYTX | | |
| | | | | | | | | | | | |
| | | | | | |
| | | | |
| | | | | | | | |
| | |
| | Life is Complex. | | |
| | |
| | Nuveen makes things e-simple. | | |
| | |
| | It only takes a minute to sign up for e-Reports. Once enrolled, you’ll receive an e-mail as soon as your Nuveen Fund information is ready. No more waiting for delivery by regular mail. Just click on the link within the e-mail to see the report and save it on your computer if you wish. | | |
| | | | |
| | | | | | Free e-Reports right to your e-mail! | | |
| | | |
| | | | | | www.investordelivery.com If you receive your Nuveen Fund distributions and statements from your
financial advisor or brokerage account. |
| | | | |
| | | | or | | www.nuveen.com/accountaccess If you receive your Nuveen Fund distributions and statements directly from Nuveen. Must be preceded by or accompanied by a prospectus. NOT FDIC INSURED MAY LOSE VALUE
NO BANK GUARANTEE | | |
| | | | | | | | | | |
| | | | | | | | | | | | | |
Table
of Contents
Chairman’s Letter
to Shareholders

Dear Shareholders,
Financial markets ended 2017 on a high note. Concurrent growth across the world’s major economies, strong corporate profits, low inflation and accommodative central banks provided an optimal environment for rising asset prices with remarkably low volatility. Political risks, which were expected to be a wildcard in 2017, did not materialize. The Trump administration achieved one of its major policy goals with the passage of the Tax cuts and Jobs Act, the European Union (EU) member governments elected EU-friendly leadership, Brexit negotiations moved forward and China’s 19th Party Congress concluded with no major surprises in its economic policy objectives.
Conditions have turned more volatile in 2018, but the positive fundamentals underpinning the markets’ rise over the past year remain intact. In early February, fears of rising inflation, which could prompt more aggressive action by the Federal Reserve, triggered a widespread sell-off across U.S. and global equity markets. Yet, global economies are still expanding and corporate earnings look healthy.
We do believe volatility will feature more prominently in 2018. Interest rates continue to rise and inflation pressures are mounting and investors are uncertain about how markets will react amid tighter financial conditions. After the relative calm of the past few years, it’s anticipated that price fluctuations will begin trending toward a more historically normal range. But we also note that signs foreshadowing recession are lacking at this point.
Maintaining perspective can be difficult with daily headlines focused predominantly on short-term news. Nuveen believes this can be an opportune time to check in with your financial advisor. Strong market appreciation such as that in 2017 may create an imbalance in a diversified portfolio. Your advisor can help you reexamine your investment goals and risk tolerance, and realign your portfolio’s investment mix appropriately. On behalf of the other members of the Nuveen Fund Board, we look forward to continuing to earn your trust in the months and years ahead.
Sincerely,

William J. Schneider
Chairman of the Board
February 23, 2018
Portfolio Managers’
Comments
Nuveen Global Infrastructure Fund
Nuveen Real Asset Income Fund
Nuveen Real Estate Securities Fund
These Funds feature portfolio management by Nuveen Asset Management, LLC, an affiliate of Nuveen LLC. For the Nuveen Global Infrastructure Fund, Jay L. Rosenberg has been a portfolio manager since its inception in 2007 and Tryg T. Sarsland has been a portfolio manager since 2012. For the Nuveen Real Asset Income Fund, both Jay L. Rosenberg and Jeffrey T. Schmitz, CFA, have been portfolio managers since the Fund’s inception in 2011. Brenda A. Langenfeld, CFA, and Tryg T. Sarsland were added as portfolio managers in 2015. For the Nuveen Real Estate Securities Fund, Jay L. Rosenberg has served as a portfolio manager since he joined the Fund’s management team in 2005, while Scott C. Sedlak joined the team as a portfolio manager in 2011.
Effective June 15, 2017, Sarah Wade was added as a portfolio manager for the Nuveen Real Estate Securities Fund.
Effective January 26, 2018 (subsequent to the close of this reporting period), the Nuveen Fund Board approved an investment policy change for the Nuveen Real Asset Income Fund that allows investment of up to 5% in real assets-related senior loans.
On the following pages, the portfolio management teams for the Funds discuss the economy and financial markets, key investment strategies and the Funds’ performance for the twelve-month reporting period ended December 31, 2017.
What factors affected the U.S. economy and financial markets during the twelve-month reporting period ended December 31, 2017?
The U.S. economy began the year at a sluggish pace but gained momentum mid-year, growing at an annualized rate above 3% in the second and third quarters of 2017. In the final three months of 2017, the economy slowed slightly to 2.6%, as reported by the Bureau of Economic Analysis “advance” estimate of fourth-quarter gross domestic product (GDP). GDP is the value of goods and services produced by the nation’s economy less the value of the goods and services used up in production, adjusted for price changes.
Although the hurricanes temporarily weakened shopping and dining out activity, consumer spending remained the main driver of demand in the economy, as consumers benefited from employment and wage gains. Business investment, which had been lackluster in the recovery so far, accelerated in 2017, and hiring continued to boost employment. As reported by the Bureau of Labor Statistics, the unemployment rate fell to 4.1% in December 2017 from 4.7% in December 2016 and job gains averaged around 171,000 per month for the past twelve months. Higher energy prices, especially gasoline, helped drive a steady increase in inflation over this reporting period. The Consumer Price Index (CPI) increased 2.1% over the twelve-month reporting period ended December 31, 2017 on a seasonally adjusted basis, as reported by the Bureau of Labor Statistics. The core CPI (which excludes food and energy) increased 1.8% during the same period, slightly below the Federal Reserve’s (Fed) unofficial longer term inflation objective of 2.0%.
This material is not intended to be a recommendation or investment advice, does not constitute a solicitation to buy or sell securities, and is not provided in a fiduciary capacity. The information provided does not take into account the specific objectives or circumstances of any particular investor, or suggest any specific course of action. Investment decisions should be made based on an investor’s objectives and circumstances and in consultation with his or her advisors.
Certain statements in this report are forward-looking statements. Discussions of specific investments are for illustration only and are not intended as recommendations of individual investments. The forward-looking statements and other views expressed herein are those of the portfolio managers as of the date of this report. Actual future results or occurrences may differ significantly from those anticipated in any forward-looking statements and the views expressed herein are subject to change at any time, due to numerous market and other factors. The Funds disclaim any obligation to update publicly or revise any forward-looking statements or views expressed herein.
For financial reporting purposes, the ratings disclosed are the highest rating given by one of the following national rating agencies: Standard & Poor’s (S&P), Moody’s Investors Service, Inc. (Moody’s) or Fitch, Inc. (Fitch). This treatment of split-rated securities may differ from that used for other purposes, such as for Fund investment policies. Credit ratings are subject to change. AAA, AA, A and BBB are investment grade ratings; BB, B, CCC, CC, C and D are below investment grade ratings. Holdings designated N/R are not rated by these national rating agencies.
Refer to the Glossary of Terms Used in this report for further definition of the terms used within this section.
Portfolio Managers’ Comments (continued)
The housing market also continued to improve, with historically low mortgage rates and low inventory driving home prices higher. The S&P CoreLogic Case-Shiller U.S. National Home Price Index, which covers all nine U.S. census divisions, recorded a 6.2% annual gain in November 2017 (most recent data available at the time this report was prepared). The 10-City and 20-City Composites reported year-over-year increases of 6.1% and 6.4%, respectively.
With the U.S. economy delivering a sustainable growth rate and employment strengthening, the Fed’s policy making committee raised its main benchmark interest rate in December 2016, March 2017, June 2017 and December 2017. These moves were widely expected by the markets, as were the Fed’s decisions to leave rates unchanged at the July, September and October/November 2017 meetings. (There was no August meeting.) The Fed also announced it would begin reducing its balance sheet in October 2017 by allowing a small amount of maturing Treasury and mortgage securities to roll off without reinvestment. The market expects the pace to remain moderate and predictable, with minimal market disruption.
While the markets remained comfortable with the course of monetary policy during this reporting period, the political environment was frequently a source of uncertainty. Markets were initially highly optimistic about pricing in the new administration’s “pro-growth” fiscal agenda after Donald Trump won the election. After stumbling with health care reform earlier in 2017, legislators passed a major tax overhaul at the end of December, which lowered individual and corporate tax rates. While the new tax law changes are expected to be stimulative to the economy, there are some concerns that it could pose challenges to the Fed’s ability to manage interest rates in the future. Although incoming Fed Chairman Jerome Powell is expected to maintain the course established by outgoing Chair Janet Yellen, after her term expired in February 2018, markets may deem this as another source of uncertainty.
Geopolitical risks were prominent, but some concerns eased by the end of the period. Rhetoric surrounding U.S. trade with China and the renegotiation of the North American Free Trade Agreement (NAFTA) was toned down. After an uncertain start, the “Brexit” talks between the U.K. and European Union progressed to the next phase. Closely watched elections in the Netherlands, France and Germany yielded market friendly results. Tensions between the U.S. and North Korea intensified but did not have a lasting impact on the markets.
Stock markets continued their banner year with the total return of the S&P 500® Index increasing every month in 2017 for the first time in history. Corporate earnings enjoyed a string of seemingly never-ending positive surprises, followed by constant upward earnings revisions. U.S. equity markets reached record levels throughout the reporting period with the S&P 500® surpassing 2600 for the first time ever in late November 2017 and flirting with 2700 by the end of the reporting period. The bellwether large-cap index closed out the year with a 21.83% advance. Nine of the 11 sectors in the index posted gains led by the information technology sector, which returned nearly 40% in the S&P 500® during the reporting period. Five other sectors advanced more than 20% including materials, consumer discretionary, financials, health care and industrials. Telecommunications services and energy were the only index sectors in negative territory during the reporting period. Growth-oriented stocks continued their leadership, beating out value stocks across the capitalization spectrum. In the large-cap focused Russell 1000® Index, for example, growth outperformed value by more than 16% during the reporting period. Large caps also outpaced small caps with the Russell 2000® Index gaining 14.65% for the reporting period. Developed markets overall, as measured by the MSCI EAFE Index, advanced 25.62%, but were surpassed by emerging market stocks, which advanced 37.75% for the reporting period in U.S. dollar terms (MSCI Emerging Markets Index).
Nuveen Global Infrastructure Fund
How did the Fund perform during the twelve-month period ended December 31, 2017?
The table in the Fund Performance and Expense Ratios section of this report provides total returns for the Fund for the one-year, five-year, ten-year and/or since inception periods ended December 31, 2017. Comparative performance information is provided for the Fund’s Class A Shares at net asset value (NAV). The Fund’s Class A Shares at NAV underperformed the S&P Global Infrastructure Index and outperformed the Lipper classification average during the twelve-month reporting period.
What strategies were used to manage the Fund during the reporting period and how did these strategies influence performance?
The Fund seeks to provide long-term growth of capital and income by investing primarily in equity securities issued by U.S. and non-U.S. companies that typically derive the majority of their value from owned or operated infrastructure assets. During the reporting period, our strategy for managing the Fund remained consistent as we focused on buying global infrastructure companies that own and operate long life assets that have visible cash flows, strong balance sheets, manageable amounts of leverage and inelastic demand characteristics. We believe these types of companies will have ongoing access to capital and the best chances for producing sustainable and growing cash flow. The Fund is structured using a number of core infrastructure companies that we believe should provide long-term outperformance versus the market, combined with more opportunistic holdings that we believe are undervalued by the market in the short term. We have exposure around the globe to a mixture of holdings that represent significant value, as well as positions in companies that may prove to be more stable in a slowly growing global economy.
During the twelve-month reporting period, the global infrastructure sector posted a strong 20.13% return as measured by the S&P Global Infrastructure Index, but fell short of the broad U.S. equity market return of 21.83% (S&P 500® Index) and the global equity market return of 24.62% (MSCI ACWI Index). In the first six months of the reporting period, the more defensive characteristics of infrastructure assets won out in terms of performance as inflation remained in check, the 10-year Treasury yield remained relatively well anchored and the outlook for global GDP growth gained a little momentum. The long-dated nature of many of the contracts and concession agreements that govern infrastructure company revenues makes their cash flow streams more visible and consistent, which continued to gain favor with investors in the first half of the reporting period. However, the opposite was true in the second half of the reporting period as investors shifted toward higher growth sectors and those with a little more sensitivity to global economic cycles. The improving global economic backdrop favored some of the more cyclically sensitive sectors within infrastructure such as toll roads and airports, along with technology infrastructure, which was the best performing category during the reporting period. These groups reported some of the best absolute returns in the index, while the diversified, master limited partnership (MLP), logistics and pipelines sectors lagged. The pressure in the pipeline and MLP segments mainly happened in the first half of the reporting period when the price of crude fell significantly due to ongoing oversupply concerns caused by increased production from U.S. shale.
The Fund outperformed the Lipper peer group, but fell short of the benchmark S&P Global Infrastructure Index return during the twelve-month reporting period. On the positive side of the equation, the Fund benefited from the technology infrastructure, diversified infrastructure, pipeline and gas utilities sectors. On the other hand, the Fund experienced weakness from the MLP, airport and rail sectors.
Technology infrastructure, a sector not represented in the index that comprised more than 6% of the Fund’s portfolio, was the leading contributor over the twelve-month reporting period. The sector posted the strongest gains in the infrastructure universe as positive underlying fundamentals for data centers and cell phone towers continued to drive the Fund’s holdings forward, collectively advancing more than 48% during the reporting period. Cellular towers continued to show fundamental strength not only in the U.S., but also internationally as service providers upgraded existing technology and improved coverage through tower densification. In the cell tower area, our position in SBA Communications Corporation was the largest contributor. The company is slightly more sensitive to growth in the sector because its revenue is marginally less long-term contractual in nature, which helped it outperform its U.S. counterparts. SBA Communications also carries a little more balance sheet leverage, which provided an additional lift in the up market. On the international front, Cellnex Telecom S.A.U., a Spanish listed company with assets in various European markets, also performed well for the Fund. Cellnex continued to execute on its well-communicated acquisition plans, which gave investors sustained confidence in the management team and provided positive momentum for the stock. The company was also aided by better-than-expected economic growth in Europe, while sovereign bond yields remained in check. In the data center area, the secular growth trends remained in place during the reporting period. The need for data center space due to individual and corporate demand for cloud computing and web-based enterprise technology solutions continued to outstrip supply, benefiting data center companies. Within that sub-sector, our position in Equinix Inc., the largest publicly traded data center company, benefited the Fund. We were able to add the company to our portfolio at an attractive entry point toward the end of 2016 during its equity issuance for an asset acquisition and the stock has performed well since our purchase.
Portfolio Managers’ Comments (continued)
Within the diversified space, the Fund benefited from security selection, specifically our continued underweight to the only benchmark constituent, Macquarie Infrastructure Corporation. During the reporting period, the Fund averaged nearly a zero weight in the company. While Macquarie Infrastructure is classified as a diversified infrastructure company, its largest business is oil and gas storage. We typically prefer to gain access to these types of companies through more “pure-play” pipeline and MLP companies, rather than owning this name. Although most energy infrastructure companies rebounded on the back of increasing oil prices during the reporting period, Macquarie’s shares fell due to multiple issues. Earlier in the reporting period, a well-respected energy analyst initiated coverage on Macquarie and recommended shorting the stock, sending shares sharply lower. Also, the unexpected resignation of the company’s well-liked CEO James Hooke in September 2017 put further downward pressure on the shares, which may have been exacerbated by hedge fund selling and tax loss harvesting at the end of the year.
The pipeline sector also contributed favorably to the Fund’s relative performance during the reporting period. In the benchmark, the sector produced only about a 3.5% return during the reporting period due to the pressure on crude oil prices in the first half of the reporting period, whereas the Fund’s holdings collectively gained about 6.5%. After the rally in crude oil, most of the names in the energy space did move higher, but not to the degree of the commodity itself. The greatest benefit to the Fund’s performance was our underweight in the largest benchmark holding, Enbridge Energy Partners LP, which is Canada’s biggest crude oil pipeline company. Enbridge remained out of favor not only on the back of downward pressure on oil prices, but also because of its merger with Spectra Energy. Perceived complexities due to the multiple limited partnerships that fall under the Enbridge corporate entity also may have weighed on the name. Energy companies that have been simplifying their structures seem to have been favored by investors.
Stock selection within gas utilities also benefited the Fund’s results, led by an underweight position in Sempra Energy. In August 2017, Sempra announced its intention to buy Oncor Electric Delivery, a regulated electric distribution company in Texas. Given the sheer size of the deal, we believed Sempra would likely have to do a substantial equity issuance, which would be dilutive to existing shareholders and be an overhang on the stock. Indeed, in October 2017 the company announced that it would need to issue more equity instead of bringing in other outside investors to help fund the takeover, sending shares sharply lower. Additionally, we thought the devastating wildfires in California would likely keep downward pressure on this company. While Southern California Edison is the company in question regarding the most recent fires near Los Angeles, investors are shying away from California gas utilities in general because of the state’s inverse condemnation law, which makes the potential liability of owning a utility there simply too great. The law essentially states that a utility in California is responsible for any damages if its equipment was found to have caused the fire, even if the company was fully compliant with regulations. Although Sempra’s shares were up overall for the reporting period, they advanced much less than the gas utilities group as a whole and we sold our position in Sempra Energy during the reporting period.
The MLP sector detracted the most from the Fund’s relative performance due to our overweight allocation to this poorly performing group. It is important to note, however, that the entire benchmark weight comes from only one holding, Targa Resources Corp., whereas we prefer to maintain broader exposure to the space. Within MLPs, we continued to focus on owning high quality companies and those that derive a substantial amount of their cash flows from the Permian Basin, where demand for oil infrastructure remains strongest due to continued production growth. The Fund’s out-of-index position in Plains GP Holdings LP was the biggest detractor. While Plains meets our criteria for Permian Basin exposure, its shares fell sharply because of the company’s purchase of a Permian oil gathering asset from a private entity. Although the asset is strategically a good fit and should provide substantial value over time, the company didn’t issue equity to fund the purchase immediately after the announcement and the uncertainty surrounding the timing of a capital raise weighed on the stock’s performance. Also during the reporting period, a large shareholder of Plains announced the likely sale of an approximately $1 billion position, causing an additional overhang due to the uncertain timing. However, we saw no change in guidance and the company appeared on target to hit its numbers so we maintained our position. Plains also appeared attractively valued relative to the peer group, providing us with additional rationale for continuing to hold the position. We continue to hold our position in Plains GP Holdings LP.
Airports produced very strong absolute returns in both the index and Fund during the reporting period, making it the third top performing sector. However, the Fund had an underweight to the sector, which detracted from performance. More specifically, our underweights to Aena S.A., Aeroports de Paris and BBA Aviation plc were the biggest drags on results. Spanish airport group Aena, the largest benchmark weight, remained the Fund’s largest airport holding and has been our favorite company in the sector. However, we remained underweight throughout the reporting period simply due to the overall size of the company’s weight in the
benchmark. After a brief downturn in Aena during the reporting period due to the unexpected resignation of its CEO and trepidation resulting from the independence referendum in Catalonia, it bounced back strongly toward the end of 2017. Shares advanced on the back of continued stronger-than-expected European growth, well-contained sovereign bond yields around the region and the improving situation in Catalonia, where protests abated and life got back to normal leading to optimism about travel within the state. An underweight to Aeroports de Paris also hampered relative performance because the company posted outsized returns relative to most of the index constituents. The company benefited from stronger-than-expected economic growth in France, which led to upside surprises in terms of traffic through the airport. Optimism within the country due to the policies of President Emmanuel Macron provided a tailwind and sovereign bond yields remained well contained, which benefited long life assets like airports. The Fund remained modestly underweight in the name based on relative valuation. While BBA Aviation is listed in London, its primary business is to provide fueling services at U.S. airports; therefore, it doesn’t meet our more strict definition of infrastructure. The Fund did not own the name and its shares advanced strongly.
In the rail area, we experienced a negative impact from a position in our favored out-of-index company in the sector, Genesee & Wyoming, Inc. Shares were under pressure earlier in the reporting period after the company reported flat volumes in February 2017, despite better trends among freight rail volumes across the industry. We sold our position in Genesee & Wyoming during the reporting period. Also in rail, the Fund was hindered by its underweight position in Getlink SE, formerly Groupe Eurotunnel SA, the largest index weighting in the group. We maintained a substantial underweight throughout the reporting period predicated on company-specific fundamentals and macro considerations. On the company front, low growth rates for both truck and passenger traffic continue to hamper potential earnings for Getlink, especially relative to other investment opportunities in the transportation sector that are demonstrating significantly higher growth rates. We believed that headwind, combined with macro uncertainty due to ongoing Brexit negotiations between the U.K. and the European Union, added undue risk and made it difficult to understand the company’s potential future growth. However, earlier in the reporting period, a very large U.K. investor, who has a reputation of having an activist agenda, took a significant position in Getlink. This news gave investors’ confidence that there may be a potential positive catalyst for improvement going forward. Although that catalyst has yet to materialize, it appears the involvement was enough to boost the company’s shares through the end of the reporting period.
During the reporting period, we essentially rebalanced the portfolio at the margin by adding to names and sectors that underperformed, while largely using proceeds from reductions in areas that performed well. The most substantial change came by way of positioning within the electric utility sector resulting from the U.S. tax legislation that was passed in December 2017. Electric utilities with more highly regulated businesses are likely going to benefit less from the corporate tax reduction because regulators will likely force them to pass the savings through to customers via reductions in rates. Additionally those utilities with larger amounts of holding company debt used to finance operations will disproportionately lose out given the lower amount of interest expense they are able to deduct. On a net basis, this led to a small increase in the total allocated to electric utilities after we reduced the Fund’s more highly regulated exposure, but added to those names with smaller amounts of holding company debt and less regulated businesses, where they maintain a greater amount of pricing power. We also continued to add slightly to more cyclical opportunities as well with an addition to Australian toll road operator Transurban Group after it underperformed relative to most other toll companies. It also did a rights offering to raise capital for a new project that gave us the opportunity to add shares at a slight discount to where they were trading. We also reduced the Fund’s exposure to gas utilities primarily from reducing our exposure to Dominion Resources Inc.
We continued to favor more exposure to high conviction cyclical names with higher growth expectations because the Fed continues to modestly increase interest rates and we anticipate higher growth due to fiscal stimulus from tax legislation. We believe these companies could hold up better in what may become an environment of modestly increasing long-term interest rates. The Fund has remained rather neutral to the benchmark in the energy space because valuations appeared fair and the outlook for further growth may be muted. However, any significant geopolitical event could have a meaningful impact on the price of the commodity and push the names higher. We want exposure to the space, but given the uncertainties, do not expect to make a significant bet one way or the other.
Geographically, we have recently kept the portfolio predisposed to developed markets over emerging markets. That being said, fundamentals continue to improve in China. Port throughput volumes have picked up in the region and growth in that sector is stronger than we’ve seen in several years. We began to narrow the Fund’s underweight to select companies on compelling valuations. The Chinese government continues to show its commitment to incent businesses to invest in environmental services as a
Portfolio Managers’ Comments (continued)
result of the country’s pollution issues. We believe this should be supportive of waste-to-energy, water and gas distribution businesses.
Nuveen Real Asset Income Fund
How did the Fund perform during the twelve-month period ended December 31, 2017?
The table in the Fund Performance and Expense Ratios section of this report provides total returns for the Fund for the one-year, five-year and since inception periods ended December 31, 2017. Comparative performance information is provided for the Fund’s Class A Shares at net asset value (NAV). The Fund’s Class A Shares at NAV underperformed the Real Asset Income Blend benchmark and the Lipper classification average, but outperformed the Bloomberg Barclays U.S. Corporate High Yield Index during the twelve-month reporting period.
What strategies were used to manage the Fund during the reporting period and how did these strategies influence performance?
The Fund seeks a high level of current income with a secondary objective of capital appreciation by investing in a global portfolio of infrastructure and commercial real estate related securities (i.e. real assets) across the capital structure. These securities include a combination of infrastructure and real estate common stock, infrastructure and real estate preferred stock, and infrastructure and real estate related debt. Our goal is to combine these securities into a portfolio that provides investors with an attractive level of income and dampens levels of risk versus the broader equity market. We continued to select securities using an investment process that screens for companies and assets across the real assets market that provide higher yields. From the group of securities providing significant yields, we focus on owning those companies and securities with the highest total return potential in the Fund. Our process places a premium on finding securities whose revenues come from tangible assets with long-term concessions, contracts or leases and are therefore capable of producing steady, predictable and recurring cash flows. The Fund’s management team employs a bottom-up, fundamental approach to security selection and portfolio construction. We look for stable companies that demonstrate consistent and growing cash flow, strong balance sheets and histories of being good stewards of shareholder capital. Also during the reporting period, the Fund continued to short U.S. Treasury future contracts to hedge against interest rate risk within the high yield bond portfolio. We expanded the hedge program to include selling 10-year, 20-year and 30-year Treasury futures to better match the maturities of bonds within the high yield portfolio.
Despite episodes of geopolitical turmoil and policy uncertainty during the reporting period, risk appetites in the financial markets remained supported by economic activity and financial conditions. Volatility remained extremely low, while corporate earnings enjoyed a string of seemingly never-ending positive surprises, followed by constant upward earnings revisions. Strong upward momentum for equities continued throughout the reporting period and even accelerated somewhat as the year wound to a close, with several indices repeatedly reaching record levels. Sentiment in the markets remained decidedly positive, while the tax legislation that passed near the end of the reporting period further bolstered equity market optimism for most sectors within the U.S.
All five of the “real asset” categories represented in the Real Asset Income Blend benchmark produced strong absolute returns. The public commercial real estate sector posted an 11.4% return (FTSE EPRA/NAREIT Developed Index) during the reporting period, with global real estate outperforming U.S. real estate returns throughout 2017. Despite these solid results, the real estate sector significantly underperformed the strong gains in both the broader global equity markets, which advanced 23.1% as measured by the MSCI World Index, and the infrastructure sector. REIT investors remained cautious based on the anticipation of global interest rates moving higher and weaker underlying fundamentals within real estate relative to other areas. Global infrastructure equities produced the strongest results among the five real asset categories represented in the Fund. The segment was up a healthy 20.13% (S&P Global Infrastructure Index), outpacing REITs by almost 9%, but falling short of global equities. The improving global economic backdrop favored some of the more cyclically sensitive sectors within infrastructure such as toll roads and airports, along with technology infrastructure, which was the best performing category during the reporting period. Ongoing secular growth trends remained supportive of technology infrastructure stocks, which advanced once again due to the strength of data center and cell tower companies. The high yield sector extended its year-to-date gains, producing a 7.5% return in 2017 as measured by the Bloomberg Barclays U.S. Corporate High Yield Index; however, the pace slowed a bit as the year progressed. High yield spreads versus Treasuries continued to compress throughout the reporting period, ending near their tightest level in 10 years. The two preferred indices within the Fund’s Real Asset
Income Blend both turned in strong results, also extending their strong 2017 gains. The Wells Fargo Hybrid & Preferred Securities REIT Index advanced 11.5% and the Bloomberg Barclays Global Capital Securities Index gained 15.5% for the reporting period.
The Fund continued to generate a consistent gross yield that remained above our overall yield hurdle, outpacing the Bloomberg Barclays U.S. Corporate High Yield Index, but underperforming the total return of its Real Asset Income Blend benchmark and the Lipper classification average. We attempt to add value versus the benchmark in two ways: by re-allocating money among five main security types when we see pockets of value at differing times and, more importantly, through individual security selection. The goal of this Fund is to provide a portfolio of securities with steady income and growth potential. During the reporting period, the high yield and REIT common equity segments produced favorable results relative to the benchmark, whereas the global infrastructure and infrastructure preferred sectors were the primary performance detractors. The REIT preferred segment had little impact on the Fund’s relative performance during the reporting period.
High yield debt contributed the most to the Fund’s relative returns. Overall, the high yield asset class continued its string of strong performance that started in February 2016. The investing backdrop for high yield remained favorable given the strong economic growth trends across the globe. The sector continued to benefit from both solid fundamentals and technicals. Corporate balance sheets continued to strengthen due to the combination of decent topline growth, lack of meaningful inflation to impact operating costs and an exceedingly conducive market for new issuance. Demand for yield from investors, coupled with modestly lower new issuance volumes, also contributed to a very positive technical backdrop for the asset class. The tax changes signed into law toward the end of the reporting period, while still not completely understood, appear to provide more financial relief for bond issuers. Although valuations in terms of spreads to Treasuries ended the reporting period near 10-year lows, the high yield market continued to be supported by the outlook for modest defaults over the next year and investors’ need for current income. As of December 2017, Moody’s Investors Service was estimating a 2% global speculative grade default rate in the next 12 months compared to the 4.5% historical average. In terms of specific contributors, most of our high yield portfolio’s outperformance versus the benchmark resulted from its underweight to certain industrial sectors, which fell short of the broader benchmark return. A structural underweight to industrials is typical for the Fund because most of the companies within that space don’t meet our definition of infrastructure or real estate. Also, as the reporting period progressed and spreads has less room to tighten, our high yield portfolio benefited from its higher yield compared to the benchmark.
Real estate common equities also contributed favorably to the Fund’s relative returns. Within the sector, the Fund’s underweight to regional malls as well as favorable security selection within the group led the positive contributors. U.S.-based mall companies remained under pressure during the reporting period as brick-and-mortar retail continued to struggle in the face of e-commerce disruption and elevated retail store closings. The Fund remained largely out of the U.S. mall space in terms of equity exposure, preferring instead to gain limited exposure to the sector through non-U.S. holdings. This worked in our favor because the Fund’s international holdings in this sector generated strongly positive total returns, while the mall sector within the index gained around 3% over the same period. In the industrial REIT sector, the underlying fundamentals remained strong because of the continued demand for space due in large part to online retailing, the same forces putting downward pressure on the mall category. Given the strong demand, high occupancy and relatively low existing supply of capital stock, industrial REITs generally outperformed the overall real estate sector, gaining nearly 24% as measured by index holdings. The Fund’s holdings in this area generated even higher returns than the index provided, also contributing to our relative outperformance in the real estate common equity space. Also, in the health care REIT area, the Fund benefited from its underweight position in Ventas, Inc., one of the largest index constituents. Within the health care REIT sector, we continued to like the secular trend of outpatient medical care as well as companies focused on medical office space and lab space for the biopharmaceutical industry.
The infrastructure common equity area was the Fund’s primary performance detractor, due in large part to the Fund’s overweight to master limited partnerships (MLPs); however, the index does contain only one MLP holding. Much of the Fund’s underperformance within the group was stock specific because some MLP shares were able to post modest gains over the period due to oil price stabilization. The portfolio’s position in Plains All American Pipeline L.P. caused the bulk of the relative return shortfall after the company held a disastrous earnings call reporting second-quarter results. Management had also previously stated that the company had hedges in place to insulate it from downward oil price movements, yet multiple times, the company guided earnings down due to weak oil prices from previous quarters. Plains also announced it would likely have to cut its dividend, but was unclear as to what
Portfolio Managers’ Comments (continued)
level. The weaker earnings, multiple downward revisions to expectations, and uncertainty about the timing and size of a dividend cut put sustained pressure on the stock price. Also in the infrastructure common equity area, transportation assets such as airports performed very well because underlying airport volume trends were supportive. Our portfolio was positioned with an underweight to the airport area, not because we don’t like the space, but due to the fact that the Fund’s primary objective is to deliver a high level of income. Within airports, we have a hard time finding common equity opportunities because their dividend yields typically fall below the qualification hurdle for this strategy. As a result, our underweight to the sector contributed to the shortfall in infrastructure common equity.
The infrastructure preferred equity area also hindered performance, due mostly to the Fund’s overweight to preferred securities from midstream energy pipeline companies. Around the world, concerns began to wane about the ongoing supply glut as oil inventories were consistently drawn down, given continued global demand as many economies grew faster than anticipated. Although this resulted in strength in the price of the commodity, many investors remained on the sidelines regarding energy exposure, likely because of the previous volatility and uncertainty in the sector. As a result, midstream energy underperformed, which hurt the portfolio in relative terms because the index has hardly any exposure to pipeline preferreds, whereas it was the Fund’s second largest allocation.
We continued to actively manage the Fund’s allocations among the five investment categories to reflect what we believed to be the best opportunities in our investment universe. As the reporting period progressed, we reduced exposure to the infrastructure equity sector based on relative valuations after the space performed very well in 2017. The change in allocation essentially served as a rebalance, trimming areas that had moved significantly higher and adding to those that had lagged. The proceeds from the reduction to infrastructure equities were reallocated to the preferred area where we added to both infrastructure as well as real estate, although more heavily to the infrastructure segment. On balance, the Fund’s broader allocation to equities decreased at the margin, while preferreds moved slightly higher. We will continue to make changes within those larger categories where we see the best opportunities, but are currently comfortable with the overall asset mix.
The Fund’s fixed income exposure remained underweight versus the benchmark during the reporting period. Also, the composition of the debt portfolio remained higher in quality relative to historic ranges. Approximately one third of its holdings were rated investment grade, whereas traditionally the exposure has been very heavily weighted to high yield. We continued to find opportunities to invest in a number of attractive bonds with stable cash flows and minimal exposure to volatile commodity prices as well as non-U.S. opportunities, which transformed the Fund’s debt mix into something more akin to the geographic representation of the equity and preferred categories. Utilities, pipelines and technology infrastructure holdings comprised the three largest sectors in the debt portion of the portfolio at the end of the reporting period.
As mentioned previously, the Fund shorted U.S. Treasury futures contracts to hedge against potential increases in interest rates. The contracts had a negligible effect on the Fund’s performance during the reporting period.
Nuveen Real Estate Securities Fund
How did the Fund perform during the twelve-month period ended December 31, 2017?
The table in the Fund Performance and Expense Ratios section of this report provides total returns for the Fund for the one-year, five-year, ten-year and/or since inception periods ended December 31, 2017. Comparative performance information is provided for the Fund’s Class A Shares at net asset value (NAV). The Fund’s Class A Shares at NAV outperformed the MSCI U.S. REIT Index and underperformed the Lipper classification average during the twelve-month reporting period.
What strategies were used to manage the Fund during the reporting period and how did these strategies influence performance?
The Fund seeks to provide above average income potential and long-term capital appreciation by investing in income producing common stocks of publicly traded companies engaged in the real estate industry. During the reporting period, we continued to implement the Fund’s strategy of investing on a relative value basis with a focus on individual stocks rather than economic or market cycles. We also continued to invest the Fund in a fairly sector neutral manner (with a couple of notable exceptions within the
industrial, office, health care and net lease sectors) with a goal of providing a well-diversified portfolio of public real estate stocks to our shareholders. A sector neutral approach reduces the impact of any one property type on performance. Additionally, we continued to invest in a broader universe of stocks than our benchmark index to access more dynamic parts of the commercial real estate cycle.
During the twelve-month reporting period, the public commercial real estate sector returned 5.07% (MSCI U.S. REIT Index), significantly underperforming the broad U.S. equity market, as measured by the S&P 500® Index, which advanced 21.83%. The U.S. Treasury yield curve flattened dramatically with the 30-year Treasury yield closing 30 basis points lower during the reporting period, while the two-year Treasury yield increased nearly 70 basis points, reaching its highest level of this cycle. However, the 10-year portion of the curve was the pivot point, with yields on 10-year Treasuries virtually unchanged during the reporting period. Catalysts for the curve flattening included stronger economic data, the Feds rate hikes and continued benign inflation. For several years now, real estate investment trust (REIT) equities have demonstrated an elevated correlation or sensitivity to changes in U.S. interest rates.
During the reporting period, performance dispersion among the various REIT sectors continued to be significant. The sectors with the strongest underlying fundamentals and stock price momentum, included the technology infrastructure and industrial sectors. Technology infrastructure, as measured by benchmark constituents, was up more than 28% and industrial names gained nearly 21% during the reporting period. This is in stark contrast to the declines in the retail space, including malls and community centers. Between malls and community centers, retail comprises nearly 20% of the index. These segments suffered from continued downward pressure due to store closing announcements, weaker-than-expected sales figures and Amazon’s acquisition of Whole Foods. However, the retail sectors did see a bit of a relief rally later in the reporting period after their depressed valuations drew some investor interest.
Although REIT fundamentals remained largely positive overall, projections for net operating income growth continued to moderate in some sectors and may even be declining in others, indicating we might be in the latter stages of the commercial real estate cycle. Given that property values have more than doubled since the nadir of the financial crisis and we are approaching eight years on the recovery, investors’ expectations regarding the likely pace of gains for commercial real estate should be tempered. In fact, gains at the property level appear to have ceased for the most part and are likely slightly down in the retail sector. That being said, REIT’s valuations have become more attractive relative to other equities on the back of this year’s underperformance.
The Fund’s leading contribution during the reporting period came from favorable stock selection and allocation effect in the health care REIT sector. We maintained the Fund’s underweight in the sector throughout the reporting period due to the risk of legislative action on the Affordable Care Act and poor fundamentals in senior housing and skilled nursing. In terms of the former, the individual mandate repeal became part of the tax package and was eventually passed along with the rest of the tax bill in late December. Our underweight was expressed through lower-than-benchmark exposure to large-cap health care names, which were notable underperformers during the reporting period after consensus estimates for earnings were revised lower. The Fund’s primary underweight positions that contributed significantly were Ventas Inc. and Welltower, Inc., two of the largest index constituents. Within the health care REIT sector, however, we continued to like the secular trend of outpatient medical care as well as companies focused on medical office space and lab space for the biopharmaceutical industry. Along those lines, the Fund benefited from our overweight position in Alexandria Real Estate Equities Inc., which is focused on developing urban properties catering to the collaborative life sciences and technology industries.
The mall sector was also a top performance contributor for the Fund during the reporting period. Given the slowdown in fundamentals due to weak earnings from retailers, especially apparel, we remained very strategic in terms of the Fund’s exposure within the regional mall space. We focused the vast majority of our exposure in only two of the eight index constituents, Simon Property Group, Inc. and GGP, Inc., which are the largest U.S. mall owners. Along with possessing a large number of properties, both companies also have very high underlying property quality. We believe this best insulates them from potential negative economic consequences among brick-and-mortar retailers due to the online retailing disruption. During the reporting period, most of the Fund’s outperformance in this sector was driven by its lack of exposure to the rest of the index constituents because they all posted negative absolute returns. Later in the reporting period, however, the mall sector did recover some of its losses following an announcement by Brookfield Property Partners LP to buy out GGP’s remaining shares at a significant premium to where they had been trading. Also, hedge fund activity in two other mall property owners, Macerich Company and Taubman Centers Inc., buoyed those stocks and
Portfolio Managers’ Comments (continued)
the mall space in general. Value buyers became interested in the companies that had been trading at considerable discounts to their underlying asset value.
Manufactured homes also generated positive relative outperformance for the Fund. The benchmark contains only three names and our portfolio held significant overweights in the two largest names, Equity Lifestyle Properties Inc. and Sun Communities Inc. In particular, our overweight to Equity Lifestyle drove the bulk of the outperformance after its shares made strong gains during the reporting period. Demographics remained favorable for the age-restricted manufactured housing segment because the target market is baby boomers. With supportive demand combined with lack of competitive supply, the underlying fundamentals remained strong. We believe Equity LifeStyle, the largest player in the sector, deserves a premium valuation because of its economies of scale. The company operates efficiently and has grown occupancy for 20 consecutive quarters, which we believe will continue and lead to further upside. Equity LifeStyle also has compelling dividend growth potential, which will likely continue given the underlying fundamental strength and current payout ratio that is well below the REIT average.
On the negative side, the Fund’s cash position was a fairly significant detractor due to the market’s advance during the reporting period. We also saw slight drags on results from the specialty and office sectors. In the specialty sector, the main culprits were our underweight positions in both Iron Mountain Inc. and Gaming and Leisure Properties Inc. In terms of Iron Mountain, investors gravitated toward this name during the reporting period, driving up its share price as they sought diversification away from more rent-based real estate companies. Iron Mountain also likely benefited from positive momentum in expected earnings growth and an attractive yield. Likewise, investors bid up shares of Gaming and Leisure as they shifted away from retail-oriented triple net lease companies. Gaming and Leisure’s attractive valuation and above-average yield also likely contributed to its favorable performance.
The office sector also modestly detracted from the Fund’s relative performance during the reporting period. The underperformance resulted from our overweight positions in Mack-Cali Realty Corporation and Vornado Realty Trust. Shares of Mack Cali sold off after the company reduced its earnings outlook toward the end of the reporting period. Additionally, but related to the earnings outlook, the company also failed to execute on previous leasing projections, which caused some concern and underperformance. Meanwhile, investors shied away from Vornado Realty Trust, which owns properties mainly in the New York City and Washington D.C. markets, due to the company’s impending spin-off of its Washington D.C. assets into a new entity called JBG Smith. Vornado was also negatively impacted by the company’s street retail exposure, which will represent 30% of its portfolio post-spinoff and some continued uncertainty around New York City office fundamentals. We maintained our position because we anticipate sentiment surrounding the name will start to change now that the spinoff is complete. However, we will need to see some execution on the leasing and development front.
In terms of changes during the reporting period, we maintained our slight biases to large cap over small cap and high quality over lower quality, which was reflected in the Fund’s focus on core/high conviction names, especially within the mall sector. As the reporting period progressed, we added modestly to strip-center retail due to substantial valuation discounts, which brought a previous underweight position to a slight overweight relative to the index. We continued to overweight the technology infrastructure and industrial sectors, which exhibited the strongest fundamentals among the various property types. We also maintained the Fund’s overweight in the office sector, which underperformed for the reporting period, given somewhat attractive relative valuations in the space. However, we did slightly reduce the total exposure to the sector late in the reporting period. We continued to carry underweights to sectors that exhibit a greater sensitivity to interest rates, such as net lease and health care REITs, due to longer average lease durations.
Risk Considerations
and Dividend Information
Risk Considerations
Nuveen Global Infrastructure Fund
Mutual fund investing involves risk; principal loss is possible. Concentration in infrastructure-related securities involves sector risk and concentration risk, particularly greater exposure to adverse economic, regulatory, political, legal, liquidity, and tax risks associated with master limited partnerships (MLPs) and real estate investment trusts (REITS). Foreign investments involve additional risks including currency fluctuations and economic and political instability. These risks are magnified in emerging markets. Common stocks are subject to market risk or the risk of decline. Small- and mid-cap stocks are subject to greater price volatility. The use of derivatives involves substantial financial risks and transaction costs. The Fund’s potential investment in other investment companies means shareholders bear their proportionate share of fund expenses and indirectly, the expenses of other investment companies. Fund investments in exchange trade funds (ETFs) may involve tracking error. Preferred securities may involve greater credit risk than other debt instruments.
Nuveen Real Asset Income Fund
Mutual fund investing involves risk; principal loss is possible. Equity investments such as those held by the Fund are subject to market risk, call risk, derivatives risk, other investment companies risk, common stock risk, and tax risks associated with master limited partnerships (MLPs). Concentration in specific sectors may involve greater risk and volatility than more diversified investments: real estate sector involves the risk of exposure to economic downturns and changes in real estate values, rents, property taxes, interest rates and tax laws; infrastructure-related securities may involve greater exposure to adverse economic, regulatory, political, legal, and other changes affecting such securities. Foreign investments involve additional risks, including currency fluctuation, political and economic instability, lack of liquidity, and differing legal and accounting standards. These risks are magnified in emerging markets. Investments in small- and mid-cap companies are subject to greater volatility. In addition, the Fund will bear its proportionate share of any fees and expenses paid by the exchange trade funds (ETFs) in which it invests.
Debt or fixed income securities such as those held by the Fund are subject to market risk, credit risk, interest rate risk and income risk. As interest rates rise, bond prices fall. Below investment grade or high yield debt securities are subject to liquidity risk and heightened credit risk. Preferred securities are subordinated to bonds and other debt instruments in a company’s capital structure and therefore are subject to greater credit risk. Asset-backed and mortgage-backed securities are subject to additional risks such as prepayment risk, liquidity risk, default risk and adverse economic developments.
Nuveen Real Estate Securities Fund
Mutual fund investing involves risk; principal loss is possible. Common stocks and REITs such as those held in the Fund involve market risk, concentration risk, sector risk, and non-diversification risk. The real estate industry is greatly affected by economic downturns that may persist as well as changes in property values, taxes, and regulatory developments. Foreign investments involve additional risks including currency fluctuations, and economic or political instability. These risks are magnified in emerging markets. The use of derivatives involves substantial financial risks and transaction costs. Small cap stocks may experience more volatility than large cap stocks.
Dividend Information
Regular dividends are declared and distributed annually for Nuveen Global Infrastructure Fund, declared daily and distributed monthly for Nuveen Real Asset Income Fund and declared and distributed quarterly for Nuveen Real Estate Securities Fund. To permit a Fund to maintain a more stable dividend, the Fund may pay dividends at a rate that may be more or less than the amount of net investment income it actually earned during the period. If the Fund has cumulatively earned more than it has paid in dividends, it will hold the excess in reserve as undistributed net investment income (UNII) as part of the Fund’s NAV. Conversely, if the Fund has cumulatively
Risk Considerations and Dividend Information (continued)
paid out dividends more than it has earned, the excess will constitute negative UNII that will likewise be reflected in the Fund’s NAV. Each Fund will, over time, pay all of its net investment income as dividends to shareholders.
In certain instances, a portion of each Fund’s distributions may be paid from sources or comprised of elements other than ordinary income, including capital gains and/or a return of capital. This is generally due to the fact that the tax character of Fund distributions for a fiscal year is dependent upon the amount and tax character of distributions received from securities held in the Fund’s portfolio. Distributions received from certain securities in which the Fund invests, most notably real estate investment trust (REIT) securities, may be characterized for tax purposes as ordinary income, long-term capital gain and/or a return of capital. The issuer of a security typically reports the tax character of its distributions only once per year, generally during the first two months of the following calendar year. The full amount of the distributions received from such securities is included in the Fund’s ordinary income during the course of the year until such time the Fund is notified by the issuer of the actual tax character. To the extent that at the time of a particular distribution the Fund estimates that a portion of that distribution is attributable to a source or sources other than ordinary income, the Fund would send shareholders a notice to that effect. The final determination of the sources and tax character of all distributions for the fiscal year is made after the end of the fiscal year.
Additional Dividend Information for Nuveen Real Asset Income Fund and Nuveen Real Estate Securities Fund
Nuveen Real Asset Income Fund and Nuveen Real Estate Securities Fund seek to pay regular dividends at a rate that reflects the cash flow received from each Fund’s investments in portfolio securities. Fund distributions are not intended to include expected portfolio appreciation; however, the Funds invest in securities that make payments which ultimately may be fully or partially characterized for tax purposes by the securities’ issuers as gains or return of capital. While the reported sources of distributions may include capital gains and/or return of capital for tax purposes, the Funds intend to distribute only the net cash flow received as opposed to a distribution rate based on long-term total return. This tax treatment will generally “flow through” to the Funds’ distributions, but the specific tax treatment is often not known with certainty until after the end of the Funds’ tax year. As a result, certain portions of the regular distributions by these two Funds throughout the year were later re-characterized for tax purposes as either long-term gains (both realized and unrealized), or as a non-taxable return of capital, as set forth in each Fund’s table below.
Nuveen Real Asset Income Fund – Data as of December 31, 2017
| | | | | | | | | | | | | | | | | | | | | | | | | | | | | | |
| Calendar Year 2017 | |
| | | | | Percentage of the Distribution | | | Per Share Amounts | |
| Share Class | | Ticker Symbol | | Net
Investment
Income | | | Realized
Gains | | | Return of
Capital | | | Distributions | | | Net
Investment
Income | | | Realized
Gains | | | Return of
Capital | |
Class A | | NRIAX | | | 100.0% | | | | 0.0% | | | | 0.0% | | | $ | 1.3225 | | | $ | 1.3225 | | | $ | 0.0000 | | | $ | 0.0000 | |
Class C | | NRICX | | | 100.0% | | | | 0.0% | | | | 0.0% | | | $ | 1.1475 | | | $ | 1.1475 | | | $ | 0.0000 | | | $ | 0.0000 | |
Class R6 | | NRIFX | | | 100.0% | | | | 0.0% | | | | 0.0% | | | $ | 1.3885 | | | $ | 1.3885 | | | $ | 0.0000 | | | $ | 0.0000 | |
Class I | | NRIIX | | | 100.0% | | | | 0.0% | | | | 0.0% | | | $ | 1.3825 | | | $ | 1.3825 | | | $ | 0.0000 | | | $ | 0.0000 | |
Class T | | NRITX | | | 100.0% | | | | 0.0% | | | | 0.0% | | | $ | 0.8275 | | | $ | 0.8275 | | | $ | 0.0000 | | | $ | 0.0000 | |
Nuveen Real Estate Securities Fund – Data as of December 31, 2017(1)
| | | | | | | | | | | | | | | | | | | | | | | | | | | | | | |
| Calendar Year 2017 | |
| | | | | Percentage of the Distribution | | | Per Share Amounts | |
| Share Class | | Ticker Symbol | | Net
Investment
Income | | | Realized
Gains | | | Return of
Capital | | | Distributions | | | Net
Investment
Income | | | Realized
Gains | | | Return of
Capital | |
Class A | | FREAX | | | 13.8% | | | | 86.2% | | | | 0.0% | | | $ | 2.6956 | | | $ | 0.3725 | | | $ | 2.3231 | | | $ | 0.0000 | |
Class C | | FRLCX | | | 7.8% | | | | 92.2% | | | | 0.0% | | | $ | 2.5205 | | | $ | 0.1974 | | | $ | 2.3231 | | | $ | 0.0000 | |
Class R3 | | FRSSX | | | 12.3% | | | | 87.7% | | | | 0.0% | | | $ | 2.6475 | | | $ | 0.3244 | | | $ | 2.3231 | | | $ | 0.0000 | |
Class R6 | | FREGX | | | 16.0% | | | | 84.0% | | | | 0.0% | | | $ | 2.7642 | | | $ | 0.4411 | | | $ | 2.3231 | | | $ | 0.0000 | |
Class I | | FARCX | | | 15.8% | | | | 84.2% | | | | 0.0% | | | $ | 2.7595 | | | $ | 0.4364 | | | $ | 2.3231 | | | $ | 0.0000 | |
Class T | | FRYTX | | | 10.3% | | | | 89.7% | | | | 0.0% | | | $ | 2.5904 | | | $ | 0.2669 | | | $ | 2.3235 | | | $ | 0.0000 | |
| (1) | The Fund owns REIT securities which attribute their distributions to various sources, including net investment income, gains and return of capital. |
The amount and sources of distributions reported in this notice are for financial reporting purposes and are not being provided for tax reporting purposes. The actual amounts and character of the distributions for tax reporting purposes will be reported to shareholders on Form 1099-DIV which will be sent to shareholders shortly after calendar year-end. More details about each Fund’s distributions and the basis for these estimates are available on www.nuveen.com.
The Tax Cuts and Jobs Act
A large portion of the Funds’ portfolio holdings consist of Real Estate Investment Trusts (REITs). For tax years beginning after December 31, 2017, The Tax Cuts and Jobs Act generally would allow a non-corporate taxpayer a deduction of 20% of the investor’s domestic qualified business income received from certain pass-through entities, including REITs. However, Regulated Investment Companies (RICs) such as the Funds are not explicitly given the ability to pass the deduction through to their non-corporate shareholders. Treasury has been approached to provide RICs the ability to report a portion of their distributions as qualified business income eligible for the 20% deduction. However, until such relief is provided, non-corporate investors will not be able to receive the tax benefit that they would otherwise receive investing directly in the individual REIT securities.
THIS PAGE INTENTIONALLY LEFT BLANK
Fund Performance
and Expense Ratios
The Fund Performance and Expense Ratios for each Fund are shown within this section of the report.
Returns quoted represent past performance, which is no guarantee of future results. Investment returns and principal value will fluctuate so that when shares are redeemed, they may be worth more or less than their original cost. Current performance may be higher or lower than the performance shown. Total returns for a period of less than one year are not annualized. Returns at net asset value (NAV) would be lower if the sales charge were included. Returns assume reinvestment of dividends and capital gains. For performance current to the most recent month-end visit nuveen.com or call (800) 257-8787.
Returns do not reflect the deduction of taxes that a shareholder would pay on Fund distributions or the redemption of Fund shares.
Returns may reflect fee waivers and/or expense reimbursements by the investment adviser during the periods presented. If any such waivers and/or reimbursements had not been in place, returns would have been reduced. See Notes to Financial Statements, Note 7—Management Fees and Other Transactions with Affiliates for more information.
Returns reflect differences in sales charges and expenses, which are primarily differences in distribution and service fees, and assume reinvestment of dividends and capital gains.
Comparative index and Lipper return information is provided for Class A Shares at NAV only.
The expense ratios shown reflect total operating expenses (before fee waivers and/or expense reimbursements, if any) as shown in the most recent prospectus. The expense ratios include management fees and other fees and expenses.
Fund Performance and Expense Ratios (continued)
Nuveen Global Infrastructure Fund
Refer to the first page of this Fund Performance and Expense Ratios section for further explanation of the information included within this section. Refer to the Glossary of Terms Used in this Report for definitions of terms used within this section.
Fund Performance
Average Annual Total Returns as of December 31, 2017
| | | | | | | | | | | | |
| | | Average Annual | |
| | | 1-Year | | | 5-Year | | | 10-Year | |
Class A Shares at NAV | | | 19.38% | | | | 9.38% | | | | 5.67% | |
Class A Shares at maximum Offering Price | | | 12.53% | | | | 8.10% | | | | 5.04% | |
S&P Global Infrastructure Index | | | 20.13% | | | | 9.21% | | | | 3.42% | |
Lipper Global Infrastructure Funds Classification Average | | | 17.40% | | | | 8.46% | | | | 3.22% | |
| | | |
Class I Shares | | | 19.61% | | | | 9.66% | | | | 5.93% | |
| |
| | | Average Annual | |
| | | 1-Year | | | 5-Year | | | Since
Inception | |
Class C Shares | | | 18.55% | | | | 8.59% | | | | 10.86% | |
Class R3 Shares | | | 19.03% | | | | 9.11% | | | | 11.35% | |
Class R6 Shares | | | 19.95% | | | | N/A | | | | 8.99% | |
Class T Shares* | | | N/A | | | | N/A | | | | 4.58% | |
Class T Shares at maximum Offering Price* | | | N/A | | | | N/A | | | | 2.00% | |
Since inception returns for Class C Shares and Class R3 Shares are from 11/03/08; since inception return for Class R6 Shares is from 6/30/16; since inception returns for Class T Shares are from 5/31/17. Indexes and Lipper averages are not available for direct investment.
Class A Shares have a maximum 5.75% sales charge (Offering Price). Class A Share purchases of $1 million or more are sold at net asset value without an up-front sales charge but may be subject to a contingent deferred sales charge (CDSC) of 1% if redeemed within eighteen months of purchase. Class C Shares have a 1% CDSC for redemptions within less than twelve months, which is not reflected in the one-year total return. Class R3 Shares have no sales charge and are only available for purchase by eligible retirement plans. Class R6 Shares have no sales charge and are available only to certain limited categories of investors as described in the prospectus. Class I Shares have no sales charge and may be purchased under limited circumstances or by specified classes of investors. Class T Shares have a maximum 2.50% sales charge (Offering Price).
Expense Ratios as of Most Recent Prospectus
| | | | | | | | | | | | | | | | | | | | | | | | |
| | | Share Class | |
| | | Class A | | | Class C | | | Class R3 | | | Class R6 | | | Class I | | | Class T* | |
Gross Expense Ratios | | | 1.46% | | | | 2.22% | | | | 1.72% | | | | 1.10% | | | | 1.21% | | | | 1.46% | |
Net Expense Ratios | | | 1.23% | | | | 1.98% | | | | 1.48% | | | | 0.87% | | | | 0.98% | | | | 1.23% | |
The Fund’s investment adviser has contractually agreed to waive fees and/or reimburse other Fund expenses through July 31, 2019 so that total annual Fund operating expenses (excluding 12b-1 distribution and/or service fees, interest expenses, taxes, acquired fund fees and expenses, fees incurred in acquiring and disposing of portfolio securities and extraordinary expenses) do not exceed 1.00% of the average daily net assets of any class of Fund shares. However, because Class R6 Shares are not subject to sub-transfer agent and similar fees, the total annual Fund operating expenses for Class R6 Shares will be less than the expense limitation. This expense limitation may be terminated or modified prior to that date only with the approval of the Board of Directors of the Fund.
| * | Class T shares are not available for public offering. |
Growth of an Assumed $10,000 Investment as of December 31, 2017 – Class A Shares
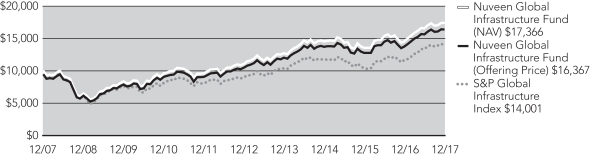
The graphs do not reflect the deduction of taxes that a shareholder may pay on Fund distributions or the redemption of Fund shares.
Fund Performance and Expense Ratios (continued)
Nuveen Real Asset Income Fund
Refer to the first page of this Fund Performance and Expense Ratios section for further explanation of the information included within this section. Refer to the Glossary of Terms Used in this Report for definitions of terms used within this section.
Fund Performance
Average Annual Total Returns as of December 31, 2017
| | | | | | | | | | | | |
| | | Average Annual | |
| | | 1-Year | | | 5-Year | | | Since
Inception | |
Class A Shares at NAV | | | 12.07% | | | | 7.81% | | | | 9.38% | |
Class A Shares at maximum Offering Price | | | 5.63% | | | | 6.54% | | | | 8.36% | |
Bloomberg Barclays U.S. Corporate High Yield Bond Index | | | 7.50% | | | | 5.78% | | | | 7.65% | |
Real Asset Income Blend | | | 13.77% | | | | 7.27% | | | | 9.13% | |
Lipper Global Flexible Portfolio Funds Classification Average | | | 12.73% | | | | 6.18% | | | | 7.02% | |
| | | |
Class C Shares | | | 11.25% | | | | 7.02% | | | | 8.57% | |
Class I Shares | | | 12.35% | | | | 8.08% | | | | 9.65% | |
| | | | | | | | |
| | | Average Annual | |
| | | 1-Year | | | Since
Inception | |
Class R6 Shares | | | 12.47% | | | | 7.80% | |
Class T Shares* | | | N/A | | | | 4.68% | |
Class T Shares at maximum Offering Price* | | | N/A | | | | 2.07% | |
Since inception returns for Class A Shares, Class C Shares and Class I Shares are from 9/13/11; since inception return for Class R6 Shares is from 6/30/16; since inception returns for Class T shares are from 5/31/17. Indexes and Lipper averages are not available for direct investment.
Class A Shares have a maximum 5.75% sales charge (Offering Price). Class A Share purchases of $1 million or more are sold at net asset value without an up-front sales charge but may be subject to a contingent deferred sales charge (CDSC) of 1% if redeemed within eighteen months of purchase. Class C Shares have a 1% CDSC for redemptions within less than twelve months, which is not reflected in the one-year total return. Class R6 Shares have no sales charge and are available only to certain limited categories of investors as described in the prospectus. Class I Shares have no sales charge and may be purchased under limited circumstances or by specified classes of investors. Class T Shares have a maximum 2.50% sales charge (Offering Price).
Expense Ratios as of Most Recent Prospectus
| | | | | | | | | | | | | | | | | | | | |
| | | Share Class | |
| | | Class A | | | Class C | | | Class R6 | | | Class I | | | Class T* | |
Gross Expense Ratios | | | 1.19% | | | | 1.94% | | | | 0.85% | | | | 0.94% | | | | 1.19% | |
Net Expense Ratios | | | 1.17% | | | | 1.92% | | | | 0.83% | | | | 0.92% | | | | 1.17% | |
The Fund’s investment adviser has contractually agreed to waive fees and/or reimburse other Fund expenses through July 31, 2019 so that total annual Fund operating expenses (excluding 12b-1 distribution and/or service fees, interest expenses, taxes, acquired fund fees and expenses, fees incurred in acquiring and disposing of portfolio securities and extraordinary expenses) do not exceed 0.95% of the average daily net assets of any class of Fund shares. However, because Class R6 Shares are not subject to sub-transfer agent and similar fees, the total annual Fund operating expenses for Class R6 Shares will be less than the expense limitation. This expense limitation may be terminated or modified prior to that date only with the approval of the Board of Directors of the Fund.
| * | Class T shares are not available for public offering. |
Growth of an Assumed $10,000 Investment as of December 31, 2017 – Class A Shares
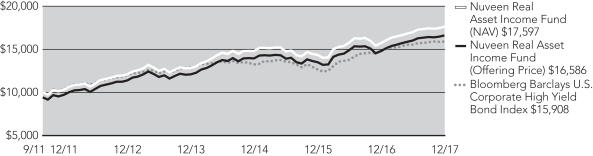
The graphs do not reflect the deduction of taxes that a shareholder may pay on Fund distributions or the redemption of Fund shares.
Fund Performance and Expense Ratios (continued)
Nuveen Real Estate Securities Fund
Refer to the first page of this Fund Performance and Expense Ratios section for further explanation of the information included within this section. Refer to the Glossary of Terms Used in this Report for definitions of terms used within this section.
Fund Performance
Average Annual Total Returns as of December 31, 2017
| | | | | | | | | | | | |
| | | Average Annual | |
| | | 1-Year | | | 5-Year | | | 10-Year | |
Class A Shares at NAV | | | 5.34% | | | | 8.93% | | | | 7.96% | |
Class A Shares at maximum Offering Price | | | (0.72)% | | | | 7.65% | | | | 7.32% | |
MSCI U.S. REIT Index | | | 5.07% | | | | 9.34% | | | | 7.44% | |
Lipper Real Estate Funds Classification Average | | | 6.02% | | | | 8.46% | | | | 6.79% | |
| | | |
Class C Shares | | | 4.59% | | | | 8.11% | | | | 7.15% | |
Class R3 Shares | | | 5.08% | | | | 8.65% | | | | 7.69% | |
Class I Shares | | | 5.61% | | | | 9.19% | | | | 8.22% | |
| | | | | | | | |
| | | Average Annual | |
| | | 1-Year | | | Since
Inception | |
Class R6 Shares | | | 5.78% | | | | 7.05% | |
Class T Shares* | | | N/A | | | | 4.67% | |
Class T Shares at maximum Offering Price* | | | N/A | | | | 2.04% | |
Since inception return for Class R6 Shares is from 4/30/13. Since Inception returns for Class T Shares are from 5/31/17. Indexes and Lipper averages are not available for direct investment.
Class A Shares have a maximum 5.75% sales charge (Offering Price). Class A Share purchases of $1 million or more are sold at net asset value without an up-front sales charge but may be subject to a contingent deferred sales charge (CDSC) of 1% if redeemed within eighteen months of purchase. Class C Shares have a 1% CDSC for redemptions within less than twelve months, which is not reflected in the one-year total return. Class R3 Shares have no sales charge and are only available for purchase by eligible retirement plans. Class R6 Shares have no sales charge and are available only to certain limited categories of investors as described in the prospectus. Class I Shares have no sales charge and may be purchased under limited circumstances or by specified classes of investors. Class T Shares have a maximum 2.50% sales charge (Offering Price).
Expense Ratios as of Most Recent Prospectus
| | | | | | | | | | | | | | | | | | | | | | | | |
| | | Share Class | |
| | | Class A | | | Class C | | | Class R3 | | | Class R6 | | | Class I | | | Class T* | |
Expense Ratios | | | 1.30% | | | | 2.05% | | | | 1.55% | | | | 0.87% | | | | 1.05% | | | | 1.30% | |
| * | Class T shares are not available for public offering. |
Growth of an Assumed $10,000 Investment as of December 31, 2017 – Class A Shares
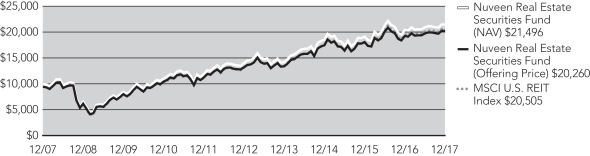
The graphs do not reflect the deduction of taxes that a shareholder may pay on Fund distributions or the redemption of Fund shares.
Holding
Summaries as of December 31, 2017
This data relates to the securities held in each Fund’s portfolio of investments as of the end of this reporting period. It should not be construed as a measure of performance for the Fund itself. Holdings are subject to change.
Nuveen Global Infrastructure Fund
Fund Allocation
(% of net assets)
| | | | |
Common Stocks | | | 92.7% | |
Real Estate Investment Trust Common Stocks | | | 4.3% | |
Investment Companies | | | 0.9% | |
Repurchase Agreements | | | 1.5% | |
Other Assets Less Liabilities | | | 0.6% | |
Net Assets | | | 100% | |
Top Five Common Stock & Real Estate Investment Trust
Common Stock Holdings
(% of net assets)
| | | | |
Transurban Group | | | 5.6% | |
TransCanada Corporation | | | 3.7% | |
Vinci S.A. | | | 3.5% | |
Enbridge Inc. | | | 3.5% | |
Atlantia SpA | | | 3.5% | |
Portfolio Composition
(% of net assets)
| | | | |
Transportation Infrastructure | | | 28.5% | |
Oil, Gas & Consumable Fuels | | | 17.4% | |
Electric Utilities | | | 15.8% | |
Multi-Utilities | | | 10.0% | |
Construction & Engineering | | | 6.1% | |
Other | | | 19.2% | |
Repurchase Agreements | | | 1.5% | |
Investment Companies | | | 0.9% | |
Other Assets Less Liabilities | | | 0.6% | |
Net Assets | | | 100% | |
Country Allocation1
(% of net assets)
| | | | |
United States | | | 29.6% | |
Canada | | | 13.2% | |
Australia | | | 11.0% | |
France | | | 9.6% | |
Spain | | | 8.6% | |
Italy | | | 5.3% | |
China | | | 3.5% | |
New Zealand | | | 2.3% | |
Singapore | | | 2.2% | |
Japan | | | 2.0% | |
Mexico | | | 2.0% | |
Other | | | 10.1% | |
Other Assets Less Liabilities | | | 0.6% | |
Net Assets | | | 100% | |
| 1 | Includes 8.5% (as a percentage of net assets) in emerging market countries. |
Nuveen Real Asset Income Fund
Fund Allocation
(% of net assets)
| | | | |
Real Estate Investment Trust Common Stocks | | | 23.2% | |
$25 Par (or similar) Retail Preferred | | | 21.3% | |
Corporate Bonds | | | 17.4% | |
Common Stocks | | | 16.6% | |
$1,000 Par (or similar) Institutional Preferred | | | 11.5% | |
Convertible Preferred Securities | | | 5.8% | |
Investment Companies | | | 1.3% | |
Convertible Bonds | | | 0.9% | |
Sovereign Debt | | | 0.4% | |
Repurchase Agreements | | | 0.7% | |
Other Assets Less Liabilities | | | 0.9% | |
Net Assets | | | 100% | |
Top Five Common Stock & Real Estate Investment Trust
Common Stock Holdings
(% of net assets)
| | | | |
Enbridge Inc. | | | 2.4% | |
TransCanada Trust | | | 2.3% | |
Dominion Resources Inc. | | | 2.2% | |
DTE Energy Company | | | 2.2% | |
NextEra Energy Inc. | | | 2.0% | |
Portfolio Composition
(% of net assets)
| | | | |
Electric Utilities | | | 17.6% | |
Equity Real Estate Investment Trusts | | | 17.0% | |
Oil, Gas & Consumable Fuels | | | 11.7% | |
Multi-Utilities | | | 6.4% | |
Industrial | | | 6.0% | |
Transportation Infrastructure | | | 3.8% | |
Health Care | | | 3.6% | |
Diversified | | | 3.4% | |
Independent Power & Renewable Electricity Producers | | | 3.0% | |
Retail | | | 2.7% | |
Hotels & Resorts | | | 2.6% | |
Other | | | 18.9% | |
Investment Companies | | | 1.3% | |
Repurchase Agreements | | | 0.7% | |
Sovereign Debt | | | 0.4% | |
Other Assets Less Liabilities | | | 0.9% | |
Net Assets | | | 100% | |
Country Allocation1
(% of net assets)
| | | | |
United States | | | 55.7% | |
Canada | | | 13.6% | |
Singapore | | | 5.0% | |
Australia | | | 3.2% | |
Italy | | | 2.7% | |
Hong Kong | | | 2.2% | |
France | | | 2.2% | |
Spain | | | 2.0% | |
Mexico | | | 2.0% | |
United Kingdom | | | 2.0% | |
New Zealand | | | 1.1% | |
Other | | | 7.4% | |
Other Assets Less Liabilities | | | 0.9% | |
Net Assets | | | 100% | |
| 1 | Includes 6.7% (as a percentage of net assets) in emerging market countries. |
Holding Summaries as of December 31, 2017 (continued)
Nuveen Real Estate Securities Fund
Fund Allocation
(% of net assets)
| | | | |
Real Estate Investment Trust Common Stocks | | | 98.0% | |
Investments Purchased with Collateral from Securities Lending | | | 0.1% | |
Money Market Funds | | | 1.3% | |
Other Assets Less Liabilities | | | 0.6% | |
Net Assets | | | 100% | |
Portfolio Composition
(% of net assets)
| | | | |
Residential | | | 21.5% | |
Specialized | | | 16.8% | |
Retail | | | 16.8% | |
Office | | | 15.6% | |
Industrial | | | 10.2% | |
Health Care | | | 8.8% | |
Hotels & Resorts | | | 5.4% | |
Diversified | | | 2.3% | |
Mortgage | | | 0.6% | |
Investments Purchased With Collateral from Securities Lending | | | 0.1% | |
Money Market Funds | | | 1.3% | |
Other Assets Less Liabilities | | | 0.6% | |
Net Assets | | | 100% | |
Top Five Real Estate Investment Trust Common Stock Holdings
(% of net assets)
| | | | |
Simon Property Group, Inc. | | | 6.3% | |
Avalon Bay Communities, Inc. | | | 4.9% | |
Public Storage, Inc. | | | 4.4% | |
Duke Realty Corporation | | | 4.2% | |
Equinix Inc. | | | 3.9% | |
Expense
Examples
As a shareholder of one or more of the Funds, you incur two types of costs: (1) transaction costs, including up-front and back-end sales charges (loads) or redemption fees, where applicable; and (2) ongoing costs, including management fees; distribution and service (12b-1) fees, where applicable; and other Fund expenses. The Examples below are intended to help you understand your ongoing costs (in dollars) of investing in the Funds and to compare these costs with the ongoing costs of investing in other mutual funds.
The Examples below are based on an investment of $1,000 invested at the beginning of the period and held through the period ended December 31, 2017.
The beginning of the period is July 1, 2017.
The information under “Actual Performance,” together with the amount you invested, allows you to estimate actual expenses incurred over the reporting period. Simply divide your account value by $1,000 (for example, an $8,600 account value divided by $1,000 = 8.60) and multiply the result by the cost shown for your share class, in the row entitled “Expenses Incurred During Period” to estimate the expenses incurred on your account during this period.
The information under “Hypothetical Performance,” provides information about hypothetical account values and hypothetical expenses based on each Fund’s actual expense ratio and an assumed rate of return of 5% per year before expenses, which is not the Fund’s actual return. The hypothetical account values and expenses may not be used to estimate the actual ending account balance or expense you incurred for the period. You may use this information to compare the ongoing costs of investing in the Fund and other funds. To do so, compare this 5% hypothetical example with the 5% hypothetical examples that appear in the shareholder reports of the other funds.
Please note that the expenses shown in the following tables are meant to highlight your ongoing costs only and do not reflect any transaction costs. Therefore, the hypothetical information is useful in comparing ongoing costs only, and will not help you determine the relative total costs of owning different funds or share classes. In addition, if these transaction costs were included, your costs would have been higher.
Nuveen Global Infrastructure Fund
| | | | | | | | | | | | | | | | | | | | | | | | |
| | | Share Class | |
| | | Class A | | | Class C | | | Class R3 | | | Class R6 | | | Class I | | | Class T* | |
Actual Performance | | | | | | | | | | | | | | | | | | | | | | | | |
Beginning Account Value | | $ | 1,000.00 | | | $ | 1,000.00 | | �� | $ | 1,000.00 | | | $ | 1,000.00 | | | $ | 1,000.00 | | | $ | 1,000.00 | |
Ending Account Value | | $ | 1,047.80 | | | $ | 1,044.30 | | | $ | 1,046.80 | | | $ | 1,051.30 | | | $ | 1,049.40 | | | $ | 1,048.70 | |
Expenses Incurred During the Period | | $ | 6.30 | | | $ | 10.15 | | | $ | 7.58 | | | $ | 4.14 | | | $ | 5.01 | | | $ | 6.30 | |
Hypothetical Performance (5% annualized return before expenses) | | | | | | | | | | | | | | | | | | | | | | | | |
Beginning Account Value | | $ | 1,000.00 | | | $ | 1,000.00 | | | $ | 1,000.00 | | | $ | 1,000.00 | | | $ | 1,000.00 | | | $ | 1,000.00 | |
Ending Account Value | | $ | 1,019.06 | | | $ | 1,015.27 | | | $ | 1,017.80 | | | $ | 1,021.17 | | | $ | 1,020.32 | | | $ | 1,019.06 | |
Expenses Incurred During the Period | | $ | 6.21 | | | $ | 10.01 | | | $ | 7.48 | | | $ | 4.08 | | | $ | 4.94 | | | $ | 6.21 | |
For each class of the Fund, expenses are equal to the Fund’s annualized net expense ratio of 1.22%, 1.97%, 1.47%, 0.80%, 0.97% and 1.22% for Classes A, C, R3, R6, I and T respectively, multiplied by the average account value over the period, multiplied by 184/365 (to reflect the one-half year period).
Expense Examples (continued)
Nuveen Real Asset Income Fund
| | | | | | | | | | | | | | | | | | | | |
| | | Share Class | |
| | | Class A | | | Class C | | | Class R6 | | | Class I | | | Class T* | |
Actual Performance | | | | | | | | | | | | | | | | | | | | |
Beginning Account Value | | $ | 1,000.00 | | | $ | 1,000.00 | | | $ | 1,000.00 | | | $ | 1,000.00 | | | $ | 1,000.00 | |
Ending Account Value | | $ | 1,036.90 | | | $ | 1,033.10 | | | $ | 1,039.00 | | | $ | 1,038.20 | | | $ | 1,036.90 | |
Expenses Incurred During the Period | | $ | 5.85 | | | $ | 9.69 | | | $ | 4.16 | | | $ | 4.62 | | | $ | 5.96 | |
Hypothetical Performance (5% annualized return before expenses) | | | | | | | | | | | | | | | | | | | | |
Beginning Account Value | | $ | 1,000.00 | | | $ | 1,000.00 | | | $ | 1,000.00 | | | $ | 1,000.00 | | | $ | 1,000.00 | |
Ending Account Value | | $ | 1,019.46 | | | $ | 1,015.68 | | | $ | 1,021.12 | | | $ | 1,020.67 | | | $ | 1,019.36 | |
Expenses Incurred During the Period | | $ | 5.80 | | | $ | 9.60 | | | $ | 4.13 | | | $ | 4.58 | | | $ | 5.90 | |
For each class of the Fund, expenses are equal to the Fund’s annualized net expense ratio of 1.14%, 1.89%, 0.81%, 0.90% and 1.16% for Classes A, C, R6, I and T respectively, multiplied by the average account value over the period, multiplied by 184/365 (to reflect the one-half year period).
Nuveen Real Estate Securities Fund
| | | | | | | | | | | | | | | | | | | | | | | | |
| | | Share Class | |
| | | Class A | | | Class C | | | Class R3 | | | Class R6 | | | Class I | | | Class T* | |
Actual Performance | | | | | | | | | | | | | | | | | | | | | | | | |
Beginning Account Value | | $ | 1,000.00 | | | $ | 1,000.00 | | | $ | 1,000.00 | | | $ | 1,000.00 | | | $ | 1,000.00 | | | $ | 1,000.00 | |
Ending Account Value | | $ | 1,027.80 | | | $ | 1,023.90 | | | $ | 1,026.30 | | | $ | 1,029.70 | | | $ | 1,028.40 | | | $ | 1,027.60 | |
Expenses Incurred During the Period | | $ | 6.44 | | | $ | 10.25 | | | $ | 7.71 | | | $ | 4.50 | | | $ | 5.21 | | | $ | 6.54 | |
Hypothetical Performance (5% annualized return before expenses) | | | | | | | | | | | | | | | | | | | | | | | | |
Beginning Account Value | | $ | 1,000.00 | | | $ | 1,000.00 | | | $ | 1,000.00 | | | $ | 1,000.00 | | | $ | 1,000.00 | | | $ | 1,000.00 | |
Ending Account Value | | $ | 1,018.85 | | | $ | 1,015.07 | | | $ | 1,017.59 | | | $ | 1,020.77 | | | $ | 1,020.06 | | | $ | 1,018.75 | |
Expenses Incurred During the Period | | $ | 6.41 | | | $ | 10.21 | | | $ | 7.68 | | | $ | 4.48 | | | $ | 5.19 | | | $ | 6.51 | |
For each class of the Fund, expenses are equal to the Fund’s annualized net expense ratio of 1.26%, 2.01%, 1.51%, 0.88%, 1.02% and 1.28% for Classes A, C, R3, R6, I and T respectively, multiplied by the average account value over the period, multiplied by 184/365 (to reflect the one-half year period).
| * | Class T Shares are not available for public offering. |
Report of
Independent Registered Public Accounting Firm
To the Board of Directors of Nuveen Investment Funds, Inc. and Shareholders of Nuveen Global Infrastructure Fund, Nuveen Real Asset Income Fund and Nuveen Real Estate Securities Fund
Opinion on the Financial Statements
We have audited the accompanying statements of assets and liabilities, including the portfolios of investments, of Nuveen Global Infrastructure Fund, Nuveen Real Asset Income Fund and Nuveen Real Estate Securities Fund (three of the Funds constituting Nuveen Investment Funds, Inc., referred to hereafter as the “Funds”) as of December 31, 2017, the related statements of operations for the year ended December 31, 2017, the statements of changes in net assets for each of the two years in the period ended December 31, 2017, including the related notes, and the financial highlights for each of the periods indicated therein (collectively referred to as the “financial statements”). In our opinion, the financial statements present fairly, in all material respects, the financial position of the Funds as of December 31, 2017, the results of each of their operations for the year then ended, the changes in each of their net assets for each of the two years in the period ended December 31, 2017 and the financial highlights for each of the periods indicated therein in conformity with accounting principles generally accepted in the United States of America.
Basis for Opinion
These financial statements are the responsibility of the Funds’ management. Our responsibility is to express an opinion on the Funds’ financial statements based on our audits. We are a public accounting firm registered with the Public Company Accounting Oversight Board (United States) (“PCAOB”) and are required to be independent with respect to the Funds in accordance with the U.S. federal securities laws and the applicable rules and regulations of the Securities and Exchange Commission and the PCAOB.
We conducted our audits of these financial statements in accordance with the standards of the PCAOB. Those standards require that we plan and perform the audits to obtain reasonable assurance about whether the financial statements are free of material misstatement, whether due to error or fraud.
Our audits included performing procedures to assess the risks of material misstatement of the financial statements, whether due to error or fraud, and performing procedures that respond to those risks. Such procedures included examining, on a test basis, evidence regarding the amounts and disclosures in the financial statements. Our audits also included evaluating the accounting principles used and significant estimates made by management, as well as evaluating the overall presentation of the financial statements. Our procedures included confirmation of securities owned as of December 31, 2017 by correspondence with the custodian and brokers; when replies were not received from brokers, we performed other auditing procedures. We believe that our audits provide a reasonable basis for our opinion.
PricewaterhouseCoopers LLP
Chicago, Illinois
February 27, 2018
We have served as the auditor of one or more investment companies in Nuveen Funds since 2002.
Nuveen Global Infrastructure Fund
| | |
| Portfolio of Investments | | December 31, 2017 |
| | | | | | | | | | | | | | | | |
| Shares | | | Description (1) | | | | | | | | Value | |
| | | | |
| | | | LONG-TERM INVESTMENTS – 97.9% | | | | | | | | | | | | |
| | | | |
| | | | COMMON STOCKS – 92.7% | | | | | | | | | | | | |
| | | | |
| | | | Air Freight & Logistics – 0.2% | | | | | | | | | |
| | | | |
| | 26,672 | | | Oesterreichische Post AG, (2) | | | | | | | | | | $ | 1,198,069 | |
| | | | |
| | | | Commercial Services & Supplies – 4.5% | | | | | | | | | |
| | | | |
| | 75,151 | | | Advanced Disposal Services, Inc., (3) | | | | | | | | | | | 1,799,115 | |
| | | | |
| | 2,974,478 | | | China Everbright International Limited, (2) | | | | | | | | | | | 4,243,523 | |
| | | | |
| | 46,154 | | | Republic Services, Inc. | | | | | | | | | | | 3,120,472 | |
| | | | |
| | 255,017 | | | Waste Connections Inc. | | | | | | | | | | | 18,090,906 | |
| | | | |
| | 2,287 | | | Waste Management, Inc. | | | | | | | | | | | 197,368 | |
| | | | Total Commercial Services & Supplies | | | | | | | | | | | 27,451,384 | |
| | | | |
| | | | Construction & Engineering – 6.1% | | | | | | | | | |
| | | | |
| | 93,321 | | | Eiffage SA, (2) | | | | | | | | | | | 10,213,187 | |
| | | | |
| | 227,219 | | | Ferrovial SA, (2) | | | | | | | | | | | 5,156,312 | |
| | | | |
| | 211,286 | | | Vinci S.A, (2) | | | | | | | | | | | 21,570,518 | |
| | | | Total Construction & Engineering | | | | | | | | | | | 36,940,017 | |
| | | | |
| | | | Diversified Telecommunication Services – 1.9% | | | | | | | | | |
| | | | |
| | 456,808 | | | Bharti Infratel Limited, (2) | | | | | | | | | | | 2,706,275 | |
| | | | |
| | 66,672 | | | Cellnex Telecom S.A.U, (2), (3) | | | | | | | | | | | 1,705,830 | |
| | | | |
| | 505,552 | | | Infrastrutture Wireless Italiane SpA, (2) | | | | | | | | | | | 3,753,797 | |
| | | | |
| | 4,404,759 | | | Netlink NBN Trust, (3) | | | | | | | | | | | 2,749,990 | |
| | | | |
| | 1,189,306 | | | Tower Bersama Infrastructure Tbk PT, (2) | | | | | | | | | | | 561,970 | |
| | | | Total Diversified Telecommunication Services | | | | | | | | | | | 11,477,862 | |
| | | | |
| | | | Electric Utilities – 15.8% | | | | | | | | | |
| | | | |
| | 26,773 | | | Alliant Energy Corporation | | | | | | | | | | | 1,140,798 | |
| | | | |
| | 135,098 | | | Alupar Investimento SA, (2) | | | | | | | | | | | 751,367 | |
| | | | |
| | 99,670 | | | American Electric Power Company, Inc. | | | | | | | | | | | 7,332,722 | |
| | | | |
| | 1,948,135 | | | AusNet Services, (2) | | | | | | | | | | | 2,737,721 | |
| | | | |
| | 835 | | | Avangrid Inc. | | | | | | | | | | | 42,234 | |
| | | | |
| | 64,360 | | | Brookfield Infrastructure Partners LP | | | | | | | | | | | 2,883,972 | |
| | | | |
| | 134,021 | | | Cheung Kong Infrastructure Holdings Limited, (2) | | | | | | | | | | | 1,150,055 | |
| | | | |
| | 105,323 | | | CLP Holdings Limited | | | | | | | | | | | 1,077,785 | |
| | | | |
| | 139,956 | | | Duke Energy Corporation | | | | | | | | | | | 11,771,699 | |
| | | | |
| | 64,619 | | | Edison International | | | | | | | | | | | 4,086,506 | |
| | | | |
| | 8,499 | | | Elia System Operator SA NV | | | | | | | | | | | 488,461 | |
| | | | |
| | 44,373 | | | Emera Incorporated | | | | | | | | | | | 1,658,428 | |
| | | | |
| | 99,137 | | | Enersis Chile SA | | | | | | | | | | | 563,098 | |
| | | | | | | | | | | | | | | | |
| Shares | | | Description (1) | | | | | | | | Value | |
| | | | |
| | | | Electric Utilities (continued) | | | | | | | | | |
| | | | |
| | 78,313 | | | Eversource Energy | | | | | | | | | | $ | 4,947,815 | |
| | | | |
| | 2,219 | | | Great Plains Energy Incorporated | | | | | | | | | | | 71,541 | |
| | | | |
| | 1,205,061 | | | Iberdrola SA, (2) | | | | | | | | | | | 9,328,718 | |
| | | | |
| | 785,281 | | | Infratil Limited, (2) | | | | | | | | | | | 1,845,708 | |
| | | | |
| | 73,724 | | | NextEra Energy Inc. | | | | | | | | | | | 11,514,952 | |
| | | | |
| | 103,419 | | | PG&E Corporation | | | | | | | | | | | 4,636,274 | |
| | | | |
| | 19,207 | | | Pinnacle West Capital Corporation | | | | | | | | | | | 1,636,052 | |
| | | | |
| | 153,091 | | | Power Assets Holdings Limited, (2) | | | | | | | | | | | 1,290,391 | |
| | | | |
| | 1,461,971 | | | Power Grid Corporation of India Limited, (2) | | | | | | | | | | | 4,579,220 | |
| | | | |
| | 257,215 | | | Red Electrica Corporacion SA, (2), (3) | | | | | | | | | | | 5,773,763 | |
| | | | |
| | 26,189 | | | Scottish and Southern Energy PLC, (2) | | | | | | | | | | | 465,583 | |
| | | | |
| | 52,817 | | | Southern Company | | | | | | | | | | | 2,539,970 | |
| | | | |
| | 3,522,329 | | | Spark Infrastructure Group, (2) | | | | | | | | | | | 6,885,397 | |
| | | | |
| | 184,316 | | | Terna-Rete Elettrica Nazionale SpA, (2) | | | | | | | | | | | 1,071,440 | |
| | | | |
| | 239,045 | | | Transmissora Alianca de Energia Eletrica SA | | | | | | | | | | | 1,537,855 | |
| | | | |
| | 55,769 | | | Xcel Energy, Inc. | | | | | | | | | | | 2,683,047 | |
| | | | Total Electric Utilities | | | | | | | | | | | 96,492,572 | |
| | | | |
| | | | Gas Utilities – 3.2% | | | | | | | | | |
| | | | |
| | 431,981 | | | APA Group, (2) | | | | | | | | | | | 2,801,165 | |
| | | | |
| | 9,426 | | | Chesapeake Utilities Corporation | | | | | | | | | | | 740,412 | |
| | | | |
| | 1,435,471 | | | China Resources Gas Group Limited, (2) | | | | | | | | | | | 5,195,803 | |
| | | | |
| | 446,884 | | | ENN Energy Holdings Limited, (2) | | | | | | | | | | | 3,178,445 | |
| | | | |
| | 150,370 | | | Gas Natural SDG S.A, (2) | | | | | | | | | | | 3,470,308 | |
| | | | |
| | 824,791 | | | Hong Kong and China Gas Company Limited, (2) | | | | | | | | | | | 1,615,181 | |
| | | | |
| | 210,788 | | | Infraestructura Energitca Nova SAB de CV | | | | | | | | | | | 1,031,293 | |
| | | | |
| | 8,959 | | | National Fuel Gas Company | | | | | | | | | | | 491,939 | |
| | | | |
| | 13,486 | | | One Gas Inc. | | | | | | | | | | | 987,984 | |
| | | | Total Gas Utilities | | | | | | | | | | | 19,512,530 | |
| | | | |
| | | | Independent Power & Renewable Electricity Producers – 0.3% | | | | | | | | | |
| | | | |
| | 56,187 | | | Brookfield Renewable Energy Partners LP | | | | | | | | | | | 1,958,276 | |
| | | | |
| | | | Media – 0.0% | | | | | | | | | |
| | | | |
| | 41 | | | Eutelsat Communications, (2) | | | | | | | | | | | 949 | |
| | | | |
| | | | Multi-Utilities – 10.0% | | | | | | | | | |
| | | | |
| | 142,171 | | | Ameren Corporation | | | | | | | | | | | 8,386,667 | |
| | | | |
| | 206,756 | | | CMS Energy Corporation | | | | | | | | | | | 9,779,559 | |
| | | | |
| | 38,890 | | | Dominion Resources, Inc. | | | | | | | | | | | 3,152,423 | |
| | | | |
| | 48,471 | | | DTE Energy Company | | | | | | | | | | | 5,305,636 | |
| | | | |
| | 126,820 | | | Engie, (2) | | | | | | | | | | | 2,180,226 | |
| | | | |
| | 573,813 | | | Hera SpA, (2) | | | | | | | | | | | 2,002,535 | |
Nuveen Global Infrastructure Fund (continued)
| | |
| Portfolio of Investments | | December 31, 2017 |
| | | | | | | | | | | | | | | | |
| Shares | | | Description (1) | | | | | | | | Value | |
| | | | |
| | | | Multi-Utilities (continued) | | | | | | | | | |
| | | | |
| | 32,348 | | | Innogy SE, (2) | | | | | | | | | | $ | 1,265,993 | |
| | | | |
| | 70,262 | | | National Grid PLC, ADR | | | | | | | | | | | 4,132,108 | |
| | | | |
| | 261,874 | | | NiSource Inc. | | | | | | | | | | | 6,722,306 | |
| | | | |
| | 684,326 | | | Suez Environment Company, (2) | | | | | | | | | | | 12,021,978 | |
| | | | |
| | 30,823 | | | Unitil Corp. | | | | | | | | | | | 1,406,145 | |
| | | | |
| | 68,493 | | | WEC Energy Group, Inc. | | | | | | | | | | | 4,549,990 | |
| | | | Total Multi-Utilities | | | | | | | | | | | 60,905,566 | |
| | | | |
| | | | Oil, Gas & Consumable Fuels – 17.4% | | | | | | | | | |
| | | | |
| | 75,957 | | | Cheniere Energy Inc., (3) | | | | | | | | | | | 4,089,525 | |
| | | | |
| | 76,884 | | | Enagas, (2) | | | | | | | | | | | 2,198,838 | |
| | | | |
| | 546,156 | | | Enbridge Inc. | | | | | | | | | | | 21,360,161 | |
| | | | |
| | 248,503 | | | Enterprise Products Partnership LP | | | | | | | | | | | 6,587,815 | |
| | | | |
| | 178,003 | | | Keyera Corporation | | | | | | | | | | | 5,015,804 | |
| | | | |
| | 611,466 | | | Kinder Morgan, Inc. | | | | | | | | | | | 11,049,191 | |
| | | | |
| | 1,413 | | | Koninklijke Vopak NV, (2) | | | | | | | | | | | 61,895 | |
| | | | |
| | 99,172 | | | Magellan Midstream Partners LP | | | | | | | | | | | 7,035,262 | |
| | | | |
| | 70,170 | | | ONEOK, Inc. | | | | | | | | | | | 3,750,586 | |
| | | | |
| | 145,370 | | | Pembina Pipeline Corporation | | | | | | | | | | | 5,263,157 | |
| | | | |
| | 436,805 | | | Petronet LNG Ltd, (2) | | | | | | | | | | | 1,735,857 | |
| | | | |
| | 364,209 | | | Snam Rete Gas S.p.A, (2) | | | | | | | | | | | 1,783,706 | |
| | | | |
| | 66,723 | | | Targa Resources Corporation | | | | | | | | | | | 3,230,728 | |
| | | | |
| | 209,279 | | | TransCanada Corporation | | | | | | | | | | | 10,179,331 | |
| | | | |
| | 248,417 | | | TransCanada Corporation | | | | | | | | | | | 12,090,813 | |
| | | | |
| | 340,947 | | | Williams Companies Inc. | | | | | | | | | | | 10,395,474 | |
| | | | Total Oil, Gas & Consumable Fuels | | | | | | | | | | | 105,828,143 | |
| | | | |
| | | | Road & Rail – 2.9% | | | | | | | | | |
| | | | |
| | 689,279 | | | Aurizon Holdings Limited, (2) | | | | | | | | | | | 2,655,966 | |
| | | | |
| | 22,869 | | | Central Japan Railway Company, (2), (WI/DD) | | | | | | | | | | | 4,092,649 | |
| | | | |
| | 2,491,266 | | | ComfortDelGro Corporation, (2) | | | | | | | | | | | 3,680,824 | |
| | | | |
| | 38,635 | | | East Japan Railway Company, (2) | | | | | | | | | | | 3,767,616 | |
| | | | |
| | 979,045 | | | Mexico Transportes SAB de CV, (3) | | | | | | | | | | | 1,476,348 | |
| | | | |
| | 114,048 | | | MTR Corporation, (2) | | | | | | | | | | | 667,537 | |
| | | | |
| | 231,506 | | | Rumo SA, (2), (3) | | | | | | | | | | | 905,614 | |
| | | | |
| | 5,350 | | | Union Pacific Corporation | | | | | | | | | | | 717,435 | |
| | | | Total Road & Rail | | | | | | | | | | | 17,963,989 | |
| | | | |
| | | | Transportation Infrastructure – 28.5% | | | | | | | | | |
| | | | |
| | 507,266 | | | Abertis Infraestructuras S.A, (2) | | | | | | | | | | | 11,286,495 | |
| | | | |
| | 65,529 | | | Aena S.A, (2), (3) | | | | | | | | | | | 13,261,701 | |
| | | | |
| | 50,116 | | | Aeroports de Paris, (2) | | | | | | | | | | | 9,529,494 | |
| | | | | | | | | | | | | | | | |
| Shares | | | Description (1) | | | | | | | | Value | |
| | | | |
| | | | Transportation Infrastructure (continued) | | | | | | | | | |
| | | | |
| | 667,753 | | | Atlantia SpA, (2) | | | | | | | | | | $ | 21,051,834 | |
| | | | |
| | 1,988,136 | | | Auckland International Airport Limited, (2) | | | | | | | | | | | 9,126,096 | |
| | | | |
| | 721,169 | | | CCR SA, (2) | | | | | | | | | | | 3,512,571 | |
| | | | |
| | 1,631,074 | | | China Merchants Holdings International Company Limited, (2) | | | | | | | | | | | 4,260,265 | |
| | | | |
| | 1,359,378 | | | Cosco Shipping Ports Limited | | | | | | | | | | | 1,414,560 | |
| | | | |
| | 203,218 | | | Enav S.p.A, (2) | | | | | | | | | | | 1,099,720 | |
| | | | |
| | 91,439 | | | Flughafen Wien AG | | | | | | | | | | | 3,691,843 | |
| | | | |
| | 45,605 | | | Flughafen Zuerich AG, (2) | | | | | | | | | | | 10,423,784 | |
| | | | |
| | 63,285 | | | Fraport AG, (2) | | | | | | | | | | | 6,951,141 | |
| | | | |
| | 117,037 | | | Groupe Eurotunnel SA | | | | | | | | | | | 1,505,375 | |
| | | | |
| | 69,488 | | | Grupo Aeroportuario Centro Norte, SA, ADR | | | | | | | | | | | 2,882,362 | |
| | | | |
| | 45,596 | | | Grupo Aeroportuario del Pacifico S.A.B. de CV, ADR | | | | | | | | | | | 4,685,445 | |
| | | | |
| | 5,621 | | | Grupo Aeroportuario del Sureste SA de CV | | | | | | | | | | | 1,025,889 | |
| | | | |
| | 35,580 | | | Hamburger Hafen und Logistik AG, (2) | | | | | | | | | | | 1,008,341 | |
| | | | |
| | 159,759 | | | Hopewell Highway Infrastructure Limited, (2) | | | | | | | | | | | 101,680 | |
| | | | |
| | 2,593,819 | | | Hutchison Port Holdings Trust, (2) | | | | | | | | | | | 1,073,820 | |
| | | | |
| | 61,041 | | | Japan Airport Terminal Company, (2) | | | | | | | | | | | 2,259,958 | |
| | | | |
| | 100,849 | | | Kamigumi Company Limited, (2) | | | | | | | | | | | 2,228,696 | |
| | | | |
| | 963,410 | | | Macquarie Atlas Roads Group, (2) | | | | | | | | | | | 4,710,671 | |
| | | | |
| | 20,868 | | | Macquarie Infrastructure Corporation | | | | | | | | | | | 1,339,726 | |
| | | | |
| | 896,751 | | | Port of Tauranga Limited | | | | | | | | | | | 3,139,506 | |
| | | | |
| | 119,941 | | | Promotora y Operadora de Infraestructura SAB de CV (Pinfra) | | | | | | | | | | | 1,185,045 | |
| | | | |
| | 90,770 | | | Promotora y Operadora de Infraestructura SAB de CV (Pinfra) | | | | | | | | | | | 669,378 | |
| | | | |
| | 119,734 | | | Singapore Airport Terminal Services Limited | | | | | | | | | | | 465,525 | |
| | | | |
| | 39,896 | | | Societa Iniziative Autostradali e Servizi SpA | | | | | | | | | | | 742,930 | |
| | | | |
| | 2,379,594 | | | Sydney Airport, (2) | | | | | | | | | | | 13,057,110 | |
| | | | |
| | 3,507,475 | | | Transurban Group, (2) | | | | | | | | | | | 33,945,507 | |
| | | | |
| | 87,310 | | | Westshore Terminals Investment Corporation | | | | | | | | | | | 1,826,078 | |
| | | | Total Transportation Infrastructure | | | | | | | | | | | 173,462,546 | |
| | | | |
| | | | Water Utilities – 1.7% | | | | | | | | | |
| | | | |
| | 1,960,921 | | | Aguas Andinas SA. Class A | | | | | | | | | | | 1,287,312 | |
| | | | |
| | 3,322,931 | | | Beijing Enterprises Water Group, (2) | | | | | | | | | | | 2,567,133 | |
| | | | |
| | 1,756,709 | | | China Everbright Water Limited | | | | | | | | | | | 571,362 | |
| | | | |
| | 46,886 | | | Cia de Saneamento do Parana, (3) | | | | | | | | | | | 846,665 | |
| | | | |
| | 2,392 | | | Connecticut Water Service, Inc. | | | | | | | | | | | 137,325 | |
| | | | |
| | 8,318 | | | Evoqua Water Technologies Co, (3) | | | | | | | | | | | 197,220 | |
| | | | |
| | 2,073,501 | | | Guangdong Investment Limited, (2) | | | | | | | | | | | 2,772,277 | |
| | | | |
| | 9,942 | | | Pennon Group PLC, (2) | | | | | | | | | | | 104,960 | |
| | | | |
| | 63,828 | | | Severn Trent PLC, (2) | | | | | | | | | | | 1,859,858 | |
| | | | |
| | 25,316 | | | United Utilities PLC | | | | | | | | | | | 283,527 | |
| | | | Total Water Utilities | | | | | | | | | | | 10,627,639 | |
Nuveen Global Infrastructure Fund (continued)
| | |
| Portfolio of Investments | | December 31, 2017 |
| | | | | | | | | | | | | | | | | | | | |
| Shares | | | Description (1) | | | | | | | | | | | Value | |
| | | | | |
| | | | Wireless Telecommunication Services – 0.2% | | | | | | | | | | | | |
| | | | | |
| | 5,095,083 | | | Sarana Menara Nusantara Tbk PT | | | | | | | | | | | | | | $ | 1,502,144 | |
| | | | Total Common Stocks (cost $462,278,287) | | | | | | | | | | | | | | | 565,321,686 | |
| | | | | |
| Shares | | | Description (1) | | | | | | | | | | | Value | |
| | | | | |
| | | | REAL ESTATE INVESTMENT TRUST COMMON STOCKS – 4.3% | | | | | | | | | | | | | | | | |
| | | | | |
| | | | Health Care – 0.5% | | | | | | | | | | | | |
| | | | | |
| | 1,415,111 | | | Parkway Life Real Estate Investment Trust | | | | | | | | | | | | | | $ | 3,163,619 | |
| | | | | |
| | | | Specialized – 3.8% | | | | | | | | | | | | |
| | | | | |
| | 107,639 | | | American Tower Corporation, REIT | | | | | | | | | | | | | | | 15,356,856 | |
| | | | | |
| | 13,593 | | | CyrusOne Inc. | | | | | | | | | | | | | | | 809,191 | |
| | | | | |
| | 24,412 | | | Digital Realty Trust Inc. | | | | | | | | | | | | | | | 2,780,527 | |
| | | | | |
| | 2,777 | | | Equinix Inc. | | | | | | | | | | | | | | | 1,258,592 | |
| | | | | |
| | 195,670 | | | Keppel DC REIT | | | | | | | | | | | | | | | 209,210 | |
| | | | | |
| | 15,831 | | | SBA Communications Corporation, (3) | | | | | | | | | | | | | | | 2,586,152 | |
| | | | Total Specialized | | | | | | | | | | | | | | | 23,000,528 | |
| | | | Total Real Estate Investment Trust Common Stocks (cost $23,690,259) | | | | | | | | | | | | | | | 26,164,147 | |
| | | | | |
| Shares | | | Description (1), (4) | | | | | | | | | | | Value | |
| | | | | |
| | | | INVESTMENT COMPANIES – 0.9% | | | | | | | | | | | | |
| | | | | |
| | 511,811 | | | 3I Infrastructure PLC | | | | | | | | | | | | | | $ | 1,437,326 | |
| | | | | |
| | 464,012 | | | John Laing Infrastructure Fund | | | | | | | | | | | | | | | 771,831 | |
| | | | | |
| | 7,051,847 | | | Keppel Infrastructure Trust | | | | | | | | | | | | | | | 3,031,748 | |
| | | | Total Investment Companies (cost $4,519,104) | | | | | | | | | | | | | | | 5,240,905 | |
| | | | Total Long-Term Investments (cost $490,487,650) | | | | | | | | | | | | | | | 596,726,738 | |
| | | | | |
Principal
Amount (000) | | | Description (1) | | Coupon | | | Maturity | | | | | | Value | |
| | | | | |
| | | | SHORT-TERM INVESTMENTS – 1.5% | | | | | | | | | | | | | | | | |
| | | | | |
| | | | REPURCHASE AGREEMENTS – 1.5% | | | | | | | | | | | | |
| | | | | |
| $ | 9,361 | | | Repurchase Agreement with Fixed Income Clearing Corporation, dated 12/29/17, repurchase price $9,361,110, collateralized by $9,100,000 U.S. Treasury Inflation Indexed Obligations, 0.125%, due 4/15/19, value $9,552,088 | | | 0.540% | | | | 1/02/18 | | | | | | | $ | 9,360,548 | |
| | | | Total Short-Term Investments (cost $9,360,548) | | | | | | | | | | | | | | | 9,360,548 | |
| | | | Total Investments (cost $499,848,198) – 99.4% | | | | | | | | | | | | | | | 606,087,286 | |
| | | | Other Assets Less Liabilities – 0.6% | | | | | | | | | | | | | | | 3,516,702 | |
| | | | Net Assets – 100% | | | | | | | | | | | | | | $ | 609,603,988 | |
For Fund portfolio compliance purposes, the Fund’s industry classifications refer to any one or more of the industry sub-classifications used by one or more widely recognized market indexes or ratings group indexes, and/or as defined by Fund management. This definition may not apply for purposes of this report, which may combine industry sub-classifications into sectors for reporting ease.
| (1) | All percentages shown in the Portfolio of Investments are based on net assets. |
| (2) | For fair value measurement disclosure purposes, investment classified as Level 2. See Notes to Financial Statements, Note 2 – Investment Valuation and Fair Value Measurements for more information. |
| (3) | Non-income producing; issuer has not declared a dividend within the past twelve months. |
| (4) | A copy of the most recent financial statements for these investment companies can be obtained directly from the Securities and Exchange Commission on its website at http://www.sec.gov. |
| ADR | American Depositary Receipt. |
| REIT | Real Estate Investment Trust |
| WI/DD | Investment, or portion of investment, purchased on a when-issued or delayed delivery basis. |
See accompanying notes to financial statements.
Nuveen Real Asset Income Fund
| | |
| Portfolio of Investments | | December 31, 2017 |
| | | | | | | | | | | | | | | | | | | | |
| Shares | | | Description (1) | | | | | | | | | | | Value | |
| | | | | |
| | | | LONG-TERM INVESTMENTS – 98.4% | | | | | | | | | | | | | | | | |
| | | | | |
| | | | REAL ESTATE INVESTMENT TRUST COMMON STOCKS – 23.2% | | | | | | | | | | | | | | | | |
| | | | | |
| | | | Diversified – 3.4% | | | | | | | | | | | | |
| | | | | |
| | 230,508 | | | AEW UK REIT PLC | | | | | | | | | | | | | | $ | 309,664 | |
| | | | | |
| | 80,730 | | | Armada Hoffler Properties Inc. | | | | | | | | | | | | | | | 1,253,737 | |
| | | | | |
| | 51,197 | | | Cofinimmo, SANV, (2) | | | | | | | | | | | | | | | 6,741,852 | |
| | | | | |
| | 877,449 | | | Dream Global Real Estate Investment Trust | | | | | | | | | | | | | | | 8,530,173 | |
| | | | | |
| | 3,454,222 | | | Fibra Uno Administracion SA | | | | | | | | | | | | | | | 5,110,404 | |
| | | | | |
| | 40,073 | | | Fonciere Des Regions, Reg S, (2) | | | | | | | | | | | | | | | 4,536,681 | |
| | | | | |
| | 407,052 | | | Gramercy Property Trust | | | | | | | | | | | | | | | 10,852,006 | |
| | | | | |
| | 463,766 | | | Growthpoint Properties Australia Limited, (2) | | | | | | | | | | | | | | | 1,231,777 | |
| | | | | |
| | 95,085 | | | ICADE | | | | | | | | | | | | | | | 9,347,203 | |
| | | | | |
| | 125,487 | | | Lexington Corporate Properties Trust | | | | | | | | | | | | | | | 1,210,950 | |
| | | | | |
| | 5,579,218 | | | Mapletree Greater China Commercial Trust | | | | | | | | | | | | | | | 5,130,987 | |
| | | | | |
| | 51,778 | | | NSI NV | | | | | | | | | | | | | | | 2,159,803 | |
| | | | | |
| | 1,871,447 | | | VEREIT, Inc. | | | | | | | | | | | | | | | 14,578,572 | |
| | | | Total Diversified | | | | | | | | | | | | | | | 70,993,809 | |
| | | | | |
| | | | Health Care – 3.6% | | | | | | | | | | | | |
| | | | | |
| | 115,419 | | | Community Healthcare Trust Inc. | | | | | | | | | | | | | | | 3,243,274 | |
| | | | | |
| | 610,749 | | | Health Care Property Investors Inc. | | | | | | | | | | | | | | | 15,928,334 | |
| | | | | |
| | 677,877 | | | MedEquities Realty Trust, Inc. | | | | | | | | | | | | | | | 7,605,780 | |
| | | | | |
| | 516,575 | | | Medical Properties Trust Inc. | | | | | | | | | | | | | | | 7,118,404 | |
| | | | | |
| | 1,597,387 | | | NorthWest Healthcare Properties REIT | | | | | | | | | | | | | | | 14,448,918 | |
| | | | | |
| | 3,577,667 | | | Parkway Life Real Estate Investment Trust | | | | | | | | | | | | | | | 7,998,224 | |
| | | | | |
| | 309,728 | | | Physicians Realty Trust | | | | | | | | | | | | | | | 5,572,007 | |
| | | | | |
| | 45,116 | | | Sabra Health Care Real Estate Investment Trust Inc. | | | | | | | | | | | | | | | 846,827 | |
| | | | | |
| | 123,346 | | | Ventas Inc. | | | | | | | | | | | | | | | 7,401,993 | |
| | | | | |
| | 83,471 | | | Welltower Inc. | | | | | | | | | | | | | | | 5,322,946 | |
| | | | Total Health Care | | | | | | | | | | | | | | | 75,486,707 | |
| | | | | |
| | | | Hotels & Resorts – 2.6% | | | | | | | | | | | | |
| | | | | |
| | 990,912 | | | American Hotel Income Properties REIT LP | | | | | | | | | | | | | | | 7,362,862 | |
| | | | | |
| | 10,143,610 | | | Concentradora Fibra Hotelera Mexicana SA de CV, 144A | | | | | | | | | | | | | | | 5,968,802 | |
| | | | | |
| | 81,293 | | | Hersha Hospitality Trust | | | | | | | | | | | | | | | 1,414,498 | |
| | | | | |
| | 3,103 | | | Invincible Investment Corporation | | | | | | | | | | | | | | | 1,320,513 | |
| | | | | |
| | 393,126 | | | LaSalle Hotel Properties | | | | | | | | | | | | | | | 11,035,047 | |
| | | | | |
| | 630,767 | | | MGM Growth Properties LLC | | | | | | | | | | | | | | | 18,386,858 | |
| | | | | |
| | 236,526 | | | Park Hotels & Resorts, Inc. | | | | | | | | | | | | | | | 6,800,123 | |
| | | | | |
| | 22,895 | | | RLJ Lodging Trust | | | | | | | | | | | | | | | 503,003 | |
| | | | | | | | | | | | | | | | | | | | |
| Shares | | | Description (1) | | | | | | | | | | | Value | |
| | | | | |
| | | | Hotels & Resorts (continued) | | | | | | | | | | | | |
| | | | | |
| | 75,409 | | | Sunstone Hotel Investors Inc. | | | | | | | | | | | | | | $ | 1,246,511 | |
| | | | Total Hotels & Resorts | | | | | | | | | | | | | | | 54,038,217 | |
| | | | | |
| | | | Industrial – 6.0% | | | | | | | | | | | | |
| | | | | |
| | 1,286,005 | | | Ascendas Real Estate Investment Trust, (2) | | | | | | | | | | | | | | | 2,610,011 | |
| | | | | |
| | 13,572 | | | Centuria Industrial REIT | | | | | | | | | | | | | | | 26,951 | |
| | | | | |
| | 604,670 | | | Dream Industrial Real Estate Investment Trust | | | | | | | | | | | | | | | 4,233,171 | |
| | | | | |
| | 59,336 | | | Duke Realty Corporation | | | | | | | | | | | | | | | 1,614,533 | |
| | | | | |
| | 15,882,310 | | | Frasers Logistics & Industrial Trust | | | | | | | | | | | | | | | 13,775,076 | |
| | | | | |
| | 5,771,838 | | | Mapletree Industrial Trust | | | | | | | | | | | | | | | 8,760,575 | |
| | | | | |
| | 22,769,020 | | | Mapletree Logistics Trust | | | | | | | | | | | | | | | 22,471,947 | |
| | | | | |
| | 2,470,537 | | | Nexus Real Estate Investment Trust | | | | | | | | | | | | | | | 3,970,155 | |
| | | | | |
| | 390,637 | | | Prologis Property Mexico SA de CV | | | | | | | | | | | | | | | 675,283 | |
| | | | | |
| | 3,172,495 | | | Propertylink Group | | | | | | | | | | | | | | | 2,475,340 | |
| | | | | |
| | 771,421 | | | Pure Industrial Real Estate Trust | | | | | | | | | | | | | | | 4,154,750 | |
| | | | | |
| | 910,455 | | | STAG Industrial Inc. | | | | | | | | | | | | | | | 24,882,735 | |
| | | | | |
| | 2,630,805 | | | Summit Industrial Income REIT | | | | | | | | | | | | | | | 15,382,989 | |
| | | | | |
| | 6,491,833 | | | TF Administradora Industrial S de RL de CV | | | | | | | | | | | | | | | 9,842,164 | |
| | | | | |
| | 872,876 | | | WPT Industrial Real Estate Investment Trust | | | | | | | | | | | | | | | 11,102,983 | |
| | | | Total Industrial | | | | | | | | | | | | | | | 125,978,663 | |
| | | | | |
| | | | Mortgage – 2.3% | | | | | | | | | | | | |
| | | | | |
| | 39,254 | | | Apollo Commercial Real Estate Finance, Inc. | | | | | | | | | | | | | | | 724,236 | |
| | | | | |
| | 109,936 | | | Ares Commercial Real Estate Corporation | | | | | | | | | | | | | | | 1,418,174 | |
| | | | | |
| | 325,846 | | | Blackstone Mortgage Trust Inc., Class A | | | | | | | | | | | | | | | 10,485,724 | |
| | | | | |
| | 246,668 | | | Granite Point Mortgage Trust Inc. | | | | | | | | | | | | | | | 4,375,890 | |
| | | | | |
| | 511,427 | | | KKR Real Estate Finance Trust, Inc. | | | | | | | | | | | | | | | 10,233,654 | |
| | | | | |
| | 526,801 | | | Starwood Property Trust Inc. | | | | | | | | | | | | | | | 11,247,201 | |
| | | | | |
| | 472,857 | | | TPG Re Finance Trust Inc. | | | | | | | | | | | | | | | 9,007,926 | |
| | | | Total Mortgage | | | | | | | | | | | | | | | 47,492,805 | |
| | | | | |
| | | | Office – 0.9% | | | | | | | | | | | | |
| | | | | |
| | 1,289,729 | | | Centuria Metropolitan REIT | | | | | | | | | | | | | | | 2,405,084 | |
| | | | | |
| | 881,339 | | | City Office REIT, Inc. | | | | | | | | | | | | | | | 11,466,220 | |
| | | | | |
| | 314,123 | | | Piedmont Office Realty Trust | | | | | | | | | | | | | | | 6,159,952 | |
| | | | Total Office | | | | | | | | | | | | | | | 20,031,256 | |
| | | | | |
| | | | Residential – 0.7% | | | | | | | | | | | | |
| | | | | |
| | 3,466,508 | | | Empiric Student Property PLC | | | | | | | | | | | | | | | 4,340,986 | |
| | | | | |
| | 227,833 | | | Independence Realty Trust | | | | | | | | | | | | | | | 2,298,835 | |
| | | | | |
| | 753,581 | | | Killam Apartment Real Estate I | | | | | | | | | | | | | | | 8,524,998 | |
| | | | Total Residential | | | | | | | | | | | | | | | 15,164,819 | |
Nuveen Real Asset Income Fund (continued)
| | |
| Portfolio of Investments | | December 31, 2017 |
| | | | | | | | | | | | | | | | | | | | |
| Shares | | | Description (1) | | | | | | | | | | | Value | |
| | | | | |
| | | | Retail – 2.7% | | | | | | | | | | | | |
| | | | | |
| | 501,564 | | | Brixmor Property Group Inc. | | | | | | | | | | | | | | $ | 9,359,184 | |
| | | | | |
| | 412,047 | | | Charter Hall Retail REIT, (2) | | | | | | | | | | | | | | | 1,335,417 | |
| | | | | |
| | 89,615 | | | Choice Properties Real Estate Investment Trust | | | | | | | | | | | | | | | 951,758 | |
| | | | | |
| | 110,720 | | | DDR Corp. | | | | | | | | | | | | | | | 992,051 | |
| | | | | |
| | 50,042 | | | Eurocommercial Properties NV | | | | | | | | | | | | | | | 2,180,156 | |
| | | | | |
| | 8,072,831 | | | Fortune REIT | | | | | | | | | | | | | | | 9,981,447 | |
| | | | | |
| | 4,881,729 | | | Frasers Centrepoint Trust | | | | | | | | | | | | | | | 8,176,061 | |
| | | | | |
| | 11,288,830 | | | IGB Real Estate Investment Trust | | | | | | | | | | | | | | | 5,020,976 | |
| | | | | |
| | 646,803 | | | Immobiliare Grande Distribuzione SIIQ SpA | | | | | | | | | | | | | | | 748,128 | |
| | | | | |
| | 18,466 | | | Kimco Realty Corporation | | | | | | | | | | | | | | | 335,158 | |
| | | | | |
| | 6,085,793 | �� | | Mapletree Commercial Trust | | | | | | | | | | | | | | | 7,371,479 | |
| | | | | |
| | 90,141 | | | Mercialys, (2) | | | | | | | | | | | | | | | 1,993,314 | |
| | | | | |
| | 531,793 | | | Plaza Retail REIT | | | | | | | | | | | | | | | 1,802,258 | |
| | | | | |
| | 61,856 | | | Smart Real Estate Investment Trust | | | | | | | | | | | | | | | 1,521,057 | |
| | | | | |
| | 1,394,556 | | | Viva Energy REIT | | | | | | | | | | | | | | | 2,459,112 | |
| | | | | |
| | 47,856 | | | Wereldhave NV, (2) | | | | | | | | | | | | | | | 2,294,312 | |
| | | | Total Retail | | | | | | | | | | | | | | | 56,521,868 | |
| | | | | |
| | | | Specialized – 1.0% | | | | | | | | | | | | |
| | | | | |
| | 262,422 | | | Automotive Properties Real Estate Investment Trust | | | | | | | | | | | | | | | 2,277,664 | |
| | | | | |
| | 176,989 | | | Gaming and Leisure Properties Inc. | | | | | | | | | | | | | | | 6,548,593 | |
| | | | | |
| | 205,190 | | | Iron Mountain Inc. | | | | | | | | | | | | | | | 7,741,819 | |
| | | | | |
| | 4,258,806 | | | Keppel DC REIT | | | | | | | | | | | | | | | 4,553,511 | |
| | | | | |
| | 254,900 | | | National Storage REIT, (2) | | | | | | | | | | | | | | | 304,675 | |
| | | | Total Specialized | | | | | | | | | | | | | | | 21,426,262 | |
| | | | Total Real Estate Investment Trust Common Stocks (cost $460,732,476) | | | | | | | | 487,134,406 | |
| | | | | |
| Shares | | | Description (1) | | Coupon | | | | | | Ratings (3) | | | Value | |
| | | | | |
| | | | $25 PAR (OR SIMILAR) RETAIL PREFERRED – 21.3% | | | | | | | | | | | | | | | | |
| | | | | |
| | | | Electric Utilities – 4.6% | | | | | | | | | | | | |
| | | | | |
| | 39,142 | | | APT Pipelines Limited | | | 6.205% | | | | | | | | N/R | | | $ | 3,058,927 | |
| | | | | |
| | 286,541 | | | Brookfield Infrastructure Partners LP | | | 5.350% | | | | | | | | BBB– | | | | 5,885,830 | |
| | | | | |
| | 272,650 | | | Entergy Arkansas Inc. | | | 4.875% | | | | | | | | A | | | | 6,851,694 | |
| | | | | |
| | 115,398 | | | Entergy Louisiana LLC | | | 4.875% | | | | | | | | A | | | | 2,864,178 | |
| | | | | |
| | 39,573 | | | Entergy New Orleans, LLC | | | 5.500% | | | | | | | | A | | | | 1,011,882 | |
| | | | | |
| | 64,344 | | | Entergy Texas Inc. | | | 5.625% | | | | | | | | A | | | | 1,705,759 | |
| | | | | |
| | 423,412 | | | Georgia Power Company | | | 5.000% | | | | | | | | A– | | | | 10,843,581 | |
| | | | | |
| | 313,473 | | | Integrys Energy Group Inc., (2) | | | 6.000% | | | | | | | | Baa1 | | | | 8,479,445 | |
| | | | | |
| | 463,249 | | | NextEra Energy Inc. | | | 5.250% | | | | | | | | BBB | | | | 11,845,277 | |
| | | | | |
| | 167,125 | | | NextEra Energy Inc. | | | 5.000% | | | | | | | | BBB | | | | 4,171,440 | |
| | | | | |
| | 366,966 | | | PPL Capital Funding, Inc. | | | 5.900% | | | | | | | | BBB | | | | 9,390,660 | |
| | | | | | | | | | | | | | | | | | | | |
| Shares | | | Description (1) | | Coupon | | | | | | Ratings (3) | | | Value | |
| | | | | |
| | | | Electric Utilities (continued) | | | | | | | | | | | | |
| | | | | |
| | 243,423 | | | SCE Trust VI | | | 5.000% | | | | | | | | Baa1 | | | $ | 5,847,020 | |
| | | | | |
| | 443,489 | | | Southern Company | | | 5.250% | | | | | | | | BBB | | | | 11,397,667 | |
| | | | | |
| | 502,679 | | | Southern Company | | | 5.250% | | | | | | | | BBB | | | | 12,793,181 | |
| | | | Total Electric Utilities | | | | | | | | | | | | | | | 96,146,541 | |
| | | | | |
| | | | Equity Real Estate Investment Trusts – 12.7% | | | | | | | | | | | | |
| | | | | |
| | 261,355 | | | American Homes 4 Rent | | | 6.350% | | | | | | | | N/R | | | | 7,001,700 | |
| | | | | |
| | 216,810 | | | American Homes 4 Rent | | | 5.875% | | | | | | | | BB | | | | 5,541,664 | |
| | | | | |
| | 127,975 | | | American Homes 4 Rent | | | 5.500% | | | | | | | | N/R | | | | 3,640,889 | |
| | | | | |
| | 114,874 | | | American Homes 4 Rent | | | 6.500% | | | | | | | | N/R | | | | 3,145,250 | |
| | | | | |
| | 218,878 | | | American Homes 4 Rent | | | 5.875% | | | | | | | | BB | | | | 5,509,159 | |
| | | | | |
| | 330,156 | | | CBL & Associates Properties Inc. | | | 7.375% | | | | | | | | BB– | | | | 7,217,210 | |
| | | | | |
| | 20,177 | | | CBL & Associates Properties Inc. | | | 6.625% | | | | | | | | BB– | | | | 444,903 | |
| | | | | |
| | 66,488 | | | Cedar Shopping Centers Inc., Series A | | | 7.250% | | | | | | | | N/R | | | | 1,679,487 | |
| | | | | |
| | 310,009 | | | Cedar Shopping Centers Inc., Series A | | | 6.500% | | | | | | | | N/R | | | | 7,762,625 | |
| | | | | |
| | 468,181 | | | City Office REIT, Inc. | | | 6.625% | | | | | | | | N/R | | | | 11,788,797 | |
| | | | | |
| | 78,309 | | | Colony Northstar, Inc. | | | 7.500% | | | | | | | | N/R | | | | 1,969,471 | |
| | | | | |
| | 26,774 | | | Colony Northstar, Inc. | | | 7.150% | | | | | | | | N/R | | | | 674,169 | |
| | | | | |
| | 152,858 | | | Colony Northstar, Inc. | | | 7.125% | | | | | | | | N/R | | | | 3,826,036 | |
| | | | | |
| | 334,047 | | | Colony Northstar, Inc. | | | 7.125% | | | | | | | | N/R | | | | 8,354,515 | |
| | | | | |
| | 313,487 | | | DDR Corporation | | | 6.375% | | | | | | | | BB | | | | 8,244,708 | |
| | | | | |
| | 239,264 | | | Digital Realty Trust Inc. | | | 5.250% | | | | | | | | Baa3 | | | | 6,005,526 | |
| | | | | |
| | 271,889 | | | EPR Properties Inc. | | | 5.750% | | | | | | | | Baa3 | | | | 6,805,382 | |
| | | | | |
| | 88,371 | | | Farmland Partners, Inc. | | | 6.000% | | | | | | | | N/R | | | | 2,277,321 | |
| | | | | |
| | 154,694 | | | GGP, Inc. | | | 6.375% | | | | | | | | N/R | | | | 3,904,477 | |
| | | | | |
| | 82,660 | | | Gladstone Commercial Corporation | | | 7.000% | | | | | | | | N/R | | | | 2,140,894 | |
| | | | | |
| | 201,184 | | | Gramercy Property Trust | | | 7.125% | | | | | | | | BB+ | | | | 5,385,696 | |
| | | | | |
| | 165,117 | | | Hersha Hospitality Trust | | | 6.875% | | | | | | | | N/R | | | | 4,136,181 | |
| | | | | |
| | 319,412 | | | Hersha Hospitality Trust | | | 6.500% | | | | | | | | N/R | | | | 7,902,253 | |
| | | | | |
| | 497,089 | | | Hersha Hospitality Trust | | | 6.500% | | | | | | | | N/R | | | | 12,258,215 | |
| | | | | |
| | 391,000 | | | Investors Real Estate Trust | | | 6.625% | | | | | | | | N/R | | | | 10,150,360 | |
| | | | | |
| | 1,966 | | | Kimco Realty Corporation | | | 5.500% | | | | | | | | Baa2 | | | | 49,229 | |
| | | | | |
| | 184,206 | | | Kimco Realty Corporation | | | 5.250% | | | | | | | | Baa2 | | | | 4,594,098 | |
| | | | | |
| | 1,749 | | | Kimco Realty Corporation | | | 5.125% | | | | | | | | Baa2 | | | | 43,270 | |
| | | | | |
| | 7,862 | | | LaSalle Hotel Properties | | | 6.375% | | | | | | | | N/R | | | | 197,336 | |
| | | | | |
| | 271,921 | | | LaSalle Hotel Properties | | | 6.300% | | | | | | | | N/R | | | | 6,999,247 | |
| | | | | |
| | 9,531 | | | Mid-America Apartment Communities Inc. | | | 8.500% | | | | | | | | BBB– | | | | 619,610 | |
| | | | | |
| | 547,117 | | | Monmouth Real Estate Investment Corp | | | 6.125% | | | | | | | | N/R | | | | 13,699,810 | |
| | | | | |
| | 103,811 | | | National Retail Properties Inc. | | | 5.200% | | | | | | | | Baa2 | | | | 2,604,618 | |
| | | | | |
| | 52,004 | | | National Storage Affiliates Trust | | | 6.000% | | | | | | | | N/R | | | | 1,354,184 | |
Nuveen Real Asset Income Fund (continued)
| | |
| Portfolio of Investments | | December 31, 2017 |
| | | | | | | | | | | | | | | | | | | | |
| Shares | | | Description (1) | | Coupon | | | | | | Ratings (3) | | | Value | |
| | | | | |
| | | | Equity Real Estate Investment Trusts (continued) | | | | | | | | | | | | |
| | | | | |
| | 339,951 | | | Pebblebrook Hotel Trust | | | 6.500% | | | | | | | | N/R | | | $ | 8,590,562 | |
| | | | | |
| | 252,502 | | | Pebblebrook Hotel Trust | | | 6.375% | | | | | | | | N/R | | | | 6,494,351 | |
| | | | | |
| | 163,234 | | | Penn Real Estate Investment Trust | | | 6.875% | | | | | | | | N/R | | | | 4,098,806 | |
| | | | | |
| | 144,845 | | | PS Business Parks, Inc. | | | 5.250% | | | | | | | | BBB | | | | 3,658,785 | |
| | | | | |
| | 189,014 | | | PS Business Parks, Inc. | | | 5.200% | | | | | | | | Baa2 | | | | 4,744,251 | |
| | | | | |
| | 159 | | | Public Storage, Inc. | | | 5.050% | | | | | | | | A3 | | | | 3,967 | |
| | | | | |
| | 1,350 | | | Public Storage, Inc. | | | 5.150% | | | | | | | | A3 | | | | 33,777 | |
| | | | | |
| | 939 | | | Rexford Industrial Realty Inc. | | | 5.875% | | | | | | | | BB | | | | 23,898 | |
| | | | | |
| | 13,242 | | | Senior Housing Properties Trust | | | 6.250% | | | | | | | | BBB– | | | | 355,680 | |
| | | | | |
| | 131,814 | | | STAG Industrial Inc. | | | 6.875% | | | | | | | | BB+ | | | | 3,450,890 | |
| | | | | |
| | 278,674 | | | Summit Hotel Properties Inc. | | | 7.125% | | | | | | | | N/R | | | | 7,072,746 | |
| | | | | |
| | 134,529 | | | Summit Hotel Properties Inc. | | | 6.450% | | | | | | | | N/R | | | | 3,430,490 | |
| | | | | |
| | 373,322 | | | Summit Hotel Properties Inc. | | | 6.250% | | | | | | | | N/R | | | | 9,583,176 | |
| | | | | |
| | 93,551 | | | Sunstone Hotel Investors Inc. | | | 6.950% | | | | | | | | N/R | | | | 2,450,101 | |
| | | | | |
| | 235,186 | | | Sunstone Hotel Investors Inc. | | | 6.450% | | | | | | | | N/R | | | | 5,907,872 | |
| | | | | |
| | 59,212 | | | Taubman Centers Incorporated, Series K | | | 6.250% | | | | | | | | N/R | | | | 1,493,919 | |
| | | | | |
| | 141,914 | | | UMH Properties Inc. | | | 8.000% | | | | | | | | N/R | | | | 3,871,414 | |
| | | | | |
| | 361,119 | | | UMH Properties Inc. | | | 6.750% | | | | | | | | N/R | | | | 9,753,824 | |
| | | | | |
| | 196,101 | | | Urstadt Biddle Properties | | | 6.750% | | | | | | | | N/R | | | | 5,137,846 | |
| | | | | |
| | 188,992 | | | Urstadt Biddle Properties | | | 6.250% | | | | | | | | N/R | | | | 4,942,141 | |
| | | | | |
| | 114,418 | | | Ventas Realty LP | | | 5.450% | | | | | | | | BBB+ | | | | 2,874,180 | |
| | | | | |
| | 411,073 | | | Vornado Realty Trust | | | 5.250% | | | | | | | | BBB– | | | | 10,753,670 | |
| | | | | |
| | 43,543 | | | Washington Prime Group, Inc. | | | 6.875% | | | | | | | | Ba1 | | | | 1,078,560 | |
| | | | Total Equity Real Estate Investment Trusts | | | | | | | | | | | | | | | 267,733,196 | |
| | | |
| | | | Independent Power & Renewable Electricity Producers – 0.2% | | | | | | | |
| | | | | |
| | 156,528 | | | Brookfield Renewable Partners | | | 5.750% | | | | | | | | BBB– | | | | 3,255,085 | |
| | | | | |
| | | | Multi-Utilities – 2.3% | | | | | | | | | | | | |
| | | | | |
| | 768,383 | | | Dominion Resources Inc. | | | 5.250% | | | | | | | | BBB– | | | | 19,647,553 | |
| | | | | |
| | 279,006 | | | DTE Energy Company | | | 6.000% | | | | | | | | Baa2 | | | | 7,468,991 | |
| | | | | |
| | 359,669 | | | DTE Energy Company | | | 5.375% | | | | | | | | Baa2 | | | | 9,160,769 | |
| | | | | |
| | 115,738 | | | DTE Energy Company | | | 5.250% | | | | | | | | Baa2 | | | | 2,905,024 | |
| | | | | |
| | 369,627 | | | DTE Energy Company | | | 5.250% | | | | | | | | Baa2 | | | | 9,499,414 | |
| | | | Total Multi-Utilities | | | | | | | | | | | | | | | 48,681,751 | |
| | | | | |
| | | | Oil, Gas & Consumable Fuels – 1.1% | | | | | | | | | | | | |
| | | | | |
| | 184,164 | | | NGL Energy Partner LP | | | 9.000% | | | | | | | | N/R | | | | 4,493,602 | |
| | | | | |
| | 532,353 | | | Nustar Energy LP | | | 8.500% | | | | | | | | Ba3 | | | | 13,228,972 | |
| | | | | |
| | 133,977 | | | Nustar Energy LP | | | 7.625% | | | | | | | | Ba3 | | | | 3,034,579 | |
| | | | | |
| | 156,033 | | | Pembina Pipeline Corporation | | | 5.750% | | | | | | | | BB+ | | | | 3,265,894 | |
| | | | | |
| | 10,280 | | | Teekay LNG Partners LP | | | 8.500% | | | | | | | | N/R | | | | 252,271 | |
| | | | Total Oil, Gas & Consumable Fuels | | | | | | | | | | | | | | | 24,275,318 | |
| | | | | | | | | | | | | | | | | | | | |
| Shares | | | Description (1) | | Coupon | | | | | | Ratings (3) | | | Value | |
| | | | |
| | | | Real Estate Management & Development – 0.4% | | | | | | | | | | |
| | | | | |
| | 324,287 | | | Landmark Infrastructure Partners LP | | | 8.000% | | | | | | | | N/R | | | $ | 8,256,347 | |
| | | | Total $25 Par (or similar) Retail Preferred (cost $438,558,104) | | | | | | | | 448,348,238 | |
| | | | | |
Principal
Amount (000) (4) | | | Description (1) | | Coupon | | | Maturity | | | Ratings (3) | | | Value | |
| | | | | |
| | | | CORPORATE BONDS – 17.4% | | | | | | | | | | | | | | | | |
| | | | | |
| | | | Commercial Services & Supplies – 1.4% | | | | | | | | | | | | |
| | | | | |
| $ | 5,330 | | | Advanced Disposal Services, Inc., 144A | | | 5.625% | | | | 11/15/24 | | | | B | | | $ | 5,449,925 | |
| | | | | |
| | 6,786 | | | Covanta Holding Corporation | | | 5.875% | | | | 3/01/24 | | | | B1 | | | | 6,887,790 | |
| | | | | |
| | 4,055 | | | Covanta Holding Corporation | | | 5.875% | | | | 7/01/25 | | | | B1 | | | | 4,075,275 | |
| | | | | |
| | 5,290 | | | GFL Environmental Corporation, 144A | | | 5.625% | | | | 5/01/22 | | | | B– | | | | 5,488,375 | |
| | | | | |
| | 6,499 | | | Tervita Escrow Corporation, 144A | | | 7.625% | | | | 12/01/21 | | | | B | | | | 6,515,248 | |
| | | | | |
| | 860 | | | Wrangler Buyer Corp., 144A | | | 6.000% | | | | 10/01/25 | | | | CCC+ | | | | 885,800 | |
| | | | Total Commercial Services & Supplies | | | | | | | | | | | | | | | 29,302,413 | |
| | | | | |
| | | | Construction & Engineering – 1.1% | | | | | | | | | | | | |
| | | | | |
| | 4,610 | | | AECOM Technology Corporation | | | 5.125% | | | | 3/15/27 | | | | BB | | | | 4,695,976 | |
| | | | | |
| | 22,105,680 | COP | | Fideicomiso Ruta Al Mar., 144A | | | 6.750% | | | | 2/15/44 | | | | Baa3 | | | | 7,314,389 | |
| | | | | |
| | 8,500 | EUR | | Superstrada Pedemontana Veneta | | | 0.000% | | | | 6/30/47 | | | | N/R | | | | 10,122,229 | |
| | | | Total Construction & Engineering | | | | | | | | | | | | | | | 22,132,594 | |
| | | | | |
| | | | Diversified Financial Services – 0.4% | | | | | | | | | | | | |
| | | | | |
| | 4,195 | | | Ladder Capital Finance Holdings LLLP/ Ladder Capital Finance Corp., 144A | | | 5.250% | | | | 10/01/25 | | | | BB | | | | 4,174,025 | |
| | | | | |
| | 4,830 | | | Stoneway Capital Corporation, 144A | | | 10.000% | | | | 3/01/27 | | | | B | | | | 5,135,739 | |
| | | | Total Diversified Financial Services | | | | | | | | | | | | | | | 9,309,764 | |
| | | | | |
| | | | Electric Utilities – 4.4% | | | | | | | | | | | | |
| | | | | |
| | 15,365 | | | ACWA Power Management And Investment One Ltd, 144A | | | 5.950% | | | | 12/15/39 | | | | BBB– | | | | 15,729,150 | |
| | | | | |
| | 3,781 | | | Brooklyn Navy Yard Cogeneration Partners LP, 144A | | | 7.420% | | | | 10/01/20 | | | | B+ | | | | 3,421,634 | |
| | | | | |
| | 3,925 | | | Comision Federal de Electricidad of the United States of Mexico, 144A | | | 6.125% | | | | 6/16/45 | | | | BBB+ | | | | 4,352,825 | |
| | | | | |
| | 12,648 | | | Crocket Cogeneration LP, 144A | | | 5.869% | | | | 3/30/25 | | | | BB+ | | | | 12,702,258 | |
| | | | | |
| | 7,725 | | | DCP Midstream Operating LP, 144A | | | 5.850% | | | | 5/21/43 | | | | BB– | | | | 7,184,250 | |
| | | | | |
| | 4,200 | GBP | | Electricite de France S.A, Reg S | | | 5.875% | | | | N/A (7) | | | | BBB | | | | 5,909,934 | |
| | | | | |
| | 6,245 | | | Exelon Corporation | | | 6.250% | | | | 10/01/39 | | | | BBB | | | | 7,300,353 | |
| | | | | |
| | 2,649 | | | FPL Energy National Wind LLC, 144A | | | 5.608% | | | | 3/10/24 | | | | Baa3 | | | | 2,665,799 | |
| | | | | |
| | 4,040 | GBP | | Intergen NV | | | 7.500% | | | | 6/30/21 | | | | B1 | | | | 5,318,244 | |
| | | | | |
| | 4,867 | | | Mirant Mid–Atlantic Series C Pass Through Trust | | | 10.060% | | | | 12/30/28 | | | | B– | | | | 4,890,934 | |
| | | | | |
| | 9,480 | | | Panoche Energy Center LLC, 144A | | | 6.885% | | | | 7/31/29 | | | | Baa3 | | | | 9,538,356 | |
| | | | | |
| | 11,675 | | | Red Oak Power LLC | | | 9.200% | | | | 11/30/29 | | | | BB– | | | | 13,251,125 | |
| | | | Total Electric Utilities | | | | | | | | | | | | | | | 92,264,862 | |
Nuveen Real Asset Income Fund (continued)
| | |
| Portfolio of Investments | | December 31, 2017 |
| | | | | | | | | | | | | | | | | | | | |
Principal
Amount (000) (4) | | | Description (1) | | Coupon | | | Maturity | | | Ratings (3) | | | Value | |
| | | | | |
| | | | Equity Real Estate Investment Trusts – 2.1% | | | | | | | | | | | | |
| | | | | |
| $ | 6,375 | | | Care Capital Properties, Inc. | | | 5.125% | | | | 8/15/26 | | | | BBB– | | | $ | 6,462,658 | |
| | | | | |
| | 3,870 | | | CoreCivic, Inc. | | | 4.750% | | | | 10/15/27 | | | | Ba1 | | | | 3,821,625 | |
| | | | | |
| | 1,790 | | | CTR Partnership LP/CareTrust Capital Corporation | | | 5.250% | | | | 6/01/25 | | | | BB– | | | | 1,825,800 | |
| | | | | |
| | 4,050 | | | CyrusOne LP Finance, 144A | | | 5.375% | | | | 3/15/27 | | | | BB+ | | | | 4,252,500 | |
| | | | | |
| | 1,125 | | | CyrusOne LP Finance, 144A | | | 5.375% | | | | 3/15/27 | | | | BB+ | | | | 1,181,250 | |
| | | | | |
| | 7,380 | | | Geo Group Inc. | | | 6.000% | | | | 4/15/26 | | | | B+ | | | | 7,582,950 | |
| | | | | |
| | 4,225 | | | Iron Mountain Inc., 144A | | | 5.250% | | | | 3/15/28 | | | | BB– | | | | 4,203,875 | |
| | | | | |
| | 4,125 | | | MPT Operating Partnership Finance | | | 5.000% | | | | 10/15/27 | | | | BBB– | | | | 4,202,344 | |
| | | | | |
| | 6,200 | | | SBA Communications Corporation | | | 4.875% | | | | 9/01/24 | | | | B+ | | | | 6,370,500 | |
| | | | | |
| | 3,525 | | | Trust F/1401, 144A | | | 6.950% | | | | 1/30/44 | | | | Baa2 | | | | 3,833,437 | |
| | | | Total Equity Real Estate Investment Trusts | | | | | | | | | | | | | | | 43,736,939 | |
| | | | | |
| | | | Gas Utilities – 0.9% | | | | | | | | | | | | |
| | | | | |
| | 1,870 | | | AmeriGas Partners LP/AmeriGas Finance Corporation | | | 5.750% | | | | 5/20/27 | | | | BB | | | | 1,888,700 | |
| | | | | |
| | 2,045 | | | Ferrellgas LP | | | 6.750% | | | | 1/15/22 | | | | B– | | | | 1,891,625 | |
| | | | | |
| | 47,768 | MXN | | Gas Natural Mexico SA | | | 7.670% | | | | 7/03/25 | | | | N/R | | | | 2,205,406 | |
| | | | | |
| | 54,265 | MXN | | Infraestructura Energetica Nova SAB de CV | | | 6.300% | | | | 2/02/23 | | | | Baa1 | | | | 2,494,603 | |
| | | | | |
| | 4,870 | | | National Gas Company of Trinidad and Tobago, 144A | | | 6.050% | | | | 1/15/36 | | | | BBB | | | | 5,040,450 | |
| | | | | |
| | 3,184 | | | Suburban Propane Partners LP | | | 5.750% | | | | 3/01/25 | | | | BB– | | | | 3,144,200 | |
| | | | | |
| | 2,215 | | | Suburban Propane Partners LP | | | 5.875% | | | | 3/01/27 | | | | BB– | | | | 2,165,162 | |
| | | | Total Gas Utilities | | | | | | | | | | | | | | | 18,830,146 | |
| | | | | |
| | | | Health Care Providers & Services – 0.1% | | | | | | | | | | | | |
| | | | | |
| | 1,985 | | | HCA Inc. | | | 5.500% | | | | 6/15/47 | | | | BBB– | | | | 1,980,038 | |
| | | | | |
| | | | Hotels, Restaurants & Leisure – 0.3% | | | | | | | | | | | | |
| | | | | |
| | 3,428 | | | Grupo Posadas SAB de CV, 144A | | | 7.875% | | | | 6/30/22 | | | | B+ | | | | 3,539,410 | |
| | | | | |
| | 3,345 | | | MGM Growth Properties Operating Partnership LP / MGP Escrow Co-Issuer, Inc., 144A | | | 4.500% | | | | 1/15/28 | | | | BB– | | | | 3,278,100 | |
| | | | Total Hotels, Restaurants & Leisure | | | | | | | | | | | | | | | 6,817,510 | |
| | | | | |
| | | | Independent Power & Renewable Electricity Producers – 1.1% | | | | | | | | | | | | |
| | | | | |
| | 5,690 | | | Azure Power Energy Ltd, 144A | | | 5.500% | | | | 11/03/22 | | | | Ba3 | | | | 5,783,885 | |
| | | | | |
| | 3,000 | | | Calpine Corporation, 144A | | | 5.250% | | | | 6/01/26 | | | | BB+ | | | | 2,940,030 | |
| | | | | |
| | 3,240 | | | Capex SA, 144A | | | 6.875% | | | | 5/15/24 | | | | B+ | | | | 3,380,875 | |
| | | | | |
| | 4,665 | | | Dynegy Inc., 144A | | | 8.000% | | | | 1/15/25 | | | | B+ | | | | 5,049,862 | |
| | | | | |
| | 1,200 | | | Emirates Semb Corp Water & Power, 144A | | | 4.450% | | | | 8/01/35 | | | | A2 | | | | 1,223,858 | |
| | | | | |
| | 1,450 | | | GenOn Energy Inc., (5) | | | 9.500% | | | | 10/15/18 | | | | N/R | | | | 1,152,750 | |
| | | | | |
| | 3,945 | | | NRG Energy Inc., 144A | | | 5.750% | | | | 1/15/28 | | | | BB– | | | | 3,984,450 | |
| | | | Total Independent Power & Renewable Electricity Producers | | | | | | | | | | | | | | | 23,515,710 | |
| | | | | |
| | | | IT Services – 0.5% | | | | | | | | | | | | |
| | | | | |
| | 9,985 | | | Zayo Group LLC / Zayo Capital Inc., 144A | | | 5.750% | | | | 1/15/27 | | | | B | | | | 10,184,700 | |
| | | | | | | | | | | | | | | | | | | | |
Principal
Amount (000) (4) | | | Description (1) | | Coupon | | | Maturity | | | Ratings (3) | | | Value | |
| | | | | |
| | | | Marine – 0.1% | | | | | | | | | | | | |
| | | | | |
| | 16,000 | NOK | | FJORD 1 ASA, Reg S | | | 4.260% | | | | 11/22/22 | | | | N/R | | | $ | 1,958,795 | |
| | | | | |
| | | | Multi-Utilities – 0.2% | | | | | | | | | | | | |
| | | | | |
| | 3,085 | | | Dominion Resources Inc. | | | 5.750% | | | | 10/01/54 | | | | BBB– | | | | 3,331,800 | |
| | | | |
| | | | Mortgage Real Estate Investment Trusts – 0.2% | | | | | | | | | | |
| | | | | |
| | 4,020 | | | Starwood Property Trust, 144A | | | 4.750% | | | | 3/15/25 | | | | BB– | | | | 3,989,850 | |
| | | | | |
| | | | Oil, Gas & Consumable Fuels – 2.1% | | | | | | | | | | | | |
| | | | | |
| | 5,195 | | | Abu Dhabi Crude Oil Pipeline LLC, 144A | | | 4.600% | | | | 11/02/47 | | | | AA | | | | 5,343,213 | |
| | | | | |
| | 2,915 | | | Calumet Specialty Products | | | 6.500% | | | | 4/15/21 | | | | CCC+ | | | | 2,900,425 | |
| | | | | |
| | 3,624 | | | Calumet Specialty Products | | | 7.625% | | | | 1/15/22 | | | | CCC+ | | | | 3,628,530 | |
| | | | | |
| | 745 | | | Delek & Avner Tamar Bond Ltd, 144A | | | 5.412% | | | | 12/30/25 | | | | BBB– | | | | 749,902 | |
| | | | | |
| | 5,505 | | | Genesis Energy LP | | | 5.625% | | | | 6/15/24 | | | | BB– | | | | 5,367,375 | |
| | | | | |
| | 4,205 | CAD | | Gibson Energy, 144A | | | 5.250% | | | | 7/15/24 | | | | BB | | | | 3,361,391 | |
| | | | | |
| | 1,670 | | | Global Partners LP/GLP Finance | | | 6.250% | | | | 7/15/22 | | | | B+ | | | | 1,715,925 | |
| | | | | |
| | 1,640 | | | Global Partners LP/GLP Finance | | | 7.000% | | | | 6/15/23 | | | | B+ | | | | 1,685,100 | |
| | | | | |
| | 3,495 | | | Martin Mid-Stream Partners LP Finance | | | 7.250% | | | | 2/15/21 | | | | B– | | | | 3,529,950 | |
| | | | | |
| | 2,887 | | | NGL Energy Partners LP/Fin Co | | | 7.500% | | | | 11/01/23 | | | | B+ | | | | 2,988,045 | |
| | | | | |
| | 5,890 | | | Par Petroleum LLC / Petroleum Finance Corp., 144A | | | 7.750% | | | | 12/15/25 | | | | BB– | | | | 5,867,913 | |
| | | | | |
| | 5,225 | | | PBF Holding Company LLC | | | 7.250% | | | | 6/15/25 | | | | BB | | | | 5,492,781 | |
| | | | | |
| | 33,156 | MXN | | Petroleos Mexicanos, 144A | | | 7.190% | | | | 9/12/24 | | | | A– | | | | 1,489,372 | |
| | | | Total Oil, Gas & Consumable Fuels | | | | | | | | | | | | | | | 44,119,922 | |
| | | | |
| | | | Real Estate Management & Development – 0.7% | | | | | | | | | | |
| | | | | |
| | 6,905 | | | Hunt Companies Inc., 144A | | | 9.625% | | | | 3/01/21 | | | | N/R | | | | 7,276,144 | |
| | | | | |
| | 6,216 | | | Kennedy-Wilson Holdings Incorporated | | | 5.875% | | | | 4/01/24 | | | | BB | | | | 6,418,020 | |
| | | | Total Real Estate Management & Development | | | | | | | | | | | | | | | 13,694,164 | |
| | | | | |
| | | | Software – 0.1% | | | | | | | | | | | | |
| | | | | |
| | 1,989 | | | SixSigma Networks Mexico SA de CV, 144A | | | 8.250% | | | | 11/07/21 | | | | B+ | | | | 2,103,368 | |
| | | | | |
| | | | Transportation Infrastructure – 1.1% | | | | | | | | | | | | |
| | | | | |
| | 2,590 | | | Aeropuertos Argentina 2000 SA, 144A | | | 6.875% | | | | 2/01/27 | | | | BB– | | | | 2,800,386 | |
| | | | | |
| | 1,635 | | | Aeropuertos Dominicanos SA, 144A | | | 6.750% | | | | 3/30/29 | | | | BB– | | | | 1,790,325 | |
| | | | | |
| | 2,570 | | | Delhi International Airport Ltd, 144A | | | 6.125% | | | | 10/31/26 | | | | BB | | | | 2,717,775 | |
| | | | | |
| | 10,691 | MXN | | Grupo Aeroportuario Del Centro Norte, SAB de CV | | | 6.850% | | | | 6/07/21 | | | | N/R | | | | 513,405 | |
| | | | | |
| | 4,860 | | | Mexico City Airport Trust, 144A | | | 5.500% | | | | 7/31/47 | | | | BBB+ | | | | 4,799,250 | |
| | | | | |
| | 4,170 | | | Rumo Luxembourg Sarl, 144A | | | 7.375% | | | | 2/09/24 | | | | BB– | | | | 4,487,337 | |
| | | | | |
| | 6,486 | | | Terminales Portuarios, 144A | | | 8.125% | | | | 4/01/37 | | | | BB | | | | 6,955,713 | |
| | | | | |
| | 865 | EUR | | Swissport Financing SARL, 144A | | | 9.750% | | | | 12/15/22 | | | | Caa1 | | | | 1,078,407 | |
| | | | Total Transportation Infrastructure | | | | | | | | | | | | | | | 25,142,598 | |
| | | | | |
| | | | Water Utilities – 0.1% | | | | | | | | | | | | |
| | | | | |
| | 1,445 | | | AEGEA Finance SARL, 144A | | | 5.750% | | | | 10/10/24 | | | | Ba2 | | | | 1,466,675 | |
Nuveen Real Asset Income Fund (continued)
| | |
| Portfolio of Investments | | December 31, 2017 |
| | | | | | | | | | | | | | | | | | | | |
Principal
Amount (000) (4) | | | Description (1) | | Coupon | | | Maturity | | | Ratings (3) | | | Value | |
| | | | | |
| | | | Wireless Telecommunication Services – 0.5% | | | | | | | | | | | | |
| | | | | |
| $ | 7,101 | | | Inmarsat Finance PLC, 144A | | | 6.500% | | | | 10/01/24 | | | | BB+ | | | $ | 7,207,515 | |
| | | | | |
| | 3,885 | | | ViaSat Inc., 144A | | | 5.625% | | | | 9/15/25 | | | | BB– | | | | 3,914,137 | |
| | | | Total Wireless Telecommunication Services | | | | | | | | | | | | | | | 11,121,652 | |
| | | | Total Corporate Bonds (cost $359,559,677) | | | | | | | | | | | | | | | 365,003,500 | |
| | | | | |
| Shares | | | Description (1) | | | | | | | | | | | Value | |
| | | | | |
| | | | COMMON STOCKS – 16.6% | | | | | | | | | | | | | | | | |
| | | | | |
| | | | Air Freight & Logistics – 0.3% | | | | | | | | | | | | |
| | | | | |
| | 156,493 | | | Oesterreichische Post AG, (2) | | | | | | | | | | | | | | $ | 7,029,448 | |
| | | | | |
| | | | Commercial Services & Supplies – 0.2% | | | | | | | | | | | | |
| | | | | |
| | 190,424 | | | Covanta Holding Corporation | | | | | | | | | | | | | | | 3,218,166 | |
| | | | |
| | | | Diversified Telecommunication Services – 0.9% | | | | | | | | | | |
| | | | | |
| | 4,261,764 | | | HKBN Limited | | | | | | | | | | | | | | | 5,389,356 | |
| | | | | |
| | 5,075,383 | | | HKT Trust and HKT Limited | | | | | | | | | | | | | | | 6,470,214 | |
| | | | | |
| | 63,679 | | | Inmarsat PLC, (2) | | | | | | | | | | | | | | | 421,224 | |
| | | | | |
| | 11,012,780 | | | Netlink NBN Trust, (6) | | | | | | | | | | | | | | | 6,875,523 | |
| | | | Total Diversified Telecommunication Services | | | | | | | | | | | | | | | 19,156,317 | |
| | | | | |
| | | | Electric Utilities – 4.6% | | | | | | | | | | | | |
| | | | | |
| | 7,848,161 | | | AusNet Services, (2) | | | | | | | | | | | | | | | 11,029,047 | |
| | | | | |
| | 1,299,793 | | | Contact Energy Limited, (2) | | | | | | | | | | | | | | | 5,119,917 | |
| | | | | |
| | 748,865 | | | Endesa S.A, (2), (6) | | | | | | | | | | | | | | | 16,016,583 | |
| | | | | |
| | 764,673 | | | Enersis Chile SA | | | | | | | | | | | | | | | 4,343,343 | |
| | | | | |
| | 341,662 | | | Iberdrola SA, (2) | | | | | | | | | | | | | | | 2,644,902 | |
| | | | | |
| | 2,186,599 | | | Infratil Limited, (2) | | | | | | | | | | | | | | | 5,139,335 | |
| | | | | |
| | 205,742 | | | Power Assets Holdings Limited, (2) | | | | | | | | | | | | | | | 1,734,182 | |
| | | | | |
| | 14,189 | | | Red Electrica Corporacion SA, (2), (6) | | | | | | | | | | | | | | | 318,504 | |
| | | | | |
| | 581,465 | | | Scottish and Southern Energy PLC, (2) | | | | | | | | | | | | | | | 10,337,164 | |
| | | | | |
| | 59,482 | | | Southern Company | | | | | | | | | | | | | | | 2,860,489 | |
| | | | | |
| | 14,253,900 | | | Spark Infrastructure Group, (2) | | | | | | | | | | | | | | | 27,863,306 | |
| | | | | |
| | 1,483,695 | | | Transmissora Alianca de Energia Eletrica SA | | | | | | | | | | | | | | | 9,545,100 | |
| | | | Total Electric Utilities | | | | | | | | | | | | | | | 96,951,872 | |
| | | | | |
| | | | Gas Utilities – 0.5% | | | | | | | | | | | | |
| | | | | |
| | 34,936 | | | AmeriGas Partners, LP | | | | | | | | | | | | | | | 1,615,091 | |
| | | | | |
| | 80,977 | | | APA Group, (2) | | | | | | | | | | | | | | | 525,093 | |
| | | | | |
| | 316,400 | | | Gas Natural SDG S.A, (2) | | | | | | | | | | | | | | | 7,302,025 | |
| | | | Total Gas Utilities | | | | | | | | | | | | | | | 9,442,209 | |
| | | | | | | | | | | | | | | | | | | | |
| | | | | |
| Shares | | | Description (1) | | | | | | | | | | | Value | |
| | | | | |
| | | | Health Care Providers & Services – 0.3% | | | | | | | | | | | | |
| | | | | |
| | 432,598 | | | Sienna Senior Living Inc., Subscription | | | | | | | | | | | | | | $ | 6,270,434 | |
| | | | | |
| | | | Household Durables – 0.2% | | | | | | | | | | | | |
| | | | | |
| | 96,146 | | | Kaufman and Broad SA, (2) | | | | | | | | | | | | | | | 4,563,676 | |
| | | | | |
| | | | Independent Power & Renewable Electricity Producers – 1.7% | | | | | | | | | | | | |
| | | | | |
| | 455,680 | | | Brookfield Renewable Energy Partners LP | | | | | | | | | | | | | | | 15,881,735 | |
| | | | | |
| | 2,034,561 | | | Meridian Energy Limited | | | | | | | | | | | | | | | 4,217,539 | |
| | | | | |
| | 26,810 | | | NRG Yield, Inc., Class C Shares | | | | | | | | | | | | | | | 506,709 | |
| | | | | |
| | 218,932 | | | Pattern Energy Group Inc. | | | | | | | | | | | | | | | 4,704,849 | |
| | | | | |
| | 732,291 | | | Saeta Yield S.A, (6) | | | | | | | | | | | | | | | 8,619,447 | |
| | | | | |
| | 240,673 | | | TransAlta Renewables Inc. | | | | | | | | | | | | | | | 2,563,732 | |
| | | | Total Independent Power & Renewable Electricity Producers | | | | | | | | | | | | | | | 36,494,011 | |
| | | | | |
| | | | Media – 0.1% | | | | | | | | | | | | |
| | | | | |
| | 69,191 | | | Eutelsat Communications, (2) | | | | | | | | | | | | | | | 1,601,947 | |
| | | | | |
| | | | Multi-Utilities – 1.5% | | | | | | | | | | | | |
| | | | | |
| | 575,916 | | | Engie, (2) | | | | | | | | | | | | | | | 9,900,858 | |
| | | | | |
| | 127,429 | | | National Grid PLC | | | | | | | | | | | | | | | 7,494,100 | |
| | | | | |
| | 1,843,900 | | | Redes Energeticas Nacionais SA | | | | | | | | | | | | | | | 5,484,545 | |
| | | | | |
| | 3,634,735 | | | Vector Limited, (2) | | | | | | | | | | | | | | | 8,930,154 | |
| | | | Total Multi-Utilities | | | | | | | | | | | | | | | 31,809,657 | |
| | | | | |
| | | | Oil, Gas & Consumable Fuels – 2.2% | | | | | | | | | | | | |
| | | | | |
| | 16,795 | | | DCP Midstream LP | | | | | | | | | | | | | | | 610,162 | |
| | | | | |
| | 286,578 | | | Enagas, (2) | | | | | | | | | | | | | | | 8,195,964 | |
| | | | | |
| | 33,293 | | | Enbridge Energy Partners LP | | | | | | | | | | | | | | | 459,776 | |
| | | | | |
| | 88,695 | | | Enbridge Income Fund Holdings Inc. | | | | | | | | | | | | | | | 2,103,419 | |
| | | | | |
| | 438,722 | | | Enterprise Products Partnership LP | | | | | | | | | | | | | | | 11,630,520 | |
| | | | | |
| | 33,327 | | | Magellan Midstream Partners LP | | | | | | | | | | | | | | | 2,364,217 | |
| | | | | |
| | 164,465 | | | ONEOK, Inc. | | | | | | | | | | | | | | | 8,790,654 | |
| | | | | |
| | 30,507 | | | Pembina Pipeline Corporation | | | | | | | | | | | | | | | 1,104,514 | |
| | | | | |
| | 56,012 | | | Plains GP Holdings LP, Class A Shares | | | | | | | | | | | | | | | 1,229,463 | |
| | | | | |
| | 1,816,043 | | | Snam Rete Gas S.p.A, (2) | | | | | | | | | | | | | | | 8,894,034 | |
| | | | | |
| | 32,462 | | | Williams Partners LP | | | | | | | | | | | | | | | 1,258,876 | |
| | | | Total Oil, Gas & Consumable Fuels | | | | | | | | | | | | | | | 46,641,599 | |
| | | | | |
| | | | Real Estate Management & Development – 0.5% | | | | | | | | | | | | |
| | | | | |
| | 438,536 | | | Atrium European Real Estate Ltd | | | | | | | | | | | | | | | 2,183,635 | |
| | | | | |
| | 255,719 | | | Brookfield Property Partners | | | | | | | | | | | | | | | 5,666,733 | |
| | | | | |
| | 879,328 | | | Citycon Oyj | | | | | | | | | | | | | | | 2,276,822 | |
| | | | | |
| | 16,314 | | | Landmark Infrastructure Partners LP | | | | | | | | | | | | | | | 295,283 | |
| | | | Total Real Estate Management & Development | | | | | | | | | | | | | | | 10,422,473 | |
Nuveen Real Asset Income Fund (continued)
| | |
| Portfolio of Investments | | December 31, 2017 |
| | | | | | | | | | | | | | | | | | | | |
| Shares | | | Description (1) | | | | | | | | | | | Value | |
| | | | | |
| | | | Road & Rail – 0.5% | | | | | | | | | | | | |
| | | | | |
| | 1,655,853 | | | Aurizon Holdings Limited, (2) | | | | | | | | | | | | | | $ | 6,380,420 | |
| | | | | |
| | 1,463,057 | | | ComfortDelGro Corporation, (2) | | | | | | | | | | | | | | | 2,161,654 | |
| | | | | |
| | 514,410 | | | Stagocoach Group PLC | | | | | | | | | | | | | | | 1,143,893 | |
| | | | Total Road & Rail | | | | | | | | | | | | | | | 9,685,967 | |
| | | | |
| | | | Semiconductors & Semiconductor Equipment – 0.1% | | | | | | | | | | |
| | | | | |
| | 3,400 | | | Canadian Solar, Inc. | | | | | | | | | | | | | | | 2,917,950 | |
| | | | | |
| | | | Transportation Infrastructure – 2.6% | | | | | | | | | | | | |
| | | | | |
| | 598,243 | | | Abertis Infraestructuras S.A, (2) | | | | | | | | | | | | | | | 13,310,703 | |
| | | | | |
| | 81,278 | | | CCR SA, (2) | | | | | | | | | | | | | | | 395,878 | |
| | | | | |
| | 652,349 | | | Enav S.p.A, (2) | | | | | | | | | | | | | | | 3,530,206 | |
| | | | | |
| | 17,710,570 | | | Hopewell Highway Infrastructure Limited, (2) | | | | | | | | | | | | | | | 11,272,053 | |
| | | | | |
| | 19,103,430 | | | Hutchison Port Holdings Trust, (2) | | | | | | | | | | | | | | | 7,908,669 | |
| | | | | |
| | 355,108 | | | Jiangsu Expressway Company Limited, (2) | | | | | | | | | | | | | | | 539,869 | |
| | | | | |
| | 139,790 | | | Macquarie Infrastructure Corporation | | | | | | | | | | | | | | | 8,974,518 | |
| | | | | |
| | 334,990 | | | Sydney Airport, (2) | | | | | | | | | | | | | | | 1,838,129 | |
| | | | | |
| | 704,953 | | | Transurban Group, (2) | | | | | | | | | | | | | | | 6,822,568 | |
| | | | | |
| | 363,967 | | | Zhejiang Expressway Company Limited | | | | | | | | | | | | | | | 400,171 | |
| | | | Total Transportation Infrastructure | | | | | | | | | | | | | | | 54,992,764 | |
| | | | | |
| | | | Water Utilities – 0.4% | | | | | | | | | | | | |
| | | | | |
| | 2,567,183 | | | Aguas Andinas SA. Class A | | | | | | | | | | | | | | | 1,685,314 | |
| | | | | |
| | 141,338 | | | Cia de Saneamento do Parana, (6) | | | | | | | | | | | | | | | 2,552,273 | |
| | | | | |
| | 2,409,747 | | | Inversiones Aguas Metropolitanas SA | | | | | | | | | | | | | | | 4,573,586 | |
| | | | | |
| | 1,987 | | | Pennon Group PLC, (2) | | | | | | | | | | | | | | | 20,977 | |
| | | | Total Water Utilities | | | | | | | | | | | | | | | 8,832,150 | |
| | | | Total Common Stocks (cost $323,097,867) | | | | | | | | | | | | | | | 350,030,640 | |
| | | | | |
Principal
Amount (000) | | | Description (1) | | Coupon | | | Maturity | | | Ratings (3) | | | Value | |
| | | | | |
| | | | $1,000 PAR (OR SIMILAR) INSTITUTIONAL PREFERRED – 11.5% | | | | | | | | | | | | | | | | |
| | | | | |
| | | | Diversified Financial Services – 0.3% | | | | | | | | | | | | |
| | | | | |
| $ | 2,625 | | | National Rural Utilities Cooperative Finance Corporation | | | 5.250% | | | | 4/20/46 | | | | A3 | | | $ | 2,819,170 | |
| | | | | |
| | 3,965 | | | RKP Overseas Finance 2016 A, Reg S | | | 7.950% | | | | N/A (7) | | | | B1 | | | | 4,070,362 | |
| | | | Total Diversified Financial Services | | | | | | | | | | | | | | | 6,889,532 | |
| | | | | |
| | | | Electric Utilities – 3.3% | | | | | | | | | | | | |
| | | | | |
| | 5,420 | | | AES Gener SA, 144A | | | 8.375% | | | | 12/18/73 | | | | BB | | | | 5,668,073 | |
| | | | | |
| | 27,565 | | | Emera, Inc. | | | 6.750% | | | | 6/15/76 | | | | BBB– | | | | 31,010,625 | |
| | | | | |
| | 10,670 | | | Enel SpA, 144A | | | 8.750% | | | | 9/24/73 | | | | BBB– | | | | 13,257,475 | |
| | | | | |
| | 6,540 | | | Exelon Corporation | | | 6.350% | | | | 3/15/33 | | | | Baa2 | | | | 7,161,300 | |
| | | | | |
| | 12,925 | | | NextEra Energy Inc. | | | 4.800% | | | | 12/01/77 | | | | BBB | | | | 12,957,313 | |
| | | | Total Electric Utilities | | | | | | | | | | | | | | | 70,054,786 | |
| | | | | | | | | | | | | | | | | | | | |
Principal
Amount (000) | | | Description (1) | | Coupon | | | Maturity | | | Ratings (3) | | | Value | |
| | | | | |
| | | | Energy Equipment & Services – 2.3% | | | | | | | | | | | | |
| | | | | |
| $ | 15,770 | | | TransCanada Trust | | | 5.875% | | | | 8/15/76 | | | | BBB | | | $ | 17,071,025 | |
| | | | | |
| | 15,805 | | | TransCanada Trust | | | 5.625% | | | | 5/20/75 | | | | BBB | | | | 16,634,762 | |
| | | | | |
| | 14,070 | | | TransCanada Trust | | | 5.300% | | | | 3/15/77 | | | | BBB | | | | 14,509,688 | |
| | | | Total Energy Equipment & Services | | | | | | | | | | | | | | | 48,215,475 | |
| | | | | |
| | | | Multi-Utilities – 0.4% | | | | | | | | | | | | |
| | | | | |
| | 7,070 | | | RWE AG, Reg S | | | 6.625% | | | | 7/30/75 | | | | BB+ | | | | 8,037,685 | |
| | | | | |
| | | | Oil, Gas & Consumable Fuels – 4.6% | | | | | | | | | | | | |
| | | | | |
| | 2,694 | | | DCP Midstream LP | | | 7.375% | | | | N/A (7) | | | | BB– | | | | 2,672,448 | |
| | | | | |
| | 8,718 | | | Enbridge Energy Partners LP | | | 5.131% | | | | 10/01/77 | | | | BB+ | | | | 8,641,738 | |
| | | | | |
| | 22,894 | | | Enbridge Inc. | | | 6.000% | | | | 1/15/77 | | | | BBB– | | | | 23,809,921 | |
| | | | | |
| | 27,215 | | | Enbridge Inc. | | | 5.500% | | | | 7/15/77 | | | | BBB– | | | | 27,073,754 | |
| | | | | |
| | 2,694 | | | Energy Transfer Partners | | | 6.250% | | | | N/A (7) | | | | BB | | | | 2,616,548 | |
| | | | | |
| | 16,420 | | | Enterprise Products Operating LLP | | | 5.250% | | | | 8/16/77 | | | | Baa2 | | | | 16,255,800 | |
| | | | | |
| | 2,255 | | | Enterprise Products Operating LP | | | 7.034% | | | | 1/15/68 | | | | Baa2 | | | | 2,255,000 | |
| | | | | |
| | 11,770 | | | Plains All American Pipeline LP | | | 6.125% | | | | N/A (7) | | | | BB | | | | 11,752,345 | |
| | | | | |
| | 1,865 | | | Summit Midstream Partner LP | | | 9.500% | | | | N/A (7) | | | | B– | | | | 1,888,313 | |
| | | | Total Oil, Gas & Consumable Fuels | | | | | | | | | | | | | | | 96,965,867 | |
| | | | | |
| | | | Real Estate Management & Development – 0.6% | | | | | | | | | | | | |
| | | | | |
| | 12,250 | | | AT Securities BV, Reg S | | | 5.250% | | | | N/A (7) | | | | BBB– | | | | 12,403,125 | |
| | | | Total $1,000 Par (or similar) Institutional Preferred (cost $236,196,734) | | | | | | | | | | | | | | | 242,566,470 | |
| | | | | |
| Shares | | | Description (1) | | Coupon | | | | | | Ratings (3) | | | Value | |
| | | | |
| | | | CONVERTIBLE PREFERRED SECURITIES – 5.8% | | | | | | | | | | | | | |
| | | | | |
| | | | Electric Utilities – 0.7% | | | | | | | | | | | | |
| | | | | |
| | 249,066 | | | NextEra Energy Inc. | | | 6.123% | | | | | | | | BBB | | | $ | 13,997,509 | |
| | | | | |
| | | | Equity Real Estate Investment Trusts – 2.2% | | | | | | | | | | | | |
| | | | | |
| | 83,365 | | | Alexandria Real Estate Equities Inc. | | | 7.000% | | | | | | | | Baa3 | | | | 3,051,159 | |
| | | | | |
| | 216,926 | | | Ashford Hospitality Prime, Inc. | | | 5.500% | | | | | | | | N/R | | | | 4,336,351 | |
| | | | | |
| | 12,666 | | | Crown Castle International Corporation | | | 6.875% | | | | | | | | N/R | | | | 13,294,107 | |
| | | | | |
| | 93,205 | | | EPR Properties Inc. | | | 9.000% | | | | | | | | BB | | | | 3,406,643 | |
| | | | | |
| | 8,306 | | | EPR Properties Inc. | | | 5.750% | | | | | | | | N/R | | | | 223,598 | |
| | | | | |
| | 94,737 | | | Equity Commonwealth | | | 6.500% | | | | | | | | Baa3 | | | | 2,500,109 | |
| | | | | |
| | 29,575 | | | Lexington Corporate Properties Trust, Series B | | | 6.500% | | | | | | | | N/R | | | | 1,505,663 | |
| | | | | |
| | 279,079 | | | Ramco-Gershenson Properties Trust | | | 7.250% | | | | | | | | N/R | | | | 16,074,950 | |
| | | | | |
| | 35,929 | | | RLJ Lodging Trust | | | 1.950% | | | | | | | | B– | | | | 970,442 | |
| | | | Total Equity Real Estate Investment Trusts | | | | | | | | | | | | | | | 45,363,022 | |
Nuveen Real Asset Income Fund (continued)
| | |
| Portfolio of Investments | | December 31, 2017 |
| | | | | | | | | | | | | | | | | | | | |
| Shares | | | Description (1) | | Coupon | | | | | | Ratings (3) | | | Value | |
| | | | | |
| | | | Multi-Utilities – 2.0% | | | | | | | | | | | | |
| | | | | |
| | 29,105 | | | Black Hills Corp | | | 7.750% | | | | | | | | N/R | | | $ | 1,936,647 | |
| | | | | |
| | 462,119 | | | Dominion Resources Inc. | | | 6.750% | | | | | | | | BBB– | | | | 23,873,068 | |
| | | | | |
| | 322,717 | | | DTE Energy Company | | | 5.000% | | | | | | | | N/R | | | | 17,413,809 | |
| | | | Total Multi-Utilities | | | | | | | | | | | | | | | 43,223,524 | |
| | | | | |
| | | | Oil, Gas & Consumable Fuels – 0.9% | | | | | | | | | | | | |
| | | | | |
| | 134,625 | | | Anadarko Petroleum Corporation | | | 7.500% | | | | | | | | N/R | | | | 4,666,102 | |
| | | | | |
| | 390,353 | | | Kinder Morgan Inc., Delaware | | | 9.750% | | | | | | | | N/R | | | | 14,817,800 | |
| | | | Total Oil, Gas & Consumable Fuels | | | | | | | | | | | | | | | 19,483,902 | |
| | | | Total Convertible Preferred Securities (cost $121,484,606) | | | | | | | | 122,067,957 | |
| | | | | |
| Shares | | | Description (1), (8) | | | | | | | | | | | Value | |
| | | | | |
| | | | INVESTMENT COMPANIES – 1.3% | | | | | | | | | | | | | | | | |
| | | | | |
| | 4,722,842 | | | John Laing Infrastructure Fund | | | | | | | | | | | | | | $ | 7,855,908 | |
| | | | | |
| | 36,303,010 | | | Keppel Infrastructure Trust | | | | | | | | | | | | | | | 15,607,486 | |
| | | | | |
| | 1,408,614 | | | NextEnergy Solar Fund Limited | | | | | | | | | | | | | | | 2,149,081 | |
| | | | | |
| | 1,788,175 | | | Starwood European Real Estate Finance Limited | | | | | | | | | | | | | | | 2,643,665 | |
| | | | Total Investment Companies (cost $26,422,808) | | | | | | | | | | | | | | | 28,256,140 | |
| | | | | |
Principal
Amount (000) | | | Description (1) | | Coupon | | | Maturity | | | Ratings (3) | | | Value | |
| | | | | |
| | | | CONVERTIBLE BONDS – 0.9% | | | | | | | | | | | | | | | | |
| | | | | |
| | | | Oil, Gas & Consumable Fuels – 0.7% | | | | | | | | | | | | |
| | | | | |
| $ | 19,235 | | | Cheniere Energy Inc. | | | 4.250% | | | | 3/15/45 | | | | N/R | | | $ | 13,644,828 | |
| | | | |
| | | | Real Estate Management & Development – 0.2% | | | | | | | | | | |
| | | | | |
| | 4,055 | | | Tricon Capital Group Inc., 144A | | | 5.750% | | | | 3/31/22 | | | | N/R | | | | 4,541,600 | |
| $ | 23,290 | | | Total Convertible Bonds (cost $17,568,269) | | | | | | | | | | | | | | | 18,186,428 | |
| | | | | |
Principal
Amount (000) (4) | | | Description (1) | | Coupon | | | Maturity | | | Ratings (3) | | | Value | |
| | | | | |
| | | | SOVEREIGN DEBT – 0.4% | | | | | | | | | | | | | | | | |
| | | | | |
| | | | Costa Rica – 0.1% | | | | | | | | | | | | |
| | | | | |
| $ | 3,183 | | | Instituto Costarricense de Electricidad, 144A | | | 6.375% | | | | 5/15/43 | | | | Ba2 | | | $ | 2,934,790 | |
| | | | | |
| | | | India – 0.3% | | | | | | | | | | | | |
| | | | | |
| | 400,000 | INR | | National Highways Authority of India, Reg S | | | 7.300% | | | | 5/18/22 | | | | N/R | | | | 6,305,539 | |
| | | | Total Sovereign Debt (cost $9,085,566) | | | | | | | | | | | | | | | 9,240,329 | |
| | | | Total Long-Term Investments (cost $1,992,706,107) | | | | | | | | 2,070,834,108 | |
| | | | | | | | | | | | | | | | | | | | |
Principal
Amount (000) | | | Description (1) | | Coupon | | | Maturity | | | | | | Value | |
| | | | | |
| | | | SHORT-TERM INVESTMENTS – 0.7% | | | | | | | | | | | | | | | | |
| | | | | |
| | | | REPURCHASE AGREEMENTS – 0.7% | | | | | | | | | | | | |
| | | | | |
| $ | 14,030 | | | Repurchase Agreement with Fixed Income Clearing Corporation, dated 12/29/17, repurchase price $14,030,862, collateralized by $13,635,000 U.S. Treasury Inflation Indexed Obligations, 0.125%, due 4/15/19, value $14,312,387 | | | 0.540% | | | | 1/02/18 | | | | | | | $ | 14,030,020 | |
| | | | Total Short-Term Investments (cost $14,030,020) | | | | | | | | | | | | | | | 14,030,020 | |
| | | | Total Investments (cost $2,006,736,127) – 99.1% | | | | | | | | | | | | | | | 2,084,864,128 | |
| | | | Other Assets Less Liabilities – 0.9% (9) | | | | | | | | | | | | | | | 18,885,452 | |
| | | | Net Assets – 100% | | | | | | | | | | | | | | $ | 2,103,749,580 | |
Investments in Derivatives
Futures Contracts
| | | | | | | | | | | | | | | | | | | | | | | | | | | | |
| Description | | Contract
Position | | | Number of
Contracts | | | Expiration
Date | | | Notional
Amount | | | Value | | | Unrealized
Appreciation
(Depreciation)
| | | Variation
Margin
Receivable/
(Payable) | |
U.S. Treasury 5-Year Note | | | Short | | | | (98 | ) | | | 3/18 | | | $ | (11,440,926 | ) | | $ | (11,384,078 | ) | | $ | 56,847 | | | $ | (9,188 | ) |
U.S. Treasury 10-Year Note | | | Short | | | | (239 | ) | | | 3/18 | | | | (29,804,962 | ) | | | (29,647,203 | ) | | | 157,759 | | | | (48,547 | ) |
U.S. Treasury Long Bond | | | Short | | | | (122 | ) | | | 3/18 | | | | (18,698,972 | ) | | | (18,666,000 | ) | | | 32,972 | | | | (34,312 | ) |
U.S. Treasury Ultra Bond | | | Short | | | | (111 | ) | | | 3/18 | | | | (18,495,899 | ) | | | (18,609,844 | ) | | | (113,944 | ) | | | (48,562 | ) |
Total | | | | | | | | | | | | | | $ | (78,440,759 | ) | | $ | (78,307,125 | ) | | $ | 133,634 | | | $ | (140,609 | ) |
Total receivable for variation margin on futures contracts | | | | | | | | | | | | | | | | | | | | | | | $ | — | |
| Total payable for variation margin on futures contracts | | | | | | | | | | | | | | | | | | | | | | | $ | (140,609 | ) |
For Fund portfolio compliance purposes, the Fund’s industry classifications refer to any one or more of the industry sub-classifications used by one or more widely recognized market indexes or ratings group indexes, and/or as defined by Fund management. This definition may not apply for purposes of this report, which may combine industry sub-classifications into sectors for reporting ease.
| (1) | All percentages shown in the Portfolio of Investments are based on net assets. |
| (2) | For fair value measurement disclosure purposes, investment classified as Level 2. See Notes to Financial Statements, Note 2 – Investment Valuation and Fair Value Measurements for more information. |
| (3) | For financial reporting purposes, the ratings disclosed are the highest of Standard & Poor’s Group (“Standard & Poor’s”), Moody’s Investors Service, Inc. (“Moody’s”) or Fitch, Inc. (“Fitch”) rating. This treatment of split-rated securities may differ from that used for other purposes, such as for Fund investment policies. Ratings below BBB by Standard & Poor’s, Baa by Moody’s or BBB by Fitch are considered to be below investment grade. Holdings designated N/R are not rated by any of these national rating agencies. Ratings are not covered by the report of independent registered public accounting firm. |
| (4) | Principal Amount (000) denominated in U.S. Dollars, unless otherwise noted. |
| (5) | As of, or subsequent to, the end of the reporting period, this security is non-income producing. Non-income producing, in the case of a fixed-income security, generally denotes that the issuer has (1) defaulted on the payment of principal or interest, (2) is under the protection of the Federal Bankruptcy Court or (3) the Fund’s Adviser has concluded that the issue is not likely to meet its future interest payment obligations and has ceased accruing additional income on the Fund’s records. |
| (6) | Non-income producing; issuer has not declared a dividend within the past twelve months. |
| (7) | Perpetual security. Maturity date is not applicable. |
| (8) | A copy of the most recent financial statements for these investment companies can be obtained directly from the Securities and Exchange Commission on its website at http://www.sec.gov. |
| (9) | Other assets less liabilities include the unrealized appreciation (depreciation) of over-the-counter (“OTC”) derivatives as presented on the Statement of Assets and Liabilities, when applicable. The unrealized appreciation (depreciation) of OTC cleared and exchange-traded derivatives is recognized as part of the receivable or payable for variation margin as presented on the Statement of Assets and Liabilities, when applicable. |
| 144A | Investment is exempt from registration under Rule 144A of the Securities Act of 1933, as amended. These investments may only be resold in transactions exempt from registration, which are normally those transactions with qualified institutional buyers. |
| REIT | Real Estate Investment Trust |
| Reg S | Regulation S allows U.S. companies to sell securities to persons or entities located outside of the United States without registering those securities with the SEC. Specifically, Regulation S provides a safe harbor from the registration requirements of the Securities Act for the offers and sales of securities by both foreign and domestic issuers that are made outside the United States. |
See accompanying notes to financial statements.
Nuveen Real Estate Securities Fund
| | |
| Portfolio of Investments | | December 31, 2017 |
| | | | | | | | | | | | | | | | |
| Shares | | | Description (1) | | | | | | | | Value | |
| | | | |
| | | | LONG-TERM INVESTMENTS – 98.0% | | | | | | | | | | | | |
| | | | |
| | | | REAL ESTATE INVESTMENT TRUST COMMON STOCKS – 98.0% | | | | | | | | | | | | |
| | | | |
| | | | Diversified – 2.3% | | | | | | | | | |
| | | | |
| | 69,247 | | | Alexander & Baldwin Inc. | | | | | | | | | | $ | 1,920,912 | |
| | | | |
| | 20,467 | | | Empire State Realty Trust Inc. | | | | | | | | | | | 420,188 | |
| | | | |
| | 20,140 | | | Forest City Realty Trust Inc. | | | | | | | | | | | 485,374 | |
| | | | |
| | 733,875 | | | Gramercy Property Trust | | | | | | | | | | | 19,565,108 | |
| | | | |
| | 270,610 | | | Investors Real Estate Trust | | | | | | | | | | | 1,537,065 | |
| | | | |
| | 6,521 | | | Lexington Corporate Properties Trust | | | | | | | | | | | 62,928 | |
| | | | |
| | 486,485 | | | Liberty Property Trust | | | | | | | | | | | 20,923,720 | |
| | | | |
| | 2,614,696 | | | VEREIT, Inc. | | | | | | | | | | | 20,368,482 | |
| | | | |
| | 727,610 | | | Washington Real Estate Investment Trust | | | | | | | | | | | 22,643,223 | |
| | | | Total Diversified | | | | | | | | | | | 87,927,000 | |
| | | | |
| | | | Health Care – 8.8% | | | | | | | | | |
| | | | |
| | 179,727 | | | Chartwell Retirement Residences | | | | | | | | | | | 2,324,870 | |
| | | | |
| | 3,023,329 | | | Health Care Property Investors Inc. | | | | | | | | | | | 78,848,420 | |
| | | | |
| | 677,033 | | | Healthcare Realty Trust, Inc. | | | | | | | | | | | 21,746,300 | |
| | | | |
| | 1,531,300 | | | Healthcare Trust of America Inc., Class A | | | | | | | | | | | 46,000,252 | |
| | | | |
| | 52,520 | | | LTC Properties Inc. | | | | | | | | | | | 2,287,246 | |
| | | | |
| | 792,031 | | | MedEquities Realty Trust, Inc. | | | | | | | | | | | 8,886,588 | |
| | | | |
| | 110,913 | | | Medical Properties Trust Inc. | | | | | | | | | | | 1,528,381 | |
| | | | |
| | 9,931,663 | | | Parkway Life Real Estate Investment Trust | | | | | | | | | | | 22,203,202 | |
| | | | |
| | 2,134,753 | | | Physicians Realty Trust | | | | | | | | | | | 38,404,206 | |
| | | | |
| | 598 | | | Sabra Health Care Real Estate Investment Trust Inc. | | | | | | | | | | | 11,224 | |
| | | | |
| | 922,840 | | | Ventas Inc. | | | | | | | | | | | 55,379,628 | |
| | | | |
| | 845,750 | | | Welltower Inc. | | | | | | | | | | | 53,933,478 | |
| | | | Total Health Care | | | | | | | | | | | 331,553,795 | |
| | | | |
| | | | Hotels & Resorts – 5.4% | | | | | | | | | |
| | | | |
| | 182,530 | | | Apple Hospitality REIT, Inc. | | | | | | | | | | | 3,579,413 | |
| | | | |
| | 945,549 | | | DiamondRock Hospitality Company | | | | | | | | | | | 10,675,248 | |
| | | | |
| | 125,643 | | | Hersha Hospitality Trust | | | | | | | | | | | 2,186,188 | |
| | | | |
| | 1,279,547 | | | Host Hotels & Resorts Inc. | | | | | | | | | | | 25,399,008 | |
| | | | |
| | 849,792 | | | LaSalle Hotel Properties | | | | | | | | | | | 23,853,661 | |
| | | | |
| | 981,917 | | | MGM Growth Properties LLC | | | | | | | | | | | 28,622,881 | |
| | | | |
| | 2,894,983 | | | Summit Hotel Properties Inc. | | | | | | | | | | | 44,090,591 | |
| | | | |
| | 4,058,829 | | | Sunstone Hotel Investors Inc. | | | | | | | | | | | 67,092,443 | |
| | | | Total Hotels & Resorts | | | | | | | | | | | 205,499,433 | |
| | | | | | | | | | | | | | | | |
| Shares | | | Description (1) | | | | | | | | Value | |
| | | | |
| | | | Industrial – 10.2% | | | | | | | | | |
| | | | |
| | 415,180 | | | DCT Industrial Trust Inc. | | | | | | | | | | $ | 24,404,280 | |
| | | | |
| | 5,817,792 | | | Duke Realty Corporation | | | | | | | | | | | 158,302,120 | |
| | | | |
| | 2,795,026 | | | First Industrial Realty Trust, Inc. | | | | | | | | | | | 87,959,468 | |
| | | | |
| | 1,306,503 | | | Prologis Inc. | | | | | | | | | | | 84,282,509 | |
| | | | |
| | 1,078,996 | | | STAG Industrial Inc. | | | | | | | | | | | 29,488,961 | |
| | | | |
| | 5,235 | | | Terreno Realty Corporation | | | | | | | | | | | 183,539 | |
| | | | Total Industrial | | | | | | | | | | | 384,620,877 | |
| | | | |
| | | | Mortgage – 0.6% | | | | | | | | | |
| | | | |
| | 333,945 | | | Blackstone Mortgage Trust Inc, Class A | | | | | | | | | | | 10,746,350 | |
| | | | |
| | 237,708 | | | KKR Real Estate Finance Trust, Inc. | | | | | | | | | | | 4,756,537 | |
| | | | |
| | 45,650 | | | Starwood Property Trust Inc. | | | | | | | | | | | 974,628 | |
| | | | |
| | 349,306 | | | TPG Re Finance Trust Inc. | | | | | | | | | | | 6,654,279 | |
| | | | Total Mortgage | | | | | | | | | | | 23,131,794 | |
| | | | |
| | | | Office – 15.6% | | | | | | | | | |
| | | | |
| | 685,183 | | | Alexandria Real Estate Equities Inc. | | | | | | | | | | | 89,478,048 | |
| | | | |
| | 711,788 | | | Boston Properties, Inc. | | | | | | | | | | | 92,553,794 | |
| | | | |
| | 1,473,497 | | | Corporate Office Properties | | | | | | | | | | | 43,026,112 | |
| | | | |
| | 3,811,235 | | | Cousins Properties, Inc. | | | | | | | | | | | 35,253,924 | |
| | | | |
| | 2,960 | | | Douglas Emmett Inc. | | | | | | | | | | | 121,538 | |
| | | | |
| | 431,454 | | | Easterly Government Properties, Inc. | | | | | | | | | | | 9,207,228 | |
| | | | |
| | 1,827,485 | | | Equity Commonwealth | | | | | | | | | | | 55,756,567 | |
| | | | |
| | 955,227 | | | Highwoods Properties, Inc. | | | | | | | | | | | 48,630,607 | |
| | | | |
| | 2,214,499 | | | Hudson Pacific Properties Inc. | | | | | | | | | | | 75,846,591 | |
| | | | |
| | 39,851 | | | Kilroy Realty Corporation | | | | | | | | | | | 2,974,877 | |
| | | | |
| | 1,092,130 | | | Mack-Cali Realty Corporation | | | | | | | | | | | 23,546,323 | |
| | | | |
| | 1,414,108 | | | Paramount Group Inc. | | | | | | | | | | | 22,413,612 | |
| | | | |
| | 2,070,918 | | | Piedmont Office Realty Trust | | | | | | | | | | | 40,610,702 | |
| | | | |
| | 33,992 | | | SL Green Realty Corporation | | | | | | | | | | | 3,430,813 | |
| | | | |
| | 607,594 | | | Vornado Realty Trust | | | | | | | | | | | 47,501,699 | |
| | | | Total Office | | | | | | | | | | | 590,352,435 | |
| | | | |
| | | | Residential – 21.5% | | | | | | | | | |
| | | | |
| | 2,431,311 | | | American Homes 4 Rents, Class A | | | | | | | | | | | 53,099,832 | |
| | | | |
| | 1,106,965 | | | Apartment Investment & Management Company, Class A | | | | | | | | | | | 48,385,440 | |
| | | | |
| | 1,037,165 | | | AvalonBay Communities, Inc. | | | | | | | | | | | 185,040,608 | |
| | | | |
| | 1,063,006 | | | Camden Property Trust | | | | | | | | | | | 97,860,332 | |
| | | | |
| | 247,399 | | | Education Realty Trust Inc. | | | | | | | | | | | 8,639,173 | |
| | | | |
| | 490,189 | | | Equity Lifestyles Properties Inc. | | | | | | | | | | | 43,636,625 | |
| | | | |
| | 1,393,703 | | | Equity Residential | | | | | | | | | | | 88,876,440 | |
| | | | |
| | 280,204 | | | Essex Property Trust Inc. | | | | | | | | | | | 67,632,840 | |
Nuveen Real Estate Securities Fund (continued)
| | |
| Portfolio of Investments | | December 31, 2017 |
| | | | | | | | | | | | | | | | |
| Shares | | | Description (1) | | | | | | | | Value | |
| | | | |
| | | | Residential (continued) | | | | | | | | | |
| | | | |
| | 688,152 | | | Mid-America Apartment Communities | | | | | | | | | | $ | 69,200,565 | |
| | | | |
| | 981,448 | | | Sun Communities Inc. | | | | | | | | | | | 91,058,745 | |
| | | | |
| | 1,567,537 | | | UDR Inc. | | | | | | | | | | | 60,381,525 | |
| | | | Total Residential | | | | | | | | | | | 813,812,125 | |
| | | | |
| | | | Retail – 16.8% | | | | | | | | | |
| | | | |
| | 1,366 | | | Acadia Realty Trust | | | | | | | | | | | 37,374 | |
| | | | |
| | 94,634 | | | Agree Realty Corporation | | | | | | | | | | | 4,867,973 | |
| | | | |
| | 5,274 | | | Alexander’s Inc. | | | | | | | | | | | 2,087,713 | |
| | | | |
| | 3,930,453 | | | Brixmor Property Group Inc. | | | | | | | | | | | 73,342,253 | |
| | | | |
| | 252,743 | | | DDR Corp. | | | | | | | | | | | 2,264,577 | |
| | | | |
| | 974,733 | | | Federal Realty Investment Trust | | | | | | | | | | | 129,454,290 | |
| | | | |
| | 2,933,981 | | | GGP, Inc. | | | | | | | | | | | 68,625,816 | |
| | | | |
| | 270,548 | | | National Retail Properties, Inc. | | | | | | | | | | | 11,668,735 | |
| | | | |
| | 865,474 | | | Realty Income Corporation | | | | | | | | | | | 49,349,327 | |
| | | | |
| | 506,107 | | | Regency Centers Corporation | | | | | | | | | | | 35,012,482 | |
| | | | |
| | 1,384,006 | | | Simon Property Group, Inc., (2) | | | | | | | | | | | 237,689,190 | |
| | | | |
| | 265,995 | | | Taubman Centers Inc., (2) | | | | | | | | | | | 17,404,053 | |
| | | | |
| | 5,720 | | | Urban Edge Properties | | | | | | | | | | | 145,803 | |
| | | | |
| | 219,137 | | | Urstadt Biddle Properties Inc. | | | | | | | | | | | 4,764,038 | |
| | | | Total Retail | | | | | | | | | | | 636,713,624 | |
| | | | |
| | | | Specialized – 16.8% | | | | | | | | | |
| | | | |
| | 581,543 | | | American Tower Corporation, REIT | | | | | | | | | | | 82,968,740 | |
| | | | |
| | 263,142 | | | CatchMark Timber Trust Inc., Class A | | | | | | | | | | | 3,455,054 | |
| | | | |
| | 139,325 | | | Coresite Realty Corporation | | | | | | | | | | | 15,869,118 | |
| | | | |
| | 972,086 | | | CubeSmart | | | | | | | | | | | 28,112,727 | |
| | | | |
| | 589,855 | | | CyrusOne Inc. | | | | | | | | | | | 35,114,068 | |
| | | | |
| | 1,064,091 | | | Digital Realty Trust Inc. | | | | | | | | | | | 121,199,965 | |
| | | | |
| | 327,439 | | | Equinix Inc. | | | | | | | | | | | 148,401,904 | |
| | | | |
| | 699 | | | Extra Space Storage Inc. | | | | | | | | | | | 61,128 | |
| | | | |
| | 261,684 | | | Gaming and Leisure Properties Inc. | | | | | | | | | | | 9,682,308 | |
| | | | |
| | 435,217 | | | Iron Mountain Inc. | | | | | | | | | | | 16,420,737 | |
| | | | |
| | 7,849 | | | Life Storage, Inc. | | | | | | | | | | | 699,110 | |
| | | | |
| | 71,599 | | | National Storage Affiliates Trust | | | | | | | | | | | 1,951,789 | |
| | | | |
| | 788,509 | | | Public Storage, Inc. | | | | | | | | | | | 164,798,381 | |
| | | | |
| | 58,142 | | | SBA Communications Corporation, (3) | | | | | | | | | | | 9,498,077 | |
| | | | Total Specialized | | | | | | | | | | | 638,233,106 | |
| | | | Total Long-Term Investments (cost $2,995,319,830) | | | | | | | | | | | 3,711,844,189 | |
| | | | | | | | | | | | | | | | |
| Shares | | | Description (1) | | Coupon | | | | | | Value | |
| | | | |
| | | | INVESTMENTS PURCHASED WITH COLLATERAL FROM SECURITIES LENDING – 0.1% | | | | | | | | | | | | |
| | | | |
| | | | Money Market Funds – 0.1% | | | | | | | | | |
| | | | |
| | 2,723,550 | | | First American Government Obligations Fund, Class X, (4) | | | 1.196% (5) | | | | | | | $ | 2,723,550 | |
| | | | Total Investments Purchased with Collateral from Securities Lending (cost $2,723,550) | | | | 2,723,550 | |
| | | | |
| Shares | | | Description (1) | | Coupon | | | | | | Value | |
| | | | |
| | | | SHORT-TERM INVESTMENTS – 1.3% | | | | | | | | | | | | |
| | | | |
| | | | Money Market Funds – 1.3% | | | | | | | | | |
| | | | |
| | 48,038,384 | | | First American Treasury Obligations Fund, Class Z | | | 1.181% (5) | | | | | | | $ | 48,038,384 | |
| | | | Total Short-Term Investments (cost $48,038,384) | | | | | | | | | | | 48,038,384 | |
| | | | Total Investments (cost $3,046,081,764) – 99.4% | | | | | | | | | | | 3,762,606,123 | |
| | | | Other Assets Less Liabilities – 0.6% | | | | | | | | | | | 24,147,100 | |
| | | | Net Assets – 100% | | | | | | | | | | $ | 3,786,753,223 | |
For Fund portfolio compliance purposes, the Fund’s industry classifications refer to any one or more of the industry sub-classifications used by one or more widely recognized market indexes or ratings group indexes, and/or as defined by Fund management. This definition may not apply for purposes of this report, which may combine industry sub-classifications into sectors for reporting ease.
| (1) | All percentages shown in the Portfolio of Investments are based on net assets. |
| (2) | Investment, or a portion of investment, is out on loan for securities lending. The total value of the securities out on loan as of the end of the reporting period was $2,674,256. |
| (3) | Non-income producing; issuer has not declared a dividend within the past twelve months. |
| (4) | The Fund may loan securities representing up to one third of the fair value of its total assets (which includes collateral for securities on loan) to broker dealers, banks, and other institutions. The Fund maintains collateral equal to at least 100% of the fair value of the securities loaned. The cash collateral received by the Fund is invested in this money market fund. See Notes to Financial Statements, Note 3 – Portfolio Securities and Investments in Derivatives, Securities Lending for more information. |
| (5) | The rate shown is the annualized seven-day subsidized yield as of the end of the reporting period. |
| REIT | Real Estate Investment Trust |
See accompanying notes to financial statements.
Statement of
| | | | |
| | Assets and Liabilities | | December 31, 2017 |
| | | | | | | | | | | | |
| | | Global
Infrastructure | | | Real
Asset Income | | | Real Estate
Securities | |
Assets | | | | | | | | | | | | |
Long-term investments, at value (cost $490,487,650, $1,992,706,107 and $2,995,319,830, respectively) | | $ | 596,726,738 | | | $ | 2,070,834,108 | | | $ | 3,711,844,189 | |
Short-term investments, at value (cost approximates value) | | | 9,360,548 | | | | 14,030,020 | | | | 48,038,384 | |
Investments purchased with collateral from securities lending, at value (cost approximates value) | | | — | | | | — | | | | 2,723,550 | |
Cash | | | 36,410 | | | | 81,119 | | | | — | |
Cash collateral at brokers for investments in futures contracts(1) | | | — | | | | 1,060,000 | | | | — | |
Cash denominated in foreign currencies (cost $70,993, $515,132 and $—, respectively) | | | 70,984 | | | | 516,287 | | | | — | |
Receivable for: | | | | | | | | | | | | |
Dividends | | | 1,245,798 | | | | 8,597,103 | | | | 21,201,982 | |
Due from broker | | | — | | | | — | | | | 2,615 | |
Interest | | | 421 | | | | 10,697,215 | | | | 66,443 | |
Investments sold | | | 17,463,386 | | | | 10,794,098 | | | | 49,594,130 | |
Reclaims | | | 201,213 | | | | 173,253 | | | | 46,604 | |
Shares sold | | | 2,089,253 | | | | 7,965,005 | | | | 12,131,916 | |
Other assets | | | 52,205 | | | | 100,135 | | | | 285,586 | |
Total assets | | | 627,246,956 | | | | 2,124,848,343 | | | | 3,845,935,399 | |
Liabilities | | | | | | | | | | | | |
Payable for: | | | | | | | | | | | | |
Collateral from securities lending program | | | — | | | | — | | | | 2,723,550 | |
Dividends | | | — | | | | 640,598 | | | | 4,098 | |
Investments purchased | | | 16,051,605 | | | | 13,276,690 | | | | 24,922,400 | |
Shares redeemed | | | 631,643 | | | | 4,534,454 | | | | 26,220,758 | |
Variation margin on futures contracts | | | — | | | | 140,609 | | | | — | |
Accrued expenses: | | | | | | | | | | | | |
Directors fees | | | 31,954 | | | | 46,458 | | | | 265,198 | |
Management fees | | | 315,617 | | | | 1,297,148 | | | | 2,709,962 | |
12b-1 distribution and service fees | | | 43,583 | | | | 251,044 | | | | 173,083 | |
Other | | | 568,566 | | | | 911,762 | | | | 2,163,127 | |
Total liabilities | | | 17,642,968 | | | | 21,098,763 | | | | 59,182,176 | |
Net assets | | $ | 609,603,988 | | | $ | 2,103,749,580 | | | $ | 3,786,753,223 | |
Class A Shares | | | | | | | | | | | | |
Net assets | | $ | 87,875,951 | | | $ | 225,281,589 | | | $ | 459,034,391 | |
Shares outstanding | | | 8,036,945 | | | | 9,331,479 | | | | 22,694,813 | |
Net asset value (“NAV”) per share | | $ | 10.93 | | | $ | 24.14 | | | $ | 20.23 | |
Offering price per share (NAV per share plus maximum sales charge of 5.75% of offering price) | | $ | 11.60 | | | $ | 25.61 | | | $ | 21.46 | |
Class C Shares | | | | | | | | | | | | |
Net assets | | $ | 29,227,335 | | | $ | 241,843,846 | | | $ | 66,953,082 | |
Shares outstanding | | | 2,694,084 | | | | 10,013,819 | | | | 3,409,900 | |
NAV and offering price per share | | $ | 10.85 | | | $ | 24.15 | | | $ | 19.63 | |
Class R3 Shares | | | | | | | | | | | | |
Net assets | | $ | 337,082 | | | $ | — | | | $ | 36,829,033 | |
Shares outstanding | | | 30,342 | | | | — | | | | 1,791,639 | |
NAV and offering price per share | | $ | 11.11 | | | $ | — | | | $ | 20.56 | |
Class R6 Shares | | | | | | | | | | | | |
Net assets | | $ | 19,574,622 | | | $ | 29,332,137 | | | $ | 277,978,072 | |
Shares outstanding | | | 1,794,668 | | | | 1,210,305 | | | | 13,398,659 | |
NAV and offering price per share | | $ | 10.91 | | | $ | 24.24 | | | $ | 20.75 | |
Class I Shares | | | | | | | | | | | | |
Net assets | | $ | 472,564,315 | | | $ | 1,607,266,710 | | | $ | 2,945,935,401 | |
Shares outstanding | | | 43,379,337 | | | | 66,575,401 | | | | 143,328,406 | |
NAV and offering price per share | | $ | 10.89 | | | $ | 24.14 | | | $ | 20.55 | |
Class T Shares(2) | | | | | | | | | | | | |
Net assets | | $ | 24,683 | | | $ | 25,298 | | | $ | 23,244 | |
Shares outstanding | | | 2,264 | | | | 1,048 | | | | 1,131 | |
NAV per share | | $ | 10.90 | | | $ | 24.14 | | | $ | 20.56 | |
Offering price per share (NAV per share plus maximum sales charge of 2.50% of offering price) | | $ | 11.18 | | | $ | 24.76 | | | $ | 21.09 | |
See accompanying notes to financial statements.
| | | | | | | | | | | | |
| | | Global
Infrastructure | | | Real
Asset Income | | | Real Estate
Securities | |
Net assets consist of: | | | | | | | | | | | | |
Capital paid-in | | $ | 512,125,031 | | | $ | 2,059,632,338 | | | $ | 3,096,241,761 | |
Undistributed (Over-distribution of) net investment income | | | (1,559,143 | ) | | | (17,776,791 | ) | | | (9,279,223 | ) |
Accumulated net realized gain (loss) | | | (7,183,108 | ) | | | (16,367,959 | ) | | | (16,735,889 | ) |
Net unrealized appreciation (depreciation) | | | 106,221,208 | | | | 78,261,992 | | | | 716,526,574 | |
Net assets | | $ | 609,603,988 | | | $ | 2,103,749,580 | | | $ | 3,786,753,223 | |
Authorized shares – per class | | | 2 billion | | | | 2 billion | | | | 2 billion | |
Par value per share | | $ | 0.0001 | | | $ | 0.0001 | | | $ | 0.0001 | |
| (1) | Cash pledged to collateralize the net payment obligations for investments in futures contracts. |
| (2) | Class T shares are not available for public offering. |
See accompanying notes to financial statements.
Statement of
| | | | |
| | Operations | | Year Ended December 31, 2017 |
| | | | | | | | | | | | |
| | | Global
Infrastructure | | | Real
Asset Income | | | Real
Estate Securities | |
Investment Income | | | | | | | | | | | | |
Dividend (net of foreign tax withheld of $1,421,709, $2,389,009 and $120,559, respectively) | | $ | 20,618,201 | | | $ | 73,076,237 | | | $ | 116,239,141 | |
Interest (net of foreign tax withheld of $—, $11,555 and $—, respectively) | | | 110,783 | | | | 27,923,802 | | | | 603,678 | |
Securities lending income | | | — | | | | — | | | | 26,301 | |
Total investment income | | | 20,728,984 | | | | 101,000,039 | | | | 116,869,120 | |
Expenses | | | | | | | | | | | | |
Management fees | | | 5,637,211 | | | | 12,494,679 | | | | 34,295,227 | |
12b-1 service fees – Class A Shares | | | 207,526 | | | | 534,822 | | | | 1,366,769 | |
12b-1 distribution and service fees – Class C Shares | | | 275,304 | | | | 2,171,358 | | | | 789,708 | |
12b-1 distribution and service fees – Class R3 Shares | | | 2,948 | | | | — | | | | 221,377 | |
12b-1 distribution and service fees – Class T Shares(1) | | | 38 | | | | 36 | | | | 37 | |
Shareholder servicing agent fees | | | 1,058,581 | | | | 1,568,158 | | | | 6,685,422 | |
Custodian fees | | | 337,659 | | | | 441,615 | | | | 412,266 | |
Directors fees | | | 19,877 | | | | 58,163 | | | | 136,028 | |
Professional fees | | | 89,422 | | | | 118,491 | | | | 291,008 | |
Shareholder reporting expenses | | | 65,774 | | | | 596,705 | | | | 769,711 | |
Federal and state registration fees | | | 104,382 | | | | 253,006 | | | | 139,329 | |
Other | | | 21,052 | | | | 27,942 | | | | 59,265 | |
Total expenses before fee waiver/expense reimbursement | | | 7,819,774 | | | | 18,264,975 | | | | 45,166,147 | |
Fee waiver/expense reimbursement | | | (1,272,992 | ) | | | — | | | | — | |
Net expenses | | | 6,546,782 | | | | 18,264,975 | | | | 45,166,147 | |
Net investment income (loss) | | | 14,182,202 | | | | 82,735,064 | | | | 71,702,973 | |
Realized and Unrealized Gain (Loss) | | | | | | | | | | | | |
Net realized gain (loss) from: | | | | | | | | | | | | |
Investments and foreign currency | | | 34,485,700 | | | | 22,133,762 | | | | 509,608,165 | |
Futures contracts | | | — | | | | (1,474,938 | ) | | | — | |
Change in net unrealized appreciation (depreciation) of: | | | | | | | | | | | | |
Investments and foreign currency | | | 55,311,953 | | | | 81,496,437 | | | | (357,541,933 | ) |
Futures contracts | | | — | | | | 164,232 | | | | — | |
Net realized and unrealized gain (loss) | | | 89,797,653 | | | | 102,319,493 | | | | 152,066,232 | |
Net increase (decrease) in net assets from operations | | $ | 103,979,855 | | | $ | 185,054,557 | | | $ | 223,769,205 | |
| (1) | Class T shares are not available for public offering. |
See accompanying notes to financial statements.
Statement of
| | | | | | | | | | | | | | | | | | | | |
| | | Global Infrastructure | | | | | | Real Asset Income | |
| | | Year Ended
12/31/17 | | | Year Ended
12/31/16 | | | | | | Year Ended
12/31/17 | | | Year Ended
12/31/16 | |
Operations | | | | | | | | | | | | | | | | | | | | |
Net investment income (loss) | | $ | 14,182,202 | | | $ | 13,385,629 | | | | | | | $ | 82,735,064 | | | $ | 48,578,772 | |
Net realized gain (loss) from: | | | | | | | | | | | | | | | | | | | | |
Investments and foreign currency | | | 34,485,700 | | | | 17,484,759 | | | | | | | | 22,133,762 | | | | (7,604,540 | ) |
Futures contracts | | | — | | | | — | | | | | | | | (1,474,938 | ) | | | 298,789 | |
Change in net unrealized appreciation (depreciation) of: | | | | | | | | | | | | | | | | | | | | |
Investments and foreign currency | | | 55,311,953 | | | | 26,962,900 | | | | | | | | 81,496,437 | | | | 35,725,297 | |
Futures contracts | | | — | | | | — | | | | | | | | 164,232 | | | | (60,312 | ) |
Net increase (decrease) in net assets from operations | | | 103,979,855 | | | | 57,833,288 | | | | | | | | 185,054,557 | | | | 76,938,006 | |
Distributions to Shareholders | | | | | | | | | | | | | | | | | | | | |
From net investment income: | | | | | | | | | | | | | | | | | | | | |
Class A Shares | | | (1,786,862 | ) | | | (2,014,559 | ) | | | | | | | (11,889,954 | ) | | | (9,520,295 | ) |
Class C Shares | | | (381,137 | ) | | | (514,945 | ) | | | | | | | (10,520,728 | ) | | | (6,288,827 | ) |
Class R3 Shares | | | (5,403 | ) | | | (20,108 | ) | | | | | | | — | | | | — | |
Class R6 Shares | | | (465,059 | ) | | | (265,656 | ) | | | | | | | (866,572 | ) | | | (160,669 | ) |
Class I Shares | | | (10,725,425 | ) | | | (10,851,267 | ) | | | | | | | (75,567,965 | ) | | | (34,064,245 | ) |
Class T Shares(1) | | | (530 | ) | | | — | | | | | | | | (868 | ) | | | — | |
From accumulated net realized gains: | | | | | | | | | | | | | | | | | | | | |
Class A Shares | | | (3,143,477 | ) | | | (2,826,222 | ) | | | | | | | — | | | | — | |
Class C Shares | | | (1,055,878 | ) | | | (1,101,213 | ) | | | | | | | — | | | | — | |
Class R3 Shares | | | (12,352 | ) | | | (33,392 | ) | | | | | | | — | | | | — | |
Class R6 Shares | | | (689,041 | ) | | | (382,645 | ) | | | | | | | — | | | | — | |
Class I Shares | | | (17,143,256 | ) | | | (15,447,553 | ) | | | | | | | — | | | | — | |
Class T Shares(1) | | | (932 | ) | | | — | | | | | | | | — | | | | — | |
Return of capital: | | | | | | | | | | | | | | | | | | | | |
Class A Shares | | | — | | | | — | | | | | | | | — | | | | (583,101 | ) |
Class C Shares | | | — | | | | — | | | | | | | | — | | | | (454,517 | ) |
Class R3 Shares | | | — | | | | — | | | | | | | | — | | | | — | |
Class R6 Shares | | | — | | | | — | | | | | | | | — | | | | (22,047 | ) |
Class I Shares | | | — | | | | — | | | | | | | | — | | | | (1,983,562 | ) |
Class T Shares(1) | | | — | | | | — | | | | | | | | — | | | | — | |
Decrease in net assets from distributions to shareholders | | | (35,409,352 | ) | | | (33,457,560 | ) | | | | | | | (98,846,087 | ) | | | (53,077,263 | ) |
Fund Share Transactions | | | | | | | | | | | | | | | | | | | | |
Proceeds from sale of shares | | | 402,437,948 | | | | 166,091,008 | | | | | | | | 1,113,449,576 | | | | 668,957,937 | |
Proceeds from shares issued to shareholders due to reinvestment of distributions | | | 24,729,268 | | | | 20,959,883 | | | | | | | | 91,668,223 | | | | 49,515,897 | |
| | | 427,167,216 | | | | 187,050,891 | | | | | | | | 1,205,117,799 | | | | 718,473,834 | |
Cost of shares redeemed | | | (301,532,839 | ) | | | (426,771,123 | ) | | | | | | | (458,636,990 | ) | | | (316,788,188 | ) |
Net increase (decrease) in net assets from Fund share transactions | | | 125,634,377 | | | | (239,720,232 | ) | | | | | | | 746,480,809 | | | | 401,685,646 | |
Net increase (decrease) in net assets | | | 194,204,880 | | | | (215,344,504 | ) | | | | | | | 832,689,279 | | | | 425,546,389 | |
Net assets at the beginning of period | | | 415,399,108 | | | | 630,743,612 | | | | | | | | 1,271,060,301 | | | | 845,513,912 | |
Net assets at the end of period | | $ | 609,603,988 | | | $ | 415,399,108 | | | | | | | $ | 2,103,749,580 | | | $ | 1,271,060,301 | |
Undistributed (Over-distribution of) net investment income at the end of period | | $ | (1,559,143 | ) | | $ | (640,960 | ) | | | | | | $ | (17,776,791 | ) | | $ | (2,742,160 | ) |
| (1) | Class T shares are not available for public offering. |
See accompanying notes to financial statements.
Statement of Changes in Net Assets (continued)
| | | | | | | | |
| | | Real Estate Securities | |
| | | Year Ended
12/31/17 | | | Year Ended
12/31/16 | |
Operations | | | | | | | | |
Net investment income (loss) | | $ | 71,702,973 | | | $ | 75,469,362 | |
Net realized gain (loss) from: | | | | | | | | |
Investments and foreign currency | | | 509,608,165 | | | | 347,129,624 | |
Futures contracts | | | — | | | | — | |
Change in net unrealized appreciation (depreciation) of: | | | | | | | | |
Investments and foreign currency | | | (357,541,933 | ) | | | (121,760,330 | ) |
Futures contracts | | | — | | | | — | |
Net increase (decrease) in net assets from operations | | | 223,769,205 | | | | 300,838,656 | |
Distributions to Shareholders | | | | | | | | |
From net investment income: | | | | | | | | |
Class A Shares | | | (8,821,795 | ) | | | (9,663,575 | ) |
Class C Shares | | | (687,996 | ) | | | (535,203 | ) |
Class R3 Shares | | | (604,809 | ) | | | (705,167 | ) |
Class R6 Shares | | | (5,200,299 | ) | | | (4,932,521 | ) |
Class I Shares | | | (62,520,427 | ) | | | (60,167,816 | ) |
Class T Shares(1) | | | (302 | ) | | | — | |
From accumulated net realized gains: | | | | | | | | |
Class A Shares | | | (48,611,490 | ) | | | (60,499,061 | ) |
Class C Shares | | | (7,546,887 | ) | | | (8,266,798 | ) |
Class R3 Shares | | | (3,883,041 | ) | | | (4,721,116 | ) |
Class R6 Shares | | | (28,246,190 | ) | | | (25,948,085 | ) |
Class I Shares | | | (311,294,960 | ) | | | (315,591,167 | ) |
Class T Shares(1) | | | (2,627 | ) | | | — | |
Return of capital: | | | | | | | | |
Class A Shares | | | — | | | | — | |
Class C Shares | | | — | | | | — | |
Class R3 Shares | | | — | | | | — | |
Class R6 Shares | | | — | | | | — | |
Class I Shares | | | — | | | | — | |
Class T Shares(1) | | | — | | | | — | |
Decrease in net assets from distributions to shareholders | | | (477,420,823 | ) | | | (491,030,509 | ) |
Fund Share Transactions | | | | | | | | |
Proceeds from sale of shares | | | 1,001,907,714 | | | | 1,348,388,830 | |
Proceeds from shares issued to shareholders due to reinvestment of distributions | | | 379,758,213 | | | | 381,812,671 | |
| | | 1,381,665,927 | | | | 1,730,201,501 | |
Cost of shares redeemed | | | (1,968,091,405 | ) | | | (1,674,627,567 | ) |
Net increase (decrease) in net assets from Fund share transactions | | | (586,425,478 | ) | | | 55,573,934 | |
Net increase (decrease) in net assets | | | (840,077,096 | ) | | | (134,617,919 | ) |
Net assets at the beginning of period | | | 4,626,830,319 | | | | 4,761,448,238 | |
Net assets at the end of period | | $ | 3,786,753,223 | | | $ | 4,626,830,319 | |
Undistributed (Over-distribution of) net investment income at the end of period | | $ | (9,279,223 | ) | | $ | (3,193,974 | ) |
| (1) | Class T shares are not available for public offering. |
See accompanying notes to financial statements.
THIS PAGE INTENTIONALLY LEFT BLANK
Financial
Highlights
Global Infrastructure
Selected data for a share outstanding throughout each period:
| | | | | | | | | | | | | | | | | | | | | | | | | | | | | | | | | | | | |
| | | | |
| | | | Investment Operations | | | | | | Less Distributions | | | | |
| | | | | | | | | |
Class (Commencement Date) Year Ended December 31, | | Beginning
NAV | | | Net
Investment
Income
(Loss)(a) | | | Net
Realized/
Unrealized
Gain (Loss) | | | Total | | | | | | From
Net
Investment
Income | | | From
Accumulated
Net Realized
Gains | | | Total | | | Ending
NAV | |
Class A (12/07) | | | | | | | | | | | | | | | | | | | | | | | | | | | | | | | | | |
2017 | | $ | 9.69 | | | $ | 0.22 | | | $ | 1.66 | | | $ | 1.88 | | | | | | | $ | (0.23 | ) | | $ | (0.41 | ) | | $ | (0.64 | ) | | $ | 10.93 | |
2016 | | | 9.75 | | | | 0.25 | | | | 0.49 | | | | 0.74 | | | | | | | | (0.30 | ) | | | (0.50 | ) | | | (0.80 | ) | | | 9.69 | |
2015 | | | 10.79 | | | | 0.19 | | | | (0.93 | ) | | | (0.74 | ) | | | | | | | (0.20 | ) | | | (0.10 | ) | | | (0.30 | ) | | | 9.75 | |
2014 | | | 10.35 | | | | 0.20 | | | | 1.24 | | | | 1.44 | | | | | | | | (0.16 | ) | | | (0.84 | ) | | | (1.00 | ) | | | 10.79 | |
2013 | | | 9.56 | | | | 0.21 | | | | 1.17 | | | | 1.38 | | | | | | | | (0.16 | ) | | | (0.43 | ) | | | (0.59 | ) | | | 10.35 | |
Class C (11/08) | | | | | | | | | | | | | | | | | | | | | | | | | | | | | | | | | |
2017 | | | 9.62 | | | | 0.14 | | | | 1.65 | | | | 1.79 | | | | | | | | (0.15 | ) | | | (0.41 | ) | | | (0.56 | ) | | | 10.85 | |
2016 | | | 9.69 | | | | 0.16 | | | | 0.49 | | | | 0.65 | | | | | | | | (0.22 | ) | | | (0.50 | ) | | | (0.72 | ) | | | 9.62 | |
2015 | | | 10.71 | | | | 0.11 | | | | (0.91 | ) | | | (0.80 | ) | | | | | | | (0.12 | ) | | | (0.10 | ) | | | (0.22 | ) | | | 9.69 | |
2014 | | | 10.27 | | | | 0.11 | | | | 1.23 | | | | 1.34 | | | | | | | | (0.06 | ) | | | (0.84 | ) | | | (0.90 | ) | | | 10.71 | |
2013 | | | 9.49 | | | | 0.13 | | | | 1.17 | | | | 1.30 | | | | | | | | (0.09 | ) | | | (0.43 | ) | | | (0.52 | ) | | | 10.27 | |
Class R3 (11/08) | | | | | | | | | | | | | | | | | | | | | | | | | | | | | | | | | |
2017 | | | 9.85 | | | | 0.20 | | | | 1.68 | | | | 1.88 | | | | | | | | (0.21 | ) | | | (0.41 | ) | | | (0.62 | ) | | | 11.11 | |
2016 | | | 9.90 | | | | 0.22 | | | | 0.51 | | | | 0.73 | | | | | | | | (0.28 | ) | | | (0.50 | ) | | | (0.78 | ) | | | 9.85 | |
2015 | | | 10.95 | | | | 0.17 | | | | (0.95 | ) | | | (0.78 | ) | | | | | | | (0.17 | ) | | | (0.10 | ) | | | (0.27 | ) | | | 9.90 | |
2014 | | | 10.48 | | | | 0.18 | | | | 1.25 | | | | 1.43 | | | | | | | | (0.12 | ) | | | (0.84 | ) | | | (0.96 | ) | | | 10.95 | |
2013 | | | 9.68 | | | | 0.19 | | | | 1.18 | | | | 1.37 | | | | | | | | (0.14 | ) | | | (0.43 | ) | | | (0.57 | ) | | | 10.48 | |
Class R6 (6/16) | | | | | | | | | | | | | | | | | | | | | | | | | | | | | | | | | | | | |
2017 | | | 9.65 | | | | 0.27 | | | | 1.66 | | | | 1.93 | | | | | | | | (0.26 | ) | | | (0.41 | ) | | | (0.67 | ) | | | 10.91 | |
2016(e) | | | 11.06 | | | | 0.11 | | | | (0.67 | ) | | | (0.56 | ) | | | | | | | (0.35 | ) | | | (0.50 | ) | | | (0.85 | ) | | | 9.65 | |
Class I (12/07) | | | | | | | | | | | | | | | | | | | | | | | | | | | | | | | | | |
2017 | | | 9.66 | | | | 0.26 | | | | 1.64 | | | | 1.90 | | | | | | | | (0.26 | ) | | | (0.41 | ) | | | (0.67 | ) | | | 10.89 | |
2016 | | | 9.73 | | | | 0.27 | | | | 0.50 | | | | 0.77 | | | | | | | | (0.34 | ) | | | (0.50 | ) | | | (0.84 | ) | | | 9.66 | |
2015 | | | 10.77 | | | | 0.22 | | | | (0.94 | ) | | | (0.72 | ) | | | | | | | (0.22 | ) | | | (0.10 | ) | | | (0.32 | ) | | | 9.73 | |
2014 | | | 10.35 | | | | 0.21 | | | | 1.26 | | | | 1.47 | | | | | | | | (0.21 | ) | | | (0.84 | ) | | | (1.05 | ) | | | 10.77 | |
2013 | | | 9.57 | | | | 0.24 | | | | 1.17 | | | | 1.41 | | | | | | | | (0.20 | ) | | | (0.43 | ) | | | (0.63 | ) | | | 10.35 | |
Class T (5/17)(f) | | | | | | | | | | | | | | | | | | | | | | | | | | | | | | | | | | | | |
2017(g) | | | 11.04 | | | | 0.12 | | | | 0.39 | | | | 0.51 | | | | | | | | (0.24 | ) | | | (0.41 | ) | | | (0.65 | ) | | | 10.90 | |
| | | | | | | | | | | | | | | | | | | | | | | | | | | | | | | | | | |
| | | | Ratios/Supplemental Data | |
| | | | | | | | | | Ratios to Average
Net Assets Before
Waiver/Reimbursement | | | | | | Ratios to Average
Net Assets After
Waiver/Reimbursement(c) | | | | |
| | | | | | | | |
Total
Return(b) | | | Ending
Net
Assets
(000) | | | | | | Expenses | | | Net
Investment
Income
(Loss) | | | | | | Expenses | | | Net
Investment
Income
(Loss) | | | Portfolio
Turnover
Rate(d) | |
| | | | | | | | | | | | | | | | | | | | | | | | | | | | | | | | | | |
| | 19.38 | % | | $ | 87,876 | | | | | | | | 1.42 | % | | | 1.85 | % | | | | | | | 1.22 | % | | | 2.05 | % | | | 161 | % |
| | 7.61 | | | | 70,173 | | | | | | | | 1.45 | | | | 2.20 | | | | | | | | 1.22 | | | | 2.42 | | | | 149 | |
| | (6.89 | ) | | | 287,424 | | | | | | | | 1.45 | | | | 1.59 | | | | | | | | 1.22 | | | | 1.82 | | | | 133 | |
| | 14.11 | | | | 268,672 | | | | | | | | 1.43 | | | | 1.57 | | | | | | | | 1.22 | | | | 1.77 | | | | 162 | |
| | 14.73 | | | | 107,137 | | | | | | | | 1.43 | | | | 1.87 | | | | | | | | 1.23 | | | | 2.07 | | | | 166 | |
| | | | | | | | | | | | | | | | | | | | | | | | | | | | | | | | | | |
| | 18.55 | | | | 29,227 | | | | | | | | 2.17 | | | | 1.11 | | | | | | | | 1.97 | | | | 1.31 | | | | 161 | |
| | 6.71 | | | | 22,868 | | | | | | | | 2.21 | | | | 1.30 | | | | | | | | 1.97 | | | | 1.53 | | | | 149 | |
| | (7.50 | ) | | | 22,307 | | | | | | | | 2.20 | | | | 0.83 | | | | | | | | 1.97 | | | | 1.05 | | | | 133 | |
| | 13.28 | | | | 24,820 | | | | | | | | 2.18 | | | | 0.74 | | | | | | | | 1.97 | | | | 0.95 | | | | 162 | |
| | 13.90 | | | | 20,127 | | | | | | | | 2.18 | | | | 1.11 | | | | | | | | 1.98 | | | | 1.31 | | | | 166 | |
| | | | | | | | | | | | | | | | | | | | | | | | | | | | | | | | | | |
| | 19.03 | | | | 337 | | | | | | | | 1.67 | | | | 1.63 | | | | | | | | 1.47 | | | | 1.83 | | | | 161 | |
| | 7.37 | | | | 730 | | | | | | | | 1.71 | | | | 1.81 | | | | | | | | 1.47 | | | | 2.04 | | | | 149 | |
| | (7.10 | ) | | | 607 | | | | | | | | 1.70 | | | | 1.39 | | | | | | | | 1.47 | | | | 1.62 | | | | 133 | |
| | 13.86 | | | | 399 | | | | | | | | 1.68 | | | | 1.33 | | | | | | | | 1.47 | | | | 1.54 | | | | 162 | |
| | 14.40 | | | | 138 | | | | | | | | 1.67 | | | | 1.61 | | | | | | | | 1.48 | | | | 1.81 | | | | 166 | |
| | | | | | | | | | | | | | | | | | | | | | | | | | | | | | | | | | |
| | 19.95 | | | | 19,575 | | | | | | | | 1.02 | | | | 2.24 | | | | | | | | 0.80 | | | | 2.46 | | | | 161 | |
| | (5.08 | ) | | | 7,627 | | | | | | | | 1.09 | * | | | 1.78 | * | | | | | | | 0.86 | * | | | 2.02 | * | | | 149 | |
| | | | | | | | | | | | | | | | | | | | | | | | | | | | | | | | | | |
| | 19.61 | | | | 472,564 | | | | | | | | 1.17 | | | | 2.14 | | | | | | | | 0.97 | | | | 2.34 | | | | 161 | |
| | 7.91 | | | | 314,001 | | | | | | | | 1.20 | | | | 2.30 | | | | | | | | 0.97 | | | | 2.54 | | | | 149 | |
| | (6.67 | ) | | | 320,406 | | | | | | | | 1.20 | | | | 1.83 | | | | | | | | 0.97 | | | | 2.05 | | | | 133 | |
| | 14.46 | | | | 374,631 | | | | | | | | 1.18 | | | | 1.68 | | | | | | | | 0.97 | | | | 1.88 | | | | 162 | |
| | 15.03 | | | | 525,149 | | | | | | | | 1.18 | | | | 2.12 | | | | | | | | 0.98 | | | | 2.33 | | | | 166 | |
| | | | | | | | | | | | | | | | | | | | | | | | | | | | | | | | | | |
| | 4.58 | | | | 25 | | | | | | | | 1.44 | * | | | 1.55 | * | | | | | | | 1.22 | * | | | 1.76 | * | | | 161 | |
| (a) | Per share Net Investment Income (Loss) is calculated using the average daily shares method. | |
| (b) | Total return is the combination of changes in NAV without any sales charge, reinvested dividend income at NAV and reinvested capital gains distributions at NAV, if any. Total returns are not annualized. | |
| (c) | After fee waiver and/or expense reimbursement from the Adviser, where applicable. | |
| (d) | Portfolio Turnover Rate is calculated based on the lesser of long-term purchases or sales (as disclosed in Note 5 – Investment Transactions) divided by the average long-term market value during the period. | |
| (e) | For the period June 30, 2016 (commencement of operations) through December 31, 2016. | |
| (f) | Class T shares are not available for public offering. | |
| (g) | For the period May 31, 2017 (commencement of operations) through December 31, 2017. | |
See accompanying notes to financial statements.
Financial Highlights (continued)
Real Asset Income
Selected data for a share outstanding throughout each period:
| | | | | | | | | | | | | | | | | | | | | | | | | | | | | | | | | | | | | | | | |
| | | | | |
| | | | | | Investment Operations | | | | | | Less Distributions | | | | |
| | | | | | | | | | |
Class (Commencement Date) Year Ended December 31, | | Beginning
NAV | | | Net
Investment
Income
(Loss)(a) | | | Net
Realized/
Unrealized
Gain (Loss) | | | Total | | | | | | From
Net
Investment
Income | | | From
Accumulated
Net Realized
Gains | | | Return
of
Capital | | | Total | | | Ending
NAV | |
Class A (9/11) | | | | | | | | | | | | | | | | | | | | | | | | | | | | | | | | | | | | | |
2017 | | $ | 22.76 | | | $ | 1.11 | | | $ | 1.59 | | | $ | 2.70 | | | | | | | $ | (1.32 | ) | | $ | — | | | $ | — | | | $ | (1.32 | ) | | $ | 24.14 | |
2016 | | | 21.87 | | | | 1.08 | | | | 1.00 | | | | 2.08 | | | | | | | | (1.12 | ) | | | — | | | | (0.07 | ) | | | (1.19 | ) | | | 22.76 | |
2015 | | | 23.78 | | | | 1.08 | | | | (1.80 | ) | | | (0.72 | ) | | | | | | | (1.08 | ) | | | (0.01 | ) | | | (0.10 | ) | | | (1.19 | ) | | | 21.87 | |
2014 | | | 22.01 | | | | 1.15 | | | | 2.18 | | | | 3.33 | | | | | | | | (1.16 | ) | | | (0.40 | ) | | | — | | | | (1.56 | ) | | | 23.78 | |
2013 | | | 22.27 | | | | 1.14 | | | | 0.21 | | | | 1.35 | | | | | | | | (1.12 | ) | | | (0.49 | ) | | | — | | | | (1.61 | ) | | | 22.01 | |
Class C (9/11) | | | | | | | | | | | | | | | | | | | | | | | | | | | | | | | | | | | | | |
2017 | | | 22.77 | | | | 0.94 | | | | 1.59 | | | | 2.53 | | | | | | | | (1.15 | ) | | | — | | | | — | | | | (1.15 | ) | | | 24.15 | |
2016 | | | 21.89 | | | | 0.91 | | | | 0.99 | | | | 1.90 | | | | | | | | (0.95 | ) | | | — | | | | (0.07 | ) | | | (1.02 | ) | | | 22.77 | |
2015 | | | 23.79 | | | | 0.92 | | | | (1.81 | ) | | | (0.89 | ) | | | | | | | (0.90 | ) | | | (0.01 | ) | | | (0.10 | ) | | | (1.01 | ) | | | 21.89 | |
2014 | | | 22.01 | | | | 0.98 | | | | 2.18 | | | | 3.16 | | | | | | | | (0.98 | ) | | | (0.40 | ) | | | — | | | | (1.38 | ) | | | 23.79 | |
2013 | | | 22.26 | | | | 0.99 | | | | 0.19 | | | | 1.18 | | | | | | | | (0.94 | ) | | | (0.49 | ) | | | — | | | | (1.43 | ) | | | 22.01 | |
Class R6 (6/16) | | | | | | | | | | | | | | | | | | | | | | | | | | | | | | | | | | | | | | | | |
2017 | | | 22.83 | | | | 1.22 | | | | 1.58 | | | | 2.80 | | | | | | | | (1.39 | ) | | | — | | | | — | | | | (1.39 | ) | | | 24.24 | |
2016(e) | | | 23.49 | | | | 0.48 | | | | (0.57 | ) | | | (0.09 | ) | | | | | | | (0.50 | ) | | | — | | | | (0.07 | ) | | | (0.57 | ) | | | 22.83 | |
Class I (9/11) | | | | | | | | | | | | | | | | | | | | | | | | | | | | | | | | | | | | | |
2017 | | | 22.76 | | | | 1.18 | | | | 1.58 | | | | 2.76 | | | | | | | | (1.38 | ) | | | — | | | | — | | | | (1.38 | ) | | | 24.14 | |
2016 | | | 21.88 | | | | 1.14 | | | | 0.98 | | | | 2.12 | | | | | | | | (1.17 | ) | | | — | | | | (0.07 | ) | | | (1.24 | ) | | | 22.76 | |
2015 | | | 23.78 | | | | 1.14 | | | | (1.79 | ) | | | (0.65 | ) | | | | | | | (1.14 | ) | | | (0.01 | ) | | | (0.10 | ) | | | (1.25 | ) | | | 21.88 | |
2014 | | | 22.01 | | | | 1.27 | | | | 2.12 | | | | 3.39 | | | | | | | | (1.22 | ) | | | (0.40 | ) | | | — | | | | (1.62 | ) | | | 23.78 | |
2013 | | | 22.27 | | | | 1.21 | | | | 0.19 | | | | 1.40 | | | | | | | | (1.17 | ) | | | (0.49 | ) | | | — | | | | (1.66 | ) | | | 22.01 | |
Class T (5/17)(f) | | | | | | | | | | | | | | | | | | | | | | | | | | | | | | | | | | | | | | | | |
2017(g) | | | 23.86 | | | | 0.58 | | | | 0.53 | | | | 1.11 | | | | | | | | (0.83 | ) | | | — | | | | — | | | | (0.83 | ) | | | 24.14 | |
| | | | | | | | | | | | | | | | | | | | | | | | | | | | | | | | | | |
| | | | Ratios/Supplemental Data | |
| | | | | | | | | | Ratios to Average
Net Assets Before
Waiver/Reimbursement | | | | | | Ratios to Average
Net Assets After
Waiver/Reimbursement(c) | | | | |
| | | | | | | | |
Total
Return(b) | | | Ending
Net
Assets
(000) | | | | | | Expenses | | | Net
Investment
Income
(Loss) | | | | | | Expenses | | | Net
Investment
Income
(Loss) | | | Portfolio
Turnover
Rate(d) | |
| | | | | | | | | | | | | | | | | | | | | | | | | | | | | | | | | | |
| | 12.07 | % | | $ | 225,282 | | | | | | | | 1.15 | % | | | 4.64 | % | | | | | | | 1.15 | % | | | 4.64 | % | | | 84 | % |
| | 9.60 | | | | 234,495 | | | | | | | | 1.18 | | | | 4.72 | | | | | | | | 1.16 | | | | 4.74 | | | | 89 | |
| | (3.19 | ) | | | 161,064 | | | | | | | | 1.18 | | | | 4.68 | | | | | | | | 1.16 | | | | 4.69 | | | | 82 | |
| | 15.40 | | | | 115,322 | | | | | | | | 1.25 | | | | 4.77 | | | | | | | | 1.17 | | | | 4.85 | | | | 86 | |
| | 6.13 | | | | 49,174 | | | | | | | | 1.34 | | | | 4.87 | | | | | | | | 1.17 | | | | 5.05 | | | | 141 | |
| | | | | | | | | | | | | | | | | | | | | | | | | | | | | | | | | | |
| | 11.25 | | | | 241,844 | | | | | | | | 1.90 | | | | 3.94 | | | | | | | | 1.90 | | | | 3.94 | | | | 84 | |
| | 8.74 | | | | 182,744 | | | | | | | | 1.93 | | | | 3.97 | | | | | | | | 1.91 | | | | 3.99 | | | | 89 | |
| | (3.88 | ) | | | 129,301 | | | | | | | | 1.92 | | | | 3.99 | | | | | | | | 1.91 | | | | 4.01 | | | | 82 | |
| | 14.54 | | | | 65,928 | | | | | | | | 2.00 | | | | 4.07 | | | | | | | | 1.92 | | | | 4.14 | | | | 86 | |
| | 5.38 | | | | 24,648 | | | | | | | | 2.09 | | | | 4.19 | | | | | | | | 1.92 | | | | 4.37 | | | | 141 | |
| | | | | | | | | | | | | | | | | | | | | | | | | | | | | | | | | | |
| | 12.47 | | | | 29,332 | | | | | | | | 0.81 | | | | 5.10 | | | | | | | | 0.81 | | | | 5.10 | | | | 84 | |
| | (0.43 | ) | | | 7,237 | | | | | | | | 0.84 | * | | | 4.08 | * | | | | | | | 0.82 | * | | | 4.11 | * | | | 89 | |
| | | | | | | | | | | | | | | | | | | | | | | | | | | | | | | | | | |
| | 12.35 | | | | 1,607,267 | | | | | | | | 0.90 | | | | 4.96 | | | | | | | | 0.90 | | | | 4.96 | | | | 84 | |
| | 9.82 | | | | 846,584 | | | | | | | | 0.93 | | | | 4.98 | | | | | | | | 0.91 | | | | 5.00 | | | | 89 | |
| | (2.90 | ) | | | 555,149 | | | | | | | | 0.93 | | | | 4.97 | | | | | | | | 0.91 | | | | 4.98 | | | | 82 | |
| | 15.69 | | | | 345,747 | | | | | | | | 0.99 | | | | 5.29 | | | | | | | | 0.92 | | | | 5.37 | | | | 86 | |
| | 6.40 | | | | 58,677 | | | | | | | | 1.10 | | | | 5.11 | | | | | | | | 0.92 | | | | 5.29 | | | | 141 | |
| | | | | | | | | | | | | | | | | | | | | | | | | | | | | | | | | | |
| | 4.68 | | | | 25 | | | | | | | | 1.16 | * | | | 4.09 | * | | | | | | | 1.16 | * | | | 4.09 | * | | | 84 | |
| (a) | Per share Net Investment Income (Loss) is calculated using the average daily shares method. | |
| (b) | Total return is the combination of changes in NAV without any sales charge, reinvested dividend income at NAV and reinvested capital gains distributions at NAV, if any. Total returns are not annualized. | |
| (c) | After fee waiver and/or expense reimbursement from the Adviser, where applicable. | |
| (d) | Portfolio Turnover Rate is calculated based on the lesser of long-term purchases or sales (as disclosed in Note 5 – Investment Transactions) divided by the average long-term market value during the period. | |
| (e) | For the period June 30, 2016 (commencement of operations) through December 31, 2016. | |
| (f) | Class T shares are not available for public offering. | |
| (g) | For the period May 31, 2017 (commencement of operations) through December 31, 2017. | |
See accompanying notes to financial statements.
Financial Highlights (continued)
Real Estate Securities
Selected data for a share outstanding throughout each period:
| | | | | | | | | | | | | | | | | | | | | | | | | | | | | | | | | | | | | | | | |
| | | | |
| | | | Investment Operations | | | | | | Less Distributions | | | | |
| | | | | | | | | | |
Class (Commencement Date) Year Ended December 31, | | Beginning
NAV | | | Net
Investment
Income
(Loss)(a) | | | Net
Realized/
Unrealized
Gain (Loss) | | | Total | | | | | | From Net
Investment
Income | | | From Accumulated Net Realized Gains | | | Return
of
Capital | | | Total | | | Ending
NAV | |
Class A (9/95) | | | | | | | | | | | | | | | | | | | | | | | | | | | | | | | | | | | | | |
2017 | | $ | 21.75 | | | $ | 0.32 | | | $ | 0.85 | | | $ | 1.17 | | | | | | | $ | (0.37 | ) | | $ | (2.32 | ) | | $ | — | | | $ | (2.69 | ) | | $ | 20.23 | |
2016 | | | 22.66 | | | | 0.31 | | | | 1.14 | | | | 1.45 | | | | | | | | (0.31 | ) | | | (2.05 | ) | | | — | | | | (2.36 | ) | | | 21.75 | |
2015 | | | 23.79 | | | | 0.32 | | | | 0.38 | | | | 0.70 | | | | | | | | (0.37 | ) | | | (1.46 | ) | | | — | | | | (1.83 | ) | | | 22.66 | |
2014 | | | 19.46 | | | | 0.32 | | | | 5.62 | | | | 5.94 | | | | | | | | (0.33 | ) | | | (1.28 | ) | | | — | | | | (1.61 | ) | | | 23.79 | |
2013 | | | 21.02 | | | | 0.27 | | | | (0.06 | ) | | | 0.21 | | | | | | | | (0.29 | ) | | | (1.35 | ) | | | (0.13 | ) | | | (1.77 | ) | | | 19.46 | |
Class C (2/00) | | | | | | | | | | | | | | | | | | | | | | | | | | | | | | | | | | | | | |
2017 | | | 21.18 | | | | 0.15 | | | | 0.82 | | | | 0.97 | | | | | | | | (0.20 | ) | | | (2.32 | ) | | | — | | | | (2.52 | ) | | | 19.63 | |
2016 | | | 22.11 | | | | 0.12 | | | | 1.12 | | | | 1.24 | | | | | | | | (0.12 | ) | | | (2.05 | ) | | | — | | | | (2.17 | ) | | | 21.18 | |
2015 | | | 23.24 | | | | 0.15 | | | | 0.36 | | | | 0.51 | | | | | | | | (0.18 | ) | | | (1.46 | ) | | | — | | | | (1.64 | ) | | | 22.11 | |
2014 | | | 19.03 | | | | 0.15 | | | | 5.50 | | | | 5.65 | | | | | | | | (0.16 | ) | | | (1.28 | ) | | | — | | | | (1.44 | ) | | | 23.24 | |
2013 | | | 20.59 | | | | 0.12 | | | | (0.08 | ) | | | 0.04 | | | | | | | | (0.12 | ) | | | (1.35 | ) | | | (0.13 | ) | | | (1.60 | ) | | | 19.03 | |
Class R3 (9/01) | | | | | | | | | | | | | | | | | | | | | | | | | | | | | | | | | | | | | |
2017 | | | 22.08 | | | | 0.27 | | | | 0.85 | | | | 1.12 | | | | | | | | (0.32 | ) | | | (2.32 | ) | | | — | | | | (2.64 | ) | | | 20.56 | |
2016 | | | 23.00 | | | | 0.26 | | | | 1.16 | | | | 1.42 | | | | | | | | (0.29 | ) | | | (2.05 | ) | | | — | | | | (2.34 | ) | | | 22.08 | |
2015 | | | 24.13 | | | | 0.25 | | | | 0.40 | | | | 0.65 | | | | | | | | (0.32 | ) | | | (1.46 | ) | | | — | | | | (1.78 | ) | | | 23.00 | |
2014 | | | 19.72 | | | | 0.28 | | | | 5.69 | | | | 5.97 | | | | | | | | (0.28 | ) | | | (1.28 | ) | | | — | | | | (1.56 | ) | | | 24.13 | |
2013 | | | 21.29 | | | | 0.23 | | | | (0.08 | ) | | | 0.15 | | | | | | | | (0.24 | ) | | | (1.35 | ) | | | (0.13 | ) | | | (1.72 | ) | | | 19.72 | |
Class R6 (4/13) | | | | | | | | | | | | | | | | | | | | | | | | | | | | | | | | | | | | | |
2017 | | | 22.23 | | | | 0.46 | | | | 0.82 | | | | 1.28 | | | | | | | | (0.44 | ) | | | (2.32 | ) | | | — | | | | (2.76 | ) | | | 20.75 | |
2016 | | | 23.07 | | | | 0.43 | | | | 1.16 | | | | 1.59 | | | | | | | | (0.38 | ) | | | (2.05 | ) | | | — | | | | (2.43 | ) | | | 22.23 | |
2015 | | | 24.17 | | | | 0.43 | | | | 0.37 | | | | 0.80 | | | | | | | | (0.44 | ) | | | (1.46 | ) | | | — | | | | (1.90 | ) | | | 23.07 | |
2014 | | | 19.72 | | | | 0.48 | | | | 5.65 | | | | 6.13 | | | | | | | | (0.40 | ) | | | (1.28 | ) | | | — | | | | (1.68 | ) | | | 24.17 | |
2013(c) | | | 24.06 | | | | 0.31 | | | | (2.94 | ) | | | (2.63 | ) | | | | | | | (0.23 | ) | | | (1.35 | ) | | | (0.13 | ) | | | (1.71 | ) | | | 19.72 | |
Class I (6/95) | | | | | | | | | | | | | | | | | | | | | | | | | | | | | | | | | | | | | |
2017 | | | 22.07 | | | | 0.40 | | | | 0.84 | | | | 1.24 | | | | | | | | (0.44 | ) | | | (2.32 | ) | | | — | | | | (2.76 | ) | | | 20.55 | |
2016 | | | 22.97 | | | | 0.38 | | | | 1.15 | | | | 1.53 | | | | | | | | (0.38 | ) | | | (2.05 | ) | | | — | | | | (2.43 | ) | | | 22.07 | |
2015 | | | 24.10 | | | | 0.38 | | | | 0.39 | | | | 0.77 | | | | | | | | (0.44 | ) | | | (1.46 | ) | | | — | | | | (1.90 | ) | | | 22.97 | |
2014 | | | 19.70 | | | | 0.40 | | | | 5.68 | | | | 6.08 | | | | | | | | (0.40 | ) | | | (1.28 | ) | | | — | | | | (1.68 | ) | | | 24.10 | |
2013 | | | 21.26 | | | | 0.35 | | | | (0.08 | ) | | | 0.27 | | | | | | | | (0.35 | ) | | | (1.35 | ) | | | (0.13 | ) | | | (1.83 | ) | | | 19.70 | |
Class T (5/17)(e) | | | | | | | | | | | | | | | | | | | | | | | | | | | | | | | | | | | | | | | | |
2017(f) | | | 22.11 | | | | 0.19 | | | | 0.85 | | | | 1.04 | | | | | | | | (0.27 | ) | | | (2.32 | ) | | | — | | | | (2.59 | ) | | | 20.56 | |
| | | | | | | | | | | | | | | | | | | | | | | | | | |
| | | | Ratios/Supplemental Data | |
| | | | | | | | | | Ratios to Average
Net Assets Before
Waiver/Reimbursement | | | | | | | |
| | | | | | |
Total
Return(b) | | | Ending
Net
Assets
(000) | | | | | | Expenses | | | Net
Investment
Income
(Loss) | | | | | | Portfolio
Turnover
Rate(d) | |
| | | | | | | | | | | | | | | | | | | | | | | | | | |
| | 5.34 | % | | $ | 459,034 | | | | | | | | 1.29 | % | | | 1.47 | % | | | | | | | 131 | % |
| | 6.58 | | | | 679,318 | | | | | | | | 1.30 | | | | 1.32 | | | | | | | | 139 | |
| | 3.22 | | | | 690,025 | | | | | | | | 1.30 | | | | 1.37 | | | | | | | | 104 | |
| | 30.94 | | | | 751,098 | | | | | | | | 1.30 | | | | 1.44 | | | | | | | | 89 | |
| | 1.04 | | | | 634,978 | | | | | | | | 1.25 | | | | 1.25 | | | | | | | | 89 | |
| | | | | | | | | | | | | | | | | | | | | | | | | | |
| | 4.59 | | | | 66,953 | | | | | | | | 2.04 | | | | 0.71 | | | | | | | | 131 | |
| | 5.76 | | | | 89,123 | | | | | | | | 2.05 | | | | 0.55 | | | | | | | | 139 | |
| | 2.45 | | | | 93,499 | | | | | | | | 2.05 | | | | 0.65 | | | | | | | | 104 | |
| | 29.99 | | | | 91,172 | | | | | | | | 2.05 | | | | 0.69 | | | | | | | | 89 | |
| | 0.25 | | | | 72,172 | | | | | | | | 2.00 | | | | 0.56 | | | | | | | | 89 | |
| | | | | | | | | | | | | | | | | | | | | | | | | | |
| | 5.08 | | | | 36,829 | | | | | | | | 1.54 | | | | 1.23 | | | | | | | | 131 | |
| | 6.31 | | | | 53,413 | | | | | | | | 1.55 | | | | 1.11 | | | | | | | | 139 | |
| | 2.95 | | | | 57,416 | | | | | | | | 1.55 | | | | 1.06 | | | | | | | | 104 | |
| | 30.66 | | | | 68,569 | | | | | | | | 1.55 | | | | 1.22 | | | | | | | | 89 | |
| | 0.75 | | | | 59,238 | | | | | | | | 1.50 | | | | 1.02 | | | | | | | | 89 | |
| | | | | | | | | | | | | | | | | | | | | | | | | | |
| | 5.78 | | | | 277,978 | | | | | | | | 0.87 | | | | 2.04 | | | | | | | | 131 | |
| | 7.05 | | | | 307,921 | | | | | | | | 0.87 | | | | 1.83 | | | | | | | | 139 | |
| | 3.60 | | | | 254,414 | | | | | | | | 0.87 | | | | 1.80 | | | | | | | | 104 | |
| | 31.51 | | | | 250,116 | | | | | | | | 0.89 | | | | 2.12 | | | | | | | | 89 | |
| | (10.88 | ) | | | 79,796 | | | | | | | | 0.88 | * | | | 2.15 | * | | | | | | | 89 | |
| | | | | | | | | | | | | | | | | | | | | | | | | | |
| | 5.61 | | | | 2,945,935 | | | | | | | | 1.04 | | | | 1.78 | | | | | | | | 131 | |
| | 6.79 | | | | 3,497,055 | | | | | | | | 1.05 | | | | 1.61 | | | | | | | | 139 | |
| | 3.48 | | | | 3,666,093 | | | | | | | | 1.05 | | | | 1.58 | | | | | | | | 104 | |
| | 31.28 | | | | 4,085,270 | | | | | | | | 1.05 | | | | 1.75 | | | | | | | | 89 | |
| | 1.32 | | | | 3,105,950 | | | | | | | | 1.00 | | | | 1.56 | | | | | | | | 89 | |
| | | | | | | | | | | | | | | | | | | | | | | | | | |
| | 4.67 | | | | 23 | | | | | | | | 1.28 | * | | | 1.48 | * | | | | | | | 131 | |
| (a) | Per share Net Investment Income (Loss) is calculated using the average daily shares method. | |
| (b) | Total return is the combination of changes in NAV without any sales charge, reinvested dividend income at NAV and reinvested capital gains distributions at NAV, if any. Total returns are not annualized. | |
| (c) | For the period April 30, 2013 (commencement of operations) through December 31, 2013. | |
| (d) | Portfolio Turnover Rate is calculated based on the lesser of long-term purchases or sales (as disclosed in Note 5 – Investment Transactions) divided by the average long-term market value during the period. | |
| (e) | Class T shares are not available for public offering. | |
| (f) | For the period May 31, 2017 (commencement of operations) through December 31, 2017. | |
See accompanying notes to financial statements.
Notes to
Financial Statements
1. General Information and Significant Accounting Policies
General Information
Trust and Fund Information
Nuveen Investment Funds, Inc. (the “Trust”), is an open-end management investment company registered under the Investment Company Act of 1940, as amended. The Trust is comprised of Nuveen Global Infrastructure Fund (“Global Infrastructure”), Nuveen Real Asset Income Fund (“Real Asset Income”) and Nuveen Real Estate Securities Fund (“Real Estate Securities”) (each a “Fund” and collectively, the “Funds”), as diversified funds, among others. The Trust was incorporated in the state of Maryland on August 20, 1987.
The end of the reporting period for the Funds is December 31, 2017, and the period covered by these Notes to Financial Statements is the fiscal year ended December 31, 2017 (the “current fiscal period”).
Investment Adviser
The Funds’ investment adviser is Nuveen Fund Advisors, LLC (the “Adviser”), a subsidiary of Nuveen, LLC (“Nuveen”). Nuveen is the investment management arm of Teachers Insurance and Annuity Association of America (TIAA). The Adviser has overall responsibility for management of the Funds, oversees the management of the Funds’ portfolios, manages the Funds’ business affairs and provides certain clerical, bookkeeping and other administrative services, and, if necessary, asset allocation decisions. The Adviser has entered into sub-advisory agreements with Nuveen Asset Management, LLC, (the “Sub-Adviser”), a subsidiary of the Adviser, under which the Sub-Adviser manages the investment portfolios of the Funds.
Investment Objectives
Global Infrastructure’s investment objective is to seek long-term growth of capital and income. Real Asset Income’s investment objective is to seek a high level of current income. The secondary investment objective of the Fund is to seek capital appreciation. Real Estate Securities’ investment objective is to provide above average current income and long-term capital appreciation.
The Funds’ most recent prospectus provides further descriptions of each Fund’s investment objective, principal investment strategies and principal risks.
Significant Accounting Policies
Each Fund is an investment company and follows accounting and reporting guidance under Financial Accounting Standards Board (“FASB”) Accounting Standards Codification (ASC) Topic 946 “Financial Services – Investment Companies.” The following is a summary of significant accounting policies followed by the Funds in the preparation of their financial statements in accordance with accounting principles generally accepted in the United States of America (“U.S. GAAP”).
Investment Transactions
Investment transactions are recorded on a trade date basis. Realized gains and losses from investment transactions are determined on the specific identification method, which is the same basis used for federal income tax purposes. Investments purchased on a when-issued/delayed delivery basis may have extended settlement periods. Any investments so purchased are subject to market fluctuation during this period. The Funds have earmarked securities in their portfolios with a current value at least equal to the amount of the when-issued/delayed delivery purchase commitments.
As of the end of the reporting period, the following Fund’s outstanding when-issued/delayed delivery purchase commitments were as follows:
| | | | |
| | | Global
Infrastructure | |
| Outstanding when-issued/delayed delivery purchase commitments | | $ | 2,831,467 | |
Investment Income
Dividend income is recorded on the ex-dividend date or, for foreign securities, when information is available. Interest income, which reflects the amortization of premiums and includes accretion of discounts for financial reporting purposes, is recorded on an accrual basis. Interest income also reflects payment-in-kind (“PIK”) interest and paydown gains and losses, if any. PIK interest represents income received in the form of securities in lieu of cash. Securities lending income is comprised of fees earned from borrowers and income earned on cash collateral investments, net of lending agent fees, when applicable.
Professional Fees
Professional fees presented on the Statement of Operations consist of legal fees incurred in the normal course of operations, audit fees, tax consulting fees and, in some cases, workout expenditures. Workout expenditures are incurred in an attempt to protect or enhance an investment or to pursue other claims or legal actions on behalf of Fund shareholders. If a refund is received for workout expenditures paid in a prior reporting period, such amounts will be recognized as “Legal fee refund” on the Statement of Operations.
Dividends and Distributions to Shareholders
Dividends from net investment income, if any, are declared and distributed to shareholders annually for Global Infrastructure and quarterly for Real Estate Securities. Real Asset Income’s dividends from net investment income are declared daily and distributed to shareholders monthly, and the Fund’s shares begin to accrue dividends on the business day after the day when the monies used to purchase Fund shares are collected by the transfer agent.
Net realized capital gains from investment transactions, if any, are declared and distributed to shareholders at least annually. Furthermore, capital gains are distributed only to the extent they exceed available capital loss carryforwards.
Distributions to shareholders are recorded on the ex-dividend date. The amount and timing of distributions are determined in accordance with federal income tax regulations, which may differ from U.S. GAAP.
The tax character of Fund distributions for a fiscal year is dependent upon the amount and tax character of distributions received from securities held in the Funds’ portfolios. Distributions received from certain securities in which the Funds invest, most notably real estate investment trust (“REIT”) securities, may be characterized for tax purposes as ordinary income, long-term capital gain and/or a return of capital. The issuer of a security reports the tax character of its distributions only once per year, generally during the first two months of the calendar year. The distribution is included in the Funds’ ordinary income until such time the Fund is notified by the issuer of the actual tax character. For financial reporting purposes, dividend income, net realized gain (loss) and unrealized appreciation (depreciation) recognized on the Statement of Operations reflect the amounts of income, capital gain, and/or return of capital as reported by the issuers of such securities for distributions during the current fiscal period.
Share Classes and Sales Charges
Class A Shares are generally sold with an up-front sales charge and incur a 0.25% annual 12b-1 service fee. Class A Share purchases of $1 million or more are sold at net asset value (“NAV”) without an up-front sales charge but may be subject to a contingent deferred sales charge (“CDSC”) of 1% if redeemed within eighteen months of purchase. Class C Shares are sold without an up-front sales charge but incur a 0.75% annual 12b-1 distribution fee and a 0.25% annual 12b-1 service fee. Class C Shares are subject to a CDSC of 1% if redeemed within twelve months of purchase. Class R3 Shares are sold without an up-front sales charge but incur a 0.25% annual 12b-1 distribution and a 0.25% annual 12b-1 service fee. Class R6 Shares and Class I Shares are not subject to any sales charge or 12b-1 distribution or service fees. Class T Shares are generally sold with an up-front sales charge and incur a 0.25% annual 12b-1 service fee.
Multiclass Operations and Allocations
Income and expenses of Global Infrastructure and Real Estate Securities that are not directly attributable to a specific class of shares are prorated among the classes of each Fund based on the relative net assets of each class. Income and expenses of Real Asset Income that are not directly attributable to a specific class of shares are prorated among the classes based on the relative settled shares of each class. Expenses directly attributable to a class of shares are recorded to the specific class. Currently, the only expenses that are allocated on a class-specific basis are 12b-1 distribution and service fees.
Sub-transfer agent fees, which are recognized as a component of “Shareholder servicing agent fees” on the Statement of Operations, are not charged to Class R6 Shares and are prorated among the other classes based on their relative net assets.
Realized and unrealized capital gains and losses of the Funds are prorated among the classes based on the relative net assets of each class.
Compensation
The Trust pays no compensation directly to those of its directors who are affiliated with the Adviser or to its officers, all of whom receive remuneration for their services to the Trust from the Adviser or its affiliates. The Funds’ Board of Directors (the “Board”) has adopted a deferred compensation plan for independent directors that enables directors to elect to defer receipt of all or a portion of the annual compensation they are entitled to receive from certain Nuveen-advised funds. Under the plan, deferred amounts are treated as though equal dollar amounts had been invested in shares of select Nuveen-advised funds.
Indemnifications
Under the Trust’s organizational documents, its officers and directors are indemnified against certain liabilities arising out of the performance of their duties to the Trust. In addition, in the normal course of business, the Trust enters into contracts that provide general indemnifications to other parties. The Trust’s maximum exposure under these arrangements is unknown as this would involve future claims that may be made against the Trust that have not yet occurred. However, the Trust has not had prior claims or losses pursuant to these contracts and expects the risk of loss to be remote.
Netting Agreements
In the ordinary course of business, the Funds may enter into transactions subject to enforceable master repurchase agreements, International Swaps and Derivatives Association, Inc. (ISDA) master agreements or other similar arrangements (“netting agreements”). Generally, the right to offset in netting agreements allows each Fund to offset certain securities and derivatives, when applicable, with a specific counterparty as well as any collateral received or delivered to that counterparty based on the terms of the agreements. Generally, each Fund manages its cash collateral and securities collateral on a counterparty basis.
Notes to Financial Statements (continued)
The Funds’ investments subject to netting agreements as of the end of the reporting period, if any, are further described in Note 3 – Portfolio Securities and Investments in Derivatives.
Use of Estimates
The preparation of financial statements in conformity with U.S. GAAP requires management to make estimates and assumptions that affect the reported amounts of assets and liabilities at the date of the financial statements and the reported amounts of increases and decreases in net assets from operations during the current fiscal period. Actual results may differ from those estimates.
2. Investment Valuation and Fair Value Measurements
The fair valuation input levels as described below are for fair value measurement purposes.
Fair value is defined as the price that would be received upon selling an investment or transferring a liability in an orderly transaction to an independent buyer in the principal or most advantageous market for the investment. A three-tier hierarchy is used to maximize the use of observable market data and minimize the use of unobservable inputs and to establish classification of fair value measurements for disclosure purposes. Observable inputs reflect the assumptions market participants would use in pricing the asset or liability. Observable inputs are based on market data obtained from sources independent of the reporting entity. Unobservable inputs reflect the reporting entity’s own assumptions about the assumptions market participants would use in pricing the asset or liability. Unobservable inputs are based on the best information available in the circumstances. The following is a summary of the three-tiered hierarchy of valuation input levels.
| | |
| Level 1 – | | Inputs are unadjusted and prices are determined using quoted prices in active markets for identical securities. |
| Level 2 – | | Prices are determined using other significant observable inputs (including quoted prices for similar securities, interest rates, prepayment speeds, credit risk, etc.). |
| Level 3 – | | Prices are determined using significant unobservable inputs (including management’s assumptions in determining the fair value of investments). |
Common stocks and other equity-type securities are valued at the last sales price on the securities exchange on which such securities are primarily traded and are generally classified as Level 1. Securities primarily traded on the NASDAQ National Market (“NASDAQ”) are valued at the NASDAQ Official Closing Price and are generally classified as Level 1. However, securities traded on a securities exchange or NASDAQ for which there were no transactions on a given day or securities not listed on a securities exchange or NASDAQ are valued at the quoted bid price and are generally classified as Level 2. Prices of certain American Depositary Receipts (“ADR”) held by the Funds that trade in the United States are valued based on the last traded price, official closing price, or the most recent bid price of the underlying non-U.S.-traded stock, adjusted as appropriate for the underlying-to-ADR conversion ratio and foreign exchange rate, and from time-to-time may also be adjusted further to take into account material events that may take place after the close of the local non-U.S. market but before the close of the New York Stock Exchange (“NYSE”), which may represent a transfer from a Level 1 to a Level 2 security.
Prices of fixed-income securities are provided by an independent pricing service (“pricing service”) approved by the Board. The pricing service establishes a security’s fair value using methods that may include consideration of the following: yields or prices of investments of comparable quality, type of issue, coupon, maturity and rating, market quotes or indications of value from security dealers, evaluations of anticipated cash flows or collateral, general market conditions and other information and analysis, including the obligor’s credit characteristics considered relevant. These securities are generally classified as Level 2. In pricing certain securities, particularly less liquid and lower quality securities, the pricing service may consider information about a security, its issuer or market activity, provided by the Adviser. These securities are generally classified as Level 2 or Level 3 depending on the observability of the significant inputs.
Investments in investment companies are valued at their respective NAVs on the valuation date and are generally classified as Level 1.
Futures contracts are valued using the closing settlement price or, in the absence of such a price, the last traded price and are generally classified as Level 1.
Repurchase agreements are valued at contract amount plus accrued interest, which approximates market value. These securities are generally classified as Level 2.
Investments initially valued in currencies other than the U.S. dollar are converted to the U.S. dollar using exchange rates obtained from pricing services. As a result, the NAV of the Funds’ shares may be affected by changes in the value of currencies in relation to the U.S. dollar. The value of securities traded in markets outside the United States or denominated in currencies other than the U.S. dollar may be affected significantly on a day that the NYSE is closed and an investor is not able to purchase, redeem or exchange shares. If significant market events occur between the time of determination of the closing price of a foreign security on an exchange and the time that the Funds’ NAV is determined, or if under the Funds’ procedures, the closing price of a foreign security is not deemed to be reliable, the security would be valued at fair value as determined in accordance with procedures established in good faith by the Board. These securities are generally classified as Level 2 or Level 3 depending on the observability of the significant inputs.
Certain securities may not be able to be priced by the pre-established pricing methods as described above. Such securities may be valued by the Board and/or its appointee at fair value. These securities generally include, but are not limited to, restricted securities (securities which may not be publicly sold without registration under the Securities Act of 1933, as amended) for which a pricing service is unable to provide a market price; securities whose trading has been formally suspended; debt securities that have gone into default and for which there is no current market quotation; a security whose market price is not available from a pre-established pricing source; a security with respect to which an event has occurred that is likely to materially affect the value of the security after the market has closed but before the calculation of a Fund’s NAV (as may be the case in non-U.S. markets on which the security is primarily traded) or make it difficult or impossible to obtain a reliable market quotation; and a security whose price, as provided by the pricing service, is not deemed to reflect the security’s fair value. As a general principle, the fair value of a security would appear to be the amount that the owner might reasonably expect to receive for it in a current sale. A variety of factors may be considered in determining the fair value of such securities, which may include consideration of the following: yields or prices of investments of comparable quality, type of issue, coupon, maturity and rating, market quotes or indications of value from security dealers, evaluations of anticipated cash flows or collateral, general market conditions and other information and analysis, including the obligor’s credit characteristics considered relevant. These securities are generally classified as Level 2 or Level 3 depending on the observability of the significant inputs. Regardless of the method employed to value a particular security, all valuations are subject to review by the Board and/or its appointee.
The inputs or methodologies used for valuing securities are not an indication of the risks associated with investing in those securities. The following is a summary of each Fund’s fair value measurements as of the end of the reporting period:
| | | | | | | | | | | | | | | | |
| Global Infrastructure | | Level 1 | | | Level 2 | | | Level 3 | | | Total | |
| Long-Term Investments*: | | | | | | | | | | | | | | | | |
Common Stocks | | $ | 266,856,645 | | | $ | 298,465,041 | ** | | $ | — | | | $ | 565,321,686 | |
Real Estate Investment Trust Common Stocks | | | 26,164,147 | | | | — | | | | — | | | | 26,164,147 | |
Investment Companies | | | 5,240,905 | | | | — | | | | — | | | | 5,240,905 | |
| Short-Term Investments: | | | | | | | | | | | | | | | | |
Repurchase Agreements | | | — | | | | 9,360,548 | | | | — | | | | 9,360,548 | |
| Total | | $ | 298,261,697 | | | $ | 307,825,589 | | | $ | — | | | $ | 606,087,286 | |
| | | | |
| Real Asset Income | | | | | | | | | | | | |
| Long-Term Investments*: | | | | | | | | | | | | | | | | |
Real Estate Investment Trust Common Stocks | | $ | 466,086,367 | | | $ | 21,048,039 | ** | | $ | — | | | $ | 487,134,406 | |
$25 Par (or similar) Retail Preferred | | | 439,868,793 | | | | 8,479,445 | ** | | | — | | | | 448,348,238 | |
Corporate Bonds | | | — | | | | 365,003,500 | | | | — | | | | 365,003,500 | |
Common Stocks | | | 158,282,151 | | | | 191,748,489 | ** | | | — | | | | 350,030,640 | |
$1,000 Par (or similar) Institutional Preferred | | | — | | | | 242,566,470 | | | | — | | | | 242,566,470 | |
Convertible Preferred Securities | | | 122,067,957 | | | | — | | | | — | | | | 122,067,957 | |
Investment Companies | | | 28,256,140 | | | | — | | | | — | | | | 28,256,140 | |
Convertible Bonds | | | — | | | | 18,186,428 | | | | — | | | | 18,186,428 | |
Sovereign Debt | | | — | | | | 9,240,329 | | | | — | | | | 9,240,329 | |
| Short-Term Investments: | | | | | | | | | | | | | | | | |
Repurchase Agreements | | | — | | | | 14,030,020 | | | | — | | | | 14,030,020 | |
| Investments in Derivatives: | | | | | | | | | | | | | | | | |
Futures Contracts*** | | | 133,634 | | | | — | | | | — | | | | 133,634 | |
| Total | | $ | 1,214,695,042 | | | $ | 870,302,720 | | | $ | — | | | $ | 2,084,997,762 | |
| | | | |
| Real Estate Securities | | | | | | | | | | | | |
| Long-Term Investments*: | | | | | | | | | | | | | | | | |
Real Estate Investment Trust Common Stocks | | $ | 3,711,844,189 | | | $ | — | | | $ | — | | | $ | 3,711,844,189 | |
| Investments Purchased with Collateral from Securities Lending | | | 2,723,550 | | | | — | | | | — | | | | 2,723,550 | |
| Short-Term Investments: | | | | | | | | | | | | | | | | |
Money Market Funds | | | 48,038,384 | | | | — | | | | — | | | | 48,038,384 | |
| Total | | $ | 3,762,606,123 | | | $ | — | | | $ | — | | | $ | 3,762,606,123 | |
| * | Refer to the Fund’s Portfolio of Investments for industry, state and country classifications, where applicable. |
| ** | Refer to the Fund’s Portfolio of Investments for securities classified as Level 2. |
| *** | Represents net unrealized appreciation (depreciation) as reported in the Fund’s Portfolio of Investments. |
Notes to Financial Statements (continued)
The table below presents the transfers in and out of the three valuation levels for the following Funds as of the end of the current fiscal period when compared to the valuation levels as of the end of the previous fiscal year. Changes in valuation inputs or methodologies may result in transfers into or out of an assigned level within the fair value hierarchy. Transfers in or out of levels are generally due to the availability of publicly available information and to the significance or extent the Adviser determines that the valuation inputs or methodologies may impact the valuation of those securities.
| | | | | | | | | | | | | | | | | | | | | | | | | | | | | | | | |
| | | Level 1 | | | | | | Level 2 | | | | | | Level 3 | |
| | | Transfer In | | | (Transfers Out) | | | | | | Transfer In | | | (Transfers Out) | | | | | | Transfer In | | | (Transfers Out) | |
Global Infrastructure | | | | | | | | | | | | | | | | | | | | | | | | | | | | | | | | |
Common Stocks | | $ | 10,018,432 | | | $ | (5,581,760 | ) | | | | | | $ | 5,581,760 | | | $ | (10,018,432 | ) | | | | | | $ | — | | | $ | — | |
Real Estate Investment Trust Common Stocks | | | 209,210 | | | | — | | | | | | | | — | | | | (209,210 | ) | | | | | | | — | | | | — | |
Real Asset Income | | | | | | | | | | | | | | | | | | | | | | | | | | | | | | | | |
Common Stocks | | $ | 35,042,968 | | | $ | — | | | | | | | $ | — | | | $ | (35,042,968 | ) | | | | | | $ | — | | | $ | — | |
Real Estate Investment Trust Common Stocks | | | 72,374,778 | | | | — | | | | | | | | — | | | | (72,374,778 | ) | | | | | | | — | | | | — | |
The Board is responsible for the valuation process and has appointed the oversight of the daily valuation process to the Adviser’s Valuation Committee. The Valuation Committee, pursuant to the valuation policies and procedures adopted by the Board is responsible for making fair value determinations, evaluating the effectiveness of the Funds’ pricing policies and reporting to the Board. The Valuation Committee is aided in its efforts by the Adviser’s dedicated Securities Valuation Team, which is responsible for administering the daily valuation process and applying fair value methodologies as approved by the Valuation Committee. When determining the reliability of the independent pricing services for investments owned by the Funds, the Valuation Committee, among other things, conducts due diligence reviews of the pricing services and monitors the quality of security prices received through various testing reports conducted by the Securities Valuation Team.
The Valuation Committee will consider pricing methodologies it deems relevant and appropriate when making a fair value determination, based on the facts and circumstances specific to the portfolio instrument. Fair value determinations generally will be derived as follows, using public or private market information:
| | (i) | If available, fair value determinations shall be derived by extrapolating from recent transactions or quoted prices for identical or comparable securities. |
| | (ii) | If such information is not available, an analytical valuation methodology may be used based on other available information including, but not limited to: analyst appraisals, research reports, corporate action information, issuer financial statements and shelf registration statements. Such analytical valuation methodologies may include, but are not limited to: multiple of earnings, discount from market value of a similar freely-traded security, discounted cash flow analysis, book value or a multiple thereof, risk premium/yield analysis, yield to maturity and/or fundamental investment analysis. |
The purchase price of a portfolio instrument will be used to fair value the instrument only if no other valuation methodology is available or deemed appropriate, and it is determined that the purchase price fairly reflects the instrument’s current value.
For each portfolio security that has been fair valued pursuant to the policies adopted by the Board, the fair value price is compared against the last available and next available market quotations. The Valuation Committee reviews the results of such testing and fair valuation occurrences are reported to the Board.
3. Portfolio Securities and Investments in Derivatives
Portfolio Securities
Foreign Currency Transactions
To the extent that the Funds invest in securities and/or contracts that are denominated in a currency other than U.S. dollars, the Funds will be subject to currency risk, which is the risk that an increase in the U.S. dollar relative to the foreign currency will reduce returns or portfolio value. Generally, when the U.S. dollar rises in value against a foreign currency, the Funds’ investments denominated in that currency will lose value because their currency is worth fewer U.S. dollars; the opposite effect occurs if the U.S. dollar falls in relative value. Investments and other assets and liabilities denominated in foreign currencies are converted into U.S. dollars on a spot (i.e. cash) basis at the spot rate prevailing in the foreign currency exchange market at the time of valuation. Purchases and sales of investments and income denominated in foreign currencies are translated into U.S. dollars on the respective dates of such transactions.
As of the end of the end of the reporting period, the following Funds’ investments in non-U.S. securities were as follows:
| | | | | | | | |
| Global Infrastructure | | Value | | | % of
Net Assets | |
| Country: | | | | | | | | |
Canada | | $ | 80,326,925 | | | | 13.2 | % |
Australia | | | 66,793,537 | | | | 11.0 | |
France | | | 58,309,039 | | | | 9.6 | |
Spain | | | 52,224,200 | | | | 8.6 | |
Italy | | | 32,069,061 | | | | 5.3 | |
China | | | 21,431,091 | | | | 3.5 | |
New Zealand | | | 14,111,310 | | | | 2.3 | |
Singapore | | | 13,300,917 | | | | 2.2 | |
Japan | | | 12,348,920 | | | | 2.0 | |
Mexico | | | 11,924,466 | | | | 2.0 | |
Other | | | 62,532,984 | | | | 10.1 | |
| Total non-U.S. securities | | $ | 425,372,450 | | | | 69.8 | % |
| | |
| Real Asset Income | | | | | | |
| Country: | | | | | | | | |
Canada | | $ | 285,413,239 | | | | 13.6 | % |
Singapore | | | 105,492,533 | | | | 5.0 | |
Australia | | | 66,524,070 | | | | 3.2 | |
Italy | | | 56,911,998 | | | | 2.7 | |
Hong Kong | | | 46,826,283 | | | | 2.2 | |
France | | | 45,902,837 | | | | 2.2 | |
Spain | | | 42,596,950 | | | | 2.0 | |
Mexico | | | 42,227,719 | | | | 2.0 | |
United Kingdom | | | 41,280,512 | | | | 2.0 | |
New Zealand | | | 23,406,945 | | | | 1.1 | |
Other | | | 155,557,545 | | | | 7.4 | |
| Total non-U.S. securities | | $ | 912,140,631 | | | | 43.4 | % |
The books and records of the Funds are maintained in U.S. dollars. Foreign currencies, assets and liabilities are translated into U.S. dollars at 4:00 p.m. Eastern Time. Investment transactions, income and expenses are translated on the respective dates of such transactions. Net realized foreign currency gains and losses resulting from changes in exchange rates include foreign currency gains and losses between trade date and settlement date of the transactions, foreign currency transactions and the difference between the amounts of interest and dividends recorded on the books of a Fund and the amounts actually received.
The realized gains and losses resulting from changes in foreign currency exchange rates and changes in foreign exchange rates associated with (i) foreign currency, (ii) investments, (iii) investments in derivatives and (iv) other assets less liabilities are recognized as a component of “Net realized gain (loss) from investments and foreign currency,” on the Statement of Operations, when applicable.
The unrealized gains and losses resulting from changes in foreign currency exchange rates and changes in foreign exchange rates associated with (i) investments and (ii) other assets and liabilities are recognized as a component of “Change in net unrealized appreciation (depreciation) of investments and foreign currency,” on the Statement of Operations, when applicable. The unrealized gains and losses resulting from changes in foreign exchange rates associated with investments in derivatives are recognized as a component of the respective derivative’s related “Change in net unrealized appreciation (depreciation)” on the Statement of Operations, when applicable.
Securities Lending
In order to generate additional income, Real Estate Securities may lend securities representing up to one-third of the value of its total assets (which includes collateral for securities on loan) to broker-dealers, banks or other institutions. When loaning securities, the Fund retains the benefits of owning the securities, including the economic equivalent of dividends or interest generated by the security. The Fund also has the ability to recall the securities on loan at any time.
The Fund’s policy is to receive, at the inception of a loan, cash collateral equal to at least 102% of the value of securities loaned, which is recognized as “Payable for collateral from securities lending program” on the Statement of Assets and Liabilities. Collateral for securities on loan is invested in a money market fund, which is recognized as “Investments purchased with collateral from securities lending, at value” on the Statement of Assets and Liabilities. The market value of the securities loaned is determined at the close of each business day in order to determine the adequacy of the collateral. If the value of the securities on loan increases such that the level of collateralization falls below 100%, additional collateral is received from the borrower on the next business day, which is recognized as “Due from broker” on the Statement of Assets and Liabilities.
Notes to Financial Statements (continued)
Securities out on loan are subject to termination at any time at the option of the borrower or the Fund. Upon termination, the borrower is required to return to the Fund securities identical to the securities loaned. Generally, in the event the borrower defaults on its obligation to return the loaned securities, the Fund has the right to use the collateral to acquire identical securities. In the event the Fund is delayed or prevented from exercising its right to dispose of the collateral, there may be a loss to the Fund. Under the Fund’s securities lending agreement, however, the securities lending agent has indemnified the Fund against losses resulting from borrower default, except to the extent that those losses result from a decrease in the value of the collateral due to its investment by the Fund. The Fund bears the risk of loss with respect to the investment of collateral.
The Fund’s custodian, U.S. Bank National Association (“U.S. Bank”), serves as its securities lending agent. Income earned from the securities lending program is paid to the Fund, net of fees paid, if any. Income from securities lending is recognized as “Securities lending income” on the Statement of Operations.
The following table presents the securities out on loan for the Fund, if any, and the collateral delivered related to those securities as of the end of the reporting period.
| | | | | | | | | | | | | | |
| Fund | | Asset Class out on Loan | | Long-Term
Investments, at Value | | | Collateral Pledged (From)
Counterparty* | | | Net
Exposure | |
| Real Estate Securities | | Real Estate Investment Trust Common Stocks | | $ | 2,674,256 | | | $ | (2,674,256 | ) | | $ | — | |
| * | As of the end of the reporting period, the value of the collateral pledged from the counterparty exceeded the value of the securities out on loan. Refer to the Fund’s Portfolio of Investments for details on the securities out on loan. |
Repurchase Agreements
In connection with transactions in repurchase agreements, it is each Fund’s policy that its custodian take possession of the underlying collateral securities, the fair value of which exceeds the principal amount of the repurchase transaction, including accrued interest, at all times. If the counterparty defaults, and the fair value of the collateral declines, realization of the collateral may be delayed or limited.
The following table presents the repurchase agreements for the Funds that are subject to netting agreements as of the end of the reporting period, and the collateral delivered related to those repurchase agreements.
| | | | | | | | | | | | | | |
| Fund | | Counterparty | | Short-Term Investments, at Value | | | Collateral Pledged (From)
Counterparty* | | | Net
Exposure | |
| Global Infrastructure | | Fixed Income Clearing Corporation | | $ | 9,360,548 | | | $ | (9,360,548 | ) | | $ | — | |
| Real Asset Income | | Fixed Income Clearing Corporation | | | 14,030,020 | | | | (14,030,020 | ) | | | — | |
| * | As of the end of the reporting period, the value of the collateral pledged from the counterparty exceeded the value of the repurchase agreements. Refer to the Fund’s Portfolio of Investments for details on the repurchase agreements. |
Investments in Derivatives
Each Fund is authorized to invest in certain derivative instruments. The Funds record derivative instruments at fair value, with changes in fair value recognized on the Statement of Operations, when applicable. Even though the Funds’ investments in derivatives may represent economic hedges, they are not considered to be hedge transactions for financial reporting purposes.
Futures Contracts
Upon execution of a futures contract, a Fund is obligated to deposit cash or eligible securities, also known as “initial margin,” into an account at its clearing broker equal to a specified percentage of the contract amount. Cash held by the broker to cover initial margin requirements on open futures contracts, if any, is recognized as “Cash collateral at brokers for investments in futures contracts” on the Statement of Assets and Liabilities. Investments in futures contracts obligate a Fund and the clearing broker to settle monies on a daily basis representing changes in the prior days “mark-to-market” of the open contracts. If a Fund has unrealized appreciation the clearing broker would credit the Fund’s account with an amount equal to appreciation and conversely if a Fund has unrealized depreciation the clearing broker would debit the Fund’s account with an amount equal to depreciation. These daily cash settlements are also known as “variation margin.” Variation margin is recognized as a receivable and/or payable for “Variation margin on futures contracts” on the Statement of Assets and Liabilities.
During the period the futures contract is open, changes in the value of the contract are recognized as an unrealized gain or loss by “marking-to-market” on a daily basis to reflect the changes in market value of the contract, which is recognized as a component of “Change in net unrealized appreciation (depreciation) of futures contracts” on the Statement of Operations. When the contract is closed or expired, a Fund records a realized gain or loss equal to the difference between the value of the contract on the closing date and value of the contract when originally entered into, which is recognized as a component of “Net realized gain (loss) from futures contracts” on the Statement of Operations.
Risks of investments in futures contracts include the possible adverse movement in the price of the securities or indices underlying the contracts, the possibility that there may not be a liquid secondary market for the contracts and/or that a change in the value of the contract may not correlate with a change in the value of the underlying securities or indices.
During the current fiscal period, Real Asset Income shorted short-term U.S. Treasury futures contracts to hedge against potential increases in interest rates.
The average notional amount of futures contracts outstanding during the current fiscal period was as follows:
| | | | |
| | | Real Asset
Income | |
| Average notional amount of futures contracts outstanding* | | $ | 65,851,264 | |
| * | The average notional amount is calculated based on the absolute aggregate notional amount of contracts outstanding at the beginning of the current fiscal period and at the end of each fiscal quarter within the current fiscal period. |
The following table presents the fair value of futures contracts held by the Fund as of the end of the reporting period, the location of these instruments on the Statement of Assets and Liabilities and the primary underlying risk exposure.
| | | | | | | | | | | | | | |
Underlying
Risk Exposure | | Derivative Instrument | | Location on the Statement of Assets and Liabilities | |
| | | Asset Derivatives | | | (Liability) Derivatives | |
| | | Location | | Value | | | Location | | Value | |
Real Asset Income | | | | | | | | | | | | |
| | | | | |
Interest rate | | Futures contracts | | — | | $ | — | | | Payable for variation margin
on futures contracts* | | $ | 247,578 | |
Interest rate | | Futures contracts | | — | | | — | | | Payable for variation margin
on futures contracts* | | | (113,944 | ) |
Total | | | | | | $ | — | | | | | $ | 133,634 | |
| * | Value represents unrealized appreciation (depreciation) of futures contracts as reported in the Fund’s Portfolio of Investments and not the asset and/or liability derivative location as described in the table above. |
The following table presents the amount of net realized gain (loss) and change in net unrealized appreciation (depreciation) recognized on futures contracts on the Statement of Operations during the current fiscal period, and the primary underlying risk exposure.
| | | | | | | | | | | | |
| Fund | | Underlying
Risk Exposure | | Derivative
Instrument | | Net Realized
Gain (Loss) from
Futures Contracts | | | Change in Net
Unrealized Appreciation
(Depreciation) of
Futures Contracts | |
| Real Asset Income | | Interest rate | | Futures contracts | | $ | (1,474,938 | ) | | $ | 164,232 | |
Market and Counterparty Credit Risk
In the normal course of business each Fund may invest in financial instruments and enter into financial transactions where risk of potential loss exists due to changes in the market (market risk) or failure of the other party to the transaction to perform (counterparty credit risk). The potential loss could exceed the value of the financial assets recorded on the financial statements. Financial assets, which potentially expose each Fund to counterparty credit risk, consist principally of cash due from counterparties on forward, option and swap transactions, when applicable. The extent of each Fund’s exposure to counterparty credit risk in respect to these financial assets approximates their carrying value as recorded on the Statement of Assets and Liabilities.
Each Fund helps manage counterparty credit risk by entering into agreements only with counterparties the Adviser believes have the financial resources to honor their obligations and by having the Adviser monitor the financial stability of the counterparties. Additionally, counterparties may be required to pledge collateral daily (based on the daily valuation of the financial asset) on behalf of each Fund with a value approximately equal to the amount of any unrealized gain above a pre-determined threshold. Reciprocally, when each Fund has an unrealized loss, the Funds have instructed the custodian to pledge assets of the Funds as collateral with a value approximately equal to the amount of the unrealized loss above a pre-determined threshold. Collateral pledges are monitored and subsequently adjusted if and when the valuations fluctuate, either up or down, by at least the pre-determined threshold amount.
Notes to Financial Statements (continued)
4. Fund Shares
Each Fund has an effective registration statement on file with the Securities and Exchange Commission (SEC) to issue Class T Shares. The Funds issued Class T Shares during the period; however, these Shares were not available for public offering.
Transactions in Fund shares during the current and prior fiscal period were as follows:
| | | | | | | | | | | | | | | | |
| | | Year Ended
12/31/17 | | | Year Ended
12/31/16 | |
| Global Infrastructure(1) | | Shares | | | Amount | | | Shares | | | Amount | |
| Shares sold: | | | | | | | | | | | | | | | | |
Class A | | | 3,595,000 | | | $ | 38,217,726 | | | | 5,155,964 | | | $ | 53,254,715 | |
Class C | | | 664,302 | | | | 7,050,982 | | | | 431,228 | | | | 4,433,218 | |
Class R3 | | | 9,860 | | | | 108,340 | | | | 17,972 | | | | 190,472 | |
Class R6 | | | 1,623,109 | | | | 18,478,636 | | | | 63,010 | | | | 692,820 | |
Class R6 – exchanges | | | — | | | | — | | | | 737,190 | | | | 8,153,326 | |
Class I | | | 32,082,878 | | | | 338,557,067 | | | | 9,489,551 | | | | 99,366,457 | |
Class T | | | 2,282 | | | | 25,197 | | | | — | | | | — | |
| Shares issued to shareholders due to reinvestment of distributions: | | | | | | | | | | | | | | | | |
Class A | | | 438,813 | | | | 4,859,812 | | | | 478,158 | | | | 4,691,873 | |
Class C | | | 125,183 | | | | 1,371,545 | | | | 156,986 | | | | 1,524,848 | |
Class R3 | | | 1,456 | | | | 16,357 | | | | 5,247 | | | | 52,277 | |
Class R6 | | | 50,077 | | | | 553,639 | | | | 66,042 | | | | 648,301 | |
Class I | | | 1,622,904 | | | | 17,927,915 | | | | 1,431,270 | | | | 14,042,584 | |
Class T | | | — | | | | — | | | | — | | | | — | |
| | | | 40,215,864 | | | | 427,167,216 | | | | 18,032,618 | | | | 187,050,891 | |
| Shares redeemed: | | | | | | | | | | | | | | | | |
Class A | | | (3,235,955 | ) | | | (34,311,779 | ) | | | (27,863,798 | ) | | | (302,916,501 | ) |
Class C | | | (471,470 | ) | | | (5,087,735 | ) | | | (515,142 | ) | | | (5,339,444 | ) |
Class R3 | | | (55,111 | ) | | | (614,421 | ) | | | (10,394 | ) | | | (106,013 | ) |
Class R6 | | | (668,553 | ) | | | (7,680,340 | ) | | | (76,207 | ) | | | (786,663 | ) |
Class I | | | (22,835,259 | ) | | | (253,838,367 | ) | | | (10,598,022 | ) | | | (109,469,176 | ) |
Class I – exchanges | | | — | | | | — | | | | (737,190 | ) | | | (8,153,326 | ) |
Class T | | | (18 | ) | | | (197 | ) | | | — | | | | — | |
| | | | (27,266,366 | ) | | | (301,532,839 | ) | | | (39,800,753 | ) | | | (426,771,123 | ) |
| Net increase (decrease) | | | 12,949,498 | | | $ | 125,634,377 | | | | (21,768,135 | ) | | $ | (239,720,232 | ) |
| (1) | Class R6 Shares were established on June 30, 2016. |
| | | | | | | | | | | | | | | | |
| | | Year Ended
12/31/17 | | | Year Ended
12/31/16 | |
| Real Asset Income(1) | | Shares | | | Amount | | | Shares | | | Amount | |
| Shares sold: | | | | | | | | | | | | | | | | |
Class A | | | 4,677,501 | | | $ | 111,327,706 | | | | 5,722,635 | | | $ | 131,943,277 | |
Class C | | | 3,451,220 | | | | 82,256,778 | | | | 3,404,677 | | | | 78,698,371 | |
Class R6 | | | 932,501 | | | | 22,734,475 | | | | 57,875 | | | | 1,386,452 | |
Class R6 – exchanges | | | — | | | | — | | | | 309,038 | | | | 7,259,298 | |
Class I | | | 37,739,689 | | | | 897,105,617 | | | | 19,534,116 | | | | 449,670,539 | |
Class T | | | 1,048 | | | | 25,000 | | | | — | | | | — | |
| Shares issued to shareholders due to reinvestment of distributions: | | | | | | | | | | | | | | | | |
Class A | | | 473,514 | | | | 11,334,244 | | | | 421,921 | | | | 9,670,648 | |
Class C | | | 412,875 | | | | 9,903,488 | | | | 272,050 | | | | 6,235,373 | |
Class R6 | | | 35,003 | | | | 845,591 | | | | 7,292 | | | | 170,784 | |
Class I | | | 2,898,758 | | | | 69,584,900 | | | | 1,459,527 | | | | 33,439,092 | |
Class T | | | — | | | | — | | | | — | | | | — | |
| | | | 50,622,109 | | | | 1,205,117,799 | | | | 31,189,131 | | | | 718,473,834 | |
| Shares redeemed: | | | | | | | | | | | | | | | | |
Class A | | | (6,122,375 | ) | | | (143,220,328 | ) | | | (3,204,943 | ) | | | (72,928,829 | ) |
Class C | | | (1,874,744 | ) | | | (44,760,396 | ) | | | (1,559,908 | ) | | | (35,306,965 | ) |
Class R6 | | | (74,235 | ) | | | (1,790,849 | ) | | | (57,169 | ) | | | (1,323,524 | ) |
Class I | | | (11,255,741 | ) | | | (268,865,417 | ) | | | (8,869,246 | ) | | | (199,969,572 | ) |
Class I – exchanges | | | — | | | | — | | | | (309,038 | ) | | | (7,259,298 | ) |
Class T | | | — | | | | — | | | | — | | | | — | |
| | | | (19,327,095 | ) | | | (458,636,990 | ) | | | (14,000,304 | ) | | | (316,788,188 | ) |
| Net increase (decrease) | | | 31,295,014 | | | $ | 746,480,809 | | | | 17,188,827 | | | $ | 401,685,646 | |
| (1) Class R6 Shares were established on June 30, 2016. | | | | | | |
| | |
| | | Year Ended
12/31/17 | | | Year Ended
12/31/16 | |
| Real Estate Securities | | Shares | | | Amount | | | Shares | | | Amount | |
| Shares sold: | | | | | | | | | | | | | | | | |
Class A | | | 5,063,726 | | | $ | 111,156,037 | | | | 9,533,474 | | | $ | 221,454,825 | |
Class C | | | 296,401 | | | | 6,228,404 | | | | 624,914 | | | | 14,236,446 | |
Class R3 | | | 345,421 | | | | 7,659,454 | | | | 613,783 | | | | 14,541,084 | |
Class R6 | | | 6,715,414 | | | | 151,304,995 | | | | 6,161,037 | | | | 146,404,137 | |
Class I | | | 32,715,930 | | | | 725,533,824 | | | | 40,145,493 | | | | 951,752,338 | |
Class T | | | 1,131 | | | | 25,000 | | | | — | | | | — | |
| Shares issued to shareholders due to reinvestment of distributions: | | | | | | | | | | | | | | | | |
Class A | | | 2,688,307 | | | | 55,710,371 | | | | 3,097,541 | | | | 68,654,893 | |
Class C | | | 324,131 | | | | 6,492,768 | | | | 293,827 | | | | 6,304,093 | |
Class R3 | | | 204,617 | | | | 4,304,565 | | | | 237,765 | | | | 5,344,337 | |
Class R6 | | | 1,450,973 | | | | 30,795,964 | | | | 1,265,776 | | | | 28,604,859 | |
Class I | | | 13,410,267 | | | | 282,454,545 | | | | 12,121,452 | | | | 272,904,489 | |
Class T | | | — | | | | — | | | | — | | | | — | |
| | | | 63,216,318 | | | | 1,381,665,927 | | | | 74,095,062 | | | | 1,730,201,501 | |
| Shares redeemed: | | | | | | | | | | | | | | | | |
Class A | | | (16,283,116 | ) | | | (357,528,372 | ) | | | (11,857,315 | ) | | | (274,875,688 | ) |
Class C | | | (1,418,459 | ) | | | (30,111,161 | ) | | | (939,880 | ) | | | (21,183,306 | ) |
Class R3 | | | (1,177,970 | ) | | | (26,240,078 | ) | | | (928,528 | ) | | | (21,724,631 | ) |
Class R6 | | | (8,621,916 | ) | | | (192,533,611 | ) | | | (4,598,599 | ) | | | (108,573,282 | ) |
Class I | | | (61,224,634 | ) | | | (1,361,678,183 | ) | | | (53,476,339 | ) | | | (1,248,270,660 | ) |
Class T | | | — | | | | — | | | | — | | | | — | |
| | | | (88,726,095 | ) | | | (1,968,091,405 | ) | | | (71,800,661 | ) | | | (1,674,627,567 | ) |
| Net increase (decrease) | | | (25,509,777 | ) | | $ | (586,425,478 | ) | | | 2,294,401 | | | $ | 55,573,934 | |
Notes to Financial Statements (continued)
5. Investment Transactions
Long-term purchases and sales (including maturities but excluding investments purchased with collateral from securities lending and derivative transactions, where applicable) during the current fiscal period were as follows:
| | | | | | | | | | | | |
| | | Global
Infrastructure | | | Real Asset
Income | | | Real Estate
Securities | |
| Purchases | | $ | 1,072,490,429 | | | $ | 2,185,942,626 | | | $ | 5,313,240,338 | |
| Sales and maturities | | | 975,396,595 | | | | 1,431,136,545 | | | | 6,149,382,181 | |
6. Income Tax Information
Each Fund is a separate taxpayer for federal income tax purposes. Each Fund intends to distribute substantially all of its net investment income and net capital gains to shareholders and to otherwise comply with the requirements of Subchapter M of the Internal Revenue Code applicable to regulated investment companies. Therefore, no federal income tax provision is required.
For all open tax years and all major taxing jurisdictions, management of the Funds has concluded that there are no significant uncertain tax positions that would require recognition in the financial statements. Open tax years are those that are open for examination by taxing authorities (i.e., generally the last four tax year ends and the interim tax period since then). Furthermore, management of the Funds is also not aware of any tax positions for which it is reasonably possible that the total amounts of unrecognized tax benefits will significantly change in the next twelve months.
The following information is presented on an income tax basis. Differences between amounts for financial statement and federal income tax purposes are primarily due to timing differences in recognizing certain gains and losses on investment transactions. To the extent that differences arise that are permanent in nature, such amounts are reclassified within the capital accounts as detailed below. Temporary differences do not require reclassification. Temporary and permanent differences do not impact the NAVs of the Funds.
The tables below present the cost and unrealized appreciation (depreciation) of each Fund’s investment portfolio, as determined on a federal income tax basis, as of December 31, 2017.
For purposes of this disclosure, derivative tax cost is generally the sum of any upfront fees or premiums exchanged and any amounts unrealized for income statement reporting but realized in income and/or capital gains for tax reporting. If a particular derivative category does not disclose any tax unrealized appreciation or depreciation, the change in value of those derivatives have generally been fully realized for tax purposes.
| | | | | | | | | | | | |
| | | Global
Infrastructure | | | Real Asset
Income | | | Real Estate
Securities | |
| Tax cost of investments | | $ | 516,107,395 | | | $ | 2,034,598,009 | | | $ | 3,127,197,507 | |
| Gross unrealized: | | | | | | | | | | | | |
Appreciation | | $ | 111,878,366 | | | $ | 101,785,826 | | | $ | 737,830,665 | |
Depreciation | | | (21,898,475 | ) | | | (51,519,707 | ) | | | (102,422,049 | ) |
| Net unrealized appreciation (depreciation) of investments | | $ | 89,979,891 | | | $ | 50,266,119 | | | $ | 635,408,616 | |
| | | | | | | | | Real Asset
Income | |
| Tax cost of futures | | | | | | | | | | | 133,634 | |
| Net unrealized appreciation (depreciation) of futures | | | | | | | | | | | — | |
Permanent differences, primarily due to the federal taxes paid, REIT adjustments, foreign currency transactions, tax equalization, bond premium amortization adjustments, investments in passive foreign investment companies, investments in partnerships and complex securities character adjustments, resulted in reclassifications among the Funds’ components of net assets as of December 31, 2017, the Funds’ tax year end, as follows:
| | | | | | | | | | | | |
| | | Global
Infrastructure | | | Real Asset
Income | | | Real Estate
Securities | |
| Paid-in surplus | | $ | 4,060,374 | | | $ | 187,508 | | | $ | 35,346,060 | |
| Undistributed (Over-distribution of) net investment income | | | (1,735,969 | ) | | | 1,076,392 | | | | 47,406 | |
| Accumulated net realized gain (loss) | | | (2,324,405 | ) | | | (1,263,900 | ) | | | (35,393,466 | ) |
The tax components of undistributed net ordinary income and net long-term capital gains as of December 31, 2017, the Funds’ tax year end, were as follows:
| | | | | | | | | | | | |
| | | Global
Infrastructure | | | Real Asset
Income | | | Real Estate
Securities | |
| Undistributed net ordinary income1 | | $ | 7,048,343 | | | $ | 1,694,069 | | | $ | 8,923,279 | |
| Undistributed net long-term capital gains | | | 495,251 | | | | — | | | | 46,412,444 | |
| 1 | Net ordinary income consists of net taxable income derived from dividends, interest, and net short-term capital gains, if any. |
The tax character of distributions paid during the Funds’ tax years ended December 31, 2017 and December 31, 2016, was designated for purposes of the dividends paid deduction as follows:
| | | | | | | | | | | | |
2017 | | Global
Infrastructure | | | Real Asset
Income | | | Real Estate
Securities | |
| Distributions from net ordinary income1 | | $ | 30,170,112 | | | $ | 98,846,087 | | | $ | 192,423,771 | |
| Distributions from net long-term capital gains | | | 6,372,115 | | | | — | | | | 284,997,052 | |
| Return of capital | | | — | | | | — | | | | — | |
| | | | | | | | | | | | |
| 2016 | | Global
Infrastructure | | | Real Asset
Income | | | Real Estate
Securities | |
| Distributions from net ordinary income1 | | $ | 29,202,773 | | | $ | 50,034,036 | | | $ | 173,750,038 | |
| Distributions from net long-term capital gains | | | 4,254,787 | | | | — | | | | 317,280,471 | |
| Return of capital | | | — | | | | 3,043,227 | | | | — | |
| 1 | Net ordinary income consists of net taxable income derived from dividends, interest, and net short-term capital gains, if any. |
As of December 31, 2017, the Funds’ tax year end, the following Fund had unused capital losses carrying forward available for federal income tax purposes to be applied against future capital gains, if any. The capital losses are not subject to expiration.
| | | | |
| | | Real Asset
Income | |
| Capital losses to be carried forward – not subject to expiration | | $ | 7,272,367 | |
During the Funds’ tax year ended December 31, 2017, Real Asset Income utilized $20,765,202 of its capital loss carryforward.
7. Management Fees and Other Transactions with Affiliates
Management Fees
Each Fund’s management fee compensates the Adviser for the overall investment advisory and administrative services and general office facilities. The Sub-Adviser is compensated for its services to the Funds from the management fees paid to the Adviser.
Each Fund’s management fee consists of two components – a fund-level fee, based only on the amount of assets within each individual Fund, and a complex-level fee, based on the aggregate amount of all eligible fund assets managed by the Adviser. This pricing structure enables each Fund’s shareholders to benefit from growth in the assets within their respective Fund as well as from growth in the amount of complex-wide assets managed by the Adviser.
For the period January 1, 2017 through July 31, 2017, the annual fund-level fee, payable monthly, for each Fund was calculated according to the following schedule:
| | | | | | | | | | | | |
| Average Daily Net Assets | | Global
Infrastructure | | | Real Asset
Income | | | Real Estate
Securities | |
| For the first $125 million | | | 0.7500 | % | | | 0.6000 | % | | | 0.7000 | % |
| For the next $125 million | | | 0.7375 | | | | 0.5875 | | | | 0.6875 | |
| For the next $250 million | | | 0.7250 | | | | 0.5750 | | | | 0.6750 | |
| For the next $500 million | | | 0.7125 | | | | 0.5625 | | | | 0.6625 | |
| For the next $1 billion | | | 0.7000 | | | | 0.5500 | | | | 0.6500 | |
| For net assets over $2 billion | | | 0.6750 | | | | 0.5250 | | | | 0.6250 | |
Effective August 1, 2017, the annual fund-level fee, payable monthly, for each Fund is calculated according to the following schedules:
| | | | | | | | |
| Average Daily Net Assets | | Global
Infrastructure | | | Real Estate
Securities | |
| For the first $125 million | | | 0.7500 | % | | | 0.7000 | % |
| For the next $125 million | | | 0.7375 | | | | 0.6875 | |
| For the next $250 million | | | 0.7250 | | | | 0.6750 | |
| For the next $500 million | | | 0.7125 | | | | 0.6625 | |
| For the next $1 billion | | | 0.7000 | | | | 0.6500 | |
| For the next $3 billion | | | 0.6750 | | | | 0.6250 | |
| For the next $2.5 billion | | | 0.6500 | | | | 0.6000 | |
| For the next $2.5 billion | | | 0.6375 | | | | 0.5875 | |
| For net assets over $10 billion | | | 0.6250 | | | | 0.5750 | |
Notes to Financial Statements (continued)
| | | | |
| Average Daily Net Assets | | Real Asset
Income | |
| For the first $125 million | | | 0.6000 | % |
| For the next $125 million | | | 0.5875 | |
| For the next $250 million | | | 0.5750 | |
| For the next $500 million | | | 0.5625 | |
| For the next $1 billion | | | 0.5500 | |
| For the next $3 billion | | | 0.5250 | |
| For the next $5 billion | | | 0.5000 | |
| For net assets over $10 billion | | | 0.4875 | |
The annual complex-level fee, payable monthly, for each Fund is determined by taking the complex-level fee rate, which is based on the aggregate amount of “eligible assets” of all Nuveen funds as set forth in the schedule below, and (except for Real Asset Income) making, as appropriate, an upward adjustment to that rate based upon the percentage of the particular fund’s assets that are not “eligible assets.” The complex level fee schedule for each Fund is as follows:
| | | | |
| Complex-Level Eligible Asset Breakpoint Level* | | Effective Complex-Level Fee
Rate at Breakpoint Level | |
| $55 billion | | | 0.2000 | % |
| $56 billion | | | 0.1996 | |
| $57 billion | | | 0.1989 | |
| $60 billion | | | 0.1961 | |
| $63 billion | | | 0.1931 | |
| $66 billion | | | 0.1900 | |
| $71 billion | | | 0.1851 | |
| $76 billion | | | 0.1806 | |
| $80 billion | | | 0.1773 | |
| $91 billion | | | 0.1691 | |
| $125 billion | | | 0.1599 | |
| $200 billion | | | 0.1505 | |
| $250 billion | | | 0.1469 | |
| $300 billion | | | 0.1445 | |
| * | The complex-level fee is calculated based upon the aggregate daily “eligible assets” of all Nuveen open-end and closed-end Funds. Eligible assets do not include assets attributable to investments in other Nuveen funds or assets in excess of a determined amount (originally $2 billion) added to the Nuveen fund complex in connection with the Adviser’s assumption of the management of the former First American Funds effective January 1, 2011. Eligible assets include closed-end fund assets managed by the Adviser that are attributable to certain types of leverage. For these purposes, leverage includes the closed-end funds’ use of preferred stock and borrowings and certain investments in the residual interest certificates (also called inverse floating rate securities) in tender option bond (TOB) trusts, including the portion of assets held by a TOB trust that has been effectively financed by the trust’s issuance of floating rate securities, subject to an agreement by the Adviser as to certain funds to limit the amount of such assets for determining eligible assets in certain circumstances. As of December 31, 2017, the complex-level fee for each Fund was as follows: |
| | | | |
| Fund | | Complex-Level Fee | |
Global Infrastructure | | | 0.1690 | % |
Real Asset Income | | | 0.1595 | |
Real Estate Securities | | | 0.1843 | |
The Adviser has agreed to waive fees and/or reimburse expenses of Global Infrastructure and Real Asset Income through July 31, 2019 so that total annual Fund operating expenses (excluding 12b-1 distribution and/or service fees, interest expenses, taxes, acquired fund fees and expenses, fees incurred in acquiring and disposing of portfolio securities and extraordinary expenses) do not exceed 1.00% and 0.95% of the average daily net assets of any class of Fund shares, respectively. However, because Class R6 Shares are not subject to sub-transfer agent and similar fees, the total annual Fund operating expense for the Class R6 Shares will be less than the expense limitation. The expense limitations may be terminated or modified prior to July 31, 2019 only with the approval of the Board.
Other Transactions with Affiliates
During the current fiscal period, Nuveen Securities, LLC (the “Distributor”), a wholly-owned subsidiary of Nuveen, collected sales charges on purchases of Class A Shares, the majority of which were paid out as concessions to financial intermediaries as follows:
| | | | | | | | | | | | |
| | | Global
Infrastructure | | | Real Asset
Income | | | Real Estate
Securities | |
| Sales charges collected (Unaudited) | | $ | 630,876 | | | $ | 1,752,727 | | | $ | 118,367 | |
| Paid to financial intermediaries (Unaudited) | | | 558,405 | | | | 1,553,260 | | | | 104,991 | |
The Distributor also received 12b-1 service fees on Class A Shares, substantially all of which were paid to compensate financial intermediaries for providing services to shareholders relating to their investments.
During the current fiscal period, the Distributor compensated financial intermediaries directly with commission advances at the time of purchase as follows:
| | | | | | | | | | | | |
| | | Global
Infrastructure | | | Real Asset
Income | | | Real Estate
Securities | |
| Commission advances (Unaudited) | | $ | 113,524 | | | $ | 891,467 | | | $ | 52,287 | |
To compensate for commissions advanced to financial intermediaries, all 12b-1 service and distribution fees collected on C Shares during the first year following a purchase were retained by the Distributor. During the current fiscal period, the Distributor retained such 12b-1 fees as follows:
| | | | | | | | | | | | |
| | | Global
Infrastructure | | | Real Asset
Income | | | Real Estate
Securities | |
| 12b-1 fees retained (Unaudited) | | $ | 63,552 | | | $ | 809,287 | | | $ | 87,611 | |
The remaining 12b-1 fees charged to each Fund were paid to compensate financial intermediaries for providing services to shareholders relating to their investments.
The Distributor also collected and retained CDSC on share redemptions during the current fiscal period, as follows:
| | | | | | | | | | | | |
| | | Global
Infrastructure | | | Real Asset
Income | | | Real Estate
Securities | |
| CDSC retained (Unaudited) | | $ | 8,680 | | | $ | 64,272 | | | $ | 8,489 | |
As of the end of the reporting period, Nuveen owned shares of the Funds:
| | | | | | | | | | | | |
| | | Global
Infrastructure | | | Real Asset
Income | | | Real Estate
Securities | |
| Class T Shares | | | 2,264 | | | | 1,048 | | | | 1,131 | |
8. Borrowing Arrangements
Uncommitted Line of Credit
During the current fiscal period, the Funds participated in an unsecured bank line of credit (“Unsecured Credit Line”) under which outstanding balances would bear interest at a variable rate. Although the Funds participated in the Unsecured Credit Line, they did not have any outstanding balances during the current fiscal period.
The Unsecured Credit Line was not renewed after its scheduled termination date of July 27, 2017.
Committed Line of Credit
The Funds, along with certain other funds managed by the Adviser (“Participating Funds”), have established a 364-day, approximately $3 billion standby credit facility with a group of lenders, under which the Participating Funds may borrow for various purposes other than leveraging for investment purposes. A large portion of this facility’s capacity (and its associated costs as described below) is currently dedicated for use by a small number of Participating Funds, which does not include any of the Funds covered by this shareholder report. The remaining capacity under the facility (and the corresponding portion of the facility’s annual costs) is separately dedicated to most of the other open-end funds in the Nuveen fund family, including all of the Funds covered by this shareholder report, along with a number of Nuveen closed-end funds. The credit facility expires in July 2018 unless extended or renewed.
The credit facility has the following terms: a fee of 0.15% per annum on unused commitment amounts, and interest at a rate equal to the higher of (a) one-month LIBOR (London Inter-Bank Offered Rate) plus 1.25% per annum or (b) the Fed Funds rate plus 1.25% per annum on amounts borrowed. Participating Funds paid administration, legal and arrangement fees, which are recognized as a component of “Other expenses” on the Statement of Operations, and along with commitment fees, have been allocated among such Participating Funds based upon the relative proportions of the facility’s aggregate capacity reserved for them and other factors deemed relevant by the Adviser and the Board of each Participating Fund.
During the current fiscal period, none of the Funds utilized this facility.
9. New Accounting Pronouncements
FASB Accounting Standards Update (“ASU”) 2017-08 (“ASU 2017-08”) Premium Amortization on Purchased Callable Debt Securities
The FASB has issued ASU 2017-08, which shortens the premium amortization period for purchased non-contingently callable debt securities. ASU 2017-08 specifies that the premium amortization period ends at the earliest call date, for purchased non-contingently callable debt securities. ASU 2017-08 is effective for fiscal years, and interim periods within those fiscal years, beginning after December 15, 2018. Management is currently evaluating the implications of ASU 2017-08, if any.
Notes to Financial Statements (continued)
10. Subsequent Events
Investment Policy Change for Real Asset Income
Effective January 26, 2018, as approved by the Board, the Fund changed its investment policies related to investments in senior loans. Specifically, the new policy provides that under normal market conditions, the Fund may invest up to 5% of its net assets in senior loans.
Additional
Fund Information (Unaudited)
| | | | | | | | | | |
| | | | | |
| | Fund Manager Nuveen Fund Advisors, LLC 333 West Wacker Drive Chicago, IL 60606 Sub-Adviser Nuveen Asset Management, LLC 333 West Wacker Drive Chicago, IL 60606 | | Independent Registered
Public Accounting Firm PricewaterhouseCoopers LLP One North Wacker Drive Chicago, IL 60606 Custodians State Street Bank & Trust
Company One Lincoln Street Boston, MA 02111 U.S. Bank National Association* 1555 North RiverCenter Drive Suite 302 Milwaukee, WI 53202 | | Legal Counsel Chapman and Cutler LLP Chicago, IL 60603 | | Transfer Agent and
Shareholder Services DST Asset Manager Solutions, Inc. (DST) P.O. Box 8530 Boston, MA 02266-8530 (800) 257-8787 | | |
| | | | | |
| | | | * For Nuveen Real Estate Securities Fund only. | | | | | | |
| | | | | | | | | | | | | | |
| | | | | |
| | | | | | | | | | |
| | |
| | Long-Term Capital Gain Distributions: The Funds hereby designate as long-term capital gain dividends, pursuant to Internal Revenue Code Section 852(b)(3), the amount shown in the accompanying table or, if greater, the amount necessary to reduce earnings and profits of the Funds related to net capital gain to zero for the tax year ended December 31, 2017. | | |
| | | | | |
| | | | | Global Infrastructure | | Real Asset Income | | Real Estate Securities | | |
| | Long-term capital gain dividends | | $10,434,036 | | $— | | $320,343,124 | | |
| | |
| | Distribution Information: The Funds hereby designate their percentages of dividends paid from net ordinary income as dividends qualifying for the 70% dividends received deduction (“DRD”) for corporations and their percentages as qualified dividend income (“QDI”) for individuals under Section 1(h)(11) of the Internal Revenue Code as shown in the accompanying table. The actual qualified dividend income distributions will be reported to shareholders on Form 1099-DIV which will be sent to shareholders shortly after calendar year end. | | |
| | | | | |
| | | | | Global Infrastructure | | Real Asset Income | | Real Estate Securities | | |
| | % QDI | | 60.3% | | 25.2% | | 0.0% | | |
| | % DRD | | 15.7% | | 6.5% | | 0.0% | | |
| | | | | | | | | | | | | | |
| | | | | |
| | | | | | | | | | |
| | |
| | Quarterly Form N-Q Portfolio of Investments Information: Each Fund is required to file its complete schedule of portfolio holdings with the Securities and Exchange Commission (SEC) for the first and third quarters of each fiscal year on Form N-Q. You may obtain this information directly from the SEC. Visit the SEC on-line at http://www.sec.gov or in person at the SEC’s Public Reference Room in Washington, D.C. Call the SEC toll-free at (800) SEC-0330 for room hours and operation. | | |
| | | |
| | | | | | |
| | |
| | Nuveen Funds’ Proxy Voting Information: You may obtain (i) information regarding how each fund voted proxies relating to portfolio securities held during the most recent twelve-month period ended June 30, without charge, upon request, by calling Nuveen toll-free at (800) 257-8787 or on Nuveen’s website at www.nuveen.com and (ii) a description of the policies and procedures that each fund used to determine how to vote proxies relating to portfolio securities without charge, upon request, by calling Nuveen toll-free at (800) 257-8787. You may also obtain this information directly from the SEC. Visit the SEC on-line at http://www.sec.gov. | | |
| | | |
| | | | | | |
| | |
| | FINRA BrokerCheck: The Financial Industry Regulatory Authority (FINRA) provides information regarding the disciplinary history of FINRA member firms and associated investment professionals. This information as well as an investor brochure describing FINRA BrokerCheck is available to the public by calling the FINRA BrokerCheck Hotline number at (800) 289-9999 or by visiting www.FlNRA.org. | | |
Glossary of Terms
Used in this Report (Unaudited)
Average Annual Total Return: This is a commonly used method to express an investment’s performance over a particular, usually multi-year time period. It expresses the return that would have been necessary each year to equal the investment’s actual cumulative performance (including change in NAV or offer price and reinvested dividends and capital gains distributions, if any) over the time period being considered.
Basis Point: One one-hundredth of one percentage point, or 0.01%. For example, 25 basis points equals 0.25%.
Beta: A measure of the volatility of a portfolio relative to the overall market. A beta less than 1.0 indicates lower risk than the market; a beta greater than 1.0 indicates higher risk than the market.
Bloomberg Barclays U.S. Corporate High Yield Bond Index: An index that covers the universe of fixed-rate, non-investment-grade corporate debt of issuers in non-emerging market countries. Eurobonds and debt issues from countries designated as emerging markets are excluded. Index returns assume reinvestment of distributions, but do not reflect any applicable sales charges or management fees.
Gross Domestic Product (GDP): The total market value of all final goods and services produced in a country/region in a given year, equal to total consumer, investment and government spending, plus the value of exports, minus the value of imports.
Lipper Global Flexible Portfolio Funds Classification Average: Represents the average annualized returns for all reporting funds in the Lipper Global Flexible Portfolio Funds Classification. Lipper returns account for the effects of management fees and assume reinvestment of distributions, but do not reflect any applicable sales charges.
Lipper Real Estate Funds Classification Average: Represents the average annualized returns for all reporting funds in the Lipper Real Estate Funds Classification. Lipper returns account for the effects of management fees and assume reinvestment of distributions, but do not reflect any applicable sales charges.
Lipper Global Infrastructure Funds Classification Average: Represents the average annualized returns for all reporting funds in the Lipper Global Infrastructure Funds Classification. Lipper returns account for the effects of management fees and assume reinvestment of distributions, but do not reflect any applicable sales charge.
MSCI EAFE Index: The MSCI (Morgan Stanley Capital International) EAFE (Europe, Australasia, Far East) Index is a free float-adjusted market capitalization weighted index designed to measure developed market equity performance, excluding the U.S. and Canada. The index returns assume reinvestment of distributions, but do not reflect any applicable sales charges or management fees.
MSCI Emerging Markets Index: An unmanaged index considered representative of stocks of developing countries. The index returns assume reinvestment of distributions, but do not reflect any applicable sales charges or management fees.
MSCI (Morgan Stanley Capital International) All Country World Index (ACWI): A free-float adjusted market capitalization index that is designed to measure equity market performance in the global developed and emerging markets. Index returns assume reinvestment of distributions, but do not reflect any applicable sales charges or management fees.
Morgan Stanley Capital International (MSCI) World Index: A free-float adjusted market capitalization-weighted index that is designed to measure equity market performance of developed markets. Index returns assume reinvestment of distributions, but do not include the effects of any applicable sales charges or management fees.
MSCI U.S. REIT Index: An unmanaged index that tracks the performance of real estate investment trusts (REITs). Index returns assume reinvestment of distributions, but do not reflect any applicable sales charges or management fees.
Net Asset Value (NAV) Per Share: A fund’s Net Assets is equal to its total assets (securities, cash and accrued earnings) less its total liabilities. For funds with multiple classes, Net Assets are determined separately for each share class. NAV per share is equal to the fund’s (or share class’) Net Assets divided by its number of shares outstanding.
Real Asset Income Blend: A five index blend comprised of weightings approximating the Fund’s proposed portfolio. The Fund’s proposed portfolio may differ significantly from the blended portfolio and actual returns may be substantially lower. Benchmark returns do not include the effects of any sales charges or management fees.
| | | | |
Weighting
Percentage | | Index | | Definition |
| 28% | | S&P Global Infrastructure Index | | An unmanaged index comprised of 75 of the largest publicly listed infrastructure companies that meet specific investability requirements. |
| 21% | | Financial Times Stock Exchange - European Public Real Estate Association/National Association of Real Estate Investments Trust
(FTSE EPRA/NAREIT) Developed Index | | An index designed to track the performance of listed real estate companies and REITs worldwide. |
| 18% | | Wells Fargo Hybrid & Preferred Securities REIT Index | | An Index designed to track the performance of preferred securities issued in the U.S. market by real estate investment trusts (REITs). The index is composed exclusively of preferred shares and depositary shares. |
| 18% | | Bloomberg Barclays U.S. Corporate High Yield Bond Index | | An index that covers the U.S. dollar-denominated, non-investment grade, fixed-rate, taxable corporate bond market. |
| 15% | | Bloomberg Barclays Global Capital Securities Index | | An index that tracks fixed-rate, investment grade capital securities denominated in USD, EUR and GBP. |
Russell 2000® Index: A market-weighted index published by the Frank Russell Company measuring the performance of the 2,000 smallest companies in the Russell 3000® Index. The Russell 3000® is made up of 3,000 of the largest U.S. stocks and represents approximately 98% of the U.S. equity market. The Russell 2000® serves as a benchmark for small-cap stocks in the U.S. Index returns assume reinvestment of distributions, but do not reflect any applicable sales charges or management fees.
S&P Global Infrastructure Index: An index that provides liquid and tradable exposure to 75 companies from around the world that represent the listed infrastructure universe. To create diversified exposure across the global listed infrastructure market, the index has balanced weights across three distinct infrastructure clusters: utilities, transportation, and energy. Index returns assume reinvestment of distributions, but do not reflect any applicable sales charges or management fees.
S&P 500® Index: An unmanaged index generally considered representative of the U.S. stock market. Index returns assume reinvestment of distributions, but do not include the effects of any applicable sales charges or management fees.
Tax Equalization: The practice of treating a portion of the distribution made to a redeeming shareholder, which represents his proportionate part of undistributed net investment income and capital gain as a distribution for tax purposes. Such amounts are referred to as the equalization debits (or payments) and will be considered a distribution to the shareholder of net investment income and capital gain for calculation of the fund’s dividends paid deduction.
Directors
and Officers (Unaudited)
The management of the Funds, including general supervision of the duties performed for the Funds by the Adviser, is the responsibility of the Board of Directors of the Funds. The number of Directors of the Funds is currently set at eleven. None of the Directors who are not “interested” persons of the Funds (referred to herein as “independent Directors”) has ever been a director or employee of, or consultant to, Nuveen or its affiliates. The names and business addresses of the Directors and officers of the Funds, their principal occupations and other affiliations during the past five years, the number of portfolios each oversees and other directorships they hold are set forth below.
The Funds’ Statement of Additional Information (“SAI”) includes more information about the Directors. To request a free copy, call Nuveen Investments at (800) 257-8787 or visit the Funds’ website at www.nuveen.com.
| | | | | | | | |
Name, Year of Birth & Address | | Position(s) Held with the Funds | | Year First Elected or Appointed (1) | | Principal Occupation(s) Including other Directorships During Past 5 Years | | Number of Portfolios in Fund Complex Overseen by
Director |
| | | |
| Independent Directors: | | | | |
William J. Schneider 1944 333 W. Wacker Drive Chicago, IL 60606 | | Chairman and Director | | 1996 | | Chairman of Miller-Valentine Partners, a real estate investment company; Board Member of WDPR Public Radio station; formerly, Senior Partner and Chief Operating Officer (retired (2004) of Miller-Valentine Group; formerly, Board member, Business Advisory Council of the Cleveland Federal Reserve Bank and University of Dayton Business School Advisory Council; past Chair and Director, Dayton Development Coalition. | | 174 |
Jack B. Evans 1948 333 W. Wacker Drive Chicago, IL 60606 | | Director | | 1999 | | President, The Hall-Perrine Foundation, a private philanthropic corporation (since 1996); Director and Chairman, United Fire Group, a publicly held company; Director, Public member, American Board of Orthopaedic Surgery (since 2015); Life Trustee of Coe College and the Iowa College Foundation; formerly, President Pro-Tem of the Board of Regents for the State of Iowa University System; formerly, Director, Alliant Energy and The Gazette Company; formerly, Director, Federal Reserve Bank of Chicago; formerly, President and Chief Operating Officer, SCI Financial Group, Inc., a regional financial services firm. | | 174 |
William C. Hunter 1948 333 W. Wacker Drive Chicago, IL 60606 | | Director | | 2003 | | Dean Emeritus, formerly, Dean, Tippie College of Business, University of Iowa (2006-2012); Director (since 2004) of Xerox Corporation; Director of Wellmark, Inc. (since 2009); past Director (2005-2015), and past President (2010- 2014) Beta Gamma Sigma, Inc., The International Business Honor Society; formerly, Dean and Distinguished Professor of Finance, School of Business at the University of Connecticut (2003-2006); previously, Senior Vice President and Director of Research at the Federal Reserve Bank of Chicago (1995-2003); formerly, Director (1997-2007), Credit Research Center at Georgetown University. | | 174 |
Albin F. Moschner 1952 333 W. Wacker Drive Chicago, IL 60606 | | Director | | 2016 | | Founder and Chief Executive Officer, Northcroft Partners, LLC, a management consulting firm (since 2012); Director, USA Technologies, Inc., a provider of solutions and services to facilitate electronic payment transactions (since 2012); formerly, Director, Wintrust Financial Corporation (1996-2016); previously, held positions at Leap Wireless International, Inc., including Consultant (2011-2012), Chief Operating Officer (2008-2011), and Chief Marketing Officer (2004-2008); formerly, President, Verizon Card Services division of Verizon Communications, Inc. (2000-2003); formerly, President, One Point Services at One Point Communications (1999-2000); formerly, Vice Chairman of the Board, Diba, Incorporated (1996-1997); formerly, various executive positions with Zenith Electronics Corporation (1991-1996). | | 174 |
| | | | | | | | |
Name, Year of Birth & Address | | Position(s) Held with the Funds | | Year First Elected or Appointed (1) | | Principal Occupation(s) Including other Directorships During Past 5 Years | | Number of Portfolios in Fund Complex Overseen by
Director |
John K. Nelson 1962 333 W. Wacker Drive Chicago, IL 60606 | | Director | | 2013 | | Member of Board of Directors of Core12 LLC (since 2008), a private firm which develops branding, marketing and communications strategies for clients; Director of The Curran Center for Catholic American Studies (since 2009) and The President’s Council, Fordham University (since 2010); formerly senior external advisor to the financial services practice of Deloitte Consulting LLP (2012-2014); formerly, Chairman of the Board of Trustees of Marian University (2010 as trustee, 2011-2014 as Chairman); formerly, Chief Executive Officer of ABN AMRO N.V. North America, and Global Head of its Financial Markets Division (2007-2008); prior senior positions held at ABN AMRO include Corporate Executive Vice President and Head of Global Markets-the Americas (2006-2007), CEO of Wholesale Banking-North America and Global Head of Foreign Exchange and Futures Markets (2001-2006), and Regional Commercial Treasurer and Senior Vice President Trading-North America (1996-2001); formerly, Trustee at St. Edmund Preparatory School in New York City. | | 174 |
Judith M. Stockdale 1947 333 W. Wacker Drive Chicago, IL 60606 | | Director | | 1997 | | Board Member, Land Trust Alliance (since 2013) and U.S. Endowment for Forestry and Communities (since 2013); formerly, Executive Director (1994-2012), Gaylord and Dorothy Donnelley Foundation; prior thereto, Executive Director, Great Lakes Protection Fund (1990-1994). | | 174 |
Carole E. Stone 1947 333 W. Wacker Drive Chicago, IL 60606 | | Director | | 2007 | | Former Director, Chicago Board Options Exchange (2006-2017) and C2 Options Exchange, Incorporated (2009-2017); Director, CBOE Global Markets, Inc., formerly CBOE Holdings, Inc. (since 2010); formerly, Commissioner, New York State Commission on Public Authority Reform (2005-2010). | | 174 |
Terence J. Toth 1959 333 W. Wacker Drive Chicago, IL 60606 | | Director | | 2008 | | Formerly, a Co-Founding Partner, Promus Capital (2008-2017); Director, Fulcrum IT Service LLC (since 2010) and Quality Control Corporation (since 2012); member: Catalyst Schools of Chicago Board (since 2008) and Mather Foundation Board (since 2012), and chair of its investment committee; formerly, Director, Legal & General Investment Management America, Inc. (2008-2013); formerly, CEO and President, Northern Trust Global Investments (2004-2007); Executive Vice President, Quantitative Management & Securities Lending (2000-2004); prior thereto, various positions with Northern Trust Company (since 1994); formerly, Member, Northern Trust Mutual Funds Board (2005-2007), Northern Trust Global Investments Board (2004-2007), Northern Trust Japan Board (2004-2007), Northern Trust Securities Inc. Board (2003- 2007) and Northern Trust Hong Kong Board (1997-2004). | | 174 |
Margaret L. Wolff 1955 333 W. Wacker Drive Chicago, IL 60606 | | Director | | 2016 | | Formerly, member of the Board of Directors (2013-2017) of Travelers Insurance Company of Canada and The Dominion of Canada General Insurance Company (each, a part of Travelers Canada, the Canadian operation of The Travelers Companies, Inc.); formerly, Of Counsel, Skadden, Arps, Slate, Meagher & Flom LLP (Mergers & Acquisitions Group) (2005-2014); Member of the Board of Trustees of New York-Presbyterian Hospital (since 2005); Member (since 2004) and Chair (since 2015) of the Board of Trustees of The John A. Hartford Foundation (a philanthropy dedicated to improving the care of older adults); formerly, Member (2005-2015) and Vice Chair (2011-2015) of the Board of Trustees of Mt. Holyoke College. | | 174 |
Directors and Officers (Unaudited) (continued)
| | | | | | | | |
Name, Year of Birth & Address | | Position(s) Held with the Funds | | Year First Elected or Appointed (1) | | Principal Occupation(s) Including other Directorships During Past 5 Years | | Number of Portfolios in Fund Complex Overseen by
Director |
Robert L. Young(2) 1963 333 W. Wacker Drive Chicago, IL 60606 | | Director | | 2017 | | Formerly, Chief Operating Officer and Director, J.P. Morgan Investment Management Inc. (2010-2016); formerly, President and Principal Executive Officer (2013-2016), and Senior Vice President and Chief Operating Officer (2005-2010), of J.P. Morgan Funds; formerly, Director and various officer positions for J.P. Morgan Investment Management Inc. (formerly, JPMorgan Funds Management, Inc. and formerly, One Group Administrative Services) and JPMorgan Distribution Services, Inc. (formerly, One Group Dealer Services, Inc.) (1999-2017). | | 172 |
| | | | | | | | |
Name, Year of Birth & Address | | Position(s) Held with the Funds | | Year First Elected or Appointed (1) | | Principal Occupation(s) Including other Directorships During Past 5 Years | | Number of Portfolios in Fund Complex Overseen by Trustee |
| | | |
| Interested Director: | | | | |
Margo L. Cook(3) 1964 333 W. Wacker Drive Chicago, IL 60606 | | Director | | 2016 | | President (since April 2017), formerly, Co-Chief Executive Officer and Co-President (2016-2017), formerly, Senior Executive Vice President of Nuveen Investments, Inc; Executive Vice President (since February 2017) of Nuveen, LLC; President, Global Products and Solutions (since July 2017), and Co-Chief Executive Officer (since 2015), formerly, Executive Vice President (2013-2015) of Nuveen Securities, LLC; President (since August 2017), formerly, Co-President (October 2016-August 2017), formerly Senior Executive Vice President (2015-2016) of Nuveen Fund Advisors, LLC (Executive Vice President 2011-2015); President (since 2017), Nuveen Alternative Investments, LLC; Chartered Financial Analyst. | | 174 |
| | | | | | | | |
Name, Year of Birth & Address | | Position(s) Held with the Funds | | Year First Elected or Appointed (4) | | Principal Occupation(s) During Past 5 Years | | Number of Portfolios in Fund Complex Overseen by Officer |
| | | |
| Officers of the Funds: | | | | |
Greg A. Bottjer 1971 333 W. Wacker Drive Chicago, IL 60606 | | Chief Administrative Officer | | 2016 | | Senior (since 2017) Managing Director (since 2011), formerly, Senior Vice President (2007-2010) of Nuveen; Senior (since 2017) Managing Director (since October 2016) of Nuveen Fund Advisors, LLC; Chartered Financial Analyst. | | 88 |
Lorna C. Ferguson 1945 333 W. Wacker Drive Chicago, IL 60606 | | Vice President | | 1998 | | Senior Managing Director (since February 2017), formerly, Managing Director (2004-2017) of Nuveen. | | 174 |
Stephen D. Foy 1954 333 W. Wacker Drive Chicago, IL 60606 | | Vice President and Controller | | 1998 | | Managing Director (since 2014), formerly, Senior Vice President (2013-2014) and Vice President (2005-2013) of Nuveen Fund Advisors, LLC; Managing Director (since 2016) of Nuveen Securities, LLC; Certified Public Accountant. | | 174 |
Nathaniel T. Jones 1979 333 W. Wacker Drive Chicago, IL 60606 | | Vice President and Treasurer | | 2016 | | Managing Director (since January 2017), formerly, Senior Vice President (2016-2017), formerly, Vice President (2011-2016) of Nuveen; Chartered Financial Analyst. | | 174 |
| | | | | | | | |
Name, Year of Birth & Address | | Position(s) Held with the Funds | | Year First Elected or Appointed (4) | | Principal Occupation(s) During Past 5 Years | | Number of Portfolios in Fund Complex Overseen by Officer |
Walter M. Kelly 1970 333 W. Wacker Drive Chicago, IL 60606 | | Chief Compliance Officer and Vice President | | 2003 | | Managing Director (since January 2017), formerly, Senior Vice President (2008-2017) of Nuveen Investments Holdings, Inc. | | 174 |
Tina M. Lazar 1961 333 W. Wacker Drive Chicago, IL 60606 | | Vice President | | 2002 | | Managing Director (since January 2017), formerly, Senior Vice President (2014-2017) of Nuveen Securities, LLC. | | 174 |
Kevin J. McCarthy 1966 333 W. Wacker Drive Chicago, IL 60606 | | Vice President and Secretary | | 2007 | | Senior Managing Director (since February 2017) and Secretary and General Counsel (since 2016) of Nuveen Investments, Inc., formerly, Executive Vice President (2016-2017) and Managing Director and Assistant Secretary (2008-2016); Senior Managing Director (since January 2017) and Assistant Secretary (since 2008) of Nuveen Securities, LLC, formerly Executive Vice President (2016-2017) and Managing Director (2008-2016); Senior Managing Director (since February 2017), Secretary (since 2016) and Co-General Counsel (since 2011) of Nuveen Fund Advisors, LLC, formerly, Executive Vice President (2016-2017), Managing Director (2008-2016) and Assistant Secretary (2007-2016); Senior Managing Director (since February 2017), Secretary (since 2016) and Associate General Counsel (since 2011 of Nuveen Asset Management, LLC, formerly Executive Vice President (2016-2017) and Managing Director and Assistant Secretary (2011-2016); Senior Managing Director (since February 2017) and Secretary (since 2016) of Nuveen Investments Advisers, LLC, formerly Executive Vice President (2016-2017); Vice President (since 2007) and Secretary (since 2016), formerly, Assistant Secretary, of NWQ Investment Management Company, LLC, Symphony Asset Management LLC Santa Barbara Asset Management, LLC and Winslow Capital Management, LLC (since 2010). | | 174 |
Kathleen L. Prudhomme 1953 901 Marquette Avenue Minneapolis, MN 55402 | | Vice President and Assistant Secretary | | 2011 | | Managing Director, Assistant Secretary and Co-General Counsel (since 2011) of Nuveen Fund Advisors, LLC; Managing Director, Assistant Secretary and Associate General Counsel (since 2011) of Nuveen Asset Management, LLC; Managing Director and Assistant Secretary (since 2011) of Nuveen Securities, LLC; formerly, Deputy General Counsel, FAF Advisors, Inc. (2004-2010). | | 174 |
Christopher M. Rohrbacher 1971 333 W. Wacker Drive Chicago, IL 60606 | | Vice President and Assistant Secretary | | 2008 | | Managing Director (since January 2017) of Nuveen Securities, LLC; Managing Director (Since January 2017), formerly, Senior Vice President (2016-2017) and Assistant Secretary (since October 2016) of Nuveen Fund Advisors, LLC. | | 174 |
William A. Siffermann 1975 333 W. Wacker Drive Chicago, IL 60606 | | Vice President | | 2017 | | Managing Director (Since February 2017), formerly Senior Vice President (2016-2017) and Vice President (2011-2016) of Nuveen. | | 174 |
Joel T. Slager 1978 333 W. Wacker Drive Chicago, IL 60606 | | Vice President and Assistant Secretary | | 2013 | | Fund Tax Director for Nuveen Funds (since 2013); previously, Vice President of Morgan Stanley Investment Management, Inc., Assistant Treasurer of the Morgan Stanley Funds (from 2010 to 2013). | | 174 |
Directors and Officers (Unaudited) (continued)
| | | | | | | | |
Name, Year of Birth & Address | | Position(s) Held with the Funds | | Year First Elected or Appointed (4) | | Principal Occupation(s) During Past 5 Years | | Number of Portfolios in Fund Complex Overseen by Officer |
Gifford R. Zimmerman 1956 333 W. Wacker Drive Chicago, IL 60606 | | Vice President and Assistant Secretary | | 1988 | | Managing Director (since 2002), and Assistant Secretary of Nuveen Securities, LLC; Managing Director (since 2004) and Assistant Secretary (since 1994) of Nuveen Investments, Inc.; Managing Director (since 2002), Assistant Secretary (since 1997) and Co-General Counsel (since 2011) of Nuveen Fund Advisors, LLC; Managing Director, Assistant Secretary and Associate General Counsel of Nuveen Asset Management, LLC (since 2011); Vice President (since February 2017), formerly, Managing Director (2003-2017) and Assistant Secretary (since 2003) of Symphony Asset Management LLC ; Managing Director and Assistant Secretary (since 2002) of Nuveen Investments Advisers, LLC; Vice President and Assistant Secretary of NWQ Investment Management Company, LLC (since 2002), Santa Barbara Asset Management, LLC (since 2006) and of Winslow Capital Management, LLC, (since 2010); Chartered Financial Analyst. | | 174 |
| (1) | Directors serve an indefinite term until his/her successor is elected or appointed. The year first elected or appointed represents the year in which the director was first elected or appointed to any fund in the Nuveen Fund Complex. |
| (2) | On May 25, 2017, Mr. Young was appointed as a Board Member, effective July 1, 2017. He is a Board Member of each of the Nuveen Funds, except Nuveen Diversified Dividend and Income Fund and Nuveen Real Estate Income Fund. |
| (3) | “Interested person” of the Trust, as defined in the 1940 Act, by reason of her position with Nuveen, LLC. and certain of its subsidiaries. |
| (4) | Officers serve one year terms through August of each year. The year first elected or appointed represents the year in which the officer was first elected or appointed to any fund in the Nuveen Fund Complex. |
Annual Investment Management Agreement
Approval Process (Unaudited)
The Board of Directors (the “Board,” and each Director, a “Board Member”) of the Funds, including the Board Members who are not parties to the Funds’ advisory or sub-advisory agreements or “interested persons” of any such parties (the “Independent Board Members”), oversees the management of the Funds, including the performance of Nuveen Fund Advisors, LLC, the Funds’ investment adviser (the “Adviser”), and Nuveen Asset Management, LLC, the Funds’ sub-adviser (the “Sub-Adviser”). As required by applicable law, after the initial term of the respective Fund following commencement of its operations, the Board is required to consider annually whether to renew the Fund’s management agreement with the Adviser (the “Investment Management Agreement”) and its sub-advisory agreement with the Sub-Adviser (the “Sub-Advisory Agreement” and, together with the Investment Management Agreement, the “Advisory Agreements”). Accordingly, the Board met in person on April 11-12, 2017 (the “April Meeting”) and May 23-25, 2017 (the “May Meeting”) to consider the approval of each Advisory Agreement for the Funds that was up for renewal for an additional one-year period.
The Board considered its review of the Advisory Agreements as an ongoing process encompassing the information received and the deliberations the Board and its committees have had throughout the year. The Board met regularly during the year and received materials and discussed topics that were relevant to the annual consideration of the renewal of the Advisory Agreements, including, among other things, overall market performance and developments; fund investment performance; investment team review; valuation of securities; compliance, regulatory and risk management matters; payments to intermediaries such as 12b-1 fees, sub-transfer agency fees and other payments; and other developments. The Board had also established several standing committees, including the Open-end Fund Committee and Closed-end Fund Committee, which met regularly throughout the year to permit the Board Members to delve deeper into the topics particularly relevant to the respective product line. The Board further continued its practice of seeking to meet periodically with the Sub-Adviser and its investment team. The accumulated information, knowledge, and experience the Board Members had gained during their tenure on the Board governing the Funds and working with the Fund Advisers (as defined below) were taken into account in their review of the Advisory Agreements.
In addition to the materials received by the Board or its committees throughout the year, the Board reviewed extensive additional materials prepared specifically for its annual review of the Advisory Agreements in response to a request by independent legal counsel on behalf of the Independent Board Members. The materials addressed a variety of topics, including, but not limited to, a description of the services provided by the Adviser and Sub-Adviser (the Adviser and the Sub-Adviser are each a “Fund Adviser”); an analysis of fund performance including comparative industry data and a detailed focus on performance outliers; an analysis of the Sub-Adviser; an analysis of the fees and expense ratios of the Nuveen funds in absolute terms and in comparison to the fees and expenses of peers with a focus on any expense outliers; an assessment of shareholder services for the Nuveen funds and of the performance of certain service providers; a review of initiatives instituted or continued during the past year; and information regarding the profitability of the Fund Advisers, the compensation of portfolio managers, and compliance and risk matters. The materials provided in connection with the annual review included information compiled and prepared by Broadridge Financial Solutions, Inc. (“Broadridge” or “Lipper”), an independent provider of investment company data, comparing, in relevant part, each Fund’s fees and expenses with those of a comparable universe of funds (the “Peer Universe”) and with a more focused subset of the Peer Universe (the “Peer Group”), as selected by Broadridge (the “Broadridge Report”). The Independent Board Members also received a memorandum from independent legal counsel outlining their fiduciary duties and legal standards in reviewing the Advisory Agreements.
As part of its annual review, the Board met at the April Meeting to review the investment performance of the Funds and to consider the Adviser’s analysis of the Sub-Adviser evaluating, among other things, the Sub-Adviser’s assets under management, investment team, performance, organizational stability, and investment approach. During the review, the Independent Board Members requested and received additional information from management. At the May Meeting, the Board, including the Independent Board Members, continued its review and ultimately approved the continuation of the Advisory Agreements for an additional year. Throughout the year and throughout their review of the Advisory Agreements, the Independent Board Members were assisted by independent legal counsel and met with counsel separately without management present. In deciding to renew the Advisory Agreements, the Independent Board Members did not identify a particular factor as determinative, but rather the decision reflected the comprehensive consideration of all the information presented, and each Board Member may have attributed different weights to the various factors and information considered in connection with the approval process. The following summarizes the principal factors, but not all the factors, the Board considered in its review of the Advisory Agreements and its conclusions.
A. Nature, Extent and Quality of Services
In evaluating the renewal of the Advisory Agreements, the Independent Board Members received and considered information regarding the nature, extent and quality of the applicable Fund Adviser’s services provided to the respective Fund and the resulting performance of each Fund. The Board recognized the myriad of services the Adviser and its affiliates provided to manage and operate the Nuveen funds, including (a) product management (such as managing distributions, positioning the product in the marketplace, managing the relationships with the distribution platforms, maintaining
Annual Investment Management Agreement Approval Process (Unaudited) (continued)
and enhancing shareholder communications and reporting to the Board); (b) investment oversight, risk management and securities valuation (such as overseeing the sub-advisers and other service providers, analyzing investment performance and risks, overseeing risk management and disclosure, executing the daily valuation of securities, and analyzing trade execution); (c) fund administration (such as helping to prepare fund tax returns and complete other tax compliance matters and helping to prepare regulatory filings and shareholder reports); (d) fund board administration (such as preparing board materials and organizing and providing assistance for board meetings); (e) compliance (such as helping to devise and maintain the Nuveen funds’ compliance program and test for adherence); (f) legal support (such as helping to prepare registration statements and proxy statements, interpreting regulations and policies and overseeing fund activities); (g) with respect to certain closed-end funds, providing leverage, capital and distribution management services; and (h) with respect to certain open-end funds with portfolios that have a leverage component, providing such leverage management services.
The Board further noted the Adviser’s continued dedication to investing in its business to enhance the quality and breadth of the services provided to the Funds. The Board recognized the Adviser’s investment in staffing over recent years to support the services provided to the Nuveen funds in key areas, including in investment services, product management, retail distribution and information technology, closed-end funds and structured products, as well as in fund administration, operations and risk management. The Board further noted the Adviser’s continued commitment to enhancing its compliance program by, among other things, restructuring the compliance organization, developing a unified compliance program, adding compliance staff, and developing and/or revising policies and procedures as well as building further infrastructure to address new regulatory requirements or guidance and the growth of the complex. The Board also considered the enhancements to Nuveen’s cybersecurity capabilities, systems and processes to value securities, stress test reporting and risk and control self-assessments.
In addition, the Independent Board Members considered information highlighting the various initiatives that the Adviser had implemented or continued over recent years to benefit the open-end fund and closed-end fund product lines and/or particular Nuveen funds. The Board noted the Adviser’s continued efforts to rationalize the open-end fund and closed-end fund product lines through, among other things, mergers, liquidations and repositionings in seeking to provide enhanced shareholder value over the years through increased efficiency, reduced costs, improved performance and revised investment approaches that are more relevant to current shareholder needs. With respect to open-end Nuveen funds, such initiatives also included, but were not limited to, (a) implementing the multi-class solutions platform through the launch of several multi-asset income funds; (b) creating new share classes on several funds to potentially attract new clients and respond to regulatory developments, including Nuveen Global Infrastructure Fund (the “Global Fund”) and Nuveen Real Asset Income Fund (the “Real Asset Fund”); (c) reviewing the pricing of the open-end product line which resulted in the reduction of the management fee and/or temporary expense cap for various funds; (d) lowering the sales load breakpoints on certain municipal open-end funds to make them more competitive in the marketplace; (e) modifying the investment policies of various funds; and (f) creating a new product line of exchange-traded funds (“ETFs”).
In its review, the Board recognized that initiatives that attracted assets to the Nuveen family of funds generally benefited the Nuveen funds in the complex as fixed costs would be spread over a larger asset base and, as described below, through the complex-wide fee arrangement which generally provides that the management fees of the Nuveen funds (subject to limited exceptions) are reduced as asset levels in the complex reach certain breakpoints in the fee schedule.
Similarly, the Board considered the sub-advisory services provided by the Sub-Adviser to the Funds. The Sub-Adviser generally provided portfolio advisory services for the Funds. The Board reviewed the Adviser’s analysis of the Sub-Adviser which evaluated, among other things, the investment team and any changes thereto, the stability and history of the organization, the assets under management, the investment approach and the performance of the Nuveen funds it sub-advises. The Board noted that the Adviser recommended the renewal of the Sub-Advisory Agreements.
Based on its review, the Board determined, in the exercise of its reasonable business judgment, that it was satisfied with the nature, extent and quality of services provided to the respective Funds under each applicable Advisory Agreement.
B. The Investment Performance of the Funds and Fund Advisers
As part of its evaluation of the services provided by the Fund Advisers, the Board reviewed Fund performance over the quarter, one-, three- and five-year periods ending December 31, 2016 as well as performance data for the first quarter of 2017 ending March 31, 2017. The Board reviewed performance on an absolute basis and in comparison to the performance of peer funds (the “Performance Peer Group”) and recognized and/or customized benchmarks (i.e., generally benchmarks derived from multiple recognized benchmarks). The review and analysis of performance information during the annual review of Advisory Agreements incorporated the discussions and performance information the Board Members have had at each of their quarterly meetings throughout the year.
In evaluating performance data, the Independent Board Members recognized some of the limitations of such data and the difficulty in establishing appropriate peer groups and benchmarks for certain of the Nuveen funds. They recognized that each fund operates pursuant to its own investment objective(s), parameters and restrictions which may differ from that of the Performance Peer Group or benchmark. Certain funds may also utilize leverage which may provide benefits or risks to their portfolio compared to an unlevered benchmark. The Independent Board Members had noted that management had classified the Performance Peer Groups as low, medium and high in relevancy to the applicable fund as a result of these differences
or other factors. The Independent Board Members recognized that the variations between the Performance Peer Group or benchmark and the applicable Fund will lead to differing performance results and may limit the value of the comparative performance data in assessing the particular Fund’s performance.
In addition, the Independent Board Members recognized that the performance data is a snapshot in time, in this case as of the end of the 2016 calendar year or end of the first quarter of 2017. A different period may generate significantly different results and longer term performance can be adversely affected by even one period of significant underperformance. Further, a shareholder’s experience in a Fund depends on his or her own holding period which may differ from that reviewed by the Independent Board Members. The Independent Board Members also noted that although the open-end funds offer multiple classes and the performance data was based on Class A shares, the performance of the other classes of a fund should be substantially similar on a relative basis because all of the classes would be invested in the same portfolio of securities and differences in performance among classes could be principally attributed to the variations in distribution and servicing expenses of each class.
In their review of performance, the Independent Board Members focused, in particular, on the Adviser’s analysis of Nuveen funds determined to be underperforming performance outliers and the factors contributing to the respective fund’s performance and any efforts to address performance concerns. With respect to any Nuveen funds for which the Board has identified performance issues, the Board monitors such funds closely until performance improves, discusses with the Adviser the reasons for such results, considers any steps necessary or appropriate to address such issues, and reviews the results of any efforts undertaken. The Board, however, acknowledged that shareholders chose to invest or remain invested in a fund knowing that the Adviser and applicable sub-adviser manage the fund, knowing the fund’s investment strategy and seeking exposure to that strategy (even if the strategy was “out of favor” in the marketplace) and knowing the fund’s fee structure.
For the Global Fund, the Board noted that the Fund ranked in its Performance Peer Group in the third quartile in the one-year period, the first quartile in the three-year period and the second quartile in the five-year period. Although the Fund underperformed its benchmark in the one-year period, the Fund outperformed its benchmark in the three- and five-year periods. The Board was satisfied with the Fund’s overall performance.
For the Real Asset Fund, the Board noted that the Fund performed well against its Performance Peer Group, ranking in the first quartile in its Performance Peer Group in the one-, three- and five-year periods. The Fund also outperformed its benchmark in such periods. The Board was satisfied with the Fund’s overall performance.
For Nuveen Real Estate Securities Fund (the “Real Estate Fund”), the Board noted that although the Fund underperformed its benchmark in the one-, three- and five-year periods, the Fund ranked in its Performance Peer Group in the second quartile in the one-year period and first quartile in the three- and five-year periods. The Board was satisfied with the Fund’s overall performance.
C. Fees, Expenses and Profitability
1. Fees and Expenses
The Board evaluated the management fees and other fees and expenses of each Fund. The Board reviewed and considered, among other things, the gross management fees and, after taking into effect any expense limitation arrangement and/or fee waivers (to the extent applicable), the net management fees paid by the Funds. The Board further considered the net total expense ratio of each Fund (expressed as a percentage of average net assets) as the expense ratio is most reflective of the investors’ net experience in a Fund as it directly reflected the costs of investing in the respective Fund.
In addition, the Board reviewed the Broadridge Report comparing, in relevant part, each Fund’s gross and net advisory fees and net total expense ratio with those of a Peer Universe and/or Peer Group, as applicable. The Independent Board Members also reviewed the methodology regarding the construction of the applicable Peer Universe and Peer Group by Broadridge. In reviewing the comparative data, the Board was aware that various factors may limit some of the usefulness of the data, such as differences in size of the peers; the composition of the Peer Universe or Peer Group; changes each year of funds comprising the Peer Universe and Peer Group; and levels of expense reimbursements and fee waivers. Nevertheless, in reviewing a fund’s fees and expenses compared to the fees and expenses of its peers, the Board generally considered a fund’s expenses and fees to be higher if they were over 10 basis points higher, slightly higher if they were 6 to 10 basis points higher, in line if they were within approximately 5 basis points higher than the peer average and below if they were below the peer average of the Peer Group. The Board noted that the substantial majority of the Nuveen funds had a net expense ratio that was near or below their respective peer average.
The Independent Board Members noted that the Global Fund had a net management fee and a net expense ratio below the average of its Peer Group; and the Real Asset Fund and the Real Estate Fund each had a net management fee slightly higher than its respective peer average but a net expense ratio in line with its respective peer average.
In their evaluation of the management fee schedule, the Independent Board Members also reviewed the fund-level and complex-wide breakpoint schedules, as described in further detail below. In this regard, the Board was aware that as a result of a review of the pricing of the Nuveen open-end funds, the management fees and/or expense caps of various open-end funds had been reduced in 2016. The Independent Board Members also took into account any expense reimbursements and/or fee waivers provided by Nuveen. In addition, the Independent Board
Annual Investment Management Agreement Approval Process (Unaudited) (continued)
Members recognized that the fund-level breakpoint schedules of the Nuveen open-end funds recently were revised resulting in the addition of more breakpoints in the management fee schedules of the funds. The Board recognized that the revised schedules would provide for the potential of additional savings for shareholders if the respective fund’s assets under management grow.
Based on their review of the information provided, the Board determined that each Fund’s management fees (as applicable) to a Fund Adviser were reasonable in light of the nature, extent and quality of services provided to the Fund.
2. Comparisons with the Fees of Other Clients
The Board also reviewed information regarding the respective Fund Adviser’s fee rates for providing advisory services to other types of clients. For the Adviser and/or the Sub-Adviser, such other clients may include: separately managed accounts (such as retail, institutional or wrap accounts), other investment companies that are not offered by Nuveen but are sub-advised by the Sub-Adviser, foreign investment companies offered by Nuveen, and collective investment trusts. The Board further noted that the Adviser also advises certain ETFs sponsored by Nuveen.
In reviewing the fee rates assessed to other clients, the Board reviewed, among other things, the range of fees assessed for managed accounts and the foreign investment companies offered by Nuveen. With respect to foreign funds, the Board noted that unlike the management fees for the Nuveen funds, the management fees for the foreign funds may include distribution fees paid to intermediaries. The Board also reviewed the average fee rate for certain strategies offered by the Sub-Adviser.
The Board recognized the inherent differences between the Nuveen funds and the other types of clients. The Board considered information regarding these various differences which included, among other things, the services required, product distribution, average account sizes, types of investors targeted, legal structure and operations, and applicable laws and regulations. The Independent Board Members recognized that the foregoing variations resulted in different economics among the product structures and culminated in varying management fees among the types of clients and the Nuveen funds. In general, the Board noted that higher fee levels reflected higher levels of service provided by the Fund Adviser, increased investment management complexity, greater product management requirements and higher levels of business risk or some combination of the foregoing. The Board recognized the breadth of services the Adviser provided to support the Nuveen funds as summarized above and noted that many of such administrative services may not be required to the same extent or at all for the institutional clients or other clients. The Board further recognized the passive management of ETFs compared to the active management required of other Nuveen funds would contribute to differing fee levels.
The Independent Board Members noted that the sub-advisory fees paid by the Adviser to the Sub-Adviser, however, were generally for portfolio management services. The Board noted such sub-advisory fees were more comparable to the fees of retail wrap accounts and other external sub-advisory mandates.
Given the inherent differences in the various products, particularly the extensive services provided to the Funds, the Board concluded that such facts justify the different levels of fees.
3. Profitability of Fund Advisers
In conjunction with their review of fees, the Independent Board Members also considered Nuveen’s level of profitability for its advisory services to the Nuveen funds for the calendar years 2016 and 2015. In considering profitability, the Independent Board Members considered the level of profitability realized by Nuveen before the imposition of any distribution and marketing expenses incurred by the firm from its own resources. In evaluating the profitability, the Independent Board Members evaluated the analysis employed in developing the profitability figures, including the assumptions and methodology employed in allocating expenses. The Independent Board Members recognized the inherent limitations to any cost allocation methodology as different and reasonable approaches may be used and yet yield differing results. The Independent Board Members further reviewed an analysis of the history of the profitability methodology used explaining any changes to the methodology over the years. The Board has appointed two Independent Board Members, who along with independent legal counsel, helped to review and discuss the methodology employed to develop the profitability analysis each year and any proposed changes thereto and to keep the Board apprised of such changes during the year.
In their review, the Independent Board Members evaluated, among other things, Nuveen’s adjusted operating margins, the gross and net revenue margins (pre-tax and after-tax) for advisory activities for the Nuveen funds, and the revenues, expenses, and net income (pre-tax and after-tax) of Nuveen for each of the last two calendar years. The Independent Board Members also reviewed an analysis of the key drivers behind the changes in revenues and expenses that impacted profitability in 2016 versus 2015. The Board, however, observed that Nuveen’s operating margins for its advisory activities in 2016 were similar to that of 2015.
In addition to reviewing Nuveen’s profitability in absolute terms, the Independent Board Members also reviewed the adjusted total company margins of other advisory firms that had publicly available information and comparable assets under management (based on asset size and asset composition). The Independent Board Members, however, noted that the usefulness of the comparative data may be limited as the other firms may
have a different business mix and their profitability data may be affected by numerous other factors such as the types of funds managed, the cost allocation methodology used, and their capital structure. Nevertheless, the Board noted that Nuveen’s adjusted operating margins appeared comparable to the adjusted margins of the peers.
Further, the Adviser is a subsidiary of Nuveen, LLC, the investment management arm of Teachers Insurance and Annuity Association of America (“TIAA”). To have a fuller picture of the financial condition and strength of the TIAA complex, together with Nuveen, the Board reviewed a balance sheet for TIAA reflecting its assets, liabilities and capital and contingency reserves for the 2016 and 2015 calendar years.
In addition to the Adviser’s profitability, the Independent Board Members also considered the profitability of the Sub-Adviser from its relationship with the Nuveen funds. The Independent Board Members reviewed the Sub-Adviser’s revenues, expenses and revenue margins (pre- and post-tax) for its advisory activities for the calendar year ended December 31, 2016. The Independent Board Members also reviewed a profitability analysis reflecting the revenues, expenses and revenue margin (pre- and post-tax) by asset type for the Sub-Adviser for the calendar year ending December 31, 2016.
In evaluating the reasonableness of the compensation, the Independent Board Members also considered other amounts paid to a Fund Adviser for its services to the Funds as well as indirect benefits (such as soft dollar arrangements), if any, the Fund Adviser and its affiliates received or were expected to receive that were directly attributable to the management of a Fund. See Section E below for additional information on indirect benefits a Fund Adviser may receive as a result of its relationship with the Funds.
Based on a consideration of all the information provided, the Board noted that Nuveen’s and the Sub-Adviser’s level of profitability was acceptable and not unreasonable in light of the services provided.
D. Economies of Scale and Whether Fee Levels Reflect These Economies of Scale
When evaluating the level of the advisory fees, the Independent Board Members considered whether there will be any economies of scale that may be realized by the Fund Adviser as a Fund grows and the extent to which these economies were shared with the Funds and shareholders. The Board recognized that economies of scale are difficult to measure with precision; however, the Board considered that there were several ways the Fund Adviser may share the benefits of economies of scale with the Nuveen funds, including through breakpoints in the management fee schedule reducing the fee rates as asset levels grow, fee waivers and/or expense limitation agreements and the Adviser’s investment in its business which can enhance the services provided to the Nuveen funds. With respect to the fee structure, the Independent Board Members have recognized that economies of scale may be realized when a particular fund grows, but also when the total size of the fund complex grows (even if the assets of a particular fund in the complex have not changed or have decreased). Accordingly, subject to certain exceptions, the funds in the Nuveen complex pay a management fee to the Adviser which is generally comprised of a fund-level component and complex-level component, each of which has a breakpoint schedule. Subject to certain exceptions, the fund-level fee component declines as the assets of the particular fund grow and the complex-level fee component declines when eligible assets of all the Nuveen funds (except for Nuveen ETFs which are subject to a unitary fee) in the Nuveen complex combined grow. As noted, the Board had recently approved revised fund-level breakpoint schedules for the open-end funds which resulted in additional breakpoints added to the breakpoint schedules and therefore the potential for additional savings as a fund’s asset level grows.
The Independent Board Members also noted that additional economies of scale were shared with shareholders of the Global Fund and the Real Asset Fund through their temporary expense caps. The Independent Board Members reviewed the breakpoint and complex-wide schedules and any savings achieved from fee waivers and expense reimbursements (if applicable) as well as fee reductions as a result of the fund-level and complex-level breakpoints for the 2016 calendar year.
In addition, the Independent Board Members recognized the Adviser’s ongoing investment in its business to expand or enhance the services provided to the benefit of all of the Nuveen funds.
Based on their review, the Board concluded that the current fee structure was acceptable and reflected economies of scale to be shared with shareholders when assets under management increase.
E. Indirect Benefits
The Independent Board Members received and considered information regarding other benefits the respective Fund Adviser or its affiliates may receive as a result of their relationship with the Nuveen funds, including compensation paid to affiliates of a Fund Adviser for services rendered to the funds and research services received by a Fund Adviser from broker-dealers that execute fund trades. In this regard, the Independent Board Members recognized that an affiliate of the Adviser served as the principal underwriter for the open-end funds providing distribution and shareholder services to the funds for which it may be compensated through sales charges and distribution fees and shareholder services fees pursuant to the funds’ Rule 12b-1 distribution and service plan or otherwise. The Independent Board Members therefore took into account, among other things, the 12b-1 fees retained by Nuveen during the calendar year ending December 31, 2016.
In addition to the above, the Independent Board Members considered that the Funds’ portfolio transactions are allocated by the Sub-Adviser and the Sub-Adviser may benefit from research received from broker-dealers that execute Fund portfolio transactions. The Board noted, however, that with
Annual Investment Management Agreement Approval Process (Unaudited) (continued)
respect to transactions in fixed income securities, such securities generally trade on a principal basis and do not generate soft dollar credits. Although the Board recognized the Sub-Adviser may benefit from a soft dollar arrangement if it does not have to pay for this research out of its own assets, the Board also recognized that the research may benefit the Funds to the extent it enhances the ability of the Sub-Adviser to manage the Funds.
Based on their review, the Board concluded that any indirect benefits received by a Fund Adviser as a result of its relationship with the Funds were reasonable and within acceptable parameters.
F. Other Considerations
The Board Members did not identify any single factor discussed previously as all-important or controlling. The Board Members, including the Independent Board Members, concluded that the terms of each Advisory Agreement were fair and reasonable, that the respective Fund Adviser’s fees were reasonable in light of the services provided to each Fund and that the Advisory Agreements be renewed.
Notes
Notes
Notes
| | | | | | | | | | | | | | |
| | | | | | | | |
| | | | |
| | | | | | | | |
| | |
| | Nuveen: | | |
| | | | Serving Investors for Generations | | | | |
| | |
| | | | |
| | | |
| | | | Since 1898, financial advisors and their clients have relied on Nuveen to provide
dependable investment solutions through continued adherence to proven, long-term investing
principles. Today, we offer a range of high quality solutions designed to
be integral components of a well-diversified core portfolio.
| | |
| | | |
| | | | | | |
| | | | |
| | | | | | Focused on meeting investor needs. Nuveen is the investment manager of TIAA. We have grown into one of the world’s premier global asset managers, with specialist knowledge across all major asset classes and particular strength in solutions that provide income for investors and that draw on our expertise in alternatives and responsible investing. Nuveen is driven not only by the independent investment processes across the firm, but also the insights, risk management, analytics and other tools and resources that a truly world-class platform provides. As a global asset manager, our mission is to work in partnership with our clients to create solutions which help them secure their financial future. | | |
| | | | | |
| | | | | | | | | | |
| | | | | | Find out how we can help you.
To learn more about how the products and services of Nuveen
may be able to help you meet your financial goals, talk to your
financial advisor, or call us at (800) 257-8787. Please read the information
provided carefully before you invest. Investors should consider the
investment objective and policies, risk considerations, charges and
expenses of any investment carefully. Where applicable, be sure to obtain a
prospectus, which contains this and other relevant information. To obtain
a prospectus, please contact your securities representative or Nuveen,
333 W. Wacker Dr., Chicago, IL 60606. Please read the
prospectus carefully before you invest or send money.
Learn more about Nuveen Funds at: www.nuveen.com/mf
| | |
| | | | | | |
| | | | | | | | | | | | |
| | Securities offered through Nuveen Securities, LLC, member FINRA and SIPC | 333 West Wacker Drive Chicago, IL 60606 | www.nuveen.com | | |
MAN-FREGIF-1217D 427250-INV-B-02/19
ITEM 2. CODE OF ETHICS.
As of the end of the period covered by this report, the registrant has adopted a code of ethics that applies to the registrant’s principal executive officer, principal financial officer, principal accounting officer or controller, or persons performing similar functions. There were no amendments to or waivers from the code during the period covered by this report. The registrant has posted the code of ethics on its website at www.nuveen.com/MutualFunds/ShareholderResources/FundGovernance.aspx. (To view the code, click on Code of Conduct.)
ITEM 3. AUDIT COMMITTEE FINANCIAL EXPERT.
As of the end of the period covered by this report, the registrant’s Board of Directors or Trustees (“Board”) determined that the registrant has at least one “audit committee financial expert” (as defined in Item 3 of Form N-CSR) serving on its Audit Committee. The registrant’s audit committee financial experts are Carole E. Stone and Jack B. Evans, who are “independent” for purposes of Item 3 of Form N-CSR.
Ms. Stone served for five years as Director of the New York State Division of the Budget. As part of her role as Director, Ms. Stone was actively involved in overseeing the development of the State’s operating, local assistance and capital budgets, its financial plan and related documents; overseeing the development of the State’s bond-related disclosure documents and certifying that they fairly presented the State’s financial position; reviewing audits of various State and local agencies and programs; and coordinating the State’s system of internal audit and control. Prior to serving as Director, Ms. Stone worked as a budget analyst/examiner with increasing levels of responsibility over a 30 year period, including approximately five years as Deputy Budget Director. Ms. Stone has also served as Chair of the New York State Racing Association Oversight Board, as Chair of the Public Authorities Control Board, as a Commissioner on the New York State Commission on Public Authority Reform and as a member of the Boards of Directors of several New York State public authorities. These positions have involved overseeing operations and finances of certain entities and assessing the adequacy of project/entity financing and financial reporting. Currently, Ms. Stone is on the Board of Directors of CBOE Holdings, Inc., of the Chicago Board Options Exchange, and of C2 Options Exchange. Ms. Stone’s position on the boards of these entities and as a member of both CBOE Holdings’ Audit Committee and its Finance Committee has involved, among other things, the oversight of audits, audit plans and preparation of financial statements.
Mr. Evans was formerly President and Chief Operating Officer of SCI Financial Group, Inc., a full service registered broker-dealer and registered investment adviser (“SCI”). As part of his role as President and Chief Operating Officer, Mr. Evans actively supervised the Chief Financial Officer (the “CFO”) and actively supervised the CFO’s preparation of financial statements and other filings with various regulatory authorities. In such capacity, Mr. Evans was actively involved in the preparation of SCI’s financial statements and the resolution of issues raised in connection therewith. Mr. Evans has also served on the audit committee of various reporting companies. At such companies, Mr. Evans was involved in the oversight of audits, audit plans, and the preparation of financial statements. Mr. Evans also formerly chaired the audit committee of the Federal Reserve Bank of Chicago.
ITEM 4. PRINCIPAL ACCOUNTANT FEES AND SERVICES.
The following tables show the amount of fees that PricewaterhouseCoopers LLP, the Funds’ auditor, billed to the Funds’ during the Funds’ last two full fiscal years. The Audit Committee approved in advance all audit services and non-audit services that PricewaterhouseCoopers LLP provided to the Funds, except for those non-audit services that were subject to the pre-approval exception under Rule 2-01 of Regulation S-X (the “pre-approval exception”). The preapproval exception for services provided directly to the Funds waives the pre-approval requirement for services other than audit, review or attest services if: (A) the aggregate amount of all such services provided constitutes no more than 5% of the total amount of revenues paid by the Funds during the fiscal year in which the services are provided; (B) the Funds did not recognize the services as non-audit services at the time of the engagement; and (C) the services are promptly brought to the Audit Committee’s attention, and the Committee (or its delegate) approves the services before the audit is completed.
The Audit Committee has delegated certain pre-approval responsibilities to its Chairman (or, in his absence, any other member of the Audit Committee).
| | | | | | | | | | | | | | | | |
Fiscal Year Ended December 31, 2017 | | Audit Fees Billed
to Funds 1 | | | Audit-Related Fees
Billed to Funds 2 | | | Tax Fees Billed
to Funds 3 | | | All Other Fees
Billed to Funds 4 | |
Fund Name | | | | | | | | | | | | | | | | |
Nuveen Global Infrastructure Fund | | | 45,460 | | | | 0 | | | | 17,298 | | | | 0 | |
Nuveen Real Estate Securities Fund | | | 62,728 | | | | 0 | | | | 4,768 | | | | 0 | |
Nuveen Real Asset Income Fund | | | 49,177 | | | | 0 | | | | 4,312 | | | | 0 | |
| | | | | | | | | | | | | | | | |
Total | | $ | 157,365 | | | $ | 0 | | | $ | 26,378 | | | $ | 0 | |
| 1 | | “Audit Fees” are the aggregate fees billed for professional services for the audit of the Fund’s annual financial statements and services provided in connection with statutory and regulatory filings or engagements. |
| 2 | | “Audit-Related Fees” are the aggregate fees billed for assurance and related services reasonably related to the performance of the audit or review of financial statements that are not reported under “Audit Fees”. These fees include offerings related to the Fund’s common shares and leverage. |
| 3 | | “Tax Fees” are the aggregate fees billed for professional services for tax advice, tax compliance, and tax planning. These fees include: all global withholding tax services; excise and state tax reviews; capital gain, tax equalization and taxable basis calculations performed by the principal accountant. |
| 4 | | “All Other Fees” are the aggregate fees billed for products and services other than “Audit Fees”, “Audit-Related Fees” and “Tax Fees”. These fees represent all “Agreed-Upon Procedures” engagements pertaining to the Fund’s use of leverage. |
| | | | | | | | | | | | | | | | |
| | | Percentage Approved Pursuant to Pre-approval Exception | |
| | | Audit Fees Billed
to Funds | | | Audit-Related Fees
Billed to Funds | | | Tax Fees
Billed to Funds | | | All Other Fees
Billed to Funds | |
Fund Name | | | | | | | | | | | | | | | | |
Nuveen Global Infrastructure Fund | | | 0 | % | | | 0 | % | | | 0 | % | | | 0 | % |
Nuveen Real Estate Securities Fund | | | 0 | % | | | 0 | % | | | 0 | % | | | 0 | % |
Nuveen Real Asset Income Fund | | | 0 | % | | | 0 | % | | | 0 | % | | | 0 | % |
| | | | |
Fiscal Year Ended December 31, 2016 | | Audit Fees Billed
to Funds 1 | | | Audit-Related Fees
Billed to Funds 2 | | | Tax Fees
Billed to Funds 3 | | | All Other Fees
Billed to Funds 4 | |
Fund Name | | | | | | | | | | | | | | | | |
Nuveen Global Infrastructure Fund | | | 44,293 | | | | 0 | | | | 28,036 | | | | 0 | |
Nuveen Real Estate Securities Fund | | | 61,920 | | | | 0 | | | | 5,842 | | | | 0 | |
Nuveen Real Asset Income Fund | | | 45,284 | | | | 0 | | | | 5,842 | | | | 0 | |
| | | | | | | | | | | | | | | | |
Total | | $ | 151,497 | | | $ | 0 | | | $ | 39,721 | | | $ | 0 | |
| 1 | | “Audit Fees” are the aggregate fees billed for professional services for the audit of the Fund’s annual financial statements and services provided in connection with statutory and regulatory filings or engagements. |
| 2 | | “Audit-Related Fees” are the aggregate fees billed for assurance and related services reasonably related to the performance of the audit or review of financial statements that are not reported under “Audit Fees”. These fees include offerings related to the Fund’s common shares and leverage. |
| 3 | | “Tax Fees” are the aggregate fees billed for professional services for tax advice, tax compliance, and tax planning. These fees include: all global withholding tax services; excise and state tax reviews; capital gain, tax equalization and taxable basis calculations performed by the principal accountant. |
| 4 | | “All Other Fees” are the aggregate fees billed for products and services other than “Audit Fees”, “Audit-Related Fees” and “Tax Fees”. These fees represent all “Agreed-Upon Procedures” engagements pertaining to the Fund’s use of leverage. |
| | | | | | | | | | | | | | | | |
| | | Percentage Approved Pursuant to Pre-approval Exception | |
| | | Audit Fees Billed
to Funds | | | Audit-Related Fees
Billed to Funds | | | Tax Fees
Billed to Funds | | | All Other Fees
Billed to Funds | |
Fund Name | | | | | | | | | | | | | | | | |
Nuveen Global Infrastructure Fund | | | 0 | % | | | 0 | % | | | 0 | % | | | 0 | % |
Nuveen Real Estate Securities Fund | | | 0 | % | | | 0 | % | | | 0 | % | | | 0 | % |
Nuveen Real Asset Income Fund | | | 0 | % | | | 0 | % | | | 0 | % | | | 0 | % |
| | | | | | | | | | | | |
Fiscal Year Ended December 31, 2017 | | Audit-Related Fees
Billed to Adviser and
Affiliated Fund
Service Providers | | | Tax Fees Billed to
Adviser and
Affiliated Fund
Service Providers | | | All Other Fees
Billed to Adviser
and Affiliated Fund
Service Providers | |
Nuveen Investment Funds, Inc. | | $ | 0 | | | $ | 0 | | | $ | 0 | |
| |
| | | Percentage Approved Pursuant to Pre-approval Exception | |
| | | Audit-Related Fees
Billed to Adviser and
Affiliated Fund
Service Providers | | | Tax Fees Billed to
Adviser and
Affiliated Fund
Service Providers | | | All Other Fees
Billed to Adviser
and Affiliated Fund
Service Providers | |
| | | 0 | % | | | 0 | % | | | 0 | % |
| | | |
Fiscal Year Ended December 31, 2016 | | Audit-Related Fees
Billed to Adviser and
Affiliated Fund
Service Providers | | | Tax Fees Billed to
Adviser and
Affiliated Fund
Service Providers | | | All Other Fees
Billed to Adviser
and Affiliated Fund
Service Providers | |
Nuveen Investment Funds, Inc. | | $ | 0 | | | $ | 0 | | | $ | 0 | |
| |
| | | Percentage Approved Pursuant to Pre-approval Exception | |
| | | Audit-Related Fees
Billed to Adviser and
Affiliated Fund
Service Providers | | | Tax Fees Billed to
Adviser and
Affiliated Fund
Service Providers | | | All Other Fees
Billed to Adviser
and Affiliated Fund
Service Providers | |
| | | 0 | % | | | 0 | % | | | 0 | % |
| | | | | | | | | | | | | | | | |
Fiscal Year Ended December 31, 2017 | | Total Non-Audit Fees
Billed to Trust | | | Total Non-Audit Fees
billed to Adviser and
Affiliated Fund Service
Providers (engagements
related directly to the
operations and financial
reporting of the Trust) | | | Total Non-Audit Fees
billed to Adviser and
Affiliated Fund Service
Providers (all other
engagements) | | | Total | |
Fund Name | | | | | | | | | | | | | | | | |
Nuveen Global Infrastructure Fund | | | 17,298 | | | | 0 | | | | 0 | | | | 17,298 | |
Nuveen Real Estate Securities Fund | | | 4,768 | | | | 0 | | | | 0 | | | | 4,768 | |
Nuveen Real Asset Income Fund | | | 4,312 | | | | 0 | | | | 0 | | | | 4,312 | |
| | | | | | | | | | | | | | | | |
Total | | $ | 26,378 | | | $ | 0 | | | $ | 0 | | | $ | 26,378 | |
“Non-Audit Fees billed to Fund” for both fiscal year ends represent “Tax Fees” and “All Other Fees” billed to Fund in their respective amounts from the previous table.
Less than 50 percent of the hours expended on the principal accountant’s engagement to audit the registrant’s financial statements for the most recent fiscal year were attributed to work performed by persons other than the principal accountant’s full-time, permanent employees.
| | | | | | | | | | | | | | | | |
Fiscal Year Ended December 31, 2016 | | Total Non-Audit Fees
Billed to Trust | | | Total Non-Audit Fees
billed to Adviser and
Affiliated Fund Service
Providers (engagements
related directly to the
operations and financial
reporting of the Trust) | | | Total Non-Audit Fees
billed to Adviser and
Affiliated Fund Service
Providers (all other
engagements) | | | Total | |
Fund Name | | | | | | | | | | | | | | | | |
Nuveen Global Infrastructure Fund | | | 28,036 | | | | 0 | | | | 0 | | | | 28,036 | |
Nuveen Real Estate Securities Fund | | | 5,842 | | | | 0 | | | | 0 | | | | 5,842 | |
Nuveen Real Asset Income Fund | | | 5,842 | | | | 0 | | | | 0 | | | | 5,842 | |
| | | | | | | | | | | | | | | | |
Total | | $ | 39,721 | | | $ | 0 | | | $ | 0 | | | $ | 39,720 | |
“Non-Audit Fees billed to Fund” for both fiscal year ends represent “Tax Fees” and “All Other Fees” billed to Fund in their respective amounts from the previous table.
Audit Committee Pre-Approval Policies and Procedures. Generally, the Audit Committee must approve (i) all non-audit services to be performed for the Funds by the Funds’ independent accountant and (ii) all audit and non-audit services to be performed by the Funds’ independent accountant for the Affiliated Fund Service Providers with respect to the operations and financial reporting of the Funds. Regarding tax and research projects conducted by the independent accountant for the Funds and Affiliated Fund Service Providers (with respect to operations and financial reports of the Trust), such engagements will be (i) pre-approved by the Audit Committee if they are expected to be for amounts greater than $10,000; (ii) reported to the Audit Committee Chairman for his verbal approval prior to engagement if they are expected to be for amounts under $10,000 but greater than $5,000; and (iii) reported to the Audit Committee at the next Audit Committee meeting if they are expected to be for an amount under $5,000.
ITEM 5. AUDIT COMMITTEE OF LISTED REGISTRANTS.
Not applicable to this registrant.
ITEM 6. SCHEDULE OF INVESTMENTS.
| a) | | See Portfolio of Investments in Item 1. |
ITEM 7. DISCLOSURE OF PROXY VOTING POLICIES AND PROCEDURES FOR CLOSED-END
MANAGEMENT INVESTMENT COMPANIES.
Not applicable to this registrant.
ITEM 8. PORTFOLIO MANAGERS OF CLOSED-END MANAGEMENT INVESTMENT COMPANIES.
Not applicable to this registrant.
ITEM 9. PURCHASES OF EQUITY SECURITIES BY CLOSED-END MANAGEMENT INVESTMENT COMPANY AND AFFILIATED PURCHASERS.
Not applicable to this registrant.
ITEM 10. SUBMISSION OF MATTERS TO A VOTE OF SECURITY HOLDERS.
There have been no material changes to the procedures by which shareholders may recommend nominees to the registrant’s Board of Trustees implemented after the registrant last provided disclosure in response to this Item.
ITEM 11. CONTROLS AND PROCEDURES.
| | (a) | | The registrant’s principal executive and principal financial officers, or persons performing similar functions, have concluded that the registrant’s disclosure controls and procedures (as defined in Rule 30a-3(c) under the Investment Company Act of 1940, as amended (the “1940 Act”) (17 CFR 270.30a-3(c))) are effective, as of a date within 90 days of the filing date of this report that includes the disclosure required by this paragraph, based on their evaluation of the controls and procedures required by Rule 30a-3(b) under the 1940 Act (17 CFR 270.30a-3(b)) and Rules 13a-15(b) or 15d-15(b) under the Securities Exchange Act of 1934, as amended (the “Exchange Act”) (17 CFR 240.13a-15(b) or 240.15d-15(b)). |
| | (b) | | There were no changes in the registrant’s internal control over financial reporting (as defined in Rule 30a-3(d) under the 1940 Act (17 CFR 270.30a-3(d)) that occurred during the second fiscal quarter of the period covered by this report that has materially affected, or is reasonably likely to materially affect, the registrant’s internal control over financial reporting. |
ITEM 12. EXHIBITS.
File the exhibits listed below as part of this Form.
| | |
| (a)(1) | | Any code of ethics, or amendment thereto, that is the subject of the disclosure required by Item 2, to the extent that the registrant intends to satisfy the Item 2 requirements through filing of an exhibit: Not applicable because the code is posted on registrant’s website at www.nuveen.com/MutualFunds/ShareholderResources/FundGovernance.aspx and there were no amendments during the period covered by this report. (To view the code, click on Code of Conduct.) |
| |
| (a)(2) | | A separate certification for each principal executive officer and principal financial officer of the registrant as required by Rule 30a-2(a) under the 1940 Act (17 CFR 270.30a-2(a)) in the exact form set forth below: See EX-99.CERT attached hereto. |
| |
| (a)(3) | | Any written solicitation to purchase securities under Rule 23c-1 under the 1940 Act (17 CFR 270.23c-1) sent or given during the period covered by the report by or on behalf of the registrant to 10 or more persons: Not applicable to this registrant. |
| |
| (b) | | If the report is filed under Section 13(a) or 15(d) of the Exchange Act, provide the certifications required by Rule 30a-2(b) under the 1940 Act (17 CFR 270.30a-2(b)), Rule 13a-14(b) or Rule 15d-14(b) under the Exchange Act (17 CFR 240.13a-14(b) or 240.15d-14(b)), and Section 1350 of Chapter 63 of Title 18 of the United States Code (18 U.S.C. 1350) as an Exhibit. A certification furnished pursuant to this paragraph will not be deemed “filed” for purposes of Section 18 of the Exchange Act (15 U.S.C. 78r), or otherwise subject to the liability of that section. Such certification will not be deemed to be incorporated by reference into any filing under the Securities Act of 1933 or the Exchange Act, except to the extent that the registration specifically incorporates it by reference: See EX-99.906 CERT attached hereto. |
SIGNATURES
Pursuant to the requirements of the Securities Exchange Act of 1934 and the Investment Company Act of 1940, the registrant has duly caused this report to be signed on its behalf by the undersigned, thereunto duly authorized.
(Registrant) Nuveen Investment Funds, Inc.
| | |
| |
| By (Signature and Title) | | /s/ Kathleen L. Prudhomme |
| | Kathleen L. Prudhomme |
| | Vice President and Secretary |
Date: March 8, 2018
Pursuant to the requirements of the Securities Exchange Act of 1934 and the Investment Company Act of 1940, this report has been signed below by the following persons on behalf of the registrant and in the capacities and on the dates indicated.
| | |
| |
| By (Signature and Title) | | /s/ Greg A. Bottjer |
| | Greg A. Bottjer |
| | Chief Administrative Officer |
| | (principal executive officer) |
Date: March 8, 2018
| | |
| |
| By (Signature and Title) | | /s/ Stephen D. Foy |
| | Stephen D. Foy |
| | Vice President and Controller |
| | (principal financial officer) |
Date: March 8, 2018