UNITED STATES
SECURITIES AND EXCHANGE COMMISSION
Washington, D.C. 20549
FORM N-CSR
CERTIFIED SHAREHOLDER REPORT OF REGISTERED MANAGEMENT
INVESTMENT COMPANIES
Investment Company Act file number 811-05309
Nuveen Investment Funds, Inc.
(Exact name of registrant as specified in charter)
Nuveen Investments
333 West Wacker Drive, Chicago, IL 60606
(Address of principal executive offices) (Zip code)
Kathleen L. Prudhomme
Vice President and Secretary
901 Marquette Avenue
Minneapolis, Minnesota 55402
(Name and address of agent for service)
Registrant’s telephone number, including area code: (312) 917-7700
Date of fiscal year end: June 30
Date of reporting period: June 30, 2017
Form N-CSR is to be used by management investment companies to file reports with the Commission not later than 10 days after the transmission to stockholders of any report that is required to be transmitted to stockholders under Rule 30e-1 under the Investment Company Act of 1940 (17 CFR 270.30e-1). The Commission may use the information provided on Form N-CSR in its regulatory, disclosure review, inspection, and policy making roles.
A registrant is required to disclose the information specified by Form N-CSR, and the Commission will make this information public. A registrant is not required to respond to the collection of information contained in Form N-CSR unless the Form displays a currently valid Office of Management and Budget (“OMB”) control number. Please direct comments concerning the accuracy of the information collection burden estimate and any suggestions for reducing the burden to Secretary, Securities and Exchange Commission, 450 Fifth Street, NW, Washington, DC 20549-0609. The OMB has reviewed this collection of information under the clearance requirements of 44 U.S.C. ss.3507.
ITEM 1. REPORTS TO STOCKHOLDERS.
| | |
| | |  |
| Mutual Funds | |
| | | | | | |
| | | | | | | Annual Report June 30, 2017 |
| | | | | | | | | | | | | | | | | | |
| | | | | | | Share Class / Ticker Symbol | | |
| | | Fund Name | | | | Class A | | Class C | | Class R3 | | Class R6 | | Class I | | Class T | | |
| | |
| | Nuveen Core Bond Fund | | | | FAIIX | | NTIBX | | — | | NTIFX | | FINIX | | FIDTX | | |
| | Nuveen Core Plus Bond Fund | | | | FAFIX | | FFAIX | | FFISX | | FPCFX | | FFIIX | | FFITX | | |
| | Nuveen High Income Bond Fund | | | | FJSIX | | FCSIX | | FANSX | | — | | FJSYX | | FCPTX | | |
| | Nuveen Inflation Protected Securities Fund | | | | FAIPX | | FCIPX | | FRIPX | | FISFX | | FYIPX | | FIFTX | | |
| | Nuveen Intermediate Government Bond Fund | | | | FIGAX | | FYGCX | | FYGRX | | — | | FYGYX | | FYGTX | | |
| | Nuveen Short Term Bond Fund | | | | FALTX | | FBSCX | | NSSRX | | NSSFX | | FLTIX | | NSATX | | |
| | Nuveen Strategic Income Fund | | | | FCDDX | | FCBCX | | FABSX | | FSFRX | | FCBYX | | FSFTX | | |
| | | | | | | | | | | | |
| | | | | | |
| | | | |
| | | | | | | | |
| | |
| | Life is Complex. | | |
| | |
| | Nuveen makes things e-simple. | | |
| | |
| | It only takes a minute to sign up for e-Reports. Once enrolled, you’ll receive an e-mail as soon as your Nuveen Fund information is ready. No more waiting for delivery by regular mail. Just click on the link within the e-mail to see the report and save it on your computer if you wish. | | |
| | | | |
| | | | | | Free e-Reports right to your e-mail! | | |
| | | |
| | | | | | www.investordelivery.com If you receive your Nuveen Fund distributions and statements from your
financial advisor or brokerage account. |
| | | | |
| | | | or | | www.nuveen.com/accountaccess If you receive your Nuveen Fund distributions and statements directly from Nuveen. Must be preceded by or accompanied by a prospectus. NOT FDIC INSURED MAY LOSE VALUE
NO BANK GUARANTEE | | |
| | | | | | | | | | |
| | | | | | | | | | | | | |
Table
of Contents
Chairman’s Letter
to Shareholders

Dear Shareholders,
Some of the key assumptions driving the markets higher at the beginning of 2017 have recently come into question. Following the collapse of the health care reform bill in the Senate, progress on the rest of the White House’s pro-growth fiscal agenda, including tax reform and large infrastructure projects, is expected to be delayed. Economic growth projections, in turn, have been lowered, and with inflation recently waning, the markets are expecting fewer rate hikes from the Federal Reserve (Fed) than the Fed itself had predicted. Yet, asset prices continued to rise.
Investors have largely looked beyond policy disappointments and focused instead on the healthy profits reported by U.S. companies during the first two quarters of 2017. U.S. growth has remained slow and steady, European growth has surprised to the upside and concern that China would decelerate too rapidly has eased, further contributing to an optimistic tone in the markets. Additionally, political risk in Europe has moderated, with the election of mainstream candidates in the Dutch and French elections earlier this year.
The remainder of the year could bring challenges to this benign macro environment. The debt ceiling looms, with a vote needed from Congress to raise or suspend the nation’s borrowing limit before the Treasury is unable to pay its bills in full or on time (likely in early October). The mechanics of the U.K.’s separation from the European Union remain to be seen, as “Brexit” negotiations develop. A tightening of financial conditions in China or a more aggressive-than-expected policy action from the Fed, European Central Bank or Bank of Japan could also turn into headwinds.
Market volatility readings have been remarkably low lately, but conditions can change quickly. As market conditions evolve, Nuveen remains committed to rigorously assessing opportunities and risks. If you’re concerned about how resilient your investment portfolio might be, we encourage you to talk to your financial advisor. On behalf of the other members of the Nuveen Fund Board, we look forward to continuing to earn your trust in the months and years ahead.
Sincerely,

William J. Schneider
Chairman of the Board
August 23, 2017
Portfolio Managers’
Comments
Nuveen Core Bond Fund
Nuveen Core Plus Bond Fund
Nuveen High Income Bond Fund
Nuveen Inflation Protected Securities Fund
Nuveen Intermediate Government Bond Fund
Nuveen Short Term Bond Fund
Nuveen Strategic Income Fund
These Funds feature portfolio management by Nuveen Asset Management, LLC, an affiliate of Nuveen, LLC. In this report, the various portfolio management teams for the Funds discuss the economy and financial markets, key investment strategies and the Funds’ performance for the twelve-month reporting period ended June 30, 2017.
Effective, August 4, 2017 (subsequent to the close of this reporting period), investment policy changes were approved for the Nuveen High Income Bond Fund: Investments in preferred securities and contingent capital securities (CoCos) will be a principal investment strategy of the Fund. Because the fund must invest 80% of its assets in bonds, investments in preferred securities and CoCos, in the aggregate, will be limited to 20% of net assets (assuming no other securities are in the 20% bucket); Nuveen Core-Plus Bond Fund: Investments in preferred securities and CoCos will be a principal investment strategy of the Fund. Investments in preferred securities and CoCos, in the aggregate, will be limited to 15% of net assets; and the Nuveen Strategic Income Fund: The policy requiring the Fund to invest at least 80% of its assets in debt securities will be revised to require the Fund to invest at least 80% of its assets in income producing securities, and preferred securities and CoCos will be added to the list of securities comprising the 80% bucket and investments in preferred securities and CoCos, in the aggregate, will be limited to 20% of net assets.
These management teams include:
Nuveen Core Bond Fund
Jeffrey J. Ebert, Wan-Chong Kung, CFA, Chris J. Neuharth and Jason J. O’Brien, CFA, have been part of the management team for the Fund since 2000, 2002, 2012 and 2016, respectively.
Nuveen Core Plus Bond Fund
Timothy A. Palmer, CFA, has managed the Fund since 2003. Wan-Chong Kung, CFA, Jeffrey J. Ebert and Chris J. Neuharth joined the Fund as portfolio managers in 2001, 2005 and 2006, respectively. Douglas M. Baker, CFA, joined the Fund as portfolio manager in 2016.
This material is not intended to be a recommendation or investment advice, does not constitute a solicitation to buy or sell securities, and is not provided in a fiduciary. The information provided does not take into account the specific objectives or circumstances of any particular investor, or suggest any specific course of action. Investment decisions should be made based on an investor’s objectives or circumstances and in consultation with his or her advisors.
Certain statements in this report are forward-looking statements. Discussions of specific investments are for illustration only and are not intended as recommendations of individual investments. The forward-looking statements and other views expressed herein are those of the portfolio managers as of the date of this report. Actual future results or occurrences may differ significantly from those anticipated in any forward-looking statements and the views expressed herein are subject to change at any time, due to numerous market and other factors. The Funds disclaim any obligation to update publicly or revise any forward-looking statements or views expressed herein.
For financial reporting purposes, the ratings disclosed are the highest rating given by one of the following national rating agencies: Standard & Poor’s (S&P), Moody’s Investors Service, Inc. (Moody’s) or Fitch, Inc. (Fitch). This treatment of split-rated securities may differ from that used for other purposes, such as for Fund investment policies. Credit ratings are subject to change. AAA, AA, A and BBB are investment grade ratings; BB, B, CCC, CC, C and D are below investment grade ratings. Certain bonds backed by U.S. Government or agency securities are regarded as having an implied rating equal to the rating of such securities. Holdings designated N/R are not rated by these national rating agencies.
Refer to the Glossary of Terms Used in this Report for further definition of the terms used within this section.
Portfolio Managers’ Comments (continued)
Nuveen High Income Bond Fund
John T. Fruit, CFA, has managed the Fund since 2006. Jeffrey T. Schmitz, CFA, has been part of the management team for the Fund since 2008
Nuveen Inflation Protected Securities Fund
Wan-Chong Kung, CFA, has managed the Fund since its inception in 2004 and Chad W. Kemper joined the Fund as a portfolio manager in 2010.
Nuveen Intermediate Government Bond Fund
Wan-Chong Kung, CFA, has managed the Fund since 2002. Chris J. Neuharth and Jason J. O’Brien, CFA, have been on the Fund’s management team since 2009.
Nuveen Short Term Bond Fund
Chris J. Neuharth and Peter L. Agrimson, CFA, have been on the management team since 2004 and 2011, respectively. Jason J. O’Brien, CFA, and Mackenzie S. Meyer joined the Fund in 2016.
Nuveen Strategic Income Fund
Timothy A. Palmer, CFA, has managed the Fund since 2005. Jeffrey J. Ebert, Marie A. Newcome, CFA, and Douglas M. Baker, CFA, joined the Fund as co-portfolio managers in 2000, 2011 and 2016, respectively.
What factors affected the U.S. economy and financial markets during the twelve-month reporting period ended June 30, 2017?
During the twelve-month reporting period, the U.S. economy continued to grow moderately, now ranking the current expansion as the third-longest since World War II, according to the National Bureau of Economic Research. The second half of 2016 saw a short-term boost in economic activity, driven by a one-time jump in exports during the third quarter, but the economy resumed a below-trend pace thereafter. The Bureau of Economic Analysis reported an annual growth rate of 2.6% for the U.S. economy in the second quarter of 2017, as measured by the “advance” estimate of real gross domestic product (GDP), which is the value of goods and services produced by the nation’s economy less the value of the goods and services used up in production, adjusted for price changes. By comparison, the annual GDP growth rate in the first quarter of 2017 was 1.2%.
Despite the slowdown in early 2017, other data pointed to positive momentum as the labor market continued to tighten, manufacturing improved and consumer and business confidence surveys reflected optimism about the economy’s prospects. As reported by the Bureau of Labor Statistics, the unemployment rate fell to 4.4% in June 2017 from 4.9% in June 2016 and job gains averaged around 181,000 per month for the past twelve months. The Consumer Price Index (CPI) increased 1.6% over the twelve-month reporting period ended June 30, 2017 on a seasonally adjusted basis, as reported by the Bureau of Labor Statistics. The core CPI (which excludes food and energy) increased 1.7% during the same period, slightly below the Federal Reserve’s (Fed) unofficial longer term inflation objective of 2.0%. The housing market also continued to improve, with historically low mortgage rates and low inventory driving home prices higher. The S&P CoreLogic Case-Shiller U.S. National Home Price Index, which covers all nine U.S. census divisions, recorded a 5.6% annual gain in May 2017 (most recent data available at the time this report was prepared). The 10-City and 20-City Composites reported year-over-year increases of 4.9% and 5.7%, respectively.
The U.S. economic outlook struck a more optimistic tone, prompting the Fed’s policy making committee to raise its main benchmark interest rate in December 2016, March 2017 and June 2017. These moves were widely expected by the markets and, while the Fed acknowledged in its June 2017 statement that inflation has remained unexpectedly low, an additional increase is anticipated later in 2017 as the Fed seeks to gradually “normalize” interest rates. Also after the June 2017 meeting, the Fed revealed its plan to begin shrinking its balance sheets by allowing a small amount of maturing Treasury and mortgage securities to roll off without reinvestment. The timing of this is less certain, however, as it depends on whether the economy performs in line with the Fed’s expectations.
Politics also dominated the headlines in this reporting period with two major electoral surprises: the U.K.’s vote to leave the European Union and Donald Trump’s win in the U.S. presidential race. Market volatility increased as markets digested the initial shocks,
but generally recovered and, in the case of the “Trump rally,” U.S. equities experienced significant gains. Investors also closely watched elections across Europe. To the markets’ relief, more mainstream candidates were elected in the Dutch and French elections in the spring of 2017. However, Britain’s June 2017 snap election unexpectedly overturned the Conservative Party’s majority in Parliament, which increased uncertainties about the Brexit negotiation process. Additionally, in the U.S., legislative delays with health care reform made President Trump’s plans for tax cuts and other fiscal stimulus look less likely to happen this year.
What strategies were used to manage the Funds during the twelve-month reporting period and how did these strategies influence performance?
All of the Funds continued to employ the same fundamental investment strategies and tactics used previously, although implementation of those strategies depended on the individual characteristics of the portfolios, as well as market conditions. The Funds’ management teams use a highly collaborative, research-driven approach that we believe offers the best opportunity to achieve consistent, superior long-term performance on a risk-adjusted basis across the full range of market environments. During the reporting period, the Funds were generally positioned for an environment of continued moderate economic growth. Nonetheless, during the reporting period we made smaller scaled shifts on an ongoing basis that were geared toward improving each Fund’s profile in response to changing conditions and valuations. These strategic moves are discussed in more detail within each Fund’s section of this report.
Nuveen Core Bond Fund
The Fund’s Class A Shares at net asset value (NAV) underperformed both the Bloomberg Barclays U.S. Aggregate Bond Index and the Lipper Core Bond Funds Classification Average for the twelve-month reporting period.
Treasury rates rose sharply across the yield curve, particularly in the first half of the reporting period, as investors braced for strong fiscal stimulus and factored in a higher risk of inflation following the U.S. election, while remaining concerned about the possibility of reduced accommodation by global central banks. However, in the final months of the reporting period, three consecutive months of weaker-than-expected inflation readings were the catalyst for yields to move lower at the long end of the Treasury yield curve. Ten-year Treasury rates rose by more than 115 basis points through mid-March 2017, before falling approximately 30 basis points to end the reporting period about 85 basis points higher.
Around the rest of the world, global rates remained at exceptionally low levels due to accommodative central banks, resulting in strong demand from overseas investors for U.S. securities with incremental income. That technical underpinning, combined with the improved economic outlook, strong fundamentals and low market volatility, led investment grade corporate bonds to outperform during the reporting period. The segment generated strong excess returns over Treasuries and outperformed all other investment grade sectors despite heavy supply as issuers took advantage of favorable financing conditions and possible shifts in tax policy.
In the securitized sectors, agency mortgage-backed securities (MBS) performed well earlier in the reporting period due to continued bank and foreign purchases of the securities, the range-bound rate environment and lower levels of volatility. However, the sharp rise in interest rates and volatility, as well as relatively large net supply midway through the reporting period, proved to be a difficult environment for these securities. These factors, combined with increased rhetoric and the Fed’s eventual June 2017 announcement regarding plans to end its MBS reinvestments, weighed on agency MBS performance later in the reporting period. Over the full reporting period, agency MBS posted slight excess returns versus duration-matched Treasuries. Despite elevated levels of issuance in the first half of the reporting period, the commercial mortgage-backed securities (CMBS) sector finished the reporting period with a positive excess return over Treasuries. The segment benefited from the risk-on environment, steady demand, investors’ favorable reaction to the new risk retention rules and the associated lower CMBS issuance. However, toward the end of the reporting period, negative headlines surrounding retail loans in the CMBS segment mitigated most of the positive performance, especially for lower rated securities. Consumer related asset-backed securities (ABS) outpaced both the MBS and CMBS sectors, as well as duration-matched Treasuries. Demand for short-duration, high quality yield overshadowed ongoing headlines warning of weaker consumers and auto lending risks.
Sharply rising interest rates were a headwind for the Fund’s performance relative to its benchmark and peers in the first half of the reporting period. More specifically, we had the Fund positioned to benefit from a flatter Treasury yield curve at the time of the
Portfolio Managers’ Comments (continued)
November 2016 election. We did this by overweighting securities in the 10-year and 30-year portions of the yield curve, while underweighting securities with maturities of five years and under. However, the election’s surprising results sparked a sharp increase in rates and a dramatic steepening of the curve, with intermediate and long-term rates rising more than short-term rates. Although we shifted the Fund to a bias for a steeper yield curve as we neared the end of 2016, we did not make the move quickly enough. As a result, our yield curve positioning in the first half of the reporting period detracted the most from the Fund’s results. We also maintained a strategically short duration, or interest rate sensitivity, versus the benchmark during much of the reporting period, while tactically trading rates throughout. In aggregate, these duration moves detracted modestly from the Fund’s performance.
Conversely, our sector positioning had a positive impact on the Fund’s relative returns versus the benchmark. Given our longer-term outlook for moderate economic growth and a stable economy, we maintained the Fund’s approximately 10% overweight versus the benchmark in investment grade credit for much of the reporting period, which boosted results. Toward the end of the reporting period, we increased this overweight even further. Within corporates, our overweight to BBB rated credit was particularly beneficial due to the segment’s excess returns versus higher rated segments of the investment grade market. Also, our overweight positions in financials and industrials within investment grade credit generated excess returns.
In aggregate, our exposures in securitized sectors had little impact on the Fund’s results. On the positive side, the Fund’s performance benefited from our overweight exposure to high quality, short maturity ABS, which we increased slightly as the reporting period progressed. These securities benefited from strong demand for yield at the front end of the yield curve and the sector outperformed despite a relatively heavy new issuance calendar. The Fund’s overweight exposure to the CMBS sector was also modestly beneficial, especially our bias toward securities rated below AAA because these securities outperformed. On the other hand, the Fund’s underweight to agency MBS in the first half of the reporting period was a slight drag on performance because the sector produced excess returns. Also, within the MBS segment, the Fund’s overweight to 30-year MBS detracted because longer maturity MBS underperformed the rest of the segment toward the end of 2016.
We maintained essentially the same overarching investment themes during the reporting period. We maintained a portfolio duration that is modestly shorter than the benchmark and an underweight to the front end of the Treasury yield curve. As of the end of the reporting period, we had the Fund positioned to benefit from a flatter yield curve with a modest overweight in intermediate to longer maturity securities. This positioning was in response to weaker inflation numbers and the lack of any meaningful progress on various initiatives in Washington.
We also maintained the Fund’s focus on generating above market income by investing primarily in securities from the investment grade corporate and securitized sectors, with an emphasis on individual security selection. We believe the macro-economic backdrop remains constructive for these spread sectors because credit fundamentals are steady and investors’ continued quest for yield should keep spreads firm. However, valuations in the corporate market have meaningfully richened. While we don’t see a catalyst for significant spread widening in the near term, valuations at these levels warrant a strong focus on bottom-up fundamental research. We have maintained the Fund’s overweight position in investment grade credit with a bias toward securities in the financial and industrial sectors. Within investment grade, we are also maintaining an overweight in BBB rated credit versus the benchmark. In the MBS sector, we are positioned with a modest underweight to the sector because we expect to see some weakness after the Fed’s schedule to begin unwinding its balance sheet becomes more concrete. We are also maintaining overweight exposure in short maturity ABS versus the benchmark. We believe the short end of the ABS curve still offers value to investors versus positions in short maturity Treasuries. We continue to overweight the CMBS sector in the Fund’s portfolio.
In addition, we continued to use various derivative instruments in the Fund during the reporting period. We used U.S. Treasury note and bond futures as part of an overall construction strategy to manage the Fund’s duration and yield curve exposure. The effect of these activities during the reporting period was negative.
Nuveen Core Plus Bond Fund
The Fund’s Class A Shares at net asset value (NAV) outperformed both the Bloomberg Barclays U.S. Aggregate Bond Index and the Lipper Core Plus Bond Funds Classification Average for the twelve-month reporting period.
Treasury rates rose sharply across the yield curve, particularly in the first half of the reporting period, as investors braced for strong fiscal stimulus and factored in a higher risk of inflation following the U.S. election, while remaining concerned about the possibility of
reduced accommodation by global central banks. However, in the final months of the reporting period, three consecutive months of weaker-than-expected inflation readings were the catalyst for yields to move lower at the long end of the Treasury yield curve. Ten-year Treasury rates rose by more than 115 basis points through mid-March, before falling approximately 30 basis points to end the reporting period about 85 basis points higher.
Around the rest of the world, global rates remained at exceptionally low levels due to accommodative central banks, resulting in strong demand from overseas investors for U.S. securities with incremental income. That technical underpinning, combined with the improved economic outlook, strong fundamentals and low market volatility, led high yield and investment grade corporate bonds to outperform during the reporting period, despite record issuance. High yield bonds enjoyed very strong performance helped along by continued accommodative Fed policy, which in turn drove more inflows into the market. The high yield market did reprice noticeably in March after a record-setting eight-day streak of outflows from exchange-traded funds (ETFs), and in June, the energy segment of the market saw spreads widen due to oil price pressures. However, toward the end of the reporting period, high yield spreads versus Treasuries had tightened to levels not seen since mid-2014. Investment grade corporate bonds generated strong excess returns over Treasuries and outperformed all other investment grade sectors despite heavy supply as issuers took advantage of favorable financing conditions and possible shifts in tax policy. International credit also performed well with European and U.K. credit rallying early in the reporting period as Brexit uncertainty faded and later in the reporting period due to the positive French election outcome and continued Eurozone economic strength.
In the securitized sectors, agency MBS performed well earlier in the reporting period due to continued bank and foreign purchases of the securities, the range-bound rate environment and lower levels of volatility. However, the sharp rise in interest rates and volatility, as well as relatively large net supply midway through the reporting period, proved to be a difficult environment for these securities. These factors, combined with increased rhetoric and the Fed’s eventual June 2017 announcement regarding plans to end its MBS reinvestments, weighed on agency MBS performance later in the reporting period. Over the full reporting period, agency MBS posted excess returns versus duration-matched Treasuries. Despite elevated levels of issuance in the first half of the reporting period, the commercial mortgage-backed securities (CMBS) sector finished the reporting period with a positive excess return over Treasuries. The segment benefited from the risk-on environment, steady demand, investors’ favorable reaction to the new risk retention rules and the associated lower CMBS issuance. However, toward the end of the reporting period, negative headlines surrounding retail loans in the CMBS segment mitigated most of the positive performance, especially for lower rated securities. Consumer related asset-backed securities (ABS) outpaced both the MBS and CMBS sectors, as well as duration-matched Treasuries. Demand for short-duration, high quality yield overshadowed ongoing headlines warning of weaker consumers and auto lending risks.
Emerging market (EM) bonds posted solid returns, supported by a larger scale global growth recovery, firming risk sentiment, easy financial conditions and strong inflows into EM assets in search of yield. Business sentiment and manufacturing trade improved as developed market activity supported EM economies through trade. Later in the reporting period, investors maintained their appetite for risk despite tighter credit and regulatory conditions in China and lower commodity prices. EM currencies declined in the broad-based dollar rally in the first half of the reporting period, with U.S. trade and protectionist pressures hitting the Mexican peso and ongoing domestic pressures hindering the Turkish lira. However, in the second half of the reporting period, the U.S. dollar reversed its post-election gains and most EM currencies benefited, especially Eastern European EM currencies. Russia and Colombia underperformed into the end of the reporting period following oil price declines.
Global rates remained low for much of the first half of the reporting period, until sprinting higher on the heels of the U.S. election. Throughout the reporting period, global yields remained sensitive to shifting growth conditions and changing fiscal and monetary policy expectations. Early in the reporting period, low inflation, continued stimulus from major central banks, and the surprise Brexit vote all exerted downward pressure on global yields. Then, the U.S. election drove a sudden shift toward increased expectations for fiscal stimulus and business spending, which combined with better economic data in developed and emerging markets to push rates up by approximately 80 basis points. The prospect for additional Fed rate hikes and an eventual reduction in extraordinary monetary stimulus globally also added to rate pressures as more central banks moderated their dovish outlooks. European rates were influenced during the reporting period by uncertainty surrounding April’s French election and questions regarding the future path of quantitative easing by the European Central Bank.
During the reporting period, non-U.S. markets outperformed Treasuries as global spreads moved in their favor, with the spread between Treasuries and German Bunds reaching a new historical wide, until late in the reporting period when broadening global
Portfolio Managers’ Comments (continued)
growth led several key central banks to question the need for continued aggressive stimulus. The U.S. dollar strengthened by 3-6% versus most major currencies in the first half of the reporting period due to higher growth, the policy outlook and interest rate differentials. However, in the second half of the reporting period, the dollar fell broadly versus most currencies except for the Japanese yen after U.S. fiscal policy optimism faded, trade fears receded and other central bankers shifted tone. In the final months of the reporting period, the euro rose more than 7% versus the dollar. Over the entire reporting period, the South African rand and European currencies were among the top performers, while the Turkish lira and Japanese yen lagged.
Broadly speaking, the Fund’s outperformance versus its benchmarks was driven by the continued improvement in global economic conditions and a strong improvement in market risk sentiment, accompanied by flows into bonds. More specifically, the Fund benefited from the demand for and continued outperformance of corporate credit sectors, through both the tightening of credit spreads and the Fund’s yield advantage versus the benchmark. Investment grade was the largest contributor to the Fund’s outperformance during the reporting period. A significant overweight to the sector relative to the benchmark, including an overweight to BBB rated securities, was the largest contributor to return. The BBB segment topped investment grade returns as quality spreads contracted amid ongoing improvement in the outlook for credit fundamentals, optimism about the strengthening economy and investors’ unrelenting demand for yield. Issue selection within the investment grade corporate sector was also a meaningful contributor to return. Exposure to cyclical credits and a significant overweight to the financial sector, including bank preferred securities, were advantageous.
High yield corporates were also a source of relative outperformance, both through an overweight to the sector and from issue selection. During the first part of the reporting period, the Fund was positioned near the top end of its high yield allocation range and benefited from tightening credit spreads and the sector’s higher income. Our credit selection within high yield also added to returns, particularly our overweight to more cyclical industries such as paper and chemicals, as well as our exposure to EM credit. As the reporting period progressed, we reduced the Fund’s high yield weighting and hedged part of the exposure; however, performance continued to benefit from our issue selection and positioning in the sector.
Our relatively small sovereign bond and currency positioning had a minimal net impact on the Fund’s performance. Overall interest rate positioning detracted modestly. Small gains from our defensive duration stance were more than offset by shifts in the yield curve since bonds with 10-year maturities underperformed in late 2016.
Our strategy during the reporting period remained biased toward earning income from credit sectors against the backdrop of supportive economics and financial conditions. We continued to overweight corporates with a focus on bottom-up, issue-specific credit selection and careful attention to risk management following the tightening of valuations throughout the reporting period. Due to the strong performance and substantial spread tightening in high yield credit, we significantly reduced exposure to this segment, including taking gains on targeted cyclical credits that had performed well and met targets. We also hedged a portion of our remaining high yield exposure, which allowed the portfolio to potentially benefit from credit selection and earn incremental yield, while seeking to dampen the impact of overall moves in high yield. We largely redeployed the sale proceeds into ABS, CMBS and higher quality investment grade corporates. We also used market opportunities to add to bank preferred securities; the Fund’s portfolio remained significantly overweight in financials. The portfolio was positioned with an overweight in BBB rated companies, but we also reduced this exposure as the reporting period progressed due to the strong outperformance of lower rated investment grade credits. Although we remained constructive on investment grade and high yield corporates as the reporting period ended, we took the opportunity after recent strength to reduce the overall risk profile of the Fund due to narrower risk premiums providing less compensation for ongoing policy and geopolitical risks.
Away from these sectors, we continued to find opportunities in securitized sectors such as ABS and CMBS, as well as in select foreign markets. Non-U.S. positions remained relatively low and tactical in nature during the reporting period, owing to shifting fundamentals and episodic market volatility. Other portfolio activity focused on individual credit selection and relative value opportunities. We continued to hold a large underweight in Treasuries, given our constructive economic view and the relatively unattractive duration and yield profile of the sector.
Interest rate positioning was marginally defensive for most of the reporting period, with adjustments based on valuations and risk management. At the end of the reporting period, the Fund’s duration remained moderately shorter than the benchmark index, given our bias for higher yields this year. Although the potential for volatility continues, particularly associated with central bank balance
sheet and policy transition, we expect the current rate cycle to be drawn out and the upside move in rates to be contained by macro factors. As a result, we do not believe that an aggressive positioning in interest rates is a beneficial strategy from a risk/reward perspective. Our strategic focus on diversified income and managing credit risk will be the important value drivers.
During the reporting period, we also continued to use various derivative instruments. We used Treasury note and bond futures as part of an overall construction strategy to manage the Fund’s duration and yield curve exposure. These derivative positions had a positive impact on performance during the reporting period. We also used interest rate swaps to manage portfolio duration and overall portfolio yield curve exposure. These positions had a negligible impact on performance and these positions were terminated prior to the end of the reporting period.
We used forward foreign currency exchange contracts to manage the Fund’s foreign currency exposure. For example, the Fund may reduce unwanted currency exposure from the Fund’s bond portfolio, or may take long forward positions in select currencies in an attempt to benefit from the potential price appreciation. These positions had a negative impact on performance during the reporting period.
The Fund also entered into credit default swaps to hedge credit risk. The effect of these activities on performance was negligible during the reporting period.
The Fund purchased currency put options which were used as part of an overall portfolio construction strategy to manage foreign currency exposure. These put options had a negligible impact on performance during the reporting period.
The Fund also purchased a small amount of currency call options as part of its overwrite strategy and purchased a small amount of call options on futures during the period. The call options had a negligible impact on performance during the reporting period.
Nuveen High Income Bond Fund
The Fund’s Class A Shares at net asset value (NAV) outperformed both the Bloomberg Barclays High Yield 2% Issuer Capped Index and the Lipper High Yield Funds Classification Average for the twelve-month reporting period.
Treasury rates rose sharply across the yield curve, particularly in the first half of the reporting period, as investors braced for strong fiscal stimulus and factored in a higher risk of inflation following the U.S. election, while remaining concerned about the possibility of reduced accommodation by global central banks. However, in the final months of the reporting period, three consecutive months of weaker-than-expected inflation readings were the catalyst for yields to move lower at the long end of the Treasury yield curve. Ten-year Treasury rates rose by more than 115 basis points through mid-March, before falling approximately 30 basis points to end the reporting period about 85 basis points higher.
Around the world, global rates remained at exceptionally low levels due to accommodative central banks, resulting in strong demand from overseas investors for U.S. securities with incremental income. That technical underpinning, combined with a pickup in economic activity around the world, solid corporate earnings, strong fundamentals and low market volatility, led high yield corporate bonds to significantly outperform all other fixed income asset classes over the reporting period, despite record M&A-driven issuance at the end of 2016 and the first few months of 2017. High yield bonds were also helped along by continued accommodative Fed policy, which in turn drove more inflows into the market over much of the reporting period. Also, year-over-year revenue growth for high yield companies improved for five consecutive quarters. In March 2017, the high yield market did reprice noticeably after a record-setting eight-day streak of outflows from exchange-traded funds (ETFs), and in June, the energy segment of the market saw spreads widen due to oil price pressures. However, toward the end of the reporting period, high yield spreads versus Treasuries had tightened to levels not seen since mid-2014. As the reporting period ended, inflows into the market subsided as investors grew concerned about policy risk surrounding the Trump administration, geopolitical tensions, the decline in oil, lofty valuations and heightened risks heading into September with European Central Bank and Fed meetings.
Oil prices fell in the second half of the reporting period to below $43 per barrel by late June 2017, due to rising crude inventories in the United States. While the fall in oil and its relation to the health of the high yield market has become topical once again, we don’t believe it is yet a cause for credit loss concerns among energy producers, or for the broader high yield market. However, we acknowledge that the situation surrounding oil prices is still fluid, and the market is closer to a point (sub-$40 per barrel oil) where
Portfolio Managers’ Comments (continued)
this narrative could begin to change. Changes in the credit market’s structure have materially impacted the future sensitivity of corporate credit markets to oil prices. Easy access to debt and equity capital markets has allowed most energy firms to shore up their near-term liquidity and extend maturity profiles. As a result, the number of those credits rated B and below on negative outlook and most at risk of default has declined by 35-40%. To that point, some of the weakest credits from two years ago have undergone restructuring or defaulted and are no longer in high yield indices. However, energy does remain a large concentration in U.S. high yield indices, directly accounting for $178 billion in debt (13%), down from 15-20% at peak levels.
Over the reporting period, lower quality bonds significantly outperformed higher quality bonds as investors added risk to their portfolios due to the strong high yield market conditions. We witnessed a fair amount of spread compression between CCC rated securities and their higher quality single B and BB counterparts as the credit cycle was extended and friendly central bank policy and other factors helped to dampen corporate default rates. By June 2017, Moody’s global speculative grade default rate had fallen to 3.2%, down from its August 2016 high of 4.8% for this cycle. The uptick in global default rates due to the spike in defaults among energy and commodity companies over the past two years has run its course. Higher risk, CCC rated bonds gained 20.77% during the reporting period, compared to a return of 9.83% for BB rated bonds. Although in the final months of the reporting period, investors did favor the higher quality BB rated segment of high yield due to oil-driven risk aversion and renewed interest in Treasuries.
The leading sectors within high yield continued to be basic materials and energy for the reporting period. Within those sectors, the top performing industries were refining, metals and mining, chemicals and oilfield services, which benefited along with other cyclical sectors from a snap back after the oil price collapse in 2014 and 2015. Chemicals were strong because of developing tailwinds from what appeared to be the bottoming of certain commodity prices, while many companies within the index were also in deleveraging mode. The less cyclical telecommunications area of the market also showed strong results. Laggards during the reporting period included the secularly challenged retail sector and more defensive areas of the market such as supermarkets.
The Fund’s outperformance during the reporting period was mainly driven by the better environment for risk appetites that led to a substantial improvement in market liquidity and the outperformance of lower quality credit. We had positioned the Fund with an overweight in CCC rated debt, which was a significant driver of its favorable results. The increase in risk appetites also buoyed the previously lagging growth-sensitive areas of the market, specifically basic materials and energy. We saw particular strength among many distressed coal, energy and various other commodity-related bonds. The risk-on environment also led to strength in some of the Fund’s smaller-cap and small-issue size credits that had previously suffered simply because of illiquid market conditions.
In terms of sector allocations, the Fund benefited from overweight positions in chemicals, metals and mining, oilfield services, paper and financials. Underweights to retailers and consumer non-cyclical also proved helpful. While the Fund maintained close to a market weight in energy, it benefited from a down-in-quality bias within the exploration and production (E&P) sector because the stabilization in energy prices worked to lift many of the marginal producers. Similarly, within the mining sector, an uptick in natural gas prices helped to improve the relative attractiveness of coal, and by extension the performance of coal credits, which had been severely oversold on the heels of multiple industry bankruptcies. Therefore, the Fund’s overweight to coal within metals and mining was a net benefactor to performance. The Fund’s overweights to chemicals and paper were helpful since both sectors are cyclically exposed and had suffered disproportionately during 2015 and the beginning of 2016 when global growth scares were pervasive. Modest detractors to performance included underweights to health care, technology, cable/satellite and wireless communications.
The Fund also had modest exposure to Brazilian corporates, which were negatively affected by the country’s latest political scandal later in the reporting period. We accepted modest losses in a large agribusiness company that was at the forefront of the latest bribery scandal, while maintaining the Fund’s exposure to Petrobras, the large quasi-sovereign oil company that has proven rather resilient.
Elsewhere, the Fund’s holdings in European credit, particularly in the financial sector, performed well. European banks were increasingly in a much better situation with excess capital positions, while earnings were generally solid with few negative surprises. Regulators have mandated higher capital ratios, and an improving economy has benefited asset quality. Yields continue to look compelling when compared to large parts of the European high yield market, creating a large technical bid to the market.
As we neared the end of the reporting period, we reduced the Fund’s overweight to CCC rated debt, ending the reporting period with a modest overweight relative to the benchmark. We still believe that credit risk can continue to do well, but following the strong
performance of lower rated credit over the past two years, valuations are simply not as compelling as they had been for the lower tiers of corporate credit. With valuations near their tightest levels, it is important to assess the risks that potentially lie ahead. As central banks move to becoming less accommodative, monetary policy uncertainty will remain at the forefront of investor concerns. Continued oil and commodity volatility also remains a concern, even though we believe the sensitivity of credit spreads to oil prices should be lower than the in the recent past. Despite these issues, we continue to find attractive sources of yield in the CCC space on a selected basis. Also, we want to keep a modest overweight in CCCs because we believe lower quality securities will likely outperform higher quality paper if the interest rate threat facing the market over the next three to six months come to fruition.
Within energy, we maintained close to a neutral weighting versus that of the benchmark, but with a small emphasis toward higher beta within the energy E&P industry and a small overweight to oilfield services. Both of those sectors underperformed the market with the retreat of oil prices from the low $50s to the low $40s in the second half of the reporting period. Spreads within the energy E&P sector widened out by 75-100 basis points in the final two months of the reporting period and are at one-year highs, arguably offering value within a market that has seen spreads on broader BB rated securities reach historically tight levels. As noted above, we believe the changes in composition to the sector have reduced high yield’s sensitivity to oil, and that a decrease in production costs and a stronger cohort of surviving companies are all reasons not to abandon the sector. While we plan to take a cautious approach to energy investments given the uncertain path of oil prices and the inherent volatility, we do believe there are attractive opportunities to add portfolio yield. While fundamentally attractive, we continue to underweight health care, cable/satellite communications and technology based on valuation considerations, although we do find select opportunities in those sectors. In the case of health care, there are still many unknowns regarding the administration’s repeal and replace legislation.
We maintained the Fund’s emerging market (EM) exposure at slightly less than 5%. We are seeing pervasive evidence of a broad-based improvement in the industrial economy, not just in the U.S., but also in several emerging markets like China and Brazil. The medium-term drivers for these markets remain constructive because we believe the worst of the fundamental downturn has passed. The Fund owned modest weightings in preferred securities, split between $25-par preferred securities and hybrid capital European bank preferred securities, and contingent capital securities (CoCos). We also maintained small weights in various closed-end funds that invest in leveraged loans, high yield bonds and EM debt, as well as a small allocation to equities.
The Fund’s average duration (interest rate sensitivity) was 3.73 years at the end of the reporting period, essentially the same as the benchmark’s duration. Despite the spread narrowing in lower quality market segments, we continue to believe that high yield offers more protection from interest rate moves than other fixed income asset classes. The asset class has naturally low duration, while its incremental yield helps mitigate price movements in a rising rate environment.
During the reporting period, we also continued to use various derivative instruments. We used U.S. Treasury note and bond futures as part of an overall portfolio construction strategy to manage the Fund’s duration and yield curve exposure. The effect of these activities during the period was negative.
We used foreign currency exchange contracts to manage the Fund’s foreign currency exposures. During the reporting period, these instruments were used primarily for hedging purposes to reduce unwanted currency exposure from the Fund’s bond portfolio. These positions had a positive impact on performance during the reporting period.
The Fund also entered into credit default swaps to take on credit risk and earn a commensurate credit spread. The effect of these activities on performance was negligible and these positions were terminated prior to the end of the reporting period.
Nuveen Inflation Protected Securities Fund
The Fund’s Class A Shares at net asset value (NAV) underperformed both the Bloomberg Barclays U.S. TIPS Index and the Lipper Inflation-Protected Bond Funds Classification Average for the twelve-month reporting period.
Treasury rates rose sharply across the yield curve during the reporting period as investors braced for strong fiscal stimulus and factored in a higher risk of inflation following the U.S. election, while remaining concerned about the possibility of reduced accommodation by global central banks. In the Treasury inflation-protected securities (TIPS) market, the asset class saw strong inflows
Portfolio Managers’ Comments (continued)
during the first half of the reporting period, reflecting increased investor interest in inflation protection after implied inflation expectations reached 2% by the end of 2016. Inflows continued in the second half of the reporting period, but at a slower pace. Strong
seasonal Consumer Price Index (CPI) prints at the beginning of 2017 and investor optimism about reflationary fiscal policies by the new Trump administration faded as the reporting period progressed. In the final months of the reporting period, three consecutive months of weaker-than-expected CPI prints were the catalyst for yields to move lower at the long end of the nominal Treasury curve and caused breakeven rates to narrow. (The breakeven rate measures the difference between the yields of nominal Treasuries versus TIPS with the same maturity.)
TIPS yields were higher, and therefore prices were lower, across the board during the reporting period. However, yields for shorter maturity TIPS rose much more than longer maturities because the falling price of oil caused shorter securities to struggle. The yield on five-year TIPS moved out of deeply negative territory at the beginning of the reporting period, jumping 63 basis points to end the reporting period at 0.22%. (Because the yield on a TIPS bond is equal to the corresponding Treasury bond yield minus the expected rate of inflation, it falls into negative territory if the inflation rate is higher than the current Treasury yield.) Meanwhile, the 10-year TIPS yield increased 53 basis points to end the reporting period at 0.57%, while 30-year TIPS yields rose 31 basis points to end at 0.99%. As a result, the TIPS yield curve flattened over the reporting period since short rates rose significantly more than longer rates. Meanwhile, the TIPS breakeven rate rose sharply at the end of 2016, indicating investor expectations of increased inflation risk, before reversing somewhat during the second quarter of 2017, but still ending the reporting period higher. The TIPS sector ended the reporting period in negative territory with a return of -0.63% for the Bloomberg Barclays U.S. TIPS Index, but still outperformed nominal Treasury securities.
Around the world, global rates remained at exceptionally low levels due to accommodative central banks, resulting in strong demand from overseas investors for U.S. securities with incremental income. That technical underpinning, combined with the improved economic outlook, strong fundamentals and low market volatility, led high yield and investment grade corporate bonds to outperform during the reporting period, despite record issuance. High yield bonds enjoyed very strong performance helped along by continued accommodative Fed policy, which in turn drove more inflows into the market. The high yield market did reprice noticeably in March after a record-setting eight-day streak of outflows from exchange-traded funds (ETFs), and in June, the energy segment of the market saw spreads widen due to oil price pressures. However, toward the end of the reporting period, high yield spreads versus Treasuries had tightened to levels not seen since mid-2014. Investment grade corporate bonds generated strong excess returns over Treasuries and outperformed all other investment grade sectors despite heavy supply as issuers took advantage of favorable financing conditions and possible shifts in tax policy.
In the securitized sectors, agency mortgage-backed securities (MBS) performed well earlier in the reporting period due to continued bank and foreign purchases of the securities, the range-bound rate environment and lower levels of volatility. However, the sharp rise in interest rates and volatility, as well as relatively large net supply midway through the reporting period, proved to be a difficult environment for these securities. These factors, combined with increased rhetoric and the Fed’s eventual June 2017 announcement regarding plans to end its MBS reinvestments, weighed on agency MBS performance later in the reporting period. Over the full reporting period, agency MBS posted slightly positive excess returns versus duration-matched Treasuries. Despite elevated levels of issuance in the first half of the reporting period, the commercial mortgage-backed securities (CMBS) sector finished the reporting period with a positive excess return over Treasuries. The segment benefited from the risk-on environment, steady demand, investors’ favorable reaction to the new risk retention rules and the associated lower CMBS issuance. However, toward the end of the reporting period, negative headlines surrounding retail loans in the CMBS segment mitigated most of the positive performance, especially for lower rated securities. Consumer related asset-backed securities (ABS) outpaced duration-matched Treasuries as well. Demand for short-duration, high quality yield overshadowed ongoing headlines warning of weaker consumers and auto lending risks.
The Fund held an overweight in nominal Treasuries versus the benchmark, which is comprised of 100% TIPS, to take advantage of changing inflation expectations along the TIPS yield curve. Although we shifted the Fund’s TIPS exposure from a low of approximately 81% of the Fund’s assets to about 88% of the portfolio by year-end 2016, our position still represented an underweight versus the index’s TIPS exposure with a bias to remain overweight to spread sectors. This positioning was a detractor through year-end 2016 as breakeven rates performed well following the November 2016 election.
Volatile real rates, especially at the end of 2016, were also a headwind for the Fund’s performance relative to its benchmark. Our yield curve positioning was a drag on results with most of the negative impact occurring in the first two months of the reporting period. The Fund was positioned with an underweight to securities at the long end of the yield curve, which flattened through August 2016 before reversing in September 2016.
On the positive side, the Fund’s approximately 10-12% weight among spread sectors, including ABS, CMBS, high yield credit and investment grade credit, benefited performance. As noted above, spread sectors, especially high yield corporates, produced strong excess returns during the reporting period. In addition, we positioned the Fund with a duration that was modestly shorter than the benchmark throughout the reporting period, which provided a modest boost to performance.
Toward the end of the reporting period, we slightly lowered the Fund’s TIPS exposure and invested the proceeds into nominal Treasuries. Despite attractive breakeven levels and a positive technical backdrop, soft inflation projections are weighing on the TIPS asset class. This increased the Fund’s weight in nominal Treasuries and agency debentures to approximately 3% of its portfolio. We also continued to favor modest exposure to several out-of-index spread sectors, including ABS, CMBS, high yield corporate bonds and investment grade corporate bonds, which represented a little more than 10% of the portfolio. We believe the macro-economic backdrop remains constructive for these spread sectors because credit fundamentals are steady and investors’ continued quest for yield should keep spreads firm. However, valuations in the corporate market have meaningfully richened. While we don’t see a catalyst for significant spread widening in the near term, valuations at these levels warrant a strong focus on bottom-up fundamental research. As noted, the Fund’s duration was kept modestly shorter than the benchmark, given our bias for rates to move slowly higher through the rest of the 2017.
We also used U.S. Treasury note and bond futures as part of an overall portfolio construction strategy to manage the Fund’s duration and yield curve exposure. These derivative positions had a negative impact on performance during the reporting period.
Nuveen Intermediate Government Bond Fund
The Fund’s Class A Shares at net asset value (NAV) underperformed both the Bloomberg Barclays Intermediate Government Bond Index and the Lipper Intermediate U.S. Government Funds Classification Average for the twelve-month reporting period.
Treasury rates rose fairly dramatically across the yield curve, particularly in the first half of the reporting period, as investors braced for strong fiscal stimulus and factored in a higher risk of inflation following the U.S. election, while remaining concerned about the possibility of reduced accommodation by global central banks. At the front end of the Treasury yield curve, rates reflected Fed tightening with yields rising throughout the reporting period for maturities of three years and under. For example, the one-year Treasury yield was up approximately 80 basis points during the reporting period. In the more intermediate range of the Treasury yield curve, rates for five-year Treasuries increased by approximately 90 basis points. Meanwhile, rates for longer-term Treasuries rose significantly through mid-March 2016; however, in the final months, three consecutive inflation readings that were weaker than expected contributed to lower yields at the long end of the Treasury yield curve. Rates for 10-year Treasuries rose by more than 115 basis points, before falling approximately 30 basis points to end the reporting period about 85 basis points higher. Around the rest of the world, global rates remained at exceptionally low levels due to accommodative central banks, resulting in strong demand from overseas investors for U.S. securities with incremental income.
In the securitized sectors, mortgage-backed securities (MBS) issued by government agencies such as Fannie Mae (FNMA), Ginnie Mae (GNMA) and Freddie Mac (FHLMC) performed well earlier in the reporting period due to continued bank and foreign purchases of the securities, the range-bound rate environment and lower levels of volatility. However, the sharp rise in interest rates and volatility, as well as relatively large net supply midway through the reporting period, proved to be a difficult environment for these securities. These factors, combined with increased rhetoric and the Fed’s eventual June announcement regarding plans to end its MBS reinvestments, weighed on agency MBS performance later in the reporting period. The GNMA segment underperformed because lower all-in yields kept those buyers on the sidelines, while conventional FNMA and FHLMC MBS outperformed. The agency MBS sector as a whole posted slight excess returns versus duration-matched Treasuries. Despite high levels of issuance in late 2016, the commercial mortgage-backed securities (CMBS) sector performed well in the risk-on environment following the election. The segment benefited from the recovery in the broader markets, strong demand for high quality, non-government securities and the lower level of CMBS issuance in the second half of the reporting period. However, toward the end of the reporting period, negative headlines surrounding retail loans in the CMBS segment mitigated most of the positive performance, especially for lower rated securities.
Portfolio Managers’ Comments (continued)
Overall, CMBS finished the reporting period with positive excess returns over Treasuries. Consumer related asset-backed securities (ABS) outpaced duration-matched Treasuries on the back of strong consumer health and low volatility. Demand for short-duration, high quality yield overshadowed headlines warning of weaker consumers and auto lending risks as the reporting period progressed.
Sharply rising interest rates were a headwind for the Fund’s performance relative to its benchmark and peers during the reporting period. More specifically, we had the Fund positioned to benefit from a flatter Treasury yield curve at the time of the election. We did this by overweighting securities in the 10-year portion of the yield curve, while underweighting securities with maturities of five years and under. However, the election’s surprising results sparked a sharp increase in rates and a dramatic steepening of the curve, with intermediate and long-term rates rising more than short-term rates. Although we shifted to a bias for a steeper yield curve and reduced the Fund’s exposure to 10-year securities as we neared the end of 2016, the move was made after the rapid repricing of the curve post-election. As a result, our yield curve positioning detracted from the Fund’s results, mostly in the first half of the reporting period. In the second half of the reporting period, however, the Treasury yield curve was meaningfully flatter after the two Fed rate hikes pushed short rates higher, while longer term rates fell due to lower inflation readings. During the final months of the reporting period, our yield curve positioning proved beneficial, but it was not enough to offset the earlier shortfall. We also tactically traded the Fund’s duration, or interest rate sensitivity, throughout the reporting period. In aggregate, these duration moves slightly detracted from the Fund’s performance.
On the positive side, the Fund benefited from its sector weights, including overweight positions in securitized sectors of the market and a corresponding underweight to U.S. Treasuries. More specifically, the Fund benefited from overweights to ABS and CMBS. Demand remained strong for high quality, liquid paper and spreads tightened versus Treasuries for both ABS and CMBS throughout reporting period, but particularly after the election. However, the Fund experienced a slight drag on performance from a heavier overweight to longer maturity MBS, which underperformed during the interest rate volatility in late 2016.
While inflation came in consistently below the Fed’s target later in the reporting period, policymakers described this as transitory in nature and continued to signal their intent to normalize monetary policy. In addition, the Fed indicated its intent to begin shrinking the balance sheet in the second half of 2017. With this expectation, we preferred to maintain a defensive duration strategy for the Fund. We targeted a portfolio duration, or interest rate sensitivity, that was shorter than the benchmark at approximately 3.65 years as the reporting period came to a close. We are maintaining the Fund’s overweight to the intermediate to 10-year part of the curve because we expect yields on the shortest securities will rise more quickly as the Fed continues to increase the fed funds rate. While we typically do not make major changes to the Fund’s overall sector weightings, we made some minor adjustments. Over the reporting period, we modestly reduced the Fund’s floating rate MBS positions because they had reached our spread targets and invested part of the proceeds in the ABS sector through bottom-up security selection. We also slightly increased the Fund’s agency debenture and municipal bond weights.
In addition, we used U.S. Treasury note and bond futures as part of an overall portfolio construction strategy to manage the Fund’s duration and yield curve exposure. These derivative positions had a negative impact on performance during the reporting period.
Nuveen Short Term Bond Fund
The Fund’s Class A Shares at net asset value (NAV) outperformed the Bloomberg Barclays 1-3 Year Government/Credit Bond Index and underperformed the Lipper Short Investment Grade Debt Funds Classification Average for the twelve-month reporting period.
Treasury rates rose sharply across the yield curve, particularly in the first half of the reporting period, as investors braced for strong fiscal stimulus and factored in a higher risk of inflation following the U.S. election, while remaining concerned about the possibility of reduced accommodation by global central banks. At the front end of the Treasury yield curve, rates reflected Fed tightening with yields rising throughout the reporting period for maturities of three years and under. For Treasury securities in the two-to-five-year range, rates increased by between 80 and 90 basis points over the reporting period. Rates for longer-term Treasuries rose during the first half of the reporting period; however, in the final months of the reporting period, three consecutive months of weaker-than-expected inflation readings and tighter Fed policy were the catalyst for yields to move lower at the long end of the Treasury yield curve.
Around the rest of the world, global rates remained at exceptionally low levels due to accommodative central banks, resulting in strong demand from overseas investors for U.S. securities with incremental income. That technical underpinning, combined with the
improved economic outlook, strong fundamentals and low market volatility, led shorter duration investment grade U.S. corporate bonds and, to an even greater degree, high yield U.S. corporates to perform well. Credit fundamentals remained stable as strong earnings growth helped to support corporate leverage levels. These segments generated substantial excess returns over Treasuries despite heavy issuance as issuers took advantage of favorable financing conditions and possible shifts in tax policy. By the end of the reporting period, credit spreads had tightened to levels not seen since mid-2014. Financials posted strong returns based on the potential for a more favorable regulatory environment under the new administration, while the energy and basic material sectors outperformed, mostly in the first half of the reporting period, on the back of higher commodity prices.
In the securitized sectors, consumer-related asset-backed securities (ABS) outpaced duration-matched Treasuries on the back of strong consumer health and low volatility. Demand for short-duration, high quality yield overshadowed headlines warning of weaker consumers and auto lending risks as the reporting period progressed. Despite elevated levels of issuance in late 2016, the commercial mortgage-backed securities (CMBS) sector performed well in the risk-on environment following the election. The segment benefited from a recovery in the broader markets, strong demand for high quality non-government securities and the lower level of CMBS issuance in the second half of the reporting period. Overall, CMBS finished the reporting period with positive excess returns over Treasuries. Short maturity residential MBS performed well supported by lower levels of volatility, continued strong fundamentals and investor demand. Mortgage delinquencies continued to decline and home price appreciation continued at a modest pace given historically low levels of supply and positive affordability metrics. As the reporting period progressed, residential MBS continued to benefit from strong fundamentals and low supply and posted excess returns versus duration-matched Treasuries.
The most substantial driver of the Fund’s outperformance relative to the benchmarks was its broad overweight to the corporate and securitized sectors and corresponding underweight to Treasuries. The Fund’s exposure to short duration high yield credit was a significant contributor to returns relative to the benchmark, given the spread tightening that took place in that segment. We maintained between 3%-6% of the Fund’s portfolio in bonds rated BB and single-B in the two-year to four-year portion of the yield curve during the reporting period. The Fund’s approximately 5-7% overweight in investment grade corporate bonds also added incremental return during the reporting period, particularly from our overweight to industrials and financials. We maintained a weighting of around 40% in investment grade corporates, with an emphasis on BBB rated paper. At the same time, we positioned approximately 40% of the Fund’s portfolio in securitized product, broadly diversified across the ABS, CMBS and residential MBS sectors. The Fund benefited from short duration ABS and CMBS because demand remained strong for high quality, liquid paper and spreads tightened versus Treasuries throughout the reporting period. Certain segments of the non-agency MBS sector also performed well.
In aggregate, the Fund also benefited modestly from our interest rate strategy. Throughout the reporting period, we positioned the Fund defensively to limit its sensitivity to rising rates with a duration between 0.30 and 0.50 years shorter than the benchmark, which produced a gain. Yields at the front end of the Treasury curve rose to their highest level since 2008 based on constructive domestic economic data and continued moves by the Fed to normalize monetary policy. On the other hand, our yield curve positioning didn’t have a noticeable impact on performance during the reporting period.
We believe short rates will continue to trend higher, with the market pricing in one more rate hike during 2017. While inflation came in consistently below the Fed’s target later in the reporting period, policymakers described this as transitory in nature and continued to signal their intent to normalize monetary policy. In addition, the Fed indicated its intent to begin shrinking the balance sheet in the second half of 2017. With this expectation, we maintained a defensive duration strategy for the Fund. As of the end of the reporting period, we were targeting a portfolio duration, or interest rate sensitivity, between 0.25-0.50 years shorter than the benchmark.
We also continued to focus our efforts on generating an attractive level of income by maintaining the Fund’s modest overweight to the non-government sectors of the bond market. The Fund’s portfolio was positioned with approximately a 5-7% overweight in the investment grade corporate sector during the reporting period. We reduced high yield exposure to around 3% of the portfolio and reinvested the proceeds into investment grade credit after the spread between the two areas narrowed to levels not seen since mid-2014. Within investment grade, we rotated up in quality from BBB rated to A rated companies toward the end of the reporting period, while also increasing the Fund’s overweight to financials due to the Fed’s expected tightening path.
We maintained the Fund’s weightings in the securitized sectors at approximately 40-45% of its portfolio. However, toward the end of the reporting period, we made a modest shift out of CMBS because of tight spreads and rotated into the ABS sector. Also, because
Portfolio Managers’ Comments (continued)
commercial real estate is further along in the credit cycle, we will continue to closely monitor fundamentals in the CMBS sector. We will likely continue to target higher quality bonds, while adding more risk opportunistically. Fundamentals in the ABS segment are supportive because consumer balance sheets remain healthy. We expect returns in the ABS segment to be income driven due to tight spreads, but continue to expect low volatility because of the high quality nature of the sector. We maintained the Fund’s weight in residential MBS because we believe the sector offers attractive income and shorter duration. Low levels of inventory and rising borrower income continue to provide a tailwind to appreciation in home prices. The residential MBS sector remains an area that provides incremental income to the portfolio, but with a low correlation to broader markets. Across the securitized sectors, we are maintaining ample liquidity to take advantage of bottom-up, relative-value opportunities. We also kept 5% to 10% of the Fund’s assets invested in Treasury and agency securities as a liquidity and volatility buffer.
In addition, we used U.S. Treasury note futures as part of an overall portfolio construction strategy to manage the Fund’s duration and yield curve exposure. These derivative positions had a negative impact on performance during the reporting period.
Nuveen Strategic Income Fund
The Fund’s Class A Shares at net asset value (NAV) outperformed both the Bloomberg Barclays U.S. Aggregate Bond Index and the Lipper Multi-Sector Income Funds Classification Average for the twelve-month reporting period.
Treasury rates rose sharply across the yield curve, particularly in the first half of the reporting period, as investors braced for strong fiscal stimulus and factored in a higher risk of inflation following the U.S. election, while remaining concerned about the possibility of reduced accommodation by global central banks. However, in the final months of the reporting period, three consecutive months of weaker-than-expected inflation readings were the catalyst for yields to move lower at the long end of the Treasury yield curve. Ten-year Treasury rates rose by more than 115 basis points through mid-March, before falling approximately 30 basis points to end the reporting period about 85 basis points higher.
Around the rest of the world, global rates remained at exceptionally low levels due to accommodative central banks, resulting in strong demand from overseas investors for U.S. securities with incremental income. That technical underpinning, combined with the improved economic outlook, strong fundamentals and low market volatility, led high yield and investment grade corporate bonds to outperform during the reporting period, despite record issuance. High yield bonds enjoyed very strong performance helped along by continued accommodative Fed policy, which in turn drove more inflows into the market. The high yield market did reprice noticeably in March after a record-setting eight-day streak of outflows from exchange-traded funds (ETFs), and in June, the energy segment of the market saw spreads widen due to oil price pressures. However, toward the end of the reporting period, high yield spreads versus Treasuries had tightened to levels not seen since mid-2014. Investment grade corporate bonds generated strong excess returns over Treasuries and outperformed all other investment grade sectors despite heavy supply as issuers took advantage of favorable financing conditions and possible shifts in tax policy. International credit also performed well with European and U.K. credit rallying early in the reporting period as Brexit uncertainty faded and later in the reporting period due to the positive French election outcome and continued Eurozone economic strength.
In the securitized sectors, agency MBS performed well earlier in the reporting period due to continued bank and foreign purchases of the securities, the range-bound rate environment and lower levels of volatility. However, the sharp rise in interest rates and volatility, as well as relatively large net supply midway through the reporting period, proved to be a difficult environment for these securities. These factors, combined with increased rhetoric and the Fed’s eventual June 2017 announcement regarding plans to end its MBS reinvestments, weighed on agency MBS performance later in the reporting period. Over the reporting period, agency MBS posted excess returns versus duration-matched Treasuries. Despite elevated levels of issuance in the first half of the reporting period, the commercial mortgage-backed securities (CMBS) sector finished the reporting period with a positive excess return over Treasuries. The segment benefited from the risk-on environment, steady demand, investors’ favorable reaction to the new risk retention rules and the associated lower CMBS issuance. However, toward the end of the reporting period, negative headlines surrounding retail loans in the CMBS segment mitigated most of the positive performance, especially for lower-rated securities. Consumer related asset-backed securities (ABS) outpaced both the MBS and CMBS sectors, as well as duration-matched Treasuries. Demand for short-duration, high-quality yield overshadowed ongoing headlines warning of weaker consumers and auto lending risks.
Emerging market (EM) bonds posted solid returns, supported by a larger scale global growth recovery, firming risk sentiment, easy financial conditions and strong inflows into EM assets in search of yield. Business sentiment and manufacturing trade improved as
developed market activity supported EM economies through trade. Later in the reporting period, investors maintained their appetite for risk despite tighter credit and regulatory conditions in China and lower commodity prices. EM currencies declined in the broad-based dollar rally in the first half of the reporting period, with U.S. trade and protectionist pressures hitting the Mexican peso and ongoing domestic pressures hindering the Turkish lira. However, in the second half of the reporting period, the U.S. dollar reversed its post-election gains and most EM currencies benefited, especially Eastern European EM currencies. Russia and Colombia underperformed into the end of the reporting period following oil price declines.
Global rates remained low for much of the first half of the reporting period, until sprinting higher on the heels of the U.S. election. Throughout the reporting period, global yields remained sensitive to shifting growth conditions and changing fiscal and monetary policy expectations. Early in the reporting period, low inflation, continued stimulus from major central banks, and the surprise Brexit vote all exerted downward pressure on global yields. Then, the U.S. election drove a sudden shift toward increased expectations for fiscal stimulus and business spending, which combined with better economic data in developed and emerging markets to push rates up by approximately 80 basis points. The prospect for additional Fed rate hikes and an eventual reduction in extraordinary monetary stimulus globally also added to rate pressures as more central banks moderated their dovish outlooks. European rates were influenced during the reporting period by uncertainty surrounding April’s French election and questions regarding the future path of quantitative easing by the European Central Bank.
During the reporting period, non-U.S. markets outperformed Treasuries as global spreads moved in their favor, with the spread between Treasuries and German Bunds reaching a new historical wide, until late in the reporting period when broadening global growth led several key central banks to question the need for continued aggressive stimulus. The U.S. dollar strengthened by 3-6% versus most major currencies in the first half of the reporting period due to higher growth, the policy outlook and interest rate differentials. However, in the second half of the reporting period, the dollar fell broadly versus most currencies except for the Japanese yen after U.S. fiscal policy optimism faded, trade fears receded and other central bankers shifted tone. In the final months of the reporting period, the euro rose more than 7% versus the dollar. Over the reporting period, the South African rand and European currencies were among the top performers, while the Turkish lira and Japanese yen lagged.
Broadly speaking, the Fund’s outperformance versus its benchmarks was driven by the continued improvement in global economic conditions, continued strong credit conditions and firm market risk sentiment supporting investor flows. More specifically, the Fund benefited from the demand for and continued outperformance of corporate credit sectors, through both tightening of credit spreads and the Fund’s yield advantage versus the benchmark. By far the most impactful driver of outperformance was the Fund’s positioning in high yield corporates, both through a significant overweight as well as from positive credit selection within the sector. For much of the early part of the reporting period, the Fund was positioned near the top end of its high yield allocation range and benefited substantially from the sector’s higher income and gains from tightening credit spreads. Our credit selection within high yield also added to returns, particularly our overweight to more cyclical industries such as paper and chemicals and communications/media credits. Although we reduced our high yield weighting and hedged part of the exposure as the reporting period progressed, performance continued to be boosted by our issue selection and positioning in the sector.
Investment grade credit was also a strong contributor to the Fund’s returns, due to both our security selection and overweight position in the sector versus the benchmark. Security selection within investment grade corporates was positive, driven by a meaningful overweight to the financial sector, including bank preferred securities and exposure to cyclical credits. Also, the Fund’s substantial weighting in BBB rated securities benefited performance. Securities rate BBB topped investment grade returns as quality spreads contracted amid ongoing improvement in the outlook for credit fundamentals, optimism about growth and investors’ unrelenting demand for yield.
EM credit exposure was a modest contributor to the Fund’s results given the strong performance of our country specific selections, despite fairly low exposure to that sector. Our relatively small sovereign bond positioning also had a small positive impact on the Fund’s performance.
Currency positioning was a drag on results over the reporting period, given the strong rebound of currencies where the Fund was employing hedges against a stronger U.S. dollar, particularly the Mexican peso and South Korean won. Also, our overall interest rate positioning detracted modestly, mostly due to shifts in the yield curve since bonds with 10-year maturities underperformed in late 2016.
Portfolio Managers’ Comments (continued)
Our strategy during the reporting period remained biased toward earning income from credit sectors against the backdrop of supportive economics and financial conditions. We continued to overweight corporates with a focus on bottom-up, issue-specific credit selection and careful attention to risk management following the tightening of valuations throughout the reporting period. Due to the strong performance and substantial spread tightening in high yield credit, we significantly reduced exposure to this segment, including taking gains on targeted cyclical and energy credits that had performed well and met targets. We also hedged a substantial portion of our remaining high yield exposure, which allowed the portfolio to potentially benefit from credit selection and earn incremental yield, while seeking to dampen the impact of overall moves in high yield. We largely redeployed the sale proceeds into AAA rated ABS, MBS and A rated investment grade corporates. We also used market opportunities to add to bank preferred securities; the Fund’s portfolio remained significantly overweight in financials. The Fund was positioned with an overweight in BBB rated companies, but we also reduced this exposure as the reporting period progressed due to the strong outperformance of lower rated investment grade credits. Although we remained constructive on investment grade and high yield corporates as the reporting period ended, we took the opportunity after recent strength to reduce the overall risk profile of the Fund due to narrower risk premiums providing less compensation for ongoing policy and geopolitical risks.
Away from these sectors, we maintained a bottom-up focused approach to finding opportunities in securitized sectors such as ABS and CMBS, as well as in select foreign markets. Non-U.S. positions remained relatively low and tactical in nature during the reporting period, owing to shifting fundamentals and episodic market volatility. We continued to hold a large underweight in Treasuries, given our constructive economic view and the relatively unattractive duration and yield profile of the sector.
Interest rate positioning was marginally defensive for most of the reporting period, with adjustments based on valuations and risk management. At the end of the reporting period, the Fund’s duration remained moderately shorter than the benchmark index. Although the potential for volatility continues, particularly associated with central bank balance sheet and policy transition, we expect the current rate cycle to be drawn out and the upside move in rates to be contained by macro factors. As a result, we do not believe that an aggressive positioning in interest rates is a beneficial strategy from a risk/reward perspective. Our strategic focus on diversified income and managing credit risk will be the important value drivers.
During the reporting period, we also continued to use various derivative instruments. We used foreign currency exchange forward contracts to manage the Fund’s foreign currency exposure. For example, the Fund may reduce unwanted currency exposure from the Fund’s portfolio, or may take long forward positions in select currencies in an attempt to benefit from the potential price appreciation. These positions had a negative impact on performance during the reporting period.
We used U.S. Treasury futures and Eurodollar futures as part of an overall portfolio construction strategy to manage portfolio duration and yield curve exposure and selected foreign bond futures to actively manage exposure to those markets. These positions had a positive impact on performance during the reporting period. We also used interest rate swaps to manage portfolio duration and overall portfolio yield curve exposure. These positions had a negligible impact on performance during the reporting period and these positions were terminated prior to the end of the reporting period.
In addition, we entered into credit default swaps as a way to assume and hedge credit risk. The effect of these activities on performance was negative during the reporting period.
The Fund purchased currency put options which were used as part of an overall portfolio construction strategy to manage foreign currency exposure. These put options had a negligible impact on performance during the reporting period.
The Fund also purchased a small amount of currency call options as part of its overwrite strategy and purchased a small amount of call options on futures during the period. The call options had a negligible impact on performance during the reporting period.
Risk Considerations
and Dividend Information
Risk Considerations
Nuveen Core Bond Fund
Mutual fund investing involves risk; principal loss is possible. Debt or fixed income securities such as those held by the Fund, are subject to market risk, credit risk, interest rate risk, call risk, derivatives risk, dollar roll transaction risk, and income risk. As interest rates rise, bond prices fall. Foreign investments involve additional risks, including currency fluctuation, political and economic instability, lack of liquidity, and differing legal and accounting standards. Asset-backed and mortgage-backed securities are subject to additional risks such as prepayment risk, liquidity risk, default risk and adverse economic developments.
Nuveen Core Plus Bond Fund
Mutual fund investing involves risk; principal loss is possible. Debt or fixed income securities such as those held by the Fund, are subject to market risk, credit risk, interest rate risk, call risk, derivatives risk, dollar roll transaction risk, and income risk. As interest rates rise, bond prices fall. Below investment grade or high yield debt securities are subject to liquidity risk and heightened credit risk. Foreign investments involve additional risks, including currency fluctuation, political and economic instability, lack of liquidity and differing legal and accounting standards. Asset-backed and mortgage-backed securities are subject to additional risks such as prepayment risk, liquidity risk, default risk and adverse economic developments.
Nuveen High Income Bond Fund
Mutual fund investing involves risk; principal loss is possible. Debt or fixed income securities such as those held by the Fund, are subject to market risk, credit risk, interest rate risk, call risk, derivatives risk, income risk, and other investment company risk. As interest rates rise, bond prices fall. Below investment grade or high yield debt securities are subject to liquidity risk and heightened credit risk. Foreign investments involve additional risks, including currency fluctuation, political and economic instability, lack of liquidity and differing legal and accounting standards.
Nuveen Inflation Protected Securities Fund
Mutual fund investing involves risk; principal loss is possible. Debt or fixed income securities such as those held by the Fund, are subject to market risk, credit risk, interest rate risk, call risk, derivatives risk, income risk, and index methodology risk. As interest rates rise, bond prices fall. Below investment grade or high yield debt securities are subject to liquidity risk and heightened credit risk. The guarantee provided by the U.S. government to treasury inflation protected securities (TIPS) relates only to the prompt payment of principal and interest and does not remove the market risks of investing in the Fund shares. Foreign investments involve additional risks, including currency fluctuation, political and economic instability, lack of liquidity and differing legal and accounting standards. Asset-backed and mortgage-backed securities are subject to additional risks such as prepayment risk, liquidity risk, default risk, and adverse economic developments. The Fund’s investment in inflation protected securities has tax consequences that may result in income distributions to shareholders.
Nuveen Intermediate Government Bond Fund
Mutual fund investing involves risk; principal loss is possible. Debt or fixed income securities such as those held by the Fund, are subject to market risk, credit risk, interest rate risk, call risk, derivatives risk, dollar roll transaction risk, and income risk. As interest rates rise, bond prices fall. Asset-backed and mortgage-backed securities are subject to additional risks such as prepayment risk, liquidity risk, default risk and adverse economic developments.
Nuveen Short Term Bond Fund
Mutual fund investing involves risk; principal loss is possible. Debt or fixed income securities such as those held by the Fund, are subject to market risk, credit risk, interest rate risk, call risk, derivatives risk, and income risk. As interest rates rise, bond prices fall. Below investment grade or high yield debt securities are subject to liquidity risk and heightened credit risk. Foreign investments
Risk Considerations and Dividend Information (continued)
involve additional risks, including currency fluctuation, political and economic instability, lack of liquidity and differing legal and accounting standards. Asset-backed and mortgage-backed securities are subject to additional risks such as prepayment risk, liquidity risk, default risk and adverse economic developments.
Nuveen Strategic Income Fund
Mutual fund investing involves risk; principal loss is possible. Debt or fixed income securities such as those held by the Fund, are subject to market risk, credit risk, interest rate risk, call risk, derivatives risk, dollar roll transaction risk, and income risk. As interest rates rise, bond prices fall. Below investment grade or high yield debt securities are subject to liquidity risk and heightened credit risk. Foreign investments involve additional risks, including currency fluctuation, political and economic instability, lack of liquidity and differing legal and accounting standards. The Fund gains additional exposure to currency rates, and therefore to the risk of currency fluctuation, through investment in foreign currency contracts. The risks of foreign investments are magnified in emerging markets. Asset-backed and mortgage-backed securities are subject to additional risks such as prepayment risk, liquidity risk, default risk and adverse economic developments.
Dividend Information
Each Fund seeks to pay regular monthly dividends out of its net investment income at a rate that reflects its past and projected net income performance. To permit each Fund to maintain a more stable monthly dividend, the Fund may pay dividends at a rate that may be more or less than the amount of net income actually earned by the Fund during the period. If a Fund has cumulatively earned more than it has paid in dividends, it will hold the excess in reserve as undistributed net investment income (UNII) as part of the Fund’s net asset value. Conversely, if a Fund has cumulatively paid in dividends more than it has earned, the excess will constitute a negative UNII that will likewise be reflected in the Fund’s net asset value. Each Fund will, over time, pay all its net investment income as dividends to shareholders.
As of June 30, 2017, Nuveen High Income Bond Fund, Nuveen Inflation Protected Securities Fund and Nuveen Intermediate Government Bond Fund had positive UNII balances while the other Funds in this report had zero UNII balances for tax purposes. Nuveen High Income Bond Fund and Nuveen Inflation Protected Securities Fund had positive UNII balances, while the other Funds in this report had negative UNII balances for financial reporting purposes.
All monthly dividends paid by each Fund during the current reporting period were paid from net investment income. If a portion of a Fund’s monthly distributions was sourced from or comprised of elements other than net investment income, including capital gains and/or a return of capital, shareholders would have received a notice to that effect. For financial reporting purposes, the composition and per share amounts of each Fund’s dividends for the reporting period are presented in this report’s Statement of Changes in Net Assets and Financial Highlights, respectively. For income tax purposes, distribution information for each Fund as of its most recent tax year end is presented in Note 6 – Income Tax Information within the Notes to Financial Statements of this report.
Nuveen Core Bond Fund, Nuveen Core Plus Bond Fund, Nuveen Short Term Bond Fund and Nuveen Strategic Income Fund seek to pay regular monthly distributions at a level rate that reflects past and projected net income of the Funds. The Funds may own certain investments that can create uneven income flows. In some cases, such as a credit default swap position whose value falls after purchase, these investments may actually decrease overall levels of net income. During the current fiscal year, certain investments owned by the Funds decreased income. Although the Funds reduced their distribution level twice during the year, the Funds’ distribution amount over the entire fiscal year exceeded the actual amount of net income. As a result, a portion of the Funds’ fiscal year distribution have been deemed to be a return of capital, which is identified in the table below.
Nuveen Core Bond Fund
| | | | | | | | | | | | | | | | |
| | | Share Class | |
| Fiscal Year Ended June 30, 2017 | | Class A | | | Class C | | | Class R6 | | | Class I | |
Regular monthly per share distribution | | | | | | | | | | | | | | | | |
From net investment income | | $ | 0.2146 | | | $ | 0.1391 | | | $ | 0.2386 | | | $ | 0.2386 | |
From net realized capital gains | | | — | | | | — | | | | — | | | | — | |
Return of capital | | | 0.0174 | | | | 0.0174 | | | | 0.0174 | | | | 0.0174 | |
Total per share distribution | | $ | 0.2320 | | | $ | 0.1565 | | | $ | 0.2560 | | | $ | 0.2560 | |
Nuveen Core Plus Bond Fund
| | | | | | | | | | | | | | | | | | | | |
| | | Share Class | |
| Fiscal Year Ended June 30, 2017 | | Class A | | | Class C | | | Class R3 | | | Class R6 | | | Class I | |
Regular monthly per share distribution | | | | | | | | | | | | | | | | | | | | |
From net investment income | | $ | 0.2595 | | | $ | 0.1760 | | | $ | 0.2355 | | | $ | 0.2885 | | | $ | 0.2885 | |
From net realized capital gains | | | — | | | | — | | | | — | | | | — | | | | — | |
Return of capital | | | 0.1460 | | | | 0.1460 | | | | 0.1460 | | | | 0.1460 | | | | 0.1460 | |
Total per share distribution | | $ | 0.4055 | | | $ | 0.3220 | | | $ | 0.3815 | | | $ | 0.4345 | | | $ | 0.4345 | |
Nuveen Short Term Bond Fund
| | | | | | | | | | | | | | | | | | | | |
| | | Share Class | |
| Fiscal Year Ended June 30, 2017 | | Class A | | | Class C | | | Class R3 | | | Class R6 | | | Class I | |
Regular monthly per share distribution | | | | | | | | | | | | | | | | | | | | |
From net investment income | | $ | 0.1462 | | | $ | 0.0682 | | | $ | 0.1162 | | | $ | 0.1702 | | | $ | 0.1702 | |
From net realized capital gains | | | — | | | | — | | | | — | | | | — | | | | — | |
Return of capital | | | 0.0098 | | | | 0.0098 | | | | 0.0098 | | | | 0.0098 | | | | 0.0098 | |
Total per share distribution | | $ | 0.1560 | | | $ | 0.0780 | | | $ | 0.1260 | | | $ | 0.1800 | | | $ | 0.1800 | |
Nuveen Strategic Income Fund
| | | | | | | | | | | | | | | | | | | | | | | | |
| | | Share Class | |
| Fiscal Year Ended June 30, 2017 | | Class A | | | Class C | | | Class R3 | | | Class R6 | | | Class I | | | Class T | |
Regular monthly per share distribution | | | | | | | | | | | | | | | | | | | | | | | | |
From net investment income | | $ | 0.2974 | | | $ | 0.2134 | | | $ | 0.2734 | | | $ | 0.3214 | | | $ | 0.3214 | | | $ | — | |
From net realized capital gains | | | — | | | | — | | | | — | | | | — | | | | — | | | | — | |
Return of capital | | | 0.2366 | | | | 0.2366 | | | | 0.2366 | | | | 0.2366 | | | | 0.2366 | | | | 0.0445 | |
Total per share distribution | | $ | 0.5340 | | | $ | 0.4500 | | | $ | 0.5100 | | | $ | 0.5580 | | | $ | 0.5580 | | | $ | 0.0445 | |
THIS PAGE INTENTIONALLY LEFT BLANK
Fund Performance
and Expense Ratios
The Fund Performance and Expense Ratios for each Fund are shown within this section of the report.
Returns quoted represent past performance, which is no guarantee of future results. Investment returns and principal value will fluctuate so that when shares are redeemed, they may be worth more or less than their original cost. Current performance may be higher or lower than the performance shown. Total returns for a period of less than one year are not annualized. Returns at net asset value (NAV) would be lower if the sales charge were included. Returns assume reinvestment of dividends and capital gains. For performance current to the most recent month-end visit nuveen.com or call (800) 257-8787.
Returns do not reflect the deduction of taxes that a shareholder would pay on Fund distributions or the redemption of Fund shares.
Returns may reflect fee waivers and/or expense reimbursements by the investment adviser during the periods presented. If any such waivers and/or reimbursements had not been in place, returns would have been reduced. See Notes to Financial Statements, Note 7—Management Fees and Other Transactions with Affiliates for more information.
Returns reflect differences in sales charges and expenses, which are primarily differences in distribution and service fees, and assume reinvestment of dividends and capital gains.
Comparative index and Lipper return information is provided for Class A Shares at NAV only.
The expense ratios shown reflect total operating expenses (before fee waivers and/or expense reimbursements, if any) as shown in the most recent prospectus. The expense ratios include management fees and other fees and expenses.
Fund Performance and Expense Ratios (continued)
Nuveen Core Bond Fund
Refer to the first page of this Fund Performance and Expense Ratios section for further explanation of the information included within this section. Refer to the Glossary of Terms Used in this Report for definitions of terms used within this section.
Fund Performance
Average Annual Total Returns as of June 30, 2017
| | | | | | | | | | | | |
| | | Average Annual | |
| | | 1-Year | | | 5-Year | | | 10-Year | |
Class A Shares at NAV | | | (0.56)% | | | | 1.89% | | | | 3.94% | |
Class A Shares at maximum Offering Price | | | (3.54)% | | | | 1.27% | | | | 3.62% | |
Bloomberg Barclays U.S. Aggregate Bond Index | | | (0.31)% | | | | 2.21% | | | | 4.48% | |
Lipper Core Bond Classification Average | | | 0.46% | | | | 2.29% | | | | 4.14% | |
| | | |
Class I Shares | | | (0.32)% | | | | 2.14% | | | | 4.14% | |
| | | | | | | | | | | | |
| | | Average Annual | |
| | | 1-Year | | | 5-Year | | | Since
Inception | |
Class C Shares | | | (1.33)% | | | | 1.14% | | | | 1.77% | |
| | | | | | | | |
| | | Average Annual | |
| | | 1-Year | | | Since
Inception | |
Class R6 Shares | | | (0.22)% | | | | 1.07% | |
Since inception return for Class C Shares is from 1/18/11. Since inception return for Class R6 Shares is from 1/20/15. Indexes and Lipper averages are not available for direct investment.
Class A Shares have a maximum 3.00% sales charge (Offering Price). Class A Share purchases of $1 million or more are sold at net asset value without an up-front sales charge but may be subject to a contingent deferred sales charge (CDSC) equal to 1%, if redeemed within eighteen months of purchase. Class C Shares have a 1% CDSC for redemptions within less than twelve months, which is not reflected in the one-year total return. Class R6 Shares have no sales charge and are available only to certain limited categories as described in the prospectus. Class I Shares have no sales charge and may be purchased under limited circumstances or by specified classes of investors.
Expense Ratios as of Most Recent Prospectus
| | | | | | | | | | | | | | | | |
| | | Share Class | |
| | | Class A | | | Class C | | | Class R6 | | | Class I | |
Gross Expense Ratios | | | 0.88% | | | | 1.64% | | | | 0.58% | | | | 0.63% | |
Net Expense Ratios | | | 0.79% | | | | 1.54% | | | | 0.49% | | | | 0.54% | |
The Fund’s investment adviser has contractually agreed to waive fees and/or reimburse other Fund expenses through October 31, 2018 so that total annual Fund operating expenses (excluding 12b-1 distribution and/or service fees, interest expenses, taxes, acquired fund fees and expenses, fees incurred in acquiring and disposing of portfolio securities and extraordinary expenses) do not exceed 0.53% of the average daily net assets of any class of Fund shares. However, because Class R6 Shares are not subject to sub-transfer agent and similar fees, the total annual Fund operating expenses for the Class R6 Shares will be less than the expense limitation. Fee waivers and/or expense reimbursements will not be terminated prior to that time without the approval of the Board of Directors of the Fund.
Growth of an Assumed $10,000 Investment as of June 30, 2017 – Class A Shares
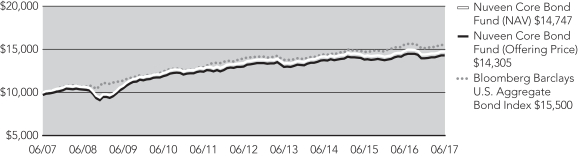
The graphs do not reflect the deduction of taxes that a shareholder may pay on Fund distributions or the redemption of Fund shares.
Fund Performance and Expense Ratios (continued)
Nuveen Core Plus Bond Fund
Refer to the first page of this Fund Performance and Expense Ratios section for further explanation of the information included within this section. Refer to the Glossary of Terms Used in this Report for definitions of terms used within this section.
Fund Performance
Average Annual Total Returns as of June 30, 2017
| | | | | | | | | | | | |
| | | Average Annual | |
| | | 1-Year | | | 5-Year | | | 10-Year | |
Class A Shares at NAV | | | 4.03% | | | | 3.22% | | | | 4.74% | |
Class A Shares at maximum Offering Price | | | (0.41)% | | | | 2.33% | | | | 4.29% | |
Bloomberg Barclays U.S. Aggregate Bond Index | | | (0.31)% | | | | 2.21% | | | | 4.48% | |
Lipper Core Bond Plus Classification Average | | | 2.07% | | | | 2.92% | | | | 4.94% | |
| | | |
Class C Shares | | | 3.16% | | | | 2.44% | | | | 3.96% | |
Class R3 Shares | | | 3.88% | | | | 2.98% | | | | 4.52% | |
Class I Shares | | | 4.21% | | | | 3.46% | | | | 5.00% | |
| | | | | | | | |
| | | Average Annual | |
| | | 1-Year | | | Since
Inception | |
Class R6 Shares | | | 4.30% | | | | 2.59% | |
Since inception return for Class R6 Shares is from 1/20/15. Indexes and Lipper averages are not available for direct investment.
Class A Shares have a maximum 4.25% sales charge (Offering Price). Class A Share purchases of $1 million or more are sold at net asset value without an up-front sales charge but may be subject to a contingent deferred sales charge (CDSC) equal to 1%, if redeemed within eighteen months of purchase. Class C Shares have a 1% CDSC for redemptions within less than twelve months, which is not reflected in the one-year total return. Class R3 Shares have no sales charge and are only available for purchase by eligible retirement plans. Class R6 Shares have no sales charge and are available only to certain limited categories as described in the prospectus. Class I Shares have no sales charge and may be purchased under limited circumstances or by specified classes of investors.
Expense Ratios as of Most Recent Prospectus
| | | | | | | | | | | | | | | | | | | | |
| | | Share Class | |
| | | Class A | | | Class C | | | Class R3 | | | Class R6 | | | Class I | |
Gross Expense Ratios | | | 0.88% | | | | 1.63% | | | | 1.13% | | | | 0.57% | | | | 0.63% | |
Net Expense Ratios | | | 0.78% | | | | 1.53% | | | | 1.03% | | | | 0.47% | | | | 0.53% | |
The Fund’s investment adviser has contractually agreed to waive fees and/or reimburse other Fund expenses through October 31, 2018 so that total annual Fund operating expenses (excluding 12b-1 distribution and/or service fees, interest expenses, taxes, acquired fund fees and expenses, fees incurred in acquiring and disposing of portfolio securities and extraordinary expenses) do not exceed 0.52% of the average daily net assets of any class of Fund shares. However, because Class R6 Shares are not subject to sub-transfer agent and similar fees, the total annual Fund operating expenses for the Class R6 Shares will be less than the expense limitation. Fee waivers and/or expense reimbursements will not be terminated prior to that time without the approval of the Board of Directors of the Fund.
Growth of an Assumed $10,000 Investment as of June 30, 2017 – Class A Shares
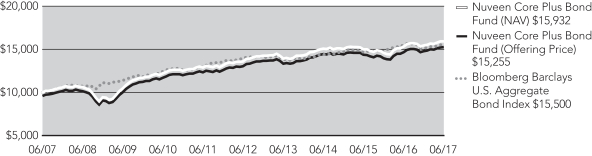
The graphs do not reflect the deduction of taxes that a shareholder may pay on Fund distributions or the redemption of Fund shares.
Fund Performance and Expense Ratios (continued)
Nuveen High Income Bond Fund
Refer to the first page of this Fund Performance and Expense Ratios section for further explanation of the information included within this section. Refer to the Glossary of Terms Used in this Report for definitions of terms used in this section.
Fund Performance
Average Annual Total Returns as of June 30, 2017
| | | | | | | | | | | | |
| | | Average Annual | |
| | | 1-Year | | | 5-Year | | | 10-Year | |
Class A Shares at NAV | | | 15.75% | | | | 5.65% | | | | 6.15% | |
Class A Shares at maximum Offering Price | | | 10.25% | | | | 4.63% | | | | 5.63% | |
Bloomberg Barclays High Yield 2% Issuer Capped Index | | | 12.69% | | | | 6.90% | | | | 7.76% | |
Lipper High Current Yield Funds Classification Average | | | 10.70% | | | | 5.69% | | | | 6.04% | |
| | | |
Class C Shares | | | 14.93% | | | | 4.89% | | | | 5.39% | |
Class R3 Shares | | | 15.46% | | | | 5.40% | | | | 5.88% | |
Class I Shares | | | 15.97% | | | | 5.94% | | | | 6.43% | |
| | | | |
| | | Cumulative | |
| | | Since
Inception | |
Class T Shares* | | | (0.58)% | |
Class T Shares at maximum Offering Price* | | | (3.03)% | |
Since inception return for Class T Shares is from 5/31/17. Indexes and Lipper averages are not available for direct investment.
Class A Shares have a maximum 4.75% sales charge (Offering Price). Class A Share purchases of $1 million or more are sold at net asset value without an up-front sales charge but may be subject to a contingent deferred sales charge (CDSC) equal to 1%, if redeemed within eighteen months of purchase. Class C Shares have a 1% CDSC for redemptions within less than twelve months, which is not reflected in the one-year total return. Class R3 Shares have no sales charge and are only available for purchase by eligible retirement plans. Class I Shares have no sales charge and may be purchased under limited circumstances or by specified classes of investors. Class T Shares have a maximum 2.50% sales charge (Offering Price).
Expense Ratios as of Most Recent Prospectus
| | | | | | | | | | | | | | | | | | | | |
| | | Share Class | |
| | | Class A | | | Class C | | | Class R3 | | | Class I | | | Class T* | |
Gross Expense Ratios | | | 1.08% | | | | 1.84% | | | | 1.34% | | | | 0.83% | | | | 1.08% | |
Net Expense Ratios | | | 1.05% | | | | 1.80% | | | | 1.30% | | | | 0.80% | | | | 1.05% | |
The Fund’s investment adviser has contractually agreed to waive fees and/or reimburse other Fund expenses through October 31, 2018 so that total annual Fund operating expenses (excluding 12b-1 distribution and/or service fees, interest expenses, taxes, acquired fund fees and expenses, fees incurred in acquiring and disposing of portfolio securities and extraordinary expenses) do not exceed 0.75% of the average daily net assets of any class of Fund shares. Fee waivers and/or expense reimbursements will not be terminated prior to that time without the approval of the Board of Directors of the Fund.
| * | Class T Shares are not available for public offering. |
Growth of an Assumed $10,000 Investment as of June 30, 2017 – Class A Shares
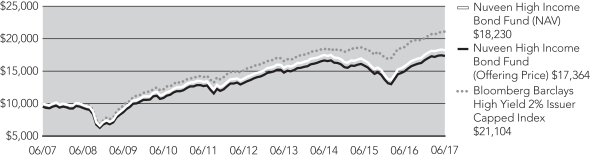
The graphs do not reflect the deduction of taxes that a shareholder may pay on Fund distributions or the redemption of Fund shares.
Fund Performance and Expense Ratios (continued)
Nuveen Inflation Protected Securities Fund
Refer to the first page of this Fund Performance and Expense Ratios section for further explanation of the information included within this section. Refer to the Glossary of Terms Used in this Report for definitions of terms used within this section.
Fund Performance
Average Annual Total Returns as of June 30, 2017
| | | | | | | | | | | | |
| | | Average Annual | |
| | | 1-Year | | | 5-Year | | | 10-Year | |
Class A Shares at NAV | | | (1.53)% | | | | (0.22)% | | | | 3.85% | |
Class A Shares at maximum Offering Price | | | (5.71)% | | | | (1.08)% | | | | 3.40% | |
Bloomberg Barclays U.S. TIPS Index | | | (0.63)% | | | | 0.27% | | | | 4.27% | |
Lipper Inflation-Protected Bond Funds Classification Average | | | 0.23% | | | | (0.10)% | | | | 3.31% | |
| | | |
Class C Shares | | | (2.33)% | | | | (0.85)% | | | | 3.13% | |
Class R3 Shares | | | (1.86)% | | | | (0.45)% | | | | 3.52% | |
Class I Shares | | | (1.27)% | | | | 0.14% | | | | 4.16% | |
| | | | | | | | |
| | | Average Annual | |
| | | 1-Year | | | Since
Inception | |
Class R6 Shares | | | (1.10)% | | | | 0.58% | |
Since inception return for Class R6 Shares is from 1/20/15. Indexes and Lipper averages are not available for direct investment.
Class A Shares have a maximum 4.25% sales charge (Offering Price). Class A Share purchases of $1 million or more are sold at net asset value without an up-front sales charge but may be subject to a contingent deferred sales charge (CDSC) equal to 1%, if redeemed within eighteen months of purchase. Class C Shares have a 1% CDSC for redemptions within less than twelve months, which is not reflected in the one-year total return. Class R3 Shares have no sales charge and are only available for purchase by eligible retirement plans. Class R6 Shares have no sales charge and are available only to certain limited categories as described in the prospectus. Class I Shares have no sales charge and may be purchased under limited circumstances or by specified classes of investors.
Expense Ratios as of Most Recent Prospectus
| | | | | | | | | | | | | | | | | | | | |
| | | Share Class | |
| | | Class A | | | Class C | | | Class R3 | | | Class R6 | | | Class I | |
Gross Expense Ratios | | | 0.97% | | | | 1.72% | | | | 1.23% | | | | 0.51% | | | | 0.72% | |
Net Expense Ratios | | | 0.80% | | | | 1.55% | | | | 1.05% | | | | 0.34% | | | | 0.55% | |
The Fund’s investment adviser has contractually agreed to waive fees and/or reimburse other Fund expenses through October 31, 2018 so that total annual Fund operating expenses (excluding 12b-1 distribution and/or service fees, interest expenses, taxes, acquired fund fees and expenses, fees incurred in acquiring and disposing of portfolio securities and extraordinary expenses) do not exceed 0.56% of the average daily net assets of any class of Fund shares. However, because Class R6 Shares are not subject to sub-transfer agent and similar fees, the total annual Fund operating expenses for the Class R6 Shares will be less than the expense limitation. Fee waivers and/or expense reimbursements will not be terminated prior to that time without the approval of the Board of Directors of the Fund.
Growth of an Assumed $10,000 Investment as of June 30, 2017 – Class A Shares
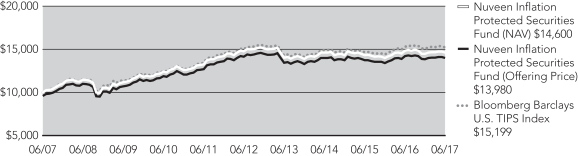
The graphs do not reflect the deduction of taxes that a shareholder may pay on Fund distributions or the redemption of Fund shares.
Fund Performance and Expense Ratios (continued)
Nuveen Intermediate Government Bond Fund
Refer to the first page of this Fund Performance and Expense Ratios section for further explanation of the information included within this section. Refer to the Glossary of Terms Used in this Report for definitions of terms used within this section.
Fund Performance
Average Annual Total Returns as of June 30, 2017
| | | | | | | | | | | | |
| | | Average Annual | |
| | | 1-Year | | | 5-Year | | | 10-Year | |
Class A Shares at NAV | | | (2.08)% | | | | 0.55% | | | | 2.94% | |
Class A Shares at maximum Offering Price | | | (5.05)% | | | | (0.06)% | | | | 2.63% | |
Bloomberg Barclays Intermediate Government Bond Index | | | (1.25)% | | | | 1.07% | | | | 3.39% | |
Lipper Intermediate U.S. Government Funds Classification Average | | | (1.30)% | | | | 1.01% | | | | 3.28% | |
| | | |
Class I Shares | | | (1.92)% | | | | 0.78% | | | | 3.15% | |
| | | | | | | | | | | | |
| | | Average Annual | |
| | | 1-Year | | | 5-Year | | | Since
Inception | |
Class C Shares | | | (2.81)% | | | | (0.19)% | | | | 0.99% | |
Class R3 Shares | | | (2.46)% | | | | 0.30% | | | | 1.47% | |
Since inception returns for Class C and Class R3 Shares are from 10/28/09. Indexes and Lipper averages are not available for direct investment.
Class A Shares have a maximum 3.00% sales charge (Offering Price). Class A Share purchases of $1 million or more are sold at net asset value without an up-front sales charge but may be subject to a contingent deferred sales charge (CDSC) equal to 1%, if redeemed within eighteen months of purchase. Class C Shares have a 1% CDSC for redemptions within less than twelve months, which is not reflected in the one-year total return. Class R3 Shares have no sales charge and are only available for purchase by eligible retirement plans. Class I Shares have no sales charge and may be purchased under limited circumstances or by specified classes of investors.
Expense Ratios as of Most Recent Prospectus
| | | | | | | | | | | | | | | | |
| | | Share Class | |
| | | Class A | | | Class C | | | Class R3 | | | Class I | |
Gross Expense Ratios | | | 0.98% | | | | 1.73% | | | | 1.23% | | | | 0.73% | |
Net Expense Ratios | | | 0.79% | | | | 1.54% | | | | 1.04% | | | | 0.54% | |
The Fund’s investment adviser has contractually agreed to waive fees and/or reimburse other Fund expenses through October 31, 2018, so that total annual Fund operating expenses (excluding 12b-1 distribution and/or service fees, interest expenses, taxes, acquired fund fees and expenses, fees incurred in acquiring and disposing of portfolio securities and extraordinary expenses) do not exceed expenses) do not exceed 0.54% of the average daily net assets of any class of Fund shares. Fee waivers and/or expense reimbursements will not be terminated prior to that time without the approval of the Board of Directors of the Fund.
Growth of an Assumed $10,000 Investment as of June 30, 2017 – Class A Shares
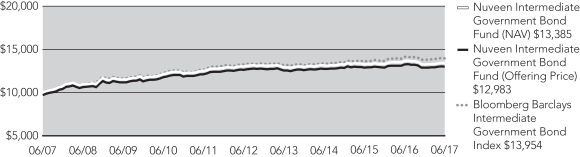
The graphs do not reflect the deduction of taxes that a shareholder may pay on Fund distributions or the redemption of Fund shares.
Fund Performance and Expense Ratios (continued)
Nuveen Short Term Bond Fund
Refer to the first page of this Fund Performance and Expense Ratios section for further explanation of the information included within this section. Refer to the Glossary of Terms Used in this Report for definitions of terms used within this section.
Fund Performance
Average Annual Total Returns as of June 30, 2017
| | | | | | | | | | | | |
| | | Average Annual | |
| | | 1-Year | | | 5-Year | | | 10-Year | |
Class A Shares at NAV | | | 1.39% | | | | 1.54% | | | | 2.53% | |
Class A Shares at maximum Offering Price | | | (0.92)% | | | | 1.08% | | | | 2.29% | |
Bloomberg Barclays 1-3 Year Government/Credit Bond Index | | | 0.35% | | | | 0.95% | | | | 2.30% | |
Lipper Short Investment Grade Debt Funds Classification Average | | | 1.55% | | | | 1.37% | | | | 2.27% | |
| | | |
Class I Shares | | | 1.63% | | | | 1.81% | | | | 2.73% | |
| | | | | | | | | | | | |
| | | Average Annual | |
| | | 1-Year | | | 5-Year | | | Since
Inception | |
Class C Shares | | | 0.59% | | | | 0.79% | | | | 1.12% | |
Class R3 Shares | | | 1.08% | | | | 1.26% | | | | 1.59% | |
| | | | | | | | |
| | | Average Annual | |
| | | 1-Year | | | Since
Inception | |
Class R6 Shares | | | 1.63% | | | | 1.59% | |
Since inception return for Class C, Class R3 and Class R6 Shares are from 10/28/09, 9/23/11 and 1/20/15, respectively. Indexes and Lipper averages are not available for direct investment.
Class A Shares have a maximum 2.25% sales charge (Offering Price). Class A Share purchases of $250,000 or more are sold at net asset value without an up-front sales charge but may be subject to a contingent deferred sales charge (CDSC) equal to 1%, if redeemed within eighteen months of purchase. Class C Shares have a 1% CDSC for redemptions within less than twelve months, which is not reflected in the one-year total return. Class R3 Shares have no sales charge and are only available for purchase by eligible retirement plans. Class R6 Shares have no sales charge and are available only to certain limited categories as described in the prospectus. Class I Shares have no sales charge and may be purchased under limited circumstances or by specified classes of investors.
Expense Ratios as of Most Recent Prospectus
| | | | | | | | | | | | | | | | | | | | |
| | | Share Class | |
| | | Class A | | | Class C | | | Class R3 | | | Class R6 | | | Class I | |
Gross Expense Ratios | | | 0.76% | | | | 1.51% | | | | 1.01% | | | | 0.47% | | | | 0.51% | |
Net Expense Ratios | | | 0.72% | | | | 1.47% | | | | 0.97% | | | | 0.43% | | | | 0.47% | |
The Fund’s investment adviser has contractually agreed to waive fees and/or reimburse other Fund expenses through October 31, 2018 so that total annual fund operating expenses (excluding 12b-1 distribution and/or service fees, interest expenses, taxes, acquired fund fees and expenses, fees incurred in acquiring and disposing of portfolio securities and extraordinary expenses) do not exceed 0.47% of the average daily net assets of any class of Fund shares. However, because Class R6 Shares are not subject to sub-transfer agent and similar fees, the total annual Fund operating expenses for the Class R6 Shares will be less than the expense limitation. Fee waivers and/or expense reimbursements will not be terminated prior to that time without the approval of the Board of Directors of the Fund.
Growth of an Assumed $10,000 Investment as of June 30, 2017 – Class A Shares
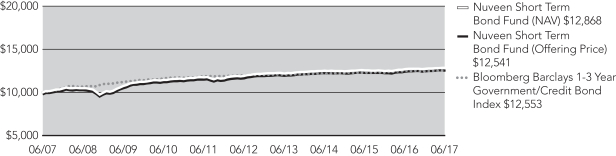
The graphs do not reflect the deduction of taxes that a shareholder may pay on Fund distributions or the redemption of Fund shares.
Fund Performance and Expense Ratios (continued)
Nuveen Strategic Income Fund
Refer to the first page of this Fund Performance and Expense Ratios section for further explanation of the information included within this section. Refer to the Glossary of Terms Used in this Report for definitions of terms used in this section.
Fund Performance
Average Annual Total Returns as of June 30, 2017
| | | | | | | | | | | | |
| | | Average Annual | |
| | | 1-Year | | | 5-Year | | | 10-Year | |
Class A Shares at NAV | | | 6.43% | | | | 4.58% | | | | 6.15% | |
Class A Shares at maximum Offering Price | | | 1.88% | | | | 3.67% | | | | 5.68% | |
Bloomberg Barclays U.S. Aggregate Bond Index | | | (0.31)% | | | | 2.21% | | | | 4.48% | |
Lipper Multi-Sector Income Funds Classification Average | | | 5.90% | | | | 4.06% | | | | 5.18% | |
| | | |
Class C Shares | | | 5.63% | | | | 3.81% | | | | 5.34% | |
Class R3 Shares | | | 6.17% | | | | 4.31% | | | | 5.84% | |
Class I Shares | | | 6.77% | | | | 4.84% | | | | 6.39% | |
| | | | | | | | |
| | | Average Annual | |
| | | 1-Year | | | Since
Inception | |
Class R6 Shares | | | 6.86% | | | | 3.25% | |
| | | | |
| | | Cumulative | |
| | | Since
Inception | |
Class T Shares* | | | 0.23% | |
Class T Shares at maximum Offering Price* | | | (2.24)% | |
Since inception return for Class R6 Shares is from 1/20/15. Since inception return for Class T shares is from 5/31/17. Indexes and Lipper averages are not available for direct investment.
Class A Shares have a maximum 4.25% sales charge (Offering Price). Class A Share purchases of $1 million or more are sold at net asset value without an up-front sales charge but may be subject to a contingent deferred sales charge (CDSC) equal to 1%, if redeemed within eighteen months of purchase. Class C Shares have a 1% CDSC for redemptions within less than twelve months, which is not reflected in the one-year total return. Class R3 Shares have no sales charge and are only available for purchase by eligible retirement plans. Class R6 Shares have no sales charge and are available only to certain limited categories of investors as described in the prospectus. Class I Shares have no sales charge and may be purchased under limited circumstances or by specified classes of investors. Class T Shares have a maximum 2.50% sales change (Offering Price).
Expense Ratios as of Most Recent Prospectus
| | | | | | | | | | | | | | | | | | | | | | | | |
| | | Share Class | |
| | | Class A | | | Class C | | | Class R3 | | | Class R6 | | | Class I | | | Class T* | |
Gross Expense Ratios | | | 0.92% | | | | 1.67% | | | | 1.17% | | | | 0.60% | | | | 0.67% | | | | 0.92% | |
Net Expense Ratios | | | 0.83% | | | | 1.58% | | | | 1.08% | | | | 0.50% | | | | 0.58% | | | | 0.83% | |
The Fund’s investment adviser has contractually agreed to waive fees and/or reimburse other Fund expenses through October 31, 2018, so that total annual Fund operating expenses (excluding 12b-1 distribution and/or service fees, interest expenses, taxes, acquired fund fees and expenses, fees incurred in acquiring and disposing of portfolio securities and extraordinary expenses) do not exceed 0.59% of the average daily net assets of any class of Fund shares. However, because Class R6 shares are not subject to sub-transfer agent and similar fees, the total annual Fund operating expenses for the Class R6 shares will be less than the expense limitation. Fee waivers and/or expense reimbursements will not be terminated prior to that time without the approval of the Board of Directors of the Fund.
| * | Class T Shares are not available for public offering. |
Growth of an Assumed $10,000 Investment as of June 30, 2017 – Class A Shares
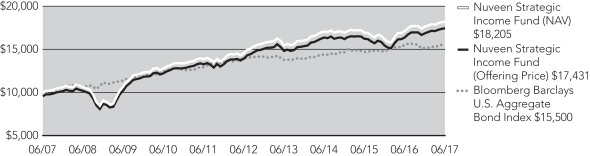
The graphs do not reflect the deduction of taxes that a shareholder may pay on Fund distributions or the redemption of Fund shares.
Yields as of June 30, 2017
Dividend Yield is the most recent dividend per share (annualized) divided by the offering price per share.
The SEC 30-Day Yield is a standardized measure of a fund’s yield that accounts for the future amortization of premiums or discounts of bonds held in the fund’s portfolio. The SEC 30-Day Yield is computed under an SEC standardized formula and is based on the maximum offer price per share. Subsidized yields reflect fee waivers and/or expense reimbursements from the investment adviser during the period. If any such waivers and/or reimbursements had not been in place, yields would have been reduced. Unsubsidized yields do not reflect waivers and/or reimbursements from the investment adviser during the period. Refer to the Notes to Financial Statements, Note 7 – Management Fees and Other Transactions with Affiliates for further details on the investment adviser’s most recent agreement with the Fund to waive fees and/or reimburse expenses, where applicable. Dividend Yield may differ from the SEC 30-Day Yield because the fund may be paying out more or less than it is earning and it may not include the effect of amortization of bond premium.
Nuveen Core Bond Fund
| | | | | | | | | | | | | | | | |
| | | Share Class | |
| | | Class A1 | | | Class C | | | Class R6 | | | Class I | |
Dividend Yield | | | 2.20% | | | | 1.60% | | | | 2.59% | | | | 2.59% | |
SEC 30-Day Yield-Subsidized | | | 2.21% | | | | 1.60% | | | | 2.60% | | | | 2.60% | |
SEC 30-Day Yield-Unsubsidized | | | 2.11% | | | | 1.43% | | | | 2.51% | | | | 2.43% | |
Nuveen Core Plus Bond Fund
| | | | | | | | | | | | | | | | | | | | |
| | | Share Class | |
| | | Class A1 | | | Class C | | | Class R3 | | | Class R6 | | | Class I | |
Dividend Yield | | | 2.99% | | | | 2.51% | | | | 3.03% | | | | 3.48% | | | | 3.49% | |
SEC 30-Day Yield-Subsidized | | | 2.65% | | | | 2.14% | | | | 2.61% | | | | 3.22% | | | | 3.14% | |
SEC 30-Day Yield-Unsubsidized | | | 2.65% | | | | 2.06% | | | | 2.61% | | | | 3.10% | | | | 3.06% | |
Nuveen High Income Bond Fund
| | | | | | | | | | | | | | | | | | | | |
| | | Share Class | |
| | | Class A1 | | | Class C | | | Class R3 | | | Class I | | | Class T | |
Dividend Yield | | | 6.21% | | | | 6.08% | | | | 6.56% | | | | 7.06% | | | | 6.66% | |
SEC 30-Day Yield-Subsidized | | | 6.97% | | | | 6.91% | | | | 7.42% | | | | 7.96% | | | | 7.56% | |
SEC 30-Day Yield-Unsubsidized | | | 6.97% | | | | 6.91% | | | | 7.42% | | | | 7.96% | | | | 7.54% | |
Nuveen Inflation Protected Securities Fund
| | | | | | | | | | | | | | | | | | | | |
| | | Share Class | |
| | | Class A1 | | | Class C | | | Class R3 | | | Class R6 | | | Class I | |
Dividend Yield | | | 0.60% | | | | — | | | | 0.44% | | | | 0.91% | | | | 0.92% | |
SEC 30-Day Yield-Subsidized | | | 2.63% | | | | 2.09% | | | | 2.58% | | | | 3.44% | | | | 3.12% | |
SEC 30-Day Yield-Unsubsidized | | | 2.61% | | | | 1.94% | | | | 2.41% | | | | 3.22% | | | | 2.98% | |
Nuveen Intermediate Government Bond Fund
| | | | | | | | | | | | | | | | |
| | | Share Class | |
| | | Class A1 | | | Class C | | | Class R3 | | | Class I | |
Dividend Yield | | | 1.11% | | | | 0.41% | | | | 0.90% | | | | 1.45% | |
SEC 30-Day Yield-Subsidized | | | 1.30% | | | | 0.64% | | | | 1.13% | | | | 1.64% | |
SEC 30-Day Yield-Unsubsidized | | | 1.07% | | | | 0.36% | | | | 0.86% | | | | 1.35% | |
Nuveen Short Term Bond Fund
| | | | | | | | | | | | | | | | | | | | |
| | | Share Class | |
| | | Class A1 | | | Class C | | | Class R3 | | | Class R6 | | | Class I | |
Dividend Yield | | | 1.50% | | | | 0.79% | | | | 1.28% | | | | 1.82% | | | | 1.82% | |
SEC 30-Day Yield-Subsidized | | | 1.51% | | | | 0.84% | | | | 1.33% | | | | 1.87% | | | | 1.83% | |
SEC 30-Day Yield-Unsubsidized | | | 1.50% | | | | 0.79% | | | | 1.29% | | | | 1.83% | | | | 1.78% | |
Nuveen Strategic Income Fund
| | | | | | | | | | | | | | | | | | | | | | | | |
| | | Share Class | |
| | | Class A1 | | | Class C | | | Class R3 | | | Class R6 | | | Class I | | | Class T | |
Dividend Yield | | | 4.80% | | | | 4.25% | | | | 4.77% | | | | 5.23% | | | | 5.24% | | | | 4.89% | |
SEC 30-Day Yield-Subsidized | | | 2.77% | | | | 2.28% | | | | 2.78% | | | | 3.32% | | | | 3.28% | | | | 2.95% | |
SEC 30-Day Yield-Unsubsidized | | | 2.77% | | | | 2.19% | | | | 2.69% | | | | 3.30% | | | | 3.20% | | | | 2.87% | |
| 1 | The SEC Yield for Class A Shares quoted in the table reflects the maximum sales load. Investors paying a reduced load because of volume discounts, investors paying no load because they qualify for one of the several exclusions from the load, and existing shareholders who previously paid a load but would like to know the SEC Yield applicable to their shares on a going-forward basis, should understand that the SEC Yield effectively applicable to them would be higher than the figure quoted in the table. |
Holding
Summaries as of June 30, 2017
This data relates to the securities held in each Fund’s portfolio of investments as of the end of this reporting period. It should not be construed as a measure of performance for the Fund itself. Holdings are subject to change
For financial reporting purposes, the ratings disclosed are the highest rating given by one of the following national rating agencies: Standard & Poor’s, Moody’s Investors Service, Inc. or Fitch, Inc. This treatment of split-rated securities may differ from that used for other purposes, such as for Fund investment policies. Credit ratings are subject to change. AAA, AA, A and BBB are investment grade ratings; BB, B, CCC, CC, C and D are below investment grade ratings. Certain bonds backed by U.S. Government or agency securities are regarded as having an implied rating equal to the rating of such securities. Holdings designated N/R are not rated by these national rating agencies.
Refer to the Glossary of Terms Used in this Report for further definition of the terms used within this section.
Nuveen Core Bond Fund
Fund Allocation
(% of net assets)
| | | | |
Corporate Bonds | | | 46.3% | |
$1,000 Par (or similar) Institutional Preferred | | | 0.5% | |
U.S. Government and Agency Obligations | | | 7.0% | |
Asset-Backed and Mortgage-Backed Securities | | | 43.0% | |
Investments Purchased with Collateral from Securities Lending | | | 0.6% | |
Money Market Funds | | | 2.6% | |
Other Assets Less Liabilities | | | 0.0% | |
Net Assets | | | 100% | |
Corporate Bonds: Industries
(% of total corporate bonds)
| | | | |
Banks | | | 16.2% | |
Capital Markets | | | 12.2% | |
Insurance | | | 8.3% | |
Media | | | 7.4% | |
Diversified Telecommunication Services | | | 5.2% | |
Oil, Gas & Consumable Fuels | | | 3.6% | |
Equity Real Estate Investment Trusts | | | 3.5% | |
Food & Staples Retailing | | | 3.4% | |
Diversified Financial Services | | | 3.0% | |
Health Care Providers & Services | | | 2.8% | |
Beverages | | | 2.8% | |
Biotechnology | | | 2.7% | |
Specialty Retail | | | 2.3% | |
Pharmaceuticals | | | 2.3% | |
Machinery | | | 2.2% | |
Semiconductors & Semiconductor Equipment | | | 2.2% | |
Other | | | 19.9% | |
Total | | | 100% | |
Portfolio Credit Quality
(% of total long-term
investments)
| | | | |
AAA/U.S. Guaranteed | | | 44.4% | |
AA | | | 9.8% | |
A | | | 24.8% | |
BBB | | | 20.9% | |
N/R (not rated) | | | 0.1% | |
Total | | | 100% | |
Nuveen Core Plus Bond Fund
Fund Allocation
(% of net assets)
| | | | |
Corporate Bonds | | | 52.9% | |
$1,000 Par (or similar) Institutional Preferred | | | 5.8% | |
Contingent Capital Securities | | | 1.5% | |
Municipal Bonds | | | 0.3% | |
Asset-Backed and Mortgage-Backed Securities | | | 35.9% | |
Sovereign Debt | | | 2.7% | |
Investments Purchased with Collateral from Securities Lending | | | 2.4% | |
Money Market Funds | | | 5.0% | |
Other Assets Less Liabilities | | | (6.5)% | |
Net Assets | | | 100% | |
Corporate Bonds: Industries
(% of total corporate bonds)
| | | | |
Banks | | | 19.6% | |
Capital Markets | | | 10.5% | |
Oil, Gas & Consumable Fuels | | | 8.4% | |
Media | | | 7.2% | |
Diversified Telecommunication Services | | | 5.0% | |
Insurance | | | 3.9% | |
Aerospace & Defense | | | 3.7% | |
Chemicals | | | 3.2% | |
Equity Real Estate Investment Trusts | | | 2.9% | |
Consumer Finance | | | 2.7% | |
Diversified Financial Services | | | 2.3% | |
Wireless Telecommunication Services | | | 1.9% | |
Specialty Retail | | | 1.8% | |
Food Products | | | 1.7% | |
Airlines | | | 1.5% | |
Paper & Forest Products | | | 1.5% | |
Machinery | | | 1.5% | |
Technology Hardware, Storage & Peripherals | | | 1.5% | |
Other | | | 19.2% | |
Total | | | 100% | |
Portfolio Credit Quality
(% of total long-term
investments)
| | | | |
AAA/U.S. Guaranteed | | | 29.0% | |
AA | | | 3.2% | |
A | | | 27.4% | |
BBB | | | 33.9% | |
BB or Lower | | | 6.5% | |
Total | | | 100% | |
Holding Summaries as of June 30, 2017 (continued)
Nuveen High Income Bond Fund
Fund Allocation
(% of net assets)
| | | | |
Common Stocks | | | 1.3% | |
Convertible Preferred Securities | | | 1.1% | |
Variable Rate Senior Loan Interests | | | 3.0% | |
$25 Par (or similar) Retail Preferred | | | 2.0% | |
Corporate Bonds | | | 80.3% | |
$1,000 (par or similar) Institutional Preferred | | | 2.9% | |
Contingent Capital Securities | | | 2.7% | |
Asset-Backed Securities | | | 0.0% | |
Investment Companies | | | 2.2% | |
Warrants | | | 0.0% | |
Investments Purchased with Collateral from Securities Lending | | | 12.3% | |
Money Market Funds | | | 2.9% | |
Other Assets Less Liabilities | | | (10.7)% | |
Net Assets | | | 100% | |
Corporate Bonds: Industries
(% of total corporate bonds)
| | | | |
Oil, Gas & Consumable Fuels | | | 12.5% | |
Media | | | 8.7% | |
Metals & Mining | | | 6.1% | |
Diversified Telecommunication Services | | | 5.9% | |
Chemicals | | | 4.1% | |
Energy Equipment & Services | | | 4.1% | |
Food & Staples Retailing | | | 3.7% | |
Diversified Financial Services | | | 3.0% | |
Hotels, Restaurants & Leisure | | | 3.0% | |
Wireless Telecommunication Services | | | 2.7% | |
Household Durables | | | 2.7% | |
Road & Rail | | | 2.5% | |
Internet Software & Services | | | 2.5% | |
Health Care Providers & Services | | | 2.4% | |
Real Estate Management & Development | | | 2.1% | |
Aerospace & Defense | | | 2.1% | |
Independent Power & Renewable Electricity Producers | | | 2.0% | |
Machinery | | | 1.7% | |
Food Products | | | 1.7% | |
Commercial Services & Supplies | | | 1.5% | |
Construction & Engineering | | | 1.5% | |
Consumer Finance | | | 1.5% | |
Auto Components | | | 1.5% | |
Paper & Forest Products | | | 1.5% | |
Other | | | 19.0% | |
Total | | | 100% | |
Portfolio Credit Quality
(% of total long-term fixed-income investments)
| | | | |
AAA/U.S. Guaranteed | | | 0.0% | |
BBB | | | 3.8% | |
BB or Lower | | | 90.5% | |
N/R (not rated) | | | 5.7% | |
Total | | | 100% | |
Nuveen Inflation Protected Securities Fund
Fund Allocation
(% of net assets)
| | | | |
Convertible Preferred Securities | | | 0.0% | |
Corporate Bonds | | | 3.8% | |
Municipal Bonds | | | 0.2% | |
U.S. Government and Agency Obligations | | | 87.8% | |
Asset-Backed and Mortgage-Backed Securities | | | 6.3% | |
Sovereign Debt | | | 0.8% | |
Investments Purchased with Collateral from Securities Lending | | | 0.3% | |
Money Market Funds | | | 1.4% | |
Other Assets Less Liabilities | | | (0.6)% | |
Net Assets | | | 100% | |
Portfolio Credit Quality
(% of total long-term
investments)
| | | | |
AAA/U.S. Guaranteed | | | 91.4% | |
AA | | | 0.9% | |
A | | | 0.2% | |
BBB | | | 4.5% | |
BB or Lower | | | 2.5% | |
N/R (not rated) | | | 0.5% | |
Total | | | 100% | |
Holding Summaries as of June 30, 2017 (continued)
Nuveen Intermediate Government Bond Fund
Fund Allocation
(% of net assets)
| | | | |
Municipal Bonds | | | 4.3% | |
U.S. Government and Agency Obligations | | | 73.3% | |
Asset-Backed and Mortgage-Backed Securities | | | 21.5% | |
Investments Purchased with Collateral from Securities Lending | | | 0.6% | |
Money Market Funds | | | 0.5% | |
Other Assets Less Liabilities | | | (0.2)% | |
Net Assets | | | 100% | |
Portfolio Credit Quality
(% of total long-term investments)
| | | | |
AAA/U.S. Guaranteed | | | 93.5% | |
AA | | | 3.8% | |
A | | | 1.5% | |
BBB | | | 0.3% | |
N/R (not rated) | | | 0.9% | |
Total | | | 100% | |
Nuveen Short Term Bond Fund
Fund Allocation
(% of net assets)
| | | | |
Corporate Bonds | | | 46.1% | |
Municipal Bonds | | | 1.0% | |
U.S. Government and Agency Obligations | | | 8.8% | |
Asset-Backed and Mortgage-Backed Securities | | | 42.0% | |
Investments Purchased with Collateral from Securities Lending | | | 0.5% | |
Money Market Funds | | | 4.4% | |
Other Assets Less Liabilities | | | (2.8)% | |
Net Assets | | | 100% | |
Corporate Bonds: Industries
(% of total corporate bonds)
| | | | |
Banks | | | 21.5% | |
Capital Markets | | | 7.1% | |
Diversified Telecommunication Services | | | 6.2% | |
Insurance | | | 5.5% | |
Consumer Finance | | | 5.3% | |
Oil, Gas & Consumable Fuels | | | 4.2% | |
Food & Staples Retailing | | | 3.8% | |
Media | | | 3.6% | |
Wireless Telecommunication Services | | | 3.2% | |
Tobacco | | | 2.6% | |
Health Care Providers & Services | | | 2.5% | |
Technology Hardware, Storage & Peripherals | | | 2.3% | |
Food Products | | | 2.3% | |
Chemicals | | | 2.2% | |
Diversified Financial Services | | | 2.1% | |
Aerospace & Defense | | | 2.0% | |
Beverages | | | 2.0% | |
Electric Utilities | | | 1.6% | |
Other | | | 20.0% | |
Total | | | 100% | |
Portfolio Credit Quality
(% of total long-term investments)
| | | | |
AAA/U.S. Guaranteed | | | 34.9% | |
AA | | | 11.3% | |
A | | | 28.5% | |
BBB | | | 19.8% | |
BB or Lower | | | 3.1% | |
N/R (not rated) | | | 2.4% | |
Total | | | 100% | |
Holding Summaries as of June 30, 2017 (continued)
Nuveen Strategic Income Fund
Fund Allocation
(% of net assets)
| | | | |
Common Stocks | | | 0.1% | |
Convertible Preferred Securities | | | 0.0% | |
Variable Rate Senior Loan Interests | | | 0.7% | |
$25 Par (or similar) Retail Preferred | | | 0.3% | |
Corporate Bonds | | | 58.0% | |
Municipal Bonds | | | 0.2% | |
$1,000 (par or similar) Institutional Preferred | | | 6.3% | |
Contingent Capital Securities | | | 3.0% | |
Asset-Backed and Mortgage-Backed Securities | | | 23.9% | |
Sovereign Debt | | | 5.3% | |
Investments Purchased with Collateral from Securities Lending | | | 3.3% | |
Money Market Funds | | | 11.1% | |
Other Assets Less Liabilities | | | (12.2)% | |
Net Assets | | | 100% | |
Corporate Bonds: Industries
(% of total corporate bonds)
| | | | |
Banks | | | 18.3% | |
Capital Markets | | | 10.7% | |
Oil, Gas & Consumable Fuels | | | 7.5% | |
Media | | | 5.6% | |
Insurance | | | 5.0% | |
Diversified Telecommunication Services | | | 4.2% | |
Consumer Finance | | | 3.4% | |
Chemicals | | | 2.8% | |
Diversified Financial Services | | | 2.5% | |
Aerospace & Defense | | | 2.4% | |
Wireless Telecommunication Services | | | 2.4% | |
Specialty Retail | | | 2.0% | |
Household Durables | | | 2.0% | |
Energy Equipment & Services | | | 1.9% | |
Airlines | | | 1.8% | |
Equity Real Estate Investment Trusts | | | 1.6% | |
Food Products | | | 1.5% | |
Metals & Mining | | | 1.4% | |
Beverages | | | 1.4% | |
Electric Utilities | | | 1.4% | |
Internet Software & Services | | | 1.3% | |
Other | | | 18.9% | |
Total | | | 100% | |
Portfolio Credit Quality
(% of total long-term fixed-income investments)
| | | | |
AAA/U.S. Guaranteed | | | 21.4% | |
AA | | | 1.4% | |
A | | | 25.8% | |
BBB | | | 32.9% | |
BB or Lower | | | 18.3% | |
N/R (not rated) | | | 0.2% | |
Total | | | 100% | |
Expense
Examples
As a shareholder of one or more of the Funds, you incur two types of costs: (1) transaction costs, including up-front and back-end sales charges (loads) or redemption fees, where applicable; and (2) ongoing costs, including management fees; distribution and service (12b-1) fees, where applicable; and other Fund expenses. The Examples below are intended to help you understand your ongoing costs (in dollars) of investing in the Funds and to compare these costs with the ongoing costs of investing in other mutual funds. Since the expense examples for Class T Shares of Nuveen High Income Bond Fund and Nuveen Strategic Income Fund reflect only the first 31 days of the Classes’ operations, they may not provide a meaningful understanding of the Classes’ ongoing expenses.
The Examples below are based on an investment of $1,000 invested at the beginning of the period and held through the period ended June 30, 2017.
The beginning of the period for the funds is January 1, 2017.
The information under “Actual Performance,” together with the amount you invested, allows you to estimate actual expenses incurred over the reporting period. Simply divide your account value by $1,000 (for example, an $8,600 account value divided by $1,000 = 8.60) and multiply the result by the cost shown for your share class, in the row entitled “Expenses Incurred During Period” to estimate the expenses incurred on your account during this period.
The information under “Hypothetical Performance,” provides information about hypothetical account values and hypothetical expenses based on each Fund’s actual expense ratio and an assumed rate of return of 5% per year before expenses, which is not the Fund’s actual return. The hypothetical account values and expenses may not be used to estimate the actual ending account balance or expense you incurred for the period. You may use this information to compare the ongoing costs of investing in the Fund and other funds. To do so, compare this 5% hypothetical example with the 5% hypothetical examples that appear in the shareholder reports of the other funds.
Please note that the expenses shown in the tables are meant to highlight your ongoing costs only and do not reflect any transaction costs. Therefore, the hypothetical information is useful in comparing ongoing costs only, and will not help you determine the relative total costs of owning different funds or share classes. In addition, if these transaction costs were included, your costs would have been higher.
Nuveen Core Bond Fund
| | | | | | | | | | | | | | | | |
| | | Share Class | |
| | | Class A | | | Class C | | | Class R6 | | | Class I | |
Actual Performance | | | | | | | | | | | | | | | | |
Beginning Account Value | | $ | 1,000.00 | | | $ | 1,000.00 | | | $ | 1,000.00 | | | $ | 1,000.00 | |
Ending Account Value | | $ | 1,023.30 | | | $ | 1,019.60 | | | $ | 1,025.70 | | | $ | 1,024.70 | |
Expenses Incurred During the Period | | $ | 3.91 | | | $ | 7.66 | | | $ | 2.31 | | | $ | 2.66 | |
Hypothetical Performance (5% annualized return before expenses) | | | | | | | | | | | | | | | | |
Beginning Account Value | | $ | 1,000.00 | | | $ | 1,000.00 | | | $ | 1,000.00 | | | $ | 1,000.00 | |
Ending Account Value | | $ | 1,020.93 | | | $ | 1,017.21 | | | $ | 1,022.51 | | | $ | 1,022.17 | |
Expenses Incurred During the Period | | $ | 3.91 | | | $ | 7.65 | | | $ | 2.31 | | | $ | 2.66 | |
For each class of the Fund, expenses are equal to the Fund’s annualized net expense ratio of 0.78%, 1.53%, 0.46% and 0.53% for Classes A, C, R6 and I, respectively, multiplied by the average account value over the period, multiplied by 181/365 (to reflect the one-half year period).
Expense Examples (continued)
Nuveen Core Plus Bond Fund
| | | | | | | | | | | | | | | | | | | | |
| | | Share Class | |
| | | Class A | | | Class C | | | Class R3 | | | Class R6 | | | Class I | |
Actual Performance | | | | | | | | | | | | | | | | | | | | |
Beginning Account Value | | $ | 1,000.00 | | | $ | 1,000.00 | | | $ | 1,000.00 | | | $ | 1,000.00 | | | $ | 1,000.00 | |
Ending Account Value | | $ | 1,032.40 | | | $ | 1,028.60 | | | $ | 1,031.10 | | | $ | 1,033.70 | | | $ | 1,033.80 | |
Expenses Incurred During the Period | | $ | 3.88 | | | $ | 7.65 | | | $ | 5.14 | | | $ | 2.27 | | | $ | 2.62 | |
Hypothetical Performance (5% annualized return before expenses) | | | | | | | | | | | | | | | | | | | | |
Beginning Account Value | | $ | 1,000.00 | | | $ | 1,000.00 | | | $ | 1,000.00 | | | $ | 1,000.00 | | | $ | 1,000.00 | |
Ending Account Value | | $ | 1,020.98 | | | $ | 1,017.26 | | | $ | 1,019.74 | | | $ | 1,022.56 | | | $ | 1,022.22 | |
Expenses Incurred During the Period | | $ | 3.86 | | | $ | 7.60 | | | $ | 5.11 | | | $ | 2.26 | | | $ | 2.61 | |
For each class of the Fund, expenses are equal to the Fund’s annualized net expense ratio of 0.77%, 1.52%, 1.02%, 0.45% and 0.52% for Classes A, C, R3, R6 and I, respectively, multiplied by the average account value over the period, multiplied by 181/365 (to reflect the one-half year period).
Nuveen High Income Bond Fund
| | | | | | | | | | | | | | | | | | | | |
| | | Share Class | |
| | | A Shares | | | C Shares | | | R3 Shares | | | I Shares | | | T Shares* | |
Actual Performance | | | | | | | | | | | | | | | | | | | | |
Beginning Account Value | | $ | 1,000.00 | | | $ | 1,000.00 | | | $ | 1,000.00 | | | $ | 1,000.00 | | | $ | 1,000.00 | |
Ending Account Value | | $ | 1,039.70 | | | $ | 1,035.90 | | | $ | 1,037.10 | | | $ | 1,039.40 | | | $ | 994.20 | |
Expenses Incurred During the Period | | $ | 5.06 | | | $ | 8.88 | | | $ | 6.36 | | | $ | 3.84 | | | $ | 0.82 | |
Hypothetical Performance | | | | | | | | | | | | | | | | | | | | |
Beginning Account Value | | $ | 1,000.00 | | | $ | 1,000.00 | | | $ | 1,000.00 | | | $ | 1,000.00 | | | $ | 1,000.00 | |
Ending Account Value | | $ | 1,019.84 | | | $ | 1,016.07 | | | $ | 1,018.55 | | | $ | 1,021.03 | | | $ | 1,019.84 | |
Expenses Incurred During the Period | | $ | 5.01 | | | $ | 8.80 | | | $ | 6.31 | | | $ | 3.81 | | | $ | 0.83 | |
For each class of the Fund, expenses are equal to the Fund’s annualized net expense ratio of 1.00%, 1.76%, 1.26% and 0.76% for Classes A, C, R3 and I, respectively, multiplied by the average account value over the period, multiplied by 181/365 (to reflect the one-half year period). For Class T expenses are equal to the Fund’s annualized net expense ratio of 1.00% multiplied by the average account value over the period, multiplied by 31/365 (to reflect the 31 days in the period since class commencement of operations).
| * | Class T Shares are not available for public offering. |
Nuveen Inflation Protected Securities Fund
| | | | | | | | | | | | | | | | | | | | |
| | | Share Class | |
| | | Class A | | | Class C | | | Class R3 | | | Class R6 | | | Class I | |
Actual Performance | | | | | | | | | | | | | | | | | | | | |
Beginning Account Value | | $ | 1,000.00 | | | $ | 1,000.00 | | | $ | 1,000.00 | | | $ | 1,000.00 | | | $ | 1,000.00 | |
Ending Account Value | | $ | 1,008.80 | | | $ | 1,005.60 | | | $ | 1,007.70 | | | $ | 1,011.80 | | | $ | 1,010.90 | |
Expenses Incurred During the Period | | $ | 3.93 | | | $ | 7.66 | | | $ | 5.18 | | | $ | 1.50 | | | $ | 2.69 | |
Hypothetical Performance (5% annualized return before expenses) | | | | | | | | | | | | | | | | | | | | |
Beginning Account Value | | $ | 1,000.00 | | | $ | 1,000.00 | | | $ | 1,000.00 | | | $ | 1,000.00 | | | $ | 1,000.00 | |
Ending Account Value | | $ | 1,020.88 | | | $ | 1,017.16 | | | $ | 1,019.64 | | | $ | 1,023.31 | | | $ | 1,022.12 | |
Expenses Incurred During the Period | | $ | 3.96 | | | $ | 7.70 | | | $ | 5.21 | | | $ | 1.51 | | | $ | 2.71 | |
For each class of the Fund, expenses are equal to the Fund’s annualized net expense ratio of 0.79%, 1.54%, 1.04%, 0.30% and 0.54% for Classes A, C, R3, R6 and I, respectively, multiplied by the average account value over the period, multiplied by 181/365 (to reflect the one-half year period).
Nuveen Intermediate Government Bond Fund
| | | | | | | | | | | | | | | | |
| | | Share Class | |
| | | Class A | | | Class C | | | Class R3 | | | Class I | |
Actual Performance | | | | | | | | | | | | | | | | |
Beginning Account Value | | $ | 1,000.00 | | | $ | 1,000.00 | | | $ | 1,000.00 | | | $ | 1,000.00 | |
Ending Account Value | | $ | 1,009.40 | | | $ | 1,005.50 | | | $ | 1,006.80 | | | $ | 1,009.60 | |
Expenses Incurred During the Period | | $ | 3.94 | | | $ | 7.66 | | | $ | 5.17 | | | $ | 2.69 | |
Hypothetical Performance (5% annualized return before expenses) | | | | | | | | | | | | | | | | |
Beginning Account Value | | $ | 1,000.00 | | | $ | 1,000.00 | | | $ | 1,000.00 | | | $ | 1,000.00 | |
Ending Account Value | | $ | 1,020.88 | | | $ | 1,017.16 | | | $ | 1,019.64 | | | $ | 1,022.12 | |
Expenses Incurred During the Period | | $ | 3.96 | | | $ | 7.70 | | | $ | 5.21 | | | $ | 2.71 | |
For each class of the Fund, expenses are equal to the Fund’s annualized net expense ratio of 0.79%, 1.54%, 1.04% and 0.54% for Classes A, C, R3 and I, respectively, multiplied by the average account value over the period, multiplied by 181/365 (to reflect the one-half year period).
Nuveen Short Term Bond Fund
| | | | | | | | | | | | | | | | | | | | |
| | | Share Class | |
| | | Class A | | | Class C | | | Class R3 | | | Class R6 | | | Class I | |
Actual Performance | | | | | | | | | | | | | | | | | | | | |
Beginning Account Value | | $ | 1,000.00 | | | $ | 1,000.00 | | | $ | 1,000.00 | | | $ | 1,000.00 | | | $ | 1,000.00 | |
Ending Account Value | | $ | 1,010.00 | | | $ | 1,006.00 | | | $ | 1,008.40 | | | $ | 1,011.20 | | | $ | 1,011.20 | |
Expenses Incurred During the Period | | $ | 3.59 | | | $ | 7.31 | | | $ | 4.83 | | | $ | 2.09 | | | $ | 2.34 | |
Hypothetical Performance (5% annualized return before expenses) | | | | | | | | | | | | | | | | | | | | |
Beginning Account Value | | $ | 1,000.00 | | | $ | 1,000.00 | | | $ | 1,000.00 | | | $ | 1,000.00 | | | $ | 1,000.00 | |
Ending Account Value | | $ | 1,021.22 | | | $ | 1,017.50 | | | $ | 1,019.98 | | | $ | 1,022.71 | | | $ | 1,022.46 | |
Expenses Incurred During the Period | | $ | 3.61 | | | $ | 7.35 | | | $ | 4.86 | | | $ | 2.11 | | | $ | 2.36 | |
For each class of the Fund, expenses are equal to the Fund’s annualized net expense ratio of 0.72%, 1.47%, 0.97%, 0.42% and 0.47% for Classes A, C, R3, R6 and I, respectively, multiplied by the average account value over the period, multiplied by 181/365 (to reflect the one-half year period).
Nuveen Strategic Income Fund
| | | | | | | | | | | | | | | | | | | | | | | | |
| | | Share Class | |
| | | A Shares | | | C Shares | | | R3 Shares | | | R6 Shares | | | I Shares | | | T Shares* | |
Actual Performance | | | | | | | | | | | | | | | | | | | | | | | | |
Beginning Account Value | | $ | 1,000.00 | | | $ | 1,000.00 | | | $ | 1,000.00 | | | $ | 1,000.00 | | | $ | 1,000.00 | | | $ | 1,000.00 | |
Ending Account Value | | $ | 1,033.10 | | | $ | 1,029.20 | | | $ | 1,031.80 | | | $ | 1,035.20 | | | $ | 1,035.30 | | | $ | 1,002.30 | |
Expenses Incurred During the Period | | $ | 4.18 | | | $ | 7.95 | | | $ | 5.44 | | | $ | 2.57 | | | $ | 2.93 | | | $ | 0.68 | |
Hypothetical Performance (5% annualized return before expenses) | | | | | | | | | | | | | | | | | | | | | | | | |
Beginning Account Value | | $ | 1,000.00 | | | $ | 1,000.00 | | | $ | 1,000.00 | | | $ | 1,000.00 | | | $ | 1,000.00 | | | $ | 1,000.00 | |
Ending Account Value | | $ | 1,020.68 | | �� | $ | 1,016.96 | | | $ | 1,019.44 | | | $ | 1,022.27 | | | $ | 1,021.92 | | | $ | 1,020.68 | |
Expenses Incurred During the Period | | $ | 4.16 | | | $ | 7.90 | | | $ | 5.41 | | | $ | 2.56 | | | $ | 2.91 | | | $ | 0.69 | |
For each class of the Fund, expenses are equal to the Fund’s annualized net expense ratio of 0.83%, 1.58%, 1.08% and 0.51%, 0.58% for Classes A, C, R3, R6 and I, respectively, multiplied by the average account value over the period, multiplied by 181/365 (to reflect the one-half year period). For Class T expenses are equal to the Fund’s annualized net expense ratio of 0.83% multiplied by the average account value over the period, multiplied by 31/365 (to reflect the 31 days in the period since class commencement of operations).
| * | Class T Shares are not available for public offering. |
Report of
Independent Registered Public Accounting Firm
To the Board of Directors of Nuveen Investment Funds, Inc. and Shareholders of
Nuveen Core Bond Fund
Nuveen Core Plus Bond Fund
Nuveen High Income Bond Fund
Nuveen Inflation Protected Securities Fund
Nuveen Intermediate Government Bond Fund
Nuveen Short Term Bond Fund and
Nuveen Strategic Income Fund:
In our opinion, the accompanying statements of assets and liabilities, including the portfolios of investments, and the related statements of operations and of changes in net assets and the financial highlights present fairly, in all material respects, the financial position of Nuveen Core Bond Fund, Nuveen Core Plus Bond Fund, Nuveen High Income Bond Fund, Nuveen Inflation Protected Securities Fund, Nuveen Intermediate Government Bond Fund, Nuveen Short Term Bond Fund, and Nuveen Strategic Income Fund (separate portfolios of Nuveen Investment Funds, Inc., hereafter referred to as the “Funds”) as of June 30, 2017, the results of each of their operations for the year then ended, the changes in each of their net assets for each of the two years in the period then ended and the financial highlights for each of the five years in the period then ended, in conformity with accounting principles generally accepted in the United States of America. These financial statements and financial highlights (hereafter referred to as “financial statements”) are the responsibility of the Funds’ management. Our responsibility is to express an opinion on these financial statements based on our audits. We conducted our audits of these financial statements in accordance with the standards of the Public Company Accounting Oversight Board (United States). Those standards require that we plan and perform the audit to obtain reasonable assurance about whether the financial statements are free of material misstatement. An audit includes examining, on a test basis, evidence supporting the amounts and disclosures in the financial statements, assessing the accounting principles used and significant estimates made by management, and evaluating the overall financial statement presentation. We believe that our audits, which included confirmation of securities as of June 30, 2017 by correspondence with the custodian and brokers, provide a reasonable basis for our opinion.
PricewaterhouseCoopers LLP
Chicago, IL
August 25, 2017
Nuveen Core Bond Fund
| | |
| Portfolio of Investments | | June 30, 2017 |
| | | | | | | | | | | | | | | | | | | | |
Principal
Amount (000) | | | Description (1) | | Coupon | | | Maturity | | | Ratings (2) | | | Value | |
| | | | | |
| | | | LONG-TERM INVESTMENTS – 96.8% | | | | | | | | | | | | | | | | |
| | | | | |
| | | | CORPORATE BONDS – 46.3% | | | | | | | | | | | | | | | | |
| | | | | |
| | | | Airlines – 0.2% | | | | | | | | | | | | |
| | | | | |
| $ | 375 | | | American Airlines Inc., Pass Through Trust 2016-1A | | | 3.575% | | | | 1/15/28 | | | | AA+ | | | $ | 383,894 | |
| | | | | |
| | | | Auto Components – 0.2% | | | | | | | | | | | | |
| | | | | |
| | 355 | | | Lear Corporation | | | 5.375% | | | | 3/15/24 | | | | BBB– | | | | 377,085 | |
| | | | | |
| | | | Automobiles – 0.5% | | | | | | | | | | | | |
| | | | | |
| | 750 | | | General Motors Corporation | | | 4.000% | | | | 4/01/25 | | | | BBB | | | | 752,863 | |
| | | | | |
| | | | Banks – 7.5% | | | | | | | | | | | | |
| | | | | |
| | 290 | | | Bank of America Corporation | | | 4.000% | | | | 4/01/24 | | | | A | | | | 303,906 | |
| | | | | |
| | 490 | | | Bank of America Corporation | | | 3.875% | | | | 8/01/25 | | | | A | | | | 506,957 | |
| | | | | |
| | 1,000 | | | Bank of America Corporation | | | 4.450% | | | | 3/03/26 | | | | A– | | | | 1,040,843 | |
| | | | | |
| | 460 | | | Barclays Bank PLC | | | 3.650% | | | | 3/16/25 | | | | A | | | | 457,713 | |
| | | | | |
| | 1,005 | | | Citigroup Inc. | | | 4.500% | | | | 1/14/22 | | | | A | | | | 1,080,573 | |
| | | | | |
| | 650 | | | Citigroup Inc. | | | 3.300% | | | | 4/27/25 | | | | A | | | | 650,253 | |
| | | | | |
| | 365 | | | Citigroup Inc. | | | 4.300% | | | | 11/20/26 | | | | A– | | | | 374,945 | |
| | | | | |
| | 807 | | | Fifth Third Bancorp. | | | 3.500% | | | | 3/15/22 | | | | A | | | | 833,400 | |
| | | | | |
| | 1,510 | | | GE Capital International Funding | | | 4.418% | | | | 11/15/35 | | | | AA– | | | | 1,645,202 | |
| | | | | |
| | 400 | | | ING Groep N.V | | | 3.950% | | | | 3/29/27 | | | | A+ | | | | 415,982 | |
| | | | | |
| | 505 | | | JPMorgan Chase & Company | | | 3.200% | | | | 1/25/23 | | | | A+ | | | | 514,817 | |
| | | | | |
| | 695 | | | JPMorgan Chase & Company | | | 3.875% | | | | 9/10/24 | | | | A | | | | 717,121 | |
| | | | | |
| | 1,000 | | | JPMorgan Chase & Company | | | 6.400% | | | | 5/15/38 | | | | A+ | | | | 1,341,343 | |
| | | | | |
| | 805 | | | Santander UK PLC | | | 3.050% | | | | 8/23/18 | | | | Aa3 | | | | 815,105 | |
| | 9,982 | | | Total Banks | | | | | | | | | | | | | | | 10,698,160 | |
| | | | | |
| | | | Beverages – 1.3% | | | | | | | | | | | | |
| | | | | |
| | 1,395 | | | Anheuser Busch InBev Financial Inc. | | | 3.650% | | | | 2/01/26 | | | | A– | | | | 1,437,363 | |
| | | | | |
| | 420 | | | Dr. Pepper Snapple Group Inc. | | | 2.550% | | | | 9/15/26 | | | | BBB+ | | | | 395,534 | |
| | 1,815 | | | Total Beverages | | | | | | | | | | | | | | | 1,832,897 | |
| | | | | |
| | | | Biotechnology – 1.3% | | | | | | | | | | | | |
| | | | | |
| | 500 | | | Baxalta, Inc. | | | 4.000% | | | | 6/23/25 | | | | BBB– | | | | 521,553 | |
| | | | | |
| | 630 | | | Biogen Inc. | | | 3.625% | | | | 9/15/22 | | | | A– | | | | 658,813 | |
| | | | | |
| | 595 | | | Celgene Corporation, Convertible Notes | | | 3.625% | | | | 5/15/24 | | | | BBB+ | | | | 616,176 | |
| | 1,725 | | | Total Biotechnology | | | | | | | | | | | | | | | 1,796,542 | |
| | | | | |
| | | | Capital Markets – 5.7% | | | | | | | | | | | | |
| | | | | |
| | 665 | | | Charles Schwab Corporation | | | 3.000% | | | | 3/10/25 | | | | A | | | | 665,123 | |
| | | | | |
| | 1,280 | | | Goldman Sachs Group, Inc. | | | 5.750% | | | | 1/24/22 | | | | A | | | | 1,440,972 | |
Nuveen Core Bond Fund (continued)
| | |
| Portfolio of Investments | | June 30, 2017 |
| | | | | | | | | | | | | | | | | | | | |
Principal
Amount (000) | | | Description (1) | | Coupon | | | Maturity | | | Ratings (2) | | | Value | |
| | | | | |
| | | | Capital Markets (continued) | | | | | | | | | | | | |
| | | | | |
| $ | 1,090 | | | Goldman Sachs Group, Inc. | | | 6.750% | | | | 10/01/37 | | | | A– | | | $ | 1,418,023 | |
| | | | | |
| | 460 | | | Lazard Group LLC | | | 3.625% | | | | 3/01/27 | | | | A– | | | | 454,410 | |
| | | | | |
| | 1,740 | | | Morgan Stanley | | | 4.000% | | | | 7/23/25 | | | | A | | | | 1,816,264 | |
| | | | | |
| | 1,145 | | | Morgan Stanley | | | 3.950% | | | | 4/23/27 | | | | A– | | | | 1,152,320 | |
| | | | | |
| | 1,105 | | | State Street Corporation | | | 3.300% | | | | 12/16/24 | | | | AA– | | | | 1,136,437 | |
| | 7,485 | | | Total Capital Markets | | | | | | | | | | | | | | | 8,083,549 | |
| | | | | |
| | | | Chemicals – 0.8% | | | | | | | | | | | | |
| | | | | |
| | 500 | | | Agrium Inc. | | | 3.375% | | | | 3/15/25 | | | | BBB | | | | 500,097 | |
| | | | | |
| | 550 | | | LYB International Finance BV | | | 4.000% | | | | 7/15/23 | | | | Baa1 | | | | 582,636 | |
| | 1,050 | | | Total Chemicals | | | | | | | | | | | | | | | 1,082,733 | |
| | | | | |
| | | | Commercial Services & Supplies – 0.3% | | | | | | | | | | | | |
| | | | | |
| | 430 | | | AerCap Ireland Capital Limited / AerCap Global Aviation Trust | | | 3.950% | | | | 2/01/22 | | | | BBB– | | | | 447,661 | |
| | | | | |
| | | | Consumer Finance – 0.8% | | | | | | | | | | | | |
| | | | | |
| | 490 | | | Capital One Bank | | | 3.375% | | | | 2/15/23 | | | | Baa1 | | | | 494,120 | |
| | | | | |
| | 545 | | | Discover Financial Services | | | 5.200% | | | | 4/27/22 | | | | BBB+ | | | | 593,196 | |
| | 1,035 | | | Total Consumer Finance | | | | | | | | | | | | | | | 1,087,316 | |
| | | | | |
| | | | Containers & Packaging – 0.3% | | | | | | | | | | | | |
| | | | | |
| | 480 | | | Packaging Corporation of America | | | 3.650% | | | | 9/15/24 | | | | BBB | | | | 489,494 | |
| | | | | |
| | | | Diversified Financial Services – 1.4% | | | | | | | | | | | | |
| | | | | |
| | 525 | | | BNP Paribas, 144A | | | 4.375% | | | | 5/12/26 | | | | A | | | | 543,727 | |
| | | | | |
| | 365 | | | Jefferies Group Inc. | | | 4.850% | | | | 1/15/27 | | | | BBB– | | | | 381,288 | |
| | | | | |
| | 995 | | | Rabobank Nederland | | | 3.875% | | | | 2/08/22 | | | | Aa2 | | | | 1,055,470 | |
| | 1,885 | | | Total Diversified Financial Services | | | | | | | | | | | | | | | 1,980,485 | |
| | | | | |
| | | | Diversified Telecommunication Services – 2.4% | | | | | | | | | | | | |
| | | | | |
| | 360 | | | AT&T, Inc. | | | 3.800% | | | | 3/15/22 | | | | A– | | | | 372,572 | |
| | | | | |
| | 365 | | | AT&T, Inc. | | | 4.750% | | | | 5/15/46 | | | | A– | | | | 358,410 | |
| | | | | |
| | 2,020 | | | SBA Tower Trust, 144A | | | 3.598% | | | | 4/15/43 | | | | BBB | | | | 2,020,648 | |
| | | | | |
| | 750 | | | Verizon Communications | | | 4.125% | | | | 8/15/46 | | | | A– | | | | 668,446 | |
| | 3,495 | | | Total Diversified Telecommunication Services | | | | | | | | | | | | | | | 3,420,076 | |
| | | | | |
| | | | Energy Equipment & Services – 0.4% | | | | | | | | | | | | |
| | | | | |
| | 565 | | | Origin Energy Finance Limited, 144A | | | 3.500% | | | | 10/09/18 | | | | BBB– | | | | 571,503 | |
| | | | | |
| | | | Equity Real Estate Investment Trusts – 1.6% | | | | | | | | | | | | |
| | | | | |
| | 635 | | | American Tower Company | | | 5.000% | | | | 2/15/24 | | | | BBB | | | | 701,684 | |
| | | | | |
| | 380 | | | Crown Castle International Corporation | | | 3.700% | | | | 6/15/26 | | | | BBB– | | | | 383,292 | |
| | | | | |
| | 635 | | | Digital Realty Trust Inc. | | | 3.625% | | | | 10/01/22 | | | | BBB | | | | 650,959 | |
| | | | | |
| | 550 | | | WP Carey Inc. | | | 4.600% | | | | 4/01/24 | | | | BBB | | | | 572,808 | |
| | 2,200 | | | Total Equity Real Estate Investment Trusts | | | | | | | | | | | | | | | 2,308,743 | |
| | | | | | | | | | | | | | | | | | | | |
Principal
Amount (000) | | | Description (1) | | Coupon | | | Maturity | | | Ratings (2) | | | Value | |
| | | | | |
| | | | Food & Staples Retailing – 1.6% | | | | | | | | | | | | |
| | | | | |
| $ | 930 | | | CVS Health Corporation | | | 3.875% | | | | 7/20/25 | | | | BBB+ | | | $ | 967,050 | |
| | | | | |
| | 730 | | | Sysco Corporation | | | 3.750% | | | | 10/01/25 | | | | A3 | | | | 756,840 | |
| | | | | |
| | 515 | | | Walgreen Company | | | 3.100% | | | | 9/15/22 | | | | BBB | | | | 525,273 | |
| | 2,175 | | | Total Food & Staples Retailing | | | | | | | | | | | | | | | 2,249,163 | |
| | | | | |
| | | | Food Products – 0.3% | | | | | | | | | | | | |
| | | | | |
| | 500 | | | Bunge Limited Finance Company | | | 3.250% | | | | 8/15/26 | | | | BBB | | | | 477,793 | |
| | | | | |
| | | | Health Care Providers & Services – 1.3% | | | | | | | | | | | | |
| | | | | |
| | 630 | | | Anthem, Inc. | | | 3.125% | | | | 5/15/22 | | | | A | | | | 641,666 | |
| | | | | |
| | 1,215 | | | UnitedHealth Group Incorporated | | | 2.875% | | | | 3/15/22 | | | | A+ | | | | 1,242,104 | |
| | 1,845 | | | Total Health Care Providers & Services | | | | | | | | | | | | | | | 1,883,770 | |
| | | | | |
| | | | Household Durables – 0.4% | | | | | | | | | | | | |
| | | | | |
| | 545 | | | Newell Brands Inc. | | | 4.200% | | | | 4/01/26 | | | | BBB– | | | | 578,729 | |
| | | | | |
| | | | Insurance – 3.8% | | | | | | | | | | | | |
| | | | | |
| | 131 | | | AFLAC Insurance | | | 6.450% | | | | 8/15/40 | | | | A– | | | | 173,671 | |
| | | | | |
| | 620 | | | American International Group, Inc. | | | 3.750% | | | | 7/10/25 | | | | BBB+ | | | | 631,576 | |
| | | | | |
| | 990 | | | Berkshire Hathaway Inc. | | | 3.125% | | | | 3/15/26 | | | | AA | | | | 1,001,236 | |
| | | | | |
| | 750 | | | Lincoln National Corporation | | | 4.000% | | | | 9/01/23 | | | | A– | | | | 790,038 | |
| | | | | |
| | 600 | | | MetLife Inc. | | | 3.000% | | | | 3/01/25 | | | | A– | | | | 601,839 | |
| | | | | |
| | 940 | | | Prudential Financial Inc. | | | 3.500% | | | | 5/15/24 | | | | A | | | | 978,691 | |
| | | | | |
| | 465 | | | Symetra Financial Corporation | | | 4.250% | | | | 7/15/24 | | | | Baa1 | | | | 471,998 | |
| | | | | |
| | 435 | | | Unum Group | | | 4.000% | | | | 3/15/24 | | | | BBB | | | | 449,328 | |
| | | | | |
| | 365 | | | Willis North America, Inc. | | | 3.600% | | | | 5/15/24 | | | | BBB | | | | 368,584 | |
| | 5,296 | | | Total Insurance | | | | | | | | | | | | | | | 5,466,961 | |
| | | | | |
| | | | Internet and Direct Marketing Retail – 0.4% | | | | | | | | | | | | |
| | | | | |
| | 560 | | | Amazon.com Incorporated | | | 3.800% | | | | 12/05/24 | | | | AA– | | | | 597,000 | |
| | | | | |
| | | | Internet Software & Services – 0.5% | | | | | | | | | | | | |
| | | | | |
| | 655 | | | eBay Inc. | | | 3.800% | | | | 3/09/22 | | | | BBB+ | | | | 684,402 | |
| | | | | |
| | | | IT Services – 0.7% | | | | | | | | | | | | |
| | | | | |
| | 955 | | | Visa Inc. | | | 3.150% | | | | 12/14/25 | | | | A+ | | | | 969,673 | |
| | | | | |
| | | | Leisure Products – 0.7% | | | | | | | | | | | | |
| | | | | |
| | 1,025 | | | Hyatt Hotels Corporation | | | 3.375% | | | | 7/15/23 | | | | BBB | | | | 1,042,652 | |
| | | | | |
| | | | Machinery – 1.0% | | | | | | | | | | | | |
| | | | | |
| | 830 | | | Ingersoll-Rand Luxembourg Finance SA | | | 3.550% | | | | 11/01/24 | | | | BBB | | | | 850,111 | |
| | | | | |
| | 640 | | | John Deere Capital Corporation | | | 2.650% | | | | 6/24/24 | | | | A | | | | 635,357 | |
| | 1,470 | | | Total Machinery | | | | | | | | | | | | | | | 1,485,468 | |
| | | | | |
| | | | Media – 3.4% | | | | | | | | | | | | |
| | | | | |
| | 605 | | | 21st Century Fox America Inc. | | | 4.000% | | | | 10/01/23 | | | | BBB+ | | | | 638,877 | |
Nuveen Core Bond Fund (continued)
| | |
| Portfolio of Investments | | June 30, 2017 |
| | | | | | | | | | | | | | | | | | | | |
Principal
Amount (000) | | | Description (1) | | Coupon | | | Maturity | | | Ratings (2) | | | Value | |
| | | | | |
| | | | Media (continued) | | | | | | | | | | | | |
| | | | | |
| $ | 350 | | | 21st Century Fox America Inc. | | | 6.650% | | | | 11/15/37 | | | | BBB+ | | | $ | 462,240 | |
| | | | | |
| | 510 | | | CBS Corporation | | | 4.900% | | | | 8/15/44 | | | | BBB | | | | 536,323 | |
| | | | | |
| | 635 | | | Charter Communications Operating Capital Corporation | | | 4.908% | | | | 7/23/25 | | | | BBB– | | | | 686,062 | |
| | | | | |
| | 305 | | | Cox Communications Inc., 144A, (3) | | | 3.850% | | | | 2/01/25 | | | | BBB+ | | | | 307,325 | |
| | | | | |
| | 435 | | | Cox Communications Inc., 144A | | | 3.350% | | | | 9/15/26 | | | | BBB+ | | | | 427,191 | |
| | | | | |
| | 660 | | | Discovery Communications Inc. | | | 3.800% | | | | 3/13/24 | | | | BBB– | | | | 667,196 | |
| | | | | |
| | 885 | | | NBC Universal Media LLC | | | 6.400% | | | | 4/30/40 | | | | A– | | | | 1,189,072 | |
| | 4,385 | | | Total Media | | | | | | | | | | | | | | | 4,914,286 | |
| | | | | |
| | | | Metals & Mining – 0.4% | | | | | | | | | | | | |
| | | | | |
| | 495 | | | Nucor Corporation | | | 4.000% | | | | 8/01/23 | | | | A– | | | | 523,128 | |
| | | | | |
| | | | Oil, Gas & Consumable Fuels – 1.7% | | | | | | | | | | | | |
| | | | | |
| | 550 | | | EOG Resources Inc. | | | 4.100% | | | | 2/01/21 | | | | BBB+ | | | | 576,832 | |
| | | | | |
| | 340 | | | Occidental Petroleum Corporation | | | 3.400% | | | | 4/15/26 | | | | A | | | | 343,108 | |
| | | | | |
| | 270 | | | Sabine Pass Liquefaction, LLC | | | 5.875% | | | | 6/30/26 | | | | BBB– | | | | 302,183 | |
| | | | | |
| | 590 | | | Spectra Energy Partners LP | | | 4.750% | | | | 3/15/24 | | | | BBB+ | | | | 635,908 | |
| | | | | |
| | 540 | | | Valero Energy Corporation | | | 3.400% | | | | 9/15/26 | | | | BBB | | | | 528,304 | |
| | 2,290 | | | Total Oil, Gas & Consumable Fuels | | | | | | | | | | | | | | | 2,386,335 | |
| | | | | |
| | | | Pharmaceuticals – 1.1% | | | | | | | | | | | | |
| | | | | |
| | 995 | | | Merck & Company Inc. | | | 2.750% | | | | 2/10/25 | | | | AA | | | | 990,973 | |
| | | | | |
| | 550 | | | Teva Pharmaceutical Finance III , (3) | | | 3.150% | | | | 10/01/26 | | | | BBB | | | | 522,378 | |
| | 1,545 | | | Total Pharmaceuticals | | | | | | | | | | | | | | | 1,513,351 | |
| | | | | |
| | | | Road & Rail – 0.7% | | | | | | | | | | | | |
| | | | | |
| | 895 | | | Burlington Northern Santa Fe, LLC | | | 3.400% | | | | 9/01/24 | | | | A | | | | 931,798 | |
| | | | | |
| | | | Semiconductors & Semiconductor Equipment – 1.0% | | | | | | | | | | | | |
| | | | | |
| | 740 | | | Applied Materials Inc. | | | 4.300% | | | | 6/15/21 | | | | A– | | | | 798,710 | |
| | | | | |
| | 630 | | | Intel Corporation | | | 3.150% | | | | 5/11/27 | | | | A+ | | | | 632,222 | |
| | 1,370 | | | Total Semiconductors & Semiconductor Equipment | | | | | | | | | | | | | | | 1,430,932 | |
| | | | | |
| | | | Specialty Retail – 1.1% | | | | | | | | | | | | |
| | | | | |
| | 520 | | | Home Depot, Inc. | | | 2.625% | | | | 6/01/22 | | | | A | | | | 527,802 | |
| | | | | |
| | 455 | | | Lowe’s Companies | | | 3.100% | | | | 5/03/27 | | | | A– | | | | 452,973 | |
| | | | | |
| | 525 | | | Swiss Re Treasury US Corporation, 144A | | | 4.250% | | | | 12/06/42 | | | | AA– | | | | 540,553 | |
| | 1,500 | | | Total Specialty Retail | | | | | | | | | | | | | | | 1,521,328 | |
| | | | | |
| | | | Technology Hardware, Storage & Peripherals – 0.4% | | | | | | | | | | | | |
| | | | | |
| | 555 | | | HP Inc. | | | 4.650% | | | | 12/09/21 | | | | BBB+ | | | | 598,931 | |
| | | | | |
| | | | Tobacco – 0.4% | | | | | | | | | | | | |
| | | | | |
| | 520 | | | Reynolds American Inc. | | | 3.250% | | | | 11/01/22 | | | | BBB+ | | | | 523,075 | |
| | | | | | | | | | | | | | | | | | | | |
Principal
Amount (000) | | | Description (1) | | Coupon | | | Maturity | | | Ratings (2) | | | Value | |
| | | | | |
| | | | Wireless Telecommunication Services – 0.7% | | | | | | | | | | | | |
| | | | | |
| $ | 510 | | | Rogers Communications Inc. | | | 3.625% | | | | 12/15/25 | | | | BBB+ | | | $ | 522,178 | |
| | | | | |
| | 525 | | | Telefonica Emisiones SAU | | | 4.103% | | | | 3/08/27 | | | | BBB | | | | 542,459 | |
| | 1,035 | | | Total Wireless Telecommunication Services | | | | | | | | | | | | | | | 1,064,637 | |
| $ | 63,243 | | | Total Corporate Bonds (cost $63,964,860) | | | | | | | | | | | | | | | 66,156,413 | |
| | | | | |
Principal
Amount (000) | | | Description (1) | | Coupon | | | Maturity | | | Ratings (2) | | | Value | |
| | | | | |
| | | | $1,000 PAR (OR SIMILAR) INSTITUTIONAL PREFERRED – 0.5% | | | | | | | | | | | | | | | | |
| | | | | |
| | | | Banks – 0.5% | | | | | | | | | | | | |
| | | | | |
| $ | 700 | | | Wachovia Capital Trust III | | | 5.570% | | | | N/A (4) | | | | BBB | | | $ | 703,850 | |
| $ | 700 | | | Total $1,000 Par (or similar) Institutional Preferred (cost $620,920) | | | | | | | | | | | | | | | 703,850 | |
| | | | | |
Principal
Amount (000) | | | Description (1) | | Coupon | | | Maturity | | | Ratings (2) | | | Value | |
| | | | | |
| | | | U.S. GOVERNMENT AND AGENCY OBLIGATIONS – 7.0% | | | | | | | | | | | | |
| | | | | |
| $ | 60 | | | Federal Home Loan Mortgage Corporation, Notes , (3) | | | 1.750% | | | | 5/30/19 | | | | Aaa | | | $ | 60,407 | |
| | | | | |
| | 2,055 | | | Freddie Mac Reference Notes | | | 5.000% | | | | 12/14/18 | | | | Aa2 | | | | 2,159,766 | |
| | | | | |
| | 220 | | | United States of America Treasury Bonds | | | 3.625% | | | | 2/15/44 | | | | Aaa | | | | 253,825 | |
| | | | | |
| | 20 | | | United States of America Treasury Bonds | | | 2.500% | | | | 2/15/45 | | | | Aaa | | | | 18,695 | |
| | | | | |
| | 300 | | | United States of America Treasury Bonds | | | 2.250% | | | | 8/15/46 | | | | Aaa | | | | 264,609 | |
| | | | | |
| | 525 | | | United States of America Treasury Bonds | | | 3.000% | | | | 2/15/47 | | | | Aaa | | | | 542,513 | |
| | | | | |
| | 375 | | | United States Treasury Notes | | | 2.000% | | | | 7/31/22 | | | | Aaa | | | | 376,626 | |
| | | | | |
| | 385 | | | United States Treasury Notes | | | 1.375% | | | | 6/30/23 | | | | Aaa | | | | 370,608 | |
| | | | | |
| | 4,235 | | | United States Treasury Notes | | | 2.875% | | | | 11/15/46 | | | | Aaa | | | | 4,265,606 | |
| | | | | |
| | 1,685 | | | United States Treasury Notes | | | 3.000% | | | | 5/15/47 | | | | Aaa | | | | 1,742,000 | |
| $ | 9,860 | | | Total U.S. Government and Agency Obligations (cost $9,663,376) | | | | | | | | | | | | | | | 10,054,655 | |
| | | | | |
Principal
Amount (000) | | | Description (1) | | Coupon | | | Maturity | | | Ratings (2) | | | Value | |
| | | | | |
| | | | ASSET-BACKED AND MORTGAGED-BACKED SECURITIES – 43.0% | | | | | | | | | | | | |
| | | | | |
| $ | 1,000 | | | 321 Henderson Receivables LLC, Series 2010-3A, 144A | | | 3.820% | | | | 12/15/48 | | | | Aaa | | | $ | 1,010,116 | |
| | | | | |
| | 874 | | | American Homes 4 Rent, Series 2014-SFR2, 144A | | | 3.786% | | | | 10/17/36 | | | | Aaa | | | | 912,745 | |
| | | | | |
| | 500 | | | American Homes 4 Rent, Series 2015-SFR2, 144A | | | 5.036% | | | | 10/17/45 | | | | Baa2 | | | | 533,371 | |
| | | | | |
| | 600 | | | AmeriCold LLC Trust, Series 2010, 144A | | | 6.031% | | | | 1/14/29 | | | | AA | | | | 660,449 | |
| | | | | |
| | 260 | | | Bank of America Commercial Mortgage Inc., Commercial Mortgage Pass-Through Certificates, Series 2015-UBS7 | | | 4.366% | | | | 9/15/48 | | | | A– | | | | 261,890 | |
| | | | | |
| | 165 | | | Bank of America Commercial Mortgage Inc., Commercial Mortgage Pass-Through Certificates, Series 2015-UBS7 | | | 3.167% | | | | 9/15/48 | | | | BBB– | | | | 132,169 | |
| | | | | |
| | 600 | | | CarFinance Capital Auto Trust, Automobile Receivables-Backed Notes, Series 2013-1, 144A | | | 4.680% | | | | 11/15/19 | | | | A1 | | | | 602,131 | |
| | | | | |
| | 1,000 | | | Citigroup Commercial Mortgage Trust Series 2012-GC8 | | | 3.024% | | | | 9/10/45 | | | | Aaa | | | | 1,022,777 | |
Nuveen Core Bond Fund (continued)
| | |
| Portfolio of Investments | | June 30, 2017 |
| | | | | | | | | | | | | | | | | | | | |
Principal
Amount (000) | | | Description (1) | | Coupon | | | Maturity | | | Ratings (2) | | | Value | |
| | | | | |
| | | | ASSET-BACKED AND MORTGAGED-BACKED SECURITIES (continued) | | | | | | | | | | | | |
| | | | | |
| $ | 725 | | | Cold Storage Trust, Commercial Mortgage Backed Securities, Series 2017-ICE3, 144A | | | 2.226% | | | | 4/15/36 | | | | AAA | | | $ | 725,898 | |
| | | | | |
| | 1,709 | | | Colony American Homes Trust 2014-1A, 144A | | | 2.376% | | | | 5/17/31 | | | | Aaa | | | | 1,718,724 | |
| | | | | |
| | 625 | | | Commercial Mortgage Pass-Through Certificates, Series 2015-CR26 | | | 4.494% | | | | 10/10/48 | | | | A– | | | | 605,664 | |
| | | | | |
| | 242 | | | Conns Receivables Funding Trust II, Series 2016-B, 144A | | | 3.730% | | | | 10/15/18 | | | | BBB | | | | 242,240 | |
| | | | | |
| | 492 | | | DT Auto Owner Trust, Series 2015-3A, 144A | | | 2.460% | | | | 11/15/19 | | | | AAA | | | | 492,657 | |
| | | | | |
| | 500 | | | Exeter Auto Receivables Trust, Series 2013-2A, 144A | | | 6.810% | | | | 8/17/20 | | | | A– | | | | 512,329 | |
| | | | | |
| | 200 | | | Fannie Mae Grantor Trust, Series 2014-T1 | | | 2.898% | | | | 6/25/27 | | | | N/R | | | | 198,586 | |
| | | | | |
| | 636 | | | Fannie Mae Mortgage Pool FN 725205 | | | 5.000% | | | | 3/01/34 | | | | Aaa | | | | 695,628 | |
| | | | | |
| | 963 | | | Fannie Mae Mortgage Pool FN 960605 | | | 5.000% | | | | 8/01/37 | | | | Aaa | | | | 1,057,370 | |
| | | | | |
| | 1,222 | | | Fannie Mae Mortgage Pool FN AD1593 | | | 4.500% | | | | 2/01/40 | | | | Aaa | | | | 1,319,272 | |
| | | | | |
| | 1,612 | | | Fannie Mae Mortgage Pool FNAE0217 | | | 4.500% | | | | 8/01/40 | | | | Aaa | | | | 1,741,439 | |
| | | | | |
| | 1,203 | | | Fannie Mae Mortgage Pool FN 890310 | | | 4.500% | | | | 12/01/40 | | | | Aaa | | | | 1,301,162 | |
| | | | | |
| | 1,847 | | | Fannie Mae Mortgage Pool FN AB2085 | | | 4.000% | | | | 1/01/41 | | | | Aaa | | | | 1,949,093 | |
| | | | | |
| | 696 | | | Fannie Mae Mortgage Pool FN AH3804 | | | 4.000% | | | | 2/01/41 | | | | Aaa | | | | 734,590 | |
| | | | | |
| | 1,916 | | | Fannie Mae Mortgage Pool FN AH55575 | | | 4.000% | | | | 2/01/41 | | | | Aaa | | | | 2,021,949 | |
| | | | | |
| | 1,490 | | | Fannie Mae Mortgage Pool FN AE0981 | | | 3.500% | | | | 3/01/41 | | | | Aaa | | | | 1,538,526 | |
| | | | | |
| | 1,690 | | | Fannie Mae Mortgage Pool FN AL0215 | | | 4.500% | | | | 4/01/41 | | | | Aaa | | | | 1,827,700 | |
| | | | | |
| | 1,551 | | | Fannie Mae Mortgage Pool FN AH8954 | | | 4.000% | | | | 4/01/41 | | | | Aaa | | | | 1,636,507 | |
| | | | | |
| | 912 | | | Fannie Mae Mortgage Pool FN AL0160 | | | 4.500% | | | | 5/01/41 | | | | Aaa | | | | 986,021 | |
| | | | | |
| | 1,383 | | | Fannie Mae Mortgage Pool FN MA1028 | | | 4.000% | | | | 4/01/42 | | | | Aaa | | | | 1,459,425 | |
| | | | | |
| | 2,656 | | | Fannie Mae Mortgage Pool FN AB9659 | | | 3.000% | | | | 6/01/43 | | | | Aaa | | | | 2,674,281 | |
| | | | | |
| | 1,235 | | | Fannie Mae Mortgage Pool FN AU3353 | | | 3.000% | | | | 8/01/43 | | | | Aaa | | | | 1,239,946 | |
| | | | | |
| | 1,704 | | | Fannie Mae Mortgage Pool FN AY3376 | | | 3.500% | | | | 4/01/45 | | | | Aaa | | | | 1,750,178 | |
| | | | | |
| | 1,488 | | | Fannie Mae Mortgage Pool FN AS6398 | | | 3.500% | | | | 12/01/45 | | | | Aaa | | | | 1,528,588 | |
| | | | | |
| | 528 | | | Fannie Mae Mortgage Pool FN G08687 | | | 3.500% | | | | 1/01/46 | | | | Aaa | | | | 542,371 | |
| | | | | |
| | 1,443 | | | Fannie Mae Mortgage Pool FN AS6652 | | | 3.500% | | | | 2/01/46 | | | | Aaa | | | | 1,482,175 | |
| | | | | |
| | 830 | | | Fannie Mae Mortgage Pool FN BC0830 | | | 3.000% | | | | 4/01/46 | | | | Aaa | | | | 828,871 | |
| | | | | |
| | 2 | | | Fannie Mae Real Estate Mortgage Investment Conduit, Pass Through Certificates | | | 6.500% | | | | 7/25/20 | | | | Aaa | | | | 1,799 | |
| | | | | |
| | 250 | | | Fannie Mae, Connecticut Avenue Securities, Series 2014-C03 | | | 2.432% | | | | 7/25/24 | | | | AA+ | | | | 250,601 | |
| | | | | |
| | 725 | | | Fannie Mae, Connecticut Avenue Securities, Series 2017-C03 | | | 2.182% | | | | 10/25/29 | | | | Baa3 | | | | 728,855 | |
| | | | | |
| | 51 | | | Federal Home Loan Mortgage Corporation, REMIC | | | 5.000% | | | | 2/15/19 | | | | Aaa | | | | 51,677 | |
| | | | | |
| | 2 | | | Federal Home Loan Mortgage Corporation, REMIC | | | 7.500% | | | | 11/15/21 | | | | Aaa | | | | 2,679 | |
| | | | | |
| | 5 | | | Federal Home Loan Mortgage Corporation, REMIC | | | 6.000% | | | | 5/15/22 | | | | Aaa | | | | 5,055 | |
| | | | | |
| | 716 | | | Freddie Mac Gold Pool | | | 5.500% | | | | 3/01/39 | | | | Aaa | | | | 794,165 | |
| | | | | |
| | 880 | | | Freddie Mac Mortgage Trust, Multifamily Mortgage Pass-Through Certificates, Series 2013-K712, 144A | | | 3.365% | | | | 5/25/45 | | | | AA | | | | 900,488 | |
| | | | | |
| | 1,715 | | | Freddie Mac Multifamily Structured Pass- Through Certificates FHMS K053 | | | 2.995% | | | | 12/25/25 | | | | Aaa | | | | 1,748,446 | |
| | | | | |
| | 876 | | | Ginnie Mae Mortgage Pool | | | 3.500% | | | | 1/20/45 | | | | Aaa | | | | 908,505 | |
| | | | | |
| | 600 | | | GLS Auto Receivables Trust 2017-1A, 144A | | | 2.670% | | | | 4/15/21 | | | | A | | | | 599,583 | |
| | | | | | | | | | | | | | | | | | | | |
Principal
Amount (000) | | | Description (1) | | Coupon | | | Maturity | | | Ratings (2) | | | Value | |
| | | | | |
| | | | ASSET-BACKED AND MORTGAGED-BACKED SECURITIES (continued) | | | | | | | | | | | | |
| | | | | |
| $ | 2,431 | | | Government National Mortgage Association Pool | | | 3.500% | | | | 6/15/42 | | | | Aaa | | | $ | 2,524,426 | |
| | | | | |
| | 1,100 | | | Invitation Homes Trust 2015-SFR3, 144A | | | 2.526% | | | | 8/17/32 | | | | Aaa | | | | 1,104,625 | |
| | | | | |
| | 1,086 | | | JP Morgan Mortgage Trust, Series 2016-A5, 144A | | | 3.500% | | | | 5/25/46 | | | | Aaa | | | | 1,105,723 | |
| | | | | |
| | 686 | | | JP Morgan Mortgage Trust, Series 2017-1, 144A | | | 3.500% | | | | 1/25/47 | | | | Aaa | | | | 700,575 | |
| | | | | |
| | 297 | | | Master Resecuritization Trust 2009-1, 144A | | | 6.000% | | | | 10/25/36 | | | | AA | | | | 302,595 | |
| | | | | |
| | 1,100 | | | Mercedes-Benz Auto Lease Trust 2017-A | | | 1.530% | | | | 8/15/19 | | | | AAA | | | | 1,099,570 | |
| | | | | |
| | 775 | | | New Residential Advance Receivable Trust, Series 2017-T1, 144A | | | 3.214% | | | | 2/15/51 | | | | AAA | | | | 779,342 | |
| | | | | |
| | 685 | | | New Residential Mortgage Loan Trust, Mortgage Pass Through Certificates, Series 2017-3A, 144A | | | 4.000% | | | | 4/25/57 | | | | AAA | | | | 710,991 | |
| | | | | |
| | 682 | | | New Residential Mortgage Loan Trust, Series 2017-1A, 144A | | | 4.000% | | | | 2/25/57 | | | | AAA | | | | 708,584 | |
| | | | | |
| | 825 | | | OMART Receivables Trust, Series 2016-T1, 144A | | | 2.521% | | | | 8/17/48 | | | | AAA | | | | 821,213 | |
| | | | | |
| | 785 | | | Springleaf Mortgage Loan Trust 2013-2A, 144A | | | 3.520% | | | | 12/25/65 | | | | AA | | | | 783,900 | |
| | | | | |
| | 313 | | | Structured Agency Credit Risk Debt Notes, 2013-DN2 | | | 2.682% | | | | 11/25/23 | | | | Aa1 | | | | 314,307 | |
| | | | | |
| | 710 | | | Synchrony Credit Card Master Note Trust, Series 2017-1 | | | 1.930% | | | | 6/15/23 | | | | Aaa | | | | 707,614 | |
| | | | | |
| | 745 | | | TCF Auto Receivables Owner Trust, Series 2016-1A, 144A | | | 1.710% | | | | 4/15/21 | | | | AAA | | | | 742,597 | |
| | | | | |
| | 1,884 | | | United States Department of Veterans, Affairs, Guaranteed REMIC Pass-Through Certificates, Vendee Mortgage Trust, Series 2011-1 | | | 3.750% | | | | 2/15/35 | | | | Aaa | | | | 1,952,862 | |
| | | | | |
| | 330 | | | Walter Investment Management Company Capital Trust, Series 2012-AA, 144A | | | 4.549% | | | | 10/16/50 | | | | A | | | | 330,616 | |
| | | | | |
| | 1,534 | | | U.S. Small Business Administration Guaranteed Participating Securities, Participation Certificates, Series 2010-P10B | | | 3.215% | | | | 9/10/20 | | | | Aaa | | | | 1,568,705 | |
| | | | | |
| | 1,207 | | | Atlantic City Electric Transition Funding LLC, Transition Bonds, Series 2002-1 | | | 5.550% | | | | 10/20/23 | | | | AAA | | | | 1,299,855 | |
| $ | 59,494 | | | Total Asset-Backed and Mortgage-Backed Securities (cost $60,285,075) | | | | | | | | | | | | | | | 61,496,791 | |
| | | | Total Long-Term Investments (cost $134,534,231) | | | | | | | | | | | | | | | 138,411,709 | |
| | | | | |
| Shares | | | Description (1) | | Coupon | | | | | | | | | Value | |
| | | | |
| | | | INVESTMENTS PURCHASED WITH COLLATERAL FROM SECURITIES LENDING – 0.6% | | | | | | | | | | | | | |
| | | | | |
| | | | Money Market Funds – 0.6% | | | | | | | | | | | | |
| | | | | |
| | 768,400 | | | First American Government Obligations Fund, Class X, (6) | | | 0.883% (5) | | | | | | | | | | | $ | 768,400 | |
| | | | Total Investments Purchased with Collateral from Securities Lending (cost $768,400) | | | | | | | | | | | | 768,400 | |
| | | | | |
| Shares | | | Description (1) | | Coupon | | | | | | | | | Value | |
| | | | | |
| | | | SHORT-TERM INVESTMENTS – 2.6% | | | | | | | | | | | | | | | | |
| | | | | |
| | | | Money Market Funds – 2.6% | | | | | | | | | | | | |
| | | | | |
| | 3,740,769 | | | First American Treasury Obligations Fund, Class Z | | | 0.847% (5) | | | | | | | | | | | $ | 3,740,769 | |
| | | | Total Short-Term Investments (cost $3,740,769) | | | | | | | | | | | | | | | 3,740,769 | |
| | | | Total Investments (cost $139,043,400) – 100.0% | | | | | | | | | | | | | | | 142,920,878 | |
| | | | Other Assets Less Liabilities – 0.0% (7) | | | | | | | | | | | | | | | 54,449 | |
| | | | Net Assets – 100% | | | | | | | | | | | | | | $ | 142,975,327 | |
Nuveen Core Bond Fund (continued)
| | |
| Portfolio of Investments | | June 30, 2017 |
Investments in Derivatives as of June 30, 2017
Futures Contracts
| | | | | | | | | | | | | | | | | | | | | | | | |
| Description | | Contract
Position | | | Number of
Contracts | | | Contract
Expiration | | | Notional
Amount
at Value* | | | Variation Margin
Receivable/
(Payable) | | | Unrealized
Appreciation
(Depreciation) | |
U.S. Treasury 2-Year Note | | | Short | | | | (53 | ) | | | 9/17 | | | $ | (11,453,797 | ) | | $ | 4,933 | | | $ | 12,476 | |
U.S. Treasury 5-Year Note | | | Short | | | | (164 | ) | | | 9/17 | | | | (19,325,094 | ) | | | 28,187 | | | | 63,349 | |
U.S. Treasury 10-Year Note | | | Short | | | | (19 | ) | | | 9/17 | | | | (2,385,094 | ) | | | 5,344 | | | | 8,925 | |
U.S. Treasury Long Bond | | | Long | | | | 14 | | | | 9/17 | | | | 2,151,625 | | | | (7,875 | ) | | | 19,594 | |
U.S. Treasury Ultra Bond | | | Long | | | | 33 | | | | 9/17 | | | | 5,473,875 | | | | (22,688 | ) | | | 87,326 | |
| | | | | | | | | | | | | | | $ | (25,538,485 | ) | | $ | 7,901 | | | $ | 191,670 | |
| * | The aggregate Notional Amount at Value of long and short positions is $7,625,500 and $(33,163,985), respectively. |
For Fund portfolio compliance purposes, the Fund’s industry classifications refer to any one or more of the industry sub-classifications used by one or more widely recognized market indexes or ratings group indexes, and/or as defined by Fund management. This definition may not apply for purposes of this report, which may combine industry sub-classifications into sectors for reporting ease.
| (1) | All percentages shown in the Portfolio of Investments are based on net assets. |
| (2) | For financial reporting purposes, the ratings disclosed are the highest of Standard & Poor’s Group (“Standard & Poor’s”), Moody’s Investors Service, Inc. (“Moody’s”) or Fitch, Inc. (“Fitch”) rating. This treatment of split-rated securities may differ from that used for other purposes, such as for Fund investment policies. Ratings below BBB by Standard & Poor’s, Baa by Moody’s or BBB by Fitch are considered to be below investment grade. Holdings designated N/R are not rated by any of these national rating agencies. Ratings are not covered by the report of independent registered public accounting firm. |
| (3) | Investment, or a portion of investment, is out on loan for securities lending. The total value of the securities out on loan as of the end of the reporting period was $744,004. |
| (4) | Perpetual security. Maturity date is not applicable. |
| (5) | The rate shown is the annualized seven-day subsidized yield as of the end of the reporting period. |
| (6) | The Fund may loan securities representing up to one third of the fair value of its total assets (which includes collateral for securities on loan) to broker-dealers, banks and other institutions. The Fund maintains collateral equal to at least 100% of the fair value of the securities loaned. The cash collateral received by the Fund is invested in this money market fund. See Notes to Financial Statements, Note 3 – Portfolio Securities and Investments in Derivatives, Securities Lending for more information. |
| (7) | Other assets less liabilities includes the unrealized appreciation (depreciation) of certain over-the-counter (“OTC”) derivatives as presented on the Statement of Assets and Liabilities, when applicable. The unrealized appreciation (depreciation) of OTC-cleared and exchange-traded derivatives is recognized as part of the cash collateral at brokers and/or receivable or payable for variation margin as presented on the Statement of Assets and Liabilities, when applicable. |
| 144A | Investment is exempt from registration under Rule 144A of the Securities Act of 1933, as amended. These investments may only be resold in transactions exempt from registration, which are normally those transactions with qualified institutional buyers. |
See accompanying notes to financial statements.
Nuveen Core Plus Bond Fund
| | |
| Portfolio of Investments | | June 30, 2017 |
| | | | | | | | | | | | | | | | | | | | |
Principal
Amount (000) | | | Description (1) | | Coupon | | | Maturity | | | Ratings (2) | | | Value | |
| | | | | |
| | | | LONG-TERM INVESTMENTS – 99.1% | | | | | | | | | | | | | | | | |
| | | | | |
| | | | CORPORATE BONDS – 52.9% | | | | | | | | | | | | | | | | |
| | | | | |
| | | | Aerospace & Defense – 2.0% | | | | | | | | | | | | |
| | | | | |
| $ | 1,530 | | | Airbus SE, 144A | | | 3.150% | | | | 4/10/27 | | | | A+ | | | $ | 1,543,089 | |
| | | | | |
| | 1,295 | | | BAE Systems Holdings, 144A | | | 3.850% | | | | 12/15/25 | | | | BBB | | | | 1,347,530 | |
| | | | | |
| | 945 | | | L-3 Communications Corporation | | | 3.850% | | | | 12/15/26 | | | | BBB– | | | | 974,257 | |
| | | | | |
| | 1,460 | | | Martin Marietta Materials | | | 4.250% | | | | 7/02/24 | | | | BBB+ | | | | 1,532,302 | |
| | | | | |
| | 1,625 | | | Rockwell Collins Inc. | | | 3.500% | | | | 3/15/27 | | | | BBB | | | | 1,647,984 | |
| | 6,855 | | | Total Aerospace & Defense | | | | | | | | | | | | | | | 7,045,162 | |
| | | | | |
| | | | Air Freight & Logistics – 0.3% | | | | | | | | | | | | |
| | | | | |
| | 1,095 | | | FedEx Corporation | | | 3.250% | | | | 4/01/26 | | | | BBB | | | | 1,104,513 | |
| | | | | |
| | | | Airlines – 0.8% | | | | | | | | | | | | |
| | | | | |
| | 1,272 | | | American Airlines Inc., Pass Through Trust 2016-1A | | | 3.575% | | | | 1/15/28 | | | | AA+ | | | | 1,301,251 | |
| | | | | |
| | 1,448 | | | Northwest Airlines Trust Pass Through Certificates 2007-1 | | | 7.027% | | | | 11/01/19 | | | | A | | | | 1,604,162 | |
| | 2,720 | | | Total Airlines | | | | | | | | | | | | | | | 2,905,413 | |
| | | | | |
| | | | Auto Components – 0.3% | | | | | | | | | | | | |
| | | | | |
| | 920 | | | Lear Corporation | | | 5.375% | | | | 3/15/24 | | | | BBB– | | | | 977,234 | |
| | | | | |
| | | | Automobiles – 0.5% | | | | | | | | | | | | |
| | | | | |
| | 1,810 | | | General Motors Corporation | | | 4.000% | | | | 4/01/25 | | | | BBB | | | | 1,816,911 | |
| | | | | |
| | | | Banks – 10.4% | | | | | | | | | | | | |
| | | | | |
| | 1,480 | | | Bank of America Corporation | | | 5.000% | | | | 5/13/21 | | | | A | | | | 1,614,727 | |
| | | | | |
| | 1,465 | | | Bank of America Corporation | | | 4.000% | | | | 4/01/24 | | | | A | | | | 1,535,247 | |
| | | | | |
| | 2,250 | | | Bank of America Corporation | | | 4.250% | | | | 10/22/26 | | | | A– | | | | 2,317,232 | |
| | | | | |
| | 1,990 | | | Bank of America Corporation | | | 3.248% | | | | 10/21/27 | | | | A | | | | 1,923,224 | |
| | | | | |
| | 2,085 | | | Barclays Bank PLC | | | 3.650% | | | | 3/16/25 | | | | A | | | | 2,074,635 | |
| | | | | |
| | 1,695 | | | Citigroup Inc. | | | 4.500% | | | | 1/14/22 | | | | A | | | | 1,822,459 | |
| | | | | |
| | 1,000 | | | Citigroup Inc. | | | 3.750% | | | | 6/16/24 | | | | A | | | | 1,036,078 | |
| | | | | |
| | 1,775 | | | Citigroup Inc. | | | 3.300% | | | | 4/27/25 | | | | A | | | | 1,775,690 | |
| | | | | |
| | 795 | | | Citigroup Inc. | | | 3.200% | | | | 10/21/26 | | | | A | | | | 773,237 | |
| | | | | |
| | 2,000 | | | Citigroup Inc. | | | 4.300% | | | | 11/20/26 | | | | A– | | | | 2,054,492 | |
| | | | | |
| | 2,100 | | | GE Capital International Funding | | | 4.418% | | | | 11/15/35 | | | | AA– | | | | 2,288,030 | |
| | | | | |
| | 1,390 | | | HSBC Holdings PLC | | | 6.800% | | | | 6/01/38 | | | | A+ | | | | 1,858,782 | |
| | | | | |
| | 1,000 | | | ING Groep N.V | | | 3.950% | | | | 3/29/27 | | | | A+ | | | | 1,039,954 | |
| | | | | |
| | 1,330 | | | JP Morgan Chase & Company | | | 4.500% | | | | 1/24/22 | | | | A+ | | | | 1,440,039 | |
| | | | | |
| | 1,665 | | | JP Morgan Chase & Company | | | 3.200% | | | | 1/25/23 | | | | A+ | | | | 1,697,366 | |
| | | | | |
| | 1,560 | | | JP Morgan Chase & Company | | | 3.900% | | | | 7/15/25 | | | | A+ | | | | 1,627,022 | |
Nuveen Core Plus Bond Fund (continued)
| | |
| Portfolio of Investments | | June 30, 2017 |
| | | | | | | | | | | | | | | | | | | | |
Principal
Amount (000) | | | Description (1) | | Coupon | | | Maturity | | | Ratings (2) | | | Value | |
| | | | | |
| | | | Banks (continued) | | | | | | | | | | | | |
| | | | | |
| $ | 795 | | | JP Morgan Chase & Company | | | 2.950% | | | | 10/01/26 | | | | A+ | | | $ | 767,336 | |
| | | | | |
| | 1,150 | | | JP Morgan Chase & Company | | | 6.400% | | | | 5/15/38 | | | | A+ | | | | 1,542,544 | |
| | | | | |
| | 1,095 | | | Lloyds Banking Group PLC | | | 3.100% | | | | 7/06/21 | | | | A+ | | | | 1,112,158 | |
| | | | | |
| | 1,135 | | | PNC Financial Services Inc. | | | 3.150% | | | | 5/19/27 | | | | A+ | | | | 1,129,460 | |
| | | | | |
| | 1,200 | | | Royal Bank of Scotland Group PLC | | | 6.100% | | | | 6/10/23 | | | | BBB | | | | 1,322,054 | |
| | | | | |
| | 1,400 | | | Santander UK PLC, 144A | | | 5.000% | | | | 11/07/23 | | | | A– | | | | 1,500,825 | |
| | | | | |
| | 1,470 | | | Standard Chartered PLC, 144A | | | 5.700% | | | | 3/26/44 | | | | A– | | | | 1,672,124 | |
| | | | | |
| | 1,330 | | | Wells Fargo & Company | | | 4.600% | | | | 4/01/21 | | | | AA– | | | | 1,433,551 | |
| | 35,155 | | | Total Banks | | | | | | | | | | | | | | | 37,358,266 | |
| | | | | |
| | | | Beverages – 0.3% | | | | | | | | | | | | |
| | | | | |
| | 1,085 | | | Heineken NV, 144A | | | 3.500% | | | | 1/29/28 | | | | BBB+ | | | | 1,101,223 | |
| | | | | |
| | | | Biotechnology – 0.6% | | | | | | | | | | | | |
| | | | | |
| | 1,905 | | | Baxalta, Inc. | | | 4.000% | | | | 6/23/25 | | | | BBB– | | | | 1,987,115 | |
| | | | | |
| | | | Building Products – 0.6% | | | | | | | | | | | | |
| | | | | |
| | 635 | | | LafargeHolcim Finance US LLC, 144A | | | 3.500% | | | | 9/22/26 | | | | BBB | | | | 627,864 | |
| | | | | |
| | 1,385 | | | Owens Corning Incorporated | | | 4.200% | | | | 12/15/22 | | | | BBB | | | | 1,461,113 | |
| | 2,020 | | | Total Building Products | | | | | | | | | | | | | | | 2,088,977 | |
| | | | | |
| | | | Capital Markets – 5.6% | | | | | | | | | | | | | | | | |
| | | | | |
| | 660 | | | Goldman Sachs Group, Inc. | | | 5.250% | | | | 7/27/21 | | | | A | | | | 723,326 | |
| | | | | |
| | 3,000 | | | Goldman Sachs Group, Inc. | | | 5.750% | | | | 1/24/22 | | | | A | | | | 3,377,277 | |
| | | | | |
| | 3,630 | | | Goldman Sachs Group, Inc. | | | 4.000% | | | | 3/03/24 | | | | A | | | | 3,800,254 | |
| | | | | |
| | 2,450 | | | Lazard Group LLC | | | 3.625% | | | | 3/01/27 | | | | A– | | | | 2,420,225 | |
| | | | | |
| | 5,075 | | | Morgan Stanley | | | 5.500% | | | | 7/28/21 | | | | A | | | | 5,626,921 | |
| | | | | |
| | 2,825 | | | Morgan Stanley | | | 3.950% | | | | 4/23/27 | | | | A– | | | | 2,843,060 | |
| | | | | |
| | 1,140 | | | Northern Trust Company | | | 3.950% | | | | 10/30/25 | | | | A+ | | | | 1,207,008 | |
| | 18,780 | | | Total Capital Markets | | | | | | | | | | | | | | | 19,998,071 | |
| | | | | |
| | | | Chemicals – 1.7% | | | | | | | | | | | | |
| | | | | |
| | 2,000 | | | Agrium Inc. | | | 3.375% | | | | 3/15/25 | | | | BBB | | | | 2,000,388 | |
| | | | | |
| | 875 | | | Braskem Finance Limited, 144A | | | 5.750% | | | | 4/15/21 | | | | BBB– | | | | 913,325 | |
| | | | | |
| | 450 | | | Chemours Co | | | 5.375% | | | | 5/15/27 | | | | B+ | | | | 461,813 | |
| | | | | |
| | 1,425 | | | LYB International Finance BV | | | 4.000% | | | | 7/15/23 | | | | Baa1 | | | | 1,509,557 | |
| | | | | |
| | 1,075 | | | PolyOne Corporation | | | 5.250% | | | | 3/15/23 | | | | BB– | | | | 1,128,750 | |
| | 5,825 | | | Total Chemicals | | | | | | | | | | | | | | | 6,013,833 | |
| | | | | |
| | | | Commercial Services & Supplies – 0.3% | | | | | | | | | | | | |
| | | | | |
| | 1,045 | | | AerCap Ireland Capital Limited / AerCap Global Aviation Trust | | | 3.950% | | | | 2/01/22 | | | | BBB– | | | | 1,087,920 | |
| | | | | |
| | | | Communications Equipment – 0.3% | | | | | | | | | | | | |
| | | | | |
| | 1,080 | | | Qualcomm, Inc. | | | 2.100% | | | | 5/20/20 | | | | A1 | | | | 1,084,895 | |
| | | | | | | | | | | | | | | | | | | | |
Principal
Amount (000) | | | Description (1) | | Coupon | | | Maturity | | | Ratings (2) | | | Value | |
| | | | | |
| | | | Consumer Finance – 1.4% | | | | | | | | | | | | |
| | | | | |
| $ | 1,148 | | | Capital One Bank | | | 3.375% | | | | 2/15/23 | | | | Baa1 | | | $ | 1,157,654 | |
| | | | | |
| | 1,790 | | | Discover Financial Services | | | 5.200% | | | | 4/27/22 | | | | BBB+ | | | | 1,948,295 | |
| | | | | |
| | 2,000 | | | Ford Motor Credit Company | | | 3.810% | | | | 1/09/24 | | | | BBB | | | | 2,024,560 | |
| | 4,938 | | | Total Consumer Finance | | | | | | | | | | | | | | | 5,130,509 | |
| | | | | |
| | | | Diversified Financial Services – 1.2% | | | | | | | | | | | | |
| | | | | |
| | 1,720 | | | BNP Paribas, 144A | | | 4.375% | | | | 5/12/26 | | | | A | | | | 1,781,352 | |
| | | | | |
| | 935 | | | Jefferies Group Inc. | | | 4.850% | | | | 1/15/27 | | | | BBB– | | | | 976,725 | |
| | | | | |
| | 1,475 | | | Rabobank Nederland | | | 3.950% | | | | 11/09/22 | | | | A | | | | 1,540,322 | |
| | 4,130 | | | Total Diversified Financial Services | | | | | | | | | | | | | | | 4,298,399 | |
| | | | | |
| | | | Diversified Telecommunication Services – 2.6% | | | | | | | | | | | | |
| | | | | |
| | 2,270 | | | AT&T, Inc. | | | 3.800% | | | | 3/15/22 | | | | A– | | | | 2,349,273 | |
| | | | | |
| | 965 | | | AT&T, Inc. | | | 4.750% | | | | 5/15/46 | | | | A– | | | | 947,578 | |
| | | | | |
| | 2,190 | | | Qwest Corporation | | | 6.750% | | | | 12/01/21 | | | | BBB– | | | | 2,419,199 | |
| | | | | |
| | 2,610 | | | SBA Tower Trust, 144A | | | 3.598% | | | | 4/15/43 | | | | BBB | | | | 2,610,837 | |
| | | | | |
| | 1,260 | | | Verizon Communications | | | 4.125% | | | | 8/15/46 | | | | A– | | | | 1,122,989 | |
| | 9,295 | | | Total Diversified Telecommunication Services | | | | | | | | | | | | | | | 9,449,876 | |
| | | | | |
| | | | Electric Utilities – 0.2% | | | | | | | | | | | | |
| | | | | |
| | 540 | | | ACWA Power Management And Investment One Ltd, 144A | | | 5.950% | | | | 12/15/39 | | | | BBB– | | | | 550,867 | |
| | | | | |
| | | | Electrical Equipment – 0.2% | | | | | | | | | | | | |
| | | | | |
| | 700 | | | Park Aerospace Holdings Limited, 144A | | | 5.500% | | | | 2/15/24 | | | | BB | | | | 731,150 | |
| | | | | |
| | | | Energy Equipment & Services – 0.7% | | | | | | | | | | | | |
| | | | | |
| | 1,070 | | | Nabors Industries Inc., 144A, (3) | | | 5.500% | | | | 1/15/23 | | | | BBB– | | | | 1,013,825 | |
| | | | | |
| | 1,600 | | | Origin Energy Finance Limited, 144A | | | 3.500% | | | | 10/09/18 | | | | BBB– | | | | 1,618,416 | |
| | 2,670 | | | Total Energy Equipment & Services | | | | | | | | | | | | | | | 2,632,241 | |
| | | | | |
| | | | Equity Real Estate Investment Trusts – 1.5% | | | | | | | | | | | | |
| | | | | |
| | 1,410 | | | American Tower Company | | | 5.000% | | | | 2/15/24 | | | | BBB | | | | 1,558,070 | |
| | | | | |
| | 785 | | | Crown Castle International Corporation | | | 3.700% | | | | 6/15/26 | | | | BBB– | | | | 791,800 | |
| | | | | |
| | 1,815 | | | Piedmont Operating Partnership LP | | | 4.450% | | | | 3/15/24 | | | | BBB | | | | 1,858,738 | |
| | | | | |
| | 1,200 | | | Plum Creek Timberlands LP | | | 4.700% | | | | 3/15/21 | | | | BBB | | | | 1,277,347 | |
| | 5,210 | | | Total Equity Real Estate Investment Trusts | | | | | | | | | | | | | | | 5,485,955 | |
| | | | | |
| | | | Food & Staples Retailing – 0.5% | | | | | | | | | | | | |
| | | | | |
| | 525 | | | Pomegranate Merger Sub, Inc., (3) | | | 9.750% | | | | 5/01/23 | | | | B– | | | | 440,344 | |
| | | | | |
| | 1,225 | | | Sysco Corporation | | | 3.300% | | | | 7/15/26 | | | | A3 | | | | 1,215,403 | |
| | 1,750 | | | Total Food & Staples Retailing | | | | | | | | | | | | | | | 1,655,747 | |
| | | | | |
| | | | Food Products – 0.9% | | | | | | | | | | | | |
| | | | | |
| | 1,200 | | | Bunge Limited Finance Company | | | 3.250% | | | | 8/15/26 | | | | BBB | | | | 1,146,703 | |
| | | | | |
| | 1,045 | | | Kraft Heinz Foods Company | | | 4.375% | | | | 6/01/46 | | | | BBB– | | | | 1,018,442 | |
Nuveen Core Plus Bond Fund (continued)
| | |
| Portfolio of Investments | | June 30, 2017 |
| | | | | | | | | | | | | | | | | | | | |
Principal
Amount (000) | | | Description (1) | | Coupon | | | Maturity | | | Ratings (2) | | | Value | |
| | | | | |
| | | | Food Products (continued) | | | | | | | | | | | | |
| | | | | |
| $ | 1,045 | | | Smithfield Foods Inc., 144A | | | 4.250% | | | | 2/01/27 | | | | BBB | | | $ | 1,071,706 | |
| | 3,290 | | | Total Food Products | | | | | | | | | | | | | | | 3,236,851 | |
| | | | | |
| | | | Health Care Equipment & Supplies – 0.1% | | | | | | | | | | | | |
| | | | | |
| | 360 | | | THC Escrow Corp III, 144A | | | 5.125% | | | | 5/01/25 | | | | Ba3 | | | | 361,350 | |
| | | | | |
| | | | Health Care Providers & Services – 0.6% | | | | | | | | | | | | |
| | | | | |
| | 430 | | | HCA Inc. | | | 5.500% | | | | 6/15/47 | | | | BBB– | | | | 445,050 | |
| | | | | |
| | 540 | | | Lifepoint Health Inc. | | | 5.375% | | | | 5/01/24 | | | | Ba2 | | | | 558,900 | |
| | | | | |
| | 1,150 | | | UnitedHealth Group Incorporated | | | 4.750% | | | | 7/15/45 | | | | A+ | | | | 1,322,863 | |
| | 2,120 | | | Total Health Care Providers & Services | | | | | | | | | | | | | | | 2,326,813 | |
| | | | | |
| | | | Health Care Technology – 0.1% | | | | | | | | | | | | |
| | | | | |
| | 535 | | | Exela Intermediate LLC / Exela Financial Inc., 144A, (WI/DD) | | | 10.000% | | | | 7/15/23 | | | | B | | | | 528,313 | |
| | | | | |
| | | | Household Durables – 0.6% | | | | | | | | | | | | |
| | | | | |
| | 875 | | | Harman International Industries, Inc. | | | 4.150% | | | | 5/15/25 | | | | BBB+ | | | | 909,648 | |
| | | | | |
| | 10 | | | Lennar Corporation | | | 4.750% | | | | 4/01/21 | | | | Ba1 | | | | 10,600 | |
| | | | | |
| | 1,230 | | | Newell Brands Inc. | | | 4.200% | | | | 4/01/26 | | | | BBB– | | | | 1,306,122 | |
| | 2,115 | | | Total Household Durables | | | | | | | | | | | | | | | 2,226,370 | |
| | | | | |
| | | | Industrial Conglomerates – 0.4% | | | | | | | | | | | | |
| | | | | |
| | 1,550 | | | Siemens Financieringsmaatschappij NV, 144A | | | 3.400% | | | | 3/16/27 | | | | A+ | | | | 1,584,188 | |
| | | | | |
| | | | Insurance – 2.1% | | | | | | | | | | | | |
| | | | | |
| | 385 | | | AFLAC Insurance | | | 6.450% | | | | 8/15/40 | | | | A– | | | | 510,408 | |
| | | | | |
| | 555 | | | Genworth Holdings Inc. | | | 4.800% | | | | 2/15/24 | | | | Ba3 | | | | 457,875 | |
| | | | | |
| | 2,030 | | | Lincoln National Corporation | | | 4.000% | | | | 9/01/23 | | | | A– | | | | 2,138,370 | |
| | | | | |
| | 1,000 | | | Symetra Financial Corporation | | | 4.250% | | | | 7/15/24 | | | | Baa1 | | | | 1,015,050 | |
| | | | | |
| | 1,020 | | | Unum Group | | | 4.000% | | | | 3/15/24 | | | | BBB | | | | 1,053,598 | |
| | | | | |
| | 850 | | | Willis North America, Inc. | | | 3.600% | | | | 5/15/24 | | | | BBB | | | | 858,346 | |
| | | | | |
| | 1,440 | | | XLIT Limited | | | 4.450% | | | | 3/31/25 | | | | BBB | | | | 1,484,654 | |
| | 7,280 | | | Total Insurance | | | | | | | | | | | | | | | 7,518,301 | |
| | | | | |
| | | | Internet Software & Services – 0.5% | | | | | | | | | | | | |
| | | | | |
| | 1,370 | | | eBay Inc. | | | 3.800% | | | | 3/09/22 | | | | BBB+ | | | | 1,431,498 | |
| | | | | |
| | 500 | | | j2 Cloud LLC/Global Inc., 144A | | | 6.000% | | | | 7/15/25 | | | | BB | | | | 515,000 | |
| | 1,870 | | | Total Internet Software & Services | | | | | | | | | | | | | | | 1,946,498 | |
| | | | | |
| | | | Leisure Products – 0.6% | | | | | | | | | | | | |
| | | | | |
| | 1,950 | | | Hyatt Hotels Corporation | | | 3.375% | | | | 7/15/23 | | | | BBB | | | | 1,983,581 | |
| | | | | |
| | | | Machinery – 0.8% | | | | | | | | | | | | |
| | | | | |
| | 1,120 | | | Cummins Engine Inc. | | | 4.875% | | | | 10/01/43 | | | | A+ | | | | 1,266,752 | |
| | | | | |
| | 1,590 | | | John Deere Capital Corporation | | | 2.650% | | | | 6/24/24 | | | | A | | | | 1,578,466 | |
| | 2,710 | | | Total Machinery | | | | | | | | | | | | | | | 2,845,218 | |
| | | | | | | | | | | | | | | | | | | | |
Principal
Amount (000) | | | Description (1) | | Coupon | | | Maturity | | | Ratings (2) | | | Value | |
| | | | | |
| | | | Media – 3.8% | | | | | | | | | | | | |
| | | | | |
| $ | 2,155 | | | 21st Century Fox America Inc. | | | 6.650% | | | | 11/15/37 | | | | BBB+ | | | $ | 2,846,080 | |
| | | | | |
| | 1,065 | | | CBS Corporation | | | 4.000% | | | | 1/15/26 | | | | BBB | | | | 1,102,135 | |
| | | | | |
| | 1,060 | | | Charter Communications Operating Capital Corporation | | | 4.908% | | | | 7/23/25 | | | | BBB– | | | | 1,145,237 | |
| | | | | |
| | 560 | | | Cox Communications Inc., 144A | | | 3.850% | | | | 2/01/25 | | | | BBB+ | | | | 564,269 | |
| | | | | |
| | 1,000 | | | Cox Communications Inc., 144A | | | 3.350% | | | | 9/15/26 | | | | BBB+ | | | | 982,048 | |
| | | | | |
| | 1,165 | | | Discovery Communications Inc. | | | 3.800% | | | | 3/13/24 | | | | BBB– | | | | 1,177,702 | |
| | | | | |
| | 1,895 | | | NBC Universal Media LLC | | | 6.400% | | | | 4/30/40 | | | | A– | | | | 2,546,092 | |
| | | | | |
| | 1,635 | | | SES SA, 144A | | | 3.600% | | | | 4/04/23 | | | | BBB | | | | 1,662,141 | |
| | | | | |
| | 1,290 | | | Time Warner Inc. | | | 3.875% | | | | 1/15/26 | | | | BBB+ | | | | 1,311,978 | |
| | | | | |
| | 375 | | | Unitymedia KabelBW GmbH, 144A | | | 6.125% | | | | 1/15/25 | | | | B | | | | 402,188 | |
| | 12,200 | | | Total Media | | | | | | | | | | | | | | | 13,739,870 | |
| | | | | |
| | | | Metals & Mining – 0.2% | | | | | | | | | | | | |
| | | | | |
| | 550 | | | Xstrata Finance Canada Limited, 144A | | | 6.900% | | | | 11/15/37 | | | | BBB | | | | 662,621 | |
| | | | | |
| | | | Oil, Gas & Consumable Fuels – 4.4% | | | | | | | | | | | | |
| | | | | |
| | 1,685 | | | Berkshire Hathaway Energy Company | | | 6.125% | | | | 4/01/36 | | | | A– | | | | 2,167,048 | |
| | | | | |
| | 460 | | | Calumet Specialty Products | | | 6.500% | | | | 4/15/21 | | | | CCC+ | | | | 397,900 | |
| | | | | |
| | 370 | | | Canadian Natural Resources Limited | | | 5.850% | | | | 2/01/35 | | | | BBB+ | | | | 410,765 | |
| | | | | |
| | 455 | | | Cheniere Corpus Christi Holdings, LLC, 144A | | | 5.125% | | | | 6/30/27 | | | | BB– | | | | 466,375 | |
| | | | | |
| | 700 | | | Hess Corporation | | | 3.500% | | | | 7/15/24 | | | | BBB– | | | | 681,118 | |
| | | | | |
| | 955 | | | Kinder Morgan Energy Partners, LP | | | 4.250% | | | | 9/01/24 | | | | BBB– | | | | 986,815 | |
| | | | | |
| | 1,335 | | | MPLX LP | | | 4.875% | | | | 6/01/25 | | | | BBB– | | | | 1,415,751 | |
| | | | | |
| | 885 | | | Occidental Petroleum Corporation | | | 3.400% | | | | 4/15/26 | | | | A | | | | 893,090 | |
| | | | | |
| | 630 | | | Petro Canada | | | 6.800% | | | | 5/15/38 | | | | A– | | | | 821,939 | |
| | | | | |
| | 750 | | | Petroleos del Peru SA, 144A | | | 4.750% | | | | 6/19/32 | | | | BBB+ | | | | 744,375 | |
| | | | | |
| | 1,050 | | | Petroleos Mexicanos, 144A | | | 5.375% | | | | 3/13/22 | | | | BBB+ | | | | 1,105,387 | |
| | | | | |
| | 1,150 | | | Reliance Holdings USA Inc., 144A | | | 5.400% | | | | 2/14/22 | | | | BBB+ | | | | 1,259,550 | |
| | | | | |
| | 645 | | | Sabine Pass Liquefaction | | | 5.875% | | | | 6/30/26 | | | | BBB– | | | | 721,882 | |
| | | | | |
| | 880 | | | Southwestern Energy Company, (3) | | | 4.100% | | | | 3/15/22 | | | | BB | | | | 820,050 | |
| | | | | |
| | 495 | | | Targa Resources Inc. | | | 4.250% | | | | 11/15/23 | | | | BB– | | | | 483,244 | |
| | | | | |
| | 1,185 | | | Valero Energy Corporation | | | 3.400% | | | | 9/15/26 | | | | BBB | | | | 1,159,334 | |
| | | | | |
| | 1,380 | | | Woodside Finance Limited, 144A | | | 3.650% | | | | 3/05/25 | | | | BBB+ | | | | 1,375,111 | |
| | 15,010 | | | Total Oil, Gas & Consumable Fuels | | | | | | | | | | | | | | | 15,909,734 | |
| | | | | |
| | | | Paper & Forest Products – 0.8% | | | | | | | | | | | | |
| | | | | |
| | 1,785 | | | Domtar Corporation | | | 6.750% | | | | 2/15/44 | | | | BBB– | | | | 1,931,623 | |
| | | | | |
| | 990 | | | Resolute Forest Products, (3) | | | 5.875% | | | | 5/15/23 | | | | B+ | | | | 964,013 | |
| | 2,775 | | | Total Paper & Forest Products | | | | | | | | | | | | | | | 2,895,636 | |
| | | | | |
| | | | Personal Products – 0.3% | | | | | | | | | | | | |
| | | | | |
| | 840 | | | International Paper Company | | | 8.700% | | | | 6/15/38 | | | | BBB | | | | 1,235,892 | |
Nuveen Core Plus Bond Fund (continued)
| | |
| Portfolio of Investments | | June 30, 2017 |
| | | | | | | | | | | | | | | | | | | | |
Principal
Amount (000) | | | Description (1) | | Coupon | | | Maturity | | | Ratings (2) | | | Value | |
| | | | | |
| | | | Pharmaceuticals – 0.6% | | | | | | | | | | | | |
| | | | | |
| $ | 1,000 | | | Endo Finance LLC / Endo Finco Inc., 144A, (3) | | | 6.000% | | | | 2/01/25 | | | | B– | | | $ | 815,000 | |
| | | | | |
| | 1,215 | | | Teva Pharmaceutical Finance III, (3) | | | 3.150% | | | | 10/01/26 | | | | BBB | | | | 1,153,980 | |
| | 2,215 | | | Total Pharmaceuticals | | | | | | | | | | | | | | | 1,968,980 | |
| | | | | |
| | | | Real Estate Management & Development – 0.1% | | | | | | | | | | | | |
| | | | | |
| | 310 | | | Mattamy Group Corporation, 144A | | | 6.875% | | | | 12/15/23 | | | | BB | | | | 316,588 | |
| | | | | |
| | | | Road & Rail – 0.2% | | | | | | | | | | | | |
| | | | | |
| | 450 | | | Avis Budget Car Rental, 144A, (3) | | | 6.375% | | | | 4/01/24 | | | | BB– | | | | 448,875 | |
| | | | | |
| | 355 | | | The Hertz Corporation, 144A, (3) | | | 7.625% | | | | 6/01/22 | | | | BB– | | | | 354,148 | |
| | 805 | | | Total Road & Rail | | | | | | | | | | | | | | | 803,023 | |
| | | |
| | | | Semiconductors & Semiconductor Equipment – 0.4% | | | | | | | |
| | | | | |
| | 1,255 | | | Intel Corporation | | | 3.150% | | | | 5/11/27 | | | | A+ | | | | 1,259,426 | |
| | | | | |
| | | | Software – 0.3% | | | | | | | | | | | | |
| | | | | |
| | 1,165 | | | Microsoft Corporation | | | 3.300% | | | | 2/06/27 | | | | AAA | | | | 1,197,857 | |
| | | | | |
| | | | Specialty Retail – 0.9% | | | | | | | | | | | | |
| | | | | |
| | 1,005 | | | AutoNation Inc. | | | 4.500% | | | | 10/01/25 | | | | BBB– | | | | 1,048,728 | |
| | | | | |
| | 1,380 | | | Bed Bath and Beyond Incorporated | | | 5.165% | | | | 8/01/44 | | | | BBB+ | | | | 1,216,142 | |
| | | | | |
| | 1,145 | | | Lowes Companies, Inc. | | | 3.100% | | | | 5/03/27 | | | | A– | | | | 1,139,899 | |
| | 3,530 | | | Total Specialty Retail | | | | | | | | | | | | | | | 3,404,769 | |
| | | |
| | | | Technology Hardware, Storage & Peripherals – 0.8% | | | | | | | |
| | | | | |
| | 1,930 | | | Hewlett Packard Enterprise Co | | | 4.900% | | | | 10/15/25 | | | | BBB+ | | | | 2,023,586 | |
| | | | | |
| | 710 | | | Western Digital Corporation, 144A | | | 7.375% | | | | 4/01/23 | | | | BBB– | | | | 780,112 | |
| | 2,640 | | | Total Technology Hardware, Storage & Peripherals | | | | | | | | | | | | | | | 2,803,698 | |
| | | | | |
| | | | Trading Companies & Distributors – 0.4% | | | | | | | | | | | | |
| | | | | |
| | 1,425 | | | Air Lease Corporation | | | 3.875% | | | | 4/01/21 | | | | BBB | | | | 1,486,325 | |
| | | | | |
| | | | Wireless Telecommunication Services – 1.0% | | | | | | | | | | | | |
| | | | | |
| | 840 | | | Millicom International Cellular SA, 144A | | | 6.625% | | | | 10/15/21 | | | | BB+ | | | | 873,600 | |
| | | | | |
| | 1,410 | | | Sprint Spectrum Co LLC / Sprint Spectrum Co II LLC / Sprint Spectrum Co III LLC, 144A | | | 3.360% | | | | 9/20/21 | | | | Baa2 | | | | 1,422,338 | |
| | | | | |
| | 1,275 | | | Telefonica Emisiones SAU | | | 4.103% | | | | 3/08/27 | | | | BBB | | | | 1,317,400 | |
| | 3,525 | | | Total Wireless Telecommunication Services | | | | | | | | | | | | | | | 3,613,338 | |
| $ | 181,553 | | | Total Corporate Bonds (cost $183,014,089) | | | | | | | | | | | | | | | 190,359,517 | |
| | | | | |
Principal
Amount (000) | | | Description (1) | | Coupon | | | Maturity | | | Ratings (2) | | | Value | |
| | | |
| | | | $1,000 PAR (OR SIMILAR) INSTITUTIONAL PREFERRED – 5.8% | | | | | | | | | |
| | | | | |
| | | | Banks – 2.5% | | | | | | | | | | | | |
| | | | | |
| $ | 835 | | | Bank of America Corporation | | | 6.300% | | | | N/A (4) | | | | BB+ | | | $ | 936,244 | |
| | | | | |
| | 990 | | | Citigroup Inc. | | | 6.250% | | | | N/A (4) | | | | BB+ | | | | 1,098,281 | |
| | | | | |
| | 1,851 | | | General Electric Capital Corporation | | | 5.000% | | | | N/A (4) | | | | A | | | | 1,964,651 | |
| | | | | | | | | | | | | | | | | | | | |
Principal
Amount (000) | | | Description (1) | | Coupon | | | Maturity | | | Ratings (2) | | | Value | |
| | | | | |
| | | | Banks (continued) | | | | | | | | | | | | |
| | | | | |
| $ | 2,250 | | | JP Morgan Chase & Company | | | 6.750% | | | | N/A (4) | | | | BBB– | | | $ | 2,556,563 | |
| | | | | |
| | 1,100 | | | KeyCorp | | | 5.000% | | | | N/A (4) | | | | Baa3 | | | | 1,120,625 | |
| | | | | |
| | 1,085 | | | SunTrust Bank Inc. | | | 5.050% | | | | N/A (4) | | | | Baa3 | | | | 1,101,275 | |
| | 8,111 | | | Total Banks | | | | | | | | | | | | | | | 8,777,639 | |
| | | | | |
| | | | Capital Markets – 0.6% | | | | | | | | | | | | |
| | | | | |
| | 755 | | | Bank of New York Mellon | | | 4.950% | | | | N/A (4) | | | | Baa1 | | | | 787,465 | |
| | | | | |
| | 780 | | | Goldman Sachs Group Inc., (3) | | | 5.300% | | | | N/A (4) | | | | Ba1 | | | | 819,000 | |
| | | | | |
| | 625 | | | State Street Corporation | | | 5.250% | | | | N/A (4) | | | | Baa1 | | | | 659,375 | |
| | 2,160 | | | Total Capital Markets | | | | | | | | | | | | | | | 2,265,840 | |
| | | | | |
| | | | Commercial Services & Supplies – 0.2% | | | | | | | | | | | | |
| | | | | |
| | 770 | | | AerCap Global Aviation Trust, (3) | | | 6.500% | | | | 6/15/45 | | | | BB | | | | 818,125 | |
| | | | | |
| | | | Consumer Finance – 0.6% | | | | | | | | | | | | |
| | | | | |
| | 985 | | | American Express Company | | | 5.200% | | | | N/A (4) | | | | Baa2 | | | | 1,020,706 | |
| | | | | |
| | 1,165 | | | Capital One Financial Corporation | | | 5.550% | | | | N/A (4) | | | | Baa3 | | | | 1,223,250 | |
| | 2,150 | | | Total Consumer Finance | | | | | | | | | | | | | | | 2,243,956 | |
| | | | | |
| | | | Food Products – 0.4% | | | | | | | | | | | | |
| | | | | |
| | 1,300 | | | Land O’ Lakes Incorporated, 144A | | | 8.000% | | | | N/A (4) | | | | BB | | | | 1,426,750 | |
| | | | | |
| | | | Insurance – 1.5% | | | | | | | | | | | | |
| | | | | |
| | 1,000 | | | Allstate Corporation | | | 5.750% | | | | 8/15/53 | | | | Baa1 | | | | 1,095,000 | |
| | | | | |
| | 1,245 | | | MetLife Inc. | | | 5.250% | | | | N/A (4) | | | | BBB | | | | 1,292,584 | |
| | | | | |
| | 1,395 | | | Principal Financial Group | | | 4.700% | | | | 5/15/55 | | | | Baa2 | | | | 1,440,338 | |
| | | | | |
| | 1,500 | | | Prudential Financial Inc. | | | 5.200% | | | | 3/15/44 | | | | BBB+ | | | | 1,590,000 | |
| | 5,140 | | | Total Insurance | | | | | | | | | | | | | | | 5,417,922 | |
| $ | 19,631 | | | Total $1,000 Par (or similar) Institutional Preferred (cost $19,551,921) | | | | | | | | | | | | | | | 20,950,232 | |
| | | | | |
Principal
Amount (000) | | | Description (1) | | Coupon | | | Maturity | | | Ratings (2) | | | Value | |
| | | | | |
| | | | CONTINGENT CAPITAL SECURITIES – 1.5% (5) | | | | | | | | | | | | |
| | | | | |
| | | | Banks – 1.2% | | | | | | | | | | | | |
| | | | | |
| $ | 770 | | | Australia and New Zealand Banking Group Limited of the United Kingdom, 144A, (3) | | | 6.750% | | | | N/A (4) | | | | Baa2 | | | $ | 851,347 | |
| | | | | |
| | 1,160 | | | HSBC Holdings PLC | | | 6.875% | | | | N/A (4) | | | | BBB | | | | 1,252,800 | |
| | | | | |
| | 1,525 | | | Nordea Bank AB, 144A | | | 6.125% | | | | N/A (4) | | | | BBB | | | | 1,593,625 | |
| | | | | |
| | 590 | | | Standard Chartered PLC, 144A | | | 7.500% | | | | N/A (4) | | | | Ba1 | | | | 631,300 | |
| | 4,045 | | | Total Banks | | | | | | | | | | | | | | | 4,329,072 | |
| | | | | |
| | | | Capital Markets – 0.3% | | | | | | | | | | | | |
| | | | | |
| | 1,000 | | | UBS Group AG, Reg S | | | 7.125% | | | | N/A (4) | | | | BB+ | | | | 1,058,750 | |
| $ | 5,045 | | | Total Contingent Capital Securities (cost $5,088,492) | | | | | | | | | | | | | | | 5,387,822 | |
Nuveen Core Plus Bond Fund (continued)
| | |
| Portfolio of Investments | | June 30, 2017 |
| | | | | | | | | | | | | | | | | | | | |
Principal
Amount (000) | | | Description (1) | | | | | Optional Call Provisions (6) | | | Ratings (2) | | | Value | |
| | | | | |
| | | | MUNICIPAL BONDS – 0.3% | | | | | | | | | | | | |
| | | | | |
| | | | Georgia – 0.3% | | | | | | | | | | | | |
| | | | | |
| $ | 750 | | | Georgia Municipal Electric Authority, Plant Vogtle Units 3 & 4 Project P Bonds, Refunding Taxable Build America Bonds Series 2010A, 7.055%, 4/01/57 | | | | | | | No Opt. Call | | | | A– | | | $ | 865,342 | |
| $ | 750 | | | Total Municipal Bonds (cost $816,228) | | | | | | | | | | | | | | | 865,342 | |
| | | | | |
Principal
Amount (000) | | | Description (1) | | Coupon | | | Maturity | | | Ratings (2) | | | Value | |
| | | |
| | | | ASSET-BACKED AND MORTGAGED-BACKED SECURITIES – 35.9% | | | | | | | |
| | | | | |
| $ | 2,294 | | | 321 Henderson Receivables LLC, Series 2010-3A | | | 3.820% | | | | 12/15/48 | | | | Aaa | | | $ | 2,317,456 | |
| | | | | |
| | 2,420 | | | Ally Auto Receivables Trust, Series 2017-3 | | | 2.010% | | | | 3/15/22 | | | | AAA | | | | 2,421,586 | |
| | | | | |
| | 2,590 | | | American Express Credit Card Master Trust, Series 2017-1 | | | 1.930% | | | | 9/15/22 | | | | Aaa | | | | 2,595,690 | |
| | | | | |
| | 1,556 | | | American Homes 4 Rent, Series 2014-SFR2 | | | 3.786% | | | | 10/17/36 | | | | Aaa | | | | 1,625,983 | |
| | | | | |
| | 3,165 | | | AmeriCold LLC Trust, Series 2010 | | | 6.811% | | | | 1/14/29 | | | | A+ | | | | 3,540,829 | |
| | | | | |
| | 2,165 | | | Bank 2017, Mortgage Series BNK4 | | | 3.625% | | | | 5/15/50 | | | | Aaa | | | | 2,245,838 | |
| | | | | |
| | 540 | | | Bank of America Commercial Mortgage Inc., Commercial Mortgage Pass-Through Certificates, Series 2015-UBS7 | | | 4.366% | | | | 9/15/48 | | | | A– | | | | 543,926 | |
| | | | | |
| | 345 | | | Bank of America Commercial Mortgage Inc., Commercial Mortgage Pass-Through Certificates, Series 2015-UBS7 | | | 3.167% | | | | 9/15/48 | | | | BBB– | | | | 276,352 | |
| | | | | |
| | 2,500 | | | Bank of America Credit Card Trust, Series 2017-A1 | | | 1.950% | | | | 8/15/22 | | | | Aaa | | | | 2,508,262 | |
| | | | | |
| | 153 | | | Bank of America Funding Trust, Mortgage Pass-Through Certificates, Series 2007-4 | | | 5.500% | | | | 6/25/37 | | | | C | | | | 25,398 | |
| | | | | |
| | 1,100 | | | Barclays Commercial Mortgage, Mortgage Pass-Through Certificates, Series 2015-STP | | | 4.284% | | | | 9/10/28 | | | | BBB– | | | | 1,112,047 | |
| | | | | |
| | 950 | | | Bayview Financial Mortgage Pass-Through Trust, Mortgage Pass-Through Certificate Series 2005-D | | | 5.500% | | | | 12/28/35 | | | | A+ | | | | 952,327 | |
| | | | | |
| | 3,010 | | | Capital One Multi-Asset Execution Trust, Series 2016-A4 | | | 1.330% | | | | 6/15/22 | | | | AAA | | | | 2,984,528 | |
| | | | | |
| | 2,360 | | | CitiBank Credit Card Issuance Trust, Series 2014-A6 | | | 2.150% | | | | 7/15/21 | | | | Aaa | | | | 2,379,278 | |
| | | | | |
| | 2,342 | | | CitiBank Credit Card Issuance Trust, Series 2014-A1 | | | 2.880% | | | | 1/23/23 | | | | Aaa | | | | 2,412,260 | |
| | | | | |
| | 1,785 | | | Commercial Mortgage Pass-Through Certificates 2015-CR22 | | | 4.123% | | | | 3/10/48 | | | | A– | | | | 1,772,458 | |
| | | | | |
| | 1,485 | | | Commercial Mortgage Pass-Through Certificates, Series 2015-CR26 | | | 4.494% | | | | 10/10/48 | | | | A– | | | | 1,439,056 | |
| | | | | |
| | 1,795 | | | Commercial Mortgage Pass-Through Certificates, Series 2016-SAVA | | | 3.526% | | | | 10/15/34 | | | | AA– | | | | 1,803,432 | |
| | | | | |
| | 97 | | | Countrywide Alternative Loan Trust, Mortgage Pass-Through Certificates, Series 2004-J1 | | | 6.000% | | | | 2/25/34 | | | | A+ | | | | 99,081 | |
| | | | | |
| | 12 | | | Countrywide Home Loans, Asset-Backed Certificates, Series 2003-SC1 | | | 3.466% | | | | 9/25/23 | | | | Baa3 | | | | 14,058 | |
| | | | | |
| | 1,885 | | | Credit Suisse First Boston Mortgage Securities Corporation, Mortgage-Backed Pass-Through Certificates, Series 2003-8 | | | 6.158% | | | | 4/25/33 | | | | BBB– | | | | 1,873,066 | |
| | | | | |
| | 1,165 | | | Discover Card Execution Note Trust 2012-A6 | | | 1.670% | | | | 1/18/22 | | | | AAA | | | | 1,163,492 | |
| | | | | |
| | 930 | | | Discover Card Execution Trust 2015-A2 | | | 1.900% | | | | 10/17/22 | | | | AAA | | | | 931,113 | |
| | | | | |
| | 1,485 | | | Discover Card Execution Trust 2017-A2 | | | 2.390% | | | | 7/15/24 | | | | AAA | | | | 1,498,346 | |
| | | | | |
| | 1,745 | | | Dominos Pizza Master Issuer LLC, Series 2017-1A, (WI/DD) | | | 3.082% | | | | 7/25/47 | | | | BBB+ | | | | 1,736,547 | |
| | | | | |
| | 19 | | | Fannie Mae Mortgage Pool FN 673010 | | | 5.500% | | | | 12/01/17 | | | | Aaa | | | | 19,148 | |
| | | | | | | | | | | | | | | | | | | | |
Principal
Amount (000) | | | Description (1) | | Coupon | | | Maturity | | | Ratings (2) | | | Value | |
| | | |
| | | | ASSET-BACKED AND MORTGAGED-BACKED SECURITIES (continued) | | | | | | | |
| | | | | |
| $ | 271 | | | Fannie Mae Mortgage Pool FN 254513 | | | 6.000% | | | | 10/01/22 | | | | Aaa | | | $ | 304,351 | |
| | | | | |
| | 802 | | | Fannie Mae Mortgage Pool FN 255575 | | | 5.500% | | | | 1/01/25 | | | | Aaa | | | | 887,658 | |
| | | | | |
| | 57 | | | Fannie Mae Mortgage Pool FN 340798 | | | 7.000% | | | | 4/01/26 | | | | Aaa | | | | 61,169 | |
| | | | | |
| | 50 | | | Fannie Mae Mortgage Pool FN 250551 | | | 7.000% | | | | 5/01/26 | | | | Aaa | | | | 55,585 | |
| | | | | |
| | 516 | | | Fannie Mae Mortgage Pool FN 256852 | | | 6.000% | | | | 8/01/27 | | | | Aaa | | | | 579,797 | |
| | | | | |
| | 223 | | | Fannie Mae Mortgage Pool FN 252255 | | | 6.500% | | | | 2/01/29 | | | | Aaa | | | | 248,083 | |
| | | | | |
| | 429 | | | Fannie Mae Mortgage Pool FN 254169 | | | 6.500% | | | | 12/01/31 | | | | Aaa | | | | 496,186 | |
| | | | | |
| | 481 | | | Fannie Mae Mortgage Pool FN 745101 | | | 6.000% | | | | 4/01/32 | | | | Aaa | | | | 533,182 | |
| | | | | |
| | 416 | | | Fannie Mae Mortgage Pool FN 254379 | | | 7.000% | | | | 7/01/32 | | | | Aaa | | | | 490,371 | |
| | | | | |
| | 156 | | | Fannie Mae Mortgage Pool FN 545813 | | | 7.000% | | | | 7/01/32 | | | | Aaa | | | | 179,285 | |
| | | | | |
| | 97 | | | Fannie Mae Mortgage Pool FN 545815 | | | 7.000% | | | | 7/01/32 | | | | Aaa | | | | 114,521 | |
| | | | | |
| | 784 | | | Fannie Mae Mortgage Pool FN 6888330 | | | 6.000% | | | | 3/01/33 | | | | Aaa | | | | 900,157 | |
| | | | | |
| | 559 | | | Fannie Mae Mortgage Pool FN 555798 | | | 6.500% | | | | 5/01/33 | | | | Aaa | | | | 634,560 | |
| | | | | |
| | 1,495 | | | Fannie Mae Mortgage Pool FN 709446 | | | 5.500% | | | | 7/01/33 | | | | Aaa | | | | 1,684,132 | |
| | | | | |
| | 1,040 | | | Fannie Mae Mortgage Pool FN 735273 | | | 6.500% | | | | 6/01/34 | | | | Aaa | | | | 1,192,278 | |
| | | | | |
| | 136 | | | Fannie Mae Mortgage Pool FN 781776 | | | 6.000% | | | | 10/01/34 | | | | Aaa | | | | 155,578 | |
| | | | | |
| | 390 | | | Fannie Mae Mortgage Pool FN 885536 | | | 6.000% | | | | 8/01/36 | | | | Aaa | | | | 449,351 | |
| | | | | |
| | 452 | | | Fannie Mae Mortgage Pool FN 900555 | | | 6.000% | | | | 9/01/36 | | | | Aaa | | | | 520,724 | |
| | | | | |
| | 128 | | | Fannie Mae Mortgage Pool FN 256845 | | | 6.500% | | | | 8/01/37 | | | | Aaa | | | | 143,277 | |
| | | | | |
| | 166 | | | Fannie Mae Mortgage Pool FN 256890 | | | 6.000% | | | | 9/01/37 | | | | Aaa | | | | 178,299 | |
| | | | | |
| | — | (7) | | Fannie Mae Mortgage Pool FN 983077 | | | 5.000% | | | | 5/01/38 | | | | Aaa | | | | 159 | |
| | | | | |
| | — | (7) | | Fannie Mae Mortgage Pool FN 985344 | | | 5.500% | | | | 7/01/38 | | | | Aaa | | | | 96 | |
| | | | | |
| | 1,852 | | | Fannie Mae Mortgage Pool FN AC1877 | | | 4.500% | | | | 9/01/39 | | | | Aaa | | | | 1,995,575 | |
| | | | | |
| | 1,520 | | | Fannie Mae Mortgage Pool FN 932323 | | | 4.500% | | | | 12/01/39 | | | | Aaa | | | | 1,636,811 | |
| | | | | |
| | 1,918 | | | Fannie Mae Mortgage Pool FN AD4375 | | | 5.000% | | | | 5/01/40 | | | | Aaa | | | | 2,096,329 | |
| | | | | |
| | 3,713 | | | Fannie Mae Mortgage Pool FN AE7265 | | | 4.000% | | | | 1/01/41 | | | | Aaa | | | | 3,919,342 | |
| | | | | |
| | 816 | | | Fannie Mae Mortgage Pool FN MA1028 | | | 4.000% | | | | 4/01/42 | | | | Aaa | | | | 860,899 | |
| | | | | |
| | 2,944 | | | Fannie Mae Mortgage Pool FN AT2722 | | | 3.000% | | | | 5/01/43 | | | | Aaa | | | | 2,955,871 | |
| | | | | |
| | 1,857 | | | Fannie Mae Mortgage Pool FN AS3907 | | | 4.000% | | | | 11/01/44 | | | | Aaa | | | | 1,952,646 | |
| | | | | |
| | 1,763 | | | Fannie Mae Mortgage Pool FN MA2484 | | | 4.000% | | | | 12/01/45 | | | | Aaa | | | | 1,853,777 | |
| | | | | |
| | 2,257 | | | Fannie Mae Mortgage Pool AS6652 | | | 3.500% | | | | 2/01/46 | | | | Aaa | | | | 2,319,216 | |
| | | | | |
| | 2,429 | | | Fannie Mae Mortgage Pool FN AS6880 | | | 3.500% | | | | 3/01/46 | | | | Aaa | | | | 2,495,767 | |
| | | | | |
| | 3,557 | | | Fannie Mae Mortgage Pool FN AS7544 | | | 3.500% | | | | 7/01/46 | | | | Aaa | | | | 3,654,394 | |
| | | | | |
| | 6,942 | | | Fannie Mae Mortgage Pool FN MA2808 | | | 4.000% | | | | 11/01/46 | | | | Aaa | | | | 7,299,268 | |
| | | | | |
| | 1 | | | Fannie Mae Real Estate Mortgage Investment Conduit, Pass Through Certificates R 1988-24 G | | | 7.000% | | | | 10/25/18 | | | | Aaa | | | | 1,110 | |
| | | | | |
| | 1 | | | Fannie Mae Real Estate Mortgage Investment Conduit, Pass Through Certificates R 1989-44 H | | | 9.000% | | | | 7/25/19 | | | | Aaa | | | | 721 | |
| | | | | |
| | 1 | | | Fannie Mae Real Estate Mortgage Investment Conduit, Pass Through Certificates R 1989-90 E | | | 8.700% | | | | 12/25/19 | | | | Aaa | | | | 549 | |
Nuveen Core Plus Bond Fund (continued)
| | |
| Portfolio of Investments | | June 30, 2017 |
| | | | | | | | | | | | | | | | | | | | |
Principal
Amount (000) | | | Description (1) | | Coupon | | | Maturity | | | Ratings (2) | | | Value | |
| | | |
| | | | ASSET-BACKED AND MORTGAGED-BACKED SECURITIES (continued) | | | | | | | |
| | | | | |
| $ | 1 | | | Fannie Mae Real Estate Mortgage Investment Conduit, Pass Through Certificates R 1990-30 E | | | 6.500% | | | | 3/25/20 | | | | Aaa | | | $ | 1,192 | |
| | | | | |
| | 4 | | | Fannie Mae Real Estate Mortgage Investment Conduit, Pass Through Certificates R 1990-61 H | | | 7.000% | | | | 6/25/20 | | | | Aaa | | | | 3,861 | |
| | | | | |
| | 3 | | | Fannie Mae Real Estate Mortgage Investment Conduit, Pass Through Certificates R 1990-72 B | | | 9.000% | | | | 7/25/20 | | | | Aaa | | | | 3,711 | |
| | | | | |
| | 5 | | | Fannie Mae Real Estate Mortgage Investment Conduit, Pass Through Certificates R 1990-102 J | | | 6.500% | | | | 8/25/20 | | | | Aaa | | | | 5,726 | |
| | | | | |
| | 36 | | | Fannie Mae Real Estate Mortgage Investment Conduit, Pass Through Certificates R 1990-105 J | | | 6.500% | | | | 9/25/20 | | | | Aaa | | | | 37,864 | |
| | | | | |
| | 14 | | | Fannie Mae Real Estate Mortgage Investment Conduit, Pass Through Certificates R 1991-56 M | | | 6.750% | | | | 6/25/21 | | | | Aaa | | | | 14,498 | |
| | | | | |
| | 25 | | | Fannie Mae Real Estate Mortgage Investment Conduit, Pass Through Certificates R 1991-134 Z | | | 7.000% | | | | 10/25/21 | | | | Aaa | | | | 27,116 | |
| | | | | |
| | 2 | | | Fannie Mae Real Estate Mortgage Investment Conduit, Pass Through Certificates R 1992-120 C | | | 6.500% | | | | 7/25/22 | | | | Aaa | | | | 2,436 | |
| | | | | |
| | 131 | | | Fannie Mae Real Estate Mortgage Investment Conduit, Pass Through Certificates R 1996-35 Z | | | 7.000% | | | | 7/25/26 | | | | Aaa | | | | 146,825 | |
| | | | | |
| | 889 | | | Fannie Mae Real Estate Mortgage Investment Conduit, Pass Through Certificates R 2005-62 JE | | | 5.000% | | | | 6/25/35 | | | | Aaa | | | | 938,791 | |
| | | | | |
| | 738 | | | Fannie Mae REMIC Pass-Through Certificates | | | 3.843% | | | | 12/25/42 | | | | AAA | | | | 287,645 | |
| | | | | |
| | 1,000 | | | Fannie Mae TBA, Mortgage Pool, (WI/DD) | | | 5.000% | | | | TBA | | | | Aaa | | | | 1,091,247 | |
| | | | | |
| | 5,465 | | | Fannie Mae TBA, Mortgage Pool, (WI/DD) | | | 4.500% | | | | TBA | | | | Aaa | | | | 5,853,950 | |
| | | | | |
| | 1,195 | | | Fannie Mae TBA, Mortgage Pool, (WI/DD) | | | 4.000% | | | | TBA | | | | Aaa | | | | 1,253,793 | |
| | | | | |
| | 2,850 | | | Fannie Mae TBA, Mortgage Pool, (WI/DD) | | | 3.500% | | | | TBA | | | | Aaa | | | | 2,921,164 | |
| | | | | |
| | 5,165 | | | Fannie Mae TBA, Mortgage Pool, (WI/DD) | | | 3.000% | | | | TBA | | | | Aaa | | | | 5,148,855 | |
| | | | | |
| | — | (7) | | Federal Home Loan Mortgage Corporation, REMIC R 6 C | | | 9.050% | | | | 6/15/19 | | | | Aaa | | | | 76 | |
| | | | | |
| | 3 | | | Federal Home Loan Mortgage Corporation, REMIC R 1022 J | | | 6.000% | | | | 12/15/20 | | | | Aaa | | | | 3,505 | |
| | | | | |
| | 6 | | | Federal Home Loan Mortgage Corporation, REMIC R 162 F | | | 7.000% | | | | 5/15/21 | | | | Aaa | | | | 6,328 | |
| | | | | |
| | 5 | | | Federal Home Loan Mortgage Corporation, REMIC R 1118 Z | | | 8.250% | | | | 7/15/21 | | | | Aaa | | | | 4,926 | |
| | | | | |
| | 23 | | | Federal Home Loan Mortgage Corporation, REMIC R 188 H | | | 7.000% | | | | 9/15/21 | | | | Aaa | | | | 24,395 | |
| | | | | |
| | 4 | | | Federal Home Loan Mortgage Corporation, REMIC R 1790 A | | | 7.000% | | | | 4/15/22 | | | | Aaa | | | | 3,706 | |
| | | | | |
| | 257 | | | Federal Home Loan Mortgage Corporation, REMIC R 3591 FP | | | 1.826% | | | | 6/15/39 | | | | Aaa | | | | 258,225 | |
| | | | | |
| | 16 | | | Freddie Mac Mortgage Pool, Various FG 10023 | | | 4.500% | | | | 3/01/18 | | | | Aaa | | | | 16,115 | |
| | | | | |
| | 88 | | | Freddie Mac Mortgage Pool, Various FG P10032 | | | 4.500% | | | | 5/01/18 | | | | Aaa | | | | 87,990 | |
| | | | | |
| | 232 | | | Freddie Mac Mortgage Pool, Various FG C00676 | | | 6.500% | | | | 11/01/28 | | | | Aaa | | | | 263,965 | |
| | | | | |
| | 349 | | | Freddie Mac Mortgage Pool, Various FG A17212 | | | 6.500% | | | | 7/01/31 | | | | Aaa | | | | 385,656 | |
| | | | | |
| | 154 | | | Freddie Mac Mortgage Pool, Various FG A15521 | | | 6.000% | | | | 11/01/33 | | | | Aaa | | | | 173,053 | |
| | | | | |
| | 85 | | | Freddie Mac Mortgage Pool, Various FG H09059 | | | 7.000% | | | | 8/01/37 | | | | Aaa | | | | 92,221 | |
| | | | | |
| | 1,000 | | | Freddie Mac Mortgage Trust, Multifamily Mortgage Pass-Through Certificates, Series 2012-K711 | | | 3.562% | | | | 8/25/45 | | | | AA | | | | 1,024,399 | |
| | | | | | | | | | | | | | | | | | | | |
Principal
Amount (000) | | | Description (1) | | Coupon | | | Maturity | | | Ratings (2) | | | Value | |
| | | |
| | | | ASSET-BACKED AND MORTGAGED-BACKED SECURITIES (continued) | | | | | | | |
| | | | | |
| $ | 1,315 | | | Freddie Mac Mortgage Trust, Multifamily Mortgage Pass-Through Certificates, Series 2013-K712 | | | 3.365% | | | | 5/25/45 | | | | AA | | | $ | 1,345,615 | |
| | | | | |
| | 433 | | | Goldman Sachs Mortgage Securities Corporation, Mortgage Pass-Through Certificates, Series 2005-RP2 1A2 | | | 7.500% | | | | 3/25/35 | | | | B1 | | | | 467,601 | |
| | | | | |
| | 473 | | | Goldman Sachs Mortgage Securities Corporation, Mortgage Pass-Through Certificates, Series 2005-RP3 1A2 | | | 7.500% | | | | 9/25/35 | | | | B3 | | | | 503,285 | |
| | | | | |
| | 1,175 | | | Goldman Sachs Mortgage Securities Trust, Mortgage Pass Through Certificates, Series 2015-GC32 | | | 3.345% | | | | 7/10/48 | | | | BBB– | | | | 930,928 | |
| | | | | |
| | 87 | | | Government National Mortgage Association Pool GN 537699 | | | 7.500% | | | | 11/15/30 | | | | Aaa | | | | 95,532 | |
| | | | | |
| | 2,398 | | | Government National Mortgage Association Pool G2 4946 | | | 4.500% | | | | 2/20/41 | | | | Aaa | | | | 2,576,524 | |
| | | | | |
| | 2,055 | | | JP Morgan Chase Commercial Mortgage Securities Trust, Pass-Through Certificates 2017-JP5 | | | 3.723% | | | | 3/15/50 | | | | Aaa | | | | 2,151,824 | |
| | | | | |
| | 21 | | | Lehman Mortgage Trust, Mortgage Pass Through Certificates, Series 2008-6 | | | 5.052% | | | | 7/25/47 | | | | A+ | | | | 20,600 | |
| | | | | |
| | 446 | | | Master Resecuritization Trust 2009-1 | | | 6.000% | | | | 10/25/36 | | | | AA | | | | 453,893 | |
| | | | | |
| | 1,459 | | | Mid-State Capital Corporation Trust Notes, Series 2005-1 | | | 5.745% | | | | 1/15/40 | | | | AA | | | | 1,558,691 | |
| | | | | |
| | 1,290 | | | Morgan Stanley Bank of America Merrill Lynch Trust, Series 2014-C16, 144A | | | 4.756% | | | | 6/15/47 | | | | BBB– | | | | 1,159,950 | |
| | | | | |
| | 895 | | | Morgan Stanley Bank of America Merrill Lynch Trust, Series 2015-C22 | | | 4.242% | | | | 4/15/48 | | | | BBB– | | | | 756,006 | |
| | | | | |
| | 515 | | | Mortgage Asset Securitization Transaction Inc., Alternative Loan Trust Mortgage Pass-Through Certificates Series 2004-1 | | | 7.000% | | | | 1/25/34 | | | | BBB– | | | | 524,000 | |
| | | | | |
| | 970 | | | New Residential Advance Receivable Trust , Series 2016-T1 | | | 4.377% | | | | 6/15/49 | | | | BBB | | | | 975,491 | |
| | | | | |
| | 1,455 | | | New Residential Advance Receivable Trust, Series 2017-T1, 144A | | | 4.002% | | | | 2/15/51 | | | | BBB | | | | 1,463,000 | |
| | | | | |
| | 1,915 | | | OMART Receivables Trust, Series 2016-T2 | | | 4.446% | | | | 8/16/49 | | | | BBB | | | | 1,867,925 | |
| | | | | |
| | 2,856 | | | United States Department of Veterans, Affairs, Guaranteed REMIC Pass-Through Certificates, Vendee Mortgage Trust, Series 2011-1 | | | 3.750% | | | | 2/15/35 | | | | Aaa | | | | 2,960,539 | |
| | | | | |
| | 1,327 | | | Wachovia Mortgage Loan Trust LLC, Mortgage Pass-Through Certificates, Series 2005-B | | | 3.334% | | | | 10/20/35 | | | | D | | | | 1,166,254 | |
| | | | | |
| | 2,650 | | | Wells Fargo Commercial Mortgage Trust, Commercial Mortgage Pass-Through Certificates, Series 2015-C29 | | | 3.637% | | | | 6/15/48 | | | | Aaa | | | | 2,753,753 | |
| | | | | |
| | 920 | | | Wells Fargo Commercial Mortgage Trust, Commercial Mortgage Pass-Through Certificates, Series 2015-C30, 144A | | | 4.495% | | | | 9/15/58 | | | | BBB– | | | | 804,956 | |
| | | | | |
| | 1,240 | | | World Omni Auto Receivables Trust, Series 2016-B | | | 1.300% | | | | 2/15/22 | | | | AAA | | | | 1,229,468 | |
| $ | 125,752 | | | Total Asset-Backed and Mortgaged-Backed Securities (cost $126,083,434) | | | | | | | | | | | | | | | 128,991,700 | |
| | | | | |
Principal
Amount (000) (8) | | | Description (1) | | Coupon | | | Maturity | | | Ratings (2) | | | Value | |
| | | | | |
| | | | SOVEREIGN DEBT – 2.7% | | | | | | | | | | | | |
| | | | | |
| | | | Argentina – 0.3% | | | | | | | | | | | | |
| | | | | |
| $ | 1,100 | | | Republic of Argentina | | | 6.875% | | | | 1/26/27 | | | | B | | | $ | 1,137,400 | |
| | | | | |
| | | | Egypt – 0.2% | | | | | | | | | | | | |
| | | | | |
| | 680 | | | Arab Republic of Egypt, 144A | | | 7.500% | | | | 1/31/27 | | | | B | | | | 722,160 | |
Nuveen Core Plus Bond Fund (continued)
| | |
| Portfolio of Investments | | June 30, 2017 |
| | | | | | | | | | | | | | | | | | | | |
Principal
Amount (000) (8) | | | Description (1) | | Coupon | | | Maturity | | | Ratings (2) | | | Value | |
| | | | | |
| | | | Germany – 1.0% | | | | | | | | | | | | |
| | | | | |
| | 3100 | EUR | | Deutschland Republic, Reg S | | | 0.250% | | | | 2/15/27 | | | | Aaa | | | $ | 3,463,864 | |
| | | | | |
| | | | Mexico – 1.0% | | | | | | | | | | | | |
| | | | | |
| | 741 | MXN | | Mexico Bonos de DeSarrollo | | | 5.750% | | | | 3/05/26 | | | | A3 | | | | 3,811,574 | |
| | | | | |
| | | | Sri Lanka – 0.2% | | | | | | | | | | | | |
| | | | | |
| $ | 700 | | | Republic of Sri Lanka, 144A | | | 6.200% | | | | 5/11/27 | | | | B+ | | | | 698,886 | |
| | | | Total Sovereign Debt (cost $9,575,010) | | | | | | | | | | | | | | | 9,833,884 | |
| | | | Total Long-Term Investments (cost $344,129,174) | | | | | | | | | | | | 356,388,497 | |
| | | | | |
| Shares | | | Description (1) | | Coupon | | | | | | | | | Value | |
| | | |
| | | | INVESTMENTS PURCHASED WITH COLLATERAL FROM SECURITIES LENDING – 2.4% | | | | | | | |
| | | | | |
| | | | Money Market Funds – 2.4% | | | | | | | | | | | | |
| | | | | |
| | 8,787,463 | | | First American Government Obligations Fund, Class X, (13) | | | 0.883% (9) | | | | | | | | | | | $ | 8,787,463 | |
| | | | Total Investments Purchased with Collateral from Securities Lending (cost $8,787,463) | | | | | | | | 8,787,463 | |
| | | | | |
| Shares | | | Description (1) | | Coupon | | | | | | | | | Value | |
| | | | | |
| | | | SHORT-TERM INVESTMENTS – 5.0% | | | | | | | | | | | | |
| | | | | |
| | | | Money Market Funds – 5.0% | | | | | | | | | | | | |
| | | | | |
| | 18,106,253 | | | First American Treasury Obligations Fund, Class Z | | | 0.847% (9) | | | | | | | | | | | $ | 18,106,253 | |
| | | | Total Short-Term Investments (cost $18,106,253) | | | | | | | | | | | | 18,106,253 | |
| | | | Total Investments (cost $371,022,890) – 106.5% | | | | | | | | | | | | 383,282,213 | |
| | | | Other Assets Less Liabilities – (6.5)% (10) | | | | | | | | | | | | (23,458,976 | ) |
| | | | Net Assets – 100% | | | | | | | | | | | | | | $ | 359,823,237 | |
Investments in Derivatives as of June 30, 2017
Forward Foreign Currency Exchange Contracts
| | | | | | | | | | | | | | | | | | | | | | |
| Counterparty | | Currency Contracts to Deliver | | Notional
Amount
(Local Currency) | | | In Exchange
For Currency | | | Notional
Amount
(Local Currency) | | | Settlement
Date | | | Unrealized
Appreciation
(Depreciation)
(U.S. Dollars) | |
| Bank of America, N.A. | | Euro | | | 3,065,000 | | | | U.S. Dollar | | | | 3,432,622 | | | | 8/25/17 | | | $ | (78,525 | ) |
| Morgan Stanley Capital Services LLC | | Hungarian Forint | | | 520,000,000 | | | | U.S. Dollar | | | | 1,823,257 | | | | 7/17/17 | | | | (101,172 | ) |
| Morgan Stanley Capital Services LLC | | U.S. Dollar | | | 1,900,828 | | | | Hungarian Forint | | | | 520,000,000 | | | | 7/17/17 | | | | 23,601 | |
| Morgan Stanley Capital Services LLC | | Mexican Peso | | | 68,000,000 | | | | U.S. Dollar | | | | 3,681,822 | | | | 8/11/17 | | | | (38,695 | ) |
| | | | | | | | | | | | | | | | | | | | | $ | (194,791 | ) |
Credit Default Swaps (OTC Cleared)
| | | | | | | | | | | | | | | | | | | | | | | | | | | | | | | | | | |
| Clearing Broker | | Referenced Entity | | Buy/Sell
Protection (11) | | | Current
Credit
Spread (12) | | | Notional
Amount | | | Fixed Rate
(Annualized) | | | Termination
Date | | | Value | | | Variation Margin
Receivable/
(Payable) | | | Unrealized
Appreciation
(Depreciation) | |
Citigroup Global Markets, Inc.* | | Markit CDX.NA.HY.28 | | | Buy | | | | 3.392 | % | | $ | 7,600,000 | | | | 5.000 | % | | | 6/20/22 | | | $ | (535,237 | ) | | $ | 27,732 | | | $ | (3,126 | ) |
| * | Chicago Mercantile Exchange is the clearing house for this transaction. |
Futures Contracts
| | | | | | | | | | | | | | | | | | | | | | | | |
| Description | | Contract
Position | | | Number of
Contracts | | | Contract
Expiration | | | Notional
Amount
at Value* | | | Variation Margin
Receivable/
(Payable) | | | Unrealized
Appreciation
(Depreciation) | |
U.S. Treasury 10-Year Note | | | Short | | | | (239 | ) | | | 9/17 | | | $ | (30,001,969 | ) | | $ | 67,218 | | | $ | 80,203 | |
U.S. Treasury 5-Year Note | | | Long | | | | 49 | | | | 9/17 | | | | 5,773,961 | | | | (8,422 | ) | | | (13,146 | ) |
U.S. Treasury Long Bond | | | Long | | | | 16 | | | | 9/17 | | | | 2,459,000 | | | | (9,000 | ) | | | 22,393 | |
U.S. Treasury Ultra Bond | | | Long | | | | 46 | | | | 9/17 | | | | 7,630,250 | | | | (31,625 | ) | | | 123,093 | |
| | | | | | | | | | | | | | | $ | (14,138,758 | ) | | $ | 18,171 | | | $ | 212,543 | |
| * | The aggregate Notional Amount at Value of long and short positions is $15,863,211 and $(30,001,969), respectively. |
Options Purchased
| | | | | | | | | | | | | | | | | | |
Number of
Contracts | | Description | | Notional
Amount (14) | | | Expiration
Date | | | Strike
Price | | | Value | |
| 63 | | U.S. Treasury 10-Year Future | | $ | 803,250 | | | | 8/17 | | | $ | 127.5 | | | $ | 2,953 | |
| 63 | | Total Call Options Purchased (premiums paid $16,604) | | | | | | | | | | | | | | $ | 2,953 | |
For Fund portfolio compliance purposes, the Fund’s industry classifications refer to any one or more of the industry sub-classifications used by one or more widely recognized market indexes or ratings group indexes, and/or as defined by Fund management. This definition may not apply for purposes of this report, which may combine industry sub-classifications into sectors for reporting ease.
| (1) | All percentages shown in the Portfolio of Investments are based on net assets. |
| (2) | For financial reporting purposes, the ratings disclosed are the highest of Standard & Poor’s Group (“Standard & Poor’s”), Moody’s Investors Service, Inc. (“Moody’s”) or Fitch, Inc. (“Fitch”) rating. This treatment of split-rated securities may differ from that used for other purposes, such as for Fund investment policies. Ratings below BBB by Standard & Poor’s, Baa by Moody’s or BBB by Fitch are considered to be below investment grade. Holdings designated N/R are not rated by any of these national rating agencies. Ratings are not covered by the report of independent registered public accounting firm. |
| (3) | Investment, or a portion of investment, is out on loan for securities lending. The total value of the securities out on loan as of the end of the reporting period was $8,437,582. |
| (4) | Perpetual security. Maturity date is not applicable. |
| (5) | Contingent Capital Securities (“CoCos”) are hybrid securities with loss absorption characteristics built into the terms of the security for the benefit of the issuer. For example, the terms may specify an automatic write-down of principal or a mandatory conversion into the issuer’s common stock under certain adverse circumstances, such as the issuer’s capital ratio falling below a specified level. |
| (6) | Optional Call Provisions: Dates (month and year) and prices of the earliest optional call or redemption. There may be other call provisions at varying prices at later dates. Certain mortgage-backed securities may be subject to periodic principal paydowns. Optional Call Provisions are not covered by the report of independent registered public accounting firm. |
| (7) | Principal Amount (000) rounds to less than $1,000. |
| (8) | Principal Amount (000) denominated in U.S. Dollars, unless otherwise noted. |
| (9) | The rate shown is the annualized seven-day subsidized yield as of the end of the reporting period. |
| (10) | Other assets less liabilities includes the unrealized appreciation (depreciation) of certain over-the-counter (“OTC”) derivatives as presented on the Statement of Assets and Liabilities, when applicable. The unrealized appreciation (depreciation) of OTC-cleared and exchange-traded derivatives is recognized as part of the cash collateral at brokers and/or receivable or payable for variation margin as presented on the Statement of Assets and Liabilities, when applicable. |
| (11) | The Fund entered into the credit default swaps to gain investment exposure to the referenced entity. Selling protection has a similar credit risk position to owning the referenced entity. Buying protection has a similar credit risk position to selling the referenced entity short. |
| (12) | The credit spread generally serves as an indication of the current status of the payment/performance risk and therefore the likelihood of default of the credit derivative. The credit spread also reflects the cost of buying/selling protection and may include upfront payments required to be made to enter into a credit default swap contract. Higher credit spreads are indicative of higher likelihood of performance by the seller of protection. |
| (13) | The Fund may loan securities representing up to one third of the fair value of its total assets (which includes collateral for securities on loan) to broker-dealers, banks and other institutions. The Fund maintains collateral equal to at least 100% of the fair value of the securities loaned. The cash collateral received by the Fund is invested in this money market fund. See Notes to Financial Statements, Note 3 – Portfolio Securities and Investments in Derivatives, Securities Lending for more information. |
| (14) | For disclosure purposes, Notional Amount is calculated by multiplying the Number of Contracts by the Strike Price by 100. |
| (WI/DD) | Investment, or portion of investment, purchased on a when-issued or delayed delivery basis. |
| 144A | Investment is exempt from registration under Rule 144A of the Securities Act of 1933, as amended. These investments may only be resold in transactions exempt from registration, which are normally those transactions with qualified institutional buyers. |
| Reg S | Regulation S allows U.S. companies to sell securities to persons or entities located outside of the United States without registering those securities with the Securities and Exchange Commission. Specifically, Regulation S provides a safe harbor from the registration requirements of the Securities Act for the offers and sales of securities by both foreign and domestic issuers that are made outside the United States. |
| TBA | To be announced. Maturity date not known prior to settlement of this transaction. |
See accompanying notes to financial statements.
Nuveen High Income Bond Fund
| | |
| Portfolio of Investments | | June 30, 2017 |
| | | | | | | | | | | | | | | | | | | | |
| Shares | | | Description (1) | | | | | | | | | | | Value | |
| | | | | |
| | | | LONG-TERM INVESTMENTS – 95.5% | | | | | | | | | | | | | | | | |
| | | | | |
| | | | COMMON STOCKS – 1.3% | | | | | | | | | | | | | | | | |
| | | | | |
| | | | Building Products – 0.0% | | | | | | | | | | | | |
| | | | | |
| | 526 | | | Dayton Superior Corporation, (2), (3) | | | | | | | | | | | | | | $ | 30,195 | |
| | | | | |
| | 585 | | | Dayton Superior, (3) | | | | | | | | | | | | | | | 33,550 | |
| | | | Total Building Products | | | | | | | | | | | | | | | 63,745 | |
| | | | | |
| | | | Capital Markets – 0.0% | | | | | | | | | | | | |
| | | | | |
| | 5,732 | | | Adamas Finance Asia Limited, (2) | | | | | | | | | | | | | | | 3,267 | |
| | | | | |
| | 10,000 | | | Och-Ziff Capital Management Group, Class A Shares | | | | | | | | | | | | | | | 25,600 | |
| | | | Total Capital Markets | | | | | | | | | | | | | | | 28,867 | |
| | | | | |
| | | | Electric Utilities – 0.7% | | | | | | | | | | | | |
| | | | | |
| | 71,545 | | | Exelon Corporation | | | | | | | | | | | | | | | 2,580,628 | |
| | | | | |
| | | | Energy Equipment & Services – 0.1% | | | | | | | | | | | | |
| | | | | |
| | 1,644 | | | Key Energy Services Inc., (2), (4) | | | | | | | | | | | | | | | 31,639 | |
| | | | | |
| | 10,000 | | | Patterson-UTI Energy, Inc. | | | | | | | | | | | | | | | 201,900 | |
| | | | Total Energy Equipment & Services | | | | | | | | | | | | | | | 233,539 | |
| | | | | |
| | | | Independent Power & Renewable Electricity Producers – 0.1% | | | | | | | | | | | | |
| | | | | |
| | 38,125 | | | Vistra Energy Corporation, (2) | | | | | | | | | | | | | | | 640,119 | |
| | | | | |
| | | | Metals & Mining – 0.0% | | | | | | | | | | | | |
| | | | | |
| | 499,059 | | | Northland Resources SA, (2), (3) | | | | | | | | | | | | | | | 50 | |
| | | | | |
| | | | Oil, Gas & Consumable Fuels – 0.4% | | | | | | | | | | | | |
| | | | | |
| | 8,999 | | | Arch Coal Inc., (4) | | | | | | | | | | | | | | | 614,700 | |
| | | | | |
| | 50,119 | | | Connacher Oil and Gas Limited, (2), (3) | | | | | | | | | | | | | | | 5 | |
| | | | | |
| | 19,121 | | | Golden Close Maritime Corporation Limited, (2), (5) | | | | | | | | | | | | | | | 5,153 | |
| | | | | |
| | 32,250 | | | Peabody Energy Corporation, (2), (4) | | | | | | | | | | | | | | | 788,512 | |
| | | | | |
| | 4,145 | | | Penn Virginia Corporation, (2) | | | | | | | | | | | | | | | 152,338 | |
| | | | Total Oil, Gas & Consumable Fuels | | | | | | | | | | | | | | | 1,560,708 | |
| | | | Total Common Stocks (cost $6,604,468) | | | | | | | | | | | | | | | 5,107,656 | |
| | | | | |
| Shares | | | Description (1) | | Coupon | | | | | | Ratings (6) | | | Value | |
| | | | | |
| | | | CONVERTIBLE PREFERRED SECURITIES – 1.1% | | | | | | | | | | | | | | | | |
| | | | | |
| | | | Independent Power & Renewable Electricity Producers – 0.1% | | | | | | | | | | | | |
| | | | | |
| | 14,500 | | | Dynegy Inc., (5) | | | 5.375% | | | | | | | | N/R | | | $ | 416,875 | |
| | | | | |
| | | | Multi-Utilities – 0.6% | | | | | | | | | | | | |
| | | | | |
| | 27,000 | | | Dominion Resources Inc. | | | 6.375% | | | | | | | | BBB | | | | 1,290,600 | |
| | | | | |
| | 20,000 | | | DTE Energy Company | | | 5.000% | | | | | | | | BBB– | | | | 1,097,000 | |
| | | | Total Multi-Utilities | | | | | | | | | | | | | | | 2,387,600 | |
| | | | | | | | | | | | | | | | | | | | |
| Shares | | | Description (1) | | Coupon | | | | | | Ratings (6) | | | Value | |
| | | | | |
| | | | Oil, Gas & Consumable Fuels – 0.4% | | | | | | | | | | | | |
| | | | | |
| | 29,700 | | | Anadarko Petroleum Corporation | | | 7.500% | | | | | | | | N/R | | | $ | 1,220,343 | |
| | | | Total Convertible Preferred Securities (cost $4,175,730) | | | | | | | | | | | | | | | 4,024,818 | |
| | | | | |
Principal
Amount (000) | | | Description (1) | | Coupon (8) | | | Maturity (7) | | | Ratings (6) | | | Value | |
| | | | | |
| | | | VARIABLE RATE SENIOR LOAN INTERESTS – 3.0% (8) | | | | | | | | | | | | | | | | |
| | | | | |
| | | | Containers & Packaging – 0.2% | | | | | | | | | | | | |
| | | | | |
| $ | 1,000 | | | Packaging Coordinators Inc, Second Lien Term Loan | | | 9.900% | | | | 6/30/24 | | | | CCC+ | | | $ | 990,000 | |
| | | | | |
| | | | Diversified Financial Services – 0.4% | | | | | | | | | | | | |
| | | | | |
| | 1,759 | | | Jill Acquisition LLC, First Lien Term Loan B | | | 6.180% | | | | 5/08/22 | | | | B | | | | 1,724,614 | |
| | | | | |
| | | | Diversified Telecommunication Services – 0.3% | | | | | | | | | | | | |
| | | | | |
| | 1,363 | | | Birch Communications Inc., First Lien Term Loan B | | | 8.400% | | | | 4/19/20 | | | | B– | | | | 1,004,229 | |
| | | | | |
| | | | Hotels, Restaurants & Leisure – 0.2% | | | | | | | | | | | | |
| | | | | |
| | 656 | | | Amaya BV, Second Lien Term Loan | | | 8.147% | | | | 7/29/22 | | | | B | | | | 660,270 | |
| | | | | |
| | | | Independent Power & Renewable Electricity Producers – 0.4% | | | | | | | | | | | | |
| | | | | |
| | 130 | | | Empire Generating Company LLC, Term Loan C | | | 5.430% | | | | 3/13/21 | | | | B | | | | 125,760 | |
| | | | | |
| | 1,319 | | | Empire Generating Company LLC | | | 5.430% | | | | 3/13/21 | | | | B | | | | 1,272,176 | |
| | 1,449 | | | Total Independent Power & Renewable Electricity Producers | | | | | | | | | | | | | | | 1,397,936 | |
| | | | | |
| | | | IT Services – 0.1% | | | | | | | | | | | | |
| | | | | |
| | 500 | | | Optiv Security Inc., Second Lien Term Loan | | | 8.438% | | | | 1/13/25 | | | | Caa1 | | | | 490,625 | |
| | | | | |
| | | | Oil, Gas & Consumable Fuels – 0.4% | | | | | | | | | | | | |
| | | | | |
| | 2,493 | | | Fieldwood Energy LLC, Second Lien Term Loan | | | 8.375% | | | | 9/30/20 | | | | CCC– | | | | 1,402,094 | |
| | | | | |
| | | | Paper & Forest Products – 0.2% | | | | | | | | | | | | |
| | | | | |
| | 933 | | | Verso Paper Holdings LLC, First Lien Term Loan | | | 12.242% | | | | 10/14/21 | | | | BB | | | | 933,775 | |
| | | | | |
| | | | Professional Services – 0.8% | | | | | | | | | | | | |
| | | | | |
| | 2,000 | | | Sedgwick Claims Management Service Inc., Second Lien Term Loan | | | 6.795% | | | | 2/28/22 | | | | CCC+ | | | | 2,015,000 | |
| | | | | |
| | 1,000 | | | Sedgwick Claims Management Service Inc., Second Lien Term Loan | | | 6.952% | | | | 2/28/22 | | | | CCC+ | | | | 1,005,630 | |
| | 3,000 | | | Total Professional Services | | | | | | | | | | | | | | | 3,020,630 | |
| $ | 13,153 | | | Total Variable Rate Senior Loan Interests (cost $12,244,990) | | | | | | | | | | | | | | | 11,624,173 | |
| | | | | |
| Shares | | | Description (1) | | Coupon | | | | | | Ratings (6) | | | Value | |
| | | | | |
| | | | $25 PAR (OR SIMILAR) RETAIL PREFERRED – 2.0% | | | | | | | | | | | | | | | | |
| | | | | |
| | | | Equity Real Estate Investment Trusts – 0.8% | | | | | | | | | | | | |
| | | | | |
| | 60,000 | | | Colony Northstar, Inc., (5) | | | 7.500% | | | | | | | | N/R | | | $ | 1,590,600 | |
| | | | | |
| | 50,960 | | | Colony Northstar, Inc. | | | 7.125% | | | | | | | | N/R | | | | 1,312,220 | |
| | | | Total Equity Real Estate Investment Trusts | | | | | | | | | | | | | | | 2,902,820 | |
| | | | | |
| | | | Food Products – 0.3% | | | | | | | | | | | | |
| | | | | |
| | 34,685 | | | CHS Inc. | | | 6.750% | | | | | | | | N/R | | | | 980,892 | |
Nuveen High Income Bond Fund (continued)
| | |
| Portfolio of Investments | | June 30, 2017 |
| | | | | | | | | | | | | | | | | | | | |
| Shares | | | Description (1) | | Coupon | | | | | | Ratings (6) | | | Value | |
| | | | | |
| | | | Household Durables – 0.1% | | | | | | | | | | | | |
| | | | | |
| | 63,610 | | | Hovnanian Enterprises Incorporated | | | 7.625% | | | | | | | | Ca | | | $ | 451,631 | |
| | | | | |
| | | | Insurance – 0.4% | | | | | | | | | | | | |
| | | | | |
| | 60,000 | | | AmTrust Financial Services Inc., (4) | | | 7.250% | | | | | | | | N/R | | | | 1,464,000 | |
| | | | | |
| | | | Oil, Gas & Consumable Fuels – 0.4% | | | | | | | | | | | | |
| | | | | |
| | 60,000 | | | Nustar Energy LP | | | 8.500% | | | | | | | | Ba3 | | | | 1,567,800 | |
| | | | Total $25 Par (or similar) Retail Preferred (cost $7,381,545) | | | | | | | | | | | | | | | 7,367,143 | |
| | | | | |
Principal
Amount (000) (9) | | | Description (1) | | Coupon | | | Maturity | | | Ratings (6) | | | Value | |
| | | | | |
| | | | CORPORATE BONDS – 80.3% | | | | | | | | | | | | | | | | |
| | | | | |
| | | | Aerospace & Defense – 1.7% | | | | | | | | | | | | |
| | | | | |
| $ | 2,500 | | | Bombardier Inc., 144A | | | 7.500% | | | | 3/15/25 | | | | B | | | $ | 2,593,750 | |
| | | | | |
| | 1,500 | | | StandardAero Aviation Holdings Inc., 144A | | | 10.000% | | | | 7/15/23 | | | | CCC | | | | 1,661,250 | |
| | | | | |
| | 2,200 | | | TransDigm Inc. | | | 6.375% | | | | 6/15/26 | | | | B– | | | | 2,233,000 | |
| | | | Total Aerospace & Defense | | | | | | | | | | | | | | | 6,488,000 | |
| | | | | |
| | | | Airlines – 1.2% | | | | | | | | | | | | |
| | | | | |
| | 175 | | | American Airlines Group Inc., 144A, (4) | | | 4.625% | | | | 3/01/20 | | | | BB– | | | | 180,997 | |
| | | | | |
| | 2,000 | | | Virgin Australia Holdings Limited, 144A | | | 7.875% | | | | 10/15/21 | | | | B– | | | | 2,087,500 | |
| | | | | |
| | 3,175 | | | VistaJet Malta Finance PLC, 144A | | | 7.750% | | | | 6/01/20 | | | | B– | | | | 2,222,500 | |
| | | | Total Airlines | | | | | | | | | | | | | | | 4,490,997 | |
| | | | | |
| | | | Auto Components – 1.2% | | | | | | | | | | | | |
| | | | | |
| | 2,500 | | | Dana Holding Corporation | | | 6.000% | | | | 9/15/23 | | | | BB | | | | 2,606,250 | |
| | | | | |
| | 1,950 | | | Tupy S/A, 144A | | | 6.625% | | | | 7/17/24 | | | | BB | | | | 1,998,750 | |
| | | | Total Auto Components | | | | | | | | | | | | | | | 4,605,000 | |
| | | | | |
| | | | Banks – 0.4% | | | | | | | | | | | | |
| | | | | |
| | 1,500 | | | Curo Financial Technologies Corporation, 144A | | | 12.000% | | | | 3/01/22 | | | | B– | | | | 1,575,000 | |
| | | | | |
| | | | Building Products – 1.1% | | | | | | | | | | | | |
| | | | | |
| | 809 | | | Corporativo Javer S.A. de C.V, 144A | | | 9.875% | | | | 4/06/21 | | | | BB– | | | | 833,270 | |
| | | | | |
| | 1,500 | | | Euramax International Inc., 144A | | | 12.000% | | | | 8/15/20 | | | | B– | | | | 1,635,000 | |
| | | | | |
| | 2,000 | | | NWH Escrow Corporation, 144A | | | 7.500% | | | | 8/01/21 | | | | B– | | | | 1,780,000 | |
| | | | | |
| | 300 | | | Odebrecht Finance Limited, 144A | | | 7.125% | | | | 6/26/42 | | | | CCC+ | | | | 120,750 | |
| | | | Total Building Products | | | | | | | | | | | | | | | 4,369,020 | |
| | | | | |
| | | | Chemicals – 3.3% | | | | | | | | | | | | |
| | | | | |
| | 1,500 | | | CF Industries Inc. | | | 5.375% | | | | 3/15/44 | | | | BB+ | | | | 1,342,500 | |
| | | | | |
| | 2,000 | | | Chemours Co | | | 7.000% | | | | 5/15/25 | | | | B+ | | | | 2,180,000 | |
| | | | | |
| | 2,400 | | | CVR Partners LP / CVR Nitrogen Finance Corp., 144A | | | 9.250% | | | | 6/15/23 | | | | B+ | | | | 2,511,000 | |
| | | | | |
| | 2,838 | | | Kraton Polymers LLC/CAP, 144A | | | 10.500% | | | | 4/15/23 | | | | B– | | | | 3,277,890 | |
| | | | | |
| | 2,000 | | | NOVA Chemicals Corporation, 144A | | | 5.250% | | | | 8/01/23 | | | | BBB– | | | | 2,055,000 | |
| | | | | |
| | 1,300 | | | PolyOne Corporation | | | 5.250% | | | | 3/15/23 | | | | BB– | | | | 1,365,000 | |
| | | | Total Chemicals | | | | | | | | | | | | | | | 12,731,390 | |
| | | | | | | | | | | | | | | | | | | | |
Principal
Amount (000) (9) | | | Description (1) | | Coupon | | | Maturity | | | Ratings (6) | | | Value | |
| | | | | |
| | | | Commercial Services & Supplies – 1.2% | | | | | | | | | | | | |
| | | | | |
| $ | 2,000 | | | ADT Corporation | | | 6.250% | | | | 10/15/21 | | | | BB– | | | $ | 2,177,500 | |
| | | | | |
| | 2,375 | | | R.R. Donnelley & Sons Company | | | 7.875% | | | | 3/15/21 | | | | B+ | | | | 2,570,938 | |
| | | | Total Commercial Services & Supplies | | | | | | | | | | | | | | | 4,748,438 | |
| | | | | |
| | | | Construction & Engineering – 1.2% | | | | | | | | | | | | |
| | | | | |
| | 2,250 | | | HC2 Holdings, Inc., 144A | | | 11.000% | | | | 12/01/19 | | | | B– | | | | 2,300,625 | |
| | | | | |
| | 2,472 | | | Michael Baker Holdings LLC Finance Corporation, 144A | | | 8.875% | | | | 4/15/19 | | | | CCC | | | | 2,422,338 | |
| | | | Total Construction & Engineering | | | | | | | | | | | | | | | 4,722,963 | |
| | | | | |
| | | | Construction Materials – 0.5% | | | | | | | | | | | | |
| | | | | |
| | 1,750 | | | Norbord Inc., 144A | | | 6.250% | | | | 4/15/23 | | | | Ba1 | | | | 1,868,125 | |
| | | | | |
| | | | Consumer Finance – 1.2% | | | | | | | | | | | | |
| | | | | |
| | 3,000 | | | Enova International, Inc. | | | 9.750% | | | | 6/01/21 | | | | B– | | | | 3,120,000 | |
| | | | | |
| | 1,500 | | | First Data Corporation, 144A | | | 7.000% | | | | 12/01/23 | | | | B | | | | 1,601,250 | |
| | | | Total Consumer Finance | | | | | | | | | | | | | | | 4,721,250 | |
| | | | | |
| | | | Containers & Packaging – 0.8% | | | | | | | | | | | | |
| | | | | |
| | 2,120 | | | Cascades Inc., 144A | | | 5.500% | | | | 7/15/22 | | | | BB– | | | | 2,162,400 | |
| | | | | |
| | 1,275 | | | PaperWorks Industries Inc., 144A | | | 9.500% | | | | 8/15/19 | | | | CCC+ | | | | 943,500 | |
| | | | Total Containers & Packaging | | | | | | | | | | | | | | | 3,105,900 | |
| | | | | |
| | | | Diversified Consumer Services – 0.6% | | | | | | | | | | | | |
| | | | | |
| | 3,185 | | | Jones Group Inc. | | | 6.125% | | | | 11/15/34 | | | | Ca | | | | 589,225 | |
| | | | | |
| | 1,600 | | | Prime Security Services Borrower LLC / Prime Finance, Inc., 144A | | | 9.250% | | | | 5/15/23 | | | | B– | | | | 1,738,656 | |
| | | | Total Diversified Consumer Services | | | | | | | | | | | | | | | 2,327,881 | |
| | | | | |
| | | | Diversified Financial Services – 2.4% | | | | | | | | | | | | |
| | | | | |
| | 3,470 | | | CNG Holdings Inc., 144A | | | 9.375% | | | | 5/15/20 | | | | CCC | | | | 3,070,950 | |
| | | | | |
| | 2,000 | | | Hexion 2 US Financial Corp., 144A | | | 13.750% | | | | 2/01/22 | | | | CCC | | | | 1,760,000 | |
| | | | | |
| | 2,180 | | | James Hardie International Finance Limited, 144A | | | 5.875% | | | | 2/15/23 | | | | Ba1 | | | | 2,283,550 | |
| | | | | |
| | 2,200 | | | Stoneway Capital Corporation, 144A | | | 10.000% | | | | 3/01/27 | | | | B | | | | 2,321,704 | |
| | | | Total Diversified Financial Services | | | | | | | | | | | | | | | 9,436,204 | |
| | | | | |
| | | | Diversified Telecommunication Services – 4.7% | | | | | | | | | | | | |
| | | | | |
| | 1,000 | | | CenturyLink Inc. | | | 5.800% | | | | 3/15/22 | | | | BB+ | | | | 1,040,000 | |
| | | | | |
| | 3,350 | | | CenturyLink Inc. | | | 7.650% | | | | 3/15/42 | | | | BB+ | | | | 3,111,312 | |
| | | | | |
| | 2,350 | | | Consolidated Communications Finance Company | | | 6.500% | | | | 10/01/22 | | | | B– | | | | 2,338,250 | |
| | | | | |
| | 2,000 | | | Frontier Communications Corporation | | | 10.500% | | | | 9/15/22 | | | | B+ | | | | 1,907,500 | |
| | | | | |
| | 3,675 | | | GCI Inc. | | | 6.875% | | | | 4/15/25 | | | | BB– | | | | 3,973,594 | |
| | | | | |
| | 1,500 | | | Inelsat Connect Finance SA, 144A | | | 12.500% | | | | 4/01/22 | | | | CCC– | | | | 1,353,750 | |
| | | | | |
| | 1,000 | | | IntelSat Jackson Holdings | | | 5.500% | | | | 8/01/23 | | | | CCC+ | | | | 827,500 | |
| | | | | |
| | 1,000 | | | IntelSat Limited | | | 7.750% | | | | 6/01/21 | | | | CCC– | | | | 550,000 | |
| | | | | |
| | 1,560 | | | Xplornet Communications, Inc., 144A | | | 9.625% | | | | 6/01/22 | | | | CCC | | | | 1,622,400 | |
Nuveen High Income Bond Fund (continued)
| | |
| Portfolio of Investments | | June 30, 2017 |
| | | | | | | | | | | | | | | | | | | | |
Principal
Amount (000) (9) | | | Description (1) | | Coupon | | | Maturity | | | Ratings (6) | | | Value | |
| | | | | |
| | | | Diversified Telecommunication Services (continued) | | | | | | | | | | | | |
| | | | | |
| $ | 1,500 | | | Ziggo Secured Finance BV, 144A | | | 5.500% | | | | 1/15/27 | | | | BB+ | | | $ | 1,531,875 | |
| | | | Total Diversified Telecommunication Services | | | | | | | | | | | | | | | 18,256,181 | |
| | | | | |
| | | | Electric Utilities – 0.8% | | | | | | | | | | | | |
| | | | | |
| | 3,000 | | | ACWA Power Management And Investment One Ltd, 144A | | | 5.950% | | | | 12/15/39 | | | | BBB– | | | | 3,060,372 | |
| | | | | |
| | 1,000 | | | Texas Competitive Electric Holdings Co LLC / TCEH Finance, Inc., 144A | | | 11.500% | | | | 10/01/20 | | | | N/R | | | | 2,500 | |
| | | | Total Electric Utilities | | | | | | | | | | | | | | | 3,062,872 | |
| | | | | |
| | | | Electrical Equipment – 0.4% | | | | | | | | | | | | |
| | | | | |
| | 1,500 | | | Park Aerospace Holdings Limited, 144A | | | 5.500% | | | | 2/15/24 | | | | BB | | | | 1,566,750 | |
| | | | | |
| | | | Energy Equipment & Services – 3.3% | | | | | | | | | | | | |
| | | | | |
| | 2,650 | | | Calfrac Holdings LP, 144A | | | 7.500% | | | | 12/01/20 | | | | CCC– | | | | 2,279,000 | |
| | | | | |
| | 2,750 | | | Ensco PLC, (4) | | | 4.500% | | | | 10/01/24 | | | | BB | | | | 2,117,500 | |
| | | | | |
| | 4,000 | | | Murray Energy Corporation, 144A | | | 11.250% | | | | 4/15/21 | | | | CCC | | | | 3,020,000 | |
| | | | | |
| | 1,700 | | | Noble Holding International Limited | | | 7.750% | | | | 1/15/24 | | | | BB– | | | | 1,341,827 | |
| | | | | |
| | 1,170 | | | Pacific Drilling V Limited, 144A | | | 7.250% | | | | 12/01/17 | | | | Ca | | | | 595,237 | |
| | | | | |
| | 2,379 | | | Parker Drilling Company | | | 6.750% | | | | 7/15/22 | | | | B– | | | | 1,825,883 | |
| | | | | |
| | 599 | | | SAExploration Holdings Inc., 144A | | | 10.000% | | | | 4/14/19 | | | | N/R | | | | 387,741 | |
| | | | | |
| | 1,200 | | | SESI, LLC, (4) | | | 7.125% | | | | 12/15/21 | | | | BB– | | | | 1,143,000 | |
| | | | Total Energy Equipment & Services | | | | | | | | | | | | | | | 12,710,188 | |
| | | | | |
| | | | Equity Real Estate Investment Trusts – 0.8% | | | | | | | | | | | | |
| | | | | |
| | 2,000 | | | Communications Sales & Leasing Inc., 144A, (4) | | | 6.000% | | | | 4/15/23 | | | | BB+ | | | | 2,081,240 | |
| | | | | |
| | 1,000 | | | Uniti Group Inc/Uniti Fiber Holdings Inc/ CLS Capital LLC, 144A | | | 7.125% | | | | 12/15/24 | | | | BB– | | | | 991,250 | |
| | | | Total Equity Real Estate Investment Trusts | | | | | | | | | | | | | | | 3,072,490 | |
| | | | | |
| | | | Food & Staples Retailing – 2.9% | | | | | | | | | | | | |
| | | | | |
| | 2,000 | | | Albersons Cos LLC/Safeway Inc/New Albertson’s Inc/Albertson’s LLC, 144A | | | 6.625% | | | | 6/15/24 | | | | B+ | | | | 1,985,000 | |
| | | | | |
| | 1,819 | | | Albertson’s, Inc. | | | 7.450% | | | | 8/01/29 | | | | B– | | | | 1,764,430 | |
| | | | | |
| | 2,000 | | | Pomegranate Merger Sub, Inc., 144A, (4) | | | 9.750% | | | | 5/01/23 | | | | B– | | | | 1,677,500 | |
| | | | | |
| | 1,750 | | | Rite Aid Corporation | | | 6.750% | | | | 6/15/21 | | | | B | | | | 1,797,250 | |
| | | | | |
| | 2,750 | | | Supervalu Inc., (4) | | | 7.750% | | | | 11/15/22 | | | | B– | | | | 2,674,375 | |
| | | | | |
| | 1,750 | | | Tops Holding LLC / Tops Markets II Corporation, 144A | | | 8.000% | | | | 6/15/22 | | | | CCC+ | | | | 1,437,187 | |
| | | | Total Food & Staples Retailing | | | | | | | | | | | | | | | 11,335,742 | |
| | | | | |
| | | | Food Products – 1.3% | | | | | | | | | | | | |
| | | | | |
| | 500 | | | JBS USA LLC, 144A | | | 7.250% | | | | 6/01/21 | | | | BB | | | | 499,750 | |
| | | | | |
| | 2,000 | | | Marfrig Holding Europe BV, 144A | | | 7.000% | | | | 3/15/24 | | | | BB– | | | | 1,932,500 | |
| | | | | |
| | 2,700 | | | Nova Austral SA, 144A, Reg S, (WI/DD) | | | 8.250% | | | | 5/26/21 | | | | N/R | | | | 2,723,625 | |
| | | | Total Food Products | | | | | | | | | | | | | | | 5,155,875 | |
| | | | | |
| | | | Health Care Equipment & Supplies – 0.9% | | | | | | | | | | | | |
| | | | | |
| | 1,000 | | | Tenet Healthcare Corporation, 144A, (4) | | | 7.500% | | | | 1/01/22 | | | | Ba3 | | | | 1,084,800 | |
| | | | | | | | | | | | | | | | | | | | |
Principal
Amount (000) (9) | | | Description (1) | | Coupon | | | Maturity | | | Ratings (6) | | | Value | |
| | | | | |
| | | | Health Care Equipment & Supplies (continued) | | | | | | | | | | | | |
| | | | | |
| $ | 2,250 | | | Tenet Healthcare Corporation | | | 6.000% | | | | 10/01/20 | | | | BB– | | | $ | 2,410,312 | |
| | | | Total Health Care Equipment & Supplies | | | | | | | | | | | | | | | 3,495,112 | |
| | | | | |
| | | | Health Care Providers & Services – 1.9% | | | | | | | | | | | | |
| | | | | |
| | 2,200 | | | Community Health Systems, Inc. | | | 6.875% | | | | 2/01/22 | | | | CCC+ | | | | 1,922,250 | |
| | | | | |
| | 1,775 | | | HCA Inc. | | | 5.250% | | | | 6/15/26 | | | | BBB– | | | | 1,914,337 | |
| | | | | |
| | 2,000 | | | Kindred Healthcare Inc. | | | 8.000% | | | | 1/15/20 | | | | B– | | | | 2,100,000 | |
| | | | | |
| | 1,500 | | | Kindred Healthcare Inc., (4) | | | 8.750% | | | | 1/15/23 | | | | B– | | | | 1,576,875 | |
| | | | Total Health Care Providers & Services | | | | | | | | | | | | | | | 7,513,462 | |
| | | | | |
| | | | Health Care Technology – 0.6% | | | | | | | | | | | | |
| | | | | |
| | 2,500 | | | Exela Intermediate LLC / Exela Financial Inc., 144A, (WI/DD) | | | 10.000% | | | | 7/15/23 | | | | B | | | | 2,468,750 | |
| | | | | |
| | | | Hotels, Restaurants & Leisure – 2.4% | | | | | | | | | | | | |
| | | | | |
| | 2,250 | | | 1011778 BC ULC/New Red Finance Inc., 144A | | | 4.250% | | | | 5/15/24 | | | | Ba3 | | | | 2,235,803 | |
| | | | | |
| | 3,100 | | | Grupo Posadas SAB de CV, 144A | | | 7.875% | | | | 6/30/22 | | | | B+ | | | | 3,200,750 | |
| | | | | |
| | 2,500 | | | Penn National Gaming Inc., 144A | | | 5.625% | | | | 1/15/27 | | | | B+ | | | | 2,546,875 | |
| | 1600 | CAD | | River Cree Enterprises LP, 144A | | | 11.000% | | | | 1/20/21 | | | | CCC+ | | | | 1,259,778 | |
| | | | Total Hotels, Restaurants & Leisure | | | | | | | | | | | | | | | 9,243,206 | |
| | | | | |
| | | | Household Durables – 2.1% | | | | | | | | | | | | |
| | | | | |
| | 3,950 | | | Beazer Homes USA, Inc. | | | 8.750% | | | | 3/15/22 | | | | B3 | | | | 4,404,250 | |
| | | | | |
| | 1,800 | | | New Home Company Inc., 144A | | | 7.250% | | | | 4/01/22 | | | | B– | | | | 1,863,000 | |
| | | | | |
| | 500 | | | Rent-A-Center, Inc., (4) | | | 4.750% | | | | 5/01/21 | | | | B3 | | | | 452,500 | |
| | | | | |
| | 1,500 | | | William Lyon Homes Incorporated | | | 5.875% | | | | 1/31/25 | | | | B– | | | | 1,545,000 | |
| | | | Total Household Durables | | | | | | | | | | | | | | | 8,264,750 | |
| | | | | |
| | | | Independent Power & Renewable Electricity Producers – 1.6% | | | | | | | | | | | | |
| | | | | |
| | 1,800 | | | Dynegy Inc., 144A, (4) | | | 8.000% | | | | 1/15/25 | | | | B+ | | | | 1,746,000 | |
| | | | | |
| | 1,000 | | | GenOn Energy Inc., (10) | | | 9.500% | | | | 10/15/18 | | | | Caa3 | | | | 605,000 | |
| | | | | |
| | 2,000 | | | NRG Energy Inc., (4) | | | 6.250% | | | | 5/01/24 | | | | BB– | | | | 2,020,000 | |
| | | | | |
| | 2,450 | | | Talen Energy Supply LLC, (4) | | | 6.500% | | | | 6/01/25 | | | | BB– | | | | 1,727,250 | |
| | | | Total Independent Power & Renewable Electricity Producers | | | | | | | | | | | | | | | 6,098,250 | |
| | | | | |
| | | | Industrial Conglomerates – 0.4% | | | | | | | | | | | | |
| | | | | |
| | 1,750 | | | Techniplas, LLC, 144A | | | 10.000% | | | | 5/01/20 | | | | B | | | | 1,505,000 | |
| | | | | |
| | | | Insurance – 0.4% | | | | | | | | | | | | |
| | | | | |
| | 1,500 | | | Genworth Financial Inc. | | | 7.625% | | | | 9/24/21 | | | | Ba3 | | | | 1,447,500 | |
| | | | | |
| | | | Internet Software & Services – 2.0% | | | | | | | | | | | | |
| | | | | |
| | 3,860 | | | Donnelley Financial Solutions, Inc. | | | 8.250% | | | | 10/15/24 | | | | B | | | | 4,091,600 | |
| | | | | |
| | 2,300 | | | Inception Merger Sub Inc / Rackspace Hosting Inc., 144A, (4) | | | 8.625% | | | | 11/15/24 | | | | BB– | | | | 2,449,500 | |
| | | | | |
| | 1,500 | | | Sungard Availability Services Capital, Inc., 144A | | | 8.750% | | | | 4/01/22 | | | | CCC | | | | 1,237,500 | |
| | | | Total Internet Software & Services | | | | | | | | | | | | | | | 7,778,600 | |
Nuveen High Income Bond Fund (continued)
| | |
| Portfolio of Investments | | June 30, 2017 |
| | | | | | | | | | | | | | | | | | | | |
Principal
Amount (000) (9) | | | Description (1) | | Coupon | | | Maturity | | | Ratings (6) | | | Value | |
| | | | | |
| | | | IT Services – 0.9% | | | | | | | | | | | | |
| | | | | |
| $ | 3,280 | | | Zayo Group LLC / Zayo Capital Inc. | | | 6.375% | | | | 5/15/25 | | | | B | | | $ | 3,540,334 | |
| | | | | |
| | | | Leisure Products – 0.5% | | | | | | | | | | | | |
| | | | | |
| | 1,750 | | | Gateway Casinos & Entertainment Limited, 144A | | | 8.250% | | | | 3/01/24 | | | | CCC+ | | | | 1,820,000 | |
| | | | | |
| | | | Machinery – 1.4% | | | | | | | | | | | | |
| | | | | |
| | 1,730 | | | Airxcel Incorporated, 144A | | | 8.500% | | | | 2/15/22 | | | | B | | | | 1,820,825 | |
| | | | | |
| | 1,500 | | | BlueLine Rental Finance Corp / BlueLine Rental LLC, 144A | | | 9.250% | | | | 3/15/24 | | | | B | | | | 1,560,000 | |
| | | | | |
| | 1,750 | | | CNH Industrial Capital LLC | | | 4.375% | | | | 11/06/20 | | | | BBB– | | | | 1,835,330 | |
| | | | Total Machinery | | | | | | | | | | | | | | | 5,216,155 | |
| | | | | |
| | | | Marine – 1.1% | | | | | | | | | | | | |
| | | | | |
| | 2,000 | | | Eletson Holdings Inc., 144A | | | 9.625% | | | | 1/15/22 | | | | B2 | | | | 1,640,000 | |
| | | | | |
| | 2,900 | | | Navios Maritime Acquisition Corporation, 144A | | | 8.125% | | | | 11/15/21 | | | | B | | | | 2,457,750 | |
| | | | Total Marine | | | | | | | | | | | | | | | 4,097,750 | |
| | | | | |
| | | | Media – 7.0% | | | | | | | | | | | | |
| | | | | |
| | 2,500 | | | CBS Radio, Inc., 144A, (4) | | | 7.250% | | | | 11/01/24 | | | | B– | | | | 2,575,000 | |
| | | | | |
| | 1,000 | | | CCO Holdings LLC Finance Corporation | | | 5.250% | | | | 9/30/22 | | | | BB+ | | | | 1,029,400 | |
| | | | | |
| | 1,850 | | | Charter Communications, CCO Holdings LLC | | | 5.125% | | | | 2/15/23 | | | | BB+ | | | | 1,908,969 | |
| | | | | |
| | 2,000 | | | Dish DBS Corporation | | | 6.750% | | | | 6/01/21 | | | | Ba3 | | | | 2,220,000 | |
| | | | | |
| | 925 | | | iHeartCommunications, Inc. | | | 11.250% | | | | 3/01/21 | | | | Caa1 | | | | 697,219 | |
| | | | | |
| | 1,950 | | | iHeartCommunications, Inc. | | | 7.250% | | | | 10/15/27 | | | | CC | | | | 721,500 | |
| | | | | |
| | 1,750 | | | Lee Enterprises Inc., 144A, (4) | | | 9.500% | | | | 3/15/22 | | | | B2 | | | | 1,802,500 | |
| | | | | |
| | 1,500 | | | McClatchy Company, (4) | | | 9.000% | | | | 12/15/22 | | | | B1 | | | | 1,552,500 | |
| | | | | |
| | 2,450 | | | McGraw-Hill Global Education Holdings, 144A, (4) | | | 7.875% | | | | 5/15/24 | | | | B3 | | | | 2,370,375 | |
| | | | | |
| | 3,350 | | | Numericable Group SA, 144A | | | 7.375% | | | | 5/01/26 | | | | B+ | | | | 3,634,750 | |
| | | | | |
| | 2,000 | | | Sirius XM Radio Inc., 144A | | | 5.375% | | | | 4/15/25 | | | | BB | | | | 2,067,500 | |
| | | | | |
| | 750 | | | SiTV Inc., 144A | | | 10.375% | | | | 7/01/19 | | | | CCC+ | | | | 528,750 | |
| | | | | |
| | 3150 | CAD | | Videotron Limited, 144A | | | 5.625% | | | | 6/15/25 | | | | BB | | | | 2,554,347 | |
| | | | | |
| | 3,000 | | | VTR Finance BV, 144A | | | 6.875% | | | | 1/15/24 | | | | BB– | | | | 3,180,000 | |
| | | | Total Media | | | | | | | | | | | | | | | 26,842,810 | |
| | | | | |
| | | | Metals & Mining – 4.9% | | | | | | | | | | | | |
| | | | | |
| | 1,000 | | | AK Steel Corporation, (4) | | | 7.000% | | | | 3/15/27 | | | | B– | | | | 1,032,500 | |
| | | | | |
| | 2,000 | | | Aleris International Inc., 144A | | | 9.500% | | | | 4/01/21 | | | | B | | | | 2,056,580 | |
| | | | | |
| | 1,000 | | | Allegheny Technologies Inc. | | | 7.875% | | | | 8/15/23 | | | | B | | | | 1,045,000 | |
| | | | | |
| | 500 | | | Ferroglobe PLC / Globe Specialty Metals Inc., 144A | | | 9.375% | | | | 3/01/22 | | | | B+ | | | | 537,500 | |
| | | | | |
| | 1,500 | | | FMG Resources, 144A | | | 5.125% | | | | 5/15/24 | | | | BB+ | | | | 1,500,000 | |
| | | | | |
| | 2,395 | | | Hudbay Minerals, Inc., 144A | | | 7.625% | | | | 1/15/25 | | | | B | | | | 2,508,762 | |
| | | | | |
| | 2,000 | | | IAMGOLD Corporation, 144A | | | 7.000% | | | | 4/15/25 | | | | B+ | | | | 2,060,000 | |
| | | | | |
| | 1,500 | | | New Gold Incorporated, 144A | | | 6.375% | | | | 5/15/25 | | | | B | | | | 1,545,000 | |
| | | | | |
| | 3,504 | | | Northland Resources AB, 144A, Reg S | | | 15.000% | | | | 7/15/19 | | | | N/R | | | | 35,044 | |
| | | | | | | | | | | | | | | | | | | | |
Principal
Amount (000) (9) | | | Description (1) | | Coupon | | | Maturity | | | Ratings (6) | | | Value | |
| | | | | |
| | | | Metals & Mining (continued) | | | | | | | | | | | | |
| | | | | |
| $ | 1,583 | | | Northland Resources AB, 144A, Reg S, (10) | | | 4.000% | | | | 10/15/20 | | | | N/R | | | $ | 16 | |
| | | | | |
| | 3,150 | | | SunCoke Energy Partners LP / SunCoke Energy Partners Finance Corp., 144A | | | 7.500% | | | | 6/15/25 | | | | BB– | | | | 3,110,625 | |
| | | | | |
| | 2,000 | | | Taseko Mines Limited, 144A | | | 8.750% | | | | 6/15/22 | | | | B– | | | | 1,995,000 | |
| | | | | |
| | 1,835 | | | Westmoreland Coal Co, 144A | | | 8.750% | | | | 1/01/22 | | | | CCC+ | | | | 1,614,800 | |
| | | | Total Metals & Mining | | | | | | | | | | | | | | | 19,040,827 | |
| | | | | |
| | | | Multiline Retail – 0.4% | | | | | | | | | | | | |
| | | | | |
| | 2,000 | | | J.C. Penney Company Inc. | | | 7.400% | | | | 4/01/37 | | | | B+ | | | | 1,515,000 | |
| | | | | |
| | | | Oil, Gas & Consumable Fuels – 10.0% | | | | | | | | | | | | |
| | | | | |
| | 2,529 | | | American Eagle Energy Corporation, 144A, (10) | | | 11.000% | | | | 9/01/19 | | | | N/R | | | | 25,289 | |
| | | | | |
| | 2,834 | | | Armstrong Energy Inc., (10) | | | 11.750% | | | | 12/15/19 | | | | Caa2 | | | | 1,133,600 | |
| | | | | |
| | 2,125 | | | Ascent Resources – Utica LLC / AEU Finance Corporation, 144A | | | 10.000% | | | | 4/01/22 | | | | B– | | | | 2,125,000 | |
| | | | | |
| | 2,150 | | | Bellatrix Exploration Limited, 144A | | | 8.500% | | | | 5/15/20 | | | | B | | | | 1,932,312 | |
| | | | | |
| | 1,500 | | | Bill Barrett Corporation, 144A | | | 8.750% | | | | 6/15/25 | | | | CCC+ | | | | 1,260,000 | |
| | | | | |
| | 1,500 | | | California Resources Corporation, 144A | | | 8.000% | | | | 12/15/22 | | | | CCC+ | | | | 948,750 | |
| | | | | |
| | 1,300 | | | Calumet Specialty Products | | | 6.500% | | | | 4/15/21 | | | | CCC+ | | | | 1,124,500 | |
| | | | | |
| | 1,100 | | | Calumet Specialty Products | | | 7.625% | | | | 1/15/22 | | | | CCC+ | | | | 962,500 | |
| | | | | |
| | 1,840 | | | Cheniere Corpus Christi Holdings, LLC | | | 5.875% | | | | 3/31/25 | | | | BB– | | | | 1,961,900 | |
| | | | | |
| | 1,000 | | | Chesapeake Energy Corporation, 144A, (4) | | | 8.000% | | | | 6/15/27 | | | | CCC | | | | 982,500 | |
| | | | | |
| | 2,650 | | | Chesapeake Energy Corporation | | | 6.875% | | | | 11/15/20 | | | | CCC | | | | 2,650,000 | |
| | | | | |
| | 1,875 | | | Clean Energy Fuels Corporation, 144A | | | 5.250% | | | | 10/01/18 | | | | N/R | | | | 1,846,875 | |
| | | | | |
| | 1,499 | | | Cloud Peak Energy Resources LLC and Cloud Peak Energy Finance Corporation | | | 12.000% | | | | 11/01/21 | | | | B– | | | | 1,543,970 | |
| | | | | |
| | 2,700 | | | Denbury Resources Inc., 144A | | | 9.000% | | | | 5/15/21 | | | | B | | | | 2,571,750 | |
| | | | | |
| | 2,000 | | | DOF Subsea AS, 144A | | | 9.500% | | | | 3/14/22 | | | | N/R | | | | 1,940,018 | |
| | | | | |
| | 750 | | | EP Energy LLC and Everest Acquisition Finance, Inc., 144A | | | 8.000% | | | | 2/15/25 | | | | Caa1 | | | | 558,750 | |
| | | | | |
| | 760 | | | Golden Close Maritime Corporation Limited, 144A, Reg S, (10) | | | 8.000% | | | | 3/29/22 | | | | N/R | | | | 691,206 | |
| | | | | |
| | — | (13) | | Golden Close Maritime Corporation Limited | | | 0.000% | | | | 3/29/22 | | | | N/R | | | | 22 | |
| | | | | |
| | 2,000 | | | Gulfport Energy Corporation, 144A | | | 6.375% | | | | 5/15/25 | | | | B+ | | | | 1,970,000 | |
| | | | | |
| | 1,425 | | | Halcon Resources Corporation, 144A, (4) | | | 6.750% | | | | 2/15/25 | | | | B– | | | | 1,282,500 | |
| | | | | |
| | 1,360 | | | Martin Mid-Stream Partners LP Finance | | | 7.250% | | | | 2/15/21 | | | | B– | | | | 1,373,600 | |
| | | | | |
| | 2,704 | | | Metro Exploration Holding Inc., (10) | | | 11.500% | | | | 2/16/20 | | | | N/R | | | | 270 | |
| | | | | |
| | 1,050 | | | Oasis Petroleum Inc., (4) | | | 6.875% | | | | 3/15/22 | | | | B+ | | | | 1,018,500 | |
| | | | | |
| | 1,000 | | | PBF Holding Company LLC, 144A | | | 7.250% | | | | 6/15/25 | | | | BB | | | | 963,750 | |
| | | | | |
| | 3,000 | | | Peabody Energy Corporation, (3) | | | 6.500% | | | | 9/15/20 | | | | N/R | | | | — | |
| | | | | |
| | 1,350 | | | Petrobras Global Finance BV | | | 6.250% | | | | 3/17/24 | | | | BB | | | | 1,375,650 | |
| | | | | |
| | 2,750 | | | Petrobras Global Finance BV | | | 7.375% | | | | 1/17/27 | | | | BB | | | | 2,909,500 | |
| | | | | |
| | 1,952 | | | Talos Production LLC, 144A | | | 9.750% | | | | 2/15/18 | | | | N/R | | | | 1,239,520 | |
| | | | | |
| | 2,250 | | | Ultra Resources, Inc., 144A | | | 7.125% | | | | 4/15/25 | | | | BB | | | | 2,219,063 | |
| | | | Total Oil, Gas & Consumable Fuels | | | | | | | | | | | | | | | 38,611,295 | |
Nuveen High Income Bond Fund (continued)
| | |
| Portfolio of Investments | | June 30, 2017 |
| | | | | | | | | | | | | | | | | | | | |
Principal
Amount (000) (9) | | | Description (1) | | Coupon | | | Maturity | | | Ratings (6) | | | Value | |
| | | | | |
| | | | Paper & Forest Products – 1.2% | | | | | | | | | | | | |
| | | | | |
| $ | 1,750 | | | Mercer International Inc., 144A | | | 6.500% | | | | 2/01/24 | | | | BB– | | | $ | 1,827,332 | |
| | | | | |
| | 781 | | | Millar Western Forest Products Ltd | | | 9.000% | | | | 4/30/22 | | | | N/R | | | | 769,285 | |
| | | | | |
| | 2,000 | | | Resolute Forest Products, (4) | | | 5.875% | | | | 5/15/23 | | | | B+ | | | | 1,947,500 | |
| | | | Total Paper & Forest Products | | | | | | | | | | | | | | | 4,544,117 | |
| | | | | |
| | | | Pharmaceuticals – 0.7% | | | | | | | | | | | | |
| | | | | |
| | 2,700 | | | VP Escrow Corporation, 144A, (4) | | | 6.375% | | | | 10/15/20 | | | | B– | | | | 2,615,625 | |
| | | | | |
| | | | Real Estate Management & Development – 1.7% | | | | | | | | | | | | |
| | | | | |
| | 2,000 | | | AV Homes, Inc., 144A | | | 6.625% | | | | 5/15/22 | | | | B– | | | | 2,062,500 | |
| | | | | |
| | 2,750 | | | Crescent Communities LLC, 144A | | | 8.875% | | | | 10/15/21 | | | | B+ | | | | 2,887,500 | |
| | | | | |
| | 1,500 | | | Hunt Companies Inc., 144A | | | 9.625% | | | | 3/01/21 | | | | N/R | | | | 1,582,500 | |
| | | | Total Real Estate Management & Development | | | | | | | | | | | | | | | 6,532,500 | |
| | | | | |
| | | | Road & Rail – 2.1% | | | | | | | | | | | | |
| | | | | |
| | 2,000 | | | Avis Budget Car Rental, 144A, (4) | | | 5.125% | | | | 6/01/22 | | | | BB– | | | | 1,980,000 | |
| | | | | |
| | 2,180 | | | Herc Rentals, Inc., 144A | | | 7.500% | | | | 6/01/22 | | | | B+ | | | | 2,299,900 | |
| | | | | |
| | 2,000 | | | The Hertz Corporation, (4) | | | 5.875% | | | | 10/15/20 | | | | B– | | | | 1,935,000 | |
| | | | | |
| | 1,950 | | | The Hertz Corporation, (4) | | | 6.250% | | | | 10/15/22 | | | | B– | | | | 1,701,375 | |
| | | | Total Road & Rail | | | | | | | | | | | | | | | 7,916,275 | |
| | | | | |
| | | | Software – 0.1% | | | | | | | | | | | | |
| | | | | |
| | 180 | | | SS&C Technologies Holdings, Inc. | | | 5.875% | | | | 7/15/23 | | | | B+ | | | | 191,738 | |
| | | | | |
| | | | Specialty Retail – 0.9% | | | | | | | | | | | | |
| | | | | |
| | 1,500 | | | Neiman Marcus Group Inc., 144A | | | 8.750% | | | | 10/15/21 | | | | Caa3 | | | | 720,000 | |
| | | | | |
| | 1,000 | | | PetSmart, Inc., 144A | | | 8.875% | | | | 6/01/25 | | | | B– | | | | 923,600 | |
| | | | | |
| | 2,000 | | | The Men’s Warehouse Inc., (4) | | | 7.000% | | | | 7/01/22 | | | | B3 | | | | 1,750,000 | |
| | | | Total Specialty Retail | | | | | | | | | | | | | | | 3,393,600 | |
| | | | | |
| | | | Technology Hardware, Storage & Peripherals – 0.7% | | | | | | | | | | | | |
| | | | | |
| | 2,350 | | | Western Digital Corporation | | | 10.500% | | | | 4/01/24 | | | | BB+ | | | | 2,772,248 | |
| | | | | |
| | | | Tobacco – 0.4% | | | | | | | | | | | | |
| | | | | |
| | 1,500 | | | Vector Group Limited, 144A | | | 6.125% | | | | 2/01/25 | | | | BB– | | | | 1,558,125 | |
| | | | | |
| | | | Trading Companies & Distributors – 0.3% | | | | | | | | | | | | |
| | | | | |
| | 1,250 | | | Avation Capital SA, 144A | | | 7.500% | | | | 5/27/20 | | | | B+ | | | | 1,256,250 | |
| | | | | |
| | | | Transportation Infrastructure – 0.5% | | | | | | | | | | | | |
| | | | | |
| | 1,900 | | | Navigator Holdings Limited, Reg S | | | 7.750% | | | | 2/10/21 | | | | N/R | | | | 1,890,500 | |
| | | | | |
| | | | Wireless Telecommunication Services – 2.2% | | | | | | | | | | | | |
| | | | | |
| | 2,000 | | | Altice Financing SA, 144A | | | 7.500% | | | | 5/15/26 | | | | BB– | | | | 2,220,000 | |
| | | | | |
| | 2,500 | | | Digicel Limited, 144A | | | 6.000% | | | | 4/15/21 | | | | B1 | | | | 2,396,875 | |
| | | | | |
| | 1,000 | | | Inmarsat Finance PLC, 144A | | | 4.875% | | | | 5/15/22 | | | | BB+ | | | | 1,015,000 | |
| | | | | |
| | 1,000 | | | Millicom International Cellular SA, 144A | | | 6.000% | | | | 3/15/25 | | | | BB+ | | | | 1,049,420 | |
| | | | | |
| | 1,000 | | | Sprint Communications Inc. | | | 7.000% | | | | 8/15/20 | | | | B+ | | | | 1,100,000 | |
| | | | | | | | | | | | | | | | | | | | |
Principal
Amount (000) (9) | | | Description (1) | | Coupon | | | Maturity | | | Ratings (6) | | | Value | |
| | | | | |
| | | | Wireless Telecommunication Services (continued) | | | | | | | | | | | | |
| | | | | |
| $ | 500 | | | Wind Acquisition Finance SA, 144A | | | 7.375% | | | | 4/23/21 | | | | B | | | $ | 520,000 | |
| | | | Total Wireless Telecommunication Services | | | | | | | | | | | | | | | 8,301,295 | |
| | | | Total Corporate Bonds (cost $323,499,408) | | | | | | | | | | | | | | | 309,821,340 | |
| | | | | |
Principal
Amount (000) | | | Description (1) | | Coupon | | | Maturity | | | Ratings (6) | | | Value | |
| | | | | |
| | | | $1,000 PAR (OR SIMILAR) INSTITUTIONAL PREFERRED – 2.9% | | | | | | | | | | | | | | | | |
| | | | | |
| | | | Commercial Services & Supplies – 0.7% | | | | | | | | | | | | |
| | | | | |
| $ | 2,500 | | | AerCap Global Aviation Trust, (4) | | | 6.500% | | | | 6/15/45 | | | | BB | | | $ | 2,656,250 | |
| | | | | |
| | | | Electric Utilities – 0.1% | | | | | | | | | | | | |
| | | | | |
| | 300 | | | DCP Midstream Operating LP, 144A | | | 5.850% | | | | 5/21/43 | | | | BB– | | | | 277,500 | |
| | | | | |
| | | | Food Products – 1.7% | | | | | | | | | | | | |
| | | | | |
| | 2,000 | | | Dairy Farmers of America Inc., 144A | | | 7.125% | | | | N/A (11) | | | | Baa3 | | | | 2,232,500 | |
| | | | | |
| | 2,000 | | | Land O’ Lakes Incorporated, 144A | | | 8.000% | | | | N/A (11) | | | | BB | | | | 2,195,000 | |
| | | | | |
| | 2,000 | | | Land O’ Lakes Incorporated, 144A | | | 7.250% | | | | N/A (11) | | | | BB | | | | 2,137,500 | |
| | 6,000 | | | Total Food Products | | | | | | | | | | | | | | | 6,565,000 | |
| | | | | |
| | | | Industrial Conglomerates – 0.0% | | | | | | | | | | | | |
| | | | | |
| | 2,000 | | | OAS Financial Limited, 144A | | | 8.875% | | | | N/A (11) | | | | N/R | | | | 100,000 | |
| | | | | |
| | | | Wireless Telecommunication Services – 0.4% | | | | | | | | | | | | |
| | | | | |
| | 1,500 | | | Colombia Telecommunicaciones S.A. ESP, 144A | | | 8.500% | | | | N/A (11) | | | | B | | | | 1,556,250 | |
| $ | 12,300 | | | Total $1,000 Par (or similar) Institutional Preferred (cost $12,422,814) | | | | | | | | | | | | | | | 11,155,000 | |
| | | | | |
Principal
Amount (000) | | | Description (1) | | Coupon | | | Maturity | | | Ratings (6) | | | Value | |
| | | | | |
| | | | CONTINGENT CAPITAL SECURITIES – 2.7% (12) | | | | | | | | | | | | | | | | |
| | | | | |
| | | | Banks – 1.8% | | | | | | | | | | | | |
| | | | | |
| $ | 2,000 | | | Intesa Sanpaolo SpA, 144A | | | 7.700% | | | | N/A (11) | | | | Ba3 | | | $ | 2,077,500 | |
| | | | | |
| | 1,600 | | | Societe Generale, 144A | | | 7.375% | | | | N/A (11) | | | | BB+ | | | | 1,720,000 | |
| | | | | |
| | 3,000 | | | UniCredit SpA, Reg S | | | 8.000% | | | | N/A (11) | | | | BB– | | | | 3,080,748 | |
| | 6,600 | | | Total Banks | | | | | | | | | | | | | | | 6,878,248 | |
| | | | | |
| | | | Capital Markets – 0.9% | | | | | | | | | | | | |
| | | | | |
| | 3,600 | | | Deutsche Bank AG, Reg S | | | 6.250% | | | | N/A (11) | | | | BB | | | | 3,545,698 | |
| $ | 10,200 | | | Total Contingent Capital Securities (cost $9,526,566) | | | | | | | | | | | | | | | 10,423,946 | |
| | | | | |
Principal
Amount (000) | | | Description (1) | | | | | | | | Ratings (6) | | | Value | |
| | | | | |
| | | | ASSET-BACKED SECURITIES – 0.0% | | | | | | | | | | | | |
| | | | | |
| $ | — | (13) | | Green Tree Financial Corporation, Manufactured Housing Contract Pass Through Certificates, Series 1998-1 | | | 6.040% | | | | 11/01/29 | | | | AAA | | | $ | 138 | |
| $ | — | (13) | | Total Asset-Backed Securities (cost $138) | | | | | | | | | | | | | | | 138 | |
Nuveen High Income Bond Fund (continued)
| | |
| Portfolio of Investments | | June 30, 2017 |
| | | | | | | | | | | | | | | | | | | | |
| Shares | | | Description (1), (14) | | | | | | | | | | | Value | |
| | | | | |
| | | | INVESTMENT COMPANIES – 2.2% | | | | | | | | | | | | |
| | | | | |
| | 12,000 | | | Adams Natural Resources Fund Inc. | | | | | | | | | | | | | | $ | 224,400 | |
| | | | | |
| | 94,000 | | | Blackrock Credit Allocation Income Trust IV | | | | | | | | | | | | | | | 1,264,300 | |
| | | | | |
| | 129,500 | | | First Trust Strategic High Income Fund II | | | | | | | | | | | | | | | 1,767,675 | |
| | | | | |
| | 7,000 | | | Gabelli Global Gold Natural Resources and Income Trust | | | | | | | | | | | | | | | 38,570 | |
| | | | | |
| | 157,500 | | | Invesco Dynamic Credit Opportunities Fund, (4) | | | | | | | | | | | | | | | 1,891,575 | |
| | | | | |
| | 106,500 | | | Pimco Income Strategy Fund | | | | | | | | | | | | | | | 1,257,765 | |
| | | | | |
| | 71,000 | | | Pioneer Floating Rate Trust | | | | | | | | | | | | | | | 844,900 | |
| | | | | |
| | 48,421 | | | Western Asset Emerging Market Debt Fund Incorporated | | | | | | | | | | | | | | | 753,915 | |
| | | | | |
| | 34,351 | | | WhiteHorse Finance Incorporated | | | | | | | | | | | | | | | 459,273 | |
| | | | Total Investment Companies (cost $8,091,585) | | | | | | | | | | | | | | | 8,502,373 | |
| | | | | |
| Shares | | | Description (1) | | | | | | | | | | | Value | |
| | | | | |
| | | | WARRANTS – 0.0% | | | | | | | | | | | | | | | | |
| | | | | |
| | | | Energy – 0.0% | | | | | | | | | | | | |
| | | | | |
| | 336,891 | | | Iona Energy Inc., (3) | | | | | | | | | | | | | | $ | — | |
| | | | | |
| | | | Materials – 0.0% | | | | | | | | | | | | |
| | | | | |
| | 3,165 | | | Verso Corporation, (5) | | | | | | | | | | | | | | | 475 | |
| | | | | |
| | | | Telecommunication Services – 0.0% | | | | | | | | | | | | |
| | | | | |
| | 6,706 | | | FairPoint Communications Inc., (5) | | | | | | | | | | | | | | | 101 | |
| | | | | |
| | | | Transportation – 0.0% | | | | | | | | | | | | |
| | | | | |
| | 8,907 | | | Jack Cooper Enterprises, Warrants, 144A, (3) | | | | | | | | | | | | | | | — | |
| | | | Total Warrants (cost $0) | | | | | | | | | | | | | | | 576 | |
| | | | Total Long-Term Investments (cost $383,947,244) | | | | | | | | | | | | | | | 368,027,163 | |
| | | | | |
| Shares | | | Description (1) | | Coupon | | | | | | | | | Value | |
| | | | |
| | | | INVESTMENTS PURCHASED WITH COLLATERAL FROM SECURITIES LENDING – 12.3% | | | | | | | | | | | | | |
| | | | | |
| | | | Money Market Funds – 12.3% | | | | | | | | | | | | |
| | | | | |
| | 47,531,423 | | | First American Government Obligations Fund, Class X, (16) | | | 0.883% (15) | | | | | | | | | | | $ | 47,531,423 | |
| | | | Total Investments Purchased with Collateral from Securities Lending (cost $47,531,423) | | | | | | | | | | | | 47,531,423 | |
| | | | | |
| Shares | | | Description (1) | | Coupon | | | | | | | | | Value | |
| | | | | |
| | | | SHORT-TERM INVESTMENTS – 2.9% | | | | | | | | | | | | | | | | |
| | | | | |
| | | | Money Market Funds – 2.9% | | | | | | | | | | | | |
| | | | | |
| | 11,297,772 | | | First American Treasury Obligations Fund, Class Z | | | 0.847% (15) | | | | | | | | | | | $ | 11,297,772 | |
| | | | Total Short-Term Investments (cost $11,297,772) | | | | | | | | | | | | | | | 11,297,772 | |
| | | | Total Investments (cost $442,776,439) – 110.7% | | | | | | | | | | | | | | | 426,856,358 | |
| | | | Other Assets Less Liabilities – (10.7)% (17) | | | | | | | | | | | | | | | (41,091,887 | ) |
| | | | Net Assets – 100% | | | | | | | | | | | | | | $ | 385,764,471 | |
Investments in Derivatives as of June 30, 2017
Forward Foreign Currency Exchange Contracts
| | | | | | | | | | | | | | | | | | | | | | |
| Counterparty | | Currency Contracts to Deliver | | Notional
Amount
(Local Currency) | | | In Exchange
For Currency | | | Notional
Amount
(Local Currency) | | | Settlement
Date | | | Unrealized
Appreciation
(Depreciation)
(U.S. Dollars) | |
| Goldman Sacks Bank USA | | Canadian Dollar | | | 4,243,000 | | | | U.S. Dollar | | | | 3,090,989 | | | | 7/11/17 | | | $ | (182,075 | ) |
Futures Contracts
| | | | | | | | | | | | | | | | | | | | | | | | |
| Description | | Contract
Position | | | Number of
Contracts | | | Contract
Expiration | | | Notional
Amount
at Value | | | Variation Margin
Receivable/
(Payable) | | | Unrealized
Appreciation
(Depreciation) | |
U.S. Treasury 10-Year Note | | | Long | | | | 20 | | | | 9/17 | | | $ | 2,510,625 | | | $ | (5,625 | ) | | $ | (2,863 | ) |
For Fund portfolio compliance purposes, the Fund’s industry classifications refer to any one or more of the industry sub-classifications used by one or more widely recognized market indexes or ratings group indexes, and/or as defined by Fund management. This definition may not apply for purposes of this report, which may combine industry sub-classifications into sectors for reporting ease.
| (1) | All percentages shown in the Portfolio of Investments are based on net assets. |
| (2) | Non-income producing; issuer has not declared a dividend within the past twelve months. |
| (3) | Investment valued at fair value using methods determined in good faith by, or at the discretion of the Board. For fair value measurement disclosure purposes, investment classified as Level 3. See Notes to Financial Statements, Note 2 – Investment Valuation and Fair Value Measurements for more information. |
| (4) | Investment, or a portion of investment, is out on loan for securities lending. The total value of the securities out on loan as of the end of the reporting period was $44,088,463. |
| (5) | For fair value measurement disclosure purposes, investment classified as Level 2. See Notes to Financial Statements, Note 2 – Investment Valuation and Fair Value Measurements for more information. |
| (6) | For financial reporting purposes, the ratings disclosed are the highest of Standard & Poor’s Group (“Standard & Poor’s”), Moody’s Investors Service, Inc. (“Moody’s”) or Fitch, Inc. (“Fitch”) rating. This treatment of split-rated securities may differ from that used for other purposes, such as for Fund investment policies. Ratings below BBB by Standard & Poor’s, Baa by Moody’s or BBB by Fitch are considered to be below investment grade. Holdings designated N/R are not rated by any of these national rating agencies. Ratings not covered by the report of independent registered public accounting firm. |
| (7) | Senior loans generally are subject to mandatory and/or optional prepayment. Because of these mandatory prepayment conditions and because there may be significant economic incentives for a borrower to prepay, prepayments of senior loans may occur. As a result, the actual remaining maturity of senior loans held may be substantially less than the stated maturities shown. |
| (8) | Senior loans generally pay interest at rates which are periodically adjusted by reference to a base short-term, floating lending rate plus an assigned fixed rate. These floating lending rates are generally (i) the lending rate referenced by the London Inter-Bank Offered Rate (“LIBOR”), or (ii) the prime rate offered by one or more major United States banks. Senior loans may be considered restricted in that the Fund ordinarily is contractually obligated to receive approval from the Agent Bank and/or borrower prior to the disposition of a senior loan. The rate shown is the coupon as of the end of the reporting period. |
| (9) | Principal Amount (000) denominated in U.S. Dollars, unless otherwise noted. |
| (10) | As of, or subsequent to, the end of the reporting period, this security is non-income producing. Non-income producing, in the case of a fixed-income security, generally denotes that the issuer has (1) defaulted on the payment of principal or interest, (2) is under the protection of the Federal Bankruptcy Court or (3) the Fund’s Adviser has concluded that the issue is not likely to meet its future interest payment obligations and has ceased accruing additional income on the Fund’s records. |
| (11) | Perpetual security. Maturity date is not applicable. |
| (12) | Contingent Capital Securities (“CoCos”) are hybrid securities with loss absorption characteristics built into the terms of the security for the benefit of the issuer. For example, the terms may specify an automatic write-down of principal or a mandatory conversion into the issuer’s common stock under certain adverse circumstances, such as the issuer’s capital ratio falling below a specified level. |
| (13) | Principal Amount (000) rounds to less than $1,000. |
| (14) | A copy of the most recent financial statements for these investment companies can be obtained directly from the Securities and Exchange Commission on its website at http://www.sec.gov. |
| (15) | The rate shown is the annualized seven-day subsidized yield as of the end of the reporting period. |
| (16) | The Fund may loan securities representing up to one third of the fair value of its total assets (which includes collateral for securities on loan) to broker-dealers, banks and other institutions. |
| | The Fund maintains collateral equal to at least 100% of the fair value of the securities loaned. The cash collateral received by the Fund is invested in this money market fund. See Notes to Financial Statements, Note 3 – Portfolio Securities and Investments in Derivatives, Securities Lending for more information. |
| (17) | Other assets less liabilities includes the unrealized appreciation (depreciation) of certain over-the-counter (“OTC”) derivatives as presented on the Statement of Assets and Liabilities, when applicable. The unrealized appreciation (depreciation) of OTC-cleared and exchange-traded derivatives is recognized as part of the cash collateral at brokers and/or receivable or payable for variation margin as presented on the Statement of Assets and Liabilities, when applicable. |
| (WI/DD) | Investment, or portion of investment, purchased on a when-issued or delayed delivery basis. |
| Reg S | Regulation S allows U.S. companies to sell securities to persons or entities located outside of the United States without registering those securities with the Securities and Exchange Commission. Specifically, Regulation S provides a safe harbor from the registration requirements of the Securities Act for the offers and sales of securities by both foreign and domestic issuers that are made outside the United States. |
| 144A | Investment is exempt from registration under Rule 144A of the Securities Act of 1933, as amended. These investments may only be resold in transactions exempt from registration, which are normally those transactions with qualified institutional buyers. |
See accompanying notes to financial statements.
Nuveen Inflation Protected Securities Fund
| | |
| Portfolio of Investments | | June 30, 2017 |
| | | | | | | | | | | | | | | | | | | | |
| Shares | | | Description (1) | | Coupon | | | | | | Ratings (2) | | | Value | |
| | | | | |
| | | | LONG-TERM INVESTMENTS – 98.9% | | | | | | | | | | | | | | | | |
| | | | |
| | | | CONVERTIBLE PREFERRED SECURITIES – 0.0% | | | | | | | | | | | | | |
| | | | | |
| | | | Banks – 0.0% | | | | | | | | | | | | |
| | | | | |
| | 200 | | | Bank of America Corporation | | | 7.250% | | | | | | | | BB+ | | | $ | 252,398 | |
| | | | Total Convertible Preferred Securities (cost $174,350) | | | | | | | | 252,398 | |
| | | | | |
Principal
Amount (000) | | | Description (1) | | Coupon | | | Maturity | | | Ratings (2) | | | Value | |
| | | | | |
| | | | CORPORATE BONDS – 3.8% | | | | | | | | | | | | | | | | |
| | | | | |
| | | | Airlines – 0.1% | | | | | | | | | | | | |
| | | | | |
| $ | 372 | | | American Airlines Inc., Pass Through Trust 2013-2B, 144A | | | 5.600% | | | | 7/15/20 | | | | BBB– | | | $ | 388,776 | |
| | | | | |
| | | | Auto Components – 0.1% | | | | | | | | | | | | |
| | | | | |
| | 300 | | | American & Axle Manufacturing Inc., (3) | | | 6.625% | | | | 10/15/22 | | | | BB– | | | | 307,500 | |
| | | | | |
| | 300 | | | Tenneco Inc. | | | 5.375% | | | | 12/15/24 | | | | BB+ | | | | 309,750 | |
| | 600 | | | Total Auto Components | | | | | | | | | | | | | | | 617,250 | |
| | | | | |
| | | | Automobiles – 0.1% | | | | | | | | | | | | |
| | | | | |
| | 465 | | | General Motors Corporation | | | 4.000% | | | | 4/01/25 | | | | BBB | | | | 466,775 | |
| | | | | |
| | | | Banks – 0.1% | | | | | | | | | | | | |
| | | | | |
| | 129 | | | CIT Group Inc., 144A | | | 5.500% | | | | 2/15/19 | | | | BB+ | | | | 135,450 | |
| | | | | |
| | 170 | | | CIT Group Inc. | | | 5.000% | | | | 8/01/23 | | | | BB+ | | | | 183,175 | |
| | 299 | | | Total Banks | | | | | | | | | | | | | | | 318,625 | |
| | | | | |
| | | | Building Products – 0.0% | | | | | | | | | | | | |
| | | | | |
| | 250 | | | Owens Corning Incorporated | | | 4.200% | | | | 12/15/22 | | | | BBB | | | | 263,739 | |
| | | | | |
| | | | Chemicals – 0.2% | | | | | | | | | | | | |
| | | | | |
| | 515 | | | CF Industries Inc., (3) | | | 3.450% | | | | 6/01/23 | | | | BB+ | | | | 486,675 | |
| | | | | |
| | 250 | | | NOVA Chemicals Corporation, 144A | | | 5.250% | | | | 8/01/23 | | | | BBB– | | | | 256,875 | |
| | | | | |
| | 400 | | | PolyOne Corporation | | | 5.250% | | | | 3/15/23 | | | | BB– | | | | 420,000 | |
| | 1,165 | | | Total Chemicals | | | | | | | | | | | | | | | 1,163,550 | |
| | | | | |
| | | | Commercial Services & Supplies – 0.2% | | | | | | | | | | | | |
| | | | | |
| | 512 | | | Covanta Energy Corporation, Synthetic Letter of Credit | | | 6.375% | | | | 10/01/22 | | | | B1 | | | | 527,360 | |
| | | | | |
| | 400 | | | R.R. Donnelley & Sons Company | | | 7.875% | | | | 3/15/21 | | | | B+ | | | | 433,000 | |
| | 912 | | | Total Commercial Services & Supplies | | | | | | | | | | | | | | | 960,360 | |
| | | | | |
| | | | Construction & Engineering – 0.1% | | | | | | | | | | | | |
| | | | | |
| | 500 | | | AECOM Technology Corporation | | | 5.750% | | | | 10/15/22 | | | | BB | | | | 523,125 | |
| | | | | |
| | | | Construction Materials – 0.1% | | | | | | | | | | | | |
| | | | | |
| | 300 | | | Cemex SAB de CV, 144A | | | 5.700% | | | | 1/11/25 | | | | BB– | | | | 318,375 | |
| | | | | |
| | 130 | | | Norbord Inc., 144A | | | 5.375% | | | | 12/01/20 | | | | Ba1 | | | | 136,500 | |
| | | | | | | | | | | | | | | | | | | | |
Principal
Amount (000) | | | Description (1) | | Coupon | | | Maturity | | | Ratings (2) | | | Value | |
| | | | | |
| | | | Construction Materials (continued) | | | | | | | | | | | | |
| | | | | |
| $ | 250 | | | Norbord Inc., 144A | | | 6.250% | | | | 4/15/23 | | | | Ba1 | | | $ | 266,875 | |
| | 680 | | | Total Construction Materials | | | | | | | | | | | | | | | 721,750 | |
| | | | | |
| | | | Containers & Packaging – 0.0% | | | | | | | | | | | | |
| | | | | |
| | 175 | | | Graphic Packaging International Inc. | | | 4.875% | | | | 11/15/22 | | | | BB+ | | | | 185,500 | |
| | | | | |
| | | | Diversified Financial Services – 0.0% | | | | | | | | | | | | |
| | | | | |
| | 90 | | | Nationstar Mortgage LLC Capital Corporation | | | 7.875% | | | | 10/01/20 | | | | B+ | | | | 92,475 | |
| | | | | |
| | | | Diversified Telecommunication Services – 0.8% | | | | | | | | | | | | |
| | | | | |
| | 400 | | | CenturyLink Inc. | | | 5.625% | | | | 4/01/20 | | | | BB+ | | | | 423,124 | |
| | | | | |
| | 200 | | | CenturyLink Inc. | | | 6.750% | | | | 12/01/23 | | | | BB+ | | | | 215,376 | |
| | | | | |
| | 400 | | | GCI Inc. | | | 6.875% | | | | 4/15/25 | | | | BB– | | | | 432,500 | |
| | | | | |
| | 750 | | | Qualitytech LP/QTS Finance Corp. | | | 5.875% | | | | 8/01/22 | | | | BB | | | | 780,938 | |
| | | | | |
| | 3,060 | | | SBA Tower Trust, 144A | | | 3.598% | | | | 4/15/43 | | | | BBB | | | | 3,060,981 | |
| | 4,810 | | | Total Diversified Telecommunication Services | | | | | | | | | | | | | | | 4,912,919 | |
| | | | | |
| | | | Electrical Equipment – 0.1% | | | | | | | | | | | | |
| | | | | |
| | 520 | | | Park Aerospace Holdings Limited, 144A | | | 5.500% | | | | 2/15/24 | | | | BB | | | | 543,140 | |
| | | | | |
| | | | Energy Equipment & Services – 0.1% | | | | | | | | | | | | |
| | | | | |
| | 500 | | | Regency Energy Partners Finance | | | 6.500% | | | | 7/15/21 | | | | BBB– | | | | 510,000 | |
| | | | | |
| | | | Equity Real Estate Investment Trusts – 0.1% | | | | | | | | | | | | |
| | | | | |
| | 200 | | | Realogy Group LLC / Realogy Co-Issuer Corporation, 144A | | | 5.250% | | | | 12/01/21 | | | | B+ | | | | 209,600 | |
| | | | | |
| | 400 | | | Vereit Operating Partner | | | 3.000% | | | | 2/06/19 | | | | BBB– | | | | 403,676 | |
| | 600 | | | Total Equity Real Estate Investment Trusts | | | | | | | | | | | | | | | 613,276 | |
| | | | | |
| | | | Health Care Providers & Services – 0.4% | | | | | | | | | | | | |
| | | | | |
| | 200 | | | Community Health Systems, Inc., (3) | | | 5.125% | | | | 8/01/21 | | | | BB | | | | 202,500 | |
| | | | | |
| | 500 | | | HCA Inc. | | | 4.250% | | | | 10/15/19 | | | | BBB– | | | | 518,750 | |
| | | | | |
| | 1,715 | | | Mayo Clinic Rochester | | | 3.774% | | | | 11/15/43 | | | | AA | | | | 1,705,214 | |
| | 2,415 | | | Total Health Care Providers & Services | | | | | | | | | | | | | | | 2,426,464 | |
| | | | | |
| | | | Hotels, Restaurants & Leisure – 0.1% | | | | | | | | | | | | |
| | | | | |
| | 475 | | | 1011778 BC ULC/New Red Finance Inc., 144A | | | 4.250% | | | | 5/15/24 | | | | Ba3 | | | | 472,003 | |
| | | | | |
| | 200 | | | Wynn Macau Limited, 144A | | | 5.250% | | | | 10/15/21 | | | | B1 | | | | 205,000 | |
| | 675 | | | Total Hotels, Restaurants & Leisure | | | | | | | | | | | | | | | 677,003 | |
| | | | | |
| | | | Household Durables – 0.2% | | | | | | | | | | | | |
| | | | | |
| | 450 | | | Brookfield Residential Properties Inc., 144A | | | 6.500% | | | | 12/15/20 | | | | B+ | | | | 464,625 | |
| | | | | |
| | 250 | | | CalAtlantic Group Inc. | | | 5.875% | | | | 11/15/24 | | | | BB | | | | 270,938 | |
| | | | | |
| | 400 | | | Rialto Holdings LLC-Rialto Corporation, 144A | | | 7.000% | | | | 12/01/18 | | | | B1 | | | | 406,000 | |
| | 1,100 | | | Total Household Durables | | | | | | | | | | | | | | | 1,141,563 | |
| | | | | |
| | | | Internet Software & Services – 0.1% | | | | | | | | | | | | |
| | | | | |
| | 500 | | | Donnelley Financial Solutions, Inc. | | | 8.250% | | | | 10/15/24 | | | | B | | | | 530,000 | |
Nuveen Inflation Protected Securities Fund (continued)
| | |
| Portfolio of Investments | | June 30, 2017 |
| | | | | | | | | | | | | | | | | | | | |
Principal
Amount (000) | | | Description (1) | | Coupon | | | Maturity | | | Ratings (2) | | | Value | |
| | | | | |
| | | | Media – 0.1% | | | | | | | | | | | | |
| | | | | |
| $ | 200 | | | Charter Communications, CCO Holdings LLC | | | 5.125% | | | | 2/15/23 | | | | BB+ | | | $ | 206,375 | |
| | | | | |
| | 300 | | | Dish DBS Corporation | | | 4.250% | | | | 4/01/18 | | | | Ba3 | | | | 303,846 | |
| | | | | |
| | 200 | | | Numericable Group SA, 144A | | | 6.000% | | | | 5/15/22 | | | | B+ | | | | 209,250 | |
| | 700 | | | Total Media | | | | | | | | | | | | | | | 719,471 | |
| | | | | |
| | | | Metals & Mining – 0.1% | | | | | | | | | | | | |
| | | | | |
| | 550 | | | Hudbay Minerals, Inc., 144A | | | 7.250% | | | | 1/15/23 | | | | B | | | | 567,187 | |
| | | | | |
| | | | Oil, Gas & Consumable Fuels – 0.2% | | | | | | | | | | | | |
| | | | | |
| | 215 | | | Calumet Specialty Products | | | 7.625% | | | | 1/15/22 | | | | CCC+ | | | | 188,125 | |
| | | | | |
| | 550 | | | Cheniere Corpus Christi Holdings, LLC | | | 5.875% | | | | 3/31/25 | | | | BB– | | | | 586,438 | |
| | | | | |
| | 200 | | | Rose Rock Midstream LP / Rose Rock Finance Corporation | | | 5.625% | | | | 7/15/22 | | | | B+ | | | | 192,500 | |
| | | | | |
| | 150 | | | Targa Resources Inc. | | | 4.250% | | | | 11/15/23 | | | | BB– | | | | 146,437 | |
| | 1,115 | | | Total Oil, Gas & Consumable Fuels | | | | | | | | | | | | | | | 1,113,500 | |
| | | | | |
| | | | Real Estate Management & Development – 0.0% | | | | | | | | | | | | |
| | | | | |
| | 275 | | | Mattamy Group Corporation, 144A | | | 6.875% | | | | 12/15/23 | | | | BB | | | | 280,844 | |
| | | | | |
| | | | Road & Rail – 0.1% | | | | | | | | | | | | |
| | | | | |
| | 610 | | | Avis Budget Car Rental, 144A, (3) | | | 6.375% | | | | 4/01/24 | | | | BB– | | | | 608,475 | |
| | | | | |
| | 175 | | | The Hertz Corporation, 144A, (3) | | | 7.625% | | | | 6/01/22 | | | | BB– | | | | 174,580 | |
| | 785 | | | Total Road & Rail | | | | | | | | | | | | | | | 783,055 | |
| | | | |
| | | | Technology Hardware, Storage & Peripherals – 0.1% | | | | | | | | | | |
| | | | | |
| | 500 | | | NCR Corporation | | | 5.000% | | | | 7/15/22 | | | | BB | | | | 510,000 | |
| | | | | |
| | | | Textiles, Apparel & Luxury Goods – 0.1% | | | | | | | | | | | | |
| | | | | |
| | 300 | | | Levi Strauss & Company | | | 5.000% | | | | 5/01/25 | | | | BB+ | | | | 313,500 | |
| | | | | |
| | | | Wireless Telecommunication Services – 0.2% | | | | | | | | | | | | |
| | | | | |
| | 200 | | | Altice Financing SA, 144A | | | 6.625% | | | | 2/15/23 | | | | BB– | | | | 212,188 | |
| | | | | |
| | 200 | | | Millicom International Cellular SA, 144A | | | 6.625% | | | | 10/15/21 | | | | BB+ | | | | 208,000 | |
| | | | | |
| | 200 | | | Softbank Corporation, 144A | | | 4.500% | | | | 4/15/20 | | | | BB+ | | | | 207,918 | |
| | | | | |
| | 200 | | | Sprint Communications Inc., 144A | | | 7.000% | | | | 3/01/20 | | | | BB | | | | 219,500 | |
| | | | | |
| | 400 | | | Telecom Italia SpA, 144A | | | 5.303% | | | | 5/30/24 | | | | BBB– | | | | 429,000 | |
| | 1,200 | | | Total Wireless Telecommunication Services | | | | | | | | | | | | | | | 1,276,606 | |
| $ | 22,053 | | | Total Corporate Bonds (cost $22,251,564) | | | | | | | | | | | | | | | 22,620,453 | |
| | | | | |
Principal
Amount (000) | | | Description (1) | | | | | Optional Call
Provisions (4) | | | Ratings (2) | | | Value | |
| | | | | |
| | | | MUNICIPAL BONDS – 0.2% | | | | | | | | | | | | | | | | |
| | | | | |
| | | | Maryland – 0.2% | | | | | | | | | | | | |
| | | | | |
| $ | 1,250 | | | Baltimore County, Maryland, General Obligation Bonds, Taxable Series 2012, 0.951%, 8/01/17 | | | | | | | No Opt. Call | | | | AAA | | | $ | 1,249,800 | |
| $ | 1,250 | | | Total Municipal Bonds (cost $1,250,000) | | | | | | | | | | | | | | | 1,249,800 | |
| | | | | | | | | | | | | | | | | | | | |
Principal
Amount (000) | | | Description (1) | | Coupon | | | Maturity | | | Ratings (2) | | | Value | |
| | | | |
| | | | U.S. GOVERNMENT AND AGENCY OBLIGATIONS – 87.8% | | | | | | | | | | |
| | | | | |
| $ | 5,913 | | | United States of America Treasury Bonds | | | 3.875% | | | | 4/15/29 | | | | Aaa | | | $ | 8,025,077 | |
| | | | | |
| | 275 | | | United States of America Treasury Bonds | | | 3.000% | | | | 2/15/47 | | | | Aaa | | | | 284,174 | |
| | | | | |
| | 203 | | | United States of America Treasury Bonds | | | 0.875% | | | | 2/15/47 | | | | Aaa | | | | 196,596 | |
| | | | | |
| | 5,273 | | | United States of America Treasury Inflation Indexed Obligations | | | 0.125% | | | | 4/15/18 | | | | Aaa | | | | 5,254,300 | |
| | | | | |
| | 3,579 | | | United States of America Treasury Inflation Indexed Obligations | | | 1.375% | | | | 1/15/20 | | | | Aaa | | | | 3,709,677 | |
| | | | | |
| | 43,464 | | | United States of America Treasury Inflation Indexed Obligations | | | 0.125% | | | | 4/15/20 | | | | Aaa | | | | 43,529,380 | |
| | | | | |
| | 4,143 | | | United States of America Treasury Inflation Indexed Obligations | | | 1.250% | | | | 7/15/20 | | | | Aaa | | | | 4,318,850 | |
| | | | | |
| | 21,350 | | | United States of America Treasury Inflation Indexed Obligations | | | 1.125% | | | | 1/15/21 | | | | Aaa | | | | 22,170,914 | |
| | | | | |
| | 33,882 | | | United States of America Treasury Inflation Indexed Obligations | | | 0.125% | | | | 4/15/21 | | | | Aaa | | | | 33,828,084 | |
| | | | | |
| | 12,487 | | | United States of America Treasury Inflation Indexed Obligations | | | 0.625% | | | | 7/15/21 | | | | Aaa | | | | 12,796,805 | |
| | | | | |
| | 28,089 | | | United States of America Treasury Inflation Indexed Obligations | | | 0.125% | | | | 1/15/22 | | | | Aaa | | | | 28,044,389 | |
| | | | | |
| | 9,049 | | | United States of America Treasury Inflation Indexed Obligations | | | 0.125% | | | | 4/15/22 | | | | Aaa | | | | 9,004,093 | |
| | | | | |
| | 23,276 | | | United States of America Treasury Inflation Indexed Obligations | | | 0.125% | | | | 7/15/22 | | | | Aaa | | | | 23,243,907 | |
| | | | | |
| | 29,148 | | | United States of America Treasury Inflation Indexed Obligations | | | 0.125% | | | | 1/15/23 | | | | Aaa | | | | 28,877,153 | |
| | | | | |
| | 16,602 | | | United States of America Treasury Inflation Indexed Obligations | | | 0.375% | | | | 7/15/23 | | | | Aaa | | | | 16,707,286 | |
| | | | | |
| | 23,548 | | | United States of America Treasury Inflation Indexed Obligations | | | 0.625% | | | | 1/15/24 | | | | Aaa | | | | 23,877,957 | |
| | | | | |
| | 11,565 | | | United States of America Treasury Inflation Indexed Obligations | | | 0.125% | | | | 7/15/24 | | | | Aaa | | | | 11,357,040 | |
| | | | | |
| | 53,493 | | | United States of America Treasury Inflation Indexed Obligations | | | 0.250% | | | | 1/15/25 | | | | Aaa | | | | 52,529,044 | |
| | | | | |
| | 4,355 | | | United States of America Treasury Inflation Indexed Obligations | | | 2.000% | | | | 1/15/26 | | | | Aaa | | | | 4,879,594 | |
| | | | | |
| | 54,629 | | | United States of America Treasury Inflation Indexed Obligations | | | 0.625% | | | | 1/15/26 | | | | Aaa | | | | 54,964,175 | |
| | | | | |
| | 20,229 | | | United States of America Treasury Inflation Indexed Obligations | | | 0.125% | | | | 7/15/26 | | | | Aaa | | | | 19,507,473 | |
| | | | | |
| | 4,547 | | | United States of America Treasury Inflation Indexed Obligations | | | 2.375% | | | | 1/15/27 | | | | Aaa | | | | 5,277,511 | |
| | | | | |
| | 7,794 | | | United States of America Treasury Inflation Indexed Obligations | | | 0.375% | | | | 1/15/27 | | | | Aaa | | | | 7,653,274 | |
| | | | | |
| | 1,745 | | | United States of America Treasury Inflation Indexed Obligations | | | 1.750% | | | | 1/15/28 | | | | Aaa | | | | 1,944,440 | |
| | | | | |
| | 1,550 | | | United States of America Treasury Inflation Indexed Obligations | | | 3.625% | | | | 4/15/28 | | | | Aaa | | | | 2,023,822 | |
| | | | | |
| | 3,639 | | | United States of America Treasury Inflation Indexed Obligations | | | 2.500% | | | | 1/15/29 | | | | Aaa | | | | 4,373,822 | |
| | | | | |
| | 3,846 | | | United States of America Treasury Inflation Indexed Obligations | | | 2.125% | | | | 2/15/40 | | | | Aaa | | | | 4,782,750 | |
| | | | | |
| | 5,633 | | | United States of America Treasury Inflation Indexed Obligations | | | 2.125% | | | | 2/15/41 | | | | Aaa | | | | 7,036,527 | |
| | | | | |
| | 19,890 | | | United States of America Treasury Inflation Indexed Obligations | | | 0.750% | | | | 2/15/42 | | | | Aaa | | | | 18,921,059 | |
| | | | | |
| | 21,399 | | | United States of America Treasury Inflation Indexed Obligations | | | 0.625% | | | | 2/15/43 | | | | Aaa | | | | 19,682,513 | |
| | | | | |
| | 4,915 | | | United States of America Treasury Inflation Indexed Obligations | | | 1.375% | | | | 2/15/44 | | | | Aaa | | | | 5,346,029 | |
| | | | | |
| | 9,725 | | | United States of America Treasury Inflation Indexed Obligations | | | 0.750% | | | | 2/15/45 | | | | Aaa | | | | 9,120,406 | |
| | | | | |
| | 20,622 | | | United States Treasury Notes | | | 0.375% | | | | 7/15/25 | | | | Aaa | | | | 20,463,690 | |
| | | | | |
| | 15,465 | | | United States Treasury Notes | | | 3.000% | | | | 5/15/47 | | | | Aaa | | | | 15,988,150 | |
| $ | 525,322 | | | Total U.S. Government and Agency Obligations (cost $530,480,060) | | | | 529,719,961 | |
Nuveen Inflation Protected Securities Fund (continued)
| | |
| Portfolio of Investments | | June 30, 2017 |
| | | | | | | | | | | | | | | | | | | | |
Principal
Amount (000) | | | Description (1) | | Coupon | | | Maturity | | | Ratings (2) | | | Value | |
| | |
| | | | ASSET-BACKED AND MORTGAGE-BACKED SECURITIES – 6.3% | | | | |
| | | | | |
| $ | 3,000 | | | Bank of America Commercial Mortgage Inc. , Commercial Mortgage Pass-Through Certificates, Series 2015-UBS7 | | | 3.167% | | | | 9/15/48 | | | | BBB– | | | $ | 2,403,064 | |
| | | | | |
| | 2,000 | | | Cabela’s Master Credit Card Trust, Series 2013-2A A2, 144A | | | 2.170% | | | | 8/16/21 | | | | AAA | | | | 2,007,421 | |
| | | | | |
| | 4,218 | | | Carmax Auto Owners Trust, Series 2016-4 | | | 1.210% | | | | 11/15/19 | | | | Aaa | | | | 4,211,406 | |
| | | | | |
| | 2,722 | | | Colony American Homes Trust 2014-1A, 144A | | | 2.376% | | | | 5/17/31 | | | | Aaa | | | | 2,736,566 | |
| | | | | |
| | 1,895 | | | Commercial Mortgage Pass Through Certificates Series 2012-CR4 | | | 1.801% | | | | 10/15/45 | | | | AAA | | | | 1,895,723 | |
| | | | | |
| | 964 | | | Conns Receivables Funding Trust II, Series 2016-B, 144A | | | 3.730% | | | | 10/15/18 | | | | BBB | | | | 965,467 | |
| | | | | |
| | 2,975 | | | Dominos Pizza Master Issuer LLC, Series 2017-1A, 144A, (WI/DD) | | | 3.082% | | | | 7/25/47 | | | | BBB+ | | | | 2,960,589 | |
| | | | | |
| | 1,587 | | | DT Auto Owner Trust, Series 2015-3A, 144A | | | 2.460% | | | | 11/15/19 | | | | AAA | | | | 1,589,216 | |
| | | | | |
| | 680 | | | Freddie Mac Mortgage Trust, Multifamily Mortgage Pass-Through Certificates, Series 2013-K712, 144A | | | 3.365% | | | | 5/25/45 | | | | AA | | | | 695,832 | |
| | | | | |
| | 2,050 | | | Goldman Sachs Mortgage Securities Trust, Mortgage Pass Through Certificates, Series 2015-GC32 | | | 3.345% | | | | 7/10/48 | | | | BBB– | | | | 1,624,171 | |
| | | | | |
| | 1,530 | | | Green Tree Agency Funding Trust, Manufactured Housing Contract Pass Through Certificates, Series 2016-T1, 144A | | | 4.058% | | | | 10/15/48 | | | | BBB | | | | 1,520,652 | |
| | | | | |
| | 177 | | | Greenwich Capital Commercial Funding Corporation, Commercial Mortgage Pass Through Certificates, Series 2007-GG11 | | | 5.736% | | | | 12/10/49 | | | | AAA | | | | 176,407 | |
| | | | | |
| | 1,024 | | | Honor Automobile Trust, Series 2016-1A, 144A | | | 2.940% | | | | 11/15/19 | | | | A | | | | 1,027,363 | |
| | | | | |
| | 1,500 | | | Jimmy Johns Funding LLC, Series 2017-1A, 144A, (WI/DD) | | | 3.610% | | | | 7/30/47 | | | | BBB | | | | 1,500,000 | |
| | | | | |
| | 2,230 | | | Morgan Stanley Bank of America Merrill Lynch Trust, Series 2014-C16, 144A | | | 4.756% | | | | 6/15/47 | | | | BBB– | | | | 2,005,186 | |
| | | | | |
| | 2,000 | | | Morgan Stanley Bank of America Merrill Lynch Trust, Series 2015-C22, 144A | | | 4.242% | | | | 4/15/48 | | | | BBB– | | | | 1,689,399 | |
| | | | | |
| | 1,500 | | | Morgan Stanley Bank of America Merrill Lynch Trust, Series 2015-C25 | | | 3.068% | | | | 10/15/48 | | | | BBB– | | | | 1,202,466 | |
| | | | | |
| | 1,000 | | | New Residential Advance Receivable Trust Series 2016-T2, 144A | | | 4.005% | | | | 10/15/49 | | | | BBB | | | | 998,458 | |
| | | | | |
| | 2,565 | | | New Residential Advance Receivable Trust, Series 2017-T1, 144A | | | 4.002% | | | | 2/15/51 | | | | BBB | | | | 2,579,104 | |
| | | | | |
| | 1,062 | | | OneMain Direct Auto Receivables Trust, Series 2016-1, 144A | | | 2.040% | | | | 1/15/21 | | | | Aa1 | | | | 1,063,281 | |
| | | | | |
| | 2,000 | | | TCF Auto Receivables Owner trust, Series 2015-2A, 144A | | | 2.550% | | | | 4/15/21 | | | | AAA | | | | 2,010,741 | |
| | | | | |
| | 1,580 | | | Wells Fargo Commercial Mortgage Trust, Commercial Mortgage Pass-Through Certificates, Series 2015-C30, 144A | | | 4.495% | | | | 9/15/58 | | | | BBB– | | | | 1,382,425 | |
| $ | 40,259 | | | Total Asset-Backed and Mortgage-Backed Securities (cost $37,657,213) | | | | 38,244,937 | |
| | | | | |
Principal
Amount (000) | | | Description (1) | | Coupon | | | Maturity | | | Ratings (2) | | | Value | |
| | | | | |
| | | | SOVEREIGN DEBT – 0.8% | | | | | | | | | | | | | | | | |
| | | | | |
| | | | Canada – 0.3% | | | | | | | | | | | | |
| | | | | |
| $ | 1,500 | | | Quebec Province | | | 7.500% | | | | 7/15/23 | | | | Aa2 | | | $ | 1,889,119 | |
| | | | | |
| | | | Tunisia – 0.5% | | | | | | | | | | | | |
| | | | | |
| | 3,000 | | | Tunisia Government AID Bonds | | | 1.416% | | | | 8/05/21 | | | | N/R | | | | 2,935,341 | |
| $ | 4,500 | | | Total Sovereign Debt (cost $4,867,193) | | | | | | | | | | | | | | | 4,824,460 | |
| | | | Total Long-Term Investments (cost $596,680,380) | | | | | | | | | | | | | | | 596,912,009 | |
| | | | | | | | | | | | | | | | | | | | |
| Shares | | | Description (1) | | Coupon | | | | | | | | | Value | |
| | |
| | | | INVESTMENTS PURCHASED WITH COLLATERAL FROM SECURITIES LENDING – 0.3% | | | | | |
| | | | | |
| | | | Money Market Funds – 0.3% | | | | | | | | | | | | |
| | | | | |
| | 1,844,888 | | | First American Government Obligations Fund, Class X, (6) | | | 0.883% (5) | | | | | | | | | | | $ | 1,844,888 | |
| | | | Total Investments Purchased with Collateral from Securities Lending (cost $1,844,888) | | | | 1,844,888 | |
| | | | | |
| Shares | | | Description (1) | | Coupon | | | | | | | | | Value | |
| | | | | |
| | | | SHORT-TERM INVESTMENTS – 1.4% | | | | | | | | | | | | |
| | | | | |
| | | | Money Market Funds – 1.4% | | | | | | | | | | | | |
| | | | | |
| | 8,148,259 | | | First American Treasury Obligations Fund, Class Z | | | 0.847% (5) | | | | | | | | | | | $ | 8,148,259 | |
| | | | Total Short-Term Investments (cost $8,148,259) | | | | | | | | | | | | | | | 8,148,259 | |
| | | | Total Investments (cost $606,673,527) – 100.6% | | | | | | | | | | | | | | | 606,905,156 | |
| | | | Other Assets Less Liabilities – (0.6)% (7) | | | | | | | | | | | | | | | (3,554,183) | |
| | | | Net Assets – 100% | | | | | | | | | | | | | | $ | 603,350,973 | |
Investments in Derivatives as of June 30, 2017
Futures Contracts
| | | | | | | | | | | | | | | | | | | | | | | | |
| Description | | Contract
Position | | | Number of
Contracts | | | Contract
Expiration | | | Notional
Amount
at Value* | | | Variation Margin
Receivable/
(Payable) | | | Unrealized
Appreciation
(Depreciation) | |
U.S. Treasury 2-Year Note | | | Short | | | | (132 | ) | | | 9/17 | | | $ | (28,526,438 | ) | | $ | 12,375 | | | $ | 38,215 | |
U.S. Treasury 5-Year Note | | | Short | | | | (197 | ) | | | 9/17 | | | | (23,213,680 | ) | | | 33,757 | | | | 92,895 | |
U.S. Treasury 10-Year Note | | | Short | | | | (30 | ) | | | 9/17 | | | | (3,765,937 | ) | | | 9,481 | | | | 9,925 | |
U.S. Treasury Long Bond | | | Short | | | | (31 | ) | | | 9/17 | | | | (4,764,312 | ) | | | 17,120 | | | | 59,493 | |
U.S. Treasury Ultra Bond | | | Long | | | | 20 | | | | 9/17 | | | | 3,317,500 | | | | (13,750 | ) | | | 48,887 | |
| | | | | | | | | | | | | | | $ | (56,952,867 | ) | | $ | 58,983 | | | $ | 249,415 | |
| * | The aggregate Notional Amount at Value of long and short positions is $3,317,500 and $(60,270,367), respectively. |
For Fund portfolio compliance purposes, the Fund’s industry classifications refer to any one or more of the industry sub-classifications used by one or more widely recognized market indexes or ratings group indexes, and/or as defined by Fund management. This definition may not apply for purposes of this report, which may combine industry sub-classifications into sectors for reporting ease.
| (1) | All percentages shown in the Portfolio of Investments are based on net assets. |
| (2) | For financial reporting purposes, the ratings disclosed are the highest of Standard & Poor’s Group (“Standard & Poor’s”), Moody’s Investors Service, Inc. (“Moody’s”) or Fitch, Inc. (“Fitch”) rating. This treatment of split-rated securities may differ from that used for other purposes, such as for Fund investment policies. Ratings below BBB by Standard & Poor’s, Baa by Moody’s or BBB by Fitch are considered to be below investment grade. Holdings designated N/R are not rated by any of these national rating agencies. Ratings are not covered by the report of independent registered public accounting firm. |
| (3) | Investment, or a portion of investment, is out on loan for securities lending. The total value of the securities out on loan as of the end of the reporting period was $1,779,730. |
| (4) | Optional Call Provisions: Dates (month and year) and prices of the earliest optional call or redemption. There may be other call provisions at varying prices at later dates. Certain mortgagebacked securities may be subject to periodic principal paydowns. Optional Call Provisions are not covered by the report of independent registered public accounting firm. |
| (5) | The rate shown is the annualized seven-day subsidized yield as of the end of the reporting period. |
| (6) | The Fund may loan securities representing up to one third of the fair value of its total assets (which includes collateral for securities on loan) to broker-dealers, banks and other institutions. The Fund maintains collateral equal to at least 100% of the fair value of the securities loaned. The cash collateral received by the Fund is invested in this money market fund. See Notes to Financial Statements, Note 3 – Portfolio Securities and Investments in Derivatives, Securities Lending for more information. |
| (7) | Other assets less liabilities includes the unrealized appreciation (depreciation) of certain over-the-counter (“OTC”) derivatives as presented on the Statement of Assets and Liabilities, when applicable. The unrealized appreciation (depreciation) of OTC-cleared and exchange-traded derivatives is recognized as part of the cash collateral at brokers and/or receivable or payable for variation margin as presented on the Statement of Assets and Liabilities, when applicable. |
| (WI/DD) | Investment, or portion of investment, purchased on a when-issued or delayed delivery basis. |
| 144A | Investment is exempt from registration under Rule 144A of the Securities Act of 1933, as amended. These investments may only be resold in transactions exempt from registration, which are normally those transactions with qualified institutional buyers. |
See accompanying notes to financial statements.
Nuveen Intermediate Government Bond Fund
| | |
| Portfolio of Investments | | June 30, 2017 |
| | | | | | | | | | | | | | | | | | | | |
Principal
Amount (000) | | | Description (1) | | | | | Optional Call
Provisions (2) | | | Ratings (3) | | | Value | |
| | | | | |
| | | | LONG-TERM INVESTMENTS – 99.1% | | | | | | | | | | | | | | | | |
| | | | | |
| | | | MUNICIPAL BONDS – 4.3% | | | | | | | | | | | | |
| | | | | |
| | | | Louisana – 0.6% | | | | | | | | | | | | |
| | | | | |
| $ | 284 | | | Louisana Local Governmnent Environmental Facilities and Community Development Authority, System Restoration Revenue Bonds, Louisana Utilities Resoration Corporation Project/EGSL, Series 2010, 3.220%, 2/01/21 | | | | | | | No Opt. Call | | | | AAA | | | $ | 286,406 | |
| | | | | |
| | | | New York – 0.5% | | | | | | | | | | | | |
| | | | | |
| | 265 | | | New York City, New York, General Obligation Bonds, Fiscal 2017 Series B-2, 3.100%, 12/01/25 | | | | | | | No Opt. Call | | | | AA | | | | 268,673 | |
| | | | | |
| | | | Ohio – 2.3% | | | | | | | | | | | | |
| | | | | |
| | 345 | | | Columbus, Ohio, General Obligation Bonds, Various Purpose, Taxable Series 2014C, 3.000%, 2/15/19 | | | | | | | No Opt. Call | | | | AAA | | | | 353,107 | |
| | | | | |
| | 845 | | | Ohio State, General Obligation Bonds, Higher Education, Build America Bond Series 2010E, 3.328%, 8/01/17 – AGM Insured | | | | | | | No Opt. Call | | | | AA+ | | | | 846,859 | |
| | 1,190 | | | Total Ohio | | | | | | | | | | | | | | | 1,199,966 | |
| | | | | |
| | | | Pennsylvania – 0.9% | | | | | | | | | | | | |
| | | | | |
| | 260 | | | Pennsylvania State, General Obligation Bonds, Build America Taxable Bonds, Series 2010B, 4.650%, 2/15/26 | | | | | | | No Opt. Call | | | | AA– | | | | 283,371 | |
| | | | | |
| | 175 | | | Pittsburgh, Pennsylvania, General Obligation Bonds, Pension Series 1998C, 6.600%, 3/01/21 – NPFG Insured | | | | | | | No Opt. Call | | | | AA– | | | | 199,497 | |
| | 435 | | | Total Pennsylvania | | | | | | | | | | | | | | | 482,868 | |
| $ | 2,174 | | | Total Municipal Bonds (cost $2,242,748) | | | | | | | | | | | | | | | 2,237,913 | |
| | | | | |
Principal
Amount (000) | | | Description (1) | | Coupon | | | Maturity | | | Ratings (3) | | | Value | |
| | | |
| | | | U.S. GOVERNMENT AND AGENCY OBLIGATIONS – 73.3% | | | | | | | |
| | | | | |
| $ | 580 | | | Fannie Mae Mortgage Pool | | | 1.000% | | | | 8/28/19 | | | | Aaa | | | $ | 574,358 | |
| | | | | |
| | 600 | | | Fannie Mae Mortgage Pools | | | 1.375% | | | | 10/07/21 | | | | Aaa | | | | 589,134 | |
| | | | | |
| | 1,000 | | | Fannie Mae Notes | | | 1.330% | | | | 10/24/19 | | | | Aaa | | | | 995,930 | |
| | | | | |
| | 820 | | | Fannie Mae Notes, (4) | | | 1.000% | | | | 10/24/19 | | | | Aaa | | | | 810,952 | |
| | | | | |
| | 790 | | | Fannie Mae Notes | | | 1.500% | | | | 11/30/20 | | | | Aaa | | | | 785,075 | |
| | | | | |
| | 1,330 | | | Federal Farm Credit Bank Discount Notes | | | 1.550% | | | | 9/27/19 | | | | Aaa | | | | 1,328,609 | |
| | | | | |
| | 560 | | | Federal Farm Credit Bank Discount Notes | | | 1.550% | | | | 4/13/20 | | | | Aaa | | | | 558,633 | |
| | | | | |
| | 360 | | | Federal Farm Credit Banks, Consolidated Systemwide Notes | | | 1.750% | | | | 4/01/21 | | | | Aaa | | | | 357,123 | |
| | | | | |
| | 1,080 | | | Federal Home Loan Bank Bonds | | | 4.125% | | | | 3/13/20 | | | | Aaa | | | | 1,151,674 | |
| | | | | |
| | 300 | | | Federal Home Loan Bank Bonds, (4) | | | 1.125% | | | | 7/14/21 | | | | Aaa | | | | 292,293 | |
| | | | | |
| | 775 | | | Federal Home Loan Bank Bonds | | | 1.875% | | | | 12/09/22 | | | | Aaa | | | | 767,410 | |
| | | | | |
| | 955 | | | Federal Home Loan Bank Bonds | | | 2.875% | | | | 6/14/24 | | | | Aaa | | | | 988,368 | |
| | | | | |
| | 2,260 | | | Federal Home Loan Bank Bonds | | | 2.875% | | | | 9/13/24 | | | | Aaa | | | | 2,342,976 | |
| | | | | |
| | 825 | | | Federal Home Loan Bank Bonds | | | 2.375% | | | | 3/14/25 | | | | Aaa | | | | 817,722 | |
| | | | | | | | | | | | | | | | | | | | |
| | | | | |
Principal
Amount (000) | | | Description (1) | | Coupon | | | Maturity | | | Ratings (3) | | | Value | |
| | |
| | | | U.S. GOVERNMENT AND AGENCY OBLIGATIONS (continued) | | | | |
| | | | | |
| $ | 715 | | | Federal Home Loan Bank Bonds | | | 3.000% | | | | 9/11/26 | | | | Aaa | | | $ | 738,931 | |
| | | | | |
| | 735 | | | Federal Home Loan Banks, Discount Notes | | | 2.220% | | | | 3/28/23 | | | | Aaa | | | | 737,351 | |
| | | | | |
| | 590 | | | Federal Home Loan Mortgage Corporation, Notes | | | 2.375% | | | | 1/13/22 | | | | Aaa | | | | 602,340 | |
| | | | | |
| | 535 | | | Federal National Mortgage Association | | | 0.000% | | | | 10/09/19 | | | | Aaa | | | | 513,236 | |
| | | | | |
| | 775 | | | Federal National Mortgage Association | | | 2.125% | | | | 4/24/26 | | | | Aaa | | | | 754,684 | |
| | | | | |
| | 250 | | | Financing Corporation | | | 9.400% | | | | 2/08/18 | | | | Aaa | | | | 262,283 | |
| | | | | |
| | 750 | | | Freddie Mac Notes | | | 1.500% | | | | 1/17/20 | | | | Aaa | | | | 748,769 | |
| | | | | |
| | 270 | | | Freddie Mac Reference Notes | | | 5.000% | | | | 12/14/18 | | | | Aa2 | | | | 283,765 | |
| | | | | |
| | 560 | | | Freddie Mac Reference Notes | | | 1.375% | | | | 4/20/20 | | | | Aaa | | | | 556,646 | |
| | | | | |
| | 820 | | | Freddie Mac Reference Notes | | | 1.125% | | | | 8/12/21 | | | | Aaa | | | | 797,372 | |
| | | | | |
| | 225 | | | United States of America Treasury Bonds | | | 8.750% | | | | 8/15/20 | | | | Aaa | | | | 273,938 | |
| | | | | |
| | 1,025 | | | United States of America Treasury Bonds | | | 8.125% | | | | 8/15/21 | | | | Aaa | | | | 1,282,851 | |
| | | | | |
| | 535 | | | United States of America Treasury Bonds | | | 7.250% | | | | 8/15/22 | | | | Aaa | | | | 673,724 | |
| | | | | |
| | 3,505 | | | United States of America Treasury Inflation Indexed Obligations | | | 2.000% | | | | 2/15/25 | | | | Aaa | | | | 3,456,123 | |
| | | | | |
| | 860 | | | United States of America Treasury Inflation Indexed Obligations | | | 2.000% | | | | 8/15/25 | | | | Aaa | | | | 845,218 | |
| | | | | |
| | 1,135 | | | United States of America Treasury Notes | | | 2.750% | | | | 11/15/23 | | | | Aaa | | | | 1,181,154 | |
| | | | | |
| | 1,145 | | | United States of America Treasury Securities, Stripped Interest Payments | | | 0.000% | | | | 2/15/22 | | | | Aaa | | | | 1,047,989 | |
| | | | | |
| | 495 | | | United States Treasury Notes | | | 2.000% | | | | 11/15/21 | | | | Aaa | | | | 499,138 | |
| | | | | |
| | 2,500 | | | United States Treasury Notes | | | 1.500% | | | | 1/31/22 | | | | Aaa | | | | 2,462,012 | |
| | | | | |
| | 1,210 | | | United States Treasury Notes | | | 2.000% | | | | 2/15/22 | | | | Aaa | | | | 1,219,028 | |
| | | | | |
| | 2,240 | | | United States Treasury Notes | | | 2.000% | | | | 7/31/22 | | | | Aaa | | | | 2,249,713 | |
| | | | | |
| | 1,685 | | | United States Treasury Notes | | | 1.750% | | | | 5/15/2023 | | | | Aaa | | | | 1,659,593 | |
| | | | | |
| | 1,000 | | | United States Treasury Notes | | | 2.250% | | | | 1/31/24 | | | | Aaa | | | | 1,009,141 | |
| | | | | |
| | 1,540 | | | United States Treasury Notes | | | 2.125% | | | | 5/15/25 | | | | Aaa | | | | 1,530,135 | |
| | | | | |
| | 640 | | | United States Treasury Notes | | | 2.250% | | | | 11/15/25 | | | | Aaa | | | | 640,075 | |
| $ | 37,975 | | | Total U.S. Government and Agency Obligations (cost $38,023,627) | | | | | | | | | | | | | | | 38,385,466 | |
| | | | | |
Principal
Amount (000) | | | Description (1) | | Coupon | | | Maturity | | | Ratings (3) | | | Value | |
| | |
| | | | ASSET-BACKED AND MOTRGAGE-BACKED SECURITIES – 21.5% | | | | |
| | | | | |
| $ | 392 | | | 321 Henderson Receivables LLC, Series 2010-3A, 144A | | | 3.820% | | | | 12/15/48 | | | | Aaa | | | $ | 395,554 | |
| | | | | |
| | 496 | | | 321 Henderson Receivables LLC., Series 2010-1A, 144A | | | 5.560% | | | | 7/15/59 | | | | Aaa | | | | 532,849 | |
| | | | | |
| | 284 | | | Colony Anerican Homes Trust 2014-1A, 144A | | | 2.376% | | | | 5/17/31 | | | | Aaa | | | | 285,710 | |
| | | | | |
| | 254 | | | DT Auto Owner Trust, Series 2015-3A, 144A | | | 2.460% | | | | 11/15/19 | | | | AAA | | | | 254,275 | |
| | | | | |
| | 267 | | | Entergy Arkansas Restoration Funding LLC, Senior Secured Storm Recovery Bonds, Series 2010-A | | | 2.300% | | | | 8/01/21 | | | | AAA | | | | 268,268 | |
| | | | | |
| | 458 | | | Entergy New Orleans Store Recovery Funding LLC, Series 2015-1 | | | 2.670% | | | | 6/01/27 | | | | AAA | | | | 462,367 | |
| | | | | |
| | 138 | | | Fannie Mae Alternative Credit Enhanced Securities | | | 1.637% | | | | 11/25/17 | | | | Aaa | | | | 137,499 | |
| | | | | |
| | 98 | | | Fannie Mae Alternative Credit Enhanced Securities | | | 1.285% | | | | 12/25/17 | | | | Aaa | | | | 97,966 | |
Nuveen Intermediate Government Bond Fund (continued)
| | |
| Portfolio of Investments | | June 30, 2017 |
| | | | | | | | | | | | | | | | | | | | |
| | | | | |
Principal
Amount (000) | | | Description (1) | | Coupon | | | Maturity | | | Ratings (3) | | | Value | |
| | |
| | | | ASSET-BACKED AND MORTGAGE-BACKED SECURITIES (continued) | | | | |
| | | | | |
| $ | 470 | | | Fannie Mae Grantor Trust, Series 2014-T1 | | | 2.898% | | | | 6/25/27 | | | | N/R | | | $ | 466,676 | |
| | | | | |
| | – | (5) | | Fannie Mae Mortgage Pool FN 254373 | | | 6.500% | | | | 7/01/17 | | | | Aaa | | | | 15 | |
| | | | | |
| | 3 | | | Fannie Mae Mortgage Pool FN 673010 | | | 5.500% | | | | 12/01/17 | | | | Aaa | | | | 2,681 | |
| | | | | |
| | 8 | | | Fannie Mae Mortgage Pool FN 695765 | | | 5.500% | | | | 4/01/18 | | | | Aaa | | | | 8,402 | |
| | | | | |
| | 15 | | | Fannie Mae Mortgage Pool FN 254720 | | | 4.500% | | | | 5/01/18 | | | | Aaa | | | | 15,413 | |
| | | | | |
| | 39 | | | Fannie Mae Mortgage Pool FN 725793 | | | 5.500% | | | | 9/01/19 | | | | Aaa | | | | 39,912 | |
| | | | | |
| | 41 | | | Fannie Mae Mortgage Pool FN 254179 | | | 6.000% | | | | 1/01/22 | | | | Aaa | | | | 46,462 | |
| | | | | |
| | 46 | | | Fannie Mae Mortgage Pool FN 254344 | | | 6.500% | | | | 6/01/22 | | | | Aaa | | | | 50,505 | |
| | | | | |
| | 59 | | | Fannie Mae Mortgage Pool FN 596680 | | | 7.000% | | | | 9/01/31 | | | | Aaa | | | | 64,864 | |
| | | | | |
| | 86 | | | Fannie Mae Mortgage Pool FN 254169 | | | 6.500% | | | | 12/01/31 | | | | Aaa | | | | 99,237 | |
| | | | | |
| | 150 | | | Fannie Mae Mortgage Pool FN 745101 | | | 6.000% | | | | 4/01/32 | | | | Aaa | | | | 166,438 | |
| | | | | |
| | 138 | | | Fannie Mae Mortgage Pool FN 596712 | | | 6.500% | | | | 6/01/32 | | | | Aaa | | | | 153,735 | |
| | | | | |
| | 21 | | | Fannie Mae Mortgage Pool FN 656269 | | | 6.000% | | | | 8/01/32 | | | | Aaa | | | | 21,919 | |
| | | | | |
| | 46 | | | Fannie Mae Mortgage Pool FN 887017 | | | 6.500% | | | | 8/01/36 | | | | Aaa | | | | 52,104 | |
| | | | | |
| | 68 | | | Fannie Mae Mortgage Pool FN 928519 | | | 7.000% | | | | 6/01/37 | | | | Aaa | | | | 75,395 | |
| | | | | |
| | 255 | | | Fannie Mae Mortgage Pool FN AE4876 | | | 3.500% | | | | 10/01/40 | | | | Aaa | | | | 263,628 | |
| | | | | |
| | 42 | | | Fannie Mae Mortgage Pool FN AE0981 | | | 3.500% | | | | 3/01/41 | | | | Aaa | | | | 43,865 | |
| | | | | |
| | 243 | | | Fannie Mae REMIC Pass-Through Certificates | | | 7.500% | | | | 2/25/42 | | | | Aaa | | | | 275,335 | |
| | | | | |
| | 63 | | | Fannie Mae, Connecticut Avenue Securities, Series 2014-C03 | | | 2.432% | | | | 7/25/24 | | | | AA+ | | | | 62,650 | |
| | | | | |
| | 280 | | | FDIC Structures Sale Guaranteed Notes, Series 2010-S1, 144A | | | 3.250% | | | | 4/25/38 | | | | Aaa | | | | 281,677 | |
| | | | | |
| | 445 | | | Federal Home Loan Mortgage Corporation, REMIC | | | 1.476% | | | | 11/15/42 | | | | Aaa | | | | 443,200 | |
| | | | | |
| | 35 | | | Freddie Mac Mortgage Pool, Various G00876 | | | 6.500% | | | | 1/01/28 | | | | Aaa | | | | 38,539 | |
| | | | | |
| | 19 | | | Freddie Mac Mortgage Pool, Various C35768 | | | 7.500% | | | | 1/01/30 | | | | Aaa | | | | 20,565 | |
| | | | | |
| | 103 | | | Freddie Mac Mortgage Pool, Various G01244 | | | 6.500% | | | | 3/01/31 | | | | Aaa | | | | 117,000 | |
| | | | | |
| | 154 | | | Freddie Mac Mortgage Trust 2013-KF02, 144A | | | 4.060% | | | | 12/25/45 | | | | Baa1 | | | | 156,097 | |
| | | | | |
| | 300 | | | Freddie Mac Mortgage Trust, Structured Pass Through Certificates, Series 2011-K702, 144A | | | 4.765% | | | | 4/25/44 | | | | A1 | | | | 304,820 | |
| | | | | |
| | 360 | | | Freddie Mac Multifamily Aggregation Period Risk Transfer Trust, Series 2017-KT01 | | | 1.552% | | | | 2/25/20 | | | | Aaa | | | | 360,947 | |
| | | | | |
| | 257 | | | Freddie Mac Multifamily Structured Pass Through Certificates, Series K010 A1 | | | 3.320% | | | | 7/25/20 | | | | Aaa | | | | 259,233 | |
| | | | | |
| | 350 | | | Freddie Mac Multifamily Structured Pass Through Certificates, Series K715 | | | 2.059% | | | | 3/25/20 | | | | Aaa | | | | 351,684 | |
| | | | | |
| | 395 | | | Freddie Mac Multifamily Structured Pass-Through Certificates, FHMS K726 | | | 2.905% | | | | 7/25/49 | | | | AAA | | | | 403,452 | |
| | | | | |
| | 59 | | | Freddie Mac Structured Pass Through Certificates, Series K-502 A2 | | | 1.426% | | | | 8/25/17 | | | | AAA | | | | 59,370 | |
| | | | | |
| | 193 | | | Freddie Mac Structured Pass-Through Certificates, Series K008 | | | 2.746% | | | | 12/25/19 | | | | Aaa | | | | 196,065 | |
| | | | | |
| | 16 | | | Government National Mortgage Association Pool 347332 | | | 7.500% | | | | 12/15/22 | | | | Aaa | | | | 15,650 | |
| | | | | |
| | 94 | | | Government National Mortgage Association Pool 780825 | | | 6.500% | | | | 7/15/28 | | | | Aaa | | | | 107,608 | |
| | | | | |
| | 38 | | | Government National Mortgage Association Pool 3120 | | | 6.500% | | | | 8/20/31 | | | | Aaa | | | | 44,198 | |
| | | | | |
| | 59 | | | Government National Mortgage Association Pool 570134 | | | 7.500% | | | | 12/15/31 | | | | Aaa | | | | 61,639 | |
| | | | | |
| | 527 | | | Government National Mortgage Association Pool 633605 | | | 6.000% | | | | 9/15/34 | | | | Aaa | | | | 616,087 | |
| | | | | |
| | 238 | | | Government National Mortgage Association Pool 4946 | | | 4.500% | | | | 2/20/41 | | | | Aaa | | | | 255,589 | |
| | | | | | | | | | | | | | | | | | | | |
| | | | | |
Principal
Amount (000) | | | Description (1) | | Coupon | | | Maturity | | | Ratings (3) | | | Value | |
| | | | | |
| | | | ASSET-BACKED AND MOTRGAGE-BACKED SECURITIES (continued) | | | | | | | | | | | | |
| | | | | |
| $ | 278 | | | JP Morgan Mortgage Trust, Series 2017-1, 144A | | | 3.500% | | | | 1/25/47 | | | | Aaa | | | $ | 284,149 | |
| | | | | |
| | 365 | | | New Residential Advance Receivable Trust, Series 2017-T1, 144A | | | 3.214% | | | | 2/15/51 | | | | AAA | | | | 367,045 | |
| | | | | |
| | 350 | | | OMART Receivables Trust, Series 2016-T1, 144A | | | 2.521% | | | | 8/17/48 | | | | AAA | | | | 348,393 | |
| | | | | |
| | 269 | | | Origen Manufactured Housing Contract Trust Collaterlized Notes Series 2005B | | | 5.990% | | | | 1/15/37 | | | | A+ | | | | 275,648 | |
| | | | | |
| | 227 | | | RBSSP Resecuritization Trust 2009-7, 144A | | | 1.395% | | | | 6/26/37 | | | | A | | | | 219,341 | |
| | | | | |
| | 245 | | | TCF Auto Receivables Owner Trust, Series 2016-1A, 144A | | | 1.710% | | | | 4/15/21 | | | | AAA | | | | 244,210 | |
| | | | | |
| | 294 | | | United States Department of Veterans, Affairs, Guaranteed REMIC Pass-Through Certificates, Vendee Mortgage Trust, Series 2011-1 | | | 3.750% | | | | 2/15/35 | | | | Aaa | | | | 304,646 | |
| | | | | |
| | 490 | | | U.S. Small Business Administration Gauranteed Participating Securities Participation Certificates, Series 2017-10A | | | 2.845% | | | | 3/10/27 | | | | Aaa | | | | 496,848 | |
| | | | | |
| | 81 | | | U.S. Small Business Administration Guaranteed Participating Securities Participation Certificates, Series 2008-10A | | | 5.902% | | | | 2/10/18 | | | | Aaa | | | | 82,471 | |
| | | | | |
| | 188 | | | U.S. Small Business Administration Guaranteed Participating Securities Participation Certificates, Series 2010-P10A | | | 4.108% | | | | 3/10/20 | | | | Aaa | | | | 195,067 | |
| $ | 10,889 | | | Total Asset-Backed and Mortgage-Backed Securities (cost $10,933,178) | | | | | | | | 11,254,962 | |
| | | | Total Long-Term Investments (cost $51,199,553) | | | | | | | | 51,878,341 | |
| | | | | |
| Shares | | | Description (1) | | Coupon | | | | | | | | | Value | |
| | |
| | | | INVESTMENTS PURCHASED WITH COLLATERAL FROM SECURITIES LENDING – 0.6% | | | | | |
| | | | | |
| | | | Money Market Funds – 0.6% | | | | | | | | | | | | |
| | | | | |
| | 328,063 | | | First American Government Obligations Fund, Class X, (7) | | | 0.883% (6) | | | | | | | | | | | $ | 328,063 | |
| | | | Total Investments Purchased with Collateral from Securities Lending (cost $328,063) | | | | 328,063 | |
| | | | | |
| Shares | | | Description (1) | | Coupon | | | | | | | | | Value | |
| | | | | |
| | | | SHORT-TERM INVESTMENTS – 0.5% | | | | | | | | | | | | | | | | |
| | | | | |
| | | | Money Market Funds – 0.5% | | | | | | | | | | | | |
| | | | | |
| | 274,447 | | | First American Treasury Obligations Fund, Class Z | | | 0.847% (6) | | | | | | | | | | | $ | 274,447 | |
| | | | Total Short-Term Investments (cost $274,447) | | | | | | | | 274,447 | |
| | | | Total Investments (cost $51,802,063) – 100.2% | | | | | | | | 52,480,851 | |
| | | | Other Assets Less Liabilities – (0.2)% (8) | | | | | | | | (90,055) | |
| | | | Net Assets – 100% | | | | | | | | | | | | | | $ | 52,390,796 | |
Investments in Derivatives as of June 30, 2017
Futures Contracts
| | | | | | | | | | | | | | | | | | | | | | | | |
| Description | | Contract
Position | | | Number of
Contracts | | | Contract
Expiration | | | Notional
Amount
at Value* | | | Variation Margin
Receivable/
(Payable) | | | Unrealized
Appreciation
Depreciation) | |
U.S. Treasury 2-Year Note | | | Short | | | | (23 | ) | | | 9/17 | | | $ | (4,970,516 | ) | | $ | 2,145 | | | $ | 5,668 | |
U.S. Treasury 5-Year Note | | | Short | | | | (53 | ) | | | 9/17 | | | | (6,245,305 | ) | | | 9,109 | | | | 19,928 | |
U.S. Treasury 10-Year Note | | | Long | | | | 3 | | | | 9/17 | | | | 376,594 | | | | (844 | ) | | | (2,773 | ) |
| | | | | | | | | | | | | | | $ | (10,839,227 | ) | | $ | 10,410 | | | $ | 22,823 | |
| * | The aggregate Notional Amount at Value of long and short positions is $376,594 and $(11,215,821), respectively. |
Nuveen Intermediate Government Bond Fund (continued)
| | |
| Portfolio of Investments | | June 30, 2017 |
For Fund portfolio compliance purposes, the Fund’s industry classifications refer to any one or more of the industry sub-classifications used by one or more widely recognized market indexes or ratings group indexes, and/or as defined by Fund management. This definition may not apply for purposes of this report, which may combine industry sub-classifications into sectors for reporting ease.
| (1) | All percentages shown in the Portfolio of Investments are based on net assets. |
| (2) | Optional Call Provisions: Dates (month and year) and prices of the earliest optional call or redemption. There may be other call provisions at varying prices at later dates. Certain mortgagebacked securities may be subject to periodic principal paydowns. Optional Call Provisions are not covered by the report of independent registered public accounting firm. |
| (3) | For financial reporting purposes, the ratings disclosed are the highest of Standard & Poor’s Group (“Standard & Poor’s”), Moody’s Investors Service, Inc. (“Moody’s”) or Fitch, Inc. (“Fitch”) rating. This treatment of split-rated securities may differ from that used for other purposes, such as for Fund investment policies. Ratings below BBB by Standard & Poor’s, Baa by Moody’s or BBB by Fitch are considered to be below investment grade. Holdings designated N/R are not rated by any of these national rating agencies. Ratings are not covered by the report of independent registered public accounting firm. |
| (4) | Investment, or a portion of investment, is out on loan for securities lending. The total value of the securities out on loan as of the end of the reporting period was $319,948. |
| (5) | Principal Amount (000) rounds to less than $1,000. |
| (6) | The rate shown is the annualized seven-day subsidized yield as of the end of the reporting period. |
| (7) | The Fund may loan securities representing up to one third of the fair value of its total assets (which includes collateral for securities on loan) to broker-dealers, banks and other institutions. The Fund maintains collateral equal to at least 100% of the fair value of the securities loaned. The cash collateral received by the Fund is invested in this money market fund. See Notes to Financial Statements, Note 3 – Portfolio Securities and Investments in Derivatives, Securities Lending for more information. |
| (8) | Other assets less liabilities includes the unrealized appreciation (depreciation) of certain over-the-counter (“OTC”) derivatives as presented on the Statement of Assets and Liabilities, when applicable. The unrealized appreciation (depreciation) of OTC-cleared and exchange-traded derivatives is recognized as part of the cash collateral at brokers and/or receivable or payable for variation margin as presented on the Statement of Assets and Liabilities, when applicable. |
| 144A | Investment is exempt from registration under Rule 144A of the Securities Act of 1933, as amended. These investments may only be resold in transactions exempt from registration, which are normally those transactions with qualified institutional buyers. |
See accompanying notes to financial statements.
Nuveen Short Term Bond Fund
| | |
| Portfolio of Investments | | June 30, 2017 |
| | | | | | | | | | | | | | | | | | | | |
Principal
Amount (000) | | | Description (1) | | Coupon | | | Maturity | | | Ratings (2) | | | Value | |
| | | | | |
| | | | LONG-TERM INVESTMENTS – 97.9% | | | | | | | | | | | | | | | | |
| | | | | |
| | | | CORPORATE BONDS – 46.1% | | | | | | | | | | | | | | | | |
| | | | | |
| | | | Aerospace & Defense – 0.9% | | | | | | | | | | | | |
| | | | | |
| $ | 1,565 | | | BAE Systems Holdings, 144A | | | 6.375% | | | | 6/01/19 | | | | BBB | | | $ | 1,685,482 | |
| | | | | |
| | 1,790 | | | Honeywell International Inc. | | | 1.400% | | | | 10/30/19 | | | | A | | | | 1,777,944 | |
| | | | | |
| | 1,580 | | | L-3 Communications Corporation | | | 4.950% | | | | 2/15/21 | | | | BBB– | | | | 1,703,238 | |
| | 4,935 | | | Total Aerospace & Defense | | | | | | | | | | | | | | | 5,166,664 | |
| | | | | |
| | | | Airlines – 0.5% | | | | | | | | | | | | |
| | | | | |
| | 1,192 | | | Delta Air Lines Pass Through Certificates, Series 2012-1B | | | 6.875% | | | | 5/07/19 | | | | BBB | | | | 1,266,435 | |
| | | | | |
| | 270 | | | Delta Airlines | | | 5.300% | | | | 4/15/19 | | | | A1 | | | | 283,807 | |
| | | | | |
| | 886 | | | Northwest Airlines Trust Pass Through Certificates 2007-1 | | | 7.027% | | | | 11/01/19 | | | | A | | | | 981,021 | |
| | | | | |
| | 534 | | | US Airways Pass Through Trust | | | 7.076% | | | | 3/20/21 | | | | A | | | | 570,261 | |
| | 2,882 | | | Total Airlines | | | | | | | | | | | | | | | 3,101,524 | |
| | | | | |
| | | | Auto Components – 0.2% | | | | | | | | | | | | |
| | | | | |
| | 853 | | | American & Axle Manufacturing Inc., (3) | | | 6.625% | | | | 10/15/22 | | | | BB– | | | | 874,325 | |
| | | | | |
| | | | Automobiles – 0.7% | | | | | | | | | | | | |
| | | | | |
| | 2,000 | | | Daimler Finance NA LLC, 144A | | | 1.500% | | | | 7/05/19 | | | | A | | | | 1,981,036 | |
| | | | | |
| | 2,000 | | | General Motors Financial Company Inc. | | | 3.200% | | | | 7/13/20 | | | | BBB | | | | 2,037,674 | |
| | 4,000 | | | Total Automobiles | | | | | | | | | | | | | | | 4,018,710 | |
| | | | | |
| | | | Banks – 9.9% | | | | | | | | | | | | |
| | | | | |
| | 5,925 | | | Bank of America Corporation | | | 5.650% | | | | 5/01/18 | | | | A | | | | 6,111,116 | |
| | | | | |
| | 1,500 | | | Bank of America Corporation | | | 2.250% | | | | 4/21/20 | | | | A | | | | 1,500,503 | |
| | | | | |
| | 2,065 | | | Bank of Montreal | | | 1.500% | | | | 7/18/19 | | | | AA– | | | | 2,045,688 | |
| | | | | |
| | 2,870 | | | Barclays PLC | | | 2.750% | | | | 11/08/19 | | | | A | | | | 2,895,850 | |
| | | | | |
| | 3,280 | | | BB&T Corporation | | | 2.450% | | | | 1/15/20 | | | | A+ | | | | 3,316,428 | |
| | | | | |
| | 4,000 | | | Citigroup Inc. | | | 2.150% | | | | 7/30/18 | | | | A | | | | 4,012,664 | |
| | | | | |
| | 1,500 | | | Citizens Bank NA | | | 2.500% | | | | 3/14/19 | | | | A– | | | | 1,511,043 | |
| | | | | |
| | 2,000 | | | Fifth Third Bancorp. | | | 4.500% | | | | 6/01/18 | | | | A– | | | | 2,047,620 | |
| | | | | |
| | 5,000 | | | General Electric Capital Corporation | | | 5.625% | | | | 5/01/18 | | | | AA– | | | | 5,170,500 | |
| | | | | |
| | 3,440 | | | HSBC USA Inc. | | | 2.750% | | | | 8/07/20 | | | | AA– | | | | 3,495,955 | |
| | | | | |
| | 1,600 | | | ING Bank NV, 144A | | | 2.300% | | | | 3/22/19 | | | | A1 | | | | 1,607,637 | |
| | | | | |
| | 5,780 | | | JP Morgan Chase & Company | | | 1.850% | | | | 3/22/19 | | | | A+ | | | | 5,774,122 | |
| | | | | |
| | 1,445 | | | JP Morgan Chase & Company | | | 2.250% | | | | 1/23/20 | | | | A+ | | | | 1,449,387 | |
| | | | | |
| | 1,655 | | | KeyCorp. | | | 2.300% | | | | 12/13/18 | | | | A– | | | | 1,663,990 | |
| | | | | |
| | 2,000 | | | PNC Bank NA | | | 2.400% | | | | 10/18/19 | | | | A+ | | | | 2,018,910 | |
| | | | | |
| | 2,250 | | | Santander UK PLC | | | 3.050% | | | | 8/23/18 | | | | Aa3 | | | | 2,278,244 | |
| | | | | |
| | 2,000 | | | Societe Generale, 144A | | | 2.500% | | | | 4/08/21 | | | | A | | | | 2,005,468 | |
Nuveen Short Term Bond Fund (continued)
| | |
| Portfolio of Investments | | June 30, 2017 |
| | | | | | | | | | | | | | | | | | | | |
Principal
Amount (000) | | | Description (1) | | Coupon | | | Maturity | | | Ratings (2) | | | Value | |
| | | | | |
| | | | Banks (continued) | | | | | | | | | | | | |
| | | | | |
| $ | 1,720 | | | SunTrust Banks Inc. | | | 2.900% | | | | 3/03/21 | | | | A– | | | $ | 1,746,067 | |
| | | | | |
| | 4,995 | | | Wells Fargo & Company | | | 2.125% | | | | 4/22/19 | | | | AA– | | | | 5,021,853 | |
| | 55,025 | | | Total Banks | | | | | | | | | | | | | | | 55,673,045 | |
| | | | | |
| | | | Beverages – 0.9% | | | | | | | | | | | | |
| | | | | |
| | 2,500 | | | Anheuser Busch InBev | | | 7.750% | | | | 1/15/19 | | | | A– | | | | 2,719,975 | |
| | | | | |
| | 2,385 | | | PepsiCo Inc. | | | 1.350% | | | | 10/04/19 | | | | A+ | | | | 2,364,048 | |
| | 4,885 | | | Total Beverages | | | | | | | | | | | | | | | 5,084,023 | |
| | | | | |
| | | | Biotechnology – 0.7% | | | | | | | | | | | | |
| | | | | |
| | 1,375 | | | Biogen Inc. | | | 2.900% | | | | 9/15/20 | | | | A– | | | | 1,404,340 | |
| | | | | |
| | 2,320 | | | Celgene Corporation | | | 2.125% | | | | 8/15/18 | | | | BBB+ | | | | 2,329,013 | |
| | 3,695 | | | Total Biotechnology | | | | | | | | | | | | | | | 3,733,353 | |
| | | | | |
| | | | Capital Markets – 3.2% | | | | | | | | | | | | |
| | | | | |
| | 4,000 | | | Goldman Sachs Group, Inc. | | | 2.000% | | | | 4/25/19 | | | | A | | | | 3,996,636 | |
| | | | | |
| | 1,870 | | | Goldman Sachs Group, Inc. | | | 2.750% | | | | 9/15/20 | | | | A | | | | 1,892,376 | |
| | | | | |
| | 5,995 | | | Morgan Stanley | | | 2.650% | | | | 1/27/20 | | | | A | | | | 6,057,810 | |
| | | | | |
| | 2,250 | | | Nomura Holdings Incorporated | | | 2.750% | | | | 3/19/19 | | | | A– | | | | 2,272,595 | |
| | | | | |
| | 2,000 | | | State Street Corporation | | | 2.550% | | | | 8/18/20 | | | | AA– | | | | 2,037,392 | |
| | | | | |
| | 2,000 | | | UBS AG Stamford | | | 2.350% | | | | 3/26/20 | | | | A+ | | | | 2,011,728 | |
| | 18,115 | | | Total Capital Markets | | | | | | | | | | | | | | | 18,268,537 | |
| | | | | |
| | | | Chemicals – 1.0% | | | | | | | | | | | | |
| | | | | |
| | 2,215 | | | Eastman Chemical Company | | | 2.700% | | | | 1/15/20 | | | | BBB | | | | 2,244,045 | |
| | | | | |
| | 1,935 | | | LyondellBasell Industries NV | | | 5.000% | | | | 4/15/19 | | | | Baa1 | | | | 2,022,990 | |
| | | | | |
| | 1,490 | | | Sherwin-Williams Company | | | 2.250% | | | | 5/15/20 | | | | BBB | | | | 1,493,220 | |
| | 5,640 | | | Total Chemicals | | | | | | | | | | | | | | | 5,760,255 | |
| | | | | |
| | | | Commercial Services & Supplies – 0.4% | | | | | | | | | | | | |
| | | | | |
| | 2,000 | | | AerCap Ireland Capital Limited / AerCap Global Aviation Trust | | | 3.750% | | | | 5/15/19 | | | | BBB– | | | | 2,054,338 | |
| | | | | |
| | | | Communications Equipment – 0.3% | | | | | | | | | | | | |
| | | | | |
| | 1,775 | | | Qualcomm, Inc. | | | 2.100% | | | | 5/20/20 | | | | A1 | | | | 1,783,044 | |
| | | | | |
| | | | Consumer Finance – 2.4% | | | | | | | | | | | | |
| | | | | |
| | 1,200 | | | Ally Financial Inc | | | 8.000% | | | | 12/31/18 | | | | BB | | | | 1,294,500 | |
| | | | | |
| | 2,750 | | | American Express Company | | | 1.550% | | | | 5/22/18 | | | | A | | | | 2,749,293 | |
| | | | | |
| | 1,355 | | | Capital One Financial Corporation | | | 2.450% | | | | 4/24/19 | | | | A– | | | | 1,362,294 | |
| | | | | |
| | 845 | | | Capital One Financial Corporation | | | 2.500% | | | | 5/12/20 | | | | A– | | | | 848,600 | |
| | | | | |
| | 1,690 | | | Discover Bank | | | 2.600% | | | | 11/13/18 | | | | BBB+ | | | | 1,704,455 | |
| | | | | |
| | 2,000 | | | Ford Motor Credit Company | | | 2.597% | | | | 11/04/19 | | | | BBB | | | | 2,013,388 | |
| | | | | |
| | 1,250 | | | Navient Corporation | | | 5.000% | | | | 10/26/20 | | | | BB | | | | 1,296,875 | |
| | | | | |
| | 2,315 | | | Toyota Motor Credit Corporation | | | 2.000% | | | | 10/24/18 | | | | AA– | | | | 2,327,631 | |
| | 13,405 | | | Total Consumer Finance | | | | | | | | | | | | | | | 13,597,036 | |
| | | | | | | | | | | | | | | | | | | | |
Principal
Amount (000) | | | Description (1) | | Coupon | | | Maturity | | | Ratings (2) | | | Value | |
| | | | | |
| | | | Diversified Financial Services – 1.0% | | | | | | | | | | | | |
| | | | | |
| $ | 2,570 | | | BNP Paribas | | | 2.700% | | | | 8/20/18 | | | | A1 | | | $ | 2,599,221 | |
| | | | | |
| | 1,500 | | | Rabobank Nederland | | | 2.250% | | | | 1/14/19 | | | | Aa2 | | | | 1,509,632 | |
| | | | | |
| | 1,280 | | | Synchrony Financial | | | 3.000% | | | | 8/15/19 | | | | BBB– | | | | 1,298,099 | |
| | 5,350 | | | Total Diversified Financial Services | | | | | | | | | | | | | | | 5,406,952 | |
| | | | | |
| | | | Diversified Telecommunication Services – 2.9% | | | | | | | | | | | | |
| | | | | |
| | 4,440 | | | AT&T, Inc. | | | 2.300% | | | | 3/11/19 | | | | A– | | | | 4,466,489 | |
| | | | | |
| | 1,500 | | | CenturyLink Inc. | | | 5.625% | | | | 4/01/20 | | | | BB+ | | | | 1,586,715 | |
| | | | | |
| | 1,250 | | | Frontier Communications Corporation | | | 8.125% | | | | 10/01/18 | | | | B+ | | | | 1,320,312 | |
| | | | | |
| | 1,665 | | | Orange SA | | | 1.625% | | | | 11/03/19 | | | | BBB+ | | | | 1,650,558 | |
| | | | | |
| | 3,420 | | | SBA Tower Trust, 144A | | | 3.598% | | | | 4/15/43 | | | | BBB | | | | 3,421,096 | |
| | | | | |
| | 3,635 | | | Verizon Communications | | | 3.650% | | | | 9/14/18 | | | | A– | | | | 3,715,646 | |
| | 15,910 | | | Total Diversified Telecommunication Services | | | | | | | | | | | | | | | 16,160,816 | |
| | | | | |
| | | | Electric Utilities – 0.7% | | | | | | | | | | | | |
| | | | | |
| | 2,000 | | | Exelon Generation Co. LLC | | | 2.950% | | | | 1/15/20 | | | | BBB | | | | 2,035,494 | |
| | | | | |
| | 2,000 | | | FPL Group Capital Inc. | | | 6.000% | | | | 3/01/19 | | | | A– | | | | 2,127,254 | |
| | 4,000 | | | Total Electric Utilities | | | | | | | | | | | | | | | 4,162,748 | |
| | | | | |
| | | | Electronic Equipment, Instruments & Components – 0.3% | | | | | | | | | | | | |
| | | | | |
| | 1,500 | | | Corning Incorporated | | | 4.250% | | | | 8/15/20 | | | | BBB+ | | | | 1,580,975 | |
| | | | | |
| | | | Energy Equipment & Services – 0.2% | | | | | | | | | | | | |
| | | | | |
| | 1,000 | | | Regency Energy Partners Finance | | | 6.500% | | | | 7/15/21 | | | | BBB– | | | | 1,020,000 | |
| | | | | |
| | | | Food & Staples Retailing – 1.8% | | | | | | | | | | | | |
| | | | | |
| | 2,000 | | | CVS Health Corporation | | | 2.800% | | | | 7/20/20 | | | | BBB+ | | | | 2,036,038 | |
| | | | | |
| | 2,000 | | | Kroger Co | | | 1.500% | | | | 9/30/19 | | | | Baa1 | | | | 1,970,400 | |
| | | | | |
| | 750 | | | Supervalu Inc., (3) | | | 6.750% | | | | 6/01/21 | | | | B– | | | | 735,000 | |
| | | | | |
| | 2,015 | | | Sysco Corporation | | | 2.600% | | | | 10/01/20 | | | | A3 | | | | 2,039,789 | |
| | | | | |
| | 3,000 | | | Walgreens Boots Alliance, Inc. | | | 2.700% | | | | 11/18/19 | | | | BBB | | | | 3,047,271 | |
| | 9,765 | | | Total Food & Staples Retailing | | | | | | | | | | | | | | | 9,828,498 | |
| | | | | |
| | | | Food Products – 1.0% | | | | | | | | | | | | |
| | | | | |
| | 2,175 | | | Bunge Limited Finance Company | | | 3.500% | | | | 11/24/20 | | | | BBB | | | | 2,229,640 | |
| | | | | |
| | 1,065 | | | Kraft Heinz Foods Company | | | 2.000% | | | | 7/02/18 | | | | BBB– | | | | 1,067,707 | |
| | | | | |
| | 2,500 | | | Tyson Foods | | | 2.650% | | | | 8/15/19 | | | | BBB | | | | 2,531,628 | |
| | 5,740 | | | Total Food Products | | | | | | | | | | | | | | | 5,828,975 | |
| | | | | |
| | | | Gas Utilities – 0.2% | | | | | | | | | | | | |
| | | | | |
| | 1,300 | | | Ferrellgas LP | | | 8.625% | | | | 6/15/20 | | | | CCC+ | | | | 1,228,500 | |
| | | | | |
| | | | Health Care Equipment & Supplies – 0.2% | | | | | | | | | | | | |
| | | | | |
| | 1,120 | | | Abbott Laboratories | | | 2.900% | | | | 11/30/21 | | | | BBB | | | | 1,130,657 | |
Nuveen Short Term Bond Fund (continued)
| | |
| Portfolio of Investments | | June 30, 2017 |
| | | | | | | | | | | | | | | | | | | | |
Principal
Amount (000) | | | Description (1) | | Coupon | | | Maturity | | | Ratings (2) | | | Value | |
| | | | | |
| | | | Health Care Providers & Services – 1.1% | | | | | | | | | | | | |
| | | | | |
| $ | 3,000 | | | Cardinal Health Inc. | | | 2.400% | | | | 11/15/19 | | | | A– | | | $ | 3,017,247 | |
| | | | | |
| | 1,500 | | | HCA Inc. | | | 4.250% | | | | 10/15/19 | | | | BBB– | | | | 1,556,250 | |
| | | | | |
| | 1,765 | | | UnitedHealth Group Incorporated | | | 3.875% | | | | 10/15/20 | | | | A+ | | | | 1,857,948 | |
| | 6,265 | | | Total Health Care Providers & Services | | | | | | | | | | | | | | | 6,431,445 | |
| | | | | |
| | | | Hotels, Restaurants & Leisure – 0.2% | | | | | | | | | | | | |
| | | | | |
| | 1,250 | | | MGM Resorts International Inc. | | | 6.750% | | | | 10/01/20 | | | | BB | | | | 1,384,875 | |
| | | | | |
| | | | Household Durables – 0.4% | | | | | | | | | | | | |
| | | | | |
| | 2,009 | | | Newell Brands Inc. | | | 2.600% | | | | 3/29/19 | | | | BBB– | | | | 2,028,658 | |
| | | | | |
| | | | Independent Power & Renewable Electricity Producers – 0.2% | | | | | | | | | | | | |
| | | | | |
| | 1,300 | | | Dynegy Inc. | | | 6.750% | | | | 11/01/19 | | | | B+ | | | | 1,340,625 | |
| | | | | |
| | | | Industrial Conglomerates – 0.3% | | | | | | | | | | | | |
| | | | | |
| | 2,000 | | | Siemens Financieringsmaatschappij NV, 144A | | | 1.300% | | | | 9/13/19 | | | | A+ | | | | 1,975,422 | |
| | | | | |
| | | | Insurance – 2.6% | | | | | | | | | | | | |
| | | | | |
| | 2,000 | | | AFLAC Insurance | | | 2.400% | | | | 3/16/20 | | | | A– | | | | 2,020,992 | |
| | | | | |
| | 2,415 | | | American International Group, Inc. | | | 3.375% | | | | 8/15/20 | | | | BBB+ | | | | 2,498,829 | |
| | | | | |
| | 2,760 | | | Berkshire Hathaway Finance Corporation | | | 4.250% | | | | 1/15/21 | | | | AA | | | | 2,971,024 | |
| | | | | |
| | 1,500 | | | Hartford Financial Services Group Inc. | | | 5.500% | | | | 3/30/20 | | | | BBB+ | | | | 1,629,864 | |
| | | | | |
| | 2,025 | | | Marsh & McLennan Companies | | | 2.350% | | | | 3/06/20 | | | | A– | | | | 2,035,238 | |
| | | | | |
| | 1,500 | | | Met Life Global Funding I, 144A | | | 2.000% | | | | 4/14/20 | | | | AA– | | | | 1,495,788 | |
| | | | | |
| | 1,570 | | | Prudential Financial Inc. | | | 4.500% | | | | 11/15/20 | | | | A | | | | 1,684,180 | |
| | 13,770 | | | Total Insurance | | | | | | | | | | | | | | | 14,335,915 | |
| | | | | |
| | | | Internet Software & Services – 0.4% | | | | | | | | | | | | |
| | | | | |
| | 2,185 | | | eBay Inc. | | | 2.200% | | | | 8/01/19 | | | | BBB+ | | | | 2,193,841 | |
| | | | | |
| | | | IT Services – 0.6% | | | | | | | | | | | | |
| | | | | |
| | 3,490 | | | Visa Inc. | | | 2.200% | | | | 12/14/20 | | | | A+ | | | | 3,518,873 | |
| | | | | |
| | | | Leisure Products – 0.4% | | | | | | | | | | | | |
| | | | | |
| | 1,980 | | | Carnival Corporation | | | 3.950% | | | | 10/15/20 | | | | A– | | | | 2,095,749 | |
| | | | | |
| | | | Machinery – 0.5% | | | | | | | | | | | | |
| | | | | |
| | 1,365 | | | Ingersoll-Rand Luxembourg Finance SA | | | 2.625% | | | | 5/01/20 | | | | BBB | | | | 1,378,402 | |
| | | | | |
| | 1,610 | | | John Deere Capital Corporation | | | 1.950% | | | | 6/22/20 | | | | A | | | | 1,614,225 | |
| | 2,975 | | | Total Machinery | | | | | | | | | | | | | | | 2,992,627 | |
| | | | | |
| | | | Media – 1.6% | | | | | | | | | | | | |
| | | | | |
| | 1,735 | | | 21st Century Fox America Inc. | | | 4.500% | | | | 2/15/21 | | | | BBB+ | | | | 1,859,068 | |
| | | | | |
| | 1,890 | | | CBS Corporation | | | 5.750% | | | | 4/15/20 | | | | BBB | | | | 2,067,280 | |
| | | | | |
| | 2,000 | | | Charter Communications Operating Capital Corporation | | | 3.579% | | | | 7/23/20 | | | | BBB– | | | | 2,066,592 | |
| | | | | |
| | 1,600 | | | Discovery Communications Inc. | | | 5.050% | | | | 6/01/20 | | | | BBB– | | | | 1,711,587 | |
| | | | | | | | | | | | | | | | | | | | |
Principal
Amount (000) | | | Description (1) | | Coupon | | | Maturity | | | Ratings (2) | | | Value | |
| | | | | |
| | | | Media (continued) | | | | | | | | | | | | |
| | | | | |
| $ | 1,500 | | | Dish DBS Corporation | | | 4.250% | | | | 4/01/18 | | | | Ba3 | | | $ | 1,519,230 | |
| | 8,725 | | | Total Media | | | | | | | | | | | | | | | 9,223,757 | |
| | | | | |
| | | | Metals & Mining – 0.5% | | | | | | | | | | | | |
| | | | | |
| | 1,250 | | | Alcoa Inc. | | | 6.150% | | | | 8/15/20 | | | | BBB– | | | | 1,345,312 | |
| | | | | |
| | 1,500 | | | Nucor Corporation | | | 5.850% | | | | 6/01/18 | | | | A– | | | | 1,554,264 | |
| | 2,750 | | | Total Metals & Mining | | | | | | | | | | | | | | | 2,899,576 | |
| | | | | |
| | | | Oil, Gas & Consumable Fuels – 2.0% | | | | | | | | | | | | |
| | | | | |
| | 1,700 | | | BP Capital Markets PLC | | | 2.521% | | | | 1/15/20 | | | | A1 | | | | 1,723,560 | |
| | | | | |
| | 645 | | | Calumet Specialty Products | | | 6.500% | | | | 4/15/21 | | | | CCC+ | | | | 557,925 | |
| | | | | |
| | 1,430 | | | ConocoPhillips | | | 4.200% | | | | 3/15/21 | | | | A– | | | | 1,516,023 | |
| | | | | |
| | 1,645 | | | Petroleos Mexicanos | | | 5.500% | | | | 2/04/19 | | | | BBB+ | | | | 1,717,380 | |
| | | | | |
| | 750 | | | Sabine Pass Liquefaction LLC | | | 5.625% | | | | 2/01/21 | | | | BBB– | | | | 816,442 | |
| | | | | |
| | 1,000 | | | Southwestern Energy Company, (3) | | | 5.800% | | | | 1/23/20 | | | | BB | | | | 1,024,500 | |
| | | | | |
| | 1,370 | | | Spectra Energy Partners LP | | | 2.950% | | | | 9/25/18 | | | | BBB+ | | | | 1,385,441 | |
| | | | | |
| | 1,300 | | | Valero Energy Corporation | | | 6.125% | | | | 2/01/20 | | | | BBB | | | | 1,425,148 | |
| | | | | |
| | 750 | | | WPX Energy Inc. | | | 7.500% | | | | 8/01/20 | | | | B+ | | | | 787,500 | |
| | 10,590 | | | Total Oil, Gas & Consumable Fuels | | | | | | | | | | | | | | | 10,953,919 | |
| | | | | |
| | | | Pharmaceuticals – 0.2% | | | | | | | | | | | | |
| | | | | |
| | 1,245 | | | Teva Pharmaceutical Finance III | | | 1.700% | | | | 7/19/19 | | | | BBB | | | | 1,233,912 | |
| | | | | |
| | | | Software – 0.4% | | | | | | | | | | | | |
| | | | | |
| | 2,015 | | | Microsoft Corporation | | | 1.850% | | | | 2/06/20 | | | | AAA | | | | 2,019,997 | |
| | | | | |
| | | | Specialty Retail – 0.7% | | | | | | | | | | | | |
| | | | | |
| | 1,625 | | | AutoNation Inc. | | | 6.750% | | | | 4/15/18 | | | | BBB– | | | | 1,686,116 | |
| | | | | |
| | 2,020 | | | Hyundai Capital America, 144A | | | 2.400% | | | | 10/30/18 | | | | A– | | | | 2,024,276 | |
| | 3,645 | | | Total Specialty Retail | | | | | | | | | | | | | | | 3,710,392 | |
| | | | | |
| | | | Technology Hardware, Storage & Peripherals – 1.1% | | | | | | | | | | | | |
| | | | | |
| | 2,720 | | | Apple Inc. | | | 2.100% | | | | 5/06/19 | | | | AA+ | | | | 2,745,603 | |
| | | | | |
| | 500 | | | Dell Inc. | | | 5.875% | | | | 6/15/19 | | | | Ba2 | | | | 527,655 | |
| | | | | |
| | 1,100 | | | Hewlett Packard Enterprise Co | | | 2.850% | | | | 10/05/18 | | | | BBB+ | | | | 1,109,440 | |
| | | | | |
| | 1,625 | | | International Business Machines Corporation | | | 1.800% | | | | 5/17/19 | | | | A+ | | | | 1,628,866 | |
| | 5,945 | | | Total Technology Hardware, Storage & Peripherals | | | | | | | | | | | | | | | 6,011,564 | |
| | | | | |
| | | | Tobacco – 1.2% | | | | | | | | | | | | |
| | | | | |
| | 1,700 | | | Altria Group Inc. | | | 2.625% | | | | 1/14/20 | | | | A– | | | | 1,726,243 | |
| | | | | |
| | 1,970 | | | Philip Morris International | | | 1.375% | | | | 2/25/19 | | | | A | | | | 1,957,162 | |
| | | | | |
| | 2,915 | | | Reynolds American Inc. | | | 3.250% | | | | 6/12/20 | | | | BBB+ | | | | 3,000,876 | |
| | 6,585 | | | Total Tobacco | | | | | | | | | | | | | | | 6,684,281 | |
Nuveen Short Term Bond Fund (continued)
| | |
| Portfolio of Investments | | June 30, 2017 |
| | | | | | | | | | | | | | | | | | | | |
Principal
Amount (000) | | | Description (1) | | Coupon | | | Maturity | | | Ratings (2) | | | Value | |
| | | | | |
| | | | Trading Companies & Distributors – 0.4% | | | | | | | | | | | | |
| | | | | |
| $ | 1,500 | | | Air Lease Corporation | | | 2.625% | | | | 9/04/18 | | | | BBB | | | $ | 1,511,178 | |
| | | | | |
| | 500 | | | Air Lease Corporation | | | 3.375% | | | | 6/01/21 | | | | BBB | | | | 513,225 | |
| | 2,000 | | | Total Trading Companies & Distributors | | | | | | | | | | | | | | | 2,024,403 | |
| | | | | |
| | | | Transportation Infrastructure – 0.4% | | | | | | | | | | | | |
| | | | | |
| | 2,000 | | | Aviation Capital Group Corporation, 144A | | | 2.875% | | | | 9/17/18 | | | | A– | | | | 2,019,298 | |
| | | | | |
| | | | Wireless Telecommunication Services – 1.5% | | | | | | | | | | | | |
| | | | | |
| | 1,570 | | | America Movil S.A. de C.V. | | | 5.000% | | | | 3/30/20 | | | | A | | | | 1,686,392 | |
| | | | | |
| | 2,000 | | | Deutsche Telekom International Finance BV | | | 6.000% | | | | 7/08/19 | | | | BBB+ | | | | 2,155,524 | |
| | | | | |
| | 1,250 | | | Softbank Corporation, 144A | | | 4.500% | | | | 4/15/20 | | | | BB+ | | | | 1,299,487 | |
| | | | | |
| | 3,035 | | | Vodafone Group PLC | | | 4.375% | | | | 3/16/21 | | | | BBB+ | | | | 3,235,283 | |
| | 7,855 | | | Total Wireless Telecommunication Services | | | | | | | | | | | | | | | 8,376,686 | |
| $ | 253,474 | | | Total Corporate Bonds (cost $257,880,924) | | | | | | | | | | | | | | | 258,918,790 | |
| | | | | |
Principal
Amount (000) | | | Description (1) | | | | | Optional Call
Provisions (4) | | | Ratings (2) | | | Value | |
| | | | | |
| | | | MUNICIPAL BONDS – 1.0% | | | | | | | | | | | | | | | | |
| | | | | |
| | | | Guam – 0.2% | | | | | | | | | | | | |
| | | | | |
| $ | 1,190 | | | Government of Guam, Business Privilege Tax Bonds, Taxable Series 2012B-2, 3.301%, 1/01/18 | | | | | | | No Opt. Call | | | | A | | | $ | 1,191,892 | |
| | | | | |
| | | | Massachusetts – 0.5% | | | | | | | | | | | | |
| | | | | |
| | 2,750 | | | University of Massachusetts Building Authority, Project Revenue Bonds, Senior Series 2014-2, 1.185%, 11/01/17 | | | | | | | No Opt. Call | | | | Aa2 | | | | 2,750,578 | |
| | | | | |
| | | | Ohio – 0.3% | | | | | | | | | | | | |
| | | | | |
| | 1,470 | | | Ohio State, General Obligation Bonds, Higher Education, Build America Bond Series 2010E, 3.328%, 8/01/17 – AGM Insured | | | | | | | No Opt. Call | | | | AA+ | | | | 1,473,234 | |
| $ | 5,410 | | | Total Municipal Bonds (cost $5,412,758) | | | | | | | | | | | | | | | 5,415,704 | |
| | | | | |
Principal
Amount (000) | | | Description (1) | | Coupon | | | Maturity | | | Ratings (2) | | | Value | |
| | | | | |
| | | | U.S. GOVERNMENT AND AGENCY OBLIGATIONS – 8.8% | | | | | | | | | | | | |
| | | | | |
| $ | 13,000 | | | Federal National Mortgage Association | | | 1.000% | | | | 2/26/19 | | | | Aaa | | | $ | 12,913,654 | |
| | | | | |
| | 5,500 | | | Freddie Mac Notes | | | 1.500% | | | | 1/17/20 | | | | Aaa | | | | 5,490,974 | |
| | | | | |
| | 8,000 | | | United States of America Treasury Notes | | | 1.000% | | | | 8/15/18 | | | | Aaa | | | | 7,973,592 | |
| | | | | |
| | 3,000 | | | United States Treasury Notes | | | 0.875% | | | | 11/30/17 | | | | Aaa | | | | 2,996,868 | |
| | | | | |
| | 14,045 | | | United States Treasury Notes | | | 0.750% | | | | 12/31/17 | | | | Aaa | | | | 14,016,840 | |
| | | | | |
| | 4,000 | | | United States Treasury Notes | | | 1.000% | | | | 3/15/18 | | | | Aaa | | | | 3,993,436 | |
| | | | | |
| | 2,000 | | | United States Treasury Notes | | | 1.000% | | | | 10/15/19 | | | | Aaa | | | | 1,981,172 | |
| $ | 49,545 | | | Total U.S. Government and Agency Obligations (cost $49,412,045) | | | | | | | | | | | | | | | 49,366,536 | |
| | | | | | | | | | | | | | | | | | | | |
Principal
Amount (000) | | | Description (1) | | Coupon | | | Maturity | | | Ratings (2) | | | Value | |
| | | | | |
| | | | ASSET-BACKED AND MORTGAGE-BACKED SECURITIES – 42.0% | | | | | | | | | | | | |
| | | | | |
| $ | 2,314 | | | 321 Henderson Receivables LLC, Series 2005-1A, 144A | | | 1.456% | | | | 11/15/40 | | | | AAA | | | $ | 2,201,249 | |
| | | | | |
| | 1,850 | | | 321 Henderson Receivables LLC, Series 2006-4A | | | 1.426% | | | | 12/15/41 | | | | AAA | | | | 1,803,989 | |
| | | | | |
| | 476 | | | ACE Securities Corporation, Manufactured Housing Trust Series 2003-MH1 | | | 6.500% | | | | 8/15/30 | | | | AA | | | | 532,238 | |
| | | | | |
| | 1,198 | | | Agate Bay Mortgage Loan Trust, Mortgage Loan Pass-Through Certificates, Series 2016-3 | | | 3.500% | | | | 8/25/46 | | | | AAA | | | | 1,222,920 | |
| | | | | |
| | 4,198 | | | American Express Credit Account Master Trust, Series 2013-1 | | | 1.646% | | | | 2/16/21 | | | | Aaa | | | | 4,213,413 | |
| | | | | |
| | 2,649 | | | AmeriCold LLC Trust, Series 2010 | | | 2.724% | | | | 1/14/29 | | | | AAA | | | | 2,653,457 | |
| | | | | |
| | 352 | | | Amortizing Residential Collateral Trust Series 2002-BC4 M1 | | | 2.282% | | | | 7/25/32 | | | | A3 | | | | 352,140 | |
| | | | | |
| | 1,892 | | | Amortizing Residential Collateral Trust, Series 2002-BC7 | | | 1.992% | | | | 10/25/32 | | | | Aa1 | | | | 1,673,958 | |
| | | | | |
| | 2,910 | | | Asset Backed Securities Corp Home Equity Loan Trust, Series 2002-HE1 | | | 2.876% | | | | 3/15/32 | | | | BBB | | | | 2,893,719 | |
| | | | | |
| | 3,000 | | | Barclays Commercial Mortgage, Mortgage Pass-Through Certificates, Series 2015-STP | | | 4.284% | | | | 9/10/28 | | | | A– | | | | 3,077,721 | |
| | | | | |
| | 2,790 | | | BXHTL Mortgage Trust, Series 2015-JWRZ | | | 2.456% | | | | 5/15/29 | | | | AAA | | | | 2,793,500 | |
| | | | | |
| | 84 | | | California Republic Auto Receivables Trust 2013-2 | | | 1.230% | | | | 3/15/19 | | | | Aaa | | | | 84,227 | |
| | | | | |
| | 4,061 | | | California Republic Auto Receivables Trust, Series 2014-4 | | | 1.840% | | | | 6/15/20 | | | | AAA | | | | 4,065,848 | |
| | | | | |
| | 669 | | | California Republic Auto Receivables Trust, Series 2016-2 | | | 1.340% | | | | 3/15/19 | | | | AAA | | | | 668,507 | |
| | | | | |
| | 4,155 | | | Capital One Multi Asset Execution Trust, Series 2014-A3 | | | 1.606% | | | | 1/18/22 | | | | AAA | | | | 4,172,799 | |
| | | | | |
| | 3,928 | | | Capital One Multi Asset Execution Trust, Series 2015-A5 | | | 1.600% | | | | 5/17/21 | | | | AAA | | | | 3,930,292 | |
| | | | | |
| | 2,930 | | | Capital One Multi Asset Execution Trust, Series 2016-A1 | | | 1.676% | | | | 2/15/22 | | | | AAA | | | | 2,947,237 | |
| | | | | |
| | 2,350 | | | CarFinance Capital Auto Trust, Automobile Receivables-Backed Notes, Series 2013-1, 144A | | | 4.680% | | | | 11/15/19 | | | | A1 | | | | 2,358,348 | |
| | | | | |
| | 4,500 | | | CarMax Auto Owner Trust, Series 2017-1 A2 | | | 1.540% | | | | 2/18/20 | | | | Aaa | | | | 4,499,519 | |
| | | | | |
| | 3,379 | | | Chase Issuance Trust, Series 2013-A9 | | | 1.646% | | | | 11/16/20 | | | | AAA | | | | 3,393,360 | |
| | | | | |
| | 4,000 | | | Chase Issuance Trust, Series 2015-A7 | | | 1.620% | | | | 7/15/20 | | | | AAA | | | | 4,004,410 | |
| | | | | |
| | 4,700 | | | Chase Issuance Trust, Series 2016-A1 | | | 1.636% | | | | 5/17/21 | | | | AAA | | | | 4,725,271 | |
| | | | | |
| | 3,623 | | | Chrysler Capital Receivables Trust, Series 2015-BA, 144A | | | 1.910% | | | | 3/16/20 | | | | AAA | | | | 3,629,383 | |
| | | | | |
| | 3,000 | | | CitiBank Credit Card Issuance Trust 2016-A1 | | | 1.750% | | | | 11/19/21 | | | | AAA | | | | 2,997,341 | |
| | | | | |
| | 3,170 | | | CitiBank Credit Card Issuance Trust, Series 2017-A2 | | | 1.740% | | | | 1/19/21 | | | | AAA | | | | 3,174,036 | |
| | | | | |
| | 40 | | | Citicorp Mortgage Securities I, REMIC Pass-Through Certificates, Series 2007-9 | | | 5.500% | | | | 12/25/22 | | | | Baa2 | | | | 39,668 | |
| | | | | |
| | 87 | | | Citicorp Mortgage Securities Inc., REMIC Pass-Through Certificates, Series 2006-1 5A1 | | | 5.500% | | | | 2/25/26 | | | | Ba2 | | | | 87,870 | |
| | | | | |
| | 2,000 | | | Cold Storage Trust, Commercial Mortgage Backed Securities, Series 2017-ICE3, 144A | | | 2.226% | | | | 4/15/36 | | | | AAA | | | | 2,002,477 | |
| | | | | |
| | 2,960 | | | Colony American Homes Trust 2015-1A | | | 3.176% | | | | 7/17/32 | | | | A2 | | | | 2,968,668 | |
| | | | | |
| | 2,000 | | | Colony American Homes Trust 2014-1A | | | 2.576% | | | | 5/17/31 | | | | Aa1 | | | | 2,002,799 | |
| | | | | |
| | 2,000 | | | Colony Starwood Homes, Series 2016-1A | | | 4.328% | | | | 7/17/33 | | | | Baa2 | | | | 2,053,127 | |
| | | | | |
| | 1,505 | | | Commercial Mortgage Pass-Through Certificates, Series 2016-SAVA | | | 3.526% | | | | 10/15/34 | | | | AA– | | | | 1,512,070 | |
| | | | | |
| | 1,036 | | | Conns Receivables Funding Trust II, Series 2016-B, 144A | | | 3.730% | | | | 10/15/18 | | | | BBB | | | | 1,037,673 | |
| | | | | |
| | 3,072 | | | Conns Receivables Funding Trust II, Series 2017-A, 144A | | | 2.730% | | | | 5/15/20 | | | | BBB | | | | 3,076,305 | |
| | | | | |
| | 2,262 | | | Credit Suisse Commercial Mortgage Trust, 2015-2 | | | 3.000% | | | | 2/25/45 | | | | AAA | | | | 2,261,510 | |
| | | | | |
| | 351 | | | Credit Suisse First Boston Mortgage Securities Corporation, Mortgage-Backed Pass-Through Certificates, Series 2003-23 | | | 5.750% | | | | 9/25/33 | | | | AA+ | | | | 368,001 | |
Nuveen Short Term Bond Fund (continued)
| | |
| Portfolio of Investments | | June 30, 2017 |
| | | | | | | | | | | | | | | | | | | | |
Principal
Amount (000) | | | Description (1) | | Coupon | | | Maturity | | | Ratings (2) | | | Value | |
| | | | | |
| | | | ASSET-BACKED AND MORTGAGE-BACKED SECURITIES (continued) | | | | | | | | | | | | |
| | | | | |
| $ | 2,327 | | | Credit-Based Asset Servicing and Securitization Pool 2007-SP1 | | | 6.020% | | | | 12/25/37 | | | | AA | | | $ | 2,400,656 | |
| | | | | |
| | 2,488 | | | DB Master Finance LLC, Series 2015-1A | | | 3.262% | | | | 2/20/45 | | | | BBB | | | | 2,502,639 | |
| | | | | |
| | 2,000 | | | Discover Card Execution Note Trust 2012-A6 | | | 1.670% | | | | 1/18/22 | | | | AAA | | | | 1,997,412 | |
| | | | | |
| | 2,812 | | | DT Auto Owner Trust, Series 2013-2A, 144A | | | 4.180% | | | | 6/15/20 | | | | AAA | | | | 2,813,718 | |
| | | | | |
| | 1,413 | | | DT Auto Owner Trust, Series 2014-1A | | | 3.980% | | | | 1/15/21 | | | | AAA | | | | 1,422,394 | |
| | | | | |
| | 1,695 | | | DT Auto Owner Trust, Series 2015-3A, 144A | | | 2.460% | | | | 11/15/19 | | | | AAA | | | | 1,697,919 | |
| | | | | |
| | 2,250 | | | Exeter Auto Receivables Trust, Series 2013-2A, 144A | | | 6.810% | | | | 8/17/20 | | | | A– | | | | 2,305,479 | |
| | | | | |
| | 1,000 | | | Exeter Auto Receivables Trust, Series 2014-2A, 144A | | | 3.260% | | | | 12/16/19 | | | | AA– | | | | 1,006,238 | |
| | | | | |
| | 749 | | | Fannie Mae Connecticut Avenue Securities , Series 2016-C03 | | | 3.432% | | | | 10/25/28 | | | | BBB– | | | | 760,257 | |
| | | | | |
| | 281 | | | Fannie Mae Mortgage Interest Strips | | | 5.000% | | | | 9/25/24 | | | | Aaa | | | | 12,346 | |
| | | | | |
| | 13 | | | Fannie Mae Real Estate Mortgage Investment Conduit, Pass Through Certificates | | | 5.500% | | | | 9/25/22 | | | | Aaa | | | | 13,706 | |
| | | | | |
| | 208 | | | Fannie Mae Real Estate Mortgage Investment Conduit, Pass Through Certificates | | | 1.532% | | | | 11/25/34 | | | | Aaa | | | | 208,242 | |
| | | | | |
| | 175 | | | Fannie Mae REMIC Pass-Through Certificates | | | 2.750% | | | | 6/25/20 | | | | Aaa | | | | 176,752 | |
| | | | | |
| | 1,908 | | | Fannie Mae, Connecticut Avenue Securities, Series 2016-C07 | | | 2.532% | | | | 5/25/29 | | | | BBB– | | | | 1,921,854 | |
| | | | | |
| | 1,939 | | | Fannie Mae, Connecticut Avenue Securities, Series 2017-C02 | | | 2.382% | | | | 9/25/29 | | | | BBB– | | | | 1,956,460 | |
| | | | | |
| | 2,418 | | | Fannie Mae, Connecticut Avenue Securities, Series 2017-C03 | | | 2.182% | | | | 10/25/29 | | | | Baa3 | | | | 2,429,517 | |
| | | | | |
| | 1,100 | | | FDIC Structures Sale Guaranteed Notes, Series 2010-S1 | | | 3.250% | | | | 4/25/38 | | | | Aaa | | | | 1,106,731 | |
| | | | | |
| | 3 | | | Federal Home Loan Mortgage Corporation, REMIC | | | 6.000% | | | | 12/15/20 | | | | Aaa | | | | 3,458 | |
| | | | | |
| | 34 | | | Freddie Mac Mortgage Pool, Various | | | 4.500% | | | | 4/1/2022 | | | | Aaa | | | | 34,744 | |
| | | | | |
| | 1,556 | | | Freddie Mac Mortgage Trust 2013-KF02 | | | 4.060% | | | | 12/25/45 | | | | Baa1 | | | | 1,581,245 | |
| | | | | |
| | 2,605 | | | Freddie Mac Mortgage Trust, Multifamily Mortgage Pass-Through Certificates, Series 2012-K711 | | | 3.562% | | | | 8/25/45 | | | | AA | | | | 2,668,560 | |
| | | | | |
| | 2,940 | | | Freddie Mac Mortgage Trust, Multifamily Mortgage Pass-Through Certificates, Series 2013-K712 | | | 3.365% | | | | 5/25/45 | �� | | | AA | | | | 3,008,448 | |
| | | | | |
| | 2,000 | | | Freddie Mac Mortgage Trust, Multifamily Mortgage Pass-Through Certificates, Series 2013-K712 | | | 3.365% | | | | 5/25/45 | | | | A | | | | 2,008,984 | |
| | | | | |
| | 4,015 | | | Freddie Mac Mortgage Trust, Structured Pass Through Certificates, Series 2011- K702 | | | 4.765% | | | | 4/25/44 | | | | A1 | | | | 4,079,512 | |
| | | | | |
| | 1,805 | | | Freddie Mac Mortgage Trust, Structured Pass-Through Certificates, Series 2011 K-10 | | | 4.625% | | | | 11/25/49 | | | | A | | | | 1,912,447 | |
| | | | | |
| | 1,995 | | | Freddie Mac Mortgage Trust, Structured Pass-Through Certificates, Series 2012- K707 | | | 3.883% | | | | 1/25/47 | | | | Aa3 | | | | 2,039,047 | |
| | | | | |
| | 317 | | | Freddie Mac Multi-Class Certificates | | | 1.626% | | | | 12/15/20 | | | | Aaa | | | | 318,041 | |
| | | | | |
| | 3,030 | | | Freddie Mac Multifamily Mortgage Trust, Series 2011-K704, 144A | | | 4.536% | | | | 10/25/30 | | | | A2 | | | | 3,101,153 | |
| | | | | |
| | 1,300 | | | Freddie Mac MultiFamily Mortgage Trust, Structured Pass Through Certificates, Series 2012-K710 | | | 3.813% | | | | 6/25/47 | | | | A– | | | | 1,336,130 | |
| | | | | |
| | 2,960 | | | Freddie Mac MultiFamily Mortgage Trust, Structured Pass Through Certificates, Series 2013-K502 | | | 2.821% | | | | 3/25/45 | | | | A1 | | | | 2,956,454 | |
| | | | | |
| | 2,235 | | | Freddie Mac Multifamily Structured Pass Through Certificates, Series KLH1 | | | 1.924% | | | | 11/25/22 | | | | Aaa | | | | 2,243,403 | |
| | | | | |
| | 632 | | | GAHR Commercial Mortgage Trust, Commercial Mortgage Pass-Through Certificates, Series 2015-NRF | | | 2.459% | | | | 12/15/34 | | | | AAA | | | | 633,364 | |
| | | | | |
| | 3,620 | | | General Electric Capital Credit Card Master Trust, Series 2012-6 | | | 1.360% | | | | 8/17/20 | | | | AAA | | | | 3,619,662 | |
| | | | | |
| | 2,400 | | | GLS Auto Receivables Trust 2017-1A | | | 2.670% | | | | 4/15/21 | | | | A | | | | 2,398,331 | |
| | | | | | | | | | | | | | | | | | | | |
Principal
Amount (000) | | | Description (1) | | Coupon | | | Maturity | | | Ratings (2) | | | Value | |
| | | | | |
| | | | ASSET-BACKED AND MORTGAGE-BACKED SECURITIES (continued) | | | | | | | | | | | | |
| | | | | |
| $ | 1 | | | Goldman Sachs Mortgage Securities Corporation II, Commercial Mortgage Pass-Through Certificates, Series 2014-GSFL | | | 2.226% | | | | 7/15/31 | | | | AAA | | | $ | 1,449 | |
| | | | | |
| | 1,045 | | | Goldman Sachs Mortgage Securities Corporation II, Commercial Mortgage Pass-Through Certificates, Series 2010-C1 | | | 3.679% | | | | 8/10/43 | | | | Aaa | | | | 1,068,399 | |
| | | | | |
| | 44 | | | Government National Mortgage Association, Guaranteed REMIC Pass-Through Securities and MX Securities Trust | | | 4.500% | | | | 5/16/38 | | | | Aaa | | | | 44,851 | |
| | | | | |
| | 2,025 | | | GP Portfolio Trust 2014-GPP A | | | 4.159% | | | | 2/15/27 | | | | BBB– | | | | 2,030,422 | |
| | | | | |
| | 2,500 | | | Green Tree Agency Funding Trust, Manufactured Housing Contract Pass Through Certificates, Series 2016-T1, 144A | | | 2.380% | | | | 10/15/48 | | | | AAA | | | | 2,489,647 | |
| | | | | |
| | 203 | | | Greenwich Capital Commercial Funding Corporation, Commercial Mortgage Pass Through Certificates, Series 2007-GG11 | | | 5.736% | | | | 12/10/49 | | | | AAA | | | | 203,207 | |
| | | | | |
| | 1,698 | | | Honor Automobile Trust, Series 2016-1A | | | 2.940% | | | | 11/15/19 | | | | A | | | | 1,704,213 | |
| | | | | |
| | 2,500 | | | Hyatt Hotel Portfolio Trust, Mortgage Pass-Through Certificate, Series 2015-HYT | | | 2.926% | | | | 11/15/29 | | | | AA– | | | | 2,503,150 | |
| | | | | |
| | 569 | | | IMC Home Mortgage Company, Home Equity Loan Pass-Through Certificates, Series 1998-3 | | | 6.720% | | | | 8/20/29 | | | | AA | | | | 573,615 | |
| | | | | |
| | 3,787 | | | Invitation Homes Trust 2014-SFR2 | | | 2.829% | | | | 9/17/31 | | | | Aa2 | | | | 3,786,995 | |
| | | | | |
| | 1,909 | | | Invitation Homes Trust 2014-SFR2 | | | 2.326% | | | | 9/17/31 | | | | Aaa | | | | 1,912,680 | |
| | | | | |
| | 268 | | | Invitation Homes Trust 2014-SFR3 | | | 3.726% | | | | 12/17/31 | | | | Aaa | | | | 270,536 | |
| | | | | |
| | 2,496 | | | Invitation Homes Trust 2015-SFR3, 144A | | | 2.526% | | | | 8/17/32 | | | | Aaa | | | | 2,507,019 | |
| | | | | |
| | 2,807 | | | JP Morgan Chase Commercial Mortgage Securities Corporation, Commercial Mortgage Pass-Through Certificates, Series 2010-C2 A3 | | | 4.070% | | | | 11/15/43 | | | | AAA | | | | 2,943,852 | |
| | | | | |
| | 2,632 | | | JP Morgan Mortgage Trust, Series 2017-1 | | | 3.500% | | | | 1/25/47 | | | | Aaa | | | | 2,689,618 | |
| | | | | |
| | 2,831 | | | JP Morgan Mortgage Trust, Series 2017-2, 144A | | | 3.500% | | | | 5/25/47 | | | | Aaa | | | | 2,891,573 | |
| | | | | |
| | 2,383 | | | Lehman Brothers-UBS Commercial Mortgage Pass-Through Certificates, Series 2008-C1 | | | 6.120% | | | | 4/15/41 | | | | AAA | | | | 2,429,054 | |
| | | | | |
| | 891 | | | Master Resecuritization Trust 2009-1 | | | 6.000% | | | | 10/25/36 | | | | AA | | | | 907,786 | |
| | | | | |
| | 1,922 | | | Merrill Lynch Mortgage Trust, Commercial Mortgage Pass-Through Certificates, Series 2008-C1 | | | 5.690% | | | | 2/12/51 | | | | AAA | | | | 1,930,382 | |
| | | | | |
| | 1,160 | | | Morgan Stanley Capital I Trust, Commercial Mortgage Pass-Through Certificates, Series 2007-IQ16 | | | 5.809% | | | | 12/12/49 | | | | AAA | | | | 1,163,481 | |
| | | | | |
| | 934 | | | Murray Hill Marketplace Trust, Series 2016-LC1, 144A | | | 4.190% | | | | 11/25/22 | | | | N/R | | | | 942,398 | |
| | | | | |
| | 1,000 | | | New Residential Advance Receivable Trust , Series 2016-T1 | | | 4.377% | | | | 6/15/49 | | | | BBB | | | | 1,005,661 | |
| | | | | |
| | 600 | | | New Residential Advance Receivable Trust, Series 2017-T1, 144A | | | 3.214% | | | | 2/15/51 | | | | AAA | | �� | | 603,361 | |
| | | | | |
| | 2,164 | | | New Residential Mortgage Loan Trust, Mortgage Pass Through Certificates, Series 2014-2A | | | 3.750% | | | | 5/25/54 | | | | AAA | | | | 2,208,421 | |
| | | | | |
| | 2,055 | | | New Residential Mortgage Loan Trust, Mortgage Pass Through Certificates, Series 2015-A1 | | | 3.750% | | | | 5/28/52 | | | | Aaa | | | | 2,109,529 | |
| | | | | |
| | 2,327 | | | New Residential Mortgage Loan Trust, Mortgage Pass Through Certificates, Series 2016-1A | | | 3.750% | | | | 3/25/56 | | | | AAA | | | | 2,385,206 | |
| | | | | |
| | 2,602 | | | New Residential Mortgage Loan Trust, Series 2017-1A, 144A | | | 4.000% | | | | 2/25/57 | | | | AAA | | | | 2,705,068 | |
| | | | | |
| | 3,084 | | | OMART Receivables Trust, Series 2015-T3 | | | 3.211% | | | | 11/15/47 | | | | AAA | | | | 3,076,728 | |
| | | | | |
| | 3,185 | | | OMART Receivables Trust, Series 2016-T2 | | | 2.722% | | | | 8/16/49 | | | | AAA | | | | 3,173,802 | |
Nuveen Short Term Bond Fund (continued)
| | |
| Portfolio of Investments | | June 30, 2017 |
| | | | | | | | | | | | | | | | | | | | |
Principal
Amount (000) | | | Description (1) | | Coupon | | | Maturity | | | Ratings (2) | | | Value | |
| | | | | |
| | | | ASSET-BACKED AND MORTGAGE-BACKED SECURITIES (continued) | | | | | | | | | | | | |
| | | | | |
| $ | 1,636 | | | OneMain Direct Auto Receivables Trust, Series 2016-1, 144A | | | 2.040% | | | | 1/15/21 | | | | Aa1 | | | $ | 1,638,174 | |
| | | | | |
| | 2,657 | | | Opteum Mortgage Acceptance Corporation, Asset Backed Pass-Through Certificates, Series 2005-1 | | | 2.087% | | | | 2/25/35 | | | | AAA | | | | 2,654,084 | |
| | | | | |
| | 1,917 | | | OWS Structured Asset Trust, Series 2016-NPL1 | | | 3.750% | | | | 7/25/56 | | | | N/R | | | | 1,928,682 | |
| | | | | |
| | 873 | | | PennyMac Loan Trust, Series 2015-NPL1 | | | 4.000% | | | | 3/25/55 | | | | N/R | | | | 876,685 | |
| | | | | |
| | 3,842 | | | Pretium Mortgage Credit Partners I, Series 2017-NPL1 | | | 3.500% | | | | 4/29/32 | | | | N/R | | | | 3,856,138 | |
| | | | | |
| | 326 | | | RBSSP Resecuritization Trust 2009-10 | | | 1.316% | | | | 3/26/37 | | | | N/R | | | | 146,218 | |
| | | | | |
| | 878 | | | RBSSP Resecuritization Trust 2009-5 | | | 1.727% | | | | 8/26/37 | | | | A | | | | 839,923 | |
| | | | | |
| | 1,299 | | | Santander Drive Auto Receivables Trust, Series 2014-1 | | | 2.360% | | | | 4/15/20 | | | | AAA | | | | 1,301,842 | |
| | | | | |
| | 2,500 | | | Sunset Mortgage Loan Company, Series 2017-NPL1, 144A | | | 3.500% | | | | 6/15/47 | | | | N/R | | | | 2,498,816 | |
| | | | | |
| | 3,524 | | | Susquehanna Auto Receivables Trust, Series 2014-1A, 144A | | | 1.430% | | | | 8/15/19 | | | | AAA | | | | 3,523,710 | |
| | | | | |
| | 1,449 | | | Synchrony Credit Card Master Note Trust, Series 2015-3 | | | 1.740% | | | | 9/15/21 | | | | AAA | | | | 1,450,005 | |
| | | | | |
| | 2,775 | | | TCF Auto Receivables Owner Trust, Series 2016-1A | | | 1.710% | | | | 4/15/21 | | | | AAA | | | | 2,766,049 | |
| | | | | |
| | 3,000 | | | Toyota Auto Receivables Owner Trust, Series 2017-B | | | 2.050% | | | | 9/15/22 | | | | AAA | | | | 3,008,545 | |
| | | | | |
| | 681 | | | Vericrest Opportunity Loan Transferee, Series 2014-NPL8 | | | 3.375% | | | | 10/26/54 | | | | N/R | | | | 682,856 | |
| | | | | |
| | 2,156 | | | Vericrest Opportunity Loan Transferee, Series 2015-NPL5 | | | 3.500% | | | | 3/25/55 | | | | N/R | | | | 2,163,605 | |
| | | | | |
| | 1,565 | | | VNO Mortgage Trust, Series 2013-PENN | | | 3.808% | | | | 12/13/29 | | | | AAA | | | | 1,639,187 | |
| | | | | |
| | 1,251 | | | Volkswagen Auto Loan Enhanced Trust, Series 2014-2 | | | 0.950% | | | | 4/22/19 | | | | AAA | | | | 1,249,927 | |
| | | | | |
| | 2,604 | | | Vornado DP LLC Commercial Mortgage Credit Tenant Lease Series 2010-VNO | | | 2.970% | | | | 9/13/28 | | | | AAA | | | | 2,647,792 | |
| | | | | |
| | 807 | | | Walter Investment Management Company Capital Trust, Series 2012-AA | | | 4.549% | | | | 10/16/50 | | | | A | | | | 807,944 | |
| | | | | |
| | 2,754 | | | Wells Fargo Commercial Mortgage Trust, Commercial Mortgage Pass-Through Certificates, Series 2015-LC22 | | | 1.639% | | | | 9/15/58 | | | | Aaa | | | | 2,746,433 | |
| | | | | |
| | 12 | | | Wells Fargo Mortgage Backed Securities, 2005-AR16 Class 3A2 | | | 3.208% | | | | 3/25/35 | | | | A+ | | | | 12,469 | |
| | | | | |
| | 1,215 | | | World Omni Auto Receivables Trust, Series 2017-A | | | 1.680% | | | | 12/16/19 | | | | Aaa | | | | 1,214,736 | |
| $ | 235,057 | | | Total Asset-Backed and Mortgage-Backed Securities (cost $236,092,878) | | | | | | | | | | | | | | | 236,070,276 | |
| | | | Total Long-Term Investments (cost $548,798,605) | | | | | | | | | | | | | | | 549,771,306 | |
| | | | | |
| Shares | | | Description (1) | | Coupon | | | | | | | | | Value | |
| |
| | | | INVESTMENTS PURCHASED WITH COLLATERAL FROM SECURITIES LENDING – 0.5% | |
| | | | | |
| | | | Money Market Funds – 0.5% | | | | | | | | | | | | |
| | | | | |
| | 2,658,212 | | | First American Government Obligations Fund, Class X, (6) | | | 0.883% (5) | | | | | | | | | | | $ | 2,658,212 | |
| | | | Total Investments Purchased with Collateral from Securities Lending (cost $2,658,212) | | | | | | | | 2,658,212 | |
| | | | | |
| Shares | | | Description (1) | | Coupon | | | | | | | | | Value | |
| | | | | |
| | | | SHORT-TERM INVESTMENTS – 4.4% | | | | | | | | | | | | |
| | | | | |
| | | | Money Market Funds – 4.4% | | | | | | | | | | | | |
| | | | | |
| | 24,846,144 | | | First American Treasury Obligations Fund, Class Z | | | 0.847% (5) | | | | | | | | | | | $ | 24,846,144 | |
| | | | Total Short-Term Investments (cost $24,846,144) | | | | | | | | | | | | | | | 24,846,144 | |
| | | | Total Investments (cost $576,302,961) – 102.8% | | | | | | | | | | | | | | | 577,275,662 | |
| | | | Other Assets Less Liabilities – (2.8)% (7) | | | | | | | | | | | | | | | (15,577,755) | |
| | | | Net Assets – 100% | | | | | | | | | | | | | | $ | 561,697,907 | |
Investments in Derivatives as of June 30, 2017
Futures Contracts
| | | | | | | | | | | | | | | | | | | | | | | | |
| Description | | Contract
Position | | | Number of
Contracts | | | Contract
Expiration | | | Notional
Amount
at Value* | | | Variation
Margin
Receivable/
(Payable) | | | Unrealized
Appreciation
(Depreciation) | |
U.S. Treasury 2-Year Note | | | Long | | | | 236 | | | | 9/17 | | | $ | 51,001,813 | | | $ | (22,125 | ) | | $ | (67,760 | ) |
U.S. Treasury 5-Year Note | | | Short | | | | (283 | ) | | | 9/17 | | | | (33,347,871 | ) | | | 48,638 | | | | 98,003 | |
| | | | | | | | | | | | | | | $ | 17,654,242 | | | $ | 26,513 | | | $ | 30,243 | |
| * | The aggregate Notional Amount at Value of long and short positions is $51,001,813 and $(33,347,871), respectively. |
For Fund portfolio compliance purposes, the Fund’s industry classifications refer to any one or more of the industry sub-classifications used by one or more widely recognized market indexes or ratings group indexes, and/or as defined by Fund management. This definition may not apply for purposes of this report, which may combine industry sub-classifications into sectors for reporting ease.
| (1) | All percentages shown in the Portfolio of Investments are based on net assets. |
| (2) | For financial reporting purposes, the ratings disclosed are the highest of Standard & Poor’s Group (“Standard & Poor’s”), Moody’s Investors Service, Inc. (“Moody’s”) or Fitch, Inc. (“Fitch”) rating. This treatment of split-rated securities may differ from that used for other purposes, such as for Fund investment policies. Ratings below BBB by Standard & Poor’s, Baa by Moody’s or BBB by Fitch are considered to be below investment grade. Holdings designated N/R are not rated by any of these national rating agencies. Ratings are not covered by the report of independent registered public accounting firm. |
| (3) | Investment, or a portion of investment, is out on loan for securities lending. The total value of the securities out on loan as of the end of the reporting period was $2,582,600. |
| (4) | Optional Call Provisions: Dates (month and year) and prices of the earliest optional call or redemption. There may be other call provisions at varying prices at later dates. Certain mortgagebacked securities may be subject to periodic principal paydowns. Optional Call Provisions are not covered by the report of independent registered public accounting firm. |
| (5) | The rate shown is the annualized seven-day subsidized yield as of the end of the reporting period. |
| (6) | The Fund may loan securities representing up to one third of the fair value of its total assets (which includes collateral for securities on loan) to broker-dealers, banks and other institutions. The Fund maintains collateral equal to at least 100% of the fair value of the securities loaned. The cash collateral received by the Fund is invested in this money market fund. See Notes to Financial Statements, Note 3 – Portfolio Securities and Investments in Derivatives, Securities Lending for more information. |
| (7) | Other assets less liabilities includes the unrealized appreciation (depreciation) of certain over-the-counter (“OTC”) derivatives as presented on the Statement of Assets and Liabilities, when applicable. The unrealized appreciation (depreciation) of OTC-cleared and exchange-traded derivatives is recognized as part of the cash collateral at brokers and/or receivable or payable for variation margin as presented on the Statement of Assets and Liabilities, when applicable. |
| 144A | Investment is exempt from registration under Rule 144A of the Securities Act of 1933, as amended. These investments may only be resold in transactions exempt from registration, which are normally those transactions with qualified institutional buyers. |
See accompanying notes to financial statements.
Nuveen Strategic Income Fund
| | |
| Portfolio of Investments | | June 30, 2017 |
| | | | | | | | | | | | | | | | | | | | |
| Shares | | | Description (1) | | | | | | | | | | | Value | |
| | | | | |
| | | | LONG-TERM INVESTMENTS – 97.8% | | | | | | | | | | | | | | | | |
| | | | | |
| | | | COMMON STOCKS – 0.1% | | | | | | | | | | | | | | | | |
| | | | | |
| | | | Building Products – 0.0% | | | | | | | | | | | | |
| | | | | |
| | 49 | | | Dayton Superior Corporation, (2), (3) | | | | | | | | | | | | | | $ | 2,839 | |
| | | | | |
| | 55 | | | Dayton Superior, (2), (3) | | | | | | | | | | | | | | | 3,154 | |
| | | | Total Building Products | | | | | | | | | | | | | | | 5,993 | |
| | | | | |
| | | | Electric Utilities – 0.1% | | | | | | | | | | | | |
| | | | | |
| | 21,463 | | | Exelon Corporation | | | | | | | | | | | | | | | 774,170 | |
| | | | Total Common Stocks (cost $758,461) | | | | | | | | | | | | | | | 780,163 | |
| | | | | |
| Shares | | | Description (1) | | Coupon | | | | | | Ratings (4) | | | Value | |
| | | | |
| | | | CONVERTIBLE PREFERRED SECURITIES – 0.0% | | | | | | | | | | | | | |
| | | |
| | | | Independent Power & Renewable Electricity Producers – 0.0% | | | | | | | |
| | | | | |
| | 2,500 | | | Dynegy Inc., (14) | | | 5.375% | | | | | | | | N/R | | | $ | 71,875 | |
| | | | | |
| | | | Multi-Utilities – 0.0% | | | | | | | | | | | | |
| | | | | |
| | 5,000 | | | Dominion Resources Inc. | | | 6.375% | | | | | | | | BBB | | | | 239,000 | |
| | | | Total Convertible Preferred Securities (cost $500,000) | | | | | | | | | | | | | | | 310,875 | |
| | | | | |
Principal
Amount (000) | | | Description (1) | | Coupon (6) | | | Maturity (5) | | | Ratings (4) | | | Value | |
| | | | |
| | | | VARIABLE RATE SENIOR LOAN INTERESTS – 0.7% (6) | | | | | | | | | | | | | |
| | | | | |
| | | | Containers & Packaging – 0.2% | | | | | | | | | | | | |
| | | | | |
| $ | 1,000 | | | Packaging Coordinators Inc, Second Lien Term Loan | | | 9.900% | | | | 6/30/24 | | | | CCC+ | | | $ | 990,000 | |
| | | | | |
| | 993 | | | Packaging Coordinators Inc, First Lien Term Loan | | | 5.150% | | | | 6/29/23 | | | | B | | | | 992,500 | |
| | 1,993 | | | Total Containers & Packaging | | | | | | | | | | | | | | | 1,982,500 | |
| | | | | |
| | | | Diversified Financial Services – 0.1% | | | | | | | | | | | | |
| | | | | |
| | 879 | | | Jill Acquisition LLC, First Lien Term Loan B | | | 6.180% | | | | 5/08/22 | | | | B | | | | 862,306 | |
| | | |
| | | | Independent Power & Renewable Electricity Producers – 0.1% | | | | | | | |
| | | | | |
| | 65 | | | Empire Generating Company LLC, Term Loan C | | | 5.430% | | | | 3/13/21 | | | | B | | | | 62,881 | |
| | | | | |
| | 660 | | | Empire Generating Company LLC | | | 5.430% | | | | 3/13/21 | | | | B | | | | 636,089 | |
| | 725 | | | Total Independent Power & Renewable Electricity Producers | | | | | | | | | | | | | | | 698,970 | |
| | | | | |
| | | | Professional Services – 0.3% | | | | | | | | | | | | |
| | | | | |
| | 1,000 | | | Sedgwick Claims Management Service Inc., Second Lien Term Loan | | | 6.795% | | | | 2/28/22 | | | | CCC+ | | | | 1,007,500 | |
| | | | | |
| | 1,000 | | | Sedgwick Claims Management Service Inc., Second Lien Term Loan | | | 6.952% | | | | 2/28/22 | | | | CCC+ | | | | 1,005,630 | |
| | 2,000 | | | Total Professional Services | | | | | | | | | | | | | | | 2,013,130 | |
| $ | 5,597 | | | Total Variable Rate Senior Loan Interests (cost $5,551,894) | | | | | | | | | | | | | | | 5,556,906 | |
| | | | | | | | | | | | | | | | | | | | |
| Shares | | | Description (1) | | Coupon | | | | | | Ratings (4) | | | Value | |
| | | |
| | | | $25 PAR (OR SIMILAR) RETAIL PREFERRED – 0.3% | | | | | | | | | |
| | | | | |
| | | | Banks – 0.3% | | | | | | | | | | | | |
| | | | | |
| | 20,600 | | | AgriBank FCB, (14) | | | 6.875% | | | | | | | | BBB+ | | | $ | 2,249,907 | |
| | | | Total $25 Par (or similar) Retail Preferred (cost $2,060,000) | | | | | | | | | | | | | | | 2,249,907 | |
| | | | | |
Principal
Amount (000) (7) | | | Description (1) | | Coupon | | | Maturity | | | Ratings (4) | | | Value | |
| | | | | |
| | | | CORPORATE BONDS – 58.0% | | | | | | | | | | | | | | | | |
| | | | | |
| | | | Aerospace & Defense – 1.4% | | | | | | | | | | | | |
| | | | | |
| $ | 2,785 | | | BAE Systems Holdings, 144A | | | 3.850% | | | | 12/15/25 | | | | BBB | | | $ | 2,897,971 | |
| | | | | |
| | 1,200 | | | Bombardier Inc., 144A | | | 8.750% | | | | 12/01/21 | | | | B | | | | 1,332,000 | |
| | | | | |
| | 3,000 | | | Martin Marietta Materials | | | 4.250% | | | | 7/02/24 | | | | BBB+ | | | | 3,148,566 | |
| | | | | |
| | 3,380 | | | Rockwell Collins Inc. | | | 3.500% | | | | 3/15/27 | | | | BBB | | | | 3,427,807 | |
| | | | Total Aerospace & Defense | | | | | | | | | | | | | | | 10,806,344 | |
| | | | | |
| | | | Air Freight & Logistics – 0.3% | | | | | | | | | | | | |
| | | | | |
| | 2,280 | | | FedEx Corporation | | | 3.300% | | | | 3/15/27 | | | | BBB | | | | 2,285,223 | |
| | | | | |
| | | | Airlines – 1.0% | | | | | | | | | | | | |
| | | | | |
| | 2,000 | | | American Airlines Group Inc., 144A, (8) | | | 4.625% | | | | 3/01/20 | | | | BB– | | | | 2,068,540 | |
| | | | | |
| | 1,464 | | | American Airlines Inc., Pass Through Trust 2013-2B, 144A | | | 5.600% | | | | 7/15/20 | | | | BBB– | | | | 1,527,892 | |
| | | | | |
| | 975 | | | American Airlines Inc., Pass Through Trust 2016-1A | | | 3.575% | | | | 1/15/28 | | | | AA+ | | | | 997,127 | |
| | | | | |
| | 2,599 | | | Northwest Airlines Trust Pass Through Certificates 2007-1 | | | 7.027% | | | | 11/01/19 | | | | A | | | | 2,878,600 | |
| | | | | |
| | 765 | | | VistaJet Malta Finance PLC, 144A | | | 7.750% | | | | 6/01/20 | | | | B– | | | | 535,500 | |
| | | | Total Airlines | | | | | | | | | | | | | | | 8,007,659 | |
| | | | | |
| | | | Auto Components – 0.7% | | | | | | | | | | | | |
| | | | | |
| | 750 | | | American & Axle Manufacturing Inc., 144A, (8) | | | 6.250% | | | | 4/01/25 | | | | BB– | | | | 731,250 | |
| | | | | |
| | 1,180 | | | American & Axle Manufacturing Inc., (8) | | | 6.625% | | | | 10/15/22 | | | | BB– | | | | 1,209,500 | |
| | | | | |
| | 2,000 | | | Lear Corporation | | | 5.375% | | | | 3/15/24 | | | | BBB– | | | | 2,124,422 | |
| | | | | |
| | 1,000 | | | Tupy S/A, 144A | | | 6.625% | | | | 7/17/24 | | | | BB | | | | 1,025,000 | |
| | | | Total Auto Components | | | | | | | | | | | | | | | 5,090,172 | |
| | | | | |
| | | | Automobiles – 0.7% | | | | | | | | | | | | |
| | | | | |
| | 5,680 | | | General Motors Corporation | | | 4.000% | | | | 4/01/25 | | | | BBB | | | | 5,701,686 | |
| | | | | |
| | | | Banks – 10.6% | | | | | | | | | | | | |
| | | | | |
| | 6,520 | | | Bank of America Corporation | | | 4.000% | | | | 4/01/24 | | | | A | | | | 6,832,634 | |
| | | | | |
| | 4,210 | | | Bank of America Corporation | | | 4.200% | | | | 8/26/24 | | | | A– | | | | 4,367,665 | |
| | | | | |
| | 8,115 | | | Bank of America Corporation | | | 3.248% | | | | 10/21/27 | | | | A | | | | 7,842,693 | |
| | | | | |
| | 2,700 | | | Barclays Bank PLC | | | 3.650% | | | | 3/16/25 | | | | A | | | | 2,686,578 | |
| | | | | |
| | 1,405 | | | Citigroup Inc. | | | 4.500% | | | | 1/14/22 | | | | A | | | | 1,510,652 | |
| | | | | |
| | 5,710 | | | Citigroup Inc. | | | 3.750% | | | | 6/16/24 | | | | A | | | | 5,916,005 | |
| | | | | |
| | 1,610 | | | Citigroup Inc. | | | 3.300% | | | | 4/27/25 | | | | A | | | | 1,610,626 | |
| | | | | |
| | 3,300 | | | Citigroup Inc. | | | 3.200% | | | | 10/21/26 | | | | A | | | | 3,209,663 | |
Nuveen Strategic Income Fund (continued)
| | |
| Portfolio of Investments | | June 30, 2017 |
| | | | | | | | | | | | | | | | | | | | |
Principal
Amount (000) (7) | | | Description (1) | | Coupon | | | Maturity | | | Ratings (4) | | | Value | |
| | | | | |
| | | | Banks (continued) | | | | | | | | | | | | |
| | | | | |
| $ | 6,000 | | | Citigroup Inc. | | | 4.300% | | | | 11/20/26 | | | | A– | | | $ | 6,163,476 | |
| | | | | |
| | 3,465 | | | GE Capital International Funding CO | | | 4.418% | | | | 11/15/35 | | | | AA– | | | | 3,775,249 | |
| | | | | |
| | 2,360 | | | HSBC Holdings PLC | | | 6.800% | | | | 6/01/38 | | | | A+ | | | | 3,155,917 | |
| | | | | |
| | 2,100 | | | ING Groep N.V | | | 3.950% | | | | 3/29/27 | | | | A+ | | | | 2,183,903 | |
| | | | | |
| | 1,400 | | | JPMorgan Chase & Company | | | 4.500% | | | | 1/24/22 | | | | A+ | | | | 1,515,830 | |
| | | | | |
| | 7,500 | | | JPMorgan Chase & Company | | | 3.200% | | | | 1/25/23 | | | | A+ | | | | 7,645,793 | |
| | | | | |
| | 3,000 | | | JPMorgan Chase & Company | | | 3.875% | | | | 9/10/24 | | | | A | | | | 3,095,487 | |
| | | | | |
| | 4,050 | | | JPMorgan Chase & Company | | | 2.950% | | | | 10/01/26 | | | | A+ | | | | 3,909,072 | |
| | | | | |
| | 2,280 | | | JPMorgan Chase & Company | | | 6.400% | | | | 5/15/38 | | | | A+ | | | | 3,058,262 | |
| | | | | |
| | 2,425 | | | PNC Financial Services Inc. | | | 3.150% | | | | 5/19/27 | | | | A+ | | | | 2,413,164 | |
| | | | | |
| | 1,220 | | | Royal Bank of Scotland Group PLC | | | 6.100% | | | | 6/10/23 | | | | BBB | | | | 1,344,089 | |
| | | | | |
| | 3,335 | | | Santander UK PLC, 144A | | | 5.000% | | | | 11/07/23 | | | | A– | | | | 3,575,180 | |
| | | | | |
| | 1,960 | | | Standard Chartered PLC, 144A | | | 5.700% | | | | 3/26/44 | | | | A– | | | | 2,229,498 | |
| | | | | |
| | 3,505 | | | Wells Fargo & Company | | | 4.600% | | | | 4/01/21 | | | | AA– | | | | 3,777,892 | |
| | | | Total Banks | | | | | | | | | | | | | | | 81,819,328 | |
| | | | | |
| | | | Beverages – 0.8% | | | | | | | | | | | | |
| | | | | |
| | 1,250 | | | Andalou Efes Biracilik ve Malt Sanayii AS, 144A | | | 3.375% | | | | 11/01/22 | | | | BBB– | | | | 1,204,700 | |
| | | | | |
| | 1,350 | | | Constellation Brands Inc. | | | 4.250% | | | | 5/01/23 | | | | BBB– | | | | 1,437,016 | |
| | | | | |
| | 1,431 | | | DS Services of America, Inc., 144A | | | 10.000% | | | | 9/01/21 | | | | Ba2 | | | | 1,516,860 | |
| | | | | |
| | 2,260 | | | Heineken NV, 144A | | | 3.500% | | | | 1/29/28 | | | | BBB+ | | | | 2,293,792 | |
| | | | Total Beverages | | | | | | | | | | | | | | | 6,452,368 | |
| | | | | |
| | | | Building Products – 0.5% | | | | | | | | | | | | |
| | | | | |
| | 1,000 | | | Euramax International Inc., 144A | | | 12.000% | | | | 8/15/20 | | | | B– | | | | 1,090,000 | |
| | | | | |
| | 2,740 | | | Owens Corning Incorporated | | | 4.200% | | | | 12/15/22 | | | | BBB | | | | 2,890,577 | |
| | | | Total Building Products | | | | | | | | | | | | | | | 3,980,577 | |
| | | | | |
| | | | Capital Markets – 6.2% | | | | | | | | | | | | |
| | | | | |
| | 1,375 | | | Goldman Sachs Group, Inc. | | | 5.250% | | | | 7/27/21 | | | | A | | | | 1,506,928 | |
| | | | | |
| | 900 | | | Goldman Sachs Group, Inc. | | | 5.750% | | | | 1/24/22 | | | | A | | | | 1,013,183 | |
| | | | | |
| | 14,800 | | | Goldman Sachs Group, Inc. | | | 4.000% | | | | 3/03/24 | | | | A | | | | 15,494,150 | |
| | | | | |
| | 1,920 | | | Goldman Sachs Group, Inc. | | | 4.250% | | | | 10/21/25 | | | | A– | | | | 1,984,810 | |
| | | | | |
| | 4,915 | | | Lazard Group LLC | | | 3.625% | | | | 3/01/27 | | | | A– | | | | 4,855,268 | |
| | | | | |
| | 9,295 | | | Morgan Stanley | | | 4.000% | | | | 7/23/25 | | | | A | | | | 9,702,400 | |
| | | | | |
| | 10,500 | | | Morgan Stanley | | | 3.950% | | | | 4/23/27 | | | | A– | | | | 10,567,127 | |
| | | | | |
| | 2,415 | | | Northern Trust Company | | | 3.950% | | | | 10/30/25 | | | | A+ | | | | 2,556,951 | |
| | | | Total Capital Markets | | | | | | | | | | | | | | | 47,680,817 | |
| | | | | |
| | | | Chemicals – 1.6% | | | | | | | | | | | | |
| | | | | |
| | 3,000 | | | Agrium Inc. | | | 3.375% | | | | 3/15/25 | | | | BBB | | | | 3,000,582 | |
| | | | | |
| | 2,125 | | | Braskem Finance Limited, 144A | | | 5.750% | | | | 4/15/21 | | | | BBB– | | | | 2,218,075 | |
| | | | | | | | | | | | | | | | | | | | |
Principal
Amount (000) (7) | | | Description (1) | | Coupon | | | Maturity | | | Ratings (4) | | | Value | |
| | | | | |
| | | | Chemicals (continued) | | | | | | | | | | | | |
| | | | | |
| $ | 995 | | | Chemours Co | | | 5.375% | | | | 5/15/27 | | | | B+ | | | $ | 1,021,119 | |
| | | | | |
| | 1,000 | | | CVR Partners LP / CVR Nitrogen Finance Corp., 144A | | | 9.250% | | | | 6/15/23 | | | | B+ | | | | 1,046,250 | |
| | | | | |
| | 1,450 | | | Hexion Inc. | | | 6.625% | | | | 4/15/20 | | | | CCC+ | | | | 1,323,125 | |
| | | | | |
| | 1,500 | | | NOVA Chemicals Corporation, 144A | | | 5.250% | | | | 8/01/23 | | | | BBB– | | | | 1,541,250 | |
| | | | | |
| | 1,350 | | | NOVA Chemicals Corporation, 144A | | | 5.000% | | | | 5/01/25 | | | | BBB– | | | | 1,343,250 | |
| | | | | |
| | 1,000 | | | Office Cherifien Des Phosphates SA, 144A | | | 5.625% | | | | 4/25/24 | | | | BBB– | | | | 1,081,620 | |
| | | | Total Chemicals | | | | | | | | | | | | | | | 12,575,271 | |
| | | | | |
| | | | Commercial Services & Supplies – 0.3% | | | | | | | | | | | | |
| | | | | |
| | 2,105 | | | AerCap Ireland Capital Limited / AerCap Global Aviation Trust | | | 3.950% | | | | 2/01/22 | | | | BBB– | | | | 2,191,457 | |
| | | | | |
| | | | Communications Equipment – 0.3% | | | | | | | | | | | | |
| | | | | |
| | 2,300 | | | Qualcomm, Inc. | | | 2.100% | | | | 5/20/20 | | | | A1 | | | | 2,310,424 | |
| | | | | |
| | | | Consumer Finance – 2.0% | | | | | | | | | | | | |
| | | | | |
| | 3,938 | | | Capital One Bank | | | 3.375% | | | | 2/15/23 | | | | Baa1 | | | | 3,971,115 | |
| | | | | |
| | 750 | | | Credit Acceptance Corporation | | | 7.375% | | | | 3/15/23 | | | | BB | | | | 780,000 | |
| | | | | |
| | 3,500 | | | Discover Bank | | | 4.250% | | | | 3/13/26 | | | | BBB+ | | | | 3,595,301 | |
| | | | | |
| | 3,215 | | | Discover Financial Services | | | 5.200% | | | | 4/27/22 | | | | BBB+ | | | | 3,499,312 | |
| | | | | |
| | 3,405 | | | Ford Motor Credit Company | | | 3.810% | | | | 1/09/24 | | | | BBB | | | | 3,446,813 | |
| | | | Total Consumer Finance | | | | | | | | | | | | | | | 15,292,541 | |
| | | | | |
| | | | Diversified Consumer Services – 0.2% | | | | | | | | | | | | |
| | | | | |
| | 1,250 | | | Prime Security Services Borrower LLC / Prime Finance, Inc., 144A | | | 9.250% | | | | 5/15/23 | | | | B– | | | | 1,358,325 | |
| | | | | |
| | | | Diversified Financial Services – 1.5% | | | | | | | | | | | | |
| | | | | |
| | 3,510 | | | BNP Paribas, 144A | | | 4.375% | | | | 5/12/26 | | | | A | | | | 3,635,202 | |
| | | | | |
| | 750 | | | CNG Holdings Inc., 144A | | | 9.375% | | | | 5/15/20 | | | | CCC | | | | 663,750 | |
| | | | | |
| | 1,955 | | | Jefferies Group Inc. | | | 4.850% | | | | 1/15/27 | | | | BBB– | | | | 2,042,244 | |
| | | | | |
| | 450 | | | Nationstar Mortgage LLC Capital Corporation | | | 7.875% | | | | 10/01/20 | | | | B+ | | | | 462,375 | |
| | | | | |
| | 650 | | | Stoneway Capital Corporation, 144A | | | 10.000% | | | | 3/01/27 | | | | B | | | | 685,958 | |
| | | | | |
| | 3,705 | | | Synchrony Financial | | | 4.250% | | | | 8/15/24 | | | | BBB– | | | | 3,784,609 | |
| | | | Total Diversified Financial Services | | | | | | | | | | | | | | | 11,274,138 | |
| | | |
| | | | Diversified Telecommunication Services – 2.5% | | | | | | | |
| | | | | |
| | 2,335 | | | AT&T, Inc. | | | 3.800% | | | | 3/15/22 | | | | A– | | | | 2,416,543 | |
| | | | | |
| | 2,000 | | | AT&T, Inc. | | | 4.750% | | | | 5/15/46 | | | | A– | | | | 1,963,892 | |
| | | | | |
| | 883 | | | Frontier Communications Corporation | | | 8.500% | | | | 4/15/20 | | | | B+ | | | | 928,254 | |
| | | | | |
| | 1,500 | | | Frontier Communications Corporation | | | 11.000% | | | | 9/15/25 | | | | B+ | | | | 1,391,250 | |
| | | | | |
| | 2,750 | | | GCI Inc. | | | 6.875% | | | | 4/15/25 | | | | BB– | | | | 2,973,438 | |
| | | | | |
| | 900 | | | IntelSat Jackson Holdings | | | 7.500% | | | | 4/01/21 | | | | CCC+ | | | | 830,250 | |
| | | | | |
| | 2,500 | | | Neptune Finco Corporation, 144A | | | 10.125% | | | | 1/15/23 | | | | B+ | | | | 2,900,000 | |
| | | | | |
| | 2,360 | | | Qwest Corporation | | | 6.750% | | | | 12/01/21 | | | | BBB– | | | | 2,606,991 | |
Nuveen Strategic Income Fund (continued)
| | |
| Portfolio of Investments | | June 30, 2017 |
| | | | | | | | | | | | | | | | | | | | |
Principal
Amount (000) (7) | | | Description (1) | | Coupon | | | Maturity | | | Ratings (4) | | | Value | |
| | | |
| | | | Diversified Telecommunication Services (continued) | | | | | | | |
| | | | | |
| $ | 3,215 | | | Verizon Communications | | | 4.125% | | | | 8/15/46 | | | | A– | | | $ | 2,865,404 | |
| | | | Total Diversified Telecommunication Services | | | | | | | | | | | | | | | 18,876,022 | |
| | | | | |
| | | | Electric Utilities – 0.8% | | | | | | | | | | | | |
| | | | | |
| | 1,905 | | | ACWA Power Management And Investment One Ltd, 144A | | | 5.950% | | | | 12/15/39 | | | | BBB– | | | | 1,943,336 | |
| | | | | |
| | 2,600 | | | Eskom Holdings Limited, 144A | | | 7.125% | | | | 2/11/25 | | | | Ba3 | | | | 2,652,000 | |
| | | | | |
| | 1,115 | | | FirstEnergy Transmission LLC, 144A | | | 4.350% | | | | 1/15/25 | | | | Baa2 | | | | 1,165,193 | |
| | | | | |
| | 680 | | | Intergen NV, 144A | | | 7.000% | | | | 6/30/23 | | | | B1 | | | | 654,500 | |
| | | | Total Electric Utilities | | | | | | | | | | | | | | | 6,415,029 | |
| | | |
| | | | Electrical Equipment, Instruments & Components – 0.2% | | | | | | | |
| | | | | |
| | 1,500 | | | Park Aerospace Holdings Limited, 144A | | | 5.500% | | | | 2/15/24 | | | | BB | | | | 1,566,750 | |
| | | | | |
| | | | Energy Equipment & Services – 1.1% | | | | | | | | | | | | |
| | | | | |
| | 1,500 | | | Ensco PLC, (8) | | | 5.200% | | | | 3/15/25 | | | | BB | | | | 1,218,750 | |
| | | | | |
| | 1,875 | | | Murray Energy Corporation, 144A | | | 11.250% | | | | 4/15/21 | | | | CCC | | | | 1,415,625 | |
| | | | | |
| | 2,000 | | | Origin Energy Finance Limited, 144A | | | 3.500% | | | | 10/09/18 | | | | BBB– | | | | 2,023,020 | |
| | | | | |
| | 750 | | | Parker Drilling Company | | | 6.750% | | | | 7/15/22 | | | | B– | | | | 575,625 | |
| | | | | |
| | 500 | | | Precision Drilling Corporation, 144A | | | 7.750% | | | | 12/15/23 | | | | BB | | | | 492,500 | |
| | | | | |
| | 2,750 | | | Regency Energy Partners Finance | | | 5.000% | | | | 10/01/22 | | | | BBB– | | | | 2,949,070 | |
| | | | Total Energy Equipment & Services | | | | | | | | | | | | | | | 8,674,590 | |
| | | | | |
| | | | Equity Real Estate Investment Trusts – 0.9% | | | | | | | | | | | | |
| | | | | |
| | 3,070 | | | American Tower Company | | | 5.000% | | | | 2/15/24 | | | | BBB | | | | 3,392,393 | |
| | | | | |
| | 2,080 | | | Piedmont Operating Partnership LP | | | 4.450% | | | | 3/15/24 | | | | BBB | | | | 2,130,124 | |
| | | | | |
| | 1,420 | | | Plum Creek Timberlands LP | | | 4.700% | | | | 3/15/21 | | | | BBB | | | | 1,511,528 | |
| | | | Total Equity Real Estate Investment Trusts | | | | | | | | | | | | | | | 7,034,045 | |
| | | | | |
| | | | Food & Staples Retailing – 0.7% | | | | | | | | | | | | |
| | | | | |
| | 1,175 | | | Pomegranate Merger Sub, Inc., 144A, (8) | | | 9.750% | | | | 5/01/23 | | | | B– | | | | 985,531 | |
| | | | | |
| | 500 | | | Rite Aid Corporation, 144A, (8) | | | 6.125% | | | | 4/01/23 | | | | B | | | | 491,875 | |
| | | | | |
| | 1,475 | | | Sysco Corporation | | | 3.300% | | | | 7/15/26 | | | | A3 | | | | 1,463,445 | |
| | | | | |
| | 2,000 | | | Walgreens Boots Alliance, Inc. | | | 3.800% | | | | 11/18/24 | | | | BBB | | | | 2,077,376 | |
| | | | Total Food & Staples Retailing | | | | | | | | | | | | | | | 5,018,227 | |
| | | | | |
| | | | Food Products – 0.9% | | | | | | | | | | | | |
| | | | | |
| | 2,460 | | | Bunge Limited Finance Company | | | 3.250% | | | | 8/15/26 | | | | BBB | | | | 2,350,742 | |
| | | | | |
| | 2,000 | | | Grupo Bimbo SAB de CV, 144A | | | 3.875% | | | | 6/27/24 | | | | BBB | | | | 2,058,241 | |
| | | | | |
| | 2,235 | | | Kraft Heinz Foods Company | | | 4.375% | | | | 6/01/46 | | | | BBB– | | | | 2,178,200 | |
| | | | Total Food Products | | | | | | | | | | | | | | | 6,587,183 | |
| | | | | |
| | | | Gas Utilities – 0.2% | | | | | | | | | | | | |
| | | | | |
| | 1,250 | | | Suburban Propane Partners LP | | | 5.500% | | | | 6/01/24 | | | | BB– | | | | 1,243,750 | |
| | | | | | | | | | | | | | | | | | | | |
Principal
Amount (000) (7) | | | Description (1) | | Coupon | | | Maturity | | | Ratings (4) | | | Value | |
| | | | | |
| | | | Health Care Equipment & Supplies – 0.2% | | | | | | | | | | | | |
| | | | | |
| $ | 400 | EUR | | Synlab Bondco PLC | | | 6.250% | | | | 7/01/22 | | | | B+ | | | $ | 494,147 | |
| | | | | |
| | 775 | | | THC Escrow Corp III, 144A | | | 5.125% | | | | 5/01/25 | | | | Ba3 | | | | 777,906 | |
| | | | Total Health Care Equipment & Supplies | | | | | | | | | | | | | | | 1,272,053 | |
| | | | | |
| | | | Health Care Providers & Services – 0.3% | | | | | | | | | | | | |
| | | | | |
| | 1,000 | | | Community Health Systems, Inc. | | | 6.875% | | | | 2/01/22 | | | | CCC+ | | | | 873,750 | |
| | | | | |
| | 920 | | | HCA Inc. | | | 5.500% | | | | 6/15/47 | | | | BBB– | | | | 952,200 | |
| | | | | |
| | 500 | | | Kindred Healthcare Inc. | | | 6.375% | | | | 4/15/22 | | | | B– | | | | 492,500 | |
| | | | Total Health Care Providers & Services | | | | | | | | | | | | | | | 2,318,450 | |
| | | | | |
| | | | Health Care Technology – 0.2% | | | | | | | | | | | | |
| | | | | |
| | 250 | | | Change Healthcare Holdings LLC / Change Healthcare Finance Inc., 144A | | | 5.750% | | | | 3/01/25 | | | | B– | | | | 255,000 | |
| | | | | |
| | 1,145 | | | Exela Intermediate LLC / Exela Financial Inc., 144A, (WI/DD) | | | 10.000% | | | | 7/15/23 | | | | B | | | | 1,130,688 | |
| | | | Total Health Care Technology | | | | | | | | | | | | | | | 1,385,688 | |
| | | | | |
| | | | Hotels, Restaurants & Leisure – 0.1% | | | | | | | | | | | | |
| | | | | |
| | 1,000 | | | Grupo Posadas SAB de CV, 144A, (8) | | | 7.875% | | | | 6/30/22 | | | | B+ | | | | 1,032,500 | |
| | | | | |
| | | | Household Durables – 1.1% | | | | | | | | | | | | |
| | | | | |
| | 1,500 | | | Beazer Homes USA, Inc., (8) | | | 8.750% | | | | 3/15/22 | | | | B3 | | | | 1,672,500 | |
| | | | | |
| | 2,940 | | | Harman International Industries, Inc. | | | 4.150% | | | | 5/15/25 | | | | BBB+ | | | | 3,056,418 | |
| | | | | |
| | 2,505 | | | Newell Brands Inc. | | | 4.200% | | | | 4/01/26 | | | | BBB– | | | | 2,660,029 | |
| | | | | |
| | 1,350 | | | RSI Home Products Incorporated, 144A | | | 6.500% | | | | 3/15/23 | | | | BB– | | | | 1,420,875 | |
| | | | Total Household Durables | | | | | | | | | | | | | | | 8,809,822 | |
| | | | | |
| | | | Household Products – 0.2% | | | | | | | | | | | | |
| | | | | |
| | 1,300 | | | Kimberly-Clark de Mexico, S.A.B. de C.V, 144A | | | 3.250% | | | | 3/12/25 | | | | A | | | | 1,265,298 | |
| | | |
| | | | Independent Power & Renewable Electricity Producers – 0.5% | | | | | | | |
| | | | | |
| | 1,000 | | | Columbia Pipeline Group, Inc. | | | 4.500% | �� | | | 6/01/25 | | | | BBB+ | | | | 1,064,580 | |
| | | | | |
| | 1,500 | | | NRG Energy Inc. | | | 6.625% | | | | 3/15/23 | | | | BB– | | | | 1,541,250 | |
| | | | | |
| | 265 | | | Talen Energy Supply LLC, 144A | | | 4.625% | | | | 7/15/19 | | | | B– | | | | 258,375 | |
| | | | | |
| | 1,000 | | | Talen Energy Supply LLC, (8) | | | 6.500% | | | | 6/01/25 | | | | BB– | | | | 705,000 | |
| | | | Total Independent Power & Renewable Electricity Producers | | | | | | | | | | | | | | | 3,569,205 | |
| | | | | |
| | | | Industrial Conglomerates – 0.7% | | | | | | | | | | | | |
| | | | | |
| | 1,000 | | | Alfa SAB de CV, 144A, (8) | | | 5.250% | | | | 3/25/24 | | | | BBB– | | | | 1,075,000 | |
| | | | | |
| | 3,200 | | | Siemens Financieringsmaatschappij NV, 144A | | | 3.400% | | | | 3/16/27 | | | | A+ | | | | 3,270,582 | |
| | | | | |
| | 1,000 | | | Stena International SA, 144A | | | 5.750% | | | | 3/01/24 | | | | BB– | | | | 877,500 | |
| | | | Total Industrial Conglomerates | | | | | | | | | | | | | | | 5,223,082 | |
| | | | | |
| | | | Insurance – 2.9% | | | | | | | | | | | | |
| | | | | |
| | 646 | | | AFLAC Insurance | | | 6.450% | | | | 8/15/40 | | | | A– | | | | 856,425 | |
| | | | | |
| | 3,000 | | | Fairfax US Inc., 144A | | | 4.875% | | | | 8/13/24 | | | | BBB– | | | | 3,111,237 | |
| | | | | |
| | 3,370 | | | Liberty Mutual Group Inc., 144A | | | 4.950% | | | | 5/01/22 | | | | BBB | | | | 3,695,694 | |
Nuveen Strategic Income Fund (continued)
| | |
| Portfolio of Investments | | June 30, 2017 |
| | | | | | | | | | | | | | | | | | | | |
Principal
Amount (000) (7) | | | Description (1) | | Coupon | | | Maturity | | | Ratings (4) | | | Value | |
| | | | | |
| | | | Insurance (continued) | | | | | | | | | | | | |
| | | | | |
| $ | 2,535 | | | Lincoln National Corporation | | | 4.000% | | | | 9/01/23 | | | | A– | | | $ | 2,670,328 | |
| | | | | |
| | 3,015 | | | Symetra Financial Corporation | | | 4.250% | | | | 7/15/24 | | | | Baa1 | | | | 3,060,376 | |
| | | | | |
| | 2,075 | | | Unum Group | | | 4.000% | | | | 3/15/24 | | | | BBB | | | | 2,143,348 | |
| | | | | |
| | 1,805 | | | Willis North America, Inc. | | | 3.600% | | | | 5/15/24 | | | | BBB | | | | 1,822,723 | |
| | | | | |
| | 4,790 | | | XLIT Limited | | | 4.450% | | | | 3/31/25 | | | | BBB | | | | 4,938,538 | |
| | | | Total Insurance | | | | | | | | | | | | | | | 22,298,669 | |
| | | | | |
| | | | Internet Software & Services – 0.8% | | | | | | | | | | | | |
| | | | | |
| | 1,750 | | | Donnelley Financial Solutions, Inc. | | | 8.250% | | | | 10/15/24 | | | | B | | | | 1,855,000 | |
| | | | | |
| | 2,865 | | | eBay Inc. | | | 3.800% | | | | 3/09/22 | | | | BBB+ | | | | 2,993,607 | |
| | | | | |
| | 1,065 | | | j2 Cloud LLC/Global Inc., 144A | | | 6.000% | | | | 7/15/25 | | | | BB | | | | 1,096,950 | |
| | | | Total Internet Software & Services | | | | | | | | | | | | | | | 5,945,557 | |
| | | | | |
| | | | Machinery – 0.4% | | | | | | | | | | | | |
| | | | | |
| | 3,370 | | | John Deere Capital Corporation | | | 2.650% | | | | 6/24/24 | | | | A | | | | 3,345,554 | |
| | | | | |
| | | | Marine – 0.3% | | | | | | | | | | | | |
| | | | | |
| | 1,700 | | | Eletson Holdings Inc., 144A | | | 9.625% | | | | 1/15/22 | | | | B2 | | | | 1,394,000 | |
| | | | | |
| | 1,340 | | | Navios Maritime Acquisition Corporation, 144A | | | 8.125% | | | | 11/15/21 | | | | B | | | | 1,135,650 | |
| | | | Total Marine | | | | | | | | | | | | | | | 2,529,650 | |
| | | | | |
| | | | Media – 3.2% | | | | | | | | | | | | |
| | | | | |
| | 2,750 | | | 21st Century Fox America Inc. | | | 6.650% | | | | 11/15/37 | | | | BBB+ | | | | 3,631,889 | |
| | | | | |
| | 2,260 | | | CBS Corporation | | | 4.000% | | | | 1/15/26 | | | | BBB | | | | 2,338,804 | |
| | | | | |
| | 2,560 | | | Charter Communications Operating Capital Corporation | | | 4.908% | | | | 7/23/25 | | | | BBB– | | | | 2,765,855 | |
| | | | | |
| | 1,790 | | | Comcast Corporation | | | 6.400% | | | | 5/15/38 | | | | A– | | | | 2,383,220 | |
| | | | | |
| | 840 | | | Cox Communications Inc., 144A, (8) | | | 3.850% | | | | 2/01/25 | | | | BBB+ | | | | 846,403 | |
| | | | | |
| | 2,000 | | | Cox Communications Inc., 144A | | | 3.350% | | | | 9/15/26 | | | | BBB+ | | | | 1,964,096 | |
| | | | | |
| | 2,430 | | | Discovery Communications Inc. | | | 3.800% | | | | 3/13/24 | | | | BBB– | | | | 2,456,494 | |
| | | | | |
| | 1,000 | | | iHeartCommunications, Inc. | | | 11.250% | | | | 3/01/21 | | | | Caa1 | | | | 753,750 | |
| | | | | |
| | 1,500 | | | Lee Enterprises Inc., 144A, (8) | | | 9.500% | | | | 3/15/22 | | | | B2 | | | | 1,545,000 | |
| | | | | |
| | 1,805 | | | Time Warner Inc. | | | 3.875% | | | | 1/15/26 | | | | BBB+ | | | | 1,835,752 | |
| | | | | |
| | 750 | | | Unitymedia KabelBW GmbH, 144A | | | 6.125% | | | | 1/15/25 | | | | B | | | | 804,375 | |
| | | | | |
| | 1750 | CAD | | Videotron Limited, 144A | | | 5.625% | | | | 6/15/25 | | | | BB | | | | 1,419,082 | |
| | | | | |
| | 2,000 | | | VTR Finance BV, 144A | | | 6.875% | | | | 1/15/24 | | | | BB– | | | | 2,120,000 | |
| | | | Total Media | | | | | | | | | | | | | | | 24,864,720 | |
| | | | | |
| | | | Metals & Mining – 0.8% | | | | | | | | | | | | |
| | | | | |
| | 1,000 | | | Aleris International Inc., 144A | | | 9.500% | | | | 4/01/21 | | | | B | | | | 1,028,290 | |
| | | | | |
| | 1,434 | | | Constellium N.V, 144A, (8) | | | 8.000% | | | | 1/15/23 | | | | CCC+ | | | | 1,477,020 | |
| | | | | |
| | 1,520 | | | Hudbay Minerals, Inc., 144A | | | 7.250% | | | | 1/15/23 | | | | B | | | | 1,567,500 | |
| | | | | |
| | 1,000 | | | IAMGOLD Corporation, 144A | | | 7.000% | | | | 4/15/25 | | | | B+ | | | | 1,030,000 | |
| | | | | | | | | | | | | | | | | | | | |
Principal
Amount (000) (7) | | | Description (1) | | Coupon | | | Maturity | | | Ratings (4) | | | Value | |
| | | | | |
| | | | Metals & Mining (continued) | | | | | | | | | | | | |
| | | | | |
| $ | 1,125 | | | Xstrata Finance Canada Limited, 144A | | | 6.900% | | | | 11/15/37 | | | | BBB | | | $ | 1,355,362 | |
| | | | Total Metals & Mining | | | | | | | | | | | | | | | 6,458,172 | |
| | | | | |
| | | | Oil, Gas & Consumable Fuels – 4.3% | | | | | | | | | | | | |
| | | | | |
| | 1,295 | | | Berkshire Hathaway Energy Company | | | 6.125% | | | | 4/01/36 | | | | A– | | | | 1,665,476 | |
| | | | | |
| | 1,025 | | | Calumet Specialty Products | | | 7.625% | | | | 1/15/22 | | | | CCC+ | | | | 896,875 | |
| | | | | |
| | 1,410 | | | Canadian Natural Resources Limited | | | 5.850% | | | | 2/01/35 | | | | BBB+ | | | | 1,565,347 | |
| | | | | |
| | 1,025 | | | Cheniere Corpus Christi Holdings, LLC, 144A | | | 5.125% | | | | 6/30/27 | | | | BB– | | | | 1,050,625 | |
| | | | | |
| | 1,000 | | | Global Partners LP/GLP Finance | | | 6.250% | | | | 7/15/22 | | | | B+ | | | | 1,005,000 | |
| | | | | |
| | 2,300 | | | Hess Corporation | | | 3.500% | | | | 7/15/24 | | | | BBB– | | | | 2,237,957 | |
| | | | | |
| | 2,415 | | | Kinder Morgan Energy Partners, LP | | | 4.250% | | | | 9/01/24 | | | | BBB– | | | | 2,495,453 | |
| | | | | |
| | 2,700 | | | MPLX LP | | | 4.875% | | | | 6/01/25 | | | | BBB– | | | | 2,863,318 | |
| | | | | |
| | 1,500 | | | Newfield Exploration Company | | | 5.375% | | | | 1/01/26 | | | | BB+ | | | | 1,552,500 | |
| | | | | |
| | 1,880 | | | Occidental Petroleum Corporation | | | 3.400% | | | | 4/15/26 | | | | A | | | | 1,897,185 | |
| | | | | |
| | 1,000 | | | PBF Holding Company LLC, 144A | | | 7.250% | | | | 6/15/25 | | | | BB | | | | 963,750 | |
| | | | | |
| | 1,275 | | | Petro Canada | | | 6.800% | | | | 5/15/38 | | | | A– | | | | 1,663,447 | |
| | | | | |
| | 1,000 | | | Petrobras Global Finance BV | | | 7.375% | | | | 1/17/27 | | | | BB | | | | 1,058,000 | |
| | | | | |
| | 1,575 | | | Petroleos del Peru SA, 144A | | | 4.750% | | | | 6/19/32 | | | | BBB+ | | | | 1,563,188 | |
| | | | | |
| | 2,000 | | | Reliance Holdings USA Inc., 144A | | | 5.400% | | | | 2/14/22 | | | | BBB+ | | | | 2,190,522 | |
| | | | | |
| | 1,345 | | | Sabine Pass Liquefication LLC | | | 5.875% | | | | 6/30/26 | | | | BBB– | | | | 1,505,320 | |
| | | | | |
| | 1,445 | | | Southwestern Energy Company, (8) | | | 4.100% | | | | 3/15/22 | | | | BB | | | | 1,346,559 | |
| | | | | |
| | 670 | | | Targa Resources Inc. | | | 4.250% | | | | 11/15/23 | | | | BB– | | | | 654,087 | |
| | | | | |
| | 2,500 | | | Valero Energy Corporation | | | 3.400% | | | | 9/15/26 | | | | BBB | | | | 2,445,852 | |
| | | | | |
| | 2,875 | | | Woodside Finance Limited, 144A | | | 3.650% | | | | 3/05/25 | | | | BBB+ | | | | 2,864,814 | |
| | | | Total Oil, Gas & Consumable Fuels | | | | | | | | | | | | | | | 33,485,275 | |
| | | | | |
| | | | Paper & Forest Products – 0.4% | | | | | | | | | | | | |
| | | | | |
| | 2,100 | | | Domtar Corporation | | | 6.750% | | | | 2/15/44 | | | | BBB– | | | | 2,272,498 | |
| | | | | |
| | 1,000 | | | Resolute Forest Products, (8) | | | 5.875% | | | | 5/15/23 | | | | B+ | | | | 973,750 | |
| | | | Total Paper & Forest Products | | | | | | | | | | | | | | | 3,246,248 | |
| | | | | |
| | | | Personal Products – 0.3% | | | | | | | | | | | | |
| | | | | |
| | 1,740 | | | International Paper Company | | | 8.700% | | | | 6/15/38 | | | | BBB | | | | 2,560,062 | |
| | | | | |
| | | | Pharmaceuticals – 0.5% | | | | | | | | | | | | |
| | | | | |
| | 2,000 | | | Endo Finance LLC, 144A | | | 5.750% | | | | 1/15/22 | | | | B– | | | | 1,799,600 | |
| | | | | |
| | 2,450 | | | Teva Pharmaceutical Finance III, (8) | | | 3.150% | | | | 10/01/26 | | | | BBB | | | | 2,326,956 | |
| | | | Total Pharmaceuticals | | | | | | | | | | | | | | | 4,126,556 | |
| | | | | |
| | | | Real Estate Management & Development – 0.4% | | | | | | | | | | | | |
| | | | | |
| | 1,000 | | | Crescent Communities LLC, 144A | | | 8.875% | | | | 10/15/21 | | | | B+ | | | | 1,050,000 | |
| | | | | |
| | 1,250 | | | Hunt Companies Inc., 144A | | | 9.625% | | | | 3/01/21 | | | | N/R | | | | 1,318,750 | |
Nuveen Strategic Income Fund (continued)
| | |
| Portfolio of Investments | | June 30, 2017 |
| | | | | | | | | | | | | | | | | | | | |
Principal
Amount (000) (7) | | | Description (1) | | Coupon | | | Maturity | | | Ratings (4) | | | Value | |
| | | | | |
| | | | Real Estate Management & Development (continued) | | | | | | | | | | | | |
| | | | | |
| $ | 530 | | | Mattamy Group Corporation, 144A | | | 6.875% | | | | 12/15/23 | | | | BB | | | $ | 541,262 | |
| | | | Total Real Estate Management & Development | | | | | | | | | | | | | | | 2,910,012 | |
| | | | | |
| | | | Road & Rail – 0.6% | | | | | | | | | | | | |
| | | | | |
| | 825 | | | Avis Budget Car Rental, 144A, (8) | | | 6.375% | | | | 4/01/24 | | | | BB– | | | | 822,937 | |
| | | | | |
| | 2,500 | | | Herc Rentals, Inc., 144A | | | 7.750% | | | | 6/01/24 | | | | B+ | | | | 2,637,500 | |
| | | | | |
| | 765 | | | The Hertz Corporation, 144A, (8) | | | 7.625% | | | | 6/01/22 | | | | BB– | | | | 763,164 | |
| | | | | |
| | 635 | | | Watco Companies LLC Finance, 144A | | | 6.375% | | | | 4/01/23 | | | | B– | | | | 661,987 | |
| | | | Total Road & Rail | | | | | | | | | | | | | | | 4,885,588 | |
| | | | | |
| | | | Semiconductors & Semiconductor Equipment – 0.4% | | | | | | | | | | | | |
| | | | | |
| | 2,655 | | | Intel Corporation | | | 3.150% | | | | 5/11/27 | | | | A+ | | | | 2,664,364 | |
| | | | | |
| | | | Software – 0.3% | | | | | | | | | | | | |
| | | | | |
| | 2,450 | | | Microsoft Corporation | | | 3.300% | | | | 2/06/27 | | | | AAA | | | | 2,519,097 | |
| | | | | |
| | | | Specialty Retail – 1.2% | | | | | | | | | | | | |
| | | | | |
| | 2,000 | | | AutoNation Inc. | | | 4.500% | | | | 10/01/25 | | | | BBB– | | | | 2,087,020 | |
| | | | | |
| | 2,900 | | | Bed Bath and Beyond Incorporated | | | 5.165% | | | | 8/01/44 | | | | BBB+ | | | | 2,555,660 | |
| | | | | |
| | 1,500 | | | L Brands, Inc. | | | 6.875% | | | | 11/01/35 | | | | BB+ | | | | 1,447,500 | |
| | | | | |
| | 2,405 | | | Lowes Companies, Inc. | | | 3.100% | | | | 5/03/27 | | | | A– | | | | 2,394,286 | |
| | | | | |
| | 500 | | | The Men’s Warehouse Inc., (8) | | | 7.000% | | | | 7/01/22 | | | | B3 | | | | 437,500 | |
| | | | Total Specialty Retail | | | | | | | | | | | | | | | 8,921,966 | |
| | | | | |
| | | | Technology Hardware, Storage & Peripherals – 0.6% | | | | | | | | | | | | |
| | | | | |
| | 2,970 | | | Hewlett Packard Enterprise Co | | | 4.900% | | | | 10/15/25 | | | | BBB+ | | | | 3,114,015 | |
| | | | | |
| | 1,425 | | | Western Digital Corporation, 144A | | | 7.375% | | | | 4/01/23 | | | | BBB– | | | | 1,565,719 | |
| | 4,395 | | | Total Technology Hardware, Storage & Peripherals | | | | | | | | | | | | | | | 4,679,734 | |
| | | | | |
| | | | Trading Companies & Distributors – 0.3% | | | | | | | | | | | | |
| | | | | |
| | 1,995 | | | Air Lease Corporation | | | 3.875% | | | | 4/01/21 | | | | BBB | | | | 2,080,855 | |
| | | | | |
| | | | Transportation Infrastructure – 0.2% | | | | | | | | | | | | |
| | | | | |
| | 1,110 | | | Rumo Luxembourg Sarl, 144A | | | 7.375% | | | | 2/09/24 | | | | BB– | | | | 1,140,081 | |
| | | | | |
| | | | Wireless Telecommunication Services – 1.4% | | | | | | | | | | | | |
| | | | | |
| | 1,900 | | | Colombia Telecommunicaciones S.A. ESP, 144A, (8) | | | 8.500% | | | | N/A (9) | | | | B | | | | 1,971,250 | |
| | | | | |
| | 1,250 | | | Digicel Group, Limited, 144A | | | 8.250% | | | | 9/30/20 | | | | B– | | | | 1,168,625 | |
| | | | | |
| | 1,000 | | | Hughes Satellite Systems Corporation | | | 6.625% | | | | 8/01/26 | | | | BB– | | | | 1,075,000 | |
| | | | | |
| | 2,275 | | | Sprint Spectrum Co LLC / Sprint Spectrum Co II LLC / Sprint Spectrum Co III LLC, 144A | | | 3.360% | | | | 9/20/21 | | | | Baa2 | | | | 2,294,906 | |
| | | | | |
| | 1,350 | | | Telecom Italia SpA, 144A | | | 5.303% | | | | 5/30/24 | | | | BBB– | | | | 1,447,875 | |
| | | | | |
| | 2,650 | | | Telefonica Emisiones SAU | | | 4.103% | | | | 3/08/27 | | | | BBB | | | | 2,738,126 | |
| | | | Total Wireless Telecommunication Services | | | | | | | | | | | | | | | 10,695,782 | |
| | | | Total Corporate Bonds (cost $433,425,994) | | | | | | | | | | | | | | | 446,475,966 | |
| | | | | | | | | | | | | | | | | | | | |
| | | | | |
Principal
Amount (000) | | | Description (1) | | | | | Optional Call
Provisions (10) | | | Ratings (4) | | | Value | |
| | | | | |
| | | | MUNICIPAL BONDS – 0.2% | | | | | | | | | | | | | | | | |
| | | | | |
| | | | Georgia – 0.2% | | | | | | | | | | | | |
| | | | | |
| $ | 1,550 | | | Georgia Municipal Electric Authority, Plant Vogtle Units 3 & 4 Project P Bonds, Refunding Taxable Build America Bonds Series 2010A, 7.055%, 4/01/57 | | | | | | | No Opt. Call | | | | A– | | | $ | 1,788,374 | |
| $ | 1,550 | | | Total Municipal Bonds (cost $1,686,872) | | | | | | | | | | | | | | | 1,788,374 | |
| | | | | |
Principal
Amount (000) | | | Description (1) | | Coupon | | | Maturity | | | Ratings (4) | | | Value | |
| | | | | |
| | | | $1,000 PAR (OR SIMILAR) INSTITUTIONAL PREFERRED – 6.3% | | | | | | | | | | | | | | | | |
| | | | | |
| | | | Banks – 3.2% | | | | | | | | | | | | |
| | | | | |
| $ | 2,695 | | | Bank of America Corporation | | | 6.300% | | | | N/A (9) | | | | BB+ | | | $ | 3,021,769 | |
| | | | | |
| | 2,965 | | | Citigroup Inc. | | | 6.250% | | | | N/A (9) | | | | BB+ | | | | 3,289,297 | |
| | | | | |
| | 2,000 | | | Cobank Agricultural Credit Bank | | | 6.250% | | | | N/A (9) | | | | BBB+ | | | | 2,196,442 | |
| | | | | |
| | 3,086 | | | General Electric Capital Corporation | | | 5.000% | | | | N/A (9) | | | | A | | | | 3,275,480 | |
| | | | | |
| | 3,000 | | | JP Morgan Chase & Company | | | 6.750% | | | | N/A (9) | | | | BBB– | | | | 3,408,750 | |
| | | | | |
| | 2,797 | | | KeyCorp | | | 5.000% | | | | N/A (9) | | | | Baa3 | | | | 2,849,444 | |
| | | | | |
| | 1,000 | | | M&T Bank Corporation | | | 5.125% | | | | N/A (9) | | | | Baa2 | | | | 1,038,750 | |
| | | | | |
| | 4,570 | | | SunTrust Bank Inc. | | | 5.050% | | | | N/A (9) | | | | Baa3 | | | | 4,638,550 | |
| | | | | |
| | 1,000 | | | Wachovia Capital Trust III | | | 5.570% | | | | N/A (9) | | | | BBB | | | | 1,005,500 | |
| | 23,113 | | | Total Banks | | | | | | | | | | | | | | | 24,723,982 | |
| | | | | |
| | | | Capital Markets – 1.0% | | | | | | | | | | | | |
| | | | | |
| | 2,325 | | | Bank of New York Mellon | | | 4.950% | | | | N/A (9) | | | | Baa1 | | | | 2,424,975 | |
| | | | | |
| | 2,330 | | | Goldman Sachs Group Inc., (8) | | | 5.300% | | | | N/A (9) | | | | Ba1 | | | | 2,446,500 | |
| | | | | |
| | 1,000 | | | Morgan Stanley | | | 5.550% | | | | N/A (9) | | | | Ba1 | | | | 1,044,750 | |
| | | | | |
| | 1,605 | | | State Street Corporation | | | 5.250% | | | | N/A (9) | | | | Baa1 | | | | 1,693,275 | |
| | 7,260 | | | Total Capital Markets | | | | | | | | | | | | | | | 7,609,500 | |
| | | | | |
| | | | Commercial Services & Supplies – 0.2% | | | | | | | | | | | | |
| | | | | |
| | 1,550 | | | AerCap Global Aviation Trust, (8) | | | 6.500% | | | | N/A (9) | | | | BB | | | | 1,646,875 | |
| | | | | |
| | | | Consumer Finance – 0.8% | | | | | | | | | | | | |
| | | | | |
| | 1,620 | | | American Express Company | | | 5.200% | | | | N/A (9) | | | | Baa2 | | | | 1,678,725 | |
| | | | | |
| | 3,920 | | | Capital One Financial Corporation | | | 5.550% | | | | N/A (9) | | | | Baa3 | | | | 4,116,000 | |
| | 5,540 | | | Total Consumer Finance | | | | | | | | | | | | | | | 5,794,725 | |
| | | | | |
| | | | Food Products – 0.4% | | | | | | | | | | | | |
| | | | | |
| | 2,780 | | | Land O’ Lakes Incorporated, 144A | | | 8.000% | | | | N/A (9) | | | | BB | | | | 3,051,050 | |
| | | | | |
| | | | Industrial Conglomerates – 0.0% | | | | | | | | | | | | |
| | | | | |
| | 1,000 | | | OAS Financial Limited, 144A | | | 0.000% | | | | N/A (9) | | | | N/R | | | | 50,000 | |
| | | | | |
| | | | Insurance – 0.7% | | | | | | | | | | | | |
| | | | | |
| | 1,500 | | | Allstate Corporation | | | 5.750% | | | | N/A (9) | | | | Baa1 | | | | 1,642,500 | |
Nuveen Strategic Income Fund (continued)
| | |
| Portfolio of Investments | | June 30, 2017 |
| | | | | | | | | | | | | | | | | | | | |
Principal
Amount (000) | | | Description (1) | | Coupon | | | Maturity | | | Ratings (4) | | | Value | |
| | | | | |
| | | | Insurance (continued) | | | | | | | | | | | | |
| | | | | |
| $ | 3,730 | | | MetLife Inc. | | | 5.250% | | | | N/A (9) | | | | BBB | | | $ | 3,872,561 | |
| | 5,230 | | | Total Insurance | | | | | | | | | | | | | | | 5,515,061 | |
| $ | 46,473 | | | Total $1,000 Par (or similar) Institutional Preferred (cost $46,591,053) | | | | | | | | | | | | | | | 48,391,193 | |
| | | | | |
Principal
Amount (000) | | | Description (1) | | Coupon | | | Maturity | | | Ratings (4) | | | Value | |
| | | | | |
| | | | CONTINGENT CAPTIAL SECURITIES – 3.0% (11) | | | | | | | | | | | | |
| | | | | |
| | | | Banks – 2.3% | | | | | | | | | | | | |
| | | | | |
| $ | 1,590 | | | Australia and New Zealand Banking Group Limited of the United Kingdom, 144A, (8) | | | 6.750% | | | | N/A (9) | | | | Baa2 | | | $ | 1,757,977 | |
| | | | | |
| | 1,300 | | | Banco Mercantil del Norte, 144A, (WI/DD) | | | 7.625% | | | | N/A (9) | | | | BB | | | | 1,345,240 | |
| | | | | |
| | 2,000 | | | Credit Agricole SA, 144A | | | 8.125% | | | | N/A (9) | | | | BBB– | | | | 2,323,400 | |
| | | | | |
| | 2,410 | | | HSBC Holdings PLC | | | 6.875% | | | | N/A (9) | | | | BBB | | | | 2,602,800 | |
| | | | | |
| | 2,000 | | | ING Groep N.V | | | 6.000% | | | | N/A (9) | | | | BBB– | | | | 2,045,000 | |
| | | | | |
| | 1,300 | | | Intesa Sanpaolo SpA, 144A | | | 7.700% | | | | N/A (9) | | | | Ba3 | | | | 1,350,375 | |
| | | | | |
| | 1,600 | | | Nordea Bank AB, 144A | | | 6.125% | | | | N/A (9) | | | | BBB | | | | 1,672,000 | |
| | | | | |
| | 1,000 | | | Societe Generale, 144A | | | 0.000% | | | | N/A (9) | | | | BB+ | | | | 1,075,000 | |
| | | | | |
| | 1,880 | | | Standard Chartered PLC, 144A | | | 7.500% | | | | N/A (9) | | | | Ba1 | | | | 2,011,600 | |
| | | | | |
| | 1,535 | | | UniCredit SpA, Reg S | | | 8.000% | | | | N/A (9) | | | | B+ | | | | 1,576,316 | |
| | 16,615 | | | Total Banks | | | | | | | | | | | | | | | 17,759,708 | |
| | | | | |
| | | | Capital Markets – 0.7% | | | | | | | | | | | | |
| | | | | |
| | 2,000 | | | Macquarie Bank Limited, 144A, (8) | | | 0.000% | | | | N/A (9) | | | | Ba1 | | | | 2,045,000 | |
| | | | | |
| | 2,800 | | | UBS Group AG, Reg S | | | 5.625% | | | | N/A (9) | | | | BB+ | | | | 2,964,500 | |
| | 4,800 | | | Total Capital Markets | | | | | | | | | | | | | | | 5,009,500 | |
| $ | 21,415 | | | Total Contingent Capital Securities (cost $21,406,985) | | | | | | | | | | | | | | | 22,769,208 | |
| | | | | |
Principal
Amount (000) | | | Description (1) | | Coupon | | | Maturity | | | Ratings (4) | | | Value | |
| | | | | |
| | | | ASSET-BACKED AND MORTGAGE-BACKED SECURITIES – 23.9% | | | | | | | | | | | | |
| | | | | |
| $ | 901 | | | 321 Henderson Receivables LLC, Series 2010-3A, 144A | | | 3.820% | | | | 12/15/48 | | | | Aaa | | | $ | 909,551 | |
| | | | | |
| | 5,075 | | | Ally Auto Receivables Trust, Series 2017-3 | | | 2.010% | | | | 3/15/22 | | | | AAA | | | | 5,078,325 | |
| | | | | |
| | 5,390 | | | American Express Credit Card Master Trust, Series 2017-1 | | | 1.930% | | | | 9/15/22 | | | | Aaa | | | | 5,401,841 | |
| | | | | |
| | 2,301 | | | American Homes 4 Rent, Series 2014-SFR2, 144A | | | 3.786% | | | | 10/17/36 | | | | Aaa | | | | 2,404,061 | |
| | | | | |
| | 2,270 | | | AmeriCold LLC Trust, Series 2010, 144A | | | 6.811% | | | | 1/14/29 | | | | A+ | | | | 2,539,552 | |
| | | | | |
| | 27 | | | Bank of America Alternative Loan Trust, Series 2005-5 2 CB1 | | | 6.000% | | | | 6/25/35 | | | | Caa1 | | | | 26,273 | |
| | | | | |
| | 1,200 | | | Bank of America Commercial Mortgage Inc. , Commercial Mortgage Pass-Through Certificates, Series 2015-UBS7 | | | 4.366% | | | | 9/15/48 | | | | A– | | | | 1,208,725 | |
| | | | | |
| | 770 | | | Bank of America Commercial Mortgage Inc. , Commercial Mortgage Pass-Through Certificates, Series 2015-UBS7 | | | 3.167% | | | | 9/15/48 | | | | BBB– | | | | 616,786 | |
| | | | | |
| | 5,155 | | | Bank of America Credit Card Trust, Series 2017-A1 | | | 1.950% | | | | 8/15/22 | | | | Aaa | | | | 5,172,037 | |
| | | | | | | | | | | | | | | | | | | | |
Principal
Amount (000) | | | Description (1) | | Coupon | | | Maturity | | | Ratings (4) | | | Value | |
| | | | | |
| | | | ASSET-BACKED AND MORTGAGE-BACKED SECURITIES (continued) | | | | | | | | | | | | |
| | | | | |
| $ | 2,400 | | | Barclays Commercial Mortgage, Mortgage Pass-Through Certificates, Series 2015-STP, 144A | | | 4.284% | | | | 9/10/28 | | | | BBB– | | | $ | 2,426,283 | |
| | | | | |
| | 4,900 | | | CitiBank Credit Card Issuance Trust, Series 2014-A6 | | | 2.150% | | | | 7/15/21 | | | | Aaa | | | | 4,940,027 | |
| | | | | |
| | 4,258 | | | Colony American Homes Trust 2014-1A, 144A | | | 2.376% | | | | 5/17/31 | | | | Aaa | | | | 4,281,186 | |
| | | | | |
| | 3,940 | | | Commercial Mortgage Pass-Through Certificates 2015-CR22 | | | 4.123% | | | | 3/10/48 | | | | A– | | | | 3,912,315 | |
| | | | | |
| | 3,260 | | | Commercial Mortgage Pass-Through Certificates, Series 2015-CR26 | | | 4.494% | | | | 10/10/48 | | | | A– | | | | 3,159,141 | |
| | | | | |
| | 112 | | | Countrywide Alternative Loan Trust, Mortgage Pass-Through Certificates, Series 2004-24CB | | | 5.000% | | | | 11/25/19 | | | | BB+ | | | | 112,191 | |
| | | | | |
| | 835 | | | Countrywide Home Loans Mortgage, Series 2005-27 | | | 5.500% | | | | 12/25/35 | | | | Caa1 | | | | 774,051 | |
| | | | | |
| | 132 | | | Credit Suisse First Boston Mortgage Securities Corporation, Mortgage-Backed Pass-Through Certificates, Series 2003-23 | | | 5.750% | | | | 9/25/33 | | | | AA+ | | | | 138,368 | |
| | | | | |
| | 2,430 | | | Discover Card Execution Note Trust 2012-A6 | | | 1.670% | | | | 1/18/22 | | | | AAA | | | | 2,426,855 | |
| | | | | |
| | 1,950 | | | Discover Card Execution Trust 2015-A2 | | | 1.900% | | | | 10/17/22 | | | | AAA | | | | 1,952,334 | |
| | | | | |
| | 3,115 | | | Discover Card Execution Trust 2017-A2 | | | 2.390% | | | | 7/15/24 | | | | AAA | | | | 3,142,994 | |
| | | | | |
| | 3,680 | | | Dominos Pizza Master Issuer LLC, Series 2017-1A, 144A, (WI/DD) | | | 3.082% | | | | 7/25/47 | | | | BBB+ | | | | 3,662,174 | |
| | | | | |
| | 165 | | | Fannie Mae Mortgage Interest Strips | | | 5.000% | | | | 9/25/24 | | | | Aaa | | | | 7,250 | |
| | | | | |
| | 4 | | | Fannie Mae Mortgage Pool FN AL 1187 | | | 5.500% | | | | 7/01/24 | | | | Aaa | | | | 4,439 | |
| | | | | |
| | 761 | | | Fannie Mae Mortgage Pool FN 255956 | | | 5.500% | | | | 10/01/25 | | | | Aaa | | | | 842,666 | |
| | | | | |
| | 46 | | | Fannie Mae Mortgage Pool FN 745101 | | | 6.000% | | | | 4/01/32 | | | | Aaa | | | | 50,691 | |
| | | | | |
| | 193 | | | Fannie Mae Mortgage Pool FN 745324 | | | 6.000% | | | | 3/01/34 | | | | Aaa | | | | 212,662 | |
| | | | | |
| | 95 | | | Fannie Mae Mortgage Pool FN 725205 | | | 5.000% | | | | 3/01/34 | | | | Aaa | | | | 103,767 | |
| | | | | |
| | 133 | | | Fannie Mae Mortgage Pool FN 725773 | | | 5.500% | | | | 9/01/34 | | | | Aaa | | | | 148,359 | |
| | | | | |
| | 53 | | | Fannie Mae Mortgage Pool FN 735060 | | | 6.000% | | | | 11/01/34 | | | | Aaa | | | | 60,106 | |
| | | | | |
| | 39 | | | Fannie Mae Mortgage Pool FN 824163 | | | 5.500% | | | | 4/01/35 | | | | Aaa | | | | 43,949 | |
| | | | | |
| | 56 | | | Fannie Mae Mortgage Pool FN 831377 | | | 6.500% | | | | 4/01/36 | | | | Aaa | | | | 64,054 | |
| | | | | |
| | 28 | | | Fannie Mae Mortgage Pool FN 852909 | | | 6.500% | | | | 4/01/36 | | | | Aaa | | | | 30,939 | |
| | | | | |
| | 87 | | | Fannie Mae Mortgage Pool FN 893318 | | | 6.500% | | | | 8/01/36 | | | | Aaa | | | | 98,833 | |
| | | | | |
| | 12 | | | Fannie Mae Mortgage Pool FN 905597 | | | 3.391% | | | | 12/01/36 | | | | Aaa | | | | 12,333 | |
| | | | | |
| | 58 | | | Fannie Mae Mortgage Pool FN 944340 | | | 6.000% | | | | 6/01/37 | | | | Aaa | | | | 65,557 | |
| | | | | |
| | 38 | | | Fannie Mae Mortgage Pool FN 946228 | | | 5.978% | | | | 9/01/37 | | | | Aaa | | | | 40,557 | |
| | | | | |
| | 76 | | | Fannie Mae Mortgage Pool FN 256890 | | | 6.000% | | | | 9/01/37 | | | | Aaa | | | | 82,196 | |
| | | | | |
| | — | (19) | | Fannie Mae Mortgage Pool FN 889618 | | | 5.500% | | | | 5/01/38 | | | | Aaa | | | | 136 | |
| | | | | |
| | — | (19) | | Fannie Mae Mortgage Pool FN 985344 | | | 5.500% | | | | 7/01/38 | | | | Aaa | | | | 75 | |
| | | | | |
| | 232 | | | Fannie Mae Mortgage Pool FN AA0005 | | | 5.500% | | | | 11/01/38 | | | | Aaa | | | | 259,000 | |
| | | | | |
| | 192 | | | Fannie Mae Mortgage Pool FN AA0889 | | | 5.500% | | | | 12/01/38 | | | | Aaa | | | | 212,601 | |
| | | | | |
| | 10,356 | | | Fannie Mae Mortgage Pool FN AS7348 | | | 3.500% | | | | 6/01/46 | | | | Aaa | | | | 10,639,396 | |
| | | | | |
| | 9,689 | | | Fannie Mae Mortgage Pool FN AS8269 | | | 3.000% | | | | 11/01/46 | | | | Aaa | | | | 9,680,734 | |
| | | | | |
| | 10,990 | | | Fannie Mae TBA, (WI/DD) | | | 4.500% | | | | TBA | | | | Aaa | | | | 11,772,170 | |
| | | | | |
| | 24,320 | | | Fannie Mae TBA, (WI/DD) | | | 4.000% | | | | TBA | | | | Aaa | | | | 25,516,524 | |
Nuveen Strategic Income Fund (continued)
| | |
| Portfolio of Investments | | June 30, 2017 |
| | | | | | | | | | | | | | | | | | | | |
Principal
Amount (000) | | | Description (1) | | Coupon | | | Maturity | | | Ratings (4) | | | Value | |
| | | | | |
| | | | ASSET-BACKED AND MORTGAGE-BACKED SECURITIES (continued) | | | | | | | | | | | | |
| | | | | |
| $ | 18,060 | | | Fannie Mae TBA, (WI/DD) | | | 3.500% | | | | TBA | | | | Aaa | | | $ | 18,510,957 | |
| | | | | |
| | 15,205 | | | Fannie Mae TBA, (WI/DD) | | | 3.000% | | | | TBA | | | | Aaa | | | | 15,157,473 | |
| | | | | |
| | 7,382 | | | Freddie Mac Gold Mortgage Pool, (WI/DD) | | | 3.500% | | | | 2/01/47 | | | | Aaa | | | | 7,587,441 | |
| | | | | |
| | 236 | | | Freddie Mac Mortgage Pool, Various FG A17212 | | | 6.500% | | | | 7/01/31 | | | | Aaa | | | | 260,937 | |
| | | | | |
| | 46 | | | Freddie Mac Mortgage Pool, Various FG H09059 | | | 7.000% | | | | 8/01/37 | | | | Aaa | | | | 50,560 | |
| | | | | |
| | 1,405 | | | Freddie Mac Mortgage Trust, Multifamily Mortgage Pass-Through Certificates, Series 2013-K712, 144A | | | 3.365% | | | | 5/25/45 | | | | AA | | | | 1,437,711 | |
| | | | | |
| | 2,465 | | | Goldman Sachs Mortgage Securities Trust, Mortgage Pass Through Certificates, Series 2015-GC32 | | | 3.345% | | | | 7/10/48 | | | | BBB– | | | | 1,952,967 | |
| | | | | |
| | 19 | | | Government National Mortgage Association, Guaranteed REMIC Pass-Through Securities and MX Securities Trust | | | 4.500% | | | | 5/16/38 | | | | Aaa | | | | 18,732 | |
| | | | | |
| | 3,000 | | | Honda Auto Receivables Owner Trust 2017-2 | | | 1.870% | | | | 9/15/23 | | | | AAA | | | | 2,991,045 | |
| | | | | |
| | 1,275 | | | Impac Secured Assets Corporation, Mortgage Pass-Through Certificates, Series 2000-3 | | | 8.000% | | | | 10/25/30 | | | | CCC | | | | 1,199,101 | |
| | | | | |
| | 757 | | | JP Morgan Alternative Loan Trust, Mortgage Pass-Through Certificates, Series 2007-S1 | | | 1.512% | | | | 4/25/47 | | | | Caa1 | | | | 727,600 | |
| | | | | |
| | 22 | | | Lehman Mortgage Trust, Mortgage Pass Through Certificates, Series 2008-6 | | | 5.052% | | | | 7/25/47 | | | | A+ | | | | 21,743 | |
| | | | | |
| | 2,327 | | | Master RePerforming Loan Trust 2005-1, 144A | | | 7.500% | | | | 8/25/34 | | | | B3 | | | | 2,436,956 | |
| | | | | |
| | 2,750 | | | Morgan Stanley Bank of America Merrill Lynch Trust, Series 2014-C16, 144A | | | 4.756% | | | | 6/15/47 | | | | BBB– | | | | 2,472,762 | |
| | | | | |
| | 1,955 | | | Morgan Stanley Bank of America Merrill Lynch Trust, Series 2015-C22, 144A | | | 4.242% | | | | 4/15/48 | | | | BBB– | | | | 1,651,388 | |
| | | | | |
| | 1,930 | | | New Residential Advance Receivable Trust , Series 2016-T1, 144A | | | 4.377% | | | | 6/15/49 | | | | BBB | | | | 1,940,925 | |
| | | | | |
| | 3,100 | | | New Residential Advance Receivable Trust, Series 2017-T1, 144A | | | 4.002% | | | | 2/15/51 | | | | BBB | | | | 3,117,045 | |
| | | | | |
| | 3,900 | | | OMART Receivables Trust, Series 2016-T2, 144A | | | 4.446% | | | | 8/16/49 | | | | BBB | | | | 3,804,130 | |
| | | | | |
| | 90 | | | Residential Accredit Loans Inc., Mortgage Asset-Backed Pass-Through Certificates, Series 2005-QS12 | | | 5.500% | | | | 8/25/35 | | | | Caa2 | | | | 83,288 | |
| | | | | |
| | 216 | | | Wachovia Mortgage Loan Trust LLC, Mortgage Pass-Through Certificates, Series 2005-B | | | 3.334% | | | | 10/20/35 | | | | D | | | | 189,833 | |
| | | | | |
| | 195 | | | Washington Mutual Mortgage Securities Corporation, Mortgage Pass-Through Certificates, Series 2004-RA3 | | | 6.262% | | | | 8/25/38 | | | | AA | | | | 204,778 | |
| | | | | |
| | 1,635 | | | Wells Fargo Commercial Mortgage Trust, Commercial Mortgage Pass-Through Certificates, Series 2015-C30, 144A | | | 4.495% | | | | 9/15/58 | | | | BBB– | | | | 1,430,548 | |
| | | | | |
| | 12 | | | Wells Fargo Mortgage Backed Securities, 2005-AR16 Class 3A2 | | | 3.208% | | | | 3/25/35 | | | | A+ | | | | 12,571 | |
| | | | | |
| | 2,580 | | | World Omni Auto Receivables Trust, Series 2016-B | | | 1.300% | | | | 2/15/22 | | | | AAA | | | | 2,558,086 | |
| $ | 182,286 | | | Total Asset-Backed and Mortgage-Backed Securities (cost $183,278,490) | | | | | | | | | | | | | | | 184,052,641 | |
| | | | | |
Principal
Amount (000) (7) | | | Description (1) | | Coupon | | | Maturity | | | Ratings (4) | | | Value | |
| | | | | |
| | | | SOVEREIGN DEBT – 5.3% | | | | | | | | | | | | | | | | |
| | | | | |
| | | | Argentina – 0.5% | | | | | | | | | | | | |
| | | | | |
| $ | 2,460 | | | Republic of Argentina | | | 6.875% | | | | 1/26/27 | | | | B | | | $ | 2,543,640 | |
| | | | | |
| | 1,000 | | | Republic of Argentina | | | 7.625% | | | | 4/22/46 | | | | B | | | | 1,024,000 | |
| | | | Total Argentina | | | | | | | | | | | | | | | 3,567,640 | |
| | | | | | | | | | | | | | | | | | | | |
Principal
Amount (000) (7) | | | Description (1) | | Coupon | | | Maturity | | | Ratings (4) | | | Value | |
| | | | | |
| | | | Egypt – 0.4% | | | | | | | | | | | | |
| | | | | |
| $ | 3,090 | | | Arab Republic of Egypt, 144A | | | 7.500% | | | | 1/31/27 | | | | B | | | $ | 3,281,580 | |
| | | | | |
| | | | El Salvador – 0.1% | | | | | | | | | | | | |
| | | | | |
| | 1,100 | | | Republic of El Salvador, 144A | | | 6.375% | | | | 1/18/27 | | | | Caa1 | | | | 992,750 | |
| | | | | |
| | | | Germany – 2.0% | | | | | | | | | | | | |
| | | | | |
| | 13,800 | EUR | | Deutschland Republic, Reg S | | | 0.250% | | | | 2/15/27 | | | | Aaa | | | | 15,419,783 | |
| | | | | |
| | | | Mexico – 2.1% | | | | | | | | | | | | |
| | | | | |
| | 3,070 | MXN | | Mexico Bonos de DeSarrollo | | | 5.750% | | | | 3/05/26 | | | | A3 | | | | 15,791,544 | |
| | | | | |
| | | | Sri Lanka – 0.2% | | | | | | | | | | | | |
| | | | | |
| | 1,400 | | | Republic of Sri Lanka, 144A | | | 6.200% | | | | 5/11/27 | | | | B+ | | | | 1,397,771 | |
| | | | Total Sovereign Debt (cost $39,336,817) | | | | | | | | | | | | | | | 40,451,068 | |
| | | | Total Long-Term Investments (cost $734,596,566) | | | | | | | | | | | | | | | 752,826,301 | |
| | | | | |
| Shares | | | Description (1) | | Coupon | | | | | | | | | Value | |
| | | | |
| | | | INVESTMENTS PURCHASED WITH COLLATERAL FROM SECURITIES LENDING – 3.3% | | | | | | | | | | | | | |
| | | | | |
| | | | Money Market Funds – 3.3% | | | | | | | | | | | | |
| | | | | |
| | 25,533,148 | | | First American Government Obligations Fund, Class X, (13) | | | 0.883% (12) | | | | | | | | | | | $ | 25,533,148 | |
| | | | Total Investments Purchased with Collateral from Securities Lending (cost $25,533,148) | | | | | | | | | | | | 25,533,148 | |
| | | | | |
| Shares | | | Description (1) | | Coupon | | | | | | | | | Value | |
| | | | | |
| | | | SHORT-TERM INVESTMENTS – 11.1% | | | | | | | | | | | | | | | | |
| | | | | |
| | | | Money Market Funds – 11.1% | | | | | | | | | | | | |
| | | | | |
| | 85,819,945 | | | First American Treasury Obligations Fund, Class Z | | | 0.847% (12) | | | | | | | | | | | $ | 85,819,945 | |
| | | | Total Short-Term Investments (cost $85,819,945) | | | | | | | | | | | | | | | 85,819,945 | |
| | | | Total Investments (cost $845,949,659) – 112.2% | | | | | | | | | | | | | | | 864,179,394 | |
| | | | Other Assets Less Liabilities – (12.2)% (15) | | | | | | | | | | | | | | | (93,886,384 | ) |
| | | | Net Assets – 100% | | | | | | | | | | | | | | $ | 770,293,010 | |
Investments in Derivatives as of June 30, 2017
Forward Foreign Currency Exchange Contracts
| | | | | | | | | | | | | | | | | | | | | | |
| Counterparty | | Currency Contracts to Deliver | | Notional
Amount
(Local Currency) | | | In Exchange
For Currency | | | Notional
Amount
(Local Currency) | | | Settlement
Date | | | Unrealized
Appreciation
(Depreciation)
(U.S. Dollars) | |
| Goldman Sacks Bank USA | | Canadian Dollar | | | 1,339,000 | | | | U.S Dollar | | | | 975,450 | | | | 7/17/17 | | | $ | (57,459 | ) |
| Citibank, National Association | | Euro | | | 410,000 | | | | U.S Dollar | | | | 446,876 | | | | 7/17/17 | | | | (21,843 | ) |
| Bank of America, N.A. | | Euro | | | 13,660,000 | | | | U.S Dollar | | | | 15,298,408 | | | | 8/25/17 | | | | (349,969 | ) |
| Morgan Stanley Capital Services LLC | | U.S. Dollar | | | 8,685,322 | | | | Hungarian Forint | | | | 2,376,000,000 | | | | 7/17/17 | | | | 107,838 | |
| Morgan Stanley Capital Services LLC | | Hungarian Forint | | | 2,376,000,000 | | | | U.S Dollar | | | | 8,330,882 | | | | 7/17/17 | | | | (462,278 | ) |
| Morgan Stanley Capital Services LLC | | Mexican Peso | | | 281,700,000 | | | | U.S Dollar | | | | 15,252,489 | | | | 8/11/17 | | | | (160,300 | ) |
| | | | | | | | | | | | | | | | | | | | | $ | (944,011 | ) |
Nuveen Strategic Income Fund (continued)
| | |
| Portfolio of Investments | | June 30, 2017 |
Credit Default Swaps (OTC Cleared)
| | | | | | | | | | | | | | | | | | | | | | | | | | | | | | | | | | |
| Clearing Broker | | Referenced Entity | | Buy/Sell
Protection (16) | | | Current
Credit
Spread (17) | | | Notional
Amount | | | Fixed Rate
(Annualized) | | | Termination
Date | | | Value | | | Variation Margin
Receivable/
(Payable) | | | Unrealized
Appreciation
(Depreciation) | |
Citigroup Global Markets, Inc.* | | Markit CDX.NA.HY.28 | | | Buy | | | | 3.392 | % | | $ | 63,000,000 | | | | 5.000 | % | | | 6/20/22 | | | $ | (4,436,830 | ) | | $ | 240,568 | | | $ | (2,088 | ) |
Citigroup Global Markets, Inc.* | | Markit iTraxx Europe | | | Buy | | | | 0.565 | | | | 15,000,000 | | | | 5.000 | | | | 6/20/22 | | | | (1,992,873 | ) | | | 72,758 | | | | (538,340 | ) |
| | | | | | | | | | | | | $ | 78,000,000 | | | | | | | | | | | $ | (6,429,703 | ) | | $ | 313,326 | | | $ | (540,428 | ) |
| * | Chicago Mercantile Exchange is the clearing house for this transaction. |
Futures Contracts
| | | | | | | | | | | | | | | | | | | | | | | | |
| Description | | Contract
Position | | | Number of
Contracts | | | Contract
Expiration | | | Notional
Amount
at Value* | | | Variation Margin
Receivable/
(Payable) | | | Unrealized
Appreciation
(Depreciation) | |
U.S. Treasury 5-Year Note | | | Long | | | | 286 | | | | 9/17 | | | $ | 33,701,078 | | | $ | (49,156 | ) | | $ | (76,028 | ) |
U.S. Treasury 10-Year Note | | | Short | | | | (1,141 | ) | | | 9/17 | | | | (143,231,156 | ) | | | 320,906 | | | | 416,772 | |
U.S. Treasury Long Bond | | | Long | | | | 57 | | | | 9/17 | | | | 8,760,188 | | | | (32,063 | ) | | | 79,775 | |
U.S. Treasury Ultra Bond | | | Long | | | | 228 | | | | 9/17 | | | | 37,819,500 | | | | (156,756 | ) | | | 597,235 | |
| | | | | | | | | | | | | | | $ | (62,950,390 | ) | | $ | 82,931 | | | $ | 1,017,754 | |
| * | Total aggregate Notional Amount at Value of long and short positions is $80,280,766 and $(143,231,156), respectively. |
Options Purchased
| | | | | | | | | | | | | | | | | | |
Number of
Contracts | | Description | | Notional
Amount (18) | | | Expiration
Date | | | Strike
Price | | | Value | |
274 | | U.S. Treasury 10-Year Future | | $ | 3,493,500 | | | | 8/17 | | | $ | 127.5 | | | $ | 12,844 | |
274 | | Total Call Options Purchased (premiums paid $71,345) | | | | | | | | | | | | | | $ | 12,844 | |
For Fund portfolio compliance purposes, the Fund’s industry classifications refer to any one or more of the industry sub-classifications used by one or more widely recognized market indexes or ratings group indexes, and/or as defined by Fund management. This definition may not apply for purposes of this report, which may combine industry sub-classifications into sectors for reporting ease.
| (1) | All percentages shown in the Portfolio of Investments are based on net assets. |
| (2) | Non-income producing; issuer has not declared a dividend within the past twelve months. |
| (3) | Investment valued at fair value using methods determined in good faith by, or at discretion of, the Board. For fair value measurement disclosure purposes, investment classified as Level 3. See Notes to Financial Statements, Note 2 – Investment Valuation and Fair Value Measurements for more information. |
| (4) | For financial reporting purposes, the ratings disclosed are the highest of Standard & Poor’s Group (“Standard & Poor’s”), Moody’s Investors Service, Inc. (“Moody’s”) or Fitch, Inc. (“Fitch”) rating. This treatment of split-rated securities may differ from that used for other purposes, such as for Fund investment policies. Ratings below BBB by Standard & Poor’s, Baa by Moody’s or BBB by Fitch are considered to be below investment grade. Holdings designated N/R are not rated by any of these national rating agencies. Ratings are not covered by the report of independent registered public accounting firm. |
| (5) | Senior loans generally are subject to mandatory and/or optional prepayment. Because of these mandatory prepayment conditions and because there may be significant economic incentives for a borrower to prepay, prepayments of senior loans may occur. As a result, the actual remaining maturity of senior loans held may be substantially less than the stated maturities shown. |
| (6) | Senior loans generally pay interest at rates which are periodically adjusted by reference to a base short-term, floating lending rate plus an assigned fixed rate. These floating lending rates are generally (i) the lending rate referenced by the London Inter-Bank Offered Rate (“LIBOR”), or (ii) the prime rate offered by one or more major United States banks. Senior loans may be considered restricted in that the Fund ordinarily is contractually obligated to receive approval from the agent bank and/or borrower prior to the disposition of a senior loan. The rate shown is the coupon as of the end of the reporting period. |
| (7) | Principal Amount (000) denominated in U.S. Dollars, unless otherwise noted. |
| (8) | Investment, or a portion of investment, is out on loan for securities lending. The total value of the securities out on loan as of the end of the reporting period was $24,598,754. |
| (9) | Perpetual security. Maturity date is not applicable. |
| (10) | Optional Call Provisions: Dates (month and year) and prices of the earliest optional call or redemption. There may be other call provisions at varying prices at later dates. Certain mortgagebacked securities may be subject to periodic principal paydowns. Optional Call Provisions are not covered by the report of independent registered public accounting firm. |
| (11) | Contingent Capital Securities (“CoCos”) are hybrid securities with loss absorption characteristics built into the terms of the security for the benefit of the issuer. For example, the terms may specify an automatic write-down of principal or a mandatory conversion into the issuer’s common stock under certain adverse circumstances, such as the issuer’s capital ratio falling below a specified level. |
| (12) | The rate shown is the annualized seven-day subsidized yield as of the end of the reporting period. |
| (13) | The Fund may loan securities representing up to one third of the fair value of its total assets (which includes collateral for securities on loan) to broker-dealers, banks and other institutions. The Fund maintains collateral equal to at least 100% of the fair value of the securities loaned. The cash collateral received by the Fund is invested in this money market fund. See Notes to Financial Statements, Note 3 – Portfolio Securities and Investments in Derivatives, Securities Lending for more information. |
| (14) | For fair value measurement disclosure purposes, investment classified as Level 2. See Notes to Financial Statements, Note 2 – Investment Valuation and Fair Value Measurements for more information. |
| (15) | Other assets less liabilities includes the unrealized appreciation (depreciation) of certain over-the-counter (“OTC”) derivatives as presented on the Statement of Assets and Liabilities, when applicable. The unrealized appreciation (depreciation) of OTC-cleared and exchange-traded derivatives is recognized as part of the cash collateral at brokers and/or receivable or payable for variation margin as presented on the Statement of Assets and Liabilities, when applicable. |
| (16) | The Fund entered into the credit default swaps to gain investment exposure to the referenced entity. Selling protection has a similar credit risk position to owning the referenced entity. Buying protection has a similar credit risk position to selling the referenced entity short. |
| (17) | The credit spread generally serves as an indication of the current status of the payment/performance risk and therefore the likelihood of default of the credit derivative. The credit spread also reflects the cost of buying/selling protection and may include upfront payments required to be made to enter into a credit default swap contract. Higher credit spreads are indicative of higher likelihood of performance by the seller of protection. |
| (18) | For disclosure purposes, Notional Amount is calculated by multiplying the Number of Contracts by the Strike Price by 100. |
| (19) | Principal Amount (000) rounds to less than $1,000. |
| (WI/DD) | Investment, or portion of investment, purchased on a when-issued or delayed delivery basis. |
| TBA | To be announced. Maturity date not known prior to settlement of this transaction. |
| 144A | Investment is exempt from registration under Rule 144A of the Securities Act of 1933, as amended. These investments may only be resold in transactions exempt from registration, which are normally those transactions with qualified institutional buyers. |
| Reg S | Regulation S allows U.S. companies to sell securities to persons or entities located outside of the United States without registering those securities with the Securities and Exchange Commission. Specifically, Regulation S provides a safe harbor from the registration requirements of the Securities Act for the offers and sales of securities by both foreign and domestic issuers that are made outside the United States. |
See accompanying notes to financial statements.
Statement of
| | | | |
| | Assets and Liabilities | | June 30, 2017 |
| | | | | | | | | | | | | | | | |
| | | Core
Bond | | | Core Plus
Bond | | | High Income
Bond | | | Inflation
Protected
Securities | |
Assets | | | | | | | | | | | | | | | | |
Long-term investments, at value (cost $134,534,231, $344,129,174, $383,947,244 and $596,680,380, respectively) | | $ | 138,411,709 | | | $ | 356,388,497 | | | $ | 368,027,163 | | | $ | 596,912,009 | |
Investments purchased with collateral from securities lending, at value (cost approximates value) | | | 768,400 | | | | 8,787,463 | | | | 47,531,423 | | | | 1,844,888 | |
Short-term investments, at value (cost approximates value) | | | 3,740,769 | | | | 18,106,253 | | | | 11,297,772 | | | | 8,148,259 | |
Cash denominated in foreign currencies (cost $—, $—, $65,207 and $—, respectively) | | | — | | | | — | | | | 68,317 | | | | — | |
Cash | | | — | | | | — | | | | 2,711,893 | | | | — | |
Cash collateral at brokers(1) | | | 96,100 | | | | 828,963 | | | | 28,600 | | | | 250,800 | |
Options purchased, at value (premiums paid $—, $16,404, $— and $—, respectively) | | | — | | | | 2,953 | | | | — | | | | — | |
Receivable for: | | | | | | | | | | | | | | | | |
Dividends | | | — | | | | — | | | | 117,765 | | | | 3,625 | |
Due from broker | | | 167 | | | | 5,283 | | | | 40,722 | | | | 2,753 | |
Interest | | | 896,700 | | | | 2,891,101 | | | | 6,447,973 | | | | 1,567,283 | |
Investments sold | | | — | | | | 2,305,453 | | | | 4,157,869 | | | | 1,816,137 | |
Reclaims | | | — | | | | 25,906 | | | | — | | | | — | |
Shares sold | | | 129,752 | | | | 189,527 | | | | 653,910 | | | | 2,055,395 | |
Variation margin on futures contracts | | | 38,464 | | | | 67,218 | | | | — | | | | 72,733 | |
Variation margin on swap contracts | | | — | | | | 27,732 | | | | — | | | | — | |
Other assets | | | 33,316 | | | | 47,609 | | | | 63,147 | | | | 35,370 | |
Total assets | | | 144,115,377 | | | | 389,673,958 | | | | 441,146,554 | | | | 612,709,252 | |
Liabilities | | | | | | | | | | | | | | | | |
Cash overdraft | | | — | | | | — | | | | — | | | | 156,934 | |
Credit default swaps premium received | | | — | | | | 532,111 | | | | — | | | | — | |
Unrealized depreciation on forward foreign currency exchange contracts, net | | | — | | | | 194,791 | | | | 182,075 | | | | — | |
Payable for: | | | | | | | | | | | | | | | | |
Collateral from securities lending program | | | 768,400 | | | | 8,787,463 | | | | 47,531,423 | | | | 1,844,888 | |
Dividends | | | 112,324 | | | | 432,593 | | | | 394,508 | | | | 272,196 | |
Investments purchased | | | — | | | | 19,309,827 | | | | 5,200,000 | | | | 5,640,000 | |
Shares redeemed | | | 87,340 | | | | 221,152 | | | | 1,611,308 | | | | 789,973 | |
Variation margin on future contracts | | | 30,563 | | | | 49,047 | | | | 5,625 | | | | 13,750 | |
Accrued expenses: | | | | | | | | | | | | | | | | |
Management fees | | | 35,441 | | | | 113,571 | | | | 207,066 | | | | 127,249 | |
Directors fees | | | 17,851 | | | | 30,187 | | | | 31,809 | | | | 23,729 | |
Professional fees | | | 45,188 | | | | 49,499 | | | | 40,769 | | | | 52,660 | |
12b-1 distribution and service fees | | | 4,106 | | | | 18,150 | | | | 71,709 | | | | 35,508 | |
Other | | | 38,837 | | | | 112,330 | | | | 105,791 | | | | 401,392 | |
Total liabilities | | | 1,140,050 | | | | 29,850,721 | | | | 55,382,083 | | | | 9,358,279 | |
Net assets | | $ | 142,975,327 | | | $ | 359,823,237 | | | $ | 385,764,471 | | | $ | 603,350,973 | |
| (1) | Cash pledged to collateralize the net payment obligations for investments in derivatives. |
See accompanying notes to financial statements.
| | | | | | | | | | | | |
| | | Intermediate
Government
Bond | | | Short Term
Bond | | | Strategic
Income | |
Assets | | | | | | | | | | | | |
Long-term investments, at value (cost $51,199,553, $548,798,605 and $734,596,566,
respectively) | | $ | 51,878,341 | | | $ | 549,771,306 | | | $ | 752,826,301 | |
Investments purchased with collateral from securities lending, at value (cost approximates value) | | | 328,063 | | | | 2,658,212 | | | | 25,533,148 | |
Short-term investments, at value (cost approximates value) | | | 274,447 | | | | 24,846,144 | | | | 85,819,945 | |
Cash denominated in foreign currencies (cost $—, $— and $36,226, respectively) | | | — | | | | — | | | | 37,954 | |
Cash | | | — | | | | — | | | | — | |
Cash collateral at brokers(1) | | | 46,000 | | | | 132,000 | | | | 9,223,352 | |
Options purchased, at value (premiums paid $—, $— and $71,345, respectively) | | | — | | | | — | | | | 12,844 | |
Receivable for: | | | | | | | | | | | | |
Dividends | | | — | | | | — | | | | 3,984 | |
Due from broker | | | 84 | | | | 1,332 | | | | 18,309 | |
Interest | | | 317,284 | | | | 2,827,527 | | | | 7,256,414 | |
Investments sold | | | — | | | | 3,824,286 | | | | 8,868,337 | |
Reclaims | | | — | | | | — | | | | — | |
Shares sold | | | 28,539 | | | | 646,250 | | | | 1,601,596 | |
Variation margin on futures contracts | | | 11,254 | | | | 48,638 | | | | 320,906 | |
Variation margin on swap contracts | |
| —
|
| | | — | | |
| 313,326
|
|
Other assets | | | 13,326 | | | | 62,613 | | | | 56,604 | |
Total assets | | | 52,897,338 | | | | 584,818,308 | | | | 891,893,020 | |
Liabilities | | | | | | | | | | | | |
Cash overdraft | | | — | | | | — | | | | — | |
Credit default swaps premium received | | | — | | | | — | | | | 5,889,275 | |
Unrealized depreciation on forward foreign currency exchange contracts, net | | | — | | | | — | | | | 944,011 | |
Payable for: | | | | | | | | | | | | |
Collateral from securities lending program | | | 328,063 | | | | 2,658,212 | | | | 25,533,148 | |
Dividends | | | 42,058 | | | | 409,590 | | | | 1,328,591 | |
Investments purchased | | | — | | | | 18,964,351 | | | | 85,020,485 | |
Shares redeemed | | | 55,838 | | | | 648,619 | | | | 1,909,974 | |
Variation margin on future contracts | | | 844 | | | | 22,125 | | | | 237,975 | |
Accrued expenses: | | | | | | | | | | | | |
Management fees | | | 7,440 | | | | 167,753 | | | | 282,504 | |
Directors fees | | | 772 | | | | 41,234 | | | | 43,803 | |
Professional fees | | | 43,387 | | | | 53,843 | | | | 57,763 | |
12b-1 distribution and service fees | | | 3,032 | | | | 40,970 | | | | 94,745 | |
Other | | | 25,108 | | | | 113,704 | | | | 257,736 | |
Total liabilities | | | 506,542 | | | | 23,120,401 | | | | 121,600,010 | |
Net assets | | $ | 52,390,796 | | | $ | 561,697,907 | | | $ | 770,293,010 | |
| (1) | Cash pledged to collateralize the net payment obligations for investments in derivatives. |
See accompanying notes to financial statements.
Statement of Assets and Liabilities (continued)
| | | | | | | | | | | | | | | | |
| | | Core
Bond | | | Core Plus
Bond | | | High Income
Bond | | | Inflation
Protected
Securities | |
Class A Shares | | | | | | | | | | | | | | | | |
Net assets | | $ | 13,182,451 | | | $ | 57,299,214 | | | $ | 136,976,869 | | | $ | 104,587,718 | |
Shares outstanding | | | 1,350,516 | | | | 5,192,074 | | | | 17,557,595 | | | | 9,496,030 | |
Net asset value (“NAV”) per share | | $ | 9.76 | | | $ | 11.04 | | | $ | 7.80 | | | $ | 11.01 | |
Offering price per share (NAV per share plus maximum sales charge of 3.00%, 4.25%, 4.75%, and 4.25%, respectively, of offering price) | | $ | 10.06 | | | $ | 11.53 | | | $ | 8.19 | | | $ | 11.50 | |
Class C Shares | | | | | | | | | | | | | | | | |
Net assets | | $ | 1,720,186 | | | $ | 6,984,522 | | | $ | 47,697,739 | | | $ | 10,638,748 | |
Shares outstanding | | | 176,757 | | | | 635,857 | | | | 6,122,520 | | | | 982,091 | |
NAV and offering price per share | | $ | 9.73 | | | $ | 10.98 | | | $ | 7.79 | | | $ | 10.83 | |
Class R3 Shares | | | | | | | | | | | | | | | | |
Net assets | | $ | — | | | $ | 1,205,375 | | | $ | 755,504 | | | $ | 5,618,443 | |
Shares outstanding | | | — | | | | 108,656 | | | | 94,873 | | | | 514,785 | |
NAV and offering price per share | | $ | — | | | $ | 11.09 | | | $ | 7.96 | | | $ | 10.91 | |
Class R6 Shares | | | | | | | | | | | | | | | | |
Net assets | | $ | 58,544,749 | | | $ | 23,797,971 | | | $ | — | | | $ | 23,654,247 | |
Shares outstanding | | | 6,012,910 | | | | 2,157,723 | | | | — | | | | 2,113,571 | |
NAV and offering price per share | | $ | 9.74 | | | $ | 11.03 | | | $ | — | | | $ | 11.19 | |
Class I Shares | | | | | | | | | | | | | | | | |
Net assets | | $ | 69,527,941 | | | $ | 270,536,155 | | | $ | 200,309,633 | | | $ | 458,851,817 | |
Shares outstanding | | | 7,152,405 | | | | 24,562,955 | | | | 25,598,756 | | | | 41,184,441 | |
NAV and offering price per share | | $ | 9.72 | | | $ | 11.01 | | | $ | 7.82 | | | $ | 11.14 | |
Class T Shares(1) | | | | | | | | | | | | | | | | |
Net assets | | $ | — | | | $ | — | | | $ | 24,726 | | | $ | — | |
Shares outstanding | | | — | | | | — | | | | 3,161 | | | | — | |
NAV per share | | $ | — | | | $ | — | | | $ | 7.82 | | | $ | — | |
Offering price per share (NAV per share plus maximum sales charge of —%, —%, 2.50%, and —%, respectively, of offering price) | | $ | — | | | $ | — | | | $ | 8.02 | | | $ | — | |
Net assets consist of: | | | | | | | | | | | | | | | | |
Capital paid-in | | $ | 142,683,740 | | | $ | 357,956,198 | | | $ | 495,786,154 | | | $ | 602,965,561 | |
Undistributed (Over-distribution of) net investment income | | | (319,856 | ) | | | (2,578,372 | ) | | | 1,125,810 | | | | 5,088,282 | |
Accumulated net realized gain (loss) | | | (3,457,705 | ) | | | (7,811,628 | ) | | | (95,048,421 | ) | | | (5,183,914 | ) |
Net unrealized appreciation (depreciation) | | | 4,069,148 | | | | 12,257,039 | | | | (16,099,072 | ) | | | 481,044 | |
Net assets | | $ | 142,975,327 | | | $ | 359,823,237 | | | $ | 385,764,471 | | | $ | 603,350,973 | |
Authorized shares – per class | | | 2 billion | | | | 2 billion | | | | 2 billion | | | | 2 billion | |
Par value per share | | | 0.0001 | | | | 0.0001 | | | | 0.0001 | | | | 0.0001 | |
| (1) | Class T Shares are not available for public offering. |
See accompanying notes to financial statements.
| | | | | | | | | | | | |
| | | Intermediate
Government
Bond | | | Short Term
Bond | | | Strategic
Income | |
Class A Shares | | | | | | | | | | | | |
Net assets | | $ | 9,457,920 | | | $ | 92,966,847 | | | $ | 137,072,258 | |
Shares outstanding | | | 1,090,749 | | | | 9,430,905 | | | | 12,869,686 | |
Net asset value (“NAV”) per share | | $ | 8.67 | | | $ | 9.86 | | | $ | 10.65 | |
Offering price per share (NAV per share plus maximum sales charge of 3.00%,
2.25% and 4.25%, respectively, of offering price) | | $ | 8.94 | | | $ | 10.09 | | | $ | 11.12 | |
Class C Shares | | | | | | | | |
Net assets | | $ | 1,169,002 | | | $ | 25,326,443 | | | $ | 76,513,131 | |
Shares outstanding | | | 134,579 | | | | 2,558,502 | | | | 7,222,481 | |
NAV and offering price per share | | $ | 8.69 | | | $ | 9.90 | | | $ | 10.59 | |
Class R3 Shares | | | | | | | | | | | | |
Net assets | | $ | 81,591 | | | $ | 435,756 | | | $ | 7,320,348 | |
Shares outstanding | | | 9,408 | | | | 44,112 | | | | 684,748 | |
NAV and offering price per share | | $ | 8.67 | | | $ | 9.88 | | | $ | 10.69 | |
Class R6 Shares | | | | | | | | | | | | |
Net assets | | $ | — | | | $ | 95,753,892 | | | $ | 8,994,549 | |
Shares outstanding | | | — | | | | 9,690,953 | | | | 843,339 | |
NAV and offering price per share | | $ | — | | | $ | 9.88 | | | $ | 10.67 | |
Class I Shares | | | | | | | | | | | | |
Net assets | | $ | 41,682,283 | | | $ | 347,214,969 | | | $ | 540,367,774 | |
Shares outstanding | | | 4,805,239 | | | | 35,189,523 | | | | 50,756,416 | |
NAV and offering price per share | | $ | 8.67 | | | $ | 9.87 | | | $ | 10.65 | |
Class T Shares(1) | | | | | | | | | | | | |
Net assets | | $ | — | | | $ | — | | | $ | 24,950 | |
Shares outstanding | | | — | | | | — | | | | 2,343 | |
NAV per share | | $ | — | | | $ | — | | | $ | 10.65 | |
Offering price per share (NAV per share plus maximum sales charge of —%, —%,
and 2.50%, respectively, of offering price) | | $ | — | | | $ | — | | | $ | 10.92 | |
Net assets consist of: | | | | | | | | |
Capital paid-in | | $ | 53,021,806 | | | $ | 574,209,563 | | | $ | 853,011,831 | |
Undistributed (Over-distribution of) net investment income | | | (18,048 | ) | | | (863,647 | ) | | | (9,533,183 | ) |
Accumulated net realized gain (loss) | | | (1,314,573 | ) | | | (12,650,953 | ) | | | (90,846,276 | ) |
Net unrealized appreciation (depreciation) | | | 701,611 | | | | 1,002,944 | | | | 17,660,638 | |
Net assets | | $ | 52,390,796 | | | $ | 561,697,907 | | | $ | 770,293,010 | |
Authorized shares – per class | | | 2 billion | | | | 2 billion | | | | 2 billion | |
Par value per share | | | 0.0001 | | | | 0.0001 | | | | 0.0001 | |
| (1) | Class T Shares are not available for public offering. |
See accompanying notes to financial statements.
Statement of
| | | | |
| | Operations | | Year Ended June 30, 2017 |
| | | | | | | | | | | | | | | | |
| | | Core
Bond | | | Core Plus
Bond | | | High Income
Bond | | | Inflation
Protected
Securities | |
Investment Income | | | | | | | | | | | | | | | | |
Dividend income | | $ | — | | | $ | 222 | | | $ | 1,706,817 | | | $ | 14,511 | |
Interest income | | | 4,814,047 | | | | 15,625,859 | | | | 33,092,283 | | | | 14,737,085 | |
Securities lending income, net | | | 7,680 | | | | 61,290 | | | | 433,776 | | | | 20,819 | |
Total investment income | | | 4,821,727 | | | | 15,687,371 | | | | 35,232,876 | | | | 14,772,415 | |
Expenses | | | | | | | | | | | | | | | | |
Management fees | | | 748,182 | | | | 1,762,576 | | | | 2,552,938 | | | | 2,417,257 | |
12b-1 service fees – Class A Shares | | | 34,984 | | | | 150,218 | | | | 411,150 | | | | 265,570 | |
12b-1 distribution and service fees – Class C Shares | | | 19,071 | | | | 81,402 | | | | 464,115 | | | | 133,866 | |
12b-1 distribution and service fees – Class R3 Shares | | | — | | | | 47,551 | | | | 3,886 | | | | 56,130 | |
12b-1 distribution and service fees – Class T Shares(1) | | | — | | | | — | | | | 5 | | | | — | |
Shareholder servicing agent fees | | | 79,483 | | | | 289,258 | | | | 282,898 | | | | 1,416,743 | |
Custodian fees | | | 64,125 | | | | 132,696 | | | | 135,432 | | | | 94,656 | |
Directors fees | | | 4,867 | | | | 11,308 | | | | 13,051 | | | | 18,171 | |
Professional fees | | | 55,111 | | | | 63,715 | | | | 58,887 | | | | 75,907 | |
Shareholder reporting expenses | | | 17,646 | | | | 36,146 | | | | 52,693 | | | | 80,767 | |
Federal and state registration fees | | | 68,720 | | | | 82,144 | | | | 98,731 | | | | 104,661 | |
Other | | | 9,815 | | | | 18,879 | | | | 123,219 | | | | 12,036 | |
Total expenses before fee waiver/expense reimbursement | | | 1,102,004 | | | | 2,675,893 | | | | 4,197,005 | | | | 4,675,764 | |
Fee waiver/expense reimbursement | | | (237,399 | ) | | | (450,769 | ) | | | (5,802 | ) | | | (1,049,542 | ) |
Net expenses | | | 864,605 | | | | 2,225,124 | | | | 4,191,203 | | | | 3,626,222 | |
Net investment income (loss) | | | 3,957,122 | | | | 13,462,247 | | | | 31,041,673 | | | | 11,146,193 | |
Realized and Unrealized Gain (Loss) | | | | | | | | | | | | | | | | |
Net realized gain (loss) from: | | | | | | | | | | | | | | | | |
Investments and foreign currency | | | 1,094,016 | | | | 3,481,669 | | | | (1,337,739 | ) | | | 1,334,814 | |
Forward foreign currency exchange contracts | | | — | | | | (377,450 | ) | | | 210,744 | | | | — | |
Futures contracts | | | (1,099,892 | ) | | | 117,343 | | | | (137,663 | ) | | | (3,448,952 | ) |
Options purchased | | | — | | | | (189,915 | ) | | | — | | | | — | |
Swaps | | | — | | | | (2,414,363 | ) | | | (30,036 | ) | | | — | |
Net change in unrealized appreciation (depreciation) of: | | | | | | | | | | | | | | | | |
Investments and foreign currency | | | (4,983,483 | ) | | | (1,417,518 | ) | | | 32,917,584 | | | | (16,784,072 | ) |
Forward foreign currency exchange contracts | | | — | | | | 154,851 | | | | (114,776 | ) | | | — | |
Futures contracts | | | 215,835 | | | | 62,649 | | | | (275,326 | ) | | | (295,008 | ) |
Options purchased | | | — | | | | (13,451 | ) | | | — | | | | — | |
Swaps | | | — | | | | 2,131,286 | | | | — | | | | — | |
Net realized and unrealized gain (loss) | | | (4,773,524 | ) | | | 1,535,101 | | | | 31,232,788 | | | | (19,193,218 | ) |
Net increase (decrease) in net assets from operations | | $ | (816,402 | ) | | $ | 14,997,348 | | | $ | 62,274,461 | | | $ | (8,047,025 | ) |
| (1) | Class T Shares are not available for public offering. Class T Shares commenced operations on May 31, 2017. |
See accompanying notes to financial statements.
| | | | | | | | | | | | |
| | | Intermediate
Government
Bond | | | Short Term
Bond | | | Strategic
Income | |
Investment Income | | | | | | | | | | | | |
Dividend income | | $ | — | | | $ | — | | | $ | 211,505 | |
Interest income | | | 1,445,996 | | | | 13,442,475 | | | | 37,953,456 | |
Securities lending income, net | | | 6,711 | | | | 32,653 | | | | 259,802 | |
Total investment income | | | 1,452,707 | | | | 13,475,128 | | | | 38,424,763 | |
Expenses | | | | | | | | | | | | |
Management fees | | | 318,197 | | | | 2,330,699 | | | | 4,121,696 | |
12b-1 service fees – Class A Shares | | | 31,570 | | | | 243,219 | | | | 421,113 | |
12b-1 distribution and service fees – Class C Shares | | | 15,670 | | | | 300,390 | | | | 834,813 | |
12b-1 distribution and service fees – Class R3 Shares | | | 750 | | | | 1,789 | | | | 37,208 | |
12b-1 distribution and service fees – Class T Shares(1) | | | — | | | | — | | | | 5 | |
Shareholder servicing agent fees | | | 53,081 | | | | 268,905 | | | | 613,966 | |
Custodian fees | | | 41,820 | | | | 141,390 | | | | 212,209 | |
Directors fees | | | 2,192 | | | | 17,455 | | | | 23,307 | |
Professional fees | | | 51,029 | | | | 75,128 | | | | 82,444 | |
Shareholder reporting expenses | | | 13,057 | | | | 43,759 | | | | 81,337 | |
Federal and state registration fees | | | 69,941 | | | | 98,540 | | | | 94,473 | |
Other | | | 6,375 | | | | 19,988 | | | | 29,017 | |
Total expenses before fee waiver/expense reimbursement | | | 603,682 | | | | 3,541,262 | | | | 6,551,588 | |
Fee waiver/expense reimbursement | | | (173,519 | ) | | | (297,138 | ) | | | (732,889 | ) |
Net expenses | | | 430,163 | | | | 3,244,124 | | | | 5,818,699 | |
Net investment income (loss) | | | 1,022,544 | | | | 10,231,004 | | | | 32,606,064 | |
Realized and Unrealized Gain (Loss) | | | | | | | | | | | | |
Net realized gain (loss) from: | | | | | | | | | | | | |
Investments and foreign currency | | | (214,806 | ) | | | 729,844 | | | | (1,535,971 | ) |
Forward foreign currency exchange contracts | | | — | | | | — | | | | (2,742,500 | ) |
Futures contracts | | | (38,881 | ) | | | (326,015 | ) | | | 243,580 | |
Options purchased | | | — | | | | — | | | | (830,201 | ) |
Swaps | | | — | | | | — | | | | (5,806,488 | ) |
Net change in unrealized appreciation (depreciation) of: | | | | | | | | | | | | |
Investments and foreign currency | | | (2,552,387 | ) | | | (2,250,536 | ) | | | 23,950,852 | |
Forward foreign currency exchange contracts | | | — | | | | — | | | | (216,207 | ) |
Futures contracts | | | 54,540 | | | | 475,812 | | | | 1,173,900 | |
Options purchased | | | — | | | | — | | | | (58,501 | ) |
Swaps | | | — | | | | — | | | | 2,651,990 | |
Net realized and unrealized gain (loss) | | | (2,751,534 | ) | | | (1,370,895 | ) | | | 16,830,454 | |
Net increase (decrease) in net assets from operations | | $ | (1,728,990 | ) | | $ | 8,860,109 | | | $ | 49,436,518 | |
| (1) | Class T Shares are not available for public offering. Class T Shares commenced operations on May 31, 2017. |
See accompanying notes to financial statements.
Statement of
| | | | | | | | | | | | | | | | | | | | |
| | | Core Bond | | | | | | Core Plus Bond | |
| | | Year Ended
6/30/17 | | | Year Ended
6/30/16 | | | | | | Year Ended
6/30/17 | | | Year Ended
6/30/16 | |
Operations | | | | | | | | | | | | | | | | | | | | |
Net investment income (loss) | | $ | 3,957,122 | | | $ | 5,223,869 | | | | | | | $ | 13,462,247 | | | $ | 18,955,242 | |
Net realized gain (loss) from: | | | | | | | | | | | | | | | | | | | | |
Investments and foreign currency | | | 1,094,016 | | | | (1,730,332 | ) | | | | | | | 3,481,669 | | | | (11,286,495 | ) |
Forward foreign currency exchange contracts | | | — | | | | — | | | | | | | | (377,450 | ) | | | 2,551,574 | |
Futures contracts | | | (1,099,892 | ) | | | (1,374,998 | ) | | | | | | | 117,343 | | | | (1,704,965 | ) |
Options purchased | | | — | | | | — | | | | | | | | (189,915 | ) | | | — | |
Swaps | | | — | | | | (558,892 | ) | | | | | | | (2,414,363 | ) | | | (3,093,979 | ) |
Change in net unrealized appreciation (depreciation) of: | | | | | | | | | | | | | | | | | | | | |
Investments and foreign currency | | | (4,983,483 | ) | | | 6,189,948 | | | | | | | | (1,417,518 | ) | | | 2,066,990 | |
Forward foreign currency exchange contracts | | | — | | | | — | | | | | | | | 154,851 | | | | (593,304 | ) |
Futures contracts | | | 215,835 | | | | 218,283 | | | | | | | | 62,649 | | | | 59,164 | |
Options purchased | | | — | | | | — | | | | | | | | (13,451 | ) | | | — | |
Swaps | | | — | | | | 157,115 | | | | | | | | 2,131,286 | | | | (909,694 | ) |
Net increase (decrease) in net assets from operations | | | (816,402 | ) | | | 8,124,993 | | | | | | | | 14,997,348 | | | | 6,044,533 | |
Distributions to Shareholders | | | | | | | | | | | | | | | | | | | | |
From net investment income: | | | | | | | | | | | | | | | | | | | | |
Class A Shares | | | (306,135 | ) | | | (307,124 | ) | | | | | | | (1,420,028 | ) | | | (2,601,132 | ) |
Class C Shares | | | (27,096 | ) | | | (16,758 | ) | | | | | | | (132,502 | ) | | | (264,008 | ) |
Class R3 Shares | | | — | | | | — | | | | | | | | (214,891 | ) | | | (388,284 | ) |
Class R6 Shares | | | (1,414,133 | ) | | | (1,343,684 | ) | | | | | | | (635,081 | ) | | | (1,135,658 | ) |
Class I Shares | | | (2,106,287 | ) | | | (3,255,540 | ) | | | | | | | (7,238,587 | ) | | | (14,709,012 | ) |
Class T Shares(1) | | | — | | | | — | | | | | | | | — | | | | — | |
From accumulated net realized gains: | | | | | | | | | | | | | | | | | | | | |
Class A Shares | | | — | | | | (91,416 | ) | | | | | | | — | | | | (114,029 | ) |
Class C Shares | | | — | | | | (7,303 | ) | | | | | | | — | | | | (14,202 | ) |
Class R3 Shares | | | — | | | | — | | | | | | | | — | | | | (20,809 | ) |
Class R6 Shares | | | — | | | | (363,524 | ) | | | | | | | — | | | | (45,069 | ) |
Class I Shares | | | — | | | | (838,155 | ) | | | | | | | — | | | | (612,202 | ) |
Class T Shares(1) | | | — | | | | — | | | | | | | | — | | | | — | |
Return of capital: | | | | | | | | | | | | | | | | | | | | |
Class A Shares | | | (24,751 | ) | | | (60,155 | ) | | | | | | | (796,441 | ) | | | — | |
Class C Shares | | | (3,373 | ) | | | (5,269 | ) | | | | | | | (107,897 | ) | | | — | |
Class R3 Shares | | | — | | | | — | | | | | | | | (126,056 | ) | | | — | |
Class R6 Shares | | | (102,536 | ) | | | (236,107 | ) | | | | | | | (320,604 | ) | | | — | |
Class I Shares | | | (152,775 | ) | | | (566,776 | ) | | | | | | | (3,651,042 | ) | | | — | |
Class T Shares(1) | | | — | | | | — | | | | | | | | — | | | | — | |
Decrease in net assets from distributions to shareholders | | | (4,137,086 | ) | | | (7,091,811 | ) | | | | | | | (14,643,129 | ) | | | (19,904,405 | ) |
Fund Share Transactions | | | | | | | | | | | | | | | | | | | | |
Proceeds from sale of shares | | | 17,939,062 | | | | 42,385,537 | | | | | | | | 64,405,698 | | | | 51,020,002 | |
Proceeds from shares issued to shareholders due to reinvestment of distributions | | | 2,509,337 | | | | 3,646,596 | | | | | | | | 8,528,468 | | | | 10,176,954 | |
| | | 20,448,399 | | | | 46,032,133 | | | | | | | | 72,934,166 | | | | 61,196,956 | |
Cost of shares redeemed | | | (55,410,123 | ) | | | (101,207,255 | ) | | | | | | | (107,070,562 | ) | | | (220,210,716 | ) |
Net increase (decrease) in net assets from Fund share transactions | | | (34,961,724 | ) | | | (55,175,122 | ) | | | | | | | (34,136,396 | ) | | | (159,013,760 | ) |
Net increase (decrease) in net assets | | | (39,915,212 | ) | | | (54,141,940 | ) | | | | | | | (33,782,177 | ) | | | (172,873,632 | ) |
Net assets at the beginning of period | | | 182,890,539 | | | | 237,032,479 | | | | | | | | 393,605,414 | | | | 566,479,046 | |
Net assets at the end of period | | $ | 142,975,327 | | | $ | 182,890,539 | | | | | | | $ | 359,823,237 | | | $ | 393,605,414 | |
Undistributed (Over-distribution of) net investment income at the end of period | | $ | (319,856 | ) | | $ | (423,327 | ) | | | | | | $ | (2,578,372 | ) | | $ | (3,472,816 | ) |
| (1) | Class T Shares are not available for public offering. Class T Shares commenced operations on May 31, 2017. |
See accompanying notes to financial statements.
| | | | | | | | | | | | | | | | | | | | |
| | | High Income Bond | | | | | | Inflation Protected Securities | |
| | | Year Ended
6/30/17 | | | Year Ended
6/30/16 | | | | | | Year Ended
6/30/17 | | | Year Ended
6/30/16 | |
Operations | | | | | | | | | | | | | | | | | | | | |
Net investment income (loss) | | $ | 31,041,673 | | | $ | 36,034,347 | | | | | | | $ | 11,146,193 | | | $ | 2,731,449 | |
Net realized gain (loss) from: | | | | | | | | | | | | | | | | | | | | |
Investments and foreign currency | | | (1,337,739 | ) | | | (69,385,392 | ) | | | | | | | 1,334,814 | | | | (421,526 | ) |
Forward foreign currency exchange contracts | | | 210,744 | | | | 1,656,267 | | | | | | | | — | | | | — | |
Futures contracts | | | (137,663 | ) | | | 431,364 | | | | | | | | (3,448,952 | ) | | | (539,412 | ) |
Options purchased | | | — | | | | — | | | | | | | | — | | | | — | |
Swaps | | | (30,036 | ) | | | (556,245 | ) | | | | | | | — | | | | (583,194 | ) |
Change in net unrealized appreciation (depreciation) of: | | | | | | | | | | | | | | | | | | | | |
Investments and foreign currency | | | 32,917,584 | | | | (7,410,663 | ) | | | | | | | (16,784,072 | ) | | | 15,539,212 | |
Forward foreign currency exchange contracts | | | (114,776 | ) | | | (240,417 | ) | | | | | | | — | | | | — | |
Futures contracts | | | (275,326 | ) | | | 547,980 | | | | | | | | (295,008 | ) | | | 617,309 | |
Options purchased | | | — | | | | — | | | | | | | | — | | | | — | |
Swaps | | | — | | | | 250,790 | | | | | | | | — | | | | 80,776 | |
Net increase (decrease) in net assets from operations | | | 62,274,461 | | | | (38,671,969 | ) | | | | | | | (8,047,025 | ) | | | 17,424,614 | |
Distributions to Shareholders | | | | | | | | | | | | | | | | | | | | |
From net investment income: | | | | | | | | | | | | | | | | | | | | |
Class A Shares | | | (11,349,409 | ) | | | (8,982,839 | ) | | | | | | | (1,153,307 | ) | | | — | |
Class C Shares | | | (2,883,575 | ) | | | (2,834,762 | ) | | | | | | | (63,715 | ) | | | — | |
Class R3 Shares | | | (52,021 | ) | | | (62,186 | ) | | | | | | | (87,641 | ) | | | — | |
Class R6 Shares | | | — | | | | — | | | | | | | | (243,084 | ) | | | — | |
Class I Shares | | | (16,098,152 | ) | | | (21,369,935 | ) | | | | | | | (5,866,832 | ) | | | — | |
Class T Shares(1) | | | (141 | ) | | | — | | | | | | | | — | | | | — | |
From accumulated net realized gains: | | | | | | | | | | | | | | | | | | | | |
Class A Shares | | | — | | | | — | | | | | | | | — | | | | — | |
Class C Shares | | | — | | | | — | | | | | | | | — | | | | — | |
Class R3 Shares | | | — | | | | — | | | | | | | | — | | | | — | |
Class R6 Shares | | | — | | | | — | | | | | | | | — | | | | — | |
Class I Shares | | | — | | | | — | | | | | | | | — | | | | — | |
Class T Shares(1) | | | — | | | | — | | | | | | | | — | | | | — | |
Return of capital: | | | | | | | | | | | | | | | | | | | | |
Class A Shares | | | — | | | | — | | | | | | | | — | | | | — | |
Class C Shares | | | — | | | | — | | | | | | | | — | | | | — | |
Class R3 Shares | | | — | | | | — | | | | | | | | — | | | | — | |
Class R6 Shares | | | — | | | | — | | | | | | | | — | | | | — | |
Class I Shares | | | — | | | | — | | | | | | | | — | | | | — | |
Class T Shares(1) | | | — | | | | — | | | | | | | | — | | | | — | |
Decrease in net assets from distributions to shareholders | | | (30,383,298 | ) | | | (33,249,722 | ) | | | | | | | (7,414,579 | ) | | | — | |
Fund Share Transactions | | | | | | | | | | | | | | | | | | | | |
Proceeds from sale of shares | | | 527,158,862 | | | | 290,281,180 | | | | | | | | 327,307,816 | | | | 257,295,500 | |
Proceeds from shares issued to shareholders due to reinvestment of distributions | | | 23,319,008 | | | | 17,581,399 | | | | | | | | 3,010,711 | | | | — | |
| | | 550,477,870 | | | | 307,862,579 | | | | | | | | 330,318,527 | | | | 257,295,500 | |
Cost of shares redeemed | | | (561,646,868 | ) | | | (493,243,683 | ) | | | | | | | (239,408,167 | ) | | | (136,999,242 | ) |
Net increase (decrease) in net assets from Fund share transactions | | | (11,168,998 | ) | | | (185,381,104 | ) | | | | | | | 90,910,360 | | | | 120,296,258 | |
Net increase (decrease) in net assets | | | 20,722,165 | | | | (257,302,795 | ) | | | | | | | 75,448,756 | | | | 137,720,872 | |
Net assets at the beginning of period | | | 365,042,306 | | | | 622,345,101 | | | | | | | | 527,902,217 | | | | 390,181,345 | |
Net assets at the end of period | | $ | 385,764,471 | | | $ | 365,042,306 | | | | | | | $ | 603,350,973 | | | $ | 527,902,217 | |
Undistributed (Over-distribution of) net investment income at the end of period | | $ | 1,125,810 | | | $ | 533,552 | | | | | | | $ | 5,088,282 | | | $ | 1,356,668 | |
| (1) | Class T Shares are not available for public offering. Class T Shares commenced operations on May 31, 2017. |
See accompanying notes to financial statements.
Statement of Changes in Net Assets (continued)
| | | | | | | | | | | | | | | | | | | | |
| | | Intermediate Government Bond | | | | | | Short Term Bond | |
| | | Year Ended
6/30/17 | | | Year Ended
6/30/16 | | | | | | Year Ended
6/30/17 | | | Year Ended
6/30/16 | |
Operations | | | | | | | | | | | | | | | | | | | | |
Net investment income (loss) | | $ | 1,022,544 | | | $ | 1,044,703 | | | | | | | $ | 10,231,004 | | | $ | 11,911,053 | |
Net realized gain (loss) from: | | | | | | | | | | | | | | | | | | | | |
Investments and foreign currency | | | (214,806 | ) | | | 165,420 | | | | | | | | 729,844 | | | | (4,196,675 | ) |
Forward foreign currency exchange contracts | | | — | | | | — | | | | | | | | — | | | | 141,178 | |
Futures contracts | | | (38,881 | ) | | | (546,481 | ) | | | | | | | (326,015 | ) | | | (697,162 | ) |
Options purchased | | | — | | | | — | | | | | | | | — | | | | — | |
Swaps | | | — | | | | (66,161 | ) | | | | | | | — | | | | (1,481,338 | ) |
Change in net unrealized appreciation (depreciation) of: | | | | | | | | | | | | | | | | | | | | |
Investments and foreign currency | | | (2,552,387 | ) | | | 1,874,881 | | | | | | | | (2,250,536 | ) | | | 1,317,230 | |
Forward foreign currency exchange contracts | | | — | | | | — | | | | | | | | — | | | | — | |
Futures contracts | | | 54,540 | | | | (31,945 | ) | | | | | | | 475,812 | | | | (245,584 | ) |
Options purchased | | | — | | | | — | | | | | | | | — | | | | — | |
Swaps | | | — | | | | (10,105 | ) | | | | | | | — | | | | 258,316 | |
Net increase (decrease) in net assets from operations | | | (1,728,990 | ) | | | 2,430,312 | | | | | | | | 8,860,109 | | | | 7,007,018 | |
Distributions to Shareholders | | | | | | | | | | | | | | | | | | | | |
From net investment income: | | | | | | | | | | | | | | | | | | | | |
Class A Shares | | | (150,158 | ) | | | (141,814 | ) | | | | | | | (1,440,422 | ) | | | (1,508,399 | ) |
Class C Shares | | | (6,809 | ) | | | (5,691 | ) | | | | | | | (206,915 | ) | | | (238,936 | ) |
Class R3 Shares | | | (1,372 | ) | | | (1,016 | ) | | | | | | | (4,210 | ) | | | (3,012 | ) |
Class R6 Shares | | | — | | | | — | | | | | | | | (1,266,480 | ) | | | (1,053,567 | ) |
Class I Shares | | | (823,411 | ) | | | (893,921 | ) | | | | | | | (6,537,353 | ) | | | (8,317,947 | ) |
Class T Shares(1) | | | — | | | | — | | | | | | | | — | | | | — | |
From accumulated net realized gains: | | | | | | | | | | | | | | | | | | | | |
Class A Shares | | | — | | | | — | | | | | | | | — | | | | — | |
Class C Shares | | | — | | | | — | | | | | | | | — | | | | — | |
Class R3 Shares | | | — | | | | — | | | | | | | | — | | | | — | |
Class R6 Shares | | | — | | | | — | | | | | | | | — | | | | — | |
Class I Shares | | | — | | | | — | | | | | | | | — | | | | — | |
Class T Shares(1) | | | — | | | | — | | | | | | | | — | | | | — | |
Return of capital: | | | | | | | | | | | | | | | | | | | | |
Class A Shares | | | — | | | | — | | | | | | | | (96,946 | ) | | | — | |
Class C Shares | | | — | | | | — | | | | | | | | (29,934 | ) | | | — | |
Class R3 Shares | | | — | | | | — | | | | | | | | (357 | ) | | | — | |
Class R6 Shares | | | — | | | | — | | | | | | | | (73,173 | ) | | | — | |
Class I Shares | | | — | | | | — | | | | | | | | (378,818 | ) | | | — | |
Class T Shares(1) | | | — | | | | — | | | | | | | | — | | | | — | |
Decrease in net assets from distributions to shareholders | | | (981,750 | ) | | | (1,042,442 | ) | | | | | | | (10,034,608 | ) | | | (11,121,861 | ) |
Fund Share Transactions | | | | | | | | | | | | | | | | | | | | |
Proceeds from sale of shares | | | 17,334,085 | | | | 30,723,506 | | | | | | | | 253,678,451 | | | | 213,859,742 | |
Proceeds from shares issued to shareholders due to reinvestment of distributions | | | 361,910 | | | | 369,458 | | | | | | | | 4,633,178 | | | | 4,309,842 | |
| | | 17,695,995 | | | | 31,092,964 | | | | | | | | 258,311,629 | | | | 218,169,584 | |
Cost of shares redeemed | | | (43,353,450 | ) | | | (27,384,958 | ) | | | | | | | (305,880,953 | ) | | | (294,336,996 | ) |
Net increase (decrease) in net assets from Fund share transactions | | | (25,657,455 | ) | | | 3,708,006 | | | | | | | | (47,569,324 | ) | | | (76,167,412 | ) |
Net increase (decrease) in net assets | | | (28,368,195 | ) | | | 5,095,876 | | | | | | | | (48,743,823 | ) | | | (80,282,255 | ) |
Net assets at the beginning of period | | | 80,758,991 | | | | 75,663,115 | | | | | | | | 610,441,730 | | | | 690,723,985 | |
Net assets at the end of period | | $ | 52,390,796 | | | $ | 80,758,991 | | | | | | | $ | 561,697,907 | | | $ | 610,441,730 | |
Undistributed (Over-distribution of) net investment income at the end of period | | $ | (18,048 | ) | | $ | (58,842 | ) | | | | | | $ | (863,647 | ) | | $ | (1,639,325 | ) |
| (1) | Class T Shares are not available for public offering. Class T Shares commenced operations on May 31, 2017. |
See accompanying notes to financial statements.
| | | | | | | | |
| | | Strategic Income | |
| | | Year Ended
6/30/17 | | | Year Ended
6/30/16 | |
Operations | | | | | | | | |
Net investment income (loss) | | $ | 32,606,064 | | | $ | 46,798,233 | |
Net realized gain (loss) from: | | | | | | | | |
Investments and foreign currency | | | (1,535,971 | ) | | | (70,792,612 | ) |
Forward foreign currency exchange contracts | | | (2,742,500 | ) | | | 13,528,427 | |
Futures contracts | | | 243,580 | | | | (4,939,649 | ) |
Options purchased | | | (830,201 | ) | | | — | |
Swaps | | | (5,806,488 | ) | | | (6,260,347 | ) |
Change in net unrealized appreciation (depreciation) of: | | | | | | | | |
Investments and foreign currency | | | 23,950,852 | | | | 18,506,687 | |
Forward foreign currency exchange contracts | | | (216,207 | ) | | | (1,335,064 | ) |
Futures contracts | | | 1,173,900 | | | | 247,635 | |
Options purchased | | | (58,501 | ) | | | — | |
Swaps | | | 2,651,990 | | | | (1,362,803 | ) |
Net increase (decrease) in net assets from operations | | | 49,436,518 | | | | (5,609,493 | ) |
Distributions to Shareholders | | | | | | | | |
From net investment income: | | | | | | | | |
Class A Shares | | | (4,700,078 | ) | | | (11,921,409 | ) |
Class C Shares | | | (1,697,178 | ) | | | (4,273,552 | ) |
Class R3 Shares | | | (189,836 | ) | | | (464,157 | ) |
Class R6 Shares | | | (888,278 | ) | | | (1,603,676 | ) |
Class I Shares | | | (14,906,062 | ) | | | (31,361,137 | ) |
Class T Shares(1) | | | — | | | | — | |
From accumulated net realized gains: | | | | | | | | |
Class A Shares | | | — | | | | — | |
Class C Shares | | | — | | | | — | |
Class R3 Shares | | | — | | �� | | — | |
Class R6 Shares | | | — | | | | — | |
Class I Shares | | | — | | | | — | |
Class T Shares(1) | | | — | | | | — | |
Return of capital: | | | | | | | | |
Class A Shares | | | (3,734,095 | ) | | | — | |
Class C Shares | | | (1,850,649 | ) | | | — | |
Class R3 Shares | | | (164,969 | ) | | | — | |
Class R6 Shares | | | (655,316 | ) | | | — | |
Class I Shares | | | (10,925,506 | ) | | | — | |
Class T Shares(1) | | | (104 | ) | | | — | |
Decrease in net assets from distributions to shareholders | | | (39,712,071 | ) | | | (49,623,931 | ) |
Fund Share Transactions | | | | | | | | |
Proceeds from sale of shares | | | 244,895,885 | | | | 192,983,898 | |
Proceeds from shares issued to shareholders due to reinvestment of distributions | | | 23,514,671 | | | | 28,548,825 | |
| | | 268,410,556 | | | | 221,532,723 | |
Cost of shares redeemed | | | (300,622,459 | ) | | | (578,746,922 | ) |
Net increase (decrease) in net assets from Fund share transactions | | | (32,211,903 | ) | | | (357,214,199 | ) |
Net increase (decrease) in net assets | | | (22,487,456 | ) | | | (412,447,623 | ) |
Net assets at the beginning of period | | | 792,780,466 | | | | 1,205,228,089 | |
Net assets at the end of period | | $ | 770,293,010 | | | $ | 792,780,466 | |
Undistributed (Over-distribution of) net investment income at the end of period | | $ | (9,533,183 | ) | | $ | (5,931,705 | ) |
| (1) | Class T Shares are not available for public offering. Class T Shares commenced operations on May 31, 2017. |
See accompanying notes to financial statements.
Financial
Highlights
Core Bond
Selected data for a share outstanding throughout each period:
| | | | | | | | | | | | | | | | | | | | | | | | | | | | | | | | | | | | | | | | |
| | | | | |
| | | | | | Investment Operations | | | | | | Less Distributions | | | | |
| | | | | | | | | | |
Class (Commencement Date) Year Ended June 30, | | Beginning
NAV | | | Net
Investment
Income
(Loss)(a) | | | Net
Realized/
Unrealized
Gain (Loss) | | | Total | | | | | | From
Net
Investment
Income | | | From
Accumulated
Net Realized
Gains | | | Return
of
Capital | | | Total | | | Ending
NAV | |
Class A (1/95) | | | | | | | | | | | | | | | | | | | | | | | | | | | | | | | | | |
2017 | | $ | 10.05 | | | $ | 0.22 | | | $ | (0.28 | ) | | $ | (0.06 | ) | | | | | | $ | (0.21 | ) | | $ | — | | | $ | (0.02 | ) | | $ | (0.23 | ) | | $ | 9.76 | |
2016 | | | 9.97 | | | | 0.23 | | | | 0.17 | | | | 0.40 | | | | | | | | (0.22 | ) | | | (0.06 | ) | | | (0.04 | ) | | | (0.32 | ) | | | 10.05 | |
2015 | | | 10.36 | | | | 0.25 | | | | (0.19 | ) | | | 0.06 | | | | | | | | (0.28 | ) | | | (0.17 | ) | | | — | | | | (0.45 | ) | | | 9.97 | |
2014 | | | 10.13 | | | | 0.24 | | | | 0.35 | | | | 0.59 | | | | | | | | (0.22 | ) | | | (0.14 | ) | | | — | | | | (0.36 | ) | | | 10.36 | |
2013 | | | 10.67 | | | | 0.18 | | | | (0.20 | ) | | | (0.02 | ) | | | | | | | (0.18 | ) | | | (0.34 | ) | | | — | | | | (0.52 | ) | | | 10.13 | |
Class C (1/11) | | | | | | | | | | | | | | | | | | | | | | | | | | | | | | | | | |
2017 | | | 10.02 | | | | 0.15 | | | | (0.28 | ) | | | (0.13 | ) | | | | | | | (0.14 | ) | | | — | | | | (0.02 | ) | | | (0.16 | ) | | | 9.73 | |
2016 | | | 9.94 | | | | 0.15 | | | | 0.17 | | | | 0.32 | | | | | | | | (0.14 | ) | | | (0.06 | ) | | | (0.04 | ) | | | (0.24 | ) | | | 10.02 | |
2015 | | | 10.32 | | | | 0.17 | | | | (0.19 | ) | | | (0.02 | ) | | | | | | | (0.19 | ) | | | (0.17 | ) | | | — | | | | (0.36 | ) | | | 9.94 | |
2014 | | | 10.08 | | | | 0.16 | | | | 0.36 | | | | 0.52 | | | | | | | | (0.14 | ) | | | (0.14 | ) | | | — | | | | (0.28 | ) | | | 10.32 | |
2013 | | | 10.62 | | | | 0.09 | | | | (0.19 | ) | | | (0.10 | ) | | | | | | | (0.09 | ) | | | (0.35 | ) | | | — | | | | (0.44 | ) | | | 10.08 | |
Class R6 (1/15) | | | | | | | | | | | | | | | | | | | | | | | | | | | | | | | | | |
2017 | | | 10.02 | | | | 0.25 | | | | (0.27 | ) | | | (0.02 | ) | | | | | | | (0.24 | ) | | | — | | | | (0.02 | ) | | | (0.26 | ) | | | 9.74 | |
2016 | | | 9.94 | | | | 0.26 | | | | 0.16 | | | | 0.42 | | | | | | | | (0.24 | ) | | | (0.06 | ) | | | (0.04 | ) | | | (0.34 | ) | | | 10.02 | |
2015(e) | | | 10.22 | | | | 0.12 | | | | (0.27 | ) | | | (0.15 | ) | | | | | | | (0.13 | ) | | | — | | | | — | | | | (0.13 | ) | | | 9.94 | |
Class I (1/93) | | | | | | | | | | | | | | | | | | | | | | | | | | | | | | | | | |
2017 | | | 10.01 | | | | 0.24 | | | | (0.27 | ) | | | (0.03 | ) | | | | | | | (0.24 | ) | | | — | | | | (0.02 | ) | | | (0.26 | ) | | | 9.72 | |
2016 | | | 9.93 | | | | 0.25 | | | | 0.17 | | | | 0.42 | | | | | | | | (0.24 | ) | | | (0.06 | ) | | | (0.04 | ) | | | (0.34 | ) | | | 10.01 | |
2015 | | | 10.32 | | | | 0.27 | | | | (0.19 | ) | | | 0.08 | | | | | | | | (0.30 | ) | | | (0.17 | ) | | | — | | | | (0.47 | ) | | | 9.93 | |
2014 | | | 10.09 | | | | 0.26 | | | | 0.22 | | | | 0.48 | | | | | | | | (0.11 | ) | | | (0.14 | ) | | | — | | | | (0.25 | ) | | | 10.32 | |
2013 | | | 10.63 | | | | 0.20 | | | | (0.20 | ) | | | — | | | | | | | | (0.21 | ) | | | (0.33 | ) | | | — | | | | (0.54 | ) | | | 10.09 | |
| | | | | | | | | | | | | | | | | | | | | | | | | | | | | | | | | | |
| | | | Ratios/Supplemental Data | |
| | | | | | | | | | Ratios to Average
Net Assets Before
Waiver/Reimbursement | | | | | | Ratios to Average
Net Assets After
Waiver/Reimbursement(c) | | | | |
| | | | | | | | |
Total
Return(b) | | | Ending
Net
Assets
(000) | | | | | | Expenses | | | Net
Investment
Income
(Loss) | | | | | | Expenses | | | Net
Investment
Income
(Loss) | | | Portfolio
Turnover
Rate(d) | |
| | | | | | | | | | | | | | | | | | | | | | | | | | | | | | | | | | |
| | (0.56 | )% | | $ | 13,182 | | | | | | | | 0.93 | % | | | 2.09 | % | | | | | | | 0.78 | % | | | 2.24 | % | | | 85 | % |
| | 4.12 | | | | 15,185 | | | | | | | | 0.87 | | | | 2.21 | | | | | | | | 0.78 | | | | 2.30 | | | | 75 | |
| | 0.52 | | | | 14,448 | | | | | | | | 0.85 | | | | 2.34 | | | | | | | | 0.78 | | | | 2.40 | | | | 44 | |
| | 5.94 | | | | 14,857 | | | | | | | | 0.81 | | | | 2.29 | | | | | | | | 0.78 | | | | 2.32 | | | | 49 | |
| | (0.38 | ) | | | 18,331 | | | | | | | | 0.79 | | | | 1.63 | | | | | | | | 0.78 | | | | 1.65 | | | | 85 | |
| | | | | | | | | | | | | | | | | | | | | | | | | | | | | | | | | | |
| | (1.33 | ) | | | 1,720 | | | | | | | | 1.68 | | | | 1.34 | | | | | | | | 1.53 | | | | 1.49 | | | | 85 | |
| | 3.31 | | | | 1,767 | | | | | | | | 1.63 | | | | 1.46 | | | | | | | | 1.53 | | | | 1.55 | | | | 75 | |
| | (0.20 | ) | | | 971 | | | | | | | | 1.61 | | | | 1.59 | | | | | | | | 1.53 | | | | 1.67 | | | | 44 | |
| | 5.24 | | | | 514 | | | | | | | | 1.56 | | | | 1.54 | | | | | | | | 1.53 | | | | 1.57 | | | | 49 | |
| | (1.17 | ) | | | 585 | | | | | | | | 1.54 | | | | 0.87 | | | | | | | | 1.53 | | | | 0.88 | | | | 85 | |
| | | | | | | | | | | | | | | | | | | | | | | | | | | | | | | | | | |
| | (0.22 | ) | | | 58,545 | | | | | | | | 0.61 | | | | 2.41 | | | | | | | | 0.46 | | | | 2.56 | | | | 85 | |
| | 4.38 | | | | 58,699 | | | | | | | | 0.57 | | | | 2.51 | | | | | | | | 0.48 | | | | 2.60 | | | | 75 | |
| | (1.46 | ) | | | 45,145 | | | | | | | | 0.56 | * | | | 2.60 | * | | | | | | | 0.48 | * | | | 2.68 | * | | | 44 | |
| | | | | | | | | | | | | | | | | | | | | | | | | | | | | | | | | | |
| | (0.32 | ) | | | 69,528 | | | | | | | | 0.68 | | | | 2.32 | | | | | | | | 0.53 | | | | 2.47 | | | | 85 | |
| | 4.39 | | | | 107,240 | | | | | | | | 0.62 | | | | 2.46 | | | | | | | | 0.53 | | | | 2.55 | | | | 75 | |
| | 0.78 | | | | 176,468 | | | | | | | | 0.59 | | | | 2.59 | | | | | | | | 0.53 | | | | 2.65 | | | | 44 | |
| | 6.21 | | | | 329,901 | | | | | | | | 0.56 | | | | 2.53 | | | | | | | | 0.53 | | | | 2.56 | | | | 49 | |
| | (0.16) | | | | 481,088 | | | | | | | | 0.54 | | | | 1.88 | | | | | | | | 0.53 | | | | 1.89 | | | | 85 | |
| (a) | Per share Net Investment Income (Loss) is calculated using the average daily shares method. | |
| (b) | Total return is the combination of changes in NAV without any sales charge, reinvested dividend income at NAV and reinvested capital gains distributions at NAV, if any. Total returns are not annualized. | |
| (c) | After fee waiver and/or expense reimbursement from the Adviser, where applicable. See Note 7 – Management Fees and Other Transactions with Affiliates, Management Fees for more information. | |
| (d) | Portfolio Turnover Rate is calculated based on the lesser of long-term purchases or sales (as disclosed in Note 5 – Investment Transactions) divided by the average long-term market value during the period. | |
| (e) | For the period January 20, 2015 (commencement of operations) through June 30, 2015. | |
See accompanying notes to financial statements.
Financial Highlights (continued)
Core Plus Bond
Selected data for a share outstanding throughout each period:
| | | | | | | | | | | | | | | | | | | | | | | | | | | | | | | | | | | | | | | | |
| | | | | |
| | | | | | Investment Operations | | | | | | Less Distributions | | | | |
| | | | | | | | | | |
Class (Commencement Date) Year Ended June 30, | | Beginning
NAV | | | Net
Investment
Income
(Loss)(a) | | | Net
Realized/
Unrealized
Gain (Loss) | | | Total | | | | | | From
Net
Investment
Income | | | From
Accumulated
Net Realized
Gains | | | Return
of
Capital | | | Total | | | Ending
NAV | |
Class A (12/87) | | | | | | | | | | | | | | | | | | | | | | | | | | | | | |
2017 | | $ | 11.01 | | | $ | 0.37 | | | $ | 0.07 | | | $ | 0.44 | | | | | | | $ | (0.26 | ) | | $ | — | | | $ | (0.15 | ) | | $ | (0.41 | ) | | $ | 11.04 | |
2016 | | | 11.25 | | | | 0.44 | | | | (0.22 | ) | | | 0.22 | | | | | | | | (0.44 | ) | | | (0.02 | ) | | | — | | | | (0.46 | ) | | | 11.01 | |
2015 | | | 11.75 | | | | 0.45 | | | | (0.49 | ) | | | (0.04 | ) | | | | | | | (0.44 | ) | | | (0.02 | ) | | | — | | | | (0.46 | ) | | | 11.25 | |
2014 | | | 11.46 | | | | 0.46 | | | | 0.45 | | | | 0.91 | | | | | | | | (0.43 | ) | | | (0.19 | ) | | | — | | | | (0.62 | ) | | | 11.75 | |
2013 | | | 11.64 | | | | 0.41 | | | | (0.12 | ) | | | 0.29 | | | | | | | | (0.42 | ) | | | (0.05 | ) | | | — | | | | (0.47 | ) | | | 11.46 | |
Class C (2/99) | | | | | | | | | | | | | | | | | | | | | | | | | | | | | |
2017 | | | 10.96 | | | | 0.29 | | | | 0.05 | | | | 0.34 | | | | | | | | (0.17 | ) | | | — | | | | (0.15 | ) | | | (0.32 | ) | | | 10.98 | |
2016 | | | 11.20 | | | | 0.35 | | | | (0.22 | ) | | | 0.13 | | | | | | | | (0.35 | ) | | | (0.02 | ) | | | — | | | | (0.37 | ) | | | 10.96 | |
2015 | | | 11.69 | | | | 0.36 | | | | (0.48 | ) | | | (0.12 | ) | | | | | | | (0.35 | ) | | | (0.02 | ) | | | — | | | | (0.37 | ) | | | 11.20 | |
2014 | | | 11.40 | | | | 0.37 | | | | 0.45 | | | | 0.82 | | | | | | | | (0.34 | ) | | | (0.19 | ) | | | — | | | | (0.53 | ) | | | 11.69 | |
2013 | | | 11.59 | | | | 0.32 | | | | (0.12 | ) | | | 0.20 | | | | | | | | (0.34 | ) | | | (0.05 | ) | | | — | | | | (0.39 | ) | | | 11.40 | |
Class R3 (9/01) | | | | | | | | | | | | | | | | | | | | | | | | | | | | | |
2017 | | | 11.05 | | | | 0.36 | | | | 0.06 | | | | 0.42 | | | | | | | | (0.23 | ) | | | — | | | | (0.15 | ) | | | (0.38 | ) | | | 11.09 | |
2016 | | | 11.29 | | | | 0.41 | | | | (0.22 | ) | | | 0.19 | | | | | | | | (0.41 | ) | | | (0.02 | ) | | | — | | | | (0.43 | ) | | | 11.05 | |
2015 | | | 11.80 | | | | 0.42 | | | | (0.50 | ) | | | (0.08 | ) | | | | | | | (0.41 | ) | | | (0.02 | ) | | | — | | | | (0.43 | ) | | | 11.29 | |
2014 | | | 11.51 | | | | 0.43 | | | | 0.46 | | | | 0.89 | | | | | | | | (0.41 | ) | | | (0.19 | ) | | | — | | | | (0.60 | ) | | | 11.80 | |
2013 | | | 11.70 | | | | 0.38 | | | | (0.12 | ) | | | 0.26 | | | | | | | | (0.40 | ) | | | (0.05 | ) | | | — | | | | (0.45 | ) | | | 11.51 | |
Class R6 (1/15) | | | | | | | | | | | | | | | | | | | | | | | | | | | | | |
2017 | | | 11.00 | | | | 0.41 | | | | 0.05 | | | | 0.46 | | | | | | | | (0.28 | ) | | | — | | | | (0.15 | ) | | | (0.43 | ) | | | 11.03 | |
2016 | | | 11.23 | | | | 0.47 | | | | (0.21 | ) | | | 0.26 | | | | | | | | (0.47 | ) | | | (0.02 | ) | | | — | | | | (0.49 | ) | | | 11.00 | |
2015(e) | | | 11.48 | | | | 0.22 | | | | (0.26 | ) | | | (0.04 | ) | | | | | | | (0.21 | ) | | | — | | | | — | | | | (0.21 | ) | | | 11.23 | |
Class I (2/94) | | | | | | | | | | | | | | | | | | | | | | | | | | | | | |
2017 | | | 10.99 | | | | 0.40 | | | | 0.05 | | | | 0.45 | | | | | | | | (0.28 | ) | | | — | | | | (0.15 | ) | | | (0.43 | ) | | | 11.01 | |
2016 | | | 11.24 | | | | 0.46 | | | | (0.22 | ) | | | 0.24 | | | | | | | | (0.47 | ) | | | (0.02 | ) | | | — | | | | (0.49 | ) | | | 10.99 | |
2015 | | | 11.74 | | | | 0.48 | | | | (0.49 | ) | | | (0.01 | ) | | | | | | | (0.47 | ) | | | (0.02 | ) | | | — | | | | (0.49 | ) | | | 11.24 | |
2014 | | | 11.44 | | | | 0.49 | | | | 0.46 | | | | 0.95 | | | | | | | | (0.46 | ) | | | (0.19 | ) | | | — | | | | (0.65 | ) | | | 11.74 | |
2013 | | | 11.64 | | | | 0.44 | | | | (0.14 | ) | | | 0.30 | | | | | | | | (0.45 | ) | | | (0.05 | ) | | | — | | | | (0.50 | ) | | | 11.44 | |
| | | | | | | | | | | | | | | | | | | | | | | | | | | | | | | | | | |
| | | | Ratios/Supplemental Data | |
| | | | | | | | | | Ratios to Average
Net Assets Before
Waiver/Reimbursement | | | | | | Ratios to Average
Net Assets After
Waiver/Reimbursement(c) | | | | |
| | | | | | | | |
Total
Return(b) | | | Ending
Net
Assets
(000) | | | | | | Expenses | | | Net
Investment
Income
(Loss) | | | | | | Expenses | | | Net
Investment
Income
(Loss) | | | Portfolio
Turnover
Rate(d) | |
| | | | | | | | | | | | | | | | | | | | | | | | | | | | | | | | | | |
| | 4.03 | % | | $ | 57,299 | | | | | | | | 0.89 | % | | | 3.27 | % | | | | | | | 0.77 | % | | | 3.39 | % | | | 131 | % |
| | 2.07 | | | | 61,769 | | | | | | | | 0.87 | | | | 3.91 | | | | | | | | 0.77 | | | | 4.00 | | | | 79 | |
| | (0.41 | ) | | | 69,968 | | | | | | | | 0.85 | | | | 3.80 | | | | | | | | 0.77 | | | | 3.88 | | | | 44 | |
| | 8.23 | | | | 68,728 | | | | | | | | 0.84 | | | | 3.89 | | | | | | | | 0.77 | | | | 3.97 | | | | 50 | |
| | 2.40 | | | | 79,740 | | | | | | | | 0.81 | | | | 3.42 | | | | | | | | 0.77 | | | | 3.46 | | | | 46 | |
| | | | | | | | | | | | | | | | | | | | | | | | | | | | | | | | | | |
| | 3.16 | | | | 6,985 | | | | | | | | 1.64 | | | | 2.52 | | | | | | | | 1.52 | | | | 2.64 | | | | 131 | |
| | 1.29 | | | | 8,387 | | | | | | | | 1.62 | | | | 3.15 | | | | | | | | 1.52 | | | | 3.25 | | | | 79 | |
| | (1.10 | ) | | | 8,580 | | | | | | | | 1.60 | | | | 3.06 | | | | | | | | 1.52 | | | | 3.15 | | | | 44 | |
| | 7.43 | | | | 7,696 | | | | | | | | 1.59 | | | | 3.13 | | | | | | | | 1.52 | | | | 3.20 | | | | 50 | |
| | 1.59 | | | | 4,200 | | | | | | | | 1.56 | | | | 2.67 | | | | | | | | 1.52 | | | | 2.71 | | | | 46 | |
| | | | | | | | | | | | | | | | | | | | | | | | | | | | | | | | | | |
| | 3.88 | | | | 1,205 | | | | | | | | 1.14 | | | | 3.08 | | | | | | | | 1.02 | | | | 3.19 | | | | 131 | |
| | 1.83 | | | | 14,871 | | | | | | | | 1.12 | | | | 3.64 | | | | | | | | 1.02 | | | | 3.74 | | | | 79 | |
| | (0.70 | ) | | | 3,751 | | | | | | | | 1.10 | | | | 3.57 | | | | | | | | 1.02 | | | | 3.65 | | | | 44 | |
| | 7.97 | | | | 638 | | | | | | | | 1.10 | | | | 3.65 | | | | | | | | 1.02 | | | | 3.73 | | | | 50 | |
| | 2.11 | | | | 350 | | | | | | | | 1.06 | | | | 3.18 | | | | | | | | 1.02 | | | | 3.22 | | | | 46 | |
| | | | | | | | | | | | | | | | | | | | | | | | | | | | | | | | | | |
| | 4.30 | | | | 23,798 | | | | | | | | 0.57 | | | | 3.58 | | | | | | | | 0.45 | | | | 3.70 | | | | 131 | |
| | 2.35 | | | | 24,899 | | | | | | | | 0.56 | | | | 4.21 | | | | | | | | 0.46 | | | | 4.31 | | | | 79 | |
| | (0.29 | ) | | | 43,680 | | | | | | | | 0.54 | * | | | 4.14 | * | | | | | | | 0.46 | * | | | 4.22 | * | | | 44 | |
| | | | | | | | | | | | | | | | | | | | | | | | | | | | | | | | | | |
| | 4.21 | | | | 270,536 | | | | | | | | 0.64 | | | | 3.52 | | | | | | | | 0.52 | | | | 3.63 | | | | 131 | |
| | 2.26 | | | | 283,680 | | | | | | | | 0.62 | | | | 4.16 | | | | | | | | 0.52 | | | | 4.25 | | | | 79 | |
| | (0.15 | ) | | | 440,499 | | | | | | | | 0.60 | | | | 4.04 | | | | | | | | 0.52 | | | | 4.12 | | | | 44 | |
| | 8.64 | | | | 514,961 | | | | | | | | 0.60 | | | | 4.17 | | | | | | | | 0.52 | | | | 4.24 | | | | 50 | |
| | 2.52 | | | | 588,627 | | | | | | | | 0.56 | | | | 3.67 | | | | | | | | 0.52 | | | | 3.71 | | | | 46 | |
| (a) | Per share Net Investment Income (Loss) is calculated using the average daily shares method. | |
| (b) | Total return is the combination of changes in NAV without any sales charge, reinvested dividend income at NAV and reinvested capital gains distributions at NAV, if any. Total returns are not annualized. | |
| (c) | After fee waiver and/or expense reimbursement from the Adviser, where applicable. See Note 7 – Management Fees and Other Transactions with Affiliates, Management Fees for more information. | |
| (d) | Portfolio Turnover Rate is calculated based on the lesser of long-term purchases or sales (as disclosed in Note 5 – Investment Transactions) divided by the average long-term market value during the period. | |
| (e) | For the period January 20, 2015 (commencement of operations) through June 30, 2015. | |
See accompanying notes to financial statements.
Financial Highlights (continued)
High Income Bond
Selected data for a share outstanding throughout each period:
| | | | | | | | | | | | | | | | | | | | | | | | | | | | | | | | | | | | |
| | | | | |
| | | | | | Investment Operations | | | | | | Less Distributions | | | | |
| | | | | | | | | |
| Year Ended June 30, | | Beginning
NAV | | | Net
Investment
Income
(Loss)(a) | | | Net
Realized/
Unrealized
Gain (Loss) | | | Total | | | | | | Net
Investment
Income | | | From
Accumulated
Net Realized
Gains | | | Total | | | Ending
Net
Asset
Value | |
Class A (8/01) | | | | | | | | | | | | | | | | | | | | | | | | | | | | | | | | | | | | |
2017 | | $ | 7.22 | | | $ | 0.54 | | | $ | 0.57 | | | $ | 1.11 | | | | | | | $ | (0.53 | ) | | $ | — | | | $ | (0.53 | ) | | $ | 7.80 | |
2016 | | | 8.23 | | | | 0.57 | | | | (1.05 | ) | | | (0.48 | ) | | | | | | | (0.53 | ) | | | — | | | | (0.53 | ) | | | 7.22 | |
2015 | | | 9.29 | | | | 0.55 | | | | (1.00 | ) | | | (0.45 | ) | | | | | | | (0.54 | ) | | | (0.07 | ) | | | (0.61 | ) | | | 8.23 | |
2014 | | | 8.99 | | | | 0.58 | | | | 0.53 | | | | 1.11 | | | | | | | | (0.61 | ) | | | (0.20 | ) | | | (0.81 | ) | | | 9.29 | |
2013 | | | 8.64 | | | | 0.63 | | | | 0.39 | | | | 1.02 | | | | | | | | (0.67 | ) | | | — | | | | (0.67 | ) | | | 8.99 | |
Class C (8/01) | | | | | | | | | | | | | | | | | | | | | | | | | | | | | | | | | | | | |
2017 | | | 7.21 | | | | 0.49 | | | | 0.57 | | | | 1.06 | | | | | | | | (0.48 | ) | | | — | | | | (0.48 | ) | | | 7.79 | |
2016 | | | 8.22 | | | | 0.53 | | | | (1.07 | ) | | | (0.54 | ) | | | | | | | (0.47 | ) | | | — | | | | (0.47 | ) | | | 7.21 | |
2015 | | | 9.27 | | | | 0.49 | | | | (0.99 | ) | | | (0.50 | ) | | | | | | | (0.48 | ) | | | (0.07 | ) | | | (0.55 | ) | | | 8.22 | |
2014 | | | 8.98 | | | | 0.51 | | | | 0.52 | | | | 1.03 | | | | | | | | (0.54 | ) | | | (0.20 | ) | | | (0.74 | ) | | | 9.27 | |
2013 | | | 8.62 | | | | 0.56 | | | | 0.40 | | | | 0.96 | | | | | | | | (0.60 | ) | | | — | | | | (0.60 | ) | | | 8.98 | |
Class R3 (9/01) | | | | | | | | | | | | | | | | | | | | | | | | | | | | | | | | | | | | |
2017 | | | 7.37 | | | | 0.54 | | | | 0.58 | | | | 1.12 | | | | | | | | (0.53 | ) | | | — | | | | (0.53 | ) | | | 7.96 | |
2016 | | | 8.40 | | | | 0.57 | | | | (1.08 | ) | | | (0.51 | ) | | | | | | | (0.52 | ) | | | — | | | | (0.52 | ) | | | 7.37 | |
2015 | | | 9.48 | | | | 0.53 | | | | (1.01 | ) | | | (0.48 | ) | | | | | | | (0.53 | ) | | | (0.07 | ) | | | (0.60 | ) | | | 8.40 | |
2014 | | | 9.17 | | | | 0.57 | | | | 0.54 | | | | 1.11 | | | | | | | | (0.60 | ) | | | (0.20 | ) | | | (0.80 | ) | | | 9.48 | |
2013 | | | 8.81 | | | | 0.62 | | | | 0.40 | | | | 1.02 | | | | | | | | (0.66 | ) | | | — | | | | (0.66 | ) | | | 9.17 | |
Class I (8/01) | | | | | | | | | | | | | | | | | | | | | | | | | | | | | | | | | | | | |
2017 | | | 7.24 | | | | 0.56 | | | | 0.57 | | | | 1.13 | | | | | | | | (0.55 | ) | | | — | | | | (0.55 | ) | | | 7.82 | |
2016 | | | 8.26 | | | | 0.60 | | | | (1.07 | ) | | | (0.47 | ) | | | | | | | (0.55 | ) | | | — | | | | (0.55 | ) | | | 7.24 | |
2015 | | | 9.31 | | | | 0.57 | | | | (0.98 | ) | | | (0.41 | ) | | | | | | | (0.57 | ) | | | (0.07 | ) | | | (0.64 | ) | | | 8.26 | |
2014 | | | 9.01 | | | | 0.60 | | | | 0.53 | | | | 1.13 | | | | | | | | (0.63 | ) | | | (0.20 | ) | | | (0.83 | ) | | | 9.31 | |
2013 | | | 8.65 | | | | 0.66 | | | | 0.39 | | | | 1.05 | | | | | | | | (0.69 | ) | | | — | | | | (0.69 | ) | | | 9.01 | |
Class T (5/17)(e) | | | | | | | | | | | | | | | | | | | | | | | | | | | | | | | | | | | | |
2017(f) | | | 7.91 | | | | 0.05 | | | | (0.10 | ) | | | (0.05 | ) | | | | | | | (0.04 | ) | | | — | | | | (0.04 | ) | | | 7.82 | |
| | | | | | | | | | | | | | | | | | | | | | | | | | | | | | | | | | |
| | | | Ratios/Supplemental Data | |
| | | | | | | | | | Ratios to Average
Net Assets Before
Waiver/Reimbursement | | | | | | Ratios to Average
Net Assets After
Waiver/Reimbursement(c) | | | | |
| | | | | | | | |
Total
Return(b) | | | Ending
Net
Assets
(000) | | | | | | Expenses | | | Net
Investment
Income
(Losss) | | | | | | Expenses | | | Net
Investment
Income
(Losss) | | | Portfolio
Turnover
Rate(d) | |
| | | | | | | | | | | | | | | | | | | | | | | | | | | | | | | | | | |
| | 15.75 | % | | $ | 136,977 | | | | | | | | 1.01 | % | | | 7.03 | % | | | | | | | 1.01 | % | | | 7.03 | % | | | 155 | % |
| | 5.48 | | | | 114,537 | | | | | | | | 1.03 | | | | 7.99 | | | | | | | | 1.03 | | | | 7.99 | | | | 91 | |
| | (4.82 | ) | | | 119,535 | | | | | | | | 0.97 | | | | 6.31 | | | | | | | | 0.97 | | | | 6.31 | | | | 80 | |
| | 12.88 | | | | 209,830 | | | | | | | | 0.95 | | | | 6.37 | | | | | | | | 0.95 | | | | 6.37 | | | | 85 | |
| | 11.99 | | | | 141,132 | | | | | | | | 0.94 | | | | 6.92 | | | | | | | | 0.94 | | | | 6.92 | | | | 133 | |
| | | | | | | | | | | | | | | | | | | | | | | | | | | | | | | | | | |
| | 14.93 | | | | 47,698 | | | | | | | | 1.76 | | | | 6.32 | | | | | | | | 1.76 | | | | 6.32 | | | | 155 | |
| | (6.27 | ) | | | 41,663 | | | | | | | | 1.79 | | | | 7.26 | | | | | | | | 1.79 | | | | 7.26 | | | | 91 | |
| | (5.45 | ) | | | 55,409 | | | | | | | | 1.72 | | | | 5.62 | | | | | | | | 1.72 | | | | 5.62 | | | | 80 | |
| | 11.98 | | | | 71,974 | | | | | | | | 1.70 | | | | 5.64 | | | | | | | | 1.70 | | | | 5.64 | | | | 85 | |
| | 11.33 | | | | 67,466 | | | | | | | | 1.70 | | | | 6.21 | | | | | | | | 1.70 | | | | 6.21 | | | | 133 | |
| | | | | | | | | | | | | | | | | | | | | | | | | | | | | | | | | | |
| | 15.46 | | | | 756 | | | | | | | | 1.26 | | | | 6.80 | | | | | | | | 1.26 | | | | 6.81 | | | | 155 | |
| | (5.76 | ) | | | 834 | | | | | | | | 1.29 | | | | 7.78 | | | | | | | | 1.29 | | | | 7.78 | | | | 91 | |
| | (5.07 | ) | | | 995 | | | | | | | | 1.21 | | | | 6.03 | | | | | | | | 1.21 | | | | 6.03 | | | | 80 | |
| | 12.65 | | | | 1,099 | | | | | | | | 1.20 | | | | 6.09 | | | | | | | | 1.20 | | | | 6.09 | | | | 85 | |
| | 11.79 | | | | 697 | | | | | | | | 1.19 | | | | 6.69 | | | | | | | | 1.19 | | | | 6.69 | | | | 133 | |
| | | | | | | | | | | | | | | | | | | | | | | | | | | | | | | | | | |
| | 15.97 | | | | 200,310 | | | | | | | | 0.75 | | | | 7.31 | | | | | | | | 0.76 | | | | 7.31 | | | | 155 | |
| | (5.21 | ) | | | 208,009 | | | | | | | | 0.78 | | | | 8.12 | | | | | | | | 0.78 | | | | 8.12 | | | | 91 | |
| | (4.55 | ) | | | 446,406 | | | | | | | | 0.72 | | | | 6.56 | | | | | | | | 0.72 | | | | 6.56 | | | | 80 | |
| | 13.15 | | | | 719,640 | | | | | | | | 0.71 | | | | 6.61 | | | | | | | | 0.71 | | | | 6.61 | | | | 85 | |
| | 12.39 | | | | 495,863 | | | | | | | | 0.70 | | | | 7.24 | | | | | | | | 0.70 | | | | 7.24 | | | | 133 | |
| | | | | | | | | | | | | | | | | | | | | | | | | | | | | | | | | | |
| | (0.58) | | | | 25 | | | | | | | | 0.98 | * | | | 7.78 | * | | | | | | | 1.00 | * | | | 7.78 | * | | | 155 | |
| (a) | Per share Net Investment Income (Loss) is calculated using the average daily shares method. | |
| (b) | Total return is the combination of changes in NAV without any sales charge, reinvested dividend income at NAV and reinvested capital gains distributions at NAV, if any. Total returns are not annualized. | |
| (c) | After fee waiver and/or expense reimbursement from the Adviser, where applicable. See Note 7 – Management Fees and Other Transactions with Affiliates, Management Fees for more information. For the period October 31, 2013 through June 29, 2016, the Adviser did not reimburse the Fund for any fees and expenses. | |
| (d) | Portfolio Turnover Rate is calculated based on the lesser of long-term purchases or sales (as disclosed in Note 5 – Investment Transactions) divided by the average long-term market value during the period. | |
| (e) | Class T Shares are not available for public offering. | |
| (f) | For the period May 31, 2017 (commencement of operations) through June 30, 2017. | |
See accompanying notes to financial statements.
Financial Highlights (continued)
Inflation Protected Securities
Selected data for a share outstanding throughout each period:
| | | | | | | | | | | | | | | | | | | | | | | | | | | | | | | | | | | | | | | | |
| | | | | |
| | | | | | Investment Operations | | | | | | Less Distributions | | | | |
| | | | | | | | | | |
Class (Commencement Date) Year Ended June 30, | | Beginning
NAV | | | Net
Investment
Income
(Loss)(a) | | | Net
Realized/
Unrealized
Gain (Loss) | | | Total | | | | | | From
Net
Investment
Income | | | From
Accumulated
Net Realized
Gains | | | Return
of
Capital | | | Total | | | Ending
NAV | |
Class A (10/04) | | | | | | | | | | | | | | | | | | | | | | | | | | | | | | | | | | | | | |
2017 | | $ | 11.30 | | | $ | 0.18 | | | $ | (0.35 | ) | | $ | (0.17 | ) | | | | | | $ | (0.12 | ) | | $ | — | | | $ | — | | | $ | (0.12 | ) | | $ | 11.01 | |
2016 | | | 10.92 | | | | 0.06 | | | | 0.32 | | | | 0.38 | | | | | | | | — | | | | — | | | | — | | | | — | | | | 11.30 | |
2015 | | | 11.26 | | | | (0.03 | ) | | | (0.20 | ) | | | (0.23 | ) | | | | | | | (0.07 | ) | | | — | | | | (0.04 | ) | | | (0.11 | ) | | | 10.92 | |
2014 | | | 11.08 | | | | 0.15 | | | | 0.32 | | | | 0.47 | | | | | | | | (0.09 | ) | | | (0.20 | ) | | | — | | | | (0.29 | ) | | | 11.26 | |
2013 | | | 11.80 | | | | 0.07 | | | | (0.66 | ) | | | (0.59 | ) | | | | | | | (0.13 | ) | | | — | | | | — | | | | (0.13 | ) | | | 11.08 | |
Class C (10/04) | | | | | | | | | | | | | | | | | | | | | | | | | | | | | | | | | | | | | |
2017 | | | 11.14 | | | | 0.10 | | | | (0.36 | ) | | | (0.26 | ) | | | | | | | (0.05 | ) | | | — | | | | — | | | | (0.05 | ) | | | 10.83 | |
2016 | | | 10.84 | | | | (0.05 | ) | | | 0.35 | | | | 0.30 | | | | | | | | — | | | | — | | | | — | | | | — | | | | 11.14 | |
2015 | | | 11.21 | | | | (0.11 | ) | | | (0.20 | ) | | | (0.31 | ) | | | | | | | (0.02 | ) | | | — | | | | (0.04 | ) | | | (0.06 | ) | | | 10.84 | |
2014 | | | 11.03 | | | | 0.06 | | | | 0.35 | | | | 0.41 | | | | | | | | (0.03 | ) | | | (0.20 | ) | | | — | | | | (0.23 | ) | | | 11.21 | |
2013 | | | 11.72 | | | | (0.03 | ) | | | (0.60 | ) | | | (0.63 | ) | | | | | | | (0.06 | ) | | | — | | | | — | | | | (0.06 | ) | | | 11.03 | |
Class R3 (10/04) | | | | | | | | | | | | | | | | | | | | | | | | | | | | | | | | | | | | | |
2017 | | | 11.21 | | | | 0.15 | | | | (0.36 | ) | | | (0.21 | ) | | | | | | | (0.09 | ) | | | — | | | | — | | | | (0.09 | ) | | | 10.91 | |
2016 | | | 10.85 | | | | 0.01 | | | | 0.35 | | | | 0.36 | | | | | | | | — | | | | — | | | | — | | | | — | | | | 11.21 | |
2015 | | | 11.21 | | | | (0.11 | ) | | | (0.16 | ) | | | (0.27 | ) | | | | | | | (0.05 | ) | | | — | | | | (0.04 | ) | | | (0.09 | ) | | | 10.85 | |
2014 | | | 11.05 | | | | 0.29 | | | | 0.14 | | | | 0.43 | | | | | | | | (0.07 | ) | | | (0.20 | ) | | | — | | | | (0.27 | ) | | | 11.21 | |
2013 | | | 11.74 | | | | 0.04 | | | | (0.62 | ) | | | (0.58 | ) | | | | | | | (0.11 | ) | | | — | | | | — | | | | (0.11 | ) | | | 11.05 | |
Class R6 (1/15) | | | | | | | | | | | | | | | | | | | | | | | | | | | | | | | | | | | | | |
2017 | | | 11.46 | | | | 0.26 | | | | (0.39 | ) | | | (0.13 | ) | | | | | | | (0.14 | ) | | | — | | | | — | | | | (0.14 | ) | | | 11.19 | |
2016 | | | 11.02 | | | | 0.09 | | | | 0.35 | | | | 0.44 | | | | | | | | — | | | | — | | | | — | | | | — | | | | 11.46 | |
2015(e) | | | 11.18 | | | | — | * | | | (0.16 | ) | | | (0.16 | ) | | | | | | | — | | | | — | | | | — | * | | | — | | | | 11.02 | |
Class I (10/04) | | | | | | | | | | | | | | | | | | | | | | | | | | | | | | | | | | | | | |
2017 | | | 11.43 | | | | 0.22 | | | | (0.37 | ) | | | (0.15 | ) | | | | | | | (0.14 | ) | | | — | | | | — | | | | (0.14 | ) | | | 11.14 | |
2016 | | | 11.02 | | | | 0.08 | | | | 0.33 | | | | 0.41 | | | | | | | | — | | | | — | | | | — | | | | — | | | | 11.43 | |
2015 | | | 11.35 | | | | (0.01 | ) | | | (0.19 | ) | | | (0.20 | ) | | | | | | | (0.09 | ) | | | — | | | | (0.04 | ) | | | (0.13 | ) | | | 11.02 | |
2014 | | | 11.14 | | | | 0.19 | | | | 0.33 | | | | 0.52 | | | | | | | | (0.11 | ) | | | (0.20 | ) | | | — | | | | (0.31 | ) | | | 11.35 | |
2013 | | | 11.81 | | | | 0.09 | | | | (0.61 | ) | | | (0.52 | ) | | | | | | | (0.15 | ) | | | — | | | | — | | | | (0.15 | ) | | | 11.14 | |
| | | | | | | | | | | | | | | | | | | | | | | | | | | | | | | | | | |
| | | | Ratios/Supplemental Data | |
| | | | | | | | | | Ratios to Average
Net Assets Before
Waiver/Reimbursement | | | | | | Ratios to Average
Net Assets After
Waiver/Reimbursement(c) | | | | |
| | | | | | | | |
Total
Return(b) | | | Ending
Net
Assets
(000) | | | | | | Expenses | | | Net
Investment
Income
(Loss) | | | | | | Expenses | | | Net
Investment
Income
(Loss) | | | Portfolio
Turnover
Rate(d) | |
| | | | | | | | | | | | | | | | | | | | | | | | | | | | | | | | | | |
| | (1.53 | )% | | $ | 104,588 | | | | | | | | 0.96 | % | | | 1.47 | % | | | | | | | 0.79 | % | | | 1.65 | % | | | 49 | % |
| | 3.48 | | | | 93,104 | | | | | | | | 0.96 | | | | 0.45 | | | | | | | | 0.83 | | | | 0.58 | | | | 26 | |
| | (2.04 | ) | | | 42,341 | | | | | | | | 0.92 | | | | (0.38 | ) | | | | | | | 0.83 | | | | (0.29 | ) | | | 34 | |
| | 4.35 | | | | 24,020 | | | | | | | | 0.86 | | | | 1.30 | | | | | | | | 0.83 | | | | 1.33 | | | | 48 | |
| | (5.07 | ) | | | 21,949 | | | | | | | | 0.81 | | | | 0.56 | | | | | | | | 0.81 | | | | 0.56 | | | | 52 | |
| | | | | | | | | | | | | | | | | | | | | | | | | | | | | | | | | | |
| | (2.33 | ) | | | 10,639 | | | | | | | | 1.71 | | | | 0.75 | | | | | | | | 1.54 | | | | 0.93 | | | | 49 | |
| | 2.77 | | | | 13,131 | | | | | | | | 1.71 | | | | (0.61 | ) | | | | | | | 1.58 | | | | (0.47 | ) | | | 26 | |
| | (2.75 | ) | | | 9,366 | | | | | | | | 1.66 | | | | (1.06 | ) | | | | | | | 1.58 | | | | (0.98 | ) | | | 34 | |
| | 3.76 | | | | 6,954 | | | | | | | | 1.61 | | | | 0.50 | | | | | | | | 1.58 | | | | 0.52 | | | | 48 | |
| | (5.39 | ) | | | 9,761 | | | | | | | | 1.56 | | | | (0.25 | ) | | | | | | | 1.56 | | | | (0.25 | ) | | | 52 | |
| | | | | | | | | | | | | | | | | | | | | | | | | | | | | | | | | | |
| | (1.86 | ) | | | 5,618 | | | | | | | | 1.21 | | | | 1.21 | | | | | | | | 1.04 | | | | 1.38 | | | | 49 | |
| | 3.32 | | | | 13,094 | | | | | | | | 1.22 | | | | (0.05 | ) | | | | | | | 1.08 | | | | 0.08 | | | | 26 | |
| | (2.38 | ) | | | 3,693 | | | | | | | | 1.15 | | | | (1.05 | ) | | | | | | | 1.08 | | | | (0.98 | ) | | | 34 | |
| | 3.97 | | | | 3,447 | | | | | | | | 1.13 | | | | 2.63 | | | | | | | | 1.08 | | | | 2.68 | | | | 48 | |
| | (5.02 | ) | | | 519 | | | | | | | | 1.06 | | | | 0.32 | | | | | | | | 1.06 | | | | 0.32 | | | | 52 | |
| | | | | | | | | | | | | | | | | | | | | | | | | | | | | | | | | | |
| | (1.10 | ) | | | 23,654 | | | | | | | | 0.48 | | | | 1.12 | | | | | | | | 0.30 | | | | 2.30 | | | | 49 | |
| | 3.99 | | | | 3,773 | | | | | | | | 0.50 | | | | 0.71 | | | | | | | | 0.37 | | | | 0.84 | | | | 26 | |
| | (1.39 | ) | | | 3,074 | | | | | | | | 0.52 | ** | | | (0.12 | )** | | | | | | | 0.41 | ** | | | (0.01 | )** | | | 34 | |
| | | | | | | | | | | | | | | | | | | | | | | | | | | | | | | | | | |
| | (1.27 | ) | | | 458,852 | | | | | | | | 0.71 | | | | 1.76 | | | | | | | | 0.54 | | | | 1.93 | | | | 49 | |
| | 3.72 | | | | 404,801 | | | | | | | | 0.71 | | | | 0.57 | | | | | | | | 0.58 | | | | 0.70 | | | | 26 | |
| | (1.78 | ) | | | 331,707 | | | | | | | | 0.66 | | | | (0.13 | ) | | | | | | | 0.58 | | | | (0.05 | ) | | | 34 | |
| | 4.82 | | | | 321,472 | | | | | | | | 0.61 | | | | 1.65 | | | | | | | | 0.58 | | | | 1.68 | | | | 48 | |
| | (4.46) | | | | 344,204 | | | | | | | | 0.56 | | | | 0.77 | | | | | | | | 0.56 | | | | 0.77 | | | | 52 | |
| (a) | Per share Net Investment Income (Loss) is calculated using the average daily shares method. | |
| (b) | Total return is the combination of changes in NAV without any sales charge, reinvested dividend income at NAV and reinvested capital gains distributions at NAV, if any. Total returns are not annualized. | |
| (c) | After fee waiver and/or expense reimbursement from the Adviser, where applicable. See Note 7 – Management Fees and Other Transactions with Affiliates, Management Fees for more information. | |
| (d) | Portfolio Turnover Rate is calculated based on the lesser of long-term purchases or sales (as disclosed in Note 5 – Investment Transactions) divided by the average long-term market value during the period. | |
| (e) | For the period January 20, 2015 (commencement of operations) through June 30, 2015. | |
| * | Rounds to less than $0.01 per share. | |
See accompanying notes to financial statements.
Financial Highlights (continued)
Intermediate Government Bond
Selected data for a share outstanding throughout each period:
| | | | | | | | | | | | | | | | | | | | | | | | | | | | | | | | | | | | | | | | |
| | | | |
| | | | Investment Operations | | | | | | Less Distributions | | | | |
| | | | | | | | | | |
Class (Commencement Date) Year Ended June 30, | | Beginning
NAV | | | Net
Investment
Income
(Loss)(a) | | | Net
Realized/
Unrealized
Gain (Loss) | | | Total | | | | | | From
Net
Investment
Income | | | From
Accumulated
Net Realized
Gains | | | Return
of
Capital | | | Total | | | Ending
NAV | |
Class A (10/02) | | | | | | | | | | | | | | | | | | | | | | | | | | | | | | | | | | | | | |
2017 | | $ | 8.96 | | | $ | 0.11 | | | $ | (0.30 | ) | | $ | (0.19 | ) | | | | | | $ | (0.10 | ) | | $ | — | | | $ | — | | | $ | (0.10 | ) | | $ | 8.67 | |
2016 | | | 8.80 | | | | 0.11 | | | | 0.16 | | | | 0.27 | | | | | | | | (0.11 | ) | | | — | | | | — | | | | (0.11 | ) | | | 8.96 | |
2015 | | | 8.81 | | | | 0.10 | | | | (0.02 | ) | | | 0.08 | | | | | | | | (0.09 | ) | | | — | | | | — | | | | (0.09 | ) | | | 8.80 | |
2014 | | | 8.79 | | | | 0.11 | | | | 0.03 | | | | 0.14 | | | | | | | | (0.11 | ) | | | — | | | | (0.01 | ) | | | (0.12 | ) | | | 8.81 | |
2013 | | | 9.02 | | | | 0.14 | | | | (0.20 | ) | | | (0.06 | ) | | | | | | | (0.17 | ) | | | — | | | | — | | | | (0.17 | ) | | | 8.79 | |
Class C (10/09) | | | | | | | | | | | | | | | | | | | | | | | | | | | | | | | | | | | | | |
2017 | | | 8.98 | | | | 0.05 | | | | (0.30 | ) | | | (0.25 | ) | | | | | | | (0.04 | ) | | | — | | | | — | | | | (0.04 | ) | | | 8.69 | |
2016 | | | 8.82 | | | | 0.04 | | | | 0.16 | | | | 0.20 | | | | | | | | (0.04 | ) | | | — | | | | — | | | | (0.04 | ) | | | 8.98 | |
2015 | | | 8.83 | | | | 0.04 | | | | (0.02 | ) | | | 0.02 | | | | | | | | (0.03 | ) | | | — | | | | — | | | | (0.03 | ) | | | 8.82 | |
2014 | | | 8.80 | | | | 0.05 | | | | 0.04 | | | | 0.09 | | | | | | | | (0.05 | ) | | | — | | | | (0.01 | ) | | | (0.06 | ) | | | 8.83 | |
2013 | | | 9.03 | | | | 0.07 | | | | (0.21 | ) | | | (0.14 | ) | | | | | | | (0.09 | ) | | | — | | | | — | | | | (0.09 | ) | | | 8.80 | |
Class R3 (10/09) | | | | | | | | | | | | | | | | | | | | | | | | | | | | | | | | | | | | | |
2017 | | | 8.97 | | | | 0.09 | | | | (0.31 | ) | | | (0.22 | ) | | | | | | | (0.08 | ) | | | — | | | | — | | | | (0.08 | ) | | | 8.67 | |
2016 | | | 8.80 | | | | 0.09 | | | | 0.16 | | | | 0.25 | | | | | | | | (0.08 | ) | | | — | | | | — | | | | (0.08 | ) | | | 8.97 | |
2015 | | | 8.81 | | | | 0.08 | | | | (0.02 | ) | | | 0.06 | | | | | | | | (0.07 | ) | | | — | | | | — | | | | (0.07 | ) | | | 8.80 | |
2014 | | | 8.78 | | | | 0.09 | | | | 0.04 | | | | 0.13 | | | | | | | | (0.09 | ) | | | — | | | | (0.01 | ) | | | (0.10 | ) | | | 8.81 | |
2013 | | | 9.01 | | | | 0.12 | | | | (0.21 | ) | | | (0.09 | ) | | | | | | | (0.14 | ) | | | — | | | | — | | | | (0.14 | ) | | | 8.78 | |
Class I (10/02) | | | | | | | | | | | | | | | | | | | | | | | | | | | | | | | | | | | | | |
2017 | | | 8.97 | | | | 0.13 | | | | (0.30 | ) | | | (0.17 | ) | | | | | | | (0.13 | ) | | | — | | | | — | | | | (0.13 | ) | | | 8.67 | |
2016 | | | 8.81 | | | | 0.13 | | | | 0.16 | | | | 0.29 | | | | | | | | (0.13 | ) | | | — | | | | — | | | | (0.13 | ) | | | 8.97 | |
2015 | | | 8.82 | | | | 0.12 | | | | (0.01 | ) | | | 0.11 | | | | | | | | (0.12 | ) | | | — | | | | — | | | | (0.12 | ) | | | 8.81 | |
2014 | | | 8.80 | | | | 0.13 | | | | 0.04 | | | | 0.17 | | | | | | | | (0.14 | ) | | | — | | | | (0.01 | ) | | | (0.15 | ) | | | 8.82 | |
2013 | | | 9.03 | | | | 0.16 | | | | (0.21 | ) | | | (0.05 | ) | | | | | | | (0.18 | ) | | | — | | | | — | | | | (0.18 | ) | | | 8.80 | |
| | | | | | | | | | | | | | | | | | | | | | | | | | | | | | | | | | |
| | | | Ratios/Supplemental Data | |
| | | | | | | | | | Ratios to Average
Net Assets Before
Waiver/Reimbursement | | | | | | Ratios to Average
Net Assets After
Waiver/Reimbursement(c) | | | | |
| | | | | | | | |
Total
Return(b) | | | Ending
Net
Assets
(000) | | | | | | Expenses | | | Net
Investment
Income
(Loss) | | | | | | Expenses | | | Net
Investment
Income
(Loss) | | | Portfolio
Turnover
Rate(d) | |
| | | | | | | | | | | | | | | | | | | | | | | | | | | | | | | | | | |
| | (2.08 | )% | | $ | 9,458 | | | | | | | | 1.04 | % | | | 1.02 | % | | | | | | | 0.79 | % | | | 1.27 | % | | | 82 | % |
| | 3.06 | | | | 13,760 | | | | | | | | 1.00 | | | | 1.08 | | | | | | | | 0.85 | | | | 1.23 | | | | 58 | |
| | 0.93 | | | | 9,010 | | | | | | | | 1.02 | | | | 1.00 | | | | | | | | 0.85 | | | | 1.17 | | | | 59 | |
| | 1.65 | | | | 9,621 | | | | | | | | 1.01 | | | | 1.14 | | | | | | | | 0.85 | | | | 1.30 | | | | 31 | |
| | (0.74 | ) | | | 11,034 | | | | | | | | 1.01 | | | | 1.41 | | | | | | | | 0.85 | | | | 1.57 | | | | 55 | |
| | | | | | | | | | | | | | | | | | | | | | | | | | | | | | | | | | |
| | (2.81 | ) | | | 1,169 | | | | | | | | 1.79 | | | | 0.27 | | | | | | | | 1.54 | | | | 0.52 | | | | 82 | |
| | 2.29 | | | | 1,550 | | | | | | | | 1.75 | | | | 0.34 | | | | | | | | 1.60 | | | | 0.49 | | | | 58 | |
| | 0.18 | | | | 667 | | | | | | | | 1.77 | | | | 0.25 | | | | | | | | 1.60 | | | | 0.42 | | | | 59 | |
| | 0.98 | | | | 639 | | | | | | | | 1.76 | | | | 0.40 | | | | | | | | 1.60 | | | | 0.56 | | | | 31 | |
| | (1.53 | ) | | | 1,090 | | | | | | | | 1.76 | | | | 0.66 | | | | | | | | 1.60 | | | | 0.82 | | | | 55 | |
| | | | | | | | | | | | | | | | | | | | | | | | | | | | | | | | | | |
| | (2.46 | ) | | | 82 | | | | | | | | 1.28 | | | | 0.76 | | | | | | | | 1.04 | | | | 1.00 | | | | 82 | |
| | 2.90 | | | | 143 | | | | | | | | 1.25 | | | | 0.83 | | | | | | | | 1.10 | | | | 0.98 | | | | 58 | |
| | 0.66 | | | | 137 | | | | | | | | 1.27 | | | | 0.75 | | | | | | | | 1.10 | | | | 0.92 | | | | 59 | |
| | 1.49 | | | | 137 | | | | | | | | 1.26 | | | | 0.89 | | | | | | | | 1.10 | | | | 1.05 | | | | 31 | |
| | (1.00 | ) | | | 168 | | | | | | | | 1.26 | | | | 1.17 | | | | | | | | 1.10 | | | | 1.32 | | | | 55 | |
| | | | | | | | | | | | | | | | | | | | | | | | | | | | | | | | | | |
| | (1.92 | ) | | | 41,682 | | | | | | | | 0.78 | | | | 1.27 | | | | | | | | 0.54 | | | | 1.51 | | | | 82 | |
| | 3.34 | | | | 65,305 | | | | | | | | 0.75 | | | | 1.33 | | | | | | | | 0.60 | | | | 1.48 | | | | 58 | |
| | 1.20 | | | | 65,850 | | | | | | | | 0.77 | | | | 1.24 | | | | | | | | 0.60 | | | | 1.40 | | | | 59 | |
| | 1.90 | | | | 86,186 | | | | | | | | 0.76 | | | | 1.36 | | | | | | | | 0.60 | | | | 1.52 | | | | 31 | |
| | (0.53) | | | | 52,291 | | | | | | | | 0.76 | | | | 1.67 | | | | | | | | 0.60 | | | | 1.83 | | | | 55 | |
| (a) | Per share Net Investment Income (Loss) is calculated using the average daily shares method. | |
| (b) | Total return is the combination of changes in NAV without any sales charge, reinvested dividend income at NAV and reinvested capital gains distributions at NAV, if any. Total returns are not annualized. | |
| (c) | After fee waiver and/or expense reimbursement from the Adviser, where applicable. See Note 7 – Management Fees and Other Transactions with Affiliates, Management Fees for more information. | |
| (d) | Portfolio Turnover Rate is calculated based on the lesser of long-term purchases or sales (as disclosed in Note 5 – Investment Transactions) divided by the average long-term market value during the period. | |
See accompanying notes to financial statements.
Financial Highlights (continued)
Short Term Bond
Selected data for a share outstanding throughout each period:
| | | | | | | | | | | | | | | | | | | | | | | | | | | | | | | | | | | | | | | | |
| | | | | |
| | | | | | Investment Operations | | | | | | Less Distributions | | | | |
| | | | | | | | | | |
Class (Commencement Date) Year Ended June 30, | | Beginning
NAV | | | Net
Investment
Income
(Loss)(a) | | | Net
Realized/
Unrealized
Gain (Loss) | | | Total | | | | | | From
Net
Investment
Income | | | From
Accumulated
Net Realized
Gains | | | Return
of
Capital | | | Total | | | Ending
NAV | |
Class A (12/92) | | | | | | | | | | | | | | | | | | | | | | | | | | | | | |
2017 | | $ | 9.88 | | | $ | 0.16 | | | $ | (0.02 | ) | | $ | 0.14 | | | | | | | $ | (0.15 | ) | | $ | — | | | $ | (0.01 | ) | | $ | (0.16 | ) | | $ | 9.86 | |
2016 | | | 9.93 | | | | 0.16 | | | | (0.06 | ) | | | 0.10 | | | | | | | | (0.15 | ) | | | — | | | | — | | | | (0.15 | ) | | | 9.88 | |
2015 | | | 10.05 | | | | 0.16 | | | | (0.13 | ) | | | 0.03 | | | | | | | | (0.15 | ) | | | — | | | | — | | | | (0.15 | ) | | | 9.93 | |
2014 | | | 9.97 | | | | 0.19 | | | | 0.08 | | | | 0.27 | | | | | | | | (0.19 | ) | | | — | | | | — | | | | (0.19 | ) | | | 10.05 | |
2013 | | | 9.95 | | | | 0.20 | | | | 0.03 | | | | 0.23 | | | | | | | | (0.21 | ) | | | — | | | | — | | | | (0.21 | ) | | | 9.97 | |
Class C (10/09) | | | | | | | | | | | | | | | | | | | | | | | | | | | | | |
2017 | | | 9.92 | | | | 0.08 | | | | (0.02 | ) | | | 0.06 | | | | | | | | (0.07 | ) | | | — | | | | (0.01 | ) | | | (0.08 | ) | | | 9.90 | |
2016 | | | 9.97 | | | | 0.09 | | | | (0.07 | ) | | | 0.02 | | | | | | | | (0.07 | ) | | | — | | | | — | | | | (0.07 | ) | | | 9.92 | |
2015 | | | 10.08 | | | | 0.08 | | | | (0.12 | ) | | | (0.04 | ) | | | | | | | (0.07 | ) | | | — | | | | — | | | | (0.07 | ) | | | 9.97 | |
2014 | | | 10.00 | | | | 0.11 | | | | 0.08 | | | | 0.19 | | | | | | | | (0.11 | ) | | | — | | | | — | | | | (0.11 | ) | | | 10.08 | |
2013 | | | 9.97 | | | | 0.12 | | | | 0.04 | | | | 0.16 | | | | | | | | (0.13 | ) | | | — | | | | — | | | | (0.13 | ) | | | 10.00 | |
Class R3 (9/11) | | | | | | | | | | | | | | | | | | | | | | | | | | | | | |
2017 | | | 9.90 | | | | 0.13 | | | | (0.02 | ) | | | 0.11 | | | | | | | | (0.12 | ) | | | — | | | | (0.01 | ) | | | (0.13 | ) | | | 9.88 | |
2016 | | | 9.95 | | | | 0.14 | | | | (0.07 | ) | | | 0.07 | | | | | | | | (0.12 | ) | | | — | | | | — | | | | (0.12 | ) | | | 9.90 | |
2015 | | | 10.07 | | | | 0.13 | | | | (0.13 | ) | | | — | | | | | | | | (0.12 | ) | | | — | | | | — | | | | (0.12 | ) | | | 9.95 | |
2014 | | | 9.99 | | | | 0.16 | | | | 0.08 | | | | 0.24 | | | | | | | | (0.16 | ) | | | — | | | | — | | | | (0.16 | ) | | | 10.07 | |
2013 | | | 9.96 | | | | 0.17 | | | | 0.04 | | | | 0.21 | | | | | | | | (0.18 | ) | | | — | | | | — | | | | (0.18 | ) | | | 9.99 | |
Class R6 (1/15) | | | | | | | | | | | | | | | | | | | | | | | | | | | | | |
2017 | | | 9.90 | | | | 0.19 | | | | (0.03 | ) | | | 0.16 | | | | | | | | (0.17 | ) | | | — | | | | (0.01 | ) | | | (0.18 | ) | | | 9.88 | |
2016 | | | 9.95 | | | | 0.19 | | | | (0.06 | ) | | | 0.13 | | | | | | | | (0.18 | ) | | | — | | | | — | | | | (0.18 | ) | | | 9.90 | |
2015(e) | | | 9.93 | | | | 0.09 | | | | — | * | | | 0.09 | | | | | | | | (0.07 | ) | | | — | | | | — | | | | (0.07 | ) | | | 9.95 | |
Class I (2/94) | | | | | | | | | | | | | | | | | | | | | | | | | | | | | |
2017 | | | 9.89 | | | | 0.18 | | | | (0.02 | ) | | | 0.16 | | | | | | | | (0.17 | ) | | | — | | | | (0.01 | ) | | | (0.18 | ) | | | 9.87 | |
2016 | | | 9.94 | | | | 0.19 | | | | (0.06 | ) | | | 0.13 | | | | | | | | (0.18 | ) | | | — | | | | — | | | | (0.18 | ) | | | 9.89 | |
2015 | | | 10.06 | | | | 0.18 | | | | (0.12 | ) | | | 0.06 | | | | | | | | (0.18 | ) | | | — | | | | — | | | | (0.18 | ) | | | 9.94 | |
2014 | | | 9.98 | | | | 0.21 | | | | 0.08 | | | | 0.29 | | | | | | | | (0.21 | ) | | | — | | | | — | | | | (0.21 | ) | | | 10.06 | |
2013 | | | 9.95 | | | | 0.22 | | | | 0.04 | | | | 0.26 | | | | | | | | (0.23 | ) | | | — | | | | — | | | | (0.23 | ) | | | 9.98 | |
| | | | | | | | | | | | | | | | | | | | | | | | | | | | | | | | | | |
| | | | Ratios/Supplemental Data | |
| | | | | | | | | | Ratios to Average
Net Assets Before
Waiver/Reimbursement | | | | | | Ratios to Average
Net Assets After
Waiver/Reimbursement(c) | | | | |
| | | | | | | | |
Total
Return(b) | | | Ending
Net
Assets
(000) | | | | | | Expenses | | | Net
Investment
Income
(Loss) | | | | | | Expenses | | | Net
Investment
Income
(Loss) | | | Portfolio
Turnover
Rate(d) | |
| | | | | | | | | | | | | | | | | | | | | | | | | | | | | | | | | | |
| | 1.39 | % | | $ | 92,967 | | | | | | | | 0.77 | % | | | 1.54 | % | | | | | | | 0.72 | % | | | 1.59 | % | | | 50 | % |
| | 1.04 | | | | 96,201 | | | | | | | | 0.76 | | | | 1.60 | | | | | | | | 0.72 | | | | 1.64 | | | | 43 | |
| | 0.32 | | | | 100,544 | | | | | | | | 0.73 | | | | 1.56 | | | | | | | | 0.71 | | | | 1.58 | | | | 43 | |
| | 2.69 | | | | 116,365 | | | | | | | | 0.73 | | | | 1.84 | | | | | | | | 0.71 | | | | 1.86 | | | | 43 | |
| | 2.30 | | | | 141,099 | | | | | | | | 0.73 | | | | 1.96 | | | | | | | | 0.71 | | | | 1.99 | | | | 42 | |
| | | | | | | | | | | | | | | | | | | | | | | | | | | | | | | | | | |
| | 0.59 | | | | 25,326 | | | | | | | | 1.52 | | | | 0.79 | | | | | | | | 1.47 | | | | 0.85 | | | | 50 | |
| | 0.25 | | | | 30,495 | | | | | | | | 1.51 | | | | 0.86 | | | | | | | | 1.47 | | | | 0.90 | | | | 43 | |
| | (0.36 | ) | | | 33,547 | | | | | | | | 1.48 | | | | 0.81 | | | | | | | | 1.46 | | | | 0.83 | | | | 43 | |
| | 1.89 | | | | 39,347 | | | | | | | | 1.48 | | | | 1.11 | | | | | | | | 1.46 | | | | 1.13 | | | | 43 | |
| | 1.61 | | | | 44,414 | | | | | | | | 1.48 | | | | 1.22 | | | | | | | | 1.46 | | | | 1.24 | | | | 42 | |
| | | | | | | | | | | | | | | | | | | | | | | | | | | | | | | | | | |
| | 1.08 | | | | 436 | | | | | | | | 1.02 | | | | 1.30 | | | | | | | | 0.97 | | | | 1.35 | | | | 50 | |
| | 0.74 | | | | 285 | | | | | | | | 1.01 | | | | 1.34 | | | | | | | | 0.97 | | | | 1.38 | | | | 43 | |
| | 0.02 | | | | 131 | | | | | | | | 0.98 | | | | 1.29 | | | | | | | | 0.96 | | | | 1.31 | | | | 43 | |
| | 2.38 | | | | 1,049 | | | | | | | | 0.98 | | | | 1.59 | | | | | | | | 0.96 | | | | 1.61 | | | | 43 | |
| | 2.10 | | | | 516 | | | | | | | | 0.98 | | | | 1.71 | | | | | | | | 0.96 | | | | 1.73 | | | | 42 | |
| | | | | | | | | | | | | | | | | | | | | | | | | | | | | | | | | | |
| | 1.63 | | | | 95,754 | | | | | | | | 0.48 | | | | 1.87 | | | | | | | | 0.42 | | | | 1.92 | | | | 50 | |
| | 1.29 | | | | 66,836 | | | | | | | | 0.47 | | | | 1.91 | | | | | | | | 0.43 | | | | 1.95 | | | | 43 | |
| | 0.96 | | | | 27,475 | | | | | | | | 0.46 | ** | | | 1.95 | ** | | | | | | | 0.43 | ** | | | 1.98 | ** | | | 43 | |
| | | | | | | | | | | | | | | | | | | | | | | | | | | | | | | | | | |
| | 1.63 | | | | 347,215 | | | | | | | | 0.52 | | | | 1.79 | | | | | | | | 0.47 | | | | 1.84 | | | | 50 | |
| | 1.29 | | | | 416,624 | | | | | | | | 0.51 | | | | 1.85 | | | | | | | | 0.47 | | | | 1.89 | | | | 43 | |
| | 0.57 | | | | 529,027 | | | | | | | | 0.48 | | | | 1.80 | | | | | | | | 0.46 | | | | 1.82 | | | | 43 | |
| | 2.93 | | | | 915,119 | | | | | | | | 0.48 | | | | 2.09 | | | | | | | | 0.46 | | | | 2.11 | | | | 43 | |
| | 2.65 | | | | 720,722 | | | | | | | | 0.48 | | | | 2.22 | | | | | | | | 0.46 | | | | 2.23 | | | | 42 | |
| (a) | Per share Net Investment Income (Loss) is calculated using the average daily shares method. | |
| (b) | Total return is the combination of changes in NAV without any sales charge, reinvested dividend income at NAV and reinvested capital gains distributions at NAV, if any. Total returns are not annualized. | |
| (c) | After fee waiver and/or expense reimbursement from the Adviser, where applicable. See Note 7 – Management Fees and Other Transactions with Affiliates, Management Fees for more information. | |
| (d) | Portfolio Turnover Rate is calculated based on the lesser of long-term purchases or sales (as disclosed in Note 5 – Investment Transactions) divided by the average long-term market value during the period. | |
| (e) | For the period January 20, 2015 (commencement of operations) through June 30, 2015. | |
| * | Rounds to less than $0.01 per share. | |
See accompanying notes to financial statements.
Financial Highlights (continued)
Strategic Income
Selected data for a share outstanding throughout each period:
| | | | | | | | | | | | | | | | | | | | | | | | | | | | | | | | | | | | | | | | |
| | | | | |
| | | | | | Investment Operations | | | | | | Less Distributions | | | | |
| | | | | | | | | | |
Class (Commencement Date) Year Ended June 30, | | Beginning
NAV | | | Net
Investment
Income
(Loss)(a) | | | Net
Realized/
Unrealized
Gain (Loss) | | | Total | | | | | | Net
Investment
Income | | | From
Accumulated
Net Realized
Gains | | | Return
of
Capital | | | Total | | | Ending
NAV | |
Class A (2/00) | | | | | | | | | | | | | | | | | | | | | | | | | | | | | | | | | | | | | | | | |
2017 | | $ | 10.52 | | | $ | 0.44 | | | $ | 0.22 | | | $ | 0.66 | | | | | | | $ | (0.29 | ) | | $ | — | | | $ | (0.24 | ) | | $ | (0.53 | ) | | $ | 10.65 | |
2016 | | | 10.97 | | | | 0.50 | | | | (0.42 | ) | | | 0.08 | | | | | | | | (0.53 | ) | | | — | | | | — | | | | (0.53 | ) | | | 10.52 | |
2015 | | | 11.60 | | | | 0.49 | | | | (0.58 | ) | | | (0.09 | ) | | | | | | | (0.54 | ) | | | — | | | | — | | | | (0.54 | ) | | | 10.97 | |
2014 | | | 11.02 | | | | 0.53 | | | | 0.59 | | | | 1.12 | | | | | | | | (0.54 | ) | | | — | | | | — | | | | (0.54 | ) | | | 11.60 | |
2013 | | | 10.83 | | | | 0.52 | | | | 0.16 | | | | 0.68 | | | | | | | | (0.49 | ) | | | — | | | | — | | | | (0.49 | ) | | | 11.02 | |
Class C (2/00) | | | | | | | | | | | | | | | | | | | | | | | | | | | | | | | | | | | | | | | | |
2017 | | | 10.46 | | | | 0.35 | | | | 0.23 | | | | 0.58 | | | | | | | | (0.21 | ) | | | — | | | | (0.24 | ) | | | (0.45 | ) | | | 10.59 | |
2016 | | | 10.90 | | | | 0.42 | | | | (0.41 | ) | | | 0.01 | | | | | | | | (0.45 | ) | | | — | | | | — | | | | (0.45 | ) | | | 10.46 | |
2015 | | | 11.52 | | | | 0.40 | | | | (0.57 | ) | | | (0.17 | ) | | | | | | | (0.45 | ) | | | — | | | | — | | | | (0.45 | ) | | | 10.90 | |
2014 | | | 10.94 | | | | 0.44 | | | | 0.60 | | | | 1.04 | | | | | | | | (0.46 | ) | | | — | | | | — | | | | (0.46 | ) | | | 11.52 | |
2013 | | | 10.76 | | | | 0.43 | | | | 0.16 | | | | 0.59 | | | | | | | | (0.41 | ) | | | — | | | | — | | | | (0.41 | ) | | | 10.94 | |
Class R3 (9/01) | | | | | | | | | | | | | | | | | | | | | | | | | | | | | | | | | | | | | | | | |
2017 | | | 10.56 | | | | 0.41 | | | | 0.23 | | | | 0.64 | | | | | | | | (0.27 | ) | | | — | | | | (0.24 | ) | | | (0.51 | ) | | | 10.69 | |
2016 | | | 11.01 | | | | 0.48 | | | | (0.42 | ) | | | 0.06 | | | | | | | | (0.51 | ) | | | — | | | | — | | | | (0.51 | ) | | | 10.56 | |
2015 | | | 11.64 | | | | 0.46 | | | | (0.57 | ) | | | (0.11 | ) | | | | | | | (0.52 | ) | | | — | | | | — | | | | (0.52 | ) | | | 11.01 | |
2014 | | | 11.05 | | | | 0.51 | | | | 0.60 | | | | 1.11 | | | | | | | | (0.52 | ) | | | — | | | | — | | | | (0.52 | ) | | | 11.64 | |
2013 | | | 10.88 | | | | 0.49 | | | | 0.15 | | | | 0.64 | | | | | | | | (0.47 | ) | | | — | | | | — | | | | (0.47 | ) | | | 11.05 | |
Class R6 (1/15) | | | | | | | | | | | | | | | | | | | | | | | | | | | | | | | | | | | | | | | | |
2017 | | | 10.52 | | | | 0.48 | | | | 0.23 | | | | 0.71 | | | | | | | | (0.32 | ) | | | — | | | | (0.24 | ) | | | (0.56 | ) | | | 10.67 | |
2016 | | | 10.96 | | | | 0.53 | | | | (0.41 | ) | | | 0.12 | | | | | | | | (0.56 | ) | | | — | | | | — | | | | (0.56 | ) | | | 10.52 | |
2015(e) | | | 11.22 | | | | 0.24 | | | | (0.25 | ) | | | (0.01 | ) | | | | | | | (0.25 | ) | | | — | | | | — | | | | (0.25 | ) | | | 10.96 | |
Class I (2/00) | | | | | | | | | | | | | | | | | | | | | | | | | | | | | | | | | | | | | | | | |
2017 | | | 10.51 | | | | 0.46 | | | | 0.24 | | | | 0.70 | | | | | | | | (0.32 | ) | | | — | | | | (0.24 | ) | | | (0.56 | ) | | | 10.65 | |
2016 | | | 10.96 | | | | 0.53 | | | | (0.42 | ) | | | 0.11 | | | | | | | | (0.56 | ) | | | — | | | | — | | | | (0.56 | ) | | | 10.51 | |
2015 | | | 11.59 | | | | 0.52 | | | | (0.58 | ) | | | (0.06 | ) | | | | | | | (0.57 | ) | | | — | | | | — | | | | (0.57 | ) | | | 10.96 | |
2014 | | | 11.01 | | | | 0.56 | | | | 0.59 | | | | 1.15 | | | | | | | | (0.57 | ) | | | — | | | | — | | | | (0.57 | ) | | | 11.59 | |
2013 | | | 10.83 | | | | 0.55 | | | | 0.15 | | | | 0.70 | | | | | | | | (0.52 | ) | | | — | | | | — | | | | (0.52 | ) | | | 11.01 | |
Class T (5/17)(f) | | | | | | | | | | | | | | | | | | | | | | | | | | | | | | | | | | | | | | | | |
2017(g) | | | 10.67 | | | | 0.03 | | | | (0.01 | ) | | | 0.02 | | | | | | | | — | | | | — | | | | (0.04 | ) | | | (0.04 | ) | | | 10.65 | |
| | | | | | | | | | | | | | | | | | | | | | | | | | | | | | | | | | |
| | | | Ratios/Supplemental Data | |
| | | | | | | | | | Ratios to Average
Net Assets Before
Waive/Reimbursement | | | | | | Ratios to Average
Net Assets After
Waive/Reimbursement(c) | | | | |
| | | | | | | | |
Total
Return(b) | | | Ending
Net
Assets
(000) | | | | | | Expenses | | | Net
Investment
Income
(Loss) | | | | | | Expenses | | | Net
Investment
Income
(Loss) | | | Portfolio
Turnover
Rate(d) | |
| | | | | | | | | | | | | | | | | | | | | | | | | | | | | | | | | | |
| | 6.43 | % | | $ | 137,072 | | | | | | | | 0.93 | % | | | 4.02 | % | | | | | | | 0.83 | % | | | 4.12 | % | | | 135 | % |
| | 0.94 | | | | 187,052 | | | | | | | | 0.92 | | | | 4.71 | | | | | | | | 0.83 | | | | 4.80 | | | | 56 | |
| | (0.80 | ) | | | 288,080 | | | | | | | | 0.92 | | | | 4.25 | | | | | | | | 0.82 | | | | 4.34 | | | | 47 | |
| | 10.46 | | | | 128,189 | | | | | | | | 0.91 | | | | 4.65 | | | | | | | | 0.84 | | | | 4.73 | | | | 50 | |
| | 6.25 | | | | 72,341 | | | | | | | | 0.90 | | | | 4.50 | | | | | | | | 0.84 | | | | 4.57 | | | | 69 | |
| | | | | | | | | | | | | | | | | | | | | | | | | | | | | | | | | | |
| | 5.63 | | | | 76,513 | | | | | | | | 1.68 | | | | 3.25 | | | | | | | | 1.58 | | | | 3.35 | | | | 135 | |
| | 0.20 | | | | 89,173 | | | | | | | | 1.67 | | | | 3.97 | | | | | | | | 1.58 | | | | 4.06 | | | | 56 | |
| | (1.50 | ) | | | 110,660 | | | | | | | | 1.67 | | | | 3.51 | | | | | | | | 1.57 | | | | 3.60 | | | | 47 | |
| | 9.59 | | | | 48,335 | | | | | | | | 1.66 | | | | 3.91 | | | | | | | | 1.59 | | | | 3.98 | | | | 50 | |
| | 5.50 | | | | 35,146 | | | | | | | | 1.65 | | | | 3.75 | | | | | | | | 1.59 | | | | 3.81 | | | | 69 | |
| | | | | | | | | | | | | | | | | | | | | | | | | | | | | | | | | | |
| | 6.17 | | | | 7,320 | | | | | | | | 1.18 | | | | 3.74 | | | | | | | | 1.08 | | | | 3.83 | | | | 135 | |
| | 0.70 | | | | 7,647 | | | | | | | | 1.17 | | | | 4.44 | | | | | | | | 1.08 | | | | 4.54 | | | | 56 | |
| | (1.01 | ) | | | 12,272 | | | | | | | | 1.17 | | | | 4.00 | | | | | | | | 1.07 | | | | 4.09 | | | | 47 | |
| | 10.19 | | | | 5,321 | | | | | | | | 1.16 | | | | 4.41 | | | | | | | | 1.09 | | | | 4.48 | | | | 50 | |
| | 5.89 | | | | 2,926 | | | | | | | | 1.15 | | | | 4.27 | | | | | | | | 1.09 | | | | 4.34 | | | | 69 | |
| | | | | | | | | | | | | | | | | | | | | | | | | | | | | | | | | | |
| | 6.86 | | | | 8,995 | | | | | | | | 0.60 | | | | 4.35 | | | | | | | | 0.51 | | | | 4.45 | | | | 135 | |
| | 1.28 | | | | 33,372 | | | | | | | | 0.60 | | | | 5.07 | | | | | | | | 0.50 | | | | 5.17 | | | | 56 | |
| | (0.10 | ) | | | 20,498 | | | | | | | | 0.61 | * | | | 4.70 | * | | | | | | | 0.50 | * | | | 4.81 | * | | | 47 | |
| | | | | | | | | | | | | | | | | | | | | | | | | | | | | | | | | | |
| | 6.77 | | | | 540,368 | | | | | | | | 0.68 | | | | 4.22 | | | | | | | | 0.58 | | | | 4.32 | | | | 135 | |
| | 1.19 | | | | 475,536 | | | | | | | | 0.67 | | | | 4.95 | | | | | | | | 0.58 | | | | 5.05 | | | | 56 | |
| | (0.54 | ) | | | 773,719 | | | | | | | | 0.67 | | | | 4.48 | | | | | | | | 0.57 | | | | 4.57 | | | | 47 | |
| | 10.77 | | | | 612,214 | | | | | | | | 0.66 | | | | 4.92 | | | | | | | | 0.59 | | | | 5.00 | | | | 50 | |
| | 6.42 | | | | 517,292 | | | | | | | | 0.65 | | | | 4.75 | | | | | | | | 0.59 | | | | 4.81 | | | | 69 | |
| | | | | | | | | | | | | | | | | | | | | | | | | | | | | | | | | | |
| | 0.23 | | | | 25 | | | | | | | | 0.92 | * | | | 3.40 | * | | | | | | | 0.83 | * | | | 3.50 | * | | | 135 | |
| (a) | Per share Net Investment Income (Loss) is calculated using the average daily shares method. | |
| (b) | Total return is the combination of changes in NAV without any sales charge, reinvested dividend income at NAV and reinvested capital gains distributions at NAV, if any. Total returns are not annualized. | |
| (c) | After fee waiver and/or expense reimbursement from the Adviser, where applicable. See Note 7 – Management Fees and Other Transactions with Affiliates, Management Fees for more information. | |
| (d) | Portfolio Turnover Rate is calculated based on the lesser of long-term purchases or sales (as disclosed in Note 5 – Investment Transactions) divided by the average long-term market value during the period. | |
| (e) | For the period January 20, 2015 (commencement of operations) through June 30, 2015. | |
| (f) | Class T Shares are not available for public offering. | |
| (g) | For the period May 31, 2017 (commencement of operations) through June 30, 2017. | |
See accompanying notes to financial statements.
Notes to
Financial Statements
1. General Information and Significant Accounting Policies
General Information
Trust and Fund Information
Nuveen Investment Funds, Inc. (the “Trust”) is an open-end management investment company registered under the Investment Company Act of 1940, as amended. The Trust is comprised of Nuveen Core Bond Fund (“Core Bond”), Nuveen Core Plus Bond Fund (“Core Plus Bond”), Nuveen High Income Bond Fund (“High Income Bond”), Nuveen Inflation Protected Securities Fund (“Inflation Protected Securities”), Nuveen Intermediate Government Bond Fund (“Intermediate Government Bond”), Nuveen Short Term Bond Fund (“Short Term Bond”) and Nuveen Strategic Income Fund (“Strategic Income”) (each a “Fund” and collectively, the “Funds”), as diversified funds, among others. The Trust was incorporated in the State of Maryland on August 20, 1987.
The end of the reporting period for the Funds is June 30, 2017, and the period covered by these Notes to Financial Statements is the fiscal year ended June 30, 2017 (the “current fiscal period”).
Investment Adviser
The Funds’ investment adviser is Nuveen Fund Advisors, LLC (the “Adviser”), a subsidiary of Nuveen, LLC (“Nuveen”). Nuveen is the investment management arm of Teachers Insurance and Annuity Association of America (TIAA). The Adviser has overall responsibility for management of the Funds, overseas the management of the Fund’s portfolios, manages the Fund’s business affairs and provides certain clerical, bookkeeping and other administrative services, and, if necessary, asset allocation decisions. The Adviser has entered into sub-advisory agreements with Nuveen Asset Management, LLC (the “Sub-Adviser”), a subsidiary of the Adviser, under which the Sub-Adviser manages the investment portfolios of the Funds.
Investment Objectives
Core Bond’s investment objective is to provide investors with current income to the extent consistent with preservation of capital. Core Plus Bond’s investment objective is to provide investors with high current income consistent with limited risk to capital. High Income Bond’s investment objective is to provide investors with a high level of current income. Inflation Protected Securities’ investment objective is to provide investors with total return while providing protection against inflation. Intermediate Government Bond’s investment objective is to provide investors with current income to the extent consistent with the preservation of capital. Short Term Bond’s investment objective is to provide investors with current income while maintaining a high degree of principal stability. Strategic Income’s investment objective is to provide investors with total return.
The Funds’ most recent prospectus provides further descriptions of each Fund’s investment objective, principal investment strategies and principal risks.
Significant Accounting Policies
Each Fund is an investment company and follows accounting and reporting guidance under Financial Accounting Standards Board (FASB) Accounting Standards Codification (ASC) Topic 946 “Financial Services – Investment Companies.” The following is a summary of significant accounting policies followed by the Funds in the preparation of their financial statements in accordance with accounting principles generally accepted in the United States of America (“U.S. GAAP”).
Investment Transactions
Investment transactions are recorded on a trade date basis. Realized gains and losses from investment transactions are determined on the specific identification method, which is the same basis used for federal income tax purposes. Investments purchased on a when-issued/delayed delivery basis may have extended settlement periods. Any investments so purchased are subject to market fluctuation during this period. The Funds have earmarked securities in their portfolios with a current value at least equal to the amount of the when-issued/delayed delivery purchase commitments.
As of the end of the reporting period, the following Funds’ outstanding when-issued/delayed delivery purchase commitments were as follows:
| | | | | | | | | | | | | | | | |
| | | Core Plus
Bond | | | High Income
Bond | | | Inflation
Protected
Securities | | | Strategic
Income | |
| Outstanding when-issued/delayed delivery purchase commitments | | $ | 19,309,762 | | | $ | 5,200,000 | | | $ | 5,640,000 | | | $ | 85,020,485 | |
Investment Income
Dividend income is recorded on the ex-dividend date or, for foreign securities, when information is available. Interest income, which reflects the amortization of premiums and includes accretion of discounts for financial reporting purposes, is recorded on an accrual basis. Interest income also
reflects paydown gains and losses, if any. Securities lending income is comprised of fees earned from borrowers and income earned on cash collateral investments, net of lending agent fees.
Professional Fees
Professional fees presented on the Statement of Operations consist of legal fees incurred in the normal course of operations, audit fees, tax consulting fees and, in some cases, workout expenditures. Workout expenditures are incurred in an attempt to protect or enhance an investment or to pursue other claims or legal actions on behalf of Fund shareholders. If a refund is received for workout expenditures paid in a prior reporting period, such amounts will be recognized as “Legal fee refund” on the Statement of Operations.
Dividends and Distributions to Shareholders
Dividends from net investment income, if any, are declared daily and distributed to shareholders monthly. Fund shares begin to accrue dividends on the business day after the day when the monies used to purchase Fund shares are collected by the transfer agent.
Net realized capital gains from investment transactions, if any, are declared and distributed to shareholders at least annually. Furthermore, capital gains are distributed only to the extent they exceed available capital loss carryforwards.
Distributions to shareholders are recorded on the ex-dividend date. The amount and timing of distributions are determined in accordance with federal income tax regulations, which may differ from U.S. GAAP.
Share Classes and Sales Charges
Class A Shares are generally sold with an up-front sales charge and incur a 0.25% annual 12b-1 service fee. Class A Share purchases of the Funds, with the exception of Short Term Bond, of $1 million or more are sold at net asset value (“NAV”) without an up-front sales charge. Class A Share purchases of Short Term Bond of $250,000 or more are sold at NAV without an up-front sales charge. Class A Share purchases may be subject to a contingent deferred sales charge (“CDSC”) equal to 1% if redeemed within eighteen months of purchase. Class C Shares are sold without an up-front sales charge but incur a 0.75% annual 12b-1 distribution fee and a 0.25% annual 12b-1 service fee. Class C Shares are subject to a CDSC of 1% if redeemed within twelve months of purchase. Class R3 Shares are sold without an up-front sales charge but incur a 0.25% annual 12b-1 distribution fee and a 0.25% annual 12b-1 service fee. Class R6 Shares and Class I Shares are not subject to any sales charge or 12b-1 distribution or service fees. Class T Shares are generally sold with an up-front sales charge and incur a 0.25% annual 12b-1 service fee.
Multiclass Operations and Allocations
Income and expenses of the Funds that are not directly attributable to a specific class of shares are prorated among the classes based on the relative settled shares of each class. Expenses directly attributable to a class of shares are recorded to the specific class. Currently, the only expenses that are allocated on a class-specific basis are 12b-1 distribution and service fees.
Sub-transfer agent fees and similar fees, which are recognized as a component of “Shareholder servicing agent fees” on the Statement of Operations, are not charged to Class R6 Shares and are prorated among the other classes based on their relative net assets.
Realized and unrealized capital gains and losses of the Funds are prorated among the classes based on the relative net assets of each class.
Compensation
The Fund pays no compensation directly to those of its trustees who are affiliated with the Adviser or to its officers, all of whom receive remuneration for their services to the Trust from the Adviser or its affiliates. The Funds’ Board of Directors (the “Board”) has adopted a deferred compensation plan for independent directors that enables directors to elect to defer receipt of all or a portion of the annual compensation they are entitled to receive from certain Nuveen-advised funds. Under the plan, deferred amounts are treated as though equal dollar amounts had been invested in shares of select Nuveen-advised funds.
Indemnifications
Under the Trust’s organizational documents, its officers and directors are indemnified against certain liabilities arising out of the performance of their duties to the Trust. In addition, in the normal course of business, the Trust enters into contracts that provide general indemnifications to other parties. The Trust’s maximum exposure under these arrangements is unknown as this would involve future claims that may be made against the Trust that have not yet occurred. However, the Trust has not had prior claims or losses pursuant to these contracts and expects the risk of loss to be remote.
Netting Agreements
In the ordinary course of business, the Funds may enter into transactions subject to enforceable International Swaps and Derivative Association, Inc. (“ISDA”) master agreements or other similar arrangements (“netting agreements”). Generally, the right to offset in netting agreements allows each Fund to offset certain securities and derivatives with a specific counterparty, when applicable, as well as any collateral received or delivered to that counterparty based on the terms of the agreements. Generally, each Fund manages its cash collateral and securities collateral on a counterparty basis.
The Funds’ investments subject to netting agreements as of the end of the reporting period, if any, are further described in Note 3 – Portfolio Securities and Investments in Derivatives.
Notes to Financial Statements (continued)
Use of Estimates
The preparation of financial statements in conformity with U.S. GAAP requires management to make estimates and assumptions that affect the reported amounts of assets and liabilities at the date of the financial statements and the reported amounts of increases and decreases in net assets from operations during the current fiscal period. Actual results may differ from those estimates.
2. Investment Valuation and Fair Value Measurements
The fair valuation input levels as described below are for fair value measurement purposes.
Fair value is defined as the price that would be received upon selling an investment or transferring a liability in an orderly transaction to an independent buyer in the principal or most advantageous market for the investment. A three-tier hierarchy is used to maximize the use of observable market data and minimize the use of unobservable inputs and to establish classification of fair value measurements for disclosure purposes. Observable inputs reflect the assumptions market participants would use in pricing the asset or liability. Observable inputs are based on market data obtained from sources independent of the reporting entity. Unobservable inputs reflect the reporting entity’s own assumptions about the assumptions market participants would use in pricing the asset or liability. Unobservable inputs are based on the best information available in the circumstances. The following is a summary of the three-tiered hierarchy of valuation input levels.
| | |
| Level 1 – | | Inputs are unadjusted and prices are determined using quoted prices in active markets for identical securities. |
| Level 2 – | | Prices are determined using other significant observable inputs (including quoted prices for similar securities, interest rates, prepayment speeds, credit risk, etc.). |
| Level 3 – | | Prices are determined using significant unobservable inputs (including management’s assumptions in determining the fair value of investments). |
Common stocks and other equity-type securities are valued at the last sales price on the securities exchange on which such securities are primarily traded and are generally classified as Level 1. Securities primarily traded on the NASDAQ National Market (“NASDAQ”) are valued at the NASDAQ Official Closing Price and are generally classified as Level 1. However, securities traded on a securities exchange or NASDAQ for which there were no transactions on a given day or securities not listed on a securities exchange or NASDAQ are valued at the quoted bid price and are generally classified as Level 2.
Investments in investment companies are valued at their respective NAVs on the valuation date and are generally classified as Level 1.
Prices of fixed-income securities are provided by an independent pricing service (“pricing service”) approved by the Board. The pricing service establishes a security’s fair value using methods that may include consideration of the following: yields or prices of investments of comparable quality, type of issue, coupon, maturity and rating, market quotes or indications of value from security dealers, evaluations of anticipated cash flows or collateral, general market conditions and other information and analysis, including the obligor’s credit characteristics considered relevant. These securities are generally classified as Level 2. In pricing certain securities, particularly less liquid and lower quality securities, the pricing service may consider information about a security, its issuer or market activity, provided by the Adviser. These securities are generally classified as Level 2 or Level 3 depending on the observability of the significant inputs.
Like most fixed-income securities, the senior and subordinated loans in which the Fund invests are not listed on an organized exchange. The secondary market of such investments may be less liquid relative to markets for other fixed-income securities. Consequently, the value of senior and subordinated loans, determined as described above, may differ significantly from the value that would have been determined had there been an active market for that senior loan. These securities are generally classified as Level 2.
Prices of forward foreign currency exchange contracts and swap contracts are also provided by a pricing service approved by the Board using the same methods as described above and are generally classified as Level 2.
Futures contracts are valued using the closing settlement price or, in the absence of such a price, the last traded price and are generally classified as Level 1.
The value of exchange-traded options are based on the mean of the closing bid and ask prices and are generally classified as Level 1. Options traded in the over-the-counter market are valued using an evaluated mean price and generally classified as Level 2.
Investments initially valued in currencies other than the U.S. dollar are converted to the U.S. dollar using exchange rates obtained from pricing services. As a result, the NAV of the Funds’ shares may be affected by changes in the value of currencies in relation to the U.S. dollar. The value of securities traded in markets outside the United States or denominated in currencies other than the U.S. dollar may be affected significantly on a day that the New York Stock Exchange is closed and an investor is not able to purchase, redeem or exchange shares. If significant market events occur between the time of determination of the closing price of a foreign security on an exchange and the time that the Funds’ NAV is determined, or if under the Funds’ procedures, the closing price of a foreign security is not deemed to be reliable, the security would be valued at fair value as determined in accordance with procedures established in good faith by the Board. These securities are generally classified as Level 2 or Level 3 depending on the observability of the significant inputs.
Certain securities may not be able to be priced by the pre-established pricing methods as described above. Such securities may be valued by the Board and/or its appointee at fair value. These securities generally include, but are not limited to, restricted securities (securities which may not be publicly sold without registration under the Securities Act of 1933, as amended) for which a pricing service is unable to provide a market price; securities whose trading has been formally suspended; debt securities that have gone into default and for which there is no current market quotation; a security whose market price is not available from a pre-established pricing source; a security with respect to which an event has occurred that is likely to
materially affect the value of the security after the market has closed but before the calculation of a Fund’s NAV (as may be the case in non-U.S. markets on which the security is primarily traded) or make it difficult or impossible to obtain a reliable market quotation; and a security whose price, as provided by the pricing service, is not deemed to reflect the security’s fair value. As a general principle, the fair value of a security would appear to be the amount that the owner might reasonably expect to receive for it in a current sale. A variety of factors may be considered in determining the fair value of such securities, which may include consideration of the following: yields or prices of investments of comparable quality, type of issue, coupon, maturity and rating, market quotes or indications of value from security dealers, evaluations of anticipated cash flows or collateral, general market conditions and other information and analysis, including the obligor’s credit characteristics considered relevant. These securities are generally classified as Level 2 or Level 3 depending on the observability of the significant inputs. Regardless of the method employed to value a particular security, all valuations are subject to review by the Board and/or its appointee.
The inputs or methodologies used for valuing securities are not an indication of the risks associated with investing in those securities. The following is a summary of each Fund’s fair value measurements as of the end of the reporting period:
| | | | | | | | | | | | | | | | |
| Core Bond | | Level 1 | | | Level 2 | | | Level 3 | | | Total | |
| Long-Term Investments*: | | | | | | | | | | | | | | | | |
Corporate Bonds | | $ | — | | | $ | 66,156,413 | | | $ | — | | | $ | 66,156,413 | |
$1,000 Par (or similar) Institutional Preferred | | | — | | | | 703,850 | | | | — | | | | 703,850 | |
U.S. Government and Agency Obligations | | | — | | | | 10,054,655 | | | | — | | | | 10,054,655 | |
Asset-Backed and Mortgage-Backed Securities | | | — | | | | 61,496,791 | | | | — | | | | 61,496,791 | |
| Investments Purchased with Collateral from Securities Lending | | | 768,400 | | | | — | | | | — | | | | 768,400 | |
| Short-Term Investments: | | | | | | | | | | | | | | | | |
Money Market Funds | | | 3,740,769 | | | | — | | | | — | | | | 3,740,769 | |
| Investments in Derivatives: | | | | | | | | | | | | | | | | |
Futures Contracts** | | | 191,670 | | | | — | | | | — | | | | 191,670 | |
| Total | | $ | 4,700,839 | | | $ | 138,411,709 | | | $ | — | | | $ | 143,112,548 | |
| | | | |
| Core Plus Bond | | | | | | | | | | | | |
| Long-Term Investments*: | | | | | | | | | | | | | | | | |
Corporate Bonds | | $ | — | | | $ | 190,359,517 | | | $ | — | | | $ | 190,359,517 | |
$1,000 Par (or similar) Institutional Preferred | | | — | | | | 20,950,232 | | | | — | | | | 20,950,232 | |
Contingent Capital Securities | | | — | | | | 5,387,822 | | | | — | | | | 5,387,822 | |
Municipal Bonds | | | — | | | | 865,342 | | | | — | | | | 865,432 | |
Asset-Backed and Mortgage-Backed Securities | | | — | | | | 128,991,700 | | | | — | | | | 128,991,700 | |
Sovereign Debt | | | — | | | | 9,833,884 | | | | — | | | | 9,833,884 | |
| Investments Purchased with Collateral from Securities Lending | | | 8,787,463 | | | | — | | | | — | | | | 8,787,463 | |
| Short-Term Investments: | | | | | | | | | | | | | | | | |
Money Market Funds | | | 18,106,253 | | | | — | | | | — | | | | 18,106,253 | |
| Investments in Derivatives: | | | | | | | | | | | | | | | | |
Forward Foreign Currency Exchange Contracts** | | | — | | | | (194,791 | ) | | | — | | | | (194,791 | ) |
Credit Default Swaps** | | | — | | | | (3,126 | ) | | | — | | | | (3,126 | ) |
Futures Contracts** | | | 212,543 | | | | — | | | | — | | | | 212,543 | |
Options purchased | |
| 2,953
|
| | | — | | | | — | | | | 2,953 | |
| Total | | $ | 27,109,212 | | | | 356,190,580 | | | $ | — | | | $ | 383,299,792 | |
| | | | |
| High Income Bond | | | | | | | | | | | | |
| Long-Term Investments*: | | | | | | | | | | | | | | | | |
Common Stocks | | $ | 5,038,703 | | | $ | 5,153 | *** | | $ | 63,800 | *** | | $ | 5,107,656 | |
Convertible Preferred Securities | | | 3,607,943 | | | | 416,875 | *** | | | — | | | | 4,024,818 | |
Variable Rate Senior Loan Interests | | | — | | | | 11,624,173 | | | | — | | | | 11,624,173 | |
$25 Par (or similar) Retail Preferred | | | 5,776,543 | | | | 1,590,600 | *** | | | — | | | | 7,367,143 | |
Corporate Bonds | | | — | | | | 309,821,340 | | | | — | **** | | | 309,821,340 | |
$1,000 Par (or similar) Institutional Preferred | | | — | | | | 11,155,000 | | | | — | | | | 11,155,000 | |
Contingent Capital Securities | | | — | | | | 10,423,946 | | | | — | | | | 10,423,946 | |
Asset-Backed Securities | | | — | | | | 138 | | | | — | | | | 138 | |
Investment Companies | | | 8,502,373 | | | | — | | | | — | | | | 8,502,373 | |
Warrants | | | — | | | | 576 | *** | | | — | **** | | | 576 | |
| Investments Purchased with Collateral from Securities Lending | | | 47,531,423 | | | | — | | | | — | | | | 47,531,423 | |
| Short-Term Investments: | | | | | | | | | | | | | | | | |
Money Market Funds | | | 11,297,772 | | | | — | | | | — | | | | 11,297,772 | |
| Investments in Derivatives: | | | | | | | | | | | | | | | | |
Forward Foreign Currency Exchange Contracts** | | | — | | | | (182,075 | ) | | | — | | | | (182,075 | ) |
Futures Contracts** | | | (2,863 | ) | | | — | | | | — | | | | (2,863 | ) |
| Total | | $ | 81,751,894 | | | $ | 344,855,726 | | | $ | 63,800 | | | $ | 426,671,420 | |
| * | Refer to the Fund’s Portfolio of Investments for industry, state and/or country classifications, where applicable. |
| ** | Represents net unrealized appreciation (depreciation) as reported in the Fund’s Portfolio of Investments. |
| *** | Refer to the Fund’s Portfolio of Investments for securities classified as Level 2 and/or Level 3. |
| **** | Refer to the Fund’s Portfolio of Investments for securities classified as Level 3. Value equals zero as of the end of the reporting period. |
Notes to Financial Statements (continued)
| | | | | | | | | | | | | | | | |
| Inflation Protected Securities | | Level 1 | | | Level 2 | | | Level 3 | | | Total | |
| Long-Term Investments*: | | | | | | | | | | | | | | | | |
Convertible Preferred Securities | | $ | 252,398 | | | $ | — | | | $ | — | | | $ | 252,398 | |
Corporate Bonds | | | — | | | | 22,620,453 | | | | — | | | | 22,620,453 | |
Municipal Bonds | | | — | | | | 1,249,800 | | | | — | | | | 1,249,800 | |
U.S. Government and Agency Obligations | | | — | | | | 529,719,961 | | | | — | | | | 529,719,961 | |
Asset-Backed and Mortgage-Backed Securities | | | — | | | | 38,244,937 | | | | — | | | | 38,244,937 | |
Sovereign Debt | | | — | | | | 4,824,460 | | | | — | | | | 4,824,460 | |
| Investments Purchased with Collateral from Securities Lending | | | 1,844,888 | | | | — | | | | — | | | | 1,844,888 | |
| Short-Term Investments: | | | | | | | | | | | | | | | | |
Money Market Funds | | | 8,148,259 | | | | — | | | | — | | | | 8,148,259 | |
| Investments in Derivatives: | | | | | | | | | | | | | | | | |
Futures Contracts** | | | 249,415 | | | | — | | | | — | | | | 249,415 | |
| Total | | $ | 10,494,960 | | | $ | 596,659,611 | | | $ | — | | | $ | 607,154,571 | |
| | | | |
| Intermediate Government Bond | | | | | | | | | | | | |
| Long-Term Investments*: | | | | | | | | | | | | | | | | |
Municipal Bonds | | $ | — | | | $ | 2,237,913 | | | $ | — | | | $ | 2,237,913 | |
U.S. Government and Agency Obligations | | | — | | | | 38,385,466 | | | | — | | | | 38,385,466 | |
Asset-Backed and Mortgage-Backed Securities | | | — | | | | 11,254,962 | | | | — | | | | 11,254,962 | |
| Investments Purchased with Collateral from Securities Lending | | | 328,063 | | | | — | | | | — | | | | 328,063 | |
| Short-Term Investments: | | | | | | | | | | | | | | | | |
Money Market Funds | | | 274,447 | | | | — | | | | — | | | | 274,447 | |
| Investments in Derivatives: | | | | | | | | | | | | | | | | |
Futures Contracts** | | | 22,823 | | | | — | | | | — | | | | 22,823 | |
| Total | | $ | 625,333 | | | $ | 51,878,341 | | | $ | — | | | $ | 52,503,674 | |
| | | | |
| Short Term Bond | | | | | | | | | | | | |
| Long-Term Investments*: | | | | | | | | | | | | | | | | |
Corporate Bonds | | $ | — | | | $ | 258,918,790 | | | $ | — | | | $ | 258,918,790 | |
Municipal Bonds | | | — | | | | 5,415,704 | | | | — | | | | 5,415,704 | |
U.S. Government and Agency Obligations | | | — | | | | 49,366,536 | | | | — | | | | 49,366,536 | |
Asset-Backed and Mortgage-Backed Securities | | | — | | | | 236,070,276 | | | | — | | | | 236,070,276 | |
| Investments Purchased with Collateral from Securities Lending | | | 2,658,212 | | | | — | | | | — | | | | 2,658,212 | |
| Short-Term Investments: | | | | | | | | | | | | | | | | |
Money Market Funds | | | 24,846,144 | | | | — | | | | — | | | | 24,846,144 | |
| Investments in Derivatives: | | | | | | | | | | | | | | | | |
Futures Contracts** | | | 30,243 | | | | — | | | | — | | | | 30,243 | |
| Total | | $ | 27,534,599 | | | $ | 549,771,306 | | | $ | — | | | $ | 577,305,905 | |
| | | | |
| Strategic Income | | | | | | | | | | | | |
| Long-Term Investments*: | | | | | | | | | | | | | | | | |
Common Stocks | | $ | 774,170 | | | $ | — | | | $ | 5,993 | *** | | $ | 780,163 | |
Convertible Preferred Securities | | | 239,000 | | | | 71,875 | *** | | | — | | | | 310,875 | |
Variable Rate Senior Loan Interests | | | — | | | | 5,556,906 | | | | — | | | | 5,556,906 | |
$25 Par (or similar) Retail Preferred | | | — | | | | 2,249,907 | *** | | | — | | | | 2,249,907 | |
Corporate Bonds | | | — | | | | 446,475,966 | | | | — | | | | 446,475,966 | |
Municipal Bonds | | | — | | | | 1,788,374 | | | | — | | | | 1,788,374 | |
$1,000 Par (or similar) Institutional Preferred | | | — | | | | 48,391,193 | | | | — | | | | 48,391,193 | |
Contingent Capital Securities | | | — | | | | 22,769,208 | | | | — | | | | 22,769,208 | |
Asset-Backed and Mortgage-Backed Securities | | | — | | | | 184,052,641 | | | | — | | | | 184,052,641 | |
Sovereign Debt | | | — | | | | 40,451,068 | | | | — | | | | 40,451,068 | |
| Investments Purchased with Collateral from Securities Lending | | | 25,533,148 | | | | — | | | | — | | | | 25,533,148 | |
| Short-Term Investments: | | | | | | | | | | | | | | | | |
Money Market Funds | | | 85,819,945 | | | | — | | | | — | | | | 85,819,945 | |
| Investments in Derivatives: | | | | | | | | | | | | | | | | |
Forward Foreign Currency Exchange Contracts** | | | — | | | | (944,011 | ) | | | — | | | | (944,011 | ) |
Credit Default Swaps** | | | — | | | | (540,428 | ) | | | — | | | | (540,428 | ) |
Futures Contracts** | | | 1,017,754 | | | | — | | | | — | | | | 1,017,754 | |
Options purchased | | | 12,844 | | | | — | | | | — | | | | 12,844 | |
| Total | | $ | 113,396,861 | | | $ | 750,322,699 | | | $ | 5,993 | | | $ | 863,725,553 | |
| * | Refer to the Fund’s Portfolio of Investments for industry, state and/or country classifications, where applicable. |
| ** | Represents net unrealized appreciation (depreciation) as reported in the Fund’s Portfolio of Investments. |
| *** | Refer to the Fund’s Portfolio of Investments for securities classified as Level 2 and/or Level 3. |
The Board is responsible for the valuation process and has appointed the oversight of the daily valuation process to the Adviser’s Valuation Committee. The Valuation Committee, pursuant to the valuation policies and procedures adopted by the Board, is responsible for making fair value determinations, evaluating the effectiveness of the Funds’ pricing policies and reporting to the Board. The Valuation Committee is aided in its efforts by the Adviser’s dedicated Securities Valuation Team, which is responsible for administering the daily valuation process and applying fair value methodologies as approved by the Valuation Committee. When determining the reliability of independent pricing services for investments owned by the Funds, the Valuation Committee, among other things, conducts due diligence reviews of the pricing services and monitors the quality of security prices received through various testing reports conducted by the Securities Valuation Team.
The Valuation Committee will consider pricing methodologies it deems relevant and appropriate when making a fair value determination, based on the facts and circumstances specific to the portfolio instrument. Fair value determinations generally will be derived as follows, using public or private market information:
| | (i) | If available, fair value determinations shall be derived by extrapolating from recent transactions or quoted prices for identical or comparable securities. |
| | (ii) | If such information is not available, an analytical valuation methodology may be used based on other available information including, but not limited to: analyst appraisals, research reports, corporate action information, issuer financial statements and shelf registration statements. Such analytical valuation methodologies may include, but are not limited to: multiple of earnings, discount from market value of a similar freely-traded security, discounted cash flow analysis, book value or a multiple thereof, risk premium/yield analysis, yield to maturity and/or fundamental investment analysis. |
The purchase price of a portfolio instrument will be used to fair value the instrument only if no other valuation methodology is available or deemed appropriate, and it is determined that the purchase price fairly reflects the instrument’s current value.
For each portfolio security that has been fair valued pursuant to the policies adopted by the Board, the fair value price is compared against the last available and next available market quotations. The Valuation Committee reviews the results of such testing and fair valuation occurrences are reported to the Board.
3. Portfolio Securities and Investments in Derivatives
Portfolio Securities
Foreign Currency Transactions
To the extent that the Funds may invest in securities and/or contracts that are denominated in a currency other than U.S. dollars, the Funds will be subject to currency risk, which is the risk that an increase in the U.S. dollar relative to the foreign currency will reduce returns or portfolio value. Generally, when the U.S. dollar rises in value against a foreign currency, the Funds’ investments denominated in that currency will lose value because their currency is worth fewer U.S. dollars; the opposite effect occurs if the U.S. dollar falls in relative value. Investments and other assets and liabilities denominated in foreign currencies are converted into U.S. dollars on a spot (i.e. cash) basis at the spot rate prevailing in the foreign currency exchange market at the time of valuation. Purchases and sales of investments and income denominated in foreign currencies are translated into U.S. dollars on the respective dates of such transactions.
The books and records of the Funds are maintained in U.S. dollars. Foreign currencies, assets and liabilities are translated into U.S. dollars at 4:00 p.m. Eastern Time. Investment transactions, income and expenses are translated on the respective dates of such transactions. Net realized foreign currency gains and losses resulting from changes in exchange rates include foreign currency gains and losses between trade date and settlement date of the transactions, foreign currency transactions and the difference between the amounts of interest and dividends recorded on the books of the Funds and the amounts actually received.
The realized gains and losses resulting from changes in foreign currency exchange rates and changes in foreign exchange rates associated with (i) foreign currency, (ii) investments, (iii) investments in derivatives and (iv) other assets and liabilities are recognized as a component of “Net realized gain (loss) from investments and foreign currency” on the Statement of Operations, when applicable.
The unrealized gains and losses resulting from changes in foreign currency exchange rates and changes in foreign exchange rates associated with (i) investments and (ii) other assets and liabilities are recognized as a component of “Change in net unrealized appreciation (depreciation) of investments and foreign currency” on the Statement of Operations, when applicable. The unrealized gains and losses resulting from changes in foreign exchange rates associated with investments in derivatives are recognized as a component of the respective derivative’s related “Change in net unrealized appreciation (depreciation)” on the Statement of Operations, when applicable.
Inflation-Indexed Bonds
Inflation-indexed bonds are fixed-income securities whose principal value is periodically adjusted to the rate of inflation. The interest rate on these bonds is generally fixed at issuance at a rate lower than typical bonds. Over the life of an inflation-indexed bond however, interest will be paid based on a principal value which is adjusted for inflation. Any increase in the principal amount of an inflation-indexed bond is recognized as a component of “Interest income” on the Statement of Operations, even though investors do not receive their principal until maturity.
Notes to Financial Statements (continued)
Securities Lending
In order to generate additional income, each Fund may lend securities representing up to one-third of the value of its total assets (which includes collateral for securities on loan) to broker-dealers, banks or other institutions. When loaning securities, the Funds retain the benefits of owning the securities, including the economic equivalent of dividends or interest generated by the security. The Funds also have the ability to recall the securities on loan at any time.
Each Fund’s policy is to receive, at the inception of a loan, cash collateral equal to at least 102% of the value of securities loaned, which is recognized as “Payable for collateral from securities lending program” on the Statement of Assets and Liabilities. Collateral for securities on loan is invested in a money market fund, which is recognized as “Investments purchased with collateral from securities lending, at value” on the Statement of Assets and Liabilities. The market value of the securities loaned is determined at the close of each business day in order to determine the adequacy of the collateral. If the value of the securities on loan increases such that the level of collateralization falls below 100%, additional collateral is received from the borrower on the next business day, which is recognized as “Due from broker” on the Statement of Assets and Liabilities.
Securities out on loan are subject to termination at any time at the option of the borrower or the Fund. Upon termination, the borrower is required to return to the Fund securities identical to the securities loaned. Generally, in the event the borrower defaults on its obligation to return the loaned securities, the Fund has the right to use the collateral to acquire identical securities. In the event the Fund is delayed or prevented from exercising its right to dispose of the collateral, there may be a loss to the Fund. Under each Fund’s securities lending agreement, however, the securities lending agent has indemnified the Fund against losses resulting from borrower default, except to the extent that those losses result from a decrease in the value of the collateral due to its investment by the Fund. The Fund bears the risk of loss with respect to the investment of collateral.
The Funds’ custodian, U.S. Bank National Association, serves as its securities lending agent. Each Fund pays the custodian a fee based on its proportional share of the custodian’s expense of operating its securities lending program. Income earned from the securities lending program is paid to the Fund, net of any fees paid. Income from securities lending, net of fees paid, is recognized as “Securities lending income, net” on the Statement of Operations.
The following table presents the securities out on loan for the Funds, and the collateral delivered related to those securities, as of the end of the reporting period.
| | | | | | | | | | | | | | |
| Fund | | Asset Class out on Loan | | Long-Term Investments, at Value | | | Collateral Pledged (From) Counterparty* | | | Net Exposure | |
| Core Bond | | | | | | | | | | | | | | |
| | Corporate Bonds | | $ | 683,597 | | | $ | (683,597 | ) | | $ | — | |
| | | U.S. Government and Agency Obligations | | | 60,407 | | | | (60,407 | ) | | | — | |
Total | | | | $ | 744,004 | | | $ | (744,004 | ) | | $ | — | |
| Core Plus Bond | | | | | | | | | | | | | | |
| | Corporate Bonds | | $ | 5,949,110 | | | $ | (5,949,110 | ) | | $ | — | |
| | | $1,000 Par (or Similar) Institutional Preferred | | | 2,488,472 | | | | (2,488,472 | ) | | | — | |
Total | | | | $ | 8,437,582 | | | $ | (8,437,582 | ) | | $ | — | |
| High Income Bond | | | | | | | | | | | | | | |
| | Common Stocks | | $ | 13,773 | | | $ | (13,773 | ) | | $ | — | |
| | $25 Par (or Similar) Retail Preferred | | | 3,806 | | | | (3,806 | ) | | | — | |
| | Corporate Bonds | | | 41,414,394 | | | | (41,414,394 | ) | | | — | |
| | $1,000 Par (or Similar) Institutional Preferred | | | 2,656,250 | | | | (2,656,250 | ) | | | — | |
| | | Investment Companies | | | 240 | | | | (240 | ) | | | — | |
Total | | | | $ | 44,088,463 | | | $ | (44,088,463 | ) | | $ | — | |
| Inflation Protected Securities | | | | | | | | | | | | | | |
| | | Corporate Bonds | | $ | 1,779,730 | | | $ | (1,779,730 | ) | | $ | — | |
| Intermediate Government Bond | | | | | | | | | | | | | | |
| | | U.S. Government and Agency Obligations | | $ | 319,948 | | | $ | (319,948 | ) | | $ | — | |
| Short Term Bond | | | | | | | | | | | | | | |
| | | Corporate Bonds | | $ | 2,582,600 | | | $ | (2,582,600 | ) | | $ | — | |
| Strategic Income | | | | | | | | | | | | | | |
| | $1,000 Par (or Similar) Institutional Preferred | | $ | 5,417,402 | | | $ | (5,417,402 | ) | | $ | — | |
| | | Corporate Bonds | | | 19,181,352 | | | | (19,181,352 | ) | | | — | |
Total | | | | $ | 24,598,754 | | | $ | (24,598,754 | ) | | $ | — | |
| * | As of the end of the reporting period, the value of the collateral pledged from the counterparty exceeded the value of the securities out on loan. Refer to the Fund's Portfolio of Investments for details on the securities out on loan. |
Securities lending fees paid by each Fund during the current fiscal period were as follows:
| | | | | | | | | | | | | | | | | | | | | | | | | | | | |
| | | Core
Bond | | | Core Plus
Bond | | | High
Income
Bond | | | Inflation
Protected
Securities | | | Intermediate
Government
Bond | | | Short Term
Bond | | | Strategic
Income | |
| Securities lending fees paid | | $ | 503 | | | $ | 3,511 | | | $ | 33,183 | | | $ | 1,186 | | | $ | — | | | $ | 1,111 | | | $ | 14,585 | |
Zero Coupon Securities
A zero coupon security does not pay a regular interest coupon to its holders during the life of the security. Income to the holder of the security comes from accretion of the difference between the original purchase price of the security at issuance and the par value of the security at maturity and is effectively paid at maturity. The market prices of zero coupon securities generally are more volatile than the market prices of securities that pay interest periodically.
Investments in Derivatives
Each Fund is authorized to invest in certain derivative instruments. The Funds record derivative instruments at fair value, with changes in fair value recognized on the Statement of Operations, when applicable. Even though the Funds’ investments in derivatives may represent economic hedges, they are not considered to be hedge transactions for financial reporting purposes.
Forward Foreign Currency Exchange Contracts
Each Fund is authorized to enter into forward foreign currency exchange contracts (“forward contracts”) under two circumstances: (i) when a Fund enters into a contract for the purchase or sale of a security denominated in a foreign currency to “lock in” the U.S. exchange rate of the transaction, with such period being a short-dated contract covering the period between transaction date and settlement date; or (ii) when the Sub-Adviser believes that the currency of a particular foreign country may experience a substantial movement against the U.S. dollar or against another foreign currency.
A forward contract is an agreement between two parties to purchase or sell a specified quantity of a currency at or before a specified date in the future at a specified price. Forward contracts are typically traded in the over-the-counter (“OTC”) markets and all details of the contract are negotiated between the counterparties to the agreement. Accordingly, the forward contracts are valued by reference to the contracts traded in the OTC markets. The contractual obligations of a buyer or seller may generally be satisfied by taking or making physical delivery of the underlying currency, establishing an opposite position in the contract and recognizing the profit or loss on both positions simultaneously on the delivery date or, in some instances, paying a cash settlement before the designated date of delivery.
Forward contracts are valued daily at the forward rate. The net amount recorded on these transactions for each counterparty is recognized as a component of “Unrealized appreciation and/or depreciation on forward foreign currency exchange contracts (, net)” on the Statement of Assets and Liabilities. The change in value of the forward contracts during the reporting period is recognized as a component of “Change in net unrealized appreciation (depreciation) of forward foreign currency exchange contracts” on the Statement of Operations. When the contract is closed or offset with the same counterparty, a Fund recognizes the difference between the value of the contract at the time it was entered and the value at the time it was closed or offset as a component of “Net realized gain (loss) from forward foreign currency exchange contracts” on the Statement of Operations.
Forward contracts will generally not be entered into for terms greater than three months, but may have maturities of up to six months or more. The use of forward contracts does not eliminate fluctuations in the underlying prices of a Fund’s investment securities; however, it does establish a rate of exchange that can be achieved in the future. The use of forward contracts involves the risk that anticipated currency movements will not be accurately predicted. A forward contract would limit the risk of loss due to a decline in the value of a particular currency; however, it also would limit any potential gain that might result should the value of the currency increase instead of decrease. These contracts may involve market risk in excess of the unrealized appreciation or depreciation reflected on the Statement of Assets and Liabilities. Forward contracts are subject to counterparty risk if the counterparty fails to perform as specified in the contract due to financial impairment or other reason.
During the current fiscal period, Core Plus Bond, High Income Bond and Strategic Income invested in forward foreign currency exchange contracts to manage foreign currency exposure. For example, the Fund may reduce unwanted currency exposure from its bond portfolio, or it may take long forward positions in select currencies in an attempt to benefit from the potential price appreciation.
The average notional amount of forward foreign currency exchange contracts outstanding during the current fiscal period was as follows:
| | | | | | | | | | | | |
| | | Core Plus
Bond | | | High Income
Bond | | | Strategic
Income | |
| Average notional amount of forward foreign currency exchange contracts outstanding* | | $ | 16,410,684 | | | $ | 5,173,892 | | | $ | 78,747,111 | |
| * | The average notional amount is calculated based on the outstanding notional at the beginning of the fiscal period and at the end of each fiscal quarter within the current fiscal period. |
Notes to Financial Statements (continued)
The following table presents the fair value of forward foreign currency exchange contracts held by the Funds as of the end of the reporting period, the location of these instruments on the Statement of Assets and Liabilities and the primary underlying risk exposure.
| | | | | | | | | | | | | | |
| | | | | Location on the Statement of Assets and Liabilities | |
| | | | | Asset Derivatives | | | (Liability) Derivatives | |
Underlying
Risk Exposure | | Derivative Instrument | | Location | | Value | | | Location | | Value | |
Core Plus Bond | | | | | | | | | | | | | | |
| | | | | |
Foreign currency exchange rate | | Forward contracts | | — | | $ | — | | | Unrealized depreciation on
forward foreign currency
exchange contracts, net | | $ | 23,601 | |
| | | Forward contracts | | — | | | — | | | Unrealized depreciation on
forward foreign currency
exchange contracts, net | | | (218,392 | ) |
Total | | | | | | $ | — | | | | | $ | (194,791 | ) |
| | | | | |
High Income Bond | | | | | | | | | | | | | | |
| | | | | |
Foreign currency exchange rate | | Forward contracts | | — | | $ | — | | | Unrealized depreciation on
forward foreign currency
exchange contracts, net | | $ | (182,075 | ) |
| | | | | |
Strategic Income | | | | | | | | | | | | | | |
| | | | | |
Foreign currency exchange rate | | Forward contracts | | — | | $ | — | | | Unrealized depreciation on
forward foreign currency
exchange contracts, net | | $ | 107,838 | |
| | | Forward contracts | | — | | | — | | | Unrealized depreciation on
forward foreign currency
exchange contracts, net | | | (1,051,849 | ) |
Total | | | | | | $ | — | | | | | $ | (944,011 | ) |
The following table presents the forward foreign currency exchange contracts subject to netting agreements and the collateral delivered related to those forward foreign currency exchange contracts as of the end of the reporting period.
| | | | | | | | | | | | | | | | | | | | | | | | | | |
| Fund | | Counterparty | | Gross
Unrealized
Appreciation on
Forward Foreign
Currency Exchange
Contracts* | | | Gross
Unrealized
(Depreciation) on
Forward Foreign
Currency Exchange
Contracts* | | | Amounts
Netted on
Statement of
Assets and
Liabilities | | | Net Unrealized
Appreciation
(Depreciation) on
Forward Foreign
Currency Exchange
Contracts | | | Collateral
Pledged
to (from)
Counterparty | | | Net
Exposure | |
| Core Plus Bond | | | | | | | | | | | | | | | | | | | | | | | | | | |
| | Bank of America, N.A. | | $ | — | | | $ | (78,525 | ) | | $ | — | | | $ | (78,525 | ) | | $ | — | | | $ | (78,525 | ) |
| | | Morgan Stanley Capital Services LLC | | | 23,601 | | | | (139,867 | ) | | | 23,601 | | | | (116,266 | ) | | | — | | | | (116,266 | ) |
Total | | | | $ | 23,601 | | | $ | (218,392 | ) | | $ | 23,601 | | | $ | (194,791 | ) | | $ | — | | | $ | (194,791 | ) |
| High Income Bond | | | | | | | | | | | | | | | | | | | | | | | | | | |
| | | Goldman Sachs Bank USA | | $ | — | | | | (182,075 | ) | | | — | | | $ | (182,075 | ) | | $ | — | | | $ | (182,075 | ) |
| Strategic Income | | | | | | | | | | | | | | | | | | | | | | | | | | |
| | Bank of America, N.A. | | $ | — | | | $ | (349,969 | ) | | $ | — | | | $ | (349,969 | ) | | $ | — | | | $ | (349,969 | ) |
| | Citibank, National Association | | | — | | | | (21,843 | ) | | | — | | | | (21,843 | ) | | | 20,000 | | | | (1,843 | ) |
| | Goldman Sachs Bank USA | | | — | | | | (57,459 | ) | | | — | | | | (57,459 | ) | | | — | | | | (57,459 | ) |
| | | Morgan Stanley Capital Services LLC | | | 107,838 | | | | (622,578 | ) | | | 107,838 | | | | (514,740 | ) | | | 514,740 | | | | — | |
Total | | | | $ | 107,838 | | | $ | (1,051,849 | ) | | $ | 107,838 | | | $ | (944,011 | ) | | $ | 534,740 | | | $ | (409,271 | ) |
| * | Represents gross unrealized appreciation (depreciation) for the counterparty as reported in the Fund’s Portfolio of Investments. |
The following table presents the amount of net realized gain (loss) and change in net unrealized appreciation (depreciation) recognized on forward foreign currency exchange contracts on the Statement of Operations during the current fiscal period, and the primary underlying risk exposure.
| | | | | | | | | | | | |
| Fund | | Underlying
Risk Exposure | | Derivative
Instrument | | Net Realized
Gain (Loss) from
Forward Foreign Currency
Exchange Contracts | | | Change in Net Unrealized
Appreciation (Depreciation) of
Forward Foreign Currency
Exchange Contracts | |
| Core Plus Bond | | Foreign currency exchange rate | | Forward contracts | | $ | (377,450 | ) | | $ | 154,851 | |
| High Income Bond | | Foreign currency exchange rate | | Forward contracts | | | 210,744 | | | | (114,776 | ) |
| Strategic Income | | Foreign currency exchange rate | | Forward contracts | | | (2,742,500 | ) | | | (216,207 | ) |
Futures Contracts
Upon execution of a futures contract, a Fund is obligated to deposit cash or eligible securities, also known as “initial margin,” into an account at its clearing broker equal to a specified percentage of the contract amount. Cash held by the broker to cover initial margin requirements on open futures contracts, if any, is recognized as “Cash collateral at brokers” on the Statement of Assets and Liabilities. Investments in futures contracts obligate a Fund and the clearing broker to settle monies on a daily basis representing changes in the prior days “mark-to-market” of the open contracts. If a Fund has unrealized appreciation the clearing broker would credit the Fund’s account with an amount equal to appreciation and conversely if a Fund has unrealized depreciation the clearing broker would debit the Fund’s account with an amount equal to depreciation. These daily cash settlements are also known as “variation margin.” Variation margin is recognized as a receivable and/or payable for “Variation margin on futures contracts” on the Statement of Assets and Liabilities.
During the period the futures contract is open, changes in the value of the contract are recognized as an unrealized gain or loss by “marking-to-market” on a daily basis to reflect the changes in market value of the contract, which is recognized as a component of “Change in net unrealized appreciation (depreciation) of futures contracts” on the Statement of Operations. When the contract is closed or expired, a Fund records a realized gain or loss equal to the difference between the value of the contract on the closing date and value of the contract when originally entered into, which is recognized as a component of “Net realized gain (loss) from futures contracts” on the Statement of Operations.
Risks of investments in futures contracts include the possible adverse movement in the price of the securities or indices underlying the contracts, the possibility that there may not be a liquid secondary market for the contracts and/or that a change in the value of the contract may not correlate with a change in the value of the underlying securities or indices.
During the current fiscal period, each Fund used U.S. Treasury futures as part of their overall portfolio construction strategy to manage portfolio duration and yield curve exposure. Strategic Income also used Eurodollar Futures; selecting foreign bond futures to actively manage exposure to those markets.
The average notional amount of futures contracts outstanding during the current fiscal period was as follows:
| | | | | | | | | | | | | | | | | | | | | | | | | | | | |
| | | Core
Bond | | | Core Plus
Bond | | | High Income
Bond | | | Inflation
Protected
Securities | | | Intermediate
Government
Bond | | | Short Term
Bond | | | Strategic
Income | |
| Average notional amount of futures contracts outstanding* | | $ | 25,014,978 | | | $ | 29,802,284 | | | $ | 9,836,055 | | | $ | 39,695,235 | | | $ | 11,561,063 | | | $ | 31,258,852 | | | $ | 194,514,811 | |
| * | The average notional amount is calculated based on the absolute aggregate notional amount of contracts outstanding at the beginning of the fiscal period and at the end of each fiscal quarter within the current fiscal period. |
The following table presents the fair value of all futures contracts held by the Funds as of the end of the reporting period, the location of these instruments on the Statement of Assets and Liabilities and the primary underlying risk exposure.
| | | | | | | | | | | | | | |
| | | | | Location on the Statement of Assets and Liabilities | |
| | | | | Asset Derivatives | | | (Liability) Derivatives | |
Underlying
Risk Exposure | | Derivative Instrument | | Location | | Value | | | Location | | Value | |
Core Bond | | | | | | | | | | | | | | |
| | | | | |
Interest rate | | Futures contracts | | Receivable for variation margin on futures contracts* | | $ | 84,750 | | | Payable for variation margin
on futures contracts* | | | $ 106,920 | |
| | | | | |
Core Plus Bond | | | | | | | | | | | | | | |
| | | | | |
Interest rate | | Futures contracts | | Receivable for variation margin on futures contracts* | | $ | 80,203 | | | Payable for variation margin
on futures contracts* | | | $ 145,486 | |
| | | | | — | | | — | | | Payable for variation margin
on futures contract* | | | (13,146 | ) |
Total | | | | | | $ | 80,203 | | | | | | $ 132,340 | |
| * | Value represents unrealized appreciation (depreciation) of futures contracts as reported on the Fund’s Portfolio of Investments and not the asset and/or liability derivatives location as described in the table above. |
Notes to Financial Statements (continued)
| | | | | | | | | | | | | | |
| | | | | Location on the Statement of Assets and Liabilities | |
| | | | | Asset Derivatives | | | (Liability) Derivatives | |
Underlying
Risk Exposure | | Derivative Instrument | | Location | | Value | | | Location | | Value | |
High Income Bond | | | | | | | | | | | | | | |
| | | | | |
Interest Rate | | Futures contracts | | — | | $ | — | | | Payable for variation margin
on futures contracts* | | $ | (2,863 | ) |
| | | | | |
Inflation Protected Securities | | | | | | | | | | | | | | |
| | | | | |
Interest Rate | | Futures contracts | | Receivable for variation margin on futures contracts* | | $ | 200,528 | | | Payable for variation margin
on futures contracts* | | $ | 48,887 | |
| | | | | |
Intermediate Government Bond | | | | | | | | | | | | | | |
| | | | | |
Interest rate | | Futures contracts | | Receivable for variation margin on futures contracts* | | $ | 25,596 | | | Payable for variation margin
on future contracts* | | $ | (2,773 | ) |
| | | | | |
Short Term Bond | | | | | | | | | | | | | | |
| | | | | |
Interest rate | | Futures contracts | | Receivable for variation margin on futures contracts* | | $ | 98,003 | | | Payable for variation margin
on futures contracts* | | $ | (67,760 | ) |
| | | | | |
Strategic Income | | | | | | | | | | | | | | |
| | | | | |
Interest Rate | | Futures contracts | | Receivable for variation margin on futures contracts* | | $ | 416,772 | | | Payable for variation margin
on futures contracts* | | $ | 677,010 | |
| | | | | — | | | — | | | Payable for variation margin
on futures contracts* | | | (76,028 | ) |
Total | | | | | | $ | 416,772 | | | | | $ | 600,982 | |
| * | Value represents unrealized appreciation (depreciation) of futures contracts as reported on the Fund’s Portfolio of Investments and not the asset and/or liability derivatives location as described in the table above. |
The following table presents the amount of net realized gain (loss) and change in net unrealized appreciation (depreciation) recognized on futures contracts on the Statement of Operations during the current fiscal period, and the primary underlying risk exposure.
| | | | | | | | | | | | |
| Fund | | Underlying
Risk Exposure | | Derivative
Instrument | | Net Realized
Gain (Loss) from
Futures Contracts | | | Change in Net Unrealized
Appreciation (Depreciation) of
Futures Contracts | |
| Core Bond | | Interest rate | | Futures contracts | | $ | (1,099,892 | ) | | $ | 215,835 | |
| Core Plus Bond | | Interest rate | | Futures contracts | | | 117,343 | | | | 62,649 | |
| High Income Bond | | Interest rate | | Futures contracts | | | (137,663 | ) | | | (275,326 | ) |
| Inflation Protected Securities | | Interest rate | | Futures contracts | | | (3,448,952 | ) | | | (295,008 | ) |
| Intermediate Government Bond | | Interest rate | | Futures contracts | | | (38,881 | ) | | | 54,540 | |
| Short Term Bond | | Interest rate | | Futures contracts | | | (326,015 | ) | | | 475,812 | |
| Strategic Income | | Interest rate | | Futures contracts | | | 243,580 | | | | 1,173,900 | |
Interest Rate Swap Contracts
Interest rate swap contracts involve a Fund’s agreement with the counterparty to pay or receive a fixed rate payment in exchange for the counterparty receiving or paying a variable rate payment. Forward interest rate swap contracts involve a Fund’s agreement with a counterparty to pay, in the future, a fixed or variable rate payment in exchange for the counterparty paying the Fund a variable or fixed rate payment, the accruals for which begin at a specified date in the future (the “effective date”).
The amount of the payment obligation is based on the notional amount and the termination date of the contract. Interest rate swap contracts do not involve the delivery of securities or other underlying assets or principal. Accordingly, the risk of loss with respect to the swap counterparty on such transactions is limited to the net amount of interest payments that the Fund is to receive.
Interest rate swap contracts are valued daily. Upon entering into an interest rate swap contract (and beginning on the effective date for a forward interest rate swap contract), the Fund accrues the fixed rate payment expected to be paid or received and the variable rate payment expected to be received or paid on the interest rate swap contracts on a daily basis, and recognizes the daily change in the fair value of the Fund’s contractual rights and obligations under the contracts. For an OTC swap that is not cleared through a clearing house (“OTC Uncleared”), the net amount recorded on these transactions, for each counterparty, is recognized on the Statement of Assets and Liabilities as a component of “Unrealized appreciation or depreciation on interest rate swaps (, net).”
Upon the execution of an OTC swap cleared through a clearing house (“OTC Cleared”), the Fund is obligated to deposit cash or eligible securities, also known as “initial margin,” into an account at its clearing broker equal to a specified percentage of the contract amount. Cash deposited by the Fund to cover initial margin requirements on open swap contracts, if any, is recognized as a component of “Cash collateral at brokers” on the Statement of Assets and Liabilities. Investments in OTC Cleared swaps obligate the Fund and the clearing broker to settle monies on a daily basis representing changes in the prior day’s “mark-to-market” of the swap contract. If the Fund has unrealized appreciation, the clearing broker will credit the Fund’s account with an amount equal to the appreciation. Conversely, if the Fund has unrealized depreciation, the clearing broker will debit the Fund’s account with an amount equal to the depreciation. These daily cash settlements are also known as “variation margin.” Variation margin for OTC Cleared swaps is recognized as a receivable and/or payable for “Variation margin on swap contracts” on the Statement of Assets and Liabilities. Upon the execution of an OTC Uncleared swap, neither the Fund nor the counterparty is required to deposit initial margin as the trades are recorded bilaterally between both parties to the swap contract, and the terms of the variation margin are subject to a predetermined threshold negotiated by the Fund and the counterparty. Variation margin for OTC Uncleared swaps is recognized as a component of “Unrealized appreciation or depreciation on interest rate swaps (, net)” as described in the preceding paragraph.
The net amount of periodic payments settled in cash are recognized as a component of “Net realized gain (loss) from swaps” on the Statement of Operations, in addition to the net realized gain or loss recorded upon the termination of the swap contract. For tax purposes, payments expected to be received or paid on the swap contracts are treated as ordinary income or expense, respectively. Changes in the value of the swap contracts during the fiscal period are recognized as a component of “Change in net unrealized appreciation (depreciation) of swaps” on the Statement of Operations. In certain instances, payments are made or received upon entering into the swap contract to compensate for differences between the stated terms of the swap agreements and prevailing market conditions (credit spreads, currency exchange rates, interest rates, and other relevant factors). Payments received or made at the beginning of the measurement period, if any, are recognized as “Interest rate swaps premiums paid and/or received” on the Statement of Assets and Liabilities.
During the current fiscal period, Core Plus Bond and Strategic Income invested in interest rate swap contracts as part of an overall portfolio construction strategy to manage duration and overall portfolio yield curve exposure.
The average notional amount of interest rate swap contracts outstanding during the current fiscal period was as follows:
| | | | | | | | |
| | | Core Plus
Bond | | | Strategic
Income | |
| Average notional amount of interest rate swap contracts outstanding* | | $ | 3,600,000 | | | $ | 5,200,000 | |
| * | The average notional amount is calculated based on the outstanding notional at the beginning of the fiscal period and at the end of each fiscal quarter within the current fiscal period. |
Credit Default Swap Contracts
A Fund may enter into a credit default swap contract to seek to maintain a total return on a particular investment or portion of its portfolio, or to take an active long or short position with respect to the likelihood of a particular issuer’s default. Credit default swap contracts involve one party making a stream of payments to another party in exchange for the right to receive a specified return if/when there is a credit event by a third party. Generally, a credit event means bankruptcy, failure to pay, or restructuring. The specific credit events applicable for each credit default swap are stated in the terms of the particular swap agreement. When a Fund has bought (sold) protection in a credit default swap upon occurrence of a specific credit event with respect to the underlying referenced entity, the Fund will either (i) deliver (receive) that security, or an equivalent amount of cash, from the counterparty in exchange for receipt (payment) of the notional amount to the counterparty, or (ii) receive (pay) a net settlement amount of the credit default swap contract less the recovery value of the referenced obligation or underlying securities comprising the referenced index. The difference between the value of the security received (delivered) and the notional amount delivered (received) is recorded as a realized gain or loss. Payments paid (received) at the beginning of the measurement period are recognized as a component of “Credit default swaps premiums paid and/or received” on the Statement of Assets and Liabilities, when applicable.
Credit default swap contracts are valued daily. Changes in the value of a credit default swap during the fiscal period are recognized as a component of “Change in net unrealized appreciation (depreciation) of swaps” and realized gains and losses are recognized as a component of “Net realized gain (loss) from swaps” on the Statement of Operations.
For OTC swaps not cleared through a clearing house (“OTC Uncleared”), the daily change in the market value of the swap contract, along with any daily interest fees accrued, are recognized as components of “Unrealized appreciation or depreciation on credit default swaps (, net)” on the Statement of Assets and Liabilities.
Upon the execution of an OTC swap cleared through a clearing house (“OTC Cleared”), a Fund is obligated to deposit cash or eligible securities, also known as “initial margin,” into an account at its clearing broker equal to a specified percentage of the contract amount. Cash held by the broker to cover initial margin requirements on open swap contracts, if any, is recognized as “Cash collateral at brokers” on the Statement of Assets and Liabilities. Investments in OTC Cleared swaps obligate a Fund and the clearing broker to settle monies on a daily basis representing changes in the prior day’s “mark-to-market” of the swap. If a Fund has unrealized appreciation the clearing broker would credit the Fund’s account with an amount equal to the appreciation and conversely if a Fund has unrealized depreciation the clearing broker would debit a Fund’s account with an amount equal to the depreciation. These daily cash settlements are also known as “variation margin.” Variation margin for OTC Cleared swaps is recognized as a
Notes to Financial Statements (continued)
receivable and/or payable for “Variation margin on swap contracts” on the Statement of Assets and Liabilities. Upon the execution of an OTC Uncleared swap, neither the Fund nor the counterparty is required to deposit initial margin as the trades are recorded bilaterally between both parties to the swap contract, and the terms of the variation margin are subject to a predetermined threshold negotiated by the Fund and the counterparty. Variation margin for OTC Uncleared swaps is recognized as a component of “Unrealized appreciation or depreciation on credit default swaps (, net)” as described in the preceding paragraph. The maximum potential amount of future payments the Fund could incur as a buyer or seller of protection in a credit default swap contract is limited to the notional amount of the contract. The maximum potential amount would be offset by the recovery value, if any, of the respective referenced entity.
During the current fiscal period, Core Plus Bond and High Income Bond entered into credit default swaps to take on credit risk and earn a commensurate credit spread. Strategic Income used High Yield credit default swaps as a way to assume and hedge credit risk.
The average notional amount of credit default swap contracts outstanding during the current fiscal period was as follows:
| | | | | | | | | | | | |
| | | Core Plus
Bond | | | High Income
Bond | | | Strategic
Income | |
| Average notional amount of credit default swap contracts outstanding* | | $ | 6,196,000 | | | $ | 4,000,000 | | | $ | 48,434,000 | |
| * | The average notional amount is calculated based on the outstanding notional at the beginning of the fiscal period and at the end of each fiscal quarter within the current fiscal period. |
The following table presents the fair value of all swap contracts held by the Funds as of the end of the reporting period, the location of these instruments on the Statement of Assets and Liabilities and the primary underlying risk exposure.
| | | | | | | | | | | | | | |
| | | | | Location on the Statement of Assets and Liabilities | |
| | | | | Asset Derivatives | | | (Liability) Derivatives | |
Underlying
Risk Exposure | | Derivative Instrument | | Location | | Value | | | Location | | Value | |
Core Plus Bond | | | | | | | | | | | | | | |
| | | | | |
Credit | | Swaps (OTC Cleared) | | Receivable for variation margin on swap contracts* | | $ | (3,126 | ) | | — | | $ | — | |
| | | | | |
Strategic Income | | | | | | | | | | | | | | |
| | | | | |
Credit | | Swaps (OTC Cleared) | | Receivable for variation margin on swap contracts* | | $ | (540,428 | ) | | — | | $ | — | |
| * | Value represents unrealized appreciation (depreciation) of swaps as reported in the Fund’s Portfolio of Investments and not the asset and/or liability derivative location as described in the table above. |
The following table presents the amount of net realized gain (loss) and change in net unrealized appreciation (depreciation) recognized on swap contracts on the Statement of Operations during the current fiscal period and the primary underlying risk exposure.
| | | | | | | | | | | | |
| Fund | | Underlying
Risk Exposure | | Derivative
Instrument | | Net Realized
Gain (Loss) from
Swaps | | | Change in Net Unrealized Appreciation
(Depreciation) of Swaps | |
| Core Plus Bond | | Credit | | Swaps | | $ | (434,102 | ) | | $ | (3,126 | ) |
| | | Interest rate | | Swaps | | | (1,980,261 | ) | | | 2,134,412 | |
| Total | | | | | | $ | (2,414,363 | ) | | $ | 2,131,286 | |
| High Income Bond | | Credit | | Swaps | | $ | (30,036 | ) | | $ | — | |
| Strategic Income | | Credit | | Swaps | | $ | (3,021,093 | ) | | $ | (431,050 | ) |
| | | Interest rate | | Swaps | | | (2,785,395 | ) | | | 3,083,040 | |
| Total | | | | | | $ | (5,806,488 | ) | | $ | 2,651,990 | |
Options Transactions
The purchase of options involves the risk of loss of all or a part of the cash paid for the options (the premium). The market risk associated with purchasing options is limited to the premium paid. The counterparty credit risk of purchasing options, however, needs to take into account the current value of the option, as this is the performance expected from the counterparty. When a Fund purchases an option, an amount equal to the premium paid (the premium plus commission) is recognized as a component of “Options purchased, at value” on the Statement of Asset and Liabilities. When a Fund writes an option, an amount equal to the net premium received (the premium less commission) is recognized as a component of “Options written, at value” on the Statement of Assets and Liabilities and is subsequently adjusted to reflect the current value of the written option until the option is exercised or expires or the Fund enters into a closing purchase transaction. The changes in the value of options purchased and/or written during the fiscal period are recognized as a component of “Change in net unrealized appreciation (depreciation) of options purchased and/or written” on the Statement of Operations. When an option is exercised or expires or a Fund enters into a closing purchase transaction, the difference between the net premium received, and any amount paid at expiration or on executing a closing purchase transaction, including commission, is recognized as a component of “Net realized gain (loss) from options purchased and/or written” on the Statement of Operations. The Fund, as writer of an option, has
no control over whether the underlying instrument may be sold (called) or purchased (put) and as a result bears the risk of an unfavorable change in the market value of the instrument underlying the written option. There is also the risk the Fund may not be able to enter into a closing transaction because of an illiquid market.
During the current fiscal period, Core Plus Bond and High Income Bond purchased currency put options which were used as part of an overall portfolio construction strategy to manage foreign currency exposure. Each fund also purchased a small amount of currency call options as part of its overwrite strategy and purchased a small amount of call options on futures during the period.
The average notional amount of outstanding options purchased during the current fiscal period, was as follows:
| | | | | | | | |
| | | Core Plus
Bond | | | Strategic
Income | |
| Average notional amount of outstanding call options purchased* | | $ | 1,612,650 | | | $ | 6,752,700 | |
| | | | | | | | |
| | | Core Plus
Bond | | | Strategic
Income | |
| Average notional amount of outstanding put options purchased* | | $ | 1,414,248 | | | $ | 5,896,596 | |
| * | The average notional amount is calculated based on the outstanding notional at the beginning of the fiscal period and at the end of each fiscal quarter within the current fiscal period. |
The following table presents the fair value of all options purchased held by the Funds as of the end of the reporting period, the location of these instruments on the Statement of Assets and Liabilities and the primary underlying risk exposure.
| | | | | | | | | | | | | | |
| | | | | Location on the Statement of Assets and Liabilities | |
| | | | | Asset Derivatives | | | (Liability) Derivatives | |
Underlying Risk Exposure | | Derivative
Instrument | | Location | | Value | | | Location | | Value | |
Core Plus Bond | | | | | | | | | | | | | | |
| | | | | |
Interest Rate | | Options | | Options purchased, at value | | $ | 2,953 | | | — | | $ | — | |
| | | | | |
Strategic Income | | | | | | | | | | | | | | |
| | | | | |
Interest Rate | | Options | | Options purchased, at value | | $ | 12,844 | | | — | | $ | — | |
The following table presents the amount of net realized gain (loss) and change in net unrealized appreciation (depreciation) recognized on options purchased on the Statement of Operations during the current fiscal period, and the primary underlying risk exposure.
| | | | | | | | | | | | |
| Fund | | Underlying
Risk Exposure | | Derivative
Instrument | | Net Realized
Gain (Loss) from
Options Purchased | | | Change in Net
Unrealized
Appreciation
(Depreciation) of
Options Purchased | |
| Core Plus Bond | | Currency | | Options | | $ | (79,688 | ) | | $ | — | |
| | | Interest Rate | | Options | | | (110,227 | ) | | | (13,541 | ) |
| Total | | | | | | $ | (189,915 | ) | | $ | (13,541 | ) |
| Strategic Income | | Currency | | Options | | $ | (557,914 | ) | | $ | — | |
| | | Interest Rate | | Options | | | (272,287 | ) | | | (58,501 | ) |
| Total | | | | | | $ | (830,201 | ) | | $ | (58,501 | ) |
Market and Counterparty Credit Risk
In the normal course of business each Fund may invest in financial instruments and enter into financial transactions where risk of potential loss exists due to changes in the market (market risk) or failure of the other party to the transaction to perform (counterparty credit risk). The potential loss could exceed the value of the financial assets recorded on the financial statements. Financial assets, which potentially expose each Fund to counterparty credit risk, consist principally of cash due from counterparties on forward, option and swap transactions, when applicable. The extent of each Fund’s exposure to counterparty credit risk in respect to these financial assets approximates their carrying value as recorded on the Statement of Assets and Liabilities.
Each Fund helps manage counterparty credit risk by entering into agreements only with counterparties the Adviser believes have the financial resources to honor their obligations and by having the Adviser monitor the financial stability of the counterparties. Additionally, counterparties may be required to pledge collateral daily (based on the daily valuation of the financial asset) on behalf of each Fund with a value approximately equal to the amount of any unrealized gain above a pre-determined threshold. Reciprocally, when each Fund has an unrealized loss, the Funds have instructed the custodian to pledge assets of the Funds as collateral with a value approximately equal to the amount of the unrealized loss above a pre-determined threshold. Collateral pledges are monitored and subsequently adjusted if and when the valuations fluctuate, either up or down, by at least the pre-determined threshold amount.
Notes to Financial Statements (continued)
4. Fund Shares
The Funds have an effective registration statement on file with the Securities and Exchange Commission (“SEC”) to issue Class T Shares, which were not yet available for public offering at the time this report was issued.
High Income Bond and Strategic Income issued Class T Shares during the period; however, these shares are not available for public offering. Class T Shares for each Fund commenced operations on May 31, 2017.
Transactions in Fund shares during the current and prior fiscal period were as follows:
| | | | | | | | | | | | | | | | |
| | | Year Ended
6/30/17 | | | Year Ended
6/30/16 | |
| Core Bond | | Shares | | | Amount | | | Shares | | | Amount | |
| Shares sold: | | | | | | | | | | | | | | | | |
Class A | | | 348,602 | | | $ | 3,417,164 | | | | 426,304 | | | $ | 4,195,062 | |
Class C | | | 60,753 | | | | 599,236 | | | | 125,119 | | | | 1,230,992 | |
Class R6 | | | 43,750 | | | | 420,000 | | | | 2,124,538 | | | | 21,050,000 | |
Class I | | | 1,378,169 | | | | 13,502,662 | | | | 1,621,099 | | | | 15,909,483 | |
| Shares issued to shareholders due to reinvestment of distributions: | | | | | | | | | | | | | | | | |
Class A | | | 31,200 | | | | 306,317 | | | | 42,495 | | | | 418,729 | |
Class C | | | 2,394 | | | | 23,407 | | | | 1,964 | | | | 19,295 | |
Class R6 | | | 155,004 | | | | 1,516,669 | | | | 197,727 | | | | 1,943,314 | |
Class I | | | 67,626 | | | | 662,944 | | | | 129,005 | | | | 1,265,258 | |
| | | | 2,087,498 | | | | 20,448,399 | | | | 4,668,251 | | | | 46,032,133 | |
| Shares redeemed: | | | | | | | | | | | | | | | | |
Class A | | | (540,191 | ) | | | (5,290,739 | ) | | | (406,929 | ) | | | (4,017,165 | ) |
Class C | | | (62,735 | ) | | | (609,443 | ) | | | (48,499 | ) | | | (476,031 | ) |
Class R6 | | | (44,334 | ) | | | (425,000 | ) | | | (1,007,593 | ) | | | (9,930,000 | ) |
Class I | | | (5,006,267 | ) | | | (49,084,941 | ) | | | (8,803,597 | ) | | | (86,784,059 | ) |
| | | | (5,653,527 | ) | | | (55,410,123 | ) | | | (10,266,618 | ) | | | (101,207,255 | ) |
| Net increase (decrease) | | | (3,566,029 | ) | | $ | (34,961,724 | ) | | | (5,598,367 | ) | | $ | (55,175,122 | ) |
| | |
| | | Year Ended
6/30/17 | | | Year Ended
6/30/16 | |
| Core Plus Bond | | Shares | | | Amount | | | Shares | | | Amount | |
| Shares sold: | | | | | | | | | | | | | | | | |
Class A | | | 611,527 | | | $ | 6,726,114 | | | | 567,458 | | | $ | 6,169,670 | |
Class C | | | 171,637 | | | | 1,886,831 | | | | 268,526 | | | | 2,904,616 | |
Class R3 | | | 615,172 | | | | 6,844,174 | | | | 1,337,253 | | | | 14,711,131 | |
Class R6 | | | 90,528 | | | | 1,011,000 | | | | — | | | | — | |
Class I | | | 4,377,518 | | | | 47,937,579 | | | | 2,497,657 | | | | 27,234,585 | |
| Shares issued to shareholders due to reinvestment of distributions: | | | | | | | | | | | | | | | | |
Class A | | | 190,198 | | | | 2,095,816 | | | | 235,090 | | | | 2,553,875 | |
Class C | | | 16,235 | | | | 178,033 | | | | 18,143 | | | | 196,041 | |
Class R3 | | | 27,701 | | | | 307,667 | | | | 37,598 | | | | 408,551 | |
Class R6 | | | 84,172 | | | | 926,719 | | | | 108,753 | | | | 1,180,728 | |
Class I | | | 456,635 | | | | 5,020,233 | | | | 538,183 | | | | 5,837,759 | |
| | | | 6,641,323 | | | | 72,934,166 | | | | 5,608,661 | | | | 61,196,956 | |
| Shares redeemed: | | | | | | | | | | | | | | | | |
Class A | | | (1,217,937 | ) | | | (13,357,088 | ) | | | (1,412,657 | ) | | | (15,338,148 | ) |
Class C | | | (317,074 | ) | | | (3,464,656 | ) | | | (287,785 | ) | | | (3,125,250 | ) |
Class R3 | | | (1,879,685 | ) | | | (20,475,673 | ) | | | (361,604 | ) | | | (3,913,849 | ) |
Class R6 | | | (280,316 | ) | | | (3,090,000 | ) | | | (1,733,305 | ) | | | (19,329,000 | ) |
Class I | | | (6,073,915 | ) | | | (66,683,145 | ) | | | (16,439,073 | ) | | | (178,504,469 | ) |
| | | | (9,768,927 | ) | | | (107,070,562 | ) | | | (20,234,424 | ) | | | (220,210,716 | ) |
| Net increase (decrease) | | | (3,127,604 | ) | | $ | (34,136,396 | ) | | | (14,625,763 | ) | | $ | (159,013,760 | ) |
| | | | | | | | | | | | | | | | |
| | | Year Ended
6/30/17 | | | Year Ended
6/30/16 | |
| High Income Bond | | Shares | | | Amount | | | Shares | | | Amount | |
| Shares sold: | | | | | | | | | | | | | | | | |
Class A | | | 32,470,739 | | | $ | 247,533,207 | | | | 22,844,430 | | | $ | 160,255,338 | |
Class C | | | 1,736,460 | | | | 13,348,306 | | | | 1,264,937 | | | | 8,863,955 | |
Class R3 | | | 45,050 | | | | 357,086 | | | | 48,170 | | | | 353,483 | |
Class I | | | 34,781,812 | | | | 265,895,263 | | | | 16,788,962 | | | | 120,808,404 | |
Class T | | | 3,161 | | | | 25,000 | | | | — | | | | — | |
| Shares issued to shareholders due to reinvestment of distributions: | | | | | | | | | | | | | | | | |
Class A | | | 1,340,981 | | | | 10,363,650 | | | | 1,135,552 | | | | 8,108,846 | |
Class C | | | 328,045 | | | | 2,530,015 | | | | 330,612 | | | | 2,364,126 | |
Class R3 | | | 4,906 | | | | 38,622 | | | | 6,483 | | | | 47,448 | |
Class I | | | 1,340,352 | | | | 10,386,721 | | | | 977,062 | | | | 7,060,979 | |
Class T | | | — | | | | — | | | | — | | | | — | |
| | | | 72,051,506 | | | | 550,477,870 | | | | 43,396,208 | | | | 307,862,579 | |
| Shares redeemed: | | | | | | | | | | | | | | | | |
Class A | | | (32,124,546 | ) | | | (247,025,407 | ) | | | (22,631,152 | ) | | | (162,494,682 | ) |
Class C | | | (1,721,578 | ) | | | (13,270,661 | ) | | | (2,557,960 | ) | | | (18,446,833 | ) |
Class R3 | | | (68,232 | ) | | | (534,057 | ) | | | (59,958 | ) | | | (428,751 | ) |
Class I | | | (39,271,277 | ) | | | (300,816,743 | ) | | | (43,094,533 | ) | | | (311,873,417 | ) |
Class T | | | — | | | | — | | | | — | | | | — | |
| | | | (73,185,633 | ) | | | (561,646,868 | ) | | | (68,343,603 | ) | | | (493,243,683 | ) |
| Net increase (decrease) | | | (1,134,127 | ) | | $ | (11,168,998 | ) | | | (24,947,395 | ) | | | (185,381,104 | ) |
| | |
| | | Year Ended
6/30/17 | | | Year Ended
6/30/16 | |
| Inflation Protected Securities | | Shares | | | Amount | | | Shares | | | Amount | |
| Shares sold: | | | | | | | | | | | | | | | | |
Class A | | | 6,040,554 | | | $ | 67,321,139 | | | | 6,144,400 | | | $ | 67,077,042 | |
Class C | | | 412,282 | | | | 4,524,060 | | | | 741,824 | | | | 7,990,319 | |
Class R3 | | | 603,269 | | | | 6,671,387 | | | | 1,147,593 | | | | 12,396,121 | |
Class R6 | | | 1,955,128 | | | | 21,949,504 | | | | 95,255 | | | | 1,059,520 | |
Class I | | | 20,142,393 | | | | 226,841,726 | | | | 15,260,983 | | | | 168,772,498 | |
| Shares issued to shareholders due to reinvestment of distributions: | | | | | | | | | | | | | | | | |
Class A | | | 59,660 | | | | 657,631 | | | | — | | | | — | |
Class C | | | 3,967 | | | | 42,609 | | | | — | | | | — | |
Class R3 | | | 2,149 | | | | 23,519 | | | | — | | | | — | |
Class R6 | | | 21,770 | | | | 243,084 | | | | — | | | | — | |
Class I | | | 182,980 | | | | 2,043,868 | | | | — | | | | — | |
| | | | 29,424,152 | | | | 330,318,527 | | | | 23,390,055 | | | | 257,295,500 | |
| Shares redeemed: | | | | | | | | | | | | | | | | |
Class A | | | (4,841,254 | ) | | | (53,604,295 | ) | | | (1,783,818 | ) | | | (19,428,090 | ) |
Class C | | | (613,289 | ) | | | (6,691,782 | ) | | | (426,654 | ) | | | (4,587,011 | ) |
Class R3 | | | (1,259,181 | ) | | | (13,919,416 | ) | | | (319,273 | ) | | | (3,455,164 | ) |
Class R6 | | | (192,582 | ) | | | (2,168,933 | ) | | | (44,890 | ) | | | (498,289 | ) |
Class I | | | (14,549,158 | ) | | | (163,023,741 | ) | | | (9,954,618 | ) | | | (109,030,688 | ) |
| | | | (21,455,464 | ) | | | (239,408,167 | ) | | | (12,529,253 | ) | | | (136,999,242 | ) |
| Net increase (decrease) | | | 7,968,688 | | | $ | 90,910,360 | | | | 10,860,802 | | | $ | 120,296,258 | |
Notes to Financial Statements (continued)
| | | | | | | | | | | | | | | | |
| | | Year Ended
6/30/17 | | | Year Ended
6/30/16 | |
| Intermediate Government Bond | | Shares | | | Amount | | | Shares | | | Amount | |
| Shares sold: | | | | | | | | | | | | | | | | |
Class A | | | 898,274 | | | $ | 7,881,888 | | | | 856,783 | | | $ | 7,580,588 | |
Class C | | | 123,756 | | | | 1,091,274 | | | | 119,557 | | | | 1,060,202 | |
Class R3 | | | 7,423 | | | | 65,740 | | | | 12,500 | | | | 111,134 | |
Class I | | | 944,414 | | | | 8,295,183 | | | | 2,482,301 | | | | 21,971,582 | |
| Shares issued to shareholders due to reinvestment of distributions: | | | | | | | | | | | | | | | | |
Class A | | | 16,460 | | | | 144,101 | | | | 15,330 | | | | 135,667 | |
Class C | | | 640 | | | | 5,611 | | | | 455 | | | | 4,029 | |
Class R3 | | | 156 | | | | 1,366 | | | | 109 | | | | 969 | |
Class I | | | 24,035 | | | | 210,832 | | | | 25,834 | | | | 228,793 | |
| | | | 2,015,158 | | | | 17,695,995 | | | | 3,512,869 | | | | 31,092,964 | |
| Shares redeemed: | | | | | | | | | | | | | | | | |
Class A | | | (1,359,324 | ) | | | (11,822,085 | ) | | | (360,314 | ) | | | (3,185,923 | ) |
Class C | | | (162,508 | ) | | | (1,419,172 | ) | | | (22,929 | ) | | | (202,864 | ) |
Class R3 | | | (14,150 | ) | | | (122,605 | ) | | | (12,149 | ) | | | (106,934 | ) |
Class I | | | (3,445,961 | ) | | | (29,989,588 | ) | | | (2,700,152 | ) | | | (23,889,237 | ) |
| | | | (4,981,943 | ) | | | (43,353,450 | ) | | | (3,095,544 | ) | | | (27,384,958 | ) |
| Net increase (decrease) | | | (2,966,785 | ) | | $ | (25,657,455 | ) | | | 417,325 | | | $ | 3,708,006 | |
| | |
| | | Year Ended
6/30/17 | | | Year Ended
6/30/16 | |
| Short Term Bond | | Shares | | | Amount | | | Shares | | | Amount | |
| Shares sold: | | | | | | | | | | | | | | | | |
Class A | | | 5,353,264 | | | $ | 52,756,422 | | | | 3,838,769 | | | $ | 37,803,170 | |
Class C | | | 1,329,379 | | | | 13,158,495 | | | | 1,251,334 | | | | 12,366,374 | |
Class R3 | | | 23,856 | | | | 235,874 | | | | 58,023 | | | | 571,798 | |
Class R6 | | | 5,437,604 | | | | 53,642,505 | | | | 4,433,924 | | | | 43,872,894 | |
Class I | | | 13,570,545 | | | | 133,885,155 | | | | 12,093,247 | | | | 119,245,506 | |
| Shares issued to shareholders due to reinvestment of distributions: | | | | | | | | | | | | | | | | |
Class A | | | 140,246 | | | | 1,383,223 | | | | 137,192 | | | | 1,351,172 | |
Class C | | | 18,098 | | | | 179,200 | | | | 17,115 | | | | 169,134 | |
Class R3 | | | 60 | | | | 589 | | | | 7 | | | | 59 | |
Class R6 | | | 90,268 | | | | 892,379 | | | | 65,586 | | | | 646,903 | |
Class I | | | 220,618 | | | | 2,177,787 | | | | 217,378 | | | | 2,142,574 | |
| | | | 26,183,938 | | | | 258,311,629 | | | | 22,112,575 | | | | 218,169,584 | |
| Shares redeemed: | | | | | | | | | | | | | | | | |
Class A | | | (5,799,396 | ) | | | (57,151,517 | ) | | | (4,359,518 | ) | | | (42,953,780 | ) |
Class C | | | (1,863,891 | ) | | | (18,443,917 | ) | | | (1,559,144 | ) | | | (15,398,873 | ) |
Class R3 | | | (8,633 | ) | | | (85,228 | ) | | | (42,339 | ) | | | (414,747 | ) |
Class R6 | | | (2,587,822 | ) | | | (25,570,087 | ) | | | (510,435 | ) | | | (5,027,503 | ) |
Class I | | | (20,733,177 | ) | | | (204,630,204 | ) | | | (23,387,149 | ) | | | (230,542,093 | ) |
| | | | (30,992,919 | ) | | | (305,880,953 | ) | | | (29,858,585 | ) | | | (294,336,996 | ) |
| Net increase (decrease) | | | (4,808,981 | ) | | $ | (47,569,324 | ) | | | (7,746,010 | ) | | $ | (76,167,412 | ) |
| | | | | | | | | | | | | | | | |
| | | Year Ended
6/30/17 | | | Year Ended
6/30/16 | |
| Strategic Income | | Shares | | | Amount | | | Shares | | | Amount | |
| Shares sold: | | | | | | | | | | | | | | | | |
Class A | | | 3,757,905 | | | $ | 39,980,395 | | | | 4,002,873 | | | $ | 41,946,560 | |
Class C | | | 1,087,361 | | | | 11,507,310 | | | | 1,310,022 | | | | 13,655,356 | |
Class R3 | | | 201,763 | | | | 2,155,820 | | | | 386,837 | | | | 4,052,221 | |
Class R6 | | | 16,930 | | | | 180,760 | | | | 1,618,829 | | | | 17,089,609 | |
Class I | | | 18,017,028 | | | | 191,046,600 | | | | 11,124,880 | | | | 116,240,152 | |
Class T | | | 2,343 | | | | 25,000 | | | | — | | | | — | |
| Shares issued to shareholders due to reinvestment of distributions: | | | | | | | | | | | | | | | | |
Class A | | | 719,575 | | | | 7,667,521 | | | | 1,068,217 | | | | 11,130,046 | |
Class C | | | 276,325 | | | | 2,927,905 | | | | 332,935 | | | | 3,443,686 | |
Class R3 | | | 17,683 | | | | 189,082 | | | | 27,543 | | | | 289,756 | |
Class R6 | | | 124,648 | | | | 1,328,825 | | | | 138,234 | | | | 1,433,538 | |
Class I | | | 1,071,000 | | | | 11,401,338 | | | | 1,175,836 | | | | 12,251,799 | |
Class T | | | — | | | | — | | | | — | | | | — | |
| | | | 25,292,561 | | | | 268,410,556 | | | | 21,186,206 | | | | 221,532,723 | |
| Shares redeemed: | | | | | | | | | | | | | | | | |
Class A | | | (9,384,268 | ) | | | (99,319,492 | ) | | | (13,554,737 | ) | | | (140,591,197 | ) |
Class C | | | (2,664,036 | ) | | | (28,194,589 | ) | | | (3,270,280 | ) | | | (33,759,300 | ) |
Class R3 | | | (258,707 | ) | | | (2,763,808 | ) | | | (804,674 | ) | | | (8,405,220 | ) |
Class R6 | | | (2,469,686 | ) | | | (26,308,349 | ) | | | (455,181 | ) | | | (4,831,119 | ) |
Class I | | | (13,558,767 | ) | | | (144,036,221 | ) | | | (37,656,644 | ) | | | (391,160,086 | ) |
Class T | | | — | | | | — | | | | — | | | | — | |
| | | | (28,335,464 | ) | | | (300,622,459 | ) | | | (55,741,516 | ) | | | (578,746,922 | ) |
| Net increase (decrease) | | | (3,042,903 | ) | | $ | (32,211,903 | ) | | | (34,555,310 | ) | | | (357,214,199 | ) |
5. Investment Transactions
Long-term purchases and sales (including maturities but excluding investments purchased with collateral from securities lending and derivative transactions) during the current fiscal period were as follows:
| | | | | | | | | | | | | | | | | | | | | | | | | | | | |
| | | Core
Bond | | | Core Plus
Bond | | | High Income
Bond | | | Inflation
Protected
Securities | | | Intermediate
Government
Bond | | | Short Term
Bond | | | Strategic
Income | |
| Purchases: | | | | | | | | | | | | | | | | | | | | | | | | | | | | |
Investment securities | | $ | 47,007,523 | | | $ | 221,959,340 | | | $ | 630,183,429 | | | $ | 47,431,543 | | | $ | 4,648,855 | | | $ | 335,440,637 | | | $ | 426,780,738 | |
U.S. Government and agency obligations | | | 85,714,312 | | | | 264,732,113 | | | | — | | | | 351,625,569 | | | | 51,677,807 | | | | 31,448,906 | | | | 596,180,399 | |
| Sales and maturities: | | | | | | | | | | | | | | | | | | | | | | | | | | | | |
Investment securities | | | 48,496,620 | | | | 229,713,185 | | | | 632,660,462 | | | | 14,523,729 | | | | 4,649,891 | | | | 254,034,907 | | | | 509,364,181 | |
U.S. Government and agency obligations | | | 99,588,573 | | | | 262,498,563 | | | | — | | | | 273,411,466 | | | | 66,697,387 | | | | 29,473,189 | | | | 529,940,178 | |
6. Income Tax Information
Each Fund is a separate taxpayer for federal income tax purposes. Each Fund intends to distribute substantially all of its net investment income and net capital gains to shareholders and to otherwise comply with the requirements of Subchapter M of the Internal Revenue Code applicable to regulated investment companies. Therefore, no federal income tax provision is required.
For all open tax years and all major taxing jurisdictions, management of the Funds has concluded that there are no significant uncertain tax positions that would require recognition in the financial statements. Open tax years are those that are open for examination by taxing authorities (i.e., generally the last four tax year ends and the interim tax period since then). Furthermore, management of the Funds is also not aware of any tax positions for which it is reasonably possible that the total amounts of unrecognized tax benefits will significantly change in the next twelve months.
The following information is presented on an income tax basis. Differences between amounts for financial statement and federal income tax purposes are primarily due to timing differences in recognizing certain gains and losses on investment transactions. To the extent that differences arise that are permanent in nature, such amounts are reclassified within the capital accounts as detailed below. Temporary differences do not require reclassification. Temporary and permanent differences do not impact the NAVs of the Funds.
Notes to Financial Statements (continued)
As of June 30, 2017, the cost and unrealized appreciation (depreciation) of investments (excluding investments in derivatives), as determined on a federal income tax basis, were as follows:
| | | | | | | | | | | | | | | | | | | | | | | | | | | | |
| | | Core
Bond | | | Core Plus
Bond | | | High Income
Bond | | | Inflation
Protected
Securities | | | Intermediate
Government
Bond | | | Short Term
Bond | | | Strategic
Income | |
| Cost of investments | | $ | 139,059,054 | | | $ | 370,810,345 | | | $ | 444,352,966 | | | $ | 607,954,690 | | | $ | 51,820,077 | | | $ | 576,423,460 | | | $ | 845,437,530 | |
| Gross unrealized: | | | | | | | | | | | | | | | | | | | | | | | | | | | | |
Appreciation | | $ | 4,136,017 | | | $ | 14,299,327 | | | $ | 12,001,583 | | | $ | 5,816,295 | | | $ | 795,118 | | | $ | 2,373,188 | | | $ | 24,426,290 | |
Depreciation | | | (274,193 | ) | | | (1,827,459 | ) | | | (29,498,191 | ) | | | (6,865,829 | ) | | | (134,344 | ) | | | (1,520,986 | ) | | | (5,684,426 | ) |
| Net unrealized appreciation (depreciation) of investments | | $ | 3,861,824 | | | $ | 12,471,868 | | | $ | (17,496,608 | ) | | $ | (1,049,534 | ) | | $ | 660,774 | | | $ | 852,202 | | | $ | 18,741,864 | |
Permanent differences, primarily due to expiration of capital loss carryforwards, federal taxes paid, foreign currency transactions, Sec. 305(c) adjustments, complex security character adjustments, investments in partnerships, treatment of notional principal contracts and amortization of mark-to-market adjustments on Sec. 311(e) assets, resulted in reclassifications among the Funds’ components of net assets as of June 30, 2017, the Funds’ tax year end, as follows:
| | | | | | | | | | | | | | | | | | | | | | | | | | | | |
| | | Core
Bond | | | Core Plus
Bond | | | High Income
Bond | | | Inflation
Protected
Securities | | | Intermediate
Government
Bond | | | Short Term
Bond | | | Strategic
Income | |
| Capital paid-in | | $ | (12 | ) | | $ | (12 | ) | | $ | (3,210 | ) | | $ | (12 | ) | | $ | (3,538,410 | ) | | $ | (1,188,211 | ) | | $ | (12 | ) |
| Undistributed (Over-distribution of) net investment income | | | — | | | | (2,926,714 | ) | | | (66,117 | ) | | | — | | | | — | | | | 54 | | | | (13,826,110 | ) |
| Accumulated net realized gain (loss) | | | 12 | | | | 2,926,726 | | | | 69,327 | | | | 12 | | | | 3,538,410 | | | | 1,188,157 | | | | 13,826,122 | |
The tax components of undistributed net ordinary income and net long-term capital gains as of June 30, 2017, the Funds’ tax year end, were as follows:
| | | | | | | | | | | | | | | | | | | | | | | | | | | | |
| | | Core
Bond | | | Core Plus
Bond | | | High Income
Bond | | | Inflation
Protected
Securities | | | Intermediate
Government
Bond | | | Short Term
Bond | | | Strategic
Income | |
| Undistributed net ordinary income1 | | $ | — | | | $ | — | | | $ | 3,327,425 | | | $ | 6,388,416 | | | $ | 43,092 | | | $ | — | | | $ | — | |
| Undistributed net long-term capital gains | | | — | | | | — | | | | — | | | | — | | | | — | | | | — | | | | — | |
| 1 | Undistributed net ordinary income (on a tax basis) has not been reduced for the dividend declared during the period June 1, 2017 through June 30, 2017 and paid on July 3, 2017. Net ordinary income consists of net taxable income derived from dividends, interest and net short-term capital gains, if any. |
The tax character of distributions paid during the Funds’ tax years ended June 30, 2017 and June 30, 2016, was designated for purposes of the dividends paid deduction as follows:
| | | | | | | | | | | | | | | | | | | | | | | | | | | | |
| 2017 | | Core
Bond | | | Core Plus
Bond | | | High Income
Bond | | | Inflation
Protected
Securities | | | Intermediate
Government
Bond | | | Short Term
Bond | | | Strategic
Income | |
| Distributions from net ordinary income2 | | $ | 3,957,392 | | | $ | 9,981,541 | | | $ | 30,659,613 | | | $ | 6,987,083 | | | $ | 1,015,757 | | | $ | 9,517,470 | | | $ | 22,549,140 | |
| Distributions from net long-term capital gains | | | — | | | | — | | | | — | | | | — | | | | — | | | | — | | | | — | |
| Return of capital | | | 283,435 | | | | 5,002,040 | | | | — | | | | — | | | | — | | | | 579,228 | | | | 17,330,639 | |
| | | | | | | | | | | | | | | | | | | | | | | | | | | | |
| 2016 | | Core
Bond | | | Core Plus
Bond | | | High Income
Bond | | | Inflation
Protected
Securities | | | Intermediate
Government
Bond | | | Short Term
Bond | | | Strategic
Income | |
| Distributions from net ordinary income2 | | $ | 5,709,771 | | | $ | 19,707,970 | | | $ | 34,298,443 | | | $ | — | | | $ | 1,027,409 | | | $ | 11,160,372 | | | $ | 51,207,124 | |
| Distributions from net long-term capital gains | | | 705,744 | | | | 801,663 | | | | — | | | | — | | | | — | | | | — | | | | — | |
| Return of capital | | | 868,307 | | | | — | | | | — | | | | — | | | | — | | | | — | | | | — | |
| 2 | Net ordinary income consists of net taxable income derived from dividends, interest and net short-term capital gains, if any. |
As of June 30, 2017, the Funds’ tax year end, the Funds had unused capital loss carryforwards available for federal income tax purposes to be applied against future capital gains, if any. If not applied, the carryforwards will expire as shown in the following table. The losses not subject to expiration will be utilized first by a Fund.
| | | | | | | | | | | | | | | | | | | | | | | | | | | | |
| | | Core
Bond | | | Core Plus
Bond | | | High Income
Bond | | | Inflation
Protected
Securities | | | Intermediate
Government
Bond | | | Short Term
Bond | | | Strategic
Income | |
| Expiration: | | | | | | | | | | | | | | | | | | | | | | | | | | | | |
June 30, 2018 | | $ | — | | | $ | — | | | $ | — | | | $ | — | | | $ | — | | | $ | 4,103,631 | | | $ | 35,110,018 | |
| Not subject to expiration | | | 2,917,952 | | | | 6,778,004 | | | | 93,516,903 | | | | 3,811,179 | | | | 1,057,024 | | | | 8,377,887 | | | | 54,722,250 | |
| Total | | $ | 2,917,952 | | | $ | 6,778,004 | | | $ | 93,516,903 | | | $ | 3,811,179 | | | $ | 1,057,024 | | | $ | 12,481,518 | | | $ | 89,832,268 | |
During the Funds’ tax year ended June 30, 2017, the following Funds utilized capital loss carryforwards as follows:
| | | | | | | | |
| | | Core Plus Bond | | | Short Term
Bond | |
| Utilized capital loss carryforwards | | $ | 3,300,381 | | | $ | 779,967 | |
As of June 30, 2017, the Funds’ tax year end, the following Funds’ capital loss carryforwards expired as follows:
| | | | | | | | |
| | | Intermediate
Government Bond | | | Short Term
Bond | |
| Expired capital loss carryforwards | | $ | 3,538,398 | | | $ | 1,188,199 | |
The Funds have elected to defer late-year losses in accordance with federal income tax rules. These losses are treated as having arisen on the first day of the following fiscal year. The following Funds have elected to defer losses as follows:
| | | | | | | | |
| | | Core Plus Bond | | | Strategic
Income | |
| Post-October capital losses3 | | $ | — | | | $ | — | |
| Late-year ordinary losses4 | | | 1,709,124 | | | | 7,226,379 | |
| 3 | Capital losses incurred from November 1, 2016 through June 30, 2017, the Funds’ tax year end. |
| 4 | Ordinary losses incurred from January 1, 2017 through June 30, 2017 and/or specified losses incurred from November 1, 2016 through June 30, 2017. |
7. Management Fees and Other Transactions with Affiliates
Management Fees
Each Fund’s management fee compensates the Adviser for the overall investment advisory and administrative services and general office facilities. The Sub-Adviser is compensated for its services to the Funds from the management fees paid to the Adviser.
Each Fund’s management fee consists of two components – a fund-level fee, based only on the amount of assets within each individual Fund, and a complex-level fee, based on the aggregate amount of all eligible fund assets managed by the Adviser. This pricing structure enables each Fund’s shareholders to benefit from growth in the assets within their respective Fund as well as from growth in the amount of complex-wide assets managed by the Adviser.
The annual Fund-level fee, payable monthly, for each Fund is calculated according to the following schedule:
| | | | | | | | | | | | | | | | | | | | | | | | | | | | |
| Average Daily Net Assets | | Core Bond | | | Core Plus Bond | | | High Income Bond | | | Inflation
Protected
Securities | | | Intermediate
Government
Bond | | | Short Term
Bond | | | Strategic
Income | |
| For the first $125 million | | | 0.2700 | % | | | 0.2800 | % | | | 0.4000 | % | | | 0.2500 | % | | | 0.2500 | % | | | 0.2200 | % | | | 0.3600 | % |
| For the next $125 million | | | 0.2575 | | | | 0.2675 | | | | 0.3875 | | | | 0.2375 | | | | 0.2375 | | | | 0.2075 | | | | 0.3475 | |
| For the next $250 million | | | 0.2450 | | | | 0.2550 | | | | 0.3750 | | | | 0.2250 | | | | 0.2250 | | | | 0.1950 | | | | 0.3350 | |
| For the next $500 million | | | 0.2325 | | | | 0.2425 | | | | 0.3625 | | | | 0.2125 | | | | 0.2125 | | | | 0.1825 | | | | 0.3225 | |
| For the next $1 billion | | | 0.2200 | | | | 0.2300 | | | | 0.3500 | | | | 0.2000 | | | | 0.2000 | | | | 0.1700 | | | | 0.3100 | |
| For net assets over $2 billion | | | 0.1950 | | | | 0.2050 | | | | 0.3250 | | | | 0.1750 | | | | 0.1750 | | | | 0.1450 | | | | 0.2850 | |
Notes to Financial Statements (continued)
The annual complex-level fee, payable monthly, for each Fund is determined by taking the complex-level fee rate, which is based on the aggregate amount of “eligible assets” of all Nuveen funds as set forth in the schedule below, and making, as appropriate, an upward adjustment to that rate based upon the percentage of the particular fund’s assets that are not “eligible assets.” The complex-level fee schedule for each Fund is as follows:
| | | | |
| Complex-Level Asset Breakpoint Level* | | Effective Rate at Breakpoint Level | |
| $55 billion | | | 0.2000 | % |
| $56 billion | | | 0.1996 | |
| $57 billion | | | 0.1989 | |
| $60 billion | | | 0.1961 | |
| $63 billion | | | 0.1931 | |
| $66 billion | | | 0.1900 | |
| $71 billion | | | 0.1851 | |
| $76 billion | | | 0.1806 | |
| $80 billion | | | 0.1773 | |
| $91 billion | | | 0.1691 | |
| $125 billion | | | 0.1599 | |
| $200 billion | | | 0.1505 | |
| $250 billion | | | 0.1469 | |
| $300 billion | | | 0.1445 | |
| * | The complex-level fee is calculated based upon the aggregate daily “eligible assets” of all Nuveen funds. Eligible assets do not include assets attributable to investments in other Nuveen funds or assets in excess of a determined amount (originally $2 billion) added to the Nuveen fund complex in connection with the Adviser’s assumption of the management of the former First American Funds effective January 1, 2011. Eligible assets include closed-end fund assets managed by the Adviser that are attributable to certain types of leverage. For these purposes, leverage includes the closed-end funds’ use of preferred stock and borrowings and certain investments in the residual interest certificates (also called inverse floating rate securities) in tender option bond (TOB) trusts, including the portion of assets held by the TOB trust that has been effectively financed by the trust’s issuance of floating rate securities, subject to an agreement by the Adviser as to certain funds to limit the amount of such assets for determining eligible assets in certain circumstances. As of June 30, 2017, the complex-level fee for each Fund was as follows: |
| | | | |
| Fund | | Complex-Level Fee | |
Core Bond | | | 0.2000 | % |
Core Plus Bond | | | 0.2000 | |
High Income Bond | | | 0.2000 | |
Inflation Protected Securities | | | 0.1723 | |
Intermediate Government Bond | | | 0.2000 | |
Short Term Bond | | | 0.2000 | |
Strategic Income | | | 0.1913 | |
The Adviser has agreed to waive fees and/or reimburse expenses (“Expense Cap”) of each Fund so that total annual Fund operating expenses (excluding 12b-1 distribution and/or service fees, interest expenses, taxes, acquired fund fees and expenses, fees occurred in acquiring and disposing of portfolio securities and extraordinary expenses) do not exceed the average daily net assets of any class of Fund shares in the amounts and for the time periods stated in the following table. However, because Class R6 Shares are not subject to sub-transfer agent and similar fees, the total annual Fund operating expenses for the Class R6 Shares will be less than the expense limitation. The expense limitation in effect thereafter may be terminated or modified only with the approval of the shareholders of each Fund.
| | | | | | |
| Fund | | Expense Cap | | | Expense Cap
Expiration Date |
| Core Bond | | | 0.53 | % | | October 31, 2018 |
| Core Plus Bond | | | 0.52 | | | October 31, 2018 |
| High Income Bond | | | 0.75 | | | October 31, 2018 |
| Inflation Protected Securities | | | 0.56 | | | October 31, 2018 |
| Intermediate Government Bond | | | 0.54 | | | October 31, 2018 |
| Short Term Bond | | | 0.47 | | | October 31, 2018 |
| Strategic Income | | | 0.59 | | | October 31, 2018 |
Other Transactions with Affiliates
During the current fiscal period, Nuveen Securities, LLC, (the “Distributor”), a wholly-owned subsidiary of Nuveen, collected sales charges on purchases of Class A Shares, the majority of which were paid out as concessions to financial intermediaries as follows:
| | | | | | | | | | | | | | | | | | | | | | | | | | | | |
| | | Core
Bond | | | Core Plus
Bond | | | High Income
Bond | | | Inflation
Protected
Securities | | | Intermediate
Government
Bond | | | Short Term
Bond | | | Strategic
Income | |
| Sales charges collected (Unaudited) | | $ | 11,642 | | | $ | 58,003 | | | $ | 530,594 | | | $ | 50,353 | | | $ | 9,481 | | | $ | 163,529 | | | $ | 268,368 | |
| Paid to financial intermediaries (Unaudited) | | | 9,813 | | | | 51,356 | | | | 472,153 | | | | 46,538 | | | | 8,030 | | | | 159,294 | | | | 243,974 | |
The Distributor also received 12b-1 service fees on Class A Shares, substantially all of which were paid to compensate financial intermediaries for providing services to shareholders relating to their investments.
During the current fiscal period, the Distributor compensated financial intermediaries directly with commission advances at the time of purchase as follows:
| | | | | | | | | | | | | | | | | | | | | | | | | | | | |
| | | Core
Bond | | | Core Plus
Bond | | | High Income
Bond | | | Inflation
Protected
Securities | | | Intermediate
Government
Bond | | | Short Term
Bond | | | Strategic
Income | |
| Commission advances (Unaudited) | | $ | 5,579 | | | $ | 20,424 | | | $ | 122,213 | | | $ | 64,788 | | | $ | 6,459 | | | $ | 146,538 | | | $ | 150,756 | |
To compensate for commissions advanced to financial intermediaries, all 12b-1 service and distribution fees collected on Class C Shares during the first year following a purchase are retained by the Distributor. During the current fiscal period, the Distributor retained such 12b-1 fees as follows:
| | | | | | | | | | | | | | | | | | | | | | | | | | | | |
| | | Core
Bond | | | Core Plus
Bond | | | High Income
Bond | | | Inflation
Protected
Securities | | | Intermediate
Government
Bond | | | Short Term
Bond | | | Strategic
Income | |
| 12b-1 fees retained (Unaudited) | | $ | 6,544 | | | $ | 16,508 | | | $ | 76,522 | | | $ | 21,455 | | | $ | 6,010 | | | $ | 54,053 | | | $ | 94,114 | |
The remaining 12b-1 fees charged to the Funds were paid to compensate financial intermediaries for providing services to shareholders relating to their investments.
The Distributor also collected and retained CDSC on share redemptions during the current fiscal period, as follows:
| | | | | | | | | | | | | | | | | | | | | | | | | | | | |
| | | Core
Bond | | | Core Plus
Bond | | | High Income
Bond | | | Inflation
Protected
Securities | | | Intermediate
Government
Bond | | | Short Term
Bond | | | Strategic
Income | |
| CDSC retained (Unaudited) | | $ | 2,993 | | | $ | 3,401 | | | $ | 9,734 | | | $ | 2,485 | | | $ | 2,947 | | | $ | 41,880 | | | $ | 10,933 | |
8. Borrowing Arrangements
Uncommitted Line of Credit
During the current fiscal period, the Funds participated in an unsecured bank line of credit (“Unsecured Credit Line”) under which outstanding balances would bear interest at a variable rate. Although the Funds participated in the Unsecured Credit Line, they did not have any outstanding balances during the current fiscal period.
Committed Line of Credit
The Funds, along with certain other funds managed by the Adviser (“Participating Funds”), have established a 364-day, approximately $3 billion standby credit facility with a group of lenders, under which the Participating Funds may borrow for various purposes other than leveraging for investment purposes. A large portion of this facility’s capacity (and its associated costs as described below) is currently dedicated for use by a small number of Participating Funds, which does not include any of the Funds covered by this shareholder report. The remaining capacity under the facility (and the corresponding portion of the facility’s annual costs) is separately dedicated to most of the other open-end funds in the Nuveen fund family, including all of the Funds covered by this shareholder report, along with a number of Nuveen closed-end funds. The credit facility expires in July 2018 unless extended or renewed.
The credit facility has the following terms: a fee of 0.15% per annum on unused commitment amounts, and interest at a rate equal to the higher of (a) one-month LIBOR (London Inter-Bank Offered Rate) plus 1.25% per annum or (b) the Fed Funds rate plus 1.25% per annum on amounts borrowed. Participating Funds paid administration, legal and arrangement fees, which are recognized as a component of “Other expenses” on the Statement of Operations, and along with commitment fees, have been allocated among such Participating Funds based upon the relative proportions of the facility’s aggregate capacity reserved for them and other factors deemed relevant by the Adviser and the Board of each Participating Fund.
During the current fiscal period, High Income Bond utilized this facility. The Fund’s average daily balance outstanding and average annual interest rate during the utilization period were $35,925,000 and 2.02%, respectively. The Fund’s maximum outstanding daily balance during the utilization period was $95,000,000. Borrowings outstanding as of the end of the reporting period are recognized as “Borrowings” on the Statement of Assets and Liabilities. None of the other Funds utilized this facility during the current fiscal period.
9. New Accounting Pronouncements
Amendments to Regulation S-X
In October 2016, the SEC adopted new rules and amended existing rules (together, the “final rules”) intended to modernize the reporting and disclosure of information by registered investment companies. In part, the final rules amend Regulation S-X and require standardized, enhanced disclosure about derivatives in investment company financial statements, as well as other amendments. The compliance date of the amendments to Regulation S-X is August 1, 2017. Management is still evaluating the impact of the final rules, if any.
Notes to Financial Statements (continued)
Accounting Standards Update (“ASU”) 2017-08 (“ASU 2017-08”) Premium Amortization on Purchased Callable Debt Securities
During March 2017, the Financial Accounting Standards Board (FASB) issued ASU 2017-08, which shortens the premium amortization period for purchased non-contingently callable debt securities. ASU 2017-08 specifies that the premium amortization period ends at the earliest call date, for purchased non-contingently callable debt securities. ASU 2017-08 is effective for fiscal years, and interim periods within those fiscal years, beginning after December 15, 2018. Management is currently evaluating the implications of ASU 2017-08, if any.
10. Subsequent Events
Management Fees
During May 2017, the Board approved a change to each Fund’s annual Fund-level management fee schedule, which will before effective on August 1, 2017.
Effective August 1, 2017 the annual Fund-level fee, payable monthly, for each Fund will be calculated according to the following schedule:
| | | | | | | | | | | | | | | | | | | | | | | | | | | | |
| Average Daily Net Assets | | Core Bond | | | Core Plus Bond | | | High Income Bond | | | Inflation Protected Securities | | | Intermediate Government Bond | | | Short Term Bond | | | Strategic Income | |
| For the first $125 million | | | 0.2700 | % | | | 0.2800 | % | | | 0.4000 | % | | | 0.2500 | % | | | 0.2500 | % | | | 0.2200 | % | | | 0.3600 | % |
| For the next $125 million | | | 0.2575 | | | | 0.2675 | | | | 0.3875 | | | | 0.2375 | | | | 0.2375 | | | | 0.2075 | | | | 0.3475 | |
| For the next $250 million | | | 0.2450 | | | | 0.2550 | | | | 0.3750 | | | | 0.2250 | | | | 0.2250 | | | | 0.1950 | | | | 0.3350 | |
| For the next $500 million | | | 0.2325 | | | | 0.2425 | | | | 0.3625 | | | | 0.2125 | | | | 0.2125 | | | | 0.1825 | | | | 0.3225 | |
| For the next $1 billion | | | 0.2200 | | | | 0.2300 | | | | 0.3500 | | | | 0.2000 | | | | 0.2000 | | | | 0.1700 | | | | 0.3100 | |
| For the next $3 billion | | | 0.1950 | | | | 0.2050 | | | | 0.3250 | | | | 0.1750 | | | | 0.1750 | | | | 0.1450 | | | | 0.2850 | |
| For the next $5 billion | | | 0.1700 | | | | 0.1800 | | | | 0.3000 | | | | 0.1500 | | | | 0.1500 | | | | 0.1200 | | | | 0.2600 | |
| For net assets over $10 billion | | | 0.1575 | | | | 0.1675 | | | | 0.2875 | | | | 0.1375 | | | | 0.1375 | | | | 0.1075 | | | | 0.2475 | |
Additional
Fund Information (Unaudited)
| | | | | | | | | | |
| | | | | |
| | Fund Manager Nuveen Fund Advisors, LLC 333 West Wacker Drive Chicago, IL 60606 Sub-Adviser Nuveen Asset Management, LLC 333 West Wacker Drive Chicago, IL 60606 | | Independent Registered
Public Accounting Firm PricewaterhouseCoopers LLP One North Wacker Drive Chicago, IL 60606 Custodian U.S. Bank National Association 1555 North RiverCenter Drive Suite 302 Milwaukee, WI 53202 | | Legal Counsel Chapman and Cutler LLP Chicago, IL 60603 | | Transfer Agent and
Shareholder Services Boston Financial
Data Services Nuveen Investor Services P.O. Box 8530 Boston, MA 02266-8530 (800) 257-8787 | | |
| | | | | | | | | | | | | | |
| | | | | |
| | | | | | | | | | |
| | |
| | Distribution Information: Nuveen High Income Bond Fund hereby designates its percentage of dividends paid from net ordinary income as dividends qualifying for the 70% dividends received deduction (“DRD”) for corporations and its percentage as qualified dividend income (“QDI”) for individuals under Section 1(h)(11) of the Internal Revenue Code as shown in the accompanying table. The actual qualified dividend income distributions will be reported to shareholders on Form 1099-DIV which will be sent to shareholders shortly after calendar year end. | | |
| | | | | | |
| | | | | | | | | | | High Income Bond | | |
| | % QDI | | 2.4% | | |
| | % DRD | | 2.2% | | |
| | | | | |
| | | | | | | | | | |
| | |
| | Quarterly Form N-Q Portfolio of Investments Information: Each Fund is required to file its complete schedule of portfolio holdings with the Securities and Exchange Commission (SEC) for the first and third quarters of each fiscal year on Form N-Q. You may obtain this information directly from the SEC. Visit the SEC on-line at http://www.sec.gov or in person at the SEC’s Public Reference Room in Washington, D.C. Call the SEC toll-free at (800) SEC-0330 for room hours and operation. | | |
| | | |
| | | | | | |
| | |
| | Nuveen Funds’ Proxy Voting Information: You may obtain (i) information regarding how each fund voted proxies relating to portfolio securities held during the most recent twelve-month period ended June 30, without charge, upon request, by calling Nuveen toll-free at (800) 257-8787 or on Nuveen’s website at www.nuveen.com and (ii) a description of the policies and procedures that each fund used to determine how to vote proxies relating to portfolio securities without charge, upon request, by calling Nuveen toll-free at (800) 257-8787. You may also obtain this information directly from the SEC. Visit the SEC on-line at http://www.sec.gov. | | |
| | | |
| | | | | | |
| | |
| | FINRA BrokerCheck: The Financial Industry Regulatory Authority (FINRA) provides information regarding the disciplinary history of FINRA member firms and associated investment professionals. This information as well as an investor brochure describing FINRA BrokerCheck is available to the public by calling the FINRA BrokerCheck Hotline number at (800) 289-9999 or by visiting www.FINRA.org. | | |
Glossary of Terms
Used in this Report (Unaudited)
Asset-Backed Securities (ABS): Securities whose value and income payments are derived from and collateralized by a specific pool of underlying assets. The pool of assets typically is a group of small and/or illiquid assets that may be difficult to sell individually. The underlying pools of asset-backed securities often include payments from credit cards, auto loans or mortgage loans.
Average Annual Total Return: This is a commonly used method to express an investment’s performance over a particular, usually multi-year time period. It expresses the return that would have been necessary each year to equal the investment’s actual cumulative performance (including change in NAV or offer price and reinvested dividends and capital gains distributions, if any) over the time period being considered.
Basis Point: One one-hundredth of one percentage point, or 0.01%. For example, 25 basis points equals 0.25%.
Beta: A measure of the variability of the change in the share price for a fund in relation to a change in the value of the fund’s market benchmark. Securities with betas higher than 1.0 have been, and are expected to be, more volatile than the benchmark; securities with betas lower than 1.0 have been, and are expected to be, less volatile than the benchmark.
Bloomberg Barclays U.S. Aggregate Bond Index: An unmanaged index that includes all investment-grade, publicly issued, fixed-rate, dollar denominated, nonconvertible debt issues and commercial mortgage-backed securities with maturities of at least one year and outstanding par values of $150 million or more. Index returns assume reinvestment of distributions, but do not include the effects of any applicable sales charges or management fees.
Bloomberg Barclays High Yield 2% Issuer Capped Index: An issuer-constrained version of the U.S. Corporate High-Yield Index that covers the U.S. dollar denominated, non-investment grade, fixed-rate, taxable corporate bond market. Index returns assume reinvestment of distributions, but do not include the effects of any applicable sales charges or management fees.
Bloomberg Barclays Intermediate Government Bond Index: An unmanaged index that includes all publicly issued, U.S. Treasury securities that have a remaining maturity of greater than or equal to 1 year and less than 10 years, are rated investment grade, and have $250 million or more of outstanding face value. Index returns assume reinvestment of distributions, but do not include the effects of any applicable sales charges or management fees.
Bloomberg Barclays U.S. TIPS Index: An unmanaged index that includes all publicly issued, U.S. Treasury inflation-protected securities that have at least one year remaining to maturity, are rated investment grade, and have $250 million or more of outstanding face value. Index returns assume reinvestment of distributions, but do not include the effects of any applicable sales charges or management fees.
Bloomberg Barclays 1-3 Year Government/Credit Bond Index: An unmanaged index that includes all medium and larger issues of U.S. government, investment-grade corporate, and investment-grade international dollar-denominated bonds that have maturities of between 1 and 3 years and are publicly issued. Index returns assume reinvestment of distributions, but do not include the effects of any applicable sales charges or management fees.
Commercial Mortgage-Backed Securities (CMBS): Commercial mortgage-backed securities are backed by cash flows of a mortgage or pool of mortgages on commercial real estate. CMBS generally are structured to provide protection to the senior class investors against potential losses on the underlying mortgage loans. CMBS are typically characterized by the following: i) loans on multi-family housing, non-residential property, ii) payments based on the amortization schedule of 25-30 years with a balloon payment due usually after 10 years, and iii) restrictions on prepayments.
Contingent Capital Securities (CoCos): CoCos are debt or capital securities of primarily non-U.S. issuers with loss absorption contingency mechanisms built into the terms of the security, for example a mandatory conversion into common stock of the issuer, or a principal write-down, which if triggered would likely cause the CoCo investment to lose value. Loss absorption mechanisms would become effective upon the occurrence of a specified contingency event, or at the discretion of a regulatory body. Specified contingency events, as identified in the CoCo’s governing documents, usually reference a decline in the issuer’s capital below a specified threshold level, and/or certain regulatory events. A loss absorption contingency event for CoCos would likely be the result of, or related to, the deterioration of the issuer’s financial condition and/or its status as a going concern. In such a case, with respect to CoCos that provide for conversion into common stock upon the occurrence of the contingency event, the market price of the issuer’s common stock received by the Acquiring Fund will have likely declined, perhaps substantially, and may continue to decline after conversion. CoCos rated below investment grade should be considered high yield securities, or “junk,” but often are issued by entities whose more senior securities are rated investment grade. CoCos are a relatively new type of security; and there is a risk that CoCo security issuers may suffer the sort of future financial distress that could materially increase the likelihood (or the market’s perception of the likelihood) that an automatic write-down or conversion event on those
issuers’ CoCos will occur. Additionally, the trading behavior of a given issuer’s CoCo may be strongly impacted by the trading behavior of other issuers’ CoCos, such that negative information from an unrelated CoCo security may cause a decline in value of one or more CoCos held by the Fund. Accordingly, the trading behavior of CoCos may not follow the trading behavior of other types of debt and preferred securities. Despite these concerns, the prospective reward vs. risk characteristics of at least certain CoCos may be very attractive relative to other fixed-income alternatives.
Duration: Duration is a measure of the expected period over which a bond’s principal and interest will be paid, and consequently is a measure of the sensitivity of a bond’s or bond fund’s value to changes when market interest rates change. Generally, the longer a bond’s or fund’s duration, the more the price of the bond or fund will change as interest rates change.
Gross Domestic Product (GDP): The total market value of all final goods and services produced in a country/region in a given year, equal to total consumer, investment and government spending, plus the value of exports, minus the value of imports.
Lipper Core Bond Classification Average: Represents the average annualized returns for all reporting funds in the Lipper Core Bond Classification. Lipper returns account for the effects of management fees and assume reinvestment of distributions, but do not reflect any applicable sales charge.
Lipper Core Bond Plus Classification Average: Represents the average annualized returns for all reporting funds in the Lipper Core Bond Plus Classification. Lipper returns account for the effects of management fees and assume reinvestment of distributions, but do not reflect any applicable sales charge.
Lipper High Current Yield Funds Classification Average: Represents the average annualized returns for all reporting funds in the Lipper High Current Yield Funds Classification. Lipper returns account for the effects of management fees and assume reinvestment of distributions, but do not reflect any applicable sales charge.
Lipper Inflation-Protected Bond Funds Classification Average: Represents the average annualized returns for all reporting funds in the Lipper Inflation-Protected Bond Funds Classification. The Lipper returns account for the effects of management fees and assume reinvestment of distributions, but do not reflect any applicable sales charge.
Lipper Intermediate U.S. Government Funds Classification Average: Represents the average annualized returns for all reporting funds in the Lipper Intermediate U.S. Government Funds Classification. Lipper returns account for the effects of management fees and assume reinvestment of distributions, but do not reflect any applicable sales charge.
Lipper Multi-Sector Income Funds Classification Average: Represents the average annualized returns for all reporting funds in the Lipper Multi-Sector Income Funds Classification. Lipper returns account for the effects of management fees and assume reinvestment of distributions, but do not reflect any applicable sales charge.
Lipper Short Investment Grade Debt Funds Classification Average: Represents the average annualized returns for all reporting funds in the Lipper Short Investment Grade Debt Funds Classification. Lipper returns account for the effects of management fees and assume reinvestment of distributions, but do not reflect any applicable sales charge.
Mortgage-Backed Securities (MBS): Mortgage-backed securities (MBS) are bonds backed by pools of mortgages, usually with similar characteristics, and which return principal and interest in each payment. MBS are composed of residential mortgages (RMBS) or commercial mortgages (CMBS). RMBS are further divided into agency RMBS and non-agency RMBS, depending on the issuer.
Net Asset Value (NAV) Per Share: A fund’s Net Assets is equal to its total assets (securities, cash and accrued earnings) less its total liabilities. For funds with multiple classes, Net Assets are determined separately for each share class. NAV per share is equal to the fund’s (or share class’) Net Assets divided by its number of shares outstanding.
Residential Mortgage-Backed Securities (RMBS): Residential mortgage-backed securities are securities the payments on which depend primarily on the cash flow from residential mortgage loans made to borrowers that are secured by residential real estate. RMBS consist of agency and non-agency RMBS. Agency RMBS have agency guarantees that assure investors that they will receive timely payment of interest and principal, regardless of delinquency or default rates on the underlying loans. Agency RMBS include securities issued by the Government National Mortgage Association, the
Federal National Mortgage Association and the Federal Home Loan Mortgage Corporation, and other federal agencies, or issues guaranteed by them. Non-agency RMBS do not have agency guarantees. Non-agency RMBS have credit enhancement built into the structure to shield investors from borrower delinquencies. The spectrum of non-agency residential mortgage loans includes traditional jumbo loans (prime), alternative-A loans (Alt-A), and home equity loans (sub-prime).
Tax Equalization: The practice of treating a portion of the distribution made to a redeeming shareholder, which represents his proportionate part of undistributed net investment income and capital gain as a distribution for tax purposes. Such amounts are referred to as the equalization debits (or payments) and will be considered a distribution to the shareholder of net investment income and capital gain for calculation of the fund’s dividends paid deduction.
Annual Investment Management Agreement
Approval Process (Unaudited)
The Board of Directors (the “Board,” and each Director, a “Board Member”) of the Funds, including the Board Members who are not parties to the Funds’ advisory or sub-advisory agreements or “interested persons” of any such parties (the “Independent Board Members”), oversees the management of the Funds, including the performance of Nuveen Fund Advisors, LLC, the Funds’ investment adviser (the “Adviser”), and Nuveen Asset Management, LLC, the Funds’ sub-adviser (the “Sub-Adviser”). As required by applicable law, after the initial term of the respective Fund following commencement of its operations, the Board is required to consider annually whether to renew the Fund’s management agreement with the Adviser (the “Investment Management Agreement”) and its sub-advisory agreement with the Sub-Adviser (the “Sub-Advisory Agreement” and, together with the Investment Management Agreement, the “Advisory Agreements”). Accordingly, the Board met in person on April 11-12, 2017 (the “April Meeting”) and May 23-25, 2017 (the “May Meeting”) to consider the approval of each Advisory Agreement for the Funds that was up for renewal for an additional one-year period.
The Board considered its review of the Advisory Agreements as an ongoing process encompassing the information received and the deliberations the Board and its committees have had throughout the year. The Board met regularly during the year and received materials and discussed topics that were relevant to the annual consideration of the renewal of the Advisory Agreements, including, among other things, overall market performance and developments; fund investment performance; investment team review; valuation of securities; compliance, regulatory and risk management matters; payments to intermediaries such as 12b-1 fees, sub-transfer agency fees and other payments; and other developments. The Board had also established several standing committees, including the Open-end Fund Committee and Closed-end Fund Committee, which met regularly throughout the year to permit the Board Members to delve deeper into the topics particularly relevant to the respective product line. The Board further continued its practice of seeking to meet periodically with the Sub-Adviser and its investment team. The accumulated information, knowledge, and experience the Board Members had gained during their tenure on the Board governing the Funds and working with the Fund Advisers (as defined below) were taken into account in their review of the Advisory Agreements.
In addition to the materials received by the Board or its committees throughout the year, the Board reviewed extensive additional materials prepared specifically for its annual review of the Advisory Agreements in response to a request by independent legal counsel on behalf of the Independent Board Members. The materials addressed a variety of topics, including, but not limited to, a description of the services provided by the Adviser and Sub-Adviser (the Adviser and the Sub-Adviser are each a “Fund Adviser”); an analysis of fund performance including comparative industry data and a detailed focus on performance outliers; an analysis of the Sub-Adviser; an analysis of the fees and expense ratios of the Nuveen funds in absolute terms and in comparison to the fees and expenses of peers with a focus on any expense outliers; an assessment of shareholder services for the Nuveen funds and of the performance of certain service providers; a review of initiatives instituted or continued during the past year; and information regarding the profitability of the Fund Advisers, the compensation of portfolio managers, and compliance and risk matters. The materials provided in connection with the annual review included information compiled and prepared by Broadridge Financial Solutions, Inc. (“Broadridge” or “Lipper”), an independent provider of investment company data, comparing, in relevant part, each Fund’s fees and expenses with those of a comparable universe of funds (the “Peer Universe”) and with a more focused subset of the Peer Universe (the “Peer Group”), as selected by Broadridge (the “Broadridge Report”). The Independent Board Members also received a memorandum from independent legal counsel outlining their fiduciary duties and legal standards in reviewing the Advisory Agreements.
As part of its annual review, the Board met at the April Meeting to review the investment performance of the Funds and to consider the Adviser’s analysis of the Sub-Adviser evaluating, among other things, the Sub-Adviser’s assets under management, investment team, performance, organizational stability, and investment approach. During the review, the Independent Board Members requested and received additional information from management. At the May Meeting, the Board, including the Independent Board Members, continued its review and ultimately approved the continuation of the Advisory Agreements for an additional year. Throughout the year and throughout their review of the Advisory Agreements, the Independent Board Members were assisted by independent legal counsel and met with counsel separately without management present. In deciding to renew the Advisory Agreements, the Independent Board Members did not identify a particular factor as determinative, but rather the decision reflected the comprehensive consideration of all the information presented, and each Board Member may have attributed different weights to the various factors and information considered in connection with the approval process. The following summarizes the principal factors, but not all the factors, the Board considered in its review of the Advisory Agreements and its conclusions.
A. Nature, Extent and Quality of Services
In evaluating the renewal of the Advisory Agreements, the Independent Board Members received and considered information regarding the nature, extent and quality of the applicable Fund Adviser’s services provided to the respective Fund and the resulting performance of each Fund. The Board recognized the myriad of services the Adviser and its affiliates provided to manage and operate the Nuveen funds, including (a) product management (such as managing distributions, positioning the product in the marketplace, managing the relationships with the distribution platforms, maintaining and enhancing shareholder communications and reporting to the Board); (b) investment oversight, risk management and securities valuation (such as
overseeing the sub-advisers and other service providers, analyzing investment performance and risks, overseeing risk management and disclosure, executing the daily valuation of securities, and analyzing trade execution); (c) fund administration (such as helping to prepare fund tax returns and complete other tax compliance matters and helping to prepare regulatory filings and shareholder reports); (d) fund board administration (such as preparing board materials and organizing and providing assistance for board meetings); (e) compliance (such as helping to devise and maintain the Nuveen funds’ compliance program and test for adherence); (f) legal support (such as helping to prepare registration statements and proxy statements, interpreting regulations and policies and overseeing fund activities); (g) with respect to certain closed-end funds, providing leverage, capital and distribution management services; and (h) with respect to certain open-end funds with portfolios that have a leverage component, providing such leverage management services.
The Board further noted the Adviser’s continued dedication to investing in its business to enhance the quality and breadth of the services provided to the Funds. The Board recognized the Adviser’s investment in staffing over recent years to support the services provided to the Nuveen funds in key areas, including in investment services, product management, retail distribution and information technology, closed-end funds and structured products, as well as in fund administration, operations and risk management. The Board further noted the Adviser’s continued commitment to enhancing its compliance program by, among other things, restructuring the compliance organization, developing a unified compliance program, adding compliance staff, and developing and/or revising policies and procedures as well as building further infrastructure to address new regulatory requirements or guidance and the growth of the complex. The Board also considered the enhancements to Nuveen’s cybersecurity capabilities, systems and processes to value securities, stress test reporting and risk and control self-assessments.
In addition, the Independent Board Members considered information highlighting the various initiatives that the Adviser had implemented or continued over recent years to benefit the open-end fund and closed-end fund product lines and/or particular Nuveen funds. The Board noted the Adviser’s continued efforts to rationalize the open-end fund and closed-end fund product lines through, among other things, mergers, liquidations and repositionings in seeking to provide enhanced shareholder value over the years through increased efficiency, reduced costs, improved performance and revised investment approaches that are more relevant to current shareholder needs. With respect to open-end Nuveen funds, such initiatives also included, but were not limited to, (a) implementing the multi-class solutions platform through the launch of several multi-asset income funds; (b) creating new share classes on several funds to potentially attract new clients and respond to regulatory developments; (c) reviewing the pricing of the open-end product line which resulted in the reduction of the management fee and/or temporary expense cap for various funds, the reduction of the temporary expense cap of Nuveen Inflation Protected Securities Fund (the “Inflation Protected Fund”) and the reduction in both the management fee and temporary expense cap of Nuveen Intermediate Government Bond Fund (the “Intermediate Government Fund”), as well as the adoption of a temporary expense cap for Nuveen High Income Bond Fund (the “High Income Fund”); (d) lowering the sales load breakpoints on certain municipal open-end funds to make them more competitive in the marketplace; (e) modifying the investment policies of various funds; and (f) creating a new product line of exchange-traded funds (“ETFs”).
In its review, the Board recognized that initiatives that attracted assets to the Nuveen family of funds generally benefited the Nuveen funds in the complex as fixed costs would be spread over a larger asset base and, as described below, through the complex-wide fee arrangement which generally provides that the management fees of the Nuveen funds (subject to limited exceptions) are reduced as asset levels in the complex reach certain breakpoints in the fee schedule.
Similarly, the Board considered the sub-advisory services provided by the Sub-Adviser to the Funds. The Sub-Adviser generally provided portfolio advisory services for the Funds. The Board reviewed the Adviser’s analysis of the Sub-Adviser which evaluated, among other things, the investment team and any changes thereto, the stability and history of the organization, the assets under management, the investment approach and the performance of the Nuveen funds it sub-advises. The Board noted that the Adviser recommended the renewal of the Sub-Advisory Agreements.
Based on its review, the Board determined, in the exercise of its reasonable business judgment, that it was satisfied with the nature, extent and quality of services provided to the respective Funds under each applicable Advisory Agreement.
B. The Investment Performance of the Funds and Fund Advisers
As part of its evaluation of the services provided by the Fund Advisers, the Board reviewed Fund performance over the quarter, one-, three- and five-year periods ending December 31, 2016 as well as performance data for the first quarter of 2017 ending March 31, 2017. The Board reviewed performance on an absolute basis and in comparison to the performance of peer funds (the “Performance Peer Group”) and recognized and/or customized benchmarks (i.e., generally benchmarks derived from multiple recognized benchmarks). The review and analysis of performance information during the annual review of Advisory Agreements incorporated the discussions and performance information the Board Members have had at each of their quarterly meetings throughout the year.
In evaluating performance data, the Independent Board Members recognized some of the limitations of such data and the difficulty in establishing appropriate peer groups and benchmarks for certain of the Nuveen funds. They recognized that each fund operates pursuant to its own investment objective(s), parameters and restrictions which may differ from that of the Performance Peer Group or benchmark. Certain funds may also utilize leverage which may provide benefits or risks to their portfolio compared to an unlevered benchmark. The Independent Board Members had noted that management had classified the Performance Peer Groups as low, medium and high in relevancy to the applicable fund as a result of these differences
Annual Investment Management Agreement Approval Process (Unaudited) (continued)
or other factors. The Independent Board Members recognized that the variations between the Performance Peer Group or benchmark and the applicable Fund will lead to differing performance results and may limit the value of the comparative performance data in assessing the particular Fund’s performance.
In addition, the Independent Board Members recognized that the performance data is a snapshot in time, in this case as of the end of the 2016 calendar year or end of the first quarter of 2017. A different period may generate significantly different results and longer term performance can be adversely affected by even one period of significant underperformance. Further, a shareholder’s experience in a Fund depends on his or her own holding period which may differ from that reviewed by the Independent Board Members. The Independent Board Members also noted that although the open-end funds offer multiple classes and the performance data was based on Class A shares, the performance of the other classes of a fund should be substantially similar on a relative basis because all of the classes would be invested in the same portfolio of securities and differences in performance among classes could be principally attributed to the variations in distribution and servicing expenses of each class.
In their review of performance, the Independent Board Members focused, in particular, on the Adviser’s analysis of Nuveen funds determined to be underperforming performance outliers and the factors contributing to the respective fund’s performance and any efforts to address performance concerns. With respect to any Nuveen funds for which the Board has identified performance issues, the Board monitors such funds closely until performance improves, discusses with the Adviser the reasons for such results, considers any steps necessary or appropriate to address such issues, and reviews the results of any efforts undertaken. The Board, however, acknowledged that shareholders chose to invest or remain invested in a fund knowing that the Adviser and applicable sub-adviser manage the fund, knowing the fund’s investment strategy and seeking exposure to that strategy (even if the strategy was “out of favor” in the marketplace) and knowing the fund’s fee structure.
For Nuveen Core Bond Fund (the “Core Fund”), the Board noted that the Fund ranked in its Performance Peer Group in the fourth quartile and underperformed its benchmark in the one-, three- and five-year periods. The Board discussed the Fund’s underperformance noting that it was driven primarily by its overweight in BBB-rated bonds during the second half of 2015 and first quarter of 2016. The Board further noted that the Fund’s longer portfolio effective duration detracted from the Fund’s peer relative performance during the second half of 2016 as longer maturities underperformed. The Board discussed with management the rationale for the duration positioning and was satisfied with the explanation of the investment strategy.
For Nuveen Core Plus Bond Fund (the “Core Plus Fund”), the Board noted that the Fund ranked in its Performance Peer Group in the first quartile in the one-year period, the third quartile in the three-year period and the second quartile in the five-year period. Although the Fund underperformed its benchmark in the three-year period, the Fund outperformed its benchmark in the one- and five-year periods. The Board was satisfied with the Fund’s overall performance.
For the High Income Fund, the Board noted that although the Fund ranked in the fourth quartile in its Performance Peer Group in the three-year period, the Fund ranked in the first quartile in the one-year period and second quartile in the five-year period. Although the Fund underperformed its benchmark in the three- and five-year periods, the Fund outperformed its benchmark in the one-year period. The Board was satisfied with the Fund’s overall performance.
For the Inflation Protected Fund, the Board noted that, although the Fund underperformed its benchmark in the one-, three- and five-year periods, it ranked in the third quartile in the one-year period and the second quartile in the three- and five-year periods. The Board was satisfied with the Fund’s overall performance.
For the Intermediate Government Fund, the Board noted that the Fund underperformed its benchmark and ranked in the fourth quartile in its Performance Peer Group in the one-, three- and five-year periods. The Board discussed the Fund’s underperformance noting that it was driven largely by the Fund’s shorter duration profile as Treasury yields declined during the first half of 2016. During the second half of 2016, however, the Treasury yields rose improving the Fund’s performance but an overweight in consumer asset backed securities detracted from Fund performance. The Board discussed with management the rationale for the duration positioning and was satisfied with the explanation of the investment strategy.
For Nuveen Short Term Bond Fund (the “Short Term Fund”), the Board noted that the Fund ranked in its Performance Peer Group in the second quartile in the one- and five-year periods and the third quartile in the three-year period. The Fund also outperformed its benchmark for the one-, three- and five-year periods. The Board was satisfied with the Fund’s overall performance.
For Nuveen Strategic Income Fund (the “Strategic Fund”), the Board noted that the Fund ranked in the second quartile in its Performance Peer Group in the one-, three- and five-year periods and outperformed its benchmark during these periods. The Board was satisfied with the Fund’s overall performance.
C. Fees, Expenses and Profitability
1. Fees and Expenses
The Board evaluated the management fees and other fees and expenses of each Fund. The Board reviewed and considered, among other things, the gross management fees and, after taking into effect any expense limitation arrangement and/or fee waivers (to the extent applicable), the net management fees paid by the Funds. The Board further considered the net total expense ratio of each Fund (expressed as a percentage of average net assets) as the expense ratio is most reflective of the investors’ net experience in a Fund as it directly reflected the costs of investing in the respective Fund.
In addition, the Board reviewed the Broadridge Report comparing, in relevant part, each Fund’s gross and net advisory fees and net total expense ratio with those of a Peer Universe and/or Peer Group, as applicable. The Independent Board Members also reviewed the methodology regarding the construction of the applicable Peer Universe and Peer Group by Broadridge. In reviewing the comparative data, the Board was aware that various factors may limit some of the usefulness of the data, such as differences in size of the peers; the composition of the Peer Universe or Peer Group; changes each year of funds comprising the Peer Universe and Peer Group; and levels of expense reimbursements and fee waivers. Nevertheless, in reviewing a fund’s fees and expenses compared to the fees and expenses of its peers, the Board generally considered a fund’s expenses and fees to be higher if they were over 10 basis points higher, slightly higher if they were 6 to 10 basis points higher, in line if they were within approximately 5 basis points higher than the peer average and below if they were below the peer average of the Peer Group. The Board noted that the substantial majority of the Nuveen funds had a net expense ratio that was near or below their respective peer average.
The Independent Board Members noted that the Core Fund had a net management fee in line with its peer average and a net expense ratio below its peer average; the Core Plus Fund, the High Income Fund, the Intermediate Government Fund, the Short Term Fund and the Strategic Fund each had a net management fee and a net expense ratio below its respective peer averages; and the Inflation Protected Fund had a net management fee below its peer average and a net expense ratio in line with its peer average.
In their evaluation of the management fee schedule, the Independent Board Members also reviewed the fund-level and complex-wide breakpoint schedules, as described in further detail below. In this regard, the Board was aware that as a result of a review of the pricing of the Nuveen open-end funds, the management fees and/or expense caps of various open-end funds had been reduced in 2016. The Independent Board Members also took into account any expense reimbursements and/or fee waivers provided by Nuveen. In addition, the Independent Board Members recognized that the fund-level breakpoint schedules of the Nuveen open-end funds recently were revised resulting in the addition of more breakpoints in the management fee schedules of the funds. The Board recognized that the revised schedules would provide for the potential of additional savings for shareholders if the respective fund’s assets under management grow.
Based on their review of the information provided, the Board determined that each Fund’s management fees (as applicable) to a Fund Adviser were reasonable in light of the nature, extent and quality of services provided to the Fund.
2. Comparisons with the Fees of Other Clients
The Board also reviewed information regarding the respective Fund Adviser’s fee rates for providing advisory services to other types of clients. For the Adviser and/or the Sub-Adviser, such other clients may include: separately managed accounts (such as retail, institutional or wrap accounts), other investment companies that are not offered by Nuveen but are sub-advised by the Sub-Adviser, foreign investment companies offered by Nuveen, and collective investment trusts. The Board further noted that the Adviser also advises certain ETFs sponsored by Nuveen.
In reviewing the fee rates assessed to other clients, the Board reviewed, among other things, the range of fees assessed for managed accounts and the foreign investment companies offered by Nuveen. With respect to foreign funds, the Board noted that unlike the management fees for the Nuveen funds, the management fees for the foreign funds may include distribution fees paid to intermediaries. The Board also reviewed the average fee rate for certain strategies offered by the Sub-Adviser.
The Board recognized the inherent differences between the Nuveen funds and the other types of clients. The Board considered information regarding these various differences which included, among other things, the services required, product distribution, average account sizes, types of investors targeted, legal structure and operations, and applicable laws and regulations. The Independent Board Members recognized that the foregoing variations resulted in different economics among the product structures and culminated in varying management fees among the types of clients and the Nuveen funds. In general, the Board noted that higher fee levels reflected higher levels of service provided by the Fund Adviser, increased investment management complexity, greater product management requirements and higher levels of business risk or some combination of the foregoing. The Board recognized the breadth of services the Adviser provided to support the Nuveen funds as summarized above and noted that many of such administrative services may not be required to the same extent or at all for the institutional clients or other clients. The Board further recognized the passive management of ETFs compared to the active management required of other Nuveen funds would contribute to differing fee levels.
The Independent Board Members noted that the sub-advisory fees paid by the Adviser to the Sub-Adviser, however, were generally for portfolio management services. The Board noted such sub-advisory fees were more comparable to the fees of retail wrap accounts and other external sub-advisory mandates.
Given the inherent differences in the various products, particularly the extensive services provided to the Funds, the Board concluded that such facts justify the different levels of fees.
3. Profitability of Fund Advisers
In conjunction with their review of fees, the Independent Board Members also considered Nuveen’s level of profitability for its advisory services to the Nuveen funds for the calendar years 2016 and 2015. In considering profitability, the Independent Board Members considered the level of profitability realized by Nuveen before the imposition of any distribution and marketing expenses incurred by the firm from its own resources. In
Annual Investment Management Agreement Approval Process (Unaudited) (continued)
evaluating the profitability, the Independent Board Members evaluated the analysis employed in developing the profitability figures, including the assumptions and methodology employed in allocating expenses. The Independent Board Members recognized the inherent limitations to any cost allocation methodology as different and reasonable approaches may be used and yet yield differing results. The Independent Board Members further reviewed an analysis of the history of the profitability methodology used explaining any changes to the methodology over the years. The Board has appointed two Independent Board Members, who along with independent legal counsel, helped to review and discuss the methodology employed to develop the profitability analysis each year and any proposed changes thereto and to keep the Board apprised of such changes during the year.
In their review, the Independent Board Members evaluated, among other things, Nuveen’s adjusted operating margins, the gross and net revenue margins (pre-tax and after-tax) for advisory activities for the Nuveen funds, and the revenues, expenses, and net income (pre-tax and after-tax) of Nuveen for each of the last two calendar years. The Independent Board Members also reviewed an analysis of the key drivers behind the changes in revenues and expenses that impacted profitability in 2016 versus 2015. The Board, however, observed that Nuveen’s operating margins for its advisory activities in 2016 were similar to that of 2015.
In addition to reviewing Nuveen’s profitability in absolute terms, the Independent Board Members also reviewed the adjusted total company margins of other advisory firms that had publicly available information and comparable assets under management (based on asset size and asset composition). The Independent Board Members, however, noted that the usefulness of the comparative data may be limited as the other firms may have a different business mix and their profitability data may be affected by numerous other factors such as the types of funds managed, the cost allocation methodology used, and their capital structure. Nevertheless, the Board noted that Nuveen’s adjusted operating margins appeared comparable to the adjusted margins of the peers.
Further, the Adviser is a subsidiary of Nuveen, LLC, the investment management arm of Teachers Insurance and Annuity Association of America (“TIAA”). To have a fuller picture of the financial condition and strength of the TIAA complex, together with Nuveen, the Board reviewed a balance sheet for TIAA reflecting its assets, liabilities and capital and contingency reserves for the 2016 and 2015 calendar years.
In addition to the Adviser’s profitability, the Independent Board Members also considered the profitability of the Sub-Adviser from its relationship with the Nuveen funds. The Independent Board Members reviewed the Sub-Adviser’s revenues, expenses and revenue margins (pre- and post-tax) for its advisory activities for the calendar year ended December 31, 2016. The Independent Board Members also reviewed a profitability analysis reflecting the revenues, expenses and revenue margin (pre- and post-tax) by asset type for the Sub-Adviser for the calendar year ending December 31, 2016.
In evaluating the reasonableness of the compensation, the Independent Board Members also considered other amounts paid to a Fund Adviser for its services to the Funds as well as indirect benefits (such as soft dollar arrangements), if any, the Fund Adviser and its affiliates received or were expected to receive that were directly attributable to the management of a Fund. See Section E below for additional information on indirect benefits a Fund Adviser may receive as a result of its relationship with the Funds.
Based on a consideration of all the information provided, the Board noted that Nuveen’s and the Sub-Adviser’s level of profitability was acceptable and not unreasonable in light of the services provided.
D. Economies of Scale and Whether Fee Levels Reflect These Economies of Scale
When evaluating the level of the advisory fees, the Independent Board Members considered whether there will be any economies of scale that may be realized by the Fund Adviser as a Fund grows and the extent to which these economies were shared with the Funds and shareholders. The Board recognized that economies of scale are difficult to measure with precision; however, the Board considered that there were several ways the Fund Adviser may share the benefits of economies of scale with the Nuveen funds, including through breakpoints in the management fee schedule reducing the fee rates as asset levels grow, fee waivers and/or expense limitation agreements and the Adviser’s investment in its business which can enhance the services provided to the Nuveen funds. With respect to the fee structure, the Independent Board Members have recognized that economies of scale may be realized when a particular fund grows, but also when the total size of the fund complex grows (even if the assets of a particular fund in the complex have not changed or have decreased). Accordingly, subject to certain exceptions, the funds in the Nuveen complex pay a management fee to the Adviser which is generally comprised of a fund-level component and complex-level component, each of which has a breakpoint schedule. Subject to certain exceptions, the fund-level fee component declines as the assets of the particular fund grow and the complex-level fee component declines when eligible assets of all the Nuveen funds (except for Nuveen ETFs which are subject to a unitary fee) in the Nuveen complex combined grow. As noted, the Board had recently approved revised fund-level breakpoint schedules for the open-end funds which resulted in additional breakpoints added to the breakpoint schedules and therefore the potential for additional savings as a fund’s asset level grows.
The Independent Board Members also noted that additional economies of scale were or would be shared with shareholders of the Funds through their temporary expense caps. The Independent Board Members reviewed the breakpoint and complex-wide schedules and any savings achieved from fee waivers and expense reimbursements (if applicable) as well as fee reductions as a result of the fund-level and complex-level breakpoints for the 2016 calendar year.
In addition, the Independent Board Members recognized the Adviser’s ongoing investment in its business to expand or enhance the services provided to the benefit of all of the Nuveen funds.
Based on their review, the Board concluded that the current fee structure was acceptable and reflected economies of scale to be shared with shareholders when assets under management increase.
E. Indirect Benefits
The Independent Board Members received and considered information regarding other benefits the respective Fund Adviser or its affiliates may receive as a result of their relationship with the Nuveen funds, including compensation paid to affiliates of a Fund Adviser for services rendered to the funds and research services received by a Fund Adviser from broker-dealers that execute fund trades. In this regard, the Independent Board Members recognized that an affiliate of the Adviser served as the principal underwriter for the open-end funds providing distribution and shareholder services to the funds for which it may be compensated through sales charges and distribution fees and shareholder services fees pursuant to the funds’ Rule 12b-1 distribution and service plan or otherwise. The Independent Board Members therefore took into account, among other things, the 12b-1 fees retained by Nuveen during the calendar year ending December 31, 2016.
In addition to the above, the Independent Board Members considered that the Funds’ portfolio transactions are allocated by the Sub-Adviser and the Sub-Adviser may benefit from research received from broker-dealers that execute Fund portfolio transactions. The Board noted, however, that with respect to transactions in fixed income securities, such securities generally trade on a principal basis and do not generate soft dollar credits. Although the Board recognized the Sub-Adviser may benefit from a soft dollar arrangement if it does not have to pay for this research out of its own assets, the Board also recognized that the research may benefit the Funds to the extent it enhances the ability of the Sub-Adviser to manage the Funds.
Based on their review, the Board concluded that any indirect benefits received by a Fund Adviser as a result of its relationship with the Funds were reasonable and within acceptable parameters.
F. Other Considerations
The Board Members did not identify any single factor discussed previously as all-important or controlling. The Board Members, including the Independent Board Members, concluded that the terms of each Advisory Agreement were fair and reasonable, that the respective Fund Adviser’s fees were reasonable in light of the services provided to each Fund and that the Advisory Agreements be renewed.
Directors
and Officers (Unaudited)
The management of the Funds, including general supervision of the duties performed for the Funds by the Adviser, is the responsibility of the Board of Directors of the Funds. The number of directors of the Funds is currently set at twelve. None of the directors who are not “interested” persons of the Funds (referred to herein as “independent directors”) has ever been a director or employee of, or consultant to, Nuveen or its affiliates. The names and business addresses of the directors and officers of the Funds, their principal occupations and other affiliations during the past five years, the number of portfolios each oversees and other directorships they hold are set forth below.
The Funds’ Statement of Additional Information (“SAI”) includes more information about the trustees. To request a free copy, call Nuveen Investments at (800) 257-8787 or visit the Funds’ website at www.nuveen.com.
| | | | | | | | |
Name, Year of Birth & Address | | Position(s) Held with the Funds | | Year First
Elected or
Appointed (1) | | Principal Occupation(s) Including other Directorships During Past 5 Years | | Number of
Portfolios in
Fund Complex
Overseen by
Director |
| | | | | |
| Independent Director: | | | | | | | | |
William J. Schneider 1944 333 W. Wacker Drive Chicago, IL 60606 | | Chairman and Director | | 1996 | | Chairman of Miller-Valentine Partners, a real estate investment company; Board Member of WDPR Public Radio station; formerly, Senior Partner and Chief Operating Officer (retired (2004) of Miller-Valentine Group; formerly, Board member, Business Advisory Council of the Cleveland Federal Reserve Bank and University of Dayton Business School Advisory Council; past Chair and Director, Dayton Development Coalition. | | 176 |
Jack B. Evans 1948 333 W. Wacker Drive Chicago, IL 60606 | | Director | | 1999 | | President, The Hall-Perrine Foundation, a private philanthropic corporation (since 1996); Director and Chairman, United Fire Group, a publicly held company; Director, Public member, American Board of Orthopaedic Surgery (since 2015); Life Trustee of Coe College and the Iowa College Foundation; formerly, President Pro-Tem of the Board of Regents for the State of Iowa University System; formerly, Director, Alliant Energy; formerly, Director, Federal Reserve Bank of Chicago; formerly, President and Chief Operating Officer, SCI Financial Group, Inc., a regional financial services firm. | | 176 |
William C. Hunter 1948 333 W. Wacker Drive Chicago, IL 60606 | | Director | | 2003 | | Dean Emeritus, formerly, Dean, Tippie College of Business, University of Iowa (2006-2012); Director (since 2004) of Xerox Corporation; past Director (2005-2015), and past President (2010-2014) Beta Gamma Sigma, Inc., The International Business Honor Society; Director of Wellmark, Inc. (since 2009); formerly, Dean and Distinguished Professor of Finance, School of Business at the University of Connecticut (2003-2006); previously, Senior Vice President and Director of Research at the Federal Reserve Bank of Chicago (1995-2003); formerly, Director (1997-2007), Credit Research Center at Georgetown University. | | 176 |
David J. Kundert 1942 333 W. Wacker Drive Chicago, IL 60606 | | Director | | 2005 | | Formerly, Director, Northwestern Mutual Wealth Management Company (2006-2013); retired (since 2004) as Chairman, JPMorgan Fleming Asset Management, President and CEO, Banc One Investment Advisors Corporation, and President, One Group Mutual Funds; prior thereto, Executive Vice President, Banc One Corporation and Chairman and CEO, Banc One Investment Management Group; Regent Emeritus, Member of Investment Committee, Luther College; member of the Wisconsin Bar Association; member of Board of Directors and Chair of Investment Committee, Greater Milwaukee Foundation; member of the Board of Directors (Milwaukee), College Possible; Board member of Milwaukee Repertory Theatre (since 2016). | | 176 |
| | | | | | | | |
Name, Year of Birth & Address | | Position(s) Held with the Funds | | Year First
Elected or
Appointed (1) | | Principal Occupation(s) Including other Directorships During Past 5 Years | | Number of
Portfolios in
Fund��Complex
Overseen by
Director |
Albin F. Moschner(2) 1952 333 W. Wacker Drive Chicago, IL 60606 | | Director | | 2016 | | Founder and Chief Executive Officer, Northcroft Partners, LLC, a management consulting firm (since 2012); previously, held positions at Leap Wireless International, Inc., including Consultant (2011-2012), Chief Operating Officer (2008-2011), and Chief Marketing Officer (2004-2008); formerly, President, Verizon Card Services division of Verizon Communications, Inc. (2000-2003); formerly, President, One Point Services at One Point Communications (1999-2000); formerly, Vice Chairman of the Board, Diba, Incorporated (1996-1997); formerly, various executive positions with Zenith Electronics Corporation (1991-1996). Director, USA Technologies, Inc., a provider of solutions and services to facilitate electronic payment transactions (since 2012); formerly, Director, Wintrust Financial Corporation (1996-2016). | | 176 |
John K. Nelson 1962 333 W. Wacker Drive Chicago, IL 60606 | | Director | | 2013 | | Member of Board of Directors of Core12 LLC (since 2008), a private firm which develops branding, marketing and communications strategies for clients; Director of The Curran Center for Catholic American Studies (since 2009) and The President’s Council, Fordham University (since 2010); formerly senior external advisor to the financial services practice of Deloitte Consulting LLP (2012-2014); formerly, Chairman of the Board of Trustees of Marian University (2010 as trustee, 2011- 2014 as Chairman); formerly, Chief Executive Officer of ABN AMRO N.V. North America, and Global Head of its Financial Markets Division (2007-2008); prior senior positions held at ABN AMRO include Corporate Executive Vice President and Head of Global Markets-the Americas (2006-2007), CEO of Wholesale Banking-North America and Global Head of Foreign Exchange and Futures Markets (2001-2006), and Regional Commercial Treasurer and Senior Vice President Trading-North America (1996-2001); formerly, Trustee at St. Edmund Preparatory School in New York City. | | 176 |
Judith M. Stockdale 1947 333 W. Wacker Drive Chicago, IL 60606 | | Director | | 1997 | | Board Member, Land Trust Alliance (since 2013) and U.S. Endowment for Forestry and Communities (since 2013); formerly, Executive Director (1994-2012), Gaylord and Dorothy Donnelley Foundation; prior thereto, Executive Director, Great Lakes Protection Fund (1990-1994). | | 176 |
Carole E. Stone 1947 333 W. Wacker Drive Chicago, IL 60606 | | Director | | 2007 | | Director, Chicago Board Options Exchange (since 2006), C2 Options Exchange, Incorporated (since 2009); Director, CBOE Holdings, Inc. (since 2010); formerly, Commissioner, New York State Commission on Public Authority Reform (2005-2010). | | 176 |
Terence J. Toth 1959 333 W. Wacker Drive Chicago, IL 60606 | | Director | | 2008 | | Co-Founding Partner, Promus Capital (since 2008); Director, Fulcrum IT Service LLC (since 2010) and Quality Control Corporation (since 2012); member: Catalyst Schools of Chicago Board (since 2008) and Mather Foundation Board (since 2012), and chair of its investment committee; formerly, Director, Legal & General Investment Management America, Inc. (2008-2013); formerly, CEO and President, Northern Trust Global Investments (2004-2007); Executive Vice President, Quantitative Management & Securities Lending (2000-2004); prior thereto, various positions with Northern Trust Company (since 1994); formerly, Member, Northern Trust Mutual Funds Board (2005-2007), Northern Trust Global Investments Board (2004-2007), Northern Trust Japan Board (2004-2007), Northern Trust Securities Inc. Board (2003- 2007) and Northern Trust Hong Kong Board (1997-2004). | | 176 |
Directors and Officers (Unaudited) (continued)
| | | | | | | | |
Name, Year of Birth & Address | | Position(s) Held with the Funds | | Year First
Elected or
Appointed (1) | | Principal Occupation(s) Including other Directorships During Past 5 Years | | Number of
Portfolios in
Fund Complex
Overseen by
Director |
Margaret L. Wolff 1955 333 W. Wacker Drive Chicago, IL 60606 | | Director | | 2016 | | Member of the Board of Directors (since 2013) of Travelers Insurance Company of Canada and The Dominion of Canada General Insurance Company (each, a part of Travelers Canada, the Canadian operation of The Travelers Companies, Inc.); formerly, Of Counsel, Skadden, Arps, Slate, Meagher & Flom LLP (Mergers & Acquisitions Group) (2005-2014); Member of the Board of Trustees of New York-Presbyterian Hospital (since 2005); Member (since 2004) and Chair (since 2015) of the Board of Trustees of The John A. Hartford Foundation (a philanthropy dedicated to improving the care of older adults); formerly, Member (2005-2015) and Vice Chair (2011-2015) of the Board of Trustees of Mt. Holyoke College. | | 176 |
Robert L. Young3 1963 333 W. Wacker Drive Chicago, IL 60606 | | Director | | 2017 | | Formerly, Chief Operating Officer and Director, J.P. Morgan Investment Management Inc. (2010-2016); formerly, President and Principal Executive Officer (2013-2016), and Senior Vice President and Chief Operating Officer (2005-2010), of J.P. Morgan Funds; formerly, Director and various officer positions for J.P. Morgan Investment Management Inc. (formerly, JPMorgan Funds Management, Inc. and formerly, One Group Administrative Services) and JPMorgan Distribution Services, Inc. (formerly, One Group Dealer Services, Inc.) (1999-2017). | | 174 |
| | | | | |
| Interested Director: | | | | | | | | |
Margo L. Cook(2)(4) 1964 333 W. Wacker Drive Chicago, IL 60606 | | Director | | 2016 | | President (since April 2017), formerly, Co-Chief Executive Officer and Co-President (2016-2017), formerly, Senior Executive Vice President of Nuveen Investments, Inc; Executive Vice President (since February 2017) of Nuveen, LLC; President, Global Products and Solutions (since July 2017), and Co-Chief Executive Officer, formerly, Executive Vice President (2013-2015) of Nuveen Securities, LLC; President (since August 2017), formerly, Co-President (since October 2016), formerly Senior Executive Vice President (2015-2016) of Nuveen Fund Advisors, LLC (Executive Vice President 2011-2015); formerly, Managing Director of Nuveen Commodities Asset Management, LLC (2011-2016); Chartered Financial Analyst. | | 176 |
| | | | | | | | |
Name, Year of Birth & Address | | Position(s) Held with the Funds | | Year First
Elected or
Appointed (5) | | Principal Occupation(s) During Past 5 Years | | Number of
Portfolios in
Fund Complex
Overseen by
Officer |
| | | | |
| Officers of the Funds: | | | | | | |
Greg A. Bottjer 1971 333 West Wacker Drive Chicago, IL 60606 | | Chief Administrative Officer | | 2016 | | Senior (since 2017) Managing Director (since 2011), formerly, Senior Vice President (2007-2010) of Nuveen; Senior (since 2017) Managing Director (since October 2016) of Nuveen Fund Advisors, LLC; Chartered Financial Analyst. | | 92 |
Lorna C. Ferguson 1945 333 W. Wacker Drive Chicago, IL 60606 | | Vice President | | 1998 | | Senior Managing Director (since February 2017), formerly, Managing Director (2004-2017) of Nuveen. | | 177 |
Stephen D. Foy 1954 333 W. Wacker Drive Chicago, IL 60606 | | Vice President and Controller | | 1998 | | Managing Director (since 2014), formerly, Senior Vice President (2013-2014) and Vice President (2005-2013) of Nuveen Fund Advisors, LLC; Chief Financial Officer of Nuveen Commodities Asset Management, LLC (since 2010); Managing Director (since 2016) of Nuveen Securities, LLC; Certified Public Accountant. | | 177 |
| | | | | | | | |
Name, Year of Birth & Address | | Position(s) Held with the Funds | | Year First
Elected or
Appointed (5) | | Principal Occupation(s) During Past 5 Years | | Number of
Portfolios in
Fund Complex
Overseen by
Officer |
Nathaniel T. Jones 1979 333 W. Wacker Drive Chicago, IL 60606 | | Vice President and Treasurer | | 2016 | | Managing Director (since January 2017), formerly, Senior Vice President (2016-2017), formerly, Vice President (2011- 2016) of Nuveen; Chartered Financial Analyst. | | 177 |
Walter M. Kelly 1970 333 W. Wacker Drive Chicago, IL 60606 | | Chief Compliance Officer and Vice President | | 2003 | | Managing Director (since January 2017), formerly, Senior Vice President (2008-2017) of Nuveen Investments Holdings, Inc. | | 177 |
Tina M. Lazar 1961 333 W. Wacker Drive Chicago, IL 60606 | | Vice President | | 2002 | | Managing Director (since January 2017), formerly, Senior Vice President (2014-2017) of Nuveen Securities, LLC. | | 177 |
Kevin J. McCarthy 1966 333 W. Wacker Drive Chicago, IL 60606 | | Vice President and Secretary | | 2007 | | Senior Managing Director (since February 2017) and Secretary and General Counsel (since 2016) of Nuveen Investments, Inc., formerly, Executive Vice President (2016-2017) and Managing Director and Assistant Secretary (2008-2016); Senior Managing Director (since January 2017) and Assistant Secretary (since 2008) of Nuveen Securities, LLC, formerly Executive Vice President (2016-2017) and Managing Director (2008-2016); Senior Managing Director (since February 2017), Secretary (since 2016) and Co-General Counsel (since 2011) of Nuveen Fund Advisors, LLC, formerly, Executive Vice President (2016-2017), Managing Director (2008-2016) and Assistant Secretary (2007-2016); Senior Managing Director (since February 2017), Secretary (since 2016) and Associate General Counsel (since 2011 of Nuveen Asset Management, LLC, formerly Executive Vice President (2016-2017) and Managing Director and Assistant Secretary (2011-2016); Senior Managing Director (since February 2017) and Secretary (since 2016) of Nuveen Investments Advisers, LLC, formerly Executive Vice President (2016-2017); Vice President (since 2007) and Secretary (since 2016), formerly, Assistant Secretary, of NWQ Investment Management Company, LLC, Symphony Asset Management LLC Santa Barbara Asset Management, LLC and Winslow Capital Management, LLC (since 2010); Vice President (since 2010) and Secretary (since 2016) of Nuveen Commodities Asset Management, LLC, formerly Assistant Secretary (2010-2016). | | 177 |
Kathleen L. Prudhomme 1953 901 Marquette Avenue Minneapolis, MN 55402 | | Vice President and Assistant Secretary | | 2011 | | Managing Director, Assistant Secretary and Co-General Counsel (since 2011) of Nuveen Fund Advisors, LLC; Managing Director, Assistant Secretary and Associate General Counsel (since 2011) of Nuveen Asset Management, LLC; Managing Director and Assistant Secretary (since 2011) of Nuveen Securities, LLC; formerly, Deputy General Counsel, FAF Advisors, Inc. (2004- 2010). | | 177 |
Christopher M. Rohrbacher 1971 333 West Wacker Drive Chicago, IL 60606 | | Vice President and Assistant Secretary | | 2008 | | Managing Director (since January 2017) of Nuveen Securities, LLC; Managing Director (Since January 2017), formerly, Senior Vice President (2016-2017) and Assistant Secretary (since October 2016) of Nuveen Fund Advisors, LLC; Vice President and Assistant Secretary (since 2010) of Nuveen Commodities Asset Management, LLC. | | 177 |
William A. Siffermann 1975 333 West Wacker Drive Chicago, IL 60606 | | Vice President | | 2017 | | Managing Director (Since February 2017), formerly Senior Vice President (2016-2017) and Vice President (2011-2016) of Nuveen. | | 177 |
Directors and Officers (Unaudited) (continued)
| | | | | | | | |
Name, Year of Birth & Address | | Position(s) Held with the Funds | | Year First
Elected or
Appointed (5) | | Principal Occupation(s) During Past 5 Years | | Number of
Portfolios in
Fund Complex
Overseen by
Officer |
Joel T. Slager 1978 333 W. Wacker Drive Chicago, IL 60606 | | Vice President and Assistant Secretary | | 2013 | | Fund Tax Director for Nuveen Funds (since 2013); previously, Vice President of Morgan Stanley Investment Management, Inc., Assistant Treasurer of the Morgan Stanley Funds (from 2010 to 2013). | | 177 |
Gifford R. Zimmerman 1956 333 W. Wacker Drive Chicago, IL 60606 | | Vice President and Assistant Secretary | | 1988 | | Managing Director (since 2002), and Assistant Secretary of Nuveen Securities, LLC; Managing Director (since 2004) and Assistant Secretary (since 1994) of Nuveen Investments, Inc.; Managing Director (since 2002), Assistant Secretary (since 1997) and Co-General Counsel (since 2011) of Nuveen Fund Advisors, LLC; Managing Director, Assistant Secretary and Associate General Counsel of Nuveen Asset Management, LLC (since 2011); Vice President (since February 2017), formerly, Managing Director (2003-2017) and Assistant Secretary (since 2003) of Symphony Asset Management LLC ; Managing Director and Assistant Secretary (since 2002) of Nuveen Investments Advisers, LLC; Vice President and Assistant Secretary of NWQ Investment Management Company, LLC (since 2002), Santa Barbara Asset Management, LLC (since 2006) and of Winslow Capital Management, LLC, (since 2010); Chartered Financial Analyst. | | 177 |
| (1) | Directors serve an indefinite term until his/her successor is elected or appointed. The year first elected or appointed represents the year in which the director was first elected or appointed to any fund in the Nuveen Fund Complex. |
| (2) | On June 22, 2016, Ms. Cook and Mr. Moschner were appointed as Board Members, effective July 1, 2016. |
| (3) | On May 25, 2017, Mr. Young was appointed as a Board Member, effective July 1, 2017. He is a Board Member of each of the Nuveen Funds, except Nuveen Diversified Dividend and Income Fund and Nuveen Real Estate Income Fund. |
| (4) | “Interested person” of the Trust, as defined in the 1940 Act, by reason of her position with Nuveen, LLC. and certain of its subsidiaries. |
| (5) | Officers serve one year terms through August of each year. The year first elected or appointed represents the year in which the officer was first elected or appointed to any fund in the Nuveen Fund Complex. |
Notes
Notes
Notes
| | | | | | | | | | | | | | |
| | | | | | | | |
| | | | |
| | | | | | | | |
| | |
| | Nuveen: | | |
| | | | Serving Investors for Generations | | |
| | |
| | | | |
| | | |
| | | | Since 1898, financial advisors and their clients have relied on Nuveen to provide dependable investment solutions through continued adherence to proven, long-term investing principles. Today, we offer a range of high quality solutions designed to be integral components of a well-diversified core portfolio. | | |
| | | |
| | | | | | |
| | | | |
| | | | | | Focused on meeting investor needs. Nuveen is the investment management arm of TIAA. We have grown into one of the world’s premier global asset managers, with specialist knowledge across all major asset classes and particular strength in solutions that provide income for investors and that draw on our expertise in alternatives and responsible investing. Nuveen is driven not only by the independent investment processes across the firm, but also the insights, risk management, analytics and other tools and resources that a truly world-class platform provides. As a global asset manager, our mission is to work in partnership with our clients to create solutions which help them secure their financial future. | | |
| | | | | |
| | | | | | | | | | |
| | | | | | Find out how we can help you.
To learn more about how the products and services of Nuveen
may be able to help you meet your financial goals, talk to your
financial advisor, or call us at (800) 257-8787. Please read the information
provided carefully before you invest. Investors should consider the
investment objective and policies, risk considerations, charges and
expenses of any investment carefully. Where applicable, be sure to obtain a
prospectus, which contains this and other relevant information. To obtain
a prospectus, please contact your securities representative or Nuveen,
333 W. Wacker Dr., Chicago, IL 60606. Please read the
prospectus carefully before you invest or send money.
Learn more about Nuveen Funds at: www.nuveen.com/mf
| | |
| | | | | | |
| | | | | | | | | | | | |
| | Securities offered through Nuveen Securities, LLC, member FINRA and SIPC | 333 West Wacker Drive Chicago, IL 60606 | www.nuveen.com | | |
MAN-FINC-0617D 243929-INV-Y-08/18
ITEM 2. CODE OF ETHICS.
As of the end of the period covered by this report, the registrant has adopted a code of ethics that applies to the registrant’s principal executive officer, principal financial officer, principal accounting officer or controller, or persons performing similar functions. There were no amendments to or waivers from the code during the period covered by this report. The registrant has posted the code of ethics on its website at www.nuveen.com/MutualFunds/ShareholderResources/FundGovernance.aspx. (To view the code, click on Code of Conduct.)
ITEM 3. AUDIT COMMITTEE FINANCIAL EXPERT.
The registrant’s Board of Directors or Trustees (“Board”) determined that the registrant has at least one “audit committee financial expert” (as defined in Item 3 of Form N-CSR) serving on its Audit Committee. The registrant’s audit committee financial experts are Carole E. Stone and Jack B. Evans, who are “independent” for purposes of Item 3 of Form N-CSR.
Ms. Stone served for five years as Director of the New York State Division of the Budget. As part of her role as Director, Ms. Stone was actively involved in overseeing the development of the State’s operating, local assistance and capital budgets, its financial plan and related documents; overseeing the development of the State’s bond-related disclosure documents and certifying that they fairly presented the State’s financial position; reviewing audits of various State and local agencies and programs; and coordinating the State’s system of internal audit and control. Prior to serving as Director, Ms. Stone worked as a budget analyst/examiner with increasing levels of responsibility over a 30 year period, including approximately five years as Deputy Budget Director. Ms. Stone has also served as Chair of the New York State Racing Association Oversight Board, as Chair of the Public Authorities Control Board, as a Commissioner on the New York State Commission on Public Authority Reform and as a member of the Boards of Directors of several New York State public authorities. These positions have involved overseeing operations and finances of certain entities and assessing the adequacy of project/entity financing and financial reporting. Currently, Ms. Stone is on the Board of Directors of CBOE Holdings, Inc., of the Chicago Board Options Exchange, and of C2 Options Exchange. Ms. Stone’s position on the boards of these entities and as a member of both CBOE Holdings’ Audit Committee and its Finance Committee has involved, among other things, the oversight of audits, audit plans and preparation of financial statements.
Mr. Evans was formerly President and Chief Operating Officer of SCI Financial Group, Inc., a full service registered broker-dealer and registered investment adviser (“SCI”). As part of his role as President and Chief Operating Officer, Mr. Evans actively supervised the Chief Financial Officer (the “CFO”) and actively supervised the CFO’s preparation of financial statements and other filings with various regulatory authorities. In such capacity, Mr. Evans was actively involved in the preparation of SCI’s financial statements and the resolution of issues raised in connection therewith. Mr. Evans has also served on the audit committee of various reporting companies. At such companies, Mr. Evans was involved in the oversight of audits, audit plans, and the preparation of financial statements. Mr. Evans also formerly chaired the audit committee of the Federal Reserve Bank of Chicago.
ITEM 4. PRINCIPAL ACCOUNTANT FEES AND SERVICES.
The following tables show the amount of fees that PricewaterhouseCoopers LLP, the Funds’ auditor, billed to the Funds’ during the Funds’ last two full fiscal years. The Audit Committee approved in advance all audit services and non-audit services that PricewaterhouseCoopers LLP provided to the Funds, except for those non-audit services that were subject to the pre-approval exception under Rule 2-01 of Regulation S-X (the “pre-approval exception”). The preapproval exception for services provided directly to the Funds waives the pre-approval requirement for services other than audit, review or attest services if: (A) the aggregate amount of all such services provided constitutes no more than 5% of the total amount of revenues paid by the Funds during the fiscal year in which the services are provided; (B) the Funds did not recognize the services as non-audit services at the time of the engagement; and (C) the services are promptly brought to the Audit Committee’s attention, and the Committee (or its delegate) approves the services before the audit is completed.
The Audit Committee has delegated certain pre-approval responsibilities to its Chairman (or, in his absence, any other member of the Audit Committee).
| | | | | | | | | | | | | | | | |
Fiscal Year Ended June 30, 2017 | | Audit Fees Billed
to Funds 1 | | | Audit-Related Fees
Billed to Funds 2 | | | Tax Fees
Billed to Funds 3 | | | All Other Fees
Billed to Funds 4 | |
| Fund Name | | | | | | | | | | | | | | | | |
Nuveen Core Plus Bond Fund | | | 43,501 | | | | 1,629 | | | | 0 | | | | 0 | |
Nuveen High Income Bond Fund | | | 34,610 | | | | 1,629 | | | | 0 | | | | 0 | |
Nuveen Intermediate Government Bond Fund | | | 42,152 | | | | 1,629 | | | | 0 | | | | 0 | |
Nuveen Inflation Protected Securities Fund | | | 43,891 | | | | 1,629 | | | | 2,270 | | | | 0 | |
Nuveen Core Bond Fund | | | 42,542 | | | | 1,629 | | | | 0 | | | | 0 | |
Nuveen Short Term Bond Fund | | | 44,856 | | | | 1,629 | | | | 3,350 | | | | 0 | |
Nuveen Strategic Income Fund | | | 45,664 | | | | 1,629 | | | | 3,350 | | | | 0 | |
| | | | | | | | | | | | | | | | |
Total | | $ | 297,216 | | | $ | 11,405 | | | $ | 8,970 | | | $ | 0 | |
| 1 | | “Audit Fees” are the aggregate fees billed for professional services for the audit of the Fund’s annual financial statements and services provided in connection with statutory and regulatory filings or engagements. |
| 2 | | “Audit-Related Fees” are the aggregate fees billed for assurance and related services reasonably related to the performance of the audit or review of financial statements that are not reported under “Audit Fees”. These fees include offerings related to the Fund’s common shares and leverage. |
| 3 | | “Tax Fees” are the aggregate fees billed for professional services for tax advice, tax compliance, and tax planning. These fees include: all global withholding tax services; excise and state tax reviews; capital gain, tax equalization and taxable basis calculations performed by the principal accountant. |
| 4 | | “All Other Fees” are the aggregate fees billed for products and services other than “Audit Fees”, “Audit-Related Fees” and “Tax Fees”. These fees represent all “Agreed-Upon Procedures” engagements pertaining to the Fund’s use of leverage. |
| | | | | | | | | | | | | | | | |
| | | Percentage Approved Pursuant to Pre-approval Exception | |
| | | Audit Fees Billed
to Funds | | | Audit-Related Fees
Billed to Funds | | | Tax Fees
Billed to Funds | | | All Other Fees
Billed to Funds | |
Fund Name | | | | | | | | | | | | | | | | |
Nuveen Core Plus Bond Fund | | | 0 | % | | | 0 | % | | | 0 | % | | | 0 | % |
Nuveen High Income Bond Fund | | | 0 | % | | | 0 | % | | | 0 | % | | | 0 | % |
Nuveen Intermediate Government Bond Fund | | | 0 | % | | | 0 | % | | | 0 | % | | | 0 | % |
Nuveen Inflation Protected Securities Fund | | | 0 | % | | | 0 | % | | | 0 | % | | | 0 | % |
Nuveen Core Bond Fund | | | 0 | % | | | 0 | % | | | 0 | % | | | 0 | % |
Nuveen Short Term Bond Fund | | | 0 | % | | | 0 | % | | | 0 | % | | | 0 | % |
Nuveen Strategic Income Fund | | | 0 | % | | | 0 | % | | | 0 | % | | | 0 | % |
| | | | | | | | | | | | | | | | |
Fiscal Year Ended June 30, 2016 | | Audit Fees Billed
to Funds 1 | | | Audit-Related Fees
Billed to Funds 2 | | | Tax Fees
Billed to Funds 3 | | | All Other Fees
Billed to Funds 4 | |
Fund Name | | | | | | | | | | | | | | | | |
Nuveen Core Plus Bond Fund | | | 42,414 | | | | 0 | | | | 2,266 | | | | 0 | |
Nuveen High Income Bond Fund | | | 32,967 | | | | 0 | | | | 98 | | | | 0 | |
Nuveen Intermediate Government Bond Fund | | | 40,918 | | | | 0 | | | | 10 | | | | 0 | |
Nuveen Inflation Protected Securities Fund | | | 41,743 | | | | 0 | | | | 3,239 | | | | 0 | |
Nuveen Core Bond Fund | | | 41,456 | | | | 0 | | | | 2,241 | | | | 0 | |
Nuveen Short Term Bond Fund | | | 43,806 | | | | 0 | | | | 103 | | | | 0 | |
Nuveen Strategic Income Fund | | | 44,623 | | | | 0 | | | | 73 | | | | 0 | |
| | | | | | | | | | | | | | | | |
Total | | $ | 287,927 | | | $ | 0 | | | $ | 8,030 | | | $ | 0 | |
| 1 | | “Audit Fees” are the aggregate fees billed for professional services for the audit of the Fund’s annual financial statements and services provided in connection with statutory and regulatory filings or engagements. |
| 2 | | “Audit-Related Fees” are the aggregate fees billed for assurance and related services reasonably related to the performance of the audit or review of financial statements that are not reported under “Audit Fees”. These fees include offerings related to the Fund’s common shares and leverage. |
| 3 | | “Tax Fees” are the aggregate fees billed for professional services for tax advice, tax compliance, and tax planning. These fees include: all global withholding tax services; excise and state tax reviews; capital gain, tax equalization and taxable basis calculations performed by the principal accountant. |
| 4 | | “All Other Fees” are the aggregate fees billed for products and services other than “Audit Fees”, “Audit-Related Fees” and “Tax Fees”. These fees represent all “Agreed-Upon Procedures” engagements pertaining to the Fund’s use of leverage. |
| | | | | | | | | | | | | | | | |
| | | Percentage Approved Pursuant to Pre-approval Exception | |
| | | Audit Fees Billed
to Funds | | | Audit-Related Fees
Billed to Funds | | | Tax Fees
Billed to Funds | | | All Other Fees
Billed to Funds | |
Fund Name | | | | | | | | | | | | | | | | |
Nuveen Core Plus Bond Fund | | | 0 | % | | | 0 | % | | | 0 | % | | | 0 | % |
Nuveen High Income Bond Fund | | | 0 | % | | | 0 | % | | | 0 | % | | | 0 | % |
Nuveen Intermediate Government Bond Fund | | | 0 | % | | | 0 | % | | | 0 | % | | | 0 | % |
Nuveen Inflation Protected Securities Fund | | | 0 | % | | | 0 | % | | | 0 | % | | | 0 | % |
Nuveen Core Bond Fund | | | 0 | % | | | 0 | % | | | 0 | % | | | 0 | % |
Nuveen Short Term Bond Fund | | | 0 | % | | | 0 | % | | | 0 | % | | | 0 | % |
Nuveen Strategic Income Fund | | | 0 | % | | | 0 | % | | | 0 | % | | | 0 | % |
| | | | | | | | | | | | |
Fiscal Year Ended June 30, 2017 | | Audit-Related Fees
Billed to Adviser and
Affiliated Fund
Service Providers | | | Tax Fees Billed to
Adviser and
Affiliated Fund
Service Providers | | | All Other Fees
Billed to Adviser
and Affiliated Fund
Service Providers | |
Nuveen Investment Funds, Inc. | | $ | 0 | | | $ | 0 | | | $ | 0 | |
| | | | | | | | | | | | |
| | | Percentage Approved Pursuant to Pre-approval Exception | |
| | | Audit-Related Fees
Billed to Adviser and
Affiliated Fund
Service Providers | | | Tax Fees Billed to
Adviser and
Affiliated Fund
Service Providers | | | All Other Fees
Billed to Adviser
and Affiliated Fund
Service Providers | |
| | | 0 | % | | | 0 | % | | | 0 | % |
| | | | | | | | | | | | |
Fiscal Year Ended June 30, 2016 | | Audit-Related Fees
Billed to Adviser and
Affiliated Fund
Service Providers | | | Tax Fees Billed to
Adviser and
Affiliated Fund
Service Providers | | | All Other Fees
Billed to Adviser
and Affiliated Fund
Service Providers | |
Nuveen Investment Funds, Inc. | | $ | 0 | | | $ | 0 | | | $ | 0 | |
| | | | | | | | | | | | |
| | | Percentage Approved Pursuant to Pre-approval Exception | |
| | | Audit-Related Fees
Billed to Adviser and
Affiliated Fund
Service Providers | | | Tax Fees Billed to
Adviser and
Affiliated Fund
Service Providers | | | All Other Fees
Billed to Adviser
and Affiliated Fund
Service Providers | |
| | | 0 | % | | | 0 | % | | | 0 | % |
| | | | | | | | | | | | | | | | |
Fiscal Year Ended June 30, 2017 | | Total Non-Audit Fees
Billed to Trust | | | Total Non-Audit Fees
billed to Adviser and
Affiliated Fund Service
Providers (engagements
related directly to the
operations and financial
reporting of the Trust) | | | Total Non-Audit Fees
billed to Adviser and
Affiliated Fund Service
Providers (all other
engagements) | | | Total | |
| Fund Name | | | | | | | | | | | | | | | | |
Nuveen Core Plus Bond Fund | | | 0 | | | | 0 | | | | 0 | | | | 0 | |
Nuveen High Income Bond Fund | | | 0 | | | | 0 | | | | 0 | | | | 0 | |
Nuveen Intermediate Government Bond Fund | | | 0 | | | | 0 | | | | 0 | | | | 0 | |
Nuveen Inflation Protected Securities Fund | | | 2,270 | | | | 0 | | | | 0 | | | | 2,270 | |
Nuveen Core Bond Fund | | | 0 | | | | 0 | | | | 0 | | | | 0 | |
Nuveen Short Term Bond Fund | | | 3,350 | | | | 0 | | | | 0 | | | | 3,350 | |
Nuveen Strategic Income Fund | | | 3,350 | | | | 0 | | | | 0 | | | | 3,350 | |
| | | | | | | | | | | | | | | | |
Total | | $ | 8,970 | | | $ | 0 | | | $ | 0 | | | $ | 8,970 | |
“Non-Audit Fees billed to Fund” for both fiscal year ends represent “Tax Fees” and “All Other Fees” billed to Fund in their respective amounts from the previous table.
Less than 50 percent of the hours expended on the principal accountant’s engagement to audit the registrant’s financial statements for the most recent fiscal year were attributed to work performed by persons other than the principal accountant’s full-time, permanent employees.
| | | | | | | | | | | | | | | | |
Fiscal Year Ended June 30, 2016 | | Total Non-Audit Fees
Billed to Trust | | | Total Non-Audit Fees
billed to Adviser and
Affiliated Fund Service
Providers (engagements
related directly to the
operations and financial
reporting of the Trust) | | | Total Non-Audit Fees
billed to Adviser and
Affiliated Fund Service
Providers (all other
engagements) | | | Total | |
Fund Name | | | | | | | | | | | | | | | | |
Nuveen Core Plus Bond Fund | | | 2,266 | | | | 0 | | | | 0 | | | | 2,266 | |
Nuveen High Income Bond Fund | | | 98 | | | | 0 | | | | 0 | | | | 98 | |
Nuveen Intermediate Government Bond Fund | | | 10 | | | | 0 | | | | 0 | | | | 10 | |
Nuveen Inflation Protected Securities Fund | | | 3,239 | | | | 0 | | | | 0 | | | | 3,239 | |
Nuveen Core Bond Fund | | | 2,241 | | | | 0 | | | | 0 | | | | 2,241 | |
Nuveen Short Term Bond Fund | | | 103 | | | | 0 | | | | 0 | | | | 103 | |
Nuveen Strategic Income Fund | | | 73 | | | | 0 | | | | 0 | | | | 73 | |
| | | | | | | | | | | | | | | | |
Total | | $ | 8,030 | | | $ | 0 | | | $ | 0 | | | $ | 8,030 | |
“Non-Audit Fees billed to Fund” for both fiscal year ends represent “Tax Fees” and “All Other Fees” billed to Fund in their respective amounts from the previous table.
Less than 50 percent of the hours expended on the principal accountant’s engagement to audit the registrant’s financial statements for the most recent fiscal year were attributed to work performed by persons other than the principal accountant’s full-time, permanent employees.
Audit Committee Pre-Approval Policies and Procedures. Generally, the Audit Committee must approve (i) all non-audit services to be performed for the Funds by the Funds’ independent accountant and (ii) all audit and non-audit services to be performed by the Funds’ independent accountant for the Affiliated Fund Service Providers with respect to the operations and financial reporting of the Funds. Regarding tax and research projects conducted by the independent accountant for the Funds and Affiliated Fund Service Providers (with respect to operations and financial reports of the Trust), such engagements will be (i) pre-approved by the Audit Committee if they are expected to be for amounts greater than $10,000; (ii) reported to the Audit Committee Chairman for his verbal approval prior to engagement if they are expected to be for amounts under $10,000 but greater than $5,000; and (iii) reported to the Audit Committee at the next Audit Committee meeting if they are expected to be for an amount under $5,000.
ITEM 5. AUDIT COMMITTEE OF LISTED REGISTRANTS.
Not applicable to this registrant.
ITEM 6. SCHEDULE OF INVESTMENTS.
| a) | | See Portfolio of Investments in Item 1. |
ITEM 7. DISCLOSURE OF PROXY VOTING POLICIES AND PROCEDURES FOR CLOSED-END
MANAGEMENT INVESTMENT COMPANIES.
Not applicable to this registrant.
ITEM 8. PORTFOLIO MANAGERS OF CLOSED-END MANAGEMENT INVESTMENT COMPANIES.
Not applicable to this registrant.
ITEM 9. PURCHASES OF EQUITY SECURITIES BY CLOSED-END MANAGEMENT INVESTMENT COMPANY AND AFFILIATED PURCHASERS.
Not applicable to this registrant.
ITEM 10. SUBMISSION OF MATTERS TO A VOTE OF SECURITY HOLDERS.
There have been no material changes to the procedures by which shareholders may recommend nominees to the registrant’s Board of Trustees implemented after the registrant last provided disclosure in response to this Item.
ITEM 11. CONTROLS AND PROCEDURES.
| | (a) | | The registrant’s principal executive and principal financial officers, or persons performing similar functions, have concluded that the registrant’s disclosure controls and procedures (as defined in Rule 30a-3(c) under the Investment Company Act of 1940, as amended (the “1940 Act”) (17 CFR 270.30a-3(c))) are effective, as of a date within 90 days of the filing date of this report that includes the disclosure required by this paragraph, based on their evaluation of the controls and procedures required by Rule 30a-3(b) under the 1940 Act (17 CFR 270.30a-3(b)) and Rules 13a-15(b) or 15d-15(b) under the Securities Exchange Act of 1934, as amended (the “Exchange Act”) (17 CFR 240.13a-15(b) or 240.15d-15(b)). |
| | (b) | | There were no changes in the registrant’s internal control over financial reporting (as defined in Rule 30a-3(d) under the 1940 Act (17 CFR 270.30a-3(d)) that occurred during the second fiscal quarter of the period covered by this report that has materially affected, or is reasonably likely to materially affect, the registrant’s internal control over financial reporting. |
ITEM 12. EXHIBITS.
File the exhibits listed below as part of this Form.
| | |
| (a)(1) | | Any code of ethics, or amendment thereto, that is the subject of the disclosure required by Item 2, to the extent that the registrant intends to satisfy the Item 2 requirements through filing of an exhibit: Not applicable because the code is posted on registrant’s website at www.nuveen.com/MutualFunds/ShareholderResources/FundGovernance.aspx and there were no amendments during the period covered by this report. (To view the code, click on Code of Conduct.) |
| |
| (a)(2) | | A separate certification for each principal executive officer and principal financial officer of the registrant as required by Rule 30a-2(a) under the 1940 Act (17 CFR 270.30a-2(a)) in the exact form set forth below: See EX-99.CERT attached hereto. |
| |
| (a)(3) | | Any written solicitation to purchase securities under Rule 23c-1 under the 1940 Act (17 CFR 270.23c-1) sent or given during the period covered by the report by or on behalf of the registrant to 10 or more persons: Not applicable to this registrant. |
| |
| (b) | | If the report is filed under Section 13(a) or 15(d) of the Exchange Act, provide the certifications required by Rule 30a-2(b) under the 1940 Act (17 CFR 270.30a-2(b)), Rule 13a-14(b) or Rule 15d-14(b) under the Exchange Act (17 CFR 240.13a-14(b) or 240.15d-14(b)), and Section 1350 of Chapter 63 of Title 18 of the United States Code (18 U.S.C. 1350) as an Exhibit. A certification furnished pursuant to this paragraph will not be deemed “filed” for purposes of Section 18 of the Exchange Act (15 U.S.C. 78r), or otherwise subject to the liability of that section. Such certification will not be deemed to be incorporated by reference into any filing under the Securities Act of 1933 or the Exchange Act, except to the extent that the registration specifically incorporates it by reference: See EX-99.906 CERT attached hereto. |
SIGNATURES
Pursuant to the requirements of the Securities Exchange Act of 1934 and the Investment Company Act of 1940, the registrant has duly caused this report to be signed on its behalf by the undersigned, thereunto duly authorized.
(Registrant) Nuveen Investment Funds, Inc.
| | |
| |
| By (Signature and Title) | | /s/ Kathleen L. Prudhomme |
| | Kathleen L. Prudhomme |
| | Vice President and Secretary |
Date: September 7, 2017
Pursuant to the requirements of the Securities Exchange Act of 1934 and the Investment Company Act of 1940, this report has been signed below by the following persons on behalf of the registrant and in the capacities and on the dates indicated.
| | |
| |
| By (Signature and Title) | | /s/ Greg A. Bottjer |
| | Greg A. Bottjer |
| | Chief Administrative Officer |
| | (principal executive officer) |
Date: September 7, 2017
| | |
| |
| By (Signature and Title) | | /s/ Stephen D. Foy |
| | Stephen D. Foy |
| | Vice President and Controller |
| | (principal financial officer) |
Date: September 7, 2017