UNITED STATES
SECURITIES AND EXCHANGE COMMISSION
Washington, D.C. 20549
FORM N-CSR
CERTIFIED SHAREHOLDER REPORT OF REGISTERED MANAGEMENT
INVESTMENT COMPANIES
Investment Company Act file number 811-05309
Nuveen Investment Funds, Inc.
(Exact name of registrant as specified in charter)
Nuveen Investments
333 West Wacker Drive, Chicago, IL 60606
(Address of principal executive offices) (Zip code)
Kathleen L. Prudhomme
Vice President and Secretary
901 Marquette Avenue
Minneapolis, Minnesota 55402
(Name and address of agent for service)
Registrant’s telephone number, including area code: (312) 917-7700
Date of fiscal year end: May 31
Date of reporting period: May 31, 2017
Form N-CSR is to be used by management investment companies to file reports with the Commission not later than 10 days after the transmission to stockholders of any report that is required to be transmitted to stockholders under Rule 30e-1 under the Investment Company Act of 1940 (17 CFR 270.30e-1). The Commission may use the information provided on Form N-CSR in its regulatory, disclosure review, inspection, and policy making roles.
A registrant is required to disclose the information specified by Form N-CSR, and the Commission will make this information public. A registrant is not required to respond to the collection of information contained in Form N-CSR unless the Form displays a currently valid Office of Management and Budget (“OMB”) control number. Please direct comments concerning the accuracy of the information collection burden estimate and any suggestions for reducing the burden to Secretary, Securities and Exchange Commission, 450 Fifth Street, NW, Washington, DC 20549-0609. The OMB has reviewed this collection of information under the clearance requirements of 44 U.S.C. ss.3507.
ITEM 1. REPORTS TO STOCKHOLDERS.
Nuveen Municipal
Bond Funds
It's not what you earn, it's what you keep.®
Annual Report May 31, 2017
| | | Class / Ticker Symbol |
| | | Fund Name | | Class A | Class C | Class C1 | Class C2 | Class I |
| | | Nuveen Minnesota Intermediate Municipal Bond Fund | | FAMAX | NIBCX | FACMX | NIBMX | FAMTX |
| | | Nuveen Minnesota Municipal Bond Fund | | FJMNX | NTCCX | FCMNX | NMBCX | FYMNX |
| | | Nuveen Nebraska Municipal Bond Fund | | FNTAX | NAAFX | FNTCX | NCNBX | FNTYX |
| | | Nuveen Oregon Intermediate Municipal Bond Fund | | FOTAX | NAFOX | — | NIMOX | FORCX |
Nuveen makes things e-simple.
It only takes a minute to sign up for e-Reports. Once enrolled, you’ll receive an e-mail as soon as your Nuveen Fund information is ready. No more waiting for delivery by regular mail. Just click on the link within the e-mail to see the report and save it on your computer if you wish.
Free e-Reports right to your e-mail!
www.investordelivery.com
If you receive your Nuveen Fund distributions and statements from your financial advisor or brokerage account.
www.nuveen.com/accountaccess
If you receive your Nuveen Fund distributions and statements directly from Nuveen.
Must be preceded by or accompanied by a prospectus.
NOT FDIC INSURED MAY LOSE VALUE
NO BANK GUARANTEE
Chairman’s Letter
to Shareholders
Dear Shareholders,
Whether politics or the economy will prevail over the financial markets this year has been a much-analyzed question. After the U.S. presidential election, stocks rallied to new all-time highs, bonds tumbled, and business and consumer sentiment grew pointedly optimistic. But, to what extent the White House can translate rhetoric into stronger economic and corporate earnings growth remains to be seen. Stock prices have experienced upward momentum driven by positive economic news and earnings growth, inflation is ticking higher and interest rates are higher amid the Federal Reserve (Fed) rate hikes.
At the year’s halfway point, the political landscape and its implications for the economy continue to be reevaluated. The lack of success in reforming health care policy has cast doubts on the president’s ability to move his agenda of pro-growth legislation forward. Additionally, Brexit negotiations in the U.K. face new uncertainties in light of the reshuffling of Parliament following the June snap election.
Nevertheless, there is a case for optimism. The jobs recovery, firming wages, the housing market and confidence measures are supportive of continued expansion in the economy. The Fed enacted a series of interest rate hikes in December 2016, March 2017 and June 2017, a vote of confidence that its employment and inflation targets are generally on track. Economies outside the U.S. have strengthened in recent months, possibly heralding the beginnings of a global synchronized recovery. Furthermore, the populist/nationalist undercurrent that helped deliver President Trump’s win and triggered the U.K.’s Brexit remained in the minority during both March’s Dutch general election and May’s French presidential election, easing the political uncertainty surrounding Germany’s elections later this year.
In the meantime, the markets will be focused on economic sentiment surveys along with “hard” data such as consumer and business spending to gauge the economy’s progress. With the Fed now signaling its intention to begin shrinking its balance sheet in addition to raising interest rates, policy moves that are more aggressive than expected could spook the markets and potentially stifle economic growth. On the political economic front, President Trump’s other signature platform plank, protectionism, is arguably anti-growth. We expect some churning in the markets as these issues sort themselves out.
Market volatility readings have been remarkably low of late, but conditions can change quickly. As market conditions evolve, Nuveen remains committed to rigorously assessing opportunities and risks. If you’re concerned about how resilient your investment portfolio might be, we encourage you to talk to your financial advisor. On behalf of the other members of the Nuveen Fund Board, we look forward to continuing to earn your trust in the months and years ahead.
Sincerely,
William J. Schneider
Chairman of the Board
July 24, 2017
Portfolio Managers’
Comments
Nuveen Minnesota Intermediate Municipal Bond Fund
Nuveen Minnesota Municipal Bond Fund
Nuveen Nebraska Municipal Bond Fund
Nuveen Oregon Intermediate Municipal Bond Fund
These Funds feature portfolio management by Nuveen Asset Management, LLC (NAM), an affiliate of Nuveen, LLC. Portfolio manager Christopher L. Drahn, CFA, has managed the Nuveen Minnesota Intermediate Municipal Bond Fund since 1994 and began managing the Nuveen Minnesota Municipal Bond Fund in November 2016. Portfolio Manager Michael S. Hamilton took over the management of the Nuveen Nebraska Municipal Bond Fund in November 2016 and has managed the Nuveen Oregon Intermediate Municipal Bond Fund since 1997.
Effective November 8, 2016, Michael Hamilton replaced Douglas J. White as Portfolio Manager on the Nuveen Nebraska Municipal Bond Fund and Christopher Drahn replaced Douglas J. White as Portfolio Manager on the Nuveen Minnesota Municipal Bond Fund.
Recently, the portfolio managers reviewed U.S. economic and municipal market conditions, key investment strategies and the Funds’ performance for the twelve-month reporting period ended May 31, 2017.
What factors affected the U.S. economy and the national municipal market during the twelve-month reporting period ended May 31, 2017?
During the twelve-month reporting period, the U.S. economy continued to grow moderately, now ranking the current expansion as the third-longest since World War II, according to the National Bureau of Economic Research. The second half of 2016 saw a short-term boost in economic activity, driven by a one-time jump in exports during the third quarter, but the economy resumed a below-trend pace thereafter. The Bureau of Economic Analysis reported an annual growth rate of 1.2% for the U.S. economy in the first quarter of 2017, as measured by the “second” estimate of real gross domestic product (GDP), which is the value of goods and services produced by the nation’s economy less the value of the goods and services used up in production, adjusted for price changes. By comparison, the annual GDP growth rate in the fourth quarter of 2016 was 2.1%.
Despite the slowdown in early 2017, other data pointed to positive momentum. The labor market continued to tighten, inflation ticked higher, and consumer and business confidence surveys reflected optimism about the economy’s prospects. As reported by the Bureau of Labor Statistics, the unemployment rate fell to 4.3% in May 2017 from 4.7% in May 2016 and job gains averaged around 181,000 per month for the past twelve months. Higher oil prices helped drive a steady increase in inflation over this reporting period. The Consumer Price Index (CPI) increased 1.9% over the twelve-month reporting period ended May 31, 2017 on a seasonally adjusted basis, as reported by the Bureau of Labor Statistics. The core CPI (which excludes food and energy) increased 1.7% during the same period, slightly below the Federal Reserve’s (Fed) unofficial longer term inflation objective of 2.0%. The housing market also continued to improve, with historically low mortgage rates and low inventory driving home prices higher. The S&P
CoreLogic Case-Shiller U.S. National Home Price Index, which covers all nine U.S. census divisions, recorded a 5.5% annual gain in
Certain statements in this report are forward-looking statements. Discussions of specific investments are for illustration only and are not intended as recommendations of individual investments. The forward-looking statements and other views expressed herein are those of the portfolio managers as of the date of this report. Actual future results or occurrences may differ significantly from those anticipated in any forward-looking statements and the views expressed herein are subject to change at any time, due to numerous market and other factors. The Funds disclaim any obligation to update publicly or revise any forward-looking statements or views expressed herein.
For financial reporting purposes, the ratings disclosed are the highest rating given by one of the following national rating agencies: Standard & Poor’s (S&P), Moody’s Investors Service, Inc. (Moody's) or Fitch, Inc (Fitch). This treatment of split-rated securities may differ from that used for other purposes, such as for Fund investment policies. Credit ratings are subject to change. AAA, AA, A, and BBB are investment grade ratings; BB, B, CCC, CC, C and D are below-investment grade ratings. Certain bonds backed by U.S. Government or agency securities are regarded as having an implied rating equal to the rating of such securities. Holdings designated N/R are not rated by these national rating agencies.
Bond insurance guarantees only the payment of principal and interest on the bond when due, and not the value of the bonds themselves, which will fluctuate with the bond market and the financial success of the issuer and the insurer. Insurance relates specifically to the bonds in the portfolio and not to the share prices of a Fund. No representation is made as to the insurers’ ability to meet their commitments.
Refer to the Glossary of Terms Used in this Report for further definition of the terms used within this section.
Portfolio Managers’ Comments (continued)
April 2017 (most recent data available at the time this report was prepared) (effective July 26, 2016, the S&P/Case-Shiller U.S. National Home Price Index was renamed the S&P CoreLogic Case-Shiller U.S. National Home Price Index). The 10-City and 20-City Composites reported year-over-year increases of 4.9% and 5.7%, respectively.
The Fed’s policy making committee raised its main benchmark interest rate in December 2016, March 2017 and June 2017 (subsequent to the close of this reporting period). These moves were widely expected by the markets and, while the Fed acknowledged in its June 2017 statement that inflation has remained unexpectedly low, an additional increase is anticipated later in 2017 as the Fed seeks to gradually “normalize” interest rates. Also after the June 2017 meeting, the Fed revealed its plan to begin shrinking its balance sheets by allowing a small amount of maturing Treasury and mortgage securities to roll off without reinvestment. The timing of this is less certain, however, as it depends on whether the economy performs in line with the Fed’s expectations.
Politics also dominated the headlines in this reporting period with two major electoral surprises: the U.K.’s vote to leave the European Union and Donald Trump’s win in the U.S. presidential race. Market volatility increased as markets digested the initial shocks, but generally recovered and, in the case of the “Trump rally,” U.S. equities saw significant gains. Investors also closely watched elections across Europe. To the markets’ relief, more mainstream candidates were elected in the Dutch and French elections in the spring of 2017. However, Britain’s June 2017 snap election unexpectedly overturned the Conservative Party’s majority in Parliament, which increased uncertainties about the Brexit negotiation process.
For the municipal bond market, performance was defined by a major sell-off in municipal bonds following the presidential election and the market’s subsequent recovery in the first half of 2017. Prior to the election, municipal bond mutual funds had been drawing steady inflows from September 2015 to October 2016, which kept demand outpacing supply and supported prices. However, beginning in mid-October, demand began to soften in anticipation of a Fed rate hike. Municipal bond prices continued to fall in November after President Trump’s win triggered rising inflation and interest rate expectations as well as speculation on tax code changes, and in December 2016 due to tax-loss selling. A sharp rise in interest rates after the election fueled a reversal in municipal bond fund flow. Municipal bond funds experienced large outflows in the fourth quarter of 2016, especially in the high yield municipal segment, which drove mutual fund managers to sell positions to help meet investor redemptions. At the same time, new issuance spiked in October 2016, further contributing to excess supply and exacerbating falling prices and credit spread widening.
However, stabilizing market conditions in December 2016 gave way to a rally in the first quarter of 2017. Concerns that the new administration’s fiscal, tax and health care policy agenda could have a potentially negative impact on municipal bonds eased somewhat. By the end of the reporting period, interest rates reached a higher level than where they began.
In the reporting period overall, municipal bond issuance nationwide totaled $421.0 billion, an 8.1% gain from the issuance for the twelve-month period ended May 31, 2016. Gross issuance remains robust as issuers continue to actively and aggressively refund their outstanding debt given the low interest rate environment. In these transactions the issuers are issuing new bonds and taking the bond proceeds and redeeming (calling) old bonds. These refunding transactions have ranged from 40%-60% of total issuance over the past few years. Thus, the net issuance (all bonds issued less bonds redeemed) is actually much lower than the gross issuance. In fact, the total municipal bonds outstanding has actually declined in each of the past four calendar years. So, the gross is surging, but the net is not and this was an overall positive technical factor on municipal bond investment performance in recent years. However, as interest rates moved higher, the pace of refunding deals began to moderate.
Although the municipal bond market experienced widening credit spreads over a short period after the election, the trend was more attributable to technical conditions than a change in the fundamental backdrop. Despite the U.S. economy’s rather sluggish recovery, improving state and local balance sheets have contributed to generally good credit fundamentals. Higher tax revenue growth, better expense management and a more cautious approach to new debt issuance have led to credit upgrades and stable credit outlooks for many state and local issuers. While some pockets of weakness continued to grab headlines, including Illinois, New Jersey and Puerto Rico, their problems were largely contained, with minimal spillover into the broader municipal market.
What were the economic and market conditions in Minnesota, Nebraska and Oregon during the twelve-month reporting period ended May 31, 2017?
Minnesota’s economic growth lagged the national growth rate in 2016 with Minnesota’s GDP growing 1.3% but outpaced its regional peers, ranking as the 23rd fastest growing state economy. Minnesota’s GDP growth was driven by gains in the durable goods manufacturing, financial & insurance services, and retail trade sectors. As of May 2017, Minnesota’s seasonally adjusted unemployment rate of 3.7% remained well below the national unemployment rate of 4.3%. Home prices in the Minneapolis area were up 6.3% year-over-year
as of April 2017 (most recent data available at the time this report was prepared), according to the S&P/Case-Shiller Home Price Index. In 2016, Minnesota state exports declined by 4.1% with the largest declines in machinery and passenger vehicles. Going into the current fiscal year, Minnesota had a $1.6 billion surplus. After an extended legislative session, Minnesota’s Legislature passed the state’s $46 billion Fiscal Year 2018-2019 budget which includes bills for $650 million in tax cuts, $483 million in additional funding to schools, $210 million increase to public colleges and universities, and $300 million in new funding for transportation. The budget bills are now waiting for Governor Dayton’s signature. As of May 26, 2017, Dayton announced that he is undecided if he will sign or veto the bills. Should the Governor veto even one spending bill, it will be returned to the legislature and will have to be renegotiated during a special session. As of May 2017, the state’s S&P and Moody’s ratings were AA+ and Aa1, respectively, and S&P maintains a positive outlook while Moody’s outlook is stable. For the twelve months ended May 31, 2017, municipal issuance in Minnesota totaled $8.1 billion, representing an 11.9% decrease from the twelve months ended May 31, 2016.
For 2016, Nebraska’s economic growth trailed the national growth rate at 1.2%, compared to national GDP growth of 1.5%, ranking as the 28th fastest growing state. State GDP growth was largely driven by gains in finance and insurance, wholesale and retail trade, and transportation and warehousing. As of May 2017, Nebraska’s seasonally adjusted unemployment rate was a low 2.9%, lower than the previous year’s rate, and remains well below the national unemployment rate of 4.3%. Nebraska’s economy remains less diverse than other states, with a high dependence on agriculture and food processing. Nebraska continues to rank as one of the nation’s top exporters of corn and soybeans. Nebraska’s state exports declined by 4.2% in 2016 driven by lower meat (beef and pork) and agricultural related equipment exports and trade with Canada, Japan and China. The state was facing a $900 million shortfall, and the State Senate passed the $8.9 billion Fiscal Year 2018-2019 two year budget on May 27, 2017. The budget includes $137 million in cuts and use of $173 million from cash reserves. The Governor vetoed $56 million in spending which was not overridden. The State of Nebraska only has one legislative house with 49 senators. Nebraska’s constitution prohibits the issuance of general obligation debt, leading Nebraska to have the lowest debt burden of any state as measured on a per-capita basis and as a percentage of personal income. Nebraska held a general obligation credit equivalent rating from S&P of AAA with a stable outlook. For the twelve months ended May 31, 2017, municipal issuance in Nebraska totaled $3.1 billion, representing a 13.5% increase from the twelve months ended May 31, 2016.
Oregon’s economy has continued to expand at a healthy pace. In 2016, the state’s economy expanded at a rate of 3.3% compared with the national growth rate of 1.5%, ranking Oregon second only behind Washington at 3.7% of GDP growth by state. Durable-goods manufacturing was the largest contributor to growth for Oregon. Intel, with more than 17,500 employees, ranked as the state’s largest private employer. As of May 2017, the state’s unemployment rate was low at 3.6%. Professional, tech and business services sectors led the way in adding jobs. Oregon’s housing market is also expanding faster than the national rate. According to the S& P/Case-Shiller Index of 20 major metropolitan areas, housing prices in Portland increased 9.3% during the twelve months ended April 2017 (most recent data available at the time this report was prepared), the second highest year-over-year increase only behind Seattle. The State of Oregon enacted an $18.0 billion 2015-2017 General Fund biennium budget and the Governor’s budget for the 2017-2019 biennium totals $20.6 billion, and is projected to have reserves in the rainy day fund and educational stability fund that total $1.2 billion by the end of the 2019 biennium. Oregon has no sales tax and personal income taxes make up a substantial percentage of the state’s revenues, accounting for a significant 86% of general fund revenues in Fiscal Year 2016. In April 2015, the Oregon Supreme Court overturned a large portion of the pension reforms enacted by the state in 2013. Therefore, the state expects to include higher pension contributions in its upcoming budgets beginning in the 2017-2019 biennium. As of May 2017, Oregon’s general obligation bonds were rated Aa1 (stable) from Moody’s and AA+ (stable) by S&P. For the twelve months ended May 2017, Oregon issued $6.8 billion in municipal bonds, a gross issuance increase of 135% from the twelve months ended May 2016.
How did the Funds perform during the twelve-month reporting period ended May 31, 2017?
The tables in the Fund Performance, Expense and Effective Leverage Ratios section of this report provide each Fund’s total return performance information for the one-year, five-year, ten-year and/or since inception periods ended May 31, 2017. Each Fund’s Class A Share at net asset value (NAV) returns are compared with the performance of a corresponding market index and its Lipper classification average.
For the twelve-month reporting period, the Class A Shares at NAV of the Minnesota Fund and the Nebraska Fund underperformed the S&P Municipal Bond Index, while the Minnesota Intermediate Fund and Oregon Intermediate Fund underperformed the S& P Municipal Bond Intermediate Index. The Minnesota, Minnesota Intermediate and Oregon Intermediate Funds outperformed their respective Lipper classification averages, while the Nebraska Fund underperformed its Lipper classification average.
Portfolio Managers’ Comments (continued)
What strategies were used to manage the Funds during the reporting period and how did these strategies influence performance?
All of the Funds continued to employ the same fundamental investment strategies and tactics long relied upon by NAM. Our municipal bond portfolios are managed with a value-oriented approach and close input from NAM’s research team. Below, we highlight the specific factors influencing each Fund’s investment strategy, as well as how we managed each portfolio in light of recent market conditions.
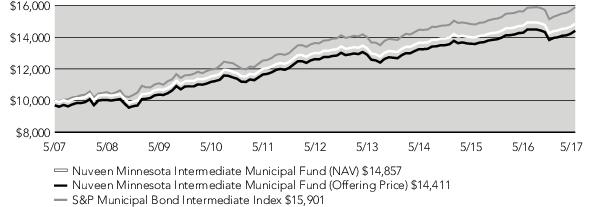
Nuveen Minnesota Intermediate Municipal Bond Fund
The Nuveen Minnesota Intermediate Municipal Bond Fund lagged the S&P Municipal Bond Intermediate Index for the twelve-month reporting period ended May 31, 2017.
This modest relative underperformance was partially attributable to the Fund’s overweighting in bonds with coupons of around 4% and below, which at times makes up a significant portion of Minnesota issuance. These securities sold off more than higher coupon bonds around the time of the U.S. election, as investors shied away from discount securities that might be subject to potentially unfavorable tax treatment if purchased in the secondary market.
We looked for opportunities to pare back exposure to lower coupon structures during the reporting period and were able to replace some with higher coupon securities. In doing so, we enhanced the Fund’s income stream and generated tax losses that we will be able to apply against future gains. Some notable sales on this theme included a number of school district local general obligation bonds. In their place, we added higher coupon securities across a number of issuers and sectors, including Minneapolis-St. Paul Metropolitan Airport, Western Minnesota Municipal Power Agency, Rochester Electric Utility, and St. Michael Independent School District. We also added a variety of charter school, hospital and long term care facility credits, a number of which were in the BB rated and non-rated categories. Continuing to add to our already overweighted position in the health care sector, especially long-term care facilities, was especially beneficial as the groups outperformed most sectors.
To a smaller extent, the Fund’s lack of exposure to two of the best performing segments of the municipal market also detracted from relative performance. Specifically, the Fund had no exposure to tobacco securitization bonds or Puerto Rico securities, both of which were buoyed by investors’ search for yield. There are no Minnesota-issued tobacco bonds and we wanted to avoid subjecting the Fund to taxation by the state of Minnesota for holding out-of-state municipal bonds.
Our decision not to own Puerto Rico securities was based on the view that the securities lacked sufficient yield given the U.S. territory’s deteriorating credit fundamentals. At period end, the Fund did have modest exposure to bonds of Guam, which, like all U.S. territorial bonds, are generally fully exempt from income taxes for residents of all 50 states. In our view, Guam offered stable credit characteristics, and we were comfortable with the Fund’s holdings in these issues.
Nuveen Minnesota Municipal Bond Fund
The Nuveen Minnesota Municipal Bond Fund underperformed the S&P Municipal Bond Index for the twelve-month reporting period ended May 31, 2017.
Some of the relative underperformance stemmed from the Fund’s coupon positioning. The Fund had an overweighting in bonds with stated interest rates of 4% and below, in part a reflection of what is sometimes available in the Minnesota municipal market. Bonds with lower coupons experienced steeper price declines than did higher coupon securities in the weeks surrounding the November 2016 U.S. election. We looked for opportunities to swap some of these holdings into similarly structured bonds with higher coupons. We believed that the higher coupon purchases could provide the Fund with a better income stream and provide somewhat lower volatility characteristics to the Fund. By engaging in these trades, we were also able to generate tax losses that we will be able to apply against future gains. In making these trades, many of the sales involved local school district general obligation bonds, which we replaced with higher coupon bonds across a number of issuers and sectors, including Minneapolis-St. Paul Metropolitan Airport, Rochester Electric Utility, Minnesota Municipal Power Agency, HealthPartners and St. Michael Independent School District.
The Fund was hurt modestly by not holding tobacco securitization bonds, a generally below investment grade category that performed extremely well during the reporting period as investors favored higher yielding securities. Tobacco bonds are not issued in Minnesota but do represent part of the Fund’s national municipal market benchmark. We were reluctant to add tobacco bonds issued in other states because they would be subject to taxation by the state of Minnesota. We experienced a similar drag on relative perfor
mance from not owning Puerto Rico bonds because of our concerns about their credit quality. However, these securities outperformed for the year, largely due to their high yields, and our lack of exposure proved detrimental.
The Fund’s duration (interest rate) positioning had a modestly negative effect on relative performance. The Fund’s duration was somewhat longer than that of the index, which added value late in the reporting period but was an offsetting negative in late 2016, when the municipal market was under pressure.
In contrast, the Fund benefited from its overweighting in bonds with more credit risk. The Fund's lower rated bonds generally outpaced the higher quality securities, bolstered by investors’ appetite for securities producing higher income.
In addition to altering the portfolio’s coupon positioning, we also identified a number of opportunities over the course of the reporting period to add to sectors at prices we believed provided relative value. Our new purchases on this theme were highlighted by charter schools with below investment grade credit ratings, which we felt offered attractive enough levels of added income over higher rated securities to compensate investors for the bonds’ heightened credit risk. We also added to the health care and airport sectors during the reporting period. Proceeds for these and other purchases predominantly came from new investment inflows, bond calls and bond maturities.
At the end of the reporting period, the Fund held a small position in tax-exempt bonds issued by Guam, as well as a modest investment in a Hawaii hospital. We felt these positions provided sufficient income to merit retention in the Fund. The overwhelming majority of the Fund’s investment remained throughout the reporting period in Minnesota municipal debt.
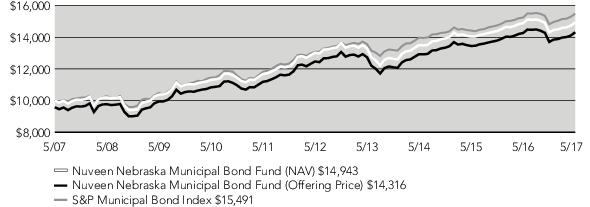
Nuveen Nebraska Municipal Bond Fund
The Nuveen Nebraska Municipal Bond Fund fell short of the S&P Municipal Bond Index for the twelve-month reporting period ended May 31, 2017.
Individual security selection detracted from relative performance. The Fund was hurt by its larger exposure to lower coupon bonds purchased in summer 2016, when prevailing bond yields hovered near their lows for the twelve-month reporting period. Subsequently, these lower coupon securities suffered when the municipal bond market declined after the U.S. elections last November 2016.
Additionally, many of our lower coupon holdings had durations of twelve to fourteen years. This proved to be a further performance negative, as bonds occupying that part of the yield curve trailed the index. However, the negative effects of that positioning were somewhat offset later in the reporting period by our purchases of higher yielding securities.
The Fund’s credit rating positioning also detracted from performance. We were hurt by an underweighting in lower rated investment grade securities, bonds rated below investment grade and non-rated debt. Generally speaking, the lower the bond’s credit rating, the better it performed during the reporting period, as investors moved down the credit scale in search of yield. Of particular note, the Fund lacked exposure to Puerto Rico debt, which made up the vast majority of the below investment grade securities in the index and performed well this reporting period.
Sector selection was another negative performance factor, with the Fund’s overweighting in pre-refunded bonds detracting the most from relative results. These securities, which are some of the shortest-maturity, highest quality bonds in the marketplace, lagged the index given that the market environment favored longer-term, higher quality bonds. Another modest negative was the Fund’s positioning in tax-supported bonds, particularly its underweighting in state-appropriation bonds. These securities performed well, and our more limited exposure to the category hurt results. In contrast, an overweighting in the utility sector, and especially our emphasis on public power bonds, was a plus in light of their relative outperformance this reporting period.
Some of our sales and purchases this reporting period focused on exchanging some lower yielding holdings bought earlier in the reporting period and into comparable securities available at higher yields after the post-election downturn in the municipal bond market.
We used proceeds from bond calls, maturities and some selling of positions that were purchased when yields were low in the summer of 2016 to fund the purchases during the reporting period. Some of the calls and maturities were a few of the non-Nebraska holdings in the Portfolio from Montana, Indiana and Colorado. At the end of the reporting period, the Fund had positions in bonds issued in the U.S. territory of Guam, as well as bonds of California, Colorado, Illinois, Missouri, Ohio and Wisconsin. Although these latter, out-of-state bonds were subject to state income taxation for Nebraska residents, we thought the securities’ higher yields and attractive valuations made them suitable investments for the Fund.
Portfolio Managers’ Comments (continued)
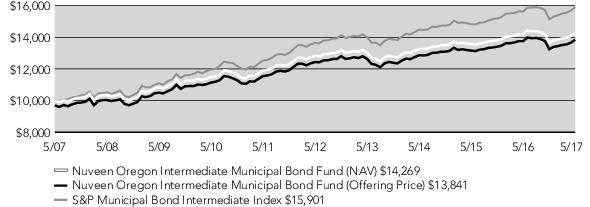
Nuveen Oregon Intermediate Municipal Bond Fund
The Nuveen Oregon Intermediate Municipal Bond Fund lagged the S&P Municipal Bond Intermediate Index for the twelve-month reporting period ended May 31, 2017, with security selection and credit positioning the two main performance negatives.
In terms of security selection, bonds we purchased in June through October 2016 generally performed poorly in the municipal bond market’s sell-off in the final two months of 2016. Overall, our Oregon security selection offered limited issuer diversification, however we did find a good supply of newer issue hospital systems, which included Legacy Health System, Samaritan Health Services and Salem Hospital Facility Authority.
On a credit rating basis, the Fund’s relative performance was hurt by its underweighting in bonds with lower investment grade credit ratings. Investors’ appetite for yield helped bonds in this credit tier outpace higher quality securities during the reporting period. In contrast, the Fund’s duration positioning added value, led by an overweighting in securities with duration under two years.
Sector allocation was another performance positive, with the Fund benefiting from an overweighting in pre-refunded securities. These bonds slightly outperformed the index in the intermediate municipal bond universe. Relative performance was also bolstered by the Fund’s underweighting in state general obligation bonds. Also of note, our underweighting in the utility sector was a modest negative, given that sector’s outperformance of the index. However, the negative effect of that positioning was somewhat offset by advantageous security selection in the category.
We were fairly active purchasers during the reporting period. Using the proceeds from bond calls, maturities and shareholder inflows, we mostly bought bonds with longer intermediate maturities, which helped us maintain the Fund’s duration at our targeted level and enhance its income stream. Our purchases, spread across sectors, included health care, utility, higher education and school district bonds. We also purchased a variable rate security issued by Salem Hospital. The security carried a seven-day call feature, which allowed us the flexibility to own an issue that we found attractive without incurring the added interest rate risk of the underlying bond’s much longer maturity date.
A Note About Investment Valuations
The municipal securities held by the Funds are valued by the Funds’ pricing service using a range of market-based inputs and assumptions. A different municipal pricing service might incorporate different assumptions and inputs into its valuation methodology, potentially resulting in different values for the same securities. These differences could be significant, both as to such individual securities, and as to the value of a given Fund’s portfolio in its entirety. Thus, the current net asset value of a Fund’s shares may be impacted, higher or lower, if the Fund were to change its pricing service, or if its pricing service were to materially change its valuation methodology. On October 4, 2016, the Funds’ current municipal bond pricing service was acquired by the parent company of another pricing service. The two services have not yet combined their valuation organizations and process, but it was recently announced that combination is scheduled to take place on October 16, 2017 (subject to change). Such changes could have an impact on the net asset value of each Fund’s shares.
Risk Considerations
and Dividend Information
Risk Considerations
Mutual fund investing involves risk; principal loss is possible. Debt or fixed income securities such as those held by the Funds, are subject to market risk, credit risk, interest rate risk, call risk, state concentration risk, tax risk, and income risk. As interest rates rise, bond prices fall. Credit risk refers to an issuers ability to make interest and principal payments when due. Below investment grade or high yield debt securities are subject to liquidity risk and heightened credit risk. The Funds’ use of inverse floaters creates effective leverage. Leverage involves the risk that the Funds could lose more than its original investment and also increases the Funds’ exposure to volatility and interest rate risk.
Dividend Information
Each Fund seeks to pay regular monthly dividends out of its net investment income at a rate that reflects its past and projected net income performance. To permit each Fund to maintain a more stable monthly dividend, the Fund may pay dividends at a rate that may be more or less than the amount of net income actually earned by the Fund during the period. If a Fund has cumulatively earned more than it has paid in dividends, it will hold the excess in reserve as undistributed net investment income (UNII) as part of the Fund’s net asset value. Conversely, if a Fund has cumulatively paid in dividends more than it has earned, the excess will constitute a negative UNII that will likewise be reflected in the Fund’s net asset value. Each Fund will, over time, pay all its net investment income as dividends to shareholders.
As of May 31, 2017, the Funds had positive UNII balances for tax purposes. Minnesota Intermediate, Minnesota and Nebraska had positive UNII balances, while Oregon Intermediate had a negative UNII balance for financial reporting purposes.
All monthly dividends paid by each Fund during the current reporting period were paid from net investment income. If a portion of the Fund’s monthly distributions was sourced from or comprised of elements other than net investment income, including capital gains and/or a return of capital, shareholders would have received a notice to that effect. For financial reporting purposes, the composition and per share amounts of each Fund’s dividends for the reporting period are presented in this report’s Statement of Changes in Net Assets and Financial Highlights, respectively. For income tax purposes, distribution information for each Fund as of its most recent tax year end is presented in Note 6 – Income Tax Information within the Notes to Financial Statements of this report.
THIS PAGE INTENTIONALLY LEFT BLANK
Fund Performance, Expense Ratios
and Effective Leverage Ratios
The Fund Performance, Expense Ratios and Effective Leverage Ratios for each Fund are shown within this section of the report.
Returns quoted represent past performance, which is no guarantee of future results. Investment returns and principal value will fluctuate so that when shares are redeemed, they may be worth more or less than their original cost. Current performance may be higher or lower than the performance shown. Total returns for a period of less than one year are not annualized. Returns at net asset value (NAV) would be lower if the sales charge were included. Returns assume reinvestment of dividends and capital gains. For performance, current to the most recent month-end visit Nuveen.com or call (800) 257-8787.
Returns do not reflect the deduction of taxes that a shareholder would pay on Fund distributions or the redemption of Fund shares. Income is generally exempt from regular federal income taxes. Some income may be subject to state and local income taxes and to the federal alternative minimum tax. Capital gains, if any, are subject to tax.
Returns may reflect fee waivers and/or expense reimbursements by the investment adviser during the periods presented. If any such waivers and/or reimbursements had not been in place, returns would have been reduced. See Notes to Financial Statements, Note 7—Management Fees and Other Transactions with Affiliates for more information.
Returns reflect differences in sales charges and expenses, which are primarily differences in distribution and service fees, and assume reinvestment of dividends and capital gains.
Comparative index and Lipper return information is provided for Class A Shares at NAV only.
The expense ratios shown reflect total operating expenses (before fee waivers and/or expense reimbursements, if any) as shown in the most recent prospectus. The expense ratios include management fees and other fees and expenses.
Leverage is created whenever a Fund has investment exposure (both reward and/or risk) equivalent to more than 100% of its investment capital. The effective leverage ratio shown for each Fund is the amount of investment exposure created either directly through borrowings or indirectly through inverse floaters, divided by the assets invested, including those assets that were purchased with the proceeds of the leverage, or referenced by the levered instrument. A Fund may from time to time borrow on a typically transient basis in connection with its day-to-day operations, primarily in connection with the need to pay cash out to redeeming shareholders or to settle portfolio trades. Such incidental borrowings, described generally in Notes to Financial Statements, Note 8—Borrowing Arrangements, are excluded from the calculation of a Fund’s effective leverage ratio.
Fund Performance, Expense Ratios and Effective Leverage Ratios (continued)
Nuveen Minnesota Intermediate Municipal Bond Fund
Refer to the first page of this Fund Performance, Expense Ratios and Effective Leverage Ratios section for further explanation of the information included within this section. Refer to the Glossary of Terms Used in this Report for definitions of terms used within this section.
Fund Performance
Average Annual Total Returns as of May 31, 2017
| | Average Annual |
| | 1-Year | 5-Year | 10-Year |
| Class A Shares at NAV | 0.88% | 2.69% | 4.07% |
| Class A Shares at maximum Offering Price | (2.15)% | 2.06% | 3.75% |
| S&P Municipal Bond Intermediate Index | 1.71% | 3.12% | 4.75% |
| Lipper Other States Intermediate Municipal Debt Funds Classification Average | 0.50% | 1.84% | 3.37% |
| Class I Shares | 1.06% | 2.88% | 4.21% |
| | Average Annual |
| | 1-Year | 5-Year | Since
Inception |
| Class C Shares | (0.02)% | N/A | 2.52% |
| Class C1 Shares | 0.42% | 2.23% | 3.49% |
| Class C2 Shares | 0.30% | 2.12% | 3.64% |
Average Annual Total Returns as of June 30, 2017 (Most Recent Calendar Quarter)
| | Average Annual |
| | 1-Year | 5-Year | 10-Year |
| Class A Shares at NAV | (0.82)% | 2.66% | 4.08% |
| Class A Shares at maximum Offering Price | (3.76)% | 2.03% | 3.77% |
| Class I Shares | (0.65)% | 2.85% | 4.22% |
| | Average Annual |
| | 1-Year | 5-Year | Since
Inception |
| Class C Shares | (1.62)% | N/A | 2.36% |
| Class C1 Shares | (1.27)% | 2.20% | 3.41% |
| Class C2 Shares | (1.39)% | 2.11% | 3.54% |
Since inception returns for Class C, Class C1 and Class C2 Shares are from 2/10/14, 10/28/09 and 1/18/11, respectively. Indexes and Lipper averages are not available for direct investment.
Class A Shares have a maximum 3.00% sales charge (Offering Price). Class A Share purchases of $250,000 ($1 million prior to November 1, 2016) or more are sold at net asset value without an up-front sales charge but may be subject to a contingent deferred sales charge (CDSC) of 1% if redeemed within eighteen months of purchase. Class C, Class C1, and Class C2 Shares have a 1% CDSC for redemptions within less than twelve months, which is not reflected in the one-year total return. Class I Shares have no sales charge and may be purchased under limited circumstances or by specified classes of investors.
Expense Ratios as of Most Recent Prospectus
| | Share Class |
| | Class A | Class C | Class C1 | Class C2 | Class I |
| Expense Ratios | 0.82% | 1.61% | 1.27% | 1.37% | 0.62% |
Effective Leverage Ratio as of May 31, 2017
| Effective Leverage Ratio | 0.00% |
Growth of an Assumed $10,000 Investment as of May 31, 2017 – Class A Shares
The graphs do not reflect the deduction of taxes, such as state and local income taxes or capital gains taxes that a shareholder may pay on Fund distributions or the redemptions of Fund shares.
Fund Performance, Expense Ratios and Effective Leverage Ratios (continued)
Nuveen Minnesota Municipal Bond Fund
Refer to the first page of this Fund Performance, Expense Ratios and Effective Leverage Ratios section for further explanation of the information included within this section. Refer to the Glossary of Terms Used in this Report for definitions of terms used within this section.
Fund Performance
Average Annual Total Returns as of May 31, 2017
| | Average Annual |
| | 1-Year | 5-Year | 10-Year |
| Class A Shares at NAV | 0.92% | 3.54% | 4.67% |
| Class A Shares at maximum Offering Price | (3.35)% | 2.65% | 4.23% |
| S&P Municipal Bond Index | 1.57% | 3.42% | 4.47% |
| Lipper Minnesota Municipal Debt Funds Classification Average | 0.75% | 2.70% | 3.73% |
| Class C1 Shares | 0.46% | 3.07% | 4.19% |
| Class I Shares | 1.13% | 3.73% | 4.87% |
| | Average Annual |
| | 1-Year | 5-Year | Since
Inception |
| Class C Shares | 0.19% | N/A | 4.05% |
| Class C2 Shares | 0.45% | 2.97% | 5.50% |
Average Annual Total Returns as of June 30, 2017 (Most Recent Calendar Quarter)
| | Average Annual |
| | 1-Year | 5-Year | 10-Year |
| Class A Shares at NAV | (0.84)% | 3.50% | 4.74% |
| Class A Shares at maximum Offering Price | (4.98)% | 2.62% | 4.29% |
| Class C1 Shares | (1.31)% | 3.03% | 4.25% |
| Class I Shares | (0.73)% | 3.70% | 4.92% |
| | Average Annual |
| | 1-Year | 5-Year | Since
Inception |
| Class C Shares | (1.73)% | N/A | 3.88% |
| Class C2 Shares | (1.48)% | 2.94% | 5.39% |
Since inception returns for Class C and Class C2 Shares are from 2/10/14 and 1/18/11, respectively. Indexes and Lipper averages are not available for direct investment.
Class A Shares have a maximum 4.20% sales charge (Offering Price). Class A Share purchases of $250,000 ($1 million prior to November 1, 2016) or more are sold at net asset value without an up-front sales charge but may be subject to a contingent deferred sales charge (CDSC) of 1% if redeemed within eighteen months of purchase. Class C, Class C1, and Class C2 Shares have a 1% CDSC for redemptions within less than twelve months, which is not reflected in the one-year total return. Class I Shares have no sales charge and may be purchased under limited circumstances or by specified classes of investors.
Expense Ratios as of Most Recent Prospectus
| | Share Class |
| | Class A | Class C | Class C1 | Class C2 | Class I |
| Expense Ratios | 0.82% | 1.62% | 1.28% | 1.38% | 0.62% |
Effective Leverage Ratio as of May 31, 2017
| Effective Leverage Ratio | 0.00% |
Growth of an Assumed $10,000 Investment as of May 31, 2017 – Class A Shares
The graphs do not reflect the deduction of taxes, such as state and local income taxes or capital gains taxes that a shareholder may pay on Fund distributions or the redemptions of Fund shares.
Fund Performance, Expense Ratios and Effective Leverage Ratios (continued)
Nuveen Nebraska Municipal Bond Fund
Refer to the first page of this Fund Performance, Expense Ratios and Effective Leverage Ratios section for further explanation of the information included within this section. Refer to the Glossary of Terms Used in this Report for definitions of terms used within this section.
Fund Performance
Average Annual Total Returns as of May 31, 2017
| | Average Annual |
| | 1-Year | 5-Year | 10-Year |
| Class A Shares at NAV | 0.32% | 2.79% | 4.13% |
| Class A Shares at maximum Offering Price | (3.93)% | 1.92% | 3.68% |
| S&P Municipal Bond Index | 1.57% | 3.42% | 4.47% |
| Lipper Other States Municipal Debt Funds Classification Average | 0.61% | 2.44% | 3.51% |
| Class C1 Shares | (0.18)% | 2.32% | 3.69% |
| Class I Shares | 0.48% | 2.98% | 4.36% |
| | Average Annual |
| | 1-Year | 5-Year | Since
Inception |
| Class C Shares | (0.51)% | N/A | 3.39% |
| Class C2 Shares | (0.35)% | 2.20% | 4.31% |
Average Annual Total Returns as of June 30, 2017 (Most Recent Calendar Quarter)
| | Average Annual |
| | 1-Year | 5-Year | 10-Year |
| Class A Shares at NAV | (1.38)% | 2.82% | 4.19% |
| Class A Shares at maximum Offering Price | (5.50)% | 1.94% | 3.74% |
| Class C1 Shares | (1.79)% | 2.36% | 3.74% |
| Class I Shares | (1.22)% | 3.01% | 4.40% |
| | Average Annual |
| | 1-Year | 5-Year | Since
Inception |
| Class C Shares | (2.20)% | N/A | 3.22% |
| Class C2 Shares | (1.95)% | 2.24% | 4.22% |
Since inception returns for Class C and Class C2 Shares are from 2/10/14 and 1/18/11, respectively. Indexes and Lipper averages are not available for direct investment.
Class A Shares have a maximum 4.20% sales charge (Offering Price). Class A Share purchases of $250,000 ($1 million prior to November 1, 2016) or more are sold at net asset value without an up-front sales charge but may be subject to a contingent deferred sales charge (CDSC) of 1% if redeemed within eighteen months of purchase. Class C, Class C1, and Class C2 Shares have a 1% CDSC for redemptions within less than twelve months, which is not reflected in the one-year total return. Class I Shares have no sales charge and may be purchased under limited circumstances or by specified classes of investors.
Expense Ratios as of Most Recent Prospectus
| | Share Class |
| | Class A | Class C | Class C1 | Class C2 | Class I |
| Gross Expense Ratios | 0.91% | 1.71% | 1.37% | 1.47% | 0.71% |
| Net Expense Ratios | 0.89% | 1.69% | 1.34% | 1.44% | 0.69% |
The Fund's investment adviser has contractually agreed to waive fees and/or reimburse other Fund expenses through September 30, 2018, so that total annual Fund operating expenses (excluding 12b-1 distribution and/or service fees, interest expenses, taxes, acquired fund fees and expenses, fees incurred in acquiring and disposing or portfolio securities and extraordinary expenses) do not exceed 0.70% of the average daily net assets of any class of Fund shares. Fee waivers and/or expense reimbursements will not be terminated prior to that time without the approval of the Board of Directors of the Fund.
Effective Leverage Ratio as of May 31, 2017
| Effective Leverage Ratio | 0.00% |
Growth of an Assumed $10,000 Investment as of May 31, 2017 – Class A Shares
The graphs do not reflect the deduction of taxes, such as state and local income taxes or capital gains taxes that a shareholder may pay on Fund distributions or the redemptions of Fund shares.
Fund Performance, Expense Ratios and Effective Leverage Ratios (continued)
Nuveen Oregon Intermediate Municipal Bond Fund
Refer to the first page of this Fund Performance, Expense Ratios and Effective Leverage Ratios section for further explanation of the information included within this section. Refer to the Glossary of Terms Used in this Report for definitions of terms used within this section.
Fund Performance
Average Annual Total Returns as of May 31, 2017
| | Average Annual |
| | 1-Year | 5-Year | 10-Year |
| Class A Shares at NAV | 0.61% | 2.17% | 3.65% |
| Class A Shares at maximum Offering Price | (2.37)% | 1.54% | 3.34% |
| S&P Municipal Bond Intermediate Index | 1.71% | 3.12% | 4.75% |
| Lipper Other States Intermediate Municipal Debt Funds Classification Average | 0.50% | 1.84% | 3.37% |
| Class I Shares | 0.78% | 2.36% | 3.83% |
| | Average Annual |
| | 1-Year | 5-Year | Since
Inception |
| Class C Shares | (0.21)% | N/A | 2.09% |
| Class C2 Shares | 0.12% | 1.62% | 3.15% |
Average Annual Total Returns as of June 30, 2017 (Most Recent Calendar Quarter)
| | Average Annual |
| | 1-Year | 5-Year | 10-Year |
| Class A Shares at NAV | (1.30)% | 2.13% | 3.67% |
| Class A Shares at maximum Offering Price | (4.27)% | 1.50% | 3.36% |
| Class I Shares | (1.13)% | 2.32% | 3.85% |
| | Average Annual |
| | 1-Year | 5-Year | Since
Inception |
| Class C Shares | (2.02)% | N/A | 1.92% |
| Class C2 Shares | (1.88)% | 1.56% | 3.03% |
Since inception returns for Class C and Class C2 Shares are from 2/10/14 and 1/18/11, respectively. Indexes and Lipper averages are not available for direct investment.
Class A Shares have a maximum 3.00% sales charge (Offering Price). Class A Share purchases of $250,000 ($1 million prior to November 1, 2016) or more are sold at net asset value without an up-front sales charge but may be subject to a contingent deferred sales charge (CDSC) of 1% if redeemed within eighteen months of purchase. Class C and Class C2 Shares have a 1% CDSC for redemptions within less than twelve months, which is not reflected in the one-year total return. Class I Shares have no sales charge and may be purchased under limited circumstances or by specified classes of investors.
Expense Ratios as of Most Recent Prospectus
| | Share Class |
| | Class A | Class C | Class C2 | Class I |
| Expense Ratios | 0.83% | 1.62% | 1.38% | 0.62% |
Effective Leverage Ratio as of May 31, 2017
| Effective Leverage Ratio | 0.00% |
Growth of an Assumed $10,000 Investment as of May 31, 2017 – Class A Shares
The graphs do not reflect the deduction of taxes, such as state and local income taxes or capital gains taxes that a shareholder may pay on Fund distributions or the redemptions of Fund shares.
Yields as of May 31, 2017
Dividend Yield is the most recent dividend per share (annualized) divided by the offering price per share.
The SEC 30-Day Yield is a standardized measure of a fund’s yield that accounts for the future amortization of premiums or discounts of bonds held in the fund’s portfolio. The SEC 30-Day Yield is computed under an SEC standardized formula and is based on the maximum offer price per share. Subsidized yields reflect fee waivers and/or expense reimbursements from the investment adviser during the period. If any such waivers and/or reimbursements had not been in place, yields would have been reduced. Unsubsidized yields do not reflect waivers and/or reimbursements from the investment adviser during the period. Refer to the Notes to Financial Statements, Note 7 – Management Fees and Other Transactions with Affiliates for further details on the investment adviser’s most recent agreement with the Fund to waive fees and/or reimburse expenses, where applicable. Dividend Yield may differ from the SEC 30-Day Yield because the fund may be paying out more or less than it is earning and it may not include the effect of amortization of bond premium.
The Taxable-Equivalent Yield represents the yield that must be earned on a fully taxable investment in order to equal the yield of the fund on an after-tax basis at a specified tax rate. If the comparison were instead to investments that generate qualified dividend income, which is taxable at a rate lower than an individual’s ordinary graduated tax rate, the fund’s Taxable-Equivalent Yield would be lower.
Nuveen Minnesota Intermediate Municipal Bond Fund
| | Share Class |
| | Class A1 | Class C | Class C1 | Class C2 | Class I |
| Dividend Yield | 2.67% | 1.96% | 2.29% | 2.19% | 2.94% |
| SEC 30-Day Yield | 1.66% | 0.92% | 1.27% | 1.17% | 1.91% |
| Taxable-Equivalent Yield (35.1%)2 | 2.56% | 1.42% | 1.96% | 1.80% | 2.94% |
Nuveen Minnesota Municipal Bond Fund
| | Share Class |
| | Class A1 | Class C | Class C1 | Class C2 | Class I |
| Dividend Yield | 2.89% | 2.20% | 2.57% | 2.45% | 3.22% |
| SEC 30-Day Yield | 2.14% | 1.45% | 1.80% | 1.70% | 2.44% |
| Taxable-Equivalent Yield (35.1%)2 | 3.30% | 2.23% | 2.77% | 2.62% | 3.76% |
Nuveen Nebraska Municipal Bond Fund
| | Share Class |
| | Class A1 | Class C | Class C1 | Class C2 | Class I |
| Dividend Yield | 2.99% | 2.29% | 2.64% | 2.56% | 3.28% |
| SEC 30-Day Yield - Subsidized | 1.52% | 0.82% | 1.14% | 1.06% | 1.79% |
| SEC 30-Day Yield - Unsubsidized | 1.47% | 0.76% | 1.10% | 1.00% | 1.74% |
| Taxable-Equivalent Yield - Subsidized (32.9%)2 | 2.27% | 1.22% | 1.70% | 1.58% | 2.67% |
| Taxable-Equivalent Yield - Unsubsidized (32.9%)2 | 2.19% | 1.13% | 1.64% | 1.49% | 2.59% |
Nuveen Oregon Intermediate Municipal Bond Fund
| | Share Class |
| | Class A1 | Class C | Class C2 | Class I |
| Dividend Yield | 2.14% | 1.40% | 1.63% | 2.38% |
| SEC 30-Day Yield | 1.18% | 0.43% | 0.68% | 1.42% |
| Taxable-Equivalent Yield (35.1%)2 | 1.82% | 0.66% | 1.05% | 2.19% |
1 The SEC Yield for Class A shares quoted in the table reflects the maximum sales load. Investors paying a reduced load because of volume discounts, investors paying no load because they qualify for one of the several exclusions from the load and existing shareholders who previously paid a load but would like to know the SEC Yield applicable to their shares on a going-forward basis, should understand that the SEC Yield effectively applicable to them would be higher than the figure quoted in the table.
2 The Taxable-Equivalent Yield is based on the Fund’s SEC 30-Day Yield on the indicated date and a combined federal and state income tax rate shown in the respective table above.
Holding
Summaries as of May 31, 2017
This data relates to the securities held in each Fund's portfolio of investments as of the end of this reporting period. It should not be construed as a measure of performance for the Fund itself. Holdings are subject to change.
For financial reporting purposes, the ratings disclosed are the highest rating given by one of the following national rating agencies: Standard & Poor’s, Moody’s Investors Service, Inc. or Fitch, Inc. This treatment of split-rated securities may differ from that used for other purposes, such as for Fund investment policies. Credit ratings are subject to change. AAA, AA, A and BBB are investment grade ratings; BB, B, CCC, CC, C and D are below investment grade ratings. Certain bonds backed by U.S. Government or agency securities are regarded as having an implied rating equal to the rating of such securities. Holdings designated N/R are not rated by these national rating agencies.
Refer to the Glossary of Terms Used in this Report for definitions of terms used within this section.
Nuveen Minnesota Intermediate Municipal Bond Fund
Fund Allocation
(% of net assets) | |
| Long-Term Municipal Bonds | 98.9% |
| Other Assets Less Liabilities | 1.1% |
| Net Assets | 100% |
Portfolio Composition
(% of total investments) | |
| Education and Civic Organizations | 22.6% |
| Health Care | 16.5% |
| Tax Obligation/General | 14.5% |
| Utilities | 13.7% |
| U.S. Guaranteed | 8.8% |
| Long-Term Care | 8.5% |
| Transportation | 7.0% |
| Other | 8.4% |
| Total | 100% |
Bond Credit Quality
(% of total investment exposure) | |
| AAA/U.S. Guaranteed | 11.2% |
| AA | 37.2% |
| A | 24.0% |
| BBB | 9.5% |
| BB or Lower | 4.1% |
| N/R (not rated) | 14.0% |
| Total | 100% |
Nuveen Minnesota Municipal Bond Fund
Fund Allocation
(% of net assets) | |
| Long-Term Municipal Bonds | 95.8% |
| Short-Term Municipal Bonds | 3.0% |
| Other Assets Less Liabilities | 1.2% |
| Net Assets | 100% |
Portfolio Composition
(% of total investments) | |
| Tax Obligation/General | 20.2% |
| Education and Civic Organizations | 19.6% |
| Health Care | 16.9% |
| Utilities | 12.0% |
| Long-Term Care | 10.3% |
| U.S. Guaranteed | 6.7% |
| Transportation | 6.2% |
| Other | 8.1% |
| Total | 100% |
Bond Credit Quality
(% of total investment exposure) | |
| AAA/U.S. Guaranteed | 9.2% |
| AA | 40.5% |
| A | 18.7% |
| BBB | 8.7% |
| BB or Lower | 7.5% |
| N/R (not rated) | 15.4% |
| Total | 100% |
Holding Summaries as of May 31, 2017 (continued)
Nuveen Nebraska Municipal Bond Fund
Fund Allocation
(% of net assets) | |
| Long-Term Municipal Bonds | 98.9% |
| Other Assets Less Liabilities | 1.1% |
| Net Assets | 100% |
Portfolio Composition
(% of total investments) | |
| Utilities | 17.6% |
| U.S. Guaranteed | 16.4% |
| Health Care | 14.4% |
| Tax Obligation/General | 14.3% |
| Education and Civic Organizations | 10.3% |
| Long-Term Care | 8.2% |
| Tax Obligation/Limited | 7.4% |
| Other | 11.4% |
| Total | 100% |
Bond Credit Quality
(% of total investment exposure) | |
| AAA/U.S. Guaranteed | 23.5% |
| AA | 38.4% |
| A | 33.7% |
| BBB | 2.9% |
| BB or Lower | 1.1% |
| N/R (not rated) | 0.4% |
| Total | 100% |
Nuveen Oregon Intermediate Municipal Bond Fund
Fund Allocation
(% of net assets) | |
| Long-Term Municipal Bonds | 99.8% |
| Short-Term Municipal Bonds | 1.8% |
| Other Assets Less Liabilities | (1.6)% |
| Net Assets | 100% |
Portfolio Composition
(% of total investments) | |
| Tax Obligation/General | 31.2% |
| Health Care | 18.0% |
| Tax Obligation/Limited | 13.0% |
| U.S. Guaranteed | 10.6% |
| Water and Sewer | 10.2% |
| Education and Civic Organizations | 7.1% |
| Other | 9.9% |
| Total | 100% |
Bond Credit Quality
(% of total investment exposure) | |
| AAA/U.S. Guaranteed | 24.7% |
| AA | 46.4% |
| A | 18.1% |
| BBB | 7.9% |
| BB or Lower | 0.6% |
| N/R (not rated) | 2.3% |
| Total | 100% |
As a shareholder of one or more of the Funds, you incur two types of costs: (1) transaction costs, including up-front and back-end sales charges (loads) or redemption fees, where applicable; and (2) ongoing costs, including management fees; distribution and service (12b-1) fees, where applicable; and other Fund expenses. The Examples below are intended to help you understand your ongoing costs (in dollars) of investing in the Funds and to compare these costs with the ongoing costs of investing in other mutual funds. The Examples below do not include the interest and related expenses from inverse floaters that are reflected in the financial statements later within this report, when applicable.
The Examples below are based on an investment of $1,000 invested at the beginning of the period and held through the period ended May 31, 2017.
The beginning of the period is December 1, 2016.
The information under “Actual Performance,” together with the amount you invested, allows you to estimate actual expenses incurred over the reporting period. Simply divide your account value by $1,000 (for example, an $8,600 account value divided by $1,000 = 8.60) and multiply the result by the cost shown for your share class, in the row entitled “Expenses Incurred During Period” to estimate the expenses incurred on your account during this period.
The information under “Hypothetical Performance,” provides information about hypothetical account values and hypothetical expenses based on each Fund’s actual expense ratio and an assumed rate of return of 5% per year before expenses, which is not the Fund’s actual return. The hypothetical account values and expenses may not be used to estimate the actual ending account balance or expense you incurred for the period. You may use this information to compare the ongoing costs of investing in the Fund and other funds. To do so, compare this 5% hypothetical example with the 5% hypothetical examples that appear in the shareholder reports of the other funds.
Please note that the expenses shown in the following tables are meant to highlight your ongoing costs only and do not reflect any transaction costs. Therefore, the hypothetical information is useful in comparing ongoing costs only, and will not help you determine the relative total costs of owning different funds or share classes. In addition, if these transaction costs were included, your costs would have been higher.
Nuveen Minnesota Intermediate Municipal Bond Fund
| | Share Class |
| | Class A | Class C | Class C1 | Class C2 | Class I |
| Actual Performance | | | | | |
| Beginning Account Value | $1,000.00 | $1,000.00 | $1,000.00 | $1,000.00 | $1,000.00 |
| Ending Account Value | $1,041.90 | $1,036.90 | $1,039.40 | $1,039.10 | $1,042.00 |
| Expenses Incurred During the Period | $ 4.12 | $ 8.18 | $ 6.41 | $ 6.91 | $ 3.11 |
Hypothetical Performance
(5% annualized return before expenses) | | | | | |
| Beginning Account Value | $1,000.00 | $1,000.00 | $1,000.00 | $1,000.00 | $1,000.00 |
| Ending Account Value | $1,020.89 | $1,016.90 | $1,018.65 | $1,018.15 | $1,021.89 |
| Expenses Incurred During the Period | $ 4.08 | $ 8.10 | $ 6.34 | $ 6.84 | $ 3.07 |
For each class of the Fund, expenses are equal to the Fund’s annualized net expense ratio of 0.81%, 1.61%, 1.26%, 1.36% and 0.61% for Classes A, C, C1, C2 and I, respectively, multiplied by the average account value over the period, multiplied by 182/365 (to reflect the one-half year period).
Nuveen Minnesota Municipal Bond Fund
| | Share Class |
| | Class A | Class C | Class C1 | Class C2 | Class I |
| Actual Performance | | | | | |
| Beginning Account Value | $1,000.00 | $1,000.00 | $1,000.00 | $1,000.00 | $1,000.00 |
| Ending Account Value | $1,054.10 | $1,050.70 | $1,051.80 | $1,051.90 | $1,055.20 |
| Expenses Incurred During the Period | $ 4.20 | $ 8.28 | $ 6.50 | $ 7.01 | $ 3.18 |
Hypothetical Performance
(5% annualized return before expenses) | | | | | |
| Beginning Account Value | $1,000.00 | $1,000.00 | $1,000.00 | $1,000.00 | $1,000.00 |
| Ending Account Value | $1,020.84 | $1,016.85 | $1,018.60 | $1,018.10 | $1,021.84 |
| Expenses Incurred During the Period | $ 4.13 | $ 8.15 | $ 6.39 | $ 6.89 | $ 3.13 |
For each class of the Fund, expenses are equal to the Fund’s annualized net expense ratio of 0.82%, 1.62%, 1.27%, 1.37% and 0.62% for Classes A, C, C1, C2 and I, respectively, multiplied by the average account value over the period, multiplied by 182/365 (to reflect the one-half year period).
Nuveen Nebraska Municipal Bond Fund
| | Share Class |
| | Class A | Class C | Class C1 | Class C2 | Class I |
| Actual Performance | | | | | |
| Beginning Account Value | $1,000.00 | $1,000.00 | $1,000.00 | $1,000.00 | $1,000.00 |
| Ending Account Value | $1,044.50 | $1,040.20 | $1,041.20 | $1,040.50 | $1,045.40 |
| Expenses Incurred During the Period | $ 4.54 | $ 8.60 | $ 6.82 | $ 7.33 | $ 3.52 |
Hypothetical Performance
(5% annualized return before expenses) | | | | | |
| Beginning Account Value | $1,000.00 | $1,000.00 | $1,000.00 | $1,000.00 | $1,000.00 |
| Ending Account Value | $1,020.49 | $1,016.50 | $1,018.25 | $1,017.75 | $1,021.49 |
| Expenses Incurred During the Period | $ 4.48 | $ 8.50 | $ 6.74 | $ 7.24 | $ 3.48 |
For each class of the Fund, expenses are equal to the Fund’s annualized net expense ratio of 0.89%, 1.69%, 1.34%, 1.44% and 0.69% for Classes A, C, C1, C2 and I, respectively, multiplied by the average account value over the period, multiplied by 182/365 (to reflect the one-half year period).
Nuveen Oregon Intermediate Municipal Bond Fund
| | Share Class |
| | Class A | Class C | Class C2 | Class I |
| Actual Performance | | | | |
| Beginning Account Value | $1,000.00 | $1,000.00 | $1,000.00 | $1,000.00 |
| Ending Account Value | $1,044.70 | $1,039.60 | $1,041.70 | $1,045.60 |
| Expenses Incurred During the Period | $ 4.18 | $ 8.24 | $ 6.97 | $ 3.16 |
Hypothetical Performance
(5% annualized return before expenses) | | | | |
| Beginning Account Value | $1,000.00 | $1,000.00 | $1,000.00 | $1,000.00 |
| Ending Account Value | $1,020.84 | $1,016.85 | $1,018.10 | $1,021.84 |
| Expenses Incurred During the Period | $ 4.13 | $ 8.15 | $ 6.89 | $ 3.13 |
For each class of the Fund, expenses are equal to the Fund’s annualized net expense ratio of 0.82%, 1.62%, 1.37% and 0.62% for Classes A, C, C2 and I, respectively, multiplied by the average account value over the period, multiplied by 182/365 (to reflect the one-half year period).
Report of
Independent Registered Public Accounting Firm
To the Board of Directors of Nuveen Investment Funds, Inc. and Shareholders of
Nuveen Minnesota Intermediate Municipal Bond Fund,
Nuveen Minnesota Municipal Bond Fund,
Nuveen Nebraska Municipal Bond Fund and
Nuveen Oregon Intermediate Municipal Bond Fund:
In our opinion, the accompanying statements of assets and liabilities, including the portfolios of investments, and the related statements of operations and of changes in net assets and the financial highlights present fairly, in all material respects, the financial position of Nuveen Minnesota Intermediate Municipal Bond Fund, Nuveen Minnesota Municipal Bond Fund, Nuveen Nebraska Municipal Bond Fund and Nuveen Oregon Intermediate Municipal Bond Fund (separate portfolios of Nuveen Investment Funds, Inc., hereafter referred to as the “Funds”) as of May 31, 2017, the results of each of their operations for the year then ended, the changes in each of their net assets for each of the two years in the period then ended and the financial highlights for each of the five years in the period then ended, in conformity with accounting principles generally accepted in the United States of America. These financial statements and financial highlights (hereafter referred to as “financial statements”) are the responsibility of the Funds' management. Our responsibility is to express an opinion on these financial statements based on our audits. We conducted our audits of these financial statements in accordance with the standards of the Public Company Accounting Oversight Board (United States). Those standards require that we plan and perform the audit to obtain reasonable assurance about whether the financial statements are free of material misstatement. An audit includes examining, on a test basis, evidence supporting the amounts and disclosures in the financial statements, assessing the accounting principles used and significant estimates made by management, and evaluating the overall financial statement presentation. We believe that our audits, which included confirmation of securities as of May 31, 2017 by correspondence with the custodian and brokers, provide a reasonable basis for our opinion.
PricewaterhouseCoopers LLP
Chicago, IL
July 26, 2017
Nuveen Minnesota Intermediate Municipal Bond Fund
| Portfolio of Investments | May 31, 2017 |
| Principal Amount (000) | | Description (1) | | Optional Call Provisions (2) | Ratings (3) | Value |
| | | LONG-TERM INVESTMENTS – 98.9% | | | | |
| | | MUNICIPAL BONDS – 98.9% | | | | |
| | | Education and Civic Organizations – 22.4% | | | | |
| $ 395 | | Anoka County, Minnesota, Charter School Lease Revenue Bonds, Spectrum Building Company, Series 2012A, 5.000%, 6/01/32 | | 6/20 at 102.00 | BBB- | $414,055 |
| | | Baytown Township, Minnesota Charter School Lease Revenue Bonds, Saint Croix Preparatory Academy, Refunding Series 2016A: | | | | |
| 425 | | 3.000%, 8/01/23 | | No Opt. Call | BB+ | 412,407 |
| 720 | | 3.500%, 8/01/25 | | No Opt. Call | BB+ | 702,238 |
| 130 | | 4.000%, 8/01/28 | | 8/26 at 100.00 | BB+ | 127,810 |
| | | City of Ham Lake, Minnesota, Charter School Lease Revenue Bonds, DaVinci Academy Project, Series 2016A: | | | | |
| 100 | | 5.000%, 7/01/31 | | 7/24 at 102.00 | N/R | 102,959 |
| 1,000 | | 5.000%, 7/01/36 | | 7/24 at 102.00 | N/R | 1,013,280 |
| 210 | | City of Woodbury, Minnesota, Charter School Lease Revenue Bonds, Math and Science Academy Building Company, Series 2012A, 5.000%, 12/01/27 | | 12/20 at 102.00 | BBB- | 222,812 |
| | | Deephaven, Minnesota, Charter School Lease Revenue Bonds, Eagle Ridge Academy Project, Series 2015A: | | | | |
| 190 | | 5.000%, 7/01/30 | | 7/25 at 100.00 | BB+ | 202,061 |
| 710 | | 5.250%, 7/01/37 | | 7/25 at 100.00 | BB+ | 749,661 |
| | | Deephaven, Minnesota, Charter School Lease Revenue Bonds, Eagle Ridge Academy Project, Series 2016A: | | | | |
| 200 | | 4.000%, 7/01/22 | | No Opt. Call | BB+ | 211,828 |
| 465 | | 4.000%, 7/01/23 | | No Opt. Call | BB+ | 492,309 |
| 150 | | 4.000%, 7/01/24 | | No Opt. Call | BB+ | 158,609 |
| 135 | | 4.000%, 7/01/25 | | No Opt. Call | BB+ | 141,612 |
| 130 | | 4.000%, 7/01/26 | | 7/25 at 100.00 | BB+ | 134,963 |
| 300 | | 4.000%, 7/01/27 | | 7/25 at 100.00 | BB+ | 309,105 |
| 370 | | 4.000%, 7/01/28 | | 7/25 at 100.00 | BB+ | 377,833 |
| 645 | | Forest Lake, Minnesota, Charter School Lease Revenue Bonds, Lakes International Language Academy, Series 2014A, 5.500%, 8/01/36 | | 8/22 at 102.00 | BB+ | 693,775 |
| | | Greenwood, Minnesota, Charter School Lease Revenue Bonds, Main Street School of Performing Arts Project, Series 2016A: | | | | |
| 1,010 | | 4.500%, 7/01/26 | | No Opt. Call | N/R | 985,689 |
| 40 | | 5.000%, 7/01/36 | | 7/26 at 100.00 | N/R | 37,924 |
| 1,820 | | Ham Lake, Minnesota Charter School Lease Revenue Bonds, Parnassus Preparatory School Project, Series 2016A, 4.000%, 11/01/26 | | No Opt. Call | BB | 1,793,264 |
| | | Independence, Minnesota, Charter School Lease Revenue Bonds, Beacon Academy Project, Series 2016A: | | | | |
| 1,000 | | 4.750%, 7/01/31 | | 7/26 at 100.00 | N/R | 993,870 |
| 500 | | 5.000%, 7/01/36 | | 7/26 at 100.00 | N/R | 494,525 |
Nuveen Minnesota Intermediate Municipal Bond Fund (continued)
| Portfolio of Investments | May 31, 2017 |
| Principal Amount (000) | | Description (1) | | Optional Call Provisions (2) | Ratings (3) | Value |
| | | Education and Civic Organizations (continued) | | | | |
| | | Itasca County, Minnesota, Revenue Bonds, Charles K. Blandin Foundation, Series 2010: | | | | |
| $ 635 | | 4.000%, 5/01/18 | | No Opt. Call | A2 | $646,843 |
| 255 | | 4.000%, 5/01/19 | | No Opt. Call | A2 | 264,591 |
| 1,350 | | Minneapolis, Minnesota, Charter School Lease Revenue Bonds, Hiawatha Academies Project, Series 2016A, 5.000%, 7/01/31 | | 7/24 at 102.00 | N/R | 1,383,628 |
| 1,300 | | Minneapolis, Minnesota, Charter School Lease Revenue Bonds, Yinghua Academy Project, Series 2013A, 6.000%, 7/01/33 | | 7/23 at 100.00 | BB | 1,387,048 |
| | | Minneapolis, Minnesota, Revenue Bonds, Blake School Project, Refunding Series 2010: | | | | |
| 550 | | 4.000%, 9/01/19 | | No Opt. Call | A2 | 581,135 |
| 315 | | 4.000%, 9/01/21 | | 9/20 at 100.00 | A2 | 337,907 |
| 1,040 | | Minneapolis, Minnesota, Revenue Bonds, University Gateway Project, Refunding Series 2015, 4.000%, 12/01/28 | | 12/24 at 100.00 | Aa1 | 1,141,972 |
| | | Minneapolis, Minnesota, Revenue Bonds, YMCA of Greater Twin Cities Project, Series 2016: | | | | |
| 500 | | 3.000%, 6/01/21 | | No Opt. Call | Baa1 | 522,105 |
| 710 | | 3.000%, 6/01/23 | | No Opt. Call | Baa1 | 744,222 |
| 815 | | Minnesota Higher Education Facilities Authority, Revenue Bonds, Augsburg College, Refunding Series 2010-7-G, 4.000%, 10/01/21 | | 10/18 at 100.00 | Baa3 | 835,285 |
| | | Minnesota Higher Education Facilities Authority, Revenue Bonds, Bethel University, Refunding Series 2007-6-R: | | | | |
| 1,125 | | 5.500%, 5/01/18 | | 7/17 at 100.00 | N/R | 1,127,092 |
| 1,185 | | 5.500%, 5/01/19 | | 7/17 at 100.00 | N/R | 1,187,240 |
| 1,050 | | 5.500%, 5/01/24 | | 7/17 at 100.00 | N/R | 1,051,890 |
| 1,600 | | Minnesota Higher Education Facilities Authority, Revenue Bonds, Carleton College, Refunding Series 2017, 4.000%, 3/01/33 | | 3/27 at 100.00 | Aa2 | 1,755,616 |
| 300 | | Minnesota Higher Education Facilities Authority, Revenue Bonds, College of St. Benedict, Series 2011-7M, 5.000%, 3/01/31 | | 3/20 at 100.00 | Baa1 | 324,306 |
| 655 | | Minnesota Higher Education Facilities Authority, Revenue Bonds, College of St. Benedict, Series 2016-8K, 3.250%, 3/01/32 | | 3/26 at 100.00 | Baa1 | 625,761 |
| 150 | | Minnesota Higher Education Facilities Authority, Revenue Bonds, College of St. Scholastica, Inc., Series 2011-7J, 6.000%, 12/01/28 | | 12/19 at 100.00 | Baa2 | 162,207 |
| | | Minnesota Higher Education Facilities Authority, Revenue Bonds, College of St. Scholastica, Inc., Series 2012-7R: | | | | |
| 200 | | 4.000%, 12/01/20 | | No Opt. Call | Baa2 | 212,248 |
| 310 | | 3.375%, 12/01/22 | | No Opt. Call | Baa2 | 325,608 |
| 380 | | Minnesota Higher Education Facilities Authority, Revenue Bonds, College of St. Scholastica, Series 2007-6S, 4.500%, 12/01/17 | | No Opt. Call | Baa2 | 386,540 |
| 750 | | Minnesota Higher Education Facilities Authority, Revenue Bonds, College of St. Scholastica, Series 20107H, 5.125%, 12/01/30 | | 12/19 at 100.00 | Baa2 | 787,575 |
| | | Minnesota Higher Education Facilities Authority, Revenue Bonds, Gustavus Adolfus College, Series 2010-7B: | | | | |
| 1,040 | | 5.000%, 10/01/23 | | 10/19 at 100.00 | A3 | 1,125,134 |
| 175 | | 4.250%, 10/01/24 | | 10/19 at 100.00 | A3 | 185,038 |
| Principal Amount (000) | | Description (1) | | Optional Call Provisions (2) | Ratings (3) | Value |
| | | Education and Civic Organizations (continued) | | | | |
| | | Minnesota Higher Education Facilities Authority, Revenue Bonds, Gustavus Adolfus College, Series 2013-7W: | | | | |
| $ 350 | | 4.000%, 10/01/21 | | No Opt. Call | A3 | $381,797 |
| 250 | | 5.000%, 10/01/22 | | No Opt. Call | A3 | 287,550 |
| 500 | | 5.000%, 10/01/23 | | No Opt. Call | A3 | 584,505 |
| 990 | | 4.250%, 10/01/28 | | 10/23 at 100.00 | A3 | 1,087,060 |
| | | Minnesota Higher Education Facilities Authority, Revenue Bonds, Hamline University of Minnesota, Refunding Series 2010E: | | | | |
| 1,000 | | 4.125%, 10/01/18 | | No Opt. Call | Baa3 | 1,034,710 |
| 1,385 | | 4.375%, 10/01/20 | | No Opt. Call | Baa3 | 1,497,739 |
| 500 | | 4.500%, 10/01/21 | | 10/20 at 100.00 | Baa3 | 539,510 |
| 250 | | 5.000%, 10/01/29 | | 10/20 at 100.00 | Baa3 | 266,372 |
| | | Minnesota Higher Education Facilities Authority, Revenue Bonds, Hamline University, Series 2011-7K1: | | | | |
| 1,000 | | 4.250%, 10/01/18 | | No Opt. Call | Baa3 | 1,030,910 |
| 625 | | 6.000%, 10/01/32 | | 10/21 at 100.00 | Baa3 | 707,694 |
| 1,250 | | Minnesota Higher Education Facilities Authority, Revenue Bonds, Macalester College, Series 201528J, 3.250%, 3/01/29 | | 3/25 at 100.00 | Aa3 | 1,294,087 |
| | | Minnesota Higher Education Facilities Authority, Revenue Bonds, Saint Catherine University, Refunding Series 2012-7Q: | | | | |
| 740 | | 5.000%, 10/01/23 | | 10/22 at 100.00 | Baa1 | 846,412 |
| 490 | | 5.000%, 10/01/24 | | 10/22 at 100.00 | Baa1 | 560,129 |
| 700 | | Minnesota Higher Education Facilities Authority, Revenue Bonds, Saint John's University, Series 2015-8I, 3.375%, 10/01/30 | | 10/25 at 100.00 | A2 | 724,703 |
| 1,000 | | Minnesota Higher Education Facilities Authority, Revenue Bonds, Saint Olaf College, Series 2015-8-G, 5.000%, 12/01/28 | | 12/25 at 100.00 | A1 | 1,191,630 |
| | | Minnesota Higher Education Facilities Authority, Revenue Bonds, University of Saint Thomas, Series 2009-7A: | | | | |
| 1,125 | | 4.500%, 10/01/18 | | No Opt. Call | A2 | 1,177,234 |
| 1,975 | | 4.500%, 10/01/19 | | No Opt. Call | A2 | 2,128,043 |
| | | Minnesota Higher Education Facilities Authority, Revenue Bonds, University of Saint Thomas, Series 2013-7U: | | | | |
| 2,000 | | 4.000%, 4/01/25 | | 4/23 at 100.00 | A2 | 2,216,300 |
| 775 | | 4.000%, 4/01/26 | | 4/23 at 100.00 | A2 | 850,640 |
| 300 | | 4.000%, 4/01/27 | | 4/23 at 100.00 | A2 | 327,003 |
| 1,000 | | Minnesota Higher Education Facilities Authority, Revenue Bonds, University of Saint Thomas, Series 2016-8L, 5.000%, 4/01/27 | | 4/26 at 100.00 | A2 | 1,206,050 |
| | | Minnesota Higher Education Facilities Authority, Saint John's University Revenue Bonds, Series 2008-6U: | | | | |
| 290 | | 4.200%, 10/01/19 | | 10/18 at 100.00 | A2 | 301,922 |
| 385 | | 4.300%, 10/01/20 | | 10/18 at 100.00 | A2 | 400,369 |
| 145 | | 4.500%, 10/01/22 | | 10/18 at 100.00 | A2 | 151,318 |
Nuveen Minnesota Intermediate Municipal Bond Fund (continued)
| Portfolio of Investments | May 31, 2017 |
| Principal Amount (000) | | Description (1) | | Optional Call Provisions (2) | Ratings (3) | Value |
| | | Education and Civic Organizations (continued) | | | | |
| | | Minnesota State Colleges and University, General Fund Revenue Bonds, Series 2009A: | | | | |
| $ 985 | | 4.000%, 10/01/22 | | 10/19 at 100.00 | AA- | $1,044,100 |
| 1,755 | | 4.000%, 10/01/23 | | 10/19 at 100.00 | AA- | 1,853,649 |
| | | Minnesota State Colleges and University, General Fund Revenue Bonds, Series 2011A: | | | | |
| 1,515 | | 4.250%, 10/01/24 | | 10/21 at 100.00 | AA- | 1,687,619 |
| 880 | | 4.375%, 10/01/25 | | 10/21 at 100.00 | AA- | 978,604 |
| 905 | | 4.500%, 10/01/26 | | 10/21 at 100.00 | AA- | 1,008,903 |
| 1,185 | | Minnesota State Colleges and University, General Fund Revenue Bonds, Series 2015A, 3.000%, 10/01/26 | | 4/25 at 100.00 | AA- | 1,259,442 |
| | | Moorhead, Minnesota, Educational Facilities Revenue Bonds, The Concordia College Corporation Project, Series 2016: | | | | |
| 980 | | 4.000%, 12/01/30 | | 12/25 at 100.00 | Baa1 | 1,034,331 |
| 1,060 | | 4.000%, 12/01/32 | | 12/25 at 100.00 | Baa1 | 1,107,403 |
| 935 | | Otsego, Minnesota, Charter School Lease Revenue Bonds, Kaleidoscope Charter School Project, Series 2014A, 5.000%, 9/01/34 | | 9/24 at 100.00 | BB+ | 969,436 |
| 450 | | Ramsey, Anoka County, Minnesota, Lease Revenue Bonds, PACT Charter School Project, Refunding Series 2013A, 5.000%, 12/01/26 | | 12/21 at 100.00 | BBB- | 477,576 |
| 680 | | Rice County, Minnesota Educational Facility Revenue Bonds, Shattuck, Saint Mary's School Project, Series 2015, 5.000%, 8/01/22 | | No Opt. Call | BB | 721,847 |
| 70 | | Saint Cloud, Minnesota, Charter School Lease Revenue Bonds, Stride Academy Project, Series 2016A, 5.000%, 4/01/36 | | 4/26 at 100.00 | CCC- | 45,500 |
| 2,005 | | Saint Paul Housing & Redevelopment Authority, Minnesota, Charter School Lease Revenue Bonds, Hmong College Prep Academy Project, Series 2016A, 5.250%, 9/01/31 | | 9/26 at 100.00 | BB+ | 2,055,045 |
| 730 | | Saint Paul Housing and Redevelopment Authority, Minnesota, Charter School Lease Revenue Bonds, Nova Classical Academy, Series 2011A, 5.700%, 9/01/21 | | No Opt. Call | BBB- | 792,269 |
| 885 | | Saint Paul Housing and Redevelopment Authority, Minnesota, Charter School Lease Revenue Bonds, Twin Cities Academy Project, Series 2015A, 5.000%, 7/01/35 | | 7/25 at 100.00 | BB | 903,249 |
| | | Saint Paul Housing and Redevelopment Authority, Minnesota, Charter School Lease Revenue Bonds, Twin Cities German Immersion School, Series 2013A: | | | | |
| 250 | | 4.000%, 7/01/23 | | No Opt. Call | BB+ | 255,278 |
| 700 | | 5.000%, 7/01/33 | | 7/23 at 100.00 | BB+ | 722,176 |
| 200 | | Saint Paul Housing and Redevelopment Authority, Minnesota, Lease Revenue Bonds, Saint Paul Conservatory for Performing Artists Charter School Project, Series 2013A, 4.000%, 3/01/28 | | 3/23 at 100.00 | BBB- | 201,320 |
| 2,395 | | Saint Paul Housing and Redevelopment Authority, Minnesota, Revenue Bonds, Minnesota Public Radio Project, Refunding Series 2010, 5.000%, 12/01/25 | | 12/20 at 100.00 | A2 | 2,660,941 |
| 2,770 | | Savage, Minnesota Charter School Lease Revenue Bonds, Aspen Academy Project, Series 2016A, 5.000%, 10/01/36 | | 10/26 at 100.00 | N/R | 2,722,633 |
| | | University of Minnesota, General Obligation Bonds, Series 2014B: | | | | |
| 1,000 | | 4.000%, 1/01/31 | | 1/24 at 100.00 | Aa1 | 1,094,970 |
| 1,000 | | 4.000%, 1/01/32 | | 1/24 at 100.00 | Aa1 | 1,087,980 |
| 1,000 | | 4.000%, 1/01/34 | | 1/24 at 100.00 | Aa1 | 1,077,910 |
| 1,020 | | University of Minnesota, General Revenue Bonds, Series 2009C, 5.000%, 12/01/19 | | 6/19 at 100.00 | Aa1 | 1,103,232 |
| Principal Amount (000) | | Description (1) | | Optional Call Provisions (2) | Ratings (3) | Value |
| | | Education and Civic Organizations (continued) | | | | |
| | | Winona Port Authority, Minnesota, Charter School Lease Revenue Bonds, Bluffview Montessori School Project, Refunding Series 2016: | | | | |
| $ 205 | | 3.750%, 6/01/26 | | 6/24 at 100.00 | N/R | $196,806 |
| 10 | | 4.500%, 6/01/36 | | 6/24 at 100.00 | N/R | 9,287 |
| 71,630 | | Total Education and Civic Organizations | | | | 75,738,773 |
| | | Health Care – 16.3% | | | | |
| 3,000 | | Chippewa County, Minnesota, Gross Revenue Hospital Bonds, Montevideo Hospital Project, Refunding Series 2016, 4.000%, 3/01/29 | | 3/26 at 100.00 | N/R | 3,135,120 |
| | | City of Plato, Minnesota, Health Care Facilities Revenue Bonds, Glencoe Regional Health Services Project, Series 2017: | | | | |
| 1,140 | | 4.000%, 4/01/29 | | 4/27 at 100.00 | BBB | 1,232,648 |
| 1,040 | | 4.000%, 4/01/32 | | 4/27 at 100.00 | BBB | 1,102,462 |
| 685 | | Cuyuna Range Hospital District, Minnesota, Health Care Facilities Gross Revenue Bonds, Refunding Series 2007, 5.000%, 6/01/17 | | No Opt. Call | N/R | 685,000 |
| 400 | | Fergus Falls, Minnesota, Health Care Facilities Revenue Bonds, Lake Region Healthcare Corporation Project, Series 2010, 4.750%, 8/01/25 | | 8/17 at 100.00 | BBB- | 401,024 |
| | | Glencoe, Minnesota, Health Care Facilities Revenue Bonds, Glencoe Regional Health Services Project, Series 2013: | | | | |
| 100 | | 4.000%, 4/01/21 | | No Opt. Call | BBB | 107,593 |
| 660 | | 4.000%, 4/01/25 | | 4/22 at 100.00 | BBB | 707,447 |
| 400 | | 4.000%, 4/01/26 | | 4/22 at 100.00 | BBB | 425,556 |
| 2,000 | | Maple Grove, Minnesota, Health Care Facilities Revenue Refunding Bonds, North Memorial Health Care, Series 2015, 5.000%, 9/01/28 | | 9/25 at 100.00 | Baa1 | 2,334,840 |
| | | Maple Grove, Minnesota, Health Care Facility Revenue Bonds, North Memorial Health Care, Series 2017: | | | | |
| 410 | | 5.000%, 5/01/31 | | 5/27 at 100.00 | Baa1 | 480,262 |
| 405 | | 5.000%, 5/01/32 | | 5/27 at 100.00 | Baa1 | 472,133 |
| 1,000 | | Meeker County, Minnesota, Gross Revenue Hospital Facilities Bonds, Meeker County Memorial Hospital Project, Series 2007, 5.625%, 11/01/22 | | 11/17 at 100.00 | N/R | 1,010,970 |
| | | Minneapolis, Minnesota, Health Care System Revenue Bonds, Fairview Health Services, Series 2015A: | | | | |
| 1,010 | | 5.000%, 11/15/28 | | 11/25 at 100.00 | A+ | 1,202,849 |
| 1,000 | | 5.000%, 11/15/29 | | 11/25 at 100.00 | A+ | 1,181,850 |
| 1,000 | | 5.000%, 11/15/30 | | 11/25 at 100.00 | A+ | 1,176,340 |
| 2,000 | | 5.000%, 11/15/32 | | 11/25 at 100.00 | A+ | 2,332,500 |
| 1,000 | | Minneapolis-Saint Paul Housing and Redevelopment Authority, Minnesota, Health Care Revenue Bonds, Children's Health Care, Series 2010A, 5.250%, 8/15/25 | | 8/20 at 100.00 | AA- | 1,112,360 |
| 500 | | Minneapolis-Saint Paul Housing and Redevelopment Authority, Minnesota, Health Care System Revenue Bonds, Allina Health System, Refunding Series 2017A, 5.000%, 11/15/29 | | 5/27 at 100.00 | AA- | 607,535 |
| 1,085 | | Minnesota Agricultural and Economic Development Board, Health Care Facilities Revenue Bonds, Essential Health Obligated Group, Refunding Series 2008C-1, 5.500%, 2/15/25 – AGC Insured | | 2/20 at 100.00 | AA | 1,197,569 |
Nuveen Minnesota Intermediate Municipal Bond Fund (continued)
| Portfolio of Investments | May 31, 2017 |
| Principal Amount (000) | | Description (1) | | Optional Call Provisions (2) | Ratings (3) | Value |
| | | Health Care (continued) | | | | |
| | | Northern Itasca Hospital District, Minnesota, Health Facilities Gross Revenue Bonds, Refunding Series 2013A: | | | | |
| $ 275 | | 4.000%, 12/01/25 | | 12/20 at 100.00 | N/R | $281,319 |
| 250 | | 4.050%, 12/01/26 | | 12/20 at 100.00 | N/R | 255,182 |
| 250 | | 4.150%, 12/01/27 | | 12/20 at 100.00 | N/R | 255,425 |
| 500 | | Northern Itasca Hospital District, Minnesota, Health Facilities Gross Revenue Bonds, Series 2013C, 5.400%, 12/01/33 | | 12/20 at 100.00 | N/R | 522,820 |
| 760 | | Redwood Falls, Minnesota, Gross Revenue Hospital Facilities Bonds, Redwood Area Hospital Project, Series 2006, 5.000%, 12/01/21 | | 7/17 at 100.00 | N/R | 761,657 |
| | | Rochester, Minnesota, Health Care Facilities Revenue Bonds, Mayo Clinic, Refunding Series 2016B: | | | | |
| 2,300 | | 5.000%, 11/15/29 | | No Opt. Call | AA | 2,914,629 |
| 1,000 | | 5.000%, 11/15/33 | | No Opt. Call | AA | 1,280,830 |
| 1,175 | | Rochester, Minnesota, Health Care Facilities Revenue Bonds, Mayo Clinic, Series 2011, 4.500%, 11/15/38 (Mandatory Put 11/15/21) | | No Opt. Call | AA | 1,334,659 |
| 905 | | Rochester, Minnesota, Health Care Facilities Revenue Bonds, Olmsted Medical Center Project, Series 2010, 5.125%, 7/01/20 | | No Opt. Call | A | 967,789 |
| 500 | | Rochester, Minnesota, Health Care Facilities Revenue Bonds, Olmsted Medical Center Project, Series 2013, 3.000%, 7/01/25 | | 7/23 at 100.00 | A | 523,535 |
| 80 | | Saint Cloud, Minnesota, Health Care Revenue Bonds, CentraCare Health System Project, Series 2010A, 4.250%, 5/01/21 | | 5/20 at 100.00 | A1 | 86,813 |
| | | Saint Paul Housing and Redevelopment Authority, Minnesota, Health Care Facility Revenue Bonds, HealthPartners Obligated Group, Refunding Series 2015A: | | | | |
| 3,225 | | 5.000%, 7/01/28 | | 7/25 at 100.00 | A | 3,811,724 |
| 1,240 | | 5.000%, 7/01/30 | | 7/25 at 100.00 | A | 1,446,832 |
| 4,500 | | 5.000%, 7/01/32 | | 7/25 at 100.00 | A | 5,190,525 |
| 1,000 | | 4.000%, 7/01/35 | | 7/25 at 100.00 | A | 1,048,560 |
| 1,200 | | Saint Paul Housing and Redevelopment Authority, Minnesota, Health Care Revenue Bonds, Allina Health System, Series 2007A, 5.000%, 11/15/19 – NPFG Insured | | 11/17 at 100.00 | AA- | 1,222,260 |
| 1,540 | | Saint Paul Housing and Redevelopment Authority, Minnesota, Health Care Revenue Bonds, Allina Health System, Series 2009A-1, 5.000%, 11/15/24 | | 11/19 at 100.00 | AA- | 1,683,143 |
| 1,025 | | Saint Paul Housing and Redevelopment Authority, Minnesota, Health Care Revenue Bonds, Gillette Children's Specialty Healthcare Project, Series 2009, 5.000%, 2/01/19 | | No Opt. Call | A | 1,081,221 |
| | | Shakopee, Minnesota, Health Care Facilities Revenue Bonds, Saint Francis Regional Medical Center, Refunding Series 2014: | | | | |
| 1,200 | | 5.000%, 9/01/27 | | 9/24 at 100.00 | A | 1,400,064 |
| 1,140 | | 5.000%, 9/01/29 | | 9/24 at 100.00 | A | 1,307,774 |
| | | St. Paul Housing and Redevelopment Authority, Minnesota, Hospital Revenue Bonds, HealthEast Inc., Series 2015A: | | | | |
| 1,000 | | 5.000%, 11/15/29 | | 11/25 at 100.00 | BBB- | 1,122,080 |
| 2,285 | | 5.000%, 11/15/30 | | 11/25 at 100.00 | BBB- | 2,553,899 |
| 1,250 | | 5.250%, 11/15/35 | | 11/20 at 100.00 | BBB- | 1,342,925 |
| 1,000 | | Winona Health Care Facilities Revenue Refunding Bonds, Minnesota, Winona Health Obligated Group, Series 2007, 5.000%, 7/01/20 | | 7/17 at 100.00 | BBB | 1,002,900 |
| Principal Amount (000) | | Description (1) | | Optional Call Provisions (2) | Ratings (3) | Value |
| | | Health Care (continued) | | | | |
| | | Winona, Minnesota, Health Care Facilities Revenue Bonds, Winona Health Obligated Group, Refunding Series 2012: | | | | |
| $ 485 | | 4.500%, 7/01/24 | | 7/21 at 100.00 | BBB | $521,938 |
| 260 | | 5.000%, 7/01/34 | | 7/21 at 100.00 | BBB | 276,955 |
| 49,180 | | Total Health Care | | | | 55,103,516 |
| | | Housing/Multifamily – 0.5% | | | | |
| 500 | | Anoka Housing and Redevelopment Authority, Minnesota, Multifamily Housing Revenue Bonds, Woodland Park Apartments Project, Series 2011A, 5.000%, 4/01/27 | | 4/19 at 100.00 | Aaa | 520,510 |
| 1,150 | | Minneapolis, Minnesota, Multi-Family Housing Revenue Bonds, Plymouth Stevens House Limited Partnership Project, Series 2016B, 2.000%, 12/01/17 | | 7/17 at 100.00 | N/R | 1,150,196 |
| 1,650 | | Total Housing/Multifamily | | | | 1,670,706 |
| | | Housing/Single Family – 0.7% | | | | |
| 610 | | Dakota County Community Development Agency, Minnesota, Single Family Mortgage Revenue Bonds, Mortgage Backed Securities Program, Series 2011A, 4.400%, 12/01/26 | | 12/20 at 100.00 | AA+ | 650,095 |
| 575 | | Minnesota Housing Finance Agency, Homeownership Finance Bonds, Mortgage-Backed Securities Program, Series 2011D, 4.375%, 7/01/26 | | 7/21 at 100.00 | Aaa | 603,871 |
| 425 | | Minnesota Housing Finance Agency, Residential Housing Finance Bonds, Series 2012A, 3.750%, 7/01/22 (Alternative Minimum Tax) | | 1/22 at 100.00 | AA+ | 459,357 |
| 140 | | Minnesota Housing Finance Agency, Residential Housing Finance Bonds, Series 2012C, 3.750%, 1/01/22 (Alternative Minimum Tax) | | No Opt. Call | AA+ | 152,666 |
| 275 | | Minnesota Housing Finance Agency, Residential Housing Finance Bonds, Series 2014C, 3.100%, 7/01/26 | | 7/24 at 100.00 | AA+ | 284,009 |
| 210 | | Minnesota Housing Finance Agency, Residential Housing Finance Bonds, Series 2015F, 3.300%, 7/01/29 | | 7/25 at 100.00 | AA+ | 218,553 |
| 2,235 | | Total Housing/Single Family | | | | 2,368,551 |
| | | Industrials – 0.9% | | | | |
| 2,020 | | Minneapolis, Minnesota, Limited Tax Supported Development Revenue Bonds, Common Bond Fund Series 2010-2A, 4.625%, 12/01/20 | | No Opt. Call | A+ | 2,219,818 |
| 1,000 | | Minneapolis, Minnesota, Limited Tax Supported Development Revenue Bonds, Common Bond Fund Series 2013-1, 4.000%, 6/01/28 | | 6/21 at 100.00 | A+ | 1,054,840 |
| 3,020 | | Total Industrials | | | | 3,274,658 |
| | | Long-Term Care – 8.4% | | | | |
| 1,000 | | Center City, Minnesota, Health Care Facilities Revenue Bonds, Hazelden Betty Ford Foundation Project, Series 2014, 5.000%, 11/01/25 | | 11/24 at 100.00 | A3 | 1,179,610 |
| 565 | | Center City, Minnesota, Health Care Facilities Revenue Bonds, Hazelden Foundation Project, Series 2011, 4.550%, 11/01/26 | | 11/19 at 100.00 | A3 | 594,521 |
| 815 | | Chisago City, Minnesota, Housing and Health Care Revenue Bonds, CDL Homes, LLC Project, Series 2013B, 6.000%, 8/01/33 | | 8/23 at 100.00 | N/R | 878,317 |
| 1,110 | | City of Minneapolis, Minnesota, Senior Housing and Healthcare Facilities Revenue Bonds, Walker Minneapolis Campus Project, Series 2015, 4.625%, 11/15/31 | | 11/22 at 100.00 | N/R | 1,115,295 |
| 325 | | City of Vergas, Minnesota, Housing and Health Care Revenue Bonds, CDL Homes, LLC Project, Refunding Series 2016, 4.000%, 8/01/31 | | 8/24 at 100.00 | N/R | 316,742 |
| 235 | | Cold Spring, Minnesota, Health Care Facilities Revenue Bonds, Assumption Home, Inc., Refunding Series 2017, 4.450%, 3/01/31 | | 3/22 at 101.00 | N/R | 239,162 |
Nuveen Minnesota Intermediate Municipal Bond Fund (continued)
| Portfolio of Investments | May 31, 2017 |
| Principal Amount (000) | | Description (1) | | Optional Call Provisions (2) | Ratings (3) | Value |
| | | Long-Term Care (continued) | | | | |
| | | Columbus, Minnesota, Senior Housing Revenue Bonds, Richfield Senior Housing, Inc., Refunding Series 2015: | | | | |
| $ 1,000 | | 4.600%, 1/01/27 | | 1/23 at 100.00 | N/R | $1,016,010 |
| 500 | | 5.000%, 1/01/34 | | 1/23 at 100.00 | N/R | 507,025 |
| | | Dakota County Community Development Agency, Minnesota, Senior Housing Revenue Bonds, Walker Highview Hills LLC Project, Refunding Series 2016A: | | | | |
| 2,385 | | 3.875%, 8/01/29 | | 8/22 at 100.00 | N/R | 2,288,455 |
| 1,100 | | 5.000%, 8/01/36 | | 8/22 at 100.00 | N/R | 1,126,565 |
| 1,435 | | Lake Crystal, Minnesota, Housing and Health Care Revenue Bonds, Ecumen-Second Century & Owatonna Senior Living Project, Refunding Series 2014A, 4.500%, 9/01/44 (Mandatory Put 9/01/24) | | 9/18 at 100.00 | N/R | 1,438,128 |
| | | Minneapolis, Minnesota, Revenue Bonds, Walker Minneapolis Campus Project, Refunding Series 2012: | | | | |
| 1,400 | | 5.000%, 11/15/24 | | 11/22 at 100.00 | N/R | 1,496,544 |
| 1,650 | | 4.750%, 11/15/28 | | 11/22 at 100.00 | N/R | 1,695,012 |
| | | Minneapolis, Minnesota, Senior Housing and Healthcare Revenue Bonds, Ecumen-Abiitan Mill City Project, Series 2015: | | | | |
| 425 | | 4.750%, 11/01/28 | | 5/23 at 100.00 | N/R | 436,335 |
| 750 | | 5.250%, 11/01/45 | | 5/23 at 100.00 | N/R | 775,365 |
| 1,000 | | Saint Louis Park, Minnesota, Health Care Facilities Revenue Bonds, Mount Olivet Careview Home Project, Series 2016B, 2.000%, 6/01/36 | | 12/17 at 100.00 | N/R | 989,860 |
| | | Saint Louis Park, Minnesota, Health Care Facilities Revenue Bonds, Mount Olivet Careview Home Project, Series 2016C: | | | | |
| 210 | | 2.000%, 6/01/19 | | No Opt. Call | N/R | 209,989 |
| 230 | | 2.125%, 6/01/20 | | No Opt. Call | N/R | 230,097 |
| 250 | | 2.500%, 6/01/22 | | 6/21 at 101.00 | N/R | 250,345 |
| 250 | | 3.050%, 6/01/27 | | 6/21 at 101.00 | N/R | 250,170 |
| 2,500 | | Saint Paul Housing and Redevelopment Authority Minnesota, Senior Housing and Health Care Revenue Bonds, Episcopal Homes Project, Series 2013, 5.000%, 5/01/33 | | 5/23 at 100.00 | N/R | 2,540,825 |
| 1,000 | | Saint Paul Housing and Redevelopment Authority, Minnesota, Senior Housing and Health Care Revenue Bonds, Episcopal Homes Project, Refunding Series 2012A, 4.000%, 11/01/22 | | 11/20 at 100.00 | N/R | 1,012,460 |
| 2,000 | | Saint Paul Port Authority, Minnesota, Revenue Bonds, Amherst H. Wilder Foundation Project, Series 2010-3, 5.000%, 12/01/24 | | 12/20 at 100.00 | Baa2 | 2,156,740 |
| 1,020 | | Sartell, Minnesota, Health Care and Housing Facilities Revenue Bonds, Country Manor Campus LLC Project, Series 2012A, 5.250%, 9/01/27 | | 9/22 at 100.00 | N/R | 1,079,201 |
| | | Sauk Rapids, Minnesota, Health Care and Housing Facilities Revenue Bonds, Good Shepherd Lutheran Home, Refunding Series 2013: | | | | |
| 180 | | 5.000%, 1/01/21 | | No Opt. Call | N/R | 189,329 |
| 2,395 | | 5.125%, 1/01/39 | | 1/23 at 100.00 | N/R | 2,416,411 |
| Principal Amount (000) | | Description (1) | | Optional Call Provisions (2) | Ratings (3) | Value |
| | | Long-Term Care (continued) | | | | |
| | | Wayzata, Minnesota, Senior Housing Revenue Bonds, Folkestone Senior Living Community, Series 2012A: | | | | |
| $ 625 | | 5.100%, 5/01/24 – AGM Insured | | 5/19 at 102.00 | N/R | $662,925 |
| 310 | | 5.300%, 5/01/27 | | 5/19 at 102.00 | N/R | 327,075 |
| 500 | | 5.300%, 11/01/27 | | 5/19 at 102.00 | N/R | 527,490 |
| 515 | | 5.500%, 11/01/32 | | 5/19 at 102.00 | N/R | 544,443 |
| 27,680 | | Total Long-Term Care | | | | 28,490,446 |
| | | Tax Obligation/General – 14.4% | | | | |
| 285 | | Anoka County, Minnesota, General Obligation Bonds, Capital Improvement, Series 2008C, 4.100%, 2/01/18 | | No Opt. Call | Aa1 | 291,373 |
| | | Bemidji, Minnesota, General Obligation Bonds, Refunding Sales Tax Series 2011: | | | | |
| 635 | | 5.500%, 2/01/23 | | 2/21 at 100.00 | Aa3 | 730,377 |
| 750 | | 5.500%, 2/01/24 | | 2/21 at 100.00 | Aa3 | 858,877 |
| 875 | | 5.500%, 2/01/25 | | 2/21 at 100.00 | Aa3 | 1,000,002 |
| 1,010 | | 5.500%, 2/01/26 | | 2/21 at 100.00 | Aa3 | 1,150,794 |
| 1,150 | | 5.500%, 2/01/27 | | 2/21 at 100.00 | Aa3 | 1,310,310 |
| 2,000 | | Buffalo-Hanover-Montrose Independent School District 877, Minnesota, General Obligation Bonds, Refunding Series 2012A, 4.000%, 2/01/23 | | 2/22 at 100.00 | Aa2 | 2,235,900 |
| 450 | | Chatfield Independent School District 227, Olmstead County, Minnesota, General Obligation Bonds, Series 2007A, 4.000%, 2/01/18 – AGM Insured | | No Opt. Call | AA+ | 459,612 |
| 1,000 | | Cloquet Independent School District 94, Carlton and Saint Louis Counties, Minnesota, General Obligation Bonds, School Building Series 2015B, 4.000%, 2/01/36 | | 2/25 at 100.00 | Aa2 | 1,052,580 |
| 1,845 | | Forest Lake Independent School District 831, Washington County, Minnesota, General Obligation Bonds, School Building Series 2016A, 3.000%, 2/01/31 | | 2/26 at 100.00 | AA+ | 1,887,472 |
| 2,220 | | Fridley Independent School District 14, Anoka County, Minnesota, General Obligation Bonds, Series 2016A, 4.000%, 2/01/29 | | 2/26 at 100.00 | Aa2 | 2,482,382 |
| 665 | | Goodhue County, Minnesota, General Obligation Bonds, Capital Improvement Plan, Series 2015A, 3.000%, 2/01/27 | | 2/23 at 100.00 | Aa2 | 689,346 |
| 455 | | Greenway Independent School District 316, Itasca County, Minnesota, General Obligation Bonds, Alternate Facilities, Series 2011C, 4.250%, 2/01/25 | | 2/19 at 100.00 | AA+ | 476,522 |
| 2,025 | | Independent School District 833, South Washington County, Minnesota, General Obligation Bonds, Crossover Refunding School Building Series 2010A, 4.000%, 2/01/22 | | 2/19 at 100.00 | AA+ | 2,121,309 |
| | | Jordan Independent School District 717, Scott County, Minnesota, General Obligation Bonds, School Building Series 2014A: | | | | |
| 1,000 | | 4.000%, 2/01/26 | | 2/23 at 100.00 | Aa2 | 1,109,540 |
| 1,275 | | 4.000%, 2/01/27 | | 2/23 at 100.00 | Aa2 | 1,405,420 |
| 1,710 | | Minneapolis Special School District 1, Hennepin County, Minnesota, General Obligation Bonds, Alternate Facility Series 2015B, 3.000%, 2/01/29 | | 2/24 at 100.00 | AA+ | 1,763,660 |
| 1,000 | | Minneapolis, Minnesota, Limited Tax Supported Development Revenue Bonds, Common Bond Fund Series 2007-2A, 5.125%, 6/01/22 (Alternative Minimum Tax) | | 6/17 at 100.00 | A+ | 1,000,000 |
| 1,000 | | Minnesota State, General Obligation Bonds, Various Purpose Refunding Series 2013F, 4.000%, 10/01/25 | | 10/23 at 100.00 | AAA | 1,137,210 |
| 2,000 | | Minnesota State, General Obligation Bonds, Various Purpose Series 2013A, 5.000%, 8/01/25 | | 8/23 at 100.00 | AAA | 2,417,120 |
Nuveen Minnesota Intermediate Municipal Bond Fund (continued)
| Portfolio of Investments | May 31, 2017 |
| Principal Amount (000) | | Description (1) | | Optional Call Provisions (2) | Ratings (3) | Value |
| | | Tax Obligation/General (continued) | | | | |
| $ 2,000 | | Minnesota State, General Obligation Bonds, Various Purpose Series 2013D, 3.500%, 10/01/28 | | 10/23 at 100.00 | AAA | $2,141,740 |
| | | Minnetonka Independent School District 276, Hennepin County, Minnesota, General Obligation Bonds, Refunding Series 2013H: | | | | |
| 525 | | 4.000%, 2/01/25 | | 2/23 at 100.00 | Aaa | 592,326 |
| 600 | | 4.000%, 2/01/26 | | 2/23 at 100.00 | Aaa | 674,292 |
| 1,475 | | Moose Lake Independent School District 97, Carlton and Pine Counties, Minnesota, General Obligation Bonds, School Building Series 2015A, 4.000%, 2/01/30 | | 2/25 at 100.00 | Aa2 | 1,624,034 |
| | | Northland Independent School District 118, Minnesota, General Obligation Bonds, Series 2016A: | | | | |
| 560 | | 3.000%, 2/01/27 | | 2/24 at 100.00 | Aa2 | 586,678 |
| 655 | | 3.000%, 2/01/28 | | 2/24 at 100.00 | Aa2 | 680,460 |
| 1,185 | | 3.000%, 2/01/29 | | 2/24 at 100.00 | Aa2 | 1,222,185 |
| 620 | | OtterTail County, Minnesota, General Obligation Bonds, Disposal System - Prairie Lakes Municipal Authority, Series 2011, 4.750%, 5/01/27 (Alternative Minimum Tax) | | 5/21 at 100.00 | AA+ | 680,239 |
| 1,880 | | Perham Independent School District 549, Minnesota, General Obligation Bonds, Series 2016A, 3.000%, 2/01/30 | | 2/24 at 100.00 | Aa2 | 1,912,900 |
| 500 | | Robbinsdale Independent School District 281, Hennepin County, Minnesota, General Obligation Bonds, Series 2008B, 4.500%, 2/01/21 | | 2/18 at 100.00 | Aa2 | 512,290 |
| 1,595 | | Rushford Peterson Independent School District 239, Minnesota, General Obligation Bonds, School Building Series 2015A, 4.000%, 2/01/29 | | 2/25 at 100.00 | Aa2 | 1,760,242 |
| 1,100 | | Saint Cloud Independent School District 742, Stearns County, Minnesota, General Obligation Bonds, Series 2015A, 4.000%, 2/01/30 | | 2/25 at 100.00 | Aa2 | 1,222,485 |
| 600 | | Saint Louis County Independent School District 2142, Minnesota, General Obligation Bonds, Refunding School Building Series 2014A, 3.500%, 2/01/23 | | 2/22 at 100.00 | AA+ | 650,184 |
| 1,565 | | Saint Michael Independent School District 885, Wright County, Minnesota, General Obligation Bonds, Refunding Series 2014A, 4.000%, 2/01/26 | | 2/24 at 100.00 | Aa2 | 1,761,642 |
| | | Saint Michael Independent School District 885, Wright County, Minnesota, General Obligation Bonds, School Building Series 2017A: | | | | |
| 750 | | 3.125%, 2/01/31 | | 2/26 at 100.00 | Aa2 | 768,578 |
| 1,225 | | 3.200%, 2/01/32 | | 2/26 at 100.00 | Aa2 | 1,257,683 |
| 1,215 | | Shakopee Independent School District 720, Scott County, Minnesota, General Obligation Bonds, School Building Series 2015A, 5.000%, 2/01/23 | | No Opt. Call | Aa2 | 1,448,730 |
| 1,240 | | South Washington County Independent School District 833, Minnesota, General Obligation Bonds, Alternate Facilities Series 2014A, 3.500%, 2/01/27 | | 2/24 at 100.00 | Aa2 | 1,347,706 |
| 2,000 | | Stillwater Independent School District 834, Washington County, Minnesota, General Obligation Bonds, School Building Series 2015A, 4.000%, 2/01/28 | | 2/24 at 100.00 | Aa2 | 2,216,040 |
| 44,640 | | Total Tax Obligation/General | | | | 48,640,240 |
| | | Tax Obligation/Limited – 4.8% | | | | |
| 780 | | Government of Guam, Business Privilege Tax Bonds, Series 2011A, 5.000%, 1/01/31 | | 1/22 at 100.00 | A | 830,146 |
| | | Hennepin County, Minnesota, Sales Tax Revenue Bonds, Ballpark Project, Second Lien Series 2008B: | | | | |
| 690 | | 4.375%, 12/15/22 | | 12/17 at 100.00 | AA+ | 702,330 |
| 1,000 | | 5.000%, 12/15/29 | | 12/17 at 100.00 | AA+ | 1,021,830 |
| Principal Amount (000) | | Description (1) | | Optional Call Provisions (2) | Ratings (3) | Value |
| | | Tax Obligation/Limited (continued) | | | | |
| $ 2,685 | | Minneapolis Special School District 1, Hennepin County, Minnesota, Certificates of Participation, Full Term Series 2015D, 3.000%, 2/01/29 | | 2/24 at 100.00 | AA+ | $2,736,096 |
| | | Minneapolis, Minnesota, Tax Increment Revenue Bonds, Grant Park Project, Refunding Series 2015: | | | | |
| 215 | | 3.050%, 3/01/21 | | No Opt. Call | N/R | 215,849 |
| 495 | | 3.650%, 3/01/24 | | 3/23 at 100.00 | N/R | 501,103 |
| 200 | | 3.800%, 3/01/25 | | 3/23 at 100.00 | N/R | 202,976 |
| 200 | | 4.000%, 3/01/27 | | 3/23 at 100.00 | N/R | 203,996 |
| | | Minneapolis, Minnesota, Tax Increment Revenue Bonds, Ivy Tower Project, Series 2015: | | | | |
| 1,115 | | 4.000%, 3/01/25 | | 3/24 at 100.00 | N/R | 1,121,032 |
| 500 | | 5.000%, 3/01/29 | | 3/24 at 100.00 | N/R | 524,580 |
| 340 | | Minneapolis, Minnesota, Tax Increment Revenue Bonds, Village at St. Anthony Falls Project, Refunding Series 2015, 4.000%, 3/01/24 | | 3/23 at 100.00 | N/R | 341,680 |
| 1,170 | | Minnesota Housing Finance Agency, Housing Infrastructure State Appropriation Bonds, Series 2015C, 4.000%, 8/01/27 | | 8/24 at 100.00 | AA | 1,293,646 |
| 350 | | Minnesota Housing Finance Agency, Housing Infrastructure State Appropriation Bonds, Series 2016A, 4.000%, 8/01/32 | | 8/25 at 100.00 | AA | 376,225 |
| 1,185 | | Minnesota Housing Finance Agency, Nonprofit Housing Bonds, State Appropriation Series 2011, 5.250%, 8/01/27 | | 8/21 at 100.00 | AA | 1,346,326 |
| | | Northeast Metropolitan Intermediate School District 916, White Bear Lake, Minnesota, Certificates of Participation, Series 2015B: | | | | |
| 605 | | 3.125%, 2/01/29 | | 2/25 at 100.00 | A1 | 614,662 |
| 350 | | 3.250%, 2/01/30 | | 2/25 at 100.00 | A1 | 356,626 |
| 630 | | Saint Cloud Independent School District 742, Stearns County, Minnesota, Certificates of Participation, Saint Cloud Area Public Schools, Series 2017A, 5.000%, 2/01/30 | | 2/25 at 100.00 | A1 | 735,336 |
| 735 | | Saint Paul, Minnesota, Sales Tax Revenue Bonds, Series 2014G, 5.000%, 11/01/29 | | 11/24 at 100.00 | A+ | 856,591 |
| 1,895 | | University of Minnesota, Special Purpose Revenue Bonds, State Supported Biomedical Science Research Facilities Funding Program, Series 2011B, 5.000%, 8/01/23 | | 8/21 at 100.00 | AA | 2,174,285 |
| 15,140 | | Total Tax Obligation/Limited | | | | 16,155,315 |
| | | Transportation – 6.9% | | | | |
| | | Minneapolis-St. Paul Metropolitan Airports Commission, Minnesota, Airport Revenue Bonds, Refunding Senior Lien Series 2009A: | | | | |
| 1,000 | | 4.000%, 1/01/19 | | No Opt. Call | AA- | 1,047,970 |
| 1,000 | | 5.000%, 1/01/20 | | 1/19 at 100.00 | AA- | 1,064,800 |
| 500 | | 5.000%, 1/01/21 | | 1/19 at 100.00 | AA- | 532,400 |
| 2,330 | | Minneapolis-St. Paul Metropolitan Airports Commission, Minnesota, Airport Revenue Bonds, Refunding Subordinate Lien Series 2011A, 5.000%, 1/01/25 | | 1/21 at 100.00 | A+ | 2,622,135 |
| | | Minneapolis-St. Paul Metropolitan Airports Commission, Minnesota, Airport Revenue Bonds, Refunding Subordinate Lien Series 2012B: | | | | |
| 2,550 | | 5.000%, 1/01/29 | | 1/22 at 100.00 | A+ | 2,911,029 |
| 2,750 | | 5.000%, 1/01/30 | | 1/22 at 100.00 | A+ | 3,089,020 |
| 2,000 | | Minneapolis-St. Paul Metropolitan Airports Commission, Minnesota, Airport Revenue Bonds, Refunding Subordinate Lien Series 2014A, 5.000%, 1/01/30 | | 1/24 at 100.00 | A+ | 2,342,760 |
Nuveen Minnesota Intermediate Municipal Bond Fund (continued)
| Portfolio of Investments | May 31, 2017 |
| Principal Amount (000) | | Description (1) | | Optional Call Provisions (2) | Ratings (3) | Value |
| | | Transportation (continued) | | | | |
| | | Minneapolis-St. Paul Metropolitan Airports Commission, Minnesota, Airport Revenue Bonds, Senior Lien Series 2016C: | | | | |
| $ 650 | | 5.000%, 1/01/34 | | 1/27 at 100.00 | AA- | $776,087 |
| 1,940 | | 5.000%, 1/01/35 | | 1/27 at 100.00 | AA- | 2,309,085 |
| 1,325 | | 5.000%, 1/01/37 | | 1/27 at 100.00 | AA- | 1,568,495 |
| 1,630 | | Minneapolis-St. Paul Metropolitan Airports Commission, Minnesota, Airport Revenue Bonds, Subordinate Lien Series 2010D, 4.000%, 1/01/23 (Alternative Minimum Tax) | | 1/20 at 100.00 | A+ | 1,712,087 |
| | | St Paul Housing and Redevelopment Authority, Minnesota, Parking Revenue Bonds, Parking Facilities Project, Refunding Series 2010A: | | | | |
| 805 | | 4.000%, 8/01/21 | | 8/18 at 102.00 | A+ | 846,562 |
| 895 | | 4.125%, 8/01/23 | | 8/18 at 102.00 | A+ | 942,283 |
| 935 | | 4.250%, 8/01/24 | | 8/18 at 102.00 | A+ | 985,855 |
| 575 | | 4.250%, 8/01/25 | | 8/18 at 102.00 | A+ | 605,791 |
| 20,885 | | Total Transportation | | | | 23,356,359 |
| | | U.S. Guaranteed – 8.7% (4) | | | | |
| 1,000 | | Anoka County, Minnesota, General Obligation Bonds, Capital Improvement, Series 2008A, 5.000%, 2/01/20 (Pre-refunded 2/01/18) | | 2/18 at 100.00 | Aa1 (4) | 1,024,970 |
| 595 | | Anoka County, Minnesota, General Obligation Bonds, Capital Improvement, Series 2008C, 4.200%, 2/01/19 (Pre-refunded 2/01/18) | | 2/18 at 100.00 | Aa1 (4) | 606,710 |
| 1,200 | | Burnsville Independent School District 191, Dakota and Scott Counties, Minnesota, General Obligation Bonds, Series 2008A, 4.250%, 2/01/20 (Pre-refunded 2/01/18) | | 2/18 at 100.00 | Aa2 (4) | 1,225,632 |
| | | Dakota County Community Development Agency, Minnesota, Governmental Housing Development General Obligation Bonds, Senior Housing Facilities, Series 2007A: | | | | |
| 510 | | 4.375%, 1/01/19 (Pre-refunded 7/01/17) | | 7/17 at 100.00 | Aaa (4) | 511,515 |
| 215 | | 4.500%, 1/01/20 (Pre-refunded 7/01/17) | | 7/17 at 100.00 | Aaa | 215,664 |
| 1,910 | | Duluth Independent School District 709, Minnesota, Certificates of Participation, Series 2008B, 4.000%, 2/01/19 (ETM) | | No Opt. Call | AA+ (4) | 2,005,748 |
| 1,185 | | Duluth Independent School District 709, Saint Louis County, Minnesota, General Obligation Bonds, Series 2008A, 4.250%, 2/01/22 (Pre-refunded 2/01/18) – AGM Insured | | 2/18 at 100.00 | Aa2 (4) | 1,211,591 |
| | | Duluth, Minnesota, General Obligation Bonds, DECC Improvement Series 2008A: | | | | |
| 1,160 | | 4.500%, 2/01/21 (Pre-refunded 2/01/18) | | 2/18 at 100.00 | AA (4) | 1,188,513 |
| 465 | | 4.500%, 2/01/22 (Pre-refunded 2/01/18) | | 2/18 at 100.00 | AA (4) | 476,430 |
| 1,100 | | 4.625%, 2/01/24 (Pre-refunded 2/01/18) | | 2/18 at 100.00 | AA (4) | 1,127,940 |
| 4,575 | | Minneapolis, Minnesota, Health Care System Revenue Bonds, Fairview Hospital and Healthcare Services, Series 2008A, 6.375%, 11/15/23 (Pre-refunded 11/15/18) | | 11/18 at 100.00 | A+ (4) | 4,936,013 |
| 3,495 | | Minneapolis, Minnesota, Revenue Bonds, National Marrow Donor Program Project, Series 2010, 4.250%, 8/01/20 (Pre-refunded 8/01/18) | | 8/18 at 100.00 | N/R (4) | 3,629,278 |
| 1,140 | | Rochester, Minnesota, General Obligation Bonds, Waste Water Series 2007A, 4.000%, 12/01/18 (Pre-refunded 6/01/17) | | 6/17 at 100.00 | AAA | 1,140,000 |
| 1,000 | | Saint Cloud, Minnesota, Health Care Revenue Bonds, CentraCare Health System Project, Series 2008D, 5.375%, 5/01/31 (Pre-refunded 5/01/19) – AGC Insured | | 5/19 at 100.00 | A1 (4) | 1,084,040 |
| 965 | | Saint Cloud, Minnesota, Health Care Revenue Bonds, CentraCare Health System Project, Series 2010A, 4.250%, 5/01/21 (Pre-refunded 5/01/20) | | 5/20 at 100.00 | N/R (4) | 1,053,471 |
| Principal Amount (000) | | Description (1) | | Optional Call Provisions (2) | Ratings (3) | Value |
| | | U.S. Guaranteed (4) (continued) | | | | |
| $ 2,500 | | Saint Louis Park, Minnesota, Health Care Facilities Revenue Bonds, Park Nicollet Health Services, Refunding Series 2008C, 5.625%, 7/01/26 (Pre-refunded 7/01/18) | | 7/18 at 100.00 | Aaa | $2,628,150 |
| 1,480 | | Saint Louis Park, Minnesota, Health Care Facilities Revenue Bonds, Park Nicollet Health Services, Refunding Series 2009, 5.500%, 7/01/29 (Pre-refunded 7/01/19) | | 7/19 at 100.00 | Aaa | 1,618,573 |
| 1,595 | | Saint Paul Housing and Redevelopment Authority, Minnesota, Health Care Revenue Bonds, Allina Health System, Series 2009A-1, 5.000%, 11/15/24 (Pre-refunded 11/15/19) | | 11/19 at 100.00 | N/R (4) | 1,749,476 |
| | | Saint Paul Housing and Redevelopment Authority, Minnesota, Recreational Facility Lease Revenue Bonds, Jimmy Lee Recreational Center, Series 2008: | | | | |
| 190 | | 4.500%, 12/01/19 (Pre-refunded 12/01/17) | | 12/17 at 100.00 | AA+ (4) | 193,507 |
| 290 | | 4.500%, 12/01/20 (Pre-refunded 12/01/17) | | 12/17 at 100.00 | AA+ (4) | 295,353 |
| | | Stevens County Housing and Redevelopment Authority, Minnesota, Public Project Revenue Bonds, Series 2009A: | | | | |
| 325 | | 4.000%, 2/01/19 (ETM) | | No Opt. Call | AA- (4) | 341,237 |
| 340 | | 4.100%, 2/01/20 (ETM) | | No Opt. Call | AA- (4) | 367,037 |
| 640 | | Wright County, Minnesota, General Obligation Bonds, Jail Series 2007A, 4.500%, 12/01/20 (Pre-refunded 12/01/17) | | 12/17 at 100.00 | AA+ (4) | 651,846 |
| 200 | | Zumbrota-Mazeppa Independent School District 2805, Wabasha County, Minnesota, General Obligation Bonds, Alternate Facilities Series 2008A, 4.000%, 2/01/19 (Pre-refunded 2/01/18) | | 2/18 at 100.00 | AA+ (4) | 203,900 |
| 28,075 | | Total U.S. Guaranteed | | | | 29,486,594 |
| | | Utilities – 13.6% | | | | |
| | | Brainerd, Minnesota, Electric Utility Revenue Bonds, Series 2014A: | | | | |
| 395 | | 3.500%, 12/01/22 – AGM Insured | | No Opt. Call | AA | 432,399 |
| 475 | | 4.000%, 12/01/28 | | 12/24 at 100.00 | AA | 516,501 |
| 495 | | 4.000%, 12/01/29 | | 12/24 at 100.00 | AA | 532,358 |
| 1,140 | | Guam Power Authority, Revenue Bonds, Series 2012A, 5.000%, 10/01/25 – AGM Insured | | 10/22 at 100.00 | AA | 1,301,777 |
| | | Hutchinson, Minnesota, Public Utility Revenue Bonds, Refunding Series 2012A: | | | | |
| 500 | | 5.000%, 12/01/25 | | 12/22 at 100.00 | A1 | 582,330 |
| 670 | | 5.000%, 12/01/26 | | 12/22 at 100.00 | A1 | 775,639 |
| 500 | | Litchfield, Minnesota, Electric Utility Revenue Bonds, Series 2009C, 5.000%, 2/01/29 – AGC Insured | | 2/18 at 100.00 | AA | 513,880 |
| 340 | | Marshall, Minnesota, Public Utility Revenue Bonds, Series 2009A, 3.750%, 7/01/18 – AGC Insured | | No Opt. Call | AA | 350,047 |
| | | Minnesota Municipal Power Agency, Electric Revenue Bonds, Refunding Series 2007: | | | | |
| 420 | | 4.125%, 10/01/17 | | No Opt. Call | A2 | 424,557 |
| 1,000 | | 5.250%, 10/01/22 | | 10/17 at 100.00 | A2 | 1,014,380 |
| | | Minnesota Municipal Power Agency, Electric Revenue Bonds, Refunding Series 2014: | | | | |
| 500 | | 5.000%, 10/01/29 | | 10/24 at 100.00 | A2 | 582,080 |
| 500 | | 5.000%, 10/01/30 | | 10/24 at 100.00 | A2 | 580,175 |
| 1,000 | | Minnesota Municipal Power Agency, Electric Revenue Bonds, Refunding Series 2014A, 3.500%, 10/01/28 | | 10/24 at 100.00 | A2 | 1,037,670 |
| 1,050 | | Northern Municipal Power Agency, Minnesota, Electric System Revenue Bonds, Refunding Series 2007A, 5.000%, 1/01/19 – AGC Insured | | 1/18 at 100.00 | AA | 1,075,106 |
Nuveen Minnesota Intermediate Municipal Bond Fund (continued)
| Portfolio of Investments | May 31, 2017 |
| Principal Amount (000) | | Description (1) | | Optional Call Provisions (2) | Ratings (3) | Value |
| | | Utilities (continued) | | | | |
| $ 2,155 | | Northern Municipal Power Agency, Minnesota, Electric System Revenue Bonds, Refunding Series 2008A, 5.000%, 1/01/21 – AGC Insured | | 1/18 at 100.00 | AA | $2,204,350 |
| 2,940 | | Northern Municipal Power Agency, Minnesota, Electric System Revenue Bonds, Series 2010A-1, 5.000%, 1/01/20 | | No Opt. Call | A- | 3,233,588 |
| 1,430 | | Northern Municipal Power Agency, Minnesota, Electric System Revenue Bonds, Series 2013A, 5.000%, 1/01/30 | | 1/23 at 100.00 | A- | 1,620,776 |
| 570 | | Rochester, Minnesota, Electric Utility Revenue Bonds, Refunding Series 2013B, 5.000%, 12/01/33 | | 12/23 at 100.00 | Aa3 | 664,671 |
| 750 | | Rochester, Minnesota, Electric Utility Revenue Bonds, Refunding Series 2015E, 3.000%, 12/01/29 | | 12/25 at 100.00 | Aa3 | 765,600 |
| | | Rochester, Minnesota, Electric Utility Revenue Bonds, Refunding Series 2017A: | | | | |
| 1,000 | | 5.000%, 12/01/33 | | 12/26 at 100.00 | Aa3 | 1,198,080 |
| 450 | | 5.000%, 12/01/34 | | 12/26 at 100.00 | Aa3 | 536,634 |
| 580 | | 5.000%, 12/01/35 | | 12/26 at 100.00 | Aa3 | 688,988 |
| 295 | | Shakopee Public Utilities Commission, Minnesota, Public Utilities Crossover Refunding Revenue Bonds, Series 2006A, 4.250%, 2/01/18 – AGM Insured | | 7/17 at 100.00 | A1 | 295,829 |
| 2,500 | | Southern Minnesota Municipal Power Agency Power Supply System Revenue Bonds, Series 2015A, 4.000%, 1/01/30 | | 1/26 at 100.00 | A+ | 2,733,425 |
| | | Southern Minnesota Municipal Power Agency, Power Supply System Revenue Bonds, Series 1994A: | | | | |
| 3,500 | | 0.000%, 1/01/20 – NPFG Insured | | No Opt. Call | AA- | 3,364,445 |
| 5,000 | | 0.000%, 1/01/21 – NPFG Insured | | No Opt. Call | AA- | 4,721,650 |
| | | Western Minnesota Municipal Power Agency, Power Supply Revenue Bonds, Refunding Series 2012A: | | | | |
| 1,000 | | 3.000%, 1/01/28 | | 1/23 at 100.00 | Aa3 | 1,032,750 |
| 1,250 | | 5.000%, 1/01/29 | | 1/23 at 100.00 | Aa3 | 1,455,050 |
| | | Western Minnesota Municipal Power Agency, Power Supply Revenue Bonds, Refunding Series 2015A: | | | | |
| 1,335 | | 5.000%, 1/01/31 | | 1/26 at 100.00 | Aa3 | 1,586,821 |
| 1,000 | | 5.000%, 1/01/33 | | 1/26 at 100.00 | Aa3 | 1,176,810 |
| | | Western Minnesota Municipal Power Agency, Power Supply Revenue Bonds, Series 2014A: | | | | |
| 2,850 | | 5.000%, 1/01/29 | | 1/24 at 100.00 | Aa3 | 3,325,123 |
| 2,750 | | 5.000%, 1/01/30 | | 1/24 at 100.00 | Aa3 | 3,188,405 |
| 1,000 | | 5.000%, 1/01/31 | | 1/24 at 100.00 | Aa3 | 1,153,490 |
| 1,150 | | 5.000%, 1/01/32 | | 1/24 at 100.00 | Aa3 | 1,321,235 |
| 42,490 | | Total Utilities | | | | 45,986,619 |
| | | Water and Sewer – 1.3% | | | | |
| | | Buffalo, Minnesota, Water and Sewer Revenue Bonds, Refunding Series 2014A: | | | | |
| 1,905 | | 4.000%, 11/01/24 – BAM Insured | | 11/23 at 100.00 | AA | 2,144,516 |
| 2,000 | | 4.000%, 11/01/28 – BAM Insured | | 11/23 at 100.00 | AA | 2,171,840 |
| Principal Amount (000) | | Description (1) | | Optional Call Provisions (2) | Ratings (3) | Value |
| | | Water and Sewer (continued) | | | | |
| $ 250 | | Guam Government Waterworks Authority, Water and Wastewater System Revenue Bonds, Series 2016, 5.000%, 7/01/22 | | No Opt. Call | A- | $ 283,105 |
| 4,155 | | Total Water and Sewer | | | | 4,599,461 |
| |
| $ 310,780 | | Total Long-Term Investments (cost $320,117,487) | | | | 334,871,238 |
| | | Other Assets Less Liabilities – 1.1% | | | | 3,627,105 |
| | | Net Assets – 100% | | | | $ 338,498,343 |
| (1) | All percentages shown in the Portfolio of Investments are based on net assets. | |
| (2) | Optional Call Provisions: Dates (month and year) and prices of the earliest optional call or redemption. There may be other call provisions at varying prices at later dates. Certain mortgage-backed securities may be subject to periodic principal paydowns. Optional Call Provisions are not covered by the report of independent registered public accounting firm. | |
| (3) | For financial reporting purposes, the ratings disclosed are the highest of Standard & Poor’s Group (“Standard & Poor’s”), Moody’s Investors Service, Inc. (“Moody’s”) or Fitch, Inc. (“Fitch”) rating. This treatment of split-rated securities may differ from that used for other purposes, such as for Fund investment policies. Ratings below BBB by Standard & Poor’s, Baa by Moody’s or BBB by Fitch are considered to be below investment grade. Holdings designated N/R are not rated by any of these national rating agencies. Ratings are not covered by the report of independent registered public accounting firm. | |
| (4) | Backed by an escrow or trust containing sufficient U.S. Government or U.S. Government agency securities, which ensure the timely payment of principal and interest. Certain bonds backed by U.S. Government or agency securities are regarded as having an implied rating equal to the rating of such securities. | |
| (ETM) | Escrowed to maturity. | |
See accompanying notes to financial statements.
NUVEEN 45
Nuveen Minnesota Municipal Bond Fund
| Portfolio of Investments | May 31, 2017 |
| Principal Amount (000) | | Description (1) | | Optional Call Provisions (2) | Ratings (3) | Value |
| | | LONG-TERM INVESTMENTS – 95.8% | | | | |
| | | MUNICIPAL BONDS – 95.8% | | | | |
| | | Consumer Staples – 0.6% | | | | |
| $ 1,800 | | Moorhead, Minnesota, Recovery Zone Facility Revenue Bonds, American Crystal Sugar Company Project, Series 2010, 5.650%, 6/01/27 | | 6/20 at 100.00 | BBB+ | $ 1,956,222 |
| | | Education and Civic Organizations – 19.1% | | | | |
| 660 | | Anoka County, Minnesota, Charter School Lease Revenue Bonds, Spectrum Building Company, Series 2012A, 5.000%, 6/01/43 | | 6/20 at 102.00 | BBB- | 684,341 |
| 1,680 | | Anoka County, Minnesota, Charter School Lease Revenue Bonds, Spectrum Building Company, Series 2014A, 5.000%, 6/01/47 | | 6/20 at 102.00 | BBB- | 1,738,128 |
| 65 | | Baytown Township, Minnesota Charter School Lease Revenue Bonds, Saint Croix Preparatory Academy, Refunding Series 2016A, 4.250%, 8/01/46 | | 8/26 at 100.00 | BB+ | 59,511 |
| 800 | | Chaska, Minnesota, Lease Revenue Bonds, World Learner School Project, Series, 8.000%, 12/01/43 | | 12/21 at 100.00 | BB+ | 926,312 |
| | | City of Ham Lake, Minnesota, Charter School Lease Revenue Bonds, DaVinci Academy Project, Series 2016A: | | | | |
| 100 | | 5.000%, 7/01/36 | | 7/24 at 102.00 | N/R | 101,328 |
| 1,000 | | 5.000%, 7/01/47 | | 7/24 at 102.00 | N/R | 1,002,330 |
| 1,515 | | City of Woodbury, Minnesota, Charter School Lease Revenue Bonds, Math and Science Academy Building Company, Series 2012A, 5.000%, 12/01/43 | | 12/20 at 102.00 | BBB- | 1,571,979 |
| | | Deephaven, Minnesota, Charter School Lease Revenue Bonds, Eagle Ridge Academy Project, Series 2015A: | | | | |
| 405 | | 5.250%, 7/01/37 | | 7/25 at 100.00 | BB+ | 427,623 |
| 500 | | 5.500%, 7/01/50 | | 7/25 at 100.00 | BB+ | 530,070 |
| 300 | | Deephaven, Minnesota, Charter School Lease Revenue Bonds, Eagle Ridge Academy Project, Series 2016A, 4.000%, 7/01/37 | | 7/25 at 100.00 | BB+ | 284,097 |
| | | Duluth Housing & Redevelopment Authority, Minnesota, Lease Revenue Bonds, Duluth Public Schools Academy, Series 2010A: | | | | |
| 1,750 | | 5.600%, 11/01/30 | | 11/18 at 102.00 | BB+ | 1,808,922 |
| 875 | | 5.875%, 11/01/40 | | 11/18 at 102.00 | BB+ | 905,336 |
| 1,000 | | Forest Lake, Minnesota, Charter School Lease Revenue Bonds, Lakes International Language Academy, Series 2014A, 5.750%, 8/01/44 | | 8/22 at 102.00 | BB+ | 1,081,290 |
| 100 | | Greenwood, Minnesota, Charter School Lease Revenue Bonds, Main Street School of Performing Arts Project, Series 2016A, 5.000%, 7/01/36 | | 7/26 at 100.00 | N/R | 94,811 |
| 5,350 | | Ham Lake, Minnesota Charter School Lease Revenue Bonds, Parnassus Preparatory School Project, Series 2016A, 5.000%, 11/01/47 | | 11/26 at 100.00 | BB | 5,397,454 |
| | | Hugo, Minnesota, Charter School Lease Revenue Bonds, Noble Academy Project, Series 2014A: | | | | |
| 600 | | 5.000%, 7/01/29 | | 7/24 at 100.00 | BB+ | 626,136 |
| 1,000 | | 5.000%, 7/01/34 | | 7/24 at 100.00 | BB+ | 1,023,910 |
| 525 | | 5.000%, 7/01/44 | | 7/24 at 100.00 | BB+ | 530,906 |
| Principal Amount (000) | | Description (1) | | Optional Call Provisions (2) | Ratings (3) | Value |
| | | Education and Civic Organizations (continued) | | | | |
| $ 3,805 | | Independence, Minnesota, Charter School Lease Revenue Bonds, Beacon Academy Project, Series 2016A, 5.000%, 7/01/46 | | 7/26 at 100.00 | N/R | $3,670,645 |
| 100 | | Minneapolis, Minnesota, Charter School Lease Revenue Bonds, Hiawatha Academies Project, Series 2016A, 5.000%, 7/01/47 | | 7/24 at 102.00 | N/R | 98,731 |
| | | Minneapolis, Minnesota, Charter School Lease Revenue Bonds, Yinghua Academy Project, Series 2013A: | | | | |
| 2,740 | | 6.000%, 7/01/43 | | 7/23 at 100.00 | BB | 2,923,470 |
| 1,260 | | 6.125%, 7/01/48 | | 7/23 at 100.00 | BB | 1,335,953 |
| | | Minnesota Higher Education Facilities Authority, Revenue Bonds, Augsburg College, Series 2014-8-C: | | | | |
| 440 | | 3.350%, 5/01/22 | | 5/21 at 100.00 | Baa3 | 451,220 |
| 395 | | 3.500%, 5/01/23 | | 5/21 at 100.00 | Baa3 | 405,377 |
| | | Minnesota Higher Education Facilities Authority, Revenue Bonds, Bethel University, Refunding Series 2007-6-R: | | | | |
| 1,725 | | 5.500%, 5/01/26 | | 7/17 at 100.00 | N/R | 1,727,846 |
| 820 | | 5.500%, 5/01/27 | | 7/17 at 100.00 | N/R | 821,304 |
| 1,545 | | 5.500%, 5/01/37 | | 7/17 at 100.00 | N/R | 1,545,819 |
| | | Minnesota Higher Education Facilities Authority, Revenue Bonds, Carleton College, Refunding Series 2017: | | | | |
| 1,000 | | 4.000%, 3/01/37 | | 3/27 at 100.00 | Aa2 | 1,076,940 |
| 1,000 | | 4.000%, 3/01/39 | | 3/27 at 100.00 | Aa2 | 1,069,110 |
| 1,835 | | Minnesota Higher Education Facilities Authority, Revenue Bonds, College of St. Scholastica, Inc., Series 2011-7J, 6.300%, 12/01/40 | | 12/19 at 100.00 | Baa2 | 1,986,718 |
| 1,000 | | Minnesota Higher Education Facilities Authority, Revenue Bonds, Gustavus Adolfus College, Series 2010-7B, 5.000%, 10/01/31 | | 10/19 at 100.00 | A3 | 1,072,660 |
| | | Minnesota Higher Education Facilities Authority, Revenue Bonds, Hamline University, Series 2011-7K1: | | | | |
| 625 | | 6.000%, 10/01/32 | | 10/21 at 100.00 | Baa3 | 707,694 |
| 2,000 | | 6.000%, 10/01/40 | | 10/21 at 100.00 | Baa3 | 2,245,480 |
| 1,000 | | Minnesota Higher Education Facilities Authority, Revenue Bonds, Macalester College, Series 201528J, 3.250%, 3/01/30 | | 3/25 at 100.00 | Aa3 | 1,026,800 |
| | | Minnesota Higher Education Facilities Authority, Revenue Bonds, Saint John's University, Series 2015-8I: | | | | |
| 350 | | 5.000%, 10/01/33 | | 10/25 at 100.00 | A2 | 405,454 |
| 385 | | 5.000%, 10/01/34 | | 10/25 at 100.00 | A2 | 443,532 |
| 1,950 | | Moorhead, Minnesota, Educational Facilities Revenue Bonds, The Concordia College Corporation Project, Series 2016, 5.000%, 12/01/40 | | 12/25 at 100.00 | Baa1 | 2,187,822 |
| 1,130 | | Otsego, Minnesota, Charter School Lease Revenue Bonds, Kaleidoscope Charter School Project, Series 2014A, 5.000%, 9/01/44 | | 9/24 at 100.00 | BB+ | 1,156,815 |
| 650 | | Ramsey, Anoka County, Minnesota, Lease Revenue Bonds, PACT Charter School Project, Series 2004A, 5.500%, 12/01/33 | | 12/21 at 100.00 | BBB- | 693,927 |
| 560 | | Rice County, Minnesota Educational Facility Revenue Bonds, Shattuck, Saint Mary's School Project, Series 2015, 5.000%, 8/01/22 | | No Opt. Call | BB | 594,462 |
| 130 | | Saint Cloud, Minnesota, Charter School Lease Revenue Bonds, Stride Academy Project, Series 2016A, 5.000%, 4/01/46 | | 4/26 at 100.00 | CCC- | 84,500 |
Nuveen Minnesota Municipal Bond Fund (continued)
| Portfolio of Investments | May 31, 2017 |
| Principal Amount (000) | | Description (1) | | Optional Call Provisions (2) | Ratings (3) | Value |
| | | Education and Civic Organizations (continued) | | | | |
| $ 2,940 | | Saint Paul Housing & Redevelopment Authority, Minnesota, Charter School Lease Revenue Bonds, Nova Classical Academy, Series 2016A, 4.125%, 9/01/47 | | 9/24 at 102.00 | BBB- | $2,887,433 |
| | | Saint Paul Housing and Redevelopment Authority, Minnesota, Charter School Lease Revenue Bonds, Hmong Education Reform Company, Series 2012A: | | | | |
| 1,560 | | 5.250%, 9/01/32 | | 9/20 at 101.00 | BB+ | 1,581,996 |
| 1,695 | | 5.500%, 9/01/43 | | 9/20 at 101.00 | BB+ | 1,718,730 |
| | | Saint Paul Housing and Redevelopment Authority, Minnesota, Charter School Lease Revenue Bonds, Twin Cities Academy Project, Series 2015A: | | | | |
| 625 | | 5.300%, 7/01/45 | | 7/25 at 100.00 | BB | 641,156 |
| 1,030 | | 5.375%, 7/01/50 | | 7/25 at 100.00 | BB | 1,058,830 |
| 1,450 | | Saint Paul Housing and Redevelopment Authority, Minnesota, Charter School Lease Revenue Bonds, Twin Cities German Immersion School, Series 2013A, 5.000%, 7/01/44 | | 7/23 at 100.00 | BB+ | 1,479,653 |
| 2,000 | | Saint Paul Housing and Redevelopment Authority, Minnesota, Educational Facility Revenue Refunding Bonds, Saint Paul Academy and Summit School Project, Series 2007, 5.000%, 10/01/24 | | 10/17 at 100.00 | A3 | 2,026,200 |
| 185 | | Saint Paul Housing and Redevelopment Authority, Minnesota, Lease Revenue Bonds, Saint Paul Conservatory for Performing Artists Charter School Project, Series 2013A, 2.600%, 3/01/18 | | No Opt. Call | BBB- | 184,451 |
| | | Savage, Minnesota Charter School Lease Revenue Bonds, Aspen Academy Project, Series 2016A: | | | | |
| 2,010 | | 5.000%, 10/01/41 | | 10/26 at 100.00 | N/R | 1,891,309 |
| 205 | | 5.125%, 10/01/48 | | 10/26 at 100.00 | N/R | 192,218 |
| 1,435 | | St. Paul Housing and Redevelopment Authority, Minnesota, Charter School Revenue Bonds, Higher Ground Academy Charter School, Series 2013A, 5.000%, 12/01/33 | | 12/22 at 100.00 | BBB- | 1,498,987 |
| 430 | | St. Paul Housing and Redevelopment Authority, Minnesota, Performing Arts Facility Revenue Bonds, Ordway Center for the Performing Arts, Series 2012, 2.200%, 7/01/18 | | 7/17 at 100.00 | N/R | 430,168 |
| | | University of Minnesota, General Obligation Bonds, Series 2014B: | | | | |
| 2,235 | | 4.000%, 1/01/33 | | 1/24 at 100.00 | Aa1 | 2,418,940 |
| 1,185 | | 4.000%, 1/01/34 | | 1/24 at 100.00 | Aa1 | 1,277,323 |
| 1,540 | | University of Minnesota, General Revenue Bonds, Series 2011A, 5.250%, 12/01/29 | | 12/20 at 100.00 | Aa1 | 1,753,521 |
| 20 | | Winona Port Authority, Minnesota, Charter School Lease Revenue Bonds, Bluffview Montessori School Project, Refunding Series 2016, 4.750%, 6/01/46 | | 6/24 at 100.00 | N/R | 18,408 |
| 65,215 | | Total Education and Civic Organizations | | | | 67,586,086 |
| | | Health Care – 14.3% | | | | |
| | | Chippewa County, Minnesota, Gross Revenue Hospital Bonds, Montevideo Hospital Project, Refunding Series 2016: | | | | |
| 500 | | 4.000%, 3/01/32 | | 3/26 at 100.00 | N/R | 515,255 |
| 2,000 | | 4.000%, 3/01/37 | | 3/26 at 100.00 | N/R | 1,999,900 |
| | | City of Plato, Minnesota, Health Care Facilities Revenue Bonds, Glencoe Regional Health Services Project, Series 2017: | | | | |
| 550 | | 3.000%, 4/01/26 | | No Opt. Call | BBB | 557,909 |
| 485 | | 5.000%, 4/01/41 | | 4/27 at 100.00 | BBB | 538,243 |
| Principal Amount (000) | | Description (1) | | Optional Call Provisions (2) | Ratings (3) | Value |
| | | Health Care (continued) | | | | |
| | | Glencoe, Minnesota, Health Care Facilities Revenue Bonds, Glencoe Regional Health Services Project, Series 2013: | | | | |
| $ 375 | | 4.000%, 4/01/22 | | No Opt. Call | BBB | $406,684 |
| 500 | | 4.000%, 4/01/27 | | 4/22 at 100.00 | BBB | 528,560 |
| 760 | | 4.000%, 4/01/31 | | 4/22 at 100.00 | BBB | 796,374 |
| 2,500 | | Hawaii Department of Budget and Finance, Special Purpose Revenue Bonds, Hawaii Pacific Health Obligated Group, Series 2010B, 5.750%, 7/01/40 | | 7/20 at 100.00 | A1 | 2,731,050 |
| 1,000 | | Maple Grove, Minnesota, Health Care Facilities Revenue Refunding Bonds, North Memorial Health Care, Series 2015, 4.000%, 9/01/35 | | 9/25 at 100.00 | Baa1 | 1,036,970 |
| | | Maple Grove, Minnesota, Health Care Facility Revenue Bonds, North Memorial Health Care, Series 2017: | | | | |
| 425 | | 5.000%, 5/01/31 | | 5/27 at 100.00 | Baa1 | 497,832 |
| 430 | | 5.000%, 5/01/32 | | 5/27 at 100.00 | Baa1 | 501,277 |
| | | Minneapolis, Minnesota, Health Care System Revenue Bonds, Fairview Health Services, Series 2015A: | | | | |
| 485 | | 4.000%, 11/15/40 | | 11/25 at 100.00 | A+ | 505,860 |
| 2,000 | | 5.000%, 11/15/44 | | 11/25 at 100.00 | A+ | 2,264,820 |
| 130 | | Minneapolis-Saint Paul Housing and Redevelopment Authority, Minnesota, Health Care Revenue Bonds, Children's Health Care, Series 2004A-1 Remarketed, 4.625%, 8/15/29 – AGM Insured | | 8/20 at 100.00 | AA | 139,270 |
| 2,435 | | Minneapolis-Saint Paul Housing and Redevelopment Authority, Minnesota, Health Care Revenue Bonds, Children's Health Care, Series 2010A, 5.250%, 8/15/35 | | 8/20 at 100.00 | AA- | 2,679,450 |
| 500 | | Minneapolis-Saint Paul Housing and Redevelopment Authority, Minnesota, Health Care System Revenue Bonds, Allina Health System, Refunding Series 2017A, 5.000%, 11/15/29 | | 5/27 at 100.00 | AA- | 607,535 |
| 1,005 | | Minnesota Agricultural and Economic Development Board, Health Care Facilities Revenue Bonds, Essential Health Obligated Group, Refunding Series 2008C-1, 5.000%, 2/15/30 – AGC Insured | | 2/20 at 100.00 | AA | 1,079,792 |
| 2,400 | | Rochester, Minnesota, Health Care Facilities Revenue Bonds, Mayo Clinic, Refunding Series 2016B, 5.000%, 11/15/33 | | No Opt. Call | AA | 3,073,992 |
| 1,700 | | Rochester, Minnesota, Health Care Facilities Revenue Bonds, Olmsted Medical Center Project, Series 2010, 5.875%, 7/01/30 | | 7/20 at 100.00 | A | 1,893,290 |
| 60 | | Saint Cloud, Minnesota, Health Care Revenue Bonds, CentraCare Health System Project, Series 2010A, 5.125%, 5/01/30 | | 5/20 at 100.00 | A1 | 65,524 |
| 675 | | Saint Cloud, Minnesota, Health Care Revenue Bonds, CentraCare Health System, Series 2016A, 5.000%, 5/01/46 | | 5/26 at 100.00 | A1 | 769,709 |
| | | Saint Paul Housing and Redevelopment Authority, Minnesota, Health Care Facility Revenue Bonds, HealthPartners Obligated Group, Refunding Series 2015A: | | | | |
| 8,030 | | 5.000%, 7/01/30 | | 7/25 at 100.00 | A | 9,369,404 |
| 4,500 | | 4.000%, 7/01/35 | | 7/25 at 100.00 | A | 4,718,520 |
| 1,505 | | Saint Paul Housing and Redevelopment Authority, Minnesota, Health Care Revenue Bonds, Allina Health System, Series 2009A-1, 5.250%, 11/15/29 | | 11/19 at 100.00 | AA- | 1,652,821 |
| 2,060 | | Saint Paul Housing and Redevelopment Authority, Minnesota, Health Care Revenue Bonds, Gillette Children's Specialty Healthcare Project, Series 2009, 5.000%, 2/01/29 | | 2/19 at 100.00 | A | 2,155,007 |
| 1,375 | | Saint Paul Port Authority, Minnesota, Lease Revenue Bonds, Regions Hospital Parking Ramp Project, Series 2007-1, 5.000%, 8/01/36 | | 7/17 at 100.00 | N/R | 1,375,825 |
Nuveen Minnesota Municipal Bond Fund (continued)
| Portfolio of Investments | May 31, 2017 |
| Principal Amount (000) | | Description (1) | | Optional Call Provisions (2) | Ratings (3) | Value |
| | | Health Care (continued) | | | | |
| | | Shakopee, Minnesota, Health Care Facilities Revenue Bonds, Saint Francis Regional Medical Center, Refunding Series 2014: | | | | |
| $ 1,980 | | 4.000%, 9/01/31 | | 9/24 at 100.00 | A | $2,117,412 |
| 1,410 | | 5.000%, 9/01/34 | | 9/24 at 100.00 | A | 1,588,534 |
| | | St. Paul Housing and Redevelopment Authority, Minnesota, Hospital Revenue Bonds, HealthEast Inc., Series 2015A: | | | | |
| 110 | | 5.250%, 11/15/35 | | 11/20 at 100.00 | BBB- | 118,178 |
| 1,615 | | 5.000%, 11/15/40 | | 11/25 at 100.00 | BBB- | 1,745,508 |
| | | Winona, Minnesota, Health Care Facilities Revenue Bonds, Winona Health Obligated Group, Refunding Series 2012: | | | | |
| 500 | | 3.750%, 7/01/21 | | No Opt. Call | BBB | 532,315 |
| 350 | | 4.000%, 7/01/22 | | 7/21 at 100.00 | BBB | 373,625 |
| 1,270 | | 4.500%, 7/01/24 | | 7/21 at 100.00 | BBB | 1,366,723 |
| 45,620 | | Total Health Care | | | | 50,303,168 |
| | | Housing/Multifamily – 0.8% | | | | |
| 2,500 | | Rochester, Minnesota, Multifamily Housing Revenue Bonds, Essex Place Apartments Project, Series 2012A, 3.750%, 6/01/29 | | 6/22 at 100.00 | Aaa | 2,625,700 |
| | | Housing/Single Family – 1.0% | | | | |
| 75 | | Minneapolis-Saint Paul Housing Finance Board, Minnesota, Single Family Mortgage Revenue Bonds, City Living Home Program, Market Series 2011B, 4.100%, 12/01/29 | | 6/21 at 100.00 | AA+ | 77,672 |
| 55 | | Minneapolis-Saint Paul Housing Finance Board, Minnesota, Single Family Mortgage Revenue Bonds, City Living Series 2006A-4, 5.000%, 11/01/38 (Alternative Minimum Tax) | | 7/17 at 100.00 | AA+ | 55,778 |
| 210 | | Minneapolis-Saint Paul Housing Finance Board, Minnesota, Single Family Mortgage Revenue Bonds, City Living Series 2007A-2, 5.520%, 3/01/41 (Alternative Minimum Tax) | | 5/25 at 100.00 | AA+ | 221,533 |
| 70 | | Minnesota Housing Finance Agency, Homeownership Finance Bonds, Mortgage-Backed Securities Program, Series 2011B, 4.000%, 7/01/21 | | No Opt. Call | Aaa | 73,555 |
| | | Minnesota Housing Finance Agency, Homeownership Finance Bonds, Mortgage-Backed Securities Program, Series 2011D: | | | | |
| 30 | | 4.375%, 7/01/26 | | 7/21 at 100.00 | Aaa | 31,506 |
| 440 | | 4.700%, 1/01/31 | | 7/21 at 100.00 | Aaa | 467,971 |
| 15 | | Minnesota Housing Finance Agency, Homeownership Finance Bonds, Mortgage-Backed Securities Program, Series 2011E, 4.000%, 7/01/26 | | 7/21 at 100.00 | Aaa | 15,386 |
| 20 | | Minnesota Housing Finance Agency, Residential Housing Finance Bonds, Series 2006Q, 5.250%, 7/01/33 (Alternative Minimum Tax) | | 7/17 at 100.00 | AA+ | 20,026 |
| 1,280 | | Minnesota Housing Finance Agency, Residential Housing Finance Bonds, Series 2015F, 3.300%, 7/01/29 | | 7/25 at 100.00 | AA+ | 1,332,134 |
| 1,320 | | Minnesota Housing Finance Agency, Residential Housing Finance Bonds, Series 2016A, 3.200%, 1/01/33 (Alternative Minimum Tax) | | 7/25 at 100.00 | AA+ | 1,305,586 |
| 3,515 | | Total Housing/Single Family | | | | 3,601,147 |
| | | Long-Term Care – 10.2% | | | | |
| 1,500 | | Anoka County Housing and Redevelopment Authority, Minnesota, Health Care Facility Care Center Project, Series 2010D, 6.750%, 11/01/36 | | 7/17 at 100.00 | N/R | 1,506,660 |
| Principal Amount (000) | | Description (1) | | Optional Call Provisions (2) | Ratings (3) | Value |
| | | Long-Term Care (continued) | | | | |
| $ 1,590 | | Anoka, Minnesota, Health Care and Housing Facility Revenue Bonds, The Homestead at Anoka, Inc. Project, Series 2014, 5.125%, 11/01/49 | | 11/24 at 100.00 | N/R | $1,614,597 |
| | | Center City, Minnesota, Health Care Facilities Revenue Bonds, Hazelden Betty Ford Foundation Project, Series 2014: | | | | |
| 375 | | 4.000%, 11/01/39 | | 11/24 at 100.00 | A3 | 385,665 |
| 500 | | 5.000%, 11/01/44 | | 11/24 at 100.00 | A3 | 544,855 |
| 1,600 | | Center City, Minnesota, Health Care Facilities Revenue Bonds, Hazelden Foundation Project, Series 2011, 5.000%, 11/01/41 | | 11/19 at 100.00 | A3 | 1,672,112 |
| 1,500 | | Chisago City, Minnesota, Housing and Health Care Revenue Bonds, CDL Homes, LLC Project, Series 2013B, 6.000%, 8/01/43 | | 8/23 at 100.00 | N/R | 1,604,055 |
| 1,180 | | Cold Spring, Minnesota, Health Care Facilities Revenue Bonds, Assumption Home, Inc., Refunding Series 2013, 5.200%, 3/01/43 | | 3/20 at 100.00 | N/R | 1,199,529 |
| | | Columbus, Minnesota, Senior Housing Revenue Bonds, Richfield Senior Housing, Inc., Refunding Series 2015: | | | | |
| 575 | | 5.250%, 1/01/40 | | 1/23 at 100.00 | N/R | 582,464 |
| 1,175 | | 5.250%, 1/01/46 | | 1/23 at 100.00 | N/R | 1,181,145 |
| 710 | | Cottage Grove, Minnesota, Senior Housing Revenue Bonds, PHS/Cottage Grove, Inc., Project, Series 2006A, 5.000%, 12/01/31 | | 12/17 at 100.00 | N/R | 710,405 |
| 1,195 | | Dakota County Community Development Agency, Minnesota, Senior Housing Revenue Bonds, Walker Highview Hills LLC Project, Refunding Series 2016A, 5.000%, 8/01/46 | | 8/22 at 100.00 | N/R | 1,216,689 |
| 1,885 | | Lake Crystal, Minnesota, Housing and Health Care Revenue Bonds, Ecumen-Second Century & Owatonna Senior Living Project, Refunding Series 2014A, 4.500%, 9/01/44 (Mandatory Put 9/01/24) | | 9/18 at 100.00 | N/R | 1,889,109 |
| | | Minneapolis, Minnesota, Revenue Bonds, Walker Minneapolis Campus Project, Refunding Series 2012: | | | | |
| 450 | | 5.000%, 11/15/24 | | 11/22 at 100.00 | N/R | 481,032 |
| 1,500 | | 4.750%, 11/15/28 | | 11/22 at 100.00 | N/R | 1,540,920 |
| 1,500 | | Minneapolis, Minnesota, Senior Housing and Healthcare Revenue Bonds, Ecumen-Abiitan Mill City Project, Series 2015, 5.250%, 11/01/45 | | 5/23 at 100.00 | N/R | 1,550,730 |
| 2,000 | | North Oaks, Minnesota, Senior Housing Revenue Bonds, Waverly Gardens Project, Refunding Series 2016, 5.000%, 10/01/47 | | 10/24 at 102.00 | N/R | 2,047,060 |
| 1,000 | | Oak Park Heights, Minnesota, Senior Housing Revenue Bonds, Oakgreen Commons Project, Memory Care Building, Series 2013, 6.500%, 8/01/43 | | 8/20 at 102.00 | N/R | 1,068,960 |
| 1,715 | | Owatonna, Minnesota, Housing and Health Care Revenue Bonds, Ecumen-Second Century & Owatonna Senior Living Project, Refunding Series 2014B, 4.500%, 9/01/44 (Mandatory Put 9/01/24) | | 9/18 at 100.00 | N/R | 1,718,739 |
| 2,700 | | Saint Louis Park, Minnesota, Health Care Facilities Revenue Bonds, Mount Olivet Careview Home Project, Series 2016B, 2.000%, 6/01/49 | | 12/17 at 100.00 | N/R | 2,649,483 |
| 250 | | Saint Louis Park, Minnesota, Health Care Facilities Revenue Bonds, Mount Olivet Careview Home Project, Series 2016C, 3.150%, 6/01/28 | | 6/21 at 101.00 | N/R | 250,128 |
| 1,842 | | Saint Paul Housing and Redevelopment Authority, Minnesota, Nursing Home Revenue Bonds, Episcopal Homes of Minnesota, Series 2006, 5.630%, 10/01/33 | | 10/17 at 100.00 | N/R | 1,849,817 |
| 1,100 | | Saint Paul Housing and Redevelopment Authority, Minnesota, Revenue Bonds, Rossy & Richard Shaller Family Sholom East Campus, Series 2007A, 5.250%, 10/01/42 | | 10/17 at 100.00 | N/R | 1,102,739 |
| 1,000 | | Saint Paul Housing and Redevelopment Authority, Minnesota, Senior Housing and Health Care Revenue Bonds, Episcopal Homes Project, Refunding Series 2012A, 5.150%, 11/01/42 | | 11/20 at 100.00 | N/R | 1,009,170 |
Nuveen Minnesota Municipal Bond Fund (continued)
| Portfolio of Investments | May 31, 2017 |
| Principal Amount (000) | | Description (1) | | Optional Call Provisions (2) | Ratings (3) | Value |
| | | Long-Term Care (continued) | | | | |
| $ 800 | | Sartell, Minnesota, Health Care and Housing Facilities Revenue Bonds, Country Manor Campus LLC Project, Series 2012A, 5.250%, 9/01/30 | | 9/22 at 100.00 | N/R | $837,240 |
| 2,390 | | Sauk Rapids, Minnesota, Health Care and Housing Facilities Revenue Bonds, Good Shepherd Lutheran Home, Refunding Series 2013, 5.125%, 1/01/39 | | 1/23 at 100.00 | N/R | 2,411,367 |
| | | Wayzata, Minnesota, Senior Housing Revenue Bonds, Folkestone Senior Living Community, Series 2012A: | | | | |
| 260 | | 5.000%, 5/01/23 | | 5/19 at 102.00 | N/R | 276,047 |
| 680 | | 5.000%, 11/01/23 | | 5/19 at 102.00 | N/R | 721,840 |
| 700 | | 5.500%, 11/01/32 | | 5/19 at 102.00 | N/R | 740,019 |
| 330 | | 6.000%, 5/01/47 | | 5/19 at 102.00 | N/R | 348,797 |
| 1,200 | | West St. Paul, Minnesota, Health Care Facilities Revenue Bonds, Walker Thompson Hill LLC Project, Series 2011A, 7.000%, 9/01/46 | | 9/19 at 100.00 | N/R | 1,245,696 |
| 35,202 | | Total Long-Term Care | | | | 35,957,069 |
| | | Materials – 0.5% | | | | |
| 2,150 | | Saint Paul Port Authority, Minnesota, Solid Waste Disposal Revenue Bonds, Gerdau Saint Paul Steel Mill Project, Series 2012-7, 4.500%, 10/01/37 (Alternative Minimum Tax) | | 10/22 at 100.00 | BBB- | 1,900,664 |
| | | Tax Obligation/General – 20.0% | | | | |
| | | Alexandria Independent School District 206, Douglas County, Minnesota, General Obligation Bonds, Refunding School Building Series 2015B: | | | | |
| 1,710 | | 5.000%, 2/01/25 | | No Opt. Call | Aa2 | 2,085,208 |
| 955 | | 5.000%, 2/01/26 | | 2/25 at 100.00 | Aa2 | 1,156,276 |
| 1,875 | | Bemidji Independent School District 31, Beltrami County, Minnesota, General Obligation Bonds, Refunding Series 2015A, 3.000%, 4/01/30 | | 4/26 at 100.00 | AA+ | 1,912,612 |
| 10,000 | | Bemidji, Minnesota, General Obligation Bonds, Refunding Sales Tax Series 2011, 6.000%, 2/01/41 | | 2/21 at 100.00 | Aa3 | 11,453,800 |
| 2,000 | | Bloomington Independent School District 271, Hennepin County, Minnesota, General Obligation Bonds, Facilities Maintenance, Series 2017A, 4.000%, 2/01/40 | | 2/27 at 100.00 | AA+ | 2,161,440 |
| 2,485 | | Burnsville Independent School District 191, Dakota and Scott Counties, Minnesota, General Obligation Bonds, School Building Series 2015A, 3.250%, 2/01/35 | | 2/25 at 100.00 | Aa2 | 2,519,691 |
| 375 | | Chaska Independent School District 112, Carver County, Minnesota, General Obligation Bonds, School Building Series 2016A, 5.000%, 2/01/23 | | No Opt. Call | Aa2 | 448,718 |
| 915 | | Circle Pines Independent School District 12, Centennial, Minnesota, General Obligation Bonds, School Building Series 2015A, 0.000%, 2/01/34 | | 2/25 at 70.20 | AA+ | 513,516 |
| | | Cloquet Independent School District 94, Carlton and Saint Louis Counties, Minnesota, General Obligation Bonds, School Building Series 2015B: | | | | |
| 1,000 | | 5.000%, 2/01/26 | | 2/25 at 100.00 | Aa2 | 1,210,760 |
| 1,000 | | 5.000%, 2/01/27 | | 2/25 at 100.00 | Aa2 | 1,200,670 |
| 1,000 | | 4.000%, 2/01/36 | | 2/25 at 100.00 | Aa2 | 1,052,580 |
| 1,100 | | Dakota County Community Development Agency, Minnesota, Governmental Housing Development General Obligation Bonds, Series 2015A, 4.000%, 1/01/42 | | 1/23 at 100.00 | Aaa | 1,138,951 |
| | | Delano Independent School District 879, Minnesota, General Obligation Bonds, Refunding School Building Series 2016A: | | | | |
| 1,000 | | 3.000%, 2/01/32 | | 2/26 at 100.00 | Aa2 | 1,003,710 |
| 2,000 | | 3.000%, 2/01/34 | | 2/26 at 100.00 | Aa2 | 1,974,280 |
| Principal Amount (000) | | Description (1) | | Optional Call Provisions (2) | Ratings (3) | Value |
| | | Tax Obligation/General (continued) | | | | |
| $ 1,000 | | Farmington Independent School District 192, Dakota County, Minnesota, General Obligation Bonds, Refunding School Building Series 2015A, 4.000%, 2/01/27 | | 2/24 at 100.00 | Aa2 | $1,115,830 |
| | | Forest Lake Independent School District 831, Washington County, Minnesota, General Obligation Bonds, School Building Series 2016A: | | | | |
| 2,405 | | 3.125%, 2/01/40 | | 2/26 at 100.00 | AA+ | 2,360,844 |
| 500 | | 3.150%, 2/01/42 | | 2/26 at 100.00 | AA+ | 490,880 |
| | | Fridley Independent School District 14, Anoka County, Minnesota, General Obligation Bonds, Alternative Facility, Series 2016B: | | | | |
| 2,000 | | 5.000%, 2/01/27 | | 2/26 at 100.00 | Aa2 | 2,461,460 |
| 1,075 | | 4.000%, 2/01/28 | | 2/26 at 100.00 | Aa2 | 1,213,686 |
| 480 | | Fridley, Minnesota, General Obligation Bonds, Capital Improvement Plan, Series 2017, 3.250%, 2/01/34 | | 2/26 at 100.00 | Aa2 | 489,758 |
| 2,500 | | Independent School District 2310(Sibley East), Minnesota, General Obligation School Building Bonds, Series 2015A, 4.000%, 2/01/40 | | 2/25 at 100.00 | Aa2 | 2,617,600 |
| | | Madison, Minnesota, General Obligation Bonds, Refunding Series 2015A: | | | | |
| 660 | | 3.600%, 1/01/35 – AGM Insured | | 1/23 at 100.00 | AA | 681,582 |
| 500 | | 4.000%, 1/01/45 – AGM Insured | | 1/23 at 100.00 | AA | 515,640 |
| 1,000 | | Mahtomedi Independent School District 832, Minnesota, General Obligation Bonds, Refunding School Building Series 2014A, 5.000%, 2/01/26 | | 2/25 at 100.00 | AA+ | 1,221,090 |
| 2,000 | | Mankato Independent School District 77, Minnesota, General Obligation Bonds, School Building Series 2014A, 4.000%, 2/01/28 | | 2/24 at 100.00 | AA+ | 2,223,900 |
| 1,905 | | Minneapolis Special School District 1, Hennepin County, Minnesota, General Obligation Bonds, Alternate Facility Series 2015B, 3.000%, 2/01/31 | | 2/24 at 100.00 | AA+ | 1,939,614 |
| 1,185 | | Minnesota State, General Obligation Bonds, Various Purpose Series 2015A, 5.000%, 8/01/32 | | 8/25 at 100.00 | AAA | 1,423,896 |
| 2,000 | | Moorhead Independent School District 152, Clay County, Minnesota, General Obligation Bonds, Refunding School Building Series 2016A, 3.000%, 2/01/36 | | 2/26 at 100.00 | Aa2 | 1,940,220 |
| 4,305 | | Mountain Iron-Buhl Independent School District 712, St. Louis County, Minnesota, General Obligation Bonds, School Building Series 2016A, 3.000%, 2/01/37 | | 2/26 at 100.00 | Aa2 | 4,179,940 |
| 1,000 | | Robbinsdale Independent School District 281, Hennepin County, Minnesota, General Obligation Bonds, Series 2016C, 3.000%, 2/01/31 | | 2/26 at 100.00 | AA+ | 1,033,980 |
| 930 | | Rocori Independent School District 750, Stearns County, Minnesota, General Obligation Bonds, School Building Series 2017A, 4.000%, 2/01/28 | | 2/27 at 100.00 | Aa2 | 1,078,019 |
| | | Saint Cloud Independent School District 742, Stearns County, Minnesota, General Obligation Bonds, Series 2015A: | | | | |
| 450 | | 3.125%, 2/01/33 | | 2/25 at 100.00 | Aa2 | 460,642 |
| 525 | | 3.125%, 2/01/35 | | 2/25 at 100.00 | Aa2 | 533,101 |
| 1,000 | | Saint James Independent School District 840, Minnesota, General Obligation Bonds, School Building Series 2015B, 4.000%, 2/01/45 | | 2/26 at 100.00 | AA+ | 1,069,480 |
| | | Saint Michael Independent School District 885, Wright County, Minnesota, General Obligation Bonds, School Building Series 2017A: | | | | |
| 1,400 | | 4.000%, 2/01/30 | | 2/26 at 100.00 | Aa2 | 1,557,976 |
| 1,885 | | 3.200%, 2/01/32 | | 2/26 at 100.00 | Aa2 | 1,935,292 |
| 2,005 | | Shakopee, Minnesota, General Obligation Tax Abatement Revenue Bonds, Series 2016A, 3.000%, 2/01/35 | | 2/25 at 100.00 | Aa1 | 1,959,106 |
Nuveen Minnesota Municipal Bond Fund (continued)
| Portfolio of Investments | May 31, 2017 |
| Principal Amount (000) | | Description (1) | | Optional Call Provisions (2) | Ratings (3) | Value |
| | | Tax Obligation/General (continued) | | | | |
| $ 1,295 | | South Washington County Independent School District 833, Minnesota, General Obligation Bonds, School Building Series 2016C, 3.000%, 2/01/30 | | 2/26 at 100.00 | Aa2 | $1,336,880 |
| 3,000 | | Spring Lake Independent School District 16, Anoka County, Minnesota, General Obligation Bonds, Refunding School Building Series 2016A, 3.000%, 2/01/35 | | 2/26 at 100.00 | Aa2 | 2,991,750 |
| | | Waseca Independent School District 829, Steele, Rice, and Waseca Counties, Minnesota, General Obligation Bonds, Series 2015A: | | | | |
| 1,315 | | 4.000%, 2/01/27 | | 2/26 at 100.00 | Aa2 | 1,492,275 |
| 500 | | 3.125%, 2/01/35 | | 2/26 at 100.00 | Aa2 | 504,065 |
| 66,235 | | Total Tax Obligation/General | | | | 70,660,718 |
| | | Tax Obligation/Limited – 4.3% | | | | |
| 135 | | Minneapolis, Minnesota, Tax Increment Revenue Bonds, Grant Park Project, Refunding Series 2015, 4.000%, 3/01/30 | | 3/23 at 100.00 | N/R | 134,646 |
| 325 | | Minneapolis, Minnesota, Tax Increment Revenue Bonds, Village at St. Anthony Falls Project, Refunding Series 2015, 4.000%, 3/01/27 | | 3/23 at 100.00 | N/R | 323,291 |
| 1,090 | | Minnesota Housing Finance Agency, Housing Infrastructure State Appropriation Bonds, Series 2015C, 3.250%, 8/01/30 | | 8/24 at 100.00 | AA | 1,115,092 |
| | | Minnesota Housing Finance Agency, Housing Infrastructure State Appropriation Bonds, Series 2016C: | | | | |
| 385 | | 4.000%, 8/01/34 | | 8/25 at 100.00 | AA | 410,106 |
| 400 | | 4.000%, 8/01/35 | | 8/25 at 100.00 | AA | 424,892 |
| 325 | | Minnetonka Independent School District 276, Hennepin County, Minnesota, Certificates of Participation, Series 2016O, 3.000%, 2/01/36 | | 2/24 at 100.00 | Aa1 | 317,161 |
| 1,015 | | Northeast Metropolitan Intermediate School District 916, White Bear Lake, Minnesota, Certificates of Participation, Series 2013A, 4.000%, 2/01/22 | | No Opt. Call | A1 | 1,123,483 |
| | | Northeast Metropolitan Intermediate School District 916, White Bear Lake, Minnesota, Certificates of Participation, Series 2015A: | | | | |
| 1,470 | | 3.625%, 2/01/34 | | 2/25 at 100.00 | A1 | 1,506,089 |
| 580 | | 3.750%, 2/01/36 | | 2/25 at 100.00 | A1 | 595,045 |
| 4,600 | | Northeast Metropolitan Intermediate School District 916, White Bear Lake, Minnesota, Certificates of Participation, Series 2015B, 4.000%, 2/01/42 | | 2/25 at 100.00 | A1 | 4,759,574 |
| | | Saint Cloud Independent School District 742, Stearns County, Minnesota, Certificates of Participation, Saint Cloud Area Public Schools, Series 2017A: | | | | |
| 355 | | 5.000%, 2/01/32 | | 2/25 at 100.00 | A1 | 410,657 |
| 520 | | 5.000%, 2/01/34 | | 2/25 at 100.00 | A1 | 595,717 |
| | | Saint Paul Housing and Redevelopment Authority, Minnesota, Multifamily Housing Revenue Bonds, 2700 University at Westgate Station, Series 2015B: | | | | |
| 500 | | 4.250%, 4/01/25 | | 4/23 at 100.00 | N/R | 510,075 |
| 430 | | 4.875%, 4/01/30 | | 4/23 at 100.00 | N/R | 437,172 |
| 1,665 | | 5.250%, 4/01/43 | | 4/23 at 100.00 | N/R | 1,678,187 |
| | | Saint Paul Housing and Redevelopment Authority, Minnesota, Upper Landing Project Tax Increment Revenue Refunding Bonds, Series 2012: | | | | |
| 150 | | 5.000%, 9/01/26 | | 3/20 at 102.00 | N/R | 156,294 |
| 800 | | 5.000%, 3/01/29 | | 3/20 at 102.00 | N/R | 828,280 |
| 14,745 | | Total Tax Obligation/Limited | | | | 15,325,761 |
| Principal Amount (000) | | Description (1) | | Optional Call Provisions (2) | Ratings (3) | Value |
| | | Transportation – 6.2% | | | | |
| $ 1,000 | | Minneapolis, Minnesota, Recovery Zone Facility Revenue Bonds, Mozaic Parking, LLC Project, Series 2010A, 8.500%, 1/01/41 | | 1/21 at 100.00 | N/R | $956,250 |
| 4,000 | | Minneapolis-St. Paul Metropolitan Airports Commission, Minnesota, Airport Revenue Bonds, Refunding Senior Lien Series 2009B, 5.000%, 1/01/20 (Alternative Minimum Tax) | | 1/19 at 100.00 | AA- | 4,249,360 |
| 135 | | Minneapolis-St. Paul Metropolitan Airports Commission, Minnesota, Airport Revenue Bonds, Refunding Senior Lien Series 2016A, 5.000%, 1/01/31 | | 1/27 at 100.00 | AA- | 163,728 |
| 130 | | Minneapolis-St. Paul Metropolitan Airports Commission, Minnesota, Airport Revenue Bonds, Refunding Subordinate Lien Series 2011A, 3.500%, 1/01/24 | | 1/21 at 100.00 | A+ | 137,774 |
| 275 | | Minneapolis-St. Paul Metropolitan Airports Commission, Minnesota, Airport Revenue Bonds, Refunding Subordinate Lien Series 2012B, 5.000%, 1/01/28 | | 1/22 at 100.00 | A+ | 314,325 |
| | | Minneapolis-St. Paul Metropolitan Airports Commission, Minnesota, Airport Revenue Bonds, Refunding Subordinate Lien Series 2014A: | | | | |
| 2,000 | | 5.000%, 1/01/31 | | 1/24 at 100.00 | A+ | 2,332,100 |
| 1,175 | | 5.000%, 1/01/32 | | 1/24 at 100.00 | A+ | 1,365,432 |
| 800 | | 5.000%, 1/01/33 | | 1/24 at 100.00 | A+ | 925,952 |
| | | Minneapolis-St. Paul Metropolitan Airports Commission, Minnesota, Airport Revenue Bonds, Refunding Subordinate Lien Series 2014B: | | | | |
| 1,000 | | 5.000%, 1/01/25 (Alternative Minimum Tax) | | 1/24 at 100.00 | A+ | 1,161,400 |
| 750 | | 5.000%, 1/01/26 (Alternative Minimum Tax) | | 1/24 at 100.00 | A+ | 860,700 |
| | | Minneapolis-St. Paul Metropolitan Airports Commission, Minnesota, Airport Revenue Bonds, Senior Lien Series 2016C: | | | | |
| 1,530 | | 5.000%, 1/01/37 | | 1/27 at 100.00 | AA- | 1,811,168 |
| 1,000 | | 5.000%, 1/01/41 | | 1/27 at 100.00 | AA- | 1,172,760 |
| 3,000 | | 5.000%, 1/01/46 | | 1/27 at 100.00 | AA- | 3,501,870 |
| 120 | | Minneapolis-St. Paul Metropolitan Airports Commission, Minnesota, Airport Revenue Bonds, Subordinate Lien Series 2010D, 4.000%, 1/01/23 (Alternative Minimum Tax) | | 1/20 at 100.00 | A+ | 126,043 |
| | | St Paul Housing and Redevelopment Authority, Minnesota, Parking Revenue Bonds, Parking Facilities Project, Refunding Series 2010A: | | | | |
| 1,070 | | 5.000%, 8/01/30 | | 8/18 at 102.00 | A+ | 1,134,350 |
| 1,500 | | 5.000%, 8/01/35 | | 8/18 at 102.00 | A+ | 1,592,805 |
| 19,485 | | Total Transportation | | | | 21,806,017 |
| | | U.S. Guaranteed – 6.6% (4) | | | | |
| 1,135 | | Deephaven, Minnesota, Charter School Lease Revenue Bonds, Eagle Ridge Academy Project, Series 2013A, 5.500%, 7/01/43 (Pre-refunded 7/01/23) | | 7/23 at 100.00 | N/R (4) | 1,376,324 |
| 2,000 | | Duluth Independent School District 709, Minnesota, Certificates of Participation, Series 2008B, 4.000%, 2/01/19 (ETM) | | No Opt. Call | AA+ (4) | 2,100,260 |
| | | Minneapolis, Minnesota, Health Care System Revenue Bonds, Fairview Hospital and Healthcare Services, Series 2008A: | | | | |
| 70 | | 6.000%, 11/15/18 (ETM) | | No Opt. Call | A+ (4) | 73,214 |
| 3,225 | | 6.625%, 11/15/28 (Pre-refunded 11/15/18) | | 11/18 at 100.00 | A+ (4) | 3,490,901 |
| 245 | | 6.750%, 11/15/32 (Pre-refunded 11/15/18) | | 11/18 at 100.00 | A+ (4) | 265,622 |
| | | Minneapolis, Minnesota, Revenue Bonds, National Marrow Donor Program Project, Series 2010: | | | | |
| 150 | | 4.250%, 8/01/20 (Pre-refunded 8/01/18) | | 8/18 at 100.00 | N/R (4) | 155,763 |
| 4,100 | | 4.875%, 8/01/25 (Pre-refunded 8/01/18) | | 8/18 at 100.00 | N/R (4) | 4,289,174 |
Nuveen Minnesota Municipal Bond Fund (continued)
| Portfolio of Investments | May 31, 2017 |
| Principal Amount (000) | | Description (1) | | Optional Call Provisions (2) | Ratings (3) | Value |
| | | U.S. Guaranteed (4) (continued) | | | | |
| $ 2,000 | | Northern Municipal Power Agency, Minnesota, Electric System Revenue Bonds, Refunding Series 2007A, 5.000%, 1/01/26 (Pre-refunded 1/01/18) – AMBAC Insured | | 1/18 at 100.00 | A- (4) | $2,048,660 |
| | | Saint Cloud, Minnesota, Health Care Revenue Bonds, CentraCare Health System Project, Series 2008D: | | | | |
| 35 | | 5.375%, 5/01/31 (Pre-refunded 5/01/19) – AGC Insured | | 5/19 at 100.00 | A1 (4) | 37,941 |
| 65 | | 5.500%, 5/01/39 (Pre-refunded 5/01/19) – AGC Insured | | 5/19 at 100.00 | A1 (4) | 70,617 |
| 1,000 | | Saint Cloud, Minnesota, Health Care Revenue Bonds, CentraCare Health System Project, Series 2010A, 5.125%, 5/01/30 (Pre-refunded 5/01/20) | | 5/20 at 100.00 | Aaa | 1,117,970 |
| 1,235 | | Saint Louis Park, Minnesota, Health Care Facilities Revenue Bonds, Park Nicollet Health Services, Refunding Series 2008C, 5.750%, 7/01/30 (Pre-refunded 7/01/18) | | 7/18 at 100.00 | Aaa | 1,299,973 |
| | | Saint Louis Park, Minnesota, Health Care Facilities Revenue Bonds, Park Nicollet Health Services, Refunding Series 2009: | | | | |
| 15 | | 5.500%, 7/01/29 (Pre-refunded 7/01/19) | | 7/19 at 100.00 | Aaa | 16,404 |
| 2,625 | | 5.750%, 7/01/39 (Pre-refunded 7/01/19) | | 7/19 at 100.00 | Aaa | 2,884,298 |
| 1,500 | | Saint Paul Housing and Redevelopment Authority, Minnesota, Charter School Lease Revenue Bonds, Nova Classical Academy, Series 2011A, 6.625%, 9/01/42 (Pre-refunded 9/01/21) | | 9/21 at 100.00 | BBB- (4) | 1,829,730 |
| 1,555 | | Saint Paul Housing and Redevelopment Authority, Minnesota, Health Care Revenue Bonds, Allina Health System, Series 2009A-1, 5.250%, 11/15/29 (Pre-refunded 11/15/19) | | 11/19 at 100.00 | N/R (4) | 1,715,010 |
| 500 | | Saint Paul Housing and Redevelopment Authority, Minnesota, Recreational Facility Lease Revenue Bonds, Jimmy Lee Recreational Center, Series 2008, 4.750%, 12/01/26 (Pre-refunded 12/01/17) | | 12/17 at 100.00 | AA+ (4) | 509,850 |
| 21,455 | | Total U.S. Guaranteed | | | | 23,281,711 |
| | | Utilities – 11.8% | | | | |
| 235 | | Guam Power Authority, Revenue Bonds, Series 2012A, 5.000%, 10/01/34 | | 10/22 at 100.00 | BBB | 249,887 |
| 5,045 | | Minnesota Municipal Power Agency, Electric Revenue Bonds, Refunding Series 2010A, 5.000%, 10/01/30 | | 10/20 at 100.00 | A2 | 5,632,591 |
| | | Minnesota Municipal Power Agency, Electric Revenue Bonds, Refunding Series 2014A: | | | | |
| 1,000 | | 4.000%, 10/01/31 | | 10/24 at 100.00 | A2 | 1,065,360 |
| 1,000 | | 4.000%, 10/01/32 | | 10/24 at 100.00 | A2 | 1,059,950 |
| 2,250 | | Minnesota Municipal Power Agency, Electric Revenue Bonds, Series 2016, 5.000%, 10/01/47 | | 10/26 at 100.00 | A2 | 2,595,600 |
| 250 | | Rochester, Minnesota, Electric Utility Revenue Bonds, Refunding Series 2013B, 5.000%, 12/01/26 | | 12/23 at 100.00 | Aa3 | 299,488 |
| | | Rochester, Minnesota, Electric Utility Revenue Bonds, Refunding Series 2017A: | | | | |
| 2,000 | | 5.000%, 12/01/42 | | 12/26 at 100.00 | Aa3 | 2,352,020 |
| 1,500 | | 5.000%, 12/01/47 | | 12/26 at 100.00 | Aa3 | 1,755,855 |
| Principal Amount (000) | | Description (1) | | Optional Call Provisions (2) | Ratings (3) | Value |
| | | Utilities (continued) | | | | |
| | | Southern Minnesota Municipal Power Agency, Power Supply System Revenue Bonds, Series 1994A: | | | | |
| $ 1,510 | | 0.000%, 1/01/19 – NPFG Insured | | No Opt. Call | AA- | $1,478,985 |
| 1,825 | | 0.000%, 1/01/21 – NPFG Insured | | No Opt. Call | AA- | 1,723,402 |
| 65 | | 0.000%, 1/01/22 – NPFG Insured | | No Opt. Call | AA- | 60,107 |
| 3,055 | | 0.000%, 1/01/23 – NPFG Insured | | No Opt. Call | AA- | 2,760,315 |
| 10,530 | | 0.000%, 1/01/24 – NPFG Insured | | No Opt. Call | AA- | 9,264,083 |
| 4,805 | | 0.000%, 1/01/25 – NPFG Insured | | No Opt. Call | AA- | 4,108,707 |
| 6,230 | | 0.000%, 1/01/26 – NPFG Insured | | No Opt. Call | AA- | 5,165,480 |
| 2,000 | | Western Minnesota Municipal Power Agency, Power Supply Revenue Bonds, Series 2014A, 5.000%, 1/01/46 | | 1/24 at 100.00 | Aa3 | 2,247,460 |
| 43,300 | | Total Utilities | | | | 41,819,290 |
| | | Water and Sewer – 0.4% | | | | |
| 1,240 | | Guam Government Waterworks Authority, Water and Wastewater System Revenue Bonds, Series 2016, 5.000%, 1/01/46 | | 7/26 at 100.00 | A- | 1,357,354 |
| |
| $ 322,462 | | Total Long-Term Investments (cost $320,883,120) | | | | 338,180,907 |
| Principal Amount (000) | | Description (1) | | Optional Call
Provisions (2) | Ratings (3) | Value |
| | | SHORT-TERM INVESTMENTS – 3.0% | | | | |
| | | MUNICIPAL BONDS – 3.0% | | | | |
| | | Health Care – 2.4% | | | | |
| $ 3,000 | | Minneapolis-Saint Paul Housing and Redevelopment Authority, Minnesota, Health Care System Revenue Bonds, Allina Health System, Series 2007C1, Variable Rate Demand Obligation, 0.890%, 11/15/34 (WI/DD, Settling 6/01/17) (5) | | 7/17 at 100.00 | AAA | $3,000,000 |
| 5,500 | | Rochester, Minnesota, Health Care Facilities Revenue Bonds, Mayo Clinic Series 2008A, Variable Rate Demand Obligation, 0.870%, 11/15/38 (5) | | 7/17 at 100.00 | AA | 5,500,000 |
| 8,500 | | Total Health Care | | | | 8,500,000 |
| | | Housing/Single Family – 0.4% | | | | |
| 1,375 | | Minnesota Housing Finance Agency, Residential Housing Finance Bonds, Series 2015D, Variable Rate Demand Obligation, 0.940%, 1/01/46 Alternative Minimum Tax (5) | | 7/17 at 100.00 | AA+ | 1,375,000 |
| | | Education and Civic Organizations – 0.2% | | | | |
| 865 | | Minneapolis, Minnesota, Revenue Bonds, University Gateway Project, Refunding Series 2009, Variable Rate Demand Obligation, 0.910%, 12/01/40 (5) | | 8/17 at 100.00 | Aa1 | 865,000 |
| $ 10,740 | | Total Short-Term Investments (cost $10,740,000) | | | | 10,740,000 |
| | | Total Investments (cost $331,623,120) – 98.8% | | | | 348,920,907 |
| | | Other Assets Less Liabilities – 1.2% | | | | 4,204,330 |
| | | Net Assets – 100% | | | | $ 353,125,237 |
Nuveen Minnesota Municipal Bond Fund (continued)
| Portfolio of Investments | May 31, 2017 |
| (1) | All percentages shown in the Portfolio of Investments are based on net assets. | |
| (2) | Optional Call Provisions: Dates (month and year) and prices of the earliest optional call or redemption. There may be other call provisions at varying prices at later dates. Certain mortgage-backed securities may be subject to periodic principal paydowns. Optional Call Provisions are not covered by the report of independent registered public accounting firm. | |
| (3) | For financial reporting purposes, the ratings disclosed are the highest of Standard & Poor’s Group (“Standard & Poor’s”), Moody’s Investors Service, Inc. (“Moody’s”) or Fitch, Inc. (“Fitch”) rating. This treatment of split-rated securities may differ from that used for other purposes, such as for Fund investment policies. Ratings below BBB by Standard & Poor’s, Baa by Moody’s or BBB by Fitch are considered to be below investment grade. Holdings designated N/R are not rated by any of these national rating agencies. Ratings are not covered by the report of independent registered public accounting firm. | |
| (4) | Backed by an escrow or trust containing sufficient U.S. Government or U.S. Government agency securities, which ensure the timely payment of principal and interest. Certain bonds backed by U.S. Government or agency securities are regarded as having an implied rating equal to the rating of such securities. | |
| (5) | Investment has a maturity of greater than one year, but has variable rate and/or demand features which qualify it as a short-term investment. The rate disclosed is that in effect as of the end of the reporting period. This rate changes periodically based on market conditions or a specified market index. | |
| (ETM) | Escrowed to maturity. | |
| (WI/DD) | Investment, or portion of investment, purchased on a when-issued or delayed delivery basis. | |
See accompanying notes to financial statements.
58 NUVEEN
Nuveen Nebraska Municipal Bond Fund
| Portfolio of Investments | May 31, 2017 |
| Principal Amount (000) | | Description (1) | | Optional Call Provisions (2) | Ratings (3) | Value |
| | | LONG-TERM INVESTMENTS – 98.9% | | | | |
| | | MUNICIPAL BONDS – 98.9% | | | | |
| | | Consumer Staples – 0.8% | | | | |
| $ 500 | | Buckeye Tobacco Settlement Financing Authority, Ohio, Tobacco Settlement Asset-Backed Revenue Bonds, Senior Lien, Series 2007A-2, 5.125%, 6/01/24 | | 6/17 at 100.00 | B- | $ 482,615 |
| | | Education and Civic Organizations – 10.1% | | | | |
| 1,000 | | Colorado Educational and Cultural Facilities Authority, Charter School Revenue Bonds, Academy of Charter Schools Project, Series 2008, 5.625%, 5/01/40 | | 5/18 at 100.00 | A | 1,036,380 |
| 1,000 | | Douglas County, Nebraska, Educational Facilities Revenue Bonds, Creighton University Projects, Refunding Series 2010A, 5.500%, 7/01/30 | | 7/20 at 100.00 | A2 | 1,105,560 |
| | | Lincoln, Nebraska, Educational Facilities Revenue and Refunding Bonds, Nebraska Wesleyan University Project, Series 2012: | | | | |
| 685 | | 3.300%, 4/01/25 | | 4/22 at 100.00 | A- | 714,729 |
| 410 | | 4.000%, 4/01/32 | | 4/22 at 100.00 | A- | 428,495 |
| 500 | | Metropolitan Community College Area, Nebraska, Certificates of Participation, Fort Omaha Campus Project, Series 2016, 3.000%, 3/01/32 | | 3/26 at 100.00 | AA | 488,875 |
| 525 | | Nebraska Educational Finance Authority, Revenue Bonds, Clarkson College Project, Refunding Series 2011, 5.450%, 9/01/35 | | 5/21 at 100.00 | Aa3 | 592,835 |
| 1,000 | | University of Nebraska, Revenue Bonds, Refunding Lincoln Student Fees and Facilities Series 2011, 5.000%, 7/01/42 | | 1/22 at 100.00 | Aa1 | 1,124,680 |
| 1,000 | | University of Nebraska, Revenue Bonds, Refunding Lincoln Student Fees and Facilities Series 2016A, 3.000%, 7/01/39 | | 7/26 at 100.00 | Aa1 | 923,810 |
| 6,120 | | Total Education and Civic Organizations | | | | 6,415,364 |
| | | Health Care – 14.2% | | | | |
| 200 | | California Statewide Communities Development Authority, California, Revenue Bonds, Loma Linda University Medical Center, Series 2016A, 144A, 5.250%, 12/01/56 | | 6/26 at 100.00 | BB+ | 218,708 |
| 565 | | Douglas County Hospital Authority 2, Nebraska, Health Facilities Revenue Bonds, Children's Hospital Obligated Group, Refunding Series 2008B, 6.000%, 8/15/28 | | 8/17 at 100.00 | A1 | 570,266 |
| 180 | | Douglas County Hospital Authority 2, Nebraska, Health Facilities Revenue Bonds, Children's Hospital Obligated Group, Series 2017, 5.000%, 11/15/37 | | 5/27 at 100.00 | AA- | 208,265 |
| 775 | | Douglas County Hospital Authority 2, Nebraska, Hospital Revenue Bonds, Madonna Rehabilitation Hospital Project, Series 2014, 5.000%, 5/15/44 | | 5/24 at 100.00 | BBB+ | 834,799 |
| | | Douglas County Hospital Authority 3, Nebraska, Health Facilities Revenue Bonds, Nebraska Methodist Health System, Refunding Series 2015: | | | | |
| 500 | | 4.125%, 11/01/36 | | 11/25 at 100.00 | A- | 522,415 |
| 1,000 | | 5.000%, 11/01/45 | | 11/25 at 100.00 | A- | 1,113,910 |
| | | Lincoln County Hospital Authority 1, Nebraska, Hospital Revenue and Refunding Bonds, Great Plains Regional Medical Center Project, Series 2012: | | | | |
| 1,000 | | 4.000%, 11/01/37 | | 11/21 at 100.00 | A- | 1,018,220 |
| 2,800 | | 5.000%, 11/01/42 | | 11/21 at 100.00 | A- | 3,019,156 |
Nuveen Nebraska Municipal Bond Fund (continued)
| Portfolio of Investments | May 31, 2017 |
| Principal Amount (000) | | Description (1) | | Optional Call Provisions (2) | Ratings (3) | Value |
| | | Health Care (continued) | | | | |
| | | Sarpy County Hospital Authority 1, Nebraska, Health Facilities Revenue Bonds, Nebraska Medicine, Series 2016: | | | | |
| $ 500 | | 4.000%, 5/15/41 | | 5/26 at 100.00 | AA- | $515,575 |
| 500 | | 3.000%, 5/15/46 | | 5/26 at 100.00 | AA- | 438,930 |
| 500 | | Scotts Bluff County Hospital Authority 1, Nebraska, Hospital Revenue Bonds, Regional West Medical Center Project, Refunding & Improvement Series 2016A, 5.250%, 2/20/37 | | 2/27 at 100.00 | BBB+ | 542,985 |
| 8,520 | | Total Health Care | | | | 9,003,229 |
| | | Housing/Single Family – 3.2% | | | | |
| 975 | | Nebraska Investment Finance Authority, Single Family Housing Revenue Bonds, Refunding Series 2016A, 3.500%, 9/01/36 | | 3/25 at 100.00 | AA+ | 1,004,367 |
| 1,000 | | Nebraska Investment Finance Authority, Single Family Housing Revenue Bonds, Series 2016C, 3.350%, 9/01/36 | | 9/25 at 100.00 | AA+ | 1,014,400 |
| 1,975 | | Total Housing/Single Family | | | | 2,018,767 |
| | | Long-Term Care – 8.1% | | | | |
| 900 | | Douglas County Hospital Authority 2, Nebraska, Health Facilities Revenue Bonds, Immanuel Obligated Group, Refunding Series 2010, 5.625%, 1/01/40 | | 1/20 at 100.00 | AA | 961,290 |
| 240 | | Illinois Finance Authority, Revenue Bonds, Three Crowns Park Plaza, Series 2006A, 5.875%, 2/15/26 | | 7/17 at 100.00 | N/R | 240,334 |
| 3,385 | | Lancaster County Hospital Authority 1, Nebraska, Health Facilities Revenue Bonds, Immanuel Obligated Group, Refunding Series 2010, 5.625%, 1/01/40 | | 1/20 at 100.00 | AA | 3,677,193 |
| 220 | | Wisconsin Health and Educational Facilities Authority, Revenue Bonds, Three Pillars Senior Living Communities, Refunding Series 2013, 5.000%, 8/15/23 | | No Opt. Call | A | 256,225 |
| 4,745 | | Total Long-Term Care | | | | 5,135,042 |
| | | Tax Obligation/General – 14.2% | | | | |
| 705 | | Adams County School District 18, Nebraska, General Obligation Bonds, Hastings Public Schools, Series 2014, 4.000%, 12/15/44 | | 7/19 at 100.00 | Aa3 | 724,056 |
| 500 | | Adams County School District 18, Nebraska, General Obligation Bonds, Hastings Public Schools, Series 2017, 4.500%, 12/15/44 | | 1/22 at 100.00 | Aa3 | 539,880 |
| 500 | | Buffalo County School District 007 Kearney Public Schools, Nebraska, General Obligation Bonds, School Building Series 2016, 3.000%, 12/15/36 | | 4/26 at 100.00 | AA- | 478,520 |
| 1,000 | | Douglas County School District 059, Nebraska, General Obligation Bonds, Bennington Public Schools, Series 2016, 3.375%, 12/15/41 | | 12/25 at 100.00 | AA- | 978,550 |
| 1,350 | | Douglas County School District 1, Nebraska, General Obligation Bonds, Refunding Series 2012, 5.000%, 6/15/24 | | No Opt. Call | AAA | 1,658,974 |
| 750 | | Douglas County School District 10 Elkhorn, Nebraska, General Obligation Bonds, Series 2016, 4.000%, 12/15/36 | | 12/25 at 100.00 | AA- | 796,238 |
| 1,000 | | Kearney County School District 503, Nebraska, General Obligation Bonds, Series 2014, 4.000%, 12/15/39 | | 12/19 at 100.00 | A+ | 1,047,270 |
| 195 | | Omaha, Nebraska, General Obligation Bonds, Convention Center Project, Series 2004, 5.250%, 4/01/26 | | No Opt. Call | AA+ | 246,712 |
| | | Omaha, Nebraska, General Obligation Bonds, Various Purpose & Refunding Series 2013A: | | | | |
| 715 | | 4.500%, 11/15/28 | | 11/23 at 100.00 | AA+ | 825,911 |
| 365 | | 4.500%, 11/15/29 | | 11/23 at 100.00 | AA+ | 419,020 |
| Principal Amount (000) | | Description (1) | | Optional Call Provisions (2) | Ratings (3) | Value |
| | | Tax Obligation/General (continued) | | | | |
| $ 650 | | Omaha, Nebraska, Special Tax Redevelopment Bonds, Redevelopment 2008, 5.250%, 10/15/28 | | 10/18 at 100.00 | AA+ | $685,276 |
| 500 | | Scotts Bluff County School District 16, Nebraska, General Obligation Bonds, Gering Public Schools Series 2017, 5.000%, 12/01/46 | | 5/22 at 100.00 | A2 | 555,925 |
| 8,230 | | Total Tax Obligation/General | | | | 8,956,332 |
| | | Tax Obligation/Limited – 7.3% | | | | |
| 265 | | Government of Guam, Business Privilege Tax Bonds, Series 2011A, 5.125%, 1/01/42 | | 1/22 at 100.00 | A | 279,350 |
| 2,460 | | Lincoln- West Haymarket Joint Public Agency, Nebraska, General Obligation Facility Bonds, Series 2011, 5.000%, 12/15/42 | | 12/21 at 100.00 | AAA | 2,776,848 |
| 500 | | Omaha Public Facilities Corporation, Nebraska, Lease Revenue Bonds, Omaha Baseball Stadium Project, Series 2016, 4.000%, 6/01/36 | | 6/26 at 100.00 | AA | 533,485 |
| 500 | | Papio-Missouri River Natural Resources District, Nebraska, Flood Protection and Water Quality Enhancement Revenue Bonds, Series 2013, 4.250%, 12/15/33 | | 7/18 at 100.00 | AA- | 519,355 |
| 500 | | Papio-Missouri River Natural Resources District, Nebraska, Flood Protection and Water Quality Enhancement Revenue Bonds, Series 2017, 4.000%, 12/15/31 (WI/DD, Settling 6/15/17) | | 6/22 at 100.00 | AA- | 530,450 |
| 4,225 | | Total Tax Obligation/Limited | | | | 4,639,488 |
| | | Transportation – 3.5% | | | | |
| 165 | | Guam International Airport Authority, Revenue Bonds, Series 2013C, 6.375%, 10/01/43 (Alternative Minimum Tax) | | 10/23 at 100.00 | BBB | 189,006 |
| 825 | | Lincoln, Nebraska, Airport Revenue Bonds, Series 2015A, 4.000%, 7/01/45 | | 7/25 at 100.00 | Aa1 | 863,280 |
| 1,000 | | Omaha Airport Authority, Nebraska, Airport Facilities Revenue Refunding Bonds, Series 2017A, 5.000%, 12/15/36 (Alternative Minimum Tax) | | 12/26 at 100.00 | AA- | 1,162,130 |
| 1,990 | | Total Transportation | | | | 2,214,416 |
| | | U.S. Guaranteed – 16.2% (4) | | | | |
| | | Douglas County Hospital Authority 3, Nebraska, Health Facilities Revenue Bonds, Nebraska Methodist Health System, Refunding Series 2008: | | | | |
| 345 | | 5.750%, 11/01/28 (Pre-refunded 11/01/18) | | 11/18 at 100.00 | A- (4) | 368,684 |
| 1,210 | | 5.500%, 11/01/38 (Pre-refunded 11/01/18) | | 11/18 at 100.00 | A- (4) | 1,288,807 |
| 500 | | Missouri Health and Educational Facilities Authority, Revenue Bonds, Washington University, Series 2008A, 5.375%, 3/15/39 (Pre-refunded 3/15/18) | | 3/18 at 100.00 | AAA | 517,940 |
| | | Nebraska Cooperative Republican Platte Enhancement, Middle Republican Natural Resources District, Platte River Flow Revenue, Series 2013: | | | | |
| 2,000 | | 5.125%, 12/15/33 (Pre-refunded 9/10/18) | | 9/18 at 100.00 | A+ (4) | 2,107,920 |
| 520 | | 5.000%, 12/15/38 (Pre-refunded 9/10/18) | | 9/18 at 100.00 | A+ (4) | 547,238 |
| | | Omaha Public Power District, Nebraska, Electric System Revenue Bonds, Series 2008A: | | | | |
| 1,010 | | 5.500%, 2/01/33 (Pre-refunded 2/01/18) | | 2/18 at 100.00 | AA (4) | 1,041,522 |
| 1,200 | | 5.500%, 2/01/35 (Pre-refunded 2/01/18) | | 2/18 at 100.00 | AA (4) | 1,237,452 |
| 450 | | Omaha, Nebraska, General Obligation Bonds, Refunding Series 2008, 5.750%, 10/15/28 (Pre-refunded 10/15/18) | | 10/18 at 100.00 | AA+ (4) | 479,956 |
| 1,500 | | Southern Nebraska Public Power District, Electric System Revenue Bonds, Series 2008, 5.250%, 12/15/28 (Pre-refunded 12/15/18) | | 12/18 at 100.00 | N/R (4) | 1,600,080 |
Nuveen Nebraska Municipal Bond Fund (continued)
| Portfolio of Investments | May 31, 2017 |
| Principal Amount (000) | | Description (1) | | Optional Call Provisions (2) | Ratings (3) | Value |
| | | U.S. Guaranteed (4) (continued) | | | | |
| $ 1,020 | | University of Nebraska, Revenue Bonds, Omaha Health & Recreation Project, Series 2008, 5.000%, 5/15/33 (Pre-refunded 5/15/18) | | 5/18 at 100.00 | Aa1 (4) | $ 1,060,474 |
| 9,755 | | Total U.S. Guaranteed | | | | 10,250,073 |
| | | Utilities – 17.4% | | | | |
| | | Central Plains Energy Project, Nebraska, Gas Project 1 Revenue Bonds, Series 2007A: | | | | |
| 20 | | 5.250%, 12/01/19 | | No Opt. Call | A | 21,875 |
| 800 | | 5.250%, 12/01/21 | | No Opt. Call | A | 910,616 |
| 2,350 | | Central Plains Energy Project, Nebraska, Gas Project 3 Revenue Bonds, Series 2012, 5.000%, 9/01/42 | | 9/22 at 100.00 | A | 2,530,433 |
| 1,500 | | Fremont, Nebraska, Combined Utilities System Revenue Bonds, Series 2014B, 5.000%, 7/15/34 | | 7/21 at 100.00 | AA- | 1,687,605 |
| 235 | | Guam Power Authority, Revenue Bonds, Series 2012A, 5.000%, 10/01/34 | | 10/22 at 100.00 | BBB | 249,887 |
| 75 | | Municipal Energy Agency of Nebraska, Power Supply System Revenue and Refunding Bonds, Series 2009A, 5.000%, 4/01/19 – BHAC Insured | | No Opt. Call | AA+ | 80,471 |
| | | Municipal Energy Agency of Nebraska, Power Supply System Revenue Bonds, Refunding Series 2012A: | | | | |
| 100 | | 5.000%, 4/01/22 | | No Opt. Call | A | 116,272 |
| 110 | | 5.000%, 4/01/31 | | 4/22 at 100.00 | A | 123,295 |
| 1,850 | | Nebraska Public Power District, General Revenue Bonds, Series 2012A, 5.000%, 1/01/34 | | 1/22 at 100.00 | A+ | 2,092,738 |
| 320 | | Omaha Public Power District, Nebraska, Separate Electric System Revenue Bonds, Nebraska City 2, Refunding Series 2015A, 3.500%, 2/01/42 | | 2/25 at 100.00 | A+ | 321,696 |
| 1,000 | | Public Power Generation Agency, Nebraska, Whelan Energy Center Unit 2 Revenue Bonds, Refunding Series 2015A, 5.000%, 1/01/31 | | 1/25 at 100.00 | A2 | 1,143,480 |
| 1,500 | | Public Power Generation Agency, Nebraska, Whelan Energy Center Unit 2 Revenue Bonds, Refunding Series 2016A, 5.000%, 1/01/40 | | 7/26 at 100.00 | A2 | 1,706,265 |
| 9,860 | | Total Utilities | | | | 10,984,633 |
| | | Water and Sewer – 3.9% | | | | |
| 415 | | Guam Government Waterworks Authority, Water and Wastewater System Revenue Bonds, Series 2016, 5.000%, 1/01/46 | | 7/26 at 100.00 | A- | 454,276 |
| 500 | | Metropolitan Utilities District Omaha, Nebraska, Water Revenue Bonds, Series 2015, 3.250%, 12/01/32 | | 12/25 at 100.00 | AA- | 507,440 |
| 1,395 | | Omaha, Nebraska, Sanitary Sewage System Revenue Bonds, Series 2011, 4.250%, 11/15/41 | | 11/21 at 100.00 | AA | 1,476,161 |
| 2,310 | | Total Water and Sewer | | | | 2,437,877 |
| |
| $ 58,230 | | Total Long-Term Investments (cost $59,461,969) | | | | 62,537,836 |
| | | Other Assets Less Liabilities – 1.1% | | | | 719,826 |
| | | Net Assets – 100% | | | | $ 63,257,662 |
| (1) | All percentages shown in the Portfolio of Investments are based on net assets. | |
| (2) | Optional Call Provisions: Dates (month and year) and prices of the earliest optional call or redemption. There may be other call provisions at varying prices at later dates. Certain mortgage-backed securities may be subject to periodic principal paydowns. Optional Call Provisions are not covered by the report of independent registered public accounting firm. | |
| (3) | For financial reporting purposes, the ratings disclosed are the highest of Standard & Poor’s Group (“Standard & Poor’s”), Moody’s Investors Service, Inc. (“Moody’s”) or Fitch, Inc. (“Fitch”) rating. This treatment of split-rated securities may differ from that used for other purposes, such as for Fund investment policies. Ratings below BBB by Standard & Poor’s, Baa by Moody’s or BBB by Fitch are considered to be below investment grade. Holdings designated N/R are not rated by any of these national rating agencies. Ratings are not covered by the report of independent registered public accounting firm. | |
| (4) | Backed by an escrow or trust containing sufficient U.S. Government or U.S. Government agency securities, which ensure the timely payment of principal and interest. Certain bonds backed by U.S. Government or agency securities are regarded as having an implied rating equal to the rating of such securities. | |
| 144A | Investment is exempt from registration under Rule 144A of the Securities Act of 1933, as amended. These investments may only be resold in transactions exempt from registration, which are normally those transactions with qualified institutional buyers. | |
| (WI/DD) | Investment, or portion of investment, purchased on a when-issued or delayed delivery basis. | |
See accompanying notes to financial statements.
NUVEEN 63
Nuveen Oregon Intermediate Municipal Bond Fund
| Portfolio of Investments | May 31, 2017 |
| Principal Amount (000) | | Description (1) | | Optional Call Provisions (2) | Ratings (3) | Value |
| | | LONG-TERM INVESTMENTS – 99.8% | | | | |
| | | MUNICIPAL BONDS – 99.8% | | | | |
| | | Education and Civic Organizations – 7.2% | | | | |
| $ 2,190 | | Forest Grove, Oregon, Campus Improvement Revenue Bonds, Pacific University Project, Refunding Series 2014A, 4.500%, 5/01/29 | | 5/22 at 100.00 | BBB | $2,376,303 |
| 1,095 | | Forest Grove, Oregon, Campus Improvement Revenue Bonds, Pacific University Project, Refunding Series 2015A, 5.000%, 5/01/30 | | 5/25 at 100.00 | BBB | 1,245,256 |
| | | Forest Grove, Oregon, Student Housing Revenue Bonds, Oak Tree Foundation, Inc. Project, Series 2017: | | | | |
| 440 | | 5.000%, 3/01/24 | | No Opt. Call | BBB- | 499,712 |
| 405 | | 5.000%, 3/01/25 | | No Opt. Call | BBB- | 461,429 |
| 1,270 | | Oregon Department of Administrative Services, State Lottery Revenue Bonds, Refunding Series 2014B, 5.000%, 4/01/27 | | 4/24 at 100.00 | AAA | 1,522,070 |
| 1,260 | | Oregon Department of Administrative Services, State Lottery Revenue Bonds, Refunding Series 2015C, 5.000%, 4/01/24 | | No Opt. Call | AAA | 1,545,617 |
| 1,000 | | Oregon Department of Administrative Services, State Lottery Revenue Bonds, Series 2015A, 5.000%, 4/01/28 | | 4/25 at 100.00 | AAA | 1,228,910 |
| 1,040 | | Oregon Facilities Authority, Revenue Bonds, Concordia University Project, Series 2010A, 6.125%, 9/01/30 | | 9/20 at 100.00 | BB+ | 1,204,809 |
| | | Oregon Facilities Authority, Revenue Bonds, Lewis & Clark College Project, Refunding Series 2011A: | | | | |
| 625 | | 4.000%, 10/01/17 | | No Opt. Call | A- | 630,487 |
| 500 | | 5.250%, 10/01/24 | | 10/21 at 100.00 | A- | 567,780 |
| 500 | | Oregon Facilities Authority, Revenue Bonds, Linfield College, Series 2010A, 4.750%, 10/01/28 | | 10/20 at 100.00 | Baa1 | 535,005 |
| 100 | | Oregon Facilities Authority, Revenue Bonds, Redmond Proficiency Academy Project, Series 2015A, 5.500%, 6/15/35 | | 6/25 at 100.00 | N/R | 104,147 |
| 600 | | Oregon Facilities Authority, Revenue Bonds, Redmond Proficiency Academy Project, Series 2016A, 5.000%, 6/15/33 | | 6/25 at 100.00 | N/R | 605,922 |
| 1,000 | | Oregon Facilities Authority, Revenue Bonds, Reed College, Refunding Series 2011A, 5.000%, 7/01/29 | | 7/20 at 100.00 | Aa2 | 1,106,340 |
| | | Oregon Facilities Authority, Revenue Bonds, University of Portland Projects, Series 2015A: | | | | |
| 450 | | 5.000%, 4/01/29 | | 4/25 at 100.00 | A- | 524,439 |
| 700 | | 5.000%, 4/01/30 | | 4/25 at 100.00 | A- | 814,310 |
| 210 | | Oregon Facilities Authority, Revenue Bonds, Willamette University, Refunding Series 2010A, 4.000%, 10/01/24 | | 4/20 at 100.00 | A | 221,388 |
| 285 | | Oregon Facilities Authority, Revenue Bonds, Willamette University, Series 2007A, 4.300%, 10/01/21 | | 10/17 at 100.00 | A | 287,391 |
| 13,670 | | Total Education and Civic Organizations | | | | 15,481,315 |
| | | Health Care – 16.5% | | | | |
| 1,035 | | Astoria Hospital Facilities Authority, Oregon, Hospital Revenue and Refunding Bonds, Columbia Memorial Hospital, Series 2012, 5.000%, 8/01/23 | | 8/22 at 100.00 | BBB- | 1,171,682 |
| Principal Amount (000) | | Description (1) | | Optional Call Provisions (2) | Ratings (3) | Value |
| | | Health Care (continued) | | | | |
| $ 500 | | Deschutes County Hospital Facility Authority, Oregon, Hospital Revenue Bonds, Saint Charles Health System, Inc., Series 2016A, 4.000%, 1/01/33 | | 1/26 at 100.00 | A+ | $529,420 |
| | | Klamath Falls Intercommunity Hospital Authority, Oregon, Revenue Bonds, Sky Lakes Medical Center Project, Refunding Series 2016: | | | | |
| 300 | | 4.000%, 9/01/20 | | No Opt. Call | A- | 325,755 |
| 495 | | 5.000%, 9/01/29 | | 9/26 at 100.00 | A- | 586,877 |
| 400 | | 5.000%, 9/01/31 | | 9/26 at 100.00 | A- | 468,768 |
| 500 | | Klamath Falls Intercommunity Hospital Authority, Oregon, Revenue Bonds, Sky Lakes Medical Center Project, Series 2012, 4.000%, 9/01/24 | | 9/22 at 100.00 | A- | 551,950 |
| 1,900 | | Medford Hospital Facilities Authority, Oregon, Hospital Revenue Bonds, Asante Health System, Refunding Series 2010, 5.500%, 8/15/28 – AGM Insured | | 8/20 at 100.00 | AA | 2,105,504 |
| | | Multnomah County Hospital Facilities Authority, Oregon, Revenue Bonds, Adventist Health System/West, Series 2009A: | | | | |
| 855 | | 4.500%, 9/01/21 | | 9/19 at 100.00 | A | 912,105 |
| 1,940 | | 5.000%, 9/01/21 | | 9/19 at 100.00 | A | 2,110,371 |
| 1,000 | | Oregon Facilities Authority, Revenue Bonds, Legacy Health Project, Refunding Series 2016A, 5.000%, 6/01/30 | | 6/26 at 100.00 | AA- | 1,183,710 |
| 1,020 | | Oregon Facilities Authority, Revenue Bonds, Legacy Health System, Refunding Series 2010A, 4.750%, 3/15/24 | | 3/20 at 100.00 | AA- | 1,104,181 |
| 1,000 | | Oregon Facilities Authority, Revenue Bonds, Peacehealth System, Refunding Series 2009A, 5.000%, 11/01/20 | | 11/19 at 100.00 | A+ | 1,093,580 |
| | | Oregon Facilities Authority, Revenue Bonds, Peacehealth System, Refunding Series 2014A: | | | | |
| 690 | | 5.000%, 11/15/25 | | 5/24 at 100.00 | A+ | 826,641 |
| 4,155 | | 4.125%, 11/15/32 | | 5/24 at 100.00 | A+ | 4,484,367 |
| 375 | | Oregon Facilities Authority, Revenue Bonds, Providence Health & Services, Series 2011C, 5.000%, 10/01/20 | | No Opt. Call | AA- | 421,485 |
| 1,815 | | Oregon Facilities Authority, Revenue Bonds, Providence Health & Services, Series 2013A, 5.000%, 10/01/23 | | No Opt. Call | AA- | 2,181,303 |
| | | Oregon Facilities Authority, Revenue Bonds, Samaritan Health Services, Refunding Series 2010A: | | | | |
| 1,250 | | 5.000%, 10/01/19 | | No Opt. Call | BBB+ | 1,350,525 |
| 500 | | 5.000%, 10/01/24 | | 10/20 at 100.00 | BBB+ | 545,585 |
| | | Oregon Facilities Authority, Revenue Bonds, Samaritan Health Services, Refunding Series 2016A: | | | | |
| 485 | | 5.000%, 10/01/29 | | 10/26 at 100.00 | BBB+ | 555,674 |
| 1,325 | | 5.000%, 10/01/30 | | 10/26 at 100.00 | BBB+ | 1,510,897 |
| | | Oregon Health and Science University, Revenue Bonds, Refunding Series 2012A: | | | | |
| 925 | | 5.000%, 7/01/25 | | 7/22 at 100.00 | AA- | 1,070,613 |
| 1,195 | | 5.000%, 7/01/26 | | 7/22 at 100.00 | AA- | 1,373,067 |
| 4,000 | | Oregon Health and Science University, Revenue Bonds, Refunding Series 2016B, 5.000%, 7/01/33 | | 7/26 at 100.00 | AA- | 4,711,920 |
| 1,000 | | Oregon Health and Science University, Revenue Bonds, Series 2012E, 4.000%, 7/01/29 | | 7/22 at 100.00 | AA- | 1,066,990 |
Nuveen Oregon Intermediate Municipal Bond Fund (continued)
| Portfolio of Investments | May 31, 2017 |
| Principal Amount (000) | | Description (1) | | Optional Call Provisions (2) | Ratings (3) | Value |
| | | Health Care (continued) | | | | |
| | | Salem Hospital Facility Authority, Oregon, Revenue Bonds, Salem Hospital Project, Refunding Series 2016A: | | | | |
| $ 1,355 | | 5.000%, 5/15/29 | | 5/26 at 100.00 | A+ | $1,606,678 |
| 560 | | 5.000%, 5/15/30 | | 5/26 at 100.00 | A+ | 657,110 |
| 1,000 | | 5.000%, 5/15/31 | | 5/26 at 100.00 | A+ | 1,167,150 |
| 31,575 | | Total Health Care | | | | 35,673,908 |
| | | Housing/Multifamily – 2.4% | | | | |
| | | Clackamas County Housing Authority, Oregon, Multifamily Housing Revenue Bonds, Easton Ridge Apartments Project, Series 2013A: | | | | |
| 285 | | 4.000%, 9/01/22 | | No Opt. Call | Aa3 | 316,267 |
| 195 | | 4.000%, 9/01/23 | | 3/23 at 100.00 | Aa3 | 216,676 |
| 340 | | Home Forward, Oregon, Multifamily Housing Revenue Bonds, Lovejoy Station Apartments, Refunding Series 2016, 4.000%, 7/15/29 | | 7/26 at 100.00 | Aa2 | 368,716 |
| | | Oregon Facilities Authority, Revenue Bonds, CHF Ashland Southern Oregon University Project Series 2012: | | | | |
| 1,185 | | 4.350%, 7/01/27 – AGM Insured | | 7/22 at 100.00 | AA | 1,278,568 |
| 400 | | 4.700%, 7/01/33 – AGM Insured | | 7/22 at 100.00 | AA | 429,564 |
| 1,000 | | Oregon Facilities Authority, Revenue Bonds, College Housing Northwest Projects, Refunding Series 2013, 5.000%, 10/01/24 | | 10/23 at 100.00 | BBB- | 1,107,910 |
| | | Oregon Housing and Community Services Department, Multifamily Housing Revenue Bonds, Refunding Series 2010A: | | | | |
| 375 | | 4.000%, 7/01/19 (Alternative Minimum Tax) | | No Opt. Call | Aaa | 392,419 |
| 255 | | 4.250%, 7/01/21 (Alternative Minimum Tax) | | 1/20 at 100.00 | Aaa | 270,897 |
| 705 | | Portland Housing Authority, Oregon, Housing Revenue Bonds, Yards at Union Station Project, Refunding Series 2007, 4.750%, 5/01/22 (Alternative Minimum Tax) | | 7/17 at 100.00 | Aa2 | 706,544 |
| 4,740 | | Total Housing/Multifamily | | | | 5,087,561 |
| | | Long-Term Care – 2.9% | | | | |
| | | Medford Hospital Facilities Authority, Oregon, Revenue Bonds, Rogue Valley Manor, Series 2013: | | | | |
| 250 | | 5.000%, 10/01/19 | | No Opt. Call | A- | 269,865 |
| 450 | | 5.000%, 10/01/24 | | 10/23 at 100.00 | A- | 522,364 |
| 1,500 | | Multnomah County Hospital Facilities Authority, Oregon, Revenue Bond, Terwilliger Plaza, Inc., Refunding Series 2012, 5.000%, 12/01/29 | | 12/22 at 100.00 | BBB | 1,672,455 |
| 325 | | Multnomah County Hospital Facilities Authority, Oregon, Revenue Bond, Terwilliger Plaza, Inc., Refunding Series 2016, 5.000%, 12/01/30 | | 12/26 at 100.00 | BBB | 373,220 |
| 700 | | Multnomah County Hospital Facilities Authority, Oregon, Revenue Bonds, Mirabella South Waterfront, Refunding Series 2014A, 5.000%, 10/01/24 | | No Opt. Call | N/R | 771,883 |
| 1,040 | | Polk County Hospital Facility Authority, Oregon, Revenue Bonds, Dallas Retirement Village Project, Series 2015A, 5.125%, 7/01/35 | | 7/25 at 100.00 | N/R | 1,048,507 |
| | | Salem Hospital Facility Authority, Oregon, Revenue Bonds, Capital Manor, Inc., Refunding Series 2012: | | | | |
| 550 | | 5.000%, 5/15/22 | | No Opt. Call | N/R | 596,497 |
| 550 | | 5.750%, 5/15/27 | | 5/22 at 100.00 | N/R | 608,905 |
| Principal Amount (000) | | Description (1) | | Optional Call Provisions (2) | Ratings (3) | Value |
| | | Long-Term Care (continued) | | | | |
| $ 450 | | Yamhill County Hospital Authority, Oregon, Revenue Bonds, Friendsview Retirement Community, Refunding Series 2016A, 5.000%, 11/15/31 | | 11/24 at 102.00 | N/R | $ 485,501 |
| 5,815 | | Total Long-Term Care | | | | 6,349,197 |
| | | Tax Obligation/General – 31.7% | | | | |
| 1,365 | | Beaverton School District 48J, Washington and Multnomah Counties, Oregon, General Obligation Bonds, Convertible Deferred Interest Series 2017D, 0.000%, 6/15/26 | | No Opt. Call | AA+ | 1,607,151 |
| 620 | | Beaverton School District 48J, Washington and Multnomah Counties, Oregon, General Obligation Bonds, Refunding Series 2016, 4.000%, 6/01/25 | | No Opt. Call | Aa2 | 721,928 |
| 1,105 | | Beaverton School District 48J, Washington and Multnomah Counties, Oregon, General Obligation Bonds, Series 2014B, 5.000%, 6/15/27 | | 6/24 at 100.00 | AA+ | 1,329,182 |
| | | Blue Mountain Hospital District, Grant County, Oregon, General Obligation Bonds, Refunding Series 2010: | | | | |
| 605 | | 4.250%, 2/01/19 | | No Opt. Call | Baa3 | 630,132 |
| 655 | | 4.500%, 2/01/20 | | No Opt. Call | Baa3 | 700,149 |
| 280 | | 5.000%, 2/01/21 | | No Opt. Call | Baa3 | 309,179 |
| | | Central Oregon Community College District, Crook, Jefferson, Deschutes, Klamath, Lake, and Wasco Counties, Oregon, General Obligation Bonds, Series 2010: | | | | |
| 1,000 | | 4.000%, 6/15/19 | | No Opt. Call | AA+ | 1,062,160 |
| 810 | | 4.500%, 6/15/20 | | No Opt. Call | AA+ | 894,499 |
| 500 | | Central Oregon Community College District, Crook, Jefferson, Deschutes, Klamath, Lake, and Wasco Counties, Oregon, General Obligation Bonds, Series 2014, 5.000%, 6/01/29 | | 6/24 at 100.00 | AA- | 585,100 |
| 1,100 | | Chemeketa Community College District, Oregon, General Obligation Bonds, Refunding Series 2014, 5.000%, 6/15/26 | | 6/24 at 100.00 | AA+ | 1,323,234 |
| 1,250 | | Clackamas and Washington Counties School District 3JT, Oregon, General Obligation Bonds, Refunding Series 2015, 5.000%, 6/15/28 | | 6/25 at 100.00 | AA+ | 1,516,650 |
| 1,135 | | Clackamas County School District 12, North Clackamas, Oregon, General Obligation Bonds, Refunding Series 2014, 5.000%, 6/15/28 | | 6/24 at 100.00 | AA+ | 1,359,015 |
| 1,000 | | Clackamas County School District 12, North Clackamas, Oregon, General Obligation Bonds, Series 2017B, 5.000%, 6/15/30 | | 6/27 at 100.00 | AA+ | 1,237,300 |
| 1,500 | | Clackamas County School District 46 Oregon Trail, Oregon, General Obligation Bonds, Refunding Series 2017, 5.000%, 6/15/30 (WI/DD, Settling 6/13/17) | | 6/27 at 100.00 | AA+ | 1,851,900 |
| 1,000 | | Clackamas County School District 46 Oregon Trail, Oregon, General Obligation Bonds, Series 2009A, 5.000%, 6/15/24 | | 6/19 at 100.00 | AA+ | 1,082,290 |
| 580 | | Clackamas County School District 62, Oregon City, Oregon, General Obligation Bonds, Refunding Series 2014, 5.000%, 6/01/29 – AGM Insured | | 6/24 at 100.00 | AA | 684,452 |
| 525 | | Clackamas County School District 86, Oregon, General Obligation Bonds, Refunding Series 2012A, 5.000%, 6/15/25 | | 6/22 at 100.00 | AA+ | 619,930 |
| 1,000 | | David Douglas School District 40, Multnomah County, Oregon, General Obligation Bonds, Series 2012B, 0.000%, 6/15/25 | | No Opt. Call | AA+ | 848,690 |
| 3,055 | | Deschutes and Jefferson Counties School District 2J Redmond, Oregon, General Obligation Bonds, Series 2008, 0.000%, 6/15/22 | | No Opt. Call | Aa1 | 2,830,641 |
| 1,770 | | Deschutes County Administrative School District 1, Bend-La Pine, Oregon, General Obligation Bonds, Refunding Series 2013, 4.000%, 6/15/21 | | No Opt. Call | Aa1 | 1,974,860 |
| 1,060 | | Deschutes County Administrative School District 1, Bend-La Pine, Oregon, General Obligation Bonds, Series 2013B, 4.000%, 6/15/19 | | No Opt. Call | Aa1 | 1,127,384 |
Nuveen Oregon Intermediate Municipal Bond Fund (continued)
| Portfolio of Investments | May 31, 2017 |
| Principal Amount (000) | | Description (1) | | Optional Call Provisions (2) | Ratings (3) | Value |
| | | Tax Obligation/General (continued) | | | | |
| | | Jackson County School District 549C, Oregon, General Obligation Bonds, Refunding Series 2015: | | | | |
| $ 2,000 | | 5.000%, 12/15/20 | | No Opt. Call | AA+ | $2,275,000 |
| 1,250 | | 5.000%, 12/15/28 | | 6/25 at 100.00 | AA+ | 1,513,050 |
| 1,000 | | Josephine County Unit School District Three Rivers, Oregon, General Obligation Bonds, Refunding Series 2005, 5.000%, 12/15/19 – FGIC Insured | | No Opt. Call | Aa1 | 1,099,590 |
| 560 | | Keizer, Oregon, General Obligation Assessment Bonds, Keizer Station Area A Local Improvement District, Series 2008, 5.200%, 6/01/31 | | 6/18 at 100.00 | Aa3 | 579,230 |
| 200 | | Lake Oswego School District 7J, Clackamas County, Oregon, General Obligation Bonds, Refunding Series 2005, 5.250%, 6/01/25 – AGM Insured | | No Opt. Call | Aa1 | 252,630 |
| | | Local Oregon Capital Assets Program, Certificates of Participation, City of Cottage Grove, Series 2013A: | | | | |
| 975 | | 4.000%, 9/15/19 | | No Opt. Call | Baa1 | 1,019,489 |
| 1,105 | | 4.250%, 9/15/23 | | 9/21 at 100.00 | Baa1 | 1,174,725 |
| 1,000 | | Marion County School District 103 Woodburn, Oregon, General Obligation Bonds, Series 2015, 5.000%, 6/15/27 | | 6/25 at 100.00 | Aa1 | 1,215,430 |
| 300 | | Marion-Clackamas Counties School District 4J Silver Falls, Oregon, General Obligation Bonds, Refunding Series 2013, 5.000%, 6/15/24 | | 6/23 at 100.00 | Aa1 | 355,488 |
| | | Multnomah County School District 7, Reynolds, Oregon, General Obligation Bonds, Series 2015A: | | | | |
| 1,500 | | 5.000%, 6/15/29 | | 6/25 at 100.00 | Aa1 | 1,811,370 |
| 2,250 | | 5.000%, 6/15/30 | | 6/25 at 100.00 | Aa1 | 2,701,845 |
| 1,015 | | Multnomah-Clackamas Counties School District 10JT, Oregon, General Obligation Bonds, Series 2005, 5.250%, 6/15/17 – AGM Insured | | No Opt. Call | AA+ | 1,016,807 |
| 1,500 | | Oregon Department of Administrative Services, General Obligation Bonds, Oregon Opportunity, Refunding Series 2010F, 5.000%, 12/01/20 | | 6/20 at 100.00 | AA+ | 1,682,415 |
| | | Oregon State, General Obligation Bonds, Alternative Energy Series 2011B: | | | | |
| 540 | | 5.000%, 1/01/20 (Alternative Minimum Tax) | | No Opt. Call | AA+ | 587,709 |
| 560 | | 5.000%, 1/01/21 (Alternative Minimum Tax) | | No Opt. Call | AA+ | 626,461 |
| 100 | | 5.000%, 1/01/23 (Alternative Minimum Tax) | | 1/21 at 100.00 | AA+ | 110,688 |
| 2,255 | | Oregon State, General Obligation Bonds, Article XI-Q State Projects, Refunding Series 2016G, 5.000%, 11/01/29 | | 5/26 at 100.00 | AA+ | 2,761,924 |
| 455 | | Pacific City Joint Water-Sanitary Authority, Tilamook County, Oregon, General Obligation Bonds, Series 2007, 4.650%, 7/01/22 | | 7/17 at 100.00 | N/R | 456,574 |
| | | Pacific Communities Health District, Oregon, General Obligation Bonds, Series 2016: | | | | |
| 750 | | 5.000%, 6/01/29 | | 6/26 at 100.00 | A1 | 906,390 |
| 1,000 | | 5.000%, 6/01/30 | | 6/26 at 100.00 | A1 | 1,194,290 |
| 770 | | 5.000%, 6/01/31 | | 6/26 at 100.00 | A1 | 914,044 |
| 900 | | Portland Community College District, Multnomah County, Oregon, General Obligation Bonds, Refunding Series 2016, 5.000%, 6/15/29 | | 6/26 at 100.00 | Aa1 | 1,104,561 |
| 2,235 | | Portland, Oregon, General Obligation Bonds, Sellwood Bridge Project, Series 2014A, 5.000%, 6/01/28 | | 6/24 at 100.00 | Aaa | 2,661,438 |
| 340 | | Redmond, Oregon, Full Faith and Credit Obligations, Refunding Series 2012A, 4.000%, 6/01/25 | | 6/22 at 100.00 | Aa3 | 371,389 |
| 350 | | Redmond, Oregon, Full Faith and Credit Obligations, Series 2014A, 5.000%, 6/01/25 | | 6/24 at 100.00 | Aa3 | 418,065 |
| Principal Amount (000) | | Description (1) | | Optional Call Provisions (2) | Ratings (3) | Value |
| | | Tax Obligation/General (continued) | | | | |
| | | Redmond, Oregon, Full Faith and Credit Obligations, Terminal Expansion Project, Series 2009: | | | | |
| $ 240 | | 4.000%, 6/01/21 | | 6/19 at 100.00 | Aa3 | $252,370 |
| 200 | | 4.250%, 6/01/23 | | 6/19 at 100.00 | Aa3 | 210,304 |
| 500 | | 4.625%, 6/01/29 | | 6/19 at 100.00 | Aa3 | 527,510 |
| 400 | | Salem, Oregon, General Obligation Bonds, Series 2009, 5.000%, 6/01/22 | | 6/19 at 100.00 | AA | 431,340 |
| 800 | | Salem-Keizer School District 24J, Marion and Polk Counties, Oregon, General Obligation Bonds, Series 2009B, 0.000%, 6/15/22 | | No Opt. Call | AA+ | 741,248 |
| 1,385 | | Tualatin Hills Park and Recreation District, Oregon, General Obligation Bonds, Refunding Series 2015, 5.000%, 6/01/26 | | 6/25 at 100.00 | Aa1 | 1,695,185 |
| 1,080 | | Umatilla County School District 016R Pendleton, Oregon, General Obligation Bonds, Series 2014A, 5.000%, 6/15/29 | | 6/24 at 100.00 | Aa1 | 1,275,286 |
| | | Umatilla County School District 6R Umatilla, Oregon, General Obligation Bonds, Series 2017: | | | | |
| 245 | | 0.000%, 6/15/27 | | No Opt. Call | AA+ | 229,496 |
| 340 | | 0.000%, 6/15/29 | | 6/27 at 100.00 | AA+ | 313,113 |
| 315 | | 0.000%, 6/15/31 | | 6/27 at 100.00 | AA+ | 286,549 |
| 500 | | Wasco County School District 012, Oregon, General Obligation Bonds, Series 2001 Refunding, 5.500%, 6/15/19 – AGM Insured | | No Opt. Call | AA | 546,060 |
| 1,250 | | Washington and Clackamas Counties School District 23J Tigard-Tualatin, Oregon, General Obligation Bonds, Series 2017, 5.000%, 6/15/30 | | 6/27 at 100.00 | AA+ | 1,546,625 |
| 965 | | Washington County School District 15, Forest Grove, Washington, General Obligation Bonds, Series 2012, 0.000%, 6/15/25 | | No Opt. Call | AA+ | 818,986 |
| 1,320 | | Washington County, Oregon, General Obligation Bonds, Full Faith & Credit Obligation Series 2016B, 4.000%, 3/01/31 | | 3/26 at 100.00 | Aaa | 1,457,227 |
| 1,200 | | Washington Multnomah & Yamhill Counties School District 1J Hillsboro, Oregon, General Obligation Bonds, Refunding Series 2012, 4.000%, 6/15/23 | | 6/22 at 100.00 | Aa1 | 1,350,720 |
| 1,000 | | Washington, Clackamas and Yamhill Counties School District 88J Sherwood, Oregon, General Obligation Bonds, Series 2017B, 5.000%, 6/15/30 | | 6/27 at 100.00 | AA+ | 1,235,290 |
| | | Yamhill County School District 40, McMinnville, Oregon, General Obligation Bonds, Refunding Series 2016: | | | | |
| 1,000 | | 4.000%, 6/15/31 | | 6/26 at 100.00 | AA+ | 1,112,120 |
| 1,000 | | 4.000%, 6/15/32 | | 6/26 at 100.00 | AA+ | 1,103,640 |
| 60,565 | | Total Tax Obligation/General | | | | 68,239,497 |
| | | Tax Obligation/Limited – 13.2% | | | | |
| | | Government of Guam, Business Privilege Tax Bonds, Refunding Series 2015D: | | | | |
| 2,260 | | 5.000%, 11/15/28 | | 11/25 at 100.00 | A | 2,544,783 |
| 500 | | 5.000%, 11/15/29 | | 11/25 at 100.00 | A | 558,700 |
| 585 | | Oregon Department of Administrative Services, Certificates of Participation, Series 2009C, 5.000%, 11/01/25 | | 11/19 at 100.00 | AA | 637,100 |
| | | Oregon State Department of Transportation, Highway User Tax Revenue Bonds, Refunding Senior Lien Series 2014A: | | | | |
| 1,980 | | 5.000%, 11/15/26 | | 11/24 at 100.00 | AAA | 2,429,896 |
| 1,000 | | 5.000%, 11/15/27 | | 11/24 at 100.00 | AAA | 1,219,210 |
Nuveen Oregon Intermediate Municipal Bond Fund (continued)
| Portfolio of Investments | May 31, 2017 |
| Principal Amount (000) | | Description (1) | | Optional Call Provisions (2) | Ratings (3) | Value |
| | | Tax Obligation/Limited (continued) | | | | |
| | | Oregon State Department of Transportation, Highway User Tax Revenue Bonds, Refunding Senior Lien Series 2015A: | | | | |
| $ 2,000 | | 5.000%, 11/15/27 | | 11/24 at 100.00 | AAA | $2,438,420 |
| 3,000 | | 5.000%, 11/15/28 | | 11/24 at 100.00 | AAA | 3,636,090 |
| 3,400 | | Oregon State Department of Transportation, Highway User Tax Revenue Bonds, Senior Lien Series 2017A, 5.000%, 11/15/27 (WI/DD, Settling 6/08/17) | | 5/27 at 100.00 | AAA | 4,322,012 |
| 1,000 | | Portland, Oregon, River District Urban Renewal and Redevelopment Bonds, Series 2012B, 5.000%, 6/15/23 | | 6/22 at 100.00 | A1 | 1,168,770 |
| 2,030 | | Portland, Oregon, South Park Blocks Urban Renewal and Redevelopment Bonds, Series 2008B, 5.000%, 6/15/21 | | 6/18 at 101.00 | Aa3 | 2,133,002 |
| 2,655 | | Portland, Oregon, Urban Renewal and Redevelopment Revenue Bonds, North Macadam Series 2010B, 5.000%, 6/15/24 | | 6/20 at 100.00 | A1 | 2,936,244 |
| | | Tri-County Metropolitan Transportation District, Oregon, Capital Grant Receipt Revenue Bonds, Series 2011A: | | | | |
| 1,000 | | 5.000%, 10/01/25 | | 10/21 at 100.00 | A | 1,134,920 |
| 1,715 | | 5.000%, 10/01/26 | | 10/21 at 100.00 | A | 1,933,971 |
| 1,205 | | Tri-County Metropolitan Transportation District, Oregon, Payroll Tax Revenue Bonds, Refunding Senior Lien Series 2016A, 4.000%, 9/01/32 | | 9/26 at 100.00 | AAA | 1,348,130 |
| 24,330 | | Total Tax Obligation/Limited | | | | 28,441,248 |
| | | Transportation – 3.5% | | | | |
| | | Jackson County, Oregon, Airport Revenue Bonds, Refunding Series 2016: | | | | |
| 395 | | 5.000%, 12/01/30 – AGM Insured | | 6/26 at 100.00 | AA | 475,616 |
| 430 | | 5.000%, 12/01/31 – AGM Insured | | 6/26 at 100.00 | AA | 515,394 |
| 380 | | 5.000%, 12/01/33 – AGM Insured | | 6/26 at 100.00 | AA | 450,752 |
| 350 | | 4.000%, 12/01/34 – AGM Insured | | 6/26 at 100.00 | AA | 374,857 |
| 1,005 | | Port of Portland, Oregon, International Airport Revenue Bonds, Series 2010-20C, 5.000%, 7/01/17 (Alternative Minimum Tax) | | No Opt. Call | AA- | 1,008,477 |
| 1,030 | | Port of Portland, Oregon, International Airport Revenue Bonds, Series 2011, 5.000%, 7/01/23 (Alternative Minimum Tax) | | 7/21 at 100.00 | AA- | 1,169,194 |
| 350 | | Port of Portland, Oregon, International Airport Revenue Bonds, Series 2011-21, 5.000%, 7/01/18 (Alternative Minimum Tax) | | No Opt. Call | AA- | 364,851 |
| 1,250 | | Port of Portland, Oregon, International Airport Revenue Bonds, Series 2015-23, 5.000%, 7/01/28 | | 7/25 at 100.00 | AA- | 1,507,875 |
| 1,500 | | Port of Portland, Oregon, Portland International Airport Passenger Facility Charge Revenue Bonds, Series 2011A, 5.000%, 7/01/26 | | 7/21 at 100.00 | A | 1,680,600 |
| 6,690 | | Total Transportation | | | | 7,547,616 |
| | | U.S. Guaranteed – 10.8% (4) | | | | |
| 1,000 | | Chemeketa Community College District, Oregon, General Obligation Bonds, Series 2008, 5.500%, 6/15/24 (Pre-refunded 6/15/18) | | 6/18 at 100.00 | AA+ (4) | 1,048,450 |
| 1,000 | | Clackamas County Hospital Facility Authority, Oregon, Revenue Bonds, Legacy Health System, Series 2009A, 5.000%, 7/15/21 (Pre-refunded 7/15/19) | | 7/19 at 100.00 | AA- (4) | 1,085,020 |
| 685 | | Clackamas County School District 12, North Clackamas, Oregon, General Obligation Bonds, Series 2007B, 5.000%, 6/15/19 (Pre-refunded 6/15/17) – AGM Insured | | 6/17 at 100.00 | AA+ (4) | 686,130 |
| Principal Amount (000) | | Description (1) | | Optional Call Provisions (2) | Ratings (3) | Value |
| | | U.S. Guaranteed (4) (continued) | | | | |
| $ 1,500 | | Deschutes County Hospital Facility Authority, Oregon, Hospital Revenue Bonds, Cascade Healthcare Community, Inc., Refunding Series 2008, 7.375%, 1/01/23 (Pre-refunded 1/01/19) | | 1/19 at 100.00 | A2 (4) | $1,648,065 |
| 1,500 | | Lane County Metropolitan Wastewater Management Commission, Oregon, Wastewater Revenue Bonds, Series 2008, 5.000%, 11/01/22 (Pre-refunded 11/01/18) | | 11/18 at 100.00 | AA (4) | 1,587,165 |
| 1,635 | | Metro, Oregon, General Obligation Bonds, Series 2007, 5.000%, 6/01/20 (Pre-refunded 6/01/17) | | 6/17 at 100.00 | AAA | 1,635,000 |
| 1,500 | | Oregon Department of Administrative Services, Certificates of Participation, Series 2009A, 4.700%, 5/01/25 (Pre-refunded 5/01/19) | | 5/19 at 100.00 | AA (4) | 1,606,380 |
| 470 | | Oregon Department of Administrative Services, Certificates of Participation, Series 2009C, 5.000%, 11/01/25 (Pre-refunded 11/01/19) | | 11/19 at 100.00 | N/R (4) | 515,205 |
| 2,000 | | Oregon Facilities Authority, Revenue Bonds, University of Portland Projects, Series 2007A, 4.500%, 4/01/21 (Pre-refunded 4/01/18) | | 4/18 at 100.00 | A- (4) | 2,061,400 |
| 800 | | Oregon Facilities Authority, Revenue Bonds, Willamette University, Series 2007A, 4.300%, 10/01/21 (Pre-refunded 10/01/17) | | 10/17 at 100.00 | N/R (4) | 809,232 |
| 1,055 | | Oregon State Department of Transportation, Highway User Tax Revenue Bonds, Senior Lien Series 2009A, 5.000%, 11/15/21 (Pre-refunded 5/15/19) | | 5/19 at 100.00 | AAA | 1,138,451 |
| 1,455 | | Portland, Oregon, Economic Development Revenue Refunding Bonds, Broadway Project, Series 2008A, 6.250%, 4/01/23 (Pre-refunded 10/01/18) | | 10/18 at 100.00 | A1 (4) | 1,556,908 |
| 1,500 | | Salem Hospital Facility Authority, Oregon, Revenue Bonds, Salem Hospital Project, Series 2008A, 5.750%, 8/15/23 (Pre-refunded 8/15/18) | | 8/18 at 100.00 | A+ (4) | 1,587,900 |
| 2,305 | | Tri-County Metropolitan Transportation District, Oregon, Payroll Tax Revenue Bonds, Senior Lien Series 2012A, 5.000%, 9/01/24 (Pre-refunded 9/01/22) | | 9/22 at 100.00 | AAA | 2,742,420 |
| 2,490 | | Washington Multnomah & Yamhill Counties School District 1J Hillsboro, Oregon, General Obligation Bonds, Series 2006, 5.000%, 6/15/19 (Pre-refunded 6/15/17) – NPFG Insured | | 6/17 at 100.00 | Aa2 (4) | 2,494,158 |
| 1,040 | | Yamhill County School District 40, McMinnville, Oregon, General Obligation Bonds, Series 2007, 5.000%, 6/15/23 (Pre-refunded 6/15/17) – AGM Insured | | 6/17 at 100.00 | Aa1 (4) | 1,041,726 |
| 21,935 | | Total U.S. Guaranteed | | | | 23,243,610 |
| | | Utilities – 1.3% | | | | |
| | | Central Lincoln Peoples Utility District, Oregon, Electric Revenue Bonds, Series 2016: | | | | |
| 500 | | 3.500%, 12/01/29 | | 12/25 at 100.00 | AA- | 529,255 |
| 610 | | 3.750%, 12/01/30 | | 12/25 at 100.00 | AA- | 654,560 |
| 350 | | 5.000%, 12/01/33 | | 12/25 at 100.00 | AA- | 408,174 |
| 350 | | 5.000%, 12/01/34 | | 12/25 at 100.00 | AA- | 406,452 |
| 500 | | Emerald Peoples Utility District, Oregon, Electric System Revenue Bonds, Refunding Series 2013, 5.000%, 11/01/22 – AGM Insured | | No Opt. Call | A1 | 583,145 |
| 250 | | Guam Power Authority, Revenue Bonds, Series 2012A, 5.000%, 10/01/21 – AGM Insured | | No Opt. Call | AA | 282,305 |
| 2,560 | | Total Utilities | | | | 2,863,891 |
| | | Water and Sewer – 10.3% | | | | |
| 1,295 | | Albany, Oregon, General Obligation Bonds, Refunding Series 2013, 5.000%, 8/01/25 | | 8/23 at 100.00 | Aa3 | 1,554,168 |
| 630 | | Bend, Deschutes County, Oregon, Water Revenue Bonds, Refunding Series 2016, 5.000%, 12/01/23 | | No Opt. Call | AA | 769,595 |
Nuveen Oregon Intermediate Municipal Bond Fund (continued)
| Portfolio of Investments | May 31, 2017 |
| Principal Amount (000) | | Description (1) | | Optional Call Provisions (2) | Ratings (3) | Value |
| | | Water and Sewer (continued) | | | | |
| | | Clackamas River Water, Oregon, Water Revenue Bonds, Series 2016: | | | | |
| $ 300 | | 4.000%, 11/01/27 | | 5/25 at 100.00 | AA- | $339,108 |
| 150 | | 5.000%, 11/01/28 | | 5/25 at 100.00 | AA- | 180,137 |
| 350 | | 5.000%, 11/01/30 | | 5/25 at 100.00 | AA- | 415,849 |
| 270 | | 5.000%, 11/01/33 | | 5/25 at 100.00 | AA- | 316,089 |
| | | Eugene, Oregon, Water Utility System Revenue Bonds, Refunding Series 2016: | | | | |
| 400 | | 5.000%, 8/01/27 | | 8/26 at 100.00 | AA+ | 497,896 |
| 500 | | 4.000%, 8/01/32 | | 8/26 at 100.00 | AA+ | 549,895 |
| | | Guam Government Waterworks Authority, Water and Wastewater System Revenue Bonds, Series 2016: | | | | |
| 1,065 | | 5.000%, 7/01/28 | | 7/26 at 100.00 | A- | 1,228,659 |
| 1,120 | | 5.000%, 7/01/29 | | 7/26 at 100.00 | A- | 1,282,086 |
| 1,180 | | 5.000%, 7/01/30 | | 7/26 at 100.00 | A- | 1,341,766 |
| 2,250 | | Lane County Metropolitan Wastewater Management Commission, Oregon, Wastewater Revenue Bonds, Refunding Series 2016, 4.000%, 11/01/24 | | No Opt. Call | AA | 2,618,460 |
| 3,070 | | Portland, Oregon, Sewer System Revenue Bonds, Second Lien Series 2015B, 5.000%, 6/01/25 | | No Opt. Call | AA- | 3,802,625 |
| 2,500 | | Portland, Oregon, Water System Revenue Bonds, Refunding First Lien Series 2016A, 4.000%, 4/01/33 | | 4/26 at 100.00 | Aaa | 2,749,700 |
| | | Redmond, Oregon, Water Revenue Bonds, Series 2010: | | | | |
| 450 | | 4.500%, 6/01/25 | | 6/20 at 100.00 | Aa3 | 488,795 |
| 5 | | 4.500%, 6/01/30 | | 6/20 at 100.00 | Aa3 | 5,346 |
| 1,000 | | Sunrise Water Authority, Oregon, Water Revenue Bonds, Refunding Series 2014, 4.000%, 3/01/23 | | No Opt. Call | AA | 1,137,150 |
| 325 | | The Dalles, Oregon, Water Revenue Bonds, Series 200, 4.250%, 6/01/20 – AMBAC Insured | | 6/17 at 100.00 | N/R | 325,868 |
| 1,435 | | Tigard, Washington County, Oregon, Water System Revenue Bonds, Series 2012, 5.000%, 8/01/26 | | 8/22 at 100.00 | AA- | 1,688,392 |
| 900 | | Woodburn, Marion County, Oregon, Wastewater Revenue Bonds, Refunding Series 2011A, 5.000%, 3/01/20 | | No Opt. Call | A2 | 984,537 |
| 19,195 | | Total Water and Sewer | | | | 22,276,121 |
| |
| $ 191,075 | | Total Long-Term Investments (cost $206,721,806) | | | | 215,203,964 |
| Principal Amount (000) | | Description (1) | | Optional Call
Provisions (2) | Ratings (3) | Value |
| | | SHORT-TERM INVESTMENTS – 1.8% | | | | |
| | | MUNICIPAL BONDS – 1.8% | | | | |
| | | Health Care – 1.8% | | | | |
| $ 3,750 | | Salem Hospital Facility Authority, Oregon, Revenue Bonds, Salem Hospital, Variable Rate Demand Obligation Series 2008B, 0.890%, 8/15/34 (5) | | 7/17 at 100.00 | A-1+ | $ 3,750,000 |
| $ 3,750 | | Total Short-Term Investments (cost $3,750,000) | | | | 3,750,000 |
| | | Total Investments (cost $210,471,806) – 101.6% | | | | 218,953,964 |
| | | Other Assets Less Liabilities – (1.6)% | | | | (3,404,175) |
| | | Net Assets – 100% | | | | $ 215,549,789 |
| (1) | All percentages shown in the Portfolio of Investments are based on net assets. | |
| (2) | Optional Call Provisions: Dates (month and year) and prices of the earliest optional call or redemption. There may be other call provisions at varying prices at later dates. Certain mortgage-backed securities may be subject to periodic principal paydowns. Optional Call Provisions are not covered by the report of independent registered public accounting firm. | |
| (3) | For financial reporting purposes, the ratings disclosed are the highest of Standard & Poor’s Group (“Standard & Poor’s”), Moody’s Investors Service, Inc. (“Moody’s”) or Fitch, Inc. (“Fitch”) rating. This treatment of split-rated securities may differ from that used for other purposes, such as for Fund investment policies. Ratings below BBB by Standard & Poor’s, Baa by Moody’s or BBB by Fitch are considered to be below investment grade. Holdings designated N/R are not rated by any of these national rating agencies. Ratings are not covered by the report of independent registered public accounting firm. | |
| (4) | Backed by an escrow or trust containing sufficient U.S. Government or U.S. Government agency securities, which ensure the timely payment of principal and interest. Certain bonds backed by U.S. Government or agency securities are regarded as having an implied rating equal to the rating of such securities. | |
| (5) | Investment has a maturity of greater than one year, but has variable rate and/or demand features which qualify it as a short-term investment. The rate disclosed is that in effect as of the end of the reporting period. This rate changes periodically based on market conditions or a specified market index. | |
| (WI/DD) | Investment, or portion of investment, purchased on a when-issued or delayed delivery basis. | |
See accompanying notes to financial statements.
NUVEEN 73
Statement of
Assets and Liabilities
May 31, 2017
| | Minnesota
Intermediate | Minnesota | Nebraska | Oregon
Intermediate |
| Assets | | | | |
| Long-term investments, at value (cost $320,117,487, $320,883,120, $59,461,969 and $206,721,806, respectively) | $334,871,238 | $338,180,907 | $62,537,836 | $215,203,964 |
| Short-term investments, at value (cost approximates value) | — | 10,740,000 | — | 3,750,000 |
| Cash | 444,215 | 1,230,258 | 650,987 | 482,768 |
| Receivable for: | | | | |
| Interest | 4,006,651 | 4,096,925 | 842,455 | 2,662,392 |
| Shares sold | 184,755 | 887,670 | 21,891 | 78,572 |
| Other assets | 20,491 | 15,935 | 14,251 | 9,741 |
| Total assets | 339,527,350 | 355,151,695 | 64,067,420 | 222,187,437 |
| Liabilities | | | | |
| Payable for: | | | | |
| Dividends | 417,256 | 210,865 | 39,196 | 223,706 |
| Investments purchased | — | 516,615 | 523,055 | 6,047,562 |
| Shares redeemed | 337,494 | 979,020 | 172,126 | 196,535 |
| Accrued expenses: | | | | |
| Directors fees | 12,908 | 7,049 | 637 | 2,122 |
| Management fees | 149,216 | 153,238 | 25,761 | 96,692 |
| 12b-1 distribution and service fees | 31,710 | 60,971 | 10,630 | 15,328 |
| Other | 80,423 | 98,700 | 38,353 | 55,703 |
| Total liabilities | 1,029,007 | 2,026,458 | 809,758 | 6,637,648 |
| Net assets | $338,498,343 | $353,125,237 | $63,257,662 | $215,549,789 |
| Class A Shares | | | | |
| Net assets | $ 90,430,662 | $152,704,441 | $26,200,839 | $ 44,776,403 |
| Shares outstanding | 8,647,364 | 13,005,835 | 2,433,885 | 4,337,553 |
| Net asset value ("NAV") per share | $ 10.46 | $ 11.74 | $ 10.77 | $ 10.32 |
| Offering price per share (NAV per share plus maximum sales charge of 3.00%, 4.20%, 4.20% and 3.00%, respectively, of offering price) | $ 10.78 | $ 12.25 | $ 11.24 | $ 10.64 |
| Class C Shares | | | | |
| Net assets | $ 13,521,938 | $ 28,194,851 | $ 2,966,446 | $ 4,065,585 |
| Shares outstanding | 1,301,024 | 2,404,354 | 276,296 | 396,106 |
| NAV and offering price per share | $ 10.39 | $ 11.73 | $ 10.74 | $ 10.26 |
| Class C1 Shares | | | | |
| Net assets | $ 2,117,923 | $ 11,561,586 | $ 2,339,299 | $ — |
| Shares outstanding | 201,929 | 988,862 | 218,829 | — |
| NAV and offering price per share | $ 10.49 | $ 11.69 | $ 10.69 | $ — |
| Class C2 Shares | | | | |
| Net assets | $ 5,937,276 | $ 8,105,906 | $ 3,549,456 | $ 6,707,954 |
| Shares outstanding | 569,848 | 690,120 | 329,459 | 651,352 |
| NAV and offering price per share | $ 10.42 | $ 11.75 | $ 10.77 | $ 10.30 |
| Class I Shares | | | | |
| Net assets | $226,490,544 | $152,558,453 | $28,201,622 | $159,999,847 |
| Shares outstanding | 21,768,690 | 13,005,830 | 2,616,512 | 15,481,960 |
| NAV and offering price per share | $ 10.40 | $ 11.73 | $ 10.78 | $ 10.33 |
| Net assets consist of: | | | | |
| Capital paid-in | $325,213,142 | $344,632,526 | $62,333,384 | $210,062,103 |
| Undistributed (Over-distribution of) net investment income | 218,351 | 262,245 | 85,782 | (20,041) |
| Accumulated net realized gain (loss) | (1,686,901) | (9,067,321) | (2,237,371) | (2,974,431) |
| Net unrealized appreciation (depreciation) | 14,753,751 | 17,297,787 | 3,075,867 | 8,482,158 |
| Net assets | $338,498,343 | $353,125,237 | $63,257,662 | $215,549,789 |
| Authorized shares – per class | 2 billion | 2 billion | 2 billion | 2 billion |
| Par value per share | $ 0.0001 | $ 0.0001 | $ 0.0001 | $ 0.0001 |
See accompanying notes to financial statements.
Statement of
Operations
Year Ended May 31, 2017
| | Minnesota
Intermediate | Minnesota | Nebraska | Oregon
Intermediate |
| Investment Income | $12,352,002 | $13,713,409 | $ 2,537,704 | $ 6,826,393 |
| Expenses | | | | |
| Management fees | 1,795,539 | 1,799,468 | 337,301 | 1,182,635 |
| 12b-1 service fees - Class A Shares | 188,377 | 316,996 | 53,383 | 109,085 |
| 12b-1 distibution and service fees - Class C Shares | 129,423 | 254,691 | 30,181 | 40,896 |
| 12b-1 distibution and service fees - Class C1 Shares | 14,263 | 79,898 | 16,872 | — |
| 12b-1 distibution and service fees - Class C2 Shares | 47,595 | 66,454 | 27,374 | 55,411 |
| Shareholder servicing agent fees | 99,735 | 124,341 | 28,684 | 52,574 |
| Custodian fees | 70,496 | 64,073 | 17,224 | 45,987 |
| Directors fees | 10,234 | 10,409 | 2,047 | 6,603 |
| Professional fees | 46,492 | 47,490 | 28,254 | 38,853 |
| Shareholder reporting expenses | 26,597 | 45,284 | 14,688 | 17,151 |
| Federal and state registration fees | 21,609 | 29,784 | 29,560 | 18,828 |
| Other | 13,062 | 13,947 | 4,263 | 8,841 |
| Total expenses before fee waiver/expense reimbursement | 2,463,422 | 2,852,835 | 589,831 | 1,576,864 |
| Fee waiver/expense reimbursement | — | — | (28,430) | — |
| Net expenses | 2,463,422 | 2,852,835 | 561,401 | 1,576,864 |
| Net investment income (loss) | 9,888,580 | 10,860,574 | 1,976,303 | 5,249,529 |
| Realized and Unrealized Gain (Loss) | | | | |
| Net realized gain (loss) from investments | (842,084) | (2,682,236) | (176,606) | (1,586,506) |
| Change in net unrealized appreciation (depreciation) of investments | (6,739,454) | (6,365,914) | (1,731,266) | (3,059,136) |
| Net realized and unrealized gain (loss) | (7,581,538) | (9,048,150) | (1,907,872) | (4,645,642) |
| Net increase (decrease) in net assets from operations | $ 2,307,042 | $ 1,812,424 | $ 68,431 | $ 603,887 |
See accompanying notes to financial statements.
Statement of
Changes in Net Assets
| | Minnesota Intermediate | | Minnesota |
| | Year Ended
5/31/17 | Year Ended
5/31/16 | | Year Ended
5/31/17 | Year Ended
5/31/16 |
| Operations | | | | | |
| Net investment income (loss) | $ 9,888,580 | $ 9,071,080 | | $ 10,860,574 | $ 9,414,649 |
| Net realized gain (loss) from investments | (842,084) | (203,453) | | (2,682,236) | 16,963 |
| Change in net unrealized appreciation (depreciation) of investments | (6,739,454) | 7,155,967 | | (6,365,914) | 7,831,343 |
| Net increase (decrease) in net assets from operations | 2,307,042 | 16,023,594 | | 1,812,424 | 17,262,955 |
| Distributions to Shareholders | | | | | |
| From net investment income: | | | | | |
| Class A Shares | (2,605,055) | (2,366,664) | | (4,922,214) | (4,666,892) |
| Class C Shares | (255,608) | (200,050) | | (583,803) | (374,219) |
| Class C1 Shares | (50,499) | (56,725) | | (327,401) | (409,457) |
| Class C2 Shares | (139,877) | (155,072) | | (226,803) | (291,498) |
| Class I Shares | (6,716,834) | (6,379,600) | | (4,774,932) | (4,084,494) |
| Decrease in net assets from distributions to shareholders | (9,767,873) | (9,158,111) | | (10,835,153) | (9,826,560) |
| Fund Share Transactions | | | | | |
| Proceeds from sale of shares | 105,369,222 | 84,471,907 | | 168,178,245 | 106,658,528 |
| Proceeds from shares issued to shareholders due to reinvestment of distributions | 4,387,380 | 3,769,715 | | 7,875,724 | 6,831,038 |
| | 109,756,602 | 88,241,622 | | 176,053,969 | 113,489,566 |
| Cost of shares redeemed | (105,187,713) | (46,280,514) | | (140,734,258) | (34,681,176) |
| Net increase (decrease) in net assets from Fund share transactions | 4,568,889 | 41,961,108 | | 35,319,711 | 78,808,390 |
| Net increase (decrease) in net assets | (2,891,942) | 48,826,591 | | 26,296,982 | 86,244,785 |
| Net assets at the beginning of period | 341,390,285 | 292,563,694 | | 326,828,255 | 240,583,470 |
| Net assets at the end of period | $ 338,498,343 | $341,390,285 | | $ 353,125,237 | $326,828,255 |
| Undistributed (Over-distribution of) net investment income at the end of period | $ 218,351 | $ 97,644 | | $ 262,245 | $ 236,824 |
See accompanying notes to financial statements.
| | Nebraska | | Oregon Intermediate |
| | Year Ended
5/31/17 | Year Ended
5/31/16 | | Year Ended
5/31/17 | Year Ended
5/31/16 |
| Operations | | | | | |
| Net investment income (loss) | $ 1,976,303 | $ 1,871,463 | | $ 5,249,529 | $ 4,914,828 |
| Net realized gain (loss) from investments | (176,606) | (4,879) | | (1,586,506) | 174,540 |
| Change in net unrealized appreciation (depreciation) of investments | (1,731,266) | 1,592,245 | | (3,059,136) | 3,611,271 |
| Net increase (decrease) in net assets from operations | 68,431 | 3,458,829 | | 603,887 | 8,700,639 |
| Distributions to Shareholders | | | | | |
| From net investment income: | | | | | |
| Class A Shares | (864,804) | (727,367) | | (1,219,869) | (1,334,561) |
| Class C Shares | (73,368) | (35,608) | | (58,517) | (55,969) |
| Class C1 Shares | (71,539) | (69,862) | | — | — |
| Class C2 Shares | (97,048) | (94,793) | | (122,865) | (171,987) |
| Class I Shares | (927,403) | (809,919) | | (3,791,803) | (3,532,188) |
| Decrease in net assets from distributions to shareholders | (2,034,162) | (1,737,549) | | (5,193,054) | (5,094,705) |
| Fund Share Transactions | | | | | |
| Proceeds from sale of shares | 11,549,182 | 11,011,396 | | 84,698,519 | 85,131,968 |
| Proceeds from shares issued to shareholders due to reinvestment of distributions | 1,517,771 | 1,229,525 | | 2,351,707 | 2,368,372 |
| | 13,066,953 | 12,240,921 | | 87,050,226 | 87,500,340 |
| Cost of shares redeemed | (10,986,021) | (8,238,986) | | (95,758,858) | (27,543,986) |
| Net increase (decrease) in net assets from Fund share transactions | 2,080,932 | 4,001,935 | | (8,708,632) | 59,956,354 |
| Net increase (decrease) in net assets | 115,201 | 5,723,215 | | (13,297,799) | 63,562,288 |
| Net assets at the beginning of period | 63,142,461 | 57,419,246 | | 228,847,588 | 165,285,300 |
| Net assets at the end of period | $ 63,257,662 | $63,142,461 | | $215,549,789 | $228,847,588 |
| Undistributed (Over-distribution of) net investment income at the end of period | $ 85,782 | $ 143,641 | | $ (20,041) | $ (76,516) |
See accompanying notes to financial statements.
NUVEEN 77
Minnesota Intermediate
Selected data for a share outstanding throughout each period:
| | | | | | | | | |
| | | | | | | | | |
| | | Investment Operations | | Less Distributions | |
| Class (Commencement Date) Year Ended May 31, | Beginning
NAV | Net
Investment
Income
(Loss)(a) | Net
Realized/
Unrealized
Gain (Loss) | Total | | From
Net
Investment
Income | From
Accumulated
Net Realized
Gains | Total | Ending
NAV |
| Class A (02/94) | | | | | | | | | |
| 2017 | $10.66 | $0.29 | $(0.20) | $ 0.09 | | $(0.29) | $ — | $(0.29) | $10.46 |
| 2016 | 10.43 | 0.30 | 0.23 | 0.53 | | (0.30) | — | (0.30) | 10.66 |
| 2015 | 10.49 | 0.31 | (0.05) | 0.26 | | (0.32) | — | (0.32) | 10.43 |
| 2014 | 10.56 | 0.33 | (0.06) | 0.27 | | (0.32) | (0.02) | (0.34) | 10.49 |
| 2013 | 10.67 | 0.32 | (0.08) | 0.24 | | (0.34) | (0.01) | (0.35) | 10.56 |
| Class C (02/14) | | | | | | | | | |
| 2017 | 10.60 | 0.21 | (0.21) | — | | (0.21) | — | (0.21) | 10.39 |
| 2016 | 10.37 | 0.21 | 0.24 | 0.45 | | (0.22) | — | (0.22) | 10.60 |
| 2015 | 10.42 | 0.22 | (0.03) | 0.19 | | (0.24) | — | (0.24) | 10.37 |
| 2014(d) | 10.27 | 0.06 | 0.16 | 0.22 | | (0.07) | — | (0.07) | 10.42 |
| Class C1 (10/09) | | | | | | | | | |
| 2017 | 10.69 | 0.25 | (0.21) | 0.04 | | (0.24) | — | (0.24) | 10.49 |
| 2016 | 10.46 | 0.25 | 0.23 | 0.48 | | (0.25) | — | (0.25) | 10.69 |
| 2015 | 10.52 | 0.27 | (0.05) | 0.22 | | (0.28) | — | (0.28) | 10.46 |
| 2014 | 10.59 | 0.29 | (0.07) | 0.22 | | (0.27) | (0.02) | (0.29) | 10.52 |
| 2013 | 10.69 | 0.28 | (0.08) | 0.20 | | (0.29) | (0.01) | (0.30) | 10.59 |
| Class C2 (01/11)(e) | | | | | | | | | |
| 2017 | 10.62 | 0.23 | (0.20) | 0.03 | | (0.23) | — | (0.23) | 10.42 |
| 2016 | 10.39 | 0.24 | 0.23 | 0.47 | | (0.24) | — | (0.24) | 10.62 |
| 2015 | 10.44 | 0.26 | (0.05) | 0.21 | | (0.26) | — | (0.26) | 10.39 |
| 2014 | 10.51 | 0.28 | (0.07) | 0.21 | | (0.26) | (0.02) | (0.28) | 10.44 |
| 2013 | 10.62 | 0.26 | (0.09) | 0.17 | | (0.27) | (0.01) | (0.28) | 10.51 |
| Class I (02/94) | | | | | | | | | |
| 2017 | 10.60 | 0.31 | (0.20) | 0.11 | | (0.31) | — | (0.31) | 10.40 |
| 2016 | 10.37 | 0.32 | 0.23 | 0.55 | | (0.32) | — | (0.32) | 10.60 |
| 2015 | 10.43 | 0.33 | (0.05) | 0.28 | | (0.34) | — | (0.34) | 10.37 |
| 2014 | 10.50 | 0.35 | (0.06) | 0.29 | | (0.34) | (0.02) | (0.36) | 10.43 |
| 2013 | 10.61 | 0.34 | (0.08) | 0.26 | | (0.36) | (0.01) | (0.37) | 10.50 |
| | | | | |
| | Ratios/Supplemental Data |
| | | Ratios to Average
Net Assets | |
Total
Return(b) | Ending
Net
Assets
(000) | Expenses | Net
Investment
Income
(Loss) | Portfolio
Turnover
Rate(c) |
| | | | | |
| 0.88% | $ 90,431 | 0.81% | 2.79% | 16% |
| 5.15 | 92,835 | 0.82 | 2.81 | 11 |
| 2.52 | 74,086 | 0.82 | 2.97 | 11 |
| 2.68 | 65,375 | 0.84 | 3.25 | 12 |
| 2.25 | 62,493 | 0.82 | 3.03 | 11 |
| | | | | |
| (0.02) | 13,522 | 1.61 | 2.00 | 16 |
| 4.34 | 12,184 | 1.61 | 1.99 | 11 |
| 1.82 | 7,067 | 1.62 | 2.13 | 11 |
| 2.19 | 1,052 | 1.64* | 2.29* | 12 |
| | | | | |
| 0.42 | 2,118 | 1.26 | 2.34 | 16 |
| 4.66 | 2,386 | 1.27 | 2.36 | 11 |
| 2.05 | 2,415 | 1.27 | 2.53 | 11 |
| 2.20 | 2,836 | 1.29 | 2.81 | 12 |
| 1.88 | 3,804 | 1.27 | 2.60 | 11 |
| | | | | |
| 0.30 | 5,937 | 1.36 | 2.25 | 16 |
| 4.57 | 6,626 | 1.37 | 2.27 | 11 |
| 2.05 | 7,093 | 1.38 | 2.44 | 11 |
| 2.09 | 8,021 | 1.39 | 2.70 | 12 |
| 1.63 | 8,795 | 1.36 | 2.44 | 11 |
| | | | | |
| 1.06 | 226,491 | 0.61 | 2.99 | 16 |
| 5.36 | 227,359 | 0.62 | 3.01 | 11 |
| 2.71 | 201,903 | 0.63 | 3.19 | 11 |
| 2.88 | 176,410 | 0.64 | 3.45 | 12 |
| 2.42 | 213,723 | 0.62 | 3.23 | 11 |
| (a) | Per share Net Investment Income (Loss) is calculated using the average daily shares method. |
| (b) | Total return is the combination of changes in NAV without any sales charge, reinvested dividend income at NAV and reinvested capital gains distributions at NAV, if any. Total returns are not annualized. |
| (c) | Portfolio Turnover Rate is calculated based on the lesser of long-term purchases or sales (as disclosed in Note 5 – Investment Transactions) divided by the average long-term market value during the period. |
| (d) | For the period February 10, 2014 (commencement of operations) through May 31, 2014. |
| (e) | Formerly Class C Shares and renamed to Class C2 Shares on February 10, 2014. |
| * | Annualized. |
See accompanying notes to financial statements.
NUVEEN 79
Financial Highlights (continued)
Minnesota
Selected data for a share outstanding throughout each period:
| | | | | | | | | |
| | | | | | | | | |
| | | Investment Operations | | Less Distributions | |
| Class (Commencement Date) Year Ended May 31, | Beginning
NAV | Net
Investment
Income
(Loss)(a) | Net
Realized/
Unrealized
Gain (Loss) | Total | | From
Net
Investment
Income | From
Accumulated
Net Realized
Gains | Total | Ending
NAV |
| Class A (07/88) | | | | | | | | | |
| 2017 | $12.00 | $0.37 | $(0.26) | $0.11 | | $(0.37) | $ — | $(0.37) | $11.74 |
| 2016 | 11.68 | 0.40 | 0.34 | 0.74 | | (0.42) | — | (0.42) | 12.00 |
| 2015 | 11.63 | 0.43 | 0.05 | 0.48 | | (0.43) | — | (0.43) | 11.68 |
| 2014 | 11.87 | 0.44 | (0.21) | 0.23 | | (0.42) | (0.05) | (0.47) | 11.63 |
| 2013 | 11.87 | 0.43 | 0.04 | 0.47 | | (0.45) | (0.02) | (0.47) | 11.87 |
| Class C (02/14) | | | | | | | | | |
| 2017 | 11.98 | 0.27 | (0.25) | 0.02 | | (0.27) | — | (0.27) | 11.73 |
| 2016 | 11.68 | 0.31 | 0.32 | 0.63 | | (0.33) | — | (0.33) | 11.98 |
| 2015 | 11.63 | 0.33 | 0.06 | 0.39 | | (0.34) | — | (0.34) | 11.68 |
| 2014(d) | 11.25 | 0.08 | 0.40 | 0.48 | | (0.10) | — | (0.10) | 11.63 |
| Class C1 (02/99) | | | | | | | | | |
| 2017 | 11.95 | 0.31 | (0.26) | 0.05 | | (0.31) | — | (0.31) | 11.69 |
| 2016 | 11.64 | 0.35 | 0.33 | 0.68 | | (0.37) | — | (0.37) | 11.95 |
| 2015 | 11.58 | 0.38 | 0.06 | 0.44 | | (0.38) | — | (0.38) | 11.64 |
| 2014 | 11.81 | 0.38 | (0.19) | 0.19 | | (0.37) | (0.05) | (0.42) | 11.58 |
| 2013 | 11.82 | 0.38 | 0.02 | 0.40 | | (0.39) | (0.02) | (0.41) | 11.81 |
| Class C2 (01/11)(e) | | | | | | | | | |
| 2017 | 12.00 | 0.30 | (0.25) | 0.05 | | (0.30) | — | (0.30) | 11.75 |
| 2016 | 11.69 | 0.34 | 0.33 | 0.67 | | (0.36) | — | (0.36) | 12.00 |
| 2015 | 11.63 | 0.36 | 0.07 | 0.43 | | (0.37) | — | (0.37) | 11.69 |
| 2014 | 11.86 | 0.37 | (0.19) | 0.18 | | (0.36) | (0.05) | (0.41) | 11.63 |
| 2013 | 11.87 | 0.35 | 0.04 | 0.39 | | (0.38) | (0.02) | (0.40) | 11.86 |
| Class I (08/97) | | | | | | | | | |
| 2017 | 11.99 | 0.39 | (0.26) | 0.13 | | (0.39) | — | (0.39) | 11.73 |
| 2016 | 11.68 | 0.43 | 0.33 | 0.76 | | (0.45) | — | (0.45) | 11.99 |
| 2015 | 11.62 | 0.45 | 0.07 | 0.52 | | (0.46) | — | (0.46) | 11.68 |
| 2014 | 11.85 | 0.46 | (0.20) | 0.26 | | (0.44) | (0.05) | (0.49) | 11.62 |
| 2013 | 11.86 | 0.45 | 0.03 | 0.48 | | (0.47) | (0.02) | (0.49) | 11.85 |
| | | | | |
| | Ratios/Supplemental Data |
| | | Ratios to Average
Net Assets | |
Total
Return(b) | Ending
Net
Assets
(000) | Expenses | Net
Investment
Income
(Loss) | Portfolio
Turnover
Rate(c) |
| | | | | |
| 0.92% | $152,704 | 0.81% | 3.11% | 22% |
| 6.48 | 152,744 | 0.82 | 3.43 | 6 |
| 4.18 | 118,335 | 0.84 | 3.65 | 10 |
| 2.19 | 110,265 | 0.86 | 3.88 | 15 |
| 4.01 | 132,705 | 0.84 | 3.57 | 7 |
| | | | | |
| 0.19 | 28,195 | 1.61 | 2.32 | 22 |
| 5.50 | 20,608 | 1.62 | 2.59 | 6 |
| 3.39 | 8,623 | 1.64 | 2.77 | 10 |
| 4.32 | 1,242 | 1.66* | 2.75* | 15 |
| | | | | |
| 0.46 | 11,562 | 1.26 | 2.67 | 22 |
| 5.93 | 13,015 | 1.28 | 2.99 | 6 |
| 3.81 | 13,296 | 1.29 | 3.21 | 10 |
| 1.79 | 14,398 | 1.31 | 3.43 | 15 |
| 3.43 | 19,234 | 1.30 | 3.15 | 7 |
| | | | | |
| 0.45 | 8,106 | 1.36 | 2.57 | 22 |
| 5.81 | 9,442 | 1.38 | 2.90 | 6 |
| 3.69 | 10,199 | 1.39 | 3.10 | 10 |
| 1.67 | 12,473 | 1.41 | 3.33 | 15 |
| 3.32 | 16,833 | 1.39 | 2.96 | 7 |
| | | | | |
| 1.13 | 152,558 | 0.61 | 3.31 | 22 |
| 6.61 | 131,019 | 0.62 | 3.62 | 6 |
| 4.49 | 90,131 | 0.64 | 3.85 | 10 |
| 2.45 | 67,580 | 0.66 | 4.07 | 15 |
| 4.08 | 90,341 | 0.65 | 3.78 | 7 |
| (a) | Per share Net Investment Income (Loss) is calculated using the average daily shares method. |
| (b) | Total return is the combination of changes in NAV without any sales charge, reinvested dividend income at NAV and reinvested capital gains distributions at NAV, if any. Total returns are not annualized. |
| (c) | Portfolio Turnover Rate is calculated based on the lesser of long-term purchases or sales (as disclosed in Note 5 – Investment Transactions) divided by the average long-term market value during the period. |
| (d) | For the period February 10, 2014 (commencement of operations) through May 31, 2014. |
| (e) | Formerly Class C Shares and renamed to Class C2 Shares on February 10, 2014. |
| * | Annualized. |
See accompanying notes to financial statements.
NUVEEN 81
Financial Highlights (continued)
Nebraska
Selected data for a share outstanding throughout each period:
| | | | | | | | | | |
| | | | | | | | | | |
| | | Investment Operations | | Less Distributions | |
| Class (Commencement Date) Year Ended May 31, | Beginning
NAV | Net
Investment
Income
(Loss)(a) | Net
Realized/
Unrealized
Gain (Loss) | Total | | From
Net
Investment
Income | From
Accumulated
Net Realized
Gains | Return of
Capital | Total | Ending
NAV |
| Class A (02/01) | | | | | | | | | | |
| 2017 | $11.09 | $0.34 | $(0.31) | $ 0.03 | | $(0.35) | $ — | $ — | $(0.35) | $10.77 |
| 2016 | 10.77 | 0.35 | 0.30 | 0.65 | | (0.33) | — | — | (0.33) | 11.09 |
| 2015 | 10.68 | 0.34 | 0.08 | 0.42 | | (0.33) | — | — | (0.33) | 10.77 |
| 2014 | 10.87 | 0.34 | (0.19) | 0.15 | | (0.34) | — | — | (0.34) | 10.68 |
| 2013 | 11.01 | 0.36 | (0.13) | 0.23 | | (0.36) | — | (0.01) | (0.37) | 10.87 |
| Class C (02/14) | | | | | | | | | | |
| 2017 | 11.06 | 0.25 | (0.31) | (0.06) | | (0.26) | — | — | (0.26) | 10.74 |
| 2016 | 10.74 | 0.26 | 0.30 | 0.56 | | (0.24) | — | — | (0.24) | 11.06 |
| 2015 | 10.65 | 0.25 | 0.09 | 0.34 | | (0.25) | — | — | (0.25) | 10.74 |
| 2014(e) | 10.38 | 0.03 | 0.32 | 0.35 | | (0.08) | — | — | (0.08) | 10.65 |
| Class C1 (02/01) | | | | | | | | | | |
| 2017 | 11.01 | 0.29 | (0.31) | (0.02) | | (0.30) | — | — | (0.30) | 10.69 |
| 2016 | 10.69 | 0.30 | 0.29 | 0.59 | | (0.27) | — | — | (0.27) | 11.01 |
| 2015 | 10.59 | 0.29 | 0.09 | 0.38 | | (0.28) | — | — | (0.28) | 10.69 |
| 2014 | 10.78 | 0.29 | (0.19) | 0.10 | | (0.29) | — | — | (0.29) | 10.59 |
| 2013 | 10.92 | 0.32 | (0.14) | 0.18 | | (0.31) | — | (0.01) | (0.32) | 10.78 |
| Class C2 (02/11)(f) | | | | | | | | | | |
| 2017 | 11.10 | 0.28 | (0.32) | (0.04) | | (0.29) | — | — | (0.29) | 10.77 |
| 2016 | 10.78 | 0.29 | 0.30 | 0.59 | | (0.27) | — | — | (0.27) | 11.10 |
| 2015 | 10.68 | 0.28 | 0.09 | 0.37 | | (0.27) | — | — | (0.27) | 10.78 |
| 2014 | 10.88 | 0.28 | (0.20) | 0.08 | | (0.28) | — | — | (0.28) | 10.68 |
| 2013 | 11.02 | 0.30 | (0.13) | 0.17 | | (0.30) | — | (0.01) | (0.31) | 10.88 |
| Class I (02/01) | | | | | | | | | | |
| 2017 | 11.10 | 0.36 | (0.31) | 0.05 | | (0.37) | — | — | (0.37) | 10.78 |
| 2016 | 10.78 | 0.37 | 0.29 | 0.66 | | (0.34) | — | — | (0.34) | 11.10 |
| 2015 | 10.68 | 0.36 | 0.09 | 0.45 | | (0.35) | — | — | (0.35) | 10.78 |
| 2014 | 10.88 | 0.36 | (0.20) | 0.16 | | (0.36) | — | — | (0.36) | 10.68 |
| 2013 | 11.01 | 0.39 | (0.13) | 0.26 | | (0.38) | — | (0.01) | (0.39) | 10.88 |
| | | | | | | |
| | Ratios/Supplemental Data |
| | | Ratios to Average
Net Assets Before
Waiver/Reimbursement | | Ratios to Average
Net Assets After
Waiver/Reimbursement(c) | |
Total
Return(b) | Ending
Net
Assets
(000) | Expenses | Net
Investment
Income
(Loss) | | Expenses | Net
Investment
Income
(Loss) | Portfolio
Turnover
Rate(d) |
| | | | | | | | |
| 0.32% | $26,201 | 0.93% | 3.08% | | 0.89% | 3.13% | 11% |
| 6.08 | 26,461 | 0.91 | 3.17 | | 0.89 | 3.19 | 8 |
| 4.00 | 23,741 | 0.92 | 3.11 | | 0.89 | 3.15 | 27 |
| 1.55 | 23,740 | 0.92 | 3.23 | | 0.89 | 3.27 | 11 |
| 2.11 | 31,576 | 0.90 | 3.25 | | 0.88 | 3.27 | 18 |
| | | | | | | | |
| (0.51) | 2,966 | 1.73 | 2.28 | | 1.69 | 2.33 | 11 |
| 5.23 | 2,552 | 1.71 | 2.33 | | 1.69 | 2.36 | 8 |
| 3.17 | 1,142 | 1.72 | 2.28 | | 1.69 | 2.31 | 27 |
| 3.36 | 172 | 1.72* | 1.96* | | 1.69* | 1.98* | 11 |
| | | | | | | | |
| (0.18) | 2,339 | 1.38 | 2.63 | | 1.34 | 2.68 | 11 |
| 5.60 | 2,805 | 1.37 | 2.72 | | 1.34 | 2.75 | 8 |
| 3.61 | 2,784 | 1.38 | 2.68 | | 1.34 | 2.72 | 27 |
| 1.03 | 3,013 | 1.37 | 2.78 | | 1.34 | 2.81 | 11 |
| 1.63 | 3,897 | 1.36 | 2.85 | | 1.33 | 2.87 | 18 |
| | | | | | | | |
| (0.35) | 3,549 | 1.48 | 2.54 | | 1.44 | 2.58 | 11 |
| 5.50 | 3,885 | 1.47 | 2.62 | | 1.44 | 2.65 | 8 |
| 3.52 | 4,183 | 1.47 | 2.56 | | 1.44 | 2.60 | 27 |
| 0.87 | 4,946 | 1.47 | 2.69 | | 1.44 | 2.73 | 11 |
| 1.56 | 8,693 | 1.45 | 2.66 | | 1.43 | 2.68 | 18 |
| | | | | | | | |
| 0.48 | 28,202 | 0.73 | 3.28 | | 0.69 | 3.33 | 11 |
| 6.25 | 27,439 | 0.71 | 3.37 | | 0.69 | 3.39 | 8 |
| 4.27 | 25,569 | 0.72 | 3.31 | | 0.69 | 3.34 | 27 |
| 1.64 | 26,400 | 0.72 | 3.43 | | 0.69 | 3.47 | 11 |
| 2.37 | 37,054 | 0.70 | 3.49 | | 0.68 | 3.51 | 18 |
| (a) | Per share Net Investment Income (Loss) is calculated using the average daily shares method. |
| (b) | Total return is the combination of changes in NAV without any sales charge, reinvested dividend income at NAV and reinvested capital gains distributions at NAV, if any. Total returns are not annualized. |
| (c) | After fee waiver and/or expense reimbursement from the Adviser, when applicable. |
| (d) | Portfolio Turnover Rate is calculated based on the lesser of long-term purchases or sales (as disclosed in Note 5 – Investment Transactions) divided by the average long-term market value during the period. |
| (e) | For the period February 10, 2014 (commencement of operations) through May 31, 2014. |
| (f) | Formerly Class C Shares and renamed to Class C2 Shares on February 10, 2014. |
| * | Annualized. |
See accompanying notes to financial statements.
NUVEEN 83
Financial Highlights (continued)
Oregon Intermediate
Selected data for a share outstanding throughout each period:
| | | | | | | | | |
| | | | | | | | | |
| | | Investment Operations | | Less Distributions | |
| Class (Commencement Date) Year Ended May 31, | Beginning
NAV | Net
Investment
Income
(Loss)(a) | Net
Realized/
Unrealized
Gain (Loss) | Total | | From
Net
Investment
Income | From
Accumulated
Net Realized
Gains | Total | Ending
NAV |
| Class A (02/99) | | | | | | | | | |
| 2017 | $10.49 | $0.23 | $(0.17) | $ 0.06 | | $(0.23) | $ — | $(0.23) | $10.32 |
| 2016 | 10.30 | 0.26 | 0.20 | 0.46 | | (0.27) | — | (0.27) | 10.49 |
| 2015 | 10.35 | 0.29 | (0.05) | 0.24 | | (0.29) | — | (0.29) | 10.30 |
| 2014 | 10.46 | 0.30 | (0.12) | 0.18 | | (0.29) | — | (0.29) | 10.35 |
| 2013 | 10.60 | 0.30 | (0.13) | 0.17 | | (0.31) | —** | (0.31) | 10.46 |
| Class C (02/14) | | | | | | | | | |
| 2017 | 10.43 | 0.15 | (0.17) | (0.02) | | (0.15) | — | (0.15) | 10.26 |
| 2016 | 10.24 | 0.17 | 0.21 | 0.38 | | (0.19) | — | (0.19) | 10.43 |
| 2015 | 10.29 | 0.20 | (0.05) | 0.15 | | (0.20) | — | (0.20) | 10.24 |
| 2014(d) | 10.16 | 0.04 | 0.15 | 0.19 | | (0.06) | — | (0.06) | 10.29 |
| Class C2 (01/11)(e) | | | | | | | | | |
| 2017 | 10.46 | 0.17 | (0.16) | 0.01 | | (0.17) | — | (0.17) | 10.30 |
| 2016 | 10.27 | 0.20 | 0.20 | 0.40 | | (0.21) | — | (0.21) | 10.46 |
| 2015 | 10.32 | 0.23 | (0.05) | 0.18 | | (0.23) | — | (0.23) | 10.27 |
| 2014 | 10.43 | 0.24 | (0.12) | 0.12 | | (0.23) | — | (0.23) | 10.32 |
| 2013 | 10.56 | 0.24 | (0.12) | 0.12 | | (0.25) | —** | (0.25) | 10.43 |
| Class I (08/97) | | | | | | | | | |
| 2017 | 10.50 | 0.25 | (0.17) | 0.08 | | (0.25) | — | (0.25) | 10.33 |
| 2016 | 10.30 | 0.28 | 0.21 | 0.49 | | (0.29) | — | (0.29) | 10.50 |
| 2015 | 10.35 | 0.31 | (0.05) | 0.26 | | (0.31) | — | (0.31) | 10.30 |
| 2014 | 10.47 | 0.32 | (0.13) | 0.19 | | (0.31) | — | (0.31) | 10.35 |
| 2013 | 10.60 | 0.32 | (0.12) | 0.20 | | (0.33) | —** | (0.33) | 10.47 |
| | | | | |
| | Ratios/Supplemental Data |
| | | Ratios to Average
Net Assets | |
Total
Return(b) | Ending
Net
Assets
(000) | Expenses | Net
Investment
Income
(Loss) | Portfolio
Turnover
Rate(c) |
| | | | | |
| 0.61% | $ 44,776 | 0.81% | 2.24% | 25% |
| 4.54 | 56,755 | 0.83 | 2.51 | 11 |
| 2.32 | 48,822 | 0.84 | 2.77 | 7 |
| 1.79 | 45,231 | 0.85 | 2.94 | 4 |
| 1.61 | 57,578 | 0.83 | 2.81 | 9 |
| | | | | |
| (0.21) | 4,066 | 1.61 | 1.44 | 25 |
| 3.73 | 3,788 | 1.62 | 1.69 | 11 |
| 1.51 | 2,505 | 1.64 | 1.94 | 7 |
| 1.89 | 545 | 1.65* | 2.04* | 4 |
| | | | | |
| 0.12 | 6,708 | 1.36 | 1.69 | 25 |
| 3.95 | 8,079 | 1.38 | 1.97 | 11 |
| 1.74 | 8,602 | 1.39 | 2.24 | 7 |
| 1.20 | 10,632 | 1.40 | 2.39 | 4 |
| 1.14 | 15,663 | 1.38 | 2.24 | 9 |
| | | | | |
| 0.78 | 160,000 | 0.61 | 2.44 | 25 |
| 4.82 | 160,225 | 0.62 | 2.69 | 11 |
| 2.50 | 105,356 | 0.64 | 2.97 | 7 |
| 1.87 | 86,520 | 0.65 | 3.14 | 4 |
| 1.88 | 115,815 | 0.63 | 3.02 | 9 |
| (a) | Per share Net Investment Income (Loss) is calculated using the average daily shares method. |
| (b) | Total return is the combination of changes in NAV without any sales charge, reinvested dividend income at NAV and reinvested capital gains distributions at NAV, if any. Total returns are not annualized. |
| (c) | Portfolio Turnover Rate is calculated based on the lesser of long-term purchases or sales (as disclosed in Note 5 – Investment Transactions) divided by the average long-term market value during the period. |
| (d) | For the period February 10, 2014 (commencement of operations) through May 31, 2014. |
| (e) | Formerly Class C Shares and renamed to Class C2 Shares on February 10, 2014. |
| * | Annualized. |
| ** | Rounds to less than $0.01 per share. |
See accompanying notes to financial statements.
NUVEEN 85
Notes to
Financial Statements
1. General Information and Significant Accounting Policies
General Information
Trust and Fund Information
Nuveen Investment Funds, Inc. (the "Trust"), is an open-end management investment company registered under the Investment Company Act of 1940, as amended. The Trust is comprised of Nuveen Minnesota Intermediate Municipal Bond Fund ("Minnesota Intermediate"), Nuveen Minnesota Municipal Bond Fund ("Minnesota"), Nuveen Nebraska Municipal Bond Fund ("Nebraska") and Nuveen Oregon Intermediate Municipal Bond Fund ("Oregon Intermediate"), (each a "Fund" and collectively, the "Funds"), as diversified funds, among others. The Trust was incorporated in the State of Maryland on August 20, 1987.
The end of the reporting period for the Funds is May 31, 2017, and the period covered by these Notes to Financial Statements is the fiscal year ended May 31, 2017 (the "current fiscal period”).
Investment Adviser
The Funds' investment adviser is Nuveen Fund Advisors, LLC (the “Adviser”), a subsidiary of Nuveen, LLC (“Nuveen”). Nuveen is the investment management arm of Teachers Insurance and Annuity Association of America (TIAA). The Adviser has overall responsibility for management of the Funds, oversees the management of the Funds' portfolios, manages the Funds' business affairs and provides certain clerical, bookkeeping and other administrative services, and, if necessary, asset allocation decisions. The Adviser has entered into sub-advisory agreements with Nuveen Asset Management, LLC, (the “Sub-Adviser”), a subsidiary of the Adviser, under which the Sub-Adviser manages the investment portfolios of the Funds.
Investment Objectives
The investment objective of each Fund is to provide maximum current income that is exempt from both federal income tax and its respective state income tax to the extent consistent with prudent investment risk.
The Funds' most recent prospectus provides further descriptions of each Fund's investment objective, principal investment strategies and principal risks.
Significant Accounting Policies
Each Fund is an investment company and follows accounting and reporting guidance under Financial Accounting Standards Board (FASB) Accounting Standards Codification (ASC) Topic 946 "Financial Services-Investment Companies." The following is a summary of significant accounting policies followed by the Funds in the preparation of their financial statements in accordance with accounting principles generally accepted in the United States of America (“U.S. GAAP”).
Investment Transactions
Investment transactions are recorded on a trade date basis. Realized gains and losses from investment transactions are determined on the specific identification method, which is the same basis used for federal income tax purposes. Investments purchased on a when-issued/delayed delivery basis may have extended settlement periods. Any investments so purchased are subject to market fluctuation during this period. The Funds have earmarked securities in their portfolios with a current value at least equal to the amount of the when-issued/delayed delivery purchase commitments.
As of the end of the reporting period, the following Funds’ outstanding when-issued/delayed delivery purchase commitments were as follows:
| | Minnesota | Nebraska | Oregon
Intermediate |
| Outstanding when-issued/delayed delivery purchase commitments | $516,615 | $523,055 | $6,047,562 |
Investment Income
Interest income, which reflects the amortization of premiums and accretion of discounts for financial reporting purposes, is recorded on an accrual basis. Interest income also reflects paydowns gains and losses, if any.
Professional Fees
Professional fees presented on the Statement of Operations consist of legal fees incurred in the normal course of operations, audit fees, tax consulting fees and, in some cases, workout expenditures. Workout expenditures are incurred in an attempt to protect or enhance an investment or to pursue other claims or legal actions on behalf of Fund shareholders. If a refund is received for workout expenditures paid in a prior reporting period, such amounts will be recognized as “Legal fee refund” on the Statement of Operations.
Dividends and Distributions to Shareholders
Dividends from net investment income, if any, are declared daily and distributed to shareholders monthly. Fund shares begin to accrue dividends on the business day after the day when the monies used to purchase Fund shares are collected by the transfer agent.
Net realized capital gains and/or market discount from investment transactions, if any, are declared and distributed to shareholders at least annually. Furthermore, capital gains are distributed only to the extent they exceed available capital loss carryforwards.
Distributions to shareholders of net investment income, net realized capital gains and/or market discount, if any, are recorded on the ex-dividend date. The amount and timing of distributions are determined in accordance with federal income tax regulations, which may differ from U.S. GAAP.
Share Classes and Sales Charges
Class A Shares are generally sold with an up-front sales charge and incur a 0.20% annual 12b-1 service fee. Class A Share purchases of $250,000 ($1 million prior to November 1, 2016) or more are sold at net asset value (“NAV”) without an up-front sales charge but may be subject to a contingent deferred sales charge (“CDSC”) of 1% if redeemed within eighteen months of purchase. Class C Shares are sold without an up-front sales charge but incur a 0.75% annual 12b-1 distribution fee and a 0.25% annual 12b-1 service fee. Class C1 Shares of the Funds (except for Oregon Intermediate, which does not offer Class C1 Shares) are not available for new accounts or for additional investment into exisiting accounts, but Class C1 Shares can be issued for purposes of dividend reinvestment. Class C1 Shares were sold without an up-front sales charge, but incur a 0.40% annual 12b-1 distribution fee and a 0.25% annual 12b-1 service fee. The Funds will issue Class C2 Shares upon the exchange of Class C2 Shares from another Nuveen municipal bond fund or for the purpose of dividend reinvestment, but Class C2 Shares are not available for new accounts or for additional investment into existing accounts. Class C2 Shares incur a 0.55% annual 12b-1 distribution fee and a 0.20% annual 12b-1 service fee. Class C, Class C1 and Class C2 Shares are subject to a CDSC of 1% if redeemed within twelve months of purchase. Class I Shares are not subject to any sales charge or 12b-1 distribution or service fees.
Multiclass Operations and Allocations
Income and expenses of the Fund that are not directly attributable to a specific class of shares are prorated among the classes based on the relative settled shares of each class. Expenses directly attributable to a class of shares are recorded to the specific class. Currently, the only expenses that are allocated on a class-specific basis are 12b-1 distribution and service fees.
Realized and unrealized capital gains and losses of the Funds are prorated among the classes based on the relative net assets of each class.
Compensation
The Trust pays no compensation directly to those of its directors who are affiliated with the Adviser or to its officers, all of whom receive remuneration for their services to the Trust from the Adviser or its affiliates. The Funds' Board of Directors ("the "Board") has adopted a deferred compensation plan for independent directors that enables directors to elect to defer receipt of all or a portion of the annual compensation they are entitled to receive from certain Nuveen-advised funds. Under the plan, deferred amounts are treated as though equal dollar amounts had been invested in shares of select Nuveen-advised funds.
Indemnifications
Under the Trust's organizational documents, its officers and directors are indemnified against certain liabilities arising out of the performance of their duties to the Trust. In addition, in the normal course of business, the Trust enters into contracts that provide general indemnifications to other parties. The Trust's maximum exposure under these arrangements is unknown as this would involve future claims that may be made against the Trust that have not yet occurred. However, the Trust has not had prior claims or losses pursuant to these contracts and expects the risk of loss to be remote.
Netting Agreements
In the ordinary course of business, the Funds may enter into transactions subject to enforceable International Swaps and Derivatives Association, Inc. (“ISDA”) master agreements or other similar arrangements (“netting agreements”). Generally, the right to offset in netting agreements allows each Fund to offset certain securities and derivatives with a specific counterparty, when applicable, as well as any collateral received or delivered to that counterparty based on the terms of the agreements. Generally, each Fund manages its cash collateral and securities collateral on a counterparty basis.
The Funds' investments subject to netting agreements as of the end of the reporting period, if any, are further described in Note 3 - Portfolio Securities and Investments in Derivatives.
Notes to Financial Statements (continued)
Use of Estimates
The preparation of financial statements in conformity with U.S. GAAP requires management to make estimates and assumptions that affect the reported amounts of assets and liabilities at the date of the financial statements and the reported amounts of increases and decreases in net assets from operations during the current fiscal period. Actual results may differ from those estimates.
2. Investment Valuation and Fair Value Measurements
The fair valuation input levels as described below are for fair value measurement purposes.
Fair value is defined as the price that would be received upon selling an investment or transferring a liability in an orderly transaction to an independent buyer in the principal or most advantageous market for the investment. A three-tier hierarchy is used to maximize the use of observable market data and minimize the use of unobservable inputs and to establish classification of fair value measurements for disclosure purposes. Observable inputs reflect the assumptions market participants would use in pricing the asset or liability. Observable inputs are based on market data obtained from sources independent of the reporting entity. Unobservable inputs reflect the reporting entity’s own assumptions about the assumptions market participants would use in pricing the asset or liability. Unobservable inputs are based on the best information available in the circumstances. The following is a summary of the three-tiered hierarchy of valuation input levels.
Level 1 – Inputs are unadjusted and prices are determined using quoted prices in active markets for identical securities.
Level 2 – Prices are determined using other significant observable inputs (including quoted prices for similar securities, interest rates, prepayment speeds, credit risk, etc.).
Level 3 – Prices are determined using significant unobservable inputs (including management’s assumptions in determining the fair value of investments).
Prices of fixed income securities are provided by an independent pricing service (“pricing service”) approved by the Board. The pricing service establishes a security’s fair value using methods that may include consideration of the following: yields or prices of investments of comparable quality, type of issue, coupon, maturity and rating, market quotes or indications of value from security dealers, evaluations of anticipated cash flows or collateral, general market conditions and other information and analysis, including the obligor’s credit characteristics considered relevant. These securities are generally classified as Level 2. In pricing certain securities, particularly less liquid and lower quality securities, the pricing service may consider information about a security, its issuer or market activity, provided by the Adviser. These securities are generally classified as Level 2 or Level 3 depending on the observability of the significant inputs.
Certain securities may not be able to be priced by the pre-established pricing methods as described above. Such securities may be valued by the Board and/or its appointee at fair value. These securities generally include, but are not limited to, restricted securities (securities which may not be publicly sold without registration under the Securities Act of 1933, as amended) for which a pricing service is unable to provide a market price; securities whose trading has been formally suspended; debt securities that have gone into default and for which there is no current market quotation; a security whose market price is not available from a pre-established pricing source; a security with respect to which an event has occurred that is likely to materially affect the value of the security after the market has closed but before the calculation of a Fund’s NAV (as may be the case in non-U.S. markets on which the security is primarily traded) or make it difficult or impossible to obtain a reliable market quotation; and a security whose price, as provided by the pricing service, is not deemed to reflect the security’s fair value. As a general principle, the fair value of a security would appear to be the amount that the owner might reasonably expect to receive for it in a current sale. A variety of factors may be considered in determining the fair value of such securities, which may include consideration of the following: yields or prices of investments of comparable quality, type of issue, coupon, maturity and rating, market quotes or indications of value from security dealers, evaluations of anticipated cash flows or collateral, general market conditions and other information and analysis, including the obligor’s credit characteristics considered relevant. These securities are generally classified as Level 2 or Level 3 depending on the observability of the significant inputs. Regardless of the method employed to value a particular security, all valuations are subject to review by the Board and/or its appointee.
The inputs or methodologies used for valuing securities are not an indication of the risks associated with investing in those securities. The following is a summary of each Fund’s fair value measurements as of the end of the reporting period:
| Minnesota Intermediate | Level 1 | Level 2 | Level 3 | Total |
| Long-Term Investments*: | | | | |
| Municipal Bonds | $ — | $334,871,238 | $ — | $334,871,238 |
| Minnesota | Level 1 | Level 2 | Level 3 | Total |
| Long-Term Investments*: | | | | |
| Municipal Bonds | $ — | $338,180,907 | $ — | $338,180,907 |
| Short-Term Investments*: | | | | |
| Municipal Bonds | — | 10,740,000 | — | 10,740,000 |
| Total | $ — | $348,920,907 | $ — | $348,920,907 |
| Nebraska | Level 1 | Level 2 | Level 3 | Total |
| Long-Term Investments*: | | | | |
| Municipal Bonds | $ — | $62,537,836 | $ — | $62,537,836 |
| Oregon Intermediate | Level 1 | Level 2 | Level 3 | Total |
| Long-Term Investments*: | | | | |
| Municipal Bonds | $ — | $215,203,964 | $ — | $215,203,964 |
| Short-Term Investments*: | | | | |
| Municipal Bonds | — | 3,750,000 | — | 3,750,000 |
| Total | $ — | $218,953,964 | $ — | $218,953,964 |
| * | Refer to the Fund's Portfolio of Investments for industry classifications. |
The Board is responsible for the valuation process and has appointed the oversight of the daily valuation process to the Adviser’s Valuation Committee. The Valuation Committee, pursuant to the valuation policies and procedures adopted by the Board, is responsible for making fair value determinations, evaluating the effectiveness of the Funds’ pricing policies and reporting to the Board. The Valuation Committee is aided in its efforts by the Adviser’s dedicated Securities Valuation Team, which is responsible for administering the daily valuation process and applying fair value methodologies as approved by the Valuation Committee. When determining the reliability of the independent pricing services for investments owned by the Funds, the Valuation Committee, among other things, conducts due diligence reviews of the pricing services and monitors the quality of security prices received through various testing reports conducted by the Securities Valuation Team.
The Valuation Committee will consider pricing methodologies it deems relevant and appropriate when making a fair value determination, based on the facts and circumstances specific to the portfolio instrument. Fair value determinations generally will be derived as follows, using public or private market information:
| (i) | If available, fair value determinations shall be derived by extrapolating from recent transactions or quoted prices for identical or comparable securities.
|
| (ii) | If such information is not available, an analytical valuation methodology may be used based on other available information including, but not limited to: analyst appraisals, research reports, corporate action information, issuer financial statements and shelf registration statements. Such analytical valuation methodologies may include, but are not limited to: multiple of earnings, discount from market value of a similar freely- traded security, discounted cash flow analysis, book value or a multiple thereof, risk premium/yield analysis, yield to maturity and/or fundamental investment analysis. |
The purchase price of a portfolio instrument will be used to fair value the instrument only if no other valuation methodology is available or deemed appropriate, and it is determined that the purchase price fairly reflects the instrument’s current value.
For each portfolio security that has been fair valued pursuant to the policies adopted by the Board, the fair value price is compared against the last available and next available market quotations. The Valuation Committee reviews the results of such testing and fair valuation occurrences are reported to the Board.
3. Portfolio Securities and Investments in Derivatives
Portfolio Securities
Inverse Floating Rate Securities
Each Fund is authorized to invest in inverse floating rate securities. An inverse floating rate security is created by depositing a municipal bond (referred to as an “Underlying Bond”), typically with a fixed interest rate, into a special purpose tender option bond (“TOB”) trust (referred to as the “TOB Trust”) created by or at the direction of one or more Funds. In turn, the TOB Trust issues (a) floating rate certificates (referred to as “Floaters”), in face amounts equal to some fraction of the Underlying Bond’s par amount or market value, and (b) an inverse floating rate certificate (referred to as an “Inverse Floater”) that represents all remaining or residual interest in the TOB Trust. Floaters typically pay short-term tax-exempt interest rates to third parties who are also provided a right to tender their certificate and receive its par value, which may be paid from the proceeds of a remarketing of the Floaters, by a loan to the TOB Trust from a third party liquidity provider (“Liquidity Provider”), or by the sale of assets from the TOB Trust. The Inverse Floater is issued to a long term investor, such as one or more of the Funds. The income received by the Inverse Floater holder varies inversely with the short-term rate paid to holders of the Floaters, and in most circumstances the Inverse Floater holder bears substantially all of the Underlying Bond’s downside investment risk and also benefits disproportionately from any potential appreciation of the Underlying Bond’s value. The value of an Inverse Floater will be more volatile than that of the Underlying Bond because the interest rate is dependent on not only the fixed coupon rate of the Underlying Bond but also on the short-term interest paid on the Floaters, and because the Inverse Floater essentially bears the risk of loss (and possible gain) of the greater face value of the Underlying Bond.
Notes to Financial Statements (continued)
The Inverse Floater held by a Fund gives the Fund the right to (a) cause the holders of the Floaters to tender their certificates at par (or slightly more than par in certain circumstances), and (b) have the trustee of the TOB Trust (the “Trustee”) transfer the Underlying Bond held by the TOB Trust to the Fund, thereby collapsing the TOB Trust.
The Fund may acquire an Inverse Floater in a transaction where it (a) transfers an Underlying Bond that it owns to a TOB Trust created by a third party or (b) transfers an Underlying Bond that it owns, or that it has purchased in a secondary market transaction for the purpose of creating an Inverse Floater, to a TOB Trust created at its direction, and in return receives the Inverse Floater of the TOB Trust (referred to as a “self-deposited Inverse Floater”). A Fund may also purchase an Inverse Floater in a secondary market transaction from a third party creator of the TOB Trust without first owning the Underlying Bond (referred to as an “externally-deposited Inverse Floater”).
An investment in a self-deposited Inverse Floater is accounted for as a “financing” transaction (i.e., a secured borrowing). For a self-deposited Inverse Floater, the Underlying Bond deposited into the TOB Trust is identified in the Fund’s Portfolio of Investments as “(UB) – Underlying bond of an inverse floating rate trust reflected as a financing transaction,” with the Fund recognizing as liabilities, labeled “Floating rate obligations” on the Statement of Assets and Liabilities, (a) the liquidation value of Floaters issued by the TOB Trust, and (b) the amount of any borrowings by the TOB Trust from a Liquidity Provider to enable the TOB Trust to purchase outstanding Floaters in lieu of a remarketing. In addition, the Fund recognizes in “Investment Income” the entire earnings of the Underlying Bond, and recognizes (a) the interest paid to the holders of the Floaters or on the TOB Trust’s borrowings, and (b) other expenses related to remarketing, administration, trustee, liquidity and other services to a TOB Trust, as a component of “Interest expense” on the Statement of Operations.
In contrast, an investment in an externally-deposited Inverse Floater is accounted for as a purchase of the Inverse Floater and is identified in the Fund’s Portfolio of Investments as “(IF) – Inverse floating rate investment.” For an externally-deposited Inverse Floater, a Fund’s Statement of Assets and liabilities recognizes the Inverse Floater and not the Underlying Bond as an asset, and the Fund does not recognize the Floaters, or any related borrowings from a Liquidity Provider, as a liability. Additionally, the Fund reflects in “Investment Income” only the net amount of earnings on the Inverse Floater (net of the interest paid to the holders of the Floaters or the Liquidity Provider as lender, and the expenses of the Trust), and does not show the amount of that interest paid or the expenses of the TOB Trust as described above as interest expense on the Statement of Operations.
During the current fiscal period, the Funds did not have any transactions in self-deposited Inverse Floaters and/or externally-deposited Inverse Floaters.
Zero Coupon Securities
A zero coupon security does not pay a regular interest coupon to its holders during the life of the security. Income to the holder of the security comes from accretion of the difference between the original purchase price of the security at issuance and the par value of the security at maturity and is effectively paid at maturity. The market prices of zero coupon securities generally are more volatile than the market prices of securities that pay interest periodically.
Investments in Derivatives
In addition to the inverse floating rate securities in which each Fund may invest, which are considered portfolio securities for financial reporting purposes, each Fund is authorized to invest in certain derivative instruments. The Funds record derivative instruments at fair value, with changes in fair value recognized on the Statement of Operations, when applicable. Even though the Funds’ investments in derivatives may represent economic hedges, they are not considered to be hedge transactions for financial reporting purposes.
Although the Funds are authorized to invest in derivative instruments, and may do so in the future, they did not make any such investments during the current fiscal period.
Market and Counterparty Credit Risk
In the normal course of business each Fund may invest in financial instruments and enter into financial transactions where risk of potential loss exists due to changes in the market (market risk) or failure of the other party to the transaction to perform (counterparty credit risk). The potential loss could exceed the value of the financial assets recorded on the financial statements. Financial assets, which potentially expose each Fund to counterparty credit risk, consist principally of cash due from counterparties on forward, option and swap transactions, when applicable. The extent of each Fund’s exposure to counterparty credit risk in respect to these financial assets approximates their carrying value as recorded on the Statement of Assets and Liabilities.
Each Fund helps manage counterparty credit risk by entering into agreements only with counterparties the Adviser believes have the financial resources to honor their obligations and by having the Adviser monitor the financial stability of the counterparties. Additionally, counterparties may be required to pledge collateral daily (based on the daily valuation of the financial asset) on behalf of each Fund with a value approximately equal to the amount of any unrealized gain above a pre-determined threshold. Reciprocally, when each Fund has an unrealized loss, the Funds have instructed the custodian to pledge assets of the Funds as collateral with a value approximately equal to the amount of the unrealized loss above a pre-determined threshold. Collateral pledges are monitored and subsequently adjusted if and when the valuations fluctuate, either up or down, by at least the pre-determined threshold amount.
4. Fund Shares
The Funds have an effective registration statement on file with the Securities and Exchange Commission ("SEC") to issue Class T Shares, which were not yet available for public offering at the time this report was issued.
Transactions in Fund shares during the current and prior fiscal period were as follows:
| | Year Ended
5/31/17 | | Year Ended
5/31/16 |
| Minnesota Intermediate | Shares | Amount | | Shares | Amount |
| Shares sold: | | | | | |
| Class A | 3,127,399 | $ 32,669,056 | | 2,582,776 | $ 27,204,254 |
| Class C | 493,675 | 5,179,456 | | 578,307 | 6,055,990 |
| Class C1 | — | — | | — | — |
| Class C2 | 474 | 4,877 | | 183 | 1,920 |
| Class I | 6,521,957 | 67,515,833 | | 4,872,138 | 51,209,743 |
| Shares issued to shareholders due to reinvestment of distributions: | | | | | |
| Class A | 244,509 | 2,558,766 | | 220,874 | 2,329,954 |
| Class C | 24,279 | 252,318 | | 18,847 | 197,855 |
| Class C1 | 4,807 | 50,499 | | 5,353 | 56,596 |
| Class C2 | 13,226 | 137,938 | | 14,584 | 153,152 |
| Class I | 133,416 | 1,387,859 | | 98,342 | 1,032,158 |
| | 10,563,742 | 109,756,602 | | 8,391,404 | 88,241,622 |
| Shares redeemed: | | | | | |
| Class A | (3,434,146) | (35,457,925) | | (1,198,204) | (12,632,129) |
| Class C | (366,905) | (3,815,995) | | (128,750) | (1,353,018) |
| Class C1 | (26,082) | (278,067) | | (13,088) | (137,617) |
| Class C2 | (67,845) | (703,831) | | (73,590) | (769,447) |
| Class I | (6,327,935) | (64,931,895) | | (2,993,418) | (31,388,303) |
| | (10,222,913) | (105,187,713) | | (4,407,050) | (46,280,514) |
| Net increase (decrease) | 340,829 | $ 4,568,889 | | 3,984,354 | $ 41,961,108 |
| | Year Ended
5/31/17 | | Year Ended
5/31/16 |
| Minnesota | Shares | Amount | | Shares | Amount |
| Shares sold: | | | | | |
| Class A | 6,754,550 | $ 79,064,661 | | 3,616,820 | $ 42,886,892 |
| Class C | 1,002,685 | 11,835,244 | | 1,030,774 | 12,200,789 |
| Class C1 | 1,561 | 18,252 | | 1,954 | 22,994 |
| Class C2 | 2,802 | 32,513 | | 8,142 | 95,669 |
| Class I | 6,617,810 | 77,227,575 | | 4,358,449 | 51,452,184 |
| Shares issued to shareholders due to reinvestment of distributions: | | | | | |
| Class A | 407,380 | 4,781,703 | | 381,496 | 4,512,867 |
| Class C | 48,502 | 567,713 | | 30,483 | 360,836 |
| Class C1 | 26,083 | 305,174 | | 32,686 | 384,760 |
| Class C2 | 18,656 | 219,384 | | 24,253 | 286,774 |
| Class I | 171,028 | 2,001,750 | | 108,662 | 1,285,801 |
| | 15,051,057 | 176,053,969 | | 9,593,719 | 113,489,566 |
| Shares redeemed: | | | | | |
| Class A | (6,888,388) | (79,491,678) | | (1,393,251) | (16,484,157) |
| Class C | (366,784) | (4,251,156) | | (79,828) | (944,769) |
| Class C1 | (128,174) | (1,495,101) | | (87,829) | (1,030,249) |
| Class C2 | (118,104) | (1,371,668) | | (118,112) | (1,387,923) |
| Class I | (4,712,917) | (54,124,655) | | (1,256,196) | (14,834,078) |
| | (12,214,367) | (140,734,258) | | (2,935,216) | (34,681,176) |
| Net increase (decrease) | 2,836,690 | $ 35,319,711 | | 6,658,503 | $ 78,808,390 |
Notes to Financial Statements (continued)
| | Year Ended
5/31/17 | | Year Ended
5/31/16 |
| Nebraska | Shares | Amount | | Shares | Amount |
| Shares sold: | | | | | |
| Class A | 358,237 | $ 3,902,909 | | 373,393 | $ 4,089,775 |
| Class C | 119,627 | 1,295,054 | | 132,963 | 1,454,507 |
| Class C1 | 39 | 419 | | 109 | 1,176 |
| Class C2 | 17,052 | 183,489 | | 48 | 523 |
| Class I | 573,348 | 6,167,311 | | 499,263 | 5,465,415 |
| Shares issued to shareholders due to reinvestment of distributions: | | | | | |
| Class A | 79,644 | 860,043 | | 66,123 | 722,350 |
| Class C | 6,739 | 72,370 | | 3,176 | 34,653 |
| Class C1 | 6,212 | 66,667 | | 6,012 | 65,180 |
| Class C2 | 8,955 | 96,784 | | 8,625 | 94,228 |
| Class I | 39,047 | 421,907 | | 28,641 | 313,114 |
| | 1,208,900 | 13,066,953 | | 1,118,353 | 12,240,921 |
| Shares redeemed: | | | | | |
| Class A | (389,570) | (4,151,407) | | (257,848) | (2,804,105) |
| Class C | (80,799) | (861,249) | | (11,744) | (128,664) |
| Class C1 | (42,113) | (448,156) | | (11,801) | (127,619) |
| Class C2 | (46,682) | (502,700) | | (46,706) | (504,629) |
| Class I | (467,561) | (5,022,509) | | (428,742) | (4,673,969) |
| | (1,026,725) | (10,986,021) | | (756,841) | (8,238,986) |
| Net increase (decrease) | 182,175 | $ 2,080,932 | | 361,512 | $ 4,001,935 |
| | Year Ended
5/31/17 | | Year Ended
5/31/16 |
| Oregon Intermediate | Shares | Amount | | Shares | Amount |
| Shares sold: | | | | | |
| Class A | 998,350 | $ 10,394,486 | | 1,464,505 | $ 15,222,897 |
| Class C | 159,195 | 1,633,221 | | 159,301 | 1,644,244 |
| Class C2 | 1,001 | 10,564 | | 6,741 | 69,163 |
| Class I | 7,103,780 | 72,660,248 | | 6,549,972 | 68,195,664 |
| Shares issued to shareholders due to reinvestment of distributions: | | | | | |
| Class A | 112,556 | 1,160,837 | | 123,483 | 1,282,711 |
| Class C | 5,705 | 58,456 | | 5,417 | 55,979 |
| Class C2 | 11,517 | 118,522 | | 15,969 | 165,366 |
| Class I | 98,358 | 1,013,892 | | 83,069 | 864,316 |
| | 8,490,462 | 87,050,226 | | 8,408,457 | 87,500,340 |
| Shares redeemed: | | | | | |
| Class A | (2,183,560) | (22,176,929) | | (919,476) | (9,518,139) |
| Class C | (131,943) | (1,329,142) | | (46,256) | (477,834) |
| Class C2 | (133,313) | (1,357,340) | | (88,362) | (913,976) |
| Class I | (6,979,696) | (70,895,447) | | (1,599,472) | (16,634,037) |
| | (9,428,512) | (95,758,858) | | (2,653,566) | (27,543,986) |
| Net increase (decrease) | (938,050) | $ (8,708,632) | | 5,754,891 | $ 59,956,354 |
5. Investment Transactions
Long-term purchases and sales (including maturities) during the current fiscal period were as follows:
| | Minnesota
Intermediate | Minnesota | Nebraska | Oregon
Intermediate |
| Purchases | $62,910,428 | $102,005,853 | $9,811,992 | $53,582,136 |
| Sales and maturities | 54,009,001 | 74,586,574 | 6,862,363 | 56,598,608 |
6. Income Tax Information
Each Fund is a separate taxpayer for federal income tax purposes. Each Fund intends to distribute substantially all of its net investment income and net capital gains to shareholders and to otherwise comply with the requirements of Subchapter M of the Internal Revenue Code applicable to regulated investment companies. Therefore, no federal income tax provision is required. Furthermore, each Fund intends to satisfy conditions that will enable interest from municipal securities, which is exempt from regular federal and designated state income taxes, to retain such tax-exempt status when distributed to shareholders of the Funds. Net realized capital gains and ordinary income distributions paid by the Funds are subject to federal taxation.
For all open tax years and all major taxing jurisdictions, management of the Funds has concluded that there are no significant uncertain tax positions that would require recognition in the financial statements. Open tax years are those that are open for examination by taxing authorities (i.e., generally the last four tax year ends and the interim tax period since then). Furthermore, management of the Funds is also not aware of any tax positions for which it is reasonably possible that the total amounts of unrecognized tax benefits will significantly change in the next twelve months.
The following information is presented on an income tax basis. Differences between amounts for financial statement and federal income tax purposes are primarily due to timing differences in recognizing taxable market discount, timing differences in recognizing certain gains and losses on investment transactions and the treatment of investments in inverse floating rate securities reflected as financing transactions, if any. To the extent that differences arise that are permanent in nature, such amounts are reclassified within the capital accounts as detailed below. Temporary differences do not require reclassification. Temporary and permanent differences do not impact the NAVs of the Funds.
As of May 31, 2017, the cost and unrealized appreciation (depreciation) of investments, as determined on a federal income tax basis, were as follows:
| | Minnesota
Intermediate | Minnesota | Nebraska | Oregon
Intermediate |
| Cost of investments | $319,832,367 | $330,778,557 | $59,392,825 | $210,452,258 |
| Gross unrealized: | | | | |
| Appreciation | $ 15,246,111 | $ 18,472,279 | $ 3,277,132 | $ 8,715,638 |
| Depreciation | (207,240) | (329,929) | (132,121) | (213,932) |
| Net unrealized appreciation (depreciation) of investments | $ 15,038,871 | $ 18,142,350 | $ 3,145,011 | $ 8,501,706 |
Permanent differences, primarily due to the federal taxes paid, expiration of capital loss carryforwards and taxable market discount, resulted in reclassifications among the Funds' components of net assets as of May 31, 2017, the Funds' tax year end, as follows:
| | Minnesota
Intermediate | Minnesota | Nebraska | Oregon
Intermediate |
| Capital paid-in | $ (12) | $ (12) | $(199,036) | $ (12) |
| Undistributed (Over-distribution of) net investment income | — | — | — | — |
| Accumulated net realized gain (loss) | 12 | 12 | 199,036 | 12 |
The tax components of undistributed net tax-exempt income, net ordinary income and net long-term capital gains as of May 31, 2017, the Funds' tax year end, were as follows:
| | Minnesota
Intermediate | Minnesota | Nebraska | Oregon
Intermediate |
| Undistributed net tax-exempt income1 | $740,120 | $ — | $180,840 | $374,923 |
| Undistributed net ordinary income2 | — | 309,066 | — | — |
| Undistributed net long-term capital gains | — | — | — | — |
| 1 | Undistributed net tax-exempt income (on a tax basis) has not been reduced for the dividends declared during the period May 1, 2017 through May 31, 2017, and paid on June 1, 2017. |
| 2 | Net ordinary income consists of taxable market discount income and net short-term capital gains, if any. |
The tax character of distributions paid during the Funds’ tax years ended May 31, 2017 and May 31, 2016, was designated for purposes of the dividends paid deduction as follows:
| 2017 | Minnesota
Intermediate | Minnesota | Nebraska | Oregon
Intermediate |
| Distributions from net tax-exempt income3 | $9,789,546 | $10,810,717 | $1,939,106 | $5,238,853 |
| Distributions from net ordinary income2 | — | 18,083 | 87,879 | — |
| Distributions from net long-term capital gains | — | — | — | — |
| 2016 | Minnesota
Intermediate | Minnesota | Nebraska | Oregon
Intermediate |
| Distributions from net tax-exempt income | $9,060,948 | $9,515,300 | $1,720,325 | $5,012,758 |
| Distributions from net ordinary income2 | — | 164,483 | — | — |
| Distributions from net long-term capital gains | — | — | — | — |
| 2 | Net ordinary income consists of taxable market discount income and net short-term capital gains, if any. |
| 3 | The Funds hereby designate these amounts paid during the fiscal year ended May 31, 2017, as Exempt Interest Dividends. |
Notes to Financial Statements (continued)
As of May 31, 2017, the Funds’ tax year end, the Funds had unused capital loss carryforwards available for federal income tax purposes to be applied against future capital gains, if any. If not applied, the carryforwards will expire as shown in the following table. The losses not subject to expiration will be utilized first by a Fund.
| | Minnesota
Intermediate | Minnesota | Nebraska | Oregon
Intermediate |
| Expiration: | | | | |
| May 31, 2018 | $ — | $ — | $ 36,230 | $ — |
| Not subject to expiration | 1,686,901 | 9,000,300 | 2,201,141 | 2,974,431 |
| Total | $1,686,901 | $9,000,300 | $2,237,371 | $2,974,431 |
As of May 31, 2017, the Fund's tax year end, $199,024 of Nebraska's capital loss carryforward expired.
7. Management Fees and Other Transactions with Affiliates
Management Fees
Each Fund’s management fee compensates the Adviser for the overall investment advisory and administrative services and general office facilities. The Sub-Adviser is compensated for its services to the Funds from the management fees paid to the Adviser.
Each Fund’s management fee consists of two components – a fund-level fee, based only on the amount of assets within each individual Fund, and a complex-level fee, based on the aggregate amount of all eligible fund assets managed by the Adviser. This pricing structure enables each Fund’s shareholders to benefit from growth in the assets within their respective Fund as well as from growth in the amount of complex-wide assets managed by the Adviser.
The annual Fund-level fee, payable monthly, for each Fund is calculated according to the following schedule:
| Average Daily Net Assets | Minnesota
Intermediate | Minnesota | Nebraska | Oregon
Intermediate | |
| For the first $125 million | 0.3500% | 0.3500% | 0.3500% | 0.3500% | |
| For the next $125 million | 0.3375 | 0.3375 | 0.3375 | 0.3375 | |
| For the next $250 million | 0.3250 | 0.3250 | 0.3250 | 0.3250 | |
| For the next $500 million | 0.3125 | 0.3125 | 0.3125 | 0.3125 | |
| For the next $1 billion | 0.3000 | 0.3000 | 0.3000 | 0.3000 | |
| For net assets over $2 billion | 0.2750 | 0.2750 | 0.2750 | 0.2750 | |
The annual complex-level fee, payable monthly, for each Fund is determined by taking the complex-level fee rate, which is based on the aggregate amount of "eligible assets" of all Nuveen funds as set forth in the schedule below, and making, as appropriate, an upward adjustment to that rate based upon the percentage of the particular fund's assets that are not "eligible assets". The complex-level fee schedule for each Fund is as follows:
| Complex-Level Asset Breakpoint Level* | Effective Rate at Breakpoint Level |
| $55 billion | 0.2000% |
| $56 billion | 0.1996 |
| $57 billion | 0.1989 |
| $60 billion | 0.1961 |
| $63 billion | 0.1931 |
| $66 billion | 0.1900 |
| $71 billion | 0.1851 |
| $76 billion | 0.1806 |
| $80 billion | 0.1773 |
| $91 billion | 0.1691 |
| $125 billion | 0.1599 |
| $200 billion | 0.1505 |
| $250 billion | 0.1469 |
| $300 billion | 0.1445 |
* The complex-level fee is calculated based upon the aggregate daily “eligible assets” of all Nuveen funds. Eligible assets do not include assets attributable to investments in other Nuveen funds or assets in excess of a determined amount (originally $2 billion) added to the Nuveen fund complex in connection with the Adviser’s assumption of the management of the former First American Funds effective January 1, 2011. Eligible assets include closed-end fund assets managed by the Adviser that are attributable to certain types of leverage. For these purposes, leverage includes the closed-end funds’ use of preferred stock and borrowings and certain investments in the residual interest certificates (also called inverse floating rate securities) in tender option bond (TOB) trusts, including the portion of assets held by a TOB trust that has been effectively financed by the trust’s issuance of floating rate securities, subject to an agreement by the Adviser as to certain funds to limit the amount of such assets for determining eligible assets in certain circumstances. As of May 31, 2017, the complex-level fee for each Fund was as follows:
| Fund | Complex-Level Fee |
| Minnesota Intermediate | 0.1847% |
| Minnesota | 0.1763% |
| Nebraska | 0.1832% |
| Oregon Intermediate | 0.1854% |
The Adviser has agreed to waive fees and/or reimburse expenses (“Expense Cap”) of Nebraska so that total annual Fund operating expenses (excluding 12b-1 distribution and/or service fees, interest expenses, taxes, acquired fund fees and expenses, fees incurred in acquiring and disposing of portfolio securities and extraordinary expenses) do not exceed of the average daily net assets of any class of Fund shares in the amounts and for the time period stated in the following table.
| Fund | Expense Cap | Expense Cap
Expiration Date |
| Nebraska | 0.70% | September 30, 2018 |
Other Transactions with Affiliates
Each Fund is permitted to purchase or sell securities from or to certain other funds managed by the Adviser (“inter-fund trade”) under specified conditions outlined in procedures adopted by the Board. These procedures have been designed to ensure that any inter-fund trade of securities by the Fund from or to another fund that is, or could be, considered an affiliate of the Fund under certain limited circumstances by virtue of having a common investment adviser (or affiliated investment adviser), common officer and/or common trustee complies with Rule 17a-7 of the 1940 Act. Further, as defined under these procedures, each inter-fund trade is effected at the current market price as provided by an independent pricing service. Unsettled inter-fund trades as of the end of the reporting period are recognized as a component of “Receivable for investments sold” and/or “Payable for investments purchased” on the Statement of Assets and Liabilities, when applicable.
During the current fiscal period, the following Funds engaged in inter-fund trades pursuant to these procedures as follows:
| Inter-Fund Trades | Minnesota
Intermediate | Minnesota |
| Purchases | $ 4,603,767 | $10,990,320 |
| Sales | 11,728,323 | 5,275,885 |
During the current fiscal period, Nuveen Securities, LLC, (the “Distributor”), a wholly-owned subsidiary of Nuveen, collected sales charges on purchases of Class A Shares, the majority of which were paid out as concessions to financial intermediaries as follows:
| | Minnesota
Intermediate | Minnesota | Nebraska | Oregon
Intermediate |
| Sales charges collected (Unaudited) | $219,217 | $619,087 | $84,306 | $54,612 |
| Paid to financial intermediaries (Unaudited) | 189,805 | 564,875 | 72,657 | 48,641 |
The Distributor also received 12b-1 service fees on Class A Shares, substantially all of which were paid to compensate financial intermediaries for providing services to shareholders relating to their investments.
During the current fiscal period, the Distributor compensated financial intermediaries directly with commission advances at the time of purchase as follows:
| | Minnesota
Intermediate | Minnesota | Nebraska | Oregon
Intermediate |
| Commission advances (Unaudited) | $122,462 | $344,260 | $15,978 | $50,898 |
To compensate for commissions advanced to financial intermediaries, all 12b-1 service and distribution fees collected on Class C and Class C2 Shares during the first year following a purchase are retained by the Distributor. During the current fiscal period, the Distributor retained such 12b-1 fees as follows:
| | Minnesota
Intermediate | Minnesota | Nebraska | Oregon
Intermediate |
| 12b-1 fees retained (Unaudited) | $53,577 | $132,090 | $16,191 | $15,078 |
Notes to Financial Statements (continued)
The remaining 12b-1 fees charged to each Fund were paid to compensate financial intermediaries for providing services to shareholders relating to their investments.
The Distributor also collected and retained CDSC on share redemptions during the current fiscal period, as follows:
| | Minnesota
Intermediate | Minnesota | Nebraska | Oregon
Intermediate |
| CDSC retained (Unaudited) | $3,755 | $20,771 | $538 | $4,695 |
8. Borrowing Arrangements
Uncommitted Line of Credit
During the current fiscal period, the Funds participated in an unsecured bank line of credit (“Unsecured Credit Line”) under which outstanding balances would bear interest at a variable rate. Although the Funds participated in the Unsecured Credit Line, they did not have any outstanding balances during the current fiscal period.
Committed Line of Credit
The Funds, along with certain other funds managed by the Adviser (“Participating Funds”), have established a 364-day, approximately $3 billion standby credit facility with a group of lenders, under which the Participating Funds may borrow for various purposes other than leveraging for investment purposes. A large portion of this facility’s capacity (and its associated costs as described below) is currently dedicated for use by a small number of Participating Funds, which does not include any of the Funds covered by this shareholder report. The remaining capacity under the facility (and the corresponding portion of the facility’s annual costs) is separately dedicated to most of the other open-end funds in the Nuveen fund family, including all of the Funds covered by this shareholder report, along with a number of Nuveen closed-end funds. The credit facility expires in July 2018 unless extended or renewed.
The credit facility has the following terms: a fee of 0.15% per annum on unused commitment amounts, and interest at a rate equal to the higher of (a) one-month LIBOR (London Inter-Bank Offered Rate) plus 1.25% per annum or (b) the Fed Funds rate plus 1.25% per annum on amounts borrowed. Participating Funds paid administration, legal and arrangement fees, which are recognized as a component of “Other expenses” on the Statement of Operations, and along with commitment fees, have been allocated among such Participating Funds based upon the relative proportions of the facility’s aggregate capacity reserved for them and other factors deemed relevant by the Adviser and the Board of each Participating Fund.
During the current fiscal period, the following Funds utilized this facility ("Borrowings"). Each of the following Fund's maximum outstanding balance on the borrowings during their utilization period were as follows:
| | Minnesota
Intermediate | Minnesota | Oregon
Intermediate |
| Maximum Outstanding Balance | $6,000,000 | $10,000,000 | $10,000,000 |
During the current fiscal period, and during each Fund's utilization period, the average daily balance outstanding and average annual interest rate on the Borrowings were as follows:
| | Minnesota
Intermediate | Minnesota | Oregon
Intermediate |
| Average daily balance outstanding | $6,000,000 | $5,818,182 | $5,500,000 |
| Average annual interest rate | 2.01% | 1.88% | 1.96% |
9. New Accounting Pronouncements
Amendments to Regulation S-X
In October 2016, the SEC adopted new rules and amended existing rules (together, the “final rules”) intended to modernize the reporting and disclosure of information by registered investment companies. In part, the final rules amend Regulation S-X and require standardized, enhanced disclosure about derivatives in investment company financial statements, as well as other amendments. The compliance date of the amendments to Regulation S-X is August 1, 2017. Management is still evaluating the impact of the final rules, if any.
Accounting Standards Update 2017-08 ("ASU 2017-08") Premium Amortization on Purchased Callable Debt Securities
During March 2017, the Financial Accounting Standards Board ("FASB") issued ASU 2017-08, which shortens the premium amortization period for purchased non-contingently callable debt securities. ASU 2017-08 specifies that the premium amortization period ends at the earliest call date, for purchased non-contingently callable debt securities. ASU 2017-08 is effective for fiscal years, and interim periods within those fiscal years, beginning after December 15, 2018. Management is currently evaluating the implications of ASU 2017-08, if any.
10. Subsequent Events
Management Fees
During May 2017, the Board approved a change to each Fund’s annual Fund-level management fee schedule, which will become effective on August 1, 2017.
Effective August 1, 2017 the annual Fund-level fee, payable monthly, for each Fund will be calculated according to the following schedule:
| Average Daily Net Assets | Minnesota
Intermediate | Minnesota | Nebraska | Oregon
Intermediate |
| For the first $125 million | 0.3500% | 0.3500% | 0.3500% | 0.3500% |
| For the next $125 million | 0.3375 | 0.3375 | 0.3375 | 0.3375 |
| For the next $250 million | 0.3250 | 0.3250 | 0.3250 | 0.3250 |
| For the next $500 million | 0.3125 | 0.3125 | 0.3125 | 0.3125 |
| For the next $1 billion | 0.3000 | 0.3000 | 0.3000 | 0.3000 |
| For the next $3 billion | 0.2750 | 0.2750 | 0.2750 | 0.2750 |
| For the next $5 billion | 0.2500 | 0.2500 | 0.2500 | 0.2500 |
| For net assets of $10 billion and greater | 0.2375 | 0.2375 | 0.2375 | 0.2375 |
Uncommitted Line of Credit
The Unsecured Credit Line (as described in Note 8 - Borrowing Arrangements) was not renewed after its scheduled Termination Date on July 27, 2017.
Additional
Fund Information (Unaudited)
Fund Manager
Nuveen Fund Advisors, LLC
333 West Wacker Drive
Chicago, IL 60606
Sub-Adviser
Nuveen Asset Management, LLC
333 West Wacker Drive
Chicago, IL 60606
Independent Registered
Public Accounting Firm
PricewaterhouseCoopers LLP
One North Wacker Drive
Chicago, IL 60606
Custodian
U.S. Bank National Association
1555 North RiverCenter Drive
Suite 302
Milwaukee, WI 53202
Legal Counsel
Chapman and Cutler LLP
Chicago, IL 60603
Transfer Agent and
Shareholder Services
Boston Financial
Data Services, Inc.
Nuveen Investor Services
P.O. Box 8530
Boston, MA 02266-8530
(800) 257-8787
Quarterly Form N-Q Portfolio of Investments Information: Each Fund is required to file its complete schedule of portfolio holdings with the Securities and Exchange Commission (SEC) for the first and third quarters of each fiscal year on Form N-Q. You may obtain this information directly from the SEC. Visit the SEC on-line at http://www.sec.gov or in person at the SEC’s Public Reference Room in Washington, D.C. Call the SEC toll-free at (800) SEC-0330 for room hours and operation.
Nuveen Funds’ Proxy Voting Information: You may obtain (i) information regarding how each fund voted proxies relating to portfolio securities held during the most recent twelve-month period ended June 30, without charge, upon request, by calling Nuveen toll-free at (800) 257-8787 or on Nuveen’s website at www.nuveen.com and (ii) a description of the policies and procedures that each fund used to determine how to vote proxies relating to portfolio securities without charge, upon request, by calling Nuveen toll-free at (800) 257-8787. You may also obtain this information directly from the SEC. Visit the SEC on-line at http://www.sec.gov.
FINRA BrokerCheck: The Financial Industry Regulatory Authority (FINRA) provides information regarding the disciplinary history of FINRA member firms and associated investment professionals. This information as well as an investor brochure describing FINRA BrokerCheck is available to the public by calling the FINRA BrokerCheck Hotline number at (800) 289-9999 or by visiting www.FINRA.org.
Glossary of Terms
Used in this Report (Unaudited)
Average Annual Total Return: This is a commonly used method to express an investment’s performance over a particular, usually multi-year time period. It expresses the return that would have been necessary each year to equal the investment’s actual cumulative performance (including change in NAV or offer price and reinvested dividends and capital gains distributions, if any) over the time period being considered.
Duration: Duration is a measure of the expected period over which a bond’s principal and interest will be paid, and consequently is a measure of the sensitivity of a bond’s (or bond fund’s) value to changes when market interest rates change. Generally, the longer a bond or fund’s duration, the more the price of the bond or fund will change as interest rates change.
Effective Leverage (Effective Leverage Ratio): Effective leverage is investment exposure created either through borrowings or indirectly through inverse floaters, divided by the assets invested, including those assets that were purchased with the proceeds of the leverage, or referenced by the levered instrument. The calculation of the Effective Leverage Ratio reflects borrowings effected on a long-term basis for investment purposes, but excludes borrowings that may occur, on a transient basis, in connection with a Fund’s day-to-day operations primarily in connection with the need to pay cash out to redeeming shareholders or to settle portfolio trades.
Gross Domestic Product (GDP): The total market value of all final goods and services produced in a country/region in a given year, equal to total consumer, investment and government spending, plus the value of exports, minus the value of imports.
Industrial Development Revenue Bond (IDR): A unique type of revenue bond issued by a state or local government agency on behalf of a private sector company and intended to build or acquire factories or other heavy equipment and tools.
Inverse Floating Rate Securities: Inverse floating rate securities, also known as inverse floaters or tender option bonds (TOBs), are created by depositing a municipal bond, typically with a fixed interest rate, into a special purpose trust. This trust, in turn, (a) issues floating rate certificates typically paying short-term tax-exempt interest rates to third parties in amounts equal to some fraction of the deposited bond’s par amount or market value, and (b) issues an inverse floating rate certificate (sometimes referred to as an “inverse floater”) to an investor (such as a fund) interested in gaining investment exposure to a long-term municipal bond. The income received by the holder of the inverse floater varies inversely with the short-term rate paid to the floating rate certificates’ holders, and in most circumstances the holder of the inverse floater bears substantially all of the underlying bond’s downside investment risk. The holder of the inverse floater typically also benefits disproportionately from any potential appreciation of the underlying bond’s value. Hence, an inverse floater essentially represents an investment in the underlying bond on a leveraged basis.
Lipper Minnesota Municipal Debt Funds Classification Average: Represents the average annualized total return for all reporting funds in the Lipper Minnesota Municipal Debt Funds Classification. Lipper returns account for the effects of management fees and assume reinvestment of distributions, but do not reflect any applicable sales charge.
Lipper Other States Intermediate Municipal Debt Funds Classification Average: Represents the average annualized total return for all reporting funds in the Lipper Other States Intermediate Municipal Debt Funds Classification. Shareholders should note that the performance of the Lipper Other States Intermediate Municipal Debt Funds Classification Average represents the overall average of returns for funds from multiple states with a wide variety of municipal market
Glossary of Terms Used in this Report (Unaudited) (continued)
conditions, making direct comparisons less meaningful. Lipper returns account for the effects of management fees and assume reinvestment of distributions, but do not reflect any applicable sales charge.
Lipper Other States Municipal Debt Funds Classification Average: Represents the average annualized total return for all reporting funds in the Lipper Other States Municipal Debt Funds Classification. Shareholders should note that the performance of the Lipper Other States Municipal Debt Funds Classification Average represents the overall average of returns for funds from multiple states with a wide variety of municipal market conditions, making direct comparisons less meaningful. Lipper returns account for the effects of management fees and assume reinvestment of distributions, but do not reflect any applicable sales charge.
Net Asset Value (NAV) Per Share: A fund’s Net Assets is equal to its total assets (securities, cash and accrued earnings) less its total liabilities. For funds with multiple classes, Net Assets are determined separately for each share class. NAV per share is equal to the fund’s (or share class’) Net Assets divided by its number of shares outstanding.
Pre-Refundings: Pre-Refundings, also known as advance refundings or refinancings, occur when an issuer sells new bonds and uses the proceeds to fund principal and interest payments of older existing bonds. This process often results in lower borrowing costs for bond issuers.
S&P Municipal Bond Intermediate Index: Contains all bonds in the S&P Municipal Bond Index that mature between 3 and 14.999 years. Index returns assume reinvestment of distributions but do not reflect any applicable sales charges or management fees.
S&P Municipal Bond Index: An unleveraged, market value-weighted index designed to measure the performance of the tax exempt, investment-grade U.S. municipal bond market. Index returns assume reinvestment of distributions, but do not reflect any applicable sales charges or management fees.
Total Investment Exposure: Total investment exposure is a fund’s assets managed by the Adviser that are attributable to financial leverage. For these purposes, financial leverage includes a fund’s use of preferred stock and borrowings and investments in the residual interest certificates (also called inverse floating rate securities) in tender option bond (TOB) trusts, including the portion of assets held by a TOB trust that has been effectively financed by the trust’s issuance of floating rate securities.
Zero Coupon Bond: A zero coupon bond does not pay a regular interest coupon to its holders during the life of the bond. Income to the holder of the bond comes from accretion of the difference between the original purchase price of the bond at issuance and the par value of the bond at maturity and is effectively paid at maturity. The market prices of zero coupon bonds generally are more volatile than the market prices of bonds that pay interest periodically.
Annual Investment Management Agreement
Approval Process (Unaudited)
The Board of Directors (the “Board,” and each Director, a “Board Member”) of the Funds, including the Board Members who are not parties to the Funds’ advisory or sub-advisory agreements or “interested persons” of any such parties (the “Independent Board Members”), oversees the management of the Funds, including the performance of Nuveen Fund Advisors, LLC, the Funds’ investment adviser (the “Adviser”), and Nuveen Asset Management, LLC, the Funds’ sub-adviser (the “Sub-Adviser”). As required by applicable law, after the initial term of the respective Fund following commencement of its operations, the Board is required to consider annually whether to renew the Fund’s management agreement with the Adviser (the “Investment Management Agreement”) and its sub-advisory agreement with the Sub-Adviser (the “Sub-Advisory Agreement” and, together with the Investment Management Agreement, the “Advisory Agreements”). Accordingly, the Board met in person on April 11-12, 2017 (the “April Meeting”) and May 23-25, 2017 (the “May Meeting”) to consider the approval of each Advisory Agreement for the Funds that was up for renewal for an additional one-year period.
The Board considered its review of the Advisory Agreements as an ongoing process encompassing the information received and the deliberations the Board and its committees have had throughout the year. The Board met regularly during the year and received materials and discussed topics that were relevant to the annual consideration of the renewal of the Advisory Agreements, including, among other things, overall market performance and developments; fund investment performance; investment team review; valuation of securities; compliance, regulatory and risk management matters; payments to intermediaries such as 12b-1 fees, sub-transfer agency fees and other payments; and other developments. The Board had also established several standing committees, including the Open-end Fund Committee and Closed-end Fund Committee, which met regularly throughout the year to permit the Board Members to delve deeper into the topics particularly relevant to the respective product line. The Board further continued its practice of seeking to meet periodically with the Sub-Adviser and its investment team. The accumulated information, knowledge, and experience the Board Members had gained during their tenure on the Board governing the Funds and working with the Fund Advisers (as defined below) were taken into account in their review of the Advisory Agreements.
In addition to the materials received by the Board or its committees throughout the year, the Board reviewed extensive additional materials prepared specifically for its annual review of the Advisory Agreements in response to a request by independent legal counsel on behalf of the Independent Board Members. The materials addressed a variety of topics, including, but not limited to, a description of the services provided by the Adviser and Sub-Adviser (the Adviser and the Sub-Adviser are each a “Fund Adviser”); an analysis of fund performance including comparative industry data and a detailed focus on any performance outliers; an analysis of the Sub-Adviser; an analysis of the fees and expense ratios of the Nuveen funds in absolute terms and in comparison to the fees and expenses of peers with a focus on any expense outliers; an assessment of shareholder services for the Nuveen funds and of the performance of certain service providers; a review of initiatives instituted or continued during the past year; and information regarding the profitability of the Fund Advisers, the compensation of portfolio managers, and compliance and risk matters. The materials provided in connection with the annual review included information compiled and prepared by Broadridge Financial Solutions, Inc. (“Broadridge” or “Lipper”), an independent provider of investment company data, comparing, in relevant part, each Fund’s fees and expenses with those of a comparable universe of funds (the “Peer Universe”) and with a more focused subset of the Peer Universe (the “Peer Group”), as selected by Broadridge (the “Broadridge Report”). The Independent Board Members also received a memorandum from independent legal counsel outlining their fiduciary duties and legal standards in reviewing the Advisory Agreements.
As part of its annual review, the Board met at the April Meeting to review the investment performance of the Funds and to consider the Adviser’s analysis of the Sub-Adviser evaluating, among other things, the Sub-Adviser’s assets under management, investment team, performance, organizational stability, and investment approach. During the review, the Independent Board Members requested and received additional information from management. At the May Meeting, the Board, including the Independent Board Members, continued its review and ultimately approved the continuation of the Advisory Agreements for an additional year. Throughout the year and throughout their review of the Advisory Agreements, the Independent Board Members were assisted by independent legal counsel and met with counsel separately without management present. In deciding to renew the Advisory Agreements, the Independent Board Members did not identify a particular factor as determinative, but rather the decision reflected the comprehensive consideration of all the information presented, and each Board Member may have attributed different weights to the various factors and information considered in connection with the approval process. The following summarizes the principal factors, but not all the factors, the Board considered in its review of the Advisory Agreements and its conclusions.
A. Nature, Extent and Quality of Services
In evaluating the renewal of the Advisory Agreements, the Independent Board Members received and considered information regarding the nature, extent and quality of the applicable Fund Adviser’s services provided to the respective Fund and the resulting performance of each Fund. The Board recognized the myriad of services the Adviser and its affiliates provided to manage and operate the Nuveen funds, including (a) product management (such as managing distributions, positioning the product in the marketplace, managing the relationships with the distribution platforms, maintaining
Annual Investment Management Agreement Approval Process (Unaudited) (continued)
and enhancing shareholder communications and reporting to the Board); (b) investment oversight, risk management and securities valuation (such as overseeing the sub-advisers and other service providers, analyzing investment performance and risks, overseeing risk management and disclosure, executing the daily valuation of securities, and analyzing trade execution); (c) fund administration (such as helping to prepare fund tax returns and complete other tax compliance matters and helping to prepare regulatory filings and shareholder reports); (d) fund board administration (such as preparing board materials and organizing and providing assistance for board meetings); (e) compliance (such as helping to devise and maintain the Nuveen funds’ compliance program and test for adherence); (f) legal support (such as helping to prepare registration statements and proxy statements, interpreting regulations and policies and overseeing fund activities); (g) with respect to certain closed-end funds, providing leverage, capital and distribution management services; and (h) with respect to certain open-end funds with portfolios that have a leverage component, providing such leverage management services.
The Board further noted the Adviser’s continued dedication to investing in its business to enhance the quality and breadth of the services provided to the Funds. The Board recognized the Adviser’s investment in staffing over recent years to support the services provided to the Nuveen funds in key areas, including in investment services, product management, retail distribution and information technology, closed-end funds and structured products, as well as in fund administration, operations and risk management. The Board further noted the Adviser’s continued commitment to enhancing its compliance program by, among other things, restructuring the compliance organization, developing a unified compliance program, adding compliance staff, and developing and/or revising policies and procedures as well as building further infrastructure to address new regulatory requirements or guidance and the growth of the complex. The Board also considered the enhancements to Nuveen’s cybersecurity capabilities, systems and processes to value securities, stress test reporting and risk and control self-assessments.
In addition, the Independent Board Members considered information highlighting the various initiatives that the Adviser had implemented or continued over recent years to benefit the open-end fund and closed-end fund product lines and/or particular Nuveen funds. The Board noted the Adviser’s continued efforts to rationalize the open-end fund and closed-end fund product lines through, among other things, mergers, liquidations and repositionings in seeking to provide enhanced shareholder value over the years through increased efficiency, reduced costs, improved performance and revised investment approaches that are more relevant to current shareholder needs. With respect to open-end Nuveen funds, such initiatives also included, but were not limited to, (a) implementing the multi-class solutions platform through the launch of several multi-asset income funds; (b) creating new share classes on several funds to potentially attract new clients and respond to regulatory developments; (c) reviewing the pricing of the open-end product line which resulted in the reduction of the management fee and/or temporary expense cap for various funds; (d) lowering the sales load breakpoints on certain municipal open-end funds to make them more competitive in the marketplace; (e) modifying the investment policies of various funds; and (f) creating a new product line of exchange-traded funds (“ETFs”).
With respect to municipal funds, the Independent Board Members also appreciated, in particular, the astute portfolio management of the municipal funds with respect to the Puerto Rico debt crisis.
In its review, the Board recognized that initiatives that attracted assets to the Nuveen family of funds generally benefited the Nuveen funds in the complex as fixed costs would be spread over a larger asset base and, as described below, through the complex-wide fee arrangement which generally provides that the management fees of the Nuveen funds (subject to limited exceptions) are reduced as asset levels in the complex reach certain breakpoints in the fee schedule.
Similarly, the Board considered the sub-advisory services provided by the Sub-Adviser to the Funds. The Sub-Adviser generally provided portfolio advisory services for the Funds. The Board reviewed the Adviser’s analysis of the Sub-Adviser which evaluated, among other things, the investment team and any changes thereto, the stability and history of the organization, the assets under management, the investment approach and the performance of the Nuveen funds it sub-advises. The Board noted that the Adviser recommended the renewal of the Sub-Advisory Agreements.
Based on its review, the Board determined, in the exercise of its reasonable business judgment, that it was satisfied with the nature, extent and quality of services provided to the respective Funds under each applicable Advisory Agreement.
B. The Investment Performance of the Funds and Fund Advisers
As part of its evaluation of the services provided by the Fund Advisers, the Board reviewed Fund performance over the quarter, one-, three- and five-year periods ending December 31, 2016 as well as performance data for the first quarter of 2017 ending March 31, 2017. The Board reviewed performance on an absolute basis and in comparison to the performance of peer funds (the “Performance Peer Group”) and recognized and/or customized benchmarks (i.e., generally benchmarks derived from multiple recognized benchmarks). The review and analysis of performance information during the annual review of Advisory Agreements incorporated the discussions and performance information the Board Members have had at each of their quarterly meetings throughout the year.
In evaluating performance data, the Independent Board Members recognized some of the limitations of such data and the difficulty in establishing appropriate peer groups and benchmarks for certain of the Nuveen funds. They recognized that each fund operates pursuant to its own investment objective(s), parameters and restrictions which may differ from that of the Performance Peer Group or benchmark. Certain funds may also utilize leverage which may provide benefits or risks to their portfolio compared to an unlevered benchmark. The Independent Board Members had noted that manage
ment had classified the Performance Peer Groups as low, medium and high in relevancy to the applicable fund as a result of these differences or other factors. The Independent Board Members recognized that the variations between the Performance Peer Group or benchmark and the applicable Fund will lead to differing performance results and may limit the value of the comparative performance data in assessing the particular Fund’s performance.
In addition, the Independent Board Members recognized that the performance data is a snapshot in time, in this case as of the end of the 2016 calendar year or end of the first quarter of 2017. A different period may generate significantly different results and longer term performance can be adversely affected by even one period of significant underperformance. Further, a shareholder’s experience in a Fund depends on his or her own holding period which may differ from that reviewed by the Independent Board Members. The Independent Board Members also noted that although the open-end funds offer multiple classes and the performance data was based on Class A shares, the performance of the other classes of a fund should be substantially similar on a relative basis because all of the classes would be invested in the same portfolio of securities and differences in performance among classes could be principally attributed to the variations in distribution and servicing expenses of each class.
In their review of performance, the Independent Board Members focused, in particular, on the Adviser’s analysis of Nuveen funds determined to be underperforming performance outliers and the factors contributing to the respective fund’s performance and any efforts to address performance concerns. With respect to any Nuveen funds for which the Board has identified performance issues, the Board monitors such funds closely until performance improves, discusses with the Adviser the reasons for such results, considers any steps necessary or appropriate to address such issues, and reviews the results of any efforts undertaken. The Board, however, acknowledged that shareholders chose to invest or remain invested in a fund knowing that the Adviser and applicable sub-adviser manage the fund, knowing the fund’s investment strategy and seeking exposure to that strategy (even if the strategy was “out of favor” in the marketplace) and knowing the fund’s fee structure.
In reviewing the performance of the Nuveen municipal funds, the Board recognized the challenged and volatile conditions of the municipal market in the fourth quarter of 2016 which impacted the performance of many of the municipal funds. The Board further considered that the municipal market had generally rebounded in the first quarter of 2017. In reviewing the performance of the municipal funds, the Board considered the impact of the market conditions.
For Nuveen Minnesota Intermediate Municipal Bond Fund (the “Minnesota Intermediate Fund”), although the Fund underperformed its benchmark in the one-, three- and five-year periods, the Fund ranked in the first quartile of its Performance Peer Group over such periods. The Board was satisfied with the Fund’s overall performance.
For Nuveen Minnesota Municipal Bond Fund (the “Minnesota Fund”), although the Fund ranked in the fourth quartile in its Performance Peer Group and underperformed its benchmark for the one-year period, the Fund ranked in the first quartile of its Performance Peer Group and outperformed its benchmark for the three- and five-year periods. The Board was satisfied with the Fund’s overall performance.
For Nuveen Nebraska Municipal Bond Fund (the “Nebraska Fund”), the Board noted that although the Fund ranked in its Performance Peer Group in the fourth quartile in the one-year period, the Fund ranked in the first quartile in the three-year period and second quartile in the five-year period. The Fund also underperformed its benchmark in the one- and five-year periods but outperformed its benchmark in the three-year period. The Board was satisfied with the Fund’s performance.
For Nuveen Oregon Intermediate Municipal Bond Fund (the “Oregon Fund”), the Board noted that, although the Fund underperformed its benchmark in the one-, three- and five-year periods, the Fund ranked in its Performance Peer Group in the third quartile in the one-year period and first quartile in the three- and five-year periods. The Board was satisfied with the Fund’s overall performance.
C. Fees, Expenses and Profitability
1. Fees and Expenses
The Board evaluated the management fees and other fees and expenses of each Fund. The Board reviewed and considered, among other things, the gross management fees and after taking into effect any expense limitation arrangement and/or fee waivers (to the extent applicable), the net management fees paid by the Funds. The Board further considered the net total expense ratios of each Fund (expressed as a percentage of average net assets) as the expense ratio is most reflective of the investors’ net experience in a Fund as it directly reflected the costs of investing in the respective Fund.
In addition, the Board reviewed the Broadridge Report comparing, in relevant part, each Fund’s gross and net advisory fees and net total expense ratios with those of a Peer Universe and/or Peer Group, as applicable. The Independent Board Members also reviewed the methodology regarding the construction of the applicable Peer Universe and Peer Group by Broadridge. In reviewing the comparative data, the Board was aware that various factors may limit some of the usefulness of the data, such as differences in size of the peers; the composition of the Peer Universe or Peer Group; changes each year of funds comprising the Peer Universe and Peer Group; and levels of expense reimbursements and fee waivers. Nevertheless, in reviewing a fund’s fees and expenses compared to the fees and expenses of its peers, the Board generally considered a fund’s expenses and fees to be higher if they were over 10 basis points higher, slightly higher if they were 6 to 10 basis points higher, in line if they were within approximately 5 basis points higher than the peer average and below if they were below the peer average of the Peer Group. The Board noted that the substantial majority of the Nuveen funds had a net expense ratio that was near or below their respective peer average.
Annual Investment Management Agreement Approval Process (Unaudited) (continued)
The Independent Board Members noted that the Minnesota Intermediate Fund and the Oregon Fund each had a net management fee slightly higher than its respective peer average but a net expense ratio below its respective peer average, and the Minnesota Fund and the Nebraska Fund each had a net management fee slightly higher than its respective peer average but a net expense ratio in line with its respective peer average.
In their evaluation of the management fee schedule, the Independent Board Members also reviewed the fund-level and complex-wide breakpoint schedules, as described in further detail below. In this regard, the Board was aware that as a result of a review of the pricing of the Nuveen open-end funds, the management fees and/or expense caps of various open-end funds had been reduced in 2016. The Independent Board Members also took into account any expense reimbursements and/or fee waivers provided by Nuveen. In addition, the Independent Board Members recognized that the fund-level breakpoint schedules of the Nuveen open-end funds recently were revised resulting in the addition of more breakpoints in the management fee schedules of the funds. The Board recognized that the revised schedules would provide for the potential of additional savings for shareholders if the respective fund’s assets under management grow.
Based on their review of the information provided, the Board determined that each Fund’s management fees (as applicable) to a Fund Adviser were reasonable in light of the nature, extent and quality of services provided to the Fund.
2. Comparisons with the Fees of Other Clients
The Board also reviewed information regarding the respective Fund Adviser’s fee rates for providing advisory services to other types of clients. For the Adviser and/or the Sub-Adviser, such other clients may include municipal separately managed accounts and passively managed ETFs sub-advised by the Sub-Adviser but that are offered by another fund complex.
The Board recognized that each Fund had an affiliated sub-adviser. In reviewing the fee rates assessed to other clients, with respect to affiliated sub-advisers, the Board reviewed, among other things, the range of fees and average fee rates assessed for managed accounts.
The Board recognized the inherent differences between the Nuveen funds and the other types of clients. The Board considered information regarding these various differences which included, among other things, the services required, product distribution, average account sizes, types of investors targeted, legal structure and operations, and applicable laws and regulations. The Independent Board Members recognized that the foregoing variations resulted in different economics among the product structures and culminated in varying management fees among the types of clients and the Nuveen funds. In general, the Board noted that higher fee levels reflected higher levels of service provided by the Fund Adviser, increased investment management complexity, greater product management requirements and higher levels of business risk or some combination of the foregoing. The Board recognized the breadth of services the Adviser provided to support the Nuveen funds as summarized above and noted that many of such administrative services may not be required to the same extent or at all for the institutional clients or other clients. The Board further recognized the passive management of ETFs compared to the active management required of other Nuveen funds would contribute to differing fee levels.
The Independent Board Members noted that the sub-advisory fees paid by the Adviser to the Sub-Adviser, however, were generally for portfolio management services. With respect to affiliated sub-advisers, the Board noted such sub-advisory fees were more comparable to the fees of retail wrap accounts and other external sub-advisory mandates.
Given the inherent differences in the various products, particularly the extensive services provided to the Funds, the Board concluded that such facts justify the different levels of fees.
3. Profitability of Fund Advisers
In conjunction with their review of fees, the Independent Board Members also considered Nuveen’s level of profitability for its advisory services to the Nuveen funds for the calendar years 2016 and 2015. In considering profitability, the Independent Board Members considered the level of profitability realized by Nuveen before the imposition of any distribution and marketing expenses incurred by the firm from its own resources. In evaluating the profitability, the Independent Board Members evaluated the analysis employed in developing the profitability figures, including the assumptions and methodology employed in allocating expenses. The Independent Board Members recognized the inherent limitations to any cost allocation methodology as different and reasonable approaches may be used and yet yield differing results. The Independent Board Members further reviewed an analysis of the history of the profitability methodology used explaining any changes to the methodology over the years. The Board has appointed two Independent Board Members, who along with independent legal counsel, helped to review and discuss the methodology employed to develop the profitability analysis each year and any proposed changes thereto and to keep the Board apprised of such changes during the year.
In their review, the Independent Board Members evaluated, among other things, Nuveen’s adjusted operating margins, the gross and net revenue margins (pre-tax and after-tax) for advisory activities for the Nuveen funds, and the revenues, expenses, and net income (pre-tax and after-tax) of Nuveen for each of the last two calendar years. The Independent Board Members also reviewed an analysis of the key drivers behind the changes in revenues and expenses that impacted profitability in 2016 versus 2015. The Board, however, observed that Nuveen’s operating margins for its advisory activities in 2016 were similar to that of 2015.
In addition to reviewing Nuveen’s profitability in absolute terms, the Independent Board Members also reviewed the adjusted total company margins of other advisory firms that had publicly available information and comparable assets under management (based on asset size and asset composition). The Independent Board Members, however, noted that the usefulness of the comparative data may be limited as the other firms may have a different business mix and their profitability data may be affected by numerous other factors such as the types of funds managed, the cost allocation methodology used, and their capital structure. Nevertheless, the Board noted that Nuveen’s adjusted operating margins appeared comparable to the adjusted margins of the peers.
Further, the Adviser is a subsidiary of Nuveen, LLC, the investment management arm of Teachers Insurance and Annuity Association of America (“TIAA”). To have a fuller picture of the financial condition and strength of the TIAA complex, together with Nuveen, the Board reviewed a balance sheet for TIAA reflecting its assets, liabilities and capital and contingency reserves for the 2016 and 2015 calendar years.
In addition to the Adviser’s profitability, the Independent Board Members also considered the profitability of the Sub-Adviser from its relationship with the Nuveen funds. The Independent Board Members reviewed the Sub-Adviser’s revenues, expenses and revenue margins (pre- and post-tax) for its advisory activities for the calendar year ended December 31, 2016. The Independent Board Members also reviewed a profitability analysis reflecting the revenues, expenses and revenue margin (pre- and post-tax) by asset type for the Sub-Adviser for the calendar year ending December 31, 2016.
In evaluating the reasonableness of the compensation, the Independent Board Members also considered other amounts paid to a Fund Adviser for its services to the Funds as well as indirect benefits (such as soft dollar arrangements), if any, the Fund Adviser and its affiliates received or were expected to receive that were directly attributable to the management of a Fund. See Section E below for additional information on indirect benefits a Fund Adviser may receive as a result of its relationship with the Funds.
Based on a consideration of all the information provided, the Board noted that Nuveen’s and the Sub-Adviser’s level of profitability was acceptable and not unreasonable in light of the services provided.
D. Economies of Scale and Whether Fee Levels Reflect These Economies of Scale
When evaluating the level of the advisory fees, the Independent Board Members considered whether there will be any economies of scale that may be realized by the Fund Adviser as a Fund grows and the extent to which these economies were shared with the Funds and shareholders. The Board recognized that economies of scale are difficult to measure with precision; however, the Board considered that there were several ways the Fund Adviser may share the benefits of economies of scale with the Nuveen funds, including through breakpoints in the management fee schedule reducing the fee rates as asset levels grow, fee waivers and/or expense limitation agreements and the Adviser’s investment in its business which can enhance the services provided to the Nuveen funds. With respect to the fee structure, the Independent Board Members have recognized that economies of scale may be realized when a particular fund grows, but also when the total size of the fund complex grows (even if the assets of a particular fund in the complex have not changed or have decreased). Accordingly, subject to certain exceptions, the funds in the Nuveen complex pay a management fee to the Adviser which is generally comprised of a fund-level component and complex-level component, each of which has a breakpoint schedule. Subject to certain exceptions, the fund-level fee component declines as the assets of the particular fund grow and the complex-level fee component declines when eligible assets of all the funds (except for Nuveen ETFs which are subject to a unitary fee) in the Nuveen complex combined grow. As noted, the Board had recently approved revised fund-level breakpoint schedules for the Nuveen open-end funds which resulted in additional breakpoints added to the breakpoint schedules and therefore the potential for additional savings as a fund’s asset level grows.
The Independent Board Members also noted that additional economies of scale were shared with shareholders of the Nebraska Fund through its temporary expense cap. The Independent Board Members reviewed the breakpoint and complex-wide schedules and any savings achieved from fee waivers and expense reimbursements (if applicable), as well as fee reductions as a result of the fund-level and complex-level breakpoints for the 2016 calendar year. In addition, the Independent Board Members recognized the Adviser’s ongoing investment in its business to expand or enhance the services provided to the benefit of all of the Nuveen funds.
Based on their review, the Board concluded that the current fee structure was acceptable and reflected economies of scale to be shared with shareholders when assets under management increase.
E. Indirect Benefits
The Independent Board Members received and considered information regarding other benefits the respective Fund Adviser or its affiliates may receive as a result of their relationship with the Nuveen funds, including compensation paid to affiliates of a Fund Adviser for services rendered to the funds and research services received by a Fund Adviser from broker-dealers that execute fund trades. In this regard, the Independent Board Members recognized that an affiliate of the Adviser served as the principal underwriter for the open-end funds providing distribution and shareholder services to the funds for which it may be compensated through sales charges and distribution fees and shareholder services fees pursuant to the funds’ Rule 12b-1 distribution and service plan or otherwise. The Independent Board Members therefore took into account, among other things, the 12b-1 fees retained by Nuveen during the calendar year ending December 31, 2016.
Annual Investment Management Agreement Approval Process (Unaudited) (continued)
In addition to the above, the Independent Board Members considered that the Funds’ portfolio transactions are allocated by the Sub-Adviser and the Sub-Adviser may benefit from research received from broker-dealers that execute Fund portfolio transactions. The Board noted, however, that with respect to transactions in fixed income securities, such securities generally trade on a principal basis and do not generate soft dollar credits. Although the Board recognized the Sub-Adviser may benefit from a soft dollar arrangement if it does not have to pay for this research out of its own assets, the Board also recognized that the research may benefit the Funds to the extent it enhances the ability of the Sub-Adviser to manage the Funds.
Based on their review, the Board concluded that any indirect benefits received by a Fund Adviser as a result of its relationship with the Funds were reasonable and within acceptable parameters.
F. Other Considerations
The Board Members did not identify any single factor discussed previously as all-important or controlling. The Board Members, including the Independent Board Members, concluded that the terms of each Advisory Agreement were fair and reasonable, that the respective Fund Adviser’s fees were reasonable in light of the services provided to each Fund and that the Advisory Agreements be renewed.
Directors
and Officers (Unaudited)
The management of the Funds, including general supervision of the duties performed for the Funds by the Adviser, is the responsibility of the Board of Directors of the Funds. The number of Directors of the Funds is currently set at twelve. None of the Directors who are not “interested” persons of the Funds (referred to herein as “independent Directors”) has ever been a Director or employee of, or consultant to, Nuveen or its affiliates. The names and business addresses of the Directors and officers of the Funds, their principal occupations and other affiliations during the past five years, the number of portfolios each oversees and other directorships they hold are set forth below.
The Funds’ Statement of Additional Information (“SAI”) includes more information about the Directors. To request a free copy, call Nuveen Investments at (800) 257-8787 or visit the Funds’ website at www.nuveen.com.
Name,
Year of Birth
& Address | Position(s)
Held with
the Funds | Year First
Elected or
Appointed (1) | Principal Occupation(s)
Including other Directorships
During Past 5 Years | Number of
Portfolios in
Fund Complex
Overseen by
Director |
| Independent Directors: | | | |
William J. Schneider
1944
333 W. Wacker Drive
Chicago, IL 60606 | Chairman and
Director | 1996 | Chairman of Miller-Valentine Partners, a real estate investment company; Board Member of WDPR Public Radio station; formerly, Senior Partner and Chief Operating Officer (retired (2004) of Miller-Valentine Group; formerly, Board member, Business Advisory Council of the Cleveland Federal Reserve Bank and University of Dayton Business School Advisory Council; past Chair and Director, Dayton Development Coalition. | 176 |
Jack B. Evans
1948
333 W. Wacker Drive
Chicago, IL 60606 | Director | 1999 | President, The Hall-Perrine Foundation, a private philanthropic corporation (since 1996); Director and Chairman, United Fire Group, a publicly held company; Director, Public member, American Board of Orthopaedic Surgery (since 2015); Life Trustee of Coe College and the Iowa College Foundation; formerly, President Pro-Tem of the Board of Regents for the State of Iowa University System; formerly, Director, Alliant Energy; formerly, Director, Federal Reserve Bank of Chicago; formerly, President and Chief Operating Officer, SCI Financial Group, Inc., a regional financial services firm. | 176 |
William C. Hunter
1948
333 W. Wacker Drive
Chicago, IL 60606 | Director | 2003 | Dean Emeritus, formerly, Dean, Tippie College of Business, University of Iowa (2006-2012); Director (since 2004) of Xerox Corporation; past Director (2005-2015), and past President (2010- 2014) Beta Gamma Sigma, Inc., The International Business Honor Society; Director of Wellmark, Inc. (since 2009); formerly, Dean and Distinguished Professor of Finance, School of Business at the University of Connecticut (2003-2006); previously, Senior Vice President and Director of Research at the Federal Reserve Bank of Chicago (1995-2003); formerly, Director (1997-2007), Credit Research Center at Georgetown University. | 176 |
Directors and Officers (Unaudited) (continued)
Name,
Year of Birth
& Address | Position(s)
Held with
the Funds | Year First
Elected or
Appointed (1) | Principal Occupation(s)
Including other Directorships
During Past 5 Years | Number of
Portfolios in
Fund Complex
Overseen by
Director |
David J. Kundert
1942
333 W. Wacker Drive
Chicago, IL 60606 | Director | 2005 | Formerly, Director, Northwestern Mutual Wealth Management Company (2006-2013); retired (since 2004) as Chairman, JPMorgan Fleming Asset Management, President and CEO, Banc One Investment Advisors Corporation, and President, One Group Mutual Funds; prior thereto, Executive Vice President, Banc One Corporation and Chairman and CEO, Banc One Investment Management Group; Regent Emeritus, Member of Investment Committee, Luther College; member of the Wisconsin Bar Association; member of Board of Directors and Chair of Investment Committee, Greater Milwaukee Foundation; member of the Board of Directors (Milwaukee), College Possible; Board member of Milwaukee Repertory Theatre (since 2016). | 176 |
Albin F. Moschner(2)
1952
333 W. Wacker Drive
Chicago, IL 60606 | Director | 2016 | Founder and Chief Executive Officer, Northcroft Partners, LLC, a management consulting firm (since 2012); previously, held positions at Leap Wireless International, Inc., including Consultant (2011-2012), Chief Operating Officer (2008-2011), and Chief Marketing Officer (2004-2008); formerly, President, Verizon Card Services division of Verizon Communications, Inc. (2000-2003); formerly, President, One Point Services at One Point Communications (1999-2000); formerly, Vice Chairman of the Board, Diba, Incorporated (1996-1997); formerly, various executive positions with Zenith Electronics Corporation (1991-1996). Director, USA Technologies, Inc., a provider of solutions and services to facilitate electronic payment transactions (since 2012); formerly, Director, Wintrust Financial Corporation (1996-2016). | 176 |
John K. Nelson
1962
333 W. Wacker Drive
Chicago, IL 60606 | Director | 2013 | Member of Board of Directors of Core12 LLC (since 2008), a private firm which develops branding, marketing and communications strategies for clients; Director of The Curran Center for Catholic American Studies (since 2009) and The President's Council, Fordham University (since 2010); formerly senior external advisor to the financial services practice of Deloitte Consulting LLP (2012-2014); formerly, Chairman of the Board of Trustees of Marian University (2010 as trustee, 2011- 2014 as Chairman); formerly, Chief Executive Officer of ABN AMRO N.V. North America, and Global Head of its Financial Markets Division (2007-2008); prior senior positions held at ABN AMRO include Corporate Executive Vice President and Head of Global Markets-the Americas (2006-2007), CEO of Wholesale Banking-North America and Global Head of Foreign Exchange and Futures Markets (2001-2006), and Regional Commercial Treasurer and Senior Vice President Trading-North America (1996-2001); formerly, Trustee at St. Edmund Preparatory School in New York City. | 176 |
Judith M. Stockdale
1947
333 W. Wacker Drive
Chicago, IL 60606 | Director | 1997 | Board Member, Land Trust Alliance (since 2013) and U.S. Endowment for Forestry and Communities (since 2013); formerly, Executive Director (1994-2012), Gaylord and Dorothy Donnelley Foundation; prior thereto, Executive Director, Great Lakes Protection Fund (1990-1994). | 176 |
Carole E. Stone
1947
333 W. Wacker Drive
Chicago, IL 60606 | Director | 2007 | Director, Chicago Board Options Exchange (since 2006), C2 Options Exchange, Incorporated (since 2009); Director, CBOE Holdings, Inc. (since 2010); formerly, Commissioner, New York State Commission on Public Authority Reform (2005-2010). | 176 |
Name,
Year of Birth
& Address | Position(s)
Held with
the Funds | Year First
Elected or
Appointed (1) | Principal Occupation(s)
Including other Directorships
During Past 5 Years | Number of
Portfolios in
Fund Complex
Overseen by
Director |
Terence J. Toth
1959
333 W. Wacker Drive
Chicago, IL 60606 | Director | 2008 | Co-Founding Partner, Promus Capital (since 2008); Director, Fulcrum IT Service LLC (since 2010) and Quality Control Corporation (since 2012); member: Catalyst Schools of Chicago Board (since 2008) and Mather Foundation Board (since 2012), and chair of its investment committee; formerly, Director, Legal & General Investment Management America, Inc. (2008-2013); formerly, CEO and President, Northern Trust Global Investments (2004-2007); Executive Vice President, Quantitative Management & Securities Lending (2000-2004); prior thereto, various positions with Northern Trust Company (since 1994); formerly, Member, Northern Trust Mutual Funds Board (2005-2007), Northern Trust Global Investments Board (2004-2007), Northern Trust Japan Board (2004-2007), Northern Trust Securities Inc. Board (2003- 2007) and Northern Trust Hong Kong Board (1997-2004). | 176 |
Margaret L. Wolff
1955
333 W. Wacker Drive
Chicago, IL 60606 | Director | 2016 | Member of the Board of Directors (since 2013) of Travelers Insurance Company of Canada and The Dominion of Canada General Insurance Company (each, a part of Travelers Canada, the Canadian operation of The Travelers Companies, Inc.); formerly, Of Counsel, Skadden, Arps, Slate, Meagher & Flom LLP (Mergers & Acquisitions Group) (2005-2014); Member of the Board of Trustees of New York-Presbyterian Hospital (since 2005); Member (since 2004) and Chair (since 2015) of the Board of Trustees of The John A. Hartford Foundation (a philanthropy dedicated to improving the care of older adults); formerly, Member (2005-2015) and Vice Chair (2011-2015) of the Board of Trustees of Mt. Holyoke College. | 176 |
Robert L. Young3
1963
333 W. Wacker Drive
Chicago, IL 60606 | Director | 2017 | Formerly, Chief Operating Officer and Director, J.P. Morgan Investment Management Inc. (2010-2016); formerly, President and Principal Executive Officer (2013-2016), and Senior Vice President and Chief Operating Officer (2005-2010), of J.P. Morgan Funds; formerly, Director and various officer positions for J.P. Morgan Investment Management Inc. (formerly, JPMorgan Funds Management, Inc. and formerly, One Group Administrative Services) and JPMorgan Distribution Services, Inc. (formerly, One Group Dealer Services, Inc.) (1999-2017). | 174 |
Name,
Year of Birth
& Address | Position(s)
Held with
the Funds | Year First
Elected or
Appointed (1) | Principal Occupation(s)
Including other Directorships
During Past 5 Years | Number of
Portfolios in
Fund Complex
Overseen by
Director |
| Interested Director: | | | |
Margo L. Cook(2)(4)
1964
333 W. Wacker Drive
Chicago, IL 60606 | Director | 2016 | President (since April 2017), formerly, Co-Chief Executive Officer and Co-President (2016-2017), formerly, Senior Executive Vice President of Nuveen Investments, Inc; Executive Vice President (since February 2017) of Nuveen, LLC; President, Global Products and Solutions (since July 2017), and Co-Chief Executive Officer, formerly, Executive Vice President (2013-2015) of Nuveen Securities, LLC; Co-President (since October 2016), formerly Senior Executive Vice President (2015-2016) of Nuveen Fund Advisors, LLC (Executive Vice President 2011-2015); formerly, Managing Director of Nuveen Commodities Asset Management, LLC (2011- 2016); Chartered Financial Analyst. | 176 |
Directors and Officers (Unaudited) (continued)
Name,
Year of Birth
& Address | Position(s)
Held with
the Funds | Year First
Elected or
Appointed (5) | Principal Occupation(s)
During Past 5 Years | Number of
Portfolios in
Fund Complex
Overseen by
Officer |
| Officers of the Funds: | | | |
Greg A. Bottjer
1971
333 West Wacker Drive
Chicago, IL 60606 | Chief Administrative Officer | 2016 | Senior (since 2017) Managing Director (since 2011), formerly, Senior Vice President (2007-2010) of Nuveen; Senior (since 2017) Managing Director (since October 2016) of Nuveen Fund Advisors, LLC; Chartered Financial Analyst. | 92 |
Lorna C. Ferguson
1945
333 W. Wacker Drive
Chicago, IL 60606 | Vice President | 1998 | Senior Managing Director (since February 2017), formerly, Managing Director (2004-2017) of Nuveen. | 177 |
Stephen D. Foy
1954
333 W. Wacker Drive
Chicago, IL 60606 | Vice President
and
Controller | 1998 | Managing Director (since 2014), formerly, Senior Vice President (2013-2014) and Vice President (2005-2013) of Nuveen Fund Advisors, LLC; Chief Financial Officer of Nuveen Commodities Asset Management, LLC (since 2010); Managing Director (since 2016) of Nuveen Securities, LLC; Certified Public Accountant. | 177 |
Nathaniel T. Jones
1979
333 W. Wacker Drive
Chicago, IL 60606 | Vice President
and Treasurer | 2016 | Managing Director (since January 2017), formerly, Senior Vice President (2016-2017), formerly, Vice President (2011- 2016) of Nuveen; Chartered Financial Analyst. | 177 |
Walter M. Kelly
1970
333 W. Wacker Drive
Chicago, IL 60606 | Chief Compliance
Officer and Vice
President | 2003 | Managing Director (since January 2017), formerly, Senior Vice President (2008-2017) of Nuveen Investments Holdings, Inc. | 177 |
Tina M. Lazar
1961
333 W. Wacker Drive
Chicago, IL 60606 | Vice President | 2002 | Managing Director (since January 2017), formerly, Senior Vice President (2014-2017) of Nuveen Securities, LLC. | 177 |
Kevin J. McCarthy
1966
333 W. Wacker Drive
Chicago, IL 60606 | Vice President
and Secretary | 2007 | Senior Managing Director (since February 2017) and Secretary and General Counsel (since 2016) of Nuveen Investments, Inc., formerly, Executive Vice President (2016-2017) and Managing Director and Assistant Secretary (2008-2016); Senior Managing Director (since January 2017) and Assistant Secretary (since 2008) of Nuveen Securities, LLC, formerly Executive Vice President (2016-2017) and Managing Director (2008-2016); Senior Managing Director (since February 2017), Secretary (since 2016) and Co-General Counsel (since 2011) of Nuveen Fund Advisors, LLC, formerly, Executive Vice President (2016-2017), Managing Director (2008-2016) and Assistant Secretary (2007-2016); Senior Managing Director (since February 2017), Secretary (since 2016) and Associate General Counsel (since 2011 of Nuveen Asset Management, LLC, formerly Executive Vice President (2016-2017) and Managing Director and Assistant Secretary (2011-2016); Senior Managing Director (since February 2017) and Secretary (since 2016) of Nuveen Investments Advisers, LLC, formerly Executive Vice President (2016-2017); Vice President (since 2007) and Secretary (since 2016), formerly, Assistant Secretary, of NWQ Investment Management Company, LLC, Symphony Asset Management LLC Santa Barbara Asset Management, LLC and Winslow Capital Management, LLC (since 2010); Vice President (since 2010) and Secretary (since 2016) of Nuveen Commodities Asset Management, LLC, formerly Assistant Secretary (2010-2016). | 177 |
Name,
Year of Birth
& Address | Position(s)
Held with
the Funds | Year First
Elected or
Appointed (5) | Principal Occupation(s)
During Past 5 Years | Number of
Portfolios in
Fund Complex
Overseen by
Officer |
Kathleen L. Prudhomme
1953
901 Marquette Avenue
Minneapolis, MN 55402 | Vice President
and Assistant
Secretary | 2011 | Managing Director, Assistant Secretary and Co-General Counsel (since 2011) of Nuveen Fund Advisors, LLC; Managing Director, Assistant Secretary and Associate General Counsel (since 2011) of Nuveen Asset Management, LLC; Managing Director and Assistant Secretary (since 2011) of Nuveen Securities, LLC; formerly, Deputy General Counsel, FAF Advisors, Inc. (2004- 2010). | 177 |
Christopher M. Rohrbacher
1971
333 West Wacker Drive
Chicago, IL 60606 | Vice President
and Assistant
Secretary | 2008 | Managing Director (since January 2017) of Nuveen Securities, LLC; Managing Director (Since January 2017), formerly, Senior Vice President (2016-2017) and Assistant Secretary (since October 2016) of Nuveen Fund Advisors, LLC; Vice President and Assistant Secretary (since 2010) of Nuveen Commodities Asset Management, LLC. | 177 |
Joel T. Slager
1978
333 W. Wacker Drive
Chicago, IL 60606 | Vice President
and Assistant
Secretary | 2013 | Fund Tax Director for Nuveen Funds (since 2013); previously, Vice President of Morgan Stanley Investment Management, Inc., Assistant Treasurer of the Morgan Stanley Funds (from 2010 to 2013). | 177 |
Gifford R. Zimmerman
1956
333 W. Wacker Drive
Chicago, IL 60606
| Vice President
and Assistant
Secretary | 1988 | Managing Director (since 2002), and Assistant Secretary of Nuveen Securities, LLC; Managing Director (since 2004) and Assistant Secretary (since 1994) of Nuveen Investments, Inc.; Managing Director (since 2002), Assistant Secretary (since 1997) and Co-General Counsel (since 2011) of Nuveen Fund Advisors, LLC; Managing Director, Assistant Secretary and Associate General Counsel of Nuveen Asset Management, LLC (since 2011); Vice President (since February 2017), formerly, Managing Director (2003-2017) and Assistant Secretary (since 2003) of Symphony Asset Management LLC ; Managing Director and Assistant Secretary (since 2002) of Nuveen Investments Advisers, LLC; Vice President and Assistant Secretary of NWQ Investment Management Company, LLC (since 2002), Santa Barbara Asset Management, LLC (since 2006) and of Winslow Capital Management, LLC, (since 2010); Chartered Financial Analyst. | 177 |
(1) Directors serve an indefinite term until his/her successor is elected or appointed. The year first elected or appointed represents the year in which the director was first elected or appointed to any fund in the Nuveen Fund Complex.
(2) On June 22, 2016, Ms. Cook and Mr. Moschner were appointed as Board Members, effective July 1, 2016.
(3) On May 25, 2017, Mr. Young was appointed as a Board Member, effective July 1, 2017. He is a Board Member of each of the Nuveen Funds, except Nuveen Diversified Dividend and Income Fund and Nuveen Real Estate Income Fund.
(4) “Interested person” of the Trust, as defined in the 1940 Act, by reason of her position with Nuveen, LLC. and certain of its subsidiaries.
(5) Officers serve one year terms through August of each year. The year first elected or appointed represents the year in which the officer was first elected or appointed to any fund in the Nuveen Fund Complex.
Nuveen:
Serving Investors for Generations
Since 1898, financial advisors and their clients have relied on Nuveen to provide dependable investment solutions through continued adherence to proven, long-term investing principles. Today, we offer a range of high quality solutions designed to be integral components of a well-diversified core portfolio.
Focused on meeting investor needs.
Nuveen is the investment management arm of TIAA. We have grown into one of world’s premier global asset managers, with specialist knowledge across all major asset classes and particular strength in solutions that provide income for investors and that draw on our expertise in alternatives and responsible investing. Nuveen is driven not only by the independent investment processes across the firm, but also the insights, risk management, analytics and other tools and resources that a truly world-class platform provides. As a global asset manager, our mission is to work in partnership with our clients to create solutions which help them secure their financial future.
Find out how we can help you.
To learn more about how the products and services of Nuveen may be able to help you meet your financial goals, talk to your financial advisor, or call us at (800) 257-8787. Please read the information provided carefully before you invest. Investors should consider the investment objective and policies, risk considerations, charges and expenses of any investment carefully. Where applicable, be sure to obtain a prospectus, which contains this and other relevant information. To obtain a prospectus, please contact your securities representative or Nuveen, 333 W. Wacker Dr., Chicago, IL 60606. Please read the prospectus carefully before you invest or send money.
Learn more about Nuveen Funds at: www.nuveen.com/mf
Securities offered through Nuveen Securities, LLC, member FINRA and SIPC | 333 West Wacker Drive Chicago, IL 60606 | www.nuveen.com
MAN-FTFI-0517D227089-INV-Y-07/18
ITEM 2. CODE OF ETHICS.
As of the end of the period covered by this report, the registrant has adopted a code of ethics that applies to the registrant’s principal executive officer, principal financial officer, principal accounting officer or controller, or persons performing similar functions. There were no amendments to or waivers from the code during the period covered by this report. The registrant has posted the code of ethics on its website at www.nuveen.com/MutualFunds/ShareholderResources/FundGovernance.aspx. (To view the code, click on Code of Conduct.)
ITEM 3. AUDIT COMMITTEE FINANCIAL EXPERT.
The registrant’s Board of Directors or Trustees (“Board”) determined that the registrant has at least one “audit committee financial expert” (as defined in Item 3 of Form N-CSR) serving on its Audit Committee. The registrant’s audit committee financial experts are Carole E. Stone and Jack B. Evans, who are “independent” for purposes of Item 3 of Form N-CSR.
Ms. Stone served for five years as Director of the New York State Division of the Budget. As part of her role as Director, Ms. Stone was actively involved in overseeing the development of the State’s operating, local assistance and capital budgets, its financial plan and related documents; overseeing the development of the State’s bond-related disclosure documents and certifying that they fairly presented the State’s financial position; reviewing audits of various State and local agencies and programs; and coordinating the State’s system of internal audit and control. Prior to serving as Director, Ms. Stone worked as a budget analyst/examiner with increasing levels of responsibility over a 30 year period, including approximately five years as Deputy Budget Director. Ms. Stone has also served as Chair of the New York State Racing Association Oversight Board, as Chair of the Public Authorities Control Board, as a Commissioner on the New York State Commission on Public Authority Reform and as a member of the Boards of Directors of several New York State public authorities. These positions have involved overseeing operations and finances of certain entities and assessing the adequacy of project/entity financing and financial reporting. Currently, Ms. Stone is on the Board of Directors of CBOE Holdings, Inc., of the Chicago Board Options Exchange, and of C2 Options Exchange. Ms. Stone’s position on the boards of these entities and as a member of both CBOE Holdings’ Audit Committee and its Finance Committee has involved, among other things, the oversight of audits, audit plans and preparation of financial statements.
Mr. Evans was formerly President and Chief Operating Officer of SCI Financial Group, Inc., a full service registered broker-dealer and registered investment adviser (“SCI”). As part of his role as President and Chief Operating Officer, Mr. Evans actively supervised the Chief Financial Officer (the “CFO”) and actively supervised the CFO’s preparation of financial statements and other filings with various regulatory authorities. In such capacity, Mr. Evans was actively involved in the preparation of SCI’s financial statements and the resolution of issues raised in connection therewith. Mr. Evans has also served on the audit committee of various reporting companies. At such companies, Mr. Evans was involved in the oversight of audits, audit plans, and the preparation of financial statements. Mr. Evans also formerly chaired the audit committee of the Federal Reserve Bank of Chicago.
ITEM 4. PRINCIPAL ACCOUNTANT FEES AND SERVICES.
The following tables show the amount of fees that PricewaterhouseCoopers LLP, the Funds’ auditor, billed to the Funds’ during the Funds’ last two full fiscal years. The Audit Committee approved in advance all audit services and non-audit services that PricewaterhouseCoopers LLP provided to the Funds, except for those non-audit services that were subject to the pre-approval exception under Rule 2-01 of Regulation S-X (the “pre-approval exception”). The preapproval exception for services provided directly to the Funds waives the pre-approval requirement for services other than audit, review or attest services if: (A) the aggregate amount of all such services provided constitutes no more than 5% of the total amount of revenues paid by the Funds during the fiscal year in which the services are provided; (B) the Funds did not recognize the services as non-audit services at the time of the engagement; and (C) the services are promptly brought to the Audit Committee’s attention, and the Committee (or its delegate) approves the services before the audit is completed.
The Audit Committee has delegated certain pre-approval responsibilities to its Chairman (or, in his absence, any other member of the Audit Committee).
| | | | | | | | | | | | | | | | |
Fiscal Year Ended May 31, 2017 | | Audit Fees Billed
to Funds 1 | | | Audit-Related Fees
Billed to Funds 2 | | | Tax Fees
Billed to Funds 3 | | | All Other Fees
Billed to Funds 4 | |
| Fund Name | | | | | | | | | | | | | | | | |
Nuveen Minnesota Municipal Bond Fund | | | 19,345 | | | | 1,629 | | | | 0 | | | | 0 | |
Nuveen Minnesota Intermediate Municipal Bond Fund | | | 19,277 | | | | 1,629 | | | | 0 | | | | 0 | |
Nuveen Nebraska Municipal Bond Fund | | | 18,096 | | | | 1,629 | | | | 0 | | | | 0 | |
Nuveen Oregon Intermediate Municipal Bond Fund | | | 18,735 | | | | 1,629 | | | | 0 | | | | 0 | |
| | | | | | | | | | | | | | | | |
Total | | $ | 75,453 | | | $ | 6,516 | | | $ | 0 | | | $ | 0 | |
| 1 | | “Audit Fees” are the aggregate fees billed for professional services for the audit of the Fund’s annual financial statements and services provided in connection with statutory and regulatory filings or engagements. |
| 2 | | “Audit-Related Fees” are the aggregate fees billed for assurance and related services reasonably related to the performance of the audit or review of financial statements that are not reported under “Audit Fees”. These fees include offerings related to the Fund’s common shares and leverage. |
| 3 | | “Tax Fees” are the aggregate fees billed for professional services for tax advice, tax compliance, and tax planning. These fees include: all global withholding tax services; excise and state tax reviews; capital gain, tax equalization and taxable basis calculations performed by the principal accountant. |
| 4 | | “All Other Fees” are the aggregate fees billed for products and services other than “Audit Fees”, “Audit-Related Fees” and “Tax Fees”. These fees represent all “Agreed-Upon Procedures” engagements pertaining to the Fund’s use of leverage. |
| | | | | | | | | | | | | | | | |
| | | Percentage Approved Pursuant to Pre-approval Exception | |
| | | Audit Fees Billed
to Funds | | | Audit-Related Fees
Billed to Funds | | | Tax Fees
Billed to Funds | | | All Other Fees
Billed to Funds | |
Fund Name | | | | | | | | | | | | | | | | |
Nuveen Minnesota Municipal Bond Fund | | | 0 | % | | | 0 | % | | | 0 | % | | | 0 | % |
Nuveen Minnesota Intermediate Municipal Bond Fund | | | 0 | % | | | 0 | % | | | 0 | % | | | 0 | % |
Nuveen Nebraska Municipal Bond Fund | | | 0 | % | | | 0 | % | | | 0 | % | | | 0 | % |
Nuveen Oregon Intermediate Municipal Bond Fund | | | 0 | % | | | 0 | % | | | 0 | % | | | 0 | % |
| | | | | | | | | | | | | | | | |
May 31, 2016 | | Audit Fees Billed
to Funds 1 | | | Audit-Related Fees
Billed to Funds 2 | | | Tax Fees
Billed to Funds 3 | | | All Other Fees
Billed to Funds 4 | |
Fund Name | | | | | | | | | | | | | | | | |
Nuveen Minnesota Municipal Bond Fund | | | 18,582 | | | | 0 | | | | 21 | | | | 0 | |
Nuveen Minnesota Intermediate Municipal Bond Fund | | | 18,724 | | | | 0 | | | | 25 | | | | 0 | |
Nuveen Nebraska Municipal Bond Fund | | | 17,508 | | | | 0 | | | | 6 | | | | 0 | |
Nuveen Oregon Intermediate Municipal Bond Fund | | | 18,186 | | | | 0 | | | | 15 | | | | 0 | |
| | | | | | | | | | | | | | | | |
Total | | $ | 73,000 | | | $ | 0 | | | $ | 67 | | | $ | 0 | |
| 1 | | “Audit Fees” are the aggregate fees billed for professional services for the audit of the Fund’s annual financial statements and services provided in connection with statutory and regulatory filings or engagements. |
| 2 | | “Audit-Related Fees” are the aggregate fees billed for assurance and related services reasonably related to the performance of the audit or review of financial statements that are not reported under “Audit Fees”. These fees include offerings related to the Fund’s common shares and leverage. |
| 3 | | “Tax Fees” are the aggregate fees billed for professional services for tax advice, tax compliance, and tax planning. These fees include: all global withholding tax services; excise and state tax reviews; capital gain, tax equalization and taxable basis calculations performed by the principal accountant. |
| 4 | | “All Other Fees” are the aggregate fees billed for products and services other than “Audit Fees”, “Audit-Related Fees” and “Tax Fees”. These fees represent all “Agreed-Upon Procedures” engagements pertaining to the Fund’s use of leverage. |
| | | | | | | | | | | | | | | | |
| | | Percentage Approved Pursuant to Pre-approval Exception | |
| | | Audit Fees Billed
to Funds | | | Audit-Related Fees
Billed to Funds | | | Tax Fees
Billed to Funds | | | All Other Fees
Billed to Funds | |
Fund Name | | | | | | | | | | | | | | | | |
Nuveen Minnesota Municipal Bond Fund | | | 0 | % | | | 0 | % | | | 0 | % | | | 0 | % |
Nuveen Minnesota Intermediate Municipal Bond Fund | | | 0 | % | | | 0 | % | | | 0 | % | | | 0 | % |
Nuveen Nebraska Municipal Bond Fund | | | 0 | % | | | 0 | % | | | 0 | % | | | 0 | % |
Nuveen Oregon Intermediate Municipal Bond Fund | | | 0 | % | | | 0 | % | | | 0 | % | | | 0 | % |
| | | | | | | | | | | | |
Fiscal Year Ended May 31, 2017 | | Audit-Related Fees
Billed to Adviser and
Affiliated Fund
Service Providers | | | Tax Fees Billed to
Adviser and
Affiliated Fund
Service Providers | | | All Other Fees
Billed to Adviser
and Affiliated Fund
Service Providers | |
Nuveen Investment Funds, Inc. | | $ | 0 | | | $ | 0 | | | $ | 0 | |
| | | | | | | | | | | | |
| | | Percentage Approved Pursuant to Pre-approval Exception | |
| | | Audit-Related Fees
Billed to Adviser and
Affiliated Fund
Service Providers | | | Tax Fees Billed to
Adviser and
Affiliated Fund
Service Providers | | | All Other Fees
Billed to Adviser
and Affiliated Fund
Service Providers | |
| | | 0 | % | | | 0 | % | | | 0 | % |
| | | |
Fiscal Year Ended May 31, 2016 | | Audit-Related Fees
Billed to Adviser and
Affiliated Fund
Service Providers | | | Tax Fees Billed to
Adviser and
Affiliated Fund
Service Providers | | | All Other Fees
Billed to Adviser
and Affiliated Fund
Service Providers | |
Nuveen Investment Funds, Inc. | | $ | 0 | | | $ | 0 | | | $ | 0 | |
| |
| | | Percentage Approved Pursuant to Pre-approval Exception | |
| | | Audit-Related Fees
Billed to Adviser and
Affiliated Fund
Service Providers | | | Tax Fees Billed to
Adviser and
Affiliated Fund
Service Providers | | | All Other Fees
Billed to Adviser
and Affiliated Fund
Service Providers | |
| | | 0 | % | | | 0 | % | | | 0 | % |
| | | | | | | | | | | | | | | | |
Fiscal Year Ended May 31, 2017 | | Total Non-Audit Fees
Billed to Trust | | | Total Non-Audit Fees
billed to Adviser and
Affiliated Fund Service
Providers (engagements
related directly to the
operations and financial
reporting of the Trust) | | | Total Non-Audit Fees
billed to Adviser and
Affiliated Fund Service
Providers (all other
engagements) | | | Total | |
| Fund Name | | | | | | | | | | | | |
Nuveen Minnesota Municipal Bond Fund | | | 0 | | | | 0 | | | | 0 | | | | 0 | |
Nuveen Minnesota Intermediate Municipal Bond Fund | | | 0 | | | | 0 | | | | 0 | | | | 0 | |
Nuveen Nebraska Municipal Bond Fund | | | 0 | | | | 0 | | | | 0 | | | | 0 | |
Nuveen Oregon Intermediate Municipal Bond Fund | | | 0 | | | | 0 | | | | 0 | | | | 0 | |
| | | | | | | | | | | | | | | | |
Total | | $ | 0 | | | $ | 0 | | | $ | 0 | | | $ | 0 | |
“Non-Audit Fees billed to Fund” for both fiscal year ends represent “Tax Fees” and “All Other Fees” billed to Fund in their respective amounts from the previous table.
Less than 50 percent of the hours expended on the principal accountant’s engagement to audit the registrant’s financial statements for the most recent fiscal year were attributed to work performed by persons other than the principal accountant’s full-time, permanent employees.
| | | | | | | | | | | | | | | | |
Fiscal Year Ended May 31, 2016 | | Total Non-Audit Fees
Billed to Trust | | | Total Non-Audit Fees
billed to Adviser and
Affiliated Fund Service
Providers (engagements
related directly to the
operations and financial
reporting of the Trust) | | | Total Non-Audit Fees
billed to Adviser and
Affiliated Fund Service
Providers (all other
engagements) | | | Total | |
Fund Name | | | | | | | | | | | | | | | | |
Nuveen Minnesota Municipal Bond Fund | | | 21 | | | | 0 | | | | 0 | | | | 21 | |
Nuveen Minnesota Intermediate Municipal Bond Fund | | | 25 | | | | 0 | | | | 0 | | | | 25 | |
Nuveen Nebraska Municipal Bond Fund | | | 6 | | | | 0 | | | | 0 | | | | 6 | |
Nuveen Oregon Intermediate Municipal Bond Fund | | | 15 | | | | 0 | | | | 0 | | | | 15 | |
| | | | | | | | | | | | | | | | |
Total | | $ | 67 | | | $ | 0 | | | $ | 0 | | | $ | 67 | |
“Non-Audit Fees billed to Fund” for both fiscal year ends represent “Tax Fees” and “All Other Fees” billed to Fund in their respective amounts from the previous table.
Audit Committee Pre-Approval Policies and Procedures. Generally, the Audit Committee must approve (i) all non-audit services to be performed for the Funds by the Funds’ independent accountant and (ii) all audit and non-audit services to be performed by the Funds’ independent accountant for the Affiliated Fund Service Providers with respect to the operations and financial reporting of the Funds. Regarding tax and research projects conducted by the independent accountant for the Funds and Affiliated Fund Service Providers (with respect to operations and financial reports of the Trust), such engagements will be (i) pre-approved by the Audit Committee if they are expected to be for amounts greater than $10,000; (ii) reported to the Audit Committee Chairman for his verbal approval prior to engagement if they are expected to be for amounts under $10,000 but greater than $5,000; and (iii) reported to the Audit Committee at the next Audit Committee meeting if they are expected to be for an amount under $5,000.
ITEM 5. AUDIT COMMITTEE OF LISTED REGISTRANTS.
Not applicable to this registrant.
ITEM 6. SCHEDULE OF INVESTMENTS.
| a) | | See Portfolio of Investments in Item 1. |
ITEM 7. DISCLOSURE OF PROXY VOTING POLICIES AND PROCEDURES FOR CLOSED-END
MANAGEMENT INVESTMENT COMPANIES.
Not applicable to this registrant.
ITEM 8. PORTFOLIO MANAGERS OF CLOSED-END MANAGEMENT INVESTMENT COMPANIES.
Not applicable to this registrant.
ITEM 9. PURCHASES OF EQUITY SECURITIES BY CLOSED-END MANAGEMENT INVESTMENT COMPANY AND AFFILIATED PURCHASERS.
Not applicable to this registrant.
ITEM 10. SUBMISSION OF MATTERS TO A VOTE OF SECURITY HOLDERS.
There have been no material changes to the procedures by which shareholders may recommend nominees to the registrant’s Board of Trustees implemented after the registrant last provided disclosure in response to this Item.
ITEM 11. CONTROLS AND PROCEDURES.
| | (a) | | The registrant’s principal executive and principal financial officers, or persons performing similar functions, have concluded that the registrant’s disclosure controls and procedures (as defined in Rule 30a-3(c) under the Investment Company Act of 1940, as amended (the “1940 Act”) (17 CFR 270.30a-3(c))) are effective, as of a date within 90 days of the filing date of this report that includes the disclosure required by this paragraph, based on their evaluation of the controls and procedures required by Rule 30a-3(b) under the 1940 Act (17 CFR 270.30a-3(b)) and Rules 13a-15(b) or 15d-15(b) under the Securities Exchange Act of 1934, as amended (the “Exchange Act”) (17 CFR 240.13a-15(b) or 240.15d-15(b)). |
| | (b) | | There were no changes in the registrant’s internal control over financial reporting (as defined in Rule 30a-3(d) under the 1940 Act (17 CFR 270.30a-3(d)) that occurred during the second fiscal quarter of the period covered by this report that has materially affected, or is reasonably likely to materially affect, the registrant’s internal control over financial reporting. |
ITEM 12. EXHIBITS.
File the exhibits listed below as part of this Form.
| | |
| (a)(1) | | Any code of ethics, or amendment thereto, that is the subject of the disclosure required by Item 2, to the extent that the registrant intends to satisfy the Item 2 requirements through filing of an exhibit: Not applicable because the code is posted on registrant’s website at www.nuveen.com/MutualFunds/ShareholderResources/FundGovernance.aspx and there were no amendments during the period covered by this report. (To view the code, click on Code of Conduct.) |
| |
| (a)(2) | | A separate certification for each principal executive officer and principal financial officer of the registrant as required by Rule 30a-2(a) under the 1940 Act (17 CFR 270.30a-2(a)) in the exact form set forth below: See EX-99.CERT attached hereto. |
| |
| (a)(3) | | Any written solicitation to purchase securities under Rule 23c-1 under the 1940 Act (17 CFR 270.23c-1) sent or given during the period covered by the report by or on behalf of the registrant to 10 or more persons: Not applicable to this registrant. |
| |
| (b) | | If the report is filed under Section 13(a) or 15(d) of the Exchange Act, provide the certifications required by Rule 30a-2(b) under the 1940 Act (17 CFR 270.30a-2(b)), Rule 13a-14(b) or Rule 15d-14(b) under the Exchange Act (17 CFR 240.13a-14(b) or 240.15d-14(b)), and Section 1350 of Chapter 63 of Title 18 of the United States Code (18 U.S.C. 1350) as an Exhibit. A certification furnished pursuant to this paragraph will not be deemed “filed” for purposes of Section 18 of the Exchange Act (15 U.S.C. 78r), or otherwise subject to the liability of that section. Such certification will not be deemed to be incorporated by reference into any filing under the Securities Act of 1933 or the Exchange Act, except to the extent that the registration specifically incorporates it by reference: See EX-99.906 CERT attached hereto. |
SIGNATURES
Pursuant to the requirements of the Securities Exchange Act of 1934 and the Investment Company Act of 1940, the registrant has duly caused this report to be signed on its behalf by the undersigned, thereunto duly authorized.
(Registrant) Nuveen Investment Funds, Inc.
| | |
| |
| By (Signature and Title) | | /s/ Kathleen L. Prudhomme |
| | Kathleen L. Prudhomme |
| | Vice President and Secretary |
Date: August 7, 2017
Pursuant to the requirements of the Securities Exchange Act of 1934 and the Investment Company Act of 1940, this report has been signed below by the following persons on behalf of the registrant and in the capacities and on the dates indicated.
| | |
| |
| By (Signature and Title) | | /s/ Greg A. Bottjer |
| | Greg A. Bottjer |
| | Chief Administrative Officer |
| | (principal executive officer) |
Date: August 7, 2017
| | |
| |
| By (Signature and Title) | | /s/ Stephen D. Foy |
| | Stephen D. Foy |
| | Vice President and Controller |
| | (principal financial officer) |
Date: August 7, 2017