UNITED STATES
SECURITIES AND EXCHANGE COMMISSION
Washington, D.C. 20549
FORM N-CSR
CERTIFIED SHAREHOLDER REPORT OF REGISTERED MANAGEMENT
INVESTMENT COMPANIES
Investment Company Act file number 811-05309
Nuveen Investment Funds, Inc.
(Exact name of registrant as specified in charter)
Nuveen Investments
333 West Wacker Drive, Chicago, IL 60606
(Address of principal executive offices) (Zip code)
Kathleen L. Prudhomme
Nuveen Investments
333 West Wacker Drive
Chicago, IL 60606
(Name and address of agent for service)
Registrant’s telephone number, including area code: (312) 917-7700
Date of fiscal year end: October 31
Date of reporting period: October 31, 2016
Form N-CSR is to be used by management investment companies to file reports with the Commission not later than 10 days after the transmission to stockholders of any report that is required to be transmitted to stockholders under Rule 30e-1 under the Investment Company Act of 1940 (17 CFR 270.30e-1). The Commission may use the information provided on Form N-CSR in its regulatory, disclosure review, inspection, and policy making roles.
A registrant is required to disclose the information specified by Form N-CSR, and the Commission will make this information public. A registrant is not required to respond to the collection of information contained in Form N-CSR unless the Form displays a currently valid Office of Management and Budget (“OMB”) control number. Please direct comments concerning the accuracy of the information collection burden estimate and any suggestions for reducing the burden to Secretary, Securities and Exchange Commission, 450 Fifth Street, NW, Washington, DC 20549-0609. The OMB has reviewed this collection of information under the clearance requirements of 44 U.S.C. ss.3507.
ITEM 1. REPORTS TO STOCKHOLDERS.
| | |
| | |  |
| Mutual Funds | |
| | | | | | |
| | | | | | | Annual Report October 31, 2016 |
| | | | | | | | | | | | | | |
| | | | | | | Share Class / Ticker Symbol | | |
| | | Fund Name | | | | Class A | | Class C | | Class R3 | | Class I | | |
| | |
| | Nuveen Equity Index Fund | | | | FAEIX | | FCEIX | | FADSX | | FEIIX | | |
| | Nuveen Mid Cap Index Fund | | | | FDXAX | | FDXCX | | FMCYX | | FIMEX | | |
| | Nuveen Small Cap Index Fund | | | | FMDAX | | FPXCX | | ARSCX | | ASETX | | |
| | | | | | | | | | | | |
| | | | | | |
| | | | |
| | | | | | | | |
| | |
| | Life is Complex. | | |
| | |
| | Nuveen makes things e-simple. | | |
| | |
| | It only takes a minute to sign up for e-Reports. Once enrolled, you’ll receive an e-mail as soon as your Nuveen Fund information is ready. No more waiting for delivery by regular mail. Just click on the link within the e-mail to see the report and save it on your computer if you wish. | | |
| | | | |
| | | | | | Free e-Reports right to your e-mail! | | |
| | | |
| | | | | | www.investordelivery.com If you receive your Nuveen Fund distributions and statements from your
financial advisor or brokerage account. |
| | | | |
| | | | or | | www.nuveen.com/accountaccess If you receive your Nuveen Fund distributions and statements directly from Nuveen. Must be preceded by or accompanied by a prospectus. NOT FDIC INSURED MAY LOSE VALUE
NO BANK GUARANTEE | | |
| | | | | | | | | | |
| | | | | | | | | | | | | |
Table
of Contents
Chairman’s Letter
to Shareholders

Dear Shareholders,
After a sluggish first half of 2016, the U.S. economy gained some momentum in the third quarter. In fact, it was the economy’s strongest quarterly acceleration in two years, propelled by healthy consumer spending, a temporary surge in exports and a turnaround in inventories. As the year winds down, 2016 looks on track to deliver the same steady-but-slow growth that has characterized the seven-year recovery.
A year ago, the U.S. Federal Reserve (Fed) took the first step toward policy “normalization” by raising its benchmark interest rate at its December 2015 meeting. Speculation about the Fed’s intentions since then has been a strong influence on the markets throughout 2016. After remaining on hold for a year, the Fed judged that the economy’s modest growth, the return to “full” employment and an uptick in inflation were sufficient to raise the target rate at the December 2016 meeting.
Global conditions continue to look subdued by comparison. Investors continue to adjust to the idea of a slower Chinese economy, which has helped commodity prices stabilize and lift global inflation expectations. The U.K.’s June 23rd “Brexit” vote to leave the European Union introduced a new set of economic and political uncertainties to the already fragile conditions across Europe. Moreover, there are growing concerns that global central banks’ unprecedented efforts to revive growth may be showing signs of fatigue. Interest rates are currently negative in Europe and Japan and near or at zero in the U.S., U.K. and elsewhere; nonetheless, growth has remained subdued.
Since the election, U.S. stocks have rallied strongly on expectations that the Republican controlled Congress and Trump administration will pursue more business friendly policies. But the details have yet to be seen. Given muted global growth, the risk of policy errors by central banks around the world, the unfolding Brexit process and an uncertain political outlook (not just in the U.S. but also in Europe), we anticipate that turbulence remains on the horizon for the time being. In this environment, Nuveen remains committed to both managing downside risks and seeking upside potential. If you’re concerned about how resilient your investment portfolio might be, we encourage you to talk to your financial advisor. On behalf of the other members of the Nuveen Fund Board, we look forward to continuing to earn your trust in the months and years ahead.
Sincerely,

William J. Schneider
Chairman of the Board
December 22, 2016
Portfolio Managers’
Comments
Nuveen Equity Index Fund
Nuveen Mid Cap Index Fund
Nuveen Small Cap Index Fund
These Funds feature portfolio management by Nuveen Asset Management, LLC, an affiliate of Nuveen Investments, Inc. During this reporting period, David A. Friar and Michael N. Lindh, CFA and CPA, were the portfolio managers for the Funds. David has managed the Nuveen Equity Index Fund since 2000 and the Nuveen Mid Cap Index Fund and the Nuveen Small Cap Index Fund since 2001. Michael was named co-manager of all three Funds in 2014.
The Nuveen Equity Index, the Nuveen Mid Cap Index and the Nuveen Small Cap Index Funds will be liquidated after the close of business on April 27, 2017.
On the following pages, the portfolio management teams for the Funds discuss economic and market conditions, key investment strategies and the Funds’ performance for the twelve-month reporting period ended October 31, 2016.
What factors affected the U.S. economy and the financial markets during the twelve-month reporting period ended October 31, 2016?
The restrained pace of growth that has defined the U.S. economic recovery since 2009 continued in the twelve-month reporting period. Growth over the previous four calendar quarters averaged below 2% (annualized), as measured by real gross domestic product (GDP), which is the value of goods and services produced by the nation’s economy less the value of the goods and services used up in production, adjusted for price changes. For most of the reporting period, consumer spending remained healthy but was offset by the drag from the inventory cycle, lackluster business spending and weak net exports. As a result, GDP growth stayed below 1.5% from the fourth quarter of 2015 through the second quarter of 2016. However, decent consumer spending, an inventory turnaround and a short-term jump in exports contributed to a more robust gain of 3.2% in the third quarter, as reported by the “second” estimate of the Bureau of Economic Analysis.
Consumers, whose purchases comprise the largest component of the U.S. economy, benefited from employment growth and firming wages over the twelve-month reporting period. As reported by the Bureau of Labor Statistics, the unemployment rate was little changed at 4.9% in October 2016 from 5.0% in October 2015, and job gains averaged slightly above 200,000 per month for the past twelve months. Although consumer spending gains were rather muted in the latter half of 2015, spending surged in the second quarter of 2016. Although inflation began to accelerate slightly in the reporting period, the overall level remained low, which also contributed to consumers’ willingness to buy. The Consumer Price Index (CPI) rose 1.6% over the twelve-month reporting period ended October 2016 on a seasonally adjusted basis, as reported by the U.S. Bureau of Labor Statistics. The core CPI (which excludes food and energy) increased 2.1% during the same period, slightly above the Fed’s unofficial longer term inflation objective of 2.0%.
The housing market was another bright spot in the economy. The S&P CoreLogic Case-Shiller U.S. National Home Price Index, which covers all nine U.S. census divisions, recorded a 5.5% annual gain in September 2016 (most recent data available at the time this report was prepared) (effective July 26, 2016, the S&P/Case-Shiller U.S. National Home Price Index was renamed the S&P CoreLogic Case-Shiller U.S. National Home Price Index). The 10-City and 20-City Composites reported year-over-year increases of 4.3% and 5.1%, respectively.
Certain statements in this report are forward-looking statements. Discussions of specific investments are for illustration only and are not intended as recommendations of individual investments. The forward-looking statements and other views expressed herein are those of the portfolio managers as of the date of this report. Actual future results or occurrences may differ significantly from those anticipated in any forward-looking statements and the views expressed herein are subject to change at any time, due to numerous market and other factors. The Funds disclaim any obligation to update publicly or revise any forward-looking statements or views expressed herein.
Refer to the Glossary of Terms Used in this Report for further definition of the terms used within this section.
Portfolio Managers’ Comments (continued)
However, business investment remained soft over the reporting period. Corporate earnings growth continued to be constrained by diminished demand expectations amid sluggish U.S. and global growth, the impact of falling commodity prices and a strong U.S. dollar. Additionally, a murky outlook kept capital spending muted. Concerns about financial market turbulence in early 2016, the U.K.’s “Brexit” vote to leave the European Union (EU) and the U.S. presidential election weighed on business sentiment throughout the reporting period.
The consistent growth of the economy prompted the U.S. Federal Reserve (Fed) to raise the Fed funds rate from the zero bound range to a range of 0.25% to 0.50% in December 2015. The widely anticipated move had little impact on the financial markets. Over the remainder of the reporting period, speculation on the timing of future rate hikes drove short-term swings in the markets, including falling bond yields, rallies in the U.S. dollar and bouts of volatility in stock prices. For most of 2016, the Fed kept this rate unchanged due to concerns ranging from low inflation in the U.S. to weakening growth prospects globally and the U.K.’s Brexit vote. However, the third quarter’s strong GDP report and an uptick in inflation boosted expectations that the Fed would likely increase the target rate at the December 2016 meeting. As anticipated, subsequent to the close of the reporting period, the Fed raised the rate to a range of 0.50% to 0.75%.
Other market-moving events during the reporting period included a spike in volatility in January and February 2016 triggered by deteriorating sentiment about China’s economy, another sharp downturn in oil prices and concerns about central bank policy both in the U.S. and around the world. The Brexit referendum on June 23 also caught investors off guard. In response, U.K. sterling fell to 30-year lows and global equities tumbled while perceived safe-haven assets such as gold, the U.S. dollar and government bonds saw large inflows. However, the markets stabilized fairly quickly post-Brexit vote, buoyed by reassurances from global central banks and a perception that the temporary price rout presented an attractive buying opportunity. Following a relatively calm July and August 2016, volatility resumed in the final months of the reporting period. Investors worried whether central banks were reaching the limits of their effectiveness as global growth continues to stagnate. The health of the European banking sector came into question, renewing concerns about the potential to trigger a wider crisis. Political uncertainty increased leading up to the November U.S. presidential election, and after the close of the reporting period, the unexpected win of Donald Trump contributed to an initial sell-off across global markets. However, after digesting the “shock”, U.S. equities rallied strongly and global developed market stocks pared their losses, while emerging markets, fixed income and gold remained lower.
Despite several bouts of significant volatility, the U.S. equity market ended the twelve-month reporting period with a gain of 4.51% as measured by the S&P 500® Index. Small-cap stocks in the U.S. recovered from last year’s significant underperformance with a 4.11% return according to the Russell 2000® Index. Mid-cap stocks were in the same range. Across the capitalization spectrum in the U.S., investors favored the relatively safer, more defensive areas of the market for much of the reporting period, leading value stocks to strongly outperform growth stocks. Emerging markets outpaced other developed markets overseas as investors returned to this asset class in the second half of the reporting period, largely due to commodity price stability and the ongoing search for yield and returns. The MSCI Emerging Markets Index advanced 9.67%. Meanwhile, in developed overseas markets, Europe struggled and turned in negative results, dragging down the overall return of the MSCI EAFE Index to -2.74% for the twelve-month reporting period.
Nuveen Equity Index Fund
How did the Fund perform during the twelve-month reporting period ended October 31, 2016?
The tables in the Fund Performance and Expense Ratios section of this report provide total returns for the Fund for the one-year, five-year and ten-year periods ended October 31, 2016. Comparative performance information is provided for the Fund’s Class A Shares at net asset value (NAV). The Fund’s Class A Shares at NAV outperformed the Lipper S&P 500® Index Objective Funds Classification Average, but underperformed the S&P 500® Index during the twelve-month reporting period.
What strategies were used to manage the Fund during the reporting period and how did these strategies influence performance?
The Fund’s investment objective is to replicate the return of the S&P 500® Index as closely as possible, with consideration given to turnover costs and fees. S&P Dow Jones changes the index definition as often as weekly, deleting firms as they are acquired or when the membership committee determines that a firm is no longer representative of the index definition. Additionally, index weights are changed to reflect merger and acquisition activity or share issuance and repurchasing. These changes typically result in low turnover, well below 10% per year. We believe the Fund’s objective can best be achieved by investing in approximately 90% to 100% of the
issues included in the S&P 500® Index, depending on the size of the Fund. During the reporting period, we held essentially all of the issues found in the index. In addition, we aggressively tracked and implemented the occasional changes to index member names, as well as changes to the relative weights in the index.
The Fund underperformed the S&P 500® Index during the twelve-month reporting period. The index experienced a divergence of nearly 21% between the returns of its best and worst performing sectors. The utilities sector was the standout performer due to heightened investor interest in more defensive, yield generating stocks, returning approximately 17% in the S&P 500® Index during the reporting period. The information technology and telecommunication services sectors also produced double-digit returns in the index, with both segments gaining nearly 11%. Only two sectors in the index reported negative results, health care and consumer discretionary. Health care fell approximately 4% in the index mainly due to weak results from the biotechnology and pharmaceuticals industries, which suffered from continued fears regarding drug pricing controls. The consumer discretionary sector was down approximately 2% on the back of cautious consumer spending. The newly formed real estate investment trust (REIT) sector, which was officially broken out from the financial sector during the reporting period, also turned in fairly lackluster results of around 2%. Following stronger results earlier in the year, the REIT sector took a step back after investors began to price in a higher likelihood that the Fed would raise rates later in 2016.
We also continued to invest in S&P 500® Index futures to convert cash into the equivalent of an S&P 500® Index holding in order to manage cash flow activity and minimize tracking error to the Fund’s benchmark index. These contracts are used as a means to efficiently gain exposure to a broad base of equity securities. The Fund’s holdings of futures, which were matched to the level of cash, were helpful in keeping the Fund fully invested, neither overexposed nor underexposed to equities, despite cash flows. Due to the positive equity returns over the reporting period, these positions benefited the Fund’s performance.
Nuveen Mid Cap Index Fund
How did the Fund perform during the twelve-month reporting period ended October 31, 2016?
The tables in the Fund Performance and Expense Ratios section of this report provide total returns for the Fund for the one-year, five-year and ten-year periods ended October 31, 2016. Comparative performance information is provided for the Fund’s Class A Shares at net asset value (NAV). The Fund’s Class A Shares at NAV outperformed the Lipper Mid-Cap Core Funds Classification Average, but underperformed the S&P MidCap 400® Index for the twelve-month reporting period.
What strategies were used to manage the Fund during the reporting period and how did these strategies influence performance?
The Fund’s investment objective is to replicate the return of the S&P MidCap 400® Index as closely as possible, with consideration given to turnover costs and fees. S&P Dow Jones changes the index definition as often as weekly, deleting firms as they are acquired or when the membership committee determines that a firm is no longer representative of the index definition. Additionally, index weights are changed to reflect merger and acquisition activity or share issuance and repurchasing. These changes typically result in low turnover, well below 20% per year. We believe the Fund’s objective can best be achieved by investing in approximately 90% to 100% of the issues included in the S&P MidCap 400® Index, depending on the size of the Fund. During the reporting period, we held essentially all of the issues found in the index. In addition, we aggressively tracked and implemented the occasional changes to index member names, as well as changes to the relative weights in the index.
The Fund underperformed the S&P MidCap 400® Index during the twelve-month reporting period. The index experienced a divergence of more than 52% between the returns of its best and worst performing sectors. The utilities sector was the standout performer due to heightened investor interest in more defensive, yield generating stocks, returning approximately 22% in the S&P MidCap 400® Index during the reporting period. The materials sector also produced a double-digit return in the index, gaining nearly 19%. The newly formed real estate investment trust (REIT) sector, which was officially broken out from the financial sector during the reporting period, was another area of strength in the mid-cap universe. The sector was up more than 13%, holding onto gains realized earlier in the reporting period. Energy was the most significant laggard in the mid-cap space, ending the reporting period down almost 31% as many mid-cap companies have not yet recovered from the significant oil price decline over the past year. Telecommunication services and consumer discretionary also ended in negative territory, down approximately 8% and 3%, respectively.
Portfolio Managers’ Comments (continued)
We also continued to invest in E-mini S&P MidCap 400® futures to convert cash into the equivalent of an S&P MidCap 400® Index holding in order to manage cash flow activity and minimize tracking error to the Fund’s benchmark index. These contracts are used as a means to efficiently gain exposure to a broad base of equity securities. The Fund’s holdings of futures, which were matched to the level of cash, were helpful in keeping the Fund fully invested, neither overexposed nor underexposed to equities, despite cash flows. Due to the positive equity returns over the reporting period, these positions benefited the Fund’s performance.
Nuveen Small Cap Index Fund
How did the Fund perform during the twelve-month reporting period ended October 31, 2016?
The tables in the Fund Performance and Expense Ratios section of this report provide total returns for the Fund for the one-year, five-year and ten-year periods ended October 31, 2016. Comparative performance information is provided for the Fund’s Class A Shares at net asset value (NAV). The Fund’s Class A Shares at NAV outperformed the Lipper Small-Cap Core Funds Classification Average, but underperformed the Russell 2000® Index for the twelve-month reporting period.
What strategies were used to manage the Fund during the reporting period and how did these strategies influence performance?
The Fund’s investment objective is to replicate the return of the Russell 2000® Index as closely as possible, with consideration given to turnover costs and fees. Russell Investments reconstitutes this index near the end of June each year, generally selecting the stocks that are numbered 1001 through 3000 of the largest eligible U.S. companies. (To reduce turnover expenses, companies near the 1000 breakpoint remain in their prior category.) Throughout the remainder of the year, the number of stocks in the index will vary as appropriate IPOs are added quarterly and stocks are removed because of merger and acquisition activity or delisting. Share changes due to issuance and repurchasing are adjusted monthly. These changes typically result in low turnover, well below 20% per year. The majority of changes are from successful firms that move up to the Russell 1000® Index. We believe the Fund’s objective can best be achieved by investing in approximately 90% to 100% of the issues included in the Russell 2000® Index, depending on the size of the Fund. During the reporting period, we held essentially all of the issues found in the index. In addition, we aggressively tracked and implemented the occasional changes to index member names, as well as changes to the relative weights in the index.
The Fund underperformed the Russell 2000® Index during the reporting period. The index experienced a divergence of more than 33% between the returns of its best and worst performing sectors. The utilities sector was the standout performer due to heightened investor interest in more defensive, yield generating stocks, returning approximately 17% in the Russell 2000® Index during the reporting period. Four other sectors produced double-digit returns in the index, including materials, information technology, real estate investment trusts (REITs) and consumer staples, returning approximately 16%, 11%, 11% and 10%, respectively. The newly formed REIT sector was officially broken out from the financial sector during the reporting period. Energy was the most significant laggard in the small-cap space, ending the reporting period down more than 16% as many small-cap companies have not yet recovered from the significant oil price decline over the past year. Health care and consumer discretionary also ended in negative territory, down approximately 8% and 6%, respectively.
We also continued to invest in E-mini Russell 2000® futures to convert cash into the equivalent of a Russell 2000® Index holding in order to manage cash flow activity and minimize tracking error to the Fund’s benchmark index. These contracts are used as a means to efficiently gain exposure to a broad base of equity securities. The Fund’s holdings of futures, which were matched to the level of cash, were helpful in keeping the Fund fully invested, neither overexposed nor underexposed to equities, despite cash flows. Due to the positive equity returns over the reporting period, these positions benefited the Fund’s performance.
Risk Considerations
Nuveen Equity Index Fund
Nuveen Mid Cap Index Fund
Nuveen Small Cap Index Fund
Mutual fund investing involves risk; principal loss is possible. The Funds’ investments in common stocks involve the risk of decline due to adverse company or industry news or a general economic decline. The use of derivatives involves substantial financial risk and transaction costs. In addition, each Fund may fail to match index performance. Small- and mid-cap stocks are subject to greater price volatility and liquidity risks.
THIS PAGE INTENTIONALLY LEFT BLANK
Fund Performance
and Expense Ratios
The Fund Performance and Expense Ratios for each Fund are shown within this section of the report.
Returns quoted represent past performance, which is no guarantee of future results. Investment returns and principal value will fluctuate so that when shares are redeemed, they may be worth more or less than their original cost. Current performance may be higher or lower than the performance shown. Total returns for a period of less than one year are not annualized. Returns at net asset value (NAV) would be lower if the sales charge were included. Returns assume reinvestment of dividends and capital gains. For performance, current to the most recent month-end visit Nuveen.com or call (800) 257-8787.
Returns do not reflect the deduction of taxes that a shareholder would pay on Fund distributions or the redemption of Fund shares.
Returns may reflect fee waivers and/or expense reimbursements by the investment adviser during the periods presented. If any such waivers and/or reimbursements had not been in place, returns would have been reduced. See Notes to Financial Statements, Note 7—Management Fees and Other Transactions with Affiliates for more information.
Returns reflect differences in sales charges and expenses, which are primarily differences in distribution and service fees, and assume reinvestment of dividends and capital gains.
Comparative index and Lipper return information is provided for Class A Shares at NAV only.
The expense ratios shown reflect total operating expenses (before fee waivers and/or expense reimbursements, if any) as shown in the most recent prospectus. The expense ratios include management fees and other fees and expenses.
Fund Performance and Expense Ratios (continued)
Nuveen Equity Index Fund
Refer to the first page of this Fund Performance and Expense Ratios section for further explanation of the information included within this section. Refer to the Glossary of Terms Used in this Report for definitions of terms used within this section.
Fund Performance
Average Annual Total Returns as of October 31, 2016
| | | | | | | | | | | | |
| | | Average Annual | |
| | | 1-Year | | | 5-Year | | | 10-Year | |
Class A Shares | | | 3.91% | | | | 12.88% | | | | 6.13% | |
S&P 500® Index | | | 4.51% | | | | 13.57% | | | | 6.70% | |
Lipper S&P 500® Index Objective Funds Classification Average | | | 3.84% | | | | 12.93% | | | | 6.13% | |
| | | |
Class C Shares | | | 3.10% | | | | 12.04% | | | | 5.33% | |
Class R3 Shares | | | 3.65% | | | | 12.60% | | | | 5.87% | |
Class I Shares | | | 4.17% | | | | 13.17% | | | | 6.39% | |
Average Annual Total Returns as of September 30, 2016 (Most Recent Calendar Quarter)
| | | | | | | | | | | | |
| | | Average Annual | |
| | | 1-Year | | | 5-Year | | | 10-Year | |
Class A Shares | | | 14.74% | | | | 15.68% | | | | 6.66% | |
Class C Shares | | | 13.89% | | | | 14.81% | | | | 5.87% | |
Class R3 Shares | | | 14.45% | | | | 15.39% | | | | 6.40% | |
Class I Shares | | | 15.03% | | | | 15.97% | | | | 6.93% | |
Index and Lipper averages are not available for direct investment.
Class A Shares have no sales charge and are available only through fee-based programs and certain retirement plans. Class C Shares have a 1% contingent deferred sales charge (CDSC) for redemptions within less than twelve months of purchase, which is not reflected in the one-year total return. Class R3 Shares have no sales charge and are available to only certain retirement plans. Class I Shares have no sales charge and may be purchased under limited circumstances or by specified classes of investors.
Expense Ratios as of Most Recent Prospectus
| | | | | | | | | | | | | | | | |
| | | Share Class | |
| | | Class A | | | Class C | | | Class R3 | | | Class I | |
Gross Expense Ratios | | | 0.71% | | | | 1.46% | | | | 0.96% | | | | 0.46% | |
Net Expense Ratios | | | 0.59% | | | | 1.34% | | | | 0.84% | | | | 0.34% | |
The Fund’s investment adviser has contractually agreed to waive fees and/or reimburse other Fund expenses through February 28, 2018, so that total annual Fund operating expenses (excluding 12b-1 distribution and/or service fees, interest expenses, taxes, acquired fund fees and expenses, fees incurred in acquiring and disposing of portfolio securities and extraordinary expenses) do not exceed 0.34% of the average daily net assets of any class of Fund shares. Fee waivers and/or expense reimbursements will not be terminated prior to that time without the approval of the Board of Directors of the Fund.
Growth of an Assumed $10,000 Investment as of October 31, 2016 – Class A Shares
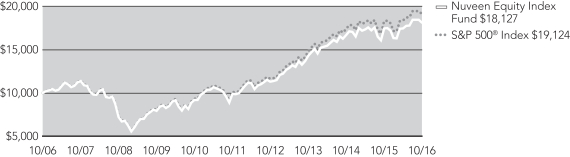
The graphs do not reflect the deduction of taxes that a shareholder may pay on Fund distributions or the redemption of Fund shares.
Fund Performance and Expense Ratios (continued)
Nuveen Mid Cap Index Fund
Refer to the first page of this Fund Performance and Expense Ratios section for further explanation of the information included within this section. Refer to the Glossary of Terms Used in this Report for definitions of terms used within this section.
Fund Performance
Average Annual Total Returns as of October 31, 2016
| | | | | | | | | | | | |
| | | Average Annual | |
| | | 1-Year | | | 5-Year | | | 10-Year | |
Class A Shares | | | 5.43% | | | | 12.18% | | | | 7.78% | |
S&P MidCap 400® Index | | | 6.26% | | | | 12.92% | | | | 8.38% | |
Lipper Mid-Cap Core Funds Classification Average | | | 2.79% | | | | 11.24% | | | | 6.39% | |
| | | |
Class C Shares | | | 4.67% | | | | 11.35% | | | | 6.97% | |
Class R3 Shares | | | 5.15% | | | | 11.89% | | | | 7.51% | |
Class I Shares | | | 5.76% | | | | 12.47% | | | | 8.04% | |
Average Annual Total Returns as of September 30, 2016 (Most Recent Calendar Quarter)
| | | | | | | | | | | | |
| | | Average Annual | |
| | | 1-Year | | | 5-Year | | | 10-Year | |
Class A Shares | | | 14.51% | | | | 15.74% | | | | 8.51% | |
Class C Shares | | | 13.68% | | | | 14.89% | | | | 7.71% | |
Class R3 Shares | | | 14.27% | | | | 15.45% | | | | 8.24% | |
Class I Shares | | | 14.82% | | | | 16.03% | | | | 8.79% | |
Index and Lipper averages are not available for direct investment.
Class A Shares have no sales charge and are available only through fee-based programs and certain retirement plans. Class C Shares have a 1% contingent deferred sales charge (CDSC) for redemptions within less than twelve months of purchase, which is not reflected in the one-year total return. Class R3 Shares have no sales charge and are available to only certain retirement plans. Class I Shares have no sales charge and may be purchased under limited circumstances or by specified classes of investors.
Expense Ratios as of Most Recent Prospectus
| | | | | | | | | | | | | | | | |
| | | Share Class | |
| | | Class A | | | Class C | | | Class R3 | | | Class I | |
Gross Expense Ratios | | | 0.79% | | | | 1.54% | | | | 1.04% | | | | 0.54% | |
Net Expense Ratios | | | 0.64% | | | | 1.39% | | | | 0.89% | | | | 0.39% | |
The Fund’s investment adviser has contractually agreed to waive fees and/or reimburse other Fund expenses through February 28, 2018, so that total annual Fund operating expenses (excluding 12b-1 distribution and/or service fees, interest expenses, taxes, acquired fund fees and expenses, fees incurred in acquiring and disposing of portfolio securities and extraordinary expenses) do not exceed 0.41% of the average daily net assets of any class of Fund shares. Fee waivers and/or expense reimbursements will not be terminated prior to that time without the approval of the Board of Directors of the Fund.
Growth of an Assumed $10,000 Investment as of October 31, 2016 – Class A Shares
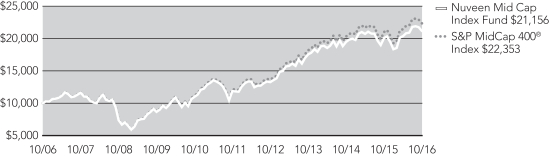
The graphs do not reflect the deduction of taxes that a shareholder may pay on Fund distributions or the redemption of Fund shares.
Fund Performance and Expense Ratios (continued)
Nuveen Small Cap Index Fund
Refer to the first page of this Fund Performance and Expense Ratios section for further explanation of the information included within this section. Refer to the Glossary of Terms Used in this Report for definitions of terms used within this section.
Fund Performance
Average Annual Total Returns as of October 31, 2016
| | | | | | | | | | | | |
| | | Average Annual | |
| | | 1-Year | | | 5-Year | | | 10-Year | |
Class A Shares | | | 3.58% | | | | 10.89% | | | | 5.46% | |
Russell 2000® Index | | | 4.11% | | | | 11.51% | | | | 5.96% | |
Lipper Small-Cap Core Funds Classification Average | | | 3.01% | | | | 10.67% | | | | 5.89% | |
| | | |
Class C Shares | | | 2.82% | | | | 10.05% | | | | 4.67% | |
Class R3 Shares | | | 3.31% | | | | 10.61% | | | | 5.20% | |
Class I Shares | | | 3.86% | | | | 11.17% | | | | 5.73% | |
Average Annual Total Returns as of September 30, 2016 (Most Recent Calendar Quarter)
| | | | | | | | | | | | |
| | | Average Annual | |
| | | 1-Year | | | 5-Year | | | 10-Year | |
Class A Shares | | | 14.85% | | | | 15.18% | | | | 6.57% | |
Class C Shares | | | 14.05% | | | | 14.32% | | | | 5.78% | |
Class R3 Shares | | | 14.65% | | | | 14.89% | | | | 6.30% | |
Class I Shares | | | 15.20% | | | | 15.46% | | | | 6.84% | |
Index and Lipper averages are not available for direct investment.
Class A Shares have no sales charge and are available only through fee-based programs and certain retirement plans. Class C Shares have a 1% contingent deferred sales charge (CDSC) for redemptions within less than twelve months of purchase, which is not reflected in the one-year total return. Class R3 Shares have no sales charge and are available to only certain retirement plans. Class I Shares have no sales charge and may be purchased under limited circumstances or by specified classes of investors.
Expense Ratios as of Most Recent Prospectus
| | | | | | | | | | | | | | | | |
| | | Share Class | |
| | | Class A | | | Class C | | | Class R3 | | | Class I | |
Gross Expense Ratios | | | 1.00% | | | | 1.75% | | | | 1.25% | | | | 0.74% | |
Net Expense Ratios | | | 0.77% | | | | 1.52% | | | | 1.02% | | | | 0.52% | |
The Fund’s investment adviser has contractually agreed to waive fees and/or reimburse other Fund expenses through February 28, 2018, so that total annual fund operating expenses (excluding 12b-1 distribution and/or service fees, interest expenses, taxes, acquired fund fees and expenses, fees incurred in acquiring and disposing of portfolio securities and extraordinary expenses) do not exceed 0.54% of the average daily net assets of any class of Fund shares. Fee waivers and/or expense reimbursements will not be terminated prior to that time without the approval of the Board of Directors of the Fund.
Growth of an Assumed $10,000 Investment as of October 31, 2016 – Class A Shares
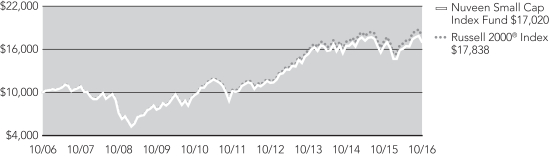
The graphs do not reflect the deduction of taxes that a shareholder may pay on Fund distributions or the redemption of Fund shares.
Holding
Summaries as of October 31, 2016
This data relates to the securities held in each Fund’s portfolio of investments as of the end of this reporting period. It should not be construed as a measure of performance for the Fund itself. Holdings are subject to change.
Nuveen Equity Index Fund
Fund Allocation
(% of net assets)
| | | | |
Common Stocks | | | 95.4% | |
Common Stock Rights | | | 0.0% | |
Investments Purchased with Collateral from Securities Lending | | | 1.2% | |
Money Market Funds | | | 4.4% | |
U.S. Government and Agency Obligations | | | 0.4% | |
Other Assets Less Liabilities | | | (1.4)% | |
Net Assets | | | 100% | |
Portfolio Composition
(% of net assets)
| | | | |
Oil, Gas & Consumable Fuels | | | 5.8% | |
Banks | | | 5.5% | |
Pharmaceuticals | | | 5.1% | |
Internet Software & Services | | | 4.5% | |
Software | | | 4.3% | |
Technology Hardware, Storage & Peripherals | | | 3.7% | |
IT Services | | | 3.6% | |
Semiconductors & Semiconductor Equipment | | | 3.1% | |
Media | | | 2.8% | |
Equity Real Estate Investment Trusts | | | 2.8% | |
Biotechnology | | | 2.6% | |
Insurance | | | 2.6% | |
Health Care Equipment & Supplies | | | 2.5% | |
Capital Markets | | | 2.5% | |
Internet and Direct Marketing Retail | | | 2.4% | |
Industrial Conglomerates | | | 2.4% | |
Health Care Providers & Services | | | 2.4% | |
Diversified Telecommunication Services | | | 2.4% | |
Specialty Retail | | | 2.3% | |
Beverages | | | 2.1% | |
Aerospace & Defense | | | 2.1% | |
Food & Staples Retailing | | | 2.1% | |
Electric Utilities | | | 2.0% | |
Chemicals | | | 2.0% | |
Household Products | | | 1.9% | |
Other | | | 19.9% | |
Common Stock Rights | | | 0.0% | |
Investments Purchased with Collateral from Securities Lending | | | 1.2% | |
Money Market Funds | | | 4.4% | |
U.S. Government and Agency Obligations | | | 0.4% | |
Other Assets Less Liabilities | | | (1.4)% | |
Net Assets | | | 100% | |
Top Five Common Stock Holdings
(% of net assets)
| | | | |
Apple, Inc. | | | 3.2% | |
Microsoft Corporation | | | 2.4% | |
Exxon Mobil Corporation | | | 1.8% | |
Johnson & Johnson | | | 1.6% | |
Amazon.com, Inc. | | | 1.6% | |
Nuveen Mid Cap Index Fund
Fund Allocation
(% of net assets)
| | | | |
Common Stocks | | | 97.4% | |
Common Stock Rights | | | 0.0% | |
Investments Purchased with Collateral from Securities Lending | | | 5.6% | |
Money Market Funds | | | 2.3% | |
U.S. Government and Agency Obligations | | | 0.5% | |
Other Assets Less Liabilities | | | (5.8)% | |
Net Assets | | | 100% | |
Portfolio Composition
(% of net assets)
| | | | |
Equity Real Estate Investment Trusts | | | 11.0% | |
Banks | | | 5.8% | |
Insurance | | | 5.1% | |
Machinery | | | 4.7% | |
Software | | | 4.6% | |
Electronic Equipment, Instruments & Components | | | 4.0% | |
IT Services | | | 3.8% | |
Health Care Equipment & Supplies | | | 3.7% | |
Capital Markets | | | 3.4% | |
Chemicals | | | 2.9% | |
Food Products | | | 2.8% | |
Hotels, Restaurants & Leisure | | | 2.6% | |
Semiconductors & Semiconductor Equipment | | | 2.5% | |
Specialty Retail | | | 2.2% | |
Gas Utilities | | | 2.2% | |
Oil, Gas & Consumable Fuels | | | 2.1% | |
Aerospace & Defense | | | 2.0% | |
Electric Utilities | | | 1.9% | |
Metals & Mining | | | 1.9% | |
Health Care Providers & Services | | | 1.8% | |
Containers & Packaging | | | 1.7% | |
Household Durables | | | 1.5% | |
Communications Equipment | | | 1.5% | |
Energy, Equipment & Services | | | 1.4% | |
Media | | | 1.3% | |
Other | | | 19.0% | |
Common Stock Rights | | | 0.0% | |
Investments Purchased with Collateral from Securities Lending | | | 5.6% | |
Money Market Funds | | | 2.3% | |
U.S. Government and Agency Obligations | | | 0.5% | |
Other Assets Less Liabilities | | | (5.8)% | |
Net Assets | | | 100% | |
Top Five Common Stock Holdings
(% of net assets)
| | | | |
Idexx Labs Inc. | | | 0.7% | |
WhiteWave Foods Company | | | 0.6% | |
Everest Reinsurance Group Ltd | | | 0.6% | |
Ingredion Inc. | | | 0.6% | |
Duke Realty Corporation | | | 0.6% | |
Holding Summaries as of October 31, 2016 (continued)
Nuveen Small Cap Index Fund
Fund Allocation
(% of net assets)
| | | | |
Common Stocks | | | 94.3% | |
Exchange-Traded Funds | | | 0.0% | |
Common Stock Rights | | | 0.0% | |
Warrants | | | 0.0% | |
Investments Purchased with Collateral from Securities Lending | | | 9.3% | |
Money Market Funds | | | 5.5% | |
U.S. Government and Agency Obligations | | | 0.3% | |
Other Assets Less Liabilities | | | (9.4)% | |
Net Assets | | | 100% | |
Portfolio Composition
(% of net assets)
| | | | |
Banks | | | 9.8% | |
Equity Real Estate Investment Trusts | | | 7.2% | |
Biotechnology | | | 4.5% | |
Software | | | 4.1% | |
Semiconductors & Semiconductor Equipment | | | 3.6% | |
Machinery | | | 3.3% | |
Health Care Equipment & Supplies | | | 3.0% | |
Hotels, Restaurants & Leisure | | | 2.8% | |
Electronic Equipment, Instruments & Components | | | 2.7% | |
Internet Software & Services | | | 2.4% | |
Chemicals | | | 2.3% | |
Specialty Retail | | | 2.3% | |
Insurance | | | 2.2% | |
Commercial Services & Supplies | | | 2.2% | |
Thrifts & Mortgage Finance | | | 2.1% | |
Oil, Gas & Consumable Fuels | | | 2.1% | |
Health Care Providers & Services | | | 2.0% | |
IT Services | | | 2.0% | |
Pharmaceuticals | | | 1.7% | |
Communications Equipment | | | 1.7% | |
Aerospace & Defense | | | 1.5% | |
Media | | | 1.4% | |
Food Products | | | 1.4% | |
Capital Markets | | | 1.3% | |
Professional Services | | | 1.3% | |
Household Durables | | | 1.2% | |
Metals & Mining | | | 1.2% | |
Auto Components | | | 1.2% | |
Other | | | 19.8% | |
Exchange-Traded Funds | | | 0.0% | |
Common Stock Rights | | | 0.0% | |
Warrants | | | 0.0% | |
Investments Purchased with Collateral from Securities Lending | | | 9.3% | |
Money Market Funds | | | 5.5% | |
U.S. Government and Agency Obligations | | | 0.3% | |
Other Assets Less Liabilities | | | (9.4)% | |
Net Assets | | | 100% | |
Top Five Common Stock Holdings
(% of net assets)
| | | | |
Advanced Micro Devices, Inc. | | | 0.3% | |
Microsemi Corporation | | | 0.3% | |
Aspen Technology Inc. | | | 0.2% | |
Curtiss Wright Corporation | | | 0.2% | |
IDACORP, INC | | | 0.2% | |
Expense
Examples
As a shareholder of one or more of the Funds, you incur two types of costs: (1) transaction costs, including up-front and back-end sales charges (loads) or redemption fees, where applicable; and (2) ongoing costs, including management fees; distribution and service (12b-1) fees, where applicable; and other Fund expenses. The Examples below are intended to help you understand your ongoing costs (in dollars) of investing in the Funds and to compare these costs with the ongoing costs of investing in other mutual funds.
The Examples below are based on an investment of $1,000 invested at the beginning of the period and held through the period ended October 31, 2016.
The beginning of the period is May 1, 2016.
The information under “Actual Performance,” together with the amount you invested, allows you to estimate actual expenses incurred over the reporting period. Simply divide your account value by $1,000 (for example, an $8,600 account value divided by $1,000 = 8.60) and multiply the result by the cost shown for your share class, in the row entitled “Expenses Incurred During Period” to estimate the expenses incurred on your account during this period.
The information under “Hypothetical Performance,” provides information about hypothetical account values and hypothetical expenses based on each Fund’s actual expense ratios and an assumed rate of return of 5% per year before expenses, which is not the Fund’s actual return. The hypothetical account values and expenses may not be used to estimate the actual ending account balance or expense you incurred for the period. You may use this information to compare the ongoing costs of investing in the Fund and other funds. To do so, compare this 5% hypothetical example with the 5% hypothetical examples that appear in the shareholder reports of the other funds.
Please note that the expenses shown in the tables are meant to highlight your ongoing costs only and do not reflect any transaction costs. Therefore, the hypothetical information is useful in comparing ongoing costs only, and will not help you determine the relative total costs of owning different funds or share classes. In addition, if these transaction costs were included, your costs would have been higher.
Nuveen Equity Index Fund
| | | | | | | | | | | | | | | | |
| | | Share Class | |
| | | Class A | | | Class C | | | Class R3 | | | Class I | |
Actual Performance | | | | | | | | | | | | | | | | |
Beginning Account Value | | $ | 1,000.00 | | | $ | 1,000.00 | | | $ | 1,000.00 | | | $ | 1,000.00 | |
Ending Account Value | | $ | 1,037.80 | | | $ | 1,033.50 | | | $ | 1,036.50 | | | $ | 1,039.10 | |
Expenses Incurred During Period | | $ | 3.07 | | | $ | 6.90 | | | $ | 4.35 | | | $ | 1.79 | |
Hypothetical Performance (5% annualized return before expenses) | | | | | | | | | | | | | | | | |
Beginning Account Value | | $ | 1,000.00 | | | $ | 1,000.00 | | | $ | 1,000.00 | | | $ | 1,000.00 | |
Ending Account Value | | $ | 1,022.12 | | | $ | 1,018.35 | | | $ | 1,020.86 | | | $ | 1,023.38 | |
Expenses Incurred During Period | | $ | 3.05 | | | $ | 6.85 | | | $ | 4.32 | | | $ | 1.78 | |
For each class of the Fund, expenses are equal to the Fund’s annualized net expense ratio of 0.60%, 1.35%, 0.85% and 0.35% for Classes A, C, R3 and I, respectively, multiplied by the average account value over the period, multiplied by 184/366 (to reflect the one-half year period).
Expense Examples (continued)
Nuveen Mid Cap Index Fund
| | | | | | | | | | | | | | | | |
| | | Share Class | |
| | | Class A | | | Class C | | | Class R3 | | | Class I | |
Actual Performance | | | | | | | | | | | | | | | | |
Beginning Account Value | | $ | 1,000.00 | | | $ | 1,000.00 | | | $ | 1,000.00 | | | $ | 1,000.00 | |
Ending Account Value | | $ | 1,037.60 | | | $ | 1,033.70 | | | $ | 1,036.40 | | | $ | 1,039.30 | |
Expenses Incurred During Period | | $ | 3.43 | | | $ | 7.21 | | | $ | 4.66 | | | $ | 2.10 | |
Hypothetical Performance (5% annualized return before expenses) | | | | | | | | | | | | | | | | |
Beginning Account Value | | $ | 1,000.00 | | | $ | 1,000.00 | | | $ | 1,000.00 | | | $ | 1,000.00 | |
Ending Account Value | | $ | 1,021.77 | | | $ | 1,018.05 | | | $ | 1,020.56 | | | $ | 1,023.08 | |
Expenses Incurred During Period | | $ | 3.40 | | | $ | 7.15 | | | $ | 4.62 | | | $ | 2.08 | |
For each class of the Fund, expenses are equal to the Fund’s annualized net expense ratio of 0.67%, 1.41%, 0.91% and 0.41% for Classes A, C, R3 and I, respectively, multiplied by the average account value over the period, multiplied by 184/366 (to reflect the one-half year period).
Nuveen Small Cap Index Fund
| | | | | | | | | | | | | | | | |
| | | Share Class | |
| | | Class A | | | Class C | | | Class R3 | | | Class I | |
Actual Performance | | | | | | | | | | | | | | | | |
Beginning Account Value | | $ | 1,000.00 | | | $ | 1,000.00 | | | $ | 1,000.00 | | | $ | 1,000.00 | |
Ending Account Value | | $ | 1,058.40 | | | $ | 1,054.30 | | | $ | 1,056.90 | | | $ | 1,059.80 | |
Expenses Incurred During Period | | $ | 4.09 | | | $ | 7.95 | | | $ | 5.38 | | | $ | 2.80 | |
Hypothetical Performance (5% annualized return before expenses) | | | | | | | | | | | | | | | | |
Beginning Account Value | | $ | 1,000.00 | | | $ | 1,000.00 | | | $ | 1,000.00 | | | $ | 1,000.00 | |
Ending Account Value | | $ | 1,021.17 | | | $ | 1,017.39 | | | $ | 1,019.91 | | | $ | 1,022.42 | |
Expenses Incurred During Period | | $ | 4.01 | | | $ | 7.81 | | | $ | 5.28 | | | $ | 2.75 | |
For each class of the Fund, expenses are equal to the Fund’s annualized net expense ratio of 0.79%, 1.54%, 1.04% and 0.54% for Classes A, C, R3 and I, respectively, multiplied by the average account value over the period, multiplied by 184/366 (to reflect the one-half year period).
Report of
Independent Registered Public Accounting Firm
To the Board of Directors and Shareholders of
Nuveen Investment Funds, Inc.:
In our opinion, the accompanying statements of assets and liabilities, including the portfolios of investments, and the related statements of operations and of changes in net assets and the financial highlights present fairly, in all material respects, the financial position of Nuveen Equity Index Fund, Nuveen Mid Cap Index Fund and Nuveen Small Cap Index Fund (each a series of the Nuveen Investment Funds, Inc., hereinafter referred to as the “Funds”) at October 31, 2016, the results of each of their operations for the year then ended, the changes in each of their net assets for each of the two years in the period then ended and the financial highlights for the five years in the period then ended, in conformity with accounting principles generally accepted in the United States of America. These financial statements and financial highlights (hereafter referred to as “financial statements”) are the responsibility of the Fund’s management. Our responsibility is to express an opinion on these financial statements based on our audits. We conducted our audits of these financial statements in accordance with the standards of the Public Company Accounting Oversight Board (United States). Those standards require that we plan and perform the audit to obtain reasonable assurance about whether the financial statements are free of material misstatement. An audit includes examining, on a test basis, evidence supporting the amounts and disclosures in the financial statements, assessing the accounting principles used and significant estimates made by management, and evaluating the overall financial statement presentation. We believe that our audits, which included confirmation of securities at October 31, 2016 by correspondence with the custodian and brokers, provide a reasonable basis for our opinion.
As disclosed in Note 9 – Subsequent Events of the Notes to Financial Statements, after the close of business on April 27, 2017, the Funds will liquidate any remaining shareholder accounts and cease operations.
PricewaterhouseCoopers LLP
Chicago, IL
December 28, 2016
Nuveen Equity Index Fund
| | |
| Portfolio of Investments | | October 31, 2016 |
| | | | | | | | | | | | | | | | | | | | |
| Shares | | | Description (1) | | | | | | | | | | | Value | |
| | | | | |
| | | | LONG-TERM INVESMTENTS – 95.4% | | | | | | | | | | | | | | | | |
| | | | | |
| | | | COMMON STOCKS – 95.4% | | | | | | | | | | | | | | | | |
| | | | | |
| | | | Aerospace & Defense – 2.1% | | | | | | | | | | | | |
| | | | | |
| | 21,619 | | | Boeing Company | | | | | | | | | | | | | | $ | 3,079,194 | |
| | | | | |
| | 10,694 | | | General Dynamics Corporation | | | | | | | | | | | | | | | 1,612,014 | |
| | | | | |
| | 3,019 | | | L-3 Communications Holdings, Inc. | | | | | | | | | | | | | | | 413,422 | |
| | | | | |
| | 9,406 | | | Lockheed Martin Corporation | | | | | | | | | | | | | | | 2,317,450 | |
| | | | | |
| | 6,654 | | | Northrop Grumman Corporation | | | | | | | | | | | | | | | 1,523,766 | |
| | | | | |
| | 11,602 | | | Raytheon Company | | | | | | | | | | | | | | | 1,584,949 | |
| | | | | |
| | 4,888 | | | Rockwell Collins, Inc. | | | | | | | | | | | | | | | 412,156 | |
| | | | | |
| | 10,522 | | | Textron Inc. | | | | | | | | | | | | | | | 421,722 | |
| | | | | |
| | 1,242 | | | TransDigm Group Inc., (2) | | | | | | | | | | | | | | | 338,395 | |
| | | | | |
| | 30,186 | | | United Technologies Corporation | | | | | | | | | | | | | | | 3,085,009 | |
| | | | Total Aerospace & Defense | | | | | | | | | | | | | | | 14,788,077 | |
| | | | | |
| | | | Air Freight & Logistics – 0.7% | | | | | | | | | | | | |
| | | | | |
| | 5,690 | | | C.H. Robinson Worldwide, Inc. | | | | | | | | | | | | | | | 387,603 | |
| | | | | |
| | 7,067 | | | Expeditors International of Washington, Inc. | | | | | | | | | | | | | | | 363,738 | |
| | | | | |
| | 9,103 | | | FedEx Corporation | | | | | | | | | | | | | | | 1,586,835 | |
| | | | | |
| | 25,760 | | | United Parcel Service, Inc., Class B | | | | | | | | | | | | | | | 2,775,898 | |
| | | | Total Air Freight & Logistics | | | | | | | | | | | | | | | 5,114,074 | |
| | | | | |
| | | | Airlines – 0.5% | | | | | | | | | | | | |
| | | | | |
| | 782 | | | Alaska Air Group, Inc. | | | | | | | | | | | | | | | 56,476 | |
| | | | | |
| | 20,610 | | | American Airlines Group Inc. | | | | | | | | | | | | | | | 836,766 | |
| | | | | |
| | 29,128 | | | Delta Air Lines, Inc. | | | | | | | | | | | | | | | 1,216,677 | |
| | | | | |
| | 24,760 | | | Southwest Airlines Co. | | | | | | | | | | | | | | | 991,638 | |
| | | | | |
| | 13,038 | | | United Continental Holdings Inc., (2) | | | | | | | | | | | | | | | 733,127 | |
| | | | Total Airlines | | | | | | | | | | | | | | | 3,834,684 | |
| | | | | |
| | | | Auto Components – 0.2% | | | | | | | | | | | | |
| | | | | |
| | 3,517 | | | Adient PLC, (2) | | | | | | | | | | | | | | | 160,084 | |
| | | | | |
| | 7,505 | | | BorgWarner Inc. | | | | | | | | | | | | | | | 268,979 | |
| | | | | |
| | 10,164 | | | Delphi Automotive PLC | | | | | | | | | | | | | | | 661,371 | |
| | | | | |
| | 10,363 | | | Goodyear Tire & Rubber Company | | | | | | | | | | | | | | | 300,838 | |
| | | | Total Auto Components | | | | | | | | | | | | | | | 1,391,272 | |
| | | | | |
| | | | Automobiles – 0.5% | | | | | | | | | | | | |
| | | | | |
| | 145,417 | | | Ford Motor Company | | | | | | | | | | | | | | | 1,707,196 | |
| | | | | |
| | 51,842 | | | General Motors Company | | | | | | | | | | | | | | | 1,638,207 | |
| | | | | |
| | 6,663 | | | Harley-Davidson, Inc. | | | | | | | | | | | | | | | 379,924 | |
| | | | Total Automobiles | | | | | | | | | | | | | | | 3,725,327 | |
| | | | | | | | | | | | | | | | | | | | |
| Shares | | | Description (1) | | | | | | | | | | | Value | |
| | | | | |
| | | | Banks – 5.5% | | | | | | | | | | | | |
| | | | | |
| | 380,265 | | | Bank of America Corporation | | | | | | | | | | | | | | $ | 6,274,373 | |
| | | | | |
| | 31,443 | | | BB&T Corporation | | | | | | | | | | | | | | | 1,232,566 | |
| | | | | |
| | 108,264 | | | Citigroup Inc. | | | | | | | | | | | | | | | 5,321,176 | |
| | | | | |
| | 8,058 | | | Citizens Financial Group Inc. | | | | | | | | | | | | | | | 212,248 | |
| | | | | |
| | 7,141 | | | Comerica Incorporated | | | | | | | | | | | | | | | 371,975 | |
| | | | | |
| | 34,253 | | | Fifth Third Bancorp. | | | | | | | | | | | | | | | 745,345 | |
| | | | | |
| | 32,229 | | | Huntington BancShares Inc. | | | | | | | | | | | | | | | 341,627 | |
| | | | | |
| | 134,595 | | | JP Morgan Chase & Co. | | | | | | | | | | | | | | | 9,322,050 | |
| | | | | |
| | 33,744 | | | KeyCorp. | | | | | | | | | | | | | | | 476,465 | |
| | | | | |
| | 5,767 | | | M&T Bank Corporation | | | | | | | | | | | | | | | 707,784 | |
| | | | | |
| | 12,440 | | | People’s United Financial, Inc. | | | | | | | | | | | | | | | 202,026 | |
| | | | | |
| | 18,312 | | | PNC Financial Services Group, Inc. | | | | | | | | | | | | | | | 1,750,627 | |
| | | | | |
| | 53,171 | | | Regions Financial Corporation | | | | | | | | | | | | | | | 569,461 | |
| | | | | |
| | 20,341 | | | SunTrust Banks, Inc. | | | | | | | | | | | | | | | 920,023 | |
| | | | | |
| | 59,951 | | | U.S. Bancorp | | | | | | | | | | | | | | | 2,683,407 | |
| | | | | |
| | 169,212 | | | Wells Fargo & Company | | | | | | | | | | | | | | | 7,785,444 | |
| | | | | |
| | 8,340 | | | Zions Bancorporation | | | | | | | | | | | | | | | 268,631 | |
| | | | Total Banks | | | | | | | | | | | | | | | 39,185,228 | |
| | | | | |
| | | | Beverages – 2.1% | | | | | | | | | | | | |
| | | | | |
| | 6,797 | | | Brown-Forman Corporation | | | | | | | | | | | | | | | 313,817 | |
| | | | | |
| | 141,956 | | | Coca-Cola Company | | | | | | | | | | | | | | | 6,018,934 | |
| | | | | |
| | 6,903 | | | Constellation Brands, Inc., Class A | | | | | | | | | | | | | | | 1,153,629 | |
| | | | | |
| | 7,661 | | | Dr. Pepper Snapple Group | | | | | | | | | | | | | | | 672,559 | |
| | | | | |
| | 7,172 | | | Molson Coors Brewing Company, Class B | | | | | | | | | | | | | | | 744,525 | |
| | | | | |
| | 5,037 | | | Monster Beverage Corporation, (2) | | | | | | | | | | | | | | | 727,041 | |
| | | | | |
| | 53,627 | | | PepsiCo, Inc. | | | | | | | | | | | | | | | 5,748,814 | |
| | | | Total Beverages | | | | | | | | | | | | | | | 15,379,319 | |
| | | | | |
| | | | Biotechnology – 2.6% | | | | | | | | | | | | |
| | | | | |
| | 60,686 | | | AbbVie Inc. | | | | | | | | | | | | | | | 3,385,065 | |
| | | | | |
| | 8,356 | | | Alexion Pharmaceuticals Inc., (2) | | | | | | | | | | | | | | | 1,090,458 | |
| | | | | |
| | 27,887 | | | Amgen Inc. | | | | | | | | | | | | | | | 3,936,529 | |
| | | | | |
| | 8,165 | | | Biogen Inc., (2) | | | | | | | | | | | | | | | 2,287,670 | |
| | | | | |
| | 28,884 | | | Celgene Corporation, (2) | | | | | | | | | | | | | | | 2,951,367 | |
| | | | | |
| | 49,174 | | | Gilead Sciences, Inc. | | | | | | | | | | | | | | | 3,620,682 | |
| | | | | |
| | 2,812 | | | Regeneron Pharmaceuticals, Inc., (2) | | | | | | | | | | | | | | | 970,196 | |
| | | | | |
| | 9,233 | | | Vertex Pharmaceuticals Inc., (2) | | | | | | | | | | | | | | | 700,415 | |
| | | | Total Biotechnology | | | | | | | | | | | | | | | 18,942,382 | |
| | | | | |
| | | | Building Products – 0.3% | | | | | | | | | | | | |
| | | | | |
| | 3,729 | | | Allegion PLC | | | | | | | | | | | | | | | 238,059 | |
Nuveen Equity Index Fund (continued)
| | |
| Portfolio of Investments | | October 31, 2016 |
| | | | | | | | | | | | | | | | | | | | |
| Shares | | | Description (1) | | | | | | | | | | | Value | |
| | | | | |
| | | | Building Products (continued) | | | | | | | | | | | | |
| | | | | |
| | 2,840 | | | Fortune Brands Home & Security | | | | | | | | | | | | | | $ | 155,149 | |
| | | | | |
| | 35,175 | | | Johnson Controls International PLC | | | | | | | | | | | | | | | 1,418,256 | |
| | | | | |
| | 12,958 | | | Masco Corporation | | | | | | | | | | | | | | | 400,143 | |
| | | | Total Building Products | | | | | | | | | | | | | | | 2,211,607 | |
| | | | | |
| | | | Capital Markets – 2.5% | | | | | | | | | | | | |
| | | | | |
| | 2,007 | | | Affiliated Managers Group Inc., (2) | | | | | | | | | | | | | | | 266,249 | |
| | | | | |
| | 6,016 | | | Ameriprise Financial, Inc. | | | | | | | | | | | | | | | 531,754 | |
| | | | | |
| | 39,786 | | | Bank New York Mellon | | | | | | | | | | | | | | | 1,721,540 | |
| | | | | |
| | 4,547 | | | BlackRock Inc. | | | | | | | | | | | | | | | 1,551,618 | |
| | | | | |
| | 44,862 | | | Charles Schwab Corporation | | | | | | | | | | | | | | | 1,422,125 | |
| | | | | |
| | 12,627 | | | CME Group, Inc. | | | | | | | | | | | | | | | 1,263,963 | |
| | | | | |
| | 12,615 | | | E*Trade Group Inc., (2) | | | | | | | | | | | | | | | 355,238 | |
| | | | | |
| | 13,096 | | | Franklin Resources, Inc. | | | | | | | | | | | | | | | 440,811 | |
| | | | | |
| | 14,052 | | | Goldman Sachs Group, Inc. | | | | | | | | | | | | | | | 2,504,628 | |
| | | | | |
| | 4,435 | | | Intercontinental Exchange Group, Inc. | | | | | | | | | | | | | | | 1,199,180 | |
| | | | | |
| | 15,274 | | | Invesco LTD | | | | | | | | | | | | | | | 429,047 | |
| | | | | |
| | 3,436 | | | Legg Mason, Inc. | | | | | | | | | | | | | | | 98,682 | |
| | | | | |
| | 6,729 | | | Moody’s Corporation | | | | | | | | | | | | | | | 676,399 | |
| | | | | |
| | 54,855 | | | Morgan Stanley | | | | | | | | | | | | | | | 1,841,482 | |
| | | | | |
| | 5,009 | | | NASDAQ Stock Market, Inc. | | | | | | | | | | | | | | | 320,426 | |
| | | | | |
| | 7,936 | | | Northern Trust Corporation | | | | | | | | | | | | | | | 574,725 | |
| | | | | |
| | 10,295 | | | S&P Global, Inc. | | | | | | | | | | | | | | | 1,254,446 | |
| | | | | |
| | 13,661 | | | State Street Corporation | | | | | | | | | | | | | | | 959,139 | |
| | | | | |
| | 9,261 | | | T. Rowe Price Group Inc. | | | | | | | | | | | | | | | 592,797 | |
| | | | Total Capital Markets | | | | | | | | | | | | | | | 18,004,249 | |
| | | | | |
| | | | Chemicals – 2.0% | | | | | | | | | | | | |
| | | | | |
| | 1 | | | AdvanSix, Inc. | | | | | | | | | | | | | | | 8 | |
| | | | | |
| | 7,532 | | | Air Products & Chemicals Inc. | | | | | | | | | | | | | | | 1,004,919 | |
| | | | | |
| | 4,343 | | | Albemarle Corporation | | | | | | | | | | | | | | | 362,858 | |
| | | | | |
| | 9,353 | | | CF Industries Holdings, Inc. | | | | | | | | | | | | | | | 224,566 | |
| | | | | |
| | 41,990 | | | Dow Chemical Company | | | | | | | | | | | | | | | 2,259,482 | |
| | | | | |
| | 32,581 | | | E.I. Du Pont de Nemours and Company | | | | | | | | | | | | | | | 2,241,247 | |
| | | | | |
| | 5,504 | | | Eastman Chemical Company | | | | | | | | | | | | | | | 395,793 | |
| | | | | |
| | 9,625 | | | Ecolab Inc. | | | | | | | | | | | | | | | 1,098,886 | |
| | | | | |
| | 5,363 | | | FMC Corporation | | | | | | | | | | | | | | | 251,471 | |
| | | | | |
| | 2,965 | | | International Flavors & Fragrances Inc. | | | | | | | | | | | | | | | 387,763 | |
| | | | | |
| | 12,702 | | | LyondellBasell Industries NV | | | | | | | | | | | | | | | 1,010,444 | |
| | | | | |
| | 16,306 | | | Monsanto Company | | | | | | | | | | | | | | | 1,643,156 | |
| | | | | |
| | 13,125 | | | Mosaic Company | | | | | | | | | | | | | | | 308,831 | |
| | | | | | | | | | | | | | | | | | | | |
| Shares | | | Description (1) | | | | | | | | | | | Value | |
| | | | | |
| | | | Chemicals (continued) | | | | | | | | | | | | |
| | | | | |
| | 9,922 | | | PPG Industries, Inc. | | | | | | | | | | | | | | $ | 924,036 | |
| | | | | |
| | 10,741 | | | Praxair, Inc. | | | | | | | | | | | | | | | 1,257,341 | |
| | | | | |
| | 2,989 | | | Sherwin-Williams Company | | | | | | | | | | | | | | | 731,887 | |
| | | | Total Chemicals | | | | | | | | | | | | | | | 14,102,688 | |
| | | | | |
| | | | Commercial Services & Supplies – 0.3% | | | | | | | | | | | | |
| | | | | |
| | 3,399 | | | Cintas Corporation | | | | | | | | | | | | | | | 362,571 | |
| | | | | |
| | 6,915 | | | Pitney Bowes Inc. | | | | | | | | | | | | | | | 123,364 | |
| | | | | |
| | 9,234 | | | Republic Services, Inc. | | | | | | | | | | | | | | | 485,985 | |
| | | | | |
| | 3,405 | | | Stericycle Inc., (2) | | | | | | | | | | | | | | | 272,706 | |
| | | | | |
| | 16,083 | | | Waste Management, Inc. | | | | | | | | | | | | | | | 1,056,010 | |
| | | | Total Commercial Services & Supplies | | | | | | | | | | | | | | | 2,300,636 | |
| | | | | |
| | | | Communications Equipment – 1.0% | | | | | | | | | | | | |
| | | | | |
| | 187,425 | | | Cisco Systems, Inc. | | | | | | | | | | | | | | | 5,750,199 | |
| | | | | |
| | 2,468 | | | F5 Networks, Inc., (2) | | | | | | | | | | | | | | | 341,102 | |
| | | | | |
| | 4,578 | | | Harris Corporation | | | | | | | | | | | | | | | 408,403 | |
| | | | | |
| | 14,194 | | | Juniper Networks Inc. | | | | | | | | | | | | | | | 373,870 | |
| | | | | |
| | 6,156 | | | Motorola Solutions Inc. | | | | | | | | | | | | | | | 446,802 | |
| | | | Total Communications Equipment | | | | | | | | | | | | | | | 7,320,376 | |
| | | | | |
| | | | Construction & Engineering – 0.1% | | | | | | | | | | | | |
| | | | | |
| | 5,189 | | | Fluor Corporation | | | | | | | | | | | | | | | 269,776 | |
| | | | | |
| | 4,847 | | | Jacobs Engineering Group, Inc., (2) | | | | | | | | | | | | | | | 250,008 | |
| | | | | |
| | 6,535 | | | Quanta Services Incorporated, (2) | | | | | | | | | | | | | | | 187,881 | |
| | | | Total Construction & Engineering | | | | | | | | | | | | | | | 707,665 | |
| | | | | |
| | | | Construction Materials – 0.1% | | | | | | | | | | | | |
| | | | | |
| | 2,285 | | | Martin Marietta Materials | | | | | | | | | | | | | | | 423,593 | |
| | | | | |
| | 5,082 | | | Vulcan Materials Company | | | | | | | | | | | | | | | 575,282 | |
| | | | Total Construction Materials | | | | | | | | | | | | | | | 998,875 | |
| | | | | |
| | | | Consumer Finance – 0.7% | | | | | | | | | | | | |
| | | | | |
| | 28,916 | | | American Express Company | | | | | | | | | | | | | | | 1,920,601 | |
| | | | | |
| | 18,858 | | | Capital One Financial Corporation | | | | | | | | | | | | | | | 1,396,246 | |
| | | | | |
| | 15,041 | | | Discover Financial Services | | | | | | | | | | | | | | | 847,260 | |
| | | | | |
| | 13,898 | | | Navient Corporation | | | | | | | | | | | | | | | 177,616 | |
| | | | | |
| | 23,362 | | | Synchrony Financial | | | | | | | | | | | | | | | 667,920 | |
| | | | Total Consumer Finance | | | | | | | | | | | | | | | 5,009,643 | |
| | | | | |
| | | | Containers & Packaging – 0.3% | | | | | | | | | | | | |
| | | | | |
| | 3,670 | | | Avery Dennison Corporation | | | | | | | | | | | | | | | 256,129 | |
| | | | | |
| | 5,545 | | | Ball Corporation | | | | | | | | | | | | | | | 427,353 | |
| | | | | |
| | 15,955 | | | International Paper Company | | | | | | | | | | | | | | | 718,454 | |
| | | | | |
| | 6,135 | | | Owens-Illinois, Inc., (2) | | | | | | | | | | | | | | | 118,406 | |
Nuveen Equity Index Fund (continued)
| | |
| Portfolio of Investments | | October 31, 2016 |
| | | | | | | | | | | | | | | | | | | | |
| Shares | | | Description (1) | | | | | | | | | | | Value | |
| | | | | |
| | | | Containers & Packaging (continued) | | | | | | | | | | | | |
| | | | | |
| | 7,605 | | | Sealed Air Corporation | | | | | | | | | | | | | | $ | 347,016 | |
| | | | | |
| | 9,850 | | | WestRock Company | | | | | | | | | | | | | | | 454,972 | |
| | | | Total Containers & Packaging | | | | | | | | | | | | | | | 2,322,330 | |
| | | | | |
| | | | Distributors – 0.1% | | | | | | | | | | | | |
| | | | | |
| | 5,550 | | | Genuine Parts Company | | | | | | | | | | | | | | | 502,775 | |
| | | | | |
| | 9,149 | | | LKQ Corporation, (2) | | | | | | | | | | | | | | | 295,330 | |
| | | | Total Distributors | | | | | | | | | | | | | | | 798,105 | |
| | | | | |
| | | | Diversified Consumer Services – 0.0% | | | | | | | | | | | | |
| | | | | |
| | 8,165 | | | H & R Block Inc. | | | | | | | | | | | | | | | 187,550 | |
| | | | | |
| | | | Diversified Financial Services – 1.5% | | | | | | | | | | | | |
| | | | | |
| | 70,751 | | | Berkshire Hathaway Inc., Class B, (2) | | | | | | | | | | | | | | | 10,209,369 | |
| | | | | |
| | 13,797 | | | Leucadia National Corporation | | | | | | | | | | | | | | | 257,590 | |
| | | | Total Diversified Financial Services | | | | | | | | | | | | | | | 10,466,959 | |
| | | | | |
| | | | Diversified Telecommunication Services – 2.4% | | | | | | | | | | | | |
| | | | | |
| | 229,244 | | | AT&T Inc. | | | | | | | | | | | | | | | 8,433,887 | |
| | | | | |
| | 20,345 | | | CenturyLink Inc. | | | | | | | | | | | | | | | 540,770 | |
| | | | | |
| | 44,316 | | | Frontier Communications Corporation, (3) | | | | | | | | | | | | | | | 178,150 | |
| | | | | |
| | 11,570 | | | Level 3 Communications Inc., (2) | | | | | | | | | | | | | | | 649,656 | |
| | | | | |
| | 151,885 | | | Verizon Communications Inc. | | | | | | | | | | | | | | | 7,305,670 | |
| | | | Total Diversified Telecommunication Services | | | | | | | | | | | | | | | 17,108,133 | |
| | | | | |
| | | | Electric Utilities – 2.0% | | | | | | | | | | | | |
| | | | | |
| | 6,028 | | | Alliant Energy Corporation | | | | | | | | | | | | | | | 229,365 | |
| | | | | |
| | 18,323 | | | American Electric Power Company, Inc. | | | | | | | | | | | | | | | 1,188,063 | |
| | | | | |
| | 25,673 | | | Duke Energy Corporation | | | | | | | | | | | | | | | 2,054,353 | |
| | | | | |
| | 12,444 | | | Edison International | | | | | | | | | | | | | | | 914,385 | |
| | | | | |
| | 6,670 | | | Entergy Corporation | | | | | | | | | | | | | | | 491,446 | |
| | | | | |
| | 11,820 | | | Eversource Energy | | | | | | | | | | | | | | | 650,809 | |
| | | | | |
| | 34,389 | | | Exelon Corporation | | | | | | | | | | | | | | | 1,171,633 | |
| | | | | |
| | 15,844 | | | FirstEnergy Corp. | | | | | | | | | | | | | | | 543,291 | |
| | | | | |
| | 17,405 | | | NextEra Energy Inc. | | | | | | | | | | | | | | | 2,227,840 | |
| | | | | |
| | 18,576 | | | PG&E Corporation | | | | | | | | | | | | | | | 1,153,941 | |
| | | | | |
| | 4,447 | | | Pinnacle West Capital Corporation | | | | | | | | | | | | | | | 338,550 | |
| | | | | |
| | 25,268 | | | PPL Corporation | | | | | | | | | | | | | | | 867,703 | |
| | | | | |
| | 35,423 | | | Southern Company | | | | | | | | | | | | | | | 1,826,764 | |
| | | | | |
| | 19,695 | | | Xcel Energy, Inc., (3) | | | | | | | | | | | | | | | 818,327 | |
| | | | Total Electric Utilities | | | | | | | | | | | | | | | 14,476,470 | |
| | | | | |
| | | | Electrical Equipment – 0.5% | | | | | | | | | | | | |
| | | | | |
| | 958 | | | Acuity Brands Inc. | | | | | | | | | | | | | | | 214,180 | |
| | | | | |
| | 9,141 | | | Ametek Inc. | | | | | | | | | | | | | | | 403,118 | |
| | | | | | | | | | | | | | | | | | | | |
| Shares | | | Description (1) | | | | | | | | | | | Value | |
| | | | | |
| | | | Electrical Equipment (continued) | | | | | | | | | | | | |
| | | | | |
| | 17,289 | | | Eaton PLC | | | | | | | | | | | | | | $ | 1,102,520 | |
| | | | | |
| | 23,981 | | | Emerson Electric Company | | | | | | | | | | | | | | | 1,215,357 | |
| | | | | |
| | 5,381 | | | Rockwell Automation, Inc. | | | | | | | | | | | | | | | 644,213 | |
| | | | Total Electrical Equipment | | | | | | | | | | | | | | | 3,579,388 | |
| | | | | |
| | | | Electronic Equipment, Instruments & Components – 0.4% | | | | | | | | | | | | |
| | | | | |
| | 11,505 | | | Amphenol Corporation, Class A | | | | | | | | | | | | | | | 758,525 | |
| | | | | |
| | 43,185 | | | Corning Incorporated | | | | | | | | | | | | | | | 980,731 | |
| | | | | |
| | 5,115 | | | FLIR Systems Inc. | | | | | | | | | | | | | | | 168,386 | |
| | | | | |
| | 13,250 | | | TE Connectivity Limited | | | | | | | | | | | | | | | 833,028 | |
| | | | Total Electronic Equipment, Instruments & Components | | | | | | | | | | | | | | | 2,740,670 | |
| | | | | |
| | | | Energy Equipment & Services – 1.0% | | | | | | | | | | | | |
| | | | | |
| | 15,946 | | | Baker Hughes Incorporated | | | | | | | | | | | | | | | 883,408 | |
| | | | | |
| | 8,408 | | | FMC Technologies Inc., (2) | | | | | | | | | | | | | | | 271,326 | |
| | | | | |
| | 32,088 | | | Halliburton Company | | | | | | | | | | | | | | | 1,476,048 | |
| | | | | |
| | 3,941 | | | Helmerich & Payne Inc. | | | | | | | | | | | | | | | 248,717 | |
| | | | | |
| | 14,071 | | | National-Oilwell Varco Inc. | | | | | | | | | | | | | | | 451,679 | |
| | | | | |
| | 51,822 | | | Schlumberger Limited | | | | | | | | | | | | | | | 4,054,035 | |
| | | | | |
| | 12,798 | | | Transocean Inc., (3) | | | | | | | | | | | | | | | 122,989 | |
| | | | Total Energy Equipment & Services | | | | | | | | | | | | | | | 7,508,202 | |
| | | | | |
| | | | Equity Real Estate Investment Trust – 2.8% | | | | | | | | | | | | |
| | | | | |
| | 15,855 | | | American Tower Corporation | | | | | | | | | | | | | | | 1,858,047 | |
| | | | | |
| | 6,271 | | | Apartment Investment & Management Company, Class A | | | | | | | | | | | | | | | 276,363 | |
| | | | | |
| | 5,116 | | | AvalonBay Communities, Inc. | | | | | | | | | | | | | | | 875,757 | |
| | | | | |
| | 5,727 | | | Boston Properties, Inc., (3) | | | | | | | | | | | | | | | 689,989 | |
| | | | | |
| | 12,579 | | | Crown Castle International Corporation | | | | | | | | | | | | | | | 1,144,563 | |
| | | | | |
| | 5,712 | | | Digital Realty Trust Inc., (3) | | | | | | | | | | | | | | | 533,672 | |
| | | | | |
| | 2,734 | | | Equinix Inc. | | | | | | | | | | | | | | | 976,804 | |
| | | | | |
| | 13,621 | | | Equity Residential | | | | | | | | | | | | | | | 841,097 | |
| | | | | |
| | 1,855 | | | Essex Property Trust Inc. | | | | | | | | | | | | | | | 397,137 | |
| | | | | |
| | 4,688 | | | Extra Space Storage Inc. | | | | | | | | | | | | | | | 342,927 | |
| | | | | |
| | 2,643 | | | Federal Realty Investment Trust | | | | | | | | | | | | | | | 383,843 | |
| | | | | |
| | 21,759 | | | General Growth Properties Inc. | | | | | | | | | | | | | | | 542,887 | |
| | | | | |
| | 17,424 | | | Health Care Property Investors Inc. | | | | | | | | | | | | | | | 596,772 | |
| | | | | |
| | 27,667 | | | Host Hotels & Resorts Inc. | | | | | | | | | | | | | | | 428,285 | |
| | | | | |
| | 7,699 | | | Iron Mountain Inc. | | | | | | | | | | | | | | | 259,687 | |
| | | | | |
| | 15,652 | | | Kimco Realty Corporation | | | | | | | | | | | | | | | 416,500 | |
| | | | | |
| | 4,495 | | | Macerich Company | | | | | | | | | | | | | | | 318,156 | |
| | | | | |
| | 19,635 | | | Prologis Inc. | | | | | | | | | | | | | | | 1,024,162 | |
| | | | | |
| | 5,556 | | | Public Storage, Inc. | | | | | | | | | | | | | | | 1,187,428 | |
Nuveen Equity Index Fund (continued)
| | |
| Portfolio of Investments | | October 31, 2016 |
| | | | | | | | | | | | | | | | | | | | |
| Shares | | | Description (1) | | | | | | | | | | | Value | |
| | | | | |
| | | | Equity Real Estate Investment Trust (continued) | | | | | | | | | | | | |
| | | | | |
| | 9,834 | | | Realty Income Corporation | | | | | | | | | | | | | | $ | 582,566 | |
| | | | | |
| | 11,709 | | | Simon Property Group, Inc. | | | | | | | | | | | | | | | 2,177,406 | |
| | | | | |
| | 4,109 | | | SL Green Realty Corporation | | | | | | | | | | | | | | | 403,586 | |
| | | | | |
| | 9,911 | | | UDR Inc. | | | | | | | | | | | | | | | 346,588 | |
| | | | | |
| | 13,092 | | | Ventas Inc. | | | | | | | | | | | | | | | 886,983 | |
| | | | | |
| | 6,403 | | | Vornado Realty Trust | | | | | | | | | | | | | | | 594,070 | |
| | | | | |
| | 13,338 | | | Welltower Inc. | | | | | | | | | | | | | | | 914,053 | |
| | | | | |
| | 27,900 | | | Weyerhaeuser Company | | | | | | | | | | | | | | | 835,047 | |
| | | | Total Equity Real Estate Investment Trust | | | | | | | | | | | | | | | 19,834,375 | |
| | | | | |
| | | | Food & Staples Retailing – 2.1% | | | | | | | | | | | | |
| | | | | |
| | 16,323 | | | Costco Wholesale Corporation | | | | | | | | | | | | | | | 2,413,682 | |
| | | | | |
| | 39,730 | | | CVS Health Corporation | | | | | | | | | | | | | | | 3,341,293 | |
| | | | | |
| | 35,362 | | | Kroger Co. | | | | | | | | | | | | | | | 1,095,515 | |
| | | | | |
| | 19,257 | | | Sysco Corporation | | | | | | | | | | | | | | | 926,647 | |
| | | | | |
| | 31,861 | | | Walgreens Boots Alliance Inc. | | | | | | | | | | | | | | | 2,635,861 | |
| | | | | |
| | 56,480 | | | Wal-Mart Stores, Inc. | | | | | | | | | | | | | | | 3,954,730 | |
| | | | | |
| | 11,879 | | | Whole Foods Market, Inc., (3) | | | | | | | | | | | | | | | 336,057 | |
| | | | Total Food & Staples Retailing | | | | | | | | | | | | | | | 14,703,785 | |
| | | | | |
| | | | Food Products – 1.7% | | | | | | | | | | | | |
| | | | | |
| | 21,679 | | | Archer-Daniels-Midland Company | | | | | | | | | | | | | | | 944,554 | |
| | | | | |
| | 7,228 | | | Campbell Soup Company | | | | | | | | | | | | | | | 392,770 | |
| | | | | |
| | 15,531 | | | ConAgra Foods, Inc. | | | | | | | | | | | | | | | 748,284 | |
| | | | | |
| | 22,248 | | | General Mills, Inc. | | | | | | | | | | | | | | | 1,378,931 | |
| | | | | |
| | 5,231 | | | Hershey Foods Corporation | | | | | | | | | | | | | | | 535,968 | |
| | | | | |
| | 10,069 | | | Hormel Foods Corporation | | | | | | | | | | | | | | | 387,657 | |
| | | | | |
| | 4,098 | | | JM Smucker Company | | | | | | | | | | | | | | | 538,108 | |
| | | | | |
| | 9,397 | | | Kellogg Company | | | | | | | | | | | | | | | 705,997 | |
| | | | | |
| | 22,203 | | | Kraft Heinz Company | | | | | | | | | | | | | | | 1,974,957 | |
| | | | | |
| | 4,476 | | | McCormick & Company, Incorporated | | | | | | | | | | | | | | | 429,114 | |
| | | | | |
| | 6,882 | | | Mead Johnson Nutrition Company, Class A Shares | | | | | | | | | | | | | | | 514,567 | |
| | | | | |
| | 57,964 | | | Mondelez International Inc. | | | | | | | | | | | | | | | 2,604,902 | |
| | | | | |
| | 12,127 | | | Tyson Foods, Inc., Class A | | | | | | | | | | | | | | | 859,198 | |
| | | | Total Food Products | | | | | | | | | | | | | | | 12,015,007 | |
| | | | | |
| | | | Health Care Equipment & Supplies – 2.5% | | | | | | | | | | | | |
| | | | | |
| | 54,778 | | | Abbott Laboratories | | | | | | | | | | | | | | | 2,149,489 | |
| | | | | |
| | 21,102 | | | Baxter International, Inc. | | | | | | | | | | | | | | | 1,004,244 | |
| | | | | |
| | 8,438 | | | Becton, Dickinson and Company | | | | | | | | | | | | | | | 1,416,825 | |
| | | | | |
| | 53,934 | | | Boston Scientific Corporation, (2) | | | | | | | | | | | | | | | 1,186,548 | |
| | | | | |
| | 2,978 | | | C. R. Bard, Inc. | | | | | | | | | | | | | | | 645,273 | |
| | | | | | | | | | | | | | | | | | | | |
| Shares | | | Description (1) | | | | | | | | | | | Value | |
| | | | | |
| | | | Health Care Equipment & Supplies (continued) | | | | | | | | | | | | |
| | | | | |
| | 820 | | | Cooper Companies, Inc. | | | | | | | | | | | | | | $ | 144,353 | |
| | | | | |
| | 22,562 | | | Danaher Corporation | | | | | | | | | | | | | | | 1,772,245 | |
| | | | | |
| | 5,611 | | | Dentsply Sirona Inc. | | | | | | | | | | | | | | | 323,025 | |
| | | | | |
| | 8,630 | | | Edwards Lifesciences Corporation, (2) | | | | | | | | | | | | | | | 821,749 | |
| | | | | |
| | 2,329 | | | Hologic Inc., (2) | | | | | | | | | | | | | | | 83,867 | |
| | | | | |
| | 1,486 | | | Intuitive Surgical, Inc., (2) | | | | | | | | | | | | | | | 998,711 | |
| | | | | |
| | 51,495 | | | Medtronic, PLC | | | | | | | | | | | | | | | 4,223,620 | |
| | | | | |
| | 11,306 | | | Saint Jude Medical Inc. | | | | | | | | | | | | | | | 880,059 | |
| | | | | |
| | 11,576 | | | Stryker Corporation | | | | | | | | | | | | | | | 1,335,292 | |
| | | | | |
| | 3,961 | | | Varian Medical Systems, Inc., (2) | | | | | | | | | | | | | | | 359,382 | |
| | | | | |
| | 6,856 | | | Zimmer Biomet Holdings, Inc. | | | | | | | | | | | | | | | 722,622 | |
| | | | Total Health Care Equipment & Supplies | | | | | | | | | | | | | | | 18,067,304 | |
| | | | | |
| | | | Health Care Providers & Services – 2.4% | | | | | | | | | | | | |
| | | | | |
| | 13,990 | | | Aetna Inc. | | | | | | | | | | | | | | | 1,501,828 | |
| | | | | |
| | 6,737 | | | AmerisourceBergen Corporation | | | | | | | | | | | | | | | 473,746 | |
| | | | | |
| | 9,808 | | | Anthem Inc. | | | | | | | | | | | | | | | 1,195,203 | |
| | | | | |
| | 11,872 | | | Cardinal Health, Inc. | | | | | | | | | | | | | | | 815,488 | |
| | | | | |
| | 2,920 | | | Centene Corporation, (2) | | | | | | | | | | | | | | | 182,442 | |
| | | | | |
| | 9,561 | | | CIGNA Corporation | | | | | | | | | | | | | | | 1,136,134 | |
| | | | | |
| | 6,167 | | | Davita Inc., (2) | | | | | | | | | | | | | | | 361,510 | |
| | | | | |
| | 23,484 | | | Express Scripts, Holding Company, (2) | | | | | | | | | | | | | | | 1,582,822 | |
| | | | | |
| | 11,006 | | | HCA Holdings Inc., (2) | | | | | | | | | | | | | | | 842,289 | |
| | | | | |
| | 3,346 | | | Henry Schein Inc., (2) | | | | | | | | | | | | | | | 499,223 | |
| | | | | |
| | 5,946 | | | Humana Inc. | | | | | | | | | | | | | | | 1,019,917 | |
| | | | | |
| | 3,709 | | | Laboratory Corporation of America Holdings, (2) | | | | | | | | | | | | | | | 464,886 | |
| | | | | |
| | 8,410 | | | McKesson HBOC Inc. | | | | | | | | | | | | | | | 1,069,500 | |
| | | | | |
| | 3,484 | | | Patterson Companies, Inc. | | | | | | | | | | | | | | | 148,802 | |
| | | | | |
| | 5,760 | | | Quest Diagnostics Incorporated | | | | | | | | | | | | | | | 469,094 | |
| | | | | |
| | 35,489 | | | UnitedHealth Group Incorporated | | | | | | | | | | | | | | | 5,015,660 | |
| | | | | |
| | 3,378 | | | Universal Health Services, Inc., Class B | | | | | | | | | | | | | | | 407,758 | |
| | | | Total Health Care Providers & Services | | | | | | | | | | | | | | | 17,186,302 | |
| | | | | |
| | | | Health Care Technology – 0.1% | | | | | | | | | | | | |
| | | | | |
| | 11,843 | | | Cerner Corporation, (2) | | | | | | | | | | | | | | | 693,763 | |
| | | | | |
| | | | Hotels, Restaurants & Leisure – 1.5% | | | | | | | | | | | | |
| | | | | |
| | 16,132 | | | Carnival Corporation | | | | | | | | | | | | | | | 792,081 | |
| | | | | |
| | 1,085 | | | Chipotle Mexican Grill, (2), (3) | | | | | | | | | | | | | | | 391,425 | |
| | | | | |
| | 4,576 | | | Darden Restaurants, Inc. | | | | | | | | | | | | | | | 296,479 | |
| | | | | |
| | 11,918 | | | Marriott International, Inc., Class A | | | | | | | | | | | | | | | 818,780 | |
| | | | | |
| | 31,799 | | | McDonald’s Corporation | | | | | | | | | | | | | | | 3,579,613 | |
Nuveen Equity Index Fund (continued)
| | |
| Portfolio of Investments | | October 31, 2016 |
| | | | | | | | | | | | | | | | | | | | |
| Shares | | | Description (1) | | | | | | | | | | | Value | |
| | | | | |
| | | | Hotels, Restaurants & Leisure (continued) | | | | | | | | | | | | |
| | | | | |
| | 6,256 | | | Royal Caribbean Cruises Limited | | | | | | | | | | | | | | $ | 480,899 | |
| | | | | |
| | 54,650 | | | Starbucks Corporation | | | | | | | | | | | | | | | 2,900,277 | |
| | | | | |
| | 4,095 | | | Wyndham Worldwide Corporation | | | | | | | | | | | | | | | 269,615 | |
| | | | | |
| | 3,260 | | | Wynn Resorts Ltd | | | | | | | | | | | | | | | 308,233 | |
| | | | | |
| | 14,096 | | | YUM! Brands, Inc. | | | | | | | | | | | | | | | 1,216,203 | |
| | | | Total Hotels, Restaurants & Leisure | | | | | | | | | | | | | | | 11,053,605 | |
| | | | | |
| | | | Household Durables – 0.4% | | | | | | | | | | | | |
| | | | | |
| | 12,845 | | | D.R. Horton, Inc. | | | | | | | | | | | | | | | 370,321 | |
| | | | | |
| | 4,545 | | | Garmin Limited | | | | | | | | | | | | | | | 219,796 | |
| | | | | |
| | 2,761 | | | Harman International Industries Inc. | | | | | | | | | | | | | | | 220,079 | |
| | | | | |
| | 5,265 | | | Leggett and Platt Inc. | | | | | | | | | | | | | | | 241,558 | |
| | | | | |
| | 7,043 | | | Lennar Corporation, Class A | | | | | | | | | | | | | | | 293,623 | |
| | | | | |
| | 2,468 | | | Mohawk Industries Inc., (2) | | | | | | | | | | | | | | | 454,852 | |
| | | | | |
| | 12,717 | | | Newell Rubbermaid Inc. | | | | | | | | | | | | | | | 610,670 | |
| | | | | |
| | 12,883 | | | PulteGroup Inc. | | | | | | | | | | | | | | | 239,624 | |
| | | | | |
| | 2,997 | | | Whirlpool Corporation | | | | | | | | | | | | | | | 449,011 | |
| | | | Total Household Durables | | | | | | | | | | | | | | | 3,099,534 | |
| | | | | |
| | | | Household Products – 1.9% | | | | | | | | | | | | |
| | | | | |
| | 7,252 | | | Church & Dwight Company Inc. | | | | | | | | | | | | | | | 349,982 | |
| | | | | |
| | 5,163 | | | Clorox Company | | | | | | | | | | | | | | | 619,663 | |
| | | | | |
| | 34,071 | | | Colgate-Palmolive Company | | | | | | | | | | | | | | | 2,431,307 | |
| | | | | |
| | 13,401 | | | Kimberly-Clark Corporation | | | | | | | | | | | | | | | 1,533,208 | |
| | | | | |
| | 99,446 | | | Procter & Gamble Company | | | | | | | | | | | | | | | 8,631,913 | |
| | | | Total Household Products | | | | | | | | | | | | | | | 13,566,073 | |
| | |
| | | | Independent Power & Renewable Electricity Producers – 0.1% | | | | |
| | | | | |
| | 25,602 | | | AES Corporation | | | | | | | | | | | | | | | 301,336 | |
| | | | | |
| | 13,326 | | | NRG Energy Inc. | | | | | | | | | | | | | | | 141,655 | |
| | | | Total Independent Power & Renewable Electricity Producers | | | | | | | | | | | | | | | 442,991 | |
| | | | | |
| | | | Industrial Conglomerates – 2.4% | | | | | | | | | | | | |
| | | | | |
| | 22,522 | | | 3M Co. | | | | | | | | | | | | | | | 3,722,887 | |
| | | | | |
| | 333,927 | | | General Electric Company | | | | | | | | | | | | | | | 9,717,276 | |
| | | | | |
| | 28,353 | | | Honeywell International Inc. | | | | | | | | | | | | | | | 3,109,757 | |
| | | | | |
| | 3,784 | | | Roper Technologies, Inc. | | | | | | | | | | | | | | | 655,805 | |
| | | | Total Industrial Conglomerates | | | | | | | | | | | | | | | 17,205,725 | |
| | | | | |
| | | | Insurance – 2.6% | | | | | | | | | | | | |
| | | | | |
| | 17,330 | | | Ace Limited | | | | | | | | | | | | | | | 2,200,910 | |
| | | | | |
| | 15,263 | | | AFLAC Incorporated | | | | | | | | | | | | | | | 1,051,163 | |
| | | | | |
| | 13,875 | | | Allstate Corporation | | | | | | | | | | | | | | | 942,113 | |
| | | | | |
| | 37,902 | | | American International Group, Inc. | | | | | | | | | | | | | | | 2,338,553 | |
| | | | | | | | | | | | | | | | | | | | |
| Shares | | | Description (1) | | | | | | | | | | | Value | |
| | | | | |
| | | | Insurance (continued) | | | | | | | | | | | | |
| | | | | |
| | 11,239 | | | AON PLC | | | | | | | | | | | | | | $ | 1,245,618 | |
| | | | | |
| | 3,298 | | | Arthur J. Gallagher & Co. | | | | | | | | | | | | | | | 159,063 | |
| | | | | |
| | 2,682 | | | Assurant Inc. | | | | | | | | | | | | | | | 215,955 | |
| | | | | |
| | 5,927 | | | Cincinnati Financial Corporation | | | | | | | | | | | | | | | 419,513 | |
| | | | | |
| | 15,393 | | | Hartford Financial Services Group, Inc. | | | | | | | | | | | | | | | 678,985 | |
| | | | | |
| | 8,674 | | | Lincoln National Corporation | | | | | | | | | | | | | | | 425,807 | |
| | | | | |
| | 10,392 | | | Loews Corporation | | | | | | | | | | | | | | | 447,168 | |
| | | | | |
| | 20,226 | | | Marsh & McLennan Companies, Inc. | | | | | | | | | | | | | | | 1,282,126 | |
| | | | | |
| | 40,948 | | | MetLife, Inc. | | | | | | | | | | | | | | | 1,922,918 | |
| | | | | |
| | 9,967 | | | Principal Financial Group, Inc. | | | | | | | | | | | | | | | 544,198 | |
| | | | | |
| | 21,684 | | | Progressive Corporation | | | | | | | | | | | | | | | 683,263 | |
| | | | | |
| | 16,285 | | | Prudential Financial, Inc. | | | | | | | | | | | | | | | 1,380,805 | |
| | | | | |
| | 4,002 | | | Torchmark Corporation | | | | | | | | | | | | | | | 253,767 | |
| | | | | |
| | 10,742 | | | Travelers Companies, Inc. | | | | | | | | | | | | | | | 1,162,070 | |
| | | | | |
| | 9,899 | | | Unum Group | | | | | | | | | | | | | | | 350,425 | |
| | | | | |
| | 4,115 | | | Willis Towers Watson PLC | | | | | | | | | | | | | | | 518,079 | |
| | | | | |
| | 11,601 | | | XL Group Limited | | | | | | | | | | | | | | | 402,555 | |
| | | | Total Insurance | | | | | | | | | | | | | | | 18,625,054 | |
| | | | | |
| | | | Internet and Direct Marketing Retail – 2.4% | | | | | | | | | | | | |
| | | | | |
| | 14,663 | | | Amazon.com, Inc., (2) | | | | | | | | | | | | | | | 11,581,131 | |
| | | | | |
| | 4,016 | | | Expedia, Inc. | | | | | | | | | | | | | | | 518,988 | |
| | | | | |
| | 16,946 | | | NetFlix.com Inc., (2) | | | | | | | | | | | | | | | 2,116,047 | |
| | | | | |
| | 1,869 | | | priceline.com Incorporated, (2), (3) | | | | | | | | | | | | | | | 2,755,336 | |
| | | | | |
| | 4,531 | | | TripAdvisor Inc., (2) | | | | | | | | | | | | | | | 292,159 | |
| | | | Total Internet and Direct Marketing Retail | | | | | | | | | | | | | | | 17,263,661 | |
| | | | | |
| | | | Internet Software & Services – 4.5% | | | | | | | | | | | | |
| | | | | |
| | 6,859 | | | Akamai Technologies, Inc., (2) | | | | | | | | | | | | | | | 476,495 | |
| | | | | |
| | 10,987 | | | Alphabet Inc., Class A, (2) | | | | | | | | | | | | | | | 8,898,371 | |
| | | | | |
| | 11,012 | | | Alphabet Inc., Class C Shares, (2) | | | | | | | | | | | | | | | 8,639,354 | |
| | | | | |
| | 41,236 | | | eBay Inc., (2) | | | | | | | | | | | | | | | 1,175,638 | |
| | | | | |
| | 86,561 | | | Facebook Inc., Class A Shares, (2) | | | | | | | | | | | | | | | 11,338,625 | |
| | | | | |
| | 4,008 | | | VeriSign, Inc., (2), (3) | | | | | | | | | | | | | | | 336,752 | |
| | | | | |
| | 33,802 | | | Yahoo! Inc., (2) | | | | | | | | | | | | | | | 1,404,473 | |
| | | | Total Internet Software & Services | | | | | | | | | | | | | | | 32,269,708 | |
| | | | | |
| | | | IT Services – 3.6% | | | | | | | | | | | | |
| | | | | |
| | 23,199 | | | Accenture Limited | | | | | | | | | | | | | | | 2,696,652 | |
| | | | | |
| | 2,300 | | | Alliance Data Systems Corporation | | | | | | | | | | | | | | | 470,281 | |
| | | | | |
| | 16,999 | | | Automatic Data Processing, Inc. | | | | | | | | | | | | | | | 1,479,933 | |
| | | | | |
| | 22,616 | | | Cognizant Technology Solutions Corporation, Class A, (2) | | | | | | | | | | | | | | | 1,161,332 | |
Nuveen Equity Index Fund (continued)
| | |
| Portfolio of Investments | | October 31, 2016 |
| | | | | | | | | | | | | | | | | | | | |
| Shares | | | Description (1) | | | | | | | | | | | Value | |
| | | | | |
| | | | IT Services (continued) | | | | | | | | | | | | |
| | | | | |
| | 5,552 | | | CSRA Inc. | | | | | | | | | | | | | | $ | 139,300 | |
| | | | | |
| | 10,714 | | | Fidelity National Information Services | | | | | | | | | | | | | | | 791,979 | |
| | | | | |
| | 8,652 | | | Fiserv, Inc., (2) | | | | | | | | | | | | | | | 852,049 | |
| | | | | |
| | 3,378 | | | Global Payments Inc. | | | | | | | | | | | | | | | 244,973 | |
| | | | | |
| | 32,412 | | | International Business Machines Corporation (IBM) | | | | | | | | | | | | | | | 4,981,400 | |
| | | | | |
| | 35,734 | | | MasterCard, Inc. | | | | | | | | | | | | | | | 3,824,253 | |
| | | | | |
| | 11,956 | | | Paychex, Inc. | | | | | | | | | | | | | | | 659,971 | |
| | | | | |
| | 41,825 | | | PayPal Holdings, Inc., (2) | | | | | | | | | | | | | | | 1,742,430 | |
| | | | | |
| | 5,162 | | | Teradata Corporation, (2) | | | | | | | | | | | | | | | 139,168 | |
| | | | | |
| | 6,539 | | | Total System Services Inc. | | | | | | | | | | | | | | | 326,165 | |
| | | | | |
| | 70,295 | | | Visa Inc. | | | | | | | | | | | | | | | 5,800,040 | |
| | | | | |
| | 18,175 | | | Western Union Company | | | | | | | | | | | | | | | 364,772 | |
| | | | | |
| | 31,717 | | | Xerox Corporation | | | | | | | | | | | | | | | 309,875 | |
| | | | Total IT Services | | | | | | | | | | | | | | | 25,984,573 | |
| | | | | |
| | | | Leisure Products – 0.1% | | | | | | | | | | | | |
| | | | | |
| | 4,512 | | | Hasbro, Inc. | | | | | | | | | | | | | | | 376,346 | |
| | | | | |
| | 13,545 | | | Mattel, Inc. | | | | | | | | | | | | | | | 427,074 | |
| | | | Total Leisure Products | | | | | | | | | | | | | | | 803,420 | |
| | | | | |
| | | | Life Sciences Tools & Services – 0.6% | | | | | | | | | | | | |
| | | | | |
| | 12,532 | | | Agilent Technologies, Inc. | | | | | | | | | | | | | | | 546,019 | |
| | | | | |
| | 5,909 | | | Illumina Inc., (2) | | | | | | | | | | | | | | | 804,451 | |
| | | | | |
| | 428 | | | Mettler-Toledo International Inc., (2) | | | | | | | | | | | | | | | 172,946 | |
| | | | | |
| | 4,551 | | | Perkinelmer Inc. | | | | | | | | | | | | | | | 231,600 | |
| | | | | |
| | 14,692 | | | Thermo Fisher Scientific, Inc. | | | | | | | | | | | | | | | 2,160,165 | |
| | | | | |
| | 3,301 | | | Waters Corporation, (2) | | | | | | | | | | | | | | | 459,301 | |
| | | | Total Life Sciences Tools & Services | | | | | | | | | | | | | | | 4,374,482 | |
| | | | | |
| | | | Machinery – 1.4% | | | | | | | | | | | | |
| | | | | |
| | 21,771 | | | Caterpillar Inc. | | | | | | | | | | | | | | | 1,817,008 | |
| | | | | |
| | 5,782 | | | Cummins Inc. | | | | | | | | | | | | | | | 739,055 | |
| | | | | |
| | 10,780 | | | Deere & Company, (3) | | | | | | | | | | | | | | | 951,874 | |
| | | | | |
| | 6,016 | | | Dover Corporation | | | | | | | | | | | | | | | 402,410 | |
| | | | | |
| | 5,014 | | | Flowserve Corporation | | | | | | | | | | | | | | | 212,343 | |
| | | | | |
| | 11,281 | | | Fortive Corporation | | | | | | | | | | | | | | | 575,895 | |
| | | | | |
| | 11,904 | | | Illinois Tool Works, Inc. | | | | | | | | | | | | | | | 1,351,937 | |
| | | | | |
| | 9,967 | | | Ingersoll Rand Company Limited, Class A | | | | | | | | | | | | | | | 670,679 | |
| | | | | |
| | 13,061 | | | PACCAR Inc. | | | | | | | | | | | | | | | 717,310 | |
| | | | | |
| | 5,242 | | | Parker Hannifin Corporation | | | | | | | | | | | | | | | 643,456 | |
| | | | | |
| | 7,079 | | | Pentair Limited | | | | | | | | | | | | | | | 390,265 | |
| | | | | |
| | 2,164 | | | Snap-on Incorporated | | | | | | | | | | | | | | | 333,472 | |
| | | | | | | | | | | | | | | | | | | | |
| Shares | | | Description (1) | | | | | | | | | | | Value | |
| | | | | |
| | | | Machinery (continued) | | | | | | | | | | | | |
| | | | | |
| | 5,911 | | | Stanley Black & Decker Inc. | | | | | | | | | | | | | | $ | 672,908 | |
| | | | | |
| | 6,927 | | | Xylem Inc. | | | | | | | | | | | | | | | 334,782 | |
| | | | Total Machinery | | | | | | | | | | | | | | | 9,813,394 | |
| | | | | |
| | | | Media – 2.8% | | | | | | | | | | | | |
| | | | | |
| | 16,368 | | | CBS Corporation, Class B | | | | | | | | | | | | | | | 926,756 | |
| | | | | |
| | 7,200 | | | Charter Communications, Inc., Class A, (2) | | | | | | | | | | | | | | | 1,799,208 | |
| | | | | |
| | 89,521 | | | Comcast Corporation, Class A | | | | | | | | | | | | | | | 5,534,188 | |
| | | | | |
| | 5,992 | | | Discovery Communications inc., Class A Shares, (2), (3) | | | | | | | | | | | | | | | 156,451 | |
| | | | | |
| | 9,236 | | | Discovery Communications Inc., Class C Shares, (2) | | | | | | | | | | | | | | | 231,916 | |
| | | | | |
| | 15,604 | | | Interpublic Group of Companies, Inc. | | | | | | | | | | | | | | | 349,374 | |
| | | | | |
| | 15,291 | | | News Corporation, Class A Shares | | | | | | | | | | | | | | | 185,327 | |
| | | | | |
| | 9,297 | | | Omnicom Group, Inc. | | | | | | | | | | | | | | | 742,087 | |
| | | | | |
| | 3,781 | | | Scripps Networks Interactive, Class A Shares | | | | | | | | | | | | | | | 243,345 | |
| | | | | |
| | 8,527 | | | TEGNA Inc. | | | | | | | | | | | | | | | 167,300 | |
| | | | | |
| | 28,985 | | | Time Warner Inc. | | | | | | | | | | | | | | | 2,579,351 | |
| | | | | |
| | 39,648 | | | Twenty First Century Fox Inc., Class A Shares | | | | | | | | | | | | | | | 1,041,553 | |
| | | | | |
| | 16,732 | | | Twenty First Century Fox Inc., Class B Shares | | | | | | | | | | | | | | | 441,557 | |
| | | | | |
| | 12,939 | | | Viacom Inc., Class B | | | | | | | | | | | | | | | 485,989 | |
| | | | | |
| | 55,096 | | | Walt Disney Company | | | | | | | | | | | | | | | 5,106,848 | |
| | | | Total Media | | | | | | | | | | | | | | | 19,991,250 | |
| | | | | |
| | | | Metals & Mining – 0.3% | | | | | | | | | | | | |
| | | | | |
| | 16,339 | | | Alcoa Inc. | | | | | | | | | | | | | | | 469,256 | |
| | | | | |
| | 45,403 | | | Freeport-McMoRan, Inc. | | | | | | | | | | | | | | | 507,606 | |
| | | | | |
| | 19,771 | | | Newmont Mining Corporation | | | | | | | | | | | | | | | 732,318 | |
| | | | | |
| | 11,863 | | | Nucor Corporation | | | | | | | | | | | | | | | 579,508 | |
| | | | Total Metals & Mining | | | | | | | | | | | | | | | 2,288,688 | |
| | | | | |
| | | | Multiline Retail – 0.5% | | | | | | | | | | | | |
| | | | | |
| | 9,659 | | | Dollar General Corporation | | | | | | | | | | | | | | | 667,340 | |
| | | | | |
| | 9,419 | | | Dollar Tree Stores Inc., (2) | | | | | | | | | | | | | | | 711,605 | |
| | | | | |
| | 7,082 | | | Kohl’s Corporation | | | | | | | | | | | | | | | 309,838 | |
| | | | | |
| | 11,494 | | | Macy’s, Inc. | | | | | | | | | | | | | | | 419,416 | |
| | | | | |
| | 5,590 | | | Nordstrom, Inc., (3) | | | | | | | | | | | | | | | 290,680 | |
| | | | | |
| | 21,422 | | | Target Corporation | | | | | | | | | | | | | | | 1,472,334 | |
| | | | Total Multiline Retail | | | | | | | | | | | | | | | 3,871,213 | |
| | | | | |
| | | | Multi-Utilities – 1.1% | | | | | | | | | | | | |
| | | | | |
| | 9,041 | | | Ameren Corporation | | | | | | | | | | | | | | | 451,598 | |
| | | | | |
| | 17,268 | | | CenterPoint Energy, Inc. | | | | | | | | | | | | | | | 393,710 | |
| | | | | |
| | 10,662 | | | CMS Energy Corporation | | | | | | | | | | | | | | | 449,403 | |
| | | | | |
| | 11,393 | | | Consolidated Edison, Inc. | | | | | | | | | | | | | | | 860,741 | |
Nuveen Equity Index Fund (continued)
| | |
| Portfolio of Investments | | October 31, 2016 |
| | | | | | | | | | | | | | | | | | | | |
| Shares | | | Description (1) | | | | | | | | | | | Value | |
| | | | | |
| | | | Multi-Utilities (continued) | | | | | | | | | | | | |
| | | | | |
| | 22,782 | | | Dominion Resources, Inc. | | | | | | | | | | | | | | $ | 1,713,206 | |
| | | | | |
| | 6,687 | | | DTE Energy Company | | | | | | | | | | | | | | | 642,019 | |
| | | | | |
| | 12,757 | | | NiSource Inc. | | | | | | | | | | | | | | | 296,728 | |
| | | | | |
| | 18,852 | | | Public Service Enterprise Group Incorporated | | | | | | | | | | | | | | | 793,292 | |
| | | | | |
| | 5,545 | | | Scana Corporation | | | | | | | | | | | | | | | 406,781 | |
| | | | | |
| | 9,150 | | | Sempra Energy | | | | | | | | | | | | | | | 979,965 | |
| | | | | |
| | 11,761 | | | WEC Energy Group, Inc. | | | | | | | | | | | | | | | 702,367 | |
| | | | Total Multi-Utilities | | | | | | | | | | | | | | | 7,689,810 | |
| | | | | |
| | | | Oil, Gas & Consumable Fuels – 5.8% | | | | | | | | | | | | |
| | | | | |
| | 19,731 | | | Anadarko Petroleum Corporation | | | | | | | | | | | | | | | 1,172,811 | |
| | | | | |
| | 14,139 | | | Apache Corporation | | | | | | | | | | | | | | | 840,988 | |
| | | | | |
| | 17,776 | | | Cabot Oil & Gas Corporation | | | | | | | | | | | | | | | 371,163 | |
| | | | | |
| | 22,842 | | | Chesapeake Energy Corporation, (3) | | | | | | | | | | | | | | | 125,859 | |
| | | | | |
| | 70,299 | | | Chevron Corporation | | | | | | | | | | | | | | | 7,363,820 | |
| | | | | |
| | 3,715 | | | Cimarex Energy Company | | | | | | | | | | | | | | | 479,718 | |
| | | | | |
| | 5,420 | | | Concho Resources Inc., (2) | | | | | | | | | | | | | | | 688,015 | |
| | | | | |
| | 46,150 | | | ConocoPhillips | | | | | | | | | | | | | | | 2,005,218 | |
| | | | | |
| | 19,512 | | | Devon Energy Corporation | | | | | | | | | | | | | | | 739,310 | |
| | | | | |
| | 20,519 | | | EOG Resources, Inc. | | | | | | | | | | | | | | | 1,855,328 | |
| | | | | |
| | 6,473 | | | EQT Corporation | | | | | | | | | | | | | | | 427,218 | |
| | | | | |
| | 154,519 | | | Exxon Mobil Corporation | | | | | | | | | | | | | | | 12,874,523 | |
| | | | | |
| | 9,677 | | | Hess Corporation | | | | | | | | | | | | | | | 464,206 | |
| | | | | |
| | 71,010 | | | Kinder Morgan, Inc. | | | | | | | | | | | | | | | 1,450,734 | |
| | | | | |
| | 31,571 | | | Marathon Oil Corporation | | | | | | | | | | | | | | | 416,106 | |
| | | | | |
| | 19,703 | | | Marathon Petroleum Corporation | | | | | | | | | | | | | | | 858,854 | |
| | | | | |
| | 6,031 | | | Murphy Oil Corporation | | | | | | | | | | | | | | | 156,022 | |
| | | | | |
| | 7,732 | | | Newfield Exploration Company, (2) | | | | | | | | | | | | | | | 313,842 | |
| | | | | |
| | 16,011 | | | Noble Energy, Inc. | | | | | | | | | | | | | | | 551,899 | |
| | | | | |
| | 28,466 | | | Occidental Petroleum Corporation | | | | | | | | | | | | | | | 2,075,456 | |
| | | | | |
| | 8,184 | | | ONEOK, Inc. | | | | | | | | | | | | | | | 396,351 | |
| | | | | |
| | 16,560 | | | Phillips 66 | | | | | | | | | | | | | | | 1,343,844 | |
| | | | | |
| | 6,320 | | | Pioneer Natural Resources Company, (3) | | | | | | | | | | | | | | | 1,131,406 | |
| | | | | |
| | 6,580 | | | Range Resources Corporation | | | | | | | | | | | | | | | 222,338 | |
| | | | | |
| | 19,191 | | | Southwestern Energy Company, (2) | | | | | | | | | | | | | | | 199,394 | |
| | | | | |
| | 26,735 | | | Spectra Energy Corporation | | | | | | | | | | | | | | | 1,117,790 | |
| | | | | |
| | 4,426 | | | Tesoro Corporation | | | | | | | | | | | | | | | 376,077 | |
| | | | | |
| | 17,191 | | | Valero Energy Corporation | | | | | | | | | | | | | | | 1,018,395 | |
| | | | | |
| | 25,451 | | | Williams Companies, Inc. | | | | | | | | | | | | | | | 743,169 | |
| | | | Total Oil, Gas & Consumable Fuels | | | | | | | | | | | | | | | 41,779,854 | |
| | | | | | | | | | | | | | | | | | | | |
| Shares | | | Description (1) | | | | | | | | | | | Value | |
| | | | | |
| | | | Personal Products – 0.1% | | | | | | | | | | | | |
| | | | | |
| | 9,683 | | | Coty Inc., Class A | | | | | | | | | | | | | | $ | 222,612 | |
| | | | | |
| | 9,064 | | | Estee Lauder Companies Inc., Class A | | | | | | | | | | | | | | | 789,746 | |
| | | | Total Personal Products | | | | | | | | | | | | | | | 1,012,358 | |
| | | | | |
| | | | Pharmaceuticals – 5.1% | | | | | | | | | | | | |
| | | | | |
| | 14,754 | | | Allergan PLC | | | | | | | | | | | | | | | 3,082,701 | |
| | | | | |
| | 62,262 | | | Bristol-Myers Squibb Company | | | | | | | | | | | | | | | 3,169,758 | |
| | | | | |
| | 36,197 | | | Eli Lilly and Company | | | | | | | | | | | | | | | 2,672,786 | |
| | | | | |
| | 7,802 | | | Endo International PLC, (2) | | | | | | | | | | | | | | | 146,288 | |
| | | | | |
| | 101,948 | | | Johnson & Johnson | | | | | | | | | | | | | | | 11,824,947 | |
| | | | | |
| | 4,639 | | | Mallinckrodt PLC, (2) | | | | | | | | | | | | | | | 274,907 | |
| | | | | |
| | 103,041 | | | Merck & Company Inc. | | | | | | | | | | | | | | | 6,050,566 | |
| | | | | |
| | 16,219 | | | Mylan NV, (2) | | | | | | | | | | | | | | | 591,994 | |
| | | | | |
| | 5,339 | | | Perrigo Company | | | | | | | | | | | | | | | 444,151 | |
| | | | | |
| | 226,026 | | | Pfizer Inc. | | | | | | | | | | | | | | | 7,167,284 | |
| | | | | |
| | 17,750 | | | Zoetis Incorporated | | | | | | | | | | | | | | | 848,450 | |
| | | | Total Pharmaceuticals | | | | | | | | | | | | | | | 36,273,832 | |
| | | | | |
| | | | Professional Services – 0.3% | | | | | | | | | | | | |
| | | | | |
| | 1,028 | | | Dun and Bradstreet Inc. | | | | | | | | | | | | | | | 128,346 | |
| | | | | |
| | 4,607 | | | Equifax Inc. | | | | | | | | | | | | | | | 571,130 | |
| | | | | |
| | 13,296 | | | Nielsen Holdings PLC | | | | | | | | | | | | | | | 598,586 | |
| | | | | |
| | 4,924 | | | Robert Half International Inc. | | | | | | | | | | | | | | | 184,256 | |
| | | | | |
| | 6,221 | | | Verisk Analytics Inc, Class A Shares, (2) | | | | | | | | | | | | | | | 507,323 | |
| | | | Total Professional Services | | | | | | | | | | | | | | | 1,989,641 | |
| | | | | |
| | | | Real Estate Management & Development – 0.0% | | | | | | | | | | | | |
| | | | | |
| | 11,131 | | | CBRE Group Inc., (2) | | | | | | | | | | | | | | | 286,735 | |
| | | | | |
| | | | Road & Rail – 0.8% | | | | | | | | | | | | |
| | | | | |
| | 35,251 | | | CSX Corporation | | | | | | | | | | | | | | | 1,075,508 | |
| | | | | |
| | 3,275 | | | J.B. Hunt Transports Serives Inc. | | | | | | | | | | | | | | | 267,273 | |
| | | | | |
| | 4,023 | | | Kansas City Southern Industries, (3) | | | | | | | | | | | | | | | 353,058 | |
| | | | | |
| | 10,938 | | | Norfolk Southern Corporation | | | | | | | | | | | | | | | 1,017,234 | |
| | | | | |
| | 1,992 | | | Ryder System, Inc. | | | | | | | | | | | | | | | 138,225 | |
| | | | | |
| | 30,742 | | | Union Pacific Corporation | | | | | | | | | | | | | | | 2,710,830 | |
| | | | Total Road & Rail | | | | | | | | | | | | | | | 5,562,128 | |
| | | | | |
| | | | Semiconductors & Semiconductor Equipment – 3.1% | | | | | | | | | | | | |
| | | | | |
| | 11,458 | | | Analog Devices, Inc. | | | | | | | | | | | | | | | 734,458 | |
| | | | | |
| | 40,278 | | | Applied Materials, Inc. | | | | | | | | | | | | | | | 1,171,284 | |
| | | | | |
| | 13,853 | | | Broadcom Limited | | | | | | | | | | | | | | | 2,358,889 | |
| | | | | |
| | 2,861 | | | First Solar Inc., (2), (3) | | | | | | | | | | | | | | | 115,842 | |
| | | | | |
| | 176,293 | | | Intel Corporation | | | | | | | | | | | | | | | 6,147,337 | |
Nuveen Equity Index Fund (continued)
| | |
| Portfolio of Investments | | October 31, 2016 |
| | | | | | | | | | | | | | | | | | | | |
| Shares | | | Description (1) | | | | | | | | | | | Value | |
| | | | | |
| | | | Semiconductors & Semiconductor Equipment (continued) | | | | | | | | | | | | |
| | | | | |
| | 5,812 | | | KLA-Tencor Corporation | | | | | | | | | | | | | | $ | 436,539 | |
| | | | | |
| | 5,972 | | | Lam Research Corporation | | | | | | | | | | | | | | | 578,448 | |
| | | | | |
| | 8,943 | | | Linear Technology Corporation | | | | | | | | | | | | | | | 537,117 | |
| | | | | |
| | 8,556 | | | Microchip Technology Incorporated, (3) | | | | | | | | | | | | | | | 518,066 | |
| | | | | |
| | 41,319 | | | Micron Technology, Inc., (2) | | | | | | | | | | | | | | | 709,034 | |
| | | | | |
| | 20,807 | | | NVIDIA Corporation | | | | | | | | | | | | | | | 1,480,626 | |
| | | | | |
| | 5,009 | | | Qorvo Inc., (2) | | | | | | | | | | | | | | | 278,751 | |
| | | | | |
| | 54,913 | | | QUALCOMM, Inc. | | | | | | | | | | | | | | | 3,773,621 | |
| | | | | |
| | 6,987 | | | Skyworks Solutions Inc. | | | | | | | | | | | | | | | 537,580 | |
| | | | | |
| | 37,383 | | | Texas Instruments Incorporated | | | | | | | | | | | | | | | 2,648,586 | |
| | | | | |
| | 9,916 | | | Xilinx, Inc. | | | | | | | | | | | | | | | 504,427 | |
| | | | Total Semiconductors & Semiconductor Equipment | | | | | | | | | | | | | | | 22,530,605 | |
| | | | | |
| | | | Software – 4.3% | | | | | | | | | | | | |
| | | | | |
| | 23,406 | | | Activision Blizzard Inc. | | | | | | | | | | | | | | | 1,010,437 | |
| | | | | |
| | 18,700 | | | Adobe Systems Incorporated, (2) | | | | | | | | | | | | | | | 2,010,437 | |
| | | | | |
| | 7,277 | | | Autodesk, Inc., (2) | | | | | | | | | | | | | | | 525,982 | |
| | | | | |
| | 11,483 | | | CA Technologies | | | | | | | | | | | | | | | 352,987 | |
| | | | | |
| | 5,975 | | | Citrix Systems, (2) | | | | | | | | | | | | | | | 506,680 | |
| | | | | |
| | 11,208 | | | Electronic Arts Inc., (2), (3) | | | | | | | | | | | | | | | 880,052 | |
| | | | | |
| | 9,131 | | | Intuit, Inc. | | | | | | | | | | | | | | | 992,905 | |
| | | | | |
| | 290,375 | | | Microsoft Corporation | | | | | | | | | | | | | | | 17,399,268 | |
| | | | | |
| | 112,147 | | | Oracle Corporation | | | | | | | | | | | | | | | 4,308,688 | |
| | | | | |
| | 6,749 | | | Red Hat, Inc., (2) | | | | | | | | | | | | | | | 522,710 | |
| | | | | |
| | 23,994 | | | Salesforce.com, Inc., (2) | | | | | | | | | | | | | | | 1,803,389 | |
| | | | | |
| | 23,668 | | | Symantec Corporation | | | | | | | | | | | | | | | 592,410 | |
| | | | Total Software | | | | | | | | | | | | | | | 30,905,945 | |
| | | | | |
| | | | Specialty Retail – 2.3% | | | | | | | | | | | | |
| | | | | |
| | 2,745 | | | Advance Auto Parts, Inc. | | | | | | | | | | | | | | | 384,520 | |
| | | | | |
| | 1,921 | | | AutoNation Inc., (2) | | | | | | | | | | | | | | | 84,274 | |
| | | | | |
| | 1,090 | | | AutoZone, Inc., (2) | | | | | | | | | | | | | | | 808,954 | |
| | | | | |
| | 5,752 | | | Bed Bath and Beyond Inc. | | | | | | | | | | | | | | | 232,496 | |
| | | | | |
| | 10,286 | | | Best Buy Co., Inc. | | | | | | | | | | | | | | | 400,228 | |
| | | | | |
| | 7,596 | | | CarMax, Inc., (2), (3) | | | | | | | | | | | | | | | 379,344 | |
| | | | | |
| | 2,521 | | | Foot Locker, Inc. | | | | | | | | | | | | | | | 168,327 | |
| | | | | |
| | 9,547 | | | Gap, Inc., (3) | | | | | | | | | | | | | | | 263,402 | |
| | | | | |
| | 46,041 | | | Home Depot, Inc. | | | | | | | | | | | | | | | 5,617,462 | |
| | | | | |
| | 8,951 | | | L Brands Inc. | | | | | | | | | | | | | | | 646,173 | |
| | | | | |
| | 32,592 | | | Lowe’s Companies, Inc. | | | | | | | | | | | | | | | 2,172,257 | |
| | | | | |
| | 3,619 | | | O’Reilly Automotive Inc., (2) | | | | | | | | | | | | | | | 957,008 | |
| | | | | | | | | | | | | | | | | | | | |
| Shares | | | Description (1) | | | | | | | | | | | Value | |
| | | | | |
| | | | Specialty Retail (continued) | | | | | | | | | | | | |
| | | | | |
| | 16,606 | | | Ross Stores, Inc. | | | | | | | | | | | | | | $ | 1,038,539 | |
| | | | | |
| | 3,194 | | | Signet Jewelers Limited, (3) | | | | | | | | | | | | | | | 259,544 | |
| | | | | |
| | 25,827 | | | Staples, Inc. | | | | | | | | | | | | | | | 191,120 | |
| | | | | |
| | 4,502 | | | Tiffany & Co., (3) | | | | | | | | | | | | | | | 330,537 | |
| | | | | |
| | 24,831 | | | TJX Companies, Inc. | | | | | | | | | | | | | | | 1,831,286 | |
| | | | | |
| | 4,622 | | | Tractor Supply Company | | | | | | | | | | | | | | | 289,476 | |
| | | | | |
| | 1,818 | | | Ulta Salon, Cosmetics & Fragrance, Inc., (2) | | | | | | | | | | | | | | | 442,392 | |
| | | | | |
| | 3,805 | | | Urban Outfitters, Inc., (2) | | | | | | | | | | | | | | | 127,277 | |
| | | | Total Specialty Retail | | | | | | | | | | | | | | | 16,624,616 | |
| | | | | |
| | | | Technology Hardware, Storage & Peripherals – 3.7% | | | | | | | | | | | | |
| | | | | |
| | 200,792 | | | Apple, Inc. | | | | | | | | | | | | | | | 22,797,922 | |
| | | | | |
| | 61,922 | | | Hewlett Packard Enterprise Co | | | | | | | | | | | | | | | 1,391,387 | |
| | | | | |
| | 63,753 | | | HP Inc. | | | | | | | | | | | | | | | 923,781 | |
| | | | | |
| | 10,384 | | | NetApp, Inc. | | | | | | | | | | | | | | | 352,433 | |
| | | | | |
| | 11,503 | | | Seagate Technology | | | | | | | | | | | | | | | 394,668 | |
| | | | | |
| | 10,592 | | | Western Digital Corporation | | | | | | | | | | | | | | | 618,996 | |
| | | | Total Technology Hardware, Storage & Peripherals | | | | | | | | | | | | | | | 26,479,187 | |
| | | | | |
| | | | Textiles, Apparel & Luxury Goods – 0.7% | | | | | | | | | | | | |
| | | | | |
| | 11,102 | | | Coach, Inc. | | | | | | | | | | | | | | | 398,451 | |
| | | | | |
| | 14,079 | | | Hanesbrands Inc. | | | | | | | | | | | | | | | 361,830 | |
| | | | | |
| | 6,297 | | | Michael Kors Holdings Limited, (2) | | | | | | | | | | | | | | | 319,762 | |
| | | | | |
| | 50,244 | | | Nike, Inc., Class B | | | | | | | | | | | | | | | 2,521,244 | |
| | | | | |
| | 3,109 | | | PVH Corporation | | | | | | | | | | | | | | | 332,601 | |
| | | | | |
| | 2,398 | | | Ralph Lauren Corporation | | | | | | | | | | | | | | | 235,244 | |
| | | | | |
| | 7,547 | | | Under Armour, Inc., Class A Shares, (2), (3) | | | | | | | | | | | | | | | 234,712 | |
| | | | | |
| | 6,870 | | | Under Armour Inc, Class C Shares, (2) | | | | | | | | | | | | | | | 177,658 | |
| | | | | |
| | 12,363 | | | VF Corporation | | | | | | | | | | | | | | | 670,198 | |
| | | | Total Textiles, Apparel & Luxury Goods | | | | | | | | | | | | | | | 5,251,700 | |
| | | | | |
| | | | Tobacco – 1.7% | | | | | | | | | | | | |
| | | | | |
| | 72,807 | | | Altria Group, Inc. | | | | | | | | | | | | | | | 4,813,999 | |
| | | | | |
| | 57,808 | | | Philip Morris International | | | | | | | | | | | | | | | 5,575,004 | |
| | | | | |
| | 30,849 | | | Reynolds American Inc. | | | | | | | | | | | | | | | 1,699,147 | |
| | | | Total Tobacco | | | | | | | | | | | | | | | 12,088,150 | |
| | | | | |
| | | | Trading Companies & Distributors – 0.2% | | | | | | | | | | | | |
| | | | | |
| | 10,768 | | | Fastenal Company | | | | | | | | | | | | | | | 419,737 | |
| | | | | |
| | 3,827 | | | United Rentals Inc., (2) | | | | | | | | | | | | | | | 289,551 | |
| | | | | |
| | 2,072 | | | W.W. Grainger, Inc. | | | | | | | | | | | | | | | 431,225 | |
| | | | Total Trading Companies & Distributors | | | | | | | | | | | | | | | 1,140,513 | |
Nuveen Equity Index Fund (continued)
| | |
| Portfolio of Investments | | October 31, 2016 |
| | | | | | | | | | | | | | | | | | | | |
| Shares | | | Description (1) | | | | | | | | | | | Value | |
| | | | | |
| | | | Water Utilities – 0.1% | | | | | | | | | | | | |
| | | | | |
| | 7,217 | | | American Water Works Company | | | | | | | | | | | | | | $ | 534,347 | |
| | | | Total Common Stocks (cost $256,368,985) | | | | | | | | | | | | | | | 685,507,237 | |
| | | | | |
| Shares | | | Description (1) | | | | | | | | | | | Value | |
| | | | | |
| | | | COMMON STOCK RIGHTS – 0.0% | | | | | | | | | | | | | | | | |
| | | | | |
| | 10,067 | | | Safeway Incorporated, (4) | | | | | | | | | | | | | | $ | 1,711 | |
| | | | | |
| | 10,067 | | | Safeway Incorporated, (4) | | | | | | | | | | | | | | | 101 | |
| | | | Total Common Stock Rights (cost $2,775) | | | | | | | | | | | | | | | 1,812 | |
| | | | Total Long-Term Investments (cost $256,371,760) | | | | | | | | | | | | | | | 685,509,049 | |
| | | | | |
| Shares | | | Description (1) | | | | | | | | | | | Value | |
| | |
| | | | INVESTMENTS PURCHASED WITH COLLATERAL FROM SECURITIES LENDING – 1.2% | | | | | |
| | | | | |
| | | | Money Market Funds – 1.2% | | | | | | | | | | | | |
| | | | | |
| | 8,819,673 | | | First American Government Obligations Fund, Class X, 0.283%, (5), (6) | | | | | | | | | | | | | | $ | 8,819,673 | |
| | | | Total Investments Purchased with Collateral from Securities Lending (cost $8,819,673) | | | | | | | | | | | | 8,819,673 | |
| | | | | |
Shares/
Principal
Amount (000) | | | Description (1) | | Coupon | | | Maturity | | | Ratings (7) | | | Value | |
| | | | | |
| | | | SHORT-TERM INVESTMENTS – 4.8% | | | | | | | | | | | | | | | | |
| | | | | |
| | | | Money Market Funds – 4.4% | | | | | | | | | | | | |
| | | | | |
| | 31,382,922 | | | First American Treasury Obligations Fund, Class Z | | | 0.222% (5) | | | | N/A | | | | N/A | | | $ | 31,382,922 | |
| | |
| | | | U.S. Government and Agency Obligations – 0.4% | | | | |
| | | | | |
| $ | 3,000 | | | U.S. Treasury Bills, (8) | | | 0.000% | | | | 2/02/17 | | | | AAA | | | | 2,997,318 | |
| | | | Total Short-Term Investments (cost $34,379,722) | | | | | | | | | | | | | | | 34,380,240 | |
| | | | Total Investments (cost $299,571,155) – 101.4% | | | | | | | | | | | | | | | 728,708,962 | |
| | | | Other Assets Less Liabilities – (1.4%) (9) | | | | | | | | | | | | | | | (9,818,908 | ) |
| | | | Net Assets – 100% | | | | | | | | | | | | | | $ | 718,890,054 | |
Investments in Derivatives as of October 31, 2016
Futures Contracts
| | | | | | | | | | | | | | | | | | | | | | | | |
| Description | | Contract
Position | | | Number of
Contracts | | | Contract
Expiration | | | Notional
Amount
at Value | | | Variation
Margin
Receivable/
(Payable) | | | Unrealized
Appreciation
(Depreciation) | |
| S&P 500® Index | | | Long | | | | 64 | | | | 12/16 | | | $ | 33,921,600 | | | $ | (59,200 | ) | | $ | (139,510 | ) |
For Fund portfolio compliance purposes, the Fund’s industry classifications refer to any one or more of the industry sub-classifications used by one or more widely recognized market indexes or ratings group indexes, and/or as defined by Fund management. This definition may not apply for purposes of this report which may combine industry sub-classifications into sectors for reporting ease.
| (1) | All percentages shown in the Portfolio of Investments are based on net assets. |
| (2) | Non-income producing; issuer has not declared a dividend within the past twelve months. |
| (3) | Investment, or a portion of investment, is out on loan for securities lending. The total value of the securities out on loan as of the end of the reporting period was $8,603,262. |
| (4) | Investment valued at fair value using methods determined in good faith by, or at the discretion of, the Board. For fair value measurement disclosure purposes, investment classified as Level 3. See Notes to Financial Statements, Note 2 – Investment Valuation and Fair Value Measurements for more information. |
| (5) | The rate shown is the annualized seven-day subsidized yield as of the end of the reporting period. |
| (6) | The Fund may loan securities representing up to one third of the fair value of its total assets (which includes collateral for securities on loan) to broker dealers, banks, and other institutions. The Fund maintains collateral equal to at least 100% of the fair value of the securities loaned. The cash collateral received by the Fund is invested in this money market fund. See Notes to Financial Statements, Note 3 – Portfolio Securities and Investments in Derivatives, Securities Lending for more information. |
| (7) | For financial reporting purposes, the ratings disclosed are the highest of Standard & Poor’s Group (“Standard & Poor’s”), Moody’s Investors Service, Inc. (“Moody’s”) or Fitch, Inc. (“Fitch”) rating. This treatment of split-rated securities may differ from that used for other purposes, such as for Fund investment policies. Ratings below BBB by Standard & Poor’s, Baa by Moody’s or BBB by Fitch are considered to be below investment grade. Holdings designated N/R are not rated by any of these national rating agencies. Rating are not covered by the report of independent registered public accounting firm. |
| (8) | Investment, or portion of investment, segregated as collateral for investments in derivatives. |
| (9) | Other assets less liabilities includes the unrealized appreciation (depreciation) of certain over-the-counter (“OTC”) derivatives as presented on the Statement of Assets and Liabilities, when applicable. The unrealized appreciation (depreciation) of OTC-cleared and exchange-traded derivatives is recognized as part of the cash collateral at broker and/or the receivable or payable for variation margin as presented on the Statement of Assets and Liabilities, when applicable. |
See accompanying notes to financial statements.
Nuveen Mid Cap Index Fund
| | |
| Portfolio of Investments | | October 31, 2016 |
| | | | | | | | | | | | | | | | | | | | |
| Shares | | | Description (1) | | | | | | | | | | | Value | |
| | | | | |
| | | | LONG-TERM INVESTMENTS – 97.4% | | | | | | | | | | | | | | | | |
| | | | | |
| | | | COMMON STOCKS – 97.4% | | | | | | | | | | | | | | | | |
| | | | | |
| | | | Aerospace & Defense – 2.0% | | | | | | | | | | | | |
| | | | | |
| | 39,964 | | | BE Aerospace Inc. | | | | | | | | | | | | | | $ | 2,378,657 | |
| | | | | |
| | 14,163 | | | Curtiss Wright Corporation | | | | | | | | | | | | | | | 1,269,288 | |
| | | | | |
| | 12,914 | | | Esterline Technologies Corporation, (2) | | | | | | | | | | | | | | | 948,533 | |
| | | | | |
| | 19,837 | | | Huntington Ingalls Industries Inc. | | | | | | | | | | | | | | | 3,200,898 | |
| | | | | |
| | 19,982 | | | KLX Inc., (2) | | | | | | | | | | | | | | | 687,780 | |
| | | | | |
| | 23,737 | | | Orbital ATK, Inc. | | | | | | | | | | | | | | | 1,765,083 | |
| | | | | |
| | 11,974 | | | Teledyne Technologies Inc., (2) | | | | | | | | | | | | | | | 1,289,360 | |
| | | | | |
| | 20,220 | | | Triumph Group Inc. | | | | | | | | | | | | | | | 479,214 | |
| | | | Total Aerospace & Defense | | | | | | | | | | | | | | | 12,018,813 | |
| | | | | |
| | | | Airlines – 0.4% | | | | | | | | | | | | |
| | | | | |
| | 127,371 | | | JetBlue Airways Corporation, (2) | | | | | | | | | | | | | | | 2,226,445 | |
| | | | | |
| | | | Auto Components – 0.5% | | | | | | | | | | | | |
| | | | | |
| | 52,874 | | | Dana Holding Corporation | | | | | | | | | | | | | | | 818,490 | |
| | | | | |
| | 117,874 | | | Gentex Corporation | | | | | | | | | | | | | | | 1,993,249 | |
| | | | Total Auto Components | | | | | | | | | | | | | | | 2,811,739 | |
| | | | | |
| | | | Automobiles – 0.2% | | | | | | | | | | | | |
| | | | | |
| | 18,086 | | | Thor Industries, Inc. | | | | | | | | | | | | | | | 1,434,401 | |
| | | | | |
| | | | Banks – 5.8% | | | | | | | | | | | | |
| | | | | |
| | 65,082 | | | Associated Banc-Corp. | | | | | | | | | | | | | | | 1,321,165 | |
| | | | | |
| | 34,136 | | | BancorpSouth Inc. | | | | | | | | | | | | | | | 802,196 | |
| | | | | |
| | 17,947 | | | Bank of Hawaii Corporation | | | | | | | | | | | | | | | 1,348,717 | |
| | | | | |
| | 32,968 | | | Bank of the Ozarks, Inc. | | | | | | | | | | | | | | | 1,218,497 | |
| | | | | |
| | 29,910 | | | Cathay General Bancorp. | | | | | | | | | | | | | | | 895,804 | |
| | | | | |
| | 28,352 | | | Chemical Financial Corporation | | | | | | | | | | | | | | | 1,217,718 | |
| | | | | |
| | 36,030 | | | Commerce Bancshares Inc., (3) | | | | | | | | | | | | | | | 1,795,015 | |
| | | | | |
| | 21,597 | | | Cullen/Frost Bankers, Inc., (3) | | | | | | | | | | | | | | | 1,641,156 | |
| | | | | |
| | 57,920 | | | East West Bancorp Inc. | | | | | | | | | | | | | | | 2,288,419 | |
| | | | | |
| | 48,665 | | | F.N.B. Corporation PA | | | | | | | | | | | | | | | 636,052 | |
| | | | | |
| | 95,564 | | | First Horizon National Corporation | | | | | | | | | | | | | | | 1,472,641 | |
| | | | | |
| | 76,330 | | | Fulton Financial Corporation | | | | | | | | | | | | | | | 1,137,317 | |
| | | | | |
| | 33,236 | | | Hancock Holding Company | | | | | | | | | | | | | | | 1,115,068 | |
| | | | | |
| | 22,992 | | | International Bancshares Corporation | | | | | | | | | | | | | | | 709,303 | |
| | | | | |
| | 26,901 | | | MB Financial, Inc. | | | | | | | | | | | | | | | 978,927 | |
| | | | | |
| | 46,277 | | | Pacwest Bancorp. | | | | | | | | | | | | | | | 2,007,959 | |
| | | | | | | | | | | | | | | | | | | | |
| Shares | | | Description (1) | | | | | | | | | | | Value | |
| | | | | |
| | | | Banks (continued) | | | | | | | | | | | | |
| | | | | |
| | 31,740 | | | Privatebancorp, Inc. | | | | | | | | | | | | | | $ | 1,435,918 | |
| | | | | |
| | 28,155 | | | Prosperity Bancshares, Inc. | | | | | | | | | | | | | | | 1,561,758 | |
| | | | | |
| | 21,545 | | | Signature Bank, (2) | | | | | | | | | | | | | | | 2,597,465 | |
| | | | | |
| | 20,874 | | | SVB Financial Group, (2) | | | | | | | | | | | | | | | 2,552,264 | |
| | | | | |
| | 56,138 | | | Synovus Financial Corp. | | | | | | | | | | | | | | | 1,856,470 | |
| | | | | |
| | 67,305 | | | TCF Financial Corporation | | | | | | | | | | | | | | | 962,462 | |
| | | | | |
| | 27,240 | | | Trustmark Corporation | | | | | | | | | | | | | | | 754,003 | |
| | | | | |
| | 82,960 | | | Umpqua Holdings Corporation | | | | | | | | | | | | | | | 1,267,629 | |
| | | | | |
| | 80,975 | | | Valley National Bancorp. | | | | | | | | | | | | | | | 798,414 | |
| | | | | |
| | 36,481 | | | Webster Financial Corporation | | | | | | | | | | | | | | | 1,473,832 | |
| | | | Total Banks | | | | | | | | | | | | | | | 35,846,169 | |
| | | | | |
| | | | Beverages – 0.1% | | | | | | | | | | | | |
| | | | | |
| | 3,632 | | | Boston Beer Company, (2), (3) | | | | | | | | | | | | | | | 563,868 | |
| | | | | |
| | | | Biotechnology – 0.4% | | | | | | | | | | | | |
| | | | | |
| | 18,497 | | | United Therapeutics Corporation, (2) | | | | | | | | | | | | | | | 2,220,935 | |
| | | | | |
| | | | Building Products – 0.8% | | | | | | | | | | | | |
| | | | | |
| | 16,078 | | | Lennox International Inc. | | | | | | | | | | | | | | | 2,345,619 | |
| | | | | |
| | 61,484 | | | Smith AO Corporation | | | | | | | | | | | | | | | 2,777,232 | |
| | | | Total Building Products | | | | | | | | | | | | | | | 5,122,851 | |
| | | | | |
| | | | Capital Markets – 3.4% | | | | | | | | | | | | |
| | | | | |
| | 34,731 | | | CBOE Holdings Inc. | | | | | | | | | | | | | | | 2,195,347 | |
| | | | | |
| | 48,763 | | | Eaton Vance Corporation | | | | | | | | | | | | | | | 1,709,631 | |
| | | | | |
| | 15,701 | | | FactSet Research Systems Inc. | | | | | | | | | | | | | | | 2,429,259 | |
| | | | | |
| | 38,208 | | | Federated Investors Inc. | | | | | | | | | | | | | | | 1,031,616 | |
| | | | | |
| | 60,651 | | | Janus Capital Group Inc. | | | | | | | | | | | | | | | 777,546 | |
| | | | | |
| | 15,006 | | | Marketaxess | | | | | | | | | | | | | | | 2,262,305 | |
| | | | | |
| | 37,051 | | | MSCI Inc., Class A Shares | | | | | | | | | | | | | | | 2,971,120 | |
| | | | | |
| | 50,145 | | | Raymond James Financial Inc. | | | | | | | | | | | | | | | 3,014,717 | |
| | | | | |
| | 53,181 | | | SEI Investments Company | | | | | | | | | | | | | | | 2,357,514 | |
| | | | | |
| | 24,641 | | | Stifel Financial Corporation, (2) | | | | | | | | | | | | | | | 964,449 | |
| | | | | |
| | 34,425 | | | Waddell & Reed Financial, Inc., Class A | | | | | | | | | | | | | | | 541,161 | |
| | | | | |
| | 46,556 | | | WisdomTree Investments Inc. | | | | | | | | | | | | | | | 399,450 | |
| | | | Total Capital Markets | | | | | | | | | | | | | | | 20,654,115 | |
| | | | | |
| | | | Chemicals – 2.9% | | | | | | | | | | | | |
| | | | | |
| | 25,514 | | | Ashland Inc. | | | | | | | | | | | | | | | 2,850,679 | |
| | | | | |
| | 24,225 | | | Cabot Corporation | | | | | | | | | | | | | | | 1,263,091 | |
| | | | | |
| | 13,928 | | | Minerals Technologies Inc. | | | | | | | | | | | | | | | 935,962 | |
| | | | | |
| | 4,036 | | | NewMarket Corporation | | | | | | | | | | | | | | | 1,618,073 | |
| | | | | |
| | 66,435 | | | Olin Corporation | | | | | | | | | | | | | | | 1,456,920 | |
Nuveen Mid Cap Index Fund (continued)
| | |
| Portfolio of Investments | | October 31, 2016 |
| | | | | | | | | | | | | | | | | | | | |
| Shares | | | Description (1) | | | | | | | | | | | Value | |
| | | | | |
| | | | Chemicals (continued) | | | | | | | | | | | | |
| | | | | |
| | 38,020 | | | PolyOne Corporation | | | | | | | | | | | | | | $ | 1,111,325 | |
| | | | | |
| | 53,822 | | | RPM International, Inc. | | | | | | | | | | | | | | | 2,558,698 | |
| | | | | |
| | 17,575 | | | Scotts Miracle Gro Company | | | | | | | | | | | | | | | 1,548,182 | |
| | | | | |
| | 18,130 | | | Sensient Technologies Corporation | | | | | | | | | | | | | | | 1,350,866 | |
| | | | | |
| | 29,312 | | | Valspar Corporation | | | | | | | | | | | | | | | 2,919,475 | |
| | | | Total Chemicals | | | | | | | | | | | | | | | 17,613,271 | |
| | | | | |
| | | | Commercial Services & Supplies – 1.3% | | | | | | | | | | | | |
| | | | | |
| | 22,336 | | | Clean Harbors, Inc., (2) | | | | | | | | | | | | | | | 1,056,940 | |
| | | | | |
| | 40,828 | | | Copart Inc., (2) | | | | | | | | | | | | | | | 2,142,245 | |
| | | | | |
| | 20,219 | | | Deluxe Corporation | | | | | | | | | | | | | | | 1,237,403 | |
| | | | | |
| | 18,218 | | | HNI Corporation | | | | | | | | | | | | | | | 740,744 | |
| | | | | |
| | 23,929 | | | Miller (Herman) Inc. | | | | | | | | | | | | | | | 665,226 | |
| | | | | |
| | 12,823 | | | MSA Safety Inc. | | | | | | | | | | | | | | | 747,581 | |
| | | | | |
| | 38,928 | | | Rollins Inc. | | | | | | | | | | | | | | | 1,199,761 | |
| | | | Total Commercial Services & Supplies | | | | | | | | | | | | | | | 7,789,900 | |
| | | | | |
| | | | Communications Equipment – 1.5% | | | | | | | | | | | | |
| | | | | |
| | 71,947 | | | Arris International PLC, (2) | | | | | | | | | | | | | | | 1,998,688 | |
| | | | | |
| | 174,970 | | | Brocade Communications Systems Inc. | | | | | | | | | | | | | | | 1,854,682 | |
| | | | | |
| | 54,864 | | | Ciena Corporation, (2) | | | | | | | | | | | | | | | 1,063,264 | |
| | | | | |
| | 14,802 | | | Interdigital Inc. | | | | | | | | | | | | | | | 1,045,761 | |
| | | | | |
| | 37,611 | | | NetScout Systems, Inc., (2) | | | | | | | | | | | | | | | 1,032,422 | |
| | | | | |
| | 16,071 | | | Plantronics Inc. | | | | | | | | | | | | | | | 831,031 | |
| | | | | |
| | 17,889 | | | ViaSat, Inc., (2), (3) | | | | | | | | | | | | | | | 1,264,037 | |
| | | | Total Communications Equipment | | | | | | | | | | | | | | | 9,089,885 | |
| | | | | |
| | | | Construction & Engineering – 1.1% | | | | | | | | | | | | |
| | | | | |
| | 60,190 | | | AECOM, (2) | | | | | | | | | | | | | | | 1,676,292 | |
| | | | | |
| | 12,735 | | | Dycom Industries Inc., (2) | | | | | | | | | | | | | | | 979,704 | |
| | | | | |
| | 23,782 | | | Emcor Group Inc. | | | | | | | | | | | | | | | 1,437,860 | |
| | | | | |
| | 14,689 | | | Granite Construction Inc. | | | | | | | | | | | | | | | 722,111 | |
| | | | | |
| | 59,455 | | | KBR Inc. | | | | | | | | | | | | | | | 880,529 | |
| | | | | |
| | 9,667 | | | Valmont Industries, Inc. | | | | | | | | | | | | | | | 1,236,893 | |
| | | | Total Construction & Engineering | | | | | | | | | | | | | | | 6,933,389 | |
| | | | | |
| | | | Construction Materials – 0.3% | | | | | | | | | | | | |
| | | | | |
| | 20,215 | | | Eagle Materials Inc. | | | | | | | | | | | | | | | 1,636,809 | |
| | | | | |
| | | | Consumer Finance – 0.2% | | | | | | | | | | | | |
| | | | | |
| | 170,772 | | | SLM Corporation | | | | | | | | | | | | | | | 1,203,943 | |
| | | | | |
| | | | Containers & Packaging – 1.7% | | | | | | | | | | | | |
| | | | | |
| | 26,438 | | | AptarGroup Inc. | | | | | | | | | | | | | | | 1,888,731 | |
| | | | | |
| | 31,959 | | | Bemis Company, Inc. | | | | | | | | | | | | | | | 1,557,042 | |
| | | | | | | | | | | | | | | | | | | | |
| Shares | | | Description (1) | | | | | | | | | | | Value | |
| | | | | |
| | | | Containers & Packaging (continued) | | | | | | | | | | | | |
| | | | | |
| | 12,325 | | | Greif Inc. | | | | | | | | | | | | | | $ | 577,550 | |
| | | | | |
| | 39,714 | | | Packaging Corp. of America | | | | | | | | | | | | | | | 3,276,405 | |
| | | | | |
| | 17,563 | | | Silgan Holdings, Inc. | | | | | | | | | | | | | | | 894,835 | |
| | | | | |
| | 41,221 | | | Sonoco Products Company | | | | | | | | | | | | | | | 2,073,004 | |
| | | | Total Containers & Packaging | | | | | | | | | | | | | | | 10,267,567 | |
| | | | | |
| | | | Distributors – 0.3% | | | | | | | | | | | | |
| | | | | |
| | 17,193 | | | Pool Corporation | | | | | | | | | | | | | | | 1,591,728 | |
| | | | | |
| | | | Diversified Consumer Services – 0.7% | | | | | | | | | | | | |
| | | | | |
| | 23,083 | | | DeVry Education Group Inc., (3) | | | | | | | | | | | | | | | 523,984 | |
| | | | | |
| | 1,775 | | | Graham Holdings Company | | | | | | | | | | | | | | | 843,125 | |
| | | | | |
| | 78,787 | | | Service Corporation International | | | | | | | | | | | | | | | 2,016,947 | |
| | | | | |
| | 19,809 | | | Sothebys Holdings Inc., (3) | | | | | | | | | | | | | | | 710,747 | |
| | | | Total Diversified Consumer Services | | | | | | | | | | | | | | | 4,094,803 | |
| | | | | |
| | | | Electric Utilities – 1.9% | | | | | | | | | | | | |
| | | | | |
| | 74,433 | | | Great Plains Energy Incorporated | | | | | | | | | | | | | | | 2,116,875 | |
| | | | | |
| | 43,845 | | | Hawaiian Electric Industries | | | | | | | | | | | | | | | 1,293,428 | |
| | | | | |
| | 20,320 | | | IDACORP, INC | | | | | | | | | | | | | | | 1,592,885 | |
| | | | | |
| | 80,438 | | | OGE Energy Corp. | | | | | | | | | | | | | | | 2,496,796 | |
| | | | | |
| | 32,174 | | | PNM Resources Inc. | | | | | | | | | | | | | | | 1,056,916 | |
| | | | | |
| | 57,292 | | | Westar Energy Inc. | | | | | | | | | | | | | | | 3,283,977 | |
| | | | Total Electric Utilities | | | | | | | | | | | | | | | 11,840,877 | |
| | | | | |
| | | | Electrical Equipment – 0.7% | | | | | | | | | | | | |
| | | | | |
| | 17,598 | | | EnerSys | | | | | | | | | | | | | | | 1,146,158 | |
| | | | | |
| | 21,752 | | | Hubbell Inc. | | | | | | | | | | | | | | | 2,273,519 | |
| | | | | |
| | 18,228 | | | Regal-Beloit Corporation | | | | | | | | | | | | | | | 1,077,275 | |
| | | | Total Electrical Equipment | | | | | | | | | | | | | | | 4,496,952 | |
| | | | | |
| | | | Electronic Equipment, Instruments & Components – 4.0% | | | | | | | | | | | | |
| | | | | |
| | 39,010 | | | Arrow Electronics, Inc., (2) | | | | | | | | | | | | | | | 2,384,291 | |
| | | | | |
| | 55,904 | | | Avnet Inc. | | | | | | | | | | | | | | | 2,345,173 | |
| | | | | |
| | 17,612 | | | Belden Inc. | | | | | | | | | | | | | | | 1,141,434 | |
| | | | | |
| | 31,769 | | | Cognex Corporation | | | | | | | | | | | | | | | 1,639,280 | |
| | | | | |
| | 62,691 | | | Ingram Micro, Inc., Class A | | | | | | | | | | | | | | | 2,332,105 | |
| | | | | |
| | 14,324 | | | IPG Photonics Corporation, (2) | | | | | | | | | | | | | | | 1,389,571 | |
| | | | | |
| | 64,892 | | | Jabil Circuit Inc. | | | | | | | | | | | | | | | 1,384,795 | |
| | | | | |
| | 59,687 | | | Keysight Technologies, Inc., (2) | | | | | | | | | | | | | | | 1,957,734 | |
| | | | | |
| | 34,346 | | | Knowles Corporation, (2), (3) | | | | | | | | | | | | | | | 513,129 | |
| | | | | |
| | 39,739 | | | National Instruments Corporation | | | | | | | | | | | | | | | 1,116,269 | |
| | | | | |
| | 11,603 | | | SYNNEX Corporation | | | | | | | | | | | | | | | 1,189,772 | |
| | | | | |
| | 15,445 | | | Tech Data Corporation, (2) | | | | | | | | | | | | | | | 1,189,574 | |
Nuveen Mid Cap Index Fund (continued)
| | |
| Portfolio of Investments | | October 31, 2016 |
| | | | | | | | | | | | | | | | | | | | |
| Shares | | | Description (1) | | | | | | | | | | | Value | |
| | | | | |
| | | | Electronic Equipment, Instruments & Components (continued) | | | | | | | | | | | | |
| | | | | |
| | 105,376 | | | Trimble Navigation Limited, (2) | | | | | | | | | | | | | | $ | 2,912,593 | |
| | | | | |
| | 45,128 | | | VeriFone Holdings Inc., (2) | | | | | | | | | | | | | | | 698,581 | |
| | | | | |
| | 54,793 | | | Vishay Intertechnology Inc., (3) | | | | | | | | | | | | | | | 772,581 | |
| | | | | |
| | 20,393 | | | Zebra Technologies Corporation, Class A, (2) | | | | | | | | | | | | | | | 1,342,675 | |
| | | | Total Electronic Equipment, Instruments & Components | | | | | | | | | | | | | | | 24,309,557 | |
| | | | | |
| | | | Energy Equipment & Services – 1.4% | | | | | | | | | | | | |
| | | | | |
| | 22,599 | | | Diamond Offshore Drilling, Inc., (3) | | | | | | | | | | | | | | | 372,658 | |
| | | | | |
| | 15,140 | | | Dril Quip Inc., (2) | | | | | | | | | | | | | | | 719,150 | |
| | | | | |
| | 122,114 | | | Ensco PLC | | | | | | | | | | | | | | | 954,931 | |
| | | | | |
| | 118,547 | | | Nabors Industries Inc. | | | | | | | | | | | | | | | 1,410,709 | |
| | | | | |
| | 98,560 | | | Noble Corporation PLC, (3) | | | | | | | | | | | | | | | 486,886 | |
| | | | | |
| | 40,523 | | | Oceaneering International Inc. | | | | | | | | | | | | | | | 964,447 | |
| | | | | |
| | 21,329 | | | Oil States International Inc., (2) | | | | | | | | | | | | | | | 623,873 | |
| | | | | |
| | 59,865 | | | Patterson-UTI Energy, Inc. | | | | | | | | | | | | | | | 1,345,765 | |
| | | | | |
| | 49,522 | | | Rowan Companies Inc. | | | | | | | | | | | | | | | 657,157 | |
| | | | | |
| | 63,254 | | | Superior Energy Services, Inc. | | | | | | | | | | | | | | | 895,677 | |
| | | | Total Energy Equipment & Services | | | | | | | | | | | | | | | 8,431,253 | |
| | | | | |
| | | | Equity Real Estate Investment Trusts – 11.0% | | | | | | | | | | | | |
| | | | | |
| | 31,597 | | | Alexandria Real Estate Equities Inc. | | | | | | | | | | | | | | | 3,406,473 | |
| | | | | |
| | 52,699 | | | American Campus Communities Inc. | | | | | | | | | | | | | | | 2,746,145 | |
| | | | | |
| | 34,878 | | | Camden Property Trust | | | | | | | | | | | | | | | 2,840,464 | |
| | | | | |
| | 33,227 | | | Care Capital Properties, Inc. | | | | | | | | | | | | | | | 882,841 | |
| | | | | |
| | 55,139 | | | Communications Sales & Leasing, Inc. | | | | | | | | | | | | | | | 1,567,602 | |
| | | | | |
| | 35,386 | | | Corporate Office Properties | | | | | | | | | | | | | | | 944,452 | |
| | | | | |
| | 47,003 | | | Corrections Corporation of America | | | | | | | | | | | | | | | 679,193 | |
| | | | | |
| | 104,378 | | | Cousins Properties, Inc. | | | | | | | | | | | | | | | 811,017 | |
| | | | | |
| | 35,608 | | | DCT Industrial Trust Inc. | | | | | | | | | | | | | | | 1,664,674 | |
| | | | | |
| | 56,524 | | | Douglas Emmett Inc. | | | | | | | | | | | | | | | 2,063,126 | |
| | | | | |
| | 142,139 | | | Duke Realty Corporation | | | | | | | | | | | | | | | 3,716,935 | |
| | | | | |
| | 29,133 | | | Education Realty Trust Inc. | | | | | | | | | | | | | | | 1,240,774 | |
| | | | | |
| | 25,603 | | | Entertainment Properties Trust | | | | | | | | | | | | | | | 1,861,850 | |
| | | | | |
| | 36,552 | | | Equity One Inc. | | | | | | | | | | | | | | | 1,041,732 | |
| | | | | |
| | 47,053 | | | First Industrial Realty Trust, Inc. | | | | | | | | | | | | | | | 1,242,670 | |
| | | | | |
| | 46,951 | | | Healthcare Realty Trust, Inc. | | | | | | | | | | | | | | | 1,497,267 | |
| | | | | |
| | 38,641 | | | Highwoods Properties, Inc. | | | | | | | | | | | | | | | 1,917,753 | |
| | | | | |
| | 66,543 | | | Hospitality Properties Trust | | | | | | | | | | | | | | | 1,820,616 | |
| | | | | |
| | 37,358 | | | Kilroy Realty Corporation | | | | | | | | | | | | | | | 2,683,425 | |
| | | | | |
| | 32,988 | | | Lamar Advertising Company | | | | | | | | | | | | | | | 2,093,089 | |
| | | | | |
| | 45,195 | | | LaSalle Hotel Properties | | | | | | | | | | | | | | | 1,073,381 | |
| | | | | | | | | | | | | | | | | | | | |
| Shares | | | Description (1) | | | | | | | | | | | Value | |
| | | | | |
| | | | Equity Real Estate Investment Trusts (continued) | | | | | | | | | | | | |
| | | | | |
| | 59,658 | | | Liberty Property Trust | | | | | | | | | | | | | | $ | 2,411,973 | |
| | | | | |
| | 18,478 | | | Life Storage, Inc. | | | | | | | | | | | | | | | 1,490,251 | |
| | | | | |
| | 35,811 | | | Mack-Cali Realty Corporation | | | | | | | | | | | | | | | 919,626 | |
| | | | | |
| | 113,534 | | | Medical Properties Trust Inc. | | | | | | | | | | | | | | | 1,582,664 | |
| | | | | |
| | 30,789 | | | Mid-America Apartment Communities | | | | | | | | | | | | | | | 2,855,680 | |
| | | | | |
| | 59,571 | | | National Retail Properties, Inc. | | | | | | | | | | | | | | | 2,717,629 | |
| | | | | |
| | 77,954 | | | Omega Healthcare Investors Inc. | | | | | | | | | | | | | | | 2,481,276 | |
| | | | | |
| | — (4) | | | Parkway, Inc. | | | | | | | | | | | | | | | 5 | |
| | | | | |
| | 21,778 | | | Post Properties, Inc. | | | | | | | | | | | | | | | 1,432,775 | |
| | | | | |
| | 16,396 | | | Potlatch Corporation | | | | | | | | | | | | | | | 629,606 | |
| | | | | |
| | 51,082 | | | Rayonier Inc. | | | | | | | | | | | | | | | 1,370,019 | |
| | | | | |
| | 42,342 | | | Regency Centers Corporation | | | | | | | | | | | | | | | 3,051,588 | |
| | | | | |
| | 96,237 | | | Senior Housing Properties Trust | | | | | | | | | | | | | | | 2,046,961 | |
| | | | | |
| | 38,405 | | | Tanger Factory Outlet Centers | | | | | | | | | | | | | | | 1,336,494 | |
| | | | | |
| | 24,150 | | | Taubman Centers Inc. | | | | | | | | | | | | | | | 1,749,909 | |
| | | | | |
| | 37,431 | | | Urban Edge Properties | | | | | | | | | | | | | | | 966,094 | |
| | | | | |
| | 76,444 | | | Washington Prime Group, Inc. | | | | | | | | | | | | | | | 801,898 | |
| | | | | |
| | 45,397 | | | Weingarten Realty Trust | | | | | | | | | | | | | | | 1,643,825 | |
| | | | Total Equity Real Estate Investment Trusts | | | | | | | | | | | | | | | 67,283,752 | |
| | | | | |
| | | | Food & Staples Retailing – 0.6% | | | | | | | | | | | | |
| | | | | |
| | 15,502 | | | Casey’s General Stores, Inc. | | | | | | | | | | | | | | | 1,751,571 | |
| | | | | |
| | 58,493 | | | Sprouts Farmers Market Inc., (2) | | | | | | | | | | | | | | | 1,295,620 | |
| | | | | |
| | 20,044 | | | United Natural Foods Inc., (2) | | | | | | | | | | | | | | | 836,637 | |
| | | | Total Food & Staples Retailing | | | | | | | | | | | | | | | 3,883,828 | |
| | | | | |
| | | | Food Products – 2.8% | | | | | | | | | | | | |
| | | | | |
| | 37,756 | | | Dean Foods Company | | | | | | | | | | | | | | | 689,425 | |
| | | | | |
| | 75,557 | | | Flowers Foods Inc., (3) | | | | | | | | | | | | | | | 1,172,645 | |
| | | | | |
| | 40,484 | | | Hain Celestial Group Inc., (2) | | | | | | | | | | | | | | | 1,472,403 | |
| | | | | |
| | 28,685 | | | Ingredion Inc. | | | | | | | | | | | | | | | 3,762,611 | |
| | | | | |
| | 7,841 | | | Lancaster Colony Corporation | | | | | | | | | | | | | | | 1,024,427 | |
| | | | | |
| | 25,923 | | | Post Holdings Inc., (2) | | | | | | | | | | | | | | | 1,976,110 | |
| | | | | |
| | 31,973 | | | Snyders Lance Inc. | | | | | | | | | | | | | | | 1,137,280 | |
| | | | | |
| | 9,013 | | | Tootsie Roll Industries Inc., (3) | | | | | | | | | | | | | | | 319,511 | |
| | | | | |
| | 22,147 | | | Treehouse Foods Inc., (2), (3) | | | | | | | | | | | | | | | 1,937,420 | |
| | | | | |
| | 70,235 | | | WhiteWave Foods Company, (2) | | | | | | | | | | | | | | | 3,827,105 | |
| | | | Total Food Products | | | | | | | | | | | | | | | 17,318,937 | |
| | | | | |
| | | | Gas Utilities – 2.2% | | | | | | | | | | | | |
| | | | | |
| | 42,083 | | | Atmos Energy Corporation | | | | | | | | | | | | | | | 3,130,554 | |
| | | | | |
| | 33,934 | | | National Fuel Gas Company | | | | | | | | | | | | | | | 1,777,463 | |
Nuveen Mid Cap Index Fund (continued)
| | |
| Portfolio of Investments | | October 31, 2016 |
| | | | | | | | | | | | | | | | | | | | |
| Shares | | | Description (1) | | | | | | | | | | | Value | |
| | | | | |
| | | | Gas Utilities (continued) | | | | | | | | | | | | |
| | | | | |
| | 34,751 | | | New Jersey Resources Corporation | | | | | | | | | | | | | | $ | 1,179,796 | |
| | | | | |
| | 20,994 | | | One Gas Inc. | | | | | | | | | | | | | | | 1,286,512 | |
| | | | | |
| | 19,399 | | | Southwest Gas Corporation | | | | | | | | | | | | | | | 1,405,652 | |
| | | | | |
| | 70,205 | | | UGI Corporation | | | | | | | | | | | | | | | 3,249,789 | |
| | | | | |
| | 20,965 | | | WGL Holdings Inc. | | | | | | | | | | | | | | | 1,322,263 | |
| | | | Total Gas Utilities | | | | | | | | | | | | | | | 13,352,029 | |
| | | | | |
| | | | Health Care Equipment & Supplies – 3.7% | | | | | | | | | | | | |
| | | | | |
| | 16,128 | | | Abiomed, Inc., (2) | | | | | | | | | | | | | | | 1,693,279 | |
| | | | | |
| | 30,492 | | | Align Technology, Inc., (2) | | | | | | | | | | | | | | | 2,619,873 | |
| | | | | |
| | 18,629 | | | Halyard Health Inc., (2) | | | | | | | | | | | | | | | 602,648 | |
| | | | | |
| | 23,191 | | | Hill Rom Holdings Inc. | | | | | | | | | | | | | | | 1,285,013 | |
| | | | | |
| | 38,100 | | | Idexx Labs Inc., (2) | | | | | | | | | | | | | | | 4,082,034 | |
| | | | | |
| | 16,862 | | | Livanova PLC, (2) | | | | | | | | | | | | | | | 955,738 | |
| | | | | |
| | 20,271 | | | NuVasive, Inc., (2) | | | | | | | | | | | | | | | 1,210,787 | |
| | | | | |
| | 56,683 | | | ResMed Inc., (3) | | | | | | | | | | | | | | | 3,387,943 | |
| | | | | |
| | 34,537 | | | Steris PLC | | | | | | | | | | | | | | | 2,307,762 | |
| | | | | |
| | 17,845 | | | Teleflex Inc. | | | | | | | | | | | | | | | 2,554,155 | |
| | | | | |
| | 29,254 | | | West Pharmaceutical Services Inc. | | | | | | | | | | | | | | | 2,224,182 | |
| | | | Total Health Care Equipment & Supplies | | | | | | | | | | | | | | | 22,923,414 | |
| | | | | |
| | | | Health Care Providers & Services – 1.8% | | | | | | | | | | | | |
| | | | | |
| | 21,709 | | | AmSurg Corporation, (2) | | | | | | | | | | | | | | | 1,297,113 | |
| | | | | |
| | 18,390 | | | Lifepoint Health Inc., (2) | | | | | | | | | | | | | | | 1,100,642 | |
| | | | | |
| | 37,826 | | | Medax Inc., (2) | | | | | | | | | | | | | | | 2,316,843 | |
| | | | | |
| | 16,026 | | | Molina Healthcare Inc., (2), (3) | | | | | | | | | | | | | | | 871,975 | |
| | | | | |
| | 25,485 | | | Owens and Minor Inc. | | | | | | | | | | | | | | | 826,988 | |
| | | | | |
| | 32,083 | | | Tenet Healthcare Corporation, (2) | | | | | | | | | | | | | | | 632,356 | |
| | | | | |
| | 32,333 | | | VCA Antech, Inc., (2), (3) | | | | | | | | | | | | | | | 1,987,186 | |
| | | | | |
| | 17,721 | | | Wellcare Health Plans Inc., (2) | | | | | | | | | | | | | | | 2,011,511 | |
| | | | Total Health Care Providers & Services | | | | | | | | | | | | | | | 11,044,614 | |
| | | | | |
| | | | Health Care Technology – 0.1% | | | | | | | | | | | | |
| | | | | |
| | 76,054 | | | Allscripts Healthcare Solutions Inc., (2) | | | | | | | | | | | | | | | 913,409 | |
| | | | | |
| | | | Hotels, Restaurants & Leisure – 2.6% | | | | | | | | | | | | |
| | | | | |
| | 25,089 | | | Brinker International Inc. | | | | | | | | | | | | | | | 1,235,382 | |
| | | | | |
| | 7,312 | | | Buffalo Wild Wings, Inc., (2) | | | | | | | | | | | | | | | 1,064,993 | |
| | | | | |
| | 9,589 | | | CBRL Group Inc., (3) | | | | | | | | | | | | | | | 1,323,282 | |
| | | | | |
| | 17,061 | | | Cheesecake Factory Inc. | | | | | | | | | | | | | | | 907,475 | |
| | | | | |
| | 4,890 | | | Churchill Downs Inc. | | | | | | | | | | | | | | | 665,040 | |
| | | | | |
| | 19,936 | | | Dominos Pizza Inc., (3) | | | | | | | | | | | | | | | 3,373,969 | |
| | | | | |
| | 35,654 | | | Dunkin Brands Group Inc. | | | | | | | | | | | | | | | 1,724,227 | |
| | | | | | | | | | | | | | | | | | | | |
| Shares | | | Description (1) | | | | | | | | | | | Value | |
| | | | | |
| | | | Hotels, Restaurants & Leisure (continued) | | | | | | | | | | | | |
| | | | | |
| | 11,274 | | | Intl Speedway Corporation | | | | | | | | | | | | | | $ | 370,915 | |
| | | | | |
| | 14,885 | | | Jack in the Box Inc. | | | | | | | | | | | | | | | 1,395,171 | |
| | | | | |
| | 9,541 | | | Panera Bread Company, (2) | | | | | | | | | | | | | | | 1,820,041 | |
| | | | | |
| | 24,572 | | | Texas Roadhouse, Inc. | | | | | | | | | | | | | | | 995,657 | |
| | | | | |
| | 94,869 | | | The Wendy’s Company | | | | | | | | | | | | | | | 1,028,380 | |
| | | | Total Hotels, Restaurants & Leisure | | | | | | | | | | | | | | | 15,904,532 | |
| | | | | |
| | | | Household Durables – 1.5% | | | | | | | | | | | | |
| | | | | |
| | 30,676 | | | CalAtlantic Group Inc. | | | | | | | | | | | | | | | 991,448 | |
| | | | | |
| | 10,053 | | | Helen of Troy Limited, (2) | | | | | | | | | | | | | | | 819,319 | |
| | | | | |
| | 36,339 | | | KB Home | | | | | | | | | | | | | | | 528,369 | |
| | | | | |
| | 1,475 | | | NVR Inc., (2), (3) | | | | | | | | | | | | | | | 2,246,425 | |
| | | | | |
| | 23,553 | | | Tempur Sealy International, Inc., (2), (3) | | | | | | | | | | | | | | | 1,273,511 | |
| | | | | |
| | 62,492 | | | Toll Brothers Inc., (2) | | | | | | | | | | | | | | | 1,714,780 | |
| | | | | |
| | 58,898 | | | Tri Pointe Group, Incorporated, (2) | | | | | | | | | | | | | | | 637,865 | |
| | | | | |
| | 20,524 | | | Tupperware Corporation | | | | | | | | | | | | | | | 1,221,588 | |
| | | | Total Household Durables | | | | | | | | | | | | | | | 9,433,305 | |
| | | | | |
| | | | Household Products – 0.2% | | | | | | | | | | | | |
| | | | | |
| | 24,911 | | | Energizer Holdings, Inc. | | | | | | | | | | | | | | | 1,158,611 | |
| | | | | |
| | | | Independent Power & Renewable Electricity Producers – 0.1% | | | | | | | | | | | | |
| | | | | |
| | 33,375 | | | Talen Energy Corporation, (2) | | | | | | | | | | | | | | | 464,914 | |
| | | | | |
| | | | Industrial Conglomerates – 0.4% | | | | | | | | | | | | |
| | | | | |
| | 25,887 | | | Carlisle Companies Inc. | | | | | | | | | | | | | | | 2,714,252 | |
| | | | | |
| | | | Insurance – 5.1% | | | | | | | | | | | | |
| | | | | |
| | 6,538 | | | Alleghany Corporation, Term Loan, (2) | | | | | | | | | | | | | | | 3,374,981 | |
| | | | | |
| | 28,928 | | | American Financial Group Inc. | | | | | | | | | | | | | | | 2,155,136 | |
| | | | | |
| | 26,433 | | | Aspen Insurance Holdings Limited | | | | | | | | | | | | | | | 1,275,392 | |
| | | | | |
| | 48,019 | | | Brown & Brown Inc. | | | | | | | | | | | | | | | 1,769,980 | |
| | | | | |
| | 80,145 | | | CNO Financial Group Inc. | | | | | | | | | | | | | | | 1,208,587 | |
| | | | | |
| | 17,367 | | | Endurance Specialty Holdings Limited | | | | | | | | | | | | | | | 1,596,896 | |
| | | | | |
| | 18,550 | | | Everest Reinsurance Group Ltd | | | | | | | | | | | | | | | 3,775,296 | |
| | | | | |
| | 43,155 | | | First American Corporation | | | | | | | | | | | | | | | 1,685,634 | |
| | | | | |
| | 200,163 | | | Genworth Financial Inc., Class A, (2) | | | | | | | | | | | | | | | 828,675 | |
| | | | | |
| | 17,796 | | | Hanover Insurance Group Inc. | | | | | | | | | | | | | | | 1,355,877 | |
| | | | | |
| | 20,946 | | | Kemper Corporation | | | | | | | | | | | | | | | 786,522 | |
| | | | | |
| | 14,657 | | | Mercury General Corporation | | | | | | | | | | | | | | | 798,367 | |
| | | | | |
| | 97,875 | | | Old Republic International Corporation | | | | | | | | | | | | | | | 1,650,173 | |
| | | | | |
| | 21,981 | | | Primerica Inc., (3) | | | | | | | | | | | | | | | 1,202,361 | |
| | | | | |
| | 28,133 | | | Reinsurance Group of America Inc. | | | | | | | | | | | | | | | 3,034,425 | |
Nuveen Mid Cap Index Fund (continued)
| | |
| Portfolio of Investments | | October 31, 2016 |
| | | | | | | | | | | | | | | | | | | | |
| Shares | | | Description (1) | | | | | | | | | | | Value | |
| | | | | |
| | | | Insurance (continued) | | | | | | | | | | | | |
| | | | | |
| | 16,378 | | | RenaissasnceRE Holdings, Limited | | | | | | | | | | | | | | $ | 2,035,622 | |
| | | | | |
| | 42,760 | | | WR Berkley Corporation | | | | | | | | | | | | | | | 2,441,596 | |
| | | | Total Insurance | | | | | | | | | | | | | | | 30,975,520 | |
| | | | | |
| | | | Internet and Direct Marketing Retail – 0.1% | | | | | | | | | | | | |
| | | | | |
| | 13,878 | | | Hosting Site Network, Inc. | | | | | | | | | | | | | | | 523,201 | |
| | | | | |
| | | | Internet Software & Services – 0.7% | | | | | | | | | | | | |
| | | | | |
| | 19,099 | | | ComScore Inc., (2) | | | | | | | | | | | | | | | 549,860 | |
| | | | | |
| | 18,548 | | | J2 Global Inc., (3) | | | | | | | | | | | | | | | 1,319,690 | |
| | | | | |
| | 43,093 | | | Rackspace Hosting Inc., (2) | | | | | | | | | | | | | | | 1,376,390 | |
| | | | | |
| | 15,125 | | | WebMD Health Corporation, Class A, (2), (3) | | | | | | | | | | | | | | | 743,091 | |
| | | | Total Internet Software & Services | | | | | | | | | | | | | | | 3,989,031 | |
| | | | | |
| | | | IT Services – 3.8% | | | | | | | | | | | | |
| | | | | |
| | 31,085 | | | Acxiom Corporation, (2) | | | | | | | | | | | | | | | 732,363 | |
| | | | | |
| | 48,742 | | | Broadridge Financial Solutions, Inc. | | | | | | | | | | | | | | | 3,151,658 | |
| | | | | |
| | 55,839 | | | Computer Sciences Corporation | | | | | | | | | | | | | | | 3,040,434 | |
| | | | | |
| | 40,988 | | | Convergys Corporation | | | | | | | | | | | | | | | 1,196,850 | |
| | | | | |
| | 37,097 | | | CoreLogic Inc. | | | | | | | | | | | | | | | 1,578,848 | |
| | | | | |
| | 11,596 | | | DST Systems Inc. | | | | | | | | | | | | | | | 1,115,071 | |
| | | | | |
| | 34,071 | | | Gartner Inc., (2) | | | | | | | | | | | | | | | 2,931,469 | |
| | | | | |
| | 32,047 | | | Henry Jack and Associates Inc. | | | | | | | | | | | | | | | 2,596,448 | |
| | | | | |
| | 57,604 | | | Leidos Holdings Inc. | | | | | | | | | | | | | | | 2,394,598 | |
| | | | | |
| | 26,383 | | | Maximus Inc. | | | | | | | | | | | | | | | 1,373,499 | |
| | | | | |
| | 22,658 | | | NeuStar, Inc., (2), (3) | | | | | | | | | | | | | | | 508,672 | |
| | | | | |
| | 16,476 | | | Science Applications International Corporation | | | | | | | | | | | | | | | 1,135,361 | |
| | | | | |
| | 15,653 | | | WEX, Inc., (2) | | | | | | | | | | | | | | | 1,707,742 | |
| | | | Total IT Services | | | | | | | | | | | | | | | 23,463,013 | |
| | | | | |
| | | | Leisure Products – 0.7% | | | | | | | | | | | | |
| | | | | |
| | 37,454 | | | Brunswick Corporation | | | | | | | | | | | | | | | 1,629,249 | |
| | | | | |
| | 25,091 | | | Polaris Industries Inc., (3) | | | | | | | | | | | | | | | 1,922,222 | |
| | | | | |
| | 26,105 | | | Vista Outdoor Inc., (2) | | | | | | | | | | | | | | | 1,009,480 | |
| | | | Total Leisure Products | | | | | | | | | | | | | | | 4,560,951 | |
| | | | | |
| | | | Life Sciences Tools & Services – 0.9% | | | | | | | | | | | | |
| | | | | |
| | 8,149 | | | Bio-Rad Laboratories Inc., (2) | | | | | | | | | | | | | | | 1,288,194 | |
| | | | | |
| | 14,057 | | | Bio-Techne Corporation | | | | | | | | | | | | | | | 1,461,787 | |
| | | | | |
| | 19,537 | | | Charles River Laboratories International, Inc., (2) | | | | | | | | | | | | | | | 1,482,468 | |
| | | | | |
| | 22,030 | | | Parexel International Corporation, (2) | | | | | | | | | | | | | | | 1,283,468 | |
| | | | Total Life Sciences Tools & Services | | | | | | | | | | | | | | | 5,515,917 | |
| | | | | | | | | | | | | | | | | | | | |
| Shares | | | Description (1) | | | | | | | | | | | Value | |
| | | | | |
| | | | Machinery – 4.7% | | | | | | | | | | | | |
| | | | | |
| | 29,487 | | | AGCO Corporation | | | | | | | | | | | | | | $ | 1,506,196 | |
| | | | | |
| | 20,365 | | | CLARCOR, Inc. | | | | | | | | | | | | | | | 1,266,907 | |
| | | | | |
| | 19,965 | | | Crane Company | | | | | | | | | | | | | | | 1,357,820 | |
| | | | | |
| | 53,124 | | | Donaldson Company, Inc. | | | | | | | | | | | | | | | 1,940,088 | |
| | | | | |
| | 22,418 | | | Graco Inc. | | | | | | | | | | | | | | | 1,679,108 | |
| | | | | |
| | 30,680 | | | IDEX Corporation | | | | | | | | | | | | | | | 2,651,979 | |
| | | | | |
| | 37,040 | | | ITT Industries, Inc. | | | | | | | | | | | | | | | 1,304,549 | |
| | | | | |
| | 39,221 | | | Joy Global Inc. | | | | | | | | | | | | | | | 1,091,520 | |
| | | | | |
| | 31,735 | | | Kennametal Inc. | | | | | | | | | | | | | | | 898,418 | |
| | | | | |
| | 26,438 | | | Lincoln Electric Holdings Inc. | | | | | | | | | | | | | | | 1,740,414 | |
| | | | | |
| | 24,173 | | | Nordson Corporation | | | | | | | | | | | | | | | 2,420,442 | |
| | | | | |
| | 29,363 | | | Oshkosh Truck Corporation | | | | | | | | | | | | | | | 1,570,921 | |
| | | | | |
| | 44,553 | | | Terex Corporation | | | | | | | | | | | | | | | 1,063,926 | |
| | | | | |
| | 30,969 | | | Timken Company | | | | | | | | | | | | | | | 1,023,525 | |
| | | | | |
| | 35,822 | | | Toro Company | | | | | | | | | | | | | | | 1,715,157 | |
| | | | | |
| | 62,574 | | | Trinity Industries Inc. | | | | | | | | | | | | | | | 1,335,955 | |
| | | | | |
| | 37,780 | | | Wabtec Corporation | | | | | | | | | | | | | | | 2,920,772 | |
| | | | | |
| | 23,835 | | | Woodward Governor Company | | | | | | | | | | | | | | | 1,405,788 | |
| | | | Total Machinery | | | | | | | | | | | | | | | 28,893,485 | |
| | | | | |
| | | | Marine – 0.2% | | | | | | | | | | | | |
| | | | | |
| | 21,704 | | | Kirby Corporation, (2) | | | | | | | | | | | | | | | 1,279,451 | |
| | | | | |
| | | | Media – 1.3% | | | | | | | | | | | | |
| | | | | |
| | 23,873 | | | AMC Networks Inc., Class A Shares, (2) | | | | | | | | | | | | | | | 1,168,106 | |
| | | | | |
| | 1,774 | | | Cable One, Inc. | | | | | | | | | | | | | | | 1,023,137 | |
| | | | | |
| | 42,058 | | | Cinemark Holdings Inc. | | | | | | | | | | | | | | | 1,673,908 | |
| | | | | |
| | 18,915 | | | John Wiley and Sons Inc., Class A | | | | | | | | | | | | | | | 976,014 | |
| | | | | |
| | 57,485 | | | Live Nation Inc., (2) | | | | | | | | | | | | | | | 1,590,610 | |
| | | | | |
| | 14,948 | | | Meredith Corporation | | | | | | | | | | | | | | | 677,892 | |
| | | | | |
| | 50,986 | | | New York Times, Class A | | | | | | | | | | | | | | | 555,747 | |
| | | | | |
| | 45,071 | | | Time Inc. | | | | | | | | | | | | | | | 585,923 | |
| | | | Total Media | | | | | | | | | | | | | | | 8,251,337 | |
| | | | | |
| | | | Metals & Mining – 1.9% | | | | | | | | | | | | |
| | | | | |
| | 43,488 | | | Allegheny Technologies, Inc., (3) | | | | | | | | | | | | | | | 593,176 | |
| | | | | |
| | 19,695 | | | Carpenter Technology Inc. | | | | | | | | | | | | | | | 622,559 | |
| | | | | |
| | 47,560 | | | Commercial Metals Company | | | | | | | | | | | | | | | 747,168 | |
| | | | | |
| | 13,545 | | | Compass Minerals International, Inc., (3) | | | | | | | | | | | | | | | 973,208 | |
| | | | | |
| | 28,723 | | | Reliance Steel & Aluminum Company | | | | | | | | | | | | | | | 1,975,568 | |
| | | | | |
| | 26,244 | | | Royal Gold, Inc. | | | | | | | | | | | | | | | 1,806,112 | |
| | | | | |
| | 96,647 | | | Steel Dynamics Inc., (3) | | | | | | | | | | | | | | | 2,653,927 | |
Nuveen Mid Cap Index Fund (continued)
| | |
| Portfolio of Investments | | October 31, 2016 |
| | | | | | | | | | | | | | | | | | | | |
| Shares | | | Description (1) | | | | | | | | | | | Value | |
| | | | | |
| | | | Metals & Mining (continued) | | | | | | | | | | | | |
| | | | | |
| | 68,267 | | | United States Steel Corporation, (3) | | | | | | | | | | | | | | $ | 1,320,284 | |
| | | | | |
| | 18,547 | | | Worthington Industries, Inc. | | | | | | | | | | | | | | | 871,709 | |
| | | | Total Metals & Mining | | | | | | | | | | | | | | | 11,563,711 | |
| | | | | |
| | | | Multiline Retail – 0.3% | | | | | | | | | | | | |
| | | | | |
| | 19,868 | | | Big Lots, Inc., (3) | | | | | | | | | | | | | | | 862,271 | |
| | | | | |
| | 123,108 | | | J.C. Penney Company, Inc., (3) | | | | | | | | | | | | | | | 1,057,498 | |
| | | | Total Multiline Retail | | | | | | | | | | | | | | | 1,919,769 | |
| | | | | |
| | | | Multi-Utilities – 1.0% | | | | | | | | | | | | |
| | | | | |
| | 20,562 | | | Black Hills Corporation, (3) | | | | | | | | | | | | | | | 1,271,760 | |
| | | | | |
| | 77,395 | | | MDU Resources Group Inc. | | | | | | | | | | | | | | | 2,028,523 | |
| | | | | |
| | 19,377 | | | Northwestern Corporation | | | | | | | | | | | | | | | 1,115,146 | |
| | | | | |
| | 33,310 | | | Vectren Corporation | | | | | | | | | | | | | | | 1,675,826 | |
| | | | Total Multi-Utilities | | | | | | | | | | | | | | | 6,091,255 | |
| | | | | |
| | | | Oil, Gas & Consumable Fuels – 2.1% | | | | | | | | | | | | |
| | | | | |
| | 75,281 | | | CONSOL Energy Inc., (3) | | | | | | | | | | | | | | | 1,276,013 | |
| | | | | |
| | 160,801 | | | Denbury Resources Inc., (3) | | | | | | | | | | | | | | | 384,314 | |
| | | | | |
| | 39,252 | | | Energen Corporation | | | | | | | | | | | | | | | 1,967,703 | |
| | | | | |
| | 49,191 | | | Gulfport Energy Corporation, (2) | | | | | | | | | | | | | | | 1,185,995 | |
| | | | | |
| | 75,076 | | | HollyFrontier Company | | | | | | | | | | | | | | | 1,873,146 | |
| | | | | |
| | 96,279 | | | QEP Resources Inc. | | | | | | | | | | | | | | | 1,547,204 | |
| | | | | |
| | 35,201 | | | SM Energy Company, (3) | | | | | | | | | | | | | | | 1,183,810 | |
| | | | | |
| | 32,632 | | | Western Refining Inc. | | | | | | | | | | | | | | | 941,433 | |
| | | | | |
| | 28,379 | | | World Fuel Services Corporation | | | | | | | | | | | | | | | 1,142,255 | |
| | | | | |
| | 138,763 | | | WPX Energy Inc., (2) | | | | | | | | | | | | | | | 1,506,966 | |
| | | | Total Oil, Gas & Consumable Fuels | | | | | | | | | | | | | | | 13,008,839 | |
| | | | | |
| | | | Paper & Forest Products – 0.3% | | | | | | | | | | | | |
| | | | | |
| | 26,244 | | | Domtar Corporation | | | | | | | | | | | | | | | 943,472 | |
| | | | | |
| | 57,007 | | | Louisiana-Pacific Corporation, (2) | | | | | | | | | | | | | | | 1,046,078 | |
| | | | Total Paper & Forest Products | | | | | | | | | | | | | | | 1,989,550 | |
| | | | | |
| | | | Personal Products – 0.5% | | | | | | | | | | | | |
| | | | | |
| | 173,242 | | | Avon Products, Inc. | | | | | | | | | | | | | | | 1,134,735 | |
| | | | | |
| | 24,911 | | | Edgewell Personal Care Co | | | | | | | | | | | | | | | 1,878,289 | |
| | | | Total Personal Products | | | | | | | | | | | | | | | 3,013,024 | |
| | | | | |
| | | | Pharmaceuticals – 0.5% | | | | | | | | | | | | |
| | | | | |
| | 35,388 | | | Akorn, Inc., (2) | | | | | | | | | | | | | | | 847,543 | |
| | | | | |
| | 50,550 | | | Catalent, Inc., (2) | | | | | | | | | | | | | | | 1,153,046 | |
| | | | | |
| | 21,336 | | | Prestige Brands Holdings Inc., (2) | | | | | | | | | | | | | | | 966,094 | |
| | | | Total Pharmaceuticals | | | | | | | | | | | | | | | 2,966,683 | |
| | | | | | | | | | | | | | | | | | | | |
| Shares | | | Description (1) | | | | | | | | | | | Value | |
| | | | | |
| | | | Professional Services – 0.6% | | | | | | | | | | | | |
| | | | | |
| | 13,653 | | | CEB Inc. | | | | | | | | | | | | | | $ | 664,218 | |
| | | | | |
| | 16,502 | | | FTI Consulting Inc., (2) | | | | | | | | | | | | | | | 642,918 | |
| | | | | |
| | 29,516 | | | Manpower Inc. | | | | | | | | | | | | | | | 2,266,829 | |
| | | | Total Professional Services | | | | | | | | | | | | | | | 3,573,965 | |
| | | | | |
| | | | Real Estate Management & Development – 0.4% | | | | | | | | | | | | |
| | | | | |
| | 18,623 | | | Alexander & Baldwin Inc. | | | | | | | | | | | | | | | 778,255 | |
| | | | | |
| | 18,000 | | | Jones Lang LaSalle Inc. | | | | | | | | | | | | | | | 1,743,300 | |
| | | | Total Real Estate Management & Development | | | | | | | | | | | | | | | 2,521,555 | |
| | | | | |
| | | | Road & Rail – 1.1% | | | | | | | | | | | | |
| | | | | |
| | 38,145 | | | Avis Budget Group Inc., (2) | | | | | | | | | | | | | | | 1,234,372 | |
| | | | | |
| | 23,062 | | | Genesee & Wyoming Inc., (2) | | | | | | | | | | | | | | | 1,566,832 | |
| | | | | |
| | 18,068 | | | Landstar System | | | | | | | | | | | | | | | 1,285,538 | |
| | | | | |
| | 28,192 | | | Old Dominion Freight Line, (2) | | | | | | | | | | | | | | | 2,105,379 | |
| | | | | |
| | 17,344 | | | Werner Enterprises, Inc. | | | | | | | | | | | | | | | 417,123 | |
| | | | Total Road & Rail | | | | | | | | | | | | | | | 6,609,244 | |
| | | | | |
| | | | Semiconductors & Semiconductor Equipment – 2.5% | | | | | | | | | | | | |
| | | | | |
| | 294,460 | | | Advanced Micro Devices, Inc., (2) | | | | | | | | | | | | | | | 2,128,944 | |
| | | | | |
| | 25,155 | | | Cirrus Logic Inc., (2) | | | | | | | | | | | | | | | 1,357,867 | |
| | | | | |
| | 41,254 | | | Cree, Inc., (2), (3) | | | | | | | | | | | | | | | 919,964 | |
| | | | | |
| | 132,849 | | | Cypress Semiconductor Corporation, (3) | | | | | | | | | | | | | | | 1,324,505 | |
| | | | | |
| | 57,253 | | | Integrated Device Technology, Inc., (2) | | | | | | | | | | | | | | | 1,185,710 | |
| | | | | |
| | 52,016 | | | Intersil Holding Corporation, Class A | | | | | | | | | | | | | | | 1,148,513 | |
| | | | | |
| | 42,902 | | | Microsemi Corporation, (2), (3) | | | | | | | | | | | | | | | 1,807,461 | |
| | | | | |
| | 15,047 | | | Monolithic Power Systems, Inc. | | | | | | | | | | | | | | | 1,185,854 | |
| | | | | |
| | 16,148 | | | Silicon Laboratories Inc., (2) | | | | | | | | | | | | | | | 968,073 | |
| | | | | |
| | 14,652 | | | Synaptics, Inc., (2) | | | | | | | | | | | | | | | 763,662 | |
| | | | | |
| | 82,674 | | | Teradyne Inc. | | | | | | | | | | | | | | | 1,925,477 | |
| | | | | |
| | 33,573 | | | Versum Materials, Inc., (2) | | | | | | | | | | | | | | | 762,107 | |
| | | | Total Semiconductors & Semiconductor Equipment | | | | | | | | | | | | | | | 15,478,137 | |
| | | | | |
| | | | Software – 4.6% | | | | | | | | | | | | |
| | | | | |
| | 46,389 | | | ACI Worldwide, Inc., (2) | | | | | | | | | | | | | | | 840,569 | |
| | | | | |
| | 37,429 | | | Ansys Inc., (2) | | | | | | | | | | | | | | | 3,419,139 | |
| | | | | |
| | 116,942 | | | Cadence Design Systems, Inc., (2) | | | | | | | | | | | | | | | 2,991,376 | |
| | | | | |
| | 64,410 | | | CDK Global Inc. | | | | | | | | | | | | | | | 3,517,430 | |
| | | | | |
| | 17,917 | | | CommVault Systems, Inc., (2) | | | | | | | | | | | | | | | 958,560 | |
| | | | | |
| | 12,743 | | | Fair Isaac Corporation | | | | | | | | | | | | | | | 1,537,825 | |
| | | | | |
| | 55,330 | | | Fortinet Inc., (2) | | | | | | | | | | | | | | | 1,773,880 | |
| | | | | |
| | 29,493 | | | Manhattan Associates Inc., (2) | | | | | | | | | | | | | | | 1,493,526 | |
| | | | | |
| | 39,112 | | | Mentor Graphics Corporation | | | | | | | | | | | | | | | 1,130,337 | |
Nuveen Mid Cap Index Fund (continued)
| | |
| Portfolio of Investments | | October 31, 2016 |
| | | | | | | | | | | | | | | | | | | | |
| Shares | | | Description (1) | | | | | | | | | | | Value | |
| | | | | |
| | | | Software (continued) | | | | | | | | | | | | |
| | | | | |
| | 47,914 | | | Parametric Technology Corporation, (2) | | | | | | | | | | | | | | $ | 2,273,040 | |
| | | | | |
| | 62,501 | | | Synopsys Inc., (2) | | | | | | | | | | | | | | | 3,706,932 | |
| | | | | |
| | 13,477 | | | Tyler Technologies Inc., (2) | | | | | | | | | | | | | | | 2,161,711 | |
| | | | | |
| | 11,450 | | | Ultimate Software Group, Inc., (2) | | | | | | | | | | | | | | | 2,415,835 | |
| | | | Total Software | | | | | | | | | | | | | | | 28,220,160 | |
| | | | | |
| | | | Specialty Retail – 2.2% | | | | | | | | | | | | |
| | | | | |
| | 26,507 | | | Aaron Rents Inc., (3) | | | | | | | | | | | | | | | 654,988 | |
| | | | | |
| | 69,104 | | | American Eagle Outfitters, Inc., (3) | | | | | | | | | | | | | | | 1,177,532 | |
| | | | | |
| | 64,679 | | | Ascena Retail Group Inc., (2) | | | | | | | | | | | | | | | 316,280 | |
| | | | | |
| | 18,934 | | | Cabela’s Incorporated, (2) | | | | | | | | | | | | | | | 1,166,524 | |
| | | | | |
| | 53,208 | | | Chico’s FAS, Inc. | | | | | | | | | | | | | | | 620,937 | |
| | | | | |
| | 30,545 | | | CST Brands Inc. | | | | | | | | | | | | | | | 1,466,771 | |
| | | | | |
| | 36,117 | | | Dick’s Sporting Goods Inc. | | | | | | | | | | | | | | | 2,009,911 | |
| | | | | |
| | 42,210 | | | GameStop Corporation, (3) | | | | | | | | | | | | | | | 1,015,151 | |
| | | | | |
| | 15,707 | | | Murphy USA Inc., (2) | | | | | | | | | | | | | | | 1,080,327 | |
| | | | | |
| | 196,559 | | | Office Depot, Inc. | | | | | | | | | | | | | | | 619,161 | |
| | | | | |
| | 15,120 | | | Restoration Hardware Holdings Incorporated, (2), (3) | | | | | | | | | | | | | | | 438,026 | |
| | | | | |
| | 52,276 | | | Sally Beauty Holdings Inc., (2) | | | | | | | | | | | | | | | 1,356,039 | |
| | | | | |
| | 33,526 | | | Williams-Sonoma Inc. | | | | | | | | | | | | | | | 1,549,572 | |
| | | | Total Specialty Retail | | | | | | | | | | | | | | | 13,471,219 | |
| | | | | |
| | | | Technology Hardware, Storage & Peripherals – 0.6% | | | | | | | | | | | | |
| | | | | |
| | 41,665 | | | 3D Systems Corporation, (2), (3) | | | | | | | | | | | | | | | 577,894 | |
| | | | | |
| | 26,092 | | | Diebold Inc. | | | | | | | | | | | | | | | 568,806 | |
| | | | | |
| | 25,150 | | | Lexmark International, Inc., Class A | | | | | | | | | | | | | | | 998,204 | |
| | | | | |
| | 49,546 | | | NCR Corporation, (2) | | | | | | | | | | | | | | | 1,736,587 | |
| | | | Total Technology Hardware, Storage & Peripherals | | | | | | | | | | | | | | | 3,881,491 | |
| | | | | |
| | | | Textiles, Apparel & Luxury Goods – 0.8% | | | | | | | | | | | | |
| | | | | |
| | 21,689 | | | Carter’s Inc. | | | | | | | | | | | | | | | 1,872,628 | |
| | | | | |
| | 13,751 | | | Deckers Outdoor Corporation, (2) | | | | | | | | | | | | | | | 717,665 | |
| | | | | |
| | 12,616 | | | Fossil Group Inc., (2), (3) | | | | | | | | | | | | | | | 344,038 | |
| | | | | |
| | 51,116 | | | Kate Spade & Company, (2) | | | | | | | | | | | | | | | 856,193 | |
| | | | | |
| | 52,296 | | | Skechers USA Inc., (2) | | | | | | | | | | | | | | | 1,099,785 | |
| | | | Total Textiles, Apparel & Luxury Goods | | | | | | | | | | | | | | | 4,890,309 | |
| | | | | |
| | | | Thrifts & Mortgage Finance – 0.6% | | | | | | | | | | | | |
| | | | | |
| | 195,124 | | | New York Community Bancorp Inc. | | | | | | | | | | | | | | | 2,801,981 | |
| | | | | |
| | 40,929 | | | Washington Federal Inc. | | | | | | | | | | | | | | | 1,115,315 | |
| | | | Total Thrifts & Mortgage Finance | | | | | | | | | | | | | | | 3,917,296 | |
| | | | | |
| | | | Trading Companies & Distributors – 0.7% | | | | | | | | | | | | |
| | | | | |
| | 18,597 | | | GATX Corporation, (3) | | | | | | | | | | | | | | | 813,991 | |
| | | | | | | | | | | | | | | | | | | | |
| Shares | | | Description (1) | | | | | | | | | | | Value | |
| | | | | |
| | | | Trading Companies & Distributors (continued) | | | | | | | | | | | | |
| | | | | |
| | 19,131 | | | MSC Industrial Direct Inc., Class A | | | | | | | | | | | | | | $ | 1,392,737 | |
| | | | | |
| | 43,336 | | | NOW Inc., (2) | | | | | | | | | | | | | | | 934,324 | |
| | | | | |
| | 10,308 | | | Watsco Inc. | | | | | | | | | | | | | | | 1,415,184 | |
| | | | Total Trading Companies & Distributors | | | | | | | | | | | | | | | 4,556,236 | |
| | | | | |
| | | | Water Utilities – 0.4% | | | | | | | | | | | | |
| | | | | |
| | 71,520 | | | Aqua America Inc. | | | | | | | | | | | | | | | 2,195,664 | |
| | | | | |
| | | | Wireless Telecommunication Services – 0.2% | | | | | | | | | | | | |
| | | | | |
| | 39,973 | | | Telephone and Data Systems Inc. | | | | | | | | | | | | | | | 1,032,902 | |
| | | | Total Common Stocks (cost $460,796,537) | | | | | | | | | | | | | | | 596,947,782 | |
| | | | | |
| Shares | | | Description (1) | | | | | | | | | | | Value | |
| | | | | |
| | | | COMMON STOCK RIGHTS – 0.0% | | | | | | | | | | | | | | | | |
| | | | | |
| | 100,634 | | | Community Health Systems Inc., (2) | | | | | | | | | | | | | | $ | 855 | |
| | | | Total Common Stock Rights (cost $0) | | | | | | | | | | | | | | | 855 | |
| | | | Total Long-Term Investments (cost $460,796,537) | | | | | | | | | | | | | | | 596,948,637 | |
| | | | | |
| Shares | | | Description (1) | | | | | | | | | | | Value | |
| | |
| | | | INVESTMENTS PURCHASED WITH COLLATERAL FROM SECURITIES LENDING – 5.6% | | | | | |
| | | | | |
| | | | Money Market Funds – 5.6% | | | | | | | | | | | | |
| | | | | |
| | 34,332,343 | | | First American Government Obligations Fund, Class X, 0.283%, (5), (6) | | | | | | | | | | | | | | $ | 34,332,343 | |
| | | | Total Investments Purchased with Collateral from Securities Lending (cost $34,332,343) | | | | | | | | 34,332,343 | |
| | | | | |
Shares/
Principal
Amount (000) | | | Description (1) | | Coupon | | | Maturity | | | Ratings (7) | | | Value | |
| | | | | |
| | | | SHORT-TERM INVESTMENTS – 2.8% | | | | | | | | | | | | | | | | |
| | | | | |
| | | | Money Market Funds – 2.3% | | | | | | | | | | | | |
| | | | | |
| | 14,046,458 | | | First American Treasury Obligations Fund, Class Z | | | 0.222% (5) | | | | N/A | | | | N/A | | | $ | 14,046,458 | |
| | | |
| | | | U.S. Government and Agency Obligations – 0.5% | | | | | | | |
| | | | | |
| $ | 3,000 | | | U.S. Treasury Bills, (8) | | | 0.000% | | | | 2/02/17 | | | | AAA | | | | 2,997,319 | |
| | | | Total Short-Term Investments (cost $17,043,258) | | | | | | | | | | | | | | | 17,043,777 | |
| | | | Total Investments (cost $512,172,138) – 105.8% | | | | | | | | | | | | | | | 648,324,757 | |
| | | | Other Assets Less Liabilities – (5.8)% (9) | | | | | | | | | | | | | | | (35,678,946) | |
| | | | Net Assets – 100% | | | | | | | | | | | | | | $ | 612,645,811 | |
Nuveen Mid Cap Index Fund (continued)
| | |
| Portfolio of Investments | | October 31, 2016 |
Investments in Derivatives as of October 31, 2016
Futures Contracts
| | | | | | | | | | | | | | | | | | | | | | | | |
| Description | | Contract
Position | | | Number of
Contracts | | | Contract
Expiration | | | Notional
Amount
at Value | | | Variation
Margin
Receivable/
(Payable) | | | Unrealized
Appreciation
(Depreciation) | |
| S&P MidCap 400® E-Mini Index | | | Long | | | | 113 | | | | 12/16 | | | $ | 17,026,840 | | | $ | 128,030 | | | $ | (193,195 | ) |
For Fund portfolio compliance purposes, the Fund’s industry classifications refer to any one or more of the industry sub-classifications used by one or more widely recognized market indexes or ratings group indexes, and/or as defined by Fund management. This definition may not apply for purposes of this report which may combine industry sub-classifications into sectors for reporting ease.
| (1) | All percentages shown in the Portfolio of Investments are based on net assets. |
| (2) | Non-income producing; issuer has not declared a dividend within the past twelve months. |
| (3) | Investment, or a portion of investment, is out on loan for securities lending. The total value of the securities out on loan as of the end of the reporting period was $33,506,591. |
| (4) | Shares round to less than 1. |
| (5) | The rate shown is the annualized seven-day subsidized yield as of the end of the reporting period. |
| (6) | The Fund may loan securities representing up to one third of the fair value of its total assets (which includes collateral for securities on loan) to broker dealers, banks, and other institutions. The Fund maintains collateral equal to at least 100% of the fair value of the securities loaned. The cash collateral received by the Fund is invested in this money market fund. See Notes to Financial Statements, Note 3 – Portfolio Securities and Investments in Derivatives, Securities Lending for more information. |
| (7) | For financial reporting purposes, the ratings disclosed are the highest of Standard & Poor’s Group (“Standard & Poor’s”), Moody’s Investors Service, Inc. (“Moody’s”) or Fitch, Inc. (“Fitch”) rating. This treatment of split-rated securities may differ from that used for other purposes, such as for Fund investment policies. Ratings below BBB by Standard & Poor’s, Baa by Moody’s or BBB by Fitch are considered to be below investment grade. Holdings designated N/R are not rated by any of these national rating agencies. Rating are not covered by the report of independent registered public accounting firm. |
| (8) | Investment, or portion of investment, segregated as collateral for investments in derivatives. |
| (9) | Other assets less liabilities includes the unrealized appreciation (depreciation) of certain over-the-counter (“OTC”) derivatives as presented on the Statement of Assets and Liabilities, when applicable. The unrealized appreciation (depreciation) of OTC-cleared and exchange-traded derivatives is recognized as part of the cash collateral at broker and/or the receivable or payable for variation margin as presented on the Statement of Assets and Liabilities, when applicable. |
See accompanying notes to financial statements.
Nuveen Small Cap Index Fund
| | |
| Portfolio of Investments | | October 31, 2016 |
| | | | | | | | | | | | | | | | | | | | |
| Shares | | | Description (1) | | | | | | | | | | | Value | |
| | | | | |
| | | | LONG-TERM INVESTMENTS – 94.3% | | | | | | | | | | | | | | | | |
| | | | | |
| | | | COMMON STOCKS – 94.3% | | | | | | | | | | | | | | | | |
| | | | | |
| | | | Aerospace & Defense – 1.5% | | | | | | | | | | | | |
| | | | | |
| | 2,070 | | | AAR Corporation | | | | | | | | | | | | | | $ | 66,592 | |
| | | | | |
| | 3,730 | | | Aerojet Rocketdyne Holdings Inc., (2) | | | | | | | | | | | | | | | 65,648 | |
| | | | | |
| | 1,282 | | | Aerovironment, Inc., (2) | | | | | | | | | | | | | | | 30,755 | |
| | | | | |
| | 1,209 | | | Astronics Corporation, (2) | | | | | | | | | | | | | | | 44,757 | |
| | | | | |
| | –(5) | | | Astronics Corporation, Class B | | | | | | | | | | | | | | | 7 | |
| | | | | |
| | 1,578 | | | Cubic Corporation | | | | | | | | | | | | | | | 67,381 | |
| | | | | |
| | 2,774 | | | Curtiss Wright Corporation | | | | | | | | | | | | | | | 248,606 | |
| | | | | |
| | 3,954 | | | DigitalGlobe Inc., (2) | | | | | | | | | | | | | | | 99,245 | |
| | | | | |
| | 652 | | | Ducommon Inc. | | | | | | | | | | | | | | | 12,414 | |
| | | | | |
| | 1,275 | | | Engility Holdings Inc., (2) | | | | | | | | | | | | | | | 36,631 | |
| | | | | |
| | 1,852 | | | Esterline Technologies Corporation, (2) | | | | | | | | | | | | | | | 136,029 | |
| | | | | |
| | 2,247 | | | Keyw Holding Corporation, (2), (3) | | | | | | | | | | | | | | | 23,571 | |
| | | | | |
| | 3,307 | | | KLX Inc., (2) | | | | | | | | | | | | | | | 113,827 | |
| | | | | |
| | 2,927 | | | Kratos Defence & Security Solutions Inc., (2) | | | | | | | | | | | | | | | 16,450 | |
| | | | | |
| | 2,439 | | | Mercury Computer Systems Inc., (2) | | | | | | | | | | | | | | | 67,753 | |
| | | | | |
| | 2,002 | | | Moog Inc., CLass A Shares, (2) | | | | | | | | | | | | | | | 116,256 | |
| | | | | |
| | 313 | | | National Presto Industries Inc. | | | | | | | | | | | | | | | 27,309 | |
| | | | | |
| | 586 | | | Sparton Corporation, (2) | | | | | | | | | | | | | | | 14,023 | |
| | | | | |
| | 3,269 | | | Taser International, Inc., (2), (3) | | | | | | | | | | | | | | | 73,160 | |
| | | | | |
| | 2,143 | | | Teledyne Technologies Inc., (2) | | | | | | | | | | | | | | | 230,758 | |
| | | | | |
| | 3,087 | | | Triumph Group Inc. | | | | | | | | | | | | | | | 73,162 | |
| | | | | |
| | 681 | | | Vectrus, Inc., (2) | | | | | | | | | | | | | | | 11,420 | |
| | | | | |
| | 3,483 | | | Wesco Aircraft Holdings Inc., (2) | | | | | | | | | | | | | | | 44,757 | |
| | | | Total Aerospace & Defense | | | | | | | | | | | | | | | 1,620,511 | |
| | | | | |
| | | | Air Freight & Logistics – 0.5% | | | | | | | | | | | | |
| | | | | |
| | 3,039 | | | Air Transport Servcies Group Inc., (2) | | | | | | | | | | | | | | | 40,206 | |
| | | | | |
| | 1,560 | | | Atlas Air Worldwide Holdings Inc., (2) | | | | | | | | | | | | | | | 65,286 | |
| | | | | |
| | 1,799 | | | Echo Global Logistics, Inc., (2) | | | | | | | | | | | | | | | 38,137 | |
| | | | | |
| | 1,864 | | | Forward Air Corporation | | | | | | | | | | | | | | | 77,020 | |
| | | | | |
| | 2,098 | | | Hub Group, Inc., (2) | | | | | | | | | | | | | | | 76,472 | |
| | | | | |
| | 567 | | | Park Ohio Holdings Corporation | | | | | | | | | | | | | | | 18,116 | |
| | | | | |
| | 2,001 | | | Radiant Logistics, Inc., (2) | | | | | | | | | | | | | | | 5,003 | |
| | | | | |
| | 6,132 | | | XPO Logistics, Incorporated, (2), (3) | | | | | | | | | | | | | | | 201,927 | |
| | | | Total Air Freight & Logistics | | | | | | | | | | | | | | | 522,167 | |
Nuveen Small Cap Index Fund (continued)
| | |
| Portfolio of Investments | | October 31, 2016 |
| | | | | | | | | | | | | | | | | | | | |
| Shares | | | Description (1) | | | | | | | | | | | Value | |
| | | | | |
| | | | Airlines – 0.4% | | | | | | | | | | | | |
| | | | | |
| | 827 | | | Allegiant Travel Company | | | | | | | | | | | | | | $ | 114,043 | |
| | | | | |
| | 3,301 | | | Hawaian Holdings Inc., (2) | | | | | | | | | | | | | | | 148,628 | |
| | | | | |
| | 3,158 | | | Skywest Inc. | | | | | | | | | | | | | | | 95,214 | |
| | | | | |
| | 1,211 | | | Virgin America Inc., (2), (3) | | | | | | | | | | | | | | | 65,818 | |
| | | | Total Airlines | | | | | | | | | | | | | | | 423,703 | |
| | | | | |
| | | | Auto Components – 1.2% | | | | | | | | | | | | |
| | | | | |
| | 4,803 | | | American Axle and Manufacturing Holdings Inc. | | | | | | | | | | | | | | | 86,070 | |
| | | | | |
| | 3,468 | | | Cooper Tire & Rubber | | | | | | | | | | | | | | | 127,449 | |
| | | | | |
| | 929 | | | Cooper-Standard Holdings Inc., (2) | | | | | | | | | | | | | | | 84,790 | |
| | | | | |
| | 9,335 | | | Dana Holding Corporation | | | | | | | | | | | | | | | 144,506 | |
| | | | | |
| | 1,659 | | | Dorman Products, Inc., (2) | | | | | | | | | | | | | | | 106,574 | |
| | | | | |
| | 1,487 | | | Drew Industries Inc. | | | | | | | | | | | | | | | 133,159 | |
| | | | | |
| | 2,055 | | | Federal Mogul Corporation, Class A Shares, (2) | | | | | | | | | | | | | | | 19,029 | |
| | | | | |
| | 1,400 | | | Fox Factory Holding Corporation, (2) | | | | | | | | | | | | | | | 30,380 | |
| | | | | |
| | 2,282 | | | Gentherm Inc., (2) | | | | | | | | | | | | | | | 64,238 | |
| | | | | |
| | 1,141 | | | Horizon Global Corporation, (2) | | | | | | | | | | | | | | | 22,866 | |
| | | | | |
| | 994 | | | Metaldyne Performance Group Inc. | | | | | | | | | | | | | | | 15,357 | |
| | | | | |
| | 3,097 | | | Modine Manufacturing Company | | | | | | | | | | | | | | | 33,912 | |
| | | | | |
| | 1,145 | | | Motorcar Parts of America, Inc., (2) | | | | | | | | | | | | | | | 30,045 | |
| | | | | |
| | 2,081 | | | Spartan Motors, Inc. | | | | | | | | | | | | | | | 17,793 | |
| | | | | |
| | 1,344 | | | Standard Motor Products Inc. | | | | | | | | | | | | | | | 65,722 | |
| | | | | |
| | 1,680 | | | Stoneridge Inc., (2) | | | | | | | | | | | | | | | 24,898 | |
| | | | | |
| | 217 | | | Strattec Security Corporation | | | | | | | | | | | | | | | 7,704 | |
| | | | | |
| | 1,572 | | | Superior Industries International Inc. | | | | | | | | | | | | | | | 38,514 | |
| | | | | |
| | 3,530 | | | Tenneco Inc., (2) | | | | | | | | | | | | | | | 194,397 | |
| | | | | |
| | 1,284 | | | Tower International Inc. | | | | | | | | | | | | | | | 27,863 | |
| | | | | |
| | 436 | | | Unique Fabricating, Inc. | | | | | | | | | | | | | | | 5,446 | |
| | | | | |
| | 758 | | | Workhorse Group, Inc., (2) | | | | | | | | | | | | | | | 5,033 | |
| | | | Total Auto Components | | | | | | | | | | | | | | | 1,285,745 | |
| | | | | |
| | | | Automobiles – 0.0% | | | | | | | | | | | | |
| | | | | |
| | 1,678 | | | Winnebago Industries Inc. | | | | | | | | | | | | | | | 47,404 | |
| | | | | |
| | | | Banks – 9.8% | | | | | | | | | | | | |
| | | | | |
| | 980 | | | 1st Source Corporation | | | | | | | | | | | | | | | 33,869 | |
| | | | | |
| | 541 | | | Access National Corporation | | | | | | | | | | | | | | | 12,751 | |
| | | | | |
| | 394 | | | ACNB Corporation | | | | | | | | | | | | | | | 10,599 | |
| | | | | |
| | 726 | | | Allegiance Bancshares, Inc., (2) | | | | | | | | | | | | | | | 19,130 | |
| | | | | |
| | 513 | | | American National Bankshares, Inc. | | | | | | | | | | | | | | | 13,875 | |
| | | | | |
| | 1,951 | | | Ameris Bancorp. | | | | | | | | | | | | | | | 70,821 | |
| | | | | |
| | 536 | | | Ames National Corporation | | | | | | | | | | | | | | | 14,526 | |
| | | | | | | | | | | | | | | | | | | | |
| Shares | | | Description (1) | | | | | | | | | | | Value | |
| | | | | |
| | | | Banks (continued) | | | | | | | | | | | | |
| | | | | |
| | 749 | | | Arrow Financial Corporation | | | | | | | | | | | | | | $ | 23,668 | |
| | | | | |
| | 1,084 | | | Atlantic Capital Bancshares, Inc., (2) | | | | | | | | | | | | | | | 16,314 | |
| | | | | |
| | 3,056 | | | Banc of California Inc., (3) | | | | | | | | | | | | | | | 40,645 | |
| | | | | |
| | 471 | | | BancFirst Corporation | | | | | | | | | | | | | | | 33,771 | |
| | | | | |
| | 1,943 | | | Banco Latinoamericano de Exportaciones S.A | | | | | | | | | | | | | | | 52,403 | |
| | | | | |
| | 2,320 | | | Bancorp, Inc., (2) | | | | | | | | | | | | | | | 14,454 | |
| | | | | |
| | 5,423 | | | BancorpSouth Inc. | | | | | | | | | | | | | | | 127,441 | |
| | | | | |
| | 373 | | | Bank of Marin Bancorp California | | | | | | | | | | | | | | | 18,930 | |
| | | | | |
| | 5,554 | | | Bank of the Ozarks, Inc. | | | | | | | | | | | | | | | 205,276 | |
| | | | | |
| | 359 | | | Bankwell Financial Group, Inc. | | | | | | | | | | | | | | | 8,853 | |
| | | | | |
| | 1,879 | | | Banner Corporation | | | | | | | | | | | | | | | 84,818 | |
| | | | | |
| | 372 | | | Bar Harbor Bankshares | | | | | | | | | | | | | | | 13,522 | |
| | | | | |
| | 1,910 | | | Berkshire Hills Bancorp, Inc. | | | | | | | | | | | | | | | 56,441 | |
| | | | | |
| | 1,543 | | | Blue Hills Bancorp, Inc., (3) | | | | | | | | | | | | | | | 23,994 | |
| | | | | |
| | 2,505 | | | BNC Bancorp. | | | | | | | | | | | | | | | 62,375 | |
| | | | | |
| | 5,125 | | | Boston Private Financial Holdings Inc. | | | | | | | | | | | | | | | 67,394 | |
| | | | | |
| | 1,046 | | | Bridge Bancorp Inc. | | | | | | | | | | | | | | | 28,817 | |
| | | | | |
| | 4,333 | | | Brookline Bancorp, Inc. | | | | | | | | | | | | | | | 55,462 | |
| | | | | |
| | 1,043 | | | Bryn Mawr Bank | | | | | | | | | | | | | | | 32,750 | |
| | | | | |
| | 213 | | | C & F Financial, Inc. | | | | | | | | | | | | | | | 8,903 | |
| | | | | |
| | 721 | | | Camden National Corporation | | | | | | | | | | | | | | | 23,807 | |
| | | | | |
| | 1,240 | | | Capital Bank Financial Corporation, Class A Shares | | | | | | | | | | | | | | | 40,610 | |
| | | | | |
| | 728 | | | Capital City Bank | | | | | | | | | | | | | | | 10,949 | |
| | | | | |
| | 1,967 | | | Cardinal Financial Corporation | | | | | | | | | | | | | | | 51,693 | |
| | | | | |
| | 640 | | | Carolina Financial Corporation, (3) | | | | | | | | | | | | | | | 14,592 | |
| | | | | |
| | 1,965 | | | Cascade Bancorp., (2) | | | | | | | | | | | | | | | 12,006 | |
| | | | | |
| | 4,650 | | | Cathay General Bancorp. | | | | | | | | | | | | | | | 139,268 | |
| | | | | |
| | 2,904 | | | Centerstate Banks of Florida, Inc. | | | | | | | | | | | | | | | 54,247 | |
| | | | | |
| | 1,895 | | | Central Pacific Financial Corporation | | | | | | | | | | | | | | | 48,569 | |
| | | | | |
| | 579 | | | Central Valley Community Bancorp. | | | | | | | | | | | | | | | 8,291 | |
| | | | | |
| | 187 | | | Century Bancorp, Inc. | | | | | | | | | | | | | | | 8,480 | |
| | | | | |
| | 4,125 | | | Chemical Financial Corporation | | | | | | | | | | | | | | | 177,169 | |
| | | | | |
| | 207 | | | Chemung Financial Corporation | | | | | | | | | | | | | | | 5,900 | |
| | | | | |
| | 733 | | | Citizens & Northern Corporation | | | | | | | | | | | | | | | 15,334 | |
| | | | | |
| | 913 | | | City Holding Company | | | | | | | | | | | | | | | 47,723 | |
| | | | | |
| | 931 | | | CNB Financial Corporation | | | | | | | | | | | | | | | 18,201 | |
| | | | | |
| | 2,347 | | | Cobiz, Inc. | | | | | | | | | | | | | | | 29,854 | |
| | | | | |
| | 535 | | | Codorus Valley Bancorp, Inc. | | | | | | | | | | | | | | | 11,192 | |
| | | | | |
| | 3,635 | | | Columbia Banking Systems Inc. | | | | | | | | | | | | | | | 120,028 | |
| | | | | |
| | 2,696 | | | Community Bank System Inc. | | | | | | | | | | | | | | | 127,009 | |
Nuveen Small Cap Index Fund (continued)
| | |
| Portfolio of Investments | | October 31, 2016 |
| | | | | | | | | | | | | | | | | | | | |
| Shares | | | Description (1) | | | | | | | | | | | Value | |
| | | | | |
| | | | Banks (continued) | | | | | | | | | | | | |
| | | | | |
| | 953 | | | Community Trust Bancorp, Inc. | | | | | | | | | | | | | | $ | 34,832 | |
| | | | | |
| | 876 | | | CommunityOne Bancorp., (2), (4) | | | | | | | | | | | | | | | 12,379 | |
| | | | | |
| | 1,879 | | | ConnectOne Bancorp, Inc. | | | | | | | | | | | | | | | 34,480 | |
| | | | | |
| | 318 | | | County Bancorp, Inc. | | | | | | | | | | | | | | | 6,265 | |
| | | | | |
| | 1,017 | | | CU Bancorp., (2) | | | | | | | | | | | | | | | 23,900 | |
| | | | | |
| | 1,525 | | | Customers Bancorp Inc., (2) | | | | | | | | | | | | | | | 41,282 | |
| | | | | |
| | 6,334 | | | CVB Financial | | | | | | | | | | | | | | | 106,285 | |
| | | | | |
| | 1,914 | | | Eagle Bancorp, Inc., (2) | | | | | | | | | | | | | | | 94,073 | |
| | | | | |
| | 630 | | | Enterprise Bancorp, Inc. | | | | | | | | | | | | | | | 16,443 | |
| | | | | |
| | 1,202 | | | Enterprise Financial Services Corporation | | | | | | | | | | | | | | | 39,786 | |
| | | | | |
| | 333 | | | Equity Bancshares Inc, Class A Shares, (2) | | | | | | | | | | | | | | | 8,668 | |
| | | | | |
| | 13,118 | | | F.N.B. Corporation PA | | | | | | | | | | | | | | | 171,452 | |
| | | | | |
| | 485 | | | Farmers Capital Bank Corporation | | | | | | | | | | | | | | | 15,229 | |
| | | | | |
| | 1,555 | | | Farmers National Banc Corporation | | | | | | | | | | | | | | | 16,328 | |
| | | | | |
| | 1,875 | | | FCB Financial Holdings, Inc., Class A Shares, (2) | | | | | | | | | | | | | | | 69,938 | |
| | | | | |
| | 1,372 | | | Fidelity Southern Corporation | | | | | | | | | | | | | | | 25,012 | |
| | | | | |
| | 869 | | | Financial Institutions, Inc. | | | | | | | | | | | | | | | 23,333 | |
| | | | | |
| | 695 | | | First Bancorp Maine | | | | | | | | | | | | | | | 16,451 | |
| | | | | |
| | 1,233 | | | First Bancorp of North Carolina, Inc. | | | | | | | | | | | | | | | 24,376 | |
| | | | | |
| | 8,409 | | | First Bancorp of Puerto Rico, (2) | | | | | | | | | | | | | | | 43,138 | |
| | | | | |
| | 1,938 | | | First Busey Corporation | | | | | | | | | | | | | | | 44,787 | |
| | | | | |
| | 506 | | | First Business Financial Services, Inc. | | | | | | | | | | | | | | | 9,538 | |
| | | | | |
| | 475 | | | First Citizens Bancshares Inc. | | | | | | | | | | | | | | | 138,225 | |
| | | | | |
| | 6,026 | | | First Commonwealth Financial Corporation | | | | | | | | | | | | | | | 61,224 | |
| | | | | |
| | 1,021 | | | First Community Bancshares, Inc. | | | | | | | | | | | | | | | 23,126 | |
| | | | | |
| | 900 | | | First Community Financial Partners, Inc., (2) | | | | | | | | | | | | | | | 8,595 | |
| | | | | |
| | 875 | | | First Connecticut Bancorp. | | | | | | | | | | | | | | | 15,531 | |
| | | | | |
| | 3,837 | | | First Financial Bancorp. | | | | | | | | | | | | | | | 82,496 | |
| | | | | |
| | 3,996 | | | First Financial Bankshares, Inc., (3) | | | | | | | | | | | | | | | 144,655 | |
| | | | | |
| | 626 | | | First Financial Corporation | | | | | | | | | | | | | | | 25,103 | |
| | | | | |
| | 826 | | | First Foundation, Inc., (2) | | | | | | | | | | | | | | | 20,435 | |
| | | | | |
| | 343 | | | First Internet Bancorp. | | | | | | | | | | | | | | | 9,004 | |
| | | | | |
| | 1,234 | | | First Interstate BancSystem Inc., Montana | | | | | | | | | | | | | | | 39,365 | |
| | | | | |
| | 2,551 | | | First Merchants Corporation | | | | | | | | | | | | | | | 71,811 | |
| | | | | |
| | 379 | | | First Mid-Illinois Bancshares, Inc. | | | | | | | | | | | | | | | 10,040 | |
| | | | | |
| | 5,043 | | | First Midwest Bancorp, Inc. | | | | | | | | | | | | | | | 97,380 | |
| | | | | |
| | 986 | | | First NBC Bank Holding Company, (2) | | | | | | | | | | | | | | | 5,324 | |
| | | | | |
| | 694 | | | First Northwest Bancorp., (2) | | | | | | | | | | | | | | | 9,501 | |
| | | | | |
| | 882 | | | First of Long Island Corporation | | | | | | | | | | | | | | | 28,180 | |
| | | | | | | | | | | | | | | | | | | | |
| Shares | | | Description (1) | | | | | | | | | | | Value | |
| | | | | |
| | | | Banks (continued) | | | | | | | | | | | | |
| | | | | |
| | 1,739 | | | Flushing Financial Corporation | | | | | | | | | | | | | | $ | 37,249 | |
| | | | | |
| | 586 | | | Franklin Financial Network, Inc., (2) | | | | | | | | | | | | | | | 19,104 | |
| | | | | |
| | 10,770 | | | Fulton Financial Corporation | | | | | | | | | | | | | | | 160,473 | |
| | | | | |
| | 897 | | | German American Bancorp, Inc. | | | | | | | | | | | | | | | 34,920 | |
| | | | | |
| | 4,773 | | | Glacier Bancorp, Inc. | | | | | | | | | | | | | | | 134,885 | |
| | | | | |
| | 711 | | | Great Southern Bancorp. | | | | | | | | | | | | | | | 29,400 | |
| | | | | |
| | 3,697 | | | Great Western Bancorp Inc. | | | | | | | | | | | | | | | 119,191 | |
| | | | | |
| | 1,368 | | | Green Bancorp, Inc., (2) | | | | | | | | | | | | | | | 14,159 | |
| | | | | |
| | 940 | | | Guaranty Bancorp. | | | | | | | | | | | | | | | 17,860 | |
| | | | | |
| | 4,847 | | | Hancock Holding Company | | | | | | | | | | | | | | | 162,617 | |
| | | | | |
| | 1,963 | | | Hanmi Financial Corporation | | | | | | | | | | | | | | | 49,075 | |
| | | | | |
| | 378 | | | Harbone Bancorp, Inc., (2) | | | | | | | | | | | | | | | 6,452 | |
| | | | | |
| | 1,374 | | | Heartland Financial USA, Inc. | | | | | | | | | | | | | | | 51,456 | |
| | | | | |
| | 1,725 | | | Heritage Commerce Coporation | | | | | | | | | | | | | | | 18,716 | |
| | | | | |
| | 1,846 | | | Heritage Financial Corporation | | | | | | | | | | | | | | | 33,966 | |
| | | | | |
| | 1,681 | | | Heritage Oaks Bancorp | | | | | | | | | | | | | | | 13,364 | |
| | | | | |
| | 4,698 | | | Hilltop Holdings Inc. | | | | | | | | | | | | | | | 116,041 | |
| | | | | |
| | 7,578 | | | Home Bancshares, Inc. | | | | | | | | | | | | | | | 163,003 | |
| | | | | |
| | 1,036 | | | HomeTrust Bancshares Inc., (2) | | | | | | | | | | | | | | | 19,270 | |
| | | | | |
| | 8,033 | | | Hope Bancorp Inc. | | | | | | | | | | | | | | | 129,653 | |
| | | | | |
| | 724 | | | Horizon Bancorp. | | | | | | | | | | | | | | | 20,996 | |
| | | | | |
| | 2,564 | | | IberiaBank Corporation | | | | | | | | | | | | | | | 168,327 | |
| | | | | |
| | 1,621 | | | Independent Bank Corporation | | | | | | | | | | | | | | | 89,398 | |
| | | | | |
| | 1,275 | | | Independent Bank Corporation | | | | | | | | | | | | | | | 21,420 | |
| | | | | |
| | 734 | | | Independent Bank Group Inc. | | | | | | | | | | | | | | | 35,452 | |
| | | | | |
| | 3,623 | | | International Bancshares Corporation | | | | | | | | | | | | | | | 111,770 | |
| | | | | |
| | 17,399 | | | Investors Bancorp, Inc. | | | | | | | | | | | | | | | 213,312 | |
| | | | | |
| | 2,568 | | | Lakeland Bancorp, Inc. | | | | | | | | | | | | | | | 36,337 | |
| | | | | |
| | 1,509 | | | Lakeland Financial Corporation | | | | | | | | | | | | | | | 55,592 | |
| | | | | |
| | 582 | | | LCNB Corporation | | | | | | | | | | | | | | | 10,010 | |
| | | | | |
| | 2,778 | | | LegacyTexas Financial Group Inc. | | | | | | | | | | | | | | | 95,035 | |
| | | | | |
| | 1,224 | | | Live Oak Bancshares Inc. | | | | | | | | | | | | | | | 19,523 | |
| | | | | |
| | 1,750 | | | Macatawa Bank Corporation | | | | | | | | | | | | | | | 14,228 | |
| | | | | |
| | 1,444 | | | Mainsource Financial Group | | | | | | | | | | | | | | | 36,042 | |
| | | | | |
| | 4,746 | | | MB Financial, Inc. | | | | | | | | | | | | | | | 172,707 | |
| | | | | |
| | 1,177 | | | MBT Financial Corporation | | | | | | | | | | | | | | | 10,358 | |
| | | | | |
| | 1,092 | | | Mercantile Bank Corporation | | | | | | | | | | | | | | | 30,052 | |
| | | | | |
| | 338 | | | Merchants Bancshares, Inc. | | | | | | | | | | | | | | | 14,534 | |
| | | | | |
| | 310 | | | Middleburg Financial Corporation | | | | | | | | | | | | | | | 9,399 | |
Nuveen Small Cap Index Fund (continued)
| | |
| Portfolio of Investments | | October 31, 2016 |
| | | | | | | | | | | | | | | | | | | | |
| Shares | | | Description (1) | | | | | | | | | | | Value | |
| | | | | |
| | | | Banks (continued) | | | | | | | | | | | | |
| | | | | |
| | 243 | | | Midland States Bancorp, Inc. | | | | | | | | | | | | | | $ | 6,204 | |
| | | | | |
| | 510 | | | MidWestOne Financial Group Inc. | | | | | | | | | | | | | | | 14,831 | |
| | | | | |
| | 361 | | | Mutualfirst Financial, Inc. | | | | | | | | | | | | | | | 9,873 | |
| | | | | |
| | 1,502 | | | National Bank Holdings Corporation | | | | | | | | | | | | | | | 36,559 | |
| | | | | |
| | 470 | | | National Bankshares, Inc. | | | | | | | | | | | | | | | 16,333 | |
| | | | | |
| | 529 | | | National Commerce Corporation, (2) | | | | | | | | | | | | | | | 14,971 | |
| | | | | |
| | 2,654 | | | NBT Bancorp, Inc. | | | | | | | | | | | | | | | 89,466 | |
| | | | | |
| | 475 | | | Nicolet Bankshares, Inc., (2) | | | | | | | | | | | | | | | 18,411 | |
| | | | | |
| | 446 | | | Northrim Bancorp, Inc. | | | | | | | | | | | | | | | 10,949 | |
| | | | | |
| | 2,709 | | | OFG Bancorp. | | | | | | | | | | | | | | | 28,851 | |
| | | | | |
| | 8,320 | | | Old National Bancorp. | | | | | | | | | | | | | | | 122,304 | |
| | | | | |
| | 2,179 | | | Old Second Bancorp, Inc. | | | | | | | | | | | | | | | 16,887 | |
| | | | | |
| | 1,073 | | | Opus Bank | | | | | | | | | | | | | | | 21,514 | |
| | | | | |
| | 489 | | | Orrstown Financial Services Inc. | | | | | | | | | | | | | | | 10,220 | |
| | | | | |
| | 1,387 | | | Pacific Continental Corporation | | | | | | | | | | | | | | | 23,787 | |
| | | | | |
| | 1,702 | | | Pacific Premier Bancorp, Inc., (2) | | | | | | | | | | | | | | | 43,997 | |
| | | | | |
| | 832 | | | Park National Corporation | | | | | | | | | | | | | | | 80,646 | |
| | | | | |
| | 3,125 | | | Park Sterling Bank Inc. | | | | | | | | | | | | | | | 26,906 | |
| | | | | |
| | 937 | | | Peapack Gladstone Financial Corporation | | | | | | | | | | | | | | | 19,818 | |
| | | | | |
| | 324 | | | Penns Woods Bancorp, Inc. | | | | | | | | | | | | | | | 13,770 | |
| | | | | |
| | 900 | | | Peoples Bancorp, Inc. | | | | | | | | | | | | | | | 22,293 | |
| | | | | |
| | 489 | | | Peoples Financial Services Corporation | | | | | | | | | | | | | | | 19,482 | |
| | | | | |
| | 859 | | | Peoples Utah Bancorp. | | | | | | | | | | | | | | | 17,223 | |
| | | | | |
| | 2,699 | | | Pinnacle Financial Partners, Inc. | | | | | | | | | | | | | | | 139,268 | |
| | | | | |
| | 803 | | | Preferred Bank Los Angeles | | | | | | | | | | | | | | | 30,450 | |
| | | | | |
| | 562 | | | Premier Financial Bancorp, Inc. | | | | | | | | | | | | | | | 9,453 | |
| | | | | |
| | 4,918 | | | Privatebancorp, Inc. | | | | | | | | | | | | | | | 222,490 | |
| | | | | |
| | 4,192 | | | Prosperity Bancshares, Inc. | | | | | | | | | | | | | | | 232,530 | |
| | | | | |
| | 755 | | | QCR Holdings, Inc. | | | | | | | | | | | | | | | 24,538 | |
| | | | | |
| | 2,557 | | | Renasant Corporation | | | | | | | | | | | | | | | 86,273 | |
| | | | | |
| | 642 | | | Republic Bancorp, Inc. | | | | | | | | | | | | | | | 20,313 | |
| | | | | |
| | 2,225 | | | Republic First Bancorp, Inc., (2) | | | | | | | | | | | | | | | 8,789 | |
| | | | | |
| | 2,250 | | | S&T Bancorp, Inc. | | | | | | | | | | | | | | | 70,628 | |
| | | | | |
| | 1,595 | | | Sandy Spring Bancorp, Inc. | | | | | | | | | | | | | | | 50,562 | |
| | | | | |
| | 1,853 | | | Seacoast Banking Corporation of Florida, (2) | | | | | | | | | | | | | | | 32,250 | |
| | | | | |
| | 1,442 | | | ServisFirst Bancshares Inc., (3) | | | | | | | | | | | | | | | 78,070 | |
| | | | | |
| | 784 | | | Shore Bancshares, Inc. | | | | | | | | | | | | | | | 10,012 | |
| | | | | |
| | 799 | | | Sierra Bancorp. | | | | | | | | | | | | | | | 14,270 | |
| | | | | |
| | 1,834 | | | Simmons First National Corporation | | | | | | | | | | | | | | | 90,508 | |
| | | | | | | | | | | | | | | | | | | | |
| Shares | | | Description (1) | | | | | | | | | | | Value | |
| | | | | |
| | | | Banks (continued) | | | | | | | | | | | | |
| | | | | |
| | 1,480 | | | South State Corporation | | | | | | | | | | | | | | $ | 108,558 | |
| | | | | |
| | 380 | | | Southern First Bancshares, Inc., (2) | | | | | | | | | | | | | | | 10,089 | |
| | | | | |
| | 742 | | | Southern National Bancorp of Virginia, Inc. | | | | | | | | | | | | | | | 9,735 | |
| | | | | |
| | 1,534 | | | Southside Bancshares, Inc. | | | | | | | | | | | | | | | 50,039 | |
| | | | | |
| | 1,230 | | | Southwest Bancorp, Inc. | | | | | | | | | | | | | | | 22,940 | |
| | | | | |
| | 2,312 | | | State Bank Financial Corporation | | | | | | | | | | | | | | | 50,980 | |
| | | | | |
| | 7,937 | | | Sterling Bancorp. | | | | | | | | | | | | | | | 142,866 | |
| | | | | |
| | 720 | | | Stonegate Bank | | | | | | | | | | | | | | | 24,941 | |
| | | | | |
| | 716 | | | Suffolk Bancorp. | | | | | | | | | | | | | | | 25,776 | |
| | | | | |
| | 551 | | | Summit Financial Group Inc. | | | | | | | | | | | | | | | 10,893 | |
| | | | | |
| | 620 | | | Sun Bancorp, Inc. | | | | | | | | | | | | | | | 14,260 | |
| | | | | |
| | 1,330 | | | SY Bancorp, Inc. | | | | | | | | | | | | | | | 45,353 | |
| | | | | |
| | 2,892 | | | Texas Capital BancShares, Inc., (2) | | | | | | | | | | | | | | | 171,496 | |
| | | | | |
| | 908 | | | Tompkins Financial Corporation | | | | | | | | | | | | | | | 71,986 | |
| | | | | |
| | 3,500 | | | Towne Bank | | | | | | | | | | | | | | | 86,800 | |
| | | | | |
| | 1,266 | | | Trico Bancshares | | | | | | | | | | | | | | | 33,321 | |
| | | | | |
| | 1,375 | | | Tristate Capital Holdings Inc., (2) | | | | | | | | | | | | | | | 24,269 | |
| | | | | |
| | 960 | | | Triumph Bancorp Inc., (2) | | | | | | | | | | | | | | | 17,856 | |
| | | | | |
| | 4,222 | | | Trustmark Corporation | | | | | | | | | | | | | | | 116,865 | |
| | | | | |
| | 2,811 | | | UMB Financial Corporation | | | | | | | | | | | | | | | 174,423 | |
| | | | | |
| | 13,838 | | | Umpqua Holdings Corporation | | | | | | | | | | | | | | | 211,445 | |
| | | | | |
| | 2,715 | | | Union Bankshares Corporation | | | | | | | | | | | | | | | 75,830 | |
| | | | | |
| | 258 | | | Union Bankshares Inc., (3) | | | | | | | | | | | | | | | 8,514 | |
| | | | | |
| | 4,112 | | | United Bankshares, Inc., (3) | | | | | | | | | | | | | | | 155,022 | |
| | | | | |
| | 4,394 | | | United Community Banks, Inc. | | | | | | | | | | | | | | | 94,779 | |
| | | | | |
| | 1,552 | | | Univest Corporation of Pennsylvania | | | | | | | | | | | | | | | 36,860 | |
| | | | | |
| | 15,038 | | | Valley National Bancorp. | | | | | | | | | | | | | | | 148,275 | |
| | | | | |
| | 516 | | | Veritex Holdings, Inc., (2) | | | | | | | | | | | | | | | 9,097 | |
| | | | | |
| | 932 | | | Washington Trust Bancorp, Inc. | | | | | | | | | | | | | | | 42,779 | |
| | | | | |
| | 535 | | | WashingtonFirst Bankshares, Inc. | | | | | | | | | | | | | | | 13,081 | |
| | | | | |
| | 5,747 | | | Webster Financial Corporation | | | | | | | | | | | | | | | 232,179 | |
| | | | | |
| | 2,514 | | | WesBanco, Inc. | | | | | | | | | | | | | | | 82,736 | |
| | | | | |
| | 1,086 | | | West Bancorp, Inc. | | | | | | | | | | | | | | | 20,960 | |
| | | | | |
| | 1,545 | | | Westamerica Bancorp., (3) | | | | | | | | | | | | | | | 76,570 | |
| | | | | |
| | 3,066 | | | Wintrust Financial Corporation | | | | | | | | | | | | | | | 165,411 | |
| | | | | |
| | 4,940 | | | Xenith Bankshares, Inc., (2) | | | | | | | | | | | | | | | 11,560 | |
| | | | | |
| | 3,124 | | | Yadkin Financial Inc. | | | | | | | | | | | | | | | 86,660 | |
| | | | Total Banks | | | | | | | | | | | | | | | 10,770,943 | |
Nuveen Small Cap Index Fund (continued)
| | |
| Portfolio of Investments | | October 31, 2016 |
| | | | | | | | | | | | | | | | | | | | |
| Shares | | | Description (1) | | | | | | | | | | | Value | |
| | | | | |
| | | | Beverages – 0.2% | | | | | | | | | | | | |
| | | | | |
| | 552 | | | Boston Beer Company, (2), (3) | | | | | | | | | | | | | | $ | 85,698 | |
| | | | | |
| | 296 | | | Coca-Cola Bottling Company Consolidated | | | | | | | | | | | | | | | 41,825 | |
| | | | | |
| | 791 | | | Craft Brewers Alliance Inc., (2) | | | | | | | | | | | | | | | 12,696 | |
| | | | | |
| | 786 | | | MGI Ingredients, Inc. | | | | | | | | | | | | | | | 27,673 | |
| | | | | |
| | 733 | | | National Beverage Corporation, (2), (3) | | | | | | | | | | | | | | | 34,627 | |
| | | | | |
| | 1,322 | | | Primo Water Corporation, (2) | | | | | | | | | | | | | | | 17,305 | |
| | | | Total Beverages | | | | | | | | | | | | | | | 219,824 | |
| | | | | |
| | | | Biotechnology – 4.5% | | | | | | | | | | | | |
| | | | | |
| | 1,715 | | | Acceleron Pharma Inc., (2) | | | | | | | | | | | | | | | 48,071 | |
| | | | | |
| | 7,335 | | | Achillion Pharmaceuticals, Inc., (2) | | | | | | | | | | | | | | | 46,064 | |
| | | | | |
| | 2,692 | | | Acorda Therapeutics, Inc., (2) | | | | | | | | | | | | | | | 47,648 | |
| | | | | |
| | 1,045 | | | Adamas Pharmaceuticals Inc., (2) | | | | | | | | | | | | | | | 14,358 | |
| | | | | |
| | 2,219 | | | Aduro Biotech, Inc., (2), (3) | | | | | | | | | | | | | | | 23,854 | |
| | | | | |
| | 2,244 | | | Advaxis Inc., (2), (3) | | | | | | | | | | | | | | | 18,154 | |
| | | | | |
| | 1,521 | | | Adverum Biotechnologies Inc., (2) | | | | | | | | | | | | | | | 4,487 | |
| | | | | |
| | 4,575 | | | Agenus Inc., (2) | | | | | | | | | | | | | | | 18,163 | |
| | | | | |
| | 1,645 | | | Aimmune Therapeutics Inc., (2) | | | | | | | | | | | | | | | 26,781 | |
| | | | | |
| | 2,249 | | | Akebia Therapeutics Inc., (2) | | | | | | | | | | | | | | | 16,912 | |
| | | | | |
| | 2,932 | | | Alder Biopharmaceuticals Inc., (2), (3) | | | | | | | | | | | | | | | 71,101 | |
| | | | | |
| | 2,183 | | | AMAG Pharmaceuticals Inc., (2), (3) | | | | | | | | | | | | | | | 56,103 | |
| | | | | |
| | 8,919 | | | Amicus Therapeutics, Inc., (2) | | | | | | | | | | | | | | | 61,541 | |
| | | | | |
| | 2,044 | | | Anavex Life Sciences Corporation, (2) | | | | | | | | | | | | | | | 5,703 | |
| | | | | |
| | 2,462 | | | Anthera Pharmaceuticals Inc., (2) | | | | | | | | | | | | | | | 5,416 | |
| | | | | |
| | 794 | | | Applied Genetic Technologies Corporation, (2) | | | | | | | | | | | | | | | 5,677 | |
| | | | | |
| | 1,075 | | | Aptevo Therapeutics, Inc., (2) | | | | | | | | | | | | | | | 2,376 | |
| | | | | |
| | 1,954 | | | Ardelyx, Inc., (2) | | | | | | | | | | | | | | | 24,034 | |
| | | | | |
| | 15,349 | | | Arena Pharmaceuticals, Inc., (2) | | | | | | | | | | | | | | | 22,717 | |
| | | | | |
| | 953 | | | Argos Therapeutics Inc., (2) | | | | | | | | | | | | | | | 4,003 | |
| | | | | |
| | 11,075 | | | Ariad Pharmaceuticals, Inc., (2), (3) | | | | | | | | | | | | | | | 96,574 | |
| | | | | |
| | 9,801 | | | Array Biopharma, Inc., (2) | | | | | | | | | | | | | | | 55,866 | |
| | | | | |
| | 3,788 | | | Arrowhead Pharmaceuticals, Incorporated, (2) | | | | | | | | | | | | | | | 21,970 | |
| | | | | |
| | 1,500 | | | Asterias Biotherapeutics, Inc., (2) | | | | | | | | | | | | | | | 4,950 | |
| | | | | |
| | 1,453 | | | Atara Biotherapeutics Inc., (2) | | | | | | | | | | | | | | | 18,598 | |
| | | | | |
| | 4,767 | | | Athersys Inc., (2), (3) | | | | | | | | | | | | | | | 8,626 | |
| | | | | |
| | 379 | | | Audentes Therapeutics, Incorporated, (2) | | | | | | | | | | | | | | | 6,060 | |
| | | | | |
| | 300 | | | AveXis, Incorporated, (2) | | | | | | | | | | | | | | | 14,250 | |
| | | | | |
| | 1,529 | | | Axovant Sciences Limited, (2) | | | | | | | | | | | | | | | 18,822 | |
| | | | | |
| | 1,311 | | | Bellicum Pharmaceuticals, Inc., (2) | | | | | | | | | | | | | | | 21,710 | |
| | | | | |
| | 4,597 | | | BioCryst Pharaceuticals, Inc., (2) | | | | | | | | | | | | | | | 18,618 | |
| | | | | | | | | | | | | | | | | | | | |
| Shares | | | Description (1) | | | | | | | | | | | Value | |
| | | | | |
| | | | Biotechnology (continued) | | | | | | | | | | | | |
| | | | | |
| | 339 | | | BioSpecifics Technologies Corporation, (2) | | | | | | | | | | | | | | $ | 14,709 | |
| | | | | |
| | 4,353 | | | BioTime Inc., (2) | | | | | | | | | | | | | | | 14,017 | |
| | | | | |
| | 2,319 | | | Bluebird Bio Inc., (2), (3) | | | | | | | | | | | | | | | 110,732 | |
| | | | | |
| | 1,252 | | | Blueprint Medicines Corporation, (2) | | | | | | | | | | | | | | | 37,535 | |
| | | | | |
| | 1,285 | | | Cara Therapeutics Inc., (2) | | | | | | | | | | | | | | | 8,982 | |
| | | | | |
| | 5,982 | | | Celldex Therapeutics, Inc., (2) | | | | | | | | | | | | | | | 18,843 | |
| | | | | |
| | 762 | | | Cellular Biomedicine Group, Inc., (2), (3) | | | | | | | | | | | | | | | 9,182 | |
| | | | | |
| | 4,552 | | | Cepheid, Inc., (2) | | | | | | | | | | | | | | | 240,801 | |
| | | | | |
| | 1,441 | | | ChemoCentryx Inc., (2) | | | | | | | | | | | | | | | 8,617 | |
| | | | | |
| | 2,672 | | | Chimerix Inc., (2) | | | | | | | | | | | | | | | 10,822 | |
| | | | | |
| | 709 | | | Cidara Therapeutics, Inc., (2) | | | | | | | | | | | | | | | 6,736 | |
| | | | | |
| | 1,989 | | | Clovis Oncology Inc., (2) | | | | | | | | | | | | | | | 57,840 | |
| | | | | |
| | 1,846 | | | Coherus Biosciences Inc., (2) | | | | | | | | | | | | | | | 50,488 | |
| | | | | |
| | 994 | | | Concert Pharmaceuticals Inc., (2) | | | | | | | | | | | | | | | 7,674 | |
| | | | | |
| | 219 | | | Corvus Pharmaceuticals, Inc., (2) | | | | | | | | | | | | | | | 2,924 | |
| | | | | |
| | 7,193 | | | Curis, Inc., (2) | | | | | | | | | | | | | | | 18,702 | |
| | | | | |
| | 2,120 | | | Cytokinetics, Inc., (2) | | | | | | | | | | | | | | | 20,564 | |
| | | | | |
| | 1,278 | | | Cytomx Therapeutics Inc., (2) | | | | | | | | | | | | | | | 14,403 | |
| | | | | |
| | 6,418 | | | CytRx Corporation, (2) | | | | | | | | | | | | | | | 2,965 | |
| | | | | |
| | 808 | | | Dimension Therapeutics Inc., (2) | | | | | | | | | | | | | | | 4,000 | |
| | | | | |
| | 2,434 | | | Dynavax Technologies Corporation, (2) | | | | | | | | | | | | | | | 22,515 | |
| | | | | |
| | 554 | | | Eagle Pharmaceuticals Inc., (2), (3) | | | | | | | | | | | | | | | 30,958 | |
| | | | | |
| | 1,016 | | | Edge Therapeutics Inc., (2) | | | | | | | | | | | | | | | 10,638 | |
| | | | | |
| | 438 | | | Editas Medicine, Incorporated, (2) | | | | | | | | | | | | | | | 6,193 | |
| | | | | |
| | 229 | | | Eiger Biopharmaceuticals, Inc., (2) | | | | | | | | | | | | | | | 2,622 | |
| | | | | |
| | 2,034 | | | Emergent BioSolutions, Inc., (2) | | | | | | | | | | | | | | | 54,348 | |
| | | | | |
| | 977 | | | Enanta Pharmaceuticals Inc., (2), (3) | | | | | | | | | | | | | | | 22,979 | |
| | | | | |
| | 2,519 | | | Epizyme Inc., (2) | | | | | | | | | | | | | | | 22,797 | |
| | | | | |
| | 896 | | | Esperion Therapeutics Inc., (2) | | | | | | | | | | | | | | | 9,229 | |
| | | | | |
| | 6,618 | | | EXACT Sciences Corporation, (2), (3) | | | | | | | | | | | | | | | 103,108 | |
| | | | | |
| | 14,233 | | | Exelixis, Inc., (2) | | | | | | | | | | | | | | | 150,727 | |
| | | | | |
| | 3,277 | | | FibroGen, Inc., (2) | | | | | | | | | | | | | | | 54,234 | |
| | | | | |
| | 1,688 | | | Five Prime Therapeutics Inc., (2) | | | | | | | | | | | | | | | 81,919 | |
| | | | | |
| | 1,454 | | | Flexion Therapeutics Inc., (2) | | | | | | | | | | | | | | | 27,771 | |
| | | | | |
| | 2,256 | | | Fortress Biotech, Inc., (2) | | | | | | | | | | | | | | | 5,369 | |
| | | | | |
| | 842 | | | Foundation Medicine Inc., (2) | | | | | | | | | | | | | | | 19,113 | |
| | | | | |
| | 12,136 | | | Galena Biopharma Inc., (2) | | | | | | | | | | | | | | | 2,788 | |
| | | | | |
| | 1,170 | | | Genomic Health, Inc., (2) | | | | | | | | | | | | | | | 34,878 | |
| | | | | |
| | 9,450 | | | Geron Corporation, (2), (3) | | | | | | | | | | | | | | | 17,483 | |
Nuveen Small Cap Index Fund (continued)
| | |
| Portfolio of Investments | | October 31, 2016 |
| | | | | | | | | | | | | | | | | | | | |
| Shares | | | Description (1) | | | | | | | | | | | Value | |
| | | | | |
| | | | Biotechnology (continued) | | | | | | | | | | | | |
| | | | | |
| | 1,036 | | | Global Blood Therapeutics Inc., (2), (3) | | | | | | | | | | | | | | $ | 18,078 | |
| | | | | |
| | 790 | | | GlycoMimetics Inc., (2) | | | | | | | | | | | | | | | 4,764 | |
| | | | | |
| | 6,826 | | | Halozyme Therapeutics, Inc., (2), (3) | | | | | | | | | | | | | | | 58,908 | |
| | | | | |
| | 1,990 | | | Heron Therapeutics Inc., (2), (3) | | | | | | | | | | | | | | | 29,552 | |
| | | | | |
| | 5,527 | | | Idera Pharmaceuticals, Inc., (2) | | | | | | | | | | | | | | | 8,567 | |
| | | | | |
| | 1,845 | | | Ignyta, Inc., (2) | | | | | | | | | | | | | | | 9,225 | |
| | | | | |
| | 915 | | | Immune Design Corporation, (2) | | | | | | | | | | | | | | | 4,895 | |
| | | | | |
| | 5,274 | | | Immunogen, Inc., (2) | | | | | | | | | | | | | | | 9,599 | |
| | | | | |
| | 5,463 | | | Immunomedics, Inc., (2), (3) | | | | | | | | | | | | | | | 12,565 | |
| | | | | |
| | 3,172 | | | Infinity Pharmaceuticals, Inc., (2) | | | | | | | | | | | | | | | 3,838 | |
| | | | | |
| | 1,092 | | | Inotek Pharmaceuticals Corporation, (2) | | | | | | | | | | | | | | | 7,644 | |
| | | | | |
| | 4,154 | | | Inovio Pharmaceuticals Inc., (2), (3) | | | | | | | | | | | | | | | 26,876 | |
| | | | | |
| | 3,877 | | | Insmed Incorporated, (2) | | | | | | | | | | | | | | | 50,323 | |
| | | | | |
| | 1,470 | | | Insys Therapeutics Inc., (2), (3) | | | | | | | | | | | | | | | 15,891 | |
| | | | | |
| | 462 | | | Intellia Therapeutics, Inc., (2) | | | | | | | | | | | | | | | 6,366 | |
| | | | | |
| | 1,424 | | | Invitae Corporation, (2) | | | | | | | | | | | | | | | 10,936 | |
| | | | | |
| | 8,099 | | | Ironwood Pharmacauticals Inc., (2) | | | | | | | | | | | | | | | 103,424 | |
| | | | | |
| | 536 | | | Kadmon Holdings, Incorporated, (2) | | | | | | | | | | | | | | | 2,439 | |
| | | | | |
| | 1,493 | | | Karyopharm Therapeutics Inc., (2) | | | | | | | | | | | | | | | 10,809 | |
| | | | | |
| | 4,943 | | | Keryx Biopharmaceuticals, Inc., (2), (3) | | | | | | | | | | | | | | | 22,293 | |
| | | | | |
| | 2,452 | | | Kite Pharma Inc., (2), (3) | | | | | | | | | | | | | | | 108,599 | |
| | | | | |
| | 871 | | | La Jolla Pharmaceutical Company, (2) | | | | | | | | | | | | | | | 15,243 | |
| | | | | |
| | 2,646 | | | Lexicon Genetics, Inc., (2), (3) | | | | | | | | | | | | | | | 39,240 | |
| | | | | |
| | 1,192 | | | Ligand Pharmceuticals, Inc., (2), (3) | | | | | | | | | | | | | | | 114,110 | |
| | | | | |
| | 3,329 | | | Lion Biotechnologies Inc., (2) | | | | | | | | | | | | | | | 20,806 | |
| | | | | |
| | 834 | | | Loxo Oncology Inc., (2) | | | | | | | | | | | | | | | 17,397 | |
| | | | | |
| | 1,995 | | | MacroGenics Inc., (2) | | | | | | | | | | | | | | | 47,262 | |
| | | | | |
| | 20,299 | | | MannKind Corporation, (2), (3) | | | | | | | | | | | | | | | 8,469 | |
| | | | | |
| | 1,798 | | | Medgenics Inc., (2) | | | | | | | | | | | | | | | 8,666 | |
| | | | | |
| | 1,859 | | | MediciNova, Inc., (2) | | | | | | | | | | | | | | | 12,623 | |
| | | | | |
| | 7,640 | | | Merrimack Pharmaceuticals, Incorporated, (2), (3) | | | | | | | | | | | | | | | 39,881 | |
| | | | | |
| | 6,399 | | | MiMedx Group Inc., (2), (3) | | | | | | | | | | | | | | | 57,015 | |
| | | | | |
| | 1,189 | | | Minerva Neurosciences, Inc., (2) | | | | | | | | | | | | | | | 13,257 | |
| | | | | |
| | 742 | | | Mirati Therapeutics, Inc., (2) | | | | | | | | | | | | | | | 3,747 | |
| | | | | |
| | 4,068 | | | Momenta Pharmaceuticals, Inc., (2) | | | | | | | | | | | | | | | 45,358 | |
| | | | | |
| | 4,226 | | | Myriad Genentics Inc., (2) | | | | | | | | | | | | | | | 83,294 | |
| | | | | |
| | 1,103 | | | NantikWest Inc., (2), (3) | | | | | | | | | | | | | | | 6,607 | |
| | | | | |
| | 1,632 | | | Natera, Inc., (2) | | | | | | | | | | | | | | | 13,839 | |
| | | | | |
| | 1,355 | | | NewLink Genetics Corporation, (2) | | | | | | | | | | | | | | | 16,463 | |
| | | | | | | | | | | | | | | | | | | | |
| Shares | | | Description (1) | | | | | | | | | | | Value | |
| | | | | |
| | | | Biotechnology (continued) | | | | | | | | | | | | |
| | | | | |
| | 16,902 | | | Novavax, Inc., (2), (3) | | | | | | | | | | | | | | $ | 25,691 | |
| | | | | |
| | 1,328 | | | Oncomed Pharamceuticals Inc., (2) | | | | | | | | | | | | | | | 12,045 | |
| | | | | |
| | 1,909 | | | Ophthotech Corporation, (2) | | | | | | | | | | | | | | | 68,380 | |
| | | | | |
| | 5,389 | | | Organovo Holdings Inc., (2) | | | | | | | | | | | | | | | 13,419 | |
| | | | | |
| | 1,234 | | | Osiris Therapeutics, Inc., (2) | | | | | | | | | | | | | | | 4,948 | |
| | | | | |
| | 1,504 | | | Otonomy, Inc., (2) | | | | | | | | | | | | | | | 22,710 | |
| | | | | |
| | 1,965 | | | OvaScience Inc., (2) | | | | | | | | | | | | | | | 9,904 | |
| | | | | |
| | 10,342 | | | PDL Biopahrma Inc. | | | | | | | | | | | | | | | 33,301 | |
| | | | | |
| | 1,139 | | | Pfenex Inc., (2) | | | | | | | | | | | | | | | 9,123 | |
| | | | | |
| | 3,901 | | | PharmAthene Incorporated, (2) | | | | | | | | | | | | | | | 10,728 | |
| | | | | |
| | 3,083 | | | Portola Pharmaceuticals Inc., (2) | | | | | | | | | | | | | | | 56,049 | |
| | | | | |
| | 4,357 | | | Progenics Pharmaceuticals, Inc., (2) | | | | | | | | | | | | | | | 21,916 | |
| | | | | |
| | 475 | | | Protagonist Therapeutics Incorporated, (2) | | | | | | | | | | | | | | | 8,930 | |
| | | | | |
| | 510 | | | Proteostasis Therapeutics, Inc., (2) | | | | | | | | | | | | | | | 3,631 | |
| | | | | |
| | 2,174 | | | Prothena Corporation PLC, (2), (3) | | | | | | | | | | | | | | | 103,961 | |
| | | | | |
| | 2,081 | | | PTC Therapeutics Inc., (2) | | | | | | | | | | | | | | | 12,923 | |
| | | | | |
| | 1,746 | | | Puma Biotechnology Inc , (2) | | | | | | | | | | | | | | | 66,872 | |
| | | | | |
| | 1,975 | | | Radius Health Inc., (2), (3) | | | | | | | | | | | | | | | 84,767 | |
| | | | | |
| | 1,268 | | | REGENXBIO Inc., (2) | | | | | | | | | | | | | | | 19,971 | |
| | | | | |
| | 2,566 | | | Regulus Therapeutics Incorporated, (2) | | | | | | | | | | | | | | | 7,057 | |
| | | | | |
| | 2,113 | | | Repligen Corporation, (2) | | | | | | | | | | | | | | | 60,368 | |
| | | | | |
| | 2,267 | | | Retrophin Inc., (2) | | | | | | | | | | | | | | | 42,733 | |
| | | | | |
| | 5,830 | | | Rigel Pharmaceuticals, Inc., (2) | | | | | | | | | | | | | | | 15,158 | |
| | | | | |
| | 1,886 | | | Sage Therapeutics, Inc., (2) | | | | | | | | | | | | | | | 82,116 | |
| | | | | |
| | 4,347 | | | Sangamo Biosciences, Inc., (2) | | | | | | | | | | | | | | | 15,432 | |
| | | | | |
| | 3,130 | | | Sarepta Therapautics Inc., (2), (3) | | | | | | | | | | | | | | | 122,821 | |
| | | | | |
| | 337 | | | Selecta Biosciences, Incorporated, (2) | | | | | | | | | | | | | | | 5,945 | |
| | | | | |
| | 1,115 | | | Seres Therapeutics Inc., (2) | | | | | | | | | | | | | | | 12,031 | |
| | | | | |
| | 1,580 | | | Sorrento Therapeutics, Inc., (2) | | | | | | | | | | | | | | | 9,085 | |
| | | | | |
| | 1,196 | | | Spark Therapeutics, Inc., (2) | | | | | | | | | | | | | | | 56,224 | |
| | | | | |
| | 4,851 | | | Spectrum Pharmaceuticals, Inc., (2) | | | | | | | | | | | | | | | 17,173 | |
| | | | | |
| | 1,059 | | | Stemline Therapeutics Inc., (2) | | | | | | | | | | | | | | | 12,073 | |
| | | | | |
| | 312 | | | Syndax Pharmaceuticals, Inc., (2), (3) | | | | | | | | | | | | | | | 3,685 | |
| | | | | |
| | 11,357 | | | Synergy Pharmaceuticals Inc., (2) | | | | | | | | | | | | | | | 52,129 | |
| | | | | |
| | 4,737 | | | Synthetic Biologics, Inc., (2), (3) | | | | | | | | | | | | | | | 6,632 | |
| | | | | |
| | 307 | | | Syros Pharmaceuticals, Incorporated, (2) | | | | | | | | | | | | | | | 4,172 | |
| | | | | |
| | 914 | | | T2 Biosystems, Inc., (2) | | | | | | | | | | | | | | | 5,776 | |
| | | | | |
| | 1,679 | | | Tesaro Inc., (2), (3) | | | | | | | | | | | | | | | 202,958 | |
| | | | | |
| | 2,305 | | | TG Therapeutics Inc., (2) | | | | | | | | | | | | | | | 12,332 | |
Nuveen Small Cap Index Fund (continued)
| | |
| Portfolio of Investments | | October 31, 2016 |
| | | | | | | | | | | | | | | | | | | | |
| Shares | | | Description (1) | | | | | | | | | | | Value | |
| | | | | |
| | | | Biotechnology (continued) | | | | | | | | | | | | |
| | | | | |
| | 554 | | | Tobira Therapeutics Inc., (2) | | | | | | | | | | | | | | $ | 23,318 | |
| | | | | |
| | 642 | | | Tokai Pharmaceuticals, Inc., (2) | | | | | | | | | | | | | | | 706 | |
| | | | | |
| | 2,800 | | | Trevena Inc., (2) | | | | | | | | | | | | | | | 13,664 | |
| | | | | |
| | 1,764 | | | Trovagene, Inc., (2) | | | | | | | | | | | | | | | 6,086 | |
| | | | | |
| | 2,255 | | | Ultragenyx Pharmaceutical Inc., (2) | | | | | | | | | | | | | | | 133,022 | |
| | | | | |
| | 2,294 | | | Vanda Pharmaceuticals, Inc., (2) | | | | | | | | | | | | | | | 34,066 | |
| | | | | |
| | 1,876 | | | Versartis Inc., (2) | | | | | | | | | | | | | | | 20,730 | |
| | | | | |
| | 1,482 | | | Vital Therapies Inc., (2) | | | | | | | | | | | | | | | 7,929 | |
| | | | | |
| | 734 | | | Voyager Therapeutics Inc., (2) | | | | | | | | | | | | | | | 8,808 | |
| | | | | |
| | 454 | | | vTv Therapeutics Inc, Class A Shares, (2) | | | | | | | | | | | | | | | 2,447 | |
| | | | | |
| | 1,094 | | | XBiotech Inc., (2) | | | | | | | | | | | | | | | 14,496 | |
| | | | | |
| | 2,012 | | | Xencor Inc., (2) | | | | | | | | | | | | | | | 42,835 | |
| | | | | |
| | 1,512 | | | Zafgen Inc., (2) | | | | | | | | | | | | | | | 4,551 | |
| | | | | |
| | 7,608 | | | ZIOPHARM Oncology, Inc., (2), (3) | | | | | | | | | | | | | | | 43,213 | |
| | | | Total Biotechnology | | | | | | | | | | | | | | | 4,929,320 | |
| | | | | |
| | | | Building Products – 1.1% | | | | | | | | | | | | |
| | | | | |
| | 2,529 | | | Aaon, Inc. | | | | | | | | | | | | | | | 75,744 | |
| | | | | |
| | 2,174 | | | Advanced Drainage Systems, Inc. | | | | | | | | | | | | | | | 41,523 | |
| | | | | |
| | 866 | | | American Woodmark Company | | | | | | | | | | | | | | | 64,690 | |
| | | | | |
| | 1,778 | | | Apogee Enterprises, Inc. | | | | | | | | | | | | | | | 72,454 | |
| | | | | |
| | 1,548 | | | Armstrong Flooring, Inc., (2) | | | | | | | | | | | | | | | 25,062 | |
| | | | | |
| | 5,250 | | | Builders FirstSource, Inc., (2) | | | | | | | | | | | | | | | 50,768 | |
| | | | | |
| | 1,492 | | | Caesarstone Sdot-Yam Limited, (2) | | | | | | | | | | | | | | | 52,742 | |
| | | | | |
| | 2,205 | | | Continental Building Products Inc., (2) | | | | | | | | | | | | | | | 45,092 | |
| | | | | |
| | 902 | | | CSW Industrials, Inc., (2) | | | | | | | | | | | | | | | 27,917 | |
| | | | | |
| | 1,974 | | | Gibraltar Industries Inc. | | | | | | | | | | | | | | | 76,789 | |
| | | | | |
| | 1,894 | | | Griffon Corporation | | | | | | | | | | | | | | | 31,630 | |
| | | | | |
| | 1,098 | | | Insteel Industries, Inc. | | | | | | | | | | | | | | | 29,536 | |
| | | | | |
| | 1,902 | | | Masonite International Corporation, (2) | | | | | | | | | | | | | | | 108,222 | |
| | | | | |
| | 1,703 | | | NCI Building Systems Inc., (2) | | | | | | | | | | | | | | | 24,523 | |
| | | | | |
| | 909 | | | Patrick Industries, Inc., (2) | | | | | | | | | | | | | | | 52,131 | |
| | | | | |
| | 3,162 | | | PGT, Inc., (2) | | | | | | | | | | | | | | | 30,988 | |
| | | | | |
| | 1,483 | | | Ply Gem Holdings Inc., (2) | | | | | | | | | | | | | | | 20,317 | |
| | | | | |
| | 2,191 | | | Quanex Building Products Corporation | | | | | | | | | | | | | | | 35,713 | |
| | | | | |
| | 2,598 | | | Simpson Manufacturing Company Inc. | | | | | | | | | | | | | | | 111,194 | |
| | | | | |
| | 1,847 | | | Trex Company Inc., (2) | | | | | | | | | | | | | | | 99,387 | |
| | | | | |
| | 1,240 | | | Universal Forest Products Inc. | | | | | | | | | | | | | | | 106,628 | |
| | | | Total Building Products | | | | | | | | | | | | | | | 1,183,050 | |
| | | | | | | | | | | | | | | | | | | | |
| Shares | | | Description (1) | | | | | | | | | | | Value | |
| | | | | |
| | | | Capital Markets – 1.3% | | | | | | | | | | | | |
| | | | | |
| | 1,411 | | | Arlington Asset Investment Corporation | | | | | | | | | | | | | | $ | 20,149 | |
| | | | | |
| | 281 | | | Associated Capital Corp. | | | | | | | | | | | | | | | 9,540 | |
| | | | | |
| | 615 | | | B. Riley Financial, Inc. | | | | | | | | | | | | | | | 7,872 | |
| | | | | |
| | 13,632 | | | BGC Partners Inc., Class A | | | | | | | | | | | | | | | 117,099 | |
| | | | | |
| | 1,117 | | | Calamos Asset Management, Inc. Class A | | | | | | | | | | | | | | | 7,216 | |
| | | | | |
| | 1,312 | | | Cohen & Steers Inc. | | | | | | | | | | | | | | | 48,780 | |
| | | | | |
| | 6,833 | | | Cowen Group, Inc, Class A, (2) | | | | | | | | | | | | | | | 22,207 | |
| | | | | |
| | 189 | | | Diamond Hill Investment Group, Inc. | | | | | | | | | | | | | | | 34,400 | |
| | | | | |
| | 2,445 | | | Evercore Partners Inc. | | | | | | | | | | | | | | | 131,419 | |
| | | | | |
| | 3,349 | | | Financial Engines Inc. | | | | | | | | | | | | | | | 92,600 | |
| | | | | |
| | 2,088 | | | Gain Capital Holdings Inc. | | | | | | | | | | | | | | | 9,605 | |
| | | | | |
| | 237 | | | GAMCO Investors Inc. | | | | | | | | | | | | | | | 6,733 | |
| | | | | |
| | 1,740 | | | Greenhill & Co Inc. | | | | | | | | | | | | | | | 40,803 | |
| | | | | |
| | 181 | | | Hennessy Advisors, Inc. | | | | | | | | | | | | | | | 5,227 | |
| | | | | |
| | 763 | | | Houlihan Lokey Inc. | | | | | | | | | | | | | | | 18,594 | |
| | | | | |
| | 943 | | | INTL FCStone Inc., (2) | | | | | | | | | | | | | | | 33,854 | |
| | | | | |
| | 2,061 | | | Investment Technology Group | | | | | | | | | | | | | | | 31,554 | |
| | | | | |
| | 9,044 | | | Janus Capital Group Inc. | | | | | | | | | | | | | | | 115,944 | |
| | | | | |
| | 3,284 | | | KCG Holdings Inc., Class A Shares, (2) | | | | | | | | | | | | | | | 41,904 | |
| | | | | |
| | 7,739 | | | Ladenburg Thalmann Financial Services Inc., (2) | | | | | | | | | | | | | | | 15,788 | |
| | | | | |
| | 989 | | | Manning & Napier Inc. | | | | | | | | | | | | | | | 6,824 | |
| | | | | |
| | 464 | | | Medley Management Inc., Class A Shares | | | | | | | | | | | | | | | 4,106 | |
| | | | | |
| | 1,137 | | | Moelis & Company | | | | | | | | | | | | | | | 28,880 | |
| | | | | |
| | 2,511 | | | OM Asset Management PLC | | | | | | | | | | | | | | | 35,330 | |
| | | | | |
| | 670 | | | Oppenheimer Holdings Inc., Class A | | | | | | | | | | | | | | | 9,380 | |
| | | | | |
| | 907 | | | Piper Jaffray Companies, (2) | | | | | | | | | | | | | | | 51,291 | |
| | | | | |
| | 1,109 | | | PJT Pertners, Inc., Class A Shares, (3) | | | | | | | | | | | | | | | 30,542 | |
| | | | | |
| | 852 | | | Pzena Investments Management, Inc. | | | | | | | | | | | | | | | 6,203 | |
| | | | | |
| | 1,260 | | | Safeguard Scientifics Inc., (2) | | | | | | | | | | | | | | | 14,868 | |
| | | | | |
| | 465 | | | Silvercrest Asset Management Corporation Class A | | | | | | | | | | | | | | | 5,369 | |
| | | | | |
| | 4,016 | | | Stifel Financial Corporation, (2) | | | | | | | | | | | | | | | 157,186 | |
| | | | | |
| | 77 | | | Value Line, Inc. | | | | | | | | | | | | | | | 1,379 | |
| | | | | |
| | 1,577 | | | Virtu Financial, Inc., Class A Shares | | | | | | | | | | | | | | | 20,186 | |
| | | | | |
| | 366 | | | Virtus Investment Partners Inc. | | | | | | | | | | | | | | | 39,272 | |
| | | | | |
| | 4,971 | | | Waddell & Reed Financial, Inc., Class A | | | | | | | | | | | | | | | 78,144 | |
| | | | | |
| | 499 | | | Westwood Holding Group Inc. | | | | | | | | | | | | | | | 25,723 | |
| | | | | |
| | 93 | | | Wins Finance Holdings Inc., (2) | | | | | | | | | | | | | | | 2,744 | |
| | | | | |
| | 7,196 | | | WisdomTree Investments Inc., (3) | | | | | | | | | | | | | | | 61,742 | |
| | | | Total Capital Markets | | | | | | | | | | | | | | | 1,390,457 | |
Nuveen Small Cap Index Fund (continued)
| | |
| Portfolio of Investments | | October 31, 2016 |
| | | | | | | | | | | | | | | | | | | | |
| Shares | | | Description (1) | | | | | | | | | | | Value | |
| | | | | |
| | | | Chemicals – 2.3% | | | | | | | | | | | | |
| | | | | |
| | 1,800 | | | A Schulman, Inc. | | | | | | | | | | | | | | $ | 51,750 | |
| | | | | |
| | 1,378 | | | AgroFresh Solutions, Inc., (2) | | | | | | | | | | | | | | | 6,477 | |
| | | | | |
| | 1,767 | | | American Vanguard Corp. | | | | | | | | | | | | | | | 26,858 | |
| | | | | |
| | 1,971 | | | Balchem Corporation | | | | | | | | | | | | | | | 149,599 | |
| | | | | |
| | 3,155 | | | Calgon Carbon Corporation | | | | | | | | | | | | | | | 49,849 | |
| | | | | |
| | 443 | | | Chase Corporation, Common Stock | | | | | | | | | | | | | | | 30,279 | |
| | | | | |
| | 11,474 | | | Chemours Company | | | | | | | | | | | | | | | 188,518 | |
| | | | | |
| | 3,990 | | | Chemtura Corporation, (2) | | | | | | | | | | | | | | | 130,872 | |
| | | | | |
| | 2,096 | | | Codexis Inc., (2) | | | | | | | | | | | | | | | 10,585 | |
| | | | | |
| | 5,211 | | | Ferro Corporation | | | | | | | | | | | | | | | 67,535 | |
| | | | | |
| | 3,428 | | | Flotek Industries Inc., (2), (3) | | | | | | | | | | | | | | | 40,382 | |
| | | | | |
| | 1,578 | | | FutureFuel Corporation | | | | | | | | | | | | | | | 17,295 | |
| | | | | |
| | 4,440 | | | GCP Applied Technologies, Inc., (2) | | | | | | | | | | | | | | | 114,774 | |
| | | | | |
| | 3,066 | | | H.B. Fuller Company | | | | | | | | | | | | | | | 128,987 | |
| | | | | |
| | 602 | | | Hawkins Inc | | | | | | | | | | | | | | | 24,291 | |
| | | | | |
| | 2,666 | | | Ingevity Corporation, (2) | | | | | | | | | | | | | | | 110,372 | |
| | | | | |
| | 1,211 | | | Innophos Holdings, Inc. | | | | | | | | | | | | | | | 55,512 | |
| | | | | |
| | 1,331 | | | Innospec, Inc. | | | | | | | | | | | | | | | 80,193 | |
| | | | | |
| | 564 | | | KMG Chemicals, Inc. | | | | | | | | | | | | | | | 15,307 | |
| | | | | |
| | 1,274 | | | Koppers Holdings Inc. | | | | | | | | | | | | | | | 41,724 | |
| | | | | |
| | 1,853 | | | Kraton Performance Polymers Inc., (2) | | | | | | | | | | | | | | | 47,492 | |
| | | | | |
| | 1,420 | | | Kronos Worldwide Inc. | | | | | | | | | | | | | | | 10,918 | |
| | | | | |
| | 1,366 | | | LSB Industries Inc., (2), (3) | | | | | | | | | | | | | | | 7,226 | |
| | | | | |
| | 2,170 | | | Minerals Technologies Inc. | | | | | | | | | | | | | | | 145,824 | |
| | | | | |
| | 10,373 | | | Olin Corporation | | | | | | | | | | | | | | | 227,480 | |
| | | | | |
| | 2,660 | | | OMNOVA Solutions Inc., (2) | | | | | | | | | | | | | | | 20,216 | |
| | | | | |
| | 5,255 | | | PolyOne Corporation | | | | | | | | | | | | | | | 153,604 | |
| | | | | |
| | 809 | | | Quaker Chemical Corporation | | | | | | | | | | | | | | | 86,968 | |
| | | | | |
| | 2,694 | | | Rayonier Advanced Materials Inc. | | | | | | | | | | | | | | | 34,833 | |
| | | | | |
| | 2,788 | | | Sensient Technologies Corporation | | | | | | | | | | | | | | | 207,734 | |
| | | | | |
| | 1,229 | | | Stepan Company | | | | | | | | | | | | | | | 87,296 | |
| | | | | |
| | 5,178 | | | TerraVia Holdings Inc., (2) | | | | | | | | | | | | | | | 12,168 | |
| | | | | |
| | 1,242 | | | Trecora Resources, (2) | | | | | | | | | | | | | | | 12,731 | |
| | | | | |
| | 1,591 | | | Tredegar Corporation | | | | | | | | | | | | | | | 29,434 | |
| | | | | |
| | 1,799 | | | Trinseo SA | | | | | | | | | | | | | | | 94,358 | |
| | | | | |
| | 4,037 | | | Tronox Limited, Class A | | | | | | | | | | | | | | | 32,700 | |
| | | | | |
| | 1,661 | | | Valhi Inc. | | | | | | | | | | | | | | | 3,256 | |
| | | | Total Chemicals | | | | | | | | | | | | | | | 2,555,397 | |
| | | | | | | | | | | | | | | | | | | | |
| Shares | | | Description (1) | | | | | | | | | | | Value | |
| | | | | |
| | | | Commercial Services & Supplies – 2.2% | | | | | | | | | | | | |
| | | | | |
| | 3,399 | | | ABM Industries Inc. | | | | | | | | | | | | | | $ | 132,833 | |
| | | | | |
| | 6,656 | | | Acco Brands Corporation, (2) | | | | | | | | | | | | | | | 73,882 | |
| | | | | |
| | 1,368 | | | American Ecology Corporation | | | | | | | | | | | | | | | 57,798 | |
| | | | | |
| | 711 | | | Aqua Metals, Inc., (2), (3) | | | | | | | | | | | | | | | 6,363 | |
| | | | | |
| | 2,639 | | | ARC Document Solutions, (2) | | | | | | | | | | | | | | | 9,052 | |
| | | | | |
| | 2,865 | | | Brady Corporation | | | | | | | | | | | | | | | 94,832 | |
| | | | | |
| | 2,821 | | | Brinks Company | | | | | | | | | | | | | | | 111,571 | |
| | | | | |
| | 2,420 | | | Casella Waste Systems, Inc., (2) | | | | | | | | | | | | | | | 27,104 | |
| | | | | |
| | 1,833 | | | CECO Environmental Corporation | | | | | | | | | | | | | | | 18,147 | |
| | | | | |
| | 3,062 | | | Deluxe Corporation | | | | | | | | | | | | | | | 187,394 | |
| | | | | |
| | 1,602 | | | Ennis Inc. | | | | | | | | | | | | | | | 23,469 | |
| | | | | |
| | 2,332 | | | Essendant Inc. | | | | | | | | | | | | | | | 35,796 | |
| | | | | |
| | 886 | | | G&K Services, Inc. | | | | | | | | | | | | | | | 83,904 | |
| | | | | |
| | 4,408 | | | Healthcare Services Group, Inc. | | | | | | | | | | | | | | | 162,964 | |
| | | | | |
| | 825 | | | Heritage-Crystal Clean, Inc., (2) | | | | | | | | | | | | | | | 10,808 | |
| | | | | |
| | 2,839 | | | HNI Corporation | | | | | | | | | | | | | | | 115,434 | |
| | | | | |
| | 2,401 | | | Innerworkings, Inc., (2) | | | | | | | | | | | | | | | 21,153 | |
| | | | | |
| | 4,051 | | | Interface, Inc. | | | | | | | | | | | | | | | 64,208 | |
| | | | | |
| | 2,312 | | | Kimball International Inc., Class B | | | | | | | | | | | | | | | 28,900 | |
| | | | | |
| | 3,008 | | | Knoll Inc. | | | | | | | | | | | | | | | 65,093 | |
| | | | | |
| | 2,001 | | | Matthews International Corporation | | | | | �� | | | | | | | | | | 119,860 | |
| | | | | |
| | 1,470 | | | McGrath Rentcorp. | | | | | | | | | | | | | | | 44,247 | |
| | | | | |
| | 3,750 | | | Miller (Herman) Inc. | | | | | | | | | | | | | | | 104,250 | |
| | | | | |
| | 2,773 | | | Mobile Mini, Inc. | | | | | | | | | | | | | | | 70,294 | |
| | | | | |
| | 1,946 | | | MSA Safety Inc. | | | | | | | | | | | | | | | 113,452 | |
| | | | | |
| | 851 | | | Multi Color Corporation | | | | | | | | | | | | | | | 55,251 | |
| | | | | |
| | 562 | | | NL Industries Inc. | | | | | | | | | | | | | | | 1,798 | |
| | | | | |
| | 1,867 | | | Quad Graphics Inc. | | | | | | | | | | | | | | | 44,360 | |
| | | | | |
| | 1,084 | | | SP Plus Corporation, (2) | | | | | | | | | | | | | | | 27,317 | |
| | | | | |
| | 5,389 | | | Steelcase Inc. | | | | | | | | | | | | | | | 71,943 | |
| | | | | |
| | 1,809 | | | Team, Inc., (2) | | | | | | | | | | | | | | | 55,627 | |
| | | | | |
| | 3,618 | | | Tetra Tech, Inc. | | | | | | | | | | | | | | | 139,112 | |
| | | | | |
| | 1,230 | | | TRC Companies, (2) | | | | | | | | | | | | | | | 10,025 | |
| | | | | |
| | 947 | | | UniFirst Corporation | | | | | | | | | | | | | | | 116,008 | |
| | | | | |
| | 1,260 | | | Viad Corporation | | | | | | | | | | | | | | | 52,290 | |
| | | | | |
| | 538 | | | VSE Corporation | | | | | | | | | | | | | | | 15,516 | |
| | | | | |
| | 2,705 | | | West Corporation | | | | | | | | | | | | | | | 53,343 | |
| | | | Total Commercial Services & Supplies | | | | | | | | | | | | | | | 2,425,398 | |
Nuveen Small Cap Index Fund (continued)
| | |
| Portfolio of Investments | | October 31, 2016 |
| | | | | | | | | | | | | | | | | | | | |
| Shares | | | Description (1) | | | | | | | | | | | Value | |
| | | | | |
| | | | Communications Equipment – 1.7% | | | | | | | | | | | | |
| | | | | |
| | 3,076 | | | ADTRAN, Inc. | | | | | | | | | | | | | | $ | 55,829 | |
| | | | | |
| | 1,499 | | | Aerohive Networks Inc., (2) | | | | | | | | | | | | | | | 7,930 | |
| | | | | |
| | 1,032 | | | Applied Optoelectronics Inc., (2) | | | | | | | | | | | | | | | 19,845 | |
| | | | | |
| | 580 | | | Bel Fuse, Inc., Class B | | | | | | | | | | | | | | | 13,833 | |
| | | | | |
| | 993 | | | Black Box Corporation | | | | | | | | | | | | | | | 11,420 | |
| | | | | |
| | 2,242 | | | CalAmp Corporation, (2) | | | | | | | | | | | | | | | 28,967 | |
| | | | | |
| | 2,584 | | | Calix Inc., (2) | | | | | | | | | | | | | | | 16,150 | |
| | | | | |
| | 8,598 | | | Ciena Corporation, (2) | | | | | | | | | | | | | | | 166,629 | |
| | | | | |
| | 729 | | | Clearfield Inc., (2) | | | | | | | | | | | | | | | 12,211 | |
| | | | | |
| | 1,414 | | | Comtech Telecom Corporation | | | | | | | | | | | | | | | 14,706 | |
| | | | | |
| | 1,613 | | | Digi International, Inc., (2) | | | | | | | | | | | | | | | 14,759 | |
| | | | | |
| | 1,636 | | | EMCORE Corporation, (2) | | | | | | | | | | | | | | | 10,716 | |
| | | | | |
| | 6,471 | | | Extreme Networks Inc., (2) | | | | | | | | | | | | | | | 27,241 | |
| | | | | |
| | 6,733 | | | Finisar Corporation, (2) | | | | | | | | | | | | | | | 184,350 | |
| | | | | |
| | 4,787 | | | Harmonic Inc., (2) | | | | | | | | | | | | | | | 24,414 | |
| | | | | |
| | 8,798 | | | Infinera Corporation, (2) | | | | | | | | | | | | | | | 68,624 | |
| | | | | |
| | 2,170 | | | Interdigital Inc. | | | | | | | | | | | | | | | 153,311 | |
| | | | | |
| | 4,018 | | | IXIA, (2) | | | | | | | | | | | | | | | 48,015 | |
| | | | | |
| | 945 | | | KVH Industries, Inc., (2) | | | | | | | | | | | | | | | 7,513 | |
| | | | | |
| | 3,163 | | | Lumentum Holdings Inc., (2) | | | | | | | | | | | | | | | 106,277 | |
| | | | | |
| | 1,731 | | | Netgear, Inc., (2) | | | | | | | | | | | | | | | 87,416 | |
| | | | | |
| | 5,611 | | | NetScout Systems, Inc., (2) | | | | | | | | | | | | | | | 154,022 | |
| | | | | |
| | 7,005 | | | Oclaro Inc., (2) | | | | | | | | | | | | | | | 51,207 | |
| | | | | |
| | 2,077 | | | Plantronics Inc. | | | | | | | | | | | | | | | 107,402 | |
| | | | | |
| | 4,175 | | | ShoreTel, Inc., (2) | | | | | | | | | | | | | | | 27,764 | |
| | | | | |
| | 351 | | | Silicom Limited | | | | | | | | | | | | | | | 13,057 | |
| | | | | |
| | 2,987 | | | Sonus Networks, Inc., (2) | | | | | | | | | | | | | | | 17,295 | |
| | | | | |
| | 1,624 | | | Ubiquiti Networks Inc. | | | | | | | | | | | | | | | 85,146 | |
| | | | | |
| | 2,783 | | | ViaSat, Inc., (2) | | | | | | | | | | | | | | | 196,647 | |
| | | | | |
| | 14,688 | | | Viavi Solutions Inc., (2) | | | | | | | | | | | | | | | 104,579 | |
| | | | Total Communications Equipment | | | | | | | | | | | | | | | 1,837,275 | |
| | | | | |
| | | | Construction & Engineering – 0.9% | | | | | | | | | | | | |
| | | | | |
| | 2,188 | | | Aegion Corporation, (2) | | | | | | | | | | | | | | | 40,500 | |
| | | | | |
| | 1,630 | | | Ameresco Inc., Class A Shares, (2) | | | | | | | | | | | | | | | 7,824 | |
| | | | | |
| | 837 | | | Argan, Inc. | | | | | | | | | | | | | | | 47,583 | |
| | | | | |
| | 2,322 | | | Comfort Systems USA Inc. | | | | | | | | | | | | | | | 66,990 | |
| | | | | |
| | 1,914 | | | Dycom Industries Inc., (2) | | | | | | | | | | | | | | | 147,244 | |
| | | | | |
| | 3,792 | | | Emcor Group Inc. | | | | | | | | | | | | | | | 229,264 | |
| | | | | |
| | 2,475 | | | Granite Construction Inc. | | | | | | | | | | | | | | | 121,671 | |
| | | | | | | | | | | | | | | | | | | | |
| Shares | | | Description (1) | | | | | | | | | | | Value | |
| | | | | |
| | | | Construction & Engineering (continued) | | | | | | | | | | | | |
| | | | | |
| | 3,907 | | | Great Lakes Dredge & Dock Corporation | | | | | | | | | | | | | | $ | 13,870 | |
| | | | | |
| | 2,210 | | | HC2 Holdings, Inc., (2) | | | | | | | | | | | | | | | 8,796 | |
| | | | | |
| | 518 | | | IES Holdings, Inc., (2) | | | | | | | | | | | | | | | 7,744 | |
| | | | | |
| | 1,198 | | | Layne Christensen Company, (2) | | | | | | | | | | | | | | | 10,267 | |
| | | | | |
| | 4,146 | | | MasTec Inc., (2) | | | | | | | | | | | | | | | 118,368 | |
| | | | | |
| | 938 | | | MYR Group Inc., (2) | | | | | | | | | | | | | | | 27,990 | |
| | | | | |
| | 485 | | | NV5 Holdings Inc., (2) | | | | | | | | | | | | | | | 13,871 | |
| | | | | |
| | 1,808 | | | Orion Marine Group Inc., (2) | | | | | | | | | | | | | | | 14,609 | |
| | | | | |
| | 2,521 | | | Primoris Services Corporation | | | | | | | | | | | | | | | 50,496 | |
| | | | | |
| | 2,365 | | | Tutor Perini Corporation, (2) | | | | | | | | | | | | | | | 45,053 | |
| | | | Total Construction & Engineering | | | | | | | | | | | | | | | 972,140 | |
| | | | | |
| | | | Construction Materials – 0.2% | | | | | | | | | | | | |
| | | | | |
| | 4,554 | | | Headwater Inc., (2) | | | | | | | | | | | | | | | 74,686 | |
| | | | | |
| | 4,768 | | | Summit Materials, Inc., Class A Shares, (2) | | | | | | | | | | | | | | | 89,352 | |
| | | | | |
| | 91 | | | United States Lime & Minerals, Inc. | | | | | | | | | | | | | | | 5,987 | |
| | | | | |
| | 897 | | | US Concrete, Inc., (2), (3) | | | | | | | | | | | | | | | 44,760 | |
| | | | Total Construction Materials | | | | | | | | | | | | | | | 214,785 | |
| | | | | |
| | | | Consumer Finance – 0.5% | | | | | | | | | | | | |
| | | | | |
| | 1,491 | | | Encore Capital Group, Inc., (2) | | | | | | | | | | | | | | | 29,596 | |
| | | | | |
| | 1,766 | | | Enova International, Inc., (2) | | | | | | | | | | | | | | | 16,600 | |
| | | | | |
| | 3,170 | | | EZCORP, Inc., (2) | | | | | | | | | | | | | | | 30,908 | |
| | | | | |
| | 2,980 | | | First Cash Financial Services, Inc. | | | | | | | | | | | | | | | 140,656 | |
| | | | | |
| | 2,672 | | | Green Dot Corporation, Class A Shares, (2) | | | | | | | | | | | | | | | 59,318 | |
| | | | | |
| | 20,592 | | | LendingClub Corporation, (2), (3) | | | | | | | | | | | | | | | 101,519 | |
| | | | | |
| | 1,267 | | | Nelnet Inc. | | | | | | | | | | | | | | | 49,641 | |
| | | | | |
| | 2,886 | | | PRA Group Inc., (2) | | | | | | | | | | | | | | | 92,063 | |
| | | | | |
| | 698 | | | Regional Management Corporation, (2) | | | | | | | | | | | | | | | 15,544 | |
| | | | | |
| | 378 | | | World Acceptance Corporation, (2), (3) | | | | | | | | | | | | | | | 17,963 | |
| | | | Total Consumer Finance | | | | | | | | | | | | | | | 553,808 | |
| | | | | |
| | | | Containers & Packaging – 0.1% | | | | | | | | | | | | |
| | | | | |
| | 253 | | | AEP Industries, Inc. | | | | | | | | | | | | | | | 27,716 | |
| | | | | |
| | 359 | | | Greif , Inc, Class B Shares | | | | | | | | | | | | | | | 20,912 | |
| | | | | |
| | 1,603 | | | Greif Inc. | | | | | | | | | | | | | | | 75,117 | |
| | | | | |
| | 1,349 | | | Multi Packaging Solutions International Limited, (2) | | | | | | | | | | | | | | | 18,225 | |
| | | | | |
| | 1,359 | | | Myers Industries, Inc. | | | | | | | | | | | | | | | 16,376 | |
| | | | | |
| | 424 | | | UFP Technologies, Inc., (2) | | | | | | | | | | | | | | | 11,321 | |
| | | | Total Containers & Packaging | | | | | | | | | | | | | | | 169,667 | |
| | | | | |
| | | | Distributors – 0.1% | | | | | | | | | | | | |
| | | | | |
| | 2,860 | | | Core-Mark Holding Company, Inc. | | | | | | | | | | | | | | | 101,101 | |
Nuveen Small Cap Index Fund (continued)
| | |
| Portfolio of Investments | | October 31, 2016 |
| | | | | | | | | | | | | | | | | | | | |
| Shares | | | Description (1) | | | | | | | | | | | Value | |
| | | | | |
| | | | Distributors (continued) | | | | | | | | | | | | |
| | | | | |
| | 407 | | | Weyco Group, Inc. | | | | | | | | | | | | | | $ | 10,301 | |
| | | | Total Distributors | | | | | | | | | | | | | | | 111,402 | |
| | | | | |
| | | | Diversified Consumer Services – 0.9% | | | | | | | | | | | | |
| | | | | |
| | 970 | | | American Public Education Inc., (2) | | | | | | | | | | | | | | | 19,546 | |
| | | | | |
| | 5,346 | | | Apollo Group, Inc., (2) | | | | | | | | | | | | | | | 46,991 | |
| | | | | |
| | 639 | | | Ascent Media Corporation, (2) | | | | | | | | | | | | | | | 13,023 | |
| | | | | |
| | 1,092 | | | Bridgepoint Education Inc., (2) | | | | | | | | | | | | | | | 7,382 | |
| | | | | |
| | 2,622 | | | Bright Horizons Family Solutions Inc., (2) | | | | | | | | | | | | | | | 175,438 | |
| | | | | |
| | 962 | | | Cambium Learning Group Inc., (2) | | | | | | | | | | | | | | | 4,983 | |
| | | | | |
| | 709 | | | Capella Education Company, (3) | | | | | | | | | | | | | | | 51,828 | |
| | | | | |
| | 4,184 | | | Career Education Corporation, (2) | | | | | | | | | | | | | | | 30,083 | |
| | | | | |
| | 925 | | | Carriage Services Inc. | | | | | | | | | | | | | | | 21,867 | |
| | | | | |
| | 5,039 | | | Chegg Inc., (2) | | | | | | | | | | | | | | | 33,509 | |
| | | | | |
| | 462 | | | Collectors Universe, Inc. | | | | | | | | | | | | | | | 8,681 | |
| | | | | |
| | 3,917 | | | DeVry Education Group Inc., (3) | | | | | | | | | | | | | | | 88,916 | |
| | | | | |
| | 2,816 | | | Grand Canyon Education Inc., (2) | | | | | | | | | | | | | | | 122,890 | |
| | | | | |
| | 7,765 | | | Houghton Mifflin Harcourt Company, (2) | | | | | | | | | | | | | | | 98,227 | |
| | | | | |
| | 2,185 | | | K12, Inc., (2) | | | | | | | | | | | | | | | 23,685 | |
| | | | | |
| | 451 | | | Liberty Tax Inc., Class A Shares | | | | | | | | | | | | | | | 5,344 | |
| | | | | |
| | 5,292 | | | LifeLock, Incorporated, (2) | | | | | | | | | | | | | | | 85,201 | |
| | | | | |
| | 2,328 | | | Regis Corporation | | | | | | | | | | | | | | | 29,519 | |
| | | | | |
| | 3,084 | | | Sothebys Holdings Inc., (3) | | | | | | | | | | | | | | | 110,654 | |
| | | | | |
| | 659 | | | Strayer Education Inc. | | | | | | | | | | | | | | | 38,657 | |
| | | | | |
| | 1,737 | | | Weight Watcher’s International Inc., (3) | | | | | | | | | | | | | | | 17,856 | |
| | | | Total Diversified Consumer Services | | | | | | | | | | | | | | | 1,034,280 | |
| | | | | |
| | | | Diversified Financial Services – 0.1% | | | | | | | | | | | | |
| | | | | |
| | 45 | | | BBX Capital Corporation, (2) | | | | | | | | | | | | | | | 916 | |
| | | | | |
| | 4,118 | | | FNFV Group, (2) | | | | | | | | | | | | | | | 49,622 | |
| | | | | |
| | 519 | | | Marlin Business Services Corporation | | | | | | | | | | | | | | | 9,083 | |
| | | | | |
| | 1,563 | | | Newstar Financial, Inc., (2) | | | | | | | | | | | | | | | 15,208 | |
| | | | | |
| | 3,003 | | | On Deck Capital, Inc., (2), (3) | | | | | | | | | | | | | | | 14,685 | |
| | | | | |
| | 1,370 | | | PICO Holdings, Inc., (2) | | | | | | | | | | | | | | | 16,577 | |
| | | | | |
| | 1,937 | | | Tiptree Financial Inc., Class A | | | | | | | | | | | | | | | 11,235 | |
| | | | Total Diversified Financial Services | | | | | | | | | | | | | | | 117,326 | |
| | | | | |
| | | | Diversified Telecommunication Services – 0.6% | | | | | | | | | | | | |
| | | | | |
| | 649 | | | Atlantic Tele-Network, Inc. | | | | | | | | | | | | | | | 43,898 | |
| | | | | |
| | 2,635 | | | Cincinnati Bell Inc., (2) | | | | | | | | | | | | | | | 51,778 | |
| | | | | |
| | 2,603 | | | Cogent Communications Group, Inc. | | | | | | | | | | | | | | | 96,051 | |
| | | | | |
| | 3,111 | | | Consolidated Communications Holdings, Inc. | | | | | | | | | | | | | | | 74,446 | |
| | | | | | | | | | | | | | | | | | | | |
| Shares | | | Description (1) | | | | | | | | | | | Value | |
| | | | | |
| | | | Diversified Telecommunication Services (continued) | | | | | | | | | | | | |
| | | | | |
| | 1,329 | | | FairPoint Communications Inc., (2) | | | | | | | | | | | | | | $ | 20,732 | |
| | | | | |
| | 1,813 | | | General Communication, Inc., (2) | | | | | | | | | | | | | | | 28,718 | |
| | | | | |
| | 23,354 | | | Globalstar, Inc., (2), (3) | | | | | | | | | | | | | | | 21,616 | |
| | | | | |
| | 1,082 | | | IDT Corporation | | | | | | | | | | | | | | | 19,357 | |
| | | | | |
| | 2,042 | | | Inteliquent Incn | | | | | | | | | | | | | | | 34,285 | |
| | | | | |
| | 2,091 | | | Intelsat SA, (2) | | | | | | | | | | | | | | | 5,667 | |
| | | | | |
| | 5,164 | | | Iridium Communications Inc., (2), (3) | | | | | | | | | | | | | | | 42,087 | |
| | | | | |
| | 1,185 | | | Lumos Networks Corporation | | | | | | | | | | | | | | | 16,839 | |
| | | | | |
| | 4,047 | | | Orbcomm, Inc., (2) | | | | | | | | | | | | | | | 36,140 | |
| | | | | |
| | 611 | | | pdvWireless Inc., (2), (3) | | | | | | | | | | | | | | | 14,420 | |
| | | | | |
| | 599 | | | Straight Path Communications Inc., Class B Shares, (2), (3) | | | | | | | | | | | | | | | 14,544 | |
| | | | | |
| | 11,964 | | | Vonage Holdings Corporation, (2) | | | | | | | | | | | | | | | 82,073 | |
| | | | | |
| | 6,011 | | | Windstream Holdings Inc., (3) | | | | | | | | | | | | | | | 47,186 | |
| | | | Total Diversified Telecommunication Services | | | | | | | | | | | | | | | 649,837 | |
| | | | | |
| | | | Electric Utilities – 1.2% | | | | | | | | | | | | |
| | | | | |
| | 3,110 | | | ALLETE Inc | | | | | | | | | | | | | | | 190,612 | |
| | | | | |
| | 2,531 | | | El Paso Electric Company | | | | | | | | | | | | | | | 116,932 | |
| | | | | |
| | 2,764 | | | Empire District Electric Company | | | | | | | | | | | | | | | 94,612 | |
| | | | | |
| | 926 | | | Genie Energy Limited, Class B Shares | | | | | | | | | | | | | | | 4,824 | |
| | | | | |
| | 3,165 | | | IDACORP, INC | | | | | | | | | | | | | | | 248,104 | |
| | | | | |
| | 2,190 | | | MGE Energy, Inc. | | | | | | | | | | | | | | | 128,006 | |
| | | | | |
| | 2,378 | | | Otter Tail Power Corporation | | | | | | | | | | | | | | | 85,489 | |
| | | | | |
| | 5,009 | | | PNM Resources Inc. | | | | | | | | | | | | | | | 164,546 | |
| | | | | |
| | 5,606 | | | Portland General Electric Company | | | | | | | | | | | | | | | 244,646 | |
| | | | | |
| | 323 | | | Spark Energy, Inc. | | | | | | | | | | | | | | | 7,817 | |
| | | | Total Electric Utilities | | | | | | | | | | | | | | | 1,285,588 | |
| | | | | |
| | | | Electrical Equipment – 0.7% | | | | | | | | | | | | |
| | | | | |
| | 388 | | | Allied Motion | | | | | | | | | | | | | | | 7,675 | |
| | | | | |
| | 776 | | | American Superconductor Corporation, (2) | | | | | | | | | | | | | | | 4,974 | |
| | | | | |
| | 760 | | | Atkore International Group Inc., (2) | | | | | | | | | | | | | | | 14,288 | |
| | | | | |
| | 1,622 | | | AZZ Inc. | | | | | | | | | | | | | | | 86,372 | |
| | | | | |
| | 2,862 | | | Babcock & Wilcox Enterprises, Inc., (2) | | | | | | | | | | | | | | | 45,048 | |
| | | | | |
| | 1,265 | | | Encore Wire Corporation | | | | | | | | | | | | | | | 43,200 | |
| | | | | |
| | 927 | | | Energous Corporation, (2), (3) | | | | | | | | | | | | | | | 12,635 | |
| | | | | |
| | 2,729 | | | EnerSys | | | | | | | | | | | | | | | 177,740 | |
| | | | | |
| | 1,484 | | | Fuelcell Energy Inc., (2), (3) | | | | | | | | | | | | | | | 4,971 | |
| | | | | |
| | 4,093 | | | Generac Holdings Inc., (2) | | | | | | | | | | | | | | | 155,902 | |
| | | | | |
| | 3,036 | | | General Cable Corporation | | | | | | | | | | | | | | | 42,504 | |
| | | | | |
| | 1,489 | | | LSI Industries, Inc. | | | | | | | | | | | | | | | 12,805 | |
Nuveen Small Cap Index Fund (continued)
| | |
| Portfolio of Investments | | October 31, 2016 |
| | | | | | | | | | | | | | | | | | | | |
| Shares | | | Description (1) | | | | | | | | | | | Value | |
| | | | | |
| | | | Electrical Equipment (continued) | | | | | | | | | | | | |
| | | | | |
| | 11,307 | | | Plug Power Inc., (2), (3) | | | | | | | | | | | | | | $ | 17,300 | |
| | | | | |
| | 545 | | | Powell Industries Inc. | | | | | | | | | | | | | | | 19,288 | |
| | | | | |
| | 300 | | | Power Solutions International Inc., (2) | | | | | | | | | | | | | | | 2,865 | |
| | | | | |
| | 156 | | | Preformed Line Products Company | | | | | | | | | | | | | | | 6,711 | |
| | | | | |
| | 3,959 | | | Sunrun Inc., (2), (3) | | | | | | | | | | | | | | | 20,626 | |
| | | | | |
| | 2,003 | | | Thermon Group Holdings Inc., (2) | | | | | | | | | | | | | | | 36,715 | |
| | | | | |
| | 376 | | | TPI Composites Incorporated, (2) | | | | | | | | | | | | | | | 5,986 | |
| | | | | |
| | 1,064 | | | Vicor Corporation | | | | | | | | | | | | | | | 13,566 | |
| | | | Total Electrical Equipment | | | | | | | | | | | | | | | 731,171 | |
| | | | | |
| | | | Electronic Equipment, Instruments & Components – 2.7% | | | | | | | | | | | | |
| | | | | |
| | 948 | | | Agilysys Inc. | | | | | | | | | | | | | | | 9,148 | |
| | | | | |
| | 1,816 | | | Anixter International Inc., (2) | | | | | | | | | | | | | | | 119,402 | |
| | | | | |
| | 2,913 | | | AVX Group | | | | | | | | | | | | | | | 40,840 | |
| | | | | |
| | 1,757 | | | Badger Meter Inc. | | | | | | | | | | | | | | | 56,488 | |
| | | | | |
| | 2,625 | | | Belden Inc. | | | | | | | | | | | | | | | 170,126 | |
| | | | | |
| | 3,099 | | | Benchmark Electronics Inc., (2) | | | | | | | | | | | | | | | 77,940 | |
| | | | | |
| | 1,516 | | | Coherent Inc., (2) | | | | | | | | | | | | | | | 157,846 | |
| | | | | |
| | 1,257 | | | Control4 Corporation, (2) | | | | | | | | | | | | | | | 14,192 | |
| | | | | |
| | 1,962 | | | CTS Corporation | | | | | | | | | | | | | | | 35,708 | |
| | | | | |
| | 2,296 | | | Daktronics Inc. | | | | | | | | | | | | | | | 19,172 | |
| | | | | |
| | 1,092 | | | DTS, Inc. | | | | | | | | | | | | | | | 46,246 | |
| | | | | |
| | 1,820 | | | Electro Scientific Industries Inc. | | | | | | | | | | | | | | | 9,428 | |
| | | | | |
| | 395 | | | ePlus, Inc., (2) | | | | | | | | | | | | | | | 36,162 | |
| | | | | |
| | 2,183 | | | Fabrinet, (2) | | | | | | | | | | | | | | | 82,867 | |
| | | | | |
| | 1,038 | | | FARO Technologies, Inc., (2) | | | | | | | | | | | | | | | 34,825 | |
| | | | | |
| | 3,725 | | | II VI Inc., (2) | | | | | | | | | | | | | | | 103,555 | |
| | | | | |
| | 2,296 | | | Insight Enterprises Inc., (2) | | | | | | | | | | | | | | | 66,102 | |
| | | | | |
| | 5,119 | | | InvenSense Incorporated, (2) | | | | | | | | | | | | | | | 39,160 | |
| | | | | |
| | 2,093 | | | Itron Inc., (2) | | | | | | | | | | | | | | | 112,813 | |
| | | | | |
| | 1,758 | | | Kimball Electronics Inc., (2) | | | | | | | | | | | | | | | 24,436 | |
| | | | | |
| | 5,528 | | | Knowles Corporation, (2), (3) | | | | | | | | | | | | | | | 82,588 | |
| | | | | |
| | 1,385 | | | Littelfuse Inc. | | | | | | | | | | | | | | | 193,208 | |
| | | | | |
| | 1,972 | | | Maxwell Technologies, Inc., (2) | | | | | | | | | | | | | | | 9,544 | |
| | | | | |
| | 187 | | | Mesa Laboratories, Inc. | | | | | | | | | | | | | | | 23,607 | |
| | | | | |
| | 2,284 | | | Methode Electronics, Inc. | | | | | | | | | | | | | | | 71,261 | |
| | | | | |
| | 964 | | | MTS Systems Corporation | | | | | | | | | | | | | | | 45,838 | |
| | | | | |
| | 1,980 | | | Novanta, Inc., (2) | | | | | | | | | | | | | | | 34,551 | |
| | | | | |
| | 1,096 | | | OSI Systems Inc., (2) | | | | | | | | | | | | | | | 76,862 | |
| | | | | |
| | 1,210 | | | Park Electrochemical Corporation | | | | | | | | | | | | | | | 18,670 | |
| | | | | | | | | | | | | | | | | | | | |
| Shares | | | Description (1) | | | | | | | | | | | Value | |
| | | | | |
| | | | Electronic Equipment, Instruments & Components (continued) | | | | | | | | | | | | |
| | | | | |
| | 691 | | | PC Connection, Inc. | | | | | | | | | | | | | | $ | 16,038 | |
| | | | | |
| | 2,088 | | | Plexus Corporation, (2) | | | | | | | | | | | | | | | 95,651 | |
| | | | | |
| | 2,357 | | | Radisys Corporation, (2) | | | | | | | | | | | | | | | 9,829 | |
| | | | | |
| | 1,692 | | | Rofin Sinar Technologies Inc., (2) | | | | | | | | | | | | | | | 55,075 | |
| | | | | |
| | 1,128 | | | Rogers Corporation, (2) | | | | | | | | | | | | | | | 61,397 | |
| | | | | |
| | 4,599 | | | Sanmina-SCI Corporation, (2) | | | | | | | | | | | | | | | 127,162 | |
| | | | | |
| | 1,572 | | | ScanSource, Inc., (2) | | | | | | | | | | | | | | | 55,020 | |
| | | | | |
| | 1,831 | | | SYNNEX Corporation | | | | | | | | | | | | | | | 187,751 | |
| | | | | |
| | 765 | | | Systemax Inc. | | | | | | | | | | | | | | | 6,005 | |
| | | | | |
| | 2,191 | | | Tech Data Corporation, (2) | | | | | | | | | | | | | | | 168,751 | |
| | | | | |
| | 4,538 | | | TTM Technologies, Inc., (2) | | | | | | | | | | | | | | | 59,675 | |
| | | | | |
| | 2,597 | | | Universal Display Corporation, (2) | | | | | | | | | | | | | | | 134,265 | |
| | | | | |
| | 8,542 | | | Vishay Intertechnology Inc. | | | | | | | | | | | | | | | 120,442 | |
| | | | | |
| | 758 | | | Vishay Precision Group Inc., (2) | | | | | | | | | | | | | | | 11,901 | |
| | | | Total Electronic Equipment, Instruments & Components | | | | | | | | | | | | | | | 2,921,547 | |
| | | | | |
| | | | Energy Equipment & Services – 1.0% | | | | | | | | | | | | |
| | | | | |
| | 4,357 | | | Archrock Inc. | | | | | | | | | | | | | | | 50,541 | |
| | | | | |
| | 3,814 | | | Atwood Oceanics Inc., (3) | | | | | | | | | | | | | | | 29,101 | |
| | | | | |
| | 2,104 | | | Bristow Group Inc. | | | | | | | | | | | | | | | 21,061 | |
| | | | | |
| | 1,218 | | | Carbo Ceramics Inc., (3) | | | | | | | | | | | | | | | 7,430 | |
| | | | | |
| | 1,262 | | | Dawson Geophysical Co, (2) | | | | | | | | | | | | | | | 8,266 | |
| | | | | |
| | 1,223 | | | ERA Group Incorporated, (2) | | | | | | | | | | | | | | | 9,234 | |
| | | | | |
| | 1,983 | | | Exterran Corp., (2) | | | | | | | | | | | | | | | 31,351 | |
| | | | | |
| | 4,885 | | | Fairmount Santrol Holdings Inc., (2) | | | | | | | | | | | | | | | 41,962 | |
| | | | | |
| | 3,760 | | | Forum Energy Technologies Incorporated, (2) | | | | | | | | | | | | | | | 67,680 | |
| | | | | |
| | 816 | | | Geospace Technologies Corporation, (2) | | | | | | | | | | | | | | | 15,039 | |
| | | | | |
| | 7,048 | | | Helix Energy Solutions Group, (2) | | | | | | | | | | | | | | | 61,459 | |
| | | | | |
| | 2,069 | | | Hornbeck Offshore Services Inc., (2), (3) | | | | | | | | | | | | | | | 8,214 | |
| | | | | |
| | 1,983 | | | Independence Contract Drilling Inc., (2) | | | | | | | | | | | | | | | 7,892 | |
| | | | | |
| | 1,665 | | | Matrix Service Company, (2) | | | | | | | | | | | | | | | 29,471 | |
| | | | | |
| | 15,135 | | | McDermott International Inc., (2) | | | | | | | | | | | | | | | 77,794 | |
| | | | | |
| | 772 | | | Natural Gas Services Group, (2) | | | | | | | | | | | | | | | 16,752 | |
| | | | | |
| | 5,193 | | | Newpark Resources Inc., (2) | | | | | | | | | | | | | | | 32,716 | |
| | | | | |
| | 3,206 | | | Oil States International Inc., (2) | | | | | | | | | | | | | | | 93,776 | |
| | | | | |
| | 7,566 | | | Parker Drilling Company, (2) | | | | | | | | | | | | | | | 15,132 | |
| | | | | |
| | 811 | | | PHI Inc Non-Voting, (2) | | | | | | | | | | | | | | | 12,635 | |
| | | | | |
| | 3,993 | | | Pioneer Energy Services Corporation, (2) | | | | | | | | | | | | | | | 14,175 | |
| | | | | |
| | 781 | | | RigNet, Inc., (2) | | | | | | | | | | | | | | | 11,715 | |
| | | | | |
| | 998 | | | SeaCor Smit Inc., (2) | | | | | | | | | | | | | | | 49,211 | |
Nuveen Small Cap Index Fund (continued)
| | |
| Portfolio of Investments | | October 31, 2016 |
| | | | | | | | | | | | | | | | | | | | |
| Shares | | | Description (1) | | | | | | | | | | | Value | |
| | | | | |
| | | | Energy Equipment & Services (continued) | | | | | | | | | | | | |
| | | | | |
| | 23,672 | | | Seadrill Limited, (3) | | | | | | | | | | | | | | $ | 50,421 | |
| | | | | |
| | 2,894 | | | Tesco Corporation | | | | | | | | | | | | | | | 19,824 | |
| | | | | |
| | 5,654 | | | TETRA Technologies, (2) | | | | | | | | | | | | | | | 30,814 | |
| | | | | |
| | 3,041 | | | Tidewater Inc., (3) | | | | | | | | | | | | | | | 5,261 | |
| | | | | |
| | 3,168 | | | Unit Corporation, (2) | | | | | | | | | | | | | | | 54,268 | |
| | | | | |
| | 4,009 | | | US Silica Holdings Inc. | | | | | | | | | | | | | | | 185,176 | |
| | | | | |
| | 2,861 | | | Willbros Group Inc., (2) | | | | | | | | | | | | | | | 4,349 | |
| | | | Total Energy Equipment & Services | | | | | | | | | | | | | | | 1,062,720 | |
| | | | | |
| | | | Equity Real Estate Investment Trusts – 7.2% | | | | | | | | | | | | |
| | | | | |
| | 5,004 | | | Acadia Realty Trust | | | | | | | | | | | | | | | 168,585 | |
| | | | | |
| | 1,424 | | | Agree Realty Corporation | | | | | | | | | | | | | | | 68,850 | |
| | | | | |
| | 134 | | | Alexander’s Inc. | | | | | | | | | | | | | | | 51,492 | |
| | | | | |
| | 2,449 | | | American Assets Trust Inc | | | | | | | | | | | | | | | 97,250 | |
| | | | | |
| | 2,059 | | | Armada Hoffler Properties Inc. | | | | | | | | | | | | | | | 27,652 | |
| | | | | |
| | 1,449 | | | Ashford Hospitality Prime Inc. | | | | | | | | | | | | | | | 18,779 | |
| | | | | |
| | 4,894 | | | Ashford Hospitality Trust Inc. | | | | | | | | | | | | | | | 28,434 | |
| | | | | |
| | 1,276 | | | Bluerock Residential Growth, Inc. | | | | | | | | | | | | | | | 15,822 | |
| | | | | |
| | 3,604 | | | CareTrust, Inc. | | | | | | | | | | | | | | | 50,744 | |
| | | | | |
| | 2,431 | | | CatchMark Timber Trust Inc., Class A | | | | | | | | | | | | | | | 25,623 | |
| | | | | |
| | 10,568 | | | CBL & Associates Properties Inc. | | | | | | | | | | | | | | | 113,078 | |
| | | | | |
| | 5,168 | | | Cedar Shopping Centers Inc. | | | | | | | | | | | | | | | 34,987 | |
| | | | | |
| | 2,477 | | | Chatham Lodging Trust | | | | | | | | | | | | | | | 43,843 | |
| | | | | |
| | 3,722 | | | Chesapeake Lodging Trust | | | | | | | | | | | | | | | 80,805 | |
| | | | | |
| | 1,350 | | | City Office, Inc. | | | | | | | | | | | | | | | 16,956 | |
| | | | | |
| | 4,070 | | | Colony Starwood Homes | | | | | | | | | | | | | | | 118,071 | |
| | | | | |
| | 834 | | | Community Healthcare Trust Inc. | | | | | | | | | | | | | | | 18,665 | |
| | | | | |
| | 2,100 | | | Coresite Realty Corporation | | | | | | | | | | | | | | | 154,854 | |
| | | | | |
| | 21,195 | | | Cousins Properties, Inc. | | | | | | | | | | | | | | | 164,685 | |
| | | | | |
| | 12,574 | | | DiamondRock Hospitality Company | | | | | | | | | | | | | | | 115,052 | |
| | | | | |
| | 4,672 | | | Dupont Fabros Technology Inc. | | | | | | | | | | | | | | | 190,664 | |
| | | | | |
| | 2,036 | | | Easterly Government Properties, Inc. | | | | | | | | | | | | | | | 38,623 | |
| | | | | |
| | 1,979 | | | EastGroup Properties Inc. | | | | | | | | | | | | | | | 134,394 | |
| | | | | |
| | 4,603 | | | Education Realty Trust Inc. | | | | | | | | | | | | | | | 196,042 | |
| | | | | |
| | 770 | | | Farmland Partners, Inc., (3) | | | | | | | | | | | | | | | 8,193 | |
| | | | | |
| | 8,536 | | | FelCor Lodging Trust Inc. | | | | | | | | | | | | | | | 54,545 | |
| | | | | |
| | 7,273 | | | First Industrial Realty Trust, Inc. | | | | | | | | | | | | | | | 192,080 | |
| | | | | |
| | 3,799 | | | First Potomac Realty Trust | | | | | | | | | | | | | | | 33,887 | |
| | | | | |
| | 3,783 | | | Four Corners Property Trust, Inc. | | | | | | | | | | | | | | | 75,963 | |
| | | | | |
| | 7,096 | | | Franklin Street Properties Corporation | | | | | | | | | | | | | | | 82,101 | |
| | | | | | | | | | | | | | | | | | | | |
| Shares | | | Description (1) | | | | | | | | | | | Value | |
| | | | | |
| | | | Equity Real Estate Investment Trusts (continued) | | | | | | | | | | | | |
| | | | | |
| | 4,649 | | | Geo Group Inc. | | | | | | | | | | | | | | $ | 111,390 | |
| | | | | |
| | 1,653 | | | Getty Realty Corporation | | | | | | | | | | | | | | | 37,573 | |
| | | | | |
| | 1,428 | | | Gladstone Commercial Corporation | | | | | | | | | | | | | | | 25,490 | |
| | | | | |
| | 1,003 | | | Global Medical REIT, Inc. | | | | | | | | | | | | | | | 9,779 | |
| | | | | |
| | 10,680 | | | Global Net Lease, Inc. | | | | | | | | | | | | | | | 79,139 | |
| | | | | |
| | 4,391 | | | Government Properties Income Trust | | | | | | | | | | | | | | | 84,044 | |
| | | | | |
| | 26,454 | | | Gramercy Property Trust | | | | | | | | | | | | | | | 243,906 | |
| | | | | |
| | 7,134 | | | Healthcare Realty Trust, Inc. | | | | | | | | | | | | | | | 227,503 | |
| | | | | |
| | 2,593 | | | Hersha Hospitality Trust | | | | | | | | | | | | | | | 46,207 | |
| | | | | |
| | 5,858 | | | Hudson Pacific Properties Inc. | | | | | | | | | | | | | | | 196,946 | |
| | | | | |
| | 3,465 | | | Independence Realty Trust | | | | | | | | | | | | | | | 28,863 | |
| | | | | |
| | 7,928 | | | Investors Real Estate Trust | | | | | | | | | | | | | | | 48,123 | |
| | | | | |
| | 4,294 | | | iStar Inc., (2), (3) | | | | | | | | | | | | | | | 47,792 | |
| | | | | |
| | 5,178 | | | Kite Realty Group Trust | | | | | | | | | | | | | | | 129,088 | |
| | | | | |
| | 6,682 | | | LaSalle Hotel Properties | | | | | | | | | | | | | | | 158,698 | |
| | | | | |
| | 14,397 | | | Lexington Corporate Properties Trust | | | | | | | | | | | | | | | 145,986 | |
| | | | | |
| | 2,359 | | | LTC Properties Inc. | | | | | | | | | | | | | | | 118,209 | |
| | | | | |
| | 5,590 | | | Mack-Cali Realty Corporation | | | | | | | | | | | | | | | 143,551 | |
| | | | | |
| | 16,356 | | | Medical Properties Trust Inc. | | | | | | | | | | | | | | | 228,003 | |
| | | | | |
| | 3,949 | | | Monmouth Real Estate Investment Corporation | | | | | | | | | | | | | | | 53,983 | |
| | | | | |
| | 10,547 | | | Monogram Residential Trust, Inc. | | | | | | | | | | | | | | | 111,165 | |
| | | | | |
| | 2,334 | | | National Health Investors Inc. | | | | | | | | | | | | | | | 176,824 | |
| | | | | |
| | 2,198 | | | National Storage Affiliates Trust | | | | | | | | | | | | | | | 43,037 | |
| | | | | |
| | 4,780 | | | New Senior Investment Group Inc. | | | | | | | | | | | | | | | 49,808 | |
| | | | | |
| | 10,347 | | | New York REIT, Inc. | | | | | | | | | | | | | | | 97,469 | |
| | | | | |
| | 1,225 | | | NexPoint Residential Trust, Inc. | | | | | | | | | | | | | | | 22,834 | |
| | | | | |
| | 3,946 | | | Northstar Realty Europe Corporation | | | | | | | | | | | | | | | 39,026 | |
| | | | | |
| | 874 | | | One Liberty Properties Inc. | | | | | | | | | | | | | | | 20,591 | |
| | | | | |
| | 2,649 | | | Parkway Properties, Inc., (2) | | | | | | | | | | | | | | | 47,739 | |
| | | | | |
| | 4,478 | | | Pebblebrook Hotel Trust, (3) | | | | | | | | | | | | | | | 108,726 | |
| | | | | |
| | 4,277 | | | Penn Real Estate Investment Trust | | | | | | | | | | | | | | | 83,444 | |
| | | | | |
| | 8,461 | | | Physicians Realty Trust | | | | | | | | | | | | | | | 167,274 | |
| | | | | |
| | 2,545 | | | Potlatch Corporation | | | | | | | | | | | | | | | 97,728 | |
| | | | | |
| | 1,506 | | | Preferred Apartment Communities Inc. | | | | | | | | | | | | | | | 19,608 | |
| | | | | |
| | 1,234 | | | PS Business Parks Inc. | | | | | | | | | | | | | | | 135,481 | |
| | | | | |
| | 2,931 | | | QTS Realty Trust Inc., Class A Shares | | | | | | | | | | | | | | | 134,709 | |
| | | | | |
| | 6,462 | | | RAIT Investment Trust | | | | | | | | | | | | | | | 19,709 | |
| | | | | |
| | 4,932 | | | Ramco-Gershenson Properties Trust | | | | | | | | | | | | | | | 85,521 | |
| | | | | |
| | 6,435 | | | Retail Opportunity Investments Corporation | | | | | | | | | | | | | | | 129,408 | |
Nuveen Small Cap Index Fund (continued)
| | |
| Portfolio of Investments | | October 31, 2016 |
| | | | | | | | | | | | | | | | | | | | |
| Shares | | | Description (1) | | | | | | | | | | | Value | |
| | | | | |
| | | | Equity Real Estate Investment Trusts (continued) | | | | | | | | | | | | |
| | | | | |
| | 4,107 | | | Rexford Industrial Realty Inc. | | | | | | | | | | | | | | $ | 86,493 | |
| | | | | |
| | 7,636 | | | RLJ Lodging Trust | | | | | | | | | | | | | | | 150,582 | |
| | | | | |
| | 2,720 | | | Ryman Hospitalities Properties | | | | | | | | | | | | | | | 137,142 | |
| | | | | |
| | 4,044 | | | Sabra Health Care Real Estate Investment Trust Inc. | | | | | | | | | | | | | | | 94,225 | |
| | | | | |
| | 630 | | | Saul Centers Inc. | | | | | | | | | | | | | | | 38,102 | |
| | | | | |
| | 3,971 | | | Select Income REIT | | | | | | | | | | | | | | | 98,243 | |
| | | | | |
| | 1,562 | | | Seritage Growth Properties, (3) | | | | | | | | | | | | | | | 71,149 | |
| | | | | |
| | 2,081 | | | Silver Bay Realty Trust Corporation | | | | | | | | | | | | | | | 34,857 | |
| | | | | |
| | 4,305 | | | STAG Industrial Inc. | | | | | | | | | | | | | | | 99,316 | |
| | | | | |
| | 5,420 | | | Summit Hotel Properties Inc. | | | | | | | | | | | | | | | 70,406 | |
| | | | | |
| | 13,613 | | | Sunstone Hotel Investors Inc. | | | | | | | | | | | | | | | 170,979 | |
| | | | | |
| | 2,782 | | | Terreno Realty Corporation | | | | | | | | | | | | | | | 72,610 | |
| | | | | |
| | 2,989 | | | Tier REIT, Inc. | | | | | | | | | | | | | | | 44,088 | |
| | | | | |
| | 1,613 | | | UMH Properties Inc. | | | | | | | | | | | | | | | 19,550 | |
| | | | | |
| | 808 | | | Universal Health Realty Income Trust | | | | | | | | | | | | | | | 47,430 | |
| | | | | |
| | 5,620 | | | Urban Edge Properties | | | | | | | | | | | | | | | 145,052 | |
| | | | | |
| | 1,801 | | | Urstadt Biddle Properties Inc. | | | | | | | | | | | | | | | 38,722 | |
| | | | | |
| | 11,634 | | | Washington Prime Group, Inc. | | | | | | | | | | | | | | | 122,041 | |
| | | | | |
| | 4,598 | | | Washington Real Estate Investment Trust | | | | | | | | | | | | | | | 135,273 | |
| | | | | |
| | 1,828 | | | Whitestone Real Estate Investment Trust | | | | | | | | | | | | | | | 24,312 | |
| | | | | |
| | 6,476 | | | Xenia Hotels & Resorts Inc. | | | | | | | | | | | | | | | 101,090 | |
| | | | Total Equity Real Estate Investment Trusts | | | | | | | | | | | | | | | 7,976,755 | |
| | | | | |
| | | | Food & Staples Retailing – 0.6% | | | | | | | | | | | | |
| | | | | |
| | 1,682 | | | Andersons, Inc. | | | | | | | | | | | | | | | 64,000 | |
| | | | | |
| | 876 | | | Ingles Markets, Inc. | | | | | | | | | | | | | | | 34,602 | |
| | | | | |
| | 581 | | | Natural Grocers by Vitamin Cottage Incorporated, (2) | | | | | | | | | | | | | | | 6,902 | |
| | | | | |
| | 2,344 | | | Performance Food Group Company, (2) | | | | | | | | | | | | | | | 56,256 | |
| | | | | |
| | 1,254 | | | PriceSmart, Inc. | | | | | | | | | | | | | | | 114,051 | |
| | | | | |
| | 1,447 | | | Smart & Final Stores, Inc., (2) | | | | | | | | | | | | | | | 17,364 | |
| | | | | |
| | 2,313 | | | SpartanNash Co | | | | | | | | | | | | | | | 64,764 | |
| | | | | |
| | 16,648 | | | SUPERVALU INC. | | | | | | | | | | | | | | | 71,420 | |
| | | | | |
| | 1,220 | | | The Chef’s Warehouse Inc., (2) | | | | | | | | | | | | | | | 13,908 | |
| | | | | |
| | 3,105 | | | United Natural Foods Inc., (2) | | | | | | | | | | | | | | | 129,603 | |
| | | | | |
| | 463 | | | Village Super Market, Inc. | | | | | | | | | | | | | | | 13,844 | |
| | | | | |
| | 600 | | | Weis Markets Inc. | | | | | | | | | | | | | | | 33,378 | |
| | | | Total Food & Staples Retailing | | | | | | | | | | | | | | | 620,092 | |
| | | | | |
| | | | Food Products – 1.4% | | | | | | | | | | | | |
| | | | | |
| | 1,355 | | | AdvancePierre Foods Holdings, Inc. | | | | | | | | | | | | | | | 37,886 | |
| | | | | |
| | 226 | | | Alico Inc. | | | | | | | | | | | | | | | 5,910 | |
| | | | | | | | | | | | | | | | | | | | |
| Shares | | | Description (1) | | | | | | | | | | | Value | |
| | | | | |
| | | | Food Products (continued) | | | | | | | | | | | | |
| | | | | |
| | 1,830 | | | Amplify Snack Brands, Inc., (2), (3) | | | | | | | | | | | | | | $ | 26,517 | |
| | | | | |
| | 4,116 | | | B&G Foods Inc. | | | | | | | | | | | | | | | 174,518 | |
| | | | | |
| | 969 | | | Calavo Growers, Inc., (3) | | | | | | | | | | | | | | | 57,316 | |
| | | | | |
| | 1,937 | | | Cal-Maine Foods, Inc., (3) | | | | | | | | | | | | | | | 74,865 | |
| | | | | |
| | 10,284 | | | Darling International Inc., (2) | | | | | | | | | | | | | | | 139,862 | |
| | | | | |
| | 5,736 | | | Dean Foods Company | | | | | | | | | | | | | | | 104,739 | |
| | | | | |
| | 503 | | | Farmer Brothers Company, (2) | | | | | | | | | | | | | | | 16,448 | |
| | | | | |
| | 2,024 | | | Fresh Del Monte Produce Inc. | | | | | | | | | | | | | | | 122,148 | |
| | | | | |
| | 1,398 | | | Freshpet, Inc., (2) | | | | | | | | | | | | | | | 11,883 | |
| | | | | |
| | 1,171 | | | Inventure Group, (2) | | | | | | | | | | | | | | | 9,907 | |
| | | | | |
| | 937 | | | J&K Snack Foods Corporation | | | | | | | | | | | | | | | 114,455 | |
| | | | | |
| | 537 | | | John B Sanfillippo & Son, Inc. | | | | | | | | | | | | | | | 27,215 | |
| | | | | |
| | 1,177 | | | Lancaster Colony Corporation | | | | | | | | | | | | | | | 153,775 | |
| | | | | |
| | 1,674 | | | Landec Corporation, (2) | | | | | | | | | | | | | | | 22,181 | |
| | | | | |
| | 294 | | | Lifeway Foods, Inc. | | | | | | | | | | | | | | | 5,257 | |
| | | | | |
| | 734 | | | Limoneira Company | | | | | | | | | | | | | | | 14,452 | |
| | | | | |
| | 1,369 | | | Omega Protein Corporation, (2) | | | | | | | | | | | | | | | 30,529 | |
| | | | | |
| | 1,252 | | | Sanderson Farms Inc., (3) | | | | | | | | | | | | | | | 112,655 | |
| | | | | |
| | 16 | | | Seaboard Corproation | | | | | | | | | | | | | | | 54,160 | |
| | | | | |
| | 411 | | | Seneca Foods Corporation, (2) | | | | | | | | | | | | | | | 12,083 | |
| | | | | |
| | 5,042 | | | Snyders Lance Inc. | | | | | | | | | | | | | | | 179,344 | |
| | | | | |
| | 1,077 | | | Tootsie Roll Industries Inc., (3) | | | | | | | | | | | | | | | 38,180 | |
| | | | Total Food Products | | | | | | | | | | | | | | | 1,546,285 | |
| | | | | |
| | | | Gas Utilities – 1.2% | | | | | | | | | | | | |
| | | | | |
| | 918 | | | Chesapeake Utilities Corporation | | | | | | | | | | | | | | | 58,798 | |
| | | | | |
| | 453 | | | Delta Natural Gas Company, Inc. | | | | | | | | | | | | | | | 10,668 | |
| | | | | |
| | 5,375 | | | New Jersey Resources Corporation | | | | | | | | | | | | | | | 182,481 | |
| | | | | |
| | 1,701 | | | Northwest Natural Gas Company | | | | | | | | | | | | | | | 100,019 | |
| | | | | |
| | 3,262 | | | One Gas Inc. | | | | | | | | | | | | | | | 199,895 | |
| | | | | |
| | 5,001 | | | South Jersey Industries Inc. | | | | | | | | | | | | | | | 148,280 | |
| | | | | |
| | 2,965 | | | Southwest Gas Corporation | | | | | | | | | | | | | | | 214,844 | |
| | | | | |
| | 2,679 | | | Spire, Inc. | | | | | | | | | | | | | | | 168,241 | |
| | | | | |
| | 3,161 | | | WGL Holdings Inc. | | | | | | | | | | | | | | | 199,364 | |
| | | | Total Gas Utilities | | | | | | | | | | | | | | | 1,282,590 | |
| | | | | |
| | | | Health Care Equipment & Supplies – 3.0% | | | | | | | | | | | | |
| | | | | |
| | 1,372 | | | Abaxis, Inc. | | | | | | | | | | | | | | | 65,499 | |
| | | | | |
| | 4,990 | | | Accuray, Inc., (2) | | | | | | | | | | | | | | | 24,451 | |
| | | | | |
| | 780 | | | Analogic Corporation | | | | | | | | | | | | | | | 63,843 | |
| | | | | |
| | 1,690 | | | AngioDynamics, Inc., (2) | | | | | | | | | | | | | | | 26,939 | |
Nuveen Small Cap Index Fund (continued)
| | |
| Portfolio of Investments | | October 31, 2016 |
| | | | | | | | | | | | | | | | | | | | |
| Shares | | | Description (1) | | | | | | | | | | | Value | |
| | | | | |
| | | | Health Care Equipment & Supplies (continued) | | | | | | | | | | | | |
| | | | | |
| | 882 | | | Anika Therapeutics, Inc., (2) | | | | | | | | | | | | | | $ | 39,126 | |
| | | | | |
| | 1,968 | | | AtriCure, Inc., (2), (3) | | | | | | | | | | | | | | | 35,896 | |
| | | | | |
| | 86 | | | ATRION Corporation | | | | | | | | | | | | | | | 37,767 | |
| | | | | |
| | 1,153 | | | Avinger, Inc., (2) | | | | | | | | | | | | | | | 4,036 | |
| | | | | |
| | 1,511 | | | AxoGen, Inc., (2) | | | | | | | | | | | | | | | 13,372 | |
| | | | | |
| | 2,243 | | | Cantel Medical Corporation | | | | | | | | | | | | | | | 159,769 | |
| | | | | |
| | 1,995 | | | Cardiovascular Systems, Inc., (2) | | | | | | | | | | | | | | | 46,743 | |
| | | | | |
| | 6,340 | | | Cerus Corporation, (2) | | | | | | | | | | | | | | | 30,559 | |
| | | | | |
| | 2,238 | | | ConforMIS Inc., (2), (3) | | | | | | | | | | | | | | | 17,076 | |
| | | | | |
| | 1,727 | | | Conmed Corporation | | | | | | | | | | | | | | | 69,080 | |
| | | | | |
| | 3,637 | | | Corindus Vascular Robotics, Inc., (2) | | | | | | | | | | | | | | | 2,801 | |
| | | | | |
| | 1,972 | | | CryoLife Inc. | | | | | | | | | | | | | | | 33,524 | |
| | | | | |
| | 735 | | | Cutera, Inc., (2) | | | | | | | | | | | | | | | 9,629 | |
| | | | | |
| | 1,485 | | | Cynosure, Inc., (2) | | | | | | | | | | | | | | | 63,335 | |
| | | | | |
| | 5,074 | | | Endologix, Inc., (2), (3) | | | | | | | | | | | | | | | 53,074 | |
| | | | | |
| | 469 | | | Entellus Medical, Inc., (2) | | | | | | | | | | | | | | | 9,591 | |
| | | | | |
| | 659 | | | Exactech, Inc., (2) | | | | | | | | | | | | | | | 15,915 | |
| | | | | |
| | 2,513 | | | Genmark Diagnostics Inc., (2) | | | | | | | | | | | | | | | 26,814 | |
| | | | | |
| | 1,046 | | | Glaukos Corporation, (2) | | | | | | | | | | | | | | | 34,936 | |
| | | | | |
| | 4,386 | | | Globus Medical Inc, Class A, (2) | | | | | | | | | | | | | | | 97,062 | |
| | | | | |
| | 1,915 | | | Greatbatch, Inc., (2) | | | | | | | | | | | | | | | 42,226 | |
| | | | | |
| | 3,204 | | | Haemonetics Corporation, (2) | | | | | | | | | | | | | | | 107,046 | |
| | | | | |
| | 2,930 | | | Halyard Health Inc., (2) | | | | | | | | | | | | | | | 94,786 | |
| | | | | |
| | 920 | | | ICU Medical, Inc., (2) | | | | | | | | | | | | | | | 128,156 | |
| | | | | |
| | 1,021 | | | Inogen Inc., (2) | | | | | | | | | | | | | | | 54,797 | |
| | | | | |
| | 3,612 | | | Insulet Corporation, (2) | | | | | | | | | | | | | | | 134,077 | |
| | | | | |
| | 1,882 | | | Integra Lifesciences Holdings Corporation, (2), (3) | | | | | | | | | | | | | | | 149,638 | |
| | | | | |
| | 1,985 | | | Invacare Corporation | | | | | | | | | | | | | | | 18,163 | |
| | | | | |
| | 2,131 | | | InVivo Therapeutics Holdings Corporation, (2), (3) | | | | | | | | | | | | | | | 9,270 | |
| | | | | |
| | 267 | | | iRadimed Corporation, (2) | | | | | | | | | | | | | | | 2,523 | |
| | | | | |
| | 498 | | | Iridex Corporation, (2) | | | | | | | | | | | | | | | 6,748 | |
| | | | | |
| | 1,611 | | | K2M Group Holdings Inc., (2) | | | | | | | | | | | | | | | 27,500 | |
| | | | | |
| | 846 | | | LeMaitre Vascular, Inc. | | | | | | | | | | | | | | | 17,715 | |
| | | | | |
| | 2,558 | | | Masimo Corporation, (2) | | | | | | | | | | | | | | | 140,690 | |
| | | | | |
| | 2,611 | | | Meridian Bioscience, Inc. | | | | | | | | | | | | | | | 42,951 | |
| | | | | |
| | 2,694 | | | Merit Medical Systems, Inc., (2) | | | | | | | | | | | | | | | 59,133 | |
| | | | | |
| | 2,036 | | | Natus Medical, Inc., (2) | | | | | | | | | | | | | | | 80,117 | |
| | | | | |
| | 2,281 | | | Neogen Corporation, (2) | | | | | | | | | | | | | | | 120,186 | |
| | | | | |
| | 1,503 | | | Nevro Corporation, (2), (3) | | | | | | | | | | | | | | | 138,156 | |
| | | | | | | | | | | | | | | | | | | | |
| Shares | | | Description (1) | | | | | | | | | | | Value | |
| | | | | |
| | | | Health Care Equipment & Supplies (continued) | | | | | | | | | | | | |
| | | | | |
| | 3,170 | | | Novocure Limited, (2) | | | | | | | | | | | | | | $ | 19,179 | |
| | | | | |
| | 3,103 | | | NuVasive, Inc., (2) | | | | | | | | | | | | | | | 185,342 | |
| | | | | |
| | 3,986 | | | Nxstage Medical, Inc., (2) | | | | | | | | | | | | | | | 90,642 | |
| | | | | |
| | 3,393 | | | OraSure Technologies, Inc., (2) | | | | | | | | | | | | | | | 25,481 | |
| | | | | |
| | 1,095 | | | Orthofix International NV, (2) | | | | | | | | | | | | | | | 40,132 | |
| | | | | |
| | 1,389 | | | Oxford Immunotec Global PLC, (2) | | | | | | | | | | | | | | | 17,863 | |
| | | | | |
| | 1,594 | | | Penumbra Inc., (2), (3) | | | | | | | | | | | | | | | 105,124 | |
| | | | | |
| | 1,681 | | | Quidel Corporation, (2) | | | | | | | | | | | | | | | 32,443 | |
| | | | | |
| | 2,999 | | | Rockwell Medical Technologies, Inc., (2), (3) | | | | | | | | | | | | | | | 17,424 | |
| | | | | |
| | 3,597 | | | RTI Biologics Inc., (2) | | | | | | | | | | | | | | | 9,172 | |
| | | | | |
| | 890 | | | Second Sight Medical Products, Inc., (2) | | | | | | | | | | | | | | | 2,323 | |
| | | | | |
| | 1,857 | | | Senseonics Holdings, Inc., (2) | | | | | | | | | | | | | | | 4,345 | |
| | | | | |
| | 2,675 | | | Spectranetics Corporation, (2) | | | | | | | | | | | | | | | 58,048 | |
| | | | | |
| | 2,505 | | | STAAR Surgical Company, (2) | | | | | | | | | | | | | | | 21,167 | |
| | | | | |
| | 811 | | | Surmodics Inc., (2) | | | | | | | | | | | | | | | 20,194 | |
| | | | | |
| | 275 | | | Tactile Systems Technology, Incorporated, (2) | | | | | | | | | | | | | | | 4,885 | |
| | | | | |
| | 1,142 | | | Tandem Diabetes Care Inc., (2) | | | | | | | | | | | | | | | 6,909 | |
| | | | | |
| | 4,605 | | | TransEnterix Inc., (2) | | | | | | | | | | | | | | | 6,908 | |
| | | | | |
| | 159 | | | Utah Medical Products, Inc. | | | | | | | | | | | | | | | 9,882 | |
| | | | | |
| | 1,056 | | | Vascular Solutions, Inc., (2) | | | | | | | | | | | | | | | 48,154 | |
| | | | | |
| | 871 | | | Veracyte Inc., (2) | | | | | | | | | | | | | | | 6,323 | |
| | | | | |
| | 439 | | | ViewRay, Inc., (2) | | | | | | | | | | | | | | | 1,177 | |
| | | | | |
| | 6,460 | | | Wright Medical Group, Inc., (2), (3) | | | | | | | | | | | | | | | 141,539 | |
| | | | | |
| | 2,220 | | | Zeltiq Aesthetics Inc, (2), (3) | | | | | | | | | | | | | | | 73,482 | |
| | | | Total Health Care Equipment & Supplies | | | | | | | | | | | | | | | 3,302,853 | |
| | | | | |
| | | | Health Care Providers & Services – 2.0% | | | | | | | | | | | | |
| | | | | |
| | 620 | | | AAC Holdings, Inc., (2), (3) | | | | | | | | | | | | | | | 10,162 | |
| | | | | |
| | 1,822 | | | Aceto Corporation | | | | | | | | | | | | | | | 33,397 | |
| | | | | |
| | 463 | | | Addus HomeCare Corporation, (2) | | | | | | | | | | | | | | | 11,714 | |
| | | | | |
| | 865 | | | Adeptus Health Inc., Class A Shares, (2), (3) | | | | | | | | | | | | | | | 26,054 | |
| | | | | |
| | 2,228 | | | Air Methods Corporation, (2) | | | | | | | | | | | | | | | 58,931 | |
| | | | | |
| | 507 | | | Almost Family, Inc., (2) | | | | | | | | | | | | | | | 19,900 | |
| | | | | |
| | 1,750 | | | Amedisys, Inc., (2) | | | | | | | | | | | | | | | 75,705 | |
| | | | | |
| | 546 | | | American Renal Assocciates Holdings, Inc , (2) | | | | | | | | | | | | | | | 9,642 | |
| | | | | |
| | 2,964 | | | AMN Healthcare Services Inc., (2) | | | | | | | | | | | | | | | 97,219 | |
| | | | | |
| | 7,039 | | | Bioscrip, Inc., (2) | | | | | | | | | | | | | | | 18,935 | |
| | | | | |
| | 1,690 | | | BioTelemetry Inc., (2) | | | | | | | | | | | | | | | 29,913 | |
| | | | | |
| | 1,761 | | | Capital Senior Living Corporation, (2) | | | | | | | | | | | | | | | 28,123 | |
| | | | | |
| | 1,013 | | | Chemed Corporation | | | | | | | | | | | | | | | 143,258 | |
Nuveen Small Cap Index Fund (continued)
| | |
| Portfolio of Investments | | October 31, 2016 |
| | | | | | | | | | | | | | | | | | | | |
| Shares | | | Description (1) | | | | | | | | | | | Value | |
| | | | | |
| | | | Health Care Providers & Services (continued) | | | | | | | | | | | | |
| | | | | |
| | 945 | | | Civitas Solutions Inc., (2) | | | | | | | | | | | | | | $ | 16,160 | |
| | | | | |
| | 6,911 | | | Community Health Systems, Inc., (2), (3) | | | | | | | | | | | | | | | 36,490 | |
| | | | | |
| | 620 | | | Corvel Corporation, (2) | | | | | | | | | | | | | | | 21,421 | |
| | | | | |
| | 2,006 | | | Cross Country Healthcare, Inc., (2) | | | | | | | | | | | | | | | 22,407 | |
| | | | | |
| | 2,862 | | | Diplomat Pharmacy, Inc., (2), (3) | | | | | | | | | | | | | | | 66,313 | |
| | | | | |
| | 2,989 | | | Ensign Group Inc. | | | | | | | | | | | | | | | 55,207 | |
| | | | | |
| | 2,343 | | | Genesis Healthcare Inc., (2) | | | | | | | | | | | | | | | 6,139 | |
| | | | | |
| | 2,701 | | | HealthEquity, Inc., (2) | | | | | | | | | | | | | | | 89,754 | |
| | | | | |
| | 5,555 | | | HealthSouth Corporation | | | | | | | | | | | | | | | 223,033 | |
| | | | | |
| | 2,008 | | | Healthways Inc., (2) | | | | | | | | | | | | | | | 49,798 | |
| | | | | |
| | 5,276 | | | Kindred Healthcare Inc. | | | | | | | | | | | | | | | 51,969 | |
| | | | | |
| | 619 | | | Landauer Inc. | | | | | | | | | | | | | | | 26,927 | |
| | | | | |
| | 939 | | | LHC Group, Inc., (2) | | | | | | | | | | | | | | | 32,180 | |
| | | | | |
| | 1,516 | | | Magellan Health Services, Inc., (2) | | | | | | | | | | | | | | | 77,998 | |
| | | | | |
| | 2,709 | | | Molina Healthcare Inc., (2), (3) | | | | | | | | | | | | | | | 147,397 | |
| | | | | |
| | 651 | | | National Healthcare Corporation | | | | | | | | | | | | | | | 42,120 | |
| | | | | |
| | 524 | | | National Research Corporation | | | | | | | | | | | | | | | 8,043 | |
| | | | | |
| | 3,671 | | | Nobilis Health Corporation, (2), (3) | | | | | | | | | | | | | | | 12,298 | |
| | | | | |
| | 3,903 | | | Owens and Minor Inc. | | | | | | | | | | | | | | | 126,652 | |
| | | | | |
| | 1,849 | | | Pharmerica Corporation, (2) | | | | | | | | | | | | | | | 44,006 | |
| | | | | |
| | 811 | | | Providence Service Corporation, (2) | | | | | | | | | | | | | | | 32,817 | |
| | | | | |
| | 1,856 | | | Quorum Health Corp., (2) | | | | | | | | | | | | | | | 7,498 | |
| | | | | |
| | 2,536 | | | RadNet, Inc., (2) | | | | | | | | | | | | | | | 17,625 | |
| | | | | |
| | 6,683 | | | Select Medical Corporation | | | | | | | | | | | | | | | 86,879 | |
| | | | | |
| | 1,165 | | | Surgery Partners Inc., (2) | | | | | | | | | | | | | | | 18,757 | |
| | | | | |
| | 1,680 | | | Surgical Care Affiliates Inc., (2) | | | | | | | | | | | | | | | 71,887 | |
| | | | | |
| | 4,249 | | | Team Health Holdings Inc., (2) | | | | | | | | | | | | | | | 182,070 | |
| | | | | |
| | 1,298 | | | Teladoc, Inc., (2), (3) | | | | | | | | | | | | | | | 21,093 | |
| | | | | |
| | 1,459 | | | Triple-S Management Corporation, Class B Shares, (2) | | | | | | | | | | | | | | | 30,172 | |
| | | | | |
| | 2,873 | | | Universal American Corporation, (2) | | | | | | | | | | | | | | | 21,576 | |
| | | | | |
| | 757 | | | US Physical Therapy, Inc. | | | | | | | | | | | | | | | 43,073 | |
| | | | Total Health Care Providers & Services | | | | | | | | | | | | | | | 2,252,712 | |
| | | | | |
| | | | Health Care Technology – 0.5% | | | | | | | | | | | | |
| | | | | |
| | 2,525 | | | Castlight Health Inc., Class B, (2) | | | | | | | | | | | | | | | 10,984 | |
| | | | | |
| | 702 | | | Computer Programs and Systems, Inc., (3) | | | | | | | | | | | | | | | 18,322 | |
| | | | | |
| | 791 | | | Cotiviti Holdings, Inc., (2) | | | | | | | | | | | | | | | 24,418 | |
| | | | | |
| | 952 | | | Evolent Health Inc., (2), (3) | | | | | | | | | | | | | | | 20,040 | |
| | | | | |
| | 1,611 | | | Healthstream, Inc., (2) | | | | | | | | | | | | | | | 43,449 | |
| | | | | |
| | 5,276 | | | HMS Holdings Corporation, (2) | | | | | | | | | | | | | | | 111,165 | |
| | | | | | | | | | | | | | | | | | | | |
| Shares | | | Description (1) | | | | | | | | | | | Value | |
| | | | | |
| | | | Health Care Technology (continued) | | | | | | | | | | | | |
| | | | | |
| | 3,443 | | | Medidata Solutions, Inc., (2) | | | | | | | | | | | | | | $ | 165,230 | |
| | | | | |
| | 437 | | | NantHealth, Incorporated, (2) | | | | | | | | | | | | | | | 5,738 | |
| | | | | |
| | 2,228 | | | Omnicell, Inc., (2) | | | | | | | | | | | | | | | 72,689 | |
| | | | | |
| | 3,198 | | | Quality Systems Inc. | | | | | | | | | | | | | | | 41,222 | |
| | | | | |
| | 1,549 | | | Vocera Communications Incorporated, (2) | | | | | | | | | | | | | | | 28,502 | |
| | | | Total Health Care Technology | | | | | | | | | | | | | | | 541,759 | |
| | | | | |
| | | | Hotels, Restaurants & Leisure – 2.8% | | | | | | | | | | | | |
| | | | | |
| | 5,240 | | | Belmond Limited, Class A, (2) | | | | | | | | | | | | | | | 67,858 | |
| | | | | |
| | 65 | | | Biglari Holdings Inc., (2) | | | | | | | | | | | | | | | 28,482 | |
| | | | | |
| | 1,461 | | | BJ’s Restaurants, Inc., (2), (3) | | | | | | | | | | | | | | | 52,742 | |
| | | | | |
| | 7,128 | | | Bloomin Brands | | | | | | | | | | | | | | | 123,314 | |
| | | | | |
| | 1,243 | | | Bob Evans Farms | | | | | | | | | | | | | | | 51,236 | |
| | | | | |
| | 648 | | | Bojangles’, Inc., (2) | | | | | | | | | | | | | | | 9,590 | |
| | | | | |
| | 5,167 | | | Boyd Gaming Corporation, (2) | | | | | | | | | | | | | | | 92,283 | |
| | | | | |
| | 1,186 | | | Buffalo Wild Wings, Inc., (2) | | | | | | | | | | | | | | | 172,741 | |
| | | | | |
| | 2,981 | | | Caesars Acquisition Compnay, Class A, (2) | | | | | | | | | | | | | | | 34,729 | |
| | | | | |
| | 3,533 | | | Caesar’s Entertainment Corporation, (2), (3) | | | | | | | | | | | | | | | 25,084 | |
| | | | | |
| | 2,150 | | | Carrols Restaurant Group, Inc., (2) | | | | | | | | | | | | | | | 26,875 | |
| | | | | |
| | 1,203 | | | CBRL Group Inc., (3) | | | | | | | | | | | | | | | 166,014 | |
| | | | | |
| | 1,334 | | | Century Casinos, Inc., (2) | | | | | | | | | | | | | | | 8,458 | |
| | | | | |
| | 2,540 | | | Cheesecake Factory Inc., (3) | | | | | | | | | | | | | | | 135,103 | |
| | | | | |
| | 823 | | | Churchill Downs Inc. | | | | | | | | | | | | | | | 111,928 | |
| | | | | |
| | 1,024 | | | Chuy’s Holdings Inc., (2) | | | | | | | | | | | | | | | 29,082 | |
| | | | | |
| | 4,029 | | | ClubCorp Holdings Inc. | | | | | | | | | | | | | | | 46,535 | |
| | | | | |
| | 2,373 | | | Dave & Buster’s Entertainment Inc., (2) | | | | | | | | | | | | | | | 98,124 | |
| | | | | |
| | 1,482 | | | Del Friscos Restaurant Group, (2) | | | | | | | | | | | | | | | 21,193 | |
| | | | | |
| | 1,448 | | | Del Taco Restaurants, Inc., (2) | | | | | | | | | | | | | | | 19,418 | |
| | | | | |
| | 4,746 | | | Denny’s Corporation, (2) | | | | | | | | | | | | | | | 49,216 | |
| | | | | |
| | 1,096 | | | DineEquity Inc. | | | | | | | | | | | | | | | 86,694 | |
| | | | | |
| | 1,341 | | | El Pollo Loco Holdings, Inc., (2) | | | | | | | | | | | | | | | 16,360 | |
| | | | | |
| | 1,823 | | | Eldorado Resorts Inc., (2) | | | | | | | | | | | | | | | 22,058 | |
| | | | | |
| | 209 | | | Empire Resorts, Inc., (2) | | | | | | | | | | | | | | | 4,002 | |
| | | | | |
| | 1,667 | | | Fiesta Restaurant Group, (2) | | | | | | | | | | | | | | | 44,009 | |
| | | | | |
| | 329 | | | Fogo De Chao, Inc., (2) | | | | | | | | | | | | | | | 3,899 | |
| | | | | |
| | 682 | | | Golden Entertainment, Inc., (2) | | | | | | | | | | | | | | | 7,816 | |
| | | | | |
| | 743 | | | Habit Restaurants Inc., Class A Shares, (2) | | | | | | | | | | | | | | | 10,513 | |
| | | | | |
| | 7,086 | | | Interval Leisure Group Inc. | | | | | | | | | | | | | | | 116,069 | |
| | | | | |
| | 1,650 | | | Intl Speedway Corporation | | | | | | | | | | | | | | | 54,285 | |
| | | | | |
| | 1,024 | | | Intrawest Resorts Holdings Inc., (2) | | | | | | | | | | | | | | | 16,804 | |
Nuveen Small Cap Index Fund (continued)
| | |
| Portfolio of Investments | | October 31, 2016 |
| | | | | | | | | | | | | | | | | | | | |
| Shares | | | Description (1) | | | | | | | | | | | Value | |
| | | | | |
| | | | Hotels, Restaurants & Leisure (continued) | | | | | | | | | | | | |
| | | | | |
| | 1,565 | | | Isle of Capri Casinos, (2) | | | | | | | | | | | | | | $ | 32,865 | |
| | | | | |
| | 894 | | | J Alexanders Holdings Inc., (2) | | | | | | | | | | | | | | | 8,046 | |
| | | | | |
| | 2,045 | | | Jack in the Box Inc., Term Loan | | | | | | | | | | | | | | | 191,678 | |
| | | | | |
| | 797 | | | Jamba, Inc., (2), (3) | | | | | | | | | | | | | | | 8,408 | |
| | | | | |
| | 547 | | | Kona Grill, Inc., (2) | | | | | | | | | | | | | | | 5,880 | |
| | | | | |
| | 5,311 | | | La Quinta Holdings Inc., (2) | | | | | | | | | | | | | | | 53,163 | |
| | | | | |
| | 974 | | | Lindblad Expeditions Holdings, Inc., (2) | | | | | | | | | | | | | | | 7,977 | |
| | | | | |
| | 1,288 | | | Luby’s Inc., (2) | | | | | | | | | | | | | | | 5,397 | |
| | | | | |
| | 1,165 | | | Marcus Corporation | | | | | | | | | | | | | | | 30,873 | |
| | | | | |
| | 1,403 | | | Marriott Vacations World | | | | | | | | | | | | | | | 89,203 | |
| | | | | |
| | 656 | | | Monarch Casino & Resort, Inc., (2) | | | | | | | | | | | | | | | 15,514 | |
| | | | | |
| | 201 | | | Nathan’s Famous, Inc., (2) | | | | | | | | | | | | | | | 10,713 | |
| | | | | |
| | 691 | | | Noodles & Company, (2) | | | | | | | | | | | | | | | 3,248 | |
| | | | | |
| | 1,701 | | | Papa John’s International, Inc., (3) | | | | | | | | | | | | | | | 128,340 | |
| | | | | |
| | 4,666 | | | Penn National Gaming, Inc., (2) | | | | | | | | | | | | | | | 60,331 | |
| | | | | |
| | 3,406 | | | Pinnacle Entertainment Inc., (2) | | | | | | | | | | | | | | | 40,361 | |
| | | | | |
| | 1,004 | | | Planet Fitness Inc., (2) | | | | | | | | | | | | | | | 21,285 | |
| | | | | |
| | 1,356 | | | Popeye’s Louisiana Kitchen Inc., (2) | | | | | | | | | | | | | | | 72,383 | |
| | | | | |
| | 1,491 | | | Potbelly Corporation, (2) | | | | | | | | | | | | | | | 19,458 | |
| | | | | |
| | 938 | | | Red Lions Hotels Corporation, (2) | | | | | | | | | | | | | | | 7,879 | |
| | | | | |
| | 856 | | | Red Robin Gourmet Burgers, Inc., (2) | | | | | | | | | | | | | | | 39,376 | |
| | | | | |
| | 1,881 | | | Red Rock Resorts, Inc. | | | | | | | | | | | | | | | 41,194 | |
| | | | | |
| | 3,720 | | | Ruby Tuesday, Inc., (2) | | | | | | | | | | | | | | | 11,048 | |
| | | | | |
| | 1,994 | | | Ruth’s Chris Steak House, Inc. | | | | | | | | | | | | | | | 31,605 | |
| | | | | |
| | 3,251 | | | Scientific Games Corporation, (2) | | | | | | | | | | | | | | | 40,312 | |
| | | | | |
| | 4,187 | | | Seaworld Entertainment, (3) | | | | | | | | | | | | | | | 58,660 | |
| | | | | |
| | 983 | | | Shake Shack Inc., Class A Shares, (2), (3) | | | | | | | | | | | | | | | 31,348 | |
| | | | | |
| | 2,946 | | | Sonic Corporation | | | | | | | | | | | | | | | 67,493 | |
| | | | | |
| | 756 | | | Speedway Motorsports Inc. | | | | | | | | | | | | | | | 14,220 | |
| | | | | |
| | 4,149 | | | Texas Roadhouse, Inc. | | | | | | | | | | | | | | | 168,117 | |
| | | | | |
| | 985 | | | Wingstop Inc., (2) | | | | | | | | | | | | | | | 26,359 | |
| | | | | |
| | 1,195 | | | Zoe’s Kitchen Inc., (2) | | | | | | | | | | | | | | | 27,091 | |
| | | | Total Hotels, Restaurants & Leisure | | | | | | | | | | | | | | | 3,122,339 | |
| | | | | |
| | | | Household Durables – 1.2% | | | | | | | | | | | | |
| | | | | |
| | 644 | | | Bassett Furniture, Inc. | | | | | | | | | | | | | | | 14,780 | |
| | | | | |
| | 2,322 | | | Beazer Homes USA, Inc., (2) | | | | | | | | | | | | | | | 23,754 | |
| | | | | |
| | 531 | | | Cavco Industries, Inc., (2) | | | | | | | | | | | | | | | 49,064 | |
| | | | | |
| | 984 | | | Century Communities, Inc., (2) | | | | | | | | | | | | | | | 19,385 | |
| | | | | |
| | 536 | | | CSS Industries Inc. | | | | | | | | | | | | | | | 13,454 | |
| | | | | | | | | | | | | | | | | | | | |
| Shares | | | Description (1) | | | | | | | | | | | Value | |
| | | | | |
| | | | Household Durables (continued) | | | | | | | | | | | | |
| | | | | |
| | 1,545 | | | Ethan Allen Interiors Inc. | | | | | | | | | | | | | | $ | 47,432 | |
| | | | | |
| | 407 | | | Flexsteel Industries, Inc. | | | | | | | | | | | | | | | 17,053 | |
| | | | | |
| | 6,325 | | | GoPro, Inc., Class A, (2), (3) | | | | | | | | | | | | | | | 80,834 | |
| | | | | |
| | 1,537 | | | Green Brick Partners, Inc., (2) | | | | | | | | | | | | | | | 11,758 | |
| | | | | |
| | 1,754 | | | Helen of Troy Limited, (2) | | | | | | | | | | | | | | | 142,951 | |
| | | | | |
| | 711 | | | Hooker Furniture Corporation | | | | | | | | | | | | | | | 18,699 | |
| | | | | |
| | 7,793 | | | Hovnanian Enterprises Inc., (2) | | | | | | | | | | | | | | | 12,157 | |
| | | | | |
| | 1,259 | | | Installed Building Products Inc., (2) | | | | | | | | | | | | | | | 41,610 | |
| | | | | |
| | 1,681 | | | Irobot Corporation, (2) | | | | | | | | | | | | | | | 85,227 | |
| | | | | |
| | 5,224 | | | KB Home, (3) | | | | | | | | | | | | | | | 75,957 | |
| | | | | |
| | 3,074 | | | La Z Boy Inc. | | | | | | | | | | | | | | | 71,932 | |
| | | | | |
| | 967 | | | LGI Homes Inc., (2), (3) | | | | | | | | | | | | | | | 28,778 | |
| | | | | |
| | 1,412 | | | Libbey Inc. | | | | | | | | | | | | | | | 22,606 | |
| | | | | |
| | 730 | | | Lifetime Brands, Inc. | | | | | | | | | | | | | | | 10,330 | |
| | | | | |
| | 1,481 | | | M/I Homes, Inc., (2) | | | | | | | | | | | | | | | 31,856 | |
| | | | | |
| | 2,478 | | | MDC Holdings Inc. | | | | | | | | | | | | | | | 58,753 | |
| | | | | |
| | 2,395 | | | Meritage Corporation, (2) | | | | | | | | | | | | | | | 74,125 | |
| | | | | |
| | 243 | | | Nacco Industries Inc. | | | | | | | | | | | | | | | 17,775 | |
| | | | | |
| | 824 | | | New Home Company Inc., (2) | | | | | | | | | | | | | | | 8,256 | |
| | | | | |
| | 1,902 | | | Taylor Morrison, (2) | | | | | | | | | | | | | | | 32,448 | |
| | | | | |
| | 2,412 | | | TopBuild Corporation, (2) | | | | | | | | | | | | | | | 72,674 | |
| | | | | |
| | 9,324 | | | Tri Pointe Group, Incorporated, (2) | | | | | | | | | | | | | | | 100,979 | |
| | | | | |
| | 535 | | | UCP Inc., Class A, (2) | | | | | | | | | | | | | | | 4,869 | |
| | | | | |
| | 886 | | | Univeral Electronics Inc., (2) | | | | | | | | | | | | | | | 62,153 | |
| | | | | |
| | 1,355 | | | WCI Communities Inc., (2) | | | | | | | | | | | | | | | 31,368 | |
| | | | | |
| | 1,582 | | | William Lyon Homes Inc, Class A Shares, (2), (3) | | | | | | | | | | | | | | | 28,255 | |
| | | | | |
| | 1,727 | | | Zagg Inc., (2) | | | | | | | | | | | | | | | 11,226 | |
| | | | Total Household Durables | | | | | | | | | | | | | | | 1,322,498 | |
| | | | | |
| | | | Household Products – 0.2% | | | | | | | | | | | | |
| | | | | |
| | 633 | | | Central Garden & Pet Company, (2) | | | | | | | | | | | | | | | 15,395 | |
| | | | | |
| | 2,093 | | | Central Garden & Pet Company, (2) | | | | | | | | | | | | | | | 48,851 | |
| | | | | |
| | 7,428 | | | HRG Group, Inc., (2) | | | | | | | | | | | | | | | 111,717 | |
| | | | | |
| | 317 | | | Oil Dri Corporation | | | | | | | | | | | | | | | 10,702 | |
| | | | | |
| | 566 | | | Orchids Paper Products Company | | | | | | | | | | | | | | | 14,524 | |
| | | | | |
| | 688 | | | WD 40 Company | | | | | | | | | | | | | | | 73,358 | |
| | | | Total Household Products | | | | | | | | | | | | | | | 274,547 | |
| | |
| | | | Independent Power & Renewable Electricity Producers – 0.6% | | | | |
| | | | | |
| | 8,065 | | | Atlantic Power Corporation | | | | | | | | | | | | | | | 18,550 | |
| | | | | |
| | 3,685 | | | Atlantica Yield PLC | | | | | | | | | | | | | | | 66,256 | |
Nuveen Small Cap Index Fund (continued)
| | |
| Portfolio of Investments | | October 31, 2016 |
| | | | | | | | | | | | | | | | | | | | |
| Shares | | | Description (1) | | | | | | | | | | | Value | |
| | |
| | | | Independent Power & Renewable Electricity Producers (continued) | | | | |
| | | | | |
| | 7,317 | | | Dynegy Inc., (2) | | | | | | | | | | | | | | $ | 77,926 | |
| | | | | |
| | 2,187 | | | NRG Yield Inc., Class A Shares | | | | | | | | | | | | | | | 32,215 | |
| | | | | |
| | 3,972 | | | NRG Yield, Inc., Class C Shares | | | | | | | | | | | | | | | 61,169 | |
| | | | | |
| | 2,436 | | | Ormat Technologies Inc. | | | | | | | | | | | | | | | 117,488 | |
| | | | | |
| | 4,152 | | | Pattern Energy Group Inc., (3) | | | | | | | | | | | | | | | 92,797 | |
| | | | | |
| | 5,278 | | | Talen Energy Corporation, (2) | | | | | | | | | | | | | | | 73,523 | |
| | | | | |
| | 5,720 | | | TerraForm Global Inc, Class A Shares | | | | | | | | | | | | | | | 21,450 | |
| | | | | |
| | 5,475 | | | TerraForm Power, Inc., (3) | | | | | | | | | | | | | | | 67,945 | |
| | | | | |
| | 1,468 | | | Vivint Solar Inc., (2) | | | | | | | | | | | | | | | 4,551 | |
| | | | Total Independent Power & Renewable Electricity Producers | | | | | | | | | | | | | | | 633,870 | |
| | | | | |
| | | | Industrial Conglomerates – 0.0% | | | | | | | | | | | | |
| | | | | |
| | 2,271 | | | Raven Industries, Inc. | | | | | | | | | | | | | | | 48,713 | |
| | | | | |
| | | | Insurance – 2.2% | | | | | | | | | | | | |
| | | | | |
| | 2,910 | | | Ambac Financial Group, Inc., (2) | | | | | | | | | | | | | | | 53,690 | |
| | | | | |
| | 5,366 | | | American Equity Investment Life Holding Company | | | | | | | | | | | | | | | 96,212 | |
| | | | | |
| | 1,186 | | | Amerisafe, Inc. | | | | | | | | | | | | | | | 65,942 | |
| | | | | |
| | 1,804 | | | Argo Group International Holdings Inc. | | | | | | | | | | | | | | | 100,302 | |
| | | | | |
| | 671 | | | Atlas Financial Holdings Inc., (2) | | | | | | | | | | | | | | | 11,508 | |
| | | | | |
| | 514 | | | Baldwin & Lyons, Class B | | | | | | | | | | | | | | | 12,644 | |
| | | | | |
| | 2,908 | | | Citizens Inc., (2), (3) | | | | | | | | | | | | | | | 22,624 | |
| | | | | |
| | 11,221 | | | CNO Financial Group Inc. | | | | | | | | | | | | | | | 169,213 | |
| | | | | |
| | 881 | | | Crawford & Co | | | | | | | | | | | | | | | 9,911 | |
| | | | | |
| | 524 | | | Donegal Group, Inc., B | | | | | | | | | | | | | | | 7,886 | |
| | | | | |
| | 1,159 | | | eHealth, Inc., (2) | | | | | | | | | | | | | | | 9,075 | |
| | | | | |
| | 507 | | | EMC Insurance Group Inc. | | | | | | | | | | | | | | | 12,345 | |
| | | | | |
| | 2,009 | | | Employers Holdings, Inc. | | | | | | | | | | | | | | | 62,982 | |
| | | | | |
| | 713 | | | Enstar Group, Limited, (2) | | | | | | | | | | | | | | | 120,212 | |
| | | | | |
| | 615 | | | FBL Financial Group Inc. | | | | | | | | | | | | | | | 38,930 | |
| | | | | |
| | 787 | | | Federated National Holding Company | | | | | | | | | | | | | | | 14,095 | |
| | | | | |
| | 462 | | | Fidelity & Guaranty Life | | | | | | | | | | | | | | | 10,210 | |
| | | | | |
| | 31,514 | | | Genworth Financial Inc., Class A, (2) | | | | | | | | | | | | | | | 130,468 | |
| | | | | |
| | 563 | | | Global Indemnity PLC, (2) | | | | | | | | | | | | | | | 16,913 | |
| | | | | |
| | 1,871 | | | Greenlight Capital Re, Ltd, (2) | | | | | | | | | | | | | | | 37,233 | |
| | | | | |
| | 915 | | | Hallmark Financial Services, Inc., (2) | | | | | | | | | | | | | | | 9,479 | |
| | | | | |
| | 554 | | | HCI Group Inc. | | | | | | | | | | | | | | | 15,019 | |
| | | | | |
| | 1,597 | | | Heritage Insurance Holdings, Inc. | | | | | | | | | | | | | | | 18,829 | |
| | | | | |
| | 2,539 | | | Horace Mann Educators Corporation | | | | | | | | | | | | | | | 91,277 | |
| | | | | |
| | 676 | | | Infinity Property and Casualty Corporation | | | | | | | | | | | | | | | 55,398 | |
| | | | | |
| | 90 | | | Investors Title Company | | | | | | | | | | | | | | | 8,640 | |
| | | | | | | | | | | | | | | | | | | | |
| Shares | | | Description (1) | | | | | | | | | | | Value | |
| | | | | |
| | | | Insurance (continued) | | | | | | | | | | | | |
| | | | | |
| | 893 | | | James River Group Holdings, Limited | | | | | | | | | | | | | | $ | 33,613 | |
| | | | | |
| | 2,483 | | | Kemper Corporation | | | | | | | | | | | | | | | 93,237 | |
| | | | | |
| | 3,702 | | | Maiden Holdings, Ltd | | | | | | | | | | | | | | | 50,532 | |
| | | | | |
| | 8,237 | | | MBIA Inc., (2) | | | | | | | | | | | | | | | 63,425 | |
| | | | | |
| | 3,031 | | | National General Holdings Corporation | | | | | | | | | | | | | | | 62,287 | |
| | | | | |
| | 462 | | | National Interstate Corporation | | | | | | | | | | | | | | | 14,969 | |
| | | | | |
| | 142 | | | National Western Life Group Inc. | | | | | | | | | | | | | | | 30,587 | |
| | | | | |
| | 685 | | | Navigators Group, Inc. | | | | | | | | | | | | | | | 63,842 | |
| | | | | |
| | 1,249 | | | OneBeacon Insurance Group Limited, Class A | | | | | | | | | | | | | | | 17,161 | |
| | | | | |
| | 719 | | | Patriot National Inc., (2), (3) | | | | | | | | | | | | | | | 4,558 | |
| | | | | |
| | 2,944 | | | Primerica Inc., (3) | | | | | | | | | | | | | | | 161,037 | |
| | | | | |
| | 2,376 | | | RLI Corporation | | | | | | | | | | | | | | | 132,438 | |
| | | | | |
| | 901 | | | Safety Insurance Group, Inc. | | | | | | | | | | | | | | | 60,998 | |
| | | | | |
| | 3,559 | | | Selective Insurance Group Inc. | | | | | | | | | | | | | | | 131,505 | |
| | | | | |
| | 969 | | | State Auto Financial Corporation | | | | | | | | | | | | | | | 22,190 | |
| | | | | |
| | 1,910 | | | State National Companies Inc. | | | | | | | | | | | | | | | 19,539 | |
| | | | | |
| | 1,431 | | | Stewart Information Services Corporation | | | | | | | | | | | | | | | 64,323 | |
| | | | | |
| | 4,136 | | | Third Point Reinsurance Limited, (2) | | | | | | | | | | | | | | | 48,598 | |
| | | | | |
| | 901 | | | Trupanion Inc., (2), (3) | | | | | | | | | | | | | | | 14,587 | |
| | | | | |
| | 1,352 | | | United Fire Group Inc. | | | | | | | | | | | | | | | 53,431 | |
| | | | | |
| | 1,109 | | | United Insurance Holdings Corporation | | | | | | | | | | | | | | | 16,081 | |
| | | | | |
| | 2,047 | | | Universal Insurance Holdings Inc., (3) | | | | | | | | | | | | | | | 43,601 | |
| | | | | |
| | 12,710 | | | WMIH Corporation, (2) | | | | | | | | | | | | | | | 26,691 | |
| | | | Total Insurance | | | | | | | | | | | | | | | 2,430,267 | |
| | | | | |
| | | | Internet and Direct Marketing Retail – 0.5% | | | | | | | | | | | | |
| | | | | |
| | 1,617 | | | 1-800-Flowers, (2) | | | | | | | | | | | | | | | 15,442 | |
| | | | | |
| | 692 | | | Blue Nile Inc., (2) | | | | | | | | | | | | | | | 24,172 | |
| | | | | |
| | 600 | | | Duluth Holdings Inc., (2) | | | | | | | | | | | | | | | 16,290 | |
| | | | | |
| | 6,573 | | | Etsy, Inc., (2) | | | | | | | | | | | | | | | 85,318 | |
| | | | | |
| | 1,091 | | | FTD Companies Inc., (2) | | | | | | | | | | | | | | | 21,951 | |
| | | | | |
| | 1,959 | | | Hosting Site Network, Inc. | | | | | | | | | | | | | | | 73,854 | |
| | | | | |
| | 934 | | | Lands’ End Inc, (2), (3) | | | | | | | | | | | | | | | 14,570 | |
| | | | | |
| | 4,545 | | | Liberty TripAdvisor Holdings Inc., (2) | | | | | | | | | | | | | | | 100,899 | |
| | | | | |
| | 1,823 | | | Nutri System Inc. | | | | | | | | | | | | | | | 57,789 | |
| | | | | |
| | 827 | | | Overstock.com, Inc., (2) | | | | | | | | | | | | | | | 12,116 | |
| | | | | |
| | 1,074 | | | PetMed Express, Inc., (3) | | | | | | | | | | | | | | | 21,340 | |
| | | | | |
| | 2,148 | | | Shutterfly, Inc., (2), (3) | | | | | | | | | | | | | | | 105,252 | |
| | | | | |
| | 1,974 | | | Wayfair Inc., Class A Shares, (2), (3) | | | | | | | | | | | | | | | 65,793 | |
| | | | Total Internet and Direct Marketing Retail | | | | | | | | | | | | | | | 614,786 | |
Nuveen Small Cap Index Fund (continued)
| | |
| Portfolio of Investments | | October 31, 2016 |
| | | | | | | | | | | | | | | | | | | | |
| Shares | | | Description (1) | | | | | | | | | | | Value | |
| | | | | |
| | | | Internet Software & Services – 2.4% | | | | | | | | | | | | |
| | | | | |
| | 2,295 | | | 2U Inc., (2), (3) | | | | | | | | | | | | | | $ | 80,004 | |
| | | | | |
| | 2,252 | | | Actua Corporation, (2) | | | | | | | | | | | | | | | 26,236 | |
| | | | | |
| | 645 | | | Alarm Com Holdings Inc., (2), (3) | | | | | | | | | | | | | | | 18,821 | |
| | | | | |
| | 1,108 | | | Amber Road Inc., (2) | | | | | | | | | | | | | | | 10,559 | |
| | | | | |
| | 2,488 | | | Angie’s List, (2), (3) | | | | | | | | | | | | | | | 19,158 | |
| | | | | |
| | 963 | | | Apigee Corp., (2) | | | | | | | | | | | | | | | 16,708 | |
| | | | | |
| | 381 | | | Appfolio Inc., Class A Shares, (2), (3) | | | | | | | | | | | | | | | 7,258 | |
| | | | | |
| | 576 | | | Autobytel, Inc., (2) | | | | | | | | | | | | | | | 9,418 | |
| | | | | |
| | 2,969 | | | Bankrate Inc., (2) | | | | | | | | | | | | | | | 23,158 | |
| | | | | |
| | 5,141 | | | Bazaarvoice Inc., (2) | | | | | | | | | | | | | | | 25,191 | |
| | | | | |
| | 805 | | | BenefitFocus Inc., (2) | | | | | | | | | | | | | | | 26,163 | |
| | | | | |
| | 2,455 | | | Blucora Inc., (2) | | | | | | | | | | | | | | | 32,652 | |
| | | | | |
| | 3,055 | | | Box, Inc., Class A Shares, (2), (3) | | | | | | | | | | | | | | | 44,053 | |
| | | | | |
| | 1,876 | | | Brightcove Inc., (2) | | | | | | | | | | | | | | | 20,917 | |
| | | | | |
| | 1,112 | | | Carbonite Inc., (2) | | | | | | | | | | | | | | | 18,960 | |
| | | | | |
| | 879 | | | CareCom Inc., (2) | | | | | | | | | | | | | | | 7,981 | |
| | | | | |
| | 1,452 | | | ChannelAdvisor Corporation, (2) | | | | | | | | | | | | | | | 15,972 | |
| | | | | |
| | 1,572 | | | Cimpress NV, (2) | | | | | | | | | | | | | | | 130,869 | |
| | | | | |
| | 2,989 | | | ComScore Inc., (2) | | | | | | | | | | | | | | | 86,053 | |
| | | | | |
| | 3,153 | | | Cornerstone OnDemand Inc., (2) | | | | | | | | | | | | | | | 130,219 | |
| | | | | |
| | 1,391 | | | Cvent Inc., (2) | | | | | | | | | | | | | | | 43,427 | |
| | | | | |
| | 3,141 | | | DHI Group Inc., (2) | | | | | | | | | | | | | | | 17,904 | |
| | | | | |
| | 6,578 | | | Earthlink Holdings Corporation | | | | | | | | | | | | | | | 37,626 | |
| | | | | |
| | 3,756 | | | Endurance International Group Holdings Inc., (2) | | | | | | | | | | | | | | | 27,607 | |
| | | | | |
| | 2,594 | | | Envestnet Inc., (2) | | | | | | | | | | | | | | | 91,698 | |
| | | | | |
| | 1,772 | | | Everyday Health Inc., (2) | | | | | | | | | | | | | | | 18,606 | |
| | | | | |
| | 2,067 | | | Five9, Inc., (2) | | | | | | | | | | | | | | | 29,599 | |
| | | | | |
| | 3,522 | | | Gogo Inc., (2), (3) | | | | | | | | | | | | | | | 35,607 | |
| | | | | |
| | 5,057 | | | GrubHub Inc., (2) | | | | | | | | | | | | | | | 192,722 | |
| | | | | |
| | 1,652 | | | GTT Communications Inc., (2) | | | | | | | | | | | | | | | 37,170 | |
| | | | | |
| | 2,524 | | | Hortonworks Inc., (2) | | | | | | | | | | | | | | | 19,283 | |
| | | | | |
| | 3,677 | | | inContact, Inc., (2) | | | | | | | | | | | | | | | 51,147 | |
| | | | | |
| | 657 | | | Instructure Inc., (2) | | | | | | | | | | | | | | | 16,721 | |
| | | | | |
| | 2,599 | | | Intralinks Holdings INc., (2) | | | | | | | | | | | | | | | 23,833 | |
| | | | | |
| | 2,949 | | | J2 Global Inc. | | | | | | | | | | | | | | | 209,821 | |
| | | | | |
| | 4,696 | | | Limelight Networks Inc., (2) | | | | | | | | | | | | | | | 8,359 | |
| | | | | |
| | 1,558 | | | Liquidity Services, Inc., (2) | | | | | | | | | | | | | | | 13,788 | |
| | | | | |
| | 3,336 | | | Liveperson, Inc., (2) | | | | | | | | | | | | | | | 28,356 | |
| | | | | |
| | 1,577 | | | LogMeIn Inc., (2) | | | | | | | | | | | | | | | 149,815 | |
| | | | | | | | | | | | | | | | | | | | |
| Shares | | | Description (1) | | | | | | | | | | | Value | |
| | | | | |
| | | | Internet Software & Services (continued) | | | | | | | | | | | | |
| | | | | |
| | 2,106 | | | Marchex, Inc. | | | | | | | | | | | | | | $ | 5,307 | |
| | | | | |
| | 2,584 | | | MeetMe Incorporated, (2) | | | | | | | | | | | | | | | 12,636 | |
| | | | | |
| | 901 | | | MINDBODY, Inc., Class A Shares, (2) | | | | | | | | | | | | | | | 18,651 | |
| | | | | |
| | 5,483 | | | Monster Worldwide Inc., (2) | | | | | | | | | | | | | | | 18,697 | |
| | | | | |
| | 1,374 | | | New Relic, Inc., (2) | | | | | | | | | | | | | | | 50,082 | |
| | | | | |
| | 3,976 | | | NIC, Incorporated | | | | | | | | | | | | | | | 91,249 | |
| | | | | |
| | 865 | | | Numerex Corporation, (2) | | | | | | | | | | | | | | | 6,150 | |
| | | | | |
| | 1,600 | | | Q2 Holdings Inc., (2) | | | | | | | | | | | | | | | 44,960 | |
| | | | | |
| | 4,013 | | | Qoutient Technology Inc., (2) | | | | | | | | | | | | | | | 42,538 | |
| | | | | |
| | 2,411 | | | QuinStreet, Inc., (2) | | | | | | | | | | | | | | | 6,992 | |
| | | | | |
| | 1,499 | | | RealNetworks Inc., (2) | | | | | | | | | | | | | | | 6,686 | |
| | | | | |
| | 550 | | | Reis, Inc. | | | | | | | | | | | | | | | 10,808 | |
| | | | | |
| | 2,413 | | | RetailMeNot Inc., (2) | | | | | | | | | | | | | | | 21,838 | |
| | | | | |
| | 727 | | | Rightside Group, Limited, (2) | | | | | | | | | | | | | | | 6,114 | |
| | | | | |
| | 1,187 | | | Shutterstock Incorporated, (2) | | | | | | | | | | | | | | | 70,021 | |
| | | | | |
| | 1,038 | | | SPS Commerce Inc., (2) | | | | | | | | | | | | | | | 64,750 | |
| | | | | |
| | 1,013 | | | Stamps.com Inc., (2), (3) | | | | | | | | | | | | | | | 98,818 | |
| | | | | |
| | 988 | | | TechTarget Inc., (2) | | | | | | | | | | | | | | | 7,983 | |
| | | | | |
| | 3,401 | | | TrueCar Inc., (2), (3) | | | | | | | | | | | | | | | 32,820 | |
| | | | | |
| | 2,662 | | | Web.com, Inc., (2) | | | | | | | | | | | | | | | 42,858 | |
| | | | | |
| | 2,337 | | | WebMD Health Corporation, Class A, (2) | | | | | | | | | | | | | | | 114,817 | |
| | | | | |
| | 1,429 | | | Xactly Corp., (2) | | | | | | | | | | | | | | | 18,434 | |
| | | | | |
| | 1,591 | | | XO Group, Incorporated, (2) | | | | | | | | | | | | | | | 29,274 | |
| | | | Total Internet Software & Services | | | | | | | | | | | | | | | 2,625,922 | |
| | | | | |
| | | | IT Services – 2.0% | | | | | | | | | | | | |
| | | | | |
| | 4,856 | | | Acxiom Corporation, (2) | | | | | | | | | | | | | | | 114,407 | |
| | | | | |
| | 1,224 | | | ALJ Regional Holdings, Inc., (2) | | | | | | | | | | | | | | | 4,884 | |
| | | | | |
| | 3,438 | | | Blackhawk Network Holdings Inc., (2) | | | | | | | | | | | | | | | 118,439 | |
| | | | | |
| | 1,524 | | | CACI International Inc., (2) | | | | | | | | | | | | | | | 149,123 | |
| | | | | |
| | 2,823 | | | Cardtronics PLC, (2) | | | | | | | | | | | | | | | 141,150 | |
| | | | | |
| | 686 | | | Cass Information Systems, Inc. | | | | | | | | | | | | | | | 36,948 | |
| | | | | |
| | 5,569 | | | Convergys Corporation | | | | | | | | | | | | | | | 162,615 | |
| | | | | |
| | 2,007 | | | CSG Systems International Inc. | | | | | | | | | | | | | | | 76,326 | |
| | | | | |
| | 1,252 | | | Datalink Corporation, (2) | | | | | | | | | | | | | | | 11,869 | |
| | | | | |
| | 3,019 | | | EPAM Systems Inc., (2) | | | | | | | | | | | | | | | 194,333 | |
| | | | | |
| | 3,978 | | | Evertec Inc. | | | | | | | | | | | | | | | 60,267 | |
| | | | | |
| | 2,038 | | | Exlservice Holdings, Inc., (2) | | | | | | | | | | | | | | | 89,733 | |
| | | | | |
| | 621 | | | Forrester Research, Inc. | | | | | | | | | | | | | | | 23,132 | |
| | | | | |
| | 1,405 | | | Hackett Group, Inc. | | | | | | | | | | | | | | | 22,649 | |
Nuveen Small Cap Index Fund (continued)
| | |
| Portfolio of Investments | | October 31, 2016 |
| | | | | | | | | | | | | | | | | | | | |
| Shares | | | Description (1) | | | | | | | | | | | Value | |
| | | | | |
| | | | IT Services (continued) | | | | | | | | | | | | |
| | | | | |
| | 2,056 | | | Information Services Group Inc., (2) | | | | | | | | | | | | | | $ | 8,121 | |
| | | | | |
| | 3,571 | | | Lionbridge Technologies, Inc., (2) | | | | | | | | | | | | | | | 17,248 | |
| | | | | |
| | 1,548 | | | ManTech International Corporation, Class A | | | | | | | | | | | | | | | 60,109 | |
| | | | | |
| | 4,019 | | | Maximus Inc. | | | | | | | | | | | | | | | 209,229 | |
| | | | | |
| | 1,982 | | | Moneygram International Inc., (2) | | | | | | | | | | | | | | | 13,894 | |
| | | | | |
| | 400 | | | Nci, Inc., (2) | | | | | | | | | | | | | | | 4,700 | |
| | | | | |
| | 3,391 | | | NeuStar, Inc., (2), (3) | | | | | | | | | | | | | | | 76,128 | |
| | | | | |
| | 2,292 | | | Perficient, Inc., (2) | | | | | | | | | | | | | | | 42,654 | |
| | | | | |
| | 972 | | | PFSweb, Inc., (2) | | | | | | | | | | | | | | | 7,018 | |
| | | | | |
| | 2,651 | | | Planet Payment Inc., (2) | | | | | | | | | | | | | | | 9,252 | |
| | | | | |
| | 2,648 | | | Science Applications International Corporation | | | | | | | | | | | | | | | 182,474 | |
| | | | | |
| | 3,809 | | | ServiceSource International Inc., (2) | | | | | | | | | | | | | | | 18,093 | |
| | | | | |
| | 2,357 | | | Sykes Enterprises Inc., (2) | | | | | | | | | | | | | | | 63,026 | |
| | | | | |
| | 2,029 | | | Syntel Inc. | | | | | | | | | | | | | | | 40,783 | |
| | | | | |
| | 1,028 | | | TeleTech Holdings, Inc. | | | | | | | | | | | | | | | 28,887 | |
| | | | | |
| | 7,235 | | | Travelport Worldwide Limited | | | | | | | | | | | | | | | 102,158 | |
| | | | | |
| | 3,145 | | | Unisys Corporation, (2) | | | | | | | | | | | | | | | 32,865 | |
| | | | | |
| | 1,732 | | | Virtusa Corporation, (2) | | | | | | | | | | | | | | | 32,804 | |
| | | | Total IT Services | | | | | | | | | | | | | | | 2,155,318 | |
| | | | | |
| | | | Leisure Products – 0.3% | | | | | | | | | | | | |
| | | | | |
| | 820 | | | Arctic Cat, Inc. | | | | | | | | | | | | | | | 12,292 | |
| | | | | |
| | 5,902 | | | Callaway Golf Company | | | | | | | | | | | | | | | 60,259 | |
| | | | | |
| | 646 | | | Escalade, Inc. | | | | | | | | | | | | | | | 7,849 | |
| | | | | |
| | 958 | | | JAKKS Pacific Inc., (3) | | | | | | | | | | | | | | | 6,419 | |
| | | | | |
| | 307 | | | Johnson Outdoors, Inc. | | | | | | | | | | | | | | | 11,046 | |
| | | | | |
| | 1,130 | | | Malibu Boats Inc., Class A, (2) | | | | | | | | | | | | | | | 16,577 | |
| | | | | |
| | 691 | | | Marine Products Corporation | | | | | | | | | | | | | | | 6,461 | |
| | | | | |
| | 472 | | | MCBC Holdings, Inc., (2) | | | | | | | | | | | | | | | 5,258 | |
| | | | | |
| | 1,920 | | | Nautilus Group, Inc., (2) | | | | | | | | | | | | | | | 33,792 | |
| | | | | |
| | 2,391 | | | Performance Sports Group Limited, (2), (4) | | | | | | | | | | | | | | | 6,291 | |
| | | | | |
| | 3,431 | | | Smith & Wesson Holding Corporation, (2), (3) | | | | | | | | | | | | | | | 90,681 | |
| | | | | |
| | 1,161 | | | Sturm, Ruger, & Company, (3) | | | | | | | | | | | | | | | 71,402 | |
| | | | Total Leisure Products | | | | | | | | | | | | | | | 328,327 | |
| | | | | |
| | | | Life Sciences Tools & Services – 0.6% | | | | | | | | | | | | |
| | | | | |
| | 1,442 | | | Accelerate Diagnostics Inc., (2), (3) | | | | | | | | | | | | | | | 30,643 | |
| | | | | |
| | 1,614 | | | Albany Molecular Research Inc., (2) | | | | | | | | | | | | | | | 25,162 | |
| | | | | |
| | 1,995 | | | Cambrex Corporation, (2) | | | | | | | | | | | | | | | 80,399 | |
| | | | | |
| | 1,895 | | | ChromaDex Corporation, (2) | | | | | | | | | | | | | | | 5,230 | |
| | | | | |
| | 2,485 | | | Enzo Biochem Inc., (2) | | | | | | | | | | | | | | | 15,159 | |
| | | | | | | | | | | | | | | | | | | | |
| Shares | | | Description (1) | | | | | | | | | | | Value | |
| | | | | |
| | | | Life Sciences Tools & Services (continued) | | | | | | | | | | | | |
| | | | | |
| | 1,862 | | | Fluidigm Corporation, (2) | | | | | | | | | | | | | | $ | 8,621 | |
| | | | | |
| | 2,592 | | | INC Research Holdings Inc., Class A Shares, (2) | | | | | | | | | | | | | | | 118,454 | |
| | | | | |
| | 2,486 | | | Luminex Corporation, (2) | | | | | | | | | | | | | | | 51,783 | |
| | | | | |
| | 509 | | | Medpace Holdings, Incorporated, (2) | | | | | | | | | | | | | | | 14,771 | |
| | | | | |
| | 927 | | | NanoString Technologies, Inc., (2) | | | | | | | | | | | | | | | 18,030 | |
| | | | | |
| | 3,320 | | | NeoGenomics Inc., (2) | | | | | | | | | | | | | | | 26,759 | |
| | | | | |
| | 5,043 | | | Pacific Biosciences of California Inc., (2), (3) | | | | | | | | | | | | | | | 42,866 | |
| | | | | |
| | 3,158 | | | Parexel International Corporation, (2) | | | | | | | | | | | | | | | 183,985 | |
| | | | | |
| | 1,514 | | | PRA Health Sciences, Inc., (2) | | | | | | | | | | | | | | | 80,575 | |
| | | | Total Life Sciences Tools & Services | | | | | | | | | | | | | | | 702,437 | |
| | | | | |
| | | | Machinery – 3.3% | | | | | | | | | | | | |
| | | | | |
| | 3,680 | | | Actuant Corporation | | | | | | | | | | | | | | | 82,064 | |
| | | | | |
| | 590 | | | Alamo Group Inc. | | | | | | | | | | | | | | | 38,303 | |
| | | | | |
| | 1,793 | | | Albany International Corporation, Class A | | | | | | | | | | | | | | | 73,065 | |
| | | | | |
| | 1,578 | | | Altra Industrial Motion, Inc. | | | | | | | | | | | | | | | 46,551 | |
| | | | | |
| | 486 | | | American Railcar Industries | | | | | | | | | | | | | | | 17,875 | |
| | | | | |
| | 1,212 | | | Astec Industries Inc. | | | | | | | | | | | | | | | 67,096 | |
| | | | | |
| | 3,147 | | | Barnes Group Inc. | | | | | | | | | | | | | | | 125,376 | |
| | | | | |
| | 2,660 | | | Briggs & Stratton Corporation | | | | | | | | | | | | | | | 49,529 | |
| | | | | |
| | 1,914 | | | Chart Industries, Inc., (2) | | | | | | | | | | | | | | | 53,094 | |
| | | | | |
| | 1,033 | | | CIRCOR International Inc. | | | | | | | | | | | | | | | 55,555 | |
| | | | | |
| | 2,982 | | | CLARCOR, Inc. | | | | | | | | | | | | | | | 185,510 | |
| | | | | |
| | 1,215 | | | Columbus McKinnon Corporation NY | | | | | | | | | | | | | | | 23,680 | |
| | | | | |
| | 1,385 | | | Douglas Dynamics Inc. | | | | | | | | | | | | | | | 44,459 | |
| | | | | |
| | 928 | | | Dynamic Material Corporation | | | | | | | | | | | | | | | 10,069 | |
| | | | | |
| | 2,156 | | | Energy Recovery, Inc., (2), (3) | | | | | | | | | | | | | | | 26,325 | |
| | | | | |
| | 1,352 | | | EnPro Industries Inc. | | | | | | | | | | | | | | | 73,170 | |
| | | | | |
| | 1,591 | | | ESCO Technologies Inc. | | | | | | | | | | | | | | | 70,879 | |
| | | | | |
| | 683 | | | ExOne Company, (2), (3) | | | | | | | | | | | | | | | 8,148 | |
| | | | | |
| | 3,757 | | | Federal Signal Corporation | | | | | | | | | | | | | | | 46,136 | |
| | | | | |
| | 2,884 | | | Franklin Electric Company, Inc. | | | | | | | | | | | | | | | 105,122 | |
| | | | | |
| | 797 | | | Freightcar America Inc. | | | | | | | | | | | | | | | 10,409 | |
| | | | | |
| | 513 | | | Gencor Industries Inc., (2) | | | | | | | | | | | | | | | 6,207 | |
| | | | | |
| | 1,322 | | | Global Brass & Copper Holdings Inc. | | | | | | | | | | | | | | | 37,941 | |
| | | | | |
| | 1,104 | | | Gorman-Rupp Company | | | | | | | | | | | | | | | 26,518 | |
| | | | | |
| | 599 | | | Graham Corporation | | | | | | | | | | | | | | | 10,692 | |
| | | | | |
| | 1,698 | | | Greenbrier Companies Inc., (3) | | | | | | | | | | | | | | | 53,487 | |
| | | | | |
| | 773 | | | Hardinge, Inc. | | | | | | | | | | | | | | | 7,498 | |
| | | | | |
| | 5,046 | | | Harsco Corporation | | | | | | | | | | | | | | | 49,199 | |
Nuveen Small Cap Index Fund (continued)
| | |
| Portfolio of Investments | | October 31, 2016 |
| | | | | | | | | | | | | | | | | | | | |
| Shares | | | Description (1) | | | | | | | | | | | Value | |
| | | | | |
| | | | Machinery (continued) | | | | | | | | | | | | |
| | | | | |
| | 3,697 | | | Hillenbrand Inc. | | | | | | | | | | | | | | $ | 112,204 | |
| | | | | |
| | 398 | | | Hurco Companies, Inc. | | | | | | | | | | | | | | | 10,428 | |
| | | | | |
| | 590 | | | Hyster-Yale Materials Handling Inc. | | | | | | | | | | | | | | | 34,344 | |
| | | | | |
| | 1,824 | | | John Bean Technologies Corporation | | | | | | | | | | | | | | | 145,646 | |
| | | | | |
| | 6,174 | | | Joy Global Inc. | | | | | | | | | | | | | | | 171,822 | |
| | | | | |
| | 671 | | | Kadant Inc. | | | | | | | | | | | | | | | 34,657 | |
| | | | | |
| | 4,947 | | | Kennametal Inc. | | | | | | | | | | | | | | | 140,050 | |
| | | | | |
| | 664 | | | Lindsay Manufacturing Company, (3) | | | | | | | | | | | | | | | 51,991 | |
| | | | | |
| | 1,040 | | | Lydall Inc., (2) | | | | | | | | | | | | | | | 48,620 | |
| | | | | |
| | 7,962 | | | Manitowoc Company Inc. | | | | | | | | | | | | | | | 32,166 | |
| | | | | |
| | 5,151 | | | Meritor Inc., (2) | | | | | | | | | | | | | | | 52,952 | |
| | | | | |
| | 732 | | | Midwest Air Group Inc. | | | | | | | | | | | | | | | 16,067 | |
| | | | | |
| | 962 | | | Milacron Holdings Corporation, (2) | | | | | | | | | | | | | | | 14,007 | |
| | | | | |
| | 3,546 | | | Mueller Industries Inc. | | | | | | | | | | | | | | | 107,408 | |
| | | | | |
| | 9,760 | | | Mueller Water Products Inc. | | | | | | | | | | | | | | | 120,243 | |
| | | | | |
| | 3,100 | | | Navistar International Corporation, (2) | | | | | | | | | | | | | | | 69,130 | |
| | | | | |
| | 1,735 | | | NN, Incorporated | | | | | | | | | | | | | | | 30,623 | |
| | | | | |
| | 187 | | | OmegaFlex, Inc. | | | | | | | | | | | | | | | 7,112 | |
| | | | | |
| | 1,545 | | | Proto Labs Incorporated, (2), (3) | | | | | | | | | | | | | | | 69,062 | |
| | | | | |
| | 1,420 | | | RBC Bearings Inc., (2) | | | | | | | | | | | | | | | 101,317 | |
| | | | | |
| | 5,191 | | | Rexnord Corporation, (2) | | | | | | | | | | | | | | | 103,249 | |
| | | | | |
| | 2,603 | | | SPX Corporation | | | | | | | | | | | | | | | 49,483 | |
| | | | | |
| | 2,210 | | | SPX Flow Inc., (2) | | | | | | | | | | | | | | | 55,449 | |
| | | | | |
| | 795 | | | Standex International Corporation | | | | | | | | | | | | | | | 60,738 | |
| | | | | |
| | 1,469 | | | Sun Hydraulics Corporation | | | | | | | | | | | | | | | 43,233 | |
| | | | | |
| | 813 | | | Supreme Industries, Inc. | | | | | | | | | | | | | | | 9,910 | |
| | | | | |
| | 1,096 | | | Tennant Company | | | | | | | | | | | | | | | 68,993 | |
| | | | | |
| | 2,770 | | | Titan International Inc. | | | | | | | | | | | | | | | 28,226 | |
| | | | | |
| | 2,822 | | | TriMas Corporation, (2) | | | | | | | | | | | | | | | 50,655 | |
| | | | | |
| | 4,039 | | | Wabash National Corporation, (2) | | | | | | | | | | | | | | | 45,439 | |
| | | | | |
| | 1,741 | | | Watts Water Technologies, Inc. | | | | | | | | | | | | | | | 104,460 | |
| | | | | |
| | 3,315 | | | Woodward Governor Company | | | | | | | | | | | | | | | 195,519 | |
| | | | Total Machinery | | | | | | | | | | | | | | | 3,589,160 | |
| | | | | |
| | | | Marine – 0.1% | | | | | | | | | | | | |
| | | | | |
| | 1,752 | | | Costamare Inc., (3) | | | | | | | | | | | | | | | 11,388 | |
| | | | | |
| | 2,709 | | | Matson Incorporated | | | | | | | | | | | | | | | 108,197 | |
| | | | | |
| | 3,692 | | | Scorpio Bulkers Inc., (2) | | | | | | | | | | | | | | | 14,399 | |
| | | | Total Marine | | | | | | | | | | | | | | | 133,984 | |
| | | | | | | | | | | | | | | | | | | | |
| Shares | | | Description (1) | | | | | | | | | | | Value | |
| | | | | |
| | | | Media – 1.4% | | | | | | | | | | | | |
| | | | | |
| | 1,354 | | | AMC Entertainment Holdings Inc., (3) | | | | | | | | | | | | | | $ | 42,583 | |
| | | | | |
| | 1,508 | | | Carmike Cinemas, Inc., (2) | | | | | | | | | | | | | | | 49,236 | |
| | | | | |
| | 4,992 | | | Central European Media Enterprises Limited, (2), (3) | | | | | | | | | | | | | | | 12,230 | |
| | | | | |
| | 70 | | | Daily Journal Corporation, (2) | | | | | | | | | | | | | | | 14,784 | |
| | | | | |
| | 3,727 | | | E.W. Scripps Company, Class A | | | | | | | | | | | | | | | 49,420 | |
| | | | | |
| | 1,625 | | | Entercom Communications Corporation | | | | | | | | | | | | | | | 21,450 | |
| | | | | |
| | 4,122 | | | Entravision Communications Corporation | | | | | | | | | | | | | | | 27,617 | |
| | | | | |
| | 1,852 | | | Eros International PLC, (2), (3) | | | | | | | | | | | | | | | 32,873 | |
| | | | | |
| | 7,360 | | | Gannett Company, Inc. | | | | | | | | | | | | | | | 57,187 | |
| | | | | |
| | 2,930 | | | Global Eagle Acquisition Corporation, (2) | | | | | | | | | | | | | | | 23,587 | |
| | | | | |
| | 4,015 | | | Gray Television Inc. | | | | | | | | | | | | | | | 35,734 | |
| | | | | |
| | 3,688 | | | Imax Corporation, (2), (3) | | | | | | | | | | | | | | | 111,562 | |
| | | | | |
| | 573 | | | Liberty Braves Group, Class A Shares, (2) | | | | | | | | | | | | | | | 9,712 | |
| | | | | |
| | 1,969 | | | Liberty Braves Group, Class-C Shares, (2) | | | | | | | | | | | | | | | 32,823 | |
| | | | | |
| | 1,432 | | | Liberty Media Group, Class-A Shares, (2) | | | | | | | | | | | | | | | 39,853 | |
| | | | | |
| | 2,890 | | | Liberty Media Group, Class-C Shares, (2) | | | | | | | | | | | | | | | 79,215 | |
| | | | | |
| | 806 | | | Loral Space & Communications, Inc., (2) | | | | | | | | | | | | | | | 31,273 | |
| | | | | |
| | 3,207 | | | MDC Partners, Inc. | | | | | | | | | | | | | | | 27,099 | |
| | | | | |
| | 6,830 | | | Media General Inc. | | | | | | | | | | | | | | | 115,086 | |
| | | | | |
| | 2,350 | | | Meredith Corporation | | | | | | | | | | | | | | | 106,573 | |
| | | | | |
| | 3,727 | | | MSG Networks Inc., (2) | | | | | | | | | | | | | | | 71,186 | |
| | | | | |
| | 3,853 | | | National CineMedia, Inc. | | | | | | | | | | | | | | | 53,441 | |
| | | | | |
| | 2,431 | | | New Media Investment Group Inc. | | | | | | | | | | | | | | | 35,006 | |
| | | | | |
| | 7,453 | | | New York Times, Class A | | | | | | | | | | | | | | | 81,238 | |
| | | | | |
| | 1,869 | | | Nexstar Broadcasting Group, Inc., (3) | | | | | | | | | | | | | | | 91,207 | |
| | | | | |
| | 1,634 | | | Radio One Inc., (2) | | | | | | | | | | | | | | | 4,085 | |
| | | | | |
| | 1,070 | | | Reading International Inc., A, (2) | | | | | | | | | | | | | | | 14,113 | |
| | | | | |
| | 246 | | | Saga Comunications Inc Class A Shares | | | | | | | | | | | | | | | 10,332 | |
| | | | | |
| | 732 | | | Salem Communications Corporation | | | | | | | | | | | | | | | 3,989 | |
| | | | | |
| | 1,693 | | | Scholastic Corporation | | | | | | | | | | | | | | | 64,757 | |
| | | | | |
| | 4,140 | | | Sinclair Broadcast Group, Series A | | | | | | | | | | | | | | | 103,914 | |
| | | | | |
| | 442 | | | T2 Biosystems, Inc., (2) | | | | | | | | | | | | | | | 3,704 | |
| | | | | |
| | 6,434 | | | Time Inc. | | | | | | | | | | | | | | | 83,642 | |
| | | | | |
| | 1,669 | | | tronc, Inc., (2) | | | | | | | | | | | | | | | 20,078 | |
| | | | | |
| | 2,263 | | | World Wrestling Entertainment Inc. | | | | | | | | | | | | | | | 40,010 | |
| | | | Total Media | | | | | | | | | | | | | | | 1,600,599 | |
| | | | | |
| | | | Metals & Mining – 1.2% | | | | | | | | | | | | |
| | | | | |
| | 14,850 | | | AK Steel Holding Corporation | | | | | | | | | | | | | | | 77,220 | |
| | | | | |
| | 6,798 | | | Allegheny Technologies, Inc., (3) | | | | | | | | | | | | | | | 92,725 | |
Nuveen Small Cap Index Fund (continued)
| | |
| Portfolio of Investments | | October 31, 2016 |
| | | | | | | | | | | | | | | | | | | | |
| Shares | | | Description (1) | | | | | | | | | | | Value | |
| | | | | |
| | | | Metals & Mining (continued) | | | | | | | | | | | | |
| | | | | |
| | 567 | | | Ampco-Pittsburgh Corporation | | | | | | | | | | | | | | $ | 6,124 | |
| | | | | |
| | 2,896 | | | Carpenter Technology Inc. | | | | | | | | | | | | | | | 91,543 | |
| | | | | |
| | 3,123 | | | Century Aluminum Company, (2) | | | | | | | | | | | | | | | 22,829 | |
| | | | | |
| | 13,810 | | | Cliffs Natural Resources Inc., (3) | | | | | | | | | | | | | | | 76,231 | |
| | | | | |
| | 10,144 | | | Coeur d’Alene Mines Corporation, (2) | | | | | | | | | | | | | | | 113,410 | |
| | | | | |
| | 7,194 | | | Commercial Metals Company | | | | | | | | | | | | | | | 113,018 | |
| | | | | |
| | 4,094 | | | Ferroglobe PLC | | | | | | | | | | | | | | | 37,870 | |
| | | | | |
| | 3,131 | | | Gold Resource Corp. | | | | | | | | | | | | | | | 17,784 | |
| | | | | |
| | 777 | | | Haynes International Inc. | | | | | | | | | | | | | | | 24,996 | |
| | | | | |
| | 23,896 | | | Hecla Mining Company | | | | | | | | | | | | | | | 143,137 | |
| | | | | |
| | 1,089 | | | Kaiser Aluminum Corporation | | | | | | | | | | | | | | | 78,942 | |
| | | | | |
| | 1,246 | | | Materion Corporation | | | | | | | | | | | | | | | 37,754 | |
| | | | | |
| | 573 | | | Olympic Steel Inc. | | | | | | | | | | | | | | | 13,231 | |
| | | | | |
| | 1,640 | | | Real Industry, Inc., (2) | | | | | | | | | | | | | | | 8,774 | |
| | | | | |
| | 833 | | | Ryerson Holding Corporation, (2) | | | | | | | | | | | | | | | 8,538 | |
| | | | | |
| | 1,633 | | | Schnitzer Steel Industries, Inc. | | | | | | | | | | | | | | | 39,437 | |
| | | | | |
| | 7,654 | | | Stillwater Mining Company, (2) | | | | | | | | | | | | | | | 101,951 | |
| | | | | |
| | 4,219 | | | SunCoke Energy Inc. | | | | | | | | | | | | | | | 43,076 | |
| | | | | |
| | 2,469 | | | TimkenSteel Corporation | | | | | | | | | | | | | | | 25,307 | |
| | | | | |
| | 2,820 | | | Worthington Industries, Inc. | | | | | | | | | | | | | | | 132,540 | |
| | | | Total Metals & Mining | | | | | | | | | | | | | | | 1,306,437 | |
| | | | | |
| | | | Mortgage Real Estate Investment Trusts – 1.1% | | | | | | | | | | | | |
| | | | | |
| | 1,758 | | | AG Mortgage Investment Trust Inc. | | | | | | | | | | | | | | | 27,302 | |
| | | | | |
| | 3,275 | | | Altisource Residential Corporation | | | | | | | | | | | | | | | 32,979 | |
| | | | | |
| | 5,993 | | | Anworth Mortgage Asset Corporation | | | | | | | | | | | | | | | 29,426 | |
| | | | | |
| | 3,231 | | | Apollo Commercial Real Estate Finance, Inc. | | | | | | | | | | | | | | | 54,669 | |
| | | | | |
| | 1,683 | | | Ares Commercial Real Estate Corporation | | | | | | | | | | | | | | | 22,081 | |
| | | | | |
| | 2,301 | | | Armour Residential Inc., (3) | | | | | | | | | | | | | | | 52,164 | |
| | | | | |
| | 5,981 | | | Capstead Mortgage Corporation | | | | | | | | | | | | | | | 56,879 | |
| | | | | |
| | 7,046 | | | Colony Financial Inc. | | | | | | | | | | | | | | | 133,944 | |
| | | | | |
| | 9,489 | | | CYS Investments Inc. | | | | | | | | | | | | | | | 81,795 | |
| | | | | |
| | 2,808 | | | Dynex Capital, Inc. | | | | | | | | | | | | | | | 19,291 | |
| | | | | |
| | 857 | | | Great Ajax Corporation | | | | | | | | | | | | | | | 11,878 | |
| | | | | |
| | 2,545 | | | Hannon Armstrong Sustainable Infrastructure Capital Inc. | | | | | | | | | | | | | | | 58,179 | |
| | | | | |
| | 7,049 | | | Invesco Mortgage Capital Inc. | | | | | | | | | | | | | | | 105,242 | |
| | | | | |
| | 2,398 | | | Ladder Capital Corporation | | | | | | | | | | | | | | | 30,407 | |
| | | | | |
| | 2,881 | | | MTGE Investment Corp. | | | | | | | | | | | | | | | 49,121 | |
| | | | | |
| | 15,219 | | | New Residential Investment | | | | | | | | | | | | | | | 212,457 | |
| | | | | |
| | 6,889 | | | New York Mortgage Trust, Inc., (3) | | | | | | | | | | | | | | | 40,714 | |
| | | | | | | | | | | | | | | | | | | | |
| Shares | | | Description (1) | | | | | | | | | | | Value | |
| | | | | |
| | | | Mortgage Real Estate Investment Trusts (continued) | | | | | | | | | | | | |
| | | | | |
| | 1,407 | | | Orchid Island Capital Inc., (3) | | | | | | | | | | | | | | $ | 14,816 | |
| | | | | |
| | 627 | | | Owens Realty Mortgage Inc. | | | | | | | | | | | | | | | 11,443 | |
| | | | | |
| | 4,267 | | | PennyMac Mortgage Investment Trust | | | | | | | | | | | | | | | 64,944 | |
| | | | | |
| | 4,775 | | | Redwood Trust Inc. | | | | | | | | | | | | | | | 67,137 | |
| | | | | |
| | 1,897 | | | Resource Capital Corporation | | | | | | | | | | | | | | | 23,504 | |
| | | | | |
| | 2,563 | | | Western Asset Mortgage Capital Corporation | | | | | | | | | | | | | | | 25,963 | |
| | | | Total Mortgage Real Estate Investment Trusts | | | | | | | | | | | | | | | 1,226,335 | |
| | | | | |
| | | | Multiline Retail – 0.2% | | | | | | | | | | | | |
| | | | | |
| | 2,791 | | | Big Lots, Inc., (3) | | | | | | | | | | | | | | | 121,129 | |
| | | | | |
| | 2,211 | | | Freds Inc. | | | | | | | | | | | | | | | 20,186 | |
| | | | | |
| | 1,265 | | | Ollie’s Bargain Outlet Holdings, Inc., (2) | | | | | | | | | | | | | | | 34,598 | |
| | | | | |
| | 745 | | | Sears Holding Corporation, (2), (3) | | | | | | | | | | | | | | | 8,277 | |
| | | | | |
| | 2,852 | | | Tuesday Morning Corporation, (2) | | | | | | | | | | | | | | | 14,117 | |
| | | | Total Multiline Retail | | | | | | | | | | | | | | | 198,307 | |
| | | | | |
| | | | Multi-Utilities – 0.5% | | | | | | | | | | | | |
| | | | | |
| | 3,965 | | | Avista Corporation | | | | | | | | | | | | | | | 164,151 | |
| | | | | |
| | 3,233 | | | Black Hills Corporation | | | | | | | | | | | | | | | 199,961 | |
| | | | | |
| | 2,920 | | | Northwestern Corporation | | | | | | | | | | | | | | | 168,046 | |
| | | | | |
| | 869 | | | Unitil Corp. | | | | | | | | | | | | | | | 35,255 | |
| | | | Total Multi-Utilities | | | | | | | | | | | | | | | 567,413 | |
| | | | | |
| | | | Oil, Gas & Consumable Fuels – 2.1% | | | | | | | | | | | | |
| | | | | |
| | 7,731 | | | Abraxas Petroleum Corporation, (2) | | | | | | | | | | | | | | | 12,524 | |
| | | | | |
| | 145 | | | Adams Resources and Energy, Incorporated | | | | | | | | | | | | | | | 5,298 | |
| | | | | |
| | 2,020 | | | Alon USA Energy, Inc. | | | | | | | | | | | | | | | 16,281 | |
| | | | | |
| | 1,865 | | | Ardmore Shipping Corporation | | | | | | | | | | | | | | | 10,910 | |
| | | | | |
| | 3,069 | | | Bill Barrett Corporation, (2) | | | | | | | | | | | | | | | 15,928 | |
| | | | | |
| | 1,984 | | | California Resources Corporation, (2), (3) | | | | | | | | | | | | | | | 20,356 | |
| | | | | |
| | 9,099 | | | Callon Petroleum Company Del, (2) | | | | | | | | | | | | | | | 118,196 | |
| | | | | |
| | 3,494 | | | Carrizo Oil & Gas, Inc., (2) | | | | | | | | | | | | | | | 118,202 | |
| | | | | |
| | 373 | | | Clayton Williams Energy, (2), (3) | | | | | | | | | | | | | | | 32,567 | |
| | | | | |
| | 5,487 | | | Clean Energy Fuels Corporation, (2) | | | | | | | | | | | | | | | 22,552 | |
| | | | | |
| | 25,547 | | | Cobalt International Energy, Inc., (2) | | | | | | | | | | | | | | | 24,119 | |
| | | | | |
| | 1,400 | | | Contango Oil & Gas Company, (2) | | | | | | | | | | | | | | | 10,962 | |
| | | | | |
| | 991 | | | CVTR Energy Inc., (3) | | | | | | | | | | | | | | | 13,141 | |
| | | | | |
| | 3,860 | | | Delek US Holdings Inc. | | | | | | | | | | | | | | | 65,234 | |
| | | | | |
| | 22,019 | | | Denbury Resources Inc. | | | | | | | | | | | | | | | 52,625 | |
| | | | | |
| | 5,747 | | | DHT Maritime Inc. | | | | | | | | | | | | | | | 23,390 | |
| | | | | |
| | 1,516 | | | Dorian LPG Limited, (2) | | | | | | | | | | | | | | | 8,535 | |
| | | | | |
| | 3,569 | | | Eclipse Resources Corporation, (2) | | | | | | | | | | | | | | | 9,779 | |
Nuveen Small Cap Index Fund (continued)
| | |
| Portfolio of Investments | | October 31, 2016 |
| | | | | | | | | | | | | | | | | | | | |
| Shares | | | Description (1) | | | | | | | | | | | Value | |
| | | | | |
| | | | Oil, Gas & Consumable Fuels (continued) | | | | | | | | | | | | |
| | | | | |
| | 2,422 | | | EP Energy Corporation, Class A Shares, (2), (3) | | | | | | | | | | | | | | $ | 8,622 | |
| | | | | |
| | 898 | | | Erin Energy Corporation, (2), (3) | | | | | | | | | | | | | | | 1,931 | |
| | | | | |
| | 1,527 | | | Evolution Petroleum Corporation | | | | | | | | | | | | | | | 11,758 | |
| | | | | |
| | 8,766 | | | Exco Resources Inc., (2) | | | | | | | | | | | | | | | 9,467 | |
| | | | | |
| | 4,067 | | | Frontline Limited, (3) | | | | | | | | | | | | | | | 29,160 | |
| | | | | |
| | 2,562 | | | GasLog Limited | | | | | | | | | | | | | | | 39,327 | |
| | | | | |
| | 2,597 | | | Gener8 Maritime Inc., (2) | | | | | | | | | | | | | | | 10,959 | |
| | | | | |
| | 5,569 | | | Golar LNG, Limited, (3) | | | | | | | | | | | | | | | 121,905 | |
| | | | | |
| | 2,267 | | | Green Plains Renewable Energy, Inc. | | | | | | | | | | | | | | | 58,942 | |
| | | | | |
| | 46 | | | Isramco, Inc., (2) | | | | | | | | | | | | | | | 4,416 | |
| | | | | |
| | 3,567 | | | Jones Energy Inc, Class A, (2) | | | | | | | | | | | | | | | 14,625 | |
| | | | | |
| | 5,199 | | | Matador Resources Company, (2), (3) | | | | | | | | | | | | | | | 113,390 | |
| | | | | |
| | 5,304 | | | Navios Maritime Acquisition Corporation | | | | | | | | | | | | | | | 6,736 | |
| | | | | |
| | 5,436 | | | Nordic American Tanker Shipping Ltd, (3) | | | | | | | | | | | | | | | 44,412 | |
| | | | | |
| | 2,926 | | | Northern Oil and Gas Inc., (2) | | | | | | | | | | | | | | | 6,145 | |
| | | | | |
| | 14,562 | | | Oasis Petroleum Inc., (2) | | | | | | | | | | | | | | | 152,755 | |
| | | | | |
| | 2,392 | | | Overseas Shipholding Group Inc. | | | | | | | | | | | | | | | 20,954 | |
| | | | | |
| | 1,795 | | | Pacific Ethanol, Inc., (2) | | | | | | | | | | | | | | | 13,373 | |
| | | | | |
| | 959 | | | Panhandle Oil and Gas Inc. | | | | | | | | | | | | | | | 17,262 | |
| | | | | |
| | 1,850 | | | Par Pacific Holdings, Inc., (2), (3) | | | | | | | | | | | | | | | 23,569 | |
| | | | | |
| | 3,322 | | | PDC Energy Inc., (2) | | | | | | | | | | | | | | | 203,738 | |
| | | | | |
| | 2,398 | | | Renewable Energy Group Inc., (2), (3) | | | | | | | | | | | | | | | 20,983 | |
| | | | | |
| | 355 | | | Rex Stores Corporation, (2) | | | | | | | | | | | | | | | 28,041 | |
| | | | | |
| | 2,239 | | | Ring Energy Inc., (2) | | | | | | | | | | | | | | | 20,666 | |
| | | | | |
| | 6,135 | | | RSP Permian Inc., (2) | | | | | | | | | | | | | | | 221,474 | |
| | | | | |
| | 3,499 | | | Sanchez Energy Corporation, (2) | | | | | | | | | | | | | | | 22,289 | |
| | | | | |
| | 10,234 | | | Scorpio Tankers Inc. | | | | | | | | | | | | | | | 39,196 | |
| | | | | |
| | 4,131 | | | SemGroup Corporation, A Shares | | | | | | | | | | | | | | | 133,225 | |
| | | | | |
| | 3,753 | | | Ship Financial International Limited, (3) | | | | | | | | | | | | | | | 47,475 | |
| | | | | |
| | 11,637 | | | Synergy Resources Corporation, (2), (3) | | | | | | | | | | | | | | | 79,597 | |
| | | | | |
| | 3,068 | | | Teekay Shipping Corporation | | | | | | | | | | | | | | | 20,034 | |
| | | | | |
| | 7,294 | | | Teekay Tankers Limited, Class A Shares | | | | | | | | | | | | | | | 15,536 | |
| | | | | |
| | 2,264 | | | W&T Offshore Inc. | | | | | | | | | | | | | | | 3,283 | |
| | | | | |
| | 5,052 | | | Western Refining Inc. | | | | | | | | | | | | | | | 145,750 | |
| | | | | |
| | 1,158 | | | Westmoreland Coal Company, (2) | | | | | | | | | | | | | | | 10,283 | |
| | | | Total Oil, Gas & Consumable Fuels | | | | | | | | | | | | | | | 2,301,877 | |
| | | | | |
| | | | Paper & Forest Products – 0.6% | | | | | | | | | | | | |
| | | | | |
| | 2,443 | | | Boise Cascade Company, (2) | | | | | | | | | | | | | | | 47,028 | |
| | | | | |
| | 1,062 | | | Clearwater Paper Corporation, (2) | | | | | | | | | | | | | | | 56,392 | |
| | | | | | | | | | | | | | | | | | | | |
| Shares | | | Description (1) | | | | | | | | | | | Value | |
| | | | | |
| | | | Paper & Forest Products (continued) | | | | | | | | | | | | |
| | | | | |
| | 664 | | | Deltic Timber Corporation | | | | | | | | | | | | | | $ | 37,304 | |
| | | | | |
| | 2,722 | | | Glatfelter | | | | | | | | | | | | | | | 60,483 | |
| | | | | |
| | 5,407 | | | KapStone Paper and Packaging Corp. | | | | | | | | | | | | | | | 98,083 | |
| | | | | |
| | 9,029 | | | Louisiana-Pacific Corporation, (2) | | | | | | | | | | | | | | | 165,682 | |
| | | | | |
| | 1,040 | | | Neenah Paper, Inc. | | | | | | | | | | | | | | | 83,096 | |
| | | | | |
| | 1,895 | | | Schweitzer-Mauduit International Inc. | | | | | | | | | | | | | | | 69,944 | |
| | | | Total Paper & Forest Products | | | | | | | | | | | | | | | 618,012 | |
| | | | | |
| | | | Personal Products – 0.3% | | | | | | | | | | | | |
| | | | | |
| | 27,582 | | | Avon Products, Inc. | | | | | | | | | | | | | | | 180,662 | |
| | | | | |
| | 1,094 | | | Inter Parfums, Inc. | | | | | | | | | | | | | | | 35,664 | |
| | | | | |
| | 909 | | | Lifevantage Corporation, (2) | | | | | | | | | | | | | | | 7,454 | |
| | | | | |
| | 654 | | | Medifast, Inc. | | | | | | | | | | | | | | | 26,853 | |
| | | | | |
| | 464 | | | Natural Health Trends Corporation, (3) | | | | | | | | | | | | | | | 10,825 | |
| | | | | |
| | 534 | | | Nature’s Sunshine Products | | | | | | | | | | | | | | | 6,702 | |
| | | | | |
| | 431 | | | Nutraceutical International Corporation, (2) | | | | | | | | | | | | | | | 12,412 | |
| | | | | |
| | 734 | | | Revlon Inc., (2) | | | | | | | | | | | | | | | 24,956 | |
| | | | | |
| | 1,442 | | | Synutra International Inc., (2) | | | | | | | | | | | | | | | 5,624 | |
| | | | | |
| | 325 | | | USANA Health Sciences, Inc., (2) | | | | | | | | | | | | | | | 41,763 | |
| | | | Total Personal Products | | | | | | | | | | | | | | | 352,915 | |
| | | | | |
| | | | Pharmaceuticals – 1.7% | | | | | | | | | | | | |
| | | | | |
| | 2,343 | | | AcelRx Pharmaceuticals Inc., (2) | | | | | | | | | | | | | | | 6,560 | |
| | | | | |
| | 596 | | | Aclaris Therapeutics Inc., (2) | | | | | | | | | | | | | | | 12,665 | |
| | | | | |
| | 1,507 | | | Aerie Pharmaceuticals Inc., (2) | | | | | | | | | | | | | | | 50,108 | |
| | | | | |
| | 868 | | | Agile Therapeutics, Inc., (2) | | | | | | | | | | | | | | | 6,597 | |
| | | | | |
| | 2,227 | | | Amphastar Pharmaceuticals, Inc., (2) | | | | | | | | | | | | | | | 40,398 | |
| | | | | |
| | 2,908 | | | Ampio Pharmaceuticals Inc., (2) | | | | | | | | | | | | | | | 1,996 | |
| | | | | |
| | 496 | | | ANI Pharmaceuticals Inc., (2) | | | | | | | | | | | | | | | 29,611 | |
| | | | | |
| | 2,087 | | | Aratana Therpaeutics Inc., (2) | | | | | | | | | | | | | | | 16,905 | |
| | | | | |
| | 735 | | | Axsome Therapeutics, Inc., (2) | | | | | | | | | | | | | | | 4,925 | |
| | | | | |
| | 5,496 | | | Bio-Path Holdings Inc., (2) | | | | | | | | | | | | | | | 5,496 | |
| | | | | |
| | 6,236 | | | Catalent, Inc., (2) | | | | | | | | | | | | | | | 142,243 | |
| | | | | |
| | 2,795 | | | Cempra Inc., (2), (3) | | | | | | | | | | | | | | | 50,659 | |
| | | | | |
| | 516 | | | Clearside Biomedical, Incorporated, (2) | | | | | | | | | | | | | | | 11,161 | |
| | | | | |
| | 847 | | | Collegium Pharmaceutical Inc., (2), (3) | | | | | | | | | | | | | | | 12,680 | |
| | | | | |
| | 4,676 | | | Corcept Therapeutics, Inc., (2) | | | | | | | | | | | | | | | 32,451 | |
| | | | | |
| | 3,821 | | | DepoMed, Inc., (2), (3) | | | | | | | | | | | | | | | 85,438 | |
| | | | | |
| | 1,539 | | | Dermira, Inc., (2) | | | | | | | | | | | | | | | 48,248 | |
| | | | | |
| | 8,352 | | | Durect Corporation, (2) | | | | | | | | | | | | | | | 9,354 | |
| | | | | |
| | 1,386 | | | Egalet Corporation, (2) | | | | | | | | | | | | | | | 7,775 | |
Nuveen Small Cap Index Fund (continued)
| | |
| Portfolio of Investments | | October 31, 2016 |
| | | | | | | | | | | | | | | | | | | | |
| Shares | | | Description (1) | | | | | | | | | | | Value | |
| | | | | |
| | | | Pharmaceuticals (continued) | | | | | | | | | | | | |
| | | | | |
| | 2,428 | | | Endocyte Inc., (2) | | | | | | | | | | | | | | $ | 6,677 | |
| | | | | |
| | 704 | | | Flex Pharma Inc., (2) | | | | | | | | | | | | | | | 3,421 | |
| | | | | |
| | 368 | | | Heska Corporation, (2) | | | | | | | | | | | | | | | 18,179 | |
| | | | | |
| | 10,100 | | | Horizon Pharma Inc., (2) | | | | | | | | | | | | | | | 168,872 | |
| | | | | |
| | 4,584 | | | Impax Laboratories Inc., (2) | | | | | | | | | | | | | | | 92,138 | |
| | | | | |
| | 5,061 | | | Innoviva, Inc. | | | | | | | | | | | | | | | 52,128 | |
| | | | | |
| | 1,596 | | | Intersect ENT, Inc., (2) | | | | | | | | | | | | | | | 23,302 | |
| | | | | |
| | 2,148 | | | Intra-Cellular Therapies Inc., (2) | | | | | | | | | | | | | | | 26,635 | |
| | | | | |
| | 1,734 | | | Lannett Company Inc., (2), (3) | | | | | | | | | | | | | | | 37,975 | |
| | | | | |
| | 1,095 | | | Lipocine, Inc., (2) | | | | | | | | | | | | | | | 3,515 | |
| | | | | |
| | 4,216 | | | Medicines Company, (2) | | | | | | | | | | | | | | | 138,917 | |
| | | | | |
| | 704 | | | MyoKardia Inc., (2), (3) | | | | | | | | | | | | | | | 9,469 | |
| | | | | |
| | 8,883 | | | Nektar Therapautics, (2) | | | | | | | | | | | | | | | 110,149 | |
| | | | | |
| | 909 | | | Neos Therapeutics Inc., (2) | | | | | | | | | | | | | | | 5,363 | |
| | | | | |
| | 1,120 | | | Ocular Therapeutix, Inc., (2) | | | | | | | | | | | | | | | 6,339 | |
| | | | | |
| | 2,532 | | | Omeros Corporation, (2), (3) | | | | | | | | | | | | | | | 20,762 | |
| | | | | |
| | 2,282 | | | Pacira Pharmaceuticals, Inc., (2) | | | | | | | | | | | | | | | 72,568 | |
| | | | | |
| | 1,147 | | | Paratek Pharmaceuticals, Inc., (2) | | | | | | | | | | | | | | | 12,273 | |
| | | | | |
| | 1,129 | | | Phibro Animal Health Corporation, Class A Shares | | | | | | | | | | | | | | | 29,298 | |
| | | | | |
| | 3,105 | | | Prestige Brands Holdings Inc., (2) | | | | | | | | | | | | | | | 140,594 | |
| | | | | |
| | 355 | | | Reata Pharmaceuticals, Inc., (2), (3) | | | | | | | | | | | | | | | 8,037 | |
| | | | | |
| | 1,279 | | | Revance Therapeutics Inc., (2) | | | | | | | | | | | | | | | 17,075 | |
| | | | | |
| | 3,136 | | | SciClone Pharmaceuticals, Inc., (2) | | | | | | | | | | | | | | | 28,067 | |
| | | | | |
| | 1,467 | | | Sucampo Pharmaceuticals, Inc., (2) | | | | | | | | | | | | | | | 16,724 | |
| | | | | |
| | 2,937 | | | Supernus Pharmaceuticals Incorporated, (2) | | | | | | | | | | | | | | | 58,153 | |
| | | | | |
| | 2,592 | | | Teligent, Inc., (2) | | | | | | | | | | | | | | | 16,874 | |
| | | | | |
| | 2,336 | | | Tetraphase Pharmaceuticals Inc., (2) | | | | | | | | | | | | | | | 8,174 | |
| | | | | |
| | 9,395 | | | TherapeuticsMD, (2), (3) | | | | | | | | | | | | | | | 53,927 | |
| | | | | |
| | 2,270 | | | Theravance Biopharma Inc., (2), (3) | | | | | | | | | | | | | | | 57,045 | |
| | | | | |
| | 1,177 | | | Titan Pharmacuetical Inc., (2) | | | | | | | | | | | | | | | 5,355 | |
| | | | | |
| | 462 | | | WaVe Life Sciences Limited, (2), (3) | | | | | | | | | | | | | | | 14,715 | |
| | | | | |
| | 1,596 | | | Zogenix Inc., (2) | | | | | | | | | | | | | | | 13,007 | |
| | | | Total Pharmaceuticals | | | | | | | | | | | | | | | 1,850,997 | |
| | | | | |
| | | | Professional Services – 1.3% | | | | | | | | | | | | |
| | | | | |
| | 3,301 | | | Acacia Research | | | | | | | | | | | | | | | 19,311 | |
| | | | | |
| | 441 | | | Barrett Business Services, Inc. | | | | | | | | | | | | | | | 19,770 | |
| | | | | |
| | 3,090 | | | CBIZ Inc., (2) | | | | | | | | | | | | | | | 34,145 | |
| | | | | |
| | 2,013 | | | CEB Inc. | | | | | | | | | | | | | | | 97,932 | |
| | | | | |
| | 1,005 | | | Cogint, Inc., (2) | | | | | | | | | | | | | | | 3,819 | |
| | | | | |
| | 499 | | | CRA International, Inc. | | | | | | | | | | | | | | | 15,539 | |
| | | | | | | | | | | | | | | | | | | | |
| Shares | | | Description (1) | | | | | | | | | | | Value | |
| | | | | |
| | | | Professional Services (continued) | | | | | | | | | | | | |
| | | | | |
| | 1,602 | | | Exponent, Inc. | | | | | | | | | | | | | | $ | 91,715 | |
| | | | | |
| | 639 | | | Franklin Covey Company, (2) | | | | | | | | | | | | | | | 11,694 | |
| | | | | |
| | 2,599 | | | FTI Consulting Inc., (2) | | | | | | | | | | | | | | | 101,257 | |
| | | | | |
| | 798 | | | GP Strategies Corporation, (2) | | | | | | | | | | | | | | | 20,628 | |
| | | | | |
| | 1,185 | | | Heidrick & Struggles International, Inc. | | | | | | | | | | | | | | | 21,923 | |
| | | | | |
| | 2,323 | | | Hill International, Inc., (2) | | | | | | | | | | | | | | | 8,944 | |
| | | | | |
| | 1,354 | | | Huron Consulting Group, Inc., (2) | | | | | | | | | | | | | | | 75,892 | |
| | | | | |
| | 1,131 | | | ICF International, Inc., (2) | | | | | | | | | | | | | | | 52,478 | |
| | | | | |
| | 982 | | | Insperity Inc. | | | | | | | | | | | | | | | 73,846 | |
| | | | | |
| | 1,925 | | | Kelly Services, Inc. | | | | | | | | | | | | | | | 36,055 | |
| | | | | |
| | 1,594 | | | KForce Inc. | | | | | | | | | | | | | | | 27,654 | |
| | | | | |
| | 3,588 | | | Korn Ferry International | | | | | | | | | | | | | | | 73,159 | |
| | | | | |
| | 1,084 | | | Mistras Group Inc., (2) | | | | | | | | | | | | | | | 22,699 | |
| | | | | |
| | 2,976 | | | Navigant Consulting Inc., (2) | | | | | | | | | | | | | | | 69,638 | |
| | | | | |
| | 3,184 | | | On Assignment, Inc., (2) | | | | | | | | | | | | | | | 109,561 | |
| | | | | |
| | 2,232 | | | Resources Connection, Inc. | | | | | | | | | | | | | | | 33,145 | |
| | | | | |
| | 3,109 | | | RPX Corporation, (2) | | | | | | | | | | | | | | | 30,344 | |
| | | | | |
| | 2,565 | | | The Advisory Board Company, (2) | | | | | | | | | | | | | | | 102,087 | |
| | | | | |
| | 2,637 | | | TriNet Group Inc., (2) | | | | | | | | | | | | | | | 49,496 | |
| | | | | |
| | 2,712 | | | TrueBlue Inc., (2) | | | | | | | | | | | | | | | 47,460 | |
| | | | | |
| | 2,286 | | | WageWorks, Incorporated, (2) | | | | | | | | | | | | | | | 134,760 | |
| | | | Total Professional Services | | | | | | | | | | | | | | | 1,384,951 | |
| | | | | |
| | | | Real Estate Management & Development – 0.5% | | | | | | | | | | | | |
| | | | | |
| | 2,920 | | | Alexander & Baldwin Inc. | | | | | | | | | | | | | | | 122,027 | |
| | | | | |
| | 724 | | | Altisource Portfolio Solutions SA, (2), (3) | | | | | | | | | | | | | | | 18,643 | |
| | | | | |
| | 787 | | | AV Homes Inc., (2), (3) | | | | | | | | | | | | | | | 12,553 | |
| | | | | |
| | 256 | | | Consolidated Tomoka Land Company | | | | | | | | | | | | | | | 12,972 | |
| | | | | |
| | 2,262 | | | Forestar Real Estate Group Inc., (2), (3) | | | | | | | | | | | | | | | 24,882 | |
| | | | | |
| | 394 | | | FRP Holdings Inc., (2) | | | | | | | | | | | | | | | 12,529 | |
| | | | | |
| | 46 | | | Griffin Land & Nurseries, Inc. | | | | | | | | | | | | | | | 1,433 | |
| | | | | |
| | 2,247 | | | HFF Inc., Class A Shares, (2) | | | | | | | | | | | | | | | 59,838 | |
| | | | | |
| | 5,164 | | | Kennedy-Wilson Holdings Inc. | | | | | | | | | | | | | | | 106,378 | |
| | | | | |
| | 961 | | | Marcus & Millichap Inc., (2) | | | | | | | | | | | | | | | 22,514 | |
| | | | | |
| | 1,174 | | | ReMax Holdings Inc. | | | | | | | | | | | | | | | 51,010 | |
| | | | | |
| | 3,162 | | | St Joe Company, (2) | | | | | | | | | | | | | | | 55,967 | |
| | | | | |
| | 411 | | | Stratus Properties, Inc., (2) | | | | | | | | | | | | | | | 9,946 | |
| | | | | |
| | 921 | | | Tejon Ranch Company, (2) | | | | | | | | | | | | | | | 20,575 | |
| | | | | |
| | 457 | | | The RMR Group Inc. | | | | | | | | | | | | | | | 15,692 | |
| | | | | |
| | 1,281 | | | Trinity Place Holdings, Inc., (2) | | | | | | | | | | | | | | | 12,374 | |
| | | | Total Real Estate Management & Development | | | | | | | | | | | | | | | 559,333 | |
Nuveen Small Cap Index Fund (continued)
| | |
| Portfolio of Investments | | October 31, 2016 |
| | | | | | | | | | | | | | | | | | | | |
| Shares | | | Description (1) | | | | | | | | | | | Value | |
| | | | | |
| | | | Road & Rail – 0.5% | | | | | | | | | | | | |
| | | | | |
| | 1,540 | | | ArcBest Corporation | | | | | | | | | | | | | | $ | 30,646 | |
| | | | | |
| | 1,803 | | | Celadon Group, Inc. | | | | | | | | | | | | | | | 11,720 | |
| | | | | |
| | 794 | | | Covenant Transport, Inc., (2) | | | | | | | | | | | | | | | 12,696 | |
| | | | | |
| | 2,884 | | | Heartland Express, Inc. | | | | | | | | | | | | | | | 53,066 | |
| | | | | |
| | 4,191 | | | Knight Transportation Inc. | | | | | | | | | | | | | | | 122,587 | |
| | | | | |
| | 1,439 | | | Marten Transport, Ltd. | | | | | | | | | | | | | | | 29,500 | |
| | | | | |
| | 156 | | | PAM Transportation Services, Inc., (2) | | | | | | | | | | | | | | | 3,073 | |
| | | | | |
| | 1,906 | | | Roadrunner Transportation System Inc., (2) | | | | | | | | | | | | | | | 14,484 | |
| | | | | |
| | 1,578 | | | Saia, Inc., (2) | | | | | | | | | | | | | | | 56,256 | |
| | | | | |
| | 4,677 | | | Swift Transportation Company, (2), (3) | | | | | | | | | | | | | | | 104,671 | |
| | | | | |
| | 552 | | | Universal Truckload Services, Inc. | | | | | | | | | | | | | | | 6,872 | |
| | | | | |
| | 510 | | | USA Truck, Inc., (2) | | | | | | | | | | | | | | | 4,197 | |
| | | | | |
| | 2,797 | | | Werner Enterprises, Inc. | | | | | | | | | | | | | | | 67,268 | |
| | | | | |
| | 2,037 | | | YRC Worldwide Inc., (2) | | | | | | | | | | | | | | | 18,089 | |
| | | | Total Road & Rail | | | | | | | | | | | | | | | 535,125 | |
| | | | | |
| | | | Semiconductors & Semiconductor Equipment – 3.6% | | | | | | | | | | | | |
| | | | | |
| | 327 | | | Acacia Energy Industries, Inc., (2), (3) | | | | | | | | | | | | | | | 22,789 | |
| | | | | |
| | 2,473 | | | Advanced Energy Industriess Inc., (2) | | | | | | | | | | | | | | | 117,962 | |
| | | | | |
| | 47,104 | | | Advanced Micro Devices, Inc., (2) | | | | | | | | | | | | | | | 340,562 | |
| | | | | |
| | 1,138 | | | Alpha & Omega Semiconductor Limited, (2) | | | | | | | | | | | | | | | 24,046 | |
| | | | | |
| | 2,004 | | | Ambarella, Incorporated, (2), (3) | | | | | | | | | | | | | | | 122,985 | |
| | | | | |
| | 6,268 | | | Amkor Technology Inc., (2) | | | | | | | | | | | | | | | 58,104 | |
| | | | | |
| | 4,751 | | | Applied Micro Circuits Corporation, (2) | | | | | | | | | | | | | | | 35,157 | |
| | | | | |
| | 1,928 | | | Axcelis Technologies Inc., (2) | | | | | | | | | | | | | | | 26,317 | |
| | | | | |
| | 4,364 | | | Brooks Automation Inc. | | | | | | | | | | | | | | | 56,863 | |
| | | | | |
| | 1,475 | | | Cabot Microelectronics Corporation | | | | | | | | | | | | | | | 81,509 | |
| | | | | |
| | 4,038 | | | Cavium Inc., (2) | | | | | | | | | | | | | | | 227,945 | |
| | | | | |
| | 1,234 | | | CEVA, Inc., (2) | | | | | | | | | | | | | | | 37,082 | |
| | | | | |
| | 3,925 | | | Cirrus Logic Inc., (2) | | | | | | | | | | | | | | | 211,872 | |
| | | | | |
| | 1,676 | | | Cohu Inc. | | | | | | | | | | | | | | | 18,754 | |
| | | | | |
| | 2,425 | | | Diodes Inc., (2) | | | | | | | | | | | | | | | 50,222 | |
| | | | | |
| | 1,446 | | | DSP Group Inc., (2) | | | | | | | | | | | | | | | 15,761 | |
| | | | | |
| | 8,856 | | | Entegris Inc., (2) | | | | | | | | | | | | | | | 140,810 | |
| | | | | |
| | 2,544 | | | Exar Corporation, (2) | | | | | | | | | | | | | | | 22,947 | |
| | | | | |
| | 4,304 | | | FormFactor Inc., (2) | | | | | | | | | | | | | | | 38,628 | |
| | | | | |
| | 3,073 | | | GigPeak, Inc., (2) | | | | | | | | | | | | | | | 7,283 | |
| | | | | |
| | 349 | | | Impinj, Inc., (2) | | | | | | | | | | | | | | | 8,617 | |
| | | | | |
| | 2,516 | | | Inphi Corporation, (2) | | | | | | | | | | | | | | | 93,344 | |
| | | | | |
| | 8,440 | | | Integrated Device Technology, Inc., (2) | | | | | | | | | | | | | | | 174,792 | |
| | | | | | | | | | | | | | | | | | | | |
| Shares | | | Description (1) | | | | | | | | | | | Value | |
| | | | | |
| | | | Semiconductors & Semiconductor Equipment (continued) | | | | | | | | | | | | |
| | | | | |
| | 8,410 | | | Intersil Holding Corporation, Class A | | | | | | | | | | | | | | $ | 185,691 | |
| | | | | |
| | 1,605 | | | IXYS Corporation | | | | | | | | | | | | | | | 17,013 | |
| | | | | |
| | 3,857 | | | Kopin Corporation, (2) | | | | | | | | | | | | | | | 8,061 | |
| | | | | |
| | 7,511 | | | Lattice Semiconductor Corporation, (2) | | | | | | | | | | | | | | | 45,592 | |
| | | | | |
| | 1,458 | | | MA-COM Technology Solutions Holdings Incorporated, (2) | | | | | | | | | | | | | | | 53,596 | |
| | | | | |
| | 3,497 | | | Maxlinear Inc., (2) | | | | | | | | | | | | | | | 65,429 | |
| | | | | |
| | 7,131 | | | Microsemi Corporation, (2) | | | | | | | | | | | | | | | 300,429 | |
| | | | | |
| | 3,334 | | | MKS Instruments Inc. | | | | | | | | | | | | | | | 168,200 | |
| | | | | |
| | 2,439 | | | Monolithic Power Systems, Inc. | | | | | | | | | | | | | | | 192,218 | |
| | | | | |
| | 1,482 | | | Nanometrics Inc., (2) | | | | | | | | | | | | | | | 30,959 | |
| | | | | |
| | 1,930 | | | NeoPhotonics Corporation, (2) | | | | | | | | | | | | | | | 27,020 | |
| | | | | |
| | 299 | | | NVE Corporation | | | | | | | | | | | | | | | 16,825 | |
| | | | | |
| | 1,746 | | | PDF Solutions, Inc., (2) | | | | | | | | | | | | | | | 34,484 | |
| | | | | |
| | 4,087 | | | Photronics Inc., (2) | | | | | | | | | | | | | | | 39,644 | |
| | | | | |
| | 1,716 | | | Power Integrations Inc. | | | | | | | | | | | | | | | 110,596 | |
| | | | | |
| | 6,808 | | | Rambus Inc., (2) | | | | | | | | | | | | | | | 82,990 | |
| | | | | |
| | 1,875 | | | Rudolph Technologies, (2) | | | | | | | | | | | | | | | 33,938 | |
| | | | | |
| | 4,047 | | | Semtech Corporation, (2) | | | | | | | | | | | | | | | 97,937 | |
| | | | | |
| | 2,397 | | | Sigma Designs, Inc., (2) | | | | | | | | | | | | | | | 17,498 | |
| | | | | |
| | 2,585 | | | Silicon Laboratories Inc., (2) | | | | | | | | | | | | | | | 154,971 | |
| | | | | |
| | 2,197 | | | Synaptics, Inc., (2) | | | | | | | | | | | | | | | 114,508 | |
| | | | | |
| | 3,084 | | | Tessera Technologies Inc. | | | | | | | | | | | | | | | 114,416 | |
| | | | | |
| | 1,991 | | | Ultra Clean Holdings, Inc., (2) | | | | | | | | | | | | | | | 16,924 | |
| | | | | |
| | 1,353 | | | Ultratech Stepper Inc., (2) | | | | | | | | | | | | | | | 28,805 | |
| | | | | |
| | 2,489 | | | Veeco Instruments Inc., (2) | | | | | | | | | | | | | | | 54,011 | |
| | | | | |
| | 3,313 | | | Xcerra Corporation, (2) | | | | | | | | | | | | | | | 18,255 | |
| | | | Total Semiconductors & Semiconductor Equipment | | | | | | | | | | | | | | | 3,964,361 | |
| | | | | |
| | | | Software – 4.1% | | | | | | | | | | | | |
| | | | | |
| | 5,523 | | | 8X8, Inc., (2) | | | | | | | | | | | | | | | 78,703 | |
| | | | | |
| | 2,759 | | | A10 Networks Inc., (2) | | | | | | | | | | | | | | | 21,134 | |
| | | | | |
| | 7,223 | | | ACI Worldwide, Inc., (2) | | | | | | | | | | | | | | | 130,881 | |
| | | | | |
| | 1,612 | | | American Software, Inc. | | | | | | | | | | | | | | | 16,813 | |
| | | | | |
| | 5,177 | | | Aspen Technology Inc., (2) | | | | | | | | | | | | | | | 254,915 | |
| | | | | |
| | 1,377 | | | Barracuda Networks Inc., (2) | | | | | | | | | | | | | | | 32,112 | |
| | | | | |
| | 2,956 | | | Blackbaud, Inc. | | | | | | | | | | | | | | | 181,498 | |
| | | | | |
| | 2,516 | | | Bottomline Technologies, Inc., (2) | | | | | | | | | | | | | | | 57,088 | |
| | | | | |
| | 1,842 | | | Broadsoft Inc., (2) | | | | | | | | | | | | | | | 76,535 | |
| | | | | |
| | 3,575 | | | Callidus Software, Inc., (2) | | | | | | | | | | | | | | | 65,244 | |
| | | | | |
| | 2,424 | | | CommVault Systems, Inc., (2) | | | | | | | | | | | | | | | 129,684 | |
| | | | | |
| | 606 | | | Digimarc Corporation, (3) | | | | | | | | | | | | | | | 19,150 | |
Nuveen Small Cap Index Fund (continued)
| | |
| Portfolio of Investments | | October 31, 2016 |
| | | | | | | | | | | | | | | | | | | | |
| Shares | | | Description (1) | | | | | | | | | | | Value | |
| | | | | |
| | | | Software (continued) | | | | | | | | | | | | |
| | | | | |
| | 1,579 | | | Ebix, Inc., (3) | | | | | | | | | | | | | | $ | 88,424 | |
| | | | | |
| | 2,052 | | | Ellie Mae Incorporated, (2) | | | | | | | | | | | | | | | 217,286 | |
| | | | | |
| | 1,751 | | | EnerNOC, Inc., (2) | | | | | | | | | | | | | | | 9,105 | |
| | | | | |
| | 918 | | | Exa Corporation, (2) | | | | | | | | | | | | | | | 12,852 | |
| | | | | |
| | 1,941 | | | Fair Isaac Corporation | | | | | | | | | | | | | | | 234,240 | |
| | | | | |
| | 2,454 | | | Fleetmatics Group Limited, (2), (3) | | | | | | | | | | | | | | | 146,995 | |
| | | | | |
| | 2,034 | | | Gigamon Inc., (2) | | | | | | | | | | | | | | | 112,480 | |
| | | | | |
| | 1,609 | | | Globant S.A, (2) | | | | | | | | | | | | | | | 69,992 | |
| | | | | |
| | 6,443 | | | Glu Mobile, Inc., (2) | | | | | | | | | | | | | | | 12,757 | |
| | | | | |
| | 1,497 | | | Guidance Software, Inc., (2) | | | | | | | | | | | | | | | 7,725 | |
| | | | | |
| | 1,806 | | | HubSpot, Inc., (2) | | | | | | | | | | | | | | | 94,725 | |
| | | | | |
| | 1,796 | | | Imperva Incorporated, (2) | | | | | | | | | | | | | | | 66,272 | |
| | | | | |
| | 3,528 | | | Infoblox, Incorporated, (2) | | | | | | | | | | | | | | | 93,492 | |
| | | | | |
| | 1,125 | | | Interactive Intelligence Group, (2) | | | | | | | | | | | | | | | 68,006 | |
| | | | | |
| | 3,614 | | | Jive Software Inc., (2) | | | | | | | | | | | | | | | 14,275 | |
| | | | | |
| | 388 | | | Majesco, (2) | | | | | | | | | | | | | | | 1,765 | |
| | | | | |
| | 6,710 | | | Mentor Graphics Corporation | | | | | | | | | | | | | | | 193,919 | |
| | | | | |
| | 594 | | | Microstrategy Inc., (2) | | | | | | | | | | | | | | | 115,717 | |
| | | | | |
| | 1,949 | | | Mitek Systems Inc., (2) | | | | | | | | | | | | | | | 13,156 | |
| | | | | |
| | 2,910 | | | MobileIron, Inc., (2) | | | | | | | | | | | | | | | 10,622 | |
| | | | | |
| | 1,353 | | | Model N Inc., (2) | | | | | | | | | | | | | | | 13,936 | |
| | | | | |
| | 2,540 | | | Monotype Imaging Holdings Inc. | | | | | | | | | | | | | | | 48,514 | |
| | | | | |
| | 856 | | | Park City Group Inc., (2) | | | | | | | | | | | | | | | 11,254 | |
| | | | | |
| | 2,755 | | | Paycom Software Inc., (2), (3) | | | | | | | | | | | | | | | 142,516 | |
| | | | | |
| | 1,349 | | | Paylocity Holding Corporation, (2) | | | | | | | | | | | | | | | 58,668 | |
| | | | | |
| | 2,258 | | | Pegasystems, Inc. | | | | | | | | | | | | | | | 69,772 | |
| | | | | |
| | 3,137 | | | Progress Software Corporation | | | | | | | | | | | | | | | 84,417 | |
| | | | | |
| | 2,556 | | | Proofpoint, Incorporated, (2), (3) | | | | | | | | | | | | | | | 200,339 | |
| | | | | |
| | 1,577 | | | PROS Holdings, Inc., (2) | | | | | | | | | | | | | | | 34,568 | |
| | | | | |
| | 490 | | | QAD Inc A | | | | | | | | | | | | | | | 11,785 | |
| | | | | |
| | 1,702 | | | Qualys Incorporated, (2) | | | | | | | | | | | | | | | 63,400 | |
| | | | | |
| | 1,245 | | | Rapid7 Inc., (2) | | | | | | | | | | | | | | | 17,841 | |
| | | | | |
| | 3,384 | | | RealPage Inc., (2) | | | | | | | | | | | | | | | 92,045 | |
| | | | | |
| | 3,669 | | | RingCentral Inc., Class A, (2) | | | | | | | | | | | | | | | 75,948 | |
| | | | | |
| | 1,209 | | | Rosetta Stone Inc., (2) | | | | | | | | | | | | | | | 8,608 | |
| | | | | |
| | 1,544 | | | Sapiens International Corporation NV | | | | | | | | | | | | | | | 21,014 | |
| | | | | |
| | 107 | | | SecureWorks Corp., (2), (3) | | | | | | | | | | | | | | | 1,262 | |
| | | | | |
| | 2,372 | | | Silver Springs Networks Inc., (2) | | | | | | | | | | | | | | | 33,350 | |
| | | | | |
| | 2,586 | | | Synchronoss Technologies, Inc., (2) | | | | | | | | | | | | | | | 94,932 | |
| | | | | | | | | | | | | | | | | | | | |
| Shares | | | Description (1) | | | | | | | | | | | Value | |
| | | | | |
| | | | Software (continued) | | | | | | | | | | | | |
| | | | | |
| | 5,211 | | | Take-Two Interactive Software, Inc., (2) | | | | | | | | | | | | | | $ | 231,316 | |
| | | | | |
| | 1,830 | | | Tangoe Inc., (2) | | | | | | | | | | | | | | | 15,701 | |
| | | | | |
| | 2,040 | | | TeleNav Inc., (2) | | | | | | | | | | | | | | | 11,118 | |
| | | | | |
| | 2,330 | | | The Rubicon Project Inc., (2) | | | | | | | | | | | | | | | 17,848 | |
| | | | | |
| | 7,330 | | | TiVo, Inc., (2) | | | | | | | | | | | | | | | 145,514 | |
| | | | | |
| | 1,377 | | | TubeMogul Inc., (2) | | | | | | | | | | | | | | | 10,052 | |
| | | | | |
| | 669 | | | Varonis Systems Inc., (2) | | | | | | | | | | | | | | | 19,100 | |
| | | | | |
| | 1,898 | | | Vasco Data Security International, Inc., (2) | | | | | | | | | | | | | | | 26,098 | |
| | | | | |
| | 3,889 | | | Verint Systems Inc., (2) | | | | | | | | | | | | | | | 140,004 | |
| | | | | |
| | 3,030 | | | VirnetX Holding Corporation, (2), (3) | | | | | | | | | | | | | | | 9,242 | |
| | | | | |
| | 1,375 | | | Workiva Inc., (2), (3) | | | | | | | | | | | | | | | 22,756 | |
| | | | | |
| | 5,083 | | | Zendesk Inc., (2) | | | | | | | | | | | | | | | 133,632 | |
| | | | | |
| | 3,333 | | | Zix Corporation, (2) | | | | | | | | | | | | | | | 13,565 | |
| | | | Total Software | | | | | | | | | | | | | | | 4,527,677 | |
| | | | | |
| | | | Specialty Retail – 2.3% | | | | | | | | | | | | |
| | | | | |
| | 4,116 | | | Aaron Rents Inc. | | | | | | | | | | | | | | | 101,706 | |
| | | | | |
| | 4,263 | | | Abercrombie & Fitch Co., Class A | | | | | | | | | | | | | | | 62,282 | |
| | | | | |
| | 10,432 | | | American Eagle Outfitters, Inc., (3) | | | | | | | | | | | | | | | 177,761 | |
| | | | | |
| | 493 | | | America’s Car-Mart, Inc., (2) | | | | | | | | | | | | | | | 20,139 | |
| | | | | |
| | 1,251 | | | Asbury Automotive Group, Inc., (2) | | | | | | | | | | | | | | | 63,738 | |
| | | | | |
| | 10,832 | | | Ascena Retail Group Inc., (2) | | | | | | | | | | | | | | | 52,968 | |
| | | | | |
| | 521 | | | At Home Group, Inc., (2) | | | | | | | | | | | | | | | 5,835 | |
| | | | | |
| | 2,508 | | | Barnes & Noble Education, Inc., (2) | | | | | | | | | | | | | | | 23,349 | |
| | | | | |
| | 3,957 | | | Barnes & Noble Inc. | | | | | | | | | | | | | | | 40,757 | |
| | | | | |
| | 1,112 | | | Big 5 Sporting Goods Corporation | | | | | | | | | | | | | | | 17,236 | |
| | | | | |
| | 881 | | | Boot Barn Holdings, Inc., (2) | | | | | | | | | | | | | | | 11,277 | |
| | | | | |
| | 1,792 | | | Buckle Inc., (3) | | | | | | | | | | | | | | | 37,363 | |
| | | | | |
| | 846 | | | Build-A-Bear-Workshop, Inc., (2) | | | | | | | | | | | | | | | 11,421 | |
| | | | | |
| | 2,683 | | | Caleres Inc. | | | | | | | | | | | | | | | 67,102 | |
| | | | | |
| | 1,600 | | | Cato Corporation | | | | | | | | | | | | | | | 47,472 | |
| | | | | |
| | 8,169 | | | Chico’s FAS, Inc. | | | | | | | | | | | | | | | 95,332 | |
| | | | | |
| | 1,172 | | | Childrens Place Retail Stores Inc. | | | | | | | | | | | | | | | 89,013 | |
| | | | | |
| | 902 | | | Citi Trends, Inc. | | | | | | | | | | | | | | | 17,914 | |
| | | | | |
| | 1,271 | | | Conn’s, Inc., (2) | | | | | | | | | | | | | | | 12,075 | |
| | | | | |
| | 1,120 | | | Container Store Group Inc., (2) | | | | | | | | | | | | | | | 5,466 | |
| | | | | |
| | 2,434 | | | Destination XL Group Inc., (2) | | | | | | | | | | | | | | | 9,858 | |
| | | | | |
| | 4,214 | | | DSW Inc. | | | | | | | | | | | | | | | 87,525 | |
| | | | | |
| | 4,656 | | | Express Inc., (2) | | | | | | | | | | | | | | | 55,965 | |
| | | | | |
| | 2,616 | | | Finish Line, Inc. | | | | | | | | | | | | | | | 51,509 | |
Nuveen Small Cap Index Fund (continued)
| | |
| Portfolio of Investments | | October 31, 2016 |
| | | | | | | | | | | | | | | | | | | | |
| Shares | | | Description (1) | | | | | | | | | | | Value | |
| | | | | |
| | | | Specialty Retail (continued) | | | | | | | | | | | | |
| | | | | |
| | 3,355 | | | Five Below, Incorporated, (2) | | | | | | | | | | | | | | $ | 126,081 | |
| | | | | |
| | 2,394 | | | Francescas Holdings Corporation, (2) | | | | | | | | | | | | | | | 38,472 | |
| | | | | |
| | 1,286 | | | Genesco Inc., (2) | | | | | | | | | | | | | | | 69,187 | |
| | | | | |
| | 4,298 | | | GNC Holdings Inc. | | | | | | | | | | | | | | | 57,722 | |
| | | | | |
| | 1,301 | | | Group 1 Automotive Inc. | | | | | | | | | | | | | | | 78,411 | |
| | | | | |
| | 3,829 | | | Guess Inc. | | | | | | | | | | | | | | | 51,692 | |
| | | | | |
| | 1,167 | | | Haverty Furniture Companies Inc. | | | | | | | | | | | | | | | 20,714 | |
| | | | | |
| | 1,387 | | | Hibbett Sporting Goods, Inc., (2), (3) | | | | | | | | | | | | | | | 53,883 | |
| | | | | |
| | 924 | | | Kirkland’s, Inc., (2) | | | | | | | | | | | | | | | 11,282 | |
| | | | | |
| | 1,487 | | | Lithia Motors Inc., (3) | | | | | | | | | | | | | | | 127,555 | |
| | | | | |
| | 1,649 | | | Lumber Liquidators Inc., (2), (3) | | | | | | | | | | | | | | | 25,576 | |
| | | | | |
| | 1,547 | | | Marinemax Inc., (2) | | | | | | | | | | | | | | | 30,863 | |
| | | | | |
| | 1,966 | | | Monro Muffler Brake, Inc. | | | | | | | | | | | | | | | 108,130 | |
| | | | | |
| | 34,646 | | | Office Depot, Inc. | | | | | | | | | | | | | | | 109,135 | |
| | | | | |
| | 1,686 | | | Party City Holdco Inc., (2) | | | | | | | | | | | | | | | 27,398 | |
| | | | | |
| | 5,069 | | | Pier 1 Imports, Inc. | | | | | | | | | | | | | | | 21,847 | |
| | | | | |
| | 3,248 | | | Rent-A-Center Inc. | | | | | | | | | | | | | | | 32,772 | |
| | | | | |
| | 2,422 | | | Restoration Hardware Holdings Incorporated, (2), (3) | | | | | | | | | | | | | | | 70,165 | |
| | | | | |
| | 744 | | | Sears Hometown and Outlet Stores, (2) | | | | | | | | | | | | | | | 3,608 | |
| | | | | |
| | 2,901 | | | Select Comfort Corporation, (2) | | | | | | | | | | | | | | | 55,670 | |
| | | | | |
| | 895 | | | Shoe Carnival, Inc. | | | | | | | | | | | | | | | 22,706 | |
| | | | | |
| | 1,751 | | | Sonic Automotive Inc. | | | | | | | | | | | | | | | 31,343 | |
| | | | | |
| | 1,615 | | | Sportsman’s Warehouse Holdings Inc., (2) | | | | | | | | | | | | | | | 14,858 | |
| | | | | |
| | 2,162 | | | Stage Stores Inc. | | | | | | | | | | | | | | | 11,005 | |
| | | | | |
| | 2,053 | | | Stein Mart, Inc. | | | | | | | | | | | | | | | 12,359 | |
| | | | | |
| | 3,067 | | | Tailored Brands, Inc. | | | | | | | | | | | | | | | 48,459 | |
| | | | | |
| | 2,039 | | | Tile Shop Holdings Inc., (2) | | | | | | | | | | | | | | | 34,561 | |
| | | | | |
| | 763 | | | Tilly’s Inc, Class A Shares, (2) | | | | | | | | | | | | | | | 7,081 | |
| | | | | |
| | 1,513 | | | Vitamin Shoppe Inc., (2) | | | | | | | | | | | | | | | 37,901 | |
| | | | | |
| | 1,162 | | | West Marine, Inc., (2) | | | | | | | | | | | | | | | 9,296 | |
| | | | | |
| | 138 | | | Winmark Corporation | | | | | | | | | | | | | | | 14,759 | |
| | | | | |
| | 1,129 | | | Zumiez, Inc., (2), (3) | | | | | | | | | | | | | | | 25,120 | |
| | | | Total Specialty Retail | | | | | | | | | | | | | | | 2,554,674 | |
| | | | | |
| | | | Technology Hardware, Storage & Peripherals – 0.6% | | | | | | | | | | | | |
| | | | | |
| | 6,717 | | | 3D Systems Corporation, (2), (3) | | | | | | | | | | | | | | | 93,165 | |
| | | | | |
| | 2,089 | | | Avid Technology Inc., (2) | | | | | | | | | | | | | | | 13,725 | |
| | | | | |
| | 1,168 | | | CPI Card Group Inc., (3) | | | | | | | | | | | | | | | 6,424 | |
| | | | | |
| | 2,520 | | | Cray, Inc., (2) | | | | | | | | | | | | | | | 52,416 | |
| | | | | |
| | 4,285 | | | Diebold Inc. | | | | | | | | | | | | | | | 93,413 | |
| | | | | | | | | | | | | | | | | | | | |
| Shares | | | Description (1) | | | | | | | | | | | Value | |
| | | | | |
| | | | Technology Hardware, Storage & Peripherals (continued) | | | | | | | | | | | | |
| | | | | |
| | 1,066 | | | Eastman Kodak Company, (2) | | | | | | | | | | | | | | $ | 15,883 | |
| | | | | |
| | 2,943 | | | Electronics For Imaging, (2) | | | | | | | | | | | | | | | 125,164 | |
| | | | | |
| | 1,812 | | | Immersion Corporation, (2) | | | | | | | | | | | | | | | 14,786 | |
| | | | | |
| | 3,941 | | | Nimble Storage Inc., (2) | | | | | | | | | | | | | | | 30,070 | |
| | | | | |
| | 4,267 | | | Pure Storage Inc, Class A Shares, (2), (3) | | | | | | | | | | | | | | | 52,655 | |
| | | | | |
| | 2,269 | | | Silicon Graphics International Corporation, (2) | | | | | | | | | | | | | | | 17,585 | |
| | | | | |
| | 3,071 | | | Stratasys, Inc., (2), (3) | | | | | | | | | | | | | | | 58,718 | |
| | | | | |
| | 2,420 | | | Super Micro Computer Inc., (2) | | | | | | | | | | | | | | | 57,354 | |
| | | | | |
| | 2,243 | | | USA Technologies Inc., (2) | | | | | | | | | | | | | | | 10,094 | |
| | | | Total Technology Hardware, Storage & Peripherals | | | | | | | | | | | | | | | 641,452 | |
| | | | | |
| | | | Textiles, Apparel & Luxury Goods – 0.8% | | | | | | | | | | | | |
| | | | | |
| | 1,688 | | | Columbia Sportswear Company | | | | | | | | | | | | | | | 95,608 | |
| | | | | |
| | 4,615 | | | Crocs, Inc., (2) | | | | | | | | | | | | | | | 35,489 | |
| | | | | |
| | 680 | | | Culp Inc. | | | | | | | | | | | | | | | 19,040 | |
| | | | | |
| | 2,031 | | | Deckers Outdoor Corporation, (2) | | | | | | | | | | | | | | | 105,996 | |
| | | | | |
| | 471 | | | Delta Apparel Inc., (2) | | | | | | | | | | | | | | | 7,772 | |
| | | | | |
| | 2,626 | | | Fossil Group Inc., (2) | | | | | | | | | | | | | | | 71,611 | |
| | | | | |
| | 2,693 | | | G III Apparel Group, Limited, (2) | | | | | | | | | | | | | | | 70,341 | |
| | | | | |
| | 2,682 | | | Iconix Brand Group, Inc., (2) | | | | | | | | | | | | | | | 21,134 | |
| | | | | |
| | 964 | | | Movado Group Inc. | | | | | | | | | | | | | | | 21,256 | |
| | | | | |
| | 952 | | | Oxford Industries Inc. | | | | | | | | | | | | | | | 59,709 | |
| | | | | |
| | 790 | | | Perry Ellis International, Inc., (2) | | | | | | | | | | | | | | | 14,686 | |
| | | | | |
| | 2,458 | | | Sequential Brands Group Inc., (2) | | | | | | | | | | | | | | | 17,698 | |
| | | | | |
| | 3,855 | | | Steven Madden Limited, (2) | | | | | | | | | | | | | | | 128,757 | |
| | | | | |
| | 532 | | | Superior Uniform Group Inc. | | | | | | | | | | | | | | | 9,464 | |
| | | | | |
| | 962 | | | Unifi Inc., (2) | | | | | | | | | | | | | | | 27,658 | |
| | | | | |
| | 1,270 | | | Vera Bradley Inc., (2) | | | | | | | | | | | | | | | 16,980 | |
| | | | | |
| | 1,376 | | | Vince Holding Company, (2) | | | | | | | | | | | | | | | 7,499 | |
| | | | | |
| | 6,067 | | | Wolverine World Wide Inc. | | | | | | | | | | | | | | | 129,530 | |
| | | | Total Textiles, Apparel & Luxury Goods | | | | | | | | | | | | | | | 860,228 | |
| | | | | |
| | | | Thrifts & Mortgage Finance – 2.1% | | | | | | | | | | | | |
| | | | | |
| | 5,764 | | | Astoria Financial Corporation | | | | | | | | | | | | | | | 84,327 | |
| | | | | |
| | 2,556 | | | Bank Mutual Corporation | | | | | | | | | | | | | | | 19,937 | |
| | | | | |
| | 951 | | | BankFinancial Corporation | | | | | | | | | | | | | | | 11,954 | |
| | | | | |
| | 1,187 | | | Bear State Financial Inc., (3) | | | | | | | | | | | | | | | 10,493 | |
| | | | | |
| | 4,396 | | | Beneficial Bancorp, Inc. | | | | | | | | | | | | | | | 63,742 | |
| | | | | |
| | 3,755 | | | BofI Holdings, Inc., (2), (3) | | | | | | | | | | | | | | | 69,956 | |
| | | | | |
| | 524 | | | BSB Bancorp Inc., (2) | | | | | | | | | | | | | | | 12,838 | |
| | | | | |
| | 7,984 | | | Capitol Federal Financial Inc. | | | | | | | | | | | | | | | 117,125 | |
Nuveen Small Cap Index Fund (continued)
| | |
| Portfolio of Investments | | October 31, 2016 |
| | | | | | | | | | | | | | | | | | | | |
| Shares | | | Description (1) | | | | | | | | | | | Value | |
| | | | | |
| | | | Thrifts & Mortgage Finance (continued) | | | | | | | | | | | | |
| | | | | |
| | 143 | | | Charter Financial Corporation | | | | | | | | | | | | | | $ | 1,809 | |
| | | | | |
| | 1,371 | | | Clifton Bancorp Inc. | | | | | | | | | | | | | | | 20,963 | |
| | | | | |
| | 2,013 | | | Dime Community Bancshares, Inc. | | | | | | | | | | | | | | | 32,611 | |
| | | | | |
| | 4,676 | | | Essent Group Limited, (2) | | | | | | | | | | | | | | | 123,633 | |
| | | | | |
| | 6,817 | | | Everbank Financial Corporation | | | | | | | | | | | | | | | 131,636 | |
| | | | | |
| | 537 | | | Federal Agricultural Mortgage Corporation | | | | | | | | | | | | | | | 21,926 | |
| | | | | |
| | 551 | | | First Defiance Financial Corporation | | | | | | | | | | | | | | | 21,753 | |
| | | | | |
| | 1,330 | | | Flagstar Bancorp Inc., (2) | | | | | | | | | | | | | | | 36,482 | |
| | | | | |
| | 200 | | | Greene County Bancorp, Inc. | | | | | | | | | | | | | | | 3,440 | |
| | | | | |
| | 85 | | | Hingham Institution for Savings | | | | | | | | | | | | | | | 12,193 | |
| | | | | |
| | 381 | | | Home Bancorp Inc. | | | | | | | | | | | | | | | 10,939 | |
| | | | | |
| | 1,495 | | | HomeStreet Inc. | | | | | | | | | | | | | | | 41,187 | |
| | | | | |
| | 583 | | | Impac Mortgage Holdings Inc., (2) | | | | | | | | | | | | | | | 9,241 | |
| | | | | |
| | 5,777 | | | Kearny Financial Corporation | | | | | | | | | | | | | | | 80,589 | |
| | | | | |
| | 519 | | | Lake Sunapee Bank Group | | | | | | | | | | | | | | | 9,456 | |
| | | | | |
| | 398 | | | LendingTree, Inc., (2), (3) | | | | | | | | | | | | | | | 31,780 | |
| | | | | |
| | 3,021 | | | Meridian Bancorp, Inc. | | | | | | | | | | | | | | | 48,185 | |
| | | | | |
| | 475 | | | Meta Financial Group, Inc. | | | | | | | | | | | | | | | 34,794 | |
| | | | | |
| | 21,370 | | | MGIC Investment Corporation, (2) | | | | | | | | | | | | | | | 174,379 | |
| | | | | |
| | 2,026 | | | Nationstar Mortgage Holdings, Incorporated, (2), (3) | | | | | | | | | | | | | | | 30,613 | |
| | | | | |
| | 3,222 | | | NMI Holdings Inc., Class A Shares, (2) | | | | | | | | | | | | | | | 24,648 | |
| | | | | |
| | 2,636 | | | Northfield Bancorp Inc. | | | | | | | | | | | | | | | 43,362 | |
| | | | | |
| | 6,015 | | | Northwest Bancshares Inc. | | | | | | | | | | | | | | | 94,676 | |
| | | | | |
| | 859 | | | OceanFirst Financial Corporation | | | | | | | | | | | | | | | 17,764 | |
| | | | | |
| | 6,299 | | | Ocwen Financial Corporation, (2) | | | | | | | | | | | | | | | 26,897 | |
| | | | | |
| | 2,416 | | | Oritani Financial Corporation | | | | | | | | | | | | | | | 37,810 | |
| | | | | |
| | 856 | | | PennyMac Financial Services Inc., (2) | | | | | | | | | | | | | | | 14,638 | |
| | | | | |
| | 3,317 | | | PHH Corporation, (2) | | | | | | | | | | | | | | | 48,163 | |
| | | | | |
| | 291 | | | Provident Bancorp, Inc., (2) | | | | | | | | | | | | | | | 4,671 | |
| | | | | |
| | 413 | | | Provident Financial Holdings, Inc. | | | | | | | | | | | | | | | 7,880 | |
| | | | | |
| | 3,824 | | | Provident Financial Services Inc. | | | | | | | | | | | | | | | 86,767 | |
| | | | | |
| | 13,483 | | | Radian Group Inc. | | | | | | | | | | | | | | | 183,234 | |
| | | | | |
| | 737 | | | SI Financial Group, Inc. | | | | | | | | | | | | | | | 9,618 | |
| | | | | |
| | 386 | | | Southern Missouri Bancorp, Inc. | | | | | | | | | | | | | | | 9,492 | |
| | | | | |
| | 474 | | | Territorial Bancorp Inc. | | | | | | | | | | | | | | | 13,518 | |
| | | | | |
| | 6,147 | | | TrustCo Bank Corporation NY | | | | | | | | | | | | | | | 43,029 | |
| | | | | |
| | 2,911 | | | United Community Financial Corporation | | | | | | | | | | | | | | | 21,394 | |
| | | | | |
| | 3,199 | | | United Financial Bancorp Inc. | | | | | | | | | | | | | | | 47,057 | |
| | | | | |
| | 1,724 | | | Walker & Dunlop Inc., (2) | | | | | | | | | | | | | | | 41,497 | |
| | | | | | | | | | | | | | | | | | | | |
| Shares | | | Description (1) | | | | | | | | | | | Value | |
| | | | | |
| | | | Thrifts & Mortgage Finance (continued) | | | | | | | | | | | | |
| | | | | |
| | 1,235 | | | Walter Investment Management Corporation | | | | | | | | | | | | | | $ | 6,175 | |
| | | | | |
| | 5,693 | | | Washington Federal Inc. | | | | | | | | | | | | | | | 155,134 | |
| | | | | |
| | 1,593 | | | Waterstone Financial Inc. | | | | | | | | | | | | | | | 27,001 | |
| | | | | |
| | 1,054 | | | Western New England Bancorp, Inc. | | | | | | | | | | | | | | | 8,327 | |
| | | | | |
| | 1,792 | | | WSFS Financial Corporation | | | | | | | | | | | | | | | 62,810 | |
| | | | Total Thrifts & Mortgage Finance | | | | | | | | | | | | | | | 2,303,543 | |
| | | | | |
| | | | Tobacco – 0.2% | | | | | | | | | | | | |
| | | | | |
| | 551 | | | Alliance One International, Inc., (2) | | | | | | | | | | | | | | | 8,182 | |
| | | | | |
| | 394 | | | Turning Point Brands, Inc., (2) | | | | | | | | | | | | | | | 4,866 | |
| | | | | |
| | 1,388 | | | Universal Corporation | | | | | | | | | | | | | | | 75,230 | |
| | | | | |
| | 5,639 | | | Vector Group Ltd. | | | | | | | | | | | | | | | 118,081 | |
| | | | Total Tobacco | | | | | | | | | | | | | | | 206,359 | |
| | | | | |
| | | | Trading Companies & Distributors – 1.0% | | | | | | | | | | | | |
| | | | | |
| | 2,989 | | | Aircastle LTD | | | | | | | | | | | | | | | 61,424 | |
| | | | | |
| | 2,272 | | | Applied Industrial Technologies Inc. | | | | | | | | | | | | | | | 115,418 | |
| | | | | |
| | 3,745 | | | Beacon Roofing Supply Company, (2) | | | | | | | | | | | | | | | 157,440 | |
| | | | | |
| | 3,449 | | | BMC Stock Holdings Inc., (2) | | | | | | | | | | | | | | | 57,081 | |
| | | | | |
| | 1,051 | | | CAI International Inc., (2) | | | | | | | | | | | | | | | 7,998 | |
| | | | | |
| | 814 | | | DXP Enterprises, Inc., (2) | | | | | | | | | | | | | | | 17,737 | |
| | | | | |
| | 2,561 | | | GATX Corporation, (3) | | | | | | | | | | | | | | | 112,095 | |
| | | | | |
| | 470 | | | GMS, Inc., (2) | | | | | | | | | | | | | | | 9,767 | |
| | | | | |
| | 1,977 | | | H&E Equipment Services, Inc. | | | | | | | | | | | | | | | 27,579 | |
| | | | | |
| | 1,497 | | | Kaman Corporation | | | | | | | | | | | | | | | 65,359 | |
| | | | | |
| | 393 | | | Lawson Products, Inc. | | | | | | | | | | | | | | | 7,408 | |
| | | | | |
| | 5,871 | | | MRC Global Inc., (2) | | | | | | | | | | | | | | | 86,539 | |
| | | | | |
| | 595 | | | Neff Corporation, Class A Shares, (2) | | | | | | | | | | | | | | | 5,385 | |
| | | | | |
| | 6,700 | | | NOW Inc., (2) | | | | | | | | | | | | | | | 144,452 | |
| | | | | |
| | 1,844 | | | Rush Enterprises, Class A, (2) | | | | | | | | | | | | | | | 48,403 | |
| | | | | |
| | 435 | | | Rush Enterprises, Class A, (2) | | | | | | | | | | | | | | | 11,049 | |
| | | | | |
| | 728 | | | SiteOne Landscape Supply, Inc., (2) | | | | | | | | | | | | | | | 22,699 | |
| | | | | |
| | 1,574 | | | Textainer Group Holdings Limited | | | | | | | | | | | | | | | 11,962 | |
| | | | | |
| | 1,121 | | | Titan Machinery, Inc., (2) | | | | | | | | | | | | | | | 10,414 | |
| | | | | |
| | 2,656 | | | Triton International Limited of Bermuda | | | | | | | | | | | | | | | 32,058 | |
| | | | | |
| | 2,691 | | | Univar Inc., (2) | | | | | | | | | | | | | | | 59,875 | |
| | | | | |
| | 551 | | | Veritiv Corporation, (2) | | | | | | | | | | | | | | | 29,726 | |
| | | | | |
| | 244 | | | Willis Lease Finance Corporation, (2) | | | | | | | | | | | | | | | 6,493 | |
| | | | Total Trading Companies & Distributors | | | | | | | | | | | | | | | 1,108,361 | |
| | | | | |
| | | | Water Utilities – 0.3% | | | | | | | | | | | | |
| | | | | |
| | 2,287 | | | American States Water Co | | | | | | | | | | | | | | | 91,434 | |
Nuveen Small Cap Index Fund (continued)
| | |
| Portfolio of Investments | | October 31, 2016 |
| | | | | | | | | | | | | | | | | | | | |
| Shares | | | Description (1) | | | | | | | | | | | Value | |
| | | | | |
| | | | Water Utilities (continued) | | | | | | | | | | | | |
| | | | | |
| | 530 | | | Artesian Resources Corporation | | | | | | | | | | | | | | $ | 14,957 | |
| | | | | |
| | 3,009 | | | California Water Service Group | | | | | | | | | | | | | | | 93,279 | |
| | | | | |
| | 679 | | | Connecticut Water Service, Inc. | | | | | | | | | | | | | | | 35,356 | |
| | | | | |
| | 952 | | | Consolidated Water Company, Limited | | | | | | | | | | | | | | | 10,662 | |
| | | | | |
| | 544 | | | Global Water Resources, Inc. | | | | | | | | | | | | | | | 4,252 | |
| | | | | |
| | 994 | | | Middlesex Water Company | | | | | | | | | | | | | | | 35,883 | |
| | | | | |
| | 1,022 | | | SJW Corporation | | | | | | | | | | | | | | | 51,846 | |
| | | | | |
| | 805 | | | York Water Company | | | | | | | | | | | | | | | 25,438 | |
| | | | Total Water Utilities | | | | | | | | | | | | | | | 363,107 | |
| | | | | |
| | | | Wireless Telecommunication Services – 0.1% | | | | | | | | | | | | |
| | | | | |
| | 2,230 | | | Boingo Wireless Inc., (2) | | | | | | | | | | | | | | | 21,676 | |
| | | | | |
| | 3,542 | | | NII Holdings, Inc., (2) | | | | | | | | | | | | | | | 8,678 | |
| | | | | |
| | 2,896 | | | Shenandoah Telecommunications Company | | | | | | | | | | | | | | | 76,451 | |
| | | | | |
| | 1,282 | | | Spok Holdings, Inc. | | | | | | | | | | | | | | | 23,140 | |
| | | | Total Wireless Telecommunication Services | | | | | | | | | | | | | | | 129,945 | |
| | | | Total Common Stocks (cost $74,166,325) | | | | | | | | | | | | | | | 103,702,687 | |
| | | | | |
| Shares | | | Description (1), (6) | | | | | | | | | | | Value | |
| | | | | |
| | | | EXCHANGE-TRADED FUNDS – 0.0% | | | | | | | | | | | | | | | | |
| | | | | |
| | 791 | | | CorEnergy Infrastructure Trust Inc. | | | | | | | | | | | | | | $ | 21,420 | |
| | | | Total Exchange-Traded Funds (cost $25,912) | | | | | | | | | | | | | | | 21,420 | |
| | | | | |
| Shares | | | Description (1) | | | | | | | | | | | Value | |
| | | | | |
| | | | COMMON STOCK RIGHTS – 0.0% | | | | | | | | | | | | | | | | |
| | | | | |
| | 6,523 | | | Chelsea Therapeutics International Limited, (4) | | | | | | | | | | | | | | $ | — | |
| | | | | |
| | 692 | | | Clinical Data, Inc., (4) | | | | | | | | | | | | | | | — | |
| | | | | |
| | 1,250 | | | Durata Therapeutics Inc., (3), (4) | | | | | | | | | | | | | | | — | |
| | | | | |
| | 10,356 | | | DYAX Corporation, (4) | | | | | | | | | | | | | | | 11,495 | |
| | | | | |
| | 4,499 | | | Leap Wireless International Inc., (4) | | | | | | | | | | | | | | | 11,338 | |
| | | | | |
| | 424 | | | Omthera Pharmaceuticals Inc., (4) | | | | | | | | | | | | | | | — | |
| | | | | |
| | 2,878 | | | Trius Therapeutics Inc., (4) | | | | | | | | | | | | | | | — | |
| | | | Total Common Stock Rights (cost $11,402) | | | | | | | | | | | | | | | 22,833 | |
| | | | | |
| Shares | | | Description (1) | | | | | | | | | | | Value | |
| | | | | |
| | | | WARRANTS – 0.0% | | | | | | | | | | | | | | | | |
| | | | | |
| | 154 | | | Asterias Biotherapeutics Inc. | | | | | | | | | | | | | | $ | 68 | |
| | | | | |
| | 106 | | | Imperial Holdings, Inc., (4) | | | | | | | | | | | | | | | 2 | |
| | | | Total Warrants (cost $100) | | | | | | | | | | | | | | | 70 | |
| | | | Total Long-Term Investments (cost $74,203,739) | | | | | | | | | | | | | | | 103,747,010 | |
| | | | | | | | | | | | | | | | | | | | |
| Shares | | | Description (1) | | | | | | | | | | | Value | |
| | | | |
| | | | INVESTMENTS PURCHASED WITH COLLATERAL FROM SECURITIES LENDING – 9.3% | | | | | | | | | | | | | |
| | | | | |
| | | | Money Market Funds – 9.3% | | | | | | | | | | | | |
| | | | | |
| | 10,228,972 | | | First American Government Obligations Fund, Class X, 0.283%, (7), (8) | | | | | | | | | | | | | | $ | 10,228,972 | |
| | | | Total Investments Purchased with Collateral from Securities Lending (cost $10,228,972) | | | | | | | | 10,228,972 | |
| | | | | |
Shares/
Principal
Amount (000) | | | Description (1) | | Coupon | | | Maturity | | | Ratings (9) | | | Value | |
| | | | | |
| | | | SHORT-TERM INVESTMENTS – 5.8% | | | | | | | | | | | | | | | | |
| | | | | |
| | | | Money Market Funds – 5.5% | | | | | | | | | | | | |
| | | | | |
| | 6,073,931 | | | First American Treasury Obligations Fund, Class Z | | | 0.222% (7) | | | | N/A | | | | N/A | | | $ | 6,073,931 | |
| | | | | |
| | | | U.S. Government and Agency Obligations – 0.3% | | | | | | | | | | | | |
| | | | | |
| $ | 275 | | | U.S. Treasury Bills, (10) | | | 0.000% | | | | 2/02/17 | | | | AAA | | | | 274,754 | |
| | | | Total Short-Term Investments (cost $6,348,638) | | | | | | | | | | | | | | | 6,348,685 | |
| | | | Total Investments (cost $90,781,349) – 109.4% | | | | | | | | | | | | | | | 120,324,667 | |
| | | | Other Assets Less Liabilities – (9.4)% (11) | | | | | | | | | | | | | | | (10,381,817) | |
| | | | Net Assets – 100% | | | | | | | | | | | | | | $ | 109,942,850 | |
Investments in Derivatives as of October 31, 2016
Futures Contracts
| | | | | | | | | | | | | | | | | | | | | | | | |
| Description | | Contract
Position | | | Number of
Contracts | | | Contract
Expiration | | | Notional
Amount
at Value | | | Variation
Margin
Receivable/
(Payable) | | | Unrealized
Appreciation
(Depreciation) | |
| Russell 2000® Mini Index | | | Long | | | | 53 | | | | 12/16 | | | $ | 6,303,290 | | | $ | 18,020 | | | $ | (159,636 | ) |
For Fund portfolio compliance purposes, the Fund’s industry classifications refer to any one or more of the industry sub-classifications used by one or more widely recognized market indexes or ratings group indexes, and/or as defined by Fund management. This definition may not apply for purposes of this report which may combine industry sub-classifications into sectors for reporting ease.
| (1) | All percentages shown in the Portfolio of Investments are based on net assets. |
| (2) | Non-income producing; issuer has not declared a dividend within the past twelve months. |
| (3) | Investment, or a portion of investment, is out on loan for securities lending. The total value of the securities out on loan as of the end of the reporting period was $9,934,978. |
| (4) | Investment valued at fair value using methods determined in good faith by, or at the discretion of, the Board. For fair value measurement disclosure purposes, investment classified as Level 3. See Notes to Financial Statements, Note 2 – Investment Valuation and Fair Value Measurements for more information. |
| (5) | Shares round to less than 1. |
| (6) | A copy of the most recent financial statements for these exchange-traded funds can be obtained directly from the Securities and Exchange Commission on its website at http://www.sec.gov. |
| (7) | The rate shown is the annualized seven-day subsidized yield as of the end of the reporting period. |
| (8) | The Fund may loan securities representing up to one third of the fair value of its total assets (which includes collateral for securities on loan) to broker dealers, banks, and other institutions. The Fund maintains collateral equal to at least 100% of the fair value of the securities loaned. The cash collateral received by the Fund is invested in this money market fund. See Notes to Financial Statements, Note 3 – Portfolio Securities and Investments in Derivatives, Securities Lending for more information. |
| (9) | For financial reporting purposes, the ratings disclosed are the highest of Standard & Poor’s Group (“Standard & Poor’s”), Moody’s Investors Service, Inc. (“Moody’s”) or Fitch, Inc. (“Fitch”) rating. This treatment of split-rated securities may differ from that used for other purposes, such as for Fund investment policies. Ratings below BBB by Standard & Poor’s, Baa by Moody’s or BBB by Fitch are considered to be below investment grade. Holdings designated N/R are not rated by any of these national rating agencies. Rating are not covered by the report of independent registered public accounting firm. |
| (10) | Investment, or portion of investment, segregated as collateral for investments in derivatives. |
| (11) | Other assets less liabilities includes the unrealized appreciation (depreciation) of certain over-the-counter (“OTC”) derivatives as presented on the Statement of Assets and Liabilities, when applicable. The unrealized appreciation (depreciation) of OTC-cleared and exchange-traded derivatives is recognized as part of the cash collateral at brokers and/or the receivable or payable for variation margin as presented on the Statement of Assets and Liabilities, when applicable. |
| REIT | Real Estate Investment Trust |
See accompanying notes to financial statements.
Statement of
| | | | |
| | Assets and Liabilities | | October 31, 2016 |
| | | | | | | | | | | | |
| | | Equity
Index | | | Mid Cap
Index | | | Small Cap
Index | |
Assets | | | | | | | | | | | | |
Long-term investments, at value (cost $256,371,760, $460,796,537 and $74,203,739, respectively) | | $ | 685,509,049 | | | $ | 596,948,637 | | | $ | 103,747,010 | |
Investments purchased with collateral from securities lending, at value (cost approximates value) | | | 8,819,673 | | | | 34,332,343 | | | | 10,228,972 | |
Short-Term investments, at value (cost $34,379,722, $17,043,258 and $6,348,638, respectively) | | | 34,380,240 | | | | 17,043,777 | | | | 6,348,685 | |
Cash | | | — | | | | — | | | | 15 | |
Cash collateral at broker(1) | | | — | | | | — | | | | 80,000 | |
Receivable for: | | | | | | | | | | | | |
Dividends | | | 675,269 | | | | 329,852 | | | | 39,907 | |
Due from broker | | | 2,603 | | | | 7,570 | | | | 17,655 | |
Interest | | | 3,999 | | | | 3,407 | | | | 426 | |
Reclaims | | | 6,096 | | | | — | | | | — | |
Shares sold | | | 486,113 | | | | 1,149,541 | | | | 248,534 | |
Variation margin on futures contracts | | | — | | | | 128,030 | | | | 18,020 | |
Other assets | | | 67,327 | | | | 60,947 | | | | 34,863 | |
Total assets | | | 729,950,369 | | | | 650,004,104 | | | | 120,764,087 | |
Liabilities | | | | | | | | | | | | |
Payable for: | | | | | | | | | | | | |
Collateral from securities lending program | | | 8,819,673 | | | | 34,332,343 | | | | 10,228,972 | |
Investments purchased | | | — | | | | — | | | | 8,796 | |
Shares redeemed | | | 1,644,743 | | | | 2,399,355 | | | | 409,561 | |
Variation margin on futures contracts | | | 59,200 | | | | — | | | | — | |
Accrued expenses: | | | | | | | | | | | | |
Directors fees | | | 37,947 | | | | 28,085 | | | | 1,018 | |
Management fees | | | 97,834 | | | | 90,335 | | | | 8,225 | |
12b-1 distribution and service fees | | | 101,755 | | | | 150,479 | | | | 28,412 | |
Other | | | 299,163 | | | | 357,696 | | | | 136,253 | |
Total liabilities | | | 11,060,315 | | | | 37,358,293 | | | | 10,821,237 | |
Net assets | | $ | 718,890,054 | | | $ | 612,645,811 | | | $ | 109,942,850 | |
Class A Shares | | | | | | | | | | | | |
Net assets | | $ | 186,922,459 | | | $ | 193,890,923 | | | $ | 35,318,638 | |
Shares outstanding | | | 6,833,113 | | | | 10,989,372 | | | | 2,530,069 | |
Net asset value (“NAV”) and offering price per share | | $ | 27.36 | | | $ | 17.64 | | | $ | 13.96 | |
Class C Shares | | | | | | | | | | | | |
Net assets | | $ | 20,060,870 | | | $ | 23,250,520 | | | $ | 4,485,577 | |
Shares outstanding | | | 742,677 | | | | 1,377,591 | | | | 339,463 | |
NAV and offering price per share | | $ | 27.01 | | | $ | 16.88 | | | $ | 13.21 | |
Class R3 Shares | | | | | | | | | | | | |
Net assets | | $ | 104,051,933 | | | $ | 204,467,324 | | | $ | 38,308,483 | |
Shares outstanding | | | 3,802,296 | | | | 11,761,837 | | | | 2,826,666 | |
NAV and offering price per share | | $ | 27.37 | | | $ | 17.38 | | | $ | 13.55 | |
Class I Shares | | | | | | | | | | | | |
Net assets | | $ | 407,854,792 | | | $ | 191,037,044 | | | $ | 31,830,152 | |
Shares outstanding | | | 14,914,230 | | | | 10,782,016 | | | | 2,272,251 | |
NAV and offering price per share | | $ | 27.35 | | | $ | 17.72 | | | $ | 14.01 | |
Net assets consist of: | | | | | | | | | | | | |
Capital paid-in | | $ | 233,702,318 | | | $ | 431,867,072 | | | $ | 76,969,122 | |
Undistributed (Over-distribution of) net investment income | | | 2,087,508 | | | | 5,577,960 | | | | 767,530 | |
Accumulated net realized gain (loss) | | | 54,101,931 | | | | 39,241,355 | | | | 2,822,516 | |
Net unrealized appreciation (depreciation) | | | 428,998,297 | | | | 135,959,424 | | | | 29,383,682 | |
Net assets | | $ | 718,890,054 | | | $ | 612,645,811 | | | $ | 109,942,850 | |
Authorized shares – per class | | | 2 billion | | | | 2 billion | | | | 2 billion | |
Par value per share | | $ | 0.0001 | | | $ | 0.0001 | | | $ | 0.0001 | |
| (1) | Cash pledged to collateralize the net payment obligations for investments in derivatives is in addition to the Fund’s securities pledged as collateral as noted in the Portfolio of Investments. |
See accompanying notes to financial statements.
Statement of
| | | | |
| | Operations | | Year Ended October 31, 2016 |
| | | | | | | | | | | | |
| | | Equity
Index | | | Mid Cap
Index | | | Small Cap
Index | |
Investment Income | | | | | | | | | | | | |
Dividend and interest income (net of foreign tax withheld of $—, $— and $505, respectively) | | $ | 15,623,212 | | | $ | 10,182,827 | | | $ | 1,658,941 | |
Securities lending income, net | | | 195,463 | | | | 378,467 | | | | 299,889 | |
Total investment income | | | 15,818,675 | | | | 10,561,294 | | | | 1,958,830 | |
Expenses | | | | | | | | | | | | |
Management fees | | | 2,042,587 | | | | 1,895,003 | | | | 385,703 | |
12b-1 service fees – Class A Shares | | | 464,135 | | | | 493,231 | | | | 93,205 | |
12b-1 distribution and service fees – Class C Shares | | | 182,832 | | | | 207,743 | | | | 37,464 | |
12b-1 distribution and service fees – Class R3 Shares | | | 515,105 | | | | 1,044,772 | | | | 203,753 | |
Shareholder servicing agent fees | | | 1,056,689 | | | | 1,001,740 | | | | 185,765 | |
Custodian fees | | | 103,282 | | | | 85,338 | | | | 133,359 | |
Directors fees | | | 20,643 | | | | 17,356 | | | | 3,281 | |
Professional fees | | | 63,522 | | | | 56,515 | | | | 35,906 | |
Shareholder reporting expenses | | | 53,572 | | | | 78,313 | | | | 27,153 | |
Maintenance expenses | | | 32,775 | | | | 34,061 | | | | 78,935 | |
Federal and state registration fees | | | 64,243 | | | | 67,187 | | | | 56,908 | |
Other | | | 16,150 | | | | 13,847 | | | | 4,166 | |
Total expenses before fee waiver/expense reimbursement | | | 4,615,535 | | | | 4,995,106 | | | | 1,245,598 | |
Fee waiver/expense reimbursement | | | (803,086 | ) | | | (500,662 | ) | | | (275,607 | ) |
Net expenses | | | 3,812,449 | | | | 4,494,444 | | | | 969,991 | |
Net investment income (loss) | | | 12,006,226 | | | | 6,066,850 | | | | 988,839 | |
Realized and Unrealized Gain (Loss) | | | | | | | | | | | | |
Net realized gain (loss) from: | | | | | | | | | | | | |
Investments | | | 71,565,110 | | | | 44,814,729 | | | | 3,263,142 | |
Futures contracts | | | 446,886 | | | | 1,774,116 | | | | 305,158 | |
Change in net unrealized appreciation (depreciation) of: | | | | | | | | | | | | |
Investments | | | (55,721,462 | ) | | | (20,059,165 | ) | | | (1,280,376 | ) |
Futures contracts | | | (780,975 | ) | | | (997,239 | ) | | | (194,281 | ) |
Net realized and unrealized gain (loss) | | | 15,509,559 | | | | 25,532,441 | | | | 2,093,643 | |
Net increase (decrease) in net assets from operations | | $ | 27,515,785 | | | $ | 31,599,291 | | | $ | 3,082,482 | |
See accompanying notes to financial statements.
Statement of
| | | | | | | | | | | | | | | | | | | | |
| | | Equity Index | | | | | | Mid Cap Index | |
| | | Year Ended
10/31/16 | | | Year Ended
10/31/15 | | | | | | Year Ended
10/31/16 | | | Year Ended
10/31/15 | |
Operations | | | | | | | | | | | | | | | | | | | | |
Net investment income (loss) | | $ | 12,006,226 | | | $ | 12,482,645 | | | | | | | $ | 6,066,850 | | | $ | 5,075,431 | |
Net realized gain (loss) from: | | | | | | | | | | | | | | | | | | | | |
Investments | | | 71,565,110 | | | | 53,316,491 | | | | | | | | 44,814,729 | | | | 47,671,172 | |
Futures contracts | | | 446,886 | | | | (773,985 | ) | | | | | | | 1,774,116 | | | | (2,125,431 | ) |
Change in net unrealized appreciation (depreciation) of: | | | | | | | | | | | | | | | | | | | | |
Investments | | | (55,721,462 | ) | | | (28,106,248 | ) | | | | | | | (20,059,165 | ) | | | (33,094,574 | ) |
Futures contracts | | | (780,975 | ) | | | 372,931 | | | | | | | | (997,239 | ) | | | 890,732 | |
Net increase (decrease) in net assets from operations | | | 27,515,785 | | | | 37,291,834 | | | | | | | | 31,599,291 | | | | 18,417,330 | |
Distributions to Shareholders | | | | | | | | | | | | | | | | | | | | |
From net investment income: | | | | | | | | | | | | | | | | | | | | |
Class A Shares | | | (2,891,544 | ) | | | (2,738,996 | ) | | | | | | | (1,530,007 | ) | | | (1,853,365 | ) |
Class C Shares | | | (147,769 | ) | | | (97,002 | ) | | | | | | | — | | | | (19,009 | ) |
Class R3 Shares | | | (1,354,376 | ) | | | (1,131,525 | ) | | | | | | | (1,009,636 | ) | | | (1,422,983 | ) |
Class I Shares | | | (7,737,471 | ) | | | (8,154,510 | ) | | | | | | | (1,961,658 | ) | | | (2,407,249 | ) |
From accumulated net realized gains: | | | | | | | | | | | | | | | | | | | | |
Class A Shares | | | (10,787,974 | ) | | | (9,192,119 | ) | | | | | | | (13,213,263 | ) | | | (9,630,727 | ) |
Class C Shares | | | (1,025,675 | ) | | | (655,527 | ) | | | | | | | (1,315,766 | ) | | | (694,689 | ) |
Class R3 Shares | | | (6,211,507 | ) | | | (4,022,116 | ) | | | | | | | (13,867,878 | ) | | | (10,517,244 | ) |
Class I Shares | | | (25,977,798 | ) | | | (24,548,328 | ) | | | | | | | (12,556,589 | ) | | | (9,847,361 | ) |
Decrease in net assets from distributions to shareholders | | | (56,134,114 | ) | | | (50,540,123 | ) | | | | | | | (45,454,797 | ) | | | (36,392,627 | ) |
Fund Share Transactions | | | | | | | | | | | | | | | | | | | | |
Proceeds from sale of shares | | | 111,779,492 | | | | 146,699,781 | | | | | | | | 116,753,673 | | | | 141,016,955 | |
Proceeds from shares issued to shareholders due to reinvestment of distributions | | | 49,057,067 | | | | 43,105,273 | | | | | | | | 41,988,502 | | | | 33,191,887 | |
| | | 160,836,559 | | | | 189,805,054 | | | | | | | | 158,742,175 | | | | 174,208,842 | |
Cost of shares redeemed | | | (199,874,881 | ) | | | (218,320,680 | ) | | | | | | | (179,497,317 | ) | | | (171,596,895 | ) |
Net increase (decrease) in net assets from Fund share transactions | | | (39,038,322 | ) | | | (28,515,626 | ) | | | | | | | (20,755,142 | ) | | | 2,611,947 | |
Net increase (decrease) in net assets | | | (67,656,651 | ) | | | (41,763,915 | ) | | | | | | | (34,610,648 | ) | | | (15,363,350 | ) |
Net assets at the beginning of period | | | 786,546,705 | | | | 828,310,620 | | | | | | | | 647,256,459 | | | | 662,619,809 | |
Net assets at the end of period | | $ | 718,890,054 | | | $ | 786,546,705 | | | | | | | $ | 612,645,811 | | | $ | 647,256,459 | |
Undistributed (Over-distribution of) net investment income at the end of period | | $ | 2,087,508 | | | $ | 2,212,442 | | | | | | | $ | 5,577,960 | | | $ | 4,012,411 | |
See accompanying notes to financial statements.
| | | | | | | | |
| | | Small Cap Index | |
| | | Year Ended
10/31/16 | | | Year Ended
10/31/15 | |
Operations | | | | | | | | |
Net investment income (loss) | | $ | 988,839 | | | $ | 1,029,913 | |
Net realized gain (loss) from: | | | | | | | | |
Investments | | | 3,263,142 | | | | 6,035,615 | |
Futures contracts | | | 305,158 | | | | (133,511 | ) |
Change in net unrealized appreciation (depreciation) of: | | | | | | | | |
Investments | | | (1,280,376 | ) | | | (7,297,609 | ) |
Futures contracts | | | (194,281 | ) | | | (63,340 | ) |
Net increase (decrease) in net assets from operations | | | 3,082,482 | | | | (428,932 | ) |
Distributions to Shareholders | | | | | | | | |
From net investment income: | | | | | | | | |
Class A Shares | | | (346,442 | ) | | | (365,247 | ) |
Class C Shares | | | (585 | ) | | | (2,919 | ) |
Class R3 Shares | | | (249,715 | ) | | | (310,921 | ) |
Class I Shares | | | (405,326 | ) | | | (520,976 | ) |
From accumulated net realized gains: | | | | | | | | |
Class A Shares | | | (1,687,506 | ) | | | (2,179,623 | ) |
Class C Shares | | | (144,401 | ) | | | (139,573 | ) |
Class R3 Shares | | | (1,880,550 | ) | | | (2,670,039 | ) |
Class I Shares | | | (1,521,121 | ) | | | (2,441,130 | ) |
Decrease in net assets from distributions to shareholders | | | (6,235,646 | ) | | | (8,630,428 | ) |
Fund Share Transactions | | | | | | | | |
Proceeds from sale of shares | | | 21,933,555 | | | | 38,060,059 | |
Proceeds from shares issued to shareholders due to reinvestment of distributions | | | 5,867,426 | | | | 7,920,049 | |
| | | 27,800,981 | | | | 45,980,108 | |
Cost of shares redeemed | | | (47,695,134 | ) | | | (44,615,077 | ) |
Net increase (decrease) in net assets from Fund share transactions | | | (19,894,153 | ) | | | 1,365,031 | |
Net increase (decrease) in net assets | | | (23,047,317 | ) | | | (7,694,329 | ) |
Net assets at the beginning of period | | | 132,990,167 | | | | 140,684,496 | |
Net assets at the end of period | | $ | 109,942,850 | | | $ | 132,990,167 | |
Undistributed (Over-distribution of) net investment income at the end of period | | $ | 767,530 | | | $ | 771,545 | |
See accompanying notes to financial statements.
Financial
Highlights
Equity Index
Selected data for a share outstanding throughout each period:
| | | | | | | | | | | | | | | | | | | | | | | | | | | | | | | | | | | | |
| | | | | |
| | | | | | Investment Operations | | | | | | Less Distributions | | | | |
| | | | | | | | | |
Class (Commencement Date) Year Ended October 31, | | Beginning
NAV | | | Net
Investment
Income
(Loss)(a) | | | Net
Realized/
Unrealized
Gain (Loss) | | | Total | | | | | | From
Net
Investment
Income | | | From Accumulated Net Realized
Gains | | | Total | | | Ending
NAV | |
Class A (12/92) | | | | | | | | | | | | | | | | | | | | | | | | | | | | | |
2016 | | $ | 28.38 | | | $ | 0.41 | | | $ | 0.61 | | | $ | 1.02 | | | | | | | $ | (0.42 | ) | | $ | (1.62 | ) | | $ | (2.04 | ) | | $ | 27.36 | |
2015 | | | 28.86 | | | | 0.40 | | | | 0.84 | | | | 1.24 | | | | | | | | (0.38 | ) | | | (1.34 | ) | | | (1.72 | ) | | | 28.38 | |
2014 | | | 27.10 | | | | 0.38 | | | | 3.78 | | | | 4.16 | | | | | | | | (0.38 | ) | | | (2.02 | ) | | | (2.40 | ) | | | 28.86 | |
2013 | | | 22.35 | | | | 0.38 | | | | 5.31 | | | | 5.69 | | | | | | | | (0.39 | ) | | | (0.55 | ) | | | (0.94 | ) | | | 27.10 | |
2012 | | | 21.44 | | | | 0.34 | | | | 2.48 | | | | 2.82 | | | | | | | | (0.35 | ) | | | (1.56 | ) | | | (1.91 | ) | | | 22.35 | |
Class C (2/99) | | | | | | | | | | | | | | | | | | | | | | | | | | | | | |
2016 | | | 28.05 | | | | 0.21 | | | | 0.58 | | | | 0.79 | | | | | | | | (0.21 | ) | | | (1.62 | ) | | | (1.83 | ) | | | 27.01 | |
2015 | | | 28.54 | | | | 0.18 | | | | 0.84 | | | | 1.02 | | | | | | | | (0.17 | ) | | | (1.34 | ) | | | (1.51 | ) | | | 28.05 | |
2014 | | | 26.82 | | | | 0.17 | | | | 3.74 | | | | 3.91 | | | | | | | | (0.17 | ) | | | (2.02 | ) | | | (2.19 | ) | | | 28.54 | |
2013 | | | 22.13 | | | | 0.20 | | | | 5.24 | | | | 5.44 | | | | | | | | (0.20 | ) | | | (0.55 | ) | | | (0.75 | ) | | | 26.82 | |
2012 | | | 21.24 | | | | 0.17 | | | | 2.46 | | | | 2.63 | | | | | | | | (0.18 | ) | | | (1.56 | ) | | | (1.74 | ) | | | 22.13 | |
Class R3 (9/01) | | | | | | | | | | | | | | | | | | | | | | | | | | | | | |
2016 | | | 28.39 | | | | 0.35 | | | | 0.60 | | | | 0.95 | | | | | | | | (0.35 | ) | | | (1.62 | ) | | | (1.97 | ) | | | 27.37 | |
2015 | | | 28.87 | | | | 0.32 | | | | 0.85 | | | | 1.17 | | | | | | | | (0.31 | ) | | | (1.34 | ) | | | (1.65 | ) | | | 28.39 | |
2014 | | | 27.04 | | | | 0.31 | | | | 3.85 | | | | 4.16 | | | | | | | | (0.31 | ) | | | (2.02 | ) | | | (2.33 | ) | | | 28.87 | |
2013 | | | 22.31 | | | | 0.31 | | | | 5.30 | | | | 5.61 | | | | | | | | (0.33 | ) | | | (0.55 | ) | | | (0.88 | ) | | | 27.04 | |
2012 | | | 21.40 | | | | 0.28 | | | | 2.48 | | | | 2.76 | | | | | | | | (0.29 | ) | | | (1.56 | ) | | | (1.85 | ) | | | 22.31 | |
Class I (2/94) | | | | | | | | | | | | | | | | | | | | | | | | | | | | | |
2016 | | | 28.37 | | | | 0.48 | | | | 0.60 | | | | 1.08 | | | | | | | | (0.48 | ) | | | (1.62 | ) | | | (2.10 | ) | | | 27.35 | |
2015 | | | 28.85 | | | | 0.47 | | | | 0.84 | | | | 1.31 | | | | | | | | (0.45 | ) | | | (1.34 | ) | | | (1.79 | ) | | | 28.37 | |
2014 | | | 27.09 | | | | 0.45 | | | | 3.78 | | | | 4.23 | | | | | | | | (0.45 | ) | | | (2.02 | ) | | | (2.47 | ) | | | 28.85 | |
2013 | | | 22.35 | | | | 0.45 | | | | 5.29 | | | | 5.74 | | | | | | | | (0.45 | ) | | | (0.55 | ) | | | (1.00 | ) | | | 27.09 | |
2012 | | | 21.43 | | | | 0.39 | | | | 2.49 | | | | 2.88 | | | | | | | | (0.40 | ) | | | (1.56 | ) | | | (1.96 | ) | | | 22.35 | |
| | | | | | | | | | | | | | | | | | | | | | | | | | | | | | | | | | |
| | | | Ratios/Supplemental Data | |
| | | | | | | | | | Ratios to Average
Net Assets Before
Waiver/Reimbursement | | | | | | Ratios to Average
Net Assets After
Waiver/Reimbursement(c) | | | | |
| | | | | | | | |
Total
Return(b) | | | Ending
Net
Assets
(000) | | | | | | Expenses | | | Net
Investment
Income
(Loss) | | | | | | Expenses | | | Net
Investment
Income
(Loss) | | | Portfolio
Turnover
Rate(d) | |
| | | | | | | | | | | | | | | | | | | | | | | | | | | | | | | | | | |
| | 3.91 | % | | $ | 186,922 | | | | | | | | 0.72 | % | | | 1.43 | % | | | | | | | 0.61 | % | | | 1.53 | % | | | 2 | % |
| | 4.63 | | | | 192,626 | | | | | | | | 0.72 | | | | 1.30 | | | | | | | | 0.62 | | | | 1.40 | | | | 2 | |
| | 16.55 | | | | 203,668 | | | | | | | | 0.73 | | | | 1.27 | | | | | | | | 0.62 | | | | 1.38 | | | | 2 | |
| | 26.32 | | | | 183,491 | | | | | | | | 0.71 | | | | 1.48 | | | | | | | | 0.62 | | | | 1.57 | | | | 2 | |
| | 14.51 | | | | 143,664 | | | | | | | | 0.69 | | | | 1.49 | | | | | | | | 0.62 | | | | 1.56 | | | | 1 | |
| | | | | | | | | | | | | | | | | | | | | | | | | | | | | | | | | | |
| | 3.10 | | | | 20,061 | | | | | | | | 1.47 | | | | 0.67 | | | | | | | | 1.36 | | | | 0.78 | | | | 2 | |
| | 3.84 | | | | 17,002 | | | | | | | | 1.47 | | | | 0.54 | | | | | | | | 1.37 | | | | 0.64 | | | | 2 | |
| | 15.71 | | | | 13,275 | | | | | | | | 1.48 | | | | 0.52 | | | | | | | | 1.37 | | | | 0.63 | | | | 2 | |
| | 25.35 | | | | 10,752 | | | | | | | | 1.46 | | | | 0.72 | | | | | | | | 1.37 | | | | 0.82 | | | | 2 | |
| | 13.70 | | | | 8,095 | | | | | | | | 1.44 | | | | 0.75 | | | | | | | | 1.37 | | | | 0.82 | | | | 1 | |
| | | | | | | | | | | | | | | | | | | | | | | | | | | | | | | | | | |
| | 3.65 | | | | 104,052 | | | | | | | | 0.97 | | | | 1.18 | | | | | | | | 0.86 | | | | 1.29 | | | | 2 | |
| | 4.37 | | | | 108,691 | | | | | | | | 0.97 | | | | 1.03 | | | | | | | | 0.87 | | | | 1.14 | | | | 2 | |
| | 16.27 | | | | 81,677 | | | | | | | | 0.98 | | | | 1.02 | | | | | | | | 0.87 | | | | 1.13 | | | | 2 | |
| | 25.96 | | | | 61,823 | | | | | | | | 0.97 | | | | 1.19 | | | | | | | | 0.87 | | | | 1.29 | | | | 2 | |
| | 14.26 | | | | 33,685 | | | | | | | | 0.94 | | | | 1.22 | | | | | | | | 0.87 | | | | 1.28 | | | | 1 | |
| | | | | | | | | | | | | | | | | | | | | | | | | | | | | | | | | | |
| | 4.17 | | | | 407,855 | | | | | | | | 0.47 | | | | 1.68 | | | | | | | | 0.36 | | | | 1.79 | | | | 2 | |
| | 4.90 | | | | 468,228 | | | | | | | | 0.47 | | | | 1.55 | | | | | | | | 0.37 | | | | 1.66 | | | | 2 | |
| | 16.84 | | | | 529,691 | | | | | | | | 0.48 | | | | 1.53 | | | | | | | | 0.37 | | | | 1.64 | | | | 2 | |
| | 26.59 | | | | 531,131 | | | | | | | | 0.46 | | | | 1.76 | | | | | | | | 0.37 | | | | 1.85 | | | | 2 | |
| | 14.85 | | | | 556,215 | | | | | | | | 0.44 | | | | 1.75 | | | | | | | | 0.37 | | | | 1.82 | | | | 1 | |
| (a) | Per share Net Investment Income (Loss) is calculated using the average daily shares method. | |
| (b) | Total return is the combination of changes in NAV, reinvested dividend income at NAV and reinvested capital gains distributions at NAV, if any. Total returns are not annualized. | |
| (c) | After fee waiver and/or expense reimbursement from the Adviser, where applicable. | |
| (d) | Portfolio Turnover Rate is calculated based on the lesser of long-term purchases or sales (as disclosed in Note 5 – Investment Transactions) divided by the average long-term market value during the period. | |
See accompanying notes to financial statements.
Financial Highlights (continued)
Mid Cap Index
Selected data for a share outstanding throughout each period:
| | | | | | | | | | | | | | | | | | | | | | | | | | | | | | | | | | | | |
| | | | | |
| | | | | | Investment Operations | | | | | | Less Distributions | | | | |
| | | | | | | | | |
Class (Commencement Date) Year Ended October 31, | | Beginning
NAV | | | Net
Investment
Income
(Loss)(a) | | | Net
Realized/
Unrealized
Gain (Loss) | | | Total | | | | | | From Net
Investment
Income | | | From
Accumulated
Net Realized
Gains | | | Total | | | Ending
NAV | |
Class A (11/99) | | | | | | | | | | | | | | | | | | | | | | | | | | | | | | | | | |
2016 | | $ | 18.05 | | | $ | 0.17 | | | $ | 0.69 | | | $ | 0.86 | | | | | | | $ | (0.12 | ) | | $ | (1.15 | ) | | $ | (1.27 | ) | | $ | 17.64 | |
2015 | | | 18.58 | | | | 0.14 | | | | 0.35 | | | | 0.49 | | | | | | | | (0.16 | ) | | | (0.86 | ) | | | (1.02 | ) | | | 18.05 | |
2014 | | | 17.50 | | | | 0.13 | | | | 1.71 | | | | 1.84 | | | | | | | | (0.11 | ) | | | (0.65 | ) | | | (0.76 | ) | | | 18.58 | |
2013 | | | 13.76 | | | | 0.13 | | | | 4.17 | | | | 4.30 | | | | | | | | (0.10 | ) | | | (0.46 | ) | | | (0.56 | ) | | | 17.50 | |
2012 | | | 12.87 | | | | 0.09 | | | | 1.31 | | | | 1.40 | | | | | | | | (0.03 | ) | | | (0.48 | ) | | | (0.51 | ) | | | 13.76 | |
Class C (9/01) | | | | | | | | | | | | | | | | | | | | | | | | | | | | | | | | | |
2016 | | | 17.32 | | | | 0.04 | | | | 0.67 | | | | 0.71 | | | | | | | | — | | | | (1.15 | ) | | | (1.15 | ) | | | 16.88 | |
2015 | | | 17.86 | | | | — | * | | | 0.34 | | | | 0.34 | | | | | | | | (0.02 | ) | | | (0.86 | ) | | | (0.88 | ) | | | 17.32 | |
2014 | | | 16.87 | | | | — | * | | | 1.64 | | | | 1.64 | | | | | | | | — | | | | (0.65 | ) | | | (0.65 | ) | | | 17.86 | |
2013 | | | 13.28 | | | | 0.01 | | | | 4.04 | | | | 4.05 | | | | | | | | — | | | | (0.46 | ) | | | (0.46 | ) | | | 16.87 | |
2012 | | | 12.51 | | | | (0.01 | ) | | | 1.26 | | | | 1.25 | | | | | | | | — | | | | (0.48 | ) | | | (0.48 | ) | | | 13.28 | |
Class R3 (11/00) | | | | | | | | | | | | | | | | | | | | | | | | | | | | | | | | | |
2016 | | | 17.80 | | | | 0.13 | | | | 0.68 | | | | 0.81 | | | | | | | | (0.08 | ) | | | (1.15 | ) | | | (1.23 | ) | | | 17.38 | |
2015 | | | 18.33 | | | | 0.10 | | | | 0.34 | | | | 0.44 | | | | | | | | (0.11 | ) | | | (0.86 | ) | | | (0.97 | ) | | | 17.80 | |
2014 | | | 17.28 | | | | 0.09 | | | | 1.68 | | | | 1.77 | | | | | | | | (0.07 | ) | | | (0.65 | ) | | | (0.72 | ) | | | 18.33 | |
2013 | | | 13.59 | | | | 0.10 | | | | 4.11 | | | | 4.21 | | | | | | | | (0.06 | ) | | | (0.46 | ) | | | (0.52 | ) | | | 17.28 | |
2012 | | | 12.73 | | | | 0.06 | | | | 1.28 | | | | 1.34 | | | | | | | | — | | | | (0.48 | ) | | | (0.48 | ) | | | 13.59 | |
Class I (11/99) | | | | | | | | | | | | | | | | | | | | | | | | | | | | | | | | | |
2016 | | | 18.12 | | | | 0.22 | | | | 0.70 | | | | 0.92 | | | | | | | | (0.17 | ) | | | (1.15 | ) | | | (1.32 | ) | | | 17.72 | |
2015 | | | 18.65 | | | | 0.19 | | | | 0.34 | | | | 0.53 | | | | | | | | (0.20 | ) | | | (0.86 | ) | | | (1.06 | ) | | | 18.12 | |
2014 | | | 17.57 | | | | 0.18 | | | | 1.70 | | | | 1.88 | | | | | | | | (0.15 | ) | | | (0.65 | ) | | | (0.80 | ) | | | 18.65 | |
2013 | | | 13.81 | | | | 0.18 | | | | 4.17 | | | | 4.35 | | | | | | | | (0.13 | ) | | | (0.46 | ) | | | (0.59 | ) | | | 17.57 | |
2012 | | | 12.92 | | | | 0.12 | | | | 1.32 | | | | 1.44 | | | | | | | | (0.07 | ) | | | (0.48 | ) | | | (0.55 | ) | | | 13.81 | |
| | | | | | | | | | | | | | | | | | | | | | | | | | | | | | | | | | |
| | | | Ratios/Supplemental Data | |
| | | | | | | | | | Ratios to Average
Net Assets Before
Waiver/Reimbursement | | | | | | Ratios to Average
Net Assets After
Waiver/Reimbursement(c) | | | | |
| | | | | | | | |
Total
Return(b) | | | Ending
Net
Assets
(000) | | | | | | Expenses | | | Net
Investment
Income
(Loss) | | | | | | Expenses | | | Net
Investment
Income
(Loss) | | | Portfolio
Turnover
Rate(d) | |
| | | | | | | | | | | | | | | | | | | | | | | | | | | | | | | | | | |
| | 5.43 | % | | $ | 193,891 | | | | | | | | 0.78 | % | | | 0.93 | % | | | | | | | 0.70 | % | | | 1.02 | % | | | 13 | % |
| | 2.86 | | | | 210,930 | | | | | | | | 0.80 | | | | 0.70 | | | | | | | | 0.73 | | | | 0.77 | | | | 12 | |
| | 10.94 | | | | 210,964 | | | | | | | | 0.80 | | | | 0.66 | | | | | | | | 0.73 | | | | 0.73 | | | | 10 | |
| | 32.46 | | | | 185,942 | | | | | | | | 0.76 | | | | 0.84 | | | | | | | | 0.73 | | | | 0.86 | | | | 7 | |
| | 11.48 | | | | 104,467 | | | | | | | | 0.80 | | | | 0.61 | | | | | | | | 0.74 | | | | 0.67 | | | | 7 | |
| | | | | | | | | | | | | | | | | | | | | | | | | | | | | | | | | | |
| | 4.67 | | | | 23,251 | | | | | | | | 1.53 | | | | 0.18 | | | | | | | | 1.44 | | | | 0.26 | | | | 13 | |
| | 2.13 | | | | 19,066 | | | | | | | | 1.55 | | | | (0.06 | ) | | | | | | | 1.48 | | | | 0.02 | | | | 12 | |
| | 10.10 | | | | 13,810 | | | | | | | | 1.55 | | | | (0.09 | ) | | | | | | | 1.48 | | | | (0.02 | ) | | | 10 | |
| | 31.51 | | | | 10,925 | | | | | | | | 1.51 | | | | 0.07 | | | | | | | | 1.48 | | | | 0.10 | | | | 7 | |
| | 10.60 | | | | 5,290 | | | | | | | | 1.55 | | | | (0.13 | ) | | | | | | | 1.49 | | | | (0.07 | ) | | | 7 | |
| | | | | | | | | | | | | | | | | | | | | | | | | | | | | | | | | | |
| | 5.15 | | | | 204,467 | | | | | | | | 1.03 | | | | 0.68 | | | | | | | | 0.95 | | | | 0.76 | | | | 13 | |
| | 2.64 | | | | 217,248 | | | | | | | | 1.05 | | | | 0.45 | | | | | | | | 0.98 | | | | 0.52 | | | | 12 | |
| | 10.64 | | | | 221,651 | | | | | | | | 1.05 | | | | 0.41 | | | | | | | | 0.98 | | | | 0.48 | | | | 10 | |
| | 32.16 | | | | 186,673 | | | | | | | | 1.01 | | | | 0.60 | | | | | | | | 0.98 | | | | 0.62 | | | | 7 | |
| | 11.14 | | | | 113,834 | | | | | | | | 1.05 | | | | 0.36 | | | | | | | | 0.99 | | | | 0.42 | | | | 7 | |
| | | | | | | | | | | | | | | | | | | | | | | | | | | | | | | | | | |
| | 5.76 | | | | 191,037 | | | | | | | | 0.53 | | | | 1.19 | | | | | | | | 0.44 | | | | 1.27 | | | | 13 | |
| | 3.11 | | | | 200,012 | | | | | | | | 0.55 | | | | 0.95 | | | | | | | | 0.48 | | | | 1.03 | | | | 12 | |
| | 11.16 | | | | 216,194 | | | | | | | | 0.55 | | | | 0.91 | | | | | | | | 0.48 | | | | 0.98 | | | | 10 | |
| | 32.82 | | | | 223,102 | | | | | | | | 0.51 | | | | 1.12 | | | | | | | | 0.48 | | | | 1.14 | | | | 7 | |
| | 11.80 | | | | 168,328 | | | | | | | | 0.55 | | | | 0.87 | | | | | | | | 0.49 | | | | 0.93 | | | | 7 | |
| (a) | Per share Net Investment Income (Loss) is calculated using the average daily shares method. | |
| (b) | Total return is the combination of changes in NAV, reinvested dividend income at NAV and reinvested capital gains distributions at NAV, if any. Total returns are not annualized. | |
| (c) | After fee waiver and/or expense reimbursement from the Adviser, where applicable. | |
| (d) | Portfolio Turnover Rate is calculated based on the lesser of long-term purchases or sales (as disclosed in Note 5 – Investment Transactions) divided by the average long-term market value during the period. | |
| * | Rounds to less than $0.01 per share. | |
See accompanying notes to financial statements.
Financial Highlights (continued)
Small Cap Index
Selected data for a share outstanding throughout each period:
| | | | | | | | | | | | | | | | | | | | | | | | | | | | | | | | | | | | |
| | | | | |
| | | | | | Investment Operations | | | | | | Less Distributions | | | | |
| | | | | | | | | |
Class (Commencement Date) Year Ended October 31, | | Beginning
NAV | | | Net
Investment
Income
(Loss)(a) | | | Net
Realized/
Unrealized
Gain (Loss) | | | Total | | | | | | From
Net
Investment
Income | | | From
Accumulated
Net Realized
Gains | | | Total | | | Ending
NAV | |
Class A (12/98) | | | | | | | | | | | | | | | | | | | | | | | | | | | | | | | | | | | | |
2016 | | $ | 14.18 | | | $ | 0.12 | | | $ | 0.35 | | | $ | 0.47 | | | | | | | $ | (0.11 | ) | | $ | (0.58 | ) | | $ | (0.69 | ) | | $ | 13.96 | |
2015 | | | 15.18 | | | | 0.11 | | | | (0.17 | ) | | | (0.06 | ) | | | | | | | (0.13 | ) | | | (0.81 | ) | | | (0.94 | ) | | | 14.18 | |
2014 | | | 14.99 | | | | 0.10 | | | | 0.98 | | | | 1.08 | | | | | | | | (0.12 | ) | | | (0.77 | ) | | | (0.89 | ) | | | 15.18 | |
2013 | | | 11.59 | | | | 0.14 | | | | 3.79 | | | | 3.93 | | | | | | | | (0.08 | ) | | | (0.45 | ) | | | (0.53 | ) | | | 14.99 | |
2012 | | | 10.43 | | | | 0.08 | | | | 1.11 | | | | 1.19 | | | | | | | | (0.03 | ) | | | — | | | | (0.03 | ) | | | 11.59 | |
Class C (9/01) | | | | | | | | | | | | | | | | | | | | | | | | | | | | | | | | | | | | |
2016 | | | 13.44 | | | | 0.02 | | | | 0.33 | | | | 0.35 | | | | | | | | — | ** | | | (0.58 | ) | | | (0.58 | ) | | | 13.21 | |
2015 | | | 14.43 | | | | — | ** | | | (0.16 | ) | | | (0.16 | ) | | | | | | | (0.02 | ) | | | (0.81 | ) | | | (0.83 | ) | | | 13.44 | |
2014 | | | 14.31 | | | | (0.01 | ) | | | 0.91 | | | | 0.90 | | | | | | | | (0.01 | ) | | | (0.77 | ) | | | (0.78 | ) | | | 14.43 | |
2013 | | | 11.08 | | | | 0.03 | | | | 3.65 | | | | 3.68 | | | | | | | | — | | | | (0.45 | ) | | | (0.45 | ) | | | 14.31 | |
2012 | | | 10.02 | | | | — | | | | 1.06 | | | | 1.06 | | | | | | | | — | | | | — | | | | — | | | | 11.08 | |
Class R3 (12/98) | | | | | | | | | | | | | | | | | | | | | | | | | | | | | | | | | | | | |
2016 | | | 13.78 | | | | 0.08 | | | | 0.34 | | | | 0.42 | | | | | | | | (0.07 | ) | | | (0.58 | ) | | | (0.65 | ) | | | 13.55 | |
2015 | | | 14.77 | | | | 0.07 | | | | (0.16 | ) | | | (0.09 | ) | | | | | | | (0.09 | ) | | | (0.81 | ) | | | (0.90 | ) | | | 13.78 | |
2014 | | | 14.62 | | | | 0.07 | | | | 0.93 | | | | 1.00 | | | | | | | | (0.08 | ) | | | (0.77 | ) | | | (0.85 | ) | | | 14.77 | |
2013 | | | 11.31 | | | | 0.10 | | | | 3.72 | | | | 3.82 | | | | | | | | (0.06 | ) | | | (0.45 | ) | | | (0.51 | ) | | | 14.62 | |
2012 | | | 10.18 | | | | 0.05 | | | | 1.08 | | | | 1.13 | | | | | | | | — | | | | — | | | | — | | | | 11.31 | |
Class I (12/98) | | | | | | | | | | | | | | | | | | | | | | | | | | | | | | | | | | | | |
2016 | | | 14.23 | | | | 0.15 | �� | | | 0.36 | | | | 0.51 | | | | | | | | (0.15 | ) | | | (0.58 | ) | | | (0.73 | ) | | | 14.01 | |
2015 | | | 15.23 | | | | 0.15 | | | | (0.17 | ) | | | (0.02 | ) | | | | | | | (0.17 | ) | | | (0.81 | ) | | | (0.98 | ) | | | 14.23 | |
2014 | | | 15.04 | | | | 0.14 | | | | 0.97 | | | | 1.11 | | | | | | | | (0.15 | ) | | | (0.77 | ) | | | (0.92 | ) | | | 15.23 | |
2013 | | | 11.63 | | | | 0.17 | | | | 3.80 | | | | 3.97 | | | | | | | | (0.11 | ) | | | (0.45 | ) | | | (0.56 | ) | | | 15.04 | |
2012 | | | 10.46 | | | | 0.11 | | | | 1.12 | | | | 1.23 | | | | | | | | (0.06 | ) | | | — | | | | (0.06 | ) | | | 11.63 | |
| | | | | | | | | | | | | | | | | | | | | | | | | | | | | | | | | | |
| | | | Ratios/Supplemental Data | |
| | | | | | | | | | Ratios to Average
Net Assets Before
Waiver/Reimbursement | | | | | | Ratios to Average
Net Assets After
Waiver/Reimbursement(c) | | | | |
| | | | | | | | |
Total
Return(b) | | | Ending
Net
Assets
(000) | | | | | | Expenses | | | Net
Investment
Income
(Loss) | | | | | | Expenses | | | Net
Investment
Income
(Loss) | | | Portfolio
Turnover
Rate(d) | |
| | | | | | | | | | | | | | | | | | | | | | | | | | | | | | | | | | |
| | 3.58 | % | | $ | 35,319 | | | | | | | | 1.04 | % | | | 0.66 | % | | | | | | | 0.80 | % | | | 0.90 | % | | | 12 | % |
| | (0.31 | ) | | | 43,050 | | | | | | | | 1.01 | | | | 0.56 | | | | | | | | 0.81 | | | | 0.75 | | | | 14 | |
| | 7.54 | | | | 42,411 | | | | | | | | 1.03 | | | | 0.49 | | | | | | | | 0.81 | | | | 0.71 | | | | 12 | |
| | 35.52 | | | | 41,769 | | | | | | | | 1.07 | | | | 0.81 | | | | | | | | 0.82 | | | | 1.06 | | | | 11 | |
| | 11.44 | | | | 28,640 | | | | | | | | 1.27 | | | | 0.28 | | | | | | | | 0.83 | | | | 0.72 | | | | 20 | |
| | | | | | | | | | | | | | | | | | | | | | | | | | | | | | | | | | |
| | 2.82 | | | | 4,486 | | | | | | | | 1.79 | | | | (0.12 | ) | | | | | | | 1.55 | | | | 0.13 | | | | 12 | |
| | (1.05 | ) | | | 3,225 | | | | | | | | 1.76 | | | | (0.20 | ) | | | | | | | 1.56 | | | | (0.01 | ) | | | 14 | |
| | 6.64 | | | | 2,500 | | | | | | | | 1.78 | | | | (0.27 | ) | | | | | | | 1.56 | | | | (0.05 | ) | | | 12 | |
| | 34.57 | | | | 2,155 | | | | | | | | 1.82 | | | | — | * | | | | | | | 1.57 | | | | 0.25 | | | | 11 | |
| | 10.58 | | | | 1,246 | | | | | | | | 2.00 | | | | (0.46 | ) | | | | | | | 1.58 | | | | (0.03 | ) | | | 20 | |
| | | | | | | | | | | | | | | | | | | | | | | | | | | | | | | | | | |
| | 3.31 | | | | 38,308 | | | | | | | | 1.29 | | | | 0.41 | | | | | | | | 1.05 | | | | 0.64 | | | | 12 | |
| | (0.52 | ) | | | 45,089 | | | | | | | | 1.26 | | | | 0.30 | | | | | | | | 1.06 | | | | 0.50 | | | | 14 | |
| | 7.19 | | | | 48,483 | | | | | | | | 1.28 | | | | 0.24 | | | | | | | | 1.06 | | | | 0.46 | | | | 12 | |
| | 35.24 | | | | 41,350 | | | | | | | | 1.32 | | | | 0.49 | | | | | | | | 1.07 | | | | 0.74 | | | | 11 | |
| | 11.13 | | | | 20,198 | | | | | | | | 1.52 | | | | 0.02 | | | | | | | | 1.08 | | | | 0.47 | | | | 20 | |
| | | | | | | | | | | | | | | | | | | | | | | | | | | | | | | | | | |
| | 3.86 | | | | 31,830 | | | | | | | | 0.79 | | | | 0.91 | | | | | | | | 0.55 | | | | 1.15 | | | | 12 | |
| | (0.06 | ) | | | 41,626 | | | | | | | | 0.75 | | | | 0.81 | | | | | | | | 0.56 | | | | 1.00 | | | | 14 | |
| | 7.76 | | | | 47,291 | | | | | | | | 0.78 | | | | 0.75 | | | | | | | | 0.56 | | | | 0.96 | | | | 12 | |
| | 35.82 | | | | 48,694 | | | | | | | | 0.82 | | | | 1.05 | | | | | | | | 0.57 | | | | 1.30 | | | | 11 | |
| | 11.79 | | | | 33,733 | | | | | | | | 1.00 | | | | 0.55 | | | | | | | | 0.58 | | | | 0.97 | | | | 20 | |
| (a) | Per share Net Investment Income (Loss) is calculated using the average daily shares method. | |
| (b) | Total return is the combination of changes in NAV, reinvested dividend income at NAV and reinvested capital gains distributions at NAV, if any. Total returns are not annualized. | |
| (c) | After fee waiver and/or expense reimbursement from the Adviser, where applicable. | |
| (d) | Portfolio Turnover Rate is calculated based on the lesser of long-term purchases or sales (as disclosed in Note 5 – Investment Transactions) divided by the average long-term market value during the period. | |
| * | Rounds to less than 0.01%. | |
| ** | Rounds to less than $0.01 per share. | |
See accompanying notes to financial statements.
Notes to
Financial Statements
1. General Information and Significant Accounting Policies
General Information
Trust and Fund Information
Nuveen Investment Funds, Inc. (the “Trust”), is an open-end management investment company registered under the Investment Company Act of 1940, as amended. The Trust is comprised of Nuveen Equity Index Fund (“Equity Index”), Nuveen Mid Cap Index Fund (“Mid Cap Index”) and Nuveen Small Cap Index Fund (“Small Cap Index”) (each a “Fund” and collectively, the “Funds”), as diversified funds, among others. The Trust was incorporated in the state of Maryland on August 20, 1987.
The end of the reporting period for the Funds is October 31, 2016, and the period covered by these Notes to Financial Statements is the fiscal year ended October 31, 2016 (the ”current fiscal period”).
Investment Adviser
The Funds’ investment adviser is Nuveen Fund Advisors, LLC (the “Adviser”), a wholly-owned subsidiary of Nuveen Investments, Inc. (“Nuveen”). Nuveen is an operating division of TIAA Global Asset Management. The Adviser has overall responsibility for management of the Funds, oversees the management of the Funds’ portfolios, manages the Funds’ business affairs and provides certain clerical, bookkeeping and other administrative services, and, if necessary, asset allocation decisions. The Adviser has entered into sub-advisory agreements with Nuveen Asset Management, LLC (the “Sub-Adviser”), a subsidiary of the Adviser, under which the Sub-Adviser manages the investment portfolios of the Funds.
Investment Objectives
Equity Index’s investment objective is to provide investment results that correspond to the performance of the Standard & Poor’s 500® Index. Mid Cap Index’s investment objective is to provide investment results that correspond to the performance of the Standard & Poor’s MidCap 400® Index. Small Cap Index’s investment objective is to provide investment results that correspond to the performance of the Russell® 2000 Index.
The Funds’ most recent prospectus provides further descriptions of each Fund’s investment objective, principal investment strategies and principal risks.
Significant Accounting Policies
Each Fund is an investment company and follows accounting and reporting guidance under Financial Accounting Standards Board (FASB) Accounting Standards Codification (ASC) Topic 946 “Financial Services – Investment Companies.” The following is a summary of significant accounting policies followed by the Funds in the preparation of their financial statements in accordance with accounting principles generally accepted in the United States of America (“U.S. GAAP”).
Investment Transactions
Investment transactions are recorded on a trade date basis. Realized gains and losses from investment transactions are determined on the specific identification method, which is the same basis used for federal income tax purposes.
Investment Income
Dividend income is recorded on the ex-dividend date or, for foreign securities, when information is available. Interest income is recorded on an accrual basis. Securities lending income is comprised of fees earned from borrowers and income earned on cash collateral investments, net of lending agent fees.
Professional Fees
Professional fees presented on the Statement of Operations consist of legal fees incurred in the normal course of operations, audit fees, tax consulting fees and, in some cases, workout expenditures. Workout expenditures are incurred in an attempt to protect or enhance an investment or to pursue other claims or legal actions on behalf of Fund shareholders. If a refund is received for workout expenditures paid in a prior reporting period, such amounts will be recognized as “Legal fee refund” on the Statement of Operations.
Dividends and Distributions to Shareholders
Dividends from net investment income, if any, are declared and distributed to shareholders annually (except for Equity Index, which are declared and distributed to shareholders quarterly). Net realized capital gains from investment transactions, if any, are declared and distributed to shareholders at least annually. Furthermore, capital gains are distributed only to the extent they exceed available capital loss carryforwards.
Distributions to shareholders are recorded on the ex-dividend date. The amount and timing of distributions are determined in accordance with federal income tax regulations, which may differ from U.S. GAAP.
Share Classes and Sales Charges
The Funds only issue Class A Shares for purchase by certain retirement plans and by qualifying clients of investment advisers, financial planners or other financial intermediaries that charge periodic or asset-based fees for their services. Class A Shares are offered to those investors at their net asset value (“NAV”) per share with no up-front sales charge. Class A Shares incur a 0.25% annual 12b-1 service fee. Class C Shares are sold without an up-front sales charge but incur a 0.75% annual 12b-1 distribution fee and a 0.25% annual 12b-1 service fee. Class C Shares are subject to a contingent deferred sales charge (“CDSC”) of 1% if redeemed within eighteen months of purchase. Class R3 Shares are sold without an up-front sales charge but incur a 0.25% annual 12b-1 distribution fee and a 0.25% annual 12b-1 service fee. Class I Shares are not subject to any sales charge or 12b-1 distribution or service fees.
Multiclass Operations and Allocations
Income and expenses of the Funds that are not directly attributable to a specific class of shares are prorated among the classes based on the relative net assets of each class. Expenses directly attributable to a class of shares are recorded to the specific class. Currently, the only expenses that are allocated on a class-specific basis are 12b-1 distribution and service fees.
Realized and unrealized capital gains and losses of the Funds are prorated among the classes based on the relative net assets of each class.
Indemnifications
Under the Trust’s organizational documents, its officers and directors are indemnified against certain liabilities arising out of the performance of their duties to the Trust. In addition, in the normal course of business, the Trust enters into contracts that provide general indemnifications to other parties. The Trust’s maximum exposure under these arrangements is unknown as this would involve future claims that may be made against the Trust that have not yet occurred. However, the Trust has not had prior claims or losses pursuant to these contracts and expects the risk of loss to be remote.
Netting Agreements
In the ordinary course of business, the Funds may enter into transactions subject to enforceable International Swaps and Derivative Association, Inc. (“ISDA”) master agreements or other similar arrangements (“netting agreements”). Generally, the right to offset in netting agreements allows each Fund to offset certain securities and derivatives with a specific counterparty, when applicable, as well as any collateral received or delivered to that counterparty based on the terms of the agreements. Generally, each Fund manages its cash collateral and securities collateral on a counterparty basis.
The Funds’ investments subject to netting agreements as of the end of the reporting period, if any, are further described in Note 3 – Portfolio Securities and Investments in Derivatives.
Use of Estimates
The preparation of financial statements in conformity with U.S. GAAP requires management to make estimates and assumptions that affect the reported amounts of assets and liabilities at the date of the financial statements and the reported amounts of increases and decreases in net assets from operations during the reporting period. Actual results may differ from those estimates.
2. Investment Valuation and Fair Value Measurements
The fair valuation input levels as described below are for fair value measurement purposes.
Fair value is defined as the price that would be received upon selling an investment or transferring a liability in an orderly transaction to an independent buyer in the principal or most advantageous market for the investment. A three-tier hierarchy is used to maximize the use of observable market data and minimize the use of unobservable inputs and to establish classification of fair value measurements for disclosure purposes. Observable inputs reflect the assumptions market participants would use in pricing the asset or liability. Observable inputs are based on market data obtained from sources independent of the reporting entity. Unobservable inputs reflect the reporting entity’s own assumptions about the assumptions market participants would use in pricing the asset or liability. Unobservable inputs are based on the best information available in the circumstances. The following is a summary of the three-tiered hierarchy of valuation input levels.
| | |
| Level 1 – | | Inputs are unadjusted and prices are determined using quoted prices in active markets for identical securities. |
| Level 2 – | | Prices are determined using other significant observable inputs (including quoted prices for similar securities, interest rates, prepayment speeds, credit risk, etc.). |
| Level 3 – | | Prices are determined using significant unobservable inputs (including management’s assumptions in determining the fair value of investments). |
Notes to Financial Statements (continued)
Common stocks and other equity-type securities are valued at the last sales price on the securities exchange on which such securities are primarily traded and are generally classified as Level 1. Securities primarily traded on the NASDAQ National Market (“NASDAQ”) are valued at the NASDAQ Official Closing Price and are generally classified as Level 1. However, securities traded on a securities exchange or NASDAQ for which there were no transactions on a given day or securities not listed on a securities exchange or NASDAQ are valued at the quoted bid price and are generally classified as Level 2. Prices of certain American Depositary Receipts (“ADR”) held by the Funds that trade in the United States are valued based on the last traded price, official closing price, or the most recent bid price of the underlying non-U.S.-traded stock, adjusted as appropriate for the underlying-to-ADR conversion ratio and foreign exchange rate, and from time-to-time may also be adjusted further to take into account material events that may take place after the close of the local non-U.S. market but before the close of the New York Stock Exchange, which may represent a transfer from a Level 1 to a Level 2 security.
Exchange-traded funds are valued at the last sales price on the securities exchange on which such securities are primarily traded and are generally classified as Level 1.
Investments in investment companies are valued at their respective NAVs on the valuation date and are generally classified as Level 1.
Prices of fixed-income securities are provided by an independent pricing service (“pricing service”) approved by the Funds’ Board of Directors (the ”Board”). The pricing service establishes a security’s fair value using methods that may include consideration of the following: yields or prices of investments of comparable quality, type of issue, coupon, maturity and rating, market quotes or indications of value from security dealers, evaluations of anticipated cash flows or collateral, general market conditions and other information and analysis, including the obligor’s credit characteristics considered relevant. These securities are generally classified as Level 2. In pricing certain securities, particularly less liquid and lower quality securities, the pricing service may consider information about a security, its issuer or market activity provided by the Adviser. These securities are generally classified as Level 2 or Level 3 depending on the observability of the significant inputs.
Futures contracts are valued using the closing settlement price or, in the absence of such a price, the last traded price and are generally classified as Level 1.
Certain securities may not be able to be priced by the pre-established pricing methods as described above. Such securities may be valued by the Board and/or its appointee at fair value. These securities generally include, but are not limited to, restricted securities (securities which may not be publicly sold without registration under the Securities Act of 1933, as amended) for which a pricing service is unable to provide a market price; securities whose trading has been formally suspended; debt securities that have gone into default and for which there is no current market quotation; a security whose market price is not available from a pre-established pricing source; a security with respect to which an event has occurred that is likely to materially affect the value of the security after the market has closed but before the calculation of a Fund’s NAV (as may be the case in non-U.S. markets on which the security is primarily traded) or make it difficult or impossible to obtain a reliable market quotation; and a security whose price, as provided by the pricing service, is not deemed to reflect the security’s fair value. As a general principle, the fair value of a security would appear to be the amount that the owner might reasonably expect to receive for it in a current sale. A variety of factors may be considered in determining the fair value of such securities, which may include consideration of the following: yields or prices of investments of comparable quality, type of issue, coupon, maturity and rating, market quotes or indications of value from security dealers, evaluations of anticipated cash flows or collateral, general market conditions and other information and analysis, including the obligor’s credit characteristics considered relevant. These securities are generally classified as Level 2 or Level 3 depending on the observability of the significant inputs. Regardless of the method employed to value a particular security, all valuations are subject to review by the Board and/or its appointee.
The inputs or methodologies used for valuing securities are not an indication of the risks associated with investing in those securities. The following is a summary of each Fund’s fair value measurements as of the end of the reporting period:
| | | | | | | | | | | | | | | | |
Equity Index | | Level 1 | | | Level 2 | | | Level 3 | | | Total | |
Long-Term Investments: | | | | | | | | | | | | | | | | |
Common Stocks* | | $ | 685,507,237 | | | $ | — | | | $ | — | | | $ | 685,507,237 | |
Common Stock Rights | | | — | | | | — | | | | 1,812 | *** | | | 1,812 | |
Investments Purchased with Collateral from Securities Lending | | | 8,819,673 | | | | — | | | | — | | | | 8,819,673 | |
Short-Term Investments: | | | | | | | | | | | | | | | | |
Money Market Funds | | | 31,382,922 | | | | — | | | | — | | | | 31,382,922 | |
U.S. Government and Agency Obligations | | | — | | | | 2,997,318 | | | | — | | | | 2,997,318 | |
Investments in Derivatives: | | | | | | | | | | | | | | | | |
Futures Contracts** | | | (139,510 | ) | | | — | | | | — | | | | (139,510 | ) |
| Total | | $ | 725,570,322 | | | $ | 2,997,318 | | | $ | 1,812 | | | $ | 728,569,452 | |
| | | | | | | | | | | | | | | | |
| Mid Cap Index | | Level 1 | | | Level 2 | | | Level 3 | | | Total | |
Long-Term Investments: | | | | | | | | | | | | | | | | |
Common Stocks* | | $ | 596,947,782 | | | $ | — | | | $ | — | | | $ | 596,947,782 | |
Common Stock Rights | | | 855 | | | | — | | | | — | | | | 855 | |
Investments Purchased with Collateral from Securities Lending | | | 34,332,343 | | | | — | | | | — | | | | 34,332,343 | |
Short-Term Investments: | | | | | | | | | | | | | | | | |
Money Market Funds | | | 14,046,458 | | | | — | | | | — | | | | 14,046,458 | |
U.S. Government & Agency Obligations | | | — | | | | 2,997,319 | | | | — | | | | 2,997,319 | |
Investments in Derivatives: | | | | | | | | | | | | | | | | |
Futures Contracts** | | | (193,195 | ) | | | — | | | | — | | | | (193,195 | ) |
| Total | | $ | 645,134,243 | | | $ | 2,997,319 | | | $ | — | | | $ | 648,131,562 | |
| | | | |
| Small Cap Index | | | | | | | | | | | | |
Long-Term Investments: | | | | | | | | | | | | | | | | |
Common Stocks* | | $ | 103,684,017 | | | $ | — | | | $ | 18,670 | *** | | $ | 103,702,687 | |
Exchange-Traded Funds | | | 21,420 | | | | — | | | | — | | | | 21,420 | |
Common Stock Rights | | | — | | | | — | | | | 22,833 | *** | | | 22,833 | |
Warrants | | | 68 | | | | — | | | | 2 | *** | | | 70 | |
Investments Purchased with Collateral from Securities Lending | | | 10,228,972 | | | | — | | | | — | | | | 10,228,972 | |
Short-Term Investments: | | | | | | | | | | | | | | | | |
Money Market Funds | | | 6,073,931 | | | | — | | | | — | | | | 6,073,931 | |
U.S. Government & Agency Obligations | | | — | | | | 274,754 | | | | — | | | | 274,754 | |
Investments in Derivatives: | | | | | | | | | | | | | | | | |
Futures Contracts** | | | (159,636 | ) | | | — | | | | — | | | | (159,636 | ) |
| Total | | $ | 119,848,772 | | | $ | 274,754 | | | $ | 41,505 | | | $ | 120,165,031 | |
| * | Refer to the Fund’s Portfolio of Investments for industry classifications. |
| ** | Represents net unrealized appreciation (depreciation) as reported in the Fund’s Portfolio of Investments. |
| *** | Refer to the Fund’s Portfolio of Investments for securities classified as Level 3. |
The Board is responsible for the valuation process and has appointed the oversight of the daily valuation process to the Adviser’s Valuation Committee. The Valuation Committee, pursuant to the valuation policies and procedures adopted by the Board, is responsible for making fair value determinations, evaluating the effectiveness of the Funds’ pricing policies and reporting to the Board. The Valuation Committee is aided in its efforts by the Adviser’s dedicated Securities Valuation Team, which is responsible for administering the daily valuation process and applying fair value methodologies as approved by the Valuation Committee. When determining the reliability of independent pricing services for investments owned by the Funds, the Valuation Committee, among other things, conducts due diligence reviews of the pricing services and monitors the quality of security prices received through various testing reports conducted by the Securities Valuation Team.
The Valuation Committee will consider pricing methodologies it deems relevant and appropriate when making a fair value determination, based on the facts and circumstances specific to the portfolio instrument. Fair value determinations generally will be derived as follows, using public or private market information:
| | (i) | If available, fair value determinations shall be derived by extrapolating from recent transactions or quoted prices for identical or comparable securities. |
| | (ii) | If such information is not available, an analytical valuation methodology may be used based on other available information including, but not limited to: analyst appraisals, research reports, corporate action information, issuer financial statements and shelf registration statements. Such analytical valuation methodologies may include, but are not limited to: multiple of earnings, discount from market value of a similar freely- traded security, discounted cash flow analysis, book value or a multiple thereof, risk premium/yield analysis, yield to maturity and/or fundamental investment analysis. |
The purchase price of a portfolio instrument will be used to fair value the instrument only if no other valuation methodology is available or deemed appropriate, and it is determined that the purchase price fairly reflects the instrument’s current value.
For each portfolio security that has been fair valued pursuant to the policies adopted by the Board, the fair value price is compared against the last available and next available market quotations. The Valuation Committee reviews the results of such testing and fair valuation occurrences are reported to the Board.
Notes to Financial Statements (continued)
3. Portfolio Securities and Investments in Derivatives
Portfolio Securities
Securities Lending
In order to generate additional income, each Fund may lend securities representing up to one-third of the value of its total assets (which includes collateral for securities on loan) to broker-dealers, banks or other institutions. When loaning securities, each Fund retains the benefits of owning the securities, including the economic equivalent of dividends or interest generated by the security. Each Fund also has the ability to recall the securities on loan at any time.
Each Fund’s policy is to receive, at the inception of a loan, cash collateral equal to at least 102% of the value of securities loaned, which is recognized as “Payable for collateral from securities lending program” on the Statement of Assets and Liabilities. Collateral for securities on loan is invested in a money market fund, which is recognized as “Investments purchased with collateral from securities lending, at value” on the Statement of Assets and Liabilities. The market value of the securities loaned is determined at the close of each business day in order to determine the adequacy of the collateral. If the value of the securities on loan increases such that the level of collateralization falls below 100%, additional collateral is received from the borrower on the next business day, which is recognized as “Due from broker” on the Statement of Assets and Liabilities.
Securities out on loan are subject to termination at any time at the option of the borrower or the Fund. Upon termination, the borrower is required to return to the Fund securities identical to the securities loaned. Generally, in the event the borrower defaults on its obligation to return the loaned securities, the Fund has the right to use the collateral to acquire identical securities. In the event the Fund is delayed or prevented from exercising its right to dispose of the collateral, there may be a loss to the Fund. Under each Fund’s securities lending agreement, however, the securities lending agent has indemnified the Fund against losses resulting from borrower default, except to the extent that those losses result from a decrease in the value of the collateral due to its investment by the Fund. The Fund bears the risk of loss with respect to the investment of collateral.
The Funds’ custodian, U.S. Bank National Association, serves as its securities lending agent. Each Fund pays the custodian a fee based on its proportional share of the custodian’s expense of operating its securities lending program. Income earned from the securities lending program is paid to the Fund, net of any fees paid. Income from securities lending, net of fees paid, is recognized as “Securities lending income, net” on the Statement of Operations.
The following table presents the securities out on loan for the Funds, and the collateral delivered related to those securities, as of the end of the reporting period.
| | | | | | | | | | | | | | |
| Fund | | Asset Class out on Loan | | Long-Term
Investments, at Value | | | Collateral
Pledged (From)
Counterparty* | | | Net
Exposure | |
| Equity Index | | Common Stocks | | $ | 8,603,262 | | | $ | (8,603,262 | ) | | $ | — | |
| Mid Cap Index | | Common Stocks | | | 33,506,591 | | | | (33,506,591 | ) | | | — | |
| Small Cap Index | | Common Stocks | | | 9,934,978 | | | | (9,934,978 | ) | | | — | |
| * | As of the end of the reporting period, the value of the collateral pledged from the counterparty exceeded the value of the securities out on loan. Refer to the Fund’s Portfolio of Investments for details on the securities out on loan. |
Securities lending fees paid by each Fund during the current fiscal period were as follows:
| | | | | | | | | | | | |
| | | Equity
Index | | | Mid Cap
Index | | | Small Cap
Index | |
| Securities lending fees paid | | $ | 21,243 | | | $ | 48,392 | | | $ | 42,537 | |
Investments in Derivatives
Each Fund is authorized to invest in certain derivative instruments. The Funds record derivative instruments at fair value, with changes in fair value recognized on the Statement of Operations, when applicable. Even though the Funds’ investments in derivatives may represent economic hedges, they are not considered to be hedge transactions for financial reporting purposes.
Futures Contracts
Upon execution of a futures contract, a Fund is obligated to deposit cash or eligible securities, also known as “initial margin,” into an account at its clearing broker equal to a specified percentage of the contract amount. Cash held by the broker to cover initial margin requirements on open futures contracts, if any, is recognized as “Cash collateral at brokers” on the Statement of Assets and Liabilities. Investments in futures contracts obligate a Fund and the clearing broker to settle monies on a daily basis representing changes in the prior days “mark-to-market” of the open contracts. If a Fund has unrealized appreciation the clearing broker would credit the Fund’s account with an amount equal to appreciation and conversely if a Fund has unrealized depreciation the clearing broker would debit the Fund’s account with an amount equal to depreciation. These daily cash settlements are also known as “variation margin.” Variation margin is recognized as a receivable and/or payable for “Variation margin on futures contracts” on the Statement of Assets and Liabilities.
During the period the futures contract is open, changes in the value of the contract are recognized as an unrealized gain or loss by “marking-to-market” on a daily basis to reflect the changes in market value of the contract, which is recognized as a component of “Change in net unrealized appreciation (depreciation) of futures contracts” on the Statement of Operations. When the contract is closed or expired, the Fund records a realized gain or loss equal to the difference between the value of the contract on the closing date and value of the contract when originally entered into, which is recognized as a component of “Net realized gain (loss) from futures contracts” on the Statement of Operations.
Risks of investments in futures contracts include the possible adverse movement in the price of the securities or indices underlying the contracts, the possibility that there may not be a liquid secondary market for the contracts and/or that a change in the value of the contract may not correlate with a change in the value of the underlying securities or indices.
During the current fiscal period, each Fund continued to invest in index futures contracts to convert cash into the equivalent of its corresponding index holding in order to manage cash flow activity and minimize tracking error to the Fund’s benchmark index. These futures contracts are used as a means to efficiently gain exposure to a broad base of equity securities. The Funds’ holdings of futures, which were matched to the level of cash, were helpful in keeping the Funds fully invested, neither overexposed nor underexposed to equities, despite cash flows.
The average notional amount of futures contracts outstanding during the current fiscal period was as follows:
| | | | | | | | | | | | |
| | | Equity
Index | | | Mid Cap
Index | | | Small Cap
Index | |
| Average notional amount of futures contracts outstanding* | | $ | 23,430,905 | | | $ | 24,318,726 | | | $ | 3,976,350 | |
| * | The average notional amount is calculated based on the absolute aggregate notional amount of contracts outstanding at the beginning of the fiscal period and at the end of each fiscal quarter within the current fiscal period. |
The following table presents the fair value of all futures contracts held by the Funds as of the end of the reporting period, the location of these instruments on the Statement of Assets and Liabilities and the primary underlying risk exposure.
| | | | | | | | | | | | | | |
| | | | | Location on the Statement of Assets and Liabilities | |
| | | | | Asset Derivatives | | | (Liability) Derivatives | |
Underlying Risk Exposure | | Derivative Instrument | | Location | | Value | | | Location | | Value | |
Equity Index | | | | | | | | | | | | | | |
| | | | | |
Equity | | Futures contracts | | — | | $ | — | | | Payable for variation margin
on futures contracts* | | $ | (139,510 | ) |
Mid Cap Index | | | | | | | | | | | | | | |
| | | | | |
Equity | | Futures contracts | | Receivable for variation margin on futures contracts* | | | (193,195 | ) | | — | | | — | |
Small Cap Index | | | | | | | | | | | | | | |
| | | | | |
Equity | | Futures contracts | | Receivable for variation margin on futures contracts* | | | (159,636 | ) | | — | | | — | |
| * | Value represents unrealized appreciation (depreciation) of futures contracts as reported in the Fund’s Portfolio of Investments and not the asset and/or liability derivative location as described in the table above. |
The following table presents the amount of net realized gain (loss) and change in net unrealized appreciation (depreciation) recognized on futures contracts on the Statement of Operations during the current fiscal period, and the primary underlying risk exposure.
| | | | | | | | | | | | |
| Fund | | Underlying
Risk Exposure | | Derivative
Instrument | | Net Realized
Gain (Loss) from
Futures Contracts | | | Change in Net Unrealized
Appreciation (Depreciation) of
Futures Contracts | |
| Equity Index | | Equity | | Futures contracts | | $ | 446,886 | | | $ | (780,975 | ) |
| Mid Cap Index | | Equity | | Futures contracts | | | 1,774,116 | | | | (997,239 | ) |
| Small Cap Index | | Equity | | Futures contracts | | | 305,158 | | | | (194,281 | ) |
Market and Counterparty Credit Risk
In the normal course of business each Fund may invest in financial instruments and enter into financial transactions where risk of potential loss exists due to changes in the market (market risk) or failure of the other party to the transaction to perform (counterparty credit risk). The potential loss could exceed the value of the financial assets recorded on the financial statements. Financial assets, which potentially expose each Fund to counterparty credit risk, consist principally of cash due from counterparties on forward, option and swap transactions, when applicable. The extent of each Fund’s exposure to counterparty credit risk in respect to these financial assets approximates their carrying value as recorded on the Statement of Assets and Liabilities.
Each Fund helps manage counterparty credit risk by entering into agreements only with counterparties the Adviser believes have the financial resources to honor their obligations and by having the Adviser monitor the financial stability of the counterparties. Additionally, counterparties may be
Notes to Financial Statements (continued)
required to pledge collateral daily (based on the daily valuation of the financial asset) on behalf of each Fund with a value approximately equal to the amount of any unrealized gain above a pre-determined threshold. Reciprocally, when each Fund has an unrealized loss, the Funds have instructed the custodian to pledge assets of the Funds as collateral with a value approximately equal to the amount of the unrealized loss above a pre-determined threshold. Collateral pledges are monitored and subsequently adjusted if and when the valuations fluctuate, either up or down, by at least the pre-determined threshold amount.
4. Fund Shares
Transactions in Fund shares during the current and prior fiscal period were as follows:
| | | | | | | | | | | | | | | | |
| | | Year Ended
10/31/16 | | | Year Ended
10/31/15 | |
| Equity Index | | Shares | | | Amount | | | Shares | | | Amount | |
| Shares sold: | | | | | | | | | | | | | | | | |
Class A | | | 922,412 | | | $ | 24,730,063 | | | | 1,212,174 | | | $ | 34,121,252 | |
Class C | | | 259,101 | | | | 6,895,542 | | | | 193,873 | | | | 5,395,103 | |
Class R3 | | | 1,047,676 | | | | 27,935,575 | | | | 1,908,120 | | | | 53,887,095 | |
Class I | | | 1,963,210 | | | | 52,218,312 | | | | 1,887,351 | | | | 53,296,331 | |
| Shares issued to shareholders due to reinvestment of distributions: | | | | | | | | | | | | | | | | |
Class A | | | 513,510 | | | | 13,592,394 | | | | 434,119 | | | | 11,853,413 | |
Class C | | | 39,683 | | | | 1,034,563 | | | | 24,084 | | | | 647,854 | |
Class R3 | | | 285,978 | | | | 7,564,920 | | | | 188,810 | | | | 5,152,266 | |
Class I | | | 1,015,025 | | | | 26,865,190 | | | | 931,976 | | | | 25,451,740 | |
| | | | 6,046,595 | | | | 160,836,559 | | | | 6,780,507 | | | | 189,805,054 | |
| Shares redeemed: | | | | | | | | | | | | | | | | |
Class A | | | (1,389,633 | ) | | | (37,194,208 | ) | | | (1,915,955 | ) | | | (53,987,783 | ) |
Class C | | | (162,264 | ) | | | (4,261,967 | ) | | | (77,013 | ) | | | (2,121,030 | ) |
Class R3 | | | (1,359,400 | ) | | | (35,833,542 | ) | | | (1,097,819 | ) | | | (30,921,236 | ) |
Class I | | | (4,566,524 | ) | | | (122,585,164 | ) | | | (4,674,020 | ) | | | (131,290,631 | ) |
| | | | (7,477,821 | ) | | | (199,874,881 | ) | | | (7,764,807 | ) | | | (218,320,680 | ) |
| Net increase (decrease) | | | (1,431,226 | ) | | $ | (39,038,322 | ) | | | (984,300 | ) | | $ | (28,515,626 | ) |
| | |
| | | Year Ended
10/31/16 | | | Year Ended
10/31/15 | |
| Mid Cap Index | | Shares | | | Amount | | | Shares | | | Amount | |
Shares sold: | | | | | | | | | | | | | | | | |
Class A | | | 2,111,356 | | | $ | 35,996,393 | | | | 3,139,586 | | | $ | 57,778,779 | |
Class C | | | 424,216 | | | | 7,021,490 | | | | 406,773 | | | | 7,204,779 | |
Class R3 | | | 1,982,443 | | | | 33,033,845 | | | | 2,148,382 | | | | 39,123,107 | |
Class I | | | 2,358,401 | | | | 40,701,945 | | | | 1,991,692 | | | | 36,910,290 | |
Shares issued to shareholders due to reinvestment of distributions: | | | | | | | | | | | | | | | | |
Class A | | | 901,201 | | | | 14,714,132 | | | | 648,368 | | | | 11,355,683 | |
Class C | | | 80,086 | | | | 1,248,545 | | | | 40,092 | | | | 669,243 | |
Class R3 | | | 924,991 | | | | 14,871,465 | | | | 692,188 | | | | 11,929,814 | |
Class I | | | 679,987 | | | | 11,154,360 | | | | 524,713 | | | | 9,237,147 | |
| | | | 9,462,681 | | | | 158,742,175 | | | | 9,591,794 | | | | 174,208,842 | |
Shares redeemed: | | | | | | | | | | | | | | | | |
Class A | | | (3,709,949 | ) | | | (63,068,597 | ) | | | (3,456,224 | ) | | | (63,497,156 | ) |
Class C | | | (227,732 | ) | | | (3,720,076 | ) | | | (118,923 | ) | | | (2,097,267 | ) |
Class R3 | | | (3,353,027 | ) | | | (56,440,509 | ) | | | (2,723,885 | ) | | | (49,197,900 | ) |
Class I | | | (3,291,982 | ) | | | (56,268,135 | ) | | | (3,071,661 | ) | | | (56,804,572 | ) |
| | | | (10,582,690 | ) | | | (179,497,317 | ) | | | (9,370,693 | ) | | | (171,596,895 | ) |
Net increase (decrease) | | | (1,120,009 | ) | | $ | (20,755,142 | ) | | | 221,101 | | | $ | 2,611,947 | |
| | | | | | | | | | | | | | | | |
| | | Year Ended
10/31/16 | | | Year Ended
10/31/15 | |
| Small Cap Index | | Shares | | | Amount | | | Shares | | | Amount | |
| Shares sold: | | | | | | | | | | | | | | | | |
Class A | | | 513,796 | | | $ | 6,831,166 | | | | 996,304 | | | $ | 14,851,836 | |
Class C | | | 126,725 | | | | 1,632,585 | | | | 82,412 | | | | 1,146,424 | |
Class R3 | | | 543,039 | | | | 7,063,169 | | | | 850,411 | | | | 12,243,536 | |
Class I | | | 481,293 | | | | 6,406,635 | | | | 661,394 | | | | 9,818,263 | |
| Shares issued to shareholders due to reinvestment of distributions: | | | | | | | | | | | | | | | | |
Class A | | | 151,998 | | | | 2,018,328 | | | | 179,793 | | | | 2,527,081 | |
Class C | | | 11,093 | | | | 139,006 | | | | 9,884 | | | | 130,829 | |
Class R3 | | | 165,441 | | | | 2,130,265 | | | | 218,581 | | | | 2,980,871 | |
Class I | | | 118,549 | | | | 1,579,827 | | | | 161,444 | | | | 2,281,268 | |
| | | | 2,111,934 | | | | 27,800,981 | | | | 3,160,223 | | | | 45,980,108 | |
| Shares redeemed: | | | | | | | | | | | | | | | | |
Class A | | | (1,171,803 | ) | | | (15,568,156 | ) | | | (934,579 | ) | | | (13,847,561 | ) |
Class C | | | (38,258 | ) | | | (491,400 | ) | | | (25,630 | ) | | | (356,749 | ) |
Class R3 | | | (1,153,682 | ) | | | (14,912,783 | ) | | | (1,079,100 | ) | | | (15,525,187 | ) |
Class I | | | (1,252,872 | ) | | | (16,722,795 | ) | | | (1,003,280 | ) | | | (14,885,580 | ) |
| | | | (3,616,615 | ) | | | (47,695,134 | ) | | | (3,042,589 | ) | | | (44,615,077 | ) |
| Net increase (decrease) | | | (1,504,681 | ) | | $ | (19,894,153 | ) | | | 117,634 | | | $ | 1,365,031 | |
5. Investment Transactions
Long-term purchases and sales (excluding investments purchased with collateral from securities lending and derivative transactions) during the current fiscal period were as follows:
| | | | | | | | | | | | |
| | | Equity
Index | | | Mid Cap
Index | | | Small Cap
Index | |
| Purchases | | $ | 15,926,104 | | | $ | 75,389,035 | | | $ | 13,610,600 | |
| Sales | | | 109,474,896 | | | | 94,522,995 | | | | 33,580,033 | |
6. Income Tax Information
Each Fund is a separate taxpayer for federal income tax purposes. Each Fund intends to distribute substantially all of its net investment income and net capital gains to shareholders and to otherwise comply with the requirements of Subchapter M of the Internal Revenue Code applicable to regulated investment companies. Therefore, no federal income tax provision is required.
For all open tax years and all major taxing jurisdictions, management of the Funds has concluded that there are no significant uncertain tax positions that would require recognition in the financial statements. Open tax years are those that are open for examination by taxing authorities (i.e., generally the last four tax year ends and the interim tax period since then). Furthermore, management of the Funds is also not aware of any tax positions for which it is reasonably possible that the total amounts of unrecognized tax benefits will significantly change in the next twelve months.
The following information is presented on an income tax basis. Differences between amounts for financial statement and federal income tax purposes are primarily due to timing differences in recognizing certain gains and losses on investment transactions. To the extent that differences arise that are permanent in nature, such amounts are reclassified within the capital accounts as detailed below. Temporary differences do not require reclassification. Temporary and permanent differences do not impact the NAVs of the Funds.
As of October 31, 2016, the cost and unrealized appreciation (depreciation) of investments (excluding investments in derivatives), as determined on a federal income tax basis, were as follows:
| | | | | | | | | | | | |
| | | Equity
Index | | | Mid Cap
Index | | | Small Cap
Index | |
| Cost of investments | | $ | 305,935,276 | | | $ | 512,538,198 | | | $ | 91,124,796 | |
| Gross unrealized: | | | | | | | | | | | | |
Appreciation | | $ | 440,299,245 | | | $ | 176,597,873 | | | $ | 39,105,280 | |
Depreciation | | | (17,525,559 | ) | | | (40,811,314 | ) | | | (9,905,409 | ) |
| Net unrealized appreciation (depreciation) of investments | | $ | 422,773,686 | | | $ | 135,786,559 | | | $ | 29,199,871 | |
Notes to Financial Statements (continued)
Permanent differences, primarily due to federal taxes paid, foreign currency transactions, investments in passive foreign investment companies and tax equalization resulted in reclassifications among the Funds’ components of net assets as of October 31, 2016, the Funds’ tax year end, as follows:
| | | | | | | | | | | | |
| | | Equity
Index | | | Mid Cap
Index | | | Small��Cap
Index | |
| Capital paid-in | | $ | 7,705,954 | | | $ | 5,924,900 | | | $ | 302,405 | |
| Undistributed (Over-distribution of) net investment income | | | — | | | | — | | | | 9,214 | |
| Accumulated net realized gain (loss) | | | (7,705,954 | ) | | | (5,924,900 | ) | | | (311,619 | ) |
The tax components of undistributed net ordinary income and net long-term capital gains as of October 31, 2016, the Funds’ tax year end, were as follows:
| | | | | | | | | | | | |
| | | Equity
Index | | | Mid Cap
Index | | | Small Cap
Index | |
| Undistributed net ordinary income1 | | $ | 2,120,594 | | | $ | 5,601,866 | | | $ | 803,648 | |
| Undistributed net long-term capital gains | | | 60,326,542 | | | | 39,414,220 | | | | 2,970,209 | |
| 1 | Net ordinary income consists of net taxable income derived from dividends, interest and short-term capital gains, if any. |
The tax character of distributions paid during the Funds’ tax years ended October 31, 2016 and October 31, 2015, was designated for purposes of the dividends paid deduction as follows:
| | | | | | | | | | | | |
| 2016 | | Equity
Index | | | Mid Cap
Index | | | Small Cap
Index | |
| Distributions from net ordinary income1 | | $ | 12,631,770 | | | $ | 4,751,633 | | | $ | 1,136,892 | |
| Distributions from net long-term capital gains | | | 43,502,344 | | | | 40,703,164 | | | | 5,098,754 | |
| | | |
| 2015 | | Equity
Index | | | Mid Cap
Index | | | Small Cap
Index | |
| Distributions from net ordinary income1 | | $ | 13,683,153 | | | $ | 9,058,762 | | | $ | 2,215,354 | |
| Distributions from net long-term capital gains | | | 36,856,970 | | | | 27,333,865 | | | | 6,415,074 | |
| 1 | Net ordinary income consists of net taxable income derived from dividends, interest and net short-term capital gains, if any. |
As of October 31, 2016, the Funds’ tax year end, the Funds did not have any unused capital loss carryforwards available for federal income tax purposes to be applied against future capital gains, if any.
7. Management Fees and Other Transactions with Affiliates
Management Fees
Each Fund’s management fee compensates the Adviser for overall investment advisory and administrative services and general office facilities. The Sub-Adviser is compensated for its services to the Funds from the management fees paid to the Adviser.
Each Fund’s management fee consists of two components – a fund-level fee, based only on the amount of assets within each individual Fund, and a complex-level fee, based on the aggregate amount of all eligible fund assets managed by the Adviser. This pricing structure enables each Fund’s shareholders to benefit from growth in the assets within their respective Fund as well as from growth in the amount of complex-wide assets managed by the Adviser.
The annual Fund-level fee, payable monthly, for each Fund is calculated according to the following schedule:
| | | | | | | | | | | | |
| Average Daily Net Assets | | Equity
Index | | | Mid Cap
Index | | | Small Cap
Index | |
| For the first $125 million | | | 0.1000 | % | | | 0.1500 | % | | | 0.1500 | % |
| For the next $125 million | | | 0.0875 | | | | 0.1375 | | | | 0.1375 | |
| For the next $250 million | | | 0.0750 | | | | 0.1250 | | | | 0.1250 | |
| For the next $500 million | | | 0.0625 | | | | 0.1125 | | | | 0.1125 | |
| For the next $1 billion | | | 0.0500 | | | | 0.1000 | | | | 0.1000 | |
| For net assets over $2 billion | | | 0.0250 | | | | 0.0750 | | | | 0.0750 | |
The annual complex-level fee, payable monthly, for each Fund is determined by taking the complex-level fee rate, which is based on the aggregate amount of “eligible assets” of all Nuveen funds as set forth in the schedule below, and making, as appropriate, an upward adjustment to that rate based upon the percentage of the particular fund’s assets that are not “eligible assets.” The complex level fee schedule for each Fund is as follows:
| | | | |
| Complex-Level Asset Breakpoint Level* | | Effective Rate at Breakpoint Level | |
| $55 billion | | | 0.2000 | % |
| $56 billion | | | 0.1996 | |
| $57 billion | | | 0.1989 | |
| $60 billion | | | 0.1961 | |
| $63 billion | | | 0.1931 | |
| $66 billion | | | 0.1900 | |
| $71 billion | | | 0.1851 | |
| $76 billion | | | 0.1806 | |
| $80 billion | | | 0.1773 | |
| $91 billion | | | 0.1691 | |
| $125 billion | | | 0.1599 | |
| $200 billion | | | 0.1505 | |
| $250 billion | | | 0.1469 | |
| $300 billion | | | 0.1445 | |
| * | The complex-level fee is calculated based upon the aggregate daily “eligible assets” of all Nuveen funds. Eligible assets do not include assets attributable to investments in other Nuveen funds or assets in excess of a determined amount (originally $2 billion) added to the Nuveen fund complex in connection with the Adviser’s assumption of the management of the former First American Funds effective January 1, 2011. Eligible assets include closed-end fund assets managed by the Adviser that are attributable to certain types of leverage. For these purposes, leverage includes the closed-end funds’ use of preferred stock and borrowings and certain investments in the residual interest certificates (also called inverse floating rate securities) in tender option bond (TOB) trusts, including the portion of assets held by the TOB trust that has been effectively financed by the trust’s issuance of floating rate securities, subject to an agreement by the Adviser as to certain funds to limit the amount of such assets for determining eligible assets in certain circumstances. As of October 31, 2016, the complex-level fee for each Fund was as follows: |
| | | | |
| Fund | | Complex-Level Fee | |
| Equity Index | | | 0.1998 | % |
| Mid Cap Index | | | 0.1760 | |
| Small Cap Index | | | 0.1841 | |
The Adviser has agreed to waive fees and/or reimburse expenses (“Expense Cap”) of each Fund so that total annual Fund operating expenses, (excluding 12b-1 distribution and/or service fees, interest expenses, taxes, acquired fund fees and expenses, fees incurred in acquiring and disposing of portfolio securities and extraordinary expenses) do not exceed the average daily net assets of any class of Fund shares in the amounts and for the time periods stated in the following table. The expense limitations expiring February 28, 2018 may be terminated or modified prior to the date only with the approval of the Board of Directors of the Funds.
| | | | | | |
| Fund | | Expense Cap | | | Expense Cap
Expiration Date |
| Equity Index | | | 0.34 | %* | | February 28, 2018 |
| Mid Cap Index | | | 0.41 | ** | | February 28, 2018 |
| Small Cap Index | | | 0.54 | *** | | February 28, 2018 |
| * | Effective June 30, 2016. Prior to June 30, 2016, the Fund’s Temporary Expense Cap was 0.37%. |
| ** | Effective June 30, 2016. Prior to June 30, 2016, the Fund’s Temporary Expense Cap was 0.50%. |
| *** | Effective June 30, 2016. Prior to June 30, 2016, the Fund’s Temporary Expense Cap was 0.58%. |
Other Transactions with Affiliates
The Trust pays no compensation directly to those of its directors who are affiliated with the Adviser or to its officers, all of whom receive remuneration for their services to the Trust from the Adviser or its affiliates. The Board has adopted a deferred compensation plan for independent directors that enables directors to elect to defer receipt of all or a portion of the annual compensation they are entitled to receive from certain Nuveen-advised funds. Under the plan, deferred amounts are treated as though equal dollar amounts had been invested in shares of select Nuveen-advised funds.
Class A Shares are offered at their NAV per share with no up-front sales charge. During the current fiscal period, Nuveen Securities, LLC (the “Distributor”), a wholly owned subsidiary of Nuveen, received 12b-1 service fees in Class A Shares, substantially all of which were paid to compensate financial intermediaries for providing services to shareholders relating to their investments.
During the current fiscal period, the Distributor compensated financial intermediaries directly with commission advances at the time of purchase as follows:
| | | | | | | | | | | | |
| | | Equity
Index | | | Mid Cap
Index | | | Small Cap
Index | |
| Commission advances (Unaudited) | | $ | 62,440 | | | $ | 66,431 | | | $ | 17,483 | |
Notes to Financial Statements (continued)
To compensate for commissions advanced to financial intermediaries, all 12b-1 service and distribution fees collected on Class C Shares during the first year following a purchase are retained by the Distributor. During the current fiscal period, the Distributor retained such 12b-1 fees as follows:
| | | | | | | | | | | | |
| | | Equity
Index | | | Mid Cap
Index | | | Small Cap
Index | |
| 12b-1 fees retained (Unaudited) | | $ | 47,263 | | | $ | 61,552 | | | $ | 14,503 | |
The remaining 12b-1 fees charged to the Funds were paid to compensate financial intermediaries for providing services to shareholders relating to their investments.
The Distributor also collected and retained CDSC on share redemptions during the current fiscal period as follows:
| | | | | | | | | | | | |
| | | Equity
Index | | | Mid Cap
Index | | | Small Cap
Index | |
| CDSC retained (Unaudited) | | $ | 2,055 | | | $ | 3,581 | | | $ | 409 | |
8. Borrowing Arrangements
Uncommitted Line of Credit
During the current fiscal period, the Funds participated in an unsecured bank line of credit (“Unsecured Credit Line”) under which outstanding balances would bear interest at a variable rate. Although the Funds participated in the Unsecured Credit Line, they did not have any outstanding balances during the current fiscal period.
Committed Line of Credit
The Funds, along with certain other funds managed by the Adviser (“Participating Funds”), have established a 364-day, approximately $2.5 billion standby credit facility with a group of lenders, under which the Participating Funds may borrow for various purposes other than leveraging for investment purposes. A large portion of this facility’s capacity (and its associated costs as described below) is currently dedicated for use by a small number of Participating Funds, which does not include any of the Funds covered by this shareholder report. The remaining capacity under the facility (and the corresponding portion of the facility’s annual costs) is separately dedicated to most of the other open-end funds in the Nuveen fund family, including all of the Funds covered by this shareholder report, along with a number of Nuveen closed-end funds. The credit facility expires in July 2017 unless extended or renewed.
The credit facility has the following terms: a fee of 0.15% per annum on unused commitment amounts, and interest at a rate equal to the higher of (a) one-month LIBOR (London Inter-Bank Offered Rate) plus 1.25% per annum or (b) the Fed Funds rate plus 1.25% per annum on amounts borrowed. Participating Funds paid administration, legal and arrangement fees, which are recognized as a component of “Other expenses” on the Statement of Operations, and along with commitment fees, have been allocated among such Participating Funds based upon the relative proportions of the facility’s aggregate capacity reserved for them and other factors deemed relevant by the Adviser and the Board of each Participating Fund.
During the current fiscal period, none of the Funds utilized this facility.
9. Subsequent Events
Fund Liquidation
On November 30, 2016, the Adviser announced that the Funds will be liquidated after the close of business on April 27, 2017, as approved by the Funds’ Board of Directors. Effective December 19, 2016, the Funds will stop accepting purchases from new investors and existing shareholders, except that defined contribution retirement plans that hold Fund shares as of November 30, 2016 may continue to purchase Fund shares until April 24, 2017. Existing shareholders may continue to reinvest dividends and capital gains distributions received from the Funds. After the close of business on April 27, 2017, the Funds will liquidate any remaining shareholder accounts and will send shareholders the proceeds of the liquidation.
Additional
Fund Information (Unaudited)
| | | | | | | | | | |
| | | | | |
| | Fund Manager Nuveen Fund Advisors, LLC 333 West Wacker Drive Chicago, IL 60606 Sub-Adviser Nuveen Asset Management, LLC 333 West Wacker Drive Chicago, IL 60606 | | Independent Registered
Public Accounting Firm PricewaterhouseCoopers LLP One North Wacker Drive Chicago, IL 60606 Custodian U.S. Bank National Association 1555 North RiverCenter Drive Suite 302 Milwaukee, WI 53202 | | Legal Counsel Chapman and Cutler LLP Chicago, IL 60603 | | Transfer Agent and
Shareholder Services
Boston Financial Data Services, Inc. Nuveen Investor Services P.O. Box 8530 Boston, MA 02266-8530 (800)257-8787 | | |
| | | | | | | | | | | | | | |
| | | | | |
| | | | | | | | | | |
| | |
| | Distribution Information: The Funds hereby designate their percentages of dividends paid from net ordinary income as dividends qualifying for the 70% dividends received deduction (“DRD”) for corporations and their percentages as qualified dividend income (“QDI”) for individuals under Section 1(h)(11) of the Internal Revenue Code as shown in the accompanying table. The actual qualified dividend income distributions will be reported to shareholders on Form 1099-DIV which will be sent to shareholders shortly after calendar year end. | | |
| | | | | | | |
| | | | | | | | | Equity
Index | | Mid Cap
Index | | Small Cap
Index | | |
| | % QDI | | 100% | | 100% | | 60% | | |
| | % DRD | | 100% | | 100% | | 57% | | |
| | |
| | Long-Term Capital Gain Distributions: The Funds hereby designate as long-term capital gain dividends, pursuant to Internal Revenue Code Section 852(b)(3), the amount shown in the accompanying table or, if greater, the amount necessary to reduce earnings and profits of the Funds related to net capital gain to zero for the tax year ended October 31, 2016: | | |
| | | | | | |
| | | | | | | Equity
Index | | Mid Cap
Index | | Small Cap
Index | | |
| | Long-term capital gain dividends | | $ 51,141,319 | | $ 46,301,576 | | $ 5,401,170 | | |
| | | | | |
| | | | | | | | | | |
| | |
| | Quarterly Form N-Q Portfolio of Investments Information: Each Fund is required to file its complete schedule of portfolio holdings with the Securities and Exchange Commission (SEC) for the first and third quarters of each fiscal year on Form N-Q. You may obtain this information directly from the SEC. Visit the SEC on-line at http://www.sec.gov or in person at the SEC’s Public Reference Room in Washington, D.C. Call the SEC toll-free at (800) SEC-0330 for room hours and operation. | | |
| | | |
| | | | | | |
| | |
| | Nuveen Funds’ Proxy Voting Information: You may obtain (i) information regarding how each fund voted proxies relating to portfolio securities held during the most recent twelve-month period ended June 30, without charge, upon request, by calling Nuveen toll-free at (800) 257-8787 or on Nuveen’s website at www.nuveen.com and (ii) a description of the policies and procedures that each fund used to determine how to vote proxies relating to portfolio securities without charge, upon request, by calling Nuveen toll-free at (800) 257-8787. You may also obtain this information directly from the SEC. Visit the SEC on-line at http://www.sec.gov. | | |
| | | |
| | | | | | |
| | |
| | FINRA BrokerCheck: The Financial Industry Regulatory Authority (FINRA) provides information regarding the disciplinary history of FINRA member firms and associated investment professionals. This information as well as an investor brochure describing FINRA BrokerCheck is available to the public by calling the FINRA BrokerCheck Hotline number at (800) 289-9999 or by visiting www.FINRA.org. | | |
Glossary of Terms
Used in this Report (Unaudited)
Average Annual Total Return: This is a commonly used method to express an investment’s performance over a particular, usually multi-year time period. It expresses the return that would have been necessary each year to equal the investment’s actual cumulative performance (including change in NAV or offer price and reinvested distributions and capital gains, if any) over the time period being considered.
Gross Domestic Product (GDP): The total market value of all final goods and services produced in a country/region in a given year, equal to total consumer, investment and government spending, plus the value of exports, minus the value of imports.
Lipper S&P 500® Index Objective Funds Classification Average: Represents the average annualized total return for all reporting funds in the Lipper S&P 500® Index Objective Funds Classification. Lipper returns account for the effects of management fees and assume reinvestment of distributions but do not reflect any applicable sales charges.
Lipper Mid-Cap Core Funds Classification Average: Represents the average annualized total return for all reporting funds in the Lipper Mid-Cap Core Funds Classification. Lipper returns account for the effects of management fees and assume reinvestment of distributions but do not reflect any applicable sales charges.
Lipper Small-Cap Core Funds Classification Average: Represents the average annualized total return for all reporting funds in the Lipper Small-Cap Core Funds Classification. Lipper returns account for the effects of management fees and assume reinvestment of distributions but do not reflect any applicable sales charges.
Net Asset Value (NAV) Per Share: A fund’s Net Assets is equal to its total assets (securities, cash and accrued earnings) less its total liabilities. For funds with multiple classes, Net Assets are determined separately for each share class. NAV per share is equal to the fund’s (or share class’) Net Assets divided by its number of shares outstanding.
Russell 2000® Index: An index that measures the performance of the small-cap segment of the U.S. equity universe. The Russell 2000 Index is a subset of the Russell 3000® Index representing approximately 10% of the total market capitalization of that index. It includes approximately 2,000 of the smallest securities based on a combination of their market cap and current index membership. The Russell 3000® Index measures the performance of the 3,000 largest companies based on total market capitalization, which represents approximately 98% of the investable U.S. equity market. The index returns assume reinvestment of distributions, but do not reflect any applicable sales charges or management fees.
S&P 500® Index: An unmanaged index generally considered representative of the U.S. stock market. The index returns assume reinvestment of distributions, but do not reflect any applicable sales charges or management fees.
S&P MidCap 400® Index: An unmanaged, market value-weighted index of 400 mid-cap companies. The index returns assume reinvestment of distributions, but do not reflect any applicable sales charges or management fees.
Tax Equalization: The practice of treating a portion of the distribution made to a redeeming shareholder, which represents his proportionate part of undistributed net investment income and capital gain as a distribution for tax purposes. Such amounts are referred to as the equalization debits (or payments) and will be considered a distribution to the shareholder of net investment income and capital gain for calculation of the fund’s dividends paid deduction.
Annual Investment Management Agreement
Approval Process (Unaudited)
The Board of Directors of each Fund (the “Board,” and each Director a “Board Member”), including the Board Members who are not parties to the Funds’ advisory or sub-advisory agreements or “interested persons” of any such parties (the “Independent Board Members”), is responsible for overseeing the performance of the investment adviser and sub-adviser to the respective Fund and determining whether to continue such Fund’s advisory agreement (the “Investment Management Agreement”) between the Fund and Nuveen Fund Advisors, LLC (the “Adviser”) and the sub-advisory agreement (the “Sub-Advisory Agreement” and, together with the Investment Management Agreement, the “Advisory Agreements”) between the Adviser and Nuveen Asset Management, LLC (the “Sub-Adviser”). Following an initial term with respect to each Fund upon its commencement of operations, the Board reviews the Investment Management Agreement and the Sub-Advisory Agreement on behalf of such Fund and votes to determine whether the respective Advisory Agreement should be renewed. Accordingly, at an in-person meeting held on May 24-26, 2016 (the “May Meeting”), the Board, including a majority of the Independent Board Members, considered and approved the existing Advisory Agreements for the Funds.
During the year, the Board and its Committees met regularly to receive materials and discuss a variety of topics impacting the Funds including, among other things, overall market conditions and market performance, Fund investment performance, brokerage execution, valuation of securities, Rule 12b-1 plans and payments, sub-transfer agency and other payments to financial intermediaries, compliance matters, securities lending, risk management and ongoing initiatives. The Board had established several standing Committees, including the Open-end Fund Committee and Closed-end Fund Committee which permit the Board Members to delve further into the topics particularly relevant to the respective product line and enhance the Board’s effectiveness and oversight of the Funds. The Board also seeks to meet with the Sub-Adviser and its investment team at least once over a multiple year rotation through site visits. The information and knowledge the Board gained throughout the year from the Board and Committee meetings, site visits and the related materials were relevant to the Board’s evaluation of the Advisory Agreements, and the Board took such information into account in its review of the Advisory Agreements.
In addition to the materials received throughout the year, the Board received additional materials prepared specifically for its annual review of the Advisory Agreements in response to a request by independent legal counsel on behalf of the Independent Board Members. The materials addressed a variety of topics, including a description of the services provided by the Adviser and the Sub-Adviser (each, a “Fund Adviser”); a review of fund performance with a detailed focus on any performance outliers; an analysis of the investment teams; an analysis of the fees and expense ratios of the Funds, including information comparing such fees and expenses to that of peer groups; an assessment of shareholder services for the Funds and of the performance of certain service providers; a review of initiatives instituted or continued during the past year; and information regarding the profitability of the Fund Advisers, the compensation of portfolio managers, and compliance and risk matters.
As part of its annual review, the Board held a separate meeting on April 12-13, 2016 to review the Funds’ investment performance and consider an analysis by the Adviser of the Sub-Adviser examining, among other things, the team’s assets under management, investment performance, investment approach, and the stability and structure of the Sub-Adviser’s organization and investment team. During the review, the Independent Board Members requested and received additional information from management. Throughout the year and throughout their review of the Advisory Agreements, the Independent Board Members were assisted by independent legal counsel. The Independent Board Members met separately with independent legal counsel without management present and received a memorandum from such counsel outlining their fiduciary duties and legal standards in reviewing the Advisory Agreements. The Independent Board Members’ review of the Advisory Agreements reflected an ongoing process that incorporated the information and considerations that occurred over the years, including the most recent year, as well as the information specifically furnished for the renewal process. In deciding to renew the Advisory Agreements, the Independent Board Members did not identify a particular factor as controlling, but rather the decision reflected the comprehensive consideration of all the information presented. The following summarizes the principal factors, but not all the factors, the Board considered in its review of the Advisory Agreements and its conclusions.
A. Nature, Extent and Quality of Services
In evaluating the renewal of the Advisory Agreements, the Independent Board Members received and considered information regarding the nature, extent and quality of the applicable Fund Adviser’s services provided to the respective Fund and the initiatives undertaken during the past year by the Adviser. The Board recognized the comprehensive set of services the Adviser provided to manage and operate the Nuveen funds, including (a) product management (such as setting dividends, positioning the product in the marketplace, managing the relationships with the distribution platforms, maintaining and enhancing shareholder communications and reporting to the Board); (b) investment services (such as overseeing sub-advisers and other service providers; analyzing investment performance and risks; overseeing risk management and disclosure; developing and interpreting investment policies; assisting in the development of products; helping to prepare financial statements and marketing disclosures; and overseeing trade execution); (c) fund administration (such as helping to prepare fund tax returns and complete other tax compliance matters; and helping to prepare regulatory filings and shareholder reports); (d) fund Board administration (such as preparing Board materials and organizing and providing assistance
Annual Investment Management Agreement Approval Process (Unaudited) (continued)
for Board meetings); (e) compliance (such as helping to devise and maintain the funds’ compliance program and related testing); and (f) legal support (such as helping to prepare registration statements and proxy statements, interpreting regulations and policies and overseeing fund activities).
The Board reviewed the continued investment the Adviser had made in its business to continue to strengthen the breadth and quality of its services to the benefit of the Nuveen funds. The Board noted the Adviser’s additional staffing in key areas that support the funds and the Board, including in investment services, operations, fund governance, compliance, fund administration, product management, retail distribution and information technology. Among the enhancements to its services, the Board recognized the Adviser’s (a) expanded activities and support required as a result of regulatory developments, including in areas of compliance and reporting; (b) increased support for dividend management; (c) continued investment in its technical capabilities as the Adviser continued to build out a centralized fund data platform, enhance mobility and remote access capabilities, rationalize and upgrade software platforms, and automate certain regulatory liquidity determinations; (d) continued efforts to rationalize the product line through mergers, liquidations and re-positioning of the Nuveen funds with the goal of increasing efficiencies, reducing costs, improving performance and addressing shareholder needs; (e) continued efforts to develop new lines of business designed to enhance the Nuveen product line and meet investor demands; and (f) continued commitment to enhance risk oversight, including the formation of the operational risk group to provide operational risk assessment, the access to platforms which provide better risk reporting to support investment teams, and the development of a new team to initially review new products and major product initiatives. The Board also recognized the Adviser’s efforts to renegotiate certain fees of other service providers which culminated in reduced expenses for all funds for custody and accounting services without diminishing the breadth and quality of the services provided. The Board considered the Chief Compliance Officer’s report regarding the Adviser’s compliance program, the Adviser’s continued development, execution and management of its compliance program, and the additions to the compliance team to support the continued growth of the Nuveen fund family and address regulatory developments.
The Board also considered information highlighting the various initiatives that the Adviser had implemented or continued during the year to enhance or support the open-end fund product line. The Board noted the Adviser’s continued initiatives (a) to develop and offer new outcome-oriented funds; (b) to refine the reports to the Board, including enhanced reporting regarding payments to intermediaries, as well as provide presentations to the Board to keep it apprised of various topics that are relevant to the open-end fund product line (such as marketing initiatives, portfolio analytics and sales results); (c) to modify the contingent deferred sales load structure for Class A shares to be more competitive with peers; (d) to launch a new share class to attract institutional clients; and (e) to change portfolio managers on various funds. The Board recognized that initiatives that attract assets to the Nuveen family of funds benefited the funds as fixed costs would be spread over a larger asset base and, as described below, through the complex-wide arrangement which generally would provide that the management fees of the funds (subject to limited exceptions) are reduced as asset levels for the complex increase. The Board also considered the Adviser’s review of the pricing on its entire open-end fund line which resulted in either a reduction in the contractual management fee, a reduction in (or, in certain cases, the adoption of) a temporary expense cap or a combination thereof for numerous funds in the complex helping to better position such funds for future growth, including Nuveen Equity Index Fund (the “Equity Index Fund”) and Nuveen Mid Cap Index Fund (the “Mid Cap Index Fund”), each of which reduced its management fee, and Nuveen Small Cap Index Fund (the “Small Cap Index Fund”), which reduced both its management fee and temporary expense cap.
As noted, the Adviser also oversees the Sub-Adviser who primarily provides the portfolio advisory services to the Funds. The Board recognized the skill and competency of the Adviser in monitoring and analyzing the performance of the Sub-Adviser and managing the sub-advisory relationship. The Board noted that the Adviser recommended the renewal of each Sub-Advisory Agreement.
Based on their review, the Independent Board Members found that, overall, the nature, extent and quality of services provided to the respective Funds under each applicable Advisory Agreement were satisfactory.
B. The Investment Performance of the Funds and Fund Advisers
The Board considered the long-term and short-term performance history of the Nuveen funds. As noted above, the Board reviewed fund performance at its quarterly meetings throughout the year and took into account the information derived from the discussions with representatives of the Adviser about fund performance at these meetings. The Board also considered the Adviser’s analysis of fund performance with particular focus on any performance outliers and the factors contributing to such performance and any steps the investment team had taken to address performance concerns. The Board reviewed, among other things, each Fund’s investment performance both on an absolute basis and in comparison to peer funds (the “Performance Peer Group”) and to recognized and/or customized benchmarks (i.e., generally benchmarks derived from multiple recognized benchmarks) for the quarter, one-, three- and five-year periods ending December 31, 2015, as well as performance information reflecting the first quarter of 2016.
In evaluating performance information, the Board recognized the following factors may impact the performance data as well as the consideration to be given to particular performance data:
| | • | | The performance data reflected a snapshot in time, in this case as of the end of the most recent calendar year or quarter. A different performance period, however, could generate significantly different results. |
| | • | | Long-term performance can be adversely affected by even one period of significant underperformance so that a single investment decision or theme had the ability to disproportionately affect long-term performance. |
| | • | | Shareholders evaluate performance based on their own holding period which may differ from the performance period reviewed by the Board, leading to different performance results. |
| | • | | Open-end funds offered multiple classes and the performance data provided for open-end funds was based on Class A shares. The performance of the other classes of a fund, however, should be substantially similar on a relative basis because all of the classes would be invested in the same portfolio of securities and differences in performance among classes could be principally attributed to the variations in distribution and servicing expenses of each class. |
| | • | | The Board recognized the difficulty in establishing appropriate peer groups and benchmarks for certain funds, including the Equity Index Fund. The Board noted that management classified the Performance Peer Groups as low, medium and high in relevancy and took the relevancy of the Performance Peer Group into account when considering the comparative performance data. If the Performance Peer Group differed somewhat from a fund, the Board recognized that the comparative performance data may be of limited value. The Board also recognized that each fund operated pursuant to its own investment objective(s), parameters and restrictions which may differ from that of the Performance Peer Group or benchmark and that these variations lead to differences in performance results. |
With respect to any Nuveen funds for which the Board has identified performance concerns, the Board monitors such funds closely until performance improves, discusses with the Adviser the reasons for such results, considers those steps necessary or appropriate to address such issues, and reviews the results of any efforts undertaken. The Board was aware, however, that shareholders chose to invest or remain invested in a fund knowing that the Adviser and the applicable sub-adviser manage the fund, knowing the fund’s investment strategy and seeking exposure to that strategy (even if the strategy was “out of favor” in the marketplace) and knowing the fund’s fee structure.
For the Equity Index Fund, the Board noted that the Fund ranked in its Performance Peer Group in the fourth quartile in the one-, three- and five-year periods and underperformed its benchmark for each of such periods. In evaluating the peer comparative data, the Board recognized that the peer group was classified as low relevancy because the Fund was compared to funds in a no-load category, limiting the comparative value among peers when assessing performance. The Board also noted that, given the Fund’s investment mandate, tracking error was a more appropriate measure of the Fund’s performance and the skill applied by the Sub-Adviser. The Board therefore considered the close tracking error for the one- and three-year periods. The Board also recognized the Fund’s positive absolute performance for the one-, three- and five-year periods. Given the Fund’s investment mandate, the Board was satisfied with the explanation for the variance from peer performance and with the Fund’s performance.
For the Mid Cap Index Fund, the Board noted that, although the Fund underperformed its benchmark in the one-, three- and five-year periods, the Fund ranked in its Performance Peer Group in the second quartile in the one- and five-year periods and the third quartile in the three-year period. The Board determined that the Fund’s performance had been satisfactory.
For the Small Cap Index Fund, the Board noted that, although the Fund underperformed its benchmark in the one-, three- and five-year periods, the Fund ranked in its Performance Peer Group in the third quartile in each of these periods. The Board determined that the Fund’s performance had been satisfactory.
C. Fees, Expenses and Profitability
1. Fees and Expenses
The Board evaluated the management fees and other fees and expenses of each Fund. The Board reviewed, among other things, the gross and net management fees and net total expenses of each Fund (expressed as a percentage of average net assets) in absolute terms and also in comparison to the fee and expense levels of a comparable universe of funds (the “Peer Universe”) and to a more focused subset in the Peer Universe (the “Peer Group”), each selected by an independent third-party fund data provider. The Independent Board Members also reviewed the methodology regarding the construction of the applicable Peer Universe and Peer Group.
In their evaluation of the management fee schedule, the Independent Board Members considered the fund-level and complex-wide breakpoint schedules, as described in further detail below. The Independent Board Members also took into account any fee waivers and/or expense reimbursements provided by Nuveen. In this regard, as noted above, the Board considered that management recently completed a review of the pricing of its open-end funds which resulted in the reduction of management fees and/or expense caps of various open-end funds. The Independent Board Members considered that the foregoing changes were estimated to result in significant savings to such funds either through a reduction in advisory fees paid or an increase in the fee waivers absorbed by Nuveen. In this regard, the Board noted that the Adviser agreed to reduce the management fee for the Equity Index Fund and the Mid Cap Index Fund and reduce both the management fee and temporary expense cap for the Small Cap Index Fund.
In reviewing the comparative fee and expense information, the Independent Board Members recognized that various factors such as the limited size and particular composition of the Peer Universe or Peer Group (including the inclusion of other Nuveen funds in the peer set); expense anomalies; changes in the funds comprising the Peer Universe or Peer Group from year to year; levels of reimbursement or fee waivers; the timing of information used; and differences in services provided can impact the usefulness of the comparative data in helping to assess the appropriateness of a fund’s fees and expenses. In addition, in reviewing a fund’s fees and expenses compared to the fees and expenses of its peers, the Board
Annual Investment Management Agreement Approval Process (Unaudited) (continued)
generally considered the fund’s expenses and fees to be higher if they were over 10 basis points higher, slightly higher if they were 6 to 10 basis points higher, in line if they were within approximately 5 basis points higher than the peer average and below if they were below the peer average of the Peer Group. The Board reviewed the net expense ratio in recognition that the net expense ratio generally best represented the net experience of the shareholders of a fund as it directly reflected the costs of investing in the respective fund. The Board noted that the majority of the Nuveen funds had a net expense ratio near or below the average of the respective peers. For funds with a net expense ratio of 6 basis points or higher than their respective peer average, the Independent Board Members reviewed the reasons for the outlier status and were satisfied with the explanation for the difference or with any steps taken to address the difference.
The Board noted that the Equity Index Fund had a net management fee below its peer average and a net expense ratio in line with its peer average, the Small Cap Index Fund had a net management fee and a net expense ratio below its respective peer average, and the Mid Cap Index Fund had a net expense ratio higher than its peer average but a net management fee in line with its peer average. The Board noted that the Mid Cap Index Fund’s net expense ratio was above its Peer Group average, in part, because some funds in the Peer Group do not assess a 12b-1 fee. Further, the Board noted that the Adviser agreed to reduce the contractual management fee for the Equity Index Fund and the Mid Cap Index Fund, and reduce both the contractual management fee and temporary expense cap for the Small Cap Index Fund.
Based on their review of the fee and expense information provided, the Independent Board Members determined that each Fund’s management fees (as applicable) to a Fund Adviser were reasonable in light of the nature, extent and quality of services provided to the Fund.
2. Comparisons with the Fees of Other Clients
The Board also reviewed information regarding the fee rates for other types of clients advised or sub-advised by the respective Fund Adviser. For the Adviser and/or its affiliated sub-advisers, such other clients may include: separately managed accounts (such as retail, institutional or wrap accounts), hedge funds, other investment companies that are not offered by Nuveen but are sub-advised by one of Nuveen’s affiliated sub-advisers, foreign investment companies offered by Nuveen, and collective investment trusts.
The Board recognized that each Fund had an affiliated sub-adviser. With respect to affiliated sub-advisers, including the Sub-Adviser, the Board reviewed, among other things, the range of advisory fee rates and average fee rate assessed for the different types of clients. The Board reviewed information regarding the different types of services provided to the Funds compared to that provided to these other clients which typically did not require the same breadth of day-to-day services required for registered funds. The Board further considered information regarding the differences in, among other things, the distribution systems, investment policies, investor profiles, and account sizes between the Nuveen funds and the other types of clients. In addition, the Independent Board Members also recognized that the management fee rates of the foreign funds advised by the Adviser may also vary due to, among other things, differences in the client base, governing bodies, operational complexities and services covered by the management fee. The Independent Board Members recognized that the foregoing variations resulted in different economics among the product structures and culminated in varying management fees among the types of clients and funds.
The Board also was aware that, since the Funds had a sub-adviser, each Fund’s management fee reflected two components, the fee retained by the Adviser for its services and the fee the Adviser paid to the Sub-Adviser. The Board noted that many of the administrative services provided to support the Funds by the Adviser may not be required to the same extent or at all for the institutional clients or other clients. In general, the Board noted that higher fee levels reflected higher levels of service provided by the Fund Adviser, increased investment management complexity, greater product management requirements and higher levels of business risk or some combination of the foregoing. Given the inherent differences in the various products, particularly the extensive services provided to the Funds, the Independent Board Members concluded such facts justify the different levels of fees.
3. Profitability of Fund Advisers
In conjunction with their review of fees, the Independent Board Members also considered the profitability of Nuveen for its advisory activities on an absolute basis and in comparison to other investment advisers. The Independent Board Members reviewed, among other things, Nuveen’s adjusted operating margins, the gross and net revenue margins (pre-tax and after-tax) for advisory activities for the Nuveen funds, and the revenues, expenses, and net income (pre-tax and after-tax) of Nuveen for each of the last two calendar years. The Independent Board Members reviewed an analysis of the key drivers behind the changes in revenues and expenses that impacted profitability in 2015. The Independent Board Members also noted that the sub-advisory fees for the Funds are paid by the Adviser, however, the Board recognized that the Sub-Adviser is affiliated with Nuveen. In their review, the Independent Board Members recognized that profitability data is rather subjective as various allocation methodologies may be reasonable to employ but yet yield different results. The Board also reviewed the results of certain alternative methodologies. The Board considered the allocation methodology employed to prepare the profitability data as well as a summary of the refinements to the methodology that had been adopted over the years which may limit some of the comparability of Nuveen’s revenue margins over time. Two Independent Board Members also served as point persons for the Board throughout the year to review and discuss the methodology employed to develop the profitability analysis and any proposed changes thereto and to keep the Board apprised of such changes during the year. In reviewing the profitability data, the Independent Board Members noted that Nuveen’s operating margin as well as its margins for its advisory activities to the Nuveen funds for 2015 were consistent with such margins for 2014.
The Board also considered Nuveen’s adjusted operating margins compared to that of other comparable investment advisers (based on asset size and composition) with publicly available data. The Independent Board Members recognized, however, the limitations of the comparative data as the other advisers may have a different business mix, employ different allocation methodologies, have different capital structure and costs, may not be representative of the industry or other factors that limit the comparability of the profitability information. Nevertheless, the Independent Board Members noted that Nuveen’s adjusted operating margins appeared comparable to the adjusted margins of the peers.
Further, as the Adviser is a wholly-owned subsidiary of Nuveen which in turn is an operating division of TIAA Global Asset Management, the investment management arm of Teachers Insurance and Annuity Association of America (“TIAA-CREF”), the Board reviewed a balance sheet for TIAA-CREF reflecting its assets, liabilities and capital and contingency reserves for the last two calendar years to have a better understanding of the financial stability and strength of the TIAA-CREF complex, together with Nuveen.
Based on the information provided, the Independent Board Members noted that the Adviser appeared to be sufficiently profitable to operate as a viable investment management firm and to honor its obligations as a sponsor of the Nuveen funds.
With respect to the Sub-Adviser, the Independent Board Members also considered the profitability of the Sub-Adviser from its relationship with the Nuveen funds. The Independent Board Members reviewed the Sub-Adviser’s revenues, expenses and revenue margins (pre- and post-tax) for its advisory activities for the calendar year ended December 31, 2015. The Independent Board Members also reviewed profitability analysis reflecting the revenues, expenses and revenue margin (pre- and post-tax) by asset type for the Sub-Adviser for the calendar year ending December 31, 2015.
In evaluating the reasonableness of the compensation, the Independent Board Members also considered other amounts paid to a Fund Adviser by the Funds as well as indirect benefits (such as soft dollar arrangements), if any, the Fund Adviser and its affiliates received or were expected to receive that were directly attributable to the management of a Fund. See Section E below for additional information on indirect benefits a Fund Adviser may receive as a result of its relationship with the Funds.
Based on their review, the Independent Board Members determined that the Adviser’s and the Sub-Adviser’s levels of profitability were reasonable in light of the respective services provided.
D. Economies of Scale and Whether Fee Levels Reflect These Economies of Scale
The Independent Board Members recognized that as the assets of a particular fund or the Nuveen complex in the aggregate increase over time, economies of scale may be realized with respect to the management of the funds, and the Independent Board Members considered the extent to which these economies are shared with the funds and their shareholders. Although the Independent Board Members recognized that economies of scale are difficult to measure with precision, the Board noted that there were several acceptable means to share economies of scale, including through breakpoints in the management fee schedule reducing the fee rates as asset levels grow, fee waiver and expense limitation agreements and the Adviser’s investment in its business which can enhance the services provided to the funds. With respect to breakpoints, the Independent Board Members noted that subject to certain exceptions, the funds in the Nuveen complex, including the Funds, pay a management fee to the Adviser which is generally comprised of a fund-level component and complex-level component. The fund-level fee component declines as the assets of the particular fund grow and the complex-level fee component declines when eligible assets of all the funds in the Nuveen complex combined grow. The complex-wide fee arrangement was designed to capture economies of scale achieved when total fund complex assets increase, even if the assets of a particular fund are unchanged or decrease. The approach reflected the notion that some of Nuveen’s costs were attributable to services provided to all its funds in the complex, and therefore all funds should benefit if these costs were spread over a larger asset base.
The Independent Board Members reviewed the breakpoint and complex-wide schedules and any savings achieved from expense caps (as applicable), fund-level breakpoints and complex-wide fee reductions for the 2015 calendar year for the funds. In this regard, the Independent Board Members noted that additional economies of scale were shared with shareholders of each Fund through its temporary expense cap.
In addition, the Independent Board Members recognized the Adviser’s ongoing investment in its business to expand or enhance the services provided to the Nuveen funds. The Independent Board Members noted, among other things, the additions to groups who play a key role in supporting the funds including in fund administration, operations, fund governance, investment services, compliance, product management, retail distribution and technology. The Independent Board Members also recognized the investments in systems necessary to manage the funds including in areas of risk oversight, information technology and compliance.
Based on their review, the Independent Board Members concluded that the current fee structure was acceptable and reflected economies of scale to be shared with shareholders when assets under management increase.
E. Indirect Benefits
The Independent Board Members received and considered information regarding other additional benefits the respective Fund Adviser or its affiliates may receive as a result of their relationship with the Funds, including compensation paid to affiliates and research received in connection with brokerage transactions (i.e., soft dollar arrangements). In this regard, the Independent Board Members recognized that an affiliate of the Adviser served as the Funds’ principal underwriter and may receive compensation therefore from, among other things, sales charges, distribution fees and shareholder
Annual Investment Management Agreement Approval Process (Unaudited) (continued)
services fees (which included fees received pursuant to any 12b-1 plan). The Independent Board Members therefore took into account, among other things, the 12b-1 fees retained by Nuveen during the last calendar year.
In addition to the above, the Independent Board Members considered that the Funds’ portfolio transactions are allocated by the Sub-Adviser and the Sub-Adviser may benefit from research received through soft-dollar arrangements. The Board noted, however, that with respect to transactions in fixed income securities, such securities generally trade on a principal basis and do not generate soft dollar credits. Although the Board recognized the Sub-Adviser may benefit from a soft dollar arrangement if it does not have to pay for this research out of its own assets, the Board also recognized that any such research may benefit the Funds to the extent it enhances the ability of the Sub-Adviser to manage the Funds.
Based on their review, the Independent Board Members concluded that any indirect benefits received by a Fund Adviser as a result of its relationship with the Funds were reasonable and within acceptable parameters.
F. Other Considerations
The Independent Board Members did not identify any single factor discussed previously as all-important or controlling. The Board Members, including the Independent Board Members, concluded that the terms of each Advisory Agreement were fair and reasonable, that the respective Fund Adviser’s fees were reasonable in light of the services provided to each Fund and that the Advisory Agreements be renewed.
Trustees
and Officers (Unaudited)
The management of the Funds, including general supervision of the duties performed for the Funds by the Adviser, is the responsibility of the Board of Trustees of the Funds. The number of directors of the Funds is set at twelve, effective July 1, 2016. None of the trustees who are not “interested” persons of the Funds (referred to herein as “independent trustees”) has ever been a director or employee of, or consultant to, Nuveen or its affiliates. The names and business addresses of the trustees and officers of the Funds, their principal occupations and other affiliations during the past five years, the number of portfolios each oversees and other directorships they hold are set forth below.
The Funds’ Statement of Additional Information (“SAI”) includes more information about the trustees. To request a free copy, call Nuveen Investments at (800) 257-8787 or visit the Funds’ website at www.nuveen.com.
| | | | | | | | |
Name,
Year of Birth
& Address | | Position(s)
Held with
the Funds | | Year First
Elected or
Appointed (1) | | Principal Occupation(s)
Including other Directorships
During Past 5 Years | | Number of
Portfolios in
Fund Complex
Overseen by
Trustee |
| |
| Independent Trustee: |
William J. Schneider 1944 333 W. Wacker Drive Chicago, IL 60606 | | Chairman and Trustee | | 1996 | | Chairman of Miller-Valentine Partners, a real estate investment company; Board Member of Med-America Health System and WDPR Public Radio station; formerly, Senior Partner and Chief Operating Officer (retired (2004) of Miller-Valentine Group; formerly, Board member, Business Advisory Council of the Cleveland Federal Reserve Bank and University of Dayton Business School Advisory Council; past Chair and Director, Dayton Development Coalition. | | 184 |
Jack B. Evans 1948 333 W. Wacker Drive Chicago, IL 60606 | | Trustee | | 1999 | | President, The Hall-Perrine Foundation, a private philanthropic corporation (since 1996); Director and Chairman, United Fire Group, a publicly held company; Director, The Gazette Company; Life Trustee of Coe College and the Iowa College Foundation; formerly, President Pro-Tem of the Board of Regents for the State of Iowa University System; formerly, Director, Alliant Energy; formerly, Director, Federal Reserve Bank of Chicago; formerly, President and Chief Operating Officer, SCI Financial Group, Inc., a regional financial services firm. | | 184 |
William C. Hunter 1948 333 W. Wacker Drive Chicago, IL 60606 | | Trustee | | 2003 | | Dean Emeritus, formerly, Dean, Tippie College of Business, University of Iowa (2006-2012); Director (since 2004) of Xerox Corporation; Director (since 2005), and past President (2010-2014) Beta Gamma Sigma, Inc., The International Business Honor Society; Director of Wellmark, Inc. (since 2009); formerly, Dean and Distinguished Professor of Finance, School of Business at the University of Connecticut (2003-2006); previously, Senior Vice President and Director of Research at the Federal Reserve Bank of Chicago (1995-2003); formerly, Director (1997-2007), Credit Research Center at Georgetown University. | | 184 |
David J. Kundert 1942 333 W. Wacker Drive Chicago, IL 60606 | | Trustee | | 2005 | | Formerly, Director, Northwestern Mutual Wealth Management Company (2006-2013); retired (since 2004) as Chairman, JPMorgan Fleming Asset Management, President and CEO, Banc One Investment Advisors Corporation, and President, One Group Mutual Funds; prior thereto, Executive Vice President, Banc One Corporation and Chairman and CEO, Banc One Investment Management Group; Regent Emeritus, Member of Investment Committee, Luther College; member of the Wisconsin Bar Association; member of Board of Directors and Chair of Investment Committee, Greater Milwaukee Foundation; member of the Board of Directors (Milwaukee), College Possible; Board member of Milwaukee Repertory Theatre (since 2016). | | 184 |
Trustees and Officers (Unaudited) (continued)
| | | | | | | | |
Name,
Year of Birth
& Address | | Position(s)
Held with
the Funds | | Year First
Elected or
Appointed (1) | | Principal Occupation(s)
Including other Directorships
During Past 5 Years | | Number of
Portfolios in
Fund Complex
Overseen by
Trustee |
Albin F. Moschner(2) 1952 333 W. Wacker Drive Chicago, IL 60606 | | Trustee | | 2016 | | Founder and Chief Executive Officer, Northcroft Partners, LLC, a management consulting firm (since 2012); previously, held positions at Leap Wireless International, Inc., including Consultant (2011-2012), Chief Operating Officer (2008-2011), and Chief Marketing Officer (2004-2008); formerly, President, Verizon Card Services division of Verizon Communications, Inc. (2000-2003); formerly, President, One Point Services at One Point Communications (1999-2000); formerly, Vice Chairman of the Board, Diba, Incorporated (1996-1997); formerly, various executive positions with Zenith Electronics Corporation (1991-1996). Director, USA Technologies, Inc., a provider of solutions and services to facilitate electronic payment transactions (since 2012); formerly, Director, Wintrust Financial Corporation (1996-2016). | | 184 |
John K. Nelson 1962 333 West Wacker Drive Chicago, IL 60606 | | Trustee | | 2013 | | Member of Board of Directors of Core12 LLC (since 2008), a private firm which develops branding, marketing and communications strategies for clients; Director of The Curran Center for Catholic American Studies (since 2009) and The President’s Council, Fordham University (since 2010); formerly senior external advisor to the financial services practice of Deloitte Consulting LLP (2012-2014); formerly, Chairman of the Board of Trustees of Marian University (2010 as trustee, 2011-2014 as Chairman); formerly, Chief Executive Officer of ABN AMRO N.V. North America, and Global Head of its Financial Markets Division (2007-2008); prior senior positions held at ABN AMRO include Corporate Executive Vice President and Head of Global Markets—the Americas (2006-2007), CEO of Wholesale Banking—North America and Global Head of Foreign Exchange and Futures Markets (2001-2006), and Regional Commercial Treasurer and Senior Vice President Trading—North America (1996-2001); formerly, Trustee at St. Edmund Preparatory School in New York City. | | 184 |
Judith M. Stockdale 1947 333 W. Wacker Drive Chicago, IL 60606 | | Trustee | | 1997 | | Board Member, Land Trust Alliance (since 2013) and U.S. Endowment for Forestry and Communities (since 2013); formerly, Executive Director (1994-2012), Gaylord and Dorothy Donnelley Foundation; prior thereto, Executive Director, Great Lakes Protection Fund (1990-1994). | | 184 |
Carole E. Stone 1947 333 W. Wacker Drive Chicago, IL 60606 | | Trustee | | 2007 | | Director, Chicago Board Options Exchange (since 2006), C2 Options Exchange, Incorporated (since 2009); Director, CBOE Holdings, Inc. (since 2010); formerly, Commissioner, New York State Commission on Public Authority Reform (2005-2010). | | 184 |
Terence J. Toth 1959 333 W. Wacker Drive Chicago, IL 60606 | | Trustee | | 2008 | | Managing Partner, Promus Capital (since 2008); Director, Fulcrum IT Service LLC (since 2010) and Quality Control Corporation (since 2012); member: Catalyst Schools of Chicago Board (since 2008) and Mather Foundation Board (since 2012), and chair of its investment committee; formerly, Director, Legal & General Investment Management America, Inc. (2008-2013); formerly, CEO and President, Northern Trust Global Investments (2004-2007); Executive Vice President, Quantitative Management & Securities Lending (2000-2004); prior thereto, various positions with Northern Trust Company (since 1994); formerly, Member, Northern Trust Mutual Funds Board (2005-2007), Northern Trust Global Investments Board (2004-2007), Northern Trust Japan Board (2004-2007), Northern Trust Securities Inc. Board (2003-2007) and Northern Trust Hong Kong Board (1997-2004). | | 184 |
| | | | | | | | |
Name,
Year of Birth
& Address | | Position(s)
Held with
the Funds | | Year First
Elected or
Appointed (1) | | Principal Occupation(s)
Including other Directorships
During Past 5 Years | | Number of
Portfolios in
Fund Complex
Overseen by
Trustee |
Margaret L. Wolff 1955 333 W. Wacker Drive Chicago, IL 60606 | | Trustee | | 2016 | | Member of the Board of Directors (since 2013) of Travelers Insurance Company of Canada and The Dominion of Canada General Insurance Company (each, a part of Travelers Canada, the Canadian operation of The Travelers Companies, Inc.); formerly, Of Counsel, Skadden, Arps, Slate, Meagher & Flom LLP (Mergers & Acquisitions Group) (2005-2014); Member of the Board of Trustees of New York-Presbyterian Hospital (since 2005); Member (since 2004) and Chair (since 2015) of the Board of Trustees of The John A. Hartford Foundation (a philanthropy dedicated to improving the care of older adults); formerly, Member (2005-2015) and Vice Chair (2011-2015) of the Board of Trustees of Mt. Holyoke College. | | 184 |
| |
| Interested Trustee: |
William Adams IV(3) 1955 333 W. Wacker Drive Chicago, IL 60606 | | Trustee | | 2013 | | Co-Chief Executive Officer and Co-President (since March 2016), formerly, Senior Executive Vice President, Global Structured Products (2010-2016), prior thereto, Executive Vice President, U.S. Structured Products (1999-2010) of Nuveen Investments, Inc.; Co-President of Nuveen Fund Advisors, LLC (since 2011); Co-Chief Executive Officer (since 2016), formerly, Senior Executive Vice President of Nuveen Securities, LLC; President (since 2011), of Nuveen Commodities Asset Management, LLC; Board Member of the Chicago Symphony Orchestra and of Gilda’s Club Chicago. | | 184 |
Margo L. Cook(2)(3) 1964 333 W. Wacker Drive Chicago, IL 60606 | | Trustee | | 2016 | | Co-Chief Executive Officer and Co-President (since March 2016), formerly, Senior Executive Vice President of Nuveen Investments, Inc; Co-Chief Executive Officer (since 2015), previously, Executive Vice President (2013-2015) of Nuveen Securities, LLC; Co-President (since October 2016), formerly, Senior Executive Vice President (2015-2016) of Nuveen Fund Advisors, LLC (Executive Vice President 2011-2015); formerly, Managing Director of Nuveen Commodities Asset Management, LLC (2011- 2016); Chartered Financial Analyst. | | 184 |
| | | | | | | | |
Name,
Year of Birth
& Address | | Position(s)
Held with
the Funds | | Year First
Elected or
Appointed (4) | | Principal Occupation(s)
During Past 5 Years | | Number of
Portfolios in
Fund Complex
Overseen by
Officer |
| |
| Officers of the Funds: |
Greg A. Bottjer 1971 333 West Wacker Drive Chicago, IL 60606 | | Chief Administrative Officer | | 2016 | | Managing Director (since 2011), formerly, Senior Vice President (2007-2010) of Nuveen Investments Holdings, Inc.; Managing Director (since October 2016) of Nuveen Fund Advisors, LLC; Chartered Financial Analyst. | | 104 |
Lorna C. Ferguson 1945 333 W. Wacker Drive Chicago, IL 60606 | | Vice President | | 1998 | | Managing Director (since 2005) of Nuveen Fund Advisors, LLC and Nuveen Securities, LLC (since 2004). | | 185 |
Stephen D. Foy 1954 333 W. Wacker Drive Chicago, IL 60606 | | Vice President and Controller | | 1998 | | Managing Director (since 2014), formerly, Senior Vice President (2013-2014) and Vice President (2005-2013) of Nuveen Fund Advisors, LLC; Chief Financial Officer of Nuveen Commodities Asset Management, LLC (since 2010); Managing Director (since 2016) of Nuveen Securities, LLC; Certified Public Accountant. | | 185 |
Trustees and Officers (Unaudited) (continued)
| | | | | | | | |
Name,
Year of Birth
& Address | | Position(s)
Held with
the Funds | | Year First
Elected or
Appointed (4) | | Principal Occupation(s)
During Past 5 Years | | Number of
Portfolios in
Fund Complex
Overseen by
Officer |
Nathaniel T. Jones 1979 333 W. Wacker Drive Chicago, IL 60606 | | Vice President and Treasurer | | 2016 | | Senior Vice President (since 2016), formerly, Vice President (2011- 2016) of Nuveen Investments Holdings, Inc.; Chartered Financial Analyst. | | 185 |
Walter M. Kelly 1970 333 W. Wacker Drive Chicago, IL 60606 | | Chief Compliance Officer and Vice President | | 2003 | | Senior Vice President (since 2008) of Nuveen Investments Holdings, Inc. | | 185 |
Tina M. Lazar 1961 333 W. Wacker Drive Chicago, IL 60606 | | Vice President | | 2002 | | Senior Vice President of Nuveen Investments Holdings, Inc. and Nuveen Securities, LLC | | 185 |
Kevin J. McCarthy 1966 333 W. Wacker Drive Chicago, IL 60606 | | Vice President and Assistant Secretary | | 2007 | | Executive Vice President, Secretary and General Counsel (since March 2016), formerly, Managing Director and Assistant Secretary of Nuveen Investments, Inc.; Executive Vice President (since March 2016), formerly, Managing Director, and Assistant Secretary (since 2008) of Nuveen Securities, LLC; Executive Vice President and Secretary (since March 2016), formerly, Managing Director (2008-2016) and Assistant Secretary (2007-2016), and Co-General Counsel (since 2011) of Nuveen Fund Advisors, LLC; Executive Vice President and Secretary (since March 2016), formerly, Managing Director, Assistant Secretary (2011-2016), and Associate General Counsel (since 2011) of Nuveen Asset Management, LLC; Executive Vice President and Secretary of Nuveen Investments Advisers, LLC; Vice President (since 2007) and Secretary (since March 2016) of NWQ Investment Management Company, LLC, Symphony Asset Management LLC, Santa Barbara Asset Management, LLC, Winslow Capital Management, LLC (since 2010) and Tradewinds Global Investors, LLC (since 2016); Vice President (since 2010) and Secretary (since 2016), formerly, Assistant Secretary of Nuveen Commodities Asset Management, LLC. | | 185 |
Kathleen L. Prudhomme 1953 901 Marquette Avenue Minneapolis, MN 55402 | | Vice President and Secretary | | 2011 | | Managing Director, Assistant Secretary and Co-General Counsel (since 2011) of Nuveen Fund Advisors, LLC; Managing Director, Assistant Secretary and Associate General Counsel (since 2011) of Nuveen Asset Management, LLC; Managing Director and Assistant Secretary (since 2011) of Nuveen Securities, LLC; formerly, Deputy General Counsel, FAF Advisors, Inc. (2004-2010). | | 185 |
Christopher M. Rohrbacher 1971 333 West Wacker Drive Chicago, IL 60606 | | Vice President and Assistant Secretary | | 2008 | | Senior Vice President (since 2011) formerly, Vice President (2008-2011) and Assistant General Counsel (since 2008) of Nuveen Investments Holdings, Inc.; Senior Vice President and Assistant Secretary (since October 2016) of Nuveen Fund Advisors, LLC; Vice President and Assistant Secretary (since 2010) of Nuveen Commodities Asset Management, LLC. | | 185 |
Joel T. Slager 1978 333 West Wacker Drive Chicago, IL 60606 | | Vice President and Assistant Secretary | | 2013 | | Fund Tax Director for Nuveen Funds (since 2013); previously, Vice President of Morgan Stanley Investment Management, Inc., Assistant Treasurer of the Morgan Stanley Funds (from 2010 to 2013). | | 185 |
Jeffery M. Wilson 1956 333 West Wacker Drive Chicago, IL 60606 | | Vice President | | 2011 | | Senior Vice President of Nuveen Investments Holdings, Inc. (since 2011); formerly Senior Vice President of Nuveen Securities, LLC (since 2011); formerly, Senior Vice President of FAF Advisors, Inc. (2000-2010). | | 104 |
| | | | | | | | |
Name,
Year of Birth
& Address | | Position(s)
Held with
the Funds | | Year First
Elected or
Appointed (4) | | Principal Occupation(s)
During Past 5 Years | | Number of
Portfolios in
Fund Complex
Overseen by
Officer |
Gifford R. Zimmerman 1956 333 W. Wacker Drive Chicago, IL 60606 | | Vice President and Assistant Secretary | | 1988 | | Managing Director (since 2002), and Assistant Secretary of Nuveen Securities, LLC; Managing Director (since 2004) and Assistant Secretary (since 1994) of Nuveen Investments, Inc.; Managing Director (since 2002), Assistant Secretary (since 1997) and Co-General Counsel (since 2011) of Nuveen Fund Advisors, LLC; Managing Director, Assistant Secretary and Associate General Counsel of Nuveen Asset Management, LLC (since 2011); Managing Director and Assistant Secretary of Nuveen Investments Advisers Inc. (since 2002), and Symphony Asset Management LLC (since 2003); Vice President and Assistant Secretary of NWQ Investment Management Company, LLC (since 2002), Santa Barbara Asset Management, LLC (since 2006) and of Winslow Capital Management, LLC, (since 2010); Vice President and Assistant Secretary (since 2013), formerly, Chief Administrative Officer and Chief Compliance Officer (2006-2013) of Nuveen Commodities Asset Management, LLC; Chartered Financial Analyst. | | 185 |
| (1) | Trustees serve an indefinite term until his/her successor is elected or appointed. The year first elected or appointed represents the year in which the director was first elected or appointed to any fund in the Nuveen Fund Complex. |
| (2) | On June 22, 2016, Ms. Cook and Mr. Moschner were appointed as Board Members, effective July 1, 2016. |
| (3) | “Interested persons” of the Trust, as defined in the 1940 Act, by reason of their positions with Nuveen and certain of its subsidiaries. |
| (4) | Officers serve one year terms through August of each year. The year first elected or appointed represents the year in which the officer was first elected or appointed to any fund in the Nuveen Fund Complex. |
Notes
Notes
| | | | | | | | | | | | | | |
| | | | | | | | |
| | | | |
| | | | | | | | |
| | |
| | Nuveen: | | |
| | | | Serving Investors for Generations | | | | |
| | |
| | | | |
| | | |
| | | | Since 1898, financial advisors and their clients have relied on Nuveen to provide
dependable investment solutions through continued adherence to proven, long-term investing
principles. Today, we offer a range of high quality equity and fixed-income solutions designed to
be integral components of a well-diversified core portfolio.
| | |
| | | |
| | | | | | |
| | | | |
| | | | | | Focused on meeting investor needs. Nuveen helps secure the long-term goals of individual investors and the advisors who serve them. As an operating division of TIAA Global Asset Management, Nuveen provides access to investment expertise from leading asset managers and solutions across traditional and alternative asset classes. Built on more than a century of industry leadership, Nuveen’s teams of experts align with clients’ specific financial needs and goals, demonstrating commitment to advisors and investors through market perspectives and wealth management and portfolio advisory services. Nuveen manages $244 billion in assets as of September 30, 2016. | | |
| | | | | |
| | | | | | | | | | |
| | | | | | Find out how we can help you.
To learn more about how the products and services of Nuveen
may be able to help you meet your financial goals, talk to your
financial advisor, or call us at (800) 257-8787. Please read the information
provided carefully before you invest. Investors should consider the
investment objective and policies, risk considerations, charges and
expenses of any investment carefully. Where applicable, be sure to obtain a
prospectus, which contains this and other relevant information. To obtain
a prospectus, please contact your securities representative or Nuveen
, 333 W. Wacker Dr., Chicago, IL 60606. Please read the
prospectus carefully before you invest or send money.
Learn more about Nuveen Funds at: www.nuveen.com/mf
| | |
| | | | | | |
| | | | | | | | | | | | |
| | Distributed by Nuveen Securities, LLC | 333 West Wacker Drive Chicago, IL 60606 | www.nuveen.com | | | | | | |
MAN-FIDX-1016D 41269-INV-B-12/17
| | |
| | |  |
| Mutual Funds | |
| | | | | | |
| | | | | | | Annual Report October 31, 2016 |
| | | | | | | | | | | | | | | | |
| | | | | | | Share Class / Ticker Symbol | | |
| | | Fund Name | | | | Class A | | Class C | | Class R3 | | Class R6 | | Class I | | |
|
| | Nuveen Dividend Value Fund | | | | FFEIX | | FFECX | | FEISX | | FFEFX | | FAQIX | | |
| | Nuveen Mid Cap Value Fund | | | | FASEX | | FACSX | | FMVSX | | — | | FSEIX | | |
| | Nuveen Small Cap Value Fund | | | | FSCAX | | FSCVX | | FSVSX | | FSCWX | | FSCCX | | |
| | | | | | | | | | | | |
| | | | | | |
| | | | |
| | | | | | | | |
| | |
| | Life is Complex. | | |
| | |
| | Nuveen makes things e-simple. | | |
| | |
| | It only takes a minute to sign up for e-Reports. Once enrolled, you’ll receive an e-mail as soon as your Nuveen Fund information is ready. No more waiting for delivery by regular mail. Just click on the link within the e-mail to see the report and save it on your computer if you wish. | | |
| | | | |
| | | | | | Free e-Reports right to your e-mail! | | |
| | | |
| | | | | | www.investordelivery.com If you receive your Nuveen Fund distributions and statements from your
financial advisor or brokerage account. |
| | | | |
| | | | or | | www.nuveen.com/accountaccess If you receive your Nuveen Fund distributions and statements directly from Nuveen. Must be preceded by or accompanied by a prospectus. NOT FDIC INSURED MAY LOSE VALUE
NO BANK GUARANTEE | | |
| | | | | | | | | | |
| | | | | | | | | | | | | |
Table
of Contents
Chairman’s Letter
to Shareholders

Dear Shareholders,
After a sluggish first half of 2016, the U.S. economy gained some momentum in the third quarter. In fact, it was the economy’s strongest quarterly acceleration in two years, propelled by healthy consumer spending, a temporary surge in exports and a turnaround in inventories. As the year winds down, 2016 looks on track to deliver the same steady-but-slow growth that has characterized the seven-year recovery.
A year ago, the U.S. Federal Reserve (Fed) took the first step toward policy “normalization” by raising its benchmark interest rate at its December 2015 meeting. Speculation about the Fed’s intentions since then has been a strong influence on the markets throughout 2016. After remaining on hold for a year, the Fed judged that the economy’s modest growth, the return to “full” employment and an uptick in inflation were sufficient to raise the target rate at the December 2016 meeting.
Global conditions continue to look subdued by comparison. Investors continue to adjust to the idea of a slower Chinese economy, which has helped commodity prices stabilize and lift global inflation expectations. The U.K.’s June 23rd “Brexit” vote to leave the European Union introduced a new set of economic and political uncertainties to the already fragile conditions across Europe. Moreover, there are growing concerns that global central banks’ unprecedented efforts to revive growth may be showing signs of fatigue. Interest rates are currently negative in Europe and Japan and near or at zero in the U.S., U.K. and elsewhere; nonetheless, growth has remained subdued.
Since the election, U.S. stocks have rallied strongly on expectations that the Republican controlled Congress and Trump administration will pursue more business friendly policies. But the details have yet to be seen. Given muted global growth, the risk of policy errors by central banks around the world, the unfolding Brexit process and an uncertain political outlook (not just in the U.S. but also in Europe), we anticipate that turbulence remains on the horizon for the time being. In this environment, Nuveen remains committed to both managing downside risks and seeking upside potential. If you’re concerned about how resilient your investment portfolio might be, we encourage you to talk to your financial advisor. On behalf of the other members of the Nuveen Fund Board, we look forward to continuing to earn your trust in the months and years ahead.
Sincerely,

William J. Schneider
Chairman of the Board
December 22, 2016
Portfolio Managers’
Comments
Nuveen Dividend Value Fund
Nuveen Mid Cap Value Fund
Nuveen Small Cap Value Fund
These Funds feature portfolio management by Nuveen Asset Management, LLC, an affiliate of Nuveen Investments, Inc.
David Chalupnik, CFA, has been the portfolio manager of the Nuveen Dividend Value Fund since 2015. Derek Sadowsky, CFA, has served as a portfolio manager for the Fund since 2012. Effective November 8, 2016, Cori Johnson, CFA, retired from the firm and is no longer a portfolio manager on the Fund.
Karen Bowie, CFA, is the portfolio manager for the Nuveen Mid Cap Value Fund and the Nuveen Small Cap Value Fund. Karen assumed portfolio management responsibilities for the Nuveen Mid Cap Value Fund in 2012 and the Nuveen Small Cap Value Fund in 2006.
Here the portfolio management teams for the Funds discuss economic and market conditions, key investment strategies and the Funds’ performance for the twelve-month reporting period ended October 31, 2016.
What factors affected the U.S. economy and the financial markets during the twelve-month reporting period ended October 31, 2016?
The restrained pace of growth that has defined the U.S. economic recovery since 2009 continued in the twelve-month reporting period. Growth over the previous four calendar quarters averaged below 2% (annualized), as measured by real gross domestic product (GDP), which is the value of goods and services produced by the nation’s economy less the value of the goods and services used up in production, adjusted for price changes. For most of the reporting period, consumer spending remained healthy but was offset by the drag from the inventory cycle, lackluster business spending and weak net exports. As a result, GDP growth stayed below 1.5% from the fourth quarter of 2015 through the second quarter of 2016. However, decent consumer spending, an inventory turnaround and a short-term jump in exports contributed to a more robust gain of 3.2% in the third quarter, as reported by the “second” estimate of the Bureau of Economic Analysis.
Consumers, whose purchases comprise the largest component of the U.S. economy, benefited from employment growth and firming wages over the twelve-month reporting period. As reported by the Bureau of Labor Statistics, the unemployment rate was little changed at 4.9% in October 2016 from 5.0% in October 2015, and job gains averaged slightly above 200,000 per month for the past twelve months. Although consumer spending gains were rather muted in the latter half of 2015, spending surged in the second quarter of 2016. Although inflation began to accelerate slightly in the reporting period, the overall level remained low, which also contributed to consumers’ willingness to buy. The Consumer Price Index (CPI) rose 1.6% over the twelve-month reporting period ended October 2016 on a seasonally adjusted basis, as reported by the U.S. Bureau of Labor Statistics. The core CPI (which excludes food and energy) increased 2.1% during the same period, slightly above the Fed’s unofficial longer term inflation objective of 2.0%.
The housing market was another bright spot in the economy. The S&P CoreLogic Case-Shiller U.S. National Home Price Index, which covers all nine U.S. census divisions, recorded a 5.5% annual gain in September 2016 (most recent data available at the time this report was prepared) (effective July 26, 2016, the S&P/Case-Shiller U.S. National Home Price Index was renamed the S&P CoreLogic Case-Shiller U.S. National Home Price Index). The 10-City and 20-City Composites reported year-over-year increases of 4.3% and 5.1%, respectively.
Certain statements in this report are forward-looking statements. Discussions of specific investments are for illustration only and are not intended as recommendations of individual investments. The forward-looking statements and other views expressed herein are those of the portfolio managers as of the date of this report. Actual future results or occurrences may differ significantly from those anticipated in any forward-looking statements and the views expressed herein are subject to change at any time, due to numerous market and other factors. The Funds disclaim any obligation to update publicly or revise any forward-looking statements or views expressed herein.
Refer to the Glossary of Terms Used in this Report for further definition of the terms used within this section.
Portfolio Managers’ Comments (continued)
However, business investment remained soft over the reporting period. Corporate earnings growth continued to be constrained by diminished demand expectations amid sluggish U.S. and global growth, the impact of falling commodity prices and a strong U.S. dollar. Additionally, a murky outlook kept capital spending muted. Concerns about financial market turbulence in early 2016, the U.K.’s “Brexit” vote to leave the European Union (EU) and the U.S. presidential election weighed on business sentiment throughout the reporting period.
The consistent growth of the economy prompted the U.S. Federal Reserve (Fed) to raise the Fed Funds rate from the zero bound range to a range of 0.25% to 0.50% in December 2015. The widely anticipated move had little impact on the financial markets. Over the remainder of the reporting period, speculation on the timing of future rate hikes drove short-term swings in the markets, including falling bond yields, rallies in the U.S. dollar and bouts of volatility in stock prices. For most of 2016, the Fed kept this rate unchanged due to concerns ranging from low inflation in the U.S. to weakening growth prospects globally and the U.K.’s Brexit vote. However, the third quarter’s strong GDP report and an uptick in inflation boosted expectations that the Fed would likely increase the target rate at the December 2016 meeting. As anticipated, subsequent to the close of the reporting period, the Fed raised the rate to a range of 0.50% to 0.75%.
Other market-moving events during the reporting period included a spike in volatility in January and February 2016 triggered by deteriorating sentiment about China’s economy, another sharp downturn in oil prices and concerns about central bank policy both in the U.S. and around the world. The Brexit referendum on June 23 also caught investors off guard. In response, U.K. sterling fell to 30-year lows and global equities tumbled while perceived safe-haven assets such as gold, the U.S. dollar and government bonds saw large inflows. However, the markets stabilized fairly quickly post-Brexit vote, buoyed by reassurances from global central banks and a perception that the temporary price rout presented an attractive buying opportunity. Following a relatively calm July and August 2016, volatility resumed in the final months of the reporting period. Investors worried whether central banks were reaching the limits of their effectiveness as global growth continues to stagnate. The health of the European banking sector came into question, renewing concerns about the potential to trigger a wider crisis. Political uncertainty increased leading up to the November U.S. presidential election, and after the close of the reporting period, the unexpected win of Donald Trump contributed to an initial sell-off across global markets. However, after digesting the “shock”, U.S. equities rallied strongly and global developed market stocks pared their losses, while emerging markets, fixed income and gold remained lower.
Despite several bouts of significant volatility, the U.S. equity market ended the twelve-month reporting period with a gain of 4.51% as measured by the S&P 500® Index. Small-cap stocks in the U.S. recovered from last year’s significant underperformance, turning in results close to their large-cap brethren with a 4.11% return according to the Russell 2000® Index. Mid-cap stocks were in the same range with a return of 4.17% as measured by the Russell Midcap® Index. Across the capitalization spectrum in the U.S., investors favored the relatively safer, more defensive areas of the market for much of the period, leading value stocks to strongly outperform growth stocks during this reporting period. Emerging markets outpaced other developed markets overseas as investors returned to this asset class in the second half of the reporting period, largely due to commodity price stability and the ongoing search for yield and returns. The MSCI Emerging Markets Index advanced 9.67%. Meanwhile, in developed overseas markets, Europe struggled and turned in negative results, dragging down the overall return of the MSCI EAFE Index to -2.74% for the twelve-month reporting period.
Nuveen Dividend Value Fund
How did the Fund perform during the twelve-month reporting period ended October 31, 2016?
The tables in the Fund Performance and Expense Ratios section of this report provide total returns for the Fund for the one-year, five-year, ten-year and since inception periods ended October 31, 2016. Comparative performance information is provided for the Fund’s Class A Shares at net asset value (NAV). The Fund’s Class A Shares at NAV underperformed the Russell 1000® Value Index and outperformed the Lipper Equity Income Funds Classification Average during the twelve-month reporting period.
What strategies were used to manage the Fund during the reporting period and how did these strategies influence performance?
During the reporting period, we continued to implement the Fund’s disciplined investment strategy. We seek to achieve consistent, long-term outperformance with lower volatility by building and managing a portfolio diversified between sustainable and opportunistic holdings with a focus on what we believe are attractively valued companies with above average current income or dividend growth. We use an integrated, multi-perspective research and analysis approach that involves a team of portfolio managers, fundamental research analysts and quantitative analysts. The Fund’s holdings exhibit attractive valuations and identifiable catalysts that we believe will drive future stock appreciation. The Fund is also actively managed in an effort to minimize distributed capital gains and maximize after-tax returns using a typical investment horizon of at least two to three years. We adhere to portfolio guidelines to manage volatility and maintain diversification, generally selling a security if it no longer is expected to meet our dividend growth or price appreciation expectations or if we find a better alternative in the marketplace.
The Fund’s underperformance versus its Russell 1000® Value benchmark was the result of both stock selection and sector allocation. Stock selection was weak in the financial, consumer staples and health care sectors. An overweight position in consumer discretionary, the worst performing sector in the Russell 1000® Value Index, also weighed on returns. On the other hand, stock selection was favorable in the energy and utilities sectors, helping the Fund to outperform the average return of its Lipper peer group. In addition, an overweight to information technology, the second strongest performing sector in the benchmark, was beneficial.
Stock selection was strong in the energy sector including a position in Pioneer Natural Resources Company, which continued to be one of the best names in the Permian Basin accounting for approximately one-fourth of all U.S. crude production. Pioneer managed its balance sheet well through the recent oil price downturn, benefiting from the shift toward gas lift and centralized facilities. Another exploration and production (E&P) holding, Anadarko Petroleum Corporation, outperformed after it announced the acquisition of Freeport McMoRan’s Gulf of Mexico assets at an attractive price, which was going to be immediately cash flow positive. This transaction allowed Anadarko to advance the development of its onshore Permian Basin acreage, which we believe has been ignored by investors and should lead to a higher valuation multiple as oil production increases in the area. Williams Companies, Inc., an energy infrastructure company focused on midstream gathering and processing, was also a top contributor for the Fund. Shares of the company bottomed in February 2016, but subsequently rallied throughout the remainder of the reporting period. Also, our overweight position in integrated producer Chevron Corporation generated positive results. The company was rewarded for aggressively cutting its capital spending plans for 2016 and reiterating its commitment to its large dividend. Chevron’s shares surged further after the company reported a third-quarter earnings beat and raised its dividend. Finally, Hess Corporation performed well as investors began to appreciate the company’s strong assets. We have sold our position in Hess Corporation.
Stock selection was favorable in the utilities sector including positions in NiSource Inc. and NextEra Energy Inc. Overall, the sector was the strongest performer in the index because investors favored dividend-paying stocks and the relatively safer, more defensive areas of the market for much of the reporting period. Our position in NiSource, one of the largest regulated natural gas utilities in the U.S., outperformed many other utility companies after the company reported strong earnings midway through the year. Investors rewarded companies that had a more visible earnings and dividend growth path such as NiSource. The Fund also benefited from the solid performance of utility NextEra, which reported a strong quarter in April 2016. NextEra saw strength in both its regulated and unregulated businesses after new infrastructure projects continued to come online and its renewable energy segment continued to see strong growth.
In the information technology sector, the Fund’s most significant contributor was semiconductor company QUALCOMM, Inc., which is primarily engaged in the design and marketing of integrated chips and system software used in mobile devices and wireless networks. The company benefited from several licensing agreements with its customers that lifted a cloud of uncertainty over the stock. Investor confidence was further bolstered when the company announced an earnings beat and raised guidance during its fiscal third-quarter earnings report. Also, later in the reporting period, investors grew excited about the prospect for QUALCOMM to acquire Netherlands-based NXP Semiconductors NV and the potential benefits of the combined entity.
In the materials sector, paper and corrugated packaging producer WestRock Company gave the Fund’s performance a boost during the reporting period. This company continued to deliver strong cash flow results from post-merger restructuring initiatives in an environment of relatively good industry pricing discipline.
While the Fund’s underweight in financials boosted results since the sector was the second worst performing area of the benchmark, our stock selection more than offset the benefit from the underweight. In particular, the Fund’s positions with high interest rate sensitivity or elevated capital markets exposure were negatively impacted since interest rates declined for much of the reporting period and the market continued to push out expectations for additional Fed rate hikes. The Fund’s most significant laggard in the sector was asset management firm Ameriprise Financial, Inc., which was hurt by asset outflows, investors’ rotation into more passive strategies and exchange-traded funds, and industry fears regarding additional government regulations for investments in retirement accounts. Because we believed Ameriprise shares were already pricing in much of the risks and that the company’s risk/reward scenario was attractive, we maintained this position. Our position in Citigroup Inc. was negatively affected by concerns about slowing equity market activity globally. We sold Citigroup and used the proceeds to invest in other financial stocks that we believed had more upside potential, while having less exposure to potentially slowing global growth. Meanwhile, Hartford Financial Services Group, Inc., an insurance and financial services company, reported second-quarter earnings that missed estimates due to higher-than-expected asbestos and environmental charges as well as significantly weaker-than-forecasted margins in the company’s
Portfolio Managers’ Comments (continued)
personal and commercial lines. The company also continued to experience headwinds due to lower interest rates, volatile equity markets and an elevated cost of capital. With management indicating no expectations for improvement in the near term, we exited our position in Hartford Financial in search of more attractive opportunities. Finally, shares of credit card firm Capital One Financial Corporation fell after investors grew concerned that higher-than-expected charge-offs would continue to increase, especially in light of weakening economic data. We decided to exit the Fund’s position in Capital One Financial.
The Fund’s results in health care were negative during the reporting period primarily due to a position in Teva Pharmaceutical Industries Limited. Company shares were weighed down by the general overhang in the pharmaceutical industry due to drug pricing issues, the collapse of the megamerger between Allergan and Pfizer because of new tax inversion rules, as well as uncertainty surrounding Teva’s pending deal to buy Allergan’s generics business. The approval of Teva’s purchase was delayed by several months while the Federal Trade Commission examined the acquisition more closely. We decided to sell our position because we became increasingly worried that management would not be able to achieve its earnings or synergy targets. In light of the downside risk to earnings, we believed Teva’s valuation no longer offered a compelling risk/reward scenario.
In telecommunication services, the Fund’s negative results were primarily driven by our overweight position in Frontier Communications Corporation. Although the company closed on its acquisition of some of Verizon’s wireline assets during the reporting period, it still lacked the scale to compete against the largest Internet service providers. In addition, investors rotated out of the defensive sectors like telecommunications later in the reporting period because valuations remained expensive compared to their historical levels. We decided to sell our position in Frontier Communications because we believed its dividend was increasingly likely to be cut in the near future since the company’s topline growth continued to experience secular headwinds.
Finally, despite the overall strength in the energy sector, it was also home to one fairly significant detractor during the reporting period. ConocoPhillips, the world’s largest independent exploration and production firm, underperformed because investors grew increasingly concerned that the company would need to eliminate its large dividend. We sold our position in ConocoPhillips.
Nuveen Mid Cap Value Fund
How did the Fund perform during the twelve-month reporting period ended October 31, 2016?
The tables in the Fund Performance and Expense Ratios section of this report provide total returns for the Fund for the one-year, five-year and ten-year periods ended October 31, 2016. Comparative performance information is provided for the Fund’s Class A Shares at net asset value (NAV). The Fund’s Class A Shares at NAV underperformed both the Russell Midcap® Value Index and the Lipper Mid-Cap Value Funds Classification Average during the twelve-month reporting period.
What strategies were used to manage the Fund during the reporting period and how did these strategies influence performance?
The Fund seeks to provide long-term capital appreciation by investing primarily in the common stocks of companies with market capitalizations at the time of purchase between approximately $1.6 billion and $28.1 billion. During the reporting period, we continued to implement the Fund’s investment process of selecting mid-cap companies that we believed were undervalued relative to other companies in the same industry or market. These companies demonstrated or are expected to demonstrate improving fundamentals and have an identifiable catalyst that could close the gap between market value and our perception of fair value. We look for companies that generate strong free cash flow, which allows them to pay down debt, increase dividends, repurchase shares or engage in merger and acquisition (M&A) activities. At the same time, we identify a short- or long-term catalyst we can track and monitor over time that could potentially propel each stock to realize its value. Generally, we sell a holding if the stock price reaches its target, the company’s fundamentals or competitive position significantly deteriorate or if a better alternative exists in the marketplace.
The Fund’s underperformance versus its benchmarks was the result of both sector allocations and stock selection. Overweight positions in the health care and consumer discretionary sectors, two of the worst performing sectors in the Russell Midcap® Value Index, and an underweight in the strongly performing utilities sector, weighed on returns. In terms of stock selection, results were negative in the consumer discretionary, financial and real estate investment trust (REIT) sectors. On the other hand, stock selection was favorable in the consumer staples, health care and energy sectors.
In consumer discretionary, shares of Signet Jewelers Limited were pressured this year due to fears over its credit card portfolio quality and unproven allegations of illegal activity in its repair services business, which resulted in investors becoming concerned about future growth prospects. In addition, higher input costs and lower mall traffic put pressure on earnings. After the stock recovered somewhat from its February lows, we sold the Fund’s shares as we believed upside would likely be limited. This was a well-timed move because Signet Jewelers’ shares dropped sharply from the end of March 2016, through the end of the reporting period. Also, office supply chain Staples Inc. experienced significant headwinds after the U.S. Federal Trade Commission (FTC) said it would challenge the company’s proposed takeover of Office Depot, which many believed would eliminate beneficial industry competition. In May 2016, a federal judge sided with the FTC and issued an injunction to block the planned takeover, which caused the two companies to abandon their plans and forced the resignation of long-time Staples CEO Ron Sargent. In light of the setback, we decided to exit the Fund’s position. Shares of Royal Caribbean Cruises Limited also struggled throughout January and February 2016 before partially rallying back. The cruise line operator provided lower-than-expected 2016 earnings guidance due in part to the negative impact of the strong dollar, fuel costs and higher interest expenses. Also, the company faced significant headline risk over fears surrounding the Zika virus outbreak in the Caribbean. We decided to sell a portion of our position in Royal Caribbean because its margins and revenue trends may have peaked after the company’s strong results over the past two years.
Generally speaking, the financial sector was a source of weakness during the reporting period as companies digested the slowdown in Fed rate hikes and the new Department of Labor regulations. The most significant laggard in the sector was Hartford Financial Services Group Inc., an insurance and financial services company. The company continued to experience headwinds due to lower interest rates, volatile equity markets and an elevated cost of capital. We sold our position and will wait on the sidelines for the time being. Also, a position in asset management firm Invesco LTD detracted after the company reported declines in sales and revenues, while fund flows remained stable. The macro environment following the Brexit vote in late June 2016, took a heavy toll on the stock since more than 22% of the company’s revenue is from the United Kingdom. However, we continued to hold Invesco because we believe the firm remains well positioned with the planned funding of a 529 plan and efficiencies expected from expense initiatives.
The Fund also experienced weakness from several of its holdings in the newly formed REIT sector, which was officially broken out from the financial sector during the reporting period. The primary laggard in the REIT space was financial and professional services firm Jones Lang LaSalle Inc., which specializes in commercial real estate services and investment management. The company’s shares came under pressure amidst signs of a slowdown in global real estate markets. In response to these concerns, shares lost more than one-third of their value despite the company’s solid diversification, appealing valuation and strong track record. We believe the company’s solid balance sheet, stable and high margins, recurring revenue streams and diversified operations make Jones Lang LaSalle a compelling investment and we continue to hold our position. Shares of Life Storage, Inc., formerly known as Sovran Self Storage, experienced significant volatility leading up to and following the company’s rebranding in the final months of the reporting period. While Sovran’s acquisition of Life Storage will be quality accretive in the long term, the deal was viewed as neutral to slightly negative given the premium pricing, timing and increased exposure to the Houston market. The most recent quarter saw higher discounts for new customers, which were driven by both a slowdown in demand and increasing supply, specifically in soft markets such as Chicago, Denver and Houston. Seven of the company’s top ten markets posted decelerating revenue growth and management reduced guidance beyond expectations. However, we continued to hold our position in Life Storage because management remains focused on maintaining occupancy and stabilizing yield going into the slow season after heightened customer price sensitivity.
On the other hand, stock selection in the consumer staples, health care and energy sectors aided the Fund’s performance during this reporting period. In consumer staples, the Fund’s standout performer was Tyson Foods Inc., the country’s largest processor and marketer of chicken, beef and pork. The company benefited from the downturn in oil prices and its promise to end the use of human antibiotics after 2015’s avian influenza outbreak. Tyson’s shares advanced strongly after the company reported record adjusted earnings and its fourth consecutive year of earnings-per-share growth, coupled with solid 2016 guidance, a dividend increase, share repurchase commitments and additional synergies that are expected to be realized from the Hillshire merger. We have sold our position in Tyson Foods Inc.
In health care, stock selection was favorable in the medical device area. The Fund benefited from a position in Teleflex Inc., a diversified firm known for its strength in medical devices for a wide range of procedures in critical care and surgery, as well as aerospace
Portfolio Managers’ Comments (continued)
and marine products. Teleflex displayed better-than-expected topline results aided by organic strength during the launch of two new products. In addition, cost cutting and restructuring aided margin progression for the firm. We have sold our position in Teleflex Inc.
In energy, the Fund benefited from a position in Pioneer Natural Resources Company, which continues to be one of the best names in the Permian Basin, accounting for approximately one-fourth of all U.S. crude production. The company has the largest land base in the Midland Basin and the most active in terms of rig counts. Pioneer managed its balance sheet well through the recent oil price downturn, benefiting from the shift toward gas lift and centralized facilities.
Stock selection was favorable in the utilities sector, but much of the benefit was offset by an underweight to this strong performing sector. The utilities sector advanced nearly 16% compared to an approximately 8% return for the Russell Midcap® Value benchmark. In terms of individual holdings, our position in Alliant Energy Corporation was additive to the Fund’s performance. Alliant Energy, the holding company of Interstate Power and Light and Wisconsin Power and Light, has been one of the Fund’s consistent performers given its constructive regulatory environment. In addition, management continues to invest in the future allowing for favorable rate base expansion, which is resulting in better-than-industry average earnings and dividend growth prospects.
Finally, although the materials sector slightly detracted, the Fund’s position in Steel Dynamics Inc. was a bright spot. While the company faced challenges in the heavy equipment, agricultural and energy markets, the automotive sector remained strong and the construction market continued to improve. Steel Dynamics’ management anticipated a significant increase in volume for its flat roll products, which account for approximately 60% of the company’s product mix, because customer inventories are now better aligned with consumption and import volumes have trended lower compared to 2015 levels. This increased demand is boosting the company’s 2016 profitability from steel operations. Steel Dynamics also announced an increase in its cash dividend during the reporting period. We have sold our position in Steel Dynamics Inc.
Nuveen Small Cap Value Fund
How did the Fund perform during the twelve-month reporting period ended October 31, 2016?
The tables in the Fund Performance and Expense Ratios section of this report provide total returns for the Fund for the one-year, five-year, ten-year and since inception periods ended October 31, 2016. Comparative performance information is provided for the Fund’s Class A Shares at net asset value (NAV). The Fund’s Class A Shares at NAV underperformed the Russell 2000® Value Index and outperformed the Lipper Small-Cap Value Funds Classification Average during the twelve-month reporting period.
What strategies were used to manage the Fund during the reporting period and how did these strategies influence performance?
The Fund seeks to provide long-term capital appreciation by investing primarily in the common stocks of companies with market capitalizations of $103 million to $4.7 billion at the time of purchase. During the reporting period, we continued to focus on building a well-diversified portfolio of small-cap stocks from companies with strengthening balance sheets and cash flow characteristics. We also continued to target companies with sound business models and strong competitive advantages that we believe can gain market share opportunistically in the current environment. We remained committed to our approach of investing in quality companies that are trading at a discount to both intrinsic and relative value metrics.
Small-cap equities encountered heightened volatility early in 2016 as investors reacted to Chinese economic data suggesting further deceleration, rising high yield credit spreads and concerns associated with the U.S. energy complex as crude oil prices continued to slide. Additionally, heightened political rhetoric and government scrutiny over pricing practices in the pharmaceutical industry drove an intense sell-off among health care stocks. Risk assets appeared to bottom in mid-February 2016. Small-cap stocks subsequently rallied on a rebound in oil prices stemming from potential production curtailments, additional Chinese economic stimulus measures and generally tepid global growth. As the reporting period progressed, small-cap stocks gained traction after equity investors shrugged off the potential economic ramifications of the U.K.’s Brexit vote and instead focused on the continued slow-but-steady advance of the U.S. economy. However, in the final month of the reporting period, uncertainty surrounding the U.S. presidential election and a potential Fed rate hike in December caused investors to rotate out of small caps. Value stocks strongly outperformed in the small-cap universe with the Russell 2000® Value Index ending the reporting period with a nearly 9% return, versus the slightly negative return of the Russell 2000® Growth Index.
The Fund outperformed its Lipper peers due in part to strong stock selection in the energy sector. Although energy was the worst performing sector in the Russell 2000® Value Index down during the reporting period, the Fund’s holdings collectively advanced. We saw particularly favorable results from our stock selection in the exploration and production (E&P) group, including a position in WPX Energy Inc., a repositioning story with core operations in the Bakken and Delaware Basins. We originally purchased its shares at a deep discount because we believed WPX Energy had an abundance of company-specific catalysts that could narrow the dramatic gap where the stock was trading. During the reporting period, the company continued to execute on the sale of non-strategic assets to reduce debt, while improving on well results in its core plays. WPX Energy’s shares subsequently rebounded due to the combination of the asset dispositions, improving operating results and rising oil prices. Given the significant move in the stock and the successful attainment of the repositioning milestones, we trimmed our position; however, we still anticipate more value creation out of WPX Energy because of its management team’s laser focus on improving well economics. Additionally, the stock continues to trade at a discount to its peers and to net asset value. We also benefited from a position in Callon Petroleum Company, a high quality North American E&P company with operations and inventory exclusively in the Permian Basin. The stock’s discount to its peer group narrowed significantly during the reporting period after the management team delivered on strong operating results, while hitting its promised milestone of cash flow neutrality. Importantly, Callon Petroleum built out its inventory base with the establishment of a new core region in Howard County, but still within the Permian Basin, via an acquisition. The deal was financed with equity in order to preserve the company’s solid balance sheet and liquidity position. Given that Callon’s management has multiple other levers to use to improve on the economics assumed in the acquisition underwriting, we remain invested in the stock.
The utilities sector benefited the Fund’s results, including strong performance from a position in California Water Service Group, the third largest public water utility in the U.S. primarily serving California. During 2015, the company’s bottom line was negatively impacted by the severe drought conditions, which resulted in conservation mandates that impacted both volumes and expenses. However, because of decoupling mechanisms, California Water has the ability to recoup most of the costs associated with the drought on a delayed basis. The stock reacted favorably to the company’s first-quarter 2016 earnings report and conference call that highlighted details around the timing of conservation cost reimbursements and the improvement in overall drought conditions via a solid snow pack in northern California. Given the improving conditions and optimism surrounding the company’s proposal for an increased rate of infrastructure replacement, we remained holders of this stock.
Results were slightly positive, but somewhat mixed overall in the industrials sector. On the positive side, we saw strong results from Quad Graphics Inc. in the print advertising and advertising services business. The company reported a very strong first quarter, which beat top-line expectations and was dramatically ahead in terms of earnings. Demand for the company’s services stabilized, while Quad Graphics experienced a strong benefit from cost-reduction efforts completed during 2015. On the other hand, shares of Korn Ferry International, the world’s largest executive search firm, were sent sharply lower despite in-line financial results. Management highlighted the potential for a pause in hiring decisions in both Europe and North America stemming from the uncertainty surrounding the Brexit vote. However, we believed the market overly discounted what seemed to be a pause in hiring versus a material downturn in overall demand. At this point, we are holding our position with Korn Ferry, but are monitoring the situation closely.
Information technology aided the Fund’s results, mainly due to our overweight position in this strongly performing sector. However, we also saw favorable performance from CSG Systems International Inc., a provider of customer care and billing solutions to the cable and direct broadcast satellite industry in North America. During the reporting period, the company reported strong results above expectations with solid net subscriber growth driving favorable revenue growth, significant margin expansion and increased free cash flow. CSG Systems also announced an incremental $50 million accelerated share repurchase program. However, later in the reporting period we decided to exit this investment given that the company’s margin improvement story had proved out and its new CEO was focusing on improving the long-term growth profile of the company via front-loading research and development and/or sales and marketing resources. We believed the timing of the intended topline benefit to this investment would be beyond a six-month time frame, while CSG Systems shares had achieved our price target.
While overall results in consumer discretionary were flat, a position in specialty home furnishings and accessories retailer Kirkland’s, Inc. continued to detract. Shares dropped sharply in August 2016, after the company missed expectations in its second-quarter report due to softer traffic trends in its stores. However, we maintained our position given that management reported a modest increase in traffic after quarter end, coupled with strength in the company’s e-commerce sales. We also believed that Kirkland’s
Portfolio Managers’ Comments (continued)
shares looked compelling at their historically low valuation level, while the company displayed balance sheet strength through its $3-per-share net cash position. Shares of leading contemporary apparel retailer Express Inc. also dropped following disappointing second-quarter results, marking the second consecutive miss at the hands of increased on-line competition and fashion miscues. However, we maintained our position in Express given its attractive valuation coupled with the company’s recent expense control initiatives. As an offset, the Fund benefited from a position in youth apparel and accessories retailer Childrens Place Retail Stores. The company’s results were boosted by a strong earnings report and higher-than-expected 2016 guidance. Our research continued to suggest a better promotional environment for Children’s Place, indicating ongoing progress in this margin improvement story. We have maintained our investment in Childrens Place.
On the other hand, the Fund’s shortfall versus the Russell 2000® Value Index was mainly the result of stock selection in the financial sector. The leading detractor was a position in the annuity-focused firm American Equity Investment Life Holding Company. The stock’s volatility was primarily because of industry noise regarding the Department of Labor’s fiduciary proposals and how they may or may not impact industry players. In addition, credit spread widening negatively impacted the perceived value of firms like American Equity Life, given its energy and material holdings. However, we remained holders because of the continued operating strength seen in annuity sales. We also saw poor results from a position in West Coast regional bank Opus Bank, which focuses on small to middle market verticals in technology and specialty commercial lending. When we purchased the stock, it was trading at a much lower price/earnings (P/E) ratio than its industry peers despite the company’s above-average deposit and loan growth. Opus Bank’s credit profile also remained stable with a solid reserve coverage cushion. Unfortunately, we witnessed a sharp uptick in non-performing loans and the company announced a new head of credit. Because we anticipated a decline in loan growth and profitability, we exited the holding.
The Fund’s position in life and health insurance firm CNO Financial Group Inc. also underperformed. The company’s most recent quarter was overshadowed by concerns regarding its long-term care reinsurance agreement with reinsurer Beechwood Re. CNO Financial’s management has stated that it is recapturing this business, which will lower excess capital and halt buybacks through year end. However, we expect buybacks to continue later next year after free cash flow rebuilds overall capital levels. CNO Financial’s core businesses continue to display good operational trends in their business lines. We are maintaining our position given overall operating fundamentals, strong cash flow trends and the company’s deep discount valuation. In addition, the Fund’s position in East West Bancorp Inc. lagged during the reporting period. The firm operates as a holding company for East West Bank, one of the largest independent banks that focuses on the Chinese-American community. Despite strong loan growth and good operating results at year-end, the company’s 2016 guidance was softer than expected because management planned to deploy more technology capital expenditures and add additional talent in 2016 to ramp up results. We decided to exit our position in East West in favor of a smaller-cap franchise positioned in the same geographic footprint with more favorable valuation metrics.
Results were modestly negative in the newly formed real estate investment trust (REIT) sector, which was officially broken out from the financial sector during the reporting period. The primary laggard was Life Storage, Inc., formerly known as Sovran Self Storage, which experienced significant volatility leading up to and following the company’s rebranding in the final months of the reporting period. While Sovran’s acquisition of Life Storage will be quality accretive in the long term, the deal was viewed as neutral to slightly negative given the premium pricing, timing and increased exposure to the Houston market. The most recent quarter saw higher discounts for new customers, which were driven by both a slowdown in demand and increasing supply, specifically in soft markets such as Chicago, Denver and Houston. However, we continued to hold our position in Life Storage because management remains focused on maintaining occupancy and stabilizing yield going into the slow season after heightened customer price sensitivity. Offsetting much of the weakness in the sector, the Fund experienced strong results from EPR Properties, a diversified REIT focused on family entertainment centers, theaters and charter/private school locations. Company management was successful at achieving above-average returns from its properties. In addition, gaming licensing approval trends were positive with regard to EPR Properties’ casino and resort project in New York. We have sold our position in EPR Properties.
Although results were flat in the health care sector, the sector was home to one significant detractor, behavioral health care provider Civitas Solutions Inc. The company reported a tough second quarter and had to lower its fiscal year 2016 guidance due to weakness from a key state, West Virginia, from the redesign of its intellectual/developmental disabilities program and higher-than-expected health care costs. However, we believe these issues are transitory and some of Civitas Solutions’ good cost management measures are being masked by the near-term situation in West Virginia, which we will continue to monitor carefully.
Risk Considerations
Nuveen Dividend Value Fund
Mutual fund investing involves risk; principal loss is possible. There is no guarantee the Fund’s investment objectives will be achieved. Dividends are not guaranteed. Prices of equity securities may decline significantly over short or extended periods of time. Non-U.S. investments involve risks such as currency fluctuation, political and economic instability, lack of liquidity and differing legal and accounting standards. These risks are magnified in emerging markets. These and other risk considerations, such as credit, derivatives, high yield securities, and interest rate risks, are described in detail in the Fund’s prospectus.
Nuveen Mid Cap Value Fund
Mutual fund investing involves risk; principal loss is possible. There is no guarantee the Fund’s investment objectives will be achieved. Prices of equity securities may decline significantly over short or extended periods of time. Investments in mid-cap companies are subject to greater volatility than those of larger companies, but may be less volatile than investments in smaller companies. Non-U.S. investments involve risks such as currency fluctuation, political and economic instability, lack of liquidity and differing legal and accounting standards. These risks are magnified in emerging markets. These and other risk considerations, such as derivatives risk, are described in detail in the Fund’s prospectus.
Nuveen Small Cap Value Fund
Mutual fund investing involves risk; principal loss is possible. There is no guarantee the Fund’s investment objectives will be achieved. Prices of equity securities may decline significantly over short or extended periods of time. Investments in smaller companies are subject to greater volatility than those of larger companies. Non-U.S. investments involve risks such as currency fluctuation, political and economic instability, lack of liquidity and differing legal and accounting standards. These risks are magnified in emerging markets. These and other risk considerations, such as derivatives risk, are described in detail in the Fund’s prospectus.
THIS PAGE INTENTIONALLY LEFT BLANK
Fund Performance
and Expense Ratios
The Fund Performance and Expense Ratios for each Fund are shown within this section of the report.
Returns quoted represent past performance, which is no guarantee of future results. Investment returns and principal value will fluctuate so that when shares are redeemed, they may be worth more or less than their original cost. Current performance may be higher or lower than the performance shown. Total returns for a period of less than one year are not annualized. Returns at net asset value (NAV) would be lower if the sales charge were included. Returns assume reinvestment of dividends and capital gains. For performance, current to the most recent month-end visit Nuveen.com or call (800) 257-8787.
Returns do not reflect the deduction of taxes that a shareholder would pay on Fund distributions or the redemption of Fund shares.
Returns may reflect fee waivers and/or expense reimbursements by the investment adviser during the periods presented. If any such waivers and/or reimbursements had not been in place, returns would have been reduced. See Notes to Financial Statements, Note 7—Management Fees and Other Transactions with Affiliates for more information.
Returns reflect differences in sales charges and expenses, which are primarily differences in distribution and service fees, and assume reinvestment of dividends and capital gains.
Comparative index and Lipper return information is provided for Class A Shares at NAV only.
The expense ratios shown reflect total operating expenses (before fee waivers and/or expense reimbursements, if any) as shown in the most recent prospectus. The expense ratios include management fees and other fees and expenses.
Fund Performance and Expense Ratios (continued)
Nuveen Dividend Value Fund
Refer to the first page of this Fund Performance and Expense Ratios section for further explanation of the information included within this section. Refer to the Glossary of Terms Used in this Report for definitions of terms used within this section.
Fund Performance
Average Annual Total Returns as of October 31, 2016
| | | | | | | | | | | | |
| | | Average Annual | |
| | | 1-Year | | | 5-Year | | | 10-Year | |
Class A Shares at NAV | | | 5.33% | | | | 11.05% | | | | 6.30% | |
Class A Shares at maximum Offering Price | | | (0.70)% | | | | 9.74% | | | | 5.67% | |
Russell 1000® Value Index | | | 6.37% | | | | 13.31% | | | | 5.35% | |
S&P 500® Index | | | 4.51% | | | | 13.57% | | | | 6.70% | |
Lipper Equity Income Funds Classification Average | | | 4.70% | | | | 10.55% | | | | 5.64% | |
| | | |
Class C Shares | | | 4.46% | | | | 10.22% | | | | 5.50% | |
Class R3 Shares | | | 5.01% | | | | 10.78% | | | | 6.02% | |
Class I Shares | | | 5.56% | | | | 11.32% | | | | 6.56% | |
| | | | | | | | |
| | | Average Annual | |
| | | 1-Year | | | Since
Inception | |
Class R6 Shares | | | 5.63% | | | | 9.28% | |
Average Annual Total Returns as of September 30, 2016 (Most Recent Calendar Quarter)
| | | | | | | | | | | | |
| | | Average Annual | |
| | | 1-Year | | | 5-Year | | | 10-Year | |
Class A Shares at NAV | | | 15.55% | | | | 13.79% | | | | 6.80% | |
Class A Shares at maximum Offering Price | | | 8.94% | | | | 12.44% | | | | 6.17% | |
Class C Shares | | | 14.66% | | | | 12.93% | | | | 6.00% | |
Class R3 Shares | | | 15.23% | | | | 13.50% | | | | 6.52% | |
Class I Shares | | | 15.78% | | | | 14.07% | | | | 7.07% | |
| | | | | | | | |
| | | Average Annual | |
| | | 1-Year | | | Since
Inception | |
Class R6 Shares | | | 15.90% | | | | 10.03% | |
Since inception returns for Class R6 Shares are from 2/28/13. Indexes and Lipper averages are not available for direct investment.
Class A Shares have a maximum 5.75% sales charge (Offering Price). Class A Share purchases of $1 million or more are sold at net asset value without an up-front sales charge but may be subject to a contingent deferred sales charge (CDSC) equal to 1%, if redeemed within eighteen months of purchase. Class C Shares have a 1% CDSC for redemptions within less than twelve months, which is not reflected in the one-year total return. Class R3 Shares have no sales charge and are only available for purchase by eligible retirement plans. Class R6 Shares have no sales charge and are available only to certain limited categories of investors as described in the prospectus. Class I Shares have no sales charge and may be purchased under limited circumstances or by specified classes of investors.
Expense Ratios as of Most Recent Prospectus
| | | | | | | | | | | | | | | | | | | | |
| | | Share Class | |
| | | Class A | | | Class C | | | Class R3 | | | Class R6 | | | Class I | |
Expense Ratios | | | 1.04% | | | | 1.79% | | | | 1.29% | | | | 0.70% | | | | 0.79% | |
Growth of an Assumed $10,000 Investment as of October 31, 2016 – Class A Shares
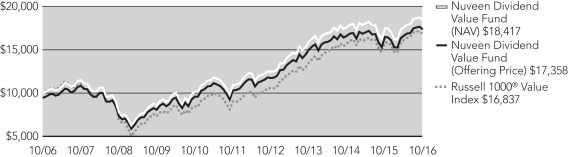
The graphs do not reflect the deduction of taxes that a shareholder may pay on Fund distributions or the redemption of Fund shares.
Fund Performance and Expense Ratios (continued)
Nuveen Mid Cap Value Fund
Refer to the first page of this Fund Performance and Expense Ratios section for further explanation of the information included within this section. Refer to the Glossary of Terms Used in this Report for definitions of terms used within this section.
Fund Performance
Average Annual Total Returns as of October 31, 2016
| | | | | | | | | | | | |
| | | Average Annual | |
| | | 1-Year | | | 5-Year | | | 10-Year | |
Class A Shares at NAV | | | 3.12% | | | | 11.49% | | | | 5.27% | |
Class A Shares at maximum Offering Price | | | (2.82)% | | | | 10.18% | | | | 4.65% | |
Russell Midcap® Value Index | | | 7.84% | | | | 14.07% | | | | 7.19% | |
Lipper Mid-Cap Value Funds Classification Average | | | 4.82% | | | | 11.71% | | | | 5.87% | |
| | | |
Class C Shares | | | 2.32% | | | | 10.65% | | | | 4.48% | |
Class R3 Shares | | | 2.86% | | | | 11.20% | | | | 5.01% | |
Class I Shares | | | 3.38% | | | | 11.76% | | | | 5.53% | |
Average Annual Total Returns as of September 30, 2016 (Most Recent Calendar Quarter)
| | | | | | | | | | | | |
| | | Average Annual | |
| | | 1-Year | | | 5-Year | | | 10-Year | |
Class A Shares at NAV | | | 15.30% | | | | 15.15% | | | | 5.98% | |
Class A Shares at maximum Offering Price | | | 8.68% | | | | 13.79% | | | | 5.36% | |
Class C Shares | | | 14.47% | | | | 14.29% | | | | 5.19% | |
Class R3 Shares | | | 15.00% | | | | 14.85% | | | | 5.72% | |
Class I Shares | | | 15.59% | | | | 15.42% | | | | 6.24% | |
Indexes and Lipper averages are not available for direct investment.
Class A Shares have a maximum 5.75% sales charge (Offering Price). Class A Share purchases of $1 million or more are sold at net asset value without an up-front sales charge but may be subject to a contingent deferred sales charge (CDSC) equal to 1%, if redeemed within eighteen months of purchase. Class C Shares have a 1% CDSC for redemptions within less than twelve months, which is not reflected in the one-year total return. Class R3 Shares have no sales charge and are only available for purchase by eligible retirement plans. Class I Shares have no sales charge and may be purchased under limited circumstances or by specified classes of investors.
Expense Ratios as of Most Recent Prospectus
| | | | | | | | | | | | | | | | |
| | | Share Class | |
| | | Class A | | | Class C | | | Class R3 | | | Class I | |
Gross Expense Ratios | | | 1.30% | | | | 2.05% | | | | 1.55% | | | | 1.05% | |
Net Expense Ratios | | | 1.17% | | | | 1.92% | | | | 1.42% | | | | 0.92% | |
The Fund’s investment adviser has contractually agreed to waive fees and/or reimburse other Fund expenses through February 28, 2018, so that total annual Fund operating expenses (excluding 12b-1 distribution and/or service fees, interest expenses, taxes, acquired fund fees and expenses, fees incurred in acquiring and disposing of portfolio securities and extraordinary expenses) do not exceed 0.92% of the average daily net assets of any class of Fund shares. Fee waivers and/or expense reimbursements will not be terminated prior to that time without the approval of the Board of Directors of the Fund.
Growth of an Assumed $10,000 Investment as of October 31, 2016 – Class A Shares
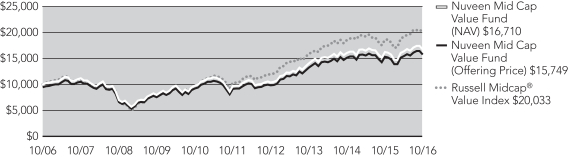
The graphs do not reflect the deduction of taxes that a shareholder may pay on Fund distributions or the redemption of Fund shares.
Fund Performance and Expense Ratios (continued)
Nuveen Small Cap Value Fund
Refer to the first page of this Fund Performance and Expense Ratios section for further explanation of the information included within this section. Refer to the Glossary of Terms Used in this Report for definitions of terms used within this section.
Fund Performance
Average Annual Total Returns as of October 31, 2016
| | | | | | | | | | | | |
| | | Average Annual | |
| | | 1-Year | | | 5-Year | | | 10-Year | |
Class A Shares at NAV | | | 6.85% | | | | 13.79% | | | | 6.71% | |
Class A Shares at maximum Offering Price | | | 0.69% | | | | 12.44% | | | | 6.08% | |
Russell 2000® Value Index | | | 8.81% | | | | 11.63% | | | | 4.91% | |
Lipper Small-Cap Value Funds Classification Average | | | 5.45% | | | | 10.66% | | | | 5.64% | |
| | | |
Class C Shares | | | 6.08% | | | | 12.94% | | | | 5.92% | |
Class R3 Shares | | | 6.58% | | | | 13.49% | | | | 6.45% | |
Class I Shares | | | 7.09% | | | | 14.06% | | | | 6.97% | |
| | | | |
| | | Cumulative | |
| | | Since
Inception | |
Class R6 Shares | | | 3.00% | |
Average Annual Total Returns as of September 30, 2016 (Most Recent Calendar Quarter)
| | | | | | | | | | | | |
| | | Average Annual | |
| | | 1-Year | | | 5-Year | | | 10-Year | |
Class A Shares at NAV | | | 18.26% | | | | 18.39% | | | | 7.61% | |
Class A Shares at maximum Offering Price | | | 11.48% | | | | 16.99% | | | | 6.97% | |
Class C Shares | | | 17.38% | | | | 17.52% | | | | 6.81% | |
Class R3 Shares | | | 17.91% | | | | 18.09% | | | | 7.34% | |
Class I Shares | | | 18.53% | | | | 18.70% | | | | 7.87% | |
| | | | |
| | | Cumulative | |
| | | Since
Inception | |
Class R6 Shares | | | 6.98% | |
Since inception returns for Class R6 Shares are from 6/30/16. Indexes and Lipper averages are not available for direct investment.
Class A Shares have a maximum 5.75% sales charge (Offering Price). Class A Share purchases of $1 million or more are sold at net asset value without an up-front sales charge but may be subject to a contingent deferred sales charge (CDSC) equal to 1%, if redeemed within eighteen months of purchase. Class C Shares have a 1% CDSC for redemptions within less than twelve months, which is not reflected in the one-year total return. Class R3 Shares have no sales charge and are only available for purchase by eligible retirement plans. Class R6 Shares have no sales charge and are available only to certain limited categories as described in the prospectus. Class I Shares have no sales charge and may be purchased under limited circumstances or by specified classes of investors.
Expense Ratios as of Most Recent Prospectus
| | | | | | | | | | | | | | | | | | | | |
| | | Share Class | |
| | | Class A | | | Class C | | | Class R3 | | | Class R6 | | | Class I | |
Gross Expense Ratios | | | 1.46% | | | | 2.21% | | | | 1.71% | | | | 1.11% | | | | 1.21% | |
Net Expense Ratios | | | 1.38% | | | | 2.13% | | | | 1.63% | | | | 1.03% | | | | 1.13% | |
The Fund’s investment adviser has contractually agreed to waive fees and/or reimburse other Fund expenses through February 28, 2018, so that total annual Fund operating expenses (excluding 12b-1 distribution and/or service fees, interest expenses, taxes, acquired fund fees and expenses, fees incurred in acquiring and disposing of portfolio securities and extraordinary expenses) do not exceed 1.02% of the average daily net assets of any class of Fund shares. Fee waivers and/or expense reimbursements will not be terminated prior to that time without the approval of the Board of Directors of the Fund.
Growth of an Assumed $10,000 Investment as of October 31, 2016 – Class A Shares
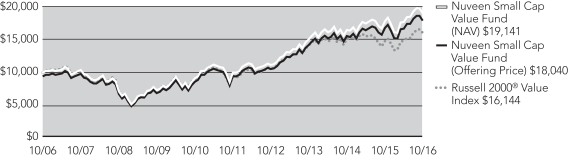
The graphs do not reflect the deduction of taxes that a shareholder may pay on Fund distributions or the redemption of Fund shares.
Holding
Summaries as of October 31, 2016
This data relates to the securities held in each Fund’s portfolio of investments as of the end of this reporting period. It should not be construed as a measure of performance for the Fund itself. Holdings are subject to change.
Nuveen Dividend Value Fund
Fund Allocation
(% of net assets)
| | | | |
Common Stocks | | | 100.2% | |
Investments Purchased with Collateral from Securities Lending | | | 0.0% | |
Money Market Funds | | | 0.2% | |
Other Assets Less Liabilities | | | (0.4)% | |
Net Assets | | | 100% | |
Portfolio Composition
(% of net assets)
| | | | |
Banks | | | 14.0% | |
Oil, Gas & Consumable Fuels | | | 12.2% | |
Pharmaceuticals | | | 6.1% | |
Real Estate Investment Trusts | | | 4.9% | |
Diversified Telecommunication Services | | | 4.8% | |
Semiconductors & Semiconductor Equipment | | | 4.2% | |
Technology Hardware, Storage & Peripherals | | | 3.9% | |
Multi-Utilities | | | 3.8% | |
Capital Markets | | | 3.7% | |
Software | | | 3.2% | |
Communications Equipment | | | 2.9% | |
Hotels, Restaurants & Leisure | | | 2.8% | |
Chemicals | | | 2.8% | |
Health Care Equipment & Supplies | | | 2.3% | |
Energy Equipment & Services | | | 2.3% | |
Tobacco | | | 2.1% | |
Health Care Providers & Services | | | 2.1% | |
Electric Utilities | | | 2.0% | |
Consumer Finance | | | 1.8% | |
Other | | | 18.3% | |
Investments Purchased with Collateral from Securities Lending | | | 0.0% | |
Money Market Funds | | | 0.2% | |
Other Assets Less Liabilities | | | (0.4)% | |
Net Assets | | | 100% | |
Top Five Common Stock Holdings (% of net assets)
| | | | |
Bank of America Corporation | | | 4.1% | |
AT&T Inc. | | | 3.8% | |
Chevron Corporation | | | 3.8% | |
JPMorgan Chase & Co. | | | 3.6% | |
Pfizer Inc. | | | 3.5% | |
Nuveen Mid Cap Value Fund
Fund Allocation
(% of net assets)
| | | | |
Common Stocks | | | 99.9% | |
Investments Purchased with
Collateral from Securities
Lending | | | 1.6% | |
Money Market Funds | | | 0.3% | |
Other Assets Less Liabilities | | | (1.8)% | |
Net Assets | | | 100% | |
Portfolio Composition
(% of net assets)
| | | | |
Equity Real Estate Investment Trusts | | | 8.9% | |
Capital Markets | | | 7.2% | |
Oil, Gas & Consumable Fuels | | | 7.0% | |
Banks | | | 6.8% | |
Machinery | | | 5.6% | |
Multi-Utilities | | | 5.0% | |
Software | | | 4.9% | |
Electric Utilities | | | 4.6% | |
Health Care Equipment & Supplies | | | 4.2% | |
Household Durables | | | 3.6% | |
Mortgage Real Estate Investment Trusts | | | 3.2% | |
Hotels, Restaurants & Leisure | | | 3.1% | |
Insurance | | | 3.1% | |
Specialty Retail | | | 3.1% | |
Containers & Packaging | | | 3.0% | |
Chemicals | | | 2.8% | |
Semiconductors & Semiconductor Equipment | | | 2.5% | |
Consumer Finance | | | 2.3% | |
Other | | | 19.0% | |
Investments Purchased with Collateral from Securities Lending | | | 1.6% | |
Money Market Funds | | | 0.3% | |
Other Assets Less Liabilities | | | (1.8)% | |
Net Assets | | | 100% | |
Top Five Common Stock Holdings (% of net assets)
| | | | |
Edison International | | | 2.6% | |
Pioneer Natural Resources Company | | | 2.5% | |
DTE Energy Company | | | 2.3% | |
Raymond James Financial Inc. | | | 2.2% | |
Western Alliance Bancorporation | | | 2.2% | |
Holding Summaries as of October 31, 2016 (continued)
Nuveen Small Cap Value Fund
Fund Allocation
(% of net assets)
| | | | |
Common Stocks | | | 98.1% | |
Investments Purchased with Collateral from Securities Lending | | | 3.2% | |
Money Market Funds | | | 4.0% | |
Other Assets Less Liabilities | | | (5.3)% | |
Net Assets | | | 100% | |
Portfolio Composition
(% of net assets)
| | | | |
Banks | | | 17.0% | |
Equity Real Estate Investment Trusts | | | 8.6% | |
Insurance | | | 6.5% | |
Communications Equipment | | | 4.7% | |
Health Care Providers & Services | | | 4.4% | |
Oil, Gas & Consumable Fuels | | | 3.9% | |
Chemicals | | | 3.4% | |
Construction & Engineering | | | 3.2% | |
Machinery | | | 3.0% | |
Electric Utilities | | | 2.9% | |
Thrifts & Mortgage Finance | | | 2.8% | |
Semiconductors & Semiconductor Equipment | | | 2.7% | |
Specialty Retail | | | 2.7% | |
Commercial Services & Supplies | | | 2.6% | |
IT Services | | | 2.3% | |
Electrical Equipment | | | 2.3% | |
Software | | | 2.3% | |
Household Durables | | | 2.3% | |
Capital Markets | | | 1.8% | |
Other | | | 18.7% | |
Investments Purchased with Collateral from Securities Lending | | | 3.2% | |
Money Market Funds | | | 4.0% | |
Other Assets Less Liabilities | | | (5.3)% | |
Net Assets | | | 100% | |
Top Five Common Stock Holdings
(% of net assets)
| | | | |
Plantronics Inc. | | | 2.1% | |
Sterling Bancorp. | | | 2.0% | |
NeuStar, Inc. | | | 1.9% | |
Webster Financial Corporation | | | 1.9% | |
Banner Corporation | | | 1.8% | |
Expense
Examples
As a shareholder of one or more of the Funds, you incur two types of costs: (1) transaction costs, including up-front and back-end sales charges (loads) or redemption fees, where applicable; and (2) ongoing costs, including management fees; distribution and service (12b-1) fees, where applicable; and other Fund expenses. The Examples below are intended to help you understand your ongoing costs (in dollars) of investing in the Funds and to compare these costs with the ongoing costs of investing in other mutual funds. Since the expense examples for Nuveen Small Cap Value Fund Class R6 Shares reflect only the first 123 days of the Class’s operation, they may not provide a meaningful understanding of the Class’s ongoing expenses.
The Examples below are based on an investment of $1,000 invested at the beginning of the period and held through the period ended October 31, 2016.
The beginning of the period is May 1, 2016.
The information under “Actual Performance,” together with the amount you invested, allows you to estimate actual expenses incurred over the reporting period. Simply divide your account value by $1,000 (for example, an $8,600 account value divided by $1,000 = 8.60) and multiply the result by the cost shown for your share class, in the row entitled “Expenses Incurred During Period” to estimate the expenses incurred on your account during this period.
The information under “Hypothetical Performance,“ provides information about hypothetical account values and hypothetical expenses based on each Fund’s actual expense ratio and an assumed rate of return of 5% per year before expenses, which is not the Fund’s actual return. The hypothetical account values and expenses may not be used to estimate the actual ending account balance or expense you incurred for the period. You may use this information to compare the ongoing costs of investing in the Fund and other funds. To do so, compare this 5% hypothetical example with the 5% hypothetical examples that appear in the shareholder reports of the other funds.
Please note that the expenses shown in the following table are meant to highlight your ongoing costs only and do not reflect any transaction costs. Therefore, the hypothetical information is useful in comparing ongoing costs only, and will not help you determine the relative total costs of owning different funds or share classes. In addition, if these transaction costs were included, your costs would have been higher.
Nuveen Dividend Value Fund
| | | | | | | | | | | | | | | | | | | | |
| | | Share Class | |
| | | Class A | | | Class C | | | Class R3 | | | Class R6 | | | Class I | |
Actual Performance | | | | | | | | | | | | | | | | | | | | |
Beginning Account Value | | $ | 1,000.00 | | | $ | 1,000.00 | | | $ | 1,000.00 | | | $ | 1,000.00 | | | $ | 1,000.00 | |
Ending Account Value | | $ | 1,045.10 | | | $ | 1,040.40 | | | $ | 1,043.20 | | | $ | 1,046.60 | | | $ | 1,046.00 | |
Expenses Incurred During the Period | | $ | 5.65 | | | $ | 9.49 | | | $ | 6.93 | | | $ | 3.86 | | | $ | 4.37 | |
Hypothetical Performance (5% annualized return before expenses) | | | | | | | | | | | | | | | | | | | | |
Beginning Account Value | | $ | 1,000.00 | | | $ | 1,000.00 | | | $ | 1,000.00 | | | $ | 1,000.00 | | | $ | 1,000.00 | |
Ending Account Value | | $ | 1,019.61 | | | $ | 1,015.84 | | | $ | 1,018.35 | | | $ | 1,021.37 | | | $ | 1,020.86 | |
Expenses Incurred During the Period | | $ | 5.58 | | | $ | 9.37 | | | $ | 6.85 | | | $ | 3.81 | | | $ | 4.32 | |
For each class of the Fund, expenses are equal to the Fund’s annualized net expense ratio of 1.10%, 1.85%, 1.35%, 0.75% and 0.85% for Classes A, C, R3, R6 and I, respectively, multiplied by the average account value over the period, multiplied by 184/366 (to reflect the one-half year period).
Expense Examples (continued)
Nuveen Mid Cap Value Fund
| | | | | | | | | | | | | | | | |
| | | Share Class | |
| | | Class A | | | Class C | | | Class R3 | | | Class I | |
Actual Performance | | | | | | | | | | | | | | | | |
Beginning Account Value | | $ | 1,000.00 | | | $ | 1,000.00 | | | $ | 1,000.00 | | | $ | 1,000.00 | |
Ending Account Value | | $ | 1,021.90 | | | $ | 1,018.10 | | | $ | 1,020.60 | | | $ | 1,023.30 | |
Expenses Incurred During the Period | | $ | 6.15 | | | $ | 9.94 | | | $ | 7.42 | | | $ | 4.88 | |
Hypothetical Performance (5% annualized return before expenses) | | | | | | | | | | | | | | | | |
Beginning Account Value | | $ | 1,000.00 | | | $ | 1,000.00 | | | $ | 1,000.00 | | | $ | 1,000.00 | |
Ending Account Value | | $ | 1,019.05 | | | $ | 1,015.28 | | | $ | 1,017.80 | | | $ | 1,020.31 | |
Expenses Incurred During the Period | | $ | 6.14 | | | $ | 9.93 | | | $ | 7.41 | | | $ | 4.88 | |
For each class of the Fund, expenses are equal to the Fund’s annualized net expense ratio of 1.21%, 1.96%, 1.46% and 0.96% for Classes A, C, R3 and I, respectively, multiplied by the average account value over the period, multiplied by 184/366 (to reflect the one-half year period).
Nuveen Small Cap Value Fund
| | | | | | | | | | | | | | | | | | | | |
| | | Share Class | |
| | | Class A | | | Class C | | | Class R3 | | | Class R6 | | | Class I | |
Actual Performance | | | | | | | | | | | | | | | | | | | | |
Beginning Account Value | | $ | 1,000.00 | | | $ | 1,000.00 | | | $ | 1,000.00 | | | $ | 1,000.00 | | | $ | 1,000.00 | |
Ending Account Value | | $ | 1,074.30 | | | $ | 1,070.00 | | | $ | 1,072.80 | | | $ | 1,030.00 | | | $ | 1,075.40 | |
Expenses Incurred During the Period | | $ | 6.62 | | | $ | 10.56 | | | $ | 7.97 | | | $ | 2.83 | | | $ | 5.37 | |
Hypothetical Performance (5% annualized return before expenses) | | | | | | | | | | | | | | | | | | | | |
Beginning Account Value | | $ | 1,000.00 | | | $ | 1,000.00 | | | $ | 1,000.00 | | | $ | 1,000.00 | | | $ | 1,000.00 | |
Ending Account Value | | $ | 1,018.75 | | | $ | 1,014.93 | | | $ | 1,017.44 | | | $ | 1,020.96 | | | $ | 1,019.96 | |
Expenses Incurred During the Period | | $ | 6.44 | | | $ | 10.28 | | | $ | 7.76 | | | $ | 2.82 | | | $ | 5.23 | |
For each class of the Fund, expenses are equal to the Fund’s annualized net expense ratio of 1.27%, 2.03%, 1.53% and 1.03% for Classes A, C, R3 and I, respectively, multiplied by the average account value over the period, multiplied by 184/366 (to reflect the one-half year period). For Class R6, expenses are equal to the Fund’s annualized net expense ratio of 0.83% multiplied by the average account value over the period, multiplied by 123/366 (to reflect the 123 days in the period since class commencement of operations).
Report of
Independent Registered Public Accounting Firm
To the Board of Directors and Shareholders of
Nuveen Investment Funds, Inc.:
In our opinion, the accompanying statements of assets and liabilities, including the portfolios of investments, and the related statements of operations and of changes in net assets and the financial highlights present fairly, in all material respects, the financial position of Nuveen Dividend Value Fund, Nuveen Mid Cap Value Fund and Nuveen Small Cap Value Fund (each a series of the Nuveen Investment Funds, Inc., hereinafter referred to as the “Funds”) at October 31, 2016, the results of each of their operations for the year then ended, the changes in each of their net assets for each of the two years in the period then ended and the financial highlights for each of the five years in the period then ended, in conformity with accounting principles generally accepted in the United States of America. These financial statements and financial highlights (hereafter referred to as “financial statements”) are the responsibility of the Funds’ management. Our responsibility is to express an opinion on these financial statements based on our audits. We conducted our audits of these financial statements in accordance with the standards of the Public Company Accounting Oversight Board (United States). Those standards require that we plan and perform the audit to obtain reasonable assurance about whether the financial statements are free of material misstatement. An audit includes examining, on a test basis, evidence supporting the amounts and disclosures in the financial statements, assessing the accounting principles used and significant estimates made by management, and evaluating the overall financial statement presentation. We believe that our audits, which included confirmation of securities at October 31, 2016 by correspondence with the custodian and brokers, provide a reasonable basis for our opinion.
PricewaterhouseCoopers LLP
Chicago, IL
December 28, 2016
Nuveen Dividend Value Fund
| | |
| Portfolio of Investments | | October 31, 2016 |
| | | | | | | | |
| Shares | | | Description (1) | | Value | |
| | |
| | | | LONG-TERM INVESTMENTS – 100.2% | | | | |
| | |
| | | | COMMON STOCKS – 100.2% | | | | |
| | |
| | | | Aerospace & Defense – 1.7% | | | |
| | |
| | 115,057 | | | General Dynamics Corporation | | $ | 17,343,692 | |
| | |
| | | | Airlines – 1.0% | | | |
| | |
| | 256,421 | | | Delta Air Lines, Inc. | | | 10,710,705 | |
| | |
| | | | Banks – 14.0% | | | |
| | |
| | 2,577,296 | | | Bank of America Corporation | | | 42,525,384 | |
| | |
| | 365,544 | | | BankUnited Inc. | | | 10,651,952 | |
| | |
| | 345,311 | | | Citigroup Inc. | | | 12,545,149 | |
| | |
| | 1,228,656 | | | Huntington BancShares Inc. | | | 13,023,754 | |
| | |
| | 543,744 | | | JPMorgan Chase & Co. | | | 37,659,709 | |
| | |
| | 1,006,761 | | | KeyCorp | | | 14,215,465 | |
| | |
| | 344,644 | | | Pacwest Bancorp | | | 14,954,103 | |
| | | | Total Banks | | | 145,575,516 | |
| | |
| | | | Biotechnology – 0.8% | | | |
| | |
| | 141,780 | | | AbbVie Inc. | | | 7,908,488 | |
| | |
| | | | Capital Markets – 3.7% | | | |
| | |
| | 158,271 | | | Ameriprise Financial, Inc. | | | 13,989,574 | |
| | |
| | 180,574 | | | NASDAQ Stock Market, Inc. | | | 11,551,319 | |
| | |
| | 207,358 | | | Raymond James Financial Inc. | | | 12,466,363 | |
| | | | Total Capital Markets | | | 38,007,256 | |
| | |
| | | | Chemicals – 2.8% | | | |
| | |
| | 137,983 | | | Celanese Corporation, Series A | | | 10,061,720 | |
| | |
| | 114,935 | | | PPG Industries, Inc. | | | 10,703,897 | |
| | |
| | 67,396 | | | Praxair, Inc. | | | 7,889,376 | |
| | | | Total Chemicals | | | 28,654,993 | |
| | |
| | | | Commercial Services & Supplies – 1.1% | | | |
| | |
| | 280,474 | | | KAR Auction Services Inc. | | | 11,942,583 | |
| | |
| | | | Communications Equipment – 2.9% | | | |
| | |
| | 998,130 | | | Cisco Systems, Inc. | | | 30,622,628 | |
| | |
| | | | Consumer Finance – 1.8% | | | |
| | |
| | 341,129 | | | Discover Financial Services | | | 19,215,797 | |
| | |
| | | | Containers & Packaging – 1.3% | | | |
| | |
| | 288,053 | | | WestRock Company | | | 13,305,168 | |
| | | | | | | | |
| Shares | | | Description (1) | | Value | |
| | |
| | | | Diversified Telecommunication Services – 4.8% | | | |
| | |
| | 1,080,036 | | | AT&T Inc. | | $ | 39,734,524 | |
| | |
| | 394,608 | | | CenturyLink Inc. | | | 10,488,681 | |
| | | | Total Diversified Telecommunication Services | | | 50,223,205 | |
| | |
| | | | Electric Utilities – 2.0% | | | |
| | |
| | 160,377 | | | NextEra Energy Inc. | | | 20,528,256 | |
| | |
| | | | Electrical Equipment – 1.5% | | | |
| | |
| | 247,875 | | | Eaton PLC | | | 15,806,989 | |
| | |
| | | | Energy Equipment & Services – 2.3% | | | |
| | |
| | 308,120 | | | Schlumberger Limited | | | 24,104,228 | |
| | |
| | | | Food & Staples Retailing – 1.0% | | | |
| | |
| | 122,888 | | | CVS Health Corporation | | | 10,334,881 | |
| | |
| | | | Health Care Equipment & Supplies – 2.3% | | | |
| | |
| | 294,111 | | | Medtronic, PLC | | | 24,122,984 | |
| | |
| | | | Health Care Providers & Services – 2.1% | | | |
| | |
| | 97,424 | | | CIGNA Corporation | | | 11,576,894 | |
| | |
| | 69,356 | | | UnitedHealth Group Incorporated | | | 9,802,083 | |
| | | | Total Health Care Providers & Services | | | 21,378,977 | |
| | |
| | | | Hotels, Restaurants & Leisure – 2.8% | | | |
| | |
| | 503,087 | | | Hilton Worldwide Holdings Inc. | | | 11,369,766 | |
| | |
| | 182,550 | | | Six Flags Entertainment Corporation | | | 10,158,907 | |
| | |
| | 82,936 | | | Wynn Resorts Ltd | | | 7,841,599 | |
| | | | Total Hotels, Restaurants & Leisure | | | 29,370,272 | |
| | |
| | | | Household Durables – 0.8% | | | |
| | |
| | 54,865 | | | Whirlpool Corporation | | | 8,219,874 | |
| | |
| | | | Industrial Conglomerates – 0.7% | | | |
| | |
| | 265,883 | | | General Electric Company | | | 7,737,195 | |
| | |
| | | | Insurance – 0.9% | | | |
| | |
| | 549,612 | | | Old Republic International Corporation | | | 9,266,458 | |
| | |
| | | | IT Services – 1.8% | | | |
| | |
| | 169,490 | | | Fidelity National Information Services | | | 12,528,701 | |
| | |
| | 221,316 | | | Sabre Corporation | | | 5,716,592 | |
| | | | Total IT Services | | | 18,245,293 | |
| | |
| | | | Leisure Equipment & Products – 1.1% | | | |
| | |
| | 346,331 | | | Mattel, Inc. | | | 10,919,816 | |
| | |
| | | | Media – 1.1% | | | |
| | |
| | 187,162 | | | Comcast Corporation, Class A | | | 11,570,355 | |
Nuveen Dividend Value Fund (continued)
| | |
| Portfolio of Investments | | October 31, 2016 |
| | | | | | | | |
| Shares | | | Description (1) | | Value | |
| | |
| | | | Multi-Utilities – 3.8% | | | |
| | |
| | 286,772 | | | CMS Energy Corporation | | $ | 12,087,440 | |
| | |
| | 169,714 | | | DTE Energy Company | | | 16,294,241 | |
| | |
| | 488,647 | | | NiSource Inc. | | | 11,365,929 | |
| | | | Total Multi-Utilities | | | 39,747,610 | |
| | |
| | | | Oil, Gas & Consumable Fuels – 12.2% | | | |
| | |
| | 327,335 | | | Anadarko Petroleum Corporation | | | 19,456,792 | |
| | |
| | 375,694 | | | Chevron Corporation | | | 39,353,947 | |
| | |
| | 276,919 | | | Exxon Mobil Corporation | | | 23,072,891 | |
| | |
| | 165,757 | | | Occidental Petroleum Corporation | | | 12,085,343 | |
| | |
| | 87,959 | | | Pioneer Natural Resources Company | | | 15,746,420 | |
| | |
| | 580,848 | | | Williams Companies, Inc. | | | 16,960,762 | |
| | | | Total Oil, Gas & Consumable Fuels | | | 126,676,155 | |
| | |
| | | | Personal Products – 1.1% | | | |
| | |
| | 282,780 | | | Unilever NV, (2) | | | 11,825,860 | |
| | |
| | | | Pharmaceuticals – 6.1% | | | |
| | |
| | 164,766 | | | GlaxoSmithKline PLC | | | 6,592,288 | |
| | |
| | 175,192 | | | Johnson & Johnson | | | 20,320,520 | |
| | |
| | 1,147,407 | | | Pfizer Inc. | | | 36,384,276 | |
| | | | Total Pharmaceuticals | | | 63,297,084 | |
| | |
| | | | Real Estate Investment Trusts – 4.9% | | | |
| | |
| | 188,622 | | | Crown Castle International Corporation | | | 17,162,716 | |
| | |
| | 299,456 | | | Lamar Advertising Company | | | 19,000,483 | |
| | |
| | 648,965 | | | Starwood Property Trust Inc. | | | 14,432,982 | |
| | | | Total Real Estate Investment Trusts | | | 50,596,181 | |
| | |
| | | | Road & Rail – 1.5% | | | |
| | |
| | 513,796 | | | CSX Corporation | | | 15,675,916 | |
| | |
| | | | Semiconductors & Semiconductor Equipment – 4.2% | | | |
| | |
| | 273,602 | | | Maxim Integrated Products, Inc. | | | 10,842,847 | |
| | |
| | 300,319 | | | QUALCOMM, Inc. | | | 20,637,922 | |
| | |
| | 244,911 | | | Xilinx, Inc. | | | 12,458,623 | |
| | | | Total Semiconductors & Semiconductor Equipment | | | 43,939,392 | |
| | |
| | | | Software – 3.2% | | | |
| | |
| | 343,546 | | | CA Technologies | | | 10,560,604 | |
| | |
| | 372,982 | | | Microsoft Corporation | | | 22,349,081 | |
| | | | Total Software | | | 32,909,685 | |
| | |
| | | | Specialty Retail – 0.9% | | | |
| | |
| | 240,103 | | | Best Buy Co., Inc. | | | 9,342,408 | |
| | | | | | | | |
| Shares | | | Description (1) | | Value | |
| | |
| | | | Technology Hardware, Storage & Peripherals – 3.9% | | | |
| | |
| | 130,708 | | | Apple, Inc. | | $ | 14,840,586 | |
| | |
| | 685,798 | | | Hewlett Packard Enterprise Co | | | 15,409,881 | |
| | |
| | 176,404 | | | Western Digital Corporation | | | 10,309,050 | |
| | | | Total Technology Hardware, Storage & Peripherals | | | 40,559,517 | |
| | |
| | | | Tobacco – 2.1% | | | |
| | |
| | 334,662 | | | Altria Group, Inc. | | | 22,127,851 | |
| | | | Total Long-Term Investments (cost $808,883,501) | | | 1,041,813,268 | |
| | |
| Shares | | | Description (1) | | Value | |
| | |
| | | | INVESTMENTS PURCHASED WITH COLLATERAL FROM SECURITIES LENDING – 0.0% | | | | |
| | |
| | | | Money Market Funds – 0.0% | | | |
| | |
| | 57,713 | | | First American Government Obligations Fund, Class X, 0.283%, (3), (4) | | $ | 57,713 | |
| | | | Total Investments Purchased with Collateral from Securities Lending (cost $57,713) | | | 57,713 | |
| | |
| Shares | | | Description (1) | | Value | |
| | |
| | | | SHORT-TERM INVESTMENTS – 0.2% | | | | |
| | |
| | | | Money Market Funds – 0.2% | | | |
| | |
| | 1,685,761 | | | First American Treasury Obligations Fund, Class Z, 0.222%, (3) | | $ | 1,685,761 | |
| | | | Total Short-Term Investments (cost $1,685,761) | | | 1,685,761 | |
| | | | Total Investments (cost $810,626,975) – 100.4% | | | 1,043,556,742 | |
| | | | Other Assets Less Liabilities – (0.4)% | | | (3,689,017 | ) |
| | | | Net Assets – 100% | | $ | 1,039,867,725 | |
For Fund portfolio compliance purposes, the Fund’s industry classifications refer to any one or more of the industry sub-classifications used by one or more widely recognized market indexes or ratings group indexes, and/or as defined by Fund management. This definition may not apply for purposes of this report, which may combine industry sub-classifications into sectors for reporting ease.
| (1) | All percentages shown in the Portfolio of Investments are based on net assets. |
| (2) | Investment, or a portion of investment, is out on loan for securities lending. The total value of the securities out on loan as of the end of the reporting period was $56,457. |
| (3) | The rate shown is the annualized seven-day subsidized yield as of the end of the reporting period. |
| (4) | The Fund may loan securities representing up to one third of the fair value of its total assets (which includes collateral for securities on loan) to broker-dealers, banks and other institutions. The Fund maintains collateral equal to at least 100% of the fair value of the securities loaned. The cash collateral received by the Fund is invested in this money market fund. See Notes to Financial Statements, Note 3 – Portfolio Securities and Investments in Derivatives, Securities Lending for more information. |
See accompanying notes to financial statements.
Nuveen Mid Cap Value Fund
| | |
| Portfolio of Investments | | October 31, 2016 |
| | | | | | | | |
| Shares | | | Description (1) | | Value | |
| | |
| | | | LONG-TERM INVESTMENTS – 99.9% | | | | |
| | |
| | | | COMMON STOCKS – 99.9% | | | | |
| | |
| | | | Aerospace & Defense – 1.5% | | | |
| | |
| | 11,137 | | | L-3 Communications Holdings, Inc. | | $ | 1,525,101 | |
| | |
| | | | Airlines – 0.6% | | | |
| | |
| | 8,585 | | | Alaska Air Group, Inc. | | | 620,009 | |
| | |
| | | | Banks – 6.8% | | | |
| | |
| | 43,373 | | | CIT Group Inc. | | | 1,575,741 | |
| | |
| | 33,596 | | | East West Bancorp Inc. | | | 1,327,378 | |
| | |
| | 159,145 | | | Huntington BancShares Inc. | | | 1,686,937 | |
| | |
| | 58,797 | | | Western Alliance Bancorporation, (2) | | | 2,196,656 | |
| | | | Total Banks | | | 6,786,712 | |
| | |
| | | | Building Products – 1.2% | | | |
| | |
| | 24,968 | | | Owens Corning | | | 1,217,939 | |
| | |
| | | | Capital Markets – 7.2% | | | |
| | |
| | 72,682 | | | E*Trade Group Inc., (2) | | | 2,046,725 | |
| | |
| | 40,045 | | | Invesco LTD | | | 1,124,864 | |
| | |
| | 27,587 | | | NASDAQ Stock Market, Inc. | | | 1,764,740 | |
| | |
| | 36,799 | | | Raymond James Financial Inc. | | | 2,212,356 | |
| | | | Total Capital Markets | | | 7,148,685 | |
| | |
| | | | Chemicals – 2.8% | | | |
| | |
| | 17,915 | | | Celanese Corporation, Series A | | | 1,306,362 | |
| | |
| | 20,601 | | | Eastman Chemical Company | | | 1,481,418 | |
| | | | Total Chemicals | | | 2,787,780 | |
| | |
| | | | Consumer Finance – 2.3% | | | |
| | |
| | 26,486 | | | Discover Financial Services | | | 1,491,956 | |
| | |
| | 106,332 | | | SLM Corporation | | | 749,641 | |
| | | | Total Consumer Finance | | | 2,241,597 | |
| | |
| | | | Containers & Packaging – 3.0% | | | |
| | |
| | 78,770 | | | Graphic Packaging Holding Company | | | 984,625 | |
| | |
| | 10,872 | | | International Paper Company | | | 489,566 | |
| | |
| | 32,543 | | | WestRock Company | | | 1,503,161 | |
| | | | Total Containers & Packaging | | | 2,977,352 | |
| | |
| | | | Diversified Telecommunication Services – 1.1% | | | |
| | |
| | 281,238 | | | Frontier Communications Corporation, (3) | | | 1,130,577 | |
| | | | | | | | |
| Shares | | | Description (1) | | Value | |
| | |
| | | | Electric Utilities – 4.6% | | | |
| | |
| | 50,300 | | | Alliant Energy Corporation | | $ | 1,913,915 | |
| | |
| | 35,669 | | | Edison International | | | 2,620,959 | |
| | | | Total Electric Utilities | | | 4,534,874 | |
| | |
| | | | Electrical Equipment – 1.1% | | | |
| | |
| | 10,789 | | | Hubbell Inc. | | | 1,127,666 | |
| | |
| | | | Electronic Equipment, Instruments & Components – 0.8% | | | |
| | |
| | 12,316 | | | Arrow Electronics, Inc., (2) | | | 752,754 | |
| | |
| | | | Energy Equipment & Services – 1.8% | | | |
| | |
| | 80,476 | | | Nabors Industries Inc. | | | 957,664 | |
| | |
| | 59,580 | | | Superior Energy Services, Inc. | | | 843,653 | |
| | | | Total Energy Equipment & Services | | | 1,801,317 | |
| | |
| | | | Equity Real Estate Investment Trusts – 8.9% | | | |
| | |
| | 98,826 | | | Developers Diversified Realty Corporation | | | 1,511,050 | |
| | |
| | 19,540 | | | Digital Realty Trust Inc. | | | 1,825,622 | |
| | |
| | 17,790 | | | Entertainment Properties Trust | | | 1,293,689 | |
| | |
| | 18,183 | | | Life Storage, Inc. | | | 1,466,459 | |
| | |
| | 21,660 | | | Post Properties, Inc. | | | 1,425,011 | |
| | |
| | 13,869 | | | SL Green Realty Corporation | | | 1,362,213 | |
| | | | Total Equity Real Estate Investment Trusts | | | 8,884,044 | |
| | |
| | | | Food Products – 1.5% | | | |
| | |
| | 29,736 | | | Pinnacle Foods Inc. | | | 1,529,025 | |
| | |
| | | | Health Care Equipment & Supplies – 4.2% | | | |
| | |
| | 43,910 | | | Boston Scientific Corporation, (2) | | | 966,020 | |
| | |
| | 30,636 | | | Hill Rom Holdings Inc. | | | 1,697,541 | |
| | |
| | 14,393 | | | Zimmer Biomet Holdings, Inc. | | | 1,517,022 | |
| | | | Total Health Care Equipment & Supplies | | | 4,180,583 | |
| | |
| | | | Health Care Providers & Services – 2.3% | | | |
| | |
| | 17,861 | | | Centene Corporation, (2) | | | 1,115,955 | |
| | |
| | 9,451 | | | CIGNA Corporation | | | 1,123,062 | |
| | | | Total Health Care Providers & Services | | | 2,239,017 | |
| | |
| | | | Hotels, Restaurants & Leisure – 3.1% | | | |
| | |
| | 76,196 | | | MGM Resorts International Inc., (2) | | | 1,994,049 | |
| | |
| | 14,811 | | | Royal Caribbean Cruises Limited | | | 1,138,522 | |
| | | | Total Hotels, Restaurants & Leisure | | | 3,132,571 | |
| | |
| | | | Household Durables – 3.6% | | | |
| | |
| | 34,716 | | | D.R. Horton, Inc. | | | 1,000,862 | |
| | |
| | 8,993 | | | Mohawk Industries Inc., (2) | | | 1,657,410 | |
| | |
| | 6,300 | | | Whirlpool Corporation | | | 943,866 | |
| | | | Total Household Durables | | | 3,602,138 | |
Nuveen Mid Cap Value Fund (continued)
| | |
| Portfolio of Investments | | October 31, 2016 |
| | | | | | | | |
| Shares | | | Description (1) | | Value | |
| | |
| | | | Insurance – 3.1% | | | |
| | |
| | 99,412 | | | Old Republic International Corporation | | $ | 1,676,086 | |
| | |
| | 40,099 | | | Unum Group | | | 1,419,505 | |
| | | | Total Insurance | | | 3,095,591 | |
| | |
| | | | IT Services – 1.5% | | | |
| | |
| | 20,072 | | | Fidelity National Information Services | | | 1,483,722 | |
| | |
| | | | Leisure Products – 1.7% | | | |
| | |
| | 19,908 | | | Hasbro, Inc. | | | 1,660,526 | |
| | |
| | | | Life Sciences Tools & Services – 0.7% | | | |
| | |
| | 16,671 | | | Agilent Technologies, Inc. | | | 726,355 | |
| | |
| | | | Machinery – 5.6% | | | |
| | |
| | 17,903 | | | Dover Corporation | | | 1,197,532 | |
| | |
| | 26,090 | | | Ingersoll Rand Company Limited, Class A | | | 1,755,596 | |
| | |
| | 12,539 | | | Parker Hannifin Corporation | | | 1,539,162 | |
| | |
| | 9,549 | | | Stanley Black & Decker Inc. | | | 1,087,058 | |
| | | | Total Machinery | | | 5,579,348 | |
| | |
| | | | Mortgage Real Estate Investment Trusts – 3.2% | | | |
| | |
| | 141,198 | | | MFA Mortgage Investments, Inc. | | | 1,032,157 | |
| | |
| | 94,800 | | | Starwood Property Trust Inc. | | | 2,108,352 | |
| | | | Total Mortgage Real Estate Investment Trusts | | | 3,140,509 | |
| | |
| | | | Multi-Utilities – 5.0% | | | |
| | |
| | 23,889 | | | DTE Energy Company | | | 2,293,583 | |
| | |
| | 73,355 | | | NiSource Inc. | | | 1,706,237 | |
| | |
| | 16,751 | | | WEC Energy Group, Inc. | | | 1,000,370 | |
| | | | Total Multi-Utilities | | | 5,000,190 | |
| | |
| | | | Oil, Gas & Consumable Fuels – 7.0% | | | |
| | |
| | 16,274 | | | Cimarex Energy Company | | | 2,101,462 | |
| | |
| | 17,744 | | | Hess Corporation | | | 851,180 | |
| | |
| | 47,365 | | | Marathon Oil Corporation | | | 624,271 | |
| | |
| | 23,601 | | | Newfield Exploration Company, (2) | | | 957,965 | |
| | |
| | 13,697 | | | Pioneer Natural Resources Company | | | 2,452,037 | |
| | | | Total Oil, Gas & Consumable Fuels | | | 6,986,915 | |
| | |
| | | | Pharmaceuticals – 1.2% | | | |
| | |
| | 35,854 | | | Medicines Company, (2) | | | 1,181,389 | |
| | |
| | | | Real Estate Management & Development – 1.3% | | | |
| | |
| | 13,275 | | | Jones Lang LaSalle Inc. | | | 1,285,684 | |
| | |
| | | | Semiconductors & Semiconductor Equipment – 2.5% | | | |
| | |
| | 11,467 | | | Lam Research Corporation | | | 1,110,694 | |
| | |
| | 80,321 | | | Micron Technology, Inc., (2) | | | 1,378,308 | |
| | | | Total Semiconductors & Semiconductor Equipment | | | 2,489,002 | |
| | | | | | | | |
| Shares | | | Description (1) | | Value | |
| | |
| | | | Software – 4.9% | | | |
| | |
| | 26,704 | | | Activision Blizzard Inc. | | $ | 1,152,812 | |
| | |
| | 50,146 | | | CA Technologies | | | 1,541,488 | |
| | |
| | 10,573 | | | Electronic Arts Inc., (2) | | | 830,192 | |
| | |
| | 19,700 | | | Nice Systems Limited | | | 1,309,459 | |
| | | | Total Software | | | 4,833,951 | |
| | |
| | | | Specialty Retail – 3.1% | | | |
| | |
| | 40,854 | | | Best Buy Co., Inc. | | | 1,589,629 | |
| | |
| | 22,497 | | | Foot Locker, Inc. | | | 1,502,125 | |
| | | | Total Specialty Retail | | | 3,091,754 | |
| | |
| | | | Thrifts & Mortgage Finance – 0.7% | | | |
| | |
| | 38,610 | | | BofI Holdings, Inc., (2), (3) | | | 719,304 | |
| | | | Total Long-Term Investments (cost $93,235,838) | | | 99,493,981 | |
| | |
| Shares | | | Description (1) | | Value | |
| | |
| | | | INVESTMENTS PURCHASED WITH COLLATERAL FROM SECURITIES LENDING – 1.6% | | | | |
| | |
| | | | Money Market Funds – 1.6% | | | |
| | |
| | 1,637,763 | | | First American Government Obligations Fund, Class X, 0.283%, (4), (5) | | $ | 1,637,763 | |
| | | | Total Investments Purchased with Collateral from Securities Lending (cost $1,637,763) | | | 1,637,763 | |
| | |
| Shares | | | Description (1) | | Value | |
| | |
| | | | SHORT-TERM INVESTMENTS – 0.3% | | | | |
| | |
| | | | Money Market Funds – 0.3% | | | |
| | |
| | 256,843 | | | First American Treasury Obligations Fund, Class Z, 0.222%, (4) | | $ | 256,843 | |
| | | | Total Short-Term Investments (cost $256,843) | | | 256,843 | |
| | | | Total Investments (cost $95,130,444) – 101.8% | | | 101,388,587 | |
| | | | Other Assets Less Liabilities – (1.8)% | | | (1,791,596 | ) |
| | | | Net Assets – 100% | | $ | 99,596,991 | |
For Fund portfolio compliance purposes, the Fund’s industry classifications refer to any one or more of the industry sub-classifications used by one or more widely recognized market indexes or ratings group indexes, and/or as defined by Fund management. This definition may not apply for purposes of this report, which may combine industry sub-classifications into sectors for reporting ease.
| (1) | All percentages shown in the Portfolio of Investments are based on net assets. |
| (2) | Non-income producing; issuer has not declared a dividend within the past twelve months. |
| (3) | Investment, or a portion of investment, is out on loan for securities lending. The total value of the securities out on loan as of the end of the reporting period was $1,583,329. |
| (4) | The rate shown is the annualized seven-day subsidized yield as of the end of the reporting period. |
| (5) | The Fund may loan securities representing up to one third of the fair value of its total assets (which includes collateral for securities on loan) to broker dealers, banks, and other institutions. The Fund maintains collateral equal to at least 100% of the fair value of the securities loaned. The cash collateral received by the Fund is invested in this money market fund. See Notes to Financial Statements, Note 3 – Portfolio Securities and Investments in Derivatives, Securities Lending for more information. |
See accompanying notes to financial statements.
Nuveen Small Cap Value Fund
| | |
| Portfolio of Investments | | October 31, 2016 |
| | | | | | | | |
| Shares | | | Description (1) | | Value | |
| | |
| | | | LONG-TERM INVESTMENTS – 98.1% | | | | |
| | |
| | | | COMMON STOCKS – 98.1% | | | | |
| | |
| | | | Aerospace & Defense – 1.3% | | | |
| | |
| | 196,139 | | | BWX Technologies, Inc. | | $ | 7,692,572 | |
| | |
| | | | Auto Components – 1.2% | | | |
| | |
| | 461,208 | | | Dana Holding Corporation | | | 7,139,500 | |
| | |
| | | | Banks – 17.0% | | | |
| | |
| | 259,908 | | | Bank of the Ozarks, Inc. | | | 9,606,200 | |
| | |
| | 245,141 | | | Banner Corporation | | | 11,065,665 | |
| | |
| | 158,050 | | | Berkshire Hills Bancorp, Inc. | | | 4,670,378 | |
| | |
| | 389,983 | | | Customers Bancorp Inc., (2) | | | 10,556,840 | |
| | |
| | 207,343 | | | First Busey Corporation | | | 4,791,697 | |
| | |
| | 257,543 | | | Heartland Financial USA, Inc. | | | 9,644,985 | |
| | |
| | 244,213 | | | Preferred Bank Los Angeles | | | 9,260,557 | |
| | |
| | 314,467 | | | Renasant Corporation | | | 10,610,117 | |
| | |
| | 662,181 | | | Sterling Bancorp. | | | 11,919,258 | |
| | |
| | 281,136 | | | Webster Financial Corporation | | | 11,357,894 | |
| | |
| | 281,738 | | | Western Alliance Bancorporation, (2) | | | 10,525,732 | |
| | | | Total Banks | | | 104,009,323 | |
| | |
| | | | Capital Markets – 1.8% | | | |
| | |
| | 174,711 | | | Evercore Partners Inc. | | | 9,390,716 | |
| | |
| | 266,918 | | | Manning & Napier Inc. | | | 1,841,734 | |
| | | | Total Capital Markets | | | 11,232,450 | |
| | |
| | | | Chemicals – 3.4% | | | |
| | |
| | 190,766 | | | Kraton Performance Polymers Inc., (2) | | | 4,889,333 | |
| | |
| | 162,727 | | | Minerals Technologies Inc. | | | 10,935,254 | |
| | |
| | 248,592 | | | Orion Engineered Carbons SA | | | 4,661,100 | |
| | | | Total Chemicals | | | 20,485,687 | |
| | |
| | | | Commercial Services & Supplies – 2.6% | | | |
| | |
| | 35,483 | | | G&K Services, Inc. | | | 3,360,240 | |
| | |
| | 304,094 | | | Quad Graphics Inc. | | | 7,225,273 | |
| | |
| | 203,604 | | | SP Plus Corporation, (2) | | | 5,130,821 | |
| | | | Total Commercial Services & Supplies | | | 15,716,334 | |
| | |
| | | | Communications Equipment – 4.7% | | | |
| | |
| | 154,485 | | | Finisar Corporation, (2) | | | 4,229,799 | |
| | |
| | 125,334 | | | Netgear, Inc., (2) | | | 6,329,367 | |
| | | | | | | | |
| Shares | | | Description (1) | | Value | |
| | |
| | | | Communications Equipment (continued) | | | |
| | |
| | 247,074 | | | Plantronics Inc. | | $ | 12,776,195 | |
| | |
| | 407,745 | | | Radware, Limited, (2) | | | 5,508,635 | |
| | | | Total Communications Equipment | | | 28,843,996 | |
| | |
| | | | Construction & Engineering – 3.2% | | | |
| | |
| | 174,773 | | | Emcor Group Inc. | | | 10,566,776 | |
| | |
| | 473,214 | | | Tutor Perini Corporation, (2) | | | 9,014,727 | |
| | | | Total Construction & Engineering | | | 19,581,503 | |
| | |
| | | | Diversified Telecommunication Services – 0.7% | | | |
| | |
| | 636,192 | | | Vonage Holdings Corporation, (2) | | | 4,364,277 | |
| | |
| | | | Electric Utilities – 2.9% | | | |
| | |
| | 196,573 | | | El Paso Electric Company | | | 9,081,673 | |
| | |
| | 267,234 | | | PNM Resources Inc. | | | 8,778,637 | |
| | | | Total Electric Utilities | | | 17,860,310 | |
| | |
| | | | Electrical Equipment – 2.3% | | | |
| | |
| | 522,578 | | | Babcock & Wilcox Enterprises, Inc., (2) | | | 8,225,378 | |
| | |
| | 98,992 | | | Regal-Beloit Corporation | | | 5,850,427 | |
| | | | Total Electrical Equipment | | | 14,075,805 | |
| | |
| | | | Electronic Equipment, Instruments & Components – 1.7% | | | |
| | |
| | 723,594 | | | Vishay Intertechnology Inc., (3) | | | 10,202,675 | |
| | |
| | | | Energy Equipment & Services – 1.0% | | | |
| | |
| | 185,740 | | | Matrix Service Company, (2) | | | 3,287,598 | |
| | |
| | 190,400 | | | Superior Energy Services, Inc. | | | 2,696,064 | |
| | | | Total Energy Equipment & Services | | | 5,983,662 | |
| | |
| | | | Equity Real Estate Investment Trusts – 8.6% | | | |
| | |
| | 509,494 | | | Brandywine Realty Trust | | | 7,897,157 | |
| | |
| | 79,603 | | | Entertainment Properties Trust | | | 5,788,730 | |
| | |
| | 299,096 | | | Kite Realty Group Trust | | | 7,456,463 | |
| | |
| | 58,173 | | | Life Storage, Inc. | | | 4,691,652 | |
| | |
| | 761,809 | | | Monogram Residential Trust, Inc. | | | 8,029,467 | |
| | |
| | 435,429 | | | STAG Industrial Inc. | | | 10,045,347 | |
| | |
| | 672,070 | | | Summit Hotel Properties Inc. | | | 8,730,189 | |
| | | | Total Equity Real Estate Investment Trusts | | | 52,639,005 | |
| | |
| | | | Food & Staples Retailing – 0.7% | | | |
| | |
| | 149,199 | | | SpartanNash Co | | | 4,177,572 | |
| | |
| | | | Food Products – 0.5% | | | |
| | |
| | 35,667 | | | Treehouse Foods Inc., (2), (3) | | | 3,120,149 | |
| | |
| | | | Gas Utilities – 1.1% | | | |
| | |
| | 110,771 | | | Spire, Inc. | | | 6,956,419 | |
Nuveen Small Cap Value Fund (continued)
| | |
| Portfolio of Investments | | October 31, 2016 |
| | | | | | | | |
| Shares | | | Description (1) | | Value | |
| | |
| | | | Health Care Equipment & Supplies – 1.4% | | | |
| | |
| | 143,988 | | | Halyard Health Inc., (2) | | $ | 4,658,012 | |
| | |
| | 178,495 | | | Nxstage Medical, Inc., (2) | | | 4,058,976 | |
| | | | Total Health Care Equipment & Supplies | | | 8,716,988 | |
| | |
| | | | Health Care Providers & Services – 4.4% | | | |
| | |
| | 178,195 | | | AMN Healthcare Services Inc., (2) | | | 5,844,796 | |
| | |
| | 420,078 | | | Civitas Solutions Inc., (2) | | | 7,183,334 | |
| | |
| | 104,522 | | | Landauer Inc. | | | 4,546,707 | |
| | |
| | 389,576 | | | Pharmerica Corporation, (2) | | | 9,271,909 | |
| | | | Total Health Care Providers & Services | | | 26,846,746 | |
| | |
| | | | Hotels, Restaurants & Leisure – 1.2% | | | |
| | |
| | 51,020 | | | CBRL Group Inc., (3) | | | 7,040,760 | |
| | |
| | | | Household Durables – 2.3% | | | |
| | |
| | 190,562 | | | CalAtlantic Group Inc. | | | 6,158,964 | |
| | |
| | 324,455 | | | La Z Boy Inc. | | | 7,592,247 | |
| | | | Total Household Durables | | | 13,751,211 | |
| | |
| | | | Insurance – 6.5% | | | |
| | |
| | 399,612 | | | American Equity Investment Life Holding Company | | | 7,165,043 | |
| | |
| | 136,160 | | | Amerisafe, Inc. | | | 7,570,496 | |
| | |
| | 136,902 | | | Argo Group International Holdings Inc. | | | 7,611,751 | |
| | |
| | 644,290 | | | CNO Financial Group Inc. | | | 9,715,893 | |
| | |
| | 210,864 | | | Horace Mann Educators Corporation | | | 7,580,561 | |
| | | | Total Insurance | | | 39,643,744 | |
| | |
| | | | IT Services – 2.3% | | | |
| | |
| | 512,412 | | | NeuStar, Inc., (2), (3) | | | 11,503,649 | |
| | |
| | 145,139 | | | Perficient, Inc., (2) | | | 2,701,037 | |
| | | | Total IT Services | | | 14,204,686 | |
| | |
| | | | Leisure Products – 0.9% | | | |
| | |
| | 124,974 | | | Brunswick Corporation | | | 5,436,369 | |
| | |
| | | | Machinery – 3.0% | | | |
| | |
| | 278,207 | | | Altra Industrial Motion, Inc. | | | 8,207,106 | |
| | |
| | 571,606 | | | NN, Incorporated | | | 10,088,846 | |
| | | | Total Machinery | | | 18,295,952 | |
| | |
| | | | Media – 1.2% | | | |
| | |
| | 165,686 | | | Meredith Corporation | | | 7,513,860 | |
| | |
| | | | Metals & Mining – 1.5% | | | |
| | |
| | 591,497 | | | Commercial Metals Company | | | 9,292,418 | |
| | |
| | | | Mortgage Real Estate Investment Trusts – 1.2% | | | |
| | |
| | 986,209 | | | MFA Mortgage Investments, Inc. | | | 7,209,188 | |
| | | | | | | | |
| Shares | | | Description (1) | | Value | |
| | |
| | | | Oil, Gas, & Consumable Fuels – 3.9% | | | |
| | |
| | 536,338 | | | Callon Petroleum Company, (2) | | $ | 6,967,031 | |
| | |
| | 139,974 | | | PDC Energy Inc., (2) | | | 8,584,605 | |
| | |
| | 1,190,560 | | | Scorpio Tankers Inc. | | | 4,559,845 | |
| | |
| | 369,133 | | | WPX Energy Inc., (2) | | | 4,008,784 | |
| | | | Total Oil, Gas, & Consumable Fuels | | | 24,120,265 | |
| | |
| | | | Professional Services – 0.8% | | | |
| | |
| | 238,759 | | | Korn Ferry International | | | 4,868,296 | |
| | |
| | | | Semiconductors & Semiconductor Equipment – 2.7% | | | |
| | |
| | 844,081 | | | Cypress Semiconductor Corporation | | | 8,415,488 | |
| | |
| | 160,157 | | | MKS Instruments Inc. | | | 8,079,921 | |
| | | | Total Semiconductors & Semiconductor Equipment | | | 16,495,409 | |
| | |
| | | | Software – 2.3% | | | |
| | |
| | 226,205 | | | Mentor Graphics Corporation | | | 6,537,325 | |
| | |
| | 202,691 | | | Synchronoss Technologies, Inc., (2) | | | 7,440,787 | |
| | | | Total Software | | | 13,978,112 | |
| | |
| | | | Specialty Retail – 2.7% | | | |
| | |
| | 73,735 | | | Childrens Place Retail Stores Inc. | | | 5,600,173 | |
| | |
| | 420,659 | | | Express Inc., (2) | | | 5,056,321 | |
| | |
| | 468,581 | | | Kirkland’s, Inc., (2) | | | 5,721,374 | |
| | | | Total Specialty Retail | | | 16,377,868 | |
| | |
| | | | Textiles Apparel & Luxury Goods – 0.8% | | | |
| | |
| | 165,357 | | | Culp Inc. | | | 4,629,996 | |
| | |
| | | | Thrifts & Mortgage Finance – 2.8% | | | |
| | |
| | 696,621 | | | Radian Group Inc. | | | 9,467,079 | |
| | |
| | 213,625 | | | WSFS Financial Corporation | | | 7,487,556 | |
| | | | Total Thrifts & Mortgage Finance | | | 16,954,635 | |
| | |
| | | | Water Utilities – 1.5% | | | |
| | |
| | 286,389 | | | California Water Service Group | | | 8,878,059 | |
| | | | Total Long-Term Investments (cost $574,110,132) | | | 598,335,801 | |
| | |
| Shares | | | Description (1) | | Value | |
| | |
| | | | INVESTMENTS PURCHASED WITH COLLATERAL FROM SECURITIES LENDING – 3.2% | | | | |
| | |
| | | | Money Market Funds – 3.2% | | | |
| | |
| | 19,618,596 | | | First American Treasury Obligations Fund, Class X, 0.283%, (4), (5) | | $ | 19,618,596 | |
| | | | Total Investments Purchased with Collateral from Securities Lending (cost $19,618,596) | | | 19,618,596 | |
Nuveen Small Cap Value Fund (continued)
| | |
| Portfolio of Investments | | October 31, 2016 |
| | | | | | | | |
| Shares | | | Description (1) | | Value | |
| | |
| | | | SHORT-TERM INVESTMENTS – 4.0% | | | | |
| | |
| | | | Money Market Funds – 4.0% | | | |
| | |
| | 24,503,340 | | | First American Treasury Obligations Fund, Class Z, 0.222%, (4) | | $ | 24,503,340 | |
| | | | Total Short-Term Investments (cost $24,503,340) | | | 24,503,340 | |
| | | | Total Investments (cost $618,232,068) – 105.3% | | | 642,457,737 | |
| | | | Other Assets Less Liabilities – (5.3)% | | | (32,308,481 | ) |
| | | | Net Assets – 100% | | $ | 610,149,256 | |
For Fund portfolio compliance purposes, the Fund’s industry classifications refer to any one or more of the industry sub-classifications used by one or more widely recognized market indexes or ratings group indexes, and/or as defined by Fund management. This definition may not apply for purposes of this report, which may combine industry sub-classifications into sectors for reporting ease.
| (1) | All percentages shown in the Portfolio of Investments are based on net assets. |
| (2) | Non-income producing; issuer has not declared a dividend within the past twelve months. |
| (3) | Investment, or a portion of investment, is out on loan for securities lending. The total value of the securities out on loan as of the end of the reporting period was $19,037,736. |
| (4) | The rate shown is the annualized seven-day subsidized yield as of the end of the reporting period. |
| (5) | The Fund may loan securities representing up to one third of the fair value of its total assets (which includes collateral for securities on loan) to broker dealers, banks, and other institutions. The Fund maintains collateral equal to at least 100% of the fair value of the securities loaned. The cash collateral received by the Fund is invested in this money market fund. See Notes to Financial Statements, Note 3 – Portfolio Securities and Investments in Derivatives, Securities Lending for more information. |
See accompanying notes to financial statements.
Statement of
| | | | |
| | Assets and Liabilities | | October 31, 2016 |
| | | | | | | | | | | | |
| | | Dividend
Value | | | Mid Cap
Value | | | Small Cap
Value | |
Assets | | | | | | | | | | | | |
Long-term investments, at value (cost $808,883,501, $93,235,838 and $574,110,132, respectively) | | $ | 1,041,813,268 | | | $ | 99,493,981 | | | $ | 598,335,801 | |
Investments purchased with collateral from securities lending, at value (cost approximates value) | | | 57,713 | | | | 1,637,763 | | | | 19,618,596 | |
Short-term investments, at value (cost approximates value) | | | 1,685,761 | | | | 256,843 | | | | 24,503,340 | |
Receivable for: | | | | | | | | | | | | |
Dividends | | | 969,477 | | | | 68,408 | | | | 230,896 | |
Due from broker | | | 413 | | | | 526 | | | | 5,143 | |
Interest | | | 723 | | | | 104 | | | | 3,120 | |
Investments sold | | | — | | | | — | | | | 124,104 | |
Reclaims | | | 20,573 | | | | — | | | | — | |
Shares sold | | | 409,591 | | | | 35,184 | | | | 8,225,393 | |
Other assets | | | 99,023 | | | | 35,812 | | | | 64,457 | |
Total assets | | | 1,045,056,542 | | | | 101,528,621 | | | | 651,110,850 | |
Liabilities | | | | | | | | | | | | |
Payable for: | | | | | | | | | | | | |
Collateral from securities lending program | | | 57,713 | | | | 1,637,763 | | | | 19,618,596 | |
Investments purchased | | | — | | | | — | | | | 20,129,387 | |
Shares redeemed | | | 3,950,793 | | | | 149,815 | | | | 530,319 | |
Accrued expenses: | | | | | | | | | | | | |
Management fees | | | 603,767 | | | | 59,359 | | | | 355,215 | |
Directors fees | | | 67,894 | | | | 7,023 | | | | 5,106 | |
12b-1 distribution and service fees | | | 106,591 | | | | 15,489 | | | | 67,972 | |
Shareholder servicing agent fees | | | 288,362 | | | | 35,441 | | | | 176,469 | |
Other | | | 113,697 | | | | 26,740 | | | | 78,530 | |
Total liabilities | | | 5,188,817 | | | | 1,931,630 | | | | 40,961,594 | |
Net assets | | $ | 1,039,867,725 | | | $ | 99,596,991 | | | $ | 610,149,256 | |
Class A Shares | | | | | | | | | | | | |
Net assets | | $ | 259,457,406 | | | $ | 34,230,395 | | | $ | 167,840,044 | |
Shares outstanding | | | 17,162,645 | | | | 971,598 | | | | 8,001,102 | |
Net asset value (“NAV”) per share | | $ | 15.12 | | | $ | 35.23 | | | $ | 20.98 | |
Offering price per share (NAV per share plus maximum sales charge of 5.75% of offering price) | | $ | 16.04 | | | $ | 37.38 | | | $ | 22.26 | |
Class C Shares | | | | | | | | | | | | |
Net assets | | $ | 43,097,098 | | | $ | 6,529,171 | | | $ | 26,815,495 | |
Shares outstanding | | | 2,891,922 | | | | 194,896 | | | | 1,496,576 | |
NAV and offering price per share | | $ | 14.90 | | | $ | 33.50 | | | $ | 17.92 | |
Class R3 Shares | | | | | | | | | | | | |
Net assets | | $ | 31,758,181 | | | $ | 5,205,940 | | | $ | 26,509,988 | |
Shares outstanding | | | 2,105,865 | | | | 149,007 | | | | 1,292,284 | |
NAV and offering price per share | | $ | 15.08 | | | $ | 34.94 | | | $ | 20.51 | |
Class R6 Shares | | | | | | | | | | | | |
Net assets | | $ | 50,588,195 | | | | — | | | $ | 19,967,271 | |
Shares outstanding | | | 3,301,599 | | | | — | | | | 919,639 | |
NAV and offering price per share | | $ | 15.32 | | | | — | | | $ | 21.71 | |
Class I Shares | | | | | | | | | | | | |
Net assets | | $ | 654,966,845 | | | $ | 53,631,485 | | | $ | 369,016,458 | |
Shares outstanding | | | 42,891,442 | | | | 1,516,709 | | | | 17,003,694 | |
NAV and offering price per share | | $ | 15.27 | | | $ | 35.36 | | | $ | 21.70 | |
Net assets consist of: | | | | | | | | | | | | |
Capital paid-in | | $ | 665,034,497 | | | $ | 89,557,885 | | | $ | 566,335,203 | |
Undistributed (Over-distribution of) net investment income | | | 70,623 | | | | 972,053 | | | | 2,646,457 | |
Accumulated net realized gain (loss) | | | 141,832,838 | | | | 2,808,910 | | | | 16,941,927 | |
Net unrealized appreciation (depreciation) | | | 232,929,767 | | | | 6,258,143 | | | | 24,225,669 | |
Net assets | | $ | 1,039,867,725 | | | $ | 99,596,991 | | | $ | 610,149,256 | |
Authorized shares – per class | | | 2 billion | | | | 2 billion | | | | 2 billion | |
Par value per share | | $ | 0.0001 | | | $ | 0.0001 | | | $ | 0.0001 | |
See accompanying notes to financial statements.
Statement of
| | | | |
| | Operations | | Year Ended October 31, 2016 |
| | | | | | | | | | | | |
| | | Dividend
Value | | | Mid Cap
Value | | | Small Cap
Value | |
Investment Income | | | | | | | | | | | | |
Dividend and interest income (net of foreign tax withheld of $122,566, $2,109 and $20,695, respectively) | | $ | 32,799,126 | | | $ | 2,205,326 | | | $ | 6,579,805 | |
Securities lending income, net | | | 235,251 | | | | 41,385 | | | | 185,043 | |
Total investment income | | | 33,034,377 | | | | 2,246,711 | | | | 6,764,848 | |
Expenses | | | | | | | | | | | | |
Management fees | | | 8,553,014 | | | | 919,407 | | | | 2,846,516 | |
12b-1 service fees – Class A Shares | | | 690,795 | | | | 86,873 | | | | 241,640 | |
12b-1 distribution and service fees – Class C Shares | | | 466,982 | | | | 68,135 | | | | 151,284 | |
12b-1 distribution and service fees – Class R3 Shares | | | 166,176 | | | | 28,446 | | | | 89,975 | |
Shareholder servicing agent fees | | | 1,299,960 | | | | 155,039 | | | | 591,243 | |
Custodian fees | | | 117,100 | | | | 15,991 | | | | 36,709 | |
Directors fees | | | 32,563 | | | | 3,045 | | | | 9,493 | |
Professional fees | | | 108,181 | | | | 30,918 | | | | 41,778 | |
Shareholder reporting expenses | | | 87,483 | | | | 21,413 | | | | 69,499 | |
Federal and state registration fees | | | 86,397 | | | | 55,545 | | | | 99,459 | |
Other | | | 15,364 | | | | 4,237 | | | | 6,305 | |
Total expenses before fee waiver/expense reimbursement | | | 11,624,015 | | | | 1,389,049 | | | | 4,183,901 | |
Fee waiver/expense reimbursement | | | — | | | | (137,439 | ) | | | (123,754 | ) |
Net expenses | | | 11,624,015 | | | | 1,251,610 | | | | 4,060,147 | |
Net investment income (loss) | | | 21,410,362 | | | | 995,101 | | | | 2,704,701 | |
Realized and Unrealized Gain (Loss) | | | | | | | | | | | | |
Net realized gain (loss) from investments and foreign currency | | | 162,436,627 | | | | 3,430,012 | | | | 18,233,821 | |
Change in net unrealized appreciation (depreciation) of investments and foreign currency | | | (129,987,502 | ) | | | (1,529,551 | ) | | | 5,372,607 | |
Net realized and unrealized gain (loss) | | | 32,449,125 | | | | 1,900,461 | | | | 23,606,428 | |
Net increase (decrease) in net assets from operations | | $ | 53,859,487 | | | $ | 2,895,562 | | | $ | 26,311,129 | |
See accompanying notes to financial statements.
Statement of
| | | | | | | | |
| | | Dividend Value | |
| | | Year Ended
10/31/16 | | | Year Ended
10/31/15 | |
Operations | | | | | | | | |
Net investment income (loss) | | $ | 21,410,362 | | | $ | 29,625,558 | |
Net realized gain (loss) from investments and foreign currency | | | 162,436,627 | | | | 113,532,620 | |
Change in net unrealized appreciation (depreciation) of investments and foreign currency | | | (129,987,502 | ) | | | (154,434,094 | ) |
Net increase (decrease) in net assets from operations | | | 53,859,487 | | | | (11,275,916 | ) |
Distributions to Shareholders | | | | | | | | |
From net investment income: | | | | | | | | |
Class A Shares | | | (5,715,430 | ) | | | (7,171,529 | ) |
Class C Shares | | | (612,225 | ) | | | (795,215 | ) |
Class R3 Shares | | | (624,815 | ) | | | (845,243 | ) |
Class R6 Shares | | | (1,227,231 | ) | | | (1,370,813 | ) |
Class I Shares | | | (17,539,508 | ) | | | (24,645,360 | ) |
From accumulated net realized gains: | | | | | | | | |
Class A Shares | | | (21,268,193 | ) | | | (23,911,932 | ) |
Class C Shares | | | (3,676,882 | ) | | | (4,268,650 | ) |
Class R3 Shares | | | (2,990,313 | ) | | | (3,107,058 | ) |
Class R6 Shares | | | (4,000,310 | ) | | | (3,832,324 | ) |
Class I Shares | | | (61,767,745 | ) | | | (74,744,699 | ) |
Decrease in net assets from distributions to shareholders | | | (119,422,652 | ) | | | (144,692,823 | ) |
Fund Share Transactions | | | | | | | | |
Proceeds from sale of shares | | | 119,078,342 | | | | 176,433,011 | |
Proceeds from shares issued to shareholders due to reinvestment of distributions | | | 83,621,803 | | | | 97,550,897 | |
| | | 202,700,145 | | | | 273,983,908 | |
Cost of shares redeemed | | | (490,421,841 | ) | | | (451,688,334 | ) |
Net increase (decrease) in net assets from Fund share transactions | | | (287,721,696 | ) | | | (177,704,426 | ) |
Net increase (decrease) in net assets | | | (353,284,861 | ) | | | (333,673,165 | ) |
Net assets at the beginning of period | | | 1,393,152,586 | | | | 1,726,825,751 | |
Net assets at the end of period | | $ | 1,039,867,725 | | | $ | 1,393,152,586 | |
Undistributed (Over-distribution of) net investment income at the end of period | | $ | 70,623 | | | $ | 4,748,083 | |
See accompanying notes to financial statements.
Statement of Changes in Net Assets (continued)
| | | | | | | | | | | | | | | | | | | | |
| | | Mid Cap Value | | | | | | Small Cap Value | |
| | | Year Ended
10/31/16 | | | Year Ended
10/31/15 | | | | | | Year Ended
10/31/16 | | | Year Ended
10/31/15 | |
Operations | | | | | | | | | | | | | | | | | | | | |
Net investment income (loss) | | $ | 995,101 | | | $ | 476,452 | | | | | | | $ | 2,704,701 | | | $ | 572,818 | |
Net realized gain (loss) from investments and foreign currency | | | 3,430,012 | | | | 10,210,863 | | | | | | | | 18,233,821 | | | | 10,440,246 | |
Change in net unrealized appreciation (depreciation) of investments and foreign currency | | | (1,529,551 | ) | | | (9,200,460 | ) | | | | | | | 5,372,607 | | | | (433,839 | ) |
Net increase (decrease) in net assets from operations | | | 2,895,562 | | | | 1,486,855 | | | | | | | | 26,311,129 | | | | 10,579,225 | |
Distributions to Shareholders | | | | | | | | | | | | | | | | | | | | |
From net investment income: | | | | | | | | | | | | | | | | | | | | |
Class A Shares | | | (97,894 | ) | | | (332,351 | ) | | | | | | | (28,208 | ) | | | (170,384 | ) |
Class C Shares | | | — | | | | (9,811 | ) | | | | | | | — | | | | — | |
Class R3 Shares | | | (822 | ) | | | (50,129 | ) | | | | | | | — | | | | (16,250 | ) |
Class R6 Shares1 | | | — | | | | — | | | | | | | | — | | | | — | |
Class I Shares | | | (341,526 | ) | | | (797,785 | ) | | | | | | | (375,766 | ) | | | (438,364 | ) |
From accumulated net realized gains: | | | | | | | | | | | | | | | | | | | | |
Class A Shares | | | (1,108,462 | ) | | | — | | | | | | | | (862,983 | ) | | | — | |
Class C Shares | | | (233,340 | ) | | | — | | | | | | | | (124,053 | ) | | | — | |
Class R3 Shares | | | (188,365 | ) | | | — | | | | | | | | (232,444 | ) | | | — | |
Class R6 Shares1 | | | — | | | | — | | | | | | | | (1,795 | ) | | | — | |
Class I Shares | | | (2,009,699 | ) | | | — | | | | | | | | (1,680,323 | ) | | | — | |
Decrease in net assets from distributions to shareholders | | | (3,980,108 | ) | | | (1,190,076 | ) | | | | | | | (3,305,572 | ) | | | (624,998 | ) |
Fund Share Transactions | | | | | | | | | | | | | | | | | | | | |
Proceeds from sale of shares | | | 7,781,027 | | | | 8,431,067 | | | | | | | | 557,945,540 | | | | 46,357,629 | |
Proceeds from shares issued to shareholders due to reinvestment of distributions | | | 2,825,124 | | | | 644,548 | | | | | | | | 2,834,177 | | | | 549,545 | |
| | | 10,606,151 | | | | 9,075,615 | | | | | | | | 560,779,717 | | | | 46,907,174 | |
Cost of shares redeemed | | | (28,457,575 | ) | | | (23,144,338 | ) | | | | | | | (132,358,905 | ) | | | (28,935,630 | ) |
Net increase (decrease) in net assets from Fund share transactions | | | (17,851,424 | ) | | | (14,068,723 | ) | | | | | | | 428,420,812 | | | | 17,971,544 | |
Net increase (decrease) in net assets | | | (18,935,970 | ) | | | (13,771,944 | ) | | | | | | | 451,426,369 | | | | 27,925,771 | |
Net assets at the beginning of period | | | 118,532,961 | | | | 132,304,905 | | | | | | | | 158,722,887 | | | | 130,797,116 | |
Net assets at the end of period | | $ | 99,596,991 | | | $ | 118,532,961 | | | | | | | $ | 610,149,256 | | | $ | 158,722,887 | |
Undistributed (Over-distribution of) net investment income at the end of period | | $ | 972,053 | | | $ | 417,252 | | | | | | | $ | 2,646,457 | | | $ | 345,424 | |
| 1 | Class R6 Shares for Small Cap Value were established on June 30, 2016. |
See accompanying notes to financial statements.
THIS PAGE INTENTIONALLY LEFT BLANK
Financial
Highlights
Dividend Value
Selected data for a share outstanding throughout each period:
| | | | | | | | | | | | | | | | | | | | | | | | | | | | | | | | | | | | |
| | | | | |
| | | | | | Investment Operations | | | | | | Less Distributions | | | | |
| | | | | | | | | |
Class (Commencement Date) Year Ended October 31, | | Beginning
NAV | | | Net
Investment
Income
(Loss)(a) | | | Net
Realized/
Unrealized
Gain (Loss) | | | Total | | | | | | From Net
Investment
Income | | | From Accumulated Net Realized
Gains | | | Total | | | Ending
NAV | |
Class A (12/92) | | | | | | | | | | | | | | | | | | | | | | | | | | | | | | | | | |
2016 | | $ | 15.81 | | | $ | 0.25 | | | $ | 0.48 | | | $ | 0.73 | | | | | | | $ | (0.30 | ) | | $ | (1.12 | ) | | $ | (1.42 | ) | | $ | 15.12 | |
2015 | | | 17.44 | | | | 0.28 | | | | (0.44 | ) | | | (0.16 | ) | | | | | | | (0.34 | ) | | | (1.13 | ) | | | (1.47 | ) | | | 15.81 | |
2014 | | | 17.79 | | | | 0.37 | | | | 1.36 | | | | 1.73 | | | | | | | | (0.38 | ) | | | (1.70 | ) | | | (2.08 | ) | | | 17.44 | |
2013 | | | 14.60 | | | | 0.30 | | | | 3.59 | | | | 3.89 | | | | | | | | (0.30 | ) | | | (0.40 | ) | | | (0.70 | ) | | | 17.79 | |
2012 | | | 13.05 | | | | 0.27 | | | | 1.59 | | | | 1.86 | | | | | | | | (0.31 | ) | | | — | | | | (0.31 | ) | | | 14.60 | |
Class C (2/99) | | | | | | | | | | | | | | | | | | | | | | | | | | | | | | | | | |
2016 | | | 15.60 | | | | 0.14 | | | | 0.47 | | | | 0.61 | | | | | | | | (0.19 | ) | | | (1.12 | ) | | | (1.31 | ) | | | 14.90 | |
2015 | | | 17.23 | | | | 0.16 | | | | (0.44 | ) | | | (0.28 | ) | | | | | | | (0.22 | ) | | | (1.13 | ) | | | (1.35 | ) | | | 15.60 | |
2014 | | | 17.59 | | | | 0.24 | | | | 1.34 | | | | 1.58 | | | | | | | | (0.24 | ) | | | (1.70 | ) | | | (1.94 | ) | | | 17.23 | |
2013 | | | 14.42 | | | | 0.18 | | | | 3.57 | | | | 3.75 | | | | | | | | (0.18 | ) | | | (0.40 | ) | | | (0.58 | ) | | | 17.59 | |
2012 | | | 12.92 | | | | 0.17 | | | | 1.54 | | | | 1.71 | | | | | | | | (0.21 | ) | | | — | | | | (0.21 | ) | | | 14.42 | |
Class R3 (9/01) | | | | | | | | | | | | | | | | | | | | | | | | | | | | | | | | | |
2016 | | | 15.77 | | | | 0.22 | | | | 0.47 | | | | 0.69 | | | | | | | | (0.26 | ) | | | (1.12 | ) | | | (1.38 | ) | | | 15.08 | |
2015 | | | 17.41 | | | | 0.24 | | | | (0.45 | ) | | | (0.21 | ) | | | | | | | (0.30 | ) | | | (1.13 | ) | | | (1.43 | ) | | | 15.77 | |
2014 | | | 17.75 | | | | 0.33 | | | | 1.36 | | | | 1.69 | | | | | | | | (0.33 | ) | | | (1.70 | ) | | | (2.03 | ) | | | 17.41 | |
2013 | | | 14.58 | | | | 0.26 | | | | 3.57 | | | | 3.83 | | | | | | | | (0.26 | ) | | | (0.40 | ) | | | (0.66 | ) | | | 17.75 | |
2012 | | | 13.03 | | | | 0.24 | | | | 1.59 | | | | 1.83 | | | | | | | | (0.28 | ) | | | — | | | | (0.28 | ) | | | 14.58 | |
Class R6 (2/13) | | | | | | | | | | | | | | | | | | | | | | | | | | | | | | | | | |
2016 | | | 15.99 | | | | 0.30 | | | | 0.49 | | | | 0.79 | | | | | | | | (0.34 | ) | | | (1.12 | ) | | | (1.46 | ) | | | 15.32 | |
2015 | | | 17.62 | | | | 0.34 | | | | (0.45 | ) | | | (0.11 | ) | | | | | | | (0.39 | ) | | | (1.13 | ) | | | (1.52 | ) | | | 15.99 | |
2014 | | | 17.93 | | | | 0.43 | | | | 1.38 | | | | 1.81 | | | | | | | | (0.42 | ) | | | (1.70 | ) | | | (2.12 | ) | | | 17.62 | |
2013(d) | | | 15.36 | | | | 0.22 | | | | 2.60 | | | | 2.82 | | | | | | | | (0.25 | ) | | | — | | | | (0.25 | ) | | | 17.93 | |
Class I (8/94) | | | | | | | | | | | | | | | | | | | | | | | | | | | | | | | | | |
2016 | | | 15.95 | | | | 0.29 | | | | 0.49 | | | | 0.78 | | | | | | | | (0.34 | ) | | | (1.12 | ) | | | (1.46 | ) | | | 15.27 | |
2015 | | | 17.60 | | | | 0.33 | | | | (0.46 | ) | | | (0.13 | ) | | | | | | | (0.39 | ) | | | (1.13 | ) | | | (1.52 | ) | | | 15.95 | |
2014 | | | 17.93 | | | | 0.42 | | | | 1.37 | | | | 1.79 | | | | | | | | (0.42 | ) | | | (1.70 | ) | | | (2.12 | ) | | | 17.60 | |
2013 | | | 14.72 | | | | 0.35 | | | | 3.61 | | | | 3.96 | | | | | | | | (0.35 | ) | | | (0.40 | ) | | | (0.75 | ) | | | 17.93 | |
2012 | | | 13.16 | | | | 0.31 | | | | 1.60 | | | | 1.91 | | | | | | | | (0.35 | ) | | | — | | | | (0.35 | ) | | | 14.72 | |
| | | | | | | | | | | | | | | | | | | | | | | | | | | | | | | | | | |
| | | | Ratios/Supplemental Data | |
| | | | | | | | | | Ratios to Average
Net Assets Before Waiver/Reimbursement | | | | | | Ratios to Average
Net Assets After
Waiver/Reimbursement(c) | | | | |
| | | | | | | | |
Total
Return(b) | | | Ending
Net
Assets
(000) | | | | | | Expenses | | | Net
Investment
Income
(Loss) | | | | | | Expenses | | | Net
Investment
Income
(Loss) | | | Portfolio
Turnover
Rate(e) | |
| | | | | | | | | | | | | | | | | | | | | | | | | | | | | | | | | | |
| | 5.33 | % | | $ | 259,457 | | | | | | | | 1.14 | % | | | 1.69 | % | | | | | | | 1.14 | % | | | 1.69 | % | | | 67 | % |
| | (0.87 | ) | | | 310,055 | | | | | | | | 1.15 | | | | 1.72 | | | | | | | | 1.15 | | | | 1.72 | | | | 53 | |
| | 10.78 | | | | 371,703 | | | | | | | | 1.15 | | | | 2.19 | | | | | | | | 1.15 | | | | 2.19 | | | | 27 | |
| | 27.72 | | | | 384,226 | | | | | | | | 1.13 | | | | 1.88 | | | | | | | | 1.12 | | | | 1.89 | | | | 44 | |
| | 14.31 | | | | 273,317 | | | | | | | | 1.16 | | | | 1.95 | | | | | | | | 1.16 | | | | 1.95 | | | | 24 | |
| | | | | | | | | | | | | | | | | | | | | | | | | | | | | | | | | | |
| | 4.46 | | | | 43,097 | | | | | | | | 1.89 | | | | 0.94 | | | | | | | | 1.89 | | | | 0.94 | | |
| 67
|
|
| | (1.59 | ) | | | 53,507 | | | | | | | | 1.90 | | | | 0.98 | | | | | | | | 1.90 | | | | 0.98 | | | | 53 | |
| | 10.01 | | | | 65,366 | | | | | | | | 1.90 | | | | 1.43 | | | | | | | | 1.90 | | | | 1.43 | | | | 27 | |
| | 26.95 | | | | 59,753 | | | | | | | | 1.88 | | | | 1.09 | | | | | | | | 1.87 | | | | 1.10 | | | | 44 | |
| | 13.29 | | | | 29,234 | | | | | | | | 1.91 | | | | 1.21 | | | | | | | | 1.91 | | | | 1.21 | | | | 24 | |
| | | | | | | | | | | | | | | | | | | | | | | | | | | | | | | | | | |
| | 5.01 | | | | 31,758 | | | | | | | | 1.39 | | | | 1.49 | | | | | | | | 1.39 | | | | 1.49 | | | | 67 | |
| | (1.12 | ) | | | 42,618 | | | | | | | | 1.40 | | | | 1.45 | | | | | | | | 1.40 | | | | 1.45 | | | | 53 | |
| | 10.59 | | | | 48,476 | | | | | | | | 1.40 | | | | 1.92 | | | | | | | | 1.40 | | | | 1.92 | | | | 27 | |
| | 27.30 | | | | 38,589 | | | | | | | | 1.38 | | | | 1.61 | | | | | | | | 1.37 | | | | 1.62 | | | | 44 | |
| | 14.13 | | | | 21,649 | | | | | | | | 1.41 | | | | 1.70 | | | | | | | | 1.41 | | | | 1.70 | | | | 24 | |
| | | | | | | | | | | | | | | | | | | | | | | | | | | | | | | | | | |
| | 5.63 | | | | 50,588 | | | | | | | | 0.79 | | | | 2.04 | | | | | | | | 0.79 | | | | 2.04 | | | | 67 | |
| | (0.51 | ) | | | 56,123 | | | | | | | | 0.81 | | | | 2.03 | | | | | | | | 0.81 | | | | 2.03 | | | | 53 | |
| | 11.23 | | | | 62,309 | | | | | | | | 0.81 | | | | 2.52 | | | | | | | | 0.81 | | | | 2.52 | | | | 27 | |
| | 18.52 | | | | 67,620 | | | | | | | | 0.80 | * | | | 1.98 | * | | | | | | | 0.80 | * | | | 1.98 | * | | | 44 | |
| | | | | | | | | | | | | | | | | | | | | | | | | | | | | | | | | | |
| | 5.56 | | | | 654,967 | | | | | | | | 0.89 | | | | 1.95 | | | | | | | | 0.89 | | | | 1.95 | | | | 67 | |
| | (0.64 | ) | | | 930,850 | | | | | | | | 0.90 | | | | 1.99 | | | | | | | | 0.90 | | | | 1.99 | | | | 53 | |
| | 11.11 | | | | 1,178,972 | | | | | | | | 0.90 | | | | 2.42 | | | | | | | | 0.90 | | | | 2.42 | | | | 27 | |
| | 27.96 | | | | 1,151,408 | | | | | | | | 0.88 | | | | 2.16 | | | | | | | | 0.87 | | | | 2.16 | | | | 44 | |
| | 14.65 | | | | 1,072,335 | | | | | | | | 0.91 | | | | 2.23 | | | | | | | | 0.91 | | | | 2.23 | | | | 24 | |
| (a) | Per share Net Investment Income (Loss) is calculated using the average daily shares method. | |
| (b) | Total return is the combination of changes in NAV without any sales charge, reinvested dividend income at NAV and reinvested capital gains distributions at NAV, if any. Total returns are not annualized. | |
| (c) | After fee waiver and/or expense reimbursement from the Adviser, where applicable. | |
| (d) | For the period February 28, 2013 (commencement of operations) through October 31, 2013. | |
| (e) | Portfolio Turnover Rate is calculated based on the lesser of long-term purchases or sales (as disclosed in Note 5 – Investment Transactions) divided by the average long-term market value during the period. | |
See accompanying notes to financial statements.
Financial Highlights (continued)
Mid Cap Value
Selected data for a share outstanding throughout each period:
| | | | | | | | | | | | | | | | | | | | | | | | | | | | | | | | | | | | |
| | | | | |
| | | | | | Investment Operations | | | | | | Less Distributions | | | | |
| | | | | | | | | |
Class (Commencement Date) Year Ended October 31, | | Beginning
NAV | | | Net
Investment
Income
(Loss)(a) | | | Net
Realized/
Unrealized
Gain (Loss) | | | Total | | | | | | From
Net
Investment
Income | | | From
Accumulated
Net Realized
Gains | | | Total | | | Ending
NAV | |
Class A (12/87) | | | | | | | | | | | | | | | | | | | | | | | | | | | | | | | | | |
2016 | | $ | 35.39 | | | $ | 0.30 | | | $ | 0.72 | | | $ | 1.02 | | | | | | | $ | (0.09 | ) | | $ | (1.09 | ) | | $ | (1.18 | ) | | $ | 35.23 | |
2015 | | | 35.37 | | | | 0.10 | | | | 0.22 | | | | 0.32 | | | | | | | | (0.30 | ) | | | — | | | | (0.30 | ) | | | 35.39 | |
2014 | | | 31.00 | | | | 0.23 | | | | 4.30 | | | | 4.53 | | | | | | | | (0.16 | ) | | | — | | | | (0.16 | ) | | | 35.37 | |
2013 | | | 23.22 | | | | 0.12 | | | | 7.91 | | | | 8.03 | | | | | | | | (0.25 | ) | | | — | | | | (0.25 | ) | | | 31.00 | |
2012 | | | 21.83 | | | | 0.18 | | | | 1.35 | | | | 1.53 | | | | | | | | (0.14 | ) | | | — | | | | (0.14 | ) | | | 23.22 | |
Class C (2/99) | | | | | | | | | | | | | | | | | | | | | | | | | | | | | | | | | |
2016 | | | 33.86 | | | | 0.04 | | | | 0.69 | | | | 0.73 | | | | | | | | — | | | | (1.09 | ) | | | (1.09 | ) | | | 33.50 | |
2015 | | | 33.86 | | | | (0.16 | ) | | | 0.20 | | | | 0.04 | | | | | | | | (0.04 | ) | | | — | | | | (0.04 | ) | | | 33.86 | |
2014 | | | 29.76 | | | | (0.02 | ) | | | 4.12 | | | | 4.10 | | | | | | | | — | | | | — | | | | — | | | | 33.86 | |
2013 | | | 22.29 | | | | (0.08 | ) | | | 7.62 | | | | 7.54 | | | | | | | | (0.07 | ) | | | — | | | | (0.07 | ) | | | 29.76 | |
2012 | | | 20.99 | | | | 0.01 | | | | 1.29 | | | | 1.30 | | | | | | | | — | | | | — | | | | — | | | | 22.29 | |
Class R3 (9/01) | | | | | | | | | | | | | | | | | | | | | | | | | | | | | | | | | |
2016 | | | 35.17 | | | | 0.21 | | | | 0.65 | | | | 0.86 | | | | | | | | — | | | | (1.09 | ) | | | (1.09 | ) | | | 34.94 | |
2015 | | | 35.15 | | | | 0.02 | | | | 0.21 | | | | 0.23 | | | | | | | | (0.21 | ) | | | — | | | | (0.21 | ) | | | 35.17 | |
2014 | | | 30.82 | | | | 0.15 | | | | 4.27 | | | | 4.42 | | | | | | | | (0.09 | ) | | | — | | | | (0.09 | ) | | | 35.15 | |
2013 | | | 23.08 | | | | 0.06 | | | | 7.87 | | | | 7.93 | | | | | | | | (0.19 | ) | | | — | | | | (0.19 | ) | | | 30.82 | |
2012 | | | 21.70 | | | | 0.12 | | | | 1.33 | | | | 1.45 | | | | | | | | (0.07 | ) | | | — | | | | (0.07 | ) | | | 23.08 | |
Class I (2/94) | | | | | | | | | | | | | | | | | | | | | | | | | | | | | | | | | |
2016 | | | 35.52 | | | | 0.38 | | | | 0.73 | | | | 1.11 | | | | | | | | (0.18 | ) | | | (1.09 | ) | | | (1.27 | ) | | | 35.36 | |
2015 | | | 35.50 | | | | 0.20 | | | | 0.20 | | | | 0.40 | | | | | | | | (0.38 | ) | | | — | | | | (0.38 | ) | | | 35.52 | |
2014 | | | 31.10 | | | | 0.32 | | | | 4.31 | | | | 4.63 | | | | | | | | (0.23 | ) | | | — | | | | (0.23 | ) | | | 35.50 | |
2013 | | | 23.29 | | | | 0.19 | | | | 7.93 | | | | 8.12 | | | | | | | | (0.31 | ) | | | — | | | | (0.31 | ) | | | 31.10 | |
2012 | | | 21.99 | | | | 0.24 | | | | 1.33 | | | | 1.57 | | | | | | | | (0.27 | ) | | | — | | | | (0.27 | ) | | | 23.29 | |
| | | | | | | | | | | | | | | | | | | | | | | | | | | | | | | | | | |
| | | | Ratios/Supplemental Data | |
| | | | | | | | | | Ratios to Average
Net Assets Before
Waiver/Reimbursement | | | | | | Ratios to Average
Net Assets After
Waiver/Reimbursement(c) | | | | |
| | | | | | | | |
Total
Return(b) | | | Ending
Net
Assets
(000) | | | | | | Expenses | | | Net
Investment
Income
(Loss) | | | | | | Expenses | | | Net
Investment
Income
(Loss) | | | Portfolio
Turnover
Rate(d) | |
| | | | | | | | | | | | | | | | | | | | | | | | | | | | | | | | | | |
| | 3.12 | % | | $ | 34,230 | | | | | | | | 1.39 | % | | | 0.73 | % | | | | | | | 1.26 | % | | | 0.86 | % | | | 44 | % |
| | 0.89 | | | | 36,378 | | | | | | | | 1.41 | | | | 0.20 | | | | | | | | 1.32 | | | | 0.29 | | | | 111 | |
| | 14.65 | | | | 39,858 | | | | | | | | 1.42 | | | | 0.61 | | | | | | | | 1.34 | | | | 0.69 | | | | 127 | |
| | 34.93 | | | | 35,719 | | | | | | | | 1.39 | | | | 0.40 | | | | | | | | 1.33 | | | | 0.45 | | | | 118 | |
| | 7.03 | | | | 35,633 | | | | | | | | 1.49 | | | | 0.58 | | | | | | | | 1.28 | | | | 0.79 | | | | 140 | |
| | | | | | | | | | | | | | | | | | | | | | | | | | | | | | | | | | |
| | 2.32 | | | | 6,529 | | | | | | | | 2.14 | | | | (0.02 | ) | | | | | | | 2.01 | | | | 0.11 | | | | 44 | |
| | 0.15 | | | | 7,379 | | | | | | | | 2.16 | | | | (0.55 | ) | | | | | | | 2.07 | | | | (0.46 | ) | | | 111 | |
| | 13.78 | | | | 8,066 | | | | | | | | 2.17 | | | | (0.14 | ) | | | | | | | 2.09 | | | | (0.06 | ) | | | 127 | |
| | 33.94 | | | | 8,042 | | | | | | | | 2.14 | | | | (0.35 | ) | | | | | | | 2.08 | | | | (0.29 | ) | | | 118 | |
| | 6.19 | | | | 7,855 | | | | | | | | 2.24 | | | | (0.17 | ) | | | | | | | 2.02 | | | | 0.05 | | | | 140 | |
| | | | | | | | | | | | | | | | | | | | | | | | | | | | | | | | | | |
| | 2.86 | | | | 5,206 | | | | | | | | 1.64 | | | | 0.48 | | | | | | | | 1.51 | | | | 0.61 | | | | 44 | |
| | 0.65 | | | | 6,942 | | | | | | | | 1.66 | | | | (0.04 | ) | | | | | | | 1.57 | | | | 0.05 | | | | 111 | |
| | 14.35 | | | | 8,401 | | | | | | | | 1.67 | | | | 0.37 | | | | | | | | 1.59 | | | | 0.46 | | | | 127 | |
| | 34.63 | | | | 8,401 | | | | | | | | 1.64 | | | | 0.16 | | | | | | | | 1.58 | | | | 0.22 | | | | 118 | |
| | 6.70 | | | | 9,576 | | | | | | | | 1.74 | | | | 0.31 | | | | | | | | 1.53 | | | | 0.52 | | | | 140 | |
| | | | | | | | | | | | | | | | | | | | | | | | | | | | | | | | | | |
| | 3.38 | | | | 53,631 | | | | | | | | 1.14 | | | | 0.98 | | | | | | | | 1.01 | | | | 1.11 | | | | 44 | |
| | 1.12 | | | | 67,834 | | | | | | | | 1.16 | | | | 0.46 | | | | | | | | 1.07 | | | | 0.55 | | | | 111 | |
| | 14.95 | | | | 75,981 | | | | | | | | 1.17 | | | | 0.86 | | | | | | | | 1.09 | | | | 0.94 | | | | 127 | |
| | 35.29 | | | | 90,212 | | | | | | | | 1.13 | | | | 0.66 | | | | | | | | 1.08 | | | | 0.71 | | | | 118 | |
| | 7.23 | | | | 106,276 | | | | | | | | 1.24 | | | | 0.82 | | | | | | | | 1.03 | | | | 1.03 | | | | 140 | |
| (a) | Per share Net Investment Income (Loss) is calculated using the average daily shares method. | |
| (b) | Total return is the combination of changes in NAV without any sales charge, reinvested dividend income at NAV and reinvested capital gains distributions at NAV, if any. Total returns are not annualized. | |
| (c) | After fee waiver and/or expense reimbursement from the Adviser, where applicable. | |
| (d) | Portfolio Turnover Rate is calculated based on the lesser of long-term purchases or sales (as disclosed in Note 5 – Investment Transactions) divided by the average long-term market value during the period. | |
See accompanying notes to financial statements.
Financial Highlights (continued)
Small Cap Value
Selected data for a share outstanding throughout each period:
| | | | | | | | | | | | | | | | | | | | | | | | | | | | | | | | | | | | |
| | | | | |
| | | | | | Investment Operations | | | | | | Less Distributions | | | | |
| | | | | | | | | |
Class (Commencement Date) Year Ended October 31, | | Beginning
NAV | | | Net
Investment
Income
(Loss)(a) | | | Net
Realized/
Unrealized
Gain (Loss) | | | Total | | | | | | From
Net
Investment
Income | | | From
Accumulated
Net Realized
Gains | | | Total | | | Ending
NAV | |
Class A (8/94) | | | | | | | | | | | | | | | | | | | | | | | | | | | | | | | | | |
2016 | | $ | 19.95 | | | $ | 0.14 | | | $ | 1.20 | | | $ | 1.34 | | | | | | | $ | (0.01 | ) | | $ | (0.30 | ) | | $ | (0.31 | ) | | $ | 20.98 | |
2015 | | | 18.55 | | | | 0.07 | | | | 1.40 | | | | 1.47 | | | | | | | | (0.07 | ) | | | — | | | | (0.07 | ) | | | 19.95 | |
2014 | | | 16.98 | | | | 0.05 | | | | 1.58 | | | | 1.63 | | | | | | | | (0.06 | ) | | | — | | | | (0.06 | ) | | | 18.55 | |
2013 | | | 12.63 | | | | 0.06 | | | | 4.34 | | | | 4.40 | | | | | | | | (0.05 | ) | | | — | | | | (0.05 | ) | | | 16.98 | |
2012 | | | 11.30 | | | | 0.05 | | | | 1.28 | | | | 1.33 | | | | | | | | — | | | | — | | | | — | | | | 12.63 | |
Class C (2/99) | | | | | | | | | | | | | | | | | | | | | | | | | | | | | | | | | |
2016 | | | 17.20 | | | | (0.01 | ) | | | 1.03 | | | | 1.02 | | | | | | | | — | | | | (0.30 | ) | | | (0.30 | ) | | | 17.92 | |
2015 | | | 16.06 | | | | (0.07 | ) | | | 1.21 | | | | 1.14 | | | | | | | | — | | | | — | | | | — | | | | 17.20 | |
2014 | | | 14.76 | | | | (0.07 | ) | | | 1.37 | | | | 1.30 | | | | | | | | — | | | | — | | | | — | | | | 16.06 | |
2013 | | | 11.02 | | | | (0.05 | ) | | | 3.79 | | | | 3.74 | | | | | | | | — | | | | — | | | | — | | | | 14.76 | |
2012 | | | 9.93 | | | | (0.04 | ) | | | 1.13 | | | | 1.09 | | | | | | | | — | | | | — | | | | — | | | | 11.02 | |
Class R3 (9/01) | | | | | | | | | | | | | | | | | | | | | | | | | | | | | | | | | |
2016 | | | 19.56 | | | | 0.09 | | | | 1.16 | | | | 1.25 | | | | | | | | — | | | | (0.30 | ) | | | (0.30 | ) | | | 20.51 | |
2015 | | | 18.19 | | | | 0.02 | | | | 1.38 | | | | 1.40 | | | | | | | | (0.03 | ) | | | — | | | | (0.03 | ) | | | 19.56 | |
2014 | | | 16.65 | | | | 0.01 | | | | 1.55 | | | | 1.56 | | | | | | | | (0.02 | ) | | | — | | | | (0.02 | ) | | | 18.19 | |
2013 | | | 12.39 | | | | 0.01 | | | | 4.27 | | | | 4.28 | | | | | | | | (0.02 | ) | | | — | | | | (0.02 | ) | | | 16.65 | |
2012 | | | 11.11 | | | | 0.02 | | | | 1.26 | | | | 1.28 | | | | | | | | — | | | | — | | | | — | | | | 12.39 | |
Class R6 (6/16) | |
2016(d) | | | 21.08 | | | | 0.07 | | | | 0.56 | | | | 0.63 | | | | | | | | — | | | | — | * | | | — | | | | 21.71 | |
Class I (8/94) | | | | | | | | | | | | | | | | | | | | | | | | | | | | | | | | | |
2016 | | | 20.63 | | | | 0.19 | | | | 1.24 | | | | 1.43 | | | | | | | | (0.06 | ) | | | (0.30 | ) | | | (0.36 | ) | | | 21.70 | |
2015 | | | 19.18 | | | | 0.12 | | | | 1.45 | | | | 1.57 | | | | | | | | (0.12 | ) | | | — | | | | (0.12 | ) | | | 20.63 | |
2014 | | | 17.55 | | | | 0.10 | | | | 1.63 | | | | 1.73 | | | | | | | | (0.10 | ) | | | — | | | | (0.10 | ) | | | 19.18 | |
2013 | | | 13.06 | | | | 0.10 | | | | 4.48 | | | | 4.58 | | | | | | | | (0.09 | ) | | | — | | | | (0.09 | ) | | | 17.55 | |
2012 | | | 11.65 | | | | 0.08 | | | | 1.33 | | | | 1.41 | | | | | | | | — | | | | — | | | | — | | | | 13.06 | |
| | | | | | | | | | | | | | | | | | | | | | | | | | | | | | | | | | |
| | | | Ratios/Supplemental Data | |
| | | | | | | | | | Ratios to Average
Net Assets Before
Waiver/Reimbursement | | | | | | Ratios to Average
Net Assets After
Waiver/Reimbursement(c) | | | | |
| | | | | | | | |
Total
Return(b) | | | Ending
Net
Assets
(000) | | | | | | Expenses | | | Net
Investment
Income
(Loss) | | | | | | Expenses | | | Net
Investment
Income
(Loss) | | | Portfolio
Turnover
Rate(e) | |
| | | | | | | | | | | | | | | | | | | | | | | | | | | | | | | | | | |
| | 6.85 | % | | $ | 167,840 | | | | | | | | 1.34 | % | | | 0.65 | % | | | | | | | 1.30 | % | | | 0.68 | % | | | 40 | % |
| | 7.95 | | | | 48,656 | | | | | | | | 1.40 | | | | 0.32 | | | | | | | | 1.39 | | | | 0.34 | | | | 49 | |
| | 9.61 | | | | 44,739 | | | | | | | | 1.47 | | | | 0.25 | | | | | | | | 1.43 | | | | 0.28 | | | | 55 | |
| | 34.98 | | | | 45,225 | | | | | | | | 1.47 | | | | 0.37 | | | | | | | | 1.46 | | | | 0.38 | | | | 56 | |
| | 11.77 | | | | 32,208 | | | | | | | | 1.58 | | | | 0.26 | | | | | | | | 1.46 | | | | 0.39 | | | | 46 | |
| | | | | | | | | | | | | | | | | | | | | | | | | | | | | | | | | | |
| | 6.08 | | | | 26,815 | | | | | | | | 2.09 | | | | (0.11 | ) | | | | | | | 2.05 | | | | (0.08 | ) | | | 40 | |
| | 7.10 | | | | 4,507 | | | | | | | | 2.15 | | | | (0.44 | ) | | | | | | | 2.14 | | | | (0.42 | ) | | | 49 | |
| | 8.81 | | | | 3,008 | | | | | | | | 2.21 | | | | (0.51 | ) | | | | | | | 2.18 | | | | (0.48 | ) | | | 55 | |
| | 33.94 | | | | 3,297 | | | | | | | | 2.22 | | | | (0.43 | ) | | | | | | | 2.20 | | | | (0.42 | ) | | | 56 | |
| | 10.98 | | | | 1,367 | | | | | | | | 2.34 | | | | (0.47 | ) | | | | | | | 2.21 | | | | (0.34 | ) | | | 46 | |
| | | | | | | | | | | | | | | | | | | | | | | | | | | | | | | | | | |
| | 6.58 | | | | 26,510 | | | | | | | | 1.59 | | | | 0.43 | | | | | | | | 1.56 | | | | 0.46 | | | | 40 | |
| | 7.62 | | | | 14,516 | | | | | | | | 1.65 | | | | 0.07 | | | | | | | | 1.64 | | | | 0.09 | | | | 49 | |
| | 9.38 | | | | 11,530 | | | | | | | | 1.72 | | | | 0.01 | | | | | | | | 1.68 | | | | 0.04 | | | | 55 | |
| | 34.59 | | | | 8,549 | | | | | | | | 1.72 | | | | 0.06 | | | | | | | | 1.71 | | | | 0.07 | | | | 56 | |
| | 11.52 | | | | 2,653 | | | | | | | | 1.83 | | | | 0.01 | | | | | | | | 1.71 | | | | 0.14 | | | | 46 | |
| | | | | | | | | | | | | | | | | | | | | | | | | | | | | | | | | | |
| | 3.00 | | | | 19,967 | | | | | | | | 0.89 | ** | | | 0.85 | ** | | | | | | | 0.83 | ** | | | 0.91 | ** | | | 40 | |
| | | | | | | | | | | | | | | | | | | | | | | | | | | | | | | | | | |
| | 7.09 | | | | 369,016 | | | | | | | | 1.09 | | | | 0.90 | | | | | | | | 1.05 | | | | 0.93 | | | | 40 | |
| | 8.22 | | | | 91,044 | | | | | | | | 1.15 | | | | 0.58 | | | | | | | | 1.14 | | | | 0.59 | | | | 49 | |
| | 9.89 | | | | 71,521 | | | | | | | | 1.22 | | | | 0.51 | | | | | | | | 1.18 | | | | 0.54 | | | | 55 | |
| | 35.34 | | | | 48,281 | | | | | | | | 1.22 | | | | 0.64 | | | | | | | | 1.21 | | | | 0.65 | | | | 56 | |
| | 12.02 | | | | 41,444 | | | | | | | | 1.34 | | | | 0.53 | | | | | | | | 1.21 | | | | 0.66 | | | | 46 | |
| (a) | Per share Net Investment Income (Loss) is calculated using the average daily shares method. | |
| (b) | Total return is the combination of changes in NAV without any sales charge, reinvested dividend income at NAV and reinvested capital gains distributions at NAV, if any. Total returns are not annualized. | |
| (c) | After fee waiver and/or expense reimbursement from the Adviser, where applicable. | |
| (d) | For the period June 30, 2016 (commencement of operations) through October 31, 2016. | |
| (e) | Portfolio Turnover Rate is calculated based on the lesser of long-term purchases or sales (as disclosed in Note 5 – Investment Transactions) divided by the average long-term market value during the period. | |
| * | Round to less than $(0.01). | |
See accompanying notes to financial statements.
Notes to
Financial Statements
1. General Information and Significant Accounting Policies
General Information
Trust and Fund Information
Nuveen Investment Funds, Inc. (the “Trust”), is an open-end management investment company registered under the Investment Company Act of 1940, as amended. The Trust is comprised of Nuveen Dividend Value Fund (“Dividend Value”), Nuveen Mid Cap Value Fund (“Mid Cap Value”) and Nuveen Small Cap Value Fund (“Small Cap Value”), (each a “Fund” and collectively, the “Funds”), as diversified funds, among others. The Trust was incorporated in the State of Maryland on August 20, 1987.
The end of the reporting period for the Funds is October 31, 2016, and the period covered by these Notes to Financial Statements is the fiscal year ended October 31, 2016 (the “current fiscal period”).
Investment Adviser
The Funds’ investment adviser is Nuveen Fund Advisors, LLC (the “Adviser”), a wholly-owned subsidiary of Nuveen Investments, Inc. (“Nuveen”). Nuveen is an operating division of TIAA Global Asset Management. The Adviser has overall responsibility for management of the Funds, oversees the management of the Funds’ portfolios, manages the Funds’ business affairs and provides certain clerical, bookkeeping and other administrative services, and if necessary, asset allocation decisions. The Adviser has entered into sub-advisory agreements with Nuveen Asset Management, LLC (the “Sub-Adviser”), a subsidiary of the Adviser, under which the Sub-Adviser manages the investment portfolio of the Fund.
Investment Objectives
Dividend Value’s investment objective is long-term growth of capital and income while Mid Cap Value’s and Small Cap Value’s is capital appreciation.
The Funds’ most recent prospectus provides further descriptions of each Fund’s investment objective, principal investment strategies and principal risks.
Significant Accounting Policies
Each Fund is an investment company and follows accounting and reporting guidance under Financial Accounting Standards Board (FASB) Accounting Standards Codification (ASC) Topic 946 “Financial Services-Investment Companies.” The following is a summary of significant accounting policies followed by the Funds in the preparation of their financial statements in accordance with accounting principles generally accepted in the United States of America (“U.S. GAAP”).
Investment Transactions
Investment transactions are recorded on a trade date basis. Realized gains and losses from investment transactions are determined on the specific identification method, which is the same basis used for federal income tax purposes.
Investment Income
Dividend income is recorded on the ex-dividend date or, for foreign securities, when information is available. Interest income is recorded on an accrual basis. Securities lending income is comprised of fees earned from borrowers and income earned on cash collateral investments, net of lending agent fees.
Professional Fees
Professional fees presented on the Statement of Operations consist of legal fees incurred in the normal course of operations, audit fees, tax consulting fees and, in some cases, workout expenditures. Workout expenditures are incurred in an attempt to protect or enhance an investment or to pursue other claims or legal actions on behalf of Fund shareholders. If a refund is received for workout expenditures paid in a prior reporting period, such amounts will be recognized as “Legal fee refund” on the Statement of Operations.
Dividends and Distributions to Shareholders
Dividends from net investment income, if any, are declared and distributed to shareholders annually (except for Dividend Value, which are declared and distributed to shareholders quarterly). Net realized capital gains from investment transactions, if any, are declared and distributed to shareholders at least annually. Furthermore, capital gains are distributed only to the extent they exceed available capital loss carryforwards.
Distributions to shareholders are recorded on the ex-dividend date. The amount and timing of distributions are determined in accordance with federal income tax regulations, which may differ from U.S. GAAP.
Share Classes and Sales Charges
Class A Shares are generally sold with an up-front sales charge and incur a 0.25% annual 12b-1 service fee. Class A Share purchases of $1 million or more are sold at net asset value (“NAV”) without an up-front sales charge but may be subject to a contingent deferred sales charge (“CDSC”) equal to 1% if redeemed within eighteen months of purchase. Class C Shares are sold without an up-front sales charge but incur a 0.75% annual 12b-1 distribution fee and a 0.25% annual 12b-1 service fee. Class C Shares are subject to a CDSC of 1% if redeemed within twelve months of purchase. Class R3 Shares are sold without an up-front sales charge but incur a 0.25% annual 12b-1 distribution fee and a 0.25% annual 12b-1 service fee. Class R6 Shares and Class I Shares are not subject to any sales charge or 12b-1 distribution or service fees.
Multiclass Operations and Allocations
Income and expenses of the Funds that are not directly attributable to a specific class of shares are prorated among the classes based on the relative net assets of each class. Expenses directly attributable to a class of shares are recorded to the specific class. Currently, the only expenses that are allocated on a class-specific basis are 12b-1 distribution and service fees.
Sub-transfer agent fees, which are recognized as a component of “Shareholder servicing agent fees” on the Statement of Operations, are not charged to Class R6 Shares and are prorated among the other classes based on their relative net assets.
Realized and unrealized capital gains and losses of the Funds are prorated among the classes based on the relative net assets of each class.
Indemnifications
Under the Trust’s organizational documents, its officers and trustees are indemnified against certain liabilities arising out of the performance of their duties to the Trust. In addition, in the normal course of business, the Trust enters into contracts that provide general indemnifications to other parties. The Trust’s maximum exposure under these arrangements is unknown as this would involve future claims that may be made against the Trust that have not yet occurred. However, the Trust has not had prior claims or losses pursuant to these contracts and expects the risk of loss to be remote.
Netting Agreements
In the ordinary course of business, the Funds may enter into transactions subject to enforceable International Swaps and Derivative Association, Inc. (“ISDA”) master agreements or other similar arrangements (“netting agreements”). Generally, the right to offset in netting agreements allows each Fund to offset certain securities and derivatives with a specific counterparty, when applicable, as well as any collateral received or delivered to that counterparty based on the terms of the agreements. Generally, each Fund manages its cash collateral and securities collateral on a counterparty basis.
The Funds’ investments subject to netting agreements as of the end of the reporting period, if any, are further described in Note 3 – Portfolio Securities and Investments in Derivatives.
Use of Estimates
The preparation of financial statements in conformity with U.S. GAAP requires management to make estimates and assumptions that affect the reported amounts of assets and liabilities at the date of the financial statements and the reported amounts of increases and decreases in net assets from operations during the reporting period. Actual results may differ from those estimates.
2. Investment Valuation and Fair Value Measurements
The fair valuation input levels as described below are for fair value measurement purposes.
Fair value is defined as the price that would be received upon selling an investment or transferring a liability in an orderly transaction to an independent buyer in the principal or most advantageous market for the investment. A three-tier hierarchy is used to maximize the use of observable market data and minimize the use of unobservable inputs and to establish classification of fair value measurements for disclosure purposes. Observable inputs reflect the assumptions market participants would use in pricing the asset or liability. Observable inputs are based on market data obtained from sources independent of the reporting entity. Unobservable inputs reflect the reporting entity’s own assumptions about the assumptions market participants would use in pricing the asset or liability. Unobservable inputs are based on the best information available in the circumstances. The following is a summary of the three-tiered hierarchy of valuation input levels.
| | |
| Level 1 – | | Inputs are unadjusted and prices are determined using quoted prices in active markets for identical securities. |
| Level 2 – | | Prices are determined using other significant observable inputs (including quoted prices for similar securities, interest rates, prepayment speeds, credit risk, etc.). |
| Level 3 – | | Prices are determined using significant unobservable inputs (including management’s assumptions in determining the fair value of investments). |
Common stocks and other equity-type securities are valued at the last sales price on the securities exchange on which such securities are primarily traded and are generally classified as Level 1. Securities primarily traded on the NASDAQ National Market (“NASDAQ”) are valued at the NASDAQ Official Closing Price and are generally classified as Level 1. However, securities traded on a securities exchange or NASDAQ for which there were no transactions on a given day or securities not listed on a securities exchange or NASDAQ are valued at the quoted bid price and are generally classified as Level 2.
Notes to Financial Statements (continued)
Investments in investment companies are valued at their respective NAVs on the valuation date and are generally classified as Level 1.
Investments initially valued in currencies other than the U.S. dollar are converted to the U.S. dollar using exchange rates obtained from independent pricing services (“pricing service”). As a result, the NAV of the Funds’ shares may be affected by changes in the value of currencies in relation to the U.S. dollar. The value of securities traded in markets outside the United States or denominated in currencies other than the U.S. dollar may be affected significantly on a day that the New York Stock Exchange is closed and an investor is not able to purchase, redeem or exchange shares. If significant market events occur between the time of determination of the closing price of a foreign security on an exchange and the time that the Funds’ NAV is determined, or if under the Funds’ procedures, the closing price of a foreign security is not deemed to be reliable, the security would be valued at fair value as determined in accordance with procedures established in good faith by the Funds’ Board of Directors (the “Board”). These securities are generally classified as Level 2 or Level 3 depending on the observability of the significant inputs.
Certain securities may not be able to be priced by the pre-established pricing methods as described above. Such securities may be valued by the Board and/or its appointee at fair value. These securities generally include, but are not limited to, restricted securities (securities which may not be publicly sold without registration under the Securities Act of 1933, as amended) for which a pricing service is unable to provide a market price; securities whose trading has been formally suspended; debt securities that have gone into default and for which there is no current market quotation; a security whose market price is not available from a pre-established pricing source; a security with respect to which an event has occurred that is likely to materially affect the value of the security after the market has closed but before the calculation of a Fund’s NAV (as may be the case in non-U.S. markets on which the security is primarily traded) or make it difficult or impossible to obtain a reliable market quotation; and a security whose price, as provided by the pricing service, is not deemed to reflect the security’s fair value. As a general principle, the fair value of a security would appear to be the amount that the owner might reasonably expect to receive for it in a current sale. A variety of factors may be considered in determining the fair value of such securities, which may include consideration of the following: yields or prices of investments of comparable quality, type of issue, coupon, maturity and rating, market quotes or indications of value from security dealers, evaluations of anticipated cash flows or collateral, general market conditions and other information and analysis, including the obligor’s credit characteristics considered relevant. These securities are generally classified as Level 2 or Level 3 depending on the observability of the significant inputs. Regardless of the method employed to value a particular security, all valuations are subject to review by the Board and/or its appointee.
The inputs or methodologies used for valuing securities are not an indication of the risks associated with investing in those securities. The following is a summary of each Fund’s fair value measurements as of the end of the reporting period:
| | | | | | | | | | | | | | | | |
| Dividend Value | | Level 1 | | | Level 2 | | | Level 3 | | | Total | |
| Long-Term Investments*: | | | | | | | | | | | | | | | | |
Common Stocks | | $ | 1,041,813,268 | | | $ | — | | | $ | — | | | $ | 1,041,813,268 | |
| Investments Purchased with Collateral from Securities Lending | | | 57,713 | | | | — | | | | — | | | | 57,713 | |
| Short-Term Investments: | | | | | | | | | | | | | | | | |
Money Market Funds | | | 1,685,761 | | | | — | | | | — | | | | 1,685,761 | |
| Total | | $ | 1,043,556,742 | | | $ | — | | | $ | — | | | $ | 1,043,556,742 | |
| | | | |
| Mid Cap Value | | | | | | | | | | | | |
| Long-Term Investments*: | | | | | | | | | | | | | | | | |
Common Stocks | | $ | 99,493,981 | | | $ | — | | | $ | — | | | $ | 99,493,981 | |
| Investments Purchased with Collateral from Securities Lending | | | 1,637,763 | | | | — | | | | — | | | | 1,637,763 | |
| Short-Term Investments: | | | | | | | | | | | | | | | | |
Money Market Funds | | | 256,843 | | | | — | | | | — | | | | 256,843 | |
| Total | | $ | 101,388,587 | | | $ | — | | | $ | — | | | $ | 101,388,587 | |
| | | | |
| Small Cap Value | | | | | | | | | | | | |
| Long-Term Investments*: | | | | | | | | | | | | | | | | |
Common Stocks | | $ | 598,335,801 | | | $ | — | | | $ | — | | | $ | 598,335,801 | |
| Investments Purchased with Collateral from Securities Lending | | | 19,618,596 | | | | — | | | | — | | | | 19,618,596 | |
| Short-Term Investments: | | | | | | | | | | | | | | | | |
Money Market Funds | | | 24,503,340 | | | | — | | | | — | | | | 24,503,340 | |
| Total | | $ | 642,457,737 | | | $ | — | | | $ | — | | | $ | 642,457,737 | |
| * | Refer to the Fund’s Portfolio of Investments for industry classifications. |
The Board is responsible for the valuation process and has appointed the oversight of the daily valuation process to the Adviser’s Valuation Committee. The Valuation Committee, pursuant to the valuation policies and procedures adopted by the Board, is responsible for making fair value determinations, evaluating the effectiveness of the Funds’ pricing policies and reporting to the Board. The Valuation Committee is aided in its efforts by the Adviser’s dedicated Securities Valuation Team, which is responsible for administering the daily valuation process and applying fair value methodologies as approved by the Valuation Committee. When determining the reliability of independent pricing services for investments owned by the Funds, the
Valuation Committee, among other things, conducts due diligence reviews of the pricing services and monitors the quality of security prices received through various testing reports conducted by the Securities Valuation Team.
The Valuation Committee will consider pricing methodologies it deems relevant and appropriate when making a fair value determination, based on the facts and circumstances specific to the portfolio instrument. Fair value determinations generally will be derived as follows, using public or private market information:
| | (i) | If available, fair value determinations shall be derived by extrapolating from recent transactions or quoted prices for identical or comparable securities. |
| | (ii) | If such information is not available, an analytical valuation methodology may be used based on other available information including, but not limited to: analyst appraisals, research reports, corporate action information, issuer financial statements and shelf registration statements. Such analytical valuation methodologies may include, but are not limited to: multiple of earnings, discount from market value of a similar freely-traded security, discounted cash flow analysis, book value or a multiple thereof, risk premium/yield analysis, yield to maturity and/or fundamental investment analysis. |
The purchase price of a portfolio instrument will be used to fair value the instrument only if no other valuation methodology is available or deemed appropriate, and it is determined that the purchase price fairly reflects the instrument’s current value.
For each portfolio security that has been fair valued pursuant to the policies adopted by the Board, the fair value price is compared against the last available and next available market quotations. The Valuation Committee reviews the results of such testing and fair valuation occurrences are reported to the Board.
3. Portfolio Securities and Investments in Derivatives
Portfolio Securities
Foreign Currency Transactions
To the extent that a Fund may invest in securities and/or contracts that are denominated in a currency other than U.S. dollars, the Fund will be subject to currency risk, which is the risk that an increase in the U.S. dollar relative to the foreign currency will reduce returns or portfolio value. Generally, when the U.S. dollar rises in value against a foreign currency, the Fund’s investments denominated in that currency will lose value because its currency is worth fewer U.S. dollars; the opposite effect occurs if the U.S. dollar falls in relative value. Investments and other assets and liabilities denominated in foreign currencies are converted into U.S. dollars on a spot (i.e. cash) basis at the spot rate prevailing in the foreign currency exchange market at the time of valuation. Purchases and sales of investments and income denominated in foreign currencies are translated into U.S. dollars on the respective dates of such transactions.
The books and records of the Funds are maintained in U.S. dollars. Foreign currencies, assets and liabilities are translated into U.S. dollars at 4:00 p.m. Eastern Time. Investment transactions, income and expenses are translated on the respective dates of such transactions. Net realized foreign currency-gains and losses resulting from changes in exchange rates include foreign currency gains and losses between trade date and settlement date of the transactions, foreign currency transactions and the difference between the amounts of interest and dividends recorded on the books of a Fund and the amounts actually received.
The realized gains and losses resulting from changes in foreign currency exchange rates and changes in foreign exchange rates associated with (i) foreign currency, (ii) investments, (iii) investments in derivatives and (iv) other assets and liabilities are recognized as a component of “Net realized gain (loss) from investments and foreign currency” on the Statement of Operations, when applicable.
The unrealized gains and losses resulting from changes in foreign currency exchange rates and changes in foreign exchange rates associated with (i) investments and (ii) other assets and liabilities are recognized as a component of “Change in net unrealized appreciation (depreciation) of investments and foreign currency” on the Statement of Operations, when applicable. The unrealized gains and losses resulting from changes in foreign exchange rates associated with investments in derivatives are recognized as a component of the respective derivative’s related “Change in net unrealized appreciation (depreciation)” on the Statement of Operations, when applicable.
Securities Lending
In order to generate additional income, the Funds may lend securities representing up to one-third of the value of its total assets (which includes collateral for securities on loan) to broker-dealers, banks or other institutions. When loaning securities, each Fund retains the benefits of owning the securities, including the economic equivalent of dividends or interest generated by the security. Each Fund also has the ability to recall the securities on loan at any time.
Each Fund’s policy is to receive, at the inception of a loan, cash collateral equal to at least 102% of the value of securities loaned, which is recognized as “Payable for collateral from securities lending program” on the Statement of Assets and Liabilities. Collateral for securities on loan is invested in a money market fund, which is recognized as “Investments purchased with collateral from securities lending, at value” on the Statement of Assets and Liabilities. The market value of the securities loaned is determined at the close of each business day in order to determine the adequacy of the
Notes to Financial Statements (continued)
collateral. If the value of the securities on loan increases such that the level of collateralization falls below 100%, additional collateral is received from the borrower on the next business day, which is recognized as “Due from broker” on the Statement of Assets and Liabilities.
Securities out on loan are subject to termination at any time at the option of the borrower or the Fund. Upon termination, the borrower is required to return to the Fund securities identical to the securities loaned. Generally, in the event the borrower defaults on its obligation to return the loaned securities, the Fund has the right to use the collateral to acquire identical securities. In the event the Fund is delayed or prevented from exercising its right to dispose of the collateral, there may be a loss to the Fund. Under each Fund’s securities lending agreement, however, the securities lending agent has indemnified the Fund against losses resulting from borrower default, except to the extent that those losses result from a decrease in the value of the collateral due to its investment by the Fund. The Fund bears the risk of loss with respect to the investment of collateral.
The Funds’ custodian, U.S. Bank National Association, serves as their securities lending agent. Each Fund pays the custodian a fee based on its proportional share of the custodian’s expense of operating its securities lending program. Income earned from the securities lending program is paid to the Fund, net of any fees paid. Income from securities lending, net of fees paid, is recognized as “Securities lending income, net” on the Statement of Operations.
The following table presents the securities out on loan for the Funds, and the collateral delivered related to those securities, as of the end of the reporting period.
| | | | | | | | | | | | | | |
| Fund | | Asset Class out on Loan | | Long-Term
Investments, at Value | | | Collateral
Pledged (From)
Counterparty* | | | Net
Exposure | |
| Dividend Value | | Common Stocks | | $ | 56,457 | | | $ | (56,457 | ) | | $ | — | |
| Mid Cap Value | | Common Stocks | | | 1,583,329 | | | | (1,583,329 | ) | | | — | |
| Small Cap Value | | Common Stocks | | | 19,037,736 | | | | (19,037,736 | ) | | | — | |
| * | As of the end of the reporting period, the value of the collateral pledged from the counterparty exceeded the value of the securities out on loan. Refer to the Fund’s Portfolio of Investments for details on the securities out on loan. |
Securities lending fees paid by each Fund during the current fiscal period were as follows:
| | | | | | | | | | | | |
| | | Dividend
Value | | | Mid Cap
Value | | | Small Cap
Value | |
| Securities lending fees paid | | $ | 21,748 | | | $ | 4,634 | | | $ | 25,780 | |
Investments in Derivatives
Each Fund is authorized to invest in certain derivative instruments. The Funds record derivative instruments at fair value, with changes in fair value recognized on the Statement of Operations, when applicable. Even though the Funds’ investments in derivatives may represent economic hedges, they are not considered to be hedge transactions for financial reporting purposes.
Although the Funds are authorized to invest in derivative instruments, and may do so in the future, they did not make any such investments during the current fiscal period.
Market and Counterparty Credit Risk
In the normal course of business each Fund may invest in financial instruments and enter into financial transactions where risk of potential loss exists due to changes in the market (market risk) or failure of the other party to the transaction to perform (counterparty credit risk). The potential loss could exceed the value of the financial assets recorded on the financial statements. Financial assets, which potentially expose each Fund to counterparty credit risk, consist principally of cash due from counterparties on forward, option and swap transactions, when applicable. The extent of each Fund’s exposure to counterparty credit risk in respect to these financial assets approximates their carrying value as recorded on the Statement of Assets and Liabilities.
Each Fund helps manage counterparty credit risk by entering into agreements only with counterparties the Adviser believes have the financial resources to honor their obligations and by having the Adviser monitor the financial stability of the counterparties. Additionally, counterparties may be required to pledge collateral daily (based on the daily valuation of the financial asset) on behalf of each Fund with a value approximately equal to the amount of any unrealized gain above a pre-determined threshold. Reciprocally, when each Fund has an unrealized loss, the Funds have instructed the custodian to pledge assets of the Funds as collateral with a value approximately equal to the amount of the unrealized loss above a pre-determined threshold. Collateral pledges are monitored and subsequently adjusted if and when the valuations fluctuate, either up or down, by at least the pre-determined threshold amount.
4. Fund Shares
Transactions in Fund shares during the current and prior fiscal period were as follows:
| | | | | | | | | | | | | | | | |
| | | Year Ended
10/31/16 | | | Year Ended
10/31/15 | |
| Dividend Value | | Shares | | | Amount | | | Shares | | | Amount | |
| Shares sold: | | | | | | | | | | | | | | | | |
Class A | | | 1,572,170 | | | $ | 22,788,334 | | | | 2,424,656 | | | $ | 39,498,173 | |
Class C | | | 289,723 | | | | 4,143,968 | | | | 309,435 | | | | 5,036,236 | |
Class R3 | | | 693,375 | | | | 10,154,053 | | | | 734,617 | | | | 11,943,772 | |
Class R6 | | | 128,155 | | | | 1,947,541 | | | | 315,607 | | | | 5,276,030 | |
Class I | | | 5,566,055 | | | | 80,044,446 | | | | 6,957,058 | | | | 114,678,800 | |
| Shares issued to shareholders due to reinvestment of distributions: | | | | | | | | | | | | | | | | |
Class A | | | 1,707,600 | | | | 24,563,216 | | | | 1,810,421 | | | | 28,853,242 | |
Class C | | | 257,721 | | | | 3,645,391 | | | | 265,889 | | | | 4,176,547 | |
Class R3 | | | 231,787 | | | | 3,321,566 | | | | 232,274 | | | | 3,692,283 | |
Class R6 | | | 335,499 | | | | 4,890,404 | | | | 293,862 | | | | 4,731,582 | |
Class I | | | 3,247,650 | | | | 47,201,226 | | | | 3,487,027 | | | | 56,097,243 | |
| | | | 14,029,735 | | | | 202,700,145 | | | | 16,830,846 | | | | 273,983,908 | |
| Shares redeemed: | | | | | | | | | | | | | | | | |
Class A | | | (5,734,596 | ) | | | (84,348,161 | ) | | | (5,926,661 | ) | | | (96,466,967 | ) |
Class C | | | (1,085,823 | ) | | | (15,727,843 | ) | | | (939,209 | ) | | | (15,092,734 | ) |
Class R3 | | | (1,521,725 | ) | | | (21,265,869 | ) | | | (1,049,386 | ) | | | (17,076,854 | ) |
Class R6 | | | (672,355 | ) | | | (10,064,804 | ) | | | (635,972 | ) | | | (10,727,069 | ) |
Class I | | | (24,271,877 | ) | | | (359,015,164 | ) | | | (19,092,966 | ) | | | (312,324,710 | ) |
| | | | (33,286,376 | ) | | | (490,421,841 | ) | | | (27,644,194 | ) | | | (451,688,334 | ) |
| Net increase (decrease) | | | (19,256,641 | ) | | $ | (287,721,696 | ) | | | (10,813,348 | ) | | $ | (177,704,426 | ) |
| | |
| | | Year Ended
10/31/16 | | | Year Ended
10/31/15 | |
| Mid Cap Value | | Shares | | | Amount | | | Shares | | | Amount | |
| Shares sold: | | | | | | | | | | | | | | | | |
Class A | | | 88,646 | | | $ | 3,059,697 | | | | 80,414 | | | $ | 2,851,498 | |
Class C | | | 14,254 | | | | 466,345 | | | | 13,059 | | | | 447,157 | |
Class R3 | | | 22,389 | | | | 762,436 | | | | 32,371 | | | | 1,151,229 | |
Class I | | | 101,924 | | | | 3,492,549 | | | | 111,344 | | | | 3,981,183 | |
| Shares issued to shareholders due to reinvestment of distributions: | | | | | | | | | | | | | | | | |
Class A | | | 36,041 | | | | 1,194,339 | | | | 9,129 | | | | 328,561 | |
Class C | | | 6,925 | | | | 218,837 | | | | 261 | | | | 9,039 | |
Class R3 | | | 6,105 | | | | 189,187 | | | | 1,330 | | | | 47,658 | |
Class I | | | 36,761 | | | | 1,222,761 | | | | 7,192 | | | | 259,290 | |
| | | | 313,045 | | | | 10,606,151 | | | | 255,100 | | | | 9,075,615 | |
| Shares redeemed: | | | | | | | | | | | | | | | | |
Class A | | | (180,926 | ) | | | (6,252,400 | ) | | | (188,525 | ) | | | (6,729,568 | ) |
Class C | | | (44,182 | ) | | | (1,437,273 | ) | | | (33,626 | ) | | | (1,156,437 | ) |
Class R3 | | | (76,866 | ) | | | (2,620,398 | ) | | | (75,285 | ) | | | (2,671,845 | ) |
Class I | | | (531,537 | ) | | | (18,147,504 | ) | | | (349,402 | ) | | | (12,586,488 | ) |
| | | | (833,511 | ) | | | (28,457,575 | ) | | | (646,838 | ) | | | (23,144,338 | ) |
| Net increase (decrease) | | | (520,466 | ) | | $ | (17,851,424 | ) | | | (391,738 | ) | | $ | (14,068,723 | ) |
Notes to Financial Statements (continued)
| | | | | | | | | | | | | | | | |
| | | Year Ended
10/31/16 | | | Year Ended
10/31/15 | |
| Small Cap Value | | Shares | | | Amount | | | Shares | | | Amount | |
| Shares sold: | | | | | | | | | | | | | | | | |
Class A | | | 7,471,151 | | | $ | 150,782,821 | | | | 463,591 | | | $ | 9,062,521 | |
Class C | | | 1,339,465 | | | | 22,885,502 | | | | 113,427 | | | | 1,912,427 | |
Class R3 | | | 904,344 | | | | 17,949,703 | | | | 318,020 | | | | 6,035,655 | |
Class R61 | | | 7,991 | | | | 176,784 | | | | — | | | | — | |
Class R61 – exchanges | | | 997,294 | | | | 21,022,961 | | | | — | | | | — | |
Class I | | | 16,536,967 | | | | 345,127,769 | | | | 1,452,674 | | | | 29,347,026 | |
| Shares issued to shareholders due to reinvestment of distributions: | | | | | | | | | | | | | | | | |
Class A | | | 45,734 | | | | 876,042 | | | | 8,762 | | | | 167,348 | |
Class C | | | 6,655 | | | | 109,586 | | | | — | | | | — | |
Class R3 | | | 11,775 | | | | 220,805 | | | | 836 | | | | 15,678 | |
Class R61 | | | 82 | | | | 1,795 | | | | — | | | | — | |
Class I | | | 81,896 | | | | 1,625,949 | | | | 18,596 | | | | 366,519 | |
| | | | 27,403,354 | | | | 560,779,717 | | | | 2,375,906 | | | | 46,907,174 | |
| Shares redeemed: | | | | | | | | | | | | | | | | |
Class A | | | (1,954,548 | ) | | | (38,629,027 | ) | | | (445,277 | ) | | | (8,535,603 | ) |
Class C | | | (111,496 | ) | | | (1,869,261 | ) | | | (38,815 | ) | | | (646,389 | ) |
Class R3 | | | (366,010 | ) | | | (7,024,234 | ) | | | (210,587 | ) | | | (3,994,821 | ) |
Class R61 | | | (85,728 | ) | | | (1,905,002 | ) | | | — | | | | — | |
Class I | | | (3,030,624 | ) | | | (61,908,420 | ) | | | (787,140 | ) | | | (15,758,817 | ) |
Class I – exchanges | | | (997,294 | ) | | | (21,022,961 | ) | | | — | | | | — | |
| | | | (6,545,700 | ) | | | (132,358,905 | ) | | | (1,481,819 | ) | | | (28,935,630 | ) |
| Net increase (decrease) | | | 20,857,654 | | | $ | 428,420,812 | | | | 894,087 | | | $ | 17,971,544 | |
| 1 | Class R6 Shares were established on June 30, 2016. |
5. Investment Transactions
Long-term purchases and sales (excluding investments purchased with collateral from securities lending) during the current fiscal period were as follows:
| | | | | | | | | | | | |
| | | Dividend
Value | | | Mid Cap
Value | | | Small Cap
Value | |
| Purchases | | $ | 781,494,906 | | | $ | 46,690,734 | | | $ | 559,438,962 | |
| Sales | | | 1,159,385,963 | | | | 66,148,693 | | | | 134,064,926 | |
6. Income Tax Information
Each Fund is a separate taxpayer for federal income tax purposes. Each Fund intends to distribute substantially all of its net investment income and net capital gains to shareholders and to otherwise comply with the requirements of Subchapter M of the Internal Revenue Code applicable to regulated investment companies. Therefore, no federal income tax provision is required.
For all open tax years and all major taxing jurisdictions, management of the Funds has concluded that there are no significant uncertain tax positions that would require recognition in the financial statements. Open tax years are those that are open for examination by taxing authorities (i.e., generally the last four tax year ends and the interim tax period since then). Furthermore, management of the Funds is also not aware of any tax positions for which it is reasonably possible that the total amounts of unrecognized tax benefits will significantly change in the next twelve months.
The following information is presented on an income tax basis. Differences between amounts for financial statement and federal income tax purposes are primarily due to timing differences in recognizing certain gains and losses on investment transactions. To the extent that differences arise that are permanent in nature, such amounts are reclassified within the capital accounts as detailed below. Temporary differences do not require reclassification. Temporary and permanent differences do not impact the NAVs of the Funds.
As of October 31, 2016, the cost and unrealized appreciation (depreciation) of investments, as determined on a federal income tax basis, were as follows:
| | | | | | | | | | | | |
| | | Dividend
Value | | | Mid Cap
Value | | | Small Cap
Value | |
| Cost of investments | | $ | 813,042,937 | | | $ | 95,180,464 | | | $ | 618,574,959 | |
| Gross unrealized: | | | | | | | | | | | | |
Appreciation | | $ | 238,511,048 | | | $ | 10,394,738 | | | $ | 41,507,231 | |
Depreciation | | | (7,997,243 | ) | | | (4,186,615 | ) | | | (17,624,453 | ) |
| Net unrealized appreciation (depreciation) of investments | | $ | 230,513,805 | | | $ | 6,208,123 | | | $ | 23,882,778 | |
Permanent differences, primarily due to the federal taxes paid, foreign currency transactions, tax equalization, investments in partnerships and distribution reallocations, resulted in reclassifications among the Funds’ components of net assets as of October 31, 2016, the Funds’ tax year end, as follows:
| | | | | | | | | | | | |
| | | Dividend
Value | | | Mid Cap
Value | | | Small Cap
Value | |
| Capital paid-in | | $ | 14,280,958 | | | $ | 429,256 | | | $ | 1,217,707 | |
| Undistributed (Over-distribution of) net investment income | | | (368,613 | ) | | | (58 | ) | | | 306 | |
| Accumulated net realized gain (loss) | | | (13,912,345 | ) | | | (429,198 | ) | | | (1,218,013 | ) |
The tax components of undistributed net ordinary income and net long-term capital gains as of October 31, 2016, the Funds’ tax year end, were as follows:
| | | | | | | | | | | | |
| | | Dividend
Value | | | Mid Cap
Value | | | Small Cap
Value | |
| Undistributed net ordinary income1 | | $ | 131,254 | | | $ | 978,378 | | | $ | 12,736,950 | |
| Undistributed net long-term capital gains | | | 144,248,800 | | | | 2,858,930 | | | | 7,196,233 | |
| 1 | Net ordinary income consists of net taxable income derived from dividends, interest, and net short-term capital gains, if any. |
The tax character of distributions paid during the Funds’ tax years ended October 31, 2016 and October 31, 2015, was designated for purposes of the dividends paid deduction as follows:
| | | | | | | | | | | | |
| 2016 | | Dividend
Value | | | Mid Cap
Value | | | Small Cap
Value | |
| Distributions from net ordinary income2 | | $ | 25,719,209 | | | $ | 440,300 | | | $ | 403,881 | |
| Distributions from net long-term capital gains | | | 93,703,442 | | | | 3,539,808 | | | | 2,901,691 | |
| | | |
| 2015 | | Dividend
Value | | | Mid Cap
Value | | | Small Cap
Value | |
| Distributions from net ordinary income2 | | $ | 34,828,160 | | | $ | 1,190,076 | | | $ | 624,998 | |
| Distributions from net long-term capital gains | | | 109,864,663 | | | | — | | | | — | |
| 2 | Net ordinary income consists of net taxable income derived from dividends, interest, net short-term capital gains and current year earnings and profits attributable to realized gain, if any. |
As of October 31, 2016, the Funds’ tax year end, the Funds did not have any unused capital loss carryforwards available for federal income tax purposes to be applied against future capital gains.
During the Funds’ tax year ended October 31, 2016, Dividend Value utilized $4,135,445 of its capital loss carryforwards.
7. Management Fees and Other Transactions with Affiliates
Management Fees
Each Fund’s management fee compensates the Adviser for the overall investment advisory and administrative services and general office facilities. The Sub-Adviser is compensated for its services to the Funds from the management fees paid to the Adviser.
Each Fund’s management fee consists of two components – a fund-level fee, based only on the amount of assets within each individual Fund, and a complex-level fee, based on the aggregate amount of all eligible fund assets managed by the Adviser. This pricing structure enables each Fund’s shareholders to benefit from growth in the assets within their respective Fund as well as from growth in the amount of complex-wide assets managed by the Adviser.
Notes to Financial Statements (continued)
The annual Fund-level fee, payable monthly, for each Fund is calculated according to the following schedule:
| | | | | | | | | | | | | | | | | | | | | | | | |
| | | Dividend Value | | | Mid Cap Value | | | Small Cap Value | |
| Average Daily Net Assets | | (For the period
November 1, 2015
through
June 29, 2016) | | | (Effective
June 30, 2016) | | | (For the period
November 1, 2015
through
June 29, 2016) | | | (Effective
June 30, 2016) | | | (For the period
November 1, 2015
through
June 29, 2016) | | | (Effective
June 30, 2016) | |
| For the first $125 million | | | 0.6000 | % | | | 0.5000 | % | | | 0.7000 | % | | | 0.6000 | % | | | 0.7000 | % | | | 0.6500 | % |
| For the next $125 million | | | 0.5875 | | | | 0.4875 | | | | 0.6875 | | | | 0.5875 | | | | 0.6875 | | | | 0.6375 | |
| For the next $250 million | | | 0.5750 | | | | 0.4750 | | | | 0.6750 | | | | 0.5750 | | | | 0.6750 | | | | 0.6250 | |
| For the next $500 million | | | 0.5625 | | | | 0.4625 | | | | 0.6625 | | | | 0.5625 | | | | 0.6625 | | | | 0.6125 | |
| For the next $1 billion | | | 0.5500 | | | | 0.4500 | | | | 0.6500 | | | | 0.5500 | | | | 0.6500 | | | | 0.6000 | |
| For net assets over $2 billion | | | 0.5250 | | | | 0.4250 | | | | 0.6250 | | | | 0.5250 | | | | 0.6250 | | | | 0.5750 | |
The annual complex-level fee, payable monthly, for each Fund is determined by taking the complex-level free rate, which is based on the aggregate amount of “eligible assets” of all Nuveen funds as set forth in the schedule below, and making, as appropriate, an upward adjustment to that rate based upon the percentage of the particular fund’s assets that are not “eligible assets”. The complex-level fee schedule for each Fund is as follows:
| | | | |
| Complex-Level Asset Breakpoint Level* | | Effective Rate at Breakpoint Level | |
| $55 billion | | | 0.2000 | % |
| $56 billion | | | 0.1996 | |
| $57 billion | | | 0.1989 | |
| $60 billion | | | 0.1961 | |
| $63 billion | | | 0.1931 | |
| $66 billion | | | 0.1900 | |
| $71 billion | | | 0.1851 | |
| $76 billion | | | 0.1806 | |
| $80 billion | | | 0.1773 | |
| $91 billion | | | 0.1691 | |
| $125 billion | | | 0.1599 | |
| $200 billion | | | 0.1505 | |
| $250 billion | | | 0.1469 | |
| $300 billion | | | 0.1445 | |
| * | The complex-level fee is calculated based upon the aggregate daily “eligible assets” of all Nuveen funds. Eligible assets do not include assets attributable to investments in other Nuveen funds or assets in excess of a determined amount (originally $2 billion) added to the Nuveen fund complex in connection with the Adviser’s assumption of the management of the former First American Funds effective January 1, 2011. Eligible assets include closed-end fund assets managed by the Adviser that are attributable to certain types of leverage. For these purposes, leverage includes the closed-end funds’ use of preferred stock and borrowings and certain investments in the residual interest certificates (also called inverse floating rate securities) in tender option bond (TOB) trusts, including the portion of assets held by the TOB trust that has been effectively financed by the trust’s issuance of floating rate securities, subject to an agreement by the Adviser as to certain funds to limit the amount of such assets for determining eligible assets in certain circumstances. As of October 31, 2016, the complex-level fee rate for each Fund was as follows: |
| | | | |
| Fund | | Complex-Level Fee | |
Dividend Value | | | 0.1998 | % |
Mid Cap Value | | | 0.1998 | |
Small Cap Value | | | 0.1673 | |
The Adviser has agreed to waive fees and/or reimburse expenses (“Expense Cap”) of the following Funds so that total annual Fund operating expenses (excluding 12b-1 distribution and/or service fees, interest expenses, taxes, acquired fund fees and expenses, fees incurred in acquiring and disposing of portfolio securities and extraordinary expenses) do not exceed the average daily net assets of any class of Fund shares in the amounts and for the time periods stated in the following table. However, because Class R6 shares are not subject to sub-transfer agent and similar fees, the total annual Fund operating expense for the Class R6 shares will be less than the expense limitation. The expense limitation expiring February 28, 2018 may be terminated or modified prior to that date only with the approval of the Board of Directors of the Funds.
| | | | | | |
| Fund | | Expense Cap | | | Expense Cap
Expiration Date |
Mid Cap Value | | | 0.92 | %* | | February 28, 2018 |
Small Cap Value | | | 1.02 | ** | | February 28, 2018 |
| * | Effective June 30, 2016. Prior to June 30, 2016, the Fund’s Expense Cap was 1.05%. |
| ** | Effective June 30, 2016. Prior to June 30, 2016, the Fund’s Expense Cap was 1.15%. |
Other Transactions with Affiliates
The Trust pays no compensation directly to those of its directors who are affiliated with the Adviser or to its officers, all of whom receive remuneration for their services to the Trust from the Adviser or its affiliates. The Board has adopted a deferred compensation plan for independent directors that enables directors to elect to defer receipt of all or a portion of the annual compensation they are entitled to receive from certain Nuveen-advised funds. Under the plan, deferred amounts are treated as though equal dollar amounts had been invested in shares of select Nuveen-advised funds.
During the current fiscal period, Nuveen Securities, LLC (the “Distributor”), a wholly-owned subsidiary of Nuveen, collected sales charges on purchases of Class A Shares, the majority of which were paid out as concessions to financial intermediaries as follows:
| | | | | | | | | | | | |
| | | Dividend
Value | | | Mid Cap
Value | | | Small Cap
Value | |
| Sales charges collected (Unaudited) | | $ | 139,013 | | | $ | 28,752 | | | $ | 253,506 | |
| Paid to financial intermediaries (Unaudited) | | | 122,290 | | | | 25,607 | | | | 223,828 | |
The Distributor also received 12b-1 service fees on Class A Shares, substantially all of which were paid to compensate financial intermediaries for pro-viding services to shareholders relating to their investments.
During the current fiscal period, the Distributor compensated financial intermediaries directly with commission advances at the time of purchase as follows:
| | | | | | | | | | | | |
| | | Dividend
Value | | | Mid Cap
Value | | | Small Cap
Value | |
| Commission advances (Unaudited) | | $ | 25,397 | | | $ | 6,483 | | | $ | 225,967 | |
To compensate for commissions advanced to financial intermediaries, all 12b-1 service and distribution fees collected on Class C Shares during the first year following a purchase are retained by the Distributor. During the current fiscal period, the Distributor retained such 12b-1 fees as follows:
| | | | | | | | | | | | |
| | | Dividend
Value | | | Mid Cap
Value | | | Small Cap
Value | |
| 12b-1 fees retained (Unaudited) | | $ | 22,828 | | | $ | 3,244 | | | $ | 117,985 | |
The remaining 12b-1 fees charged to the Funds were paid to compensate financial intermediaries for providing services to shareholders relating to their investments.
The Distributor also collected and retained CDSC on share redemptions during the current fiscal period, as follows:
| | | | | | | | | | | | |
| | | Dividend
Value | | | Mid Cap
Value | | | Small Cap
Value | |
| CDSC retained (Unaudited) | | $ | 2,016 | | | $ | 50 | | | $ | 4,865 | |
8. Borrowing Arrangements
Uncommitted Line of Credit
During the current fiscal period, the Funds participated in an unsecured bank line of credit (“Unsecured Credit Line”) under which outstanding balances would bear interest at a variable rate. Although the Funds participated in the Unsecured Credit Line, they did not have any outstanding balances during the current fiscal period.
Committed Line of Credit
The Funds, along with certain other funds managed by the Adviser (“Participating Funds”), have established a 364-day, approximately $2.5 billion standby credit facility with a group of lenders, under which the Participating Funds may borrow for various purposes other than leveraging for investment purposes. A large portion of this facility’s capacity (and its associated costs as described below) is currently dedicated for use by a small number of Participating Funds, which does not include any of the Funds covered by this shareholder report. The remaining capacity under the facility (and the corresponding portion of the facility’s annual costs) is separately dedicated to most of the other open-end funds in the Nuveen fund family, including all of the Funds covered by this shareholder report, along with a number of Nuveen closed-end funds. The credit facility expires in July 2017 unless extended or renewed.
The credit facility has the following terms: a fee of 0.15% per annum on unused commitment amounts, and interest at a rate equal to the higher of (a) one-month LIBOR (London Inter-Bank Offered Rate) plus 1.25% per annum or (b) the Fed Funds rate plus 1.25% per annum on amounts borrowed. Participating Funds paid administration, legal and arrangement fees, which are recognized as a component of “Other expenses” on the Statement of Operations, and along with commitment fees, have been allocated among such Participating Funds based upon the relative proportions of the facility’s aggregate capacity reserved for them and other factors deemed relevant by the Adviser and the Board of each Participating Fund.
During the current fiscal period, none of the Funds utilized this facility.
Additional
Fund Information (Unaudited)
| | | | | | | | | | |
| | | | | |
| | Fund Manager Nuveen Fund Advisors, LLC 333 West Wacker Drive Chicago, IL 60606 Sub-Adviser Nuveen Asset Management, LLC 333 West Wacker Drive Chicago, IL 60606 | | Independent Registered
Public Accounting Firm PricewaterhouseCoopers LLP One North Wacker Drive Chicago, IL 60606 Custodian U.S. Bank National Association 1555 North RiverCenter Drive, Suite 302 Milwaukee, WI 53202 | | Legal Counsel Chapman and Cutler LLP Chicago, IL 60603 | | Transfer Agent and
Shareholder Services Boston Financial
Data Services, Inc. Nuveen Investor Services P.O. Box 8530 Boston, MA 02266-8530 (800) 257-8787 | | |
| | | | | | | | | | | | | | |
| | | | | |
| | | | | | | | | | |
| | |
| | Distribution Information: The Funds hereby designate their percentages of dividends paid from net ordinary income as dividends qualifying for the 70% dividends received deduction (“DRD”) for corporations and their percentages as qualified dividend income (“QDI”) for individuals under Section 1 (h)(11) of the Internal Revenue Code as shown in the accompanying table. The actual qualified dividend income distributions will be reported to shareholders on Form 1099-DIV which will be sent to shareholders shortly after calendar year end. | | |
| | | | | | | |
| | | | | | | | | Dividend Value | | Mid Cap Value | | Small Cap Value | | |
| | % QDI | | 100% | | 100% | | 100% | | |
| | % DRD | | 100% | | 100% | | 100% | | |
| | |
| | Long-Term Capital Gain Distributions: The Funds hereby designate as long-term capital gain dividends, pursuant to Internal Revenue Code Section 852 (b)(3), the amount shown in the accompanying table or, if greater, the amount necessary to reduce earnings and profits of the Funds related to net capital gain to zero for the tax year ended October 31, 2016: | | |
| | | | | | | |
| | | | | | | | | Dividend Value | | Mid Cap Value | | Small Cap Value | | |
| | Long-term capital gain dividends | | $107,784,671 | | $3,964,971 | | $4,128,612 | | |
| | | |
| | | | | | |
| | |
| | Quarterly Form N-Q Portfolio of Investments Information: Each Fund is required to file its complete schedule of portfolio holdings with the Securities and Exchange Commission (SEC) for the first and third quarters of each fiscal year on Form N-Q. You may obtain this information directly from the SEC. Visit the SEC on-line at http://www.sec.gov or in person at the SEC’s Public Reference Room in Washington, D.C. Call the SEC toll-free at (800) SEC-0330 for room hours and operation. | | |
| | | |
| | | | | | |
| | |
| | Nuveen Funds’ Proxy Voting Information: You may obtain (i) information regarding how each fund voted proxies relating to portfolio securities held during the most recent twelve-month period ended June 30, without charge, upon request, by calling Nuveen toll-free at (800) 257-8787 or on Nuveen’s website at www.nuveen.com and (ii) a description of the policies and procedures that each fund used to determine how to vote proxies relating to portfolio securities without charge, upon request, by calling Nuveen toll-free at (800) 257-8787. You may also obtain this information directly from the SEC. Visit the SEC on-line at http://www.sec.gov. | | |
| | | |
| | | | | | |
| | |
| | FINRA BrokerCheck: The Financial Industry Regulatory Authority (FINRA) provides information regarding the disciplinary history of FINRA member firms and associated investment professionals. This information as well as an investor brochure describing FINRA BrokerCheck is available to the public by calling the FINRA BrokerCheck Hotline number at (800) 289-9999 or by visiting www.FINRA.org. | | |
Glossary of Terms
Used in this Report (Unaudited)
Average Annual Total Return: This is a commonly used method to express an investment’s performance over a particular, usually multi-year time period. It expresses the return that would have been necessary each year to equal the investment’s actual cumulative performance (including change in NAV or offer price and reinvested distributions and capital gains, if any) over the time period being considered.
Gross Domestic Product (GDP): The total market value of all final goods and services produced in a country/region in a given year, equal to total consumer, investment and government spending, plus the value of exports, minus the value of imports.
Lipper Equity Income Funds Classification Average: Represents the average annualized total return for all reporting funds in the Lipper Equity Income Funds Classification. Lipper returns account for the effects of management fees and assume reinvestment of distributions but do not reflect any applicable sales charges.
Lipper Mid-Cap Value Funds Classification Average: Represents the average annualized total return for all reporting funds in the Lipper Mid-Cap Value Funds Classification. Lipper returns account for the effects of management fees and assume reinvestment of distributions but do not reflect any applicable sales charges.
Lipper Small-Cap Value Funds Classification Average: Represents the average annualized total return for all reporting funds in the Lipper Small-Cap Value Funds Classification. Lipper returns account for the effects of management fees and assume reinvestment of distributions but do not reflect any applicable sales charges.
Market Capitalization: The market capitalization of a company is equal to the number of the company’s common shares outstanding multiplied by the current price of the company’s stock.
MSCI EAFE Index: The MSCI (Morgan Stanley Capital International) EAFE (Europe, Australasia, Far East) Index is a free float-adjusted market capitalization weighted index designed to measure developed market equity performance, excluding the U.S. and Canada. The index returns assume reinvestment of distributions, but do not reflect any applicable sales charges or management fees.
MSCI Emerging Markets Index: A free-float-adjusted market capitalization index that is designed to measure equity market performance in the global emerging markets. Index returns assume reinvestment of distributions, but do not reflect any applicable sales charges or management fees.
Net Asset Value (NAV) Per Share: A fund’s Net Assets is equal to its total assets (securities, cash and accrued earnings) less its total liabilities. For funds with multiple classes, Net Assets are determined separately for each share class. NAV per share is equal to the fund’s (or share class’) Net Assets divided by its number of shares outstanding.
Russell 1000® Index: An unmanaged index, considered representative of large-cap stocks. The index returns assume reinvestment of distributions, but do not reflect any applicable sales charges or management fees.
Russell 1000® Value Index: An index that measures the performance of those Russell 1000 companies with lower price-to-book ratios and lower forecasted growth values. The index returns assume reinvestment of distributions, but do not reflect any applicable sales charges or management fees.
Russell 2000® Index: An index that measures the performance of the small-cap segment of the U.S. equity universe. The Russell 2000® Index is a subset of the Russell 3000® Index representing approximately 10% of the total market capitalization of that index. It includes approximately 2,000 of the smallest securities based on a combination of their market cap and current index membership. The index returns assume reinvestment of distributions, but do not reflect any applicable sales charges or management fees.
Glossary of Terms Used in this Report (Unaudited) (continued)
Russell 2000® Value Index: An index that measures the performance of those Russell 2000 companies with lower price-to-book ratios and lower forecasted growth values. The index returns assume reinvestment of distributions, but do not reflect any applicable sales charges or management fees.
Russell Midcap® Value Index: An index that measures the performance of the mid-cap value segment of the U.S. equity universe. It includes those Russell Midcap Index companies with lower price-to-book ratios and lower forecasted growth values. The index returns assume reinvestment of distributions, but do not reflect any applicable sales charges or management fees.
S&P 500® Index: An unmanaged index generally considered representative of the U.S. stock market. Index returns assume reinvestment of distributions, but do not include the effects of any applicable sales charges or management fees.
Tax Equalization: The practice of treating a portion of the distribution made to a redeeming shareholder, which represents his proportionate part of undistributed net investment income and capital gain as a distribution for tax purposes. Such amounts are referred to as the equalization debits (or payments) and will be considered a distribution to the shareholder of net investment income and capital gain for calculation of the fund’s dividends paid deduction.
Annual Investment Management Agreement
Approval Process (Unaudited)
The Board of Directors of each Fund (the “Board,” and each Director a “Board Member”), including the Board Members who are not parties to the Funds’ advisory or sub-advisory agreements or “interested persons” of any such parties (the “Independent Board Members”), is responsible for overseeing the performance of the investment adviser and sub-adviser to the respective Fund and determining whether to continue such Fund’s advisory agreement (the “Investment Management Agreement”) between the Fund and Nuveen Fund Advisors, LLC (the “Adviser”) and the sub-advisory agreement (the “Sub-Advisory Agreement” and, together with the Investment Management Agreement, the “Advisory Agreements”) between the Adviser and Nuveen Asset Management, LLC (the “Sub-Adviser”). Following an initial term with respect to each Fund upon its commencement of operations, the Board reviews the Investment Management Agreement and the Sub-Advisory Agreement on behalf of such Fund and votes to determine whether the respective Advisory Agreement should be renewed. Accordingly, at an in-person meeting held on May 24-26, 2016 (the “May Meeting”), the Board, including a majority of the Independent Board Members, considered and approved the existing Advisory Agreements for the Funds.
During the year, the Board and its Committees met regularly to receive materials and discuss a variety of topics impacting the Funds including, among other things, overall market conditions and market performance, Fund investment performance, brokerage execution, valuation of securities, Rule 12b-1 plans and payments, sub-transfer agency and other payments to financial intermediaries, compliance matters, securities lending, risk management and ongoing initiatives. The Board had established several standing Committees, including the Open-end Fund Committee and Closed-end Fund Committee which permit the Board Members to delve further into the topics particularly relevant to the respective product line and enhance the Board’s effectiveness and oversight of the Funds. The Board also seeks to meet with the Sub-Adviser and its investment team at least once over a multiple year rotation through site visits. The information and knowledge the Board gained throughout the year from the Board and Committee meetings, site visits and the related materials were relevant to the Board’s evaluation of the Advisory Agreements, and the Board took such information into account in its review of the Advisory Agreements.
In addition to the materials received throughout the year, the Board received additional materials prepared specifically for its annual review of the Advisory Agreements in response to a request by independent legal counsel on behalf of the Independent Board Members. The materials addressed a variety of topics, including a description of the services provided by the Adviser and the Sub-Adviser (each, a “Fund Adviser”); a review of fund performance with a detailed focus on any performance outliers; an analysis of the investment teams; an analysis of the fees and expense ratios of the Funds, including information comparing such fees and expenses to that of peer groups; an assessment of shareholder services for the Funds and of the performance of certain service providers; a review of initiatives instituted or continued during the past year; and information regarding the profitability of the Fund Advisers, the compensation of portfolio managers, and compliance and risk matters.
As part of its annual review, the Board held a separate meeting on April 12-13, 2016 to review the Funds’ investment performance and consider an analysis by the Adviser of the Sub-Adviser examining, among other things, the team’s assets under management, investment performance, investment approach, and the stability and structure of the Sub-Adviser’s organization and investment team. During the review, the Independent Board Members requested and received additional information from management. Throughout the year and throughout their review of the Advisory Agreements, the Independent Board Members were assisted by independent legal counsel. The Independent Board Members met separately with independent legal counsel without management present and received a memorandum from such counsel outlining their fiduciary duties and legal standards in reviewing the Advisory Agreements. The Independent Board Members’ review of the Advisory Agreements reflected an ongoing process that incorporated the information and considerations that occurred over the years, including the most recent year, as well as the information specifically furnished for the renewal process. In deciding to renew the Advisory Agreements, the Independent Board Members did not identify a particular factor as controlling, but rather the decision reflected the comprehensive consideration of all the information presented. The following summarizes the principal factors, but not all the factors, the Board considered in its review of the Advisory Agreements and its conclusions.
A. Nature, Extent and Quality of Services
In evaluating the renewal of the Advisory Agreements, the Independent Board Members received and considered information regarding the nature, extent and quality of the applicable Fund Adviser’s services provided to the respective Fund and the initiatives undertaken during the past year by the Adviser. The Board recognized the comprehensive set of services the Adviser provided to manage and operate the Nuveen funds, including (a) product management (such as setting dividends, positioning the product in the marketplace, managing the relationships with the distribution platforms, maintaining and enhancing shareholder communications and reporting to the Board); (b) investment services (such as overseeing sub-advisers and other service providers; analyzing investment performance and risks; overseeing risk management and disclosure; developing and interpreting investment policies; assisting in the development of products; helping to prepare financial statements and marketing disclosures; and overseeing trade execution); (c) fund administration (such as helping to prepare fund tax returns and complete other tax compliance matters; and helping to prepare regulatory filings and shareholder reports); (d) fund Board administration (such as preparing Board materials and organizing and providing assistance
Annual Investment Management Agreement Approval Process (Unaudited) (continued)
for Board meetings); (e) compliance (such as helping to devise and maintain the funds’ compliance program and related testing); and (f) legal support (such as helping to prepare registration statements and proxy statements, interpreting regulations and policies and overseeing fund activities).
The Board reviewed the continued investment the Adviser had made in its business to continue to strengthen the breadth and quality of its services to the benefit of the Nuveen funds. The Board noted the Adviser’s additional staffing in key areas that support the funds and the Board, including in investment services, operations, fund governance, compliance, fund administration, product management, retail distribution and information technology. Among the enhancements to its services, the Board recognized the Adviser’s (a) expanded activities and support required as a result of regulatory developments, including in areas of compliance and reporting; (b) increased support for dividend management; (c) continued investment in its technical capabilities as the Adviser continued to build out a centralized fund data platform, enhance mobility and remote access capabilities, rationalize and upgrade software platforms, and automate certain regulatory liquidity determinations; (d) continued efforts to rationalize the product line through mergers, liquidations and re-positioning of the Nuveen funds with the goal of increasing efficiencies, reducing costs, improving performance and addressing shareholder needs; (e) continued efforts to develop new lines of business designed to enhance the Nuveen product line and meet investor demands; and (f) continued commitment to enhance risk oversight, including the formation of the operational risk group to provide operational risk assessment, the access to platforms which provide better risk reporting to support investment teams, and the development of a new team to initially review new products and major product initiatives. The Board also recognized the Adviser’s efforts to renegotiate certain fees of other service providers which culminated in reduced expenses for all funds for custody and accounting services without diminishing the breadth and quality of the services provided. The Board considered the Chief Compliance Officer’s report regarding the Adviser’s compliance program, the Adviser’s continued development, execution and management of its compliance program, and the additions to the compliance team to support the continued growth of the Nuveen fund family and address regulatory developments.
The Board also considered information highlighting the various initiatives that the Adviser had implemented or continued during the year to enhance or support the open-end fund product line. The Board noted the Adviser’s continued initiatives (a) to develop and offer new outcome-oriented funds; (b) to refine the reports to the Board, including enhanced reporting regarding payments to intermediaries, as well as provide presentations to the Board to keep it apprised of various topics that are relevant to the open-end fund product line (such as marketing initiatives, portfolio analytics and sales results); (c) to modify the contingent deferred sales load structure for Class A shares to be more competitive with peers; (d) to launch a new share class to attract institutional clients; and (e) to change portfolio managers on various funds. The Board recognized that initiatives that attract assets to the Nuveen family of funds benefited the funds as fixed costs would be spread over a larger asset base and, as described below, through the complex-wide arrangement which generally would provide that the management fees of the funds (subject to limited exceptions) are reduced as asset levels for the complex increase. The Board also considered the Adviser’s review of the pricing on its entire open-end fund line which resulted in either a reduction in the contractual management fee, a reduction in (or, in certain cases, the adoption of) a temporary expense cap or a combination thereof for numerous funds in the complex helping to better position such funds for future growth, including Nuveen Dividend Value Fund (the “Dividend Fund”), which reduced its management fee, and Nuveen Mid Cap Value Fund (the “Mid Cap Fund”) and Nuveen Small Cap Value Fund (the “Small Cap Fund”), each of which reduced both its management fee and temporary expense cap.
As noted, the Adviser also oversees the Sub-Adviser who primarily provides the portfolio advisory services to the Funds. The Board recognized the skill and competency of the Adviser in monitoring and analyzing the performance of the Sub-Adviser and managing the sub-advisory relationship. The Board noted that the Adviser recommended the renewal of each Sub-Advisory Agreement.
Based on their review, the Independent Board Members found that, overall, the nature, extent and quality of services provided to the respective Funds under each applicable Advisory Agreement were satisfactory.
B. The Investment Performance of the Funds and Fund Advisers
The Board considered the long-term and short-term performance history of the Nuveen funds. As noted above, the Board reviewed fund performance at its quarterly meetings throughout the year and took into account the information derived from the discussions with representatives of the Adviser about fund performance at these meetings. The Board also considered the Adviser’s analysis of fund performance with particular focus on any performance outliers and the factors contributing to such performance and any steps the investment team had taken to address performance concerns. The Board reviewed, among other things, each Fund’s investment performance both on an absolute basis and in comparison to peer funds (the “Performance Peer Group”) and to recognized and/or customized benchmarks (i.e., generally benchmarks derived from multiple recognized benchmarks) for the quarter, one-, three- and five-year periods ending December 31, 2015, as well as performance information reflecting the first quarter of 2016.
In evaluating performance information, the Board recognized the following factors may impact the performance data as well as the consideration to be given to particular performance data:
| | • | | The performance data reflected a snapshot in time, in this case as of the end of the most recent calendar year or quarter. A different performance period, however, could generate significantly different results. |
| | • | | Long-term performance can be adversely affected by even one period of significant underperformance so that a single investment decision or theme had the ability to disproportionately affect long-term performance. |
| | • | | Shareholders evaluate performance based on their own holding period which may differ from the performance period reviewed by the Board, leading to different performance results. |
| | • | | Open-end funds offered multiple classes and the performance data provided for open-end funds was based on Class A shares. The performance of the other classes of a fund, however, should be substantially similar on a relative basis because all of the classes would be invested in the same portfolio of securities and differences in performance among classes could be principally attributed to the variations in distribution and servicing expenses of each class. |
| | • | | The Board recognized the difficulty in establishing appropriate peer groups and benchmarks for certain funds. The Board noted that management classified the Performance Peer Groups as low, medium and high in relevancy and took the relevancy of the Performance Peer Group into account when considering the comparative performance data. If the Performance Peer Group differed somewhat from a fund, the Board recognized that the comparative performance data may be of limited value. The Board also recognized that each fund operated pursuant to its own investment objective(s), parameters and restrictions which may differ from that of the Performance Peer Group or benchmark and that these variations lead to differences in performance results. |
With respect to any Nuveen funds for which the Board has identified performance concerns, the Board monitors such funds closely until performance improves, discusses with the Adviser the reasons for such results, considers those steps necessary or appropriate to address such issues, and reviews the results of any efforts undertaken. The Board was aware, however, that shareholders chose to invest or remain invested in a fund knowing that the Adviser and the applicable sub-adviser manage the fund, knowing the fund’s investment strategy and seeking exposure to that strategy (even if the strategy was “out of favor” in the marketplace) and knowing the fund’s fee structure.
For the Dividend Fund, the Board noted that, although the Fund ranked in its Performance Peer Group in the fourth quartile for the one-year period and underperformed its benchmark in the one-, three- and five-year periods, the Fund ranked in the third quartile in the three-year period and the second quartile in the five-year period. The Board determined that the Fund’s performance had been satisfactory.
For the Mid Cap Fund, the Board noted that the Fund ranked in its Performance Peer Group in the third quartile in the five-year period and the second quartile in the one- and three-year periods. In addition, although the Fund underperformed its benchmark in the five-year period, the Fund outperformed its benchmark in the one- and three-year periods. The Board determined that the Fund’s performance had been satisfactory.
For the Small Cap Fund, the Board noted that the Fund ranked in its Performance Peer Group in the first quartile in the one-, three- and five-year periods and outperformed its benchmark in each of these periods. The Board determined that the Fund’s performance had been favorable.
C. Fees, Expenses and Profitability
1. Fees and Expenses
The Board evaluated the management fees and other fees and expenses of each Fund. The Board reviewed, among other things, the gross and net management fees and net total expenses of each Fund (expressed as a percentage of average net assets) in absolute terms and also in comparison to the fee and expense levels of a comparable universe of funds (the “Peer Universe”) and to a more focused subset in the Peer Universe (the “Peer Group”), each selected by an independent third-party fund data provider. The Independent Board Members also reviewed the methodology regarding the construction of the applicable Peer Universe and Peer Group.
In their evaluation of the management fee schedule, the Independent Board Members considered the fund-level and complex-wide breakpoint schedules, as described in further detail below. The Independent Board Members also took into account any fee waivers and/or expense reimbursements provided by Nuveen. In this regard, as noted above, the Board considered that management recently completed a review of the pricing of its open-end funds which resulted in the reduction of management fees and/or expense caps of various open-end funds. The Independent Board Members considered that the foregoing changes were estimated to result in significant savings to such funds either through a reduction in advisory fees paid or an increase in the fee waivers absorbed by Nuveen. In this regard, the Board noted that the Adviser agreed to reduce the management fee for the Dividend Fund and reduce both the management fee and temporary expense cap for the Mid Cap Fund and the Small Cap Fund.
In reviewing the comparative fee and expense information, the Independent Board Members recognized that various factors such as the limited size and particular composition of the Peer Universe or Peer Group (including the inclusion of other Nuveen funds in the peer set); expense anomalies; changes in the funds comprising the Peer Universe or Peer Group from year to year; levels of reimbursement or fee waivers; the timing of information used; and differences in services provided can impact the usefulness of the comparative data in helping to assess the appropriateness of a fund’s fees and expenses. In addition, in reviewing a fund’s fees and expenses compared to the fees and expenses of its peers, the Board generally considered the fund’s expenses and fees to be higher if they were over 10 basis points higher, slightly higher if they were 6 to 10 basis points higher, in line if they were within approximately 5 basis points higher than the peer average and below if they were below the peer average of the Peer Group. The Board reviewed the net expense ratio in recognition that the net expense ratio generally best represented the net experience of the shareholders of a fund as it directly reflected the costs of investing in the respective fund. The Board noted that the majority of the Nuveen funds had a net expense ratio near or below the average of the respective peers. For funds with a net expense ratio of 6 basis points or
Annual Investment Management Agreement Approval Process (Unaudited) (continued)
higher than their respective peer average, the Independent Board Members reviewed the reasons for the outlier status and were satisfied with the explanation for the difference or with any steps taken to address the difference.
The Board noted that the Small Cap Fund had a net management fee and a net expense ratio below its respective peer average, the Mid Cap Fund had a net management fee slightly higher than its peer average but a net expense ratio below its peer average, and the Dividend Fund had a net management fee and a net expense ratio slightly higher than its respective peer average. The Board, however, recognized that the Adviser had agreed to reduce the contractual management fee of the Dividend Fund. The Board also noted that the Adviser had agreed to reduce the contractual management fee and temporary expense cap for the Mid Cap Fund and the Small Cap Fund.
Based on their review of the fee and expense information provided, the Independent Board Members determined that each Fund’s management fees (as applicable) to a Fund Adviser were reasonable in light of the nature, extent and quality of services provided to the Fund.
2. Comparisons with the Fees of Other Clients
The Board also reviewed information regarding the fee rates for other types of clients advised or sub-advised by the respective Fund Adviser. For the Adviser and/or its affiliated sub-advisers, such other clients may include: separately managed accounts (such as retail, institutional or wrap accounts), hedge funds, other investment companies that are not offered by Nuveen but are sub-advised by one of Nuveen’s affiliated sub-advisers, foreign investment companies offered by Nuveen, and collective investment trusts.
The Board recognized that each Fund had an affiliated sub-adviser. With respect to affiliated sub-advisers, including the Sub-Adviser, the Board reviewed, among other things, the range of advisory fee rates and average fee rate assessed for the different types of clients. The Board reviewed information regarding the different types of services provided to the Funds compared to that provided to these other clients which typically did not require the same breadth of day-to-day services required for registered funds. The Board further considered information regarding the differences in, among other things, the distribution systems, investment policies, investor profiles, and account sizes between the Nuveen funds and the other types of clients. In addition, the Independent Board Members also recognized that the management fee rates of the foreign funds advised by the Adviser may also vary due to, among other things, differences in the client base, governing bodies, operational complexities and services covered by the management fee. The Independent Board Members recognized that the foregoing variations resulted in different economics among the product structures and culminated in varying management fees among the types of clients and funds.
The Board also was aware that, since the Funds had a sub-adviser, each Fund’s management fee reflected two components, the fee retained by the Adviser for its services and the fee the Adviser paid to the Sub-Adviser. The Board noted that many of the administrative services provided to support the Funds by the Adviser may not be required to the same extent or at all for the institutional clients or other clients. In general, the Board noted that higher fee levels reflected higher levels of service provided by the Fund Adviser, increased investment management complexity, greater product management requirements and higher levels of business risk or some combination of the foregoing. Given the inherent differences in the various products, particularly the extensive services provided to the Funds, the Independent Board Members concluded such facts justify the different levels of fees.
3. Profitability of Fund Advisers
In conjunction with their review of fees, the Independent Board Members also considered the profitability of Nuveen for its advisory activities on an absolute basis and in comparison to other investment advisers. The Independent Board Members reviewed, among other things, Nuveen’s adjusted operating margins, the gross and net revenue margins (pre-tax and after-tax) for advisory activities for the Nuveen funds, and the revenues, expenses, and net income (pre-tax and after-tax) of Nuveen for each of the last two calendar years. The Independent Board Members reviewed an analysis of the key drivers behind the changes in revenues and expenses that impacted profitability in 2015. The Independent Board Members also noted that the sub-advisory fees for the Funds are paid by the Adviser, however, the Board recognized that the Sub-Adviser is affiliated with Nuveen. In their review, the Independent Board Members recognized that profitability data is rather subjective as various allocation methodologies may be reasonable to employ but yet yield different results. The Board also reviewed the results of certain alternative methodologies. The Board considered the allocation methodology employed to prepare the profitability data as well as a summary of the refinements to the methodology that had been adopted over the years which may limit some of the comparability of Nuveen’s revenue margins over time. Two Independent Board Members also served as point persons for the Board throughout the year to review and discuss the methodology employed to develop the profitability analysis and any proposed changes thereto and to keep the Board apprised of such changes during the year. In reviewing the profitability data, the Independent Board Members noted that Nuveen’s operating margin as well as its margins for its advisory activities to the Nuveen funds for 2015 were consistent with such margins for 2014.
The Board also considered Nuveen’s adjusted operating margins compared to that of other comparable investment advisers (based on asset size and composition) with publicly available data. The Independent Board Members recognized, however, the limitations of the comparative data as the other advisers may have a different business mix, employ different allocation methodologies, have different capital structure and costs, may not be representative of the industry or other factors that limit the comparability of the profitability information. Nevertheless, the Independent Board Members noted that Nuveen’s adjusted operating margins appeared comparable to the adjusted margins of the peers.
Further, as the Adviser is a wholly-owned subsidiary of Nuveen which in turn is an operating division of TIAA Global Asset Management, the investment management arm of Teachers Insurance and Annuity Association of America (“TIAA-CREF”), the Board reviewed a balance sheet for TIAA-CREF reflecting its assets, liabilities and capital and contingency reserves for the last two calendar years to have a better understanding of the financial stability and strength of the TIAA-CREF complex, together with Nuveen.
Based on the information provided, the Independent Board Members noted that the Adviser appeared to be sufficiently profitable to operate as a viable investment management firm and to honor its obligations as a sponsor of the Nuveen funds.
With respect to the Sub-Adviser, the Independent Board Members also considered the profitability of the Sub-Adviser from its relationship with the Nuveen funds. The Independent Board Members reviewed the Sub-Adviser’s revenues, expenses and revenue margins (pre- and post-tax) for its advisory activities for the calendar year ended December 31, 2015. The Independent Board Members also reviewed profitability analysis reflecting the revenues, expenses and revenue margin (pre- and post-tax) by asset type for the Sub-Adviser for the calendar year ending December 31, 2015.
In evaluating the reasonableness of the compensation, the Independent Board Members also considered other amounts paid to a Fund Adviser by the Funds as well as indirect benefits (such as soft dollar arrangements), if any, the Fund Adviser and its affiliates received or were expected to receive that were directly attributable to the management of a Fund. See Section E below for additional information on indirect benefits a Fund Adviser may receive as a result of its relationship with the Funds.
Based on their review, the Independent Board Members determined that the Adviser’s and the Sub-Adviser’s levels of profitability were reasonable in light of the respective services provided.
D. Economies of Scale and Whether Fee Levels Reflect These Economies of Scale
The Independent Board Members recognized that as the assets of a particular fund or the Nuveen complex in the aggregate increase over time, economies of scale may be realized with respect to the management of the funds, and the Independent Board Members considered the extent to which these economies are shared with the funds and their shareholders. Although the Independent Board Members recognized that economies of scale are difficult to measure with precision, the Board noted that there were several acceptable means to share economies of scale, including through breakpoints in the management fee schedule reducing the fee rates as asset levels grow, fee waiver and expense limitation agreements and the Adviser’s investment in its business which can enhance the services provided to the funds. With respect to breakpoints, the Independent Board Members noted that subject to certain exceptions, the funds in the Nuveen complex, including the Funds, pay a management fee to the Adviser which is generally comprised of a fund-level component and complex-level component. The fund-level fee component declines as the assets of the particular fund grow and the complex-level fee component declines when eligible assets of all the funds in the Nuveen complex combined grow. The complex-wide fee arrangement was designed to capture economies of scale achieved when total fund complex assets increase, even if the assets of a particular fund are unchanged or decrease. The approach reflected the notion that some of Nuveen’s costs were attributable to services provided to all its funds in the complex, and therefore all funds should benefit if these costs were spread over a larger asset base.
The Independent Board Members reviewed the breakpoint and complex-wide schedules and any savings achieved from expense caps (as applicable), fund-level breakpoints and complex-wide fee reductions for the 2015 calendar year for the funds. In this regard, the Independent Board Members noted that additional economies of scale were shared with shareholders of the Mid Cap Fund and the Small Cap Fund through their temporary expense caps.
In addition, the Independent Board Members recognized the Adviser’s ongoing investment in its business to expand or enhance the services provided to the Nuveen funds. The Independent Board Members noted, among other things, the additions to groups who play a key role in supporting the funds including in fund administration, operations, fund governance, investment services, compliance, product management, retail distribution and technology. The Independent Board Members also recognized the investments in systems necessary to manage the funds including in areas of risk oversight, information technology and compliance.
Based on their review, the Independent Board Members concluded that the current fee structure was acceptable and reflected economies of scale to be shared with shareholders when assets under management increase.
E. Indirect Benefits
The Independent Board Members received and considered information regarding other additional benefits the respective Fund Adviser or its affiliates may receive as a result of their relationship with the Funds, including compensation paid to affiliates and research received in connection with brokerage transactions (i.e., soft dollar arrangements). In this regard, the Independent Board Members recognized that an affiliate of the Adviser served as the Funds’ principal underwriter and may receive compensation therefore from, among other things, sales charges, distribution fees and shareholder services fees (which included fees received pursuant to any 12b-1 plan). The Independent Board Members therefore took into account, among other things, the 12b-1 fees retained by Nuveen during the last calendar year.
In addition to the above, the Independent Board Members considered that the Funds�� portfolio transactions are allocated by the Sub-Adviser and the Sub-Adviser may benefit from research received through soft-dollar arrangements. The Board noted, however, that with respect to transactions in fixed
Annual Investment Management Agreement Approval Process (Unaudited) (continued)
income securities, such securities generally trade on a principal basis and do not generate soft dollar credits. Although the Board recognized the Sub-Adviser may benefit from a soft dollar arrangement if it does not have to pay for this research out of its own assets, the Board also recognized that any such research may benefit the Funds to the extent it enhances the ability of the Sub-Adviser to manage the Funds.
Based on their review, the Independent Board Members concluded that any indirect benefits received by a Fund Adviser as a result of its relationship with the Funds were reasonable and within acceptable parameters.
F. Other Considerations
The Independent Board Members did not identify any single factor discussed previously as all-important or controlling. The Board Members, including the Independent Board Members, concluded that the terms of each Advisory Agreement were fair and reasonable, that the respective Fund Adviser’s fees were reasonable in light of the services provided to each Fund and that the Advisory Agreements be renewed.
Trustees
and Officers (Unaudited)
The management of the Funds, including general supervision of the duties performed for the Funds by the Adviser, is the responsibility of the Board of Trustees of the Funds. The number of directors of the Funds is set at twelve, effective July 1, 2016. None of the trustees who are not “interested” persons of the Funds (referred to herein as “independent trustees”) has ever been a director or employee of, or consultant to, Nuveen or its affiliates. The names and business addresses of the trustees and officers of the Funds, their principal occupations and other affiliations during the past five years, the number of portfolios each oversees and other directorships they hold are set forth below.
The Funds’ Statement of Additional Information (“SAI”) includes more information about the trustees. To request a free copy, call Nuveen Investments at (800) 257-8787 or visit the Funds’ website at www.nuveen.com.
| | | | | | | | |
Name,
Year of Birth
& Address | | Position(s)
Held with
the Funds | | Year First
Elected or
Appointed (1) | | Principal Occupation(s)
Including other Directorships
During Past 5 Years | | Number of
Portfolios in
Fund Complex
Overseen by
Trustee |
| |
| Independent Trustee: |
William J. Schneider 1944 333 W. Wacker Drive Chicago, IL 60606 | | Chairman and Trustee | | 1996 | | Chairman of Miller-Valentine Partners, a real estate investment company; Board Member of Med-America Health System and WDPR Public Radio station; formerly, Senior Partner and Chief Operating Officer (retired (2004) of Miller-Valentine Group; formerly, Board member, Business Advisory Council of the Cleveland Federal Reserve Bank and University of Dayton Business School Advisory Council; past Chair and Director, Dayton Development Coalition. | | 184 |
Jack B. Evans 1948 333 W. Wacker Drive Chicago, IL 60606 | | Trustee | | 1999 | | President, The Hall-Perrine Foundation, a private philanthropic corporation (since 1996); Director and Chairman, United Fire Group, a publicly held company; Director, The Gazette Company; Life Trustee of Coe College and the Iowa College Foundation; formerly, President Pro-Tem of the Board of Regents for the State of Iowa University System; formerly, Director, Alliant Energy; formerly, Director, Federal Reserve Bank of Chicago; formerly, President and Chief Operating Officer, SCI Financial Group, Inc., a regional financial services firm. | | 184 |
William C. Hunter 1948 333 W. Wacker Drive Chicago, IL 60606 | | Trustee | | 2003 | | Dean Emeritus, formerly, Dean, Tippie College of Business, University of Iowa (2006-2012); Director (since 2004) of Xerox Corporation; Director (since 2005), and past President (2010-2014) Beta Gamma Sigma, Inc., The International Business Honor Society; Director of Wellmark, Inc. (since 2009); formerly, Dean and Distinguished Professor of Finance, School of Business at the University of Connecticut (2003-2006); previously, Senior Vice President and Director of Research at the Federal Reserve Bank of Chicago (1995-2003); formerly, Director (1997-2007), Credit Research Center at Georgetown University. | | 184 |
David J. Kundert 1942 333 W. Wacker Drive Chicago, IL 60606 | | Trustee | | 2005 | | Formerly, Director, Northwestern Mutual Wealth Management Company (2006-2013); retired (since 2004) as Chairman, JPMorgan Fleming Asset Management, President and CEO, Banc One Investment Advisors Corporation, and President, One Group Mutual Funds; prior thereto, Executive Vice President, Banc One Corporation and Chairman and CEO, Banc One Investment Management Group; Regent Emeritus, Member of Investment Committee, Luther College; member of the Wisconsin Bar Association; member of Board of Directors and Chair of Investment Committee, Greater Milwaukee Foundation; member of the Board of Directors (Milwaukee), College Possible; Board member of Milwaukee Repertory Theatre (since 2016). | | 184 |
Trustees and Officers (Unaudited) (continued)
| | | | | | | | |
Name,
Year of Birth
& Address | | Position(s)
Held with
the Funds | | Year First
Elected or
Appointed (1) | | Principal Occupation(s)
Including other Directorships
During Past 5 Years | | Number of
Portfolios in
Fund Complex
Overseen by
Trustee |
Albin F. Moschner(2) 1952 333 W. Wacker Drive Chicago, IL 60606 | | Trustee | | 2016 | | Founder and Chief Executive Officer, Northcroft Partners, LLC, a management consulting firm (since 2012); previously, held positions at Leap Wireless International, Inc., including Consultant (2011-2012), Chief Operating Officer (2008-2011), and Chief Marketing Officer (2004-2008); formerly, President, Verizon Card Services division of Verizon Communications, Inc. (2000-2003); formerly, President, One Point Services at One Point Communications (1999-2000); formerly, Vice Chairman of the Board, Diba, Incorporated (1996-1997); formerly, various executive positions with Zenith Electronics Corporation (1991-1996). Director, USA Technologies, Inc., a provider of solutions and services to facilitate electronic payment transactions (since 2012); formerly, Director, Wintrust Financial Corporation (1996-2016). | | 184 |
John K. Nelson 1962 333 West Wacker Drive Chicago, IL 60606 | | Trustee | | 2013 | | Member of Board of Directors of Core12 LLC (since 2008), a private firm which develops branding, marketing and communications strategies for clients; Director of The Curran Center for Catholic American Studies (since 2009) and The President’s Council, Fordham University (since 2010); formerly senior external advisor to the financial services practice of Deloitte Consulting LLP (2012-2014); formerly, Chairman of the Board of Trustees of Marian University (2010 as trustee, 2011-2014 as Chairman); formerly, Chief Executive Officer of ABN AMRO N.V. North America, and Global Head of its Financial Markets Division (2007-2008); prior senior positions held at ABN AMRO include Corporate Executive Vice President and Head of Global Markets—the Americas (2006-2007), CEO of Wholesale Banking—North America and Global Head of Foreign Exchange and Futures Markets (2001-2006), and Regional Commercial Treasurer and Senior Vice President Trading—North America (1996-2001); formerly, Trustee at St. Edmund Preparatory School in New York City. | | 184 |
Judith M. Stockdale 1947 333 W. Wacker Drive Chicago, IL 60606 | | Trustee | | 1997 | | Board Member, Land Trust Alliance (since 2013) and U.S. Endowment for Forestry and Communities (since 2013); formerly, Executive Director (1994-2012), Gaylord and Dorothy Donnelley Foundation; prior thereto, Executive Director, Great Lakes Protection Fund (1990-1994). | | 184 |
Carole E. Stone 1947 333 W. Wacker Drive Chicago, IL 60606 | | Trustee | | 2007 | | Director, Chicago Board Options Exchange (since 2006), C2 Options Exchange, Incorporated (since 2009); Director, CBOE Holdings, Inc. (since 2010); formerly, Commissioner, New York State Commission on Public Authority Reform (2005-2010). | | 184 |
Terence J. Toth 1959 333 W. Wacker Drive Chicago, IL 60606 | | Trustee | | 2008 | | Managing Partner, Promus Capital (since 2008); Director, Fulcrum IT Service LLC (since 2010) and Quality Control Corporation (since 2012); member: Catalyst Schools of Chicago Board (since 2008) and Mather Foundation Board (since 2012), and chair of its investment committee; formerly, Director, Legal & General Investment Management America, Inc. (2008-2013); formerly, CEO and President, Northern Trust Global Investments (2004-2007); Executive Vice President, Quantitative Management & Securities Lending (2000-2004); prior thereto, various positions with Northern Trust Company (since 1994); formerly, Member, Northern Trust Mutual Funds Board (2005-2007), Northern Trust Global Investments Board (2004-2007), Northern Trust Japan Board (2004-2007), Northern Trust Securities Inc. Board (2003-2007) and Northern Trust Hong Kong Board (1997-2004). | | 184 |
| | | | | | | | |
Name,
Year of Birth
& Address | | Position(s)
Held with
the Funds | | Year First
Elected or
Appointed (1) | | Principal Occupation(s)
Including other Directorships
During Past 5 Years | | Number of
Portfolios in
Fund Complex
Overseen by
Trustee |
Margaret L. Wolff 1955 333 W. Wacker Drive Chicago, IL 60606 | | Trustee | | 2016 | | Member of the Board of Directors (since 2013) of Travelers Insurance Company of Canada and The Dominion of Canada General Insurance Company (each, a part of Travelers Canada, the Canadian operation of The Travelers Companies, Inc.); formerly, Of Counsel, Skadden, Arps, Slate, Meagher & Flom LLP (Mergers & Acquisitions Group) (2005-2014); Member of the Board of Trustees of New York-Presbyterian Hospital (since 2005); Member (since 2004) and Chair (since 2015) of the Board of Trustees of The John A. Hartford Foundation (a philanthropy dedicated to improving the care of older adults); formerly, Member (2005-2015) and Vice Chair (2011-2015) of the Board of Trustees of Mt. Holyoke College. | | 184 |
| |
| Interested Trustee: |
William Adams IV(3) 1955 333 W. Wacker Drive Chicago, IL 60606 | | Trustee | | 2013 | | Co-Chief Executive Officer and Co-President (since March 2016), formerly, Senior Executive Vice President, Global Structured Products (2010-2016), prior thereto, Executive Vice President, U.S. Structured Products (1999-2010) of Nuveen Investments, Inc.; Co-President of Nuveen Fund Advisors, LLC (since 2011); Co-Chief Executive Officer (since 2016), formerly, Senior Executive Vice President of Nuveen Securities, LLC; President (since 2011), of Nuveen Commodities Asset Management, LLC; Board Member of the Chicago Symphony Orchestra and of Gilda’s Club Chicago. | | 184 |
Margo L. Cook(2)(3) 1964 333 W. Wacker Drive Chicago, IL 60606 | | Trustee | | 2016 | | Co-Chief Executive Officer and Co-President (since March 2016), formerly, Senior Executive Vice President of Nuveen Investments, Inc; Co-Chief Executive Officer (since 2015), previously, Executive Vice President (2013-2015) of Nuveen Securities, LLC; Co-President (since October 2016), formerly, Senior Executive Vice President (2015-2016) of Nuveen Fund Advisors, LLC (Executive Vice President 2011-2015); formerly, Managing Director of Nuveen Commodities Asset Management, LLC (2011- 2016); Chartered Financial Analyst. | | 184 |
| | | | | | | | |
Name,
Year of Birth
& Address | | Position(s)
Held with
the Funds | | Year First
Elected or
Appointed (4) | | Principal Occupation(s)
During Past 5 Years | | Number of
Portfolios in
Fund Complex
Overseen by
Officer |
| |
| Officers of the Funds: |
Greg A. Bottjer 1971 333 West Wacker Drive Chicago, IL 60606 | | Chief Administrative Officer | | 2016 | | Managing Director (since 2011), formerly, Senior Vice President (2007-2010) of Nuveen Investments Holdings, Inc.; Managing Director (since October 2016) of Nuveen Fund Advisors, LLC; Chartered Financial Analyst. | | 104 |
Lorna C. Ferguson 1945 333 W. Wacker Drive Chicago, IL 60606 | | Vice President | | 1998 | | Managing Director (since 2005) of Nuveen Fund Advisors, LLC and Nuveen Securities, LLC (since 2004). | | 185 |
Stephen D. Foy 1954 333 W. Wacker Drive Chicago, IL 60606 | | Vice President and Controller | | 1998 | | Managing Director (since 2014), formerly, Senior Vice President (2013-2014) and Vice President (2005-2013) of Nuveen Fund Advisors, LLC; Chief Financial Officer of Nuveen Commodities Asset Management, LLC (since 2010); Managing Director (since 2016) of Nuveen Securities, LLC; Certified Public Accountant. | | 185 |
Trustees and Officers (Unaudited) (continued)
| | | | | | | | |
Name,
Year of Birth
& Address | | Position(s)
Held with
the Funds | | Year First
Elected or
Appointed (4) | | Principal Occupation(s)
During Past 5 Years | | Number of
Portfolios in
Fund Complex
Overseen by
Officer |
Nathaniel T. Jones 1979 333 W. Wacker Drive Chicago, IL 60606 | | Vice President and Treasurer | | 2016 | | Senior Vice President (since 2016), formerly, Vice President (2011- 2016) of Nuveen Investments Holdings, Inc.; Chartered Financial Analyst. | | 185 |
Walter M. Kelly 1970 333 W. Wacker Drive Chicago, IL 60606 | | Chief Compliance Officer and Vice President | | 2003 | | Senior Vice President (since 2008) of Nuveen Investments Holdings, Inc. | | 185 |
Tina M. Lazar 1961 333 W. Wacker Drive Chicago, IL 60606 | | Vice President | | 2002 | | Senior Vice President of Nuveen Investments Holdings, Inc. and Nuveen Securities, LLC | | 185 |
Kevin J. McCarthy 1966 333 W. Wacker Drive Chicago, IL 60606 | | Vice President and Assistant Secretary | | 2007 | | Executive Vice President, Secretary and General Counsel (since March 2016), formerly, Managing Director and Assistant Secretary of Nuveen Investments, Inc.; Executive Vice President (since March 2016), formerly, Managing Director, and Assistant Secretary (since 2008) of Nuveen Securities, LLC; Executive Vice President and Secretary (since March 2016), formerly, Managing Director (2008-2016) and Assistant Secretary (2007-2016), and Co-General Counsel (since 2011) of Nuveen Fund Advisors, LLC; Executive Vice President and Secretary (since March 2016), formerly, Managing Director, Assistant Secretary (2011-2016), and Associate General Counsel (since 2011) of Nuveen Asset Management, LLC; Executive Vice President and Secretary of Nuveen Investments Advisers, LLC; Vice President (since 2007) and Secretary (since March 2016) of NWQ Investment Management Company, LLC, Symphony Asset Management LLC, Santa Barbara Asset Management, LLC, Winslow Capital Management, LLC (since 2010) and Tradewinds Global Investors, LLC (since 2016); Vice President (since 2010) and Secretary (since 2016), formerly, Assistant Secretary of Nuveen Commodities Asset Management, LLC. | | 185 |
Kathleen L. Prudhomme 1953 901 Marquette Avenue Minneapolis, MN 55402 | | Vice President and Secretary | | 2011 | | Managing Director, Assistant Secretary and Co-General Counsel (since 2011) of Nuveen Fund Advisors, LLC; Managing Director, Assistant Secretary and Associate General Counsel (since 2011) of Nuveen Asset Management, LLC; Managing Director and Assistant Secretary (since 2011) of Nuveen Securities, LLC; formerly, Deputy General Counsel, FAF Advisors, Inc. (2004-2010). | | 185 |
Christopher M. Rohrbacher 1971 333 West Wacker Drive Chicago, IL 60606 | | Vice President and Assistant Secretary | | 2008 | | Senior Vice President (since 2011) formerly, Vice President (2008-2011) and Assistant General Counsel (since 2008) of Nuveen Investments Holdings, Inc.; Senior Vice President and Assistant Secretary (since October 2016) of Nuveen Fund Advisors, LLC; Vice President and Assistant Secretary (since 2010) of Nuveen Commodities Asset Management, LLC. | | 185 |
Joel T. Slager 1978 333 West Wacker Drive Chicago, IL 60606 | | Vice President and Assistant Secretary | | 2013 | | Fund Tax Director for Nuveen Funds (since 2013); previously, Vice President of Morgan Stanley Investment Management, Inc., Assistant Treasurer of the Morgan Stanley Funds (from 2010 to 2013). | | 185 |
Jeffery M. Wilson 1956 333 West Wacker Drive Chicago, IL 60606 | | Vice President | | 2011 | | Senior Vice President of Nuveen Investments Holdings, Inc. (since 2011); formerly Senior Vice President of Nuveen Securities, LLC (since 2011); formerly, Senior Vice President of FAF Advisors, Inc. (2000-2010). | | 104 |
| | | | | | | | |
Name,
Year of Birth
& Address | | Position(s)
Held with
the Funds | | Year First
Elected or
Appointed (4) | | Principal Occupation(s)
During Past 5 Years | | Number of
Portfolios in
Fund Complex
Overseen by
Officer |
Gifford R. Zimmerman 1956 333 W. Wacker Drive Chicago, IL 60606 | | Vice President and Assistant Secretary | | 1988 | | Managing Director (since 2002), and Assistant Secretary of Nuveen Securities, LLC; Managing Director (since 2004) and Assistant Secretary (since 1994) of Nuveen Investments, Inc.; Managing Director (since 2002), Assistant Secretary (since 1997) and Co-General Counsel (since 2011) of Nuveen Fund Advisors, LLC; Managing Director, Assistant Secretary and Associate General Counsel of Nuveen Asset Management, LLC (since 2011); Managing Director and Assistant Secretary of Nuveen Investments Advisers Inc. (since 2002), and Symphony Asset Management LLC (since 2003); Vice President and Assistant Secretary of NWQ Investment Management Company, LLC (since 2002), Santa Barbara Asset Management, LLC (since 2006) and of Winslow Capital Management, LLC, (since 2010); Vice President and Assistant Secretary (since 2013), formerly, Chief Administrative Officer and Chief Compliance Officer (2006-2013) of Nuveen Commodities Asset Management, LLC; Chartered Financial Analyst. | | 185 |
| (1) | Trustees serve an indefinite term until his/her successor is elected or appointed. The year first elected or appointed represents the year in which the director was first elected or appointed to any fund in the Nuveen Fund Complex. |
| (2) | On June 22, 2016, Ms. Cook and Mr. Moschner were appointed as Board Members, effective July 1, 2016. |
| (3) | “Interested persons” of the Trust, as defined in the 1940 Act, by reason of their positions with Nuveen and certain of its subsidiaries. |
| (4) | Officers serve one year terms through August of each year. The year first elected or appointed represents the year in which the officer was first elected or appointed to any fund in the Nuveen Fund Complex. |
| | | | | | | | | | | | | | |
| | | | | | | | |
| | | | |
| | | | | | | | |
| | | |
| | Nuveen: | | | | |
| | | | Serving Investors for Generations | | |
| | |
| | | | |
| | | |
| | | | Since 1898, financial advisors and their clients have relied on Nuveen to provide dependable investment solutions through continued adherence to proven, long-term investing principles. Today, we offer a range of high quality equity and fixed-income solutions designed to be integral components of a well-diversified core portfolio. | | |
| | | |
| | | | | | |
| | | | |
| | | | | | Focused on meeting investor needs. Nuveen helps secure the long-term goals of individual investors and the advisors who serve them. As an operating division of TIAA Global Asset Management, Nuveen provides access to investment expertise from leading asset managers and solutions across traditional and alternative asset classes. Built on more than a century of industry leadership, Nuveen’s teams of experts align with clients’ specific financial needs and goals, demonstrating commitment to advisors and investors through market perspectives and wealth management and portfolio advisory services. Nuveen manages $244 billion in assets as of September 30, 2016. | | |
| | | | | |
| | | | | | | | | | |
| | | | | | Find out how we can help you. To learn more about how the products and services of Nuveen may be able to help you meet your financial goals, talk to your financial advisor, or call us at (800) 257-8787. Please read the information provided carefully before you invest. Investors should consider the investment objective and policies, risk considerations, charges and expenses of any investment carefully. Where applicable, be sure to obtain a prospectus, which contains this and other relevant information. To obtain a prospectus, please contact your securities representative or Nuveen, 333 W. Wacker Dr., Chicago, IL 60606. Please read the prospectus carefully before you invest or send money. Learn more about Nuveen Funds at: www.nuveen.com/mf | | |
| | | | | | |
| | | | | | | | | | | | |
| | Distributed by Nuveen Securities, LLC | 333 West Wacker Drive Chicago, IL 60606 | www.nuveen.com | | |
MAN-FSTK-1016P 21468-INV-Y-12/17
| | |
| | |  |
| Mutual Funds | |
| | | | | | |
| | | | | | | Annual Report October 31, 2016 |
| | | | | | | | | | | | | | | | |
| | | | | | | Share Class / Ticker Symbol |
| | | Fund Name | | | | Class A | | Class C | | Class R3 | | Class R6 | | Class I | | |
| | |
| | Nuveen Large Cap Growth Opportunities Fund | | | | FRGWX | | FAWCX | | FLCYX | | FLCFX | | FIGWX | | |
| | Nuveen Mid Cap Growth Opportunities Fund | | | | FRSLX | | FMECX | | FMEYX | | FMEFX | | FISGX | | |
| | Nuveen Small Cap Growth Opportunities Fund | | | | FRMPX | | FMPCX | | FMPYX | | FMPFX | | FIMPX | | |
| | | | | | | | | | | | |
| | | | | | |
| | | | |
| | | | | | | | |
| | |
| | Life is Complex. | | |
| | |
| | Nuveen makes things e-simple. | | |
| | |
| | It only takes a minute to sign up for e-Reports. Once enrolled, you’ll receive an e-mail as soon as your Nuveen Fund information is ready. No more waiting for delivery by regular mail. Just click on the link within the e-mail to see the report and save it on your computer if you wish. | | |
| | | | |
| | | | | | Free e-Reports right to your e-mail! | | |
| | | |
| | | | | | www.investordelivery.com If you receive your Nuveen Fund distributions and statements from your
financial advisor or brokerage account. |
| | | | |
| | | | or | | www.nuveen.com/accountaccess If you receive your Nuveen Fund distributions and statements directly from Nuveen. Must be preceded by or accompanied by a prospectus. NOT FDIC INSURED MAY LOSE VALUE
NO BANK GUARANTEE | | |
| | | | | | | | | | |
| | | | | | | | | | | | | |
Table
of Contents
Chairman’s Letter
to Shareholders

Dear Shareholders,
After a sluggish first half of 2016, the U.S. economy gained some momentum in the third quarter. In fact, it was the economy’s strongest quarterly acceleration in two years, propelled by healthy consumer spending, a temporary surge in exports and a turnaround in inventories. As the year winds down, 2016 looks on track to deliver the same steady-but-slow growth that has characterized the seven-year recovery.
A year ago, the U.S. Federal Reserve (Fed) took the first step toward policy “normalization” by raising its benchmark interest rate at its December 2015 meeting. Speculation about the Fed’s intentions since then has been a strong influence on the markets throughout 2016. After remaining on hold for a year, the Fed judged that the economy’s modest growth, the return to “full” employment and an uptick in inflation were sufficient to raise the target rate at the December 2016 meeting.
Global conditions continue to look subdued by comparison. Investors continue to adjust to the idea of a slower Chinese economy, which has helped commodity prices stabilize and lift global inflation expectations. The U.K.’s June 23rd “Brexit” vote to leave the European Union introduced a new set of economic and political uncertainties to the already fragile conditions across Europe. Moreover, there are growing concerns that global central banks’ unprecedented efforts to revive growth may be showing signs of fatigue. Interest rates are currently negative in Europe and Japan and near or at zero in the U.S., U.K. and elsewhere; nonetheless, growth has remained subdued.
Since the election, U.S. stocks have rallied strongly on expectations that the Republican controlled Congress and Trump administration will pursue more business friendly policies. But the details have yet to be seen. Given muted global growth, the risk of policy errors by central banks around the world, the unfolding Brexit process and an uncertain political outlook (not just in the U.S. but also in Europe), we anticipate that turbulence remains on the horizon for the time being. In this environment, Nuveen remains committed to both managing downside risks and seeking upside potential. If you’re concerned about how resilient your investment portfolio might be, we encourage you to talk to your financial advisor. On behalf of the other members of the Nuveen Fund Board, we look forward to continuing to earn your trust in the months and years ahead.
Sincerely,

William J. Schneider
Chairman of the Board
December 22, 2016
Portfolio Managers’
Comments
Nuveen Large Cap Growth Opportunities Fund
Nuveen Mid Cap Growth Opportunities Fund
Nuveen Small Cap Growth Opportunities Fund
These Funds feature portfolio management by Nuveen Asset Management, LLC, an affiliate of Nuveen Investments, Inc.
David Chalupnik, CFA, has been the portfolio manager of the Nuveen Large Cap Growth Opportunities Fund since 2015. Harold (Hal) Goldstein has served as a portfolio manager for the Fund since 2002. Effective November 8, 2016 (subsequent to the close of this reporting period), Scott Mullinix, CFA, was no longer a portfolio manager on the Fund.
James (Jim) Diedrich, CFA, has been the portfolio manager of the Nuveen Mid Cap Growth Opportunities Fund since 2006. Harold (Hal) Goldstein has served as a portfolio manager for the Fund since 2005. Effective November 8, 2016 (subsequent to the close of this reporting period), Scott Mullinix, CFA, was no longer a portfolio manager on the Fund.
Jon Loth, CFA, has been a portfolio manager for the Nuveen Small Cap Growth Opportunities Fund since 2007. Effective November 8, 2016 (subsequent to the close of this reporting period), Rob McDougall, CFA, was no longer a portfolio manager on the Fund.
On the following pages, the portfolio management teams for the Funds discuss economic and market conditions, key investment strategies and the Funds’ performance for the twelve-month reporting period ended October 31, 2016.
What factors affected the U.S. economy and the financial markets during the twelve-month reporting period ended October 31, 2016?
The restrained pace of growth that has defined the U.S. economic recovery since 2009 continued in the twelve-month reporting period. Growth over the previous four calendar quarters averaged below 2% (annualized), as measured by real gross domestic product (GDP), which is the value of goods and services produced by the nation’s economy less the value of the goods and services used up in production, adjusted for price changes. For most of the reporting period, consumer spending remained healthy but was offset by the drag from the inventory cycle, lackluster business spending and weak net exports. As a result, GDP growth stayed below 1.5% from the fourth quarter of 2015 through the second quarter of 2016. However, decent consumer spending, an inventory turnaround and a short-term jump in exports contributed to a more robust gain of 3.2% in the third quarter, as reported by the “second” estimate of the Bureau of Economic Analysis.
Consumers, whose purchases comprise the largest component of the U.S. economy, benefited from employment growth and firming wages over the twelve-month reporting period. As reported by the Bureau of Labor Statistics, the unemployment rate was little changed at 4.9% in October 2016 from 5.0% in October 2015, and job gains averaged slightly above 200,000 per month for the past twelve months. Although consumer spending gains were rather muted in the latter half of 2015, spending surged in the second quarter of 2016. Although inflation began to accelerate slightly in the reporting period, the overall level remained low, which also contributed to consumers’ willingness to buy. The Consumer Price Index (CPI) rose 1.6% over the twelve-month reporting period ended October 2016 on a seasonally adjusted basis, as reported by the U.S. Bureau of Labor Statistics. The core CPI (which excludes food and energy) increased 2.1% during the same period, slightly above the Fed’s unofficial longer term inflation objective of 2.0%.
Certain statements in this report are forward-looking statements. Discussions of specific investments are for illustration only and are not intended as recommendations of individual investments. The forward-looking statements and other views expressed herein are those of the portfolio managers as of the date of this report. Actual future results or occurrences may differ significantly from those anticipated in any forward-looking statements and the views expressed herein are subject to change at any time, due to numerous market and other factors. The Funds disclaim any obligation to update publicly or revise any forward-looking statements or views expressed herein.
Refer to the Glossary of Terms Used in this Report for further definition of the terms used within this section.
Portfolio Managers’ Comments (continued)
The housing market was another bright spot in the economy. The S&P CoreLogic Case-Shiller U.S. National Home Price Index, which covers all nine U.S. census divisions, recorded a 5.5% annual gain in September 2016 (most recent data available at the time this report was prepared) (effective July 26, 2016, the S&P/Case-Shiller U.S. National Home Price Index was renamed the S&P CoreLogic Case-Shiller U.S. National Home Price Index). The 10-City and 20-City Composites reported year-over-year increases of 4.3% and 5.1%, respectively.
However, business investment remained soft over the reporting period. Corporate earnings growth continued to be constrained by diminished demand expectations amid sluggish U.S. and global growth, the impact of falling commodity prices and a strong U.S. dollar. Additionally, a murky outlook kept capital spending muted. Concerns about financial market turbulence in early 2016, the U.K.’s “Brexit” vote to leave the European Union (EU) and the U.S. presidential election weighed on business sentiment throughout the reporting period.
The consistent growth of the economy prompted the U.S. Federal Reserve (Fed) to raise the Fed funds rate from the zero bound range to a range of 0.25% to 0.50% in December 2015. The widely anticipated move had little impact on the financial markets. Over the remainder of the reporting period, speculation on the timing of future rate hikes drove short-term swings in the markets, including falling bond yields, rallies in the U.S. dollar and bouts of volatility in stock prices. For most of 2016, the Fed kept this rate unchanged due to concerns ranging from low inflation in the U.S. to weakening growth prospects globally and the U.K.’s Brexit vote. However, the third quarter’s strong GDP report and an uptick in inflation boosted expectations that the Fed would likely increase the target rate at the December 2016 meeting. As anticipated, subsequent to the close of the reporting period, the Fed raised the rate to a range of 0.50% to 0.75%.
Other market-moving events during the reporting period included a spike in volatility in January and February 2016 triggered by deteriorating sentiment about China’s economy, another sharp downturn in oil prices and concerns about central bank policy both in the U.S. and around the world. The Brexit referendum on June 23, 2016, also caught investors off guard. In response, U.K. sterling fell to 30-year lows and global equities tumbled while perceived safe-haven assets such as gold, the U.S. dollar and government bonds saw large inflows. However, the markets stabilized fairly quickly post-Brexit vote, buoyed by reassurances from global central banks and a perception that the temporary price rout presented an attractive buying opportunity. Following a relatively calm July and August 2016, volatility resumed in the final months of the reporting period. Investors worried whether central banks were reaching the limits of their effectiveness as global growth continues to stagnate. The health of the European banking sector came into question, renewing concerns about the potential to trigger a wider crisis. Political uncertainty increased leading up to the November U.S. presidential election, and after the close of the reporting period, the unexpected win of Donald Trump contributed to an initial sell-off across global markets. However, after digesting the “shock”, U.S. equities rallied strongly and global developed market stocks pared their losses, while emerging markets, fixed income and gold remained lower.
Despite several bouts of significant volatility, the U.S. equity market ended the twelve-month reporting period with a gain of 4.51% as measured by the S&P 500® Index. Small-cap stocks in the U.S. recovered from last year’s significant underperformance, turning in results close to their large-cap brethren with a 4.11% return according to the Russell 2000® Index. Mid-cap stocks were in the same range with a return of 4.17% as measured by the Russell Midcap® Index. Across the capitalization spectrum in the U.S., investors favored the relatively safer, more defensive areas of the market for much of the reporting period, leading value stocks to strongly outperform growth stocks. Emerging markets outpaced other developed markets overseas as investors returned to this asset class in the second half of the reporting period, largely due to commodity price stability and the ongoing search for yield and returns. The MSCI Emerging Markets Index advanced 9.67%. Meanwhile, in developed overseas markets, Europe struggled and turned in negative results, dragging down the overall return of the MSCI EAFE Index to -2.74% for the twelve-month reporting period.
Nuveen Large Cap Growth Opportunities Fund
How did the Fund perform during the twelve-month reporting period ended October 31, 2016?
The tables in the Fund Performance and Expense Ratios section of this report provide total returns for the Fund for the one-year, five-year and ten-year periods ended October 31, 2016. Comparative performance information is provided for the Fund’s Class A Shares at net asset value (NAV). The Fund’s Class A Shares at NAV underperformed both the Russell 1000® Growth Index and the Lipper Large-Cap Growth Funds Classification Average during the twelve-month reporting period.
What strategies were used to manage the Fund during the reporting period and how did these strategies influence performance?
The Fund seeks to provide long-term capital appreciation by investing primarily in the common stocks of companies that have market capitalizations of $5 billion or greater at the time of purchase. We start by identifying what we believe are exceptional growth companies with open-ended growth prospects, outstanding financial characteristics and solid management teams. From that highly selective group, we invest in companies where our expectations for earnings growth exceed consensus expectations. For each Fund holding, we develop a proprietary growth thesis. When the growth thesis is validated, we hold or buy more; however, when our growth thesis is not validated, we sell the holding. Although we made individual position changes during the reporting period, our underlying investment strategy remained consistent.
The Fund’s underperformance versus its benchmarks was primarily the result of stock selection, with sector allocations also modestly detracting. In terms of the former, stock selection was weak in the consumer staples, industrials, health care and information technology sectors. Underweight positions in two of the stronger performing sectors in the Russell 1000® Growth benchmark, telecommunication services and consumer staples, also hindered relative returns. On the other hand, stock selection in the consumer discretionary sector was beneficial to the Fund’s performance during this reporting period.
In the consumer staples sector, some of the shortfall resulted from the Fund’s position in grocery store chain Kroger Co. The company reported second-quarter results that included a sixth straight quarterly miss in terms of total sales, causing management to trim fiscal 2016 earnings projections. Kroger is facing intense competition from other large grocery chains, conventional retailers and specialty gourmet retailers on all fronts including pricing, store expansion and promotional activities. In a deflationary environment, it is difficult for stores to generate positive same-store sales, which they need to do to leverage expenses. Therefore, we decided to sell our position in Kroger. Also, the Fund’s results were hindered by our lack of exposure to several of the more stable, large index constituents that performed well during the reporting period such as Altria Group Inc., Coca-Cola Company, PepsiCo Inc. and Philip Morris International Inc.
The main detractor within industrials was our position in global information and data company Nielsen Holdings PLC, which specializes in measuring the viewing, listening and buying habits of consumers. The company’s shares dropped sharply after third-quarter earnings fell short of expectations. Management attributed the disappointing results to a challenging market environment and higher-than-expected charges as a result of Nielsen exiting some of its non-core businesses. Results were disappointing in developed markets, particularly the U.S., while emerging markets continued to be profitable. We decided to sell our position in Nielsen.
Overall stock selection in information technology was a drag on the Fund’s relative performance, although the sector was also home to several standouts. On the negative side of the ledger, we experienced weak results from a position in LinkedIn Corporation, the world’s largest online networking and job search site for workplace professionals. When the company reported fourth-quarter earnings in January 2016, management guided toward a much slower growth trajectory than we had anticipated. As a result, we decided to sell the stock and LinkedIn’s shares subsequently plummeted in February 2016. However, later in the reporting period, shares rallied after software giant Microsoft Corporation announced an agreement to acquire LinkedIn in an all-cash transaction for a significant premium, causing its stock price to soar in mid-June 2016. A position in Microsoft also detracted, mainly because of the timing surrounding the Fund’s ownership in the stock. We missed out on some of the stock’s strong results early in the reporting period, but then purchased Microsoft in mid-January after seeing some positive signs including a CEO change and corporate restructuring. Microsoft’s shares subsequently fell after the company produced an underwhelming third fiscal quarter report in April 2016. Between late-June and early-October 2016, the Fund had an underweight and the stock advanced again. We decided to move back to an overweight in Microsoft in early-October because we believe the company will continue to grow its already strong corporate cloud-based business and return capital to shareholders. Also, an underweight position in large benchmark constituent Apple, Inc. weighed on the Fund’s returns after its shares advanced strongly later in the reporting period. While initial expectations were low for the iPhone 7 launch, news of stronger-than-expected sales and the corresponding higher margins on this latest product release caught investors’ attention and led them to bid up the stock.
Health care was the second worst performing sector in the Russell 1000® Growth Index during the reporting period, particularly pharmaceuticals and biotechnology, whereas medical technology and health care services held up better. Two of the Fund’s lagging positions, Allergan PLC and Teva Pharmaceutical Industries Limited, suffered from the general overhang in the pharmaceutical
Portfolio Managers’ Comments (continued)
industry due to drug pricing concerns, along with issues surrounding their merger and acquisition deals. Allergan’s shares sold off in April 2016, after the U.S. Treasury’s announcement of new tax inversion rules that ultimately ended the company’s potential merger with Pfizer. Meanwhile, Teva Pharmaceutical was under pressure after its purchase of Allergan’s generics business was delayed by several months while the Federal Trade Commission examined the acquisition more closely. In the case of Teva, we had hoped that the closing of the transaction with Allergan this summer would lead to more positive investor sentiment regarding the company. Unfortunately, however, generic price deflation appeared to worsen, causing us to sell the stock in September 2016. In terms of Allergan, investors were unimpressed with the first capital deployment moves the company made after the completion of the Teva deal, including some merger and acquisition activity, share repurchases and the initiation of a dividend. We sold this stock (subsequent of the close of this reporting period) and redeployed the proceeds from both sales into the biotechnology and pharmaceutical spaces, where the Fund now has a modest overweight.
Results were positive in the consumer discretionary sector where we saw favorable results from several holdings including Ulta Salon, Cosmetics & Fragrance Inc. The company owns a chain of stores that offer cosmetics, skincare items, fragrances and haircare products for both women and men. Ulta’s same-store sales growth of around 15% remained one of the strongest in retailing and continued to show acceleration. Also in discretionary, the Fund’s position in online retail giant Amazon.com, Inc. benefited results during the reporting period. The company continued to experience strong revenue growth, particularly from its retail and Amazon Web Services segments. Also, Amazon Prime membership continued to show impressive growth, while the recent introduction of the voice assistant Alexa had investors excited about the potential opportunities within home automation.
In energy, the Fund benefited from a position in Pioneer Natural Resources Company, which continued to be one of the best names in the Permian Basin accounting for approximately one-fourth of all U.S. crude production. Pioneer managed its balance sheet well through the recent oil price downturn, benefiting from the shift toward gas lift and centralized facilities.
Despite overall weakness in health care and information technology, the sectors were also home to several strong performers. In health care, the Fund’s position in medical device developer and manufacturer Boston Scientific Corporation was a standout. Our investment in the company was originally predicated on two factors. First, we believed Boston Scientific would see an acceleration of revenue growth, primarily due to new product introductions. Second, we believed the company would experience a meaningful improvement in operating margins, which were materially lower than those of its peers. During the reporting period, Boston Scientific demonstrated substantial progress on both fronts, including recent FDA approvals for a number of catheter, stent and ventricular lead products.
In technology, the Fund saw favorable results from positions in Activision Blizzard Inc. and Facebook Inc. Activision is the leading publisher of video games for personal computers, consoles such as PlayStation, Xbox and Wii, online gaming platforms and mobile devices. After falling sharply early in 2016 along with many high quality growth stocks, Activision’s shares advanced strongly over the remainder of the reporting period. In February, the company closed on its acquisition of King Digital Entertainment, the creator and publisher of the extremely popular Candy Crush mobile game series, which is proving to be materially accretive to earnings. Also, Activision continues to attract more players, drive engagement and realize meaningful margin expansion as more of its revenues come from eSports. With Facebook, investors’ expectations for earnings improved due to evidence of the company’s success in growing its user base and mobile business, where users are spending more time and money, which is leading to increased overall advertising revenues. Facebook comes in second only to Alphabet’s Google in the U.S. mobile advertising market, but is gaining ground on the search giant. The company is particularly well positioned as video viewing accelerates and advertisers are increasing the portion of their budgets allocated to highly targeted online video campaigns.
Nuveen Mid Cap Growth Opportunities Fund
How did the Fund perform during the twelve-month reporting period ended October 31, 2016?
The tables in the Fund Performance and Expense Ratios section of this report provide total returns for the Fund for the one-year, five-year and ten-year periods ended October 31, 2016. Comparative performance information is provided for the Fund’s Class A Shares at net asset value (NAV). The Fund’s Class A Shares at NAV underperformed both the Russell Midcap® Growth Index and the Lipper Multi-Cap Growth Funds Classification Average during the twelve-month reporting period.
What strategies were used to manage the Fund during the reporting period and how did these strategies influence performance?
The Fund pursues a long-term capital appreciation strategy by investing primarily in the common stocks of companies that have market capitalizations between approximately $1.6 billion and $28.1 billion at the time of purchase. We start by identifying what we believe are exceptional growth companies with open ended growth prospects, outstanding financial characteristics and solid management teams. From that highly selective group, we invest in companies where our expectations for earnings growth exceed consensus expectations. For each Fund holding, we develop a proprietary growth thesis. When the growth thesis is validated, we hold or buy more; however, when our growth thesis is not validated, we sell the holding. Although we made individual position changes during the reporting period, our underlying investment strategy remained consistent.
The Fund’s underperformance versus its benchmarks was primarily the result of stock selection, particularly in the information technology and health care sectors. An underweight position in the second strongest performing sector in the Russell Midcap® Growth benchmark, consumer staples, also hindered relative returns. On the other hand, stock selection was favorable in the energy and financials sectors during this reporting period.
In the information technology sector, the leading detractor was a position in LinkedIn Corporation, the world’s largest online networking and job search site for workplace professionals. When the company reported fourth-quarter earnings in January 2016, management guided toward a much slower growth trajectory than we had anticipated for the coming year, causing us to sell the stock. The Fund also experienced negative results from Fitbit Inc., the leading provider of fitness tracker devices with more than 85% market share and global distribution across 50 countries. Although the company reported a large beat in revenues and earnings per share (EPS) as expected, its first-quarter 2016 guidance disappointed. We decided to sell Fitbit because we believed the company would have more difficulty beating consensus estimates over time. Finally, in technology, our lack of exposure to benchmark constituent NVIDIA Corporation was a drag on the Fund’s results during the reporting period. The company manufactures graphics processing units (GPUs) and system-on-a-chip units for the mobile computing market. NVIDIA reported strong results in the second quarter of 2016 and guided third quarter’s EPS well above consensus due to strong growth in revenues from its core gaming GPU segment. As a result, shares hit a new all-time high in July 2016 and continued on an upward trajectory through the end of the reporting period.
Health care was the second worst performing sector in the Russell MidCap® Growth Index during the reporting period, primarily due to the pharmaceutical and biotechnology segments, whereas medical technology and health care services held up better. The biotech and pharmaceutical industries suffered broadly from a continuation of fears that the political environment was changing meaningfully with regard to drug pricing. The Fund was hindered by several holdings that meaningfully underperformed, as well as an overweight position in the sector. Shares of Irish-domiciled biotechnology company Alkermes Plc sold off sharply during the reporting period. We were excited about the growth prospects for Alkermes, which already has two approved products, a royalty-generating technology platform and three late-stage development candidates that may address large opportunities in depression, schizophrenia and multiple sclerosis. However, during the reporting period, the company reported disappointing Phase III trial data from its program for depression, which caught investors by surprise after Phase II results were strong. We sold out of Alkermes because the success of this drug and its large potential market were a significant part of our growth thesis. Also, shares of Pacira Pharmaceuticals Inc., a developer and marketer of the post-surgical pain injection Exparel®, were weak along with the broad pharmaceutical sell-off. We decided to sell our position in Pacira because sales of Exparel were lower than we had anticipated. The most significant laggard in health care, however, was Acadia Healthcare Company Inc., the owner and operator of inpatient mental health facilities and treatment centers. We added this holding late in 2015 because we liked its pure-play position in the growing behavioral health business. Its shares were under pressure mainly because the company announced the acquisition of U.K. company Priory Group right before the Brexit vote took place in June. After the vote, the U.S. dollar strengthened and the British pound fell sharply to a multi-decade low, resulting in lower earnings than expected for Acadia. However, we continue to like and own this company because it is showing strong organic growth and gaining market share in the highly fragmented behavioral health industry.
On the positive side, the Fund continued to benefit from stock selection in the energy sector where we focused on high quality, pure play names in the exploration and production industry from the prolific Permian Basin in Texas. Our position in Parsley Energy Inc. reacted favorably to solid production reports and opportunistic acreage acquisitions, recording substantial positive absolute returns.
Portfolio Managers’ Comments (continued)
In the financial sector, our position in financial rating, benchmark and analytics firm S&P Global Inc., which was known as McGraw Hill Financial until late April 2016, performed well for the Fund. The company has benefited from low interest rates and increasing disintermediation at large banks, which has led to a higher percentage of debt being raised in the public markets where a rating is required. S&P Global has strong pricing power due to the oligopolistic nature of the industry and the increased demand driven by new regulations.
In industrials, a position in TransDigm Group Inc. turned in favorable results. The company supplies highly engineered, proprietary aerospace components and systems used on most commercial and military aircraft with strong aftermarket exposure. By owning its designs, TransDigm has better pricing power and margins than many other suppliers. As the sole source provider for most of its products, the company also has limited competitive risks since the aerospace market has high barriers of entry. During the reporting period, the company reported large beats versus consensus in both EPS and sales driven by acquisitions and strong organic growth, which led management to raise its guidance.
Although the consumer staples sector lagged overall, it was home to standout performer Tyson Foods Inc., the country’s largest meat processor and marketer. The company reported higher-than-expected earnings and margins, driven by margin beats in chicken, beef and pork as a result of lower input costs and higher livestock supplies, with management also raising guidance for each area going forward. Tyson shares also benefited from the company’s dividend increase, share repurchase commitments and additional synergies that are expected to be realized from the Hillshire merger. We sold the Fund’s position after the stock reached our price target.
Results were modestly positive in the consumer discretionary sector where strength from several holdings was mostly offset by weakness among others. On the plus side of the equation, we saw favorable results from Ulta Salon, Cosmetics & Fragrance Inc., which owns a chain of stores that offer cosmetics, skincare items, fragrances and haircare products for both women and men. Ulta’s same-store sales growth of around 15% remained one of the strongest in retailing and showed acceleration. We continued to like this company’s fundamentals and management team. Also, our position in consumer products provider Jarden Corporation performed well during the reporting period. The company announced in mid-December that it would be acquired by Newell Rubbermaid in a deal worth roughly $16 billion, creating a consumer products powerhouse. Jarden’s stock price responded by climbing to the price target proposed by the merger, causing us to sell the stock. The merger eventually closed in mid-April.
On the other hand, the Fund saw weak results from Advance Auto Parts Inc., the largest U.S. distributor of automotive parts offering a broad assortment of parts, maintenance items and accessories to consumers and professional installers. After advancing significantly through early November 2015, Advance Auto Parts gave up all of its gains and then some after announcing disappointing third-quarter results and a CEO change. The third-quarter weakness was caused by more disruptions related to the company’s integration of General Parts than anticipated, specifically, slowing commercial sales growth. We sold our position and put the proceeds to work in O’Reilly Automotive Inc. We also saw weak results from Lions Gate Entertainment Corp., which produces and distributes movies and TV shows aimed at the pop culture youth, urban and horror categories with franchises such as The Hunger Games and Divergent and TV shows such as Orange Is the New Black. During the reporting period, Lions Gate missed expectations after the production budget for Mockingjay Part 2 and the timing of TV deliveries impacted results. The sell-off intensified following management’s warning of a second reduction in its three-year guidance. We sold the stock after it rebounded somewhat in March 2016, because we decided the company’s content investments were not paying off, which made it unlikely that Lions Gate would beat consensus estimates this year.
Nuveen Small Cap Growth Opportunities Fund
How did the Fund perform during the twelve-month reporting period ended October 31, 2016?
The tables in the Fund Performance and Expense Ratios section of this report provide total returns for the Fund for the one-year, five-year and ten-year periods ended October 31, 2016. Comparative performance information is provided for the Fund’s Class A Shares at net asset value (NAV). The Fund’s Class A Shares at NAV outperformed both the Russell 2000® Growth Index and the Lipper Small-Cap Growth Funds Classification Average during the twelve-month reporting period.
What strategies were used to manage the Fund during the reporting period and how did these strategies influence performance?
The Fund pursues a long-term capital appreciation strategy by investing primarily in equity securities of smaller-sized companies with market capitalizations within the market capitalization range of approximately $103 million to $4.7 billion. The investment process employed in the management of the Fund seeks to exploit secular growth trends that we believe will provide an investment tailwind to above-average growth that should transcend the business cycle over the longer term. Importantly, our process also emphasizes a valuation discipline designed to find attractive investment opportunities that should benefit from multiple expansion when particular investment catalysts become evident in the marketplace. The Fund’s portfolio typically features investments in high quality companies with attractive or improving margin profiles, generally healthy balance sheets and prospects for above-average revenue and earnings growth.
Small-cap equities encountered heightened volatility early in 2016 as investors reacted to Chinese economic data suggesting decelerating growth, rising high yield credit spreads and concerns associated with the flagging U.S. energy complex as crude oil prices continued to slide. Additionally, heightened political rhetoric and government scrutiny over pricing practices in the pharmaceutical industry drove an intense sell-off among health care stocks. Risk assets appeared to bottom in mid-February 2016. Small-cap stocks subsequently rallied on a rebound in oil prices stemming from anticipated production curtailments, reactionary economic stimulus in China and generally tepid global growth that diminished the likelihood of Fed rate increases in the ensuing months. As the reporting period progressed, small-cap stocks gained traction after equity investors shrugged off the potential economic ramifications of the U.K.’s Brexit vote and instead focused on the continued slow-but-steady advance of the U.S. economy and prospects that additional monetary tightening may be postponed until 2017. However, in the final month of the reporting period, uncertainty surrounding the U.S. presidential election and a potential Fed rate hike in December caused investors to rotate out of small caps. The Russell 2000® Growth Index ended the reporting period with a modestly negative return.
The Fund’s outperformance versus its benchmarks was led by strong results in information technology, both from a stock selection standpoint and from an overweight to the sector. Holdings in the energy and consumer discretionary sectors also performed well. The consumer staples and real estate investment trust (REIT) sectors were the only notable laggards in terms of stock selection during the reporting period.
The Fund benefited from widespread strength among its information technology names, led by Marketo Inc., a supplier of cloud-based marketing products. At the end of May 2016, shares jumped after the company agreed to be acquired by a private equity firm, Vista Equity Partners, for a significant premium. The Fund also experienced strong gains from its position in MKS Instruments Inc., a developer and manufacturer of instruments and process control systems that enable advanced processes and improve productivity. MKS Instruments announced a transformative acquisition of Newport Corporation, which investors ultimately realized would benefit the company in terms of scale and synergies. The Fund also saw strong appreciation in shares of Barracuda Networks Inc., a supplier of storage and security appliances and software sold primarily to the small to medium business market. After posting two consecutive disappointing quarters in 2015, Barracuda Networks exceeded expectations in the past three quarters. Investors are becoming increasingly confident in the company’s transition from hardware-based solutions to software-only offerings for cloud applications. Additionally, the diversified semiconductor firm Semtech Corporation generated strong performance due to better-than-expected revenues and earnings, which were driven by diminishing headwinds from the Chinese OEM handset market as well as the anticipated rollout of 100G for data centers. Shares of SPS Commerce Inc. appreciated strongly after the company posted solid first-quarter results following a slightly disappointing fourth quarter of 2015. SPS Commerce provides cloud-based retail solutions connecting retailers and suppliers in order and payment management. We also saw strength from our position in BroadSoft Inc., a provider of software enabling telecommunication carriers, cable operators and enterprises to convert from legacy phone systems to the newer, unified communications services. Investors rewarded BroadSoft’s stock in part due to the company’s addition of seven large service providers that are using its software to transform their old legacy systems to the newer Internet protocol-based unified communications.
The Fund continued to benefit from stock selection in the energy sector where we focused on high quality, pure play names in the exploration and production industry from the prolific Permian Basin in Texas. Our positions in Parsley Energy Inc. and RSP Permian Inc. reacted favorably to solid production reports and opportunistic acreage acquisitions, recording substantial positive absolute
Portfolio Managers’ Comments (continued)
returns. Both firms also benefited from increases in private company merger and acquisition activity, in addition to well results in the Wolfcamp and Bone Spring formations on the Delaware Basin side of the region. This area is increasingly being perceived to be just as attractive as the core Midland acreage.
In the consumer discretionary sector, the Fund benefited from its position in Thor Industries Inc., a manufacturer of recreational vehicles with the leading market share in the towable segment and the second highest share in the motorized segment. During the reporting period, Thor’s results came in ahead of expectations in part due to better revenues and materially improved margins. The company’s improved margins have been driven by a better product mix, lower material costs, increased labor efficiencies and lower warranty costs. Also, Texas Roadhouse Inc., a high quality operator of moderately-priced steak restaurants, benefited after reporting fourth-quarter results that were modestly ahead of expectations. These results, coupled with positive commentary on same-store sales trends and a favorable outlook for beef prices, which make up half of the company’s food costs, helped propel the stock during the reporting period. Following strong results from both Thor Industries and Texas Roadhouse, we eliminated the positions based on valuation.
In the consumer staples sector, the Fund had only one detractor of note during the reporting period, specialty food retailer Natural Grocers by Vitamin Cottage Inc. The company’s comparable store sales decelerated materially during the reporting period, falling short of expectations. Natural Grocers’ pre-released poor second-quarter results and subsequently lowered its outlook for the remainder of the year. The results were largely driven by higher-than-expected cannibalization from new store openings in existing markets, increased competitive pressures from other food retailers offering more organic food offerings, weak performance in oil and gas markets and weather issues in Denver, which is a substantial market for the company. Because the company’s various sales initiatives did not appear to be reversing the deceleration, we exited the position.
At the macro level, health care was the second worst-performing sector in the Russell 2000® Growth Index behind energy, down nearly 9% during the reporting period. Although our health care holdings modestly trailed overall on a relative basis, the sector was home to several significant movers in both directions. On the positive side, NxStage Medical Inc., the provider of home hemodialysis and critical care solutions, reported first-quarter results that were slightly ahead of expectations, leading management to inch guidance for the year ahead. Its shares also benefited from management providing color on its product pipeline, which includes not only a next-generation system for home hemodialysis, but also a novel system for peritoneal dialysis that could significantly expand its addressable market. We reduced the Fund’s position in NxStage Medical since the stock’s valuation was approaching our price objective, but continue to view it as a core investment holding. Also, we saw continued strength from our position in Abiomed Inc., the manufacturer of the Impella percutaneous ventricular assist device used to provide circulatory support for patients experiencing severe cardiovascular issues. The company’s shares surged after its temporary circulatory support pumps received an earlier-than-expected label expansion to include cardiogenic shock, which made management’s guidance for 30-35% revenue growth in fiscal 2017 that much more achievable. Abiomed is also benefiting from its high-risk percutaneous coronary intervention label, pipeline developments and international opportunities.
Conversely, shares of ConforMIS Inc., an emerging manufacturer of custom 3D-printed knee implants, traded sharply lower. The company reported in-line first-quarter results coupled with a sizeable reduction in annual revenue guidance at the hands of last year’s recall of surgical instruments. The company also announced that its founding CEO would be replaced. Similarly, shares of Pacira Pharmaceuticals, a developer and marketer of the post-surgical pain injection Exparel®, were weak along with the broad pharmaceutical sell-off. We eliminated both of these positions given the stress to our original investment theses.
The industrials sector was modestly positive, but home to one big mover in each direction. In the construction and engineering group, MasTec Inc., a major North American end-to-end energy and telecommunications infrastructure service provider, performed well during the reporting period. The company reported very strong results driven by robust growth in the communications and oil/gas segments. MasTec also experienced a 31% increase in its backlog, which should support accelerating topline growth through the end of this year and into 2017. On the other hand, shares of Korn Ferry International, the world’s largest executive search firm, were sent sharply lower despite in-line financial results. Management highlighted the potential for a pause in hiring decisions in both Europe and North America stemming from the Brexit vote. However, we believed the risk-versus-reward scenario for Korn/Ferry continued to be compelling and maintained the Fund’s position.
Finally, although the Fund’s results were very strong in information technology and consumer discretionary, the sectors had a few laggards. In technology, the Fund saw weak results from ARRIS International plc, the world’s leading manufacturer of set-top boxes and headend equipment used in the delivery of broadcast and Internet services. Shares fell after the Federal Communications Commission announced plans to force cable companies to allow consumers to buy their own set-top boxes, in contrast to the current rental market. While consumers can do this today, widespread purchasing and utilization of set-top boxes would create provisioning and support issues for cable companies, who would need to better develop their retail channels, leading us to sell the Fund’s holdings. In the discretionary sector, shares of Express Inc., a leading contemporary apparel retailer, dropped following disappointing second-quarter results, marking the second consecutive miss at the hands of increased on-line competition and fashion miscues. Given the lack of visibility and an identifiable catalyst, we exited this position as well.
Risk Considerations
Nuveen Large Cap Growth Opportunities Fund
Mutual fund investing involves risk; principal loss is possible. There is no guarantee that the Fund’s investment objectives will be achieved. Prices of equity securities may decline significantly over short or extended periods of time. These and other risk considerations, such as derivatives, investment focus (growth style), and non-U.S./emerging markets risks, are described in detail in the Fund’s prospectus.
Nuveen Mid Cap Growth Opportunities Fund
Mutual fund investing involves risk; principal loss is possible. There is no guarantee that the Fund’s investment objectives will be achieved. Prices of equity securities may decline significantly over short or extended periods of time. Investments in mid-cap companies are subject to greater volatility than those of larger companies, but may be less volatile than investments in smaller companies. These and other risk considerations, such as derivatives, investment focus (growth style), and non-U.S./emerging markets risks, are described in detail in the Fund’s prospectus.
Nuveen Small Cap Growth Opportunities Fund
Mutual fund investing involves risk; principal loss is possible. There is no guarantee that the Fund’s investment objectives will be achieved. Prices of equity securities may decline significantly over short or extended periods of time. Investments in smaller companies are subject to greater volatility than those of larger companies. These and other risk considerations, such as derivatives, investment focus (growth style), and non-U.S./emerging markets risks, are described in detail in the Fund’s prospectus.
Fund Performance
and Expense Ratios
The Fund Performance and Expense Ratios for each Fund are shown within this section of the report.
Returns quoted represent past performance, which is no guarantee of future results. Investment returns and principal value will fluctuate so that when shares are redeemed, they may be worth more or less than their original cost. Current performance may be higher or lower than the performance shown. Total returns for a period of less than one year are not annualized. Returns at net asset value (NAV) would be lower if the sales charge were included. Returns assume reinvestment of dividends and capital gains. For performance, current to the most recent month-end visit Nuveen.com or call (800) 257-8787.
Returns do not reflect the deduction of taxes that a shareholder would pay on Fund distributions or the redemption of Fund shares.
Returns may reflect fee waivers and/or expense reimbursements by the investment adviser during the periods presented. If any such waivers and/or reimbursements had not been in place, returns would have been reduced. See Notes to Financial Statements, Note 7—Management Fees and Other Transactions with Affiliates for more information.
Returns reflect differences in sales charges and expenses, which are primarily differences in distribution and service fees, and assume reinvestment of dividends and capital gains.
Comparative index and Lipper return information is provided for Class A Shares at NAV only.
The expense ratios shown reflect total operating expenses (before fee waivers and/or expense reimbursements, if any) as shown in the most recent prospectus. The expense ratios include management fees and other fees and expenses.
Fund Performance and Expense Ratios (continued)
Nuveen Large Cap Growth Opportunities Fund
Refer to the first page of this Fund Performance and Expense Ratios section for further explanation of the information included within this section. Refer to the Glossary of Terms Used in this Report for definitions of terms used within this section.
Fund Performance
Average Annual Total Returns as of October 31, 2016
| | | | | | | | | | | | |
| | | Average Annual | |
| | | 1-Year | | | 5-Year | | | 10-Year | |
Class A Shares at NAV | | | (2.49)% | | | | 10.72% | | | | 7.52% | |
Class A Shares at maximum Offering Price | | | (8.10)% | | | | 9.42% | | | | 6.88% | |
Russell 1000® Growth Index | | | 2.28% | | | | 13.65% | | | | 8.22% | |
Lipper Large-Cap Growth Funds Classification Average | | | (0.21)% | | | | 12.30% | | | | 7.24% | |
| | | |
Class C Shares | | | (3.21)% | | | | 9.92% | | | | 6.72% | |
Class R3 Shares | | | (2.73)% | | | | 10.45% | | | | 7.25% | |
Class I Shares | | | (2.24)% | | | | 11.01% | | | | 7.79% | |
| | | | | | | | |
| | | Average Annual | |
| | | 1-Year | | | Since
Inception | |
Class R6 Shares | | | (2.14)% | | | | 11.07% | |
Average Annual Total Returns as of September 30, 2016 (Most Recent Calendar Quarter)
| | | | | | | | | | | | |
| | | Average Annual | |
| | | 1-Year | | | 5-Year | | | 10-Year | |
Class A Shares at NAV | | | 9.28% | | | | 13.33% | | | | 8.16% | |
Class A Shares at maximum Offering Price | | | 2.99% | | | | 12.00% | | | | 7.52% | |
Class C Shares | | | 8.45% | | | | 12.50% | | | | 7.36% | |
Class R3 Shares | | | 8.98% | | | | 13.05% | | | | 7.89% | |
Class I Shares | | | 9.55% | | | | 13.62% | | | | 8.43% | |
| | | | | | | | |
| | | Average Annual | |
| | | 1-Year | | | Since
Inception | |
Class R6 Shares | | | 9.64% | | | | 12.26% | |
Since inception returns for Class R6 Shares are from 2/28/13. Indexes and Lipper averages are not available for direct investment.
Class A Shares have a maximum 5.75% sales charge (Offering Price). Class A Share purchases of $1 million or more are sold at net asset value without an up-front sales charge but may be subject to a contingent deferred sales charge (CDSC) equal to 1% if redeemed within eighteen months of purchase. Class C Shares have a 1% CDSC for redemptions within less than twelve months, which is not reflected in the one-year total return. Class R3 Shares have no sales charge and are only available for purchase by eligible retirement plans. Class R6 Shares have no sales charge and are available only to certain limited categories of investors as described in the prospectus. Class I Shares have no sales charge and may be purchased under limited circumstances or by specified classes of investors.
Expense Ratios as of Most Recent Prospectus
| | | | | | | | | | | | | | | | | | | | |
| | | Share Class | |
| | | Class A | | | Class C | | | Class R3 | | | Class R6 | | | Class I | |
Expense Ratios | | | 1.09% | | | | 1.84% | | | | 1.34% | | | | 0.75% | | | | 0.84% | |
Growth of an Assumed $10,000 Investment as of October 31, 2016 – Class A Shares
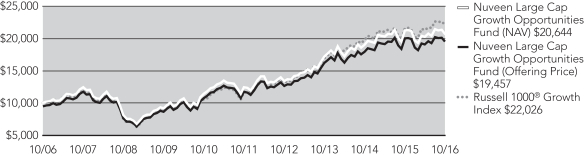
The graphs do not reflect the deduction of taxes that a shareholder may pay on Fund distributions or the redemption of Fund shares.
Fund Performance and Expense Ratios (continued)
Nuveen Mid Cap Growth Opportunities Fund
Refer to the first page of this Fund Performance and Expense Ratios section for further explanation of the information included within this section. Refer to the Glossary of Terms Used in this Report for definitions of terms used within this section.
Fund Performance
Average Annual Total Returns as of October 31, 2016
| | | | | | | | | | | | |
| | | Average Annual | |
| | | 1-Year | | | 5-Year | | | 10-Year | |
Class A Shares at NAV | | | (3.78)% | | | | 9.41% | | | | 6.73% | |
Class A Shares at maximum Offering Price | | | (9.32)% | | | | 8.13% | | | | 6.10% | |
Russell Midcap® Growth Index | | | 0.40% | | | | 12.02% | | | | 7.65% | |
Lipper Multi-Cap Growth Funds Classification Average | | | (0.83)% | | | | 11.40% | | | | 6.86% | |
| | | |
Class C Shares | | | (4.50)% | | | | 8.59% | | | | 5.93% | |
Class R3 Shares | | | (4.04)% | | | | 9.13% | | | | 6.46% | |
Class I Shares | | | (3.54)% | | | | 9.68% | | | | 7.00% | |
| | | | | | | | |
| | | Average Annual | |
| | | 1-Year | | | Since
Inception | |
Class R6 Shares | | | (3.41)% | | | | 8.92% | |
Average Annual Total Returns as of September 30, 2016 (Most Recent Calendar Quarter)
| | | | | | | | | | | | |
| | | Average Annual | |
| | | 1-Year | | | 5-Year | | | 10-Year | |
Class A Shares at NAV | | | 5.44% | | | | 13.17% | | | | 7.63% | |
Class A Shares at maximum Offering Price | | | (0.62)% | | | | 11.83% | | | | 7.00% | |
Class C Shares | | | 4.62% | | | | 12.31% | | | | 6.83% | |
Class R3 Shares | | | 5.16% | | | | 12.88% | | | | 7.36% | |
Class I Shares | | | 5.71% | | | | 13.45% | | | | 7.90% | |
| | | | | | | | |
| | | Average Annual | |
| | | 1-Year | | | Since
Inception | |
Class R6 Shares | | | 5.85% | | | | 10.76% | |
Since inception returns for Class R6 Shares are from 2/28/13. Indexes and Lipper averages are not available for direct investment.
Class A Shares have a maximum 5.75% sales charge (Offering Price). Class A Share purchases of $1 million or more are sold at net asset value without an up-front sales charge but may be subject to a contingent deferred sales charge (CDSC) equal to 1% if redeemed within eighteen months of purchase. Class C Shares have a 1% CDSC for redemptions within less than twelve months, which is not reflected in the one-year total return. Class R3 Shares have no sales charge and are only available for purchase by eligible retirement plans. Class R6 Shares have no sales charge and are available only to certain limited categories of investors as described in the prospectus. Class I Shares have no sales charge and may be purchased under limited circumstances or by specified classes of investors.
Expense Ratios as of Most Recent Prospectus
| | | | | | | | | | | | | | | | | | | | |
| | | Share Class | |
| | | Class A | | | Class C | | | Class R3 | | | Class R6 | | | Class I | |
Gross Expense Ratios | | | 1.19% | | | | 1.94% | | | | 1.44% | | | | 0.81% | | | | 0.94% | |
Net Expense Ratios | | | 1.16% | | | | 1.91% | | | | 1.41% | | | | 0.78% | | | | 0.91% | |
The Fund’s investment adviser has contractually agreed to waive fees and/or reimburse other Fund expenses through February 28, 2018, so that total annual fund operating expenses (excluding 12b-1 distribution and/or service fees, interest expenses, taxes, acquired fund fees and expenses, fees incurred in acquiring and disposing of portfolio securities and extraordinary expenses) do not exceed 0.92% of the average daily net assets of any class of Fund shares. Fee waivers and/or expense reimbursements will not be terminated prior to that time without the approval of the Board of Directors of the Fund.
Growth of an Assumed $10,000 Investment as of October 31, 2016 – Class A Shares
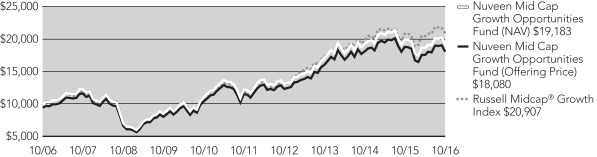
The graphs do not reflect the deduction of taxes that a shareholder may pay on Fund distributions or the redemption of Fund shares.
Fund Performance and Expense Ratios (continued)
Nuveen Small Cap Growth Opportunities Fund
Refer to the first page of this Fund Performance and Expense Ratios section for further explanation of the information included within this section. Refer to the Glossary of Terms Used in this Report for definitions of Terms used within this section.
Fund Performance
Average Annual Total Returns as of October 31, 2016
| | | | | | | | | | | | |
| | | Average Annual | |
| | | 1-Year | | | 5-Year | | | 10-Year | |
Class A Shares at NAV | | | 1.90% | | | | 10.50% | | | | 6.63% | |
Class A Shares at maximum Offering Price | | | (3.97)% | | | | 9.20% | | | | 6.00% | |
Russell 2000® Growth Index | | | (0.49)% | | | | 11.34% | | | | 6.92% | |
Lipper Small-Cap Growth Funds Classification Average | | | (0.37)% | | | | 10.06% | | | | 6.43% | |
| | | |
Class C Shares | | | 1.10% | | | | 9.67% | | | | 5.84% | |
Class R3 Shares | | | 1.62% | | | | 10.23% | | | | 6.37% | |
Class I Shares | | | 2.10% | | | | 10.77% | | | | 6.90% | |
| | | | |
| | | Cumulative | |
| | | Since
Inception | |
Class R6 Shares | | | 6.15% | |
Average Annual Total Returns as of September 30, 2016 (Most Recent Calendar Quarter)
| | | | | | | | | | | | |
| | | Average Annual | |
| | | 1-Year | | | 5-Year | | | 10-Year | |
Class A Shares at NAV | | | 13.91% | | | | 15.00% | | | | 7.95% | |
Class A Shares at maximum Offering Price | | | 7.35% | | | | 13.65% | | | | 7.32% | |
Class C Shares | | | 13.03% | | | | 14.14% | | | | 7.15% | |
Class R3 Shares | | | 13.60% | | | | 14.72% | | | | 7.69% | |
Class I Shares | | | 14.16% | | | | 15.28% | | | | 8.22% | |
| | | | |
| | | Cumulative | |
| | | Since
Inception | |
Class R6 Shares | | | 12.39% | |
Since inception returns, for Class R6 Shares are from 6/30/16. Indexes and Lipper averages are not available for direct investment.
Class A Shares have a maximum 5.75% sales charge (Offering Price). Class A Share purchases of $1 million or more are sold at net asset value without an up-front sales charge but may be subject to a contingent deferred sales charge (CDSC) equal to 1% if redeemed within eighteen months of purchase. Class C Shares have a 1% CDSC for redemptions within less than twelve months, which is not reflected in the one-year total return. Class R3 Shares have no sales charge and are only available for purchase by eligible retirement plans. Class R6 Shares have no sales charge and are available only to certain limited categories of investors as described in the prospectus. Class I Shares have no sales charge and may be purchased under limited circumstances or by specified classes of investors.
Expense Ratios as of Most Recent Prospectus
| | | | | | | | | | | | | | | | | | | | |
| | | Share Class | |
| | | Class A | | | Class C | | | Class R3 | | | Class R6 | | | Class I | |
Gross Expense Ratios | | | 1.35% | | | | 2.10% | | | | 1.60% | | | | 0.99% | | | | 1.10% | |
Net Expense Ratios | | | 1.34% | | | | 2.09% | | | | 1.59% | | | | 0.98% | | | | 1.09% | |
The Fund’s investment adviser has contractually agreed to waive fees and/or reimburse other Fund expenses through February 28, 2018, so that total annual fund operating expenses (excluding 12b-1 distribution and/or service fees, interest expenses, taxes, acquired fund fees and expenses, fees incurred in acquiring and disposing of portfolio securities and extraordinary expenses) do not exceed 1.09% of the average daily net assets of any class of Fund shares. Fee waivers and/or expense reimbursements will not be terminated prior to that time without the approval of the Board of Directors of the Fund.
Growth of an Assumed $10,000 Investment as of October 31, 2016 – Class A Shares
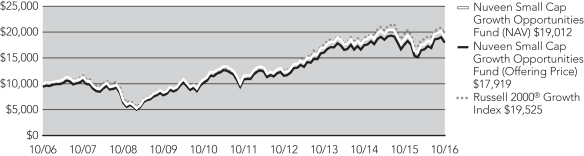
The graphs do not reflect the deduction of taxes that a shareholder may pay on Fund distributions or the redemption of Fund shares.
Holding
Summaries as of October 31, 2016
This data relates to the securities held in each Fund’s portfolio of investments as of the end of this reporting period. It should not be construed as a measure of performance for the Fund itself. Holdings are subject to change.
Nuveen Large Cap Growth Opportunities Fund
Fund Allocation (% of net assets)
| | | | |
Common Stocks | | | 99.4% | |
Investments Purchased with Collateral from Securities Lending | | | 3.8% | |
Money Market Funds | | | 0.8% | |
Other Assets Less Liabilities | | | (4.0)% | |
Net Assets | | | 100% | |
Portfolio Composition (% of net assets)
| | | | |
Internet Software & Services | | | 11.2% | |
Software | | | 11.2% | |
IT Services | | | 9.4% | |
Internet and Direct Marketing Retail | | | 9.2% | |
Biotechnology | | | 6.2% | |
Specialty Retail | | | 6.1% | |
Technology Hardware, Storage & Peripherals | | | 4.6% | |
Industrial Conglomerates | | | 4.0% | |
Beverages | | | 3.8% | |
Hotels, Restaurants & Leisure | | | 3.7% | |
Chemicals | | | 3.5% | |
Health Care Equipment & Supplies | | | 3.3% | |
Household Products | | | 3.1% | |
Media | | | 2.3% | |
Other | | | 17.8% | |
Investments Purchased with Collateral from Securities Lending | | | 3.8% | |
Money Market Funds | | | 0.8% | |
Other Assets Less Liabilities | | | (4.0)% | |
Net Assets | | | 100% | |
Top Five Common Stock Holdings (% of net assets)
| | | | |
Alphabet Inc., Class A | | | 6.9% | |
Amazon.com, Inc. | | | 5.6% | |
Microsoft Corporation | | | 5.0% | |
Apple, Inc. | | | 4.6% | |
Facebook Inc., Class A Shares | | | 4.4% | |
Nuveen Mid Cap Growth Opportunities Fund
Fund Allocation (% of net assets)
| | | | |
Common Stocks | | | 99.7% | |
Investments Purchased with Collateral from Securities Lending | | | 5.2% | |
Money Market Funds | | | 1.4% | |
Other Assets Less Liabilities | | | (6.3)% | |
Net Assets | | | 100% | |
Portfolio Composition (% of net assets)
| | | | |
IT Services | | | 9.1% | |
Software | | | 9.1% | |
Capital Markets | | | 7.4% | |
Specialty Retail | | | 6.7% | |
Health Care Equipment & Supplies | | | 5.4% | |
Media | | | 5.4% | |
Life Sciences Tools & Services | | | 4.1% | |
Machinery | | | 3.9% | |
Professional Services | | | 3.8% | |
Hotels, Restaurants & Leisure | | | 3.5% | |
Semiconductors & Semiconductor Equipment | | | 3.4% | |
Building Products | | | 2.9% | |
Household Durables | | | 2.8% | |
Commercial Services & Supplies | | | 2.6% | |
Biotechnology | | | 2.5% | |
Communications Equipment | | | 2.3% | |
Health Care Providers & Services | | | 1.8% | |
Chemicals | | | 1.7% | |
Multiline Retail | | | 1.7% | |
Other | | | 19.6% | |
Investments Purchased with Collateral from Securities Lending | | | 5.2% | |
Money Market Funds | | | 1.4% | |
Other Assets Less Liabilities | | | (6.3)% | |
Net Assets | | | 100% | |
Top Five Common Stock Holdings (% of net assets)
| | | | |
Total System Services Inc. | | | 2.0% | |
Electronic Arts Inc. | | | 2.0% | |
Equifax Inc. | | | 2.0% | |
S&P Global, Inc. | | | 1.9% | |
O’Reilly Automotive Inc. | | | 1.8% | |
Holding Summaries as of October 31, 2016 (continued)
Nuveen Small Cap Growth Opportunities Fund
Fund Allocation (% of net assets)
| | | | |
Common Stocks | | | 96.4% | |
Investments Purchased with Collateral from Securities Lending | | | 10.6% | |
Money Market Funds | | | 4.1% | |
Other Assets Less Liabilities | | | (11.1)% | |
Net Assets | | | 100% | |
Portfolio Composition (% of net assets)
| | | | |
Software | | | 10.3% | |
Health Care Equipment & Supplies | | | 9.6% | |
Semiconductors & Semiconductor Equipment | | | 7.7% | |
Internet Software & Services | | | 6.6% | |
Biotechnology | | | 6.1% | |
Machinery | | | 4.5% | |
Health Care Providers & Services | | | 4.4% | |
Banks | | | 4.4% | |
Communications Equipment | | | 4.4% | |
Hotels, Restaurants & Leisure | | | 3.9% | |
Equity Real Estate Investment Trusts | | | 3.5% | |
Food Products | | | 3.0% | |
Commercial Services & Supplies | | | 2.8% | |
Professional Services | | | 2.5% | |
Electronic Equipment, Instruments & Comp | | | 2.4% | |
Capital Markets | | | 1.8% | |
Other | | | 18.5% | |
Investments Purchased with Collateral from Securities Lending | | | 10.6% | |
Money Market Funds | | | 4.1% | |
Other Assets Less Liabilities | | | (11.1)% | |
Net Assets | | | 100% | |
Top Five Common Stock Holdings (% of net assets)
| | | | |
CommVault Systems, Inc. | | | 1.9% | |
Evercore Partners Inc. | | | 1.8% | |
RealPage Inc. | | | 1.7% | |
MKS Instruments Inc. | | | 1.7% | |
NN, Incorporated | | | 1.6% | |
Expense
Examples
As a shareholder of one or more of the Funds, you incur two types of costs: (1) transaction costs, including up-front and back-end sales charges (loads) or redemption fees, where applicable; and (2) ongoing costs, including management fees; distribution and service (12b-1) fees, where applicable; and other Fund expenses. The Examples below are intended to help you understand your ongoing costs (in dollars) of investing in the Funds and to compare these costs with the ongoing costs of investing in other mutual funds. Since the expense examples for Nuveen Small Cap Growth Opportunities Fund Class R6 Shares reflect only the first 123 days of the Class’s operation, they may not provide a meaningful understanding of the Class’s ongoing expenses.
The Examples below are based on an investment of $1,000 invested at the beginning of the period and held through the period ended October 31, 2016.
The beginning of the period is May 1, 2016.
The information under “Actual Performance,” together with the amount you invested, allows you to estimate actual expenses incurred over the reporting period. Simply divide your account value by $1,000 (for example, an $8,600 account value divided by $1,000 = 8.60) and multiply the result by the cost shown for your share class, in the row entitled “Expenses Incurred During Period” to estimate the expenses incurred on your account during this period.
The information under “Hypothetical Performance,” provides information about hypothetical account values and hypothetical expenses based on each Fund’s actual expense ratio and an assumed rate of return of 5% per year before expenses, which is not the Fund’s actual return. The hypothetical account values and expenses may not be used to estimate the actual ending account balance or expense you incurred for the period. You may use this information to compare the ongoing costs of investing in the Fund and other funds. To do so, compare this 5% hypothetical example with the 5% hypothetical examples that appear in the shareholder reports of the other funds.
Please note that the expenses shown in the following table are meant to highlight your ongoing costs only and do not reflect any transaction costs. Therefore, the hypothetical information is useful in comparing ongoing costs only, and will not help you determine the relative total costs of owning different funds or share classes. In addition, if these transaction costs were included, your costs would have been higher.
Nuveen Large Cap Growth Opportunities Fund
| | | | | | | | | | | | | | | | | | | | |
| | | Share Class | |
| | | Class A | | | Class C | | | Class R3 | | | Class R6 | | | Class I | |
Actual Performance | | | | | | | | | | | | | | | | | | | | |
Beginning Account Value | | $ | 1,000.00 | | | $ | 1,000.00 | | | $ | 1,000.00 | | | $ | 1,000.00 | | | $ | 1,000.00 | |
Ending Account Value | | $ | 1,023.10 | | | $ | 1,019.50 | | | $ | 1,022.00 | | | $ | 1,025.30 | | | $ | 1,024.80 | |
Expenses Incurred During the Period | | $ | 5.95 | | | $ | 9.80 | | | $ | 7.22 | | | $ | 4.17 | | | $ | 4.68 | |
Hypothetical Performance (5% annualized return before expenses) | | | | | | | | | | | | | | | | | | | | |
Beginning Account Value | | $ | 1,000.00 | | | $ | 1,000.00 | | | $ | 1,000.00 | | | $ | 1,000.00 | | | $ | 1,000.00 | |
Ending Account Value | | $ | 1,019.25 | | | $ | 1,015.43 | | | $ | 1,018.10 | | | $ | 1,041.80 | | | $ | 1,020.51 | |
Expenses Incurred During the Period | | $ | 5.94 | | | $ | 9.78 | | | $ | 7.20 | | | $ | 4.21 | | | $ | 4.67 | |
For each class of the Fund, expenses are equal to the Fund’s annualized net expense ratio of 1.17%, 1.93%, 1.42%, 0.82% and 0.92% for Classes A, C, R3, R6 and I, respectively, multiplied by the average account value over the period, multiplied by 184/366 (to reflect the one-half year period).
Expense Examples (continued)
Nuveen Mid Cap Growth Opportunities Fund
| | | | | | | | | | | | | | | | | | | | |
| | | Share Class | |
| | | Class A | | | Class C | | | Class R3 | | | Class R6 | | | Class I | |
Actual Performance | | | | | | | | | | | | | | | | | | | | |
Beginning Account Value | | $ | 1,000.00 | | | $ | 1,000.00 | | | $ | 1,000.00 | | | $ | 1,000.00 | | | $ | 1,000.00 | |
Ending Account Value | | $ | 1,030.60 | | | $ | 1,026.40 | | | $ | 1,028.90 | | | $ | 1,032.40 | | | $ | 1,031.80 | |
Expenses Incurred During the Period | | $ | 6.23 | | | $ | 10.03 | | | $ | 7.50 | | | $ | 4.14 | | | $ | 4.90 | |
Hypothetical Performance (5% annualized return before expenses) | | | | | | | | | | | | | | | | | | | | |
Beginning Account Value | | $ | 1,000.00 | | | $ | 1,000.00 | | | $ | 1,000.00 | | | $ | 1,000.00 | | | $ | 1,000.00 | |
Ending Account Value | | $ | 1,019.00 | | | $ | 1,015.23 | | | $ | 1,017.75 | | | $ | 1,041.90 | | | $ | 1,020.31 | |
Expenses Incurred During the Period | | $ | 6.19 | | | $ | 9.98 | | | $ | 7.46 | | | $ | 4.16 | | | $ | 4.88 | |
For each class of the Fund, expenses are equal to the Fund’s annualized net expense ratio of 1.22%, 1.97%, 1.47%, 0.81% and 0.96% for Classes A, C, R3, R6 and I, respectively, multiplied by the average account value over the period, multiplied by 184/366 (to reflect the one-half year period).
Nuveen Small Cap Growth Opportunities Fund
| | | | | | | | | | | | | | | | | | | | |
| | | Share Class | |
| | | Class A | | | Class C | | | Class R3 | | | Class R6 | | | Class I | |
Actual Performance | | | | | | | | | | | | | | | | | | | | |
Beginning Account Value | | $ | 1,000.00 | | | $ | 1,000.00 | | | $ | 1,000.00 | | | $ | 1,000.00 | | | $ | 1,000.00 | |
Ending Account Value | | $ | 1,077.40 | | | $ | 1,073.00 | | | $ | 1,076.60 | | | $ | 1,061.50 | | | $ | 1,078.50 | |
Expenses Incurred During the Period | | $ | 7.21 | | | $ | 11.10 | | | $ | 8.51 | | | $ | 3.33 | | | $ | 5.96 | |
Hypothetical Performance (5% annualized return before expenses) | | | | | | | | | | | | | | | | | | | | |
Beginning Account Value | | $ | 1,000.00 | | | $ | 1,000.00 | | | $ | 1,000.00 | | | $ | 1,000.00 | | | $ | 1,000.00 | |
Ending Account Value | | $ | 1,018.20 | | | $ | 1,014.43 | | | $ | 1,016.94 | | | $ | 1,040.40 | | | $ | 1,019.41 | |
Expenses Incurred During the Period | | $ | 7.00 | | | $ | 10.79 | | | $ | 8.26 | | | $ | 3.29 | | | $ | 5.79 | |
For each class of the Fund, expenses are equal to the Fund’s annualized net expense ratio of 1.38%, 2.13%, 1.63% and 1.14% for Classes A, C, R3 and I, respectively, multiplied by the average account value over the period, multiplied by 184/366 (to reflect the one-half year period). For Class R6, expenses are equal to the Fund’s annualized net expense ratio of 0.96% multiplied by the average account value over the period, multiplied by 123/366 (to reflect the 123 days in the period since class commencement of operations).
Report of
Independent Registered Public Accounting Firm
To the Board of Directors and Shareholders of
Nuveen Investment Funds, Inc.:
In our opinion, the accompanying statements of assets and liabilities, including the portfolios of investments, and the related statements of operations and of changes in net assets and the financial highlights present fairly, in all material respects, the financial position of Nuveen Large Cap Growth Opportunities Fund, Nuveen Mid Cap Growth Opportunities Fund and Nuveen Small Cap Growth Opportunities Fund (each a series of the Nuveen Investment Funds, Inc., hereinafter referred to as the “Funds”) at October 31, 2016, the results of each of their operations for the year then ended, the changes in each of their net assets for each of the two years in the period then ended and the financial highlights for each of five years in the period then ended, in conformity with accounting principles generally accepted in the United States of America. These financial statements and financial highlights (hereafter referred to as “financial statements”) are the responsibility of the Funds’ management. Our responsibility is to express an opinion on these financial statements based on our audits. We conducted our audits of these financial statements in accordance with the standards of the Public Company Accounting Oversight Board (United States). Those standards require that we plan and perform the audit to obtain reasonable assurance about whether the financial statements are free of material misstatement. An audit includes examining, on a test basis, evidence supporting the amounts and disclosures in the financial statements, assessing the accounting principles used and significant estimates made by management, and evaluating the overall financial statement presentation. We believe that our audits, which included confirmation of securities at October 31, 2016 by correspondence with the custodian and brokers, provide a reasonable basis for our opinion.
PricewaterhouseCoopers LLP
Chicago, IL
December 28, 2016
Nuveen Large Cap Growth Opportunities Fund
| | |
| Portfolio of Investments | | October 31, 2016 |
| | | | | | | | |
| Shares | | | Description (1) | | Value | |
| | |
| | | | LONG-TERM INVESTMENTS – 99.4% | | | | |
| | |
| | | | COMMON STOCKS – 99.4% | | | | |
| | |
| | | | Aerospace & Defense – 2.0% | | | |
| | |
| | 25,909 | | | Lockheed Martin Corporation | | $ | 6,383,459 | |
| | |
| | | | Beverages – 3.8% | | | |
| | |
| | 37,640 | | | Constellation Brands, Inc., Class A | | | 6,290,397 | |
| | |
| | 40,538 | | | Monster Beverage Corporation, (2) | | | 5,851,255 | |
| | | | Total Beverages | | | 12,141,652 | |
| | |
| | | | Biotechnology – 6.2% | | | |
| | |
| | 91,088 | | | AbbVie Inc. | | | 5,080,889 | |
| | |
| | 25,383 | | | Alexion Pharmaceuticals Inc., (2) | | | 3,312,482 | |
| | |
| | 14,395 | | | Biogen Inc., (2) | | | 4,033,191 | |
| | |
| | 45,407 | | | Celgene Corporation, (2) | | | 4,639,687 | |
| | |
| | 35,000 | | | Vertex Pharmaceuticals Inc., (2) | | | 2,655,100 | |
| | | | Total Biotechnology | | | 19,721,349 | |
| | |
| | | | Capital Markets – 0.8% | | | |
| | |
| | 26,236 | | | MSCI Inc., Class A Shares | | | 2,103,865 | |
| | |
| | | | Chemicals – 3.5% | | | |
| | |
| | 52,575 | | | Ecolab Inc. | | | 6,002,488 | |
| | |
| | 20,966 | | | Sherwin-Williams Company | | | 5,133,735 | |
| | | | Total Chemicals | | | 11,136,223 | |
| | |
| | | | Commercial Services & Supplies – 1.3% | | | |
| | |
| | 39,919 | | | Cintas Corporation | | | 4,258,160 | |
| | |
| | | | Food & Staples Retailing – 1.5% | | | |
| | |
| | 32,892 | | | Costco Wholesale Corporation | | | 4,863,740 | |
| | |
| | | | Food Products – 0.8% | | | |
| | |
| | 49,743 | | | Pinnacle Foods Inc. | | | 2,557,785 | |
| | |
| | | | Health Care Equipment & Supplies – 3.3% | | | |
| | |
| | 198,556 | | | Boston Scientific Corporation, (2) | | | 4,368,232 | |
| | |
| | 29,119 | | | Edwards Lifesciences Corporation, (2) | | | 2,772,711 | |
| | |
| | 43,269 | | | Medtronic, PLC | | | 3,548,923 | |
| | | | Total Health Care Equipment & Supplies | | | 10,689,866 | |
| | |
| | | | Health Care Providers & Services – 1.9% | | | |
| | |
| | 32,035 | | | Centene Corporation, (2) | | | 2,001,547 | |
| | |
| | 20,452 | | | CIGNA Corporation | | | 2,430,311 | |
| | |
| | 10,185 | | | Humana Inc. | | | 1,747,033 | |
| | | | Total Health Care Providers & Services | | | 6,178,891 | |
| | | | | | | | |
| Shares | | | Description (1) | | Value | |
| | |
| | | | Hotels, Restaurants & Leisure – 3.7% | | | |
| | |
| | 114,646 | | | Starbucks Corporation | | $ | 6,084,263 | |
| | |
| | 31,176 | | | Wynn Resorts Ltd | | | 2,947,691 | |
| | |
| | 30,687 | | | YUM! Brands, Inc. | | | 2,647,674 | |
| | | | Total Hotels, Restaurants & Leisure | | | 11,679,628 | |
| | |
| | | | Household Durables – 1.0% | | | |
| | |
| | 17,437 | | | Mohawk Industries Inc., (2) | | | 3,213,639 | |
| | |
| | | | Household Products – 3.1% | | | |
| | |
| | 32,940 | | | Clorox Company | | | 3,953,459 | |
| | |
| | 82,891 | | | Colgate-Palmolive Company | | | 5,915,102 | |
| | | | Total Household Products | | | 9,868,561 | |
| | |
| | | | Industrial Conglomerates – 4.0% | | | |
| | |
| | 43,348 | | | 3M Co. | | | 7,165,424 | |
| | |
| | 52,283 | | | Honeywell International Inc. | | | 5,734,399 | |
| | | | Total Industrial Conglomerates | | | 12,899,823 | |
| | |
| | | | Internet and Direct Marketing Retail – 9.2% | | | |
| | |
| | 22,621 | | | Amazon.com, Inc., (2) | | | 17,866,518 | |
| | |
| | 7,738 | | | priceline.com Incorporated, (2), (3) | | | 11,407,592 | |
| | | | Total Internet and Direct Marketing Retail | | | 29,274,110 | |
| | |
| | | | Internet Software & Services – 11.2% | | | |
| | |
| | 27,075 | | | Alphabet Inc., Class A, (2) | | | 21,928,043 | |
| | |
| | 106,938 | | | Facebook Inc., Class A Shares, (2) | | | 14,007,809 | |
| | | | Total Internet Software & Services | | | 35,935,852 | |
| | |
| | | | IT Services – 9.4% | | | |
| | |
| | 44,061 | | | Accenture Limited | | | 5,121,651 | |
| | |
| | 84,812 | | | MasterCard, Inc. | | | 9,076,580 | |
| | |
| | 130,805 | | | PayPal Holdings, Inc., (2) | | | 5,449,336 | |
| | |
| | 127,880 | | | Visa Inc. | | | 10,551,379 | |
| | | | Total IT Services | | | 30,198,946 | |
| | |
| | | | Machinery – 0.8% | | | |
| | |
| | 17,118 | | | Snap-on Incorporated | | | 2,637,884 | |
| | |
| | | | Media – 2.3% | | | |
| | |
| | 119,151 | | | Comcast Corporation, Class A | | | 7,365,915 | |
| | |
| | | | Multiline Retail – 1.1% | | | |
| | |
| | 67,329 | | | Nordstrom, Inc., (3) | | | 3,501,108 | |
| | |
| | | | Oil, Gas & Consumable Fuels – 0.8% | | | |
| | |
| | 12,624 | | | Pioneer Natural Resources Company | | | 2,259,948 | |
| | |
| | | | Personal Products – 1.3% | | | |
| | |
| | 48,826 | | | Estee Lauder Companies Inc., Class A | | | 4,254,209 | |
Nuveen Large Cap Growth Opportunities Fund (continued)
| | |
| Portfolio of Investments | | October 31, 2016 |
| | | | | | | | |
| Shares | | | Description (1) | | Value | |
| | |
| | | | Pharmaceuticals – 1.9% | | | |
| | |
| | 18,142 | | | Allergan PLC | | $ | 3,790,589 | |
| | |
| | 46,835 | | | Bristol-Myers Squibb Company | | | 2,384,370 | |
| | | | Total Pharmaceuticals | | | 6,174,959 | |
| | |
| | | | Road & Rail – 0.8% | | | |
| | |
| | 30,174 | | | J.B. Hunt Transports Serives Inc. | | | 2,462,500 | |
| | |
| | | | Semiconductors & Semiconductor Equipment – 1.8% | | | |
| | |
| | 28,346 | | | Lam Research Corporation | | | 2,745,594 | |
| | |
| | 31,283 | | | NXP Semiconductors NV, (2) | | | 3,128,300 | |
| | | | Total Semiconductors & Semiconductor Equipment | | | 5,873,894 | |
| | |
| | | | Software – 11.2% | | | |
| | |
| | 120,255 | | | Activision Blizzard Inc. | | | 5,191,408 | |
| | |
| | 59,653 | | | Adobe Systems Incorporated, (2) | | | 6,413,294 | |
| | |
| | 58,497 | | | Electronic Arts Inc., (2) | | | 4,593,184 | |
| | |
| | 269,054 | | | Microsoft Corporation | | | 16,121,716 | |
| | |
| | 46,133 | | | Salesforce.com, Inc., (2) | | | 3,467,356 | |
| | | | Total Software | | | 35,786,958 | |
| | |
| | | | Specialty Retail – 6.1% | | | |
| | |
| | 75,157 | | | Home Depot, Inc. | | | 9,169,906 | |
| | |
| | 20,550 | | | O’Reilly Automotive Inc., (2) | | | 5,434,242 | |
| | |
| | 20,356 | | | Ulta Salon, Cosmetics & Fragrance, Inc., (2) | | | 4,953,429 | |
| | | | Total Specialty Retail | | | 19,557,577 | |
| | |
| | | | Technology Hardware, Storage & Peripherals – 4.6% | | | |
| | |
| | 129,638 | | | Apple, Inc. | | | 14,719,098 | |
| | | | Total Long-Term Investments (cost $227,199,295) | | | 317,699,599 | |
| | |
| Shares | | | Description (1) | | Value | |
| | |
| | | | INVESTMENTS PURCHASED WITH COLLATERAL FROM SECURITIES LENDING – 3.8% | | | | |
| | |
| | | | MONEY MARKET FUNDS – 3.8% | | | |
| | |
| | 12,272,813 | | | First American Government Obligations Fund, Class X, 0.283%, (4), (5) | | $ | 12,272,813 | |
| | | | Total Investments Purchased with Collateral from Securities Lending (cost $12,272,813) | | | 12,272,813 | |
| | |
| Shares | | | Description (1) | | Value | |
| | |
| | | | SHORT-TERM INVESTMENTS – 0.8% | | | | |
| | |
| | | | MONEY MARKET FUNDS – 0.8% | | | |
| | |
| | 2,536,904 | | | First American Treasury Obligations Fund, Class Z, 0.222%, (4) | | $ | 2,536,904 | |
| | | | Total Short-Term Investments (cost $2,536,904) | | | 2,536,904 | |
| | | | Total Investments (cost $242,009,012) – 104.0% | | | 332,509,316 | |
| | | | Other Assets Less Liabilities – (4.0)% | | | (12,737,793 | ) |
| | | | Net Assets – 100% | | $ | 319,771,523 | |
For Fund portfolio compliance purposes, the Fund’s industry classifications refer to any one or more of the industry sub-classifications used by one or more widely recognized market indexes or ratings group indexes, and/or as defined by Fund management. This definition may not apply for purposes of this report which may combine industry sub-classifications into sectors for reporting ease.
| (1) | All percentages shown in the Portfolio of Investments are based on net assets. |
| (2) | Non-income producing; issuer has not declared a dividend within the past twelve months. |
| (3) | Investment, or a portion of investment, is out on loan for securities lending. The total value of the securities out on loan as of the end of the reporting period was $11,964,996. |
| (4) | The rate shown is the annualized seven-day subsidized yield as of the end of the reporting period. |
| (5) | The Fund may loan securities representing up to one third of the fair value of its total assets (which includes collateral for securities on loan) to broker dealers, banks, and other institutions. The Fund maintains collateral equal to at least 100% of the fair value of the securities loaned. The cash collateral received by the Fund is invested in this money market fund. See Notes to Financial Statements, Note 3 – Portfolio Securities and Investments in Derivatives, Securities Lending for more information. |
See accompanying notes to financial statements.
Nuveen Mid Cap Growth Opportunities Fund
| | |
| Portfolio of Investments | | October 31, 2016 |
| | | | | | | | |
| Shares | | | Description (1) | | Value | |
| | |
| | | | LONG-TERM INVESTMENTS – 99.7% | | | | |
| | |
| | | | COMMON STOCKS – 99.7% | | | | |
| | |
| | | | Aerospace & Defense – 1.4% | | | |
| | |
| | 47,579 | | | TransDigm Group Inc., (2) | | $ | 12,963,374 | |
| | |
| | | | Airlines – 1.3% | | | |
| | |
| | 162,905 | | | Alaska Air Group, Inc. | | | 11,764,999 | |
| | |
| | | | Beverages – 1.1% | | | |
| | |
| | 60,743 | | | Monster Beverage Corporation, (2) | | | 8,767,645 | |
| | |
| | | | Biotechnology – 2.5% | | | |
| | |
| | 69,520 | | | BioMarin Pharmaceutical Inc., (2) | | | 5,597,750 | |
| | |
| | 128,702 | | | Incyte Pharmaceuticals Inc., (2) | | | 11,193,213 | |
| | |
| | 71,303 | | | Vertex Pharmaceuticals Inc., (2) | | | 5,409,046 | |
| | | | Total Biotechnology | | | 22,200,009 | |
| | |
| | | | Building Products – 2.9% | | | |
| | |
| | 467,547 | | | Masco Corporation | | | 14,437,851 | |
| | |
| | 262,882 | | | Smith AO Corporation | | | 11,874,380 | |
| | | | Total Building Products | | | 26,312,231 | |
| | |
| | | | Capital Markets – 7.4% | | | |
| | |
| | 190,855 | | | CBOE Holdings Inc. | | | 12,063,945 | |
| | |
| | 236,370 | | | E*Trade Group Inc., (2) | | | 6,656,179 | |
| | |
| | 34,228 | | | Intercontinental Exchange Group, Inc. | | | 9,254,909 | |
| | |
| | 147,422 | | | MSCI Inc., Class A Shares | | | 11,821,770 | |
| | |
| | 158,286 | | | NASDAQ Stock Market, Inc. | | | 10,125,555 | |
| | |
| | 135,942 | | | S&P Global, Inc. | | | 16,564,533 | |
| | | | Total Capital Markets | | | 66,486,891 | |
| | |
| | | | Chemicals – 1.7% | | | |
| | |
| | 63,976 | | | Sherwin-Williams Company | | | 15,665,163 | |
| | |
| | | | Commercial Services & Supplies – 2.6% | | | |
| | |
| | 103,995 | | | Cintas Corporation | | | 11,093,147 | |
| | |
| | 276,003 | | | KAR Auction Services Inc. | | | 11,752,208 | |
| | | | Total Commercial Services & Supplies | | | 22,845,355 | |
| | |
| | | | Communications Equipment – 2.3% | | | |
| | |
| | 89,588 | | | Harris Corporation | | | 7,992,145 | |
| | |
| | 79,282 | | | Palo Alto Networks, Incorporated, (2) | | | 12,195,950 | |
| | | | Total Communications Equipment | | | 20,188,095 | |
| | | | | | | | |
| Shares | | | Description (1) | | Value | |
| | |
| | | | Containers & Packaging – 1.7% | | | |
| | |
| | 85,531 | | | Ball Corporation | | $ | 6,591,874 | |
| | |
| | 194,701 | | | Sealed Air Corporation | | | 8,884,207 | |
| | | | Total Containers & Packaging | | | 15,476,081 | |
| | |
| | | | Distributors – 1.6% | | | |
| | |
| | 443,997 | | | LKQ Corporation, (2) | | | 14,332,223 | |
| | |
| | | | Diversified Consumer Services – 1.2% | | | |
| | |
| | 663,557 | | | LifeLock, Incorporated, (2), (3) | | | 10,683,268 | |
| | |
| | | | Diversified Telecommunication Services – 1.2% | | | |
| | |
| | 95,281 | | | SBA Communications Corporation, (2) | | | 10,793,432 | |
| | |
| | | | Electrical Equipment – 0.9% | | | |
| | |
| | 31,385 | | | Acuity Brands Inc. | | | 7,016,744 | |
| | |
| | | | Electronic Equipment, Instruments & Comp – 1.7% | | | |
| | |
| | 232,740 | | | Amphenol Corporation, Class A | | | 15,344,548 | |
| | |
| | | | Equity Real Estate Investment Trusts – 1.1% | | | |
| | |
| | 207,971 | | | CyrusOne Inc. | | | 9,277,586 | |
| | |
| | | | Health Care Equipment & Supplies – 5.4% | | | |
| | |
| | 73,976 | | | Abiomed, Inc., (2) | | | 7,766,740 | |
| | |
| | 59,421 | | | C. R. Bard, Inc. | | | 12,875,342 | |
| | |
| | 45,555 | | | DexCom, Inc., (2) | | | 3,564,223 | |
| | |
| | 109,847 | | | Edwards Lifesciences Corporation, (2) | | | 10,459,631 | |
| | |
| | 389,992 | | | Hologic Inc., (2) | | | 14,043,612 | |
| | | | Total Health Care Equipment & Supplies | | | 48,709,548 | |
| | |
| | | | Health Care Providers & Services – 1.8% | | | |
| | |
| | 196,537 | | | Acadia Healthcare Company Inc., (2), (3) | | | 7,067,471 | |
| | |
| | 149,283 | | | Centene Corporation, (2) | | | 9,327,202 | |
| | | | Total Health Care Providers & Services | | | 16,394,673 | |
| | |
| | | | Hotels, Restaurants & Leisure – 3.5% | | | |
| | |
| | 78,554 | | | Marriott International, Inc., Class A | | | 5,396,660 | |
| | |
| | 516,039 | | | MGM Resorts International Inc., (2) | | | 13,504,741 | |
| | |
| | 135,563 | | | Wynn Resorts Ltd | | | 12,817,482 | |
| | | | Total Hotels, Restaurants & Leisure | | | 31,718,883 | |
| | |
| | | | Household Durables – 2.8% | | | |
| | |
| | 400,105 | | | D.R. Horton, Inc. | | | 11,535,027 | |
| | |
| | 71,042 | | | Mohawk Industries Inc., (2) | | | 13,093,041 | |
| | | | Total Household Durables | | | 24,628,068 | |
| | |
| | | | Internet and Direct Marketing Retail – 1.6% | | | |
| | |
| | 113,585 | | | Expedia, Inc. | | | 14,678,590 | |
Nuveen Mid Cap Growth Opportunities Fund (continued)
| | |
| Portfolio of Investments | | October 31, 2016 |
| | | | | | | | |
| Shares | | | Description (1) | | Value | |
| | |
| | | | IT Services – 9.1% | | | |
| | |
| | 64,975 | | | Alliance Data Systems Corporation | | $ | 13,285,438 | |
| | |
| | 191,865 | | | Fidelity National Information Services | | | 14,182,661 | |
| | |
| | 565,437 | | | First Data Corporation, Class A Shares, (2) | | | 7,910,464 | |
| | |
| | 72,659 | | | FleetCor Technologies Inc., (2), (3) | | | 12,737,123 | |
| | |
| | 181,287 | | | Gartner Inc., (2) | | | 15,597,933 | |
| | |
| | 359,821 | | | Total System Services Inc. | | | 17,947,873 | |
| | | | Total IT Services | | | 81,661,492 | |
| | |
| | | | Life Sciences Tools & Services – 4.1% | | | |
| | |
| | 577,061 | | | Accelerate Diagnostics Inc., (2) | | | 12,262,546 | |
| | |
| | 189,819 | | | Quintiles Transnational Corporation, (2) | | | 13,617,615 | |
| | |
| | 75,044 | | | Waters Corporation, (2) | | | 10,441,622 | |
| | | | Total Life Sciences Tools & Services | | | 36,321,783 | |
| | |
| | | | Machinery – 3.9% | | | |
| | |
| | 106,457 | | | Nordson Corporation | | | 10,659,539 | |
| | |
| | 84,938 | | | Snap-on Incorporated | | | 13,088,946 | |
| | |
| | 100,586 | | | Stanley Black & Decker Inc. | | | 11,450,710 | |
| | | | Total Machinery | | | 35,199,195 | |
| | |
| | | | Media – 5.4% | | | |
| | |
| | 471,573 | | | Discovery Communications inc., Class A Shares, (2), (3) | | | 12,312,771 | |
| | |
| | 404,230 | | | Interpublic Group of Companies, Inc. | | | 9,050,710 | |
| | |
| | 142,831 | | | Liberty Broadband Corporation, Class A Shares, (2) | | | 9,276,873 | |
| | |
| | 311,862 | | | Liberty Sirius Group, Class-A Shares, (2) | | | 10,375,649 | |
| | |
| | 1,797,085 | | | Sirius XM Holdings Inc., (3) | | | 7,493,844 | |
| | | | Total Media | | | 48,509,847 | |
| | |
| | | | Multiline Retail – 1.7% | | | |
| | |
| | 206,005 | | | Dollar Tree Stores Inc., (2) | | | 15,563,678 | |
| | |
| | | | Oil, Gas & Consumable Fuels – 1.3% | | | |
| | |
| | 357,357 | | | Parsley Energy Inc. Class A Shares, (2) | | | 11,757,045 | |
| | |
| | | | Pharmaceuticals – 1.1% | | | |
| | |
| | 179,034 | | | Medicines Company, (2), (3) | | | 5,899,170 | |
| | |
| | 280,709 | | | Nektar Therapautics, (2) | | | 3,480,792 | |
| | | | Total Pharmaceuticals | | | 9,379,962 | |
| | |
| | | | Professional Services – 3.8% | | | |
| | |
| | 141,344 | | | Equifax Inc. | | | 17,522,416 | |
| | |
| | 195,342 | | | Nielsen Holdings PLC | | | 8,794,297 | |
| | |
| | 257,484 | | | TransUnion, (2) | | | 8,043,800 | |
| | | | Total Professional Services | | | 34,360,513 | |
| | | | | | | | |
| Shares | | | Description (1) | | Value | |
| | |
| | | | Road & Rail – 1.3% | | | |
| | |
| | 145,560 | | | J.B. Hunt Transports Serives Inc. | | $ | 11,879,152 | |
| | |
| | | | Semiconductors & Semiconductor Equipment – 3.4% | | | |
| | |
| | 141,692 | | | Lam Research Corporation | | | 13,724,287 | |
| | |
| | 181,569 | | | MA-COM Technology Solutions Holdings Incorporated, (2) | | | 6,674,476 | |
| | |
| | 248,587 | | | Microsemi Corporation, (2) | | | 10,472,970 | |
| | | | Total Semiconductors & Semiconductor Equipment | | | 30,871,733 | |
| | |
| | | | Software – 9.1% | | | |
| | |
| | 248,607 | | | Activision Blizzard Inc. | | | 10,732,364 | |
| | |
| | 182,730 | | | Citrix Systems, (2) | | | 15,495,504 | |
| | |
| | 140,711 | | | Cyberark Software Limited, (2), (3) | | | 6,578,239 | |
| | |
| | 228,567 | | | Electronic Arts Inc., (2) | | | 17,947,081 | |
| | |
| | 86,115 | | | Intuit, Inc. | | | 9,364,145 | |
| | |
| | 60,226 | | | Parametric Technology Corporation, (2) | | | 2,857,121 | |
| | |
| | 109,519 | | | Red Hat, Inc., (2) | | | 8,482,247 | |
| | |
| | 114,506 | | | ServiceNow Inc., (2) | | | 10,066,222 | |
| | | | Total Software | | | 81,522,923 | |
| | |
| | | | Specialty Retail – 6.7% | | | |
| | |
| | 173,321 | | | Foot Locker, Inc. | | | 11,572,643 | |
| | |
| | 429,888 | | | Michaels Cos Inc., (2) | | | 9,994,896 | |
| | |
| | 60,474 | | | O’Reilly Automotive Inc., (2) | | | 15,991,745 | |
| | |
| | 177,672 | | | Ross Stores, Inc. | | | 11,111,607 | |
| | |
| | 45,816 | | | Ulta Salon, Cosmetics & Fragrance, Inc., (2) | | | 11,148,865 | |
| | | | Total Specialty Retail | | | 59,819,756 | |
| | |
| | | | Thrifts & Mortgage Finance – 1.1% | | | |
| | |
| | 500,174 | | | BofI Holdings, Inc., (2), (3) | | | 9,318,242 | |
| | | | Total Long-Term Investments (cost $789,306,543) | | | 892,412,727 | |
| | |
| Shares | | | Description (1) | | Value | |
| | |
| | | | INVESTMENTS PURCHASED WITH COLLATERAL FROM SECURITIES LENDING – 5.2% | | | | |
| | |
| | | | MONEY MARKET FUND – 5.2% | | | |
| | |
| | 46,611,706 | | | First American Government Obligations Fund, Class X, 0.283%, (4), (5) | | $ | 46,611,706 | |
| | | | Total Investments Purchased with Colateral from Securities Lending (cost $46,611,706) | | | 46,611,706 | |
Nuveen Mid Cap Growth Opportunities Fund (continued)
| | |
| Portfolio of Investments | | October 31, 2016 |
| | | | | | | | |
| Shares | | | Description (1) | | Value | |
| | |
| | | | SHORT-TERM INVESTMENTS – 1.4% | | | | |
| | |
| | | | MONEY MARKET FUNDS – 1.4% | | | |
| | |
| | 12,397,841 | | | First American Treasury Obligations Fund, Class Z, 0.222%, (4) | | $ | 12,397,841 | |
| | | | Total Short-Term Investments (cost $12,397,841) | | | 12,397,841 | |
| | | | Total Investments (cost $848,316,090) – 106.3% | | | 951,422,274 | |
| | | | Other Assets Less Liabilities – (6.3)% | | | (56,267,537 | ) |
| | | | Net Assets – 100% | | $ | 895,154,737 | |
For Fund portfolio compliance purposes, the Fund’s industry classifications refer to any one or more of the industry sub-classifications used by one or more widely recognized market indexes or ratings group indexes, and/or as defined by Fund management. This definition may not apply for purposes of this report which may combine industry sub-classifications into sectors for reporting ease.
| (1) | All percentages shown in the Portfolio of Investments are based on net assets. |
| (2) | Non-income producing; issuer has not declared a dividend within the past twelve months. |
| (3) | Investment, or a portion of investment, is out on loan for securities lending. The total value of the securities out on loan as of the end of the reporting period was $45,481,074. |
| (4) | The rate shown is the annualized seven-day subsidized yield as of the end of the reporting period. |
| (5) | The Fund may loan securities representing up to one third of the fair value of its total assets (which includes collateral for securities on loan) to broker dealers, banks, and other institutions. The Fund maintains collateral equal to at least 100% of the fair value of the securities loaned. The cash collateral received by the Fund is invested in this money market fund. See Notes to Financial Statements, Note 3 – Portfolio Securities and Investments in Derivatives, Securities Lending for more information. |
See accompanying notes to financial statements.
Nuveen Small Cap Growth Opportunities Fund
| | |
| Portfolio of Investments | | October 31, 2016 |
| | | | | | | | |
| Shares | | | Description (1) | | Value | |
| | |
| | | | LONG-TERM INVESTMENTS – 96.4% | | | | |
| | |
| | | | COMMON STOCKS – 96.4% | | | | |
| | |
| | | | Banks – 4.4% | | | |
| | |
| | 35,481 | | | Bank of the Ozarks, Inc. | | $ | 1,311,378 | |
| | |
| | 41,378 | | | Cathay General Bancorp. | | | 1,239,271 | |
| | |
| | 35,949 | | | Western Alliance Bancorporation, (2) | | | 1,343,055 | |
| | | | Total Banks | | | 3,893,704 | |
| | |
| | | | Biotechnology – 6.1% | | | |
| | |
| | 24,195 | | | Alder Biopharmaceuticals Inc., (2), (3) | | | 586,729 | |
| | |
| | 11,002 | | | Bluebird Bio Inc., (2), (3) | | | 525,346 | |
| | |
| | 14,487 | | | Five Prime Therapeutics Inc., (2) | | | 703,054 | |
| | |
| | 9,558 | | | Kite Pharma Inc., (2), (3) | | | 423,324 | |
| | |
| | 13,105 | | | Neurocrine Biosciences Inc., (2) | | | 573,606 | |
| | |
| | 11,931 | | | Prothena Corporation PLC, (2), (3) | | | 570,540 | |
| | |
| | 8,535 | | | Radius Health Inc., (2), (3) | | | 366,322 | |
| | |
| | 8,092 | | | Sarepta Therapautics Inc., (2), (3) | | | 317,530 | |
| | |
| | 6,684 | | | Tesaro Inc., (2), (3) | | | 807,962 | |
| | |
| | 9,316 | | | Ultragenyx Pharmaceutical Inc., (2) | | | 549,551 | |
| | | | Total Biotechnology | | | 5,423,964 | |
| | |
| | | | Building Products – 1.4% | | | |
| | |
| | 62,701 | | | Continental Building Products Inc., (2) | | | 1,282,235 | |
| | |
| | | | Capital Markets – 1.8% | | | |
| | |
| | 30,093 | | | Evercore Partners Inc. | | | 1,617,498 | |
| | |
| | | | Chemicals – 1.3% | | | |
| | |
| | 39,961 | | | PolyOne Corporation | | | 1,168,060 | |
| | |
| | | | Commercial Services & Supplies – 2.8% | | | |
| | |
| | 29,676 | | | HNI Corporation | | | 1,206,626 | |
| | |
| | 80,872 | | | Interface, Inc. | | | 1,281,821 | |
| | | | Total Commercial Services & Supplies | | | 2,488,447 | |
| | |
| | | | Communications Equipment – 4.4% | | | |
| | |
| | 100,450 | | | IXIA | | | 1,200,378 | |
| | |
| | 37,733 | | | Lumentum Holdings Inc., (2) | | | 1,267,829 | |
| | |
| | 27,126 | | | Plantronics Inc. | | | 1,402,685 | |
| | | | Total Communications Equipment | | | 3,870,892 | |
| | |
| | | | Construction & Engineering – 1.2% | | | |
| | |
| | 35,929 | | | MasTec Inc., (2) | | | 1,025,773 | |
Nuveen Small Cap Growth Opportunities Fund (continued)
| | |
| Portfolio of Investments | | October 31, 2016 |
| | | | | | | | |
| Shares | | | Description (1) | | Value | |
| | |
| | | | Containers & Packaging – 1.0% | | | |
| | |
| | 20,597 | | | Berry Plastics Corporation, (2) | | $ | 901,119 | |
| | |
| | | | Distributors – 1.0% | | | |
| | |
| | 9,222 | | | Pool Corporation | | | 853,773 | |
| | |
| | | | Diversified Telecommunication Services – 1.5% | | | |
| | |
| | 35,532 | | | Cogent Communications Group, Inc. | | | 1,311,131 | |
| | |
| | | | Electrical Equipment – 1.5% | | | |
| | |
| | 34,999 | | | Generac Holdings Inc., (2) | | | 1,333,112 | |
| | |
| | | | Electronic Equipment, Instruments & Comp – 2.4% | | | |
| | |
| | 41,873 | | | National Instruments Corporation | | | 1,176,213 | |
| | |
| | 36,376 | | | Orbotech, Limited, (2) | | | 996,702 | |
| | | | Total Electronic Equipment, Instruments & Comp | | | 2,172,915 | |
| | |
| | | | Equity Real Estate Investment Trusts – 3.5% | | | |
| | |
| | 23,131 | | | Dupont Fabros Technology Inc. | | | 943,976 | |
| | |
| | 11,026 | | | PS Business Parks Inc. | | | 1,210,545 | |
| | |
| | 52,631 | | | Ramco-Gershenson Properties Trust | | | 912,622 | |
| | | | Total Equity Real Estate Investment Trusts | | | 3,067,143 | |
| | |
| | | | Food Products – 3.0% | | | |
| | |
| | 37,966 | | | Snyders Lance Inc. | | | 1,350,451 | |
| | |
| | 15,305 | | | Treehouse Foods Inc., (2) | | | 1,338,881 | |
| | | | Total Food Products | | | 2,689,332 | |
| | |
| | | | Health Care Equipment & Supplies – 9.6% | | | |
| | |
| | 46,515 | | | AtriCure, Inc., (2), (3) | | | 848,434 | |
| | |
| | 87,368 | | | Endologix, Inc., (2), (3) | | | 913,869 | |
| | |
| | 35,185 | | | Glaukos Corporation, (2) | | | 1,175,179 | |
| | |
| | 29,796 | | | Insulet Corporation, (2) | | | 1,106,028 | |
| | |
| | 61,812 | | | K2M Group Holdings Inc., (2) | | | 1,055,131 | |
| | |
| | 59,909 | | | Merit Medical Systems, Inc., (2) | | | 1,315,003 | |
| | |
| | 11,572 | | | Nevro Corporation, (2), (3) | | | 1,063,698 | |
| | |
| | 45,556 | | | Nxstage Medical, Inc., (2) | | | 1,035,943 | |
| | | | Total Health Care Equipment & Supplies | | | 8,513,285 | |
| | |
| | | | Health Care Providers & Services – 4.4% | | | |
| | |
| | 27,964 | | | Amedisys, Inc., (2) | | | 1,209,723 | |
| | |
| | 36,612 | | | Diplomat Pharmacy, Inc., (2), (3) | | | 848,300 | |
| | |
| | 29,135 | | | Surgical Care Affiliates Inc., (2) | | | 1,246,687 | |
| | |
| | 37,146 | | | Teladoc, Inc., (2), (3) | | | 603,623 | |
| | | | Total Health Care Providers & Services | | | 3,908,333 | |
| | |
| | | | Health Care Technology – 1.6% | | | |
| | |
| | 67,225 | | | HMS Holdings Corporation, (2) | | | 1,416,431 | |
| | | | | | | | |
| Shares | | | Description (1) | | Value | |
| | |
| | | | Hotels, Restaurants & Leisure – 3.9% | | | |
| | |
| | 37,022 | | | BJ’s Restaurants, Inc., (2) | | $ | 1,336,494 | |
| | |
| | 8,419 | | | Buffalo Wild Wings, Inc., (2) | | | 1,226,227 | |
| | |
| | 9,551 | | | Jack in the Box Inc., Term Loan | | | 895,215 | |
| | | | Total Hotels, Restaurants & Leisure | | | 3,457,936 | |
| | |
| | | | Internet Software & Services – 6.6% | | | |
| | |
| | 29,739 | | | Cornerstone OnDemand Inc., (2) | | | 1,228,221 | |
| | |
| | 38,600 | | | Envestnet Inc., (2) | | | 1,364,510 | |
| | |
| | 11,002 | | | LogMeIn Inc., (2) | | | 1,045,190 | |
| | |
| | 52,085 | | | Mimecast Limited, (2) | | | 1,054,200 | |
| | |
| | 18,381 | | | SPS Commerce Inc., (2) | | | 1,146,607 | |
| | | | Total Internet Software & Services | | | 5,838,728 | |
| | |
| | | | IT Services – 1.2% | | | |
| | |
| | 57,765 | | | Perficient, Inc., (2) | | | 1,075,007 | |
| | |
| | | | Leisure Products – 1.1% | | | |
| | |
| | 23,181 | | | Brunswick Corporation | | | 1,008,374 | |
| | |
| | | | Life Sciences Tools & Services – 1.1% | | | |
| | |
| | 47,483 | | | Accelerate Diagnostics Inc., (2), (3) | | | 1,009,014 | |
| | |
| | | | Machinery – 4.5% | | | |
| | |
| | 21,558 | | | CLARCOR, Inc. | | | 1,341,123 | |
| | |
| | 27,659 | | | ESCO Technologies Inc. | | | 1,232,208 | |
| | |
| | 82,965 | | | NN, Incorporated | | | 1,464,331 | |
| | | | Total Machinery | | | 4,037,662 | |
| | |
| | | | Oil, Gas & Consumable Fuels – 1.2% | | | |
| | |
| | 29,866 | | | RSP Permian Inc., (2) | | | 1,078,163 | |
| | |
| | | | Personal Products – 0.5% | | | |
| | |
| | 17,547 | | | e.l.f. Beauty, Incorporated, (2) | | | 453,765 | |
| | |
| | | | Pharmaceuticals – 0.6% | | | |
| | |
| | 13,909 | | | Aerie Pharmaceuticals Inc., (2) | | | 462,474 | |
| | |
| | | | Professional Services – 2.5% | | | |
| | |
| | 29,843 | | | FTI Consulting Inc., (2) | | | 1,162,683 | |
| | |
| | 51,626 | | | Korn Ferry International | | | 1,052,654 | |
| | | | Total Professional Services | | | 2,215,337 | |
| | |
| | | | Semiconductors & Semiconductor Equipment – 7.7% | | | |
| | |
| | 49,529 | | | Maxlinear Inc., (2) | | | 926,688 | |
| | |
| | 28,903 | | | Mellanox Technologies, Limited, (2) | | | 1,254,390 | |
| | |
| | 22,093 | | | Microsemi Corporation, (2) | | | 930,778 | |
| | |
| | 29,239 | | | MKS Instruments Inc. | | | 1,475,107 | |
| | |
| | 44,586 | | | Semtech Corporation, (2) | | | 1,078,981 | |
Nuveen Small Cap Growth Opportunities Fund (continued)
| | |
| Portfolio of Investments | | October 31, 2016 |
| | | | | | | | |
| Shares | | | Description (1) | | Value | |
| | |
| | | | Semiconductors & Semiconductor Equipment (continued) | | | |
| | |
| | 49,472 | | | Teradyne Inc. | | $ | 1,152,203 | |
| | | | Total Semiconductors & Semiconductor Equipment | | | 6,818,147 | |
| | |
| | | | Software – 10.3% | | | |
| | |
| | 62,049 | | | Barracuda Networks Inc., (2) | | | 1,446,983 | |
| | |
| | 30,231 | | | Broadsoft Inc., (2) | | | 1,256,098 | |
| | |
| | 31,110 | | | CommVault Systems, Inc., (2) | | | 1,664,384 | |
| | |
| | 25,502 | | | Cyberark Software Limited, (2), (3) | | | 1,192,219 | |
| | |
| | 12,890 | | | Proofpoint, Incorporated, (2), (3) | | | 1,010,318 | |
| | |
| | 56,734 | | | RealPage Inc., (2) | | | 1,543,164 | |
| | |
| | 29,262 | | | Synchronoss Technologies, Inc., (2) | | | 1,074,208 | |
| | |
| | 591,081 | | | VideoPropulsion Inc., (2), (4) | | | 1 | |
| | | | Total Software | | | 9,187,375 | |
| | |
| | | | Specialty Retail – 0.9% | | | |
| | |
| | 49,207 | | | Tile Shop Holdings Inc., (2) | | | 834,059 | |
| | |
| | | | Textiles Apparel & Luxury Goods – 1.4% | | | |
| | |
| | 36,347 | | | Steven Madden Limited, (2) | | | 1,213,989 | |
| | | | Total Long-Term Investments (cost $76,046,697) | | | 85,627,177 | |
| | |
| Shares | | | Description (1) | | Value | |
| | |
| | | | INVESTMENTS PURCHASED WITH COLLATERAL FROM SECURITIES LENDING – 10.6% | | | | |
| | |
| | | | MONEY MARKET FUNDS – 10.6% | | | |
| | |
| | 9,455,033 | | | First American Government Obligations Fund, Class X, 0.283%, (5), (6) | | $ | 9,455,033 | |
| | | | Total Investments Purchased with Collateral from Securities Lending (cost $9,455,033) | | | 9,455,033 | |
| | |
| Shares | | | Description (1) | | Value | |
| | |
| | | | SHORT-TERM INVESTMENTS – 4.1% | | | | |
| | |
| | | | MONEY MARKET FUNDS – 4.1% | | | |
| | |
| | 3,631,946 | | | First American Treasury Obligations Fund, Class Z, 0.222%, (5) | | $ | 3,631,946 | |
| | | | Total Short-Term Investments (cost $3,631,946) | | | 3,631,946 | |
| | | | Total Investments (cost $89,133,676) – 111.1% | | | 98,714,156 | |
| | | | Other Assets Less Liabilities – (11.1)% | | | (9,864,500 | ) |
| | | | Net Assets – 100% | | $ | 88,849,656 | |
For Fund portfolio compliance purposes, the Fund’s industry classifications refer to any one or more of the industry sub-classifications used by one or more widely recognized market indexes or ratings group indexes, and/or as defined by Fund management. This definition may not apply for purposes of this report which may combine industry sub-classifications into sectors for reporting ease.
| (1) | All percentages shown in the Portfolio of Investments are based on net assets. |
| (2) | Non-income producing; issuer has not declared a dividend within the past twelve months. |
| (3) | Investment, or a portion of investment, is out on loan for securities lending. The total value of the securities out on loan as of the end of the reporting period was $9,193,294. |
| (4) | Investment valued at fair value using methods determined in good faith by, or at the discretion of, the Board. For fair value measurement disclosure purposes, investment classified as Level 3. See Notes to Financial Statements, Note 2 – Investment Valuation and Fair Value Measurements for more information. |
| (5) | The rate shown is the annualized seven-day subsidized yield as of the end of the reporting period. |
| (6) | The Fund may loan securities representing up to one third of the fair value of its total assets (which includes collateral for securities on loan) to broker dealers, banks, and other institutions. The Fund maintains collateral equal to at least 100% of the fair value of the securities loaned. The cash collateral received by the Fund is invested in this money market fund. See Notes to Financial Statements, Note 3 – Portfolio Securities and Investments in Derivatives, Securities Lending for more information. |
See accompanying notes to financial statements.
Statement of
| | | | |
| | Assets and Liabilities | | October 31, 2016 |
| | | | | | | | | | | | |
| | | Large Cap
Growth
Opportunities | | | Mid Cap
Growth
Opportunities | | | Small Cap
Growth
Opportunities | |
Assets | | | | | | | | | | | | |
Long-term investments, at value (cost $227,199,295, $789,306,543, and $76,046,697, respectively) | | $ | 317,699,599 | | | $ | 892,412,727 | | | $ | 85,627,177 | |
Investments purchased with collateral from securities lending, at value (cost approximates value) | | | 12,272,813 | | | | 46,611,706 | | | | 9,455,033 | |
Short-term investments, at value (cost approximates value) | | | 2,536,904 | | | | 12,397,841 | | | | 3,631,946 | |
Receivables: | | | | | | | | | | | | |
Dividends | | | 215,569 | | | | 1,489,120 | | | | 5,390 | |
Due from broker | | | 3,435 | | | | 7,798 | | | | 13,843 | |
Interest | | | 189 | | | | 1,264 | | | | 526 | |
Investments sold | | | 2,348,114 | | | | 5,730,491 | | | | 455,300 | |
Reclaims | | | 10,527 | | | | — | | | | — | |
Shares sold | | | 192,517 | | | | 1,238,374 | | | | 16,563 | |
Other assets | | | 56,140 | | | | 88,236 | | | | 36,010 | |
Total assets | | | 335,335,807 | | | | 959,977,557 | | | | 99,241,788 | |
Liabilities | | | | | | | | | | | | |
Payables for: | | | | | | | | | | | | |
Collateral from securities lending program | | | 12,272,813 | | | | 46,611,706 | | | | 9,455,033 | |
Investments purchased | | | 2,097,116 | | | | 14,884,216 | | | | 790,120 | |
Shares redeemed | | | 773,359 | | | | 2,176,650 | | | | 20,746 | |
Accrued expenses: | | | | | | | | | | | | |
Directors fees | | | 24,650 | | | | 56,442 | | | | 827 | |
Management fees | | | 210,265 | | | | 562,877 | | | | 65,023 | |
12b-1 distribution and service fees | | | 32,328 | | | | 101,089 | | | | 9,272 | |
Other | | | 153,753 | | | | 429,840 | | | | 51,111 | |
Total liabilities | | | 15,564,284 | | | | 64,822,820 | | | | 10,392,132 | |
Net assets | | $ | 319,771,523 | | | $ | 895,154,737 | | | $ | 88,849,656 | |
Class A Shares | | | | | | | | | | | | |
Net assets | | $ | 92,207,803 | | | $ | 280,681,459 | | | $ | 31,255,450 | |
Shares outstanding | | | 3,105,316 | | | | 7,778,136 | | | | 1,570,733 | |
Net asset value (“NAV”) per share | | $ | 29.69 | | | $ | 36.09 | | | $ | 19.90 | |
Offering price per share (NAV per share plus maximum sales charge of 5.75% of offering price) | | $ | 31.50 | | | $ | 38.29 | | | $ | 21.11 | |
Class C Shares | | | | | | | | | | | | |
Net assets | | $ | 10,598,801 | | | $ | 16,955,990 | | | $ | 1,970,968 | |
Shares outstanding | | | 430,334 | | | | 589,947 | | | | 123,011 | |
NAV and offering price per share | | $ | 24.63 | | | $ | 28.74 | | | $ | 16.02 | |
Class R3 Shares | | | | | | | | | | | | |
Net assets | | $ | 6,456,726 | | | $ | 55,093,006 | | | $ | 1,630,849 | |
Shares outstanding | | | 227,485 | | | | 1,613,530 | | | | 85,988 | |
NAV and offering price per share | | $ | 28.38 | | | $ | 34.14 | | | $ | 18.97 | |
Class R6 Shares | | | | | | | | | | | | |
Net assets | | $ | 15,868,579 | | | $ | 50,677,223 | | | $ | 19,524,067 | |
Shares outstanding | | | 489,514 | | | | 1,203,397 | | | | 850,383 | |
NAV and offering price per share | | $ | 32.42 | | | $ | 42.11 | | | $ | 22.96 | |
Class I Shares | | | | | | | | | | | | |
Net assets | | $ | 194,639,614 | | | $ | 491,747,059 | | | $ | 34,468,322 | |
Shares outstanding | | | 6,032,445 | | | | 11,745,366 | | | | 1,502,351 | |
NAV and offering price per share | | $ | 32.27 | | | $ | 41.87 | | | $ | 22.94 | |
Net Assets Consist of: | | | | | | | | | | | | |
Capital paid-in | | $ | 193,388,208 | | | $ | 761,914,161 | | | $ | 79,687,467 | |
Undistributed (Over-distribution of) net investment income | | | (108,808 | ) | | | (1,700,163 | ) | | | (321,130 | ) |
Accumulated net realized gain (loss) | | | 35,991,819 | | | | 31,834,555 | | | | (97,161 | ) |
Net unrealized appreciation (depreciation) | | | 90,500,304 | | | | 103,106,184 | | | | 9,580,480 | |
Net Assets | | $ | 319,771,523 | | | $ | 895,154,737 | | | $ | 88,849,656 | |
Authorized shares – per class | | | 2 billion | | | | 2 billion | | | | 2 billion | |
Par value per share | | $ | 0.0001 | | | $ | 0.0001 | | | $ | 0.0001 | |
See accompanying notes to financial statements.
Statement of
| | | | |
| | Operations | | Year Ended October 31, 2016 |
| | | | | | | | | | | | |
| | | Large Cap
Growth
Opportunities | | | Mid Cap
Growth
Opportunities | | | Small Cap
Growth
Opportunities | |
Investment Income | | | | | | | | | | | | |
Dividend and interest income (net of foreign tax withheld of $13,452, $15,069 and $—, respectively) | | $ | 4,029,449 | | | $ | 8,535,595 | | | $ | 513,014 | |
Securities lending income, net | | | 103,141 | | | | 944,898 | | | | 304,220 | |
Total investment income | | | 4,132,590 | | | | 9,480,493 | | | | 817,234 | |
Expenses | | | | | | | | | | | | |
Management fees | | | 3,058,948 | | | | 8,471,242 | | | | 857,321 | |
12b-1 service fees — Class A Shares | | | 258,952 | | | | 796,364 | | | | 78,303 | |
12b-1 distribution and service fees — Class C Shares | | | 127,659 | | | | 189,363 | | | | 20,561 | |
12b-1 distribution and service fees — Class R3 Shares | | | 32,738 | | | | 289,200 | | | | 6,721 | |
Shareholder servicing agent fees | | | 453,281 | | | | 1,544,562 | | | | 124,683 | |
Custodian fees | | | 42,970 | | | | 103,191 | | | | 14,600 | |
Directors fees | | | 10,913 | | | | 28,378 | | | | 2,580 | |
Professional fees | | | 49,233 | | | | 95,894 | | | | 26,719 | |
Shareholder reporting expenses | | | 49,949 | | | | 79,879 | | | | 18,402 | |
Federal and state registration fees | | | 72,209 | | | | 83,894 | | | | 58,474 | |
Other | | | 15,925 | | | | 31,936 | | | | 3,819 | |
Total expenses before fee waiver/expense reimbursement | | | 4,172,777 | | | | 11,713,903 | | | | 1,212,183 | |
Fee waiver/expense reimbursement | | | — | | | | (192,574 | ) | | | (50,590 | ) |
Net expenses | | | 4,172,777 | | | | 11,521,329 | | | | 1,161,593 | |
Net investment income (loss) | | | (40,187 | ) | | | (2,040,836 | ) | | | (344,359 | ) |
Realized and Unrealized Gain (Loss) | | | | | | | | | | | | |
Net realized gain (loss) from investments | | | 44,904,829 | | | | 39,438,510 | | | | 230,549 | |
Change in net unrealized appreciation (depreciation) of investments | | | (55,738,026 | ) | | | (84,112,052 | ) | | | 1,751,276 | |
Net realized and unrealized gain (loss) | | | (10,833,197 | ) | | | (44,673,542 | ) | | | 1,981,825 | |
Net increase (decrease) in net assets from operations | | $ | (10,873,384 | ) | | $ | (46,714,378 | ) | | $ | 1,637,466 | |
See accompanying notes to financial statements.
Statement of
| | | | | | | | | | | | | | | | | | | | | | | | | | | | | | | | |
| | | Large Cap Growth Opportunities | | | | | | Mid Cap Growth Opportunities | | | | | | Small Cap Growth Opportunities | |
| | | Year Ended
10/31/16 | | | Year Ended
10/31/15 | | | | | | Year Ended
10/31/16 | | | Year Ended
10/31/15 | | | | | | Year Ended
10/31/16 | | | Year Ended
10/31/15 | |
Operations | | | | | | | | | | | | | | | | | | | | | | | | | | | | | | | | |
Net investment income (loss) | | $ | (40,187 | ) | | $ | (153,886 | ) | | | | | | $ | (2,040,836 | ) | | $ | (7,547,050 | ) | | | | | | $ | (344,359 | ) | | $ | (884,764 | ) |
Net realized gain (loss) from investments | | | 44,904,829 | | | | 81,224,898 | | | | | | | | 39,438,510 | | | | 93,276,543 | | | | | | | | 230,549 | | | | 9,729,822 | |
Change in net unrealized appreciation (depreciation) of investments | | | (55,738,026 | ) | | | (25,402,229 | ) | | | | | | | (84,112,052 | ) | | | (37,039,615 | ) | | | | | | | 1,751,276 | | | | (8,261,028 | ) |
Net increase (decrease) in net assets from operations | | | (10,873,384 | ) | | | 55,668,783 | | | | | | | | (46,714,378 | ) | | | 48,689,878 | | | | | | | | 1,637,466 | | | | 584,030 | |
Distributions to Shareholders | | | | | | | | | | | | | | | | | | | | | | | | | | | | | | | | |
From net investment income: | | | | | | | | | | | | | | | | | | | | | | | | | | | | | | | | |
Class A Shares | | | (1,326,762 | ) | | | — | | | | | | | | — | | | | — | | | | | | | | — | | | | — | |
Class C Shares | | | (44,124 | ) | | | — | | | | | | | | — | | | | — | | | | | | | | — | | | | — | |
Class R3 Shares | | | (69,770 | ) | | | — | | | | | | | | — | | | | — | | | | | | | | — | | | | — | |
Class R6 Shares | | | (252,750 | ) | | | — | | | | | | | | — | | | | — | | | | | | | | — | | | | — | |
Class I Shares | | | (4,043,340 | ) | | | — | | | | | | | | — | | | | — | | | | | | | | — | | | | — | |
From accumulated net realized gains: | | | | | | | | | | | | | | | | | | | | | | | | | | | | | | | | |
Class A Shares | | | (20,516,896 | ) | | | (23,403,600 | ) | | | | | | | (29,764,786 | ) | | | (63,095,209 | ) | | | | | | | (3,119,388 | ) | | | (4,471,368 | ) |
Class C Shares | | | (3,078,627 | ) | | | (2,680,855 | ) | | | | | | | (2,169,779 | ) | | | (4,791,958 | ) | | | | | | | (257,365 | ) | | | (319,340 | ) |
Class R3 Shares | | | (1,454,143 | ) | | | (1,555,935 | ) | | | | | | | (5,269,991 | ) | | | (11,403,833 | ) | | | | | | | (141,730 | ) | | | (245,744 | ) |
Class R6 Shares | | | (3,020,951 | ) | | | (3,364,017 | ) | | | | | | | (2,160,039 | ) | | | (2,495,372 | ) | | | | | | | — | | | | — | |
Class I Shares | | | (50,204,420 | ) | | | (58,751,935 | ) | | | | | | | (50,466,827 | ) | | | (123,471,077 | ) | | | | | | | (5,003,863 | ) | | | (6,745,694 | ) |
Decrease in net assets from distributions to shareholders | | | (84,011,783 | ) | | | (89,756,342 | ) | | | | | | | (89,831,422 | ) | | | (205,257,449 | ) | | | | | | | (8,522,346 | ) | | | (11,782,146 | ) |
Fund Share Transactions | | | | | | | | | | | | | | | | | | | | | | | | | | | | | | | | |
Proceeds from sale of shares | | | 41,124,698 | | | | 43,245,242 | | | | | | | | 168,865,444 | | | | 219,634,570 | | | | | | | | 29,902,736 | | | | 16,031,783 | |
Proceeds from shares issued to shareholders due to reinvestment of distributions | | | 60,048,952 | | | | 63,521,406 | | | | | | | | 81,262,369 | | | | 180,877,868 | | | | | | | | 7,074,849 | | | | 9,392,517 | |
| | | 101,173,650 | | | | 106,766,648 | | | | | | | | 250,127,813 | | | | 400,512,438 | | | | | | | | 36,977,585 | | | | 25,424,300 | |
Cost of shares redeemed | | | (153,233,088 | ) | | | (171,182,954 | ) | | | | | | | (422,698,529 | ) | | | (330,668,906 | ) | | | | | | | (41,285,778 | ) | | | (20,387,721 | ) |
Net increase (decrease) in net assets from Fund share transactions | | | (52,059,438 | ) | | | (64,416,306 | ) | | | | | | | (172,570,716 | ) | | | 69,843,532 | | | | | | | | (4,308,193 | ) | | | 5,036,579 | |
Net increase (decrease) in net assets | | | (146,944,605 | ) | | | (98,503,865 | ) | | | | | | | (309,116,516 | ) | | | (86,724,039 | ) | | | | | | | (11,193,073 | ) | | | (6,161,537 | ) |
Net assets at the beginning of period | | | 466,716,128 | | | | 565,219,993 | | | | | | | | 1,204,271,253 | | | | 1,290,995,292 | | | | | | | | 100,042,729 | | | | 106,204,266 | |
Net assets at the end of period | | $ | 319,771,523 | | | $ | 466,716,128 | | | | | | | $ | 895,154,737 | | | $ | 1,204,271,253 | | | | | | | $ | 88,849,656 | | | $ | 100,042,729 | |
Undistributed (Over-distribution of) net investment income at the end of period | | $ | (108,808 | ) | | $ | 5,448,515 | | | | | | | $ | (1,700,163 | ) | | $ | (6,726,087 | ) | | | | | | $ | (321,130 | ) | | $ | — | |
See accompanying notes to financial statements.
Financial
Highlights
Large Cap Growth Opportunities
Selected data for a share outstanding throughout each period:
| | | | | | | | | | | | | | | | | | | | | | | | | | | | | | | | | | | | |
| | | | | |
| | | | | | Investment Operations | | | | | | Less Distributions | | | | |
| | | | | | | | | |
Class (Commencement Date) Year Ended October 31, | | Beginning
NAV | | | Net
Investment
Income
(Loss)(a) | | | Net
Realized/
Unrealized
Gain (Loss) | | | Total | | | | | | From
Net
Investment
Income | | | From
Accumulated
Net Realized
Gains | | | Total | | | Ending
NAV | |
Class A (1/95) | | | | | | | | | | | | | | | | | | | | | | | | | | | | | | | | | | | | |
2016 | | $ | 37.55 | | | $ | (0.05 | ) | | $ | (0.73 | ) | | $ | (0.78 | ) | | | | | | $ | (0.36 | ) | | $ | (6.72 | ) | | $ | (7.08 | ) | | $ | 29.69 | |
2015 | | | 40.48 | | | | (0.05 | ) | | | 3.99 | | | | 3.94 | | | | | | | | — | | | | (6.87 | ) | | | (6.87 | ) | | | 37.55 | |
2014 | | | 43.26 | | | | (0.16 | ) | | | 4.12 | | | | 3.96 | | | | | | | | — | | | | (6.74 | ) | | | (6.74 | ) | | | 40.48 | |
2013 | | | 34.09 | | | | (0.05 | ) | | | 9.63 | | | | 9.58 | | | | | | | | — | | | | (0.41 | ) | | | (0.41 | ) | | | 43.26 | |
2012 | | | 32.92 | | | | (0.13 | ) | | | 2.46 | | | | 2.33 | | | | | | | | — | | | | (1.16 | ) | | | (1.16 | ) | | | 34.09 | |
Class C (9/01) | | | | | | | | | | | | | | | | | | | | | | | | | | | | | | | | | | | | |
2016 | | | 32.27 | | | | (0.23 | ) | | | (0.61 | ) | | | (0.84 | ) | | | | | | | (0.08 | ) | | | (6.72 | ) | | | (6.80 | ) | | | 24.63 | |
2015 | | | 35.97 | | | | (0.30 | ) | | | 3.47 | | | | 3.17 | | | | | | | | — | | | | (6.87 | ) | | | (6.87 | ) | | | 32.27 | |
2014 | | | 39.42 | | | | (0.40 | ) | | | 3.69 | | | | 3.29 | | | | | | | | — | | | | (6.74 | ) | | | (6.74 | ) | | | 35.97 | |
2013 | | | 31.34 | | | | (0.31 | ) | | | 8.80 | | | | 8.49 | | | | | | | | — | | | | (0.41 | ) | | | (0.41 | ) | | | 39.42 | |
2012 | | | 30.57 | | | | (0.35 | ) | | | 2.28 | | | | 1.93 | | | | | | | | — | | | | (1.16 | ) | | | (1.16 | ) | | | 31.34 | |
Class R3 (11/00) | | | | | | | | | | | | | | | | | | | | | | | | | | | | | | | | | | | | |
2016 | | | 36.18 | | | | (0.12 | ) | | | (0.70 | ) | | | (0.82 | ) | | | | | | | (0.26 | ) | | | (6.72 | ) | | | (6.98 | ) | | | 28.38 | |
2015 | | | 39.33 | | | | (0.17 | ) | | | 3.89 | | | | 3.72 | | | | | | | | — | | | | (6.87 | ) | | | (6.87 | ) | | | 36.18 | |
2014 | | | 42.32 | | | | (0.25 | ) | | | 4.00 | | | | 3.75 | | | | | | | | — | | | | (6.74 | ) | | | (6.74 | ) | | | 39.33 | |
2013 | | | 33.44 | | | | (0.14 | ) | | | 9.43 | | | | 9.29 | | | | | | | | — | | | | (0.41 | ) | | | (0.41 | ) | | | 42.32 | |
2012 | | | 32.39 | | | | (0.22 | ) | | | 2.43 | | | | 2.21 | | | | | | | | — | | | | (1.16 | ) | | | (1.16 | ) | | | 33.44 | |
Class R6 (2/13) | | | | | | | | | | | | | | | | | | | | | | | | | | | | | | | | | | | | |
2016 | | | 40.35 | | | | 0.06 | | | | (0.78 | ) | | | (0.72 | ) | | | | | | | (0.49 | ) | | | (6.72 | ) | | | (7.21 | ) | | | 32.42 | |
2015 | | | 42.85 | | | | 0.07 | | | | 4.30 | | | | 4.37 | | | | | | | | — | | | | (6.87 | ) | | | (6.87 | ) | | | 40.35 | |
2014 | | | 45.27 | | | | (0.02 | ) | | | 4.34 | | | | 4.32 | | | | | | | | — | | | | (6.74 | ) | | | (6.74 | ) | | | 42.85 | |
2013(d) | | | 37.47 | | | | (0.02 | ) | | | 7.82 | | | | 7.80 | | | | | | | | — | | | | — | | | | — | | | | 45.27 | |
Class I (12/92) | | | | | | | | | | | | | | | | | | | | | | | | | | | | | | | | | | | | |
2016 | | | 40.23 | | | | 0.03 | | | | (0.79 | ) | | | (0.76 | ) | | | | | | | (0.48 | ) | | | (6.72 | ) | | | (7.20 | ) | | | 32.27 | |
2015 | | | 42.78 | | | | 0.02 | | | | 4.30 | | | | 4.32 | | | | | | | | — | | | | (6.87 | ) | | | (6.87 | ) | | | 40.23 | |
2014 | | | 45.24 | | | | (0.06 | ) | | | 4.34 | | | | 4.28 | | | | | | | | — | | | | (6.74 | ) | | | (6.74 | ) | | | 42.78 | |
2013 | | | 35.55 | | | | 0.06 | | | | 10.04 | | | | 10.10 | | | | | | | | — | | | | (0.41 | ) | | | (0.41 | ) | | | 45.24 | |
2012 | | | 34.19 | | | | (0.04 | ) | | | 2.56 | | | | 2.52 | | | | | | | | — | | | | (1.16 | ) | | | (1.16 | ) | | | 35.55 | |
| | | | | | | | | | | | | | | | | | | | | | | | | | | | | | | | | | |
| | | | Ratios/Supplemental Data | |
| | | | | | | | | | Ratios to Average
Net Assets Before
Waiver/Reimbursement | | | | | | Ratios to Average
Net Assets After
Waiver/Reimbursement(c) | | | | |
| | | | | | | | |
Total
Return(b) | | | Ending
Net
Assets
(000) | | | | | | Expenses | | | Net
Investment
Income
(Loss) | | | | | | Expenses | | | Net
Investment
Income
(Loss) | | | Portfolio
Turnover
Rate(e) | |
| | | | | | | | | | | | | | | | | | | | | | | | | | | | | | | | | | |
| | (2.49 | )% | | $ | 92,208 | | | | | | | | 1.22 | % | | | (0.16 | )% | | | | | | | 1.22 | % | | | (0.16 | )% | | | 60 | % |
| | 11.75 | | | | 117,688 | | | | | | | | 1.25 | | | | (0.13 | ) | | | | | | | 1.25 | | | | (0.13 | ) | | | 79 | |
| | 10.50 | | | | 143,891 | | | | | | | | 1.25 | | | | (0.40 | ) | | | | | | | 1.25 | | | | (0.40 | ) | | | 66 | |
| | 28.39 | | | | 165,791 | | | | | | | | 1.24 | | | | (0.14 | ) | | | | | | | 1.24 | | | | (0.14 | ) | | | 72 | |
| | 7.66 | | | | 134,788 | | | | | | | | 1.26 | | | | (0.42 | ) | | | | | | | 1.23 | | | | (0.39 | ) | | | 73 | |
| | | | | | | | | | | | | | | | | | | | | | | | | | | | | | | | | | |
| | (3.21 | ) | | | 10,599 | | | | | | | | 1.97 | | | | (0.91 | ) | | | | | | | 1.97 | | | | (0.91 | ) | | | 60 | |
| | 10.92 | | | | 14,575 | | | | | | | | 2.00 | | | | (0.95 | ) | | | | | | | 2.00 | | | | (0.95 | ) | | | 79 | |
| | 9.73 | | | | 14,462 | | | | | | | | 2.00 | | | | (1.15 | ) | | | | | | | 2.00 | | | | (1.15 | ) | | | 66 | |
| | 27.43 | | | | 14,963 | | | | | | | | 1.99 | | | | (0.89 | ) | | | | | | | 1.99 | | | | (0.89 | ) | | | 72 | |
| | 6.88 | | | | 11,193 | | | | | | | | 2.01 | | | | (1.16 | ) | | | | | | | 1.98 | | | | (1.14 | ) | | | 73 | |
| | | | | | | | | | | | | | | | | | | | | | | | | | | | | | | | | | |
| | (2.73 | ) | | | 6,457 | | | | | | | | 1.47 | | | | (0.41 | ) | | | | | | | 1.47 | | | | (0.41 | ) | | | 60 | |
| | 11.47 | | | | 7,996 | | | | | | | | 1.50 | | | | (0.48 | ) | | | | | | | 1.50 | | | | (0.48 | ) | | | 79 | |
| | 10.22 | | | | 8,724 | | | | | | | | 1.50 | | | | (0.64 | ) | | | | | | | 1.50 | | | | (0.64 | ) | | | 66 | |
| | 28.07 | | | | 11,320 | | | | | | | | 1.49 | | | | (0.39 | ) | | | | | | | 1.49 | | | | (0.39 | ) | | | 72 | |
| | 7.40 | | | | 9,658 | | | | | | | | 1.51 | | | | (0.70 | ) | | | | | | | 1.48 | | | | (0.67 | ) | | | 73 | |
| | | | | | | | | | | | | | | | | | | | | | | | | | | | | | | | | | |
| | (2.14 | ) | | | 15,869 | | | | | | | | 0.87 | | | | 0.19 | | | | | | | | 0.87 | | | | 0.19 | | | | 60 | |
| | 12.14 | | | | 18,632 | | | | | | | | 0.91 | | | | 0.17 | | | | | | | | 0.91 | | | | 0.17 | | | | 79 | |
| | 10.90 | | | | 22,672 | | | | | | | | 0.90 | | | | (0.05 | ) | | | | | | | 0.90 | | | | (0.05 | ) | | | 66 | |
| | 20.82 | | | | 28,966 | | | | | | | | 0.91 | * | | | (0.06 | )* | | | | | | | 0.91 | * | | | (0.06 | )* | | | 72 | |
| | | | | | | | | | | | | | | | | | | | | | | | | | | | | | | | | | |
| | (2.24 | ) | | | 194,640 | | | | | | | | 0.97 | | | | 0.10 | | | | | | | | 0.97 | | | | 0.10 | | | | 60 | |
| | 12.05 | | | | 307,826 | | | | | | | | 1.00 | | | | 0.05 | | | | | | | | 1.00 | | | | 0.05 | | | | 79 | |
| | 10.78 | | | | 375,471 | | | | | | | | 1.00 | | | | (0.15 | ) | | | | | | | 1.00 | | | | (0.15 | ) | | | 66 | |
| | 28.69 | | | | 403,480 | | | | | | | | 0.99 | | | | 0.14 | | | | | | | | 0.99 | | | | 0.14 | | | | 72 | |
| | 7.94 | | | | 418,144 | | | | | | | | 1.01 | | | | (0.13 | ) | | | | | | | 0.98 | | | | (0.11 | ) | | | 73 | |
| (a) | Per share Net Investment Income (Loss) is calculated using the average daily shares method. | |
| (b) | Total return is the combination of changes in NAV without any sales charge, reinvested dividend income at NAV and reinvested capital gains distributions at NAV, if any. Total returns are not annualized. | |
| (c) | After fee waiver and/or expense reimbursement from the Adviser, where applicable. | |
| (d) | For the period February 28, 2013 (commencement of operations) through October 31, 2013. | |
| (e) | Portfolio Turnover Rate is calculated based on the lesser of long-term purchases or sales (as disclosed in Note 5 – Investment Transactions) divided by the average long-term market value during the period. | |
See accompanying notes to financial statements.
Financial Highlights (continued)
Mid Cap Growth Opportunities
Selected data for a share outstanding throughout each period:
| | | | | | | | | | | | | | | | | | | | | | | | | | | | | | | | | | | | |
| | | | | |
| | | | | | Investment Operations | | | | | | Less Distributions | | | | |
| | | | | | | | | |
Class (Commencement Date) Year Ended October 31, | | Beginning
NAV | | | Net
Investment
Income
(Loss)(a) | | | Net
Realized/
Unrealized
Gain (Loss) | | | Total | | | | | | From
Net
Investment
Income | | | From
Accumulated
Net Realized
Gains | | | Total | | | Ending
NAV | |
Class A (1/95) | | | | | | | | | | | | | | | | | | | | | | | | | | | | | | | | | | | | |
2016 | | $ | 40.91 | | | $ | (0.12 | ) | | $ | (1.36 | ) | | $ | (1.48 | ) | | | | | | $ | — | | | $ | (3.34 | ) | | $ | (3.34 | ) | | $ | 36.09 | |
2015 | | | 47.67 | | | | (0.31 | ) | | | 1.72 | | | | 1.41 | | | | | | | | — | | | | (8.17 | ) | | | (8.17 | ) | | | 40.91 | |
2014 | | | 51.11 | | | | (0.38 | ) | | | 6.09 | | | | 5.71 | | | | | | | | — | | | | (9.15 | ) | | | (9.15 | ) | | | 47.67 | |
2013 | | | 42.38 | | | | (0.17 | ) | | | 12.05 | | | | 11.88 | | | | | | | | — | | | | (3.15 | ) | | | (3.15 | ) | | | 51.11 | |
2012 | | | 41.36 | | | | (0.16 | ) | | | 2.77 | | | | 2.61 | | | | | | | | — | | | | (1.59 | ) | | | (1.59 | ) | | | 42.38 | |
Class C (9/01) | | | | | | | | | | | | | | | | | | | | | | | | | | | | | | | | | | | | |
2016 | | | 33.50 | | | | (0.31 | ) | | | (1.11 | ) | | | (1.42 | ) | | | | | | | — | | | | (3.34 | ) | | | (3.34 | ) | | | 28.74 | |
2015 | | | 40.77 | | | | (0.52 | ) | | | 1.42 | | | | 0.90 | | | | | | | | — | | | | (8.17 | ) | | | (8.17 | ) | | | 33.50 | |
2014 | | | 45.29 | | | | (0.63 | ) | | | 5.26 | | | | 4.63 | | | | | | | | — | | | | (9.15 | ) | | | (9.15 | ) | | | 40.77 | |
2013 | | | 38.17 | | | | (0.45 | ) | | | 10.72 | | | | 10.27 | | | | | | | | — | | | | (3.15 | ) | | | (3.15 | ) | | | 45.29 | |
2012 | | | 37.70 | | | | (0.43 | ) | | | 2.49 | | | | 2.06 | | | | | | | | — | | | | (1.59 | ) | | | (1.59 | ) | | | 38.17 | |
Class R3 (12/00) | | | | | | | | | | | | | | | | | | | | | | | | | | | | | | | | | | | | |
2016 | | | 38.98 | | | | (0.20 | ) | | | (1.30 | ) | | | (1.50 | ) | | | | | | | — | | | | (3.34 | ) | | | (3.34 | ) | | | 34.14 | |
2015 | | | 45.90 | | | | (0.40 | ) | | | 1.65 | | | | 1.25 | | | | | | | | — | | | | (8.17 | ) | | | (8.17 | ) | | | 38.98 | |
2014 | | | 49.65 | | | | (0.49 | ) | | | 5.89 | | | | 5.40 | | | | | | | | — | | | | (9.15 | ) | | | (9.15 | ) | | | 45.90 | |
2013 | | | 41.35 | | | | (0.27 | ) | | | 11.72 | | | | 11.45 | | | | | | | | — | | | | (3.15 | ) | | | (3.15 | ) | | | 49.65 | |
2012 | | | 40.50 | | | | (0.27 | ) | | | 2.71 | | | | 2.44 | | | | | | | | — | | | | (1.59 | ) | | | (1.59 | ) | | | 41.35 | |
Class R6 (2/13) | | | | | | | | | | | | | | | | | | | | | | | | | | | | | | | | | | | | |
2016 | | | 47.00 | | | | 0.06 | | | | (1.61 | ) | | | (1.55 | ) | | | | | | | — | | | | (3.34 | ) | | | (3.34 | ) | | | 42.11 | |
2015 | | | 53.36 | | | | (0.16 | ) | | | 1.97 | | | | 1.81 | | | | | | | | — | | | | (8.17 | ) | | | (8.17 | ) | | | 47.00 | |
2014 | | | 55.97 | | | | (0.23 | ) | | | 6.77 | | | | 6.54 | | | | | | | | — | | | | (9.15 | ) | | | (9.15 | ) | | | 53.36 | |
2013(d) | | | 46.61 | | | | (0.05 | ) | | | 9.41 | | | | 9.36 | | | | | | | | — | | | | — | | | | — | | | | 55.97 | |
Class I (12/89) | | | | | | | | | | | | | | | | | | | | | | | | | | | | | | | | | | | | |
2016 | | | 46.81 | | | | (0.04 | ) | | | (1.56 | ) | | | (1.60 | ) | | | | | | | — | | | | (3.34 | ) | | | (3.34 | ) | | | 41.87 | |
2015 | | | 53.24 | | | | (0.23 | ) | | | 1.97 | | | | 1.74 | | | | | | | | — | | | | (8.17 | ) | | | (8.17 | ) | | | 46.81 | |
2014 | | | 55.93 | | | | (0.29 | ) | | | 6.75 | | | | 6.46 | | | | | | | | — | | | | (9.15 | ) | | | (9.15 | ) | | | 53.24 | |
2013 | | | 45.97 | | | | (0.06 | ) | | | 13.17 | | | | 13.11 | | | | | | | | — | | | | (3.15 | ) | | | (3.15 | ) | | | 55.93 | |
2012 | | | 44.62 | | | | (0.06 | ) | | | 3.00 | | | | 2.94 | | | | | | | | — | | | | (1.59 | ) | | | (1.59 | ) | | | 45.97 | |
| | | | | | | | | | | | | | | | | | | | | | | | | | | | | | | | | | |
| | | | Ratios/Supplemental Data | |
| | | | | | | | | | Ratios to Average
Net Assets Before
Waiver/Reimbursement | | | | | | Ratios to Average
Net Assets After
Waiver/Reimbursement(c) | | | | |
| | | | | | | | |
Total
Return(b) | | | Ending
Net
Assets
(000) | | | | | | Expenses | | | Net
Investment
Income
(Loss) | | | | | | Expenses | | | Net
Investment
Income
(Loss) | | | Portfolio
Turnover
Rate(e) | |
| | | | | | | | | | | | | | | | | | | | | | | | | | | | | | | | | | |
| | (3.78 | )% | | $ | 280,681 | | | | | | | | 1.29 | % | | | (0.35 | )% | | | | | | | 1.27 | % | | | (0.33 | )% | | | 89 | % |
| | 3.68 | | | | 365,394 | | | | | | | | 1.30 | | | | (0.72 | ) | | | | | | | 1.30 | | | | (0.72 | ) | | | 118 | |
| | 12.89 | | | | 371,601 | | | | | | | | 1.30 | | | | (0.81 | ) | | | | | | | 1.30 | | | | (0.81 | ) | | | 106 | |
| | 30.27 | | | | 355,086 | | | | | | | | 1.30 | | | | (0.38 | ) | | | | | | | 1.29 | | | | (0.38 | ) | | | 108 | |
| | 6.88 | | | | 306,507 | | | | | | | | 1.30 | | | | (0.42 | ) | | | | | | | 1.27 | | | | (0.39 | ) | | | 113 | |
| | | | | | | | | | | | | | | | | | | | | | | | | | | | | | | | | | |
| | (4.50 | ) | | | 16,956 | | | | | | | | 2.04 | | | | (1.10 | ) | | | | | | | 2.02 | | | | (1.08 | ) | | | 89 | |
| | 2.91 | | | | 22,284 | | | | | | | | 2.05 | | | | (1.47 | ) | | | | | | | 2.05 | | | | (1.47 | ) | | | 118 | |
| | 12.01 | | | | 24,304 | | | | | | | | 2.05 | | | | (1.56 | ) | | | | | | | 2.05 | | | | (1.56 | ) | | | 106 | |
| | 29.33 | | | | 22,181 | | | | | | | | 2.05 | | | | (1.14 | ) | | | | | | | 2.04 | | | | (1.13 | ) | | | 108 | |
| | 6.06 | | | | 17,874 | | | | | | | | 2.05 | | | | (1.16 | ) | | | | | | | 2.02 | | | | (1.13 | ) | | | 113 | |
| | | | | | | | | | | | | | | | | | | | | | | | | | | | | | | | | | |
| | (4.04 | ) | | | 55,093 | | | | | | | | 1.54 | | | | (0.59 | ) | | | | | | | 1.52 | | | | (0.57 | ) | | | 89 | |
| | 3.43 | | | | 54,866 | | | | | | | | 1.55 | | | | (0.98 | ) | | | | | | | 1.55 | | | | (0.98 | ) | | | 118 | |
| | 12.59 | | | | 64,262 | | | | | | | | 1.55 | | | | (1.10 | ) | | | | | | | 1.55 | | | | (1.10 | ) | | | 106 | |
| | 29.97 | | | | 47,168 | | | | | | | | 1.55 | | | | (0.63 | ) | | | | | | | 1.54 | | | | (0.63 | ) | | | 108 | |
| | 6.59 | | | | 38,869 | | | | | | | | 1.55 | | | | (0.67 | ) | | | | | | | 1.52 | | | | (0.64 | ) | | | 113 | |
| | | | | | | | | | | | | | | | | | | | | | | | | | | | | | | | | | |
| | (3.41 | ) | | | 50,677 | | | | | | | | 0.89 | | | | 0.12 | | | | | | | | 0.86 | | | | 0.14 | | | | 89 | |
| | 4.09 | | | | 31,167 | | | | | | | | 0.92 | | | | (0.33 | ) | | | | | | | 0.92 | | | | (0.33 | ) | | | 118 | |
| | 13.31 | | | | 16,192 | | | | | | | | 0.92 | | | | (0.44 | ) | | | | | | | 0.92 | | | | (0.44 | ) | | | 106 | |
| | 20.12 | | | | 25,874 | | | | | | | | 0.92 | * | | | (0.14 | )* | | | | | | | 0.92 | * | | | (0.14 | )* | | | 108 | |
| | | | | | | | | | | | | | | | | | | | | | | | | | | | | | | | | | |
| | (3.54 | ) | | | 491,747 | | | | | | | | 1.04 | | | | (0.10 | ) | | | | | | | 1.02 | | | | (0.08 | ) | | | 89 | |
| | 3.95 | | | | 730,560 | | | | | | | | 1.05 | | | | (0.47 | ) | | | | | | | 1.05 | | | | (0.47 | ) | | | 118 | |
| | 13.15 | | | | 814,636 | | | | | | | | 1.05 | | | | (0.56 | ) | | | | | | | 1.05 | | | | (0.56 | ) | | | 106 | |
| | 30.60 | | | | 776,915 | | | | | | | | 1.05 | | | | (0.13 | ) | | | | | | | 1.04 | | | | (0.12 | ) | | | 108 | |
| | 7.13 | | | | 744,480 | | | | | | | | 1.05 | | | | (0.17 | ) | | | | | | | 1.02 | | | | (0.14 | ) | | | 113 | |
| (a) | Per share Net Investment Income (Loss) is calculated using the average daily shares method. | |
| (b) | Total return is the combination of changes in NAV without any sales charge, reinvested dividend income at NAV and reinvested capital gains distributions at NAV, if any. Total returns are not annualized. | |
| (c) | After fee waiver and/or expense reimbursement from the Adviser, where applicable. | |
| (d) | For the period February 28, 2013 (commencement of operations) through October 31, 2013. | |
| (e) | Portfolio Turnover Rate is calculated based on the lesser of long-term purchases or sales (as disclosed in Note 5 – Investment Transactions) divided by the average long-term market value during the period. | |
See accompanying notes to financial statements.
Financial Highlights (continued)
Small Cap Growth Opportunities
Selected data for a share outstanding throughout each period:
| | | | | | | | | | | | | | | | | | | | | | | | | | | | | | | | | | | | |
| | | | | |
| | | | | | Investment Operations | | | | | | Less Distributions | | | | |
| | | | | | | | | |
Class (Commencement Date) Year Ended October 31, | | Beginning
NAV | | | Net
Investment
Income
(Loss)(a) | | | Net
Realized/
Unrealized
Gain (Loss) | | | Total | | | | | | From
Net
Investment
Income | | | From
Accumulated
Net Realized
Gains | | | Total | | | Ending
NAV | |
Class A (8/95) | | | | | | | | | | | | | | | | | | | | | | | | | | | | | | | | | |
2016 | | $ | 21.57 | | | $ | (0.10 | ) | | $ | 0.45 | | | $ | 0.35 | | | | | | | $ | — | | | $ | (2.02 | ) | | $ | (2.02 | ) | | $ | 19.90 | |
2015 | | | 24.41 | | | | (0.22 | ) | | | 0.33 | | | | 0.11 | | | | | | | | — | | | | (2.95 | ) | | | (2.95 | ) | | | 21.57 | |
2014 | | | 27.13 | | | | (0.26 | ) | | | 2.35 | | | | 2.09 | | | | | | | | — | | | | (4.81 | ) | | | (4.81 | ) | | | 24.41 | |
2013 | | | 21.25 | | | | (0.26 | ) | | | 7.93 | | | | 7.67 | | | | | | | | — | | | | (1.79 | ) | | | (1.79 | ) | | | 27.13 | |
2012 | | | 20.41 | | | | (0.21 | ) | | | 1.35 | | | | 1.14 | | | | | | | | — | | | | (0.30 | ) | | | (0.30 | ) | | | 21.25 | |
Class C (9/01) | | | | | | | | | | | | | | | | | | | | | | | | | | | | | | | | | |
2016 | | | 17.89 | | | | (0.20 | ) | | | 0.35 | | | | 0.15 | | | | | | | | — | | | | (2.02 | ) | | | (2.02 | ) | | | 16.02 | |
2015 | | | 20.89 | | | | (0.33 | ) | | | 0.28 | | | | (0.05 | ) | | | | | | | — | | | | (2.95 | ) | | | (2.95 | ) | | | 17.89 | |
2014 | | | 24.05 | | | | (0.38 | ) | | | 2.03 | | | | 1.65 | | | | | | | | — | | | | (4.81 | ) | | | (4.81 | ) | | | 20.89 | |
2013 | | | 19.17 | | | | (0.38 | ) | | | 7.05 | | | | 6.67 | | | | | | | | — | | | | (1.79 | ) | | | (1.79 | ) | | | 24.05 | |
2012 | | | 18.58 | | | | (0.34 | ) | | | 1.23 | | | | 0.89 | | | | | | | | — | | | | (0.30 | ) | | | (0.30 | ) | | | 19.17 | |
Class R3 (12/00) | | | | | | | | | | | | | | | | | | | | | | | | | | | | | | | | | |
2016 | | | 20.71 | | | | (0.14 | ) | | | 0.42 | | | | 0.28 | | | | | | | | — | | | | (2.02 | ) | | | (2.02 | ) | | | 18.97 | |
2015 | | | 23.60 | | | | (0.27 | ) | | | 0.33 | | | | 0.06 | | | | | | | | — | | | | (2.95 | ) | | | (2.95 | ) | | | 20.71 | |
2014 | | | 26.45 | | | | (0.31 | ) | | | 2.27 | | | | 1.96 | | | | | | | | — | | | | (4.81 | ) | | | (4.81 | ) | | | 23.60 | |
2013 | | | 20.81 | | | | (0.30 | ) | | | 7.73 | | | | 7.43 | | | | | | | | — | | | | (1.79 | ) | | | (1.79 | ) | | | 26.45 | |
2012 | | | 20.04 | | | | (0.26 | ) | | | 1.33 | | | | 1.07 | | | | | | | | — | | | | (0.30 | ) | | | (0.30 | ) | | | 20.81 | |
Class R6 (6/16) | | | | | | | | | | | | | | | | | | | | | | | | | | | | | | | | | | | | |
2016(e) | | | 21.63 | | | | (0.02 | ) | | | 1.35 | | | | 1.33 | | | | | | | | — | | | | — | | | | — | | | | 22.96 | |
Class I (8/95) | | | | | | | | | | | | | | | | | | | | | | | | | | | | | | | | | |
2016 | | | 24.51 | | | | (0.06 | ) | | | 0.51 | | | | 0.45 | | | | | | | | — | | | | (2.02 | ) | | | (2.02 | ) | | | 22.94 | |
2015 | | | 27.26 | | | | (0.19 | ) | | | 0.39 | | | | 0.20 | | | | | | | | — | | | | (2.95 | ) | | | (2.95 | ) | | | 24.51 | |
2014 | | | 29.68 | | | | (0.23 | ) | | | 2.62 | | | | 2.39 | | | | | | | | — | | | | (4.81 | ) | | | (4.81 | ) | | | 27.26 | |
2013 | | | 23.03 | | | | (0.21 | ) | | | 8.65 | | | | 8.44 | | | | | | | | — | | | | (1.79 | ) | | | (1.79 | ) | | | 29.68 | |
2012 | | | 22.04 | | | | (0.17 | ) | | | 1.46 | | | | 1.29 | | | | | | | | — | | | | (0.30 | ) | | | (0.30 | ) | | | 23.03 | |
| | | | | | | | | | | | | | | | | | | | | | | | | | | | | | | | | | |
| | | | Ratios/Supplemental Data | |
| | | | | | | | | | Ratios to Average
Net Assets Before
Waiver/Reimbursement | | | | | | Ratios to Average
Net Assets After
Waiver/Reimbursement(c) | | | | |
| | | | | | | | |
Total
Return(b) | | | Ending
Net
Assets
(000) | | | | | | Expenses | | | Net
Investment
Income
(Loss) | | | | | | Expenses | | | Net
Investment
Income
(Loss) | | | Portfolio
Turnover
Rate(d) | |
| | | | | | | | | | | | | | | | | | | | | | | | | | | | | | | | | | |
| | 1.90 | % | | $ | 31,255 | | | | | | | | 1.48 | % | | | (0.58 | )% | | | | | | | 1.42 | % | | | (0.52 | )% | | | 106 | % |
| | 0.72 | | | | 33,922 | | | | | | | | 1.50 | | | | (1.00 | ) | | | | | | | 1.47 | | | | (0.97 | ) | | | 128 | |
| | 9.07 | | | | 38,990 | | | | | | | | 1.57 | | | | (1.19 | ) | | | | | | | 1.47 | | | | (1.09 | ) | | | 125 | |
| | 39.22 | | | | 40,965 | | | | | | | | 1.55 | | | | (1.17 | ) | | | | | | | 1.46 | | | | (1.09 | ) | | | 119 | |
| | 5.73 | | | | 35,306 | | | | | | | | 1.72 | | | | (1.21 | ) | | | | | | | 1.47 | | | | (0.97 | ) | | | 118 | |
| | | | | | | | | | | | | | | | | | | | | | | | | | | | | | | | | | |
| | 1.10 | | | | 1,971 | | | | | | | | 2.23 | | | | (1.32 | ) | | | | | | | 2.18 | | | | (1.27 | ) | | | 106 | |
| | (0.03 | ) | | | 2,278 | | | | | | | | 2.25 | | | | (1.75 | ) | | | | | | | 2.22 | | | | (1.72 | ) | | | 128 | |
| | 8.26 | | | | 2,250 | | | | | | | | 2.32 | | | | (1.94 | ) | | | | | | | 2.22 | | | | (1.84 | ) | | | 125 | |
| | 38.17 | | | | 2,350 | | | | | | | | 2.30 | | | | (1.91 | ) | | | | | | | 2.22 | | | | (1.83 | ) | | | 119 | |
| | 4.93 | | | | 1,568 | | | | | | | | 2.46 | | | | (1.96 | ) | | | | | | | 2.22 | | | | (1.72 | ) | | | 118 | |
| | | | | | | | | | | | | | | | | | | | | | | | | | | | | | | | | | |
| | 1.62 | | | | 1,631 | | | | | | | | 1.73 | | | | (0.83 | ) | | | | | | | 1.67 | | | | (0.78 | ) | | | 106 | |
| | 0.50 | | | | 1,439 | | | | | | | | 1.75 | | | | (1.26 | ) | | | | | | | 1.72 | | | | (1.23 | ) | | | 128 | |
| | 8.77 | | | | 2,077 | | | | | | | | 1.82 | | | | (1.44 | ) | | | | | | | 1.72 | | | | (1.34 | ) | | | 125 | |
| | 38.86 | | | | 1,941 | | | | | | | | 1.80 | | | | (1.40 | ) | | | | | | | 1.72 | | | | (1.32 | ) | | | 119 | |
| | 5.48 | | | | 2,395 | | | | | | | | 1.96 | | | | (1.46 | ) | | | | | | | 1.72 | | | | (1.22 | ) | | | 118 | |
| | | | | | | | | | | | | | | | | | | | | | | | | | | | | | | | | | |
| | 6.15 | | | | 19,524 | | | | | | | | 1.02 | * | | | (0.29 | )* | | | | | | | 0.96 | * | | | (0.23 | )* | | | 106 | |
| | | | | | | | | | | | | | | | | | | | | | | | | | | | | | | | | | |
| | 2.10 | | | | 34,468 | | | | | | | | 1.24 | | | | (0.32 | ) | | | | | | | 1.19 | | | | (0.26 | ) | | | 106 | |
| | 1.00 | | | | 62,403 | | | | | | | | 1.25 | | | | (0.75 | ) | | | | | | | 1.22 | | | | (0.71 | ) | | | 128 | |
| | 9.34 | | | | 62,887 | | | | | | | | 1.32 | | | | (0.94 | ) | | | | | | | 1.22 | | | | (0.84 | ) | | | 125 | |
| | 39.55 | | | | 48,141 | | | | | | | | 1.30 | | | | (0.90 | ) | | | | | | | 1.22 | | | | (0.82 | ) | | | 119 | |
| | 5.99 | | | | 48,111 | | | | | | | | 1.47 | | | | (0.96 | ) | | | | | | | 1.22 | | | | (0.72 | ) | | | 118 | |
| (a) | Per share Net Investment Income (Loss) is calculated using the average daily shares method. | |
| (b) | Total return is the combination of changes in NAV without any sales charge, reinvested dividend income at NAV and reinvested capital gains distributions at NAV, if any. Total returns are not annualized. | |
| (c) | After fee waiver and/or expense reimbursement from the Adviser, where applicable. | |
| (d) | Portfolio Turnover Rate is calculated based on the lesser of long-term purchases or sales (as disclosed in Note 5 – Investment Transactions) divided by the average long-term market value during the period. | |
| (e) | For the period June 30, 2016 (commencement of operations) through October 31, 2016. | |
See accompanying notes to financial statements.
Notes to
Financial Statements
1. General Information and Significant Accounting Policies
General Information
Trust and Fund Information
Nuveen Investment Funds, Inc. (the “Trust”), is an open-end investment company registered under the Investment Company Act of 1940, as amended. The Trust is comprised of Nuveen Large Cap Growth Opportunities Fund (“Large Cap Growth Opportunities”), Nuveen Mid Cap Growth Opportunities Fund (“Mid Cap Growth Opportunities”) and Nuveen Small Cap Growth Opportunities Fund (“Small Cap Growth Opportunities”), (each a “Fund” and collectively, the “Funds”), as diversified funds, among others. The Trust was incorporated in the State of Maryland on August 20, 1987.
The end of the reporting period for the Funds is October 31, 2016, and the period covered by these Notes to Financial Statements is the fiscal year ended October 31, 2016 (the “current fiscal period”).
Investment Adviser
The Funds’ investment adviser is Nuveen Fund Advisors, LLC (the “Adviser”), a wholly-owned subsidiary of Nuveen Investments, Inc. (“Nuveen”). Nuveen is an operating division of TIAA Global Asset Management. The Adviser has overall responsibility for management of the Funds, oversees the management of the Funds’ portfolio, manages the Funds’ business affairs and provides certain clerical, bookkeeping and other administrative services, and, if necessary, asset allocation decisions. The Adviser has entered into sub-advisory agreements with Nuveen Asset Management, LLC (the “Sub-Adviser”), a subsidiary of the Adviser, under which the Sub-Adviser manages the investment portfolios of the Funds.
Investment Objectives
Large Cap Growth Opportunities’ investment objective is long-term growth of capital. Mid Cap Growth Opportunities’ investment objective is capital appreciation. Small Cap Growth Opportunities’ investment objective is growth of capital.
The Funds’ most recent prospectus provides further descriptions of each Fund’s investment objective, principal investment strategies and principal risks.
Significant Accounting Policies
Each Fund is an investment company and follows accounting and reporting guidance under Financial Accounting Standards Board (FASB) Accounting Standards Codification (ASC) Topic 946 “Financial Services-Investment Companies.” The following is a summary of significant accounting policies followed by the Funds in the preparation of their financial statements in accordance with accounting principles generally accepted in the United States of America (“U.S. GAAP”).
Investment Transactions
Investment transactions are recorded on a trade date basis. Realized gains and losses from investment transactions are determined on the specific identification method, which is the same basis used for federal income tax purposes.
Investment Income
Dividend income is recorded on the ex-dividend date or, for foreign securities, when information is available. Interest income is recorded on an accrual basis. Securities lending income is comprised of fees earned from borrowers and income earned on cash collateral investments, net of lending agent fees.
Professional Fees
Professional fees presented on the Statement of Operations consist of legal fees incurred in the normal course of operations, audit fees, tax consulting fees and, in some cases, workout expenditures. Workout expenditures are incurred in an attempt to protect or enhance an investment or to pursue other claims or legal actions on behalf of Fund shareholders. If a refund is received for workout expenditures paid in a prior reporting period, such amounts will be recognized as “Legal fee refund” on the Statement of Operations.
Dividends and Distributions to Shareholders
Dividends from net investment income, if any, are declared and distributed to shareholders annually. Net realized capital gains from investment transactions, if any, are declared and distributed to shareholders at least annually. Furthermore, capital gains are distributed only to the extent they exceed available capital loss carryforwards.
Distributions to shareholders are recorded on the ex-dividend date. The amount and timing of distributions are determined in accordance with federal income tax regulations, which may differ from U.S. GAAP.
Share Classes and Sales Charges
Class A Shares are generally sold with an up-front sales charge and incur a 0.25% annual 12b-1 service fee. Class A Share purchases of $1 million or more are sold at net asset value (“NAV”) without an up-front sales charge but may be subject to a contingent deferred sales charge (“CDSC”) equal to 1% if redeemed within eighteen months of purchase. Class C Shares are sold without an up-front sales charge but incur a 0.75% annual 12b-1 distribution fee and a 0.25% annual 12b-1 service fee. Class C Shares are subject to a CDSC of 1% if redeemed within twelve months of purchase. Class R3 Shares are sold without an up-front sales charge but incur a 0.25% annual 12b-1 distribution fee and a 0.25% annual 12b-1 service fee. Class R6 Shares and Class I Shares are not subject to any sales charge or 12b-1 distribution or service fees.
Multiclass Operations and Allocations
Income and expenses of the Funds that are not directly attributable to a specific class of shares are prorated among the classes based on the relative net assets of each class. Expenses directly attributable to a class of shares are recorded to the specific class. Currently, the only expenses that are allocated on a class-specific basis are 12b-1 distribution and service fees.
Sub-transfer agent fees, which are recognized as a component of “Shareholder servicing agent fees” on the Statement of Operations, are not charged to Class R6 Shares and are prorated among the other classes based on their relative net assets.
Realized and unrealized capital gains and losses of the Funds are prorated among the classes based on the relative net assets of each class.
The Indemnifications
Under the Trust’s organizational documents, its officers and trustees are indemnified against certain liabilities arising out of the performance of their duties to the Trust. In addition, in the normal course of business, the Trust enters into contracts that provide general indemnifications to other parties. The Trust’s maximum exposure under these arrangements is unknown as this would involve future claims that may be made against the Trust that have not yet occurred. However, the Trust has not had prior claims or losses pursuant to these contracts and expects the risk of loss to be remote.
Netting Agreements
In the ordinary course of business, the Funds may enter into transactions subject to enforceable International Swaps and Derivative Association, Inc. (“ISDA”) master agreements or other similar arrangements (“netting agreements”). Generally, the right to offset in netting agreements allows each Fund to offset certain securities and derivatives with a specific counterparty, when applicable, as well as any collateral received or delivered to that counterparty based on the terms of the agreements. Generally, each Fund manages its cash collateral and securities collateral on a counterparty basis.
The Funds’ investments subject to netting agreements as of the end of the reporting period, if any, are further described in Note 3 – Portfolio Securities and Investments in Derivatives.
Use of Estimates
The preparation of financial statements in conformity with U.S. GAAP requires management to make estimates and assumptions that affect the reported amounts of assets and liabilities at the date of the financial statements and the reported amounts of increases and decreases in net assets from operations during the reporting period. Actual results may differ from those estimates.
2. Investment Valuation and Fair Value Measurements
The fair valuation input levels as described below are for fair value measurement purposes.
Fair value is defined as the price that would be received upon selling an investment or transferring a liability in an orderly transaction to an independent buyer in the principal or most advantageous market for the investment. A three-tier hierarchy is used to maximize the use of observable market data and minimize the use of unobservable inputs and to establish classification of fair value measurements for disclosure purposes. Observable inputs reflect the assumptions market participants would use in pricing the asset or liability. Observable inputs are based on market data obtained from sources independent of the reporting entity. Unobservable inputs reflect the reporting entity’s own assumptions about the assumptions market participants would use in pricing the asset or liability. Unobservable inputs are based on the best information available in the circumstances. The following is a summary of the three-tiered hierarchy of valuation input levels.
| | |
| Level 1 – | | Inputs are unadjusted and prices are determined using quoted prices in active markets for identical securities. |
| Level 2 – | | Prices are determined using other significant observable inputs (including quoted prices for similar securities, interest rates, prepayment speeds, credit risk, etc.). |
| Level 3 – | | Prices are determined using significant unobservable inputs (including management’s assumptions in determining the fair value of investments). |
Notes to Financial Statements (continued)
Common stocks and other equity-type securities are valued at the last sales price on the securities exchange on which such securities are primarily traded and are generally classified as Level 1. Securities primarily traded on the NASDAQ National Market (“NASDAQ”) are valued at the NASDAQ Official Closing Price and are generally classified as Level 1. However, securities traded on a securities exchange or NASDAQ for which there were no transactions on a given day or securities not listed on a securities exchange or NASDAQ are valued at the quoted bid price and are generally classified as Level 2.
Investments in investment companies are valued at their respective NAVs on the valuation date and are generally classified as Level 1.
Certain securities may not be able to be priced by the pre-established pricing methods as described above. Such securities may be valued by the Funds’ Board of Directors (the “Board”) and/or its appointee at fair value. These securities generally include, but are not limited to, restricted securities (securities which may not be publicly sold without registration under the Securities Act of 1933, as amended) for which an independent pricing service (“pricing service”) is unable to provide a market price; securities whose trading has been formally suspended; debt securities that have gone into default and for which there is no current market quotation; a security whose market price is not available from a pre-established pricing source; a security with respect to which an event has occurred that is likely to materially affect the value of the security after the market has closed but before the calculation of a Fund’s NAV (as may be the case in non-U.S. markets on which the security is primarily traded) or make it difficult or impossible to obtain a reliable market quotation; and a security whose price, as provided by the pricing service, is not deemed to reflect the security’s fair value. As a general principle, the fair value of a security would appear to be the amount that the owner might reasonably expect to receive for it in a current sale. A variety of factors may be considered in determining the fair value of such securities, which may include consideration of the following: yields or prices of investments of comparable quality, type of issue, coupon, maturity and rating, market quotes or indications of value from security dealers, evaluations of anticipated cash flows or collateral, general market conditions and other information and analysis, including the obligor’s credit characteristics considered relevant. These securities are generally classified as Level 2 or Level 3 depending on the observability of the significant inputs. Regardless of the method employed to value a particular security, all valuations are subject to review by the the Board and/or its appointee.
The inputs or methodologies used for valuing securities are not an indication of the risks associated with investing in those securities. The following is a summary of each Fund’s fair value measurements as of the end of the reporting period:
| | | | | | | | | | | | | | | | |
| Large Cap Growth Opportunities | | Level 1 | | | Level 2 | | | Level 3 | | | Total | |
| Long-Term Investments*: | | | | | | | | | | | | | | | | |
Common Stocks | | $ | 317,699,599 | | | $ | — | | | $ | — | | | $ | 317,699,599 | |
| Investments Purchased with Collateral from Securities Lending | | | 12,272,813 | | | | — | | | | — | | | | 12,272,813 | |
| Short-Term Investments: | | | | | | | | | | | | | | | | |
Money Market Funds | | | 2,536,904 | | | | — | | | | — | | | | 2,536,904 | |
| Total | | $ | 332,509,316 | | | $ | — | | | $ | — | | | $ | 332,509,316 | |
| | | | |
| Mid Cap Growth Opportunities | | | | | | | | | | | | |
| Long-Term Investments*: | | | | | | | | | | | | | | | | |
Common Stocks | | $ | 892,412,727 | | | $ | — | | | $ | — | | | $ | 892,412,727 | |
| Investments Purchased with Collateral from Securities Lending | | | 46,611,706 | | | | — | | | | — | | | | 46,611,706 | |
| Short-Term Investments: | | | | | | | | | | | | | | | | |
Money Market Funds | | | 12,397,841 | | | | — | | | | — | | | | 12,397,841 | |
| Total | | $ | 951,422,274 | | | $ | — | | | $ | — | | | $ | 951,422,274 | |
| | | | |
| Small Cap Growth Opportunities | | | | | | | | | | | | |
| Long-Term Investments*: | | | | | | | | | | | | | | | | |
Common Stocks | | $ | 85,627,176 | | | $ | — | | | $ | 1 | ** | | $ | 85,627,177 | |
| Investments Purchased with Collateral from Securities Lending | | | 9,455,033 | | | | — | | | | — | | | | 9,455,033 | |
| Short-Term Investments: | | | | | | | | | | | | | | | | |
Money Market Funds | | | 3,631,946 | | | | — | | | | — | | | | 3,631,946 | |
| Total | | $ | 98,714,155 | | | $ | — | | | $ | 1 | | | $ | 98,714,156 | |
| * | Refer to Fund’s Portfolio of Investments for industry classifications. |
| ** | Refer to the Fund’s Portfolio of Investments for securities classified as Level 3. |
The Board is responsible for the valuation process and has appointed the oversight of the daily valuation process to the Adviser’s Valuation Committee. The Valuation Committee, pursuant to the valuation policies and procedures adopted by the Board, is responsible for making fair value determinations, evaluating the effectiveness of the Funds’ pricing policies and reporting to the Board. The Valuation Committee is aided in its efforts by the Adviser’s dedicated Securities Valuation Team, which is responsible for administering the daily valuation process and applying fair value methodologies as approved by the Valuation Committee. When determining the reliability of independent pricing services for investments owned by the Funds, the Valuation Committee, among other things, conducts due diligence reviews of the pricing services and monitors the quality of security prices received through various testing reports conducted by the Securities Valuation Team.
The Valuation Committee will consider pricing methodologies it deems relevant and appropriate when making a fair value determination, based on the facts and circumstances specific to the portfolio instrument. Fair value determinations generally will be derived as follows, using public or private market information:
| | (i) | If available, fair value determinations shall be derived by extrapolating from recent transactions or quoted prices for identical or comparable securities. |
| | (ii) | If such information is not available, an analytical valuation methodology may be used based on other available information including, but not limited to: analyst appraisals, research reports, corporate action information, issuer financial statements and shelf registration statements. Such analytical valuation methodologies may include, but are not limited to: multiple of earnings, discount from market value of a similar freely- traded security, discounted cash flow analysis, book value or a multiple thereof, risk premium/yield analysis, yield to maturity and/or fundamental investment analysis. |
The purchase price of a portfolio instrument will be used to fair value the instrument only if no other valuation methodology is available or deemed appropriate, and it is determined that the purchase price fairly reflects the instrument’s current value.
For each portfolio security that has been fair valued pursuant to the policies adopted by the Board, the fair value price is compared against the last available and next available market quotations. The Valuation Committee reviews the results of such testing and fair valuation occurrences are reported to the Board.
3. Portfolio Securities and Investments in Derivatives
Portfolio Securities
Securities Lending
In order to generate additional income, each Fund may lend securities representing up to one-third of the value of its total assets (which includes collateral for securities on loan) to broker-dealers, banks or other institutions. When loaning securities, each Fund retains the benefits of owning the securities, including the economic equivalent of dividends or interest generated by the security. Each Fund also has the ability to recall the securities on loan at any time.
Each Fund’s policy is to receive, at the inception of a loan, cash collateral equal to at least 102% of the value of securities loaned, which is recognized as “Payable for collateral from securities lending program” on the Statement of Assets and Liabilities. Collateral for securities on loan is invested in a money market fund, which is recognized as “Investments purchased with collateral from securities lending, at value” on the Statement of Assets and Liabilities. The market value of the securities loaned is determined at the close of each business day in order to determine the adequacy of the collateral. If the value of the securities on loan increases such that the level of collateralization falls below 100%, additional collateral is received from the borrower on the next business day, which is recognized as “Due from broker” on the Statement of Assets and Liabilities.
Securities out on loan are subject to termination at any time at the option of the borrower or the Fund. Upon termination, the borrower is required to return to the Fund securities identical to the securities loaned. Generally, in the event the borrower defaults on its obligation to return the loaned securities, the Fund has the right to use the collateral to acquire identical securities. In the event the Fund is delayed or prevented from exercising its right to dispose of the collateral, there may be a loss to the Fund. Under each Fund’s securities lending agreement, however, the securities lending agent has indemnified the Fund against losses resulting from borrower default, except to the extent that those losses result from a decrease in the value of the collateral due to its investment by the Fund. The Fund bears the risk of loss with respect to the investment of collateral.
The Funds’ custodian, U.S. Bank National Association, serves as its securities lending agent. Each Fund pays the custodian a fee based on its proportional share of the custodian’s expense of operating its securities lending program. Income earned from the securities lending program is paid to the Fund, net of any fees paid. Income from securities lending, net of fees paid, is recognized as “Securities lending income, net” on the Statement of Operations.
The following table presents the securities out on loan for the Funds, and the collateral delivered related to those securities, as of the end of the reporting period.
| | | | | | | | | | | | | | |
| Fund | | Asset Class out on Loan | | Long-Term
Investments, at Value | | | Collateral
Pledged (From)
Counterparty* | | | Net
Exposure | |
| Large Cap Growth Opportunities | | Common Stocks | | $ | 11,964,996 | | | $ | (11,964,996 | ) | | $ | — | |
| Mid Cap Growth Opportunities | | Common Stocks | | | 45,481,074 | | | | (45,481,074 | ) | | | — | |
| Small Cap Growth Opportunities | | Common Stocks | | | 9,193,294 | | | | (9,193,294 | ) | | | — | |
| * | As of the end of the reporting period, the value of the collateral pledged from the counterparty exceeded the value of the securities out on loan. Refer to the Fund’s Portfolio of Investments for details on the securities out on loan. |
Notes to Financial Statements (continued)
Securities lending fees paid by each Fund during the current fiscal period were as follows:
| | | | | | | | | | | | |
| | | Large Cap
Growth
Opportunities | | | Mid Cap
Growth
Opportunities | | | Small Cap
Growth
Opportunities | |
| Securities lending fees paid | | $ | 10,281 | | | $ | 110,279 | | | $ | 40,484 | |
Investments in Derivatives
Each Fund is authorized to invest in certain derivative instruments. The Funds record derivative instruments at fair value, with changes in fair value recognized on the Statement of Operations, when applicable. Even though the Funds’ investments in derivatives may represent economic hedges, they are not considered to be hedge transactions for financial reporting purposes.
Although the Funds are authorized to invest in derivative instruments, and may do so in the future, they did not make any such investments during the current fiscal period.
Market and Counterparty Credit Risk
In the normal course of business each Fund may invest in financial instruments and enter into financial transactions where risk of potential loss exists due to changes in the market (market risk) or failure of the other party to the transaction to perform (counterparty credit risk). The potential loss could exceed the value of the financial assets recorded on the financial statements. Financial assets, which potentially expose each Fund to counterparty credit risk, consist principally of cash due from counterparties on forward, option and swap transactions, when applicable. The extent of each Fund’s exposure to counterparty credit risk in respect to these financial assets approximates their carrying value as recorded on the Statement of Assets and Liabilities.
Each Fund helps manage counterparty credit risk by entering into agreements only with counterparties the Adviser believes have the financial resources to honor their obligations and by having the Adviser monitor the financial stability of the counterparties. Additionally, counterparties may be required to pledge collateral daily (based on the daily valuation of the financial asset) on behalf of each Fund with a value approximately equal to the amount of any unrealized gain above a pre-determined threshold. Reciprocally, when each Fund has an unrealized loss, the Funds have instructed the custodian to pledge assets of the Funds as collateral with a value approximately equal to the amount of the unrealized loss above a pre-determined threshold. Collateral pledges are monitored and subsequently adjusted if and when the valuations fluctuate, either up or down, by at least the predetermined threshold amount.
4. Fund Shares
Transactions in Fund shares during the current and prior fiscal period were as follows:
| | | | | | | | | | | | | | | | |
| | | Year Ended
10/31/16 | | | Year Ended
10/31/15 | |
| Large Cap Growth Opportunities | | Shares | | | Amount | | | Shares | | | Amount | |
| Shares sold: | | | | | | | | | | | | | | | | |
Class A | | | 298,709 | | | $ | 9,006,187 | | | | 293,385 | | | $ | 10,733,704 | |
Class C | | | 96,601 | | | | 2,511,881 | | | | 95,594 | | | | 2,942,818 | |
Class R3 | | | 51,879 | | | | 1,496,322 | | | | 62,194 | | | | 2,236,858 | |
Class R6 | | | 41,020 | | | | 1,330,519 | | | | 23,033 | | | | 865,090 | |
Class I | | | 786,069 | | | | 26,779,789 | | | | 687,823 | | | | 26,466,772 | |
| Shares issued to shareholders due to reinvestment of distributions: | | | | | | | | | | | | | | | | |
Class A | | | 698,514 | | | | 21,462,783 | | | | 686,565 | | | | 23,054,856 | |
Class C | | | 91,518 | | | | 2,328,427 | | | | 63,421 | | | | 1,842,376 | |
Class R3 | | | 48,358 | | | | 1,419,840 | | | | 45,621 | | | | 1,479,480 | |
Class R6 | | | 91,507 | | | | 3,068,118 | | | | 87,371 | | | | 3,142,735 | |
Class I | | | 951,156 | | | | 31,769,784 | | | | 947,393 | | | | 34,001,959 | |
| | | | 3,155,331 | | | | 101,173,650 | | | | 2,992,400 | | | | 106,766,648 | |
| Shares redeemed: | | | | | | | | | | | | | | | | |
Class A | | | (1,025,885 | ) | | | (31,271,276 | ) | | | (1,400,857 | ) | | | (51,235,903 | ) |
Class C | | | (209,415 | ) | | | (5,204,689 | ) | | | (109,400 | ) | | | (3,417,208 | ) |
Class R3 | | | (93,721 | ) | | | (2,614,137 | ) | | | (108,635 | ) | | | (3,786,733 | ) |
Class R6 | | | (104,797 | ) | | | (3,555,621 | ) | | | (177,680 | ) | | | (7,112,374 | ) |
Class I | | | (3,357,144 | ) | | | (110,587,365 | ) | | | (2,760,177 | ) | | | (105,630,736 | ) |
| | | | (4,790,962 | ) | | | (153,233,088 | ) | | | (4,556,749 | ) | | | (171,182,954 | ) |
| Net increase (decrease) | | | (1,635,631 | ) | | $ | (52,059,438 | ) | | | (1,564,349 | ) | | $ | (64,416,306 | ) |
| | | | | | | | | | | | | | | | |
| | | Year Ended
10/31/16 | | | Year Ended
10/31/15 | |
| Mid Cap Growth Opportunities | | Shares | | | Amount | | | Shares | | | Amount | |
| Shares sold: | | | | | | | | | | | | | | | | |
Class A | | | 1,286,993 | | | $ | 46,257,083 | | | | 1,685,601 | | | $ | 71,861,448 | |
Class C | | | 49,057 | | | | 1,433,532 | | | | 96,491 | | | | 3,326,130 | |
Class R3 | | | 930,527 | | | | 31,797,493 | | | | 483,013 | | | | 19,544,907 | |
Class R6 | | | 748,186 | | | | 31,832,382 | | | | 714,512 | | | | 34,158,123 | |
Class I | | | 1,389,963 | | | | 57,544,954 | | | | 1,868,955 | | | | 90,743,962 | |
| Shares issued to shareholders due to reinvestment of distributions: | | | | | | | | | | | | | | | | |
Class A | | | 792,841 | | | | 29,200,332 | | | | 1,578,073 | | | | 61,923,572 | |
Class C | | | 66,705 | | | | 1,969,787 | | | | 126,736 | | | | 4,099,904 | |
Class R3 | | | 149,955 | | | | 5,236,446 | | | | 302,689 | | | | 11,344,768 | |
Class R6 | | | 49,885 | | | | 2,136,595 | | | | 53,391 | | | | 2,398,848 | |
Class I | | | 1,001,858 | | | | 42,719,209 | | | | 2,256,936 | | | | 101,110,776 | |
| | | | 6,465,970 | | | | 250,127,813 | | | | 9,166,397 | | | | 400,512,438 | |
| Shares redeemed: | | | | | | | | | | | | | | | | |
Class A | | | (3,233,940 | ) | | | (117,025,698 | ) | | | (2,127,432 | ) | | | (89,836,493 | ) |
Class C | | | (190,972 | ) | | | (5,612,585 | ) | | | (154,133 | ) | | | (5,431,709 | ) |
Class R3 | | | (874,522 | ) | | | (29,582,220 | ) | | | (778,132 | ) | | | (30,838,598 | ) |
Class R6 | | | (257,869 | ) | | | (10,831,697 | ) | | | (408,175 | ) | | | (20,301,930 | ) |
Class I | | | (6,254,743 | ) | | | (259,646,329 | ) | | | (3,818,895 | ) | | | (184,260,176 | ) |
| | | | (10,812,046 | ) | | | (422,698,529 | ) | | | (7,286,767 | ) | | | (330,668,906 | ) |
| Net increase (decrease) | | | (4,346,076 | ) | | $ | (172,570,716 | ) | | | 1,879,630 | | | $ | 69,843,532 | |
| | |
| | | Year Ended
10/31/16 | | | Year Ended
10/31/15 | |
| Small Cap Growth Opportunities | | Shares | | | Amount | | | Shares | | | Amount | |
| Shares sold: | | | | | | | | | | | | | | | | |
Class A | | | 86,880 | | | $ | 1,652,635 | | | | 74,804 | | | $ | 1,732,493 | |
Class C | | | 12,361 | | | | 175,990 | | | | 39,382 | | | | 746,413 | |
Class R3 | | | 55,049 | | | | 1,026,498 | | | | 31,859 | | | | 697,321 | |
Class R61 – exchanges | | | 938,692 | | | | 20,303,916 | | | | — | | | | — | |
Class I | | | 306,571 | | | | 6,743,697 | | | | 483,063 | | | | 12,855,556 | |
| Shares issued to shareholders due to reinvestment of distributions: | | | | | | | | | | | | | | | | |
Class A | | | 156,382 | | | | 3,021,304 | | | | 204,286 | | | | 4,310,437 | |
Class C | | | 15,927 | | | | 249,421 | | | | 17,461 | | | | 307,657 | |
Class R3 | | | 7,678 | | | | 141,728 | | | | 12,106 | | | | 245,744 | |
Class R61 | | | — | | | | — | | | | — | | | | — | |
Class I | | | 164,750 | | | | 3,662,396 | | | | 189,325 | | | | 4,528,679 | |
| | | | 1,744,290 | | | | 36,977,585 | | | | 1,052,286 | | | | 25,424,300 | |
| Shares redeemed: | | | | | | | | | | | | | | | | |
Class A | | | (244,847 | ) | | | (4,712,686 | ) | | | (303,868 | ) | | | (7,042,087 | ) |
Class C | | | (32,616 | ) | | | (496,420 | ) | | | (37,225 | ) | | | (712,570 | ) |
Class R3 | | | (46,235 | ) | | | (850,147 | ) | | | (62,478 | ) | | | (1,388,398 | ) |
Class R61 | | | (88,309 | ) | | | (2,100,000 | ) | | | — | | | | — | |
Class I | | | (576,362 | ) | | | (12,822,609 | ) | | | (432,828 | ) | | | (11,244,666 | ) |
Class I – exchanges | | | (938,692 | ) | | | (20,303,916 | ) | | | — | | | | — | |
| | | | (1,927,061 | ) | | | (41,285,778 | ) | | | (836,399 | ) | | | (20,387,721 | ) |
| Net increase (decrease) | | | (182,771 | ) | | $ | (4,308,193 | ) | | | 215,887 | | | $ | 5,036,579 | |
| 1 | Class R6 Shares were established on June 30, 2016. |
5. Investment Transactions
Long-term purchases and sales (excluding investments purchased with collateral from securities lending) during the current fiscal period were as follows:
| | | | | | | | | | | | |
| | | Large Cap
Growth
Opportunities | | | Mid Cap
Growth
Opportunities | | | Small Cap
Growth
Opportunities | |
| Purchases | | $ | 229,983,297 | | | $ | 899,258,832 | | | $ | 93,093,463 | |
| Sales | | | 368,272,570 | | | | 1,157,284,109 | | | | 105,186,013 | |
Notes to Financial Statements (continued)
6. Income Tax Information
Each Fund is a separate taxpayer for federal income tax purposes. Each Fund intends to distribute substantially all of its net investment income and net capital gains to shareholders and to otherwise comply with the requirements of Subchapter M of the Internal Revenue Code applicable to regulated investment companies. Therefore, no federal income tax provision is required.
For all open tax years and all major taxing jurisdictions, management of the Funds has concluded that there are no significant uncertain tax positions that would require recognition in the financial statements. Open tax years are those that are open for examination by taxing authorities (i.e., generally the last four tax year ends and the interim tax period since then). Furthermore, management of the Funds is also not aware of any tax positions for which it is reasonably possible that the total amounts of unrecognized tax benefits will significantly change in the next twelve months.
The following information is presented on an income tax basis. Differences between amounts for financial statement and federal income tax purposes are primarily due to timing differences in recognizing certain gains and losses on investment transactions. To the extent that differences arise that are permanent in nature, such amounts are reclassified within the capital accounts as detailed below. Temporary differences do not require reclassification. Temporary and permanent differences do not impact the NAVs of the Funds.
As of October 31, 2016, the cost and unrealized appreciation (depreciation) of investments, as determined on a federal income tax basis, were as follows:
| | | | | | | | | | | | |
| | | Large Cap
Growth
Opportunities | | | Mid Cap
Growth
Opportunities | | | Small Cap
Growth
Opportunities | |
| Cost of investments | | $ | 242,639,299 | | | $ | 853,638,026 | | | $ | 89,614,968 | |
| Gross unrealized: | | | | | | | | | | | | |
Appreciation | | $ | 95,057,173 | | | $ | 124,399,503 | | | $ | 12,768,662 | |
Depreciation | | | (5,187,156 | ) | | | (26,615,255 | ) | | | (3,669,474 | ) |
| Net unrealized appreciation (depreciation) of investments | | $ | 89,870,017 | | | $ | 97,784,248 | | | $ | 9,099,188 | |
Permanent differences, primarily due to distribution reclasses, net operating losses, tax equalization, investments in partnerships and investments in passive foreign investment companies, resulted in reclassifications among the Funds’ components of net assets as of October 31, 2016, the Funds’ tax year end, as follows:
| | | | | | | | | | | | |
| | | Large Cap
Growth
Opportunities | | | Mid Cap
Growth
Opportunities | | | Small Cap
Growth
Opportunities | |
| Capital paid-in | | $ | 4,957,977 | | | $ | (6,285,119 | ) | | $ | (19,569 | ) |
| Undistributed (Over-distribution of) net investment income | | | 219,610 | | | | 7,066,760 | | | | 23,229 | |
| Accumulated net realized gain (loss) | | | (5,177,587 | ) | | | (781,641 | ) | | | (3,660 | ) |
The tax components of undistributed net ordinary income and net long-term capital gains as of October 31, 2016, the Funds’ tax year end, were as follows:
| | | | | | | | | | | | |
| | | Large Cap
Growth
Opportunities | | | Mid Cap
Growth
Opportunities | | | Small Cap
Growth
Opportunities | |
| Undistributed net ordinary income1 | | $ | — | | | $ | — | | | $ | — | |
| Undistributed net long-term capital gains | | | 36,622,106 | | | | 37,156,491 | | | | 384,131 | |
| 1 | Net ordinary income consists of net taxable income derived from dividends, interest and net short-term capital gains, if any. |
The tax character of distributions paid during the Funds’ tax years ended October 31, 2016, and October 31, 2015 was designated for purposes of the dividends paid deduction as follows:
| | | | | | | | | | | | |
| 2016 | | Large Cap
Growth
Opportunities | | | Mid Cap
Growth
Opportunities | | | Small Cap
Growth
Opportunities | |
| Distributions from net ordinary income1 | | $ | 5,517,136 | | | $ | — | | | $ | 1,799,025 | |
| Distributions from net long-term capital gains | | | 78,494,647 | | | | 89,831,422 | | | | 6,723,321 | |
| | | | | | | | | | | | |
2015 | | Large Cap
Growth
Opportunities | | | Mid Cap
Growth
Opportunities | | | Small Cap
Growth
Opportunities | |
| Distributions from net ordinary income1 | | $ | 4,222,148 | | | $ | 39,080,850 | | | $ | 3,544,233 | |
| Distributions from net long-term capital gains | | | 85,534,194 | | | | 166,176,599 | | | | 8,237,913 | |
| 1 | Net ordinary income consists of net taxable income derived from dividends, interest and net short-term capital gains, if any. |
As of October 31, 2016, the Funds’ tax year end, the Funds did not have any unused capital loss carryforwards available for federal income tax purposes to be applied against future capital gains, if any.
The Funds have elected to defer late-year losses in accordance with federal income tax rules. These losses are treated as having arisen on the first day of the following fiscal year. The Funds have elected to defer losses as follows:
| | | | | | | | | | | | |
| | | Large Cap Growth
Opportunities | | | Mid Cap Growth
Opportunities | | | Small Cap Growth
Opportunities | |
| Post-October capital losses2 | | $ | — | | | $ | — | | | $ | — | |
| Late-year ordinary losses3 | | $ | 86,548 | | | $ | 1,650,071 | | | $ | 321,130 | |
| 2 | Capital losses incurred from November 1, 2015 through October 31, 2016, the Funds’ tax year end. |
| 3 | Ordinary losses incurred from January 1, 2016 through October 31, 2016, and/or specified losses incurred from November 1, 2015 through October 31, 2016. |
7. Management Fees and Other Transactions with Affiliates
Management Fees
Each Fund’s management fee compensates the Adviser for the overall investment advisory and administrative services and general office facilities. The Sub-Adviser is compensated for its services to the Funds from the management fees paid to the Adviser.
Each Fund’s management fee consists of two components – a fund-level fee, based only on the amount of assets within each individual Fund, and a complex-level fee, based on the aggregate amount of all eligible fund assets managed by the Adviser. This pricing structure enables each Fund’s shareholders to benefit from growth in the assets within their respective Fund as well as from growth in the amount of complex-wide assets managed by the Adviser.
The annual Fund-level fee, payable monthly, for each Fund is calculated according to the following schedule:
| | | | | | | | | | | | | | | | | | | | | | | | |
| | | Large Cap Growth Opportunities | | | Mid Cap Growth Opportunities | | | Small Cap Growth Opportunities | |
| Average Daily Net Assets | | (For the period
November 1, 2015
through
June 29, 2016) | | | (Effective
June 30, 2016) | | | (For the period
November 1, 2015
through
June 29, 2016) | | | (Effective
June 30, 2016) | | | (For the period
November 1, 2015
through
June 29, 2016) | | | (Effective
June 30, 2016) | |
| For the first $125 million | | | 0.6500 | % | | | 0.5000 | % | | | 0.7000 | % | | | 0.6000 | % | | | 0.8000 | % | | | 0.6500 | % |
| For the next $125 million | | | 0.6375 | | | | 0.4875 | | | | 0.6875 | | | | 0.5875 | | | | 0.7875 | | | | 0.6375 | |
| For the next $250 million | | | 0.6250 | | | | 0.4750 | | | | 0.6750 | | | | 0.5750 | | | | 0.7750 | | | | 0.6250 | |
| For the next $500 million | | | 0.6125 | | | | 0.4625 | | | | 0.6625 | | | | 0.5625 | | | | 0.7625 | | | | 0.6125 | |
| For the next $1 billion | | | 0.6000 | | | | 0.4500 | | | | 0.6500 | | | | 0.5500 | | | | 0.7500 | | | | 0.6000 | |
| For net assets over $2 billion | | | 0.5750 | | | | 0.4250 | | | | 0.6250 | | | | 0.5250 | | | | 0.7250 | | | | 0.5750 | |
The annual complex-level fee, payable monthly, for each Fund is determined by taking the complex-level free rate, which is based on the aggregate amount of “eligible assets” of all Nuveen funds as set forth in the schedule below, and making, as appropriate, an upward adjustment to that rate based upon the percentage of the particular fund’s assets that are not “eligible assets”. The complex-level fee schedule for each Fund is as follows:
| | | | |
| Complex-Level Asset Breakpoint Level* | | Effective Rate at Breakpoint Level | |
| $55 billion | | | 0.2000 | % |
| $56 billion | | | 0.1996 | |
| $57 billion | | | 0.1989 | |
| $60 billion | | | 0.1961 | |
| $63 billion | | | 0.1931 | |
| $66 billion | | | 0.1900 | |
| $71 billion | | | 0.1851 | |
| $76 billion | | | 0.1806 | |
| $80 billion | | | 0.1773 | |
| $91 billion | | | 0.1691 | |
| $125 billion | | | 0.1599 | |
| $200 billion | | | 0.1505 | |
| $250 billion | | | 0.1469 | |
| $300 billion | | | 0.1445 | |
| * | The complex-level fee is calculated based upon the aggregate daily “eligible assets” of all Nuveen funds. Eligible assets do not include assets attributable to investments in other Nuveen funds or assets in excess of a determined amount (originally $2 billion) added to the Nuveen fund complex in connection with the Adviser’s assumption of the management of the former First American Funds effective January 1, 2011. Eligible assets include closed-end fund assets managed by the Adviser that are attributable to certain types of leverage. For these purposes, leverage includes the closed-end funds’ use of preferred stock and borrowings and certain investments in the residual interest certificates (also called inverse floating rate securities) in tender option bond (TOB) trusts, including the portion of assets held by the TOB trust that has been effectively financed by the trust’s issuance of floating rate securities, subject to an agreement by the Adviser as to certain funds to limit the amount of such assets for determining eligible assets in certain circumstances. As of October 31, 2016, the complex-level fee rate for each Fund was as follows: |
| | | | |
| Fund | | Complex-Level Fee | |
Large Cap Growth Opportunities | | | 0.1998 | % |
Mid Cap Growth Opportunities | | | 0.1998 | |
Small Cap Growth Opportunities | | | 0.1998 | |
Notes to Financial Statements (continued)
The Adviser has agreed to waive fees and/or reimburse expenses (“Expense Cap”) of the Funds so that total annual Fund operating expenses, (excluding 12b-1 distribution and/or service fees, interest expenses, taxes, acquired fund fees and expenses, fees incurred in acquiring and disposing of portfolio securities and extraordinary expenses) do not exceed the percentages of the average daily net assets of any class of Fund shares in the amounts and for the time period stated in the following table. However, because Class R6 shares are not subject to sub-transfer agent and similar fees, the total annual Fund operating expenses for the Class R6 shares will be less than the expense limitation. The expense limitation expiring February 28, 2018 may be terminated or modified prior to that date only with the approval of the Board of Directors of the Funds.
| | | | | | |
| Fund | | Expense Cap | | | Expense Cap
Expiration Date |
Large Cap Growth Opportunities | | | 0.89 | %* | | February 28, 2018 |
Mid Cap Growth Opportunities | | | 0.92 | * | | February 28, 2018 |
Small Cap Growth Opportunities | | | 1.09 | ** | | February 28, 2018 |
| * | Effective June 30, 2016. |
| ** | Effective June 30, 2016. Prior to June 30, 2016, the Fund’s Expense Cap was 1.22%. |
Other Transactions with Affiliates
The Trust pays no compensation directly to those of its directors who are affiliated with the Adviser or to its officers, all of whom receive remuneration for their services to the Trust from the Adviser or its affiliates. The Board has adopted a deferred compensation plan for independent directors that enables directors to elect to defer receipt of all or a portion of the annual compensation they are entitled to receive from certain Nuveen-advised funds. Under the plan, deferred amounts are treated as though equal dollar amounts had been invested in shares of select Nuveen-advised funds.
During the current fiscal period, Nuveen Securities, LLC, (the “Distributor”), a wholly-owned subsidiary of Nuveen, collected sales charges on purchases of Class A Shares, the majority of which were paid out as concessions to financial intermediaries as follows:
| | | | | | | | | | | | |
| | | Large Cap
Growth
Opportunities | | | Mid Cap
Growth
Opportunities | | | Small Cap
Growth
Opportunities | |
| Sales charges collected (Unaudited) | | $ | 49,249 | | | $ | 66,171 | | | $ | 12,317 | |
| Paid to financial intermediaries (Unaudited) | | | 43,483 | | | | 58,027 | | | | 10,873 | |
The Distributor also received 12b-1 service fees on Class A Shares, substantially all of which were paid to compensate financial intermediaries for providing services to shareholders relating to their investments.
During the current fiscal period, the Distributor compensated financial intermediaries directly with commission advances at the time of purchase as follows:
| | | | | | | | | | | | |
| | | Large Cap
Growth
Opportunities | | | Mid Cap
Growth
Opportunities | | | Small Cap
Growth
Opportunities | |
| Commission advances (Unaudited) | | $ | 12,749 | | | $ | 8,134 | | | $ | 2,889 | |
To compensate for commissions advanced to financial intermediaries, all 12b-1 service and distribution fees collected on Class C Shares during the first year following a purchase are retained by the Distributor. During the current fiscal period, the Distributor retained such 12b-1 fees as follows:
| | | | | | | | | | | | |
| | | Large Cap
Growth
Opportunities | | | Mid Cap
Growth
Opportunities | | | Small Cap
Growth
Opportunities | |
| 12b-1 fees retained (Unaudited) | | $ | 14,680 | | | $ | 11,052 | | | $ | 3,592 | |
The remaining 12b-1 fees charged to the Funds were paid to compensate financial intermediaries for providing services to shareholders relating to their investments.
The Distributor also collected and retained CDSC on share redemptions during the current fiscal period, as follows:
| | | | | | | | | | | | |
| | | Large Cap
Growth
Opportunities | | | Mid Cap
Growth
Opportunities | | | Small Cap
Growth
Opportunities | |
| CDSC retained (Unaudited) | | $ | 1,455 | | | $ | 959 | | | $ | 19 | |
8. Borrowings Arrangements
Uncommitted Line of Credit
During the current fiscal period, the Funds participated in an unsecured bank line of credit (“Unsecured Credit Line”) under which outstanding balances would bear interest at a variable rate. On December 31, 2015, Mid Cap Growth Opportunities utilized $723,550 of the Unsecured Credit Line at an annualized interest rate of 1.68% on its outstanding balance. The remaining Funds in this report did not draw on this Unsecured Credit Line during the current fiscal period.
Committed Line of Credit
The Funds, along with certain other funds managed by the Adviser (“Participating Funds”), have established a 364-day approximately, $2.5 billion standby credit facility with a group of lenders, under which the Participating Funds may borrow for various purposes other than leveraging for investment purposes. A large portion of this facility’s capacity (and its associated costs as described below) is currently dedicated for use by a small number of Participating Funds, which does not include any of the Funds covered by this shareholder report. The remaining capacity under the facility (and the corresponding portion of the facility’s annual costs) is separately dedicated to most of the other open-end funds in the Nuveen fund family, including all of the Funds covered by this shareholder report, along with a number of Nuveen closed-end funds. The credit facility expires in July 2017 unless extended or renewed.
The credit facility has the following terms: a fee of 0.15% per annum on unused commitment amounts, and interest at a rate equal to the higher of (a) one-month LIBOR (London Inter-Bank Offered Rate) plus 1.25% per annum or (b) the Fed Funds rate plus 1.25% per annum on amounts borrowed. Participating Funds paid administration, legal and arrangement fees, which are recognized as a component of “Other expenses” on the Statement of Operations, and along with commitment fees, have been allocated among such Participating Funds based upon the relative proportions of the facility’s aggregate capacity reserved for them and other factors deemed relevant by the Adviser and the Board of each Participating Fund.
During the current fiscal period, Mid Cap Growth Opportunities utilized this facility. The Fund’s average daily balance outstanding and average annual interest rate during the utilization period were $10,000,000 and 1.78%, respectively. The Fund’s maximum outstanding daily balance during the utilization period was $10,000,000. Borrowings outstanding as of the end of the reporting period are recognized as “Borrowings” on the Statement of Assets and Liabilities. Large Cap Growth Opportunities and Small Cap Growth Opportunities did not utilize this facility during the current fiscal period.
Additional
Fund Information (Unaudited)
| | | | | | | | | | |
| | | | | |
| | Fund Manager Nuveen Fund Advisors, LLC 333 West Wacker Drive Chicago, IL 60606 Sub-Adviser Nuveen Asset Management, LLC 333 West Wacker Drive Chicago, IL 60606 | | Independent Registered
Public Accounting Firm PricewaterhouseCoopers LLP One North Wacker Drive Chicago, IL 60606 Custodian U.S. Bank National Association 1555 North RiverCenter Drive, Suite 302 Milwaukee, WI 53202 | | Legal Counsel Chapman and Cutler LLP Chicago, IL 60603 | | Transfer Agent and
Shareholder Services Boston Financial
Data Services, Inc. Nuveen Investor Services P.O. Box 8530 Boston, MA 02266-8530 (800) 257-8787 | | |
| | | | | | | | | | | | |
| | | | |
| | | | | | | | |
| |
| | Distribution Information: The Funds hereby designate their percentages of dividends paid from net ordinary income as dividends qualifying for the 70% dividends received deduction (“DRD”) for corporations and their percentages as qualified dividend income (“QDI”) for individuals under Section 1(h)(11) of the Internal Revenue Code as shown in the accompanying table. The actual qualified dividend income distributions will be reported to shareholders on Form 1099-DIV which will be sent to shareholders shortly after calendar year end. |
| | | | | | |
| | | | | | | | | | | Large Cap Growth
Opportunities | | Small Cap Growth
Opportunities |
| | % of QDI | | | | 100% | | 16% |
| | % of DRD | | | | 82% | | 16% |
| | | | | |
| | | | | | | | | | |
| | | | | | | | | | | | | | |
| | |
| | Long-Term Capital Gain Distributions: The Funds hereby designate as long-term capital gain dividends, pursuant to Internal Revenue Code Section 852(b)(3), the amount shown in the accompanying table or, if greater, the amount necessary to reduce earnings and profits of the Funds related to net capital gain to zero for the tax year ended October 31, 2016: | | |
| | | | | | | |
| | | | | | | | | Large Cap Growth
Opportunities | | Mid Cap Growth
Opportunities | | Small Cap Growth
Opportunities | | |
| | Long-term capital gain dividends | | $83,442,983 | | $89,831,422 | | $6,723,321 | | |
| | | |
| | | | | | |
| | |
| | Quarterly Form N-Q Portfolio of Investments Information: Each Fund is required to file its complete schedule of portfolio holdings with the Securities and Exchange Commission (SEC) for the first and third quarters of each fiscal year on Form N-Q. You may obtain this information directly from the SEC. Visit the SEC on-line at http://www.sec.gov or in person at the SEC’s Public Reference Room in Washington, D.C. Call the SEC toll-free at (800) SEC-0330 for room hours and operation. | | |
| | | |
| | | | | | |
| | |
| | Nuveen Funds’ Proxy Voting Information: You may obtain (i) information regarding how each fund voted proxies relating to portfolio securities held during the most recent twelve-month period ended June 30, without charge, upon request, by calling Nuveen toll-free at (800) 257-8787 or on Nuveen’s website at www.nuveen.com and (ii) a description of the policies and procedures that each fund used to determine how to vote proxies relating to portfolio securities without charge, upon request, by calling Nuveen toll-free at (800) 257-8787. You may also obtain this information directly from the SEC. Visit the SEC on-line at http://www.sec.gov. | | |
| | | |
| | | | | | |
| | |
| | FINRA BrokerCheck: The Financial Industry Regulatory Authority (FINRA) provides information regarding the disciplinary history of FINRA member firms and associated investment professionals. This information as well as an investor brochure describing FINRA BrokerCheck is available to the public by calling the FINRA BrokerCheck Hotline number at (800) 289-9999 or by visiting www.FINRA.org. | | |
Glossary of Terms
Used in this Report (Unaudited)
Average Annual Total Return: This is a commonly used method to express an investment’s performance over a particular, usually multi-year time period. It expresses the return that would have been necessary each year to equal the investment’s actual cumulative performance (including change in NAV or offer price and reinvested distributions and capital gains, if any) over the time period being considered.
Gross Domestic Product (GDP): The total market value of all final goods and services produced in a country/region in a given year, equal to total consumer, investment and government spending, plus the value of exports, minus the value of imports.
Lipper Large-Cap Growth Funds Classification Average: Represents the average annualized total return for all reporting funds in the Lipper Large-Cap Growth Funds Classification. Lipper returns account for the effects of management fees and assume reinvestment of distributions but do not reflect any applicable sales charges.
Lipper Multi-Cap Growth Funds Classification Average: Represents the average annualized total return for all reporting funds in the Lipper Multi-Cap Growth Funds Classification. Lipper returns account for the effects of management fees and assume reinvestment of distributions but do not reflect any applicable sales charges.
Lipper Small-Cap Growth Funds Classification Average: Represents the average annualized total return for all reporting funds in the Lipper Small-Cap Growth Funds Classification. Lipper returns account for the effects of management fees and assume reinvestment of distributions but do not reflect any applicable sales charges.
Market Capitalization: The market capitalization of a company is equal to the number of the company’s common shares outstanding multiplied by the current price of the company’s stock.
MSCI EAFE Index: The MSCI (Morgan Stanley Capital International) EAFE (Europe, Australasia, Far East) Index is a free float-adjusted market capitalization weighted index designed to measure developed market equity performance, excluding the U.S. and Canada. The index returns assume reinvestment of distributions, but do not reflect any applicable sales charges or management fees.
MSCI Emerging Markets Index: The MSCI (Morgan Stanley Capital International) Emerging Markets Index is a free-float-adjusted market capitalization index that is designed to measure equity market performance in the global emerging markets. Index returns assume reinvestment of distributions, but do not reflect any applicable sales charges or management fees.
Net Asset Value (NAV) Per Share: A fund’s Net Assets is equal to its total assets (securities, cash and accrued earnings) less its total liabilities. For funds with multiple classes, Net Assets are determined separately for each share class. NAV per share is equal to the fund’s (or share class’) Net Assets divided by its number of shares outstanding.
Russell 1000® Growth Index: An index that measures the performance of those Russell 1000 companies with higher price-to-book ratios and higher forecasted growth values. The index returns assume reinvestment of distributions, but do not reflect any applicable sales charges or management fees.
Russell 2000® Growth Index: An index that measures the performance of those Russell 2000 companies with higher price-to-book ratios and higher forecasted growth values. The index returns assume reinvestment of distributions, but do not reflect any applicable sales charges or management fees.
Russell 1000® Index: An unmanaged index, considered representative of large-cap stocks. The index returns assume reinvestment of distributions, but do not reflect any applicable sales charges or management fees.
Glossary of Terms Used in this Report (Unaudited) (continued)
Russell 2000® Index: An index that measures the performance of the small-cap segment of the U.S. equity universe. The Russell 2000® Index is a subset of the Russell 3000® Index representing approximately 10% of the total market capitalization of that index. It includes approximately 2,000 of the smallest securities based on a combination of their market cap and current index membership. The Russell 3000® Index measures the performance of the 3,000 largest companies based on total market capitalization, which represents approximately 98% of the investable U.S. equity market. The index returns assume reinvestment of distributions, but do not reflect any applicable sales charges or management fees.
Russell Midcap® Growth Index: An index that measures the performance of the mid-cap growth segment of the U.S. equity universe. It includes those Russell Midcap Index companies with higher price-to-book ratios and higher forecasted growth values. The index returns assume reinvestment of distributions, but do not reflect any applicable sales charges or management fees.
Russell Midcap® Index: A market-weighted index measuring the performance of the mid-cap segment of the equity market which includes the smallest 800 securities within the Russell 1000® Index. Index returns assume reinvestment of distributions, but do not reflect any applicable sales charges or management fees.
S&P 500® Index: An unmanaged index generally considered representative of the U.S. stock market. Index returns assume reinvestment of distributions, but do not include the effects of any applicable sales charges or management fees.
Tax Equalization: The practice of treating a portion of the distribution made to a redeeming shareholder, which represents his proportionate part of undistributed net investment income and capital gain as a distribution for tax purposes. Such amounts are referred to as the equalization debits (or payments) and will be considered a distribution to the shareholder of net investment income and capital gain for calculation of the fund’s dividends paid deduction.
Annual Investment Management Agreement
Approval Process (Unaudited)
The Board of Directors of each Fund (the “Board,” and each Director a “Board Member”), including the Board Members who are not parties to the Funds’ advisory or sub-advisory agreements or “interested persons” of any such parties (the “Independent Board Members”), is responsible for overseeing the performance of the investment adviser and sub-adviser to the respective Fund and determining whether to continue such Fund’s advisory agreement (the “Investment Management Agreement”) between the Fund and Nuveen Fund Advisors, LLC (the “Adviser”) and the sub-advisory agreement (the “Sub-Advisory Agreement” and, together with the Investment Management Agreement, the “Advisory Agreements”) between the Adviser and Nuveen Asset Management, LLC (the “Sub-Adviser”). Following an initial term with respect to each Fund upon its commencement of operations, the Board reviews the Investment Management Agreement and the Sub-Advisory Agreement on behalf of such Fund and votes to determine whether the respective Advisory Agreement should be renewed. Accordingly, at an in-person meeting held on May 24-26, 2016 (the “May Meeting”), the Board, including a majority of the Independent Board Members, considered and approved the existing Advisory Agreements for the Funds.
During the year, the Board and its Committees met regularly to receive materials and discuss a variety of topics impacting the Funds including, among other things, overall market conditions and market performance, Fund investment performance, brokerage execution, valuation of securities, Rule 12b-1 plans and payments, sub-transfer agency and other payments to financial intermediaries, compliance matters, securities lending, risk management and ongoing initiatives. The Board had established several standing Committees, including the Open-end Fund Committee and Closed-end Fund Committee which permit the Board Members to delve further into the topics particularly relevant to the respective product line and enhance the Board’s effectiveness and oversight of the Funds. The Board also seeks to meet with the Sub-Adviser and its investment team at least once over a multiple year rotation through site visits. The information and knowledge the Board gained throughout the year from the Board and Committee meetings, site visits and the related materials were relevant to the Board’s evaluation of the Advisory Agreements, and the Board took such information into account in its review of the Advisory Agreements.
In addition to the materials received throughout the year, the Board received additional materials prepared specifically for its annual review of the Advisory Agreements in response to a request by independent legal counsel on behalf of the Independent Board Members. The materials addressed a variety of topics, including a description of the services provided by the Adviser and the Sub-Adviser (each, a “Fund Adviser”); a review of fund performance with a detailed focus on any performance outliers; an analysis of the investment teams; an analysis of the fees and expense ratios of the Funds, including information comparing such fees and expenses to that of peer groups; an assessment of shareholder services for the Funds and of the performance of certain service providers; a review of initiatives instituted or continued during the past year; and information regarding the profitability of the Fund Advisers, the compensation of portfolio managers, and compliance and risk matters.
As part of its annual review, the Board held a separate meeting on April 12-13, 2016 to review the Funds’ investment performance and consider an analysis by the Adviser of the Sub-Adviser examining, among other things, the team’s assets under management, investment performance, investment approach, and the stability and structure of the Sub-Adviser’s organization and investment team. During the review, the Independent Board Members requested and received additional information from management. Throughout the year and throughout their review of the Advisory Agreements, the Independent Board Members were assisted by independent legal counsel. The Independent Board Members met separately with independent legal counsel without management present and received a memorandum from such counsel outlining their fiduciary duties and legal standards in reviewing the Advisory Agreements. The Independent Board Members’ review of the Advisory Agreements reflected an ongoing process that incorporated the information and considerations that occurred over the years, including the most recent year, as well as the information specifically furnished for the renewal process. In deciding to renew the Advisory Agreements, the Independent Board Members did not identify a particular factor as controlling, but rather the decision reflected the comprehensive consideration of all the information presented. The following summarizes the principal factors, but not all the factors, the Board considered in its review of the Advisory Agreements and its conclusions.
A. Nature, Extent and Quality of Services
In evaluating the renewal of the Advisory Agreements, the Independent Board Members received and considered information regarding the nature, extent and quality of the applicable Fund Adviser’s services provided to the respective Fund and the initiatives undertaken during the past year by the Adviser. The Board recognized the comprehensive set of services the Adviser provided to manage and operate the Nuveen funds, including (a) product management (such as setting dividends, positioning the product in the marketplace, managing the relationships with the distribution platforms, maintaining and enhancing shareholder communications and reporting to the Board); (b) investment services (such as overseeing sub-advisers and other service providers; analyzing investment performance and risks; overseeing risk management and disclosure; developing and interpreting investment policies; assisting in the development of products; helping to prepare financial statements and marketing disclosures; and overseeing trade execution); (c) fund administration (such as helping to prepare fund tax returns and complete other tax compliance matters; and helping to prepare regulatory filings and shareholder reports); (d) fund Board administration (such as preparing Board materials and organizing and providing assistance
Annual Investment Management Agreement Approval Process (Unaudited) (continued)
for Board meetings); (e) compliance (such as helping to devise and maintain the funds’ compliance program and related testing); and (f) legal support (such as helping to prepare registration statements and proxy statements, interpreting regulations and policies and overseeing fund activities).
The Board reviewed the continued investment the Adviser had made in its business to continue to strengthen the breadth and quality of its services to the benefit of the Nuveen funds. The Board noted the Adviser’s additional staffing in key areas that support the funds and the Board, including in investment services, operations, fund governance, compliance, fund administration, product management, retail distribution and information technology. Among the enhancements to its services, the Board recognized the Adviser’s (a) expanded activities and support required as a result of regulatory developments, including in areas of compliance and reporting; (b) increased support for dividend management; (c) continued investment in its technical capabilities as the Adviser continued to build out a centralized fund data platform, enhance mobility and remote access capabilities, rationalize and upgrade software platforms, and automate certain regulatory liquidity determinations; (d) continued efforts to rationalize the product line through mergers, liquidations and re-positioning of the Nuveen funds with the goal of increasing efficiencies, reducing costs, improving performance and addressing shareholder needs; (e) continued efforts to develop new lines of business designed to enhance the Nuveen product line and meet investor demands; and (f) continued commitment to enhance risk oversight, including the formation of the operational risk group to provide operational risk assessment, the access to platforms which provide better risk reporting to support investment teams, and the development of a new team to initially review new products and major product initiatives. The Board also recognized the Adviser’s efforts to renegotiate certain fees of other service providers which culminated in reduced expenses for all funds for custody and accounting services without diminishing the breadth and quality of the services provided. The Board considered the Chief Compliance Officer’s report regarding the Adviser’s compliance program, the Adviser’s continued development, execution and management of its compliance program, and the additions to the compliance team to support the continued growth of the Nuveen fund family and address regulatory developments.
The Board also considered information highlighting the various initiatives that the Adviser had implemented or continued during the year to enhance or support the open-end fund product line. The Board noted the Adviser’s continued initiatives (a) to develop and offer new outcome-oriented funds; (b) to refine the reports to the Board, including enhanced reporting regarding payments to intermediaries, as well as provide presentations to the Board to keep it apprised of various topics that are relevant to the open-end fund product line (such as marketing initiatives, portfolio analytics and sales results); (c) to modify the contingent deferred sales load structure for Class A shares to be more competitive with peers; (d) to launch a new share class to attract institutional clients; and (e) to change portfolio managers on various funds. The Board recognized that initiatives that attract assets to the Nuveen family of funds benefited the funds as fixed costs would be spread over a larger asset base and, as described below, through the complex-wide arrangement which generally would provide that the management fees of the funds (subject to limited exceptions) are reduced as asset levels for the complex increase. The Board also considered the Adviser’s review of the pricing on its entire open-end fund line which resulted in either a reduction in the contractual management fee, a reduction in (or, in certain cases, the adoption of) a temporary expense cap or a combination thereof for numerous funds in the complex helping to better position such funds for future growth, including Nuveen Large Cap Growth Opportunities Fund (the “Large Cap Fund”) and Nuveen Mid Cap Growth Opportunities Fund (the “Mid Cap Fund”), each of which reduced its management fee and adopted a temporary expense cap, and Nuveen Small Cap Growth Opportunities Fund (the “Small Cap Fund”), which reduced both its management fee and temporary expense cap.
As noted, the Adviser also oversees the Sub-Adviser who primarily provides the portfolio advisory services to the Funds. The Board recognized the skill and competency of the Adviser in monitoring and analyzing the performance of the Sub-Adviser and managing the sub-advisory relationship. The Board noted that the Adviser recommended the renewal of each Sub-Advisory Agreement.
Based on their review, the Independent Board Members found that, overall, the nature, extent and quality of services provided to the respective Funds under each applicable Advisory Agreement were satisfactory.
B. The Investment Performance of the Funds and Fund Advisers
The Board considered the long-term and short-term performance history of the Nuveen funds. As noted above, the Board reviewed fund performance at its quarterly meetings throughout the year and took into account the information derived from the discussions with representatives of the Adviser about fund performance at these meetings. The Board also considered the Adviser’s analysis of fund performance with particular focus on any performance outliers and the factors contributing to such performance and any steps the investment team had taken to address performance concerns. The Board reviewed, among other things, each Fund’s investment performance both on an absolute basis and in comparison to peer funds (the “Performance Peer Group”) and to recognized and/or customized benchmarks (i.e., generally benchmarks derived from multiple recognized benchmarks) for the quarter, one-, three- and five-year periods ending December 31, 2015, as well as performance information reflecting the first quarter of 2016.
In evaluating performance information, the Board recognized the following factors may impact the performance data as well as the consideration to be given to particular performance data:
| | • | | The performance data reflected a snapshot in time, in this case as of the end of the most recent calendar year or quarter. A different performance period, however, could generate significantly different results. |
| | • | | Long-term performance can be adversely affected by even one period of significant underperformance so that a single investment decision or theme had the ability to disproportionately affect long-term performance. |
| | • | | Shareholders evaluate performance based on their own holding period which may differ from the performance period reviewed by the Board, leading to different performance results. |
| | • | | Open-end funds offered multiple classes and the performance data provided for open-end funds was based on Class A shares. The performance of the other classes of a fund, however, should be substantially similar on a relative basis because all of the classes would be invested in the same portfolio of securities and differences in performance among classes could be principally attributed to the variations in distribution and servicing expenses of each class. |
| | • | | The Board recognized the difficulty in establishing appropriate peer groups and benchmarks for certain funds. The Board noted that management classified the Performance Peer Groups as low, medium and high in relevancy and took the relevancy of the Performance Peer Group into account when considering the comparative performance data. If the Performance Peer Group differed somewhat from a fund, the Board recognized that the comparative performance data may be of limited value. The Board also recognized that each fund operated pursuant to its own investment objective(s), parameters and restrictions which may differ from that of the Performance Peer Group or benchmark and that these variations lead to differences in performance results. |
With respect to any Nuveen funds for which the Board has identified performance concerns, the Board monitors such funds closely until performance improves, discusses with the Adviser the reasons for such results, considers those steps necessary or appropriate to address such issues, and reviews the results of any efforts undertaken. The Board was aware, however, that shareholders chose to invest or remain invested in a fund knowing that the Adviser and the applicable sub-adviser manage the fund, knowing the fund’s investment strategy and seeking exposure to that strategy (even if the strategy was “out of favor” in the marketplace) and knowing the fund’s fee structure.
For the Large Cap Fund, the Board noted that the Fund ranked in its Performance Peer Group in the third quartile for the three- and five-year periods and the first quartile in the one-year period. In addition, although the Fund underperformed its benchmark in the three- and five-year periods, the Fund outperformed its benchmark in the one-year period. The Board determined that the Fund’s performance had been satisfactory.
For the Mid Cap Fund, the Board noted that, although the Fund underperformed its benchmark for the one-, three- and five-year periods and ranked in its Performance Peer Group in the fourth quartile in the one-year period, the Fund ranked in the third quartile in the three- and five-year periods. The Board determined that the Fund’s overall performance had been satisfactory.
For the Small Cap Fund, the Board noted that, although the Fund underperformed its benchmark in the one-, three- and five-year periods, the Fund ranked in its Performance Peer Group in the third quartile in the one- and five-year periods and the second quartile in the three-year period. The Board determined that the Fund’s performance had been satisfactory.
C. Fees, Expenses and Profitability
1. Fees and Expenses
The Board evaluated the management fees and other fees and expenses of each Fund. The Board reviewed, among other things, the gross and net management fees and net total expenses of each Fund (expressed as a percentage of average net assets) in absolute terms and also in comparison to the fee and expense levels of a comparable universe of funds (the “Peer Universe”) and to a more focused subset in the Peer Universe (the “Peer Group”), each selected by an independent third-party fund data provider. The Independent Board Members also reviewed the methodology regarding the construction of the applicable Peer Universe and Peer Group.
In their evaluation of the management fee schedule, the Independent Board Members considered the fund-level and complex-wide breakpoint schedules, as described in further detail below. The Independent Board Members also took into account any fee waivers and/or expense reimbursements provided by Nuveen. In this regard, as noted above, the Board considered that management recently completed a review of the pricing of its open-end funds which resulted in the reduction of management fees and/or expense caps of various open-end funds. The Independent Board Members considered that the foregoing changes were estimated to result in significant savings to such funds either through a reduction in advisory fees paid or an increase in the fee waivers absorbed by Nuveen. In this regard, the Board noted that the Adviser agreed to reduce the management fee and adopt a temporary expense cap for the Large Cap Fund and the Mid Cap Fund, and to reduce both the management fee and temporary expense cap for the Small Cap Fund.
In reviewing the comparative fee and expense information, the Independent Board Members recognized that various factors such as the limited size and particular composition of the Peer Universe or Peer Group (including the inclusion of other Nuveen funds in the peer set); expense anomalies; changes in the funds comprising the Peer Universe or Peer Group from year to year; levels of reimbursement or fee waivers; the timing of information used; and differences in services provided can impact the usefulness of the comparative data in helping to assess the appropriateness of a fund’s fees and expenses. In addition, in reviewing a fund’s fees and expenses compared to the fees and expenses of its peers, the Board generally considered the fund’s expenses and fees to be higher if they were over 10 basis points higher, slightly higher if they were 6 to 10 basis
Annual Investment Management Agreement Approval Process (Unaudited) (continued)
points higher, in line if they were within approximately 5 basis points higher than the peer average and below if they were below the peer average of the Peer Group. The Board reviewed the net expense ratio in recognition that the net expense ratio generally best represented the net experience of the shareholders of a fund as it directly reflected the costs of investing in the respective fund. The Board noted that the majority of the Nuveen funds had a net expense ratio near or below the average of the respective peers. For funds with a net expense ratio of 6 basis points or higher than their respective peer average, the Independent Board Members reviewed the reasons for the outlier status and were satisfied with the explanation for the difference or with any steps taken to address the difference.
The Board noted that the Large Cap Fund had a net management fee slightly higher than its peer average but a net expense ratio in line with its peer average, the Small Cap Fund had a net management fee higher than its peer average but a net expense ratio in line with its peer average and the Mid Cap Fund had a net management fee and a net expense ratio higher than its respective peer average. The Board noted, however, that the Adviser had agreed to reduce the contractual management fee and adopt a temporary expense cap for the Large Cap Fund and the Mid Cap Fund, and to reduce both the contractual management fee and temporary expense cap for the Small Cap Fund.
Based on their review of the fee and expense information provided, the Independent Board Members determined that each Fund’s management fees (as applicable) to a Fund Adviser were reasonable in light of the nature, extent and quality of services provided to the Fund.
2. Comparisons with the Fees of Other Clients
The Board also reviewed information regarding the fee rates for other types of clients advised or sub-advised by the respective Fund Adviser. For the Adviser and/or its affiliated sub-advisers, such other clients may include: separately managed accounts (such as retail, institutional or wrap accounts), hedge funds, other investment companies that are not offered by Nuveen but are sub-advised by one of Nuveen’s affiliated sub-advisers, foreign investment companies offered by Nuveen, and collective investment trusts.
The Board recognized that each Fund had an affiliated sub-adviser. With respect to affiliated sub-advisers, including the Sub-Adviser, the Board reviewed, among other things, the range of advisory fee rates and average fee rate assessed for the different types of clients. The Board reviewed information regarding the different types of services provided to the Funds compared to that provided to these other clients which typically did not require the same breadth of day-to-day services required for registered funds. The Board further considered information regarding the differences in, among other things, the distribution systems, investment policies, investor profiles, and account sizes between the Nuveen funds and the other types of clients. In addition, the Independent Board Members also recognized that the management fee rates of the foreign funds advised by the Adviser may also vary due to, among other things, differences in the client base, governing bodies, operational complexities and services covered by the management fee. The Independent Board Members recognized that the foregoing variations resulted in different economics among the product structures and culminated in varying management fees among the types of clients and funds.
The Board also was aware that, since the Funds had a sub-adviser, each Fund’s management fee reflected two components, the fee retained by the Adviser for its services and the fee the Adviser paid to the Sub-Adviser. The Board noted that many of the administrative services provided to support the Funds by the Adviser may not be required to the same extent or at all for the institutional clients or other clients. In general, the Board noted that higher fee levels reflected higher levels of service provided by the Fund Adviser, increased investment management complexity, greater product management requirements and higher levels of business risk or some combination of the foregoing. Given the inherent differences in the various products, particularly the extensive services provided to the Funds, the Independent Board Members concluded such facts justify the different levels of fees.
3. Profitability of Fund Advisers
In conjunction with their review of fees, the Independent Board Members also considered the profitability of Nuveen for its advisory activities on an absolute basis and in comparison to other investment advisers. The Independent Board Members reviewed, among other things, Nuveen’s adjusted operating margins, the gross and net revenue margins (pre-tax and after-tax) for advisory activities for the Nuveen funds, and the revenues, expenses, and net income (pre-tax and after-tax) of Nuveen for each of the last two calendar years. The Independent Board Members reviewed an analysis of the key drivers behind the changes in revenues and expenses that impacted profitability in 2015. The Independent Board Members also noted that the sub-advisory fees for the Funds are paid by the Adviser, however, the Board recognized that the Sub-Adviser is affiliated with Nuveen. In their review, the Independent Board Members recognized that profitability data is rather subjective as various allocation methodologies may be reasonable to employ but yet yield different results. The Board also reviewed the results of certain alternative methodologies. The Board considered the allocation methodology employed to prepare the profitability data as well as a summary of the refinements to the methodology that had been adopted over the years which may limit some of the comparability of Nuveen’s revenue margins over time. Two Independent Board Members also served as point persons for the Board throughout the year to review and discuss the methodology employed to develop the profitability analysis and any proposed changes thereto and to keep the Board apprised of such changes during the year. In reviewing the profitability data, the Independent Board Members noted that Nuveen’s operating margin as well as its margins for its advisory activities to the Nuveen funds for 2015 were consistent with such margins for 2014.
The Board also considered Nuveen’s adjusted operating margins compared to that of other comparable investment advisers (based on asset size and composition) with publicly available data. The Independent Board Members recognized, however, the limitations of the comparative data as
the other advisers may have a different business mix, employ different allocation methodologies, have different capital structure and costs, may not be representative of the industry or other factors that limit the comparability of the profitability information. Nevertheless, the Independent Board Members noted that Nuveen’s adjusted operating margins appeared comparable to the adjusted margins of the peers.
Further, as the Adviser is a wholly-owned subsidiary of Nuveen which in turn is an operating division of TIAA Global Asset Management, the investment management arm of Teachers Insurance and Annuity Association of America (“TIAA-CREF”), the Board reviewed a balance sheet for TIAA-CREF reflecting its assets, liabilities and capital and contingency reserves for the last two calendar years to have a better understanding of the financial stability and strength of the TIAA-CREF complex, together with Nuveen.
Based on the information provided, the Independent Board Members noted that the Adviser appeared to be sufficiently profitable to operate as a viable investment management firm and to honor its obligations as a sponsor of the Nuveen funds.
With respect to the Sub-Adviser, the Independent Board Members also considered the profitability of the Sub-Adviser from its relationship with the Nuveen funds. The Independent Board Members reviewed the Sub-Adviser’s revenues, expenses and revenue margins (pre- and post-tax) for its advisory activities for the calendar year ended December 31, 2015. The Independent Board Members also reviewed profitability analysis reflecting the revenues, expenses and revenue margin (pre- and post-tax) by asset type for the Sub-Adviser for the calendar year ending December 31, 2015.
In evaluating the reasonableness of the compensation, the Independent Board Members also considered other amounts paid to a Fund Adviser by the Funds as well as indirect benefits (such as soft dollar arrangements), if any, the Fund Adviser and its affiliates received or were expected to receive that were directly attributable to the management of a Fund. See Section E below for additional information on indirect benefits a Fund Adviser may receive as a result of its relationship with the Funds.
Based on their review, the Independent Board Members determined that the Adviser’s and the Sub-Adviser’s levels of profitability were reasonable in light of the respective services provided.
D. Economies of Scale and Whether Fee Levels Reflect These Economies of Scale
The Independent Board Members recognized that as the assets of a particular fund or the Nuveen complex in the aggregate increase over time, economies of scale may be realized with respect to the management of the funds, and the Independent Board Members considered the extent to which these economies are shared with the funds and their shareholders. Although the Independent Board Members recognized that economies of scale are difficult to measure with precision, the Board noted that there were several acceptable means to share economies of scale, including through breakpoints in the management fee schedule reducing the fee rates as asset levels grow, fee waiver and expense limitation agreements and the Adviser’s investment in its business which can enhance the services provided to the funds. With respect to breakpoints, the Independent Board Members noted that subject to certain exceptions, the funds in the Nuveen complex, including the Funds, pay a management fee to the Adviser which is generally comprised of a fund-level component and complex-level component. The fund-level fee component declines as the assets of the particular fund grow and the complex-level fee component declines when eligible assets of all the funds in the Nuveen complex combined grow. The complex-wide fee arrangement was designed to capture economies of scale achieved when total fund complex assets increase, even if the assets of a particular fund are unchanged or decrease. The approach reflected the notion that some of Nuveen’s costs were attributable to services provided to all its funds in the complex, and therefore all funds should benefit if these costs were spread over a larger asset base.
The Independent Board Members reviewed the breakpoint and complex-wide schedules and any savings achieved from expense caps (as applicable), fund-level breakpoints and complex-wide fee reductions for the 2015 calendar year for the funds, and considered the adoption or reduction of temporary expense caps for certain funds. In this regard, the Independent Board Members noted that additional economies of scale were or would be shared with shareholders of the Funds through their temporary expense caps.
In addition, the Independent Board Members recognized the Adviser’s ongoing investment in its business to expand or enhance the services provided to the Nuveen funds. The Independent Board Members noted, among other things, the additions to groups who play a key role in supporting the funds including in fund administration, operations, fund governance, investment services, compliance, product management, retail distribution and technology. The Independent Board Members also recognized the investments in systems necessary to manage the funds including in areas of risk oversight, information technology and compliance.
Based on their review, the Independent Board Members concluded that the current fee structure was acceptable and reflected economies of scale to be shared with shareholders when assets under management increase.
E. Indirect Benefits
The Independent Board Members received and considered information regarding other additional benefits the respective Fund Adviser or its affiliates may receive as a result of their relationship with the Funds, including compensation paid to affiliates and research received in connection with brokerage transactions (i.e., soft dollar arrangements). In this regard, the Independent Board Members recognized that an affiliate of the Adviser served as the Funds’ principal underwriter and may receive compensation therefore from, among other things, sales charges, distribution fees and shareholder services fees (which included fees received pursuant to any 12b-1 plan). The Independent Board Members therefore took into account, among other things, the 12b-1 fees retained by Nuveen during the last calendar year.
Annual Investment Management Agreement Approval Process (Unaudited) (continued)
In addition to the above, the Independent Board Members considered that the Funds’ portfolio transactions are allocated by the Sub-Adviser and the Sub-Adviser may benefit from research received through soft-dollar arrangements. The Board noted, however, that with respect to transactions in fixed income securities, such securities generally trade on a principal basis and do not generate soft dollar credits. Although the Board recognized the Sub-Adviser may benefit from a soft dollar arrangement if it does not have to pay for this research out of its own assets, the Board also recognized that any such research may benefit the Funds to the extent it enhances the ability of the Sub-Adviser to manage the Funds.
Based on their review, the Independent Board Members concluded that any indirect benefits received by a Fund Adviser as a result of its relationship with the Funds were reasonable and within acceptable parameters.
F. Other Considerations
The Independent Board Members did not identify any single factor discussed previously as all-important or controlling. The Board Members, including the Independent Board Members, concluded that the terms of each Advisory Agreement were fair and reasonable, that the respective Fund Adviser’s fees were reasonable in light of the services provided to each Fund and that the Advisory Agreements be renewed.
Trustees
and Officers (Unaudited)
The management of the Funds, including general supervision of the duties performed for the Funds by the Adviser, is the responsibility of the Board of Trustees of the Funds. The number of directors of the Funds is set at twelve, effective July 1, 2016. None of the trustees who are not “interested” persons of the Funds (referred to herein as “independent trustees”) has ever been a director or employee of, or consultant to, Nuveen or its affiliates. The names and business addresses of the trustees and officers of the Funds, their principal occupations and other affiliations during the past five years, the number of portfolios each oversees and other directorships they hold are set forth below.
The Funds’ Statement of Additional Information (“SAI”) includes more information about the trustees. To request a free copy, call Nuveen Investments at (800) 257-8787 or visit the Funds’ website at www.nuveen.com.
| | | | | | | | |
Name,
Year of Birth
& Address | | Position(s)
Held with
the Funds | | Year First
Elected or
Appointed (1) | | Principal Occupation(s)
Including other Directorships
During Past 5 Years | | Number of
Portfolios in
Fund Complex
Overseen by
Trustee |
| |
| Independent Trustee: |
William J. Schneider 1944 333 W. Wacker Drive Chicago, IL 60606 | | Chairman and Trustee | | 1996 | | Chairman of Miller-Valentine Partners, a real estate investment company; Board Member of Med-America Health System and WDPR Public Radio station; formerly, Senior Partner and Chief Operating Officer (retired (2004) of Miller-Valentine Group; formerly, Board member, Business Advisory Council of the Cleveland Federal Reserve Bank and University of Dayton Business School Advisory Council; past Chair and Director, Dayton Development Coalition. | | 184 |
Jack B. Evans 1948 333 W. Wacker Drive Chicago, IL 60606 | | Trustee | | 1999 | | President, The Hall-Perrine Foundation, a private philanthropic corporation (since 1996); Director and Chairman, United Fire Group, a publicly held company; Director, The Gazette Company; Life Trustee of Coe College and the Iowa College Foundation; formerly, President Pro-Tem of the Board of Regents for the State of Iowa University System; formerly, Director, Alliant Energy; formerly, Director, Federal Reserve Bank of Chicago; formerly, President and Chief Operating Officer, SCI Financial Group, Inc., a regional financial services firm. | | 184 |
William C. Hunter 1948 333 W. Wacker Drive Chicago, IL 60606 | | Trustee | | 2003 | | Dean Emeritus, formerly, Dean, Tippie College of Business, University of Iowa (2006-2012); Director (since 2004) of Xerox Corporation; Director (since 2005), and past President (2010-2014) Beta Gamma Sigma, Inc., The International Business Honor Society; Director of Wellmark, Inc. (since 2009); formerly, Dean and Distinguished Professor of Finance, School of Business at the University of Connecticut (2003-2006); previously, Senior Vice President and Director of Research at the Federal Reserve Bank of Chicago (1995-2003); formerly, Director (1997-2007), Credit Research Center at Georgetown University. | | 184 |
David J. Kundert 1942 333 W. Wacker Drive Chicago, IL 60606 | | Trustee | | 2005 | | Formerly, Director, Northwestern Mutual Wealth Management Company (2006-2013); retired (since 2004) as Chairman, JPMorgan Fleming Asset Management, President and CEO, Banc One Investment Advisors Corporation, and President, One Group Mutual Funds; prior thereto, Executive Vice President, Banc One Corporation and Chairman and CEO, Banc One Investment Management Group; Regent Emeritus, Member of Investment Committee, Luther College; member of the Wisconsin Bar Association; member of Board of Directors and Chair of Investment Committee, Greater Milwaukee Foundation; member of the Board of Directors (Milwaukee), College Possible; Board member of Milwaukee Repertory Theatre (since 2016). | | 184 |
Trustees and Officers (Unaudited) (continued)
| | | | | | | | |
Name,
Year of Birth
& Address | | Position(s)
Held with
the Funds | | Year First
Elected or
Appointed (1) | | Principal Occupation(s)
Including other Directorships
During Past 5 Years | | Number of
Portfolios in
Fund Complex
Overseen by
Trustee |
Albin F. Moschner(2) 1952 333 W. Wacker Drive Chicago, IL 60606 | | Trustee | | 2016 | | Founder and Chief Executive Officer, Northcroft Partners, LLC, a management consulting firm (since 2012); previously, held positions at Leap Wireless International, Inc., including Consultant (2011-2012), Chief Operating Officer (2008-2011), and Chief Marketing Officer (2004-2008); formerly, President, Verizon Card Services division of Verizon Communications, Inc. (2000-2003); formerly, President, One Point Services at One Point Communications (1999-2000); formerly, Vice Chairman of the Board, Diba, Incorporated (1996-1997); formerly, various executive positions with Zenith Electronics Corporation (1991-1996). Director, USA Technologies, Inc., a provider of solutions and services to facilitate electronic payment transactions (since 2012); formerly, Director, Wintrust Financial Corporation (1996-2016). | | 184 |
John K. Nelson 1962 333 West Wacker Drive Chicago, IL 60606 | | Trustee | | 2013 | | Member of Board of Directors of Core12 LLC (since 2008), a private firm which develops branding, marketing and communications strategies for clients; Director of The Curran Center for Catholic American Studies (since 2009) and The President’s Council, Fordham University (since 2010); formerly senior external advisor to the financial services practice of Deloitte Consulting LLP (2012-2014); formerly, Chairman of the Board of Trustees of Marian University (2010 as trustee, 2011-2014 as Chairman); formerly, Chief Executive Officer of ABN AMRO N.V. North America, and Global Head of its Financial Markets Division (2007-2008); prior senior positions held at ABN AMRO include Corporate Executive Vice President and Head of Global Markets—the Americas (2006-2007), CEO of Wholesale Banking—North America and Global Head of Foreign Exchange and Futures Markets (2001-2006), and Regional Commercial Treasurer and Senior Vice President Trading—North America (1996-2001); formerly, Trustee at St. Edmund Preparatory School in New York City. | | 184 |
Judith M. Stockdale 1947 333 W. Wacker Drive Chicago, IL 60606 | | Trustee | | 1997 | | Board Member, Land Trust Alliance (since 2013) and U.S. Endowment for Forestry and Communities (since 2013); formerly, Executive Director (1994-2012), Gaylord and Dorothy Donnelley Foundation; prior thereto, Executive Director, Great Lakes Protection Fund (1990-1994). | | 184 |
Carole E. Stone 1947 333 W. Wacker Drive Chicago, IL 60606 | | Trustee | | 2007 | | Director, Chicago Board Options Exchange (since 2006), C2 Options Exchange, Incorporated (since 2009); Director, CBOE Holdings, Inc. (since 2010); formerly, Commissioner, New York State Commission on Public Authority Reform (2005-2010). | | 184 |
Terence J. Toth 1959 333 W. Wacker Drive Chicago, IL 60606 | | Trustee | | 2008 | | Managing Partner, Promus Capital (since 2008); Director, Fulcrum IT Service LLC (since 2010) and Quality Control Corporation (since 2012); member: Catalyst Schools of Chicago Board (since 2008) and Mather Foundation Board (since 2012), and chair of its investment committee; formerly, Director, Legal & General Investment Management America, Inc. (2008-2013); formerly, CEO and President, Northern Trust Global Investments (2004-2007); Executive Vice President, Quantitative Management & Securities Lending (2000-2004); prior thereto, various positions with Northern Trust Company (since 1994); formerly, Member, Northern Trust Mutual Funds Board (2005-2007), Northern Trust Global Investments Board (2004-2007), Northern Trust Japan Board (2004-2007), Northern Trust Securities Inc. Board (2003-2007) and Northern Trust Hong Kong Board (1997-2004). | | 184 |
| | | | | | | | |
Name,
Year of Birth
& Address | | Position(s)
Held with
the Funds | | Year First
Elected or
Appointed (1) | | Principal Occupation(s)
Including other Directorships
During Past 5 Years | | Number of
Portfolios in
Fund Complex
Overseen by
Trustee |
Margaret L. Wolff 1955 333 W. Wacker Drive Chicago, IL 60606 | | Trustee | | 2016 | | Member of the Board of Directors (since 2013) of Travelers Insurance Company of Canada and The Dominion of Canada General Insurance Company (each, a part of Travelers Canada, the Canadian operation of The Travelers Companies, Inc.); formerly, Of Counsel, Skadden, Arps, Slate, Meagher & Flom LLP (Mergers & Acquisitions Group) (2005-2014); Member of the Board of Trustees of New York-Presbyterian Hospital (since 2005); Member (since 2004) and Chair (since 2015) of the Board of Trustees of The John A. Hartford Foundation (a philanthropy dedicated to improving the care of older adults); formerly, Member (2005-2015) and Vice Chair (2011-2015) of the Board of Trustees of Mt. Holyoke College. | | 184 |
| |
| Interested Trustee: |
William Adams IV(3) 1955 333 W. Wacker Drive Chicago, IL 60606 | | Trustee | | 2013 | | Co-Chief Executive Officer and Co-President (since March 2016), formerly, Senior Executive Vice President, Global Structured Products (2010-2016), prior thereto, Executive Vice President, U.S. Structured Products (1999-2010) of Nuveen Investments, Inc.; Co-President of Nuveen Fund Advisors, LLC (since 2011); Co-Chief Executive Officer (since 2016), formerly, Senior Executive Vice President of Nuveen Securities, LLC; President (since 2011), of Nuveen Commodities Asset Management, LLC; Board Member of the Chicago Symphony Orchestra and of Gilda’s Club Chicago. | | 184 |
Margo L. Cook(2)(3) 1964 333 W. Wacker Drive Chicago, IL 60606 | | Trustee | | 2016 | | Co-Chief Executive Officer and Co-President (since March 2016), formerly, Senior Executive Vice President of Nuveen Investments, Inc; Co-Chief Executive Officer (since 2015), previously, Executive Vice President (2013-2015) of Nuveen Securities, LLC; Co-President (since October 2016), formerly, Senior Executive Vice President (2015-2016) of Nuveen Fund Advisors, LLC (Executive Vice President 2011-2015); formerly, Managing Director of Nuveen Commodities Asset Management, LLC (2011- 2016); Chartered Financial Analyst. | | 184 |
| | | | | | | | |
Name,
Year of Birth
& Address | | Position(s)
Held with
the Funds | | Year First
Elected or
Appointed (4) | | Principal Occupation(s)
During Past 5 Years | | Number of
Portfolios in
Fund Complex
Overseen by
Officer |
| |
| Officers of the Funds: |
Greg A. Bottjer 1971 333 West Wacker Drive Chicago, IL 60606 | | Chief Administrative Officer | | 2016 | | Managing Director (since 2011), formerly, Senior Vice President (2007-2010) of Nuveen Investments Holdings, Inc.; Managing Director (since October 2016) of Nuveen Fund Advisors, LLC; Chartered Financial Analyst. | | 104 |
Lorna C. Ferguson 1945 333 W. Wacker Drive Chicago, IL 60606 | | Vice President | | 1998 | | Managing Director (since 2005) of Nuveen Fund Advisors, LLC and Nuveen Securities, LLC (since 2004). | | 185 |
Stephen D. Foy 1954 333 W. Wacker Drive Chicago, IL 60606 | | Vice President and Controller | | 1998 | | Managing Director (since 2014), formerly, Senior Vice President (2013-2014) and Vice President (2005-2013) of Nuveen Fund Advisors, LLC; Chief Financial Officer of Nuveen Commodities Asset Management, LLC (since 2010); Managing Director (since 2016) of Nuveen Securities, LLC; Certified Public Accountant. | | 185 |
Trustees and Officers (Unaudited) (continued)
| | | | | | | | |
Name,
Year of Birth
& Address | | Position(s)
Held with
the Funds | | Year First
Elected or
Appointed (4) | | Principal Occupation(s)
During Past 5 Years | | Number of
Portfolios in
Fund Complex
Overseen by
Officer |
Nathaniel T. Jones 1979 333 W. Wacker Drive Chicago, IL 60606 | | Vice President and Treasurer | | 2016 | | Senior Vice President (since 2016), formerly, Vice President (2011- 2016) of Nuveen Investments Holdings, Inc.; Chartered Financial Analyst. | | 185 |
Walter M. Kelly 1970 333 W. Wacker Drive Chicago, IL 60606 | | Chief Compliance Officer and Vice President | | 2003 | | Senior Vice President (since 2008) of Nuveen Investments Holdings, Inc. | | 185 |
Tina M. Lazar 1961 333 W. Wacker Drive Chicago, IL 60606 | | Vice President | | 2002 | | Senior Vice President of Nuveen Investments Holdings, Inc. and Nuveen Securities, LLC | | 185 |
Kevin J. McCarthy 1966 333 W. Wacker Drive Chicago, IL 60606 | | Vice President and Assistant Secretary | | 2007 | | Executive Vice President, Secretary and General Counsel (since March 2016), formerly, Managing Director and Assistant Secretary of Nuveen Investments, Inc.; Executive Vice President (since March 2016), formerly, Managing Director, and Assistant Secretary (since 2008) of Nuveen Securities, LLC; Executive Vice President and Secretary (since March 2016), formerly, Managing Director (2008-2016) and Assistant Secretary (2007-2016), and Co-General Counsel (since 2011) of Nuveen Fund Advisors, LLC; Executive Vice President and Secretary (since March 2016), formerly, Managing Director, Assistant Secretary (2011-2016), and Associate General Counsel (since 2011) of Nuveen Asset Management, LLC; Executive Vice President and Secretary of Nuveen Investments Advisers, LLC; Vice President (since 2007) and Secretary (since March 2016) of NWQ Investment Management Company, LLC, Symphony Asset Management LLC, Santa Barbara Asset Management, LLC, Winslow Capital Management, LLC (since 2010) and Tradewinds Global Investors, LLC (since 2016); Vice President (since 2010) and Secretary (since 2016), formerly, Assistant Secretary of Nuveen Commodities Asset Management, LLC. | | 185 |
Kathleen L. Prudhomme 1953 901 Marquette Avenue Minneapolis, MN 55402 | | Vice President and Secretary | | 2011 | | Managing Director, Assistant Secretary and Co-General Counsel (since 2011) of Nuveen Fund Advisors, LLC; Managing Director, Assistant Secretary and Associate General Counsel (since 2011) of Nuveen Asset Management, LLC; Managing Director and Assistant Secretary (since 2011) of Nuveen Securities, LLC; formerly, Deputy General Counsel, FAF Advisors, Inc. (2004-2010). | | 185 |
Christopher M. Rohrbacher 1971 333 West Wacker Drive Chicago, IL 60606 | | Vice President and Assistant Secretary | | 2008 | | Senior Vice President (since 2011) formerly, Vice President (2008-2011) and Assistant General Counsel (since 2008) of Nuveen Investments Holdings, Inc.; Senior Vice President and Assistant Secretary (since October 2016) of Nuveen Fund Advisors, LLC; Vice President and Assistant Secretary (since 2010) of Nuveen Commodities Asset Management, LLC. | | 185 |
Joel T. Slager 1978 333 West Wacker Drive Chicago, IL 60606 | | Vice President and Assistant Secretary | | 2013 | | Fund Tax Director for Nuveen Funds (since 2013); previously, Vice President of Morgan Stanley Investment Management, Inc., Assistant Treasurer of the Morgan Stanley Funds (from 2010 to 2013). | | 185 |
Jeffery M. Wilson 1956 333 West Wacker Drive Chicago, IL 60606 | | Vice President | | 2011 | | Senior Vice President of Nuveen Investments Holdings, Inc. (since 2011); formerly Senior Vice President of Nuveen Securities, LLC (since 2011); formerly, Senior Vice President of FAF Advisors, Inc. (2000-2010). | | 104 |
| | | | | | | | |
Name,
Year of Birth
& Address | | Position(s)
Held with
the Funds | | Year First
Elected or
Appointed (4) | | Principal Occupation(s)
During Past 5 Years | | Number of
Portfolios in
Fund Complex
Overseen by
Officer |
Gifford R. Zimmerman 1956 333 W. Wacker Drive Chicago, IL 60606 | | Vice President and Assistant Secretary | | 1988 | | Managing Director (since 2002), and Assistant Secretary of Nuveen Securities, LLC; Managing Director (since 2004) and Assistant Secretary (since 1994) of Nuveen Investments, Inc.; Managing Director (since 2002), Assistant Secretary (since 1997) and Co-General Counsel (since 2011) of Nuveen Fund Advisors, LLC; Managing Director, Assistant Secretary and Associate General Counsel of Nuveen Asset Management, LLC (since 2011); Managing Director and Assistant Secretary of Nuveen Investments Advisers Inc. (since 2002), and Symphony Asset Management LLC (since 2003); Vice President and Assistant Secretary of NWQ Investment Management Company, LLC (since 2002), Santa Barbara Asset Management, LLC (since 2006) and of Winslow Capital Management, LLC, (since 2010); Vice President and Assistant Secretary (since 2013), formerly, Chief Administrative Officer and Chief Compliance Officer (2006-2013) of Nuveen Commodities Asset Management, LLC; Chartered Financial Analyst. | | 185 |
| (1) | Trustees serve an indefinite term until his/her successor is elected or appointed. The year first elected or appointed represents the year in which the director was first elected or appointed to any fund in the Nuveen Fund Complex. |
| (2) | On June 22, 2016, Ms. Cook and Mr. Moschner were appointed as Board Members, effective July 1, 2016. |
| (3) | “Interested persons” of the Trust, as defined in the 1940 Act, by reason of their positions with Nuveen and certain of its subsidiaries. |
| (4) | Officers serve one year terms through August of each year. The year first elected or appointed represents the year in which the officer was first elected or appointed to any fund in the Nuveen Fund Complex. |
Notes
Notes
| | | | | | | | | | | | | | |
| | | | | | | | |
| | | | |
| | | | | | | | |
| | | | | |
| | Nuveen: | | | | | | | | |
| | | | Serving Investors for Generations | | | | |
| | |
| | | | |
| | | |
| | | | Since 1898, financial advisors and their clients have relied on Nuveen to provide dependable investment solutions through continued adherence to proven, long-term investing principles. Today, we offer a range of high quality equity and fixed-income solutions designed to be integral components of a well-diversified core portfolio. | | |
| | | |
| | | | | | |
| | | | |
| | | | | | Focused on meeting investor needs. Nuveen helps secure the long-term goals of individual investors and the advisors who serve them. As an operating division of TIAA Global Asset Management, Nuveen provides access to investment expertise from leading asset managers and solutions across traditional and alternative asset classes. Built on more than a century of industry leadership, Nuveen’s teams of experts align with clients’ specific financial needs and goals, demonstrating commitment to advisors and investors through market perspectives and wealth management and portfolio advisory services. Nuveen manages $244 billion in assets as of September 30, 2016. | | |
| | | | | |
| | | | | | | | | | |
| | | | | | Find out how we can help you. To learn more about how the products and services of Nuveen may be able to help you meet your financial goals, talk to your financial advisor, or call us at (800) 257-8787. Please read the information provided carefully before you invest. Investors should consider the investment objective and policies, risk considerations, charges and expenses of any investment carefully. Where applicable, be sure to obtain a prospectus, which contains this and other relevant information. To obtain a prospectus, please contact your securities representative or Nuveen, 333 W. Wacker Dr., Chicago, IL 60606. Please read the prospectus carefully before you invest or send money. Learn more about Nuveen Funds at: www.nuveen.com/mf | | |
| | | | | | |
| | | | | | | | | | | | |
| | Distributed by Nuveen Securities, LLC | 333 West Wacker Drive Chicago, IL 60606 | www.nuveen.com | | |
MAN-FCGO-1016P 21466-INV-Y-12/17
| | |
| | |  |
| Mutual Funds | |
| | | | | | |
| | | | | | | Annual Report October 31, 2016 |
| | | | | | | | | | | | | | |
| | | | | | | Share Class / Ticker Symbol | | |
| | | Fund Name | | | | Class A | | Class C | | Class R3 | | Class I | | |
| | |
| | Nuveen Large Cap Select Fund | | | | FLRAX | | FLYCX | | — | | FLRYX | | |
| | Nuveen Small Cap Select Fund | | | | EMGRX | | FHMCX | | ASEIX | | ARSTX | | |
| | | | | | | | | | | | |
| | | | | | |
| | | | |
| | | | | | | | |
| | |
| | Life is Complex. | | |
| | |
| | Nuveen makes things e-simple. | | |
| | |
| | It only takes a minute to sign up for e-Reports. Once enrolled, you’ll receive an e-mail as soon as your Nuveen Fund information is ready. No more waiting for delivery by regular mail. Just click on the link within the e-mail to see the report and save it on your computer if you wish. | | |
| | | | |
| | | | | | Free e-Reports right to your e-mail! | | |
| | | |
| | | | | | www.investordelivery.com If you receive your Nuveen Fund distributions and statements from your
financial advisor or brokerage account. |
| | | | |
| | | | or | | www.nuveen.com/accountaccess If you receive your Nuveen Fund distributions and statements directly from Nuveen. Must be preceded by or accompanied by a prospectus. NOT FDIC INSURED MAY LOSE VALUE
NO BANK GUARANTEE | | |
| | | | | | | | | | |
| | | | | | | | | | | | | |
Table
of Contents
Chairman’s Letter
to Shareholders

Dear Shareholders,
After a sluggish first half of 2016, the U.S. economy gained some momentum in the third quarter. In fact, it was the economy’s strongest quarterly acceleration in two years, propelled by healthy consumer spending, a temporary surge in exports and a turnaround in inventories. As the year winds down, 2016 looks on track to deliver the same steady-but-slow growth that has characterized the seven-year recovery.
A year ago, the U.S. Federal Reserve (Fed) took the first step toward policy “normalization” by raising its benchmark interest rate at its December 2015 meeting. Speculation about the Fed’s intentions since then has been a strong influence on the markets throughout 2016. After remaining on hold for a year, the Fed judged that the economy’s modest growth, the return to “full” employment and an uptick in inflation were sufficient to raise the target rate at the December 2016 meeting.
Global conditions continue to look subdued by comparison. Investors continue to adjust to the idea of a slower Chinese economy, which has helped commodity prices stabilize and lift global inflation expectations. The U.K.’s June 23rd “Brexit” vote to leave the European Union introduced a new set of economic and political uncertainties to the already fragile conditions across Europe. Moreover, there are growing concerns that global central banks’ unprecedented efforts to revive growth may be showing signs of fatigue. Interest rates are currently negative in Europe and Japan and near or at zero in the U.S., U.K. and elsewhere; nonetheless, growth has remained subdued.
Since the election, U.S. stocks have rallied strongly on expectations that the Republican controlled Congress and Trump administration will pursue more business friendly policies. But the details have yet to be seen. Given muted global growth, the risk of policy errors by central banks around the world, the unfolding Brexit process and an uncertain political outlook (not just in the U.S. but also in Europe), we anticipate that turbulence remains on the horizon for the time being. In this environment, Nuveen remains committed to both managing downside risks and seeking upside potential. If you’re concerned about how resilient your investment portfolio might be, we encourage you to talk to your financial advisor. On behalf of the other members of the Nuveen Fund Board, we look forward to continuing to earn your trust in the months and years ahead.
Sincerely,

William J. Schneider
Chairman of the Board
December 22, 2016
Portfolio Managers’
Comments
Nuveen Large Cap Select Fund
Nuveen Small Cap Select Fund
These Funds feature portfolio management by Nuveen Asset Management, LLC, an affiliate of Nuveen Investments, Inc.
David Chalupnik, CFA, and Tony Burger, CFA, are the portfolio managers for the Nuveen Large Cap Select Fund. David assumed portfolio management responsibilities in 2003 and Tony joined the management team for the Fund in 2004.
Mark Traster, CFA, and Gregory Ryan, CFA, are the portfolio managers for the Nuveen Small Cap Select Fund. Mark assumed portfolio manager responsibilities in 2008 and Greg joined the portfolio management team for the Fund in 2013.
On the following pages, the portfolio management teams for the Funds discuss economic and market conditions, key investment strategies and the Funds’ performance for the twelve-month reporting period ended October 31, 2016.
What factors affected the U.S. economy and the financial markets during the twelve-month reporting period ended October 31, 2016?
The restrained pace of growth that has defined the U.S. economic recovery since 2009 continued in the twelve-month reporting period. Growth over the previous four calendar quarters averaged below 2% (annualized), as measured by real gross domestic product (GDP), which is the value of goods and services produced by the nation’s economy less the value of the goods and services used up in production, adjusted for price changes. For most of the reporting period, consumer spending remained healthy but was offset by the drag from the inventory cycle, lackluster business spending and weak net exports. As a result, GDP growth stayed below 1.5% from the fourth quarter of 2015 through the second quarter of 2016. However, decent consumer spending, an inventory turnaround and a short-term jump in exports contributed to a more robust gain of 3.2% in the third quarter, as reported by the “second” estimate of the Bureau of Economic Analysis.
Consumers, whose purchases comprise the largest component of the U.S. economy, benefited from employment growth and firming wages over the twelve-month reporting period. As reported by the Bureau of Labor Statistics, the unemployment rate was little changed at 4.9% in October 2016 from 5.0% in October 2015, and job gains averaged slightly above 200,000 per month for the past twelve months. Although consumer spending gains were rather muted in the latter half of 2015, spending surged in the second quarter of 2016. Although inflation began to accelerate slightly in the reporting period, the overall level remained low, which also contributed to consumers’ willingness to buy. The Consumer Price Index (CPI) rose 1.6% over the twelve-month reporting period ended October 2016 on a seasonally adjusted basis, as reported by the U.S. Bureau of Labor Statistics. The core CPI (which excludes food and energy) increased 2.1% during the same period, slightly above the Fed’s unofficial longer term inflation objective of 2.0%.
The housing market was another bright spot in the economy. The S&P CoreLogic Case-Shiller U.S. National Home Price Index, which covers all nine U.S. census divisions, recorded a 5.5% annual gain in September 2016 (most recent data available at the time this report was prepared) (effective July 26, 2016, the S&P/Case-Shiller U.S. National Home Price Index was renamed the S&P CoreLogic Case-Shiller U.S. National Home Price Index). The 10-City and 20-City Composites reported year-over-year increases of 4.3% and 5.1%, respectively.
Certain statements in this report are forward-looking statements. Discussions of specific investments are for illustration only and are not intended as recommendations of individual investments. The forward-looking statements and other views expressed herein are those of the portfolio managers as of the date of this report. Actual future results or occurrences may differ significantly from those anticipated in any forward-looking statements and the views expressed herein are subject to change at any time, due to numerous market and other factors. The Funds disclaim any obligation to update publicly or revise any forward-looking statements or views expressed herein.
Refer to the Glossary of Terms Used in this Report for further definition of the terms used within this section.
Portfolio Managers’ Comments (continued)
However, business investment remained soft over the reporting period. Corporate earnings growth continued to be constrained by diminished demand expectations amid sluggish U.S. and global growth, the impact of falling commodity prices and a strong U.S. dollar. Additionally, a murky outlook kept capital spending muted. Concerns about financial market turbulence in early 2016, the U.K.’s “Brexit” vote to leave the European Union (EU) and the U.S. presidential election weighed on business sentiment throughout the reporting period.
The consistent growth of the economy prompted the U.S. Federal Reserve (Fed) to raise the Fed funds rate from the zero bound range to a range of 0.25% to 0.50% in December 2015. The widely anticipated move had little impact on the financial markets. Over the remainder of the reporting period, speculation on the timing of future rate hikes drove short-term swings in the markets, including falling bond yields, rallies in the U.S. dollar and bouts of volatility in stock prices. For most of 2016, the Fed kept this rate unchanged due to concerns ranging from low inflation in the U.S. to weakening growth prospects globally and the U.K.’s Brexit vote. However, the third quarter’s strong GDP report and an uptick in inflation boosted expectations that the Fed would likely increase the target rate at the December 2016 meeting. As anticipated, subsequent to the close of the reporting period, the Fed raised the rate to a range of 0.50% to 0.75%.
Other market-moving events during the reporting period included a spike in volatility in January and February 2016 triggered by deteriorating sentiment about China’s economy, another sharp downturn in oil prices and concerns about central bank policy both in the U.S. and around the world. The Brexit referendum on June 23, 2016, also caught investors off guard. In response, U.K. sterling fell to 30-year lows and global equities tumbled while perceived safe-haven assets such as gold, the U.S. dollar and government bonds saw large inflows. However, the markets stabilized fairly quickly post-Brexit vote, buoyed by reassurances from global central banks and a perception that the temporary price rout presented an attractive buying opportunity. Following a relatively calm July and August 2016, volatility resumed in the final months of the reporting period. Investors worried whether central banks were reaching the limits of their effectiveness as global growth continues to stagnate. The health of the European banking sector came into question, renewing concerns about the potential to trigger a wider crisis. Political uncertainty increased leading up to the November U.S. presidential election, and after the close of the reporting period, the unexpected win of Donald Trump contributed to an initial sell-off across global markets. However, after digesting the “shock”, U.S. equities rallied strongly and global developed market stocks pared their losses, while emerging markets, fixed income and gold remained lower.
Despite several bouts of significant volatility, the U.S. equity market ended the twelve-month reporting period with a gain of 4.51% as measured by the S&P 500® Index. Small-cap stocks in the U.S. recovered from last year’s significant underperformance, turning in results close to their large-cap brethren with a 4.11% return according to the Russell 2000® Index. Mid-cap stocks were in the same range with a return of 4.17% as measured by the Russell Midcap® Index. Across the capitalization spectrum in the U.S., investors favored the relatively safer, more defensive areas of the market for much of the reporting period, leading value stocks to strongly outperform growth stocks. Emerging markets outpaced other developed markets overseas as investors returned to this asset class in the second half of the reporting period, largely due to commodity price stability and the ongoing search for yield and returns. The MSCI Emerging Markets Index advanced 9.67%. Meanwhile, in developed overseas markets, Europe struggled and turned in negative results, dragging down the overall return of the MSCI EAFE Index to -2.74% for the twelve-month reporting period.
Nuveen Large Cap Select Fund
How did the Fund perform during the twelve-month reporting period ended October 31, 2016?
The tables in the Fund Performance and Expense Ratios section of this report provide total returns for the Fund for the one-year, five-year and ten-year periods ended October 31, 2016. Comparative performance information is provided for the Fund’s Class A Shares at net asset value (NAV). The Fund’s Class A Shares at NAV underperformed the S&P 500® Index and outperformed the Lipper Large-Cap Core Funds Classification Average during the twelve-month reporting period.
What strategies were used to manage the Fund during the reporting period and how did these strategies influence performance?
The Fund pursues long-term capital appreciation by investing primarily in the common stocks of companies that have market capitalizations of $5 billion or greater at the time of purchase. During the reporting period, we continued to employ our deep, rigorous research approach to find and invest in stocks that we believed had strong and/or improving fundamentals, attractive valuations and a catalyst to drive future performance. Our process focuses on constructing a portfolio that we believe offers the best opportunity to
achieve superior, risk-adjusted returns over the long term. Throughout the reporting period, the Fund remained cyclically oriented with the most significant change in positioning coming from an approximately 9% increase in its industrial weighting. We also increased the Fund’s information technology and financial exposure to maintain overweights during the reporting period. On the other hand, we reduced the Fund’s health care and consumer discretionary exposure from overweight to underweight, while eliminating its real estate and telecommunications exposure.
The energy sector was the strongest performing area of the Fund, in part because of our focus on high quality, pure play names from the exploration and production (E&P) industry in the prolific Permian Basin in Texas. Favorable results were led by a position in Parsley Energy Inc., which produced several strong quarters of performance after beating expectations in terms of production, cost cutting and unexpected hedging premiums. The company has also surprised investors with results from its Southern Delaware Basin assets in Texas, where it now has about 41,000 net acres. A quality balance sheet provided Parsley Energy with additional liquidity, which the company used to increase capital expenditures and support completions. Our position in Pioneer Natural Resources Company also boosted the Fund’s results during the reporting period. This onshore E&P company remains one of the best names in the Permian Basin accounting for approximately one-fourth of all U.S. crude production. Pioneer managed its balance sheet well through the oil price downturn, benefiting from the shift toward gas lift and centralized facilities. Additionally, a position in Williams Companies Inc., an energy infrastructure company focused on midstream gathering and processing, was another top contributor for the Fund. Shares of the company bottomed in February 2016, but subsequently rallied through the end of the reporting period. Investors have reacted positively to a string of developments including clarification on a board transformation, sale of its Canadian assets and contract renegotiations. We believe that Williams remains a complicated turnaround story, but one that continues to have compelling return potential.
Results were modestly positive in consumer staples due to solid performance from Tyson Foods Inc., the country’s largest processor and marketer of chicken, beef and pork. Tyson’s shares advanced strongly after the company reported higher-than-expected earnings and margins coupled with increased guidance, a dividend increase and share repurchase commitments. However, we decided to exit the position this summer, given the possibility that protein producers would be coming off peak margins and that input prices such as corn and soybean meal might remain elevated in the near term.
In the utility sector, our position in NextEra Energy Inc. benefited the Fund after posting strong first-quarter results in April 2016, exceeding consensus expectations. NextEra saw strength in both its regulated and unregulated businesses as new infrastructure projects continued to come online and its renewable energy segment continued to see strong growth. We believe the company has one of the better growth profiles in utilities given its dominance in the renewable space, selling merchant power and additional pipeline contracts.
Although the Fund benefited from an overweight in information technology, stock selection generally detracted in the sector. The sector was home to one standout performer, Microsoft Corporation. Shares rallied later in the reporting period after the company reported better-than-expected revenue and earnings per share (EPS) for the final quarter of its fiscal year and guidance indicating a notable deceleration in gross margin decline. Although forward revenue guidance came in below consensus, Microsoft continued to increase its momentum in cloud computing and digital. While still a relatively small slice of the company’s revenues, the cloud business will likely drive acceleration in profitability in the long run and will be watched closely.
Stock selection detracted in financials, health care and consumer discretionary versus the S&P 500® Index. Shares of financial companies dropped sharply at the beginning of 2016, particularly in the banking industry, after concerns surrounding global economic health, plunging oil prices and the uncertain future pace of Fed interest rate increases weighed heavily on the sector. In particular, our holdings with high interest rate sensitivity or elevated capital markets exposure were negatively impacted since interest rates declined and the market continued to push out the Fed’s timeline for rate hikes. Shares of Ameriprise Financial Inc. suffered as a result of the company’s greater interest rate exposure, macro concerns, increasing competition and a slight taper in trading volumes. Also, our position in Citigroup Inc. was negatively affected by concerns about slowing equity market activity globally, which put downward pressure on its shares. We eliminated both positions during the reporting period.
Results were negative overall in the health care sector where two of the Fund’s significant laggards suffered from the general overhang in the biotechnology and pharmaceutical industries due to drug pricing concerns. The first, biotechnology firm Alexion
Portfolio Managers’ Comments (continued)
Pharmaceuticals Inc., saw its shares sell off significantly after reporting lower-than-expected first-quarter revenue due to problems surrounding the sale of its flagship drug Soliris in Latin American markets. We believe the company’s long-term growth outlook remains on positive trajectory and continue to own Alexion Pharmaceuticals. Meanwhile, shares of Teva Pharmaceutical Industries Limited, the branded and generic drug manufacturer, were under pressure throughout the reporting period. The company’s purchase of Allergan’s generics business was delayed by several months while the Federal Trade Commission examined the acquisition more closely. Although the deal is now complete, many investors believed Teva Pharmaceutical paid too high of a price for the business. The company’s acquisition of Mexican company Rimsa also garnered scrutiny in the face of a number of issues around the deal. Shares took an additional hit after the U.S. Patent Trial and Appeal Board invalidated three of the company’s Copaxone patents under review, potentially loosening Teva Pharmaceutical’s grip on the multiple sclerosis market. As a result, we decided to eliminate this position in October 2016.
Offsetting some of the weakness in health care, the Fund benefited from our well-timed moves surrounding Allergan plc, which has been a meaningful consolidator in the specialty pharmaceutical industry. Last fall, the market speculated about a large transaction with Pfizer, which drove Allergan’s stock price higher. After the deal was formally announced, we reduced the Fund’s weight in Allergan because we anticipated a long regulatory review process for the deal. In April 2016, shares sold off sharply after the two companies announced they were scrapping the merger following the U.S. Treasury’s announcement of new tax inversion rules designed to dissuade companies from domiciling overseas to cut corporate taxes.
In the consumer discretionary sector, the Fund’s most significant laggard was a position in Signet Jewelers Limited, which was weighed down in part due to its revenue and currency exposure to the U.K. and Europe, which represents nearly 15% of its business. Shares were also pressured by fears over the company’s credit card portfolio quality, lower mall traffic and higher input costs, which resulted in investors becoming concerned about future growth prospects. After the stock recovered somewhat from its February lows, we decided to sell Signet Jewelers because we agreed that upside was likely limited due to these issues.
While results were positive overall in industrials, shares of Delta Air Lines Inc. detracted during the reporting period. Although the company reported first-quarter margins, EPS and cash flows that were in-line or a slight beat, investors were focused on passenger unit revenue, otherwise known as PRASM, which declined fairly significantly due to fare price competition. Some of the industry competition was due to lower fuel costs and some was because of aggressive expansion by smaller carriers in select markets. Because we were unsure if this issue would resolve itself in the near term, we reduced the Fund’s Delta position. However, we added back to the position in July 2016, given Delta’s strong balance sheet and consistent free cash flow. We also believed PRASM trends could turn position by the end of 2016.
Nuveen Small Cap Select Fund
How did the Fund perform during the twelve-month reporting period ended October 31, 2016?
The tables in the Fund Performance and Expense Ratios section of this report provide total returns for the Fund for the one-year, five-year and ten-year periods ended October 31, 2016. Comparative performance information is provided for the Fund’s Class A Shares at net asset value (NAV). The Fund’s Class A Shares at NAV performed in line with the Russell 2000® Index and outperformed the Lipper Small-Cap Core Funds Classification Average during the twelve-month reporting period.
What strategies were used to manage the Fund during the reporting period and how did these strategies influence performance?
The Fund seeks to provide long-term capital appreciation by investing at least 80% of the sum of its net assets and the amount of any borrowings for investment purposes primarily in the common stocks of small-capitalization companies with market capitalizations of $103 million to $4.7 billion at the time of purchase. During this reporting period, we continued to execute on our strategy of investing in well run small-cap companies that we believe offer good value in order to generate competitive returns for the Fund. We continued to tap into our firm’s strong fundamental research capabilities in order to find what we believe to be the best ideas within the small-cap universe. These companies exhibit strong cash flows and attractive valuations, plus have identifiable, near-term catalysts that could be realized over the next 12 to 24 months.
The Fund’s results were led by strong stock selection in the information technology, consumer discretionary and energy sectors. The technology sector, in particular, had quite a few standouts including CSG Systems International Inc., which provides customer care and billing solutions to the cable and direct broadcast satellite industry in North America. During the reporting period, the company reported strong results above expectations with solid net subscriber growth driving favorable revenue growth, significant margin expansion and increased free cash flow. CSG Systems also announced an incremental $50 million as part of an accelerated share repurchase program. We believe this company’s markets will continue to expand and cash flow should increase as CSG Systems leverages working capital. The Fund also experienced strong gains from its position in MKS Instruments Inc., a developer and manufacturer of instruments and process control systems that enable advanced processes and improve productivity. MKS Instruments announced a transformative acquisition of Newport Corporation, which immediately benefited the company in terms of scale and synergies. The company also benefited from strength in end-market spending in 3D NAND and leading-edge foundry. The Fund was also aided by its position in BroadSoft Inc., a provider of software that enables telecommunication carriers, cable operators and enterprises to convert from using legacy phone systems to the newer unified communications services. Investors rewarded BroadSoft’s stock in part due to the company’s addition of seven large service providers that are using its software to transform their old legacy systems to the newer Internet protocol-based unified communications. Finally, the Fund experienced strong results from a position in Fleetmatics Group Limited, a provider of software-as-a-service (SaaS) fleet management solutions that help mainly small businesses to improve their fleet productivity. During the reporting period, Verizon Communications announced an offer to buy Fleetmatics for $60 per share, which was a significant premium over its recent price. The deal closed after the reporting period ended in early November.
Stock selection was also strong overall in consumer discretionary where the Fund benefited from a position in Capella Education Company, a for-profit online education provider catering to working adults seeking mostly advanced degrees. Following disappointing fourth-quarter guidance from management last October 2015, expectations and valuation for Capella Education were quite low. The company reported first-quarter results in April 2016, that were materially above expectations, driven largely by better profit margins and essentially inline guidance for the second quarter. Shortly after, Capella Education announced two small, but interesting acquisitions that should help accelerate revenue growth this year and in the future. The company has benefited from its FlexPath program. After the end of the reporting period, we exited the Fund’s position in Capella Education because the stock had hit our price target and the valuation appeared stretched at that level. Additionally, the Fund experienced positive results from its position in Texas Roadhouse Inc., a high quality operator of moderately priced steak restaurants. The company reported fourth-quarter results that were modestly ahead of expectations. These results, coupled with positive commentary on same-store sales trends and a favorable outlook for beef prices, which make up half of the company’s food costs, helped propel the stock during the reporting period. We exited the Fund’s Texas Roadhouse position due to valuation.
Energy was the worst performing sector in the Russell 2000® Index, down more than 16% during the reporting period. We saw particularly favorable results from our stock selection in the exploration and production industry, where we focused the Fund’s exposure in high quality, pure play Permian Basin names such as Callon Petroleum Company. The stock’s discount to its peer group narrowed after the management team delivered on strong operating results, while hitting its promised milestone of cash flow neutrality. Importantly, Callon Petroleum built out its inventory base with the establishment of a new core region in the Permian Basin via an acquisition. The deal was financed with equity in order to preserve the company’s solid balance sheet and liquidity position. Given that Callon Petroleum’s management team has multiple other levers to use to improve on the economics assumed in the acquisition underwriting, we remained invested in this stock.
On the other hand, results were weak in the financial, consumer staples and real estate investment trust (REIT) sectors during the reporting period. The financial sector was the most noteworthy drag on relative results, mainly due to our position in annuity focused firm American Equity Investment Life Holding Company. The stock’s volatility was primarily the result of industry noise regarding the Department of Labor’s fiduciary proposals and how these may or may not impact industry players. In addition, credit spread widening negatively impacted the perceived value of firms like American Equity Life, given its energy and material holdings. However, we remained holders because of the continued operating strength seen in annuity sales.
The consumer staples sector also detracted as a whole, with the main drag resulting from our position in natural and organic food company SunOpta, Inc. The company manufactures private-label packaged goods for companies like Trader Joes, Target and Costco. Earlier in the reporting period, the company reported disappointing results after sales and margins for its consumer products
Portfolio Managers’ Comments (continued)
division came in well below expectations due to excess capacity within the group. Although we began to see improvement from this division as the reporting period progressed, SunOpta had a food safety recall in its roasted sunflower business, which led to negative sentiment given prior operational miscues. Because the company was unable to predict how big the financial impact of this recall could be, we decided to exit our position.
In the newly formed REITs sector, which was recently carved out of the broader financial services sector, the Fund’s position in Life Storage Inc. detracted. The company, which was formerly known as Sovran Storage, announced a major acquisition during the reporting period along with the rebranding of its franchise. However, dilution from issuing equity and debt to fund the acquisition was seen as a near-term negative, despite Life Storage’s strong same-store net operating income and occupancy improvements during the reporting period. We maintained our position in this name given the integration opportunities from acquisitions made to date, coupled with stability in the energy patch, which should benefit the company’s Houston exposure in its portfolio. We also believe the franchise trades at an attractive discount valuation relative to its peers.
At the macro level, health care was the second worst performing sector in the Russell 2000® Index behind energy, down more than 7% during the reporting period. Although our health care holdings modestly trailed overall on a relative basis, the sector was home to several significant movers in both directions. On the positive side, NxStage Medical, Inc., the provider of home hemodialysis and critical care solutions, reported first-quarter results that were slightly ahead of expectations. Its shares also benefited from the extension of a major contract with a nationally-recognized in-center dialysis chain as well as an improvement in training fees for the benefit, which may ultimately lead to increased reimbursement. Although we reduced the Fund’s weight in NxStage Medical after its valuation approached our price objective, we have maintained a position due to the company’s significant catalysts and growth opportunities. On the other hand, shares of ConforMIS Inc., an emerging manufacturer of custom 3D-printed knee implants, traded sharply lower. The company reported in-line first-quarter results coupled with a sizeable reduction in annual revenue guidance at the hands of last year’s recall of surgical instruments. ConforMIS also announced that its founding CEO would be replaced. Because the near-term catalysts for the company have been pushed out, we exited our position.
While the consumer discretionary sector was generally a source of strength for the Fund, it also had several laggards during the reporting period including home accessories and furnishings retailer Kirkland’s Inc. The company reported a miss in its first-quarter results on lower margins due to higher promotions, reduced traffic and new store openings. However, we remained holders given the attractive relative valuation and catalyst tailwinds, including inventory management coupled with the company’s new third-party dropship capabilities. We also like Kirkland’s for its positioning as a beneficiary of increased housing-related spending. Shares of Express Inc., a leading contemporary apparel retailer, dropped following disappointing second-quarter results, marking the second consecutive miss at the hands of increased on-line competition and fashion miscues. Given the lack of visibility and an identifiable catalyst, we exited the position.
The industrials sector was modestly positive, but home to one big mover in each direction. In the construction and engineering group, MasTec Inc., a major North American end-to-end energy and telecommunications infrastructure service provider, performed well during the reporting period. The company reported very strong results driven by robust growth in the communications and oil/gas segments. MasTec also experienced a 31% increase in its backlog, which should support accelerating topline growth through the end of this year and into 2017. On the other hand, shares of Korn/Ferry International, the world’s largest executive search firm, were sent sharply lower despite in-line financial results. Management highlighted the potential for a pause in hiring decisions in both Europe and North America stemming from the Brexit vote. However, we believe the market overly discounted what seems to be a pause in hiring versus a material downturn in overall demand. We decided to stick with Korn/Ferry, but lowered the Fund’s weight and continue to monitor the situation closely.
Risk Considerations
Nuveen Large Cap Select Fund
Mutual fund investing involves risk; principal loss is possible. Equity investments, such as those held by the Fund, are subject to market risk, derivatives risk, and common stock risk. Foreign investments involve additional risks including currency fluctuations, political and economic instability, and lack of liquidity. These risks are magnified in emerging markets.
Nuveen Small Cap Select Fund
Mutual fund investing involves risk; principal loss is possible. Equity investments, such as those held by the Fund, are subject to market risk, derivatives risk, IPO risk, and common stock risk. Small-cap stocks are subject to greater volatility and liquidity risks. Foreign investments involve additional risks including currency fluctuations, political and economic instability, and lack of liquidity. These risks are magnified in emerging markets.
THIS PAGE INTENTIONALLY LEFT BLANK
Fund Performance
and Expense Ratios
The Fund Performance and Expense Ratios for each Fund are shown within this section of the report.
Returns quoted represent past performance, which is no guarantee of future results. Investment returns and principal value will fluctuate so that when shares are redeemed, they may be worth more or less than their original cost. Current performance may be higher or lower than the performance shown. Total returns for a period of less than one year are not annualized. Returns at net asset value (NAV) would be lower if the sales charge were included. Returns assume reinvestment of dividends and capital gains. For performance, current to the most recent month-end visit Nuveen.com or call (800) 257-8787.
Returns do not reflect the deduction of taxes that a shareholder would pay on Fund distributions or the redemption of Fund shares.
Returns may reflect fee waivers and/or expense reimbursements by the investment adviser during the periods presented. If any such waivers and/or reimbursements had not been in place, returns would have been reduced. See Notes to Financial Statements, Note 7—Management Fees and Other Transactions with Affiliates for more information.
Returns reflect differences in sales charges and expenses, which are primarily differences in distribution and service fees, and assume reinvestment of dividends and capital gains.
Comparative index and Lipper return information is provided for Class A Shares at NAV only.
The expense ratios shown reflect total operating expenses (before fee waivers and/or expense reimbursements, if any) as shown in the most recent prospectus. The expense ratios include management fees and other fees and expenses.
Fund Performance and Expense Ratios (continued)
Nuveen Large Cap Select Fund
Refer to the first page of this Fund Performance and Expense Ratios section for further explanation of the information included within this section. Refer to the Glossary of Terms Used in this Report for definitions of term used within this section.
Fund Performance
Average Annual Total Returns as of October 31, 2016
| | | | | | | | | | | | |
| | | Average Annual | |
| | | 1-Year | | | 5-Year | | | 10-Year | |
Class A Shares at NAV | | | 3.40% | | | | 12.91% | | | | 5.42% | |
Class A Shares at maximum Offering Price | | | (2.56)% | | | | 11.57% | | | | 4.79% | |
S&P 500® Index | | | 4.51% | | | | 13.57% | | | | 6.70% | |
Lipper Large-Cap Core Funds Classification Average | | | 2.53% | | | | 11.98% | | | | 5.90% | |
| | | |
Class C Shares | | | 2.64% | | | | 12.07% | | | | 4.60% | |
Class I Shares | | | 3.69% | | | | 13.21% | | | | 5.69% | |
Average Annual Total Returns as of September 30, 2016 (Most Recent Calendar Quarter)
| | | | | | | | | | | | |
| | | Average Annual | |
| | | 1-Year | | | 5-Year | | | 10-Year | |
Class A Shares at NAV | | | 13.58% | | | | 16.11% | | | | 5.90% | |
Class A Shares at maximum Offering Price | | | 7.07% | | | | 14.75% | | | | 5.28% | |
Class C Shares | | | 12.72% | | | | 15.24% | | | | 5.08% | |
Class I Shares | | | 13.86% | | | | 16.41% | | | | 6.17% | |
Indexes and Lipper averages are not available for direct investment.
Class A Shares have a maximum 5.75% sales charge (Offering Price). Class A Share purchases of $1 million or more are sold at net asset value without an up-front sales charge but may be subject to a contingent deferred sales charge (CDSC) equal to 1% if redeemed within eighteen months of purchase. Class C Shares have a 1% CDSC for redemptions within less than twelve months, which is not reflected in the one-year total return. Class I Shares have no sales charge and may be purchased under limited circumstances or by specified classes of investors.
Expense Ratios as of Most Recent Prospectus
| | | | | | | | | | | | |
| | | Share Class | |
| | | Class A | | | Class C | | | Class I | |
Gross Expense Ratios | | | 1.18% | | | | 1.93% | | | | 0.93% | |
Net Expense Ratios | | | 1.14% | | | | 1.89% | | | | 0.89% | |
The Fund’s investment adviser has contractually agreed to waive fees and/or reimburse other Fund expenses through February 28, 2018, so that total annual Fund operating expenses (excluding 12b-1 distribution and/or service fees, interest expenses, taxes, acquired fund fees and expenses, fees incurred in acquiring and disposing of portfolio securities and extraordinary expenses) do not exceed 0.89% of the average daily net assets of any class of Fund shares. Fee waivers and/or expense reimbursements will not be terminated prior to that time without the approval of the Board of Directors of the Fund.
Growth of an Assumed $10,000 Investment as of October 31, 2016 – Class A Shares
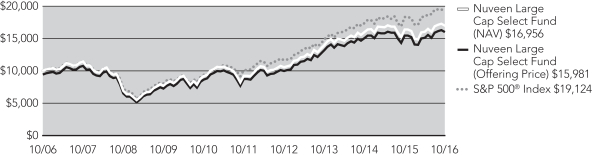
The graphs do not reflect the deduction of taxes that a shareholder may pay on Fund distributions or the redemption of Fund shares.
Fund Performance and Expense Ratios (continued)
Nuveen Small Cap Select Fund
Refer to the first page of this Fund Performance and Expense Ratios section for further explanation of the information included within this section. Refer to the Glossary of Terms Used in this Report for definitions of term used within this section.
Fund Performance
Average Annual Total Returns as of October 31, 2016
| | | | | | | | | | | | |
| | | Average Annual | |
| | | 1-Year | | | 5-Year | | | 10-Year | |
Class A Shares at NAV | | | 4.05% | | | | 11.03% | | | | 5.55% | |
Class A Shares at maximum Offering Price | | | (1.92)% | | | | 9.73% | | | | 4.93% | |
Russell 2000® Index | | | 4.11% | | | | 11.51% | | | | 5.96% | |
Lipper Small-Cap Core Funds Classification Average | | | 3.01% | | | | 10.67% | | | | 5.89% | |
| | | |
Class C Shares | | | 3.37% | | | | 10.21% | | | | 4.76% | |
Class R3 Shares | | | 3.76% | | | | 10.75% | | | | 5.28% | |
Class I Shares | | | 4.33% | | | | 11.32% | | | | 5.81% | |
Average Annual Total Returns as of September 30, 2016 (Most Recent Calendar Quarter)
| | | | | | | | | | | | |
| | | Average Annual | |
| | | 1-Year | | | 5-Year | | | 10-Year | |
Class A Shares at NAV | | | 17.00% | | | | 15.62% | | | | 6.47% | |
Class A Shares at maximum Offering Price | | | 10.25% | | | | 14.26% | | | | 5.84% | |
Class C Shares | | | 16.15% | | | | 14.76% | | | | 5.68% | |
Class R3 Shares | | | 16.76% | | | | 15.37% | | | | 6.21% | |
Class I Shares | | | 17.23% | | | | 15.91% | | | | 6.73% | |
Indexes and Lipper averages are not available for direct investment.
Class A Shares have a maximum 5.75% sales charge (Offering Price). Class A Share purchases of $1 million or more are sold at net asset value without an up-front sales charge but may be subject to a contingent deferred sales charge (CDSC) equal to 1% if redeemed within eighteen months of purchase. Class C Shares have a 1% CDSC for redemptions within less than twelve months, which is not reflected in the one-year total return. Class R3 Shares have no sales charge and are only available for purchase by eligible retirement plans. Class I Shares have no sales charge and may be purchased under limited circumstances or by specified classes of investors.
Expense Ratios as of Most Recent Prospectus
| | | | | | | | | | | | | | | | |
| | | Share Class | |
| | | Class A | | | Class C | | | Class R3 | | | Class I | |
Expense Ratios | | | 1.46% | | | | 2.21% | | | | 1.71% | | | | 1.21% | |
Growth of an Assumed $10,000 Investment as of October 31, 2016 – Class A Shares
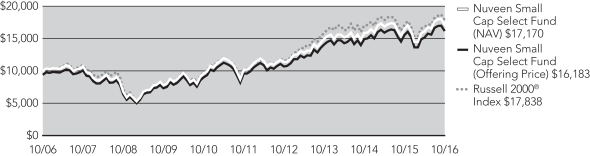
The graphs do not reflect the deduction of taxes that a shareholder may pay on Fund distributions or the redemption of Fund shares.
Holding
Summaries as of October 31, 2016
This data relates to the securities held in each Fund’s portfolio of investments as of the end of this reporting period. It should not be construed as a measure of performance for the Fund itself. Holdings are subject to change.
Nuveen Large Cap Select Fund
Fund Allocation
(% of net assets)
| | | | |
Common Stocks | | | 99.4% | |
Money Market Funds | | | 0.4% | |
Other Assets Less Liabilities | | | 0.2% | |
Net Assets | | | 100% | |
Portfolio Composition
(% of net assets)
| | | | |
Software | | | 10.4% | |
Banks | | | 9.6% | |
Technology Hardware, Storage & Peripherals | | | 6.5% | |
Capital Markets | | | 5.9% | |
Chemicals | | | 5.1% | |
Oil, Gas & Consumable Fuels | | | 4.8% | |
Internet Software & Services | | | 4.6% | |
Biotechnology | | | 4.3% | |
Internet and Direct Marketing Retail | | | 4.2% | |
Semiconductors & Semiconductor Equipment | | | 3.9% | |
Health Care Equipment & Supplies | | | 3.6% | |
IT Services | | | 2.9% | |
Health Care Providers & Services | | | 2.9% | |
Airlines | | | 2.7% | |
Pharmaceuticals | | | 2.6% | |
Machinery | | | 2.4% | |
Hotels, Restaurants & Leisure | | | 2.3% | |
Electrical Equipment | | | 2.2% | |
Other | | | 18.5% | |
Money Market Funds | | | 0.4% | |
Other Assets Less Liabilities | | | 0.2% | |
Net Assets | | | 100% | |
Top Five Common Stock Holdings
(% of net assets)
| | | | |
Microsoft Corporation | | | 5.5% | |
Apple, Inc. | | | 5.3% | |
Bank of America Corporation | | | 3.9% | |
JPMorgan Chase & Co. | | | 3.2% | |
Alphabet Inc., Class A | | | 3.0% | |
Nuveen Small Cap Select Fund
Fund Allocation
(% of net assets)
| | | | |
Common Stocks | | | 97.8% | |
Investments Purchased with Collateral from Securities Lending | | | 7.9% | |
Money Market Funds | | | 3.1% | |
Other Assets Less Liabilities | | | (8.8)% | |
Net Assets | | | 100% | |
Portfolio Composition
(% of net assets)
| | | | |
Banks | | | 10.5% | |
Equity Real Estate Investment Trusts | | | 7.5% | |
Software | | | 5.4% | |
Health Care Providers & Services | | | 4.7% | |
Hotels, Restaurants & Leisure | | | 4.5% | |
Machinery | | | 4.3% | |
Internet Software & Services | | | 4.1% | |
Semiconductors & Semiconductor Equipment | | | 3.8% | |
Biotechnology | | | 3.8% | |
Insurance | | | 3.6% | |
Health Care Equipment & Supplies | | | 2.9% | |
Food Products | | | 2.9% | |
Communications Equipment | | | 2.9% | |
Oil, Gas & Consumable Fuels | | | 2.8% | |
Commercial Services & Supplies | | | 2.7% | |
Textiles, Apparel & Luxury Goods | | | 2.5% | |
Electric Utilities | | | 2.4% | |
Professional Services | | | 2.4% | |
Electrical Equipment | | | 2.2% | |
Life Sciences Tools & Services | | | 2.0% | |
Other | | | 19.9% | |
Investments Purchased with Collateral from Securities Lending | | | 7.9% | |
Money Market Funds | | | 3.1% | |
Other Assets Less Liabilities | | | (8.8)% | |
Net Assets | | | 100% | |
Top Five Common Stock Holdings
(% of net assets)
| | | | |
Synchronoss Technologies, Inc. | | | 1.8% | |
Plantronics Inc. | | | 1.7% | |
Snyders Lance Inc. | | | 1.7% | |
NeuStar, Inc. | | | 1.6% | |
CommVault Systems, Inc. | | | 1.6% | |
Expense
Examples
As a shareholder of one or more of the Funds, you incur two types of costs: (1) transaction costs, including up-front and back-end sales charges (loads) or redemption fees, where applicable; and (2) ongoing costs, including management fees; distribution and service (12b-1) fees, where applicable; and other Fund expenses. The Examples below are intended to help you understand your ongoing costs (in dollars) of investing in the Funds and to compare these costs with the ongoing costs of investing in other mutual funds.
The Examples below are based on an investment of $1,000 invested at the beginning of the period and held through the period ended October 31, 2016.
The beginning of the period is May 1, 2016.
The information under “Actual Performance,” together with the amount you invested, allows you to estimate actual expenses incurred over the reporting period. Simply divide your account value by $1,000 (for example, an $8,600 account value divided by $1,000 = 8.60) and multiply the result by the cost shown for your share class, in the row entitled “Expenses Incurred During Period” to estimate the expenses incurred on your account during this period.
The information under “Hypothetical Performance,” provides information about hypothetical account values and hypothetical expenses based on each respective Fund’s actual expense ratio and an assumed rate of return of 5% per year before expenses, which is not the Fund’s actual return. The hypothetical account values and expenses may not be used to estimate the actual ending account balance or expense you incurred for the period. You may use this information to compare the ongoing costs of investing in the Fund and other funds. To do so, compare this 5% hypothetical example with the 5% hypothetical examples that appear in the shareholder reports of the other funds.
Please note that the expenses shown in the table are meant to highlight your ongoing costs only and do not reflect any transaction costs. Therefore, the hypothetical information is useful in comparing ongoing costs only, and will not help you determine the relative total costs of owning different funds or share classes. In addition, if these transaction costs were included, your costs would have been higher.
Nuveen Large Cap Select Fund
| | | | | | | | | | | | |
| | | Share Class | |
| | | Class A | | | Class C | | | Class I | |
Actual Performance | | | | | | | | | | | | |
Beginning Account Value | | $ | 1,000.00 | | | $ | 1,000.00 | | | $ | 1,000.00 | |
Ending Account Value | | $ | 1,058.30 | | | $ | 1,054.30 | | | $ | 1,059.90 | |
Expenses Incurred During the Period | | $ | 6.05 | | | $ | 9.91 | | | $ | 4.76 | |
Hypothetical Performance (5% annualized return before expenses) | | | | | | | | | | | | |
Beginning Account Value | | $ | 1,000.00 | | | $ | 1,000.00 | | | $ | 1,000.00 | |
Ending Account Value | | $ | 1,019.25 | | | $ | 1,015.48 | | | $ | 1,020.51 | |
Expenses Incurred During the Period | | $ | 5.94 | | | $ | 9.73 | | | $ | 4.67 | |
For each class of the Fund, expenses are equal to the Fund’s annualized net expense ratio of 1.17%, 1.92% and 0.92% for Classes A, C and I, respectively, multiplied by the average account value over the period, multiplied by 184/366 (to reflect the one-half year period).
Nuveen Small Cap Select Fund
| | | | | | | | | | | | | | | | |
| | | Share Class | |
| | | Class A | | | Class C | | | Class R3 | | | Class I | |
Actual Performance | | | | | | | | | | | | | | | | |
Beginning Account Value | | $ | 1,000.00 | | | $ | 1,000.00 | | | $ | 1,000.00 | | | $ | 1,000.00 | |
Ending Account Value | | $ | 1,064.70 | | | $ | 1,061.80 | | | $ | 1,062.30 | | | $ | 1,065.40 | |
Expenses Incurred During the Period | | $ | 7.32 | | | $ | 11.19 | | | $ | 8.61 | | | $ | 6.02 | |
Hypothetical Performance (5% annualized return before expenses) | | | | | | | | | | | | | | | | |
Beginning Account Value | | $ | 1,000.00 | | | $ | 1,000.00 | | | $ | 1,000.00 | | | $ | 1,000.00 | |
Ending Account Value | | $ | 1,018.05 | | | $ | 1,014.28 | | | $ | 1,016.79 | | | $ | 1,019.30 | |
Expenses Incurred During the Period | | $ | 7.15 | | | $ | 10.94 | | | $ | 8.42 | | | $ | 5.89 | |
For each class of the Fund, expenses are equal to the Fund’s annualized net expense ratio of 1.41%, 2.16%, 1.66% and 1.16% for Classes A, C, R3 and I, respectively, multiplied by the average account value over the period, multiplied by 184/366 (to reflect the one-half year period).
Report of
Independent Registered Public Accounting Firm
To the Board of Directors and Shareholders of
Nuveen Investment Funds, Inc.:
In our opinion, the accompanying statements of assets and liabilities, including the portfolios of investments, and the related statements of operations and of changes in net assets and the financial highlights present fairly, in all material respects, the financial position of Nuveen Large Cap Select Fund and Nuveen Small Cap Select Fund (each a series of Nuveen Investment Funds, Inc., hereinafter referred to as the “Funds”) at October 31, 2016, the results of each of their operations for the year then ended, the changes in each of their net assets for each of the two years in the period then ended and the financial highlights for each of the five years in the period then ended, in conformity with accounting principles generally accepted in the United States of America. These financial statements and financial highlights (hereafter referred to as “financial statements”) are the responsibility of the Funds’ management. Our responsibility is to express an opinion on these financial statements based on our audits. We conducted our audits of these financial statements in accordance with the standards of the Public Company Accounting Oversight Board (United States). Those standards require that we plan and perform the audit to obtain reasonable assurance about whether the financial statements are free of material misstatement. An audit includes examining, on a test basis, evidence supporting the amounts and disclosures in the financial statements, assessing the accounting principles used and significant estimates made by management, and evaluating the overall financial statement presentation. We believe that our audits, which included confirmation of securities at October 31, 2016 by correspondence with the custodian and brokers, provide a reasonable basis for our opinion.
PricewaterhouseCoopers LLP
Chicago, IL
December 28, 2016
Nuveen Large Cap Select Fund
| | |
| Portfolio of Investments | | October 31, 2016 |
| | | | | | | | |
| Shares | | | Description (1) | | Value | |
| | |
| | | | LONG-TERM INVESTMENTS – 99.4% | | | | |
| | |
| | | | COMMON STOCKS – 99.4% | | | | |
| | |
| | | | Aerospace & Defense – 1.6% | | | |
| | |
| | 2,967 | | | Lockheed Martin Corporation | | $ | 731,009 | |
| | |
| | | | Air Freight & Logistics – 1.7% | | | |
| | |
| | 7,319 | | | United Parcel Service, Inc., Class B | | | 788,695 | |
| | |
| | | | Airlines – 2.7% | | | |
| | |
| | 17,653 | | | Delta Air Lines, Inc. | | | 737,366 | |
| | |
| | 9,030 | | | United Continental Holdings Inc., (2) | | | 507,757 | |
| | | | Total Airlines | | | 1,245,123 | |
| | |
| | | | Banks – 9.6% | | | |
| | |
| | 111,424 | | | Bank of America Corporation | | | 1,838,496 | |
| | |
| | 13,166 | | | CIT Group Inc. | | | 478,321 | |
| | |
| | 21,656 | | | JPMorgan Chase & Co. | | | 1,499,895 | |
| | |
| | 46,180 | | | KeyCorp. | | | 652,062 | |
| | | | Total Banks | | | 4,468,774 | |
| | |
| | | | Biotechnology – 4.3% | | | |
| | |
| | 10,994 | | | AbbVie Inc. | | | 613,245 | |
| | |
| | 3,911 | | | Alexion Pharmaceuticals Inc., (2) | | | 510,386 | |
| | |
| | 1,797 | | | Biogen Inc., (2) | | | 503,483 | |
| | |
| | 5,270 | | | Vertex Pharmaceuticals Inc., (2) | | | 399,782 | |
| | | | Total Biotechnology | | | 2,026,896 | |
| | |
| | | | Capital Markets – 5.9% | | | |
| | |
| | 18,166 | | | Charles Schwab Corporation | | | 575,862 | |
| | |
| | 22,597 | | | E*Trade Group Inc., (2) | | | 636,332 | |
| | |
| | 5,563 | | | Goldman Sachs Group, Inc. | | | 991,549 | |
| | |
| | 8,286 | | | NASDAQ Stock Market, Inc. | | | 530,055 | |
| | | | Total Capital Markets | | | 2,733,798 | |
| | |
| | | | Chemicals – 5.1% | | | |
| | |
| | 6,823 | | | Celanese Corporation, Series A | | | 497,533 | |
| | |
| | 8,885 | | | Eastman Chemical Company | | | 638,920 | |
| | |
| | 7,135 | | | Monsanto Company | | | 718,994 | |
| | |
| | 2,222 | | | Sherwin-Williams Company | | | 544,079 | |
| | | | Total Chemicals | | | 2,399,526 | |
| | |
| | | | Communications Equipment – 1.9% | | | |
| | |
| | 29,709 | | | Cisco Systems, Inc. | | | 911,472 | |
Nuveen Large Cap Select Fund (continued)
| | |
| Portfolio of Investments | | October 31, 2016 |
| | | | | | | | |
| Shares | | | Description (1) | | Value | |
| | |
| | | | Consumer Finance – 2.0% | | | |
| | |
| | 16,847 | | | Discover Financial Services | | $ | 948,992 | |
| | |
| | | | Containers & Packaging – 1.9% | | | |
| | |
| | 10,195 | | | International Paper Company | | | 459,081 | |
| | |
| | 8,837 | | | WestRock Company | | | 408,181 | |
| | | | Total Containers & Packaging | | | 867,262 | |
| | |
| | | | Electric Utilities – 1.1% | | | |
| | |
| | 3,878 | | | NextEra Energy Inc. | | | 496,384 | |
| | |
| | | | Electrical Equipment – 2.2% | | | |
| | |
| | 9,177 | | | Eaton PLC | | | 585,217 | |
| | |
| | 4,164 | | | Hubbell Inc. | | | 435,221 | |
| | | | Total Electrical Equipment | | | 1,020,438 | |
| | |
| | | | Energy Equipment & Services – 1.0% | | | |
| | |
| | 5,796 | | | Schlumberger Limited | | | 453,421 | |
| | |
| | | | Equity Real Estate Investment Trusts – 1.0% | | | |
| | |
| | 4,013 | | | American Tower Corporation, REIT | | | 470,283 | |
| | |
| | | | Health Care Equipment & Supplies – 3.6% | | | |
| | |
| | 23,410 | | | Boston Scientific Corporation, (2) | | | 515,020 | |
| | |
| | 8,823 | | | Medtronic, PLC | | | 723,662 | |
| | |
| | 4,089 | | | Zimmer Biomet Holdings, Inc. | | | 430,981 | |
| | | | Total Health Care Equipment & Supplies | | | 1,669,663 | |
| | |
| | | | Health Care Providers & Services – 2.9% | | | |
| | |
| | 6,674 | | | Aetna Inc. | | | 716,454 | |
| | |
| | 5,257 | | | CIGNA Corporation | | | 624,689 | |
| | | | Total Health Care Providers & Services | | | 1,341,143 | |
| | |
| | | | Hotels, Restaurants & Leisure – 2.3% | | | |
| | |
| | 27,180 | | | Hilton Worldwide Holdings Inc. | | | 614,268 | |
| | |
| | 4,660 | | | Wynn Resorts Ltd | | | 440,603 | |
| | | | Total Hotels, Restaurants & Leisure | | | 1,054,871 | |
| | |
| | | | Household Durables – 0.9% | | | |
| | |
| | 2,937 | | | Whirlpool Corporation | | | 440,021 | |
| | |
| | | | Internet and Direct Marketing Retail – 4.2% | | | |
| | |
| | 1,287 | | | Amazon.com, Inc., (2) | | | 1,016,498 | |
| | |
| | 627 | | | priceline.com Incorporated, (2) | | | 924,342 | |
| | | | Total Internet and Direct Marketing Retail | | | 1,940,840 | |
| | |
| | | | Internet Software & Services – 4.6% | | | |
| | |
| | 1,704 | | | Alphabet Inc., Class A, (2) | | | 1,380,070 | |
| | |
| | 5,685 | | | Facebook Inc., Class A Shares, (3) | | | 744,678 | |
| | | | Total Internet Software & Services | | | 2,124,748 | |
| | | | | | | | |
| Shares | | | Description (1) | | Value | |
| | |
| | | | IT Services – 2.9% | | | |
| | |
| | 2,158 | | | Alliance Data Systems Corporation | | $ | 441,246 | |
| | |
| | 8,527 | | | MasterCard, Inc. | | | 912,560 | |
| | | | Total IT Services | | | 1,353,806 | |
| | |
| | | | Machinery – 2.4% | | | |
| | |
| | 7,282 | | | Ingersoll Rand Company Limited, Class A | | | 490,006 | |
| | |
| | 5,481 | | | Stanley Black & Decker Inc. | | | 623,957 | |
| | | | Total Machinery | | | 1,113,963 | |
| | |
| | | | Media – 1.8% | | | |
| | |
| | 13,537 | | | Comcast Corporation, Class A | | | 836,857 | |
| | |
| | | | Oil, Gas & Consumable Fuels – 4.8% | | | |
| | |
| | 11,620 | | | Anadarko Petroleum Corporation | | | 690,693 | |
| | |
| | 12,682 | | | Parsley Energy Inc. Class A Shares, (2) | | | 417,238 | |
| | |
| | 3,526 | | | Pioneer Natural Resources Company | | | 631,225 | |
| | |
| | 17,290 | | | Williams Companies, Inc. | | | 504,868 | |
| | | | Total Oil, Gas & Consumable Fuels | | | 2,244,024 | |
| | |
| | | | Pharmaceuticals – 2.6% | | | |
| | |
| | 10,913 | | | Medicines Company, (2) | | | 359,583 | |
| | |
| | 27,437 | | | Pfizer Inc. | | | 870,027 | |
| | | | Total Pharmaceuticals | | | 1,229,610 | |
| | |
| | | | Road & Rail – 1.5% | | | |
| | |
| | 23,062 | | | CSX Corporation | | | 703,622 | |
| | |
| | | | Semiconductors & Semiconductor Equipment – 3.9% | | | |
| | |
| | 3,314 | | | Broadcom Limited | | | 564,308 | |
| | |
| | 37,166 | | | Micron Technology, Inc., (2) | | | 637,769 | |
| | |
| | 6,358 | | | NXP Semiconductors NV, (2) | | | 635,800 | |
| | | | Total Semiconductors & Semiconductor Equipment | | | 1,837,877 | |
| | |
| | | | Software – 10.4% | | | |
| | |
| | 14,164 | | | Activision Blizzard Inc. | | | 611,460 | |
| | |
| | 5,092 | | | Adobe Systems Incorporated, (2) | | | 547,441 | |
| | |
| | 6,018 | | | Citrix Systems, (2) | | | 510,326 | |
| | |
| | 7,927 | | | Electronic Arts Inc., (2) | | | 622,428 | |
| | |
| | 43,123 | | | Microsoft Corporation | | | 2,583,930 | |
| | | | Total Software | | | 4,875,585 | |
| | |
| | | | Specialty Retail – 1.1% | | | |
| | |
| | 12,814 | | | Best Buy Co., Inc. | | | 498,593 | |
| | |
| | | | Technology Hardware, Storage & Peripherals – 6.5% | | | |
| | |
| | 21,653 | | | Apple, Inc. | | | 2,458,483 | |
| | |
| | 25,433 | | | Hewlett Packard Enterprise Co | | | 571,480 | |
| | | | Total Technology Hardware, Storage & Peripherals | | | 3,029,963 | |
Nuveen Large Cap Select Fund (continued)
| | |
| Portfolio of Investments | | October 31, 2016 |
| | | | | | | | |
| Shares | | | Description (1) | | Value | |
| | |
| | | | Trading Companies & Distributors – 1.0% | | | |
| | |
| | 14,915 | | | HD Supply Holdings Inc., (2) | | $ | 492,195 | |
| | | | Total Long-Term Investments (cost $43,406,188) | | | 46,349,454 | |
| | |
| Shares | | | Description (1) | | Value | |
| | |
| | | | SHORT-TERM INVESTMENTS – 0.4% | | | | |
| | |
| | | | Money Market Funds – 0.4% | | | |
| | |
| | 203,179 | | | First American Treasury Obligations Fund, Class Z, 0.222%, (3) | | $ | 203,179 | |
| | | | Total Short-Term Investments (cost $203,179) | | | 203,179 | |
| | | | Total Investments (cost $43,609,367) – 99.8% | | | 46,552,633 | |
| | | | Other Assets Less Liabilities – 0.2% | | | 101,874 | |
| | | | Net Assets – 100% | | $ | 46,654,507 | |
For Fund portfolio compliance purposes, the Fund’s industry classifications refer to any one or more of the industry sub-classifications used by one or more widely recognized market indexes or ratings group indexes, and/or as defined by Fund management. This definition may not apply for purposes of this report which may combine industry sub-classifications into sectors for reporting ease.
| (1) | All percentages shown in the Portfolio of Investments are based on net assets. |
| (2) | Non-income producing; issuer has not declared a dividend within the past twelve months. |
| (3) | The rate shown is the annualized seven-day subsidized yield as of the end of the reporting period. |
| REIT | Real Estate Investment Trust |
See accompanying notes to financial statements.
Nuveen Small Cap Select Fund
| | |
| Portfolio of Investments | | October 31, 2016 |
| | | | | | | | |
| Shares | | | Description (1) | | Value | |
| | |
| | | | LONG-TERM INVESTMENTS – 97.8% | | | | |
| | |
| | | | COMMON STOCKS – 97.8% | | | | |
| | |
| | | | Auto Components – 1.3% | | | |
| | |
| | 44,254 | | | Cooper Tire & Rubber | | $ | 1,626,335 | |
| | |
| | | | Banks – 10.5% | | | |
| | |
| | 45,906 | | | Bank of the Ozarks, Inc. | | | 1,696,686 | |
| | |
| | 29,745 | | | Banner Corporation | | | 1,342,689 | |
| | |
| | 63,775 | | | Customers Bancorp Inc., (3) | | | 1,726,389 | |
| | |
| | 52,053 | | | Glacier Bancorp, Inc. | | | 1,471,018 | |
| | |
| | 48,510 | | | Renasant Corporation | | | 1,636,727 | |
| | |
| | 100,566 | | | Sterling Bancorp. | | | 1,810,188 | |
| | |
| | 41,381 | | | Webster Financial Corporation | | | 1,671,792 | |
| | |
| | 44,622 | | | Western Alliance Bancorporation, (3) | | | 1,667,078 | |
| | | | Total Banks | | | 13,022,567 | |
| | |
| | | | Biotechnology – 3.8% | | | |
| | |
| | 15,867 | | | Alder Biopharmaceuticals Inc., (2), (3) | | | 384,775 | |
| | |
| | 11,491 | | | Bluebird Bio Inc., (2), (3) | | | 548,695 | |
| | |
| | 45,145 | | | Emergent BioSolutions, Inc., (3) | | | 1,206,274 | |
| | |
| | 7,351 | | | Kite Pharma Inc., (2), (3) | | | 325,576 | |
| | |
| | 9,133 | | | Prothena Corporation PLC, (2), (3) | | | 436,740 | |
| | |
| | 11,891 | | | Radius Health Inc., (2), (3) | | | 510,362 | |
| | |
| | 6,384 | | | Sarepta Therapautics Inc., (2), (3) | | | 250,508 | |
| | |
| | 4,399 | | | Tesaro Inc., (2), (3) | | | 531,751 | |
| | |
| | 8,303 | | | Ultragenyx Pharmaceutical Inc., (3) | | | 489,794 | |
| | | | Total Biotechnology | | | 4,684,475 | |
| | |
| | | | Building Products – 1.3% | | | |
| | |
| | 75,852 | | | Continental Building Products Inc., (3) | | | 1,551,173 | |
| | |
| | | | Capital Markets – 1.3% | | | |
| | |
| | 30,762 | | | Evercore Partners Inc. | | | 1,653,458 | |
| | |
| | | | Chemicals – 2.0% | | | |
| | |
| | 39,097 | | | Kraton Performance Polymers Inc., (3) | | | 1,002,056 | |
| | |
| | 49,065 | | | PolyOne Corporation | | | 1,434,170 | |
| | | | Total Chemicals | | | 2,436,226 | |
| | |
| | | | Commercial Services & Supplies – 2.7% | | | |
| | |
| | 38,232 | | | HNI Corporation | | | 1,554,513 | |
| | |
| | 108,886 | | | Interface, Inc. | | | 1,725,843 | |
| | | | Total Commercial Services & Supplies | | | 3,280,356 | |
Nuveen Small Cap Select Fund (continued)
| | |
| Portfolio of Investments | | October 31, 2016 |
| | | | | | | | |
| Shares | | | Description (1) | | Value | |
| | |
| | | | Communications Equipment – 2.9% | | | |
| | |
| | 27,903 | | | Netgear, Inc., (3) | | $ | 1,409,102 | |
| | |
| | 41,067 | | | Plantronics Inc. | | | 2,123,575 | |
| | | | Total Communications Equipment | | | 3,532,677 | |
| | |
| | | | Construction & Engineering – 1.1% | | | |
| | |
| | 49,646 | | | MasTec Inc., (3) | | | 1,417,393 | |
| | |
| | | | Containers & Packaging – 1.0% | | | |
| | |
| | 29,167 | | | Berry Plastics Corporation, (3) | | | 1,276,056 | |
| | |
| | | | Diversified Consumer Services – 1.0% | | | |
| | |
| | 16,242 | | | Capella Education Company, (2) | | | 1,187,290 | |
| | |
| | | | Electric Utilities – 2.4% | | | |
| | |
| | 26,682 | | | ALLETE Inc | | | 1,635,340 | |
| | |
| | 41,722 | | | PNM Resources Inc. | | | 1,370,568 | |
| | | | Total Electric Utilities | | | 3,005,908 | |
| | |
| | | | Electrical Equipment – 2.2% | | | |
| | |
| | 46,471 | | | Generac Holdings Inc., (3) | | | 1,770,080 | |
| | |
| | 16,840 | | | Regal-Beloit Corporation | | | 995,244 | |
| | | | Total Electrical Equipment | | | 2,765,324 | |
| | |
| | | | Electronic Equipment, Instruments & Components – 1.5% | | | |
| | |
| | 133,530 | | | Vishay Intertechnology Inc. | | | 1,882,773 | |
| | |
| | | | Energy Equipment & Services – 0.7% | | | |
| | |
| | 49,933 | | | Matrix Service Company, (3) | | | 883,814 | |
| | |
| | | | Equity Real Estate Investment Trusts – 7.5% | | | |
| | |
| | 92,181 | | | Brandywine Realty Trust | | | 1,428,806 | |
| | |
| | 13,736 | | | Entertainment Properties Trust | | | 998,882 | |
| | |
| | 53,211 | | | Kite Realty Group Trust | | | 1,326,550 | |
| | |
| | 9,392 | | | Life Storage, Inc. | | | 757,465 | |
| | |
| | 137,595 | | | Monogram Residential Trust, Inc. | | | 1,450,251 | |
| | |
| | 80,332 | | | STAG Industrial Inc. | | | 1,853,259 | |
| | |
| | 118,332 | | | Summit Hotel Properties Inc. | | | 1,537,133 | |
| | | | Total Equity Real Estate Investment Trusts | | | 9,352,346 | |
| | |
| | | | Food Products – 2.9% | | | |
| | |
| | 57,676 | | | Snyders Lance Inc. | | | 2,051,535 | |
| | |
| | 17,949 | | | Treehouse Foods Inc., (3) | | | 1,570,179 | |
| | | | Total Food Products | | | 3,621,714 | |
| | |
| | | | Gas Utilities – 1.3% | | | |
| | |
| | 22,863 | | | Southwest Gas Corporation | | | 1,656,653 | |
| | | | | | | | |
| Shares | | | Description (1) | | Value | |
| | |
| | | | Health Care Equipment & Supplies – 2.9% | | | |
| | |
| | 62,085 | | | Endologix, Inc., (2), (3) | | $ | 649,409 | |
| | |
| | 34,005 | | | Glaukos Corporation, (3) | | | 1,135,767 | |
| | |
| | 29,894 | | | K2M Group Holdings Inc., (3) | | | 510,291 | |
| | |
| | 59,055 | | | Nxstage Medical, Inc., (3) | | | 1,342,911 | |
| | | | Total Health Care Equipment & Supplies | | | 3,638,378 | |
| | |
| | | | Health Care Providers & Services – 4.7% | | | |
| | |
| | 49,514 | | | AMN Healthcare Services Inc., (3) | | | 1,624,059 | |
| | |
| | 36,540 | | | Diplomat Pharmacy, Inc., (2), (3) | | | 846,632 | |
| | |
| | 32,374 | | | HealthSouth Corporation | | | 1,299,816 | |
| | |
| | 84,797 | | | Surgery Partners Inc., (3) | | | 1,365,232 | |
| | |
| | 40,473 | | | Teladoc, Inc., (2), (3) | | | 657,686 | |
| | | | Total Health Care Providers & Services | | | 5,793,425 | |
| | |
| | | | Hotels, Restaurants & Leisure – 4.5% | | | |
| | |
| | 41,300 | | | BJ’s Restaurants, Inc., (2), (3) | | | 1,490,930 | |
| | |
| | 9,409 | | | Buffalo Wild Wings, Inc., (3) | | | 1,370,421 | |
| | |
| | 16,252 | | | Jack in the Box Inc., Term Loan | | | 1,523,300 | |
| | |
| | 44,900 | | | Marcus Corporation | | | 1,189,850 | |
| | | | Total Hotels, Restaurants & Leisure | | | 5,574,501 | |
| | |
| | | | Insurance – 3.6% | | | |
| | |
| | 72,219 | | | American Equity Investment Life Holding Company | | | 1,294,887 | |
| | |
| | 26,879 | | | Amerisafe, Inc. | | | 1,494,472 | |
| | |
| | 108,014 | | | CNO Financial Group Inc. | | | 1,628,851 | |
| | | | Total Insurance | | | 4,418,210 | |
| | |
| | | | Internet Software & Services – 4.1% | | | |
| | |
| | 38,676 | | | Cornerstone OnDemand Inc., (3) | | | 1,597,319 | |
| | |
| | 43,238 | | | Mimecast Limited, (3) | | | 875,137 | |
| | |
| | 41,050 | | | Q2 Holdings Inc., (3) | | | 1,153,505 | |
| | |
| | 23,150 | | | SPS Commerce Inc., (3) | | | 1,444,097 | |
| | | | Total Internet Software & Services | | | 5,070,058 | |
| | |
| | | | IT Services – 1.6% | | | |
| | |
| | 89,122 | | | NeuStar, Inc., (2), (3) | | | 2,000,789 | |
| | |
| | | | Leisure Products – 1.4% | | | |
| | |
| | 39,997 | | | Brunswick Corporation | | | 1,739,870 | |
| | |
| | | | Life Sciences Tools & Services – 2.0% | | | |
| | |
| | 41,030 | | | Accelerate Diagnostics Inc., (3) | | | 871,888 | |
| | |
| | 41,261 | | | Cambrex Corporation, (3) | | | 1,662,818 | |
| | | | Total Life Sciences Tools & Services | | | 2,534,706 | |
Nuveen Small Cap Select Fund (continued)
| | |
| Portfolio of Investments | | October 31, 2016 |
| | | | | | | | |
| Shares | | | Description (1) | | Value | |
| | |
| | | | Machinery – 4.3% | | | |
| | |
| | 29,279 | | | CLARCOR, Inc. | | $ | 1,821,447 | |
| | |
| | 41,041 | | | ESCO Technologies Inc. | | | 1,828,377 | |
| | |
| | 96,372 | | | NN, Incorporated | | | 1,700,966 | |
| | | | Total Machinery | | | 5,350,790 | |
| | |
| | | | Mortgage Real Estate Investment Trusts – 1.3% | | | |
| | |
| | 212,544 | | | MFA Mortgage Investments, Inc. | | | 1,553,697 | |
| | |
| | | | Oil, Gas & Consumable Fuels – 2.8% | | | |
| | |
| | 138,486 | | | Callon Petroleum Company Del, (3) | | | 1,798,933 | |
| | |
| | 48,986 | | | Carrizo Oil & Gas, Inc., (3) | | | 1,657,196 | |
| | | | Total Oil, Gas & Consumable Fuels | | | 3,456,129 | |
| | |
| | | | Personal Products – 0.5% | | | |
| | |
| | 24,577 | | | e.l.f. Beauty, Incorporated, (3) | | | 635,561 | |
| | |
| | | | Professional Services – 2.4% | | | |
| | |
| | 41,200 | | | FTI Consulting Inc., (3) | | | 1,605,152 | |
| | |
| | 64,853 | | | Korn Ferry International | | | 1,322,353 | |
| | | | Total Professional Services | | | 2,927,505 | |
| | |
| | | | Semiconductors & Semiconductor Equipment – 3.8% | | | |
| | |
| | 124,755 | | | Cypress Semiconductor Corporation | | | 1,243,807 | |
| | |
| | 38,500 | | | Microsemi Corporation, (3) | | | 1,622,005 | |
| | |
| | 36,868 | | | MKS Instruments Inc. | | | 1,859,991 | |
| | | | Total Semiconductors & Semiconductor Equipment | | | 4,725,803 | |
| | |
| | | | Software – 5.4% | | | |
| | |
| | 30,305 | | | Broadsoft Inc., (3) | | | 1,259,173 | |
| | |
| | 36,018 | | | CommVault Systems, Inc., (3) | | | 1,926,963 | |
| | |
| | 15,248 | | | Proofpoint, Incorporated, (2), (3) | | | 1,195,137 | |
| | |
| | 61,591 | | | Synchronoss Technologies, Inc., (3) | | | 2,261,005 | |
| | | | Total Software | | | 6,642,278 | |
| | |
| | | | Specialty Retail – 1.3% | | | |
| | |
| | 40,646 | | | Hibbett Sporting Goods, Inc., (2), (3) | | | 1,579,097 | |
| | |
| | | | Textiles, Apparel & Luxury Goods – 2.5% | | | |
| | |
| | 28,370 | | | Deckers Outdoor Corporation, (3) | | | 1,480,630 | |
| | |
| | 48,638 | | | Steven Madden Limited, (3) | | | 1,624,508 | |
| | | | Total Textiles, Apparel & Luxury Goods | | | 3,105,138 | |
| | |
| | | | Thrifts & Mortgage Finance – 1.3% | | | |
| | |
| | 117,379 | | | Radian Group Inc. | | | 1,595,181 | |
| | | | Total Long-Term Investments (cost $106,788,196) | | | 121,177,654 | |
| | | | | | | | |
| Shares | | | Description (1) | | Value | |
| | |
| | | | INVESTMENTS PURCHASED WITH COLLATERAL FROM SECURITIES LENDING – 7.9% | | | | |
| | |
| | | | Money Market Funds – 7.9% | | | |
| | |
| | 9,852,598 | | | First American Government Obligations Fund, Class X, 0.283%, (4), (5) | | $ | 9,852,598 | |
| | | | Total Investments Purchased with Collateral from Securities Lending (cost $9,852,598) | | | 9,852,598 | |
| | |
| Shares | | | Description (1) | | Value | |
| | |
| | | | SHORT-TERM INVESTMENTS – 3.1% | | | | |
| | |
| | | | Money Market Funds – 3.1% | | | |
| | |
| | 3,857,627 | | | First American Treasury Obligations Fund, Class Z, 0.222%, (4) | | $ | 3,857,627 | |
| | | | Total Short-Term Investments (cost $3,857,627) | | | 3,857,627 | |
| | | | Total Investments (cost $120,498,421) – 108.8% | | | 134,887,879 | |
| | | | Other Assets Less Liabilities – (8.8)% | | | (10,950,120 | ) |
| | | | Net Assets – 100% | | $ | 123,937,759 | |
For Fund portfolio compliance purposes, the Fund’s industry classifications refer to any one or more of the industry sub-classifications used by one or more widely recognized market indexes or ratings group indexes, and/or as defined by Fund management. This definition may not apply for purposes of this report which may combine industry sub-classifications into sectors for reporting ease.
| (1) | All percentages shown in the Portfolio of Investments are based on net assets. |
| (2) | Investment, or a portion of investment, is out on loan for securities lending. The total value of the securities out on loan as of the end of the reporting period was $9,554,140. |
| (3) | Non-income producing; issuer has not declared a dividend within the past twelve months. |
| (4) | The rate shown is the annualized seven-day subsidized yield as of the end of the reporting period. |
| (5) | The Fund may loan securities representing up to one third of the fair value of its total assets (which includes collateral for securities on loan) to broker dealers, banks, and other institutions. The Fund maintains collateral equal to at least 100% of the fair value of the securities loaned. The cash collateral received by the Fund is invested in this money market fund. See Notes to Financial Statements, Note 3 – Portfolio Securities and Investments in Derivatives, Securities Lending for more information. |
See accompanying notes to financial statements.
Statement of
| | | | |
| | Assets and Liabilities | | October 31, 2016 |
| | | | | | | | |
| | | Large Cap
Select | | | Small Cap
Select | |
Assets | | | | | | | | |
Long-term investments, at value (cost $43,406,188 and $106,788,196, respectively) | | $ | 46,349,454 | | | $ | 121,177,654 | |
Investments purchased with collateral from securities lending, at value (cost approximates value) | | | — | | | | 9,852,598 | |
Short-term investments, at value (cost approximates value) | | | 203,179 | | | | 3,857,627 | |
Receivable for: | | | | | | | | |
Dividends | | | 13,344 | | | | 30,199 | |
Due from broker | | | 7 | | | | 9,636 | |
Interest | | | 63 | | | | 508 | |
Investments sold | | | 1,167,745 | | | | 904,878 | |
Shares sold | | | 83 | | | | 353,399 | |
Other assets | | | 24,109 | | | | 47,618 | |
Total assets | | | 47,757,984 | | | | 136,234,117 | |
Liabilities | | | | | | | | |
Payable for: | | | | | | | | |
Collateral from securities lending program | | | — | | | | 9,852,598 | |
Investments purchased | | | 1,054,074 | | | | 1,791,718 | |
Shares redeemed | | | 284 | | | | 425,649 | |
Accrued expenses: | | | | | | | | |
Directors fees | | | 401 | | | | 15,687 | |
Management fees | | | 27,625 | | | | 95,284 | |
12b-1 distribution and service fees | | | 2,626 | | | | 22,219 | |
Other | | | 18,467 | | | | 93,203 | |
Total liabilities | | | 1,103,477 | | | | 12,296,358 | |
Net assets | | $ | 46,654,507 | | | $ | 123,937,759 | |
Class A Shares | | | | | | | | |
Net assets | | $ | 7,983,011 | | | $ | 67,428,475 | |
Shares outstanding | | | 375,826 | | | | 7,321,589 | |
Net asset value (“NAV”) per share | | $ | 21.24 | | | $ | 9.21 | |
Offering price per share (NAV per share plus maximum sales charge of 5.75% of offering price) | | $ | 22.54 | | | $ | 9.77 | |
Class C Shares | | | | | | | | |
Net assets | | $ | 1,074,408 | | | $ | 5,624,713 | |
Shares outstanding | | | 54,205 | | | | 839,973 | |
NAV and offering price per share | | $ | 19.82 | | | $ | 6.70 | |
Class R3 Shares | | | | | | | | |
Net assets | | $ | — | | | $ | 5,310,285 | |
Shares outstanding | | | — | | | | 622,300 | |
NAV and offering price per share | | $ | — | | | $ | 8.53 | |
Class I Shares | | | | | | | | |
Net assets | | $ | 37,597,088 | | | $ | 45,574,286 | |
Shares outstanding | | | 1,755,363 | | | | 4,054,544 | |
NAV and offering price per share | | $ | 21.42 | | | $ | 11.24 | |
Net assets consist of: | | | | | | | | |
Capital paid-in | | $ | 96,037,532 | | | $ | 98,316,209 | |
Undistributed (Over-distribution of) net investment income | | | 252,677 | | | | 166,586 | |
Accumulated net realized gain (loss) | | | (52,578,968 | ) | | | 11,065,506 | |
Net unrealized appreciation (depreciation) | | | 2,943,266 | | | | 14,389,458 | |
Net assets | | $ | 46,654,507 | | | $ | 123,937,759 | |
Authorized shares – per class | | | 2 billion | | | | 2 billion | |
Par value per share | | $ | 0.0001 | | | $ | 0.0001 | |
See accompanying notes to financial statements.
Statement of
| | | | |
| | Operations | | Year Ended October 31, 2016 |
| | | | | | | | |
| | | Large Cap
Select | | | Small Cap
Select | |
Investment Income | | | | | | | | |
Dividend and interest income (net of foreign tax withheld of $1,728 and $—, respectively) | | $ | 693,839 | | | $ | 1,779,081 | |
Securities lending income, net | | | 10,645 | | | | 378,739 | |
Total investment income | | | 704,484 | | | | 2,157,820 | |
Expenses | | | | | | | | |
Management fees | | | 310,199 | | | | 1,232,603 | |
12b-1 service fees – Class A Shares | | | 19,078 | | | | 176,865 | |
12b-1 distribution and service fees – Class C Shares | | | 12,239 | | | | 67,447 | |
12b-1 distribution and service fees – Class R3 Shares | | | — | | | | 31,549 | |
Shareholder servicing agent fees | | | 15,429 | | | | 265,270 | |
Custodian fees | | | 9,207 | | | | 19,766 | |
Directors fees | | | 1,257 | | | | 3,972 | |
Professional fees | | | 22,664 | | | | 33,704 | |
Shareholder reporting expenses | | | 5,502 | | | | 43,133 | |
Federal and state registration fees | | | 43,392 | | | | 57,014 | |
Other | | | 5,119 | | | | 5,978 | |
Total expenses before fee waiver/expense reimbursement | | | 444,086 | | | | 1,937,301 | |
Fee waiver/expense reimbursement | | | (4,413 | ) | | | — | |
Net expenses | | | 439,673 | | | | 1,937,301 | |
Net investment income (loss) | | | 264,811 | | | | 220,519 | |
Realized and Unrealized Gain (Loss) | | | | | | | | |
Net realized gain (loss) from investments | | | 1,215,496 | | | | 14,043,619 | |
Change in net unrealized appreciation (depreciation) of investments | | | (306,572 | ) | | | (9,694,484 | ) |
Net realized and unrealized gain (loss) | | | 908,924 | | | | 4,349,135 | |
Net increase (decrease) in net assets from operations | | $ | 1,173,735 | | | $ | 4,569,654 | |
See accompanying notes to financial statements.
Statement of
| | | | | | | | | | | | | | | | | | | | |
| | | Large Cap Select | | | | | | Small Cap Select | |
| | | Year Ended
10/31/16 | | | Year Ended
10/31/15 | | | | | | Year Ended
10/31/16 | | | Year Ended
10/31/15 | |
Operations | | | | | | | | | | | | | | | | | | | | |
Net investment income (loss) | | $ | 264,811 | | | $ | 254,629 | | | | | | | $ | 220,519 | | | $ | (102,045 | ) |
Net realized gain (loss) from investments | | | 1,215,496 | | | | 3,227,610 | | | | | | | | 14,043,619 | | | | 35,032,905 | |
Change in net unrealized appreciation (depreciation) of investments | | | (306,572 | ) | | | (2,149,683 | ) | | | | | | | (9,694,484 | ) | | | (24,021,705 | ) |
Net increase (decrease) in net assets from operations | | | 1,173,735 | | | | 1,332,556 | | | | | | | | 4,569,654 | | | �� | 10,909,155 | |
Distributions to Shareholders | | | | | | | | | | | | | | | | | | | | |
From net investment income: | | | | | | | | | | | | | | | | | | | | |
Class A Shares | | | (18,734 | ) | | | (26,786 | ) | | | | | | | — | | | | — | |
Class C Shares | | | — | | | | — | | | | | | | | — | | | | — | |
Class R3 Shares | | | — | | | | — | | | | | | | | — | | | | — | |
Class I Shares | | | (171,210 | ) | | | (231,222 | ) | | | | | | | — | | | | — | |
From accumulated net realized gains: | | | | | | | | | | | | | | | | | | | | |
Class A Shares | | | — | | | | — | | | | | | | | (15,055,213 | ) | | | (25,790,799 | ) |
Class C Shares | | | — | | | | — | | | | | | | | (1,864,296 | ) | | | (2,732,315 | ) |
Class R3 Shares | | | — | | | | — | | | | | | | | (1,548,159 | ) | | | (2,665,298 | ) |
Class I Shares | | | — | | | | — | | | | | | | | (10,869,213 | ) | | | (30,829,009 | ) |
Decrease in net assets from distributions to shareholders | | | (189,944 | ) | | | (258,008 | ) | | | | | | | (29,336,881 | ) | | | (62,017,421 | ) |
Fund Share Transactions | | | | | | | | | | | | | | | | | | | | |
Proceeds from sale of shares | | | 11,274,510 | | | | 2,758,955 | | | | | | | | 12,433,450 | | | | 29,500,410 | |
Proceeds from shares issued to shareholders due to reinvestment of distributions | | | 126,784 | | | | 178,501 | | | | | | | | 27,114,416 | | | | 55,704,100 | |
| | | 11,401,294 | | | | 2,937,456 | | | | | | | | 39,547,866 | | | | 85,204,510 | |
Cost of shares redeemed | | | (8,412,340 | ) | | | (9,475,431 | ) | | | | | | | (84,823,769 | ) | | | (117,686,278 | ) |
Net increase (decrease) in net assets from Fund share transactions | | | 2,988,954 | | | | (6,537,975 | ) | | | | | | | (45,275,903 | ) | | | (32,481,768 | ) |
Net increase (decrease) in net assets | | | 3,972,745 | | | | (5,463,427 | ) | | | | | | | (70,043,130 | ) | | | (83,590,034 | ) |
Net assets at the beginning of period | | | 42,681,762 | | | | 48,145,189 | | | | | | | | 193,980,889 | | | | 277,570,923 | |
Net assets at the end of period | | $ | 46,654,507 | | | $ | 42,681,762 | | | | | | | $ | 123,937,759 | | | $ | 193,980,889 | |
Undistributed (Over-distribution of) net investment income at the end of period | | $ | 252,677 | | | $ | 177,810 | | | | | | | $ | 166,586 | | | $ | (28,198 | ) |
See accompanying notes to financial statements.
THIS PAGE INTENTIONALLY LEFT BLANK
Financial
Highlights
Large Cap Select
Selected data for a share outstanding throughout the period:
| | | | | | | | | | | | | | | | | | | | | | | | | | | | | | | | | | | | |
| | | | | | | | | | | | | | | | | | | | | | | | | | | | |
| | | | | | Investment Operations | | | | | |
Less Distributions | | | | |
| | | | | | | | | |
Class (Commencement Date) Year Ended October 31, | | Beginning
NAV | | | Net
Investment
Income
(Loss)(a) | | | Net
Realized/
Unrealized
Gain (Loss) | | | Total | | | | | | From
Net
Investment
Income | | | From
Accumulated
Net Realized
Gains | | | Total | | | Ending
NAV | |
Class A (1/03) | | | | | | | | | | | | | | | | | | | | | | | | | | | | | | | | | |
2016 | | $ | 20.59 | | | $ | 0.09 | | | $ | 0.61 | | | $ | 0.70 | | | | | | | $ | (0.05 | ) | | $ | — | | | $ | (0.05 | ) | | $ | 21.24 | |
2015 | | | 20.13 | | | | 0.08 | | | | 0.46 | | | | 0.54 | | | | | | | | (0.08 | ) | | | — | | | | (0.08 | ) | | | 20.59 | |
2014 | | | 17.65 | | | | 0.05 | | | | 2.48 | | | | 2.53 | | | | | | | | (0.05 | ) | | | — | | | | (0.05 | ) | | | 20.13 | |
2013 | | | 13.42 | | | | 0.07 | | | | 4.22 | | | | 4.29 | | | | | | | | (0.06 | ) | | | — | | | | (0.06 | ) | | | 17.65 | |
| 2012 | | | 11.73 | | | | 0.03 | | | | 1.66 | | | | 1.69 | | | | | | | | — | | | | — | | | | — | | | | 13.42 | |
Class C (1/03) | | | | | | | | | | | | | | | | | | | | | | | | | | | | | | | | | |
2016 | | | 19.31 | | | | (0.06 | ) | | | 0.57 | | | | 0.51 | | | | | | | | — | | | | — | | | | — | | | | 19.82 | |
2015 | | | 18.96 | | | | (0.07 | ) | | | 0.42 | | | | 0.35 | | | | | | | | — | | | | — | | | | — | | | | 19.31 | |
2014 | | | 16.70 | | | | (0.09 | ) | | | 2.35 | | | | 2.26 | | | | | | | | — | | | | — | | | | — | | | | 18.96 | |
2013 | | | 12.73 | | | | (0.05 | ) | | | 4.02 | | | | 3.97 | | | | | | | | — | | | | — | | | | — | | | | 16.70 | |
| 2012 | | | 11.21 | | | | (0.06 | ) | | | 1.58 | | | | 1.52 | | | | | | | | — | | | | — | | | | — | | | | 12.73 | |
Class I (1/03) | | | | | | | | | | | | | | | | | | | | | | | | | | | | | | | | | |
2016 | | | 20.76 | | | | 0.14 | | | | 0.62 | | | | 0.76 | | | | | | | | (0.10 | ) | | | — | | | | (0.10 | ) | | | 21.42 | |
2015 | | | 20.30 | | | | 0.13 | | | | 0.46 | | | | 0.59 | | | | | | | | (0.13 | ) | | | — | | | | (0.13 | ) | | | 20.76 | |
2014 | | | 17.79 | | | | 0.09 | | | | 2.51 | | | | 2.60 | | | | | | | | (0.09 | ) | | | — | | | | (0.09 | ) | | | 20.30 | |
2013 | | | 13.52 | | | | 0.11 | | | | 4.26 | | | | 4.37 | | | | | | | | (0.10 | ) | | | — | | | | (0.10 | ) | | | 17.79 | |
| 2012 | | | 11.80 | | | | 0.07 | | | | 1.66 | | | | 1.73 | | | | | | | | (0.01 | ) | | | — | | | | (0.01 | ) | | | 13.52 | |
| | | | | | | | | | | | | | | | | | | | | | | | | | | | | | | | | | |
| | | | Ratios/Supplemental Data | |
| | | | | | | | | | Ratios to Average
Net Assets Before
Waiver/Reimbursement | | | | | | Ratios to Average
Net Assets After
Waiver/Reimbursement(c) | | | | |
| | | | | | | | |
Total
Return(b) | | | Ending
Net
Assets
(000) | | | | | | Expenses | | | Net
Investment
Income
(Loss) | | | | | | Expenses | | | Net
Investment
Income
(Loss) | | | Portfolio
Turnover
Rate(d) | |
| | | | | | | | | | | | | | | | | | | | | | | | | | | | | | | | | | |
| | 3.40 | % | | $ | 7,983 | | | | | | | | 1.22 | % | | | 0.44 | % | | | | | | | 1.21 | % | | | 0.45 | % | | | 116 | % |
| | 2.66 | | | | 7,383 | | | | | | | | 1.25 | | | | 0.36 | | | | | | | | 1.25 | | | | 0.36 | | | | 124 | |
| | 14.35 | | | | 6,511 | | | | | | | | 1.31 | | | | 0.23 | | | | | | | | 1.30 | | | | 0.24 | | | | 154 | |
| | 32.14 | | | | 4,625 | | | | | | | | 1.33 | | | | 0.43 | | | | | | | | 1.33 | | | | 0.43 | | | | 117 | |
| | 14.41 | | | | 2,924 | | | | | | | | 1.43 | | | | 0.26 | | | | | | | | 1.43 | | | | 0.26 | | | | 127 | |
| | | | | | | | | | | | | | | | | | | | | | | | | | | | | | | | | | |
| | 2.64 | | | | 1,074 | | | | | | | | 1.97 | | | | (0.32 | ) | | | | | | | 1.96 | | | | (0.31 | ) | | | 116 | |
| | 1.85 | | | | 684 | | | | | | | | 2.00 | | | | (0.38 | ) | | | | | | | 2.00 | | | | (0.38 | ) | | | 124 | |
| | 13.53 | | | | 683 | | | | | | | | 2.07 | | | | (0.53 | ) | | | | | | | 2.05 | | | | (0.51 | ) | | | 154 | |
| | 31.08 | | | | 518 | | | | | | | | 2.07 | | | | (0.34 | ) | | | | | | | 2.07 | | | | (0.34 | ) | | | 117 | |
| | 13.65 | | | | 195 | | | | | | | | 2.18 | | | | (0.49 | ) | | | | | | | 2.18 | | | | (0.49 | ) | | | 127 | |
| | | | | | | | | | | | | | | | | | | | | | | | | | | | | | | | | | |
| | 3.69 | | | | 37,597 | | | | | | | | 0.97 | | | | 0.69 | | | | | | | | 0.96 | | | | 0.70 | | | | 116 | |
| | 2.88 | | | | 34,615 | | | | | | | | 1.00 | | | | 0.63 | | | | | | | | 1.00 | | | | 0.63 | | | | 124 | |
| | 14.66 | | | | 40,952 | | | | | | | | 1.06 | | | | 0.48 | | | | | | | | 1.05 | | | | 0.49 | | | | 154 | |
| | 32.43 | | | | 34,444 | | | | | | | | 1.08 | | | | 0.72 | | | | | | | | 1.08 | | | | 0.72 | | | | 117 | |
| | 14.79 | | | | 34,554 | | | | | | | | 1.18 | | | | 0.54 | | | | | | | | 1.18 | | | | 0.54 | | | | 127 | |
| (a) | Per share Net Investment Income (Loss) is calculated using the average daily shares method. | |
| (b) | Total return is the combination of changes in NAV without any sales charge, reinvested dividend income at NAV and reinvested capital gains distributions at NAV, if any. Total returns are not annualized. | |
| (c) | After fee waiver and/or expense reimbursement from the Adviser, where applicable. | |
| (d) | Portfolio Turnover Rate is calculated based on the lesser of long-term purchases or sales (as disclosed in Note 5 – Investment Transactions) divided by the average long-term market value during the period. | |
See accompanying notes to financial statements.
Financial Highlights (continued)
Small Cap Select
Selected data for a share outstanding throughout each period:
| | | | | | | | | | | | | | | | | | | | | | | | | | | | | | | | | | | | |
| | | | | |
| | | | | | Investment Operations | | | | | | Less Distributions | | | | |
| | | | | | | | | |
Class (Commencement Date) Year Ended October 31, | | Beginning
NAV | | | Net
Investment
Income
(Loss)(a) | | | Net
Realized/
Unrealized
Gain (Loss) | | | Total | | | | | | From
Net
Investment
Income | | | From
Accumulated
Net Realized
Gains | | | Total | | | Ending
NAV | |
Class A (5/92) | | | | | | | | | | | | | | | | | | | | | | | | | | | | | | | | | |
2016 | | $ | 11.01 | | | $ | 0.01 | | | $ | 0.30 | | | $ | 0.31 | | | | | | | $ | — | | | $ | (2.11 | ) | | $ | (2.11 | ) | | $ | 9.21 | |
2015 | | | 14.48 | | | | (0.02 | ) | | | 0.37 | | | | 0.35 | | | | | | | | — | | | | (3.82 | ) | | | (3.82 | ) | | | 11.01 | |
2014 | | | 15.02 | | | | (0.05 | ) | | | 0.87 | | | | 0.82 | | | | | | | | (0.02 | ) | | | (1.34 | ) | | | (1.36 | ) | | | 14.48 | |
2013 | | | 13.54 | | | | — | * | | | 3.63 | | | | 3.63 | | | | | | | | — | | | | (2.15 | ) | | | (2.15 | ) | | | 15.02 | |
2012 | | | 12.44 | | | | (0.05 | ) | | | 1.45 | | | | 1.40 | | | | | | | | — | | | | (0.30 | ) | | | (0.30 | ) | | | 13.54 | |
Class C (9/01) | | | | | | | | | | | | | | | | | | | | | | | | | | | | | | | | | |
2016 | | | 8.64 | | | | (0.04 | ) | | | 0.21 | | | | 0.17 | | | | | | | | — | | | | (2.11 | ) | | | (2.11 | ) | | | 6.70 | |
2015 | | | 12.28 | | | | (0.08 | ) | | | 0.26 | | | | 0.18 | | | | | | | | — | | | | (3.82 | ) | | | (3.82 | ) | | | 8.64 | |
2014 | | | 13.00 | | | | (0.14 | ) | | | 0.76 | | | | 0.62 | | | | | | | | — | | | | (1.34 | ) | | | (1.34 | ) | | | 12.28 | |
2013 | | | 12.09 | | | | (0.09 | ) | | | 3.15 | | | | 3.06 | | | | | | | | — | | | | (2.15 | ) | | | (2.15 | ) | | | 13.00 | |
2012 | | | 11.22 | | | | (0.13 | ) | | | 1.30 | | | | 1.17 | | | | | | | | — | | | | (0.30 | ) | | | (0.30 | ) | | | 12.09 | |
Class R3 (1/94) | | | | | | | | | | | | | | | | | | | | | | | | | | | | | | | | | |
2016 | | | 10.38 | | | | (0.01 | ) | | | 0.27 | | | | 0.26 | | | | | | | | — | | | | (2.11 | ) | | | (2.11 | ) | | | 8.53 | |
2015 | | | 13.91 | | | | (0.04 | ) | | | 0.33 | | | | 0.29 | | | | | | | | — | | | | (3.82 | ) | | | (3.82 | ) | | | 10.38 | |
2014 | | | 14.49 | | | | (0.08 | ) | | | 0.84 | | | | 0.76 | | | | | | | | — | | | | (1.34 | ) | | | (1.34 | ) | | | 13.91 | |
2013 | | | 13.17 | | | | (0.03 | ) | | | 3.50 | | | | 3.47 | | | | | | | | — | | | | (2.15 | ) | | | (2.15 | ) | | | 14.49 | |
2012 | | | 12.13 | | | | (0.08 | ) | | | 1.42 | | | | 1.34 | | | | | | | | — | | | | (0.30 | ) | | | (0.30 | ) | | | 13.17 | |
Class I (5/92) | | | | | | | | | | | | | | | | | | | | | | | | | | | | | | | | | |
2016 | | | 12.93 | | | | 0.04 | | | | 0.38 | | | | 0.42 | | | | | | | | — | | | | (2.11 | ) | | | (2.11 | ) | | | 11.24 | |
2015 | | | 16.30 | | | | 0.02 | | | | 0.43 | | | | 0.45 | | | | | | | | — | | | | (3.82 | ) | | | (3.82 | ) | | | 12.93 | |
2014 | | | 16.73 | | | | (0.02 | ) | | | 0.99 | | | | 0.97 | | | | | | | | (0.06 | ) | | | (1.34 | ) | | | (1.40 | ) | | | 16.30 | |
2013 | | | 14.82 | | | | 0.04 | | | | 4.02 | | | | 4.06 | | | | | | | | — | | | | (2.15 | ) | | | (2.15 | ) | | | 16.73 | |
2012 | | | 13.54 | | | | (0.02 | ) | | | 1.60 | | | | 1.58 | | | | | | | | — | | | | (0.30 | ) | | | (0.30 | ) | | | 14.82 | |
| | | | | | | | | | | | | | | | | | | | | | | | | | | | | | | | | | |
| | | | Ratios/Supplemental Data | |
| | | | | | | | | | Ratios to Average
Net Assets Before
Waiver/Reimbursement | | | | | | Ratios to Average
Net Assets After
Waiver/Reimbursement(c) | | | | |
| | | | | | | | |
Total
Return(b) | | | Ending
Net
Assets
(000) | | | | | | Expenses | | | Net
Investment
Income
(Loss) | | | | | | Expenses | | | Net
Investment
Income
(Loss) | | | Portfolio
Turnover
Rate(d) | |
| | | | | | | | | | | | | | | | | | | | | | | | | | | | | | | | | | |
| | 4.05 | % | | $ | 67,428 | | | | | | | | 1.44 | % | | | 0.10 | % | | | | | | | 1.44 | % | | | 0.10 | % | | | 66 | % |
| | 4.08 | | | | 82,080 | | | | | | | | 1.42 | | | | (0.14 | ) | | | | | | | 1.42 | | | | (0.14 | ) | | | 75 | |
| | 5.98 | | | | 100,733 | | | | | | | | 1.43 | | | | (0.37 | ) | | | | | | | 1.43 | | | | (0.37 | ) | | | 90 | |
| | 31.74 | | | | 161,488 | | | | | | | | 1.34 | | | | (0.01 | ) | | | | | | | 1.33 | | | | — | ** | | | 78 | |
| | 11.62 | | | | 155,624 | | | | | | | | 1.36 | | | | (0.49 | ) | | | | | | | 1.28 | | | | (0.41 | ) | | | 71 | |
| | | | | | | | | | | | | | | | | | | | | | | | | | | | | | | | | | |
| | 3.37 | | | | 5,625 | | | | | | | | 2.19 | | | | (0.65 | ) | | | | | | | 2.19 | | | | (0.65 | ) | | | 66 | |
| | 3.19 | | | | 8,036 | | | | | | | | 2.17 | | | | (0.88 | ) | | | | | | | 2.17 | | | | (0.88 | ) | | | 75 | |
| | 5.28 | | | | 8,976 | | | | | | | | 2.19 | | | | (1.12 | ) | | | | | | | 2.19 | | | | (1.12 | ) | | | 90 | |
| | 30.67 | | | | 10,331 | | | | | | | | 2.09 | | | | (0.75 | ) | | | | | | | 2.08 | | | | (0.74 | ) | | | 78 | |
| | 10.81 | | | | 10,058 | | | | | | | | 2.11 | | | | (1.21 | ) | | | | | | | 2.03 | | | | (1.13 | ) | | | 71 | |
| | | | | | | | | | | | | | | | | | | | | | | | | | | | | | | | | | |
| | 3.76 | | | | 5,310 | | | | | | | | 1.69 | | | | (0.12 | ) | | | | | | | 1.69 | | | | (0.12 | ) | | | 66 | |
| | 3.75 | | | | 7,794 | | | | | | | | 1.67 | | | | (0.38 | ) | | | | | | | 1.67 | | | | (0.38 | ) | | | 75 | |
| | 5.75 | | | | 11,570 | | | | | | | | 1.68 | | | | (0.61 | ) | | | | | | | 1.68 | | | | (0.61 | ) | | | 90 | |
| | 31.37 | | | | 19,673 | | | | | | | | 1.59 | | | | (0.25 | ) | | | | | | | 1.58 | | | | (0.25 | ) | | | 78 | |
| | 11.42 | | | | 18,386 | | | | | | | | 1.61 | | | | (0.69 | ) | | | | | | | 1.53 | | | | (0.61 | ) | | | 71 | |
| | | | | | | | | | | | | | | | | | | | | | | | | | | | | | | | | | |
| | 4.33 | | | | 45,574 | | | | | | | | 1.19 | | | | 0.36 | | | | | | | | 1.19 | | | | 0.36 | | | | 66 | |
| | 4.29 | | | | 96,071 | | | | | | | | 1.17 | | | | 0.11 | | | | | | | | 1.17 | | | | 0.11 | | | | 75 | |
| | 6.23 | | | | 156,292 | | | | | | | | 1.18 | | | | (0.11 | ) | | | | | | | 1.18 | | | | (0.11 | ) | | | 90 | |
| | 32.02 | | | | 283,064 | | | | | | | | 1.09 | | | | 0.24 | | | | | | | | 1.08 | | | | 0.25 | | | | 78 | |
| | 12.01 | | | | 261,760 | | | | | | | | 1.11 | | | | (0.19 | ) | | | | | | | 1.03 | | | | (0.11 | ) | | | 71 | |
| (a) | Per share Net Investment Income (Loss) is calculated using the average daily shares method. | |
| (b) | Total return is the combination of changes in NAV without any sales charge, reinvested dividend income at NAV and reinvested capital gains distributions at NAV, if any. Total returns are not annualized. | |
| (c) | After fee waiver and/or expense reimbursement from the Adviser, where applicable. | |
| (d) | Portfolio Turnover Rate is calculated based on the lesser of long-term purchases or sales (as disclosed in Note 5 – Investment Transactions) divided by the average long-term market value during the period. | |
| * | Rounds to less than $0.01 per share. | |
| ** | Rounds to less than 0.01%. | |
See accompanying notes to financial statements.
Notes to
Financial Statements
1. General Information and Significant Accounting Policies
General Information
Trust and Fund Information
Nuveen Investment Funds, Inc. (the “Trust”), is an open-end management investment company registered under the Investment Company Act of 1940, as amended. The Trust is comprised of Nuveen Large Cap Select Fund (“Large Cap Select”) and Nuveen Small Cap Select Fund (“Small Cap Select”), (each a “Fund” and collectively, the “Funds”), as diversified funds, among others. The Trust was incorporated in the State of Maryland on August 20, 1987.
The end of the reporting period for the Funds is October 31, 2016, and the period covered by these Notes to Financial Statements is the fiscal year ended October 31, 2016 (the “current fiscal period”).
Investment Adviser
The Funds’ investment adviser is Nuveen Fund Advisors, LLC (the “Adviser”), a wholly-owned subsidiary of Nuveen Investments, Inc. (“Nuveen”). Nuveen is an operating division of TIAA Global Asset Management. The Adviser has overall responsibility for management of the Funds, oversees the management of the Funds’ portfolio, manages the Funds’ business affairs and provides certain clerical, bookkeeping and other administrative services, and, if necessary, asset allocation decisions. The Adviser has entered into sub-advisory agreements with Nuveen Asset Management, LLC (the “Sub-Adviser”), a subsidiary of the Adviser, under which the Sub-Adviser manages the investment portfolios of the Funds.
Investment Objectives
The investment objective of Large Cap Select and Small Cap Select is to seek capital appreciation.
The Funds’ most recent prospectus provides further descriptions of each Fund’s investment objective, principal investment strategies and principal risks.
Significant Accounting Policies
Each Fund is an investment company and follows accounting and reporting guidance under Financial Accounting Standards Board (FASB) Accounting Standards Codification (ASC) Topic 946 “Financial Services-Investment Companies.” The following is a summary of significant accounting policies followed by the Funds in the preparation of their financial statements in accordance with accounting principals generally accepted in the United States of America (“U.S. GAAP”).
Investment Transactions
Investment transactions are recorded on a trade date basis. Realized gains and losses from investment transactions are determined on the specific identification method, which is the same basis used for federal income tax purposes.
Investment Income
Dividend income is recorded on the ex-dividend date or, for foreign securities, when information is available. Interest income is recorded on an accrual basis. Securities lending income is comprised of fees earned from borrowers and income earned on cash collateral investments, net of lending agent fees.
Professional Fees
Professional fees presented on the Statement of Operations consist of legal fees incurred in the normal course of operations, audit fees, tax consulting fees and, in some cases, workout expenditures. Workout expenditures are incurred in an attempt to protect or enhance an investment or to pursue other claims or legal actions on behalf of Fund shareholders. If a refund is received for workout expenditures paid in a prior reporting period, such amounts will be recognized as “Legal fee refund” on the Statement of Operations.
Dividends and Distributions to Shareholders
Dividends from net investment income, if any, are declared and distributed to shareholders annually. Net realized capital gains from investment transactions, if any, are declared and distributed to shareholders at least annually. Furthermore, capital gains are distributed only to the extent they exceed available capital loss carryforwards.
Distributions to shareholders are recorded on the ex-dividend date. The amount and timing of distributions are determined in accordance with federal income tax regulations, which may differ from U.S. GAAP.
Share Classes and Sales Charges
Class A Shares are generally sold with an up-front sales charge and incur a 0.25% annual 12b-1 service fee. Class A Share purchases of $1 million or more are sold at net asset value (“NAV”) without an up-front sales charge but may be subject to a contingent deferred sales charge (“CDSC”) equal to 1% if redeemed within eighteen months of purchase. Class C Shares are sold without an up-front sales charge but incur a 0.75% annual 12b-1 distribution fee and a 0.25% annual 12b-1 service fee. Class C Shares are subject to a CDSC of 1% if redeemed within twelve months of purchase. Class R3 Shares are sold without an up-front sales charge but incur a 0.25% annual 12b-1 distribution fee and a 0.25% annual 12b-1 service fee. Class I Shares are not subject to any sales charge or 12b-1 distribution or service fees.
Multiclass Operations and Allocations
Income and expenses of the Funds that are not directly attributable to a specific class of shares are prorated among the classes based on the relative net assets of each class. Expenses directly attributable to a class of shares are recorded to the specific class. Currently, the only expenses that are allocated on a class-specific basis are 12b-1 distribution and service fees.
Realized and unrealized capital gains and losses of the Funds are prorated among the classes based on the relative net assets of each class.
Indemnifications
Under the Trust’s organizational documents, its officers and directors are indemnified against certain liabilities arising out of the performance of their duties to the Trust. In addition, in the normal course of business, the Trust enters into contracts that provide general indemnifications to other parties. The Trust’s maximum exposure under these arrangements is unknown as this would involve future claims that may be made against the Trust that have not yet occurred. However, the Trust has not had prior claims or losses pursuant to these contracts and expects the risk of loss to be remote.
Netting Agreements
In the ordinary course of business, the Funds may enter into transactions subject to enforceable International Swaps and Derivative Association, Inc. (��ISDA”) master agreements or other similar arrangements (“netting agreements”). Generally, the right to offset in netting agreements allows each Fund to offset certain securities and derivatives with a specific counterparty, when applicable, as well as any collateral received or delivered to that counterparty based on the terms of the agreements. Generally, each Fund manages its cash collateral and securities collateral on a counterparty basis.
The Funds’ investments subject to netting agreements as of the end of the reporting period, if any, are further described in Note 3 – Portfolio Securities and Investments in Derivatives.
Use of Estimates
The preparation of financial statements in conformity with U.S. GAAP requires management to make estimates and assumptions that affect the reported amounts of assets and liabilities at the date of the financial statements and the reported amounts of increases and decreases in net assets from operations during the reporting period. Actual results may differ from those estimates.
2. Investment Valuation and Fair Value Measurements
The fair valuation input levels as described below are for fair value measurement purposes.
Fair value is defined as the price that would be received upon selling an investment or transferring a liability in an orderly transaction to an independent buyer in the principal or most advantageous market for the investment. A three-tier hierarchy is used to maximize the use of observable market data and minimize the use of unobservable inputs and to establish classification of fair value measurements for disclosure purposes. Observable inputs reflect the assumptions market participants would use in pricing the asset or liability. Observable inputs are based on market data obtained from sources independent of the reporting entity. Unobservable inputs reflect the reporting entity’s own assumptions about the assumptions market participants would use in pricing the asset or liability. Unobservable inputs are based on the best information available in the circumstances. The following is a summary of the three-tiered hierarchy of valuation input levels.
| | |
| Level 1 – | | Inputs are unadjusted and prices are determined using quoted prices in active markets for identical securities. |
| Level 2 – | | Prices are determined using other significant observable inputs (including quoted prices for similar securities, interest rates, prepayment speeds, credit risk, etc.). |
| Level 3 – | | Prices are determined using significant unobservable inputs (including management’s assumptions in determining the fair value of investments). |
Common stocks and other equity-type securities are valued at the last sales price on the securities exchange on which such securities are primarily traded and are generally classified as Level 1. Securities primarily traded on the NASDAQ National Market (“NASDAQ”) are valued at the NASDAQ Official Closing Price and are generally classified as Level 1. However, securities traded on a securities exchange or NASDAQ for which there were no transactions on a given day or securities not listed on a securities exchange or NASDAQ are valued at the quoted bid price and are generally classified as Level 2. Prices of certain American Depositary Receipts (“ADR”) held by the Funds that trade in the United States are valued based on the last traded price, official closing price, or the most recent bid price of the underlying non-U.S.-traded stock, adjusted as appropriate for the underlying-to-ADR
Notes to Financial Statements (continued)
conversion ratio and foreign exchange rate, and from time-to-time may also be adjusted further to take into account material events that may take place after the close of the local non-U.S. market but before the close of the New York Stock Exchange, which may represent a transfer from a Level 1 to a Level 2 security.
Investments in investment companies are valued at their respective NAVs on the valuation date and are generally classified as Level 1.
Certain securities may not be able to be priced by the pre-established pricing methods as described above. Such securities may be valued by the Funds’ Board of Directors (the “Board”) and/or its appointee at fair value. These securities generally include, but are not limited to, restricted securities (securities which may not be publicly sold without registration under the Securities Act of 1933, as amended) for which an independent pricing service (“pricing service”) is unable to provide a market price; securities whose trading has been formally suspended; debt securities that have gone into default and for which there is no current market quotation; a security whose market price is not available from a pre-established pricing source; a security with respect to which an event has occurred that is likely to materially affect the value of the security after the market has closed but before the calculation of a Fund’s NAV (as may be the case in non-U.S. markets on which the security is primarily traded) or make it difficult or impossible to obtain a reliable market quotation; and a security whose price, as provided by the pricing service, is not deemed to reflect the security’s fair value. As a general principle, the fair value of a security would appear to be the amount that the owner might reasonably expect to receive for it in a current sale. A variety of factors may be considered in determining the fair value of such securities, which may include consideration of the following: yields or prices of investments of comparable quality, type of issue, coupon, maturity and rating, market quotes or indications of value from security dealers, evaluations of anticipated cash flows or collateral, general market conditions and other information and analysis, including the obligor’s credit characteristics considered relevant. These securities are generally classified as Level 2 or Level 3 depending on the observability of the significant inputs. Regardless of the method employed to value a particular security, all valuations are subject to review by the Board and/or its appointee.
The inputs or methodologies used for valuing securities are not an indication of the risks associated with investing in those securities. The following is a summary of each Fund’s fair value measurements as of the end of the reporting period:
| | | | | | | | | | | | | | | | |
| Large Cap Select | | Level 1 | | | Level 2 | | | Level 3 | | | Total | |
| Long-Term Investments*: | | | | | | | | | | | | | | | | |
Common Stocks | | $ | 46,349,454 | | | $ | — | | | $ | — | | | $ | 46,349,454 | |
| Short-Term Investments: | | | | | | | | | | | | | | | | |
Money Market Funds | | | 203,179 | | | | — | | | | — | | | | 203,179 | |
| Total | | $ | 46,552,633 | | | $ | — | | | $ | — | | | $ | 46,552,633 | |
| | | | |
| Small Cap Select | | | | | | | | | | | | |
| Long-Term Investments*: | | | | | | | | | | | | | | | | |
Common Stocks | | $ | 121,177,654 | | | $ | — | | | $ | — | | | $ | 121,177,654 | |
| Investments Purchased with Collateral from Securities Lending | | | 9,852,598 | | | | — | | | | — | | | | 9,852,598 | |
| Short-Term Investments: | | | | | | | | | | | | | | | | |
Money Market Funds | | | 3,857,627 | | | | — | | | | — | | | | 3,857,627 | |
| Total | | $ | 134,887,879 | | | $ | — | | | $ | — | | | $ | 134,887,879 | |
| * | Refer to the Fund’s Portfolio of Investments for industry classifications. |
The Board is responsible for the valuation process and has appointed the oversight of the daily valuation process to the Adviser’s Valuation Committee. The Valuation Committee, pursuant to the valuation policies and procedures adopted by the Board is responsible for making fair value determinations, evaluating the effectiveness of the Funds’ pricing policies and reporting to the Board. The Valuation Committee is aided in its efforts by the Adviser’s dedicated Securities Valuation Team, which is responsible for administering the daily valuation process and applying fair value methodologies as approved by the Valuation Committee. When determining the reliability of independent pricing services for investments owned by the Funds, the Valuation Committee, among other things, conducts due diligence reviews of the pricing services and monitors the quality of security prices received through various testing reports conducted by the Securities Valuation Team.
The Valuation Committee will consider pricing methodologies it deems relevant and appropriate when making a fair value determination, based on the facts and circumstances specific to the portfolio instrument. Fair value determinations generally will be derived as follows, using public or private market information:
| | (i) | If available, fair value determinations shall be derived by extrapolating from recent transactions or quoted prices for identical or comparable securities. |
| | (ii) | If such information is not available, an analytical valuation methodology may be used based on other available information including, but not limited to: analyst appraisals, research reports, corporate action information, issuer financial statements and shelf registration statements. Such analytical valuation methodologies may include, but are not limited to: multiple of earnings, discount from market value of a similar freely- traded security, discounted cash flow analysis, book value or a multiple thereof, risk premium/yield analysis, yield to maturity and/or fundamental investment analysis. |
The purchase price of a portfolio instrument will be used to fair value the instrument only if no other valuation methodology is available or deemed appropriate, and it is determined that the purchase price fairly reflects the instrument’s current value.
For each portfolio security that has been fair valued pursuant to the policies adopted by the Board, the fair value price is compared against the last available and next available market quotations. The Valuation Committee reviews the results of such testing and fair valuation occurrences are reported to the Board.
3. Portfolio Securities and Investments in Derivatives
Portfolio Securities
Securities Lending
In order to generate additional income, each Fund may lend securities representing up to one-third of the value of its total assets (which includes collateral for securities on loan) to broker-dealers, banks or other institutions. When loaning securities, the Funds retain the benefits of owning the securities, including the economic equivalent of dividends or interest generated by the security. The Funds also have the ability to recall the securities on loan at any time.
Each Fund’s policy is to receive, at the inception of a loan, cash collateral equal to at least 102% of the value of securities loaned, which is recognized as “Payable for collateral from securities lending program” on the Statement of Assets and Liabilities, when applicable. Collateral for securities on loan is invested in a money market fund, which is recognized as “Investments purchased with collateral from securities lending, at value” on the Statement of Assets and Liabilities. The market value of the securities loaned is determined at the close of each business day in order to determine the adequacy of the collateral. If the value of the securities on loan increases such that the level of collateralization falls below 100%, additional collateral is received from the borrower on the next business day, which is recognized as “Due from broker” on the Statement of Assets and Liabilities.
Securities out on loan are subject to termination at any time at the option of the borrower or the Funds. Upon termination, the borrower is required to return to the Funds securities identical to the securities loaned. Generally, in the event the borrower defaults on its obligation to return the loaned securities, the Funds have the right to use the collateral to acquire identical securities. In the event the Funds are delayed or prevented from exercising its right to dispose of the collateral, there may be a loss to the Funds. Under the Funds’ securities lending agreement, however, the securities lending agent has indemnified the Funds against losses resulting from borrower default, except to the extent that those losses result from a decrease in the value of the collateral due to its investment by the Funds. The Funds bear the risk of loss with respect to the investment of collateral.
The Funds’ custodian, U.S. Bank National Association, serves as their securities lending agent. Each Fund pays the custodian a fee based on its proportional share of the custodian’s expense of operating its securities lending program. Income earned from the securities lending program is paid to the Fund, net of any fees paid. Income from securities lending, net of fees paid, is recognized as “Securities lending income, net” on the Statement of Operations.
The following table presents the securities out on loan for the Funds, if any, and the collateral delivered related to those securities as of the end of the reporting period.
| | | | | | | | | | | | | | |
| Fund | | Asset Class out on Loan | | Long-Term
Investments, at Value | | | Collateral
Pledged (From)
Counterparty* | | | Net
Exposure | |
| Small Cap Select | | Common Stocks | | $ | 9,554,140 | | | $ | (9,554,140 | ) | | $ | — | |
| * | As of the end of the reporting period, the value of the collateral pledged from the counterparty exceeded the value of the securities out on loan. Refer to the Fund’s Portfolio of Investments for details on the securities out on loan. |
Securities lending fees paid by each Fund during the current fiscal period were as follows:
| | | | | | | | |
| | | Large Cap
Select | | | Small Cap
Select | |
| Securities lending fees paid | | $ | 1,086 | | | $ | 48,789 | |
Investments in Derivatives
Each Fund is authorized to invest in certain derivative instruments. The Funds record derivative instruments at fair value, with changes in fair value recognized on the Statement of Operations, when applicable. Even though the Funds’ investments in derivatives may represent economic hedges, they are not considered to be hedge transactions for financial reporting purposes.
Although the Funds are authorized to invest in derivative instruments, and may do so in the future, they did not make any such investments during the current fiscal period.
Notes to Financial Statements (continued)
Market and Counterparty Credit Risk
In the normal course of business each Fund may invest in financial instruments and enter into financial transactions where risk of potential loss exists due to changes in the market (market risk) or failure of the other party to the transaction to perform (counterparty credit risk). The potential loss could exceed the value of the financial assets recorded on the financial statements. Financial assets, which potentially expose each Fund to counterparty credit risk, consist principally of cash due from counterparties on forward, option and swap transactions, when applicable. The extent of each Fund’s exposure to counterparty credit risk in respect to these financial assets approximates their carrying value as recorded on the Statement of Assets and Liabilities.
Each Fund helps manage counterparty credit risk by entering into agreements only with counterparties the Adviser believes have the financial resources to honor their obligations and by having the Adviser monitor the financial stability of the counterparties. Additionally, counterparties may be required to pledge collateral daily (based on the daily valuation of the financial asset) on behalf of each Fund with a value approximately equal to the amount of any unrealized gain above a pre-determined threshold. Reciprocally, when each Fund has an unrealized loss, the Funds have instructed the custodian to pledge assets of the Funds as collateral with a value approximately equal to the amount of the unrealized loss above a pre-determined threshold. Collateral pledges are monitored and subsequently adjusted if and when the valuations fluctuate, either up or down, by at least the pre-determined threshold amount.
4. Fund Shares
Transactions in Fund shares during the current and prior fiscal period were as follows:
| | | | | | | | | | | | | | | | |
| | | Year Ended
10/31/16 | | | Year Ended
10/31/15 | |
| Large Cap Select | | Shares | | | Amount | | | Shares | | | Amount | |
| Shares sold: | | | | | | | | | | | | | | | | |
Class A | | | 54,204 | | | $ | 1,127,672 | | | | 81,389 | | | $ | 1,696,526 | |
Class C | | | 76,566 | | | | 1,458,171 | | | | 22,172 | | | | 431,699 | |
Class I | | | 412,747 | | | | 8,688,667 | | | | 29,957 | | | | 630,730 | |
| Shares issued to shareholders due to reinvestment of distributions: | | | | | | | | | | | | | | | | |
Class A | | | 782 | | | | 15,925 | | | | 1,196 | | | | 24,872 | |
Class C | | | — | | | | — | | | | — | | | | — | |
Class I | | | 5,413 | | | | 110,859 | | | | 7,340 | | | | 153,629 | |
| | | | 549,712 | | | | 11,401,294 | | | | 142,054 | | | | 2,937,456 | |
| Shares redeemed: | | | | | | | | | | | | | | | | |
Class A | | | (37,719 | ) | | | (768,416 | ) | | | (47,387 | ) | | | (994,200 | ) |
Class C | | | (57,761 | ) | | | (1,050,436 | ) | | | (22,793 | ) | | | (432,615 | ) |
Class I | | | (329,867 | ) | | | (6,593,488 | ) | | | (387,520 | ) | | | (8,048,616 | ) |
| | | | (425,347 | ) | | | (8,412,340 | ) | | | (457,700 | ) | | | (9,475,431 | ) |
| Net increase (decrease) | | | 124,365 | | | $ | 2,988,954 | | | | (315,646 | ) | | $ | (6,537,975 | ) |
| | |
| | | Year Ended
10/31/16 | | | Year Ended
10/31/15 | |
| Small Cap Select | | Shares | | | Amount | | | Shares | | | Amount | |
| | | | |
| Shares sold: | | | | | | | | | | | | | | | | |
Class A | | | 652,426 | | | $ | 5,830,381 | | | | 1,193,375 | | | $ | 13,818,203 | |
Class C | | | 45,717 | | | | 282,999 | | | | 53,958 | | | | 483,464 | |
Class R3 | | | 132,060 | | | | 1,086,215 | | | | 178,413 | | | | 1,929,280 | |
Class I | | | 487,410 | | | | 5,233,855 | | | | 978,280 | | | | 13,269,463 | |
| Shares issued to shareholders due to reinvestment of distributions: | | | | | | | | | | | | | | | | |
Class A | | | 1,724,098 | | | | 14,930,690 | | | | 2,472,811 | | | | 25,593,597 | |
Class C | | | 279,101 | | | | 1,769,503 | | | | 318,086 | | | | 2,601,946 | |
Class R3 | | | 192,470 | | | | 1,547,457 | | | | 272,307 | | | | 2,663,158 | |
Class I | | | 840,452 | | | | 8,866,766 | | | | 2,048,260 | | | | 24,845,399 | |
| | | | 4,353,734 | | | | 39,547,866 | | | | 7,515,490 | | | | 85,204,510 | |
| Shares redeemed: | | | | | | | | | | | | | | | | |
Class A | | | (2,510,592 | ) | | | (22,602,897 | ) | | | (3,164,926 | ) | | | (36,453,448 | ) |
Class C | | | (414,610 | ) | | | (2,839,116 | ) | | | (173,411 | ) | | | (1,585,350 | ) |
Class R3 | | | (452,990 | ) | | | (3,726,307 | ) | | | (531,855 | ) | | | (6,042,343 | ) |
Class I | | | (4,701,403 | ) | | | (55,655,449 | ) | | | (5,184,892 | ) | | | (73,605,137 | ) |
| | | | (8,079,595 | ) | | | (84,823,769 | ) | | | (9,055,084 | ) | | | (117,686,278 | ) |
| Net increase (decrease) | | | (3,725,861 | ) | | $ | (45,275,903 | ) | | | (1,539,594 | ) | | $ | (32,481,768 | ) |
5. Investment Transactions
Long-term purchases and sales (excluding investments purchased with collateral from securities lending) during the current fiscal period were as follows:
| | | | | | | | |
| | | Large
Cap Select | | | Small Cap
Select | |
| Purchases | | $ | 52,153,806 | | | $ | 92,906,839 | |
| Sales | | | 49,317,651 | | | | 166,853,175 | |
6. Income Tax Information
Each Fund is a separate taxpayer for federal income tax purposes. Each Fund intends to distribute substantially all of its net investment income and net capital gains to shareholders and to otherwise comply with the requirements of Subchapter M of the Internal Revenue Code applicable to regulated investment companies. Therefore, no federal income tax provision is required.
For all open tax years and all major taxing jurisdictions, management of the Funds has concluded that there are no significant uncertain tax positions that would require recognition in the financial statements. Open tax years are those that are open for examination by taxing authorities (i.e., generally the last four tax year ends and the interim tax period since then). Furthermore, management of the Funds is also not aware of any tax positions for which it is reasonably possible that the total amounts of unrecognized tax benefits will significantly change in the next twelve months.
The following information is presented on an income tax basis. Differences between amounts for financial statement and federal income tax purposes are primarily due to timing differences in recognizing certain gains and losses on investment transactions. To the extent that differences arise that are permanent in nature, such amounts are reclassified within the capital accounts as detailed below. Temporary differences do not require reclassification. Temporary and permanent differences do not impact the NAVs of the Funds.
As of October 31, 2016, the cost and unrealized appreciation (depreciation) of investments, as determined on a federal income tax basis, were as follows:
| | | | | | | | |
| | | Large Cap
Select | | | Small Cap
Select | |
| Cost of investments | | $ | 43,625,372 | | | $ | 122,272,294 | |
| Gross unrealized: | | | | | | | | |
Appreciation | | $ | 3,868,787 | | | $ | 17,944,861 | |
Depreciation | | | (941,526 | ) | | | (5,329,276 | ) |
| Net unrealized appreciation (depreciation) of investments | | $ | 2,927,261 | | | $ | 12,615,585 | |
Permanent differences, primarily due to federal taxes paid, distribution reallocations and tax equalization, resulted in reclassifications among the Funds’ components of net assets as of October 31, 2016, the Funds’ tax year end, as follows:
| | | | | | | | |
| | | Large Cap
Select | | | Small Cap
Select | |
| Capital paid-in | | $ | (11 | ) | | $ | 1,216,967 | |
| Undistributed (Over-distribution of) net investment income | | | — | | | | (25,735 | ) |
| Accumulated net realized gain (loss) | | | 11 | | | | (1,191,232 | ) |
The tax components of undistributed net ordinary income and net long-term capital gains as of October 31, 2016, the Funds’ tax year end, were as follows:
| | | | | | | | |
| | | Large Cap
Select | | | Small Cap
Select | |
| Undistributed net ordinary income1 | | $ | 252,677 | | | $ | 313,977 | |
| Undistributed net long-term capital gains | | | — | | | | 12,839,379 | |
| 1 | Net ordinary income consists of net taxable income derived from dividends, interest and net short-term capital gains, if any. |
The tax character of distributions paid during the Funds’ tax years ended October 31, 2016 and October 31, 2015, was designated for purposes of the dividends paid deduction as follows:
| | | | | | | | |
| 2016 | | Large Cap
Select | | | Small Cap
Select | |
| Distributions from net ordinary income1 | | $ | 189,944 | | | $ | 7,985,811 | |
| Distributions from net long-term capital gains | | | — | | | | 21,351,070 | |
| | | | | | | | |
| 2015 | | Large Cap
Select | | | Small Cap
Select | |
| Distributions from net ordinary income1 | | $ | 258,008 | | | $ | 15,050,248 | |
| Distributions from net long-term capital gains | | | — | | | | 46,967,173 | |
| 1 | Net ordinary income consists of net taxable income derived from dividends, interest, and net short-term capital gains, if any. |
Notes to Financial Statements (continued)
As of October 31, 2016, the Funds’ tax year end, the following Fund had unused capital loss carryforwards available for federal income tax purposes to be applied against future capital gains, if any. If not applied, the carryforwards will expire as shown in the following table. The losses not subject to expiration will be utilized first by the Fund.
| | | | |
| | | Large Cap
Select | |
| Expiration: | | | | |
October 31, 2017 | | $ | 52,562,963 | |
| Not subject to expiration | | | — | |
| Total | | $ | 52,562,963 | |
During the Funds’ tax year ended October 31, 2016, Large Cap Select utilized $1,224,920 of its capital loss carryforward.
The Funds have elected to defer late-year losses in accordance with federal income tax rules. These losses are treated as having arisen on the first day of the following fiscal year. The following Fund has elected to defer losses as follows:
| | | | |
| | | Small Cap Select | |
| Post-October capital losses2 | | $ | — | |
| Late-year ordinary losses3 | | | 132,586 | |
| 2 | Capital losses incurred from November 1, 2015 through October 31, 2016, the Funds’ tax year end. |
| 3 | Ordinary losses incurred from January 1, 2016 through October 31, 2016 and/or specified losses incurred from November 1, 2015 through October 31, 2016. |
7. Management Fees and Other Transactions with Affiliates
Management Fees
Each Fund’s management fee compensates the Adviser for overall investment advisory and administrative services and general office facilities. The Sub-Adviser is compensated for its services to the Funds from the management fees paid to the Adviser.
Each Fund’s management fee consists of two components – a fund-level fee, based only on the amount of assets within each individual Fund, and a complex-level fee, based on the aggregate amount of all eligible fund assets managed by the Adviser. This pricing structure enables each Fund’s shareholders to benefit from growth in the assets within their respective Fund as well as from growth in the amount of complex-wide assets managed by the Adviser.
The annual Fund-level fee, payable monthly, for each Fund is calculated according to the following schedule:
| | | | | | | | | | | | | | | | |
| | | Large Cap Select | | | Small Cap Select | |
Average Daily Net Assets | | (For the period
November 1, 2015
through
June 29, 2016) | | | (Effective
June 30, 2016) | | | (For the period
November 1, 2015
through
June 29, 2016) | | | (Effective
June 30, 2016) | |
| For the first $125 million | | | 0.5500 | % | | | 0.5000 | % | | | 0.7000 | % | | | 0.6500 | % |
| For the next $125 million | | | 0.5375 | | | | 0.4875 | | | | 0.6875 | | | | 0.6375 | |
| For the next $250 million | | | 0.5250 | | | | 0.4750 | | | | 0.6750 | | | | 0.6250 | |
| For the next $500 million | | | 0.5125 | | | | 0.4625 | | | | 0.6625 | | | | 0.6125 | |
| For the next $1 billion | | | 0.5000 | | | | 0.4500 | | | | 0.6500 | | | | 0.6000 | |
| For net assets over $2 billion | | | 0.4750 | | | | 0.4250 | | | | 0.6250 | | | | 0.5750 | |
The annual complex-level fee, payable monthly, for each Fund is determined by taking the complex-level fee rate, which is based on the aggregate amount of “eligible assets” of all Nuveen funds as set forth in the schedule below, and making, as appropriate, an upward adjustment to that rate based upon the percentage of the particular fund’s assets that are not “eligible assets.” The complex level fee schedule for each Fund is as follows:
| | | | |
| Complex-Level Asset Breakpoint Level* | | Effective Rate at Breakpoint Level | |
| $55 billion | | | 0.2000 | % |
| $56 billion | | | 0.1996 | |
| $57 billion | | | 0.1989 | |
| $60 billion | | | 0.1961 | |
| $63 billion | | | 0.1931 | |
| $66 billion | | | 0.1900 | |
| $71 billion | | | 0.1851 | |
| $76 billion | | | 0.1806 | |
| $80 billion | | | 0.1773 | |
| $91 billion | | | 0.1691 | |
| $125 billion | | | 0.1599 | |
| $200 billion | | | 0.1505 | |
| $250 billion | | | 0.1469 | |
| $300 billion | | | 0.1445 | |
| * | The complex-level fee is calculated based upon the aggregate daily “eligible assets” of all Nuveen funds. Eligible assets do not include assets attributable to investments in other Nuveen funds or assets in excess of a determined amount (originally $2 billion) added to the Nuveen fund complex in connection with the Adviser’s assumption of the management of the former First American Funds effective January 1, 2011. Eligible assets include closed-end fund assets managed by the Adviser that are attributable to certain types of leverage. For these purposes, leverage includes the closed-end funds’ use of preferred stock and borrowings and certain investments in the residual interest certificates (also called inverse floating rate securities) in tender option bond (TOB) trusts, including the portion of assets held by the TOB trust that has been effectively financed by the trust’s issuance of floating rate securities, subject to an agreement by the Adviser as to certain funds to limit the amount of such assets for determining eligible assets in certain circumstances. As of October 31, 2016, the complex-level fee for each Fund was as follows: |
| | | | |
| Fund | | Complex-Level Fee | |
Large Cap Select | | | 0.1998 | % |
Small Cap Select | | | 0.1998 | |
The Adviser has agreed to waive fees and/or reimburse expenses (“Expense Cap”) of each Fund so that total annual Fund operating expenses (excluding 12b-1 distribution and/or service fees, interest expenses, taxes, acquired fund fees and expenses, fees incurred in acquiring and disposing of portfolio securities and extraordinary expenses) do not exceed the average daily net assets of any class of Fund shares in the amounts and for the time periods stated in the following table. The expense limitations expiring February 28, 2018 may be terminated or modified prior to that date only with the approval of the Board of Directors of the Funds.
| | | | | | |
| Fund | | Expense Cap | | | Expense Cap
Expiration Date |
| Large Cap Select | | | 0.89 | %* | | February 28, 2018 |
| Small Cap Select | | | 1.15 | ** | | February 28, 2018 |
| * | Effective June 30, 2016. Prior to June 30, 2016, the Fund’s Expense Cap was 1.05%. |
| ** | Effective June 30, 2016. Prior to June 30, 2016, the Fund did not have an Expense Cap. |
Other Transactions with Affiliates
The Trust pays no compensation directly to those of its directors who are affiliated with the Adviser or to its officers, all of whom receive remuneration for their services to the Trust from the Adviser or its affiliates. The Board has adopted a deferred compensation plan for independent directors that enables directors to elect to defer receipt of all or a portion of the annual compensation they are entitled to receive from certain Nuveen-advised funds. Under the plan, deferred amounts are treated as though equal dollar amounts had been invested in shares of select Nuveen-advised funds.
During the current fiscal period, Nuveen Securities, LLC (the “Distributor”), a wholly-owned subsidiary of Nuveen, collected sales charges on purchases of Class A Shares, the majority of which were paid out as concessions to financial intermediaries as follows:
| | | | | | | | |
| | | Large Cap
Select | | | Small Cap
Select | |
| Sales charges collected (Unaudited) | | $ | 6,074 | | | $ | 15,378 | |
| Paid to financial intermediaries (Unaudited) | | | 5,787 | | | | 13,548 | |
The Distributor also received 12b-1 service fees on Class A Shares, substantially all of which were paid to compensate financial intermediaries for providing services to shareholders relating to their investments.
During the current fiscal period, the Distributor compensated financial intermediaries directly with commission advances at the time of purchase as follows:
| | | | | | | | |
| | | Large Cap
Select | | | Small Cap
Select | |
| Commission advances (Unaudited) | | $ | 5,041 | | | $ | 1,333 | |
Notes to Financial Statements (continued)
To compensate for commissions advanced to financial intermediaries, all 12b-1 service and distribution fees collected on Class C Shares during the first year following a purchase are retained by the Distributor. During the current fiscal period, the Distributor retained such 12b-1 fees as follows:
| | | | | | | | |
| | | Large Cap
Select | | | Small Cap
Select | |
| 12b-1 fees retained (Unaudited) | | $ | 2,766 | | | $ | 1,706 | |
The remaining 12b-1 fees charged to the Funds were paid to compensate financial intermediaries for providing services to shareholders relating to their investments.
The Distributor also collected and retained CDSC on share redemptions during the current fiscal period, as follows:
| | | | | | | | |
| | | Large Cap
Select | | | Small Cap
Select | |
| CDSC retained (Unaudited) | | $ | 605 | | | $ | 138 | |
8. Borrowing Arrangements
Uncommitted Line of Credit
During the current fiscal period, the Funds participated in an unsecured bank line of credit (“Unsecured Credit Line”) under which outstanding balances would bear interest at a variable rate. Although the Funds participated in the Unsecured Credit Line, they did not have any outstanding balances during the current fiscal period.
Committed Line of Credit
The Funds, along with certain other funds managed by the Adviser (“Participating Funds”), have established a 364-day, approximately $2.5 billion standby credit facility with a group of lenders, under which the Participating Funds may borrow for various purposes other than leveraging for investment purposes. A large portion of this facility’s capacity (and its associated costs as described below) is currently dedicated for use by a small number of Participating Funds, which does not include any of the Funds covered by this shareholder report. The remaining capacity under the facility (and the corresponding portion of the facility’s annual costs) is separately dedicated to most of the other open-end funds in the Nuveen fund family, including all of the Funds covered by this shareholder report, along with a number of Nuveen closed-end funds. The credit facility expires in July 2017 unless extended or renewed.
The credit facility has the following terms: a fee of 0.15% per annum on unused commitment amounts, and interest at a rate equal to the higher of (a) one-month LIBOR (London Inter-Bank Offered Rate) plus 1.25% per annum or (b) the Fed Funds rate plus 1.25% per annum on amounts borrowed. Participating Funds paid administration, legal and arrangement fees, which are recognized as a component of “Other expenses” on the Statement of Operations, and along with commitment fees, have been allocated among such Participating Funds based upon the relative proportions of the facility’s aggregate capacity reserved for them and other factors deemed relevant by the Adviser and the Board of each Participating Fund.
During the current fiscal period, none of the Funds utilized this facility.
Additional
Fund Information (Unaudited)
| | | | | | | | | | |
| | | | | |
| | Fund Manager Nuveen Fund Advisors, LLC 333 West Wacker Drive Chicago, IL 60606 Sub-Adviser Nuveen Asset Management, LLC 333 West Wacker Drive Chicago, IL 60606 | | Independent Registered
Public Accounting Firm PricewaterhouseCoopers LLP One North Wacker Drive Chicago, IL 60606 Custodian U.S. Bank National Association 1555 North Rivercenter Drive
Suite 302 Milwaukee, WI 53202 | | Legal Counsel Chapman and Cutler LLP Chicago, IL 60603 | | Transfer Agent and
Shareholder Services Boston Financial
Data Services, Inc. Nuveen Investor Services P.O. Box 8530 Boston, MA 02266-8530 (800) 257-8787 | | |
| | | | | | | | | | | | | | |
| | | | | |
| | | | | | | | | | |
| | |
| | Long-Term Capital Gain Distributions: The following Fund hereby designates as long-term capital gain dividends, pursuant to Internal Revenue Code Section 852 (b)(3), the amount shown in the accompanying table or, if greater, the amount necessary to reduce earnings and profits of the Fund related to net capital gain to zero for the tax year ended October 31, 2016: | | |
| | | | | | | |
| | | | | | | | | | | | | Small Cap
Select | | |
| | Long-term capital gain dividends | | $22,488,506 | | |
| | |
| | Distribution Information: The Funds hereby designate their percentages of dividends paid from net ordinary income as dividends qualifying for the 70% dividends received deduction (“DRD”) for corporations and their percentages as qualified dividend income (“QDI”) for individuals under Section 1(h)(11) of the Internal Revenue Code as shown in the accompanying table. The actual qualified dividend income distributions will be reported to shareholders on Form 1099-DIV which will be sent to shareholders shortly after calendar year end. | | |
| | | | | | | |
| | | | | | | | | | | Large Cap Select | | Small Cap Select | | |
| | % QDI | | 100% | | 26% | | |
| | % DRD | | 100% | | 24% | | |
| | | | | |
| | | | | | | | | | |
| | |
| | Quarterly Form N-Q Portfolio of Investments Information: Each Fund is required to file its complete schedule of portfolio holdings with the Securities and Exchange Commission (SEC) for the first and third quarters of each fiscal year on Form N-Q. You may obtain this information directly from the SEC. Visit the SEC on-line at http://www.sec.gov or in person at the SEC’s Public Reference Room in Washington, D.C. Call the SEC toll-free at (800) SEC-0330 for room hours and operation. | | |
| | | | | |
| | | | | | | | | | |
| | |
| | Nuveen Funds’ Proxy Voting Information: You may obtain (i) information regarding how each fund voted proxies relating to portfolio securities held during the most recent twelve-month period ended June 30, without charge, upon request, by calling Nuveen toll-free at (800) 257-8787 or on Nuveen’s website at www.nuveen.com and (ii) a description of the policies and procedures that each fund used to determine how to vote proxies relating to portfolio securities without charge, upon request, by calling Nuveen toll-free at (800) 257-8787. You may also obtain this information directly from the SEC. Visit the SEC on-line at http://www.sec.gov. | | |
| | | | | |
| | | | | | | | | | |
| | |
| | FINRA BrokerCheck: The Financial Industry Regulatory Authority (FINRA) provides information regarding the disciplinary history of FINRA member firms and associated investment professionals. This information as well as an investor brochure describing FINRA BrokerCheck is available to the public by calling the FINRA BrokerCheck Hotline number at (800) 289-9999 or by visiting www.FINRA.org. | | |
Glossary of Terms
Used in this Report (Unaudited)
Average Annual Total Return: This is a commonly used method to express an investment’s performance over a particular, usually multi-year time period. It expresses the return that would have been necessary each year to equal the investment’s actual cumulative performance (including change in NAV or offer price and reinvested distributions and capital gains, if any) over the time period being considered.
Gross Domestic Product (GDP): The total market value of all final goods and services produced in a country/region in a given year, equal to total consumer, investment and government spending, plus the value of exports, minus the value of imports.
Lipper Large-Cap Core Funds Classification Average: Represents the average annualized total return for all reporting funds in the Lipper Large-Cap Core Funds Classification. Lipper returns account for the effects of management fees and assume reinvestment of distributions but do not reflect any applicable sales charges.
Lipper Small-Cap Core Funds Classification Average: Represents the average annualized total return for all reporting funds in the Lipper Small-Cap Core Funds Classification. Lipper returns account for the effects of management fees and assume reinvestment of distributions but do not reflect any applicable sales charges.
Market Capitalization: The market capitalization of a company is equal to the number of the company’s common shares outstanding multiplied by the current price of the company’s stock.
MSCI EAFE Index: The MSCI (Morgan Stanley Capital International) EAFE (Europe, Australasia, Far East) Index is a free float-adjusted market capitalization weighted index designed to measure developed market equity performance, excluding the U.S. and Canada. The index returns assume reinvestment of distributions, but do not reflect any applicable sales charges or management fees.
MSCI Emerging Markets Index: An unmanaged index considered representative of stocks of developing countries. The index returns assume reinvestment of distributions, but do not reflect any applicable sales charges or management fees.
Net Asset Value (NAV) Per Share: A fund’s Net Assets is equal to its total assets (securities, cash and accrued earnings) less its total liabilities. For funds with multiple classes, Net Assets are determined separately for each share class. NAV per share is equal to the fund’s (or share class’) Net Assets divided by its number of shares outstanding.
Russell 1000® Index: An unmanaged index, considered representative of large-cap stocks. The index returns assume reinvestment of distributions, but do not reflect any applicable sales charges or management fees.
Russell 2000® Index: An index that measures the performance of the small-cap segment of the U.S. equity universe. The Russell 2000 Index is a subset of the Russell 3000® Index representing approximately 10% of the total market capitalization of that index. It includes approximately 2,000 of the smallest securities based on a combination of their market cap and current index membership. The Russell 3000® Index measures the performance of the 3,000 largest companies based on total market capitalization, which represents approximately 98% of the investable U.S. equity market. The index returns assume reinvestment of distributions, but do not reflect any applicable sales charges or management fees.
Russell Midcap® Index: A market-weighted index measuring the performance of the mid-cap segment of the equity market which includes the smallest 800 securities within the Russell 1000® Index. Index returns assume reinvestment of distributions, but do not reflect any applicable sales charges or management fees.
S&P 500® Index: An unmanaged index generally considered representative of the U.S. stock market. The index returns assume reinvestment of distributions, but do not reflect any applicable sales charges or management fees.
Tax Equalization: The practice of treating a portion of the distribution made to a redeeming shareholder, which represents his proportionate part of undistributed net investment income and capital gain as a distribution for tax purposes. Such amounts are referred to as the equalization debits (or payments) and will be considered a distribution to the shareholder of net investment income and capital gain for calculation of the fund’s dividends paid deduction.
Annual Investment Management Agreement
Approval Process (Unaudited)
The Board of Directors of each Fund (the “Board,” and each Director a “Board Member”), including the Board Members who are not parties to the Funds’ advisory or sub-advisory agreements or “interested persons” of any such parties (the “Independent Board Members”), is responsible for overseeing the performance of the investment adviser and sub-adviser to the respective Fund and determining whether to continue such Fund’s advisory agreement (the “Investment Management Agreement”) between the Fund and Nuveen Fund Advisors, LLC (the “Adviser”) and the sub-advisory agreement (the “Sub-Advisory Agreement” and, together with the Investment Management Agreement, the “Advisory Agreements”) between the Adviser and Nuveen Asset Management, LLC (the “Sub-Adviser”). Following an initial term with respect to each Fund upon its commencement of operations, the Board reviews the Investment Management Agreement and the Sub-Advisory Agreement on behalf of such Fund and votes to determine whether the respective Advisory Agreement should be renewed. Accordingly, at an in-person meeting held on May 24-26, 2016 (the “May Meeting”), the Board, including a majority of the Independent Board Members, considered and approved the existing Advisory Agreements for the Funds.
During the year, the Board and its Committees met regularly to receive materials and discuss a variety of topics impacting the Funds including, among other things, overall market conditions and market performance, Fund investment performance, brokerage execution, valuation of securities, Rule 12b-1 plans and payments, sub-transfer agency and other payments to financial intermediaries, compliance matters, securities lending, risk management and ongoing initiatives. The Board had established several standing Committees, including the Open-end Fund Committee and Closed-end Fund Committee which permit the Board Members to delve further into the topics particularly relevant to the respective product line and enhance the Board’s effectiveness and oversight of the Funds. The Board also seeks to meet with the Sub-Adviser and its investment team at least once over a multiple year rotation through site visits. The information and knowledge the Board gained throughout the year from the Board and Committee meetings, site visits and the related materials were relevant to the Board’s evaluation of the Advisory Agreements, and the Board took such information into account in its review of the Advisory Agreements.
In addition to the materials received throughout the year, the Board received additional materials prepared specifically for its annual review of the Advisory Agreements in response to a request by independent legal counsel on behalf of the Independent Board Members. The materials addressed a variety of topics, including a description of the services provided by the Adviser and the Sub-Adviser (each, a “Fund Adviser”); a review of fund performance with a detailed focus on any performance outliers; an analysis of the investment teams; an analysis of the fees and expense ratios of the Funds, including information comparing such fees and expenses to that of peer groups; an assessment of shareholder services for the Funds and of the performance of certain service providers; a review of initiatives instituted or continued during the past year; and information regarding the profitability of the Fund Advisers, the compensation of portfolio managers, and compliance and risk matters.
As part of its annual review, the Board held a separate meeting on April 12-13, 2016 to review the Funds’ investment performance and consider an analysis by the Adviser of the Sub-Adviser examining, among other things, the team’s assets under management, investment performance, investment approach, and the stability and structure of the Sub-Adviser’s organization and investment team. During the review, the Independent Board Members requested and received additional information from management. Throughout the year and throughout their review of the Advisory Agreements, the Independent Board Members were assisted by independent legal counsel. The Independent Board Members met separately with independent legal counsel without management present and received a memorandum from such counsel outlining their fiduciary duties and legal standards in reviewing the Advisory Agreements. The Independent Board Members’ review of the Advisory Agreements reflected an ongoing process that incorporated the information and considerations that occurred over the years, including the most recent year, as well as the information specifically furnished for the renewal process. In deciding to renew the Advisory Agreements, the Independent Board Members did not identify a particular factor as controlling, but rather the decision reflected the comprehensive consideration of all the information presented. The following summarizes the principal factors, but not all the factors, the Board considered in its review of the Advisory Agreements and its conclusions.
A. Nature, Extent and Quality of Services
In evaluating the renewal of the Advisory Agreements, the Independent Board Members received and considered information regarding the nature, extent and quality of the applicable Fund Adviser’s services provided to the respective Fund and the initiatives undertaken during the past year by the Adviser. The Board recognized the comprehensive set of services the Adviser provided to manage and operate the Nuveen funds, including (a) product management (such as setting dividends, positioning the product in the marketplace, managing the relationships with the distribution platforms, maintaining and enhancing shareholder communications and reporting to the Board); (b) investment services (such as overseeing sub-advisers and other service providers; analyzing investment performance and risks; overseeing risk management and disclosure; developing and interpreting investment policies; assisting in the development of products; helping to prepare financial statements and marketing disclosures; and overseeing trade execution); (c) fund administration (such as helping to prepare fund tax returns and complete other tax compliance matters; and helping to prepare regulatory filings and shareholder reports); (d) fund Board administration (such as preparing Board materials and organizing and providing assistance
for Board meetings); (e) compliance (such as helping to devise and maintain the funds’ compliance program and related testing); and (f) legal support (such as helping to prepare registration statements and proxy statements, interpreting regulations and policies and overseeing fund activities).
The Board reviewed the continued investment the Adviser had made in its business to continue to strengthen the breadth and quality of its services to the benefit of the Nuveen funds. The Board noted the Adviser’s additional staffing in key areas that support the funds and the Board, including in investment services, operations, fund governance, compliance, fund administration, product management, retail distribution and information technology. Among the enhancements to its services, the Board recognized the Adviser’s (a) expanded activities and support required as a result of regulatory developments, including in areas of compliance and reporting; (b) increased support for dividend management; (c) continued investment in its technical capabilities as the Adviser continued to build out a centralized fund data platform, enhance mobility and remote access capabilities, rationalize and upgrade software platforms, and automate certain regulatory liquidity determinations; (d) continued efforts to rationalize the product line through mergers, liquidations and re-positioning of the Nuveen funds with the goal of increasing efficiencies, reducing costs, improving performance and addressing shareholder needs; (e) continued efforts to develop new lines of business designed to enhance the Nuveen product line and meet investor demands; and (f) continued commitment to enhance risk oversight, including the formation of the operational risk group to provide operational risk assessment, the access to platforms which provide better risk reporting to support investment teams, and the development of a new team to initially review new products and major product initiatives. The Board also recognized the Adviser’s efforts to renegotiate certain fees of other service providers which culminated in reduced expenses for all funds for custody and accounting services without diminishing the breadth and quality of the services provided. The Board considered the Chief Compliance Officer’s report regarding the Adviser’s compliance program, the Adviser’s continued development, execution and management of its compliance program, and the additions to the compliance team to support the continued growth of the Nuveen fund family and address regulatory developments.
The Board also considered information highlighting the various initiatives that the Adviser had implemented or continued during the year to enhance or support the open-end fund product line. The Board noted the Adviser’s continued initiatives (a) to develop and offer new outcome-oriented funds; (b) to refine the reports to the Board, including enhanced reporting regarding payments to intermediaries, as well as provide presentations to the Board to keep it apprised of various topics that are relevant to the open-end fund product line (such as marketing initiatives, portfolio analytics and sales results); (c) to modify the contingent deferred sales load structure for Class A shares to be more competitive with peers; (d) to launch a new share class to attract institutional clients; and (e) to change portfolio managers on various funds. The Board recognized that initiatives that attract assets to the Nuveen family of funds benefited the funds as fixed costs would be spread over a larger asset base and, as described below, through the complex-wide arrangement which generally would provide that the management fees of the funds (subject to limited exceptions) are reduced as asset levels for the complex increase. The Board also considered the Adviser’s review of the pricing on its entire open-end fund line which resulted in either a reduction in the contractual management fee, a reduction in (or, in certain cases, the adoption of) a temporary expense cap or a combination thereof for numerous funds in the complex helping to better position such funds for future growth, including Nuveen Large Cap Select Fund (the “Large Cap Fund”), which reduced both its management fee and temporary expense cap, and Nuveen Small Cap Select Fund (the “Small Cap Fund”), which reduced its management fee and adopted a temporary expense cap.
As noted, the Adviser also oversees the Sub-Adviser who primarily provides the portfolio advisory services to the Funds. The Board recognized the skill and competency of the Adviser in monitoring and analyzing the performance of the Sub-Adviser and managing the sub-advisory relationship. The Board noted that the Adviser recommended the renewal of each Sub-Advisory Agreement.
Based on their review, the Independent Board Members found that, overall, the nature, extent and quality of services provided to the respective Funds under each applicable Advisory Agreement were satisfactory.
B. The Investment Performance of the Funds and Fund Advisers
The Board considered the long-term and short-term performance history of the Nuveen funds. As noted above, the Board reviewed fund performance at its quarterly meetings throughout the year and took into account the information derived from the discussions with representatives of the Adviser about fund performance at these meetings. The Board also considered the Adviser’s analysis of fund performance with particular focus on any performance outliers and the factors contributing to such performance and any steps the investment team had taken to address performance concerns. The Board reviewed, among other things, each Fund’s investment performance both on an absolute basis and in comparison to peer funds (the “Performance Peer Group”) and to recognized and/or customized benchmarks (i.e., generally benchmarks derived from multiple recognized benchmarks) for the quarter, one-, three- and five-year periods ending December 31, 2015, as well as performance information reflecting the first quarter of 2016.
In evaluating performance information, the Board recognized the following factors may impact the performance data as well as the consideration to be given to particular performance data:
| | • | | The performance data reflected a snapshot in time, in this case as of the end of the most recent calendar year or quarter. A different performance period, however, could generate significantly different results. |
| | • | | Long-term performance can be adversely affected by even one period of significant underperformance so that a single investment decision or theme had the ability to disproportionately affect long-term performance. |
Annual Investment Management Agreement Approval Process (Unaudited) (continued)
| | • | | Shareholders evaluate performance based on their own holding period which may differ from the performance period reviewed by the Board, leading to different performance results. |
| | • | | Open-end funds offered multiple classes and the performance data provided for open-end funds was based on Class A shares. The performance of the other classes of a fund, however, should be substantially similar on a relative basis because all of the classes would be invested in the same portfolio of securities and differences in performance among classes could be principally attributed to the variations in distribution and servicing expenses of each class. |
| | • | | The Board recognized the difficulty in establishing appropriate peer groups and benchmarks for certain funds. The Board noted that management classified the Performance Peer Groups as low, medium and high in relevancy and took the relevancy of the Performance Peer Group into account when considering the comparative performance data. If the Performance Peer Group differed somewhat from a fund, the Board recognized that the comparative performance data may be of limited value. The Board also recognized that each fund operated pursuant to its own investment objective(s), parameters and restrictions which may differ from that of the Performance Peer Group or benchmark and that these variations lead to differences in performance results. |
With respect to any Nuveen funds for which the Board has identified performance concerns, the Board monitors such funds closely until performance improves, discusses with the Adviser the reasons for such results, considers those steps necessary or appropriate to address such issues, and reviews the results of any efforts undertaken. The Board was aware, however, that shareholders chose to invest or remain invested in a fund knowing that the Adviser and the applicable sub-adviser manage the fund, knowing the fund’s investment strategy and seeking exposure to that strategy (even if the strategy was “out of favor” in the marketplace) and knowing the fund’s fee structure.
For the Large Cap Fund, the Board noted that, although the Fund underperformed its benchmark in the one-, three- and five-year periods, the Fund ranked in its Performance Peer Group in the third quartile for the one- and five-year periods and ranked in the second quartile in the three-year period. The Board determined that the Fund’s performance was satisfactory.
For the Small Cap Fund, the Board noted that the Fund ranked in its Performance Peer Group in the third quartile in the three- and five-year periods and the second quartile in the one-year period. In addition, although the Fund underperformed its benchmark in the three- and five-year periods, the Fund outperformed its benchmark in the one-year period. The Board determined that the Fund’s performance had been satisfactory.
C. Fees, Expenses and Profitability
1. Fees and Expenses
The Board evaluated the management fees and other fees and expenses of each Fund. The Board reviewed, among other things, the gross and net management fees and net total expenses of each Fund (expressed as a percentage of average net assets) in absolute terms and also in comparison to the fee and expense levels of a comparable universe of funds (the “Peer Universe”) and to a more focused subset in the Peer Universe (the “Peer Group”), each selected by an independent third-party fund data provider. The Independent Board Members also reviewed the methodology regarding the construction of the applicable Peer Universe and Peer Group.
In their evaluation of the management fee schedule, the Independent Board Members considered the fund-level and complex-wide breakpoint schedules, as described in further detail below. The Independent Board Members also took into account any fee waivers and/or expense reimbursements provided by Nuveen. In this regard, as noted above, the Board considered that management recently completed a review of the pricing of its open-end funds which resulted in the reduction of management fees and/or expense caps of various open-end funds. The Independent Board Members considered that the foregoing changes were estimated to result in significant savings to such funds either through a reduction in advisory fees paid or an increase in the fee waivers absorbed by Nuveen. In this regard, the Board noted that the Adviser agreed to reduce the management fee and temporary expense cap for the Large Cap Fund, and to reduce the management fee and adopt a temporary expense cap for the Small Cap Fund.
In reviewing the comparative fee and expense information, the Independent Board Members recognized that various factors such as the limited size and particular composition of the Peer Universe or Peer Group (including the inclusion of other Nuveen funds in the peer set); expense anomalies; changes in the funds comprising the Peer Universe or Peer Group from year to year; levels of reimbursement or fee waivers; the timing of information used; and differences in services provided can impact the usefulness of the comparative data in helping to assess the appropriateness of a fund’s fees and expenses. In addition, in reviewing a fund’s fees and expenses compared to the fees and expenses of its peers, the Board generally considered the fund’s expenses and fees to be higher if they were over 10 basis points higher, slightly higher if they were 6 to 10 basis points higher, in line if they were within approximately 5 basis points higher than the peer average and below if they were below the peer average of the Peer Group. The Board reviewed the net expense ratio in recognition that the net expense ratio generally best represented the net experience of the shareholders of a fund as it directly reflected the costs of investing in the respective fund. The Board noted that the majority of the Nuveen funds had a net expense ratio near or below the average of the respective peers. For funds with a net expense ratio of 6 basis points or higher than their respective peer average, the Independent Board Members reviewed the reasons for the outlier status and were satisfied with the explanation for the difference or with any steps taken to address the difference.
The Board noted that the Large Cap Fund had a net management fee slightly higher than its peer average but a net expense ratio below its peer average, and the Small Cap Fund had a net management fee slightly higher than its peer average but a net expense ratio in line with its peer average. The Board also noted that the Adviser agreed to reduce the contractual management fee and temporary expense cap for the Large Cap Fund, and to reduce the contractual management fee and adopt a temporary expense cap for the Small Cap Fund.
Based on their review of the fee and expense information provided, the Independent Board Members determined that each Fund’s management fees (as applicable) to a Fund Adviser were reasonable in light of the nature, extent and quality of services provided to the Fund.
2. Comparisons with the Fees of Other Clients
The Board also reviewed information regarding the fee rates for other types of clients advised or sub-advised by the respective Fund Adviser. For the Adviser and/or its affiliated sub-advisers, such other clients may include: separately managed accounts (such as retail, institutional or wrap accounts), hedge funds, other investment companies that are not offered by Nuveen but are sub-advised by one of Nuveen’s affiliated sub-advisers, foreign investment companies offered by Nuveen, and collective investment trusts.
The Board recognized that each Fund had an affiliated sub-adviser. With respect to affiliated sub-advisers, including the Sub-Adviser, the Board reviewed, among other things, the range of advisory fee rates and average fee rate assessed for the different types of clients. The Board reviewed information regarding the different types of services provided to the Funds compared to that provided to these other clients which typically did not require the same breadth of day-to-day services required for registered funds. The Board further considered information regarding the differences in, among other things, the distribution systems, investment policies, investor profiles, and account sizes between the Nuveen funds and the other types of clients. In addition, the Independent Board Members also recognized that the management fee rates of the foreign funds advised by the Adviser may also vary due to, among other things, differences in the client base, governing bodies, operational complexities and services covered by the management fee. The Independent Board Members recognized that the foregoing variations resulted in different economics among the product structures and culminated in varying management fees among the types of clients and funds.
The Board also was aware that, since the Funds had a sub-adviser, each Fund’s management fee reflected two components, the fee retained by the Adviser for its services and the fee the Adviser paid to the Sub-Adviser. The Board noted that many of the administrative services provided to support the Funds by the Adviser may not be required to the same extent or at all for the institutional clients or other clients. In general, the Board noted that higher fee levels reflected higher levels of service provided by the Fund Adviser, increased investment management complexity, greater product management requirements and higher levels of business risk or some combination of the foregoing. Given the inherent differences in the various products, particularly the extensive services provided to the Funds, the Independent Board Members concluded such facts justify the different levels of fees.
3. Profitability of Fund Advisers
In conjunction with their review of fees, the Independent Board Members also considered the profitability of Nuveen for its advisory activities on an absolute basis and in comparison to other investment advisers. The Independent Board Members reviewed, among other things, Nuveen’s adjusted operating margins, the gross and net revenue margins (pre-tax and after-tax) for advisory activities for the Nuveen funds, and the revenues, expenses, and net income (pre-tax and after-tax) of Nuveen for each of the last two calendar years. The Independent Board Members reviewed an analysis of the key drivers behind the changes in revenues and expenses that impacted profitability in 2015. The Independent Board Members also noted that the sub-advisory fees for the Funds are paid by the Adviser, however, the Board recognized that the Sub-Adviser is affiliated with Nuveen. In their review, the Independent Board Members recognized that profitability data is rather subjective as various allocation methodologies may be reasonable to employ but yet yield different results. The Board also reviewed the results of certain alternative methodologies. The Board considered the allocation methodology employed to prepare the profitability data as well as a summary of the refinements to the methodology that had been adopted over the years which may limit some of the comparability of Nuveen’s revenue margins over time. Two Independent Board Members also served as point persons for the Board throughout the year to review and discuss the methodology employed to develop the profitability analysis and any proposed changes thereto and to keep the Board apprised of such changes during the year. In reviewing the profitability data, the Independent Board Members noted that Nuveen’s operating margin as well as its margins for its advisory activities to the Nuveen funds for 2015 were consistent with such margins for 2014.
The Board also considered Nuveen’s adjusted operating margins compared to that of other comparable investment advisers (based on asset size and composition) with publicly available data. The Independent Board Members recognized, however, the limitations of the comparative data as the other advisers may have a different business mix, employ different allocation methodologies, have different capital structure and costs, may not be representative of the industry or other factors that limit the comparability of the profitability information. Nevertheless, the Independent Board Members noted that Nuveen’s adjusted operating margins appeared comparable to the adjusted margins of the peers.
Further, as the Adviser is a wholly-owned subsidiary of Nuveen which in turn is an operating division of TIAA Global Asset Management, the investment management arm of Teachers Insurance and Annuity Association of America (“TIAA-CREF”), the Board reviewed a balance sheet for TIAA-CREF reflecting its assets, liabilities and capital and contingency reserves for the last two calendar years to have a better understanding of the financial stability and strength of the TIAA-CREF complex, together with Nuveen.
Annual Investment Management Agreement Approval Process (Unaudited) (continued)
Based on the information provided, the Independent Board Members noted that the Adviser appeared to be sufficiently profitable to operate as a viable investment management firm and to honor its obligations as a sponsor of the Nuveen funds.
With respect to the Sub-Adviser, the Independent Board Members also considered the profitability of the Sub-Adviser from its relationship with the Nuveen funds. The Independent Board Members reviewed the Sub-Adviser’s revenues, expenses and revenue margins (pre- and post-tax) for its advisory activities for the calendar year ended December 31, 2015. The Independent Board Members also reviewed profitability analysis reflecting the revenues, expenses and revenue margin (pre- and post-tax) by asset type for the Sub-Adviser for the calendar year ending December 31, 2015.
In evaluating the reasonableness of the compensation, the Independent Board Members also considered other amounts paid to a Fund Adviser by the Funds as well as indirect benefits (such as soft dollar arrangements), if any, the Fund Adviser and its affiliates received or were expected to receive that were directly attributable to the management of a Fund. See Section E below for additional information on indirect benefits a Fund Adviser may receive as a result of its relationship with the Funds.
Based on their review, the Independent Board Members determined that the Adviser’s and the Sub-Adviser’s levels of profitability were reasonable in light of the respective services provided.
D. Economies of Scale and Whether Fee Levels Reflect These Economies of Scale
The Independent Board Members recognized that as the assets of a particular fund or the Nuveen complex in the aggregate increase over time, economies of scale may be realized with respect to the management of the funds, and the Independent Board Members considered the extent to which these economies are shared with the funds and their shareholders. Although the Independent Board Members recognized that economies of scale are difficult to measure with precision, the Board noted that there were several acceptable means to share economies of scale, including through breakpoints in the management fee schedule reducing the fee rates as asset levels grow, fee waiver and expense limitation agreements and the Adviser’s investment in its business which can enhance the services provided to the funds. With respect to breakpoints, the Independent Board Members noted that subject to certain exceptions, the funds in the Nuveen complex, including the Funds, pay a management fee to the Adviser which is generally comprised of a fund-level component and complex-level component. The fund-level fee component declines as the assets of the particular fund grow and the complex-level fee component declines when eligible assets of all the funds in the Nuveen complex combined grow. The complex-wide fee arrangement was designed to capture economies of scale achieved when total fund complex assets increase, even if the assets of a particular fund are unchanged or decrease. The approach reflected the notion that some of Nuveen’s costs were attributable to services provided to all its funds in the complex, and therefore all funds should benefit if these costs were spread over a larger asset base.
The Independent Board Members reviewed the breakpoint and complex-wide schedules and any savings achieved from expense caps (as applicable), fund-level breakpoints and complex-wide fee reductions for the 2015 calendar year for the funds, and considered the adoption or reduction of temporary expense caps for certain funds. In this regard, the Independent Board Members noted that additional economies of scale were or would be shared with shareholders of the Funds through their temporary expense caps.
In addition, the Independent Board Members recognized the Adviser’s ongoing investment in its business to expand or enhance the services provided to the Nuveen funds. The Independent Board Members noted, among other things, the additions to groups who play a key role in supporting the funds including in fund administration, operations, fund governance, investment services, compliance, product management, retail distribution and technology. The Independent Board Members also recognized the investments in systems necessary to manage the funds including in areas of risk oversight, information technology and compliance.
Based on their review, the Independent Board Members concluded that the current fee structure was acceptable and reflected economies of scale to be shared with shareholders when assets under management increase.
E. Indirect Benefits
The Independent Board Members received and considered information regarding other additional benefits the respective Fund Adviser or its affiliates may receive as a result of their relationship with the Funds, including compensation paid to affiliates and research received in connection with brokerage transactions (i.e., soft dollar arrangements). In this regard, the Independent Board Members recognized that an affiliate of the Adviser served as the Funds’ principal underwriter and may receive compensation therefore from, among other things, sales charges, distribution fees and shareholder services fees (which included fees received pursuant to any 12b-1 plan). The Independent Board Members therefore took into account, among other things, the 12b-1 fees retained by Nuveen during the last calendar year.
In addition to the above, the Independent Board Members considered that the Funds’ portfolio transactions are allocated by the Sub-Adviser and the Sub-Adviser may benefit from research received through soft-dollar arrangements. The Board noted, however, that with respect to transactions in fixed income securities, such securities generally trade on a principal basis and do not generate soft dollar credits. Although the Board recognized the Sub-Adviser may benefit from a soft dollar arrangement if it does not have to pay for this research out of its own assets, the Board also recognized that any such research may benefit the Funds to the extent it enhances the ability of the Sub-Adviser to manage the Funds.
Based on their review, the Independent Board Members concluded that any indirect benefits received by a Fund Adviser as a result of its relationship with the Funds were reasonable and within acceptable parameters.
F. Other Considerations
The Independent Board Members did not identify any single factor discussed previously as all-important or controlling. The Board Members, including the Independent Board Members, concluded that the terms of each Advisory Agreement were fair and reasonable, that the respective Fund Adviser’s fees were reasonable in light of the services provided to each Fund and that the Advisory Agreements be renewed.
Trustees
and Officers (Unaudited)
The management of the Funds, including general supervision of the duties performed for the Funds by the Adviser, is the responsibility of the Board of Trustees of the Funds. The number of directors of the Funds is set at twelve, effective July 1, 2016. None of the trustees who are not “interested” persons of the Funds (referred to herein as “independent trustees”) has ever been a director or employee of, or consultant to, Nuveen or its affiliates. The names and business addresses of the trustees and officers of the Funds, their principal occupations and other affiliations during the past five years, the number of portfolios each oversees and other directorships they hold are set forth below.
The Funds’ Statement of Additional Information (“SAI”) includes more information about the trustees. To request a free copy, call Nuveen Investments at (800) 257-8787 or visit the Funds’ website at www.nuveen.com.
| | | | | | | | |
Name,
Year of Birth
& Address | | Position(s)
Held with
the Funds | | Year First
Elected or
Appointed (1) | | Principal Occupation(s)
Including other Directorships
During Past 5 Years | | Number of
Portfolios in
Fund Complex
Overseen by
Trustee |
| |
| Independent Trustee: |
William J. Schneider 1944 333 W. Wacker Drive Chicago, IL 60606 | | Chairman and Trustee | | 1996 | | Chairman of Miller-Valentine Partners, a real estate investment company; Board Member of Med-America Health System and WDPR Public Radio station; formerly, Senior Partner and Chief Operating Officer (retired (2004) of Miller-Valentine Group; formerly, Board member, Business Advisory Council of the Cleveland Federal Reserve Bank and University of Dayton Business School Advisory Council; past Chair and Director, Dayton Development Coalition. | | 184 |
Jack B. Evans 1948 333 W. Wacker Drive Chicago, IL 60606 | | Trustee | | 1999 | | President, The Hall-Perrine Foundation, a private philanthropic corporation (since 1996); Director and Chairman, United Fire Group, a publicly held company; Director, The Gazette Company; Life Trustee of Coe College and the Iowa College Foundation; formerly, President Pro-Tem of the Board of Regents for the State of Iowa University System; formerly, Director, Alliant Energy; formerly, Director, Federal Reserve Bank of Chicago; formerly, President and Chief Operating Officer, SCI Financial Group, Inc., a regional financial services firm. | | 184 |
William C. Hunter 1948 333 W. Wacker Drive Chicago, IL 60606 | | Trustee | | 2003 | | Dean Emeritus, formerly, Dean, Tippie College of Business, University of Iowa (2006-2012); Director (since 2004) of Xerox Corporation; Director (since 2005), and past President (2010-2014) Beta Gamma Sigma, Inc., The International Business Honor Society; Director of Wellmark, Inc. (since 2009); formerly, Dean and Distinguished Professor of Finance, School of Business at the University of Connecticut (2003-2006); previously, Senior Vice President and Director of Research at the Federal Reserve Bank of Chicago (1995-2003); formerly, Director (1997-2007), Credit Research Center at Georgetown University. | | 184 |
David J. Kundert 1942 333 W. Wacker Drive Chicago, IL 60606 | | Trustee | | 2005 | | Formerly, Director, Northwestern Mutual Wealth Management Company (2006-2013); retired (since 2004) as Chairman, JPMorgan Fleming Asset Management, President and CEO, Banc One Investment Advisors Corporation, and President, One Group Mutual Funds; prior thereto, Executive Vice President, Banc One Corporation and Chairman and CEO, Banc One Investment Management Group; Regent Emeritus, Member of Investment Committee, Luther College; member of the Wisconsin Bar Association; member of Board of Directors and Chair of Investment Committee, Greater Milwaukee Foundation; member of the Board of Directors (Milwaukee), College Possible; Board member of Milwaukee Repertory Theatre (since 2016). | | 184 |
| | | | | | | | |
Name,
Year of Birth
& Address | | Position(s)
Held with
the Funds | | Year First
Elected or
Appointed (1) | | Principal Occupation(s)
Including other Directorships
During Past 5 Years | | Number of
Portfolios in
Fund Complex
Overseen by
Trustee |
Albin F. Moschner(2) 1952 333 W. Wacker Drive Chicago, IL 60606 | | Trustee | | 2016 | | Founder and Chief Executive Officer, Northcroft Partners, LLC, a management consulting firm (since 2012); previously, held positions at Leap Wireless International, Inc., including Consultant (2011-2012), Chief Operating Officer (2008-2011), and Chief Marketing Officer (2004-2008); formerly, President, Verizon Card Services division of Verizon Communications, Inc. (2000-2003); formerly, President, One Point Services at One Point Communications (1999-2000); formerly, Vice Chairman of the Board, Diba, Incorporated (1996-1997); formerly, various executive positions with Zenith Electronics Corporation (1991-1996). Director, USA Technologies, Inc., a provider of solutions and services to facilitate electronic payment transactions (since 2012); formerly, Director, Wintrust Financial Corporation (1996-2016). | | 184 |
John K. Nelson 1962 333 West Wacker Drive Chicago, IL 60606 | | Trustee | | 2013 | | Member of Board of Directors of Core12 LLC (since 2008), a private firm which develops branding, marketing and communications strategies for clients; Director of The Curran Center for Catholic American Studies (since 2009) and The President’s Council, Fordham University (since 2010); formerly senior external advisor to the financial services practice of Deloitte Consulting LLP (2012-2014); formerly, Chairman of the Board of Trustees of Marian University (2010 as trustee, 2011-2014 as Chairman); formerly, Chief Executive Officer of ABN AMRO N.V. North America, and Global Head of its Financial Markets Division (2007-2008); prior senior positions held at ABN AMRO include Corporate Executive Vice President and Head of Global Markets—the Americas (2006-2007), CEO of Wholesale Banking—North America and Global Head of Foreign Exchange and Futures Markets (2001-2006), and Regional Commercial Treasurer and Senior Vice President Trading—North America (1996-2001); formerly, Trustee at St. Edmund Preparatory School in New York City. | | 184 |
Judith M. Stockdale 1947 333 W. Wacker Drive Chicago, IL 60606 | | Trustee | | 1997 | | Board Member, Land Trust Alliance (since 2013) and U.S. Endowment for Forestry and Communities (since 2013); formerly, Executive Director (1994-2012), Gaylord and Dorothy Donnelley Foundation; prior thereto, Executive Director, Great Lakes Protection Fund (1990-1994). | | 184 |
Carole E. Stone 1947 333 W. Wacker Drive Chicago, IL 60606 | | Trustee | | 2007 | | Director, Chicago Board Options Exchange (since 2006), C2 Options Exchange, Incorporated (since 2009); Director, CBOE Holdings, Inc. (since 2010); formerly, Commissioner, New York State Commission on Public Authority Reform (2005-2010). | | 184 |
Terence J. Toth 1959 333 W. Wacker Drive Chicago, IL 60606 | | Trustee | | 2008 | | Managing Partner, Promus Capital (since 2008); Director, Fulcrum IT Service LLC (since 2010) and Quality Control Corporation (since 2012); member: Catalyst Schools of Chicago Board (since 2008) and Mather Foundation Board (since 2012), and chair of its investment committee; formerly, Director, Legal & General Investment Management America, Inc. (2008-2013); formerly, CEO and President, Northern Trust Global Investments (2004-2007); Executive Vice President, Quantitative Management & Securities Lending (2000-2004); prior thereto, various positions with Northern Trust Company (since 1994); formerly, Member, Northern Trust Mutual Funds Board (2005-2007), Northern Trust Global Investments Board (2004-2007), Northern Trust Japan Board (2004-2007), Northern Trust Securities Inc. Board (2003-2007) and Northern Trust Hong Kong Board (1997-2004). | | 184 |
Trustees and Officers (Unaudited) (continued)
| | | | | | | | |
Name,
Year of Birth
& Address | | Position(s)
Held with
the Funds | | Year First
Elected or
Appointed (1) | | Principal Occupation(s)
Including other Directorships
During Past 5 Years | | Number of
Portfolios in
Fund Complex
Overseen by
Trustee |
Margaret L. Wolff 1955 333 W. Wacker Drive Chicago, IL 60606 | | Trustee | | 2016 | | Member of the Board of Directors (since 2013) of Travelers Insurance Company of Canada and The Dominion of Canada General Insurance Company (each, a part of Travelers Canada, the Canadian operation of The Travelers Companies, Inc.); formerly, Of Counsel, Skadden, Arps, Slate, Meagher & Flom LLP (Mergers & Acquisitions Group) (2005-2014); Member of the Board of Trustees of New York-Presbyterian Hospital (since 2005); Member (since 2004) and Chair (since 2015) of the Board of Trustees of The John A. Hartford Foundation (a philanthropy dedicated to improving the care of older adults); formerly, Member (2005-2015) and Vice Chair (2011-2015) of the Board of Trustees of Mt. Holyoke College. | | 184 |
| |
| Interested Trustee: |
William Adams IV(3) 1955 333 W. Wacker Drive Chicago, IL 60606 | | Trustee | | 2013 | | Co-Chief Executive Officer and Co-President (since March 2016), formerly, Senior Executive Vice President, Global Structured Products (2010-2016), prior thereto, Executive Vice President, U.S. Structured Products (1999-2010) of Nuveen Investments, Inc.; Co-President of Nuveen Fund Advisors, LLC (since 2011); Co-Chief Executive Officer (since 2016), formerly, Senior Executive Vice President of Nuveen Securities, LLC; President (since 2011), of Nuveen Commodities Asset Management, LLC; Board Member of the Chicago Symphony Orchestra and of Gilda’s Club Chicago. | | 184 |
Margo L. Cook(2)(3) 1964 333 W. Wacker Drive Chicago, IL 60606 | | Trustee | | 2016 | | Co-Chief Executive Officer and Co-President (since March 2016), formerly, Senior Executive Vice President of Nuveen Investments, Inc; Co-Chief Executive Officer (since 2015), previously, Executive Vice President (2013-2015) of Nuveen Securities, LLC; Co-President (since October 2016), formerly, Senior Executive Vice President (2015-2016) of Nuveen Fund Advisors, LLC (Executive Vice President 2011-2015); formerly, Managing Director of Nuveen Commodities Asset Management, LLC (2011- 2016); Chartered Financial Analyst. | | 184 |
| | | | | | | | |
Name,
Year of Birth
& Address | | Position(s)
Held with
the Funds | | Year First
Elected or
Appointed (4) | | Principal Occupation(s)
During Past 5 Years | | Number of
Portfolios in
Fund Complex
Overseen by
Officer |
| |
| Officers of the Funds: |
Greg A. Bottjer 1971 333 West Wacker Drive Chicago, IL 60606 | | Chief Administrative Officer | | 2016 | | Managing Director (since 2011), formerly, Senior Vice President (2007-2010) of Nuveen Investments Holdings, Inc.; Managing Director (since October 2016) of Nuveen Fund Advisors, LLC; Chartered Financial Analyst. | | 104 |
Lorna C. Ferguson 1945 333 W. Wacker Drive Chicago, IL 60606 | | Vice President | | 1998 | | Managing Director (since 2005) of Nuveen Fund Advisors, LLC and Nuveen Securities, LLC (since 2004). | | 185 |
Stephen D. Foy 1954 333 W. Wacker Drive Chicago, IL 60606 | | Vice President and Controller | | 1998 | | Managing Director (since 2014), formerly, Senior Vice President (2013-2014) and Vice President (2005-2013) of Nuveen Fund Advisors, LLC; Chief Financial Officer of Nuveen Commodities Asset Management, LLC (since 2010); Managing Director (since 2016) of Nuveen Securities, LLC; Certified Public Accountant. | | 185 |
| | | | | | | | |
Name,
Year of Birth
& Address | | Position(s)
Held with
the Funds | | Year First
Elected or
Appointed (4) | | Principal Occupation(s)
During Past 5 Years | | Number of
Portfolios in
Fund Complex
Overseen by
Officer |
Nathaniel T. Jones 1979 333 W. Wacker Drive Chicago, IL 60606 | | Vice President and Treasurer | | 2016 | | Senior Vice President (since 2016), formerly, Vice President (2011- 2016) of Nuveen Investments Holdings, Inc.; Chartered Financial Analyst. | | 185 |
Walter M. Kelly 1970 333 W. Wacker Drive Chicago, IL 60606 | | Chief Compliance Officer and Vice President | | 2003 | | Senior Vice President (since 2008) of Nuveen Investments Holdings, Inc. | | 185 |
Tina M. Lazar 1961 333 W. Wacker Drive Chicago, IL 60606 | | Vice President | | 2002 | | Senior Vice President of Nuveen Investments Holdings, Inc. and Nuveen Securities, LLC | | 185 |
Kevin J. McCarthy 1966 333 W. Wacker Drive Chicago, IL 60606 | | Vice President and Assistant Secretary | | 2007 | | Executive Vice President, Secretary and General Counsel (since March 2016), formerly, Managing Director and Assistant Secretary of Nuveen Investments, Inc.; Executive Vice President (since March 2016), formerly, Managing Director, and Assistant Secretary (since 2008) of Nuveen Securities, LLC; Executive Vice President and Secretary (since March 2016), formerly, Managing Director (2008-2016) and Assistant Secretary (2007-2016), and Co-General Counsel (since 2011) of Nuveen Fund Advisors, LLC; Executive Vice President and Secretary (since March 2016), formerly, Managing Director, Assistant Secretary (2011-2016), and Associate General Counsel (since 2011) of Nuveen Asset Management, LLC; Executive Vice President and Secretary of Nuveen Investments Advisers, LLC; Vice President (since 2007) and Secretary (since March 2016) of NWQ Investment Management Company, LLC, Symphony Asset Management LLC, Santa Barbara Asset Management, LLC, Winslow Capital Management, LLC (since 2010) and Tradewinds Global Investors, LLC (since 2016); Vice President (since 2010) and Secretary (since 2016), formerly, Assistant Secretary of Nuveen Commodities Asset Management, LLC. | | 185 |
Kathleen L. Prudhomme 1953 901 Marquette Avenue Minneapolis, MN 55402 | | Vice President and Secretary | | 2011 | | Managing Director, Assistant Secretary and Co-General Counsel (since 2011) of Nuveen Fund Advisors, LLC; Managing Director, Assistant Secretary and Associate General Counsel (since 2011) of Nuveen Asset Management, LLC; Managing Director and Assistant Secretary (since 2011) of Nuveen Securities, LLC; formerly, Deputy General Counsel, FAF Advisors, Inc. (2004-2010). | | 185 |
Christopher M. Rohrbacher 1971 333 West Wacker Drive Chicago, IL 60606 | | Vice President and Assistant Secretary | | 2008 | | Senior Vice President (since 2011) formerly, Vice President (2008-2011) and Assistant General Counsel (since 2008) of Nuveen Investments Holdings, Inc.; Senior Vice President and Assistant Secretary (since October 2016) of Nuveen Fund Advisors, LLC; Vice President and Assistant Secretary (since 2010) of Nuveen Commodities Asset Management, LLC. | | 185 |
Joel T. Slager 1978 333 West Wacker Drive Chicago, IL 60606 | | Vice President and Assistant Secretary | | 2013 | | Fund Tax Director for Nuveen Funds (since 2013); previously, Vice President of Morgan Stanley Investment Management, Inc., Assistant Treasurer of the Morgan Stanley Funds (from 2010 to 2013). | | 185 |
Jeffery M. Wilson 1956 333 West Wacker Drive Chicago, IL 60606 | | Vice President | | 2011 | | Senior Vice President of Nuveen Investments Holdings, Inc. (since 2011); formerly Senior Vice President of Nuveen Securities, LLC (since 2011); formerly, Senior Vice President of FAF Advisors, Inc. (2000-2010). | | 104 |
Trustees and Officers (Unaudited) (continued)
| | | | | | | | |
Name,
Year of Birth
& Address | | Position(s)
Held with
the Funds | | Year First
Elected or
Appointed (4) | | Principal Occupation(s)
During Past 5 Years | | Number of
Portfolios in
Fund Complex
Overseen by
Officer |
Gifford R. Zimmerman 1956 333 W. Wacker Drive Chicago, IL 60606 | | Vice President and Assistant Secretary | | 1988 | | Managing Director (since 2002), and Assistant Secretary of Nuveen Securities, LLC; Managing Director (since 2004) and Assistant Secretary (since 1994) of Nuveen Investments, Inc.; Managing Director (since 2002), Assistant Secretary (since 1997) and Co-General Counsel (since 2011) of Nuveen Fund Advisors, LLC; Managing Director, Assistant Secretary and Associate General Counsel of Nuveen Asset Management, LLC (since 2011); Managing Director and Assistant Secretary of Nuveen Investments Advisers Inc. (since 2002), and Symphony Asset Management LLC (since 2003); Vice President and Assistant Secretary of NWQ Investment Management Company, LLC (since 2002), Santa Barbara Asset Management, LLC (since 2006) and of Winslow Capital Management, LLC, (since 2010); Vice President and Assistant Secretary (since 2013), formerly, Chief Administrative Officer and Chief Compliance Officer (2006-2013) of Nuveen Commodities Asset Management, LLC; Chartered Financial Analyst. | | 185 |
| (1) | Trustees serve an indefinite term until his/her successor is elected or appointed. The year first elected or appointed represents the year in which the director was first elected or appointed to any fund in the Nuveen Fund Complex. |
| (2) | On June 22, 2016, Ms. Cook and Mr. Moschner were appointed as Board Members, effective July 1, 2016. |
| (3) | “Interested persons” of the Trust, as defined in the 1940 Act, by reason of their positions with Nuveen and certain of its subsidiaries. |
| (4) | Officers serve one year terms through August of each year. The year first elected or appointed represents the year in which the officer was first elected or appointed to any fund in the Nuveen Fund Complex. |
Notes
| | | | | | | | | | | | | | |
| | | | | | | | |
| | | | |
| | | | | | | | |
| | |
| | Nuveen: | | |
| | | | Serving Investors for Generations | | | | |
| | |
| | | | |
| | | |
| | | | Since 1898, financial advisors and their clients have relied on Nuveen to provide dependable investment solutions through continued adherence to proven, long-term investing principles. Today, we offer a range of high quality equity and fixed-income solutions designed to be integral components of a well-diversified core portfolio. | | |
| | | |
| | | | | | |
| | | | |
| | | | | | Focused on meeting investor needs. Nuveen helps secure the long-term goals of individual investors and the advisors who serve them. As an operating division of TIAA Global Asset Management, Nuveen provides access to investment expertise from leading asset managers and solutions across traditional and alternative asset classes. Built on more than a century of industry leadership, Nuveen’s teams of experts align with clients’ specific financial needs and goals, demonstrating commitment to advisors and investors through market perspectives and wealth management and portfolio advisory services. Nuveen manages $244 billion in assets as of September 30, 2016. | | |
| | | | | |
| | | | | | | | | | |
| | | | | | Find out how we can help you. To learn more about how the products and services of Nuveen may be able to help you meet your financial goals, talk to your financial advisor, or call us at (800) 257-8787. Please read the information provided carefully before you invest. Investors should consider the investment objective and policies, risk considerations, charges and expenses of any investment carefully. Where applicable, be sure to obtain a prospectus, which contains this and other relevant information. To obtain a prospectus, please contact your securities representative or Nuveen, 333 W. Wacker Dr., Chicago, IL 60606. Please read the prospectus carefully before you invest or send money. | | |
| | | | | | Learn more about Nuveen Funds at: www.nuveen.com/mf | | |
| | | | | | | | | | | | |
| | Distributed by Nuveen Securities, LLC | 333 West Wacker Drive Chicago, IL 60606 | www.nuveen.com | | | | |
MAN-FSLCT-1016P 21467-INV-Y-12/17
ITEM 2. CODE OF ETHICS.
As of the end of the period covered by this report, the registrant has adopted a code of ethics that applies to the registrant’s principal executive officer, principal financial officer, principal accounting officer or controller, or persons performing similar functions. There were no amendments to or waivers from the code during the period covered by this report. The registrant has posted the code of ethics on its website at www.nuveen.com/MutualFunds/ShareholderResources/FundGovernance.aspx. (To view the code, click on Code of Conduct.)
ITEM 3. AUDIT COMMITTEE FINANCIAL EXPERT.
The registrant’s Board of Directors or Trustees (“Board”) determined that the registrant has at least one “audit committee financial expert” (as defined in Item 3 of Form N-CSR) serving on its Audit Committee. The registrant’s audit committee financial experts are Carole E. Stone and Jack B. Evans, who are “independent” for purposes of Item 3 of Form N-CSR.
Ms. Stone served for five years as Director of the New York State Division of the Budget. As part of her role as Director, Ms. Stone was actively involved in overseeing the development of the State’s operating, local assistance and capital budgets, its financial plan and related documents; overseeing the development of the State’s bond-related disclosure documents and certifying that they fairly presented the State’s financial position; reviewing audits of various State and local agencies and programs; and coordinating the State’s system of internal audit and control. Prior to serving as Director, Ms. Stone worked as a budget analyst/examiner with increasing levels of responsibility over a 30 year period, including approximately five years as Deputy Budget Director. Ms. Stone has also served as Chair of the New York State Racing Association Oversight Board, as Chair of the Public Authorities Control Board, as a Commissioner on the New York State Commission on Public Authority Reform and as a member of the Boards of Directors of several New York State public authorities. These positions have involved overseeing operations and finances of certain entities and assessing the adequacy of project/entity financing and financial reporting. Currently, Ms. Stone is on the Board of Directors of CBOE Holdings, Inc., of the Chicago Board Options Exchange, and of C2 Options Exchange. Ms. Stone’s position on the boards of these entities and as a member of both CBOE Holdings’ Audit Committee and its Finance Committee has involved, among other things, the oversight of audits, audit plans and preparation of financial statements.
Mr. Evans was formerly President and Chief Operating Officer of SCI Financial Group, Inc., a full service registered broker-dealer and registered investment adviser (“SCI”). As part of his role as President and Chief Operating Officer, Mr. Evans actively supervised the Chief Financial Officer (the “CFO”) and actively supervised the CFO’s preparation of financial statements and other filings with various regulatory authorities. In such capacity, Mr. Evans was actively involved in the preparation of SCI’s financial statements and the resolution of issues raised in connection therewith. Mr. Evans has also served on the audit committee of various reporting companies. At such companies, Mr. Evans was involved in the oversight of audits, audit plans, and the preparation of financial statements. Mr. Evans also formerly chaired the audit committee of the Federal Reserve Bank of Chicago.
ITEM 4. PRINCIPAL ACCOUNTANT FEES AND SERVICES.
The following tables show the amount of fees that PricewaterhouseCoopers LLP, the Funds’ auditor, billed to the Funds’ during the Funds’ last two full fiscal years. The Audit Committee approved in advance all audit services and non-audit services that PricewaterhouseCoopers LLP provided to the Funds, except for those non-audit services that were subject to the pre-approval exception under Rule 2-01 of Regulation S-X (the “pre-approval exception”). The preapproval exception for services provided directly to the Funds waives the pre-approval requirement for services other than audit, review or attest services if: (A) the aggregate amount of all such services provided constitutes no more than 5% of the total amount of revenues paid by the Funds during the fiscal year in which the services are provided; (B) the Funds did not recognize the services as non-audit services at the time of the engagement; and (C) the services are promptly brought to the Audit Committee’s attention, and the Committee (or its delegate) approves the services before the audit is completed.
The Audit Committee has delegated certain pre-approval responsibilities to its Chairman (or, in his absence, any other member of the Audit Committee).
| | | | | | | | | | | | | | | | |
Fiscal Year Ended October 31, 2016 | | Audit Fees Billed
to Funds 1 | | | Audit-Related Fees
Billed to Funds 2 | | | Tax Fees
Billed to Funds 3 | | | All Other Fees
Billed to Funds 4 | |
Fund Name | | | | | | | | | | | | | | | | |
Nuveen Dividend Value Fund | | | 18,403 | | | | 2,139 | | | | 2,760 | | | | 0 | |
Nuveen Equity Index Fund | | | 16,471 | | | | 2,139 | | | | 2,760 | | | | 0 | |
Nuveen Large Cap Growth Opportunities Fund | | | 15,016 | | | | 1,639 | | | | 2,760 | | | | 0 | |
Nuveen Large Cap Select Fund | | | 13,476 | | | | 139 | | | | 2,760 | | | | 0 | |
Nuveen Mid Cap Growth Opportunities Fund | | | 17,586 | | | | 2,000 | | | | 2,760 | | | | 0 | |
Nuveen Mid Cap Index Fund | | | 15,902 | | | | 2,000 | | | | 2,760 | | | | 0 | |
Nuveen Mid Cap Value Fund | | | 13,749 | | | | 1,500 | | | | 2,760 | | | | 0 | |
Nuveen Small Cap Growth Opportunities Fund | | | 13,664 | | | | 0 | | | | 2,760 | | | | 0 | |
Nuveen Small Cap Index Fund | | | 13,788 | | | | 2,000 | | | | 2,760 | | | | 0 | |
Nuveen Small Cap Select Fund | | | 13,881 | | | | 2,000 | | | | 2,760 | | | | 0 | |
Nuveen Small Cap Value Fund | | | 14,391 | | | | 1,500 | | | | 2,760 | | | | 0 | |
| | | | | | | | | | | | | | | | |
Total | | $ | 166,327 | | | $ | 17,055 | | | $ | 30,360 | | | $ | 0 | |
| 1 | | “Audit Fees” are the aggregate fees billed for professional services for the audit of the Fund’s annual financial statements and services provided in connection with statutory and regulatory filings or engagements. |
| 2 | | “Audit-Related Fees” are the aggregate fees billed for assurance and related services reasonably related to the performance of the audit or review of financial statements that are not reported under “Audit Fees”. These fees include offerings related to the Fund’s common shares and leverage. |
| 3 | | “Tax Fees” are the aggregate fees billed for professional services for tax advice, tax compliance, and tax planning. These fees include: all global withholding tax services; excise and state tax reviews; capital gain, tax equalization and taxable basis calculations performed by the principal accountant. |
| 4 | | “All Other Fees” are the aggregate fees billed for products and services other than “Audit Fees”, “Audit-Related Fees” and “Tax Fees”. These fees represent all “Agreed-Upon Procedures” engagements pertaining to the Fund’s use of leverage. |
| | | | | | | | | | | | | | | | |
| | | Percentage Approved Pursuant to Pre-approval Exception | |
| | | Audit Fees Billed
to Funds | | | Audit-Related Fees
Billed to Funds | | | Tax Fees
Billed to Funds | | | All Other Fees
Billed to Funds | |
Fund Name | | | | | | | | | | | | | | | | |
Nuveen Dividend Value Fund | | | 0 | % | | | 0 | % | | | 0 | % | | | 0 | % |
Nuveen Equity Index Fund | | | 0 | % | | | 0 | % | | | 0 | % | | | 0 | % |
Nuveen Large Cap Growth Opportunities Fund | | | 0 | % | | | 0 | % | | | 0 | % | | | 0 | % |
Nuveen Large Cap Select Fund | | | 0 | % | | | 0 | % | | | 0 | % | | | 0 | % |
Nuveen Mid Cap Growth Opportunities Fund | | | 0 | % | | | 0 | % | | | 0 | % | | | 0 | % |
Nuveen Mid Cap Index Fund | | | 0 | % | | | 0 | % | | | 0 | % | | | 0 | % |
Nuveen Mid Cap Value Fund | | | 0 | % | | | 0 | % | | | 0 | % | | | 0 | % |
Nuveen Small Cap Growth Opportunities Fund | | | 0 | % | | | 0 | % | | | 0 | % | | | 0 | % |
Nuveen Small Cap Index Fund | | | 0 | % | | | 0 | % | | | 0 | % | | | 0 | % |
Nuveen Small Cap Select Fund | | | 0 | % | | | 0 | % | | | 0 | % | | | 0 | % |
Nuveen Small Cap Value Fund | | | 0 | % | | | 0 | % | | | 0 | % | | | 0 | % |
| | | | | | | | | | | | | | | | |
Fiscal Year Ended October 31, 2015 | | Audit Fees Billed
to Funds 1 | | | Audit-Related Fees
Billed to Funds 2 | | | Tax Fees
Billed to Funds 3 | | | All Other Fees
Billed to Funds 4 | |
Fund Name | | | | | | | | | | | | | | | | |
Nuveen Dividend Value Fund | | | 19,329 | | | | 0 | | | | 3,856 | | | | 0 | |
Nuveen Equity Index Fund | | | 16,214 | | | | 0 | | | | 5,762 | | | | 0 | |
Nuveen Large Cap Growth Opportunities Fund | | | 14,832 | | | | 0 | | | | 2,739 | | | | 0 | |
Nuveen Large Cap Select Fund | | | 13,034 | | | | 0 | | | | 2,684 | | | | 0 | |
Nuveen Mid Cap Growth Opportunities Fund | | | 18,172 | | | | 0 | | | | 4,408 | | | | 0 | |
Nuveen Mid Cap Index Fund | | | 15,671 | | | | 0 | | | | 4,246 | | | | 0 | |
Nuveen Mid Cap Value Fund | | | 13,378 | | | | 0 | | | | 2,695 | | | | 0 | |
Nuveen Small Cap Growth Opportunities Fund | | | 13,281 | | | | 0 | | | | 2,689 | | | | 0 | |
Nuveen Small Cap Index Fund | | | 13,430 | | | | 0 | | | | 2,694 | | | | 0 | |
Nuveen Small Cap Select Fund | | | 13,810 | | | | 0 | | | | 5,718 | | | | 0 | |
Nuveen Small Cap Value Fund | | | 13,389 | | | | 0 | | | | 2,692 | | | | 0 | |
| | | | | | | | | | | | | | | | |
Total | | $ | 164,540 | | | $ | 0 | | | $ | 40,185 | | | $ | 0 | |
| 1 | | “Audit Fees” are the aggregate fees billed for professional services for the audit of the Fund’s annual financial statements and services provided in connection with statutory and regulatory filings or engagements. |
| 2 | | “Audit-Related Fees” are the aggregate fees billed for assurance and related services reasonably related to the performance of the audit or review of financial statements that are not reported under “Audit Fees”. These fees include offerings related to the Fund’s common shares and leverage. |
| 3 | | “Tax Fees” are the aggregate fees billed for professional services for tax advice, tax compliance, and tax planning. These fees include: all global withholding tax services; excise and state tax reviews; capital gain, tax equalization and taxable basis calculations performed by the principal accountant. |
| 4 | | “All Other Fees” are the aggregate fees billed for products and services other than “Audit Fees”, “Audit-Related Fees” and “Tax Fees”. These fees represent all “Agreed-Upon Procedures” engagements pertaining to the Fund’s use of leverage. |
| | | | | | | | | | | | | | | | |
| | | Percentage Approved Pursuant to Pre-approval Exception | |
| | | Audit Fees Billed
to Funds | | | Audit-Related Fees
Billed to Funds | | | Tax Fees
Billed to Funds | | | All Other Fees
Billed to Funds | |
Fund Name | | | | | | | | | | | | | | | | |
Nuveen Dividend Value Fund | | | 0 | % | | | 0 | % | | | 0 | % | | | 0 | % |
Nuveen Equity Index Fund | | | 0 | % | | | 0 | % | | | 0 | % | | | 0 | % |
Nuveen Large Cap Growth Opportunities Fund | | | 0 | % | | | 0 | % | | | 0 | % | | | 0 | % |
Nuveen Large Cap Select Fund | | | 0 | % | | | 0 | % | | | 0 | % | | | 0 | % |
Nuveen Mid Cap Growth Opportunities Fund | | | 0 | % | | | 0 | % | | | 0 | % | | | 0 | % |
Nuveen Mid Cap Index Fund | | | 0 | % | | | 0 | % | | | 0 | % | | | 0 | % |
Nuveen Mid Cap Value Fund | | | 0 | % | | | 0 | % | | | 0 | % | | | 0 | % |
Nuveen Small Cap Growth Opportunities Fund | | | 0 | % | | | 0 | % | | | 0 | % | | | 0 | % |
Nuveen Small Cap Index Fund | | | 0 | % | | | 0 | % | | | 0 | % | | | 0 | % |
Nuveen Small Cap Select Fund | | | 0 | % | | | 0 | % | | | 0 | % | | | 0 | % |
Nuveen Small Cap Value Fund | | | 0 | % | | | 0 | % | | | 0 | % | | | 0 | % |
| | | | | | | | | | | | |
Fiscal Year Ended October 31, 2016 | | Audit-Related Fees
Billed to Adviser and
Affiliated Fund
Service Providers | | | Tax Fees Billed to
Adviser and
Affiliated Fund
Service Providers | | | All Other Fees
Billed to Adviser
and Affiliated Fund
Service Providers | |
Nuveen Investment Funds, Inc. | | $ | 0 | | | $ | 0 | | | $ | 0 | |
| |
| | | Percentage Approved Pursuant to Pre-approval Exception | |
| | | Audit-Related Fees
Billed to Adviser and
Affiliated Fund
Service Providers | | | Tax Fees Billed to
Adviser and
Affiliated Fund
Service Providers | | | All Other Fees
Billed to Adviser
and Affiliated Fund
Service Providers | |
| | | 0 | % | | | 0 | % | | | 0 | % |
| | | |
Fiscal Year Ended October 31, 2015 | | Audit-Related Fees
Billed to Adviser and
Affiliated Fund
Service Providers | | | Tax Fees Billed to
Adviser and
Affiliated Fund
Service Providers | | | All Other Fees
Billed to Adviser
and Affiliated Fund
Service Providers | |
Nuveen Investment Funds, Inc. | | $ | 0 | | | $ | 0 | | | $ | 0 | |
| |
| | | Percentage Approved Pursuant to Pre-approval Exception | |
| | | Audit-Related Fees
Billed to Adviser and
Affiliated Fund
Service Providers | | | Tax Fees Billed to
Adviser and
Affiliated Fund
Service Providers | | | All Other Fees
Billed to Adviser
and Affiliated Fund
Service Providers | |
| | | 0 | % | | | 0 | % | | | 0 | % |
| | | | | | | | | | | | | | | | |
| | | | | | Total Non-Audit Fees | | | | | | | |
| | | | | | billed to Adviser and | | | | | | | |
| | | | | | Affiliated Fund Service | | | Total Non-Audit Fees | | | | |
| | | | | | Providers (engagements | | | billed to Adviser and | | | | |
| | | | | | related directly to the | | | Affiliated Fund Service | | | | |
| | | Total Non-Audit Fees | | | operations and financial | | | Providers (all other | | | | |
Fiscal Year Ended October 31, 2016 | | Billed to Trust | | | reporting of the Trust) | | | engagements) | | | Total | |
Fund Name | | | | | | | | | | | | | | | | |
Nuveen Dividend Value Fund | | | 2,760 | | | | 0 | | | | 0 | | | | 2,760 | |
Nuveen Equity Index Fund | | | 2,760 | | | | 0 | | | | 0 | | | | 2,760 | |
Nuveen Large Cap Growth Opportunities Fund | | | 2,760 | | | | 0 | | | | 0 | | | | 2,760 | |
Nuveen Large Cap Select Fund | | | 2,760 | | | | 0 | | | | 0 | | | | 2,760 | |
Nuveen Mid Cap Growth Opportunities Fund | | | 2,760 | | | | 0 | | | | 0 | | | | 2,760 | |
Nuveen Mid Cap Index Fund | | | 2,760 | | | | 0 | | | | 0 | | | | 2,760 | |
Nuveen Mid Cap Value Fund | | | 2,760 | | | | 0 | | | | 0 | | | | 2,760 | |
Nuveen Small Cap Growth Opportunities Fund | | | 2,760 | | | | 0 | | | | 0 | | | | 2,760 | |
Nuveen Small Cap Index Fund | | | 2,760 | | | | 0 | | | | 0 | | | | 2,760 | |
Nuveen Small Cap Select Fund | | | 2,760 | | | | 0 | | | | 0 | | | | 2,760 | |
Nuveen Small Cap Value Fund | | | 2,760 | | | | 0 | | | | 0 | | | | 2,760 | |
| | | | | | | | | | | | | | | | |
Total | | $ | 30,360 | | | $ | 0 | | | $ | 0 | | | $ | 30,360 | |
“Non-Audit Fees billed to Fund” for both fiscal year ends represent “Tax Fees” and “All Other Fees” billed to Fund in their respective amounts from the previous table.
Less than 50 percent of the hours expended on the principal accountant’s engagement to audit the registrant’s financial statements for the most recent fiscal year were attributed to work performed by persons other than the principal accountant’s full-time, permanent employees.
| | | | | | | | | | | | | | | | |
| | | | | | Total Non-Audit Fees | | | | | | | |
| | | | | | billed to Adviser and | | | | | | | |
| | | | | | Affiliated Fund Service | | | Total Non-Audit Fees | | | | |
| | | | | | Providers (engagements | | | billed to Adviser and | | | | |
| | | | | | related directly to the | | | Affiliated Fund Service | | | | |
| | | Total Non-Audit Fees | | | operations and financial | | | Providers (all other | | | | |
Fiscal Year Ended October 31, 2015 | | Billed to Trust | | | reporting of the Trust) | | | engagements) | | | Total | |
Fund Name | | | | | | | | | | | | | | | | |
Nuveen Dividend Value Fund | | | 3,856 | | | | 0 | | | | 0 | | | | 3,856 | |
Nuveen Equity Index Fund | | | 5,762 | | | | 0 | | | | 0 | | | | 5,762 | |
Nuveen Large Cap Growth Opportunities Fund | | | 2,739 | | | | 0 | | | | 0 | | | | 2,739 | |
Nuveen Large Cap Select Fund | | | 2,684 | | | | 0 | | | | 0 | | | | 2,684 | |
Nuveen Mid Cap Growth Opportunities Fund | | | 4,408 | | | | 0 | | | | 0 | | | | 4,409 | |
Nuveen Mid Cap Index Fund | | | 4,246 | | | | 0 | | | | 0 | | | | 4,246 | |
Nuveen Mid Cap Value Fund | | | 2,695 | | | | 0 | | | | 0 | | | | 2,695 | |
Nuveen Small Cap Growth Opportunities Fund | | | 2,689 | | | | 0 | | | | 0 | | | | 2,689 | |
Nuveen Small Cap Index Fund | | | 2,694 | | | | 0 | | | | 0 | | | | 2,694 | |
Nuveen Small Cap Select Fund | | | 5,718 | | | | 0 | | | | 0 | | | | 5,719 | |
Nuveen Small Cap Value Fund | | | 2,692 | | | | 0 | | | | 0 | | | | 2,692 | |
| | | | | | | | | | | | | | | | |
Total | | $ | 40,185 | | | $ | 0 | | | $ | 0 | | | $ | 40,185 | |
“Non-Audit Fees billed to Fund” for both fiscal year ends represent “Tax Fees” and “All Other Fees” billed to Fund in their respective amounts from the previous table.
Audit Committee Pre-Approval Policies and Procedures. Generally, the Audit Committee must approve (i) all non-audit services to be performed for the Funds by the Funds’ independent accountant and (ii) all audit and non-audit services to be performed by the Funds’ independent accountant for the Affiliated Fund Service Providers with respect to the operations and financial reporting of the Funds. Regarding tax and research projects conducted by the independent accountant for the Funds and Affiliated Fund Service Providers (with respect to operations and financial reports of the Trust), such engagements will be (i) pre-approved by the Audit Committee if they are expected to be for amounts greater than $10,000; (ii) reported to the Audit Committee Chairman for his verbal approval prior to engagement if they are expected to be for amounts under $10,000 but greater than $5,000; and (iii) reported to the Audit Committee at the next Audit Committee meeting if they are expected to be for an amount under $5,000.
ITEM 5. AUDIT COMMITTEE OF LISTED REGISTRANTS.
Not applicable to this registrant.
ITEM 6. SCHEDULE OF INVESTMENTS.
| a) | | See Portfolio of Investments in Item 1. |
ITEM 7. DISCLOSURE OF PROXY VOTING POLICIES AND PROCEDURES FOR CLOSED-END
MANAGEMENT INVESTMENT COMPANIES.
Not applicable to this registrant.
ITEM 8. PORTFOLIO MANAGERS OF CLOSED-END MANAGEMENT INVESTMENT COMPANIES.
Not applicable to this registrant.
ITEM 9. PURCHASES OF EQUITY SECURITIES BY CLOSED-END MANAGEMENT INVESTMENT COMPANY AND AFFILIATED PURCHASERS.
Not applicable to this registrant.
ITEM 10. SUBMISSION OF MATTERS TO A VOTE OF SECURITY HOLDERS.
There have been no material changes to the procedures by which shareholders may recommend nominees to the registrant’s Board of Trustees implemented after the registrant last provided disclosure in response to this Item.
ITEM 11. CONTROLS AND PROCEDURES.
| | (a) | | The registrant’s principal executive and principal financial officers, or persons performing similar functions, have concluded that the registrant’s disclosure controls and procedures (as defined in Rule 30a-3(c) under the Investment Company Act of 1940, as amended (the “1940 Act”) (17 CFR 270.30a-3(c))) are effective, as of a date within 90 days of the filing date of this report that includes the disclosure required by this paragraph, based on their evaluation of the controls and procedures required by Rule 30a-3(b) under the 1940 Act (17 CFR 270.30a-3(b)) and Rules 13a-15(b) or 15d-15(b) under the Securities Exchange Act of 1934, as amended (the “Exchange Act”) (17 CFR 240.13a-15(b) or 240.15d-15(b)). |
| | (b) | | There were no changes in the registrant’s internal control over financial reporting (as defined in Rule 30a-3(d) under the 1940 Act (17 CFR 270.30a-3(d)) that occurred during the second fiscal quarter of the period covered by this report that has materially affected, or is reasonably likely to materially affect, the registrant’s internal control over financial reporting. |
ITEM 12. EXHIBITS.
File the exhibits listed below as part of this Form.
| | |
| (a)(1) | | Any code of ethics, or amendment thereto, that is the subject of the disclosure required by Item 2, to the extent that the registrant intends to satisfy the Item 2 requirements through filing of an exhibit: Not applicable because the code is posted on registrant’s website at www.nuveen.com/MutualFunds/ShareholderResources/FundGovernance.aspx and there were no amendments during the period covered by this report. (To view the code, click on Code of Conduct.) |
| |
| (a)(2) | | A separate certification for each principal executive officer and principal financial officer of the registrant as required by Rule 30a-2(a) under the 1940 Act (17 CFR 270.30a-2(a)) in the exact form set forth below: See EX-99.CERT attached hereto. |
| |
| (a)(3) | | Any written solicitation to purchase securities under Rule 23c-1 under the 1940 Act (17 CFR 270.23c-1) sent or given during the period covered by the report by or on behalf of the registrant to 10 or more persons: Not applicable to this registrant. |
| |
| (b) | | If the report is filed under Section 13(a) or 15(d) of the Exchange Act, provide the certifications required by Rule 30a-2(b) under the 1940 Act (17 CFR 270.30a-2(b)), Rule 13a-14(b) or Rule 15d-14(b) under the Exchange Act (17 CFR 240.13a-14(b) or 240.15d-14(b)), and Section 1350 of Chapter 63 of Title 18 of the United States Code (18 U.S.C. 1350) as an Exhibit. A certification furnished pursuant to this paragraph will not be deemed “filed” for purposes of Section 18 of the Exchange Act (15 U.S.C. 78r), or otherwise subject to the liability of that section. Such certification will not be deemed to be incorporated by reference into any filing under the Securities Act of 1933 or the Exchange Act, except to the extent that the registration specifically incorporates it by reference: See EX-99.906 CERT attached hereto. |
SIGNATURES
Pursuant to the requirements of the Securities Exchange Act of 1934 and the Investment Company Act of 1940, the registrant has duly caused this report to be signed on its behalf by the undersigned, thereunto duly authorized.
(Registrant) Nuveen Investment Funds, Inc.
| | |
| |
| By (Signature and Title) | | /s/ Kathleen L. Prudhomme |
| | Kathleen L. Prudhomme |
| | Vice President and Secretary |
Date: January 9, 2017
Pursuant to the requirements of the Securities Exchange Act of 1934 and the Investment Company Act of 1940, this report has been signed below by the following persons on behalf of the registrant and in the capacities and on the dates indicated.
| | |
| |
| By (Signature and Title) | | /s/ Greg A. Bottjer |
| | Greg A. Bottjer |
| | Chief Administrative Officer |
| | (principal executive officer) |
Date: January 9, 2017
| | |
| |
| By (Signature and Title) | | /s/ Stephen D. Foy |
| | Stephen D. Foy |
| | Vice President and Controller |
| | (principal financial officer) |
Date: January 9, 2017