UNITED STATES
SECURITIES AND EXCHANGE COMMISSION
Washington, D.C. 20549
FORM N-CSR
CERTIFIED SHAREHOLDER REPORT OF REGISTERED MANAGEMENT
INVESTMENT COMPANIES
Investment Company Act file number 811-05309
Nuveen Investment Funds, Inc.
(Exact name of registrant as specified in charter)
Nuveen Investments
333 West Wacker Drive, Chicago, IL 60606
(Address of principal executive offices) (Zip code)
Mark J. Czarniecki
Vice President and Secretary
333 West Wacker Drive,
Chicago, IL 60606
(Name and address of agent for service)
Registrant’s telephone number, including area code: (312) 917-7700
Date of fiscal year end: December 31
Date of reporting period: December 31, 2020
Form N-CSR is to be used by management investment companies to file reports with the Commission not later than 10 days after the transmission to stockholders of any report that is required to be transmitted to stockholders under Rule 30e-1 under the Investment Company Act of 1940 (17 CFR 270.30e-1). The Commission may use the information provided on Form N-CSR in its regulatory, disclosure review, inspection, and policy making roles.
A registrant is required to disclose the information specified by Form N-CSR, and the Commission will make this information public. A registrant is not required to respond to the collection of information contained in Form N-CSR unless the Form displays a currently valid Office of Management and Budget (“OMB”) control number. Please direct comments concerning the accuracy of the information collection burden estimate and any suggestions for reducing the burden to Secretary, Securities and Exchange Commission, 450 Fifth Street, NW, Washington, DC 20549-0609. The OMB has reviewed this collection of information under the clearance requirements of 44 U.S.C. ss.3507.
| ITEM 1. | REPORTS TO STOCKHOLDERS. |

Mutual Funds
31 December
2020
Nuveen Equity Funds
| | | | | | | | | | |
| Fund Name | | Class A | | Class C | | Class R3 | | Class R6 | | Class I |
| Nuveen Global Infrastructure Fund | | FGIAX | | FGNCX | | FGNRX | | FGIWX | | FGIYX |
| Nuveen Global Real Estate Securities Fund | | NGJAX | | NGJCX | | — | | NGJFX | | NGJIX |
| Nuveen Real Asset Income Fund | | NRIAX | | NRICX | | — | | NRIFX | | NRIIX |
| Nuveen Real Estate Securities Fund | | FREAX | | FRLCX | | FRSSX | | FREGX | | FARCX |
As permitted by regulations adopted by the Securities and Exchange Commission, paper copies of the Funds’ annual and semi-annual shareholder reports will not be sent to you by mail unless you specifically request paper copies of the reports. Instead, the reports will be made available on the Funds’ website (www.nuveen.com), and you will be notified by mail each time a report is posted and provided with a website link to access the report.
You may elect to receive shareholder reports and other communications from the Funds electronically at any time by contacting the financial intermediary (such as a broker-dealer or bank) through which you hold your Fund shares or, if you are a direct investor, by enrolling at www.nuveen.com/e-reports.
You may elect to receive all future shareholder reports in paper free of charge at any time by contacting your financial intermediary or, if you are a direct investor, by calling 800-257-8787 and selecting option #1. Your election to receive reports in paper will apply to all funds held in your account with your financial intermediary or, if you are a direct investor, to all your directly held Nuveen Funds and any other directly held funds within the same group of related investment companies.
Annual Report
Life is Complex.
Nuveen makes things e-simple.
It only takes a minute to sign up for e-Reports. Once enrolled, you’ll receive an e-mail as soon as your Nuveen Fund information is ready. No more waiting for delivery by regular mail. Just click on the link within the e-mail to see the report and save it on your computer if you wish.
Free e-Reports right to your email!
www.investordelivery.com
If you receive your Nuveen Fund distributions and statements from your financial professional or brokerage account.
or
www.nuveen.com/client-access
If you receive your Nuveen Fund distributions and statements directly from Nuveen.
Must be preceded by or accompanied by a prospectus.
NOT FDIC INSURED MAY LOSE VALUE NO BANK GUARANTEE
Table
of Contents
3
Chair’s Letter to Shareholders

Dear Shareholders,
The rollout of COVID-19 vaccines has kindled the promise of a more normal economy in 2021. Until then, the economic shortfall is expected to be bridged by a combination of fiscal relief measures and easier financial conditions aimed at supporting individuals, businesses and state and local governments. The measures taken to date have already helped the U.S. economy make a significant, although incomplete, turnaround from the depths of a historic recession. In late December 2020, the U.S. government enacted another $900 billion in aid to individuals and businesses, extending some of the programs enacted earlier in the COVID-19 crisis, and more stimulus is anticipated. The U.S. Federal Reserve, along with other central banks around the world, have pledged to keep monetary conditions accommodative for as long as necessary.
While the markets’ longer-term outlook has brightened, we expect intermittent bouts of volatility to continue. COVID-19 cases are still alarmingly high in some regions, and recent economic indicators have shown the dampening effect of renewed restrictions on social and business activity in the latter months of 2020. The pandemic’s course can still be unpredictable, and achieving sufficient inoculation of the population depends on many variables, including logistics, public confidence, real-world efficacy and the emergence of variant virus strains. Additionally, the Biden administration’s full policy agenda and the potential for Congressional gridlock remain to be seen, which could cause investment outlooks to shift. Nevertheless, short-term market fluctuations can provide opportunities to invest in new ideas as well as upgrade existing positioning, within our goal of providing long-term value for our shareholders. For more than 120 years, the careful consideration of risk and reward has guided Nuveen’s focus on delivering long-term results to our shareholders.
The beginning of the year can be an opportune time to assess your portfolio’s resilience and readiness for what may come next. We encourage you to review your time horizon, risk tolerance and investment goals with your financial professional. On behalf of the other members of the Nuveen Fund Board, we look forward to continuing to earn your trust in the months and years ahead.
Sincerely,

Terence J. Toth
Chair of the Board
February 22, 2021
4
Portfolio Managers’ Comments
Nuveen Global Infrastructure Fund
Nuveen Global Real Estate Securities Fund
Nuveen Real Asset Income Fund
Nuveen Real Estate Securities Fund
These Funds feature portfolio management by Nuveen Asset Management, LLC, an affiliate of Nuveen Fund Advisors, LLC, the Funds’ investment adviser. For the Nuveen Global Infrastructure Fund, Jay L. Rosenberg has been a portfolio manager since its inception in 2007 and Tryg T. Sarsland has been a portfolio manager since 2012, and Jagdeep S. Ghuman joined in 2019. For the Nuveen Global Real Estate Securities Fund, Jay L. Rosenberg along with Scott C. Sedlak have been portfolio managers since its inception in 2018. Benjamin T. Kerl and Jagdeep S. Ghuman joined the Nuveen Global Real Estate Securities Fund as portfolio managers in 2019. For the Nuveen Real Asset Income Fund, Jay L. Rosenberg has been portfolio manager since the Fund’s inception in 2011. Brenda A. Langenfeld, CFA, and Tryg T. Sarsland were added as portfolio managers in 2015 and Jean C. Lin, CFA joined in 2019. For the Nuveen Real Estate Securities Fund, Jay L. Rosenberg has served as a portfolio manager since he joined the Fund’s management team in 2005, while Scott C. Sedlak and Sarah Wade joined the team as portfolio managers in 2011 and 2017, respectively.
On the following pages, the portfolio management teams for the Funds discuss the economy and financial markets, key investment strategies and the Funds’ performance for the twelve-month reporting period ended December 31, 2020.
What factors affected the U.S. economy and financial markets during the twelve-month reporting period ended December 31, 2020?
The U.S. economy rebounded more quickly than expected from the deep downturn caused by the COVID-19 crisis and containment measures, but it was not fully recovered by the year’s end. U.S. gross domestic product (GDP) grew 4.0% on an annualized basis in the fourth quarter of 2020 and 33.1% (annualized) in the third quarter, but remained down 3.5% in 2020 overall (from the 2019 annual level to the 2020 annual level) as measured by the Bureau of Economic Analysis “advance” estimate. GDP measures the value of goods and services produced by the nation’s economy less the value of the goods and services used up in production, adjusted for price changes. The economy fell into a deep recession in February 2020 due to the restrictions on business and social activity to mitigate the COVID-19 spread. In the first and second quarters of 2020, annualized GDP shrank 5% and 31.4%, respectively. Government relief programs provided significant aid to individuals and businesses as the economy began reopening in May 2020, which helped the economy bounce back strongly over the second half of the year.
Consumer spending, the largest driver of the economy, remained resilient despite the disruption caused by the health and economic crisis. Consumer spending declined significantly and unemployment rose sharply starting in March 2020. These measures rebounded markedly in the second half of the year, although the momentum slowed toward year end amid a resurgence of coronavirus infections. The Bureau of Labor Statistics said the unemployment rate rose to 6.7% in December 2020 from 3.6% in December 2019. As of December 2020, slightly more than half of the 22 million jobs lost in March and April 2020 have been recovered. The average
This material is not intended to be a recommendation or investment advice, does not constitute a solicitation to buy, sell or hold a security or an investment strategy and is not provided in a fiduciary capacity. The information provided does not take into account the specific objectives or circumstances of any particular investor, or suggest any specific course of action. Investment decisions should be made based on an investor’s objectives and circumstances and in consultation with his or her advisors.
Certain statements in this report are forward-looking statements. Discussions of specific investments are for illustration only and are not intended as recommendations of individual investments. The forward-looking statements and other views expressed herein are those of the portfolio managers as of the date of this report. Actual future results or occurrences may differ significantly from those anticipated in any forward-looking statements and the views expressed herein are subject to change at any time, due to numerous market and other factors. The Funds disclaim any obligation to update publicly or revise any forward-looking statements or views expressed herein.
For financial reporting purposes, the ratings disclosed are the highest rating given by one of the following national rating agencies: Standard & Poor’s (S&P), Moody’s Investors Service, Inc. (Moody’s) or Fitch, Inc. (Fitch). This treatment of split-rated securities may differ from that used for other purposes, such as for Fund investment policies. Credit ratings are subject to change. AAA, AA, A and BBB are investment grade ratings; BB, B, CCC, CC, C and D are below investment grade ratings. Holdings designated N/R are not rated by these national rating agencies.
Refer to the Glossary of Terms Used in this report for further definition of the terms used within this section.
5
Portfolio Managers’ Comments (continued)
hourly earnings rate appeared to increase, growing at an annualized rate of 5.1% in December 2020, despite the spike in unemployment. Earnings data was skewed by the concentration of job losses in lower-wage work, which effectively eliminated most of the low-wage data, resulting in an average of mostly higher numbers. The overall trend of inflation remained muted, as decreases in gasoline, apparel and transportation prices offset an increase in food prices. The Bureau of Labor Statistics said the Consumer Price Index (CPI) increased 1.4% over the twelve-month reporting period ended December 31, 2020 before seasonal adjustment.
Prior to the COVID-19 crisis recession, the U.S. Federal Reserve (the Fed) had reduced its benchmark interest rate to support the economy’s slowing growth. The Fed also stopped shrinking its bond portfolio sooner than scheduled and began buying short-term Treasury bills to help money markets operate smoothly and maintain short-term borrowing rates at low levels. As the health and economic crisis deepened, the Fed enacted an array of emergency measures in March 2020 to stabilize the financial system and support the markets, including cutting its main interest rate to near zero, offering lending programs to aid small and large companies and allowing unlimited bond purchases, known as quantitative easing. In August 2020, the Fed announced a change in inflation policy to average inflation targeting. Under this regime, the Fed will tolerate the inflation rate temporarily overshooting the target rate to offset periods of below-target inflation, so that inflation averages a 2% rate over time. Fed officials remained cautious, acknowledging the economy’s improvement but concerned about near-term weakness, and left policy unchanged over the remainder of their meetings in 2020.
In March and April 2020, the U.S. government approved three aid packages. These included $2 trillion allocated across direct payments to Americans, an expansion of unemployment insurance, loans to large and small businesses, funding to hospitals and health agencies and support to state and local governments, and more than $100 billion in funding to health agencies and employers offering paid leave. In December 2020, the government enacted a $900 billion relief package extending some of these programs. With Joe Biden winning the U.S. presidential election in November 2020, more fiscal stimulus is anticipated in 2021.
The COVID-19 crisis rapidly dwarfed all other market concerns starting in late February 2020. Equity and commodity markets sold off and safe-haven assets rallied in March 2020 as China, other countries and then the United States initiated quarantines, restricted travel and shuttered factories and businesses. The potential economic shock was particularly difficult to assess, which amplified market volatility. An ill-timed oil price war between the Organization of the Petroleum Exporting Countries (OPEC) and non-OPEC member Russia, which caused oil prices to plunge in March 2020, exacerbated the market sell-off. At year end, the announcement of high efficacy rates in several COVID-19 vaccine trials, followed by regulatory authorizations and public vaccination drives across Western countries, improved the outlook for 2021 and led to risk-on sentiment in the markets.
Geopolitical uncertainty remained elevated during 2020 in anticipation of the U.S. presidential election in November 2020 and the Brexit transition period set to expire in December 2020. Political risks eased somewhat toward the end of the reporting period, as markets ultimately viewed a Biden administration positively and the European Union (EU) and United Kingdom (U.K.) finalized a trade deal in the final days of the transition period. Although China and the U.S. signed a “phase one” trade deal in January 2020, tensions continued to flare over other trade and technology/security issues, Hong Kong’s sovereignty and the management of the COVID-19 crisis.
Nuveen Global Infrastructure Fund
How did the Fund perform during the twelve-month reporting period ended December 31, 2020?
The table in the Performance Overview and Holding Summaries section of this report provides total returns at net asset value (NAV) for the period ended December 31, 2020. The Fund’s total returns on NAV are compared with the performance of a corresponding market index.
The Fund’s Class A Shares at NAV outperformed the S&P Global Infrastructure Index NR (Net Return) but underperformed the Lipper classification average during the twelve-month reporting period.
What strategies were used to manage the Fund during the reporting period and how did these strategies influence performance?
The Fund seeks to provide long-term growth of capital and income by investing primarily in equity securities issued by U.S. and non-U.S. companies that typically derive the majority of their value from owned or operated infrastructure assets. During the reporting period, our strategy for managing the Fund remained consistent as we focused on buying global infrastructure companies that
6
own and operate long life assets that have visible cash flows, strong balance sheets, manageable amounts of leverage and inelastic demand characteristics. We believe these types of companies will have ongoing access to capital and the best chances for producing sustainable and growing cash flow. The Fund is structured using a number of core infrastructure companies that we believe should provide long-term outperformance versus the market, combined with more opportunistic holdings that we believe are undervalued by the market in the short term. We have exposure around the globe to a mixture of holdings that represent significant value, as well as positions in companies that may prove to be more stable in a slowly growing global economy.
During the first three months of the reporting period, the health and financial crisis brought about by the COVID-19 crisis clearly impacted markets and caused a sharp sell-off in the global infrastructure sector. As COVID-19 spread, investor confidence was shattered after global output collapsed due to wide swaths of the economy being shut down and entire countries finding themselves locked down in an attempt to blunt the spread of the infection. Within the infrastructure universe, we saw significant divergences in returns between businesses that were most impacted by economic closures and social distancing and those whose businesses were less sensitive to the crisis.
Following the initial crisis, markets shifted sharply again as a result of the massive amounts of global monetary and fiscal stimulus coupled with a significant improvement on the health front as economies that had been affected by the COVID-19 crisis the earliest made headway in its containment. As a result, investor sentiment began to improve dramatically and markets looked forward to recovery as economies started to reopen. However, while broader equity markets showed strength, especially large technology companies, the infrastructure segment remained quite bifurcated because some business models continued to be much more negatively impacted by the ongoing health crisis. Although the unprecedented amounts of global monetary and fiscal certainly benefited the infrastructure group, the most challenged sectors continued to languish in the absence of a marked improvement on the health front and the corresponding lack of global mobility and utilization of the assets.
In the final two months of the reporting period, the infrastructure segment rebounded following favorable vaccine announcements from Pfizer and Moderna, which immediately changed the investment landscape and reversed nearly all the trends within infrastructure that had developed over the past ten months. All of the sectors that had previously been most negatively impacted by the COVID-19 crisis, economic closures and lack of global mobility rallied significantly as investors anticipated a worldwide return to more normalized economic activity in 2021, given the efficacy of the vaccines. However, despite the rally in the infrastructure sector in the final months of the reporting period, it was not enough to make up for the segment’s earlier shortfall. During the reporting period, the infrastructure segment returned -5.76%, as measured by the S&P Global Infrastructure Index NR, significantly underperforming the broader domestic equity market, which returned 18.40%, as measured by the S&P 500® Index, and global equities, which returned 16.25%, as measured by the MSCI All Country World Index. As a result of these dynamics, the various sectors within infrastructure posted quite divergent returns during the reporting period. The Fund’s out-of-index sector exposures in renewable energy, waste and technology infrastructure showed strong gains. More defensive areas like electric utilities and water utilities also posted relatively solid advances. However, sectors with more exposure to the economic cycle, such as pipelines, airports and seaports, sold off sharply.
From a broad perspective, the Fund benefited on a relative basis versus its benchmark from a tilt toward less economically sensitive areas of infrastructure. This shift led to significant outperformance for the Fund relative to the benchmark during the market sell-off in March 2020, and for the reporting period as a whole. Early in the COVID-19 crisis, we believed it would be critically important to reduce exposures to businesses most impacted, while overweighting businesses that would suffer the least. This positioning was successful during the extreme market turmoil. Specifically, we made notable reductions in the pipeline, airport and rail sectors, which funded substantial increases in exposure to technology infrastructure, regulated electric utilities and water utilities. However this same defensive bias, which was further increased during the sell-off, led to some relative underperformance during a portion of the remaining reporting period after many of the most negatively impacted groups recovered sharply.
While the Fund significantly outperformed its benchmark during the reporting period, it still produced negative absolute returns. Compared to the index, the Fund experienced its strongest relative results in the renewable energy, technology infrastructure, electric transmission and waste sectors. The Fund had relatively few noteworthy laggards versus the benchmark during the reporting period, although the airport segment did detract. The Fund underperformed the Lipper average because some of its peers have more exposure to the technology infrastructure sector.
7
Portfolio Managers’ Comments (continued)
The Fund experienced its most favorable relative results in the renewable energy sector, a group that has no exposure in the benchmark. Pure-play renewable companies continued to benefit as the power generation mix moves away from fossil fuels and toward more sustainable sources. Regulators and politicians continued to support capital expenditures to provide the grid with electricity from wind, solar and other renewable, more carbon friendly options. These companies earn a regulated return on that capital expenditure and have a long runway for continued growth. They have also been supported by technicals in the marketplace as investor capital, particularly from institutions, has been supporting the stock prices. Late in fall 2020, shares of these companies advanced strongly after the Biden campaign gained ground and Wall Street began to price in a possible Democratic sweep of the presidency and Senate. That momentum continued into the end of the reporting period following the election results, while all of the fundamental and technical tailwinds for the sector remained firmly in place.
Technology infrastructure exhibited the second strongest area of performance for the Fund during the reporting period. The sector, which primarily consists of cellular tower and data center companies, also has no representation in the benchmark. Tech infrastructure is arguably the sector least affected by the COVID-19 crisis because social distancing measures don’t impact these companies, given that they earn revenue by leasing space to equipment rather than people. Additionally, demand for their assets held steady throughout the reporting period and may have actually increased as people were forced to work and attend school from home. Leading up to the COVID-19 vaccine announcements, tech infrastructure companies had performed very strongly in 2020 as investors looked for defensive areas that had attractive growth prospects. After the announcements, however, this segment served as a source of funds as investors rebalanced their portfolios to get more exposure to value, which had been largely ignored. That said, the Fund benefited from its broad exposure to this sector throughout the reporting period as its holdings posted a collective gain of 22% over the reporting period, led by positions in Cellnex Telecom S.A. and Equinix Inc.
The Fund’s security selection and overweight in the electric transmission sector also contributed favorably to results versus the benchmark. This more defensive area offered substantial insulation from the massive declines experienced by some of the more economically sensitive areas within the Fund’s opportunity set during the March 2020 sell-off. While electricity demand certainly fell among industrial and commercial users due to stay-at-home orders during the COVID-19 crisis, increases in residential demand offset that disruption to some extent. Therefore, although the transmission sector was not able to completely avoid stock price declines during the sell-off, they were much less severe. The Fund’s performance also benefited from our greater diversification within the sector.
The Fund’s waste sector exposure also contributed, which is another area that is not represented in its benchmark. Waste is a group that is more exposed to broader economic activity, especially construction, which has improved dramatically after the relaxation of stay-at-home orders and broad economic closures worldwide. The group as a whole has benefited from these reopening dynamics and all but one of our holdings in the sector posted solid double-digit returns over the reporting period. The Fund’s positions in Waste Management Inc. and French waste company SUEZ SA were standout performers. During the reporting period, Waste Management’s shares advanced strongly after the company finally got approval from the Department of Justice to acquire Advanced Disposal Services following a lengthy delay and some required dispositions. Because of market conditions at the time, Advanced Disposal agreed to a lower purchase price than the previous agreement. Also due to the delay, Waste Management was able to buy back bonds it had previously issued for the acquisition and refinance them at a more attractive rate. In addition, investors were encouraged that the company was able to control costs and actually slightly expand margins during the reporting period, despite the drop in revenues from the COVID-19 crisis. In the case of SUEZ, shares advanced strongly after another French waste and water company, Veolia, made bid for a significant portion of its shares and subsequently raised its offer. Investors were enthused about the potential merger of the two companies. Because the benchmark has no exposure to these two names, their strong returns resulted in significant outperformance.
The Fund’s main detractor resulted from its underweight position in the airport sector. The Fund began the reporting period with an underweight, which was increased further as the COVID-19 crisis burst on the scene and fundamentals in the segment were quite challenged. The segment suffered significantly earlier in 2020 due to the COVID-19 crisis lockdowns, which caused a sharp sell-off among airport stocks. However, as the reporting period progressed, investors began to look for valuation opportunities in areas like airports that had been beaten up earlier in the reporting period. Optimism began to increase regarding the COVID-19 health situation, especially outside the U.S., and passenger traffic showed a slight improvement. However, it was the vaccine announcements in early November 2020 that were the major impetus for a sharp turnaround in the sector.
8
Before the COVID-19 vaccine announcements, we had been modestly rebalancing the Fund back into various areas that had suffered the most during the reporting period, narrowing some of the portfolio’s wide and persistent underweights. However, the COVID-19 vaccine news accelerated these changes as it became clear the worst case scenario was eliminated and vaccine efficacy was better than even the most optimistic expectations. We reduced the Fund’s largest relative overweight in technology infrastructure, and made an even greater reduction to electric utilities. Geographically, we continued to keep the Fund’s portfolio well diversified with broad exposure to well over 20 different countries. Spreading the Fund’s holdings out over many geographies and regulatory jurisdictions to mitigate risk.
Nuveen Global Real Estate Securities Fund
How did the Fund perform during the twelve-month reporting period ended December 31, 2020?
The table in the Performance Overview and Holding Summaries section of this report provides total returns at net asset value (NAV) for the period ended December 31, 2020. The Fund’s total returns on NAV are compared with the performance of a corresponding market index.
The Fund’s Class A Shares at NAV outperformed the FTSE EPRA/Nareit Developed Index NR (Net Return) and the Lipper classification average during the twelve-month reporting period.
What strategies were used to manage the Fund during the reporting period and how did these strategies influence performance?
The Fund seeks long-term capital appreciation with a secondary objective to provide current income. The Fund invests in income producing equities of companies engaged in the real estate industry. Applying a fundamentally based, relative value process, the investment team diversifies across geographies and sectors of listed global commercial real estate by investing at least 80% of the sum of its net assets and the amount of any borrowings for investment purposes in common stocks, preferred securities and other equity securities issued by U.S. and non-U.S. companies in the real estate industry, including real estate investment trusts (REITs) and similar REIT-like entities. REITs are types of real estate companies that pool investors’ funds for investment in real estate or in real estate related loans or other interests. REITs in the U.S. are generally not taxed on income distributed to shareholders as long as they meet certain requirements of the Internal Revenue Code. Foreign REITs and REIT-like entities are organized outside of the U.S. and generally have operations and receive tax treatment in their respective countries similar to that of U.S. REITs, though some countries may have REIT-like structures that are significantly different from U.S. REITs or may not have adopted a REIT-like structure at all. Equity securities in which the Fund may invest may be of any market capitalization, including small- and mid-capitalization companies.
The Fund may invest at least 40% of its net assets in securities of non-U.S. issuers and, in any case, will invest at least 30% of its net assets in such issuers. The Fund will invest in securities of issuers in at least three different countries and may invest up to 25% of its total assets in securities of emerging market issuers.
The Fund may utilize derivatives, including options, futures contracts, options on futures contracts, and forward foreign currency exchange contracts. The Fund may use these derivatives to manage market or business risk, enhance the Fund’s return, or hedge against adverse movements in currency exchange rates.
During the first three months of the reporting period, the health and financial crisis brought about by the COVID-19 crisis clearly had a devastating impact on financial markets. Although many defensive areas of the markets outperformed broader equities, the traditionally defensive global real estate group did not. The sector experienced a massive sell-off in March 2020 that exceeded even the swiftness of the broader equity market declines. Many global REITs suffered disproportionately at the hands of the COVID-19 crisis because most property types are comprised of physical assets that are meant to facilitate the gathering of people. However, over half of the world’s population was either mandated or strongly encouraged to do precisely the opposite. As a result, some tenants were not able to pay rent to property owners, which affected profitability and cash flow for REITs.
Following the initial crisis, markets shifted sharply again as a result of the massive amounts of global monetary and fiscal stimulus coupled with a significant improvement on the health front as economies that had been affected by the virus the earliest made headway in its containment. As a result, investor sentiment began to improve dramatically and markets looked forward to recovery as
9
Portfolio Managers’ Comments (continued)
economies started to reopen. However, while broader equity markets showed strength, especially large technology-focused companies, global real estate continued to underperform because the segment will likely take longer to recover from the lingering effects of the shutdowns related to the health crisis. The slow pace of reopenings and the difficulty countries had in containing the virus continued to be overhangs for this segment. Retail shopping centers, hotels, restaurants and theaters saw improvements in activity and sales, but at a gradual and uneven pace. The good news, however, was that fundamentals remained solid for several property types that didn’t experience a drop off in demand like data centers, cellular tower companies, industrial facilities and self-storage.
In the final two months of the reporting period, the global real estate segment rebounded following favorable COVID-19 vaccine announcements from several companies, which immediately changed the investment landscape. Investors rotated back into areas of the equity market that had underperformed for most of the reporting period and stand to benefit more from an anticipated return to stronger economic growth in the second half of 2021. As a result, the areas that most significantly underperformed previously within global real estate dramatically reversed course with various retail shopping centers, hotels and some areas of office posting strong gains following the COVID-19 vaccine announcement. The reporting period’s previous winners such as data centers, cellular tower companies, industrial facilities and self-storage were targeted as a source of funds for portfolio rebalancings throughout the industry, including the Fund’s portfolio. While the underlying fundamentals within these categories remained strong, their defensive characteristics and substantial relative outperformance dampened their short-term prospects as the market looked forward to some semblance of normalcy later in 2021. Despite the rally in global real estate in the final months of the reporting period, however, it was not enough to make up for the segment’s earlier shortfall. During the reporting period, the sector returned -8.18%, as measured by the FTSE EPRA/Nareit Developed Index, underperforming the broader domestic equity market by nearly 25%, as measured by the MSCI World Index return of 15.90%. Regionally within the global listed REIT markets, the U.S. return of -7.57%, as measured by the MSCI U.S. REIT Index underperformed Europe’s return of -2.70%.
The Fund significantly outperformed the FTSE EPRA/Nareit Developed Index benchmark and Lipper peer group during the reporting period but still produced slightly negative absolute returns. Generally speaking, the Fund benefited in relative terms by being defensively positioned for the first ten months of the reporting period. We emphasized companies that were less economically sensitive with business models that could function better during the COVID-19 crisis and underweighted areas we felt would be most disproportionately affected by the health crisis such as retail and lodging. From a relative performance standpoint, the Fund experienced positive results primarily from the industrial, technology infrastructure, office and mall sectors, while the specialty and self-storage segments detracted from performance.
The Fund’s overweight and positive selection effect in industrial real estate contributed strongly to relative outperformance and led all other sectors as the drivers affecting the group remained intact throughout the reporting period. The industrial sector continued to directly benefit from the same dynamics in the marketplace that weigh on the regional mall/retail real estate sector from a fundamental point-of-view, which is the disruption from ecommerce. This secular trend was only accentuated by the COVID-19 crisis as many retail stores closed to try to slow the spread. However, industrial facilities remained open and became even more important as much more commerce was executed from people’s homes. Additionally, it was easier for industrial facilities to practice social distancing while remaining operational, which was nearly impossible for several other property types. The industrial group continued to demonstrate some of the strongest fundamentals with ever-increasing demand for logistics and fulfillment facilities outstripping what has been a rather contained supply situation. As the reporting period drew to a close, it appeared this trend was continuing irrespective of the COVID-19 crisis as the group continued to outpace many other categories. The industrial sector trailed only the technology infrastructure sector in terms of absolute returns over the reporting period, and represented the Fund’s largest overweight versus the benchmark.
The technology infrastructure sector, which primarily consists of global data center and cell phone tower companies, also contributed strongly to the Fund’s relative outperformance during the reporting period. Many of the companies within the group posted the strongest absolute returns within the global real estate investable universe. The Fund’s overweight and broad exposure to the group, especially in many companies that don’t have benchmark representation, drove the bulk of the relative gains. Technology infrastructure businesses derive their revenues from leases, which unlike many other real assets, are unaffected by social distancing because the structures possess only equipment and require very little to no human occupancy or interaction. Additionally, demand for the services these companies provide has been much less impacted by lower global mobility and the slowdown in overall economic activity. The sector did experience selling pressure toward the end of the reporting period as money managers repositioned
10
their portfolios toward companies that stand to benefit the most from a more normalized economic environment once the COVID-19 crisis loses steam. Although we trimmed exposure slightly, technology infrastructure still represented the Fund’s second largest overweight at the end of the reporting period versus the index.
The Fund also experienced outperformance from security selection in the office sector, led by an overweight position in Sirius Real Estate Limited, a German firm focused on suburban office parks. Our outlook has been constructive toward German commercial real estate relative to other European countries for some time. Shares were rewarded after investors recognized the company’s attractive valuation relative to European peers, which drove the stock higher at the same time the outlook for the office sector was improving because of the COVID-19 vaccine announcements. Performance within the office segment also benefited from the Fund’s overweight to Norwegian office specialist Entra ASA. Relative to much of the world, the fundamentals in Norway were above average and Entra’s shares were trading at an attractive valuation. Downward pressure on sovereign yields in the country suggested likely tailwinds for the company as well. Toward the end of the reporting period, the stock rallied after its property portfolio was assigned a higher underlying value and Entra received multiple takeover bids.
The mall sector was also a contributor to the Fund’s relative performance due to the Fund’s underweight position. Retail store closures were already near or at peak historical levels in 2018 and 2019 in the U.S. before the COVID-19 crisis hit. While the situation across the rest of the world wasn’t quite as dire because supply wasn’t as elevated on a per capita basis, the impact from ecommerce was still clearly being felt. The COVID-19 crisis only served to make the situation much more severe and the market has significant concerns about tenants’ ability or willingness to pay rent to mall owners. The Fund benefited from its nearly 4% underweight in the mall group. The global mall group still declined by more than 30% in 2020.
The specialty sector, which rebounded after substantial first quarter 2020 weakness, was a modest detractor during the reporting period. Within the benchmark, gaming companies comprise a significant weight within the specialty sector. The gaming segment performed strongly later in the reporting period based on reopening news and the prospect that people would return to casinos following favorable COVID-19 vaccine news. The Fund’s underweight positions in the two of the largest gaming companies in the index, Gaming & Leisure Properties and VICI Properties Inc., led to the relative underperformance within the segment.
The self-storage sector also detracted from the Fund’s relative performance during the reporting period. Heading into the reporting period, we were concerned about modest market oversupply and growing expenses, which somewhat muted the group’s growth prospects. However, the defensive properties of self-storage garnered investor attention during the COVID-19 crisis. As a result, the group provided returns that were substantially better than many areas that experienced massive business disruptions. While we added self-storage exposure to the Fund during the reporting period, a slight underweight persisted resulting in relative underperformance.
The Fund maintained a bias toward higher quality companies and assets within the REIT sector in general because asset type and balance sheet strength remained important considerations for investment. The Fund remained defensively positioned based on our preference for companies with business models that are better able to function well in the current COVID-19 crisis environment. However, the COVID-19 vaccine news late in the reporting period provided a light at the end of the tunnel for most of the more maligned areas of real estate and was the catalyst for rebalancing the Fund’s portfolio. The Fund reduced exposure in sectors that had worked the best prior to the COVID-19 vaccine announcements, namely industrial and technology infrastructure, using the proceeds to fund purchases in areas that had been the most challenged such as retail and net lease. As a result, the Fund’s sector weights showed less deviation versus the index at the end of the reporting period.
Nuveen Real Asset Income Fund
How did the Fund perform during the twelve-month reporting period ended December 31, 2020?
The table in the Performance Overview and Holding Summaries section of this report provides total returns at net asset value (NAV) for the period ended December 31, 2020. The Fund’s total returns on NAV are compared with the performance of a corresponding market index.
The Fund’s Class A Shares at NAV underperformed the Real Asset Income Blend benchmark, the Bloomberg Barclays U.S. Corporate High Yield Bond Index and the Lipper classification average during the twelve-month reporting period.
11
Portfolio Managers’ Comments (continued)
What strategies were used to manage the Fund during the reporting period and how did these strategies influence performance?
The Fund seeks a high level of current income with a secondary objective of capital appreciation by investing in a global portfolio of infrastructure and commercial real estate related securities (i.e. real assets) across the capital structure. These securities include a combination of infrastructure and real estate common stock, infrastructure and real estate preferred stock, and infrastructure and real estate related debt. Our goal is to combine these securities into a portfolio that provides investors with an attractive level of income and dampens levels of risk versus the broader equity market. We continued to select securities using an investment process that screens for companies and assets across the real assets market that provide higher yields. From the group of securities providing significant yields, we focus on owning those companies and securities with the highest total return potential in the Fund. Our process places a premium on finding securities whose revenues come from tangible assets with long-term concessions, contracts or leases and are therefore capable of producing steady, predictable and recurring cash flows. The Fund’s management team employs a bottom-up, fundamental approach to security selection and portfolio construction. We look for stable companies that demonstrate consistent and growing cash flow, strong balance sheets and histories of being good stewards of shareholder capital.
During the reporting period, the returns among the five “real asset” categories within the Real Asset Income Blend benchmark were quite divergent with an almost 20% spread between the top and bottoming performing categories. The equity market experienced a dramatic sell-off in March 2020 that more significantly impacted the typically defensive real estate and global infrastructure sectors. Although these two segments were able to recover some of the losses later in the reporting period, they still sharply underperformed the broader U.S. and global equity markets. Global real estate was the worst performing segment within the Real Asset Income Blend, ending the reporting period with a -8.18% return, as measured by the FTSE EPRA/NAREIT Developed Index and underperforming the U.S. real estate market. The global infrastructure segment outpaced global real estate, but also ended lower with a return of -5.76%, as measured by the S&P Global Infrastructure Index Net Return (NR). For comparison purposes, U.S. equities gained 18.40% during the reporting period as measure by the S&P 500® Index.
The reason for the substantial underperformance of real estate and global infrastructure was because both segments were more directly impacted by the COVID-19 crisis and the resulting shutdowns. In real estate, most property types are comprised of physical assets that are meant to facilitate the gathering of people, but over half of the world’s population was either mandated or strongly encouraged to do precisely the opposite. Retail shopping centers were closed, hotel occupancy cratered and restaurants and theaters were empty. As the reporting period progressed, the slow and uneven pace of reopenings and the resurgence of the COVID-19 virus in some more populated states of the U.S. and overseas continued to be an overhang for this segment. As a result, some tenants were not able to pay rent to property owners, which affected profitability and cash flow for real estate investment trusts (REITs). In November 2020, however, the real estate segment rebounded following favorable COVID-19 vaccine announcements from Pfizer and Moderna. Investors rotated back into areas of the equity market that had underperformed for most of the reporting period and stand to benefit more from an anticipated return to stronger economic growth in the second half of 2021. Within real estate, retail shopping centers, hotels and some areas of office posted strong gains following the COVID-19 vaccine announcement, while the reporting period’s previous winners such as data centers, cellular tower companies, industrial facilities and self-storage were targeted as a source of funds for portfolio rebalancings throughout the industry.
For infrastructure, two of its largest segments were similarly impacted. Transportation infrastructure, which includes airports, toll roads and passenger rail lines, operated at a fraction of capacity due to lockdowns, border closures, social distancing and general fear of the coronavirus. Although their usage began to increase as the reporting period progressed, restrictions remained. For the same reasons, energy infrastructure was significantly impacted by reduced demand, which came at a time when supply was already elevated. The price war between Saudi Arabia and Russia exacerbated the imbalance and pushed oil prices to an 18-year low in March 2020, which further reduced the need for pipeline infrastructure to move the commodity as production slowed. Energy infrastructure saw some improvement as the reporting period progressed as demand increased after many economies came back online, while OPEC and other oil-producing nations agreed to stem production. However, it was the COVID-19 vaccine announcements in the final two months of the reporting period that buoyed the price of crude oil, as well as the whole energy sector, because of the likely economic reopenings that will eventually result.
In the high yield market, the COVID-19 crisis led to a near complete shutdown of the capital markets in March 2020, which was exacerbated by the sharp drop in crude oil prices. Together these forces drove a spike in risk premiums and high yield outflows, with
12
high yield spreads peaking at 1,100 basis points over Treasuries at the reporting period’s widest point in March 2020. However, policymakers immediately implemented a number of tools at their disposal to support healthy market and economic functioning and companies tapped credit facilities. Investors took courage from these steps resulting in sizable inflows back into the high yield market for the remainder of the reporting period, which were met with the largest net new issuance on record in 2020 as companies aimed to optimize their capital structure. Over the remainder of the reporting period, the high yield market continued to be supported by accommodative policies, gradual reopenings and falling unemployment. After the sharp underperformance in March 2020, high yield spreads retraced to 361 basis points by year end and the market ended the reporting period with a surprisingly strong 7.11% return, as measured by the Bloomberg Barclays U.S. Corporate High Yield Index. Meanwhile, returns between the two preferred indices within the Real Asset Income Blend Index varied more than normal, highlighting the disproportionate impact the COVID-19 crisis has had on real estate. The Bloomberg Barclays Global Capital Securities Index advanced 10.67%, while the return of the Wells Fargo Hybrid & Preferred Securities REIT Index was much more muted at 2.82%.
Throughout the reporting period, the Fund generated a consistent gross yield that remained above our overall yield hurdle, which served as a source of stability for the Fund as it has during previous market declines. However, the Fund underperformed relative to its blended benchmark mainly because of its specific mandate to own only real asset companies, which ended up being disproportionately affected by social distancing and the closure of economies worldwide. Areas that the Fund is unable to own because of its real asset mandate generally held up better. The Fund’s shortfall versus its Lipper group was primarily due to its greater focus on yield compared to its peers because of its income objective. For much of the reporting period, investors remained focused on companies with superior growth expectations over more value-oriented or higher yielding securities. The Fund underperformed the Bloomberg Barclays U.S. Corporate High Yield Bond Index because of its exposures to the real estate and infrastructure equity segments, which significantly underperformed high yield bonds during the reporting period.
The Fund attempted to add value versus the Real Asset Income Blend benchmark in two ways, by re-allocating money among five main security types, finding pockets of value at differing times and, more importantly, through individual security selection. The Fund’s performance was hindered in varying degrees by four of the five segments (real estate preferred, high yield debt, infrastructure preferreds and real estate common equity), while its exposure in the infrastructure equity segment benefited performance results.
The real estate preferred segment was the most significant drag on performance, primarily due to the Fund’s overweight to hotel REIT preferreds and underweight to the self-storage area. Certain sub-property types were much less affected by social distancing, primarily due to the fact that their tenants, in large part, are not people. Self-storage was an area that provided defensive characteristics and garnered investor attention because it is a rather low cost expense for most households and requires no human interaction. As a result, self-storage REIT preferred securities provided positive returns that were substantially better than many areas that experienced massive business disruptions from the COVID-19 crisis. On the other hand, hotel demand cratered as country borders were closed to international air traffic and domestic travel was largely halted from stay-at-home orders and general health concerns.
In the debt area, results were hurt by the Fund’s lack of industrial exposure, which represents almost 15% of the high yield index. The Fund typically has an underweight to industrials because most of the companies within that space don’t meet our definition of infrastructure or real estate. However, much of the industrial category that the Fund is precluded from owning outperformed during the reporting period, leading to its shortfall in the debt portfolio.
While an overweight allocation to the infrastructure preferred segment was positive during the reporting period, security selection detracted primarily due to energy holdings. This segment is a disproportionately large part of the Fund’s investable universe given its real asset mandate. Energy infrastructure, as previously mentioned, was significantly impacted earlier in the reporting period by reduced demand for oil as travel restrictions and shelter-in-place/work-from-home policies greatly reduced both air and automobile traffic. Elevated supply, cratering demand and dramatic price declines for crude oil reduced the need for infrastructure assets as drillers and exploration and production cut activity and expenditures. The Fund’s investments focused on higher quality midstream companies, which performed much better than lower quality upstream, which were not immune to the significant price depreciation. Later in the reporting period, the price of crude oil and the energy sector was buoyed by significant strides made around the world in containing COVID-19, economic reopenings and the COVID-19 vaccine announcements. The Fund’s reduced its energy exposure early in the downturn, and remained committed to its high quality positions within midstream, especially within the preferred group.
13
Portfolio Managers’ Comments (continued)
The Fund was positioned with a modest overweight in real estate common equity relative to the benchmark heading into the reporting period, which proved detrimental given the weakness in the segment. Within the segment, an overweight to the net lease sector detracted the most. Net lease is typically a more defensive group because lease structures are usually longer term in nature, which has historically provided some consistency to earnings in an economic decline. These companies also pay higher dividends than many other sectors, which makes them more appropriate for an income-focused portfolio versus other property types that may not produce high enough dividends. However, many property types were subject to forced closures, which caused considerable fears about future earnings and potential dividend cuts due to the possible inability for tenants to pay rent.
The infrastructure common equity sector aided the Fund’s performance results during the reporting period, mostly due to its out-of-index exposure in alternative energy, by far the strongest performing area within the sector. An overweight in electric transmission and significant underweight within airports also proved beneficial. Besides the energy sector, no group suffered more for most of the reporting period than airports due to the collapse of passenger traffic amidst the COVID-19 crisis. Conversely, no group benefited more from the COVID-19 vaccine announcements, even though airline and airport CEOs remained tempered regarding their projected timelines for a return to pre-COVID activity. Due to the income objective of the Fund, few of the publicly traded airport companies are viable investment opportunities given their low dividend yields. However, because airports are a significant portion of the benchmark, the Fund’s underweight was beneficial.
We continued to actively manage the Fund’s allocations among the five investment categories to reflect what we believed to be the best opportunities in our investment universe. Toward the end of the reporting period following the COVID-19 vaccine announcements, we made substantial portfolio shifts. The Fund narrowed its underweight in equities by the end of the reporting period, adding to areas such as pipelines and renewable energy in infrastructure, along with additions to REIT equities, while reducing U.S. utility equity exposure. We also made small additions to many other equity sectors funded by a decrease in preferred holdings as spreads continued to narrow and yield characteristics in the equity universe became more attractive in relative terms. We reduced debt exposure and also redirected those proceeds into equities, ending the reporting period with a slight underweight in high yield debt relative to the benchmark. Preferred securities continued to represent an overweight, although narrower than at the beginning of the reporting period.
The Fund began using interest rate futures to partially hedge the portfolio against movements in interest rates. The futures contracts’ impact on performance was negligible during the reporting period.
Nuveen Real Estate Securities Fund
How did the Fund perform during the twelve-month reporting period ended December 31, 2020?
The table in the Performance Overview and Holding Summaries section of this report provides total returns at net asset value (NAV) for the period ended December 31, 2020. The Fund’s total returns on NAV are compared with the performance of a corresponding market index.
The Fund’s Class A Shares at NAV outperformed the MSCI U.S. REIT Index but underperformed the Lipper classification average during the twelve-month reporting period.
What strategies were used to manage the Fund during the reporting period and how did these strategies influence performance?
The Fund seeks to provide above average current income and long-term capital appreciation by investing in income producing common stocks of publicly traded companies engaged in the real estate industry. During the reporting period, we continued to implement the Fund’s strategy of investing on a relative value basis. However, the COVID-19 crisis caused significant bifurcation in performance between sectors that were able to continue to operate well during the crisis versus those that were much more negatively impacted. As a result, we made larger-than-normal deviations at the sector level relative to the benchmark, focusing even more on areas like data centers, cell towers and industrial because fundamentals in those sectors were much less impacted by social distancing. We avoided sectors such as retail and lodging, which we believed were most at risk. In the final months of the reporting period, the encouraging news about several COVID-19 vaccines caused us to begin shifting the Fund’s sector weights back toward a more neutral positioning.
14
During the first three months of the reporting period, the health and financial crisis brought about by the COVID-19 crisis clearly had a devastating impact on financial markets. Although many defensive areas of the markets outperformed broader equities, the traditionally defensive real estate group did not. The sector experienced a massive sell-off in March 2020 that exceeded even the swiftness of the broader equity market declines. Many real estate investment trusts (REITs) suffered disproportionately at the hands of the COVID-19 crisis because most property types are comprised of physical assets that are meant to facilitate the gathering of people. However, over half of the world’s population was either mandated or strongly encouraged to do precisely the opposite. As a result, some tenants were not able to pay rent to property owners, which affected profitability and cash flow for REITs.
Following the initial crisis, markets shifted sharply again as a result of the massive amounts of global monetary and fiscal stimulus coupled with a significant improvement on the health front as economies that had been affected by COVID-19 the earliest made headway in its containment. As a result, investor sentiment began to improve dramatically and markets looked forward to recovery as economies started to reopen. However, while broader equity markets showed strength, especially large technology-focused companies, real estate continued to underperform because the segment will likely take longer to recover from the lingering effects of the shutdowns related to the health crisis. The slow pace of reopenings and the difficulty the U.S. had in containing COVID-19 continued to be overhangs for this segment. Retail shopping centers, hotels, restaurants and theaters saw improvements in activity and sales, but at a very gradual and uneven pace. The good news, however, was that fundamentals remained solid for several property types that didn’t experience a drop off in demand like data centers, cellular tower companies, industrial facilities and self-storage.
In the final two months of the reporting period, the real estate segment rebounded following favorable COVID-19 vaccine announcements from Pfizer and Moderna, which immediately changed the investment landscape. Investors rotated back into areas of the equity market that had underperformed for most of the reporting period and stand to benefit more from an anticipated return to stronger economic growth in the second half of 2021. As a result, the areas that most significantly underperformed previously within the real estate sector dramatically reversed course with various retail shopping centers, hotels and some areas of office posting strong gains following the COVID-19 vaccine announcement. The reporting period’s previous winners such as data centers, cellular tower companies, industrial facilities and self-storage were targeted as a source of funds for portfolio rebalancings throughout the industry, including the Fund’s portfolio. While the underlying fundamentals within these categories remained strong, their defensive characteristics and substantial relative outperformance dampened their short-term prospects as the market looked forward to some semblance of normalcy later in 2021. However, despite the rally in real estate in the final months of the reporting period, it was not enough to make up for the segment’s earlier shortfall. During the reporting period, the sector returned -7.57%, as measured by the MSCI U.S. REIT Total Return Index, significantly underperforming the broader domestic equity market, which returned 18.40%, as measured by the S&P 500® Index.
The Fund outperformed the MSCI U.S. REIT benchmark but still produced negative absolute returns during the reporting period. From a relative performance standpoint, the Fund saw positive results primarily from the industrial, multi-family/apartment, community centers and health care REIT sectors. On the negative side, the self-storage, specialty and technology infrastructure segments detracted from performance.
The Fund’s leading contribution came from an overweight allocation to industrial real estate. As we entered the reporting period, the industrial sector was directly benefiting from the same dynamic in the marketplace that was weighing on the regional mall/retail real estate sector, which was the disruption from ecommerce. This secular trend was only accentuated by the COVID-19 crisis as many retail stores were closed to try to slow the spread of COVID-19. However, industrial facilities remained open and became even more important as much more commerce was executed from people’s homes. While warehouses and distribution facilities certainly have people present, they are able to easily practice social distancing. Many of these sites also served businesses that were deemed essential and fulfilled ecommerce orders, while brick-and-mortar retail facilities were closed. The industrial group continued to demonstrate some of the strongest fundamentals with ever-increasing demand for these logistics and fulfillment facilities outstripping what has been a rather contained supply situation. These underlying fundamentals, along with being less affected by social distancing, led to significant outperformance of the group relative to the broader benchmark.
The Fund also benefited from favorable stock selection and allocation effect within the multi-family/apartment sector. The impact from COVID-19 on rents has been dramatic, especially in urban centers of gateway markets like New York City and San Francisco. Unemployment due to the health crisis has disproportionately impacted urban centers relative to suburban areas, including much of
15
Portfolio Managers’ Comments (continued)
the workforce that rents rather than owns property. Demand for apartment space has fallen as renters look for alternative living arrangements, causing rents to decline to stem the outflow. The combination of lower occupancy with lower rents portends more difficult economics for the multi-family sector going forward and the group’s performance suffered as a result. The return for the property type in the index fell more than 15%. The Fund’s underweight position in several large benchmark constituents, as well as more muted losses for its holdings, led to outperformance in the segment.
Community centers, another underweighted sector, contributed to the Fund’s performance. We reduced the Fund’s overall allocation to the group because the underlying fundamentals for retail businesses remained low, especially in light of increasing domestic COVID-19 infections. Of all the business models within the real estate universe, we believed retail would likely remain the most challenged as ecommerce trends showed no signs of slowing their already significant pace of market share gains in terms of overall sales. The market drew the same conclusion as the reporting period progressed. The sector was one of the worst performers in the index during the reporting period in absolute terms.
The health care REIT sector also contributed favorably to the Fund’s relative performance, driven entirely by stock selection. We continued to favor the life science area (lab space for research), as well as medical office space within the group. The Fund’s overweight positions in companies whose businesses are more focused in these areas generated the most outperformance. Demand for and utilization of life science space only grew during the reporting period as testing and research were key to finding a path forward for dealing with COVID-19. Specifically within the life science area, the Fund’s overweight position in Alexandria Real Estate Equities Inc. was the largest contributor. In the medical office space, demand did fall precipitously earlier in the reporting period because patients chose to stay home and put off visits and elective surgeries. However, in relative terms, the segment remained in a favored position due to financial strength and the likelihood that rents would be less impacted than other areas.
The self-storage sector was the leading detractor from the Fund’s relative performance. Heading into the reporting period, we were concerned about modest market oversupply and growing expenses, which somewhat muted the group’s growth prospects. However, the world quickly changed and the defensive properties of self-storage garnered investor attention during the COVID-19 crisis. As a result, the group provided returns that were substantially better than many areas that experienced massive business disruptions. While the Fund added self-storage exposure during the reporting period, a slight underweight persisted resulting in relative underperformance.
The specialty sector, which rebounded after substantial first quarter 2020 weakness, was a modest detractor during the reporting period. Within the benchmark, gaming companies comprise a significant weight within the specialty sector. The gaming segment performed strongly later in the reporting period based on reopening news and the prospect that people would return to casinos following favorable vaccine news. Our Fund’s underweight positions in the two of the largest gaming companies in the index, Gaming & Leisure Properties and VICI Properties Inc., led to the relative underperformance within the segment.
The technology infrastructure sector also modestly detracted from relative performance during the reporting period after enjoying the strongest returns in the first half of the reporting period. This sector saw selling pressure toward the end of the reporting period as money managers repositioned their portfolios toward companies that stand to benefit the most from a more normalized economic environment once the COVID-19 crisis loses steam. The primary detractor was the Fund’s small underweight to one of the larger holdings in the benchmark index, Digital Realty Trust Inc., which was mainly due to its elevated valuation versus its peers.
The Fund maintained a bias toward higher quality companies and assets within the REIT sector in general because asset type and balance sheet strength remained important considerations for investment. The Fund remained defensively positioned based on our preference for companies with business models that are better able to function well in the current COVID-19 crisis environment. However, the COVID-19 vaccine news late in the reporting period provided a light at the end of the tunnel for most of the more maligned areas of real estate and was the catalyst for rebalancing the Fund’s portfolio. The Fund reduced its exposure in sectors that had worked the best prior to the COVID-19 vaccine announcements, namely industrial and technology infrastructure, using the proceeds to fund purchases in areas that had been the most challenged such as retail, net lease, apartments and office.
16
Risk Considerations and Dividend Information
Risk Considerations
Nuveen Global Infrastructure Fund
Mutual fund investing involves risk; principal loss is possible. Concentration in infrastructure-related securities involves sector risk and concentration risk, particularly greater exposure to adverse economic, regulatory, political, legal, liquidity, and tax risks associated with master limited partnerships (MLPs) and real estate investment trusts (REITS). Foreign investments involve additional risks including currency fluctuations and economic and political instability. These risks are magnified in emerging markets. Common stocks are subject to market risk or the risk of decline. Small- and mid-cap stocks are subject to greater price volatility. The use of derivatives involves substantial financial risks and transaction costs. The Fund’s potential investment in other investment companies means shareholders bear their proportionate share of fund expenses and indirectly, the expenses of other investment companies. Fund investments in exchange trade funds (ETFs) may involve tracking error. Preferred securities may involve greater credit risk than other debt instruments.
Nuveen Global Real Estate Securities Fund
Mutual fund investing involves risk; principal loss is possible. There is no guarantee the Fund’s investment objectives will be achieved. The real estate industry is greatly affected by economic downturns or by changes in real estate values, rents, property taxes, interest rates, tax treatment, regulations, or the legal structure of the REIT. Prices of equity securities may decline significantly over short or extended periods of time. Non-U.S. investments involve risks such as currency fluctuation, political and economic instability, lack of liquidity and differing legal and accounting standards. These risks are magnified in emerging markets. These and other risk considerations, such as active management, derivatives, preferred security, and, small and mid-cap risks, are described in detail in the Fund’s prospectus.
Nuveen Real Asset Income Fund
Mutual fund investing involves risk; principal loss is possible. Equity investments such as those held by the Fund are subject to market risk, call risk, derivatives risk, other investment companies risk, common stock risk, and tax risks associated with master limited partnerships (MLPs). Concentration in specific sectors may involve greater risk and volatility than more diversified investments: real estate sector involves the risk of exposure to economic downturns and changes in real estate values, rents, property taxes, interest rates and tax laws; infrastructure-related securities may involve greater exposure to adverse economic, regulatory, political, legal, and other changes affecting such securities. Foreign investments involve additional risks, including currency fluctuation, political and economic instability, lack of liquidity, and differing legal and accounting standards. These risks are magnified in emerging markets. Investments in small- and mid-cap companies are subject to greater volatility. In addition, the Fund will bear its proportionate share of any fees and expenses paid by the exchange trade funds (ETFs) in which it invests.
Debt or fixed income securities such as those held by the Fund are subject to market risk, credit risk, interest rate risk and income risk. As interest rates rise, bond prices fall. Below investment grade or high yield debt securities are subject to liquidity risk and heightened credit risk. Preferred securities are subordinated to bonds and other debt instruments in a company’s capital structure and therefore are subject to greater credit risk. Asset-backed and mortgage-backed securities are subject to additional risks such as prepayment risk, liquidity risk, default risk and adverse economic developments.
Nuveen Real Estate Securities Fund
Mutual fund investing involves risk; principal loss is possible. Common stocks and REITs such as those held in the Fund involve market risk, concentration risk, sector risk, and non-diversification risk. The real estate industry is greatly affected by economic downturns that may persist as well as changes in property values, taxes, and regulatory developments. Foreign investments involve additional risks including currency fluctuations, and economic or political instability. These risks are magnified in emerging markets. The use of derivatives involves substantial financial risks and transaction costs. Small cap stocks may experience more volatility than large cap stocks.
17
Risk Considerations and Dividend Information (continued)
Dividend Information
Regular dividends are declared and distributed annually for Nuveen Global Infrastructure Fund, declared daily and distributed monthly for Nuveen Real Asset Income Fund and declared and distributed quarterly for Nuveen Global Real Estate Securities Fund and Nuveen Real Estate Securities Fund. To permit a Fund to maintain a more stable dividend, the Fund may pay dividends at a rate that may be more or less than the amount of net investment income it actually earned during the period.
In certain instances, a portion of each Fund’s distributions may be paid from sources or comprised of elements other than ordinary income, including capital gains and/or a return of capital. This is generally due to the fact that the tax character of Fund distributions for a fiscal year is dependent upon the amount and tax character of distributions received from securities held in the Fund’s portfolio. Distributions received from certain securities in which the Fund invests, most notably real estate investment trust (REIT) securities, may be characterized for tax purposes as ordinary income, long-term capital gain and/or a return of capital. The issuer of a security typically reports the tax character of its distributions only once per year, generally during the first two months of the following calendar year. The full amount of the distributions received from such securities is included in the Fund’s ordinary income during the course of the year until such time the Fund is notified by the issuer of the actual tax character. To the extent that at the time of a particular distribution the Fund estimates that a portion of that distribution is attributable to a source or sources other than ordinary income, the Fund would send shareholders a notice to that effect. The final determination of the sources and tax character of all distributions for the fiscal year is made after the end of the fiscal year.
Additional Dividend Information for Nuveen Global Real Estate Securities Fund, Nuveen Real Asset Income Fund and Nuveen Real Estate Securities Fund
Nuveen Global Real Estate Securities Fund, Nuveen Real Asset Income Fund and Nuveen Real Estate Securities Fund seek to pay regular dividends at a rate that reflects the cash flow received from each Fund’s investments in portfolio securities. Fund distributions are not intended to include expected portfolio appreciation; however, the Funds invest in securities that make payments which ultimately may be fully or partially characterized for tax purposes by the securities’ issuers as gains or return of capital. While the reported sources of distributions may include capital gains and/or return of capital for tax purposes, the Funds intend to distribute only the net cash flow received as opposed to a distribution rate based on long-term total return. This tax treatment will generally “flow through” to the Funds’ distributions, but the specific tax treatment is often not known with certainty until after the end of the Funds’ tax year. As a result, certain portions of the regular distributions by Nuveen Global Real Estate Securities Fund and Nuveen Real Estate Securities Fund throughout the year were later re-characterized for tax purposes as either long-term gains (both realized and unrealized), or as a non-taxable return of capital, as set forth in each Fund’s table below. Nuveen Real Asset Income Fund did not have any such distribution re-characterizations.
Nuveen Global Real Estate Securities Fund – Data as of December 31, 2020
| | | | | | | | | | | | | | | | | | | | | | | | | | | | | | |
| Calendar Year 2020 | |
| | | | | Percentage of the Distribution | | | Per Share Amounts | |
| Share Class | | Ticker Symbol | | Net
Investment
Income | | | Realized
Gains | | | Return of
Capital | | | Distributions | | | Net
Investment
Income | | | Realized
Gains | | | Return of
Capital | |
Class A | | NRIAX | | | 71.79% | | | | 28.21% | | | | 0.00% | | | $ | 0.6329 | | | $ | 0.4544 | | | $ | 0.1785 | | | $ | 0.0000 | |
Class C | | NRICX | | | 63.02% | | | | 36.98% | | | | 0.00% | | | $ | 0.4827 | | | $ | 0.3042 | | | $ | 0.1785 | | | $ | 0.0000 | |
Class R6 | | NRIFX | | | 74.33% | | | | 25.67% | | | | 0.00% | | | $ | 0.6956 | | | $ | 0.5170 | | | $ | 0.1785 | | | $ | 0.0000 | |
Class I | | NRIIX | | | 73.85% | | | | 26.15% | | | | 0.00% | | | $ | 0.6830 | | | $ | 0.5044 | | | $ | 0.1785 | | | $ | 0.0000 | |
18
Nuveen Real Estate Securities Fund – Data as of December 31, 2020(1)
| | | | | | | | | | | | | | | | | | | | | | | | | | | | | | |
| Calendar Year 2020 | |
| | | | | Percentage of the Distribution | | | Per Share Amounts | |
| Share Class | | Ticker Symbol | | Net
Investment
Income | | | Realized
Gains | | | Return of
Capital | | | Distributions | | | Net
Investment
Income | | | Realized
Gains | | | Return of
Capital | |
Class A | | FREAX | | | 28.68% | | | | 71.32% | | | | 0.0% | | | $ | 0.4899 | | | $ | 0.1405 | | | $ | 0.3494 | | | $ | 0.0000 | |
Class C | | FRLCX | | | 0.00% | | | | 100.00% | | | | 0.0% | | | $ | 0.3494 | | | $ | 0.0000 | | | $ | 0.3494 | | | $ | 0.0000 | |
Class R3 | | FRSSX | | | 22.44% | | | | 77.56% | | | | 0.0% | | | $ | 0.4505 | | | $ | 0.1011 | | | $ | 0.3494 | | | $ | 0.0000 | |
Class R6 | | FREGX | | | 39.52% | | | | 60.48% | | | | 0.0% | | | $ | 0.5777 | | | $ | 0.2283 | | | $ | 0.3494 | | | $ | 0.0000 | |
Class I | | FARCX | | | 35.48% | | | | 64.52% | | | | 0.0% | | | $ | 0.5415 | | | $ | 0.1921 | | | $ | 0.3494 | | | $ | 0.0000 | |
| (1) | The Fund owns REIT securities which attribute their distributions to various sources, including net investment income, gains and return of capital. |
The amount and sources of distributions reported in this notice are for financial reporting purposes and are not being provided for tax reporting purposes. The actual amounts and character of the distributions for tax reporting purposes will be reported to shareholders on Form 1099-DIV which will be sent to shareholders shortly after calendar year-end. More details about each Fund’s distributions and the basis for these estimates are available on www.nuveen.com.
19
THIS PAGE INTENTIONALLY LEFT BLANK
20
Fund Performance and Expense Ratios
The Fund Performance and Expense Ratios for each Fund are shown within this section of the report.
Fund Performance
Returns quoted represent past performance, which is no guarantee of future results. Investment returns and principal value will fluctuate so that when shares are redeemed, they may be worth more or less than their original cost. Current performance may be higher or lower than the performance shown.
Total returns for a period of less than one year are not annualized (i.e. cumulative returns). Since inception returns are shown for share classes that have less than 10-years of performance. Returns at net asset value (NAV) would be lower if the sales charge were included. Returns assume reinvestment of dividends and capital gains. For performance current to the most recent month-end visit nuveen.com or call (800) 257-8787.
Returns do not reflect the deduction of taxes that a shareholder would pay on Fund distributions or the redemption of Fund shares.
Returns may reflect fee waivers and/or expense reimbursements by the investment adviser during the periods presented. If any such waivers and/or reimbursements had not been in place, returns would have been reduced. See Notes to Financial Statements, Note 7—Management Fees and Other Transactions with Affiliates for more information.
Returns reflect differences in sales charges and expenses, which are primarily differences in distribution and service fees, and assume reinvestment of dividends and capital gains.
Comparative index and Lipper return information is provided for Class A Shares at NAV only.
Expense Ratios
The expense ratios shown are as of the Fund’s most recent prospectus. The expense ratios shown reflect total operating expenses (before fee waivers and/or expense reimbursements, if any). The expense ratios include management fees and other fees and expenses.
21
Fund Performance and Expense Ratios (continued)
Nuveen Global Infrastructure Fund
Refer to the first page of this Fund Performance and Expense Ratios section for further explanation of the information included within this section. Refer to the Glossary of Terms Used in this Report for definitions of terms used within this section.
Fund Performance and Expense Ratios
| | | | | | | | | | | | | | | | | | | | | | | | |
| | | Inception
Date | | | Total Returns as of December 31, 2020* | | | | |
| | | Average Annual | | | Expense Ratios** | |
| | | 1-Year | | | 5-Year | | | 10-Year | | | Gross | | | Net | |
Class A Shares at NAV | | | 12/17/07 | | | | (2.76)% | | | | 8.27% | | | | 7.69% | | | | 1.36% | | | | 1.22% | |
Class A Shares at maximum Offering Price | | | 12/17/07 | | | | (8.37)% | | | | 7.00% | | | | 7.06% | | | | — | | | | — | |
S&P Global Infrastructure Index NR | | | — | | | | (6.49)% | | | | 6.94% | | | | 5.56% | | | | — | | | | — | |
Lipper Global Infrastructure Funds Classification Average | | | — | | | | 0.79% | | | | 8.10% | | | | 7.63% | | | | — | | | | — | |
| | | | | | |
Class C Shares | | | 11/03/08 | | | | (3.56)% | | | | 7.44% | | | | 6.89% | | | | 2.11% | | | | 1.97% | |
Class R3 Shares | | | 11/03/08 | | | | (3.10)% | | | | 7.98% | | | | 7.37% | | | | 1.61% | | | | 1.47% | |
Class I Shares | | | 12/17/07 | | | | (2.55)% | | | | 8.53% | | | | 7.96% | | | | 1.11% | | | | 0.97% | |
| | | |
| | | | | | Total Returns as of December 31, 2020* | | | | |
| | | | | | Average Annual | | | Expense Ratios** | |
| | | Inception
Date | | | 1-Year | | | 5-Year | | | Since
Inception | | | Gross | | | Net | |
Class R6 Shares | | | 6/30/16 | | | | (2.39)% | | | | N/A | | | | 6.58% | | | | 1.03% | | | | 0.89% | |
| * | Class A Shares have a maximum 5.75% sales charge (Offering Price). Class A Share purchases of $1 million or more are sold at net asset value without an up-front sales charge but may be subject to a contingent deferred sales charge (CDSC) of 1% if redeemed within eighteen months of purchase. Class C Shares have a 1% CDSC for redemptions within less than twelve months, which is not reflected in the total returns. Class C Shares automatically convert to Class A Shares ten years after purchase. Effective March 1, 2021, Class C Shares will automatically convert to Class A Shares eight years after purchase. Class R3 Shares have no sales charge and are only available for purchase by eligible retirement plans. Class R6 Shares have no sales charge and are available only to certain limited categories of investors as described in the prospectus. Class I Shares have no sales charge and may be purchased under limited circumstances or by specified classes of investors. |
| ** | The Fund’s investment adviser has contractually agreed to waive fees and/or reimburse other Fund expenses through July 31, 2022 so that total annual Fund operating expenses (excluding 12b-1 distribution and/or service fees, interest expenses, taxes, acquired fund fees and expenses, fees incurred in acquiring and disposing of portfolio securities and extraordinary expenses) do not exceed 1.00% of the average daily net assets of any class of Fund shares. However, because Class R6 Shares are not subject to sub-transfer agent and similar fees, the total annual Fund operating expenses for Class R6 Shares will be less than the expense limitation. This expense limitation may be terminated or modified prior to that date only with the approval of the Board of Directors of the Fund. |
Growth of an Assumed $10,000 Investment as of December 31, 2020 – Class A Shares
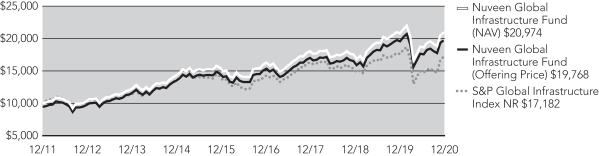
The graphs do not reflect the deduction of taxes that a shareholder may pay on Fund distributions or the redemption of Fund shares.
22
Fund Performance and Expense Ratios (continued)
Nuveen Global Real Estate Securities Fund
Refer to the first page of this Fund Performance and Expense Ratios section for further explanation of the information included within this section. Refer to the Glossary of Terms Used in this Report for definitions of terms used within this section.
Fund Performance and Expense Ratios
| | | | | | | | | | | | | | | | | | | | |
| | | Inception
Date | | | Total Returns as of December 31, 2020* | | | | | | | |
| | | Average Annual | | | Expense Ratios** | |
| | | 1-Year | | | Since
Inception | | | Gross | | | Net | |
Class A Shares at NAV | | | 3/20/18 | | | | (1.32)% | | | | 8.13% | | | | 3.21% | | | | 1.30% | |
Class A Shares at maximum Offering Price | | | 3/20/18 | | | | (6.99)% | | | | 5.86% | | | | — | | | | — | |
FTSE EPRA/NAREIT Developed Index NR | | | — | | | | (9.04)% | | | | 3.43% | | | | — | | | | — | |
Lipper Global Real Estate Funds Classification Average | | | — | | | | (5.05)% | | | | 5.48% | | | | — | | | | — | |
| | | | | |
Class C Shares | | | 3/20/18 | | | | (2.04)% | | | | 7.33% | | | | 3.96% | | | | 2.05% | |
Class R6 Shares | | | 3/20/18 | | | | (0.95)% | | | | 8.48% | | | | 2.88% | | | | 0.97% | |
Class I Shares | | | 3/20/18 | | | | (1.02)% | | | | 8.40% | | | | 2.96% | | | | 1.05% | |
| * | Class A Shares have a maximum 5.75% sales charge (Offering Price). Class A Share purchases of $1 million or more are sold at net asset value without an up-front sales charge but may be subject to a contingent deferred sales charge (CDSC) of 1% if redeemed within eighteen months of purchase. Class C Shares have a 1% CDSC for redemptions within less than twelve months, which is not reflected in the total returns. Class C Shares automatically convert to Class A Shares ten years after purchase. Effective March 1, 2021, Class C Shares will automatically convert to Class A Shares eight years after purchase. Class R6 Shares have no sales charge and are available only to certain limited categories of investors as described in the prospectus. Class I Shares have no sales charge and may be purchased under limited circumstances or by specified classes of investors. |
| ** | The Fund’s investment adviser has contractually agreed to waive fees and/or reimburse other Fund expenses through July 31, 2022 so that total annual Fund operating expenses (excluding 12b-1 distribution and/or service fees, interest expenses, taxes, acquired fund fees and expenses, fees incurred in acquiring and disposing of portfolio securities and extraordinary expenses) do not exceed 1.09% of the average daily net assets of any class of Fund shares. However, because Class R6 Shares are not subject to sub-transfer agent and similar fees, the total annual Fund operating expenses for Class R6 Shares will be less than the expense limitation. This expense limitation may be terminated or modified prior to that date only with the approval of the Board of Trustees of the Fund. |
Growth of an Assumed $10,000 Investment as of December 31, 2020 – Class A Shares
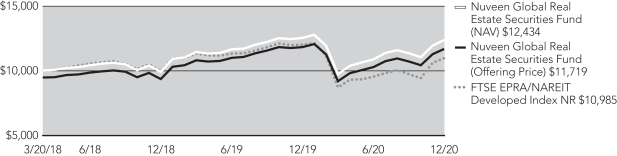
The graphs do not reflect the deduction of taxes that a shareholder may pay on Fund distributions or the redemption of Fund shares.
23
Fund Performance and Expense Ratios (continued)
Nuveen Real Asset Income Fund
Refer to the first page of this Fund Performance and Expense Ratios section for further explanation of the information included within this section. Refer to the Glossary of Terms Used in this Report for definitions of terms used within this section.
Fund Performance and Expense Ratios
| | | | | | | | | | | | | | | | | | | | |
| | | Inception
Date | | | Total Returns as of December 31, 2020* | | | | |
| | | Average Annual | | | | |
| | | 1-Year | | | 5-Year | | | Since
Inception | | | Expense
Ratios | |
Class A Shares at NAV | | | 9/13/11 | | | | (3.71)% | | | | 6.27% | | | | 7.39% | | | | 1.14% | |
Class A Shares at maximum Offering Price | | | 9/13/11 | | | | (9.24)% | | | | 5.02% | | | | 6.71% | | | | — | |
Bloomberg Barclays U.S. Corporate High Yield Bond Index | | | — | | | | 7.11% | | | | 8.59% | | | | 7.19% | | | | — | |
Real Asset Income Blend | | | — | | | | 0.81% | | | | 6.76% | | | | 7.20% | | | | — | |
Lipper Real Return Classification Average | | | — | | | | 0.51% | | | | 5.07% | | | | 2.16% | | | | — | |
| | | | | |
Class C Shares | | | 9/13/11 | | | | (4.43)% | | | | 5.47% | | | | 6.60% | | | | 1.89% | |
Class R6 Shares | | | 6/30/16 | | | | (3.40)% | | | | N/A | | | | 5.04% | | | | 0.80% | |
Class I Shares | | | 9/13/11 | | | | (3.47)% | | | | 6.52% | | | | 7.66% | | | | 0.89% | |
| * | Class A Shares have a maximum 5.75% sales charge (Offering Price). Class A Share purchases of $1 million or more are sold at net asset value without an up-front sales charge but may be subject to a contingent deferred sales charge (CDSC) of 1% if redeemed within eighteen months of purchase. Class C Shares have a 1% CDSC for redemptions within less than twelve months, which is not reflected in the total returns. Class C Shares automatically convert to Class A Shares ten years after purchase. Effective March 1, 2021, Class C Shares will automatically convert to Class A Shares eight years after purchase. Class R6 Shares have no sales charge and are available only to certain limited categories of investors as described in the prospectus. Class I Shares have no sales charge and may be purchased under limited circumstances or by specified classes of investors. |
Growth of an Assumed $10,000 Investment as of December 31, 2020 – Class A Shares
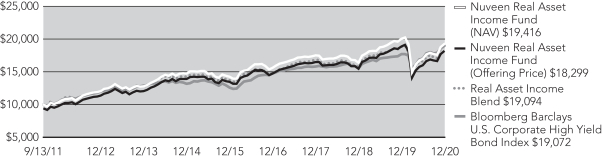
The graphs do not reflect the deduction of taxes that a shareholder may pay on Fund distributions or the redemption of Fund shares.
24
Fund Performance and Expense Ratios (continued)
Nuveen Real Estate Securities Fund
Refer to the first page of this Fund Performance and Expense Ratios section for further explanation of the information included within this section. Refer to the Glossary of Terms Used in this Report for definitions of terms used within this section.
Fund Performance and Expense Ratios
| | | | | | | | | | | | | | | | | | | | |
| | | Inception
Date | | | Total Returns as of December 31, 2020* | | | | |
| | | Average Annual | | | Expense
Ratios | |
| | | 1-Year | | | 5-Year | | | 10-Year | |
Class A Shares at NAV | | | 9/29/95 | | | | (6.37)% | | | | 4.41% | | | | 7.98% | | | | 1.30% | |
Class A Shares at maximum Offering Price | | | 9/29/95 | | | | (11.74)% | | | | 3.18% | | | | 7.34% | | | | — | |
MSCI U.S. REIT Index | | | — | | | | (7.57)% | | | | 4.84% | | | | 8.30% | | | | — | |
Lipper Real Estate Funds Classification Average | | | — | | | | (3.60)% | | | | 5.28% | | | | 8.10% | | | | — | |
| | | | | |
Class C Shares | | | 2/01/00 | | | | (7.03)% | | | | 3.64% | | | | 7.17% | | | | 2.06% | |
Class R3 Shares | | | 9/24/01 | | | | (6.57)% | | | | 4.15% | | | | 7.71% | | | | 1.55% | |
Class I Shares | | | 6/30/95 | | | | (6.12)% | | | | 4.67% | | | | 8.25% | | | | 1.06% | |
| | | |
| | | Inception
Date | | | Total Returns as of December 31, 2020* | | | | |
| | | Average Annual | | | Expense
Ratios | |
| | | 1-Year | | | 5-Year | | | Since
Inception | |
Class R6 Shares | | | 4/30/13 | | | | (5.95)% | | | | 4.85% | | | | 5.78% | | | | 0.88% | |
| * | Class A Shares have a maximum 5.75% sales charge (Offering Price). Class A Share purchases of $1 million or more are sold at net asset value without an up-front sales charge but may be subject to a contingent deferred sales charge (CDSC) of 1% if redeemed within eighteen months of purchase. Class C Shares have a 1% CDSC for redemptions within less than twelve months, which is not reflected in the total returns. Class C Shares automatically convert to Class A Shares ten years after purchase. Effective March 1, 2021, Class C Shares will automatically convert to Class A Shares eight years after purchase. Class R3 Shares have no sales charge and are only available for purchase by eligible retirement plans. Class R6 Shares have no sales charge and are available only to certain limited categories of investors as described in the prospectus. Class I Shares have no sales charge and may be purchased under limited circumstances or by specified classes of investors. |
Growth of an Assumed $10,000 Investment as of December 31, 2020 – Class A Shares
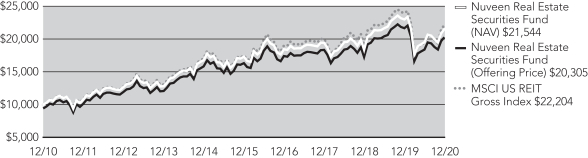
The graphs do not reflect the deduction of taxes that a shareholder may pay on Fund distributions or the redemption of Fund shares
25
Holding Summaries as of December 31, 2020
This data relates to the securities held in each Fund’s portfolio of investments as of the end of this reporting period. It should not be construed as a measure of performance for the Fund itself. Holdings are subject to change.
Nuveen Global Infrastructure Fund
Fund Allocation
(% of net assets)
| | | | |
| | |
Common Stocks | | | 86.8% | |
| |
Real Estate Investment Trust Common Stocks | | | 9.6% | |
| |
Investment Companies | | | 0.1% | |
| |
Investments Purchased with Collateral from Securities Lending | | | 1.2% | |
| |
Repurchase Agreements | | | 1.7% | |
| |
Other Assets Less Liabilities | | | 0.6% | |
| |
Net Assets | | | 100% | |
Top Five Common Stock & Real Estate Investment Trust
Common Stock Holdings
(% of net assets)
| | | | |
| | |
Transurban Group | | | 5.0% | |
| |
Aena SME SA | | | 3.9% | |
| |
American Tower Corp | | | 3.7% | |
| |
NextEra Energy Inc | | | 3.7% | |
| |
TC Energy Corp | | | 2.9% | |
Portfolio Composition
(% of net assets)
| | | | |
| | |
Transportation Infrastructure | | | 26.0% | |
| |
Electric Utilities | | | 19.4% | |
| |
Multi-Utilities | | | 12.0% | |
| |
Specialized | | | 8.8% | |
| |
Oil, Gas & Consumable Fuels | | | 8.7% | |
| |
Road & Rail | | | 4.7% | |
| |
Other2 | | | 16.8% | |
| |
Investment Companies | | | 0.1% | |
| |
Investments Purchased with Collateral from Securities Lending | | | 1.2% | |
| |
Repurchase Agreements | | | 1.7% | |
| |
Other Assets Less Liabilities | | | 0.6% | |
| |
Net Assets | | | 100% | |
Country Allocation¹
(% of net assets)
| | | | |
| | |
United States | | | 37.8% | |
| |
Australia | | | 9.4% | |
| |
Spain | | | 9.2% | |
| |
Canada | | | 8.5% | |
| |
France | | | 7.6% | |
| |
Italy | | | 7.0% | |
| |
Germany | | | 3.4% | |
| |
Mexico | | | 3.0% | |
| |
United Kingdom | | | 3.0% | |
| |
New Zealand | | | 1.8% | |
| |
Other | | | 8.7% | |
| |
Other Assets Less Liabilities | | | 0.6% | |
| |
Net Assets | | | 100% | |
| 1 | Includes 5.8% (as a percentage of net assets) in emerging market countries. |
| 2 | See Portfolio of Investments for details on “other” Portfolio Composition. |
26
Nuveen Global Real Estate Securities Fund
Fund Allocation
(% of net assets)
| | | | |
| | |
Real Estate Investment Trust Common Stocks | | | 75.9% | |
| |
Common Stocks | | | 22.9% | |
| |
Repurchase Agreements | | | 0.8% | |
| |
Other Assets Less Liabilities | | | 0.4% | |
| |
Net Assets | | | 100% | |
Top Five Common Stock & Real
Estate Investment Trust
Common Stock Holdings
(% of net assets)
| | | | |
| | |
Prologis Inc | | | 4.8% | |
| |
Equinix Inc | | | 3.0% | |
| |
LEG Immobilien AG | | | 2.3% | |
| |
TAG Immobilien AG | | | 2.2% | |
| |
Public Storage | | | 1.9% | |
Portfolio Composition
(% of net assets)
| | | | |
| | |
Real Estate Management & Development | | | 21.2% | |
| |
Industrial | | | 19.2% | |
| |
Specialized | | | 13.7% | |
| |
Residential | | | 12.3% | |
| |
Retail | | | 8.9% | |
| |
Diversified | | | 8.1% | |
| |
Office | | | 7.0% | |
| |
Health Care | | | 5.2% | |
| |
Other | | | 3.2% | |
| |
Repurchase Agreements | | | 0.8% | |
| |
Other Assets Less Liabilities | | | 0.4% | |
| |
Net Assets | | | 100% | |
Country Allocation¹
(% of net assets)
| | | | |
| | |
United States | | | 50.2% | |
| |
Japan | | | 11.7% | |
| |
Germany | | | 7.5% | |
| |
United Kingdom | | | 4.7% | |
| |
Singapore | | | 4.0% | |
| |
Australia | | | 3.7% | |
| |
Hong Kong | | | 3.6% | |
| |
Canada | | | 3.0% | |
| |
Sweden | | | 2.8% | |
| |
France | | | 1.9% | |
| |
Other | | | 6.5% | |
| |
Other Assets Less Liabilities | | | 0.4% | |
| |
Net Assets | | | 100% | |
| 1 | Includes 2.2% (as a percentage of net assets) in emerging market countries. |
27
Holding Summaries as of December 31, 2020 (continued)
Nuveen Real Asset Income Fund
Fund Allocation
(% of net assets)
| | | | |
| | |
Real Estate Investment Trust Common Stocks | | | 23.8% | |
| |
Common Stocks | | | 22.2% | |
| |
Corporate Bonds | | | 15.7% | |
| |
$25 Par (or similar) Retail Preferred | | | 15.3% | |
| |
$1,000 Par (or similar) Institutional Preferred | | | 10.6% | |
| |
Convertible Preferred Securities | | | 7.1% | |
| |
Variable Rate Senior Loan Interests | | | 1.1% | |
| |
Investment Companies | | | 0.6% | |
| |
Convertible Bonds | | | 0.6% | |
| |
Asset-Backed Securities | | | 0.3% | |
| |
Investments Purchased with
Collateral from Securities Lending | | | 1.6% | |
| |
Repurchase Agreements | | | 2.1% | |
| |
Other Assets Less Liabilities | | | (1.0)% | |
| |
Net Assets | | | 100% | |
Top Five Common Stock & Real
Estate Investment Trust
Common Stock Holdings
(% of net assets)
| | | | |
| | |
STAG Industrial Inc | | | 1.3% | |
| |
Enagas SA | | | 1.2% | |
| |
Physicians Realty Trust | | | 1.2% | |
| |
Snam SpA | | | 1.2% | |
| |
SSE PLC | | | 1.2% | |
Portfolio Composition
(% of net assets)
| | | | |
| | |
Electric Utilities | | | 17.1% | |
| |
Equity Real Estate Investment Trust | | | 12.0% | |
| |
Oil, Gas & Consumable Fuels | | | 9.7% | |
| |
Multi-Utilities | | | 9.2% | |
| |
Real Estate Management & Development | | | 5.2% | |
| |
Retail | | | 4.8% | |
| |
Industrial | | | 4.7% | |
| |
Diversified | | | 4.5% | |
| |
Health Care | | | 4.4% | |
| |
Gas Utilities | | | 4.0% | |
| |
Independent Power & Renewable Electricity Producers | | | 3.3% | |
| |
Other2 | | | 17.5% | |
| |
Investment Companies | | | 0.6% | |
| |
Asset-Backed Securities | | | 0.3% | |
| |
Investments Purchased with Collateral from Securities Lending | | | 1.6% | |
| |
Repurchase Agreements | | | 2.1% | |
| |
Other Assets Less Liabilities | | | (1.0)% | |
| |
Net Assets | | | 100% | |
Country Allocation¹
(% of net assets)
| | | | |
| | |
United States | | | 54.9% | |
| |
Canada | | | 13.6% | |
| |
Australia | | | 5.1% | |
| |
United Kingdom | | | 4.0% | |
| |
Singapore | | | 3.1% | |
| |
Spain | | | 3.0% | |
| |
Italy | | | 3.0% | |
| |
Hong Kong | | | 2.7% | |
| |
Japan | | | 1.4% | |
| |
France | | | 1.3% | |
| |
Other | | | 8.9% | |
| |
Other Assets Less Liabilities | | | (1.0)% | |
| |
Net Assets | | | 100% | |
| 1 | Includes 4.7% (as a percentage of net assets) in emerging market countries. |
| 2 | See Portfolio of Investments for details on “other” Portfolio Composition. |
28
Nuveen Real Estate Securities Fund
Fund Allocation
(% of net assets)
| | | | |
| | |
Real Estate Investment Trust
Common Stocks | | | 97.4% | |
| |
Common Stocks | | | 0.8% | |
| |
Repurchase Agreements | | | 1.1% | |
| |
Other Assets Less Liabilities | | | 0.7% | |
| |
Net Assets | | | 100% | |
Portfolio Composition
(% of net assets)
| | | | |
| | |
Specialized | | | 24.9% | |
| |
Industrial | | | 19.5% | |
| |
Residential | | | 18.6% | |
| |
Retail | | | 10.2% | |
| |
Office | | | 9.8% | |
| |
Health Care | | | 8.8% | |
| |
Other | | | 6.4% | |
| |
Repurchase Agreements | | | 1.1% | |
| |
Other Assets Less Liabilities | | | 0.7% | |
| |
Net Assets | | | 100% | |
Top Five Common Stock & Real Estate Investment Trust
Common Stock Holdings
(% of net assets)
| | | | |
| | |
Prologis Inc | | | 9.5% | |
| |
Equinix Inc | | | 6.1% | |
| |
Public Storage | | | 3.8% | |
| |
Digital Realty Trust Inc | | | 3.6% | |
| |
American Tower Corp | | | 3.2% | |
29
Expense Examples
As a shareholder of one or more of the Funds, you incur two types of costs: (1) transaction costs, including up-front and back-end sales charges (loads) or redemption fees, where applicable; and (2) ongoing costs, including management fees; distribution and service (12b-1) fees, where applicable; and other Fund expenses. The Examples below are intended to help you understand your ongoing costs (in dollars) of investing in the Funds and to compare these costs with the ongoing costs of investing in other mutual funds.
The Examples below are based on an investment of $1,000 invested at the beginning of the period and held through the period ended December 31, 2020.
The beginning of the period is July 1, 2020.
The information under “Actual Performance,” together with the amount you invested, allows you to estimate actual expenses incurred over the reporting period. Simply divide your account value by $1,000 (for example, an $8,600 account value divided by $1,000 = 8.60) and multiply the result by the cost shown for your share class, in the row entitled “Expenses Incurred During Period” to estimate the expenses incurred on your account during this period.
The information under “Hypothetical Performance,” provides information about hypothetical account values and hypothetical expenses based on each Fund’s actual expense ratio and an assumed rate of return of 5% per year before expenses, which is not the Fund’s actual return. The hypothetical account values and expenses may not be used to estimate the actual ending account balance or expense you incurred for the period. You may use this information to compare the ongoing costs of investing in the Fund and other funds. To do so, compare this 5% hypothetical example with the 5% hypothetical examples that appear in the shareholder reports of the other funds.
Please note that the expenses shown in the following tables are meant to highlight your ongoing costs only and do not reflect any transaction costs. Therefore, the hypothetical information is useful in comparing ongoing costs only, and will not help you determine the relative total costs of owning different funds or share classes. In addition, if these transaction costs were included, your costs would have been higher.
Nuveen Global Infrastructure Fund
| | | | | | | | | | | | | | | | | | | | |
| | | Share Class | |
| | | Class A | | | Class C | | | Class R3 | | | Class R6 | | | Class I | |
Actual Performance | | | | | | | | | | | | | | | | | | | | |
Beginning Account Value | | $ | 1,000.00 | | | $ | 1,000.00 | | | $ | 1,000.00 | | | $ | 1,000.00 | | | $ | 1,000.00 | |
Ending Account Value | | $ | 1,122.48 | | | $ | 1,118.05 | | | $ | 1,121.09 | | | $ | 1,124.84 | | | $ | 1,124.44 | |
Expenses Incurred During the Period | | $ | 6.51 | | | $ | 10.49 | | | $ | 7.78 | | | $ | 4.86 | | | $ | 5.18 | |
Hypothetical Performance (5% annualized return before expenses) | | | | | | | | | | | | | | | | | | | | |
Beginning Account Value | | $ | 1,000.00 | | | $ | 1,000.00 | | | $ | 1,000.00 | | | $ | 1,000.00 | | | $ | 1,000.00 | |
Ending Account Value | | $ | 1,019.00 | | | $ | 1,015.23 | | | $ | 1,017.80 | | | $ | 1,020.56 | | | $ | 1,020.26 | |
Expenses Incurred During the Period | | $ | 6.19 | | | $ | 9.98 | | | $ | 7.41 | | | $ | 4.62 | | | $ | 4.93 | |
For each class of the Fund, expenses are equal to the Fund’s annualized net expense ratio of 1.22%, 1.97%, 1.47%, 0.90%, and 0.97% for Classes A, C, R3, R6, and I respectively, multiplied by the average account value over the period, multiplied by 184/366 (to reflect the one-half year period).
30
Nuveen Global Real Estate Securities Fund
| | | | | | | | | | | | | | | | |
| | | Share Class | |
| | | Class A | | | Class C | | | Class R6 | | | Class I | |
Actual Performance | | | | | | | | | | | | | | | | |
Beginning Account Value | | $ | 1,000.00 | | | $ | 1,000.00 | | | $ | 1,000.00 | | | $ | 1,000.00 | |
Ending Account Value | | $ | 1,143.26 | | | $ | 1,139.05 | | | $ | 1,145.48 | | | $ | 1,144.66 | |
Expenses Incurred During the Period | | $ | 7.00 | | | $ | 9.95 | | | $ | 5.61 | | | $ | 5.66 | |
Hypothetical Performance (5% annualized return before expenses) | | | | | | | | | | | | | | | | |
Beginning Account Value | | $ | 1,000.00 | | | $ | 1,000.00 | | | $ | 1,000.00 | | | $ | 1,000.00 | |
Ending Account Value | | $ | 1,018.60 | | | $ | 1,015.84 | | | $ | 1,019.91 | | | $ | 1,019.86 | |
Expenses Incurred During the Period | | $ | 6.60 | | | $ | 9.37 | | | $ | 5.28 | | | $ | 5.33 | |
For each class of the Fund, expenses are equal to the Fund’s annualized net expense ratio of 1.30%, 1.86%, 1.03%, and 1.04% for Classes A, C, R6, and I respectively, multiplied by the average account value over the period, multiplied by 184/366 (to reflect the one-half year period).
Nuveen Real Asset Income Fund
| | | | | | | | | | | | | | | | |
| | | Share Class | |
| | | Class A | | | Class C | | | Class R6 | | | Class I | |
Actual Performance | | | | | | | | | | | | | | | | |
Beginning Account Value | | $ | 1,000.00 | | | $ | 1,000.00 | | | $ | 1,000.00 | | | $ | 1,000.00 | |
Ending Account Value | | $ | 1,138.64 | | | $ | 1,134.56 | | | $ | 1,140.67 | | | $ | 1,140.49 | |
Expenses Incurred During the Period | | $ | 6.24 | | | $ | 14.70 | | | $ | 4.52 | | | $ | 4.84 | |
Hypothetical Performance (5% annualized return before expenses) | | | | | | | | | | | | | | | | |
Beginning Account Value | | $ | 1,000.00 | | | $ | 1,000.00 | | | $ | 1,000.00 | | | $ | 1,000.00 | |
Ending Account Value | | $ | 1,019.30 | | | $ | 1,011.36 | | | $ | 1,020.91 | | | $ | 1,020.61 | |
Expenses Incurred During the Period | | $ | 5.89 | | | $ | 13.85 | | | $ | 4.27 | | | $ | 4.57 | |
For each class of the Fund, expenses are equal to the Fund’s annualized net expense ratio of 1.16%, 1.91%, 0.82%, and 0.91% for Classes A, C, R6, and I respectively, multiplied by the average account value over the period, multiplied by 184/366 (to reflect the one-half year period).
Nuveen Real Estate Securities Fund
| | | | | | | | | | | | | | | | | | | | |
| | | Share Class | |
| | | Class A | | | Class C | | | Class R3 | | | Class R6 | | | Class I | |
Actual Performance | | | | | | | | | | | | | | | | | | | | |
Beginning Account Value | | $ | 1,000.00 | | | $ | 1,000.00 | | | $ | 1,000.00 | | | $ | 1,000.00 | | | $ | 1,000.00 | |
Ending Account Value | | $ | 1,100.68 | | | $ | 1,097.23 | | | $ | 1,100.00 | | | $ | 1,103.10 | | | $ | 1,102.16 | |
Expenses Incurred During the Period | | $ | 6.65 | | | $ | 10.44 | | | $ | 7.97 | | | $ | 4.81 | | | $ | 5.39 | |
Hypothetical Performance (5% annualized return before expenses) | | | | | | | | | | | | | | | | | | | | |
Beginning Account Value | | $ | 1,000.00 | | | $ | 1,000.00 | | | $ | 1,000.00 | | | $ | 1,000.00 | | | $ | 1,000.00 | |
Ending Account Value | | $ | 1,018.80 | | | $ | 1,015.18 | | | $ | 1,017.55 | | | $ | 1,020.56 | | | $ | 1,020.01 | |
Expenses Incurred During the Period | | $ | 6.39 | | | $ | 10.03 | | | $ | 7.66 | | | $ | 4.62 | | | $ | 5.18 | |
For each class of the Fund, expenses are equal to the Fund’s annualized net expense ratio of 1.26%, 2.00%, 1.51%, 0.91%, and 1.02% for Classes A, C, R3, R6, and I respectively, multiplied by the average account value over the period, multiplied by 184/366 (to reflect the one-half year period).
31
Report of Independent Registered
Public Accounting Firm
To the Board of Directors of Nuveen Investment Funds, Inc. and Board of Trustees of Nuveen Investment Trust V and Shareholders of Nuveen Global Infrastructure Fund, Nuveen Global Real Estate Securities Fund, Nuveen Real Asset Income Fund and Nuveen Real Estate Securities Fund
Opinions on the Financial Statements
We have audited the accompanying statements of assets and liabilities, including the portfolios of investments, of Nuveen Global Infrastructure Fund, Nuveen Real Asset Income Fund and Nuveen Real Estate Securities Fund (three of the funds constituting Nuveen Investment Funds, Inc.) and Nuveen Global Real Estate Securities Fund (one of the funds constituting Nuveen Investment Trust V) (hereafter collectively referred to as the “Funds”) as of December 31, 2020, the related statements of operations for the year ended December 31, 2020, the statements of changes in net assets for each of the two years in the period ended December 31, 2020, including the related notes, and the financial highlights for each of the periods indicated therein (collectively referred to as the “financial statements”). In our opinion, the financial statements present fairly, in all material respects, the financial position of each of the Funds as of December 31, 2020, the results of each of their operations for the year then ended, the changes in each of their net assets for each of the two years in the period ended December 31, 2020 and each of the financial highlights for each of the periods indicated therein in conformity with accounting principles generally accepted in the United States of America.
Basis for Opinions
These financial statements are the responsibility of the Funds’ management. Our responsibility is to express an opinion on the Funds’ financial statements based on our audits. We are a public accounting firm registered with the Public Company Accounting Oversight Board (United States) (PCAOB) and are required to be independent with respect to the Funds in accordance with the U.S. federal securities laws and the applicable rules and regulations of the Securities and Exchange Commission and the PCAOB.
We conducted our audits of these financial statements in accordance with the standards of the PCAOB. Those standards require that we plan and perform the audit to obtain reasonable assurance about whether the financial statements are free of material misstatement, whether due to error or fraud.
Our audits included performing procedures to assess the risks of material misstatement of the financial statements, whether due to error or fraud, and performing procedures that respond to those risks. Such procedures included examining, on a test basis, evidence regarding the amounts and disclosures in the financial statements. Our audits also included evaluating the accounting principles used and significant estimates made by management, as well as evaluating the overall presentation of the financial statements. Our procedures included confirmation of securities owned as of December 31, 2020 by correspondence with the custodian, brokers and agent banks; when replies were not received from brokers or agent banks, we performed other auditing procedures. We believe that our audits provide a reasonable basis for our opinions.
/s/ PricewaterhouseCoopers LLP
Chicago, Illinois
February 25, 2021
We have served as the auditor of one or more investment companies in Nuveen Funds since 2002.
32
Nuveen Global Infrastructure Fund
Portfolio of Investments December 31, 2020
| | | | | | | | | | | | | | | | |
| Shares | | | Description (1) | | | | | | | | Value | |
| | | | |
| | | | LONG-TERM INVESTMENTS – 96.5% | | | | | | | | | | | | |
| | | | |
| | | | COMMON STOCKS – 86.8% | | | | | | | | | | | | |
| | | | |
| | | | Commercial Services & Supplies – 2.0% | | | | | | | | | |
| | | | |
| | 343,923 | | | Biffa PLC, 144A, (2), (3) | | | | | | | | | | $ | 1,081,865 | |
| | | | |
| | 22,043 | | | Casella Waste Systems Inc, (3) | | | | | | | | | | | 1,365,564 | |
| | | | |
| | 1,250,218 | | | China Everbright Environment Group Ltd, (2) | | | | | | | | | | | 706,217 | |
| | | | |
| | 24,125 | | | Republic Services Inc | | | | | | | | | | | 2,323,237 | |
| | | | |
| | 47,738 | | | Waste Connections Inc | | | | | | | | | | | 4,896,487 | |
| | | | |
| | 14,175 | | | Waste Management Inc | | | | | | | | | | | 1,671,658 | |
| | | | Total Commercial Services & Supplies | | | | | | | | | | | 12,045,028 | |
| | | | |
| | | | Construction & Engineering – 4.6% | | | | | | | | | |
| | | | |
| | 10,882 | | | Ameresco Inc, (3) | | | | | | | | | | | 568,476 | |
| | | | |
| | 77,052 | | | Eiffage SA, (2) | | | | | | | | | | | 7,447,990 | |
| | | | |
| | 254,109 | | | Ferrovial SA, (2) | | | | | | | | | | | 7,026,237 | |
| | | | |
| | 130,520 | | | Vinci SA, (2) | | | | | | | | | | | 13,001,010 | |
| | | | Total Construction & Engineering | | | | | | | | | | | 28,043,713 | |
| | | | |
| | | | Diversified Telecommunication Services – 2.7% | | | | | | | | | |
| | | | |
| | 173,139 | | | Cellnex Telecom SA, 144A, (2) | | | | | | | | | | | 10,397,506 | |
| | | | |
| | 1,153,285 | | | HKBN Ltd, (2) | | | | | | | | | | | 1,786,397 | |
| | | | |
| | 111,792 | | | Infrastrutture Wireless Italiane SpA, 144A, (2) | | | | | | | | | | | 1,355,195 | |
| | | | |
| | 4,282,078 | | | NetLink NBN Trust, (2) | | | | | | | | | | | 3,129,753 | |
| | | | Total Diversified Telecommunication Services | | | | | | | | | | | 16,668,851 | |
| | | | |
| | | | Electric Utilities – 19.4% | | | | | | | | | |
| | | | |
| | 147,763 | | | Alliant Energy Corp | | | | | | | | | | | 7,614,227 | |
| | | | |
| | 211,706 | | | Alupar Investimento SA, (2) | | | | | | | | | | | 1,105,585 | |
| | | | |
| | 19,950 | | | American Electric Power Co Inc | | | | | | | | | | | 1,661,237 | |
| | | | |
| | 1,532,070 | | | AusNet Services, (2) | | | | | | | | | | | 2,076,388 | |
| | | | |
| | 20,302 | | | Avangrid Inc | | | | | | | | | | | 922,726 | |
| | | | |
| | 391,490 | | | CK Infrastructure Holdings Ltd, (2) | | | | | | | | | | | 2,102,458 | |
| | | | |
| | 94,751 | | | Duke Energy Corp | | | | | | | | | | | 8,675,402 | |
| | | | |
| | 365,407 | | | EDP – Energias de Portugal SA, (2) | | | | | | | | | | | 2,293,479 | |
| | | | |
| | 7,609 | | | Elia Group SA/NV, (2) | | | | | | | | | | | 908,213 | |
| | | | |
| | 82,143 | | | Endesa SA, (2), (4) | | | | | | | | | | | 2,253,092 | |
| | | | |
| | 541,340 | | | Enel SpA, (2) | | | | | | | | | | | 5,507,987 | |
| | | | |
| | 33,150 | | | Entergy Corp | | | | | | | | | | | 3,309,696 | |
| | | | |
| | 25,445 | | | Evergy Inc | | | | | | | | | | | 1,412,452 | |
| | | | |
| | 60,942 | | | Eversource Energy | | | | | | | | | | | 5,272,092 | |
| | | | |
| | 652,214 | | | Iberdrola SA, (2) | | | | | | | | | | | 9,372,504 | |
| | | | |
| | 252,416 | | | Neoenergia SA, (2) | | | | | | | | | | | 861,731 | |
33
Nuveen Global Infrastructure Fund (continued)
Portfolio of Investments December 31, 2020
| | | | | | | | | | | | | | | | |
| Shares | | | Description (1) | | | | | | | | Value | |
| | | | |
| | | | Electric Utilities (continued) | | | | | | | | | |
| | | | |
| | 289,536 | | | NextEra Energy Inc | | | | | | | | | | $ | 22,337,702 | |
| | | | |
| | 25,940 | | | Orsted AS, 144A, (2) | | | | | | | | | | | 5,307,458 | |
| | | | |
| | 464,388 | | | Power Grid Corp of India Ltd, (2) | | | | | | | | | | | 1,198,700 | |
| | | | |
| | 56,964 | | | Red Electrica Corp SA, (2) | | | | | | | | | | | 1,169,532 | |
| | | | |
| | 123,296 | | | Southern Co | | | | | | | | | | | 7,574,073 | |
| | | | |
| | 578,605 | | | Spark Infrastructure Group, (2) | | | | | | | | | | | 940,723 | |
| | | | |
| | 258,574 | | | SSE PLC, (2) | | | | | | | | | | | 5,296,418 | |
| | | | |
| | 1,133,780 | | | Terna Rete Elettrica Nazionale SpA, (2) | | | | | | | | | | | 8,712,168 | |
| | | | |
| | 81,933 | | | Transmissora Alianca de Energia Eletrica SA, (2) | | | | | | | | | | | 526,936 | |
| | | | |
| | 144,869 | | | Xcel Energy Inc | | | | | | | | | | | 9,658,416 | |
| | | | Total Electric Utilities | | | | | | | | | | | 118,071,395 | |
| | | | |
| | | | Gas Utilities – 1.8% | | | | | | | | | |
| | | | |
| | 163,147 | | | APA Group, (2) | | | | | | | | | | | 1,213,890 | |
| | | | |
| | 256,669 | | | China Gas Holdings Ltd, (2) | | | | | | | | | | | 1,017,102 | |
| | | | |
| | 385,560 | | | China Resources Gas Group Ltd, (2) | | | | | | | | | | | 2,049,421 | |
| | | | |
| | 76,672 | | | Enagas SA, (2) | | | | | | | | | | | 1,686,763 | |
| | | | |
| | 424,128 | | | Italgas SpA, (2) | | | | | | | | | | | 2,701,700 | |
| | | | |
| | 451,996 | | | Snam SpA, (2) | | | | | | | | | | | 2,552,690 | |
| | | | Total Gas Utilities | | | | | | | | | | | 11,221,566 | |
| | | | |
| | | | Independent Power & Renewable Electricity Producers – 2.1% | | | | | | | | | |
| | | | |
| | 45,864 | | | Atlantica Sustainable Infrastructure PLC | | | | | | | | | | | 1,741,915 | |
| | | | |
| | 21,509 | | | Brookfield Renewable Partners LP | | | | | | | | | | | 928,113 | |
| | | | |
| | 51,600 | | | Clearway Energy Inc | | | | | | | | | | | 1,647,588 | |
| | | | |
| | 112,681 | | | EDP Renovaveis SA | | | | | | | | | | | 3,138,574 | |
| | | | |
| | 57,107 | | | NextEra Energy Partners LP | | | | | | | | | | | 3,829,025 | |
| | | | |
| | 165,319 | | | Omega Geracao SA, (2), (3) | | | | | | | | | | | 1,289,567 | |
| | | | Total Independent Power & Renewable Electricity Producers | | | | | | | | | | | 12,574,782 | |
| | | | |
| | | | IT Services – 0.1% | | | | | | | | | |
| | | | |
| | 2,723 | | | GDS Holdings Ltd, ADR, (3) | | | | | | | | | | | 254,982 | |
| | | | |
| | 63,351 | | | NEXTDC Ltd, (2), (3) | | | | | | | | | | | 597,804 | |
| | | | Total IT Services | | | | | | | | | | | 852,786 | |
| | | | |
| | | | Media – 0.3% | | | | | | | | | |
| | | | |
| | 4,784,433 | | | Converge ICT Solutions Inc, (3) | | | | | | | | | | | 1,484,441 | |
| | | | |
| | | | Multi-Utilities – 12.0% | | | | | | | | | |
| | | | |
| | 9,901 | | | Brookfield Infrastructure Partners LP | | | | | | | | | | | 489,109 | |
| | | | |
| | 204,636 | | | CenterPoint Energy Inc | | | | | | | | | | | 4,428,323 | |
| | | | |
| | 26,653 | | | CMS Energy Corp | | | | | | | | | | | 1,626,099 | |
| | | | |
| | 202,288 | | | Dominion Energy Inc | | | | | | | | | | | 15,212,058 | |
| | | | |
| | 22,639 | | | DTE Energy Co | | | | | | | | | | | 2,748,601 | |
| | | | |
| | 522,499 | | | Engie SA, (2) | | | | | | | | | | | 8,009,914 | |
| | | | |
| | 1,173,255 | | | EON SE, (2) | | | | | | | | | | | 12,991,729 | |
34
| | | | | | | | | | | | | | | | |
| Shares | | | Description (1) | | | | | | | | Value | |
| | | | |
| | | | Multi-Utilities (continued) | | | | | | | | | |
| | | | |
| | 812,922 | | | Hera SpA, (2) | | | | | | | | | | $ | 2,958,171 | |
| | | | |
| | 177,392 | | | Iren SpA, (2) | | | | | | | | | | | 463,004 | |
| | | | |
| | 62,393 | | | National Grid PLC, Sponsored ADR | | | | | | | | | | | 3,683,059 | |
| | | | |
| | 127,637 | | | NiSource Inc | | | | | | | | | | | 2,927,993 | |
| | | | |
| | 159,457 | | | REN – Redes Energeticas Nacionais SGPS SA, (2) | | | | | | | | | | | 459,437 | |
| | | | |
| | 152,099 | | | RWE AG, (2) | | | | | | | | | | | 6,434,888 | |
| | | | |
| | 58,496 | | | Sempra Energy | | | | | | | | | | | 7,452,975 | |
| | | | |
| | 91,008 | | | Suez SA, (2) | | | | | | | | | | | 1,803,712 | |
| | | | |
| | 49,284 | | | Veolia Environnement SA, (2) | | | | | | | | | | | 1,215,212 | |
| | | | Total Multi-Utilities | | | | | | | | | | | 72,904,284 | |
| | | | |
| | | | Oil, Gas & Consumable Fuels – 8.7% | | | | | | | | | |
| | | | |
| | 71,509 | | | Cheniere Energy Inc, (3) | | | | | | | | | | | 4,292,685 | |
| | | | |
| | 478,213 | | | Enbridge Inc | | | | | | | | | | | 15,298,034 | |
| | | | |
| | 108,804 | | | Enterprise Products Partners LP | | | | | | | | | | | 2,131,470 | |
| | | | |
| | 189,703 | | | Gibson Energy Inc | | | | | | | | | | | 3,064,101 | |
| | | | |
| | 217,015 | | | Kinder Morgan Inc | | | | | | | | | | | 2,966,595 | |
| | | | |
| | 20,455 | | | Koninklijke Vopak NV | | | | | | | | | | | 1,074,271 | |
| | | | |
| | 53,364 | | | Pembina Pipeline Corp | | | | | | | | | | | 1,261,887 | |
| | | | |
| | 437,721 | | | TC Energy Corp, (4) | | | | | | | | | | | 17,795,634 | |
| | | | |
| | 264,061 | | | Williams Cos Inc | | | | | | | | | | | 5,294,423 | |
| | | | Total Oil, Gas & Consumable Fuels | | | | | | | | | | | 53,179,100 | |
| | | | |
| | | | Road & Rail – 4.7% | | | | | | | | | |
| | | | |
| | 56,338 | | | Canadian National Railway Co | | | | | | | | | | | 6,188,729 | |
| | | | |
| | 18,036 | | | Canadian Pacific Railway Ltd | | | | | | | | | | | 6,252,901 | |
| | | | |
| | 27,197 | | | CSX Corp | | | | | | | | | | | 2,468,128 | |
| | | | |
| | 14,323 | | | East Japan Railway Co, (2) | | | | | | | | | | | 955,565 | |
| | | | |
| | 27,911 | | | Kansas City Southern | | | | | | | | | | | 5,697,472 | |
| | | | |
| | 34,320 | | | Union Pacific Corp | | | | | | | | | | | 7,146,110 | |
| | | | Total Road & Rail | | | | | | | | | | | 28,708,905 | |
| | | | |
| | | | Transportation Infrastructure – 26.0% | | | | | | | | | |
| | | | |
| | 137,000 | | | Aena SME SA, 144A, (2) | | | | | | | | | | | 23,817,351 | |
| | | | |
| | 52,978 | | | Aeroports de Paris, (2) | | | | | | | | | | | 6,854,115 | |
| | | | |
| | 135,428 | | | ASTM SpA, (2), (3) | | | | | | | | | | | 3,414,676 | |
| | | | |
| | 606,220 | | | Atlantia SpA, (2), (3) | | | | | | | | | | | 10,947,086 | |
| | | | |
| | 962,370 | | | Atlas Arteria Ltd, (2) | | | | | | | | | | | 4,839,208 | |
| | | | |
| | 1,401,294 | | | Auckland International Airport Ltd, (2) | | | | | | | | | | | 7,663,133 | |
| | | | |
| | 405,345 | | | Enav SpA, 144A, (2) | | | | | | | | | | | 1,783,186 | |
| | | | |
| | 44,542 | | | Flughafen Wien AG, (2) | | | | | | | | | | | 1,630,431 | |
| | | | |
| | 32,908 | | | Flughafen Zurich AG, (2) | | | | | | | | | | | 5,806,331 | |
| | | | |
| | 25,556 | | | Fraport AG Frankfurt Airport Services Worldwide, (2) | | | | | | | | | | | 1,541,872 | |
| | | | |
| | 458,165 | | | Getlink SE, (2) | | | | | | | | | | | 7,926,807 | |
35
Nuveen Global Infrastructure Fund (continued)
Portfolio of Investments December 31, 2020
| | | | | | | | | | | | | | | | |
| Shares | | | Description (1) | | | | | | | | Value | |
| | | | |
| | | | Transportation Infrastructure (continued) | | | | | | | | | |
| | | | |
| | 110,016 | | | Grupo Aeroportuario del Centro Norte SAB de CV, ADR, (3) | | | | | | | | | | $ | 5,685,627 | |
| | | | |
| | 82,920 | | | Grupo Aeroportuario del Pacifico SAB de CV, ADR, (3), (4) | | | | | | | | | | | 9,228,167 | |
| | | | |
| | 1,047,438 | | | International Container Terminal Services Inc, (2) | | | | | | | | | | | 2,694,005 | |
| | | | |
| | 328,434 | | | Jiangsu Expressway Co Ltd, (2) | | | | | | | | | | | 367,353 | |
| | | | |
| | 262,658 | | | Kamigumi Co Ltd, (2) | | | | | | | | | | | 4,798,334 | |
| | | | |
| | 113,561 | | | Macquarie Infrastructure Corp | | | | | | | | | | | 4,264,216 | |
| | | | |
| | 663,959 | | | Port of Tauranga Ltd, (2) | | | | | | | | | | | 3,542,484 | |
| | | | |
| | 356,217 | | | Promotora y Operadora de Infraestructura SAB de CV | | | | | | | | | | | 3,158,417 | |
| | | | |
| | 67,535 | | | Promotora y Operadora de Infraestructura SAB de CV | | | | | | | | | | | 366,497 | |
| | | | |
| | 728,621 | | | Qube Holdings Ltd, (2) | | | | | | | | | | | 1,649,652 | |
| | | | |
| | 3,091,431 | | | Sydney Airport, (2), (3) | | | | | | | | | | | 15,302,026 | |
| | | | |
| | 2,917,326 | | | Transurban Group, (2) | | | | | | | | | | | 30,742,200 | |
| | | | |
| | 56,547 | | | Westshore Terminals Investment Corp, (4) | | | | | | | | | | | 692,566 | |
| | | | Total Transportation Infrastructure | | | | | | | | | | | 158,715,740 | |
| | | | |
| | | | Water Utilities – 2.4% | | | | | | | | | |
| | | | |
| | 27,632 | | | American Water Works Co Inc | | | | | | | | | | | 4,240,683 | |
| | | | |
| | 1,853,735 | | | Guangdong Investment Ltd, (2) | | | | | | | | | | | 3,341,705 | |
| | | | |
| | 180,078 | | | Pennon Group PLC, (2) | | | | | | | | | | | 2,330,744 | |
| | | | |
| | 158,514 | | | Severn Trent PLC, (2) | | | | | | | | | | | 4,948,497 | |
| | | | Total Water Utilities | | | | | | | | | | | 14,861,629 | |
| | | | Total Common Stocks (cost $426,648,922) | | | | | | | | | | | 529,332,220 | |
| | | | |
| Shares | | | Description (1) | | | | | | | | Value | |
| | | | |
| | | | REAL ESTATE INVESTMENT TRUST COMMON STOCKS – 9.6% | | | | | | | | | | | | |
| | | | |
| | | | Health Care – 0.2% | | | | | | | | | |
| | | | |
| | 381,982 | | | Parkway Life Real Estate Investment Trust | | | | | | | | | | $ | 1,118,546 | |
| | | | |
| | | | Industrial – 0.4% | | | | | | | | | |
| | | | |
| | 61,806 | | | Americold Realty Trust | | | | | | | | | | | 2,307,217 | |
| | | | |
| | | | Mortgage – 0.2% | | | | | | | | | |
| | | | |
| | 15,124 | | | Hannon Armstrong Sustainable Infrastructure Capital Inc | | | | | | | | | | | 959,316 | |
| | | | |
| | | | Specialized – 8.8% | | | | | | | | | |
| | | | |
| | 100,547 | | | American Tower Corp | | | | | | | | | | | 22,568,780 | |
| | | | |
| | 68,686 | | | Crown Castle International Corp | | | | | | | | | | | 10,934,124 | |
| | | | |
| | 28,745 | | | CyrusOne Inc | | | | | | | | | | | 2,102,697 | |
| | | | |
| | 25,785 | | | Digital Realty Trust Inc | | | | | | | | | | | 3,597,265 | |
| | | | |
| | 1,324 | | | Equinix Inc | | | | | | | | | | | 945,574 | |
| | | | |
| | 438,311 | | | Keppel DC REIT, (2) | | | | | | | | | | | 933,351 | |
| | | | |
| | 41,326 | | | QTS Realty Trust Inc | | | | | | | | | | | 2,557,253 | |
| | | | |
| | 36,397 | | | SBA Communications Corp | | | | | | | | | | | 10,268,686 | |
| | | | Total Specialized | | | | | | | | | | | 53,907,730 | |
| | | | Total Real Estate Investment Trust Common Stocks (cost $53,350,514) | | | | | | | | | | | 58,292,809 | |
36
| | | | | | | | | | | | | | | | |
| Shares | | | Description (1), (5) | | | | | | | | Value | |
| | | | |
| | | | INVESTMENT COMPANIES – 0.1% | | | | | | | | | |
| | | | |
| | 216,647 | | | 3i Infrastructure PLC | | | | | | | | | | $ | 913,498 | |
| | | | Total Investment Companies (cost $667,073) | | | | | | | | | | | 913,498 | |
| | | | Total Long-Term Investments (cost $480,666,509) | | | | | | | | | | | 588,538,527 | |
| | | | |
| Shares | | | Description (1) | | Coupon | | | | | | Value | |
| | |
| | | | INVESTMENTS PURCHASED WITH COLLATERAL FROM SECURITIES LENDING – 1.2% | | | | | |
| | | | |
| | | | Money Market Funds – 1.2% | | | | | | | | | |
| | | | |
| | 7,480,123 | | | State Street Navigator Securities Lending Government Money Market Portfolio, (6) | | | 0.080% (7) | | | | | | | $ | 7,480,123 | |
| | | | Total Investments Purchased with Collateral from Securities Lending (cost $7,480,123) | | | | 7,480,123 | |
| | | | |
Principal
Amount (000) | | | Description (1) | | Coupon | | | Maturity | | | Value | |
| | | | |
| | | | SHORT-TERM INVESTMENTS – 1.7% | | | | | | | | | | | | |
| | | | |
| | | | REPURCHASE AGREEMENTS – 1.7% | | | | | | | | | | | | |
| | | | |
| $ | 10,108 | | | Repurchase Agreement with Fixed Income Clearing Corporation, dated 12/31/20, repurchase price $10,107,579, collateralized by $9,973,500, U.S. Treasury Notes, 1.250%, due 7/31/23, value $10,309,737 | | | 0.000% | | | | 1/04/21 | | | $ | 10,107,579 | |
| | | | Total Short-Term Investments (cost $10,107,579) | | | | | | | | | | | 10,107,579 | |
| | | | Total Investments (cost $498,254,211) – 99.4% | | | | | | | | | | | 606,126,229 | |
| | | | Other Assets Less Liabilities – 0.6% | | | | | | | | | | | 3,552,863 | |
| | | | Net Assets – 100% | | | | | | | | | | $ | 609,679,092 | |
For Fund portfolio compliance purposes, the Fund’s industry classifications refer to any one or more of the industry sub-classifications used by one or more widely recognized market indexes or ratings group indexes, and/or as defined by Fund management. This definition may not apply for purposes of this report, which may combine industry sub-classifications into sectors for reporting ease.
| (1) | All percentages shown in the Portfolio of Investments are based on net assets. |
| (2) | For fair value measurement disclosure purposes, investment classified as Level 2. See Notes to Financial Statements, Note 3 – Investment Valuation and Fair Value Measurements for more information. |
| (3) | Non-income producing; issuer has not declared an ex-dividend date within the past twelve months. |
| (4) | Investment, or a portion of investment, is out on loan for securities lending. The total value of the securities out on loan as of the end of the reporting period was $7,181,157. |
| (5) | A copy of the most recent financial statements for these investment companies can be obtained directly from the Securities and Exchange Commission on its website at http://www.sec.gov. |
| (6) | The Fund may loan securities representing up to one third of the fair value of its total assets (which includes collateral for securities on loan) to broker dealers, banks, and other institutions. The Fund maintains collateral equal to at least 100% of the fair value of the securities loaned. The cash collateral received by the Fund is invested in this money market fund. See Notes to Financial Statements, Note 4- Portfolio Securities and Investments in Derivatives for more information. |
| (7) | The rate shown is the one-day yield as of the end of the reporting period. |
| 144A | Investment is exempt from registration under Rule 144A of the Securities Act of 1933, as amended. These investments may only be resold in transactions exempt from registration, which are normally those transactions with qualified institutional buyers. |
| ADR | American Depositary Receipt |
| REIT | Real Estate Investment Trust |
See accompanying notes to financial statements.
37
Nuveen Global Real Estate Securities Fund
Portfolio of Investments December 31, 2020
| | | | | | | | | | | | | | | | |
| Shares | | | Description (1) | | | | | | | | Value | |
| | | | |
| | | | LONG-TERM INVESTMENTS – 98.8% | | | | | | | | | | | | |
| | | | |
| | | | REAL ESTATE INVESTMENT TRUST COMMON STOCKS – 75.9% | | | | | | | | | | | | |
| | | | |
| | | | Diversified – 8.1% | | | | | | | | | |
| | | | |
| | 2,082 | | | Broadstone Net Lease Inc | | | | | | | | | | $ | 40,765 | |
| | | | |
| | 32,381 | | | Centuria Capital Group, (2) | | | | | | | | | | | 65,533 | |
| | | | |
| | 23,254 | | | Charter Hall Long Wale REIT, (2) | | | | | | | | | | | 83,336 | |
| | | | |
| | 1,165 | | | Cofinimmo SA, (2) | | | | | | | | | | | 173,365 | |
| | | | |
| | 71,685 | | | Cromwell European Real Estate Investment Trust, (2) | | | | | | | | | | | 42,109 | |
| | | | |
| | 150 | | | Daiwa House REIT Investment Corp, (2) | | | | | | | | | | | 371,080 | |
| | | | |
| | 3,330 | | | Essential Properties Realty Trust Inc | | | | | | | | | | | 70,596 | |
| | | | |
| | 3,547 | | | Gecina SA, (2) | | | | | | | | | | | 551,559 | |
| | | | |
| | 17,462 | | | Goodman Property Trust, (2) | | | | | | | | | | | 29,280 | |
| | | | |
| | 34,043 | | | GPT Group, (2) | | | | | | | | | | | 118,413 | |
| | | | |
| | 241 | | | Hulic Reit Inc, (2) | | | | | | | | | | | 359,825 | |
| | | | |
| | 92,952 | | | LondonMetric Property PLC, (2) | | | | | | | | | | | 291,479 | |
| | | | |
| | 347,517 | | | LXI REIT plc, (2) | | | | | | | | | | | 566,167 | |
| | | | |
| | 25,099 | | | Merlin Properties Socimi SA, (2) | | | | | | | | | | | 239,322 | |
| | | | |
| | 105,052 | | | Mirvac Group, (2) | | | | | | | | | | | 213,358 | |
| | | | |
| | 242 | | | Nomura Real Estate Master Fund Inc, (2) | | | | | | | | | | | 346,312 | |
| | | | |
| | 1,833 | | | PS Business Parks Inc | | | | | | | | | | | 243,551 | |
| | | | |
| | 441 | | | Star Asia Investment Corp, (2) | | | | | | | | | | | 215,698 | |
| | | | |
| | 48,973 | | | Stockland, (2) | | | | | | | | | | | 158,113 | |
| | | | |
| | 16,105 | | | Stride Property Group, (2) | | | | | | | | | | | 27,368 | |
| | | | |
| | 8,387 | | | VEREIT Inc | | | | | | | | | | | 316,945 | |
| | | | |
| | 3,479 | | | Washington Real Estate Investment Trust | | | | | | | | | | | 75,251 | |
| | | | |
| | 2,302 | | | WP Carey Inc | | | | | | | | | | | 162,475 | |
| | | | Total Diversified | | | | | | | | | | | 4,761,900 | |
| | | | |
| | | | Health Care – 5.2% | | | | | | | | | |
| | | | |
| | 2,486 | | | Aedifica SA, (2) | | | | | | | | | | | 298,656 | |
| | | | |
| | 2,735 | | | CareTrust REIT Inc | | | | | | | | | | | 60,662 | |
| | | | |
| | 9,235 | | | Healthcare Realty Trust Inc | | | | | | | | | | | 273,356 | |
| | | | |
| | 7,182 | | | Healthcare Trust of America Inc | | | | | | | | | | | 197,792 | |
| | | | |
| | 12,764 | | | Healthpeak Properties Inc | | | | | | | | | | | 385,856 | |
| | | | |
| | 1,123 | | | LTC Properties Inc | | | | | | | | | | | 43,696 | |
| | | | |
| | 14,767 | | | Medical Properties Trust Inc | | | | | | | | | | | 321,773 | |
| | | | |
| | 13,373 | | | NorthWest Healthcare Properties Real Estate Investment Trust | | | | | | | | | | | 132,375 | |
| | | | |
| | 2,010 | | | Omega Healthcare Investors Inc | | | | | | | | | | | 73,003 | |
| | | | |
| | 410 | | | Parkway Life Real Estate Investment Trust | | | | | | | | | | | 1,200 | |
| | | | |
| | 10,095 | | | Physicians Realty Trust | | | | | | | | | | | 179,691 | |
38
| | | | | | | | | | | | | | | | |
| Shares | | | Description (1) | | | | | | | | Value | |
| | | | |
| | | | Health Care (continued) | | | | | | | | | |
| | | | |
| | 3,526 | | | Sabra Health Care REIT Inc | | | | | | | | | | $ | 61,247 | |
| | | | |
| | 4,324 | | | Ventas Inc | | | | | | | | | | | 212,049 | |
| | | | |
| | 12,266 | | | Welltower Inc | | | | | | | | | | | 792,629 | |
| | | | Total Health Care | | | | | | | | | | | 3,033,985 | |
| | | | |
| | | | Hotels – 1.4% | | | | | | | | | |
| | | | |
| | 19,221 | | | Apple Hospitality REIT Inc | | | | | | | | | | | 248,143 | |
| | | | |
| | 5,283 | | | Host Hotels & Resorts Inc | | | | | | | | | | | 77,290 | |
| | | | |
| | 278 | | | Japan Hotel REIT Investment Corp, (2) | | | | | | | | | | | 142,956 | |
| | | | |
| | 6,543 | | | MGM Growth Properties LLC | | | | | | | | | | | 204,796 | |
| | | | |
| | 1,551 | | | Summit Hotel Properties Inc | | | | | | | | | | | 13,975 | |
| | | | |
| | 11,582 | | | Sunstone Hotel Investors Inc | | | | | | | | | | | 131,224 | |
| | | | Total Hotels | | | | | | | | | | | 818,384 | |
| | | | |
| | | | Industrial – 19.2% | | | | | | | | | |
| | | | |
| | 15,944 | | | Americold Realty Trust | | | | | | | | | | | 595,190 | |
| | | | |
| | 21,323 | | | APN Industria REIT, (2) | | | | | | | | | | | 47,166 | |
| | | | |
| | 252,981 | | | Ascendas Real Estate Investment Trust, (2) | | | | | | | | | | | 571,094 | |
| | | | |
| | 86,825 | | | Centuria Industrial REIT, (2) | | | | | | | | | | | 205,908 | |
| | | | |
| | 16,714 | | | Deutsche Industrie REIT AG, (2) | | | | | | | | | | | 304,199 | |
| | | | |
| | 7,754 | | | Dream Industrial Real Estate Investment Trust | | | | | | | | | | | 80,105 | |
| | | | |
| | 18,364 | | | Duke Realty Corp | | | | | | | | | | | 734,009 | |
| | | | |
| | 756 | | | EastGroup Properties Inc | | | | | | | | | | | 104,373 | |
| | | | |
| | 99,982 | | | ESR-REIT, (2) | | | | | | | | | | | 29,916 | |
| | | | |
| | 9,916 | | | First Industrial Realty Trust Inc | | | | | | | | | | | 417,761 | |
| | | | |
| | 32,961 | | | Frasers Logistics & Commercial Trust, (2) | | | | | | | | | | | 35,234 | |
| | | | |
| | 188 | | | GLP J-Reit, (2) | | | | | | | | | | | 296,666 | |
| | | | |
| | 18,756 | | | Goodman Group, (2) | | | | | | | | | | | 274,165 | |
| | | | |
| | 109 | | | Industrial & Infrastructure Fund Investment Corp, (2) | | | | | | | | | | | 201,247 | |
| | | | |
| | 246 | | | LaSalle Logiport REIT, (2) | | | | | | | | | | | 396,966 | |
| | | | |
| | 17,658 | | | Lexington Realty Trust | | | | | | | | | | | 187,528 | |
| | | | |
| | 150,827 | | | Mapletree Industrial Trust, (2) | | | | | | | | | | | 330,150 | |
| | | | |
| | 294,921 | | | Mapletree Logistics Trust, (2) | | | | | | | | | | | 448,859 | |
| | | | |
| | 67 | | | Mitsubishi Estate Logistics REIT Investment Corp, (2) | | | | | | | | | | | 279,515 | |
| | | | |
| | 93 | | | Mitsui Fudosan Logistics Park Inc, (2) | | | | | | | | | | | 471,661 | |
| | | | |
| | 241 | | | Montea CVA, (2) | | | | | | | | | | | 27,315 | |
| | | | |
| | 12 | | | Nippon Prologis REIT Inc, (2) | | | | | | | | | | | 37,489 | |
| | | | |
| | 28,069 | | | Prologis Inc | | | | | | | | | | | 2,797,357 | |
| | | | |
| | 3,774 | | | Rexford Industrial Realty Inc | | | | | | | | | | | 185,341 | |
| | | | |
| | 51,648 | | | Segro PLC, (2) | | | | | | | | | | | 670,171 | |
| | | | |
| | 15,575 | | | STAG Industrial Inc | | | | | | | | | | | 487,809 | |
| | | | |
| | 40,351 | | | Summit Industrial Income REIT | | | | | | | | | | | 432,706 | |
39
Nuveen Global Real Estate Securities Fund (continued)
Portfolio of Investments December 31, 2020
| | | | | | | | | | | | | | | | |
| Shares | | | Description (1) | | | | | | | | Value | |
| | | | |
| | | | Industrial (continued) | | | | | | | | | |
| | | | |
| | 4,492 | | | Terreno Realty Corp | | | | | | | | | | $ | 262,827 | |
| | | | |
| | 109,868 | | | Urban Logistics REIT PLC | | | | | | | | | | | 214,850 | |
| | | | |
| | 9,620 | | | WPT Industrial Real Estate Investment Trust | | | | | | | | | | | 139,009 | |
| | | | Total Industrial | | | | | | | | | | | 11,266,586 | |
| | | | |
| | | | Mortgage – 0.1% | | | | | | | | | |
| | | | |
| | 903 | | | Hannon Armstrong Sustainable Infrastructure Capital Inc | | | | | | | | | | | 57,277 | |
| | | | |
| | | | Office – 7.0% | | | | | | | | | |
| | | | |
| | 4,963 | | | Alexandria Real Estate Equities Inc | | | | | | | | | | | 884,506 | |
| | | | |
| | 5,379 | | | Boston Properties Inc | | | | | | | | | | | 508,477 | |
| | | | |
| | 8,426 | | | Corporate Office Properties Trust | | | | | | | | | | | 219,750 | |
| | | | |
| | 914 | | | Covivio, (2) | | | | | | | | | | | 83,870 | |
| | | | |
| | 25 | | | Daiwa Office Investment Corp, (2) | | | | | | | | | | | 158,940 | |
| | | | |
| | 15,273 | | | Dexus, (2) | | | | | | | | | | | 110,774 | |
| | | | |
| | 5,068 | | | Douglas Emmett Inc | | | | | | | | | | | 147,884 | |
| | | | |
| | 6,194 | | | Dream Office Real Estate Investment Trust | | | | | | | | | | | 96,348 | |
| | | | |
| | 9,792 | | | Easterly Government Properties Inc | | | | | | | | | | | 221,789 | |
| | | | |
| | 45,873 | | | Elite Commercial REIT, (2) | | | | | | | | | | | 41,329 | |
| | | | |
| | 163,963 | | | GDI Property Group, (2) | | | | | | | | | | | 153,074 | |
| | | | |
| | 6,702 | | | Highwoods Properties Inc | | | | | | | | | | | 265,600 | |
| | | | |
| | 10,523 | | | Hudson Pacific Properties Inc | | | | | | | | | | | 252,762 | |
| | | | |
| | 127 | | | Ichigo Office REIT Investment Corp, (2) | | | | | | | | | | | 91,732 | |
| | | | |
| | 1,009 | | | Invesco Office J-Reit Inc, (2) | | | | | | | | | | | 148,094 | |
| | | | |
| | 142 | | | Japan Excellent Inc, (2) | | | | | | | | | | | 176,154 | |
| | | | |
| | 689 | | | JBG SMITH Properties | | | | | | | | | | | 21,545 | |
| | | | |
| | 2,459 | | | Kilroy Realty Corp | | | | | | | | | | | 141,147 | |
| | | | |
| | 8,780 | | | Mack-Cali Realty Corp | | | | | | | | | | | 109,399 | |
| | | | |
| | 12 | | | Nippon Building Fund Inc, (2) | | | | | | | | | | | 69,596 | |
| | | | |
| | 1,975 | | | Paramount Group Inc | | | | | | | | | | | 17,854 | |
| | | | |
| | 7,109 | | | Piedmont Office Realty Trust Inc | | | | | | | | | | | 115,379 | |
| | | | |
| | 78,025 | | | Precinct Properties New Zealand Ltd, (2) | | | | | | | | | | | 98,923 | |
| | | | Total Office | | | | | | | | | | | 4,134,926 | |
| | | | |
| | | | Residential – 12.3% | | | | | | | | | |
| | | | |
| | 84 | | | Advance Residence Investment Corp, (2) | | | | | | | | | | | 251,909 | |
| | | | |
| | 9,352 | | | American Homes 4 Rent | | | | | | | | | | | 280,560 | |
| | | | |
| | 1,448 | | | Apartment Income REIT Corp, (3) | | | | | | | | | | | 55,618 | |
| | | | |
| | 2,319 | | | AvalonBay Communities Inc | | | | | | | | | | | 372,037 | |
| | | | |
| | 4,684 | | | Boardwalk Real Estate Investment Trust | | | | | | | | | | | 124,156 | |
| | | | |
| | 2,417 | | | Camden Property Trust | | | | | | | | | | | 241,507 | |
| | | | |
| | 3,407 | | | Canadian Apartment Properties REIT | | | | | | | | | | | 133,802 | |
| | | | |
| | 1,413 | | | Centerspace | | | | | | | | | | | 99,814 | |
40
| | | | | | | | | | | | | | | | |
| Shares | | | Description (1) | | | | | | | | Value | |
| | | | |
| | | | Residential (continued) | | | | | | | | | |
| | | | |
| | 9,506 | | | Equity LifeStyle Properties Inc | | | | | | | | | | $ | 602,300 | |
| | | | |
| | 14,053 | | | Equity Residential | | | | | | | | | | | 833,062 | |
| | | | |
| | 2,226 | | | Essex Property Trust Inc | | | | | | | | | | | 528,497 | |
| | | | |
| | 53,803 | | | Ingenia Communities Group, (2) | | | | | | | | | | | 203,683 | |
| | | | |
| | 2,384 | | | InterRent Real Estate Investment Trust | | | | | | | | | | | 25,640 | |
| | | | |
| | 28,545 | | | Invitation Homes Inc | | | | | | | | | | | 847,786 | |
| | | | |
| | 84,530 | | | Irish Residential Properties REIT PLC | | | | | | | | | | | 154,486 | |
| | | | |
| | 210 | | | Kenedix Residential Next Investment Corp, (2) | | | | | | | | | | | 385,875 | |
| | | | |
| | 14,841 | | | Killam Apartment Real Estate Investment Trust | | | | | | | | | | | 199,489 | |
| | | | |
| | 5,864 | | | Mid-America Apartment Communities Inc | | | | | | | | | | | 742,910 | |
| | | | |
| | 1,222 | | | NexPoint Residential Trust Inc | | | | | | | | | | | 51,703 | |
| | | | |
| | 25 | | | Nippon Accommodations Fund Inc, (2) | | | | | | | | | | | 140,532 | |
| | | | |
| | 152,298 | | | PRS REIT Plc, (2) | | | | | | | | | | | 160,055 | |
| | | | |
| | 3,207 | | | Sun Communities Inc | | | | | | | | | | | 487,304 | |
| | | | |
| | 8,229 | | | UDR Inc | | | | | | | | | | | 316,240 | |
| | | | Total Residential | | | | | | | | | | | 7,238,965 | |
| | | | |
| | | | Retail – 8.9% | | | | | | | | | |
| | | | |
| | 3,275 | | | Agree Realty Corp | | | | | | | | | | | 218,050 | |
| | | | |
| | 15,354 | | | APN Convenience Retail REIT, (2) | | | | | | | | | | | 41,858 | |
| | | | |
| | 6,648 | | | Brixmor Property Group Inc | | | | | | | | | | | 110,024 | |
| | | | |
| | 267,849 | | | CapitaRetail China Trust, (2) | | | | | | | | | | | 282,184 | |
| | | | |
| | 767 | | | Crombie Real Estate Investment Trust | | | | | | | | | | | 8,647 | |
| | | | |
| | 13,012 | | | CT Real Estate Investment Trust | | | | | | | | | | | 160,184 | |
| | | | |
| | 3,332 | | | Federal Realty Investment Trust | | | | | | | | | | | 283,620 | |
| | | | |
| | 175,362 | | | Fortune Real Estate Investment Trust, (2) | | | | | | | | | | | 167,013 | |
| | | | |
| | 261,553 | | | Frasers Centrepoint Trust, (2) | | | | | | | | | | | 486,817 | |
| | | | |
| | 62,816 | | | HomeCo Daily Needs REIT, (3) | | | | | | | | | | | 60,293 | |
| | | | |
| | 18 | | | Kenedix Retail REIT Corp, (2) | | | | | | | | | | | 43,925 | |
| | | | |
| | 12,562 | | | Kimco Realty Corp | | | | | | | | | | | 188,556 | |
| | | | |
| | 3,510 | | | Kite Realty Group Trust | | | | | | | | | | | 52,510 | |
| | | | |
| | 43,765 | | | Link REIT, (2) | | | | | | | | | | | 397,464 | |
| | | | |
| | 3,688 | | | National Retail Properties Inc | | | | | | | | | | | 150,913 | |
| | | | |
| | 4,007 | | | NETSTREIT Corp | | | | | | | | | | | 78,097 | |
| | | | |
| | 14,366 | | | Realty Income Corp | | | | | | | | | | | 893,134 | |
| | | | |
| | 6,438 | | | Regency Centers Corp | | | | | | | | | | | 293,508 | |
| | | | |
| | 14,670 | | | RioCan Real Estate Investment Trust | | | | | | | | | | | 193,042 | |
| | | | |
| | 80,359 | | | Scentre Group, (2) | | | | | | | | | | | 172,610 | |
| | | | |
| | 5,641 | | | Shaftesbury PLC, (2) | | | | | | | | | | | 43,988 | |
| | | | |
| | 3,881 | | | Simon Property Group Inc | | | | | | | | | | | 330,972 | |
| | | | |
| | 6,540 | | | SITE Centers Corp | | | | | | | | | | | 66,185 | |
41
Nuveen Global Real Estate Securities Fund (continued)
Portfolio of Investments December 31, 2020
| | | | | | | | | | | | | | | | |
| Shares | | | Description (1) | | | | | | | | Value | |
| | | | |
| | | | Retail (continued) | | | | | | | | | |
| | | | |
| | 3,008 | | | Spirit Realty Capital Inc | | | | | | | | | | $ | 120,831 | |
| | | | |
| | 5,362 | | | Urban Edge Properties | | | | | | | | | | | 69,384 | |
| | | | |
| | 107,431 | | | Vicinity Centres, (2) | | | | | | | | | | | 132,835 | |
| | | | |
| | 8,179 | | | Weingarten Realty Investors | | | | | | | | | | | 177,239 | |
| | | | Total Retail | | | | | | | | | | | 5,223,883 | |
| | | | |
| | | | Specialized – 13.7% | | | | | | | | | |
| | | | |
| | 4,173 | | | American Tower Corp | | | | | | | | | | | 936,672 | |
| | | | |
| | 4,667 | | | ARGAN SA, (2) | | | | | | | | | | | 479,778 | |
| | | | |
| | 369 | | | CoreSite Realty Corp | | | | | | | | | | | 46,228 | |
| | | | |
| | 633 | | | Crown Castle International Corp | | | | | | | | | | | 100,767 | |
| | | | |
| | 3,640 | | | CubeSmart | | | | | | | | | | | 122,340 | |
| | | | |
| | 3,257 | | | CyrusOne Inc | | | | | | | | | | | 238,250 | |
| | | | |
| | 7,540 | | | Digital Realty Trust Inc | | | | | | | | | | | 1,051,905 | |
| | | | |
| | 2,507 | | | Equinix Inc | | | | | | | | | | | 1,790,449 | |
| | | | |
| | 3,732 | | | Extra Space Storage Inc | | | | | | | | | | | 432,390 | |
| | | | |
| | 4,526 | | | Four Corners Property Trust Inc | | | | | | | | | | | 134,739 | |
| | | | |
| | 6,607 | | | Gaming and Leisure Properties Inc | | | | | | | | | | | 280,137 | |
| | | | |
| | 1,284 | | | Iron Mountain Inc | | | | | | | | | | | 37,852 | |
| | | | |
| | 34,644 | | | Keppel DC REIT, (2) | | | | | | | | | | | 73,772 | |
| | | | |
| | 1,793 | | | Life Storage Inc | | | | | | | | | | | 214,066 | |
| | | | |
| | 1,406 | | | National Storage Affiliates Trust | | | | | | | | | | | 50,658 | |
| | | | |
| | 37,380 | | | National Storage REIT, (2) | | | | | | | | | | | 55,034 | |
| | | | |
| | 4,839 | | | Public Storage | | | | | | | | | | | 1,117,470 | |
| | | | |
| | 2,182 | | | QTS Realty Trust Inc | | | | | | | | | | | 135,022 | |
| | | | |
| | 2,104 | | | Rayonier Inc | | | | | | | | | | | 61,816 | |
| | | | |
| | 10,098 | | | Safestore Holdings PLC, (2) | | | | | | | | | | | 107,928 | |
| | | | |
| | 492 | | | SBA Communications Corp | | | | | | | | | | | 138,808 | |
| | | | |
| | 14,830 | | | VICI Properties Inc | | | | | | | | | | | 378,165 | |
| | | | |
| | 2,054 | | | Weyerhaeuser Co | | | | | | | | | | | 68,871 | |
| | | | Total Specialized | | | | | | | | | | | 8,053,117 | |
| | | | Total Real Estate Investment Trust Common Stocks (cost $38,661,193) | | | | | | | | | | | 44,589,023 | |
| | | | |
| Shares | | | Description (1) | | | | | | | | Value | |
| | | | |
| | | | COMMON STOCKS – 22.9% | | | | | | | | | | | | |
| | | | |
| | | | Diversified Telecommunication Services – 1.1% | | | | | | | | | |
| | | | |
| | 10,638 | | | Cellnex Telecom SA, 144A, (2) | | | | | | | | | | $ | 638,843 | |
| | | | |
| | | | Health Care Providers & Services – 0.1% | | | | | | | | | |
| | | | |
| | 5,081 | | | Sienna Senior Living Inc | | | | | | | | | | | 56,442 | |
| | | | |
| | | | Hotels, Restaurants & Leisure – 0.1% | | | | | | | | | |
| | | | |
| | 602 | | | Hilton Worldwide Holdings Inc | | | | | | | | | | | 66,979 | |
42
| | | | | | | | | | | | | | | | |
| Shares | | | Description (1) | | | | | | | | Value | |
| | | | |
| | | | Household Durables – 0.2% | | | | | | | | | |
| | | | |
| | 2,520 | | | PulteGroup Inc | | | | | | | | | | $ | 108,662 | |
| | | | |
| | | | IT Services – 0.2% | | | | | | | | | |
| | | | |
| | 935 | | | GDS Holdings Ltd, ADR, (3) | | | | | | | | | | | 87,553 | |
| | | | |
| | 5,859 | | | NEXTDC Ltd, (2), (3) | | | | | | | | | | | 55,288 | |
| | | | Total IT Services | | | | | | | | | | | 142,841 | |
| | | | |
| | | | Real Estate Management & Development – 21.2% | | | | | | | | | |
| | | | |
| | 24,298 | | | Amot Investments Ltd, (2) | | | | | | | | | | | 136,178 | |
| | | | |
| | 7,805 | | | CA Immobilien Anlagen AG, (2) | | | | | | | | | | | 297,445 | |
| | | | |
| | 8,084 | | | CapitaLand Ltd, (2) | | | | | | | | | | | 20,059 | |
| | | | |
| | 3,565 | | | Castellum AB, (2) | | | | | | | | | | | 90,874 | |
| | | | |
| | 142,608 | | | China Resources Land Ltd, (2) | | | | | | | | | | | 587,672 | |
| | | | |
| | 10,146 | | | Cibus Nordic Real Estate AB, (2) | | | | | | | | | | | 208,136 | |
| | | | |
| | 28,011 | | | CK Asset Holdings Ltd, (2) | | | | | | | | | | | 143,329 | |
| | | | |
| | 47,103 | | | CLS Holdings PLC, (2) | | | | | | | | | | | 144,429 | |
| | | | |
| | 50,533 | | | Corp Inmobiliaria Vesta SAB de CV | | | | | | | | | | | 99,037 | |
| | | | |
| | 39,559 | | | Cyrela Commercial Properties SA Empreendimentos e Participacoes, (2) | | | | | | | | | | | 104,725 | |
| | | | |
| | 29,207 | | | DIC Asset AG, (2) | | | | | | | | | | | 481,264 | |
| | | | |
| | 5,010 | | | Entra ASA, 144A, (2) | | | | | | | | | | | 113,628 | |
| | | | |
| | 8,290 | | | ESR Cayman Ltd, 144A, (2), (3) | | | | | | | | | | | 29,758 | |
| | | | |
| | 6,282 | | | Fabege AB, (2) | | | | | | | | | | | 99,249 | |
| | | | |
| | 7,239 | | | Fastighets AB Balder, (2), (3) | | | | | | | | | | | 377,979 | |
| | | | |
| | 42,526 | | | Grainger plc, (2) | | | | | | | | | | | 165,414 | |
| | | | |
| | 30,662 | | | Hulic Co Ltd, (2) | | | | | | | | | | | 337,287 | |
| | | | |
| | 765 | | | Ichigo Inc, (2) | | | | | | | | | | | 2,305 | |
| | | | |
| | 15,558 | | | Instone Real Estate Group AG, 144A, (2), (3) | | | | | | | | | | | 397,206 | |
| | | | |
| | 8,096 | | | Keihanshin Building Co Ltd, (2) | | | | | | | | | | | 146,178 | |
| | | | |
| | 5,532 | | | Kennedy-Wilson Holdings Inc | | | | | | | | | | | 98,967 | |
| | | | |
| | 40,332 | | | Kungsleden AB, (2) | | | | | | | | | | | 442,114 | |
| | | | |
| | 282,716 | | | Land & Houses PCL, (2) | | | | | | | | | | | 75,069 | |
| | | | |
| | 464,034 | | | Langham Hospitality Investments Ltd, (2) | | | | | | | | | | | 61,180 | |
| | | | |
| | 8,556 | | | LEG Immobilien AG, (2) | | | | | | | | | | | 1,327,419 | |
| | | | |
| | 58 | | | LOG Commercial Properties e Participacoes SA, (2) | | | | | | | | | | | 384 | |
| | | | |
| | 56,238 | | | Longfor Group Holdings Ltd, 144A, (2) | | | | | | | | | | | 328,963 | |
| | | | |
| | 39,744 | | | Mitsubishi Estate Co Ltd, (2) | | | | | | | | | | | 638,798 | |
| | | | |
| | 42,778 | | | Mitsui Fudosan Co Ltd, (2) | | | | | | | | | | | 895,752 | |
| | | | |
| | 102,830 | | | New World Development Co Ltd, (2) | | | | | | | | | | | 478,407 | |
| | | | |
| | 14,444 | | | Platzer Fastigheter Holding AB, (2) | | | | | | | | | | | 189,947 | |
| | | | |
| | 10,640 | | | Sagax AB, (2) | | | | | | | | | | | 219,801 | |
| | | | |
| | 37,954 | | | Sino Land Co Ltd, (2) | | | | | | | | | | | 49,390 | |
| | | | |
| | 73,116 | | | St Modwen Properties PLC, (2) | | | | | | | | | | | 401,737 | |
43
Nuveen Global Real Estate Securities Fund (continued)
Portfolio of Investments December 31, 2020
| | | | | | | | | | | | | | | | |
| Shares | | | Description (1) | | | | | | | | Value | |
| | | | |
| | | | Real Estate Management & Development (continued) | | | | | | | | | |
| | | | |
| | 7,656 | | | Sumitomo Realty & Development Co Ltd, (2) | | | | | | | | | | $ | 236,362 | |
| | | | |
| | 64,415 | | | Sun Hung Kai Properties Ltd, (2) | | | | | | | | | | | 823,802 | |
| | | | |
| | 40,238 | | | TAG Immobilien AG, (2) | | | | | | | | | | | 1,284,073 | |
| | | | |
| | 2,025 | | | VGP NV, (2) | | | | | | | | | | | 303,461 | |
| | | | |
| | 12,269 | | | VIB Vermoegen AG, (2) | | | | | | | | | | | 429,919 | |
| | | | |
| | 2,278 | | | Vonovia SE, (2) | | | | | | | | | | | 166,372 | |
| | | | Total Real Estate Management & Development | | | | | | | | | | | 12,434,069 | |
| | | | Total Common Stocks (cost $11,569,038) | | | | | | | | | | | 13,447,836 | |
| | | | Total Long-Term Investments (cost $50,230,231) | | | | | | | | | | | 58,036,859 | |
| | | | |
Principal
Amount (000) | | | Description (1) | | Coupon | | | Maturity | | | Value | |
| | | | |
| | | | SHORT-TERM INVESTMENTS – 0.8% | | | | | | | | | | | | |
| | | | |
| | | | REPURCHASE AGREEMENTS – 0.8% | | | | | | | | | |
| | | | |
| $ | 433 | | | Repurchase Agreement with Fixed Income Clearing Corporation, dated 12/31/20, repurchase price $432,916, collateralized by $441,600, U.S. Treasury Notes, 0.125%, due 7/15/23, value $441,612 | | | 0.000% | | | | 1/04/21 | | | $ | 432,916 | |
| | | | Total Short-Term Investments (cost $432,916) | | | | | | | | | | | 432,916 | |
| | | | Total Investments (cost $50,663,151) – 99.6% | | | | | | | | | | | 58,469,775 | |
| | | | Other Assets Less Liabilities – 0.4% | | | | | | | | | | | 261,349 | |
| | | | Net Assets – 100% | | | | | | | | | | $ | 58,731,124 | |
For Fund portfolio compliance purposes, the Fund’s industry classifications refer to any one or more of the industry sub-classifications used by one or more widely recognized market indexes or ratings group indexes, and/or as defined by Fund management. This definition may not apply for purposes of this report, which may combine industry sub-classifications into sectors for reporting ease.
| (1) | All percentages shown in the Portfolio of Investments are based on net assets. |
| (2) | For fair value measurement disclosure purposes, investment classified as Level 2. See Notes to Financial Statements, Note 3 – Investment Valuation and Fair Value Measurements for more information. |
| (3) | Non-income producing; issuer has not declared an ex-dividend date within the past twelve months. |
| 144A | Investment is exempt from registration under Rule 144A of the Securities Act of 1933, as amended. These investments may only be resold in transactions exempt from registration, which are normally those transactions with qualified institutional buyers. |
| ADR | American Depositary Receipt |
| REIT | Real Estate Investment Trust |
See accompanying notes to financial statements.
44
Nuveen Real Asset Income Fund
Portfolio of Investments December 31, 2020
| | | | | | | | | | | | | | | | | | | | | | | | | | | | |
| Shares | | | Description (1) | | | | | | | | | | | | | | | | | Value | |
| | | | | | | |
| | | | LONG-TERM INVESTMENTS – 97.3% | | | | | | | | | | | | | | | | | | | | | | | | |
| | | | | | | |
| | | | REAL ESTATE INVESTMENT TRUST COMMON STOCKS – 23.8% | | | | | | | | | | | | | | | | | | | | | | | | |
| | | | | | | |
| | | | Diversified – 4.5% | | | | | | | | | | | | | | | | | | |
| | | | | | | |
| | 1,465,120 | | | Abacus Property Group, (2) | | | | | | | | | | | | | | | | | | | | | | $ | 3,238,839 | |
| | | | | | | |
| | 333,604 | | | Broadstone Net Lease Inc | | | | | | | | | | | | | | | | | | | | | | | 6,531,966 | |
| | | | | | | |
| | 1,564,109 | | | Charter Hall Long Wale REIT, (2) | | | | | | | | | | | | | | | | | | | | | | | 5,605,362 | |
| | | | | | | |
| | 1,702,284 | | | Cromwell European Real Estate Investment Trust, (2) | | | | | | | | | | | | | | | | | | | | | | | 999,963 | |
| | | | | | | |
| | 106,385 | | | Essential Properties Realty Trust Inc | | | | | | | | | | | | | | | | | | | | | | | 2,255,362 | |
| | | | | | | |
| | 7,495 | | | Gecina SA, (2) | | | | | | | | | | | | | | | | | | | | | | | 1,165,473 | |
| | | | | | | |
| | 1,394,005 | | | GPT Group, (2) | | | | | | | | | | | | | | | | | | | | | | | 4,848,809 | |
| | | | | | | |
| | 816,154 | | | Growthpoint Properties Australia Ltd, (2) | | | | | | | | | | | | | | | | | | | | | | | 2,195,734 | |
| | | | | | | |
| | 497,839 | | | Home Reit PLC, (3) | | | | | | | | | | | | | | | | | | | | | | | 735,259 | |
| | | | | | | |
| | 2,077 | | | Hulic Reit Inc, (2) | | | | | | | | | | | | | | | | | | | | | | | 3,101,065 | |
| | | | | | | |
| | 72,530 | | | ICADE, (2) | | | | | | | | | | | | | | | | | | | | | | | 5,576,490 | |
| | | | | | | |
| | 2,942,564 | | | LXI REIT plc, (2) | | | | | | | | | | | | | | | | | | | | | | | 4,793,959 | |
| | | | | | | |
| | 870,646 | | | Nexus Real Estate Investment Trust | | | | | | | | | | | | | | | | | | | | | | | 1,320,093 | |
| | | | | | | |
| | 4,350 | | | Nomura Real Estate Master Fund Inc, (2) | | | | | | | | | | | | | | | | | | | | | | | 6,225,038 | |
| | | | | | | |
| | 636,127 | | | Secure Income REIT Plc | | | | | | | | | | | | | | | | | | | | | | | 2,609,713 | |
| | | | | | | |
| | 6,625 | | | Star Asia Investment Corp, (2) | | | | | | | | | | | | | | | | | | | | | | | 3,240,358 | |
| | | | | | | |
| | 1,607,024 | | | Stockland, (2) | | | | | | | | | | | | | | | | | | | | | | | 5,188,391 | |
| | | | | | | |
| | 515,242 | | | Stride Property Group, (2) | | | | | | | | | | | | | | | | | | | | | | | 875,574 | |
| | | | | | | |
| | 1,070,556 | | | Tritax EuroBox PLC, 144A | | | | | | | | | | | | | | | | | | | | | | | 1,446,418 | |
| | | | | | | |
| | 188,014 | | | Vornado Realty Trust | | | | | | | | | | | | | | | | | | | | | | | 5,021,854 | |
| | | | | | | |
| | 3,362 | | | Washington Real Estate Investment Trust | | | | | | | | | | | | | | | | | | | | | | | 72,720 | |
| | | | | | | |
| | 83,014 | | | WP Carey Inc | | | | | | | | | | | | | | | | | | | | | | | 5,859,128 | |
| | | | Total Diversified | | | | | | | | | | | | | | | | | | | | | | | 72,907,568 | |
| | | | | | | |
| | | | Health Care – 4.4% | | | | | | | | | | | | | | | | | | |
| | | | | | | |
| | 268,417 | | | CareTrust REIT Inc | | | | | | | | | | | | | | | | | | | | | | | 5,953,489 | |
| | | | | | | |
| | 330,096 | | | Healthcare Trust of America Inc | | | | | | | | | | | | | | | | | | | | | | | 9,090,844 | |
| | | | | | | |
| | 197,368 | | | Healthpeak Properties Inc | | | | | | | | | | | | | | | | | | | | | | | 5,966,435 | |
| | | | | | | |
| | 51,252 | | | LTC Properties Inc | | | | | | | | | | | | | | | | | | | | | | | 1,994,215 | |
| | | | | | | |
| | 576,815 | | | Medical Properties Trust Inc | | | | | | | | | | | | | | | | | | | | | | | 12,568,799 | |
| | | | | | | |
| | 562,712 | | | NorthWest Healthcare Properties Real Estate Investment Trust | | | | | | | | | | | | | | | | | | | | | | | 5,570,093 | |
| | | | | | | |
| | 208,867 | | | Omega Healthcare Investors Inc | | | | | | | | | | | | | | | | | | | | | | | 7,586,049 | |
| | | | | | | |
| | 1,084,636 | | | Physicians Realty Trust | | | | | | | | | | | | | | | | | | | | | | | 19,306,521 | |
| | | | | | | |
| | 204,500 | | | Sabra Health Care REIT Inc | | | | | | | | | | | | | | | | | | | | | | | 3,552,165 | |
| | | | Total Health Care | | | | | | | | | | | | | | | | | | | | | | | 71,588,610 | |
| | | | | | | |
| | | | Hotels – 0.9% | | | | | | | | | | | | | | | | | | |
| | | | | | | |
| | 446,871 | | | MGM Growth Properties LLC | | | | | | | | | | | | | | | | | | | | | | | 13,987,062 | |
45
Nuveen Real Asset Income Fund (continued)
Portfolio of Investments December 31, 2020
| | | | | | | | | | | | | | | | | | | | | | | | | | | | |
| Shares | | | Description (1) | | | | | | | | | | | | | | | | | Value | |
| | | | | | | |
| | | | Industrial – 4.7% | | | | | | | | | | | | | | | | | | |
| | | | | | | |
| | 1,166,596 | | | APN Industria REIT, (2) | | | | | | | | | | | | | | | | | | | | | | $ | 2,580,469 | |
| | | | | | | |
| | 2,849,891 | | | Ascendas Real Estate Investment Trust, (2) | | | | | | | | | | | | | | | | | | | | | | | 6,433,508 | |
| | | | | | | |
| | 3,140,497 | | | Centuria Industrial REIT, (2) | | | | | | | | | | | | | | | | | | | | | | | 7,447,795 | |
| | | | | | | |
| | 845,698 | | | Dream Industrial Real Estate Investment Trust | | | | | | | | | | | | | | | | | | | | | | | 8,736,687 | |
| | | | | | | |
| | 1,312,757 | | | ESR-REIT, (2) | | | | | | | | | | | | | | | | | | | | | | | 392,790 | |
| | | | | | | |
| | 5,718,569 | | | Frasers Logistics & Commercial Trust, (2) | | | | | | | | | | | | | | | | | | | | | | | 6,112,924 | |
| | | | | | | |
| | 84,179 | | | Industrial Logistics Properties Trust | | | | | | | | | | | | | | | | | | | | | | | 1,960,529 | |
| | | | | | | |
| | 2,720,328 | | | Mapletree Logistics Trust, (2) | | | | | | | | | | | | | | | | | | | | | | | 4,140,244 | |
| | | | | | | |
| | 650,604 | | | STAG Industrial Inc | | | | | | | | | | | | | | | | | | | | | | | 20,376,917 | |
| | | | | | | |
| | 164,380 | | | Summit Industrial Income REIT | | | | | | | | | | | | | | | | | | | | | | | 1,762,736 | |
| | | | | | | |
| | 2,540,109 | | | Urban Logistics REIT PLC | | | | | | | | | | | | | | | | | | | | | | | 4,967,250 | |
| | | | | | | |
| | 2,530,318 | | | Warehouse Reit PLC | | | | | | | | | | | | | | | | | | | | | | | 4,152,254 | |
| | | | | | | |
| | 441,555 | | | WPT Industrial Real Estate Investment Trust | | | | | | | | | | | | | | | | | | | | | | | 6,380,470 | |
| | | | Total Industrial | | | | | | | | | | | | | | | | | | | | | | | 75,444,573 | |
| | | | | | | |
| | | | Mortgage – 0.4% | | | | | | | | | | | | | | | | | | |
| | | | | | | |
| | 91,213 | | | Blackstone Mortgage Trust Inc | | | | | | | | | | | | | | | | | | | | | | | 2,511,094 | |
| | | | | | | |
| | 108,214 | | | Nexpoint Real Estate Finance Inc | | | | | | | | | | | | | | | | | | | | | | | 1,787,695 | |
| | | | | | | |
| | 152,649 | | | Starwood Property Trust Inc | | | | | | | | | | | | | | | | | | | | | | | 2,946,126 | |
| | | | Total Mortgage | | | | | | | | | | | | | | | | | | | | | | | 7,244,915 | |
| | | | | | | |
| | | | Office – 2.9% | | | | | | | | | | | | | | | | | | |
| | | | | | | |
| | 232,669 | | | Brandywine Realty Trust | | | | | | | | | | | | | | | | | | | | | | | 2,771,088 | |
| | | | | | | |
| | 609,823 | | | Centuria Office REIT, (2) | | | | | | | | | | | | | | | | | | | | | | | 1,006,375 | |
| | | | | | | |
| | 160,063 | | | City Office REIT Inc | | | | | | | | | | | | | | | | | | | | | | | 1,563,815 | |
| | | | | | | |
| | 45,642 | | | Covivio, (2) | | | | | | | | | | | | | | | | | | | | | | | 4,188,198 | |
| | | | | | | |
| | 84,915 | | | Dream Office Real Estate Investment Trust | | | | | | | | | | | | | | | | | | | | | | | 1,320,856 | |
| | | | | | | |
| | 70,168 | | | Easterly Government Properties Inc | | | | | | | | | | | | | | | | | | | | | | | 1,589,305 | |
| | | | | | | |
| | 1,030,523 | | | Elite Commercial REIT, (2) | | | | | | | | | | | | | | | | | | | | | | | 928,454 | |
| | | | | | | |
| | 3,925,450 | | | GDI Property Group, (2) | | | | | | | | | | | | | | | | | | | | | | | 3,664,750 | |
| | | | | | | |
| | 160,442 | | | Globalworth Real Estate Investments Ltd | | | | | | | | | | | | | | | | | | | | | | | 1,396,528 | |
| | | | | | | |
| | 148,646 | | | Highwoods Properties Inc | | | | | | | | | | | | | | | | | | | | | | | 5,890,841 | |
| | | | | | | |
| | 101,939 | | | Intervest Offices & Warehouses NV, (2) | | | | | | | | | | | | | | | | | | | | | | | 2,820,905 | |
| | | | | | | |
| | 21,411 | | | Invesco Office J-Reit Inc, (2) | | | | | | | | | | | | | | | | | | | | | | | 3,142,553 | |
| | | | | | | |
| | 1,569 | | | Japan Excellent Inc, (2) | | | | | | | | | | | | | | | | | | | | | | | 1,946,375 | |
| | | | | | | |
| | 131,092 | | | NSI NV, (2) | | | | | | | | | | | | | | | | | | | | | | | 5,234,440 | |
| | | | | | | |
| | 180,614 | | | Piedmont Office Realty Trust Inc | | | | | | | | | | | | | | | | | | | | | | | 2,931,365 | |
| | | | | | | |
| | 99,095 | | | Postal Realty Trust Inc | | | | | | | | | | | | | | | | | | | | | | | 1,672,724 | |
| | | | | | | |
| | 838,282 | | | True North Commercial Real Estate Investment Trust | | | | | | | | | | | | | | | | | | | | | | | 4,155,518 | |
| | | | Total Office | | | | | | | | | | | | | | | | | | | | | | | 46,224,090 | |
| | | | | | | |
| | | | Residential – 0.2% | | | | | | | | | | | | | | | | | | |
| | | | | | | |
| | 65,132 | | | Apartment Income REIT Corp, (3) | | | | | | | | | | | | | | | | | | | | | | | 2,501,720 | |
46
| | | | | | | | | | | | | | | | | | | | | | | | | | | | |
| Shares | | | Description (1) | | | | | | | | | | | | | | | | | Value | |
| | | | | | | |
| | | | Residential (continued) | | | | | | | | | | | | | | | | | | |
| | | | | | | |
| | 6 | | | Kenedix Residential Next Investment Corp, (2) | | | | | | | | | | | | | | | | | | | | | | $ | 11,025 | |
| | | | Total Residential | | | | | | | | | | | | | | | | | | | | | | | 2,512,745 | |
| | | | | | | |
| | | | Retail – 4.8% | | | | | | | | | | | | | | | | | | |
| | | | | | | |
| | 7,023 | | | Altarea SCA | | | | | | | | | | | | | | | | | | | | | | | 1,230,322 | |
| | | | | | | |
| | 695,598 | | | APN Convenience Retail REIT, (2) | | | | | | | | | | | | | | | | | | | | | | | 1,896,352 | |
| | | | | | | |
| | 6,003,376 | | | CapitaRetail China Trust, (2) | | | | | | | | | | | | | | | | | | | | | | | 6,324,676 | |
| | | | | | | |
| | 169,637 | | | Choice Properties Real Estate Investment Trust | | | | | | | | | | | | | | | | | | | | | | | 1,733,818 | |
| | | | | | | |
| | 24,227 | | | Crombie Real Estate Investment Trust | | | | | | | | | | | | | | | | | | | | | | | 273,122 | |
| | | | | | | |
| | 191,515 | | | CT Real Estate Investment Trust | | | | | | | | | | | | | | | | | | | | | | | 2,357,640 | |
| | | | | | | |
| | 6,224,376 | | | Fortune Real Estate Investment Trust, (2) | | | | | | | | | | | | | | | | | | | | | | | 5,928,046 | |
| | | | | | | |
| | 4,409,881 | | | Frasers Centrepoint Trust, (2) | | | | | | | | | | | | | | | | | | | | | | | 8,207,914 | |
| | | | | | | |
| | 654 | | | Kenedix Retail REIT Corp, (2) | | | | | | | | | | | | | | | | | | | | | | | 1,595,948 | |
| | | | | | | |
| | 125,000 | | | National Retail Properties Inc | | | | | | | | | | | | | | | | | | | | | | | 5,115,000 | |
| | | | | | | |
| | 1,285 | | | NETSTREIT Corp | | | | | | | | | | | | | | | | | | | | | | | 25,045 | |
| | | | | | | |
| | 156,009 | | | Realty Income Corp | | | | | | | | | | | | | | | | | | | | | | | 9,699,079 | |
| | | | | | | |
| | 504,992 | | | RioCan Real Estate Investment Trust | | | | | | | | | | | | | | | | | | | | | | | 6,645,154 | |
| | | | | | | |
| | 2,842,010 | | | Scentre Group, (2) | | | | | | | | | | | | | | | | | | | | | | | 6,104,602 | |
| | | | | | | |
| | 71,806 | | | Simon Property Group Inc | | | | | | | | | | | | | | | | | | | | | | | 6,123,616 | |
| | | | | | | |
| | 224,652 | | | Spirit Realty Capital Inc | | | | | | | | | | | | | | | | | | | | | | | 9,024,271 | |
| | | | | | | |
| | 253,174 | | | Urban Edge Properties | | | | | | | | | | | | | | | | | | | | | | | 3,276,071 | |
| | | | | | | |
| | 556,333 | | | Waypoint REIT, (2) | | | | | | | | | | | | | | | | | | | | | | | 1,170,647 | |
| | | | | | | |
| | 35,449 | | | Weingarten Realty Investors | | | | | | | | | | | | | | | | | | | | | | | 768,180 | |
| | | | Total Retail | | | | | | | | | | | | | | | | | | | | | | | 77,499,503 | |
| | | | | | | |
| | | | Specialized – 1.0% | | | | | | | | | | | | | | | | | | |
| | | | | | | |
| | 331,416 | | | Automotive Properties Real Estate Investment Trust | | | | | | | | | | | | | | | | | | | | | | | 2,788,487 | |
| | | | | | | |
| | 203,318 | | | CatchMark Timber Trust Inc | | | | | | | | | | | | | | | | | | | | | | | 1,903,056 | |
| | | | | | | |
| | 490,315 | | | Charter Hall Social Infrastructure REIT, (2) | | | | | | | | | | | | | | | | | | | | | | | 1,236,985 | |
| | | | | | | |
| | 55,393 | | | Iron Mountain Inc | | | | | | | | | | | | | | | | | | | | | | | 1,632,986 | |
| | | | | | | |
| | 310,180 | | | VICI Properties Inc | | | | | | | | | | | | | | | | | | | | | | | 7,909,590 | |
| | | | Total Specialized | | | | | | | | | | | | | | | | | | | | | | | 15,471,104 | |
| | | | Total Real Estate Investment Trust Common Stocks (cost $327,057,025) | | | | | | | | | | | | | | | | | | | | | | | 382,880,170 | |
| | | | | | | |
| Shares | | | Description (1) | | | | | | | | | | | | | | | | | Value | |
| | | | | | | |
| | | | COMMON STOCKS – 22.2% | | | | | | | | | | | | | | | | | | |
| | | | | | | |
| | | | Air Freight & Logistics – 0.3% | | | | | | | | | | | | | | | | | | |
| | | | | | | |
| | 154,278 | | | Oesterreichische Post AG, (2), (4) | | | | | | | | | | | | | | | | | | | | | | $ | 5,396,928 | |
| | | | | | | |
| | | | Diversified Financial Services – 0.2% | | | | | | | | | | | | | | | | | | |
| | | | | | | |
| | 1,708,247 | | | Sdcl Energy Efficiency Income Trust PLC | | | | | | | | | | | | | | | | | | | | | | | 2,487,871 | |
| | | | | | | |
| | | | Diversified Telecommunication Services – 1.3% | | | | | | | | | | | | | | | | | | |
| | | | | | | |
| | 3,843,714 | | | HKBN Ltd, (2) | | | | | | | | | | | | | | | | | | | | | | | 5,953,776 | |
47
Nuveen Real Asset Income Fund (continued)
Portfolio of Investments December 31, 2020
| | | | | | | | | | | | | | | | | | | | | | | | | | | | |
| Shares | | | Description (1) | | | | | | | | | | | | | | | | | Value | |
| | | | | | | |
| | | | Diversified Telecommunication Services (continued) | | | | | | | | | | | | | | | | | | |
| | | | | | | |
| | 1,570,703 | | | HKT Trust & HKT Ltd, (2) | | | | | | | | | | | | | | | | | | | | | | $ | 2,037,092 | |
| | | | | | | |
| | 18,825,420 | | | NetLink NBN Trust, (2) | | | | | | | | | | | | | | | | | | | | | | | 13,759,422 | |
| | | | Total Diversified Telecommunication Services | | | | | | | | | | | | | | | | | | | | | | | 21,750,290 | |
| | | | | | | |
| | | | Electric Utilities – 6.1% | | | | | | | | | | | | | | | | | | |
| | | | | | | |
| | 5,369,518 | | | AusNet Services, (2) | | | | | | | | | | | | | | | | | | | | | | | 7,277,217 | |
| | | | | | | |
| | 64,676 | | | CEZ AS, (2) | | | | | | | | | | | | | | | | | | | | | | | 1,551,195 | |
| | | | | | | |
| | 513,682 | | | Cia de Transmissao de Energia Eletrica Paulista, (2) | | | | | | | | | | | | | | | | | | | | | | | 2,755,977 | |
| | | | | | | |
| | 261,188 | | | CK Infrastructure Holdings Ltd, (2) | | | | | | | | | | | | | | | | | | | | | | | 1,402,684 | |
| | | | | | | |
| | 59,109 | | | Emera Inc | | | | | | | | | | | | | | | | | | | | | | | 2,512,214 | |
| | | | | | | |
| | 649,691 | | | Endesa SA, (2), (4) | | | | | | | | | | | | | | | | | | | | | | | 17,820,311 | |
| | | | | | | |
| | 285,971 | | | Enel Chile SA, ADR | | | | | | | | | | | | | | | | | | | | | | | 1,112,427 | |
| | | | | | | |
| | 1,107,735 | | | Power Assets Holdings Ltd, (2) | | | | | | | | | | | | | | | | | | | | | | | 5,999,085 | |
| | | | | | | |
| | 267,346 | | | PPL Corp | | | | | | | | | | | | | | | | | | | | | | | 7,539,157 | |
| | | | | | | |
| | 763,568 | | | Red Electrica Corp SA, (2) | | | | | | | | | | | | | | | | | | | | | | | 15,676,869 | |
| | | | | | | |
| | 10,947 | | | Southern Co | | | | | | | | | | | | | | | | | | | | | | | 672,474 | |
| | | | | | | |
| | 6,906,949 | | | Spark Infrastructure Group, (2) | | | | | | | | | | | | | | | | | | | | | | | 11,229,644 | |
| | | | | | | |
| | 919,365 | | | SSE PLC, (2) | | | | | | | | | | | | | | | | | | | | | | | 18,831,518 | |
| | | | | | | |
| | 494,512 | | | Transmissora Alianca de Energia Eletrica SA, (2) | | | | | | | | | | | | | | | | | | | | | | | 3,180,355 | |
| | | | Total Electric Utilities | | | | | | | | | | | | | | | | | | | | | | | 97,561,127 | |
| | | | | | | |
| | | | Gas Utilities – 3.0% | | | | | | | | | | | | | | | | | | |
| | | | | | | |
| | 271,885 | | | AltaGas Ltd | | | | | | | | | | | | | | | | | | | | | | | 3,998,497 | |
| | | | | | | |
| | 368,586 | | | APA Group, (2) | | | | | | | | | | | | | | | | | | | | | | | 2,742,453 | |
| | | | | | | |
| | 900,066 | | | Enagas SA, (2) | | | | | | | | | | | | | | | | | | | | | | | 19,801,205 | |
| | | | | | | |
| | 445,901 | | | Italgas SpA, (2) | | | | | | | | | | | | | | | | | | | | | | | 2,840,394 | |
| | | | | | | |
| | 3,343,602 | | | Snam SpA, (2) | | | | | | | | | | | | | | | | | | | | | | | 18,883,308 | |
| | | | Total Gas Utilities | | | | | | | | | | | | | | | | | | | | | | | 48,265,857 | |
| | | | | | | |
| | | | Independent Power & Renewable Electricity Producers – 1.9% | | | | | | | | | | | | | | | | | | |
| | | | | | | |
| | 273,967 | | | Atlantica Sustainable Infrastructure PLC | | | | | | | | | | | | | | | | | | | | | | | 10,405,266 | |
| | | | | | | |
| | 1,989 | | | Canadian Solar Infrastructure Fund Inc, (2) | | | | | | | | | | | | | | | | | | | | | | | 2,571,517 | |
| | | | | | | |
| | 160,719 | | | Clearway Energy Inc | | | | | | | | | | | | | | | | | | | | | | | 5,131,758 | |
| | | | | | | |
| | 737,920 | | | TransAlta Renewables Inc | | | | | | | | | | | | | | | | | | | | | | | 12,614,612 | |
| | | | Total Independent Power & Renewable Electricity Producers | | | | | | | | | | | | | | | | | | | | | | | 30,723,153 | |
| | | | | | | |
| | | | Multi-Utilities – 2.2% | | | | | | | | | | | | | | | | | | |
| | | | | | | |
| | 378,316 | | | Canadian Utilities Ltd | | | | | | | | | | | | | | | | | | | | | | | 9,240,195 | |
| | | | | | | |
| | 100,919 | | | Engie SA, (2) | | | | | | | | | | | | | | | | | | | | | | | 1,547,089 | |
| | | | | | | |
| | 173,230 | | | EON SE, (2) | | | | | | | | | | | | | | | | | | | | | | | 1,918,217 | |
| | | | | | | |
| | 184,877 | | | National Grid PLC, Sponsored ADR | | | | | | | | | | | | | | | | | | | | | | | 10,913,289 | |
| | | | | | | |
| | 2,961,138 | | | REN – Redes Energeticas Nacionais SGPS SA, (2) | | | | | | | | | | | | | | | | | | | | | | | 8,531,799 | |
| | | | | | | |
| | 918,413 | | | Vector Ltd, (2) | | | | | | | | | | | | | | | | | | | | | | | 2,811,950 | |
| | | | Total Multi-Utilities | | | | | | | | | | | | | | | | | | | | | | | 34,962,539 | |
48
| | | | | | | | | | | | | | | | | | | | | | | | | | | | |
| Shares | | | Description (1) | | | | | | | | | | | | | | | | | Value | |
| | | | | | | |
| | | | Oil, Gas & Consumable Fuels – 3.0% | | | | | | | | | | | | | | | | | | |
| | | | | | | |
| | 300,871 | | | Enbridge Inc | | | | | | | | | | | | | | | | | | | | | | $ | 9,624,863 | |
| | | | | | | |
| | 339,531 | | | Enterprise Products Partners LP | | | | | | | | | | | | | | | | | | | | | | | 6,651,412 | |
| | | | | | | |
| | 401,090 | | | Gibson Energy Inc | | | | | | | | | | | | | | | | | | | | | | | 6,478,443 | |
| | | | | | | |
| | 271,800 | | | Kinder Morgan Inc | | | | | | | | | | | | | | | | | | | | | | | 3,715,506 | |
| | | | | | | |
| | 120,593 | | | Pembina Pipeline Corp | | | | | | | | | | | | | | | | | | | | | | | 2,851,637 | |
| | | | | | | |
| | 6,585 | | | Plains GP Holdings LP | | | | | | | | | | | | | | | | | | | | | | | 55,643 | |
| | | | | | | |
| | 136,459 | | | TC Energy Corp | | | | | | | | | | | | | | | | | | | | | | | 5,547,768 | |
| | | | | | | |
| | 611,072 | | | Williams Cos Inc | | | | | | | | | | | | | | | | | | | | | | | 12,251,994 | |
| | | | | | | |
| | 277,589 | | | Z Energy Ltd, (2), (3) | | | | | | | | | | | | | | | | | | | | | | | 640,289 | |
| | | | Total Oil, Gas & Consumable Fuels | | | | | | | | | | | | | | | | | | | | | | | 47,817,555 | |
| | | | | | | |
| | | | Real Estate Management & Development – 3.0% | | | | | | | | | | | | | | | | | | |
| | | | | | | |
| | 562,666 | | | Amot Investments Ltd, (2) | | | | | | | | | | | | | | | | | | | | | | | 3,153,454 | |
| | | | | | | |
| | 371,481 | | | Ascendas India Trust, (2) | | | | | | | | | | | | | | | | | | | | | | | 387,821 | |
| | | | | | | |
| | 381,706 | | | Cibus Nordic Real Estate AB, (2) | | | | | | | | | | | | | | | | | | | | | | | 7,830,368 | |
| | | | | | | |
| | 1,902,309 | | | Corp Inmobiliaria Vesta SAB de CV | | | | | | | | | | | | | | | | | | | | | | | 3,728,237 | |
| | | | | | | |
| | 273,550 | | | DIC Asset AG, (2) | | | | | | | | | | | | | | | | | | | | | | | 4,507,473 | |
| | | | | | | |
| | 272,237 | | | Dios Fastigheter AB, (2) | | | | | | | | | | | | | | | | | | | | | | | 2,543,326 | |
| | | | | | | |
| | 93,852 | | | Kennedy-Wilson Holdings Inc | | | | | | | | | | | | | | | | | | | | | | | 1,679,012 | |
| | | | | | | |
| | 6,161,495 | | | Land & Houses PCL, (2) | | | | | | | | | | | | | | | | | | | | | | | 1,636,052 | |
| | | | | | | |
| | 2,098,066 | | | New World Development Co Ltd, (2) | | | | | | | | | | | | | | | | | | | | | | | 9,761,055 | |
| | | | | | | |
| | 5,437,954 | | | Sino Land Co Ltd, (2) | | | | | | | | | | | | | | | | | | | | | | | 7,076,495 | |
| | | | | | | |
| | 407,345 | | | Sun Hung Kai Properties Ltd, (2) | | | | | | | | | | | | | | | | | | | | | | | 5,209,526 | |
| | | | Total Real Estate Management & Development | | | | | | | | | | | | | | | | | | | | | | | 47,512,819 | |
| | | | | | | |
| | | | Road & Rail – 0.5% | | | | | | | | | | | | | | | | | | |
| | | | | | | |
| | 2,592,984 | | | Aurizon Holdings Ltd, (2) | | | | | | | | | | | | | | | | | | | | | | | 7,790,435 | |
| | | | | | | |
| | | | Thrifts & Mortgage Finance – 0.1% | | | | | | | | | | | | | | | | | | |
| | | | | | | |
| | 962,100 | | | Real Estate Credit Investments Ltd, (4) | | | | | | | | | | | | | | | | | | | | | | | 1,736,688 | |
| | | | | | | |
| | | | Transportation Infrastructure – 0.2% | | | | | | | | | | | | | | | | | | |
| | | | | | | |
| | 81,685 | | | Dalrymple Bay Infrastructure Ltd, (3) | | | | | | | | | | | | | | | | | | | | | | | 131,618 | |
| | | | | | | |
| | 1,585,512 | | | Jiangsu Expressway Co Ltd, (2) | | | | | | | | | | | | | | | | | | | | | | | 1,773,392 | |
| | | | | | | |
| | 53,832 | | | Macquarie Infrastructure Corp | | | | | | | | | | | | | | | | | | | | | | | 2,021,392 | |
| | | | Total Transportation Infrastructure | | | | | | | | | | | | | | | | | | | | | | | 3,926,402 | |
| | | | | | | |
| | | | Water Utilities – 0.4% | | | | | | | | | | | | | | | | | | |
| | | | | | | |
| | 516,237 | | | Guangdong Investment Ltd, (2) | | | | | | | | | | | | | | | | | | | | | | | 930,614 | |
| | | | | | | |
| | 900,382 | | | Inversiones Aguas Metropolitanas SA, (2) | | | | | | | | | | | | | | | | | | | | | | | 747,034 | |
| | | | | | | |
| | 440,387 | | | United Utilities Group PLC, (2) | | | | | | | | | | | | | | | | | | | | | | | 5,386,359 | |
| | | | Total Water Utilities | | | | | | | | | | | | | | | | | | | | | | | 7,064,007 | |
| | | | Total Common Stocks (cost $321,158,392) | | | | | | | | | | | | | | | | | | | | | | | 356,995,671 | |
49
Nuveen Real Asset Income Fund (continued)
Portfolio of Investments December 31, 2020
| | | | | | | | | | | | | | | | | | | | | | | | | | | | |
Principal
Amount (000) (5) | | | Description (1) | | | | | | | | Coupon | | | Maturity | | | Ratings (6) | | | Value | |
| | | | | | | |
| | | | CORPORATE BONDS – 15.7% | | | | | | | | | | | | | | | | | | | | | | | | |
| | | | | | | |
| | | | Air Freight & Logistics – 0.3% | | | | | | | | | | | | | | | | | | |
| | | | | | | |
| $ | 4,675 | | | Cargo Aircraft Management Inc, 144A | | | | | | | | | | | 4.750% | | | | 2/01/28 | | | | Ba3 | | | $ | 4,821,094 | |
| | | | | | | |
| | | | Chemicals – 0.0% | | | | | | | | | | | | | | | | | | |
| | | | | |
| | 500 | | | Calumet Specialty Products Partners LP / Calumet Finance Corp, 144A | | | | 11.000% | | | | 4/15/25 | | | | B– | | | | 505,000 | |
| | | | | | | |
| | | | Commercial Services & Supplies – 0.3% | | | | | | | | | | | | | | | | | | |
| | | | | | | |
| | 963 | | | Atento Luxco 1 SA, 144A, (4) | | | | | | | | | | | 6.125% | | | | 8/10/22 | | | | Ba3 | | | | 947,361 | |
| | | | | | | |
| | 2,250 | | | GFL Environmental Inc, 144A | | | | | | | | | | | 4.250% | | | | 6/01/25 | | | | BB– | | | | 2,334,375 | |
| | | | | | | |
| | 200 | | | GFL Environmental Inc, 144A | | | | | | | | | | | 5.125% | | | | 12/15/26 | | | | BB– | | | | 212,750 | |
| | | | | | | |
| | 1,300 | | | GFL Environmental Inc, 144A | | | | | | | | | | | 3.500% | | | | 9/01/28 | | | | BB– | | | | 1,326,273 | |
| | | | | | | |
| | 550 | | | Stericycle Inc, 144A | | | | | | | | | | | 3.875% | | | | 1/15/29 | | | | BB | | | | 565,125 | |
| | | | Total Commercial Services & Supplies | | | | | | | | | | | | | | | | | | | | | | | 5,385,884 | |
| | | | | | | |
| | | | Communications Equipment – 0.3% | | | | | | | | | | | | | | | | | | |
| | | | | | | |
| | 780 | | | ViaSat Inc, 144A | | | | | | | | | | | 5.625% | | | | 9/15/25 | | | | BB– | | | | 797,784 | |
| | | | | | | |
| | 3,325 | | | ViaSat Inc, 144A, (4) | | | | | | | | | | | 6.500% | | | | 7/15/28 | | | | BB– | | | | 3,598,348 | |
| | | | Total Communications Equipment | | | | | | | | | | | | | | | | | | | | | | | 4,396,132 | |
| | | | | | | |
| | | | Construction & Engineering – 0.4% | | | | | | | | | | | | | | | | | | |
| | | | | | | |
| | 1,800 | | | GMR Hyderabad International Airport Ltd, 144A | | | | | | | | | | | 5.375% | | | | 4/10/24 | | | | BB+ | | | | 1,825,129 | |
| | | | | | | |
| | 1,500 | | | IHS Netherlands Holdco BV, 144A | | | | | | | | | | | 8.000% | | | | 9/18/27 | | | | B2 | | | | 1,612,500 | |
| | | | | | | |
| | 997 | | | International Airport Finance SA, 144A | | | | | | | | | | | 12.000% | | | | 3/15/33 | | | | B– | | | | 992,695 | |
| | | | | | | |
| | 1,350 | | | Pike Corp, 144A | | | | | | | | | | | 5.500% | | | | 9/01/28 | | | | B3 | | | | 1,425,938 | |
| | | | Total Construction & Engineering | | | | | | | | | | | | | | | | | | | | | | | 5,856,262 | |
| | | | | | | |
| | | | Diversified Financial Services – 0.5% | | | | | | | | | | | | | | | | | | |
| | | | | | | |
| | 1,223 | | | Cometa Energia SA de CV, 144A | | | | | | | | | | | 6.375% | | | | 4/24/35 | | | | Baa3 | | | | 1,430,658 | |
| | | | | | | |
| | 975 | | | Genesis Energy LP / Genesis Energy Finance Corp | | | | | | | | | | | 7.750% | | | | 2/01/28 | | | | B+ | | | | 933,563 | |
| | | | | | | |
| | 1,815 | | | Minejesa Capital BV, 144A | | | | | | | | | | | 5.625% | | | | 8/10/37 | | | | Baa3 | | | | 1,991,963 | |
| | | | | | | |
| | 17,061 | BRL | | Swiss Insured Brazil Power Finance Sarl, 144A | | | | | | | | | | | 9.850% | | | | 7/16/32 | | | | AAA | | | | 3,736,316 | |
| | | | Total Diversified Financial Services | | | | | | | | | | | | | | | | | | | | | | | 8,092,500 | |
| | | | | |
| | | | Diversified Telecommunication Services – 0.7% | | | | | | | | | | | | | |
| | | | | | | |
| | 1,325 | | | Altice France SA/France, 144A | | | | | | | | | | | 5.500% | | | | 1/15/28 | | | | B | | | | 1,385,301 | |
| | | | | | | |
| | 1,670 | | | Level 3 Financing Inc, 144A | | | | | | | | | | | 4.625% | | | | 9/15/27 | | | | BB | | | | 1,744,206 | |
| | | | | | | |
| | 2,750 | | | Level 3 Financing Inc, 144A | | | | | | | | | | | 4.250% | | | | 7/01/28 | | | | BB | | | | 2,825,625 | |
| | | | | | | |
| | 1,750 | | | QualityTech LP / QTS Finance Corp, 144A | | | | | | | | | | | 3.875% | | | | 10/01/28 | | | | BB | | | | 1,785,000 | |
| | | | | | | |
| | 1,825 | | | Switch Ltd, 144A | | | | | | | | | | | 3.750% | | | | 9/15/28 | | | | BB | | | | 1,852,375 | |
| | | | | | | |
| | 2,000 | | | Zayo Group Holdings Inc, 144A | | | | | | | | | | | 4.000% | | | | 3/01/27 | | | | B1 | | | | 2,005,000 | |
| | | | Total Diversified Telecommunication Services | | | | | | | | | | | | | | | | | | | | | | | 11,597,507 | |
| | | | | | | |
| | | | Electric Utilities – 1.9% | | | | | | | | | | | | | | | | | | |
| | | | | |
| | 1,810 | | | Acwa Power Management And Investments One Ltd, 144A | | | | 5.950% | | | | 12/15/39 | | | | Baa3 | | | | 2,162,190 | |
| | | | | |
| | 1,925 | | | Adani Green Energy UP Ltd / Prayatna Developers Pvt Ltd / Parampujya Solar Energ, 144A | | | | 6.250% | | | | 12/10/24 | | | | BB+ | | | | 2,134,344 | |
50
| | | | | | | | | | | | | | | | | | | | | | | | | | | | |
Principal
Amount (000) (5) | | | Description (1) | | | | | | | | Coupon | | | Maturity | | | Ratings (6) | | | Value | |
| | | | | | | |
| | | | Electric Utilities (continued) | | | | | | | | | | | | | | | | | | |
| | | | | | | |
| $ | 386 | | | Adani Transmission Ltd, 144A | | | | | | | | | | | 4.250% | | | | 5/21/36 | | | | BBB– | | | $ | 408,197 | |
| | | | | | | |
| | 850 | | | AES Panama Generation Holdings SRL, 144A | | | | | | | | | | | 4.375% | | | | 5/31/30 | | | | Baa3 | | | | 919,615 | |
| | | | | | | |
| | 1,500 | | | Cikarang Listrindo Tbk PT, 144A | | | | | | | | | | | 4.950% | | | | 9/14/26 | | | | BB+ | | | | 1,560,000 | |
| | | | | | | |
| | 1,200 | | | Empresa de Transmision Electrica SA, 144A | | | | | | | | | | | 5.125% | | | | 5/02/49 | | | | Baa1 | | | | 1,492,692 | |
| | | | | | | |
| | 5,700,000 | COP | | Empresas Publicas de Medellin ESP, 144A | | | | | | | | | | | 8.375% | | | | 11/08/27 | | | | Baa3 | | | | 1,768,994 | |
| | | | | | | |
| | 2,600 | | | Instituto Costarricense de Electricidad, 144A | | | | | | | | | | | 6.950% | | | | 11/10/21 | | | | B1 | | | | 2,590,250 | |
| | | | | | | |
| | 1,500 | | | Lamar Funding Ltd, 144A | | | | | | | | | | | 3.958% | | | | 5/07/25 | | | | Ba3 | | | | 1,472,430 | |
| | | | | | | |
| | 1,221 | | | LLPL Capital Pte Ltd, 144A | | | | | | | | | | | 6.875% | | | | 2/04/39 | | | | Baa3 | | | | 1,439,205 | |
| | | | | | | |
| | 1,550 | | | NRG Energy Inc, 144A | | | | | | | | | | | 3.625% | | | | 2/15/31 | | | | BB+ | | | | 1,594,640 | |
| | | | | | | |
| | 2,175 | | | Pacific Gas and Electric Co, (4) | | | | | | | | | | | 3.300% | | | | 8/01/40 | | | | BBB– | | | | 2,165,622 | |
| | | | | |
| | 1,155 | | | Pattern Energy Operations LP / Pattern Energy Operations Inc, 144A | | | | 4.500% | | | | 8/15/28 | | | | BB– | | | | 1,218,525 | |
| | | | | | | |
| | 4,020 | | | Southern Co | | | | | | | | | | | 4.000% | | | | 1/15/51 | | | | BBB | | | | 4,257,481 | |
| | | | | | | |
| | 1,750 | | | Talen Energy Supply LLC | | | | | | | | | | | 6.500% | | | | 6/01/25 | | | | B | | | | 1,426,250 | |
| | | | | | | |
| | 3,050 | | | TerraForm Power Operating LLC, 144A | | | | | | | | | | | 4.750% | | | | 1/15/30 | | | | BB | | | | 3,263,500 | |
| | | | Total Electric Utilities | | | | | | | | | | | | | | | | | | | | | | | 29,873,935 | |
| | | | | | | |
| | | | Energy Equipment & Services – 0.3% | | | | | | | | | | | | | | | | | | |
| | | | | |
| | 850 | | | Archrock Partners LP / Archrock Partners Finance Corp, 144A | | | | 6.250% | | | | 4/01/28 | | | | B+ | | | | 884,816 | |
| | | | | | | |
| | 1,000 | | | Boardwalk Pipelines LP | | | | | | | | | | | 3.400% | | | | 2/15/31 | | | | BBB– | | | | 1,042,850 | |
| | | | | | | |
| | 1,950 | | | Galaxy Pipeline Assets Bidco Ltd, 144A | | | | | | | | | | | 3.250% | | | | 9/30/40 | | | | Aa2 | | | | 2,057,483 | |
| | | | | | | |
| | 1,200 | | | Genesis Energy LP / Genesis Energy Finance Corp | | | | | | | | | | | 8.000% | | | | 1/15/27 | | | | B+ | | | | 1,194,000 | |
| | | | Total Energy Equipment & Services | | | | | | | | | | | | | | | | | | | | | | | 5,179,149 | |
| | | | | | | |
| | | | Equity Real Estate Investment Trust – 2.7% | | | | | | | | | | | | | | | | | | |
| | | | | |
| | 2,750 | | | Brookfield Property REIT Inc / BPR Cumulus LLC / BPR Nimbus LLC / GGSI Sellco LL, 144A | | | | 5.750% | | | | 5/15/26 | | | | BB+ | | | | 2,713,081 | |
| | | | | | | |
| | 3,075 | | | GLP Capital LP / GLP Financing II Inc | | | | | | | | | | | 4.000% | | | | 1/15/31 | | | | BBB– | | | | 3,355,502 | |
| | | | | | | |
| | 1,300 | | | HAT Holdings I LLC / HAT Holdings II LLC, 144A | | | | | | | | | | | 3.750% | | | | 9/15/30 | | | | BB+ | | | | 1,348,750 | |
| | | | | | | |
| | 1,475 | | | Host Hotels & Resorts LP | | | | | | | | | | | 3.500% | | | | 9/15/30 | | | | BBB– | | | | 1,553,143 | |
| | | | | | | |
| | 1,535 | | | Iron Mountain Inc, 144A | | | | | | | | | | | 5.250% | | | | 3/15/28 | | | | BB– | | | | 1,619,870 | |
| | | | | | | |
| | 800 | | | Iron Mountain Inc, 144A | | | | | | | | | | | 4.500% | | | | 2/15/31 | | | | BB– | | | | 838,000 | |
| | | | | | | |
| | 4,250 | | | iStar Inc | | | | | | | | | | | 4.750% | | | | 10/01/24 | | | | BB | | | | 4,303,125 | |
| | | | | |
| | 1,500 | | | MGM Growth Properties Operating Partnership LP / MGP Finance Co-Issuer Inc | | | | 5.750% | | | | 2/01/27 | | | | BB+ | | | | 1,682,805 | |
| | | | | | | |
| | 3,375 | | | MPT Operating Partnership LP / MPT Finance Corp | | | | | | | | | | | 3.500% | | | | 3/15/31 | | | | BBB– | | | | 3,484,688 | |
| | | | | | | |
| | 3,800 | | | Retail Properties of America Inc | | | | | | | | | | | 4.750% | | | | 9/15/30 | | | | BBB– | | | | 4,032,496 | |
| | | | | | | |
| | 2,615 | | | Sabra Health Care LP | | | | | | | | | | | 5.125% | | | | 8/15/26 | | | | BBB– | | | | 2,914,839 | |
| | | | | | | |
| | 4,475 | | | SBA Communications Corp | | | | | | | | | | | 3.875% | | | | 2/15/27 | | | | BB– | | | | 4,698,750 | |
| | | | | | | |
| | 3,030 | | | Scentre Group Trust 2, 144A | | | | | | | | | | | 5.125% | | | | 9/24/80 | | | | BBB+ | | | | 3,193,934 | |
| | | | | | | |
| | 700 | | | Starwood Property Trust Inc, 144A | | | | | | | | | | | 5.500% | | | | 11/01/23 | | | | Ba3 | | | | 731,500 | |
| | | | | |
| | 1,500 | | | Uniti Group LP / Uniti Fiber Holdings Inc / CSL Capital LLC, 144A | | | | 7.875% | | | | 2/15/25 | | | | BB+ | | | | 1,611,315 | |
| | | | | | | |
| | 1,525 | | | VICI Properties LP / VICI Note Co Inc, 144A | | | | | | | | | | | 4.250% | | | | 12/01/26 | | | | BB | | | | 1,581,654 | |
| | | | | | | |
| | 975 | | | VICI Properties LP / VICI Note Co Inc, 144A | | | | | | | | | | | 4.625% | | | | 12/01/29 | | | | BB | | | | 1,043,250 | |
51
Nuveen Real Asset Income Fund (continued)
Portfolio of Investments December 31, 2020
| | | | | | | | | | | | | | | | | | | | | | | | | | | | |
Principal
Amount (000) (5) | | | Description (1) | | | | | | | | Coupon | | | Maturity | | | Ratings (6) | | | Value | |
| | | | | |
| | | | Equity Real Estate Investment Trust (continued) | | | | | | | | | | | | | |
| | | | | | | |
| $ | 2,625 | | | VICI Properties LP / VICI Note Co Inc, 144A | | | | | | | | | | | 4.125% | | | | 8/15/30 | | | | BB | | | $ | 2,771,029 | |
| | | | Total Equity Real Estate Investment Trust | | | | | | | | | | | | | | | | | | | | | | | 43,477,731 | |
| | | | | | | |
| | | | Gas Utilities – 0.5% | | | | | | | | | | | | | | | | | | |
| | | | | | | |
| | 2,100 | | | LBC Tank Terminals Holding Netherlands BV, 144A | | | | | | | | | | | 6.875% | | | | 5/15/23 | | | | B– | | | | 2,100,000 | |
| | | | | | | |
| | 2,850 | | | National Gas Co of Trinidad & Tobago Ltd, 144A | | | | | | | | | | | 6.050% | | | | 1/15/36 | | | | BBB– | | | | 3,067,312 | |
| | | | | |
| | 2,915 | | | Suburban Propane Partners LP/Suburban Energy Finance Corp | | | | 5.875% | | | | 3/01/27 | | | | BB– | | | | 3,046,175 | |
| | | | Total Gas Utilities | | | | | | | | | | | | | | | | | | | | | | | 8,213,487 | |
| | | | | | | |
| | | | Health Care Providers & Services – 0.6% | | | | | | | | | | | | | | | | | | |
| | | | | | | |
| | 450 | | | CHS/Community Health Systems Inc, 144A | | | | | | | | | | | 5.625% | | | | 3/15/27 | | | | B | | | | 483,863 | |
| | | | | | | |
| | 150 | | | CHS/Community Health Systems Inc, 144A | | | | | | | | | | | 6.000% | | | | 1/15/29 | | | | B | | | | 162,039 | |
| | | | | | | |
| | 1,200 | | | Cushman & Wakefield US Borrower LLC, 144A | | | | | | | | | | | 6.750% | | | | 5/15/28 | | | | BB– | | | | 1,323,000 | |
| | | | | | | |
| | 1,241 | | | HCA Inc | | | | | | | | | | | 3.500% | | | | 9/01/30 | | | | Ba2 | | | | 1,317,968 | |
| | | | | | | |
| | 1,675 | | | LifePoint Health Inc, 144A | | | | | | | | | | | 5.375% | | | | 1/15/29 | | | | CCC+ | | | | 1,673,827 | |
| | | | | | | |
| | 750 | | | Tenet Healthcare Corp, 144A | | | | | | | | | | | 7.500% | | | | 4/01/25 | | | | BB– | | | | 819,375 | |
| | | | | | | |
| | 3,925 | | | Tenet Healthcare Corp, 144A | | | | | | | | | | | 6.125% | | | | 10/01/28 | | | | B | | | | 4,096,346 | |
| | | | Total Health Care Providers & Services | | | | | | | | | | | | | | | | | | | | | | | 9,876,418 | |
| | | | | | | |
| | | | Hotels, Restaurants & Leisure – 0.5% | | | | | | | | | | | | | | | | | | |
| | | | | |
| | 575 | | | Cedar Fair LP / Canada’s Wonderland Co / Magnum Management Corp / Millennium Op, 144A | | | | 5.500% | | | | 5/01/25 | | | | Ba2 | | | | 599,438 | |
| | | | | | | |
| | 1,625 | | | Hilton Domestic Operating Co Inc, 144A | | | | | | | | | | | 5.750% | | | | 5/01/28 | | | | BB | | | | 1,767,187 | |
| | | | | | | |
| | 3,000 | | | Hilton Domestic Operating Co Inc, 144A | | | | | | | | | | | 4.000% | | | | 5/01/31 | | | | N/R | | | | 3,165,330 | |
| | | | | |
| | 750 | | | MGM Growth Properties Operating Partnership LP / MGP Finance Co-Issuer Inc, 144A | | | | 4.625% | | | | 6/15/25 | | | | BB+ | | | | 803,250 | |
| | | | | |
| | 1,695 | | | MGM Growth Properties Operating Partnership LP / MGP Finance Co-Issuer Inc | | | | 4.500% | | | | 1/15/28 | | | | BB+ | | | | 1,803,277 | |
| | | | Total Hotels, Restaurants & Leisure | | | | | | | | | | | | | | | | | | | | | | | 8,138,482 | |
| | | | |
| | | | Independent Power & Renewable Electricity Producers – 0.9% | | | | | | | | | | |
| | | | | | | |
| | 1,685 | | | Azure Power Energy Ltd, 144A | | | | | | | | | | | 5.500% | | | | 11/03/22 | | | | Ba2 | | | | 1,727,631 | |
| | | | | | | |
| | 878 | | | Calpine Corp, 144A | | | | | | | | | | | 5.250% | | | | 6/01/26 | | | | BB+ | | | | 908,291 | |
| | | | | | | |
| | 4,200 | | | Calpine Corp, 144A | | | | | | | | | | | 3.750% | | | | 3/01/31 | | | | BB+ | | | | 4,159,386 | |
| | | | | | | |
| | 1,170 | | | Clearway Energy Operating LLC, 144A | | | | | | | | | | | 4.750% | | | | 3/15/28 | | | | BB | | | | 1,254,825 | |
| | | | | |
| | 1,300 | | | EnfraGen Energia Sur SA / EnfraGen Spain SA / Prime Energia SpA, 144A | | | | 5.375% | | | | 12/30/30 | | | | Ba3 | | | | 1,348,750 | |
| | | | | | | |
| | 1,500 | | | Kallpa Generacion SA, 144A | | | | | | | | | | | 4.125% | | | | 8/16/27 | | | | Baa3 | | | | 1,616,250 | |
| | | | | | | |
| | 1,325 | | | NRG Energy Inc, 144A | | | | | | | | | | | 5.250% | | | | 6/15/29 | | | | BB+ | | | | 1,457,500 | |
| | | | | | | |
| | 1,500 | | | Talen Energy Supply LLC, 144A | | | | | | | | | | | 7.625% | | | | 6/01/28 | | | | BB | | | | 1,616,250 | |
| | | | | | | |
| | 1,020 | | | UEP Penonome II SA, 144A | | | | | | | | | | | 6.500% | | | | 10/01/38 | | | | BB | | | | 1,062,605 | |
| | | | Total Independent Power & Renewable Electricity Producers | | | | | | | | 15,151,488 | |
| | | | | | | |
| | | | Industrial Conglomerates – 0.0% | | | | | | | | | | | | | | | | | | |
| | | | | | | |
| | 700 | | | Stena International SA, 144A | | | | | | | | | | | 6.125% | | | | 2/01/25 | | | | BB– | | | | 691,250 | |
| | | | | | | |
| | | | Media – 0.8% | | | | | | | | | | | | | | | | | | |
| | | | | | | |
| | 1,775 | | | Altice Financing SA, 144A | | | | | | | | | | | 5.000% | | | | 1/15/28 | | | | B | | | | 1,818,727 | |
52
| | | | | | | | | | | | | | | | | | | | | | | | | | | | |
Principal
Amount (000) (5) | | | Description (1) | | | | | | | | Coupon | | | Maturity | | | Ratings (6) | | | Value | |
| | | | | | | |
| | | | Media (continued) | | | | | | | | | | | | | | | | | | |
| | | | | | | |
| $ | 200 | | | Cablevision Lightpath LLC, 144A | | | | | | | | | | | 3.875% | | | | 9/15/27 | | | | B+ | | | $ | 201,250 | |
| | | | | | | |
| | 1,200 | | | Cablevision Lightpath LLC, 144A | | | | | | | | | | | 5.625% | | | | 9/15/28 | | | | B | | | | 1,255,500 | |
| | | | | | | |
| | 4,600 | | | CCO Holdings LLC / CCO Holdings Capital Corp, 144A | | | | | | | | | | | 4.500% | | | | 5/01/32 | | | | BB | | | | 4,911,512 | |
| | | | | | | |
| | 2,500 | | | CSC Holdings LLC, 144A | | | | | | | | | | | 3.375% | | | | 2/15/31 | | | | BB | | | | 2,453,125 | |
| | | | | | | |
| | 1,900 | | | Lamar Media Corp | | | | | | | | | | | 3.750% | | | | 2/15/28 | | | | BB– | | | | 1,952,630 | |
| | | | Total Media | | | | | | | | | | | | | | | | | | | | | | | 12,592,744 | |
| | | | | |
| | | | Mortgage Real Estate Investment Trust – 0.5% | | | | | | | | | | | | | |
| | | | | | | |
| | 1,900 | | | HAT Holdings I LLC / HAT Holdings II LLC, 144A | | | | | | | | | | | 5.250% | | | | 7/15/24 | | | | BB+ | | | | 1,976,000 | |
| | | | | |
| | 3,850 | | | Ladder Capital Finance Holdings LLLP / Ladder Capital Finance Corp, 144A | | | | 4.250% | | | | 2/01/27 | | | | BB+ | | | | 3,782,625 | |
| | | | | | | |
| | 1,720 | | | Starwood Property Trust Inc | | | | | | | | | | | 4.750% | | | | 3/15/25 | | | | Ba3 | | | | 1,763,000 | |
| | | | Total Mortgage Real Estate Investment Trust | | | | | | | | | | | | | | | | | | | | | | | 7,521,625 | |
| | | | | | | |
| | | | Oil, Gas & Consumable Fuels – 2.5% | | | | | | | | | | | | | | | | | | |
| | | | | |
| | 1,800 | | | Antero Midstream Partners LP / Antero Midstream Finance Corp, 144A | | | | 7.875% | | | | 5/15/26 | | | | B– | | | | 1,858,644 | |
| | | | | |
| | 2,235 | | | Crestwood Midstream Partners LP / Crestwood Midstream Finance Corp, 144A | | | | 5.625% | | | | 5/01/27 | | | | BB– | | | | 2,212,650 | |
| | | | | | | |
| | 200 | | | EnLink Midstream LLC, 144A | | | | | | | | | | | 5.625% | | | | 1/15/28 | | | | BB+ | | | | 204,297 | |
| | | | | | | |
| | 4,190 | | | Enterprise Products Operating LLC | | | | | | | | | | | 5.375% | | | | 2/15/78 | | | | Baa2 | | | | 4,232,313 | |
| | | | | | | |
| | 4,110 | | | Enviva Partners LP / Enviva Partners Finance Corp, 144A | | | | | | | | | | | 6.500% | | | | 1/15/26 | | | | BB– | | | | 4,366,875 | |
| | | | | | | |
| | 775 | | | EQM Midstream Partners LP, 144A | | | | | | | | | | | 6.000% | | | | 7/01/25 | | | | BB | | | | 848,625 | |
| | | | | | | |
| | 1,215 | | | EQM Midstream Partners LP | | | | | | | | | | | 5.500% | | | | 7/15/28 | | | | BB | | | | 1,327,813 | |
| | | | | | | |
| | 2,320 | | | Global Partners LP / GLP Finance Corp | | | | | | | | | | | 7.000% | | | | 8/01/27 | | | | B+ | | | | 2,482,400 | |
| | | | | | | |
| | 2,425 | | | Leviathan Bond Ltd, Reg S, 144A | | | | | | | | | | | 6.750% | | | | 6/30/30 | | | | BB | | | | 2,751,726 | |
| | | | | | | |
| | 2,875 | | | M/I Homes Inc | | | | | | | | | | | 4.950% | | | | 2/01/28 | | | | BB– | | | | 3,043,331 | |
| | | | | | | |
| | 675 | | | NuStar Logistics LP | | | | | | | | | | | 6.375% | | | | 10/01/30 | | | | BB– | | | | 764,640 | |
| | | | | | | |
| | 300 | | | Oleoducto Central SA, 144A | | | | | | | | | | | 4.000% | | | | 7/14/27 | | | | BBB– | | | | 325,653 | |
| | | | | | | |
| | 2,000 | | | ONEOK Inc | | | | | | | | | | | 6.350% | | | | 1/15/31 | | | | BBB | | | | 2,562,934 | |
| | | | | | | |
| | 1,200 | | | Peru LNG Srl, 144A | | | | | | | | | | | 5.375% | | | | 3/22/30 | | | | BB– | | | | 1,070,400 | |
| | | | | | | |
| | 1,250 | | | Plains All American Pipeline LP / PAA Finance Corp | | | | | | | | | | | 3.800% | | | | 9/15/30 | | | | BBB– | | | | 1,343,101 | |
| | | | | | | |
| | 275 | | | Promigas SA ESP / Gases del Pacifico SAC, 144A | | | | | | | | | | | 3.750% | | | | 10/16/29 | | | | Baa3 | | | | 292,534 | |
| | | | | | | |
| | 3,000 | | | Sunoco LP / Sunoco Finance Corp | | | | | | | | | | | 5.875% | | | | 3/15/28 | | | | BB | | | | 3,240,000 | |
| | | | | | | |
| | 3,015 | | | TransMontaigne Partners LP / TLP Finance Corp | | | | | | | | | | | 6.125% | | | | 2/15/26 | | | | BB | | | | 3,030,075 | |
| | | | | | | |
| | 600 | | | Transportadora de Gas del Sur SA, 144A | | | | | | | | | | | 6.750% | | | | 5/02/25 | | | | CCC+ | | | | 550,506 | |
| | | | | |
| | 1,325 | | | USA Compression Partners LP / USA Compression Finance Corp | | | | 6.875% | | | | 9/01/27 | | | | BB– | | | | 1,414,544 | |
| | | | | | | |
| | 1,675 | | | Western Midstream Operating LP | | | | | | | | | | | 5.050% | | | | 2/01/30 | | | | BB | | | | 1,863,437 | |
| | | | Total Oil, Gas & Consumable Fuels | | | | | | | | | | | | | | | | | | | | | | | 39,786,498 | |
| | | | | |
| | | | Real Estate Management & Development – 0.6% | | | | | | | | | | | | | |
| | | | | | | |
| | 5,285 | | | Hunt Cos Inc, 144A | | | | | | | | | | | 6.250% | | | | 2/15/26 | | | | BB– | | | | 5,417,125 | |
| | | | | | | |
| | 2,775 | EUR | | Peach Property Finance GmbH, 144A | | | | | | | | | | | 4.375% | | | | 11/15/25 | | | | BB– | | | | 3,538,131 | |
| | | | | | | |
| | 600 | | | RKI Overseas Finance 2016 B Ltd, Reg S | | | | | | | | | | | 4.700% | | | | 9/06/21 | | | | BB– | | | | 600,473 | |
| | | | Total Real Estate Management & Development | | | | | | | | | | | | | | | | | | | | | | | 9,555,729 | |
53
Nuveen Real Asset Income Fund (continued)
Portfolio of Investments December 31, 2020
| | | | | | | | | | | | | | | | | | | | | | | | | | | | |
Principal
Amount (000) (5) | | | Description (1) | | | | | | | | Coupon | | | Maturity | | | Ratings (6) | | | Value | |
| | | | | | | |
| | | | Road & Rail – 0.3% | | | | | | | | | | | | | | | | | | |
| | | | | | | |
| $ | 525 | | | ENA Master Trust, 144A | | | | | | | | | | | 4.000% | | | | 5/19/48 | | | | Baa1 | | | $ | 565,687 | |
| | | | | | | |
| | 1,700 | | | Rumo Luxembourg Sarl, 144A | | | | | | | | | | | 5.875% | | | | 1/18/25 | | | | BB | | | | 1,795,642 | |
| | | | | | | |
| | 1,700 | | | Transnet SOC Ltd, 144A | | | | | | | | | | | 4.000% | | | | 7/26/22 | | | | BBB– | | | | 1,718,768 | |
| | | | Total Road & Rail | | | | | | | | | | | | | | | | | | | | | | | 4,080,097 | |
| | | | | | | |
| | | | Trading Companies & Distributors – 0.2% | | | | | | | | | | | | | | | | | | |
| | | | | |
| | 2,430 | | | Fortress Transportation and Infrastructure Investors LLC, 144A | | | | 6.500% | | | | 10/01/25 | | | | Ba3 | | | | 2,539,617 | |
| | | | | | | |
| | | | Transportation Infrastructure – 0.7% | | | | | | | | | | | | | | | | | | |
| | | | | | | |
| | 1,400 | | | Adani Ports & Special Economic Zone Ltd, 144A | | | | | | | | | | | 4.000% | | | | 7/30/27 | | | | BBB– | | | | 1,492,666 | |
| | | | | | | |
| | 1,635 | | | Aeropuerto Internacional de Tocumen SA, 144A | | | | | | | | | | | 6.000% | | | | 11/18/48 | | | | BBB– | | | | 1,952,008 | |
| | | | | | | |
| | 2,810 | | | Aeropuertos Dominicanos Siglo XXI SA, 144A | | | | | | | | | | | 6.750% | | | | 3/30/29 | | | | B+ | | | | 2,915,375 | |
| | | | | | | |
| | 1,130 | | | Autopistas del Sol SA/Costa Rica, 144A | | | | | | | | | | | 7.375% | | | | 12/30/30 | | | | B | | | | 1,062,297 | |
| | | | | | | |
| | 1,700 | | | DP World PLC, 144A | | | | | | | | | | | 5.625% | | | | 9/25/48 | | | | Baa3 | | | | 2,164,440 | |
| | | | | | | |
| | 10,692 | MXN | | Grupo Aeroportuario del Centro Norte SAB de CV | | | | | | | | | | | 6.850% | | | | 6/07/21 | | | | N/R | | | | 542,481 | |
| | | | | | | |
| | 1,800 | | | Mexico City Airport Trust, 144A | | | | | | | | | | | 4.250% | | | | 10/31/26 | | | | BBB | | | | 1,903,500 | |
| | | | Total Transportation Infrastructure | | | | | | | | | | | | | | | | | | | | | | | 12,032,767 | |
| | | |
| | | | Wireless Telecommunication Services – 0.2% | | | | | | | |
| | | | | | | |
| | 2,225 | | | Hughes Satellite Systems Corp | | | | | | | | | | | 6.625% | | | | 8/01/26 | | | | BB | | | | 2,517,521 | |
| | | | Total Corporate Bonds (cost $240,317,903) | | | | | | | | | | | | | | | | | | | | | | | 251,882,917 | |
| | | | | | | |
| Shares | | | Description (1) | | | | | | | | Coupon | | | | | | Ratings (6) | | | Value | |
| | | |
| | | | $25 PAR (OR SIMILAR) RETAIL PREFERRED – 15.3% | | | | | | | | | |
| | | | | | | |
| | | | Diversified Financial Services – 0.2% | | | | | | | | | | | | | | | | | | |
| | | | | | | |
| | 56,532 | | | Brookfield Finance Inc | | | | | | | | | | | 4.625% | | | | | | | | BBB | | | $ | 1,463,048 | |
| | | | | | | |
| | 72,968 | | | National Rural Utilities Cooperative Finance Corp | | | | | | | | | | | 5.500% | | | | | | | | A3 | | | | 2,136,503 | |
| | | | Total Diversified Financial Services | | | | | | | | | | | | | | | | | | | | | | | 3,599,551 | |
| | | | | | | |
| | | | Electric Utilities – 2.2% | | | | | | | | | | | | | | | | | | |
| | | | | | | |
| | 106,905 | | | DTE Energy Co | | | | | | | | | | | 4.375% | | | | | | | | BBB– | | | | 2,901,402 | |
| | | | | | | |
| | 29,445 | | | Duke Energy Corp, (4) | | | | | | | | | | | 5.750% | | | | | | | | BBB | | | | 839,477 | |
| | | | | | | |
| | 43,026 | | | Entergy Arkansas LLC | | | | | | | | | | | 4.875% | | | | | | | | A | | | | 1,132,875 | |
| | | | | | | |
| | 39,700 | | | Entergy Texas Inc | | | | | | | | | | | 5.375% | | | | | | | | BBB– | | | | 1,084,405 | |
| | | | | | | |
| | 118,399 | | | Georgia Power Co | | | | | | | | | | | 5.000% | | | | | | | | BBB | | | | 3,380,291 | |
| | | | | | | |
| | 291,329 | | | Integrys Holding Inc, (2) | | | | | | | | | | | 6.000% | | | | | | | | BBB | | | | 7,784,311 | |
| | | | | | | |
| | 78,119 | | | NextEra Energy Capital Holdings Inc | | | | | | | | | | | 5.250% | | | | | | | | BBB | | | | 2,054,530 | |
| | | | | | | |
| | 167,906 | | | Southern Co | | | | | | | | | | | 5.250% | | | | | | | | BBB | | | | 4,509,955 | |
| | | | | | | |
| | 33,787 | | | Southern Co | | | | | | | | | | | 5.250% | | | | | | | | BBB | | | | 922,723 | |
| | | | | | | |
| | 220,294 | | | Southern Co | | | | | | | | | | | 4.950% | | | | | | | | BBB | | | | 6,036,056 | |
| | | | | | | |
| | 162,718 | | | Southern Co | | | | | | | | | | | 4.200% | | | | | | | | BBB | | | | 4,380,368 | |
| | | | Total Electric Utilities | | | | | | | | | | | | | | | | | | | | | | | 35,026,393 | |
54
| | | | | | | | | | | | | | | | | | | | | | | | | | | | |
| Shares | | | Description (1) | | | | | | | | Coupon | | | | | | Ratings (6) | | | Value | |
| | | | | | | |
| | | | Equity Real Estate Investment Trust – 8.5% | | | | | | | | | | | | | | | | | | |
| | | | | | | |
| | 92,905 | | | American Homes 4 Rent | | | | | | | | | | | 6.500% | | | | | | | | BB | | | $ | 2,354,213 | |
| | | | | | | |
| | 171,522 | | | American Homes 4 Rent | | | | | | | | | | | 6.350% | | | | | | | | BB | | | | 4,360,089 | |
| | | | | | | |
| | 145,243 | | | American Homes 4 Rent | | | | | | | | | | | 5.875% | | | | | | | | BB | | | | 3,747,269 | |
| | | | | | | |
| | 191,214 | | | American Homes 4 Rent | | | | | | | | | | | 5.875% | | | | | | | | BB | | | | 4,965,828 | |
| | | | | | | |
| | 5,906 | | | American Homes 4 Rent | | | | | | | | | | | 6.250% | | | | | | | | Ba1 | | | | 157,572 | |
| | | | | | | |
| | 175,273 | | | Armada Hoffler Properties Inc | | | | | | | | | | | 6.750% | | | | | | | | N/R | | | | 4,567,614 | |
| | | | | | | |
| | 19,261 | | | Boston Properties Inc | | | | | | | | | | | 5.250% | | | | | | | | Baa2 | | | | 499,823 | |
| | | | | | | |
| | 321,425 | | | Centerspace | | | | | | | | | | | 6.625% | | | | | | | | N/R | | | | 8,357,050 | |
| | | | | | | |
| | 186,655 | | | City Office REIT Inc | | | | | | | | | | | 6.625% | | | | | | | | N/R | | | | 5,084,482 | |
| | | | | | | |
| | 149,053 | | | DiamondRock Hospitality Co | | | | | | | | | | | 8.250% | | | | | | | | N/R | | | | 4,002,073 | |
| | | | | | | |
| | 175,141 | | | Digital Realty Trust Inc | | | | | | | | | | | 5.250% | | | | | | | | Baa3 | | | | 4,585,191 | |
| | | | | | | |
| | 65,146 | | | Digital Realty Trust Inc | | | | | | | | | | | 6.625% | | | | | | | | Baa3 | | | | 1,663,829 | |
| | | | | | | |
| | 112,037 | | | Digital Realty Trust Inc | | | | | | | | | | | 5.850% | | | | | | | | Baa3 | | | | 3,133,675 | |
| | | | | | | |
| | 165,705 | | | Digital Realty Trust Inc | | | | | | | | | | | 5.200% | | | | | | | | Baa3 | | | | 4,523,746 | |
| | | | | | | |
| | 6,401 | | | Federal Realty Investment Trust | | | | | | | | | | | 5.000% | | | | | | | | Baa1 | | | | 165,594 | |
| | | | | | | |
| | 176,353 | | | Kimco Realty Corp | | | | | | | | | | | 5.250% | | | | | | | | Baa2 | | | | 4,692,753 | |
| | | | | | | |
| | 28,095 | | | Kimco Realty Corp | | | | | | | | | | | 5.125% | | | | | | | | Baa2 | | | | 738,056 | |
| | | | | | | |
| | 5,975 | | | Mid-America Apartment Communities Inc | | | | | | | | | | | 8.500% | | | | | | | | BBB– | | | | 400,265 | |
| | | | | | | |
| | 185,873 | | | Monmouth Real Estate Investment Corp | | | | | | | | | | | 6.125% | | | | | | | | N/R | | | | 4,665,412 | |
| | | | | | | |
| | 44,063 | | | National Retail Properties Inc | | | | | | | | | | | 5.200% | | | | | | | | Baa2 | | | | 1,136,385 | |
| | | | | | | |
| | 102,745 | | | National Storage Affiliates Trust | | | | | | | | | | | 6.000% | | | | | | | | N/R | | | | 2,711,441 | |
| | | | | | | |
| | 85,594 | | | Pebblebrook Hotel Trust | | | | | | | | | | | 6.500% | | | | | | | | N/R | | | | 2,127,867 | |
| | | | | | | |
| | 131,642 | | | Pebblebrook Hotel Trust | | | | | | | | | | | 6.375% | | | | | | | | N/R | | | | 3,244,975 | |
| | | | | | | |
| | 161,659 | | | Pebblebrook Hotel Trust | | | | | | | | | | | 6.300% | | | | | | | | N/R | | | | 3,910,531 | |
| | | | | | | |
| | 282 | | | PS Business Parks Inc | | | | | | | | | | | 5.250% | | | | | | | | BBB | | | | 7,366 | |
| | | | | | | |
| | 154,831 | | | PS Business Parks Inc | | | | | | | | | | | 5.200% | | | | | | | | BBB | | | | 4,041,089 | |
| | | | | | | |
| | 294,853 | | | PS Business Parks Inc | | | | | | | | | | | 4.875% | | | | | | | | BBB | | | | 8,076,024 | |
| | | | | | | |
| | 903 | | | Public Storage | | | | | | | | | | | 5.050% | | | | | | | | A3 | | | | 24,697 | |
| | | | | | | |
| | 23,153 | | | Public Storage, (4) | | | | | | | | | | | 5.600% | | | | | | | | A3 | | | | 666,575 | |
| | | | | | | |
| | 115,854 | | | Public Storage | | | | | | | | | | | 4.875% | | | | | | | | A3 | | | | 3,205,680 | |
| | | | | | | |
| | 594 | | | Public Storage | | | | | | | | | | | 4.750% | | | | | | | | A3 | | | | 16,834 | |
| | | | | | | |
| | 93,719 | | | Public Storage | | | | | | | | | | | 4.625% | | | | | | | | A3 | | | | 2,543,534 | |
| | | | | | | |
| | 4,377 | | | QTS Realty Trust Inc | | | | | | | | | | | 7.125% | | | | | | | | B– | | | | 121,155 | |
| | | | | | | |
| | 228,808 | | | Rexford Industrial Realty Inc | | | | | | | | | | | 5.625% | | | | | | | | BB+ | | | | 6,164,087 | |
| | | | | | | |
| | 64,059 | | | Saul Centers Inc | | | | | | | | | | | 6.125% | | | | | | | | N/R | | | | 1,553,431 | |
| | | | | | | |
| | 90,741 | | | Saul Centers Inc | | | | | | | | | | | 6.000% | | | | | | | | N/R | | | | 2,137,858 | |
| | | | | | | |
| | 78,724 | | | SITE Centers Corp | | | | | | | | | | | 6.375% | | | | | | | | BB+ | | | | 1,895,674 | |
| | | | | | | |
| | 34,578 | | | SL Green Realty Corp | | | | | | | | | | | 6.500% | | | | | | | | Ba1 | | | | 869,637 | |
| | | | | | | |
| | 28,813 | | | STAG Industrial Inc | | | | | | | | | | | 6.875% | | | | | | | | BB+ | | | | 730,410 | |
| | | | | | | |
| | 34,412 | | | Summit Hotel Properties Inc | | | | | | | | | | | 6.450% | | | | | | | | N/R | | | | 794,573 | |
| | | | | | | |
| | 173,717 | | | Summit Hotel Properties Inc | | | | | | | | | | | 6.250% | | | | | | | | N/R | | | | 3,913,844 | |
55
Nuveen Real Asset Income Fund (continued)
Portfolio of Investments December 31, 2020
| | | | | | | | | | | | | | | | | | | | | | | | | | | | |
| Shares | | | Description (1) | | | | | | | | Coupon | | | | | | Ratings (6) | | | Value | |
| | | | | | | |
| | | | Equity Real Estate Investment Trust (continued) | | | | | | | | | | | | | | | | | | |
| | | | | | | |
| | 36,665 | | | Sunstone Hotel Investors Inc | | | | | | | | | | | 6.950% | | | | | | | | N/R | | | $ | 896,093 | |
| | | | | | | |
| | 174,666 | | | Sunstone Hotel Investors Inc | | | | | | | | | | | 6.450% | | | | | | | | N/R | | | | 4,113,384 | |
| | | | | | | |
| | 163,454 | | | UMH Properties Inc | | | | | | | | | | | 6.750% | | | | | | | | N/R | | | | 4,169,712 | |
| | | | | | | |
| | 103,767 | | | Urstadt Biddle Properties Inc | | | | | | | | | | | 6.250% | | | | | | | | N/R | | | | 2,596,250 | |
| | | | | | | |
| | 102,400 | | | Urstadt Biddle Properties Inc | | | | | | | | | | | 5.875% | | | | | | | | N/R | | | | 2,547,712 | |
| | | | | | | |
| | 36,763 | | | Vornado Realty Trust | | | | | | | | | | | 5.700% | | | | | | | | Baa3 | | | | 924,957 | |
| | | | | | | |
| | 334,094 | | | Vornado Realty Trust | | | | | | | | | | | 5.250% | | | | | | | | Baa3 | | | | 8,806,718 | |
| | | | Total Equity Real Estate Investment Trust | | | | | | | | | | | | | | | | | | | | | | | 136,613,027 | |
| | | | | | | |
| | | | Gas Utilities – 0.5% | | | | | | | | | | | | | | | | | | |
| | | | | | | |
| | 230,748 | | | South Jersey Industries Inc | | | | | | | | | | | 5.625% | | | | | | | | BB+ | | | | 5,953,298 | |
| | | | | | | |
| | 72,047 | | | Spire Inc | | | | | | | | | | | 5.900% | | | | | | | | BBB | | | | 1,998,584 | |
| | | | Total Gas Utilities | | | | | | | | | | | | | | | | | | | | | | | 7,951,882 | |
| | | | |
| | | | Independent Power & Renewable Electricity Producers – 0.5% | | | | | | | | | | |
| | | | | | | |
| | 113,538 | | | Brookfield Renewable Partners LP | | | | | | | | | | | 5.750% | | | | | | | | BBB– | | | | 2,252,207 | |
| | | | | | | |
| | 196,333 | | | Brookfield Renewable Partners LP | | | | | | | | | | | 5.250% | | | | | | | | BBB– | | | | 5,355,965 | |
| | | | Total Independent Power & Renewable Electricity Producers | | | | | | | | 7,608,172 | |
| | | | | | | |
| | | | Multi-Utilities – 2.3% | | | | | | | | | | | | | | | | | | |
| | | | | | | |
| | 74,178 | | | Algonquin Power & Utilities Corp | | | | | | | | | | | 6.200% | | | | | | | | BB+ | | | | 2,087,369 | |
| | | | | | | |
| | 270,643 | | | Brookfield Infrastructure Partners LP | | | | | | | | | | | 5.350% | | | | | | | | BBB– | | | | 5,275,083 | |
| | | | | | | |
| | 214,172 | | | Brookfield Infrastructure Partners LP | | | | | | | | | | | 5.125% | | | | | | | | BBB– | | | | 5,709,826 | |
| | | | | | | |
| | 113,521 | | | CMS Energy Corp | | | | | | | | | | | 5.875% | | | | | | | | Baa2 | | | | 3,168,371 | |
| | | | | | | |
| | 159,199 | | | Dominion Energy Inc | | | | | | | | | | | 5.250% | | | | | | | | BBB– | | | | 4,167,830 | |
| | | | | | | |
| | 153,264 | | | DTE Energy Co, (4) | | | | | | | | | | | 5.375% | | | | | | | | BBB– | | | | 3,963,407 | |
| | | | | | | |
| | 6,716 | | | DTE Energy Co | | | | | | | | | | | 5.250% | | | | | | | | BBB– | | | | 182,675 | |
| | | | | | | |
| | 123,988 | | | NiSource Inc, (4) | | | | | | | | | | | 6.500% | | | | | | | | BBB– | | | | 3,532,418 | |
| | | | | | | |
| | 323,795 | | | Sempra Energy | | | | | | | | | | | 5.750% | | | | | | | | BBB– | | | | 9,205,492 | |
| | | | Total Multi-Utilities | | | | | | | | | | | | | | | | | | | | | | | 37,292,471 | |
| | | |
| | | | Oil, Gas & Consumable Fuels – 0.0% | | | | | | | |
| | | | | | | |
| | 46,536 | | | NuStar Energy LP | | | | | | | | | | | 7.625% | | | | | | | | B2 | | | | 836,717 | |
| | | | |
| | | | Real Estate Management & Development – 1.1% | | | | | | | | | | |
| | | | | | | |
| | 239,073 | | | Brookfield Property Partners LP | | | | | | | | | | | 5.750% | | | | | | | | BB+ | | | | 5,116,162 | |
| | | | | | | |
| | 197,991 | | | Brookfield Property Partners LP | | | | | | | | | | | 6.375% | | | | | | | | BB+ | | | | 4,591,411 | |
| | | | | | | |
| | 217,031 | | | Brookfield Property Partners LP | | | | | | | | | | | 6.500% | | | | | | | | BB+ | | | | 5,080,696 | |
| | | | | | | |
| | 128,733 | | | Landmark Infrastructure Partners LP | | | | | | | | | | | 7.900% | | | | | | | | N/R | | | | 3,272,393 | |
| | | | Total Real Estate Management & Development | | | | | | | | | | | | 18,060,662 | |
| | | | Total $25 Par (or similar) Retail Preferred (cost $232,782,078) | | | | | | | | | | | | 246,988,875 | |
56
| | | | | | | | | | | | | | | | | | | | | | | | | | | | |
Principal
Amount (000) (5) | | | Description (1) | | | | | | | | Coupon | | | Maturity | | | Ratings (6) | | | Value | |
| |
| | | | $1,000 PAR (OR SIMILAR) INSTITUTIONAL PREFERRED – 10.6% | |
| | | |
| | | | Diversified Financial Services – 0.4% | | | | | | | |
| | | | | | | |
| $ | 2,230 | | | National Rural Utilities Cooperative Finance Corp | | | | | | | | | | | 5.250% | | | | 4/20/46 | | | | A3 | | | $ | 2,470,672 | |
| | | | | | | |
| | 4,447 | | | Transcanada Trust | | | | | | | | | | | 5.625% | | | | 5/20/75 | | | | BBB | | | | 4,873,325 | |
| | | | Total Diversified Financial Services | | | | | | | | | | | | | | | | | | | | | | | 7,343,997 | |
| | | | | | | |
| | | | Electric Utilities – 3.2% | | | | | | | | | | | | | | | | | | |
| | | | | | | |
| | 4,240 | | | AusNet Services Holdings Pty Ltd, Reg S | | | | | | | | | | | 5.750% | | | | 3/17/76 | | | | BBB | | | | 4,337,520 | |
| | | | | | | |
| | 1,985 | | | ComEd Financing III | | | | | | | | | | | 6.350% | | | | 3/15/33 | | | | Baa2 | | | | 2,387,807 | |
| | | | | | | |
| | 6,975 | | | Duke Energy Corp | | | | | | | | | | | 4.875% | | | | N/A (7) | | | | BBB | | | | 7,552,739 | |
| | | | | | | |
| | 2,400 | GBP | | Electricite de France SA, Reg S | | | | | | | | | | | 5.875% | | | | N/A (7) | | | | BBB | | | | 3,807,122 | |
| | | | | | | |
| | 11,570 | | | Emera Inc | | | | | | | | | | | 6.750% | | | | 6/15/76 | | | | BB+ | | | | 13,522,437 | |
| | | | | | | |
| | 6,350 | | | Enel SpA, 144A | | | | | | | | | | | 8.750% | | | | 9/24/73 | | | | BBB | | | | 7,415,530 | |
| | | | | | | |
| | 4,725 | | | NextEra Energy Capital Holdings Inc | | | | | | | | | | | 4.800% | | | | 12/01/77 | | | | BBB | | | | 5,173,875 | |
| | | | | | | |
| | 4,590 | | | NextEra Energy Capital Holdings Inc | | | | | | | | | | | 5.650% | | | | 5/01/79 | | | | BBB | | | | 5,405,492 | |
| | | | | | | |
| | 1,515 | | | SSE PLC, Reg S | | | | | | | | | | | 4.750% | | | | 9/16/77 | | | | BBB– | | | | 1,571,813 | |
| | | | Total Electric Utilities | | | | | | | | | | | | | | | | | | | | | | | 51,174,335 | |
| | | | | | | |
| | | | Marine – 0.1% | | | | | | | | | | | | | | | | | | |
| | | | | | | |
| | 2,195 | | | Royal Capital BV, Reg S | | | | | | | | | | | 4.875% | | | | N/A (7) | | | | N/R | | | | 2,236,266 | |
| | | | | | | |
| | | | Multi-Utilities – 2.4% | | | | | | | | | | | | | | | | | | |
| | | | | | | |
| | 8,995 | | | CenterPoint Energy Inc | | | | | | | | | | | 6.125% | | | | N/A (7) | | | | BBB– | | | | 9,422,262 | |
| | | | | | | |
| | 3,105 | | | CMS Energy Corp | | | | | | | | | | | 4.750% | | | | 6/01/50 | | | | Baa2 | | | | 3,496,124 | |
| | | | | | | |
| | 2,740 | | | Dominion Energy Inc | | | | | | | | | | | 5.750% | | | | 10/01/54 | | | | BBB– | | | | 3,052,613 | |
| | | | | | | |
| | 3,480 | | | Dominion Energy Inc | | | | | | | | | | | 4.650% | | | | N/A (7) | | | | BBB– | | | | 3,668,502 | |
| | | | | | | |
| | 2,165 | | | NiSource Inc | | | | | | | | | | | 5.650% | | | | N/A (7) | | | | BBB– | | | | 2,224,538 | |
| | | | | | | |
| | 5,126 | | | RWE AG, Reg S | | | | | | | | | | | 6.625% | | | | 7/30/75 | | | | BB+ | | | | 5,951,952 | |
| | | | | | | |
| | 8,005 | | | Sempra Energy | | | | | | | | | | | 4.875% | | | | N/A (7) | | | | BBB– | | | | 8,555,344 | |
| | | | | |
| | 1,930 | | | WEC Energy Group Inc, (3-Month LIBOR reference rate + 2.113% spread), (8) | | | | 2.334% | | | | 5/15/67 | | | | BBB | | | | 1,654,935 | |
| | | | Total Multi-Utilities | | | | | | | | | | | | | | | | | | | | | | | 38,026,270 | |
| | |
| | | | Oil, Gas & Consumable Fuels – 3.7% | | | | |
| | | | | | | |
| | 10,962 | | | Enbridge Inc | | | | | | | | | | | 6.000% | | | | 1/15/77 | | | | BBB– | | | | 11,701,935 | |
| | | | | | | |
| | 12,494 | | | Enbridge Inc | | | | | | | | | | | 5.500% | | | | 7/15/77 | | | | BBB– | | | | 12,812,847 | |
| | | | | | | |
| | 4,437 | | | Enbridge Inc | | | | | | | | | | | 6.250% | | | | 3/01/78 | | | | BBB– | | | | 4,850,750 | |
| | | | | | | |
| | 4,050 | | | Enbridge Inc | | | | | | | | | | | 5.750% | | | | 7/15/80 | | | | BBB– | | | | 4,557,357 | |
| | | | | |
| | 3,941 | | | Energy Transfer Operating LP, (3-Month LIBOR reference rate + 3.018% spread), (8) | | | | 3.232% | | | | 11/01/66 | | | | Ba1 | | | | 2,748,848 | |
| | | | | | | |
| | 7,201 | | | Enterprise Products Operating LLC | | | | | | | | | | | 5.250% | | | | 8/16/77 | | | | Baa2 | | | | 7,298,175 | |
| | | | | | | |
| | 4,365 | CAD | | Inter Pipeline Ltd | | | | | | | | | | | 6.625% | | | | 11/19/79 | | | | BB | | | | 3,527,766 | |
| | | | | | | |
| | 7,700 | | | Transcanada Trust | | | | | | | | | | | 5.875% | | | | 8/15/76 | | | | BBB | | | | 8,585,500 | |
| | | | | | | |
| | 3,565 | | | Transcanada Trust | | | | | | | | | | | 5.500% | | | | 9/15/79 | | | | BBB | | | | 3,921,500 | |
| | | | Total Oil, Gas & Consumable Fuels | | | | | | | | | | | | | | | | | | | | | | | 60,004,678 | |
57
Nuveen Real Asset Income Fund (continued)
Portfolio of Investments December 31, 2020
| | | | | | | | | | | | | | | | | | | | | | | | | | | | |
Principal
Amount (000) (5) | | | Description (1) | | | | | | | | Coupon | | | Maturity | | | Ratings (6) | | | Value | |
| |
| | | | Real Estate Management & Development – 0.6% | |
| | | | | | | |
| $ | 6,250 | | | AT Securities BV, Reg S | | | | | | | | | | | 5.250% | | | | N/A (7) | | | | BBB– | | | $ | 6,515,625 | |
| | | | | | | |
| | 3,500 | SGD | | Frasers Property Treasury Pte Ltd, Reg Sv | | | | | | | | | | | 3.950% | | | | N/A (7) | | | | N/R | | | | 2,535,991 | |
| | | | Total Real Estate Management & Development | | | | 9,051,616 | |
| | | | | | | |
| | | | Road & Rail – 0.2% | | | | | | | | | | | | | | | | | | |
| | | | | | | |
| | 3,135 | | | BNSF Funding Trust I | | | | | | | | | | | 6.613% | | | | 12/15/55 | | | | A– | | | | 3,577,819 | |
| | | | Total $1,000 Par (or similar) Institutional Preferred (cost $158,522,164) | | | | | | | | 171,414,981 | |
| | | | | | | |
| Shares | | | Description (1) | | | | | | | | Coupon | | | | | | Ratings (6) | | | Value | |
| | | |
| | | | CONVERTIBLE PREFERRED SECURITIES – 7.1% | | | | | | | |
| | | | | | | |
| | | | Commercial Services & Supplies – 0.3% | | | | | | | | | | | | | | | | | | |
| | | | | | | |
| | 65,911 | | | GFL Environmental Inc | | | | | | | | | | | 6.000% | | | | | | | | N/R | | | $ | 4,644,089 | |
| | | | | | | |
| | | | Electric Utilities – 3.6% | | | | | | | | | | | | | | | | | | |
| | | | | | | |
| | 189,786 | | | American Electric Power Co Inc, (4) | | | | | | | | | | | 6.125% | | | | | | | | BBB | | | | 9,508,278 | |
| | | | | | | |
| | 143,648 | | | American Electric Power Co Inc, (2) | | | | | | | | | | | 6.125% | | | | | | | | BBB | | | | 7,152,234 | |
| | | | | | | |
| | 163,813 | | | NextEra Energy Inc | | | | | | | | | | | 4.872% | | | | | | | | A– | | | | 9,697,729 | |
| | | | | | | |
| | 196,333 | | | NextEra Energy Inc | | | | | | | | | | | 5.279% | | | | | | | | BBB | | | | 9,981,570 | |
| | | | | | | |
| | 109,159 | | | NextEra Energy Inc | | | | | | | | | | | 6.219% | | | | | | | | BBB | | | | 5,607,498 | |
| | | | | | | |
| | 48,112 | | | PG&E Corp | | | | | | | | | | | 5.500% | | | | | | | | N/R | | | | 5,910,078 | |
| | | | | | | |
| | 191,223 | | | Southern Co | | | | | | | | | | | 6.750% | | | | | | | | BBB | | | | 9,924,474 | |
| | | | Total Electric Utilities | | | | | | | | | | | | | | | | | | | | | | | 57,781,861 | |
| | | |
| | | | Equity Real Estate Investment Trust – 0.8% | | | | | | | |
| | | | | | | |
| | 26,744 | | | Equity Commonwealth | | | | | | | | | | | 6.500% | | | | | | | | N/R | | | | 799,111 | |
| | | | | | | |
| | 23,018 | | | Lexington Realty Trust | | | | | | | | | | | 6.500% | | | | | | | | N/R | | | | 1,367,695 | |
| | | | | | | |
| | 55,551 | | | QTS Realty Trust Inc | | | | | | | | | | | 6.500% | | | | | | | | B– | | | | 7,882,687 | |
| | | | | | | |
| | 46,340 | | | RPT Realty, (4) | | | | | | | | | | | 7.250% | | | | | | | | BB | | | | 2,309,585 | |
| | | | Total Equity Real Estate Investment Trust | | | | | | | | | | | | | | | | | | | | | | | 12,359,078 | |
| | | | | | | |
| | | | Gas Utilities – 0.0% | | | | | | | | | | | | | | | | | | |
| | | | | | | |
| | 6,887 | | | South Jersey Industries Inc, (4) | | | | | | | | | | | 7.250% | | | | | | | | N/R | | | | 245,866 | |
| | | | | | | |
| | | | Multi-Utilities – 2.3% | | | | | | | | | | | | | | | | | | |
| | | | | | | |
| | 122,834 | | | CenterPoint Energy Inc | | | | | | | | | | | 7.000% | | | | | | | | N/R | | | | 5,011,627 | |
| | | | | | | |
| | 100,595 | | | Dominion Energy Inc | | | | | | | | | | | 7.250% | | | | | | | | BBB– | | | | 10,092,697 | |
| | | | | | | |
| | 259,840 | | | DTE Energy Co | | | | | | | | | | | 6.250% | | | | | | | | BBB– | | | | 12,508,698 | |
| | | | | | | |
| | 58,232 | | | Sempra Energy | | | | | | | | | | | 6.000% | | | | | | | | N/R | | | | 5,809,224 | |
| | | | | | | |
| | 35,992 | | | Sempra Energy, (4) | | | | | | | | | | | 6.750% | | | | | | | | N/R | | | | 3,733,450 | |
| | | | Total Multi-Utilities | | | | | | | | | | | | | | | | | | | | | | | 37,155,696 | |
| | | | | | | |
| | | | Water Utilities – 0.1% | | | | | | | | | | | | | | | | | | |
| | | | | | | |
| | 21,787 | | | Essential Utilities Inc | | | | | | | | | | | 6.000% | | | | | | | | N/R | | | | 1,351,230 | |
| | | | Total Convertible Preferred Securities (cost $106,038,232) | | | | | | | | 113,537,820 | |
58
| | | | | | | | | | | | | | | | | | | | | | | | | | | | |
Principal
Amount (000) | | | Description (1) | | Coupon (9) | | | Reference
Rate (9) | | | Spread (9) | | | Maturity (10) | | | Ratings (6) | | | Value | |
| | | |
| | | | VARIABLE RATE SENIOR LOAN INTERESTS – 1.1% (9) | | | | | | | |
| | | | |
| | | | Electric Utilities – 0.1% | | | | | | | | | | |
| | | | | | | |
| $ | 2,055 | | | Exgen Renewables IV LLC, 2020 Term Loan | | | 3.750% | | | | 3-Month LIBOR | | | | 2.750% | | | | 12/11/27 | | | | BB– | | | $ | 2,058,082 | |
| | | | |
| | | | Health Care Providers & Services – 0.2% | | | | | | | | | | |
| | | | | | | |
| | 2,805 | | | Lifepoint Health, Inc., New Term Loan B | | | 3.897% | | | | 1-Month LIBOR | | | | 3.750% | | | | 11/16/25 | | | | B1 | | | | 2,802,638 | |
| | | | |
| | | | Oil, Gas & Consumable Fuels – 0.1% | | | | | | | | | | |
| | | | | | | |
| | 1,588 | | | Buckeye Partners, Term Loan, First Lien | | | 2.897% | | | | 1-Month LIBOR | | | | 2.750% | | | | 11/01/26 | | | | BBB– | | | | 1,588,500 | |
| | | | |
| | | | Real Estate Management & Development – 0.3% | | | | | | | | | | |
| | | | | | | |
| | 3,900 | | | GGP, Term Loan B | | | 2.647% | | | | 1-Month LIBOR | | | | 2.500% | | | | 8/24/25 | | | | BB+ | | | | 3,709,519 | |
| | | | | | | |
| | | | Road & Rail – 0.4% | | | | | | | | | | | | | | | | | | |
| | | | | | | |
| | 5,652 | | | Genesee & Wyoming Inc., Term Loan, First Lien | | | 2.254% | | | | 3-Month LIBOR | | | | 2.000% | | | | 12/30/26 | | | | BB+ | | | | 5,648,730 | |
| | | | | | | |
| | 989 | | | Kenan Advantage Group Inc, Term Loan | | | 4.000% | | | | 1-Month LIBOR | | | | 3.000% | | | | 8/01/22 | | | | B– | | | | 982,748 | |
| | | | | | | |
| | 235 | | | Kenan Advantage Group Inc, Term Loan B | | | 4.000% | | | | 1-Month LIBOR | | | | 3.000% | | | | 7/29/22 | | | | B– | | | | 233,697 | |
| | 6,876 | | | Total Road & Rail | | | | | | | | | | | | | | | | | | | | | | | 6,865,175 | |
| $ | 17,224 | | | Total Variable Rate Senior Loan Interests (cost $16,893,106) | | | | | | | | | | | | 17,023,914 | |
| | | | | | | |
| Shares | | | Description (1), (11) | | | | | | | | | | | | | | | | | Value | |
| | | | |
| | | | INVESTMENT COMPANIES – 0.6% | | | | | | | | | | | | | |
| | | | |
| | 1,040,407 | | | Greencoat UK Wind PLC | | | | | | | | | | | $ | 1,908,426 | |
| | | | | |
| | 1,263,516 | | | Keppel Infrastructure Trust | | | | | | | | | | | | | | | | 521,462 | |
| | | | | |
| | 1,507,913 | | | Renewables Infrastructure Group Ltd | | | | | | | | | | | | | | | | 2,634,998 | |
| | | | | |
| | 1,352,929 | | | Sequoia Economic Infrastructure Income Fund Ltd | | | | | | | | | | | | | | | | 2,031,444 | |
| | | | | |
| | 2,116,391 | | | Starwood European Real Estate Finance Ltd | | | | | | | | | | | | | | | | 2,604,750 | |
| | | | Total Investment Companies (cost $9,458,594) | | | | | | | | | | | | 9,701,080 | |
| | | | | | | |
Principal
Amount (000) | | | Description (1) | | | | | | | | Coupon | | | Maturity | | | Ratings (6) | | | Value | |
| | | | |
| | | | CONVERTIBLE BONDS – 0.6% | | | | | | | | | | |
| | | | |
| | | | Oil, Gas & Consumable Fuels – 0.4% | | | | | | | | | | |
| | | | | | | |
| $ | 8,785 | | | Cheniere Energy Inc | | | | | | | | | | | 4.250% | | | | 3/15/45 | | | | N/R | | | $ | 6,863,463 | |
| | | | | |
| | | | Real Estate Management & Development – 0.2% | | | | | | | | | | | | | |
| | | | | |
| | 2,585 | | | Tricon Residential Inc, 144A | | | | 5.750% | | | | 3/31/22 | | | | N/R | | | | 2,662,550 | |
| $ | 11,370 | | | Total Convertible Bonds (cost $8,803,171) | | | | | | | | | | | | | | | | 9,526,013 | |
59
Nuveen Real Asset Income Fund (continued)
Portfolio of Investments December 31, 2020
| | | | | | | | | | | | | | | | | | | | |
Principal
Amount (000) | | | Description (1) | | Coupon | | | Maturity | | | Ratings (6) | | | Value | |
| | |
| | | | ASSET-BACKED SECURITIES – 0.3% | | | | |
| | | | | |
| $ | 1,265 | | | Benchmark 2020-B18 Mortgage Trust, 144A | | | 4.139% | | | | 7/15/53 | | | | B– | | | $ | 1,272,572 | |
| | | | | |
| | 335 | | | COMM 2013-CCRE10 Mortgage Trust, 144A | | | 4.789% | | | | 8/10/46 | | | | A2 | | | | 340,287 | |
| | | | | |
| | 550 | | | Credit Suisse Mortgage Capital Certificates 2019-ICE4, 144A, (1-Month LIBOR reference rate + 2.150% spread), (8) | | | 2.309% | | | | 5/15/36 | | | | Ba3 | | | | 546,773 | |
| | | | | |
| | 560 | | | GS Mortgage Securities Trust 2016-GS4 | | | 3.811% | | | | 11/10/49 | | | | A– | | | | 531,351 | |
| | | | | |
| | 800 | | | Natixis Commercial Mortgage Securities Trust 2019-MILE, 144A, (1-Month LIBOR reference rate + 2.750% spread), (8) | | | 2.909% | | | | 7/15/36 | | | | N/R | | | | 774,248 | |
| | | | | |
| | 1,300 | | | Natixis Commercial Mortgage Securities Trust 2019-MILE, 144A, (1-Month LIBOR reference rate + 4.250% spread), (8) | | | 4.409% | | | | 7/15/36 | | | | N/R | | | | 1,229,153 | |
| $ | 4,810 | | | Total Asset-Backed Securities (cost $4,692,517) | | | | | | | | | | | | | | | 4,694,384 | |
| | | | Total Long-Term Investments (cost $1,425,723,182) | | | | 1,564,645,825 | |
| | | | | |
| Shares | | | Description (1) | | Coupon | | | | | | | | | Value | |
| |
| | | | INVESTMENTS PURCHASED WITH COLLATERAL FROM SECURITIES LENDING – 1.6% | |
| | | | | |
| | | | Money Market Funds – 1.6% | | | | | | | | | | | | |
| | | | | |
| | 26,510,561 | | | State Street Navigator Securities Lending Government Money Market Portfolio, (12) | | | 0.080% (13) | | | | | | | | | | | $ | 26,510,561 | |
| | | | Total Investments Purchased with Collateral from Securities Lending (cost $26,510,561) | | | | 26,510,561 | |
| | | | | |
Principal
Amount (000) | | | Description (1) | | Coupon | | | Maturity | | | | | | Value | |
| | | | | |
| | | | SHORT-TERM INVESTMENTS – 2.1% | | | | | | | | | | | | | | | | |
| | | | | |
| | | | REPURCHASE AGREEMENTS – 2.1% | | | | | | | | | | | | |
| | | | | |
| $ | 33,043 | | | Repurchase Agreement with Fixed Income Clearing Corporation, dated 12/31/20, repurchase price $33,043,010, collateralized by $33,703,000, U.S. Treasury Notes, 0.125%, due 7/15/23, value $33,703,912 | | | 0.000% | | | | 1/04/21 | | | | | | | $ | 33,043,010 | |
| | | | Total Short-Term Investments (cost $33,043,010) | | | | | | | | 33,043,010 | |
| | | | Total Investments (cost $1,485,276,753) – 101.0% | | | | | | | | 1,624,199,396 | |
| | | | Other Assets Less Liabilities – (1.0)% (14) | | | | | | | | | | | | | | | (15,338,381 | ) |
| | | | Net Assets – 100% | | | | | | | | | | | | | | $ | 1,608,861,015 | |
Investments in Derivatives
Futures Contracts
| | | | | | | | | | | | | | | | | | | | | | | | | | | | |
| Description | | Contract
Position | | | Number of
Contracts | | | Expiration
Date | | | Notional
Amount | | | Value | | | Unrealized
Appreciation
(Depreciation) | | | Variation
Margin
Receivable/
(Payable) | |
|
U.S. Treasury 10-Year Note | | | Short | | | | (152 | ) | | | 3/21 | | | $ | (20,955,430 | ) | | $ | (20,987,875 | ) | | $ | (32,445 | ) | | $ | (16,625 | ) |
U.S. Treasury 10-Year Ultra Note | | | Short | | | | (68 | ) | | | 3/21 | | | | (10,674,116 | ) | | | (10,632,438 | ) | | | 41,679 | | | | (14,875 | ) |
U.S. Treasury Ultra Bond | | | Short | | | | (18 | ) | | | 3/21 | | | | (3,902,527 | ) | | | (3,844,125 | ) | | | 58,401 | | | | (13,500 | ) |
Total | | | | | | | | | | | | | | $ | (35,532,073 | ) | | $ | (35,464,438 | ) | | $ | 67,635 | | | $ | (45,000 | ) |
60
For Fund portfolio compliance purposes, the Fund’s industry classifications refer to any one or more of the industry sub-classifications used by one or more widely recognized market indexes or ratings group indexes, and/or as defined by Fund management. This definition may not apply for purposes of this report, which may combine industry sub-classifications into sectors for reporting ease.
| (1) | All percentages shown in the Portfolio of Investments are based on net assets. |
| (2) | For fair value measurement disclosure purposes, investment classified as Level 2. See Notes to Financial Statements, Note 3 – Investment Valuation and Fair Value Measurements for more information. |
| (3) | Non-income producing; issuer has not declared an ex-dividend date within the past twelve months. |
| (4) | Investment, or a portion of investment, is out on loan for securities lending. The total value of the securities out on loan as of the end of the reporting period was $25,138,919. |
| (5) | Principal Amount (000) denominated in U.S. Dollars, unless otherwise noted. |
| (6) | For financial reporting purposes, the ratings disclosed are the highest of Standard & Poor’s Group (“Standard & Poor’s”), Moody’s Investors Service, Inc. (“Moody’s”) or Fitch, Inc. (“Fitch”) rating. This treatment of split-rated securities may differ from that used for other purposes, such as for Fund investment policies. Ratings below BBB by Standard & Poor’s, Baa by Moody’s or BBB by Fitch are considered to be below investment grade. Holdings designated N/R are not rated by any of these national rating agencies. Ratings are not covered by the report of independent registered public accounting firm. |
| (7) | Perpetual security. Maturity date is not applicable. |
| (8) | Variable rate security. The rate shown is the coupon as of the end of the reporting period. |
| (9) | Senior loans generally pay interest at rates which are periodically adjusted by reference to a base short-term, floating lending rate (Reference Rate) plus an assigned fixed rate (Spread). These floating lending rates are generally (i) the lending rate referenced by the London Inter-Bank Offered Rate (“LIBOR”), or (ii) the prime rate offered by one or more major United States banks. Senior loans may be considered restricted in that the Fund ordinarily is contractually obligated to receive approval from the agent bank and/or borrower prior to the disposition of a senior loan. The rate shown is the coupon as of the end of the reporting period. |
| (10) | Senior Loans generally are subject to mandatory and/or optional prepayment. Because of these mandatory prepayment conditions and because there may be significant economic incentives for a borrower to prepay, prepayments of senior loans may occur. As a result, the actual remaining maturity of senior loans held may be substantially less than the stated maturities shown. |
| (11) | A copy of the most recent financial statements for these investment companies can be obtained directly from the Securities and Exchange Commission on its website at http://www.sec.gov. |
| (12) | The Fund may loan securities representing up to one third of the fair value of its total assets (which includes collateral for securities on loan) to broker dealers, banks, and other institutions. The Fund maintains collateral equal to at least 100% of the fair value of the securities loaned. The cash collateral received by the Fund is invested in this money market fund. See Notes to Financial Statements, Note 4- Portfolio Securities and Investments in Derivatives for more information. |
| (13) | The rate shown is the one-day yield as of the end of the reporting period. |
| (14) | Other assets less liabilities includes the unrealized appreciation (depreciation) of certain over-the-counter (“OTC”) derivatives as presented on the Statement of Assets and Liabilities, when applicable. The unrealized appreciation (depreciation) of OTC cleared and exchange-traded derivatives is recognized as part of the cash collateral at brokers and/or the receivable or payable for variation margin as presented on the Statement of Assets and Liabilities, when applicable. |
| 144A | Investment is exempt from registration under Rule 144A of the Securities Act of 1933, as amended. These investments may only be resold in transactions exempt from registration, which are normally those transactions with qualified institutional buyers. |
| ADR | American Depositary Receipt |
| LIBOR | London Inter-Bank Offered Rate |
| Reg S | Regulation S allows U.S. companies to sell securities to persons or entities located outside of the United States without registering those securities with the Securities and Exchange Commission. Specifically, Regulation S provides a safe harbor from the registration requirements of the Securities Act for the offers and sales of securities by both foreign and domestic issuers that are made outside the United States. |
| REIT | Real Estate Investment Trust |
See accompanying notes to financial statements.
61
Nuveen Real Estate Securities Fund
Portfolio of Investments December 31, 2020
| | | | | | | | | | | | | | | | |
| Shares | | | Description (1) | | | | | | | | Value | |
| | | | |
| | | | LONG-TERM INVESTMENTS – 98.2% | | | | | | | | | | | | |
| | | | |
| | | | REAL ESTATE INVESTMENT TRUST COMMON STOCKS – 97.4% | | | | | | | | | | | | |
| | | | |
| | | | Diversified – 3.1% | | | | | | | | | |
| | | | |
| | 157,551 | | | Broadstone Net Lease Inc | | | | | | | | | | $ | 3,084,849 | |
| | | | |
| | 249,324 | | | Essential Properties Realty Trust Inc | | | | | | | | | | | 5,285,669 | |
| | | | |
| | 140,780 | | | PS Business Parks Inc | | | | | | | | | | | 18,705,439 | |
| | | | |
| | 632,186 | | | VEREIT Inc | | | | | | | | | | | 23,890,309 | |
| | | | |
| | 265,207 | | | Washington Real Estate Investment Trust | | | | | | | | | | | 5,736,427 | |
| | | | |
| | 173,875 | | | WP Carey Inc | | | | | | | | | | | 12,272,097 | |
| | | | Total Diversified | | | | | | | | | | | 68,974,790 | |
| | | | |
| | | | Health Care – 8.8% | | | | | | | | | |
| | | | |
| | 208,100 | | | CareTrust REIT Inc | | | | | | | | | | | 4,615,658 | |
| | | | |
| | 701,432 | | | Healthcare Realty Trust Inc | | | | | | | | | | | 20,762,387 | |
| | | | |
| | 540,944 | | | Healthcare Trust of America Inc | | | | | | | | | | | 14,897,598 | |
| | | | |
| | 960,328 | | | Healthpeak Properties Inc | | | | | | | | | | | 29,030,715 | |
| | | | |
| | 85,290 | | | LTC Properties Inc | | | | | | | | | | | 3,318,634 | |
| | | | |
| | 1,113,651 | | | Medical Properties Trust Inc | | | | | | | | | | | 24,266,455 | |
| | | | |
| | 155,390 | | | Omega Healthcare Investors Inc | | | | | | | | | | | 5,643,765 | |
| | | | |
| | 766,670 | | | Physicians Realty Trust | | | | | | | | | | | 13,646,726 | |
| | | | |
| | 268,398 | | | Sabra Health Care REIT Inc | | | | | | | | | | | 4,662,073 | |
| | | | |
| | 329,114 | | | Ventas Inc | | | | | | | | | | | 16,139,751 | |
| | | | |
| | 927,194 | | | Welltower Inc | | | | | | | | | | | 59,915,276 | |
| | | | Total Health Care | | | | | | | | | | | 196,899,038 | |
| | | | |
| | | | Hotels – 2.3% | | | | | | | | | |
| | | | |
| | 1,471,443 | | | Apple Hospitality REIT Inc | | | | | | | | | | | 18,996,329 | |
| | | | |
| | 401,432 | | | Host Hotels & Resorts Inc | | | | | | | | | | | 5,872,950 | |
| | | | |
| | 496,028 | | | MGM Growth Properties LLC | | | | | | | | | | | 15,525,677 | |
| | | | |
| | 117,813 | | | Summit Hotel Properties Inc | | | | | | | | | | | 1,061,495 | |
| | | | |
| | 888,081 | | | Sunstone Hotel Investors Inc | | | | | | | | | | | 10,061,958 | |
| | | | Total Hotels | | | | | | | | | | | 51,518,409 | |
| | | | |
| | | | Industrial – 19.5% | | | | | | | | | |
| | | | |
| | 1,203,823 | | | Americold Realty Trust | | | | | | | | | | | 44,938,713 | |
| | | | |
| | 1,377,202 | | | Duke Realty Corp | | | | | | | | | | | 55,046,764 | |
| | | | |
| | 57,974 | | | EastGroup Properties Inc | | | | | | | | | | | 8,003,890 | |
| | | | |
| | 744,798 | | | First Industrial Realty Trust Inc | | | | | | | | | | | 31,378,340 | |
| | | | |
| | 1,337,462 | | | Lexington Realty Trust | | | | | | | | | | | 14,203,846 | |
| | | | |
| | 2,144,660 | | | Prologis Inc | | | | | | | | | | | 213,736,816 | |
| | | | |
| | 293,594 | | | Rexford Industrial Realty Inc | | | | | | | | | | | 14,418,401 | |
62
| | | | | | | | | | | | | | | | |
| Shares | | | Description (1) | | | | | | | | Value | |
| | | | |
| | | | Industrial (continued) | | | | | | | | | |
| | | | |
| | 1,188,981 | | | STAG Industrial Inc | | | | | | | | | | $ | 37,238,885 | |
| | | | |
| | 340,923 | | | Terreno Realty Corp | | | | | | | | | | | 19,947,405 | |
| | | | Total Industrial | | | | | | | | | | | 438,913,060 | |
| | | | |
| | | | Mortgage – 0.2% | | | | | | | | | |
| | | | |
| | 68,240 | | | Hannon Armstrong Sustainable Infrastructure Capital Inc | | | | | | | | | | | 4,328,463 | |
| | | | |
| | | | Office – 9.8% | | | | | | | | | |
| | | | |
| | 374,805 | | | Alexandria Real Estate Equities Inc | | | | | | | | | | | 66,797,747 | |
| | | | |
| | 405,181 | | | Boston Properties Inc | | | | | | | | | | | 38,301,760 | |
| | | | |
| | 643,579 | | | Corporate Office Properties Trust | | | | | | | | | | | 16,784,540 | |
| | | | |
| | 386,587 | | | Douglas Emmett Inc | | | | | | | | | | | 11,280,609 | |
| | | | |
| | 745,758 | | | Easterly Government Properties Inc | | | | | | | | | | | 16,891,419 | |
| | | | |
| | 506,073 | | | Highwoods Properties Inc | | | | | | | | | | | 20,055,673 | |
| | | | |
| | 803,787 | | | Hudson Pacific Properties Inc | | | | | | | | | | | 19,306,964 | |
| | | | |
| | 52,246 | | | JBG SMITH Properties | | | | | | | | | | | 1,633,732 | |
| | | | |
| | 185,749 | | | Kilroy Realty Corp | | | | | | | | | | | 10,661,993 | |
| | | | |
| | 666,086 | | | Mack-Cali Realty Corp | | | | | | | | | | | 8,299,431 | |
| | | | |
| | 149,847 | | | Paramount Group Inc | | | | | | | | | | | 1,354,617 | |
| | | | |
| | 551,922 | | | Piedmont Office Realty Trust Inc | | | | | | | | | | | 8,957,694 | |
| | | | Total Office | | | | | | | | | | | 220,326,179 | |
| | | | |
| | | | Residential – 18.6% | | | | | | | | | |
| | | | |
| | 708,602 | | | American Homes 4 Rent | | | | | | | | | | | 21,258,060 | |
| | | | |
| | 109,703 | | | Apartment Income REIT Corp, (2) | | | | | | | | | | | 4,213,692 | |
| | | | |
| | 177,272 | | | AvalonBay Communities Inc | | | | | | | | | | | 28,439,747 | |
| | | | |
| | 183,320 | | | Camden Property Trust | | | | | | | | | | | 18,317,334 | |
| | | | |
| | 107,658 | | | Centerspace | | | | | | | | | | | 7,604,961 | |
| | | | |
| | 723,599 | | | Equity LifeStyle Properties Inc | | | | | | | | | | | 45,847,233 | |
| | | | |
| | 1,092,310 | | | Equity Residential | | | | | | | | | | | 64,752,137 | |
| | | | |
| | 169,134 | | | Essex Property Trust Inc | | | | | | | | | | | 40,155,794 | |
| | | | |
| | 2,168,953 | | | Invitation Homes Inc | | | | | | | | | | | 64,417,904 | |
| | | | |
| | 446,648 | | | Mid-America Apartment Communities Inc | | | | | | | | | | | 56,585,835 | |
| | | | |
| | 93,276 | | | NexPoint Residential Trust Inc | | | | | | | | | | | 3,946,508 | |
| | | | |
| | 242,205 | | | Sun Communities Inc | | | | | | | | | | | 36,803,050 | |
| | | | |
| | 632,189 | | | UDR Inc | | | | | | | | | | | 24,295,023 | |
| | | | Total Residential | | | | | | | | | | | 416,637,278 | |
| | | | |
| | | | Retail – 10.2% | | | | | | | | | |
| | | | |
| | 246,365 | | | Agree Realty Corp | | | | | | | | | | | 16,402,982 | |
| | | | |
| | 505,366 | | | Brixmor Property Group Inc | | | | | | | | | | | 8,363,807 | |
| | | | |
| | 252,072 | | | Federal Realty Investment Trust | | | | | | | | | | | 21,456,369 | |
| | | | |
| | 952,736 | | | Kimco Realty Corp | | | | | | | | | | | 14,300,567 | |
| | | | |
| | 267,690 | | | Kite Realty Group Trust | | | | | | | | | | | 4,004,642 | |
63
Nuveen Real Estate Securities Fund (continued)
Portfolio of Investments December 31, 2020
| | | | | | | | | | | | | | | | |
| Shares | | | Description (1) | | | | | | | | Value | |
| | | | |
| | | | Retail (continued) | | | | | | | | | |
| | | | |
| | 278,612 | | | National Retail Properties Inc | | | | | | | | | | $ | 11,400,803 | |
| | | | |
| | 302,353 | | | NETSTREIT Corp | | | | | | | | | | | 5,892,860 | |
| | | | |
| | 1,080,591 | | | Realty Income Corp | | | | | | | | | | | 67,180,342 | |
| | | | |
| | 488,759 | | | Regency Centers Corp | | | | | | | | | | | 22,282,523 | |
| | | | |
| | 303,806 | | | Simon Property Group Inc | | | | | | | | | | | 25,908,576 | |
| | | | |
| | 500,640 | | | SITE Centers Corp | | | | | | | | | | | 5,066,477 | |
| | | | |
| | 228,367 | | | Spirit Realty Capital Inc | | | | | | | | | | | 9,173,502 | |
| | | | |
| | 404,773 | | | Urban Edge Properties | | | | | | | | | | | 5,237,763 | |
| | | | |
| | 620,448 | | | Weingarten Realty Investors | | | | | | | | | | | 13,445,108 | |
| | | | Total Retail | | | | | | | | | | | 230,116,321 | |
| | | | |
| | | | Specialized – 24.9% | | | | | | | | | |
| | | | |
| | 315,839 | | | American Tower Corp | | | | | | | | | | | 70,893,222 | |
| | | | |
| | 28,235 | | | CoreSite Realty Corp | | | | | | | | | | | 3,537,281 | |
| | | | |
| | 47,839 | | | Crown Castle International Corp | | | | | | | | | | | 7,615,490 | |
| | | | |
| | 271,524 | | | CubeSmart | | | | | | | | | | | 9,125,922 | |
| | | | |
| | 247,323 | | | CyrusOne Inc | | | | | | | | | | | 18,091,677 | |
| | | | |
| | 576,563 | | | Digital Realty Trust Inc | | | | | | | | | | | 80,436,304 | |
| | | | |
| | 193,350 | | | Equinix Inc | | | | | | | | | | | 138,086,703 | |
| | | | |
| | 284,424 | | | Extra Space Storage Inc | | | | | | | | | | | 32,953,365 | |
| | | | |
| | 341,715 | | | Four Corners Property Trust Inc | | | | | | | | | | | 10,172,855 | |
| | | | |
| | 500,927 | | | Gaming and Leisure Properties Inc | | | | | | | | | | | 21,239,305 | |
| | | | |
| | 99,471 | | | Iron Mountain Inc | | | | | | | | | | | 2,932,405 | |
| | | | |
| | 137,088 | | | Life Storage Inc | | | | | | | | | | | 16,366,936 | |
| | | | |
| | 108,787 | | | National Storage Affiliates Trust | | | | | | | | | | | 3,919,596 | |
| | | | |
| | 366,748 | | | Public Storage | | | | | | | | | | | 84,693,116 | |
| | | | |
| | 166,801 | | | QTS Realty Trust Inc | | | | | | | | | | | 10,321,646 | |
| | | | |
| | 160,829 | | | Rayonier Inc | | | | | | | | | | | 4,725,156 | |
| | | | |
| | 38,394 | | | SBA Communications Corp | | | | | | | | | | | 10,832,099 | |
| | | | |
| | 1,127,284 | | | VICI Properties Inc | | | | | | | | | | | 28,745,742 | |
| | | | |
| | 158,345 | | | Weyerhaeuser Co | | | | | | | | | | | 5,309,308 | |
| | | | Total Specialized | | | | | | | | | | | 559,998,128 | |
| | | | Total Real Estate Investment Trust Common Stocks (cost $1,652,694,217) | | | | | | | | | | | 2,187,711,666 | |
| | | | |
| Shares | | | Description (1) | | | | | | | | Value | |
| | | | |
| | | | COMMON STOCKS – 0.8% | | | | | | | | | | | | |
| | | | |
| | | | Hotels, Restaurants & Leisure – 0.2% | | | | | | | | | |
| | | | |
| | 45,804 | | | Hilton Worldwide Holdings Inc | | | | | | | | | | $ | 5,096,153 | |
| | | | |
| | | | Household Durables – 0.4% | | | | | | | | | |
| | | | |
| | 189,337 | | | PulteGroup Inc | | | | | | | | | | | 8,164,211 | |
64
| | | | | | | | | | | | | | | | |
| Shares | | | Description (1) | | | | | | | | Value | |
| | | | |
| | | | Real Estate Management & Development – 0.2% | | | | | | | | | |
| | | | |
| | 223,440 | | | Kennedy-Wilson Holdings Inc | | | | | | | | | | $ | 3,997,342 | |
| | | | Total Common Stocks (cost $17,483,682) | | | | | | | | | | | 17,257,706 | |
| | | | Total Long-Term Investments (cost $1,670,177,899) | | | | | | | | | | | 2,204,969,372 | |
| | | | |
Principal
Amount (000) | | | Description (1) | | Coupon | | | Maturity | | | Value | |
| | | | |
| | | | SHORT-TERM INVESTMENTS – 1.1% | | | | | | | | | | | | |
| | | | |
| | | | REPURCHASE AGREEMENTS – 1.1% | | | | | | | | | |
| | | | |
| $ | 24,373 | | | Repurchase Agreement with Fixed Income Clearing Corporation, dated 12/31/20, repurchase price $24,373,393, collateralized by $24,860,200, U.S. Treasury Notes, 0.125%, due 7/15/23, value $24,860,872 | | | 0.000% | | | | 1/04/21 | | | $ | 24,373,393 | |
| | | | Total Short-Term Investments (cost $24,373,393) | | | | | | | | | | | 24,373,393 | |
| | | | Total Investments (cost $1,694,551,292) – 99.3% | | | | | | | | | | | 2,229,342,765 | |
| | | | Other Assets Less Liabilities – 0.7% | | | | | | | | | | | 16,291,902 | |
| | | | Net Assets – 100% | | | | | | | | | | $ | 2,245,634,667 | |
For Fund portfolio compliance purposes, the Fund’s industry classifications refer to any one or more of the industry sub-classifications used by one or more widely recognized market indexes or ratings group indexes, and/or as defined by Fund management. This definition may not apply for purposes of this report, which may combine industry sub-classifications into sectors for reporting ease.
| (1) | All percentages shown in the Portfolio of Investments are based on net assets. |
| (2) | Non-income producing; issuer has not declared an ex-dividend date within the past twelve months. |
| REIT | Real Estate Investment Trust |
See accompanying notes to financial statements.
65
Statement of Assets and Liabilities
December 31, 2020
| | | | | | | | | | | | | | | | |
| | | Global
Infrastructure | | | Global
Real Estate
Securities | | | Real
Asset Income | | | Real Estate
Securities | |
Assets | | | | | | | | | | | | | | | | |
Long-term investments, at value (cost $480,666,509, $50,230,231, $1,425,723,182 and $1,670,177,899, respectively)(1) | | $ | 588,538,527 | | | $ | 58,036,859 | | | $ | 1,564,645,825 | | | $ | 2,204,969,372 | |
Investment purchased with collateral from securities lending, at value (cost approximates value) | | | 7,480,123 | | | | — | | | | 26,510,561 | | | | — | |
Short-term investments, at value (cost approximates value) | | | 10,107,579 | | | | 432,916 | | | | 33,043,010 | | | | 24,373,393 | |
Cash | | | 17,178 | | | | — | | | | 9,328 | | | | — | |
Cash collateral at brokers for investments in futures contracts(2) | | | — | | | | — | | | | 569,506 | | | | — | |
Cash denominated in foreign currencies (cost $—, $—, $3,456,566 and $—, respectively) | | | — | | | | — | | | | 3,600,950 | | | | — | |
Receivable for: | | | | | | | | | | | | | | | | |
Dividends | | | 1,222,996 | | | | 192,398 | | | | 5,343,543 | | | | 9,488,407 | |
Interest | | | — | | | | — | | | | 6,468,315 | | | | — | |
Investments sold | | | 3,094,917 | | | | 578,647 | | | | 12,583,351 | | | | 17,961,840 | |
Reclaims | | | 224,192 | | | | 15,535 | | | | 341,916 | | | | 36,137 | |
Shares sold | | | 10,021,828 | | | | 506 | | | | 1,486,764 | | | | 5,889,483 | |
Other assets | | | 84,472 | | | | 23,551 | | | | 167,815 | | | | 339,427 | |
Total assets | | | 620,791,812 | | | | 59,280,412 | | | | 1,654,770,884 | | | | 2,263,058,059 | |
Liabilities | | | | | | | | | | | | | | | | |
Cash overdraft | | | — | | | | 20 | | | | — | | | | — | |
Cash overdraft denominated in foreign currencies (cost $—, $15,172, $— and $—, respectively) | | | — | | | | 15,192 | | | | — | | | | — | |
Payable for: | | | | | | | | | | | | | | | | |
Collateral from securities lending program | | | 7,480,123 | | | | — | | | | 26,510,561 | | | | — | |
Dividends | | | 84 | | | | — | | | | 425,844 | | | | 9 | |
Investments purchased – regular settlement | | | 2,354,879 | | | | 264,201 | | | | 12,355,766 | | | | 9,010,871 | |
Shares redeemed | | | 418,295 | | | | 136 | | | | 4,334,433 | | | | 4,451,195 | |
Variation margin on futures contracts | | | — | | | | — | | | | 45,000 | | | | — | |
Accrued expenses: | | | | | | | | | | | | | | | | |
Custodian fees | | | 205,745 | | | | 216,333 | | | | 335,216 | | | | 75,738 | |
Directors/Trustees fees | | | 37,224 | | | | 300 | | | | 73,729 | | | | 291,235 | |
Management fees | | | 351,184 | | | | 14,319 | | | | 867,042 | | | | 1,622,295 | |
Shareholder servicing agent fees | | | 199,984 | | | | 381 | | | | 449,282 | | | | 1,687,392 | |
12b-1 distribution and service fees | | | 25,083 | | | | 30 | | | | 170,190 | | | | 55,288 | |
Other | | | 40,119 | | | | 38,376 | | | | 342,806 | | | | 229,369 | |
Total liabilities | | | 11,112,720 | | | | 549,288 | | | | 45,909,869 | | | | 17,423,392 | |
Net assets | | $ | 609,679,092 | | | $ | 58,731,124 | | | $ | 1,608,861,015 | | | $ | 2,245,634,667 | |
Class A Shares | | | | | | | | | | | | | | | | |
Net assets | | $ | 44,235,333 | | | $ | 36,887 | | | $ | 173,139,224 | | | $ | 176,739,385 | |
Shares outstanding | | | 4,031,356 | | | | 1,736 | | | | 7,612,075 | | | | 9,604,087 | |
Net asset value (“NAV”) per share | | $ | 10.97 | | | $ | 21.25 | | | $ | 22.75 | | | $ | 18.40 | |
Offering price per share (NAV per share plus maximum sales charge of 5.75% of offering price) | | $ | 11.64 | | | $ | 22.55 | | | $ | 24.14 | | | $ | 19.52 | |
Class C Shares | | | | | | | | | | | | | | | | |
Net assets | | $ | 18,464,550 | | | $ | 26,563 | | | $ | 156,390,586 | | | $ | 14,874,315 | |
Shares outstanding | | | 1,698,269 | | | | 1,250 | | | | 6,872,500 | | | | 835,859 | |
NAV and offering price per share | | $ | 10.87 | | | $ | 21.25 | | | $ | 22.76 | | | $ | 17.80 | |
Class R3 Shares | | | | | | | | | | | | | | | | |
Net assets | | $ | 238,280 | | | $ | — | | | $ | — | | | $ | 12,460,819 | |
Shares outstanding | | | 21,347 | | | | — | | | | — | | | | 664,676 | |
NAV and offering price per share | | $ | 11.16 | | | $ | — | | | $ | — | | | $ | 18.75 | |
Class R6 Shares | | | | | | | | | | | | | | | | |
Net assets | | $ | 107,341,664 | | | $ | 58,479,681 | | | $ | 223,948,111 | | | $ | 437,016,461 | |
Shares outstanding | | | 9,796,594 | | | | 2,749,585 | | | | 9,793,186 | | | | 23,029,864 | |
NAV and offering price per share | | $ | 10.96 | | | $ | 21.27 | | | $ | 22.87 | | | $ | 18.98 | |
Class I Shares | | | | | | | | | | | | | | | | |
Net assets | | $ | 439,399,265 | | | $ | 187,993 | | | $ | 1,055,383,094 | | | $ | 1,604,543,687 | |
Shares outstanding | | | 40,199,335 | | | | 8,845 | | | | 46,399,554 | | | | 85,619,024 | |
NAV and offering price per share | | $ | 10.93 | | | $ | 21.25 | | | $ | 22.75 | | | $ | 18.74 | |
Fund level net assets consist of: | | | | | | | | | | | | | | | | |
Capital paid-in | | $ | 523,557,107 | | | $ | 52,614,262 | | | $ | 1,772,387,744 | | | $ | 1,803,983,685 | |
Total distributable earnings | | | 86,121,985 | | | | 6,116,862 | | | | (163,526,729 | ) | | | 441,650,982 | |
Fund level net assets | | $ | 609,679,092 | | | $ | 58,731,124 | | | $ | 1,608,861,015 | | | $ | 2,245,634,667 | |
Authorized shares – per class | | | 2 billion | | | | Unlimited | | | | 2 billion | | | | 2 billion | |
Par value per share | | $ | 0.0001 | | | $ | 0.01 | | | $ | 0.0001 | | | $ | 0.0001 | |
| (1) | Includes securities loaned of $7,181,157 and $25,138,919 for Global Infrastructure and Real Asset Income, respectively. |
| (2) | Cash pledged to collateralize the net payment obligations for investments in derivatives. |
See accompanying notes to financial statements.
66
Statement of Operations
Year Ended December 31, 2020
| | | | | | | | | | | | | | | | |
| | | Global
Infrastructure | | | Global
Real Estate
Securities | | | Real
Asset Income | | | Real Estate
Securities | |
| | | | |
Investment Income | | | | | | | | | | | | | | | | |
| | | | |
Dividends | | $ | 14,783,118 | | | $ | 1,231,693 | | | $ | 66,469,559 | | | $ | 59,360,649 | |
| | | | |
Interest | | | 17,774 | | | | 614 | | | | 31,281,850 | | | | 128,394 | |
| | | | |
Foreign tax withheld on dividend income | | | (840,919 | ) | | | (59,760 | ) | | | (3,251,902 | ) | | | (5,303 | ) |
| | | | |
Foreign tax withheld from interest income | | | — | | | | — | | | | (8,470 | ) | | | — | |
| | | | |
Securities lending income | | | 6,283 | | | | 259 | | | | 132,223 | | | | 1,238 | |
| | | | |
Total investment income | | | 13,966,256 | | | | 1,172,806 | | | | 94,623,260 | | | | 59,484,978 | |
| | | | |
Expenses | | | | | | | | | | | | | | | | |
| | | | |
Management fees | | | 5,105,267 | | | | 370,810 | | | | 12,849,665 | | | | 20,192,168 | |
| | | | |
12b-1 service fees – Class A Shares | | | 113,577 | | | | 80 | | | | 447,119 | | | | 482,056 | |
| | | | |
12b-1 distribution and service fees – Class C Shares | | | 196,726 | | | | 320 | | | | 1,733,949 | | | | 237,411 | |
| | | | |
12b-1 distribution and service fees – Class R3 Shares | | | 1,408 | | | | — | | | | — | | | | 74,454 | |
| | | | |
Shareholder servicing agent fees | | | 432,879 | | | | 1,110 | | | | 1,703,411 | | | | 2,929,773 | |
| | | | |
Custodian fees | | | 297,327 | | | | 281,057 | | | | 507,189 | | | | 220,570 | |
| | | | |
Directors/Trustees fees | | | 15,233 | | | | 1,089 | | | | 47,495 | | | | 61,651 | |
| | | | |
Professional fees | | | 85,070 | | | | 119,871 | | | | 143,075 | | | | 246,308 | |
| | | | |
Shareholder reporting expenses | | | 105,918 | | | | 22,665 | | | | 796,261 | | | | 273,852 | |
| | | | |
Federal and state registration fees | | | 95,224 | | | | 75,961 | | | | 129,651 | | | | 120,647 | |
| | | | |
Other | | | 18,039 | | | | 6,743 | | | | 39,365 | | | | 63,683 | |
| | | | |
Total expenses before fee waiver/expense reimbursement | | | 6,466,668 | | | | 879,706 | | | | 18,397,180 | | | | 24,902,573 | |
| | | | |
Fee waiver/expense reimbursement | | | (729,920 | ) | | | (470,653 | ) | | | (119,957 | ) | | | — | |
| | | | |
Net expenses | | | 5,736,748 | | | | 409,053 | | | | 18,277,223 | | | | 24,902,573 | |
| | | | |
Net investment income (loss) | | | 8,229,508 | | | | 763,753 | | | | 76,346,037 | | | | 34,582,405 | |
| | | | |
Realized and Unrealized Gain (Loss) | | | | | | | | | | | | | | | | |
| | | | |
Net realized gain (loss) from: | | | | | | | | | | | | | | | | |
| | | | |
Investments and foreign currency | | | (8,819,624 | ) | | | (638,998 | ) | | | (253,449,443 | ) | | | (60,061,464 | ) |
| | | | |
Futures contracts | | | — | | | | — | | | | (1,513,596 | ) | | | — | |
| | | | |
Change in net unrealized appreciation (depreciation) of: | | | | | | | | | | | | | | | | |
| | | | |
Investments and foreign currency | | | (16,594,704 | ) | | | 4,912,232 | | | | 2,745,237 | | | | (189,321,504 | ) |
| | | | |
Futures contracts | | | — | | | | — | | | | 67,635 | | | | — | |
| | | | |
Net realized and unrealized gain (loss) | | | (25,414,328 | ) | | | 4,273,234 | | | | (252,150,167 | ) | | | (249,382,968 | ) |
| | | | |
Net increase (decrease) in net assets from operations | | $ | (17,184,820 | ) | | $ | 5,036,987 | | | $ | (175,804,130 | ) | | $ | (214,800,563 | ) |
See accompanying notes to financial statements.
67
Statement of Changes in Net Assets
| | | | | | | | | | | | | | | | | | | | |
| | | Global Infrastructure | | | | | | Global Real Estate Securities | |
| | | Year Ended
12/31/20 | | | Year Ended
12/31/19 | | | | | | Year Ended
12/31/20 | | | Year Ended
12/31/19 | |
| | | | | |
Operations | | | | | | | | | | | | | | | | | | | | |
| | | | | |
Net investment income (loss) | | $ | 8,229,508 | | | $ | 11,381,966 | | | | | | | $ | 763,753 | | | $ | 538,673 | |
| | | | | |
Net realized gain (loss) from: | | | | | | | | | | | | | | | | | | | | |
| | | | | |
Investments and foreign currency | | | (8,819,624 | ) | | | 40,026,850 | | | | | | | | (638,998 | ) | | | 2,520,749 | |
| | | | | |
Futures contracts | | | — | | | | — | | | | | | | | — | | | | — | |
| | | | | |
Change in net unrealized appreciation (depreciation) of: | | | | | | | | | | | | | | | | | | | | |
| | | | | |
Investments and foreign currency | | | (16,594,704 | ) | | | 79,549,316 | | | | | | | | 4,912,232 | | | | 3,552,336 | |
| | | | | |
Futures contracts | | | — | | | | — | | | | | | | | — | | | | — | |
| | | | | |
Net increase (decrease) in net assets from operations | | | (17,184,820 | ) | | | 130,958,132 | | | | | | | | 5,036,987 | | | | 6,611,758 | |
| | | | | |
Distributions to Shareholders | | | | | | | | | | | | | | | | | | | | |
| | | | | |
Dividends: | | | | | | | | | | | | | | | | | | | | |
| | | | | |
Class A Shares | | | (610,511 | ) | | | (3,877,179 | ) | | | | | | | (1,051 | ) | | | (3,173 | ) |
| | | | | |
Class C Shares | | | (128,020 | ) | | | (1,500,681 | ) | | | | | | | (667 | ) | | | (2,785 | ) |
| | | | | |
Class R3 Shares | | | (2,658 | ) | | | (22,743 | ) | | | | | | | — | | | | — | |
| | | | | |
Class R6 Shares | | | (1,787,597 | ) | | | (4,360,413 | ) | | | | | | | (1,702,248 | ) | | | (2,643,546 | ) |
| | | | | |
Class I Shares | | | (6,941,931 | ) | | | (33,676,572 | ) | | | | | | | (5,631 | ) | | | (14,624 | ) |
| | | | | |
Return of Capital: | | | | | | | | | | | | | | | | | | | | |
| | | | | |
Class A Shares | | | — | | | | — | | | | | | | | — | | | | — | |
| | | | | |
Class C Shares | | | — | | | | — | | | | | | | | — | | | | — | |
| | | | | |
Class R3 Shares | | | — | | | | — | | | | | | | | — | | | | — | |
| | | | | |
Class R6 Shares | | | — | | | | — | | | | | | | | — | | | | — | |
| | | | | |
Class I Shares | | | — | | | | — | | | | | | | | — | | | | — | |
| | | | | |
Decrease in net assets from distributions to shareholders | | | (9,470,717 | ) | | | (43,437,588 | ) | | | | | | | (1,709,597 | ) | | | (2,664,128 | ) |
| | | | | |
Fund Share Transactions | | | | | | | | | | | | | | | | | | | | |
| | | | | |
Proceeds from sale of shares | | | 175,535,225 | | | | 248,764,694 | | | | | | | | 26,732,246 | | | | 164,015 | |
| | | | | |
Proceeds from shares issued to shareholders due to reinvestment of distributions | | | 6,595,453 | | | | 29,867,584 | | | | | | | | 840,457 | | | | 13,021 | |
| | | | | |
| | | 182,130,678 | | | | 278,632,278 | | | | | | | | 27,572,703 | | | | 177,036 | |
| | | | | |
Cost of shares redeemed | | | (165,539,064 | ) | | | (184,363,049 | ) | | | | | | | (136,501 | ) | | | (962 | ) |
| | | | | |
Net increase (decrease) in net assets from Fund share transactions | | | 16,591,614 | | | | 94,269,229 | | | | | | | | 27,436,202 | | | | 176,074 | |
| | | | | |
Net increase (decrease) in net assets | | | (10,063,923 | ) | | | 181,789,773 | | | | | | | | 30,763,592 | | | | 4,123,704 | |
| | | | | |
Net assets at the beginning of period | | | 619,743,015 | | | | 437,953,242 | | | | | | | | 27,967,532 | | | | 23,843,828 | |
| | | | | |
Net assets at the end of period | | $ | 609,679,092 | | | $ | 619,743,015 | | | | | | | $ | 58,731,124 | | | $ | 27,967,532 | |
See accompanying notes to financial statements.
68
| | | | | | | | | | | | | | | | | | | | |
| | | Real Asset Income | | | | | | Real Estate Securities | |
| | | Year Ended
12/31/20 | | | Year Ended
12/31/19 | | | | | | Year Ended
12/31/20 | | | Year Ended
12/31/19 | |
| | | | | |
Operations | | | | | | | | | | | | | | | | | | | | |
| | | | | |
Net investment income (loss) | | $ | 76,346,037 | | | $ | 84,406,133 | | | | | | | $ | 34,582,405 | | | $ | 58,063,374 | |
| | | | | |
Net realized gain (loss) from: | | | | | | | | | | | | | | | | | | | | |
| | | | | |
Investments and foreign currency | | | (253,449,443 | ) | | | 58,948,028 | | | | | | | | (60,061,464 | ) | | | 348,063,149 | |
| | | | | |
Futures contracts | | | (1,513,596 | ) | | | — | | | | | | | | — | | | | — | |
| | | | | |
Change in net unrealized appreciation (depreciation) of: | | | | | | | | | | | | | | | | | | | | |
| | | | | |
Investments and foreign currency | | | 2,745,237 | | | | 245,455,301 | | | | | | | | (189,321,504 | ) | | | 327,922,170 | |
| | | | | |
Futures contracts | | | 67,635 | | | | — | | | | | | | | — | | | | — | |
| | | | | |
Net increase (decrease) in net assets from operations | | | (175,804,130 | ) | | | 388,809,462 | | | | | | | | (214,800,563 | ) | | | 734,048,693 | |
| | | | | |
Distributions to Shareholders | | | | | | | | | | | | | | | | | | | | |
| | | | | |
Dividends: | | | | | | | | | | | | | | | | | | | | |
| | | | | |
Class A Shares | | | (8,322,205 | ) | | | (11,627,309 | ) | | | | | | | (5,074,310 | ) | | | (26,598,316 | ) |
| | | | | |
Class C Shares | | | (6,771,926 | ) | | | (10,327,392 | ) | | | | | | | (396,370 | ) | | | (3,934,152 | ) |
| | | | | |
Class R3 Shares | | | — | | | | — | | | | | | | | (340,462 | ) | | | (2,189,834 | ) |
| | | | | |
Class R6 Shares | | | (5,360,790 | ) | | | (3,824,352 | ) | | | | | | | (13,385,125 | ) | | | (50,325,533 | ) |
| | | | | |
Class I Shares | | | (65,114,685 | ) | | | (92,558,832 | ) | | | | | | | (48,899,918 | ) | | | (239,701,123 | ) |
| | | | | |
Return of Capital: | | | | | | | | | | | | | | | | | | | | |
| | | | | |
Class A Shares | | | — | | | | (319,381 | ) | | | | | | | — | | | | — | |
| | | | | |
Class C Shares | | | — | | | | (326,727 | ) | | | | | | | — | | | | — | |
| | | | | |
Class R3 Shares | | | — | | | | — | | | | | | | | — | | | | — | |
| | | | | |
Class R6 Shares | | | — | | | | (96,249 | ) | | | | | | | — | | | | — | |
| | | | | |
Class I Shares | | | — | | | | (2,433,660 | ) | | | | | | | — | | | | — | |
| | | | | |
Decrease in net assets from distributions to shareholders | | | (85,569,606 | ) | | | (121,513,902 | ) | | | | | | | (68,096,185 | ) | | | (322,748,958 | ) |
| | | | | |
Fund Share Transactions | | | | | | | | | | | | | | | | | | | | |
| | | | | |
Proceeds from sale of shares | | | 609,855,057 | | | | 695,040,316 | | | | | | | | 576,399,850 | | | | 753,698,574 | |
| | | | | |
Proceeds from shares issued to shareholders due to reinvestment of distributions | | | 78,076,488 | | | | 110,345,096 | | | | | | | | 55,749,963 | | | | 262,074,094 | |
| | | | | |
| | | 687,931,545 | | | | 805,385,412 | | | | | | | | 632,149,813 | | | | 1,015,772,668 | |
| | | | | |
Cost of shares redeemed | | | (1,062,944,740 | ) | | | (532,060,862 | ) | | | | | | | (1,039,354,881 | ) | | | (1,469,696,254 | ) |
| | | | | |
Net increase (decrease) in net assets from Fund share transactions | | | (375,013,195 | ) | | | 273,324,550 | | | | | | | | (407,205,068 | ) | | | (453,923,586 | ) |
| | | | | |
Net increase (decrease) in net assets | | | (636,386,931 | ) | | | 540,620,110 | | | | | | | | (690,101,816 | ) | | | (42,623,851 | ) |
| | | | | |
Net assets at the beginning of period | | | 2,245,247,946 | | | | 1,704,627,836 | | | | | | | | 2,935,736,483 | | | | 2,978,360,334 | |
| | | | | |
Net assets at the end of period | | $ | 1,608,861,015 | | | $ | 2,245,247,946 | | | | | | | $ | 2,245,634,667 | | | $ | 2,935,736,483 | |
See accompanying notes to financial statements.
69
Financial Highlights
Global Infrastructure
Selected data for a share outstanding throughout each period:
| | | | | | | | | | | | | | | | | | | | | | | | | | | | | | | | | | | | | | | | |
| | | | |
| | | | Investment Operations | | | | | | Less Distributions | | | | |
| | | | | | | | | | |
Class (Commencement Date) Year Ended December 31, | | Beginning
NAV | | | Net
Investment
Income
(Loss)(a) | | | Net
Realized/
Unrealized
Gain (Loss) | | | Total | | | | | | From
Net
Investment
Income | | | From
Accumulated
Net Realized
Gains | | | Return
of
Capital | | | Total | | | Ending
NAV | |
| | | | | | | | | |
Class A (12/07) | | | | | | | | | | | | | | | | | | | | | | | | | | | | | | | | | | | | | |
| | | | | | | | | | |
2020 | | $ | 11.45 | | | $ | 0.13 | | | $ | (0.46 | ) | | $ | (0.33 | ) | | | | | | $ | (0.11 | ) | | $ | (0.04 | ) | | $ | — | | | $ | (0.15 | ) | | $ | 10.97 | |
| | | | | | | | | | |
2019 | | | 9.48 | | | | 0.22 | | | | 2.56 | | | | 2.78 | | | | | | | | (0.20 | ) | | | (0.61 | ) | | | — | | | | (0.81 | ) | | | 11.45 | |
| | | | | | | | | | |
2018 | | | 10.93 | | | | 0.20 | | | | (1.05 | ) | | | (0.85 | ) | | | | | | | (0.22 | ) | | | (0.36 | ) | | | (0.02 | ) | | | (0.60 | ) | | | 9.48 | |
| | | | | | | | | | |
2017 | | | 9.69 | | | | 0.22 | | | | 1.66 | | | | 1.88 | | | | | | | | (0.23 | ) | | | (0.41 | ) | | | — | | | | (0.64 | ) | | | 10.93 | |
| | | | | | | | | | |
2016 | | | 9.75 | | | | 0.25 | | | | 0.49 | | | | 0.74 | | | | | | | | (0.30 | ) | | | (0.50 | ) | | | — | | | | (0.80 | ) | | | 9.69 | |
| | | | | | | | | |
Class C (11/08) | | | | | | | | | | | | | | | | | | | | | | | | | | | | | | | | | | | | | |
| | | | | | | | | | |
2020 | | | 11.35 | | | | 0.05 | | | | (0.46 | ) | | | (0.41 | ) | | | | | | | (0.03 | ) | | | (0.04 | ) | | | — | | | | (0.07 | ) | | | 10.87 | |
| | | | | | | | | | |
2019 | | | 9.41 | | | | 0.14 | | | | 2.52 | | | | 2.66 | | | | | | | | (0.11 | ) | | | (0.61 | ) | | | — | | | | (0.72 | ) | | | 11.35 | |
| | | | | | | | | | |
2018 | | | 10.85 | | | | 0.12 | | | | (1.04 | ) | | | (0.92 | ) | | | | | | | (0.14 | ) | | | (0.36 | ) | | | (0.02 | ) | | | (0.52 | ) | | | 9.41 | |
| | | | | | | | | | |
2017 | | | 9.62 | | | | 0.14 | | | | 1.65 | | | | 1.79 | | | | | | | | (0.15 | ) | | | (0.41 | ) | | | — | | | | (0.56 | ) | | | 10.85 | |
| | | | | | | | | | |
2016 | | | 9.69 | | | | 0.16 | | | | 0.49 | | | | 0.65 | | | | | | | | (0.22 | ) | | | (0.50 | ) | | | — | | | | (0.72 | ) | | | 9.62 | |
| | | | | | | | | |
Class R3 (11/08) | | | | | | | | | | | | | | | | | | | | | | | | | | | | | | | | | | | | | |
| | | | | | | | | | |
2020 | | | 11.64 | | | | 0.11 | | | | (0.46 | ) | | | (0.35 | ) | | | | | | | (0.09 | ) | | | (0.04 | ) | | | — | | | | (0.13 | ) | | | 11.16 | |
| | | | | | | | | | |
2019 | | | 9.64 | | | | 0.19 | | | | 2.59 | | | | 2.78 | | | | | | | | (0.17 | ) | | | (0.61 | ) | | | — | | | | (0.78 | ) | | | 11.64 | |
| | | | | | | | | | |
2018 | | | 11.11 | | | | 0.18 | | | | (1.07 | ) | | | (0.89 | ) | | | | | | | (0.20 | ) | | | (0.36 | ) | | | (0.02 | ) | | | (0.58 | ) | | | 9.64 | |
| | | | | | | | | | |
2017 | | | 9.85 | | | | 0.20 | | | | 1.68 | | | | 1.88 | | | | | | | | (0.21 | ) | | | (0.41 | ) | | | — | | | | (0.62 | ) | | | 11.11 | |
| | | | | | | | | | |
2016 | | | 9.90 | | | | 0.22 | | | | 0.51 | | | | 0.73 | | | | | | | | (0.28 | ) | | | (0.50 | ) | | | — | | | | (0.78 | ) | | | 9.85 | |
| | | | | | | | | | |
Class R6 (6/16) | | | | | | | | | | | | | | | | | | | | | | | | | | | | | | | | | | | | | | | | |
| | | | | | | | | | |
2020 | | | 11.42 | | | | 0.16 | | | | (0.44 | ) | | | (0.28 | ) | | | | | | | (0.14 | ) | | | (0.04 | ) | | | — | | | | (0.18 | ) | | | 10.96 | |
| | | | | | | | | | |
2019 | | | 9.47 | | | | 0.26 | | | | 2.54 | | | | 2.80 | | | | | | | | (0.24 | ) | | | (0.61 | ) | | | — | | | | (0.85 | ) | | | 11.42 | |
| | | | | | | | | | |
2018 | | | 10.91 | | | | 0.22 | | | | (1.03 | ) | | | (0.81 | ) | | | | | | | (0.25 | ) | | | (0.36 | ) | | | (0.02 | ) | | | (0.63 | ) | | | 9.47 | |
| | | | | | | | | | |
2017 | | | 9.65 | | | | 0.27 | | | | 1.66 | | | | 1.93 | | | | | | | | (0.26 | ) | | | (0.41 | ) | | | — | | | | (0.67 | ) | | | 10.91 | |
| | | | | | | | | | |
2016(e) | | | 11.06 | | | | 0.11 | | | | (0.67 | ) | | | (0.56 | ) | | | | | | | (0.35 | ) | | | (0.50 | ) | | | — | | | | (0.85 | ) | | | 9.65 | |
| | | | | | | | | |
Class I (12/07) | | | | | | | | | | | | | | | | | | | | | | | | | | | | | | | | | | | | | |
| | | | | | | | | | |
2020 | | | 11.40 | | | | 0.15 | | | | (0.44 | ) | | | (0.29 | ) | | | | | | | (0.14 | ) | | | (0.04 | ) | | | — | | | | (0.18 | ) | | | 10.93 | |
| | | | | | | | | | |
2019 | | | 9.44 | | | | 0.25 | | | | 2.54 | | | | 2.79 | | | | | | | | (0.22 | ) | | | (0.61 | ) | | | — | | | | (0.83 | ) | | | 11.40 | |
| | | | | | | | | | |
2018 | | | 10.89 | | | | 0.22 | | | | (1.04 | ) | | | (0.82 | ) | | | | | | | (0.25 | ) | | | (0.36 | ) | | | (0.02 | ) | | | (0.63 | ) | | | 9.44 | |
| | | | | | | | | | |
2017 | | | 9.66 | | | | 0.26 | | | | 1.64 | | | | 1.90 | | | | | | | | (0.26 | ) | | | (0.41 | ) | | | — | | | | (0.67 | ) | | | 10.89 | |
| | | | | | | | | | |
2016 | | | 9.73 | | | | 0.27 | | | | 0.50 | | | | 0.77 | | | | | | | | (0.34 | ) | | | (0.50 | ) | | | — | | | | (0.84 | ) | | | 9.66 | |
See accompanying notes to financial statements.
70
| | | | | | | | | | | | | | | | | | | | | | | | | | | | | | | | | | |
| | | | Ratios/Supplemental Data | |
| | | | | | | | | | Ratios to Average
Net Assets Before
Waiver/Reimbursement | | | | | | Ratios to Average
Net Assets After
Waiver/Reimbursement(c) | | | | |
| | | | | | | | |
Total
Return(b) | | | Ending
Net
Assets
(000) | | | | | | Expenses | | | Net
Investment
Income
(Loss) | | | | | | Expenses | | | Net
Investment
Income
(Loss) | | | Portfolio
Turnover
Rate(d) | |
| | | | | | | | |
| | | | | | | | | | | | | | | | | | | | | | | | | | | | | | | | | | |
| | | | | | | | |
| | (2.76 | )% | | $ | 44,235 | | | | | | | | 1.35 | % | | | 1.11 | % | | | | | | | 1.22 | % | | | 1.24 | % | | | 181 | % |
| | | | | | | | |
| | 29.27 | | | | 57,379 | | | | | | | | 1.36 | | | | 1.85 | | | | | | | | 1.22 | | | | 1.99 | | | | 144 | |
| | | | | | | | |
| | (7.88 | ) | | | 55,856 | | | | | | | | 1.35 | | | | 1.74 | | | | | | | | 1.22 | | | | 1.87 | | | | 174 | |
| | | | | | | | |
| | 19.38 | | | | 87,876 | | | | | | | | 1.42 | | | | 1.85 | | | | | | | | 1.22 | | | | 2.05 | | | | 161 | |
| | | | | | | | |
| | 7.61 | | | | 70,173 | | | | | | | | 1.45 | | | | 2.20 | | | | | | | | 1.22 | | | | 2.42 | | | | 149 | |
| | | | | | | | |
| | | | | | | | | | | | | | | | | | | | | | | | | | | | | | | | | | |
| | | | | | | | |
| | (3.56 | ) | | | 18,465 | | | | | | | | 2.10 | | | | 0.37 | | | | | | | | 1.97 | | | | 0.49 | | | | 181 | |
| | | | | | | | |
| | 28.37 | | | | 24,640 | | | | | | | | 2.11 | | | | 1.11 | | | | | | | | 1.97 | | | | 1.26 | | | | 144 | |
| | | | | | | | |
| | (8.60 | ) | | | 24,556 | | | | | | | | 2.11 | | | | 1.00 | | | | | | | | 1.97 | | | | 1.13 | | | | 174 | |
| | | | | | | | |
| | 18.55 | | | | 29,227 | | | | | | | | 2.17 | | | | 1.11 | | | | | | | | 1.97 | | | | 1.31 | | | | 161 | |
| | | | | | | | |
| | 6.71 | | | | 22,868 | | | | | | | | 2.21 | | | | 1.30 | | | | | | | | 1.97 | | | | 1.53 | | | | 149 | |
| | | | | | | | |
| | | | | | | | | | | | | | | | | | | | | | | | | | | | | | | | | | |
| | | | | | | | |
| | (3.10 | ) | | | 238 | | | | | | | | 1.60 | | | | 0.88 | | | | | | | | 1.47 | | | | 1.01 | | | | 181 | |
| | | | | | | | |
| | 29.06 | | | | 358 | | | | | | | | 1.61 | | | | 1.54 | | | | | | | | 1.47 | | | | 1.69 | | | | 144 | |
| | | | | | | | |
| | (8.14 | ) | | | 239 | | | | | | | | 1.60 | | | | 1.54 | | | | | | | | 1.47 | | | | 1.68 | | | | 174 | |
| | | | | | | | |
| | 19.03 | | | | 337 | | | | | | | | 1.67 | | | | 1.63 | | | | | | | | 1.47 | | | | 1.83 | | | | 161 | |
| | | | | | | | |
| | 7.37 | | | | 730 | | | | | | | | 1.71 | | | | 1.81 | | | | | | | | 1.47 | | | | 2.04 | | | | 149 | |
| | | | | | | | |
| | | | | | | | | | | | | | | | | | | | | | | | | | | | | | | | | | |
| | | | | | | | |
| | (2.39 | ) | | | 107,342 | | | | | | | | 1.01 | | | | 1.44 | | | | | | | | 0.88 | | | | 1.57 | | | | 181 | |
| | | | | | | | |
| | 29.70 | | | | 60,187 | | | | | | | | 1.03 | | | | 2.11 | | | | | | | | 0.89 | | | | 2.26 | | | | 144 | |
| | | | | | | | |
| | (7.56 | ) | | | 11,520 | | | | | | | | 1.02 | | | | 1.93 | | | | | | | | 0.89 | | | | 2.06 | | | | 174 | |
| | | | | | | | |
| | 19.95 | | | | 19,575 | | | | | | | | 1.02 | | | | 2.24 | | | | | | | | 0.80 | | | | 2.46 | | | | 161 | |
| | | | | | | | |
| | (5.08 | ) | | | 7,627 | | | | | | | | 1.09 | * | | | 1.78 | * | | | | | | | 0.86 | * | | | 2.02 | * | | | 149 | |
| | | | | | | | |
| | | | | | | | | | | | | | | | | | | | | | | | | | | | | | | | | | |
| | | | | | | | |
| | (2.55 | ) | | | 439,399 | | | | | | | | 1.10 | | | | 1.37 | | | | | | | | 0.97 | | | | 1.50 | | | | 181 | |
| | | | | | | | |
| | 29.69 | | | | 477,180 | | | | | | | | 1.11 | | | | 2.10 | | | | | | | | 0.97 | | | | 2.24 | | | | 144 | |
| | | | | | | | |
| | (7.67 | ) | | | 345,782 | | | | | | | | 1.10 | | | | 1.98 | | | | | | | | 0.97 | | | | 2.11 | | | | 174 | |
| | | | | | | | |
| | 19.61 | | | | 472,564 | | | | | | | | 1.17 | | | | 2.14 | | | | | | | | 0.97 | | | | 2.34 | | | | 161 | |
| | | | | | | | |
| | 7.91 | | | | 314,001 | | | | | | | | 1.20 | | | | 2.30 | | | | | | | | 0.97 | | | | 2.54 | | | | 149 | |
| (a) | Per share Net Investment Income (Loss) is calculated using the average daily shares method. | |
| (b) | Total return is the combination of changes in NAV without any sales charge, reinvested dividend income at NAV and reinvested capital gains distributions at NAV, if any. Total returns are not annualized. | |
| (c) | After fee waiver and/or expense reimbursement from the Adviser, where applicable. See Note 7 – Management Fees and Other Transactions with Affiliates for more information. | |
| (d) | Portfolio Turnover Rate is calculated based on the lesser of long-term purchases or sales (as disclosed in Note 4 – Portfolio Securities and Investment in Derivatives) divided by the average long-term market value during the period. | |
| (e) | For the period June 30, 2016 (commencement of operations) through December 31, 2016. | |
See accompanying notes to financial statements.
71
Financial Highlights (continued)
Global Real Estate Securities
Selected data for a share outstanding throughout each period:
| | | | | | | | | | | | | | | | | | | | | | | | | | | | | | | | | | | | |
| | | | | |
| | | | | | Investment Operations | | | | | | Less Distributions | | | | |
| | | | | | | | | |
Class (Commencement Date) Year Ended December 31, | | Beginning
NAV | | | Net
Investment
Income
(Loss)(a) | | | Net
Realized/
Unrealized
Gain (Loss) | | | Total | | | | | | From
Net
Investment
Income | | | From
Accumulated
Net Realized
Gains | | | Total | | | Ending
NAV | |
| | | | | | | | | |
Class A (03/18) | | | | | | | | | | | | | | | | | | | | | | | | | | | | | | | | | | | | |
| | | | | | | | | |
2020 | | $ | 22.22 | | | $ | 0.30 | | | $ | (0.64 | ) | | $ | (0.34 | ) | | | | | | $ | (0.45 | ) | | $ | (0.18 | ) | | $ | (0.63 | ) | | $ | 21.25 | |
| | | | | | | | | |
2019 | | | 19.07 | | | | 0.36 | | | | 4.84 | | | | 5.20 | | | | | | | | (1.33 | ) | | | (0.72 | ) | | | (2.05 | ) | | | 22.22 | |
| | | | | | | | | |
2018(e) | | | 20.00 | | | | 0.32 | | | | (0.54 | ) | | | (0.22 | ) | | | | | | | (0.53 | ) | | | (0.18 | ) | | | (0.71 | ) | | | 19.07 | |
| | | | | | | | | |
Class C (03/18) | | | | | | | | | | | | | | | | | | | | | | | | | | | | | | | | | | | | |
| | | | | | | | | |
2020 | | | 22.21 | | | | 0.14 | | | | (0.62 | ) | | | (0.48 | ) | | | | | | | (0.30 | )�� | | | (0.18 | ) | | | (0.48 | ) | | | 21.25 | |
| | | | | | | | | |
2019 | | | 19.06 | | | | 0.19 | | | | 4.84 | | | | 5.03 | | | | | | | | (1.16 | ) | | | (0.72 | ) | | | (1.88 | ) | | | 22.21 | |
| | | | | | | | | |
2018(e) | | | 20.00 | | | | 0.20 | | | | (0.55 | ) | | | (0.35 | ) | | | | | | | (0.41 | ) | | | (0.18 | ) | | | (0.59 | ) | | | 19.06 | |
| | | | | | | | | |
Class R6 (03/18) | | | | | | | | | | | | | | | | | | | | | | | | | | | | | | | | | | | | |
| | | | | | | | | |
2020 | | | 22.23 | | | | 0.37 | | | | (0.63 | ) | | | (0.26 | ) | | | | | | | (0.52 | ) | | | (0.18 | ) | | | (0.70 | ) | | | 21.27 | |
| | | | | | | | | |
2019 | | | 19.07 | | | | 0.43 | | | | 4.85 | | | | 5.28 | | | | | | | | (1.40 | ) | | | (0.72 | ) | | | (2.12 | ) | | | 22.23 | |
| | | | | | | | | |
2018(e) | | | 20.00 | | | | 0.37 | | | | (0.55 | ) | | | (0.18 | ) | | | | | | | (0.57 | ) | | | (0.18 | ) | | | (0.75 | ) | | | 19.07 | |
| | | | | | | | | |
Class I (03/18) | | | | | | | | | | | | | | | | | | | | | | | | | | | | | | | | | | | | |
| | | | | | | | | |
2020 | | | 22.22 | | | | 0.34 | | | | (0.63 | ) | | | (0.29 | ) | | | | | | | (0.50 | ) | | | (0.18 | ) | | | (0.68 | ) | | | 21.25 | |
| | | | | | | | | |
2019 | | | 19.07 | | | | 0.47 | | | | 4.79 | | | | 5.26 | | | | | | | | (1.39 | ) | | | (0.72 | ) | | | (2.11 | ) | | | 22.22 | |
| | | | | | | | | |
2018(e) | | | 20.00 | | | | 0.36 | | | | (0.54 | ) | | | (0.18 | ) | | | | | | | (0.57 | ) | | | (0.18 | ) | | | (0.75 | ) | | | 19.07 | |
See accompanying notes to financial statements.
72
| | | | | | | | | | | | | | | | | | | | | | | | | | | | | | | | | | |
| | | | Ratios/Supplemental Data | |
| | | | | | | | | | Ratios to Average
Net Assets Before
Waiver/Reimbursement | | | | | | Ratios to Average
Net Assets After
Waiver/Reimbursement(c) | | | | |
| | | | | | | | |
Total
Return(b) | | | Ending
Net
Assets
(000) | | | | | | Expenses | | | Net
Investment
Income
(Loss) | | | | | | Expenses | | | Net Investment
Income
(Loss) | | | Portfolio
Turnover
Rate(d) | |
| | | | | | | | |
| | | | | | | | | | | | | | | | | | | | | | | | | | | | | | | | | | |
| | | | | | | | |
| | (1.32 | )% | | $ | 37 | | | | | | | | 2.45 | % | | | 0.33 | % | | | | | | | 1.30 | % | | | 1.48 | % | | | 159 | % |
| | | | | | | | |
| | 27.55 | | | | 35 | | | | | | | | 3.21 | | | | (0.31 | ) | | | | | | | 1.30 | | | | 1.60 | | | | 198 | |
| | | | | | | | |
| | (1.21 | ) | | | 24 | | | | | | | | 2.65 | * | | | 0.67 | * | | | | | | | 1.30 | * | | | 2.02 | * | | | 161 | |
| | | | | | | | |
| | | | | | | | | | | | | | | | | | | | | | | | | | | | | | | | | | |
| | | | | | | | |
| | (2.04 | ) | | | 27 | | | | | | | | 3.20 | | | | (0.44 | ) | | | | | | | 2.05 | | | | 0.71 | | | | 159 | |
| | | | | | | | |
| | 26.56 | | | | 33 | | | | | | | | 3.96 | | | | (1.05 | ) | | | | | | | 2.05 | | | | 0.86 | | | | 198 | |
| | | | | | | | |
| | (1.77 | ) | | | 24 | | | | | | | | 3.41 | * | | | (0.09 | )* | | | | | | | 2.05 | * | | | 1.27 | * | | | 161 | |
| | | | | | | | |
| | | | | | | | | | | | | | | | | | | | | | | | | | | | | | | | | | |
| | | | | | | | |
| | (0.95 | ) | | | 58,480 | | | | | | | | 2.15 | | | | 0.72 | | | | | | | | 1.00 | | | | 1.87 | | | | 159 | |
| | | | | | | | |
| | 27.91 | | | | 27,709 | | | | | | | | 2.88 | | | | 0.01 | | | | | | | | 0.97 | | | | 1.93 | | | | 198 | |
| | | | | | | | |
| | (0.97 | ) | | | 23,770 | | | | | | | | 2.38 | * | | | 0.94 | * | | | | | | | 1.02 | * | | | 2.30 | * | | | 161 | |
| | | | | | | | |
| | | | | | | | | | | | | | | | | | | | | | | | | | | | | | | | | | |
| | | | | | | | |
| | (1.02 | ) | | | 188 | | | | | | | | 2.20 | | | | 0.56 | | | | | | | | 1.05 | | | | 1.71 | | | | 159 | |
| | | | | | | | |
| | 27.80 | | | | 190 | | | | | | | | 2.96 | | | | 0.15 | | | | | | | | 1.05 | | | | 2.06 | | | | 198 | |
| | | | | | | | |
| | (1.03) | | | | 26 | | | | | | | | 2.42 | * | | | 0.86 | * | | | | | | | 1.05 | * | | | 2.24 | * | | | 161 | |
| (a) | Per share Net Investment Income (Loss) is calculated using the average daily shares method. | |
| (b) | Total return is the combination of changes in NAV without any sales charge, reinvested dividend income at NAV and reinvested capital gains distributions at NAV, if any. Total returns are not annualized. | |
| (c) | After fee waiver and/or expense reimbursement from the Adviser, where applicable. See Note 7 – Management Fees and Other Transactions with Affiliates for more information. | |
| (d) | Portfolio Turnover Rate is calculated based on the lesser of long-term purchases or sales (as disclosed in Note 4 – Portfolio Securities and Investment in Derivatives) divided by the average long-term market value during the period. | |
| (e) | For the period March 20, 2018 (commencement of operations) though December 31, 2018. | |
See accompanying notes to financial statements.
73
Financial Highlights (continued)
Real Asset Income
Selected data for a share outstanding throughout each period:
| | | | | | | | | | | | | | | | | | | | | | | | | | | | | | | | | | | | | | | | |
| | | | | |
| | | | | | Investment Operations | | | | | | Less Distributions | | | | |
| | | | | | | | | | |
Class (Commencement Date) Year Ended December 31, | | Beginning
NAV | | | Net
Investment
Income
(Loss)(a) | | | Net
Realized/
Unrealized
Gain (Loss) | | | Total | | | | | | From
Net
Investment
Income | | | From
Accumulated
Net Realized
Gains | | | Return
of
Capital | | | Total | | | Ending
NAV | |
| | | | | | | | | |
Class A (9/11) | | | | | | | | | | | | | | | | | | | | | | | | | | | | | | | | | | | | | |
| | | | | | | | | | |
2020 | | $ | 24.76 | | | $ | 0.90 | | | $ | (1.91 | ) | | $ | (1.01 | ) | | | | | | $ | (1.00 | ) | | $ | — | | | $ | — | | | $ | (1.00 | ) | | $ | 22.75 | |
| | | | | | | | | | |
2019 | | | 21.46 | | | | 0.99 | | | | 3.73 | | | | 4.72 | | | | | | | | (1.38 | ) | | | — | | | | (0.04 | ) | | | (1.42 | ) | | | 24.76 | |
| | | | | | | | | | |
2018 | | | 24.14 | | | | 1.12 | | | | (2.61 | ) | | | (1.49 | ) | | | | | | | (1.07 | ) | | | — | | | | (0.12 | ) | | | (1.19 | ) | | | 21.46 | |
| | | | | | | | | | |
2017 | | | 22.76 | | | | 1.11 | | | | 1.59 | | | | 2.70 | | | | | | | | (1.32 | ) | | | — | | | | — | | | | (1.32 | ) | | | 24.14 | |
| | | | | | | | | | |
2016 | | | 21.87 | | | | 1.08 | | | | 1.00 | | | | 2.08 | | | | | | | | (1.12 | ) | | | — | | | | (0.07 | ) | | | (1.19 | ) | | | 22.76 | |
| | | | | | | | | |
Class C (9/11) | | | | | | | | | | | | | | | | | | | | | | | | | | | | | | | | | | | | | |
| | | | | | | | | | |
2020 | | | 24.77 | | | | 0.73 | | | | (1.90 | ) | | | (1.17 | ) | | | | | | | (0.84 | ) | | | — | | | | — | | | | (0.84 | ) | | | 22.76 | |
| | | | | | | | | | |
2019 | | | 21.47 | | | | 0.81 | | | | 3.74 | | | | 4.55 | | | | | | | | (1.21 | ) | | | — | | | | (0.04 | ) | | | (1.25 | ) | | | 24.77 | |
| | | | | | | | | | |
2018 | | | 24.15 | | | | 0.95 | | | | (2.62 | ) | | | (1.67 | ) | | | | | | | (0.89 | ) | | | — | | | | (0.12 | ) | | | (1.01 | ) | | | 21.47 | |
| | | | | | | | | | |
2017 | | | 22.77 | | | | 0.94 | | | | 1.59 | | | | 2.53 | | | | | | | | (1.15 | ) | | | — | | | | — | | | | (1.15 | ) | | | 24.15 | |
| | | | | | | | | | |
2016 | | | 21.89 | | | | 0.91 | | | | 0.99 | | | | 1.90 | | | | | | | | (0.95 | ) | | | — | | | | (0.07 | ) | | | (1.02 | ) | | | 22.77 | |
| | | | | | | | | | |
Class R6 (6/16) | | | | | | | | | | | | | | | | | | | | | | | | | | | | | | | | | | | | | | | | |
| | | | | | | | | | |
2020 | | | 24.89 | | | | 1.00 | | | | (1.95 | ) | | | (0.95 | ) | | | | | | | (1.07 | ) | | | — | | | | — | | | | (1.07 | ) | | | 22.87 | |
| | | | | | | | | | |
2019 | | | 21.56 | | | | 1.10 | | | | 3.73 | | | | 4.83 | | | | | | | | (1.46 | ) | | | — | | | | (0.04 | ) | | | (1.50 | ) | | | 24.89 | |
| | | | | | | | | | |
2018 | | | 24.24 | | | | 1.20 | | | | (2.63 | ) | | | (1.43 | ) | | | | | | | (1.13 | ) | | | — | | | | (0.12 | ) | | | (1.25 | ) | | | 21.56 | |
| | | | | | | | | | |
2017 | | | 22.83 | | | | 1.22 | | | | 1.58 | | | | 2.80 | | | | | | | | (1.39 | ) | | | — | | | | — | | | | (1.39 | ) | | | 24.24 | |
| | | | | | | | | | |
2016(e) | | | 23.49 | | | | 0.48 | | | | (0.57 | ) | | | (0.09 | ) | | | | | | | (0.50 | ) | | | — | | | | (0.07 | ) | | | (0.57 | ) | | | 22.83 | |
| | | | | | | | | |
Class I (9/11) | | | | | | | | | | | | | | | | | | | | | | | | | | | | | | | | | | | | | |
| | | | | | | | | | |
2020 | | | 24.76 | | | | 0.94 | | | | (1.90 | ) | | | (0.96 | ) | | | | | | | (1.05 | ) | | | — | | | | — | | | | (1.05 | ) | | | 22.75 | |
| | | | | | | | | | |
2019 | | | 21.46 | | | | 1.05 | | | | 3.73 | | | | 4.78 | | | | | | | | (1.44 | ) | | | — | | | | (0.04 | ) | | | (1.48 | ) | | | 24.76 | |
| | | | | | | | | | |
2018 | | | 24.14 | | | | 1.18 | | | | (2.61 | ) | | | (1.43 | ) | | | | | | | (1.13 | ) | | | — | | | | (0.12 | ) | | | (1.25 | ) | | | 21.46 | |
| | | | | | | | | | |
2017 | | | 22.76 | | | | 1.18 | | | | 1.58 | | | | 2.76 | | | | | | | | (1.38 | ) | | | — | | | | — | | | | (1.38 | ) | | | 24.14 | |
| | | | | | | | | | |
2016 | | | 21.88 | | | | 1.14 | | | | 0.98 | | | | 2.12 | | | | | | | | (1.17 | ) | | | — | | | | (0.07 | ) | | | (1.24 | ) | | | 22.76 | |
See accompanying notes to financial statements.
74
| | | | | | | | | | | | | | | | | | | | | | | | | | | | | | | | | | |
| | | | Ratios/Supplemental Data | |
| | | | | | | | | | Ratios to Average
Net Assets Before
Waiver/Reimbursement | | | | | | Ratios to Average
Net Assets After
Waiver/Reimbursement(c) | | | | |
| | | | | | | | |
Total
Return(b) | | | Ending
Net
Assets
(000) | | | | | | Expenses | | | Net
Investment
Income
(Loss) | | | | | | Expenses | | | Net
Investment
Income
(Loss) | | | Portfolio
Turnover
Rate(d) | |
| | | | | | | | |
| | | | | | | | | | | | | | | | | | | | | | | | | | | | | | | | | | |
| | | | | | | | |
| | (3.71 | )% | | $ | 173,139 | | | | | | | | 1.16 | % | | | 4.16 | % | | | | | | | 1.16 | % | | | 4.17 | % | | | 104 | % |
| | | | | | | | |
| | 22.39 | | | | 220,665 | | | | | | | | 1.14 | | | | 4.16 | | | | | | | | 1.14 | | | | 4.16 | | | | 85 | |
| | | | | | | | |
| | (6.38 | ) | | | 178,651 | | | | | | | | 1.14 | | | | 4.85 | | | | | | | | 1.14 | | | | 4.85 | | | | 94 | |
| | | | | | | | |
| | 12.07 | | | | 225,282 | | | | | | | | 1.15 | | | | 4.64 | | | | | | | | 1.15 | | | | 4.64 | | | | 84 | |
| | | | | | | | |
| | 9.60 | | | | 234,495 | | | | | | | | 1.18 | | | | 4.72 | | | | | | | | 1.16 | | | | 4.74 | | | | 89 | |
| | | | | | | | |
| | | | | | | | | | | | | | | | | | | | | | | | | | | | | | | | | | |
| | | | | | | | |
| | (4.43 | ) | | | 156,391 | | | | | | | | 1.91 | | | | 3.40 | | | | | | | | 1.91 | | | | 3.41 | | | | 104 | |
| | | | | | | | |
| | 21.50 | | | | 217,976 | | | | | | | | 1.89 | | | | 3.41 | | | | | | | | 1.89 | | | | 3.41 | | | | 85 | |
| | | | | | | | |
| | (7.09 | ) | | | 186,043 | | | | | | | | 1.89 | | | | 4.10 | | | | | | | | 1.89 | | | | 4.11 | | | | 94 | |
| | | | | | | | |
| | 11.25 | | | | 241,844 | | | | | | | | 1.90 | | | | 3.94 | | | | | | | | 1.90 | | | | 3.94 | | | | 84 | |
| | | | | | | | |
| | 8.74 | | | | 182,744 | | | | | | | | 1.93 | | | | 3.97 | | | | | | | | 1.91 | | | | 3.99 | | | | 89 | |
| | | | | | | | |
| | | | | | | | | | | | | | | | | | | | | | | | | | | | | | | | | | |
| | | | | | | | |
| | (3.40 | ) | | | 223,948 | | | | | | | | 0.82 | | | | 4.62 | | | | | | | | 0.81 | | | | 4.63 | | | | 104 | |
| | | | | | | | |
| | 22.82 | | | | 80,903 | | | | | | | | 0.80 | | | | 4.59 | | | | | | | | 0.80 | | | | 4.59 | | | | 85 | |
| | | | | | | | |
| | (6.08 | ) | | | 27,654 | | | | | | | | 0.81 | | | | 5.18 | | | | | | | | 0.81 | | | | 5.19 | | | | 94 | |
| | | | | | | | |
| | 12.47 | | | | 29,332 | | | | | | | | 0.81 | | | | 5.10 | | | | | | | | 0.81 | | | | 5.10 | | | | 84 | |
| | | | | | | | |
| | (0.43 | ) | | | 7,237 | | | | | | | | 0.84 | * | | | 4.08 | * | | | | | | | 0.82 | * | | | 4.11 | * | | | 89 | |
| | | | | | | | |
| | | | | | | | | | | | | | | | | | | | | | | | | | | | | | | | | | |
| | | | | | | | |
| | (3.47 | ) | | | 1,055,383 | | | | | | | | 0.91 | | | | 4.37 | | | | | | | | 0.91 | | | | 4.37 | | | | 104 | |
| | | | | | | | |
| | 22.69 | | | | 1,725,703 | | | | | | | | 0.89 | | | | 4.42 | | | | | | | | 0.89 | | | | 4.42 | | | | 85 | |
| | | | | | | | |
| | (6.13 | ) | | | 1,312,280 | | | | | | | | 0.89 | | | | 5.10 | | | | | | | | 0.89 | | | | 5.11 | | | | 94 | |
| | | | | | | | |
| | 12.35 | | | | 1,607,267 | | | | | | | | 0.90 | | | | 4.96 | | | | | | | | 0.90 | | | | 4.96 | | | | 84 | |
| | | | | | | | |
| | 9.82 | | | | 846,584 | | | | | | | | 0.93 | | | | 4.98 | | | | | | | | 0.91 | | | | 5.00 | | | | 89 | |
| (a) | Per share Net Investment Income (Loss) is calculated using the average daily shares method. | |
| (b) | Total return is the combination of changes in NAV without any sales charge, reinvested dividend income at NAV and reinvested capital gains distributions at NAV, if any. Total returns are not annualized. | |
| (c) | After fee waiver and/or expense reimbursement from the Adviser, where applicable. See Note 7 – Management Fees and Other Transactions with Affiliates for more information. | |
| (d) | Portfolio Turnover Rate is calculated based on the lesser of long-term purchases or sales (as disclosed in Note 4 – Portfolio Securities and Investment in Derivatives) divided by the average long-term market value during the period. | |
| (e) | For the period June 30, 2016 (commencement of operations) through December 31, 2016. | |
See accompanying notes to financial statements.
75
Financial Highlights (continued)
Real Estate Securities
Selected data for a share outstanding throughout each period:
| | | | | | | | | | | | | | | | | | | | | | | | | | | | | | | | | | | | |
| | | | |
| | | | Investment Operations | | | | | | Less Distributions | | | | |
| | | | | | | | | |
Class (Commencement Date) Year Ended December 31, | | Beginning
NAV | | | Net
Investment
Income
(Loss)(a) | | | Net
Realized/
Unrealized
Gain (Loss) | | | Total | | | | | | From Net
Investment
Income | | | From Accumulated Net Realized Gains | | | Total | | | Ending
NAV | |
| | | | | | | | |
Class A (9/95) | | | | | | | | | | | | | | | | | | | | | | | | | | | | | | | | | |
| | | | | | | | | |
2020 | | $ | 20.22 | | | $ | 0.21 | | | $ | (1.54 | ) | | $ | (1.33 | ) | | | | | | $ | (0.14 | ) | | $ | (0.35 | ) | | $ | (0.49 | ) | | $ | 18.40 | |
| | | | | | | | | |
2019 | | | 18.03 | | | | 0.33 | | | | 4.16 | | | | 4.49 | | | | | | | | (0.33 | ) | | | (1.97 | ) | | | (2.30 | ) | | | 20.22 | |
| | | | | | | | | |
2018 | | | 20.23 | | | | 0.31 | | | | (1.43 | ) | | | (1.12 | ) | | | | | | | (0.34 | ) | | | (0.74 | ) | | | (1.08 | ) | | | 18.03 | |
| | | | | | | | | |
2017 | | | 21.75 | | | | 0.32 | | | | 0.85 | | | | 1.17 | | | | | | | | (0.37 | ) | | | (2.32 | ) | | | (2.69 | ) | | | 20.23 | |
| | | | | | | | | |
2016 | | | 22.66 | | | | 0.31 | | | | 1.14 | | | | 1.45 | | | | | | | | (0.31 | ) | | | (2.05 | ) | | | (2.36 | ) | | | 21.75 | |
| | | | | | | | |
Class C (2/00) | | | | | | | | | | | | | | | | | | | | | | | | | | | | | | | | | |
| | | | | | | | | |
2020 | | | 19.55 | | | | 0.06 | | | | (1.46 | ) | | | (1.40 | ) | | | | | | | — | | | | (0.35 | ) | | | (0.35 | ) | | | 17.80 | |
| | | | | | | | | |
2019 | | | 17.49 | | | | 0.16 | | | | 4.03 | | | | 4.19 | | | | | | | | (0.16 | ) | | | (1.97 | ) | | | (2.13 | ) | | | 19.55 | |
| | | | | | | | | |
2018 | | | 19.63 | | | | 0.17 | | | | (1.39 | ) | | | (1.22 | ) | | | | | | | (0.18 | ) | | | (0.74 | ) | | | (0.92 | ) | | | 17.49 | |
| | | | | | | | | |
2017 | | | 21.18 | | | | 0.15 | | | | 0.82 | | | | 0.97 | | | | | | | | (0.20 | ) | | | (2.32 | ) | | | (2.52 | ) | | | 19.63 | |
| | | | | | | | | |
2016 | | | 22.11 | | | | 0.12 | | | | 1.12 | | | | 1.24 | | | | | | | | (0.12 | ) | | | (2.05 | ) | | | (2.17 | ) | | | 21.18 | |
| | | | | | | | |
Class R3 (9/01) | | | | | | | | | | | | | | | | | | | | | | | | | | | | | | | | | |
| | | | | | | | | |
2020 | | | 20.59 | | | | 0.17 | | | | (1.56 | ) | | | (1.39 | ) | | | | | | | (0.10 | ) | | | (0.35 | ) | | | (0.45 | ) | | | 18.75 | |
| | | | | | | | | |
2019 | | | 18.34 | | | | 0.28 | | | | 4.23 | | | | 4.51 | | | | | | | | (0.29 | ) | | | (1.97 | ) | | | (2.26 | ) | | | 20.59 | |
| | | | | | | | | |
2018 | | | 20.56 | | | | 0.28 | | | | (1.46 | ) | | | (1.18 | ) | | | | | | | (0.30 | ) | | | (0.74 | ) | | | (1.04 | ) | | | 18.34 | |
| | | | | | | | | |
2017 | | | 22.08 | | | | 0.27 | | | | 0.85 | | | | 1.12 | | | | | | | | (0.32 | ) | | | (2.32 | ) | | | (2.64 | ) | | | 20.56 | |
| | | | | | | | | |
2016 | | | 23.00 | | | | 0.26 | | | | 1.16 | | | | 1.42 | | | | | | | | (0.29 | ) | | | (2.05 | ) | | | (2.34 | ) | | | 22.08 | |
| | | | | | | | |
Class R6 (4/13) | | | | | | | | | | | | | | | | | | | | | | | | | | | | | | | | | |
| | | | | | | | | |
2020 | | | 20.85 | | | | 0.30 | | | | (1.59 | ) | | | (1.29 | ) | | | | | | | (0.23 | ) | | | (0.35 | ) | | | (0.58 | ) | | | 18.98 | |
| | | | | | | | | |
2019 | | | 18.54 | | | | 0.44 | | | | 4.27 | | | | 4.71 | | | | | | | | (0.43 | ) | | | (1.97 | ) | | | (2.40 | ) | | | 20.85 | |
| | | | | | | | | |
2018 | | | 20.75 | | | | 0.44 | | | | (1.51 | ) | | | (1.07 | ) | | | | | | | (0.40 | ) | | | (0.74 | ) | | | (1.14 | ) | | | 18.54 | |
| | | | | | | | | |
2017 | | | 22.23 | | | | 0.46 | | | | 0.82 | | | | 1.28 | | | | | | | | (0.44 | ) | | | (2.32 | ) | | | (2.76 | ) | | | 20.75 | |
| | | | | | | | | |
2016 | | | 23.07 | | | | 0.43 | | | | 1.16 | | | | 1.59 | | | | | | | | (0.38 | ) | | | (2.05 | ) | | | (2.43 | ) | | | 22.23 | |
| | | | | | | | |
Class I (6/95) | | | | | | | | | | | | | | | | | | | | | | | | | | | | | | | | | |
| | | | | | | | | |
2020 | | | 20.59 | | | | 0.27 | | | | (1.58 | ) | | | (1.31 | ) | | | | | | | (0.19 | ) | | | (0.35 | ) | | | (0.54 | ) | | | 18.74 | |
| | | | | | | | | |
2019 | | | 18.34 | | | | 0.39 | | | | 4.22 | | | | 4.61 | | | | | | | | (0.39 | ) | | | (1.97 | ) | | | (2.36 | ) | | | 20.59 | |
| | | | | | | | | |
2018 | | | 20.55 | | | | 0.39 | | | | (1.47 | ) | | | (1.08 | ) | | | | | | | (0.39 | ) | | | (0.74 | ) | | | (1.13 | ) | | | 18.34 | |
| | | | | | | | | |
2017 | | | 22.07 | | | | 0.40 | | | | 0.84 | | | | 1.24 | | | | | | | | (0.44 | ) | | | (2.32 | ) | | | (2.76 | ) | | | 20.55 | |
| | | | | | | | | |
2016 | | | 22.97 | | | | 0.38 | | | | 1.15 | | | | 1.53 | | | | | | | | (0.38 | ) | | | (2.05 | ) | | | (2.43 | ) | | | 22.07 | |
See accompanying notes to financial statements.
76
| | | | | | | | | | | | | | | | | | | | | | | | | | |
| | | | Ratios/Supplemental Data | |
| | | | | | | | | | Ratios to Average
Net Assets | | | | | | | |
| | | | | | |
Total
Return(b) | | | Ending
Net
Assets
(000) | | | | | | Expenses | | | Net
Investment
Income
(Loss) | | | | | | Portfolio
Turnover
Rate(c) | |
| | | | | | |
| | | | | | | | | | | | | | | | | | | | | | | | | | |
| | | | | | |
| | (6.37 | )% | | $ | 176,739 | | | | | | | | 1.30 | % | | | 1.20 | % | | | | | | | 135 | % |
| | | | | | |
| | 25.24 | | | | 249,172 | | | | | | | | 1.30 | | | | 1.56 | | | | | | | | 109 | |
| | | | | | |
| | (5.78 | ) | | | 264,414 | | | | | | | | 1.26 | | | | 1.61 | | | | | | | | 131 | |
| | | | | | |
| | 5.34 | | | | 459,034 | | | | | | | | 1.29 | | | | 1.47 | | | | | | | | 131 | |
| | | | | | |
| | 6.58 | | | | 679,318 | | | | | | | | 1.30 | | | | 1.32 | | | | | | | | 139 | |
| | | | | | |
| | | | | | | | | | | | | | | | | | | | | | | | | | |
| | | | | | |
| | (7.03 | ) | | | 14,874 | | | | | | | | 2.05 | | | | 0.32 | | | | | | | | 135 | |
| | | | | | |
| | 24.28 | | | | 37,352 | | | | | | | | 2.06 | | | | 0.79 | | | | | | | | 109 | |
| | | | | | |
| | (6.46 | ) | | | 43,152 | | | | | | | | 2.02 | | | | 0.89 | | | | | | | | 131 | |
| | | | | | |
| | 4.59 | | | | 66,953 | | | | | | | | 2.04 | | | | 0.71 | | | | | | | | 131 | |
| | | | | | |
| | 5.76 | | | | 89,123 | | | | | | | | 2.05 | | | | 0.55 | | | | | | | | 139 | |
| | | | | | |
| | | | | | | | | | | | | | | | | | | | | | | | | | |
| | | | | | |
| | (6.57 | ) | | | 12,461 | | | | | | | | 1.55 | | | | 0.93 | | | | | | | | 135 | |
| | | | | | |
| | 24.88 | | | | 21,227 | | | | | | | | 1.55 | | | | 1.32 | | | | | | | | 109 | |
| | | | | | |
| | (5.98 | ) | | | 22,073 | | | | | | | | 1.52 | | | | 1.42 | | | | | | | | 131 | |
| | | | | | |
| | 5.08 | | | | 36,829 | | | | | | | | 1.54 | | | | 1.23 | | | | | | | | 131 | |
| | | | | | |
| | 6.31 | | | | 53,413 | | | | | | | | 1.55 | | | | 1.11 | | | | | | | | 139 | |
| | | | | | |
| | | | | | | | | | | | | | | | | | | | | | | | | | |
| | | | | | |
| | (5.95 | ) | | | 437,016 | | | | | | | | 0.90 | | | | 1.66 | | | | | | | | 135 | |
| | | | | | |
| | 25.74 | | | | 479,973 | | | | | | | | 0.88 | | | | 2.03 | | | | | | | | 109 | |
| | | | | | |
| | (5.39 | ) | | | 346,185 | | | | | | | | 0.88 | | | | 2.21 | | | | | | | | 131 | |
| | | | | | |
| | 5.78 | | | | 277,978 | | | | | | | | 0.87 | | | | 2.04 | | | | | | | | 131 | |
| | | | | | |
| | 7.05 | | | | 307,921 | | | | | | | | 0.87 | | | | 1.83 | | | | | | | | 139 | |
| | | | | | |
| | | | | | | | | | | | | | | | | | | | | | | | | | |
| | | | | | |
| | (6.12 | ) | | | 1,604,544 | | | | | | | | 1.05 | | | | 1.46 | | | | | | | | 135 | |
| | | | | | |
| | 25.56 | | | | 2,148,012 | | | | | | | | 1.06 | | | | 1.80 | | | | | | | | 109 | |
| | | | | | |
| | (5.51 | ) | | | 2,302,536 | | | | | | | | 1.02 | | | | 1.96 | | | | | | | | 131 | |
| | | | | | |
| | 5.61 | | | | 2,945,935 | | | | | | | | 1.04 | | | | 1.78 | | | | | | | | 131 | |
| | | | | | |
| | 6.79 | | | | 3,497,055 | | | | | | | | 1.05 | | | | 1.61 | | | | | | | | 139 | |
| (a) | Per share Net Investment Income (Loss) is calculated using the average daily shares method. | |
| (b) | Total return is the combination of changes in NAV without any sales charge, reinvested dividend income at NAV and reinvested capital gains distributions at NAV, if any. Total returns are not annualized. | |
| (c) | Portfolio Turnover Rate is calculated based on the lesser of long-term purchases or sales (as disclosed in Note 4 – Portfolio Securities and Investment in Derivatives) divided by the average long-term market value during the period. | |
See accompanying notes to financial statements.
77
Notes to Financial Statements
1. General Information
Trust and Fund Information
Nuveen Investment Funds, Inc. and Nuveen Investment Trust V (each a “Trust” and collectively, the “Trusts”), are open-end management investment companies registered under the Investment Company Act of 1940 (the “1940 Act”) as amended. Nuveen Investment Funds, Inc. is comprised of Nuveen Global Infrastructure Fund (“Global Infrastructure”), Nuveen Real Asset Income Fund (“Real Asset Income”) and Nuveen Real Estate Securities Fund (“Real Estate Securities”), among others, and Nuveen Investment Trust V is comprised of Nuveen Global Real Estate Securities Fund (“Global Real Estate Securities”), among others, (each a “Fund” and collectively, the “Funds”), as diversified funds. Nuveen Investment Funds, Inc. was incorporated in the State of Maryland on August 20, 1987 and Nuveen Investment Trust V was organized as a Massachusetts business trust on September 27, 2006.
The end of the reporting period for the Funds is December 31, 2020, and the period covered by these Notes to Financial Statements is the fiscal year ended December 31, 2020 (the “current fiscal period”).
Investment Adviser and Sub-Adviser
The Funds’ investment adviser is Nuveen Fund Advisors, LLC (the “Adviser”), a subsidiary of Nuveen, LLC (“Nuveen”). Nuveen is the investment management arm of Teachers Insurance and Annuity Association of America (TIAA). The Adviser has overall responsibility for management of the Funds, oversees the management of the Funds’ portfolios, manages the Funds’ business affairs and provides certain clerical, bookkeeping and other administrative services, and, if necessary, asset allocation decisions. The Adviser has entered into sub-advisory agreements with Nuveen Asset Management, LLC, (the “Sub-Adviser”), a subsidiary of the Adviser, under which the Sub-Adviser manages the investment portfolios of the Funds.
Share Classes and Sales Charges
Class A Shares are generally sold with an up-front sales charge. Class A Share purchases of $1 million or more are sold at net asset value (“NAV”) without an up-front sales charge but may be subject to a contingent deferred sales charge (“CDSC”) of 1% if redeemed within eighteen months of purchase. Class C Shares are sold without an up-front sales charge but are subject to a CDSC of 1% if redeemed within twelve months of purchase. Class C Shares automatically convert to Class A Shares ten years after purchase. Class R3 Shares, Class R6 Shares and I Shares are sold without an up-front sales charge.
Other Matters
The outbreak of the novel coronavirus (“COVID-19”) and subsequent global pandemic began significantly impacting the U.S. and global financial markets and economies during the calendar quarter ended March 31, 2020. The worldwide spread of COVID-19 has created significant uncertainty in the global economy. The duration and extent of COVID-19 over the long term cannot be reasonably estimated at this time. The ultimate impact of COVID-19 and the extent to which COVID-19 impacts the Funds’ normal course of business, results of operations, investments, and cash flows will depend on future developments, which are highly uncertain and difficult to predict. Management continues to monitor and evaluate this situation.
2. Significant Accounting Policies
The accompanying financial statements were prepared in accordance with accounting principles generally accepted in the United States of America (“U.S. GAAP”), which may require the use of estimates made by management and the evaluation of subsequent events. Actual results may differ from those estimates. Each Fund is an investment company and follows accounting guidance in the Financial Accounting Standards Board (“FASB”) Accounting Standards Codification 946, Financial Services – Investment Companies. The NAV for financial reporting purposes may differ from the NAV for processing security and shareholder transactions. The NAV for financial reporting purposes includes security and shareholder transactions through the date of the report. Total return is computed based on the NAV used for processing security and shareholder transactions. The following is a summary of the significant accounting policies consistently followed by the Funds.
Compensation
Neither Trust pays compensation directly to those of its directors/trustees who are affiliated with the Adviser or to its officers, all of whom receive remuneration for their services to each Trust from the Adviser or its affiliates. The Funds’ Board of Directors/Trustees (the “Board”) has adopted a deferred compensation plan for independent directors/trustees that enables directors/trustees to elect to defer receipt of all or a portion of the annual compensation they are entitled to receive from certain Nuveen-advised funds. Under the plan, deferred amounts are treated as though equal dollar amounts had been invested in shares of select Nuveen-advised funds.
Distributions to Shareholders
Distributions to shareholders are recorded on the ex-dividend date. The amount, character and timing of distributions are determined in accordance with federal income tax regulations, which may differ from U.S. GAAP.
78
The tax character of Fund distributions for a fiscal year is dependent upon the amount and tax character of distributions received from securities held in the Funds’ portfolios. Distributions received from certain securities in which the Funds invest, most notably real estate investment trust (“REIT”) securities, may be characterized for tax purposes as ordinary income, long-term capital gain and/or a return of capital. The issuer of a security reports the tax character of its distributions only once per year, generally during the first two months of the calendar year. The distribution is included in the Funds’ ordinary income until such time the Fund is notified by the issuer of the actual tax character. For the current fiscal period, dividend income, net realized gain (loss) and unrealized appreciation (depreciation) recognized on the Statement of Operations reflect the amounts of ordinary income, capital gain, and/or return of capital as reported by the issuers of such securities as of the current calendar year end.
Foreign Currency Transactions and Translation
The books and records of the Funds are maintained in U.S. dollars. Assets, including investments, and liabilities denominated in foreign currencies are translated into U.S. dollars at the end of each day. Purchases and sales of securities, income and expenses are translated into U.S. dollars at each prevailing exchange rate on the respective dates of the transactions.
Net realized foreign currency gains and losses resulting from changes in exchange rates associated with (i) foreign currency, (ii) investments and (iii) derivatives include foreign currency gains and losses between trade date and settlement date of the transactions, foreign currency transactions, and the difference between the amounts of interest and dividends recorded on the books of the Funds and the amounts actually received are recognized as a component of “Net realized gain (loss) from investments and foreign currency” on the Statement of Operations, when applicable.
The unrealized gains and losses resulting from changes in foreign currency exchange rates and changes in foreign exchange rates associated with (i) investments and (ii) other assets and liabilities are recognized as a component of “Change in net unrealized appreciation (depreciation) of investments and foreign currency” on the Statement of Operations, when applicable. The unrealized gains and losses resulting from changes in foreign exchange rates associated with investments in derivatives are recognized as a component of the respective derivative’s related “Change in net unrealized appreciation (depreciation)” on the Statement of Operations, when applicable.
As of the end of the end of the reporting period, the following Funds’ investments in non-U.S. securities were as follows:
| | | | | | | | |
| Global Infrastructure | | Value | | | % of
Net Assets | |
| Country: | | | | | | | | |
Australia | | $ | 57,361,893 | | | | 9.4 | % |
Spain | | | 56,134,533 | | | | 9.2 | |
Canada | | | 51,971,074 | | | | 8.5 | |
France | | | 46,258,759 | | | | 7.6 | |
Italy | | | 42,648,956 | | | | 7.0 | |
Germany | | | 20,968,490 | | | | 3.4 | |
Mexico | | | 18,438,708 | | | | 3.0 | |
United Kingdom | | | 18,254,080 | | | | 3.0 | |
New Zealand | | | 11,205,617 | | | | 1.8 | |
Other | | | 52,340,342 | | | | 8.7 | |
| Total non-U.S securities | | $ | 375,582,452 | | | | 61.6 | % |
| | |
| Global Real Estate Securities | | | | | | |
| Country: | | | | | | | | |
Japan | | $ | 6,842,855 | | | | 11.7 | % |
Germany | | | 4,390,452 | | | | 7.5 | |
United Kingdom | | | 2,766,218 | | | | 4.7 | |
Singapore | | | 2,320,615 | | | | 4.0 | |
Australia | | | 2,193,550 | | | | 3.7 | |
Hong Kong | | | 2,120,585 | | | | 3.6 | |
Canada | | | 1,781,943 | | | | 3.0 | |
Sweden | | | 1,628,101 | | | | 2.8 | |
France | | | 1,115,207 | | | | 1.9 | |
Other | | | 3,851,430 | | | | 6.5 | |
| Total non-U.S securities | | $ | 29,010,956 | | | | 49.4 | % |
79
Notes to Financial Statements (continued)
| | | | | | | | |
| Real Asset Income | | Value | | | % of
Net Assets | |
| Country: | | | | | | | | |
Canada | | $ | 218,199,973 | | | | 13.6 | % |
Australia | | | 81,692,158 | | | | 5.1 | |
United Kingdom | | | 63,572,261 | | | | 4.0 | |
Singapore | | | 49,357,387 | | | | 3.1 | |
Spain | | | 48,224,785 | | | | 3.0 | |
Italy | | | 48,071,970 | | | | 3.0 | |
Hong Kong | | | 43,367,758 | | | | 2.7 | |
Japan | | | 21,833,878 | | | | 1.4 | |
France | | | 21,177,102 | | | | 1.3 | |
Other | | | 145,001,562 | | | | 8.9 | |
| Total non-U.S securities | | $ | 740,498,834 | | | | 46.1 | % |
Indemnifications
Under each Trust’s organizational documents, its officers and directors/trustees are indemnified against certain liabilities arising out of the performance of their duties to each Trust. In addition, in the normal course of business, each Trust enters into contracts that provide general indemnifications to other parties. Each Trust’s maximum exposure under these arrangements is unknown as this would involve future claims that may be made against each Trust that have not yet occurred. However, each Trust has not had prior claims or losses pursuant to these contracts and expects the risk of loss to be remote.
Investments and Investment Income
Securities transactions are accounted for as of the trade date for financial reporting purposes. Trade date for senior and subordinated loans purchased in the “primary market” is considered the date on which the loan allocations are determined. Trade date for senior and subordinated loans purchased in the “secondary market” is the date on which the transaction is entered into. Realized gains and losses on securities transactions are based upon the specific identification method. Dividend income is recorded on the ex-dividend date or, for foreign securities, when information is available. Non-cash dividends received in the form of stock, if any, are recognized on the ex-dividend date and recorded at fair value. Interest income, which is recorded on an accrual basis and includes accretion of discounts and amortization of premiums for financial reporting purposes. Interest income also reflects payment-in-kind (“PIK”) interest, paydown gains and losses and fee income, if any. PIK interest represents income received in the form of securities in lieu of cash. Fee income consists primarily of amendment fees. Amendment fees are earned as compensation for evaluating and accepting changes to an original senior loan agreement and are recognized when received. Securities lending income is comprised of fees earned from borrowers and income earned on cash collateral investments.
Multiclass Operations and Allocations
Income and expenses of Global Infrastructure, Global Real Estate Securities and Real Estate Securities that are not directly attributable to a specific class of shares are prorated among the classes of each Fund based on the relative net assets of each class. Income and expenses of Real Asset Income that are not directly attributable to a specific class of shares are prorated among the classes based on the relative settled shares of each class. Expenses directly attributable to a class of shares are recorded to the specific class. 12b-1 distribution and service fees are allocated on a class-specific basis.
Sub-transfer agent fees and similar fees, which are recognized as a component of “Shareholder servicing agent fees” on the Statement of Operations, are not charged to Class R6 Shares and are prorated among the other classes based on their relative net assets for Global Infrastructure, Global Real Estate Securities and Real Estate Securities and relative settled shares for Real Asset Income.
Realized and unrealized capital gains and losses of the Funds are prorated among the classes based on the relative net assets of each class.
Netting Agreements
In the ordinary course of business, the Funds may enter into transactions subject to enforceable master repurchase agreements, International Swaps and Derivatives Association, Inc. (ISDA) master agreements or other similar arrangements (“netting agreements”). Generally, the right to offset in netting agreements allows each Fund to offset certain securities and derivatives with a specific counterparty, when applicable, as well as any collateral received or delivered to that counterparty based on the terms of the agreements. Generally, each Fund manages its cash collateral and securities collateral on a counterparty basis.
The Funds’ investments subject to netting agreements as of the end of the reporting period, if any, are further described in Note 4 – Portfolio Securities and Investments in Derivatives.
New Accounting Pronouncements and Rule Issuances
Reference Rate Reform
In March 2020, FASB issued Accounting Standards Update (“ASU”) 2020-04, Reference Rate Reform: Facilitation of the Effects of Reference Rate Reform on Financial Reporting. The main objective of the new guidance is to provide relief to companies that will be impacted by the expected change in benchmark interest rates at the end of 2021, when participating banks will no longer be required to submit London Interbank Offered Rate (LIBOR) quotes by the UK
80
Financial Conduct Authority (FCA). The new guidance allows companies to, provided the only changes to existing contracts are a change to an approved benchmark interest rate, account for modifications as a continuance of the existing contract without additional analysis. For new and existing contracts, the Funds may elect to apply the optional expedients as of March 12, 2020 through December 31, 2022. Management has not yet elected to apply the optional expedients, but is currently assessing the impact of the ASU’s adoption to the Funds’ financial statements and various filings.
Securities and Exchange Commission (“SEC”) Adopts New Rules to Modernize Fund Valuation Framework
In December 2020, the SEC voted to adopt a new rule governing fund valuation practices. New Rule 2a-5 under the 1940 Act establishes requirements for determining fair value in good faith for purposes of the 1940 Act. Rule 2a-5 will permit fund boards to designate certain parties to perform fair value determinations, subject to board oversight and certain other conditions. Rule 2a-5 also defines when market quotations are “readily available” for purposes of Section 2(a)(41) of the 1940 Act, which requires a fund to fair value a security when market quotation are not readily available. The SEC also adopted new Rule 31a-4 under the 1940 Act, which sets forth the recordkeeping requirements associated with fair value determinations. Finally, the SEC is rescinding previously issued guidance on related issues, including the role of a board in determining fair value and the accounting and auditing of fund investments. Rule 2a-5 and Rule 31a-4 will become effective on March 8, 2021, with a compliance date of September 8, 2022. A fund may voluntarily comply with the rules after the effective date, and in advance of the compliance date, under certain conditions. Management is currently assessing the impact of these provisions on the Funds’ financial statements.
3. Investment Valuation and Fair Value Measurements
The Funds’ investments in securities are recorded at their estimated fair value utilizing valuation methods approved by the Board. Fair value is defined as the price that would be received upon selling an investment or transferring a liability in an orderly transaction to an independent buyer in the principal or most advantageous market for the investment. U.S. GAAP establishes the three-tier hierarchy which is used to maximize the use of observable market data and minimize the use of unobservable inputs and to establish classification of fair value measurements for disclosure purposes. Observable inputs reflect the assumptions market participants would use in pricing the asset or liability. Observable inputs are based on market data obtained from sources independent of the reporting entity. Unobservable inputs reflect management’s assumptions about the assumptions market participants would use in pricing the asset or liability. Unobservable inputs are based on the best information available in the circumstances. The following is a summary of the three-tiered hierarchy of valuation input levels.
| | |
| Level 1 – | | Inputs are unadjusted and prices are determined using quoted prices in active markets for identical securities. |
| Level 2 – | | Prices are determined using other significant observable inputs (including quoted prices for similar securities, interest rates, credit spreads, etc.). |
| Level 3 – | | Prices are determined using significant unobservable inputs (including management’s assumptions in determining the fair value of investments). |
A description of the valuation techniques applied to the Funds’ major classifications of assets and liabilities measured at fair value follows:
Equity securities and exchange-traded funds listed or traded on a national market or exchange are valued based on their sale price at the official close of business of such market or exchange on the valuation date. Foreign equity securities are valued at the last sale price or official closing price reported on the exchange where traded and converted to U.S. dollars at the prevailing rates of exchange on the date of valuation. To the extent these securities are actively traded and that valuation adjustments are not applied, they are generally classified as Level 1. If there is no official close of business, then the latest available sale price is utilized. If no sales are reported, then the mean of the latest available bid and ask prices is utilized and are generally classified as Level 2.
Prices of fixed-income securities are generally provided by an independent pricing service (“pricing service”) approved by the Board. The pricing service establishes a security’s fair value using methods that may include consideration of the following: yields or prices of investments of comparable quality, type of issue, coupon, maturity and rating, market quotes or indications of value from security dealers, evaluations of anticipated cash flows or collateral, general market conditions and other information and analysis, including the obligor’s credit characteristics considered relevant. In pricing certain securities, particularly less liquid and lower quality securities, the pricing service may consider information about a security, its issuer or market activity, provided by the Adviser. These securities are generally classified as Level 2.
For events affecting the value of foreign securities between the time when the exchange on which they are traded closes and the time when the Funds’ net assets are calculated, such securities will be valued at fair value in accordance with procedures adopted by the Board. These foreign securities are generally classified as Level 2.
Prices of certain American Depositary Receipts (“ADR”) held by the Funds that trade in the United States are valued based on the last traded price, official closing price, or an evaluated price provided by the independent pricing service (“pricing service”) and are generally classified as Level 1 or 2.
Investments in investment companies are valued at their respective NAVs on the valuation date and are generally classified as Level 1.
Repurchase agreements are valued at contract amount plus accrued interest, which approximates market value. These securities are generally classified as Level 2.
Futures contracts are valued using the closing settlement price or, in the absence of such a price, the last traded price and are generally classified as Level 1.
Any portfolio security or derivative for which market quotations are not readily available or for which the above valuation procedures are deemed not to reflect fair value are valued at fair value, as determined in good faith using procedures approved by the Board. As a general principle, the fair value of a
81
Notes to Financial Statements (continued)
security would appear to be the amount that the owner might reasonably expect to receive for it in a current sale. A variety of factors may be considered
in determining the fair value of such securities, which may include consideration of the following: yields or prices of investments of comparable quality, type of issue, coupon, maturity and rating, market quotes or indications of value from security dealers, evaluations of anticipated cash flows or collateral, general market conditions and other information and analysis, including the obligor’s credit characteristics considered relevant. To the extent the inputs are observable and timely, the values would be classified as Level 2 of the fair value hierarchy; otherwise they would be classified as Level 3.
The following table summarizes the market value of the Funds’ investments as of the end of the reporting period, based on the inputs used to value them:
| | | | | | | | | | | | | | | | |
| Global Infrastructure | | Level 1 | | | Level 2 | | | Level 3 | | | Total | |
| Long-Term Investments*: | | | | | | | | | | | | | | | | |
Common Stocks | | $ | 239,424,913 | | | $ | 289,907,307 | ** | | $ | — | | | $ | 529,332,220 | |
Real Estate Investment Trust Common Stocks | | | 57,359,458 | | | | 933,351 | ** | | | — | | | | 58,292,809 | |
Investment Companies | | | 913,498 | | | | — | | | | — | | | | 913,498 | |
| Investments Purchased with Collateral from Securities Lending | | | 7,480,123 | | | | — | | | | — | | | | 7,480,123 | |
| Short-Term Investments: | | | | | | | | | | | | | | | | |
Repurchase Agreements | | | — | | | | 10,107,579 | | | | — | | | | 10,107,579 | |
| Total | | $ | 305,177,992 | | | $ | 300,948,237 | | | $ | — | | | $ | 606,126,229 | |
| | | | |
| Global Real Estate Securities | | | | | | | | | | | | |
| Long-Term Investments*: | | | | | | | | | | | | | | | | |
Real Estate Investment Trust Common Stocks | | $ | 30,907,627 | | | $ | 13,681,396 | ** | | $ | — | | | $ | 44,589,023 | |
Common Stocks | | | 517,640 | | | | 12,930,196 | ** | | | — | | | | 13,447,836 | |
| Short-Term Investments: | | | | | | | | | | | | | | | | |
Repurchase Agreements | | | — | | | | 432,916 | | | | — | | | | 432,916 | |
| Total | | $ | 31,425,267 | | | $ | 27,044,508 | | | $ | — | | | $ | 58,469,775 | |
| | | | |
| Real Asset Income | | | | | | | | | | | | |
| Long-Term Investments*: | | | | | | | | | | | | | | | | |
Real Estate Investment Trust Common Stocks | | $ | 253,309,140 | | | $ | 129,571,030 | ** | | $ | — | | | $ | 382,880,170 | |
Common Stocks | | | 123,101,974 | | | | 233,893,697 | ** | | | — | | | | 356,995,671 | |
Corporate Bonds | | | — | | | | 251,882,917 | | | | — | | | | 251,882,917 | |
$25 Par (or similar) Retail Preferred | | | 239,204,564 | | | | 7,784,311 | ** | | | — | | | | 246,988,875 | |
$1,000 Par (or similar) Institutional Preferred | | | — | | | | 171,414,981 | | | | — | | | | 171,414,981 | |
Convertible Preferred Securities | | | 106,385,586 | | | | 7,152,234 | ** | | | — | | | | 113,537,820 | |
Variable Rate Senior Loan Interests | | | — | | | | 17,023,914 | | | | — | | | | 17,023,914 | |
Investment Companies | | | 9,701,080 | | | | — | | | | — | | | | 9,701,080 | |
Convertible Bonds | | | — | | | | 9,526,013 | | | | — | | | | 9,526,013 | |
Asset-Backed Securities | | | — | | | | 4,694,384 | | | | — | | | | 4,694,384 | |
| Investments Purchased with Collateral from Securities Lending | | | 26,510,561 | | | | — | | | | — | | | | 26,510,561 | |
| Short-Term Investments: | | | | | | | | | | | | | | | | |
Repurchase Agreements | | | — | | | | 33,043,010 | | | | — | | | | 33,043,010 | |
| Investments in Derivatives: | | | | | | | | | | | | | | | | |
Futures Contracts*** | | | 67,635 | | | | — | | | | — | | | | 67,635 | |
| Total | | $ | 758,280,540 | | | $ | 865,986,491 | | | $ | — | | | $ | 1,624,267,031 | |
| | | | |
| Real Estate Securities | | | | | | | | | | | | |
| Long-Term Investments*: | | | | | | | | | | | | | | | | |
Real Estate Investment Trust Common Stocks | | $ | 2,187,711,666 | | | $ | — | | | $ | — | | | $ | 2,187,711,666 | |
Common Stocks | | | 17,257,706 | | | | — | | | | — | | | | 17,257,706 | |
| Short-Term Investments: | | | | | | | | | | | | | | | | |
Repurchase Agreements | | | — | | | | 24,373,393 | | | | — | | | | 24,373,393 | |
| Total | | $ | 2,204,969,372 | | | $ | 24,373,393 | | | $ | — | | | $ | 2,229,342,765 | |
| * | Refer to the Fund’s Portfolio of Investments for industry and country classifications, where applicable. |
| ** | Refer to the Fund’s Portfolio of Investments for securities classified as Level 2. |
| *** | Represents net unrealized appreciation (depreciation) as reported in the Fund’s Portfolio of Investments. |
4. Portfolio Securities and Investments in Derivatives
Portfolio Securities
Unfunded Commitments
Pursuant to the terms of certain of the variable rate senior loan agreements, Real Asset Income may have unfunded senior loan commitments. The Fund will maintain with its custodian, cash, liquid securities and/or liquid senior loans having an aggregate value at least equal to the amount of unfunded senior loan commitments. As of the end of the reporting period, the Fund had no such outstanding unfunded senior loan commitments.
82
Participation Commitments
With respect to the senior loans held in Real Asset Income’s portfolio, the Fund may: 1) invest in assignments; 2) act as a participant in primary lending syndicates; or 3) invest in participations. If the Fund purchases a participation of a senior loan interest, the Fund would typically enter into a contractual agreement with the lender or other third party selling the participation, rather than directly with the borrower. As such, the Fund not only assumes the credit risk of the borrower, but also that of the selling participant or other persons interpositioned between the Fund and the borrower. As of the end of the reporting period, the Fund had no such outstanding participation commitments.
Repurchase Agreements
In connection with transactions in repurchase agreements, it is each Fund’s policy that its custodian take possession of the underlying collateral securities, the fair value of which exceeds the principal amount of the repurchase transaction, including accrued interest, at all times. If the counterparty defaults, and the fair value of the collateral declines, realization of the collateral may be delayed or limited.
The following table presents the repurchase agreements for the Funds that are subject to netting agreements as of the end of the reporting period, and the collateral delivered related to those repurchase agreements.
| | | | | | | | | | | | | | |
| Fund | | Counterparty | | Short-Term
Investments, at Value | | | Collateral
Pledged (From)
Counterparty* | | | Net
Exposure | |
| Global Infrastructure | | Fixed Income Clearing Corporation | | $ | 10,107,579 | | | $ | (10,107,579 | ) | | $ | — | |
| Global Real Estate Securities | | Fixed Income Clearing Corporation | | | 432,916 | | | | (432,916 | ) | | | — | |
| Real Asset Income | | Fixed Income Clearing Corporation | | | 33,043,010 | | | | (33,043,010 | ) | | | — | |
| Real Estate Securities | | Fixed Income Clearing Corporation | | | 24,373,393 | | | | (24,373,393 | ) | | | — | |
| * | As of the end of the reporting period, the value of the collateral pledged from the counterparty exceeded the value of the repurchase agreements. Refer to the Fund’s Portfolio of Investments for details on the repurchase agreements. |
Securities Lending
Each Fund may lend securities representing up to one-third of the value of its total assets to broker-dealers, banks, and other institutions in order to generate additional income. When loaning securities, the Fund retains the benefits of owning the securities, including the economic equivalent of dividends or interest generated by the security. The resulting loans are continuous, can be recalled at any time, and have no set maturity. Effective July 15, 2020, Real Estate Securities terminated its securities lending agreement with U.S. Bank National Association (“U.S. Bank”), which served as the securities lending agent from the beginning of the current fiscal period through such termination date. Subsequently, each Fund entered into a securities lending agency agreement that became effective on August 14, 2020 with their custodian, State Street Bank and Trust Company (“State Street”), which serves as the Funds’ current securities lending agent (U.S. Bank and State Street are collectively and individually, the “Agent”).
When a Fund loans its portfolio securities, it will receive, at the inception of each loan, cash collateral equal to an amount not less than 100% of the market value of the loaned securities. The actual percentage of the cash collateral will vary depending upon the asset type of the loaned securities. Collateral for the loaned securities is invested in a government money market vehicle maintained by the Agent, which is subject to the requirements of Rule 2a-7 under the 1940 Act. The value of the loaned securities and the liability to return the cash collateral received are recognized on the Statement of Assets and Liabilities. If the market value of the loaned securities increases, the borrower must furnish additional collateral to the Fund, which is also recognized on the Statement of Assets and Liabilities. Securities out on loan are subject to termination at any time at the option of the borrower or the Fund. Upon termination, the borrower is required to return to the Fund securities identical to the securities loaned. During the term of the loan, the Fund bears the market risk with respect to the investment of collateral and the risk that the Agent may default on its contractual obligations to the Fund. The Agent bears the risk that the borrower may default on its obligation to return the loaned securities as the Agent is contractually obligated to indemnify the Fund if at the time of a default by a borrower some or all of the loan securities have not been returned.
Securities lending income recognized by a Fund consists of earnings on invested collateral and lending fees, net of any rebates to the borrower and compensation to the Agent. Such income is recognized on the Statements of Operations.
As of the end of the current reporting period, the total value of the loaned securities and the total value of collateral received were as follows:
| | | | | | | | | | |
| Fund | | Asset Class out on Loan | | Long-Term
Investments, at Value | | | Total Collateral Received | |
| Global Infrastructure | | Common Stocks | | $ | 7,181,157 | | | $ | 7,480,123 | |
| Real Asset Income | | Common Stocks | | $ | 20,982,859 | | | $ | 22,316,376 | |
| | Convertible Preferred Securities | | | 3,496,105 | | | | 3,507,550 | |
| | Corporate Bonds | | | 474,420 | | | | 496,335 | |
| | | $25 Par (or similar) Retail Preferred | | | 185,535 | | | | 190,300 | |
Total | | | | $ | 25,138,919 | | | $ | 26,510,561 | |
83
Notes to Financial Statements (continued)
Investment Transactions
Long-term purchases and sales (including maturities but excluding investments purchased with collateral from securities lending and derivative transactions, where applicable) during the current fiscal period were as follows:
| | | | | | | | | | | | | | | | |
| | | Global
Infrastructure | | | Global
Real Estate
Securities | | | Real Asset
Income | | | Real Estate
Securities | |
| Purchases | | $ | 1,014,891,279 | | | $ | 90,347,573 | | | $ | 1,803,694,551 | | | $ | 3,148,941,103 | |
| Sales and maturities | | | 1,006,509,129 | | | | 63,887,796 | | | | 2,152,309,943 | | | | 3,638,056,113 | |
The Funds may purchase securities on a when-issued or delayed-delivery basis. Securities purchased on a when-issued or delayed-delivery basis may have extended settlement periods; interest income is not accrued until settlement date. Any securities so purchased are subject to market fluctuation during this period. The Funds have earmarked securities in their portfolios with a current value at least equal to the amount of the when-issued/delayed-delivery purchase commitments. If a Fund has outstanding when-issued/delayed-delivery purchases commitments as of the end of the reporting period, such amounts are recognized on the Statement of Assets and Liabilities.
Investments in Derivatives
Each Fund is authorized to invest in certain derivative instruments. The Funds record derivative instruments at fair value, with changes in fair value recognized on the Statement of Operations, when applicable. Even though the Funds’ investments in derivatives may represent economic hedges, they are not considered to be hedge transactions for financial reporting purposes.
Futures Contracts
Upon execution of a futures contract, a Fund is obligated to deposit cash or eligible securities, also known as ‘‘initial margin,’’ into an account at its clearing broker equal to a specified percentage of the contract amount. Cash held by the broker to cover initial margin requirements on open futures contracts, if any, is recognized as ‘‘Cash collateral at broker for investments in futures contracts’’ on the Statement of Assets and Liabilities. Investments in futures contracts obligate a Fund and the clearing broker to settle monies on a daily basis representing changes in the prior days ‘‘mark-to-market’’ of the open contracts. If a Fund has unrealized appreciation the clearing broker would credit a Fund’s account with an amount equal to appreciation and conversely if a Fund has unrealized depreciation the clearing broker would debit a Fund’s account with an amount equal to depreciation. These daily cash settlements are also known as ‘‘variation margin.’’ Variation margin is recognized as a receivable and/or payable for ‘‘Variation margin on futures contracts’’ on the Statement of Assets and Liabilities.
During the period the futures contract is open, changes in the value of the contract are recognized as an unrealized gain or loss by ‘‘marking-to market’’ on a daily basis to reflect the changes in market value of the contract, which is recognized as a component of ‘‘Change in net unrealized appreciation (depreciation) of futures contracts’’ on the Statement of Operations. When the contract is closed or expired, a Fund records a realized gain or loss equal to the difference between the value of the contract on the closing date and value of the contract when originally entered into, which is recognized as a component of ‘‘Net realized gain (loss) from futures contracts’’ on the Statement of Operations.
Risks of investments in futures contracts include the possible adverse movement in the price of the securities or indices underlying the contracts, the possibility that there may not be a liquid secondary market for the contracts and/or that a change in the value of the contract may not correlate with a change in the value of the underlying securities or indices.
During the current fiscal period, Real Asset Income began using interest rate futures contracts to partially hedge the portfolio against movements in interest rates.
The average notional amount of futures contracts outstanding during the current fiscal period was as follows:
| | | | |
| | | Real Asset
Income | |
| Average notional amount of futures contracts outstanding* | | $ | 26,162,581 | |
| * | The average notional amount is calculated based on the absolute aggregate notional amount of contracts outstanding at the beginning of the current fiscal period and at the end of each fiscal quarter within the current fiscal period. |
The following table presents the fair value of all futures contracts held by the Fund as of end of the reporting period, the location of these instruments on the Statement of Assets and Liabilities and the primary underlying risk exposure.
| | | | | | | | | | | | | | |
| | | | | Location on the Statement of Assets and Liabilities | |
| | | | | Asset Derivatives | | | (Liability) Derivatives | |
Underlying Risk Exposure | | Derivative Instrument | | Location | | Value | | | Location | | Value | |
Real Asset Income | | | | | | | | | | | | | | |
| Interest rate | | Futures contracts | | — | | $ | — | | | Payable for variation
margin on futures contracts* | | $ | 67,635 | |
| * | Value represents the cumulative unrealized appreciation (depreciation) of futures contracts as reported in the Fund’s Portfolio of Investments and not the daily asset and/or liability derivatives location as described in the table above. |
84
The following table presents the amount of net realized gain (loss) and change in net unrealized appreciation (depreciation) recognized on futures contracts on the Statement of Operations during the current fiscal period, and the primary underlying risk exposure.
| | | | | | | | | | | | |
| Fund | | Underlying
Risk Exposure | | Derivative
Instrument | | Net Realized
Gain (Loss) from
Futures Contracts | | | Change in Net Unrealized Appreciation (Depreciation) of
Futures Contracts | |
| Real Asset Income | | Interest rate | | Futures contracts | | $ | (1,513,596 | ) | | $ | 67,635 | |
Market and Counterparty Credit Risk
In the normal course of business each Fund may invest in financial instruments and enter into financial transactions where risk of potential loss exists due to changes in the market (market risk) or failure of the other party to the transaction to perform (counterparty credit risk). The potential loss could exceed the value of the financial assets recorded on the financial statements. Financial assets, which potentially expose each Fund to counterparty credit risk, consist principally of cash due from counterparties on forward, option and swap transactions, when applicable. The extent of each Fund’s exposure to counterparty credit risk in respect to these financial assets approximates their carrying value as recorded on the Statement of Assets and Liabilities.
Each Fund helps manage counterparty credit risk by entering into agreements only with counterparties the Adviser believes have the financial resources to honor their obligations and by having the Adviser monitor the financial stability of the counterparties. Additionally, counterparties may be required to pledge collateral daily (based on the daily valuation of the financial asset) on behalf of each Fund with a value approximately equal to the amount of any unrealized gain above a pre-determined threshold. Reciprocally, when each Fund has an unrealized loss, the Funds have instructed the custodian to pledge assets of the Funds as collateral with a value approximately equal to the amount of the unrealized loss above a pre-determined threshold. Collateral pledges are monitored and subsequently adjusted if and when the valuations fluctuate, either up or down, by at least the pre-determined threshold amount.
5. Fund Shares
Transactions in Fund shares during the current and prior fiscal period were as follows:
| | | | | | | | | | | | | | | | |
| | | Year Ended
12/31/20 | | | Year Ended
12/31/19 | |
| Global Infrastructure | | Shares | | | Amount | | | Shares | | | Amount | |
| Shares sold: | | | | | | | | | | | | | | | | |
Class A | | | 599,211 | | | $ | 6,202,488 | | | | 1,136,248 | | | $ | 12,708,402 | |
Class A – automatic conversion of Class C Shares | | | 8,770 | | | | 91,612 | | | | 929 | | | | 11,004 | |
Class C | | | 136,315 | | | | 1,389,573 | | | | 166,939 | | | | 1,858,191 | |
Class R3 | | | 3,124 | | | | 33,000 | | | | 12,337 | | | | 141,144 | |
Class R6 | | | 4,772,433 | | | | 47,197,004 | | | | 4,685,272 | | | | 55,385,164 | |
Class I | | | 11,876,825 | | | | 120,621,548 | | | | 15,912,134 | | | | 178,660,789 | |
| Shares issued to shareholders due to reinvestment of distributions: | | | | | | | | | | | | |
Class A | | | 54,159 | | | | 587,139 | | | | 329,948 | | | | 3,794,245 | |
Class C | | | 11,485 | | | | 121,585 | | | | 124,927 | | | | 1,417,383 | |
Class R3 | | | 242 | | | | 2,658 | | | | 1,947 | | | | 22,743 | |
Class R6 | | | 119,400 | | | | 1,295,744 | | | | 231,381 | | | | 2,661,254 | |
Class I | | | 424,319 | | | | 4,588,327 | | | | 1,916,004 | | | | 21,971,959 | |
| | | | 18,006,283 | | | | 182,130,678 | | | | 24,518,066 | | | | 278,632,278 | |
| Shares redeemed: | | | | | | | | | | | | | | | | |
Class A | | | (1,644,157 | ) | | | (16,956,333 | ) | | | (2,345,623 | ) | | | (25,621,970 | ) |
Class C | | | (612,147 | ) | | | (6,097,375 | ) | | | (729,475 | ) | | | (7,917,611 | ) |
Class C – automatic conversion to Class A Shares | | | (8,857 | ) | | | (91,612 | ) | | | (941 | ) | | | (11,004 | ) |
Class R3 | | | (12,778 | ) | | | (133,348 | ) | | | (8,347 | ) | | | (96,436 | ) |
Class R6 | | | (363,446 | ) | | | (3,706,374 | ) | | | (865,525 | ) | | | (9,790,401 | ) |
Class I | | | (13,961,688 | ) | | | (138,554,022 | ) | | | (12,589,094 | ) | | | (140,925,627 | ) |
| | | | (16,603,073 | ) | | | (165,539,064 | ) | | | (16,539,005 | ) | | | (184,363,049 | ) |
| Net increase (decrease) | | | 1,403,210 | | | $ | 16,591,614 | | | | 7,979,061 | | | $ | 94,269,229 | |
85
Notes to Financial Statements (continued)
| | | | | | | | | | | | | | | | |
| | |
| | | Year Ended
12/31/20 | | | Year Ended
12/31/19 | |
| Global Real Estate Securities | | Shares | | | Amount | | | Shares | | | Amount | |
| Shares sold: | | | | | | | | | | | | | | | | |
Class A | | | 143 | | | $ | 3,000 | | | | 303 | | | $ | 6,675 | |
Class C | | | 220 | | | | 5,000 | | | | 231 | | | | 5,000 | |
Class R6 | | | 1,467,713 | | | | 26,694,142 | | | | — | | | | — | |
Class I | | | 1,459 | | | | 30,104 | | | | 6,705 | | | | 152,340 | |
| Shares issued to shareholders due to reinvestment of distributions: | | | | | | | | | | | | |
Class A | | | 13 | | | | 260 | | | | 27 | | | | 606 | |
Class C | | | 3 | | | | 63 | | | | 19 | | | | 429 | |
Class R6 | | | 40,556 | | | | 835,357 | | | | — | | | | — | |
Class I | | | 238 | | | | 4,777 | | | | 537 | | | | 11,986 | |
| | | | 1,510,345 | | | | 27,572,703 | | | | 7,822 | | | | 177,036 | |
| Shares redeemed: | | | | | | | | | | | | |
Class A | | | — | | | | — | | | | — | | | | — | |
Class C | | | (473 | ) | | | (9,800 | ) | | | — | | | | — | |
Class R6 | | | (4,934 | ) | | | (100,932 | ) | | | — | | | | — | |
Class I | | | (1,401 | ) | | | (25,769 | ) | | | (43 | ) | | | (962 | ) |
| | | | (6,808 | ) | | | (136,501 | ) | | | (43 | ) | | | (962 | ) |
| Net increase (decrease) | | | 1,503,537 | | | $ | 27,436,202 | | | | 7,779 | | | $ | 176,074 | |
| | |
| | | Year Ended
12/31/20 | | | Year Ended
12/31/19 | |
| Real Asset Income | | Shares | | | Amount | | | Shares | | | Amount | |
| Shares sold: | | | | | | | | | | | | | | | | |
Class A | | | 1,902,997 | | | $ | 41,643,734 | | | | 2,526,184 | | | $ | 60,388,627 | |
Class A – automatic conversion of Class C Shares | | | 17 | | | | 377 | | | | 48 | | | | 1,134 | |
Class C | | | 624,853 | | | | 14,107,617 | | | | 1,359,465 | | | | 32,603,646 | |
Class R6 | | | 6,941,969 | | | | 149,718,990 | | | | 2,167,549 | | | | 51,505,730 | |
Class I | | | 18,457,873 | | | | 404,384,339 | | | | 23,129,844 | | | | 550,541,179 | |
| Shares issued to shareholders due to reinvestment of distributions: | | | | | | | | | | | | | | | | |
Class A | | | 377,857 | | | | 8,022,999 | | | | 480,797 | | | | 11,554,673 | |
Class C | | | 301,387 | | | | 6,398,946 | | | | 417,053 | | | | 10,029,767 | |
Class R6 | | | 245,647 | | | | 5,290,262 | | | | 160,294 | | | | 3,891,286 | |
Class I | | | 2,754,414 | | | | 58,364,281 | | | | 3,529,991 | | | | 84,869,370 | |
| | | | 31,607,014 | | | | 687,931,545 | | | | 33,771,225 | | | | 805,385,412 | |
| Shares redeemed: | | | | | | | | | | | | | | | | |
Class A | | | (3,581,869 | ) | | | (75,610,634 | ) | | | (2,418,830 | ) | | | (57,264,360 | ) |
Class C | | | (2,854,626 | ) | | | (59,762,014 | ) | | | (1,640,280 | ) | | | (38,821,483 | ) |
Class C – automatic conversion to Class A Shares | | | (17 | ) | | | (377 | ) | | | (48 | ) | | | (1,134 | ) |
Class R6 | | | (645,459 | ) | | | (13,575,100 | ) | | | (359,602 | ) | | | (8,593,528 | ) |
Class I | | | (44,519,529 | ) | | | (913,996,615 | ) | | | (18,112,481 | ) | | | (427,380,357 | ) |
| | | | (51,601,500 | ) | | | (1,062,944,740 | ) | | | (22,531,241 | ) | | | (532,060,862 | ) |
| Net increase (decrease) | | | (19,994,486 | ) | | $ | (375,013,195 | ) | | | 11,239,984 | | | $ | 273,324,550 | |
86
| | | | | | | | | | | | | | | | |
| | |
| | | Year Ended
12/31/20 | | | Year Ended
12/31/19 | |
| Real Estate Securities | | Shares | | | Amount | | | Shares | | | Amount | |
| Shares sold: | | | | | | | | | | | | | | | | |
Class A | | | 2,345,637 | | | $ | 41,463,348 | | | | 2,425,074 | | | $ | 50,998,149 | |
Class A – automatic conversion of Class C Shares | | | 1,555 | | | | 27,275 | | | | 10,855 | | | | 240,439 | |
Class C | | | 67,657 | | | | 1,202,432 | | | | 128,382 | | | | 2,591,478 | |
Class R3 | | | 135,825 | | | | 2,465,994 | | | | 167,185 | | | | 3,589,539 | |
Class R6 | | | 7,414,430 | | | | 137,949,137 | | | | 7,815,191 | | | | 169,358,895 | |
Class I | | | 21,849,716 | | | | 393,291,664 | | | | 24,744,137 | | | | 526,920,074 | |
| Shares issued to shareholders due to reinvestment of distributions: | | | | | | | | | | | | | | | | |
Class A | | | 268,602 | | | | 4,588,210 | | | | 1,227,193 | | | | 24,664,074 | |
Class C | | | 20,631 | | | | 340,778 | | | | 159,188 | | | | 3,082,180 | |
Class R3 | | | 19,140 | | | | 332,810 | | | | 104,692 | | | | 2,138,636 | |
Class R6 | | | 678,888 | | | | 11,972,957 | | | | 2,272,481 | | | | 47,149,362 | |
Class I | | | 2,212,738 | | | | 38,515,208 | | | | 9,024,351 | | | | 185,039,842 | |
| | | | 35,014,819 | | | | 632,149,813 | | | | 48,078,729 | | | | 1,015,772,668 | |
| Shares redeemed: | | | | | | | | | | | | | | | | |
Class A | | | (5,336,199 | ) | | | (93,804,390 | ) | | | (6,001,448 | ) | | | (125,908,237 | ) |
Class C | | | (1,161,692 | ) | | | (19,696,843 | ) | | | (832,870 | ) | | | (17,263,648 | ) |
Class C – automatic conversion to Class A Shares | | | (1,611 | ) | | | (27,275 | ) | | | (11,207 | ) | | | (240,439 | ) |
Class R3 | | | (521,277 | ) | | | (9,168,712 | ) | | | (444,650 | ) | | | (9,429,406 | ) |
Class R6 | | | (8,082,093 | ) | | | (145,998,249 | ) | | | (5,742,061 | ) | | | (126,181,421 | ) |
Class I | | | (42,773,861 | ) | | | (770,659,412 | ) | | | (55,018,976 | ) | | | (1,190,673,103 | ) |
| | | | (57,876,733 | ) | | | (1,039,354,881 | ) | | | (68,051,212 | ) | | | (1,469,696,254 | ) |
| Net increase (decrease) | | | (22,861,914 | ) | | $ | (407,205,068 | ) | | | (19,972,483 | ) | | $ | (453,923,586 | ) |
6. Income Tax Information
Each Fund is a separate taxpayer for federal income tax purposes. Each Fund intends to distribute substantially all of its net investment income and net capital gains to shareholders and to otherwise comply with the requirements of Subchapter M of the Internal Revenue Code applicable to regulated investment companies. Therefore, no federal income tax provision is required.
For all open tax years and all major taxing jurisdictions, management of the Funds has concluded that there are no significant uncertain tax positions that would require recognition in the financial statements. Open tax years are those that are open for examination by taxing authorities (i.e., generally the last four tax year ends and the interim tax period since then). Furthermore, management of the Funds is also not aware of any tax positions for which it is reasonably possible that the total amounts of unrecognized tax benefits will significantly change in the next twelve months.
The following information is presented on an income tax basis. Differences between amounts for financial statement and federal income tax purposes are primarily due to timing differences in recognizing certain gains and losses on investment transactions. To the extent that differences arise that are permanent in nature, such amounts are reclassified within the capital accounts as detailed below. Temporary differences do not require reclassification. Temporary and permanent differences do not impact the NAVs of the Funds.
The table below presents the cost and unrealized appreciation (depreciation) of each Fund’s investment portfolio, as determined on a federal income tax basis, as of December 31, 2020.
For purposes of this disclosure, derivative tax cost is generally the sum of any upfront fees or premiums exchanged and any amounts unrealized for income statement reporting but realized in income and/or capital gains for tax reporting. If a particular derivative category does not disclose any tax unrealized appreciation or depreciation, the change in value of those derivatives have generally been fully realized for tax purposes.
| | | | | | | | | | | | | | | | |
| | | Global
Infrastructure | | | Global
Real Estate
Securities | | | Real Asset
Income | | | Real Estate
Securities | |
| Tax cost of investments: | | $ | 513,742,499 | | | $ | 53,238,824 | | | $ | 1,525,553,914 | | | $ | 1,781,222,349 | |
| Gross unrealized: | | | | | | | | | | | | | | | | |
Appreciation | | $ | 112,028,180 | | | $ | 7,973,593 | | | $ | 150,039,075 | | | $ | 536,915,520 | |
Depreciation | | | (19,644,450 | ) | | | (2,742,638 | ) | | | (51,325,958 | ) | | | (88,795,104 | ) |
| Net unrealized appreciation (depreciation) of investments | | $ | 92,383,730 | | | $ | 5,230,955 | | | $ | 98,713,117 | | | $ | 448,120,416 | |
Permanent differences, primarily due to federal taxes paid, foreign currency transactions, distribution reallocations, bond premium amortization adjustments, investments in passive foreign investment companies, investments in partnerships, REIT adjustments, Sec. 305(c) adjustments, and complex securities character adjustments, resulted in reclassifications among the Funds’ components of net assets as of December 31, 2020, the Funds’ tax year end.
87
Notes to Financial Statements (continued)
The tax components of undistributed net ordinary income and net long-term capital gains as of December 31, 2020, the Funds’ tax year end, were as follows:
| | | | | | | | | | | | | | | | |
| | | Global
Infrastructure | | | Global
Real Estate
Securities | | | Real Asset
Income | | | Real Estate
Securities | |
| Undistributed net ordinary income1 | | $ | 2,239,998 | | | $ | 963,117 | | | $ | 4,730,444 | | | $ | 11,453,669 | |
| Undistributed net long-term capital gains | | | — | | | | — | | | | — | | | | — | |
| 1 | Net ordinary income consists of net taxable income derived from dividends, interest, and net short-term capital gains, if any. |
The tax character of distributions paid during the Funds’ tax years ended December 31, 2020 and December 31, 2019 was designated for purposes of the dividends paid deduction as follows:
| | | | | | | | | | | | | | | | |
| 2020 | | Global
Infrastructure | | | Global
Real Estate
Securities | | | Real Asset
Income | | | Real Estate
Securities | |
| Distributions from net ordinary income1 | | $ | 8,389,679 | | | $ | 1,638,830 | | | $ | 85,569,606 | | | $ | 39,977,994 | |
| Distributions from net long-term capital gains2 | | | 1,081,038 | | | | 70,767 | | | | — | | | | 28,118,191 | |
| Return of capital | | | — | | | | — | | | | — | | | | — | |
| | | | |
| 2019 | | Global
Infrastructure | | | Global
Real Estate
Securities | | | Real Asset
Income | | | Real Estate
Securities | |
| Distributions from net ordinary income1 | | $ | 38,104,828 | | | $ | 2,426,283 | | | $ | 118,337,885 | | | $ | 156,022,613 | |
| Distributions from net long-term capital gains | | | 5,332,760 | | | | 237,845 | | | | — | | | | 166,726,345 | |
| Return of capital | | | — | | | | — | | | | 3,176,017 | | | | — | |
| 1 | Net ordinary income consists of net taxable income derived from dividends, interest, and net short-term capital gains, if any. |
| 2 | The Funds designate as long-term capital gain dividend, pursuant to Internal Revenue Code Section 852(b)(3), the amount necessary to reduce earnings and profits of the Funds related to net capital gain to zero for the tax year ended December 31, 2020. |
As of December 31, 2020, the Funds’ tax year end, the Funds had unused capital losses carrying forward available for federal income tax purposes to be applied against future capital gains, if any. The capital losses are not subject to expiration.
| | | | | | | | | | | | | | | | |
| | | Global Infrastructure | | | Global
Real Estate Securities | | | Real Asset Income | | | Real Estate Securities | |
| Not subject to expiration: | | | | | | | | | | | | | | | | |
Short-term | | $ | 8,478,852 | | | $ | — | | | $ | 173,421,038 | | | $ | 17,644,686 | |
Long-term | | | — | | | | 78,398 | | | | 93,526,958 | | | | — | |
| Total | | $ | 8,478,852 | | | $ | 78,398 | | | $ | 266,947,996 | | | $ | 17,644,686 | |
7. Management Fees and Other Transactions with Affiliates
Management Fees
Each Fund’s management fee compensates the Adviser for the overall investment advisory and administrative services and general office facilities. The Sub-Adviser is compensated for its services to the Funds from the management fees paid to the Adviser.
Each Fund’s management fee consists of two components – a fund-level fee, based only on the amount of assets within each individual Fund, and a complex-level fee, based on the aggregate amount of all eligible fund assets managed by the Adviser. This pricing structure enables each Fund’s shareholders to benefit from growth in the assets within their respective Fund as well as from growth in the amount of complex-wide assets managed by the Adviser.
The annual fund-level fee, payable monthly, for each Fund is calculated according to the following schedules:
| | | | | | | | |
| Average Daily Net Assets | | Global
Infrastructure
and Global
Real Estate
Securities | | | Real Estate
Securities | |
| For the first $125 million | | | 0.7500 | % | | | 0.7000 | % |
| For the next $125 million | | | 0.7375 | | | | 0.6875 | |
| For the next $250 million | | | 0.7250 | | | | 0.6750 | |
| For the next $500 million | | | 0.7125 | | | | 0.6625 | |
| For the next $1 billion | | | 0.7000 | | | | 0.6500 | |
| For the next $3 billion | | | 0.6750 | | | | 0.6250 | |
| For the next $2.5 billion | | | 0.6500 | | | | 0.6000 | |
| For the next $2.5 billion | | | 0.6375 | | | | 0.5875 | |
| For net assets over $10 billion | | | 0.6250 | | | | 0.5750 | |
88
| | | | |
| Average Daily Net Assets | | Real Asset
Income | |
| For the first $125 million | | | 0.6000 | % |
| For the next $125 million | | | 0.5875 | |
| For the next $250 million | | | 0.5750 | |
| For the next $500 million | | | 0.5625 | |
| For the next $1 billion | | | 0.5500 | |
| For the next $3 billion | | | 0.5250 | |
| For the next $5 billion | | | 0.5000 | |
| For net assets over $10 billion | | | 0.4875 | |
The annual complex-level fee, payable monthly, for each Fund is determined by taking the complex-level fee rate, which is based on the aggregate amount of “eligible assets” of all Nuveen funds as set forth in the schedule below, and (except for Global Real Estate Securities and Real Asset Income) making, as appropriate, an upward adjustment to that rate based upon the percentage of the particular fund’s assets that are not “eligible assets.” The complex level fee schedule for each Fund is as follows:
| | | | |
| Complex-Level Eligible Asset Breakpoint Level* | | Effective Complex-Level Fee
Rate at Breakpoint Level | |
| $55 billion | | | 0.2000 | % |
| $56 billion | | | 0.1996 | |
| $57 billion | | | 0.1989 | |
| $60 billion | | | 0.1961 | |
| $63 billion | | | 0.1931 | |
| $66 billion | | | 0.1900 | |
| $71 billion | | | 0.1851 | |
| $76 billion | | | 0.1806 | |
| $80 billion | | | 0.1773 | |
| $91 billion | | | 0.1691 | |
| $125 billion | | | 0.1599 | |
| $200 billion | | | 0.1505 | |
| $250 billion | | | 0.1469 | |
| $300 billion | | | 0.1445 | |
| * | The complex-level fee is calculated based upon the aggregate daily “eligible assets” of all Nuveen open-end and closed-end funds. Eligible assets do not include assets attributable to investments in other Nuveen funds or assets in excess of a determined amount (originally $2 billion) added to the Nuveen fund complex in connection with the Adviser’s assumption of the management of the former First American Funds effective January 1, 2011, but do not include certain assets of certain Nuveen funds that were reorganized into funds advised by an affiliate of the Advisor during the 2019 calendar year. Eligible assets include closed-end fund assets managed by the Adviser that are attributable to certain types of leverage. For these purposes, leverage includes the closed-end funds’ use of preferred stock and borrowings and certain investments in the residual interest certificates (also called inverse floating rate securities) in tender option bond (TOB) trusts, including the portion of assets held by a TOB trust that has been effectively financed by the trust’s issuance of floating rate securities, subject to an agreement by the Adviser as to certain funds to limit the amount of such assets for determining eligible assets in certain circumstances. As of December 31, 2020, the complex-level fee for each Fund was as follows: |
| | | | |
| Fund | | Complex-Level Fee | |
Global Infrastructure | | | 0.1662 | % |
Global Real Estate Securities | | | 0.1557 | % |
Real Asset Income | | | 0.1557 | % |
Real Estate Securities | | | 0.2000 | % |
The Adviser has agreed to waive fees and/or reimburse expenses (“Expense Cap”) of the following Funds so that the total annual Fund operating expenses (excluding 12b-1 distribution and/or service fees, interest expenses, taxes, acquired fund fees and expenses, fees incurred in acquiring and disposing of portfolio securities and extraordinary expenses) do not exceed the average daily net assets of any class of Fund shares in the amounts and for the time periods stated in the following table. However, because Class R6 Shares are not subject to sub-transfer agent and similar fees, the total annual Fund operating expenses for the Class R6 Shares will be less than the expense limitation. The expense limitations that expire may be terminated or modified prior to that date only with the approval of the Board.
| | | | | | | | |
| Fund | | Temporary
Expense Cap | | | Temporary
Expense
Cap
Expiration
Date | |
Global Infrastructure | | | 1.00 | % | | | July 31, 2022 | |
Global Real Estate Securities | | | 1.09 | | | | July 31, 2022 | |
Real Asset Income | | | 0.95 | | | | July 31, 2022 | |
Distribution and Service Fees
Each Fund has adopted a distribution and service plan under rule 12b-1 under the 1940 Act. Class A Shares incur a 0.25% annual 12b-1 service fee. Class C Shares incur a 0.75% annual 12b-1 distribution fee and a 0.25% annual 12b-1 service fee. Class R3 Shares incur a 0.25% annual 12b-1 distribution fee and a 0.25% annual 12b-1 service fee. Class R6 Shares and Class I Shares are not subject to 12b-1 distribution or service fees. The fees
89
Notes to Financial Statements (continued)
under this plan compensate Nuveen Securities, LLC, (the “Distributor”), a wholly-owned subsidiary of Nuveen, for services provided and expenses incurred in distributing shares of the Funds and establishing and maintaining shareholder accounts.
Other Transactions with Affiliates
During the current fiscal period, the Distributor, collected sales charges on purchases of Class A Shares, the majority of which were paid out as concessions to financial intermediaries as follows:
| | | | | | | | | | | | | | | | |
| | | Global
Infrastructure | | | Global
Real Estate
Securities | | | Real Asset
Income | | | Real Estate
Securities | |
| Sales charges collected (Unaudited) | | $ | 73,268 | | | $ | — | | | $ | 467,306 | | | $ | 35,827 | |
| Paid to financial intermediaries (Unaudited) | | | 65,339 | | | | — | | | | 418,060 | | | | 32,487 | |
The Distributor also received 12b-1 service fees on Class A Shares, substantially all of which were paid to compensate financial intermediaries for providing services to shareholders relating to their investments.
During the current fiscal period, the Distributor compensated financial intermediaries directly with commission advances at the time of purchase as follows:
| | | | | | | | | | | | | | | | |
| | | Global
Infrastructure | | | Global
Real Estate
Securities | | | Real Asset
Income | | | Real Estate
Securities | |
| Commission advances (Unaudited) | | $ | 20,272 | | | $ | 50 | | | $ | 196,715 | | | $ | 16,083 | |
To compensate for commissions advanced to financial intermediaries, all 12b-1 service and distribution fees collected on C Shares during the first year following a purchase were retained by the Distributor. During the current fiscal period, the Distributor retained such 12b-1 fees as follows:
| | | | | | | | | | | | | | | | |
| | | Global
Infrastructure | | | Global
Real Estate
Securities | | | Real Asset
Income | | | Real Estate
Securities | |
| 12b-1 fees retained (Unaudited) | | $ | 12,227 | | | $ | 225 | | | $ | 225,939 | | | $ | 12,879 | |
The remaining 12b-1 fees charged to each Fund were paid to compensate financial intermediaries for providing services to shareholders relating to their investments.
The Distributor also collected and retained CDSC on share redemptions during the current fiscal period, as follows:
| | | | | | | | | | | | | | | | |
| | | Global
Infrastructure | | | Global
Real Estate
Securities | | | Real Asset
Income | | | Real Estate
Securities | |
| CDSC retained (Unaudited) | | $ | 1,155 | | | $ | — | | | $ | 20,496 | | | $ | 1,106 | |
As of the end of the reporting period, the percentage of Fund shares owned by TIAA are as follows:
| | | | |
| | | Global
Real Estate
Securities | |
| TIAA owned shares | | | 45% | |
8. Borrowing Arrangements
Committed Line of Credit
The Funds, along with certain other funds managed by the Adviser (“Participating Funds”), have established a 364-day, $2.405 billion standby credit facility with a group of lenders, under which the Participating Funds may borrow for various purposes other than leveraging for investment purposes. Each Participating Fund is allocated a designated proportion of the facility’s capacity (and its associated costs, as described below) based upon a multi-factor assessment of the likelihood and frequency of its need to draw on the facility, the size of the Fund and its anticipated draws, and the potential importance of such draws to the operations and well-being of the Fund, relative to those of the other Funds. A Fund may effect draws on the facility in excess of its designated capacity if and to the extent that other Participating Funds have undrawn capacity. The credit facility expires in June 2021 unless extended or renewed.
The credit facility has the following terms: a 0.10% upfront fee, 0.15% per annum on unused commitment amounts and a drawn interest rate equal to the higher of (a) one-month LIBOR (London Inter-Bank Offered Rate) plus 1.25% (1.00% prior to June 24, 2020) per annum or (b) the Fed Funds rate plus 1.25% (1.00% prior to June 24, 2020) per annum on amounts borrowed. Participating Funds paid administration, legal and arrangement fees, which are recognized as a component of “Other expenses” on the Statement of Operations, and along with commitment fees, have been allocated among such Participating Funds based upon the relative proportions of the facility’s aggregate capacity reserved for them and other factors deemed relevant by the Adviser and the Board of each Participating Fund.
90
During the current fiscal period, the following Fund utilized this facility. The Fund’s maximum outstanding balance during the utilization period was as follows:
| | | | |
| | | Real Estate
Securities | |
| Maximum outstanding balance | | | 24,300,000 | |
During the Fund’s utilization period(s) during the current fiscal period, the average daily balance outstanding and average annual interest rate on the Borrowings were as follows:
| | | | |
| | | Real Estate
Securities | |
| Utilization period (days outstanding) | | | 4 | |
| Average daily balance outstanding | | | 19,800,000 | |
| Average annual inerest rate | | | 2.62% | |
Borrowings outstanding as of the end of the reporting period, if any, are recognized as “Borrowings” on the Statement of Assets and Liabilities, where applicable.
9. Subsequent Events
Class C Shares
Effective March 1, 2021, Class C Shares will automatically convert to Class A Shares eight years after purchase.
91
Additional Fund Information (Unaudited)
| | | | | | | | | | |
| | | | | |
| | Investment Adviser Nuveen Fund Advisors, LLC 333 West Wacker Drive Chicago, IL 60606 Sub-Adviser Nuveen Asset Management, LLC 333 West Wacker Drive Chicago, IL 60606 | | Independent Registered
Public Accounting Firm PricewaterhouseCoopers LLP One North Wacker Drive Chicago, IL 60606 Custodians State Street Bank & Trust
Company One Lincoln Street Boston, MA 02111 | | Legal Counsel Chapman and Cutler LLP Chicago, IL 60603 | | Transfer Agent and
Shareholder Services DST Asset Manager Solutions, Inc. (DST) P.O. Box 219140 Kansas City, MO 64121-9140 (800) 257-8787 | | |
| | | | | | | | | | | | | | |
| | | | | |
| | | | | | | | | | |
| |
| | Foreign Taxes: Global Infrastructure paid qualifying foreign taxes of $766,061 and earned $9,368,146 of foreign source income during the fiscal year ended December 31, 2020. Pursuant to Section 853 of the Internal Revenue Code, Global Infrastructure hereby designates $0.01405 per share as foreign taxes paid and $0.17185 per share as income earned from foreign sources for the fiscal year ended December 31, 2020. The actual foreign tax credit distribution will be reported to shareholders on Form 1099-DIV which will be sent to shareholders shortly after calendar year end. |
| | | | | |
| | | | | | | | | | |
| |
| | Distribution Information: The Funds hereby designate their percentages of dividends paid from net ordinary income as dividends qualifying for the dividends received deduction (“DRD”) for corporations, their percentages of qualified dividend income (“QDI”) for individuals under Section 1(h)(11) of the Internal Revenue Code, and their percentages of qualified business income (“QBI”) for individuals under Section 199A of the Internal Revenue Code as shown in the accompanying table. The actual qualified dividend and business income distributions will be reported to shareholders on Form 1099-DIV which will be sent to shareholders shortly after calendar year end. |
| | | | | | |
| | | Fund | | Global
Infrastructure | | Global Real
Estate Securities | | Real Asset
Income | | Real Estate
Securities | | |
| | % DRD | | 39.3% | | 0.0% | | 13.0% | | 1.9% | | |
| | % QDI | | 100.0% | | 11.3% | | 35.7% | | 1.8% | | |
| | % QBI | | 0.0% | | 20.1% | | 14.7% | | 96.2% | | |
| |
| | Real Asset Income hereby designates its percentage of dividends paid from net ordinary income as dividends qualifying as Interest-Related Dividends and/or short-term capital gain dividends as defined in Internal Revenue Code Section 871(k) for the taxable year ended December 31, 2020. |
| | % of Interest Related Dividends | | 17.7% | | |
| |
| | Real Asset Income had the following percentage, or maximum amount allowable, of ordinary dividends treated as Section 163(j) interest dividends pursuant to Section 163(j) of the Internal Revenue Code for the taxable year ended December 31, 2020: |
| | % of Section 163(j) Interest Dividends | | 25.4% | | |
| | | | | |
| | | | | | | | | | |
| | |
| | Portfolio of Investments Information: Each Fund is required to file its complete schedule of portfolio holdings with the Securities and Exchange Commission (SEC) for the first and third quarters of each fiscal year as an exhibit to its report on Form N-PORT. You may obtain this information on the SEC’s website at http://www.sec.gov. | | |
| | | | | |
| | | | | | | | | | |
| | |
| | Nuveen Funds’ Proxy Voting Information: You may obtain (i) information regarding how each fund voted proxies relating to portfolio securities held during the most recent twelve-month period ended June 30, without charge, upon request, by calling Nuveen toll-free at (800) 257-8787 or on Nuveen’s website at www.nuveen.com and (ii) a description of the policies and procedures that each fund used to determine how to vote proxies relating to portfolio securities without charge, upon request, by calling Nuveen toll-free at (800) 257-8787. You may also obtain this information directly from the SEC. Visit the SEC on-line at http://www.sec.gov. | | |
| | | | | |
| | | | | | | | | | |
| | |
| | FINRA BrokerCheck: The Financial Industry Regulatory Authority (FINRA) provides information regarding the disciplinary history of FINRA member firms and associated investment professionals. This information as well as an investor brochure describing FINRA BrokerCheck is available to the public by calling the FINRA BrokerCheck Hotline number at (800) 289-9999 or by visiting www.FlNRA.org. | | |
92
Glossary of Terms Used in this Report
(Unaudited)
Average Annual Total Return: This is a commonly used method to express an investment’s performance over a particular, usually multi-year time period. It expresses the return that would have been necessary each year to equal the investment’s actual cumulative performance (including change in NAV or offer price and reinvested dividends and capital gains distributions, if any) over the time period being considered.
Basis Point: One one-hundredth of one percentage point, or 0.01%. For example, 25 basis points equals 0.25%.
Beta: A measure of the volatility of a portfolio relative to the overall market. A beta less than 1.0 indicates lower risk than the market; a beta greater than 1.0 indicates higher risk than the market.
Bloomberg Barclays U.S. Corporate High Yield Bond Index: An index that covers the universe of fixed-rate, non-investment-grade corporate debt of issuers in non-emerging market countries. Eurobonds and debt issues from countries designated as emerging markets are excluded. Index returns assume reinvestment of distributions, but do not reflect any applicable sales charges or management fees.
FTSE EPRA/NAREIT (Financial Times Stock Exchange – European Public Real Estate Association/National Association of Real Estate Investments Trust) Developed Index NR (Net Return): An index designed to track the performance of listed real estate companies and REITS worldwide. By making the index constituents free-float adjusted, liquidity, size and revenue screened, the series is suitable for use as the basis for investment products, such as derivatives and Exchange Traded Funds (ETFs). The index returns assume reinvestment of distributions, but do not reflect any applicable sales charges or management fees.
Gross Domestic Product (GDP): The total market value of all final goods and services produced in a country/region in a given year, equal to total consumer, investment and government spending, plus the value of exports, minus the value of imports.
Lipper Global Infrastructure Funds Classification Average: Represents the average annualized returns for all reporting funds in the Lipper Global Infrastructure Funds Classification. Lipper returns account for the effects of management fees and assume reinvestment of distributions, but do not reflect any applicable sales charges.
Lipper Global Real Estate Funds Classification Average: Represents the average annualized returns for all reporting funds in the Lipper Global Real Estate Funds Classification. Lipper returns account for the effects of management fees and assume reinvestment of distributions, but do not reflect any applicable sales charges.
Lipper Real Estate Funds Classification Average: Represents the average annualized returns for all reporting funds in the Lipper Real Estate Funds Classification. Lipper returns account for the effects of management fees and assume reinvestment of distributions, but do not reflect any applicable sales charges.
Lipper Real Return Funds Classification Average: Represents the average annualized returns for all reporting funds in the Lipper Real Return Funds Classification. Lipper returns account for the effects of management fees and assume reinvestment of distributions, but do not reflect any applicable sales charges.
Morgan Stanley Capital International (MSCI) All Country World Index (ACWI): A free-float adjusted market capitalization index that is designed to measure equity market performance in the global developed and emerging markets. Index returns assume reinvestment of distributions, but do not reflect any applicable sales charges or management fees.
Morgan Stanley Capital International (MSCI) World Index: A free float-adjusted market capitalization weighted index that is designed to measure the equity market performance of developed markets. The MSCI World Index consists of the following 23 developed market country indexes: Australia, Austria, Belgium, Canada, Denmark, Finland, France, Germany, Hong Kong, Ireland, Israel, Italy, Japan, Netherlands, New Zealand, Norway, Portugal, Singapore, Spain, Sweden, Switzerland, the U.K. and the U.S. Index returns assume reinvestment of dividends, but do not include the effects of any applicable sales charges or management fees.
93
Glossary of Terms Used in this Report (continued)
MSCI EAFE Index: The MSCI (Morgan Stanley Capital International) EAFE (Europe, Australasia, Far East) Index is a free float-adjusted market capitalization weighted index designed to measure developed market equity performance, excluding the U.S. and Canada. The index returns assume reinvestment of distributions, but do not reflect any applicable sales charges or management fees.
MSCI U.S. REIT Index: An unmanaged index that tracks the performance of real estate investment trusts (REITs). Index returns assume reinvestment of distributions, but do not reflect any applicable sales charges or management fees.
Net Asset Value (NAV) Per Share: A fund’s Net Assets is equal to its total assets (securities, cash and accrued earnings) less its total liabilities. For funds with multiple classes, Net Assets are determined separately for each share class. NAV per share is equal to the fund’s (or share class’) Net Assets divided by its number of shares outstanding.
Real Asset Income Blend: A five index blend comprised of weightings approximating the Fund’s proposed portfolio. The Fund’s proposed portfolio may differ significantly from the blended portfolio and actual returns may be substantially lower. Benchmark returns do not include the effects of any sales charges or management fees.
| | | | |
Weighting
Percentage | | Index | | Definition |
| 28% | | S&P Global Infrastructure Index NR (Net Return) | | An unmanaged index comprised of 75 of the largest publicly listed infrastructure companies that meet specific investability requirements. |
| 21% | | Financial Times Stock Exchange - European Public Real Estate Association/National Association of Real Estate Investments Trust
(FTSE EPRA/NAREIT) Developed Index NR (Net Return) | | An index designed to track the performance of listed real estate companies and REITs worldwide. |
| 18% | | Wells Fargo Hybrid & Preferred Securities REIT Index TR | | An Index designed to track the performance of preferred securities issued in the U.S. market by real estate investment trusts (REITs). The index is composed exclusively of preferred shares and depositary shares. |
| 18% | | Bloomberg Barclays U.S. Corporate High Yield Bond Index TR | | An index that covers the U.S. dollar-denominated, non-investment grade, fixed-rate, taxable corporate bond market. |
| 15% | | Bloomberg Barclays Global Capital Securities Index TR | | An index that tracks fixed-rate, investment grade capital securities denominated in USD, EUR and GBP. |
Russell 2000® Index: A market-weighted index published by the Frank Russell Company measuring the performance of the 2,000 smallest companies in the Russell 3000® Index. The Russell 3000® is made up of 3,000 of the largest U.S. stocks and represents approximately 98% of the U.S. equity market. The Russell 2000® serves as a benchmark for smallcap stocks in the U.S. Index returns assume reinvestment of distributions, but do not reflect any applicable sales charges or management fees.
S&P 500®: An unmanaged Index generally considered representative of the U.S. stock market. Index returns assume reinvestment of distributions, but do not reflect of any applicable sales charges or management fees.
S&P Global Infrastructure Index NR (Net Return): An index that provides liquid and tradable exposure to 75 companies from around the world that represent the listed infrastructure universe. To create diversified exposure across the global listed infrastructure market, the index has balanced weights across three distinct infrastructure clusters: utilities, transportation, and energy. Index returns assume reinvestment of distributions, but do not reflect any applicable sales charges or management fees.
Tax Equalization: The practice of treating a portion of the distribution made to a redeeming shareholder, which represents his proportionate part of undistributed net investment income and capital gain as a distribution for tax purposes. Such amounts are referred to as the equalization debits (or payments) and will be considered a distribution to the shareholder of net investment income and capital gain for calculation of the fund’s dividends paid deduction.
94
Annual Investment Management Agreement Approval Process
(Unaudited)
At a meeting held on May 19-21, 2020 (the “May Meeting”), the Board of Directors or Trustees, as applicable (the “Board” and each Director or Trustee, a “Board Member”) of the Funds, which is comprised entirely of Board Members who are not “interested persons” (as defined under the Investment Company Act of 1940 (the “1940 Act”)) (the “Independent Board Members”), approved, for each Fund, the renewal of the management agreement (each, an “Investment Management Agreement”) with Nuveen Fund Advisors, LLC (the “Adviser”) pursuant to which the Adviser serves as investment adviser to such Fund and the sub-advisory agreement (each, a “Sub-Advisory Agreement”) with Nuveen Asset Management, LLC (the “Sub-Adviser”) pursuant to which the Sub-Adviser serves as the investment sub-adviser to such Fund. Although the 1940 Act requires that continuances of the Advisory Agreements (as defined below) be approved by the in-person vote of a majority of the Independent Board Members, the May Meeting was held virtually through the internet in view of the health risks associated with holding an in-person meeting during the COVID-19 pandemic and governmental restrictions on gatherings. The May Meeting was held in reliance on an order issued by the Securities and Exchange Commission on March 13, 2020, as extended on March 25, 2020, which provided registered investment companies temporary relief from the in-person voting requirements of the 1940 Act with respect to the approval of a fund’s advisory agreement in response to the challenges arising in connection with the COVID-19 pandemic.
Following up to an initial two-year period, the Board considers the renewal of each Investment Management Agreement and Sub-Advisory Agreement on behalf of the applicable Fund on an annual basis. The Investment Management Agreements and Sub-Advisory Agreements are collectively referred to as the “Advisory Agreements” and the Adviser and the Sub-Adviser are collectively, the “Fund Advisers” and each, a “Fund Adviser.” Throughout the year, the Board and its committees meet regularly and, at these meetings, review an extensive array of topics and information that are relevant to its annual consideration of the renewal of the advisory agreements for the Nuveen funds. Such information may address, among other things, fund performance; the Adviser’s strategic plans; the review of the funds and investment teams; compliance, regulatory and risk management matters; the trading practices of the various sub-advisers to the funds; valuation of securities; fund expenses; payments to financial intermediaries, including 12b-1 fees and sub-transfer agency fees, if applicable; and overall market and regulatory developments.
In addition to the information and materials received during the year, the Board, in response to a request made on its behalf by independent legal counsel, received extensive materials and information prepared specifically for its annual consideration of the renewal of the advisory agreements for the Nuveen funds by the Adviser and by Broadridge Financial Solutions, Inc. (“Broadridge”), an independent provider of investment company data. The materials cover a wide range of topics including, but not limited to, a description of the nature, extent and quality of services provided by the Fund Advisers; a review of each sub-adviser to the Nuveen funds and the applicable investment teams; an analysis of fund performance in absolute terms and as compared to the performance of certain peer funds and benchmarks with a focus on any performance outliers; an analysis of the fees and expense ratios of the Nuveen funds in absolute terms and as compared to those of certain peer funds with a focus on any expense outliers; a description of portfolio manager compensation; a review of the performance of various service providers; a description of various initiatives Nuveen had undertaken or continued during the year for the benefit of particular fund(s) and/or the complex; a description of the profitability or financial data of Nuveen and the sub-advisers to the Nuveen funds; and a description of indirect benefits received by the Adviser and the sub-advisers as a result of their relationships with the Nuveen funds.
In continuing its practice, the Board met prior to the May Meeting to begin its considerations of the renewal of the Advisory Agreements. Accordingly, on April 27-28, 2020 (the “April Meeting”), the Board met to review and discuss, in part, the performance of the Nuveen funds and the Adviser’s evaluation of each sub-adviser to the Nuveen funds. In its review, the Board recognized the volatile market conditions occurring during the first half of 2020 arising, in part, from the public health crisis caused by the novel coronavirus known as COVID-19 and the resulting impact on fund performance. Accordingly, the Board reviewed, among other things, fund performance reflecting the more volatile periods, including for various time periods ended the first quarter of 2020 and for various time periods ended April 17, 2020. At the April Meeting, the Board Members asked questions and requested additional information that was provided for the May Meeting. In continuing its review of the Nuveen funds in light of the extraordinary market conditions experienced in early 2020, the Board received updated fund performance data reflecting various time periods ended May 8, 2020 for its May Meeting. The Board also continued its practice of seeking to meet periodically with the various sub-advisers to the Nuveen funds and their investment teams, when feasible.
The Independent Board Members considered the review of the advisory agreements for the Nuveen funds to be an ongoing process and employed the accumulated information, knowledge, and experience the Board Members had gained during their tenure on the boards governing the Nuveen funds and working with the Adviser and sub-advisers in their review of the advisory agreements. The contractual arrangements are a result of multiple years of review, negotiation and information provided in connection with the boards’ annual review of the Nuveen funds’ advisory arrangements and oversight of the Nuveen funds.
95
Annual Investment Management Agreement Approval Process (Unaudited) (continued)
The Independent Board Members were advised by independent legal counsel during the annual review process as well as throughout the year, including meeting in executive sessions with such counsel at which no representatives from the Adviser or the Sub-Adviser were present. In connection with their annual review, the Independent Board Members also received a memorandum from independent legal counsel outlining their fiduciary duties and legal standards in reviewing the Advisory Agreements.
The Board’s decision to renew the Advisory Agreements was not based on a single identified factor, but rather the decision reflected the comprehensive consideration of all the information provided throughout the year and at the April and May Meetings, and each Board Member may have attributed different levels of importance to the various factors and information considered in connection with the approval process. The following summarizes the principal factors and information, but not all the factors, the Board considered in deciding to renew the Advisory Agreements and its conclusions.
A. Nature, Extent and Quality of Services
In evaluating the renewal of the Advisory Agreements, the Independent Board Members received and considered information regarding the nature, extent and quality of the applicable Fund Adviser’s services provided to the respective Fund with particular focus on the services and enhancements to such services provided during the last year. The Independent Board Members considered the Investment Management Agreements and the Sub-Advisory Agreements separately in the course of their review. With this approach, they considered the respective roles of the Adviser and the Sub-Adviser in providing services to the Funds.
With respect to the Adviser, the Board recognized that the Adviser has provided a vast array of services the scope of which has expanded over the years in light of regulatory, market and other developments, such as the development of a liquidity management program and expanded compliance programs for the Nuveen funds. The Board also noted the extensive resources, tools and capabilities the Adviser and its affiliates devoted to the various operations of the Nuveen funds. These services include, but are not limited to: investment oversight, risk management and securities valuation services (such as analyzing investment performance and risk data; overseeing and reviewing the various sub-advisers to the Nuveen funds and their investment teams; overseeing trade execution, soft dollar practices and securities lending activities; providing daily valuation services and developing related valuation policies, procedures and methodologies; overseeing risk disclosure; periodic testing of investment and liquidity risks; participating in financial statement and marketing disclosures; participating in product development; and participating in leverage management and liquidity monitoring); product management (such as analyzing a fund’s position in the marketplace, setting dividends, preparing shareholder and intermediary communications and other due diligence support); fund administration (such as preparing fund tax returns and other tax compliance services, overseeing the funds’ independent public accountants and other service providers; managing fund budgets and expenses; and helping to fulfill the funds’ regulatory filing requirements); oversight of shareholder services and transfer agency functions (such as overseeing transfer agent service providers which include registered shareholder customer service and transaction processing; and overseeing proxy solicitation and tabulation services); Board relations services (such as organizing and administering Board and committee meetings, preparing various reports to the Board and committees and providing other support services); compliance and regulatory oversight services (such as devising compliance programs; managing compliance policies; monitoring compliance with applicable fund policies and laws and regulations; and evaluating the compliance programs of the various sub-advisers to the Nuveen funds and certain other service providers); and legal support and oversight of outside law firms (such as helping to prepare and file registration statements and proxy statements; overseeing fund activities and providing legal interpretations regarding such activities; and negotiating agreements with other fund service providers).
The Board also recognized that the Adviser and its affiliates have undertaken a number of initiatives over the previous year that benefited the complex and/or particular Nuveen funds including, but not limited to:
| | • | | Fund Improvements and Product Management Initiatives – continuing to proactively manage the Nuveen fund complex as a whole and at the individual fund level with an aim to enhance the shareholder outcomes through, among other things, rationalizing the product line and gaining efficiencies through mergers, repositionings and liquidations; launching new share classes; reviewing and updating investment policies and benchmarks; closing funds to new investments; rebranding the exchange-traded fund (“ETF”) product line; and integrating certain investment teams and changing the portfolio managers serving various funds; |
| | • | | Capital Initiatives – continuing to invest capital to support new Nuveen funds with initial capital as well as to facilitate modifications to the strategies or structure of existing funds; |
| | • | | Liquidity Management – implementing the liquidity risk management program which was designed to assess and manage the liquidity risk of the Nuveen funds. The Board noted that this program was particularly helpful in addressing the high volatility and liquidity challenges that arose in the market, particularly for the high yield municipal sector, during the first half of 2020; |
| | • | | Compliance Program Initiatives – continuing efforts to mitigate compliance risk, increase operating efficiencies, strengthen key compliance program elements and support international business growth and other objectives through, among other things, integrating various investment teams across affiliates, consolidating marketing review functions, enhancing compliance related technologies and establishing and maintaining shared broad-based compliance policies throughout the organization and its affiliates; |
96
| | • | | Risk Management and Valuation Services – continuing efforts to provide Nuveen with a more disciplined and consistent approach to identifying and mitigating the firm’s operational risks through, among other things, enhancing the interaction and reporting between the investment risk management team and various affiliates and adopting a risk operational framework across the complex; |
| | • | | Regulatory Matters – continuing efforts to monitor regulatory trends and advocate on behalf of the Nuveen funds, to implement and comply with new or revised rules and mandates and to respond to regulatory inquiries and exams; |
| | • | | Government Relations – continuing efforts of various Nuveen teams and affiliates to develop policy positions on a broad range of issues that may impact the Nuveen funds, advocate and communicate these positions to lawmakers and other regulatory authorities and work with trade associations to ensure these positions are represented; |
| | • | | Business Continuity, Disaster Recovery and Information Services – continuing to periodically test business continuity and disaster recovery plans, maintain an information security program designed to identify and manage information security risks, and provide reports to the Board, at least annually, addressing, among other things, management’s security risk assessment, cyber risk profile, potential impact of new or revised laws and regulations, incident tracking and other relevant information technology risk-related reports; and |
| | • | | Expanded Dividend Management Services – continuing to manage the dividends among the varying types of Nuveen funds within the Nuveen complex to be consistent with the respective fund’s product design and investing resources to develop systems to assist in the process for newer products such as target term funds and ETFs. |
The Board also noted the benefits to shareholders of investing in a Nuveen fund, as each Nuveen fund is a part of a large fund complex with a variety of investment disciplines, capabilities, expertise and resources available to navigate and support the funds including during stressed times as occurred in the market in the first half of 2020. In addition to the services provided by the Adviser, the Board also considered the risks borne by the Adviser and its affiliates in managing the Nuveen funds, including entrepreneurial, operational, reputational, regulatory and litigation risks.
The Board further considered the division of responsibilities between the Adviser and the Sub-Adviser and recognized that the Sub-Adviser and its investment personnel generally are responsible for the management of each Fund’s portfolio under the oversight of the Adviser and the Board. The Board considered an analysis of the Sub-Adviser provided by the Adviser which included, among other things, the Sub-Adviser’s assets under management and changes thereto, a summary of the applicable investment team and changes thereto, the investment approach of the team and the performance of the funds sub-advised by the Sub-Adviser over various periods. The Board further considered at the May Meeting or prior meetings evaluations of the Sub-Adviser’s compliance program and trade execution. The Board also considered the structure of investment personnel compensation programs and whether this structure provides appropriate incentives to act in the best interests of the respective Nuveen funds. The Board noted that the Adviser recommended the renewal of the Sub-Advisory Agreements.
Based on its review, the Board determined, in the exercise of its reasonable business judgment, that it was satisfied with the nature, extent and quality of services provided to the respective Funds under each applicable Advisory Agreement.
B. The Investment Performance of the Funds and Fund Advisers
In evaluating the quality of the services provided by the Fund Advisers, the Board also received and considered a variety of investment performance data of the Nuveen funds they advise. In this regard, the Board reviewed, among other things, Fund performance over the quarter, one-, three- and five-year periods ending December 31, 2019 (or for shorter periods available to the extent a Fund was not in existence during such periods). The performance data was based on Class A shares; however, the performance of other classes should be substantially similar as they invest in the same portfolio of securities and differences in performance among the classes would be principally attributed to the variations in the expense structures of the classes. Unless otherwise indicated, the performance data referenced below reflects the periods ended December 31, 2019. In general, the year 2019 was a period of strong market performance. However, as noted above, the Board recognized the unprecedented market volatility and decline that occurred in early 2020 and the significant impact it would have on fund performance. As a result, the Board reviewed performance data capturing more recent time periods, including performance data reflecting the first quarter of 2020 as well as performance data for various periods ended April 17, 2020 for its April Meeting and May 8, 2020 for its May Meeting.
The Board reviewed both absolute and relative fund performance during the annual review over the various time periods. With respect to the latter, the Board considered fund performance in comparison to the performance of peer funds (the “Performance Peer Group”) and recognized and/or customized benchmarks (i.e., generally benchmarks derived from multiple recognized benchmarks). For funds that had changes in portfolio managers, the Board considered performance data of such funds before and after such changes. In considering performance data, the Board is aware of certain inherent limitations with such data, including that differences between the objective(s), strategies and other characteristics of the Nuveen funds compared to the respective Performance Peer Group and/or benchmark(s) (such as differences in the use of leverage) as well as differences in the composition of the Performance Peer Group over time will necessarily contribute to differences in performance results and limit the value of the comparative information. To assist the Board in its review of the comparability of the relative performance, the Adviser has ranked the relevancy of the peer group to the funds as low, medium or high.
97
Annual Investment Management Agreement Approval Process (Unaudited) (continued)
As noted above, the Board reviewed fund performance over various periods ended December 31, 2019 as well as the first quarter of 2020 and various time periods ended April 17, 2020 and May 8, 2020. In light of the significant market decline in the early part of 2020, the Board noted that a shorter period of underperformance may significantly impact longer term performance. Further, the Board recognized that performance data may differ significantly depending on the ending date selected and accordingly, performance results for periods ended at the year-end of 2019 may vary significantly from performance results for periods ended in the first quarter of 2020, particularly given the extraordinary market conditions at that time as the impact of COVID-19 and other market developments unfolded. The Board considered a fund’s performance in light of the overall financial market conditions. In addition, the Board recognized that shareholders may evaluate performance based on their own holding periods which may differ from the periods reviewed by the Board and lead to differing results.
In addition to the performance data prepared in connection with the annual review of the advisory agreements of the Nuveen funds, the Board reviewed fund performance throughout the year at its quarterly meetings representing differing time periods and took into account the discussions that occurred at these Board meetings in evaluating a fund’s overall performance. The Board also considered, among other things, the Adviser’s analysis of each Nuveen fund’s performance, with particular focus on funds that were considered performance outliers (both overperformance and underperformance), the factors contributing to the performance and any steps taken to address any performance concerns. Given the volatile market conditions of early 2020, the Board considered the Adviser’s analysis of the impact of such conditions on the Nuveen funds’ performance.
The Board evaluated performance in light of various factors, including general market conditions, issuer-specific information, asset class information, fund cash flows and other factors. Accordingly, depending on the facts and circumstances, the Board may be satisfied with a fund’s performance notwithstanding that its performance may be below its benchmark or peer group for certain periods. However, with respect to any Nuveen funds for which the Board had identified performance issues, the Board monitors such funds closely until performance improves, discusses with the Adviser the reasons for such results, considers whether any steps are necessary or appropriate to address such issues, and reviews the results of any efforts undertaken.
The Board’s determinations with respect to each Fund are summarized below.
For Nuveen Global Infrastructure Fund (the “Global Infrastructure Fund”), the Board noted that the Fund outperformed its benchmark and ranked in the first quartile of its Performance Peer Group for the one-, three- and five-year periods ended December 31, 2019. With the market decline in the first quarter of 2020, the Fund outperformed its benchmark for the one-, three- and five-year periods ended March 31, 2020 and ranked in the third quartile of its Performance Peer Group for the one- and three-year periods ended March 31, 2020 and second quartile of its Performance Peer Group for the five-year period ended March 31, 2020. The Board was satisfied with the Fund’s overall performance.
For Nuveen Global Real Estate Securities Fund (the “Global Real Estate Fund”), the Board noted that the Fund outperformed its benchmark and ranked in the first quartile of its Performance Peer Group for the one-year period ended December 31, 2019. With the market decline in the first quarter of 2020, the Fund continued to outperform its benchmark and ranked in the first quartile of its Performance Peer Group for the one-year period ended March 31, 2020. The Board recognized that the Fund was relatively new with limited performance information available to make a meaningful assessment of performance. Nevertheless, the Board was satisfied with the Fund’s overall performance.
For Nuveen Real Asset Income Fund (the “Real Asset Income Fund”), the Board noted that the Fund outperformed its blended benchmark and ranked in the first quartile of its Performance Peer Group for the one-, three- and five-year periods ended December 31, 2019. With the market decline in the first quarter of 2020, the Fund’s performance was below the performance of its blended benchmark for the one-, three- and five-year periods ended March 31, 2020. Although the Fund ranked in the fourth quartile of its Performance Peer Group for the one-year period ended March 31, 2020, the Fund ranked in the third quartile of its Performance Peer Group for the three-year period ended March 31, 2020 and first quartile of its Performance Peer Group for the five-year period ended March 31, 2020. The Board was satisfied with the Fund’s overall performance.
For Nuveen Real Estate Securities Fund (the “Real Estate Securities Fund”), the Board noted that the Fund’s performance was below the performance of its benchmark for the one-, three- and five-year periods ended December 31, 2019. The Fund, however, ranked in the third quartile of its Performance Peer Group for the one- and three-year periods ended December 31, 2019 and second quartile for the five-year period ended December 31, 2019. With the market decline in the first quarter of 2020, the Fund outperformed its benchmark and ranked in the third quartile of its Performance Peer Group for the one-, three- and five-year periods ended March 31, 2020. The Board was satisfied with the Fund’s overall performance.
C. Fees, Expenses and Profitability
1. Fees and Expenses
As part of its annual review, the Board considered the contractual management fee and net management fee (the management fee after taking into consideration fee waivers and/or expense reimbursements, if any) paid by a Nuveen fund to the Adviser in light of the nature, extent and quality of the services provided. The Board also considered the total operating expense ratio of each Nuveen fund before and after any fee waivers and/or expense reimbursements. More specifically, the Independent Board Members reviewed, among other things, each fund’s gross and net management fee rates (i.e., before and after expense reimbursements and/or fee waivers, if any) and net total expense ratio in relation to those of a comparable universe of funds (the “Peer Universe”) and to a more focused subset of comparable funds (the “Peer Group”) established by Broadridge. The Independent Board Members reviewed the methodology Broadridge employed to establish its Peer Universe and Peer Group and
98
recognized that differences between the applicable fund and its respective Peer Universe and/or Peer Group as well as changes to the composition of the Peer Group and/or Peer Universe from year to year may limit some of the value of the comparative data. The Independent Board Members also considered a fund’s operating expense ratio as it more directly reflected the shareholder’s costs in investing in the respective fund.
In their review, the Independent Board Members considered, in particular, each Nuveen fund with a net expense ratio of six basis points or higher compared to that of its peer average (each, an “Expense Outlier Fund”), including the Real Estate Securities Fund, and an analysis as to the factors contributing to each such fund’s higher relative net expense ratio. Accordingly, in reviewing the comparative data between a fund and its peers, the Board generally considered the fund’s net expense ratio and fees to be higher if they were over 10 basis points higher, slightly higher if they were 6 to 10 basis points higher, in line if they were within approximately 5 basis points higher than the peer average and below if they were below the peer average of the Peer Group. The Independent Board Members also considered, in relevant part, a fund’s net management fee and net total expense ratio in light of its performance history.
In their review of the fee arrangements for the Nuveen funds, the Independent Board Members considered the management fee schedules, including the complex-wide and fund-level breakpoint schedules, and the expense reimbursements and/or fee waivers provided by Nuveen for each fund, as applicable. The Board noted that across the Nuveen fund complex, the complex-wide fee breakpoints reduced fees by $56.6 million and fund-level breakpoints reduced fees by $66.8 million in 2019. Further, fee caps and waivers for all applicable Nuveen funds saved approximately an additional $13.7 million in fees for shareholders in 2019.
With respect to the Sub-Adviser, the Board also considered the sub-advisory fee schedule paid to the Sub-Adviser in light of the sub-advisory services provided to the respective Fund, the breakpoint schedule and comparative data of the fees the Sub-Adviser charges to other clients, if any. In its review, the Board recognized that the compensation paid to the Sub-Adviser is the responsibility of the Adviser, not the Funds.
The Board noted that (i) the Real Asset Income Fund had a net management fee that was higher than its peer average, but a net expense ratio that was in line with its peer average; (ii) the Global Infrastructure Fund and the Global Real Estate Fund each had a net management fee and a net expense ratio that were below the respective peer averages (and the Global Real Estate Fund did not incur a management fee after fee waivers and expense reimbursements for the last fiscal year); and (iii) the Real Estate Securities Fund had a net management fee that was slightly higher than its peer average and a net expense ratio that was higher than its peer average. The Board noted that the Real Estate Securities Fund’s net expense ratio was higher than its peer average due, in part, to fluctuations in the composition of the peer set and certain shareholder servicing fees incurred by such Fund.
Based on its review of the information provided, the Board determined that each Fund’s management fees (as applicable) to a Fund Adviser were reasonable in light of the nature, extent and quality of services provided to the Fund.
2. Comparisons with the Fees of Other Clients
In determining the appropriateness of fees, the Board also considered information regarding the fee rates the respective Fund Advisers charged to certain other types of clients and the type of services provided to these other clients. With respect to the Adviser and/or the Sub-Adviser, such other clients may include retail and institutional managed accounts advised by the Sub-Adviser; investment companies offered outside the Nuveen family and sub-advised by the Sub-Adviser; foreign investment companies offered by Nuveen and sub-advised by the Sub-Adviser; and collective investment trusts sub-advised by the Sub-Adviser. The Board further noted that the Adviser also advised certain ETFs sponsored by Nuveen.
The Board recognized that each Fund had an affiliated sub-adviser and, with respect to affiliated sub-advisers, reviewed, among other things, the range of fees assessed for managed accounts and foreign investment companies offered by Nuveen. The Board also reviewed the fee range and average fee rate of certain selected investment strategies offered in retail and institutional managed accounts advised by the Sub-Adviser and non-Nuveen investment companies sub-advised by certain affiliated sub-advisers.
In considering the fee data of other clients, the Board considered, among other things, the differences in the amount, type and level of services provided to the Nuveen funds relative to other clients as well as the differences in portfolio investment policies, investor profiles, account sizes and regulatory requirements, all of which contribute to the variations in the fee schedules. The Board recognized the complexity and myriad of services the Adviser had provided to the Nuveen funds compared to the other types of clients as the Adviser is principally responsible for all aspects of operating the funds, including complying with the increased regulatory requirements required when managing the funds as well as the increased entrepreneurial, legal and regulatory risks that the Adviser incurs in sponsoring and managing the funds. Further, with respect to ETFs, the Board considered that Nuveen ETFs are passively managed compared to the active management of the other Nuveen funds which contributed to the differences in fee levels between the Nuveen ETFs and other Nuveen funds. In general, higher fee levels reflect higher levels of service provided by the Adviser, increased investment management complexity, greater product management requirements, and higher levels of business risk or some combination of these factors. The Board further considered that the Sub-Adviser’s fee is essentially for portfolio management services and therefore more comparable to the fees it receives for retail wrap accounts and other external sub-advisory mandates. The Board concluded the varying levels of fees were justified given, among other things, the inherent differences in the products and the level of services provided to the Nuveen funds versus other clients, the differing regulatory requirements and legal liabilities and the entrepreneurial, legal and regulatory risks incurred in sponsoring and advising a registered investment company.
99
Annual Investment Management Agreement Approval Process (Unaudited) (continued)
3. Profitability of Fund Advisers
In their review, the Independent Board Members considered information regarding Nuveen’s level of profitability for its advisory services to the Nuveen funds for the calendar years 2019 and 2018. The Board reviewed, among other things, Nuveen’s net margins (pre-tax) (both including and excluding distribution expenses); gross and net revenue margins (pre- and post-tax); revenues, expenses, and net income (pre-tax and after-tax and before distribution) of Nuveen for fund advisory services; and comparative profitability data comparing the margins of Nuveen compared to the adjusted margins of certain peers with publicly available data and with the most comparable assets under management (based on asset size and asset composition) for each of the last two calendar years. The Board also reviewed the revenues and expenses the Adviser derived from its ETF product line for the 2018 and 2019 calendar years.
In reviewing the profitability data, the Independent Board Members recognized the subjective nature of calculating profitability as the information is not audited and is dependent on cost allocation methodologies to allocate expenses of Nuveen and its affiliates between the fund and non-fund businesses. The expenses to be allocated include direct expenses in servicing the Nuveen funds as well as indirect and/or shared costs (such as overhead, legal and compliance) some of which are attributed to the Nuveen funds pursuant to the cost allocation methodologies. The Independent Board Members reviewed a description of the cost allocation methodologies employed to develop the financial information and a summary of the history of changes to the methodology over the eleven-year period from 2008 to 2019. The Board had also appointed three Independent Board Members, along with the assistance of independent counsel, to serve as the Board’s liaisons to review the development of the profitability data and any proposed changes to the cost allocation methodology prior to incorporating any such changes and to report to the full Board. The Board recognized that other reasonable and valid allocation methodologies could be employed and could lead to significantly different results. Based on the data, the Independent Board Members noted that Nuveen’s net margins were higher in 2019 than the previous year and considered the key drivers behind the revenue and expense changes that impacted Nuveen’s net margins between the years. The Board also noted the reinvestments of some of the profits into the business through, among other things, the investment of seed capital in certain funds and continued investments in enhancements to information technology, internal infrastructure and data management improvements and global investment and innovation projects.
As noted above, the Independent Board Members also considered Nuveen’s margins from its relationship to the Nuveen funds compared to the adjusted margins of certain peers with publicly available data and with the most comparable assets under management (based on asset size and asset composition) to Nuveen for the calendar years 2019 and 2018. The Independent Board Members noted that Nuveen’s margins from its relationships with the Nuveen funds were on the low range compared to the adjusted margins of the peers. The Independent Board Members, however, recognized that it is difficult to make comparisons of profitability with other investment adviser peers given that comparative data is not generally public and the calculation of profitability is subjective and affected by numerous factors (such as types of funds a peer manages, its business mix, its cost of capital, the numerous assumptions underlying the methodology used to allocate expenses and other factors) which can have a significant impact on the results.
Aside from Nuveen’s profitability, the Board recognized that the Adviser is a subsidiary of Nuveen, LLC, the investment management arm of Teachers Insurance and Annuity Association of America (“TIAA”). As such, the Board also reviewed a balance sheet for TIAA reflecting its assets, liabilities and capital and contingency reserves for the 2019 and 2018 calendar years to consider the financial strength of TIAA. The Board recognized the benefit of having an investment adviser and its parent with significant resources, particularly during periods of market stress.
In addition to Nuveen, the Independent Board Members also considered the profitability of the Sub-Adviser from its relationships with the Nuveen funds. In this regard, the Independent Board Members reviewed, among other things, the Sub-Adviser’s revenues, expenses and net revenue margins (pre- and post-tax) for its advisory activities for the calendar year ended December 31, 2019 as well as its pre-tax and after-tax net revenue margins for 2019 compared to such margins for 2018. The Independent Board Members also reviewed a profitability analysis reflecting the revenues, expenses and revenue margin (pre- and post-tax) by asset type for the Sub-Adviser for the calendar year ended December 31, 2019 and the pre- and post-tax revenue margins from 2019 and 2018.
In evaluating the reasonableness of the compensation, the Independent Board Members also considered any other ancillary benefits derived by the respective Fund Adviser from its relationship with the Nuveen funds as discussed in further detail below.
Based on a consideration of all the information provided, the Board noted that Nuveen’s and the Sub-Adviser’s level of profitability was acceptable and not unreasonable in light of the services provided.
D. Economies of Scale and Whether Fee Levels Reflect These Economies of Scale
The Board considered whether there have been economies of scale with respect to the management of the Nuveen funds and whether these economies of scale have been appropriately shared with the funds. The Board recognized that although economies of scale are difficult to measure, there are several methods to help share the benefits of economies of scale, including breakpoints in the management fee schedule, fee waivers and/or expense limitations, the pricing of Nuveen funds at scale at inception and investments in Nuveen’s business which can enhance the services provided to the funds for the fees paid. The Board noted that Nuveen generally has employed these various methods. In this regard, the Board noted that the management fee of the Adviser is generally comprised of a fund-level component and a complex-level component each with its own breakpoint
100
schedule, subject to certain exceptions. The Board reviewed the fund-level and complex-level fee schedules. The Board considered that the fund-level breakpoint schedules are designed to share economies of scale with shareholders if the particular fund grows, and the complex-level breakpoint schedule is designed to deliver the benefits of economies of scale to shareholders when the eligible assets in the complex pass certain thresholds even if the assets of a particular fund are unchanged or have declined. In the calculation of the complex-level component, the Board noted that it had approved the acquisition of several Nuveen funds by similar TIAA-CREF funds in 2019. However, to mitigate the loss of the assets of these Nuveen funds deemed eligible to be included in the calculation of the complex-wide fee when these Nuveen funds left the complex upon acquisition, Nuveen agreed to credit approximately $460 million to assets under management to the Nuveen complex in calculating the complex-wide component.
In addition to the fund-level and complex-level fee schedules, the Independent Board Members considered the temporary and/or permanent expense caps applicable to certain Nuveen funds (including the amounts of fees waived or amounts reimbursed to the respective funds in 2018 and 2019), including the temporary expense caps applicable to the Global Infrastructure Fund, Global Real Estate Fund and Real Asset Income Fund.
The Independent Board Members also recognized the Adviser’s continued reinvestment in its business through, among other things, investments in its business infrastructure and information technology, portfolio accounting system and other systems and platforms that will, among other things, support growth, simplify and enhance information sharing, and enhance the investment process to the benefit of all of the Nuveen funds.
Based on its review, the Board concluded that the current fee arrangements together with the Adviser’s reinvestment in its business appropriately shared any economies of scale with shareholders.
E. Indirect Benefits
The Independent Board Members received and considered information regarding other benefits the respective Fund Adviser or its affiliates may receive as a result of their relationship with the Nuveen funds. The Independent Board Members recognized that an affiliate of the Adviser serves as principal underwriter providing distribution and/or shareholder services to the open-end funds. The Independent Board Members further noted that subject to certain exceptions, the Nuveen open-end funds pay 12b-1 fees and while a majority of such fees were paid to third party broker-dealers, the Board reviewed the amount retained by the Adviser’s affiliate. In addition, the Independent Board Members also noted that various sub-advisers (including the Sub-Adviser) may engage in soft dollar transactions pursuant to which they may receive the benefit of research products and other services provided by broker-dealers executing portfolio transactions on behalf of the applicable Nuveen funds, although the Board recognized that certain sub-advisers may be phasing out the use of soft dollars over time.
The Board, however, noted that the benefits for the Sub-Adviser when transacting in fixed-income securities may be more limited as such securities generally trade on a principal basis and therefore do not generate brokerage commissions. Further, the Board considered that although the Sub-Adviser may benefit from the receipt of research and other services that it may otherwise have to pay for out of its own resources, the research may also benefit the Nuveen funds to the extent it enhances the ability of the Sub-Adviser to manage such funds or is acquired through the commissions paid on portfolio transactions of other clients.
Based on its review, the Board concluded that any indirect benefits received by a Fund Adviser as a result of its relationship with the Funds were reasonable and within acceptable parameters.
F. Other Considerations
The Board Members did not identify any single factor discussed previously as all-important or controlling. The Board Members, including the Independent Board Members, concluded that the terms of each Advisory Agreement were fair and reasonable, that the respective Fund Adviser’s fees were reasonable in light of the services provided to each Fund and that the Advisory Agreements be renewed.
101
Trustees and Officers
(Unaudited)
The management of the Funds, including general supervision of the duties performed for the Funds by the Adviser, is the responsibility of the Board of Trustees of the Funds. None of the Trustees who are not “interested” persons of the Funds (referred to herein as “Independent Trustees”) has ever been a Trustee or employee of, or consultant to, Nuveen or its affiliates. The names and business addresses of the Trustees and officers of the Funds, their principal occupations and other affiliations during the past five years, the number of portfolios each Trustee oversees and other directorships they hold are set forth below.
The Funds’ Statement of Additional Information (“SAI”) includes more information about the Trustees. To request a free copy, call Nuveen Investments at (800) 257-8787 or visit the Funds’ website at www.nuveen.com.
| | | | | | | | |
Name, Year of Birth & Address | | Position(s) Held with the Funds | | Year First
Elected or
Appointed (1) | | Principal Occupation(s) Including other Directorships During Past 5 Years | | Number of
Portfolios in
Fund Complex
Overseen by
Trustee |
| | | |
| Independent Trustees: | | | | |
Terence J. Toth 1959 333 W. Wacker Drive Chicago, IL 60606 | | Chairman and Trustee | | 2008 | | Formerly, a Co-Founding Partner, Promus Capital (2008-2017); Director, Quality Control Corporation (manufacturing) (since 2012); member: Catalyst Schools of Chicago Board (since 2008) and Mather Foundation Board (philanthropy) (since 2012), and chair of its investment committee; formerly, Director, Fulcrum IT Services LLC (information technology services firm to government entities) (2010-2019); formerly, Director, Legal & General Investment Management America, Inc. (asset management) (2008-2013); formerly, CEO and President, Northern Trust Global Investments (financial services) (2004-2007); Executive Vice President, Quantitative Management & Securities Lending (2000-2004); prior thereto, various positions with Northern Trust Company (financial services) (since 1994); formerly, Member, Northern Trust Mutual Funds Board (2005-2007), Northern Trust Global Investments Board (2004-2007), Northern Trust Japan Board (2004-2007), Northern Trust Securities Inc. Board (2003-2007) and Northern Trust Hong Kong Board (1997-2004). | | 149 |
Jack B. Evans 1948 333 W. Wacker Drive Chicago, IL 60606 | | Trustee | | 1999 | | Chairman (since 2019), formerly, President (1996-2019), The Hall-Perrine Foundation, (private philanthropic corporation); Director and Chairman (since 2009), United Fire Group, a publicly held company; formerly, Director, Public member, American Board of Orthopaedic Surgery (2015-2020); Life Trustee of Coe College and the Iowa College Foundation; formerly, President Pro-Tem of the Board of Regents for the State of Iowa University System (2000-2004); formerly, Director (2000-2004), Alliant Energy; formerly, Director (1996-2015), The Gazette Company (media and publishing); formerly, Director (1998-2003), Federal Reserve Bank of Chicago; formerly, President and Chief Operating Officer (1972-1995), SCI Financial Group, Inc., (regional financial services firm). | | 149 |
William C. Hunter 1948 333 W. Wacker Drive Chicago, IL 60606 | | Trustee | | 2003 | | Dean Emeritus, formerly, Dean, Tippie College of Business, University of Iowa (2006-2012); Director of Wellmark, Inc. (since 2009); past Director (2005-2015), and past President (2010-2014) Beta Gamma Sigma, Inc., The International Business Honor Society; formerly, Director (2004-2018) of Xerox Corporation; Dean and Distinguished Professor of Finance, School of Business at the University of Connecticut (2003-2006); previously, Senior Vice President and Director of Research at the Federal Reserve Bank of Chicago (1995-2003); formerly, Director (1997-2007), Credit Research Center at Georgetown University. | | 149 |
102
| | | | | | | | |
Name, Year of Birth & Address | | Position(s) Held with the Funds | | Year First
Elected or
Appointed (1) | | Principal Occupation(s) Including other Directorships During Past 5 Years | | Number of
Portfolios in
Fund Complex
Overseen by
Trustee |
Albin F. Moschner 1952 333 W. Wacker Drive Chicago, IL 60606 | | Trustee | | 2016 | | Founder and Chief Executive Officer, Northcroft Partners, LLC, (management consulting) (since 2012); formerly, Chairman (2019), and Director (2012-2019), USA Technologies, Inc., (provider of solutions and services to facilitate electronic payment transactions); formerly, Director, Wintrust Financial Corporation (1996-2016); previously, held positions at Leap Wireless International, Inc. (consumer wireless services), including Consultant (2011-2012), Chief Operating Officer (2008-2011), and Chief Marketing Officer (2004-2008); formerly, President, Verizon Card Services division of Verizon Communications, Inc. (2000-2003); formerly, President, One Point Services at One Point Communications (telecommunication services) (1999-2000); formerly, Vice Chairman of the Board, Diba, Incorporated (internet technology provider) (1996-1997); formerly, various executive positions (1991-1996) and Chief Executive Officer (1995-1996) of Zenith Electronics Corporation (consumer electronics). | | 149 |
John K. Nelson 1962 333 W. Wacker Drive Chicago, IL 60606 | | Trustee | | 2013 | | Member of Board of Directors of Core12 LLC. (private firm which develops branding, marketing and communications strategies for clients) (since 2008); served The President’s Council of Fordham University (2010-2019) and previously a Director of the Curran Center for Catholic American Studies (2009-2018); formerly, senior external advisor to the Financial Services practice of Deloitte Consulting LLP. (2012-2014); former Chair of the Board of Trustees of Marian University (2010-2014 as trustee, 2011-2014 as Chair); formerly Chief Executive Officer of ABN AMRO Bank N.V., North America, and Global Head of the Financial Markets Division (2007-2008), with various executive leadership roles in ABN AMRO Bank N.V. between 1996 and 2007. | | 149 |
Judith M. Stockdale 1947 333 W. Wacker Drive Chicago, IL 60606 | | Trustee | | 1997 | | Board Member, Land Trust Alliance (national public charity addressing natural land and water conservation in the U.S.) (since 2013); formerly, Board Member, U.S. Endowment for Forestry and Communities (national endowment addressing forest health, sustainable forest production and markets, and economic health of forest-reliant communities in the U.S.) (2013-2019); formerly, Executive Director (1994-2012), Gaylord and Dorothy Donnelley Foundation (private foundation endowed to support both natural land conservation and artistic vitality); prior thereto, Executive Director, Great Lakes Protection Fund (1990-1994). | | 149 |
Carole E. Stone 1947 333 W. Wacker Drive Chicago, IL 60606 | | Trustee | | 2007 | | Former Director, Chicago Board Options Exchange (2006-2017), and C2 Options Exchange, Incorporated (2009-2017); former Director, Cboe Global Markets, Inc., formerly, CBOE Holdings, Inc. (2010-May 2020); formerly, Commissioner, New York State Commission on Public Authority Reform (2005-2010). | | 149 |
Matthew Thornton III 1958 333 W. Wacker Drive Chicago, IL 60606 | | Trustee | | 2020 | | Formerly, Executive Vice President and Chief Operating Officer (2018-2019), FedEx Freight Corporation, a subsidiary of FedEx Corporation (“FedEx”) (provider of transportation, e-commerce and business services through its portfolio of companies); formerly, Senior Vice President, U.S. Operations (2006-2018), Federal Express Corporation, a subsidiary of FedEx; formerly Member of the Board of Directors (2012-2018), Safe Kids Worldwide® (a non-profit organization dedicated to preventing childhood injuries). Member of the Board of Directors (since 2014), The Sherwin-Williams Company (develops, manufactures, distributes and sells paints, coatings and related products); Director (since November 2020), Crown Castle International (provider of communications infrastructure). | | 149 |
103
Trustees and Officers (Unaudited) (continued)
| | | | | | | | |
Name, Year of Birth & Address | | Position(s) Held with the Funds | | Year First
Elected or
Appointed (1) | | Principal Occupation(s) Including other Directorships During Past 5 Years | | Number of
Portfolios in
Fund Complex
Overseen by
Trustee |
Margaret L. Wolff 1955 333 W. Wacker Drive Chicago, IL 60606 | | Trustee | | 2016 | | Formerly, member of the Board of Directors (2013-2017) of Travelers Insurance Company of Canada and The Dominion of Canada General Insurance Company (each, a part of Travelers Canada, the Canadian operation of The Travelers Companies, Inc.); formerly, Of Counsel, Skadden, Arps, Slate, Meagher & Flom LLP (legal services, Mergers & Acquisitions Group) (2005-2014); Member of the Board of Trustees of New York-Presbyterian Hospital (since 2005); Member (since 2004) and Chair (since 2015) of the Board of Trustees of The John A. Hartford Foundation (a philanthropy dedicated to improving the care of older adults); formerly, Member (2005-2015) and Vice Chair (2011-2015) of the Board of Trustees of Mt. Holyoke College. | | 149 |
Robert L. Young 1963 333 W. Wacker Drive Chicago, IL 60606 | | Trustee | | 2017 | | Formerly, Chief Operating Officer and Director, J.P. Morgan Investment Management Inc. (financial services) (2010-2016); formerly, President and Principal Executive Officer (2013-2016), and Senior Vice President and Chief Operating Officer (2005-2010), of J.P. Morgan Funds; formerly, Director and various officer positions for J.P. Morgan Investment Management Inc. (formerly, JPMorgan Funds Management, Inc. and formerly, One Group Administrative Services) and JPMorgan Distribution Services, Inc. (financial services) (formerly, One Group Dealer Services, Inc.) (1999-2017). | | 149 |
| | | | | | |
Name, Year of Birth & Address | | Position(s) Held with the Funds | | Year First
Elected or
Appointed (2) | | Principal Occupation(s) During Past 5 Years |
| | |
| Officers of the Funds: | | |
Christopher E. Stickrod 1976 333 W. Wacker Drive Chicago, IL 60606 | | Chief Administrative Officer | | 2020 | | Senior Managing Director (since 2017) and Head of Advisory Product (since 2020), formerly, Managing Director (2016-2017) and Senior Vice President (2013-2016) of Nuveen, LLC; Senior Managing Director of Nuveen Securities, LLC (since 2018) and of Nuveen Fund Advisors, LLC (since 2019). |
Mark J. Czarniecki 1979 901 Marquette Avenue Minneapolis, MN 55402 | | Vice President and Secretary | | 2013 | | Vice President and Assistant Secretary of Nuveen Securities, LLC (since 2016) and Nuveen Fund Advisors (since 2017); Vice President and Associate General Counsel of Nuveen, LLC (since 2013) and Vice President, Assistant Secretary and Associate General Counsel of Nuveen Asset Management (since 2018). |
Diana R. Gonzalez 1978 333 W. Wacker Drive Chicago, IL 60606 | | Vice President and Assistant Secretary | | 2017 | | Vice President and Assistant Secretary of Nuveen Fund Advisors, LLC (since 2017); Vice President and Associate General Counsel of Nuveen, LLC (since 2017); Associate General Counsel of Jackson National Asset Management, LLC (2012-2017). |
Nathaniel T.Jones 1979 333 W. Wacker Drive Chicago, IL 60606 | | Vice President and Treasurer | | 2016 | | Managing Director (since 2017), formerly, Senior Vice President (2016-2017), formerly, Vice President (2011- 2016) of Nuveen, LLC; Managing Director (since 2015) of Nuveen Fund Advisors, LLC; Chartered Financial Analyst. |
Tina M. Lazar 1961 333 W. Wacker Drive Chicago, IL 60606 | | Vice President | | 2002 | | Managing Director (since 2017), formerly, Senior Vice President (2014-2017) of Nuveen Securities, LLC. |
Brian J. Lockhart 1974 333 W. Wacker Drive Chicago, IL 60606 | | Vice President | | 2019 | | Managing Director (since 2019) of Nuveen Fund Advisors, LLC; Managing Director (since 2017), formerly, Vice President (2010-2017) of Nuveen, LLC; Head of Investment Oversight (since 2017), formerly, Team Leader of Manager Oversight (2015-2017); Chartered Financial Analyst and Certified Financial Risk Manager. |
104
| | | | | | |
Name, Year of Birth & Address | | Position(s) Held with the Funds | | Year First
Elected or
Appointed (2) | | Principal Occupation(s) During Past 5 Years |
Jacques M. Longerstaey 1963 8500 Andrew Carnegie Blvd. Charlotte, NC 28262 | | Vice President | | 2019 | | Senior Managing Director, Chief Risk Officer, Nuveen, LLC (since May 2019); Senior Managing Director (since May 2019) of Nuveen Fund Advisors, LLC; formerly, Chief Investment and Model Risk Officer, Wealth & Investment Management Division, Wells Fargo Bank (NA) (2013-2019). |
Kevin J. McCarthy 1966 333 W. Wacker Drive Chicago, IL 60606 | | Vice President and Assistant Secretary | | 2007 | | Senior Managing Director (since 2017) and Secretary and General Counsel (since 2016) of Nuveen Investments, Inc., formerly, Executive Vice President (2016-2017) and Managing Director and Assistant Secretary (2008-2016); Senior Managing Director (since 2017) and Assistant Secretary (since 2008) of Nuveen Securities, LLC, formerly Executive Vice President (2016-2017) and Managing Director (2008-2016); Senior Managing Director (since 2017) and Secretary (since 2016) of Nuveen Fund Advisors, LLC, formerly, Co-General Counsel (2011-2020), Executive Vice President (2016-2017), Managing Director (2008-2016) and Assistant Secretary (2007-2016); Senior Managing Director (since 2017), Secretary (since 2016) of Nuveen Asset Management, LLC, formerly, Associate General Counsel (2011-2020), Executive Vice President (2016-2017) and Managing Director and Assistant Secretary (2011-2016); Vice President (since 2007) and Secretary (since 2016), formerly, Assistant Secretary, of NWQ Investment Management Company, LLC, Santa Barbara Asset Management, LLC and Winslow Capital Management, LLC (since 2010). Senior Managing Director (since 2017) and Secretary (since 2016) of Nuveen Alternative Investments, LLC. |
Jon Scott Meissner 1973 8500 Andrew Carnegie Blvd. Charlotte, NC 28262 | | Vice President | | 2019 | | Managing Director of Mutual Fund Tax and Financial Reporting groups at Nuveen (since 2017); Managing Director of Nuveen Fund Advisors, LLC (since 2019); Senior Director of Teachers Advisors, LLC and TIAA-CREF Investment Management, LLC (since 2016); Senior Director (since 2015) Mutual Fund Taxation to the TIAA-CREF Funds, the TIAA-CREF Life Funds, the TIAA Separate Account VA-1 and the CREF Accounts; has held various positions with TIAA since 2004. |
Deann D. Morgan 1969 730 Third Avenue New York, NY 10017 | | Vice President | | 2020 | | President, Nuveen Fund Advisors, LLC (since November 2020); Executive Vice President, Global Head of Product at Nuveen, LLC (since 2019); Co-Chief Executive Officer of Nuveen Securities, LLC (since March 2020); Managing Member of MDR Collaboratory LLC (since 2018); Managing Director, Head of Wealth Management Product Structuring & COO Multi Asset Investing. The Blackstone Group (2013-2017). |
Christopher M. Rohrbacher 1971 333 W. Wacker Drive Chicago, IL 60606 | | Vice President and Assistant Secretary | | 2008 | | Managing Director (since 2017) and Assistant Secretary of Nuveen Securities, LLC; Managing Director (since 2017), General Counsel (since 2020), and Assistant Secretary (since 2016), formerly, Senior Vice President (2016-2017) of Nuveen Fund Advisors, LLC; Managing Director, Associate General Counsel and Assistant Secretary of Nuveen Asset Management, LLC (since 2020); Managing Director (since 2017) and Associate General Counsel (since 2016), formerly, Senior Vice President (2012-2017) and Assistant General Counsel (2008-2016) of Nuveen, LLC. |
William A. Siffermann 1975 333 W. Wacker Drive Chicago, IL 60606 | | Vice President | | 2017 | | Managing Director (since 2017), formerly Senior Vice President (2016-2017) and Vice President (2011-2016) of Nuveen, LLC. |
E. Scott Wickerham 1973 8500 Andrew Carnegie Blvd. Charlotte, NC 28262 | | Vice President and Controller | | 2019 | | Senior Managing Director, Head of Fund Administration at Nuveen, LLC (since 2019), formerly, Managing Director; Senior Managing Director (since 2019) of Nuveen Fund Advisors, LLC; Principal Financial Officer, Principal Accounting Officer and Treasurer (since 2017) of the TIAA-CREF Funds, the TIAA-CREF Life Funds, the TIAA Separate Account VA-1 and the Treasurer (since 2017) to the CREF Accounts; Senior Director, TIAA-CREF Fund Administration (2014-2015); has held various positions with TIAA since 2006. |
Mark L. Winget 1968 333 W. Wacker Drive Chicago, IL 60606 | | Vice President and Assistant Secretary | | 2008 | | Vice President and Assistant Secretary of Nuveen Securities, LLC (since 2008), and Nuveen Fund Advisors, LLC (since 2019); Vice President, Associate General Counsel and Assistant Secretary of Nuveen Asset Management, LLC (since 2020); Vice President (since 2010) and Associate General Counsel (since 2019), formerly, Assistant General Counsel (2008-2016) of Nuveen, LLC. |
105
Trustees and Officers (Unaudited) (continued)
| | | | | | |
Name, Year of Birth & Address | | Position(s) Held with the Funds | | Year First
Elected or
Appointed (2) | | Principal Occupation(s) During Past 5 Years |
Gifford R. Zimmerman 1956 333 W. Wacker Drive Chicago, IL 60606 | | Vice President and Chief Compliance Officer | | 1988 | | Formerly: Managing Director (2002-2020) and Assistant Secretary (2002-2020) of Nuveen Securities, LLC; Managing Director (2002-2020), Assistant Secretary (1997-2020) and Co-General Counsel (2011-2020) of Nuveen Fund Advisors, LLC; Managing Director (2004-2020) and Assistant Secretary (1994-2020) of Nuveen Investments, Inc.; Managing Director, Assistant Secretary and Associate General Counsel of Nuveen Asset Management, LLC (2011-2020); Vice President and Assistant Secretary of NWQ Investment Management Company, LLC, Santa Barbara Asset Management, LLC (2006-2020) and Winslow Capital Management, LLC (2010-2020); Chartered Financial Analyst. |
| (1) | Trustees serve an indefinite term until his/her successor is elected or appointed. The year first elected or appointed represents the year in which the trustee was first elected or appointed to any fund in the Nuveen fund complex. |
| (2) | Officers serve one year terms through August of each year. The year first elected or appointed represents the year in which the officer was first elected or appointed to any fund in the Nuveen fund complex. |
106
Notes
107
Nuveen:
Serving Investors for Generations
Since 1898, financial professionals and their clients have relied on Nuveen to provide dependable investment solutions through continued adherence to proven, long-term investing principles. Today, we offer a range of high quality solutions designed to be integral components of a well-diversified core portfolio.
Focused on meeting investor needs.
Nuveen is the investment manager of TIAA. We have grown into one of the world’s premier global asset managers, with specialist knowledge across all major asset classes and particular strength in solutions that provide income for investors and that draw on our expertise in alternatives and responsible investing. Nuveen is driven not only by the independent investment processes across the firm, but also the insights, risk management, analytics and other tools and resources that a truly world-class platform provides. As a global asset manager, our mission is to work in partnership with our clients to create solutions which help them secure their financial future.
Find out how we can help you.
To learn more about how the products and services of Nuveen may be able to help you meet your financial goals, talk to your financial professionals, or call us at (800) 257-8787. Please read the information provided carefully before you invest. Investors should consider the investment objective and policies, risk considerations, charges and expenses of any investment carefully. Where applicable, be sure to obtain a prospectus, which contains this and other relevant information. To obtain a prospectus, please contact your securities representative or Nuveen, 333 W. Wacker Dr., Chicago, IL 60606. Please read the prospectus carefully before you invest or send money.
Learn more about Nuveen Funds at: www.nuveen.com/mutual-funds
| | |
Nuveen Securities, LLC, member FINRA and SIPC |
333 West Wacker Drive | Chicago, IL 60606 | www.nuveen.com | | MAN-FREGIF-1220D 1509794-INV-Y-02/22 |
As of the end of the period covered by this report, the registrant has adopted a code of ethics that applies to the registrant’s principal executive officer, principal financial officer, principal accounting officer or controller, or persons performing similar functions. There were no amendments to or waivers from the code during the period covered by this report. The registrant has posted the code of ethics on its website at www.nuveen.com/fund-governance. (To view the code, click on Code of Conduct.)
| ITEM 3. | AUDIT COMMITTEE FINANCIAL EXPERT. |
As of the end of the period covered by this report, the registrant’s Board of Directors or Trustees (“Board”) determined that the registrant has at least one “audit committee financial expert” (as defined in Item 3 of Form N-CSR) serving on its Audit Committee. The registrant’s audit committee financial experts are Carole E. Stone, Jack B. Evans and William C. Hunter, who are “independent” for purposes of Item 3 of Form N-CSR.
Ms. Stone served for five years as Director of the New York State Division of the Budget. As part of her role as Director, Ms. Stone was actively involved in overseeing the development of the State’s operating, local assistance and capital budgets, its financial plan and related documents; overseeing the development of the State’s bond-related disclosure documents and certifying that they fairly presented the State’s financial position; reviewing audits of various State and local agencies and programs; and coordinating the State’s system of internal audit and control. Prior to serving as Director, Ms. Stone worked as a budget analyst/examiner with increasing levels of responsibility over a 30 year period, including approximately five years as Deputy Budget Director. Ms. Stone has also served as Chair of the New York State Racing Association Oversight Board, as Chair of the Public Authorities Control Board, as a Commissioner on the New York State Commission on Public Authority Reform and as a member of the Boards of Directors of several New York State public authorities. These positions have involved overseeing operations and finances of certain entities and assessing the adequacy of project/entity financing and financial reporting. Currently, Ms. Stone is on the Board of Directors of CBOE Holdings, Inc., of the Chicago Board Options Exchange, and of C2 Options Exchange. Ms. Stone’s position on the boards of these entities and as a member of both CBOE Holdings’ Audit Committee and its Finance Committee has involved, among other things, the oversight of audits, audit plans and preparation of financial statements.
Mr. Evans was formerly President and Chief Operating Officer of SCI Financial Group, Inc., a full service registered broker-dealer and registered investment adviser (“SCI”). As part of his role as President and Chief Operating Officer, Mr. Evans actively supervised the Chief Financial Officer (the “CFO”) and actively supervised the CFO’s preparation of financial statements and other filings with various regulatory authorities. In such capacity, Mr. Evans was actively involved in the preparation of SCI’s financial statements and the resolution of issues raised in connection therewith. Mr. Evans has also served on the audit committee of various reporting companies. At such companies, Mr. Evans was involved in the oversight of audits, audit plans, and the preparation of financial statements. Mr. Evans also formerly chaired the audit committee of the Federal Reserve Bank of Chicago.
Mr. Hunter was formerly a Senior Vice President at the Federal Reserve Bank of Chicago. As part of his role as Senior Vice President, Mr. Hunter was the senior officer responsible for all operations of each of the Economic Research, Statistics, and Community and Consumer Affairs units at the Federal Reserve Bank of Chicago. In such capacity, Mr. Hunter oversaw the subunits of the Statistics and Community and Consumer Affairs divisions responsible for the analysis and evaluation of bank and bank holding company financial statements and financial filings. Prior to serving as Senior Vice President at the Federal Reserve Bank of Chicago, Mr. Hunter was the Vice President of the Financial Markets unit at the Federal Reserve Bank of Atlanta where he supervised financial staff and bank holding company analysts who analyzed and evaluated bank and bank holding company financial statements. Mr. Hunter also currently serves on the Boards of Directors of Xerox Corporation and Wellmark, Inc. as well as on the Audit Committees of such Boards. As an Audit Committee member, Mr. Hunter’s responsibilities include, among other things, reviewing financial statements, internal audits and internal controls over financial reporting. Mr. Hunter also formerly was a Professor of Finance at the University of Connecticut School of Business and has authored numerous scholarly articles on the topics of finance, accounting and economics.
| ITEM 4. | PRINCIPAL ACCOUNTANT FEES AND SERVICES. |
The following tables show the amount of fees that PriceWaterHouseCoopers LLP, the Funds’ auditor, billed to the Funds’ during the Funds’ last two full fiscal years. The Audit Committee approved in advance all audit services and non-audit services that PriceWaterHouseCoopers LLP, provided to the Funds, except for those non-audit services that were subject to the pre-approval exception under Rule 2-01 of Regulation S-X (the “pre-approval exception”). The preapproval exception for services provided directly to the Funds waives the pre-approval requirement for services other than audit, review or attest services if: (A) the aggregate amount of all such services provided constitutes no more than 5% of the total amount of revenues paid by the Funds during the fiscal year in which the services are provided; (B) the Funds did not recognize the services as non-audit services at the time of the engagement; and (C) the services are promptly brought to the Audit Committee’s attention, and the Committee (or its delegate) approves the services before the audit is completed.
The Audit Committee has delegated certain pre-approval responsibilities to its Chair (or, in her absence, any other member of the Audit Committee).
| | | | | | | | | | | | | | | | |
Fiscal Year Ended December 31, 2020 | | Audit Fees Billed
to Funds 1 | | | Audit-Related Fees
Billed to Funds 2 | | | Tax Fees Billed
to Funds 3 | | | All Other Fees
Billed to Funds 4 | |
| Fund Name | | | | | | | | | | | | | | | | |
Nuveen Global Infrastructure Fund | | | 47,370 | | | | 0 | | | | 3,249 | | | | 0 | |
Nuveen Real Estate Securities Fund | | | 54,630 | | | | 0 | | | | 0 | | | | 0 | |
Nuveen Real Asset Income Fund | | | 53,035 | | | | 0 | | | | 500 | | | | 0 | |
| | | | | | | | | | | | | | | | |
Total | | $ | 155,035 | | | $ | 0 | | | $ | 3,749 | | | $ | 0 | |
| 1 | | “Audit Fees” are the aggregate fees billed for professional services for the audit of the Fund’s annual financial statements and services provided in connection with statutory and regulatory filings or engagements. |
| 2 | | “Audit-Related Fees” are the aggregate fees billed for assurance and related services reasonably related to the performance of the audit or review of financial statements that are not reported under “Audit Fees”. These fees include offerings related to the Fund’s common shares and leverage. |
| 3 | | “Tax Fees” are the aggregate fees billed for professional services for tax advice, tax compliance, and tax planning. These fees include: all global withholding tax services; excise and state tax reviews; capital gain, tax equalization and taxable basis calculations performed by the principal accountant. |
| 4 | | “All Other Fees” are the aggregate fees billed for products and services other than “Audit Fees”, “Audit-Related Fees” and “Tax Fees”. These fees represent all “Agreed-Upon Procedures” engagements pertaining to the Fund’s use of leverage. |
| | | | | | | | | | | | | | | | |
| | | Percentage Approved Pursuant to Pre-approval Exception | |
| | | Audit Fees Billed
to Funds | | | Audit-Related Fees
Billed to Funds | | | Tax Fees
Billed to Funds | | | All Other Fees
Billed to Funds | |
| Fund Name | | | | | | | | | | | | | | | | |
Nuveen Global Infrastructure Fund | | | 0 | % | | | 0 | % | | | 0 | % | | | 0 | % |
Nuveen Real Estate Securities Fund | | | 0 | % | | | 0 | % | | | 0 | % | | | 0 | % |
Nuveen Real Asset Income Fund | | | 0 | % | | | 0 | % | | | 0 | % | | | 0 | % |
| | | | |
December 31, 2019 | | Audit Fees Billed
to Funds 1 | | | Audit-Related Fees
Billed to Funds 2 | | | Tax Fees
Billed to Funds 3 | | | All Other Fees
Billed to Funds 4 | |
| Fund Name | | | | | | | | | | | | | | | | |
Nuveen Global Infrastructure Fund | | | 46,310 | | | | 0 | | | | 19,649 | | | | 0 | |
Nuveen Real Estate Securities Fund | | | 57,950 | | | | 0 | | | | 954 | | | | 0 | |
Nuveen Real Asset Income Fund | | | 51,885 | | | | 0 | | | | 1,210 | | | | 0 | |
| | | | | | | | | | | | | | | | |
Total | | $ | 156,145 | | | $ | 0 | | | $ | 21,813 | | | $ | 0 | |
| 1 | | “Audit Fees” are the aggregate fees billed for professional services for the audit of the Fund’s annual financial statements and services provided in connection with statutory and regulatory filings or engagements. |
| 2 | | “Audit-Related Fees” are the aggregate fees billed for assurance and related services reasonably related to the performance of the audit or review of financial statements that are not reported under “Audit Fees”. These fees include offerings related to the Fund’s common shares and leverage. |
| 3 | | “Tax Fees” are the aggregate fees billed for professional services for tax advice, tax compliance, and tax planning. These fees include: all global withholding tax services; excise and state tax reviews; capital gain, tax equalization and taxable basis calculations performed by the principal accountant. |
| 4 | | “All Other Fees” are the aggregate fees billed for products and services other than “Audit Fees”, “Audit-Related Fees” and “Tax Fees”. These fees represent all “Agreed-Upon Procedures” engagements pertaining to the Fund’s use of leverage. |
| | | | | | | | | | | | | | | | |
| | | Percentage Approved Pursuant to Pre-approval Exception | |
| | | Audit Fees Billed
to Funds | | | Audit-Related Fees
Billed to Funds | | | Tax Fees
Billed to Funds | | | All Other Fees
Billed to Funds | |
| Fund Name | | | | | | | | | | | | | | | | |
Nuveen Global Infrastructure Fund | | | 0 | % | | | 0 | % | | | 0 | % | | | 0 | % |
Nuveen Real Estate Securities Fund | | | 0 | % | | | 0 | % | | | 0 | % | | | 0 | % |
Nuveen Real Asset Income Fund | | | 0 | % | | | 0 | % | | | 0 | % | | | 0 | % |
| | | | | | | | | | | | |
Fiscal Year Ended December 31, 2020 | | Audit-Related Fees
Billed to Adviser and
Affiliated Fund
Service Providers | | | Tax Fees Billed to
Adviser and
Affiliated Fund
Service Providers | | | All Other Fees
Billed to Adviser
and Affiliated Fund
Service Providers | |
Nuveen Investment Funds, Inc. | | $ | 0 | | | $ | 0 | | | $ | 0 | |
| |
| | | Percentage Approved Pursuant to Pre-approval Exception | |
| | | Audit-Related Fees
Billed to Adviser and
Affiliated Fund
Service Providers | | | Tax Fees Billed to
Adviser and
Affiliated Fund
Service Providers | | | All Other Fees
Billed to Adviser
and Affiliated Fund
Service Providers | |
| | | 0 | % | | | 0 | % | | | 0 | % |
| | | |
Fiscal Year Ended December 31, 2019 | | Audit-Related Fees
Billed to Adviser and
Affiliated Fund
Service Providers | | | Tax Fees Billed to
Adviser and
Affiliated Fund
Service Providers | | | All Other Fees
Billed to Adviser
and Affiliated Fund
Service Providers | |
Nuveen Investment Funds, Inc. | | $ | 0 | | | $ | 0 | | | $ | 0 | |
| |
| | | Percentage Approved Pursuant to Pre-approval Exception | |
| | | Audit-Related Fees
Billed to Adviser and
Affiliated Fund
Service Providers | | | Tax Fees Billed to
Adviser and
Affiliated Fund
Service Providers | | | All Other Fees
Billed to Adviser
and Affiliated Fund
Service Providers | |
| | | 0 | % | | | 0 | % | | | 0 | % |
| | | | | | | | | | | | |
Fiscal Year Ended December 31, 2020 | | Total Non-Audit Fees
Billed to Trust | | | Total Non-Audit Fees
billed to Adviser and
Affiliated Fund Service
Providers (engagements
related directly to the
operations and financial
reporting of the Trust) | | | Total Non-Audit Fees
billed to Adviser and
Affiliated Fund Service
Providers (all other
engagements) | |
| Fund Name | | | | | | | | | | | | |
Nuveen Global Infrastructure Fund | | | 3,249 | | | | 0 | | | | 0 | |
Nuveen Real Estate Securities Fund | | | 0 | | | | 0 | | | | 0 | |
Nuveen Real Asset Income Fund | | | 500 | | | | 0 | | | | 0 | |
| | | | | | | | | | | | |
Total | | $ | 3,749 | | | $ | 0 | | | $ | 0 | |
“Non-Audit Fees billed to Fund” for both fiscal year ends represent “Tax Fees” and “All Other Fees” billed to Fund in their respective amounts from the previous table.
Less than 50 percent of the hours expended on the principal accountant’s engagement to audit the registrant’s financial statements for the most recent fiscal year were attributed to work performed by persons other than the principal accountant’s full-time, permanent employees.
| | | | | | | | | | | | |
Fiscal Year Ended December 31, 2019 | | Total Non-Audit Fees
Billed to Trust | | | Total Non-Audit Fees
billed to Adviser and
Affiliated Fund Service
Providers (engagements
related directly to the
operations and financial
reporting of the Trust) | | | Total Non-Audit Fees
billed to Adviser and
Affiliated Fund Service
Providers (all other
engagements) | |
| Fund Name | | | | | | | | | | | | |
Nuveen Global Infrastructure Fund | | | 19,649 | | | | 0 | | | | 0 | |
Nuveen Real Estate Securities Fund | | | 954 | | | | 0 | | | | 0 | |
Nuveen Real Asset Income Fund | | | 1,210 | | | | 0 | | | | 0 | |
| | | | | | | | | | | | |
Total | | $ | 21,813 | | | $ | 0 | | | $ | 0 | |
“Non-Audit Fees billed to Fund” for both fiscal year ends represent “Tax Fees” and “All Other Fees” billed to Fund in their respective amounts from the previous table.
Audit Committee Pre-Approval Policies and Procedures. Generally, the Audit Committee must approve (i) all non-audit services to be performed for the Funds by the Funds’ independent accountant and (ii) all audit and non-audit services to be performed by the Funds’ independent accountant for the Affiliated Fund Service Providers with respect to the operations and financial reporting of the Funds. Regarding tax and research projects conducted by the independent accountant for the Funds and Affiliated Fund Service Providers (with respect to operations and financial reports of the Trust), such engagements will be (i) pre-approved by the Audit Committee if they are expected to be for amounts greater than $10,000; (ii) reported to the Audit Committee Chair for her verbal approval prior to engagement if they are expected to be for amounts under $10,000 but greater than $5,000; and (iii) reported to the Audit Committee at the next Audit Committee meeting if they are expected to be for an amount under $5,000.
| ITEM 5. | AUDIT COMMITTEE OF LISTED REGISTRANTS. |
Not applicable to this registrant.
| ITEM 6. | SCHEDULE OF INVESTMENTS. |
| a) | | See Portfolio of Investments in Item 1. |
| ITEM 7. | DISCLOSURE OF PROXY VOTING POLICIES AND PROCEDURES FOR CLOSED-END MANAGEMENT INVESTMENT COMPANIES. |
Not applicable to this registrant.
| ITEM 8. | PORTFOLIO MANAGERS OF CLOSED-END MANAGEMENT INVESTMENT COMPANIES. |
Not applicable to this registrant.
| ITEM 9. | PURCHASES OF EQUITY SECURITIES BY CLOSED-END MANAGEMENT INVESTMENT COMPANY AND AFFILIATED PURCHASERS. |
Not applicable to this registrant.
| ITEM 10. | SUBMISSION OF MATTERS TO A VOTE OF SECURITY HOLDERS. |
There have been no material changes to the procedures by which shareholders may recommend nominees to the registrant’s Board of Trustees implemented after the registrant last provided disclosure in response to this Item.
| ITEM 11. | CONTROLS AND PROCEDURES. |
| | (a) | | The registrant’s principal executive and principal financial officers, or persons performing similar functions, have concluded that the registrant’s disclosure controls and procedures (as defined in Rule 30a-3(c) under the Investment Company Act of 1940, as amended (the “1940 Act”) (17 CFR 270.30a-3(c))) are effective, as of a date within 90 days of the filing date of this report that includes the disclosure required by this paragraph, based on their evaluation of the controls and procedures required by Rule 30a-3(b) under the 1940 Act (17 CFR 270.30a-3(b)) and Rules 13a-15(b) or 15d-15(b) under the Securities Exchange Act of 1934, as amended (the “Exchange Act”) (17 CFR 240.13a-15(b) or 240.15d-15(b)). |
| | (b) | | There were no changes in the registrant’s internal control over financial reporting (as defined in Rule 30a-3(d) under the 1940 Act (17 CFR 270.30a-3(d)) that occurred during the period covered by this report that has materially affected, or is reasonably likely to materially affect, the registrant’s internal control over financial reporting. |
| ITEM 12. | DISCLOSURE OF SECURITIES LENDING ACTIVITIES FOR CLOSED-END MANAGEMENT INVESTMENT COMPANIES. |
Not applicable.
File the exhibits listed below as part of this Form.
SIGNATURES
Pursuant to the requirements of the Securities Exchange Act of 1934 and the Investment Company Act of 1940, the registrant has duly caused this report to be signed on its behalf by the undersigned, thereunto duly authorized.
(Registrant) Nuveen Investment Funds, Inc.
| | |
| By (Signature and Title) | | /s/ Mark J. Czarniecki |
| | Mark J. Czarniecki |
| | Vice President and Secretary |
Date: March 5, 2021
Pursuant to the requirements of the Securities Exchange Act of 1934 and the Investment Company Act of 1940, this report has been signed below by the following persons on behalf of the registrant and in the capacities and on the dates indicated.
| | |
| By (Signature and Title) | | /s/ Christopher E. Stickrod |
| | Christopher E. Stickrod |
| | Chief Administrative Officer |
| | (principal executive officer) |
Date: March 5, 2021
| | |
| By (Signature and Title) | | /s/ E. Scott Wickerham |
| | E. Scott Wickerham |
| | Vice President and Controller |
| | (principal financial officer) |
Date: March 5, 2021