UNITED STATES
SECURITIES AND EXCHANGE COMMISSION
Washington, D.C. 20549
FORM N-CSR
CERTIFIED SHAREHOLDER REPORT OF REGISTERED MANAGEMENT
INVESTMENT COMPANIES
Investment Company Act file number 811-05309
Nuveen Investment Funds, Inc.
(Exact name of registrant as specified in charter)
Nuveen Investments
333 West Wacker Drive, Chicago, IL 60606
(Address of principal executive offices) (Zip code)
Christopher M. Rohrbacher
Vice President and Secretary
333 West Wacker Drive,
Chicago, IL 60606
(Name and address of agent for service)
Registrant’s telephone number, including area code: (312) 917-7700
Date of fiscal year end: June 30
Date of reporting period: June 30, 2020
Form N-CSR is to be used by management investment companies to file reports with the Commission not later than 10 days after the transmission to stockholders of any report that is required to be transmitted to stockholders under Rule 30e-1 under the Investment Company Act of 1940 (17 CFR 270.30e-1). The Commission may use the information provided on Form N-CSR in its regulatory, disclosure review, inspection, and policy making roles.
A registrant is required to disclose the information specified by Form N-CSR, and the Commission will make this information public. A registrant is not required to respond to the collection of information contained in Form N-CSR unless the Form displays a currently valid Office of Management and Budget (“OMB”) control number. Please direct comments concerning the accuracy of the information collection burden estimate and any suggestions for reducing the burden to Secretary, Securities and Exchange Commission, 450 Fifth Street, NW, Washington, DC 20549-0609. The OMB has reviewed this collection of information under the clearance requirements of 44 U.S.C. ss.3507.
| ITEM 1. | REPORTS TO STOCKHOLDERS. |

Nuveen Income Funds
| | | | | | | | | | |
| Fund Name | | Class A | | Class C | | Class R3 | | Class R6 | | Class I |
| Nuveen Credit Income Fund (formerly known as Nuveen High Income Bond Fund) | | FJSIX | | FCSIX | | FANSX | | — | | FJSYX |
| Nuveen Strategic Income Fund | | FCDDX | | FCBCX | | FABSX | | FSFRX | | FCBYX |
Beginning on January 1, 2021, as permitted by regulations adopted by the Securities and Exchange Commission, paper copies of the Funds’ annual and semi-annual shareholder reports will no longer be sent by mail, unless you specifically request paper copies of the reports. Instead, the reports will be made available on the Funds’ website (www.nuveen.com), and you will be notified by mail each time a report is posted and provided with a website link to access the report.
If you have already elected to receive shareholder reports electronically, you will not be affected by this change and you need not take any action. You may elect to receive shareholder reports and other communications from the Funds electronically anytime by contacting the financial intermediary (such as a broker-dealer or bank) through which you hold your Fund shares or, if you are a direct investor, by enrolling at www.nuveen.com/e-reports.
You may elect to receive all future shareholder reports in paper free of charge at any time by contacting your financial intermediary or, if you are a direct investor, by calling 800-257-8787 and selecting option #1. Your election to receive reports in paper will apply to all funds held in your account with your financial intermediary or, if you are a direct investor, to all your directly held Nuveen Funds and any other directly held funds within the same group of related investment companies.
Annual Report
Life is Complex.
Nuveen makes things e-simple.
It only takes a minute to sign up for e-Reports. Once enrolled, you’ll receive an e-mail as soon as your Nuveen Fund information is ready. No more waiting for delivery by regular mail. Just click on the link within the e-mail to see the report and save it on your computer if you wish.
Free e-Reports right to your email!
www.investordelivery.com
If you receive your Nuveen Fund distributions and statements from your financial professional or brokerage account.
or
www.nuveen.com/client-access
If you receive your Nuveen Fund distributions and statements directly from Nuveen.
Must be preceded by or accompanied by a prospectus.
NOT FDIC INSURED MAY LOSE VALUE NO BANK GUARANTEE
Table
of Contents
3
Chair’s Letter to Shareholders

Dear Shareholders,
The COVID-19 crisis is taking an unprecedented toll on our health, societies, economies and financial markets. Our thoughts are with you during this time of significant disruption caused by the disease and its economic fallout. With many regions of the world suppressing the initial spread of the virus, governments and public health officials face the extraordinary challenge of balancing the resumption of economic activity with public safety. New clusters of infection emerged in the U.S. and other countries following their reopening this summer and a new school year and Northern Hemisphere flu season add new variables. Markets have turned their focus to the potential for an economic recovery, although the timing and magnitude are highly uncertain. Elevated market volatility is likely to continue, with economic data, coronavirus infection rates and the upcoming U.S. presidential election under scrutiny.
While we do not want to understate the dampening effect on the global economy, it is important to differentiate short-term interruptions from the longer-lasting implications to the economy. Prior to the COVID-19 crisis, some areas of the global economy were showing signs of improvement after trade tensions had weighed on economic activity for much of 2019. More recently, countries that have reopened have seen marked improvement in some near-term economic indicators. Central banks and governments around the world have announced economic stimulus measures and pledged to continue doing what it takes to support their economies. In the U.S., the Federal Reserve has cut its benchmark interest rate to near zero and introduced similar programs that helped revive the U.S. economy after the 2008 financial crisis. The U.S. Government has approved three relief packages, including a $2 trillion-dollar package directly supporting businesses and individuals. The Coronavirus Aid, Relief and Economic Security Act, called the CARES Act, provides direct payments and expanded unemployment benefits to individuals, loans and grants to small businesses, loans and other money to large corporations and funding for hospitals, public health, education and state and local governments. In the European Union, the European Central Bank recently increased the size of its Pandemic Emergency Purchase Program, known as PEPP, to €1.35 trillion from €750 billion and extended its duration to June 2021.
In the meantime, patience and a long-term perspective are key for investors. When market fluctuations are the leading headlines day after day, it���s tempting to “do something.” However, your long-term goals can’t be met with short-term thinking. We encourage you to talk to your financial professional, who can review your time horizon, risk tolerance and investment goals. On behalf of the other members of the Nuveen Fund Board, we look forward to continuing to earn your trust in the months and years ahead.
Sincerely,

Terence J. Toth
Chair of the Board
August 24, 2020
4
Portfolio Managers’ Comments
Nuveen Credit Income Fund (formerly known as Nuveen High Income Bond Fund)
Nuveen Strategic Income Fund
These Funds feature portfolio management by Nuveen Asset Management, LLC (NAM), an affiliate of Nuveen Fund Advisors, LLC, the Funds’ investment adviser. Kevin Lorenz, CFA and Jean C. Lin, CFA, are portfolio managers for the Nuveen Credit Income Bond Fund. Portfolio managers for the Nuveen Strategic Income Fund include Douglas M. Baker, CFA, Bill Martin, Kevin Lorenz, CFA, Katherine Renfrew and Nicholas Travaglino.
Effective July 7, 2020 (subsequent to the close of the reporting period), the Nuveen High Income Bond Fund’s name was changed to Nuveen Credit Income Fund.
Effective July 7, 2020 (subsequent to the close of the reporting period), the Nuveen Credit Income Fund’s investment objective changed to provide total return with an emphasis on a high level of current income.
Effective July 7, 2020 (subsequent to the close of the reporting period), Anders S. Persson, CFA, Bill Martin, Karina L. Bubeck, CFA and Aashh K. Parekh, CFA, were named as portfolio managers of the Nuveen Credit Income Fund.
Effective August 17, 2020 (subsequent to the close of the reporting period), Brenda A. Langenfeld, CFA, was named as portfolio manager of the Nuveen Credit Income Fund.
Subsequent to the reporting period, management announced that effective December 31, 2020, William Martin will no longer serve as a portfolio manager of the Funds.
Here the Funds’ portfolio management team discusses economic and market conditions, key investment strategies and the Funds’ performance for the twelve-month reporting period June 30, 2020.
What factors affected the U.S. economy and the global stock markets during the twelve-month annual reporting period ended June 30, 2020?
The longest economic expansion in U.S. history came to an abrupt halt in early 2020 amid the COVID-19 coronavirus pandemic. To slow the spread of the virus, large portions of the economy were shut down, with companies closing either temporarily or permanently and most of the U.S. population under stay-at-home orders during March and April 2020. A phased reopening began toward the end of May, but the disruption to the economy has been swift and severe. In June 2020, the National Bureau of Economic Research announced that the economic expansion that began in June 2009 officially ended in February 2020, marking the start of a recession (a several months’ long contraction across the broad economy). As expected, the U.S. economy suffered a sharp contraction in the second quarter of 2020, with gross domestic product (GDP) down 32.9% on an annualized basis according to the
This material is not intended to be a recommendation or investment advice, does not constitute a solicitation to buy, sell or hold a security or an investment strategy and is not provided in a fiduciary capacity. The information provided does not take into account the specific objectives or circumstances of any particular investor, or suggest any specific course of action. Investment decisions should be made based on an investor’s objectives and circumstances and in consultation with his or her advisors.
Certain statements in this report are forward-looking statements. Discussions of specific investments are for illustration only and are not intended as recommendations of individual investments. The forward-looking statements and other views expressed herein are those of the portfolio managers as of the date of this report. Actual future results or occurrences may differ significantly from those anticipated in any forward-looking statements and the views expressed herein are subject to change at any time, due to numerous market and other factors. The Funds disclaim any obligation to update publicly or revise any forward-looking statements or views expressed herein.
For financial reporting purposes, the ratings disclosed are the highest rating given by one of the following national rating agencies: Standard & Poor’s (S&P), Moody’s Investors Service, Inc. (Moody’s) or Fitch, Inc. (Fitch). This treatment of split-rated securities may differ from that used for other purposes, such as for Fund investment policies. Credit ratings are subject to change. AAA, AA, A and BBB are investment grade ratings; BB, B, CCC, CC, C and D are below investment grade ratings. Holdings designated N/R are not rated by these national rating agencies.
Refer to the Glossary of Terms Used in this Report for further definition of the terms used within this section.
5
Portfolio Managers’ Comments (continued)
Bureau of Economic Analysis “advance” estimate. GDP measures the value of goods and services produced by the nation’s economy less the value of the goods and services used up in production, adjusted for price changes. In the second quarter, steep declines in consumer spending, business investment and exports weighed on economic activity, offsetting increased government spending. By comparison, the annualized GDP growth rate shrank 5% in the first quarter of 2020, after expanding 2.4% in the fourth quarter of 2019 and 2.2% in 2019 overall.
Consumer spending, the largest driver of the economy, was well supported earlier in this reporting period by low unemployment, wage gains and tax cuts. However, the COVID-19 crisis containment measures drove a significant drop in consumer spending and a sharp rise in unemployment starting in March 2020. The Bureau of Labor Statistics said the unemployment rate rose to 11.1% in June 2020 from 3.7% in June 2019. The economy added 4.8 million jobs in June 2020, following the addition of 2.7 million jobs in May 2020. However, the combined job losses in March and April 2020 exceeded 22 million. The average hourly earnings rate appeared to soar, growing at an annualized rate of 5% in June 2020, despite the spike in unemployment. Earnings data were skewed by the concentration of job losses in lower-wage work, which effectively eliminated most of the low data, resulting in an average of mostly higher numbers. The overall trend of inflation weakened considerably, which was attributed to large decreases in gasoline, apparel, air travel and lodging prices offsetting an increase in food prices. The Bureau of Labor Statistics said the Consumer Price Index (CPI) increased 0.6% over the twelve-month reporting period ended June 30, 2020 before seasonal adjustment.
Low mortgage rates and low inventory drove home prices moderately higher in this reporting period, although the period measured only partially reflects the shutdown. The S&P CoreLogic Case-Shiller U.S. National Home Price Index, which covers all nine U.S. census divisions, was up 4.5% year-over-year in May 2020 (most recent data available at the time this report was prepared). The 10-City and 20-City Composites reported year-over-year increases of 3.1% and 3.7%, respectively.
With economic momentum slowing in 2019 from 2018’s stronger pace, the U.S. Federal Reserve (Fed) cut its benchmark interest rate by 0.25% at each of the July 2019, September 2019 and October 2019 policy committee meetings. Markets registered disappointment with the Fed’s explanation that the rate cuts were a “mid-cycle adjustment,” rather than a prolonged easing period, and its signal that there would be no additional rate cuts in 2019. Also in the latter half of 2019, the Fed announced it would stop shrinking its bond portfolio sooner than scheduled, as well as began buying short-term Treasury bills to help money markets operate smoothly and maintain short-term borrowing rates at low levels. Fed Chairman Powell emphasized that the Treasury bill purchases were not a form of quantitative easing. The Fed continued its Treasury bill buying in January 2020, as well as left its benchmark interest rate unchanged, while noting the emerging COVID-19 risks.
As the outbreak spread to the U.S. and significant restrictions on social and economic activity were imposed starting in March 2020, the Fed enacted an array of emergency measures to stabilize the financial system and support the markets, including cutting its main interest rate to near zero, offering lending programs to aid small and large companies and allowing unlimited bond purchases, known as quantitative easing. There were no policy changes at the Fed’s April and June 2020 meetings, where Chairman Powell reiterated a commitment to keep rates near zero until the economy recovers and continued to issue a cautious outlook for the U.S. economy. (Subsequent to the close of the reporting period, there were no policy changes at the Fed’s July 2020 meeting.)
Meanwhile, the U.S. government approved three aid packages, totaling more than $100 billion in funding to health agencies and employers offering paid leave and $2 trillion allocated across direct payments to Americans, an expansion of unemployment insurance, loans to large and small businesses, funding to hospitals and health agencies and support to state and local governments.
While trade and tariff policy drove market sentiment for most of the twelve-month reporting period, the outbreak of the novel coronavirus and its associated disease COVID-19 rapidly dwarfed all other market concerns starting in late February 2020. Equity and commodity markets sold-off and safe-haven assets rallied in March 2020 as China, other countries and then the United States initiated quarantines, restricted travel and shuttered factories and businesses. The potential economic shock was particularly difficult to assess, which amplified market volatility. An ill-timed oil price war between the Organization of the Petroleum Exporting Countries (OPEC) and non-OPEC member Russia, which caused oil prices to plunge in March 2020, exacerbated the market sell-off.
Outside the U.S., many countries implemented lockdowns and restrictions on business activity to reduce infection rates, with a deep impact to their economies. Pandemic responses included central bank monetary easing and quantitative easing, fiscal relief programs, the loosening of fiscal rules and, in the case of emerging markets, emergency financing and debt relief from bilateral
6
creditors and international organizations such as the International Monetary Fund and World Bank. The U.K. formally exited the European Union (EU) at the end of January 2020, triggering the one-year transition period, but Brexit talks were temporarily paused during the virus lockdown. When negotiations resumed, the U.K. continued to indicate it would not seek an extension. Italy’s prime minister unexpectedly resigned in August 2019, and the newly formed coalition government appeared to take a less antagonistic stance towards the EU. To help relieve the coronavirus impact on Italy and other more indebted Southern European countries, the European Commission proposed a €750 billion aid program to be funded by all member states, which was unanimously approved in July 2020 after the close of the reporting period. In Asia, northern countries were among the first to successfully reduce infection rates and relax coronavirus restrictions, but pockets of the disease re-emerged. The widespread anti-government protests roiling Hong Kong throughout 2019 had dissipated amid the lockdown, but tensions flared in late May 2020 when China unexpectedly announced a national security law perceived as a threat to Hong Kong’s sovereignty. India took stringent lockdown steps in March 2020 but still saw a rapid increase in cases. Latin American countries entered the health crisis in already weakened positions, with high government debt and widespread civil unrest. Venezuela’s economic and political crisis continued to deepen. Argentina surprised the market with the return of a less market-friendly administration but continued to pursue a restructuring of its debt. Brazil’s Bolsonaro administration achieved a legislative win on pension reform but had not fully delivered on reviving economic growth. As the pandemic spread to Latin America, the inconsistent government responses, reduced testing capabilities, weaker health care systems, food shortages and public protests contributed to accelerating infection and death rates, while the Southern Hemisphere winter is set to begin.
Prior to the COVID-19 crisis, global markets had become more bullish on the outlook for 2020 as trade policy and Brexit appeared to make progress at the end of 2019. The U.S. and China agreed on a partial trade deal, which included rolling back some tariffs, increasing China’s purchases of U.S. agriculture products and the consideration of intellectual property, technology and financial services rights. The “phase one” deal was signed on January 15, 2020. While much of the focus remained on the U.S.-China relationship, trade spats between the U.S. and Mexico, the EU, Brazil and Argentina also arose throughout the reporting period. In January 2020, the U.S. Congress fully approved the U.S., Mexico and Canada Agreement (USMCA), which replaces the North American Free Trade Agreement. With more clarity on trade deals, the trade-related deterioration in global manufacturing and export data was expected to improve. However, the COVID-19 crisis has since upended those assumptions. Furthermore, tensions between the U.S. and China escalated amid the pandemic, with both sides stoking resentment about the management of the health crisis, Hong Kong’s political protests and trade policy.
How did the Funds perform during the twelve-month reporting period ended June 30, 2020?
The tables in the Fund Performance and Expense Ratios section of this report provide total returns for the Funds for the one-year, five-year, ten-year and/or since inception periods ended June 30, 2020. Each Funds’ Class A Share total returns at net asset value (NAV) are compared with the performance of their corresponding market index and Lipper classification average. The Nuveen Credit Income Fund’s Class A Shares at NAV underperformed both the Bloomberg Barclays High Yield 2% Issuer Capped Index and the Lipper Global High Yield Funds Classification Average for the twelve-month reporting period. The Nuveen Strategic Income Fund’s Class A Shares at net asset value (NAV) underperformed the Bloomberg Barclays Aggregate Bond Index and outperformed the Lipper Multi-Sector Income Funds Classification Average for the twelve-month reporting period. A more detailed account of each Fund’s performance is provided later in this report.
Nuveen Credit Income Fund (formerly known as Nuveen High Income Bond Fund)
What strategies were used to manage the Fund during the twelve-month reporting period ended June 30, 2020 and how did these strategies influence performance?
The Fund has an objective of providing high income strategy that blends below investment grade bonds from U.S. and non-U.S. issuers with other income-producing investments to expand return opportunities and increase diversification while seeking a high level of current income.
Interest rates fell sharply resulting in a steepening of the Treasury yield curve. Driven by the five Fed rate cuts, three-month T-bills ended the reporting period 196 basis points lower at 0.16%. The 10-year Treasury yield hit an all-time low well below 1% during the reporting period and ended at 0.66%, which was 134 basis points lower than where it started. As a result, U.S. Treasuries were the best performing asset class during the reporting period, handily outperforming all other fixed income sectors.
7
Portfolio Managers’ Comments (continued)
The high yield market started the reporting period supported by dovish central banks and stable credit fundamentals, which kept recession at bay, while capital from around the globe continued to flow into the asset class in the hunt for yield. Although earnings momentum had moderated by the end of 2019, the supportive macro backdrop and more favorable business sentiment going into 2020 provided a strong tailwind for valuations in the high yield market. However, the sudden onset of COVID-19 led to a near complete shutdown of the capital markets in March 2020, which was exacerbated by the sharp drop in crude oil prices. Together these forces drove a spike in risk premiums and dramatic high yield outflows. High yield spreads peaked at 1,100 basis points before sharply retracing to end the reporting period at 630 basis points over Treasuries after drastic policy measures were enacted, companies tapped credit facilities and more clarity emerged regarding the differentiation between sectors, credit factors and resiliency going into recession. High yield performed well in the final three months of the reporting period as policymakers continued to support healthy market and economic functioning while portions of the country gradually reopened. As a result, high yield experienced sizable inflows back into the market, which were met with one of the largest rounds of quarterly net new issuance ($59 billion) as companies aimed to optimize their capital structure. During the reporting period, high yield significantly underperformed higher quality sectors.
The Fund outperformed during the first half of the reporting period, but significantly underperformed during the COVID-19 crisis volatility in the second half of the reporting period, leading to an overall shortfall versus the benchmark. The most notable cause of the Fund’s underperformance relative to the benchmark was its underweight position in higher quality BB rated credits since this was the best performing ratings category. In March 2020, the market saw a flight to quality that drove the outperformance of BB relative to lower quality credits as the COVID-19 crisis spread and shutdowns took effect. Higher quality was further aided by the Fed’s support of the investment grade corporate market and “fallen angels” (investment grade bonds downgraded to high yield). Despite the underperformance of lower-quality high yield during the reporting period, the Fund’s positive security selection of CCC rated securities contributed favorably, along with an underweight to that segment.
Another significant factor in the Fund’s underperformance was its overweight to the energy sector throughout the reporting period. As noted, oil prices suffered massive declines in the first part of 2020 following the price war between Saudi Arabia and Russia at the same time that demand was quickly dropping following the onset of virus-induced lockdowns. The energy market did stabilize later in the reporting period after OPEC and other oil-producing nations agreed to production cuts and the acute demand shock passed as economies gradually reopened; however, crude oil only recovered about half of the losses experienced earlier in 2020. This did lead higher quality, high yield energy and fallen angels to perform in the final three months of the reporting period, while lower rated high yield exploration and production (E&P) names remained challenged with a handful of bankruptcy filings in that segment.
At the industry level, the Fund’s underweight exposure in capital goods detracted. The segment performed in line with the index as demand for manufactured goods and durables remained intact and consumer confidence began to improve. In addition to the detrimental underweight, the Fund’s positions in aircraft manufacturer Bombardier Inc. and aircraft component maker TransDigm Inc. detracted in this environment. Also, an underweight to packaging companies hindered performance as well. The Fund continued to hold bonds from both Bombardier and TransDigm at the end of the reporting period.
On the positive side, the Fund’s underweight to the highly impacted transportation sector contributed the most to relative performance. The Fund’s exposures were focused on shipping, travel services and less volatile secured airline debt of domestic carriers, which received stimulus support. Because we expect air travel to remain depressed beyond the end of 2020, our exposure in the area had an up-in-quality bias.
Also, the Fund’s underweight to the broader consumer cyclical sector aided performance on a relative basis versus the index. Following elevated volatility, cyclicals in the index ended up rallying back to almost flat for the reporting period based on stronger sentiment driven by supportive stimulus measures, followed by a wave of secured debt issuance in the sector to alleviate solvency risk. The Fund benefited from exposure to retailers with healthy balance sheets and strong online presence (Lithia Motors Inc. and PetSmart Inc.), and underweights among destination-based gaming properties and operators in Las Vegas and Atlantic City. The Fund continued to hold bonds from both Lithia Motors and PetSmart at the end of the reporting period.
Performance was also helped by a slight overweight versus the index in the basic materials sector. An improvement in the macroeconomic backdrop increased the demand for basic materials. However, we remained somewhat cautious given questions surrounding the pace of recovery and the volatility that the sector could experience going forward. As a result, we kept the Fund only modestly
8
overweight in basic materials and with a higher quality bias among our holdings. Naturally, miners and materials producers are heavily correlated with an improvement in industrial and manufacturing activity and infrastructure spending. Although lower supply in the space has reduced concerns of near-term surplus, we will need to see continued growth in demand for the sector to outperform.
Due to the uncertainty surrounding the COVID-19 crisis, we anticipate elevated stress in the energy and consumer discretionary sectors as well as lower quality tiers. In line with that narrative, we continued to position the Fund with a cautious tone and modestly expanded the portfolio’s underweights in more volatile CCC rated securities and in the energy, consumer cyclical and real estate sectors. We believe CCC rated bonds offer poor risk-adjusted returns as they are susceptible to any deterioration in market fundamentals. We anticipate elevated defaults to last through the remainder of 2020. In energy, we decreased exposure to mainly midstream and refining because we expect the sector will continue to be weighed down by softness in demand, shifts in consumer behavior and increased bankruptcy filings in E&P. These factors will have an associated negative impact on the revenues of midstream/gathering and processing companies because production stoppages will result in less volume being processed.
We continue to position the Fund across sectors in defensive credits characterized by strong liquidity profiles, consistent cash flow generation, inelastic demand and/or long-term contracts. During the reporting period, we increased exposure to communications (cable and satellite) and technology because we believed that work-from-home mandates and at-home entertainment demands would bode well for the sectors. We also increased the Fund’s overweight exposure to utilities and increased consumer non-cyclical exposure (food and beverage, health care) in an effort to position more defensively. We maintained slight overweights in bank and non-bank financials, including money-center banks, health insurers, insurance brokers and consumer lenders that have much stronger capital reserves than they did during the 2008 recession. We also trimmed the Fund’s overweight position in the basic industry sector.
During the reporting period, we used high yield CDX swaps to increase the Fund’s high yield credit risk exposure. This had a negligible impact on performance during the reporting period.
Nuveen Strategic Income Fund
What strategies were used to manage the Fund during the twelve-month reporting period ended June 30, 2020 and how did these strategies influence performance?
The Fund seeks to provide investors with total return as a broadly flexible, multi-sector bond Fund. The team actively manages a diversified portfolio of investment grade and high yield debt securities from U.S. and non-U.S. issuers.
Interest rates fell sharply resulting in a steepening of the Treasury yield curve. Driven by the five Fed rate cuts, three-month T-bills ended the reporting period 196 basis points lower at 0.16%. The 10-year Treasury yield hit an all-time low well below 1% during the reporting period and ended at 0.66%, which was 134 basis points lower than where it started. As a result, U.S. Treasuries were the best-performing asset class during the reporting period, handily outperforming all other fixed income sectors.
Investment grade credit spreads ended 2019 as the tightest levels of the year versus Treasuries as macroeconomic tail risks receded throughout the first half of the reporting period. By March 2020, investment grade credit spreads widened the most we’ve seen since October 2008. By the end of March 2020, spreads started to rally again due to global central bank easing, the approval of the massive U.S. relief package, and the announcement of several liquidity facilities specifically designed to support U.S. investment grade corporate issuers. In the final months of the reporting period, the unprecedented stimulus, Fed support of credit markets and signs of an economic recovery as lockdowns eased helped investment grade credit rebound. In second quarter of 2020, the sector experienced its largest quarterly new issuance on record, which was easily absorbed as the segment saw record inflows. Investment grade credit underperformed Treasuries during the reporting period, but outperformed all other fixed income sectors, particularly high yield credit.
The high yield market started the reporting period supported by dovish central banks and stable credit fundamentals, which kept recession at bay, while capital from around the globe continued to flow into the asset class in the hunt for yield. Although earnings momentum had moderated by the end of 2019, the supportive macro backdrop and more favorable business sentiment going into 2020 provided a strong tailwind for valuations in the high yield market. However, the sudden onset of COVID-19 led to a near complete shutdown of the capital markets in March 2020, which was exacerbated by the sharp drop in crude oil prices. Together these forces drove a spike in risk premiums and dramatic high yield outflows. High yield spreads peaked at 1,100 basis points before
9
Portfolio Managers’ Comments (continued)
sharply retracing to end the reporting period at 630 basis points over Treasuries after drastic policy measures were enacted, companies tapped credit facilities and more clarity emerged regarding the differentiation between sectors, credit factors and resiliency going into recession. High yield performed well in the final three months of the reporting period as policymakers continued to support healthy market and economic functioning while portions of the country gradually reopened. As a result, high yield experienced sizable inflows back into the market, which were met with one of the largest rounds of quarterly net new issuance ($59 billion) as companies aimed to optimize their capital structure. During the reporting period, high yield significantly underperformed higher quality sectors.
In the securitized sectors, both commercial mortgage-backed securities (CMBS) and asset-backed securities (ABS) displayed lower volatility and modest outperformance of Treasuries in the first half of 2020. The CMBS asset class benefited from light new supply and increased demand for this longer duration sector as rates fell. The majority of consumer oriented ABS assets also performed well as the economic environment continued to support consumer credit. However, both segments experienced heavy selling pressure and severely dislocated markets in March 2020 after rates moved lower and credit spreads moved wider amid forced selling driven by mutual fund redemptions. Some of the hardest hit ABS sectors were those most heavily impacted by the COVID-19 crisis such as aircrafts and consumer discretionary, and likewise retail and hotel properties in CMBS. In the final months of the reporting period, ABS and CMBS spreads retraced some lost ground following monetary and fiscal stimulus actions and government intervention in the capital markets, led by higher quality securities. However, during the reporting period, CMBS and ABS underperformed Treasuries and also lagged well behind investment grade corporates.
The Fund outperformed the Bloomberg Barclays Aggregate Bond Index during the first half of the reporting period, but underperformed during the COVID-19 crisis volatility in the second half of the reporting period, leading to an overall shortfall versus the benchmark. The Fund was able to outpace the median return of its Lipper peer group due to our conservative positioning going into the COVID-19 crisis. In the second half of 2019, we had increased the Fund’s exposure in the high quality U.S. Treasury and agency MBS sectors to approximately 15% of the portfolio as valuations in the credit segment, in particular, become expensive. As a result, we were able to meaningfully capitalize on the market’s major dislocation during March 2020, using that liquidity to add back to the Fund’s credit exposure following the sell-off. As a result, the Fund had strong performance relative to its peers.
The most notable detractor from the Fund’s performance was its sector allocations, particularly its out-of-index exposure in high yield bonds, which underperformed the benchmark substantially with a flat return for the reporting period. Also, an underweight position in Treasuries proved detrimental because this segment outperformed all other fixed income sectors by a wide margin with a 10.45% return during the reporting period. The Fund does not have much Treasury exposure due to its broad multi-sector mandate, which favors spread sectors.
Security selection also detracted within the securitized sectors, including the ABS and CMBS segments. Generally speaking, our bias toward the U.S. consumer reflected in the Fund’s consumer-oriented ABS positions did not fare well. For example, selection detracted in ABS segments such as timeshares, restaurants and airline leases. In the CMBS sector, subordinate positions did not perform well during the COVID-19 crisis sell-off.
Interest rate positioning was also an overall drag on results given the move lower in rates. (Bond prices move in the opposite direction of rates.) We consistently positioned the Fund with a shorter duration relative to its benchmark during the reporting period, which lessened its interest rate sensitivity. However, rates fell across the curve with the most pronounced move lower taking place in March 2020 when policymakers made two emergency cuts to the fed funds rate to help combat the impact of the COVID-19 crisis on the economy.
A healthy allocation in preferred and contingent capital (CoCo) securities also hindered results, but was offset by strong security selection in the segment. Despite strong fundamentals and further policy support for the bank sector, fears of another 2008, when banks struggled meaningfully, weighing heavily on preferred and CoCo valuations. However, the Fund’s positions in mostly larger U.S. banks offered value given their historically strong capital positions before the crisis.
Allocations to the investment grade credit and MBS sectors modestly benefited the Fund’s performance. Investment grade credit was the second best performing segment during the reporting period behind Treasuries gaining just over 9%, while the MBS sector was up 5.7%. Both asset classes benefited from the Fed’s buying programs designed to stabilize the financial markets later in the reporting period.
10
Yield curve positioning was also modestly additive during the reporting period, but not enough to offset the drag from the Fund’s short duration stance versus its benchmark. We positioned the Fund to benefit from a steeper yield curve with an overweight in the intermediate portion of the curve and an underweight at the long end, which proved helpful.
The Fund ended the reporting period positioned with an above-average risk profile but we will look for opportunities to get more defensive as the recovery cycle progresses. We believe risk appetites may be stronger than warranted by economic conditions at the end of the reporting period. Therefore, we anticipate we may see buying opportunities toward the later part of 2020 as valuations in risk assets, including the credit sector, may correct as the COVID-19 crisis continues to weigh on the economy.
We ended the reporting period with overweight positions in credit, including hefty allocations in high yield bonds, leveraged loans and preferred/CoCo securities, and more moderate exposure in the ABS and CMBS sectors. Although we increased exposure to the high quality U.S. Treasury and MBS sectors in the second half of 2019 after valuations in the market become expensive, we used these more liquid segments to add back to credit positions following the sell-off caused by the COVID-19 crisis in late March 2020. Therefore, at the end of the reporting period, the Fund had no exposure to U.S. Treasuries and a significant underweight to MBS versus the index.
Toward the end of the reporting period, we shortened the Fund’s duration further in light of well-executed monetary policy and a shifting focus to further government stimulus. We are maintaining that stance because we believe it’s more likely that rates will rise from here. However, we don’t believe significant duration bets are compelling in the current environment given the heavy involvement of the Fed in the Treasury market. The portfolio also remained positioned to benefit from a steeper yield curve with a continued underweight at the long end of the Treasury curve.
During the reporting period, we also continued to use various derivative instruments. We used foreign currency exchange forward contracts to hedge a Euro denominated board position back to U.S. Dollars. This had a negligible impact on performance during the reporting period.
We used U.S. Treasury futures and Eurodollar futures as part of an overall portfolio construction strategy to manage portfolio duration and yield curve exposure and selected foreign bond futures to actively manage exposure to those markets. These positions had a positive impact on performance during the reporting period.
In addition, we used high yield CDX swaps to hedge a portion of the Fund’s high yield credit risk exposure. The effect of these activities on performance was negligible during the reporting period.
11
Risk Considerations and Dividend Information
Risk Considerations
Nuveen Credit Income Fund
Mutual fund investing involves risk; principal loss is possible. There is no guarantee the Fund’s investment objectives will be achieved. Credit risk arises from an issuer’s ability to make interest and principal payments when due, as well as the prices of bonds declining when an issuer’s credit quality is expected to deteriorate. The Fund’s income could decline during periods of falling interest rates. Investments in below investment grade or high yield securities are subject to liquidity risk and heightened credit risk. This Fund is subject to the risks of investing in loans, including senior loans and secured and unsecured junior loans. Unsecured loans are not backed by a security interest in collateral and involve a higher degree of risk than secured loans. Loans are also subject to settlement risk due to the lack of established settlement standards or remedies for failure to settle, and may have limited restrictive covenants on borrowers, which may weaken the Fund’s ability to access collateral securing the loan and enforce its rights as a lender. The Fund may also invest in a pool of loans through collateralized loan obligations (CLOs). In addition to the risks associated with loans and high yield securities, CLOs are subject to the risk that distributions from the collateral may not be adequate to make interest or other payments owed to the Fund. Asset-backed and mortgage-backed securities are subject to additional risks such as prepayment risk, liquidity risk, default risk and adverse economic developments. Preferred securities are subordinate to bonds and other debt instruments in a company’s capital structure and therefore are subject to greater credit risk. Certain types of preferred, hybrid or debt securities with special loss absorption provisions, such as contingent capital securities (CoCos), may be or become so subordinated that they present risks equivalent to, or in some cases even greater than, the same company’s common stock. Non-U.S. investments involve risks such as currency fluctuation, political and economic instability, lack of liquidity and differing legal and accounting standards. These risks are magnified in emerging markets. These and other risk considerations, such as call, derivatives, illiquid investments, interest rate, market, and valuation risks, are described in detail in the Fund’s prospectus.
Nuveen Strategic Income Fund
Mutual fund investing involves risk; principal loss is possible. Debt or fixed income securities such as those held by the Fund, are subject to market risk, credit risk, interest rate risk, call risk, derivatives risk, dollar roll transaction risk, and income risk. As interest rates rise, bond prices fall. Below investment grade or high yield debt securities are subject to liquidity risk and heightened credit risk. Foreign investments involve additional risks, including currency fluctuation, political and economic instability, lack of liquidity and differing legal and accounting standards. The Fund gains additional exposure to currency rates, and therefore to the risk of currency fluctuation, through investment in foreign currency contracts. The risks of foreign investments are magnified in emerging markets. Asset-backed and mortgage-backed securities are subject to additional risks such as prepayment risk, liquidity risk, default risk and adverse economic developments.
Dividend Information
Each Fund seeks to pay regular monthly dividends out of its net investment income at a rate that reflects its past and projected net income performance. To permit each Fund to maintain a more stable monthly dividend, the Fund may pay dividends at a rate that may be more or less than the amount of net income actually earned by the Fund during the period. Distributions to shareholders are determined on a tax basis, which may differ from amounts recorded in the accounting records. In instances where the monthly dividend exceeds the earned net investment income, the Fund would report a negative undistributed net ordinary income. Refer to Note 6 – Income Tax Information for additional information regarding the amounts of undistributed net ordinary income and undistributed net long-term capital gains and the character of the actual distributions paid by the Fund during the period.
All monthly dividends paid by each Fund during the current reporting period were paid from net investment income. If a portion of the Fund’s monthly distributions is sourced or comprised of elements other than net investment income, including capital gains and/or a return of capital, shareholders will be notified of those sources. For financial reporting purposes, the per share amounts of each Fund’s distributions for the reporting period are presented in this report’s Financial Highlights. For income tax purposes, distribution information for each Fund as of its most recent tax year end is presented in Note 6 – Income Tax Information within the Notes to Financial Statements of this report.
12
Special Dividend Information for Nuveen Credit Income Fund
The Nuveen Credit Income Fund seeks to pay regular monthly distributions at a level rate that reflects past and projected net income of the Fund. Because the Fund may utilize credit default swaps and invests in non-U.S. debt and fixed-income securities, in certain periods it can experience derivative losses and currency exchange losses on those holdings. Under applicable tax rules, foreign currency exchange gains or losses and certain gains or losses on credit default swap transactions are treated as ordinary income items. Consequently, if a Fund experiences a foreign currency exchange loss in a given fiscal period, that loss may offset and reduce net income which may result in the Fund’s distributions exceeding the amount of its net income for tax purposes, resulting in any over-distribution being reported on the Fund’s Form 1099 as a return of capital. For the fiscal year ended June 30, 2020, the Fund recognized prior year deferred losses related to foreign currency and credit default swap transactions, resulting in a portion of the Fund’s dividends being characterized as a return of capital for tax purposes at fiscal year-end, which is identified in the tables below.
Nuveen Credit Income Fund – Data as of June 30, 2020
| | | | | | | | | | | | | | | | | | | | | | | | | | | | | | |
| Fiscal Year 2020 | |
| | | | | Percentage of the Distribution | | | | | | Per Share Amounts | |
| Share Class | | Ticker Symbol | | Net
Investment
Income | | | Realized
Gains | | | Return of
Capital | | | Distributions | | | Net
Investment
Income | | | Realized
Gains | | | Return of
Capital | |
Class A | | FJSIX | | | 92.60% | | | | 0.00% | | | | 7.40% | | | $ | 0.3810 | | | $ | 0.3528 | | | $ | 0.0000 | | | $ | 0.0282 | |
Class C | | FCSIX | | | 91.36% | | | | 0.00% | | | | 8.64% | | | $ | 0.3265 | | | $ | 0.2983 | | | $ | 0.0000 | | | $ | 0.0282 | |
Class R3 | | FANSX | | | 92.36% | | | | 0.00% | | | | 7.64% | | | $ | 0.3690 | | | $ | 0.3408 | | | $ | 0.0000 | | | $ | 0.0282 | |
Class I | | FJSYX | | | 92.93% | | | | 0.00% | | | | 7.07% | | | $ | 0.3990 | | | $ | 0.3708 | | | $ | 0.0000 | | | $ | 0.0282 | |
13
THIS PAGE INTENTIONALLY LEFT BLANK
14
Fund Performance
and Expense Ratios
The Fund Performance and Expense Ratios for each Fund are shown within this section of the report.
Fund Performance
Returns quoted represent past performance, which is no guarantee of future results. Investment returns and principal value will fluctuate so that when shares are redeemed, they may be worth more or less than their original cost. Current performance may be higher or lower than the performance shown.
Total returns for a period of less than one year are not annualized (i.e. cumulative returns). Since inception returns are shown for share classes that have less than 10-years of performance. Returns at net asset value (NAV) would be lower if the sales charge were included. Returns assume reinvestment of dividends and capital gains. For performance current to the most recent month-end visit nuveen.com or call (800) 257-8787.
Returns do not reflect the deduction of taxes that a shareholder would pay on Fund distributions or the redemption of Fund shares.
Returns may reflect fee waivers and/or expense reimbursements by the investment adviser during the periods presented. If any such waivers and/or reimbursements had not been in place, returns would have been reduced. See Notes to Financial Statements, Note 7 – Management Fees and Other Transactions with Affiliates for more information.
Returns reflect differences in sales charges and expenses, which are primarily differences in distribution and service fees, and assume reinvestment of dividends and capital gains.
Comparative index and Lipper return information is provided for Class A Shares at NAV only.
Expense Ratios
The expense ratios shown are as of the Fund’s most recent prospectus. The expense ratios shown reflect total operating expenses (before fee waivers and/or expense reimbursements, if any). The expense ratios include management fees and other fees and expenses.
15
Fund Performance and Expense Ratios (continued)
Nuveen Credit Income Fund (formerly known as Nuveen High Income Bond Fund)
Refer to the first page of this Fund Performance and Expense Ratios section for further explanation of the information included within this section. Refer to the Glossary of Terms Used in this Report for definitions of terms used within this section.
Fund Performance and Expense Ratios
| | | | | | | | | | | | | | | | | | | | | | | | |
| | | | | | Total Return as of June 30, 2020* | | | | | | | |
| | | Inception Date | | | Average Annual | | | Expense Ratios** | |
| | | 1-Year | | | 5-Year | | | 10-Year | | | Gross | | | Net | |
| Class A Shares at NAV | |
| 8/30/01
|
| | | (5.15)% | | | | 2.53% | | | | 5.22% | | | | 1.04% | | | | 1.03% | |
| Class A Shares at maximum Offering Price | | | 8/30/01 | | | | (9.65)% | | | | 1.54% | | | | 4.72% | | | | — | | | | — | |
| Bloomberg Barclays High Yield 2% Issuer Capped Index | | | — | | | | (0.00)% | | | | 4.79% | | | | 6.67% | | | | — | | | | — | |
| Lipper Global High Yield Funds Classification Average | | | — | | | | (2.53)% | | | | 3.19% | | | | 5.43% | | | | — | | | | — | |
| | | | | | |
| Class C Shares | | | 8/30/01 | | | | (5.75)% | | | | 1.77% | | | | 4.47% | | | | 1.80% | | | | 1.78% | |
| Class R3 Shares | | | 9/24/01 | | | | (5.33)% | | | | 2.28% | | | | 4.97% | | | | 1.29% | | | | 1.28% | |
| Class I Shares | | | 8/30/01 | | | | (5.03)% | | | | 2.78% | | | | 5.49% | | | | 0.79% | | | | 0.78% | |
| * | Class A Shares have a maximum 4.75% sales charge (Offering Price). Class A Share purchases of $1 million or more are sold at net asset value without an up-front sales charge but may be subject to a contingent deferred sales charge (CDSC) of 1%, if redeemed within eighteen months of purchase. Class C Shares have a 1% CDSC for redemptions within less than twelve months, which is not reflected in the total returns. Class C Shares automatically convert to Class A Shares ten years after purchase. Class R3 Shares have no sales charge and are only available for purchase by eligible retirement plans. Class I Shares have no sales charge and may be purchased under limited circumstances or by specified classes of investors. |
| ** | The Fund’s investment adviser has contractually agreed to waive fees and/or reimburse expenses through July 31, 2022 so that total annual Fund operating expenses (excluding 12b-1 distribution and/or service fees, interest expenses, taxes, acquired fund fees and expenses, fees incurred in acquiring and disposing of portfolio securities (including prime broker fees and charges on short sales), dividend expense on securities sold short and extraordinary expenses) do not exceed 0.75% of the average daily net assets of any class of Fund shares. The expense limitation may be terminated or modified prior to that date only with the approval of the Board of Directors of the Fund. |
16
Growth of an Assumed $10,000 Investment as of June 30, 2020 – Class A Shares
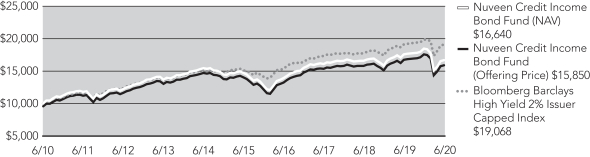
The graphs do not reflect the deduction of taxes that a shareholder may pay on Fund distributions or the redemption of Fund shares.
17
Fund Performance and Expense Ratios (continued)
Nuveen Strategic Income Fund
Refer to the first page of this Fund Performance and Expense Ratios section for further explanation of the information included within this section. Refer to the Glossary of Terms Used in this Report for definitions of terms used within this section.
Fund Performance and Expense Ratios
| | | | | | | | | | | | | | | | | | | | | | | | |
| | | | | | Total Return as of June 30, 2020* | | | | | | | |
| | | | | | Average Annual | | | Expense Ratios** | |
| | | Inception Date | | | 1-Year | | | 5-Year | | | 10-Year | | | Gross | | | Net | |
| Class A Shares at NAV | | | 2/01/00 | | | | 4.63% | | | | 3.79% | | | | 4.83% | | | | 0.97% | | | | 0.85% | |
| Class A Shares at maximum Offering Price | | | 2/01/00 | | | | 0.19% | | | | 2.88% | | | | 4.37% | | | | — | | | | — | |
| Bloomberg Barclays U.S. Aggregate Bond Index | | | — | | | | 8.74% | | | | 4.30% | | | | 3.82% | | | | — | | | | — | |
| Lipper Multi-Sector Income Funds Classification Average | | | — | | | | 1.42% | | | | 3.48% | | | | 4.62% | | | | — | | | | — | |
| | | | | | |
| Class C Shares | | | 2/01/00 | | | | 3.84% | | | | 3.03% | | | | 4.05% | | | | 1.72% | | | | 1.60% | |
| Class R3 Shares | | | 9/24/01 | | | | 4.38% | | | | 3.54% | | | | 4.56% | | | | 1.21% | | | | 1.10% | |
| Class I Shares | | | 2/01/00 | | | | 4.86% | | | | 4.05% | | | | 5.08% | | | | 0.72% | | | | 0.60% | |
| | | | | | | | | | | | | | | | | | | | | | | | |
| | | | | | Total Return as of June 30, 2020* | | | | | | | |
| | | | | | Average Annual | | | Expense Ratios** | |
| | | Inception
Date | | | 1-Year | | | 5-Year | | | Since
Inception | | | Gross | | | Net | |
Class R6 Shares | | | 1/20/15 | | | | 4.96% | | | | 4.14% | | | | 3.78% | | | | 0.63% | | | | 0.51% | |
| * | Class A Shares have a maximum 4.25% sales charge (Offering Price). Class A Share purchases of $1 million or more are sold at net asset value without an up-front sales charge but may be subject to a contingent deferred sales charge (CDSC) of 1%, if redeemed within eighteen months of purchase. Class C Shares have a 1% CDSC for redemptions within less than twelve months, which is not reflected in the total returns. Class C Shares automatically convert to Class A Shares ten years after purchase. Class R3 Shares have no sales charge and are only available for purchase by eligible retirement plans. Class R6 Shares have no sales charge and are available only to certain limited categories of investors as described in the prospectus. Class I Shares have no sales charge and may be purchased under limited circumstances or by specified classes of investors. |
| ** | The Fund’s investment adviser has contractually agreed to waive fees and/or reimburse expenses through July 31, 2021 so that total annual Fund operating expenses (excluding 12b-1 distribution and/or service fees, interest expenses, taxes, acquired fund fees and expenses, fees incurred in acquiring and disposing of portfolio securities (including prime broker fees and charges on short sales), dividend expense on securities sold short and extraordinary expenses) do not exceed 0.59% of the average daily net assets of any class of Fund shares. However, because Class R6 shares are not subject to sub-transfer agent and similar fees, total annual operating expenses for the Class R6 shares will be less than the expense limitation. The expense limitation may be terminated or modified prior to that date only with the approval of the Board of Directors of the Fund. |
18
Growth of an Assumed $10,000 Investment as of June 30, 2020 – Class A Shares
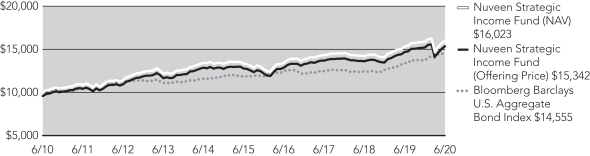
The graphs do not reflect the deduction of taxes that a shareholder may pay on Fund distributions or the redemption of Fund shares.
19
Yields as of June 30, 2020
Dividend Yield is the most recent dividend per share (annualized) divided by the offering price per share.
The SEC 30-Day Yield is a standardized measure of a fund’s yield that accounts for the future amortization of premiums or discounts of bonds held in the fund’s portfolio. The SEC 30-Day Yield is computed under an SEC standardized formula and is based on the maximum offer price per share. Subsidized yields reflect fee waivers and/or expense reimbursements from the investment adviser during the period. If any such waivers and/or reimbursements had not been in place, yields would have been reduced. Unsubsidized yields do not reflect waivers and/or reimbursements from the investment adviser during the period. If the fund did not receive a fee waiver/expense reimbursement during the period under its most recent agreement, subsidized and unsubsidized yields will be equal. Refer to the Notes to Financial Statements, Note 7 – Management Fees and Other Transactions with Affiliates for further details on the investment adviser’s most recent agreement with the Fund to waive fees and/or reimburse expenses, where applicable. Dividend Yield may differ from the SEC 30-Day Yield because the fund may be paying out more or less than it is earning and it may not include the effect of amortization of bond premium.
Nuveen Credit Income Fund
| | | | | | | | | | | | | | | | |
| | | Share Class | |
| | | Class A1 | | | Class C | | | Class R3 | | | Class I | |
Dividend Yield | | | 4.62% | | | | 4.13% | | | | 4.56% | | | | 5.10% | |
SEC 30-Day Yield-Subsidized | | | 4.83% | | | | 4.33% | | | | 4.84% | | | | 5.33% | |
SEC 30-Day Yield-Unsubsidized | | | 4.83% | | | | 4.33% | | | | 4.83% | | | | 5.33% | |
Nuveen Strategic Income Fund
| | | | | | | | | | | | | | | | | | | | |
| | | Share Class | |
| | | Class A1 | | | Class C | | | Class R3 | | | Class R6 | | | Class I | |
Dividend Yield | | | 3.55% | | | | 2.99% | | | | 3.47% | | | | 4.03% | | | | 3.93% | |
SEC 30-Day Yield-Subsidized | | | 3.46% | | | | 2.87% | | | | 3.37% | | | | 3.94% | | | | 3.87% | |
SEC 30-Day Yield-Unsubsidized | | | 3.46% | | | | 2.87% | | | | 3.37% | | | | 3.94% | | | | 3.87% | |
| 1 | The SEC Yield for Class A Shares quoted in the table reflects the maximum sales load. Investors paying a reduced load because of volume discounts, investors paying no load because they qualify for one of the several exclusions from the load, and existing shareholders who previously paid a load but would like to know the SEC Yield applicable to their shares on a going-forward basis, should understand that the SEC Yield effectively applicable to them would be higher than the figure quoted in the table. |
20
Holding Summaries as of June 30, 2020
This data relates to the securities held in each Fund’s portfolio of investments as of the end of this reporting period. It should not be construed as a measure of performance for the Fund itself. Holdings are subject to change.
For financial reporting purposes, the ratings disclosed are the highest rating given by one of the following national rating agencies: Standard & Poor’s, Moody’s Investors Service, Inc. or Fitch, Inc. This treatment of split-rated securities may differ from that used for other purposes, such as for Fund investment policies. Credit ratings are subject to change. AAA, AA, A and BBB are investment grade ratings; BB, B, CCC, CC, C and D are below investment grade ratings. Holdings designated N/R are not rated by these national rating agencies.
Refer to the Glossary of Terms Used in this Report for further definition of the terms used within this section.
Nuveen Credit Income Fund
Fund Allocation
(% of net assets)
| | | | |
| Corporate Bonds | | | 88.5% | |
| Exchange-Traded Funds | | | 4.4% | |
| Variable Rate Senior Loan Interests | | | 1.5% | |
| Contingent Capital Securities | | | 0.8% | |
| $25 Par (or similar) Retail Preferred | | | 0.4% | |
| $1,000 Par (or similar) Institutional Preferred | | | 0.2% | |
| Common Stocks | | | 0.0% | |
| Investments Purchased with Collateral from Securities Lending | | | 1.1% | |
| Money Market Funds | | | 7.3% | |
| Other Assets Less Liabilities | | | (4.2)% | |
Net Assets | | | 100% | |
Corporate Bonds: Industries
(% of total corporate bonds)
| | | | |
| Media | | | 9.6% | |
| |
Oil, Gas & Consumable Fuels | | | 8.7% | |
| |
Health Care Providers & Services | | | 8.1% | |
| |
Diversified Telecommunication Services | | | 7.1% | |
| |
Chemicals | | | 5.7% | |
| |
Electrical Utilities | | | 4.9% | |
| |
Specialty Retail | | | 4.4% | |
| |
Consumer Finance | | | 4.0% | |
| |
Auto Components | | | 3.2% | |
| |
Metals & Mining | | | 2.9% | |
| |
Diversified Financial Services | | | 2.8% | |
| |
Pharmaceuticals | | | 2.6% | |
| |
Commercial Services & Supplies | | | 2.6% | |
| |
Equity Real Estate Investment Trust | | | 2.4% | |
| |
Trading Companies & Distributors | | | 2.3% | |
| |
Automobiles | | | 2.2% | |
| |
Insurance | | | 2.0% | |
| |
Food Products | | | 2.0% | |
| |
Communications Equipment | | | 2.0% | |
| |
Household Durables | | | 1.7% | |
| |
Other | | | 18.8% | |
Total | | | 100% | |
Portfolio Credit Quality
(% of total long-term fixed-income investments)
| | | | |
| BBB | | | 12.5% | |
| |
BB or Lower | | | 87.0% | |
| |
N/R (not rated) | | | 0.5% | |
Total | | | 100% | |
21
Holding Summaries as of June 30, 2020 (continued)
Nuveen Strategic Income Fund
Fund Allocation
(% of net assets)
| | | | |
| Corporate Bonds | | | 41.3% | |
| Asset-Backed and Mortgage-Backed Securities | | | 31.6% | |
| Variable Rate Senior Loan Interests | | | 9.5% | |
| $1,000 Par (or similar) Institutional Preferred | | | 6.9% | |
| Contingent Capital Securities | | | 4.0% | |
| Sovereign Debt | | | 2.6% | |
| Municipal Bonds | | | 1.9% | |
| $25 Par (or similar) Retail Preferred | | | 0.6% | |
| Investments Purchased with Collateral from Securities Lending | | | 0.3% | |
| Money Market Funds | | | 1.8% | |
| Other Assets Less Liabilities | | | (0.5)% | |
| |
Net Assets | | | 100% | |
Corporate Bonds: Industries
(% of total corporate bonds)
| | | | |
| Banks | | | 17.4% | |
| Oil, Gas & Consumable Fuels | | | 12.5% | |
| Diversified Telecommunication Services | | | 4.7% | |
| Capital Markets | | | 4.6% | |
| Insurance | | | 4.1% | |
| Media | | | 4.1% | |
| Equity Real Estate Investment Trust | | | 3.8% | |
| Chemicals | | | 3.8% | |
| Electric Utilities | | | 3.6% | |
| Consumer Finance | | | 3.5% | |
| Diversified Financial Services | | | 3.1% | |
| Specialty Retail | | | 2.3% | |
| Wireless Telecommunication Services | | | 2.2% | |
| Road & Rail | | | 2.1% | |
| Health Care Providers & Services | | | 1.8% | |
| Aerospace & Defense | | | 1.8% | |
| Automobiles | | | 1.7% | |
| Pharmaceuticals | | | 1.6% | |
| Metals & Mining | | | 1.2% | |
| Trading Companies & Distributors | | | 1.2% | |
| Other | | | 18.9% | |
Total | | | 100% | |
Portfolio Credit Quality
(% of total long-term fixed-income investments)
| | | | |
| AAA | | | 13.6% | |
| AA | | | 3.8% | |
| A | | | 14.5% | |
| BBB | | | 32.7% | |
| BB or Lower | | | 29.4% | |
| N/R (not rated) | | | 6.0% | |
Total | | | 100% | |
22
Expense Examples
As a shareholder of one or more of the Funds, you incur two types of costs: (1) transaction costs, including up-front and back-end sales charges (loads) or redemption fees, where applicable; and (2) ongoing costs, including management fees; distribution and service (12b-1) fees, where applicable; and other Fund expenses. The Examples below are intended to help you understand your ongoing costs (in dollars) of investing in the Funds and to compare these costs with the ongoing costs of investing in other mutual funds.
The Examples below are based on an investment of $1,000 invested at the beginning of the period and held through the period ended June 30, 2020.
The beginning of the period for the funds is January 1, 2020.
The information under “Actual Performance,” together with the amount you invested, allows you to estimate actual expenses incurred over the reporting period. Simply divide your account value by $1,000 (for example, an $8,600 account value divided by $1,000 = 8.60) and multiply the result by the cost shown for your share class, in the row entitled “Expenses Incurred During Period” to estimate the expenses incurred on your account during this period.
The information under “Hypothetical Performance,” provides information about hypothetical account values and hypothetical expenses based on each Fund’s actual expense ratio and an assumed rate of return of 5% per year before expenses, which is not the Fund’s actual return. The hypothetical account values and expenses may not be used to estimate the actual ending account balance or expense you incurred for the period. You may use this information to compare the ongoing costs of investing in the Fund and other funds. To do so, compare this 5% hypothetical example with the 5% hypothetical examples that appear in the shareholder reports of the other funds.
Please note that the expenses shown in the tables are meant to highlight your ongoing costs only and do not reflect any transaction costs. Therefore, the hypothetical information is useful in comparing ongoing costs only, and will not help you determine the relative total costs of owning different funds or share classes. In addition, if these transaction costs were included, your costs would have been higher.
Nuveen Credit Income Fund
| | | | | | | | | | | | | | | | |
| | | Share Class | |
| | | A Shares | | | C Shares | | | R3 Shares | | | I Shares | |
Actual Performance | | | | | | | | | | | | | | | | |
Beginning Account Value | | $ | 1,000.00 | | | $ | 1,000.00 | | | $ | 1,000.00 | | | $ | 1,000.00 | |
Ending Account Value | | $ | 902.83 | | | $ | 900.37 | | | $ | 902.77 | | | $ | 904.28 | |
Expenses Incurred During the Period | | $ | 4.73 | | | $ | 8.27 | | | $ | 5.91 | | | $ | 3.55 | |
Hypothetical Performance (5% annualized return before expenses) | | | | | | | | | | | | | | | | |
Beginning Account Value | | $ | 1,000.00 | | | $ | 1,000.00 | | | $ | 1,000.00 | | | $ | 1,000.00 | |
Ending Account Value | | $ | 1,019.89 | | | $ | 1,016.16 | | | $ | 1,018.65 | | | $ | 1,021.13 | |
Expenses Incurred During the Period | | $ | 5.02 | | | $ | 8.77 | | | $ | 6.27 | | | $ | 3.77 | |
For each class of the Fund, expenses are equal to the Fund’s annualized net expense ratio of 1.00%, 1.75%, 1.25% and 0.75% for Classes A, C, R3 and I, respectively, multiplied by the average account value over the period, multiplied by 182/366 (to reflect the one-half year period).
23
Expense Examples (continued)
Nuveen Strategic Income Fund
| | | | | | | | | | | | | | | | | | | | |
| | | Share Class | |
| | | A Shares | | | C Shares | | | R3 Shares | | | R6 Shares | | | I Shares | |
Actual Performance | | | | | | | | | | | | | | | | | | | | |
Beginning Account Value | | $ | 1,000.00 | | | $ | 1,000.00 | | | $ | 1,000.00 | | | $ | 1,000.00 | | | $ | 1,000.00 | |
Ending Account Value | | $ | 1,009.50 | | | $ | 1,005.62 | | | $ | 1,008.34 | | | $ | 1,010.24 | | | $ | 1,010.65 | |
Expenses Incurred During the Period | | $ | 4.20 | | | $ | 7.93 | | | $ | 5.44 | | | $ | 2.45 | | | $ | 2.95 | |
Hypothetical Performance (5% annualized return before expenses) | | | | | | | | | | | | | | | | | | | | |
Beginning Account Value | | $ | 1,000.00 | | | $ | 1,000.00 | | | $ | 1,000.00 | | | $ | 1,000.00 | | | $ | 1,000.00 | |
Ending Account Value | | $ | 1,020.69 | | | $ | 1,016.96 | | | $ | 1,019.44 | | | $ | 1,022.43 | | | $ | 1,021.93 | |
Expenses Incurred During the Period | | $ | 4.22 | | | $ | 7.97 | | | $ | 5.47 | | | $ | 2.46 | | | $ | 2.97 | |
For each class of the Fund, expenses are equal to the Fund’s annualized net expense ratio of 0.84%, 1.59%, 1.09%, 0.49%, 0.59% for Classes A, C, R3, R6 and I, respectively, multiplied by the average account value over the period, multiplied by 182/366 (to reflect the one-half year period).
24
Report of Independent Registered Public Accounting Firm
To the Board of Directors of Nuveen Investment Funds, Inc. and Shareholders of
Nuveen Credit Income Fund (formerly known as Nuveen High Income Bond Fund)
Nuveen Strategic Income Fund
Opinions on the Financial Statements
We have audited the accompanying statements of assets and liabilities, including the portfolios of investments, of Nuveen Credit Income Fund (formerly known as Nuveen High Income Bond Fund) and Nuveen Strategic Income Fund (two of the Funds constituting Nuveen Investment Funds, Inc., hereafter collectively referred to as the “Funds”) as of June 30, 2020, the related statements of operations for the year ended June 30, 2020, the statements of changes in net assets for each of the two years in the period ended June 30, 2020, including the related notes, and the financial highlights for each of the five years in the period ended June 30, 2020 (collectively referred to as the “financial statements”). In our opinion, the financial statements present fairly, in all material respects, the financial position of each of the Funds as of June 30, 2020, the results of each of their operations for the year then ended, the changes in each of their net assets for each of the two years in the period ended June 30, 2020 and each of the financial highlights for each of the five years in the period ended June 30, 2020, in conformity with accounting principles generally accepted in the United States of America.
Basis for Opinions
These financial statements are the responsibility of the Funds’ management. Our responsibility is to express an opinion on the Funds’ financial statements based on our audits. We are a public accounting firm registered with the Public Company Accounting Oversight Board (United States) (PCAOB) and are required to be independent with respect to the Funds in accordance with the U.S. federal securities laws and the applicable rules and regulations of the Securities and Exchange Commission and the PCAOB.
We conducted our audits of these financial statements in accordance with the standards of the PCAOB. Those standards require that we plan and perform the audit to obtain reasonable assurance about whether the financial statements are free of material misstatement, whether due to error or fraud.
Our audits included performing procedures to assess the risks of material misstatement of the financial statements, whether due to error or fraud, and performing procedures that respond to those risks. Such procedures included examining, on a test basis, evidence regarding the amounts and disclosures in the financial statements. Our audits also included evaluating the accounting principles used and significant estimates made by management, as well as evaluating the overall presentation of the financial statements. Our procedures included confirmation of securities owned as of June 30, 2020 by correspondence with the custodians and brokers; when replies were not received from brokers, we performed other auditing procedures. We believe that our audits provide a reasonable basis for our opinions.
PricewaterhouseCoopers LLP
Chicago, Illinois
August 27, 2020
We have served as the auditor of one or more investment companies in Nuveen Funds since 2002.
25
Nuveen Credit Income Fund
(formerly known as Nuveen High Income Bond Fund)
Portfolio of Investments June 30, 2020
| | | | | | | | | | | | | | | | | | | | | | | | | | | | |
Principal
Amount (000) | | | Description (1) | | | | | | | | Coupon | | | Maturity | | | Ratings (2) | | | Value | |
| | | | | | | |
| | | | LONG-TERM INVESTMENTS – 95.8% | | | | | | | | | | | | | | | | | | | | | | | | |
| | | | | | | |
| | | | CORPORATE BONDS – 88.5% | | | | | | | | | | | | | | | | | | | | | | | | |
| | | | | | | |
| | | | Aerospace & Defense – 0.8% | | | | | | | | | | | | | | | | | | |
| | | | | | | |
| $ | 1,350 | | | Bombardier Inc, 144A | | | | | | | | | | | 7.875% | | | | 4/15/27 | | | | B | | | $ | 884,250 | |
| | | | | | | |
| | 275 | | | Howmet Aerospace Inc | | | | | | | | | | | 6.875% | | | | 5/01/25 | | | | BBB– | | | | 298,683 | |
| | | | | | | |
| | 250 | | | TransDigm Inc, 144A | | | | | | | | | | | 8.000% | | | | 12/15/25 | | | | Ba3 | | | | 262,748 | |
| | 1,875 | | | Total Aerospace & Defense | | | | | | | | | | | | | | | | | | | | | | | 1,445,681 | |
| | | | | | | |
| | | | Airlines – 1.3% | | | | | | | | | | | | | | | | | | |
| | | | | | | |
| | 900 | | | Delta Air Lines Inc, 144A | | | | | | | | | | | 7.000% | | | | 5/01/25 | | | | Baa2 | | | | 929,041 | |
| | | | | |
| | 1,400 | | | Mileage Plus Holdings LLC / Mileage Plus Intellectual Property Assets Ltd, 144A | | | | 6.500% | | | | 6/20/27 | | | | Baa3 | | | | 1,403,500 | |
| | 2,300 | | | Total Airlines | | | | | | | | | | | | | | | | | | | | | | | 2,332,541 | |
| | | | | | | |
| | | | Auto Components – 2.9% | | | | | | | | | | | | | | | | | | |
| | | | | | | |
| | 1,000 | | | Adient Global Holdings Ltd, 144A | | | | | | | | | | | 4.875% | | | | 8/15/26 | | | | B | | | | 825,000 | |
| | | | | | | |
| | 200 | | | Adient US LLC, 144A | | | | | | | | | | | 9.000% | | | | 4/15/25 | | | | Ba3 | | | | 215,440 | |
| | | | | | | |
| | 150 | | | Clarios Global LP, 144A | | | | | | | | | | | 6.750% | | | | 5/15/25 | | | | B1 | | | | 156,000 | |
| | | | | | |
| | 1,500 | | | Panther BF Aggregator 2 LP / Panther Finance Co Inc, 144A | | | | | | | | 8.500% | | | | 5/15/27 | | | | CCC+ | | | | 1,507,425 | |
| | | | | | | |
| | 175 | | | Dana Inc | | | | | | | | | | | 5.375% | | | | 11/15/27 | | | | BB+ | | | | 173,688 | |
| | | | | | | |
| | 225 | | | Dana Inc | | | | | | | | | | | 5.625% | | | | 6/15/28 | | | | BB+ | | | | 223,355 | |
| | | | | | | |
| | 700 | | | Goodyear Tire & Rubber Co | | | | | | | | | | | 9.500% | | | | 5/31/25 | | | | BB– | | | | 749,875 | |
| | | | | |
| | 1,475 | | | IHO Verwaltungs GmbH, 144A, (cash 4.750%, PIK 5.500%) | | | | 4.750% | | | | 9/15/26 | | | | BB+ | | | | 1,445,500 | |
| | 5,425 | | | Total Auto Components | | | | | | | | | | | | | | | | | | | | | | | 5,296,283 | |
| | | | | | | |
| | | | Automobiles – 2.0% | | | | | | | | | | | | | | | | | | |
| | | | | | | |
| | 375 | | | Ford Motor Co | | | | | | | | | | | 8.500% | | | | 4/21/23 | | | | BB+ | | | | 396,562 | |
| | | | | | | |
| | 375 | | | Ford Motor Co | | | | | | | | | | | 9.000% | | | | 4/22/25 | | | | BB+ | | | | 405,469 | |
| | | | | | | |
| | 225 | | | Ford Motor Co, (3) | | | | | | | | | | | 9.625% | | | | 4/22/30 | | | | BB+ | | | | 266,468 | |
| | | | | | | |
| | 1,000 | | | Ford Motor Credit Co LLC | | | | | | | | | | | 5.875% | | | | 8/02/21 | | | | BB+ | | | | 1,009,700 | |
| | | | | | | |
| | 700 | | | Ford Motor Credit Co LLC | | | | | | | | | | | 3.219% | | | | 1/09/22 | | | | BB+ | | | | 680,897 | |
| | | | | | | |
| | 1,000 | | | Ford Motor Credit Co LLC | | | | | | | | | | | 4.063% | | | | 11/01/24 | | | | BB+ | | | | 953,550 | |
| | 3,675 | | | Total Automobiles | | | | | | | | | | | | | | | | | | | | | | | 3,712,646 | |
| | | | | | | |
| | | | Building Products – 1.5% | | | | | | | | | | | | | | | | | | |
| | | | | | | |
| | 225 | | | Builders FirstSource Inc, 144A | | | | | | | | | | | 6.750% | | | | 6/01/27 | | | | BB+ | | | | 230,344 | |
| | | | | | | |
| | 2,000 | | | James Hardie International Finance DAC, 144A | | | | | | | | | | | 5.000% | | | | 1/15/28 | | | | BBB– | | | | 2,040,000 | |
| | | | | | | |
| | 425 | | | Masonite International Corp, 144A | | | | | | | | | | | 5.375% | | | | 2/01/28 | | | | BB+ | | | | 434,562 | |
| | 2,650 | | | Total Building Products | | | | | | | | | | | | | | | | | | | | | | | 2,704,906 | |
| | | | | | | |
| | | | Capital Markets – 1.1% | | | | | | | | | | | | | | | | | | |
| | | | | | | |
| | 500 | | | Donnelley Financial Solutions Inc | | | | | | | | | | | 8.250% | | | | 10/15/24 | | | | B | | | | 492,545 | |
| | | | | | | |
| | 1,250 | | | Jefferies Finance LLC / JFIN Co-Issuer Corp, 144A | | | | | | | | | | | 7.250% | | | | 8/15/24 | | | | BB– | | | | 1,100,000 | |
26
| | | | | | | | | | | | | | | | | | | | | | | | | | | | |
Principal
Amount (000) | | | Description (1) | | | | | | | | Coupon | | | Maturity | | | Ratings (2) | | | Value | |
| | | | | | | |
| | | | Capital Markets (continued) | | | | | | | | | | | | | | | | | | |
| | | | | | | |
| $ | 525 | | | LPL Holdings Inc, 144A | | | | | | | | | | | 4.625% | | | | 11/15/27 | | | | BB | | | $ | 518,438 | |
| | 2,275 | | | Total Capital Markets | | | | | | | | | | | | | | | | | | | | | | | 2,110,983 | |
| | | | | | | |
| | | | Chemicals – 5.1% | | | | | | | | | | | | | | | | | | |
| | | | | |
| | 1,000 | | | Calumet Specialty Products Partners LP / Calumet Finance Corp, 144A, (3) | | | | 11.000% | | | | 4/15/25 | | | | B– | | | | 970,000 | |
| | | | | | | |
| | 1,250 | | | CF Industries Inc | | | | | | | | | | | 5.375% | | | | 3/15/44 | | | | BB+ | | | | 1,351,625 | |
| | | | | | | |
| | 1,000 | | | Chemours Co | | | | | | | | | | | 5.375% | | | | 5/15/27 | | | | B1 | | | | 903,690 | |
| | | | | | | |
| | 1,500 | | | NOVA Chemicals Corp, 144A | | | | | | | | | | | 4.875% | | | | 6/01/24 | | | | BB– | | | | 1,398,750 | |
| | | | | | | |
| | 1,250 | | | OCI NV, 144A | | | | | | | | | | | 6.625% | | | | 4/15/23 | | | | BB | | | | 1,256,250 | |
| | | | | | | |
| | 525 | | | OCI NV, 144A | | | | | | | | | | | 5.250% | | | | 11/01/24 | | | | BB | | | | 504,000 | |
| | | | | | | |
| | 375 | | | PolyOne Corp, 144A | | | | | | | | | | | 5.750% | | | | 5/15/25 | | | | BB– | | | | 385,781 | |
| | | | | |
| | 1,000 | | | Trinseo Materials Operating SCA / Trinseo Materials Finance Inc, 144A | | | | 5.375% | | | | 9/01/25 | | | | B | | | | 947,500 | |
| | | | | | | |
| | 500 | | | Tronox Finance PLC, 144A | | | | | | | | | | | 5.750% | | | | 10/01/25 | | | | B | | | | 462,500 | |
| | | | | | | |
| | 950 | | | Tronox Inc, 144A | | | | | | | | | | | 6.500% | | | | 5/01/25 | | | | Ba3 | | | | 954,750 | |
| | | | | | | |
| | 325 | | | Univar Solutions USA Inc/Washington, 144A | | | | | | | | | | | 5.125% | | | | 12/01/27 | | | | BB | | | | 328,777 | |
| | 9,675 | | | Total Chemicals | | | | | | | | | | | | | | | | | | | | | | | 9,463,623 | |
| | | | | | | |
| | | | Commercial Services & Supplies – 2.3% | | | | | | | | | | | | | | | | | | |
| | | | | | | |
| | 1,000 | | | ADT Security Corp, 144A | | | | | | | | | | | 4.875% | | | | 7/15/32 | | | | BB– | | | | 910,000 | |
| | | | | | | |
| | 100 | | | Cimpress PLC, 144A | | | | | | | | | | | 7.000% | | | | 6/15/26 | | | | B– | | | | 92,250 | |
| | | | | | | |
| | 125 | | | GFL Environmental Inc, 144A | | | | | | | | | | | 4.250% | | | | 6/01/25 | | | | BB– | | | | 126,094 | |
| | | | | | | |
| | 135 | | | GFL Environmental Inc, 144A | | | | | | | | | | | 7.000% | | | | 6/01/26 | | | | B– | | | | 140,400 | |
| | | | | | | |
| | 175 | | | GFL Environmental Inc, 144A | | | | | | | | | | | 5.125% | | | | 12/15/26 | | | | BB– | | | | 181,125 | |
| | | | | | | |
| | 315 | | | GFL Environmental Inc, 144A | | | | | | | | | | | 8.500% | | | | 5/01/27 | | | | B– | | | | 342,562 | |
| | | | | | | |
| | 525 | | | KAR Auction Services Inc, 144A | | | | | | | | | | | 5.125% | | | | 6/01/25 | | | | B– | | | | 517,125 | |
| | | | | |
| | 1,450 | | | Prime Security Services Borrower LLC / Prime Finance Inc, 144A | | | | 6.250% | | | | 1/15/28 | | | | B– | | | | 1,365,755 | |
| | | | | | | |
| | 600 | | | Stericycle Inc, 144A | | | | | | | | | | | 5.375% | | | | 7/15/24 | | | | BB | | | | 615,000 | |
| | 4,425 | | | Total Commercial Services & Supplies | | | | | | | | | | | | | | | | | | | | | | | 4,290,311 | |
| | | | | | | |
| | | | Communications Equipment – 1.7% | | | | | | | | | | | | | | | | | | |
| | | | | | | |
| | 500 | | | CommScope Inc, 144A | | | | | | | | | | | 5.500% | | | | 6/15/24 | | | | B– | | | | 509,165 | |
| | | | | | | |
| | 750 | | | CommScope Technologies LLC, 144A | | | | | | | | | | | 6.000% | | | | 6/15/25 | | | | B– | | | | 724,275 | |
| | | | | | | |
| | 750 | | | CommScope Technologies LLC, 144A | | | | | | | | | | | 5.000% | | | | 3/15/27 | | | | B– | | | | 675,525 | |
| | | | | | | |
| | 1,325 | | | ViaSat Inc | | | | | | | | | | | 6.500% | | | | 7/15/28 | | | | BB– | | | | 1,325,278 | |
| | 3,325 | | | Total Communications Equipment | | | | | | | | | | | | | | | | | | | | | | | 3,234,243 | |
| | | | | | | |
| | | | Construction & Engineering – 0.9% | | | | | | | | | | | | | | | | | | |
| | | | | | | |
| | 350 | | | AECOM | | | | | | | | | | | 5.125% | | | | 3/15/27 | | | | BB– | | | | 376,250 | |
| | | | | | | |
| | 1,000 | | | PowerTeam Services LLC, 144A | | | | | | | | | | | 9.033% | | | | 12/04/25 | | | | B– | | | | 1,020,000 | |
| | | | | | | |
| | 250 | | | Standard Industries, Inc, 144A | | | | | | | | | | | 5.000% | | | | 2/15/27 | | | | BBB– | | | | 253,125 | |
| | 1,600 | | | Total Construction & Engineering | | | | | | | | | | | | | | | | | | | | | | | 1,649,375 | |
| | | | | | | |
| | | | Construction Materials – 0.4% | | | | | | | | | | | | | | | | | | |
| | | | | | | |
| | 800 | | | Gates Global LLC / Gates Corp, 144A | | | | | | | | | | | 6.250% | | | | 1/15/26 | | | | B | | | | 792,328 | |
27
Nuveen Credit Income Fund (continued)
(formerly known as Nuveen High Income Bond Fund)
Portfolio of Investments June 30, 2020
| | | | | | | | | | | | | | | | | | | | | | | | | | | | |
Principal
Amount (000) | | | Description (1) | | | | | | | | Coupon | | | Maturity | | | Ratings (2) | | | Value | |
| | | | | | | |
| | | | Consumer Finance – 3.6% | | | | | | | | | | | | | | | | | | |
| | | | | | | |
| $ | 1,000 | | | Curo Group Holdings Corp, 144A | | | | | | | | | | | 8.250% | | | | 9/01/25 | | | | B– | | | $ | 799,700 | |
| | | | | | | |
| | 1,000 | | | Enova International Inc, 144A | | | | | | | | | | | 8.500% | | | | 9/15/25 | | | | B2 | | | | 902,500 | |
| | | | | | | |
| | 1,500 | | | Refinitiv US Holdings Inc, 144A | | | | | | | | | | | 6.250% | | | | 5/15/26 | | | | BB+ | | | | 1,590,000 | |
| | | | | | | |
| | 1,500 | | | Refinitiv US Holdings Inc, 144A | | | | | | | | | | | 8.250% | | | | 11/15/26 | | | | B+ | | | | 1,624,455 | |
| | | | | | | |
| | 1,325 | | | Springleaf Finance Corp | | | | | | | | | | | 6.125% | | | | 3/15/24 | | | | BB– | | | | 1,346,531 | |
| | | | | | | |
| | 425 | | | Springleaf Finance Corp | | | | | | | | | | | 5.375% | | | | 11/15/29 | | | | BB– | | | | 399,500 | |
| | 6,750 | | | Total Consumer Finance | | | | | | | | | | | | | | | | | | | | | | | 6,662,686 | |
| | | | | | | |
| | | | Containers & Packaging – 0.1% | | | | | | | | | | | | | | | | | | |
| | | | | | | |
| | 125 | | | Berry Global Inc, 144A | | | | | | | | | | | 5.625% | | | | 7/15/27 | | | | BB | | | | 128,438 | |
| | | | | | | |
| | | | Diversified Consumer Services – 0.5% | | | | | | | | | | | | | | | | | | |
| | | | | | | |
| | 750 | | | frontdoor Inc, 144A | | | | | | | | | | | 6.750% | | | | 8/15/26 | | | | B | | | | 796,875 | |
| | | | | | | |
| | 200 | | | QVC Inc | | | | | | | | | | | 4.750% | | | | 2/15/27 | | | | BBB– | | | | 193,400 | |
| | 950 | | | Total Diversified Consumer Services | | | | | | | | | | | | | | | | | | | | | | | 990,275 | |
| | | | | | | |
| | | | Diversified Financial Services – 2.5% | | | | | | | | | | | | | | | | | | |
| | | | | | | |
| | 1,200 | | | Genesis Energy LP / Genesis Energy Finance Corp | | | | | | | | | | | 7.750% | | | | 2/01/28 | | | | B+ | | | | 1,068,000 | |
| | | | | | | |
| | 475 | | | HAT Holdings I LLC / HAT Holdings II LLC, 144A | | | | | | | | | | | 6.000% | | | | 4/15/25 | | | | BB+ | | | | 497,562 | |
| | | | | | | |
| | 1,000 | | | Icahn Enterprises LP / Icahn Enterprises Finance Corp | | | | | | | | | | | 6.375% | | | | 12/15/25 | | | | BB+ | | | | 990,000 | |
| | | | | | | |
| | 450 | | | Jefferies Finance LLC / JFIN Co-Issuer Corp, 144A | | | | | | | | | | | 6.250% | | | | 6/03/26 | | | | Ba2 | | | | 419,625 | |
| | | | | | | |
| | 700 | | | Lions Gate Capital Holdings LLC, 144A | | | | | | | | | | | 6.375% | | | | 2/01/24 | | | | B2 | | | | 682,500 | |
| | | | | | | |
| | 1,000 | | | Quicken Loans LLC, 144A | | | | | | | | | | | 5.250% | | | | 1/15/28 | | | | Ba1 | | | | 1,040,000 | |
| | 4,825 | | | Total Diversified Financial Services | | | | | | | | | | | | | | | | | | | | | | | 4,697,687 | |
| | | | | | | |
| | | | Diversified Telecommunication Services – 6.3% | | | | | | | | | | | | | | | | | | |
| | | | | | | |
| | 1,650 | | | DISH DBS Corp, 144A | | | | | | | | | | | 7.375% | | | | 7/01/28 | | | | B2 | | | | 1,639,687 | |
| | | | | | | |
| | 1,000 | | | Embarq Corp | | | | | | | | | | | 7.995% | | | | 6/01/36 | | | | BB | | | | 1,123,000 | |
| | | | | | | |
| | 2,050 | | | Level 3 Financing Inc, 144A | | | | | | | | | | | 4.250% | | | | 7/01/28 | | | | BB | | | | 2,047,294 | |
| | | | | | | |
| | 903 | | | Meredith Corp, 144A | | | | | | | | | | | 6.500% | | | | 7/01/25 | | | | BB– | | | | 893,970 | |
| | | | | | | |
| | 1,000 | | | Occidental Petroleum Corp, (WI/DD) | | | | | | | | | | | 8.000% | | | | 7/15/25 | | | | BB+ | | | | 1,003,750 | |
| | | | | | | |
| | 1,000 | | | Occidental Petroleum Corp, (WI/DD) | | | | | | | | | | | 8.500% | | | | 7/15/27 | | | | BB+ | | | | 1,002,500 | |
| | | | | | | |
| | 2,175 | | | Occidental Petroleum Corp, (WI/DD) | | | | | | | | | | | 8.875% | | | | 7/15/30 | | | | BB+ | | | | 2,172,281 | |
| | | | | | | |
| | 250 | | | Sprint Capital Corp | | | | | | | | | | | 8.750% | | | | 3/15/32 | | | | BB+ | | | | 357,373 | |
| | | | | | | |
| | 600 | | | Telenet Finance Luxembourg Notes Sarl, 144A | | | | | | | | | | | 5.500% | | | | 3/01/28 | | | | BB+ | | | | 624,019 | |
| | | | | | | |
| | 825 | | | Zayo Group Holdings Inc, 144A | | | | | | | | | | | 4.000% | | | | 3/01/27 | | | | B1 | | | | 782,975 | |
| | 11,453 | | | Total Diversified Telecommunication Services | | | | | | | | | | | | | | | | | | | | | | | 11,646,849 | |
| | | | | | | |
| | | | Electric Utilities – 4.3% | | | | | | | | | | | | | | | | | | |
| | | | | | | |
| | 1,000 | | | AES Corp | | | | | | | | | | | 6.000% | | | | 5/15/26 | | | | BBB– | | | | 1,045,000 | |
| | | | | | | |
| | 1,350 | | | Pacific Gas and Electric Co | | | | | | | | | | | 3.300% | | | | 8/01/40 | | | | BBB– | | | | 1,313,618 | |
| | | | | | | |
| | 3,275 | | | Pacific Gas and Electric Co | | | | | | | | | | | 3.500% | | | | 8/01/50 | | | | BBB– | | | | 3,161,619 | |
| | | | | | | |
| | 2,100 | | | Talen Energy Supply LLC | | | | | | | | | | | 6.500% | | | | 6/01/25 | | | | B | | | | 1,413,972 | |
| | | | | | | |
| | 875 | | | Talen Energy Supply LLC, 144A | | | | | | | | | | | 7.625% | | | | 6/01/28 | | | | BB | | | | 875,000 | |
28
| | | | | | | | | | | | | | | | | | | | | | | | | | | | |
Principal
Amount (000) | | | Description (1) | | | | | | | | Coupon | | | Maturity | | | Ratings (2) | | | Value | |
| | | | | | | |
| | | | Electric Utilities (continued) | | | | | | | | | | | | | | | | | | |
| | | | | | | |
| $ | 250 | | | TerraForm Power Operating LLC, 144A | | | | | | | | | | | 5.000% | | | | 1/31/28 | | | | BB | | | $ | 261,250 | |
| | 8,850 | | | Total Electric Utilities | | | | | | | | | | | | | | | | | | | | | | | 8,070,459 | |
| |
| | | | Electronic Equipment, Instruments & Components – 0.2% | |
| | | | | | | |
| | 375 | | | MTS Systems Corp, 144A | | | | | | | | | | | 5.750% | | | | 8/15/27 | | | | B+ | | | | 344,063 | |
| | | | | | | |
| | | | Energy Equipment & Services – 1.1% | | | | | | | | | | | | | | | | | | |
| | | | | |
| | 1,100 | | | Archrock Partners LP / Archrock Partners Finance Corp, 144A | | | | 6.875% | | | | 4/01/27 | | | | B+ | | | | 1,036,200 | |
| | | | | |
| | 800 | | | Archrock Partners LP / Archrock Partners Finance Corp, 144A | | | | 6.250% | | | | 4/01/28 | | | | B+ | | | | 732,240 | |
| | | | | | | |
| | 675 | | | Ensign Drilling Inc, 144A | | | | | | | | | | | 9.250% | | | | 4/15/24 | | | | CCC+ | | | | 300,375 | |
| | | | | | | |
| | 2,704 | | | Metro Exploration Holding Corp | | | | | | | | | | | 0.000% | | | | 12/31/49 | | | | N/R | | | | 270 | |
| | | | | | | |
| | 447 | | | Metro Exploration Holding Corp, (4) | | | | | | | | | | | 0.000% | | | | 12/31/49 | | | | N/R | | | | 5 | |
| | | | | | | |
| | 38 | | | Sanjel Corporation, (4), (5) | | | | | | | | | | | 0.000% | | | | 12/31/49 | | | | N/R | | | | — | |
| | 5,764 | | | Total Energy Equipment & Services | | | | | | | | | | | | | | | | | | | | | | | 2,069,090 | |
| | | | | | | |
| | | | Entertainment – 0.3% | | | | | | | | | | | | | | | | | | |
| | | | | | | |
| | 125 | | | Cinemark USA Inc, 144A | | | | | | | | | | | 8.750% | | | | 5/01/25 | | | | BB+ | | | | 129,375 | |
| | | | | | | |
| | 450 | | | Live Nation Entertainment Inc, 144A | | | | | | | | | | | 6.500% | | | | 5/15/27 | | | | Ba2 | | | | 463,500 | |
| | 575 | | | Total Entertainment | | | | | | | | | | | | | | | | | | | | | | | 592,875 | |
| |
| | | | Equity Real Estate Investment Trust – 2.2% | |
| | | | | | | |
| | 2,300 | | | GLP Capital LP / GLP Financing II Inc | | | | | | | | | | | 4.000% | | | | 1/15/31 | | | | BBB– | | | | 2,272,607 | |
| | | | | | | |
| | 1,000 | | | Iron Mountain Inc, 144A | | | | | | | | | | | 4.875% | | | | 9/15/27 | | | | BB– | | | | 974,190 | |
| | | | | | | |
| | 600 | | | iStar Inc | | | | | | | | | | | 4.750% | | | | 10/01/24 | | | | BB | | | | 560,250 | |
| | | | | | | |
| | 225 | | | Service Properties Trust | | | | | | | | | | | 7.500% | | | | 9/15/25 | | | | Baa3 | | | | 236,182 | |
| | 4,125 | | | Total Equity Real Estate Investment Trust | | | | | | | | | | | | | | | | | | | | | | | 4,043,229 | |
| | | | | | | |
| | | | Food & Staples Retailing – 0.4% | | | | | | | | | | | | | | | | | | |
| | | | | |
| | 225 | | | Albertsons Cos Inc / Safeway Inc / New Albertsons LP / Albertsons LLC, 144A | | | | 5.875% | | | | 2/15/28 | | | | B2 | | | | 232,148 | |
| | | | | |
| | 525 | | | Albertsons Cos Inc / Safeway Inc / New Albertsons LP / Albertsons LLC, 144A | | | | 4.875% | | | | 2/15/30 | | | | B2 | | | | 537,144 | |
| | 750 | | | Total Food & Staples Retailing | | | | | | | | | | | | | | | | | | | | | | | 769,292 | |
| | | | | | | |
| | | | Food Products – 1.8% | | | | | | | | | | | | | | | | | | |
| | | | | | | |
| | 1,450 | | | Kraft Heinz Foods Co, 144A | | | | | | | | | | | 3.875% | | | | 5/15/27 | | | | Baa3 | | | | 1,514,982 | |
| | | | | | | |
| | 1,350 | | | Kraft Heinz Foods Co, 144A | | | | | | | | | | | 4.250% | | | | 3/01/31 | | | | Baa3 | | | | 1,431,050 | |
| | | | | | | |
| | 375 | | | Lamb Weston Holdings Inc, 144A | | | | | | | | | | | 4.875% | | | | 11/01/26 | | | | BB+ | | | | 388,125 | |
| | 3,175 | | | Total Food Products | | | | | | | | | | | | | | | | | | | | | | | 3,334,157 | |
| |
| | | | Health Care Equipment & Supplies – 0.1% | |
| | | | | | | |
| | 175 | | | Teleflex Inc, 144A | | | | | | | | | | | 4.250% | | | | 6/01/28 | | | | BB | | | | 179,375 | |
| |
| | | | Health Care Providers & Services – 7.1% | |
| | | | | | | |
| | 400 | | | Centene Corp | | | | | | | | | | | 4.625% | | | | 12/15/29 | | | | BBB– | | | | 423,508 | |
| | | | | | | |
| | 1,000 | | | Centene Corp | | | | | | | | | | | 3.375% | | | | 2/15/30 | | | | BBB– | | | | 1,009,710 | |
| | | | | |
| | 1,500 | | | CHS/Community Health Systems Inc, 144A | | | | 8.000% | | | | 3/15/26 | | | | B | | | | 1,417,800 | |
| | | | | |
| | 765 | | | CHS/Community Health Systems Inc, 144A | | | | 8.000% | | | | 12/15/27 | | | | B | | | | 730,736 | |
| | | | | |
| | 375 | | | Cushman & Wakefield US Borrower LLC, 144A | | | | 6.750% | | | | 5/15/28 | | | | BB– | | | | 390,937 | |
29
Nuveen Credit Income Fund (continued)
(formerly known as Nuveen High Income Bond Fund)
Portfolio of Investments June 30, 2020
| | | | | | | | | | | | | | | | | | | | | | | | | | | | |
Principal
Amount (000) | | | Description (1) | | | | | | | | Coupon | | | Maturity | | | Ratings (2) | | | Value | |
| |
| | | | Health Care Providers & Services (continued) | |
| | | | | | | |
| $ | 1,000 | | | DaVita Inc | | | | | | | | | | | 5.000% | | | | 5/01/25 | | | | Ba3 | | | $ | 1,022,500 | |
| | | | | | | |
| | 625 | | | DaVita Inc, 144A | | | | | | | | | | | 4.625% | | | | 6/01/30 | | | | Ba3 | | | | 621,562 | |
| | | | | | | |
| | 550 | | | Encompass Health Corp | | | | | | | | | | | 4.500% | | | | 2/01/28 | | | | B+ | | | | 527,516 | |
| | | | | | | |
| | 1,000 | | | HCA Inc | | | | | | | | | | | 5.375% | | | | 2/01/25 | | | | Ba2 | | | | 1,071,250 | |
| | | | | | | |
| | 1,000 | | | HCA Inc | | | | | | | | | | | 3.500% | | | | 9/01/30 | | | | Ba2 | | | | 962,939 | |
| | | | | | | |
| | 1,575 | | | MEDNAX Inc, 144A | | | | | | | | | | | 6.250% | | | | 1/15/27 | | | | B+ | | | | 1,575,000 | |
| | | | | | | |
| | 250 | | | Molina Healthcare Inc, 144A | | | | | | | | | | | 4.375% | | | | 6/15/28 | | | | BB– | | | | 250,625 | |
| | | | | |
| | 1,150 | | | RegionalCare Hospital Partners Holdings Inc / LifePoint Health Inc, 144A | | | | 9.750% | | | | 12/01/26 | | | | CCC+ | | | | 1,173,000 | |
| | | | | | | |
| | 1,750 | | | Tenet Healthcare Corp | | | | | | | | | | | 6.750% | | | | 6/15/23 | | | | B– | | | | 1,736,875 | |
| | | | | | | |
| | 200 | | | Tenet Healthcare Corp, 144A | | | | | | | | | | | 7.500% | | | | 4/01/25 | | | | BB– | | | | 212,500 | |
| | | | | | | |
| | 150 | | | Tenet Healthcare Corp, 144A | | | | | | | | | | | 4.625% | | | | 6/15/28 | | | | BB– | | | | 146,952 | |
| | 13,290 | | | Total Health Care Providers & Services | | | | | | | | | | | | | | | | | | | | | | | 13,273,410 | |
| | | | | | | |
| | | | Health Care Technology – 0.1% | | | | | | | | | | | | | | | | | | |
| | | | | | | |
| | 1,000 | | | Exela Intermediate LLC / Exela Finance Inc, 144A | | | | | | | | | | | 10.000% | | | | 7/15/23 | | | | CCC– | | | | 242,500 | |
| | | | | | | |
| | | | Hotels, Restaurants & Leisure – 1.5% | | | | | | | | | | | | | | | | | | |
| | | | | | | |
| | 175 | | | 1011778 BC ULC / New Red Finance Inc, 144A | | | | | | | | | | | 5.750% | | | | 4/15/25 | | | | BB+ | | | | 183,750 | |
| | | | | |
| | 1,100 | | | Cedar Fair LP / Canada’s Wonderland Co / Magnum Management Corp / Millennium Op, 144A | | | | 5.500% | | | | 5/01/25 | | | | Ba2 | | | | 1,105,500 | |
| | | | | | | |
| | 100 | | | Hilton Domestic Operating Co Inc, 144A | | | | | | | | | | | 5.375% | | | | 5/01/25 | | | | BB | | | | 99,625 | |
| | | | | | | |
| | 100 | | | Hilton Domestic Operating Co Inc, 144A | | | | | | | | | | | 5.750% | | | | 5/01/28 | | | | BB | | | | 101,000 | |
| | | | | | | |
| | 775 | | | International Game Technology PLC, 144A | | | | | | | | | | | 5.250% | | | | 1/15/29 | | | | BB | | | | 753,688 | |
| | | | | |
| | 250 | | | MGM Growth Properties Operating Partnership LP / MGP Finance Co-Issuer Inc, 144A | | | | 4.625% | | | | 6/15/25 | | | | BB+ | | | | 245,020 | |
| | | | | | | |
| | 250 | | | Scientific Games International Inc, 144A | | | | | | | | | | | 7.250% | | | | 11/15/29 | | | | B– | | | | 200,000 | |
| | | | | | | |
| | 100 | | | Yum! Brands Inc, 144A | | | | | | | | | | | 7.750% | | | | 4/01/25 | | | | B+ | | | | 107,875 | |
| | 2,850 | | | Total Hotels, Restaurants & Leisure | | | | | | | | | | | | | | | | | | | | | | | 2,796,458 | |
| | | | | | | |
| | | | Household Durables – 1.5% | | | | | | | | | | | | | | | | | | |
| | | | | | | |
| | 375 | | | CD&R Smokey Buyer Inc, 144A, (WI/DD) | | | | | | | | | | | 6.750% | | | | 7/15/25 | | | | B | | | | 389,963 | |
| | | | | | | |
| | 665 | | | KB Home | | | | | | | | | | | 6.875% | | | | 6/15/27 | | | | BB | | | | 724,850 | |
| | | | | | | |
| | 675 | | | Mattamy Group Corp, 144A | | | | | | | | | | | 5.250% | | | | 12/15/27 | | | | BB | | | | 671,625 | |
| | | | | | | |
| | 1,000 | | | Newell Brands Inc | | | | | | | | | | | 4.875% | | | | 6/01/25 | | | | BB+ | | | | 1,047,280 | |
| | 2,715 | | | Total Household Durables | | | | | | | | | | | | | | | | | | | | | | | 2,833,718 | |
| | | | | | | |
| | | | Industrial Conglomerates – 0.9% | | | | | | | | | | | | | | | | | | |
| | | | | | | |
| | 1,000 | | | Icahn Enterprises LP / Icahn Enterprises Finance Corp | | | | | | | | | | | 4.750% | | | | 9/15/24 | | | | BB+ | | | | 945,000 | |
| | | | | | | |
| | 550 | | | Stena International SA, 144A | | | | | | | | | | | 6.125% | | | | 2/01/25 | | | | BB– | | | | 525,250 | |
| | | | | | | |
| | 250 | | | United Rentals North America Inc | | | | | | | | | | | 6.500% | | | | 12/15/26 | | | | BB– | | | | 262,500 | |
| | 1,800 | | | Total Industrial Conglomerates | | | | | | | | | | | | | | | | | | | | | | | 1,732,750 | |
| | | | | | | |
| | | | Insurance – 1.8% | | | | | | | | | | | | | | | | | | |
| | | | | | | |
| | 825 | | | Acrisure LLC / Acrisure Finance Inc, 144A | | | | | | | | | | | 10.125% | | | | 8/01/26 | | | | CCC+ | | | | 886,875 | |
| | | | | | | |
| | 1,750 | | | Genworth Holdings Inc | | | | | | | | | | | 4.800% | | | | 2/15/24 | | | | B– | | | | 1,395,625 | |
30
| | | | | | | | | | | | | | | | | | | | | | | | | | | | |
Principal
Amount (000) | | | Description (1) | | | | | | | | Coupon | | | Maturity | | | Ratings (2) | | | Value | |
| | | | | | | |
| | | | Insurance (continued) | | | | | | | | | | | | | | | | | | |
| | | | | | | |
| $ | 1,000 | | | Nationstar Mortgage Holdings Inc, 144A | | | | | | | | | | | 9.125% | | | | 7/15/26 | | | | B | | | $ | 1,056,870 | |
| | 3,575 | | | Total Insurance | | | | | | | | | | | | | | | | | | | | | | | 3,339,370 | |
| | | | | | | |
| | | | Interactive Media & Services – 0.3% | | | | | | | | | | | | | | | | | | |
| | | | | | | |
| | 500 | | | Match Group Inc, 144A | | | | | | | | | | | 4.625% | | | | 6/01/28 | | | | BB | | | | 505,575 | |
| | | | | | | |
| | | | IT Services – 0.4% | | | | | | | | | | | | | | | | | | |
| | | | | | | |
| | 600 | | | Gartner Inc, 144A | | | | | | | | | | | 4.500% | | | | 7/01/28 | | | | BB | | | | 607,020 | |
| | | | | | | |
| | 150 | | | Science Applications International Corp, 144A | | | | | | | | | | | 4.875% | | | | 4/01/28 | | | | BB– | | | | 149,529 | |
| | 750 | | | Total IT Services | | | | | | | | | | | | | | | | | | | | | | | 756,549 | |
| | | | | | | |
| | | | Leisure Products – 0.4% | | | | | | | | | | | | | | | | | | |
| | | | | | | |
| | 750 | | | Mattel Inc, 144A | | | | | | | | | | | 6.750% | | | | 12/31/25 | | | | B+ | | | | 778,125 | |
| | | | | | | |
| | | | Life Sciences Tools & Services – 0.8% | | | | | | | | | | | | | | | | | | |
| | | | | | | |
| | 175 | | | Jaguar Holding Co II / PPD Development LP, 144A | | | | | | | | | | | 4.625% | | | | 6/15/25 | | | | B | | | | 178,097 | |
| | | | | | | |
| | 1,225 | | | Jaguar Holding Co II / PPD Development LP, 144A | | | | | | | | | | | 5.000% | | | | 6/15/28 | | | | B | | | | 1,254,094 | |
| | 1,400 | | | Total Life Sciences Tools & Services | | | | | | | | | | | | | | | | | | | | | | | 1,432,191 | |
| | | | | | | |
| | | | Machinery – 1.3% | | | | | | | | | | | | | | | | | | |
| | | | | | | |
| | 1,000 | | | Dana Financing Luxembourg Sarl, 144A | | | | | | | | | | | 6.500% | | | | 6/01/26 | | | | BB+ | | | | 1,035,000 | |
| | | | | | | |
| | 1,000 | | | Maxim Crane Works Holdings Capital LLC, 144A | | | | | | | | | | | 10.125% | | | | 8/01/24 | | | | B– | | | | 983,450 | |
| | | | | | | |
| | 375 | | | Navistar International Corp, 144A | | | | | | | | | | | 9.500% | | | | 5/01/25 | | | | BB– | | | | 401,719 | |
| | 2,375 | | | Total Machinery | | | | | | | | | | | | | | | | | | | | | | | 2,420,169 | |
| | | | | | | |
| | | | Media – 8.5% | | | | | | | | | | | | | | | | | | |
| | | | | | | |
| | 950 | | | Altice Financing SA, 144A | | | | | | | | | | | 5.000% | | | | 1/15/28 | | | | B | | | | 943,692 | |
| | | | | | | |
| | 1,000 | | | Altice France SA/France, 144A | | | | | | | | | | | 7.375% | | | | 5/01/26 | | | | B | | | | 1,043,940 | |
| | | | | | | |
| | 2,000 | | | CCO Holdings LLC / CCO Holdings Capital Corp, 144A | | | | | | | | | | | 4.500% | | | | 5/01/32 | | | | BB | | | | 2,025,000 | |
| | | | | | | |
| | 1,500 | | | CSC Holdings LLC, 144A | | | | | | | | | | | 7.500% | | | | 4/01/28 | | | | B | | | | 1,636,875 | |
| | | | | | | |
| | 950 | | | CSC Holdings LLC, 144A | | | | | | | | | | | 6.500% | | | | 2/01/29 | | | | BB | | | | 1,037,875 | |
| | | | | | | |
| | 750 | | | Gray Television Inc, 144A | | | | | | | | | | | 5.125% | | | | 10/15/24 | | | | BB– | | | | 750,000 | |
| | | | | | | |
| | 1,000 | | | Gray Television Inc, 144A | | | | | | | | | | | 5.875% | | | | 7/15/26 | | | | BB– | | | | 996,250 | |
| | | | | | | |
| | 225 | | | Lamar Media Corp, 144A | | | | | | | | | | | 4.875% | | | | 1/15/29 | | | | BB– | | | | 226,125 | |
| | | | | | | |
| | 597 | | | Meredith Corp | | | | | | | | | | | 6.875% | | | | 2/01/26 | | | | CCC+ | | | | 494,919 | |
| | | | | | | |
| | 250 | | | Scripps Escrow Inc, 144A | | | | | | | | | | | 5.875% | | | | 7/15/27 | | | | B | | | | 236,875 | |
| | | | | | | |
| | 580 | | | Sirius XM Radio Inc, 144A | | | | | | | | | | | 5.375% | | | | 7/15/26 | | | | BB | | | | 598,989 | |
| | | | | | | |
| | 2,200 | | | Sirius XM Radio Inc, 144A | | | | | | | | | | | 4.125% | | | | 7/01/30 | | | | BB | | | | 2,170,212 | |
| | | | | | | |
| | 925 | | | TEGNA Inc, 144A | | | | | | | | | | | 4.625% | | | | 3/15/28 | | | | BB– | | | | 851,000 | |
| | | | | | | |
| | 1,860 | | | Terrier Media Buyer Inc, 144A | | | | | | | | | | | 8.875% | | | | 12/15/27 | | | | CCC+ | | | | 1,783,275 | |
| | | | | | | |
| | 925 | | | Virgin Media Secured Finance PLC, 144A | | | | | | | | | | | 5.500% | | | | 5/15/29 | | | | BB+ | | | | 974,848 | |
| | 15,712 | | | Total Media | | | | | | | | | | | | | | | | | | | | | | | 15,769,875 | |
| | | | | | | |
| | | | Metals & Mining – 2.5% | | | | | | | | | | | | | | | | | | |
| | | | | | | |
| | 1,000 | | | Alcoa Nederland Holding BV, 144A | | | | | | | | | | | 6.125% | | | | 5/15/28 | | | | BB+ | | | | 1,024,380 | |
| | | | | | | |
| | 275 | | | Arconic Corp, 144A | | | | | | | | | | | 6.000% | | | | 5/15/25 | | | | BB+ | | | | 282,906 | |
31
Nuveen Credit Income Fund (continued)
(formerly known as Nuveen High Income Bond Fund)
Portfolio of Investments June 30, 2020
| | | | | | | | | | | | | | | | | | | | | | | | | | | | |
Principal
Amount (000) | | | Description (1) | | | | | | | | Coupon | | | Maturity | | | Ratings (2) | | | Value | |
| | | | | | | |
| | | | Metals & Mining (continued) | | | | | | | | | | | | | | | | | | |
| | | | | | | |
| $ | 875 | | | Cleveland-Cliffs Inc, 144A | | | | | | | | | | | 9.875% | | | | 10/17/25 | | | | B | | | $ | 917,831 | |
| | | | | | | |
| | 1,100 | | | First Quantum Minerals Ltd, 144A | | | | | | | | | | | 7.500% | | | | 4/01/25 | | | | B3 | | | | 1,053,250 | |
| | | | | | | |
| | 1,400 | | | Freeport-McMoRan Inc, (3) | | | | | | | | | | | 5.250% | | | | 9/01/29 | | | | Ba1 | | | | 1,435,630 | |
| | 4,650 | | | Total Metals & Mining | | | | | | | | | | | | | | | | | | | | | | | 4,713,997 | |
| | | | | | | |
| | | | Multiline Retail – 0.3% | | | | | | | | | | | | | | | | | | |
| | | | | | | |
| | 600 | | | Macy’s Inc, 144A | | | | | | | | | | | 8.375% | | | | 6/15/25 | | | | Ba1 | | | | 597,000 | |
| | | | | | | |
| | | | Oil, Gas & Consumable Fuels – 7.7% | | | | | | | | | | | | | | | | | | |
| | | | | | | |
| | 600 | | | Cheniere Energy Partners LP, 144A | | | | | | | | | | | 4.500% | | | | 10/01/29 | | | | BB | | | | 585,000 | |
| | | | | | | |
| | 300 | | | Continental Resources Inc | | | | | | | | | | | 5.000% | | | | 9/15/22 | | | | BBB– | | | | 295,257 | |
| | | | | | | |
| | 1,200 | | | Continental Resources, Inc | | | | | | | | | | | 4.500% | | | | 4/15/23 | | | | BBB– | | | | 1,146,264 | |
| | | | | |
| | 1,140 | | | Crestwood Midstream Partners LP / Crestwood Midstream Finance Corp, 144A | | | | 5.625% | | | | 5/01/27 | | | | BB– | | | | 950,407 | |
| | | | | | | |
| | 1,000 | | | Denbury Resources Inc, 144A | | | | | | | | | | | 7.750% | | | | 2/15/24 | | | | B | | | | 380,000 | |
| | | | | | | |
| | 500 | | | EnLink Midstream Partners LP | | | | | | | | | | | 4.400% | | | | 4/01/24 | | | | BB+ | | | | 415,250 | |
| | | | | | | |
| | 575 | | | Enviva Partners LP / Enviva Partners Finance Corp, 144A | | | | | | | | | | | 6.500% | | | | 1/15/26 | | | | BB– | | | | 598,000 | |
| | | | | | | |
| | 500 | | | EQM Midstream Partners LP, 144A | | | | | | | | | | | 6.000% | | | | 7/01/25 | | | | BB | | | | 505,000 | |
| | | | | | | |
| | 800 | | | EQM Midstream Partners LP, 144A | | | | | | | | | | | 6.500% | | | | 7/01/27 | | | | BB | | | | 819,464 | |
| | | | | | | |
| | 200 | | | Global Partners LP / GLP Finance Corp | | | | | | | | | | | 7.000% | | | | 8/01/27 | | | | B+ | | | | 185,000 | |
| | | | | | | |
| | 200 | | | M/I Homes Inc | | | | | | | | | | | 4.950% | | | | 2/01/28 | | | | BB– | | | | 198,750 | |
| | | | | | | |
| | 500 | | | Moss Creek Resources Holdings Inc, 144A | | | | | | | | | | | 10.500% | | | | 5/15/27 | | | | B– | | | | 265,000 | |
| | | | | | | |
| | 815 | | | Murphy Oil Corp | | | | | | | | | | | 5.875% | | | | 12/01/27 | | | | BB+ | | | | 717,200 | |
| | | | | | | |
| | 750 | | | Occidental Petroleum Corp | | | | | | | | | | | 6.450% | | | | 9/15/36 | | | | BB+ | | | | 641,932 | |
| | | | | | | |
| | 350 | | | ONEOK Inc | | | | | | | | | | | 5.850% | | | | 1/15/26 | | | �� | BBB | | | | 399,668 | |
| | | | | | | |
| | 500 | | | Peabody Energy Corp, 144A | | | | | | | | | | | 6.375% | | | | 3/31/25 | | | | BB– | | | | 265,000 | |
| | | | | | | |
| | 1,100 | | | SM Energy Co | | | | | | | | | | | 6.125% | | | | 11/15/22 | | | | B– | | | | 803,000 | |
| | | | | | | |
| | 500 | | | SM Energy Co | | | | | | | | | | | 5.625% | | | | 6/01/25 | | | | B– | | | | 265,000 | |
| | | | | | | |
| | 800 | | | Southwestern Energy Co | | | | | | | | | | | 7.500% | | | | 4/01/26 | | | | BB | | | | 700,240 | |
| | | | | |
| | 1,000 | | | Targa Resources Partners LP / Targa Resources Partners Finance Corp | | | | 5.875% | | | | 4/15/26 | | | | BB | | | | 990,000 | |
| | | | | |
| | 425 | | | Targa Resources Partners LP / Targa Resources Partners Finance Corp | | | | 6.500% | | | | 7/15/27 | | | | BB | | | | 426,062 | |
| | | | | |
| | 1,525 | | | USA Compression Partners LP / USA Compression Finance Corp | | | | 6.875% | | | | 9/01/27 | | | | BB– | | | | 1,448,445 | |
| | | | | | | |
| | 1,000 | | | Western Midstream Operating LP | | | | | | | | | | | 4.050% | | | | 2/01/30 | | | | BB+ | | | | 962,440 | |
| | | | | | | |
| | 350 | | | WPX Energy Inc | | | | | | | | | | | 4.500% | | | | 1/15/30 | | | | BBB– | | | | 309,264 | |
| | 16,630 | | | Total Oil, Gas & Consumable Fuels | | | | | | | | | | | | | | | | | | | | | | | 14,271,643 | |
| | | | | | | |
| | | | Pharmaceuticals – 2.3% | | | | | | | | | | | | | | | | | | |
| | | | | | | |
| | 200 | | | Bausch Health Americas Inc, 144A | | | | | | | | | | | 8.500% | | | | 1/31/27 | | | | B | | | | 212,250 | |
| | | | | | | |
| | 79 | | | Bausch Health Cos Inc, 144A | | | | | | | | | | | 5.875% | | | | 5/15/23 | | | | B | | | | 78,803 | |
| | | | | | | |
| | 200 | | | Bausch Health Cos Inc, 144A | | | | | | | | | | | 5.750% | | | | 8/15/27 | | | | BB | | | | 212,000 | |
| | | | | | | |
| | 450 | | | Bausch Health Cos Inc, 144A | | | | | | | | | | | 7.000% | | | | 1/15/28 | | | | B | | | | 463,500 | |
| | | | | | | |
| | 350 | | | Bausch Health Cos Inc, 144A | | | | | | | | | | | 5.000% | | | | 1/30/28 | | | | B | | | | 329,521 | |
| | | | | | | |
| | 450 | | | Bausch Health Cos Inc, 144A | | | | | | | | | | | 6.250% | | | | 2/15/29 | | | | B | | | | 452,250 | |
32
| | | | | | | | | | | | | | | | | | | | | | | | | | | | |
Principal
Amount (000) | | | Description (1) | | | | | | | | Coupon | | | Maturity | | | Ratings (2) | | | Value | |
| | | | | | | |
| | | | Pharmaceuticals (continued) | | | | | | | | | | | | | | | | | | |
| | | | | | | |
| $ | 450 | | | Bausch Health Cos Inc, 144A | | | | | | | | | | | 5.250% | | | | 1/30/30 | | | | B | | | $ | 426,937 | |
| | | | | | | |
| | 1,575 | | | Horizon Therapeutics USA Inc, 144A | | | | | | | | | | | 5.500% | | | | 8/01/27 | | | | Ba3 | | | | 1,638,583 | |
| | | | | | | |
| | 500 | | | Par Pharmaceutical Inc, 144A | | | | | | | | | | | 7.500% | | | | 4/01/27 | | | | B+ | | | | 513,100 | |
| | 4,254 | | | Total Pharmaceuticals | | | | | | | | | | | | | | | | | | | | | | | 4,326,944 | |
| | | | | | | |
| | | | Professional Services – 0.2% | | | | | | | | | | | | | | | | | | |
| | | | | | | |
| | 400 | | | ASGN Inc, 144A | | | | | | | | | | | 4.625% | | | | 5/15/28 | | | | BB– | | | | 390,648 | |
| | | | | | | |
| | | | Software – 0.7% | | | | | | | | | | | | | | | | | | |
| | | | | | | |
| | 425 | | | Camelot Finance SA, 144A | | | | | | | | | | | 4.500% | | | | 11/01/26 | | | | B | | | | 423,938 | |
| | | | | | | |
| | 850 | | | SS&C Technologies Inc, 144A | | | | | | | | | | | 5.500% | | | | 9/30/27 | | | | B+ | | | | 865,631 | |
| | 1,275 | | | Total Software | | | | | | | | | | | | | | | | | | | | | | | 1,289,569 | |
| | | | | | | |
| | | | Specialty Retail – 3.9% | | | | | | | | | | | | | | | | | | |
| | | | | | | |
| | 1,000 | | | Ford Motor Credit Co LLC | | | | | | | | | | | 2.343% | | | | 11/02/20 | | | | BB+ | | | | 992,500 | |
| | | | | | | |
| | 350 | | | L Brands Inc, 144A | | | | | | | | | | | 6.875% | | | | 7/01/25 | | | | BB | | | | 361,375 | |
| | | | | | | |
| | 150 | | | L Brands Inc, 144A | | | | | | | | | | | 9.375% | | | | 7/01/25 | | | | B+ | | | | 150,188 | |
| | | | | | | |
| | 550 | | | Lithia Motors Inc, 144A | | | | | | | | | | | 4.625% | | | | 12/15/27 | | | | BB | | | | 544,500 | |
| | | | | | | |
| | 1,000 | | | PetSmart Inc, 144A | | | | | | | | | | | 5.875% | | | | 6/01/25 | | | | B | | | | 1,001,875 | |
| | | | | | | |
| | 2,000 | | | PetSmart Inc, 144A | | | | | | | | | | | 8.875% | | | | 6/01/25 | | | | CCC+ | | | | 1,999,920 | |
| | | | | | | |
| | 1,000 | | | Staples Inc, 144A | | | | | | | | | | | 7.500% | | | | 4/15/26 | | | | B1 | | | | 785,750 | |
| | | | | | | |
| | 2,225 | | | Staples Inc, 144A | | | | | | | | | | | 10.750% | | | | 4/15/27 | | | | B3 | | | | 1,357,005 | |
| | 8,275 | | | Total Specialty Retail | | | | | | | | | | | | | | | | | | | | | | | 7,193,113 | |
| |
| | | | Technology Hardware, Storage & Peripherals – 0.2% | |
| | | | | | | |
| | 265 | | | Dell International LLC / EMC Corp, 144A | | | | | | | | | | | 5.850% | | | | 7/15/25 | | | | BBB– | | | | 304,443 | |
| | | | | | | |
| | 100 | | | NCR Corp, 144A | | | | | | | | | | | 8.125% | | | | 4/15/25 | | | | BB– | | | | 106,000 | |
| | 365 | | | Total Technology Hardware, Storage & Peripherals | | | | | | | | | | | | | | | | | | | | | | | 410,443 | |
| | | | | | | |
| | | | Trading Companies & Distributors – 2.0% | | | | | | | | | | | | | | | | | | |
| | | | | | | |
| | 500 | | | Beacon Roofing Supply Inc, 144A | | | | | | | | | | | 4.875% | | | | 11/01/25 | | | | B– | | | | 446,250 | |
| | | | | | | |
| | 225 | | | Beacon Roofing Supply Inc, 144A | | | | | | | | | | | 4.500% | | | | 11/15/26 | | | | BB | | | | 221,270 | |
| | | | | | | |
| | 2,000 | | | H&E Equipment Services Inc | | | | | | | | | | | 5.625% | | | | 9/01/25 | | | | BB– | | | | 2,019,580 | |
| | | | | | | |
| | 575 | | | WESCO Distribution Inc, 144A | | | | | | | | | | | 7.125% | | | | 6/15/25 | | | | BB– | | | | 606,452 | |
| | | | | | | |
| | 450 | | | WESCO Distribution Inc, 144A | | | | | | | | | | | 7.250% | | | | 6/15/28 | | | | BB– | | | | 474,556 | |
| | 3,750 | | | Total Trading Companies & Distributors | | | | | | | | | | | | | | | | | | | | | | | 3,768,108 | |
| | | | | | | |
| | | | Utility – 0.7% | | | | | | | | | | | | | | | | | | |
| | | | | | | |
| | 1,250 | | | Calpine Corp, 144A | | | | | | | | | | | 5.250% | | | | 6/01/26 | | | | BB+ | | | | 1,262,138 | |
| $ | 174,083 | | | Total Corporate Bonds (cost $170,625,437) | | | | | | | | | | | | | | | | | | | | | | | 164,665,688 | |
| | | | | | | |
| Shares | | | Description (1), (6) | | | | | | | | | | | | | | | | | Value | |
| | | | | | | |
| | | | EXCHANGE-TRADED FUNDS – 4.4% | | | | | | | | | | | | | | | | | | |
| | | | | | | |
| | 24,639 | | | iShares 0-5 Year High Yield Corporate Bond ETF | | | | | | | | | | | | | | | | | | | | | | $ | 2,011,035 | |
| | | | | | | |
| | 46,893 | | | iShares iBoxx High Yield Corporate Bond ETF | | | | | | | | | | | | | | | | | | | | | | | 2,011,241 | |
33
Nuveen Credit Income Fund (continued)
(formerly known as Nuveen High Income Bond Fund)
Portfolio of Investments June 30, 2020
| | | | | | | | | | | | | | | | | | | | | | | | | | | | |
| Shares | | | Description (1), (6) | | | | | | | | | | | | | | | | | Value | |
| | | | | | | |
| | | | EXCHANGE-TRADED FUNDS (continued) | | | | | | | | | | | | | | | | | | |
| | | | | | | |
| | 19,998 | | | SPDR Bloomberg Barclays High Yield Bond ETF | | | | | | | | | | | | | | | | | | | | | | $ | 2,022,997 | |
| | | | | |
| | 81,070 | | | SPDR Bloomberg Barclays Short Term High Yield Bond ETF | | | | | | | | | | | | | | | | 2,042,964 | |
| | | | Total Exchange-Traded Funds (cost $8,002,909) | | | | | | | | | | | | | | | | | | | | | | | 8,088,237 | |
| | | | | | | |
Principal
Amount (000) | | | Description (1) | | Coupon (7) | | | Reference
Rate (7) | | | Spread (7) | | | Maturity (8) | | | Ratings (2) | | | Value | |
| |
| | | | VARIABLE RATE SENIOR LOAN INTERESTS – 1.5% (7) | |
| | | | | | | |
| | | | Commercial Services & Supplies – 1.0% | | | | | | | | | | | | | | | | | | |
| | | | | | | |
| $ | 1,995 | | | Dun & Bradstreet Corp., Initial Term Loan | | | 4.184% | | | | 1-Month LIBOR | | | | 4.000% | | | | 2/06/26 | | | | B2 | | | $ | 1,948,866 | |
| | | | | | | |
| | | | Oil, Gas & Consumable Fuels – 0.3% | | | | | | | | | | | | | | | | | | |
| | | | | | | |
| | 599 | | | Buckeye Partners, LP Term Loan B | | | 2.923% | | | | 6-Month LIBOR | | | | 2.750% | | | | 11/02/26 | | | | BBB– | | | | 575,308 | |
| | | | | | | |
| | | | Professional Services – 0.2% | | | | | | | | | | | | | | | | | | |
| | | | | | | |
| | 300 | | | Da Vinci Purchaser Corp, Term Loan B | | | 5.238% | | | | 1-Month LIBOR | | | | 4.000% | | | | 1/08/27 | | | | B | | | | 292,875 | |
| $ | 2,894 | | | Total Variable Rate Senior Loan Interests (cost $2,853,472) | | | | | | | | | | | | 2,817,049 | |
| | | | | | | |
Principal
Amount (000) | | | Description (1) | | | | | | | | Coupon | | | Maturity | | | Ratings (2) | | | Value | |
| | | | | | | |
| | | | CONTINGENT CAPITAL SECURITIES – 0.8% (9) | | | | | | | | | | | | | | | | | | | | | | | | |
| | | | | | | |
| | | | Banks – 0.4% | | | | | | | | | | | | | | | | | | |
| | | | | | | |
| $ | 750 | | | Royal Bank of Scotland Group PLC | | | | | | | | | | | 8.625% | | | | N/A (10) | | | | BBB– | | | $ | 779,812 | |
| | | | | | | |
| | | | Capital Markets – 0.4% | | | | | | | | | | | | | | | | | | |
| | | | | | | |
| | 750 | | | Credit Suisse Group AG, 144A | | | | | | | | | | | 7.500% | | | | N/A (10) | | | | BB+ | | | | 779,183 | |
| $ | 1,500 | | | Total Contingent Capital Securities (cost $1,534,119) | | | | | | | | | | | | 1,558,995 | |
| | | | | | | |
| Shares | | | Description (1) | | | | | | | | Coupon | | | | | | Ratings (2) | | | Value | |
| |
| | | | $25 PAR (OR SIMILAR) RETAIL PREFERRED – 0.4% | |
| | | | | | | |
| | | | Food Products – 0.4% | | | | | | | | | | | | | | | | | | |
| | | | | | | |
| | 34,685 | | | CHS Inc | | | | | | | | | | | 6.750% | | | | | | | | N/R | | | $ | 826,197 | |
| | | | Total $25 Par (or similar) Retail Preferred (cost $867,125) | | | | | | | | | | | | 826,197 | |
| | | | | | | |
Principal
Amount (000) | | | Description (1) | | | | | | | | Coupon | | | Maturity | | | Ratings (2) | | | Value | |
| |
| | | | $1,000 PAR (OR SIMILAR) INSTITUTIONAL PREFERRED – 0.2% | |
| | | | | | | |
| | | | Commercial Services & Supplies – 0.2% | | | | | | | | | | | | | | | | | | |
| | | | | | | |
| $ | 550 | | | AerCap Global Aviation Trust, 144A | | | | | | | | | | | 6.500% | | | | 6/15/45 | | | | BB+ | | | $ | 408,925 | |
| $ | 550 | | | Total $1,000 Par (or similar) Institutional Preferred (cost $556,956) | | | | | | | | 408,925 | |
34
| | | | | | | | | | | | | | | | | | | | | | | | | | | | |
| Shares | | | Description (1) | | | | | | | | | | | | | | | | | Value | |
| | | | | | | |
| | | | COMMON STOCKS – 0.0% | | | | | | | | | | | | | | | | | | | | | | | | |
| | | | | | | |
| | | | Energy Equipment & Services – 0.0% | | | | | | | | | | | | | | | | | | |
| | | | | | | |
| | 6 | | | Golden Close Maritime Corp Ltd, (4) | | | | | | | | | | | | | | | | | | | | | | $ | — | |
| | | | | | | |
| | | | Metals & Mining – 0.0% | | | | | | | | | | | | | | | | | | | | | | | | |
| | | | | | | |
| | 499,059 | | | Northland Resources SE, (4), (11) | | | | | | | | | | | | | | | | | | | | | | | 52 | |
| | | | | | | |
| | | | Road & Rail – 0.0% | | | | | | | | | | | | | | | | | | | | | | | | |
| | | | | | | |
| | 8,907 | | | Jack Cooper Enterprises Inc, (4), (11) | | | | | | | | | | | | | | | | | | | | | | | 89 | |
| | | | Total Common Stocks (cost $5,030) | | | | | | | | | | | | | | | | | | | | | | | 141 | |
| | | | Total Long-Term Investments (cost $184,445,048) | | | | | | | | | | | | | | | | | | | | | | | 178,365,232 | |
| | | | | | | |
| Shares | | | Description (1) | | | | | | | | Coupon | | | | | | | | | Value | |
| |
| | | | INVESTMENTS PURCHASED WITH COLLATERAL FROM SECURITIES LENDING – 1.1% | |
| | | | | | | |
| | | | Money Market Funds – 1.1% | | | | | | | | | | | | | | | | | | |
| | | | | | | |
| | 2,026,200 | | | First American Government Obligation Fund Class X, (12) | | | | | | | | | | | 0.091% (13) | | | | | | | | | | | $ | 2,026,200 | |
| | | | Total Investments Purchased with Collateral from Securities Lending (cost $2,026,200) | | | | | | | | | | | | | | | | 2,026,200 | |
| | | | | | | |
| Shares | | | Description (1) | | | | | | | | Coupon | | | | | | | | | Value | |
| | | | | | | |
| | | | SHORT-TERM INVESTMENTS – 7.3% | | | | | | | | | | | | | | | | | | | | | | | | |
| | | | | | | |
| | | | MONEY MARKET FUNDS – 7.3% | | | | | | | | | | | | | | | | | | |
| | | | | | | |
| | 13,643,460 | | | First American Treasury Obligation Fund, Class Z | | | | | | | | | | | 0.060% (13) | | | | | | | | | | | $ | 13,643,460 | |
| | | | Total Short-Term Investments (cost $13,643,460) | | | | | | | | | | | | | | | | | | | | | | | 13,643,460 | |
| | | | Total Investments (cost $200,114,708) – 104.2% | | | | | | | | | | | | | | | | | | | | | | | 194,034,892 | |
| | | | Other Assets Less Liabilities – (4.2)% | | | | | | | | | | | | | | | | | | | | | | | (7,908,147) | |
| | | | Net Assets – 100% | | | | | | | | | | | | | | | | | | | | | | $ | 186,126,745 | |
35
Nuveen Credit Income Fund (continued)
(formerly known as Nuveen High Income Bond Fund)
Portfolio of Investments June 30, 2020
| | For Fund portfolio compliance purposes, the Fund’s industry classifications refer to any one or more of the industry sub–classifications used by one or more widely recognized market indexes or ratings group indexes, and/or as defined by Fund management. This definition may not apply for purposes of this report, which may combine industry sub-classifications into sectors for reporting ease. |
| (1) | All percentages shown in the Portfolio of Investments are based on net assets applicable to common shares unless otherwise noted. |
| (2) | For financial reporting purposes, the ratings disclosed are the highest of Standard & Poor’s Group (“Standard & Poor’s”), Moody’s Investors Service, Inc. (“Moody’s”) or Fitch, Inc. (“Fitch”) rating. This treatment of split-rated securities may differ from that used for other purposes, such as for Fund investment policies. Ratings below BBB by Standard & Poor’s, Baa by Moody’s or BBB by Fitch are considered to be below investment grade. Holdings designated N/R are not rated by any of these national rating agencies. Ratings are not covered by the report of independent registered public accounting firm. |
| (3) | Investment, or a portion of investment, is out on loan for securities lending. The total value of the securities out on loan as of the end of the reporting period was $1,954,298. |
| (4) | Investment valued at fair value using methods determined in good faith by, or at the discretion of, the Board. For fair value measurement disclosure purposes, investment classified as Level 3. See Notes to Financial Statements, Note 3 – Investment Valuation and Fair Value Measurements for more information. |
| (5) | Defaulted security. A security whose issuer has failed to fully pay principal and/or interest when due, or is under the protection of bankruptcy. |
| (6) | A copy of the most recent financial statements for these investment companies can be obtained directly from the Securities and Exchange Commission on its website at http://www.sec.gov. |
| (7) | Senior loans generally pay interest at rates which are periodically adjusted by reference to a base short-term, floating lending rate (Reference Rate) plus an assigned fixed rate (Spread). These floating lending rates are generally (i) the lending rate referenced by the London Inter-Bank Offered Rate (“LIBOR”), or (ii) the prime rate offered by one or more major United States banks. Senior loans may be considered restricted in that the Fund ordinarily is contractually obligated to receive approval from the agent bank and/or borrower prior to the disposition of a senior loan. The rate shown is the coupon as of the end of the reporting period. |
| (8) | Senior loans generally are subject to mandatory and/or optional prepayment. Because of these mandatory prepayment conditions and because there may be significant economic incentives for a borrower to prepay, prepayments of senior loans may occur. As a result, the actual remaining maturity of senior loans held may be substantially less than the stated maturities shown. |
| (9) | Contingent Capital Securities (“CoCos”) are hybrid securities with loss absorption characteristics built into the terms of the security for the benefit of the issuer. For example, the terms may specify an automatic write-down of principal or a mandatory conversion into the issuer’s common stock under certain adverse circumstances, such as the issuer’s capital ratio falling below a specified level. |
| (10) | Perpetual security. Maturity date is not applicable. |
| (11) | Non-income producing; issuer has not declared a dividend within the past twelve months. |
| (12) | The Fund may loan securities representing up to one third of the fair value of its total assets (which includes collateral for securities on loan) to broker dealers, banks, and other institutions. The Fund maintains collateral equal to at least 100% of the fair value of the securities loaned. The cash collateral received by the Fund is invested in this money market fund. See Notes to Financial Statements, Note 4- Portfolio Securities and Investments in Derivatives for more information. |
| (13) | The rate shown is the annualized seven-day subsidized yield as of the end of the reporting period. |
| 144A | Investment is exempt from registration under Rule 144A of the Securities Act of 1933, as amended. These investments may only be resold in transactions exempt from registration, which are normally those transactions with qualified institutional buyers. |
| LIBOR | London Inter-Banking Offered Rate |
| PIK | Payment-in-kind (“PIK”) security. Depending on the terms of the security, income may be received in the form of cash, securities, or a combination of both. The PIK rate shown, where applicable, represents the annualized rate of the last PIK payment made by the issuer as of the end of the reporting period. |
| SPDR | Standard & Poor’s Depositary Receipt |
| WI/DD | Purchased on a when-issued or delayed delivery basis. |
See accompanying notes to financial statements.
36
Nuveen Strategic Income Fund
Portfolio of Investments June 30, 2020
| | | | | | | | | | | | | | | | | | | | | | | | | | | | |
Principal
Amount (000) | | | Description (1) | | | | | | | | Coupon | | | Maturity | | | Ratings (2) | | | Value | |
| | | | | | | |
| | | | LONG-TERM INVESTMENTS – 98.4% | | | | | | | | | | | | | | | | | | | | | | | | |
| | | | | | | |
| | | | CORPORATE BONDS – 41.3% | | | | | | | | | | | | | | | | | | | | | | | | |
| | | | | | | |
| | | | Aerospace & Defense – 0.7% | | | | | | | | | | | | | | | | | | |
| | | | | | | |
| $ | 1,380 | | | BAE Systems Holdings Inc, 144A | | | | | | | | | | | 3.850% | | | | 12/15/25 | | | | BBB | | | $ | 1,527,325 | |
| | | | | | | |
| | 670 | | | Boeing Co | | | | | | | | | | | 3.250% | | | | 2/01/35 | | | | Baa2 | | | | 610,708 | |
| | | | | | | |
| | 430 | | | Bombardier Inc, 144A | | | | | | | | | | | 7.500% | | | | 3/15/25 | | | | B | | | | 280,618 | |
| | | | | | | |
| | 1,215 | | | Carrier Global Corp, 144A | | | | | | | | | | | 2.242% | | | | 2/15/25 | | | | BBB | | | | 1,245,716 | |
| | | | | | | |
| | 150 | | | Howmet Aerospace Inc | | | | | | | | | | | 6.875% | | | | 5/01/25 | | | | BBB– | | | | 162,918 | |
| | | | | | | |
| | 515 | | | Raytheon Technologies Corp | | | | | | | | | | | 2.250% | | | | 7/01/30 | | | | A– | | | | 537,251 | |
| | 4,360 | | | Total Aerospace & Defense | | | | | | | | | | | | | | | | | | | | | | | 4,364,536 | |
| | | | | | | |
| | | | Airlines – 0.3% | | | | | | | | | | | | | | | | | | |
| | | | | | | |
| | 702 | | | American Airlines 2013-2 Class B Pass Through Trust, 144A | | | | | | | | | | | 5.600% | | | | 1/15/22 | | | | BB– | | | | 701,501 | |
| | | | | | | |
| | 833 | | | American Airlines 2016-1 Class AA Pass Through Trust | | | | | | | | | �� | | 3.575% | | | | 7/15/29 | | | | A+ | | | | 806,038 | |
| | | | | | | |
| | 175 | | | Delta Air Lines Inc, 144A | | | | | | | | | | | 7.000% | | | | 5/01/25 | | | | Baa2 | | | | 180,647 | |
| | 1,710 | | | Total Airlines | | | | | | | | | | | | | | | | | | | | | | | 1,688,186 | |
| | | | | | | |
| | | | Auto Components – 0.4% | | | | | | | | | | | | | | | | | | |
| | | | | | | |
| | 600 | | | Adient Global Holdings Ltd, 144A | | | | | | | | | | | 4.875% | | | | 8/15/26 | | | | B | | | | 495,000 | |
| | | | | | | |
| | 100 | | | Adient US LLC, 144A | | | | | | | | | | | 9.000% | | | | 4/15/25 | | | | Ba3 | | | | 107,720 | |
| | | | | | | |
| | 100 | | | Clarios Global LP, 144A | | | | | | | | | | | 6.750% | | | | 5/15/25 | | | | B1 | | | | 104,000 | |
| | | | | | | |
| | 1,000 | | | Clarios Global LP / Clarios US Finance Co, 144A | | | | | | | | | | | 8.500% | | | | 5/15/27 | | | | CCC+ | | | | 1,004,950 | |
| | | | | | | |
| | 175 | | | Dana Inc | | | | | | | | | | | 5.375% | | | | 11/15/27 | | | | BB+ | | | | 173,687 | |
| | | | | | | |
| | 500 | | | Goodyear Tire & Rubber Co | | | | | | | | | | | 9.500% | | | | 5/31/25 | | | | BB– | | | | 535,625 | |
| | 2,475 | | | Total Auto Components | | | | | | | | | | | | | | | | | | | | | | | 2,420,982 | |
| | | | | | | |
| | | | Automobiles – 0.7% | | | | | | | | | | | | | | | | | | |
| | | | | | | |
| | 250 | | | Ford Motor Co | | | | | | | | | | | 8.500% | | | | 4/21/23 | | | | BB+ | | | | 264,375 | |
| | | | | | | |
| | 250 | | | Ford Motor Co | | | | | | | | | | | 9.000% | | | | 4/22/25 | | | | BB+ | | | | 270,312 | |
| | | | | | | |
| | 1,000 | | | Ford Motor Credit Co LLC | | | | | | | | | | | 3.336% | | | | 3/18/21 | | | | BB+ | | | | 989,710 | |
| | | | | | | |
| | 2,845 | | | General Motors Financial Co Inc | | | | | | | | | | | 3.600% | | | | 6/21/30 | | | | BBB | | | | 2,762,251 | |
| | 4,345 | | | Total Automobiles | | | | | | | | | | | | | | | | | | | | | | | 4,286,648 | |
| | | | | | | |
| | | | Banks – 7.2% | | | | | | | | | | | | | | | | | | |
| | | | | | | |
| | 750 | | | Akbank TAS, 144A, (WI/DD) | | | | | | | | | | | 6.800% | | | | 2/06/26 | | | | N/R | | | | 749,925 | |
| | | | | | | |
| | 2,435 | | | Banco Santander SA | | | | | | | | | | | 3.800% | | | | 2/23/28 | | | | A | | | | 2,642,380 | |
| | | | | | | |
| | 425 | | | Bancolombia SA | | | | | | | | | | | 3.000% | | | | 1/29/25 | | | | Baa2 | | | | 416,543 | |
| | | | | | | |
| | 1,060 | | | Bank of America Corp | | | | | | | | | | | 3.559% | | | | 4/23/27 | | | | A+ | | | | 1,183,046 | |
| | | | | | | |
| | 1,105 | | | Bank of America Corp | | | | | | | | | | | 3.248% | | | | 10/21/27 | | | | A+ | | | | 1,218,676 | |
| | | | | | | |
| | 3,662 | | | Bank of America Corp | | | | | | | | | | | 3.419% | | | | 12/20/28 | | | | A+ | | | | 4,078,148 | |
| | | | | | | |
| | 850 | | | Banque Ouest Africaine de Developpement, 144A | | | | | | | | | | | 5.000% | | | | 7/27/27 | | | | Baa1 | | | | 884,000 | |
| | | | | | | |
| | 2,865 | | | Barclays PLC | | | | | | | | | | | 3.650% | | | | 3/16/25 | | | | A | | | | 3,105,975 | |
37
Nuveen Strategic Income Fund (continued)
Portfolio of Investments June 30, 2020
| | | | | | | | | | | | | | | | | | | | | | | | | | | | |
Principal
Amount (000) | | | Description (1) | | | | | | | | Coupon | | | Maturity | | | Ratings (2) | | | Value | |
| | | | | | | |
| | | | Banks (continued) | | | | | | | | | | | | | | | | | | |
| | | | | | | |
| $ | 2,010 | | | BNP Paribas SA, 144A | | | | | | | | | | | 4.375% | | | | 5/12/26 | | | | A– | | | $ | 2,216,578 | |
| | | | | |
| | 1,000 | | | Caelus Re VI Ltd, 144A, (3-Month U.S. Treasury Bill reference rate + 5.500% spread), (3) | | | | 6.950% | | | | 6/07/23 | | | | N/R | | | | 964,400 | |
| | | | | | | |
| | 1,575 | | | Citigroup Inc | | | | | | | | | | | 4.300% | | | | 11/20/26 | | | | BBB+ | | | | 1,787,654 | |
| | | | | | | |
| | 1,895 | | | Citigroup Inc | | | | | | | | | | | 4.450% | | | | 9/29/27 | | | | BBB+ | | | | 2,159,535 | |
| | | | | | | |
| | 2,080 | | | Citigroup Inc | | | | | | | | | | | 2.666% | | | | 1/29/31 | | | | A | | | | 2,158,538 | |
| | | | | | | |
| | 800 | | | Credicorp Ltd, 144A, (4) | | | | | | | | | | | 2.750% | | | | 6/17/25 | | | | BBB+ | | | | 796,120 | |
| | | | | | | |
| | 3,360 | | | Goldman Sachs Group Inc | | | | | | | | | | | 4.000% | | | | 3/03/24 | | | | A | | | | 3,712,810 | |
| | | | | | | |
| | 675 | | | Grupo Aval Ltd, 144A | | | | | | | | | | | 4.375% | | | | 2/04/30 | | | | BBB– | | | | 644,625 | |
| | | | | | | |
| | 1,465 | | | HSBC Holdings PLC | | | | | | | | | | | 2.099% | | | | 6/04/26 | | | | A+ | | | | 1,479,542 | |
| | | | | | | |
| | 815 | | | HSBC Holdings PLC | | | | | | | | | | | 4.375% | | | | 11/23/26 | | | | A3 | | | | 902,595 | |
| | | | | | | |
| | 2,100 | | | ING Groep NV | | | | | | | | | | | 3.950% | | | | 3/29/27 | | | | A+ | | | | 2,416,466 | |
| | | | | | | |
| | 1,100 | | | JPMorgan Chase & Co | | | | | | | | | | | 3.875% | | | | 9/10/24 | | | | A | | | | 1,219,594 | |
| | | | | | | |
| | 2,710 | | | JPMorgan Chase & Co | | | | | | | | | | | 3.702% | | | | 5/06/30 | | | | AA– | | | | 3,112,396 | |
| | | | | | | |
| | 600 | | | JPMorgan Chase & Co | | | | | | | | | | | 2.956% | | | | 5/13/31 | | | | A | | | | 638,027 | |
| | | | | | | |
| | 2,810 | | | Wells Fargo & Co | | | | | | | | | | | 2.879% | | | | 10/30/30 | | | | A+ | | | | 3,003,003 | |
| | | | | | | |
| | 1,500 | | | Zions Bancorp NA | | | | | | | | | | | 3.250% | | | | 10/29/29 | | | | BBB | | | | 1,478,474 | |
| | 39,647 | | | Total Banks | | | | | | | | | | | | | | | | | | | | | | | 42,969,050 | |
| | | | | | | |
| | | | Beverages – 0.0% | | | | | | | | | | | | | | | | | | |
| | | | | | | |
| | 225 | | | Constellation Brands Inc | | | | | | | | | | | 2.875% | | | | 5/01/30 | | | | BBB | | | | 238,346 | |
| | | | | | | |
| | | | Biotechnology – 0.4% | | | | | | | | | | | | | | | | | | |
| | | | | | | |
| | 2,000 | | | AbbVie Inc, 144A | | | | | | | | | | | 4.250% | | | | 11/21/49 | | | | BBB+ | | | | 2,397,423 | |
| | | | | | | |
| | | | Building Products – 0.2% | | | | | | | | | | | | | | | | | | |
| | | | | | | |
| | 930 | | | American Woodmark Corp, 144A | | | | | | | | | | | 4.875% | | | | 3/15/26 | | | | BB | | | | 904,778 | |
| | | | | | | |
| | | | Capital Markets – 1.9% | | | | | | | | | | | | | | | | | | |
| | | | | | | |
| | 1,125 | | | Donnelley Financial Solutions Inc | | | | | | | | | | | 8.250% | | | | 10/15/24 | | | | B | | | | 1,108,226 | |
| | | | | | | |
| | 1,375 | | | Goldman Sachs Group Inc | | | | | | | | | | | 5.250% | | | | 7/27/21 | | | | A | | | | 1,443,707 | |
| | | | | | | |
| | 900 | | | Goldman Sachs Group Inc | | | | | | | | | | | 5.750% | | | | 1/24/22 | | | | A | | | | 970,985 | |
| | | | | | | |
| | 2,295 | | | Goldman Sachs Group Inc | | | | | | | | | | | 4.250% | | | | 10/21/25 | | | | BBB+ | | | | 2,586,417 | |
| | | | | | | |
| | 4,635 | | | Morgan Stanley | | | | | | | | | | | 3.950% | | | | 4/23/27 | | | | BBB+ | | | | 5,216,889 | |
| | 10,330 | | | Total Capital Markets | | | | | | | | | | | | | | | | | | | | | | | 11,326,224 | |
| | | | | | | |
| | | | Chemicals – 1.6% | | | | | | | | | | | | | | | | | | |
| | | | | | | |
| | 3,000 | | | Agrium Inc | | | | | | | | | | | 3.375% | | | | 3/15/25 | | | | BBB | | | | 3,054,144 | |
| | | | | | | |
| | 925 | | | Air Products and Chemicals Inc | | | | | | | | | | | 2.800% | | | | 5/15/50 | | | | A | | | | 980,320 | |
| | | | | | | |
| | 1,465 | | | DuPont de Nemours Inc | | | | | | | | | | | 4.493% | | | | 11/15/25 | | | | BBB+ | | | | 1,686,515 | |
| | | | | | | |
| | 750 | | | MEGlobal Canada ULC, 144A | | | | | | | | | | | 5.000% | | | | 5/18/25 | | | | BBB | | | | 806,573 | |
| | | | | | | |
| | 1,500 | | | NOVA Chemicals Corp, 144A | | | | | | | | | | | 5.250% | | | | 8/01/23 | | | | BB– | | | | 1,447,500 | |
| | | | | | | |
| | 1,350 | | | NOVA Chemicals Corp, 144A | | | | | | | | | | | 5.000% | | | | 5/01/25 | | | | BB– | | | | 1,235,250 | |
| | | | | | | |
| | 100 | | | PolyOne Corp, 144A | | | | | | | | | | | 5.750% | | | | 5/15/25 | | | | BB– | | | | 102,875 | |
| | 9,090 | | | Total Chemicals | | | | | | | | | | | | | | | | | | | | | | | 9,313,177 | |
38
| | | | | | | | | | | | | | | | | | | | | | | | | | | | |
Principal
Amount (000) | | | Description (1) | | | | | | | | Coupon | | | Maturity | | | Ratings (2) | | | Value | |
| | | | | | | |
| | | | Commercial Services & Supplies – 0.4% | | | | | | | | | | | | | | | | | | |
| | | | | | | |
| $ | 1,575 | | | ADT Security Corp, 144A | | | | | | | | | | | 4.875% | | | | 7/15/32 | | | | BB– | | | $ | 1,433,250 | |
| | | | | | | |
| | 100 | | | GFL Environmental Inc, 144A | | | | | | | | | | | 4.250% | | | | 6/01/25 | | | | BB– | | | | 100,875 | |
| | | | | | | |
| | 135 | | | GFL Environmental Inc, 144A | | | | | | | | | | | 7.000% | | | | 6/01/26 | | | | B– | | | | 140,400 | |
| | | | | | | |
| | 100 | | | GFL Environmental Inc, 144A | | | | | | | | | | | 5.125% | | | | 12/15/26 | | | | BB– | | | | 103,500 | |
| | | | | | | |
| | 165 | | | GFL Environmental Inc, 144A | | | | | | | | | | | 8.500% | | | | 5/01/27 | | | | B– | | | | 179,438 | |
| | | | | |
| | 375 | | | Prime Security Services Borrower LLC / Prime Finance Inc, 144A | | | | 6.250% | | | | 1/15/28 | | | | B– | | | | 353,212 | |
| | 2,450 | | | Total Commercial Services & Supplies | | | | | | | | | | | | | | | | | | | | | | | 2,310,675 | |
| | | | | | | |
| | | | Communications Equipment – 0.3% | | | | | | | | | | | | | | | | | | |
| | | | | | | |
| | 1,950 | | | CommScope Inc, 144A | | | | | | | | | | | 8.250% | | | | 3/01/27 | | | | B– | | | | 2,004,015 | |
| | | | | | | |
| | | | Construction & Engineering – 0.1% | | | | | | | | | | | | | | | | | | |
| | | | | | | |
| | 500 | | | IHS Netherlands Holdco BV, 144A | | | | | | | | | | | 8.000% | | | | 9/18/27 | | | | B2 | | | | 503,750 | |
| | | | | | | |
| | 250 | | | PowerTeam Services LLC, 144A | | | | | | | | | | | 9.033% | | | | 12/04/25 | | | | B– | | | | 255,000 | |
| | 750 | | | Total Construction & Engineering | | | | | | | | | | | | | | | | | | | | | | | 758,750 | |
| | | | | | | |
| | | | Construction Materials – 0.3% | | | | | | | | | | | | | | | | | | |
| | | | | | | |
| | 450 | | | Cemex SAB de CV, 144A | | | | | | | | | | | 7.375% | | | | 6/05/27 | | | | BB | | | | 457,200 | |
| | | | | | | |
| | 825 | | | Cemex SAB de CV, 144A | | | | | | | | | | | 5.450% | | | | 11/19/29 | | | | BB | | | | 762,052 | |
| | | | | | | |
| | 750 | | | Gates Global LLC / Gates Corp, 144A | | | | | | | | | | | 6.250% | | | | 1/15/26 | | | | B | | | | 742,808 | |
| | 2,025 | | | Total Construction Materials | | | | | | | | | | | | | | | | | | | | | | | 1,962,060 | |
| | | | | | | |
| | | | Consumer Discretionary – 0.1% | | | | | | | | | | | | | | | | | | |
| | | | | | | |
| | 500 | | | Lamar Media Corp, 144A | | | | | | | | | | | 3.750% | | | | 2/15/28 | | | | BB– | | | | 471,400 | |
| | | | | | | |
| | | | Consumer Finance – 1.4% | | | | | | | | | | | | | | | | | | |
| | | | | | | |
| | 1,780 | | | Capital One Financial Corp | | | | | | | | | | | 3.750% | | | | 3/09/27 | | | | A– | | | | 1,965,397 | |
| | | | | | | |
| | 1,000 | | | Curo Group Holdings Corp, 144A | | | | | | | | | | | 8.250% | | | | 9/01/25 | | | | B– | | | | 799,700 | |
| | | | | | | |
| | 3,310 | | | Discover Bank | | | | | | | | | | | 4.250% | | | | 3/13/26 | | | | BBB+ | | | | 3,720,559 | |
| | | | | | | |
| | 1,500 | | | Refinitiv US Holdings Inc, 144A | | | | | | | | | | | 8.250% | | | | 11/15/26 | | | | B+ | | | | 1,624,455 | |
| | | | | | | |
| | 100 | | | Springleaf Finance Corp | | | | | | | | | | | 8.875% | | | | 6/01/25 | | | | BB– | | | | 106,919 | |
| | | | | | | |
| | 425 | | | Springleaf Finance Corp | | | | | | | | | | | 5.375% | | | | 11/15/29 | | | | BB– | | | | 399,500 | |
| | 8,115 | | | Total Consumer Finance | | | | | | | | | | | | | | | | | | | | | | | 8,616,530 | |
| | | | | | | |
| | | | Containers & Packaging – 0.0% | | | | | | | | | | | | | | | | | | |
| | | | | | | |
| | 165 | | | Bemis Co Inc | | | | | | | | | | | 2.630% | | | | 6/19/30 | | | | BBB | | | | 169,131 | |
| | | | | | | |
| | | | Diversified Consumer Services – 0.3% | | | | | | | | | | | | | | | | | | |
| | | | | | | |
| | 1,500 | | | frontdoor Inc, 144A | | | | | | | | | | | 6.750% | | | | 8/15/26 | | | | B | | | | 1,593,750 | |
| | | | | | | |
| | | | Diversified Financial Services – 1.3% | | | | | | | | | | | | | | | | | | |
| | | | | | | |
| | 1,500 | | | Discover Financial Services | | | | | | | | | | | 6.125% | | | | 3/23/66 | | | | Ba2 | | | | 1,538,550 | |
| | | | | | | |
| | 1,555 | | | GE Capital International Funding Co Unlimited Co | | | | | | | | | | | 4.418% | | | | 11/15/35 | | | | BBB+ | | | | 1,578,708 | |
| | | | | | | |
| | 425 | | | Genesis Energy LP / Genesis Energy Finance Corp | | | | | | | | | | | 7.750% | | | | 2/01/28 | | | | B+ | | | | 378,250 | |
| | | | | | | |
| | 375 | | | Indian Railway Finance Corp Ltd, 144A | | | | | | | | | | | 3.249% | | | | 2/13/30 | | | | BBB– | | | | 371,272 | |
| | | | | | | |
| | 2,000 | | | Quicken Loans LLC, 144A | | | | | | | | | | | 5.250% | | | | 1/15/28 | | | | Ba1 | | | | 2,080,000 | |
39
Nuveen Strategic Income Fund (continued)
Portfolio of Investments June 30, 2020
| | | | | | | | | | | | | | | | | | | | | | | | | | | | |
Principal
Amount (000) | | | Description (1) | | | | | | | | Coupon | | | Maturity | | | Ratings (2) | | | Value | |
| | | | | | | |
| | | | Diversified Financial Services (continued) | | | | | | | | | | | | | | | | | | |
| | | | | | | |
| $ | 400 | | | REC Ltd, 144A | | | | | | | | | | | 4.750% | | | | 5/19/23 | | | | Baa3 | | | $ | 410,723 | |
| | 1,350 | | | Total Capital International SA | | | | | | | | | | | 2.986% | | | | 6/29/41 | | | | Aa3 | | | | 1,375,852 | |
| | 7,605 | | | Total Diversified Financial Services | | | | | | | | | | | | | | | | | | | | | | | 7,733,355 | |
| | | | | | | |
| | | | Diversified Telecommunication Services – 1.9% | | | | | | | | | | | | | | | | | | |
| | | | | | | |
| | 3,950 | | | AT&T Inc | | | | | | | | | | | 4.350% | | | | 3/01/29 | | | | A– | | | | 4,604,585 | |
| | | | | | | |
| | 380 | | | AT&T Inc | | | | | | | | | | | 3.500% | | | | 6/01/41 | | | | A– | | | | 399,069 | |
| | | | | | | |
| | 625 | | | AT&T Inc | | | | | | | | | | | 4.350% | | | | 6/15/45 | | | | A– | | | | 703,075 | |
| | | | | | | |
| | 2,650 | | | Telefonica Emisiones SA | | | | | | | | | | | 4.103% | | | | 3/08/27 | | | | BBB | | | | 3,024,681 | |
| | | | | | | |
| | 2,200 | | | Telenet Finance Luxembourg Notes Sarl, 144A | | | | | | | | | | | 5.500% | | | | 3/01/28 | | | | BB+ | | | | 2,288,071 | |
| | | | | | | |
| | 500 | | | Zayo Group Holdings Inc, 144A | | | | | | | | | | | 4.000% | | | | 3/01/27 | | | | B1 | | | | 474,530 | |
| | 10,305 | | | Total Diversified Telecommunication Services | | | | | | | | | | | | | | | | | | | | | | | 11,494,011 | |
| | | | | | | |
| | | | Electric Utilities – 1.5% | | | | | | | | | | | | | | | | | | |
| | | | | | | |
| | 1,025 | | | Berkshire Hathaway Energy Co, 144A | | | | | | | | | | | 3.700% | | | | 7/15/30 | | | | A– | | | | 1,198,931 | |
| | | | | | | |
| | 990 | | | Chevron Corp | | | | | | | | | | | 2.236% | | | | 5/11/30 | | | | AA | | | | 1,036,315 | |
| | | | | | | |
| | 430 | | | NSTAR Electric Co | | | | | | | | | | | 3.950% | | | | 4/01/30 | | | | A1 | | | | 515,623 | |
| | | | | | | |
| | 2,000 | | | Oglethorpe Power Corp | | | | | | | | | | | 4.200% | | | | 12/01/42 | | | | BBB+ | | | | 2,161,160 | |
| | | | | | | |
| | 1,000 | | | Perusahaan Perseroan Persero PT Perusahaan Listrik Negara, 144A | | | | | | | | | | | 6.150% | | | | 5/21/48 | | | | Baa2 | | | | 1,242,500 | |
| | | | | | | |
| | 1,000 | | | Talen Energy Supply LLC | | | | | | | | | | | 6.500% | | | | 6/01/25 | | | | B | | | | 673,320 | |
| | | | | | | |
| | 250 | | | Vistra Operations Co LLC, 144A | | | | | | | | | | | 5.500% | | | | 9/01/26 | | | | BB | | | | 255,785 | |
| | | | | | | |
| | 1,725 | | | Vistra Operations Co LLC, 144A | | | | | | | | | | | 5.625% | | | | 2/15/27 | | | | BB | | | | 1,771,541 | |
| | 8,420 | | | Total Electric Utilities | | | | | | | | | | | | | | | | | | | | | | | 8,855,175 | |
| |
| | | | Energy Equipment & Services – 0.4% | |
| | | | | | | |
| | 1,100 | | | Archrock Partners LP / Archrock Partners Finance Corp, 144A | | | | | | | | | | | 6.875% | | | | 4/01/27 | | | | B+ | | | | 1,036,200 | |
| | | | | | | |
| | 550 | | | Archrock Partners LP / Archrock Partners Finance Corp, 144A | | | | | | | | | | | 6.250% | | | | 4/01/28 | | | | B+ | | | | 503,415 | |
| | | | | | | |
| | 1,625 | | | Ensign Drilling Inc, 144A | | | | | | | | | | | 9.250% | | | | 4/15/24 | | | | CCC+ | | | | 723,125 | |
| | 3,275 | | | Total Energy Equipment & Services | | | | | | | | | | | | | | | | | | | | | | | 2,262,740 | |
| |
| | | | Entertainment – 0.0% | |
| | | | | | | |
| | 225 | | | Live Nation Entertainment Inc, 144A | | | | | | | | | | | 6.500% | | | | 5/15/27 | | | | Ba2 | | | | 231,750 | |
| | | | | | | |
| | | | Equity Real Estate Investment Trust – 1.6% | | | | | | | | | | | | | | | | | | |
| | | | | | | |
| | 750 | | | American Tower Corp | | | | | | | | | | | 5.000% | | | | 2/15/24 | | | | BBB+ | | | | 853,932 | |
| | | | | | | |
| | 355 | | | Camden Property Trust | | | | | | | | | | | 2.800% | | | | 5/15/30 | | | | A– | | | | 383,502 | |
| | | | | | | |
| | 700 | | | Cibanco SA Ibm / PLA Administradora Industrial S de RL de CV, 144A | | | | | | | | | | | 4.962% | | | | 7/18/29 | | | | Baa3 | | | | 679,000 | |
| | | | | | | |
| | 985 | | | Crown Castle International Corp | | | | | | | | | | | 3.250% | | | | 1/15/51 | | | | BBB+ | | | | 983,000 | |
| | | | | | | |
| | 1,075 | | | Essex Portfolio LP | | | | | | | | | | | 2.650% | | | | 3/15/32 | | | | BBB+ | | | | 1,133,522 | |
| | | | | | | |
| | 595 | | | Healthcare Realty Trust Inc | | | | | | | | | | | 2.400% | | | | 3/15/30 | | | | BBB+ | | | | 565,955 | |
| | | | | | | |
| | 1,335 | | | Regency Centers LP | | | | | | | | | | | 2.950% | | | | 9/15/29 | | | | BBB+ | | | | 1,354,757 | |
| | | | | | | |
| | 2,400 | | | SBA Tower Trust, 144A | | | | | | | | | | | 2.836% | | | | 1/15/50 | | | | A2 | | | | 2,474,432 | |
| | | | | | | |
| | 1,000 | | | VICI Properties LP / VICI Note Co Inc, 144A | | | | | | | | | | | 4.125% | | | | 8/15/30 | | | | BB | | | | 953,750 | |
| | 9,195 | | | Total Equity Real Estate Investment Trust | | | | | | | | | | | | | | | | | | | | | | | 9,381,850 | |
40
| | | | | | | | | | | | | | | | | | | | | | | | | | | | |
Principal
Amount (000) | | | Description (1) | | | | | | | | Coupon | | | Maturity | | | Ratings (2) | | | Value | |
| |
| | | | Food & Staples Retailing – 0.4% | |
| | | | | | | |
| $ | 1,990 | | | CVS Health Corp | | | | | | | | | | | 4.300% | | | | 3/25/28 | | | | BBB | | | $ | 2,326,493 | |
| | | | | | | |
| | | | Food Products – 0.3% | | | | | | | | | | | | | | | | | | |
| | | | | | | |
| | 1,050 | | | BRF SA, 144A | | | | | | | | | | | 4.875% | | | | 1/24/30 | | | | Ba2 | | | | 989,625 | |
| | | | | | | |
| | 600 | | | NBM US Holdings Inc, 144A | | | | | | | | | | | 6.625% | | | | 8/06/29 | | | | BB– | | | | 608,820 | |
| | 1,650 | | | Total Food Products | | | | | | | | | | | | | | | | | | | | | | | 1,598,445 | |
| |
| | | | Gas Utilities – 0.2% | |
| | | | | | | |
| | 1,250 | | | Suburban Propane Partners LP/Suburban Energy Finance Corp | | | | | | | | | | | 5.500% | | | | 6/01/24 | | | | BB– | | | | 1,237,500 | |
| | | | | | | |
| | | | Health Care Equipment & Supplies – 0.2% | | | | | | | | | | | | | | | | | | |
| | | | | | | |
| | 1,380 | | | Boston Scientific Corp | | | | | | | | | | | 2.650% | | | | 6/01/30 | | | | Baa2 | | | | 1,433,365 | |
| | | | | | | |
| | | | Health Care Providers & Services – 0.7% | | | | | | | | | | | | | | | | | | |
| | | | | | | |
| | 1,515 | | | Centene Corp, 144A | | | | | | | | | | | 5.375% | | | | 6/01/26 | | | | BBB– | | | | 1,570,540 | |
| | | | | | | |
| | 350 | | | Centene Corp | | | | | | | | | | | 4.625% | | | | 12/15/29 | | | | BBB– | | | | 370,570 | |
| | | | | | | |
| | 715 | | | CHS/Community Health Systems Inc | | | | | | | | | | | 6.250% | | | | 3/31/23 | | | | BB | | | | 673,501 | |
| | | | | | | |
| | 275 | | | CHS/Community Health Systems Inc, 144A | | | | | | | | | | | 6.625% | | | | 2/15/25 | | | | B | | | | 258,500 | |
| | | | | | | |
| | 275 | | | Encompass Health Corp | | | | | | | | | | | 4.500% | | | | 2/01/28 | | | | B+ | | | | 263,758 | |
| | | | | | | |
| | 100 | | | HCA Inc | | | | | | | | | | | 5.625% | | | | 9/01/28 | | | | Ba2 | | | | 111,541 | |
| | | | | | | |
| | 1,000 | | | HCA Inc | | | | | | | | | | | 3.500% | | | | 9/01/30 | | | | Ba2 | | | | 962,939 | |
| | | | | | | |
| | 200 | | | Tenet Healthcare Corp, 144A | | | | | | | | | | | 7.500% | | | | 4/01/25 | | | | BB– | | | | 212,500 | |
| | 4,430 | | | Total Health Care Providers & Services | | | | | | | | | | | | | | | | | | | | | | | 4,423,849 | |
| |
| | | | Hotels, Restaurants & Leisure – 0.2% | |
| | | | | | | |
| | 100 | | | Boyd Gaming Corp, 144A | | | | | | | | | | | 8.625% | | | | 6/01/25 | | | | B– | | | | 104,500 | |
| | | | | |
| | 375 | | | Cedar Fair LP / Canada’s Wonderland Co / Magnum Management Corp / Millennium Op, 144A | | | | 5.500% | | | | 5/01/25 | | | | Ba2 | | | | 376,875 | |
| | | | | | | |
| | 400 | | | Sands China Ltd, 144A | | | | | | | | | | | 4.375% | | | | 6/18/30 | | | | Baa2 | | | | 416,128 | |
| | | | | | | |
| | 100 | | | Yum! Brands Inc, 144A | | | | | | | | | | | 7.750% | | | | 4/01/25 | | | | B+ | | | | 107,875 | |
| | 975 | | | Total Hotels, Restaurants & Leisure | | | | | | | | | | | | | | | | | | | | | | | 1,005,378 | |
| |
| | | | Independent Power & Renewable Electricity Producers – 0.1% | |
| | | | | | | |
| | 600 | | | Azure Power Solar Energy Pvt Ltd, 144A | | | | | | | | | | | 5.650% | | | | 12/24/24 | | | | Ba1 | | | | 604,050 | |
| | | | | | | |
| | 174 | | | Clearway Energy Operating LLC, 144A | | | | | | | | | | | 4.750% | | | | 3/15/28 | | | | BB | | | | 177,470 | |
| | | | | | | |
| | 42 | | | NRG Energy Inc | | | | | | | | | | | 6.625% | | | | 1/15/27 | | | | BB | | | | 43,890 | |
| | 816 | | | Total Independent Power & Renewable Electricity Producers | | | | | | | | | | | | | | | | | | | | | | | 825,410 | |
| |
| | | | Industrial Conglomerates – 0.3% | |
| | | | | | | |
| | 560 | | | General Electric Co | | | | | | | | | | | 3.625% | | | | 5/01/30 | | | | BBB+ | | | | 560,501 | |
| | | | | | | |
| | 500 | | | Icahn Enterprises LP / Icahn Enterprises Finance Corp | | | | | | | | | | | 5.250% | | | | 5/15/27 | | | | BB+ | | | | 482,500 | |
| | | | | | | |
| | 750 | | | United Rentals North America Inc | | | | | | | | | | | 6.500% | | | | 12/15/26 | | | | BB– | | | | 787,500 | |
| | 1,810 | | | Total Industrial Conglomerates | | | | | | | | | | | | | | | | | | | | | | | 1,830,501 | |
| |
| | | | Insurance – 1.7% | |
| | | | | | | |
| | 1,000 | | | AssuredPartners Inc | | | | | | | | | | | 5.500% | | | | 2/12/27 | | | | B | | | | 986,250 | |
| | | | | | | |
| | 1,230 | | | Genworth Holdings Inc, (4) | | | | | | | | | | | 4.800% | | | | 2/15/24 | | | | B– | | | | 980,925 | |
41
Nuveen Strategic Income Fund (continued)
Portfolio of Investments June 30, 2020
| | | | | | | | | | | | | | | | | | | | | | | | | | | | |
Principal
Amount (000) | | | Description (1) | | | | | | | | Coupon | | | Maturity | | | Ratings (2) | | | Value | |
| |
| | | | Insurance (continued) | |
| | | | | | | |
| $ | 1,940 | | | Liberty Mutual Group Inc, 144A | | | | | | | | | | | 4.569% | | | | 2/01/29 | | | | BBB | | | $ | 2,271,914 | |
| | | | | | | |
| | 750 | | | Nationstar Mortgage Holdings Inc, 144A | | | | | | | | | | | 8.125% | | | | 7/15/23 | | | | B | | | | 769,650 | |
| | | | | |
| | 667 | | | Sutter Re Ltd, 144A, (3-Month U.S. Treasury Bill reference rate + 5.500% spread), (3) | | | | 5.129% | | | | 6/06/22 | | | | N/R | | | | 670,535 | |
| | | | | | | |
| | 1,805 | | | Willis North America Inc | | | | | | | | | | | 3.600% | | | | 5/15/24 | | | | BBB | | | | 1,953,529 | |
| | | | | | | |
| | 2,225 | | | XLIT Ltd | | | | | | | | | | | 4.450% | | | | 3/31/25 | | | | BBB+ | | | | 2,506,409 | |
| | 9,617 | | | Total Insurance | | | | | | | | | | | | | | | | | | | | | | | 10,139,212 | |
| |
| | | | Interactive Media & Services – 0.1% | |
| | | | | | | |
| | 725 | | | Prosus NV, 144A | | | | | | | | | | | 3.680% | | | | 1/21/30 | | | | BBB– | | | | 758,977 | |
| | | | | | | |
| | | | IT Services – 0.3% | | | | | | | | | | | | | | | | | | |
| | | | | | | |
| | 1,680 | | | Fidelity National Information Services Inc | | | | | | | | | | | 3.750% | | | | 5/21/29 | | | | BBB | | | | 1,968,085 | |
| | | | | | | |
| | | | Leisure Products – 0.1% | | | | | | | | | | | | | | | | | | |
| | | | | | | |
| | 750 | | | Mattel Inc, 144A | | | | | | | | | | | 6.750% | | | | 12/31/25 | | | | B+ | | | | 778,125 | |
| | | | | | | |
| | | | Life Sciences Tools & Services – 0.1% | | | | | | | | | | | | | | | | | | |
| | | | | | | |
| | 460 | | | Thermo Fisher Scientific Inc | | | | | | | | | | | 4.133% | | | | 3/25/25 | | | | BBB+ | | | | 525,398 | |
| | | | | | | |
| | | | Machinery – 0.4% | | | | | | | | | | | | | | | | | | |
| | | | | | | |
| | 700 | | | Maxim Crane Works Holdings Capital LLC, 144A | | | | | | | | | | | 10.125% | | | | 8/01/24 | | | | B– | | | | 688,415 | |
| | | | | | | |
| | 1,405 | | | Trane Technologies Luxembourg Finance SA | | | | | | | | | | | 3.800% | | | | 3/21/29 | | | | BBB | | | | 1,589,621 | |
| | 2,105 | | | Total Machinery | | | | | | | | | | | | | | | | | | | | | | | 2,278,036 | |
| |
| | | | Media – 1.7% | |
| | | | | | | |
| | 375 | | | CCO Holdings LLC / CCO Holdings Capital Corp, 144A | | | | | | | | | | | 4.500% | | | | 8/15/30 | | | | BB | | | | 382,687 | |
| | | | | | | |
| | 2,650 | | | Comcast Corp | | | | | | | | | | | 2.650% | | | | 2/01/30 | | | | A– | | | | 2,881,342 | |
| | | | | | | |
| | 1,790 | | | Comcast Corp | | | | | | | | | | | 3.969% | | | | 11/01/47 | | | | A– | | | | 2,161,792 | |
| | | | | | | |
| | 1,200 | | | CSC Holdings LLC, 144A | | | | | | | | | | | 6.500% | | | | 2/01/29 | | | | BB | | | | 1,311,000 | |
| | | | | | | |
| | 1,500 | | | DISH DBS Corp | | | | | | | | | | | 7.750% | | | | 7/01/26 | | | | B2 | | | | 1,590,165 | |
| | | | | | | |
| | 600 | | | Entercom Media Corp, 144A | | | | | | | | | | | 6.500% | | | | 5/01/27 | | | | B– | | | | 538,500 | |
| | | | | | | |
| | 500 | | | Grupo Televisa SAB | | | | | | | | | | | 5.250% | | | | 5/24/49 | | | | BBB+ | | | | 578,707 | |
| | | | | | | |
| | 625 | | | TEGNA Inc, 144A | | | | | | | | | | | 4.625% | | | | 3/15/28 | | | | BB– | | | | 575,000 | |
| | 9,240 | | | Total Media | | | | | | | | | | | | | | | | | | | | | | | 10,019,193 | |
| |
| | | | Metals & Mining – 0.5% | |
| | | | | | | |
| | 100 | | | Arconic Corp, 144A | | | | | | | | | | | 6.000% | | | | 5/15/25 | | | | BB+ | | | | 102,875 | |
| | | | | | | |
| | 450 | | | Cleveland-Cliffs Inc, 144A | | | | | | | | | | | 9.875% | | | | 10/17/25 | | | | B | | | | 472,027 | |
| | | | | | | |
| | 1,250 | | | First Quantum Minerals Ltd, 144A | | | | | | | | | | | 6.500% | | | | 3/01/24 | | | | B– | | | | 1,178,125 | |
| | | | | | | |
| | 575 | | | Nexa Resources SA, 144A | | | | | | | | | | | 6.500% | | | | 1/18/28 | | | | BBB– | | | | 582,475 | |
| | | | | | | |
| | 700 | | | Tronox Inc, 144A | | | | | | | | | | | 6.500% | | | | 4/15/26 | | | | B | | | | 654,500 | |
| | 3,075 | | | Total Metals & Mining | | | | | | | | | | | | | | | | | | | | | | | 2,990,002 | |
| |
| | | | Oil, Gas & Consumable Fuels – 5.2% | |
| | | | | | | |
| | 1,875 | | | Cosan Ltd, 144A | | | | | | | | | | | 5.500% | | | | 9/20/29 | | | | BB | | | | 1,776,562 | |
| | | | | | | |
| | 1,000 | | | Denbury Resources Inc, 144A | | | | | | | | | | | 9.000% | | | | 5/15/21 | | | | B | | | | 387,500 | |
42
| | | | | | | | | | | | | | | | | | | | | | | | | | | | |
Principal
Amount (000) | | | Description (1) | | | | | | | | Coupon | | | Maturity | | | Ratings (2) | | | Value | |
| |
| | | | Oil, Gas & Consumable Fuels (continued) | |
| | | | | | | |
| $ | 600 | | | Denbury Resources Inc, 144A | | | | | | | | | | | 7.750% | | | | 2/15/24 | | | | B | | | $ | 228,000 | |
| | | | | | | |
| | 725 | | | Diamondback Energy Inc | | | | | | | | | | | 3.250% | | | | 12/01/26 | | | | BBB | | | | 728,943 | |
| | | | | | | |
| | 575 | | | Ecopetrol SA | | | | | | | | | | | 6.875% | | | | 4/29/30 | | | | BBB– | | | | 661,825 | |
| | | | | | | |
| | 750 | | | Ecopetrol SA | | | | | | | | | | | 5.875% | | | | 5/28/45 | | | | BBB– | | | | 784,913 | |
| | | | | | | |
| | 1,420 | | | Energy Transfer Operating LP | | | | | | | | | | | 5.000% | | | | 5/15/50 | | | | BBB– | | | | 1,341,638 | |
| | | | | | | |
| | 250 | | | EnLink Midstream LLC | | | | | | | | | | | 5.375% | | | | 6/01/29 | | | | BB+ | | | | 187,500 | |
| | | | | | | |
| | 400 | | | Enviva Partners LP / Enviva Partners Finance Corp, 144A | | | | | | | | | | | 6.500% | | | | 1/15/26 | | | | BB– | | | | 416,000 | |
| | | | | | | |
| | 500 | | | Geopark Ltd, 144A | | | | | | | | | | | 5.500% | | | | 1/17/27 | | | | B+ | | | | 430,005 | |
| | | | | | | |
| | 800 | | | KazMunayGas National Co JSC, 144A | | | | | | | | | | | 5.375% | | | | 4/24/30 | | | | Baa3 | | | | 905,000 | |
| | | | | | | |
| | 595 | | | Magellan Midstream Partners LP | | | | | | | | | | | 3.250% | | | | 6/01/30 | | | | BBB+ | | | | 630,258 | |
| | | | | | | |
| | 750 | | | Medco Oak Tree Pte Ltd, 144A | | | | | | | | | | | 7.375% | | | | 5/14/26 | | | | B1 | | | | 695,018 | |
| | | | | | | |
| | 2,000 | | | Moss Creek Resources Holdings Inc, 144A | | | | | | | | | | | 10.500% | | | | 5/15/27 | | | | B– | | | | 1,060,000 | |
| | | | | | | |
| | 3,795 | | | MPLX LP | | | | | | | | | | | 4.875% | | | | 6/01/25 | | | | BBB | | | | 4,234,178 | |
| | | | | | | |
| | 1,200 | | | Murphy Oil Corp | | | | | | | | | | | 5.875% | | | | 12/01/27 | | | | BB+ | | | | 1,056,000 | |
| | | | | | | |
| | 2,000 | | | Occidental Petroleum Corp | | | | | | | | | | | 4.300% | | | | 8/15/39 | | | | BB+ | | | | 1,379,420 | |
| | | | | | | |
| | 1,340 | | | ONEOK Inc | | | | | | | | | | | 3.400% | | | | 9/01/29 | | | | BBB | | | | 1,303,119 | |
| | | | | | | |
| | 1,000 | | | Peabody Energy Corp, 144A | | | | | | | | | | | 6.375% | | | | 3/31/25 | | | | BB– | | | | 530,000 | |
| | | | | | | |
| | 625 | | | Pertamina Persero PT, 144A | | | | | | | | | | | 4.700% | | | | 7/30/49 | | | | Baa2 | | | | 673,539 | |
| | | | | | | |
| | 593 | | | Petrobras Global Finance BV, 144A | | | | | | | | | | | 5.093% | | | | 1/15/30 | | | | Ba2 | | | | 590,628 | |
| | | | | | | |
| | 500 | | | Petrobras Global Finance BV | | | | | | | | | | | 5.600% | | | | 1/03/31 | | | | Ba2 | | | | 502,250 | |
| | | | | | | |
| | 2,200 | | | Petroleos Mexicanos | | | | | | | | | | | 6.500% | | | | 3/13/27 | | | | BBB | | | | 1,985,544 | |
| | | | | | | |
| | 1,345 | | | Sabine Pass Liquefaction LLC | | | | | | | | | | | 5.875% | | | | 6/30/26 | | | | BBB– | | | | 1,580,375 | |
| | | | | | | |
| | 1,275 | | | Suncor Energy Inc | | | | | | | | | | | 6.800% | | | | 5/15/38 | | | | BBB+ | | | | 1,650,662 | |
| | | | | | | |
| | 525 | | | Sunoco LP / Sunoco Finance Corp | | | | | | | | | | | 4.875% | | | | 1/15/23 | | | | BB | | | | 517,125 | |
| | | | | | | |
| | 500 | | | Sunoco LP / Sunoco Finance Corp | | | | | | | | | | | 6.000% | | | | 4/15/27 | | | | BB | | | | 495,000 | |
| | | | | | | |
| | 670 | | | Targa Resources Partners LP / Targa Resources Partners Finance Corp | | | | | | | | | | | 4.250% | | | | 11/15/23 | | | | BB | | | | 641,384 | |
| | | | | | | |
| | 150 | | | Targa Resources Partners LP / Targa Resources Partners Finance Corp | | | | | | | | | | | 6.500% | | | | 7/15/27 | | | | BB | | | | 150,375 | |
| | | | | | | |
| | 1,000 | | | Tullow Oil PLC, 144A | | | | | | | | | | | 6.250% | | | | 4/15/22 | | | | CCC+ | | | | 730,000 | |
| | | | | | | |
| | 975 | | | USA Compression Partners LP / USA Compression Finance Corp | | | | | | | | | | | 6.875% | | | | 9/01/27 | | | | BB– | | | | 926,055 | |
| | | | | | | |
| | 1,515 | | | WPX Energy Inc | | | | | | | | | | | 5.750% | | | | 6/01/26 | | | | BBB– | | | | 1,469,550 | |
| | | | | | | |
| | 100 | | | WPX Energy Inc | | | | | | | | | | | 4.500% | | | | 1/15/30 | | | | BBB– | | | | 88,361 | |
| | 33,548 | | | Total Oil, Gas & Consumable Fuels | | | | | | | | | | | | | | | | | | | | | | | 30,736,727 | |
| | | | | | | |
| | | | Paper & Forest Products – 0.3% | | | | | | | | | | | | | | | | | | |
| | | | | | | |
| | 500 | | | Inversiones CMPC SA, 144A | | | | | | | | | | | 4.375% | | | | 4/04/27 | | | | BBB | | | | 533,750 | |
| | | | | | | |
| | 1,100 | | | Suzano Austria GmbH | | | | | | | | | | | 5.000% | | | | 1/15/30 | | | | BBB– | | | | 1,114,300 | |
| | 1,600 | | | Total Paper & Forest Products | | | | | | | | | | | | | | | | | | | | | | | 1,648,050 | |
| |
| | | | Pharmaceuticals – 0.6% | |
| | | | | | | |
| | 1,050 | | | Bausch Health Americas Inc, 144A | | | | | | | | | | | 8.500% | | | | 1/31/27 | | | | B | | | | 1,114,312 | |
| | | | | | | |
| | 350 | | | Bausch Health Cos Inc, 144A | | | | | | | | | | | 5.000% | | | | 1/30/28 | | | | B | | | | 329,522 | |
| | | | | | | |
| | 2,310 | | | Eli Lilly and Co | | | | | | | | | | | 2.250% | | | | 5/15/50 | | | | A+ | | | | 2,214,698 | |
43
Nuveen Strategic Income Fund (continued)
Portfolio of Investments June 30, 2020
| | | | | | | | | | | | | | | | | | | | | | | | | | | | |
Principal
Amount (000) | | | Description (1) | | | | | | | | Coupon | | | Maturity | | | Ratings (2) | | | Value | |
| |
| | | | Pharmaceuticals (continued) | |
| | | | | | | |
| $ | 200 | | | Horizon Therapeutics USA Inc, 144A | | | | | | | | | | | 5.500% | | | | 8/01/27 | | | | Ba3 | | | $ | 208,074 | |
| | 3,910 | | | Total Pharmaceuticals | | | | | | | | | | | | | | | | | | | | | | | 3,866,606 | |
| |
| | | | Professional Services – 0.4% | |
| | | | | | | |
| | 250 | | | ASGN Inc, 144A | | | | | | | | | | | 4.625% | | | | 5/15/28 | | | | BB– | | | | 244,155 | |
| | | | | | | |
| | 1,635 | | | Verisk Analytics Inc | | | | | | | | | | | 4.125% | | | | 3/15/29 | | | | BBB+ | | | | 1,909,926 | |
| | 1,885 | | | Total Professional Services | | | | | | | | | | | | | | | | | | | | | | | 2,154,081 | |
| | | | | | | |
| | | | Real Estate Management & Development – 0.3% | | | | | | | | | | | | | | | | | | |
| | | | | | | |
| | 575 | | | Country Garden Holdings Co Ltd, Reg S | | | | | | | | | | | 4.750% | | | | 9/28/23 | | | | BBB– | | | | 581,507 | |
| | | | | | | |
| | 1,500 | | | Hunt Cos Inc, 144A | | | | | | | | | | | 6.250% | | | | 2/15/26 | | | | BB– | | | | 1,365,000 | |
| | 2,075 | | | Total Real Estate Management & Development | | | | | | | | | | | | | | | | | | | | | | | 1,946,507 | |
| |
| | | | Road & Rail – 0.9% | |
| | | | | | | |
| | 1,350 | | | CSX Corp | | | | | | | | | | | 3.800% | | | | 11/01/46 | | | | BBB+ | | | | 1,529,912 | |
| | | | | | | |
| | 750 | | | Rumo Luxembourg Sarl, 144A, (WI/DD) | | | | | | | | | | | 5.250% | | | | 1/10/28 | | | | BB– | | | | 750,000 | |
| | | | | | | |
| | 1,500 | | | Union Pacific Corp | | | | | | | | | | | 3.839% | | | | 3/20/60 | | | | A– | | | | 1,761,887 | |
| | | | | | | |
| | 1,000 | | | United Rentals North America Inc | | | | | | | | | | | 4.875% | | | | 1/15/28 | | | | BB– | | | | 1,025,000 | |
| | 4,600 | | | Total Road & Rail | | | | | | | | | | | | | | | | | | | | | | | 5,066,799 | |
| |
| | | | Semiconductors & Semiconductor Equipment – 0.3% | |
| | | | | | | |
| | 1,665 | | | Broadcom Corp / Broadcom Cayman Finance Ltd | | | | | | | | | | | 3.875% | | | | 1/15/27 | | | | BBB– | | | | 1,799,969 | |
| | | | | | | |
| | | | Software – 0.2% | | | | | | | | | | | | | | | | | | |
| | | | | | | |
| | 100 | | | Camelot Finance SA, 144A | | | | | | | | | | | 4.500% | | | | 11/01/26 | | | | B | | | | 99,750 | |
| | | | | | | |
| | 925 | | | SS&C Technologies Inc, 144A | | | | | | | | | | | 5.500% | | | | 9/30/27 | | | | B+ | | | | 942,011 | |
| | 1,025 | | | Total Software | | | | | | | | | | | | | | | | | | | | | | | 1,041,761 | |
| |
| | | | Specialty Retail – 1.0% | |
| | | | | | | |
| | 1,645 | | | AutoNation Inc | | | | | | | | | | | 3.800% | | | | 11/15/27 | | | | BBB– | | | | 1,701,368 | |
| | | | | | | |
| | 450 | | | Lithia Motors Inc, 144A | | | | | | | | | | | 4.625% | | | | 12/15/27 | | | | BB | | | | 445,500 | |
| | | | | | | |
| | 1,310 | | | PetSmart Inc, 144A, (4) | | | | | | | | | | | 8.875% | | | | 6/01/25 | | | | CCC+ | | | | 1,309,948 | |
| | | | | | | |
| | 1,250 | | | PGT Innovations Inc, 144A | | | | | | | | | | | 6.750% | | | | 8/01/26 | | | | B+ | | | | 1,262,500 | |
| | | | | | | |
| | 100 | | | Staples Inc, 144A | | | | | | | | | | | 7.500% | | | | 4/15/26 | | | | B1 | | | | 78,575 | |
| | | | | | | |
| | 1,550 | | | Staples Inc, 144A | | | | | | | | | | | 10.750% | | | | 4/15/27 | | | | B3 | | | | 945,329 | |
| | 6,305 | | | Total Specialty Retail | | | | | | | | | | | | | | | | | | | | | | | 5,743,220 | |
| |
| | | | Tobacco – 0.2% | |
| | | | | | | |
| | 1,130 | | | Altria Group Inc | | | | | | | | | | | 3.875% | | | | 9/16/46 | | | | A3 | | | | 1,126,514 | |
| | | | | | | |
| | | | Trading Companies & Distributors – 0.5% | | | | | | | | | | | | | | | | | | |
| | | | | | | |
| | 515 | | | Ashtead Capital Inc, 144A | | | | | | | | | | | 4.125% | | | | 8/15/25 | | | | BBB– | | | | 525,300 | |
| | | | | | | |
| | 325 | | | Beacon Roofing Supply Inc, 144A | | | | | | | | | | | 4.500% | | | | 11/15/26 | | | | BB | | | | 319,611 | |
| | | | | | | |
| | 900 | | | Fortress Transportation and Infrastructure Investors LLC, 144A | | | | | | | | | | | 6.750% | | | | 3/15/22 | | | | Ba3 | | | | 864,414 | |
| | | | | | | |
| | 1,000 | | | H&E Equipment Services Inc | | | | | | | | | | | 5.625% | | | | 9/01/25 | | | | BB– | | | | 1,009,790 | |
| | | | | | | |
| | 200 | | | WESCO Distribution Inc, 144A | | | | | | | | | | | 7.125% | | | | 6/15/25 | | | | BB– | | | | 210,940 | |
| | 2,940 | | | Total Trading Companies & Distributors | | | | | | | | | | | | | | | | | | | | | | | 2,930,055 | |
44
| | | | | | | | | | | | | | | | | | | | | | | | | | | | |
Principal
Amount (000) | | | Description (1) | | | | | | | | Coupon | | | Maturity | | | Ratings (2) | | | Value | |
| |
| | | | Utility – 0.2% | |
| | | | | | | |
| $ | 1,000 | | | Calpine Corp, 144A | | | | | | | | | | | 5.250% | | | | 6/01/26 | | | | BB+ | | | $ | 1,009,710 | |
| | | | | | | |
| | | | Wireless Telecommunication Services – 0.9% | | | | | | | | | | | | | | | | | | |
| | | | | | | |
| | 900 | | | C&W Senior Financing DAC, 144A | | | | | | | | | | | 6.875% | | | | 9/15/27 | | | | B+ | | | | 891,441 | |
| | | | | | | |
| | 1,000 | | | Hughes Satellite Systems Corp | | | | | | | | | | | 6.625% | | | | 8/01/26 | | | | BB | | | | 1,037,880 | |
| | | | | | | |
| | 1,040 | | | Millicom International Cellular SA, 144A | | | | | | | | | | | 5.125% | | | | 1/15/28 | | | | BB+ | | | | 1,045,408 | |
| | | | | | | |
| | 1,350 | | | Telecom Italia SpA/Milano, 144A | | | | | | | | | | | 5.303% | | | | 5/30/24 | | | | BB+ | | | | 1,405,714 | |
| | | | | | | |
| | 1,010 | | | T-Mobile USA Inc, 144A | | | | | | | | | | | 3.875% | | | | 4/15/30 | | | | BBB– | | | | 1,125,716 | |
| | 5,300 | | | Total Wireless Telecommunication Services | | | | | | | | | | | | | | | | | | | | | | | 5,506,159 | |
| $ | 240,528 | | | Total Corporate Bonds (cost $240,637,235) | | | | 246,468,669 | |
| | | | | | | |
Principal
Amount (000) | | | Description (1) | | | | | | | | Coupon | | | Maturity | | | Ratings (2) | | | Value | |
| |
| | | | ASSET-BACKED AND MORTGAGE-BACKED SECURITIES – 31.6% | |
| | | | | | | |
| $ | 1,907 | | | Aaset 2019-1 Trust, 144A | | | | | | | | | | | 3.844% | | | | 5/15/39 | | | | A | | | $ | 1,723,077 | |
| | | | | | | |
| | 980 | | | AASET 2020-1 Trust, 144A | | | | | | | | | | | 4.335% | | | | 1/15/40 | | | | BBB | | | | 519,393 | |
| | | | | | | |
| | 1,461 | | | Adams Outdoor Advertising LP, 144A | | | | | | | | | | | 4.810% | | | | 11/15/48 | | | | A | | | | 1,485,681 | |
| | | | | | | |
| | 2,275 | | | American Express Credit Account Master Trust | | | | | | | | | | | 2.870% | | | | 10/15/24 | | | | Aaa | | | | 2,370,364 | |
| | | | | | | |
| | 2,176 | | | American Homes 4 Rent 2014-SFR2 Trust, 144A | | | | | | | | | | | 3.786% | | | | 10/17/36 | | | | Aaa | | | | 2,337,050 | |
| | | | | | | |
| | 265 | | | AMSR 2019-SFR1 Trust, 144A | | | | | | | | | | | 3.247% | | | | 1/20/39 | | | | Baa2 | | | | 262,740 | |
| | | | | | | |
| | 2,132 | | | Angel Oak Mortgage Trust I LLC 2018-1, 144A | | | | | | | | | | | 4.100% | | | | 4/25/48 | | | | A | | | | 2,125,391 | |
| | | | | |
| | 1,000 | | | Apidos CLO XXIX, 144A, (3-Month LIBOR reference rate + 1.550% spread), (3) | | | | 2.541% | | | | 7/25/30 | | | | AA | | | | 955,712 | |
| | | | | | | |
| | 1,350 | | | Applebee’s Funding LLC / IHOP Funding LLC, 144A | | | | | | | | | | | 4.194% | | | | 6/05/49 | | | | BBB | | | | 1,196,545 | |
| | | | | | | |
| | 2,100 | | | Avis Budget Rental Car Funding AESOP LLC, 144A | | | | | | | | | | | 4.150% | | | | 9/20/23 | | | | BBB | | | | 1,955,802 | |
| | | | | | | |
| | 1,200 | | | Banc of America Commercial Mortgage Trust 2015-UBS7 | | | | | | | | | | | 4.505% | | | | 9/17/48 | | | | A– | | | | 1,125,328 | |
| | | | | | | |
| | 313 | | | Bancorp Commercial Mortgage 2018-CRE3 Trust, 144A, (1-Month LIBOR reference rate + 0.850% spread), (3) | | | | | | | | | | | 1.035% | | | | 3/16/35 | | | | Aaa | | | | 298,528 | |
| | | | | | | |
| | 13,970 | | | BANK 2019-BNK21, (I/O) | | | | | | | | | | | 0.997% | | | | 10/18/52 | | | | AAA | | | | 858,498 | |
| | | | | | | |
| | 19,554 | | | BANK 2019-BNK22, (I/O) | | | | | | | | | | | 0.719% | | | | 11/17/62 | | | | AAA | | | | 916,854 | |
| | | | | | | |
| | 8,464 | | | BANK 2019-BNK23, (I/O) | | | | | | | | | | | 0.817% | | | | 12/17/52 | | | | AAA | | | | 465,052 | |
| | | | | | | |
| | 1,250 | | | BANK 2019-BNK24 | | | | | | | | | | | 2.929% | | | | 11/17/62 | | | | AAA | | | | 1,367,208 | |
| | | | | | | |
| | 18,179 | | | BANK 2019-BNK24, (I/O) | | | | | | | | | | | 0.768% | | | | 11/17/62 | | | | AAA | | | | 888,377 | |
| | | | | | | |
| | 1,000 | | | BANK 2019-BNK24, 144A | | | | | | | | | | | 2.500% | | | | 11/17/62 | | | | BBB | | | | 775,272 | |
| | | | | | | |
| | 11,792 | | | BBCMS Mortgage Trust 2020-C6, (I/O) | | | | | | | | | | | 1.060% | | | | 2/18/53 | | | | AAA | | | | 920,381 | |
| | | | | | | |
| | 2,400 | | | BBCMS Trust 2015-STP, 144A | | | | | | | | | | | 4.427% | | | | 9/10/28 | | | | BBB– | | | | 2,390,552 | |
| | | | | | | |
| | 220 | | | Bear Stearns Commercial Mortgage Securities Trust 2005-PWR7 | | | | | | | | | | | 5.117% | | | | 2/11/41 | | | | Ba1 | | | | 218,571 | |
| | | | | | | |
| | 1,000 | | | Benchmark 2020-IG3 Mortgage Trust | | | | | | | | | | | 3.654% | | | | 9/17/48 | | | | N/R | | | | 1,044,174 | |
| | | | | |
| | 4,204 | | | BX Commercial Mortgage Trust 2019-XL, 144A, (1-Month LIBOR reference rate + 0.920% spread), (3) | | | | 1.105% | | | | 10/15/36 | | | | Aaa | | | | 4,178,853 | |
| | | | | |
| | 955 | | | BX Commercial Mortgage Trust 2019-XL, 144A, (1-Month LIBOR reference rate + 1.250% spread), (3) | | | | 1.435% | | | | 10/15/36 | | | | A3 | | | | 933,876 | |
45
Nuveen Strategic Income Fund (continued)
Portfolio of Investments June 30, 2020
| | | | | | | | | | | | | | | | | | | | | | | | | | | | |
Principal
Amount (000) | | | Description (1) | | | | | | | | Coupon | | | Maturity | | | Ratings (2) | | | Value | |
| |
| | | | ASSET-BACKED AND MORTGAGE-BACKED SECURITIES (continued) | |
| | | | | |
| $ | 955 | | | BX Commercial Mortgage Trust 2019-XL, 144A, (1-Month LIBOR reference rate + 1.800% spread), (3) | | | | 1.985% | | | | 10/15/36 | | | | N/R | | | $ | 924,313 | |
| | | | | | | |
| | 1,150 | | | CARS-DB4 LP, 144A | | | | | | | | | | | 4.520% | | | | 2/15/50 | | | | BBB | | | | 1,043,865 | |
| | | | | | | |
| | 1,000 | | | Cayuga Park CLO, Ltd, 144A, (WI/DD) | | | | | | | | | | | 0.000% | | | | 7/17/31 | | | | N/R | | | | 1,000,000 | |
| | | | | | | |
| | 50 | | | CF 2020-P1 Mortgage Trust | | | | | | | | | | | 2.840% | | | | 4/17/52 | | | | N/R | | | | 53,047 | |
| | | | | | | |
| | 750 | | | CF 2020-P1 Mortgage Trust | | | | | | | | | | | 3.603% | | | | 4/17/52 | | | | N/R | | | | 754,939 | |
| | | | | | | |
| | 750 | | | CF 2020-P1 Mortgage Trust, 144A | | | | | | | | | | | 10.010% | | | | 4/17/52 | | | | N/R | | | | 750,621 | |
| | | | | | | |
| | 436 | | | CHL Mortgage Pass-Through Trust 2005-27 | | | | | | | | | | | 5.500% | | | | 1/25/23 | | | | N/R | | | | 397,983 | |
| | | | | | | |
| | 1,200 | | | Citibank Credit Card Issuance Trust | | | | | | | | | | | 2.190% | | | | 11/20/23 | | | | AAA | | | | 1,230,609 | |
| | | | | | | |
| | 1,690 | | | Citigroup Commercial Mortgage Trust 2015-GC29 | | | | | | | | | | | 4.296% | | | | 4/10/48 | | | | A– | | | | 1,627,506 | |
| | | | | | | |
| | 2,750 | | | Citigroup Commercial Mortgage Trust 2015-GC29 | | | | | | | | | | | 3.758% | | | | 4/10/48 | | | | AA– | | | | 2,853,236 | |
| | | | | | | |
| | 325 | | | Citigroup Commercial Mortgage Trust 2016-GC36 | | | | | | | | | | | 3.349% | | | | 2/12/49 | | | | Aaa | | | | 353,025 | |
| | | | | | | |
| | 19,312 | | | Citigroup Commercial Mortgage Trust 2019-GC43, (I/O) | | | | | | | | | | | 0.750% | | | | 11/13/52 | | | | AAA | | | | 880,281 | |
| | | | | | | |
| | 16,290 | | | Citigroup Commercial Mortgage Trust 2020-GC46, (I/O) | | | | | | | | | | | 1.109% | | | | 2/18/53 | | | | AAA | | | | 1,147,022 | |
| | | | | | | |
| | 400 | | | COMM 2013-CCRE10 Mortgage Trust | | | | | | | | | | | 4.210% | | | | 8/10/46 | | | | Aaa | | | | 432,851 | |
| | | | | | | |
| | 750 | | | COMM 2014-LC17 Mortgage Trust | | | | | | | | | | | 4.188% | | | | 10/11/47 | | | | AAA | | | | 816,121 | |
| | | | | | | |
| | 1,615 | | | COMM 2015-CCRE22 Mortgage Trust | | | | | | | | | | | 4.244% | | | | 3/12/48 | | | | A– | | | | 1,612,426 | |
| | | | | | | |
| | 1,000 | | | COMM 2015-CCRE22 Mortgage Trust, 144A | | | | | | | | | | | 3.000% | | | | 3/12/48 | | | | BB– | | | | 610,707 | |
| | | | | | | |
| | 1,000 | | | COMM 2015-CCRE24 Mortgage Trust | | | | | | | | | | | 4.523% | | | | 8/12/48 | | | | AA– | | | | 1,037,754 | |
| | | | | | | |
| | 2,260 | | | COMM 2015-CCRE26 Mortgage Trust | | | | | | | | | | | 4.630% | | | | 10/10/48 | | | | A– | | | | 2,221,824 | |
| | | | | | | |
| | 250 | | | COMM 2018-COR3C Mortgage Trust | | | | | | | | | | | 4.713% | | | | 5/12/51 | | | | A– | | | | 241,204 | |
| | | | | | | |
| | 497 | | | Corevest American Finance 2020-1 Trust, 144A | | | | | | | | | | | 1.832% | | | | 3/17/50 | | | | AAA | | | | 494,959 | |
| | | | | | | |
| | 180 | | | CPT 2019 Mortgage Trust, 144A | | | | | | | | | | | 3.097% | | | | 11/16/39 | | | | N/R | | | | 162,154 | |
| | | | | | | |
| | 80 | | | Credit Suisse First Boston Mortgage Securities Corp | | | | | | | | | | | 5.750% | | | | 9/25/33 | | | | AAA | | | | 82,129 | |
| | | | | | | |
| | 1,409 | | | DB Master Finance LLC, 144A | | | | | | | | | | | 3.787% | | | | 5/20/49 | | | | BBB | | | | 1,454,435 | |
| | | | | | | |
| | 656 | | | DB Master Finance LLC, 144A | | | | | | | | | | | 4.021% | | | | 5/20/49 | | | | BBB | | | | 690,334 | |
| | | | | | | |
| | 1,550 | | | Diamond Resorts Owner Trust, 144A | | | | | | | | | | | 2.890% | | | | 2/20/32 | | | | AAA | | | | 1,557,107 | |
| | | | | | | |
| | 3,588 | | | Domino’s Pizza Master Issuer LLC, 144A | | | | | | | | | | | 3.082% | | | | 7/25/47 | | | | BBB+ | | | | 3,664,711 | |
| | | | | | | |
| | 2,000 | | | Driven Brands Funding LLC, 144A, (WI/DD) | | | | | | | | | | | 3.786% | | | | 7/20/50 | | | | N/R | | | | 2,000,000 | |
| | | | | | | |
| | 1,000 | | | Ellington Financial Mortgage Trust 2019-1, 144A | | | | | | | | | | | 3.587% | | | | 6/25/59 | | | | BBB | | | | 946,407 | |
| | | | | |
| | 5,031 | | | Fannie Mae Connecticut Avenue Securities, (1-Month LIBOR reference rate + 3.000% spread), (3) | | | | 3.185% | | | | 7/25/24 | | | | Aaa | | | | 4,404,978 | |
| | | | | |
| | 239 | | | Fannie Mae Connecticut Avenue Securities, (1-Month LIBOR reference rate + 6.950% spread), (3) | | | | 7.135% | | | | 8/25/28 | | | | A3 | | | | 252,376 | |
| | | | | |
| | 76 | | | Fannie Mae Connecticut Avenue Securities, (1-Month LIBOR reference rate + 6.000% spread), (3) | | | | 6.185% | | | | 9/25/28 | | | | AAA | | | | 79,314 | |
| | | | | | | |
| | 383 | | | Fannie Mae Connecticut Avenue Securities, (1-Month LIBOR reference rate + 5.900% spread), (3) | | | | | | | | | | | 6.085% | | | | 10/25/28 | | | | BBB | | | | 398,126 | |
| | | | | | | |
| | 325 | | | Fannie Mae Connecticut Avenue Securities, (1-Month LIBOR reference rate + 4.250% spread), (3) | | | | | | | | | | | 4.435% | | | | 4/25/29 | | | | Aaa | | | | 339,294 | |
| | | | | | | |
| | 2,819 | | | Fannie Mae Connecticut Avenue Securities, (1-Month LIBOR reference rate + 2.200% spread), (3) | | | | | | | | | | | 2.385% | | | | 1/25/30 | | | | AAA | | | | 2,815,376 | |
46
| | | | | | | | | | | | | | | | | | | | | | | | | | | | |
Principal
Amount (000) | | | Description (1) | | | | | | | | Coupon | | �� | Maturity | | | Ratings (2) | | | Value | |
| |
| | | | ASSET-BACKED AND MORTGAGE-BACKED SECURITIES (continued) | |
| | | | | | | |
| $ | 47 | | | Fannie Mae Connecticut Avenue Securities, (1-Month LIBOR reference rate + 2.550% spread), (3) | | | | | | | | | | | 2.735% | | | | 12/26/30 | | | | B+ | | | $ | 46,224 | |
| | | | | | | |
| | 3 | | | Fannie Mae Interest Strip, Series FNS 366 25, (I/O) | | | | | | | | | | | 5.000% | | | | 9/01/24 | | | | Aaa | | | | 40 | |
| | | | | | | |
| | 30 | | | Fannie Mae Mortgage Pool FN 256890 | | | | | | | | | | | 6.000% | | | | 9/01/37 | | | | Aaa | | | | 34,495 | |
| | | | | | | |
| | 29 | | | Fannie Mae Mortgage Pool FN 745101 | | | | | | | | | | | 6.000% | | | | 4/01/32 | | | | Aaa | | | | 32,661 | |
| | | | | | | |
| | 133 | | | Fannie Mae Mortgage Pool FN 745324 | | | | | | | | | | | 6.000% | | | | 3/01/34 | | | | Aaa | | | | 145,676 | |
| | | | | | | |
| | 1 | | | Fannie Mae Mortgage Pool FN 905597, (1-Month LIBOR reference rate + 1.875% spread), (3) | | | | | | | | | | | 3.875% | | | | 12/01/36 | | | | N/R | | | | 848 | |
| | | | | | | |
| | 19 | | | Fannie Mae Mortgage Pool FN 946228, (1-Month LIBOR reference rate + 1.501% spread), (3) | | | | | | | | | | | 3.751% | | | | 9/01/37 | | | | N/R | | | | 18,744 | |
| | | | | | | |
| | 1 | | | Fannie Mae Mortgage Pool FN AL1187 | | | | | | | | | | | 5.500% | | | | 7/01/24 | | | | N/R | | | | 796 | |
| | | | | | | |
| | 3,626 | | | Fannie Mae Mortgage Pool FN AS7499 | | | | | | | | | | | 3.500% | | | | 7/01/46 | | | | N/R | | | | 3,963,753 | |
| | | | | | | |
| | 3,405 | | | Fannie Mae Mortgage Pool FN BH7065 | | | | | | | | | | | 4.000% | | | | 12/01/47 | | | | Aaa | | | | 3,763,774 | |
| | | | | | | |
| | 2,022 | | | Fannie Mae Mortgage Pool FN BM5126 | | | | | | | | | | | 3.500% | | | | 1/01/48 | | | | N/R | | | | 2,216,513 | |
| | | | | | | |
| | 1,195 | | | Fannie Mae Mortgage Pool FN BM5839 | | | | | | | | | | | 3.500% | | | | 11/01/47 | | | | Aaa | | | | 1,308,647 | |
| | | | | | | |
| | 784 | | | Fannie Mae Mortgage Pool FN BM6038 | | | | | | | | | | | 4.000% | | | | 1/01/45 | | | | Aaa | | | | 853,465 | |
| | | | | | | |
| | 50 | | | Fannie Mae Mortgage Pool FN FM1108 | | | | | | | | | | | 5.000% | | | | 11/01/44 | | | | Aaa | | | | 57,668 | |
| | | | | | | |
| | 305 | | | Fannie Mae Mortgage Pool FN FM1136 | | | | | | | | | | | 5.500% | | | | 3/01/39 | | | | Aaa | | | | 350,493 | |
| | | | | | | |
| | 54 | | | Fannie Mae Mortgage Pool FN FM1137 | | | | | | | | | | | 6.000% | | | | 9/01/39 | | | | Aaa | | | | 62,927 | |
| | | | | | | |
| | 211 | | | Fannie Mae Mortgage Pool FN FM1138 | | | | | | | | | | | 6.500% | | | | 8/01/37 | | | | Aaa | | | | 238,307 | |
| | | | | | | |
| | 1,330 | | | Fannie Mae Mortgage Pool FN MA1178 | | | | | | | | | | | 4.000% | | | | 9/01/42 | | | | Aaa | | | | 1,448,690 | |
| | | | | | | |
| | 921 | | | Fannie Mae Mortgage Pool FN MA3228 | | | | | | | | | | | 3.000% | | | | 11/01/47 | | | | Aaa | | | | 953,970 | |
| | | | | | | |
| | 1,249 | | | Fannie Mae Mortgage Pool FN MA3333 | | | | | | | | | | | 4.000% | | | | 4/01/48 | | | | Aaa | | | | 1,325,363 | |
| | | | | | | |
| | 1,682 | | | Fannie Mae Mortgage Pool FN MA3416 | | | | | | | | | | | 4.500% | | | | 7/01/48 | | | | Aaa | | | | 1,806,947 | |
| | | | | |
| | 415 | | | Fannie Mae Mortgage Pool FNR 2013-98 SA, (I/O), (1-Month LIBOR reference rate + 5.950% spread), (3) | | | | 5.766% | | | | 9/25/43 | | | | Aaa | | | | 94,177 | |
| | | | | | | |
| | 389 | | | Fannie Mae Mortgage Pool FNR 2018-81 GI, (I/O) | | | | | | | | | | | 3.000% | | | | 11/25/48 | | | | Aaa | | | | 42,812 | |
| | | | | | | |
| | 389 | | | Fannie Mae Mortgage Pool FNR 2018-81 GO | | | | | | | | | | | 0.000% | | | | 11/25/48 | | | | N/R | | | | 361,449 | |
| | | | | | | |
| | 117 | | | Fannie Mae Pool, (WI/DD) | | | | | | | | | | | 4.000% | | | | 12/01/47 | | | | Aaa | | | | 124,724 | |
| | | | | | | |
| | 327 | | | Fannie Mae Pool | | | | | | | | | | | 3.000% | | | | 8/01/49 | | | | Aaa | | | | 355,478 | |
| | | | | | | |
| | 1,500 | | | Fannie Mae Pool, (WI/DD) | | | | | | | | | | | 3.000% | | | | 7/01/50 | | | | N/R | | | | 1,580,943 | |
| | | | | | | |
| | 1,273 | | | Flagstar Mortgage Trust 2017-2, 144A | | | | | | | | | | | 3.500% | | | | 10/25/47 | | | | Aaa | | | | 1,289,135 | |
| | | | | | | |
| | 94 | | | Flagstar Mortgage Trust 2017-2, 144A | | | | | | | | | | | 4.111% | | | | 10/25/47 | | | | A3 | | | | 94,575 | |
| | | | | | | |
| | 335 | | | Flagstar Mortgage Trust 2018-4, 144A | | | | | | | | | | | 4.000% | | | | 7/25/48 | | | | Aaa | | | | 335,313 | |
| | | | | | | |
| | 2,695 | | | Freddie Mac Gold Pool FG G60138 | | | | | | | | | | | 3.500% | | | | 8/01/45 | | | | Aaa | | | | 2,973,207 | |
| | | | | | | |
| | 2,954 | | | Freddie Mac Gold Pool FG G60238 | | | | | | | | | | | 3.500% | | | | 10/01/45 | | | | Aaa | | | | 3,229,989 | |
| | | | | | | |
| | 517 | | | Freddie Mac Gold Pool FG U90490 | | | | | | | | | | | 4.000% | | | | 6/01/42 | | | | N/R | | | | 562,698 | |
| | | | | |
| | 1,015 | | | Freddie Mac STACR Remic Trust 2020-DNA2, 144A, (1-Month LIBOR reference rate + 1.850% spread), (3) | | | | 2.035% | | | | 2/25/50 | | | | BB | | | | 962,326 | |
| | | | | |
| | 925 | | | Freddie Mac Stacr Remic Trust 2020-HQA2, 144A, (1-Month LIBOR reference rate + 3.100% spread), (3) | | | | 3.285% | | | | 3/25/50 | | | | Ba2 | | | | 885,624 | |
47
Nuveen Strategic Income Fund (continued)
Portfolio of Investments June 30, 2020
| | | | | | | | | | | | | | | | | | | | | | | | | | | | |
Principal
Amount (000) | | | Description (1) | | | | | | | | Coupon | | | Maturity | | | Ratings (2) | | | Value | |
| |
| | | | ASSET-BACKED AND MORTGAGE-BACKED SECURITIES (continued) | |
| | | | | |
| $ | 785 | | | Freddie Mac STACR Trust 2019-HQA2, 144A, (1-Month LIBOR reference rate + 2.050% spread), (3) | | | | 2.235% | | | | 4/26/49 | | | | B+ | | | $ | 768,492 | |
| | | | | | | |
| | 347 | | | Freddie Mac Strips, Series FHS 326 350 | | | | | | | | | | | 3.500% | | | | 3/15/44 | | | | N/R | | | | 381,169 | |
| | | | | |
| | 356 | | | Freddie Mac Strips, Series FHS 327 S8, (I/O), (1-Month LIBOR reference rate + 5.920% spread), (3) | | | | 5.735% | | | | 3/15/44 | | | | N/R | | �� | | 74,151 | |
| | | | | |
| | 1,750 | | | Freddie Mac Structured Agency Credit Risk Debt Notes 2017-DNA1 M2, (1-Month LIBOR reference rate + 3.250% spread), (3) | | | | 3.435% | | | | 7/25/29 | | | | Aaa | | | | 1,765,285 | |
| | | | | |
| | 71 | | | Freddie Mac Structured Agency Credit Risk Debt Notes 2018-SPI1 M1, 144A | | | | 3.726% | | | | 2/25/48 | | | | Aaa | | | | 71,111 | |
| | | | | |
| | 493 | | | Freddie Mac Structured Agency Credit Risk Debt Notes 2018-SPI4 M2, 144A | | | | 4.466% | | | | 11/25/48 | | | | Aaa | | | | 486,446 | |
| | | | | |
| | 100 | | | GS Mortgage Securities Trust 2013-GC13 | | | | 4.187% | | | | 7/12/46 | | | | Aaa | | | | 107,317 | |
| | | | | |
| | 2,465 | | | GS Mortgage Securities Trust 2015-GC32 | | | | 3.345% | | | | 7/10/48 | | | | BBB– | | | | 1,397,313 | |
| | | | | |
| | 1,500 | | | GS Mortgage Securities Trust 2019-GC40, 144A | | | | 3.668% | | | | 7/12/52 | | | | BBB– | | | | 1,438,033 | |
| | | | | |
| | 475 | | | GS Mortgage-Backed Securities Corp Trust 2019-PJ1, 144A | | | | 4.000% | | | | 8/25/49 | | | | Aa1 | | | | 484,992 | |
| | | | | |
| | 79 | | | GS Mortgage-Backed Securities Corp Trust 2019-PJ2, 144A | | | | 4.000% | | | | 11/25/49 | | | | Aaa | | | | 80,979 | |
| | | | | |
| | 206 | | | GS Mortgage-Backed Securities Corp Trust 2019-PJ2, 144A | | | | 4.000% | | | | 11/25/49 | | | | Aa1 | | | | 210,207 | |
| | | | | |
| | 1,679 | | | Hilton Grand Vacations Trust 2019-A, 144A | | | | 2.340% | | | | 7/25/33 | | | | AAA | | | | 1,678,849 | |
| | | | | |
| | 1,259 | | | Hilton Grand Vacations Trust 2019-A, 144A | | | | 2.840% | | | | 7/25/33 | | | | A– | | | | 1,145,646 | |
| | | | | | | |
| | 2,363 | | | Horizon Aircraft Finance II Ltd, 144A | | | | | | | | | | | 3.721% | | | | 7/15/39 | | | | A | | | | 2,078,304 | |
| | | | | | | |
| | 464 | | | Horizon Aircraft Finance II Ltd, 144A | | | | | | | | | | | 6.900% | | | | 7/15/39 | | | | BB | | | | 171,727 | |
| | | | | | | |
| | 970 | | | Horizon Aircraft Finance III Ltd, 144A | | | | | | | | | | | 3.425% | | | | 11/15/39 | | | | A | | | | 838,907 | |
| | | | | | | |
| | 976 | | | Horizon Aircraft Finance III Ltd, 144A | | | | | | | | | | | 4.458% | | | | 11/15/39 | | | | BBB | | | | 540,437 | |
| | | | | |
| | 2,000 | | | Hudson Yards 2019-30HY Mortgage Trust, 144A | | | | 3.558% | | | | 6/10/37 | | | | BBB– | | | | 2,002,857 | |
| | | | | | | |
| | 1,700 | | | Hudson Yards 2019-55HY Mortgage Trust, 144A | | | | | | | | | | | 3.041% | | | | 12/12/41 | | | | N/R | | | | 1,488,306 | |
| | | | | | | |
| | 912 | | | Impac Secured Assets CMN Owner Trust | | | | | | | | | | | 8.000% | | | | 10/25/30 | | | | CC | | | | 893,784 | |
| | | | | |
| | 2,994 | | | Invitation Homes 2018-SFR2 Trust, 144A, (1-Month LIBOR reference rate + 0.900% spread), (3) | | | | 1.085% | | | | 6/18/37 | | | | Aaa | | | | 2,956,319 | |
| | | | | |
| | 3,297 | | | Invitation Homes 2018-SFR3 Trust, 144A, (1-Month LIBOR reference rate + 1.000% spread), (3) | | | | 1.194% | | | | 7/17/37 | | | | Aaa | | | | 3,272,223 | |
| | | | | |
| | 94 | | | Invitation Homes 2018-SFR4 Trust, 144A, (1-Month LIBOR reference rate + 1.100% spread), (3) | | | | 1.294% | | | | 1/19/38 | | | | Aaa | | | | 93,509 | |
| | | | | |
| | 409 | | | JP Morgan Alternative Loan Trust 2007-S1, (1-Month LIBOR reference rate + 0.280% spread), (3) | | | | 0.465% | | | | 6/25/37 | | | | AAA | | | | 378,872 | |
| | | | | |
| | 335 | | | JP Morgan Chase Commercial Mortgage Securities Trust 2013-C16 | | | | 4.166% | | | | 12/15/46 | | | | Aaa | | | | 362,021 | |
| | | | | | | |
| | 1,587 | | | JP Morgan Mortgage Trust 2017-2, 144A | | | | | | | | | | | 3.500% | | | | 5/25/47 | | | | Aaa | | | | 1,611,316 | |
| | | | | | | |
| | 417 | | | JP Morgan Mortgage Trust 2018-3, 144A | | | | | | | | | | | 3.500% | | | | 9/25/48 | | | | AA+ | | | | 432,114 | |
| | | | | | | |
| | 134 | | | JP Morgan Mortgage Trust 2018-4, 144A | | | | | | | | | | | 3.500% | | | | 10/25/48 | | | | AA+ | | | | 136,781 | |
| | | | | | | |
| | 553 | | | JP Morgan Mortgage Trust 2018-5, 144A | | | | | | | | | | | 3.500% | | | | 10/25/48 | | | | AAA | | | | 566,986 | |
| | | | | | | |
| | 549 | | | JP Morgan Mortgage Trust 2018-8, 144A | | | | | | | | | | | 4.000% | | | | 1/25/49 | | | | Aaa | | | | 553,956 | |
| | | | | | | |
| | 831 | | | JP Morgan Mortgage Trust 2019-1, 144A | | | | | | | | | | | 4.000% | | | | 5/25/49 | | | | AAA | | | | 855,575 | |
| | | | | | | |
| | 161 | | | JP Morgan Mortgage Trust 2019-2, 144A | | | | | | | | | | | 4.000% | | | | 8/25/49 | | | | Aaa | | | | 161,733 | |
48
| | | | | | | | | | | | | | | | | | | | | | | | | | | | |
Principal
Amount (000) | | | Description (1) | | | | | | | | Coupon | | | Maturity | | | Ratings (2) | | | Value | |
| |
| | | | ASSET-BACKED AND MORTGAGE-BACKED SECURITIES (continued) | |
| | | | | | | |
| $ | 64 | | | JP Morgan Mortgage Trust 2019-3, 144A | | | | | | | | | | | 4.757% | | | | 9/25/49 | | | | Aa1 | | | $ | 67,395 | |
| | | | | | | |
| | 248 | | | JP Morgan Mortgage Trust 2020-1, 144A | | | | | | | | | | | 3.883% | | | | 6/25/50 | | | | A3 | | | | 236,737 | |
| | | | | | | |
| | 175 | | | JPMBB Commercial Mortgage Securities Trust 2014-C21 | | | | | | | | | | | 3.997% | | | | 8/16/47 | | | | Aaa | | | | 184,570 | |
| | | | | | | |
| | 1,500 | | | JPMCC Commercial Mortgage Securities Trust 2017-JP5 | | | | | | | | | | | 3.723% | | | | 3/17/50 | | | | Aaa | | | | 1,687,507 | |
| | | | | | | |
| | 608 | | | Lunar Aircraft 2020-1 LTD, 144A | | | | | | | | | | | 4.335% | | | | 2/15/45 | | | | BBB | | | | 331,044 | |
| | | | | | | |
| | 366 | | | Lunar Aircraft 2020-1 LTD, 144A | | | | | | | | | | | 6.413% | | | | 2/15/45 | | | | BB | | | | 134,679 | |
| | | | | | | |
| | 1,640 | | | MASTR Reperforming Loan Trust 2005-1, 144A | | | | | | | | | | | 7.500% | | | | 8/25/34 | | | | D | | | | 1,503,005 | |
| | | | | |
| | 283 | | | Morgan Stanley ABS Capital I Inc Trust 2004-HE6, (1-Month LIBOR reference rate + 0.825% spread), (3) | | | | 1.010% | | | | 8/25/34 | | | | BBB+ | | | | 279,035 | |
| | | | | | | |
| | 1,830 | | | MVW 2019-2 LLC, 144A | | | | | | | | | | | 2.680% | | | | 10/20/38 | | | | BBB+ | | | | 1,626,590 | |
| | | | | | | |
| | 1,588 | | | MVW Owner Trust 2019-1, 144A | | | | | | | | | | | 3.330% | | | | 11/20/36 | | | | BBB | | | | 1,478,326 | |
| | | | | |
| | 1,000 | | | Myers Park CLO Ltd, 144A, (1-Month LIBOR reference rate + 1.600% spread), (3) | | | | 2.735% | | | | 10/21/30 | | | | AA | | | | 964,046 | |
| | | | | |
| | 1,000 | | | Natixis Commercial Mortgage Securities Trust 2019-1776, 144A | | | | 3.902% | | | | 10/17/36 | | | | Ba3 | | | | 951,662 | |
| | | | | |
| | 1,500 | | | Natixis Commercial Mortgage Securities Trust 2019-MILE, 144A, (1-Month LIBOR reference rate + 3.500% spread), (3) | | | | 3.685% | | | | 7/15/36 | | | | N/R | | | | 1,379,922 | |
| | | | | |
| | 1,500 | | | Natixis Commercial Mortgage Securities Trust 2019-MILE, 144A, (1-Month LIBOR reference rate + 4.250% spread), (3) | | | | 4.435% | | | | 7/15/36 | | | | N/R | | | | 1,351,781 | |
| | | | | |
| | 1,000 | | | Neuberger Berman Loan Advisers CLO 27 Ltd, 144A, (1-Month LIBOR reference rate + 1.400% spread), (3) | | | | 2.619% | | | | 1/15/30 | | | | AA | | | | 966,324 | |
| | | | | |
| | 46 | | | New Residential Mortgage Loan Trust 2017-1, 144A | | | | 4.000% | | | | 2/25/57 | | | | Aaa | | | | 49,183 | |
| | | | | |
| | 2,009 | | | New Residential Mortgage Loan Trust 2017-6, 144A | | | | 4.000% | | | | 8/25/57 | | | | Aaa | | | | 2,142,167 | |
| | | | | |
| | 1,000 | | | Octagon Investment Partners 46 Ltd, 144A, (WI/DD), (1-Month LIBOR reference rate + 2.200% spread), (3) | | | | 2.550% | | | | 7/15/33 | | | | N/R | | | | 1,000,000 | |
| | | | | |
| | 1,150 | | | One Bryant Park Trust 2019-OBP, 144A | | | | 2.516% | | | | 9/13/54 | | | | Aaa | | | | 1,216,672 | |
| | | | | | | |
| | 1,405 | | | Pioneer Aircraft Finance Ltd, 144A | | | | | | | | | | | 3.967% | | | | 6/15/44 | | | | A | | | | 1,207,461 | |
| | | | | |
| | 2,063 | | | Planet Fitness Master Issuer LLC, 144A | | | | 4.262% | | | | 9/05/48 | | | | BBB | | | | 2,072,246 | |
| | | | | | | |
| | 57 | | | RALI Series 2005-QS12 Trust | | | | | | | | | | | 5.500% | | | | 8/25/35 | | | | Caa2 | | | | 55,230 | |
| | | | | | | |
| | 256 | | | Sequoia Mortgage Trust 2012-4 | | | | | | | | | | | 3.500% | | | | 9/25/42 | | | | Aaa | | | | 265,570 | |
| | | | | |
| | 162 | | | Sequoia Mortgage Trust 2018-7, 144A | | | | 4.000% | | | | 9/25/48 | | | | Aaa | | | | 165,361 | |
| | | | | |
| | 119 | | | Sequoia Mortgage Trust 2018-8, 144A | | | | 4.000% | | | | 11/25/48 | | | | Aaa | | | | 121,346 | |
| | | | | |
| | 360 | | | Sequoia Mortgage Trust 2018-CH4, 144A | | | | 4.500% | | | | 10/25/48 | | | | Aaa | | | | 363,879 | |
| | | | | |
| | 53 | | | Sequoia Mortgage Trust 2019-2, 144A | | | | 4.000% | | | | 6/25/49 | | | | AAA | | | | 53,680 | |
| | | | | |
| | 822 | | | Sequoia Mortgage Trust 2020-3, 144A | | | | 3.000% | | | | 4/25/50 | | | | AAA | | | | 859,449 | |
| | | | | |
| | 1,816 | | | SERVPRO Master Issuer LLC, 144A | | | | 3.882% | | | | 10/25/49 | | | | BBB– | | | | 1,825,565 | |
| | | | | | | |
| | 1,489 | | | Sesac Finance LLC, 144A | | | | | | | | | | | 5.216% | | | | 7/25/49 | | | | N/R | | | | 1,528,931 | |
| | | | | |
| | 2,363 | | | Settlement Fee Finance 2019-1 LLC, 144A | | | | 3.840% | | | | 11/01/49 | | | | N/R | | | | 2,333,983 | |
| | | | | |
| | 1,925 | | | Shellpoint Co-Originator Trust 2017-2, 144A | | | | 3.500% | | | | 10/25/47 | | | | Aaa | | | | 1,961,132 | |
| | | | | |
| | 500 | | | Sierra Ltd, 144A, (3-Month U.S. Treasury Bill reference rate + 3.250% spread), (3) | | | | 3.379% | | | | 12/28/23 | | | | N/R | | | | 497,250 | |
| | | | | |
| | 776 | | | Sierra Timeshare 2019-2 Receivables Funding LLC, 144A | | | | 4.540% | | | | 5/20/36 | | | | BB | | | | 734,440 | |
| | | | | |
| | 1,372 | | | Sierra Timeshare 2019-3 Receivables Funding LLC, 144A | | | | 4.180% | | | | 8/20/36 | | | | BB | | | | 1,242,447 | |
49
Nuveen Strategic Income Fund (continued)
Portfolio of Investments June 30, 2020
| | | | | | | | | | | | | | | | | | | | | | | | | | | | |
Principal
Amount (000) | | | Description (1) | | | | | | | | Coupon | | | Maturity | | | Ratings (2) | | | Value | |
| |
| | | | ASSET-BACKED AND MORTGAGE-BACKED SECURITIES (continued) | |
| | | | | |
| $ | 894 | | | Sierra Timeshare Conduit Receivables Funding LLC, 144A | | | | 3.200% | | | | 3/20/34 | | | | BBB | | | $ | 852,340 | |
| | | | | | | |
| | 336 | | | S-Jets 2017-1 Ltd, 144A | | | | | | | | | | | 3.967% | | | | 8/15/42 | | | | A | | | | 297,592 | |
| | | | | | | |
| | 1,924 | | | Sonic Capital LLC, 144A | | | | | | | | | | | 3.845% | | | | 1/20/50 | | | | BBB | | | | 2,016,109 | |
| | | | | |
| | 3,000 | | | STACR Trust 2018-DNA2, 144A, (1-Month LIBOR reference rate + 2.150% spread), (3) | | | | 2.335% | | | | 12/26/30 | | | | B+ | | | | 2,883,460 | |
| | | | | | | |
| | 990 | | | START Ireland, 144A | | | | | | | | | | | 5.095% | | | | 3/15/44 | | | | BB | | | | 496,151 | |
| | | | | | | |
| | 1,090 | | | Start Ltd/Bermuda, 144A | | | | | | | | | | | 4.089% | | | | 5/15/43 | | | | A | | | | 985,180 | |
| | | | | |
| | 2,890 | | | Starwood Waypoint Homes 2017-1 Trust, 144A, (1-Month LIBOR reference rate + 0.950% spread), (3) | | | | 1.135% | | | | 1/22/35 | | | | Aaa | | | | 2,877,819 | |
| | | | | | | |
| | 1,794 | | | Taco Bell Funding LLC, 144A | | | | | | | | | | | 4.377% | | | | 5/25/46 | | | | BBB | | | | 1,800,189 | |
| | | | | | | |
| | 739 | | | Taco Bell Funding LLC, 144A | | | | | | | | | | | 4.318% | | | | 11/25/48 | | | | BBB | | | | 754,471 | |
| | | | | | | |
| | 2,000 | | | Tesla Auto Lease Trust 2019-A, 144A | | | | | | | | | | | 2.130% | | | | 4/20/22 | | | | Aaa | | | | 2,022,413 | |
| | | | | | | |
| | 1,440 | | | Tesla Auto Lease Trust 2019-A, 144A | | | | | | | | | | | 5.480% | | | | 5/20/23 | | | | Ba3 | | | | 1,472,984 | |
| | | | | | | |
| | 300 | | | Tricon American Homes 2016-SFR1 Trust, 144A | | | | | | | | | | | 4.878% | | | | 11/17/33 | | | | N/R | | | | 299,678 | |
| | | | | | | |
| | 200 | | | Tricon American Homes 2017-SFR1 Trust, 144A | | | | | | | | | | | 4.011% | | | | 9/19/34 | | | | N/R | | | | 200,526 | |
| | | | | |
| | 1,000 | | | UBS-Barclays Commercial Mortgage Trust 2013-C5, 144A | | | | 4.235% | | | | 3/12/46 | | | | A3 | | | | 920,489 | |
| | | | | | | |
| | 333 | | | Vericrest Opportunity Loan Trust 2019-NPL2, 144A | | | | | | | | | | | 3.967% | | | | 2/25/49 | | | | N/R | | | | 334,169 | |
| | | | | | | |
| | 150 | | | Vericrest Opportunity Loan Trust 2019-NPL7, 144A | | | | | | | | | | | 3.967% | | | | 10/25/49 | | | | N/R | | | | 144,419 | |
| | | | | | | |
| | 468 | | | Verus Securitization Trust 2018-3, 144A | | | | | | | | | | | 4.108% | | | | 10/25/58 | | | | AAA | | | | 478,443 | |
| | | | | |
| | 99 | | | Wachovia Mortgage Loan Trust LLC Series 2005-B Trust | | | | 4.039% | | | | 10/20/35 | | | | Aaa | | | | 93,997 | |
| | | | | |
| | 91 | | | Washington Mutual MSC Mortgage Pass-Through Certificates Series 2004-RA3 Trust | | | | 6.027% | | | | 8/25/38 | | | | Aaa | | | | 94,699 | |
| | | | | | | |
| | 2,218 | | | Wendy’s Funding LLC, 144A | | | | | | | | | | | 3.573% | | | | 3/15/48 | | | | BBB | | | | 2,298,976 | |
| | | | | |
| | 2,630 | | | WFRBS Commercial Mortgage Trust 2011-C3, 144A | | | | 5.335% | | | | 3/17/44 | | | | A1 | | | | 2,544,892 | |
| | | | | |
| | 350 | | | WFRBS Commercial Mortgage Trust 2013-C14 | | | | 3.337% | | | | 6/15/46 | | | | Aaa | | | | 367,772 | |
| $ | 295,247 | | | Total Asset-Backed and Mortgage-Backed Securities (cost $193,882,483) | | | | | | | | | | | | | | | | 188,727,864 | |
| | | | | | | |
Principal
Amount (000) | | | Description (1) | | Coupon (5) | | | Reference
Rate (5) | | | Spread (5) | | | Maturity (6) | | | Ratings (2) | | | Value | |
| |
| | | | VARIABLE RATE SENIOR LOAN INTERESTS – 9.5% (5) | |
| | | | | | | |
| | | | Aerospace & Defense – 0.4% | | | | | | | | | | | | | | | | | | |
| | | | | | | |
| $ | 2,469 | | | Transdigm, Inc., Term Loan E | | | 2.428% | | | | 1-Month LIBOR | | | | 2.250% | | | | 5/30/25 | | | | N/R | | | $ | 2,230,056 | |
| | | | | | | |
| | | | Airlines – 0.1% | | | | | | | | | | | | | | | | | | |
| | | | | | | |
| | 100 | | | Delta Air Lines, Inc., Term Loan B | | | 5.510% | | | | 3-Month LIBOR | | | | 4.750% | | | | 4/27/23 | | | | Baa2 | | | | 98,407 | |
| | | | | | | |
| | 350 | | | Mileage Plus Holdings LLC, Term Loan, (WI/DD) | | | TBD | | | | TBD | | | | TBD | | | | TBD | | | | Baa3 | | | | 347,849 | |
| | 450 | | | Total Airlines | | | | | | | | | | | | | | | | | | | | | | | 446,256 | |
| | | | | | | |
| | | | Auto Components – 0.2% | | | | | | | | | | | | | | | | | | |
| | | | | | | |
| | 998 | | | Johnson Controls Inc., Term Loan B | | | 3.678% | | | | 1-Month LIBOR | | | | 3.500% | | | | 4/30/26 | | | | B1 | | | | 954,453 | |
| | | | | | | |
| | | | Building Products – 0.3% | | | | | | | | | | | | | | | | | | |
| | | | | | | |
| | 1,995 | | | Quikrete Holdings, Inc., Term Loan B | | | 2.674% | | | | 1-Month LIBOR | | | | 2.500% | | | | 2/01/27 | | | | BB– | | | | 1,925,803 | |
| | | | | | | |
| | | | Chemicals – 1.2% | | | | | | | | | | | | | | | | | | |
| | | | | | | |
| | 2,475 | | | Messer Industries GmbH, Term Loan | | | 2.808% | | | | 3-Month LIBOR | | | | 2.500% | | | | 3/02/26 | | | | BB– | | | | 2,368,464 | |
50
| | | | | | | | | | | | | | | | | | | | | | | | | | | | |
Principal
Amount (000) | | | Description (1) | | Coupon (5) | | | Reference
Rate (5) | | | Spread (5) | | | Maturity (6) | | | Ratings (2) | | | Value | |
| | | | | | | |
| | | | Chemicals (continued) | | | | | | | | | | | | | | | | | | |
| | | | | | | |
| $ | 2,468 | | | PolyOne Corp, Term Loan B | | | 1.930% | | | | 1-Month LIBOR | | | | 1.750% | | | | 1/30/26 | | | | BB+ | | | $ | 2,381,411 | |
| | | | | | | |
| | 2,046 | | | PQ Corp, Term Loan B | | | 2.428% | | | | 1-Month LIBOR | | | | 2.250% | | | | 2/08/27 | | | | BB– | | | | 1,977,368 | |
| | | | | | | |
| | 207 | | | Tronox Finance LLC, Term Loan B | | | 3.058% | | | | 3-Month LIBOR | | | | 2.750% | | | | 9/23/24 | | | | Ba3 | | | | 199,107 | |
| | | | | | | |
| | 293 | | | Tronox Finance LLC, Term Loan B | | | 2.928% | | | | 1-Month LIBOR | | | | 2.750% | | | | 9/23/24 | | | | Ba3 | | | | 282,178 | |
| | 7,489 | | | Total Chemicals | | | | | | | | | | | | | | | | | | | | | | | 7,208,528 | |
| |
| | | | Commercial Services & Supplies – 1.7% | |
| | | | | | | |
| | 2,453 | | | ADS Waste Holdings, Inc., Term Loan B | | | 3.000% | | | | 1-Week LIBOR | | | | 2.250% | | | | 11/10/23 | | | | BB+ | | | | 2,431,215 | |
| | | | | | | |
| | 1,000 | | | Amentum Government Services Holdings LLC, Term Loan B | | | 4.178% | | | | 1-Month LIBOR | | | | 4.000% | | | | 2/01/27 | | | | Ba3 | | | | 984,580 | |
| | | | | | | |
| | 1,900 | | | Filtration Group Corp, Term Loan | | | 3.178% | | | | 1-Month LIBOR | | | | 3.000% | | | | 3/31/25 | | | | B | | | | 1,814,351 | |
| | | | | | | |
| | 1,500 | | | Gopher Resource LLC, Term Loan | | | 4.250% | | | | 1-Month LIBOR | | | | 3.250% | | | | 3/06/25 | | | | B | | | | 1,428,750 | |
| | | | | | | |
| | 1,480 | | | Granite Acquisition Inc, Term Loan B | | | 4.500% | | | | 3-Month LIBOR | | | | 3.500% | | | | 12/17/21 | | | | B+ | | | | 1,456,717 | |
| | | | | | | |
| | 1,481 | | | Packers Holdings LLC, Term Loan | | | 4.000% | | | | 1-Month LIBOR | | | | 3.000% | | | | 12/04/24 | | | | B+ | | | | 1,427,742 | |
| | | | | | | |
| | 175 | | | Prime Security Services Borrower LLC, Term Loan | | | 4.250% | | | | 1-Month LIBOR | | | | 3.250% | | | | 9/23/26 | | | | BB– | | | | 168,853 | |
| | | | | | | |
| | 81 | | | Prime Security Services Borrower LLC, Term Loan | | | 4.250% | | | | 6-Month LIBOR | | | | 3.250% | | | | 9/23/26 | | | | BB– | | | | 77,692 | |
| | | | | | | |
| | 81 | | | Prime Security Services Borrower LLC, Term Loan | | | 4.250% | | | | 9-Month LIBOR | | | | 3.250% | | | | 9/23/26 | | | | BB– | | | | 77,692 | |
| | | | | | | |
| | 161 | | | Prime Security Services Borrower LLC, Term Loan | | | 4.250% | | | | 12-Month LIBOR | | | | 3.250% | | | | 9/23/26 | | | | BB– | | | | 155,385 | |
| | | | | | | |
| | 248 | | | Prometric Holdings Inc, Term Loan | | | 4.000% | | | | 1-Month LIBOR | | | | 3.000% | | | | 1/29/25 | | | | B2 | | | | 224,286 | |
| | 10,560 | | | Total Commercial Services & Supplies | | | | | | | | | | | | | | | | | | | | | | | 10,247,263 | |
| |
| | | | Communications Equipment – 0.1% | |
| | | | | | | |
| | 750 | | | Webcom Group Inc, Term Loan B | | | 3.940% | | | | 1-Month LIBOR | | | | 3.750% | | | | 10/10/25 | | | | B+ | | | | 713,437 | |
| |
| | | | Containers & Packaging – 0.1% | |
| | | | | | | |
| | 249 | | | Pregis TopCo Corp, Term Loan B | | | 4.178% | | | | 1-Month LIBOR | | | | 4.000% | | | | 7/31/26 | | | | B | | | | 241,530 | |
| | | | | | | |
| | 350 | | | Reynolds Group Holdings, Inc., Term Loan, First Lien | | | 1.928% | | | | 1-Month LIBOR | | | | 1.750% | | | | 2/04/27 | | | | BB+ | | | | 338,249 | |
| | | | | | | |
| | 199 | | | Tank Holding Corp, Term Loan | | | 3.678% | | | | 1-Month LIBOR | | | | 3.500% | | | | 3/26/26 | | | | N/R | | | | 187,035 | |
| | 798 | | | Total Containers & Packaging | | | | | | | | | | | | | | | | | | | | | | | 766,814 | |
| |
| | | | Diversified Telecommunication Services – 0.1% | |
| | | | | | | |
| | 350 | | | Zayo Group LLC, Initial Dollar Term Loan | | | 3.178% | | | | 1-Month LIBOR | | | | 3.000% | | | | 3/09/27 | | | | B1 | | | | 333,357 | |
| |
| | | | Energy Equipment & Services – 0.1% | |
| | | | | | | |
| | 575 | | | ChampionX Holding Inc, Term Loan | | | 6.000% | | | | 1-Month LIBOR | | | | 5.000% | | | | 6/03/27 | | | | BBB– | | | | 567,812 | |
| |
| | | | Food & Staples Retailing – 0.0% | |
| | | | | | | |
| | 250 | | | GOBP Holdings Inc, Term Loan | | | 3.744% | | | | 3-Month LIBOR | | | | 2.750% | | | | 10/22/25 | | | | B1 | | | | 241,250 | |
| |
| | | | Food Products – 0.4% | |
| | | | | | | |
| | 800 | | | Froneri Lux FinCo SARL, Term Loan, First Lien | | | 2.428% | | | | 1-Month LIBOR | | | | 2.250% | | | | 1/29/27 | | | | B1 | | | | 754,504 | |
| | | | | | | |
| | 1,295 | | | Hostess Brands LLC, Term Loan B | | | 3.000% | | | | 1-Month LIBOR | | | | 2.250% | | | | 8/04/25 | | | | N/R | | | | 1,253,394 | |
| | | | | | | |
| | 480 | | | Hostess Brands LLC, Term Loan B | | | 3.010% | | | | 3-Month LIBOR | | | | 2.250% | | | | 8/04/25 | | | | N/R | | | | 465,169 | |
| | 2,575 | | | Total Food Products | | | | | | | | | | | | | | | | | | | | | | | 2,473,067 | |
| |
| | | | Health Care Providers & Services – 1.2% | |
| | | | | | | |
| | 1,683 | | | Kindred at Home Hospice, Term Loan B | | | 3.438% | | | | 1-Month LIBOR | | | | 3.250% | | | | 7/02/25 | | | | N/R | | | | 1,636,676 | |
51
Nuveen Strategic Income Fund (continued)
Portfolio of Investments June 30, 2020
| | | | | | | | | | | | | | | | | | | | | | | | | | | | |
Principal
Amount (000) | | | Description (1) | | Coupon (5) | | | Reference
Rate (5) | | | Spread (5) | | | Maturity (6) | | | Ratings (2) | | | Value | |
| |
| | | | Health Care Providers & Services (continued) | |
| | | | | | | |
| $ | 1,755 | | | Lifepoint Health, Inc., New Term Loan B | | | 3.928% | | | | 1-Month LIBOR | | | | 3.750% | | | | 11/14/25 | | | | B1 | | | $ | 1,650,185 | |
| | | | | | | |
| | 2,216 | | | Pharmaceutical Product Development, Inc., Term Loan B | | | 3.500% | | | | 1-Month LIBOR | | | | 2.500% | | | | 8/18/22 | | | | Ba2 | | | | 2,193,497 | |
| | | | | | | |
| | 1,482 | | | Select Medical Corp, Term Loan B | | | 2.680% | | | | 1-Month LIBOR | | | | 2.500% | | | | 3/06/25 | | | | Ba2 | | | | 1,416,368 | |
| | 7,136 | | | Total Health Care Providers & Services | | | | | | | | | | | | | | | | | | | | | | | 6,896,726 | |
| |
| | | | Health Care Technology – 0.2% | |
| | | | | | | |
| | 262 | | | Emdeon, Inc., Term Loan | | | 3.500% | | | | 3-Month LIBOR | | | | 2.500% | | | | 3/01/24 | | | | B+ | | | | 252,582 | |
| | | | | | | |
| | 1,013 | | | Emdeon, Inc., Term Loan | | | 3.500% | | | | 1-Month LIBOR | | | | 2.500% | | | | 3/01/24 | | | | B+ | | | | 976,461 | |
| | 1,275 | | | Total Health Care Providers & Services | | | | | | | | | | | | | | | | | | | | | | | 1,229,043 | |
| |
| | | | Hotels, Restaurants & Leisure – 0.1% | |
| | | | | | | |
| | 300 | | | Caesars Resort Collection LLC, Term Loan, (WI/DD) | | | TBD | | | | TBD | | | | TBD | | | | TBD | | | | B+ | | | | 282,891 | |
| | | | | | | |
| | 398 | | | Scientific Games Corp., Initial Term Loan B5 | | | 3.612% | | | | 6-Month LIBOR | | | | 2.750% | | | | 8/14/24 | | | | B+ | | | | 354,412 | |
| | | | | | | |
| | 98 | | | Scientific Games Corp., Initial Term Loan B5 | | | 2.928% | | | | 1-Month LIBOR | | | | 2.750% | | | | 8/14/24 | | | | B+ | | | | 86,701 | |
| | | | | | | |
| | 1 | | | Scientific Games Corp., Initial Term Loan B5 | | | 3.058% | | | | 3-Month LIBOR | | | | 2.750% | | | | 8/14/24 | | | | B+ | | | | 1,131 | |
| | 797 | | | Total Hotels, Restaurants & Leisure | | | | | | | | | | | | | | | | | | | | | | | 725,135 | |
| |
| | | | Insurance – 0.2% | |
| | | | | | | |
| | 499 | | | Hub International Holdings, Inc., Term Loan B | | | 5.000% | | | | 3-Month LIBOR | | | | 4.000% | | | | 4/25/25 | | | | B | | | | 492,765 | |
| | | | | | | |
| | 498 | | | USI Holdings Corporation, NewTerm Loan | | | 3.308% | | | | 1-Month LIBOR | | | | 3.000% | | | | 5/16/24 | | | | B | | | | 474,783 | |
| | 997 | | | Total Insurance | | | | | | | | | | | | | | | | | | | | | | | 967,548 | |
| |
| | | | IT Services – 0.3% | |
| | | | | | | |
| | 1,980 | | | NeuStar Inc, Term Loan B | | | 5.572% | | | | 1-Month LIBOR | | | | 4.500% | | | | 8/08/24 | | | | B+ | | | | 1,836,628 | |
| |
| | | | Machinery – 0.1% | |
| | | | | | | |
| | 425 | | | Vertical US Newco Inc, Term Loan, (WI/DD) | | | TBD | | | | TBD | | | | TBD | | | | TBD | | | | B1 | | | | 416,500 | |
| | | | | | | |
| | 499 | | | Zodiac Pool Solutions LLC, Term Loan B | | | 2.178% | | | | 1-Month LIBOR | | | | 2.000% | | | | 7/02/25 | | | | BB | | | | 481,605 | |
| | 924 | | | Total Machinery | | | | | | | | | | | | | | | | | | | | | | | 898,105 | |
| |
| | | | Media – 0.0% | |
| | | | | | | |
| | 300 | | | Banijay Group US Holding Inc, Term Loan, (WI/DD) | | | TBD | | | | TBD | | | | TBD | | | | TBD | | | | B1 | | | | 285,000 | |
| |
| | | | Metals & Mining – 0.1% | |
| | | | | | | |
| | 500 | | | Zekelman Industries Inc, Term Loan | | | 2.430% | | | | 1-Month LIBOR | | | | 2.250% | | | | 1/25/27 | | | | BB | | | | 480,625 | |
| |
| | | | Oil, Gas & Consumable Fuels – 0.0% | |
| | | | | | | |
| | 250 | | | Delek US Holdings Inc, Term Loan | | | 6.500% | | | | 1-Month LIBOR | | | | 5.500% | | | | 3/31/25 | | | | BB+ | | | | 240,313 | |
| |
| | | | Pharmaceuticals – 0.4% | |
| | | | | | | |
| | 1,485 | | | Endo Health Solutions, Inc., Term Loan B | | | 5.000% | | | | 1-Month LIBOR | | | | 4.250% | | | | 4/29/24 | | | | B+ | | | | 1,408,889 | |
| | | | | | | |
| | 817 | | | Valeant Pharmaceuticals International, Inc., Term Loan, First Lien | | | 3.190% | | | | 1-Month LIBOR | | | | 3.000% | | | | 6/02/25 | | | | BB | | | | 796,193 | |
| | 2,302 | | | Total Pharmaceuticals | | | | | | | | | | | | | | | | | | | | | | | 2,205,082 | |
| |
| | | | Professional Services – 0.4% | |
| | | | | | | |
| | 1,700 | | | Dun & Bradstreet Corp.,Term Loan, First Lien | | | 4.184% | | | | 1-Month LIBOR | | | | 4.000% | | | | 2/06/26 | | | | BB | | | | 1,660,688 | |
| | | | | | | |
| | 835 | | | Nielsen Finance LLC, Term Loan B | | | 4.750% | | | | 1-Month LIBOR | | | | 3.750% | | | | 6/04/25 | | | | BBB– | | | | 829,259 | |
| | 2,535 | | | Total Professional Services | | | | | | | | | | | | | | | | | | | | | | | 2,489,947 | |
52
| | | | | | | | | | | | | | | | | | | | | | | | | | | | |
Principal
Amount (000) | | | Description (1) | | Coupon (5) | | | Reference
Rate (5) | | | Spread (5) | | | Maturity (6) | | | Ratings (2) | | | Value | |
| |
| | | | Real Estate Management & Development – 0.2% | |
| | | | | | | |
| $ | 1,000 | | | Cushman & Wakefield PLC, Term Loan B | | | 2.928% | | | | 1-Month LIBOR | | | | 2.750% | | | | 8/21/25 | | | | Ba3 | | | $ | 946,500 | |
| |
| | | | Road & Rail – 0.0% | |
| | | | | | | |
| | 245 | | | PODS LLC, Term Loan B | | | 3.750% | | | | 1-Month LIBOR | | | | 2.750% | | | | 12/06/24 | | | | B+ | | | | 235,669 | |
| |
| | | | Semiconductors & Semiconductor Equipment – 0.2% | |
| | | | | | | |
| | 1,027 | | | Ultra Clean Holdings Inc, Term Loan | | | 4.678% | | | | 1-Month LIBOR | | | | 4.500% | | | | 8/27/25 | | | | B+ | | | | 1,006,943 | |
| |
| | | | Software – 0.3% | |
| | | | | | | |
| | 324 | | | Thomson Reuters IP & S, Term Loan B | | | 3.178% | | | | 1-Month LIBOR | | | | 3.000% | | | | 10/30/26 | | | | B | | | | 314,817 | |
| | | | | | | |
| | 1,125 | | | T-Mobile USA, Term Loan, First Lien | | | 3.178% | | | | 1-Month LIBOR | | | | 3.000% | | | | 4/01/27 | | | | BBB– | | | | 1,124,488 | |
| | | | | | | |
| | 125 | | | Ultimate Software, Incremental Term Loan B, (WI/DD) | | | TBD | | | | TBD | | | | TBD | | | | TBD | | | | B1 | | | | 123,741 | |
| | 1,574 | | | Total Software | | | | | | | | | | | | | | | | | | | | | | | 1,563,046 | |
| |
| | | | Specialty Retail – 0.4% | |
| | | | | | | |
| | 494 | | | Petsmart Inc., Term Loan B, First Lien | | | 4.000% | | | | 6-Month LIBOR | | | | 3.000% | | | | 3/11/22 | | | | B | | | | 488,347 | |
| | | | | | | |
| | 1,980 | | | Staples Inc, Term Loan B | | | 5.687% | | | | 3-Month LIBOR | | | | 5.000% | | | | 4/12/26 | | | | B | | | | 1,719,066 | |
| | 2,474 | | | Total Specialty Retail | | | | | | | | | | | | | | | | | | | | | | | 2,207,413 | |
| |
| | | | Technology Hardware, Storage & Peripherals – 0.4% | |
| | | | | | | |
| | 495 | | | Dell International LLC, Refinancing Term Loan B1 | | | 2.750% | | | | 1-Month LIBOR | | | | 2.000% | | | | 9/19/25 | | | | Baa3 | | | | 483,209 | |
| | | | | | | |
| | 2,000 | | | Western Digital, Term Loan B | | | 1.924% | | | | 1-Month LIBOR | | | | 1.750% | | | | 4/29/23 | | | | BBB– | | | | 1,956,880 | |
| | 2,495 | | | Total Technology Hardware, Storage & Peripherals | | | | | | | | | | | | | | | | | | | | | | | 2,440,089 | |
| | | | | | | |
| | | | Textiles, Apparel & Luxury Goods – 0.2% | | | | | | | | | | | | | | | | | | |
| | | | | | | |
| | 1,388 | | | Samsonite IP Holdings Sarl, Term Loan B | | | 1.928% | | | | 1-Month LIBOR | | | | 1.750% | | | | 4/25/25 | | | | BB | | | | 1,297,418 | |
| |
| | | | Trading Companies & Distributors – 0.1% | |
| | | | | | | |
| | 434 | | | Univar, Inc., Term Loan B | | | 2.428% | | | | 1-Month LIBOR | | | | 2.250% | | | | 7/01/24 | | | | BB+ | | | | 419,455 | |
| $ | 58,892 | | | Total Variable Rate Senior Loan Interests (cost $58,049,298) | | | | | | | | 56,478,781 | |
| | | | | | | |
Principal
Amount (000) | | | Description (1) | | | | | | | | Coupon | | | Maturity | | | Ratings (2) | | | Value | |
| |
| | | | $1,000 PAR (OR SIMILAR) INSTITUTIONAL PREFERRED – 6.9% | |
| |
| | | | Automobiles – 0.4% | |
| | | | | | | |
| $ | 2,470 | | | General Motors Financial Co Inc | | | | | | | | | | | 5.750% | | | | N/A (7) | | | | BB+ | | | $ | 2,176,687 | |
| |
| | | | Banks – 4.1% | |
| | | | | | | |
| | 1,195 | | | Bank of America Corp | | | | | | | | | | | 6.300% | | | | N/A (7) | | | | BBB | | | | 1,326,116 | |
| | | | | | | |
| | 3,530 | | | Bank of America Corp | | | | | | | | | | | 6.100% | | | | N/A (7) | | | | BBB | | | | 3,724,150 | |
| | | | | | | |
| | 1,000 | | | Citigroup Inc | | | | | | | | | | | 6.300% | | | | N/A (7) | | | | BBB– | | | | 1,001,740 | |
| | | | | | | |
| | 3,000 | | | Citigroup Inc | | | | | | | | | | | 5.000% | | | | N/A (7) | | | | BBB– | | | | 2,823,915 | |
| | | | | | | |
| | 2,000 | | | CoBank ACB | | | | | | | | | | | 6.250% | | | | N/A (7) | | | | BBB+ | | | | 1,980,000 | |
| | | | | | | |
| | 750 | | | Huntington Bancshares Inc/OH | | | | | | | | | | | 5.625% | | | | N/A (7) | | | | Baa3 | | | | 775,500 | |
| | | | | | | |
| | 3,855 | | | JPMorgan Chase & Co | | | | | | | | | | | 5.000% | | | | N/A (7) | | | | BBB+ | | | | 3,707,758 | |
| | | | | | | |
| | 2,797 | | | KeyCorp | | | | | | | | | | | 5.000% | | | | N/A (7) | | | | Baa3 | | | | 2,643,165 | |
| | | | | | | |
| | 1,000 | | | M&T Bank Corp | | | | | | | | | | | 5.125% | | | | N/A (7) | | | | Baa2 | | | | 996,870 | |
53
Nuveen Strategic Income Fund (continued)
Portfolio of Investments June 30, 2020
| | | | | | | | | | | | | | | | | | | | | | | | | | | | |
Principal
Amount (000) | | | Description (1) | | | | | | | | Coupon | | | Maturity | | | Ratings (2) | | | Value | |
| |
| | | | Banks (continued) | |
| | | | | | | |
| $ | 3,000 | | | Truist Financial Corp | | | | | | | | | | | 4.800% | | | | N/A (7) | | | | Baa2 | | | $ | 2,763,240 | |
| | | | | | | |
| | 2,570 | | | Truist Financial Corp | | | | | | | | | | | 5.050% | | | | N/A (7) | | | | Baa2 | | | | 2,293,725 | |
| | | | | | | |
| | 500 | | | Wells Fargo & Co | | | | | | | | | | | 5.875% | | | | N/A (7) | | | | Baa2 | | | | 519,685 | |
| | 25,197 | | | Total Banks | | | | | | | | | | | | | | | | | | | | | | | 24,555,864 | |
| |
| | | | Capital Markets – 1.0% | |
| | | | | | | |
| | 315 | | | Bank of New York Mellon Corp | | | | | | | | | | | 4.700% | | | | N/A (7) | | | | Baa1 | | | | 327,600 | |
| | | | | | | |
| | 1,325 | | | Charles Schwab Corp | | | | | | | | | | | 5.375% | | | | N/A (7) | | | | BBB | | | | 1,415,524 | |
| | | | | | | |
| | 3,840 | | | Goldman Sachs Group Inc | | | | | | | | | | | 5.500% | | | | N/A (7) | | | | BBB– | | | | 3,979,661 | |
| | 5,480 | | | Total Capital Markets | | | | | | | | | | | | | | | | | | | | | | | 5,722,785 | |
| |
| | | | Diversified Financial Services – 0.3% | |
| | | | | | | |
| | 1,710 | | | Voya Financial Inc | | | | | | | | | | | 6.125% | | | | N/A (7) | | | | BBB– | | | | 1,672,517 | |
| |
| | | | Food Products – 0.4% | |
| | | | | | | |
| | 2,780 | | | Land O’ Lakes Inc, 144A | | | | | | | | | | | 8.000% | | | | N/A (7) | | | | BB | | | | 2,696,600 | |
| |
| | | | Multi-Utilities – 0.3% | |
| | | | | | | |
| | 150 | | | CMS Energy Corp | | | | | | | | | | | 4.750% | | | | 6/01/50 | | | | Baa2 | | | | 152,940 | |
| | | | | | | |
| | 1,500 | | | Sempra Energy | | | | | | | | | | | 4.875% | | | | N/A (7) | | | | BBB– | | | | 1,500,000 | |
| | 1,650 | | | Total Multi-Utilities | | | | | | | | | | | | | | | | | | | | | | | 1,652,940 | |
| |
| | | | Wireless Telecommunication Services – 0.4% | |
| | | | | | | |
| | 1,000 | | | Network i2i Ltd, 144A | | | | | | | | | | | 5.650% | | | | N/A (7) | | | | BB | | | | 968,000 | |
| | | | | | | |
| | 1,500 | | | Vodafone Group PLC | | | | | | | | | | | 7.000% | | | | 4/04/79 | | | | BB+ | | | | 1,758,258 | |
| | 2,500 | | | Total Wireless Telecommunication Services | | | | | | | | | | | | | | | | 2,726,258 | |
| $ | 41,787 | | | Total $1,000 Par (or similar) Institutional Preferred (cost $41,865,768) | | | | | | | | | | | | | | | | 41,203,651 | |
| | | | | | | |
Principal
Amount (000) | | | Description (1) | | | | | | | | Coupon | | | Maturity | | | Ratings (2) | | | Value | |
| |
| | | | CONTINGENT CAPITAL SECURITIES – 4.0% (8) | |
| |
| | | | Banks – 3.1% | |
| | | | | | | |
| $ | 1,030 | | | Australia & New Zealand Banking Group Ltd/United Kingdom, 144A | | | | | | | | | | | 6.750% | | | | 12/15/68 | | | | Baa2 | | | $ | 1,142,661 | |
| | | | | | | |
| | 1,400 | | | Banco Bilbao Vizcaya Argentaria SA | | | | | | | | | | | 6.500% | | | | 12/05/68 | | | | Ba2 | | | | 1,351,000 | |
| | | | | | | |
| | 980 | | | Banco Mercantil del Norte SA/Grand Cayman, 144A | | | | | | | | | | | 6.750% | | | | 9/27/68 | | | | Ba2 | | | | 926,649 | |
| | | | | | | |
| | 675 | | | Bancolombia SA | | | | | | | | | | | 4.625% | | | | 12/18/29 | | | | BB | | | | 636,188 | |
| | | | | | | |
| | 2,000 | | | Barclays PLC | | | | | | | | | | | 7.750% | | | | 12/15/68 | | | | BBB– | | | | 2,032,500 | |
| | | | | | | |
| | 2,500 | | | BNP Paribas SA, 144A | | | | | | | | | | | 6.625% | | | | 9/25/68 | | | | BBB | | | | 2,550,000 | |
| | | | | | | |
| | 2,000 | | | Credit Agricole SA, 144A | | | | | | | | | | | 8.125% | | | | 3/23/69 | | | | BBB | | | | 2,282,500 | |
| | | | | | | |
| | 1,195 | | | Intesa Sanpaolo SpA, 144A | | | | | | | | | | | 7.700% | | | | 3/17/69 | | | | BB– | | | | 1,193,506 | |
| | | | | | | |
| | 1,500 | | | Lloyds Banking Group PLC | | | | | | | | | | | 7.500% | | | | 6/27/69 | | | | Baa3 | | | | 1,555,950 | |
| | | | | | | |
| | 2,000 | | | Macquarie Bank Ltd/London, 144A | | | | | | | | | | | 6.125% | | | | 9/08/68 | | | | BB+ | | | | 1,980,000 | |
| | | | | | | |
| | 1,880 | | | Standard Chartered PLC, 144A | | | | | | | | | | | 7.500% | | | | 4/02/69 | | | | BBB– | | | | 1,940,536 | |
| | | | | | | |
| | 950 | | | UniCredit SpA | | | | | | | | | | | 8.000% | | | | 6/03/69 | | | | B+ | | | | 950,000 | |
| | 18,110 | | | Total Banks | | | | | | | | | | | | | | | | | | | | | | | 18,541,490 | |
54
| | | | | | | | | | | | | | | | | | | | | | | | | | | | |
Principal
Amount (000) | | | Description (1) | | | | | | | | Coupon | | | Maturity | | | Ratings (2) | | | Value | |
| |
| | | | Capital Markets – 0.9% | |
| | | | | | | |
| $ | 2,000 | | | Credit Suisse Group AG, 144A | | | | | | | | | | | 6.375% | | | | 2/21/69 | | | | BB+ | | | $ | 2,031,000 | |
| | | | | | | |
| | 2,000 | | | Credit Suisse Group AG, 144A | | | | | | | | | | | 7.500% | | | | 6/11/69 | | | | BB+ | | | | 2,150,000 | |
| | | | | | | |
| | 1,000 | | | UBS Group AG, 144A | | | | | | | | | | | 7.000% | | | | 7/31/68 | | | | BBB | | | | 1,038,750 | |
| | 5,000 | | | Total Capital Markets | | | | | | | | | | | | | | | | | | | | | | | 5,219,750 | |
| $ | 23,110 | | | Total Contingent Capital Securities (cost $23,238,723) | | | | | | | | | | | | | | | | | | | | | | | 23,761,240 | |
| | | | | | | |
Principal
Amount (000) | | | Description (1) | | | | | | | | Coupon | | | Maturity | | | Ratings (2) | | | Value | |
| |
| | | | SOVEREIGN DEBT – 2.6% | |
| |
| | | | Bermuda – 0.1% | |
| | | | | | | |
| $ | 850 | | | Bermuda Government International Bond, 144A | | | | | | | | | | | 3.717% | | | | 1/25/27 | | | | A+ | | | $ | 901,000 | |
| |
| | | | Colombia – 0.2% | |
| | | | | | | |
| | 850 | | | Colombia Government International Bond | | | | | | | | | | | 5.000% | | | | 6/15/45 | | | | Baa2 | | | | 954,125 | |
| |
| | | | Dominican Republic – 0.2% | |
| | | | | | | |
| | 1,000 | | | Dominican Republic International Bond, 144A | | | | | | | | | | | 6.875% | | | | 1/29/26 | | | | BB– | | | | 1,048,000 | |
| |
| | | | Egypt – 0.7% | |
| | | | | | | |
| | 3,175 | | | Egypt Government International Bond, 144A | | | | | | | | | | | 5.577% | | | | 2/21/23 | | | | B+ | | | | 3,242,469 | |
| | | | | | | |
| | 1,225 | | | Egypt Government International Bond, 144A | | | | | | | | | | | 7.053% | | | | 1/15/32 | | | | B+ | | | | 1,160,687 | |
| | 4,400 | | | Total Egypt | | | | | | | | | | | | | | | | | | | | | | | 4,403,156 | |
| |
| | | | Ghana – 0.3% | |
| | | | | | | |
| | 2,200 | | | Ghana Government International Bond, 144A | | | | | | | | | | | 8.125% | | | | 3/26/32 | | | | B | | | | 2,064,700 | |
| |
| | | | Indonesia – 0.2% | |
| | | | | | | |
| | 850 | | | Perusahaan Penerbit SBSN Indonesia III, 144A | | | | | | | | | | | 4.400% | | | | 3/01/28 | | | | BBB | | | | 943,636 | |
| |
| | | | Kazakhstan – 0.2% | |
| | | | | | | |
| | 850 | | | Kazakhstan Government International Bond, 144A | | | | | | | | | | | 4.875% | | | | 10/14/44 | | | | BBB | | | | 1,077,497 | |
| |
| | | | Kenya – 0.2% | |
| | | | | | | |
| | 1,000 | | | Kenya Government International Bond, 144A | | | | | | | | | | | 7.000% | | | | 5/22/27 | | | | B+ | | | | 985,000 | |
| |
| | | | Mexico – 0.1% | |
| | | | | | | |
| | 850 | | | Mexico Government International Bond | | | | | | | | | | | 3.750% | | | | 1/11/28 | | | | Baa1 | | | | 884,544 | |
| |
| | | | Morocco – 0.2% | |
| | | | | | | |
| | 850 | | | Morocco Government International Bond, 144A | | | | | | | | | | | 5.500% | | | | 12/11/42 | | | | BBB– | | | | 1,036,633 | |
| |
| | | | Qatar – 0.2% | |
| | | | | | | |
| | 850 | | | Qatar Government International Bond, 144A | | | | | | | | | | | 4.817% | | | | 3/14/49 | | | | AA– | | | | 1,117,096 | |
| $ | 14,550 | | | Total Sovereign Debt (cost $14,806,433) | | | | | | | | | | | | | | | | | | | | | | | 15,415,387 | |
55
Nuveen Strategic Income Fund (continued)
Portfolio of Investments June 30, 2020
| | | | | | | | | | | | | | | | | | | | | | | | | | | | |
Principal
Amount (000) | | | Description (1) | | | | | | | | | | | Optional Call
Provisions (9) | | | Ratings (2) | | | Value | |
| |
| | | | MUNICIPAL BONDS – 1.9% | |
| |
| | | | Massachusetts – 0.5% | |
| | | | | | | |
| | | | Massachusetts Water Resources Authority, General Revenue Bonds, Green Series 2019F: | | | | | | | | | | | | | | | | | | | | | | | | |
| $ | 1,300 | | | 2.453%, 8/01/31 | | | | | | | | | | | | | | | 8/29 at 100.00 | | | | AA+ | | | $ | 1,373,619 | |
| | 1,300 | | | 2.553%, 8/01/32 | | | | | | | | | | | | | | | 8/29 at 100.00 | | | | AA+ | | | | 1,371,929 | |
| | 2,600 | | | Total Massachusetts | | | | | | | | | | | | | | | | | | | | | | | 2,745,548 | |
| |
| | | | Michigan – 0.3% | |
| | | | | | | |
| | 1,500 | | | Michigan Finance Authority, Local Government Loan Program Revenue Bonds, Detroit Distributable State Aid First Lien LTGO Local Project, Refunding Taxable Series 2016C-1, 2.244%, 11/01/22 | | | | | | | | | | | | | | | No Opt. Call | | | | Aa2 | | | | 1,536,180 | |
| |
| | | | New York – 0.4% | |
| | | | | | | |
| | 1,500 | | | New York City, New York, General Obligation Bonds, Fiscal 2020 Taxable Series A-2, 2.280%, 8/01/25 | | | | | | | | | | | | | | | No Opt. Call | | | | Aa1 | | | | 1,566,225 | |
| | | | | | | |
| | 915 | | | New York Transportation Development Corporation, New York, Lease Revenue Bonds, Fuller Road Management Corporarion – Nanotechnology Facilities Project, Refunding Series 2020, 4.248%, 9/01/35 | | | | | | | | | | | | | | | No Opt. Call | | | | A+ | | | | 998,329 | |
| | 2,415 | | | Total New York | | | | | | | | | | | | | | | | | | | | | | | 2,564,554 | |
| |
| | | | Ohio – 0.4% | |
| | | | | | | |
| | | | Cleveland, Ohio, Airport System Revenue Bonds, Taxable Series 2019A: | | | | | | | | | | | | | | | | | | | | | | | | |
| | 1,000 | | | 2.492%, 1/01/25 | | | | | | | | | | | | | | | No Opt. Call | | | | A | | | | 1,034,520 | |
| | 1,500 | | | 2.832%, 1/01/30 | | | | | | | | | | | | | | | No Opt. Call | | | | A | | | | 1,530,315 | |
| | 2,500 | | | Total Ohio | | | | | | | | | | | | | | | | | | | | | | | 2,564,835 | |
| |
| | | | Texas – 0.3% | |
| | | | | | | |
| | 1,615 | | | Grand Parkway Transportation Corporation, Texas, System Toll Revenue Bonds, Taxable Refunding Subordinate Lien Series 2020B Tela Supported, 3.236%, 10/01/52 | | | | | | | | | | | | | | | 4/30 at 100.00 | | | | Aa1 | | | | 1,685,640 | |
| $ | 10,630 | | | Total Municipal Bonds (cost $10,620,760) | | | | | | | | | | | | | | | | | | | | | | | 11,096,757 | |
| | | | | | | |
| Shares | | | Description (1) | | | | | | | | | | | Coupon | | | Ratings (2) | | | Value | |
| |
| | | | $25 PAR (OR SIMILAR) RETAIL PREFERRED – 0.6% | |
| |
| | | | Diversified Financial Services – 0.3% | |
| | | | | | | |
| | 20,600 | | | AgriBank FCB, (10) | | | | | | | | | | | | | | | 6.875% | | | | BBB+ | | | $ | 2,142,400 | |
| |
| | | | Insurance – 0.3% | |
| | | | | | | |
| | 70,000 | | | Enstar Group Ltd | | | | | | | | | | | | | | | 7.000% | | | | BB+ | | | | 1,695,400 | |
| | | | Total $25 Par (or similar) Retail Preferred (cost $3,810,000) | | | | | | | | | | | | | | | | | | | | | | | 3,837,800 | |
| | | | Total Long-Term Investments (cost $586,910,700) | | | | | | | | | | | | | | | | | | | | | | | 586,990,149 | |
| | | | | | | |
| Shares | | | Description (1) | | | | | | | | | | | Coupon | | | | | | Value | |
| |
| | | | INVESTMENTS PURCHASED WITH COLLATERAL FROM SECURITIES LENDING – 0.3% | |
| |
| | | | Money Market Funds – 0.3% | |
| | | | | | | |
| | 1,721,683 | | | First American Government Obligation Fund Class X, (11) | | | | | | | | | | | | | | | 0.091% (12) | | | | | | | $ | 1,721,683 | |
| | | | Total Investments Purchased with Collateral from Securities Lending (cost $1,721,683) | | | | | | | | 1,721,683 | |
56
| | | | | | | | | | | | | | | | | | | | | | | | | | | | |
| Shares | | | Description (1) | | | | | | | | | | | Coupon | | | | | | Value | |
| |
| | | | SHORT-TERM INVESTMENTS – 1.8% | |
| |
| | | | MONEY MARKET FUNDS – 1.8% | |
| | | | | | | |
| | 10,870,340 | | | First American Treasury Obligation Fund, Class Z | | | | | | | | | | | | | | | 0.060% (12) | | | | | | | $ | 10,870,340 | |
| | | | Total Short-Term Investments (cost $10,870,340) | | | | | | | | | | | | | | | | | | | | | | | 10,870,340 | |
| | | | Total Investments (cost $599,502,723) – 100.5% | | | | | | | | | | | | | | | | | | | | | | | 599,582,172 | |
| | | | Other Assets Less Liabilities – (0.5)% (13) | | | | | | | | | | | | | | | | | | | | | | | (2,776,787) | |
| | | | Net Assets – 100% | | | | | | | | | | | | | | | | | | | | | | $ | 596,805,385 | |
Investments in Derivatives
Futures Contracts
| | | | | | | | | | | | | | | | | | | | | | | | | | | | |
| Description | | Contract
Position | | | Number of
Contracts | | | Expiration
Date | | | Notional
Amount* | | | Value | | | Unrealized
Appreciation
(Depreciation) | | | Variation
Margin
Receivable/
(Payable) | |
U.S. Treasury 5-Year Note | | | Short | | | | (147) | | | | 9/20 | | | $ | (18,427,473) | | | $ | (18,484,102) | | | $ | (56,629) | | | $ | 4,595 | |
U.S. Treasury 10-Year Note | | | Short | | | | (55) | | | | 9/20 | | | | (7,626,145) | | | | (7,654,453) | | | | (28,308) | | | | 8,595 | |
U.S. Treasury Long Bond | | | Long | | | | 72 | | | | 9/20 | | | | 12,795,373 | | | | 12,856,500 | | | | 61,127 | | | | (33,750) | |
U.S. Treasury Ultra 10-Year Note | | | Short | | | | (164) | | | | 9/20 | | | | (25,675,446) | | | | (25,827,437) | | | | (151,991) | | | | 41,001 | |
U.S. Treasury Ultra Bond | | | Long | | | | 77 | | | | 9/20 | | | | 16,732,038 | | | | 16,798,031 | | | | 65,993 | | | | (79,406) | |
Total | | | $ | (22,201,653) | | | $ | (22,311,461) | | | $ | (109,808) | | | $ | (58,965) | |
Total receivable for variation margin on futures contracts | | | | | | | | | | | | | | | $ | 54,191 | |
Total payable for variation margin on futures contracts | | | | | | | | | | | | | | | $ | (113,156) | |
| * | The aggregate notional amount of long and short-positions is $29,527,411 and $(51,729,064), respectively. |
57
Nuveen Strategic Income Fund (continued)
Portfolio of Investments June 30, 2020
For Fund portfolio compliance purposes, the Fund’s industry classifications refer to any one or more of the industry sub-classifications used by one or more widely recognized market indexes or ratings group indexes, and/or as defined by Fund management. This definition may not apply for purposes of this report, which may combine industry sub-classifications into sectors for reporting ease.
| (1) | All percentages shown in the Portfolio of Investments are based on net assets applicable to common shares unless otherwise noted. |
| (2) | For financial reporting purposes, the ratings disclosed are the highest of Standard & Poor’s Group (“Standard & Poor’s”), Moody’s Investors Service, Inc. (“Moody’s”) or Fitch, Inc. (“Fitch”) rating. This treatment of split-rated securities may differ from that used for other purposes, such as for Fund investment policies. Ratings below BBB by Standard & Poor’s, Baa by Moody’s or BBB by Fitch are considered to be below investment grade. Holdings designated N/R are not rated by any of these national rating agencies. Ratings are not covered by the report of independent registered public accounting firm. |
| (3) | Variable rate security. The rate shown is the coupon as of the end of the reporting period. |
| (4) | Investment, or a portion of investment, is out on loan for securities lending. The total value of the securities out on loan as of the end of the reporting period was $1,635,317. |
| (5) | Senior loans generally pay interest at rates which are periodically adjusted by reference to a base short-term, floating lending rate (Reference Rate) plus an assigned fixed rate (Spread). These floating lending rates are generally (i) the lending rate referenced by the London Inter-Bank Offered Rate (“LIBOR”), or (ii) the prime rate offered by one or more major United States banks. Senior loans may be considered restricted in that the Fund ordinarily is contractually obligated to receive approval from the agent bank and/or borrower prior to the disposition of a senior loan. The rate shown is the coupon as of the end of the reporting period. |
| (6) | Senior loans generally are subject to mandatory and/or optional prepayment. Because of these mandatory prepayment conditions and because there may be significant economic incentives for a borrower to prepay, prepayments of senior loans may occur. As a result, the actual remaining maturity of senior loans held may be substantially less than the stated maturities shown. |
| (7) | Perpetual security. Maturity date is not applicable. |
| (8) | Contingent Capital Securities (“CoCos”) are hybrid securities with loss absorption characteristics built into the terms of the security for the benefit of the issuer. For example, the terms may specify an automatic write-down of principal or a mandatory conversion into the issuer’s common stock under certain adverse circumstances, such as the issuer’s capital ratio falling below a specified level. |
| (9) | Optional Call Provisions: Dates (month and year) and prices of the earliest optional call or redemption. There may be other call provisions at varying prices at later dates. Certain mortgage-backed securities may be subject to periodic principal paydowns. Optional Call Provisions are not covered by the report of independent registered public accounting firm. |
| (10) | For fair value measurement disclosure purposes, investment classified as Level 2. See Notes to Financial Statements, Note 3 – Investment Valuation and Fair Value Measurements for more information. |
| (11) | The Fund may loan securities representing up to one third of the fair value of its total assets (which includes collateral for securities on loan) to broker dealers, banks, and other institutions. The Fund maintains collateral equal to at least 100% of the fair value of the securities loaned. The cash collateral received by the Fund is invested in this money market fund. See Notes to Financial Statements, Note 4- Portfolio Securities and Investments in Derivatives for more information. |
| (12) | The rate shown is the annualized seven-day subsidized yield as of the end of the reporting period. |
| (13) | Other assets less liabilities includes the unrealized appreciation (depreciation) of certain over-the-counter (“OTC”) derivatives as presented on the Statement of Assets and Liabilities, when applicable. The unrealized appreciation (depreciation) of OTC cleared and exchange-traded derivatives is recognized as part of the cash collateral at brokers and/or the receivable or payable for variation margin as presented on the Statement of Assets and Liabilities, when applicable. |
| 144A | Investment is exempt from registration under Rule 144A of the Securities Act of 1933, as amended. These investments may only be resold in transactions exempt from registration, which are normally those transactions with qualified institutional buyers. |
| I/O | Interest only security |
| LIBOR | London Inter-Bank Offered Rate |
| Reg S | Regulation S allows U.S. companies to sell securities to persons or entities located outside of the United States without registering those securities with the Securities and Exchange Commission. Specifically, Regulation S provides a safe harbor from the registration requirements of the Securities Act for the offers and sales of securities by both foreign and domestic issuers that are made outside the United States. |
| TBD | Senior loan purchased on a when-issued or delayed-delivery basis. Certain details associated with this purchase are not known prior to the settlement date of the transaction. In addition, senior loans typically trade without accrued interest and therefore a coupon rate is not available prior to settlement. At settlement, if still unknown, the borrower or counterparty will provide the Fund with the final coupon rate and maturity date. |
| WI/DD | Purchased on a when-issued or delayed delivery basis. |
See accompanying notes to financial statements.
58
Statement of Assets and Liabilities
June 30, 2020
| | | | | | | | |
| | | Credit
Income | | | Strategic
Income | |
| | | |
Assets | | | | | | | | |
| | |
Long-term investments, at value (cost $184,445,048 and $586,910,700, respectively) | | $ | 178,365,232 | | | $ | 586,990,149 | |
| | |
Investments purchased with collateral from securities lending, at value (cost approximates value) | | | 2,026,200 | | | | 1,721,683 | |
| | |
Short-term investments, at value (cost approximates value) | | | 13,643,460 | | | | 10,870,340 | |
| | |
Cash collateral at brokers for investments in futures contracts(1) | | | — | | | | 1,052,000 | |
| | |
Receivable for: | | | | | | | | |
| | |
Dividends | | | — | | | | 35,407 | |
| | |
Due from broker | | | 843 | | | | 1,574 | |
| | |
Interest | | | 2,316,209 | | | | 4,919,595 | |
| | |
Investments sold | | | 268,811 | | | | 4,221,093 | |
| | |
Shares sold | | | 275,249 | | | | 4,125,618 | |
| | |
Variation margin on futures contracts | | | — | | | | 54,191 | |
| | |
Other assets | | | 79,688 | | | | 93,644 | |
| | |
Total assets | | | 196,975,692 | | | | 614,085,294 | |
| | |
Liabilities | | | | | | | | |
| | |
Payable for: | | | | | | | | |
| | |
Collateral from securities lending program | | | 2,026,200 | | | | 1,721,683 | |
| | |
Dividends | | | 66,592 | | | | 595,371 | |
| | |
Investments purchased – regular settlement | | | 3,032,500 | | | | 2,648,878 | |
| | |
Investments purchased – when issued/delayed-delivery settlement | | | 4,550,000 | | | | 8,677,561 | |
| | |
Shares redeemed | | | 764,500 | | | | 2,807,769 | |
| | |
Variation margin on futures contracts | | | — | | | | 113,156 | |
| | |
Accrued expenses: | | | | | | | | |
| | |
Management fees | | | 128,495 | | | | 283,813 | |
| | |
Directors fees | | | 37,440 | | | | 55,185 | |
| | |
12b-1 distribution and service fees | | | 36,685 | | | | 52,951 | |
| | |
Other | | | 206,535 | | | | 323,542 | |
| | |
Total liabilities | | | 10,848,947 | | | | 17,279,909 | |
| | |
Net assets | | $ | 186,126,745 | | | $ | 596,805,385 | |
| (1) | Cash pledged to collateralize the net payment obligations for investments in derivatives. |
See accompanying notes to financial statements.
59
Statement of Assets and Liabilities (continued)
| | | | | | | | |
| | | Credit
Income | | | Strategic
Income | |
| | |
Class A Shares | | | | | | | | |
| | |
Net assets | | $ | 82,545,414 | | | $ | 101,885,955 | |
| | |
Shares outstanding | | | 12,333,261 | | | | 9,530,844 | |
| | |
Net asset value (“NAV”) per share | | $ | 6.69 | | | $ | 10.69 | |
| | |
Offering price per share (NAV per share plus maximum sales charge of 4.75% and 4.25%, respectively, of offering price) | | $ | 7.02 | | | $ | 11.16 | |
| | |
Class C Shares | | | | | | | | |
| | |
Net assets | | $ | 22,611,984 | | | $ | 37,285,219 | |
| | |
Shares outstanding | | | 3,381,954 | | | | 3,505,477 | |
| | |
NAV and offering price per share | | $ | 6.69 | | | $ | 10.64 | |
| | |
Class R3 Shares | | | | | | | | |
| | |
Net assets | | $ | 241,566 | | | $ | 3,032,982 | |
| | |
Shares outstanding | | | 35,308 | | | | 282,767 | |
| | |
NAV and offering price per share | | $ | 6.84 | | | $ | 10.73 | |
| | |
Class R6 Shares | | | | | | | | |
| | |
Net assets | | $ | — | | | $ | 59,098,781 | |
| | |
Shares outstanding | | | — | | | | 5,505,446 | |
| | |
NAV and offering price per share | | $ | — | | | $ | 10.73 | |
| | |
Class I Shares | | | | | | | | |
| | |
Net assets | | $ | 80,727,781 | | | $ | 395,502,448 | |
| | |
Shares outstanding | | | 12,028,686 | | | | 36,990,080 | |
| | |
NAV and offering price per share | | $ | 6.71 | | | $ | 10.69 | |
| | |
Fund level net assets consist of: | | | | | | | | |
| | |
Capital paid-in | | $ | 331,143,878 | | | $ | 644,226,694 | |
| | |
Total distributable earnings | | | (145,017,133 | ) | | | (47,421,309 | ) |
| | |
Fund level net assets | | $ | 186,126,745 | | | $ | 596,805,385 | |
| | |
Authorized shares – per class | | | 2 billion | | | | 2 billion | |
| | |
Par value per share | | $ | 0.0001 | | | $ | 0.0001 | |
See accompanying notes to financial statements.
60
Statement of Operations
Year Ended June 30, 2020
| | | | | | | | |
| | | Credit Income | | | Strategic
Income | |
| | |
Investment Income | | | | | | | | |
| | |
Dividend | | $ | 625,960 | | | $ | 264,129 | |
| | |
Interest | | | 13,800,844 | | | | 26,700,930 | |
| | |
Securities lending income | | | 65,634 | | | | 54,439 | |
| | |
Total investment income | | | 14,492,438 | | | | 27,019,498 | |
| | |
Expenses | | | | | | | | |
| | |
Management fees | | | 1,370,456 | | | | 3,388,797 | |
| | |
12b-1 service fees – Class A Shares | | | 280,297 | | | | 324,351 | |
| | |
12b-1 distribution and service fees – Class C Shares | | | 295,943 | | | | 384,776 | |
| | |
12b-1 distribution and service fees – Class R3 Shares | | | 1,437 | | | | 14,116 | |
| | |
Shareholder servicing agent fees | | | 217,920 | | | | 538,463 | |
| | |
Custodian fees | | | 115,571 | | | | 227,182 | |
| | |
Directors fees | | | 5,906 | | | | 3,106 | |
| | |
Professional fees | | | 128,756 | | | | 131,011 | |
| | |
Shareholder reporting expenses | | | 61,188 | | | | 76,186 | |
| | |
Federal and state registration fees | | | 81,946 | | | | 101,297 | |
| | |
Other | | | 19,353 | | | | 17,998 | |
| | |
Total expenses before fee waiver/expense reimbursement | | | 2,578,773 | | | | 5,207,283 | |
| | |
Fee waiver/expense reimbursement | | | (268,945 | ) | | | (833,082 | ) |
| | |
Net expenses | | | 2,309,828 | | | | 4,374,201 | |
| | |
Net investment income (loss) | | | 12,182,610 | | | | 22,645,297 | |
| | |
Realized and Unrealized Gain (Loss) | | | | | | | | |
| | |
Net realized gain (loss) from: | | | | | | | | |
| | |
Investments and foreign currency | | | (11,937,543 | ) | | | 7,520,443 | |
| | |
Forward foreign currency contracts | | | — | | | | (25,415 | ) |
| | |
Futures contracts | | | — | | | | 6,619,928 | |
| | |
Swaps | | | 121,582 | | | | 394,660 | |
| | |
Change in net unrealized appreciation (depreciation) of: | | | | | | | | |
| | |
Investments and foreign currency | | | (7,715,002 | ) | | | (14,138,360 | ) |
| | |
Futures contracts | | | — | | | | (893,413 | ) |
| | |
Swaps | | | (25,642 | ) | | | 242,818 | |
| | |
Net realized and unrealized gain (loss) | | | (19,556,605 | ) | | | (279,339 | ) |
| | |
Net increase (decrease) in net assets from operations | | $ | (7,373,995 | ) | | $ | 22,365,958 | |
See accompanying notes to financial statements.
61
Statement of Changes in Net Assets
| | | | | | | | | | | | | | | | | | | | |
| | | Credit Income | | | | | | Strategic Income | |
| | | Year Ended 6/30/20 | | | Year Ended
6/30/19 | | | | | | Year Ended 6/30/20 | | | Year Ended
6/30/19 | |
| | | | | |
Operations | | | | | | | | | | | | | | | | | | | | |
| | | | | |
Net investment income (loss) | | $ | 12,182,610 | | | $ | 17,868,517 | | | | | | | $ | 22,645,297 | | | $ | 25,035,511 | |
| | | | | |
Net realized gain (loss) from: | | | | | | | | | | | | | | | | | | | | |
| | | | | |
Investments and foreign currency | | | (11,937,543 | ) | | | (20,215,073 | ) | | | | | | | 7,520,443 | | | | (9,877,394 | ) |
| | | | | |
Forward foreign currency contracts | | | — | | | | (5,032 | ) | | | | | | | (25,415 | ) | | | 1,216,818 | |
| | | | | |
Futures contracts | | | — | | | | (23,672 | ) | | | | | | | 6,619,928 | | | | 3,038,432 | |
| | | | | |
Swaps | | | 121,582 | | | | (653,663 | ) | | | | | | | 394,660 | | | | (2,961,696 | ) |
| | | | | |
Change in net unrealized appreciation (depreciation) of: | | | | | | | | | | | | | | | | | | | | |
| | | | | |
Investments and foreign currency | | | (7,715,002 | ) | | | 19,540,305 | | | | | | | | (14,138,360 | ) | | | 29,005,871 | |
| | | | | |
Forward foreign currency contracts | | | — | | | | 4,044 | | | | | | | | — | | | | (273,576 | ) |
| | | | | |
Futures contracts | | | — | | | | (9,710 | ) | | | | | | | (893,413 | ) | | | (267,668 | ) |
| | | | | |
Swaps | | | (25,642 | ) | | | 25,642 | | | | | | | | 242,818 | | | | 306,212 | |
| | | | | |
Net increase (decrease) in net assets from operations | | | (7,373,995 | ) | | | 16,531,358 | | | | | | | | 22,365,958 | | | | 45,222,510 | |
| | | | | |
Distributions to Shareholders | | | | | | | | | | | | | | | | | | | | |
| | | | | |
Dividends: | | | | | | | | | | | | | | | | | | | | |
| | | | | |
Class A Shares | | | (5,570,100 | ) | | | (8,619,031 | ) | | | | | | | (4,779,380 | ) | | | (3,158,669 | ) |
| | | | | |
Class C Shares | | | (1,254,480 | ) | | | (2,145,516 | ) | | | | | | | (1,125,729 | ) | | | (1,340,031 | ) |
| | | | | |
Class R3 Shares | | | (13,351 | ) | | | (26,455 | ) | | | | | | | (97,693 | ) | | | (140,232 | ) |
| | | | | |
Class R6 Shares | | | — | | | | — | | | | | | | | (2,494,336 | ) | | | (1,664,530 | ) |
| | | | | |
Class I Shares | | | (4,571,241 | ) | | | (8,246,406 | ) | | | | | | | (15,555,242 | ) | | | (15,894,859 | ) |
| | | | | |
Return of capital: | | | | | | | | | | | | | | | | | | | | |
| | | | | |
Class A Shares | | | (439,476 | ) | | | — | | | | | | | | — | | | | — | |
| | | | | |
Class C Shares | | | (116,299 | ) | | | — | | | | | | | | — | | | | — | |
| | | | | |
Class R3 Shares | | | (1,106 | ) | | | — | | | | | | | | — | | | | — | |
| | | | | |
Class R6 Shares | | | — | | | | — | | | | | | | | — | | | | — | |
| | | | | |
Class I Shares | | | (345,576 | ) | | | — | | | | | | | | — | | | | — | |
| | | | | |
Decrease in net assets from distributions to shareholders | | | (12,311,629 | ) | | | (19,037,408 | ) | | | | | | | (24,052,380 | ) | | | (22,198,321 | ) |
| | | | | |
Fund Share Transactions | | | | | | | | | | | | | | | | | | | | |
| | | | | |
Proceeds from sale of shares | | | 200,974,291 | | | | 241,052,827 | | | | | | | | 277,348,570 | | | | 108,017,741 | |
| | | | | |
Proceeds from shares issued to shareholders due to reinvestment of distributions | | | 11,152,874 | | | | 16,637,176 | | | | | | | | 16,172,786 | | | | 13,540,440 | |
| | | | | |
| | | 212,127,165 | | | | 257,690,003 | | | | | | | | 293,521,356 | | | | 121,558,181 | |
| | | | | |
Cost of shares redeemed | | | (295,499,711 | ) | | | (273,769,766 | ) | | | | | | | (277,115,029 | ) | | | (274,492,861 | ) |
| | | | | |
Net increase (decrease) in net assets from Fund share transactions | | | (83,372,546 | ) | | | (16,079,763 | ) | | | | | | | 16,406,327 | | | | (152,934,680 | ) |
| | | | | |
Net increase (decrease) in net assets | | | (103,058,170 | ) | | | (18,585,813 | ) | | | | | | | 14,719,905 | | | | (129,910,491 | ) |
| | | | | |
Net assets at the beginning of period | | | 289,184,915 | | | | 307,770,728 | | | | | | | | 582,085,480 | | | | 711,995,971 | |
| | | | | |
Net assets at the end of period | | $ | 186,126,745 | | | $ | 289,184,915 | | | | | | | $ | 596,805,385 | | | $ | 582,085,480 | |
See accompanying notes to financial statements.
62
THIS PAGE INTENTIONALLY LEFT BLANK
63
Financial Highlights
Credit Income
Selected data for a share outstanding throughout each period:
| | | | | | | | | | | | | | | | | | | | | | | | | | | | | | | | | | | | | | | | |
| | | | | |
| | | | | | Investment Operations | | | | | | Less Distributions | | | | |
| | | | | | | | | | |
| Year Ended June 30, | | Beginning
NAV | | | Net
Investment
Income
(Loss)(a) | | | Net
Realized/
Unrealized
Gain (Loss) | | | Total | | | | | | Net
Investment
Income | | | From
Accumulated
Net Realized
Gains | | | Return of Capital | | | Total | | | Ending
NAV | |
| | | | | | | | | | |
Class A (8/01) | | | | | | | | | | | | | | | | | | | | | | | | | | | | | | | | | | | | | | | | |
| | | | | | | | | | |
2020 | | $ | 7.44 | | | $ | 0.38 | | | $ | (0.75 | ) | | $ | (0.37 | ) | | | | | | $ | (0.35 | ) | | $ | — | | | $ | (0.03 | ) | | $ | (0.38 | ) | | $ | 6.69 | |
| | | | | | | | | | |
2019 | | | 7.51 | | | | 0.46 | | | | (0.04 | ) | | | 0.42 | | | | | | | | (0.49 | ) | | | — | | | | — | | | | (0.49 | ) | | | 7.44 | |
| | | | | | | | | | |
2018 | | | 7.80 | | | | 0.52 | | | | (0.28 | ) | | | 0.24 | | | | | | | | (0.53 | ) | | | — | | | | — | | | | (0.53 | ) | | | 7.51 | |
| | | | | | | | | | |
2017 | | | 7.22 | | | | 0.54 | | | | 0.57 | | | | 1.11 | | | | | | | | (0.53 | ) | | | — | | | | — | | | | (0.53 | ) | | | 7.80 | |
| | | | | | | | | | |
2016 | | | 8.23 | | | | 0.57 | | | | (1.05 | ) | | | (0.48 | ) | | | | | | | (0.53 | ) | | | — | | | | — | | | | (0.53 | ) | | | 7.22 | |
| | | | | | | | | | |
Class C (8/01) | | | | | | | | | | | | | | | | | | | | | | | | | | | | | | | | | | | | | | | | |
| | | | | | | | | | |
2020 | | | 7.43 | | | | 0.33 | | | | (0.74 | ) | | | (0.41 | ) | | | | | | | (0.30 | ) | | | — | | | | (0.03 | ) | | | (0.33 | ) | | | 6.69 | |
| | | | | | | | | | |
2019 | | | 7.50 | | | | 0.40 | | | | (0.04 | ) | | | 0.36 | | | | | | | | (0.43 | ) | | | — | | | | — | | | | (0.43 | ) | | | 7.43 | |
| | | | | | | | | | |
2018 | | | 7.79 | | | | 0.46 | | | | (0.28 | ) | | | 0.18 | | | | | | | | (0.47 | ) | | | — | | | | — | | | | (0.47 | ) | | | 7.50 | |
| | | | | | | | | | |
2017 | | | 7.21 | | | | 0.49 | | | | 0.57 | | | | 1.06 | | | | | | | | (0.48 | ) | | | — | | | | — | | | | (0.48 | ) | | | 7.79 | |
| | | | | | | | | | |
2016 | | | 8.22 | | | | 0.53 | | | | (1.07 | ) | | | (0.54 | ) | | | | | | | (0.47 | ) | | | — | | | | — | | | | (0.47 | ) | | | 7.21 | |
| | | | | | | | | | |
Class R3 (9/01) | | | | | | | | | | | | | | | | | | | | | | | | | | | | | | | | | | | | | | | | |
| | | | | | | | | | |
2020 | | | 7.60 | | | | 0.37 | | | | (0.76 | ) | | | (0.39 | ) | | | | | | | (0.34 | ) | | | — | | | | (0.03 | ) | | | (0.37 | ) | | | 6.84 | |
| | | | | | | | | | |
2019 | | | 7.67 | | | | 0.45 | | | | (0.04 | ) | | | 0.41 | | | | | | | | (0.48 | ) | | | — | | | | — | | | | (0.48 | ) | | | 7.60 | |
| | | | | | | | | | |
2018 | | | 7.96 | | | | 0.52 | | | | (0.29 | ) | | | 0.23 | | | | | | | | (0.52 | ) | | | — | | | | — | | | | (0.52 | ) | | | 7.67 | |
| | | | | | | | | | |
2017 | | | 7.37 | | | | 0.54 | | | | 0.58 | | | | 1.12 | | | | | | | | (0.53 | ) | | | — | | | | — | | | | (0.53 | ) | | | 7.96 | |
| | | | | | | | | | |
2016 | | | 8.40 | | | | 0.57 | | | | (1.08 | ) | | | (0.51 | ) | | | | | | | (0.52 | ) | | | — | | | | — | | | | (0.52 | ) | | | 7.37 | |
| | | | | | | | | | |
Class I (8/01) | | | | | | | | | | | | | | | | | | | | | | | | | | | | | | | | | | | | | | | | |
| | | | | | | | | | |
2020 | | | 7.47 | | | | 0.40 | | | | (0.76 | ) | | | (0.36 | ) | | | | | | | (0.37 | ) | | | — | | | | (0.03 | ) | | | (0.40 | ) | | | 6.71 | |
| | | | | | | | | | |
2019 | | | 7.54 | | | | 0.48 | | | | (0.04 | ) | | | 0.44 | | | | | | | | (0.51 | ) | | | — | | | | — | | | | (0.51 | ) | | | 7.47 | |
| | | | | | | | | | |
2018 | | | 7.82 | | | | 0.54 | | | | (0.27 | ) | | | 0.27 | | | | | | | | (0.55 | ) | | | — | | | | — | | | | (0.55 | ) | | | 7.54 | |
| | | | | | | | | | |
2017 | | | 7.24 | | | | 0.56 | | | | 0.57 | | | | 1.13 | | | | | | | | (0.55 | ) | | | — | | | | — | | | | (0.55 | ) | | | 7.82 | |
| | | | | | | | | | |
2016 | | | 8.26 | | | | 0.60 | | | | (1.07 | ) | | | (0.47 | ) | | | | | | | (0.55 | ) | | | — | | | | — | | | | (0.55 | ) | | | 7.24 | |
See accompanying notes to financial statements.
64
| | | | | | | | | | | | | | | | | | | | | | | | | | | | | | | | | | |
| | | | Ratios/Supplemental Data | |
| | | | | | | | | | Ratios to Average
Net Assets Before
Waiver/Reimbursement | | | | | | Ratios to Average
Net Assets After
Waiver/Reimbursement(c) | | | | |
| | | | | | | | |
Total
Return(b) | | | Ending
Net
Assets
(000) | | | | | | Expenses | | | Net
Investment
Income
(Losss) | | | | | | Expenses | | | Net
Investment
Income
(Losss) | | | Portfolio
Turnover
Rate(d) | |
| | | | | | | | |
| | | | | | | | | | | | | | | | | | | | | | | | | | | | | | | | | | |
| | | | | | | | |
| | (5.15 | )% | | $ | 82,545 | | | | | | | | 1.12 | % | | | 5.19 | % | | | | | | | 1.00 | % | | | 5.31 | % | | | 80 | % |
| | | | | | | | |
| | 5.86 | | | | 151,673 | | | | | | | | 1.01 | | | | 6.17 | | | | | | | | 1.00 | | | | 6.19 | | | | 113 | |
| | | | | | | | |
| | 3.16 | | | | 126,376 | | | | | | | | 1.04 | | | | 6.66 | | | | | | | | 1.00 | | | | 6.70 | | | | 126 | |
| | | | | | | | |
| | 15.75 | | | | 136,977 | | | | | | | | 1.01 | | | | 7.03 | | | | | | | | 1.01 | | | | 7.03 | | | | 155 | |
| | | | | | | | |
| | 5.48 | | | | 114,537 | | | | | | | | 1.03 | | | | 7.99 | | | | | | | | 1.03 | | | | 7.99 | | | | 91 | |
| | | | | | | | |
| | | | | | | | | | | | | | | | | | | | | | | | | | | | | | | | | | |
| | | | | | | | |
| | (5.75 | ) | | | 22,612 | | | | | | | | 1.87 | | | | 4.46 | | | | | | | | 1.75 | | | | 4.58 | | | | 80 | |
| | | | | | | | |
| | 5.04 | | | | 35,655 | | | | | | | | 1.77 | | | | 5.44 | | | | | | | | 1.75 | | | | 5.46 | | | | 113 | |
| | | | | | | | |
| | 2.37 | | | | 41,121 | | | | | | | | 1.80 | | | | 5.96 | | | | | | | | 1.75 | | | | 6.00 | | | | 126 | |
| | | | | | | | |
| | 14.93 | | | | 47,698 | | | | | | | | 1.76 | | | | 6.32 | | | | | | | | 1.76 | | | | 6.32 | | | | 155 | |
| | | | | | | | |
| | (6.27 | ) | | | 41,663 | | | | | | | | 1.79 | | | | 7.26 | | | | | | | | 1.79 | | | | 7.26 | | | | 91 | |
| | | | | | | | |
| | | | | | | | | | | | | | | | | | | | | | | | | | | | | | | | | | |
| | | | | | | | |
| | (5.33 | ) | | | 242 | | | | | | | | 1.37 | | | | 4.97 | | | | | | | | 1.25 | | | | 5.09 | | | | 80 | |
| | | | | | | | |
| | 5.56 | | | | 298 | | | | | | | | 1.27 | | | | 5.95 | | | | | | | | 1.26 | | | | 5.96 | | | | 113 | |
| | | | | | | | |
| | 2.94 | | | | 473 | | | | | | | | 1.30 | | | | 6.48 | | | | | | | | 1.25 | | | | 6.52 | | | | 126 | |
| | | | | | | | |
| | 15.46 | | | | 756 | | | | | | | | 1.26 | | | | 6.80 | | | | | | | | 1.26 | | | | 6.81 | | | | 155 | |
| | | | | | | | |
| | (5.76 | ) | | | 834 | | | | | | | | 1.29 | | | | 7.78 | | | | | | | | 1.29 | | | | 7.78 | | | | 91 | |
| | | | | | | | |
| | | | | | | | | | | | | | | | | | | | | | | | | | | | | | | | | | |
| | | | | | | | |
| | (5.03 | ) | | | 80,728 | | | | | | | | 0.86 | | | | 5.36 | | | | | | | | 0.75 | | | | 5.47 | | | | 80 | |
| | | | | | | | |
| | 6.10 | | | | 101,560 | | | | | | | | 0.76 | | | | 6.44 | | | | | | | | 0.75 | | | | 6.45 | | | | 113 | |
| | | | | | | | |
| | 3.52 | | | | 139,777 | | | | | | | | 0.79 | | | | 6.91 | | | | | | | | 0.75 | | | | 6.95 | | | | 126 | |
| | | | | | | | |
| | 15.97 | | | | 200,310 | | | | | | | | 0.75 | | | | 7.31 | | | | | | | | 0.76 | | | | 7.31 | | | | 155 | |
| | | | | | | | |
| | (5.21) | | | | 208,009 | | | | | | | | 0.78 | | | | 8.12 | | | | | | | | 0.78 | | | | 8.12 | | | | 91 | |
| (a) | Per share Net Investment Income (Loss) is calculated using the average daily shares method. | |
| (b) | Total return is the combination of changes in NAV without any sales charge, reinvested dividend income at NAV and reinvested capital gains distributions at NAV, if any. Total returns are not annualized. | |
| (c) | After fee waiver and/or expense reimbursement from the Adviser, where applicable. See Note 7 – Management Fees and Other Transactions with Affiliates, Management Fees for more information. For the period October 31, 2014 through June 29, 2016, the Adviser did not reimburse the Fund for any fees and expenses. | |
| (d) | Portfolio Turnover Rate is calculated based on the lesser of long-term purchases or sales (as disclosed in Note 5 – Investment Transactions) divided by the average long-term market value during the period. | |
See accompanying notes to financial statements.
65
Financial Highlights (continued)
Strategic Income
Selected data for a share outstanding throughout each period:
| | | | | | | | | | | | | | | | | | | | | | | | | | | | | | | | | | | | | | | | |
| | | | | |
| | | | | | Investment Operations | | | | | | Less Distributions | | | | |
| | | | | | | | | | |
Class (Commencement Date) Year Ended June 30, | | Beginning
NAV | | | Net
Investment
Income
(Loss)(a) | | | Net
Realized/
Unrealized
Gain (Loss) | | | Total | | | | | | Net
Investment
Income | | | From
Accumulated
Net Realized
Gains | | | Return
of
Capital | | | Total | | | Ending
NAV | |
| | | | | | | | | | |
Class A (2/00) | | | | | | | | | | | | | | | | | | | | | | | | | | | | | | | | | | | | | | | | |
| | | | | | | | | | |
2020 | | $ | 10.60 | | | $ | 0.36 | | | $ | 0.12 | | | $ | 0.48 | | | | | | | $ | (0.39 | ) | | $ | — | | | $ | — | | | $ | (0.39 | ) | | $ | 10.69 | |
| | | | | | | | | | |
2019 | | | 10.17 | | | | 0.40 | | | | 0.38 | | | | 0.78 | | | | | | | | (0.35 | ) | | | — | | | | — | | | | (0.35 | ) | | | 10.60 | |
| | | | | | | | | | |
2018 | | | 10.65 | | | | 0.36 | | | | (0.43 | ) | | | (0.07 | ) | | | | | | | (0.21 | ) | | | — | | | | (0.20 | ) | | | (0.41 | ) | | | 10.17 | |
| | | | | | | | | | |
2017 | | | 10.52 | | | | 0.44 | | | | 0.22 | | | | 0.66 | | | | | | | | (0.29 | ) | | | — | | | | (0.24 | ) | | | (0.53 | ) | | | 10.65 | |
| | | | | | | | | | |
2016 | | | 10.97 | | | | 0.50 | | | | (0.42 | ) | | | 0.08 | | | | | | | | (0.53 | ) | | | — | | | | — | | | | (0.53 | ) | | | 10.52 | |
| | | | | | | | | | |
Class C (2/00) | | | | | | | | | | | | | | | | | | | | | | | | | | | | | | | | | | | | | | | | |
| | | | | | | | | | |
2020 | | | 10.55 | | | | 0.28 | | | | 0.12 | | | | 0.40 | | | | | | | | (0.31 | ) | | | — | | | | — | | | | (0.31 | ) | | | 10.64 | |
| | | | | | | | | | |
2019 | | | 10.12 | | | | 0.32 | | | | 0.39 | | | | 0.71 | | | | | | | | (0.28 | ) | | | — | | | | — | | | | (0.28 | ) | | | 10.55 | |
| | | | | | | | | | |
2018 | | | 10.59 | | | | 0.28 | | | | (0.42 | ) | | | (0.14 | ) | | | | | | | (0.13 | ) | | | — | | | | (0.20 | ) | | | (0.33 | ) | | | 10.12 | |
| | | | | | | | | | |
2017 | | | 10.46 | | | | 0.35 | | | | 0.23 | | | | 0.58 | | | | | | | | (0.21 | ) | | | — | | | | (0.24 | ) | | | (0.45 | ) | | | 10.59 | |
| | | | | | | | | | |
2016 | | | 10.90 | | | | 0.42 | | | | (0.41 | ) | | | 0.01 | | | | | | | | (0.45 | ) | | | — | | | | — | | | | (0.45 | ) | | | 10.46 | |
| | | | | | | | | | |
Class R3 (9/01) | | | | | | | | | | | | | | | | | | | | | | | | | | | | | | | | | | | | | | | | |
| | | | | | | | | | |
2020 | | | 10.64 | | | | 0.33 | | | | 0.13 | | | | 0.46 | | | | | | | | (0.37 | ) | | | — | | | | — | | | | (0.37 | ) | | | 10.73 | |
| | | | | | | | | | |
2019 | | | 10.21 | | | | 0.37 | | | | 0.39 | | | | 0.76 | | | | | | | | (0.33 | ) | | | — | | | | — | | | | (0.33 | ) | | | 10.64 | |
| | | | | | | | | | |
2018 | | | 10.69 | | | | 0.33 | | | | (0.42 | ) | | | (0.09 | ) | | | | | | | (0.19 | ) | | | — | | | | (0.20 | ) | | | (0.39 | ) | | | 10.21 | |
| | | | | | | | | | |
2017 | | | 10.56 | | | | 0.41 | | | | 0.23 | | | | 0.64 | | | | | | | | (0.27 | ) | | | — | | | | (0.24 | ) | | | (0.51 | ) | | | 10.69 | |
| | | | | | | | | | |
2016 | | | 11.01 | | | | 0.48 | | | | (0.42 | ) | | | 0.06 | | | | | | | | (0.51 | ) | | | — | | | | — | | | | (0.51 | ) | | | 10.56 | |
| | | | | | | | | | |
Class R6 (1/15) | | | | | | | | | | | | | | | | | | | | | | | | | | | | | | | | | | | | | | | | |
| | | | | | | | | | |
2020 | | | 10.64 | | | | 0.40 | | | | 0.12 | | | | 0.52 | | | | | | | | (0.43 | ) | | | — | | | | — | | | | (0.43 | ) | | | 10.73 | |
| | | | | | | | | | |
2019 | | | 10.20 | | | | 0.44 | | | | 0.38 | | | | 0.82 | | | | | | | | (0.38 | ) | | | — | | | | — | | | | (0.38 | ) | | | 10.64 | |
| | | | | | | | | | |
2018 | | | 10.67 | | | | 0.39 | | | | (0.42 | ) | | | (0.03 | ) | | | | | | | (0.24 | ) | | | — | | | | (0.20 | ) | | | (0.44 | ) | | | 10.20 | |
| | | | | | | | | | |
2017 | | | 10.52 | | | | 0.48 | | | | 0.23 | | | | 0.71 | | | | | | | | (0.32 | ) | | | — | | | | (0.24 | ) | | | (0.56 | ) | | | 10.67 | |
| | | | | | | | | | |
2016 | | | 10.96 | | | | 0.53 | | | | (0.41 | ) | | | 0.12 | | | | | | | | (0.56 | ) | | | — | | | | — | | | | (0.56 | ) | | | 10.52 | |
| | | | | | | | | | |
Class I (2/00) | | | | | | | | | | | | | | | | | | | | | | | | | | | | | | | | | | | | | | | | |
| | | | | | | | | | |
2020 | | | 10.60 | | | | 0.39 | | | | 0.12 | | | | 0.51 | | | | | | | | (0.42 | ) | | | — | | | | — | | | | (0.42 | ) | | | 10.69 | |
| | | | | | | | | | |
2019 | | | 10.17 | | | | 0.42 | | | | 0.39 | | | | 0.81 | | | | | | | | (0.38 | ) | | | — | | | | — | | | | (0.38 | ) | | | 10.60 | |
| | | | | | | | | | |
2018 | | | 10.65 | | | | 0.38 | | | | (0.42 | ) | | | (0.04 | ) | | | | | | | (0.24 | ) | | | — | | | | (0.20 | ) | | | (0.44 | ) | | | 10.17 | |
| | | | | | | | | | |
2017 | | | 10.51 | | | | 0.46 | | | | 0.24 | | | | 0.70 | | | | | | | | (0.32 | ) | | | — | | | | (0.24 | ) | | | (0.56 | ) | | | 10.65 | |
| | | | | | | | | | |
2016 | | | 10.96 | | | | 0.53 | | | | (0.42 | ) | | | 0.11 | | | | | | | | (0.56 | ) | | | — | | | | — | | | | (0.56 | ) | | | 10.51 | |
See accompanying notes to financial statements.
66
| | | | | | | | | | | | | | | | | | | | | | | | | | | | | | | | | | |
| | | | Ratios/Supplemental Data | |
| | | | | | | | | | Ratios to Average
Net Assets Before
Waive/Reimbursement | | | | | | Ratios to Average
Net Assets After
Waive/Reimbursement(c) | | | | |
| | | | | | | | |
Total
Return(b) | | | Ending
Net
Assets
(000) | | | | | | Expenses | | |
Net
Investment
Income
(Loss) | | | | | | Expenses | | | Net
Investment
Income
(Loss) | | | Portfolio
Turnover
Rate(d) | |
| | | | | | | | |
| | | | | | | | | | | | | | | | | | | | | | | | | | | | | | | | | | |
| | | | | | | | |
| | 4.63 | % | | $ | 101,886 | | | | | | | | 0.97 | % | | | 3.28 | % | | | | | | | 0.84 | % | | | 3.42 | % | | | 62 | % |
| | | | | | | | |
| | 7.89 | | | | 87,084 | | | | | | | | 0.96 | | | | 3.79 | | | | | | | | 0.84 | | | | 3.90 | | | | 54 | |
| | | | | | | | |
| | (0.70 | ) | | | 106,805 | | | | | | | | 0.93 | | | | 3.31 | | | | | | | | 0.83 | | | | 3.41 | | | | 124 | |
| | | | | | | | |
| | 6.43 | | | | 137,072 | | | | | | | | 0.93 | | | | 4.02 | | | | | | | | 0.83 | | | | 4.12 | | | | 135 | |
| | | | | | | | |
| | 0.94 | | | | 187,052 | | | | | | | | 0.92 | | | | 4.71 | | | | | | | | 0.83 | | | | 4.80 | | | | 56 | |
| | | | | | | | |
| | | | | | | | | | | | | | | | | | | | | | | | | | | | | | | | | | |
| | | | | | | | |
| | 3.84 | | | | 37,285 | | | | | | | | 1.72 | | | | 2.58 | | | | | | | | 1.59 | | | | 2.71 | | | | 62 | |
| | | | | | | | |
| | 7.11 | | | | 42,024 | | | | | | | | 1.71 | | | | 3.03 | | | | | | | | 1.59 | | | | 3.15 | | | | 54 | |
| | | | | | | | |
| | (1.40 | ) | | | 59,612 | | | | | | | | 1.68 | | | | 2.56 | | | | | | | | 1.58 | | | | 2.66 | | | | 124 | |
| | | | | | | | |
| | 5.63 | | | | 76,513 | | | | | | | | 1.68 | | | | 3.25 | | | | | | | | 1.58 | | | | 3.35 | | | | 135 | |
| | | | | | | | |
| | 0.20 | | | | 89,173 | | | | | | | | 1.67 | | | | 3.97 | | | | | | | | 1.58 | | | | 4.06 | | | | 56 | |
| | | | | | | | |
| | | | | | | | | | | | | | | | | | | | | | | | | | | | | | | | | | |
| | | | | | | | |
| | 4.38 | | | | 3,033 | | | | | | | | 1.22 | | | | 3.09 | | | | | | | | 1.09 | | | | 3.22 | | | | 62 | |
| | | | | | | | |
| | 7.61 | | | | 2,792 | | | | | | | | 1.20 | | | | 3.52 | | | | | | | | 1.09 | | | | 3.64 | | | | 54 | |
| | | | | | | | |
| | (0.92 | ) | | | 5,869 | | | | | | | | 1.18 | | | | 3.06 | | | | | | | | 1.08 | | | | 3.16 | | | | 124 | |
| | | | | | | | |
| | 6.17 | | | | 7,320 | | | | | | | | 1.18 | | | | 3.74 | | | | | | | | 1.08 | | | | 3.83 | | | | 135 | |
| | | | | | | | |
| | 0.70 | | | | 7,647 | | | | | | | | 1.17 | | | | 4.44 | | | | | | | | 1.08 | | | | 4.54 | | | | 56 | |
| | | | | | | | |
| | | | | | | | | | | | | | | | | | | | | | | | | | | | | | | | | | |
| | | | | | | | |
| | 4.96 | | | | 59,099 | | | | | | | | 0.63 | | | | 3.64 | | | | | | | | 0.50 | | | | 3.77 | | | | 62 | |
| | | | | | | | |
| | 8.24 | | | | 50,127 | | | | | | | | 0.62 | | | | 4.14 | | | | | | | | 0.50 | | | | 4.26 | | | | 54 | |
| | | | | | | | |
| | (0.38 | ) | | | 46,588 | | | | | | | | 0.60 | | | | 3.65 | | | | | | | | 0.50 | | | | 3.75 | | | | 124 | |
| | | | | | | | |
| | 6.86 | | | | 8,995 | | | | | | | | 0.60 | | | | 4.35 | | | | | | | | 0.51 | | | | 4.45 | | | | 135 | |
| | | | | | | | |
| | 1.28 | | | | 33,372 | | | | | | | | 0.60 | | | | 5.07 | | | | | | | | 0.50 | | | | 5.17 | | | | 56 | |
| | | | | | | | |
| | | | | | | | | | | | | | | | | | | | | | | | | | | | | | | | | | |
| | | | | | | | |
| | 4.86 | | | | 395,502 | | | | | | | | 0.72 | | | | 3.57 | | | | | | | | 0.59 | | | | 3.71 | | | | 62 | |
| | | | | | | | |
| | 8.15 | | | | 400,059 | | | | | | | | 0.71 | | | | 4.04 | | | | | | | | 0.59 | | | | 4.15 | | | | 54 | |
| | | | | | | | |
| | (0.47 | ) | | | 493,098 | | | | | | | | 0.68 | | | | 3.56 | | | | | | | | 0.58 | | | | 3.67 | | | | 124 | |
| | | | | | | | |
| | 6.77 | | | | 540,368 | | | | | | | | 0.68 | | | | 4.22 | | | | | | | | 0.58 | | | | 4.32 | | | | 135 | |
| | | | | | | | |
| | 1.19 | | | | 475,536 | | | | | | | | 0.67 | | | | 4.95 | | | | | | | | 0.58 | | | | 5.05 | | | | 56 | |
| (a) | Per share Net Investment Income (Loss) is calculated using the average daily shares method. | |
| (b) | Total return is the combination of changes in NAV without any sales charge, reinvested dividend income at NAV and reinvested capital gains distributions at NAV, if any. Total returns are not annualized. | |
| (c) | After fee waiver and/or expense reimbursement from the Adviser, where applicable. See Note 7 – Management Fees and Other Transactions with Affiliates, Management Fees for more information. | |
| (d) | Portfolio Turnover Rate is calculated based on the lesser of long-term purchases or sales (as disclosed in Note 5 – Investment Transactions) divided by the average long-term market value during the period. | |
See accompanying notes to financial statements.
67
Notes to Financial Statements
1. General Information
Trust and Fund Information
Nuveen Investment Funds, Inc. (the “Trust”) is an open-end management investment company registered under the Investment Company Act of 1940 (the “1940 Act”), as amended. The Trust is comprised of Nuveen Credit Income Fund (“Credit Income”) (formerly known as Nuveen High Income Bond Fund) and Nuveen Strategic Income Fund (“Strategic Income”) (each a “Fund” and collectively, the “Funds”), as diversified funds, among others. The Trust was incorporated in the State of Maryland on August 20, 1987.
The end of the reporting period for the Funds is June 30, 2020, and the period covered by these Notes to Financial Statements is the fiscal year ended June 30, 2020 (the “current fiscal period”).
Investment Adviser and Sub-Adviser
The Funds’ investment adviser is Nuveen Fund Advisors, LLC (the “Adviser”), a subsidiary of Nuveen, LLC (“Nuveen”). Nuveen is the investment management arm of Teachers Insurance and Annuity Association of America (TIAA). The Adviser has overall responsibility for management of the Funds, oversees the management of the Funds’ portfolios, manages the Funds’ business affairs and provides certain clerical, bookkeeping and other administrative services, and, if necessary, asset allocation decisions. The Adviser has entered into sub-advisory agreements with Nuveen Asset Management, LLC (the “Sub-Adviser”), a subsidiary of the Adviser, under which the Sub-Adviser manages the investment portfolios of the Funds.
Share Classes and Sales Charges
Class A Shares are generally sold with an up-front sales charge. Class A shares purchases of $1 million or more are sold at net asset value (“NAV”) without an up-front sales charge but may be subject to a contingent deferred sales charge (“CDSC”) of 1% if redeemed within eighteen months of purchase. Class C Shares are sold without an up-front sales charge but are subject to CDSC of 1% if redeemed within twelve months of purchase. Class C Shares automatically convert to Class A Shares ten years after purchase. Class R3, R6 and I shares are sold without an up-front sales charge.
Other Matters
The outbreak of the novel coronavirus (“COVID-19”) and subsequent global pandemic began significantly impacting the U.S. and global financial markets and economies during the calendar ended March 31, 2020. The worldwide spread of COVID-19 has created significant uncertainty in the global economy. The duration and extent of COVID-19 over the long-term cannot be reasonably estimated at this time. The ultimate impact of COVID-19 and the extent to which COVID-19 impacts the Funds’ normal course of business, results of operations, investments, and cash flows will depend on future developments, which are highly uncertain and difficult to predict. Management continues to monitor and evaluate this situation.
2. Significant Accounting Policies
The accompanying financial statements were prepared in accordance with accounting principles generally accepted in the United States of America (“U.S. GAAP”), which may require the use of estimates made by management and the evaluation of subsequent events. Actual results may differ from those estimates. Each Fund is an investment company and follows the accounting guidance in the Financial Accounting Standards Board (“FASB”) Accounting Standards Codification 946, Financial Services – Investment Companies. The NAV for financial reporting purposes may differ from the NAV for processing security and shareholder transactions. The NAV for financial reporting purposes includes security and shareholder transactions through the date of the report. Total return is computed based on the NAV used for processing security and shareholder transactions. The following is a summary the significant accounting policies consistently followed by the Funds.
Compensation
The Trust pays no compensation directly to those of its trustees who are affiliated with the Adviser or to its officers, all of whom receive remuneration for their services to the Trust from the Adviser or its affiliates. The Funds’ Board of Directors (the “Board”) has adopted a deferred compensation plan for independent directors that enables directors to elect to defer receipt of all or a portion of the annual compensation they are entitled to receive from certain Nuveen-advised funds. Under the plan, deferred amounts are treated as though equal dollar amounts had been invested in shares of select Nuveen-advised funds.
Distributions to Shareholders
Distributions to shareholders are recorded on the ex-dividend date. The amount, character and timing of distributions are determined in accordance with federal income tax regulations, which may differ from U.S. GAAP.
68
Foreign Currency Transactions and Translation
The books and records of the Funds are maintained in U.S. dollars. Assets, including investments, and liabilities denominated in foreign currencies are translated into U.S. dollars at the end of each day. Purchases and sales of securities, income and expenses are translated into U.S. dollars at each prevailing exchange rate on the respective dates of the transactions.
Net realized foreign currency gains and losses resulting from changes in exchange rates associated with (i) foreign currency, (ii) investments and (iii) derivatives include foreign currency gains and losses between trade date and settlement date of the transactions, foreign currency transactions, and the difference between the amounts of interest and dividends recorded on the books of the Funds and the amounts actually received are recognized as a component of “Net realized gain (loss) from investments and foreign currency” on the Statement of Operations, when applicable.
The unrealized gains and losses resulting from changes in foreign currency exchange rates and changes in foreign exchange rates associated with (i) investments and (ii) other assets and liabilities are recognized as a component of “Change in net unrealized appreciation (depreciation) of investments and foreign currency” on the Statement of Operations, when applicable. The unrealized gains and losses resulting from changes in foreign exchange rates associated with investments in derivatives are recognized as a component of the respective derivative’s related “Change in net unrealized appreciation (depreciation)” on the Statement of Operations, when applicable.
Indemnifications
Under the Trust’s organizational documents, its officers and directors are indemnified against certain liabilities arising out of the performance of their duties to the Trust. In addition, in the normal course of business, the Trust enters into contracts that provide general indemnifications to other parties. The Trust’s maximum exposure under these arrangements is unknown as this would involve future claims that may be made against the Trust that have not yet occurred. However, the Trust has not had prior claims or losses pursuant to these contracts and expects the risk of loss to be remote.
Investments and Investment Income
Securities transactions are accounted for as of the trade date for financial reporting purposes. Trade date for senior and subordinated loans purchased in the “primary market” is considered the date on which the loan allocations are determined. Trade date for senior and subordinated loans purchased in the “secondary market” is the date on which the transaction is entered into. Realized gains and losses on securities transactions are based upon the specific identification method. Dividend income is recorded on the ex-dividend date or, for certain foreign securities, when information is available. Non-cash dividends received in the form of stock, if any, are recognized on the ex-dividend date and recorded at fair value. Interest income, which reflects the amortization of premiums and accretion of discounts for financial reporting purposes and is recorded on an accrual basis. Interest income also reflects payment-in-kind (“PIK”) interest and paydown gains and losses, if any. PIK interest represents income received in the form of securities in lieu of cash. Securities lending income is comprised of fees earned from borrowers and income earned on cash collateral investments.
Multiclass Operations and Allocations
Income and expenses of the Funds that are not directly attributable to a specific class of shares are prorated among the classes based on the relative value of settled shares of each class. Expenses directly attributable to a class of shares are recorded to the specific class. 12b-1 distribution and ser12b-1 distribution and service fees are allocated on a class-specific basis.
Sub-transfer agent fees and similar fees, which are recognized as a component of “Shareholder servicing agent fees” on the Statement of Operations, are not charged to Class R6 Shares and are prorated among the other classes based on their relative net assets.
Realized and unrealized capital gains and losses of the Funds are prorated among the classes based on the relative net assets of each class.
Netting Agreements
In the ordinary course of business, the Funds may enter into transactions subject to enforceable International Swaps and Derivative Association, Inc. (ISDA) master agreements or other similar arrangements (“netting agreements”). Generally, the right to offset in netting agreements allows each Fund to offset certain securities and derivatives with a specific counterparty, when applicable, as well as any collateral received or delivered to that counterparty based on the terms of the agreements. Generally, each Fund manages its cash collateral and securities collateral on a counterparty basis.
The Funds’ investments subject to netting agreements as of the end of the reporting period, if any, are further described in Note 4 – Portfolio Securities and Investments in Derivatives.
New Accounting Pronouncements and Rule Issuances
FASB Accounting Standards Update (“ASU”) 2017-08 (“ASU 2017-08”) Premium Amortization on Purchased Callable Debt Securities
The FASB has issued ASU 2017-08, which shortens the premium amortization period for purchased non-contingently callable debt securities. ASU 2017-08 specifies that the premium amortization period ends at the earliest call date, for purchased non-contingently callable debt securities. ASU 2017-08 is effective for fiscal years, and interim periods within those fiscal years, beginning after December 15, 2018. During the current fiscal period, ASU 2017-08 became effective for the Fund and it did not have a material impact on the Fund’s financial statements.
Fair Value Measurement: Disclosure Framework
During August 2018, the FASB issued ASU 2018-13 (“ASU 2018-13”), Fair Value Measurement: Disclosure Framework – Changes to the Disclosure Requirements for Fair Value Measurements. ASU 2018-13 modifies the disclosures required by Topic 820, Fair Value Measurements. The amendments
69
Notes to Financial Statements (continued)
in ASU 2018-13 are effective for all entities for fiscal years, and interim periods within those fiscal years, beginning after December 15, 2019. Management has early implemented this guidance and it did not have a material impact on the Funds’ financial statements.
Reference Rate Reform
In March 2020, FASB issued ASU 2020-04, Reference Rate Reform: Facilitation of the Effects of Reference Rate Reform on Financial Reporting. The main objective of the new guidance is to provide relief to companies that will be impacted by the expected change in benchmark interest rates at the end of 2021, when participating banks will no longer be required to submit London Interbank Offered Rate (LIBOR) quotes by the UK Financial Conduct Authority (FCA). The new guidance allows companies to, provided the only change to existing contracts are a change to an approved benchmark interest rate, account for modifications as a continuance of the existing contract without additional analysis. For new and existing contracts, the Funds may elect to apply the amendments as of March 12, 2020 through December 31, 2022. Management has not yet elected to apply the amendments, but is currently assessing the impact of the ASU’s adoption to the Fund’s financial statements and various filings.
3. Investment Valuation and Fair Value Measurements
The fair valuation input levels as described below are for fair value measurement purposes.
The Funds’ investments in securities is recorded at their estimated fair value. Fair value is defined as the price that would be received upon selling an investment or transferring a liability in an orderly transaction to an independent buyer in the principal or most advantageous market for the investment. A three-tier hierarchy is used to maximize the use of observable market data and minimize the use of unobservable inputs and to establish classification of fair value measurements for disclosure purposes. Observable inputs reflect the assumptions market participants would use in pricing the asset or liability. Observable inputs are based on market data obtained from sources independent of the reporting entity. Unobservable inputs reflect the reporting entity’s own assumptions about the assumptions market participants would use in pricing the asset or liability. Unobservable inputs are based on the best information available in the circumstances. The following is a summary of the three-tiered hierarchy of valuation input levels.
| | |
| Level 1 – | | Inputs are unadjusted and prices are determined using quoted prices in active markets for identical securities. |
| Level 2 – | | Prices are determined using other significant observable inputs (including quoted prices for similar securities, interest rates, credit spreads, etc.). |
| Level 3 – | | Prices are determined using significant unobservable inputs (including management’s assumptions in determining the fair value of investments). |
Common stocks and other equity-type securities are valued at the last sales price on the securities exchange on which such securities are primarily traded and are generally classified as Level 1. Securities primarily traded on the Nasdaq National Market (“Nasdaq”) are valued at the Nasdaq Official Closing Price and are generally classified as Level 1. However, securities traded on a securities exchange or Nasdaq for which there were no transactions on a given day or securities not listed on a securities exchange or Nasdaq are valued at the quoted bid price and are generally classified as Level 2.
Prices of fixed-income securities are provided by an independent pricing service (“pricing service”) approved by the Board. The pricing service establishes a security’s fair value using methods that may include consideration of the following: yields or prices of investments of comparable quality, type of issue, coupon, maturity and rating, market quotes or indications of value from security dealers, evaluations of anticipated cash flows or collateral, general market conditions and other information and analysis, including the obligor’s credit characteristics considered relevant. These securities are generally classified as Level 2. In pricing certain securities, particularly less liquid and lower quality securities, the pricing service may consider information about a security, its issuer or market activity, provided by the Adviser. These securities are generally classified as Level 2 or Level 3 depending on the observability of the significant inputs.
Like most fixed-income securities, the senior and subordinated loans in which the Fund invests are not listed on an organized exchange. The secondary market of such investments may be less liquid relative to markets for other fixed-income securities. Consequently, the value of senior and subordinated loans, determined as described above, may differ significantly from the value that would have been determined had there been an active market for that senior loan. These securities are generally classified as Level 2.
Investments in investment companies are valued at their respective NAVs on the valuation date and are generally classified as Level 1.
Futures contracts are valued using the closing settlement price or, in the absence of such a price, the last traded price and are generally classified as Level 1.
Investments initially valued in currencies other than the U.S. dollar are converted to the U.S. dollar using exchange rates obtained from pricing services. As a result, the NAV of the Fund’s shares may be affected by changes in the value of currencies in relation to the U.S. dollar. The value of securities traded in markets outside the United States or denominated in currencies other than the U.S. dollar may be affected significantly on a day that the New York Stock Exchange is closed and an investor is not able to purchase, redeem or exchange shares. If significant market events occur between the time of determination of the closing price of a foreign security on an exchange and the time that the Funds’ NAV is determined, or if under the Funds’ procedures, the closing price of a foreign security is not deemed to be reliable, the security would be valued at fair value as determined in accordance with procedures established in good faith by the Board. These securities are generally classified as Level 2 or Level 3 depending on the observability of the significant inputs.
70
Certain securities may not be able to be priced by the pre-established pricing methods as described above. Such securities may be valued by the Board and/or its appointee at fair value. These securities generally include, but are not limited to, restricted securities (securities which may not be publicly sold without registration under the Securities Act of 1933, as amended) for which a pricing service is unable to provide a market price; securities whose trading has been formally suspended; debt securities that have gone into default and for which there is no current market quotation; a security whose market price is not available from a pre-established pricing source; a security with respect to which an event has occurred that is likely to materially affect the value of the security after the market has closed but before the calculation of a Fund’s NAV (as may be the case in non-U.S. markets on which the security is primarily traded) or make it difficult or impossible to obtain a reliable market quotation; and a security whose price, as provided by the pricing service, is not deemed to reflect the security’s fair value. As a general principle, the fair value of a security would appear to be the amount that the owner might reasonably expect to receive for it in a current sale. A variety of factors may be considered in determining the fair value of such securities, which may include consideration of the following: yields or prices of investments of comparable quality, type of issue, coupon, maturity and rating, market quotes or indications of value from security dealers, evaluations of anticipated cash flows or collateral, general market conditions and other information and analysis, including the obligor’s credit characteristics considered relevant. These securities are generally classified as Level 2 or Level 3 depending on the observability of the significant inputs. Regardless of the method employed to value a particular security, all valuations are subject to review by the Board and/or its appointee.
The inputs or methodologies used for valuing securities are not an indication of the risks associated with investing in those securities. The following is a summary of each Fund’s fair value measurements as of the end of the reporting period:
| | | | | | | | | | | | | | | | |
| Credit Income | | Level 1 | | | Level 2 | | | Level 3 | | | Total | |
| Long-Term Investments*: | | | | | | | | | | | | | | | | |
Corporate Bonds | | $ | — | | | $ | 164,665,683 | | | $ | 5 | ** | | $ | 164,665,688 | |
Exchange-Traded Funds | | | 8,088,237 | | | | — | | | | — | | | | 8,088,237 | |
Variable Rate Senior Loans Interests | | | — | | | | 2,817,049 | | | | — | | | | 2,817,049 | |
Contingent Capital Securities | | | — | | | | 1,558,995 | | | | — | | | | 1,558,995 | |
$25 Par (or similar) Retail Preferred | | | 826,197 | | | | — | | | | — | | | | 826,197 | |
$1,000 Par (or similar) Institutional Preferred | | | — | | | | 408,925 | | | | — | | | | 408,925 | |
Common Stock | | | — | | | | — | | | | 141 | ** | | | 141 | |
| Investments Purchased with Collateral from Securities Lending | | | 2,026,200 | | | | — | | | | — | | | | 2,026,200 | |
| Short-Term Investments: | | | | | | | | | | | | | | | | |
Money Market Funds | | | 13,643,460 | | | | — | | | | — | | | | 13,643,460 | |
| Total | | $ | 24,584,094 | | | $ | 169,450,652 | | | $ | 146 | | | $ | 194,034,892 | |
| | | | |
| Strategic Income | | | | | | | | | | | | |
| Long-Term Investments*: | | | | | | | | | | | | | | | | |
Corporate Bonds | | $ | — | | | $ | 246,468,669 | | | $ | — | | | $ | 246,468,669 | |
Asset-Backed and Mortgage-Backed Securities | | | — | | | | 188,727,864 | | | | — | | | | 188,727,864 | |
Variable Rate Senior Loan Interests | | | — | | | | 56,478,781 | | | | — | | | | 56,478,781 | |
$1,000 Par (or similar) Institutional Preferred | | | — | | | | 41,203,651 | | | | — | | | | 41,203,651 | |
Contingent Capital Securities | | | — | | | | 23,761,240 | | | | — | | | | 23,761,240 | |
Sovereign Debt | | | — | | | | 15,415,387 | | | | — | | | | 15,415,387 | |
Municipal Bonds | | | — | | | | 11,096,757 | | | | — | | | | 11,096,757 | |
$25 Par (or similar) Retail Preferred | | | 1,695,400 | | | | 2,142,400 | ** | | | — | | | | 3,837,800 | |
| Investments Purchased with Collateral from Securities Lending | | | 1,721,683 | | | | — | | | | — | | | | 1,721,683 | |
| Short-Term Investments: | | | | | | | | | | | | | | | | |
Money Market Funds | | | 10,870,340 | | | | — | | | | — | | | | 10,870,340 | |
| Investments in Derivatives: | | | | | | | | | | | | | | | | |
Futures Contracts*** | | | (109,808 | ) | | | — | | | | — | | | | (109,808 | ) |
| Total | | $ | 14,177,615 | | | $ | 585,294,749 | | | $ | — | | | $ | 599,472,364 | |
| * | Refer to the Fund’s Portfolio of Investments for industry, state and country classifications, where applicable. |
| ** | Refer to the Fund’s Portfolio of Investments for securities classified as Level 2 and/or Level 3, where applicable. |
| *** | Represents net unrealized appreciation (depreciation) as reported in the Fund’s Portfolio of Investments. |
4. Portfolio Securities and Investments in Derivatives
Portfolio Securities
Securities Lending
In order to generate additional income, each Fund may lend securities representing up to one-third of the value of its total assets (which includes collateral for securities on loan) to broker-dealers, banks or other institutions. When loaning securities, the Funds retain the benefits of owning the securities, including the economic equivalent of dividends or interest generated by the security. The Funds also have the ability to recall the securities on loan at any time.
71
Notes to Financial Statements (continued)
Each Fund’s policy is to receive, at the inception of a loan, cash collateral equal to at least 102% of the value of securities loaned, which is recognized as “Payable for collateral from securities lending program” on the Statement of Assets and Liabilities. Collateral for securities on loan is invested in a money market fund, which is recognized as “Investments purchased with collateral from securities lending, at value” on the Statement of Assets and Liabilities. The market value of the securities loaned is determined at the close of each business day in order to determine the adequacy of the collateral. If the value of the securities on loan increases such that the level of collateralization falls below 100%, additional collateral is received from the borrower on the next business day, which is recognized as “Due from broker” on the Statement of Assets and Liabilities.
Securities out on loan are subject to termination at any time at the option of the borrower or the Fund. Upon termination, the borrower is required to return to the Fund securities identical to the securities loaned. Generally, in the event the borrower defaults on its obligation to return the loaned securities, the Fund has the right to use the collateral to acquire identical securities. In the event the Fund is delayed or prevented from exercising its right to dispose of the collateral, there may be a loss to the Fund. Under each Fund’s securities lending agreement, however, the securities lending agent has indemnified the Fund against losses resulting from borrower default, except to the extent that those losses result from a decrease in the value of the collateral due to its investment by the Fund. The Fund bears the risk of loss with respect to the investment of collateral.
The Funds’ custodian, U.S. Bank National Association, serves as its securities lending agent. Income earned from the securities lending program is paid to the Funds. Income from securities lending is recognized as “Securities lending income” on the Statement of Operations.
The following table presents the securities out on loan for the Funds, and the collateral delivered related to those securities, as of the end of the reporting period.
| | | | | | | | | | | | | | |
| Fund | | Asset Class out on Loan | | Long-Term Investments, at Value | | | Collateral Pledged (From) Counterparty* | | | Net Exposure | |
| Credit Income | | | | | | | | | | | | | | |
| | | Corporate Bonds | | $ | 1,954,298 | | | $ | (1,954,298 | ) | | $ | — | |
| Strategic Income | | | | | | | | | | | | | | |
| | | Corporate Bonds | | $ | 1,635,317 | | | $ | (1,635,317 | ) | | $ | — | |
| * | As of the end of the reporting period, the value of the collateral pledged from the counterparty exceeded the value of the securities out on loan. Refer to the Fund's Portfolio of Investments for details on the securities out on loan. |
Zero Coupon Securities
A zero coupon security does not pay a regular interest coupon to its holders during the life of the security. Income to the holder of the security comes from accretion of the difference between the original purchase price of the security at issuance and the par value of the security at maturity and is effectively paid at maturity. The market prices of zero coupon securities generally are more volatile than the market prices of securities that pay interest periodically.
Investment Transactions
Long-term purchases and sales (including maturities but excluding investments purchased with collateral from securities lending and derivative transactions) during the current fiscal period were as follows:
| | | | | | | | |
| | | Credit
Income | | | Strategic
Income | |
| Purchases: | | | | | | | | |
Investment securities | | $ | 164,849,570 | | | $ | 407,838,127 | |
U.S. Government and agency obligations | | | — | | | | 40,504,617 | |
| Sales and maturities: | | | | | | | | |
Investment securities | | | 231,881,301 | | | | 309,490,573 | |
U.S. Government and agency obligations | | | 1,021,250 | | | | 68,321,240 | |
The Funds may purchase securities on a when-issued or delayed-delivery basis. Securities purchased on a when-issued or delayed-delivery basis may have extended settlement periods; interest income is not accrued until settlement date. Any securities so purchased are subject to market fluctuation during this period. The Funds have earmarked securities in their portfolios with a current value at least equal to the amount of the when-issued/ delayed-delivery purchase commitments. If a Fund has outstanding when-issued/delayed-delivery purchases commitments as of the end of the reporting period, such amounts are recognized on the Statement of Assets and Liabilities.
Investments in Derivatives
Each Fund is authorized to invest in certain derivative instruments. The Funds record derivative instruments at fair value, with changes in fair value recognized on the Statement of Operations, when applicable. Even though the Funds’ investments in derivatives may represent economic hedges, they are not considered to be hedge transactions for financial reporting purposes.
72
Forward Foreign Currency Contracts
Each Fund is authorized to enter into forward foreign currency contracts (“forward contracts”) under two circumstances: (i) when a Fund enters into a contract for the purchase or sale of a security denominated in a foreign currency to “lock in” the U.S. exchange rate of the transaction, with such period being a short-dated contract covering the period between transaction date and settlement date; or (ii) when the Sub-Adviser believes that the currency of a particular foreign country may experience a substantial movement against the U.S. dollar or against another foreign currency.
A forward contract is an agreement between two parties to purchase or sell a specified quantity of a currency at or before a specified date in the future at a specified price. Forward contracts are typically traded in the OTC markets and all details of the contract are negotiated between the counterparties to the agreement. Accordingly, the forward contracts are valued by reference to the contracts traded in the OTC markets. The contractual obligations of a buyer or seller may generally be satisfied by taking or making physical delivery of the underlying currency, establishing an opposite position in the contract and recognizing the profit or loss on both positions simultaneously on the delivery date or, in some instances, paying a cash settlement before the designated date of delivery.
Forward contracts are valued daily at the forward rate. The net amount recorded on these transactions for each counterparty is recognized as a component of “Unrealized appreciation and/or depreciation on forward foreign currency contracts” on the Statement of Assets and Liabilities. The change in value of the forward contracts during the reporting period is recognized as a component of “Change in net unrealized appreciation (depreciation) of forward foreign currency contracts” on the Statement of Operations. When the contract is closed or offset with the same counterparty, a Fund recognizes the difference between the value of the contract at the time it was entered and the value at the time it was closed or offset as a component of “Net realized gain (loss) from forward foreign currency contracts” on the Statement of Operations.
Forward contracts will generally not be entered into for terms greater than three months, but may have maturities of up to six months or more. The use of forward contracts does not eliminate fluctuations in the underlying prices of a Fund’s investment securities; however, it does establish a rate of exchange that can be achieved in the future. The use of forward contracts involves the risk that anticipated currency movements will not be accurately predicted. A forward contract would limit the risk of loss due to a decline in the value of a particular currency; however, it also would limit any potential gain that might result should the value of the currency increase instead of decrease. These contracts may involve market risk in excess of the unrealized appreciation or depreciation reflected on the Statement of Assets and Liabilities. Forward contracts are subject to counterparty risk if the counterparty fails to perform as specified in the contract due to financial impairment or other reason.
During the current fiscal period, Strategic Income used foreign exchange forward contracts to hedge a Euro denominated bond position back to US Dollars.
The average notional amount of forward foreign currency contracts outstanding during the current fiscal period was as follows:
| | | | |
| | | Strategic
Income | |
| Average notional amount of forward foreign currency contracts outstanding* | | $ | 197,481 | |
| * | The average notional amount is calculated based on the outstanding notional at the beginning of the current fiscal period and at the end of each fiscal quarter within the current fiscal period. |
The following table presents the amount of net realized gain (loss) and change in net unrealized appreciation (depreciation) recognized on forward foreign currency contracts on the Statement of Operations during the current fiscal period, and the primary underlying risk exposure.
| | | | | | | | | | | | |
| Fund | | Underlying
Risk Exposure | | Derivative
Instrument | | Net Realized
Gain (Loss) from Forward Foreign Currency
Contracts | | | Change in Net Unrealized
Appreciation (Depreciation) of Forward Foreign Currency
Contracts | |
| Strategic Income | | Foreign currency exchange rate | | Forward contracts | | $ | (25,415 | ) | | $ | — | |
Futures Contracts
Upon execution of a futures contract, a Fund is obligated to deposit cash or eligible securities, also known as “initial margin,” into an account at its clearing broker equal to a specified percentage of the contract amount. Cash held by the broker to cover initial margin requirements on open futures contracts, if any, is recognized as “Cash collateral at brokers for investments in futures contracts” on the Statement of Assets and Liabilities. Investments in futures contracts obligate a Fund and the clearing broker to settle monies on a daily basis representing changes in the prior days “mark-to-market” of the open contracts. If a Fund has unrealized appreciation the clearing broker would credit the Fund’s account with an amount equal to appreciation and conversely if a Fund has unrealized depreciation the clearing broker would debit the Fund’s account with an amount equal to depreciation. These daily cash settlements are also known as “variation margin.” Variation margin is recognized as a receivable and/or payable for “Variation margin on futures contracts” on the Statement of Assets and Liabilities.
During the period the futures contract is open, changes in the value of the contract are recognized as an unrealized gain or loss by “marking-to-market” on a daily basis to reflect the changes in market value of the contract, which is recognized as a component of “Change in net unrealized appreciation (depreciation) of futures contracts” on the Statement of Operations. When the contract is closed or expired, a Fund records a realized
73
Notes to Financial Statements (continued)
gain or loss equal to the difference between the value of the contract on the closing date and value of the contract when originally entered into, which is recognized as a component of “Net realized gain (loss) from futures contracts” on the Statement of Operations.
Risks of investments in futures contracts include the possible adverse movement in the price of the securities or indices underlying the contracts, the possibility that there may not be a liquid secondary market for the contracts and/or that a change in the value of the contract may not correlate with a change in the value of the underlying securities or indices.
During the current fiscal period, Strategic Income used U.S. Treasury and Eurodollar futures as part of their overall portfolio construction strategy to manage portfolio duration and yield curve exposure; using selected foreign bond futures to actively manage exposure to those markets.
The average notional amount of futures contracts outstanding during the current fiscal period was as follows:
| | | | |
| | | Strategic
Income | |
| Average notional amount of futures contracts outstanding* | | $ | 101,037,952 | |
| * | The average notional amount is calculated based on the absolute aggregate notional amount of contracts outstanding at the beginning of the current fiscal period and at the end of each fiscal quarter within the current fiscal period. |
The following table presents the fair value of all futures contracts held by the Funds as of the end of the reporting period, the location of these instruments on the Statement of Assets and Liabilities and the primary underlying risk exposure.
| | | | | | | | | | | | | | |
| | | | | Location on the Statement of Assets and Liabilities | |
| | | | | Asset Derivatives | | | (Liability) Derivatives | |
Underlying
Risk Exposure | | Derivative Instrument | | Location | | Value | | | Location | | Value | |
Strategic Income | | | | | | | | | | | | |
| | | | | |
Interest Rate | | Futures contracts | | Receivable for variation margin on futures
contracts* | | $ | (236,928 | ) | | Payable for variation
margin on futures
contracts* | | $ | 127,120 | |
| * | Value represents the cumulative unrealized appreciation (depreciation) of futures contracts as reported in the Fund’s Portfolio of Investments and not the asset and/or liability derivatives location as described in the table above. |
The following table presents the amount of net realized gain (loss) and change in net unrealized appreciation (depreciation) recognized on futures contracts on the Statement of Operations during the current fiscal period, and the primary underlying risk exposure.
| | | | | | | | | | | | |
| Fund | | Underlying
Risk Exposure | | Derivative
Instrument | | Net Realized
Gain (Loss) from
Futures Contracts | | | Change in Net
Unrealized Appreciation
(Depreciation) of
Futures Contracts | |
| Strategic Income | | Interest rate | | Futures contracts | | $ | 6,619,928 | | | $ | (893,413 | ) |
Credit Default Swap Contracts
A Fund may enter into a credit default swap contract to seek to maintain a total return on a particular investment or portion of its portfolio, or to take an active long or short position with respect to the likelihood of a particular issuer’s default. Credit default swap contracts involve one party making a stream of payments to another party in exchange for the right to receive a specified return if/when there is a credit event by a third party. Generally, a credit event means bankruptcy, failure to pay, or restructuring. The specific credit events applicable for each credit default swap are stated in the terms of the particular swap agreement. When a Fund has bought (sold) protection in a credit default swap upon occurrence of a specific credit event with respect to the underlying referenced entity, the Fund will either (i) deliver (receive) that security, or an equivalent amount of cash, from the counterparty in exchange for receipt (payment) of the notional amount to the counterparty, or (ii) receive (pay) a net settlement amount of the credit default swap contract less the recovery value of the referenced obligation or underlying securities comprising the referenced index. The difference between the value of the security received (delivered) and the notional amount delivered (received) is recorded as a realized gain or loss. Payments paid (received) at the beginning of the measurement period are recognized as a component of “Credit default swaps premiums paid and/or received” on the Statement of Assets and Liabilities, when applicable.
Credit default swap contracts are valued daily. Changes in the value of a credit default swap during the fiscal period are recognized as a component of “Change in net unrealized appreciation (depreciation) of swaps” and realized gains and losses are recognized as a component of “Net realized gain (loss) from swaps” on the Statement of Operations.
For OTC swaps not cleared through a clearing house (“OTC Uncleared”), the daily change in the market value of the swap contract, along with any daily interest fees accrued, are recognized as components of “Unrealized appreciation or depreciation on credit default swaps” on the Statement of Assets and Liabilities.
Upon the execution of an OTC swap cleared through a clearing house (“OTC Cleared”), a Fund is obligated to deposit cash or eligible securities, also known as “initial margin,” into an account at its clearing broker equal to a specified percentage of the contract amount. Cash held by the broker to
74
cover initial margin requirements on open swap contracts, if any, is recognized as “Cash collateral at brokers for investments in swaps” on the Statement of Assets and Liabilities. Investments in OTC Cleared swaps obligate a Fund and the clearing broker to settle monies on a daily basis representing changes in the prior day’s “mark-to-market” of the swap. If a Fund has unrealized appreciation, the clearing broker would credit the Fund’s account with an amount equal to the appreciation and conversely if a Fund has unrealized depreciation, the clearing broker will debit a Fund’s account with an amount equal to the depreciation. These daily cash settlements are also known as “variation margin.” Variation margin for OTC Cleared swaps is recognized as a receivable and/or payable for “Variation margin on swap contracts” on the Statement of Assets and Liabilities. Upon the execution of an OTC Uncleared swap, neither the Fund nor the counterparty is required to deposit initial margin as the trades are recorded bilaterally between both parties to the swap contract, and the terms of the variation margin are subject to a predetermined threshold negotiated by the Fund and the counterparty. Variation margin for OTC Uncleared swaps is recognized as a component of “Unrealized appreciation or depreciation on credit default swaps” as described in the preceding paragraph. The maximum potential amount of future payments the Fund could incur as a buyer or seller of protection in a credit default swap contract is limited to the notional amount of the contract. The maximum potential amount would be offset by the recovery value, if any, of the respective referenced entity.
During the current fiscal period, Credit Income used credit default swaps to increase the Fund’s high yield credit risk exposure. Strategic Income used credit default swaps hedge a portion of the fund’s high yield credit risk exposure.
The average notional amount of credit default swap contacts outstanding during the current fiscal period was as follows:
| | | | | | | | |
| | | Credit
Income | | | Strategic Income | |
| Average notional amount of credit default swap contracts outstanding* | | $ | 11,860,000 | | | $ | 17,880,000 | |
| * | The average notional amount is calculated based on the outstanding notional at the beginning of the current fiscal period and at the end of each fiscal quarter within the current fiscal period. |
The following table presents the amount of net realized gain (loss) and change in net unrealized appreciation (depreciation) recognized on swap contracts on the Statement of Operations during the current fiscal period, and the primary underlying risk exposure.
| | | | | | | | | | | | |
| Fund | | Underlying
Risk Exposure | | Derivative
Instrument | | Net Realized
Gain (Loss)
from Swaps | | | Change in Net
Unrealized Appreciation
(Depreciation) of Swaps | |
| Credit Income | | Credit | | Swaps | | $ | 121,582 | | | $ | (25,642 | ) |
| Strategic Income | | Credit | | Swaps | | $ | 394,660 | | | $ | 242,818 | |
Market and Counterparty Credit Risk
In the normal course of business each Fund may invest in financial instruments and enter into financial transactions where risk of potential loss exists due to changes in the market (market risk) or failure of the other party to the transaction to perform (counterparty credit risk). The potential loss could exceed the value of the financial assets recorded on the financial statements. Financial assets, which potentially expose each Fund to counterparty credit risk, consist principally of cash due from counterparties on forward, option and swap transactions, when applicable. The extent of each Fund’s exposure to counterparty credit risk in respect to these financial assets approximates their carrying value as recorded on the Statement of Assets and Liabilities.
Each Fund helps manage counterparty credit risk by entering into agreements only with counterparties the Adviser believes have the financial resources to honor their obligations and by having the Adviser monitor the financial stability of the counterparties. Additionally, counterparties may be required to pledge collateral daily (based on the daily valuation of the financial asset) on behalf of each Fund with a value approximately equal to the amount of any unrealized gain above a pre-determined threshold. Reciprocally, when each Fund has an unrealized loss, the Funds have instructed the custodian to pledge assets of the Funds as collateral with a value approximately equal to the amount of the unrealized loss above a pre-determined threshold. Collateral pledges are monitored and subsequently adjusted if and when the valuations fluctuate, either up or down, by at least the pre-determined threshold amount.
75
Notes to Financial Statements (continued)
5. Fund Shares
On December 12, 2018, Class T Shares were liquidated.
Transactions in Fund shares during the current and prior fiscal period were as follows:
| | | | | | | | | | | | | | | | |
| | | Year Ended
6/30/20 | | | Year Ended
6/30/19 | |
| Credit Income | | Shares | | | Amount | | | Shares | | | Amount | |
| Shares sold: | | | | | | | | | | | | | | | | |
Class A | | | 7,396,878 | | | $ | 52,078,686 | | | | 14,857,337 | | | $ | 108,487,700 | |
Class A – automatic conversion of Class C Shares | | | 92,554 | | | | 686,361 | | | | 3,891 | | | | 28,291 | |
Class C | | | 497,953 | | | | 3,579,508 | | | | 1,010,630 | | | | 7,430,289 | |
Class R3 | | | 19,134 | | | | 146,008 | | | | 7,620 | | | | 57,202 | |
Class I | | | 20,387,966 | | | | 144,483,728 | | | | 16,978,120 | | | | 125,049,345 | |
| Shares issued to shareholders due to reinvestment of distributions: | | | | | | | | | | | | | | | | |
Class A | | | 795,086 | | | | 5,715,682 | | | | 1,111,439 | | | | 8,167,919 | |
Class C | | | 180,158 | | | | 1,293,044 | | | | 271,745 | | | | 1,992,842 | |
Class R3 | | | 1,891 | | | | 13,827 | | | | 3,260 | | | | 24,443 | |
Class I | | | 571,525 | | | | 4,130,321 | | | | 875,450 | | | | 6,451,972 | |
| | | | 29,943,145 | | | | 212,127,165 | | | | 35,119,492 | | | | 257,690,003 | |
| Shares redeemed: | | | | | | | | | | | | | | | | |
Class A | | | (16,335,525 | ) | | | (117,355,977 | ) | | | (12,411,998 | ) | | | (91,239,124 | ) |
Class C | | | (2,000,325 | ) | | | (14,206,944 | ) | | | (1,962,557 | ) | | | (14,460,897 | ) |
Class C – automatic conversion of Class A Shares | | | (92,439 | ) | | | (686,361 | ) | | | (3,896 | ) | | | (28,291 | ) |
Class R3 | | | (24,891 | ) | | | (187,766 | ) | | | (33,371 | ) | | | (251,879 | ) |
Class I | | | (22,534,634 | ) | | | (163,062,663 | ) | | | (22,794,940 | ) | | | (167,766,977 | ) |
Class T | | | — | | | | — | | | | (3,161 | ) | | | (22,598 | ) |
| | | | (40,987,814 | ) | | | (295,499,711 | ) | | | (37,209,923 | ) | | | (273,769,766 | ) |
| Net increase (decrease) | | | (11,044,669 | ) | | $ | (83,372,546 | ) | | | (2,090,431 | ) | | $ | (16,079,763 | ) |
| | |
| | | Year Ended
6/30/20 | | | Year Ended
6/30/19 | |
| Strategic Income | | Shares | | | Amount | | | Shares | | | Amount | |
| Shares sold: | | | | | | | | | | | | | | | | |
Class A | | | 10,702,738 | | | $ | 114,985,580 | | | | 1,864,425 | | | $ | 19,087,479 | |
Class A – automatic conversion of Class C Shares | | | 3,361 | | | | 35,987 | | | | 9,521 | | | | 97,015 | |
Class C | | | 706,305 | | | | 7,434,086 | | | | 243,747 | | | | 2,473,021 | |
Class R3 | | | 111,810 | | | | 1,217,507 | | | | 177,043 | | | | 1,813,886 | |
Class R6 | | | 3,339,512 | | | | 35,915,057 | | | | 934,679 | | | | 9,637,881 | |
Class I | | | 11,085,334 | | | | 117,760,353 | | | | 7,319,706 | | | | 74,908,459 | |
| Shares issued to shareholders due to reinvestment of distributions: | | | | | | | | | | | | | | | | |
Class A | | | 404,976 | | | | 4,323,082 | | | | 265,623 | | | | 2,714,756 | |
Class C | | | 91,912 | | | | 973,879 | | | | 114,832 | | | | 1,166,653 | |
Class R3 | | | 6,166 | | | | 65,651 | | | | 9,027 | | | | 92,765 | |
Class R6 | | | 223,522 | | | | 2,395,791 | | | | 156,686 | | | | 1,608,403 | |
Class I | | | 790,490 | | | | 8,414,383 | | | | 778,897 | | | | 7,957,863 | |
| | | | 27,466,126 | | | | 293,521,356 | | | | 11,874,186 | | | | 121,558,181 | |
| Shares redeemed: | | | | | | | | | | | | | | | | |
Class A | | | (9,792,748 | ) | | | (99,793,855 | ) | | | (4,428,723 | ) | | | (44,937,856 | ) |
Class C | | | (1,273,193 | ) | | | (13,403,748 | ) | | | (2,256,628 | ) | | | (22,892,717 | ) |
Class C – automatic conversion of Class A Shares | | | (3,377 | ) | | | (35,987 | ) | | | (9,568 | ) | | | (97,015 | ) |
Class R3 | | | (97,573 | ) | | | (1,045,514 | ) | | | (498,671 | ) | | | (5,162,337 | ) |
Class R6 | | | (2,767,518 | ) | | | (29,775,291 | ) | | | (949,406 | ) | | | (9,731,682 | ) |
Class I | | | (12,618,276 | ) | | | (133,060,634 | ) | | | (18,860,199 | ) | | | (191,647,964 | ) |
Class T | | | — | | | | — | | | | (2,343 | ) | | | (23,290 | ) |
| | | | (26,552,685 | ) | | | (277,115,029 | ) | | | (27,005,538 | ) | | | (274,492,861 | ) |
| Net increase (decrease) | | | 913,441 | | | $ | 16,406,327 | | | | (15,131,352 | ) | | $ | (152,934,680 | ) |
6. Income Tax Information
Each Fund is a separate taxpayer for federal income tax purposes. Each Fund intends to distribute substantially all of its net investment income and net capital gains to shareholders and to otherwise comply with the requirements of Subchapter M of the Internal Revenue Code applicable to regulated investment companies. Therefore, no federal income tax provision is required.
For all open tax years and all major taxing jurisdictions, management of the Funds has concluded that there are no significant uncertain tax positions that would require recognition in the financial statements. Open tax years are those that are open for examination by taxing authorities (i.e., generally the last four tax year ends and the interim tax period since then). Furthermore, management of the Funds is also not aware of any tax positions for which it is reasonably possible that the total amounts of unrecognized tax benefits will significantly change in the next twelve months.
76
The following information is presented on an income tax basis. Differences between amounts for financial statement and federal income tax purposes are primarily due to timing differences in recognizing certain gains and losses on investment transactions. To the extent that differences arise that are permanent in nature, such amounts are reclassified within the capital accounts as detailed below. Temporary differences do not require reclassification. Temporary and permanent differences do not impact the NAVs of the Funds.
The table below presents the cost and unrealized appreciation (depreciation) of each Fund’s investment portfolio, as determined on a federal income tax basis, as of June 30, 2020.
For purposes of this disclosure, derivative tax cost is generally the sum of any upfront fees or premiums exchanged and any amounts unrealized for income statement reporting but realized in income and/or capital gains for tax reporting. If a particular derivative category does not disclose any tax unrealized appreciation or depreciation, the change in value of those derivatives have generally been fully realized for tax purposes.
| | | | | | | | |
| | | Credit
Income | | | Strategic
Income | |
| Tax cost of investments | | $ | 200,176,658 | | | $ | 598,589,796 | |
| Gross unrealized: | | | | | | | | |
Appreciation | | $ | 4,605,712 | | | $ | 19,985,139 | |
Depreciation | | | (10,747,478 | ) | | | (19,102,571 | ) |
| Net unrealized appreciation (depreciation) of investments | | $ | (6,141,766 | ) | | $ | 882,568 | |
Permanent differences, primarily due to federal taxes paid, foreign currency transactions, complex securities character adjustments, and treatment of notional principal contracts, resulted in reclassifications among the Funds’ components of net assets as of June 30, 2020, the Funds’ tax year end.
The tax components of undistributed net ordinary income and net long-term capital gains as of June 30, 2020, the Funds’ tax year end, were as follows:
| | | | | | | | |
| | | Credit
Income | | | Strategic
Income | |
| Undistributed net ordinary income1 | | $ | — | | | $ | 653,757 | |
| Undistributed net long-term capital gains | | | — | | | | — | |
| 1 | Undistributed net ordinary income (on a tax basis) has not been reduced for the dividend declared during the period June 1, 2020 through June 30, 2020 and paid on July 1, 2020. Net ordinary income consists of net taxable income derived from dividends, interest and net short-term capital gains, if any. |
The tax character of distributions paid during the Funds’ tax years ended June 30, 2020 and June 30, 2019 was designated for purposes of the dividends paid deduction as follows:
| | | | | | | | |
| 2020 | | Credit
Income | | | Strategic
Income | |
| Distributions from net ordinary income2 | | $ | 11,409,172 | | | $ | 24,052,380 | |
| Distributions from net long-term capital gains | | | — | | | | — | |
Return of Capital | | $ | 902,457 | | | | — | |
| | |
| 2019 | | Credit
Income | | | Strategic
Income | |
| Distributions from net ordinary income2 | | $ | 19,524,783 | | | $ | 22,669,921 | |
| Distributions from net long-term capital gains | | | — | | | | — | |
| 2 | Net ordinary income consists of net taxable income derived from dividends, interest and net short-term capital gains, if any. |
As of June 30, 2020, the Funds’ tax year end, the Funds had unused capital losses carrying forward available for federal income tax purposes to be applied against future capital gains, if any. The capital losses are not subject to expiration.
| | | | | | | | |
| | | Credit
Income | | | Strategic
Income | |
| Not subject to expiration: | | | | | | | | |
Short-term | | $ | 49,820,656 | | | $ | 19,976,226 | |
Long-term | | | 88,207,962 | | | | 27,027,075 | |
| Total | | $ | 138,028,618 | | | $ | 47,003,301 | |
During the Funds’ tax year ended June 30, 2020, Strategic Income utilized $13,143,178 capital loss carryforwards.
77
Notes to Financial Statements (continued)
7. Management Fees and Other Transactions with Affiliates
Management Fees
Each Fund’s management fee compensates the Adviser for the overall investment advisory and administrative services and general office facilities. The Sub-Adviser is compensated for its services to the Funds from the management fees paid to the Adviser.
Each Fund’s management fee consists of two components – a fund-level fee, based only on the amount of assets within each individual Fund, and a complex-level fee, based on the aggregate amount of all eligible fund assets managed by the Adviser. This pricing structure enables each Fund’s shareholders to benefit from growth in the assets within their respective Fund as well as from growth in the amount of complex-wide assets managed by the Adviser.
The annual fund-level fee, payable monthly, for each Fund is calculated according to the following schedule:
| | | | | | | | |
| Average Daily Net Assets | | Credit
Income | | | Strategic Income | |
| For the first $125 million | | | 0.4000 | % | | | 0.3600 | % |
| For the next $125 million | | | 0.3875 | | | | 0.3475 | |
| For the next $250 million | | | 0.3750 | | | | 0.3350 | |
| For the next $500 million | | | 0.3625 | | | | 0.3225 | |
| For the next $1 billion | | | 0.3500 | | | | 0.3100 | |
| For the next $3 billion | | | 0.3250 | | | | 0.2850 | |
| For the next $5 billion | | | 0.3000 | | | | 0.2600 | |
| For net assets over $10 billion | | | 0.2875 | | | | 0.2475 | |
The annual complex-level fee, payable monthly, for each Fund is determined by taking the complex-level fee rate, which is based on the aggregate amount of “eligible assets” of all Nuveen funds as set forth in the schedule below, and making, as appropriate, an upward adjustment to that rate based upon the percentage of the particular fund’s assets that are not “eligible assets.” The complex-level fee schedule for each Fund is as follows:
| | | | |
| Complex-Level Eligible Asset Breakpoint Level* | | Effective Complex-Level Fee Rate at Breakpoint Level | |
| $55 billion | | | 0.2000 | % |
| $56 billion | | | 0.1996 | |
| $57 billion | | | 0.1989 | |
| $60 billion | | | 0.1961 | |
| $63 billion | | | 0.1931 | |
| $66 billion | | | 0.1900 | |
| $71 billion | | | 0.1851 | |
| $76 billion | | | 0.1806 | |
| $80 billion | | | 0.1773 | |
| $91 billion | | | 0.1691 | |
| $125 billion | | | 0.1599 | |
| $200 billion | | | 0.1505 | |
| $250 billion | | | 0.1469 | |
| $300 billion | | | 0.1445 | |
| * | The complex-level fee is calculated based upon the aggregate daily “eligible assets” of all Nuveen open-end and closed-end funds. Eligible assets do not include assets attributable to investments in other Nuveen funds or assets in excess of a determined amount (originally $2 billion) added to the Nuveen fund complex in connection with the Adviser’s assumption of the management of the former First American Funds effective January 1, 2011, but do include certain assets of certain Nuveen funds that were reorganized into funds advised by an affiliate of the Adviser during the 2019 calendar year. Eligible assets include closed-end fund assets managed by the Adviser that are attributable to certain types of leverage. For these purposes, leverage includes the closed-end funds’ use of preferred stock and borrowings and certain investments in the residual interest certificates (also called inverse floating rate securities) in tender option bond (TOB) trusts, including the portion of assets held by the TOB trust that has been effectively financed by the trust’s issuance of floating rate securities, subject to an agreement by the Adviser as to certain funds to limit the amount of such assets for determining eligible assets in certain circumstances. As of June 30, 2020, the complex-level fee for each Fund was 0.2000%. |
The Adviser has agreed to waive fees and/or reimburse expenses (“Expense Cap”) of each Fund so that total annual Fund operating expenses (excluding 12b-1 distribution and/or service fees, interest expenses, taxes, acquired fund fees and expenses, fees occurred in acquiring and disposing of portfolio securities and extraordinary expenses) do not exceed the average daily net assets of any class of Fund shares in the amounts and for the time periods stated in the following table. However, because Class R6 Shares are not subject to sub-transfer agent and similar fees, the total annual Fund operating expenses for the Class R6 Shares will be less than the expense limitation. The expense limitation in effect thereafter may be terminated or modified only with the approval of the Board.
| | | | | | |
| Fund | | Expense Cap | | | Expense Cap
Expiration Date |
Credit Income | | | 0.75 | % | | July 31, 2022 |
Strategic Income | | | 0.59 | | | July 31, 2022 |
78
Distribution and Service Fees
Each Fund has adopted a distribution and service plan under rule 12b-1 under the 1940 Act. Class A Shares incur a 0.25% annual 12b-1 service fee. Class C Shares incur a 0.75% annual 12b-1 distribution fee and a 0.25% annual 12b-1 service fee. Class R3 Shares incur a 0.25% annual 12b-1 distribution fee and a 0.25% annual 12b-1 service fee. Class R6 Shares and Class I Shares are not subject to 12b-1 distribution or service fees. The fees under this plan compensate Nuveen Securities, LLC, (the “Distributor”), a wholly-owned subsidiary of Nuveen, for services provided and expenses incurred in distributing shares of the Funds and establishing and maintaining shareholder accounts.
Other Transactions with Affiliates
During the current fiscal period, the Distributor collected sales charges on purchases of Class A Shares, the majority of which were paid out as concessions to financial intermediaries as follows:
| | | | | | | | |
| | | Credit
Income | | | Strategic
Income | |
| Sales charges collected (Unaudited) | | $ | 189,472 | | | $ | 571,863 | |
| Paid to financial intermediaries (Unaudited) | | | 168,437 | | | | 501,302 | |
The Distributor also received 12b-1 service fees on Class A Shares, substantially all of which were paid to compensate financial intermediaries for providing services to shareholders relating to their investments.
During the current fiscal period, the Distributor compensated financial intermediaries directly with commission advances at the time of purchase as follows:
| | | | | | | | |
| | | Credit
Income | | | Strategic
Income | |
| Commission advances (Unaudited) | | $ | 36,553 | | | $ | 58,743 | |
To compensate for commissions advanced to financial intermediaries, all 12b-1 service and distribution fees collected on Class C Shares during the first year following a purchase are retained by the Distributor. During the current fiscal period, the Distributor retained such 12b-1 fees as follows:
| | | | | | | | |
| | | Credit
Income | | | Strategic
Income | |
| 12b-1 fees retained (Unaudited) | | $ | 37,436 | | | $ | 21,001 | |
The remaining 12b-1 fees charged to the Funds were paid to compensate financial intermediaries for providing services to shareholders relating to their investments.
The Distributor also collected and retained CDSC on share redemptions during the current fiscal period, as follows:
| | | | | | | | |
| | | Credit
Income | | | Strategic
Income | |
| CDSC retained (Unaudited) | | $ | 6,360 | | | $ | 2,329 | |
8. Borrowing Arrangements
Committed Line of Credit
The Funds, along with certain other funds managed by the Adviser (“Participating Funds”), have established a 364-day, $2.405 billion standby credit facility with a group of lenders, under which the Participating Funds may borrow for various purposes other than leveraging for investment purposes. Each Participating Fund is allocated a designated proportion of the facility’s capacity (and its associated costs, as described below) based upon a multi-factor assessment of the likelihood and frequency of its need to draw on the facility, the size of the Fund and its anticipated draws, and the potential importance of such draws to the operations and well-being of the Fund, relative to those of the other Funds. A Fund may effect draws on the facility in excess of its designated capacity if and to the extent that other Participating Funds have undrawn capacity. The credit facility expires in June 2021 unless extended or renewed.
The credit facility has the following terms: a 0.1% upfront fee, 0.15% per annum on unused commitment amounts and a drawn interest rate equal to the higher of (a) one-month LIBOR (London Inter-Bank Offered Rate) plus 1.25% (1.00% prior to June 24, 2020) per annum or (b) the Fed Funds rate plus 1.25% (1.00% prior to June 24, 2020) per annum on amounts borrowed. Participating Funds paid administration, legal and arrangement fees, which are recognized as a component of “Interest expense” on the Statement of Operations, and along with commitment fees, have been allocated among such Participating Funds based upon the relative proportions of the facility’s aggregate capacity reserved for them and other factors deemed relevant by the Adviser and the Board of each Participating Fund.
79
Notes to Financial Statements (continued)
During the current fiscal period, the following Funds utilized this facility. Each Fund’s maximum outstanding balance during the utilization period was a follows:
| | | | | | | | |
| | | Credit
Income | | | Strategic
Income | |
| Maximum outstanding balance | | $ | 19,700,000 | | | $ | 16,300,000 | |
During the Fund’s utilization period(s) during the current fiscal period, the average daily balance outstanding and average annual interest rate on the Borrowings were as follows:
| | | | | | | | |
| | | Credit
Income | | | Strategic
Income | |
Utilization period (days outstanding) | | | 1 | | | | 1 | |
Average daily balance outstanding | | $ | 19,700,000 | | | $ | 16,300,000 | |
| Average annual interest rate | | | 3.21% | | | | 1.92% | |
Borrowings outstanding as of the end of the reporting period, if any, are recognized as “Borrowings” on the Statement of Assets and Liabilities, where applicable.
9. Subsequent Events
Securities Lending
Subsequent to the reporting period, each Fund terminated U.S. Bank National Association as its securities lending agent and entered into a new securities lending agency agreement pursuant to which State Street Bank and Trust Company serves as securities lending agent. For further details, refer to the supplements dated August 14, 2020 to each Fund’s Statement of Additional Information.
80
Additional Fund Information (Unaudited)
| | | | | | | | | | |
| | | | | |
| | Investment Adviser Nuveen Fund Advisors, LLC 333 West Wacker Drive Chicago, IL 60606 Sub-Adviser Nuveen Asset Management, LLC 333 West Wacker Drive Chicago, IL 60606 | | Independent Registered
Public Accounting Firm PricewaterhouseCoopers LLP One North Wacker Drive Chicago, IL 60606 Custodian State Street Bank & Trust Company One Lincoln Street Boston, MA 02111 | | Legal Counsel Chapman and Cutler LLP Chicago, IL 60603 | | Transfer Agent and
Shareholder Services DST Asset Manager
Solutions, Inc. (DST) P.O. Box 219140 Kansas City, MO 64121-9140 (800) 257-8787 | | |
| | | | | | | | | | | | | | |
| | | | | |
| | | | | | | | | | |
| | |
| | Distribution Information: The Funds hereby designate their percentages of dividends paid from net ordinary income as dividends qualifying as Interest-Related Dividends as defined in the Internal Revenue Code Section 871(k) for the taxable periods ending December 31, 2019 and June 30, 2020: | | |
| | | | | | | |
| | | | | | | | | | | Credit Income | | Strategic Income | | |
| | July 1, 2019 through December 31, 2019 | | 86.9% | | 72.4% | | |
| | January 1, 2020 through June 30, 2020 | | 59.8% | | 60.9% | | |
| | |
| | Distribution Information: The Funds hereby designate their percentages of dividends paid from net ordinary income as dividends qualifying for the 70% dividends received deduction (“DRD”) for corporations and their percentages of qualified dividend income (“QDI”) for individuals under Section 1(h)(11) of the Internal Revenue Code as shown in the accompanying table. The actual qualified dividend income distributions will be reported to shareholders on Form 1099-DIV which will be sent to shareholders shortly after calendar year end. | | |
| | | | | | | |
| | | | | | | | | | | Credit Income | | Strategic Income | | |
| | % QDI | | 2.1% | | 24.4% | | |
| | % DRD | | 0.0% | | 13.4% | | |
| | | |
| | | | | | |
| | |
| | Portfolio of Investments Information: Each Fund is required to file its complete schedule of portfolio holdings with the Securities and Exchange Commission (SEC) for the first and third quarters of each fiscal year as an exhibit to its report on Form N-PORT. You may obtain this information on the SEC’s website at http://www.sec.gov. | | |
| | | |
| | | | | | |
| | |
| | Nuveen Funds’ Proxy Voting Information: You may obtain (i) information regarding how each fund voted proxies relating to portfolio securities held during the most recent twelve-month period ended June 30, without charge, upon request, by calling Nuveen toll-free at (800) 257-8787 or on Nuveen’s website at www.nuveen.com and (ii) a description of the policies and procedures that each fund used to determine how to vote proxies relating to portfolio securities without charge, upon request, by calling Nuveen toll-free at (800) 257-8787. You may also obtain this information directly from the SEC. Visit the SEC on-line at http://www.sec.gov. | | |
| | | |
| | | | | | |
| | |
| | FINRA BrokerCheck: The Financial Industry Regulatory Authority (FINRA) provides information regarding the disciplinary history of FINRA member firms and associated investment professionals. This information as well as an investor brochure describing FINRA BrokerCheck is available to the public by calling the FINRA BrokerCheck Hotline number at (800) 289-9999 or by visiting www.FINRA.org. | | |
81
Glossary of Terms Used in this Report
(Unaudited)
Asset-Backed Securities (ABS): Securities whose value and income payments are derived from and collateralized by a specific pool of underlying assets. The pool of assets typically is a group of small and/or illiquid assets that may be difficult to sell individually. The underlying pools of asset-backed securities often include payments from credit cards, auto loans or mortgage loans.
Average Annual Total Return: This is a commonly used method to express an investment’s performance over a particular, usually multi-year time period. It expresses the return that would have been necessary each year to equal the investment’s actual cumulative performance (including change in NAV or offer price and reinvested dividends and capital gains distributions, if any) over the time period being considered.
Basis Point: One one-hundredth of one percentage point, or 0.01%. For example, 25 basis points equals 0.25%.
Beta: A measure of the variability of the change in the share price for a fund in relation to a change in the value of the fund’s market benchmark. Securities with betas higher than 1.0 have been, and are expected to be, more volatile than the benchmark; securities with betas lower than 1.0 have been, and are expected to be, less volatile than the benchmark.
Bloomberg Barclays U.S. Aggregate Bond Index: An unmanaged index that includes all investment-grade, publicly issued, fixed-rate, dollar denominated, nonconvertible debt issues and commercial mortgage-backed securities with maturities of at least one year and outstanding par values of $150 million or more. Index returns assume reinvestment of distributions, but do not include the effects of any applicable sales charges or management fees.
Bloomberg Barclays High Yield 2% Issuer Capped Index: An issuer-constrained version of the U.S. Corporate High-Yield Index that covers the U.S. dollar denominated, non-investment grade, fixed-rate, taxable corporate bond market. Index returns assume reinvestment of distributions, but do not include the effects of any applicable sales charges or management fees.
Commercial Mortgage-Backed Securities (CMBS): Commercial mortgage-backed securities are backed by cash flows of a mortgage or pool of mortgages on commercial real estate. CMBS generally are structured to provide protection to the senior class investors against potential losses on the underlying mortgage loans. CMBS are typically characterized by the following: i) loans on multi-family housing, non-residential property, ii) payments based on the amortization schedule of 25-30 years with a balloon payment due usually after 10 years, and iii) restrictions on prepayments.
Contingent Capital Securities (CoCos): CoCos are debt or capital securities of primarily non-U.S. issuers with loss absorption contingency mechanisms built into the terms of the security, for example a mandatory conversion into common stock of the issuer, or a principal write-down, which if triggered would likely cause the CoCo investment to lose value. Loss absorption mechanisms would become effective upon the occurrence of a specified contingency event, or at the discretion of a regulatory body. Specified contingency events, as identified in the CoCo’s governing documents, usually reference a decline in the issuer’s capital below a specified threshold level, and/or certain regulatory events. A loss absorption contingency event for CoCos would likely be the result of, or related to, the deterioration of the issuer’s financial condition and/or its status as a going concern. In such a case, with respect to CoCos that provide for conversion into common stock upon the occurrence of the contingency event, the market price of the issuer’s common stock received by the Acquiring Fund will have likely declined, perhaps substantially, and may continue to decline after conversion. CoCos rated below investment grade should be considered high yield securities, or “junk,” but often are issued by entities whose more senior securities are rated investment grade. CoCos are a relatively new type of security; and there is a risk that CoCo security issuers may suffer the sort of future financial distress that could materially increase
82
Glossary of Terms Used in this Report (Unaudited) (continued)
the likelihood (or the market’s perception of the likelihood) that an automatic write-down or conversion event on those issuers’ CoCos will occur. Additionally, the trading behavior of a given issuer’s CoCo may be strongly impacted by the trading behavior of other issuers’ CoCos, such that negative information from an unrelated CoCo security may cause a decline in value of one or more CoCos held by the Fund. Accordingly, the trading behavior of CoCos may not follow the trading behavior of other types of debt and preferred securities. Despite these concerns, the prospective reward vs. risk characteristics of at least certain CoCos may be very attractive relative to other fixed-income alternatives.
Duration: Duration is a measure of the expected period over which a bond’s principal and interest will be paid, and consequently is a measure of the sensitivity of a bond’s or bond fund’s value to changes when market interest rates change. Generally, the longer a bond’s or fund’s duration, the more the price of the bond or fund will change as interest rates change.
Gross Domestic Product (GDP): The total market value of all final goods and services produced in a country/region in a given year, equal to total consumer, investment and government spending, plus the value of exports, minus the value of imports.
Lipper Global High Yield Funds Classification Average: Represents the average annualized returns for all reporting funds in the Lipper Global High Yield Funds Classification. Lipper returns account for the effects of management fees and assume reinvestment of distributions, but do not reflect any applicable sales charge.
Lipper Multi-Sector Income Funds Classification Average: Represents the average annualized returns for all reporting funds in the Lipper Multi-Sector Income Funds Classification. Lipper returns account for the effects of management fees and assume reinvestment of distributions, but do not reflect any applicable sales charge.
Mortgage-Backed Securities (MBS): Mortgage-backed securities (MBS) are bonds backed by pools of mortgages, usually with similar characteristics, and which return principal and interest in each payment. MBS are composed of residential mortgages (RMBS) or commercial mortgages (CMBS). RMBS are further divided into agency RMBS and non-agency RMBS, depending on the issuer.
Net Asset Value (NAV) Per Share: A fund’s Net Assets is equal to its total assets (securities, cash and accrued earnings) less its total liabilities. For funds with multiple classes, Net Assets are determined separately for each share class. NAV per share is equal to the fund’s (or share class’) Net Assets divided by its number of shares outstanding.
Tax Equalization: The practice of treating a portion of the distribution made to a redeeming shareholder, which represents his proportionate part of undistributed net investment income and capital gain as a distribution for tax purposes. Such amounts are referred to as the equalization debits (or payments) and will be considered a distribution to the shareholder of net investment income and capital gain for calculation of the fund’s dividends paid deduction.
83
Annual Investment Management Agreement Approval Process
At a meeting held on May 19-21, 2020 (the “May Meeting”), the Board of Directors (the “Board” and each Director, a “Board Member”) of the Funds, which is comprised entirely of Board Members who are not “interested persons” (as defined under the Investment Company Act of 1940 (the “1940 Act”)) (the “Independent Board Members”), approved, for each Fund, the renewal of the management agreement (each, an “Investment Management Agreement”) with Nuveen Fund Advisors, LLC (the “Adviser”) pursuant to which the Adviser serves as investment adviser to such Fund and the sub-advisory agreement (each, a “Sub-Advisory Agreement”) with Nuveen Asset Management, LLC (the “Sub-Adviser”) pursuant to which the Sub-Adviser serves as the investment sub-adviser to such Fund. Although the 1940 Act requires that continuances of the Advisory Agreements (as defined below) be approved by the in-person vote of a majority of the Independent Board Members, the May Meeting was held virtually through the internet in view of the health risks associated with holding an in-person meeting during the COVID-19 pandemic and governmental restrictions on gatherings. The May Meeting was held in reliance on an order issued by the Securities and Exchange Commission on March 13, 2020, as extended on March 25, 2020, which provided registered investment companies temporary relief from the in-person voting requirements of the 1940 Act with respect to the approval of a fund’s advisory agreement in response to the challenges arising in connection with the COVID-19 pandemic.
Following up to an initial two-year period, the Board considers the renewal of each Investment Management Agreement and Sub-Advisory Agreement on behalf of the applicable Fund on an annual basis. The Investment Management Agreements and Sub-Advisory Agreements are collectively referred to as the “Advisory Agreements” and the Adviser and the Sub-Adviser are collectively, the “Fund Advisers” and each, a “Fund Adviser.” Throughout the year, the Board and its committees meet regularly and, at these meetings, review an extensive array of topics and information that are relevant to its annual consideration of the renewal of the advisory agreements for the Nuveen funds. Such information may address, among other things, fund performance; the Adviser’s strategic plans; the review of the funds and investment teams; compliance, regulatory and risk management matters; the trading practices of the various sub-advisers to the funds; valuation of securities; fund expenses; payments to financial intermediaries, including 12b-1 fees and sub-transfer agency fees, if applicable; and overall market and regulatory developments.
In addition to the information and materials received during the year, the Board, in response to a request made on its behalf by independent legal counsel, received extensive materials and information prepared specifically for its annual consideration of the renewal of the advisory agreements for the Nuveen funds by the Adviser and by Broadridge Financial Solutions, Inc. (“Broadridge”), an independent provider of investment company data. The materials cover a wide range of topics including, but not limited to, a description of the nature, extent and quality of services provided by the Fund Advisers; a review of each sub-adviser to the Nuveen funds and the applicable investment teams; an analysis of fund performance in absolute terms and as compared to the performance of certain peer funds and benchmarks with a focus on any performance outliers; an analysis of the fees and expense ratios of the Nuveen funds in absolute terms and as compared to those of certain peer funds with a focus on any expense outliers; a description of portfolio manager compensation; a review of the performance of various service providers; a description of various initiatives Nuveen had undertaken or continued during the year for the benefit of particular fund(s) and/or the complex; a description of the profitability or financial data of Nuveen and the sub-advisers to the Nuveen funds; and a description of indirect benefits received by the Adviser and the sub-advisers as a result of their relationships with the Nuveen funds.
In continuing its practice, the Board met prior to the May Meeting to begin its considerations of the renewal of the Advisory Agreements. Accordingly, on April 27-28, 2020 (the “April Meeting”), the Board met to review and discuss, in part, the performance of the Nuveen funds and the Adviser’s evaluation of each sub-adviser to the Nuveen funds. In its review, the Board recognized the volatile market conditions occurring during the first half of 2020 arising, in part, from the public health crisis caused by the novel coronavirus known as COVID-19 and the resulting impact on fund performance. Accordingly, the Board reviewed, among other things, fund performance reflecting the more volatile periods, including for various time periods ended the first quarter of 2020 and for various time periods ended April 17, 2020. At the April Meeting, the Board Members asked questions and requested additional information that was provided for the May Meeting. In continuing its review of the Nuveen funds in light of the extraordinary market conditions experienced in early 2020, the Board received updated fund performance data reflecting various time periods ended May 8, 2020 for its May Meeting. The Board also continued its practice of seeking to meet periodically with the various sub-advisers to the Nuveen funds and their investment teams, when feasible.
The Independent Board Members considered the review of the advisory agreements for the Nuveen funds to be an ongoing process and employed the accumulated information, knowledge, and experience the Board Members had gained during their tenure on the boards governing the Nuveen funds and working with the Adviser and sub-advisers in their review of the advisory agreements. The contractual arrangements are a result of multiple years of review, negotiation and information provided in connection with the boards’ annual review of the Nuveen funds’ advisory arrangements and oversight of the Nuveen funds.
84
The Independent Board Members were advised by independent legal counsel during the annual review process as well as throughout the year, including meeting in executive sessions with such counsel at which no representatives from the Adviser or the Sub-Adviser were present. In connection with their annual review, the Independent Board Members also received a memorandum from independent legal counsel outlining their fiduciary duties and legal standards in reviewing the Advisory Agreements.
The Board’s decision to renew the Advisory Agreements was not based on a single identified factor, but rather the decision reflected the comprehensive consideration of all the information provided throughout the year and at the April and May Meetings, and each Board Member may have attributed different levels of importance to the various factors and information considered in connection with the approval process. The following summarizes the principal factors and information, but not all the factors, the Board considered in deciding to renew the Advisory Agreements and its conclusions.
A. Nature, Extent and Quality of Services
In evaluating the renewal of the Advisory Agreements, the Independent Board Members received and considered information regarding the nature, extent and quality of the applicable Fund Adviser’s services provided to the respective Fund with particular focus on the services and enhancements to such services provided during the last year. The Independent Board Members considered the Investment Management Agreements and the Sub-Advisory Agreements separately in the course of their review. With this approach, they considered the respective roles of the Adviser and the Sub-Adviser in providing services to the Funds.
With respect to the Adviser, the Board recognized that the Adviser has provided a vast array of services the scope of which has expanded over the years in light of regulatory, market and other developments, such as the development of a liquidity management program and expanded compliance programs for the Nuveen funds. The Board also noted the extensive resources, tools and capabilities the Adviser and its affiliates devoted to the various operations of the Nuveen funds. These services include, but are not limited to: investment oversight, risk management and securities valuation services (such as analyzing investment performance and risk data; overseeing and reviewing the various sub-advisers to the Nuveen funds and their investment teams; overseeing trade execution, soft dollar practices and securities lending activities; providing daily valuation services and developing related valuation policies, procedures and methodologies; overseeing risk disclosure; periodic testing of investment and liquidity risks; participating in financial statement and marketing disclosures; participating in product development; and participating in leverage management and liquidity monitoring); product management (such as analyzing a fund’s position in the marketplace, setting dividends, preparing shareholder and intermediary communications and other due diligence support); fund administration (such as preparing fund tax returns and other tax compliance services, overseeing the funds’ independent public accountants and other service providers; managing fund budgets and expenses; and helping to fulfill the funds’ regulatory filing requirements); oversight of shareholder services and transfer agency functions (such as overseeing transfer agent service providers which include registered shareholder customer service and transaction processing; and overseeing proxy solicitation and tabulation services); Board relations services (such as organizing and administering Board and committee meetings, preparing various reports to the Board and committees and providing other support services); compliance and regulatory oversight services (such as devising compliance programs; managing compliance policies; monitoring compliance with applicable fund policies and laws and regulations; and evaluating the compliance programs of the various sub-advisers to the Nuveen funds and certain other service providers); and legal support and oversight of outside law firms (such as helping to prepare and file registration statements and proxy statements; overseeing fund activities and providing legal interpretations regarding such activities; and negotiating agreements with other fund service providers).
The Board also recognized that the Adviser and its affiliates have undertaken a number of initiatives over the previous year that benefited the complex and/or particular Nuveen funds including, but not limited to:
| | • | | Fund Improvements and Product Management Initiatives – continuing to proactively manage the Nuveen fund complex as a whole and at the individual fund level with an aim to enhance the shareholder outcomes through, among other things, rationalizing the product line and gaining efficiencies through mergers, repositionings and liquidations; launching new share classes; reviewing and updating investment policies and benchmarks; closing funds to new investments; rebranding the exchange-traded fund (“ETF”) product line; and integrating certain investment teams and changing the portfolio managers serving various funds; |
| | • | | Capital Initiatives – continuing to invest capital to support new Nuveen funds with initial capital as well as to facilitate modifications to the strategies or structure of existing funds; |
| | • | | Liquidity Management – implementing the liquidity risk management program which was designed to assess and manage the liquidity risk of the Nuveen funds. The Board noted that this program was particularly helpful in addressing the high volatility and liquidity challenges that arose in the market, particularly for the high yield municipal sector, during the first half of 2020; |
| | • | | Compliance Program Initiatives – continuing efforts to mitigate compliance risk, increase operating efficiencies, strengthen key compliance program elements and support international business growth and other objectives through, among other things, integrating various investment teams across affiliates, consolidating marketing review functions, enhancing compliance related technologies and establishing and maintaining shared broad-based compliance policies throughout the organization and its affiliates; |
85
Annual Investment Management Agreement Approval Process (continued)
| | • | | Risk Management and Valuation Services – continuing efforts to provide Nuveen with a more disciplined and consistent approach to identifying and mitigating the firm’s operational risks through, among other things, enhancing the interaction and reporting between the investment risk management team and various affiliates and adopting a risk operational framework across the complex; |
| | • | | Regulatory Matters – continuing efforts to monitor regulatory trends and advocate on behalf of the Nuveen funds, to implement and comply with new or revised rules and mandates and to respond to regulatory inquiries and exams; |
| | • | | Government Relations – continuing efforts of various Nuveen teams and affiliates to develop policy positions on a broad range of issues that may impact the Nuveen funds, advocate and communicate these positions to lawmakers and other regulatory authorities and work with trade associations to ensure these positions are represented; |
| | • | | Business Continuity, Disaster Recovery and Information Services – continuing to periodically test business continuity and disaster recovery plans, maintain an information security program designed to identify and manage information security risks, and provide reports to the Board, at least annually, addressing, among other things, management’s security risk assessment, cyber risk profile, potential impact of new or revised laws and regulations, incident tracking and other relevant information technology risk-related reports; and |
| | • | | Expanded Dividend Management Services – continuing to manage the dividends among the varying types of Nuveen funds within the Nuveen complex to be consistent with the respective fund’s product design and investing resources to develop systems to assist in the process for newer products such as target term funds and ETFs. |
The Board also noted the benefits to shareholders of investing in a Nuveen fund, as each Nuveen fund is a part of a large fund complex with a variety of investment disciplines, capabilities, expertise and resources available to navigate and support the funds including during stressed times as occurred in the market in the first half of 2020. In addition to the services provided by the Adviser, the Board also considered the risks borne by the Adviser and its affiliates in managing the Nuveen funds, including entrepreneurial, operational, reputational, regulatory and litigation risks.
The Board further considered the division of responsibilities between the Adviser and the Sub-Adviser and recognized that the Sub-Adviser and its investment personnel generally are responsible for the management of each Fund’s portfolio under the oversight of the Adviser and the Board. The Board considered an analysis of the Sub-Adviser provided by the Adviser which included, among other things, the Sub-Adviser’s assets under management and changes thereto, a summary of the applicable investment team and changes thereto, the investment approach of the team and the performance of the funds sub-advised by the Sub-Adviser over various periods. The Board further considered at the May Meeting or prior meetings evaluations of the Sub-Adviser’s compliance program and trade execution. The Board also considered the structure of investment personnel compensation programs and whether this structure provides appropriate incentives to act in the best interests of the respective Nuveen funds. The Board noted that the Adviser recommended the renewal of the Sub-Advisory Agreements.
Based on its review, the Board determined, in the exercise of its reasonable business judgment, that it was satisfied with the nature, extent and quality of services provided to the respective Funds under each applicable Advisory Agreement.
B. The Investment Performance of the Funds and Fund Advisers
In evaluating the quality of the services provided by the Fund Advisers, the Board also received and considered a variety of investment performance data of the Nuveen funds they advise. In this regard, the Board reviewed, among other things, Fund performance over the quarter, one-, three- and five-year periods ending December 31, 2019. The performance data was based on Class A shares; however, the performance of other classes should be substantially similar as they invest in the same portfolio of securities and differences in performance among the classes would be principally attributed to the variations in the expense structures of the classes. Unless otherwise indicated, the performance data referenced below reflects the periods ended December 31, 2019. In general, the year 2019 was a period of strong market performance. However, as noted above, the Board recognized the unprecedented market volatility and decline that occurred in early 2020 and the significant impact it would have on fund performance. As a result, the Board reviewed performance data capturing more recent time periods, including performance data reflecting the first quarter of 2020 as well as performance data for various periods ended April 17, 2020 for its April Meeting and May 8, 2020 for its May Meeting.
The Board reviewed both absolute and relative fund performance during the annual review over the various time periods. With respect to the latter, the Board considered fund performance in comparison to the performance of peer funds (the “Performance Peer Group”) and recognized and/or customized benchmarks (i.e., generally benchmarks derived from multiple recognized benchmarks). For funds that had changes in portfolio managers, the Board considered performance data of such funds before and after such changes. In considering performance data, the Board is aware of certain inherent limitations with such data, including that differences between the objective(s), strategies and other characteristics of the Nuveen funds compared to the respective Performance Peer Group and/or benchmark(s) (such as differences in the use of leverage) as well as differences in the composition of the Performance Peer Group over time will necessarily contribute to differences in performance results and limit the value of the comparative information. To assist the Board in its review of the comparability of the relative performance, the Adviser has ranked the relevancy of the peer group to the funds as low, medium or high.
As noted above, the Board reviewed fund performance over various periods ended December 31, 2019 as well as the first quarter of 2020 and various time periods ended April 17, 2020 and May 8, 2020. In light of the significant market decline in the early part of 2020, the Board noted that
86
a shorter period of underperformance may significantly impact longer term performance. Further, the Board recognized that performance data may differ significantly depending on the ending date selected and accordingly, performance results for periods ended at the year-end of 2019 may vary significantly from performance results for periods ended in the first quarter of 2020, particularly given the extraordinary market conditions at that time as the impact of COVID-19 and other market developments unfolded. The Board considered a fund’s performance in light of the overall financial market conditions. In addition, the Board recognized that shareholders may evaluate performance based on their own holding periods which may differ from the periods reviewed by the Board and lead to differing results.
In addition to the performance data prepared in connection with the annual review of the advisory agreements of the Nuveen funds, the Board reviewed fund performance throughout the year at its quarterly meetings representing differing time periods and took into account the discussions that occurred at these Board meetings in evaluating a fund’s overall performance. The Board also considered, among other things, the Adviser’s analysis of each Nuveen fund’s performance, with particular focus on funds that were considered performance outliers (both overperformance and underperformance), the factors contributing to the performance and any steps taken to address any performance concerns. Given the volatile market conditions of early 2020, the Board considered the Adviser’s analysis of the impact of such conditions on the Nuveen funds’ performance.
The Board evaluated performance in light of various factors, including general market conditions, issuer-specific information, asset class information, fund cash flows and other factors. Accordingly, depending on the facts and circumstances, the Board may be satisfied with a fund’s performance notwithstanding that its performance may be below its benchmark or peer group for certain periods. However, with respect to any Nuveen funds for which the Board had identified performance issues, the Board monitors such funds closely until performance improves, discusses with the Adviser the reasons for such results, considers whether any steps are necessary or appropriate to address such issues, and reviews the results of any efforts undertaken.
The Board’s determinations with respect to each Fund are summarized below.
For Nuveen Credit Income Fund (formerly known as Nuveen High Income Bond Fund), the Board noted that although the Fund’s performance was below the performance of its benchmark for the three- and five-year periods ended December 31, 2019, the Fund outperformed its benchmark for the one-year period ended December 31, 2019. The Fund further ranked in the first quartile of its Performance Peer Group for the one- and three-year periods ended December 31, 2019 and ranked in the third quartile of its Performance Peer Group for the five-year period ended December 31, 2019. With the market decline in the first quarter of 2020, the Fund’s performance was below the performance of its benchmark for the one-, three-, and five-year periods ended March 31, 2020. The Fund also ranked in the fourth quartile of its Performance Peer Group for the three-year period ended March 31, 2020 and third quartile of its Performance Peer Group for the one- and five-year periods ended March 31, 2020. In connection with its review, the Board noted that it previously had approved at its April Meeting changes to the Fund’s name and investment objective and certain investment strategies which were expected to go effective in July 2020. In connection therewith, certain portfolio managers also would change. The Board recognized that the performance data would not reflect these recently approved changes to make a meaningful assessment of performance.
For Nuveen Strategic Income Fund, the Board noted that the Fund outperformed its benchmark for the one-, three- and five-year periods ended December 31, 2019 and ranked in the first quartile of its Performance Peer Group for the one-year period ended December 31, 2019 and third quartile of its Performance Peer Group for the three- and five-year periods ended December 31, 2019. With the market decline in the first quarter of 2020, the Fund’s performance was below the performance of its benchmark for the one-, three- and five-year periods ended March 31, 2020. The Fund, however, ranked in the first quartile of its Performance Peer Group for the one-year period ended March 31, 2020, the second quartile of its Performance Peer Group for the three-year period ended March 31, 2020 and the third quartile of its Performance Peer Group for the five-year period ended March 31, 2020. The Board was satisfied with the Fund’s overall performance.
C. Fees, Expenses and Profitability
1. Fees and Expenses
As part of its annual review, the Board considered the contractual management fee and net management fee (the management fee after taking into consideration fee waivers and/or expense reimbursements, if any) paid by a Nuveen fund to the Adviser in light of the nature, extent and quality of the services provided. The Board also considered the total operating expense ratio of each Nuveen fund before and after any fee waivers and/or expense reimbursements. More specifically, the Independent Board Members reviewed, among other things, each fund’s gross and net management fee rates (i.e., before and after expense reimbursements and/or fee waivers, if any) and net total expense ratio in relation to those of a comparable universe of funds (the “Peer Universe”) and to a more focused subset of comparable funds (the “Peer Group”) established by Broadridge. The Independent Board Members reviewed the methodology Broadridge employed to establish its Peer Universe and Peer Group and recognized that differences between the applicable fund and its respective Peer Universe and/or Peer Group as well as changes to the composition of the Peer Group and/or Peer Universe from year to year may limit some of the value of the comparative data. The Independent Board Members also considered a fund’s operating expense ratio as it more directly reflected the shareholder’s costs in investing in the respective fund.
In their review, the Independent Board Members considered, in particular, each Nuveen fund with a net expense ratio of six basis points or higher compared to that of its peer average (each, an “Expense Outlier Fund”) and an analysis as to the factors contributing to each such fund’s higher
87
Annual Investment Management Agreement Approval Process (continued)
relative net expense ratio. Accordingly, in reviewing the comparative data between a fund and its peers, the Board generally considered the fund’s net expense ratio and fees to be higher if they were over 10 basis points higher, slightly higher if they were 6 to 10 basis points higher, in line if they were within approximately 5 basis points higher than the peer average and below if they were below the peer average of the Peer Group. The Independent Board Members also considered, in relevant part, a fund’s net management fee and net total expense ratio in light of its performance history.
In their review of the fee arrangements for the Nuveen funds, the Independent Board Members considered the management fee schedules, including the complex-wide and fund-level breakpoint schedules, and the expense reimbursements and/or fee waivers provided by Nuveen for each fund, as applicable. The Board noted that across the Nuveen fund complex, the complex-wide fee breakpoints reduced fees by $56.6 million and fund-level breakpoints reduced fees by $66.8 million in 2019. Further, fee caps and waivers for all applicable Nuveen funds saved approximately an additional $13.7 million in fees for shareholders in 2019.
With respect to the Sub-Adviser, the Board also considered the sub-advisory fee schedule paid to the Sub-Adviser in light of the sub-advisory services provided to the respective Fund, the breakpoint schedule and comparative data of the fees the Sub-Adviser charges to other clients, if any. In its review, the Board recognized that the compensation paid to the Sub-Adviser is the responsibility of the Adviser, not the Funds.
The Board noted that each Fund had a net management fee and a net expense ratio that were below the respective peer averages.
Based on its review of the information provided, the Board determined that each Fund’s management fees (as applicable) to a Fund Adviser were reasonable in light of the nature, extent and quality of services provided to the Fund.
2. Comparisons with the Fees of Other Clients
In determining the appropriateness of fees, the Board also considered information regarding the fee rates the respective Fund Advisers charged to certain other types of clients and the type of services provided to these other clients. With respect to the Adviser and/or the Sub-Adviser, such other clients may include retail and institutional managed accounts advised by the Sub-Adviser; investment companies offered outside the Nuveen family and sub-advised by the Sub-Adviser; foreign investment companies offered by Nuveen and sub-advised by the Sub-Adviser; and collective investment trusts sub-advised by the Sub-Adviser. The Board further noted that the Adviser also advised certain ETFs sponsored by Nuveen.
The Board recognized that each Fund had an affiliated sub-adviser and, with respect to affiliated sub-advisers, reviewed, among other things, the range of fees assessed for managed accounts and foreign investment companies offered by Nuveen. The Board also reviewed the fee range and average fee rate of certain selected investment strategies offered in retail and institutional managed accounts advised by the Sub-Adviser and non-Nuveen investment companies sub-advised by certain affiliated sub-advisers.
In considering the fee data of other clients, the Board considered, among other things, the differences in the amount, type and level of services provided to the Nuveen funds relative to other clients as well as the differences in portfolio investment policies, investor profiles, account sizes and regulatory requirements, all of which contribute to the variations in the fee schedules. The Board recognized the complexity and myriad of services the Adviser had provided to the Nuveen funds compared to the other types of clients as the Adviser is principally responsible for all aspects of operating the funds, including complying with the increased regulatory requirements required when managing the funds as well as the increased entrepreneurial, legal and regulatory risks that the Adviser incurs in sponsoring and managing the funds. Further, with respect to ETFs, the Board considered that Nuveen ETFs are passively managed compared to the active management of the other Nuveen funds which contributed to the differences in fee levels between the Nuveen ETFs and other Nuveen funds. In general, higher fee levels reflect higher levels of service provided by the Adviser, increased investment management complexity, greater product management requirements, and higher levels of business risk or some combination of these factors. The Board further considered that the Sub-Adviser’s fee is essentially for portfolio management services and therefore more comparable to the fees it receives for retail wrap accounts and other external sub-advisory mandates. The Board concluded the varying levels of fees were justified given, among other things, the inherent differences in the products and the level of services provided to the Nuveen funds versus other clients, the differing regulatory requirements and legal liabilities and the entrepreneurial, legal and regulatory risks incurred in sponsoring and advising a registered investment company.
3. Profitability of Fund Advisers
In their review, the Independent Board Members considered information regarding Nuveen’s level of profitability for its advisory services to the Nuveen funds for the calendar years 2019 and 2018. The Board reviewed, among other things, Nuveen’s net margins (pre-tax) (both including and excluding distribution expenses); gross and net revenue margins (pre- and post-tax); revenues, expenses, and net income (pre-tax and after-tax and before distribution) of Nuveen for fund advisory services; and comparative profitability data comparing the margins of Nuveen compared to the adjusted margins of certain peers with publicly available data and with the most comparable assets under management (based on asset size and asset composition) for each of the last two calendar years. The Board also reviewed the revenues and expenses the Adviser derived from its ETF product line for the 2018 and 2019 calendar years.
In reviewing the profitability data, the Independent Board Members recognized the subjective nature of calculating profitability as the information is not audited and is dependent on cost allocation methodologies to allocate expenses of Nuveen and its affiliates between the fund and non-fund
88
businesses. The expenses to be allocated include direct expenses in servicing the Nuveen funds as well as indirect and/or shared costs (such as overhead, legal and compliance) some of which are attributed to the Nuveen funds pursuant to the cost allocation methodologies. The Independent Board Members reviewed a description of the cost allocation methodologies employed to develop the financial information and a summary of the history of changes to the methodology over the eleven-year period from 2008 to 2019. The Board had also appointed three Independent Board Members, along with the assistance of independent counsel, to serve as the Board’s liaisons to review the development of the profitability data and any proposed changes to the cost allocation methodology prior to incorporating any such changes and to report to the full Board. The Board recognized that other reasonable and valid allocation methodologies could be employed and could lead to significantly different results. Based on the data, the Independent Board Members noted that Nuveen’s net margins were higher in 2019 than the previous year and considered the key drivers behind the revenue and expense changes that impacted Nuveen’s net margins between the years. The Board also noted the reinvestments of some of the profits into the business through, among other things, the investment of seed capital in certain funds and continued investments in enhancements to information technology, internal infrastructure and data management improvements and global investment and innovation projects.
As noted above, the Independent Board Members also considered Nuveen’s margins from its relationship to the Nuveen funds compared to the adjusted margins of certain peers with publicly available data and with the most comparable assets under management (based on asset size and asset composition) to Nuveen for the calendar years 2019 and 2018. The Independent Board Members noted that Nuveen’s margins from its relationships with the Nuveen funds were on the low range compared to the adjusted margins of the peers. The Independent Board Members, however, recognized that it is difficult to make comparisons of profitability with other investment adviser peers given that comparative data is not generally public and the calculation of profitability is subjective and affected by numerous factors (such as types of funds a peer manages, its business mix, its cost of capital, the numerous assumptions underlying the methodology used to allocate expenses and other factors) which can have a significant impact on the results.
Aside from Nuveen’s profitability, the Board recognized that the Adviser is a subsidiary of Nuveen, LLC, the investment management arm of Teachers Insurance and Annuity Association of America (“TIAA”). As such, the Board also reviewed a balance sheet for TIAA reflecting its assets, liabilities and capital and contingency reserves for the 2019 and 2018 calendar years to consider the financial strength of TIAA. The Board recognized the benefit of having an investment adviser and its parent with significant resources, particularly during periods of market stress.
In addition to Nuveen, the Independent Board Members also considered the profitability of the Sub-Adviser from its relationships with the Nuveen funds. In this regard, the Independent Board Members reviewed, among other things, the Sub-Adviser’s revenues, expenses and net revenue margins (pre- and post-tax) for its advisory activities for the calendar year ended December 31, 2019 as well as its pre-tax and after-tax net revenue margins for 2019 compared to such margins for 2018. The Independent Board Members also reviewed a profitability analysis reflecting the revenues, expenses and revenue margin (pre- and post-tax) by asset type for the Sub-Adviser for the calendar year ended December 31, 2019 and the pre- and post-tax revenue margins from 2019 and 2018.
In evaluating the reasonableness of the compensation, the Independent Board Members also considered any other ancillary benefits derived by the respective Fund Adviser from its relationship with the Nuveen funds as discussed in further detail below.
Based on a consideration of all the information provided, the Board noted that Nuveen’s and the Sub-Adviser’s level of profitability was acceptable and not unreasonable in light of the services provided.
D. Economies of Scale and Whether Fee Levels Reflect These Economies of Scale
The Board considered whether there have been economies of scale with respect to the management of the Nuveen funds and whether these economies of scale have been appropriately shared with the funds. The Board recognized that although economies of scale are difficult to measure, there are several methods to help share the benefits of economies of scale, including breakpoints in the management fee schedule, fee waivers and/or expense limitations, the pricing of Nuveen funds at scale at inception and investments in Nuveen’s business which can enhance the services provided to the funds for the fees paid. The Board noted that Nuveen generally has employed these various methods. In this regard, the Board noted that the management fee of the Adviser is generally comprised of a fund-level component and a complex-level component each with its own breakpoint schedule, subject to certain exceptions. The Board reviewed the fund-level and complex-level fee schedules. The Board considered that the fund-level breakpoint schedules are designed to share economies of scale with shareholders if the particular fund grows, and the complex-level breakpoint schedule is designed to deliver the benefits of economies of scale to shareholders when the eligible assets in the complex pass certain thresholds even if the assets of a particular fund are unchanged or have declined. In the calculation of the complex-level component, the Board noted that it had approved the acquisition of several Nuveen funds by similar TIAA-CREF funds in 2019. However, to mitigate the loss of the assets of these Nuveen funds deemed eligible to be included in the calculation of the complex-wide fee when these Nuveen funds left the complex upon acquisition, Nuveen agreed to credit approximately $460 million to assets under management to the Nuveen complex in calculating the complex-wide component.
In addition to the fund-level and complex-level fee schedules, the Independent Board Members considered the temporary and/or permanent expense caps applicable to certain Nuveen funds (including the amounts of fees waived or amounts reimbursed to the respective funds in 2018 and 2019), including the temporary expense caps applicable to the Funds.
89
Annual Investment Management Agreement Approval Process (continued)
The Independent Board Members also recognized the Adviser’s continued reinvestment in its business through, among other things, investments in its business infrastructure and information technology, portfolio accounting system and other systems and platforms that will, among other things, support growth, simplify and enhance information sharing, and enhance the investment process to the benefit of all of the Nuveen funds.
Based on its review, the Board concluded that the current fee arrangements together with the Adviser’s reinvestment in its business appropriately shared any economies of scale with shareholders.
E. Indirect Benefits
The Independent Board Members received and considered information regarding other benefits the respective Fund Adviser or its affiliates may receive as a result of their relationship with the Nuveen funds. The Independent Board Members recognized that an affiliate of the Adviser serves as principal underwriter providing distribution and/or shareholder services to the open-end funds. The Independent Board Members further noted that subject to certain exceptions, the Nuveen open-end funds pay 12b-1 fees and while a majority of such fees were paid to third party broker-dealers, the Board reviewed the amount retained by the Adviser’s affiliate. In addition, the Independent Board Members also noted that various sub-advisers (including the Sub-Adviser) may engage in soft dollar transactions pursuant to which they may receive the benefit of research products and other services provided by broker-dealers executing portfolio transactions on behalf of the applicable Nuveen funds, although the Board recognized that certain sub-advisers may be phasing out the use of soft dollars over time.
The Board, however, noted that the benefits for the Sub-Adviser when transacting in fixed-income securities may be more limited as such securities generally trade on a principal basis and therefore do not generate brokerage commissions. Further, the Board considered that although the Sub-Adviser may benefit from the receipt of research and other services that it may otherwise have to pay for out of its own resources, the research may also benefit the Nuveen funds to the extent it enhances the ability of the Sub-Adviser to manage such funds or is acquired through the commissions paid on portfolio transactions of other clients.
Based on its review, the Board concluded that any indirect benefits received by a Fund Adviser as a result of its relationship with the Funds were reasonable and within acceptable parameters.
F. Other Considerations
The Board Members did not identify any single factor discussed previously as all-important or controlling. The Board Members, including the Independent Board Members, concluded that the terms of each Advisory Agreement were fair and reasonable, that the respective Fund Adviser’s fees were reasonable in light of the services provided to each Fund and that the Advisory Agreements be renewed.
90
Directors and Officers
(Unaudited)
The management of the Funds, including general supervision of the duties performed for the Funds by the Adviser, is the responsibility of the Board of Directors of the Funds. None of the Directors who are not “interested” persons of the Funds (referred to herein as “Independent Directors”) has ever been a Director or employee of, or consultant to, Nuveen or its affiliates. The names and business addresses of the Directors and officers of the Funds, their principal occupations and other affiliations during the past five years, the number of portfolios each Director oversees and other directorships they hold are set forth below.
The Funds’ Statement of Additional Information (“SAI”) includes more information about the Directors. To request a free copy, call Nuveen Investments at (800) 257-8787 or visit the Funds’ website at www.nuveen.com.
| | | | | | | | |
Name, Year of Birth & Address | | Position(s) Held with the Funds | | Year First
Elected or
Appointed (1) | | Principal Occupation(s) Including other Directorships During Past 5 Years | | Number of
Portfolios in
Fund Complex
Overseen by
Director |
| |
| Independent Directors (2): |
Terence J. Toth 1959 333 W. Wacker Drive Chicago, IL 60606 | | Chairman and Director | | 2008 | | Formerly, a Co-Founding Partner, Promus Capital (2008-2017); Director, Quality Control Corporation (since 2012); member: Catalyst Schools of Chicago Board (since 2008) and Mather Foundation Board (since 2012), and chair of its investment committee; formerly, Director, Fulcrum IT Services LLC (2010-2019); formerly, Director, Legal & General Investment Management America, Inc. (2008-2013); formerly, CEO and President, Northern Trust Global Investments (2004-2007); Executive Vice President, Quantitative Management & Securities Lending (2000-2004); prior thereto, various positions with Northern Trust Company (since 1994); formerly, Member, Northern Trust Mutual Funds Board (2005-2007), Northern Trust Global Investments Board (2004-2007), Northern Trust Japan Board (2004-2007), Northern Trust Securities Inc. Board (2003- 2007) and Northern Trust Hong Kong Board (1997-2004). | | 154 |
Jack B. Evans 1948 333 W. Wacker Drive Chicago, IL 60606 | | Director | | 1999 | | Chairman (since 2019), formerly, President (1996-2019), The Hall-Perrine Foundation, a private philanthropic corporation; Director and Chairman, United Fire Group, a publicly held company; Director, Public member, American Board of Orthopaedic Surgery (since 2015); Life Trustee of Coe College and the Iowa College Foundation; formerly, President Pro-Tem of the Board of Regents for the State of Iowa University System; formerly, Director, Alliant Energy and The Gazette Company; formerly, Director, Federal Reserve Bank of Chicago; formerly, President and Chief Operating Officer, SCI Financial Group, Inc., a regional financial services firm. | | 154 |
William C. Hunter 1948 333 W. Wacker Drive Chicago, IL 60606 | | Director | | 2003 | | Dean Emeritus, formerly, Dean, Tippie College of Business, University of Iowa (2006-2012); Director of Wellmark, Inc. (since 2009); past Director (2005-2015), and past President (2010- 2014) Beta Gamma Sigma, Inc., The International Business Honor Society; formerly, Director (2004-2018) of Xerox Corporation; Dean and Distinguished Professor of Finance, School of Business at the University of Connecticut (2003-2006); previously, Senior Vice President and Director of Research at the Federal Reserve Bank of Chicago (1995-2003); formerly, Director (1997-2007), Credit Research Center at Georgetown University. | | 154 |
91
Directors and Officers (Unaudited) (continued)
| | | | | | | | |
Name, Year of Birth & Address | | Position(s) Held with the Funds | | Year First
Elected or
Appointed (1) | | Principal Occupation(s) Including other Directorships During Past 5 Years | | Number of
Portfolios in
Fund Complex
Overseen by
Director |
Albin F. Moschner 1952 333 W. Wacker Drive Chicago, IL 60606 | | Director | | 2016 | | Founder and Chief Executive Officer, Northcroft Partners, LLC, a management consulting firm (since 2012); formerly, Chairman (2019), and Director (2012-2019), USA Technologies, Inc., a provider of solutions and services to facilitate electronic payment transactions; formerly, Director, Wintrust Financial Corporation (1996-2016); previously, held positions at Leap Wireless International, Inc., including Consultant (2011-2012), Chief Operating Officer (2008-2011), and Chief Marketing Officer (2004-2008); formerly, President, Verizon Card Services division of Verizon Communications, Inc. (2000-2003); formerly, President, One Point Services at One Point Communications (1999-2000); formerly, Vice Chairman of the Board, Diba, Incorporated (1996-1997); formerly, various executive positions (1991-1996) and Chief Executive Officer (1995-1996) of Zenith Electronics Corporation. | | 154 |
John K. Nelson 1962 333 W. Wacker Drive Chicago, IL 60606 | | Director | | 2013 | | Member of Board of Directors of Core12 LLC. (since 2008), a private firm which develops branding, marketing and communications strategies for clients; served The President’s Council of Fordham University (2010-2019) and previously a Director of the Curran Center for Catholic American Studies (2009-2018); formerly, senior external advisor to the Financial Services practice of Deloitte Consulting LLP. (2012-2014); former Chair of the Board of Trustees of Marian University (2010-2014 as trustee, 2011-2014 as Chair); formerly Chief Executive Officer of ABN AMRO Bank N.V., North America, and Global Head of the Financial Markets Division (2007-2008), with various executive leadership roles in ABN AMRO Bank N.V. between 1996 and 2007. | | 154 |
Judith M. Stockdale 1947 333 W. Wacker Drive Chicago, IL 60606 | | Director | | 1997 | | Board Member, Land Trust Alliance (since 2013); formerly, Board Member, U.S. Endowment for Forestry and Communities (2013-2019); formerly, Executive Director (1994-2012), Gaylord and Dorothy Donnelley Foundation; prior thereto, Executive Director, Great Lakes Protection Fund (1990-1994). | | 154 |
Carole E. Stone 1947 333 W. Wacker Drive Chicago, IL 60606 | | Director | | 2007 | | Former Director, Chicago Board Options Exchange (2006-2017), and C2 Options Exchange, Incorporated (2009-2017); former Director, Cboe Global Markets, Inc., formerly, CBOE Holdings, Inc. (2010-May 2020); formerly, Commissioner, New York State Commission on Public Authority Reform (2005-2010). | | 154 |
Margaret L. Wolff 1955 333 W. Wacker Drive Chicago, IL 60606 | | Director | | 2016 | | Formerly, member of the Board of Directors (2013-2017) of Travelers Insurance Company of Canada and The Dominion of Canada General Insurance Company (each, a part of Travelers Canada, the Canadian operation of The Travelers Companies, Inc.); formerly, Of Counsel, Skadden, Arps, Slate, Meagher & Flom LLP (Mergers & Acquisitions Group) (2005-2014); Member of the Board of Trustees of New York-Presbyterian Hospital (since 2005); Member (since 2004) and Chair (since 2015) of the Board of Trustees of The John A. Hartford Foundation (a philanthropy dedicated to improving the care of older adults); formerly, Member (2005-2015) and Vice Chair (2011-2015) of the Board of Trustees of Mt. Holyoke College. | | 154 |
Robert L. Young 1963 333 W. Wacker Drive Chicago, IL 60606 | | Director | | 2017 | | Formerly, Chief Operating Officer and Director, J.P. Morgan Investment Management Inc. (2010-2016); formerly, President and Principal Executive Officer (2013-2016), and Senior Vice President and Chief Operating Officer (2005-2010), of J.P. Morgan Funds; formerly, Director and various officer positions for J.P. Morgan Investment Management Inc. (formerly, JPMorgan Funds Management, Inc. and formerly, One Group Administrative Services) and JPMorgan Distribution Services, Inc. (formerly, One Group Dealer Services, Inc.) (1999-2017). | | 154 |
92
| | | | | | |
Name, Year of Birth & Address | | Position(s) Held with the Funds | | Year First
Elected or
Appointed (3) | | Principal Occupation(s) During Past 5 Years |
| |
| Officers of the Funds: |
Greg A. Bottjer 1971 333 W. Wacker Drive Chicago, IL 60606 | | Chief Administrative Officer | | 2016 | | Senior (since 2017) Managing Director (since 2011), formerly, Senior Vice President (2007-2010) of Nuveen; Senior (since 2017) Managing Director (since 2016) of Nuveen Fund Advisors, LLC; Chartered Financial Analyst. |
Mark J. Czarniecki 1979 901 Marquette Avenue Minneapolis, MN 55402 | | Vice President and Assistant Secretary | | 2013 | | Vice President and Assistant Secretary of Nuveen Securities, LLC (since 2016) and Nuveen Fund Advisors (since 2017); Vice President and Associate General Counsel of Nuveen (since 2013) and Vice President, Assistant Secretary and Associate General Counsel of Nuveen Asset Management (since 2018). |
Diana R. Gonzalez 1978 333 W. Wacker Drive Chicago, IL 60606 | | Vice President and Assistant Secretary | | 2017 | | Vice President and Assistant Secretary of Nuveen Fund Advisors, LLC (since 2017); Vice President and Associate General Counsel of Nuveen (since 2017); Associate General Counsel of Jackson National Asset Management (2012-2017). |
Nathaniel T. Jones 1979 333 W. Wacker Drive Chicago, IL 60606 | | Vice President and Treasurer | | 2016 | | Managing Director (since 2017), formerly, Senior Vice President (2016-2017), formerly, Vice President (2011- 2016) of Nuveen; Managing Director (since 2015) of Nuveen Fund Advisors, LLC; Chartered Financial Analyst. |
Walter M. Kelly 1970 333 W. Wacker Drive Chicago, IL 60606 | | Chief Compliance Officer and Vice President | | 2003 | | Managing Director (since 2017), formerly, Senior Vice President (2008-2017) of Nuveen Investments Holdings, Inc. |
Tina M. Lazar 1961 333 W. Wacker Drive Chicago, IL 60606 | | Vice President | | 2002 | | Managing Director (since 2017), formerly, Senior Vice President (2014-2017) of Nuveen Securities, LLC. |
Brian J. Lockhart 1974 333 W. Wacker Drive Chicago, IL 60606 | | Vice President | | 2019 | | Managing Director (since 2019) of Nuveen Fund Advisors, LLC; Managing Director (since 2017), formerly, Vice President (2010-2017) of Nuveen; Head of Investment Oversight (since 2017), formerly, Team Leader of Manager Oversight (2015-2017); Chartered Financial Analyst and Certified Financial Risk Manager. |
Jacques M. Longerstaey 1963 8500 Andrew Carnegie Blvd. Charlotte, NC 28262 | | Vice President | | 2019 | | Senior Managing Director, Chief Risk Officer, Nuveen, LLC (since May 2019); Senior Managing Director (since May 2019) of Nuveen Fund Advisors, LLC; formerly, Chief Investment and Model Risk Officer, Wealth & Investment Management Division, Wells Fargo Bank (NA) (from 2013-2019). |
Kevin J. McCarthy 1966 333 W. Wacker Drive Chicago, IL 60606 | | Vice President and Assistant Secretary | | 2007 | | Senior Managing Director (since 2017) and Secretary and General Counsel (since 2016) of Nuveen Investments, Inc., formerly, Executive Vice President (2016-2017) and Managing Director and Assistant Secretary (2008-2016); Senior Managing Director (since 2017) and Assistant Secretary (since 2008) of Nuveen Securities, LLC, formerly Executive Vice President (2016-2017) and Managing Director (2008-2016); Senior Managing Director (since 2017), Secretary (since 2016) and Co-General Counsel (since 2011) of Nuveen Fund Advisors, LLC, formerly, Executive Vice President (2016-2017), Managing Director (2008-2016) and Assistant Secretary (2007-2016); Senior Managing Director (since 2017), Secretary (since 2016) and Associate General Counsel (since 2011) of Nuveen Asset Management, LLC, formerly Executive Vice President (2016-2017) and Managing Director and Assistant Secretary (2011-2016); Senior Managing Director (since 2017) and Secretary (since 2016) of Nuveen Investments Advisers, LLC, formerly Executive Vice President (2016-2017); Vice President (since 2007) and Secretary (since 2016), formerly, Assistant Secretary, of NWQ Investment Management Company, LLC, Symphony Asset Management, LLC, Santa Barbara Asset Management, LLC and Winslow Capital Management, LLC (since 2010). Senior Managing Director (since 2017) and Secretary (since 2016) of Nuveen Alternative Investments, LLC. |
93
Directors and Officers (Unaudited) (continued)
| | | | | | |
Name, Year of Birth & Address | | Position(s) Held with the Funds | | Year First
Elected or
Appointed (3) | | Principal Occupation(s) During Past 5 Years |
Jon Scott Meissner 1973 8500 Andrew Carnegie Blvd. Charlotte, NC 28262 | | Vice President | | 2019 | | Managing Director of Mutual Fund Tax and Financial Reporting groups at Nuveen (since 2017); Managing Director of Nuveen Fund Advisors, LLC (since 2019); Senior Director of Teachers Advisors, LLC and TIAA-CREF Investment Management, LLC (since 2016); Senior Director (since 2015) Mutual Fund Taxation to the TIAA-CREF Funds, the TIAA-CREF Life Funds, the TIAA Separate Account VA-1 and the CREF Accounts; has held various positions with TIAA since 2004. |
Deann D. Morgan 1969 100 Park Avenue New York, NY 10016 | | Vice President | | 2020 | | Executive Vice President, Global Head of Product at Nuveen (since November 2019); Co-Chief Executive Officer of Nuveen Securities, LLC (since March 2020); Managing Member MDR Collaboratory LLC (since 2018); Managing Director, Head of Wealth Management Product Structuring & COO Multi Asset Investing. The Blackstone Group (2013-2017). |
Christopher M. Rohrbacher 1971 333 W. Wacker Drive Chicago, IL 60606 | | Vice President and Secretary | | 2008 | | Managing Director (since 2017) and Assistant Secretary of Nuveen Securities, LLC; Managing Director (since 2017), formerly, Senior Vice President (2016-2017), Co-General Counsel (since 2019) and Assistant Secretary (since 2016) of Nuveen Fund Advisors, LLC; Managing Director (since 2017), formerly, Senior Vice President (2012-2017) and Associate General Counsel (since 2016), formerly, Assistant General Counsel (2008-2016) of Nuveen. |
William A. Siffermann 1975 333 W. Wacker Drive Chicago, IL 60606 | | Vice President | | 2017 | | Managing Director (since 2017), formerly Senior Vice President (2016-2017) and Vice President (2011-2016) of Nuveen. |
E. Scott Wickerham 1973 TIAA 730 Third Avenue New York, NY 10017 | | Vice President and Controller | | 2019 | | Senior Managing Director, Head of Fund Administration at Nuveen, LLC (since 2019), formerly, Managing Director; Senior Managing Director (since 2019), Nuveen Fund Advisors, LLC; Principal Financial Officer, Principal Accounting Officer and Treasurer (since 2017) to the TIAA-CREF Funds, the TIAA-CREF Life Funds, the TIAA Separate Account VA-1 and the Treasurer (since 2017) to the CREF Accounts; Senior Director, TIAA-CREF Fund Administration (2014-2015); has held various positions with TIAA since 2006. |
Gifford R. Zimmerman 1956 333 W. Wacker Drive Chicago, IL 60606 | | Vice President and Assistant Secretary | | 1988 | | Managing Director (since 2002), and Assistant Secretary of Nuveen Securities, LLC; Managing Director (since 2004) and Assistant Secretary (since 1994) of Nuveen Investments, Inc.; Managing Director (since 2002), Assistant Secretary (since 1997) and Co-General Counsel (since 2011) of Nuveen Fund Advisors, LLC; Managing Director, Assistant Secretary and Associate General Counsel of Nuveen Asset Management, LLC (since 2011); Vice President (since 2017), formerly, Managing Director (2003-2017) and Assistant Secretary (since 2003) of Symphony Asset Management LLC ; Managing Director and Assistant Secretary (since 2002) of Nuveen Investments Advisers, LLC; Vice President and Assistant Secretary of NWQ Investment Management Company, LLC (since 2002), Santa Barbara Asset Management, LLC (since 2006) and of Winslow Capital Management, LLC, (since 2010); Chartered Financial Analyst. |
| (1) | Directors serve an indefinite term until his/her successor is elected or appointed. The year first elected or appointed represents the year in which the director was first elected or appointed to any fund in the Nuveen fund complex. |
| (2) | Matthew Thornton III has been nominated for election to the Board of Directors of the Funds and the boards of all other mutual funds in the Nuveen fund complex, and he has been appointed to the boards of all other funds in the Nuveen complex, each such appointment effective as of November 16, 2020. If Mr. Thornton is elected to the board of each such fund for which he has been nominated and assuming his appointments become effective, Mr. Thornton will oversee all the portfolios in the Nuveen fund complex. Mr. Thornton’s principal occupation and other directorships during the past five years are as follows: |
| | Formerly, Executive Vice President and Chief Operating Officer (2018-2019), FedEx Freight Corporation, a subsidiary of FedEx Corporation (“FedEx”) (provider of transportation, e-commerce and business services through its portfolio of companies); formerly, Senior Vice President, U.S. Operations (2006-2018), Federal Express Corporation, a subsidiary of FedEx; formerly, Member of the Board of Directors (2012-2018), Safe Kids Worldwide® (a non-profit organization dedicated to preventing childhood injuries); member of the Board of Directors (since 2014), The Sherwin-Williams Company (develops, manufactures, distributes and sells paints, coatings and related products). |
| (3) | Officers serve one year terms through August of each year. The year first elected or appointed represents the year in which the officer was first elected or appointed to any fund in the Nuveen fund complex. |
94
Notes
95
Nuveen:
Serving Investors for Generations
Since 1898, financial professionals and their clients have relied on Nuveen to provide dependable investment solutions through continued adherence to proven, long-term investing principles. Today, we offer a range of high quality solutions designed to be integral components of a well-diversified core portfolio.
Focused on meeting investor needs.
Nuveen is the investment manager of TIAA. We have grown into one of the world’s premier global asset managers, with specialist knowledge across all major asset classes and particular strength in solutions that provide income for investors and that draw on our expertise in alternatives and responsible investing. Nuveen is driven not only by the independent investment processes across the firm, but also the insights, risk management, analytics and other tools and resources that a truly world-class platform provides. As a global asset manager, our mission is to work in partnership with our clients to create solutions which help them secure their financial future.
Find out how we can help you.
To learn more about how the products and services of Nuveen may be able to help you meet your financial goals, talk to your financial professional, or call us at (800) 257-8787. Please read the information
provided carefully before you invest. Investors should consider the investment objective and policies, risk considerations, charges and expenses of any investment carefully. Where applicable, be sure to obtain a prospectus, which contains this and other relevant information. To obtain a prospectus, please contact your securities representative or Nuveen, 333 W. Wacker Dr., Chicago, IL 60606. Please read the prospectus carefully before you invest or send money.
Learn more about Nuveen Funds at: www.nuveen.com/mutual-funds
| | |
Nuveen Securities, LLC, member FINRA and SIPC |
333 West Wacker Drive | Chicago, IL 60606 | www.nuveen.com | | MAN-FINC-0620D 1300418-INV-BY-08/21 |
As of the end of the period covered by this report, the registrant has adopted a code of ethics that applies to the registrant’s principal executive officer, principal financial officer, principal accounting officer or controller, or persons performing similar functions. There were no amendments to or waivers from the code during the period covered by this report. The registrant has posted the code of ethics on its website at www.nuveen.com/fund-governance. (To view the code, click on Code of Conduct.)
| ITEM 3. | AUDIT COMMITTEE FINANCIAL EXPERT. |
As of the end of the period covered by this report, the registrant’s Board of Directors or Trustees (“Board”) determined that the registrant has at least one “audit committee financial expert” (as defined in Item 3 of Form N-CSR) serving on its Audit Committee. The registrant’s audit committee financial experts are Carole E. Stone, Jack B. Evans and William C. Hunter, who are “independent” for purposes of Item 3 of Form N-CSR.
Ms. Stone served for five years as Director of the New York State Division of the Budget. As part of her role as Director, Ms. Stone was actively involved in overseeing the development of the State’s operating, local assistance and capital budgets, its financial plan and related documents; overseeing the development of the State’s bond-related disclosure documents and certifying that they fairly presented the State’s financial position; reviewing audits of various State and local agencies and programs; and coordinating the State’s system of internal audit and control. Prior to serving as Director, Ms. Stone worked as a budget analyst/examiner with increasing levels of responsibility over a 30 year period, including approximately five years as Deputy Budget Director. Ms. Stone has also served as Chair of the New York State Racing Association Oversight Board, as Chair of the Public Authorities Control Board, as a Commissioner on the New York State Commission on Public Authority Reform and as a member of the Boards of Directors of several New York State public authorities. These positions have involved overseeing operations and finances of certain entities and assessing the adequacy of project/entity financing and financial reporting. Currently, Ms. Stone is on the Board of Directors of CBOE Holdings, Inc., of the Chicago Board Options Exchange, and of C2 Options Exchange. Ms. Stone’s position on the boards of these entities and as a member of both CBOE Holdings’ Audit Committee and its Finance Committee has involved, among other things, the oversight of audits, audit plans and preparation of financial statements.
Mr. Evans was formerly President and Chief Operating Officer of SCI Financial Group, Inc., a full service registered broker-dealer and registered investment adviser (“SCI”). As part of his role as President and Chief Operating Officer, Mr. Evans actively supervised the Chief Financial Officer (the “CFO”) and actively supervised the CFO’s preparation of financial statements and other filings with various regulatory authorities. In such capacity, Mr. Evans was actively involved in the preparation of SCI’s financial statements and the resolution of issues raised in connection therewith. Mr. Evans has also served on the audit committee of various reporting companies. At such companies, Mr. Evans was involved in the oversight of audits, audit plans, and the preparation of financial statements. Mr. Evans also formerly chaired the audit committee of the Federal Reserve Bank of Chicago.
Mr. Hunter was formerly a Senior Vice President at the Federal Reserve Bank of Chicago. As part of his role as Senior Vice President, Mr. Hunter was the senior officer responsible for all operations of each of the Economic Research, Statistics, and Community and Consumer Affairs units at the Federal Reserve Bank of Chicago. In such capacity, Mr. Hunter oversaw the subunits of the Statistics and Community and Consumer Affairs divisions responsible for the analysis and evaluation of bank and bank holding company financial statements and financial filings. Prior to serving as Senior Vice President at the Federal Reserve Bank of Chicago, Mr. Hunter was the Vice President of the Financial Markets unit at the Federal Reserve Bank of Atlanta where he supervised financial staff and bank holding company analysts who analyzed and evaluated bank and bank holding company financial statements. Mr. Hunter also currently serves on the Boards of Directors of Xerox Corporation and Wellmark, Inc. as well as on the Audit Committees of such Boards. As an Audit Committee member, Mr. Hunter’s responsibilities include, among other things, reviewing financial statements, internal audits and internal controls over financial reporting. Mr. Hunter also formerly was a Professor of Finance at the University of Connecticut School of Business and has authored numerous scholarly articles on the topics of finance, accounting and economics.
| ITEM 4. | PRINCIPAL ACCOUNTANT FEES AND SERVICES. |
The following tables show the amount of fees that PricewaterhouseCoopers LLP, the Funds’ auditor, billed to the Funds’ during the Funds’ last two full fiscal years. The Audit Committee approved in advance all audit services and non-audit services that PricewaterhouseCoopers LLP, provided to the Funds, except for those non-audit services that were subject to the pre-approval exception under Rule 2-01 of Regulation S-X (the “pre-approval exception”). The preapproval exception for services provided directly to the Funds waives the pre-approval requirement for services other than audit, review or attest services if: (A) the aggregate amount of all such services provided constitutes no more than 5% of the total amount of revenues paid by the Funds during the fiscal year in which the services are provided; (B) the Funds did not recognize the services as non-audit services at the time of the engagement; and (C) the services are promptly brought to the Audit Committee’s attention, and the Committee (or its delegate) approves the services before the audit is completed.
The Audit Committee has delegated certain pre-approval responsibilities to its Chair (or, in her absence, any other member of the Audit Committee).
| | | | | | | | | | | | | | | | |
Fiscal Year Ended June 30, 2020 | | Audit Fees Billed
to Funds 1 | | | Audit-Related Fees
Billed to Funds 2 | | | Tax Fees
Billed to Funds 3 | | | All Other Fees
Billed to Funds 4 | |
Fund Name | | | | | | | | | | | | | | | | |
Nuveen Credit Income Fund | | | 34,965 | | | | 0 | | | | 0 | | | | 0 | |
Nuveen Strategic Income Fund | | | 46,995 | | | | 0 | | | | 0 | | | | 0 | |
| | | | | | | | | | | | | | | | |
Total | | $ | 81,960 | | | $ | 0 | | | $ | 0 | | | $ | 0 | |
| 1 | | “Audit Fees” are the aggregate fees billed for professional services for the audit of the Fund’s annual financial statements and services provided in connection with statutory and regulatory filings or engagements. |
| 2 | | “Audit-Related Fees” are the aggregate fees billed for assurance and related services reasonably related to the performance of the audit or review of financial statements that are not reported under “Audit Fees”. These fees include offerings related to the Fund’s common shares and leverage. |
| 3 | | “Tax Fees” are the aggregate fees billed for professional services for tax advice, tax compliance, and tax planning. These fees include: all global withholding tax services; excise and state tax reviews; capital gain, tax equalization and taxable basis calculations performed by the principal accountant. |
| 4 | | “All Other Fees” are the aggregate fees billed for products and services other than “Audit Fees”, “Audit-Related Fees” and “Tax Fees”. These fees represent all “Agreed-Upon Procedures” engagements pertaining to the Fund’s use of leverage. |
| | | | | | | | | | | | | | | | |
| | | Percentage Approved Pursuant to Pre-approval Exception | |
| | | Audit Fees Billed
to Funds | | | Audit-Related Fees
Billed to Funds | | | Tax Fees
Billed to Funds | | | All Other Fees
Billed to Funds | |
Fund Name | | | | | | | | | | | | | | | | |
Nuveen Credit Income Fund | | | 0 | % | | | 0 | % | | | 0 | % | | | 0 | % |
Nuveen Strategic Income Fund | | | 0 | % | | | 0 | % | | | 0 | % | | | 0 | % |
| | | | | | | | | | | | | | | | |
Fiscal Year Ended June 30, 2019 | | Audit Fees Billed
to Funds 1 | | | Audit-Related Fees
Billed to Funds 2 | | | Tax Fees
Billed to Funds 3 | | | All Other Fees
Billed to Funds 4 | |
Fund Name | | | | | | | | | | | | | | | | |
Nuveen Credit Income Fund | | | 33,590 | | | | 0 | | | | 0 | | | | 0 | |
Nuveen Strategic Income Fund | | | 46,015 | | | | 0 | | | | 0 | | | | 0 | |
| | | | | | | | | | | | | | | | |
Total | | $ | 79,605 | | | $ | 0 | | | $ | 0 | | | $ | 0 | |
| 1 | | “Audit Fees” are the aggregate fees billed for professional services for the audit of the Fund’s annual financial statements and services provided in connection with statutory and regulatory filings or engagements. |
| 2 | | “Audit-Related Fees” are the aggregate fees billed for assurance and related services reasonably related to the performance of the audit or review of financial statements that are not reported under “Audit Fees”. These fees include offerings related to the Fund’s common shares and leverage. |
| 3 | | “Tax Fees” are the aggregate fees billed for professional services for tax advice, tax compliance, and tax planning. These fees include: all global withholding tax services; excise and state tax reviews; capital gain, tax equalization and taxable basis calculations performed by the principal accountant. |
| 4 | | “All Other Fees” are the aggregate fees billed for products and services other than “Audit Fees”, “Audit-Related Fees” and “Tax Fees”. These fees represent all “Agreed-Upon Procedures” engagements pertaining to the Fund’s use of leverage. |
| | | | | | | | | | | | | | | | |
| | | Percentage Approved Pursuant to Pre-approval Exception | |
| | | Audit Fees Billed
to Funds | | | Audit-Related Fees
Billed to Funds | | | Tax Fees
Billed to Funds | | | All Other Fees
Billed to Funds | |
Fund Name | | | | | | | | | | | | | | | | |
Nuveen Credit Income Fund | | | 0 | % | | | 0 | % | | | 0 | % | | | 0 | % |
Nuveen Strategic Income Fund | | | 0 | % | | | 0 | % | | | 0 | % | | | 0 | % |
| | | | | | | | | | | | |
Fiscal Year Ended June 30, 2020 | | Audit-Related Fees
Billed to Adviser and
Affiliated Fund
June 30, 2019 | | | Tax Fees Billed to
Adviser and
Affiliated Fund
Service Providers | | | All Other Fees
Billed to Adviser
and Affiliated Fund
Service Providers | |
Nuveen Investment Funds, Inc. | | $ | 0 | | | $ | 0 | | | $ | 0 | |
| |
| | | Percentage Approved Pursuant to Pre-approval Exception | |
| | | Audit-Related Fees
Billed to Adviser and
Affiliated Fund
Service Providers | | | Tax Fees Billed to
Adviser and
Affiliated Fund
Service Providers | | | All Other Fees
Billed to Adviser
and Affiliated Fund
Service Providers | |
| | | 0 | % | | | 0 | % | | | 0 | % |
| | | |
Fiscal Year Ended June 30, 2019 | | Audit-Related Fees
Billed to Adviser and
Affiliated Fund
Service Providers | | | Tax Fees Billed to
Adviser and
Affiliated Fund
Service Providers | | | All Other Fees
Billed to Adviser
and Affiliated Fund
Service Providers | |
Nuveen Investment Funds, Inc. | | $ | 0 | | | $ | 0 | | | $ | 0 | |
| |
| | | Percentage Approved Pursuant to Pre-approval Exception | |
| | | Affiliated Fund
Service Providers | | | Affiliated Fund
Service Providers | | | and Affiliated Fund
Service Providers | |
| | | 0 | % | | | 0 | % | | | 0 | % |
| | | | | | | | | | | | | | | | |
Fiscal Year Ended June 30, 2020 | | Total Non-Audit Fees
Billed to Trust | | | Total Non-Audit Fees
billed to Adviser and
Affiliated Fund Service
Providers (engagements
related directly to the
operations and financial
reporting of the Trust) | | | Total Non-Audit Fees
billed to Adviser and
Affiliated Fund Service
Providers (all other
engagements) | | | Total | |
Fund Name | | | | | | | | | | | | | | | | |
Nuveen Credit Income Fund | | | 0 | | | | 0 | | | | 0 | | | | 0 | |
Nuveen Strategic Income Fund | | | 0 | | | | 0 | | | | 0 | | | | 0 | |
| | | | | | | | | | | | | | | | |
Total | | $ | 0 | | | $ | 0 | | | $ | 0 | | | $ | 0 | |
“Non-Audit Fees billed to Fund” for both fiscal year ends represent “Tax Fees” and “All Other Fees” billed to Fund in their respective amounts from the previous table.
Less than 50 percent of the hours expended on the principal accountant’s engagement to audit the registrant’s financial statements for the most recent fiscal year were attributed to work performed by persons other than the principal accountant’s full-time, permanent employees.
| | | | | | | | | | | | | | | | |
Fiscal Year Ended June 30, 2019 | | Total Non-Audit Fees
Billed to Trust | | | Total Non-Audit Fees
billed to Adviser and
related directly to the
operations and financial
reporting of the Trust) | | | Affiliated Fund Service
Providers (all other
engagements) | | | Total | |
Fund Name | | | | | | | | | | | | | | | | |
Nuveen Credit Income Fund | | | 0 | | | | 0 | | | | 0 | | | | 0 | |
Nuveen Strategic Income Fund | | | 0 | | | | 0 | | | | 0 | | | | 0 | |
| | | | | | | | | | | | | | | | |
Total | | $ | 0 | | | $ | 0 | | | $ | 0 | | | $ | 0 | |
“Non-Audit Fees billed to Fund” for both fiscal year ends represent “Tax Fees” and “All Other Fees” billed to Fund in their respective amounts from the previous table.
Audit Committee Pre-Approval Policies and Procedures. Generally, the Audit Committee must approve (i) all non-audit services to be performed for the Funds by the Funds’ independent accountant and (ii) all audit and non-audit services to be performed by the Funds’ independent accountant for the Affiliated Fund Service Providers with respect to the operations and financial reporting of the Funds. Regarding tax and research projects conducted by the independent accountant for the Funds and Affiliated Fund Service Providers (with respect to operations and financial reports of the Trust), such engagements will be (i) pre-approved by the Audit Committee if they are expected to be for amounts greater than $10,000; (ii) reported to the Audit Committee Chair for her verbal approval prior to engagement if they are expected to be for amounts under $10,000 but greater than $5,000; and (iii) reported to the Audit Committee at the next Audit Committee meeting if they are expected to be for an amount under $5,000.
| ITEM 5. | AUDIT COMMITTEE OF LISTED REGISTRANTS. |
Not applicable to this registrant.
| ITEM 6. | SCHEDULE OF INVESTMENTS. |
| a) | | See Portfolio of Investments in Item 1. |
| ITEM 7. | DISCLOSURE OF PROXY VOTING POLICIES AND PROCEDURES FOR CLOSED-END MANAGEMENT INVESTMENT COMPANIES. |
Not applicable to this registrant.
| ITEM 8. | PORTFOLIO MANAGERS OF CLOSED-END MANAGEMENT INVESTMENT COMPANIES. |
Not applicable to this registrant.
| ITEM 9. | PURCHASES OF EQUITY SECURITIES BY CLOSED-END MANAGEMENT INVESTMENT COMPANY AND AFFILIATED PURCHASERS. |
Not applicable to this registrant.
| ITEM 10. | SUBMISSION OF MATTERS TO A VOTE OF SECURITY HOLDERS. |
There have been no material changes to the procedures by which shareholders may recommend nominees to the registrant’s Board of Trustees implemented after the registrant last provided disclosure in response to this Item.
| ITEM 11. | CONTROLS AND PROCEDURES. |
| | (a) | | The registrant’s principal executive and principal financial officers, or persons performing similar functions, have concluded that the registrant’s disclosure controls and procedures (as defined in Rule 30a-3(c) under the Investment Company Act of 1940, as amended (the “1940 Act”) (17 CFR 270.30a-3(c))) are effective, as of a date within 90 days of the filing date of this report that includes the disclosure required by this paragraph, based on their evaluation of the controls and procedures required by Rule 30a-3(b) under the 1940 Act (17 CFR 270.30a-3(b)) and Rules 13a-15(b) or 15d-15(b) under the Securities Exchange Act of 1934, as amended (the “Exchange Act”) (17 CFR 240.13a-15(b) or 240.15d-15(b)). |
| | (b) | | There were no changes in the registrant’s internal control over financial reporting (as defined in Rule 30a-3(d) under the 1940 Act (17 CFR 270.30a-3(d)) that occurred during the period covered by this report that has materially affected, or is reasonably likely to materially affect, the registrant’s internal control over financial reporting. |
| ITEM 12. | DISCLOSURE OF SECURITIES LENDING ACTIVITIES FOR CLOSED-END MANAGEMENT INVESTMENT COMPANIES. |
Not applicable.
File the exhibits listed below as part of this Form.
SIGNATURES
Pursuant to the requirements of the Securities Exchange Act of 1934 and the Investment Company Act of 1940, the registrant has duly caused this report to be signed on its behalf by the undersigned, thereunto duly authorized.
(Registrant) Nuveen Investment Funds, Inc.
| | |
| By (Signature and Title) | | /s/ Christopher M. Rohrbacher |
| | Christopher M. Rohrbacher |
| | Vice President and Secretary |
Date: September 4, 2020
Pursuant to the requirements of the Securities Exchange Act of 1934 and the Investment Company Act of 1940, this report has been signed below by the following persons on behalf of the registrant and in the capacities and on the dates indicated.
| | |
| By (Signature and Title) | | /s/ Greg A. Bottjer |
| | Greg A. Bottjer |
| | Chief Administrative Officer |
| | (principal executive officer) |
Date: September 4, 2020
| | |
| By (Signature and Title) | | /s/ E. Scott Wickerham |
| | E. Scott Wickerham |
| | Vice President and Controller |
| | (principal financial officer) |
Date: September 4, 2020