UNITED STATES
SECURITIES AND EXCHANGE COMMISSION
Washington, D.C. 20549
FORMN-CSR
CERTIFIED SHAREHOLDER REPORT OF REGISTERED MANAGEMENT
INVESTMENT COMPANIES
Investment Company Act file number 811-05309
Nuveen Investment Funds, Inc.
(Exact name of registrant as specified in charter)
Nuveen Investments
333 West Wacker Drive, Chicago, IL 60606
(Address of principal executive offices) (Zip code)
Christopher M. Rohrbacher
Vice President and Secretary
333 West Wacker Drive,
Chicago, IL 60606
(Name and address of agent for service)
Registrant’s telephone number, including area code:(312) 917-7700
Date of fiscal year end: December 31
Date of reporting period: December 31, 2019
FormN-CSR is to be used by management investment companies to file reports with the Commission not later than 10 days after the transmission to stockholders of any report that is required to be transmitted to stockholders under Rule30e-1 under the Investment Company Act of 1940 (17 CFR270.30e-1). The Commission may use the information provided on FormN-CSR in its regulatory, disclosure review, inspection, and policy making roles.
A registrant is required to disclose the information specified by FormN-CSR, and the Commission will make this information public. A registrant is not required to respond to the collection of information contained in FormN-CSR unless the Form displays a currently valid Office of Management and Budget (“OMB”) control number. Please direct comments concerning the accuracy of the information collection burden estimate and any suggestions for reducing the burden to Secretary, Securities and Exchange Commission, 450 Fifth Street, NW, Washington, DC 20549-0609. The OMB has reviewed this collection of information under the clearance requirements of 44 U.S.C. ss.3507.
ITEM 1. REPORTS TO STOCKHOLDERS.

Mutual Funds
31 December
2019
Nuveen Equity Funds
| | | | | | | | | | |
| Fund Name | | Class A | | Class C | | Class R3 | | Class R6 | | Class I |
| Nuveen Global Infrastructure Fund | | FGIAX | | FGNCX | | FGNRX | | FGIWX | | FGIYX |
| Nuveen Global Real Estate Securities Fund | | NGJAX | | NGJCX | | — | | NGJFX | | NGJIX |
| Nuveen Real Asset Income Fund | | NRIAX | | NRICX | | — | | NRIFX | | NRIIX |
| Nuveen Real Estate Securities Fund | | FREAX | | FRLCX | | FRSSX | | FREGX | | FARCX |
Beginning on January 1, 2021, as permitted by regulations adopted by the Securities and Exchange Commission, paper copies of the Funds’ annual and semi-annual shareholder reports will no longer be sent by mail, unless you specifically request paper copies of the reports. Instead, the reports will be made available on the Funds’ website (www.nuveen.com), and you will be notified by mail each time a report is posted and provided with a website link to access the report.
If you have already elected to receive shareholder reports electronically, you will not be affected by this change and you need not take any action. You may elect to receive shareholder reports and other communications from the Funds electronically anytime by contacting the financial intermediary (such as a broker-dealer or bank) through which you hold your Fund shares or, if you are a direct investor, by enrolling at www.nuveen.com/e-reports.
You may elect to receive all future shareholder reports in paper free of charge at any time by contacting your financial intermediary or, if you are a direct investor, by calling 800-257-8787 and selecting option #1. Your election to receive reports in paper will apply to all funds held in your account with your financial intermediary or, if you are a direct investor, to all your directly held Nuveen Funds and any other directly held funds within the same group of related investment companies.
Annual Report
Life is Complex.
Nuveen makes things e-simple.
It only takes a minute to sign up fore-Reports. Once enrolled, you’ll receive ane-mail as soon as your Nuveen Fund information is ready. No more waiting for delivery by regular mail. Just click on the link within thee-mail to see the report and save it on your computer if you wish.
Free e-Reports right to your email!
www.investordelivery.com
If you receive your Nuveen Fund distributions and statements from your financial advisor or brokerage account.
or
www.nuveen.com/client-access
If you receive your Nuveen Fund distributions and statements directly from Nuveen.
Must be preceded by or accompanied by a prospectus.
NOT FDIC INSURED MAY LOSE VALUE NO BANK GUARANTEE
Table
of Contents
3
Chair’s Letter to Shareholders

Dear Shareholders,
Financial markets finished 2019 on a high note, despite the challenges of a weak start to the year, a slower global economy and heightened geopolitical risks. While global manufacturing languished, consumers remained resilient amid tight labor markets, growing wages and tame inflation. Global business sentiment, however, was less optimistic due to trade frictions and weaker global demand. Across advanced economies growth in corporate profits and earnings was subdued in 2019. Nevertheless, the Federal Reserve’s (Fed) pivot to easing monetary conditions, along with liquidity provided by other central banks around the world, provided confidence that the economic cycle could be extended. Additionally, the year ended with a reduction in trade tensions and Brexit uncertainty, although the next phase of U.S.-China trade negotiations are expected to be more challenging and the U.K. has a relatively short transition window in which to redefine its relationship with the European Union.
We continue to anticipate muted economic growth and increased market volatility this year. The U.S. economy held steady in the second half of 2019, although growth for the year overall moderated from 2018’s pace. Consumer confidence remains underpinned by low unemployment and modest wage growth. Looser financial conditions, in part driven by the Fed’s three interest rate cuts in 2019, have revived momentum in the housing market and should continue to encourage borrowing by consumers and businesses. Although consumer spending in Europe and Japan, like in the U.S., has remained supported by jobs growth and rising wages, economic growth there appears more fragile. The COVID-19 coronavirus outbreak poses a new downside risk to the global economy, as disruptions to both demand and production ripple through global supply chains. We are closely monitoring the situation.
At Nuveen, we still see investment opportunities in the maturing economic environment, but we are taking a selective approach. If you’re concerned about where the markets are headed from here, we encourage you to work with your financial advisor to review your time horizon, risk tolerance and investment goals. On behalf of the other members of the Nuveen Fund Board, we look forward to continuing to earn your trust in the months and years ahead.
Sincerely,

Terence J. Toth
Chair of the Board
February 21, 2020
4
Portfolio Managers’ Comments
Nuveen Global Infrastructure Fund
Nuveen Global Real Estate Securities Fund
Nuveen Real Asset Income Fund
Nuveen Real Estate Securities Fund
These Funds feature portfolio management by Nuveen Asset Management, LLC, an affiliate of Nuveen Fund Advisors, LLC, the Funds’ investment adviser. For the Nuveen Global Infrastructure Fund, Jay L. Rosenberg has been a portfolio manager since its inception in 2007 and Tryg T. Sarsland has been a portfolio manager since 2012, and Jagdeep S. Ghuman joined in 2019. For the Nuveen Global Real Estate Securities Fund, Jay L. Rosenberg along with Scott C. Sedlak have been portfolio managers since its inception in 2018. Benjamin T. Kerl and Jagdeep S. Ghuman joined the Nuveen Global Real Estate Securities Fund as portfolio managers in 2019. For the Nuveen Real Asset Income Fund, Jay L. Rosenberg has been portfolio manager since the Fund’s inception in 2011. Brenda A. Langenfeld, CFA, and Tryg T. Sarsland were added as portfolio managers in 2015 and Jean C. Lin, CFA joined in 2019. For the Nuveen Real Estate Securities Fund, Jay L. Rosenberg has served as a portfolio manager since he joined the Fund’s management team in 2005, while Scott C. Sedlak and Sarah Wade joined the team as portfolio managers in 2011 and 2017, respectively.
In October 2019, Jagdeep S. Ghuman was added as a portfolio manager on the Nuveen Global Infrastructure Fund and the Fund Nuveen Global Real Estate Securities Fund.
In January 2019, Benjamin T. Kerl was added as a portfolio manager to the Nuveen Global Real Estate Securities Fund.
In January 2019, Jean C. Lin, CFA, joined as a portfolio manager on the Nuveen Real Asset Income Fund.
On the following pages, the portfolio management teams for the Funds discuss the economy and financial markets, key investment strategies and the Funds’ performance for the twelve-month reporting period ended December 31, 2019.
What factors affected the U.S. economy and financial markets during the twelve-month reporting period ended December 31, 2019?
The U.S. economy reached the tenth year of expansion since the previous recession ended in June 2009, marking the longest expansion in U.S. history. In the fourth quarter of 2019, gross domestic product (GDP) grew at an annualized rate of 2.1%, according to the “advance” estimate by the Bureau of Economic Analysis. GDP measures the value of goods and services produced by the nation’s economy less the value of the goods and services used up in production, adjusted for price changes. In the final months of the year, the economy was boosted by moderate consumer spending, along with positive contributions from government spending and trade, which offset weakness in business investment. For 2019 as a whole, U.S. GDP grew 2.3%, a decline from 2.9% in 2018 and the slowest pace since 2016.
This material is not intended to be a recommendation or investment advice, does not constitute a solicitation to buy, sell or hold a security or an investment strategy and is not provided in a fiduciary capacity. The information provided does not take into account the specific objectives or circumstances of any particular investor, or suggest any specific course of action. Investment decisions should be made based on an investor’s objectives and circumstances and in consultation with his or her advisors.
Certain statements in this report are forward-looking statements. Discussions of specific investments are for illustration only and are not intended as recommendations of individual investments. The forward-looking statements and other views expressed herein are those of the portfolio managers as of the date of this report. Actual future results or occurrences may differ significantly from those anticipated in any forward-looking statements and the views expressed herein are subject to change at any time, due to numerous market and other factors. The Funds disclaim any obligation to update publicly or revise any forward-looking statements or views expressed herein.
For financial reporting purposes, the ratings disclosed are the highest rating given by one of the following national rating agencies: Standard & Poor’s (S&P), Moody’s Investors Service, Inc. (Moody’s) or Fitch, Inc. (Fitch). This treatment of split-rated securities may differ from that used for other purposes, such as for Fund investment policies. Credit ratings are subject to change. AAA, AA, A and BBB are investment grade ratings; BB, B, CCC, CC, C and D are below investment grade ratings. Holdings designated N/R are not rated by these national rating agencies.
Refer to the Glossary of Terms Used in this report for further definition of the terms used within this section.
5
Portfolio Managers’ Comments(continued)
Consumer spending, the largest driver of the economy, remained well supported by low unemployment, wage gains and tax cuts. As reported by the Bureau of Labor Statistics, the unemployment rate fell to 3.5% in December 2019 from 3.9% in December 2018 and job gains averaged around 176,000 per month for the past twelve months. As the jobs market has tightened, average hourly earnings grew at an annualized rate of 2.9% in December 2019. However, inflation remained subdued. The Bureau of Labor Statistics said the Consumer Price Index (CPI) increased 2.3% over the twelve-month reporting period ended December 31, 2019 before seasonal adjustment.
Low mortgage rates and low inventory drove home prices moderately higher in this reporting period, despite declining new home sales and housing starts. The S&P CoreLogic Case-Shiller U.S. National Home Price Index, which covers all nine U.S. census divisions, was up 3.5% year-over-year in November 2019 (most recent data available at the time this report was prepared). The10-City and20-City Composites reported year-over-year increases of 2.0% and 2.6%, respectively.
As data pointed to slower momentum in the overall economy, the Federal Reserve (Fed) notably shifted its stance. Although the Fed had indicated in December 2018 that there could be two more rate hikes in 2019, global growth concerns kept the central bank on the sidelines. As expected by the markets, the Fed left rates unchanged throughout the first half of 2019 while speculation increased that the Fed’s next move would be a rate cut. At the July 2019, September 2019 and October 2019 policy committee meetings, the Fed announced a 0.25% cut to its main policy rate. Markets registered disappointment with the Fed’s explanation that the rate cuts were a“mid-cycle adjustment,” rather than a prolonged easing period, and its signal that there would be no additional rate cuts in 2019. Also in the latter half of 2019, the Fed announced it would stop shrinking its bond portfolio sooner than scheduled, as well as began buying short-term Treasury bills to help money markets operate smoothly and maintain short-term borrowing rates at low levels. Fed Chairman Powell emphasized that the Treasury bill purchases were not a form of quantitative easing.
During the twelve-month reporting period, geopolitical news remained a prominent market driver. Tariff and trade policy topped the list of concerns, most prominently the U.S.-China relations. After several rounds of talks, escalating rhetoric from both sides and a series of tariff increases, tensions appeared to ease in the later months of 2019. The U.S. and China signaled their agreement on a partial trade deal, which included rolling back some tariffs, increasing China’s purchases of U.S. agriculture products and the consideration of intellectual property, technology and financial services rights. (Subsequent to the close of the reporting period, the “phase one” deal was signed on January 15, 2020.) While much of the focus remained on the U.S.-China relationship, trade spats between the U.S. and Mexico, the European Union, Brazil and Argentina also arose throughout the reporting period. More than a year after the three countries signed onto the U.S., Mexico and Canada Agreement (USMCA) trade deal, which replaces the North American Free Trade Agreement, the U.S. House of Representatives approved the deal in December 2019 (and, subsequent to the close of the reporting period, the Senate voted in January 2020 to approve it). Global manufacturing and export data continued to show evidence of trade-related slumps, which increased worries that the slowdown would spread into other segments of the global economy.
The Brexit saga also appeared to make a breakthrough by the end of 2019. After former Prime Minister Theresa May was unable to secure a Brexit deal by the original March 29, 2019 deadline, she resigned as of June 7, 2019. When her successor, Boris Johnson, failed to meet the EU’s first deadline extension of October 31, 2019, the EU approved a “flextension” to January 31, 2020. A U.K. general election was scheduled for December 2019, wherein the Conservative Party won a large majority and bolstered Prime Minister Johnson’s mandate to get Brexit done. A few days later, the British Parliament passed the Brexit Bill. In Italy, investors worried about another potential budget clash between the eurosceptic coalition government and the EU. However, following the unexpected resignation of the prime minister in August 2019, the newly formed coalition government appeared to take a less antagonistic stance. Europe also contended with the “yellow vest” protests in France, immigration policy concerns, Russian sanctions and political risk in Turkey.
Elsewhere, anti-government protests erupted across Latin America, Hong Kong and Lebanon during 2019, and Venezuela’s economic and political crisis deepened. In Argentina, markets were shocked by the defeat of incumbent President Macri, prompting concerns about the economic policies favored by the incoming Fernandez administration. Brazil’s Bolsonaro administration achieved a legislative win on pension reform and kept the economy on a path of modest growth. Europe’s traditional centrist parties lost seats in the May 2019 Parliamentary elections and populist parties saw marginal gains. The ruling parties in India and South Africa maintained their majorities, where slower economic growth could complicate their respective reform mandates.
6
In the U.S., the longest bull market on record continued, but not without significant bouts of volatility. Investors were concerned about ongoing political discord, trade friction with China and the path and pace of Fed rate increases. Fueled by better-than-expected fourth-quarter 2018 earnings, equities rebounded sharply in the beginning of 2019 through April 2019. However, markets continued to be quite volatile, selling off in May 2019 due to changing expectations regarding trade and Fed policy, as well as concerns about slowing economic growth. During the summer months, stock markets advanced strongly again with the S&P 500® hitting anall-time high in late July before falling in August 2019. Markets remained choppy and continued to struggle for footing amid escalating trade tensions, weaker Chinese economic data, protests in Hong Kong, increasing recession fears and the growing prevalence of negative interest rates worldwide. In the final months of the reporting period, however, the markets rebounded sharply in the wake of the three rate cuts by the Fed. Investors dismissed fears about the U.S. and global economies slipping into recession as strength in consumer spending, the labor market and service sector offset concerns about weak manufacturing and the inverted Treasury yield curve. Notable progress on two of the most significant risks that caused increased market volatility during the reporting period as the U.S./China trade dispute and Brexit reduced two key headline risks for investors.
U.S.large-cap companies produced strong gains during the reporting period and outpacedsmaller-sized companies. For the reporting period, every sector in the index rose by double digits led by the information technology sector, followed by the communication services and financials sectors, which each rose more than 30%. Energy was the weakest sector over the course of the reporting period, pressured at times by falling energy prices due to slowing growth and oversupply. As noted,small-cap equities underperformedlarger-cap stocks during much of the reporting period, likely weighed down more by trade tensions, increasing evidence of economic deceleration and rising political uncertainty stemming from mounting impeachment rhetoric in Washington D.C. However, investors felt comfortable taking on more risk as the reporting period progressed, leading thesmall-cap segment to post a strong gain of 25.52% as measured by the Russell 2000® Index. From a style perspective, growth-oriented stocks continued their long-running trend of outperforming value stocks across the capitalization spectrum, benefiting on a relative basis from slowing corporate profit growth.
In developed markets outside the U.S., geopolitical issues in Europe including the chaos surrounding Brexit, markedly slower economic growth across Europe and in particular Germany, and the negative impact of the trade war at times created headwinds for stocks. However, by the end of the reporting period, developed markets posted a fairly strong advance of 22.66% (as measured by the MSCI EAFE Index), although less than the U.S. market. Developed markets were spurred on by the decisive Conservative Party victory in the U.K. election, which reduced the prospect of a “hard Brexit,” and thephase-one trade deal between the U.S. and China. During the reporting period, the same issues also impacted emerging markets, especially China’s slowdown since these regions tend to be more reliant on that economy and the rising U.S. dollar. But these markets also gained footing as the reporting period wore on and the trade deal was reached.
Nuveen Global Infrastructure Fund
How did the Fund perform during the twelve-month period ended December 31, 2019?
The table in the Fund Performance and Expense Ratios section of this report provides total returns for the Fund for theone-year, five-year,ten-year and/or since inception periods ended December 31, 2019. Comparative performance information is provided for the Fund’s Class A Shares at net asset value (NAV). The Fund’s Class A Shares at NAV outperformed the S&P Global Infrastructure Index NR (Net Return) and the Lipper classification average during the twelve-month reporting period.
What strategies were used to manage the Fund during the reporting period and how did these strategies influence performance?
The Fund seeks to provide long-term growth of capital and income by investing primarily in equity securities issued by U.S. andnon-U.S. companies that typically derive the majority of their value from owned or operated infrastructure assets. During the reporting period, our strategy for managing the Fund remained consistent as we focused on buying global infrastructure companies that own and operate long life assets that have visible cash flows, strong balance sheets, manageable amounts of leverage and inelastic demand characteristics. We believe these types of companies will have ongoing access to capital and the best chances for producing sustainable and growing cash flow. The Fund is structured using a number of core infrastructure companies that we believe should provide long-term outperformance versus the market, combined with more opportunistic holdings that we believe are undervalued
7
Portfolio Managers’ Comments(continued)
by the market in the short term. We have exposure around the globe to a mixture of holdings that represent significant value, as well as positions in companies that may prove to be more stable in a slowly growing global economy.
During the reporting period, the global infrastructure sector produced strong absolute returns with the segment gaining 25.75% as measured by the S&P Global Infrastructure Index NR. However, the segment wasn’t able to keep up with the strength of the broader domestic equity market, which advanced 31.49%, as measured by the S&P 500®Index. The segment also fell slightly short of global equities, as measured by the MSCI All Country World Index, which returned 26.60%. After leading markets earlier in 2019, defensive areas of the markets underperformed broader equities in the final months due to the decline in geopolitical risk (most notably the decisive win by the Conservative Party in the most recent U.K. election), improving global economic data and a“risk-on” rally in the marketplace.
For much of reporting period, the more defensive and highly regulated areas within infrastructure performed better than those that have higher potential earnings growth resulting from more of a tie to economic activity. However, that trend did reverse in the final months of the reporting period. That being said, every sector within the infrastructure index except for ports posted double-digit gains. The technology infrastructure, electric transmission, pipeline and rail sectors were standout performers during the reporting period.
The Fund experienced strong absolute and relative returns during the reporting period driven by solid outperformance across a number of sectors, led by technology infrastructure, electric utilities, toll roads and ports. The Fund had relatively few noteworthy detractors during the reporting period, although its cash position and slight weakness in the airport and electric transmission sectors were modest drags on results.
The technology infrastructure sector was the strongest contributor to the Fund’s performance. On the heels of asell-off at the end of 2018, the segment experienced a significant rebound in 2019 with the Fund’s holdings collectively advancing by more than 52%, besting all other sectors within the Fund’s benchmark. This sector, comprised of businesses such as cell tower companies and data centers, provides the infrastructure necessary for mobile communications and computing. The group seemed to hit on all cylinders during the reporting period with two companies rumored to be acquisition targets, companies reporting strong earnings and a continued path toward future growth through expected asset purchases. Technology infrastructure is not represented in the benchmark; therefore, the Fund’s approximately 7% weight to the group represents its largest overweight by sector. The segment continued to benefit from fundamentally driven demand for both cell towers and data centers based on consumer and business needs for data and required upgrades, as well as tower densification to keep pace with advancing technologies. These factors have driven strong revenue growth for companies in the sector, which remains a compelling secular story. Given the sector’s strong returns in 2019, valuations are not as attractive as they once were. However, we believe they still seem justified, given the fundamental strength we continue to see in the segment.
In electric utilities, stock selection within the group drove the Fund’s positive relative results. We remain constructive regarding electric utilities and favor the segment over other areas in the utility space such as gas utilities. In fact, the Fund currently has one of its highest weights to the sector since the portfolio’s inception, but still remains underweight by about 8% versus the benchmark given the sector’s very high exposure in the index. We prefer to be more diversified than the benchmark across all the potential investment areas within infrastructure. Utilities in general were under some technical pressure later in the reporting period as investors rotated away from lower volatility, higher yielding equities and toward cyclical areas that gave them higher amounts of earnings sensitivity to the broader economy. Our electric utilities exposure remains focused on the more regulated companies within the investable universe, given their more consistent earnings profiles and lower sensitivity to commodity prices. The resultant underweight to integrated names, especially those in Europe and the U.S. such as Exelon Corporation, E.ON SE and Duke Energy Corporation, were the largest contributors to outperformance in the sector.
Our security selection in the toll road sector also contributed significantly to the Fund’s outperformance versus the benchmark. The leading contributor was anout-of-index position in Ferrovial SA, a Spanish transportation company. Spain remains one of the strongest economies in Europe and traffic growth, while moderating, is a bright spot relative to many other geographies in the region. Ferrovial had a strong year with its shares on an upward trajectory throughout the reporting period. Anotherout-of-index position, in French concessions and construction firm Vinci SA, also contributed to results in toll roads. Following a difficult end in 2018, Vinci shares rebounded throughout the reporting period to hitall-time highs in December 2019. The company completed the acquisition
8
of U.K.’s Gatwick airport, making it the second largest airport operator in the world, while its construction business continued to benefit from a strong order backlog. Additionally, the Fund was rewarded for its underweight position in Italian toll road company Atlantia SpA, which remained mired in a conflict with the Italian government over its culpability regarding the 2018 Morandi bridge collapse in Genoa. The concession/contract agreement Atlantia has with the government for that stretch of road is a very large portion of the company’s overall revenue. The Five Star Movement, one of the parties that comprises the current coalition government in Italy, has remained steadfast in its preference to potentially revoke that concession and compensate the company as little as possible. This conflict is not likely to be resolved anytime soon and may make its way all the way to the EU courts. The uncertainty and potential negative impact from losing the concession has remained an overhang on Atlantia’s stock and led to underperformance throughout the reporting period.
Ports were the fourth leading contributor to relative performance during the reporting period, primarily due to the Fund’s regional underweight to China. This included underweight positions in two Chinese seaport index constituents and no exposure to the third: COSCO SHIPPING Ports Ltd, China Merchants Port Holdings Co. Ltd., and Hutchison Port Holdings Trust, respectively. As China continues its fiscal stimulus in an effort to boost GDP growth, the country has targeted infrastructure assets, often through tariff reductions (i.e. lowered fees). Although these reductions are typically meant to benefit consumers and exporters alike, they often have the opposite effect on the companies that operate the infrastructure assets. An overall slowdown in economic activity also played a role in throughput declines, which coupled with the ongoing tariffs imposed by the U.S. on Chinese goods, has also negatively impacted these stocks.
The leading detractor during the reporting period was the Fund’s cash exposure. We usually do not call out cash as a detractor since we keep the Fund more or less fully invested, which means the cash allocation is typically below 5% of overall portfolio assets. While less than 2.5% of the Fund was allocated to cash during the reporting period, it served as a drag on performance given the 27% gain in the global infrastructure market. Only two sectors detracted modestly from relative performance, airports and electric transmission.
Our positioning within airport companies relative to the benchmark also detracted very modestly from performance. The Fund’s lack of exposure to British air transport services firm Signature Aviation Plc, a significant benchmark weight that was previously known as BBA Aviation until late November 2019, was the leading detractor. We typically have no exposure to this company due to the highly cyclical nature of its primary business, which is airplane refueling. We don’t consider this to be an appropriate infrastructure investment given the variability of earnings. The Fund’s underweight positon in three Mexican airport groups, which together represent a significant portion of the index weight, was detrimental. We have maintained an underweight due to political risk from the current administration’s dislike of privatized infrastructure and the cancellation of the Mexico City Airport Trust project, which had already begun construction. In conjunction with that concern, the airports were in the midst of a regulatory review, which had the potential to put substantial downward pressure on allowed returns for the group. However, the outcome toward the end of the reporting period was much more favorable to the companies than had been widely anticipated, causing the shares of the Mexican airports to advance fairly strongly.
The electric transmission sector detracted modestly from the Fund’s relative returns, mainly because of the Fund’s overweight position and greater diversification in the sector. The index has only one position in the sector, U.K. regulated utility National Grid PLC, which performed well after uncertainty surrounding a disorderly Brexit dissipated. Since the original Brexit referendum, we have had modest U.K. exposure in this portion of the portfolio, which has proved helpful. Our exposure in the sector has been spread across more than a dozen electric transmission names. However, during this reporting period, our underweight in National Grid detracted since much of the overhang on the stock was lifted.
Toward the end of the reporting period, we began to increase the Fund’s exposure to areas within our investment universe that have greater sensitivity to the global economic cycle in response to the uptick in global economic data and declining geopolitical risk. More specifically, we added exposures to U.S. freight rail companies and brought down the Fund’s regulated utility exposure. This positioning contrasts the first nine months of the reporting period when we were more focused on companies whose earnings were somewhat decoupled from the economic cycle. Generally speaking, we had focused more heavily on mitigating downside risk, given how late it appeared to be in the business cycle and how much downside volatility we saw in global equity markets late in 2018. However, with the signposts that emerged in late 2019 in terms of improving trade negotiations, improvement in the global growth outlook and a decline in geopolitical risk, we believed it was prudent to make some changes to take advantage of those emerging trends.
9
Portfolio Managers’ Comments(continued)
Geographically, we continued to keep the Fund’s portfolio well diversified. At the end of the reporting period, the Fund continued to have broad exposure to well over 20 different countries. We prefer to spread the Fund’s holdings out over many geographies and regulatory jurisdictions to mitigate risk. Although we may be in a period of reaccelerating economic growth, we still believe we are closer to the end of the current expansion phase than the beginning.
Nuveen Global Real Estate Securities Fund
How did the Fund perform during the twelve-month period ended December 31, 2019?
The table in the Fund Performance and Expense Ratios section of this report provides total returns for the Fund for theone-year and since inception periods ended December 31, 2019. Comparative performance information is provided for the Fund’s Class A Shares at net asset value (NAV). The Fund’s Class A Shares at NAV outperformed the FTSE EPRA/Nareit Developed Index NR (Net Return) and the Lipper classification Average during the twelve-month reporting period.
What strategies were used to manage the Fund during the reporting period and how did these strategies influence performance?
The Fund seeks long-term capital appreciation with a secondary objective to provide current income. The Fund invests in income producing equities of companies engaged in the real estate industry. Applying a fundamentally based, relative value process, the investment team diversifies across geographies and sectors of listed global commercial real estate by investing at least 80% of the sum of its net assets and the amount of any borrowings for investment purposes in common stocks, preferred securities and other equity securities issued by U.S. andnon-U.S. companies in the real estate industry, including real estate investment trusts (REITs) and similar REIT-like entities. REITs are types of real estate companies that pool investors’ funds for investment in real estate or in real estate related loans or other interests. REITs in the U.S. are generally not taxed on income distributed to shareholders so long as they meet certain requirements of the Internal Revenue Code. Foreign REITs and REIT-like entities are organized outside of the U.S. and generally have operations and receive tax treatment in their respective countries similar to that of U.S. REITs, though some countries may have REIT-like structures that are significantly different from U.S. REITs or may not have adopted a REIT-like structure at all. Equity securities in which the Fund may invest may be of any market capitalization, including small- andmid-capitalization companies.
The Fund may invest at least 40% of its net assets in securities ofnon-U.S. issuers and, in any case, will invest at least 30% of its net assets in such issuers. The Fund will invest in securities of issuers in at least three different countries and may invest up to 25% of its total assets in securities of emerging market issuers.
The Fund may utilize derivatives, including options, futures contracts, options on futures contracts, and forward foreign currency exchange contracts. The Fund may use these derivatives to manage market or business risk, enhance the Fund’s return, or hedge against adverse movements in currency exchange rates.
During the reporting period, the Fund experienced strong relative outperformance across all geographic regions and the majority of sectors and industries. The leading contributors to the Fund’s relative performance in terms of sectors included technology infrastructure, industrial, mall, office and health care REITs, while only a modest cash position detracted from results. All of the Fund’s country exposures added value during the reporting period led by positions in the U.S., Europe, the U.K. and Canada.
The technology infrastructure sector, which is made up of mostly global data center and cell phone tower companies, contributed the most to the Fund’s relative results during the reporting period. The Fund’s broad exposure once again proved beneficial, as many of the international companies the Fund owns which aren’t represented in the benchmark posted strong gains. While the index’s exposure to technology infrastructure is limited, the Fund maintained a higher allocation to the group, both in number of holdings as well as percentage weight relative to the benchmark. The Fund’s overweight to the sector represents one of the Fund’s largest overweights versus the index, although we did reduce exposure toward the end of the reporting period given the premium valuation many of the stocks were trading at relative to their historic averages. In terms of stock selection within the category, the Fund’s exposure to Equinix Inc. led the way. The company was the Fund’s largest holding in the data center group and contributed nearly half of the relative outperformance with the technology infrastructure sector. The stock’s momentum continued as the
10
company’s earnings once again beat analysts’ estimates by a significant margin. The company also raised its full-year guidance, which led several sell-side firms to raise their respective price targets, providing another tailwind for the company’s stock performance.
The Fund also benefited equally from an overweight in industrial real estate and widespread favorable security selection within the sector. Industrial real estate is directly benefiting from the same dynamics in the marketplace that are weighing on the regional mall/retail real estate sector, which is the disruption from ecommerce. The industrial group continued to demonstrate some of the strongest fundamentals with increasing demand for logistics and fulfillment facilities outstripping what has been a rather contained supply situation. These underlying fundamentals led to solid earnings growth expectations, which were rewarded by strong investor demand. As a result, the group delivered the best total return among all of thesub-property types within the index during the reporting period. While the U.S. names did perform well during the reporting period, the Fund’s exposure to international companies, several of which are not included in the benchmark, contributed even more significantly to the outperformance.
The mall sector was also a significant contributor to the Fund’s relative performance, due to both our underweight position and security selection. The sector struggled and was the only property type to post a negative return as measured by the index constituents in an otherwise strong reporting period where the other commercial real estate sectors were up by double digits. Retail store closings were predicted to be the highest ever in 2019 due largely to the disruption from ecommerce, shrinking footprints for retailers and a change of business mix for regional malls as they target more experiential options and restaurants versus traditional apparel storefronts. As a result, we continued to see significant underperformance from some companies within the mall sector. We have focused the Fund’s exposure in higher quality mall operators where they exist and in geographies less impacted by the above-mentioned trends. Additionally, the Fund’s exposure is more than 4% lower than the weight of the mall sector in the index. Given the weak and declining fundamentals, we believed capital could be better deployed in more productive areas where positive returns were more likely.
Our stock selection within the office sector also contributed to the Fund’s relative performance versus the benchmark. The most beneficial holding was a position in Terreis, a French office company that is not represented in the index. Fundamentals remained positive within the French office sector as low vacancy rates and limited high quality space placed pricing power in the hands of the landlords, leading to solid earnings growth. Although declining interest rates served as a tailwind, the most significant company-specific driver for Terreis was its disposition of several assets to a Swiss insurer at a premium to appraised property value. Investors viewed the transaction favorably as follow through on management’s stated strategy of accretive asset recycling to create value. The sale resulted in the announcement of a significant special dividend to be paid to Terreis shareholders as well as a share buyback tender offer at a substantial premium to where shares were trading, both of which were well received.
Finally, health care was a contributor and was driven by selection within the group. We continued to favor the life science area (lab space for research), as well as medical office space within the group. The Fund’s overweight positions in companies whose businesses are more focused in these areas led the outperformance within the sector. Medical office and lab facilities continued to benefit from stronger demand in core markets, expected growth rates that are higher than other areas of health care-focused real estate, and solid expected returns on property development pipelines. These strong fundamentals were key to the investor interest in these securities, which led to their outperformance. Conversely, companies with higher amounts of senior housing and skilled nursing exposure struggled. While demographics favor the senior housing category, new supply delivered to the market over the past several years has led to underutilization of space and a lack of pricing power for property owners. Although these issues are improving, superior growth expectations elsewhere garnered higher amounts of investor interest and better returns. Therefore, our underweight exposure to this group also benefited performance.
The leading performance detractor during the reporting period was the Fund’s cash exposure. We usually do not call out cash as a detractor since we keep the Fund more or less fully invested, which means the cash allocation is typically below 5% of overall portfolio assets. While slightly less than 2% of the Fund was allocated to cash during the reporting period, it served as a drag on performance. No other sector detracted, which limits our ability to provide commentary on any material laggards.
Based on improving economic data and lessening political risk, we began to slightly shift the Fund’s positioning away from more defensive property types and toward those that have more economic sensitivity. Also, the change in investor appetite for risk provided additional momentum for some of the more cyclical sectors within the real estate universe. We added exposure in the
11
Portfolio Managers’ Comments(continued)
industrial property area while reducing exposure to the more defensive health care and self-storage areas. By the end of the reporting period, industrial real estate was the Fund’s largest overweight due to positivesupply-and-demand trends. Given the ecommerce disruption within the retail sector, the fundamental picture remains solid for the group. Also, international markets appear to be beginning to make up ground relative to the U.S. as fulfillment and third-party logistics are earlier on in their life cycle as it pertains to online retailing, which remains the secular theme most beneficial to the industrial group. Technology infrastructure was the Fund’s second largest overweight at the end of the reporting period, also driven by positivesupply-and-demand trends. In the cell tower area, global tower growth continues on the back of individual and corporate demand for more data, while necessary future equipment upgrades for 5G have benefited tower companies as well. Also, the data center industry remains poised to benefit from demand for space to house servers to support several themes including cloud computing, big data andweb-based enterprise technology solutions. While we did trim our holdings within the technology infrastructure group overall, the strength of the underlying fundamentals has so far continued somewhat uninterrupted.
Nuveen Real Asset Income Fund
How did the Fund perform during the twelve-month period ended December 31, 2019?
The table in the Fund Performance and Expense Ratios section of this report provides total returns for the Fund for theone-year, five-year and/or since inception periods ended December 31, 2019. Comparative performance information is provided for the Fund’s Class A Shares at net asset value (NAV). The Fund’s Class A Shares at NAV outperformed the Real Asset Income Blend benchmark, the Bloomberg Barclays U.S. Corporate High Yield Bond Index and the Lipper classification average during the twelve-month reporting period.
What strategies were used to manage the Fund during the reporting period and how did these strategies influence performance?
The Fund seeks a high level of current income with a secondary objective of capital appreciation by investing in a global portfolio of infrastructure and commercial real estate related securities (i.e. real assets) across the capital structure. These securities include a combination of infrastructure and real estate common stock, infrastructure and real estate preferred stock, and infrastructure and real estate related debt. Our goal is to combine these securities into a portfolio that provides investors with an attractive level of income and dampens levels of risk versus the broader equity market. We continued to select securities using an investment process that screens for companies and assets across the real assets market that provide higher yields. From the group of securities providing significant yields, we focus on owning those companies and securities with the highest total return potential in the Fund. Our process places a premium on finding securities whose revenues come from tangible assets with long-term concessions, contracts or leases and are therefore capable of producing steady, predictable and recurring cash flows. The Fund’s management team employs abottom-up, fundamental approach to security selection and portfolio construction. We look for stable companies that demonstrate consistent and growing cash flow, strong balance sheets and histories of being good stewards of shareholder capital.
During the reporting period, all five of the real asset categories represented in the Real Asset Income Blend benchmark produced strong double-digit absolute returns. After outperforming global equities for a good portion of the reporting period, global real estate took a bit of a breather in the final months of the reporting period. The global real estate sector also lagged broader global equity markets, which enjoyed a strong gain for the reporting period. The global infrastructure segment outpaced real estate during the reporting period, but also wasn’t able to keep up with the strength of broader equity markets. After leading markets earlier in the reporting period, defensive areas of the markets underperformed broader equities in the final months due to the decline in geopolitical risk (most notably the decisive win by the Conservative Party in the recent U.K. election), improving global economic data and a“risk-on” rally in the marketplace.
Given the reversal in risk appetite along with the lessening of geopolitical tensions, interest rates experienced a modest uptick in the final months of the reporting period. However, rates were still significantly lower for the reporting period, providing a favorable backdrop for debt and preferred securities. The10-year Treasury yield, for example, fell from 2.66% at the beginning of 2019 to 1.92% by the end of the reporting period. These more rate sensitive parts of the capital structure also posted strong absolute returns. High yield gained 14.32%, as measured by the Bloomberg Barclays U.S. Corporate High Yield Index, providing the strongest annual return for the sector since 2016. The high yield segment continued to benefit from strong credit fundamentals and default
12
rates nearall-time lows. The two preferred indexes within the Fund’s Real Asset Income Blend benchmark also finished the reporting period strongly in positive territory. The Wells Fargo Hybrid & Preferred Securities REIT Index returned 19.25%, while the Bloomberg Barclays Global Capital Securities Index rose 14.17% during the reporting period.
During the reporting period, the REIT common equity segment was the primary driver of the Fund’s significant outperformance versus the benchmark, although the global infrastructure preferred and REIT preferred segments of the portfolio also contributed favorably. The global infrastructure common equity and high yield segments detracted from relative results.
The vast majority of the Fund’s outperformance versus its blended benchmark was due to stock selection in the real estate common equity portion of the portfolio. Selection was particularly beneficial in health care REITs, where the Fund had a higher weight and the securities we selected outperformed. Within this more defensive sector, we continued to benefit from our emphasis on the life science area (lab space for research), as well as medical office space, which are two areas where demand remains strong. Medical office and lab facilities continue to benefit from stronger demand in core markets, expected growth rates that are higher than other areas of health care-focused real estate, and solid expected returns on property development pipelines. Strong fundamentals were key to the investor interest in these securities, which led to their outperformance. Our underweight exposure and security selection in the mall sector also benefited the Fund’s relative results in the sector. During a strong reporting period for commercial real estate where every other sector advanced by double digits, the mall sector continued to struggle due to the well-documented disruption from ecommerce, which is shrinking footprints for retailers. Also, regional malls are seeing a change in business mix as they target more experiential options and restaurants versus traditional apparel storefronts. We have focused the Fund’s exposure in higher quality mall operators and in geographies less impacted by the above-mentioned trends for quite some time, a strategy that paid off during the reporting period.
Security selection within infrastructure preferreds benefited performance. A significant portion of the outperformance was the result of the Fund’s real asset mandate, which precludes the Fund from owning financial preferreds such as banks and larger conglomerate financial institutions. Although returns for these financial preferreds were also strong, the segment underperformed due to the market’s preference for more defensive company types for most of the reporting period as well as declining interest rates that can impact banking profitability. Technology infrastructure and pipeline preferreds provided strong absolute and relative performance for the Fund, neither of which are well represented in the blended benchmark. Technology infrastructure preferreds were bolstered by strong secular demand, while positive fundamentals and increasing oil prices helped to drive pipeline preferred shares higher.
The third leading contributor to relative outperformance came largely from our security selection within the REIT preferred segment. Within the segment, the Fund benefited from our exposures to technology infrastructure and self-storage preferreds, and our continued underweight to malls. The mall underweight was predicated on continued market share gains by ecommerce companies and ongoing store closures due to falling retail sales, especially in apparel.
The global infrastructure common equity portion of the portfolio was the greatest detractor. As noted above, global infrastructure common equity was the strongest performing asset class in the Fund during the reporting period. While our infrastructure equity holdings in the portfolio slightly outperformed those of the benchmark, the Fund’s underweight allocation negatively impacted relative returns. Our underweight to the group relative to REIT equities was primarily due to regulatory and political risk, especially in Europe and the U.K. For example, the portfolio has been underweight in the U.K. for some time because of Brexit uncertainty and the subsequent potential political fallout that could impact infrastructure assets. However, late in the reporting period, the decisive Conservative Party election victory and December 2019 Parliament vote to depart from the European Union (EU) in January 2020 removed some of the uncertainty surrounding Brexit. More importantly, it also eliminated the possibility of a Labour Party government that had suggested potential nationalization of several different infrastructure business types, which had weighed on those sectors, particularly regulated utilities. Additionally, the regulatory environment in Spain had created an overhang on infrastructure, especially regulated utilities in that country as allowable returns were reset in a lower rate environment, which did impact our outlook for returns for much of the reporting period. More specifically in terms of sectors, the Fund’s underweight allocation to the pipeline and airport sectors was most detrimental to relative performance. In the pipeline area, the second strongest performing sector within global infrastructure equity during the reporting period, we have tended to focus the Fund’s exposures in preferred securities, which offer exposure to the sector with less volatility relative to the common equity exposure. We also had a lower weight than the benchmark in airports, driven almost exclusively by the Fund’s primary objective to provide income. Although many airport companies are
13
Portfolio Managers’ Comments(continued)
represented in the benchmark, few have dividend yields high enough to warrant inclusion in the portfolio, leading to the Fund’s persistent underweight to the group. Given the strong performance of both pipelines and airport equities during the year, our underweight position detracted in relative terms.
The high yield debt portfolio also detracted modestly from the Fund’s relative performance, mainly from security selection in the electric utilities sector early in the reporting period. We held two independent power producers whose primary agreements were with PG&E, California’s largest utility. These holdings underperformed after PG&E filed for Chapter 11 bankruptcy protection due to its potential liability related to a number of wildfires. Subsequently, we eliminated any material exposure to the uncertainty surrounding California wildfire liability from our debt portfolio.
We continued to actively manage the Fund’s allocations among the five investment categories to reflect what we believed to be the best opportunities in our investment universe. We took advantage of the strong high yield market and repositioned the debt portfolio. In the process, we continued to migrate the portfolio higher in quality relative to historic ranges, while reducing its exposure to less liquid issues. We also improved the high yield portfolio’s diversification by reducing issuer concentration and adding new issuers to the debt sleeve. We maintained a geographic representation in the debt portfolio that was similar to the equity and preferred categories. And similar to the preferred segment, utilities and pipeline infrastructure holdings remained the largest sectors in the debt portion of the portfolio at the end of the reporting period.
We also modestly increased exposure to equities in general, which further reduced the Fund’s overall underweight in equities. The primary source of funds for the rebalancing was a slight reduction in both infrastructure and real estate preferred shares, which both had a strong year in terms of total return. Although reduced, the Fund’s overall preferred exposure (infrastructure and real estate) remains overweight, but only slightly now meaning the allocations to equity, preferred, and debt are near neutral relative to where we would expect them to be over longer time periods.
Toward the end of the reporting period, we began to very slightly increase exposure to areas within the Fund’s investment universe that have greater sensitivity to the global economic cycle in response to the uptick in global economic data and declining geopolitical risk. This was in contrast to many of our positioning changes made throughout earlier part of the reporting period when we were more interested in companies whose earnings were somewhat decoupled from the economic cycle. However, we remained committed to higher quality companies within the Fund’s portfolio relative to historic ranges.
Nuveen Real Estate Securities Fund
How did the Fund perform during the twelve-month period ended December 31, 2019?
The table in the Fund Performance and Expense Ratios section of this report provides total returns for the Fund for theone-year, five-year,ten-year and/or since inception periods ended December 31, 2019. Comparative performance information is provided for the Fund’s Class A Shares at net asset value (NAV). The Fund’s Class A Shares at NAV underperformed the MSCI U.S. REIT Index and the Lipper classification average during the twelve-month reporting period.
What strategies were used to manage the Fund during the reporting period and how did these strategies influence performance?
The Fund seeks to provide above average current income and long-term capital appreciation by investing in income producing common stocks of publicly traded companies engaged in the real estate industry. During the reporting period, we continued to implement the Fund’s strategy of investing on a relative value basis with a focus on individual stocks rather than economic or market cycles. We also continued to invest the Fund in a fairly sector neutral manner with a goal of providing a well-diversified portfolio of public real estate stocks to our shareholders. A sector neutral approach reduces the impact of any one property type on relative performance. Additionally, we continued to invest in a broader universe of stocks than our benchmark index to access more dynamic parts of the commercial real estate cycle.
After outperforming global equities for a good portion of the reporting period, the public commercial real estate sector took a bit of a breather in the final months of the reporting period. The segment ended the reporting period with a strong advance of 25.84% (MSCI U.S. REIT Index), but shy of the overall broader equity market’s return of 31.49%, as measured by the S&P 500®. REITs
14
benefited from the Fed’s policy pivot and other central bank’s dovish moves earlier in the year, which led to an overall decline in U.S. and global interest rates. Real estate investment trusts (REITs) tend to be more sensitive to interest rate movements than equities in general. However, in the final months of the reporting period, a reduction in geopolitical risk and a global economic indicator reacceleration led to a higher appetite in the market for value and cyclicals and paved the way for modestly higher interest rates. Together, these factors contributed to short-term underperformance for commercial real estate at the end of the reporting period.
The Fund experienced strong absolute returns during the reporting period, but modestly underperformed its benchmarks. The only noteworthy detractors during the reporting period were found in the community center and net lease sectors, while the Fund experienced solid outperformance in the health care REIT, mall, industrial and technology infrastructure sectors.
The community center space was the leading detractor from the Fund’s relative performance versus its benchmark. We have maintained a bias toward higher quality companies and assets within the group similar to our positioning in the regional mall category discussed later in the report. In general terms, that meant an underweight to some of the higher yielding companies in the group whose assets trade at somewhat higher capitalization rates. However, the market favored these higher yielding names and they outperformed as rates declined, which led to the Fund’s relative underperformance in the community center space.
In the net lease sector, both security selection and an underweight versus the benchmark hurt performance during the reporting period. An underweight to WP Carey Inc. provided the largest drag within the sector after its shares performed well following a merger that was well received by the market. The Fund was underweight the stock based on our concerns regarding future earnings growth, but the transaction was the focal point for investors during the reporting period. Performance was also hindered by an overweight position in Four Corners Property Trust Inc., although we didn’t see any apparent fundamental reason that led to the underperformance of this company. It appears that investors showed favoritism for competitors with slightly lower multiples and slightly higher dividend yields during the reporting period. However, the underlying tenancy and core business of Four Corners remained solid and we maintained the Fund’s overweight.
The Fund’s leading contribution during the reporting period came from favorable stock selection in the health care REIT sector. We continued to favor the life science area (lab space for research), as well as medical office space within the group. Our overweight positions in companies whose businesses are more focused in these areas contributed to the outperformance within the sector. Medical office and lab facilities continued to benefit from stronger demand in core markets, expected growth rates that are higher than other areas of health care-focused real estate, and solid expected returns on property development pipelines. Strong fundamentals were key to the investor interest in these securities, which led to their outperformance. Specifically within the life science area, the Fund’s overweight position in Alexandria Real Estate Equities Inc. aided performance. Conversely, companies with higher amounts of senior housing and skilled nursing exposure struggled. While demographics favor the senior housing category, new supply delivered to the market over the past several years has led to underutilization of space and a lack of pricing power for property owners. Although these issues are improving, superior growth expectations elsewhere garnered higher amounts of investor interest and better returns. Therefore, our underweight exposure to this group also benefited performance.
The mall sector was the second most significant contributor to the Fund’s relative performance, due to both our security selection and underweight position. The sector struggled all year and was the only property type to post significantly negative returns with a more than 10% decline as measured by the index constituents in an otherwise strong year for commercial real estate. Retail store closings are predicted to be the highest ever in 2019 due largely to the disruption from ecommerce, shrinking footprints for retailers, and a change of business mix for regional malls as they target more experiential options and restaurants versus traditional apparel storefronts. As a result, we continued to see significant underperformance from some companies within the mall sector. For quite some time, we have emphasized exposure to higher quality mall operators that have capital to redevelop assets to keep or increase foot traffic and sales. These companies have held up much better than those whose tenants are lower quality and whose assets aren’t as likely to draw shoppers. During the reporting period, our only significant position in the sector was Simon Property Group Inc., the largest mall operator in the U.S. All of our outperformance within the group came from having little to no exposure to the remaining six of seven names in the index.
The Fund also benefited from an overweight and security selection in industrial real estate. The sector is directly benefiting from the same dynamics in the marketplace that are weighing on the regional mall/retail real estate sector, which is the disruption from ecommerce. The industrial group continued to demonstrate some of the strongest fundamentals with ever-increasing demand for
15
Portfolio Managers’ Comments(continued)
logistics and fulfillment facilities outstripping what has been a rather contained supply situation. These underlying fundamentals led to solid earnings growth expectations, which were rewarded by strong investor demand. As a result, the group delivered some of the best total returns of thesub-property types within commercial real estate during the reporting period.
Technology infrastructure, a group comprised mainly of data center and cellular tower companies, rounded out the Fund’s top four performance contributors mainly due to security selection within the data center space. Specifically, the Fund benefited from underweights to Digital Realty Trust Inc. and CyrusOne Inc. Early in the reporting period, Digital Realty came out with guidance pointing to negative high single-digit declines on previous leases for a large tenant. While the issue was well known, the magnitude may have surprised investors somewhat causing relative underperformance for the name. The company was still able to provide investors with an attractive positive return, but it substantially lagged its peers within the sector. The Fund’s underweight to CyrusOne was primarily the result of our anticipation of the company’s equity needs for new development and our somewhat lower growth expectations. CyrusOne did in fact announce an equity raise to fund new developments. Toward the end of the reporting period, the market became more focused on the company’s potential growth going forward. After raising full-year guidance in the third quarter 2019, CyrusOne’s management reversed course and lowered the high end of the range in the fourth quarter 2019, while acknowledging an impairment loss on real estate. As a result, CyrusOne gave back earlier gains.
In terms of changes during the reporting period, we maintained our biases to large cap over small cap and high quality over lower quality, which were reflected in the Fund’s core/high-conviction names, especially within the mall sector. Based on improving economic data and lessening political risk, we changed course somewhat toward the end of 2019 relative to positioning in the first nine months of the year and began to increase the Fund’s weights in areas that are more linked to the global economic cycle. We added exposure to the office, industrial and hotel REIT sectors using capital from the self-storage, manufactured home and apartment sectors.
16
Risk Considerations and Dividend Information
Risk Considerations
Nuveen Global Infrastructure Fund
Mutual fund investing involves risk; principal loss is possible. Concentration in infrastructure-related securities involves sector risk and concentration risk, particularly greater exposure to adverse economic, regulatory, political, legal, liquidity, and tax risks associated with master limited partnerships (MLPs) and real estate investment trusts (REITS). Foreign investments involve additional risks including currency fluctuations and economic and political instability. These risks are magnified in emerging markets. Common stocks are subject to market risk or the risk of decline. Small- and mid-cap stocks are subject to greater price volatility. The use of derivatives involves substantial financial risks and transaction costs. The Fund’s potential investment in other investment companies means shareholders bear their proportionate share of fund expenses and indirectly, the expenses of other investment companies. Fund investments in exchange trade funds (ETFs) may involve tracking error. Preferred securities may involve greater credit risk than other debt instruments.
Nuveen Global Real Estate Securities Fund
Mutual fund investing involves risk; principal loss is possible. There is no guarantee the Fund’s investment objectives will be achieved. The real estate industry is greatly affected by economic downturns or by changes in real estate values, rents, property taxes, interest rates, tax treatment, regulations, or the legal structure of the REIT. Prices of equity securities may decline significantly over short or extended periods of time. Non-U.S. investments involve risks such as currency fluctuation, political and economic instability, lack of liquidity and differing legal and accounting standards. These risks are magnified in emerging markets. These and other risk considerations, such as active management, derivatives, preferred security, and, small and mid-cap risks, are described in detail in the Fund’s prospectus.
Nuveen Real Asset Income Fund
Mutual fund investing involves risk; principal loss is possible. Equity investments such as those held by the Fund are subject to market risk, call risk, derivatives risk, other investment companies risk, common stock risk, and tax risks associated with master limited partnerships (MLPs). Concentration in specific sectors may involve greater risk and volatility than more diversified investments: real estate sector involves the risk of exposure to economic downturns and changes in real estate values, rents, property taxes, interest rates and tax laws; infrastructure-related securities may involve greater exposure to adverse economic, regulatory, political, legal, and other changes affecting such securities. Foreign investments involve additional risks, including currency fluctuation, political and economic instability, lack of liquidity, and differing legal and accounting standards. These risks are magnified in emerging markets. Investments in small- and mid-cap companies are subject to greater volatility. In addition, the Fund will bear its proportionate share of any fees and expenses paid by the exchange trade funds (ETFs) in which it invests.
Debt or fixed income securities such as those held by the Fund are subject to market risk, credit risk, interest rate risk and income risk. As interest rates rise, bond prices fall. Below investment grade or high yield debt securities are subject to liquidity risk and heightened credit risk. Preferred securities are subordinated to bonds and other debt instruments in a company’s capital structure and therefore are subject to greater credit risk. Asset-backed and mortgage-backed securities are subject to additional risks such as prepayment risk, liquidity risk, default risk and adverse economic developments.
Nuveen Real Estate Securities Fund
Mutual fund investing involves risk; principal loss is possible. Common stocks and REITs such as those held in the Fund involve market risk, concentration risk, sector risk, and non-diversification risk. The real estate industry is greatly affected by economic downturns that may persist as well as changes in property values, taxes, and regulatory developments. Foreign investments involve additional risks including currency fluctuations, and economic or political instability. These risks are magnified in emerging markets. The use of derivatives involves substantial financial risks and transaction costs. Small cap stocks may experience more volatility than large cap stocks.
17
Risk Considerations and Dividend Information(continued)
Dividend Information
Regular dividends are declared and distributed annually for Nuveen Global Infrastructure Fund, declared daily and distributed monthly for Nuveen Real Asset Income Fund and declared and distributed quarterly for Nuveen Global Real Estate Securities Fund and Nuveen Real Estate Securities Fund. To permit a Fund to maintain a more stable dividend, the Fund may pay dividends at a rate that may be more or less than the amount of net investment income it actually earned during the period.
In certain instances, a portion of each Fund’s distributions may be paid from sources or comprised of elements other than ordinary income, including capital gains and/or a return of capital. This is generally due to the fact that the tax character of Fund distributions for a fiscal year is dependent upon the amount and tax character of distributions received from securities held in the Fund’s portfolio. Distributions received from certain securities in which the Fund invests, most notably real estate investment trust (REIT) securities, may be characterized for tax purposes as ordinary income, long-term capital gain and/or a return of capital. The issuer of a security typically reports the tax character of its distributions only once per year, generally during the first two months of the following calendar year. The full amount of the distributions received from such securities is included in the Fund’s ordinary income during the course of the year until such time the Fund is notified by the issuer of the actual tax character. To the extent that at the time of a particular distribution the Fund estimates that a portion of that distribution is attributable to a source or sources other than ordinary income, the Fund would send shareholders a notice to that effect. The final determination of the sources and tax character of all distributions for the fiscal year is made after the end of the fiscal year.
Additional Dividend Information for Nuveen Global Real Estate Securities Fund, Nuveen Real Asset Income Fund and Nuveen Real Estate Securities Fund
Nuveen Global Real Estate Securities Fund, Nuveen Real Asset Income Fund and Nuveen Real Estate Securities Fund seek to pay regular dividends at a rate that reflects the cash flow received from each Fund’s investments in portfolio securities. Fund distributions are not intended to include expected portfolio appreciation; however, the Funds invest in securities that make payments which ultimately may be fully or partially characterized for tax purposes by the securities’ issuers as gains or return of capital. While the reported sources of distributions may include capital gains and/or return of capital for tax purposes, the Funds intend to distribute only the net cash flow received as opposed to a distribution rate based on long-term total return. This tax treatment will generally “flow through” to the Funds’ distributions, but the specific tax treatment is often not known with certainty until after the end of the Funds’ tax year. As a result, certain portions of the regular distributions by Nuveen Real Asset Income Fund and Nuveen Real Estate Securities Fund throughout the year were laterre-characterized for tax purposes as either long-term gains (both realized and unrealized), or as anon-taxable return of capital, as set forth in each Fund’s table below. Nuveen Global Real Estate Securities Fund did not have any such distribution re-characterizations.
Nuveen Real Asset Income Fund – Data as of December 31, 2019
| | | | | | | | | | | | | | | | | | | | | | | | | | | | | | |
| Calendar Year 2019 | |
| | | | | Percentage of the Distribution | | | Per Share Amounts | |
| Share Class | | Ticker Symbol | | Net
Investment
Income | | | Realized
Gains | | | Return of
Capital | | | Distributions | | | Net
Investment
Income | | | Realized
Gains | | | Return of
Capital | |
Class A | | NRIAX | | | 97.30% | | | | 0.00% | | | | 2.70% | | | $ | 1.4228 | | | $ | 1.3844 | | | $ | 0.0000 | | | $ | 0.0384 | |
Class C | | NRICX | | | 96.92% | | | | 0.00% | | | | 3.08% | | | $ | 1.2483 | | | $ | 1.2099 | | | $ | 0.0000 | | | $ | 0.0384 | |
Class R6 | | NRIFX | | | 97.44% | | | | 0.00% | | | | 2.56% | | | $ | 1.4993 | | | $ | 1.4609 | | | $ | 0.0000 | | | $ | 0.0384 | |
Class I | | NRIIX | | | 97.41% | | | | 0.00% | | | | 2.59% | | | $ | 1.4798 | | | $ | 1.4414 | | | $ | 0.0000 | | | $ | 0.0384 | |
18
Nuveen Real Estate Securities Fund – Data as of December 31, 2019(1)
| | | | | | | | | | | | | | | | | | | | | | | | | | | | | | |
| Calendar Year 2019 | |
| | | | | Percentage of the Distribution | | | Per Share Amounts | |
| Share Class | | Ticker Symbol | | Net
Investment
Income | | | Realized
Gains | | | Return of
Capital | | | Distributions | | | Net
Investment
Income | | | Realized
Gains | | | Return of
Capital | |
Class A | | FREAX | | | 14.37% | | | | 85.63% | | | | 0.0% | | | $ | 2.2982 | | | $ | 0.3303 | | | $ | 1.9679 | | | $ | 0.0000 | |
Class C | | FRLCX | | | 7.62% | | | | 92.38% | | | | 0.0% | | | $ | 2.1303 | | | $ | 0.1624 | | | $ | 1.9679 | | | $ | 0.0000 | |
Class R3 | | FRSSX | | | 12.61% | | | | 87.39% | | | | 0.0% | | | $ | 2.2519 | | | $ | 0.2840 | | | $ | 1.9679 | | | $ | 0.0000 | |
Class R6 | | FREGX | | | 17.81% | | | | 82.19% | | | | 0.0% | | | $ | 2.3942 | | | $ | 0.4263 | | | $ | 1.9679 | | | $ | 0.0000 | |
Class I | | FARCX | | | 16.61% | | | | 83.39% | | | | 0.0% | | | $ | 2.3598 | | | $ | 0.3919 | | | $ | 1.9679 | | | $ | 0.0000 | |
| (1) | The Fund owns REIT securities which attribute their distributions to various sources, including net investment income, gains and return of capital. |
The amount and sources of distributions reported in this notice are for financial reporting purposes and are not being provided for tax reporting purposes. The actual amounts and character of the distributions for tax reporting purposes will be reported to shareholders on Form 1099-DIV which will be sent to shareholders shortly after calendar year-end. More details about each Fund’s distributions and the basis for these estimates are available on www.nuveen.com.
19
THIS PAGE INTENTIONALLY LEFT BLANK
20
Fund Performance and Expense Ratios
The Fund Performance and Expense Ratios for each Fund are shown within this section of the report.
Returns quoted represent past performance, which is no guarantee of future results. Investment returns and principal value will fluctuate so that when shares are redeemed, they may be worth more or less than their original cost. Current performance may be higher or lower than the performance shown. Total returns for a period of less than one year are not annualized (i.e. cumulative returns). Since inception returns are shown for share classes that have less than 10-years of performance. Returns at net asset value (NAV) would be lower if the sales charge were included. Returns assume reinvestment of dividends and capital gains. For performance current to the most recent month-end visit nuveen.com or call (800) 257-8787.
Returns do not reflect the deduction of taxes that a shareholder would pay on Fund distributions or the redemption of Fund shares.
Returns may reflect fee waivers and/or expense reimbursements by the investment adviser during the periods presented. If any such waivers and/or reimbursements had not been in place, returns would have been reduced. See Notes to Financial Statements, Note 7—Management Fees and Other Transactions with Affiliates for more information.
Returns reflect differences in sales charges and expenses, which are primarily differences in distribution and service fees, and assume reinvestment of dividends and capital gains.
Comparative index and Lipper return information is provided for Class A Shares at NAV only.
The expense ratios shown reflect total operating expenses (before fee waivers and/or expense reimbursements, if any) as shown in the most recent prospectus. The expense ratios include management fees and other fees and expenses.
21
Fund Performance and Expense Ratios(continued)
Nuveen Global Infrastructure Fund
Refer to the first page of this Fund Performance and Expense Ratios section for further explanation of the information included within this section. Refer to the Glossary of Terms Used in this Report for definitions of terms used within this section.
Fund Performance and Expense Ratios
| | | | | | | | | | | | | | | | | | | | | | | | |
| | | Inception
Date | | | Average Annual Total Returns as of December 31, 2019* | | | Expense Ratios** | |
| | | 1-Year | | | 5-Year | | | 10-Year | | | Gross | | | Net | |
Class A Shares at NAV | | | 12/17/07 | | | | 29.27% | | | | 7.33% | | | | 9.52% | | | | 1.35% | | | | 1.22% | |
Class A Shares at maximum Offering Price | | | 12/17/07 | | | | 21.82% | | | | 6.06% | | | | 8.87% | | | | — | | | | — | |
S&P Global Infrastructure Index NR | | | — | | | | 25.75% | | | | 5.61% | | | | 6.77% | | | | — | | | | — | |
Lipper Global Infrastructure Funds Classification Average | | | — | | | | 27.10% | | | | 5.98% | | | | 8.89% | | | | — | | | | — | |
| | | | | | |
Class C Shares | | | 11/03/08 | | | | 28.37% | | | | 6.54% | | | | 8.71% | | | | 2.11% | | | | 1.97% | |
Class R3 Shares | | | 11/03/08 | | | | 29.06% | | | | 7.08% | | | | 9.20% | | | | 1.60% | | | | 1.47% | |
Class I Shares | | | 12/17/07 | | | | 29.69% | | | | 7.60% | | | | 9.80% | | | | 1.10% | | | | 0.97% | |
| | | | | | | | | | | | | | | | | | | | | | | | |
| | | Inception
Date | | | Average Annual Total Returns as of December 31, 2019* | | | Expense Ratios** | |
| | | 1-Year | | | 5-Year | | | Since Inception | | | Gross | | | Net | |
Class R6 Shares | | | 6/30/16 | | | | 29.70% | | | | N/A | | | | 9.28% | | | | 1.02% | | | | 0.89% | |
| * | Class A Shares have a maximum 5.75% sales charge (Offering Price). Class A Share purchases of $1 million or more are sold at net asset value without an up-front sales charge but may be subject to a contingent deferred sales charge (CDSC) of 1% if redeemed within eighteen months of purchase. Class C Shares have a 1% CDSC for redemptions within less than twelve months, which is not reflected in the total returns. Class C Shares automatically convert to Class A Shares ten years after purchase. Class R3 Shares have no sales charge and are only available for purchase by eligible retirement plans. Class R6 Shares have no sales charge and are available only to certain limited categories of investors as described in the prospectus. Class I Shares have no sales charge and may be purchased under limited circumstances or by specified classes of investors. |
| ** | The Fund’s investment adviser has contractually agreed to waive fees and/or reimburse other Fund expenses through July 31, 2021 so that total annual Fund operating expenses (excluding 12b-1 distribution and/or service fees, interest expenses, taxes, acquired fund fees and expenses, fees incurred in acquiring and disposing of portfolio securities and extraordinary expenses) do not exceed 1.00% of the average daily net assets of any class of Fund shares. However, because Class R6 Shares are not subject to sub-transfer agent and similar fees, the total annual Fund operating expenses for Class R6 Shares will be less than the expense limitation. This expense limitation may be terminated or modified prior to that date only with the approval of the Board of Directors of the Fund. |
Growth of an Assumed $10,000 Investment as of December 31, 2019 – Class A Shares
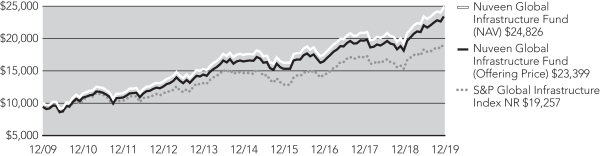
The graphs do not reflect the deduction of taxes that a shareholder may pay on Fund distributions or the redemption of Fund shares.
22
Fund Performance and Expense Ratios(continued)
Nuveen Global Real Estate Securities Fund
Refer to the first page of this Fund Performance and Expense Ratios section for further explanation of the information included within this section. Refer to the Glossary of Terms Used in this Report for definitions of terms used within this section.
Fund Performance and Expense Ratios
| | | | | | | | | | | | | | | | | | | | |
| | | | | | Average Annual Total Returns as of December 31, 2019* | | | Expense Ratios** | |
| | | Inception Date | | | 1-Year | | | Since
Inception | | | Gross | | | Net | |
Class A Shares at NAV | | | 3/20/18 | | | | 27.55% | | | | 13.81% | | | | 2.65% | | | | 1.30% | |
Class A Shares at maximum Offering Price | | | 3/20/18 | | | | 20.21% | | | | 10.10% | | | | — | | | | — | |
FTSE EPRA/NAREIT Developed Index NR | | | — | | | | 21.91% | | | | 11.17% | | | | — | | | | — | |
Lipper Global Real Estate Funds Classification Average | | | — | | | | 24.03% | | | | 11.51% | | | | — | | | | — | |
| | | | | |
Class C Shares | | | 3/20/18 | | | | 26.56% | | | | 12.96% | | | | 3.41% | | | | 2.05% | |
Class R6 Shares | | | 3/20/18 | | | | 27.91% | | | | 14.14% | | | | 2.38% | | | | 1.02% | |
Class I Shares | | | 3/20/18 | | | | 27.80% | | | | 14.06% | | | | 2.42% | | | | 1.05% | |
| * | Class A Shares have a maximum 5.75% sales charge (Offering Price). Class A Share purchases of $1 million or more are sold at net asset value without anup-front sales charge but may be subject to a contingent deferred sales charge (CDSC) of 1% if redeemed within eighteen months of purchase. Class C Shares have a 1% CDSC for redemptions within less than twelve months, which is not reflected in the total returns. Class C Shares automatically convert to Class A Shares ten years after purchase. Class R6 Shares have no sales charge and are available only to certain limited categories of investors as described in the prospectus. Class I Shares have no sales charge and may be purchased under limited circumstances or by specified classes of investors. |
| ** | The Fund’s investment adviser has contractually agreed to waive fees and/or reimburse other Fund expenses through July 31, 2021 so that total annual Fund operating expenses (excluding12b-1 distribution and/or service fees, interest expenses, taxes, acquired fund fees and expenses, fees incurred in acquiring and disposing of portfolio securities and extraordinary expenses) do not exceed 1.09% of the average daily net assets of any class of Fund shares. However, because Class R6 Shares are not subject tosub-transfer agent and similar fees, the total annual Fund operating expenses for Class R6 Shares will be less than the expense limitation. This expense limitation may be terminated or modified prior to that date only with the approval of the Board of Trustees of the Fund. |
Growth of an Assumed $10,000 Investment as of December 31, 2019 – Class A Shares
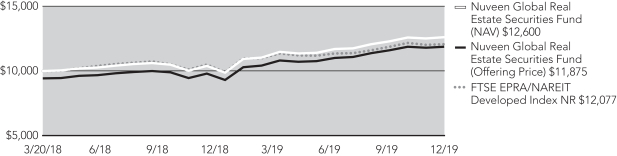
The graphs do not reflect the deduction of taxes that a shareholder may pay on Fund distributions or the redemption of Fund shares.
23
Fund Performance and Expense Ratios(continued)
Nuveen Real Asset Income Fund
Refer to the first page of this Fund Performance and Expense Ratios section for further explanation of the information included within this section. Refer to the Glossary of Terms Used in this Report for definitions of terms used within this section.
Fund Performance and Expense Ratios
| | | | | | | | | | | | | | | | | | | | |
| | | | | | Average Annual Total Returns as of December 31, 2019* | | | | |
| | | Inception
Date | | | 1-Year | | | 5-Year | | | Since
Inception | | | Expense Ratios | |
Class A Shares at NAV | | | 9/13/11 | | | | 22.39% | | | | 6.39% | | | | 8.81% | | | | 1.14% | |
Class A Shares at maximum Offering Price | | | 9/13/11 | | | | 15.36% | | | | 5.13% | | | | 8.04% | | | | — | |
Bloomberg Barclays U.S. Corporate High Yield Bond Index | | | — | | | | 14.32% | | | | 6.13% | | | | 7.20% | | | | — | |
Real Asset Income Blend | | | — | | | | 20.01% | | | | 5.79% | | | | 8.00% | | | | — | |
Lipper Real Return Classification Average | | | — | | | | 15.47% | | | | 2.33% | | | | 2.09% | | | | — | |
| | | | | |
Class C Shares | | | 9/13/11 | | | | 21.50% | | | | 5.59% | | | | 8.01% | | | | 1.89% | |
Class R6 Shares | | | 6/30/16 | | | | 22.82% | | | | N/A | | | | 7.57% | | | | 0.81% | |
Class I Shares | | | 9/13/11 | | | | 22.69% | | | | 6.65% | | | | 9.08% | | | | 0.89% | |
| * | Class A Shares have a maximum 5.75% sales charge (Offering Price). Class A Share purchases of $1 million or more are sold at net asset value without anup-front sales charge but may be subject to a contingent deferred sales charge (CDSC) of 1% if redeemed within eighteen months of purchase. Class C Shares have a 1% CDSC for redemptions within less than twelve months, which is not reflected in the total returns. Class C Shares automatically convert to Class A Shares ten years after purchase. Class R6 Shares have no sales charge and are available only to certain limited categories of investors as described in the prospectus. Class I Shares have no sales charge and may be purchased under limited circumstances or by specified classes of investors. |
Growth of an Assumed $10,000 Investment as of December 31, 2019 – Class A Shares

The graphs do not reflect the deduction of taxes that a shareholder may pay on Fund distributions or the redemption of Fund shares.
24
Fund Performance and Expense Ratios(continued)
Nuveen Real Estate Securities Fund
Refer to the first page of this Fund Performance and Expense Ratios section for further explanation of the information included within this section. Refer to the Glossary of Terms Used in this Report for definitions of terms used within this section.
Fund Performance and Expense Ratios
| | | | | | | | | | | | | | | | | | | | |
| | | Inception
Date | | | Average Annual
Total Returns as of December 31, 2019* | | | Expense
Ratios | |
| | | 1-Year | | | 5-Year | | | 10-Year | |
Class A Shares at NAV | | | 9/29/95 | | | | 25.24% | | | | 6.46% | | | | 11.60% | | | | 1.26% | |
Class A Shares at maximum Offering Price | | | 9/29/95 | | | | 18.04% | | | | 5.21% | | | | 10.94% | | | | — | |
MSCI U.S. REIT Index | | | — | | | | 25.84% | | | | 7.03% | | | | 11.93% | | | | — | |
Lipper Real Estate Funds Classification Average | | | — | | | | 26.93% | | | | 6.68% | | | | 11.32% | | | | — | |
| | | | | |
Class C Shares | | | 2/01/00 | | | | 24.28% | | | | 5.67% | | | | 10.76% | | | | 2.02% | |
Class R3 Shares | | | 9/24/01 | | | | 24.88% | | | | 6.19% | | | | 11.32% | | | | 1.52% | |
Class I Shares | | | 6/30/95 | | | | 25.56% | | | | 6.72% | | | | 11.88% | | | | 1.02% | |
| | | | | | | | | | | | | | | | | | | | |
| | | Inception
Date | | | Average Annual
Total Returns as of December 31, 2019* | | | Expense
Ratios | |
| | | 1-Year | | | 5-Year | | | Since Inception | |
Class R6 Shares | | | 4/30/13 | | | | 25.74% | | | | 6.89% | | | | 7.65% | | | | 0.88% | |
| * | Class A Shares have a maximum 5.75% sales charge (Offering Price). Class A Share purchases of $1 million or more are sold at net asset value without an up-front sales charge but may be subject to a contingent deferred sales charge (CDSC) of 1% if redeemed within eighteen months of purchase. Class C Shares have a 1% CDSC for redemptions within less than twelve months, which is not reflected in the total returns. Class C Shares automatically convert to Class A Shares ten years after purchase. Class R3 Shares have no sales charge and are only available for purchase by eligible retirement plans. Class R6 Shares have no sales charge and are available only to certain limited categories of investors as described in the prospectus. Class I Shares have no sales charge and may be purchased under limited circumstances or by specified classes of investors. |
Growth of an Assumed $10,000 Investment as of December 31, 2019 – Class A Shares
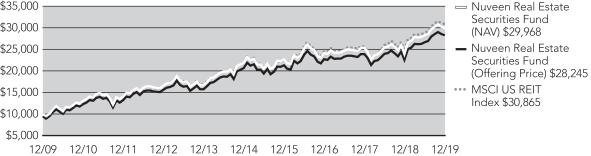
The graphs do not reflect the deduction of taxes that a shareholder may pay on Fund distributions or the redemption of Fund shares.
25
Holding Summaries as of December 31, 2019
This data relates to the securities held in each Fund’s portfolio of investments as of the end of this reporting period. It should not be construed as a measure of performance for the Fund itself. Holdings are subject to change.
Nuveen Global Infrastructure Fund
Fund Allocation
(% of net assets)
| | | | |
| | |
Common Stocks | | | 94.1% | |
| |
Real Estate Investment Trust Common Stocks | | | 3.2% | |
| |
Investment Companies | | | 0.5% | |
| |
Repurchase Agreements | | | 1.9% | |
| |
Other Assets Less Liabilities | | | 0.3% | |
| |
Net Assets | | | 100% | |
Top Five Common Stock & Real Estate Investment Trust
Common Stock Holdings
(% of net assets)
| | | | |
| | |
Transurban Group | | | 4.8% | |
| |
NextEra Energy Inc | | | 4.7% | |
| |
Aena SME SA | | | 4.6% | |
| |
Vinci SA | | | 3.7% | |
| |
Enbridge Inc | | | 3.6% | |
Portfolio Composition
(% of net assets)
| | | | |
| | |
Transportation Infrastructure | | | 27.0% | |
| |
Electric Utilities | | | 23.8% | |
| |
Oil, Gas & Consumable Fuels | | | 14.2% | |
| |
Multi-Utilities | | | 9.1% | |
| |
Construction & Engineering | | | 5.5% | |
| |
Other | | | 17.7% | |
| |
Repurchase Agreements | | | 1.9% | |
| |
Investment Companies | | | 0.5% | |
| |
Other Assets Less Liabilities | | | 0.3% | |
| |
Net Assets | | | 100% | |
Country Allocation¹
(% of net assets)
| | | | |
| | |
United States | | | 37.7% | |
| |
France | | | 10.8% | |
| |
Spain | | | 10.2% | |
| |
Australia | | | 9.3% | |
| |
Canada | | | 8.1% | |
| |
Italy | | | 8.0% | |
| |
New Zealand | | | 2.5% | |
| |
Mexico | | | 1.7% | |
| |
Germany | | | 1.5% | |
| |
United Kingdom | | | 1.4% | |
| |
Japan | | | 1.3% | |
| |
Other | | | 7.2% | |
| |
Other Assets Less Liabilities | | | 0.3% | |
| |
Net Assets | | | 100% | |
| 1 | Includes 3.6% (as a percentage of net assets) in emerging market countries. |
26
Nuveen Global Real Estate Securities Fund
Fund Allocation
(% of net assets)
| | | | |
| | |
Real Estate Investment Trust Common Stocks | | | 83.8% | |
| |
Common Stocks | | | 14.4% | |
| |
Real Estate Investment Trust Common Stocks Rights | | | 0.0% | |
| |
Repurchase Agreements | | | 1.3% | |
| |
Other Assets Less Liabilities | | | 0.5% | |
| |
Net Assets | | | 100% | |
Top Five Common Stock & Real Estate Investment Trust
Common Stock Holdings
(% of net assets)
| | | | |
| | |
Prologis Inc | | | 3.0% | |
| |
Equinix Inc | | | 2.3% | |
| |
Duke Realty Corp | | | 2.3% | |
| |
Simon Property Group Inc | | | 2.1% | |
| |
Camden Property Trust | | | 2.0% | |
Portfolio Composition
(% of net assets)
| | | | |
| | |
Residential | | | 15.7% | |
| |
Industrial | | | 14.0% | |
| |
Office | | | 13.6% | |
| |
Real Estate Management & Development | | | 13.1% | |
| |
Diversified | | | 11.6% | |
| |
Specialized | | | 10.4% | |
| |
Retail | | | 9.4% | |
| |
Health Care | | | 7.3% | |
| |
Other | | | 3.1% | |
| |
Repurchase Agreements | | | 1.3% | |
| |
Other Assets Less Liabilities | | | 0.5% | |
| |
Net Assets | | | 100% | |
Country Allocation1
(% of net assets)
| | | | |
| | |
United States | | | 52.4% | |
| |
Japan | | | 10.4% | |
| |
Canada | | | 5.5% | |
| |
Germany | | | 5.3% | |
| |
United Kingdom | | | 5.1% | |
| |
Australia | | | 4.8% | |
| |
Hong Kong | | | 3.7% | |
| |
Singapore | | | 3.0% | |
| |
France | | | 2.3% | |
| |
Sweden | | | 1.0% | |
| |
Spain | | | 0.9% | |
| |
New Zealand | | | 0.7% | |
| |
Other | | | 4.4% | |
| |
Other Assets Less Liabilities | | | 0.5% | |
| |
Net Assets | | | 100% | |
| 1 | Includes 1.6% (as a percentage of net assets) in emerging market countries. |
27
Holding Summariesas of December 31, 2019 (continued)
Nuveen Real Asset Income Fund
Fund Allocation
(% of net assets)
| | | | |
| | |
Real Estate Investment Trust Common Stocks | | | 26.8% | |
| |
Common Stocks | | | 20.2% | |
| |
$25 Par (or similar) Retail Preferred | | | 14.8% | |
| |
Corporate Bonds | | | 14.1% | |
| |
$1,000 Par (or similar) Institutional Preferred | | | 13.2% | |
| |
Convertible Preferred Securities | | | 4.5% | |
| |
Variable Rate Senior Loan Interests | | | 1.9% | |
| |
Convertible Bonds | | | 0.6% | |
| |
Investment Companies | | | 0.4% | |
| |
Asset-Backed Securities | | | 0.2% | |
| |
Real Estate Investment Trust Common Stocks Rights | | | 0.0% | |
| |
Repurchase Agreements | | | 1.8% | |
| |
Other Assets Less Liabilities | | | 1.5% | |
| |
Net Assets | | | 100% | |
Top Five Common Stock & Real Estate Investment Trust
Common Stock Holdings
(% of net assets)
| | | | |
| | |
VEREIT Inc | | | 1.7% | |
| |
Medical Properties Trust Inc | | | 1.4% | |
| |
STAG Industrial Inc | | | 1.3% | |
| |
Engie SA | | | 1.0% | |
| |
MGM Growth Properties LLC | | | 1.0% | |
Portfolio Composition
(% of net assets)
| | | | |
| | |
Oil, Gas & Consumable Fuels | | | 14.5% | |
| |
Electric Utilities | | | 14.4% | |
| |
Equity Real Estate Investment Trust | | | 11.5% | |
| |
Multi-Utilities | | | 9.1% | |
| |
Industrial | | | 5.3% | |
| |
Health Care | | | 5.1% | |
| |
Diversified | | | 4.6% | |
| |
Retail | | | 4.0% | |
| |
Real Estate Management & Development | | | 3.8% | |
| |
Gas Utilities | | | 2.8% | |
| |
Office | | | 2.4% | |
| |
Other | | | 18.6% | |
| |
Repurchase Agreements | | | 1.8% | |
| |
Investment Companies | | | 0.4% | |
| |
Asset-Backed Securities | | | 0.2% | |
| |
Other Assets Less Liabilities | | | 1.5% | |
| |
Net Assets | | | 100% | |
Country Allocation1
(% of net assets)
| | | | |
| | |
United States | | | 58.2% | |
| |
Canada | | | 13.0% | |
| |
Australia | | | 4.4% | |
| |
Singapore | | | 3.5% | |
| |
France | | | 2.8% | |
| |
Italy | | | 1.9% | |
| |
United Kingdom | | | 1.7% | |
| |
Spain | | | 1.7% | |
| |
Germany | | | 1.4% | |
| |
Portugal | | | 1.0% | |
| |
Brazil | | | 0.9% | |
| |
Other | | | 8.0% | |
| |
Other Assets Less Liabilities | | | 1.5% | |
| |
Net Assets | | | 100% | |
| 1 | Includes 5.0% (as a percentage of net assets) in emerging market countries. |
28
Nuveen Real Estate Securities Fund
Fund Allocation
(% of net assets)
| | | | |
| | |
Real Estate Investment Trust Common Stocks | | | 97.1% | |
| |
Common Stocks | | | 0.2% | |
| |
Money Market Funds | | | 1.2% | |
| |
Other Assets Less Liabilities | | | 1.5% | |
| |
Net Assets | | | 100% | |
Portfolio Composition
(% of net assets)
| | | | |
| | |
Residential | | | 21.2% | |
| |
Specialized | | | 15.4% | |
| |
Industrial | | | 14.9% | |
| |
Office | | | 12.6% | |
| |
Health Care | | | 12.6% | |
| |
Retail | | | 11.0% | |
| |
Diversified | | | 6.0% | |
| |
Other | | | 3.6% | |
| |
Money Market Funds | | | 1.2% | |
| |
Other Assets Less Liabilities | | | 1.5% | |
| |
Net Assets | | | 100% | |
Top Five Common Stock and Real Estate Investment Trust Common Stock Holdings
(% of net assets)
| | | | |
| | |
Prologis Inc | | | 5.8% | |
| |
Equinix Inc | | | 4.5% | |
| |
Duke Realty Corp | | | 4.3% | |
| |
Camden Property Trust | | | 3.9% | |
| |
Simon Property Group Inc | | | 3.9% | |
29
Expense Examples
As a shareholder of one or more of the Funds, you incur two types of costs: (1) transaction costs, including up-front and back-end sales charges (loads) or redemption fees, where applicable; and (2) ongoing costs, including management fees; distribution and service (12b-1) fees, where applicable; and other Fund expenses. The Examples below are intended to help you understand your ongoing costs (in dollars) of investing in the Funds and to compare these costs with the ongoing costs of investing in other mutual funds.
The Examples below are based on an investment of $1,000 invested at the beginning of the period and held through the period ended December 31, 2019.
The beginning of the period is July 1, 2019.
The information under “Actual Performance,” together with the amount you invested, allows you to estimate actual expenses incurred over the reporting period. Simply divide your account value by $1,000 (for example, an $8,600 account value divided by $1,000 = 8.60) and multiply the result by the cost shown for your share class, in the row entitled “Expenses Incurred During Period” to estimate the expenses incurred on your account during this period.
The information under “Hypothetical Performance,” provides information about hypothetical account values and hypothetical expenses based on each Fund’s actual expense ratio and an assumed rate of return of 5% per year before expenses, which is not the Fund’s actual return. The hypothetical account values and expenses may not be used to estimate the actual ending account balance or expense you incurred for the period. You may use this information to compare the ongoing costs of investing in the Fund and other funds. To do so, compare this 5% hypothetical example with the 5% hypothetical examples that appear in the shareholder reports of the other funds.
Please note that the expenses shown in the following tables are meant to highlight your ongoing costs only and do not reflect any transaction costs. Therefore, the hypothetical information is useful in comparing ongoing costs only, and will not help you determine the relative total costs of owning different funds or share classes. In addition, if these transaction costs were included, your costs would have been higher.
Nuveen Global Infrastructure Fund
| | | | | | | | | | | | | | | | | | | | |
| | | Share Class | |
| | | Class A | | | Class C | | | Class R3 | | | Class R6 | | | Class I | |
Actual Performance | | | | | | | | | | | | | | | | | | | | |
Beginning Account Value | | $ | 1,000.00 | | | $ | 1,000.00 | | | $ | 1,000.00 | | | $ | 1,000.00 | | | $ | 1,000.00 | |
Ending Account Value | | $ | 1,061.95 | | | $ | 1,058.69 | | | $ | 1,061.52 | | | $ | 1,063.42 | | | $ | 1,063.67 | |
Expenses Incurred During the Period | | $ | 6.34 | | | $ | 10.22 | | | $ | 7.64 | | | $ | 4.68 | | | $ | 5.05 | |
Hypothetical Performance (5% annualized return before expenses) | | | | | | | | | | | | | | | | | | | | |
Beginning Account Value | | $ | 1,000.00 | | | $ | 1,000.00 | | | $ | 1,000.00 | | | $ | 1,000.00 | | | $ | 1,000.00 | |
Ending Account Value | | $ | 1,019.06 | | | $ | 1,015.27 | | | $ | 1,017.80 | | | $ | 1,020.67 | | | $ | 1,020.32 | |
Expenses Incurred During the Period | | $ | 6.21 | | | $ | 10.01 | | | $ | 7.48 | | | $ | 4.58 | | | $ | 4.94 | |
For each class of the Fund, expenses are equal to the Fund’s annualized net expense ratio of 1.22%, 1.97%, 1.47%, 0.90%, and 0.97% for Classes A, C, R3, R6, and I respectively, multiplied by the average account value over the period, multiplied by 184/365 (to reflect theone-half year period).
30
Nuveen Global Real Estate Securities Fund
| | | | | | | | | | | | | | | | |
| | | Share Class | |
| | | Class A | | | Class C | | | Class R6 | | | Class I | |
Actual Performance | | | | | | | | | | | | | | | | |
Beginning Account Value | | $ | 1,000.00 | | | $ | 1,000.00 | | | $ | 1,000.00 | | | $ | 1,000.00 | |
Ending Account Value | | $ | 1,078.48 | | | $ | 1,074.47 | | | $ | 1,080.11 | | | $ | 1,079.32 | |
Expenses Incurred During the Period | | $ | 6.81 | | | $ | 10.72 | | | $ | 4.93 | | | $ | 5.50 | |
Hypothetical Performance (5% annualized return before expenses) | | | | | | | | | | | | | | | | |
Beginning Account Value | | $ | 1,000.00 | | | $ | 1,000.00 | | | $ | 1,000.00 | | | $ | 1,000.00 | |
Ending Account Value | | $ | 1,018.65 | | | $ | 1,014.87 | | | $ | 1,020.47 | | | $ | 1,019.91 | |
Expenses Incurred During the Period | | $ | 6.61 | | | $ | 10.41 | | | $ | 4.79 | | | $ | 5.35 | |
For each class of the Fund, expenses are equal to the Fund’s annualized net expense ratio of 1.30%, 2.05%, 0.94%, and 1.05% for Classes A, C, R6, and I respectively, multiplied by the average account value over the period, multiplied by 184/365 (to reflect the one-half year period).
Nuveen Real Asset Income Fund
| | | | | | | | | | | | | | | | |
| | | Share Class | |
| | | Class A | | | Class C | | | Class R6 | | | Class I | |
Actual Performance | | | | | | | | | | | | | | | | |
Beginning Account Value | | $ | 1,000.00 | | | $ | 1,000.00 | | | $ | 1,000.00 | | | $ | 1,000.00 | |
Ending Account Value | | $ | 1,069.97 | | | $ | 1,066.02 | | | $ | 1,071.86 | | | $ | 1,071.26 | |
Expenses Incurred During the Period | | $ | 5.95 | | | $ | 9.84 | | | $ | 4.18 | | | $ | 4.59 | |
Hypothetical Performance (5% annualized return before expenses) | | | | | | | | | | | | | | | | |
Beginning Account Value | | $ | 1,000.00 | | | $ | 1,000.00 | | | $ | 1,000.00 | | | $ | 1,000.00 | |
Ending Account Value | | $ | 1,019.46 | | | $ | 1,015.68 | | | $ | 1,021.17 | | | $ | 1,020.77 | |
Expenses Incurred During the Period | | $ | 5.80 | | | $ | 9.60 | | | $ | 4.08 | | | $ | 4.48 | |
For each class of the Fund, expenses are equal to the Fund’s annualized net expense ratio of 1.14%, 1.89%, 0.80%, and 0.88% for Classes A, C, R6, and I respectively, multiplied by the average account value over the period, multiplied by 184/365 (to reflect theone-half year period).
Nuveen Real Estate Securities Fund
| | | | | | | | | | | | | | | | | | | | |
| | | Share Class | |
| | | Class A | | | Class C | | | Class R3 | | | Class R6 | | | Class I | |
Actual Performance | | | | | | | | | | | | | | | | | | | | |
Beginning Account Value | | $ | 1,000.00 | | | $ | 1,000.00 | | | $ | 1,000.00 | | | $ | 1,000.00 | | | $ | 1,000.00 | |
Ending Account Value | | $ | 1,060.12 | | | $ | 1,055.80 | | | $ | 1,058.42 | | | $ | 1,061.80 | | | $ | 1,061.02 | |
Expenses Incurred During the Period | | $ | 6.75 | | | $ | 10.62 | | | $ | 8.04 | | | $ | 4.63 | | | $ | 5.45 | |
Hypothetical Performance (5% annualized return before expenses) | | | | | | | | | | | | | | | | | | | | |
Beginning Account Value | | $ | 1,000.00 | | | $ | 1,000.00 | | | $ | 1,000.00 | | | $ | 1,000.00 | | | $ | 1,000.00 | |
Ending Account Value | | $ | 1,018.65 | | | $ | 1,014.87 | | | $ | 1,017.39 | | | $ | 1,020.72 | | | $ | 1,019.91 | |
Expenses Incurred During the Period | | $ | 6.61 | | | $ | 10.41 | | | $ | 7.88 | | | $ | 4.53 | | | $ | 5.35 | |
For each class of the Fund, expenses are equal to the Fund’s annualized net expense ratio of 1.30%, 2.05%, 1.55%, 0.89%, and 1.05% for Classes A, C, R3, R6, and I respectively, multiplied by the average account value over the period, multiplied by 184/365 (to reflect theone-half year period).
31
Report of Independent Registered Public Accounting Firm
To the Board of Directors of Nuveen Investment Funds, Inc., Board of Trustees of Nuveen Investment Trust V and Shareholders of
Nuveen Global Infrastructure Fund
Nuveen Global Real Estate Securities Fund
Nuveen Real Asset Income Fund
Nuveen Real Estate Securities Fund
Opinions on the Financial Statements
We have audited the accompanying statements of assets and liabilities, including the portfolios of investments, of Nuveen Global Infrastructure Fund, Nuveen Global Real Estate Securities Fund, Nuveen Real Asset Income Fund and Nuveen Real Estate Securities Fund (hereafter collectively referred to as the “Funds”) as of December 31, 2019, the related statements of operations for the year ended December 31, 2019, the statements of changes in net assets for each of the two years in the period ended December 31, 2019 (for Nuveen Global Real Estate Securities Fund, for the period March 20, 2018 (commencement of operations) through December 31, 2019), including the related notes, and the financial highlights for each of the periods indicated therein (collectively referred to as the “financial statements”). In our opinion, the financial statements present fairly, in all material respects, the financial position of each of the Funds as of December 31, 2019, the results of each of their operations for the year then ended, the changes in each of their net assets for each of the two years in the period ended December 31, 2019 (for Nuveen Global Real Estate Securities Fund, for the period March 20, 2018 (commencement of operations) through December 31, 2019) and each of the financial highlights for each of the periods indicated therein in conformity with accounting principles generally accepted in the United States of America.
Basis for Opinions
These financial statements are the responsibility of the Funds’ management. Our responsibility is to express an opinion on the Funds’ financial statements based on our audits. We are a public accounting firm registered with the Public Company Accounting Oversight Board (United States) (PCAOB) and are required to be independent with respect to the Funds in accordance with the U.S. federal securities laws and the applicable rules and regulations of the Securities and Exchange Commission and the PCAOB.
We conducted our audits of these financial statements in accordance with the standards of the PCAOB. Those standards require that we plan and perform the audit to obtain reasonable assurance about whether the financial statements are free of material misstatement, whether due to error or fraud.
Our audits included performing procedures to assess the risks of material misstatement of the financial statements, whether due to error or fraud, and performing procedures that respond to those risks. Such procedures included examining, on a test basis, evidence regarding the amounts and disclosures in the financial statements. Our audits also included evaluating the accounting principles used and significant estimates made by management, as well as evaluating the overall presentation of the financial statements. Our procedures included confirmation of securities owned as of December 31, 2019 by correspondence with the custodians and brokers; when replies were not received from brokers, we performed other auditing procedures. We believe that our audits provide a reasonable basis for our opinions.
PricewaterhouseCoopers LLP
Chicago, Illinois
February 27, 2020
We have served as the auditor of one or more investment companies in Nuveen Funds since 2002.
32
Nuveen Global Infrastructure Fund
Portfolio of Investments December 31, 2019
| | | | | | | | | | | | | | | | |
| Shares | | | Description (1) | | | | | | | | Value | |
| | | | |
| | | | LONG-TERM INVESTMENTS – 97.8% | | | | | | | | | | | | |
| | | | |
| | | | COMMON STOCKS – 94.1% | | | | | | | | | | | | |
| | | | |
| | | | Air Freight & Logistics – 0.1% | | | | | | | | | |
| | | | |
| | 21,402 | | | Oesterreichische Post AG, (2) | | | | | | | | | | $ | 813,497 | |
| | | | |
| | | | Commercial Services & Supplies – 4.3% | | | | | | | | | |
| | | | |
| | 141,337 | | | Waste Connections Inc | | | | | | | | | | | 12,831,986 | |
| | | | |
| | 122,952 | | | Waste Management Inc | | | | | | | | | | | 14,011,610 | |
| | | | Total Commercial Services & Supplies | | | | | | | | | | | 26,843,596 | |
| | | | |
| | | | Construction & Engineering – 5.5% | | | | | | | | | |
| | | | |
| | 50,036 | | | Eiffage SA, (2) | | | | | | | | | | | 5,740,469 | |
| | | | |
| | 178,851 | | | Ferrovial SA, (2) | | | | | | | | | | | 5,418,674 | |
| | | | |
| | 205,741 | | | Vinci SA, (2) | | | | | | | | | | | 22,914,107 | |
| | | | Total Construction & Engineering | | | | | | | | | | | 34,073,250 | |
| | | | |
| | | | Diversified Telecommunication Services – 2.1% | | | | | | | | | |
| | | | |
| | 90,812 | | | Cellnex Telecom SA, 144A, (2), (3) | | | | | | | | | | | 3,917,231 | |
| | | | |
| | 77 | | | HKBN Ltd, (2) | | | | | | | | | | | 129 | |
| | | | |
| | 178 | | | HKT Trust & HKT Ltd, (2) | | | | | | | | | | | 251 | |
| | | | |
| | 424,734 | | | Infrastrutture Wireless Italiane SpA, 144A | | | | | | | | | | | 4,159,182 | |
| | | | |
| | 4,437,353 | | | NetLink NBN Trust | | | | | | | | | | | 3,117,810 | |
| | | | |
| | 2,094,109 | | | Telesites SAB de CV, (3) | | | | | | | | | | | 1,550,577 | |
| | | | Total Diversified Telecommunication Services | | | | | | | | | | | 12,745,180 | |
| | | | |
| | | | Electric Utilities – 23.8% | | | | | | | | | |
| | | | |
| | 59,082 | | | Alupar Investimento SA, (2) | | | | | | | | | | | 405,696 | |
| | | | |
| | 169,568 | | | American Electric Power Co Inc | | | | | | | | | | | 16,025,872 | |
| | | | |
| | 3,394,920 | | | AusNet Services, (2) | | | | | | | | | | | 4,048,394 | |
| | | | |
| | 389,936 | | | CK Infrastructure Holdings Ltd, (2) | | | | | | | | | | | 2,775,051 | |
| | | | |
| | 108,685 | | | CLP Holdings Ltd, (2) | | | | | | | | | | | 1,140,912 | |
| | | | |
| | 83,602 | | | Duke Energy Corp | | | | | | | | | | | 7,625,338 | |
| | | | |
| | 42,317 | | | Edison International | | | | | | | | | | | 3,191,125 | |
| | | | |
| | 967,041 | | | EDP – Energias de Portugal SA, (2) | | | | | | | | | | | 4,196,371 | |
| | | | |
| | 7,671 | | | Elia System Operator SA/NV | | | | | | | | | | | 680,621 | |
| | | | |
| | 1,504,522 | | | Enel SpA, (2) | | | | | | | | | | | 11,951,656 | |
| | | | |
| | 50,834 | | | Entergy Corp | | | | | | | | | | | 6,089,913 | |
| | | | |
| | 16,805 | | | Eversource Energy | | | | | | | | | | | 1,429,601 | |
| | | | |
| | 1,551,857 | | | Iberdrola SA, (2) | | | | | | | | | | | 15,992,766 | |
| | | | |
| | 76,621 | | | Interconexion Electrica SA ESP | | | | | | | | | | | 456,850 | |
| | | | |
| | 95,727 | | | Neoenergia SA, (2), (3) | | | | | | | | | | | 593,976 | |
| | | | |
| | 121,365 | | | NextEra Energy Inc | | | | | | | | | | | 29,389,748 | |
33
Nuveen Global Infrastructure Fund(continued)
Portfolio of Investments December 31, 2019
| | | | | | | | | | | | | | | | |
| Shares | | | Description (1) | | | | | | | | Value | |
| | | | |
| | | | Electric Utilities(continued) | | | | | | | | | |
| | | | |
| | 126,738 | | | Power Assets Holdings Ltd, (2) | | | | | | | | | | $ | 927,166 | |
| | | | |
| | 456,290 | | | Power Grid Corp of India Ltd | | | | | | | | | | | 1,218,424 | |
| | | | |
| | 77,939 | | | PPL Corp | | | | | | | | | | | 2,796,451 | |
| | | | |
| | 331,201 | | | Red Electrica Corp SA, (2), (3) | | | | | | | | | | | 6,673,621 | |
| | | | |
| | 115,268 | | | Southern Co | | | | | | | | | | | 7,342,572 | |
| | | | |
| | 2,587,279 | | | Terna Rete Elettrica Nazionale SpA, (2) | | | | | | | | | | | 17,303,490 | |
| | | | |
| | 180,633 | | | Transmissora Alianca de Energia Eletrica SA, (2) | | | | | | | | | | | 1,403,669 | |
| | | | |
| | 63,895 | | | Xcel Energy Inc | | | | | | | | | | | 4,056,694 | |
| | | | Total Electric Utilities | | | | | | | | | | | 147,715,977 | |
| | | | |
| | | | Gas Utilities – 2.1% | | | | | | | | | |
| | | | |
| | 229,755 | | | APA Group, (2) | | | | | | | | | | | 1,788,514 | |
| | | | |
| | 33,319 | | | Atmos Energy Corp | | | | | | | | | | | 3,727,063 | |
| | | | |
| | 123,544 | | | China Resources Gas Group Ltd, (2) | | | | | | | | | | | 678,845 | |
| | | | |
| | 27,189 | | | Enagas SA | | | | | | | | | | | 693,522 | |
| | | | |
| | 200,835 | | | ENN Energy Holdings Ltd, (2) | | | | | | | | | | | 2,194,161 | |
| | | | |
| | 353,343 | | | Hong Kong & China Gas Co Ltd, (2) | | | | | | | | | | | 690,386 | |
| | | | |
| | 99,119 | | | Italgas SpA, (2) | | | | | | | | | | | 605,984 | |
| | | | |
| | 46,577 | | | Naturgy Energy Group SA, (2), (3) | | | | | | | | | | | 1,172,856 | |
| | | | |
| | 28,085 | | | New Jersey Resources Corp | | | | | | | | | | | 1,251,748 | |
| | | | Total Gas Utilities | | | | | | | | | | | 12,803,079 | |
| | | | |
| | | | Independent Power & Renewable Electricity Producers – 0.4% | | | | | | | | | |
| | | | |
| | 50,011 | | | Clearway Energy Inc | | | | | | | | | | | 997,719 | |
| | | | |
| | 26,034 | | | NextEra Energy Partners LP | | | | | | | | | | | 1,370,690 | |
| | | | Total Independent Power & Renewable Electricity Producers | | | | | | | | | | | 2,368,409 | |
| | | | |
| | | | IT Services – 0.8% | | | | | | | | | |
| | | | |
| | 38,070 | | | InterXion Holding NV, (3) | | | | | | | | | | | 3,190,647 | |
| | | | |
| | 441,938 | | | NEXTDC Ltd, (2), (3) | | | | | | | | | | | 2,041,832 | |
| | | | Total IT Services | | | | | | | | | | | 5,232,479 | |
| | | | |
| | | | Multi-Utilities – 9.1% | | | | | | | | | |
| | | | |
| | 40,675 | | | Ameren Corp | | | | | | | | | | | 3,123,840 | |
| | | | |
| | 40,045 | | | Brookfield Infrastructure Partners LP | | | | | | | | | | | 2,001,850 | |
| | | | |
| | 92,266 | | | CMS Energy Corp | | | | | | | | | | | 5,797,995 | |
| | | | |
| | 119,539 | | | Dominion Energy Inc | | | | | | | | | | | 9,900,220 | |
| | | | |
| | 57,339 | | | DTE Energy Co | | | | | | | | | | | 7,446,616 | |
| | | | |
| | 389,005 | | | Engie SA, (2) | | | | | | | | | | | 6,301,227 | |
| | | | |
| | 396,956 | | | EON SE, (2) | | | | | | | | | | | 4,242,218 | |
| | | | |
| | 233,374 | | | Hera SpA, (2) | | | | | | | | | | | 1,022,187 | |
| | | | |
| | 85,223 | | | National Grid PLC, Sponsored ADR | | | | | | | | | | | 5,340,925 | |
| | | | |
| | 32,178 | | | Sempra Energy | | | | | | | | | | | 4,874,323 | |
| | | | |
| | 76,993 | | | Suez, (2) | | | | | | | | | | | 1,166,695 | |
34
| | | | | | | | | | | | | | | | |
| Shares | | | Description (1) | | | | | | | | Value | |
| | | | |
| | | | Multi-Utilities(continued) | | | | | | | | | |
| | | | |
| | 57,980 | | | WEC Energy Group Inc | | | | | | | | | | $ | 5,347,495 | |
| | | | Total Multi-Utilities | | | | | | | | | | | 56,565,591 | |
| | | | |
| | | | Oil, Gas & Consumable Fuels – 14.2% | | | | | | | | | |
| | | | |
| | 105,669 | | | Cheniere Energy Inc, (3) | | | | | | | | | | | 6,453,206 | |
| | | | |
| | 557,331 | | | Enbridge Inc | | | | | | | | | | | 22,165,054 | |
| | | | |
| | 26,103 | | | Enterprise Products Partners LP | | | | | | | | | | | 735,060 | |
| | | | |
| | 47,473 | | | Gibson Energy Inc | | | | | | | | | | | 972,090 | |
| | | | |
| | 130,575 | | | Inter Pipeline Ltd | | | | | | | | | | | 2,266,498 | |
| | | | |
| | 792,512 | | | Kinder Morgan Inc | | | | | | | | | | | 16,777,479 | |
| | | | |
| | 9,987 | | | Koninklijke Vopak NV, (2) | | | | | | | | | | | 542,697 | |
| | | | |
| | 31,024 | | | Magellan Midstream Partners LP | | | | | | | | | | | 1,950,479 | |
| | | | |
| | 152,303 | | | ONEOK Inc | | | | | | | | | | | 11,524,768 | |
| | | | |
| | 78,538 | | | Pembina Pipeline Corp | | | | | | | | | | | 2,910,965 | |
| | | | |
| | 150,477 | | | TC Energy Corp | | | | | | | | | | | 8,021,929 | |
| | | | |
| | 162,711 | | | TC Energy Corp | | | | | | | | | | | 8,665,891 | |
| | | | |
| | 206,071 | | | Williams Cos Inc | | | | | | | | | | | 4,888,004 | |
| | | | Total Oil, Gas & Consumable Fuels | | | | | | | | | | | 87,874,120 | |
| | | | |
| | | | Road & Rail – 3.6% | | | | | | | | | |
| | | | |
| | 677,395 | | | Aurizon Holdings Ltd, (2) | | | | | | | | | | | 2,485,988 | |
| | | | |
| | 11,343 | | | Canadian Pacific Railway Ltd | | | | | | | | | | | 2,891,898 | |
| | | | |
| | 13,292 | | | Central Japan Railway Co, (2) | | | | | | | | | | | 2,672,605 | |
| | | | |
| | 954,800 | | | ComfortDelGro Corp Ltd, (2) | | | | | | | | | | | 1,689,430 | |
| | | | |
| | 44,795 | | | East Japan Railway Co, (2) | | | | | | | | | | | 4,043,283 | |
| | | | |
| | 15,086 | | | Kansas City Southern | | | | | | | | | | | 2,310,572 | |
| | | | |
| | 360,730 | | | Rumo SA, (2), (3) | | | | | | | | | | | 2,348,123 | |
| | | | |
| | 20,175 | | | Union Pacific Corp | | | | | | | | | | | 3,647,438 | |
| | | | Total Road & Rail | | | | | | | | | | | 22,089,337 | |
| | | | |
| | | | Transportation Infrastructure – 27.0% | | | | | | | | | |
| | | | |
| | 148,760 | | | Aena SME SA, 144A, (2), (3) | | | | | | | | | | | 28,519,945 | |
| | | | |
| | 69,232 | | | Aeroports de Paris, (2) | | | | | | | | | | | 13,707,492 | |
| | | | |
| | 280,806 | | | Atlantia SpA, (2) | | | | | | | | | | | 6,553,701 | |
| | | | |
| | 1,357,010 | | | Atlas Arteria Ltd, (2) | | | | | | | | | | | 7,461,465 | |
| | | | |
| | 1,983,188 | | | Auckland International Airport Ltd, (2) | | | | | | | | | | | 11,689,664 | |
| | | | |
| | 411,560 | | | China Merchants Port Holdings Co Ltd, (2) | | | | | | | | | | | 696,368 | |
| | | | |
| | 630,133 | | | COSCO SHIPPING Ports Ltd, (2) | | | | | | | | | | | 516,093 | |
| | | | |
| | 780,756 | | | Enav SpA, 144A | | | | | | | | | | | 4,659,118 | |
| | | | |
| | 72,130 | | | Flughafen Wien AG, (2) | | | | | | | | | | | 3,064,633 | |
| | | | |
| | 40,390 | | | Flughafen Zurich AG, (2) | | | | | | | | | | | 7,372,377 | |
| | | | |
| | 54,793 | | | Fraport AG Frankfurt Airport Services Worldwide, (2) | | | | | | | | | | | 4,651,106 | |
| | | | |
| | 918,534 | | | Getlink SE, (2) | | | | | | | | | | | 16,014,517 | |
35
Nuveen Global Infrastructure Fund(continued)
Portfolio of Investments December 31, 2019
| | | | | | | | | | | | | | | | |
| Shares | | | Description (1) | | | | | | | | Value | |
| | | | |
| | | | Transportation Infrastructure(continued) | | | | | | | | | |
| | | | |
| | 41,174 | | | Grupo Aeroportuario del Centro Norte SAB de CV, ADR | | | | | | | | | | $ | 2,467,970 | |
| | | | |
| | 47,094 | | | Grupo Aeroportuario del Pacifico SAB de CV, ADR | | | | | | | | | | | 5,585,819 | |
| | | | |
| | 15,818 | | | Hamburger Hafen und Logistik AG, (2) | | | | | | | | | | | 433,748 | |
| | | | |
| | 7,296 | | | International Container Terminal Services Inc, (2) | | | | | | | | | | | 18,491 | |
| | | | |
| | 59,260 | | | Kamigumi Co Ltd, (2) | | | | | | | | | | | 1,302,645 | |
| | | | |
| | 106,597 | | | Macquarie Infrastructure Corp | | | | | | | | | | | 4,566,615 | |
| | | | |
| | 666,097 | | | Port of Tauranga Ltd, (2) | | | | | | | | | | | 3,567,295 | |
| | | | |
| | 41,246 | | | Promotora y Operadora de Infraestructura SAB de CV | | | | | | | | | | | 422,157 | |
| | | | |
| | 65,343 | | | Promotora y Operadora de Infraestructura SAB de CV | | | | | | | | | | | 483,830 | |
| | | | |
| | 213,081 | | | Societa Iniziative Autostradali e Servizi SpA | | | | | | | | | | | 3,570,853 | |
| | | | |
| | 1,672,045 | | | Sydney Airport, (2) | | | | | | | | | | | 10,158,878 | |
| | | | |
| | 2,831,871 | | | Transurban Group, (2) | | | | | | | | | | | 29,641,325 | |
| | | | |
| | 27,845 | | | Westshore Terminals Investment Corp | | | | | | | | | | | 406,348 | |
| | | | Total Transportation Infrastructure | | | | | | | | | | | 167,532,453 | |
| | | | |
| | | | Water Utilities – 1.1% | | | | | | | | | |
| | | | |
| | 2,557,330 | | | Aguas Andinas SA | | | | | | | | | | | 1,084,897 | |
| | | | |
| | 30,218 | | | American Water Works Co Inc | | | | | | | | | | | 3,712,281 | |
| | | | |
| | 822,428 | | | Guangdong Investment Ltd, (2) | | | | | | | | | | | 1,720,157 | |
| | | | |
| | 21,189 | | | Pennon Group PLC, (2) | | | | | | | | | | | 287,401 | |
| | | | Total Water Utilities | | | | | | | | | | | 6,804,736 | |
| | | | Total Common Stocks (cost $461,633,281) | | | | | | | | | | | 583,461,704 | |
| | | | |
| Shares | | | Description (1) | | | | | | | | Value | |
| | | | |
| | | | REAL ESTATE INVESTMENT TRUST COMMON STOCKS – 3.2% | | | | | | | | | | | | |
| | | | |
| | | | Health Care – 0.2% | | | | | | | | | |
| | | | |
| | 647,815 | | | Parkway Life Real Estate Investment Trust | | | | | | | | | | $ | 1,599,127 | |
| | | | |
| | | | Specialized – 3.0% | | | | | | | | | |
| | | | |
| | 17,857 | | | American Tower Corp | | | | | | | | | | | 4,103,896 | |
| | | | |
| | 16,129 | | | CoreSite Realty Corp | | | | | | | | | | | 1,808,384 | |
| | | | |
| | 57,203 | | | CyrusOne Inc | | | | | | | | | | | 3,742,792 | |
| | | | |
| | 11,057 | | | Digital Realty Trust Inc | | | | | | | | | | | 1,323,965 | |
| | | | |
| | 3,546 | | | Equinix Inc | | | | | | | | | | | 2,069,800 | |
| | | | |
| | 714,080 | | | Keppel DC REIT, (2) | | | | | | | | | | | 1,104,835 | |
| | | | |
| | 14,073 | | | QTS Realty Trust Inc | | | | | | | | | | | 763,742 | |
| | | | |
| | 14,223 | | | SBA Communications Corp | | | | | | | | | | | 3,427,601 | |
| | | | Total Specialized | | | | | | | | | | | 18,345,015 | |
| | | | Total Real Estate Investment Trust Common Stocks (cost $17,598,672) | | | | | | | | | | | 19,944,142 | |
36
| | | | | | | | | | | | | | | | |
| | | | |
| Shares | | | Description (1), (4) | | | | | | | | Value | |
| | | | |
| | | | INVESTMENT COMPANIES – 0.5% | | | | | | | | | |
| | | | |
| | 772,809 | | | 3I Infrastructure PLC | | | | | | | | | | $ | 3,012,988 | |
| | | | Total Investment Companies (cost $2,700,580) | | | | | | | | | | | 3,012,988 | |
| | | | Total Long-Term Investments (cost $481,932,533) | | | | | | | | | | | 606,418,834 | |
| | | | |
Principal
Amount (000) | | | Description (1) | | Coupon | | | Maturity | | | Value | |
| | | | |
| | | | SHORT-TERM INVESTMENTS – 1.9% | | | | | | | | | | | | |
| | | | |
| | | | REPURCHASE AGREEMENTS – 1.9% | | | | | | | | | |
| | | | |
| $ | 11,462 | | | Repurchase Agreement with Fixed Income Clearing Corporation, dated 12/31/19, repurchase price $11,462,074, collateralized by $11,260,000 U.S. Treasury Bonds, 2.500%, due 2/15/45, value $11,694,850 | | | 0.650% | | | | 1/02/20 | | | $ | 11,461,660 | |
| | | | Total Short-Term Investments (cost $11,461,660) | | | | | | | | | | | 11,461,660 | |
| | | | Total Investments (cost $493,394,193) – 99.7% | | | | | | | | | | | 617,880,494 | |
| | | | Other Assets Less Liabilities – 0.3% | | | | | | | | | | | 1,862,521 | |
| | | | Net Assets – 100% | | | | | | | | | | $ | 619,743,015 | |
For Fund portfolio compliance purposes, the Fund’s industry classifications refer to any one or more of the industrysub-classifications used by one or more widely recognized market indexes or ratings group indexes, and/or as defined by Fund management. This definition may not apply for purposes of this report, which may combine industrysub-classifications into sectors for reporting ease.
| (1) | All percentages shown in the Portfolio of Investments are based on net assets. |
| (2) | For fair value measurement disclosure purposes, investment classified as Level 2. See Notes to Financial Statements, Note 3 – Investment Valuation and Fair Value Measurements for more information. |
| (3) | Non-income producing; issuer has not declared a dividend within the past twelve months. |
| (4) | A copy of the most recent financial statements for these investment companies can be obtained directly from the Securities and Exchange Commission on its website at http://www.sec.gov. |
| 144A | Investment is exempt from registration under Rule 144A of the Securities Act of 1933, as amended. These investments may only be resold in transactions exempt from registration, which are normally those transactions with qualified institutional buyers. |
| ADR | American Depositary Receipt |
| REIT | Real Estate Investment Trust |
See accompanying notes to financial statements.
37
Nuveen Global Real Estate Securities Fund
Portfolio of Investments December 31, 2019
| | | | | | | | | | | | | | | | |
| Shares | | | Description (1) | | | | | | | | Value | |
| |
| | | | LONG-TERM INVESTMENTS – 98.2% | |
| |
| | | | REAL ESTATE INVESTMENT TRUST COMMON STOCKS – 83.8% | |
| | | | |
| | | | Diversified – 11.6% | | | | | | | | | |
| | | | |
| | 36,201 | | | Abacus Property Group, (2) | | | | | | | | | | $ | 91,680 | |
| | | | |
| | 10 | | | Activia Properties Inc, (2) | | | | | | | | | | | 50,115 | |
| | | | |
| | 1,597 | | | Alexander & Baldwin Inc | | | | | | | | | | | 33,473 | |
| | | | |
| | 2,604 | | | American Assets Trust Inc | | | | | | | | | | | 119,524 | |
| | | | |
| | 10,189 | | | Charter Hall Long Wale REIT, (2) | | | | | | | | | | | 39,321 | |
| | | | |
| | 6,909 | | | Cominar Real Estate Investment Trust | | | | | | | | | | | 75,339 | |
| | | | |
| | 115,247 | | | Cromwell European Real Estate Investment Trust | | | | | | | | | | | 69,807 | |
| | | | |
| | 33 | | | Daiwa House REIT Investment Corp, (2) | | | | | | | | | | | 86,290 | |
| | | | |
| | 1,395 | | | Empire State Realty Trust Inc | | | | | | | | | | | 19,474 | |
| | | | |
| | 1,204 | | | Gecina SA | | | | | | | | | | | 215,544 | |
| | | | |
| | 81,851 | | | Goodman Property Trust, (2) | | | | | | | | | | | 122,396 | |
| | | | |
| | 49,526 | | | GPT Group, (2) | | | | | | | | | | | 195,085 | |
| | | | |
| | 24 | | | Heiwa Real Estate REIT Inc | | | | | | | | | | | 29,996 | |
| | | | |
| | 55 | | | Hulic Reit Inc | | | | | | | | | | | 99,821 | |
| | | | |
| | 25 | | | Kenedix Office Investment Corp, (2) | | | | | | | | | | | 193,157 | |
| | | | |
| | 2,148 | | | Liberty Property Trust | | | | | | | | | | | 128,987 | |
| | | | |
| | 66,159 | | | LondonMetric Property PLC | | | | | | | | | | | 207,343 | |
| | | | |
| | 146,943 | | | LXI REIT plc | | | | | | | | | | | 272,497 | |
| | | | |
| | 10,391 | | | Merlin Properties Socimi SA, (2) | | | | | | | | | | | 149,353 | |
| | | | |
| | 38,450 | | | Mirvac Group, (2) | | | | | | | | | | | 86,063 | |
| | | | |
| | 691 | | | PS Business Parks Inc | | | | | | | | | | | 113,925 | |
| | | | |
| | 164 | | | Star Asia Investment Corp, (2) | | | | | | | | | | | 176,287 | |
| | | | |
| | 12,486 | | | Stockland, (2) | | | | | | | | | | | 40,512 | |
| | | | |
| | 17,961 | | | Stride Property Group | | | | | | | | | | | 28,536 | |
| | | | |
| | 77,290 | | | Sunlight Real Estate Investment Trust, (2) | | | | | | | | | | | 49,997 | |
| | | | |
| | 50 | | | Tokyu REIT Inc, (2) | | | | | | | | | | | 94,816 | |
| | | | |
| | 28,186 | | | VEREIT Inc | | | | | | | | | | | 260,439 | |
| | | | |
| | 78 | | | Washington Real Estate Investment Trust | | | | | | | | | | | 2,276 | |
| | | | |
| | 2,494 | | | WP Carey Inc | | | | | | | | | | | 199,620 | |
| | | | Total Diversified | | | | | | | | | | | 3,251,673 | |
| | | | |
| | | | Health Care – 7.3% | | | | | | | | | |
| | | | |
| | 180 | | | Aedifica SA | | | | | | | | | | | 22,856 | |
| | | | |
| | 8,197 | | | Healthcare Realty Trust Inc | | | | | | | | | | | 273,534 | |
| | | | |
| | 2,512 | | | Healthcare Trust of America Inc | | | | | | | | | | | 76,063 | |
| | | | |
| | 10,338 | | | Healthpeak Properties Inc | | | | | | | | | | | 356,351 | |
| | | | |
| | 10,152 | | | Medical Properties Trust Inc | | | | | | | | | | | 214,309 | |
38
| | | | | | | | | | | | | | | | |
| Shares | | | Description (1) | | | | | | | | Value | |
| | | | |
| | | | Health Care(continued) | | | | | | | | | |
| | | | |
| | 648 | | | National Health Investors Inc | | | | | | | | | | $ | 52,799 | |
| | | | |
| | 14,307 | | | NorthWest Healthcare Properties Real Estate Investment Trust | | | | | | | | | | | 131,441 | |
| | | | |
| | 3,323 | | | Omega Healthcare Investors Inc | | | | | | | | | | | 140,729 | |
| | | | |
| | 16,945 | | | Parkway Life Real Estate Investment Trust | | | | | | | | | | | 41,829 | |
| | | | |
| | 4,339 | | | Physicians Realty Trust | | | | | | | | | | | 82,181 | |
| | | | |
| | 331 | | | Primary Health Properties PLC | | | | | | | | | | | 702 | |
| | | | |
| | 3,150 | | | Ventas Inc | | | | | | | | | | | 181,881 | |
| | | | |
| | 5,812 | | | Welltower Inc | | | | | | | | | | | 475,305 | |
| | | | Total Health Care | | | | | | | | | | | 2,049,980 | |
| | | | |
| | | | Hotels – 1.8% | | | | | | | | | |
| | | | |
| | 2,579 | | | Host Hotels & Resorts Inc | | | | | | | | | | | 47,840 | |
| | | | |
| | 3,156 | | | MGM Growth Properties LLC | | | | | | | | | | | 97,741 | |
| | | | |
| | 1,461 | | | Pebblebrook Hotel Trust | | | | | | | | | | | 39,169 | |
| | | | |
| | 1,135 | | | Ryman Hospitality Properties Inc | | | | | | | | | | | 98,359 | |
| | | | |
| | 742 | | | Summit Hotel Properties Inc | | | | | | | | | | | 9,156 | |
| | | | |
| | 15,401 | | | Sunstone Hotel Investors Inc | | | | | | | | | | | 214,382 | |
| | | | Total Hotels | | | | | | | | | | | 506,647 | |
| | | | |
| | | | Industrial – 14.0% | | | | | | | | | |
| | | | |
| | 5,257 | | | Americold Realty Trust | | | | | | | | | | | 184,310 | |
| | | | |
| | 4,568 | | | APN Industria REIT, (2) | | | | | | | | | | | 9,326 | |
| | | | |
| | 61,830 | | | Ascendas Real Estate Investment Trust, (2) | | | | | | | | | | | 136,604 | |
| | | | |
| | 47,962 | | | Centuria Industrial REIT, (2) | | | | | | | | | | | 112,433 | |
| | | | |
| | 11,171 | | | Deutsche Industrie REIT AG | | | | | | | | | | | 210,513 | |
| | | | |
| | 6,633 | | | Dream Industrial Real Estate Investment Trust | | | | | | | | | | | 67,119 | |
| | | | |
| | 18,416 | | | Duke Realty Corp | | | | | | | | | | | 638,483 | |
| | | | |
| | 691 | | | EastGroup Properties Inc | | | | | | | | | | | 91,675 | |
| | | | |
| | 41,240 | | | ESR-REIT | | | | | | | | | | | 16,251 | |
| | | | |
| | 197,953 | | | Frasers Logistics & Industrial Trust | | | | | | | | | | | 182,506 | |
| | | | |
| | 95 | | | GLPJ-Reit | | | | | | | | | | | 117,947 | |
| | | | |
| | 18,488 | | | Goodman Group, (2) | | | | | | | | | | | 173,735 | |
| | | | |
| | 17 | | | LaSalle Logiport REIT, (2) | | | | | | | | | | | 25,270 | |
| | | | |
| | 9,930 | | | Lexington Realty Trust | | | | | | | | | | | 105,457 | |
| | | | |
| | 37,930 | | | Mapletree Industrial Trust, (2) | | | | | | | | | | | 73,357 | |
| | | | |
| | 69,509 | | | Mapletree Logistics Trust, (2) | | | | | | | | | | | 89,910 | |
| | | | |
| | 36 | | | Nippon Prologis REIT Inc, (2) | | | | | | | | | | | 91,689 | |
| | | | |
| | 9,519 | | | Prologis Inc | | | | | | | | | | | 848,524 | |
| | | | |
| | 2,171 | | | Rexford Industrial Realty Inc | | | | | | | | | | | 99,150 | |
| | | | |
| | 8,333 | | | Segro PLC, (2) | | | | | | | | | | | 99,225 | |
| | | | |
| | 4,877 | | | STAG Industrial Inc | | | | | | | | | | | 153,967 | |
| | | | |
| | 4,662 | | | Summit Industrial Income REIT | | | | | | | | | | | 43,297 | |
39
Nuveen Global Real Estate Securities Fund(continued)
Portfolio of Investments December 31, 2019
| | | | | | | | | | | | | | | | |
| Shares | | | Description (1) | | | | | | | | Value | |
| | | | |
| | | | Industrial(continued) | | | | | | | | | |
| | | | |
| | 1,303 | | | Terreno Realty Corp | | | | | | | | | | $ | 70,544 | |
| | | | |
| | 95,195 | | | Warehouse Reit PLC | | | | | | | | | | | 140,596 | |
| | | | |
| | 9,284 | | | WPT Industrial Real Estate Investment Trust | | | | | | | | | | | 128,026 | |
| | | | Total Industrial | | | | | | | | | | | 3,909,914 | |
| | | | |
| | | | Office – 13.6% | | | | | | | | | |
| | | | |
| | 2,469 | | | Alexandria Real Estate Equities Inc | | | | | | | | | | | 398,941 | |
| | | | |
| | 3,194 | | | Allied Properties Real Estate Investment Trust | | | | | | | | | | | 128,075 | |
| | | | |
| | 2,741 | | | Boston Properties Inc | | | | | | | | | | | 377,874 | |
| | | | |
| | 11,446 | | | CapitaLand Commercial Trust, (2) | | | | | | | | | | | 16,952 | |
| | | | |
| | 21,559 | | | Centuria Metropolitan REIT, (2) | | | | | | | | | | | 43,937 | |
| | | | |
| | 9,131 | | | COIMA RES SpA, 144A, (2) | | | | | | | | | | | 90,560 | |
| | | | |
| | 490 | | | Columbia Property Trust Inc | | | | | | | | | | | 10,246 | |
| | | | |
| | 4,398 | | | Corporate Office Properties Trust | | | | | | | | | | | 129,213 | |
| | | | |
| | 622 | | | Cousins Properties Inc | | | | | | | | | | | 25,626 | |
| | | | |
| | 19 | | | Daiwa Office Investment Corp, (2) | | | | | | | | | | | 145,903 | |
| | | | |
| | 4,335 | | | Derwent London PLC | | | | | | | | | | | 230,260 | |
| | | | |
| | 28,384 | | | Dexus, (2) | | | | | | | | | | | 233,651 | |
| | | | |
| | 5,170 | | | Douglas Emmett Inc | | | | | | | | | | | 226,963 | |
| | | | |
| | 51,246 | | | GDI Property Group | | | | | | | | | | | 53,044 | |
| | | | |
| | 75,620 | | | Hibernia REIT plc | | | | | | | | | | | 119,600 | |
| | | | |
| | 3,311 | | | Hudson Pacific Properties Inc | | | | | | | | | | | 124,659 | |
| | | | |
| | 141 | | | Ichigo Office REIT Investment | | | | | | | | | | | 146,379 | |
| | | | |
| | 7,359 | | | Inmobiliaria Colonial Socimi SA, (2), (4) | | | | | | | | | | | 93,925 | |
| | | | |
| | 3,074 | | | Intervest Offices & Warehouses NV, (2) | | | | | | | | | | | 88,374 | |
| | | | |
| | 77 | | | Japan Excellent Inc | | | | | | | | | | | 124,583 | |
| | | | |
| | 3,804 | | | JBG SMITH Properties | | | | | | | | | | | 151,742 | |
| | | | |
| | 1,102 | | | Kilroy Realty Corp | | | | | | | | | | | 92,458 | |
| | | | |
| | 1,138 | | | Mack-Cali Realty Corp | | | | | | | | | | | 26,322 | |
| | | | |
| | 34 | | | Mori Trust Sogo Reit Inc | | | | | | | | | | | 60,956 | |
| | | | |
| | 33 | | | Nippon Building Fund Inc, (2) | | | | | | | | | | | 241,898 | |
| | | | |
| | 1,019 | | | NSI NV | | | | | | | | | | | 49,607 | |
| | | | |
| | 16 | | | Orix JREIT Inc, (2) | | | | | | | | | | | 34,681 | |
| | | | |
| | 5,162 | | | Paramount Group Inc | | | | | | | | | | | 71,855 | |
| | | | |
| | 423 | | | Piedmont Office Realty Trust Inc | | | | | | | | | | | 9,408 | |
| | | | |
| | 34,067 | | | Precinct Properties New Zealand Ltd, (2) | | | | | | | | | | | 42,091 | |
| | | | |
| | 3,006 | | | Vornado Realty Trust | | | | | | | | | | | 199,899 | |
| | | | Total Office | | | | | | | | | | | 3,789,682 | |
| | | | |
| | | | Residential – 15.7% | | | | | | | | | |
| | | | |
| | 58 | | | American Campus Communities Inc | | | | | | | | | | | 2,728 | |
| | | | |
| | 8,735 | | | American Homes 4 Rent | | | | | | | | | | | 228,944 | |
40
| | | | | | | | | | | | | | | | |
| Shares | | | Description (1) | | | | | | | | Value | |
| | | | |
| | | | Residential(continued) | | | | | | | | | |
| | | | |
| | 2,835 | | | Apartment Investment & Management Co | | | | | | | | | | $ | 146,428 | |
| | | | |
| | 2,132 | | | AvalonBay Communities Inc | | | | | | | | | | | 447,080 | |
| | | | |
| | 2,066 | | | Boardwalk Real Estate Investment Trust | | | | | | | | | | | 73,075 | |
| | | | |
| | 5,255 | | | Camden Property Trust | | | | | | | | | | | 557,556 | |
| | | | |
| | 9,858 | | | Canadian Apartment Properties REIT | | | | | | | | | | | 402,428 | |
| | | | |
| | 2,613 | | | Equity LifeStyle Properties Inc | | | | | | | | | | | 183,929 | |
| | | | |
| | 3,920 | | | Equity Residential | | | | | | | | | | | 317,206 | |
| | | | |
| | 702 | | | Essex Property Trust Inc | | | | | | | | | | | 211,204 | |
| | | | |
| | 29,438 | | | European Residential Real Estate Investment Trust | | | | | | | | | | | 105,415 | |
| | | | |
| | 7,314 | | | InterRent Real Estate Investment Trust | | | | | | | | | | | 88,091 | |
| | | | |
| | 288 | | | Investors Real Estate Trust | | | | | | | | | | | 20,880 | |
| | | | |
| | 9,884 | | | Invitation Homes Inc | | | | | | | | | | | 296,223 | |
| | | | |
| | 31,944 | | | Irish Residential Properties REIT PLC, (4) | | | | | | | | | | | 56,972 | |
| | | | |
| | 153 | | | Japan Rental Housing Investments Inc | | | | | | | | | | | 149,684 | |
| | | | |
| | 49 | | | Kenedix Residential Next Investment Corp | | | | | | | | | | | 92,268 | |
| | | | |
| | 4,122 | | | Killam Apartment Real Estate Investment Trust | | | | | | | | | | | 60,121 | |
| | | | |
| | 1,636 | | | Mid-America Apartment Communities Inc | | | | | | | | | | | 215,723 | |
| | | | |
| | 3,307 | | | Minto Apartment Real Estate Investment Trust | | | | | | | | | | | 58,956 | |
| | | | |
| | 547 | | | NexPoint Residential Trust Inc | | | | | | | | | | | 24,615 | |
| | | | |
| | 1 | | | Nippon Accommodations Fund Inc | | | | | | | | | | | 6,314 | |
| | | | |
| | 1,638 | | | Sun Communities Inc | | | | | | | | | | | 245,864 | |
| | | | |
| | 4,323 | | | UDR Inc | | | | | | | | | | | 201,884 | |
| | | | |
| | 7,511 | | | UNITE Group PLC | | | | | | | | | | | 125,358 | |
| | | | |
| | 1,414 | | | Xior Student Housing NV | | | | | | | | | | | 80,097 | |
| | | | Total Residential | | | | | | | | | | | 4,399,043 | |
| | | | |
| | | | Retail – 9.4% | | | | | | | | | |
| | | | |
| | 3,896 | | | Acadia Realty Trust | | | | | | | | | | | 101,023 | |
| | | | |
| | 1,139 | | | Agree Realty Corp | | | | | | | | | | | 79,924 | |
| | | | |
| | 1 | | | Altarea SCA | | | | | | | | | | | 227 | |
| | | | |
| | 591 | | | Brixmor Property Group Inc | | | | | | | | | | | 12,772 | |
| | | | |
| | 1,240 | | | Brookfield Property REIT Inc | | | | | | | | | | | 22,872 | |
| | | | |
| | 1,003 | | | Federal Realty Investment Trust | | | | | | | | | | | 129,116 | |
| | | | |
| | 3,235 | | | First Capital Real Estate Investment Trust | | | | | | | | | | | 51,494 | |
| | | | |
| | 37,071 | | | Fortune Real Estate Investment Trust, (2) | | | | | | | | | | | 43,253 | |
| | | | |
| | 58,039 | | | Frasers Centrepoint Trust, (2) | | | | | | | | | | | 121,371 | |
| | | | |
| | 86,705 | | | IGB Real Estate Investment Trust | | | | | | | | | | | 40,062 | |
| | | | |
| | 37 | | | Kenedix Retail REIT Corp | | | | | | | | | | | 94,156 | |
| | | | |
| | 46,471 | | | Link REIT, (2) | | | | | | | | | | | 492,312 | |
| | | | |
| | 23,304 | | | Mapletree Commercial Trust, (2) | | | | | | | | | | | 41,440 | |
| | | | |
| | 3,054 | | | National Retail Properties Inc | | | | | | | | | | | 163,755 | |
41
Nuveen Global Real Estate Securities Fund(continued)
Portfolio of Investments December 31, 2019
| | | | | | | | | | | | | | | | |
| Shares | | | Description (1) | | | | | | | | Value | |
| | | | |
| | | | Retail(continued) | | | | | | | | | |
| | | | |
| | 30,453 | | | NewRiver REIT PLC | | | | | | | | | | $ | 80,878 | |
| | | | |
| | 2,862 | | | Realty Income Corp | | | | | | | | | | | 210,729 | |
| | | | |
| | 3,049 | | | Regency Centers Corp | | | | | | | | | | | 192,361 | |
| | | | |
| | 2,364 | | | RPT Realty | | | | | | | | | | | 35,555 | |
| | | | |
| | 10,070 | | | Scentre Group, (2) | | | | | | | | | | | 27,101 | |
| | | | |
| | 3,879 | | | Simon Property Group Inc | | | | | | | | | | | 577,816 | |
| | | | |
| | 5,239 | | | SITE Centers Corp | | | | | | | | | | | 73,451 | |
| | | | |
| | 1,207 | | | Urban Edge Properties | | | | | | | | | | | 23,150 | |
| | | | |
| | 50 | | | Weingarten Realty Investors | | | | | | | | | | | 1,562 | |
| | | | Total Retail | | | | | | | | | | | 2,616,380 | |
| | | | |
| | | | Specialized – 10.4% | | | | | | | | | |
| | | | |
| | 427 | | | American Tower Corp | | | | | | | | | | | 98,133 | |
| | | | |
| | 4,931 | | | ARGAN SA | | | | | | | | | | | 429,214 | |
| | | | |
| | 2,580 | | | Big Yellow Group PLC, (2) | | | | | | | | | | | 40,977 | |
| | | | |
| | 17,659 | | | Charter Hall Social Infrastructure REIT | | | | | | | | | | | 40,151 | |
| | | | |
| | 392 | | | CoreSite Realty Corp | | | | | | | | | | | 43,951 | |
| | | | |
| | 2,305 | | | CubeSmart | | | | | | | | | | | 72,561 | |
| | | | |
| | 2,478 | | | CyrusOne Inc | | | | | | | | | | | 162,136 | |
| | | | |
| | 2,433 | | | Digital Realty Trust Inc | | | | | | | | | | | 291,327 | |
| | | | |
| | 1,325 | | | EPR Properties | | | | | | | | | | | 93,598 | |
| | | | |
| | 1,120 | | | Equinix Inc | | | | | | | | | | | 653,744 | |
| | | | |
| | 995 | | | Extra Space Storage Inc | | | | | | | | | | | 105,092 | |
| | | | |
| | 3,458 | | | Four Corners Property Trust Inc | | | | | | | | | | | 97,481 | |
| | | | |
| | 39,060 | | | Keppel DC REIT, (2) | | | | | | | | | | | 60,434 | |
| | | | |
| | 2,323 | | | Public Storage | | | | | | | | | | | 494,706 | |
| | | | |
| | 55 | | | QTS Realty Trust Inc | | | | | | | | | | | 2,985 | |
| | | | |
| | 10,763 | | | Safestore Holdings PLC | | | | | | | | | | | 114,909 | |
| | | | |
| | 64 | | | SBA Communications Corp | | | | | | | | | | | 15,423 | |
| | | | |
| | 4,066 | | | VICI Properties Inc | | | | | | | | | | | 103,886 | |
| | | | Total Specialized | | | | | | | | | | | 2,920,708 | |
| | | | Total Real Estate Investment Trust Common Stocks (cost $20,906,191) | | | | | | | | | | | 23,444,027 | |
| | | | |
| Shares | | | Description (1) | | | | | | | | Value | |
| | | | |
| | | | COMMON STOCKS – 14.4% | | | | | | | | | | | | |
| | | | |
| | | | Diversified Telecommunication Services – 0.4% | | | | | | | | | |
| | | | |
| | 362 | | | Cellnex Telecom SA, 144A, (2), (4) | | | | | | | | | | $ | 15,615 | |
| | | | |
| | 5,159 | | | Infrastrutture Wireless Italiane SpA, 144A | | | | | | | | | | | 50,519 | |
| | | | |
| | 55,298 | | | Telesites SAB de CV, (4) | | | | | | | | | | | 40,945 | |
| | | | Total Diversified Telecommunication Services | | | | | | | | | | | 107,079 | |
42
| | | | | | | | | | | | | | | | |
| | | | |
| Shares | | | Description (1) | | | | | | | | Value | |
| | | | |
| | | | Health Care Providers & Services – 0.0% | | | | | | | | | |
| | | | |
| | 437 | | | Sienna Senior Living Inc | | | | | | | | | | $ | 6,145 | |
| | | | |
| | | | Hotels, Restaurants & Leisure – 0.2% | | | | | | | | | |
| | | | |
| | 2,294 | | | Pandox AB | | | | | | | | | | | 51,923 | |
| | | | |
| | | | IT Services – 0.7% | | | | | | | | | |
| | | | |
| | 1,166 | | | InterXion Holding NV, (4) | | | | | | | | | | | 97,722 | |
| | | | |
| | 19,863 | | | NEXTDC Ltd, (2), (4) | | | | | | | | | | | 91,771 | |
| | | | Total IT Services | | | | | | | | | | | 189,493 | |
| | | | |
| | | | Real Estate Management & Development – 13.1% | | | | | | | | | |
| | | | |
| | 5,600 | | | ADLER Real Estate AG, (4) | | | | | | | | | | | 85,429 | |
| | | | |
| | 8,617 | | | Aroundtown SA, (2) | | | | | | | | | | | 77,396 | |
| | | | |
| | 36,749 | | | Ascendas India Trust | | | | | | | | | | | 42,352 | |
| | | | |
| | 50,578 | | | Ayala Land Inc, (2) | | | | | | | | | | | 45,364 | |
| | | | |
| | 17,297 | | | BR Properties SA, (2) | | | | | | | | | | | 62,511 | |
| | | | |
| | 1,890 | | | CA Immobilien Anlagen AG | | | | | | | | | | | 79,395 | |
| | | | |
| | 16,321 | | | CapitaLand Ltd, (2) | | | | | | | | | | | 45,544 | |
| | | | |
| | 25 | | | City Developments Ltd, (2) | | | | | | | | | | | 203 | |
| | | | |
| | 21,599 | | | CK Asset Holdings Ltd, (2) | | | | | | | | | | | 155,863 | |
| | | | |
| | 51,117 | | | Corp Inmobiliaria Vesta SAB de CV | | | | | | | | | | | 92,244 | |
| | | | |
| | 11,633 | | | Cyrela Commercial Properties SA Empreendimentos e Participacoes, (4) | | | | | | | | | | | 73,482 | |
| | | | |
| | 2,777 | | | Dios Fastigheter AB, (2) | | | | | | | | | | | 25,446 | |
| | | | |
| | 2,847 | | | Entra ASA, 144A, (2) | | | | | | | | | | | 47,066 | |
| | | | |
| | 724 | | | Fabege AB, (2) | | | | | | | | | | | 12,027 | |
| | | | |
| | 1,050 | | | Fastighets AB Balder, (2), (4) | | | | | | | | | | | 48,595 | |
| | | | |
| | 21,696 | | | Godewind Immobilien AG, 144A, (4) | | | | | | | | | | | 115,355 | |
| | | | |
| | 25,330 | | | Grainger PLC | | | | | | | | | | | 105,085 | |
| | | | |
| | 3,619 | | | Kennedy-Wilson Holdings Inc | | | | | | | | | | | 80,704 | |
| | | | |
| | 204,935 | | | Land & Houses PCL, (4) | | | | | | | | | | | 67,049 | |
| | | | |
| | 3,292 | | | LEG Immobilien AG, (2) | | | | | | | | | | | 388,773 | |
| | | | |
| | 3,574 | | | Lifestyle Communities Ltd, (2) | | | | | | | | | | | 23,063 | |
| | | | |
| | 5,409 | | | Mitsubishi Estate Co Ltd, (2) | | | | | | | | | | | 103,500 | |
| | | | |
| | 22,197 | | | Mitsui Fudosan Co Ltd, (2), (DD1) | | | | | | | | | | | 542,493 | |
| | | | |
| | 11,787 | | | Nyfosa AB, (4) | | | | | | | | | | | 101,934 | |
| | | | |
| | 12,959 | | | Samhallsbyggnadsbolaget i Norden AB, (WI/DD) | | | | | | | | | | | 31,754 | |
| | | | |
| | 320 | | | Sino Land Co Ltd, (2) | | | | | | | | | | | 464 | |
| | | | |
| | 122,568 | | | Sirius Real Estate Ltd | | | | | | | | | | | 143,683 | |
| | | | |
| | 5,991 | | | Sumitomo Realty & Development Co Ltd, (2) | | | | | | | | | | | 209,023 | |
| | | | |
| | 19,536 | | | Sun Hung Kai Properties Ltd, (2) | | | | | | | | | | | 299,191 | |
| | | | |
| | 9,711 | | | TAG Immobilien AG, (2) | | | | | | | | | | | 241,179 | |
| | | | |
| | 11,563 | | | Tricon Capital Group Inc | | | | | | | | | | | 94,655 | |
| | | | |
| | 4,031 | | | VIB Vermoegen AG | | | | | | | | | | | 134,743 | |
43
Nuveen Global Real Estate Securities Fund(continued)
Portfolio of Investments December 31, 2019
| | | | | | | | | | | | | | | | |
| | | | |
| Shares | | | Description (1) | | | | | | | | Value | |
| | | | |
| | | | Real Estate Management & Development – 13.1% | | | | | | | | | |
| | | | |
| | 1,444 | | | Vonovia SE, (2) | | | | | | | | | | $ | 77,556 | |
| | | | Total Real Estate Management & Development | | | | | | | | | | | 3,653,121 | |
| | | | Total Common Stocks (cost $3,649,050) | | | | | | | | | | | 4,007,761 | |
| | | | |
| Shares | | | Description (1) | | | | | | | | Value | |
| | | | |
| | | | REAL ESTATE INVESTMENT TRUST COMMON STOCKS RIGHTS – 0.0% | | | | | | | | | | | | |
| | | | |
| | | | Diverse REIT – 0.0% | | | | | | | | | |
| | | | |
| | 830 | | | Charter Hall Long Wale REIT, (3), (4) | | | | | | | | | | $ | — | |
| | | | Total Real Estate Investment Trust Common Stocks Rights (cost $0) | | | | | | | | | | | — | |
| | | | Total Long-Term Investments (cost $24,555,241) | | | | | | | | | | | 27,451,788 | |
| | | | |
Principal
Amount (000) | | | Description (1) | | Coupon | | | Maturity | | | Value | |
| | | | |
| | | | SHORT-TERM INVESTMENTS – 1.3% | | | | | | | | | | | | |
| | | | |
| | | | REPURCHASE AGREEMENTS – 1.3% | | | | | | | | | |
| | | | |
| $ | 369 | | | Repurchase Agreement with Fixed Income Clearing Corporation, dated 12/31/19, repurchase price $369,066, collateralized by $365,000 U.S. Treasury Bonds, 2.500%, due 2/15/45, value $379,096 | | | 0.650% | | | | 1/02/20 | | | $ | 369,053 | |
| | | | Total Short-Term Investments (cost $369,053) | | | | | | | | | | | 369,053 | |
| | | | Total Investments (cost $24,924,294) – 99.5% | | | | | | | | | | | 27,820,841 | |
| | | | Other Assets Less Liabilities – 0.5% | | | | | | | | | | | 146,691 | |
| | | | Net Assets – 100% | | | | | | | | | | $ | 27,967,532 | |
For Fund portfolio compliance purposes, the Fund’s industry classifications refer to any one or more of the industrysub-classifications used by one or more widely recognized market indexes or ratings group indexes, and/or as defined by Fund management. This definition may not apply for purposes of this report, which may combine industrysub-classifications into sectors for reporting ease.
| (1) | All percentages shown in the Portfolio of Investments are based on net assets. |
| (2) | For fair value measurement disclosure purposes, investment classified as Level 2. See Notes to Financial Statements, Note 3 – Investment Valuation and Fair Value Measurements for more information. |
| (3) | Investment valued at fair value using methods determined in good faith by, or at the discretion of, the Board. For fair value measurement disclosure purposes, investment classified as Level 3. See Notes to Financial Statements, Note 3 – Investment Valuation and Fair Value Measurements for more information. |
| (4) | Non-income producing; issuer has not declared a dividend within the past twelve months. |
| 144A | Investment is exempt from registration under Rule 144A of the Securities Act of 1933, as amended. These investments may only be resold in transactions exempt from registration, which are normally those transactions with qualified institutional buyers. |
| DD1 | Portion of investment purchased on a delayed delivery basis. |
| WI/DD | Purchased on a when-issued or delayed delivery basis. |
| REIT | Real Estate Investment Trust |
See accompanying notes to financial statements.
44
Nuveen Real Asset Income Fund
Portfolio of Investments December 31, 2019
| | | | | | | | | | | | | | | | | | | | | | | | | | | | |
| Shares | | | Description (1) | | | | | | | | | | | | | | | | | Value | |
| | | | | | | |
| | | | LONG-TERM INVESTMENTS – 96.7% | | | | | | | | | | | | | | | | | | | | | | | | |
| | | | | | | |
| | | | REAL ESTATE INVESTMENT TRUST COMMON STOCKS – 26.8% | | | | | | | | | | | | | | | | | | | | | | | | |
| | | | | | | |
| | | | Diversified – 4.6% | | | | | | | | | | | | | | | | | | |
| | | | | | | |
| | 1,245,032 | | | Abacus Property Group, (2) | | | | | | | | | | | | | | | | | | | | | | $ | 3,153,083 | |
| | | | | | | |
| | 334,802 | | | Armada Hoffler Properties Inc | | | | | | | | | | | | | | | | | | | | | | | 6,143,617 | |
| | | | | | | |
| | 994,087 | | | Charter Hall Long Wale REIT, (2) | | | | | | | | | | | | | | | | | | | | | | | 3,836,361 | |
| | | | | | | |
| | 1,757 | | | Cofinimmo SA | | | | | | | | | | | | | | | | | | | | | | | 258,178 | |
| | | | | | | |
| | 376,621 | | | Cominar Real Estate Investment Trust | | | | | | | | | | | | | | | | | | | | | | | 4,106,853 | |
| | | | | | | |
| | 6,872,700 | | | Cromwell European Real Estate Investment Trust | | | | | | | | | | | | | | | | | | | | | | | 4,162,918 | |
| | | | | | | |
| | 292,174 | | | Growthpoint Properties Australia Ltd, (2) | | | | | | | | | | | | | | | | | | | | | | | 851,016 | |
| | | | | | | |
| | 80,270 | | | ICADE, (2) | | | | | | | | | | | | | | | | | | | | | | | 8,740,359 | |
| | | | | | | |
| | 2,481,957 | | | LXI REIT plc | | | | | | | | | | | | | | | | | | | | | | | 4,602,640 | |
| | | | | | | |
| | 2,258,989 | | | Nexus Real Estate Investment Trust | | | | | | | | | | | | | | | | | | | | | | | 3,774,985 | |
| | | | | | | |
| | 4,986 | | | Star Asia Investment Corp, (2) | | | | | | | | | | | | | | | | | | | | | | | 5,359,559 | |
| | | | | | | |
| | 897,604 | | | Stockland, (2) | | | | | | | | | | | | | | | | | | | | | | | 2,912,331 | |
| | | | | | | |
| | 761,517 | | | Stride Property Group | | | | | | | | | | | | | | | | | | | | | | | 1,209,861 | |
| | | | | | | |
| | 4,141,004 | | | VEREIT Inc | | | | | | | | | | | | | | | | | | | | | | | 38,262,877 | |
| | | | | | | |
| | 206,008 | | | WP Carey Inc | | | | | | | | | | | | | | | | | | | | | | | 16,488,880 | |
| | | | Total Diversified | | | | | | | | | | | | | | | | | | | | | | | 103,863,518 | |
| | | | | | | |
| | | | Health Care – 5.1% | | | | | | | | | | | | | | | | | | |
| | | | | | | |
| | 1,473,362 | | | Medical Properties Trust Inc | | | | | | | | | | | | | | | | | | | | | | | 31,102,672 | |
| | | | | | | |
| | 184,731 | | | National Health Investors Inc | | | | | | | | | | | | | | | | | | | | | | | 15,051,882 | |
| | | | | | | |
| | 1,508,300 | | | NorthWest Healthcare Properties Real Estate Investment Trust | | | | | | | | | | | | | | | | | | | | | | | 13,857,009 | |
| | | | | | | |
| | 471,309 | | | Omega Healthcare Investors Inc | | | | | | | | | | | | | | | | | | | | | | | 19,959,936 | |
| | | | | | | |
| | 1,734,922 | | | Parkway Life Real Estate Investment Trust | | | | | | | | | | | | | | | | | | | | | | | 4,282,643 | |
| | | | | | | |
| | 1,089,396 | | | Physicians Realty Trust | | | | | | | | | | | | | | | | | | | | | | | 20,633,160 | |
| | | | | | | |
| | 2,189,413 | | | Target Healthcare REIT PLC | | | | | | | | | | | | | | | | | | | | | | | 3,364,111 | |
| | | | | | | |
| | 111,939 | | | Ventas Inc | | | | | | | | | | | | | | | | | | | | | | | 6,463,358 | |
| | | | Total Health Care | | | | | | | | | | | | | | | | | | | | | | | 114,714,771 | |
| | | | | | | |
| | | | Hotels – 1.8% | | | | | | | | | | | | | | | | | | |
| | | | | | | |
| | 737,694 | | | MGM Growth Properties LLC | | | | | | | | | | | | | | | | | | | | | | | 22,846,383 | |
| | | | | | | |
| | 245,272 | | | Park Hotels & Resorts Inc | | | | | | | | | | | | | | | | | | | | | | | 6,345,187 | |
| | | | | | | |
| | 105,264 | | | Pebblebrook Hotel Trust | | | | | | | | | | | | | | | | | | | | | | | 2,822,128 | |
| | | | | | | |
| | 94,496 | | | Summit Hotel Properties Inc | | | | | | | | | | | | | | | | | | | | | | | 1,166,081 | |
| | | | | | | |
| | 489,438 | | | Sunstone Hotel Investors Inc | | | | | | | | | | | | | | | | | | | | | | | 6,812,977 | |
| | | | Total Hotels | | | | | | | | | | | | | | | | | | | | | | | 39,992,756 | |
| | | | | | | |
| | | | Industrial – 5.3% | | | | | | | | | | | | | | | | | | |
| | | | | | | |
| | 1,163,067 | | | APN Industria REIT, (2) | | | | | | | | | | | | | | | | | | | | | | | 2,374,491 | |
| | | | | | | |
| | 4,502,132 | | | Ascendas Real Estate Investment Trust, (2) | | | | | | | | | | | | | | | | | | | | | | | 9,946,801 | |
45
Nuveen Real Asset Income Fund(continued)
Portfolio of Investments December 31, 2019
| | | | | | | | | | | | | | | | | | | | | | | | | | | | |
| Shares | | | Description (1) | | | | | | | | | | | | | | | | | Value | |
| | | | | | | |
| | | | Industrial(continued) | | | | | | | | | | | | | | | | | | |
| | | | | | | |
| | 3,578,783 | | | Centuria Industrial REIT, (2) | | | | | | | | | | | | | | | | | | | | | | $ | 8,389,410 | |
| | | | | | | |
| | 1,639,805 | | | Dream Industrial Real Estate Investment Trust | | | | | | | | | | | | | | | | | | | | | | | 16,593,152 | |
| | | | | | | |
| | 4,032,546 | | | ESR-REIT | | | | | | | | | | | | | | | | | | | | | | | 1,589,092 | |
| | | | | | | |
| | 18,620,508 | | | Frasers Logistics & Industrial Trust | | | | | | | | | | | | | | | | | | | | | | | 17,167,501 | |
| | | | | | | |
| | 2,395,004 | | | Mapletree Industrial Trust, (2) | | | | | | | | | | | | | | | | | | | | | | | 4,631,957 | |
| | | | | | | |
| | 5,555,101 | | | Mapletree Logistics Trust, (2) | | | | | | | | | | | | | | | | | | | | | | | 7,185,569 | |
| | | | | | | |
| | 1,336,236 | | | PLA Administradora Industrial S de RL de CV | | | | | | | | | | | | | | | | | | | | | | | 2,190,840 | |
| | | | | | | |
| | 613,465 | | | Prologis Property Mexico SA de CV | | | | | | | | | | | | | | | | | | | | | | | 1,362,715 | |
| | | | | | | |
| | 915,149 | | | STAG Industrial Inc | | | | | | | | | | | | | | | | | | | | | | | 28,891,254 | |
| | | | | | | |
| | 3,009,197 | | | Warehouse Reit PLC | | | | | | | | | | | | | | | | | | | | | | | 4,444,370 | |
| | | | | | | |
| | 1,017,915 | | | WPT Industrial Real Estate Investment Trust | | | | | | | | | | | | | | | | | | | | | | | 14,037,048 | |
| | | | Total Industrial | | | | | | | | | | | | | | | | | | | | | | | 118,804,200 | |
| | | | | | | |
| | | | Mortgage – 1.2% | | | | | | | | | | | | | | | | | | |
| | | | | | | |
| | 196,958 | | | TPG RE Finance Trust Inc | | | | | | | | | | | | | | | | | | | | | | | 3,992,339 | |
| | | | | | | |
| | 591,218 | | | Blackstone Mortgage Trust Inc | | | | | | | | | | | | | | | | | | | | | | | 22,005,134 | |
| | | | | | | |
| | 29,774 | | | KKR Real Estate Finance Trust Inc | | | | | | | | | | | | | | | | | | | | | | | 607,985 | |
| | | | Total Mortgage | | | | | | | | | | | | | | | | | | | | | | | 26,605,458 | |
| | | | | | | |
| | | | Office – 2.4% | | | | | | | | | | | | | | | | | | |
| | | | | | | |
| | 31,416 | | | Befimmo SA | | | | | | | | | | | | | | | | | | | | | | | 1,906,448 | |
| | | | | | | |
| | 163,493 | | | Brandywine Realty Trust | | | | | | | | | | | | | | | | | | | | | | | 2,575,015 | |
| | | | | | | |
| | 2,839,841 | | | Centuria Metropolitan REIT, (2) | | | | | | | | | | | | | | | | | | | | | | | 5,787,500 | |
| | | | | | | |
| | 497,120 | | | City Office REIT Inc | | | | | | | | | | | | | | | | | | | | | | | 6,721,062 | |
| | | | | | | |
| | 62,281 | | | Covivio, (2) | | | | | | | | | | | | | | | | | | | | | | | 7,073,243 | |
| | | | | | | |
| | 1,757,361 | | | GDI Property Group | | | | | | | | | | | | | | | | | | | | | | | 1,819,011 | |
| | | | | | | |
| | 211,248 | | | Globalworth Real Estate Investments Ltd | | | | | | | | | | | | | | | | | | | | | | | 2,215,547 | |
| | | | | | | |
| | 418,977 | | | Inovalis Real Estate Investment Trust | | | | | | | | | | | | | | | | | | | | | | | 3,439,448 | |
| | | | | | | |
| | 196,411 | | | Intervest Offices & Warehouses NV, (2) | | | | | | | | | | | | | | | | | | | | | | | 5,646,614 | |
| | | | | | | |
| | 197,083 | | | NSI NV | | | | | | | | | | | | | | | | | | | | | | | 9,594,351 | |
| | | | | | | |
| | 1,303,417 | | | True North Commercial Real Estate Investment Trust | | | | | | | | | | | | | | | | | | | | | | | 7,317,323 | |
| | | | Total Office | | | | | | | | | | | | | | | | | | | | | | | 54,095,562 | |
| | | | | | | |
| | | | Residential – 0.3% | | | | | | | | | | | | | | | | | | |
| | | | | | | |
| | 97,300 | | | Independence Realty Trust Inc | | | | | | | | | | | | | | | | | | | | | | | 1,369,984 | |
| | | | | | | |
| | 264,935 | | | Northview Apartment Real Estate Investment Trust | | | | | | | | | | | | | | | | | | | | | | | 6,047,263 | |
| | | | Total Residential | | | | | | | | | | | | | | | | | | | | | | | 7,417,247 | |
| | | | | | | |
| | | | Retail – 4.0% | | | | | | | | | | | | | | | | | | |
| | | | | | | |
| | 15,808 | | | Altarea SCA | | | | | | | | | | | | | | | | | | | | | | | 3,590,696 | |
| | | | | | | |
| | 101,839 | | | British Land Co PLC | | | | | | | | | | | | | | | | | | | | | | | 861,715 | |
| | | | | | | |
| | 117,473 | | | Brixmor Property Group Inc | | | | | | | | | | | | | | | | | | | | | | | 2,538,592 | |
| | | | | | | |
| | 244,661 | | | Brookfield Property REIT Inc | | | | | | | | | | | | | | | | | | | | | | | 4,512,772 | |
| | | | | | | |
| | 357,198 | | | CT Real Estate Investment Trust | | | | | | | | | | | | | | | | | | | | | | | 4,439,703 | |
46
| | | | | | | | | | | | | | | | | | | | | | | | | | | | |
| Shares | | | Description (1) | | | | | | | | | | | | | | | | | Value | |
| | | | | | | |
| | | | Retail(continued) | | | | | | | | | | | | | | | | | | |
| | | | | | | |
| | 4,815,557 | | | Fortune Real Estate Investment Trust, (2) | | | | | | | | | | | | | | | | | | | | | | $ | 5,618,633 | |
| | | | | | | |
| | 3,727,250 | | | Frasers Centrepoint Trust, (2) | | | | | | | | | | | | | | | | | | | | | | | 7,794,402 | |
| | | | | | | |
| | 10,637,690 | | | IGB Real Estate Investment Trust | | | | | | | | | | | | | | | | | | | | | | | 4,915,104 | |
| | | | | | | |
| | 133,060 | | | Immobiliare Grande Distribuzione SIIQ SpA | | | | | | | | | | | | | | | | | | | | | | | 925,371 | |
| | | | | | | |
| | 2,398 | | | Kenedix Retail REIT Corp | | | | | | | | | | | | | | | | | | | | | | | 6,102,315 | |
| | | | | | | |
| | 1,532,277 | | | NewRiver REIT PLC | | | | | | | | | | | | | | | | | | | | | | | 4,069,456 | |
| | | | | | | |
| | 168,877 | | | RioCan Real Estate Investment Trust | | | | | | | | | | | | | | | | | | | | | | | 3,480,150 | |
| | | | | | | |
| | 293,499 | | | RPT Realty | | | | | | | | | | | | | | | | | | | | | | | 4,414,225 | |
| | | | | | | |
| | 1,019,174 | | | Scentre Group, (2) | | | | | | | | | | | | | | | | | | | | | | | 2,742,857 | |
| | | | | | | |
| | 75,936 | | | Simon Property Group Inc | | | | | | | | | | | | | | | | | | | | | | | 11,311,427 | |
| | | | | | | |
| | 647,805 | | | SITE Centers Corp | | | | | | | | | | | | | | | | | | | | | | | 9,082,226 | |
| | | | | | | |
| | 69,203 | | | SmartCentres Real Estate Investment Trust | | | | | | | | | | | | | | | | | | | | | | | 1,663,260 | |
| | | | | | | |
| | 3,478,821 | | | Viva Energy REIT, (2) | | | | | | | | | | | | | | | | | | | | | | | 6,507,004 | |
| | | | | | | |
| | 180,734 | | | Weingarten Realty Investors | | | | | | | | | | | | | | | | | | | | | | | 5,646,130 | |
| | | | Total Retail | | | | | | | | | | | | | | | | | | | | | | | 90,216,038 | |
| | | | | | | |
| | | | Specialized – 2.1% | | | | | | | | | | | | | | | | | | |
| | | | | | | |
| | 575,484 | | | Automotive Properties Real Estate Investment Trust | | | | | | | | | | | | | | | | | | | | | | | 5,384,568 | |
| | | | | | | |
| | 1,302,938 | | | Charter Hall Social Infrastructure REIT | | | | | | | | | | | | | | | | | | | | | | | 2,962,451 | |
| | | | | | | |
| | 273,517 | | | EPR Properties | | | | | | | | | | | | | | | | | | | | | | | 19,321,241 | |
| | | | | | | |
| | 2,393,005 | | | National Storage REIT, (2) | | | | | | | | | | | | | | | | | | | | | | | 3,080,995 | |
| | | | | | | |
| | 618,290 | | | VICI Properties Inc | | | | | | | | | | | | | | | | | | | | | | | 15,797,310 | |
| | | | Total Specialized | | | | | | | | | | | | | | | | | | | | | | | 46,546,565 | |
| | | | Total Real Estate Investment Trust Common Stocks (cost $541,359,918) | | | | 602,256,115 | |
| | | | | | | |
| Shares | | | Description (1) | | | | | | | | | | | | | | | | | Value | |
| | | | | | | |
| | | | COMMON STOCKS – 20.2% | | | | | | | | | | | | | | | | | | | | | | | | |
| | | | | | | |
| | | | Air Freight & Logistics – 0.5% | | | | | | | | | | | | | | | | | | |
| | | | | | | |
| | 101,840 | | | bpost SA, (2) | | | | | | | | | | | | | | | | | | | | | | $ | 1,177,438 | |
| | | | | | | |
| | 242,613 | | | Oesterreichische Post AG, (2) | | | | | | | | | | | | | | | | | | | | | | | 9,221,794 | |
| | | | Total Air Freight & Logistics | | | | | | | | | | | | | | | | | | | | | | | 10,399,232 | |
| | | | | | | |
| | | | Commercial Services & Supplies – 0.3% | | | | | | | | | | | | | | | | | | |
| | | | | | | |
| | 436,028 | | | Covanta Holding Corp | | | | | | | | | | | | | | | | | | | | | | | 6,470,656 | |
| | | | | | | |
| | | | Diversified Telecommunication Services – 1.1% | | | | | | | | | | | | | | | | | | |
| | | | | | | |
| | 1,186,771 | | | HKBN Ltd, (2) | | | | | | | | | | | | | | | | | | | | | | | 1,989,909 | |
| | | | | | | |
| | 2,641,176 | | | HKT Trust & HKT Ltd, (2) | | | | | | | | | | | | | | | | | | | | | | | 3,722,173 | |
| | | | | | | |
| | 23,447,947 | | | NetLink NBN Trust | | | | | | | | | | | | | | | | | | | | | | | 16,475,192 | |
| | | | | | | |
| | 1,426,173 | | | Singapore Telecommunications Ltd, (2) | | | | | | | | | | | | | | | | | | | | | | | 3,522,188 | |
| | | | Total Diversified Telecommunication Services | | | | | | | | | | | | | | | | | | | | | | | 25,709,462 | |
| | | | | | | |
| | | | Electric Utilities – 5.2% | | | | | | | | | | | | | | | | | | |
| | | | | | | |
| | 15,265,699 | | | AusNet Services, (2) | | | | | | | | | | | | | | | | | | | | | | | 18,204,129 | |
47
Nuveen Real Asset Income Fund(continued)
Portfolio of Investments December 31, 2019
| | | | | | | | | | | | | | | | | | | | | | | | | | | | |
| Shares | | | Description (1) | | | | | | | | | | | | | | | | | Value | |
| | | | | | | |
| | | | Electric Utilities(continued) | | | | | | | | | | | | | | | | | | |
| | | | | | | |
| | 208,004 | | | Cia de Transmissao de Energia Eletrica Paulista, (2) | | | | | | | | | | | | | | | | | | | | | | $ | 1,169,671 | |
| | | | | | | |
| | 1,467,731 | | | Contact Energy Ltd, (2) | | | | | | | | | | | | | | | | | | | | | | | 7,050,359 | |
| | | | | | | |
| | 2,918,995 | | | EDP – Energias de Portugal SA, (2) | | | | | | | | | | | | | | | | | | | | | | | 12,666,666 | |
| | | | | | | |
| | 423,405 | | | Endesa SA, (2), (4) | | | | | | | | | | | | | | | | | | | | | | | 11,306,913 | |
| | | | | | | |
| | 686,375 | | | Enel Chile SA, ADR | | | | | | | | | | | | | | | | | | | | | | | 3,260,281 | |
| | | | | | | |
| | 586,859 | | | HK Electric Investments & HK Electric Investments Ltd | | | | | | | | | | | | | | | | | | | | | | | 578,401 | |
| | | | | | | |
| | 860,678 | | | Power Assets Holdings Ltd, (2) | | | | | | | | | | | | | | | | | | | | | | | 6,296,390 | |
| | | | | | | |
| | 409,034 | | | PPL Corp | | | | | | | | | | | | | | | | | | | | | | | 14,676,140 | |
| | | | | | | |
| | 947,903 | | | Red Electrica Corp SA, (2), (4) | | | | | | | | | | | | | | | | | | | | | | | 19,100,018 | |
| | | | | | | |
| | 6,277,126 | | | Spark Infrastructure Group, (2) | | | | | | | | | | | | | | | | | | | | | | | 9,202,204 | |
| | | | | | | |
| | 183,718 | | | SSE PLC, (2) | | | | | | | | | | | | | | | | | | | | | | | 3,503,914 | |
| | | | | | | |
| | 1,480,566 | | | Transmissora Alianca de Energia Eletrica SA, (2) | | | | | | | | | | | | | | | | | | | | | | | 11,505,230 | |
| | | | Total Electric Utilities | | | | | | | | | | | | | | | | | | | | | | | 118,520,316 | |
| | | | | | | |
| | | | Gas Utilities – 1.6% | | | | | | | | | | | | | | | | | | |
| | | | | | | |
| | 447,593 | | | APA Group, (2) | | | | | | | | | | | | | | | | | | | | | | | 3,484,261 | |
| | | | | | | |
| | 403,447 | | | Enagas SA | | | | | | | | | | | | | | | | | | | | | | | 10,290,907 | |
| | | | | | | |
| | 283,111 | | | Naturgy Energy Group SA, (2), (4) | | | | | | | | | | | | | | | | | | | | | | | 7,129,019 | |
| | | | | | | |
| | 2,847,786 | | | Snam SpA, (2) | | | | | | | | | | | | | | | | | | | | | | | 14,973,087 | |
| | | | Total Gas Utilities | | | | | | | | | | | | | | | | | | | | | | | 35,877,274 | |
| | | | | | | |
| | | | Health Care Providers & Services – 0.0% | | | | | | | | | | | | | | | | | | |
| | | | | | | |
| | 12,636 | | | Sienna Senior Living Inc | | | | | | | | | | | | | | | | | | | | | | | 177,685 | |
| | | | | | | |
| | | | Independent Power & Renewable Electricity Producers – 0.7% | | | | | | | | | | | | | | | | | | |
| | | | | | | |
| | 21,869 | | | Atlantica Yield plc | | | | | | | | | | | | | | | | | | | | | | | 577,123 | |
| | | | | | | |
| | 45,353 | | | Brookfield Renewable Partners LP | | | | | | | | | | | | | | | | | | | | | | | 2,106,031 | |
| | | | | | | |
| | 3,216 | | | Canadian Solar Infrastructure Fund Inc, (2) | | | | | | | | | | | | | | | | | | | | | | | 3,528,224 | |
| | | | | | | |
| | 560,454 | | | TerraForm Power Inc, (4) | | | | | | | | | | | | | | | | | | | | | | | 8,625,387 | |
| | | | | | | |
| | 908 | | | TransAlta Renewables Inc | | | | | | | | | | | | | | | | | | | | | | | 10,852 | |
| | | | Total Independent Power & Renewable Electricity Producers | | | | | | | | | | | | | | | | | | | | | | | 14,847,617 | |
| | | | | | | |
| | | | Media – 0.2% | | | | | | | | | | | | | | | | | | |
| | | | | | | |
| | 260,170 | | | Eutelsat Communications SA | | | | | | | | | | | | | | | | | | | | | | | 4,228,656 | |
| | | | | | | |
| | | | Multi-Utilities – 3.3% | | | | | | | | | | | | | | | | | | |
| | | | | | | |
| | 140,798 | | | Dominion Energy Inc | | | | | | | | | | | | | | | | | | | | | | | 11,660,890 | |
| | | | | | | |
| | 1,410,945 | | | Engie SA, (2) | | | | | | | | | | | | | | | | | | | | | | | 22,854,938 | |
| | | | | | | |
| | 763,983 | | | EON SE, (2) | | | | | | | | | | | | | | | | | | | | | | | 8,164,589 | |
| | | | | | | |
| | 194,902 | | | National Grid PLC, Sponsored ADR | | | | | | | | | | | | | | | | | | | | | | | 12,214,508 | |
| | | | | | | |
| | 3,493,988 | | | REN – Redes Energeticas Nacionais SGPS SA | | | | | | | | | | | | | | | | | | | | | | | 10,660,241 | |
| | | | | | | |
| | 216,871 | | | Suez, (2) | | | | | | | | | | | | | | | | | | | | | | | 3,286,303 | |
| | | | | | | |
| | 1,913,877 | | | Vector Ltd, (2) | | | | | | | | | | | | | | | | | | | | | | | 4,807,773 | |
| | | | Total Multi-Utilities | | | | | | | | | | | | | | | | | | | | | | | 73,649,242 | |
48
| | | | | | | | | | | | | | | | | | | | | | | | | | | | |
| | | | | | | |
| Shares | | | Description (1) | | | | | | | | | | | | | | | | | Value | |
| | | | | | | |
| | | | Oil, Gas & Consumable Fuels – 4.6% | | | | | | | | | | | | | | | | | | |
| | | | | | | |
| | 556,918 | | | Enbridge Inc | | | | | | | | | | | | | | | | | | | | | | $ | 22,148,629 | |
| | | | | | | |
| | 300,332 | | | Enterprise Products Partners LP | | | | | | | | | | | | | | | | | | | | | | | 8,457,349 | |
| | | | | | | |
| | 330,280 | | | Gibson Energy Inc | | | | | | | | | | | | | | | | | | | | | | | 6,763,040 | |
| | | | | | | |
| | 652,900 | | | Inter Pipeline Ltd | | | | | | | | | | | | | | | | | | | | | | | 11,332,922 | |
| | | | | | | |
| | 25,578 | | | Keyera Corp | | | | | | | | | | | | | | | | | | | | | | | 670,104 | |
| | | | | | | |
| | 847,647 | | | Kinder Morgan Inc | | | | | | | | | | | | | | | | | | | | | | | 17,944,687 | |
| | | | | | | |
| | 223,720 | | | Magellan Midstream Partners LP | | | | | | | | | | | | | | | | | | | | | | | 14,065,276 | |
| | | | | | | |
| | 76,970 | | | ONEOK Inc | | | | | | | | | | | | | | | | | | | | | | | 5,824,320 | |
| | | | | | | |
| | 48,194 | | | Plains GP Holdings LP | | | | | | | | | | | | | | | | | | | | | | | 913,276 | |
| | | | | | | |
| | 454,561 | | | Williams Cos Inc | | | | | | | | | | | | | | | | | | | | | | | 10,782,187 | |
| | | | | | | |
| | 517,582 | | | Z Energy Ltd, (2) | | | | | | | | | | | | | | | | | | | | | | | 1,531,937 | |
| | | | Total Oil, Gas & Consumable Fuels | | | | | | | | | | | | | | | | | | | | | | | 100,433,727 | |
| | | | | | | |
| | | | Real Estate Management & Development – 0.9% | | | | | | | | | | | | | | | | | | |
| | | | | | | |
| | 3,750,580 | | | Ascendas India Trust | | | | | | | | | | | | | | | | | | | | | | | 4,322,390 | |
| | | | | | | |
| | 312,111 | | | Cibus Nordic Real Estate AB, (4) | | | | | | | | | | | | | | | | | | | | | | | 4,848,436 | |
| | | | | | | |
| | 3,050,957 | | | Corp Inmobiliaria Vesta SAB de CV | | | | | | | | | | | | | | | | | | | | | | | 5,505,681 | |
| | | | | | | |
| | 38,590 | | | DIC Asset AG | | | | | | | | | | | | | | | | | | | | | | | 688,254 | |
| | | | | | | |
| | 9,113,681 | | | Land & Houses PCL, (4) | | | | | | | | | | | | | | | | | | | | | | | 2,981,733 | |
| | | | | | | |
| | 1,206,051 | | | Sirius Real Estate Ltd | | | | | | | | | | | | | | | | | | | | | | | 1,413,818 | |
| | | | Total Real Estate Management & Development | | | | | | | | | | | | | | | | | | | | | | | 19,760,312 | |
| | | | | | | |
| | | | Road & Rail – 0.3% | | | | | | | | | | | | | | | | | | |
| | | | | | | |
| | 2,163,878 | | | Aurizon Holdings Ltd, (2) | | | | | | | | | | | | | | | | | | | | | | | 7,941,268 | |
| | | | | | | |
| | | | Thrifts & Mortgage Finance – 0.1% | | | | | | | | | | | | | | | | | | |
| | | | | | | |
| | 1,478,289 | | | Real Estate Credit Investments Ltd | | | | | | | | | | | | | | | | | | | | | | | 3,289,677 | |
| | | | | | | |
| | | | Transportation Infrastructure – 1.2% | | | | | | | | | | | | | | | | | | |
| | | | | | | |
| | 519,162 | | | COSCO SHIPPING Ports Ltd, (2) | | | | | | | | | | | | | | | | | | | | | | | 425,205 | |
| | | | | | | |
| | 38,087 | | | Grupo Aeroportuario del Pacifico SAB de CV, ADR | | | | | | | | | | | | | | | | | | | | | | | 4,517,499 | |
| | | | | | | |
| | 387,428 | | | Macquarie Infrastructure Corp | | | | | | | | | | | | | | | | | | | | | | | 16,597,416 | |
| | | | | | | |
| | 808,230 | | | Sydney Airport, (2) | | | | | | | | | | | | | | | | | | | | | | | 4,910,579 | |
| | | | Total Transportation Infrastructure | | | | | | | | | | | | | | | | | | | | | | | 26,450,699 | |
| | | | | | | |
| | | | Water Utilities – 0.2% | | | | | | | | | | | | | | | | | | |
| | | | | | | |
| | 3,706,769 | | | Aguas Andinas SA | | | | | | | | | | | | | | | | | | | | | | | 1,572,524 | |
| | | | | | | |
| | 2,934,272 | | | Inversiones Aguas Metropolitanas SA, (2) | | | | | | | | | | | | | | | | | | | | | | | 3,194,912 | |
| | | | Total Water Utilities | | | | | | | | | | | | | | | | | | | | | | | 4,767,436 | |
| | | | Total Common Stocks (cost $418,473,444) | | | | | | | | | | | | | | | | | | | | | | | 452,523,259 | |
| | | | | | | |
| Shares | | | Description (1) | | | | | | | | Coupon | | | | | | Ratings (5) | | | Value | |
| | | | | | | |
| | | | $25 PAR (OR SIMILAR) RETAIL PREFERRED – 14.8% | | | | | | | | | | | | | | | | | | | | | | | | |
| | | | | | | |
| | | | Diversified Financial Services – 0.1% | | | | | | | | | | | | | | | | | | |
| | | | | | | |
| | 109,717 | | | National Rural Utilities Cooperative Finance Corp | | | | | | | | | | | 5.500% | | | | | | | | A3 | | | $ | 3,022,703 | |
49
Nuveen Real Asset Income Fund(continued)
Portfolio of Investments December 31, 2019
| | | | | | | | | | | | | | | | | | | | | | | | | | | | |
| | | | | | | |
| Shares | | | Description (1) | | | | | | | | Coupon | | | | | | Ratings (5) | | | Value | |
| | | | | | | |
| | | | Electric Utilities – 1.9% | | | | | | | | | | | | | | | | | | |
| | | | | | | |
| | 223,352 | | | Duke Energy Corp | | | | | | | | | | | 5.750% | | | | | | | | BBB | | | $ | 6,189,084 | |
| | | | | | | |
| | 127,495 | | | Entergy Arkansas LLC | | | | | | | | | | | 4.875% | | | | | | | | A | | | | 3,318,695 | |
| | | | | | | |
| | 47,804 | | | Entergy Texas Inc | | | | | | | | | | | 5.375% | | | | | | | | BBB– | | | | 1,269,913 | |
| | | | | | | |
| | 195,036 | | | Georgia Power Co | | | | | | | | | | | 5.000% | | | | | | | | BBB | | | | 5,014,376 | |
| | | | | | | |
| | 343,355 | | | Integrys Holding Inc, (2) | | | | | | | | | | | 6.000% | | | | | | | | BBB | | | | 9,227,666 | |
| | | | | | | |
| | 1,775 | | | NextEra Energy Capital Holdings Inc | | | | | | | | | | | 5.000% | | | | | | | | BBB | | | | 45,298 | |
| | | | | | | |
| | 189,681 | | | NextEra Energy Capital Holdings Inc | | | | | | | | | | | 5.250% | | | | | | | | BBB | | | | 4,941,190 | |
| | | | | | | |
| | 83,200 | | | NextEra Energy Capital Holdings Inc | | | | | | | | | | | 5.650% | | | | | | | | BBB | | | | 2,282,176 | |
| | | | | | | |
| | 215,137 | | | Southern Co | | | | | | | | | | | 5.250% | | | | | | | | BBB | | | | 5,666,709 | |
| | | | | | | |
| | 171,081 | | | Southern Co | | | | | | | | | | | 5.250% | | | | | | | | BBB | | | | 4,501,141 | |
| | | | Total Electric Utilities | | | | | | | | | | | | | | | | | | | | | | | 42,456,248 | |
| | | | | | | |
| | | | Equity Real Estate Investment Trust – 8.4% | | | | | | | | | | | | | | | | | | |
| | | | | | | |
| | 62,259 | | | American Homes 4 Rent | | | | | | | | | | | 6.500% | | | | | | | | BB | | | | 1,630,563 | |
| | | | | | | |
| | 231,322 | | | American Homes 4 Rent | | | | | | | | | | | 6.350% | | | | | | | | BB | | | | 5,993,553 | |
| | | | | | | |
| | 103,422 | | | American Homes 4 Rent | | | | | | | | | | | 5.875% | | | | | | | | BB | | | | 2,707,588 | |
| | | | | | | |
| | 191,319 | | | American Homes 4 Rent | | | | | | | | | | | 5.875% | | | | | | | | BB | | | | 5,002,992 | |
| | | | | | | |
| | 80,462 | | | Armada Hoffler Properties Inc | | | | | | | | | | | 6.750% | | | | | | | | N/R | | | | 2,258,568 | |
| | | | | | | |
| | 27,474 | | | Cedar Realty Trust Inc | | | | | | | | | | | 7.250% | | | | | | | | N/R | | | | 689,048 | |
| | | | | | | |
| | 136,681 | | | Cedar Realty Trust Inc | | | | | | | | | | | 6.500% | | | | | | | | N/R | | | | 3,169,632 | |
| | | | | | | |
| | 217,243 | | | City Office REIT Inc | | | | | | | | | | | 6.625% | | | | | | | | N/R | | | | 5,604,869 | |
| | | | | | | |
| | 50,966 | | | Colony Capital Inc | | | | | | | | | | | 7.500% | | | | | | | | N/R | | | | 1,279,247 | |
| | | | | | | |
| | 132,198 | | | Colony Capital Inc | | | | | | | | | | | 7.125% | | | | | | | | N/R | | | | 3,162,176 | |
| | | | | | | |
| | 10,192 | | | Colony Capital Inc | | | | | | | | | | | 7.150% | | | | | | | | N/R | | | | 246,239 | |
| | | | | | | |
| | 197,332 | | | Colony Capital Inc | | | | | | | | | | | 7.125% | | | | | | | | N/R | | | | 4,718,208 | |
| | | | | | | |
| | 150,902 | | | Digital Realty Trust Inc | | | | | | | | | | | 5.250% | | | | | | | | Baa3 | | | | 3,888,745 | |
| | | | | | | |
| | 201,291 | | | Digital Realty Trust Inc | | | | | | | | | | | 5.850% | | | | | | | | Baa3 | | | | 5,535,502 | |
| | | | | | | |
| | 148,050 | | | Digital Realty Trust Inc | | | | | | | | | | | 5.200% | | | | | | | | Baa3 | | | | 3,821,170 | |
| | | | | | | |
| | 192,498 | | | EPR Properties | | | | | | | | | | | 5.750% | | | | | | | | Baa3 | | | | 4,970,298 | |
| | | | | | | |
| | 57,283 | | | Hersha Hospitality Trust | | | | | | | | | | | 6.875% | | | | | | | | N/R | | | | 1,433,221 | |
| | | | | | | |
| | 316,183 | | | Hersha Hospitality Trust | | | | | | | | | | | 6.500% | | | | | | | | N/R | | | | 7,872,957 | |
| | | | | | | |
| | 204,880 | | | Hersha Hospitality Trust | | | | | | | | | | | 6.500% | | | | | | | | N/R | | | | 5,122,000 | |
| | | | | | | |
| | 346,064 | | | Investors Real Estate Trust | | | | | | | | | | | 6.625% | | | | | | | | N/R | | | | 9,086,810 | |
| | | | | | | |
| | 147,987 | | | Kimco Realty Corp | | | | | | | | | | | 5.250% | | | | | | | | Baa2 | | | | 3,832,863 | |
| | | | | | | |
| | 4,655 | | | Mid-America Apartment Communities Inc | | | | | | | | | | | 8.500% | | | | | | | | BBB– | | | | 307,183 | |
| | | | | | | |
| | 300,876 | | | Monmouth Real Estate Investment Corp | | | | | | | | | | | 6.125% | | | | | | | | N/R | | | | 7,497,830 | |
| | | | | | | |
| | 54,608 | | | National Retail Properties Inc | | | | | | | | | | | 5.200% | | | | | | | | Baa2 | | | | 1,388,681 | |
| | | | | | | |
| | 155,592 | | | National Storage Affiliates Trust | | | | | | | | | | | 6.000% | | | | | | | | N/R | | | | 4,141,859 | |
| | | | | | | |
| | 190,311 | | | Pebblebrook Hotel Trust | | | | | | | | | | | 6.500% | | | | | | | | N/R | | | | 4,833,899 | |
| | | | | | | |
| | 223,453 | | | Pebblebrook Hotel Trust | | | | | | | | | | | 6.375% | | | | | | | | N/R | | | | 5,774,026 | |
| | | | | | | |
| | 233,790 | | | Pebblebrook Hotel Trust | | | | | | | | | | | 6.300% | | | | | | | | N/R | | | | 6,008,403 | |
| | | | | | | |
| | 93,963 | | | PS Business Parks Inc | | | | | | | | | | | 5.250% | | | | | | | | BBB | | | | 2,452,434 | |
50
| | | | | | | | | | | | | | | | | | | | | | | | | | | | |
| | | | | | | |
| Shares | | | Description (1) | | | | | | | | Coupon | | | | | | Ratings (5) | | | Value | |
| | | | | | | |
| | | | Equity Real Estate Investment Trust(continued) | | | | | | | | | | | | | | | | | | |
| | | | | | | |
| | 166,119 | | | PS Business Parks Inc | | | | | | | | | | | 5.200% | | | | | | | | Baa2 | | | $ | 4,265,936 | |
| | | | | | | |
| | 286,016 | | | PS Business Parks Inc | | | | | | | | | | | 4.875% | | | | | | | | Baa2 | | | | 7,090,337 | |
| | | | | | | |
| | 68,970 | | | Public Storage | | | | | | | | | | | 5.600% | | | | | | | | A3 | | | | 1,909,779 | |
| | | | | | | |
| | 134,285 | | | Public Storage | | | | | | | | | | | 4.875% | | | | | | | | A3 | | | | 3,457,839 | |
| | | | | | | |
| | 190,069 | | | Rexford Industrial Realty Inc | | | | | | | | | | | 5.625% | | | | | | | | BB+ | | | | 4,873,369 | |
| | | | | | | |
| | 81,295 | | | Saul Centers Inc | | | | | | | | | | | 6.125% | | | | | | | | N/R | | | | 2,096,598 | |
| | | | | | | |
| | 119,574 | | | Saul Centers Inc | | | | | | | | | | | 6.000% | | | | | | | | N/R | | | | 3,144,796 | |
| | | | | | | |
| | 184,380 | | | SITE Centers Corp | | | | | | | | | | | 6.375% | | | | | | | | BB+ | | | | 4,830,756 | |
| | | | | | | |
| | 40,951 | | | STAG Industrial Inc | | | | | | | | | | | 6.875% | | | | | | | | BB+ | | | | 1,092,573 | |
| | | | | | | |
| | 99,545 | | | Summit Hotel Properties Inc | | | | | | | | | | | 6.450% | | | | | | | | N/R | | | | 2,568,062 | |
| | | | | | | |
| | 303,814 | | | Summit Hotel Properties Inc | | | | | | | | | | | 6.250% | | | | | | | | N/R | | | | 7,762,448 | |
| | | | | | | |
| | 48,537 | | | Sunstone Hotel Investors Inc | | | | | | | | | | | 6.950% | | | | | | | | N/R | | | | 1,262,447 | |
| | | | | | | |
| | 226,193 | | | Sunstone Hotel Investors Inc | | | | | | | | | | | 6.450% | | | | | | | | N/R | | | | 5,831,256 | |
| | | | | | | |
| | 94,824 | | | UMH Properties Inc | | | | | | | | | | | 8.000% | | | | | | | | N/R | | | | 2,455,942 | |
| | | | | | | |
| | 190,740 | | | UMH Properties Inc | | | | | | | | | | | 6.750% | | | | | | | | N/R | | | | 4,985,944 | |
| | | | | | | |
| | 135,987 | | | Urstadt Biddle Properties Inc | | | | | | | | | | | 6.250% | | | | | | | | N/R | | | | 3,621,334 | |
| | | | | | | |
| | 141,255 | | | Urstadt Biddle Properties Inc | | | | | | | | | | | 5.875% | | | | | | | | N/R | | | | 3,599,177 | |
| | | | | | | |
| | 356,032 | | | Vornado Realty Trust | | | | | | | | | | | 5.250% | | | | | | | | Baa3 | | | | 9,093,057 | |
| | | | Total Equity Real Estate Investment Trust | | | | | | | | | | | | | | | | | | | | | | | 188,372,214 | |
| | | | | | | |
| | | | Gas Utilities – 0.4% | | | | | | | | | | | | | | | | | | |
| | | | | | | |
| | 240,106 | | | South Jersey Industries Inc | | | | | | | | | | | 5.625% | | | | | | | | BB+ | | | | 6,406,028 | |
| | | | | | | |
| | 86,693 | | | Spire Inc | | | | | | | | | | | 5.900% | | | | | | | | BBB | | | | 2,394,461 | |
| | | | Total Gas Utilities | | | | | | | | | | | | | | | | | | | | | | | 8,800,489 | |
| | |
| | | | Independent Power & Renewable Electricity Producers – 0.1% | | | | |
| | | | | | | |
| | 146,449 | | | Brookfield Renewable Partners LP | | | | | | | | | | | 5.750% | | | | | | | | BBB– | | | | 2,898,417 | |
| | | | | | | |
| | | | Multi-Utilities – 2.4% | | | | | | | | | | | | | | | | | | |
| | | | | | | |
| | 94,257 | | | Algonquin Power & Utilities Corp | | | | | | | | | | | 6.200% | | | | | | | | BB+ | | | | 2,658,047 | |
| | | | | | | |
| | 277,440 | | | Brookfield Infrastructure Partners LP | | | | | | | | | | | 5.350% | | | | | | | | BBB– | | | | 5,510,129 | |
| | | | | | | |
| | 140,457 | | | CMS Energy Corp | | | | | | | | | | | 5.875% | | | | | | | | Baa2 | | | | 3,835,881 | |
| | | | | | | |
| | 349,402 | | | Dominion Energy Inc | | | | | | | | | | | 5.250% | | | | | | | | BBB– | | | | 9,147,344 | |
| | | | | | | |
| | 101,462 | | | DTE Energy Co | | | | | | | | | | | 5.250% | | | | | | | | BBB– | | | | 2,593,369 | |
| | | | | | | |
| | 228,325 | | | DTE Energy Co | | | | | | | | | | | 5.375% | | | | | | | | BBB– | | | | 5,902,201 | |
| | | | | | | |
| | 196,209 | | | DTE Energy Co | | | | | | | | | | | 6.000% | | | | | | | | BBB– | | | | 5,279,984 | |
| | | | | | | |
| | 120,165 | | | DTE Energy Co | | | | | | | | | | | 5.250% | | | | | | | | BBB– | | | | 3,177,163 | |
| | | | | | | |
| | 184,347 | | | NiSource Inc | | | | | | | | | | | 6.500% | | | | | | | | BBB– | | | | 5,139,594 | |
| | | | | | | |
| | 378,614 | | | Sempra Energy | | | | | | | | | | | 5.750% | | | | | | | | Baa2 | | | | 10,059,774 | |
| | | | Total Multi-Utilities | | | | | | | | | | | | | | | | | | | | | | | 53,303,486 | |
| | | | | | | |
| | | | Oil, Gas & Consumable Fuels – 0.6% | | | | | | | | | | | | | | | | | | |
| | | | | | | |
| | 96,230 | | | Energy Transfer Operating LP | | | | | | | | | | | 7.600% | | | | | | | | BB | | | | 2,436,544 | |
| | | | | | | |
| | 153,214 | | | NGL Energy Partners LP | | | | | | | | | | | 9.000% | | | | | | | | N/R | | | | 4,015,739 | |
51
Nuveen Real Asset Income Fund(continued)
Portfolio of Investments December 31, 2019
| | | | | | | | | | | | | | | | | | | | | | | | | | | | |
| | | | | | | |
| Shares | | | Description (1) | | | | | | | | Coupon | | | | | | Ratings (5) | | | Value | |
| | | | | | | |
| | | | Oil, Gas & Consumable Fuels(continued) | | | | | | | | | | | | | | | | | | |
| | | | | | | |
| | 206,311 | | | NuStar Energy LP | | | | | | | | | | | 8.500% | | | | | | | | B1 | | | $ | 4,965,906 | |
| | | | | | | |
| | 132,440 | | | NuStar Energy LP | | | | | | | | | | | 7.625% | | | | | | | | B1 | | | | 2,867,326 | |
| | | | Total Oil, Gas & Consumable Fuels | | | | | | | | | | | | | | | | | | | | | | | 14,285,515 | |
| | | | | | | |
| | | | Real Estate Management & Development – 0.9% | | | | | | | | | | | | | | | | | | |
| | | | | | | |
| | 305,387 | | | Brookfield Property Partners LP | | | | | | | | | | | 6.500% | | | | | | | | BB+ | | | | 7,930,900 | |
| | | | | | | |
| | 289,942 | | | Brookfield Property Partners LP | | | | | | | | | | | 6.375% | | | | | | | | BB+ | | | | 7,692,161 | |
| | | | | | | |
| | 165,501 | | | Landmark Infrastructure Partners LP | | | | | | | | | | | 7.900% | | | | | | | | N/R | | | | 4,236,826 | |
| | | | Total Real Estate Management & Development | | | | | | | | | | | | | | | | | | | | | | | 19,859,887 | |
| | | | Total $25 Par (or similar) Retail Preferred (cost $318,240,249) | | | | | | | | 332,998,959 | |
| | | | | | | |
Principal
Amount (000) (6) | | | Description (1) | | | | | | | | Coupon | | | Maturity | | | Ratings (5) | | | Value | |
| | | | | | | |
| | | | CORPORATE BONDS – 14.1% | | | | | | | | | | | | | | | | | | | | | | | | |
| | | | | | | |
| | | | Chemicals – 0.1% | | | | | | | | | | | | | | | | | | |
| | | | | | | |
| $ | 2,200 | | | Calumet Specialty Products Partners LP / Calumet Finance Corp, 144A | | | | | | | | | | | 11.000% | | | | 4/15/25 | | | | B– | | | $ | 2,392,500 | |
| | | | | | | |
| | | | Commercial Services & Supplies – 1.2% | | | | | | | | | | | | | | | | | | |
| | | | | | | |
| | 1,500 | | | Atento Luxco 1 SA, 144A | | | | | | | | | | | 6.125% | | | | 8/10/22 | | | | BB | | | | 1,477,500 | |
| | | | | | | |
| | 125 | | | Clean Harbors Inc, 144A | | | | | | | | | | | 4.875% | | | | 7/15/27 | | | | BB+ | | | | 131,563 | |
| | | | | | | |
| | 2,475 | | | Clean Harbors Inc, 144A | | | | | | | | | | | 5.125% | | | | 7/15/29 | | | | BB+ | | | | 2,654,685 | |
| | | | | | | |
| | 2,516 | | | Covanta Holding Corp | | | | | | | | | | | 5.875% | | | | 7/01/25 | | | | B1 | | | | 2,654,380 | |
| | | | | | | |
| | 2,500 | EUR | | DSV Miljoe Group AS, Reg S | | | | | | | | | | | 5.900% | | | | 5/10/21 | | | | N/R | | | | 2,833,169 | |
| | | | | | | |
| | 5,970 | | | GFL Environmental Inc, 144A | | | | | | | | | | | 7.000% | | | | 6/01/26 | | | | CCC+ | | | | 6,306,708 | |
| | | | | | | |
| | 200 | | | GFL Environmental Inc, 144A | | | | | | | | | | | 5.125% | | | | 12/15/26 | | | | B+ | | | | 210,276 | |
| | | | | | | |
| | 900 | | | GFL Environmental Inc, 144A | | | | | | | | | | | 8.500% | | | | 5/01/27 | | | | CCC+ | | | | 990,000 | |
| | | | | | | |
| | 950 | | | Stericycle Inc, 144A | | | | | | | | | | | 5.375% | | | | 7/15/24 | | | | BB+ | | | | 997,500 | |
| | | | | | | |
| | 4,559 | | | Tervita Corp, 144A | | | | | | | | | | | 7.625% | | | | 12/01/21 | | | | B+ | | | | 4,587,494 | |
| | | | | | | |
| | 3,525 | | | Waste Pro USA Inc, 144A | | | | | | | | | | | 5.500% | | | | 2/15/26 | | | | B+ | | | | 3,674,812 | |
| | | | Total Commercial Services & Supplies | | | | | | | | | | | | | | | | | | | | | | | 26,518,087 | |
| | | | | | | |
| | | | Communications Equipment – 0.2% | | | | | | | | | | | | | | | | | | |
| | | | | | | |
| | 1,700 | | | IHS Netherlands Holdco BV, 144A | | | | | | | | | | | 8.000% | | | | 9/18/27 | | | | B+ | | | | 1,806,250 | |
| | | | | | | |
| | 780 | | | ViaSat Inc, 144A | | | | | | | | | | | 5.625% | | | | 9/15/25 | | | | B | | | | 803,400 | |
| | | | | | | |
| | 850 | | | ViaSat Inc, 144A | | | | | | | | | | | 5.625% | | | | 4/15/27 | | | | BB+ | | | | 909,500 | |
| | | | Total Communications Equipment | | | | | | | | | | | | | | | | | | | | | | | 3,519,150 | |
| | | | | | | |
| | | | Construction & Engineering – 0.1% | | | | | | | | | | | | | | | | | | |
| | | | | | | |
| | 1,800 | | | GMR Hyderabad International Airport Ltd, 144A | | | | | | | | | | | 5.375% | | | | 4/10/24 | | | | BB+ | | | | 1,863,791 | |
| | | | | | | |
| | 1,000 | | | International Airport Finance SA, 144A | | | | | | | | | | | 12.000% | | | | 3/15/33 | | | | B2 | | | | 1,097,500 | |
| | | | Total Construction & Engineering | | | | | | | | | | | | | | | | | | | | | | | 2,961,291 | |
| | | | | | | |
| | | | Diversified Financial Services – 0.4% | | | | | | | | | | | | | | | | | | |
| | | | | | | |
| | 1,265 | | | Cometa Energia SA de CV, 144A | | | | | | | | | | | 6.375% | | | | 4/24/35 | | | | BBB | | | | 1,375,193 | |
| | | | | | | |
| | 850 | | | Minejesa Capital BV, 144A | | | | | | | | | | | 4.625% | | | | 8/10/30 | | | | Baa3 | | | | 879,404 | |
52
| | | | | | | | | | | | | | | | | | | | | | | | | | | | |
| | | | | | | |
Principal
Amount (000) (6) | | | Description (1) | | | | | | | | Coupon | | | Maturity | | | Ratings (5) | | | Value | |
| | | | | | | |
| | | | Diversified Financial Services(continued) | | | | | | | | | | | | | | | | | | |
| | | | | | | |
| $ | 1,815 | | | Minejesa Capital BV, 144A | | | | | | | | | | | 5.625% | | | | 8/10/37 | | | | Baa3 | | | $ | 1,970,892 | |
| | | | | | | |
| | 17,405 | BRL | | Swiss Insured Brazil Power Finance Sarl, 144A | | | | | | | | | | | 9.850% | | | | 7/16/32 | | | | AAA | | | | 5,029,784 | |
| | | | Total Diversified Financial Services | | | | | | | | | | | | | | | | | | | | | | | 9,255,273 | |
| | | | | | | |
| | | | Electric Utilities – 1.6% | | | | | | | | | | | | | | | | | | |
| | | | | | | |
| | 1,810 | | | Acwa Power Management And Investments One Ltd, 144A | | | | | | | | | | | 5.950% | | | | 12/15/39 | | | | Baa3 | | | | 1,924,772 | |
| | | | | | | |
| | 2,325 | | | Adani Green Energy UP Ltd / Prayatna Developers Pvt Ltd / Parampujya Solar Energ, 144A | | | | | | | | | | | 6.250% | | | | 12/10/24 | | | | BB+ | | | | 2,498,677 | |
| | | | | | | |
| | 800 | | | Adani Transmission Ltd, 144A | | | | | | | | | | | 4.250% | | | | 5/21/36 | | | | BBB– | | | | 808,102 | |
| | | | | | | |
| | 740 | | | Consorcio Transmantaro SA, 144A | | | | | | | | | | | 4.700% | | | | 4/16/34 | | | | Baa3 | | | | 813,082 | |
| | | | | | | |
| | 1,900 | | | Empresa de Transmision Electrica SA, 144A | | | | | | | | | | | 5.125% | | | | 5/02/49 | | | | Baa1 | | | | 2,161,269 | |
| | | | | | | |
| | 5,700,000 | COP | | Empresas Publicas de Medellin ESP, 144A | | | | | | | | | | | 8.375% | | | | 11/08/27 | | | | BBB | | | | 1,826,151 | |
| | | | | | | |
| | 1,200 | | | Enel Americas SA | | | | | | | | | | | 4.000% | | | | 10/25/26 | | | | A– | | | | 1,242,012 | |
| | | | | | | |
| | 4,430 | | | Instituto Costarricense de Electricidad, 144A | | | | | | | | | | | 6.950% | | | | 11/10/21 | | | | B1 | | | | 4,618,319 | |
| | | | | | | |
| | 1,700 | | | Lamar Funding Ltd, 144A | | | | | | | | | | | 3.958% | | | | 5/07/25 | | | | Ba1 | | | | 1,659,557 | |
| | | | | | | |
| | 1,500 | | | Listrindo Capital BV, 144A | | | | | | | | | | | 4.950% | | | | 9/14/26 | | | | BB+ | | | | 1,520,775 | |
| | | | | | | |
| | 1,285 | | | LLPL Capital Pte Ltd, 144A | | | | | | | | | | | 6.875% | | | | 2/04/39 | | | | Baa3 | | | | 1,493,674 | |
| | | | | | | |
| | 600 | | | Pampa Energia SA, 144A | | | | | | | | | | | 7.500% | | | | 1/24/27 | | | | B– | | | | 511,384 | |
| | | | | | | |
| | 650 | | | Perusahaan Listrik Negara PT, 144A | | | | | | | | | | | 4.875% | | | | 7/17/49 | | | | BBB | | | | 703,625 | |
| | | | | | | |
| | 1,750 | | | Talen Energy Supply LLC | | | | | | | | | | | 6.500% | | | | 6/01/25 | | | | B | | | | 1,493,503 | |
| | | | | | | |
| | 1,650 | | | Talen Energy Supply LLC, 144A | | | | | | | | | | | 7.250% | | | | 5/15/27 | | | | BB | | | | 1,736,130 | |
| | | | | | | |
| | 4,700 | | | TerraForm Power Operating LLC, 144A | | | | | | | | | | | 4.750% | | | | 1/15/30 | | | | BB | | | | 4,782,250 | |
| | | | | | | |
| | 3,575 | | | Vistra Operations Co LLC, 144A | | | | | | | | | | | 5.625% | | | | 2/15/27 | | | | BB | | | | 3,767,156 | |
| | | | | | | |
| | 1,950 | | | Vistra Operations Co LLC, 144A | | | | | | | | | | | 5.000% | | | | 7/31/27 | | | | BB | | | | 2,037,711 | |
| | | | Total Electric Utilities | | | | | | | | | | | | | | | | | | | | | | | 35,598,149 | |
| | | | | | | |
| | | | Electrical Equipment – 0.1% | | | | | | | | | | | | | | | | | | |
| | | | | | | |
| | 3,200 | | | NextEra Energy Operating Partners LP, 144A | | | | | | | | | | | 3.875% | | | | 10/15/26 | | | | Ba1 | | | | 3,212,000 | |
| | | |
| | | | Energy Equipment & Services – 0.6% | | | | | | | |
| | | | | | | |
| | 695 | | | Archrock Partners LP / Archrock Partners Finance Corp | | | | | | | | | | | 6.000% | | | | 10/01/22 | | | | B+ | | | | 700,213 | |
| | | | | | |
| | 4,150 | | | Archrock Partners LP / Archrock Partners Finance Corp, 144A | | | | | | | | 6.875% | | | | 4/01/27 | | | | B+ | | | | 4,388,625 | |
| | | | | | |
| | 3,600 | | | Archrock Partners LP / Archrock Partners Finance Corp, 144A | | | | | | | | 6.250% | | | | 4/01/28 | | | | B+ | | | | 3,708,000 | |
| | | | | | | |
| | 2,250 | | | Transocean Poseidon Ltd, 144A | | | | | | | | | | | 6.875% | | | | 2/01/27 | | | | B1 | | | | 2,385,000 | |
| | | | | | | |
| | 2,200 | | | Transocean Sentry Ltd, 144A | | | | | | | | | | | 5.375% | | | | 5/15/23 | | | | B1 | | | | 2,238,500 | |
| | | | Total Energy Equipment & Services | | | | | | | | | | | | | | | | | | | | | | | 13,420,338 | |
| | | |
| | | | Equity Real Estate Investment Trust – 1.5% | | | | | | | |
| | | | | | | |
| | 4,250 | | | Brookfield Property REIT Inc / BPR Cumulus LLC / BPR Nimbus LLC / GGSI Sellco LL, 144A | | | | | | | | | | | 5.750% | | | | 5/15/26 | | | | BB+ | | | | 4,483,750 | |
| | | | | | | |
| | 1,285 | | | Cibanco SA Ibm / PLA Administradora Industrial S de RL de CV, 144A | | | | | | | | | | | 4.962% | | | | 7/18/29 | | | | Baa3 | | | | 1,328,382 | |
| | | | | | | |
| | 2,900 | | | Equinix Inc | | | | | | | | | | | 5.375% | | | | 5/15/27 | | | | BBB– | | | | 3,149,487 | |
| | | | | | | |
| | 600 | | | HAT Holdings I LLC / HAT Holdings II LLC, 144A | | | | | | | | | | | 5.250% | | | | 7/15/24 | | | | BB+ | | | | 630,750 | |
53
Nuveen Real Asset Income Fund(continued)
Portfolio of Investments December 31, 2019
| | | | | | | | | | | | | | | | | | | | | | | | | | | | |
| | | | | | | |
Principal
Amount (000) (6) | | | Description (1) | | | | | | | | Coupon | | | Maturity | | | Ratings (5) | | | Value | |
| | | | | | | |
| | | | Equity Real Estate Investment Trust(continued) | | | | | | | | | | | | | | | | | | |
| | | | | | | |
| $ | 2,335 | | | Iron Mountain Inc, 144A | | | | | | | | | | | 5.250% | | | | 3/15/28 | | | | BB– | | | $ | 2,428,400 | |
| | | | | | | |
| | 4,250 | | | iStar Inc | | | | | | | | | | | 4.750% | | | | 10/01/24 | | | | BB | | | | 4,404,062 | |
| | | | | | | |
| | 3,055 | | | MPT Operating Partnership LP / MPT Finance Corp | | | | | | | | | | | 5.000% | | | | 10/15/27 | | | | BBB– | | | | 3,238,300 | |
| | | | | | | |
| | 6,000 | | | MPT Operating Partnership LP / MPT Finance Corp | | | | | | | | | | | 4.625% | | | | 8/01/29 | | | | BBB– | | | | 6,180,000 | |
| | | | | | | |
| | 2,615 | | | Sabra Health Care LP | | | | | | | | | | | 5.125% | | | | 8/15/26 | | | | BBB– | | | | 2,813,644 | |
| | | | | | | |
| | 2,490 | | | SBA Communications Corp | | | | | | | | | | | 4.875% | | | | 9/01/24 | | | | BB– | | | | 2,583,375 | |
| | | | | | | |
| | 1,525 | | | VICI Properties LP / VICI Note Co Inc, 144A | | | | | | | | | | | 4.250% | | | | 12/01/26 | | | | BB | | | | 1,570,750 | |
| | | | | | | |
| | 975 | | | VICI Properties LP / VICI Note Co Inc, 144A | | | | | | | | | | | 4.625% | | | | 12/01/29 | | | | BB | | | | 1,018,875 | |
| | | | Total Equity Real Estate Investment Trust | | | | | | | | | | | | | | | | | | | | | | | 33,829,775 | |
| | | | | | | |
| | | | Gas Utilities – 0.8% | | | | | | | | | | | | | | | | | | |
| | | | | | | |
| | 4,015 | | | AmeriGas Partners LP / AmeriGas Finance Corp | | | | | | | | | | | 5.750% | | | | 5/20/27 | | | | BB | | | | 4,406,462 | |
| | | | | | | |
| | 2,100 | | | LBC Tank Terminals Holding Netherlands BV, 144A | | | | | | | | | | | 6.875% | | | | 5/15/23 | | | | B | | | | 2,123,625 | |
| | | | | | | |
| | 4,570 | | | National Gas Co of Trinidad & Tobago Ltd, 144A | | | | | | | | | | | 6.050% | | | | 1/15/36 | | | | BBB | | | | 4,775,696 | |
| | | | | | | |
| | 1,675 | | | NGL Energy Partners LP / NGL Energy Finance Corp | | | | | | | | | | | 6.125% | | | | 3/01/25 | | | | B+ | | | | 1,578,688 | |
| | | | | | | |
| | 1,900 | | | NGL Energy Partners LP / NGL Energy Finance Corp, 144A | | | | | | | | | | | 7.500% | | | | 4/15/26 | | | | B+ | | | | 1,838,250 | |
| | | | | | | |
| | 2,915 | | | Suburban Propane Partners LP/Suburban Energy Finance Corp | | | | | | | | | | | 5.875% | | | | 3/01/27 | | | | BB– | | | | 3,031,600 | |
| | | | Total Gas Utilities | | | | | | | | | | | | | | | | | | | | | | | 17,754,321 | |
| | | | | | | |
| | | | Health Care Providers & Services – 0.9% | | | | | | | | | | | | | | | | | | |
| | | | | | | |
| | 1,660 | | | CHS/Community Health Systems Inc | | | | | | | | | | | 6.250% | | | | 3/31/23 | | | | BB | | | | 1,684,900 | |
| | | | | | | |
| | 2,330 | | | CHS/Community Health Systems Inc, 144A | | | | | | | | | | | 8.000% | | | | 3/15/26 | | | | B | | | | 2,399,900 | |
| | | | | | | |
| | 4,450 | | | Encompass Health Corp | | | | | | | | | | | 5.750% | | | | 9/15/25 | | | | B+ | | | | 4,661,375 | |
| | | | | | | |
| | 200 | | | HCA Inc | | | | | | | | | | | 5.625% | | | | 9/01/28 | | | | Ba2 | | | | 227,920 | |
| | | | | | | |
| | 4,250 | | | HCA Inc | | | | | | | | | | | 5.875% | | | | 2/01/29 | | | | Ba2 | | | | 4,914,062 | |
| | | | | | | |
| | 2,595 | | | RegionalCare Hospital Partners Holdings Inc / LifePoint Health Inc, 144A | | | | | | | | | | | 9.750% | | | | 12/01/26 | | | | CCC+ | | | | 2,932,350 | |
| | | | | | | |
| | 1,500 | | | Tenet Healthcare Corp | | | | | | | | | | | 6.750% | | | | 6/15/23 | | | | B– | | | | 1,648,065 | |
| | | | | | | |
| | 1,500 | | | Tenet Healthcare Corp, 144A | | | | | | | | | | | 5.125% | | | | 11/01/27 | | | | BB– | | | | 1,584,375 | |
| | | | Total Health Care Providers & Services | | | | | | | | | | | | | | | | | | | | | | | 20,052,947 | |
| | | | | | | |
| | | | Hotels, Restaurants & Leisure – 0.1% | | | | | | | | | | | | | | | | | | |
| | | | | | | |
| | 1,695 | | | MGM Growth Properties Operating Partnership LP / MGP FinanceCo-Issuer Inc | | | | | | | | | | | 4.500% | | | | 1/15/28 | | | | BB+ | | | | 1,771,275 | |
| | | | | | | |
| | | | Household Durables – 0.2% | | | | | | | | | | | | | | | | | | |
| | | | | | | |
| | 2,400 | | | KB Home | | | | | | | | | | | 6.875% | | | | 6/15/27 | | | | BB– | | | | 2,778,000 | |
| | | | | | | |
| | 1,600 | | | LGI Homes Inc, 144A | | | | | | | | | | | 6.875% | | | | 7/15/26 | | | | BB– | | | | 1,676,000 | |
| | | | Total Household Durables | | | | | | | | | | | | | | | | | | | | | | | 4,454,000 | |
| | | |
| | | | Independent Power & Renewable Electricity Producers – 0.4% | | | | | | | |
| | | | | | | |
| | 1,685 | | | Azure Power Energy Ltd, 144A | | | | | | | | | | | 5.500% | | | | 11/03/22 | | | | Ba3 | | | | 1,717,419 | |
| | | | | | | |
| | 1,310 | | | Calpine Corp, 144A | | | | | | | | | | | 5.250% | | | | 6/01/26 | | | | BB+ | | | | 1,364,037 | |
| | | | | | | |
| | 1,500 | | | Kallpa Generacion SA, 144A | | | | | | | | | | | 4.125% | | | | 8/16/27 | | | | Baa3 | | | | 1,528,140 | |
54
| | | | | | | | | | | | | | | | | | | | | | | | | | | | |
| | | | | | | |
Principal
Amount (000) (6) | | | Description (1) | | | | | | | | Coupon | | | Maturity | | | Ratings (5) | | | Value | |
| | | |
| | | | Independent Power & Renewable Electricity Producers(continued) | | | | | | | |
| | | | | | | |
| $ | 1,325 | | | NRG Energy Inc, 144A | | | | | | | | | | | 5.250% | | | | 6/15/29 | | | | BB | | | $ | 1,432,656 | |
| | | | | | | |
| | 1,125 | | | NRG Energy Inc, 144A | | | | | | | | | | | 4.450% | | | | 6/15/29 | | | | BBB– | | | | 1,176,964 | |
| | | | | | | |
| | 1,450 | | | Termocandelaria Power Ltd, 144A | | | | | | | | | | | 7.875% | | | | 1/30/29 | | | | BB+ | | | | 1,598,625 | |
| | | | Total Independent Power & Renewable Electricity Producers | | | | | | | | 8,817,841 | |
| | | | | | | |
| | | | Machinery – 0.2% | | | | | | | | | | | | | | | | | | |
| | | | | | | |
| | 4,425 | | | USA Compression Partners LP / USA Compression Finance Corp | | | | | | | | | | | 6.875% | | | | 9/01/27 | | | | BB– | | | | 4,609,080 | |
| | | | | | | |
| | | | Media – 0.6% | | | | | | | | | | | | | | | | | | |
| | | | | | | |
| | 2,275 | | | Altice France SA/France, 144A | | | | | | | | | | | 7.375% | | | | 5/01/26 | | | | B | | | | 2,442,531 | |
| | | | | | | |
| | 1,545 | | | CSC Holdings LLC, 144A | | | | | | | | | | | 7.500% | | | | 4/01/28 | | | | B | | | | 1,745,850 | |
| | | | | | | |
| | 5,250 | | | CSC Holdings LLC, 144A | | | | | | | | | | | 5.750% | | | | 1/15/30 | | | | B | | | | 5,604,375 | |
| | | | | | | |
| | 2,950 | | | Lamar Media Corp | | | | | | | | | | | 5.750% | | | | 2/01/26 | | | | BB | | | | 3,126,705 | |
| | | | Total Media | | | | | | | | | | | | | | | | | | | | | | | 12,919,461 | |
| | |
| | | | Mortgage Real Estate Investment Trust – 0.1% | | | | |
| | | | | | | |
| | 1,500 | | | MGM Growth Properties Operating Partnership LP / MGP FinanceCo-Issuer Inc, 144A | | | | | | | | | | | 5.750% | | | | 2/01/27 | | | | BB+ | | | | 1,676,250 | |
| | | | | | | |
| | 1,720 | | | Starwood Property Trust Inc | | | | | | | | | | | 4.750% | | | | 3/15/25 | | | | BB– | | | | 1,814,600 | |
| | | | Total Mortgage Real Estate Investment Trust | | | | | | | | | | | | | | | | | | | | | | | 3,490,850 | |
| | | | | | | |
| | | | Oil, Gas & Consumable Fuels – 3.2% | | | | | | | | | | | | | | | | | | |
| | | | | | | |
| | 4,300 | | | Antero Midstream Partners LP / Antero Midstream Finance Corp, 144A | | | | | | | | | | | 5.750% | | | | 3/01/27 | | | | BB+ | | | | 3,781,313 | |
| | | | | | | |
| | 1,450 | | | Antero Midstream Partners LP / Antero Midstream Finance Corp, 144A | | | | | | | | | | | 5.750% | | | | 1/15/28 | | | | BB+ | | | | 1,261,500 | |
| | | | | | | |
| | 1,565 | | | Cheniere Corpus Christi Holdings LLC | | | | | | | | | | | 5.125% | | | | 6/30/27 | | | | BBB– | | | | 1,729,607 | |
| | | | | | | |
| | 3,485 | | | Cheniere Corpus Christi Holdings LLC, 144A | | | | | | | | | | | 3.700% | | | | 11/15/29 | | | | BBB– | | | | 3,553,941 | |
| | | | | | | |
| | 5,650 | | | Cheniere Energy Partners LP, 144A | | | | | | | | | | | 4.500% | | | | 10/01/29 | | | | BB | | | | 5,805,940 | |
| | | | | | | |
| | 4,775 | | | Crestwood Midstream Partners LP / Crestwood Midstream Finance Corp, 144A | | | | | | | | | | | 5.625% | | | | 5/01/27 | | | | BB– | | | | 4,840,656 | |
| | | | | | | |
| | 3,750 | | | DCP Midstream Operating LP | | | | | | | | | | | 5.125% | | | | 5/15/29 | | | | BB+ | | | | 3,890,625 | |
| | | | | | | |
| | 2,200 | | | EnLink Midstream LLC | | | | | | | | | | | 5.375% | | | | 6/01/29 | | | | BBB– | | | | 2,068,000 | |
| | | | | | | |
| | 3,000 | | | EnLink Midstream Partners LP | | | | | | | | | | | 4.850% | | | | 7/15/26 | | | | BBB– | | | | 2,812,500 | |
| | | | | | | |
| | 4,345 | | | Enterprise Products Operating LLC | | | | | | | | | | | 5.375% | | | | 2/15/78 | | | | Baa2 | | | | 4,318,028 | |
| | | | | | | |
| | 3,900 | | | Enviva Partners LP / Enviva Partners Finance Corp, 144A | | | | | | | | | | | 6.500% | | | | 1/15/26 | | | | BB– | | | | 4,175,457 | |
| | | | | | | |
| | 4,460 | | | Genesis Energy LP / Genesis Energy Finance Corp | | | | | | | | | | | 5.625% | | | | 6/15/24 | | | | B+ | | | | 4,303,900 | |
| | | | | | | |
| | 1,620 | | | Global Partners LP / GLP Finance Corp | | | | | | | | | | | 7.000% | | | | 6/15/23 | | | | B+ | | | | 1,668,600 | |
| | | | | | | |
| | 2,320 | | | Global Partners LP / GLP Finance Corp, 144A | | | | | | | | | | | 7.000% | | | | 8/01/27 | | | | B+ | | | | 2,465,000 | |
| | | | | | | |
| | 2,000 | | | Hess Midstream Operations LP, 144A | | | | | | | | | | | 5.625% | | | | 2/15/26 | | | | BB+ | | | | 2,081,770 | |
| | | | | | | |
| | 1,700 | | | KazTransGas JSC, 144A | | | | | | | | | | | 4.375% | | | | 9/26/27 | | | | Baa3 | | | | 1,782,324 | |
| | | | | | | |
| | 1,370 | | | Martin Midstream Partners LP / Martin Midstream Finance Corp | | | | | | | | | | | 7.250% | | | | 2/15/21 | | | | B– | | | | 1,246,700 | |
| | | | | | | |
| | 3,500 | | | NuStar Logistics LP | | | | | | | | | | | 6.000% | | | | 6/01/26 | | | | Ba2 | | | | 3,701,250 | |
55
Nuveen Real Asset Income Fund(continued)
Portfolio of Investments December 31, 2019
| | | | | | | | | | | | | | | | | | | | | | | | | | | | |
| | | | | | | |
Principal
Amount (000) (6) | | | Description (1) | | | | | | | | Coupon | | | Maturity | | | Ratings (5) | | | Value | |
| | | | | | | |
| | | | Oil, Gas & Consumable Fuels(continued) | | | | | | | | | | | | | | | | | | |
| | | | | | | |
| $ | 1,690 | | | Par Petroleum LLC / Par Petroleum Finance Corp, 144A | | | | | | | | | | | 7.750% | | | | 12/15/25 | | | | BB– | | | $ | 1,749,150 | |
| | | | | | | |
| | 1,700 | | | Peru LNG Srl, 144A | | | | | | | | | | | 5.375% | | | | 3/22/30 | | | | BBB– | | | | 1,674,517 | |
| | | | | | | |
| | 1,175 | | | Promigas SA ESP / Gases del Pacifico SAC, 144A | | | | | | | | | | | 3.750% | | | | 10/16/29 | | | | Baa3 | | | | 1,185,293 | |
| | | | | | | |
| | 3,000 | | | Sunoco LP / Sunoco Finance Corp | | | | | | | | | | | 5.875% | | | | 3/15/28 | | | | BB | | | | 3,185,415 | |
| | | | | | | |
| | 625 | | | Targa Resources Partners LP / Targa Resources Partners Finance Corp, 144A | | | | | | | | | | | 6.500% | | | | 7/15/27 | | | | BB | | | | 684,375 | |
| | | | | | | |
| | 2,500 | | | Targa Resources Partners LP / Targa Resources Partners Finance Corp, 144A | | | | | | | | | | | 6.875% | | | | 1/15/29 | | | | BB | | | | 2,775,000 | |
| | | | | | | |
| | 1,300 | | | Targa Resources Partners LP / Targa Resources Partners Finance Corp, 144A | | | | | | | | | | | 5.500% | | | | 3/01/30 | | | | BB | | | | 1,335,750 | |
| | | | | | | |
| | 3,015 | | | TransMontaigne Partners LP / TLP Finance Corp | | | | | | | | | | | 6.125% | | | | 2/15/26 | | | | BB | | | | 2,954,700 | |
| | | | | | | |
| | 600 | | | Transportadora de Gas del Sur SA, 144A | | | | | | | | | | | 6.750% | | | | 5/02/25 | | | | B– | | | | 529,500 | |
| | | | Total Oil, Gas & Consumable Fuels | | | | | | | | | | | | | | | | | | | | | | | 71,560,811 | |
| | |
| | | | Real Estate Management & Development – 0.6% | | | | |
| | | | | | | |
| | 8,685 | | | Hunt Cos Inc, 144A | | | | | | | | | | | 6.250% | | | | 2/15/26 | | | | BB– | | | | 8,576,438 | |
| | | | | | | |
| | 3,968 | | | Kennedy-Wilson Inc | | | | | | | | | | | 5.875% | | | | 4/01/24 | | | | BB | | | | 4,067,200 | |
| | | | | | | |
| | 600 | | | RKI Overseas Finance 2016 B Ltd, Reg S | | | | | | | | | | | 4.700% | | | | 9/06/21 | | | | BB– | | | | 597,664 | |
| | | | | | | |
| | 600 | | | Shimao Property Holdings Ltd, Reg S | | | | | | | | | | | 4.750% | | | | 7/03/22 | | | | BBB– | | | | 611,319 | |
| | | | Total Real Estate Management & Development | | | | | | | | | | | | | | | | | | | | | | | 13,852,621 | |
| | | | | | | |
| | | | Road & Rail – 0.2% | | | | | | | | | | | | | | | | | | |
| | | | | | | |
| | 660 | | | Lima Metro Line 2 Finance Ltd, 144A | | | | | | | | | | | 4.350% | | | | 4/05/36 | | | | Baa1 | | | | 698,775 | |
| | | | | | | |
| | 1,700 | | | Rumo Luxembourg Sarl, 144A | | | | | | | | | | | 5.875% | | | | 1/18/25 | | | | BB | | | | 1,823,250 | |
| | | | | | | |
| | 1,700 | | | Transnet SOC Ltd, 144A | | | | | | | | | | | 4.000% | | | | 7/26/22 | | | | Baa3 | | | | 1,723,800 | |
| | | | Total Road & Rail | | | | | | | | | | | | | | | | | | | | | | | 4,245,825 | |
| | | | | | | |
| | | | Thrifts & Mortgage Finance – 0.2% | | | | | | | | | | | | | | | | | | |
| | | | | | | |
| | 4,580 | | | Ladder Capital Finance Holdings LLLP / Ladder Capital Finance Corp, 144A | | | | | | | | | | | 5.250% | | | | 10/01/25 | | | | BB | | | | 4,751,750 | |
| | | |
| | | | Trading Companies & Distributors – 0.1% | | | | | | | |
| | | | | | | |
| | 2,430 | | | Fortress Transportation & Infrastructure Investors LLC, 144A | | | | | | | | | | | 6.500% | | | | 10/01/25 | | | | BB– | | | | 2,564,865 | |
| | | | | | | |
| | | | Transportation Infrastructure – 0.5% | | | | | | | | | | | | | | | | | | |
| | | | | | | |
| | 1,400 | | | Adani Ports & Special Economic Zone Ltd, 144A | | | | | | | | | | | 4.000% | | | | 7/30/27 | | | | BBB– | | | | 1,408,330 | |
| | | | | | | |
| | 1,650 | | | Aeropuerto Internacional de Tocumen SA, 144A | | | | | | | | | | | 6.000% | | | | 11/18/48 | | | | BBB+ | | | | 2,043,954 | |
| | | | | | | |
| | 2,810 | | | Aeropuertos Dominicanos Siglo XXI SA, 144A | | | | | | | | | | | 6.750% | | | | 3/30/29 | | | | BB– | | | | 3,105,078 | |
| | | | | | | |
| | 1,700 | | | DP World PLC, 144A | | | | | | | | | | | 5.625% | | | | 9/25/48 | | | | Baa1 | | | | 1,962,820 | |
| | | | | | | |
| | 10,691 | MXN | | Grupo Aeroportuario del Centro Norte SAB de CV | | | | | | | | | | | 6.850% | | | | 6/07/21 | | | | N/R | | | | 562,122 | |
| | | | | | | |
| | 1,800 | | | Mexico City Airport Trust, 144A | | | | | | | | | | | 4.250% | | | | 10/31/26 | | | | BBB+ | | | | 1,881,018 | |
| | | | Total Transportation Infrastructure | | | | | | | | | | | | | | | | | | | | | | | 10,963,322 | |
| | |
| | | | Wireless Telecommunication Services – 0.2% | | | | |
| | | | | | | |
| | 2,225 | | | Hughes Satellite Systems Corp | | | | | | | | | | | 6.625% | | | | 8/01/26 | | | | BB | | | | 2,469,750 | |
56
| | | | | | | | | | | | | | | | | | | | | | | | | | | | |
| | | | | | | |
Principal
Amount (000) (6) | | | Description (1) | | | | | | | | Coupon | | | Maturity | | | Ratings (5) | | | Value | |
| | | | | | | |
| | | | Wireless Telecommunication Services(continued) | | | | | | | | | | | | | | | | | | |
| | | | | | | |
| $ | 1,100 | | | Sprint Spectrum Co LLC / Sprint Spectrum Co II LLC / Sprint Spectrum Co III LLC, 144A | | | | | | | | | | | 5.152% | | | | 3/20/28 | | | | Baa2 | | | $ | 1,199,000 | |
| | | | Total Wireless Telecommunication Services | | | | | | | | | | | | | | | | | | | | | | | 3,668,750 | |
| | | | Total Corporate Bonds (cost $303,703,964) | | | | | | | | | | | | | | | | | | | | | | | 316,184,282 | |
| | | | | | | |
Principal
Amount (000) (6) | | | Description (1) | | | | | | | | Coupon | | | Maturity | | | Ratings (5) | | | Value | |
| | |
| | | | $1,000 PAR (OR SIMILAR) INSTITUTIONAL PREFERRED – 13.2% | | | | | |
| | | | | | | |
| | | | Diversified Financial Services – 0.6% | | | | | | | | | | | | | | | | | | |
| | | | | | | |
| $ | 2,460 | | | National Rural Utilities Cooperative Finance Corp | | | | | | | | | | | 5.250% | | | | 4/20/46 | | | | A3 | | | $ | 2,665,259 | |
| | | | | | | |
| | 10,672 | | | Transcanada Trust | | | | | | | | | | | 5.625% | | | | 5/20/75 | | | | BBB | | | | 11,125,560 | |
| | | | Total Diversified Financial Services | | | | | | | | | | | | | | | | | | | | | | | 13,790,819 | |
| | | | | | | |
| | | | Electric Utilities – 4.4% | | | | | | | | | | | | | | | | | | |
| | | | | | | |
| | 3,865 | | | AES Gener SA, 144A | | | | | | | | | | | 6.350% | | | | 10/07/79 | | | | BB | | | | 3,961,625 | |
| | | | | | | |
| | 5,850 | | | AusNet Services Holdings Pty Ltd, Reg S | | | | | | | | | | | 5.750% | | | | 3/17/76 | | | | BBB | | | | 6,113,552 | |
| | | | | | | |
| | 2,640 | | | ComEd Financing III | | | | | | | | | | | 6.350% | | | | 3/15/33 | | | | BBB | | | | 2,814,900 | |
| | | | | | | |
| | 9,450 | | | Duke Energy Corp | | | | | | | | | | | 4.875% | | | | N/A (7) | | | | BBB | | | | 9,908,797 | |
| | | | | | | |
| | 3,500 | GBP | | Electricite de France SA, Reg S | | | | | | | | | | | 5.875% | | | | N/A (7) | | | | BBB | | | | 5,068,416 | |
| | | | | | | |
| | 15,315 | | | Emera Inc | | | | | | | | | | | 6.750% | | | | 6/15/76 | | | | BBB– | | | | 17,305,950 | |
| | | | | | | |
| | 10,125 | | | Enel SpA, 144A | | | | | | | | | | | 8.750% | | | | 9/24/73 | | | | BBB | | | | 11,884,219 | |
| | | | | | | |
| | 8,859 | | | NextEra Energy Capital Holdings Inc(3-Month LIBOR reference rate + 2.068% spread), (8) | | | | | | | | | | | 3.977% | | | | 10/01/66 | | | | BBB | | | | 7,795,920 | |
| | | | | | | |
| | 13,641 | | | NextEra Energy Capital Holdings Inc(3-Month LIBOR reference rate + 2.125% spread), (8) | | | | | | | | | | | 4.019% | | | | 6/15/67 | | | | BBB | | | | 12,201,507 | |
| | | | | | | |
| | 8,585 | | | NextEra Energy Capital Holdings Inc | | | | | | | | | | | 4.800% | | | | 12/01/77 | | | | BBB | | | | 8,861,866 | |
| | | | | | | |
| | 6,540 | | | NextEra Energy Capital Holdings Inc | | | | | | | | | | | 5.650% | | | | 5/01/79 | | | | BBB | | | | 7,239,712 | |
| | | | | | | |
| | 1,858 | | | PPL Capital Funding Inc(3-Month LIBOR reference rate + 2.665% spread), (8) | | | | | | | | | | | 4.626% | | | | 3/30/67 | | | | BBB | | | | 1,773,925 | |
| | | | | | | |
| | 2,810 | | | SSE PLC, Reg S | | | | | | | | | | | 4.750% | | | | 9/16/77 | | | | BBB– | | | | 2,883,060 | |
| | | | Total Electric Utilities | | | | | | | | | | | | | | | | | | | | | | | 97,813,449 | |
| | | | | |
| | | | Independent Power & Renewable Electricity Producers – 0.2% | | | | | | | | | | | | | |
| | | | | | | |
| | 5,175 | | | AES Gener SA, 144A | | | | | | | | | | | 7.125% | | | | 3/26/79 | | | | BB | | | | 5,431,244 | |
| | | | | | | |
| | | | Marine – 0.1% | | | | | | | | | | | | | | | | | | |
| | | | | | | |
| | 2,950 | | | Royal Capital BV, Reg S | | | | | | | | | | | 4.875% | | | | N/A (7) | | | | N/R | | | | 2,982,822 | |
| | | | | | | |
| | | | Multi-Utilities – 1.6% | | | | | | | | | | | | | | | | | | |
| | | | | | | |
| | 9,510 | | | CenterPoint Energy Inc | | | | | | | | | | | 6.125% | | | | N/A (7) | | | | BBB– | | | | 10,056,825 | |
| | | | | | | |
| | 3,330 | | | Dominion Energy Inc | | | | | | | | | | | 5.750% | | | | 10/01/54 | | | | BBB– | | | | 3,589,074 | |
| | | | | | | |
| | 3,925 | | | Dominion Energy Inc | | | | | | | | | | | 4.650% | | | | N/A (7) | | | | BBB– | | | | 4,004,167 | |
| | | | | | | |
| | 2,340 | | | NiSource Inc | | | | | | | | | | | 5.650% | | | | N/A (7) | | | | BBB– | | | | 2,398,500 | |
| | | | | | | |
| | 6,700 | | | RWE AG, Reg S | | | | | | | | | | | 6.625% | | | | 7/30/75 | | | | BB+ | | | | 7,595,211 | |
57
Nuveen Real Asset Income Fund(continued)
Portfolio of Investments December 31, 2019
| | | | | | | | | | | | | | | | | | | | | | | | | | | | |
| | | | | | | |
Principal
Amount (000) (6) | | | Description (1) | | | | | | | | Coupon | | | Maturity | | | Ratings (5) | | | Value | |
| | | | | | | |
| | | | Multi-Utilities(continued) | | | | | | | | | | | | | | | | | | |
| | | | | | | |
| $ | 7,530 | | | WEC Energy Group Inc(3-Month LIBOR reference rate + 2.113% spread), (8) | | | | | | | | | | | 4.022% | | | | 5/15/67 | | | | BBB | | | $ | 7,012,890 | |
| | | | Total Multi-Utilities | | | | | | | | | | | | | | | | | | | | | | | 34,656,667 | |
| | | | | | | |
| | | | Oil, Gas & Consumable Fuels – 5.3% | | | | | | | | | | | | | | | | | | |
| | | | | | | |
| | 5,490 | | | Buckeye Partners LP | | | | | | | | | | | 6.375% | | | | 1/22/78 | | | | B+ | | | | 4,036,523 | |
| | | | | | | |
| | 6,345 | | | DCP Midstream Operating LP, 144A | | | | | | | | | | | 5.850% | | | | 5/21/43 | | | | BB– | | | | 5,900,850 | |
| | | | | | | |
| | 16,037 | | | Enbridge Inc | | | | | | | | | | | 6.000% | | | | 1/15/77 | | | | BBB– | | | | 16,979,976 | |
| | | | | | | |
| | 17,309 | | | Enbridge Inc | | | | | | | | | | | 5.500% | | | | 7/15/77 | | | | BBB– | | | | 17,857,868 | |
| | | | | | | |
| | 6,087 | | | Enbridge Inc | | | | | | | | | | | 6.250% | | | | 3/01/78 | | | | BBB– | | | | 6,601,899 | |
| | | | | | | |
| | 13,786 | | | Energy Transfer Operating LP(3-Month LIBOR reference rate + 3.018% spread), (8) | | | | | | | | | | | 4.927% | | | | 11/01/66 | | | | Ba1 | | | | 10,615,220 | |
| | | | | | | |
| | 2,189 | | | Energy Transfer Operating LP | | | | | | | | | | | 6.250% | | | | N/A (7) | | | | BB | | | | 2,057,660 | |
| | | | | | | |
| | 985 | | | EnLink Midstream Partners LP | | | | | | | | | | | 6.000% | | | | N/A (7) | | | | BB | | | | 677,187 | |
| | | | | | | |
| | 4,826 | | | Enterprise Products Operating LLC | | | | | | | | | | | 4.875% | | | | 8/16/77 | | | | Baa2 | | | | 4,765,675 | |
| | | | | | | |
| | 9,470 | | | Enterprise Products Operating LLC | | | | | | | | | | | 5.250% | | | | 8/16/77 | | | | Baa2 | | | | 9,583,451 | |
| | | | | | | |
| | 5,930 | CAD | | Inter Pipeline Ltd | | | | | | | | | | | 6.625% | | | | 11/19/79 | | | | BBB– | | | | 4,572,340 | |
| | | | | | | |
| | 9,735 | | | Plains All American Pipeline LP | | | | | | | | | | | 6.125% | | | | N/A (7) | | | | BB | | | | 9,077,888 | |
| | | | | | | |
| | 15,145 | | | TransCanada PipeLines Ltd(3-Month LIBOR reference rate + 2.210% spread), (8) | | | | | | | | | | | 4.120% | | | | 5/15/67 | | | | Baa2 | | | | 12,670,609 | |
| | | | | | | |
| | 7,510 | | | Transcanada Trust | | | | | | | | | | | 5.875% | | | | 8/15/76 | | | | BBB | | | | 8,083,013 | |
| | | | | | | |
| | 6,045 | | | Transcanada Trust | | | | | | | | | | | 5.500% | | | | 9/15/79 | | | | BBB | | | | 6,344,227 | |
| | | | Total Oil, Gas & Consumable Fuels | | | | | | | | | | | | | | | | | | | | | | | 119,824,386 | |
| | |
| | | | Real Estate Management & Development – 0.8% | | | | |
| | | | | | | |
| | 11,250 | | | AT Securities BV, Reg S | | | | | | | | | | | 5.250% | | | | N/A (7) | | | | BBB– | | | | 11,705,625 | |
| | | | | | | |
| | 3,000 | EUR | | CPI Property Group SA, Reg S | | | | | | | | | | | 4.375% | | | | N/A (7) | | | | BB+ | | | | 3,506,771 | |
| | | | | | | |
| | 4,750 | SGD | | Frasers Property Treasury Pte Ltd, Reg S | | | | | | | | | | | 3.950% | | | | N/A (7) | | | | N/R | | | | 3,489,855 | |
| | | | Total Real Estate Management & Development | | | | | | | | 18,702,251 | |
| | | | | | | |
| | | | Road & Rail – 0.2% | | | | | | | | | | | | | | | | | | |
| | | | | | | |
| | 3,730 | | | BNSF Funding Trust I | | | | | | | | | | | 6.613% | | | | 12/15/55 | | | | A– | | | | 4,177,600 | |
| | | | Total $1,000 Par (or similar) Institutional Preferred (cost $294,162,249) | | | | | | | | 297,379,238 | |
| | | | | | | |
| Shares | | | Description (1) | | | | | | | | Coupon | | | | | | Ratings (5) | | | Value | |
| | | |
| | | | CONVERTIBLE PREFERRED SECURITIES – 4.5% | | | | | | | | | |
| | | | | | | |
| | | | Electric Utilities – 1.3% | | | | | | | | | | | | | | | | | | |
| | | | | | | |
| | 181,004 | | | American Electric Power Co Inc | | | | | | | | | | | 6.125% | | | | | | | | BBB | | | $ | 9,797,746 | |
| | | | | | | |
| | 193,079 | | | NextEra Energy Inc | | | | | | | | | | | 4.872% | | | | | | | | A– | | | | 9,901,091 | |
| | | | | | | |
| | 192,622 | | | Southern Co | | | | | | | | | | | 6.750% | | | | | | | | BBB | | | | 10,382,326 | |
| | | | Total Electric Utilities | | | | | | | | | | | | | | | | | | | | | | | 30,081,163 | |
| | | |
| | | | Equity Real Estate Investment Trust – 1.4% | | | | | | | |
| | | | | | | |
| | 144,059 | | | Braemar Hotels & Resorts Inc | | | | | | | | | | | 5.500% | | | | | | | | N/R | | | | 2,737,121 | |
58
| | | | | | | | | | | | | | | | | | | | | | | | | | | | |
| | | | | | | |
| Shares | | | Description (1) | | | | | | | | Coupon | | | | | | Ratings (5) | | | Value | |
| | | |
| | | | Equity Real Estate Investment Trust(continued) | | | | | | | |
| | | | | | | |
| | 7,719 | | | Crown Castle International Corp, (2) | | | | | | | | | | | 6.875% | | | | | | | | N/R | | | $ | 9,893,027 | |
| | | | | | | |
| | 25,936 | | | Equity Commonwealth | | | | | | | | | | | 6.500% | | | | | | | | N/R | | | | 732,433 | |
| | | | | | | |
| | 25,720 | | | Lexington Realty Trust | | | | | | | | | | | 6.500% | | | | | | | | N/R | | | | 1,466,297 | |
| | | | | | | |
| | 69,496 | | | QTS Realty Trust Inc | | | | | | | | | | | 6.500% | | | | | | | | B– | | | | 8,976,798 | |
| | | | | | | |
| | 64,087 | | | RLJ Lodging Trust | | | | | | | | | | | 1.950% | | | | | | | | N/R | | | | 1,839,938 | |
| | | | | | | |
| | 98,840 | | | RPT Realty | | | | | | | | | | | 7.250% | | | | | | | | N/R | | | | 5,916,562 | |
| | | | Total Equity Real Estate Investment Trust | | | | | | | | | | | | | | | | | | | | | | | 31,562,176 | |
| | | | | | | |
| | | | Multi-Utilities – 1.8% | | | | | | | | | | | | | | | | | | |
| | | | | | | |
| | 139,736 | | | CenterPoint Energy Inc | | | | | | | | | | | 7.000% | | | | | | | | N/R | | | | 6,810,733 | |
| | | | | | | |
| | 107,469 | | | Dominion Energy Inc | | | | | | | | | | | 7.250% | | | | | | | | BBB– | | | | 11,498,108 | |
| | | | | | | |
| | 269,566 | | | DTE Energy Co | | | | | | | | | | | 6.250% | | | | | | | | BBB– | | | | 13,817,953 | |
| | | | | | | |
| | 52,933 | | | Sempra Energy | | | | | | | | | | | 6.000% | | | | | | | | N/R | | | | 6,353,019 | |
| | | | | | | |
| | 14,228 | | | Sempra Energy | | | | | | | | | | | 6.750% | | | | | | | | N/R | | | | 1,694,128 | |
| | | | Total Multi-Utilities | | | | | | | | | | | | | | | | | | | | | | | 40,173,941 | |
| | | | Total Convertible Preferred Securities (cost $92,473,524) | | | | | | | | 101,817,280 | |
| | | | | | | |
Principal
Amount (000) | | | Description (1) | | Coupon (9) | | | Reference
Rate (9) | | | Spread (9) | | | Maturity (10) | | | Ratings (5) | | | Value | |
| | |
| | | | VARIABLE RATE SENIOR LOAN INTERESTS – 1.9% (9) | | | | | |
| | |
| | | | Capital Markets – 0.1% | | | | |
| | | | | | | |
| $ | 1,602 | | | Capital Automotive LP, Term Loan, First Lien | | | 4.300% | | | | 1-Month LIBOR | | | | 2.500% | | | | 3/24/24 | | | | B1 | | | $ | 1,610,060 | |
| | | | | | | |
| | 1,537 | | | Capital Automotive LP, Term Loan, Second Lien | | | 7.800% | | | | 1-Month LIBOR | | | | 6.000% | | | | 3/24/25 | | | | CCC+ | | | | 1,545,869 | |
| | 3,139 | | | Total Capital Markets | | | | | | | | | | | | | | | | | | | | | | | 3,155,929 | |
| | | | | | | |
| | | | Chemicals – 0.1% | | | | | | | | | | | | | | | | | | |
| | | | | | | |
| | 2,481 | | | Messer Industries GmbH, Term Loan | | | 4.445% | | | | 3-Month LIBOR | | | | 2.500% | | | | 3/01/26 | | | | BB- | | | | 2,497,961 | |
| | | |
| | | | Diversified Telecommunication Services – 0.1% | | | | | | | |
| | | | | | | |
| | 1,576 | | | SBA Senior Finance II LLC, Term Loan B | | | 3.550% | | | | 1-Month LIBOR | | | | 1.750% | | | | 4/11/25 | | | | BB+ | | | | 1,583,801 | |
| | |
| | | | Equity Real Estate Investment Trust – 0.2% | | | | |
| | | | | | | |
| | 1,485 | | | Iron Mountain Inc., Term Loan B | | | 3.542% | | | | 1-Month LIBOR | | | | 1.750% | | | | 1/02/26 | | | | BB | | | | 1,483,491 | |
| | | | | | | |
| | 2,860 | | | VICI Properties 1 LLC, Term Loan B | | | 3.785% | | | | 1-Month LIBOR | | | | 2.000% | | | | 12/22/24 | | | | BBB- | | | | 2,877,460 | |
| | 4,345 | | | Total Equity Real Estate Investment Trust | | | | 4,360,951 | |
| | | |
| | | | Health Care Providers & Services – 0.2% | | | | | | | |
| | | | | | | |
| | 3,666 | | | RegionalCare Hospital Partners Holdings, Inc., Term Loan B | | | 6.299% | | | | 1-Month LIBOR | | | | 4.500% | | | | 11/16/25 | | | | B+ | | | | 3,700,621 | |
| | |
| | | | Hotels, Restaurants & Leisure – 0.1% | | | | |
| | | | | | | |
| | 2,947 | | | CityCenter Holdings LLC, Term Loan B | | | 4.049% | | | | 1-Month LIBOR | | | | 2.250% | | | | 4/18/24 | | | | BB– | | | | 2,963,445 | |
| | |
| | | | Oil, Gas & Consumable Fuels – 0.4% | | | | |
| | | | | | | |
| | 5,431 | | | BCP Renaissance Parent LLC, Term Loan B | | | 5.349% | | | | 2-Month LIBOR | | | | 3.500% | | | | 11/01/24 | | | | BB– | | | | 4,843,996 | |
59
Nuveen Real Asset Income Fund(continued)
Portfolio of Investments December 31, 2019
| | | | | | | | | | | | | | | | | | | | | | | | | | | | |
| | | | | | | |
Principal
Amount (000) | | | Description (1) | | Coupon (9) | | | Reference
Rate (9) | | | Spread (9) | | | Maturity (10) | | | Ratings (5) | | | Value | |
| | |
| | | | Oil, Gas & Consumable Fuels(continued) | | | | |
| | | | | | | |
| $ | 1,600 | | | Buckeye Partners, LP Term Loan B | | | 4.441% | | | | 1-Month LIBOR | | | | 2.750% | | | | 11/01/26 | | | | BBB– | | | $ | 1,616,448 | |
| | | | | | | |
| | 3,896 | | | Delek US Holdings Inc, Term Loan B | | | 4.042% | | | | 1-Month LIBOR | | | | 2.250% | | | | 3/30/25 | | | | BB+ | | | | 3,893,335 | |
| | 10,927 | | | Total Oil, Gas & Consumable Fuels | | | | | | | | | | | | | | | | | | | | | | | 10,353,779 | |
| | |
| | | | Real Estate Management & Development – 0.4% | | | | |
| | | | | | | |
| | 3,940 | | | Brookfield Property REIT Inc., Term Loan B | | | 4.299% | | | | 1-Month LIBOR | | | | 2.500% | | | | 8/24/25 | | | | BB+ | | | | 3,922,863 | |
| | | | | | | |
| | 4,460 | | | Invitation Homes Operating Partnership, Term Loan A | | | 3.492% | | | | 1-Month LIBOR | | | | 1.700% | | | | 2/06/22 | | | | N/R | | | | 4,400,080 | |
| | 8,400 | | | Total Real Estate Management & Development | | | | 8,322,943 | |
| | | | | | | |
| | | | Road & Rail – 0.3% | | | | | | | | | | | | | | | | | | |
| | | | | | | |
| | 4,900 | | | Genesee & Wyoming Inc, Term Loan | | | 3.906% | | | | 3-Month LIBOR | | | | 2.000% | | | | 12/30/26 | | | | Baa2 | | | | 4,953,361 | |
| | | | | | | |
| | 999 | | | Kenan Advantage Group Inc, Term Loan | | | 4.799% | | | | 1-Month LIBOR | | | | 3.000% | | | | 8/01/22 | | | | B+ | | | | 994,743 | |
| | | | | | | |
| | 238 | | | Kenan Advantage Group Inc, Term Loan B | | | 4.799% | | | | 1-Month LIBOR | | | | 3.000% | | | | 7/29/22 | | | | B+ | | | | 236,552 | |
| | 6,137 | | | Total Road & Rail | | | | | | | | | | | | | | | | | | | | | | | 6,184,656 | |
| $ | 43,618 | | | Total Variable Rate Senior Loan Interests (cost $43,354,205) | | | | 43,124,086 | |
| | | | | | | |
Principal
Amount (000) | | | Description (1) | | | | | | | | Coupon | | | Maturity | | | Ratings (5) | | | Value | |
| | |
| | | | CONVERTIBLE BONDS – 0.6% | | | | | |
| | | |
| | | | Oil, Gas & Consumable Fuels – 0.4% | | | | | | | |
| | | | | | | |
| $ | 12,325 | | | Cheniere Energy Inc | | | | | | | | | | | 4.250% | | | | 3/15/45 | | | | N/R | | | $ | 9,706,586 | |
| | |
| | | | Real Estate Management & Development – 0.2% | | | | |
| | | | | | | |
| | 3,545 | | | Tricon Capital Group Inc, 144A | | | | | | | | | | | 5.750% | | | | 3/31/22 | | | | N/R | | | | 3,669,075 | |
| $ | 15,870 | | | Total Convertible Bonds (cost $12,259,171) | | | | 13,375,661 | |
| | | | | | | |
| Shares | | | Description (1), (11) | | | | | | | | | | | | | | | | | Value | |
| | |
| | | | INVESTMENT COMPANIES – 0.4% | | | | | |
| | | | | |
| | 7,970,544 | | | Keppel Infrastructure Trust | | | | | | | | | | | | | | | $ | 3,199,952 | |
| | | | | | |
| | 3,803,382 | | | Starwood European Real Estate Finance Ltd | | | | | | | | | | | | | | | | | | | | 5,262,531 | |
| | | | Total Investment Companies (cost $7,896,966) | | | | | | | | 8,462,483 | |
| | | | | | | |
Principal
Amount (000) | | | Description (1) | | | | | | | | Coupon | | | Maturity | | | Ratings (5) | | | Value | |
| | |
| | | | ASSET-BACKED SECURITIES – 0.2% | | | | | |
| | | | | | | |
| $ | 1,500 | | | Natixis Commercial Mortgage Securities Trust 2019-MILE, 144A,(1-Month LIBOR reference rate + 2.750% spread), (8) | | | | | | | | | | | 4.490% | | | | 7/15/36 | | | | N/R | | | $ | 1,499,997 | |
| | | | | | | |
| | 2,525 | | | Natixis Commercial Mortgage Securities Trust 2019-MILE, 144A,(1-Month LIBOR reference rate + 4.250% spread), (8) | | | | | | | | | | | 5.990% | | | | 7/15/36 | | | | N/R | | | | 2,524,992 | |
| $ | 4,025 | | | Total Asset-Backed Securities (cost $4,025,000) | | | | | | | | 4,024,989 | |
60
| | | | | | | | | | | | | | | | | | | | | | | | | | | | |
| | | | | | | |
| Shares | | | Description (1) | | | | | | | | | | | | | | | | | Value | |
| | |
| | | | REAL ESTATE INVESTMENT TRUST COMMON STOCKS RIGHTS – 0.0% | | | | | |
| | | |
| | | | Diverse REIT – 0.0% | | | | | | | |
| | | | | | | |
| | 66,272 | | | Charter Hall Long Wale REIT, (3), (4) | | | | | | | | | | | | | | | | | | | | | | $ | — | |
| | | | Total Real Estate Investment Trust Common Stocks Rights (cost $0) | | | | | | | | | | | | | | | | | | | | | | | — | |
| | | | Total Long-Term Investments (cost $2,035,948,690) | | | | 2,172,146,352 | |
| | | | | | | |
Principal
Amount (000) | | | Description (1) | | | | | | | | Coupon | | | Maturity | | | | | | Value | |
| | |
| | | | SHORT-TERM INVESTMENTS – 1.8% | | | | | |
| | |
| | | | REPURCHASE AGREEMENTS – 1.8% | | | | |
| | | | | | | |
| $ | 39,454 | | | Repurchase Agreement with Fixed Income Clearing Corporation, dated 12/31/19, repurchase price $39,455,552, collateralized by $39,890,000 U.S. Treasury Notes, 2.125%, due 5/31/21, value $40,246,936 | | | | | | | | | | | 0.650% | | | | 1/02/20 | | | | | | | $ | 39,454,127 | |
| | | | Total Short-Term Investments (cost $39,454,127) | | | | 39,454,127 | |
| | | | Total Investments (cost $2,075,402,817) – 98.5% | | | | 2,211,600,479 | |
| | | | Other Assets Less Liabilities – 1.5% | | | | | | | | | | | | | | | | | | | | | | | 33,647,467 | |
| | | | Net Assets – 100% | | | | | | | | | | | | | | | | | | | | | | $ | 2,245,247,946 | |
For Fund portfolio compliance purposes, the Fund’s industry classifications refer to any one or more of the industrysub-classifications used by one or more widely recognized market indexes or ratings group indexes, and/or as defined by Fund management. This definition may not apply for purposes of this report, which may combine industrysub-classifications into sectors for reporting ease.
| (1) | All percentages shown in the Portfolio of Investments are based on net assets. |
| (2) | For fair value measurement disclosure purposes, investment classified as Level 2. See Notes to Financial Statements, Note 3 – Investment Valuation and Fair Value Measurements for more information. |
| (3) | Investment valued at fair value using methods determined in good faith by, or at the discretion of, the Board. For fair value measurement disclosure purposes, investment classified as Level 3. See Notes to Financial Statements, Note 3 – Investment Valuation and Fair Value Measurements for more information. |
| (4) | Non-income producing; issuer has not declared a dividend within the past twelve months. |
| (5) | For financial reporting purposes, the ratings disclosed are the highest of Standard & Poor’s Group (“Standard & Poor’s”), Moody’s Investors Service, Inc. (“Moody’s”) or Fitch, Inc. (“Fitch”) rating. This treatment of split-rated securities may differ from that used for other purposes, such as for Fund investment policies. Ratings below BBB by Standard & Poor’s, Baa by Moody’s or BBB by Fitch are considered to be below investment grade. Holdings designated N/R are not rated by any of these national rating agencies. Ratings are not covered by the report of independent registered public accounting firm. |
| (6) | Principal Amount (000) denominated in U.S. Dollars, unless otherwise noted. |
| (7) | Perpetual security. Maturity date is not applicable. |
| (8) | Variable rate security. The rate shown is the coupon as of the end of the reporting period. |
| (9) | Senior loans generally pay interest at rates which are periodically adjusted by reference to a base short-term, floating lending rate (Reference Rate) plus an assigned fixed rate (Spread). These floating lending rates are generally (i) the lending rate referenced by the London Inter-Bank Offered Rate (“LIBOR”), or (ii) the prime rate offered by one or more major United States banks. Senior loans may be considered restricted in that the Fund ordinarily is contractually obligated to receive approval from the agent bank and/or borrower prior to the disposition of a senior loan. The rate shown is the coupon as of the end of the reporting period. |
| (10) | Senior loans generally are subject to mandatory and/or optional prepayment. Because of these mandatory prepayment conditions and because there may be significant economic incentives for a borrower to prepay, prepayments of senior loans may occur. As a result, the actual remaining maturity of senior loans held may be substantially less than the stated maturities shown. |
| (11) | A copy of the most recent financial statements for these investment companies can be obtained directly from the Securities and Exchange Commission on its website at http://www.sec.gov. |
| 144A | Investment is exempt from registration under Rule 144A of the Securities Act of 1933, as amended. These investments may only be resold in transactions exempt from registration, which are normally those transactions with qualified institutional buyers. |
| ADR | American Depositary Receipt |
| LIBOR | London Inter-Bank Offered Rate |
| REIT | Real Estate Investment Trust |
| Reg S | Regulation S allows U.S. companies to sell securities to persons or entities located outside of the United States without registering those securities with the Securities and Exchange Commission. Specifically, Regulation S provides a safe harbor from the registration requirements of the Securities Act for the offers and sales of securities by both foreign and domestic issuers that are made outside the United States. |
See accompanying notes to financial statements.
61
Nuveen Real Estate Securities Fund
Portfolio of Investments December 31, 2019
| | | | | | | | | | | | | | | | |
| Shares | | | Description (1) | | | | | | | | Value | |
| | | | |
| | | | LONG-TERM INVESTMENTS – 97.3% | | | | | | | | | | | | |
| | | | |
| | | | REAL ESTATE INVESTMENT TRUST COMMON STOCKS – 97.1% | | | | | | | | | | | | |
| | | | |
| | | | Diversified – 6.0% | | | | | | | | | |
| | | | |
| | 318,312 | | | Alexander & Baldwin Inc | | | | | | | | | | $ | 6,671,820 | |
| | | | |
| | 520,945 | | | American Assets Trust Inc | | | | | | | | | | | 23,911,375 | |
| | | | |
| | 280,887 | | | Empire State Realty Trust Inc | | | | | | | | | | | 3,921,183 | |
| | | | |
| | 429,583 | | | Liberty Property Trust | | | | | | | | | | | 25,796,459 | |
| | | | |
| | 138,494 | | | PS Business Parks Inc | | | | | | | | | | | 22,833,506 | |
| | | | |
| | 5,664,257 | | | VEREIT Inc | | | | | | | | | | | 52,337,735 | |
| | | | |
| | 15,678 | | | Washington Real Estate Investment Trust | | | | | | | | | | | 457,484 | |
| | | | |
| | 498,622 | | | WP Carey Inc | | | | | | | | | | | 39,909,705 | |
| | | | Total Diversified | | | | | | | | | | | 175,839,267 | |
| | | | |
| | | | Health Care – 12.6% | | | | | | | | | |
| | | | |
| | 1,619,816 | | | Healthcare Realty Trust Inc | | | | | | | | | | | 54,053,260 | |
| | | | |
| | 502,170 | | | Healthcare Trust of America Inc | | | | | | | | | | | 15,205,708 | |
| | | | |
| | 2,066,047 | | | Healthpeak Properties Inc | | | | | | | | | | | 71,216,640 | |
| | | | |
| | 2,037,424 | | | Medical Properties Trust Inc | | | | | | | | | | | 43,010,021 | |
| | | | |
| | 129,888 | | | National Health Investors Inc | | | | | | | | | | | 10,583,274 | |
| | | | |
| | 666,235 | | | Omega Healthcare Investors Inc | | | | | | | | | | | 28,215,052 | |
| | | | |
| | 862,848 | | | Physicians Realty Trust | | | | | | | | | | | 16,342,341 | |
| | | | |
| | 631,998 | | | Ventas Inc | | | | | | | | | | | 36,491,565 | |
| | | | |
| | 1,157,618 | | | Welltower Inc | | | | | | | | | | | 94,670,000 | |
| | | | Total Health Care | | | | | | | | | | | 369,787,861 | |
| | | | |
| | | | Hotels – 3.4% | | | | | | | | | |
| | | | |
| | 517,794 | | | Host Hotels & Resorts Inc | | | | | | | | | | | 9,605,079 | |
| | | | |
| | 632,400 | | | MGM Growth Properties LLC | | | | | | | | | | | 19,585,428 | |
| | | | |
| | 297,511 | | | Pebblebrook Hotel Trust | | | | | | | | | | | 7,976,270 | |
| | | | |
| | 227,613 | | | Ryman Hospitality Properties Inc | | | | | | | | | | | 19,724,943 | |
| | | | |
| | 148,789 | | | Summit Hotel Properties Inc | | | | | | | | | | | 1,836,056 | |
| | | | |
| | 3,079,248 | | | Sunstone Hotel Investors Inc | | | | | | | | | | | 42,863,132 | |
| | | | Total Hotels | | | | | | | | | | | 101,590,908 | |
| | | | |
| | | | Industrial – 14.9% | | | | | | | | | |
| | | | |
| | 1,042,860 | | | Americold Realty Trust | | | | | | | | | | | 36,562,672 | |
| | | | |
| | 3,652,936 | | | Duke Realty Corp | | | | | | | | | | | 126,647,291 | |
| | | | |
| | 138,876 | | | EastGroup Properties Inc | | | | | | | | | | | 18,424,679 | |
| | | | |
| | 1,970,086 | | | Lexington Realty Trust | | | | | | | | | | | 20,922,313 | |
| | | | |
| | 1,907,522 | | | Prologis Inc | | | | | | | | | | | 170,036,511 | |
| | | | |
| | 432,133 | | | Rexford Industrial Realty Inc | | | | | | | | | | | 19,735,514 | |
| | | | |
| | 977,376 | | | STAG Industrial Inc | | | | | | | | | | | 30,855,760 | |
62
| | | | | | | | | | | | | | | | |
| Shares | | | Description (1) | | | | | | | | Value | |
| | | | |
| | | | Industrial(continued) | | | | | | | | | |
| | | | |
| | 260,492 | | | Terreno Realty Corp | | | | | | | | | | $ | 14,103,037 | |
| | | | Total Industrial | | | | | | | | | | | 437,287,777 | |
| | | | |
| | | | Office – 12.6% | | | | | | | | | |
| | | | |
| | 493,316 | | | Alexandria Real Estate Equities Inc | | | | | | | | | | | 79,709,999 | |
| | | | |
| | 550,836 | | | Boston Properties Inc | | | | | | | | | | | 75,938,251 | |
| | | | |
| | 96,282 | | | Columbia Property Trust Inc | | | | | | | | | | | 2,013,257 | |
| | | | |
| | 878,613 | | | Corporate Office Properties Trust | | | | | | | | | | | 25,813,650 | |
| | | | |
| | 125,258 | | | Cousins Properties Inc | | | | | | | | | | | 5,160,630 | |
| | | | |
| | 1,041,931 | | | Douglas Emmett Inc | | | | | | | | | | | 45,740,771 | |
| | | | |
| | 661,823 | | | Hudson Pacific Properties Inc | | | | | | | | | | | 24,917,636 | |
| | | | |
| | 754,765 | | | JBG SMITH Properties | | | | | | | | | | | 30,107,576 | |
| | | | |
| | 220,930 | | | Kilroy Realty Corp | | | | | | | | | | | 18,536,027 | |
| | | | |
| | 229,231 | | | Mack-Cali Realty Corp | | | | | | | | | | | 5,302,113 | |
| | | | |
| | 1,037,310 | | | Paramount Group Inc | | | | | | | | | | | 14,439,355 | |
| | | | |
| | 84,769 | | | Piedmont Office Realty Trust Inc | | | | | | | | | | | 1,885,263 | |
| | | | |
| | 605,281 | | | Vornado Realty Trust | | | | | | | | | | | 40,251,187 | |
| | | | Total Office | | | | | | | | | | | 369,815,715 | |
| | | | |
| | | | Residential – 21.2% | | | | | | | | | |
| | | | |
| | 11,754 | | | American Campus Communities Inc | | | | | | | | | | | 552,791 | |
| | | | |
| | 1,772,745 | | | American Homes 4 Rent | | | | | | | | | | | 46,463,646 | |
| | | | |
| | 567,567 | | | Apartment Investment & Management Co | | | | | | | | | | | 29,314,836 | |
| | | | |
| | 428,982 | | | AvalonBay Communities Inc | | | | | | | | | | | 89,957,525 | |
| | | | |
| | 1,072,371 | | | Camden Property Trust | | | | | | | | | | | 113,778,563 | |
| | | | |
| | 523,150 | | | Equity LifeStyle Properties Inc | | | | | | | | | | | 36,824,529 | |
| | | | |
| | 779,946 | | | Equity Residential | | | | | | | | | | | 63,113,230 | |
| | | | |
| | 141,054 | | | Essex Property Trust Inc | | | | | | | | | | | 42,437,506 | |
| | | | |
| | 59,046 | | | Investors Real Estate Trust | | | | | | | | | | | 4,280,835 | |
| | | | |
| | 1,950,270 | | | Invitation Homes Inc | | | | | | | | | | | 58,449,592 | |
| | | | |
| | 324,262 | | | Mid-America Apartment Communities Inc | | | | | | | | | | | 42,757,187 | |
| | | | |
| | 109,051 | | | NexPoint Residential Trust Inc | | | | | | | | | | | 4,907,295 | |
| | | | |
| | 326,116 | | | Sun Communities Inc | | | | | | | | | | | 48,950,012 | |
| | | | |
| | 865,329 | | | UDR Inc | | | | | | | | | | | 40,410,864 | |
| | | | Total Residential | | | | | | | | | | | 622,198,411 | |
| | | | |
| | | | Retail – 11.0% | | | | | | | | | |
| | | | |
| | 784,374 | | | Acadia Realty Trust | | | | | | | | | | | 20,338,818 | |
| | | | |
| | 226,496 | | | Agree Realty Corp | | | | | | | | | | | 15,893,224 | |
| | | | |
| | 118,638 | | | Brixmor Property Group Inc | | | | | | | | | | | 2,563,767 | |
| | | | |
| | 248,459 | | | Brookfield Property REIT Inc | | | | | | | | | | | 4,582,826 | |
| | | | |
| | 198,685 | | | Federal Realty Investment Trust | | | | | | | | | | | 25,576,720 | |
| | | | |
| | 611,858 | | | National Retail Properties Inc | | | | | | | | | | | 32,807,826 | |
63
Nuveen Real Estate Securities Fund(continued)
Portfolio of Investments December 31, 2019
| | | | | | | | | | | | | | | | |
| Shares | | | Description (1) | | | | | | | | Value | |
| | | | |
| | | | Retail(continued) | | | | | | | | | |
| | | | |
| | 570,757 | | | Realty Income Corp | | | | | | | | | | $ | 42,024,838 | |
| | | | |
| | 606,079 | | | Regency Centers Corp | | | | | | | | | | | 38,237,524 | |
| | | | |
| | 469,410 | | | RPT Realty | | | | | | | | | | | 7,059,926 | |
| | | | |
| | 763,654 | | | Simon Property Group Inc | | | | | | | | | | | 113,753,900 | |
| | | | |
| | 1,051,328 | | | SITE Centers Corp | | | | | | | | | | | 14,739,619 | |
| | | | |
| | 241,479 | | | Urban Edge Properties | | | | | | | | | | | 4,631,567 | |
| | | | |
| | 10,063 | | | Weingarten Realty Investors | | | | | | | | | | | 314,368 | |
| | | | Total Retail | | | | | | | | | | | 322,524,923 | |
| | | | |
| | | | Specialized – 15.4% | | | | | | | | | |
| | | | |
| | 87,009 | | | American Tower Corp | | | | | | | | | | | 19,996,408 | |
| | | | |
| | 78,460 | | | CoreSite Realty Corp | | | | | | | | | | | 8,796,935 | |
| | | | |
| | 462,331 | | | CubeSmart | | | | | | | | | | | 14,554,180 | |
| | | | |
| | 500,329 | | | CyrusOne Inc | | | | | | | | | | | 32,736,526 | |
| | | | |
| | 488,950 | | | Digital Realty Trust Inc | | | | | | | | | | | 58,546,873 | |
| | | | |
| | 265,619 | | | EPR Properties | | | | | | | | | | | 18,763,326 | |
| | | | |
| | 226,822 | | | Equinix Inc | | | | | | | | | | | 132,396,001 | |
| | | | |
| | 198,761 | | | Extra Space Storage Inc | | | | | | | | | | | 20,993,137 | |
| | | | |
| | 693,911 | | | Four Corners Property Trust Inc | | | | | | | | | | | 19,561,351 | |
| | | | |
| | 469,286 | | | Public Storage | | | | | | | | | | | 99,939,147 | |
| | | | |
| | 11,349 | | | QTS Realty Trust Inc | | | | | | | | | | | 615,910 | |
| | | | |
| | 12,792 | | | SBA Communications Corp | | | | | | | | | | | 3,082,744 | |
| | | | |
| | 822,668 | | | VICI Properties Inc | | | | | | | | | | | 21,019,167 | |
| | | | Total Specialized | | | | | | | | | | | 451,001,705 | |
| | | | Total Real Estate Investment Trust Common Stocks (cost $2,126,096,344) | | | | | | | | | | | 2,850,046,567 | |
| | | | |
| Shares | | | Description (1) | | | | | | | | Value | |
| | | | |
| | | | COMMON STOCKS – 0.2% | | | | | | | | | | | | |
| | | | |
| | | | Real Estate Management & Development – 0.2% | | | | | | | | | |
| | | | |
| | 258,274 | | | Kennedy-Wilson Holdings Inc | | | | | | | | | | $ | 5,759,510 | |
| | | | Total Common Stocks (cost $5,596,695) | | | | | | | | | | | 5,759,510 | |
| | | | Total Long-Term Investments (cost $2,131,693,039) | | | | | | | | | | | 2,855,806,077 | |
| | | | |
| Shares | | | Description (1) | | | | | Coupon | | | Value | |
| | | | |
| | | | SHORT-TERM INVESTMENTS – 1.2% | | | | | | | | | | | | |
| | | | |
| | | | MONEY MARKET FUNDS – 1.2% | | | | | | | | | |
| | | | |
| | 35,870,340 | | | First American Treasury Obligations Fund, Class Z | | | | | | | 1.488% (2) | | | $ | 35,870,340 | |
| | | | Total Short-Term Investments (cost $35,870,340) | | | | | | | | | | | 35,870,340 | |
| | | | Total Investments (cost $2,167,563,379) – 98.5% | | | | | | | | | | | 2,891,676,417 | |
| | | | Other Assets Less Liabilities – 1.5% | | | | | | | | | | | 44,060,066 | |
| | | | Net Assets – 100% | | | | | | | | | | $ | 2,935,736,483 | |
64
For Fund portfolio compliance purposes, the Fund’s industry classifications refer to any one or more of the industrysub-classifications used by one or more widely recognized market indexes or ratings group indexes, and/or as defined by Fund management. This definition may not apply for purposes of this report, which may combine industrysub-classifications into sectors for reporting ease.
| (1) | All percentages shown in the Portfolio of Investments are based on net assets. |
| (2) | The rate shown is the annualizedseven-day subsidized yield as of the end of the reporting period. |
| REIT | Real Estate Investment Trust |
See accompanying notes to financial statements.
65
Statement of Assets and Liabilities
December 31, 2019
| | | | | | | | | | | | | | | | |
| | | Global
Infrastructure | | | Global
Real Estate
Securities | | | Real
Asset Income | | | Real Estate
Securities | |
Assets | | | | | | | | | | | | | | | | |
Long-term investments, at value (cost $481,932,533, $24,555,241, $2,035,948,690 and $2,131,693,039, respectively) | | $ | 606,418,834 | | | $ | 27,451,788 | | | $ | 2,172,146,352 | | | $ | 2,855,806,077 | |
Short-term investments, at value (cost approximates value) | | | 11,461,660 | | | | 369,053 | | | | 39,454,127 | | | | 35,870,340 | |
Cash | | | 236 | | | | 904 | | | | 111,632 | | | | — | |
Cash denominated in foreign currencies (cost $84, $31,287, $141,666 and $—, respectively) | | | 85 | | | | 31,456 | | | | 141,470 | | | | — | |
Receivable for: | | | | | | | | | | | | | | | | |
Dividends | | | 1,068,785 | | | | 134,563 | | | | 7,811,230 | | | | 14,758,368 | |
From Adviser | | | — | | | | 24,833 | | | | — | | | | — | |
Interest | | | 207 | | | | 7 | | | | 9,522,889 | | | | 35,664 | |
Investments sold | | | 6,604,664 | | | | 401,434 | | | | 21,961,224 | | | | 45,940,104 | |
Reclaims | | | 306,814 | | | | 10,528 | | | | 168,709 | | | | 38,871 | |
Shares sold | | | 1,296,229 | | | | — | | | | 8,786,872 | | | | 6,699,448 | |
Other assets | | | 68,612 | | | | 14,099 | | | | 121,434 | | | | 336,955 | |
Total assets | | | 627,226,126 | | | | 28,438,665 | | | | 2,260,225,939 | | | | 2,959,485,827 | |
Liabilities | | | | | | | | | | | | | | | | |
Payable for: | | | | | | | | | | | | | | | | |
Dividends | | | — | | | | — | | | | 782,044 | | | | 503 | |
Investments purchased – regular settlement | | | 5,659,835 | | | | 233,819 | | | | 8,501,156 | | | | 12,031,015 | |
Investments purchased – when-issued/delayed-delivery settlement | | | — | | | | 58,548 | | | | — | | | | — | |
Shares redeemed | | | 966,474 | | | | — | | | | 3,018,663 | | | | 7,414,548 | |
Accrued expenses: | | | | | | | | | | | | | | | | |
Custodian fees | | | 106,879 | | | | 98,562 | | | | 197,293 | | | | 55,477 | |
Directors/Trustees fees | | | 39,942 | | | | 343 | | | | 83,569 | | | | 318,215 | |
Management fees | | | 409,052 | | | | — | | | | 1,355,948 | | | | 2,098,749 | |
Professional fees | | | 55,614 | | | | 71,061 | | | | 86,845 | | | | 120,770 | |
Shareholder servicing agent fees | | | 175,889 | | | | 218 | | | | 582,103 | | | | 1,349,549 | |
12b-1 distribution and service fees | | | 32,892 | | | | 37 | | | | 227,659 | | | | 93,715 | |
Other | | | 36,534 | | | | 8,545 | | | | 142,713 | | | | 266,803 | |
Total liabilities | | | 7,483,111 | | | | 471,133 | | | | 14,977,993 | | | | 23,749,344 | |
Net assets | | $ | 619,743,015 | | | $ | 27,967,532 | | | $ | 2,245,247,946 | | | $ | 2,935,736,483 | |
Class A Shares | | | | | | | | | | | | | | | | |
Net assets | | $ | 57,378,816 | | | $ | 35,111 | | | $ | 220,664,605 | | | $ | 249,172,095 | |
Shares outstanding | | | 5,013,373 | | | | 1,580 | | | | 8,913,073 | | | | 12,324,492 | |
Net asset value (“NAV”) per share | | $ | 11.45 | | | $ | 22.22 | | | $ | 24.76 | | | $ | 20.22 | |
Offering price per share (NAV per share plus maximum sales charge of 5.75% of offering price) | | $ | 12.15 | | | $ | 23.58 | | | $ | 26.27 | | | $ | 21.45 | |
Class C Shares | | | | | | | | | | | | | | | | |
Net assets | | $ | 24,639,525 | | | $ | 33,306 | | | $ | 217,976,461 | | | $ | 37,351,819 | |
Shares outstanding | | | 2,171,473 | | | | 1,500 | | | | 8,800,903 | | | | 1,910,874 | |
NAV and offering price per share | | $ | 11.35 | | | $ | 22.21 | | | $ | 24.77 | | | $ | 19.55 | |
Class R3 Shares | | | | | | | | | | | | | | | | |
Net assets | | $ | 358,180 | | | $ | — | | | $ | — | | | $ | 21,227,471 | |
Shares outstanding | | | 30,759 | | | | — | | | | — | | | | 1,030,988 | |
NAV and offering price per share | | $ | 11.64 | | | $ | — | | | $ | — | | | $ | 20.59 | |
Class R6 Shares | | | | | | | | | | | | | | | | |
Net assets | | $ | 60,186,904 | | | $ | 27,709,165 | | | $ | 80,903,450 | | | $ | 479,972,824 | |
Shares outstanding | | | 5,268,207 | | | | 1,246,250 | | | | 3,251,029 | | | | 23,018,639 | |
NAV and offering price per share | | $ | 11.42 | | | $ | 22.23 | | | $ | 24.89 | | | $ | 20.85 | |
Class I Shares | | | | | | | | | | | | | | | | |
Net assets | | $ | 477,179,590 | | | $ | 189,950 | | | $ | 1,725,703,430 | | | $ | 2,148,012,274 | |
Shares outstanding | | | 41,859,879 | | | | 8,549 | | | | 69,706,796 | | | | 104,330,431 | |
NAV and offering price per share | | $ | 11.40 | | | $ | 22.22 | | | $ | 24.76 | | | $ | 20.59 | |
Fund level net assets consist of: | | | | | | | | | | | | | | | | |
Capitalpaid-in | | $ | 506,966,448 | | | $ | 25,178,060 | | | $ | 2,149,359,259 | | | $ | 2,211,188,771 | |
Total distributable earnings | | | 112,776,567 | | | | 2,789,472 | | | | 95,888,687 | | | | 724,547,712 | |
Fund level net assets | | $ | 619,743,015 | | | $ | 27,967,532 | | | $ | 2,245,247,946 | | | $ | 2,935,736,483 | |
Authorized shares – per class | | | 2 billion | | | | Unlimited | | | | 2 billion | | | | 2 billion | |
Par value per share | | $ | 0.0001 | | | $ | 0.01 | | | $ | 0.0001 | | | $ | 0.0001 | |
See accompanying notes to financial statements.
66
Statement of Operations
Year Ended December 31, 2019
| | | | | | | | | | | | | | | | |
| | | Global
Infrastructure | | | Global
Real Estate
Securities | | | Real
Asset Income | | | Real Estate
Securities | |
| | | | |
Investment Income | | | | | | | | | | | | | | | | |
| | | | |
Dividends | | $ | 18,037,408 | | | $ | 848,459 | | | $ | 69,804,229 | | | $ | 91,577,778 | |
| | | | |
Interest | | | 138,515 | | | | 6,518 | | | | 37,947,976 | | | | 1,113,248 | |
| | | | |
Foreign tax withheld on dividend income | | | (1,327,430 | ) | | | (45,249 | ) | | | (3,346,756 | ) | | | 3,740 | |
| | | | |
Foreign tax withheld from interest income | | | — | | | | — | | | | 21,581 | | | | — | |
| | | | |
Securities lending income | | | — | | | | — | | | | — | | | | 2,869 | |
| | | | |
Total investment income | | | 16,848,493 | | | | 809,728 | | | | 104,427,030 | | | | 92,697,635 | |
| | | | |
Expenses | | | | | | | | | | | | | | | | |
| | | | |
Management fees | | | 4,737,248 | | | | 253,974 | | | | 14,138,415 | | | | 27,061,832 | |
| | | | |
12b-1 service fees – Class A Shares | | | 139,876 | | | | 80 | | | | 493,842 | | | | 661,530 | |
| | | | |
12b-1 distribution and service fees – Class C Shares | | | 250,558 | | | | 315 | | | | 2,021,287 | | | | 446,186 | |
| | | | |
12b-1 distribution and service fees – Class R3 Shares | | | 1,581 | | | | — | | | | — | | | | 112,793 | |
| | | | |
Shareholder servicing agent fees | | | 517,837 | | | | 1,040 | | | | 1,843,184 | | | | 4,948,136 | |
| | | | |
Custodian fees | | | 314,655 | | | | 326,706 | | | | 570,277 | | | | 332,038 | |
| | | | |
Directors/Trustees fees | | | 14,252 | | | | 763 | | | | 53,600 | | | | 89,938 | |
| | | | |
Professional fees | | | 89,898 | | | | 122,042 | | | | 128,945 | | | | 156,255 | |
| | | | |
Shareholder reporting expenses | | | 40,232 | | | | 27,371 | | | | 612,151 | | | | 501,890 | |
| | | | |
Federal and state registration fees | | | 96,043 | | | | 66,974 | | | | 116,053 | | | | 115,677 | |
| | | | |
Other | | | 14,729 | | | | 6,990 | | | | 43,143 | | | | 207,986 | |
| | | | |
Total expenses before fee waiver/expense reimbursement | | | 6,216,909 | | | | 806,255 | | | | 20,020,897 | | | | 34,634,261 | |
| | | | |
Fee waiver/expense reimbursement | | | (750,382 | ) | | | (535,200 | ) | | | — | | | | — | |
| | | | |
Net expenses | | | 5,466,527 | | | | 271,055 | | | | 20,020,897 | | | | 34,634,261 | |
| | | | |
Net investment income (loss) | | | 11,381,966 | | | | 538,673 | | | | 84,406,133 | | | | 58,063,374 | |
| | | | |
Realized and Unrealized Gain (Loss) | | | | | | | | | | | | | | | | |
| | | | |
Net realized gain (loss) from investments and foreign currency | | | 40,026,850 | | | | 2,520,749 | | | | 58,948,028 | | | | 348,063,149 | |
| | | | |
Change in net unrealized appreciation (depreciation) of investments and foreign currency | | | 79,549,316 | | | | 3,552,336 | | | | 245,455,301 | | | | 327,922,170 | |
| | | | |
Net realized and unrealized gain (loss) | | | 119,576,166 | | | | 6,073,085 | | | | 304,403,329 | | | | 675,985,319 | |
| | | | |
Net increase (decrease) in net assets from operations | | $ | 130,958,132 | | | $ | 6,611,758 | | | $ | 388,809,462 | | | $ | 734,048,693 | |
See accompanying notes to financial statements.
67
Statement of Changes in Net Assets
| | | | | | | | | | | | | | | | | | | | |
| | | Global Infrastructure | | | | | | Global Real Estate Securities | |
| | | Year Ended
12/31/19 | | | Year Ended
12/31/18 | | | | | | Year Ended
12/31/19 | | | For the period
March 20, 2018
(commencement of
operations) through
December 31, 2018 | |
| | | | | |
Operations | | | | | | | | | | | | | | | | | | | | |
| | | | | |
Net investment income (loss) | | $ | 11,381,966 | | | $ | 10,951,354 | | | | | | | $ | 538,673 | | | $ | 460,590 | |
| | | | | |
Net realized gain (loss) from: | | | | | | | | | | | | | | | | | | | | |
| | | | | |
Investments and foreign currency | | | 40,026,850 | | | | 5,967,204 | | | | | | | | 2,520,749 | | | | (32,490 | ) |
| | | | | |
Futures contracts | | | — | | | | — | | | | | | | | — | | | | — | |
| | | | |
Change in net unrealized appreciation (depreciation) of: | | | | | | | | | | | | | | | | | |
| | | | | |
Investments and foreign currency | | | 79,549,316 | | | | (61,292,713 | ) | | | | | | | 3,552,336 | | | | (656,752 | ) |
| | | | | |
Futures contracts | | | — | | | | — | | | | | | | | — | | | | — | |
| | | | | |
Net increase (decrease) in net assets from operations | | | 130,958,132 | | | | (44,374,155 | ) | | | | | | | 6,611,758 | | | | (228,652 | ) |
| | | | | |
Distributions to Shareholders | | | | | | | | | | | | | | | | | | | | |
| | | | | |
Dividends | | | | | | | | | | | | | | | | | | | | |
| | | | | |
Class A Shares | | | (3,877,179 | ) | | | (3,755,306 | ) | | | | | | | (3,173 | ) | | | (882 | ) |
| | | | | |
Class C Shares | | | (1,500,681 | ) | | | (1,273,099 | ) | | | | | | | (2,785 | ) | | | (738 | ) |
| | | | | |
Class R3 Shares | | | (22,743 | ) | | | (13,284 | ) | | | | | | | — | | | | — | |
| | | | | |
Class R6 Shares | | | (4,360,413 | ) | | | (726,034 | ) | | | | | | | (2,643,546 | ) | | | (926,961 | ) |
| | | | | |
Class I Shares | | | (33,676,572 | ) | | | (21,971,240 | ) | | | | | | | (14,624 | ) | | | (1,003 | ) |
| | | | | |
Class T Shares(1) | | | — | | | | (273 | ) | | | | | | | — | | | | — | |
| | | | | |
Return of Capital | | | | | | | | | | | | | | | | | | | | |
| | | | | |
Class A Shares | | | — | | | | (160,320 | ) | | | | | | | — | | | | — | |
| | | | | |
Class C Shares | | | — | | | | (58,872 | ) | | | | | | | — | | | | — | |
| | | | | |
Class R3 Shares | | | — | | | | (610 | ) | | | | | | | — | | | | — | |
| | | | | |
Class R6 Shares | | | — | | | | (26,614 | ) | | | | | | | — | | | | — | |
| | | | | |
Class I Shares | | | — | | | | (879,812 | ) | | | | | | | — | | | | — | |
| | | | | |
Class T Shares(1) | | | — | | | | (50 | ) | | | | | | | — | | | | — | |
| | | | | |
Decrease in net assets from distributions to shareholders | | | (43,437,588 | ) | | | (28,865,514 | ) | | | | | | | (2,664,128 | ) | | | (929,584 | ) |
| | | | | |
Fund Share Transactions | | | | | | | | | | | | | | | | | | | | |
| | | | | |
Proceeds from sale of shares | | | 248,764,694 | | | | 132,913,905 | | | | | | | | 164,015 | | | | 25,003,000 | |
| | | | | |
Proceeds from shares issued to shareholders due to reinvestment of distributions | | | 29,867,584 | | | | 21,919,163 | | | | | | | | 13,021 | | | | 73 | |
| | | | | |
| | | 278,632,278 | | | | 154,833,068 | | | | | | | | 177,036 | | | | 25,003,073 | |
| | | | | |
Cost of shares redeemed | | | (184,363,049 | ) | | | (253,244,145 | ) | | | | | | | (962 | ) | | | (1,009 | ) |
| | | | | |
Net increase (decrease) in net assets from Fund share transactions | | | 94,269,229 | | | | (98,411,077 | ) | | | | | | | 176,074 | | | | 25,002,064 | |
| | | | | |
Net increase (decrease) in net assets | | | 181,789,773 | | | | (171,650,746 | ) | | | | | | | 4,123,704 | | | | 23,843,828 | |
| | | | | |
Net assets at the beginning of period | | | 437,953,242 | | | | 609,603,988 | | | | | | | | 23,843,828 | | | | — | |
| | | | | |
Net assets at the end of period | | $ | 619,743,015 | | | $ | 437,953,242 | | | | | | | $ | 27,967,532 | | | $ | 23,843,828 | |
| (1) | Class T shares were not available for public offering. |
See accompanying notes to financial statements.
68
| | | | | | | | | | | | | | | | | | | | |
| | | Real Asset Income | | | | | | Real Estate Securities | |
| | | Year Ended
12/31/19 | | | Year Ended
12/31/18 | | | | | | Year Ended
12/31/19 | | | Year Ended
12/31/18 | |
| | | | | |
Operations | | | | | | | | | | | | | | | | | | | | |
| | | | | |
Net investment income (loss) | | $ | 84,406,133 | | | $ | 98,725,400 | | | | | | | $ | 58,063,374 | | | $ | 66,724,738 | |
| | | | | |
Net realized gain (loss) from: | | | | | | | | | | | | | | | | | | | | |
| | | | | |
Investments and foreign currency | | | 58,948,028 | | | | (37,840,856 | ) | | | | | | | 348,063,149 | | | | 67,415,493 | |
| | | | | |
Futures contracts | | | — | | | | 2,813,514 | | | | | | | | — | | | | — | |
| | | | |
Change in net unrealized appreciation (depreciation) of: | | | | | | | | | | | | | | | | | |
| | | | | |
Investments and foreign currency | | | 245,455,301 | | | | (187,951,172 | ) | | | | | | | 327,922,170 | | | | (320,335,746 | ) |
| | | | | |
Futures contracts | | | — | | | | (133,634 | ) | | | | | | | — | | | | — | |
| | | | | |
Net increase (decrease) in net assets from operations | | | 388,809,462 | | | | (124,386,748 | ) | | | | | | | 734,048,693 | | | | (186,195,515 | ) |
| | | | | |
Distributions to Shareholders | | | | | | | | | | | | | | | | | | | | |
| | | | | |
Dividends | | | | | | | | | | | | | | | | | | | | |
| | | | | |
Class A Shares | | | (11,627,309 | ) | | | (9,712,967 | ) | | | | | | | (26,598,316 | ) | | | (17,730,670 | ) |
| | | | | |
Class C Shares | | | (10,327,392 | ) | | | (8,470,366 | ) | | | | | | | (3,934,152 | ) | | | (2,449,091 | ) |
| | | | | |
Class R3 Shares | | | — | | | | — | | | | | | | | (2,189,834 | ) | | | (1,414,187 | ) |
| | | | | |
Class R6 Shares | | | (3,824,352 | ) | | | (1,478,458 | ) | | | | | | | (50,325,533 | ) | | | (20,227,182 | ) |
| | | | | |
Class I Shares | | | (92,558,832 | ) | | | (74,646,020 | ) | | | | | | | (239,701,123 | ) | | | (149,246,103 | ) |
| | | | | |
Class T Shares(1) | | | — | | | | (1,055 | ) | | | | | | | — | | | | (765 | ) |
| | | | | |
Return of Capital | | | | | | | | | | | | | | | | | | | | |
| | | | | |
Class A Shares | | | (319,381 | ) | | | (1,105,163 | ) | | | | | | | — | | | | — | |
| | | | | |
Class C Shares | | | (326,727 | ) | | | (1,153,747 | ) | | | | | | | — | | | | — | |
| | | | | |
Class R3 Shares | | | — | | | | — | | | | | | | | — | | | | — | |
| | | | | |
Class R6 Shares | | | (96,249 | ) | | | (158,482 | ) | | | | | | | — | | | | — | |
| | | | | |
Class I Shares | | | (2,433,660 | ) | | | (8,043,786 | ) | | | | | | | — | | | | — | |
| | | | | |
Class T Shares(1) | | | — | | | | (127 | ) | | | | | | | — | | | | — | |
| | | | | |
Decrease in net assets from distributions to shareholders | | | (121,513,902 | ) | | | (104,770,171 | ) | | | | | | | (322,748,958 | ) | | | (191,067,998 | ) |
| | | | | |
Fund Share Transactions | | | | | | | | | | | | | | | | | | | | |
| | | | | |
Proceeds from sale of shares | | | 695,040,316 | | | | 579,661,431 | | | | | | | | 753,698,574 | | | | 869,814,162 | |
| | | | | |
Proceeds from shares issued to shareholders due to reinvestment of distributions | | | 110,345,096 | | | | 95,025,457 | | | | | | | | 262,074,094 | | | | 154,000,537 | |
| | | | | |
| | | 805,385,412 | | | | 674,686,888 | | | | | | | | 1,015,772,668 | | | | 1,023,814,699 | |
| | | | | |
Cost of shares redeemed | | | (532,060,862 | ) | | | (844,651,713 | ) | | | | | | | (1,469,696,254 | ) | | | (1,454,944,075 | ) |
| | | | | |
Net increase (decrease) in net assets from Fund share transactions | | | 273,324,550 | | | | (169,964,825 | ) | | | | | | | (453,923,586 | ) | | | (431,129,376 | ) |
| | | | | |
Net increase (decrease) in net assets | | | 540,620,110 | | | | (399,121,744 | ) | | | | | | | (42,623,851 | ) | | | (808,392,889 | ) |
| | | | | |
Net assets at the beginning of period | | | 1,704,627,836 | | | | 2,103,749,580 | | | | | | | | 2,978,360,334 | | | | 3,786,753,223 | |
| | | | | |
Net assets at the end of period | | $ | 2,245,247,946 | | | $ | 1,704,627,836 | | | | | | | $ | 2,935,736,483 | | | $ | 2,978,360,334 | |
| (1) | Class T shares were not available for public offering. |
See accompanying notes to financial statements.
69
Financial Highlights
Global Infrastructure
Selected data for a share outstanding throughout each period:
| | | | | | | | | | | | | | | | | | | | | | | | | | | | | | | | | | | | | | | | |
| | | | |
| | | | Investment Operations | | | | | | Less Distributions | | | | |
| | | | | | | | | | |
Class (Commencement Date) Year Ended December 31, | | Beginning
NAV | | | Net
Investment
Income
(Loss)(a) | | | Net
Realized/
Unrealized
Gain (Loss) | | | Total | | | | | | From
Net
Investment
Income | | | From
Accumulated
Net Realized
Gains | | | Return
of
Capital | | | Total | | | Ending
NAV | |
| | | | | | | | | |
Class A (12/07) | | | | | | | | | | | | | | | | | | | | | | | | | | | | | | | | | | | | | |
| | | | | | | | | | |
2019 | | $ | 9.48 | | | $ | 0.22 | | | $ | 2.56 | | | $ | 2.78 | | | | | | | $ | (0.20 | ) | | $ | (0.61 | ) | | $ | — | | | $ | (0.81 | ) | | $ | 11.45 | |
| | | | | | | | | | |
2018 | | | 10.93 | | | | 0.20 | | | | (1.05 | ) | | | (0.85 | ) | | | | | | | (0.22 | ) | | | (0.36 | ) | | | (0.02 | ) | | | (0.60 | ) | | | 9.48 | |
| | | | | | | | | | |
2017 | | | 9.69 | | | | 0.22 | | | | 1.66 | | | | 1.88 | | | | | | | | (0.23 | ) | | | (0.41 | ) | | | — | | | | (0.64 | ) | | | 10.93 | |
| | | | | | | | | | |
2016 | | | 9.75 | | | | 0.25 | | | | 0.49 | | | | 0.74 | | | | | | | | (0.30 | ) | | | (0.50 | ) | | | — | | | | (0.80 | ) | | | 9.69 | |
| | | | | | | | | | |
2015 | | | 10.79 | | | | 0.19 | | | | (0.93 | ) | | | (0.74 | ) | | | | | | | (0.20 | ) | | | (0.10 | ) | | | — | | | | (0.30 | ) | | | 9.75 | |
| | | | | | | | | |
Class C (11/08) | | | | | | | | | | | | | | | | | | | | | | | | | | | | | | | | | | | | | |
| | | | | | | | | | |
2019 | | | 9.41 | | | | 0.14 | | | | 2.52 | | | | 2.66 | | | | | | | | (0.11 | ) | | | (0.61 | ) | | | — | | | | (0.72 | ) | | | 11.35 | |
| | | | | | | | | | |
2018 | | | 10.85 | | | | 0.12 | | | | (1.04 | ) | | | (0.92 | ) | | | | | | | (0.14 | ) | | | (0.36 | ) | | | (0.02 | ) | | | (0.52 | ) | | | 9.41 | |
| | | | | | | | | | |
2017 | | | 9.62 | | | | 0.14 | | | | 1.65 | | | | 1.79 | | | | | | | | (0.15 | ) | | | (0.41 | ) | | | — | | | | (0.56 | ) | | | 10.85 | |
| | | | | | | | | | |
2016 | | | 9.69 | | | | 0.16 | | | | 0.49 | | | | 0.65 | | | | | | | | (0.22 | ) | | | (0.50 | ) | | | — | | | | (0.72 | ) | | | 9.62 | |
| | | | | | | | | | |
2015 | | | 10.71 | | | | 0.11 | | | | (0.91 | ) | | | (0.80 | ) | | | | | | | (0.12 | ) | | | (0.10 | ) | | | — | | | | (0.22 | ) | | | 9.69 | |
| | | | | | | | | |
Class R3 (11/08) | | | | | | | | | | | | | | | | | | | | | | | | | | | | | | | | | | | | | |
| | | | | | | | | | |
2019 | | | 9.64 | | | | 0.19 | | | | 2.59 | | | | 2.78 | | | | | | | | (0.17 | ) | | | (0.61 | ) | | | — | | | | (0.78 | ) | | | 11.64 | |
| | | | | | | | | | |
2018 | | | 11.11 | | | | 0.18 | | | | (1.07 | ) | | | (0.89 | ) | | | | | | | (0.20 | ) | | | (0.36 | ) | | | (0.02 | ) | | | (0.58 | ) | | | 9.64 | |
| | | | | | | | | | |
2017 | | | 9.85 | | | | 0.20 | | | | 1.68 | | | | 1.88 | | | | | | | | (0.21 | ) | | | (0.41 | ) | | | — | | | | (0.62 | ) | | | 11.11 | |
| | | | | | | | | | |
2016 | | | 9.90 | | | | 0.22 | | | | 0.51 | | | | 0.73 | | | | | | | | (0.28 | ) | | | (0.50 | ) | | | — | | | | (0.78 | ) | | | 9.85 | |
| | | | | | | | | | |
2015 | | | 10.95 | | | | 0.17 | | | | (0.95 | ) | | | (0.78 | ) | | | | | | | (0.17 | ) | | | (0.10 | ) | | | — | | | | (0.27 | ) | | | 9.90 | |
| | | | | | | | | | |
Class R6 (6/16) | | | | | | | | | | | | | | | | | | | | | | | | | | | | | | | | | | | | | | | | |
| | | | | | | | | | |
2019 | | | 9.47 | | | | 0.26 | | | | 2.54 | | | | 2.80 | | | | | | | | (0.24 | ) | | | (0.61 | ) | | | — | | | | (0.85 | ) | | | 11.42 | |
| | | | | | | | | | |
2018 | | | 10.91 | | | | 0.22 | | | | (1.03 | ) | | | (0.81 | ) | | | | | | | (0.25 | ) | | | (0.36 | ) | | | (0.02 | ) | | | (0.63 | ) | | | 9.47 | |
| | | | | | | | | | |
2017 | | | 9.65 | | | | 0.27 | | | | 1.66 | | | | 1.93 | | | | | | | | (0.26 | ) | | | (0.41 | ) | | | — | | | | (0.67 | ) | | | 10.91 | |
| | | | | | | | | | |
2016(e) | | | 11.06 | | | | 0.11 | | | | (0.67 | ) | | | (0.56 | ) | | | | | | | (0.35 | ) | | | (0.50 | ) | | | — | | | | (0.85 | ) | | | 9.65 | |
| | | | | | | | | |
Class I (12/07) | | | | | | | | | | | | | | | | | | | | | | | | | | | | | | | | | | | | | |
| | | | | | | | | | |
2019 | | | 9.44 | | | | 0.25 | | | | 2.54 | | | | 2.79 | | | | | | | | (0.22 | ) | | | (0.61 | ) | | | — | | | | (0.83 | ) | | | 11.40 | |
| | | | | | | | | | |
2018 | | | 10.89 | | | | 0.22 | | | | (1.04 | ) | | | (0.82 | ) | | | | | | | (0.25 | ) | | | (0.36 | ) | | | (0.02 | ) | | | (0.63 | ) | | | 9.44 | |
| | | | | | | | | | |
2017 | | | 9.66 | | | | 0.26 | | | | 1.64 | | | | 1.90 | | | | | | | | (0.26 | ) | | | (0.41 | ) | | | — | | | | (0.67 | ) | | | 10.89 | |
| | | | | | | | | | |
2016 | | | 9.73 | | | | 0.27 | | | | 0.50 | | | | 0.77 | | | | | | | | (0.34 | ) | | | (0.50 | ) | | | — | | | | (0.84 | ) | | | 9.66 | |
| | | | | | | | | | |
2015 | | | 10.77 | | | | 0.22 | | | | (0.94 | ) | | | (0.72 | ) | | | | | | | (0.22 | ) | | | (0.10 | ) | | | — | | | | (0.32 | ) | | | 9.73 | |
70
| | | | | | | | | | | | | | | | | | | | | | | | | | | | | | | | | | |
| | | | Ratios/Supplemental Data | |
| | | | | | | | | | Ratios to Average
Net Assets Before
Waiver/Reimbursement | | | | | | Ratios to Average
Net Assets After
Waiver/Reimbursement(c) | | | | |
| | | | | | | | |
Total
Return(b) | | | Ending
Net
Assets
(000) | | | | | | Expenses | | | Net
Investment
Income
(Loss) | | | | | | Expenses | | | Net
Investment
Income
(Loss) | | | Portfolio
Turnover
Rate(d) | |
| | | | | | | | |
| | | | | | | | | | | | | | | | | | | | | | | | | | | | | | | | | | |
| | | | | | | | |
| | 29.27 | % | | $ | 57,379 | | | | | | | | 1.36 | % | | | 1.85 | % | | | | | | | 1.22 | % | | | 1.99 | % | | | 144 | % |
| | | | | | | | |
| | (7.88 | ) | | | 55,856 | | | | | | | | 1.35 | | | | 1.74 | | | | | | | | 1.22 | | | | 1.87 | | | | 174 | |
| | | | | | | | |
| | 19.38 | | | | 87,876 | | | | | | | | 1.42 | | | | 1.85 | | | | | | | | 1.22 | | | | 2.05 | | | | 161 | |
| | | | | | | | |
| | 7.61 | | | | 70,173 | | | | | | | | 1.45 | | | | 2.20 | | | | | | | | 1.22 | | | | 2.42 | | | | 149 | |
| | | | | | | | |
| | (6.89 | ) | | | 287,424 | | | | | | | | 1.45 | | | | 1.59 | | | | | | | | 1.22 | | | | 1.82 | | | | 133 | |
| | | | | | | | |
| | | | | | | | | | | | | | | | | | | | | | | | | | | | | | | | | | |
| | | | | | | | |
| | 28.37 | | | | 24,640 | | | | | | | | 2.11 | | | | 1.11 | | | | | | | | 1.97 | | | | 1.26 | | | | 144 | |
| | | | | | | | |
| | (8.60 | ) | | | 24,556 | | | | | | | | 2.11 | | | | 1.00 | | | | | | | | 1.97 | | | | 1.13 | | | | 174 | |
| | | | | | | | |
| | 18.55 | | | | 29,227 | | | | | | | | 2.17 | | | | 1.11 | | | | | | | | 1.97 | | | | 1.31 | | | | 161 | |
| | | | | | | | |
| | 6.71 | | | | 22,868 | | | | | | | | 2.21 | | | | 1.30 | | | | | | | | 1.97 | | | | 1.53 | | | | 149 | |
| | | | | | | | |
| | (7.50 | ) | | | 22,307 | | | | | | | | 2.20 | | | | 0.83 | | | | | | | | 1.97 | | | | 1.05 | | | | 133 | |
| | | | | | | | |
| | | | | | | | | | | | | | | | | | | | | | | | | | | | | | | | | | |
| | | | | | | | |
| | 29.06 | | | | 358 | | | | | | | | 1.61 | | | | 1.54 | | | | | | | | 1.47 | | | | 1.69 | | | | 144 | |
| | | | | | | | |
| | (8.14 | ) | | | 239 | | | | | | | | 1.60 | | | | 1.54 | | | | | | | | 1.47 | | | | 1.68 | | | | 174 | |
| | | | | | | | |
| | 19.03 | | | | 337 | | | | | | | | 1.67 | | | | 1.63 | | | | | | | | 1.47 | | | | 1.83 | | | | 161 | |
| | | | | | | | |
| | 7.37 | | | | 730 | | | | | | | | 1.71 | | | | 1.81 | | | | | | | | 1.47 | | | | 2.04 | | | | 149 | |
| | | | | | | | |
| | (7.10 | ) | | | 607 | | | | | | | | 1.70 | | | | 1.39 | | | | | | | | 1.47 | | | | 1.62 | | | | 133 | |
| | | | | | | | |
| | | | | | | | | | | | | | | | | | | | | | | | | | | | | | | | | | |
| | | | | | | | |
| | 29.70 | | | | 60,187 | | | | | | | | 1.03 | | | | 2.11 | | | | | | | | 0.89 | | | | 2.26 | | | | 144 | |
| | | | | | | | |
| | (7.56 | ) | | | 11,520 | | | | | | | | 1.02 | | | | 1.93 | | | | | | | | 0.89 | | | | 2.06 | | | | 174 | |
| | | | | | | | |
| | 19.95 | | | | 19,575 | | | | | | | | 1.02 | | | | 2.24 | | | | | | | | 0.80 | | | | 2.46 | | | | 161 | |
| | | | | | | | |
| | (5.08 | ) | | | 7,627 | | | | | | | | 1.09 | * | | | 1.78 | * | | | | | | | 0.86 | * | | | 2.02 | * | | | 149 | |
| | | | | | | | |
| | | | | | | | | | | | | | | | | | | | | | | | | | | | | | | | | | |
| | | | | | | | |
| | 29.69 | | | | 477,180 | | | | | | | | 1.11 | | | | 2.10 | | | | | | | | 0.97 | | | | 2.24 | | | | 144 | |
| | | | | | | | |
| | (7.67 | ) | | | 345,782 | | | | | | | | 1.10 | | | | 1.98 | | | | | | | | 0.97 | | | | 2.11 | | | | 174 | |
| | | | | | | | |
| | 19.61 | | | | 472,564 | | | | | | | | 1.17 | | | | 2.14 | | | | | | | | 0.97 | | | | 2.34 | | | | 161 | |
| | | | | | | | |
| | 7.91 | | | | 314,001 | | | | | | | | 1.20 | | | | 2.30 | | | | | | | | 0.97 | | | | 2.54 | | | | 149 | |
| | | | | | | | |
| | (6.67) | | | | 320,406 | | | | | | | | 1.20 | | | | 1.83 | | | | | | | | 0.97 | | | | 2.05 | | | | 133 | |
| (a) | Per share Net Investment Income (Loss) is calculated using the average daily shares method. | |
| (b) | Total return is the combination of changes in NAV without any sales charge, reinvested dividend income at NAV and reinvested capital gains distributions at NAV, if any. Total returns are not annualized. | |
| (c) | After fee waiver and/or expense reimbursement from the Adviser, where applicable. See Note 7 – Management Fees and Other Transactions with Affiliates, Management Fees for more information. | |
| (d) | Portfolio Turnover Rate is calculated based on the lesser of long-term purchases or sales (as disclosed in Note 4 – Portfolio Securities and Investment in Derivatives, Investment Transactions) divided by the average long-term market value during the period. | |
| (e) | For the period June 30, 2016 (commencement of operations) through December 31, 2016. | |
See accompanying notes to financial statements.
71
Financial Highlights(continued)
Global Real Estate Securities
Selected data for a share outstanding throughout each period:
| | | | | | | | | | | | | | | | | | | | | | | | | | | | | | | | | | | | |
| | | | | |
| | | | | | Investment Operations | | | | | | Less Distributions | | | | |
| | | | | | | | | |
Class (Commencement Date) Year Ended December 31, | | Beginning
NAV | | | Net
Investment
Income
(Loss)(a) | | | Net
Realized/
Unrealized
Gain (Loss) | | | Total | | | | | | From
Net
Investment
Income | | | From
Accumulated
Net Realized
Gains | | | Total | | | Ending
NAV | |
| | | | | | | | | |
Class A (03/18) | | | | | | | | | | | | | | | | | | | | | | | | | | | | | | | | | | | | |
| | | | | | | | | |
2019 | | $ | 19.07 | | | $ | 0.36 | | | $ | 4.84 | | | $ | 5.20 | | | | | | | $ | (1.33 | ) | | $ | (0.72 | ) | | $ | (2.05 | ) | | $ | 22.22 | |
| | | | | | | | | |
2018(e) | | | 20.00 | | | | 0.32 | | | | (0.54 | ) | | | (0.22 | ) | | | | | | | (0.53 | ) | | | (0.18 | ) | | | (0.71 | ) | | | 19.07 | |
| | | | | | | | | |
Class C (03/18) | | | | | | | | | | | | | | | | | | | | | | | | | | | | | | | | | | | | |
| | | | | | | | | |
2019 | | | 19.06 | | | | 0.19 | | | | 4.84 | | | | 5.03 | | | | | | | | (1.16 | ) | | | (0.72 | ) | | | (1.88 | ) | | | 22.21 | |
| | | | | | | | | |
2018(e) | | | 20.00 | | | | 0.20 | | | | (0.55 | ) | | | (0.35 | ) | | | | | | | (0.41 | ) | | | (0.18 | ) | | | (0.59 | ) | | | 19.06 | |
| | | | | | | | | |
Class R6 (03/18) | | | | | | | | | | | | | | | | | | | | | | | | | | | | | | | | | | | | |
| | | | | | | | | |
2019 | | | 19.07 | | | | 0.43 | | | | 4.85 | | | | 5.28 | | | | | | | | (1.40 | ) | | | (0.72 | ) | | | (2.12 | ) | | | 22.23 | |
| | | | | | | | | |
2018(e) | | | 20.00 | | | | 0.37 | | | | (0.55 | ) | | | (0.18 | ) | | | | | | | (0.57 | ) | | | (0.18 | ) | | | (0.75 | ) | | | 19.07 | |
| | | | | | | | | |
Class I (03/18) | | | | | | | | | | | | | | | | | | | | | | | | | | | | | | | | | | | | |
| | | | | | | | | |
2019 | | | 19.07 | | | | 0.47 | | | | 4.79 | | | | 5.26 | | | | | | | | (1.39 | ) | | | (0.72 | ) | | | (2.11 | ) | | | 22.22 | |
| | | | | | | | | |
2018(e) | | | 20.00 | | | | 0.36 | | | | (0.54 | ) | | | (0.18 | ) | | | | | | | (0.57 | ) | | | (0.18 | ) | | | (0.75 | ) | | | 19.07 | |
72
| | | | | | | | | | | | | | | | | | | | | | | | | | | | | | | | | | |
| | | | Ratios/Supplemental Data | |
| | | | | | | | | | Ratios to Average
Net Assets Before
Waiver/Reimbursement | | | | | | Ratios to Average
Net Assets After
Waiver/Reimbursement(c) | | | | |
| | | | | | | | |
Total
Return(b) | | | Ending
Net
Assets
(000) | | | | | | Expenses | | | Net
Investment
Income
(Loss) | | | | | | Expenses | | | Net Investment
Income
(Loss) | | | Portfolio
Turnover
Rate(d) | |
| | | | | | | | |
| | | | | | | | | | | | | | | | | | | | | | | | | | | | | | | | | | |
| | | | | | | | |
| | 27.55 | % | | $ | 35 | | | | | | | | 3.21 | % | | | (0.31 | )% | | | | | | | 1.30 | % | | | 1.60 | % | | | 198 | % |
| | | | | | | | |
| | (1.21 | ) | | | 24 | | | | | | | | 2.65 | * | | | 0.67 | * | | | | | | | 1.30 | * | | | 2.02 | * | | | 161 | |
| | | | | | | | |
| | | | | | | | | | | | | | | | | | | | | | | | | | | | | | | | | | |
| | | | | | | | |
| | 26.56 | | | | 33 | | | | | | | | 3.96 | | | | (1.05 | ) | | | | | | | 2.05 | | | | 0.86 | | | | 198 | |
| | | | | | | | |
| | (1.77 | ) | | | 24 | | | | | | | | 3.41 | * | | | (0.09 | )* | | | | | | | 2.05 | * | | | 1.27 | * | | | 161 | |
| | | | | | | | |
| | | | | | | | | | | | | | | | | | | | | | | | | | | | | | | | | | |
| | | | | | | | |
| | 27.91 | | | | 27,709 | | | | | | | | 2.88 | | | | 0.01 | | | | | | | | 0.97 | | | | 1.93 | | | | 198 | |
| | | | | | | | |
| | (0.97 | ) | | | 23,770 | | | | | | | | 2.38 | * | | | 0.94 | * | | | | | | | 1.02 | * | | | 2.30 | * | | | 161 | |
| | | | | | | | |
| | | | | | | | | | | | | | | | | | | | | | | | | | | | | | | | | | |
| | | | | | | | |
| | 27.80 | | | | 190 | | | | | | | | 2.96 | | | | 0.15 | | | | | | | | 1.05 | | | | 2.06 | | | | 198 | |
| | | | | | | | |
| | (1.03) | | | | 26 | | | | | | | | 2.42 | * | | | 0.86 | * | | | | | | | 1.05 | * | | | 2.24 | * | | | 161 | |
| (a) | Per share Net Investment Income (Loss) is calculated using the average daily shares method. | |
| (b) | Total return is the combination of changes in NAV without any sales charge, reinvested dividend income at NAV and reinvested capital gains distributions at NAV, if any. Total returns are not annualized. | |
| (c) | After fee waiver and/or expense reimbursement from the Adviser, where applicable. See Note 7 – Management Fees and Other Transactions with Affiliates, Management Fees for more information. | |
| (d) | Portfolio Turnover Rate is calculated based on the lesser of long-term purchases or sales (as disclosed in Note 4 – Portfolio Securities and Investment in Derivatives, Investment Transactions) divided by the average long-term market value during the period. | |
| (e) | For the period March 20, 2018 (commencement of operations) though December 31, 2018. | |
See accompanying notes to financial statements.
73
Financial Highlights(continued)
Real Asset Income
Selected data for a share outstanding throughout each period:
| | | | | | | | | | | | | | | | | | | | | | | | | | | | | | | | | | | | | | | | |
| | | | | |
| | | | | | Investment Operations | | | | | | Less Distributions | | | | |
| | | | | | | | | | |
Class (Commencement Date) Year Ended December 31, | | Beginning
NAV | | | Net
Investment
Income
(Loss)(a) | | | Net
Realized/
Unrealized
Gain (Loss) | | | Total | | | | | | From
Net
Investment
Income | | | From
Accumulated
Net Realized
Gains | | | Return
of
Capital | | | Total | | | Ending
NAV | |
| | | | | | | | | |
Class A (9/11) | | | | | | | | | | | | | | | | | | | | | | | | | | | | | | | | | | | | | |
| | | | | | | | | | |
2019 | | $ | 21.46 | | | $ | 0.99 | | | $ | 3.73 | | | $ | 4.72 | | | | | | | $ | (1.38 | ) | | $ | — | | | $ | (0.04 | ) | | $ | (1.42 | ) | | $ | 24.76 | |
| | | | | | | | | | |
2018 | | | 24.14 | | | | 1.12 | | | | (2.61 | ) | | | (1.49 | ) | | | | | | | (1.07 | ) | | | — | | | | (0.12 | ) | | | (1.19 | ) | | | 21.46 | |
| | | | | | | | | | |
2017 | | | 22.76 | | | | 1.11 | | | | 1.59 | | | | 2.70 | | | | | | | | (1.32 | ) | | | — | | | | — | | | | (1.32 | ) | | | 24.14 | |
| | | | | | | | | | |
2016 | | | 21.87 | | | | 1.08 | | | | 1.00 | | | | 2.08 | | | | | | | | (1.12 | ) | | | — | | | | (0.07 | ) | | | (1.19 | ) | | | 22.76 | |
| | | | | | | | | | |
2015 | | | 23.78 | | | | 1.08 | | | | (1.80 | ) | | | (0.72 | ) | | | | | | | (1.08 | ) | | | (0.01 | ) | | | (0.10 | ) | | | (1.19 | ) | | | 21.87 | |
| | | | | | | | | |
Class C (9/11) | | | | | | | | | | | | | | | | | | | | | | | | | | | | | | | | | | | | | |
| | | | | | | | | | |
2019 | | | 21.47 | | | | 0.81 | | | | 3.74 | | | | 4.55 | | | | | | | | (1.21 | ) | | | — | | | | (0.04 | ) | | | (1.25 | ) | | | 24.77 | |
| | | | | | | | | | |
2018 | | | 24.15 | | | | 0.95 | | | | (2.62 | ) | | | (1.67 | ) | | | | | | | (0.89 | ) | | | — | | | | (0.12 | ) | | | (1.01 | ) | | | 21.47 | |
| | | | | | | | | | |
2017 | | | 22.77 | | | | 0.94 | | | | 1.59 | | | | 2.53 | | | | | | | | (1.15 | ) | | | — | | | | — | | | | (1.15 | ) | | | 24.15 | |
| | | | | | | | | | |
2016 | | | 21.89 | | | | 0.91 | | | | 0.99 | | | | 1.90 | | | | | | | | (0.95 | ) | | | — | | | | (0.07 | ) | | | (1.02 | ) | | | 22.77 | |
| | | | | | | | | | |
2015 | | | 23.79 | | | | 0.92 | | | | (1.81 | ) | | | (0.89 | ) | | | | | | | (0.90 | ) | | | (0.01 | ) | | | (0.10 | ) | | | (1.01 | ) | | | 21.89 | |
| | | | | | | | | | |
Class R6 (6/16) | | | | | | | | | | | | | | | | | | | | | | | | | | | | | | | | | | | | | | | | |
| | | | | | | | | | |
2019 | | | 21.56 | | | | 1.10 | | | | 3.73 | | | | 4.83 | | | | | | | | (1.46 | ) | | | — | | | | (0.04 | ) | | | (1.50 | ) | | | 24.89 | |
| | | | | | | | | | |
2018 | | | 24.24 | | | | 1.20 | | | | (2.63 | ) | | | (1.43 | ) | | | | | | | (1.13 | ) | | | — | | | | (0.12 | ) | | | (1.25 | ) | | | 21.56 | |
| | | | | | | | | | |
2017 | | | 22.83 | | | | 1.22 | | | | 1.58 | | | | 2.80 | | | | | | | | (1.39 | ) | | | — | | | | — | | | | (1.39 | ) | | | 24.24 | |
| | | | | | | | | | |
2016(e) | | | 23.49 | | | | 0.48 | | | | (0.57 | ) | | | (0.09 | ) | | | | | | | (0.50 | ) | | | — | | | | (0.07 | ) | | | (0.57 | ) | | | 22.83 | |
| | | | | | | | | |
Class I (9/11) | | | | | | | | | | | | | | | | | | | | | | | | | | | | | | | | | | | | | |
| | | | | | | | | | |
2019 | | | 21.46 | | | | 1.05 | | | | 3.73 | | | | 4.78 | | | | | | | | (1.44 | ) | | | — | | | | (0.04 | ) | | | (1.48 | ) | | | 24.76 | |
| | | | | | | | | | |
2018 | | | 24.14 | | | | 1.18 | | | | (2.61 | ) | | | (1.43 | ) | | | | | | | (1.13 | ) | | | — | | | | (0.12 | ) | | | (1.25 | ) | | | 21.46 | |
| | | | | | | | | | |
2017 | | | 22.76 | | | | 1.18 | | | | 1.58 | | | | 2.76 | | | | | | | | (1.38 | ) | | | — | | | | — | | | | (1.38 | ) | | | 24.14 | |
| | | | | | | | | | |
2016 | | | 21.88 | | | | 1.14 | | | | 0.98 | | | | 2.12 | | | | | | | | (1.17 | ) | | | — | | | | (0.07 | ) | | | (1.24 | ) | | | 22.76 | |
| | | | | | | | | | |
2015 | | | 23.78 | | | | 1.14 | | | | (1.79 | ) | | | (0.65 | ) | | | | | | | (1.14 | ) | | | (0.01 | ) | | | (0.10 | ) | | | (1.25 | ) | | | 21.88 | |
74
| | | | | | | | | | | | | | | | | | | | | | | | | | | | | | | | | | |
| | | | Ratios/Supplemental Data | |
| | | | | | | | | | Ratios to Average
Net Assets Before
Waiver/Reimbursement | | | | | | Ratios to Average
Net Assets After
Waiver/Reimbursement(c) | | | | |
| | | | | | | | |
Total
Return(b) | | | Ending
Net
Assets
(000) | | | | | | Expenses | | | Net
Investment
Income
(Loss) | | | | | | Expenses | | | Net
Investment
Income
(Loss) | | | Portfolio
Turnover
Rate(d) | |
| | | | | | | | |
| | | | | | | | | | | | | | | | | | | | | | | | | | | | | | | | | | |
| | | | | | | | |
| | 22.39 | % | | $ | 220,665 | | | | | | | | 1.14 | % | | | 4.16 | % | | | | | | | 1.14 | % | | | 4.16 | % | | | 85 | % |
| | | | | | | | |
| | (6.38 | ) | | | 178,651 | | | | | | | | 1.14 | | | | 4.85 | | | | | | | | 1.14 | | | | 4.85 | | | | 94 | |
| | | | | | | | |
| | 12.07 | | | | 225,282 | | | | | | | | 1.15 | | | | 4.64 | | | | | | | | 1.15 | | | | 4.64 | | | | 84 | |
| | | | | | | | |
| | 9.60 | | | | 234,495 | | | | | | | | 1.18 | | | | 4.72 | | | | | | | | 1.16 | | | | 4.74 | | | | 89 | |
| | | | | | | | |
| | (3.19 | ) | | | 161,064 | | | | | | | | 1.18 | | | | 4.68 | | | | | | | | 1.16 | | | | 4.69 | | | | 82 | |
| | | | | | | | |
| | | | | | | | | | | | | | | | | | | | | | | | | | | | | | | | | | |
| | | | | | | | |
| | 21.50 | | | | 217,976 | | | | | | | | 1.89 | | | | 3.41 | | | | | | | | 1.89 | | | | 3.41 | | | | 85 | |
| | | | | | | | |
| | (7.09 | ) | | | 186,043 | | | | | | | | 1.89 | | | | 4.10 | | | | | | | | 1.89 | | | | 4.11 | | | | 94 | |
| | | | | | | | |
| | 11.25 | | | | 241,844 | | | | | | | | 1.90 | | | | 3.94 | | | | | | | | 1.90 | | | | 3.94 | | | | 84 | |
| | | | | | | | |
| | 8.74 | | | | 182,744 | | | | | | | | 1.93 | | | | 3.97 | | | | | | | | 1.91 | | | | 3.99 | | | | 89 | |
| | | | | | | | |
| | (3.88 | ) | | | 129,301 | | | | | | | | 1.92 | | | | 3.99 | | | | | | | | 1.91 | | | | 4.01 | | | | 82 | |
| | | | | | | | |
| | | | | | | | | | | | | | | | | | | | | | | | | | | | | | | | | | |
| | | | | | | | |
| | 22.82 | | | | 80,903 | | | | | | | | 0.80 | | | | 4.59 | | | | | | | | 0.80 | | | | 4.59 | | | | 85 | |
| | | | | | | | |
| | (6.08 | ) | | | 27,654 | | | | | | | | 0.81 | | | | 5.18 | | | | | | | | 0.81 | | | | 5.19 | | | | 94 | |
| | | | | | | | |
| | 12.47 | | | | 29,332 | | | | | | | | 0.81 | | | | 5.10 | | | | | | | | 0.81 | | | | 5.10 | | | | 84 | |
| | | | | | | | |
| | (0.43 | ) | | | 7,237 | | | | | | | | 0.84 | * | | | 4.08 | * | | | | | | | 0.82 | * | | | 4.11 | * | | | 89 | |
| | | | | | | | |
| | | | | | | | | | | | | | | | | | | | | | | | | | | | | | | | | | |
| | | | | | | | |
| | 22.69 | | | | 1,725,703 | | | | | | | | 0.89 | | | | 4.42 | | | | | | | | 0.89 | | | | 4.42 | | | | 85 | |
| | | | | | | | |
| | (6.13 | ) | | | 1,312,280 | | | | | | | | 0.89 | | | | 5.10 | | | | | | | | 0.89 | | | | 5.11 | | | | 94 | |
| | | | | | | | |
| | 12.35 | | | | 1,607,267 | | | | | | | | 0.90 | | | | 4.96 | | | | | | | | 0.90 | | | | 4.96 | | | | 84 | |
| | | | | | | | |
| | 9.82 | | | | 846,584 | | | | | | | | 0.93 | | | | 4.98 | | | | | | | | 0.91 | | | | 5.00 | | | | 89 | |
| | | | | | | | |
| | (2.90) | | | | 555,149 | | | | | | | | 0.93 | | | | 4.97 | | | | | | | | 0.91 | | | | 4.98 | | | | 82 | |
| (a) | Per share Net Investment Income (Loss) is calculated using the average daily shares method. | |
| (b) | Total return is the combination of changes in NAV without any sales charge, reinvested dividend income at NAV and reinvested capital gains distributions at NAV, if any. Total returns are not annualized. | |
| (c) | After fee waiver and/or expense reimbursement from the Adviser, where applicable. See Note 7 – Management Fees and Other Transactions with Affiliates, Management Fees for more information. | |
| (d) | Portfolio Turnover Rate is calculated based on the lesser of long-term purchases or sales (as disclosed in Note 4 – Portfolio Securities and Investment in Derivatives, Investment Transactions) divided by the average long-term market value during the period. | |
| (e) | For the period June 30, 2016 (commencement of operations) through December 31, 2016. | |
See accompanying notes to financial statements.
75
Financial Highlights(continued)
Real Estate Securities
Selected data for a share outstanding throughout each period:
| | | | | | | | | | | | | | | | | | | | | | | | | | | | | | | | | | | | |
| | | | |
| | | | Investment Operations | | | | | | Less Distributions | | | | |
| | | | | | | | | |
Class (Commencement Date) Year Ended December 31, | | Beginning
NAV | | | Net
Investment
Income
(Loss)(a) | | | Net
Realized/
Unrealized
Gain (Loss) | | | Total | | | | | | From Net
Investment
Income | | | From Accumulated Net Realized Gains | | | Total | | | Ending
NAV | |
| | | | | | | | |
Class A (9/95) | | | | | | | | | | | | | | | | | | | | | | | | | | | | | | | | | |
| | | | | | | | | |
2019 | | $ | 18.03 | | | $ | 0.33 | | | $ | 4.16 | | | $ | 4.49 | | | | | | | $ | (0.33 | ) | | $ | (1.97 | ) | | $ | (2.30 | ) | | $ | 20.22 | |
| | | | | | | | | |
2018 | | | 20.23 | | | | 0.31 | | | | (1.43 | ) | | | (1.12 | ) | | | | | | | (0.34 | ) | | | (0.74 | ) | | | (1.08 | ) | | | 18.03 | |
| | | | | | | | | |
2017 | | | 21.75 | | | | 0.32 | | | | 0.85 | | | | 1.17 | | | | | | | | (0.37 | ) | | | (2.32 | ) | | | (2.69 | ) | | | 20.23 | |
| | | | | | | | | |
2016 | | | 22.66 | | | | 0.31 | | | | 1.14 | | | | 1.45 | | | | | | | | (0.31 | ) | | | (2.05 | ) | | | (2.36 | ) | | | 21.75 | |
| | | | | | | | | |
2015 | | | 23.79 | | | | 0.32 | | | | 0.38 | | | | 0.70 | | | | | | | | (0.37 | ) | | | (1.46 | ) | | | (1.83 | ) | | | 22.66 | |
| | | | | | | | |
Class C (2/00) | | | | | | | | | | | | | | | | | | | | | | | | | | | | | | | | | |
| | | | | | | | | |
2019 | | | 17.49 | | | | 0.16 | | | | 4.03 | | | | 4.19 | | | | | | | | (0.16 | ) | | | (1.97 | ) | | | (2.13 | ) | | | 19.55 | |
| | | | | | | | | |
2018 | | | 19.63 | | | | 0.17 | | | | (1.39 | ) | | | (1.22 | ) | | | | | | | (0.18 | ) | | | (0.74 | ) | | | (0.92 | ) | | | 17.49 | |
| | | | | | | | | |
2017 | | | 21.18 | | | | 0.15 | | | | 0.82 | | | | 0.97 | | | | | | | | (0.20 | ) | | | (2.32 | ) | | | (2.52 | ) | | | 19.63 | |
| | | | | | | | | |
2016 | | | 22.11 | | | | 0.12 | | | | 1.12 | | | | 1.24 | | | | | | | | (0.12 | ) | | | (2.05 | ) | | | (2.17 | ) | | | 21.18 | |
| | | | | | | | | |
2015 | | | 23.24 | | | | 0.15 | | | | 0.36 | | | | 0.51 | | | | | | | | (0.18 | ) | | | (1.46 | ) | | | (1.64 | ) | | | 22.11 | |
| | | | | | | | |
Class R3 (9/01) | | | | | | | | | | | | | | | | | | | | | | | | | | | | | | | | | |
| | | | | | | | | |
2019 | | | 18.34 | | | | 0.28 | | | | 4.23 | | | | 4.51 | | | | | | | | (0.29 | ) | | | (1.97 | ) | | | (2.26 | ) | | | 20.59 | |
| | | | | | | | | |
2018 | | | 20.56 | | | | 0.28 | | | | (1.46 | ) | | | (1.18 | ) | | | | | | | (0.30 | ) | | | (0.74 | ) | | | (1.04 | ) | | | 18.34 | |
| | | | | | | | | |
2017 | | | 22.08 | | | | 0.27 | | | | 0.85 | | | | 1.12 | | | | | | | | (0.32 | ) | | | (2.32 | ) | | | (2.64 | ) | | | 20.56 | |
| | | | | | | | | |
2016 | | | 23.00 | | | | 0.26 | | | | 1.16 | | | | 1.42 | | | | | | | | (0.29 | ) | | | (2.05 | ) | | | (2.34 | ) | | | 22.08 | |
| | | | | | | | | |
2015 | | | 24.13 | | | | 0.25 | | | | 0.40 | | | | 0.65 | | | | | | | | (0.32 | ) | | | (1.46 | ) | | | (1.78 | ) | | | 23.00 | |
| | | | | | | | |
Class R6 (4/13) | | | | | | | | | | | | | | | | | | | | | | | | | | | | | | | | | |
| | | | | | | | | |
2019 | | | 18.54 | | | | 0.44 | | | | 4.27 | | | | 4.71 | | | | | | | | (0.43 | ) | | | (1.97 | ) | | | (2.40 | ) | | | 20.85 | |
| | | | | | | | | |
2018 | | | 20.75 | | | | 0.44 | | | | (1.51 | ) | | | (1.07 | ) | | | | | | | (0.40 | ) | | | (0.74 | ) | | | (1.14 | ) | | | 18.54 | |
| | | | | | | | | |
2017 | | | 22.23 | | | | 0.46 | | | | 0.82 | | | | 1.28 | | | | | | | | (0.44 | ) | | | (2.32 | ) | | | (2.76 | ) | | | 20.75 | |
| | | | | | | | | |
2016 | | | 23.07 | | | | 0.43 | | | | 1.16 | | | | 1.59 | | | | | | | | (0.38 | ) | | | (2.05 | ) | | | (2.43 | ) | | | 22.23 | |
| | | | | | | | | |
2015 | | | 24.17 | | | | 0.43 | | | | 0.37 | | | | 0.80 | | | | | | | | (0.44 | ) | | | (1.46 | ) | | | (1.90 | ) | | | 23.07 | |
| | | | | | | | |
Class I (6/95) | | | | | | | | | | | | | | | | | | | | | | | | | | | | | | | | | |
| | | | | | | | | |
2019 | | | 18.34 | | | | 0.39 | | | | 4.22 | | | | 4.61 | | | | | | | | (0.39 | ) | | | (1.97 | ) | | | (2.36 | ) | | | 20.59 | |
| | | | | | | | | |
2018 | | | 20.55 | | | | 0.39 | | | | (1.47 | ) | | | (1.08 | ) | | | | | | | (0.39 | ) | | | (0.74 | ) | | | (1.13 | ) | | | 18.34 | |
| | | | | | | | | |
2017 | | | 22.07 | | | | 0.40 | | | | 0.84 | | | | 1.24 | | | | | | | | (0.44 | ) | | | (2.32 | ) | | | (2.76 | ) | | | 20.55 | |
| | | | | | | | | |
2016 | | | 22.97 | | | | 0.38 | | | | 1.15 | | | | 1.53 | | | | | | | | (0.38 | ) | | | (2.05 | ) | | | (2.43 | ) | | | 22.07 | |
| | | | | | | | | |
2015 | | | 24.10 | | | | 0.38 | | | | 0.39 | | | | 0.77 | | | | | | | | (0.44 | ) | | | (1.46 | ) | | | (1.90 | ) | | | 22.97 | |
76
| | | | | | | | | | | | | | | | | | | | | | | | | | |
| | | | Ratios/Supplemental Data | |
| | | | | | | | | | Ratios to Average
Net Assets | | | | | | | |
| | | | | | |
Total
Return(b) | | | Ending
Net
Assets
(000) | | | | | | Expenses | | | Net
Investment
Income
(Loss) | | | | | | Portfolio
Turnover
Rate(c) | |
| | | | | | |
| | | | | | | | | | | | | | | | | | | | | | | | | | |
| | | | | | |
| | 25.24 | % | | $ | 249,172 | | | | | | | | 1.30 | % | | | 1.56 | % | | | | | | | 109 | % |
| | | | | | |
| | (5.78 | ) | | | 264,414 | | | | | | | | 1.26 | | | | 1.61 | | | | | | | | 131 | |
| | | | | | |
| | 5.34 | | | | 459,034 | | | | | | | | 1.29 | | | | 1.47 | | | | | | | | 131 | |
| | | | | | |
| | 6.58 | | | | 679,318 | | | | | | | | 1.30 | | | | 1.32 | | | | | | | | 139 | |
| | | | | | |
| | 3.22 | | | | 690,025 | | | | | | | | 1.30 | | | | 1.37 | | | | | | | | 104 | |
| | | | | | |
| | | | | | | | | | | | | | | | | | | | | | | | | | |
| | | | | | |
| | 24.28 | | | | 37,352 | | | | | | | | 2.06 | | | | 0.79 | | | | | | | | 109 | |
| | | | | | |
| | (6.46 | ) | | | 43,152 | | | | | | | | 2.02 | | | | 0.89 | | | | | | | | 131 | |
| | | | | | |
| | 4.59 | | | | 66,953 | | | | | | | | 2.04 | | | | 0.71 | | | | | | | | 131 | |
| | | | | | |
| | 5.76 | | | | 89,123 | | | | | | | | 2.05 | | | | 0.55 | | | | | | | | 139 | |
| | | | | | |
| | 2.45 | | | | 93,499 | | | | | | | | 2.05 | | | | 0.65 | | | | | | | | 104 | |
| | | | | | |
| | | | | | | | | | | | | | | | | | | | | | | | | | |
| | | | | | |
| | 24.88 | | | | 21,227 | | | | | | | | 1.55 | | | | 1.32 | | | | | | | | 109 | |
| | | | | | |
| | (5.98 | ) | | | 22,073 | | | | | | | | 1.52 | | | | 1.42 | | | | | | | | 131 | |
| | | | | | |
| | 5.08 | | | | 36,829 | | | | | | | | 1.54 | | | | 1.23 | | | | | | | | 131 | |
| | | | | | |
| | 6.31 | | | | 53,413 | | | | | | | | 1.55 | | | | 1.11 | | | | | | | | 139 | |
| | | | | | |
| | 2.95 | | | | 57,416 | | | | | | | | 1.55 | | | | 1.06 | | | | | | | | 104 | |
| | | | | | |
| | | | | | | | | | | | | | | | | | | | | | | | | | |
| | | | | | |
| | 25.74 | | | | 479,973 | | | | | | | | 0.88 | | | | 2.03 | | | | | | | | 109 | |
| | | | | | |
| | (5.39 | ) | | | 346,185 | | | | | | | | 0.88 | | | | 2.21 | | | | | | | | 131 | |
| | | | | | |
| | 5.78 | | | | 277,978 | | | | | | | | 0.87 | | | | 2.04 | | | | | | | | 131 | |
| | | | | | |
| | 7.05 | | | | 307,921 | | | | | | | | 0.87 | | | | 1.83 | | | | | | | | 139 | |
| | | | | | |
| | 3.60 | | | | 254,414 | | | | | | | | 0.87 | | | | 1.80 | | | | | | | | 104 | |
| | | | | | |
| | | | | | | | | | | | | | | | | | | | | | | | | | |
| | | | | | |
| | 25.56 | | | | 2,148,012 | | | | | | | | 1.06 | | | | 1.80 | | | | | | | | 109 | |
| | | | | | |
| | (5.51 | ) | | | 2,302,536 | | | | | | | | 1.02 | | | | 1.96 | | | | | | | | 131 | |
| | | | | | |
| | 5.61 | | | | 2,945,935 | | | | | | | | 1.04 | | | | 1.78 | | | | | | | | 131 | |
| | | | | | |
| | 6.79 | | | | 3,497,055 | | | | | | | | 1.05 | | | | 1.61 | | | | | | | | 139 | |
| | | | | | |
| | 3.48 | | | | 3,666,093 | | | | | | | | 1.05 | | | | 1.58 | | | | | | | | 104 | |
| (a) | Per share Net Investment Income (Loss) is calculated using the average daily shares method. | |
| (b) | Total return is the combination of changes in NAV without any sales charge, reinvested dividend income at NAV and reinvested capital gains distributions at NAV, if any. Total returns are not annualized. | |
| (c) | Portfolio Turnover Rate is calculated based on the lesser of long-term purchases or sales (as disclosed in Note 4 – Portfolio Securities and Investment in Derivatives, Investment Transactions) divided by the average long-term market value during the period. | |
See accompanying notes to financial statements.
77
Notes to Financial Statements
1. General Information
Trust and Fund Information
Nuveen Investment Funds, Inc. and Nuveen Investment Trust V (each a “Trust” and collectively, the “Trusts”), are open-end management investment companies registered under the Investment Company Act of 1940 (the “1940 Act”) as amended. Nuveen Investment Funds, Inc. is comprised of Nuveen Global Infrastructure Fund (“Global Infrastructure”), Nuveen Real Asset Income Fund (“Real Asset Income”) and Nuveen Real Estate Securities Fund (“Real Estate Securities”), among others, and Nuveen Investment Trust V is comprised of Nuveen Global Real Estate Securities Fund (“Global Real Estate Securities”), among others, (each a “Fund” and collectively, the “Funds”), as diversified funds. Nuveen Investment Funds, Inc. was incorporated in the State of Maryland on August 20, 1987 and Nuveen Investment Trust V was organized as a Massachusetts business trust on September 27, 2006.
The end of the reporting period for the Funds is December 31, 2019, and the period covered by these Notes to Financial Statements is the fiscal year ended December 31, 2019 (the “current fiscal period”).
Investment Adviser and Sub-Adviser
The Funds’ investment adviser is Nuveen Fund Advisors, LLC (the “Adviser”), a subsidiary of Nuveen, LLC (“Nuveen”). Nuveen is the investment management arm of Teachers Insurance and Annuity Association of America (TIAA). The Adviser has overall responsibility for management of the Funds, oversees the management of the Funds’ portfolios, manages the Funds’ business affairs and provides certain clerical, bookkeeping and other administrative services, and, if necessary, asset allocation decisions. The Adviser has entered into sub-advisory agreements with Nuveen Asset Management, LLC, (the “Sub-Adviser”), a subsidiary of the Adviser, under which the Sub-Adviser manages the investment portfolios of the Funds.
Share Classes and Sales Charges
Class A Shares are generally sold with anup-front sales charge. Class A Share purchases of $1 million or more are sold at net asset value (“NAV”) without anup-front sales charge but may be subject to a contingent deferred sales charge (“CDSC”) of 1% if redeemed within eighteen months of purchase. Class C Shares are sold without anup-front sales charge but are subject to a CDSC of 1% if redeemed within twelve months of purchase. Class C Shares automatically convert to Class A Shares ten years after purchase. Class R3, R6, and I Shares are sold without anup-front sales charge.
2. Significant Accounting Policies
The accompanying financial statements were prepared in accordance with accounting principles generally accepted in the United States of America (“U.S. GAAP”), which may require the use of estimates made by management and the evaluation of subsequent events. Actual results may differ from those estimates. Each Fund is an investment company and follows accounting guidance in the Financial Accounting Standards Board (“FASB”) Accounting Standards Codification 946, Financial Services – Investment Companies. The NAV for financial reporting purposes may differ from the NAV for processing security and shareholder transactions. The NAV for financial reporting purposes includes security and shareholder transactions through the date of the report. Total return is computed based on the NAV used for processing security and shareholder transactions. The following is a summary of the significant accounting policies consistently followed by the Funds.
Compensation
Neither Trust pays compensation directly to those of its directors/trustees who are affiliated with the Adviser or to its officers, all of whom receive remuneration for their services to each Trust from the Adviser or its affiliates. The Funds’ Board of Directors/Trustees (the “Board”) has adopted a deferred compensation plan for independent directors/trustees that enables directors/trustees to elect to defer receipt of all or a portion of the annual compensation they are entitled to receive from certain Nuveen-advised funds. Under the plan, deferred amounts are treated as though equal dollar amounts had been invested in shares of select Nuveen-advised funds.
Distributions to Shareholders
Distributions to shareholders are recorded on the ex-dividend date. The amount and timing of distributions are determined in accordance with federal income tax regulations, which may differ from U.S. GAAP.
The tax character of Fund distributions for a fiscal year is dependent upon the amount and tax character of distributions received from securities held in the Funds’ portfolios. Distributions received from certain securities in which the Funds invest, most notably real estate investment trust (“REIT”) securities, may be characterized for tax purposes as ordinary income, long-term capital gain and/or a return of capital. The issuer of a security reports the tax character of its distributions only once per year, generally during the first two months of the calendar year. The distribution is included in the Funds’ ordinary income until such time the Fund is notified by the issuer of the actual tax character. For the current fiscal period, dividend income, net realized gain (loss) and unrealized appreciation (depreciation) recognized on the Statement of Operations reflect the amounts of ordinary income, capital gain, and/or return of capital as reported by the issuers of such securities as of the current fiscal period.
78
Foreign currency transactions and translation
The books and records of the Funds are maintained in U.S. dollars. Assets, including investments, and liabilities denominated in foreign currencies are translated into U.S. dollars at the end of each day. Purchases and sales of securities, income and expenses are translated into U.S. dollars at each prevailing exchange rate on the respective dates of the transactions.
Net realized foreign currency gains and losses resulting from changes in exchange rates associated with (i) foreign currency, (ii) investments and (iii) derivatives include foreign currency gains and losses between trade date and settlement date of the transactions, foreign currency transactions, and the difference between the amounts of interest and dividends recorded on the books of the Funds and the amounts actually received are recognized as a component of “Net realized gain (loss) from investments and foreign currency” on the Statement of Operations, when applicable.
The unrealized gains and losses resulting from changes in foreign currency exchange rates and changes in foreign exchange rates associated with (i) investments and (ii) other assets and liabilities are recognized as a component of “Change in net unrealized appreciation (depreciation) of investments and foreign currency” on the Statement of Operations, when applicable. The unrealized gains and losses resulting from changes in foreign exchange rates associated with investments in derivatives are recognized as a component of the respective derivative’s related “Change in net unrealized appreciation (depreciation)” on the Statement of Operations, when applicable.
As of the end of the end of the reporting period, the following Funds’ investments in non-U.S. securities were as follows:
| | | | | | | | |
| Global Infrastructure | | Value | | | % of
Net Assets | |
| Country: | | | | | | | | |
France | | $ | 66,929,404 | | | | 10.8 | % |
Spain | | | 62,982,591 | | | | 10.2 | % |
Australia | | | 57,626,396 | | | | 9.3 | % |
Canada | | | 50,302,523 | | | | 8.1 | % |
Italy | | | 49,826,171 | | | | 8.0 | % |
New Zealand | | | 15,256,959 | | | | 2.5 | % |
Mexico | | | 10,510,353 | | | | 1.7 | % |
Germany | | | 9,327,072 | | | | 1.5 | % |
United Kingdom | | | 8,641,314 | | | | 1.4 | % |
Japan | | | 8,018,533 | | | | 1.3 | % |
Other | | | 44,562,817 | | | | 7.2 | % |
| Totalnon-U.S securities | | $ | 383,984,133 | | | | 62.0 | % |
| | |
| Global Real Estate Securities | | | | | | |
| Country: | | | | | | | | |
Japan | | $ | 2,917,226 | | | | 10.4 | % |
Canada | | | 1,536,549 | | | | 5.5 | % |
Germany | | | 1,474,627 | | | | 5.3 | % |
United Kingdom | | | 1,417,830 | | | | 5.1 | % |
Australia | | | 1,330,680 | | | | 4.8 | % |
Hong Kong | | | 1,041,080 | | | | 3.7 | % |
Singapore | | | 826,401 | | | | 3.0 | % |
France | | | 644,985 | | | | 2.3 | % |
Sweden | | | 271,679 | | | | 1.0 | % |
Spain | | | 258,893 | | | | 0.9 | % |
New Zealand | | | 193,023 | | | | 0.7 | % |
Other | | | 1,246,777 | | | | 4.4 | % |
| Totalnon-U.S securities | | $ | 13,159,750 | | | | 47.1 | % |
| | |
| Real Asset Income | | | | | | |
| Country: | | | | | | | | |
Canada | | $ | 290,972,091 | | | | 13.0 | % |
Australia | | | 97,584,405 | | | | 4.4 | % |
Singapore | | | 79,285,152 | | | | 3.5 | % |
France | | | 62,715,125 | | | | 2.8 | % |
Italy | | | 43,591,883 | | | | 1.9 | % |
United Kingdom | | | 39,233,451 | | | | 1.7 | % |
Spain | | | 38,194,567 | | | | 1.7 | % |
Germany | | | 32,065,458 | | | | 1.4 | % |
Portugal | | | 23,326,907 | | | | 1.0 | % |
Brazil | | | 19,527,935 | | | | 0.9 | % |
Other | | | 179,340,916 | | | | 8.0 | % |
| Totalnon-U.S securities | | $ | 905,837,890 | | | | 40.3 | % |
79
Notes to Financial Statements(continued)
Indemnifications
Under each Trust’s organizational documents, its officers and directors/trustees are indemnified against certain liabilities arising out of the performance of their duties to each Trust. In addition, in the normal course of business, each Trust enters into contracts that provide general indemnifications to other parties. Each Trust’s maximum exposure under these arrangements is unknown as this would involve future claims that may be made against each Trust that have not yet occurred. However, each Trust has not had prior claims or losses pursuant to these contracts and expects the risk of loss to be remote.
Investments and Investment Income
Securities transactions are accounted for as of the trade date for financial reporting purposes. Realized gains and losses on securities transactions are based upon the specific identification method. Dividend income is recorded on the ex-dividend date or, for foreign securities, when information is available. Non-cash dividends received in the form of stock, if any, are recognized on the ex-dividend date and recorded at fair value. Interest income, which reflects the amortization of premiums and includes accretion of discounts for financial reporting purposes, is recorded on an accrual basis. Interest income also reflects payment-in-kind (“PIK”) interest and paydown gains and losses, if any. PIK interest represents income received in the form of securities in lieu of cash. Securities lending income is comprised of fees earned from borrowers and income earned on cash collateral investments.
Multiclass Operations and Allocations
Income and expenses of Global Infrastructure, Global Real Estate Securities and Real Estate Securities that are not directly attributable to a specific class of shares are prorated among the classes of each Fund based on the relative net assets of each class. Income and expenses of Real Asset Income that are not directly attributable to a specific class of shares are prorated among the classes based on the relative settled shares of each class. Expenses directly attributable to a class of shares are recorded to the specific class. Currently, the only expenses that are allocated on a class-specific basis are 12b-1 distribution and service fees.
Sub-transfer agent fees and similar fees, which are recognized as a component of “Shareholder servicing agent fees” on the Statement of Operations, are not charged to Class R6 Shares and are prorated among the other classes based on their relative net assets for Global Infrastructure, Global Real Estate Securities and Real Estate Securities and relative settled shares for Real Asset Income.
Realized and unrealized capital gains and losses of the Funds are prorated among the classes based on the relative net assets of each class.
Netting Agreements
In the ordinary course of business, the Funds may enter into transactions subject to enforceable master repurchase agreements, International Swaps and Derivatives Association, Inc. (ISDA) master agreements or other similar arrangements (“netting agreements”). Generally, the right to offset in netting agreements allows each Fund to offset certain securities and derivatives with a specific counterparty, when applicable, as well as any collateral received or delivered to that counterparty based on the terms of the agreements. Generally, each Fund manages its cash collateral and securities collateral on a counterparty basis.
The Funds’ investments subject to netting agreements as of the end of the reporting period, if any, are further described in Note 4 – Portfolio Securities and Investments in Derivatives.
New Accounting Pronouncements and Rule Issuances
FASB Accounting Standards Update (“ASU”) 2017-08 (“ASU 2017-08”) Premium Amortization on Purchased Callable Debt Securities
The FASB has issued ASU 2017-08, which shortens the premium amortization period for purchased non-contingently callable debt securities. ASU 2017-08 specifies that the premium amortization period ends at the earliest call date, for purchased non-contingently callable debt securities. ASU 2017-08 is effective for fiscal years, and interim periods within those fiscal years, beginning after December 15, 2018. During the current fiscal period, ASU 2017-08 became effective for the Funds and it did not have a material impact on the Funds’ financial statements.
Fair Value Measurement: Disclosure Framework
During August 2018, the FASB issued ASU 2018-13 (“ASU 2018-13”), Fair Value Measurement: Disclosure Framework – Changes to the Disclosure Requirements for Fair Value Measurements. ASU 2018-13 modifies the disclosures required by Topic 820, Fair Value Measurements. The amendments in ASU 2018-13 are effective for all entities for fiscal years, and interim periods within those fiscal years, beginning after December 15, 2019. Management has early implemented this guidance and it did not have a material impact on the Funds’ financial statements.
3. Investment Valuation and Fair Value Measurements
The fair valuation input levels as described below are for fair value measurement purposes.
The Funds’ investments in securities are recorded at their estimated fair value. Fair value is defined as the price that would be received upon selling an investment or transferring a liability in an orderly transaction to an independent buyer in the principal or most advantageous market for the investment. A three-tier hierarchy is used to maximize the use of observable market data and minimize the use of unobservable inputs and to establish classification of fair value measurements for disclosure purposes. Observable inputs reflect the assumptions market participants would use in pricing the asset or liability. Observable inputs are based on market data obtained from sources independent of the reporting entity. Unobservable inputs reflect the
80
reporting entity’s own assumptions about the assumptions market participants would use in pricing the asset or liability. Unobservable inputs are based on the best information available in the circumstances. The following is a summary of the three-tiered hierarchy of valuation input levels.
| | |
| Level 1 – | | Inputs are unadjusted and prices are determined using quoted prices in active markets for identical securities. |
| Level 2 – | | Prices are determined using other significant observable inputs (including quoted prices for similar securities, interest rates, credit spreads, etc.). |
| Level 3 – | | Prices are determined using significant unobservable inputs (including management’s assumptions in determining the fair value of investments). |
Common stocks and other equity-type securities are valued at the last sales price on the securities exchange on which such securities are primarily traded and are generally classified as Level 1. Securities primarily traded on the Nasdaq National Market (“Nasdaq”) are valued at the Nasdaq Official Closing Price and are generally classified as Level 1. However, securities traded on a securities exchange or Nasdaq for which there were no transactions on a given day or securities not listed on a securities exchange or Nasdaq are valued at the quoted bid price and are generally classified as Level 2. Prices of certain American Depositary Receipts (“ADR”) held by the Funds that trade in the United States are valued based on the last traded price, official closing price, or the most recent bid price of the underlyingnon-U.S.-traded stock, adjusted as appropriate for theunderlying-to-ADR conversion ratio and foreign exchange rate, and fromtime-to-time may also be adjusted further to take into account material events that may take place after the close of the localnon-U.S. market but before the close of the New York Stock Exchange (“NYSE”), which may represent a transfer from a Level 1 to a Level 2 security.
Prices of fixed-income securities are provided by an independent pricing service (“pricing service”) approved by the Board. The pricing service establishes a security’s fair value using methods that may include consideration of the following: yields or prices of investments of comparable quality, type of issue, coupon, maturity and rating, market quotes or indications of value from security dealers, evaluations of anticipated cash flows or collateral, general market conditions and other information and analysis, including the obligor’s credit characteristics considered relevant. These securities are generally classified as Level 2. In pricing certain securities, particularly less liquid and lower quality securities, the pricing service may consider information about a security, its issuer or market activity, provided by the Adviser. These securities are generally classified as Level 2 or Level 3 depending on the observability of the significant inputs.
Like most fixed-income securities, the senior and subordinated loans in which the Fund invests are not listed on an organized exchange. The secondary market of such investments may be less liquid relative to markets for other fixed-income securities. Consequently, the value of senior and subordinated loans, determined as described above, may differ significantly from the value that would have been determined had there been an active market for that senior loan. These securities are generally classified as Level 2.
Investments in investment companies are valued at their respective NAVs on the valuation date and are generally classified as Level 1.
Repurchase agreements are valued at contract amount plus accrued interest, which approximates market value. These securities are generally classified as Level 2.
Investments initially valued in currencies other than the U.S. dollar are converted to the U.S. dollar using exchange rates obtained from pricing services. As a result, the NAV of the Funds’ shares may be affected by changes in the value of currencies in relation to the U.S. dollar. The value of securities traded in markets outside the United States or denominated in currencies other than the U.S. dollar may be affected significantly on a day that the NYSE is closed and an investor is not able to purchase, redeem or exchange shares. If significant market events occur between the time of determination of the closing price of a foreign security on an exchange and the time that the Funds’ NAV is determined, or if under the Funds’ procedures, the closing price of a foreign security is not deemed to be reliable, the security would be valued at fair value as determined in accordance with procedures established in good faith by the Board. These securities are generally classified as Level 2 or Level 3 depending on the observability of the significant inputs.
Certain securities may not be able to be priced by thepre-established pricing methods as described above. Such securities may be valued by the Board and/or its appointee at fair value. These securities generally include, but are not limited to, restricted securities (securities which may not be publicly sold without registration under the Securities Act of 1933, as amended) for which a pricing service is unable to provide a market price; securities whose trading has been formally suspended; debt securities that have gone into default and for which there is no current market quotation; a security whose market price is not available from apre-established pricing source; a security with respect to which an event has occurred that is likely to materially affect the value of the security after the market has closed but before the calculation of a Fund’s NAV (as may be the case innon-U.S. markets on which the security is primarily traded) or make it difficult or impossible to obtain a reliable market quotation; and a security whose price, as provided by the pricing service, is not deemed to reflect the security’s fair value. As a general principle, the fair value of a security would appear to be the amount that the owner might reasonably expect to receive for it in a current sale. A variety of factors may be considered in determining the fair value of such securities, which may include consideration of the following: yields or prices of investments of comparable quality, type of issue, coupon, maturity and rating, market quotes or indications of value from security dealers, evaluations of anticipated cash flows or collateral, general market conditions and other information and analysis, including the obligor’s credit characteristics considered relevant. These securities are generally classified as Level 2 or Level 3 depending on the observability of the significant inputs. Regardless of the method employed to value a particular security, all valuations are subject to review by the Board and/or its appointee.
81
Notes to Financial Statements(continued)
The inputs or methodologies used for valuing securities are not an indication of the risks associated with investing in those securities. The following is a summary of each Fund’s fair value measurements as of the end of the reporting period:
| | | | | | | | | | | | | | | | |
| Global Infrastructure | | Level 1 | | | Level 2 | | | Level 3 | | | Total | |
| Long-Term Investments*: | | | | | | | | | | | | | | | | |
Common Stocks** | | $ | 294,180,246 | | | $ | 289,281,458 | | | $ | — | | | $ | 583,461,704 | |
Real Estate Investment Trust Common Stocks** | | | 18,839,307 | | | | 1,104,835 | | | | — | | | | 19,944,142 | |
Investment Companies | | | 3,012,988 | | | | — | | | | — | | | | 3,012,988 | |
| Short-Term Investments: | | | | | | | | | | | | | | | | |
Repurchase Agreements | | | — | | | | 11,461,660 | | | | — | | | | 11,461,660 | |
| Total | | $ | 316,032,541 | | | $ | 301,847,953 | | | $ | — | | | $ | 617,880,494 | |
| | | | |
| Global Real Estate Securities | | | | | | | | | | | | |
| Long-Term Investments*: | | | | | | | | | | | | | | | | |
Real Estate Investment Trust Common Stocks** | | $ | 19,398,546 | | | $ | 4,045,481 | | | $ | — | | | $ | 23,444,027 | |
Common Stocks** | | | 1,495,118 | | | | 2,512,643 | | | | — | | | | 4,007,761 | |
Real Estate Investment Trust Common Stocks Rights | | | — | | | | — | | | | — | *** | | | — | |
| Short-Term Investments: | | | | | | | | | | | | | | | | |
Repurchase Agreements | | | — | | | | 369,053 | | | | — | | | | 369,053 | |
| Total | | $ | 20,893,664 | | | $ | 6,927,177 | | | $ | — | | | $ | 27,820,841 | |
| | | | |
| Real Asset Income | | | | | | | | | | | | |
| Long-Term Investments*: | | | | | | | | | | | | | | | | |
Real Estate Investment Trust Common Stocks** | | $ | 500,623,930 | | | $ | 101,632,185 | | | $ | — | | | $ | 602,256,115 | |
Common Stocks** | | | 246,652,168 | | | | 205,871,091 | | | | — | | | | 452,523,259 | |
$25 Par (or similar) Retail Preferred** | | | 323,771,293 | | | | 9,227,666 | | | | — | | | | 332,998,959 | |
Corporate Bonds | | | — | | | | 316,184,282 | | | | — | | | | 316,184,282 | |
$1,000 Par (or similar) Institutional Preferred | | | — | | | | 297,379,238 | | | | — | | | | 297,379,238 | |
Convertible Preferred Securities** | | | 91,924,253 | | | | 9,893,027 | | | | — | | | | 101,817,280 | |
Variable Rate Senior Loan Interests | | | — | | | | 43,124,086 | | | | — | | | | 43,124,086 | |
Convertible Bonds | | | — | | | | 13,375,661 | | | | — | | | | 13,375,661 | |
Investment Companies | | | 8,462,483 | | | | — | | | | — | | | | 8,462,483 | |
Asset-Backed Securities | | | — | | | | 4,024,989 | | | | — | | | | 4,024,989 | |
Real Estate Investment Trust Common Stocks Rights | | | — | | | | — | | | | — | *** | | | — | |
| Short-Term Investments: | | | | | | | | | | | | | | | | |
Repurchase Agreements | | | — | | | | 39,454,127 | | | | — | | | | 39,454,127 | |
| Total | | $ | 1,171,434,127 | | | $ | 1,040,166,352 | | | $ | — | | | $ | 2,211,600,479 | |
| | | | |
| Real Estate Securities | | | | | | | | | | | | |
| Long-Term Investments*: | | | | | | | | | | | | | | | | |
Real Estate Investment Trust Common Stocks | | $ | 2,850,046,567 | | | $ | — | | | $ | — | | | $ | 2,850,046,567 | |
Common Stocks | | | 5,759,510 | | | | — | | | | — | | | | 5,759,510 | |
| Short-Term Investments: | | | | | | | | | | | | | | | | |
Money Market Funds | | | 35,870,340 | | | | — | | | | — | | | | 35,870,340 | |
| Total | | $ | 2,891,676,417 | | | $ | — | | | $ | — | | | $ | 2,891,676,417 | |
| * | Refer to the Fund’s Portfolio of Investments for industry and country classifications, where applicable. |
| ** | Refer to the Fund’s Portfolio of Investments for securities classified as Level 2. |
| *** | Refer to the Fund’s Portfolio of Investments for securities classified as Level 3. Value equals zero as of the end of the reporting period. |
4. Portfolio Securities and Investments in Derivatives
Portfolio Securities
Securities Lending
In order to generate additional income, Real Estate Securities may lend securities representing up to one-third of the value of its total assets (which includes collateral for securities on loan) to broker-dealers, banks or other institutions. When loaning securities, the Fund retains the benefits of owning the securities, including the economic equivalent of dividends or interest generated by the security. The Fund also has the ability to recall the securities on loan at any time.
The Fund’s policy is to receive, at the inception of a loan, cash collateral equal to at least 102% of the value of securities loaned, which is recognized as “Payable for collateral from securities lending program” on the Statement of Assets and Liabilities. Collateral for securities on loan is invested in a money market fund, which is recognized as “Investments purchased with collateral from securities lending, at value” on the Statement of Assets and
82
Liabilities. The market value of the securities loaned is determined at the close of each business day in order to determine the adequacy of the collateral. If the value of the securities on loan increases such that the level of collateralization falls below 100%, additional collateral is received from the borrower on the next business day, which is recognized as “Due from broker” on the Statement of Assets and Liabilities.
Securities out on loan are subject to termination at any time at the option of the borrower or the Fund. Upon termination, the borrower is required to return to the Fund securities identical to the securities loaned. Generally, in the event the borrower defaults on its obligation to return the loaned securities, the Fund has the right to use the collateral to acquire identical securities. In the event the Fund is delayed or prevented from exercising its right to dispose of the collateral, there may be a loss to the Fund. Under the Fund’s securities lending agreement, however, the securities lending agent has indemnified the Fund against losses resulting from borrower default, except to the extent that those losses result from a decrease in the value of the collateral due to its investment by the Fund. The Fund bears the risk of loss with respect to the investment of collateral.
The Fund’s custodian, U.S. Bank National Association, serves as its securities lending agent. Income earned from the securities lending program is paid to the Fund. Income from securities lending is recognized as “Securities lending income” on the Statement of Operations.
The Fund had no such securities out on loan as of the end of the reporting period.
Repurchase Agreements
In connection with transactions in repurchase agreements, it is each Fund’s policy that its custodian take possession of the underlying collateral securities, the fair value of which exceeds the principal amount of the repurchase transaction, including accrued interest, at all times. If the counterparty defaults, and the fair value of the collateral declines, realization of the collateral may be delayed or limited.
The following table presents the repurchase agreements for the Funds that are subject to netting agreements as of the end of the reporting period, and the collateral delivered related to those repurchase agreements.
| | | | | | | | | | | | | | |
| Fund | | Counterparty | | Short-Term Investments, at Value | | | Collateral Pledged (From)
Counterparty* | | | Net
Exposure | |
| Global Infrastructure | | Fixed Income Clearing Corporation | | $ | 11,461,660 | | | $ | (11,461,660 | ) | | $ | — | |
| Global Real Estate Securities | | Fixed Income Clearing Corporation | | | 369,053 | | | | (369,053 | ) | | | — | |
| Real Asset Income | | Fixed Income Clearing Corporation | | | 39,454,127 | | | | (39,454,127 | ) | | | — | |
| * | As of the end of the reporting period, the value of the collateral pledged from the counterparty exceeded the value of the repurchase agreements. Refer to the Fund’s Portfolio of Investments for details on the repurchase agreements. |
Investment Transactions
Long-term purchases and sales (including maturities but excluding investments purchased with collateral from securities lending, where applicable) during the current fiscal period were as follows:
| | | | | | | | | | | | | | | | |
| | | Global
Infrastructure | | | Global
Real Estate
Securities | | | Real Asset
Income | | | Real Estate
Securities | |
| Purchases | | $ | 799,709,191 | | | $ | 53,999,610 | | | $ | 1,860,947,814 | | | $ | 3,444,275,791 | |
| Sales and maturities | | | 739,678,827 | | | | 55,790,079 | | | | 1,634,391,653 | | | | 4,166,095,773 | |
The Funds may purchase securities on a when-issued or delayed-delivery basis. Securities purchased on a when-issued or delayed-delivery basis may have extended settlement periods; interest income is not accrued until settlement date. Any securities so purchased are subject to market fluctuation during this period. The Funds have earmarked securities in their portfolios with a current value at least equal to the amount of the when-issued/delayed-delivery purchase commitments. If a Fund has outstanding when-issued/delayed-delivery purchases commitments as of the end of the reporting period, such amounts are recognized on the Statement of Assets and Liabilities.
Investments in Derivatives
Each Fund is authorized to invest in certain derivative instruments. The Funds record derivative instruments at fair value, with changes in fair value recognized on the Statement of Operations, when applicable. Even though the Funds’ investments in derivatives may represent economic hedges, they are not considered to be hedge transactions for financial reporting purposes.
Although the Funds are authorized to invest in derivative instruments, and may do so in the future, they did not make any such investments during the current fiscal period.
Market and Counterparty Credit Risk
In the normal course of business each Fund may invest in financial instruments and enter into financial transactions where risk of potential loss exists due to changes in the market (market risk) or failure of the other party to the transaction to perform (counterparty credit risk). The potential loss could exceed the value of the financial assets recorded on the financial statements. Financial assets, which potentially expose each Fund to counterparty credit risk, consist principally of cash due from counterparties on forward, option and swap transactions, when applicable. The extent of each Fund’s exposure to counterparty credit risk in respect to these financial assets approximates their carrying value as recorded on the Statement of Assets and Liabilities.
83
Notes to Financial Statements(continued)
Each Fund helps manage counterparty credit risk by entering into agreements only with counterparties the Adviser believes have the financial resources to honor their obligations and by having the Adviser monitor the financial stability of the counterparties. Additionally, counterparties may be required to pledge collateral daily (based on the daily valuation of the financial asset) on behalf of each Fund with a value approximately equal to the amount of any unrealized gain above apre-determined threshold. Reciprocally, when each Fund has an unrealized loss, the Funds have instructed the custodian to pledge assets of the Funds as collateral with a value approximately equal to the amount of the unrealized loss above apre-determined threshold. Collateral pledges are monitored and subsequently adjusted if and when the valuations fluctuate, either up or down, by at least thepre-determined threshold amount.
5. Fund Shares
On December 12, 2018, Class T Shares were liquidated.
Transactions in Fund shares during the current and prior fiscal period were as follows:
| | | | | | | | | | | | | | | | |
| | | Year Ended
12/31/19 | | | Year Ended
12/31/18 | |
| Global Infrastructure | | Shares | | | Amount | | | Shares | | | Amount | |
| Shares sold: | | | | | | | | | | | | | | | | |
Class A | | | 1,136,248 | | | $ | 12,708,402 | | | | 914,122 | | | $ | 9,675,613 | |
Class A – automatic conversion of Class C Shares | | | 929 | | | | 11,004 | | | | — | | | | — | |
Class C | | | 166,939 | | | | 1,858,191 | | | | 437,191 | | | | 4,565,763 | |
Class R3 | | | 12,337 | | | | 141,144 | | | | 5,279 | | | | 56,286 | |
Class R6 | | | 4,685,272 | | | | 55,385,164 | | | | 734,678 | | | | 7,924,547 | |
Class I | | | 15,912,134 | | | | 178,660,789 | | | | 10,499,676 | | | | 110,691,696 | |
| Shares issued to shareholders due to reinvestment of distributions: | | | | | | | | | | | | |
Class A | | | 329,948 | | | | 3,794,245 | | | | 390,426 | | | | 3,846,492 | |
Class C | | | 124,927 | | | | 1,417,383 | | | | 129,745 | | | | 1,269,665 | |
Class R3 | | | 1,947 | | | | 22,743 | | | | 1,233 | | | | 12,347 | |
Class R6 | | | 231,381 | | | | 2,661,254 | | | | 72,844 | | | | 715,551 | |
Class I | | | 1,916,004 | | | | 21,971,959 | | | | 1,641,064 | | | | 16,075,108 | |
| | | | 24,518,066 | | | | 278,632,278 | | | | 14,826,258 | | | | 154,833,068 | |
| Shares redeemed: | | | | | | | | | | | | | | | | |
Class A | | | (2,345,623 | ) | | | (25,621,970 | ) | | | (3,449,622 | ) | | | (35,564,244 | ) |
Class C | | | (729,475 | ) | | | (7,917,611 | ) | | | (650,997 | ) | | | (6,747,995 | ) |
Class C – automatic conversion of Class A Shares | | | (941 | ) | | | (11,004 | ) | | | — | | | | — | |
Class R3 | | | (8,347 | ) | | | (96,436 | ) | | | (12,032 | ) | | | (129,441 | ) |
Class R6 | | | (865,525 | ) | | | (9,790,401 | ) | | | (1,385,111 | ) | | | (14,148,033 | ) |
Class I | | | (12,589,094 | ) | | | (140,925,627 | ) | | | (18,899,242 | ) | | | (196,631,176 | ) |
Class T(1) | | | — | | | | — | | | | (2,264 | ) | | | (23,256 | ) |
| | | | (16,539,005 | ) | | | (184,363,049 | ) | | | (24,399,268 | ) | | | (253,244,145 | ) |
| Net increase (decrease) | | | 7,979,061 | | | $ | 94,269,229 | | | | (9,573,010 | ) | | $ | (98,411,077 | ) |
| (1) | Class T Shares were not available for public offering. |
| | | | | | | | | | | | | | | | |
| | | Year Ended
12/31/19 | | | For the Period 3/20/18
(commencement of operations)
through 12/31/18 | |
| Global Real Estate Securities | | Shares | | | Amount | | | Shares | | | Amount | |
| Shares sold: | | | | | | | | | | | | | | | | |
Class A | | | 303 | | | $ | 6,675 | | | | 1,250 | | | $ | 25,000 | |
Class C | | | 231 | | | | 5,000 | | | | 1,250 | | | | 25,000 | |
Class R6 | | | — | | | | — | | | | 1,246,250 | | | | 24,925,000 | |
Class I | | | 6,705 | | | | 152,340 | | | | 1,395 | | | | 28,000 | |
| Shares issued to shareholders due to reinvestment of distributions: | | | | | | | | | | | | |
Class A | | | 27 | | | | 606 | | | | — | | | | — | |
Class C | | | 19 | | | | 429 | | | | — | | | | — | |
Class R6 | | | — | | | | — | | | | — | | | | — | |
Class I | | | 537 | | | | 11,986 | | | | 4 | | | | 73 | |
| | | | 7,822 | | | | 177,036 | | | | 1,250,149 | | | | 25,003,073 | |
| Shares redeemed: | | | | | | | | | | | | | | | | |
Class A | | | — | | | | — | | | | — | | | | — | |
Class C | | | — | | | | — | | | | — | | | | — | |
Class R6 | | | — | | | | — | | | | — | | | | — | |
Class I | | | (43 | ) | | | (962 | ) | | | (49 | ) | | | (1,009 | ) |
| | | | (43 | ) | | | (962 | ) | | | (49 | ) | | | (1,009 | ) |
| Net increase (decrease) | | | 7,779 | | | $ | 176,074 | | | | 1,250,100 | | | $ | 25,002,064 | |
84
| | | | | | | | | | | | | | | | |
| | | Year Ended
12/31/19 | | | Year Ended
12/31/18 | |
| Real Asset Income | | Shares | | | Amount | | | Shares | | | Amount | |
| Shares sold: | | | | | | | | | | | | | | | | |
Class A | | | 2,526,184 | | | $ | 60,388,627 | | | | 2,308,123 | | | $ | 53,398,939 | |
Class A – automatic conversion of Class C Shares | | | 48 | | | | 1,134 | | | | 33 | | | | 756 | |
Class C | | | 1,359,465 | | | | 32,603,646 | | | | 1,286,094 | | | | 29,754,671 | |
Class R6 | | | 2,167,549 | | | | 51,505,730 | | | | 455,552 | | | | 10,521,822 | |
Class I | | | 23,129,844 | | | | 550,541,179 | | | | 21,070,549 | | | | 485,985,243 | |
| Shares issued to shareholders due to reinvestment of distributions: | | | | | | | | | | | | | | | | |
Class A | | | 480,797 | | | | 11,554,673 | | | | 458,084 | | | | 10,492,392 | |
Class C | | | 417,053 | | | | 10,029,767 | | | | 397,715 | | | | 9,115,780 | |
Class R6 | | | 160,294 | | | | 3,891,286 | | | | 71,249 | | | | 1,636,924 | |
Class I | | | 3,529,991 | | | | 84,869,370 | | | | 3,220,695 | | | | 73,780,361 | |
| | | | 33,771,225 | | | | 805,385,412 | | | | 29,268,094 | | | | 674,686,888 | |
| Shares redeemed: | | | | | | | | | | | | | | | | |
Class A | | | (2,418,830 | ) | | | (57,264,360 | ) | | | (3,772,845 | ) | | | (86,148,974 | ) |
Class C | | | (1,640,280 | ) | | | (38,821,483 | ) | | | (3,032,882 | ) | | | (69,466,348 | ) |
Class C – automatic conversion of Class A Shares | | | (48 | ) | | | (1,134 | ) | | | (33 | ) | | | (756 | ) |
Class R6 | | | (359,602 | ) | | | (8,593,528 | ) | | | (454,318 | ) | | | (10,291,330 | ) |
Class I | | | (18,112,481 | ) | | | (427,380,357 | ) | | | (29,707,203 | ) | | | (678,721,285 | ) |
Class T(1) | | | — | | | | — | | | | (1,048 | ) | | | (23,020 | ) |
| | | | (22,531,241 | ) | | | (532,060,862 | ) | | | (36,968,329 | ) | | | (844,651,713 | ) |
| Net increase (decrease) | | | 11,239,984 | | | $ | 273,324,550 | | | | (7,700,235 | ) | | $ | (169,964,825 | ) |
| (1) | Class T Shares were not available for public offering. |
| | | | | | | | | | | | | | | | |
| | | Year Ended
12/31/19 | | | Year Ended
12/31/18 | |
| Real Estate Securities | | Shares | | | Amount | | | Shares | | | Amount | |
| Shares sold: | | | | | | | | | | | | | | | | |
Class A | | | 2,425,074 | | | $ | 50,998,149 | | | | 4,023,254 | | | $ | 77,536,586 | |
Class A – automatic conversion of Class C Shares | | | 10,855 | | | | 240,439 | | | | 7,246 | | | | 146,917 | |
Class C | | | 128,382 | | | | 2,591,478 | | | | 170,862 | | | | 3,199,768 | |
Class R3 | | | 167,185 | | | | 3,589,539 | | | | 256,017 | | | | 4,986,275 | |
Class R6 | | | 7,815,191 | | | | 169,358,895 | | | | 8,589,549 | | | | 171,099,358 | |
Class I | | | 24,744,137 | | | | 526,920,074 | | | | 31,487,671 | | | | 612,845,258 | |
| Shares issued to shareholders due to reinvestment of distributions: | | | | | | | | | | | | | | | | |
Class A | | | 1,227,193 | | | | 24,664,074 | | | | 888,013 | | | | 17,118,013 | |
Class C | | | 159,188 | | | | 3,082,180 | | | | 104,841 | | | | 1,961,282 | |
Class R3 | | | 104,692 | | | | 2,138,636 | | | | 69,356 | | | | 1,360,314 | |
Class R6 | | | 2,272,481 | | | | 47,149,362 | | | | 956,296 | | | | 18,917,387 | |
Class I | | | 9,024,351 | | | | 185,039,842 | | | | 5,855,866 | | | | 114,643,541 | |
| | | | 48,078,729 | | | | 1,015,772,668 | | | | 52,408,971 | | | | 1,023,814,699 | |
| Shares redeemed: | | | | | | | | | | | | | | | | |
Class A | | | (6,001,448 | ) | | | (125,908,237 | ) | | | (12,950,508 | ) | | | (253,478,814 | ) |
Class C | | | (832,870 | ) | | | (17,263,648 | ) | | | (1,210,755 | ) | | | (22,666,215 | ) |
Class C – automatic conversion of Class A Shares | | | (11,207 | ) | | | (240,439 | ) | | | (7,467 | ) | | | (146,917 | ) |
Class R3 | | | (444,650 | ) | | | (9,429,406 | ) | | | (913,251 | ) | | | (17,938,934 | ) |
Class R6 | | | (5,742,061 | ) | | | (126,181,421 | ) | | | (4,271,476 | ) | | | (84,946,053 | ) |
Class I | | | (55,018,976 | ) | | | (1,190,673,103 | ) | | | (55,091,024 | ) | | | (1,075,744,697 | ) |
Class T(1) | | | — | | | | — | | | | (1,131 | ) | | | (22,445 | ) |
| | | | (68,051,212 | ) | | | (1,469,696,254 | ) | | | (74,445,612 | ) | | | (1,454,944,075 | ) |
| Net increase (decrease) | | | (19,972,483 | ) | | $ | (453,923,586 | ) | | | (22,036,641 | ) | | $ | (431,129,376 | ) |
| (1) | Class T Shares were not available for public offering. |
6. Income Tax Information
Each Fund is a separate taxpayer for federal income tax purposes. Each Fund intends to distribute substantially all of its net investment income and net capital gains to shareholders and to otherwise comply with the requirements of Subchapter M of the Internal Revenue Code applicable to regulated investment companies. Therefore, no federal income tax provision is required.
For all open tax years and all major taxing jurisdictions, management of the Funds has concluded that there are no significant uncertain tax positions that would require recognition in the financial statements. Open tax years are those that are open for examination by taxing authorities (i.e., generally
85
Notes to Financial Statements(continued)
the last four tax year ends and the interim tax period since then). Furthermore, management of the Funds is also not aware of any tax positions for which it is reasonably possible that the total amounts of unrecognized tax benefits will significantly change in the next twelve months.
The following information is presented on an income tax basis. Differences between amounts for financial statement and federal income tax purposes are primarily due to timing differences in recognizing certain gains and losses on investment transactions. To the extent that differences arise that are permanent in nature, such amounts are reclassified within the capital accounts as detailed below. Temporary differences do not require reclassification. Temporary and permanent differences do not impact the NAVs of the Funds.
The table below presents the cost and unrealized appreciation (depreciation) of each Fund’s investment portfolio, as determined on a federal income tax basis, as of December 31, 2019.
| | | | | | | | | | | | | | | | |
| | | Global
Infrastructure | | | Global
Real Estate
Securities | | | Real Asset
Income | | | Real Estate
Securities | |
| Tax cost of investments | | $ | 506,953,048 | | | $ | 25,488,455 | | | $ | 2,102,834,668 | | | $ | 2,211,817,676 | |
| Gross unrealized: | | | | | | | | | | | | | | | | |
Appreciation | | $ | 125,708,683 | | | $ | 2,986,080 | | | $ | 154,354,645 | | | $ | 728,705,020 | |
Depreciation | | | (14,781,237 | ) | | | (653,694 | ) | | | (45,588,834 | ) | | | (48,846,279 | ) |
| Net unrealized appreciation (depreciation) of investments | | $ | 110,927,446 | | | $ | 2,332,386 | | | $ | 108,765,811 | | | $ | 679,858,741 | |
Permanent differences, primarily due to federal taxes paid, foreign currency transactions, distribution reallocations, bond premium amortization adjustments, investments in passive foreign investment companies, investments in partnerships, REIT adjustments, Sec. 305(c) adjustments, and complex securities character adjustments, resulted in reclassifications among the Funds’ components of net assets as of December 31, 2019, the Funds’ tax year end.
The tax components of undistributed net ordinary income and net long-term capital gains as of December 31, 2019, the Funds’ tax year end, were as follows:
| | | | | | | | | | | | | | | | |
| | | Global
Infrastructure | | | Global
Real Estate
Securities | | | Real Asset
Income | | | Real Estate
Securities | |
| Undistributed net ordinary income1 | | $ | 934,968 | | | $ | 391,910 | | | $ | — | | | $ | 16,655,170 | |
| Undistributed net long-term capital gains | | | 1,066,707 | | | | 66,139 | | | | — | | | | 28,320,376 | |
| 1 | Net ordinary income consists of net taxable income derived from dividends, interest, and net short-term capital gains, if any. |
The tax character of distributions paid during the Funds’ tax years ended December 31, 2019 and December 31, 2018 was designated for purposes of the dividends paid deduction as follows:
| | | | | | | | | | | | | | | | |
| 2019 | | Global
Infrastructure | | | Global
Real Estate
Securities | | | Real Asset
Income | | | Real Estate
Securities | |
| Distributions from net ordinary income1 | | $ | 38,104,828 | | | $ | 2,426,283 | | | $ | 118,337,885 | | | $ | 156,022,613 | |
| Distributions from net long-term capital gains2 | | | 5,332,760 | | | | 237,845 | | | | — | | | | 166,726,345 | |
| Return of capital | | | — | | | | — | | | | 3,176,017 | | | | — | |
| | | | |
| 2018 | | Global
Infrastructure | | | Global
Real Estate
Securities3 | | | Real Asset
Income | | | Real Estate
Securities | |
| Distributions from net ordinary income1 | | $ | 17,050,993 | | | $ | 890,956 | | | $ | 94,308,866 | | | $ | 75,657,914 | |
| Distributions from net long-term capital gains | | | 10,688,243 | | | | 38,628 | | | | — | | | | 115,410,084 | |
| Return of capital | | | 1,126,278 | | | | — | | | | 10,461,305 | | | | — | |
| 1 | Net ordinary income consists of net taxable income derived from dividends, interest, and net short-term capital gains, if any. |
| 2 | The Funds designate as long-term capital gain dividend, pursuant to Internal Revenue Code Section 852(b)(3), the amount necessary to reduce earnings and profits of the Funds related to net capital gain to zero for the tax year ended December 31, 2019. |
| 3 | For the period March 20, 2018 (commencement of operations) through December 31, 2018. |
As of December 31, 2019, the Funds’ tax year end, the following Fund had unused capital losses carrying forward available for federal income tax purposes to be applied against future capital gains, if any. The capital losses are not subject to expiration.
| | | | |
| | | Real Asset
Income | |
| Not subject to expiration: | | | | |
Short-term | | $ | 7,298,497 | |
Long-term | | | 5,538,334 | |
| Total | | $ | 12,836,831 | |
During the Funds’ tax year ended December 31, 2019, Real Asset Income utilized $31,858,267 of its capital loss carryforward.
86
7. Management Fees and Other Transactions with Affiliates
Management Fees
Each Fund’s management fee compensates the Adviser for the overall investment advisory and administrative services and general office facilities. TheSub-Adviser is compensated for its services to the Funds from the management fees paid to the Adviser.
Each Fund’s management fee consists of two components – a fund-level fee, based only on the amount of assets within each individual Fund, and a complex-level fee, based on the aggregate amount of all eligible fund assets managed by the Adviser. This pricing structure enables each Fund’s shareholders to benefit from growth in the assets within their respective Fund as well as from growth in the amount of complex-wide assets managed by the Adviser.
The annual fund-level fee, payable monthly, for each Fund is calculated according to the following schedules:
| | | | | | | | |
| Average Daily Net Assets | | Global
Infrastructure
and Global
Real Estate
Securities | | | Real Estate
Securities | |
| For the first $125 million | | | 0.7500 | % | | | 0.7000 | % |
| For the next $125 million | | | 0.7375 | | | | 0.6875 | |
| For the next $250 million | | | 0.7250 | | | | 0.6750 | |
| For the next $500 million | | | 0.7125 | | | | 0.6625 | |
| For the next $1 billion | | | 0.7000 | | | | 0.6500 | |
| For the next $3 billion | | | 0.6750 | | | | 0.6250 | |
| For the next $2.5 billion | | | 0.6500 | | | | 0.6000 | |
| For the next $2.5 billion | | | 0.6375 | | | | 0.5875 | |
| For net assets over $10 billion | | | 0.6250 | | | | 0.5750 | |
| | | | |
| Average Daily Net Assets | | Real Asset
Income | |
| For the first $125 million | | | 0.6000 | % |
| For the next $125 million | | | 0.5875 | |
| For the next $250 million | | | 0.5750 | |
| For the next $500 million | | | 0.5625 | |
| For the next $1 billion | | | 0.5500 | |
| For the next $3 billion | | | 0.5250 | |
| For the next $5 billion | | | 0.5000 | |
| For net assets over $10 billion | | | 0.4875 | |
The annual complex-level fee, payable monthly, for each Fund is determined by taking the complex-level fee rate, which is based on the aggregate amount of “eligible assets” of all Nuveen funds as set forth in the schedule below, and (except for Global Real Estate Securities and Real Asset Income) making, as appropriate, an upward adjustment to that rate based upon the percentage of the particular fund’s assets that are not “eligible assets.” The complex level fee schedule for each Fund is as follows:
| | | | |
| Complex-Level Eligible Asset Breakpoint Level* | | Effective Complex-Level Fee
Rate at Breakpoint Level | |
| $55 billion | | | 0.2000 | % |
| $56 billion | | | 0.1996 | |
| $57 billion | | | 0.1989 | |
| $60 billion | | | 0.1961 | |
| $63 billion | | | 0.1931 | |
| $66 billion | | | 0.1900 | |
| $71 billion | | | 0.1851 | |
| $76 billion | | | 0.1806 | |
| $80 billion | | | 0.1773 | |
| $91 billion | | | 0.1691 | |
| $125 billion | | | 0.1599 | |
| $200 billion | | | 0.1505 | |
| $250 billion | | | 0.1469 | |
| $300 billion | | | 0.1445 | |
| * | The complex-level fee is calculated based upon the aggregate daily “eligible assets” of all Nuveen open-end and closed-end funds. Eligible assets do not include assets attributable to investments in other Nuveen funds or assets in excess of a determined amount (originally $2 billion) added to the Nuveen fund complex in connection with the Adviser’s assumption of the management of the former First American Funds effective January 1, 2011, but do not include certain assets of certain Nuveen funds that were reorganized into funds advised by an affiliate of the Advisor during the 2019 calendar year. Eligible assets includeclosed-end fund assets managed by the Adviser that are attributable to certain types of leverage. For these purposes, leverage includes theclosed-end funds’ use of preferred stock and borrowings and certain investments in the residual interest certificates (also called inverse floating rate securities) in tender option bond (TOB) trusts, including the |
87
Notes to Financial Statements(continued)
| | portion of assets held by a TOB trust that has been effectively financed by the trust’s issuance of floating rate securities, subject to an agreement by the Adviser as to certain funds to limit the amount of such assets for determining eligible assets in certain circumstances. As of December 31, 2019, the complex-level fee for each Fund was as follows: |
| | | | |
| Fund | | Complex-Level Fee | |
Global Infrastructure | | | 0.1661 | % |
Global Real Estate Securities | | | 0.1562 | |
Real Asset Income | | | 0.1562 | |
Real Estate Securities | | | 0.1909 | |
The Adviser has agreed to waive fees and/or reimburse expenses (“Expense Cap”) of the following Funds so that the total annual Fund operating expenses (excluding 12b-1 distribution and/or service fees, interest expenses, taxes, acquired fund fees and expenses, fees incurred in acquiring and disposing of portfolio securities and extraordinary expenses) do not exceed the average daily net assets of any class of Fund shares in the amounts and for the time periods stated in the following table. However, because Class R6 Shares are not subject to sub-transfer agent and similar fees, the total annual Fund operating expenses for the Class R6 Shares will be less than the expense limitation. The expense limitations that expire may be terminated or modified prior to that date only with the approval of the Board.
| | | | | | | | |
| Fund | | Temporary
Expense Cap | | | Temporary
Expense
Cap
Expiration
Date | |
Global Infrastructure | | | 1.00 | % | | | July 31, 2021 | |
Global Real Estate Securities | | | 1.09 | | | | July 31, 2021 | |
Real Asset Income | | | 0.95 | | | | July 31, 2021 | |
Distribution and Service Fees
Each Fund has adopted a distribution and service plan under rule12b-1 under the 1940 Act. Class A Shares incur a 0.25% annual12b-1 service fee. Class C Shares incur a 0.75% annual12b-1 distribution fee and a 0.25% annual12b-1 service fee. Class R3 Shares incur a 0.25% annual12b-1 distribution fee and a 0.25% annual12b-1 service fee. Class R6 Shares and Class I Shares are not subject to12b-1 distribution or service fees. The fees under this plan compensate Nuveen Securities, LLC, (the “Distributor”), a wholly-owned subsidiary of Nuveen, for services provided and expenses incurred in distributing shares of the Funds and establishing and maintaining shareholder accounts.
Other Transactions with Affiliates
During the current fiscal period, the Distributor, collected sales charges on purchases of Class A Shares, the majority of which were paid out as concessions to financial intermediaries as follows:
| | | | | | | | | | | | | | | | |
| | | Global
Infrastructure | | | Global
Real Estate
Securities | | | Real Asset
Income | | | Real Estate
Securities | |
| Sales charges collected (Unaudited) | | $ | 202,312 | | | $ | — | | | $ | 824,940 | | | $ | 67,305 | |
| Paid to financial intermediaries (Unaudited) | | | 179,183 | | | | — | | | | 737,031 | | | | 59,216 | |
The Distributor also received12b-1 service fees on Class A Shares, substantially all of which were paid to compensate financial intermediaries for providing services to shareholders relating to their investments.
During the current fiscal period, the Distributor compensated financial intermediaries directly with commission advances at the time of purchase as follows:
| | | | | | | | | | | | | | | | |
| | | Global
Infrastructure | | | Global
Real Estate
Securities | | | Real Asset
Income | | | Real Estate
Securities | |
| Commission advances (Unaudited) | | $ | 31,498 | | | $ | — | | | $ | 374,765 | | | $ | 15,833 | |
To compensate for commissions advanced to financial intermediaries, all12b-1 service and distribution fees collected on C Shares during the first year following a purchase were retained by the Distributor. During the current fiscal period, the Distributor retained such12b-1 fees as follows:
| | | | | | | | | | | | | | | | |
| | | Global
Infrastructure | | | Global
Real Estate
Securities | | | Real Asset
Income | | | Real Estate
Securities | |
| 12b-1 fees retained (Unaudited) | | $ | 17,168 | | | $ | 278 | | | $ | 210,195 | | | $ | 17,027 | |
The remaining 12b-1 fees charged to each Fund were paid to compensate financial intermediaries for providing services to shareholders relating to their investments.
88
The Distributor also collected and retained CDSC on share redemptions during the current fiscal period, as follows:
| | | | | | | | | | | | | | | | |
| | | Global
Infrastructure | | | Global
Real Estate
Securities | | | Real Asset
Income | | | Real Estate
Securities | |
| CDSC retained (Unaudited) | | $ | 7,247 | | | $ | — | | | $ | 11,757 | | | $ | 436 | |
As of the end of the reporting period, TIAA owned shares of the following Fund:
| | | | |
| | | Global
Real Estate
Securities | |
| Class A Shares | | | 1,250 | |
| Class C Shares | | | 1,250 | |
| Class R6 Shares | | | 1,246,250 | |
| Class I Shares | | | 1,250 | |
8. Borrowing Arrangements
Committed Line of Credit
The Funds, along with certain other funds managed by the Adviser (“Participating Funds”), have established a 364-day, $2.65 billion standby credit facility with a group of lenders, under which the Participating Funds may borrow for various purposes other than leveraging for investment purposes. Each Participating Fund is allocated a designated proportion of the facility’s capacity (and its associated costs, as described below) based upon a multi-factor assessment of the likelihood and frequency of its need to draw on the facility, the size of the Fund and its anticipated draws, and the potential importance of such draws to the operations and well-being of the Fund, relative to those of the other Funds. A Fund may effect draws on the facility in excess of its designated capacity if and to the extent that other Participating Funds have undrawn capacity. The credit facility expires in June 2020 unless extended or renewed.
The credit facility has the following terms: a fee of 0.15% per annum on unused commitment amounts, and interest at a rate equal to the higher of (a) one-month LIBOR (London Inter-Bank Offered Rate) plus 1.00% per annum or (b) the Fed Funds rate plus 1.00% per annum on amounts borrowed. Participating Funds paid administration, legal and arrangement fees, which are recognized as a component of “Other expenses” on the Statement of Operations, and along with commitment fees, have been allocated among such Participating Funds based upon the relative proportions of the facility’s aggregate capacity reserved for them and other factors deemed relevant by the Adviser and the Board of each Participating Fund.
During the current fiscal period, none of the Funds utilized this facility.
89
Additional Fund Information(Unaudited)
| | | | | | | | | | |
| | | | | |
| | Investment Adviser Nuveen Fund Advisors, LLC 333 West Wacker Drive Chicago, IL 60606 Sub-Adviser Nuveen Asset Management, LLC 333 West Wacker Drive Chicago, IL 60606 | | Independent Registered
Public Accounting Firm PricewaterhouseCoopers LLP One North Wacker Drive Chicago, IL 60606 Custodians State Street Bank & Trust
Company One Lincoln Street Boston, MA 02111 U.S. Bank National Association* 1555 North RiverCenter Drive Suite 302 Milwaukee, WI 53202 | | Legal Counsel Chapman and Cutler LLP Chicago, IL 60603 | | Transfer Agent and
Shareholder Services DST Asset Manager Solutions, Inc. (DST) P.O. Box 219140 Kansas City, MO 64121-9140 (800) 257-8787 | | |
| | | | | |
| | | | * For Nuveen Real Estate Securities Fund only. | | | | | | |
| | | | | | | | | | | | | | |
| | | | | |
| | | | | | | | | | |
| |
| | Foreign Taxes: Global Infrastructure paid qualifying foreign taxes of $1,244,837 and earned $11,739,249 of foreign source income during the fiscal year ended December 31, 2019. Pursuant to Section 853 of the Internal Revenue Code, Global Infrastructure hereby designates $0.02 per share as foreign taxes paid and $0.22 per share as income earned from foreign sources for the fiscal year ended December 31, 2019. The actual foreign tax credit distribution will be reported to shareholders on Form1099-DIV which will be sent to shareholders shortly after calendar year end. |
| | | | | |
| | | | | | | | | | |
| |
| | Distribution Information: The Funds hereby designate their percentages of dividends paid from net ordinary income as dividends qualifying for the dividends received deduction (“DRD”) for corporations, their percentages of qualified dividend income (“QDI”) for individuals under Section 1(h)(11) of the Internal Revenue Code, and their percentages of qualified business income (“QBI”) for individuals under Section 199A of the Internal Revenue Code as shown in the accompanying table. The actual qualified dividend and business income distributions will be reported to shareholders on Form1099-DIV which will be sent to shareholders shortly after calendar year end. |
| | | | | | |
| | | Fund | | Global
Infrastructure | | Global Real
Estate Securities | | Real Asset
Income | | Real Estate
Securities | | |
| | % QDI | | 37.2% | | 3.0% | | 22.9% | | 1.6% | | |
| | % DRD | | 11.6% | | 0.0% | | 9.5% | | 1.6% | | |
| | % QBI | | 0.0% | | 13.1% | | 15.6% | | 42.3% | | |
| |
| | Real Asset Income hereby designates its percentage of dividends paid from net ordinary income as dividends qualifying as Interest-Related Dividends and/or short-term capital gain dividends as defined in Internal Revenue Code Section 871(k) for the taxable year ended December 31, 2019. |
| | % of Interest Related Dividends | | 17.1% | | |
| | | | | |
| | | | | | | | | | |
| |
| | Portfolio of Investments Information: Each Fund is required to file its complete schedule of portfolio holdings with the Securities and Exchange Commission (SEC) for the first and third quarters of each fiscal year as an exhibit to its report on Form N-PORT. You may obtain this information on the SEC’s website at http://www.sec.gov. |
| | | | | |
| | | | | | | | | | |
| |
| | Nuveen Funds’ Proxy Voting Information: You may obtain (i) information regarding how each fund voted proxies relating to portfolio securities held during the most recent twelve-month period ended June 30, without charge, upon request, by calling Nuveen toll-free at (800) 257-8787 or on Nuveen’s website at www.nuveen.com and (ii) a description of the policies and procedures that each fund used to determine how to vote proxies relating to portfolio securities without charge, upon request, by calling Nuveen toll-free at(800) 257-8787. You may also obtain this information directly from the SEC. Visit the SEC on-line at http://www.sec.gov. |
| | | | | |
| | | | | | | | | | |
| |
| | FINRA BrokerCheck: The Financial Industry Regulatory Authority (FINRA) provides information regarding the disciplinary history of FINRA member firms and associated investment professionals. This information as well as an investor brochure describing FINRA BrokerCheck is available to the public by calling the FINRA BrokerCheck Hotline number at (800) 289-9999 or by visiting www.FlNRA.org. |
90
Glossary of Terms Used in this Report
(Unaudited)
Average Annual Total Return: This is a commonly used method to express an investment’s performance over a particular, usually multi-year time period. It expresses the return that would have been necessary each year to equal the investment’s actual cumulative performance (including change in NAV or offer price and reinvested dividends and capital gains distributions, if any) over the time period being considered.
Basis Point: One one-hundredth of one percentage point, or 0.01%. For example, 25 basis points equals 0.25%.
Beta: A measure of the volatility of a portfolio relative to the overall market. A beta less than 1.0 indicates lower risk than the market; a beta greater than 1.0 indicates higher risk than the market.
Bloomberg Barclays U.S. Corporate High Yield Bond Index: An index that covers the universe of fixed-rate, non-investment-grade corporate debt of issuers in non-emerging market countries. Eurobonds and debt issues from countries designated as emerging markets are excluded. Index returns assume reinvestment of distributions, but do not reflect any applicable sales charges or management fees.
FTSE EPRA/NAREIT (Financial Times Stock Exchange – European Public Real Estate Association/National Association of Real Estate Investments Trust) Developed Index NR (Net Return): An index designed to track the performance of listed real estate companies and REITS worldwide. By making the index constituents free-float adjusted, liquidity, size and revenue screened, the series is suitable for use as the basis for investment products, such as derivatives and Exchange Traded Funds (ETFs). The index returns assume reinvestment of distributions, but do not reflect any applicable sales charges or management fees.
Gross Domestic Product (GDP): The total market value of all final goods and services produced in a country/region in a given year, equal to total consumer, investment and government spending, plus the value of exports, minus the value of imports.
Lipper Global Infrastructure Funds Classification Average: Represents the average annualized returns for all reporting funds in the Lipper Global Infrastructure Funds Classification. Lipper returns account for the effects of management fees and assume reinvestment of distributions, but do not reflect any applicable sales charges.
Lipper Global Real Estate Funds Classification Average: Represents the average annualized returns for all reporting funds in the Lipper Global Real Estate Funds Classification. Lipper returns account for the effects of management fees and assume reinvestment of distributions, but do not reflect any applicable sales charges.
Lipper Real Estate Funds Classification Average: Represents the average annualized returns for all reporting funds in the Lipper Real Estate Funds Classification. Lipper returns account for the effects of management fees and assume reinvestment of distributions, but do not reflect any applicable sales charges.
Lipper Real Return Funds Classification Average: Represents the average annualized returns for all reporting funds in the Lipper Real Return Funds Classification. Lipper returns account for the effects of management fees and assume reinvestment of distributions, but do not reflect any applicable sales charges.
Morgan Stanley Capital International (MSCI) All Country World Index (ACWI): A free-float adjusted market capitalization index that is designed to measure equity market performance in the global developed and emerging markets. Index returns assume reinvestment of distributions, but do not reflect any applicable sales charges or management fees.
MSCI EAFE Index: The MSCI (Morgan Stanley Capital International) EAFE (Europe, Australasia, Far East) Index is a free float-adjusted market capitalization weighted index designed to measure developed market equity performance,
91
Glossary of Terms Used in this Report(Unaudited) (continued)
excluding the U.S. and Canada. The index returns assume reinvestment of distributions, but do not reflect any applicable sales charges or management fees.
MSCI U.S. REIT Index: An unmanaged index that tracks the performance of real estate investment trusts (REITs). Index returns assume reinvestment of distributions, but do not reflect any applicable sales charges or management fees.
Net Asset Value (NAV) Per Share: A fund’s Net Assets is equal to its total assets (securities, cash and accrued earnings) less its total liabilities. For funds with multiple classes, Net Assets are determined separately for each share class. NAV per share is equal to the fund’s (or share class’) Net Assets divided by its number of shares outstanding.
Real Asset Income Blend: A five index blend comprised of weightings approximating the Fund’s proposed portfolio. The Fund’s proposed portfolio may differ significantly from the blended portfolio and actual returns may be substantially lower. Benchmark returns do not include the effects of any sales charges or management fees.
| | | | |
Weighting
Percentage | | Index | | Definition |
| 28% | | S&P Global Infrastructure Index NR (Net Return) | | An unmanaged index comprised of 75 of the largest publicly listed infrastructure companies that meet specific investability requirements. |
| 21% | | Financial Times Stock Exchange - European Public Real Estate Association/National Association of Real Estate Investments Trust
(FTSE EPRA/NAREIT) Developed Index NR (Net Return) | | An index designed to track the performance of listed real estate companies and REITs worldwide. |
| 18% | | Wells Fargo Hybrid & Preferred Securities REIT Index TR | | An Index designed to track the performance of preferred securities issued in the U.S. market by real estate investment trusts (REITs). The index is composed exclusively of preferred shares and depositary shares. |
| 18% | | Bloomberg Barclays U.S. Corporate High Yield Bond Index TR | | An index that covers the U.S. dollar-denominated, non-investment grade, fixed-rate, taxable corporate bond market. |
| 15% | | Bloomberg Barclays Global Capital Securities Index TR | | An index that tracks fixed-rate, investment grade capital securities denominated in USD, EUR and GBP. |
Russell 2000® Index: A market-weighted index published by the Frank Russell Company measuring the performance of the 2,000 smallest companies in the Russell 3000® Index. The Russell 3000® is made up of 3,000 of the largest U.S. stocks and represents approximately 98% of the U.S. equity market. The Russell 2000® serves as a benchmark for small-cap stocks in the U.S. Index returns assume reinvestment of distributions, but do not reflect any applicable sales charges or management fees.
S&P 500®: An unmanaged Index generally considered representative of the U.S. stock market. Index returns assume reinvestment of distributions, but do not reflect of any applicable sales charges or management fees.
S&P Global Infrastructure Index NR (Net Return): An index that provides liquid and tradable exposure to 75 companies from around the world that represent the listed infrastructure universe. To create diversified exposure across the global listed infrastructure market, the index has balanced weights across three distinct infrastructure clusters: utilities, transportation, and energy. Index returns assume reinvestment of distributions, but do not reflect any applicable sales charges or management fees.
Tax Equalization: The practice of treating a portion of the distribution made to a redeeming shareholder, which represents his proportionate part of undistributed net investment income and capital gain as a distribution for tax purposes. Such amounts are referred to as the equalization debits (or payments) and will be considered a distribution to the shareholder of net investment income and capital gain for calculation of the fund’s dividends paid deduction.
92
Annual Investment Management Agreement Approval Process
(Unaudited)
At a meeting held onMay 21-23, 2019 (the“May Meeting”), the Board of Trustees or Directors, as applicable (the“Board” and each Trustee or Director, a“Board Member”) of the Funds, including the Board Members who are not “interested persons” (as defined under the Investment Company Act of 1940 (the“1940 Act”)) (the“Independent Board Members”), approved, for each Fund, the renewal of the management agreement (each, an“Investment Management Agreement”) with Nuveen Fund Advisors, LLC (the“Adviser”) pursuant to which the Adviser serves as investment adviser to such Fund and thesub-advisory agreement (each, a“Sub-Advisory Agreement”) with Nuveen Asset Management, LLC (the“Sub-Adviser”) pursuant to which theSub-Adviser serves as thesub-adviser to such Fund. Following an initialtwo-year period, the Board, including the Independent Board Members, is required under the 1940 Act to review and approve each Investment Management Agreement andSub-Advisory Agreement on behalf of the applicable Fund on an annual basis. The Investment Management Agreements andSub-Advisory Agreements are collectively referred to as the“Advisory Agreements”and the Adviser and theSub-Adviser are collectively, the“Fund Advisers” and each, a“Fund Adviser.”
In response to a request on behalf of the Independent Board Members by independent legal counsel, the Board received and reviewed prior to the May Meeting extensive materials specifically prepared for the annual review of Advisory Agreements by the Adviser as well as by Broadridge Financial Solutions, Inc. (“Broadridge”), an independent provider of investment company data. The materials provided in connection with the annual review covered a breadth of subject matter including, but not limited to, a description of the nature, extent and quality of services provided by the Fund Advisers; a review of theSub-Adviser and investment team; an analysis of fund performance in absolute terms and as compared to the performance of certain peer funds and benchmarks with a focus on any performance outliers; an analysis of the fees and expense ratios of the Nuveen funds in absolute terms and as compared to those of certain peer funds with a focus on any expense outliers; a description of portfolio manager compensation; a review of the performance of various service providers; a description of various initiatives Nuveen had undertaken or continued during the year for the benefit of particular fund(s) and/or the complex; a description of the profitability or financial data of Nuveen and theSub-Adviser; and a description of indirect benefits received by the Fund Advisers as a result of their relationships with the Nuveen funds. The Board Members held anin-person meeting onApril 17-18, 2019 (the“April Meeting”), in part, to review and discuss the performance of the Nuveen funds and the Adviser’s evaluation of the varioussub-advisers to the Nuveen funds. The Independent Board Members asked questions and requested additional information that was provided for the May Meeting.
The information prepared specifically for the annual review of the Advisory Agreements supplemented the information provided to the Board and its committees throughout the year. The Board and its committees met regularly during the year and the information provided and topics discussed were relevant to the review of the Advisory Agreements. Some of these reports and other data included, among other things, materials that outlined the investment performance of the Nuveen funds; strategic plans of the Adviser which may impact the services it provides to the Nuveen funds; the review of the Nuveen funds and applicable investment teams; compliance, regulatory and risk management matters; the trading practices of the varioussub-advisers; valuation of securities; fund expenses; payments to financial intermediaries, including12b-1 fees andsub-transfer agency fees; and overall market and regulatory developments. The Board further continued its practice of seeking to meet periodically with the varioussub-advisers to the Nuveen funds and their investment teams, when feasible. The Independent Board Members considered the review of the Advisory Agreements to be an ongoing process and employed the accumulated information, knowledge, and experience the Board Members had gained during their tenure on the boards governing the Nuveen funds and working with the Fund Advisers in their review of the Advisory Agreements. The contractual arrangements are a result of multiple years of review, negotiation and information provided in connection with the boards’ annual review of the Nuveen funds’ advisory arrangements and oversight of the Nuveen funds.
The Independent Board Members were advised by independent legal counsel during the annual review process as well as throughout the year, including meeting in executive sessions with such counsel at which no representatives from the Adviser or theSub-Adviser were present. In connection with their annual review, the Independent Board Members also received a memorandum from independent legal counsel outlining their fiduciary duties and legal standards in reviewing the Advisory Agreements.
In deciding to renew the Advisory Agreements, the Independent Board Members did not identify a particular factor or information as determinative or controlling, but rather the decision reflected the comprehensive consideration of all the information provided, and each Board Member may have attributed different levels of importance to the various factors and information considered in connection with the approval process. The following summarizes the principal factors and information, but not all the factors, the Board considered in deciding to renew the Advisory Agreements and its conclusions.
A. Nature, Extent and Quality of Services
In evaluating the renewal of the Advisory Agreements, the Independent Board Members received and considered information regarding the nature, extent and quality of the applicable Fund Adviser’s services provided to the respective Fund with particular focus on the services and enhancements to
93
Annual Investment Management Agreement Approval Process(Unaudited) (continued)
such services provided during the last year. The Board recognized that the Adviser provides a comprehensive set of services necessary to operate the Nuveen funds in a highly regulated industry and noted that the scope of such services has expanded over the years as a result of regulatory, market and other developments, such as the development of the liquidity management program and expanded compliance programs. Some of the functions the Adviser is responsible for include, but are not limited to: product management (such as analyzing a fund’s position in the marketplace, setting dividends, preparing shareholder and intermediary communications and other due diligence support); investment oversight (such as analyzing fund performance,sub-advisers and investment teams and analyzing trade executions of portfolio transactions, soft dollar practices and securities lending activities); securities valuation services (such as executing the daily valuation process for portfolio securities and developing and recommending changes to valuation policies and procedures); risk management (such as overseeing operational and investment risks, including stress testing); fund administration (such as preparing fund tax returns and other tax compliance services, overseeing the Nuveen funds’ independent public accountants and other service providers; managing fund budgets and expenses; and helping to fulfill the funds’ regulatory filing requirements); oversight of shareholder services and transfer agency functions (such as oversight and liaison of transfer agent service providers which include registered shareholder customer service and transaction processing); Board relations services (such as organizing and administering Board and committee meetings, preparing various reports to the Board and committees and providing other support services); compliance and regulatory oversight services (such as developing and maintaining a compliance program to ensure compliance with applicable laws and regulations, monitoring compliance with applicable fund policies and procedures and adherence to investment restrictions, and evaluating the compliance programs of the Nuveen fundsub-advisers and certain other service providers); and legal support and oversight of outside law firms (such as with respect to filing and updating registration statements; maintaining various regulatory registrations; and providing legal interpretations regarding fund activities, applicable regulations and implementation of policies and procedures). In reviewing the scope and quality of services, the Board recognized the continued efforts and resources the Adviser and its affiliates have employed to continue to enhance their services for the benefit of the complex as well as particular Nuveen funds over recent years. Such service enhancements have included, but are not limited to:
| | • | | Fund Improvements and Product Management Initiatives – continuing to proactively manage the Nuveen fund complex as a whole and at the individual fund level with an aim to enhance the shareholder outcomes through, among other things, repositioning funds, merging funds, introducing additional share classes, reviewing and updating investment policies and benchmarks, modifying the composition of certain portfolio management teams and analyzing various data to help devise such improvements; |
| | • | | Capital Initiatives – continuing to invest capital to support new funds with initial capital as well as to facilitate modifications to the strategies or structure of existing funds; |
| | • | | Compliance Program Initiatives – continuing efforts to enhance the compliance program through, among other things, internally integrating various portfolio management teams and aligning compliance support accordingly, completing a comprehensive review of existing policies and procedures and revising such policies and procedures as appropriate, enhancingcompliance-related technologies and workflows, and optimizing compliance shared services across the organization and affiliates; |
| | • | | Risk Management and Valuation Services – continuing efforts to strengthen the risk management functions, including through, among other things, enhancing the interaction and reporting between the investment risk management team and various affiliates, increasing the efficiency of risk monitoring performed on the Nuveen funds through improved reporting, continuing to implement risk programs designed to provide a more disciplined and consistent approach to identifying and mitigating operational risks, continuing progress on implementing a liquidity program that complies with the new liquidity regulatory requirements and continuing to oversee the daily valuation process; |
| | • | | Additional Compliance Services – continuing investment of time and resources necessary to develop the compliance policies and procedures and other related tools necessary to meet the various new regulatory requirements affecting the Nuveen funds that have been adopted over recent years; |
| | • | | Government Relations – continuing efforts of various Nuveen teams and affiliates to advocate and communicate their positions with lawmakers and other regulatory bodies on issues that will impact the Nuveen funds; |
| | • | | Business Continuity, Disaster Recovery and Information Services – establishing an information security program to help identify and manage information security risks, periodically testing disaster recovery plans, maintaining and updating business continuity plans and providing reports to the Board, at least annually, addressing, among other things, management’s security risk assessment, cyber risk profile, incident tracking and other relevant information technology risk-related reports; and |
| | • | | Expanded Dividend Management Services – continuing to expand the services necessary to manage the dividends among the varying types of Nuveen funds that have developed as the Nuveen complex has grown in size and scope. |
In addition to the services provided by the Adviser, the Board also considered the risks borne by the Adviser and its affiliates in managing the Nuveen funds, including entrepreneurial, operational, reputational, regulatory and litigation risks.
94
The Board further considered the division of responsibilities between the Adviser and theSub-Adviser and recognized that theSub-Adviser and its investment personnel generally are responsible for the management of each Fund’s portfolio. The Board noted that the Adviser oversees theSub-Adviser and considered an analysis of theSub-Adviser provided by the Adviser which included, among other things, theSub-Adviser’s assets under management and changes thereto, a summary of the investment team and changes thereto, the investment approach of the team and the performance of the fundssub-advised by theSub-Adviser over various periods. The Board further considered at the May Meeting or prior meetings evaluations of theSub-Adviser’s compliance program and trade execution. The Board noted that the Adviser recommended the renewal of theSub-Advisory Agreements.
Based on its review, the Board determined, in the exercise of its reasonable business judgment, that it was satisfied with the nature, extent and quality of services provided to the respective Funds under each applicable Advisory Agreement.
B. The Investment Performance of the Funds and Fund Advisers
In evaluating the quality of the services provided by the Fund Advisers, the Board also received and considered the investment performance of the Nuveen funds they advise. In this regard, the Board reviewed Fund performance over the quarter,one-,three- andfive-year periods ending December 31, 2018 (or for shorter periods available in the case of Nuveen Global Real Estate Securities Fund (the“Global Real Estate Securities Fund”), which was not in existence for part of the foregoing timeframe), as well as performance data for the first quarter of 2019 ending March 29, 2019. The performance data was based on Class A shares; however, the performance of other classes should be substantially similar as they invest in the same portfolio of securities and differences in performance among the classes would be principally attributed to the variations in the expense structures of the classes. Unless otherwise indicated, the performance data referenced below reflects the periods ended December 31, 2018. The Board considered the Adviser’s analysis of each fund’s performance, with particular focus on funds that were considered performance outliers and the factors contributing to their performance. The Board also noted that it received performance data of the Nuveen funds during its quarterly meetings throughout the year and took into account the discussions that occurred at these Board meetings regarding fund performance. In this regard, in its evaluation of Nuveen fund performance at meetings throughout the year, the Board considered performance information for the funds for different time periods, both absolute and relative to appropriate benchmarks and peers, with particular attention to information indicating underperformance of the respective funds and discussed with the Adviser the reasons for such underperformance.
The Board reviewed both absolute and relative fund performance during the annual review. With respect to the latter, the Board considered fund performance in comparison to the performance of peer funds (the“Performance Peer Group”) and recognized and/or customized benchmarks (i.e., generally benchmarks derived from multiple recognized benchmarks). In considering performance data, the Board is aware of certain inherent limitations with such data, including that differences between the objective(s), strategies and other characteristics of the Nuveen funds compared to the respective Performance Peer Group and/or benchmark(s) (such as differences in the use of leverage) will necessarily contribute to differences in performance results and limit the value of the comparative information. To assist the Board in its review of the comparability of the relative performance, the Adviser has ranked the relevancy of the peer group to the funds as low, medium or high. Depending on the facts and circumstances, however, the Board may be satisfied with a fund’s performance notwithstanding that its performance may be below its benchmark or peer group for certain periods. In addition, the performance data may vary significantly depending on the end date selected, and shareholders may evaluate fund performance based on their own holding period which may differ from the performance periods reviewed by the Board leading to different results. Further, the Board considered a fund’s performance in light of the overall financial market conditions during the respective periods. As noted above, the Board reviewed, among other things, Nuveen fund performance over various periods ended December 31, 2018, and the Board was aware of the market decline in the fourth quarter of 2018 and considered performance from the first quarter of 2019 as well. The Board also noted that a shorter period of underperformance may significantly impact longer term performance.
In their review of performance, the Independent Board Members focused, in particular, on the Adviser’s analysis of Nuveen funds determined to be underperforming performance outliers. The Board recognized that some periods of underperformance may only be temporary while other periods of underperformance may indicate a broader issue that may require a corrective action. Accordingly, with respect to any Nuveen funds for which the Board had identified performance issues, the Board monitors such funds closely until performance improves, discusses with the Adviser the reasons for such results, considers whether any steps are necessary or appropriate to address such issues, and reviews the results of any efforts undertaken.
The Board’s determinations with respect to each Fund are summarized below.
For Nuveen Real Estate Securities Fund (the“Real Estate Securities Fund”), the Board noted that although the Fund’s performance was below its benchmark in theone-,three- andfive-year periods, the Fund ranked in the second quartile of its Performance Peer Group in theone- andthree-year periods and first quartile in thefive-year period. The Board was satisfied with the Fund’s overall performance.
For the Global Real Estate Securities Fund, the Board noted that the Fund was new with available performance information that was too limited to make a meaningful assessment of performance.
95
Annual Investment Management Agreement Approval Process(Unaudited) (continued)
For Nuveen Global Infrastructure Fund (the“Global Infrastructure Fund”), the Board noted that although the Fund’s performance was below its benchmark in thethree-year period, the Fund outperformed its benchmark in theone- andfive-year periods and ranked in the second quartile of its Performance Peer Group in theone- andfive-year periods and third quartile in the three-year period. The Board was satisfied with the Fund’s overall performance.
For Nuveen Real Asset Income Fund (the“Real Asset Income Fund”), the Board noted that the Fund ranked in the second quartile of its Performance Peer Group in theone- and three-year periods and first quartile in the five-year period. The Board, however, noted the Performance Peer Group was rated low for relevancy. The Fund also outperformed the performance of its benchmark in theone-, three- and five-year periods. The Board was satisfied with the Fund’s overall performance.
C. Fees, Expenses and Profitability
1. Fees and Expenses
In its annual review, the Board considered the fees paid to the Fund Advisers and the total operating expense ratio of each Nuveen fund, before and after any undertaking by Nuveen to limit the fund’s total annual operating expenses to certain levels. More specifically, the Independent Board Members reviewed, among other things, each fund’s gross and net management fee rates (i.e., before and after expense reimbursements and/or fee waivers, if any) and net total expense ratio in relation to those of a comparable universe of funds (the“Peer Universe”) and to a more focused subset of comparable funds (the“Peer Group”) established by Broadridge. The Independent Board Members reviewed the methodology Broadridge employed to establish its Peer Universe and Peer Group and recognized that differences between the applicable fund and its respective Peer Universe and/or Peer Group as well as changes to the composition of the Peer Group and/or Peer Universe from year to year may limit some of the value of the comparative data. The Independent Board Members also considered a fund’s operating expense ratio as it more directly reflected the shareholder’s costs in investing in the respective fund.
In their review, the Independent Board Members considered, in particular, each fund with a net expense ratio of six basis points or higher compared to that of its peer average (each, an“Expense Outlier Fund”), including the Real Asset Income Fund, and an analysis as to the factors contributing to each such fund’s higher relative net expense ratio. Accordingly, in reviewing the comparative data between a fund and its peers, the Board generally considered the fund’s net expense ratio and fees to be higher if they were over 10 basis points higher, slightly higher if they were 6 to 10 basis points higher, in line if they were within approximately 5 basis points higher than the peer average and below if they were below the peer average of the Peer Group. The Independent Board Members also considered, in relevant part, a fund’s net management fee and net total expense ratio in light of its performance history.
In their review of the fee arrangements for the Nuveen funds, the Independent Board Members considered the management fee schedules, including thecomplex-wide andfund-level breakpoint schedules, and the expense reimbursements and/or fee waivers provided by Nuveen for each fund, as applicable. The Board noted that across the Nuveen fund complex, the complex-wide fee breakpoints reduced fees by $51.5 million and fund-level breakpoints reduced fees by $55.1 million in 2018. Further, fee caps and waivers for all applicable Nuveen funds saved an additional $15 million in fees for shareholders in 2018.
With respect to theSub-Adviser, the Board considered thesub-advisory fee paid to theSub-Adviser, including any breakpoint schedule, and as described below, comparative data of the fees theSub-Adviser charges to other clients, if any.
The Independent Board Members noted that the Global Infrastructure Fund and the Global Real Estate Securities Fund each had a net management fee and a net expense ratio that were below the respective peer averages. The Board further noted that the Global Real Estate Securities Fund did not incur a management fee after fee waivers and expense reimbursements for the last fiscal year. The Independent Board Members noted that the Real Estate Securities Fund had a net management fee and a net expense ratio that were in line with the respective peer averages. The Board noted that the Real Asset Income Fund had a net management fee that was in line with the peer average, but a net expense ratio that was slightly higher than the peer average. The Independent Board Members noted that the net expense ratio of the Real Asset Income Fund was slightly higher than the peer average due to, among other things, the smaller size of the Fund compared to peers in the Peer Group and the management fee of a peer that was subject to performance adjustments. Based on its review of the information provided, the Board determined that each Fund’s management fees (as applicable) to a Fund Adviser were reasonable in light of the nature, extent and quality of services provided to the Fund.
2. Comparisons with the Fees of Other Clients
In determining the appropriateness of fees, the Board also reviewed information regarding the fee rates the respective Fund Advisers charged to certain other types of clients and the type of services provided to these other clients. For the Adviser and/or theSub-Adviser, such other clients may include retail and institutional managed accounts;sub-advised funds outside the Nuveen family; foreign investment companies offered by Nuveen; and collective investment trusts. The Board further noted that the Adviser also advised certain exchange-traded funds (“ETFs”) sponsored by Nuveen.
96
The Board recognized that each Fund had an affiliatedsub-adviser and, with respect to affiliatedsub-advisers, reviewed, among other things, the range of fees assessed for managed accounts and foreign investment companies offered by Nuveen. The Board also reviewed the fee range and average fee rate of certain selected investment strategies offered in retail and institutional managed accounts by theSub-Adviser and of thenon-Nuveen investment companiessub-advised by affiliatedsub-advisers.
In addition to the comparative fee data, the Board also reviewed, among other things, a description of the different levels of services provided to certain other clients compared to the services provided to the Nuveen funds as well as the differences in portfolio investment policies, investor profiles, account sizes and regulatory requirements, all of which contribute to the variations in the fee schedules. The Board noted, among other things, the wide range of services in addition to investment management services provided to the Nuveen funds when the Adviser is principally responsible for all aspects of operating the funds, including the increased regulatory requirements that must be met in managing the funds, the larger account sizes of managed accounts and the increased entrepreneurial, legal and regulatory risks that the Adviser incurs in sponsoring and managing the funds. Further, with respect to ETFs, the Board considered that Nuveen ETFs are passively managed compared to the active management of other Nuveen funds which contributed to the differences in fee levels between the Nuveen ETFs and other Nuveen funds. In general, higher fee levels reflect higher levels of service provided by the Adviser, increased investment management complexity, greater product management requirements, and higher levels of business risk or some combination of these factors. The Board further considered that theSub-Adviser’s fee is essentially for portfolio management services and therefore more comparable to the fees it receives for retail wrap accounts and other externalsub-advisory mandates. The Board concluded the varying levels of fees were justified given, among other things, the inherent differences in the products and the level of services provided to the Nuveen funds versus other clients, the differing regulatory requirements and legal liabilities and the entrepreneurial, legal and regulatory risks incurred in sponsoring and advising a registered investment company.
3. Profitability of Fund Advisers
In conjunction with their review of fees, the Independent Board Members considered information regarding Nuveen’s level of profitability for its advisory services to the Nuveen funds for the calendar years 2018 and 2017. The Board reviewed, among other things, Nuveen’s net margins(pre-tax) (both including and excluding distribution expenses); gross and net revenue margins(pre- andpost-tax); revenues, expenses, and net income(pre-tax andafter-tax and before distribution) of Nuveen for fund advisory services; and comparative profitability data comparing the adjusted margins of Nuveen compared to the adjusted margins of certain peers with publicly available data and with the most comparable assets under management (based on asset size and asset composition) for each of the last two calendar years. The Board also reviewed the revenues and expenses the Adviser derived from its ETF product line that was launched in 2016. The Independent Board Members noted that Nuveen’s net margins were higher in 2018 than the previous year and considered the key drivers behind the revenue and expense changes that impacted Nuveen’s net margins between the years. The Board considered the costs of investments in the Nuveen business, including the investment of seed capital in certain Nuveen funds and additional investments in infrastructure and technology. The Independent Board Members also noted that Nuveen’s adjusted margins from its relationships with the Nuveen funds were on the low range compared to the adjusted margins of the peers; however, the Independent Board Members recognized the inherent limitations of the comparative data of other publicly traded peers given that the calculation of profitability is rather subjective and numerous factors (such as types of funds, business mix, cost of capital, methodology to allocate expenses and other factors) can have a significant impact on the results.
The Independent Board Members also reviewed a description of the expense allocation methodology employed to develop the financial information and a summary of the history of changes to the methodology over theten-year period from 2008 to 2018, and recognized that other reasonable allocation methodologies could be employed and lead to significantly different results. The Board noted that two Independent Board Members, along with independent counsel, serve as the Board’s liaisons to review profitability and discuss any proposed changes to the methodology prior to the full Board’s review.
Aside from Nuveen’s profitability, the Board recognized that the Adviser is a subsidiary of Nuveen, LLC, the investment management arm of Teachers Insurance and Annuity Association of America (“TIAA”). As such, the Board also reviewed a balance sheet for TIAA reflecting its assets, liabilities and capital and contingency reserves for the 2018 and 2017 calendar years to consider the financial strength of TIAA having recognized the importance of having an adviser with significant resources.
In addition to Nuveen, the Independent Board Members also considered the profitability of theSub-Adviser from its relationships with the Nuveen funds. In this regard, the Independent Board Members reviewed theSub-Adviser’s revenues, expenses and revenue margins(pre- andpost-tax) for its advisory activities for the calendar year ended December 31, 2018. The Independent Board Members also reviewed a profitability analysis reflecting the revenues, expenses and revenue margin(pre- andpost-tax) by asset type for theSub-Adviser for the calendar year ending December 31, 2018 and thepre- andpost-tax revenue margin from 2018 and 2017.
In evaluating the reasonableness of the compensation, the Independent Board Members also considered any other ancillary benefits derived by the respective Fund Adviser from its relationship with the Nuveen funds as discussed in further detail below.
Based on a consideration of all the information provided, the Board noted that Nuveen’s and theSub-Adviser’s level of profitability was acceptable and not unreasonable in light of the services provided.
97
Annual Investment Management Agreement Approval Process(Unaudited) (continued)
D. Economies of Scale and Whether Fee Levels Reflect These Economies of Scale
With respect to economies of scale, the Independent Board Members noted that although economies of scale are difficult to measure, the Adviser shares the benefits of economies of scale in various ways including breakpoints in the management fee schedule (subject to limited exceptions), fee waivers and/or expense limitations, the pricing of Nuveen funds at scale at inception and investments in its business which can enhance the services provided to the funds for the fees paid. With respect to breakpoint schedules, because the Board had previously recognized that economies of scale may occur not only when the assets of a particular Nuveen fund grow but also when the assets in the complex grow, the Nuveen funds generally pay the Adviser a management fee comprised of afund-level component and acomplex-level component each with its own breakpoint schedule, subject to certain exceptions. In general terms, the breakpoint schedule at the fund level reduces fees as assets in the particular fund pass certain thresholds and the breakpoint schedule at the complex level reduces fees on the Nuveen funds as the eligible assets in the complex pass certain thresholds. The Independent Board Members reviewed, among other things, the fund-level andcomplex-level fee schedules and the temporary and/or permanent expense caps applicable to certain Nuveen funds (including the amounts of fees waived or amounts reimbursed to the respective funds in 2017 and 2018), including the temporary expense caps applicable to the Global Infrastructure Fund, Global Real Estate Securities Fund and Real Asset Income Fund. The Independent Board Members noted that as a result of fund-level management fee changes implemented in June 2017, none of the Nuveenopen-end funds were above their top level fee breakpoint.
In addition, the Independent Board Members recognized the Adviser’s continued reinvestment in its business through, among other things, investments in its business infrastructure and information technology, portfolio accounting system as well as other systems and platforms that will, among other things, support growth, simplify and enhance information sharing, and enhance the investment process to the benefit of all of the Nuveen funds.
Based on its review, the Board concluded that the current fee arrangements together with the Adviser’s reinvestment in its business appropriately shared any economies of scale with shareholders.
E. Indirect Benefits
The Independent Board Members received and considered information regarding other benefits the respective Fund Adviser or its affiliates may receive as a result of their relationship with the Nuveen funds. The Independent Board Members recognized that an affiliate of the Adviser serves as principal underwriter providing distribution and/or shareholder services to theopen-end funds. The Independent Board Members further noted that the Nuveenopen-end funds pay12b-1 fees and while a majority of such fees were paid to third party broker-dealers, the Board reviewed the amount retained by the Adviser’s affiliate as a result of serving as principal underwriter. In addition, the Independent Board Members also noted that theSub-Adviser engages in soft dollar transactions pursuant to which it may receive the benefit of research products and other services provided by broker-dealers executing portfolio transactions on behalf of the applicable Nuveen funds.
The Board, however, noted that the benefits for theSub-Adviser when transacting in fixed-income securities may be more limited as such securities generally trade on a principal basis and therefore do not generate brokerage commissions. Further, the Board noted that although theSub-Adviser may benefit from the receipt of research and other services that it may otherwise have to pay for out of its own resources, the research may also benefit the Nuveen funds to the extent it enhances the ability of theSub-Adviser to manage such funds or is acquired through the commissions paid on portfolio transactions of other clients.
Based on their review, the Board concluded that any indirect benefits received by a Fund Adviser as a result of its relationship with the Funds were reasonable and within acceptable parameters.
F. Other Considerations
The Board Members did not identify any single factor discussed previously asall-important or controlling. The Board Members, including the Independent Board Members, concluded that the terms of each Advisory Agreement were fair and reasonable, that the respective Fund Adviser’s fees were reasonable in light of the services provided to each Fund and that the Advisory Agreements be renewed.
98
Directors and Officers
(Unaudited)
The management of the Funds, including general supervision of the duties performed for the Funds by the Adviser, is the responsibility of the Board of Directors of the Funds. The number of Directors of the Funds is currently set at nine. None of the Directors who are not “interested” persons of the Funds (referred to herein as “Independent Directors”) has ever been a Director or employee of, or consultant to, Nuveen or its affiliates. The names and business addresses of the Directors and officers of the Funds, their principal occupations and other affiliations during the past five years, the number of portfolios each Director oversees and other directorships they hold are set forth below.
The Funds’ Statement of Additional Information (“SAI”) includes more information about the Directors. To request a free copy, call Nuveen Investments at (800)257-8787 or visit the Funds’ website at www.nuveen.com.
| | | | | | | | |
Name, Year of Birth & Address | | Position(s) Held with the Funds | | Year First
Elected or
Appointed (1) | | Principal Occupation(s) Including other Directorships During Past 5 Years | | Number of
Portfolios in
Fund Complex
Overseen by
Director |
| | |
| Independent Directors: | | |
Terence J. Toth 1959 333 W. Wacker Drive Chicago, IL 60606 | | Chairman and Director | | 2008 | | Formerly, aCo-Founding Partner, Promus Capital (2008-2017); Director, Quality Control Corporation (since 2012); member: Catalyst Schools of Chicago Board (since 2008) and Mather Foundation Board (since 2012), and chair of its investment committee; formerly, Director, Fulcrum IT Services LLC (2010-2019); formerly, Director, Legal & General Investment Management America, Inc. (2008-2013); formerly, CEO and President, Northern Trust Global Investments (2004-2007); Executive Vice President, Quantitative Management & Securities Lending (2000-2004); prior thereto, various positions with Northern Trust Company (since 1994); formerly, Member, Northern Trust Mutual Funds Board (2005-2007), Northern Trust Global Investments Board (2004-2007), Northern Trust Japan Board (2004-2007), Northern Trust Securities Inc. Board (2003- 2007) and Northern Trust Hong Kong Board (1997-2004). | | 157 |
Jack B. Evans 1948 333 W. Wacker Drive Chicago, IL 60606 | | Director | | 1999 | | Chairman (since 2019), formerly, President (1996-2019), The Hall-Perrine Foundation, a private philanthropic corporation; Director and Chairman, United Fire Group, a publicly held company; Director, Public member, American Board of Orthopaedic Surgery (since 2015); Life Trustee of Coe College and the Iowa College Foundation; formerly, PresidentPro-Tem of the Board of Regents for the State of Iowa University System; formerly, Director, Alliant Energy and The Gazette Company; formerly, Director, Federal Reserve Bank of Chicago; formerly, President and Chief Operating Officer, SCI Financial Group, Inc., a regional financial services firm. | | 157 |
William C. Hunter 1948 333 W. Wacker Drive Chicago, IL 60606 | | Director | | 2003 | | Dean Emeritus, formerly, Dean, Tippie College of Business, University of Iowa (2006-2012); Director of Wellmark, Inc. (since 2009); past Director (2005-2015), and past President (2010- 2014) Beta Gamma Sigma, Inc., The International Business Honor Society; formerly, Director (2004-2018) of Xerox Corporation; Dean and Distinguished Professor of Finance, School of Business at the University of Connecticut (2003-2006); previously, Senior Vice President and Director of Research at the Federal Reserve Bank of Chicago (1995-2003); formerly, Director (1997-2007), Credit Research Center at Georgetown University. | | 157 |
99
Directors and Officers(Unaudited) (continued)
| | | | | | | | |
Name, Year of Birth & Address | | Position(s) Held with the Funds | | Year First
Elected or
Appointed (1) | | Principal Occupation(s) Including other Directorships During Past 5 Years | | Number of
Portfolios in
Fund Complex
Overseen by
Director |
Albin F. Moschner 1952 333 W. Wacker Drive Chicago, IL 60606 | | Director | | 2016 | | Founder and Chief Executive Officer, Northcroft Partners, LLC, a management consulting firm (since 2012); formerly, Chairman (2019), and Director (2012-2019), USA Technologies, Inc., a provider of solutions and services to facilitate electronic payment transactions; formerly, Director, Wintrust Financial Corporation (1996-2016); previously, held positions at Leap Wireless International, Inc., including Consultant (2011-2012), Chief Operating Officer (2008-2011), and Chief Marketing Officer (2004-2008); formerly, President, Verizon Card Services division of Verizon Communications, Inc. (2000-2003); formerly, President, One Point Services at One Point Communications (1999-2000); formerly, Vice Chairman of the Board, Diba, Incorporated (1996-1997); formerly, various executive positions (1991-1996) and Chief Executive Officer (1995-1996) of Zenith Electronics Corporation. | | 157 |
John K. Nelson 1962 333 W. Wacker Drive Chicago, IL 60606 | | Director | | 2013 | | Member of Board of Directors of Core12 LLC. (since 2008), a private firm which develops branding, marketing and communications strategies for clients; served The President’s Council of Fordham University (2010-2019) and previously a Director of the Curran Center for Catholic American Studies(2009-2018); formerly, senior external advisor to the Financial Services practice of Deloitte Consulting LLP. (2012-2014); former Chair of the Board of Trustees of Marian University (2010-2014 as trustee, 2011-2014 as Chair); formerly Chief Executive Officer of ABN AMRO Bank N.V., North America, and Global Head of the Financial Markets Division (2007-2008), with various executive leadership roles in ABN AMRO Bank N.V. between 1996 and 2007. | | 157 |
Judith M. Stockdale 1947 333 W. Wacker Drive Chicago, IL 60606 | | Director | | 1997 | | Board Member, Land Trust Alliance (since 2013); formerly, Board Member, U.S. Endowment for Forestry and Communities (2013-2019); formerly, Executive Director (1994-2012), Gaylord and Dorothy Donnelley Foundation; prior thereto, Executive Director, Great Lakes Protection Fund (1990-1994). | | 157 |
Carole E. Stone 1947 333 W. Wacker Drive Chicago, IL 60606 | | Director | | 2007 | | Former Director, Chicago Board Options Exchange (2006-2017), and C2 Options Exchange, Incorporated (2009-2017); Director, Cboe Global Markets, Inc., formerly, CBOE Holdings, Inc. (since 2010); formerly, Commissioner, New York State Commission on Public Authority Reform (2005-2010). | | 157 |
Margaret L. Wolff 1955 333 W. Wacker Drive Chicago, IL 60606 | | Director | | 2016 | | Formerly, member of the Board of Directors (2013-2017) of Travelers Insurance Company of Canada and The Dominion of Canada General Insurance Company (each, a part of Travelers Canada, the Canadian operation of The Travelers Companies, Inc.); formerly, Of Counsel, Skadden, Arps, Slate, Meagher & Flom LLP (Mergers & Acquisitions Group) (2005-2014); Member of the Board of Trustees of New York-Presbyterian Hospital (since 2005); Member (since 2004) and Chair (since 2015) of the Board of Trustees of The John A. Hartford Foundation (a philanthropy dedicated to improving the care of older adults); formerly, Member (2005-2015) and Vice Chair (2011-2015) of the Board of Trustees of Mt. Holyoke College. | | 157 |
100
| | | | | | | | |
Name, Year of Birth & Address | | Position(s) Held with the Funds | | Year First
Elected or
Appointed (1) | | Principal Occupation(s) Including other Directorships During Past 5 Years | | Number of
Portfolios in
Fund Complex
Overseen by
Director |
Robert L. Young(2) 1963 333 W. Wacker Drive Chicago, IL 60606 | | Director | | 2017 | | Formerly, Chief Operating Officer and Director, J.P. Morgan Investment Management Inc. (2010-2016); formerly, President and Principal Executive Officer (2013-2016), and Senior Vice President and Chief Operating Officer (2005-2010), of J.P. Morgan Funds; formerly, Director and various officer positions for J.P. Morgan Investment Management Inc. (formerly, JPMorgan Funds Management, Inc. and formerly, One Group Administrative Services) and JPMorgan Distribution Services, Inc. (formerly, One Group Dealer Services, Inc.) (1999-2017). | | 155 |
| | | | | | |
Name,
Year of Birth
& Address | | Position(s)
Held with
the Funds | | Year First
Elected or
Appointed (3) | | Principal Occupation(s)
During Past 5 Years |
| |
| Officers of the Funds: |
Greg A. Bottjer 1971 333 W. Wacker Drive Chicago, IL 60606 | | Chief Administrative Officer | | 2016 | | Senior (since 2017) Managing Director (since 2011), formerly, Senior Vice President (2007-2010) of Nuveen; Senior (since 2017) Managing Director (since 2016) of Nuveen Fund Advisors, LLC; Chartered Financial Analyst. |
Mark J. Czarniecki 1979 901 Marquette Avenue Minneapolis, MN 55402 | | Vice President and Assistant Secretary | | 2013 | | Vice President and Assistant Secretary of Nuveen Securities, LLC (since 2016) and Nuveen Fund Advisors (since 2017); Vice President and Associate General Counsel of Nuveen (since 2013) and Vice President, Assistant Secretary and Associate General Counsel of Nuveen Asset Management (since 2018). |
Diana R. Gonzalez 1978 333 W. Wacker Drive Chicago, IL 60606 | | Vice President and Assistant Secretary | | 2017 | | Vice President and Assistant Secretary of Nuveen Fund Advisors, LLC (since 2017); Vice President and Associate General Counsel of Nuveen (since 2017); Associate General Counsel of Jackson National Asset Management (2012-2017). |
Nathaniel T. Jones 1979 333 W. Wacker Drive Chicago, IL 60606 | | Vice President and Treasurer | | 2016 | | Managing Director (since 2017), formerly, Senior Vice President (2016-2017), formerly, Vice President (2011-2016) of Nuveen; Managing Director (since 2015) of Nuveen Fund Advisors, LLC; Chartered Financial Analyst. |
Walter M. Kelly 1970 333 W. Wacker Drive Chicago, IL 60606 | | Chief Compliance Officer and Vice President | | 2003 | | Managing Director (since 2017), formerly, Senior Vice President (2008-2017) of Nuveen Investments Holdings, Inc. |
Tina M. Lazar 1961 333 W. Wacker Drive Chicago, IL 60606 | | Vice President | | 2002 | | Managing Director (since 2017), formerly, Senior Vice President (2014-2017) of Nuveen Securities, LLC. |
Brian J. Lockhart 1974 333 W. Wacker Drive Chicago, IL 60606 | | Vice President | | 2019 | | Managing Director (since 2019) of Nuveen Fund Advisors, LLC; Managing Director (since 2017), formerly, Vice President (2010-2017) of Nuveen; Head of Investment Oversight (since 2017), formerly, Team Leader of Manager Oversight (2015-2017); Chartered Financial Analyst and Certified Financial Risk Manager. |
Jacques M. Longerstaey 1963 8500 Andrew Carnegie Blvd. Charlotte, NC 28262 | | Vice President | | 2019 | | Senior Managing Director, Chief Risk Officer, Nuveen, LLC (since May 2019); Senior Managing Director (since May 2019) of Nuveen Fund Advisors, LLC; formerly, Chief Investment and Model Risk Officer, Wealth & Investment Management Division, Wells Fargo Bank (NA) (from 2013-2019). |
101
Directors and Officers(Unaudited) (continued)
| | | | | | |
Name,
Year of Birth
& Address | | Position(s)
Held with
the Funds | | Year First
Elected or
Appointed (3) | | Principal Occupation(s)
During Past 5 Years |
Kevin J. McCarthy 1966 333 W. Wacker Drive Chicago, IL 60606 | | Vice President and Assistant Secretary | | 2007 | | Senior Managing Director (since 2017) and Secretary and General Counsel (since 2016) of Nuveen Investments, Inc., formerly, Executive Vice President (2016-2017) and Managing Director and Assistant Secretary (2008-2016); Senior Managing Director (since 2017) and Assistant Secretary (since 2008) of Nuveen Securities, LLC, formerly Executive Vice President (2016-2017) and Managing Director (2008-2016); Senior Managing Director (since 2017), Secretary (since 2016) andCo-General Counsel (since 2011) of Nuveen Fund Advisors, LLC, formerly, Executive Vice President (2016-2017), Managing Director (2008-2016) and Assistant Secretary (2007-2016); Senior Managing Director (since 2017), Secretary (since 2016) and Associate General Counsel (since 2011) of Nuveen Asset Management, LLC, formerly Executive Vice President (2016-2017) and Managing Director and Assistant Secretary (2011-2016); Senior Managing Director (since 2017) and Secretary (since 2016) of Nuveen Investments Advisers, LLC, formerly Executive Vice President (2016-2017); Vice President (since 2007) and Secretary (since 2016), formerly, Assistant Secretary, of NWQ Investment Management Company, LLC, Symphony Asset Management, LLC, Santa Barbara Asset Management, LLC and Winslow Capital Management, LLC (since 2010). Senior Managing Director (since 2017) and Secretary (since 2016) of Nuveen Alternative Investments, LLC. |
Jon Scott Meissner 1973 8500 Andrew Carnegie Blvd. Charlotte, NC 28262 | | Vice President | | 2019 | | Managing Director of Mutual Fund Tax and Financial Reporting groups at Nuveen (since 2017); Managing Director of Nuveen Fund Advisors, LLC (since 2019); Senior Director of Teachers Advisors, LLC and TIAA-CREF Investment Management, LLC (since 2016); Senior Director (since 2015) Mutual Fund Taxation to the TIAA-CREF Funds, the TIAA-CREF Life Funds, the TIAA Separate AccountVA-1 and the CREF Accounts; has held various positions with TIAA since 2004. |
Christopher M. Rohrbacher 1971 333 W. Wacker Drive Chicago, IL 60606 | | Vice President and Secretary | | 2008 | | Managing Director (since 2017) and Assistant Secretary of Nuveen Securities, LLC; Managing Director (since 2017), formerly, Senior Vice President (2016-2017),Co-General Counsel (since 2019) and Assistant Secretary (since 2016) of Nuveen Fund Advisors, LLC; Managing Director (since 2017), formerly, Senior Vice President (2012-2017) and Associate General Counsel (since 2016), formerly, Assistant General Counsel (2008-2016) of Nuveen. |
William A. Siffermann 1975 333 W. Wacker Drive Chicago, IL 60606 | | Vice President | | 2017 | | Managing Director (since 2017), formerly Senior Vice President (2016-2017) and Vice President (2011-2016) of Nuveen. |
E. Scott Wickerham 1973 TIAA 730 Third Avenue New York, NY 10017 | | Vice President and Controller | | 2019 | | Senior Managing Director, Head of Fund Administration at Nuveen, LLC (since 2019), formerly, Managing Director; Senior Managing Director (since 2019), Nuveen Fund Advisors, LLC; Principal Financial Officer, Principal Accounting Officer and Treasurer (since 2017) to the TIAA-CREF Funds, the TIAA-CREF Life Funds, the TIAA Separate AccountVA-1 and the Treasurer (since 2017) to the CREF Accounts; Senior Director, TIAA-CREF Fund Administration (2014-2015); has held various positions with TIAA since 2006. |
Gifford R. Zimmerman 1956 333 W. Wacker Drive Chicago, IL 60606 | | Vice President and Assistant Secretary | | 1988 | | Managing Director (since 2002), and Assistant Secretary of Nuveen Securities, LLC; Managing Director (since 2004) and Assistant Secretary (since 1994) of Nuveen Investments, Inc.; Managing Director (since 2002), Assistant Secretary (since 1997) andCo-General Counsel (since 2011) of Nuveen Fund Advisors, LLC; Managing Director, Assistant Secretary and Associate General Counsel of Nuveen Asset Management, LLC (since 2011); Vice President (since 2017), formerly, Managing Director (2003-2017) and Assistant Secretary (since 2003) of Symphony Asset Management LLC ; Managing Director and Assistant Secretary (since 2002) of Nuveen Investments Advisers, LLC; Vice President and Assistant Secretary of NWQ Investment Management Company, LLC (since 2002), Santa Barbara Asset Management, LLC (since 2006) and of Winslow Capital Management, LLC, (since 2010); Chartered Financial Analyst. |
| (1) | Directors serve an indefinite term until his/her successor is elected or appointed. The year first elected or appointed represents the year in which the director was first elected or appointed to any fund in the Nuveen fund complex. |
| (2) | Effective July 1, 2017, Mr. Young was appointed as a Board Member of each of the Nuveen Funds except Nuveen Diversified Dividend and Income Fund (JDD) and Nuveen Real Estate Income Fund (JRS). Effective February 27, 2020, Mr. Young was appointed as a Board Member of JDD and JRS. |
| (3) | Officers serve one year terms through August of each year. The year first elected or appointed represents the year in which the officer was first elected or appointed to any fund in the Nuveen fund complex. |
102
Notes
103
Nuveen:
Serving Investors for Generations
Since 1898, financial advisors and their clients have relied on Nuveen to provide dependable investment solutions through continued adherence to proven, long-term investing principles. Today, we offer a range of high quality solutions designed to be integral components of a well-diversified core portfolio.
Focused on meeting investor needs.
Nuveen is the investment manager of TIAA. We have grown into one of the world’s premier global asset managers, with specialist knowledge across all major asset classes and particular strength in solutions that provide income for investors and that draw on our expertise in alternatives and responsible investing. Nuveen is driven not only by the independent investment processes across the firm, but also the insights, risk management, analytics and other tools and resources that a truly world-class platform provides. As a global asset manager, our mission is to work in partnership with our clients to create solutions which help them secure their financial future.
Find out how we can help you.
To learn more about how the products and services of Nuveen may be able to help you meet your financial goals, talk to your financial advisor, or call us at(800) 257-8787. Please read the information provided carefully before you invest. Investors should consider the investment objective and policies, risk considerations, charges and expenses of any investment carefully. Where applicable, be sure to obtain a prospectus, which contains this and other relevant information. To obtain a prospectus, please contact your securities representative or Nuveen, 333 W. Wacker Dr., Chicago, IL 60606. Please read the prospectus carefully before you invest or send money.
Learn more about Nuveen Funds at:www.nuveen.com/mutual-funds
| | |
Nuveen Securities, LLC, member FINRA and SIPC |
333 West Wacker Drive | Chicago, IL 60606 | www.nuveen.com | | MAN-FREGIF-1219D 1077312-INV-Y-02/21 |
ITEM 2. CODE OF ETHICS.
As of the end of the period covered by this report, the registrant has adopted a code of ethics that applies to the registrant’s principal executive officer, principal financial officer, principal accounting officer or controller, or persons performing similar functions. There were no amendments to or waivers from the code during the period covered by this report. The registrant has posted the code of ethics on its website at www.nuveen.com/fund-governance. (To view the code, click on Code of Conduct.)
ITEM 3. AUDIT COMMITTEE FINANCIAL EXPERT.
As of the end of the period covered by this report, the registrant’s Board of Directors or Trustees (“Board”) determined that the registrant has at least one “audit committee financial expert” (as defined in Item 3 of Form N-CSR) serving on its Audit Committee. The registrant’s audit committee financial experts are Carole E. Stone, Jack B. Evans and William C. Hunter, who are “independent” for purposes of Item 3 of Form N-CSR.
Ms. Stone served for five years as Director of the New York State Division of the Budget. As part of her role as Director, Ms. Stone was actively involved in overseeing the development of the State’s operating, local assistance and capital budgets, its financial plan and related documents; overseeing the development of the State’s bond-related disclosure documents and certifying that they fairly presented the State’s financial position; reviewing audits of various State and local agencies and programs; and coordinating the State’s system of internal audit and control. Prior to serving as Director, Ms. Stone worked as a budget analyst/examiner with increasing levels of responsibility over a 30 year period, including approximately five years as Deputy Budget Director. Ms. Stone has also served as Chair of the New York State Racing Association Oversight Board, as Chair of the Public Authorities Control Board, as a Commissioner on the New York State Commission on Public Authority Reform and as a member of the Boards of Directors of several New York State public authorities. These positions have involved overseeing operations and finances of certain entities and assessing the adequacy of project/entity financing and financial reporting. Currently, Ms. Stone is on the Board of Directors of CBOE Holdings, Inc., of the Chicago Board Options Exchange, and of C2 Options Exchange. Ms. Stone’s position on the boards of these entities and as a member of both CBOE Holdings’ Audit Committee and its Finance Committee has involved, among other things, the oversight of audits, audit plans and preparation of financial statements.
Mr. Evans was formerly President and Chief Operating Officer of SCI Financial Group, Inc., a full service registered broker-dealer and registered investment adviser (“SCI”). As part of his role as President and Chief Operating Officer, Mr. Evans actively supervised the Chief Financial Officer (the “CFO”) and actively supervised the CFO’s preparation of financial statements and other filings with various regulatory authorities. In such capacity, Mr. Evans was actively involved in the preparation of SCI’s financial statements and the resolution of issues raised in connection therewith. Mr. Evans has also served on the audit committee of various reporting companies. At such companies, Mr. Evans was involved in the oversight of audits, audit plans, and the preparation of financial statements. Mr. Evans also formerly chaired the audit committee of the Federal Reserve Bank of Chicago.
Mr. Hunter was formerly a Senior Vice President at the Federal Reserve Bank of Chicago. As part of his role as Senior Vice President, Mr. Hunter was the senior officer responsible for all operations of each of the Economic Research, Statistics, and Community and Consumer Affairs units at the Federal Reserve Bank of Chicago. In such capacity, Mr. Hunter oversaw the subunits of the Statistics and Community and Consumer Affairs divisions responsible for the analysis and evaluation of bank and bank holding company financial statements and financial filings. Prior to serving as Senior Vice President at the Federal Reserve Bank of Chicago, Mr. Hunter was the Vice President of the Financial Markets unit at the Federal Reserve Bank of Atlanta where he supervised financial staff and bank holding company analysts who analyzed and evaluated bank and bank holding company financial statements. Mr. Hunter also currently serves on the Boards of Directors of Xerox Corporation and Wellmark, Inc. as well as on the Audit Committees of such Boards. As an Audit Committee member, Mr. Hunter’s responsibilities include, among other things, reviewing financial statements, internal audits and internal controls over financial reporting. Mr. Hunter also formerly was a Professor of Finance at the University of Connecticut School of Business and has authored numerous scholarly articles on the topics of finance, accounting and economics.
ITEM 4. PRINCIPAL ACCOUNTANT FEES AND SERVICES.
The following tables show the amount of fees that PricewaterhouseCoopers LLP, the Funds’ auditor, billed to the Funds’ during the Funds’ last two full fiscal years. The Audit Committee approved in advance all audit services and non-audit services that PricewaterhouseCoopers LLP, provided to the Funds, except for those non-audit services that were subject to the pre-approval exception under Rule 2-01 of Regulation S-X (the “pre-approval exception”). The preapproval exception for services provided directly to the Funds waives the pre-approval requirement for services other than audit, review or attest services if: (A) the aggregate amount of all such services provided constitutes no more than 5% of the total amount of revenues paid by the Funds during the fiscal year in which the services are provided; (B) the Funds did not recognize the services as non-audit services at the time of the engagement; and (C) the services are promptly brought to the Audit Committee’s attention, and the Committee (or its delegate) approves the services before the audit is completed.
The Audit Committee has delegated certain pre-approval responsibilities to its Chair (or, in her absence, any other member of the Audit Committee).
| | | | | | | | | | | | | | | | |
Fiscal Year Ended December 31, 2019 | | Audit Fees Billed
to Funds1 | | | Audit-Related Fees
Billed to Funds2 | | | Tax Fees Billed
to Funds3 | | | All Other Fees
Billed to Funds 4 | |
Fund Name | | | | | | | | | | | | | | | | |
Nuveen Global Infrastructure Fund | | | 46,310 | | | | 0 | | | | 19,649 | | | | 0 | |
Nuveen Real Estate Securities Fund | | | 57,950 | | | | 0 | | | | 954 | | | | 0 | |
Nuveen Real Asset Income Fund | | | 51,885 | | | | 0 | | | | 1,210 | | | | 0 | |
| | | | | | | | | | | | | | | | |
Total | | $ | 156,145 | | | $ | 0 | | | $ | 21,813 | | | $ | 0 | |
| 1 | | “Audit Fees” are the aggregate fees billed for professional services for the audit of the Fund’s annual financial statements and services provided in connection with statutory and regulatory filings or engagements. |
| 2 | | “Audit-Related Fees” are the aggregate fees billed for assurance and related services reasonably related to the performance of the audit or review of financial statements that are not reported under “Audit Fees”. These fees include offerings related to the Fund’s common shares and leverage. |
| 3 | | “Tax Fees” are the aggregate fees billed for professional services for tax advice, tax compliance, and tax planning. These fees include: all global withholding tax services; excise and state tax reviews; capital gain, tax equalization and taxable basis calculations performed by the principal accountant. |
| 4 | | “All Other Fees” are the aggregate fees billed for products and services other than “Audit Fees”, “Audit-Related Fees” and “Tax Fees”. These fees represent all “Agreed-Upon Procedures” engagements pertaining to the Fund’s use of leverage. |
| | | | | | | | | | | | | | | | |
| | | Percentage Approved Pursuant to Pre-approval Exception | |
| | | Audit Fees Billed
to Funds | | | Audit-Related Fees
Billed to Funds | | | Tax Fees
Billed to Funds | | | All Other Fees
Billed to Funds | |
Fund Name | | | | | | | | | | | | | | | | |
Nuveen Global Infrastructure Fund | | | 0 | % | | | 0 | % | | | 0 | % | | | 0 | % |
Nuveen Real Estate Securities Fund | | | 0 | % | | | 0 | % | | | 0 | % | | | 0 | % |
Nuveen Real Asset Income Fund | | | 0 | % | | | 0 | % | | | 0 | % | | | 0 | % |
| | | | |
December 31, 2018 | | Audit Fees Billed
to Funds1 | | | Audit-Related Fees
Billed to Funds2 | | | Tax Fees
Billed to Funds 3 | | | All Other Fees
Billed to Funds 4 | |
Fund Name | | | | | | | | | | | | | | | | |
Nuveen Global Infrastructure Fund | | | 46,663 | | | | 0 | | | | 21,943 | | | | 0 | |
Nuveen Real Estate Securities Fund | | | 58,452 | | | | 0 | | | | 5,683 | | | | 0 | |
Nuveen Real Asset Income Fund | | | 52,903 | | | | 0 | | | | 3,283 | | | | 0 | |
| | | | | | | | | | | | | | | | |
Total | | $ | 158,018 | | | $ | 0 | | | $ | 30,909 | | | $ | 0 | |
| 1 | | “Audit Fees” are the aggregate fees billed for professional services for the audit of the Fund’s annual financial statements and services provided in connection with statutory and regulatory filings or engagements. |
| 2 | | “Audit-Related Fees” are the aggregate fees billed for assurance and related services reasonably related to the performance of the audit or review of financial statements that are not reported under “Audit Fees”. These fees include offerings related to the Fund’s common shares and leverage. |
| 3 | | “Tax Fees” are the aggregate fees billed for professional services for tax advice, tax compliance, and tax planning. These fees include: all global withholding tax services; excise and state tax reviews; capital gain, tax equalization and taxable basis calculations performed by the principal accountant. |
| 4 | | “All Other Fees” are the aggregate fees billed for products and services other than “Audit Fees”, “Audit-Related Fees” and “Tax Fees”. These fees represent all “Agreed-Upon Procedures” engagements pertaining to the Fund’s use of leverage. |
| | | | | | | | | | | | | | | | |
| | | Percentage Approved Pursuant to Pre-approval Exception | |
| | | Audit Fees Billed
to Funds | | | Audit-Related Fees
Billed to Funds | | | Tax Fees
Billed to Funds | | | All Other Fees
Billed to Funds | |
Fund Name | | | | | | | | | | | | | | | | |
Nuveen Global Infrastructure Fund | | | 0 | % | | | 0 | % | | | 0 | % | | | 0 | % |
Nuveen Real Estate Securities Fund | | | 0 | % | | | 0 | % | | | 0 | % | | | 0 | % |
Nuveen Real Asset Income Fund | | | 0 | % | | | 0 | % | | | 0 | % | | | 0 | % |
| | | | | | | | | | | | |
| | | |
Fiscal Year Ended December 31, 2019 | | Audit-Related Fees
Billed to Adviser and
Affiliated Fund
Service Providers | | | Tax Fees Billed to
Adviser and
Affiliated Fund
Service Providers | | | All Other Fees
Billed to Adviser
and Affiliated Fund
Service Providers | |
Nuveen Investment Funds, Inc. | | $ | 0 | | | $ | 0 | | | $ | 0 | |
| |
| | | Percentage Approved Pursuant to Pre-approval Exception | |
| | | Audit-Related Fees
Billed to Adviser and
Affiliated Fund
Service Providers | | | Tax Fees Billed to
Adviser and
Affiliated Fund
Service Providers | | | All Other Fees
Billed to Adviser
and Affiliated Fund
Service Providers | |
| | | 0 | % | | | 0 | % | | | 0 | % |
| | | |
Fiscal Year Ended December 31, 2018 | | Audit-Related Fees
Billed to Adviser and
Affiliated Fund
Service Providers | | | Tax Fees Billed to
Adviser and
Affiliated Fund
Service Providers | | | All Other Fees
Billed to Adviser
and Affiliated Fund
Service Providers | |
Nuveen Investment Funds, Inc. | | $ | 0 | | | $ | 0 | | | $ | 0 | |
| |
| | | Percentage Approved Pursuant to Pre-approval Exception | |
| | | Audit-Related Fees
Billed to Adviser and
Affiliated Fund
Service Providers | | | Tax Fees Billed to
Adviser and
Affiliated Fund
Service Providers | | | All Other Fees
Billed to Adviser
and Affiliated Fund
Service Providers | |
| | | 0 | % | | | 0 | % | | | 0 | % |
| | | | | | | | | | | | | | | | |
Fiscal Year Ended December 31, 2019 | | Total Non-Audit Fees
Billed to Trust | | | Total Non-Audit Fees
billed to Adviser and
Affiliated Fund Service
Providers (engagements
related directly to the
operations and financial
reporting of the Trust) | | | Total Non-Audit Fees
billed to Adviser and
Affiliated Fund Service
Providers (all other
engagements) | | | Total | |
Fund Name | | | | | | | | | | | | | | | | |
Nuveen Global Infrastructure Fund | | | 19,649 | | | | 0 | | | | 0 | | | | 19,649 | |
Nuveen Real Estate Securities Fund | | | 954 | | | | 0 | | | | 0 | | | | 954 | |
Nuveen Real Asset Income Fund | | | 1,210 | | | | 0 | | | | 0 | | | | 1,210 | |
| | | | | | | | | | | | | | | | |
Total | | $ | 21,813 | | | $ | 0 | | | $ | 0 | | | $ | 21,813 | |
“Non-Audit Fees billed to Fund” for both fiscal year ends represent “Tax Fees” and “All Other Fees” billed to Fund in their respective amounts from the previous table.
Less than 50 percent of the hours expended on the principal accountant’s engagement to audit the registrant’s financial statements for the most recent fiscal year were attributed to work performed by persons other than the principal accountant’s full-time, permanent employees.
| | | | | | | | | | | | | | | | |
Fiscal Year Ended December 31, 2018 | | Total Non-Audit Fees
Billed to Trust | | | Total Non-Audit Fees
billed to Adviser and
Affiliated Fund Service
Providers (engagements
related directly to the
operations and financial
reporting of the Trust) | | | Total Non-Audit Fees
billed to Adviser and
Affiliated Fund Service
Providers (all other
engagements) | | | Total | |
Fund Name | | | | | | | | | | | | | | | | |
Nuveen Global Infrastructure Fund | | | 21,943 | | | | 0 | | | | 0 | | | | 21,943 | |
Nuveen Real Estate Securities Fund | | | 5,683 | | | | 0 | | | | 0 | | | | 5,683 | |
Nuveen Real Asset Income Fund | | | 3,283 | | | | 0 | | | | 0 | | | | 3,283 | |
| | | | | | | | | | | | | | | | |
Total | | $ | 30,909 | | | $ | 0 | | | $ | 0 | | | $ | 30,909 | |
“Non-Audit Fees billed to Fund” for both fiscal year ends represent “Tax Fees” and “All Other Fees” billed to Fund in their respective amounts from the previous table.
Audit Committee Pre-Approval Policies and Procedures. Generally, the Audit Committee must approve (i) all non-audit services to be performed for the Funds by the Funds’ independent accountant and (ii) all audit and non-audit services to be performed by the Funds’ independent accountant for the Affiliated Fund Service Providers with respect to the operations and financial reporting of the Funds. Regarding tax and research projects conducted by the independent accountant for the Funds and Affiliated Fund Service Providers (with respect to operations and financial reports of the Trust), such engagements will be (i) pre-approved by the Audit Committee if they are expected to be for amounts greater than $10,000; (ii) reported to the Audit Committee Chair for her verbal approval prior to engagement if they are expected to be for amounts under $10,000 but greater than $5,000; and (iii) reported to the Audit Committee at the next Audit Committee meeting if they are expected to be for an amount under $5,000.
ITEM 5. AUDIT COMMITTEE OF LISTED REGISTRANTS.
Not applicable to this registrant.
ITEM 6. SCHEDULE OF INVESTMENTS.
| a) | | See Portfolio of Investments in Item 1. |
ITEM 7. DISCLOSURE OF PROXY VOTING POLICIES AND PROCEDURES FORCLOSED-END
MANAGEMENT INVESTMENT COMPANIES.
Not applicable to this registrant.
ITEM 8. PORTFOLIO MANAGERS OFCLOSED-END MANAGEMENT INVESTMENT COMPANIES.
Not applicable to this registrant.
ITEM 9. PURCHASES OF EQUITY SECURITIES BYCLOSED-END MANAGEMENT INVESTMENT COMPANY AND AFFILIATED PURCHASERS.
Not applicable to this registrant.
ITEM 10. SUBMISSION OF MATTERS TO A VOTE OF SECURITY HOLDERS.
There have been no material changes to the procedures by which shareholders may recommend nominees to the registrant’s Board of Trustees implemented after the registrant last provided disclosure in response to this Item.
ITEM 11. CONTROLS AND PROCEDURES.
| | (a) | | The registrant’s principal executive and principal financial officers, or persons performing similar functions, have concluded that the registrant’s disclosure controls and procedures (as defined in Rule30a-3(c) under the Investment Company Act of 1940, as amended (the “1940 Act”) (17 CFR 270.30a-3(c))) are effective, as of a date within 90 days of the filing date of this report that includes the disclosure required by this paragraph, based on their evaluation of the controls and procedures required by Rule30a-3(b) under the 1940 Act (17 CFR 270.30a-3(b)) and Rules13a-15(b) or15d-15(b) under the Securities Exchange Act of 1934, as amended (the “Exchange Act”) (17 CFR 240.13a-15(b) or 240.15d-15(b)). |
| | (b) | | There were no changes in the registrant’s internal control over financial reporting (as defined in Rule30a-3(d) under the 1940 Act (17 CFR 270.30a-3(d)) that occurred during the period covered by this report that has materially affected, or is reasonably likely to materially affect, the registrant’s internal control over financial reporting. |
ITEM 12. DISCLOSURE OF SECURITIES LENDING ACTIVITIES FOR CLOSED-END MANAGEMENT INVESTMENT COMPANIES.
Not applicable.
ITEM 13. EXHIBITS.
File the exhibits listed below as part of this Form.
| | |
| (a)(1) | | Any code of ethics, or amendment thereto, that is the subject of the disclosure required by Item 2, to the extent that the registrant intends to satisfy the Item 2 requirements through filing of an exhibit: Not applicable because the code is posted on registrant’s website at www.nuveen.com/fund-governance and there were no amendments during the period covered by this report. (To view the code, click on Code of Conduct.) |
| |
| (a)(2) | | A separate certification for each principal executive officer and principal financial officer of the registrant as required byRule 30a-2(a) under the 1940 Act (17 CFR 270.30a-2(a)) in the exact form set forth below: SeeEX-99.CERT attached hereto. |
| |
| (a)(3) | | Any written solicitation to purchase securities under Rule23c-1 under the 1940 Act (17 CFR270.23c-1) sent or given during the period covered by the report by or on behalf of the registrant to 10 or more persons: Not applicable to this registrant. |
| |
| (a)(4) | | Change in the registrant’s independent public accountant. Not applicable. |
| |
| (b) | | If the report is filed under Section 13(a) or 15(d) of the Exchange Act, provide the certifications required by Rule30a-2(b) under the 1940 Act (17 CFR 270.30a-2(b)), Rule13a-14(b) or Rule15d-14(b) under the Exchange Act (17 CFR 240.13a-14(b) or 240.15d-14(b)), and Section 1350 of Chapter 63 of Title 18 of the United States Code (18 U.S.C. 1350) as an Exhibit. A certification furnished pursuant to this paragraph will not be deemed “filed” for purposes of Section 18 of the Exchange Act (15 U.S.C. 78r), or otherwise subject to the liability of that section. Such certification will not be deemed to be incorporated by reference into any filing under the Securities Act of 1933 or the Exchange Act, except to the extent that the registration specifically incorporates it by reference: SeeEX-99.906 CERT attached hereto. |
SIGNATURES
Pursuant to the requirements of the Securities Exchange Act of 1934 and the Investment Company Act of 1940, the registrant has duly caused this report to be signed on its behalf by the undersigned, thereunto duly authorized.
(Registrant) Nuveen Investment Funds, Inc.
| | |
| |
| By (Signature and Title) | | /s/ Christopher M. Rohrbacher |
| | Christopher M. Rohrbacher |
| | Vice President and Secretary |
Date: March 6, 2020
Pursuant to the requirements of the Securities Exchange Act of 1934 and the Investment Company Act of 1940, this report has been signed below by the following persons on behalf of the registrant and in the capacities and on the dates indicated.
| | |
| |
| By (Signature and Title) | | /s/ Greg A. Bottjer |
| | Greg A. Bottjer |
| | Chief Administrative Officer |
| | (principal executive officer) |
Date: March 6, 2020
| | |
| |
| By (Signature and Title) | | /s/ E. Scott Wickerham |
| | E. Scott Wickerham |
| | Vice President and Controller |
| | (principal financial officer) |
Date: March 6, 2020