UNITED STATES
SECURITIES AND EXCHANGE COMMISSION
Washington, D.C. 20549
FORMN-CSR
CERTIFIED SHAREHOLDER REPORT OF REGISTERED MANAGEMENT
INVESTMENT COMPANIES
Investment Company Act file number 811-05309
Nuveen Investment Funds, Inc.
(Exact name of registrant as specified in charter)
Nuveen Investments
333 West Wacker Drive, Chicago, IL 60606
(Address of principal executive offices) (Zip code)
Christopher M. Rohrbacher
Vice President and Secretary
333 West Wacker Drive,
Chicago, IL 60606
(Name and address of agent for service)
Registrant’s telephone number, including area code:(312) 917-7700
Date of fiscal year end: March 31
Date of reporting period: March 31, 2019
FormN-CSR is to be used by management investment companies to file reports with the Commission not later than 10 days after the transmission to stockholders of any report that is required to be transmitted to stockholders under Rule30e-1 under the Investment Company Act of 1940 (17 CFR270.30e-1). The Commission may use the information provided on FormN-CSR in its regulatory, disclosure review, inspection, and policy making roles.
A registrant is required to disclose the information specified by FormN-CSR, and the Commission will make this information public. A registrant is not required to respond to the collection of information contained in FormN-CSR unless the Form displays a currently valid Office of Management and Budget (“OMB”) control number. Please direct comments concerning the accuracy of the information collection burden estimate and any suggestions for reducing the burden to Secretary, Securities and Exchange Commission, 450 Fifth Street, NW, Washington, DC 20549-0609. The OMB has reviewed this collection of information under the clearance requirements of 44 U.S.C. ss.3507.
ITEM 1. REPORTS TO STOCKHOLDERS.

Nuveen Municipal
Bond Funds
| | | | | | | | | | |
| Fund Name | | Class A | | Class C | | Class C2 | | Class R6 | | Class I |
| Nuveen All-American Municipal Bond Fund | | FLAAX | | FACCX | | FAACX | | FAAWX | | FAARX |
| Nuveen Intermediate Duration Municipal Bond Fund | | NMBAX | | NNCCX | | NNSCX | | — | | NUVBX |
| Nuveen Limited Term Municipal Bond Fund | | FLTDX | | FAFJX | | FLTCX | | — | | FLTRX |
| Nuveen Short Term Municipal Bond Fund | | FSHAX | | NAAEX | | NSVCX | | — | | FSHYX |
Beginning on January 1, 2021, as permitted by regulations adopted by the Securities and Exchange Commission, paper copies of the Funds’ annual and semi-annual shareholder reports will no longer be sent by mail, unless you specifically request paper copies of the reports. Instead, the reports will be made available on the Funds’ website (www.nuveen.com), and you will be notified by mail each time a report is posted and provided with a website link to access the report.
If you have already elected to receive shareholder reports electronically, you will not be affected by this change and you need not take any action. You may elect to receive shareholder reports and other communications from the Funds electronically anytime by contacting the financial intermediary (such as a broker-dealer or bank) through which you hold your Fund shares or, if you are a direct investor, by enrolling at www.nuveen.com/e-reports.
You may elect to receive all future shareholder reports in paper free of charge at any time by contacting your financial intermediary or, if you are a direct investor, by calling 800-257-8787 and selecting option #1. Your election to receive reports in paper will apply to all funds held in your account with your financial intermediary or, if you are a direct investor, to all your directly held Nuveen Funds and any other directly held funds within the same group of related investment companies.
Annual Report
Life is Complex.
Nuveen makes things e-simple.
It only takes a minute to sign up fore-Reports. Once enrolled, you’ll receive ane-mail as soon as your Nuveen Fund information is ready. No more waiting for delivery by regular mail. Just click on the link within thee-mail to see the report and save it on your computer if you wish.
Free e-Reports right to your email!
www.investordelivery.com
If you receive your Nuveen Fund distributions and statements from your financial advisor or brokerage account.
or
www.nuveen.com/client-access
If you receive your Nuveen Fund distributions and statements directly from Nuveen.
Must be preceded by or accompanied by a prospectus.
NOT FDIC INSURED MAY LOSE VALUE NO BANK GUARANTEE
Table
of Contents
3
Chairman’s Letter to Shareholders

Dear Shareholders,
Financial markets rallied in the early months of 2019, in sharp contrast to the downturn at the end of 2018, leaving investors to wonder whether such bullishness is warranted or sustainable. By the close of 2018, economic softness in China, Europe and Japan had proven more persistent than expected. The temporary boost to the U.S. economy from tax law changes appeared to be fading. Corporate earnings and profits were slowing, and some corporate managements, especially at high-profile technology companies, were downgrading their outlooks. Politics remained unpredictable, most notably with Brexit and U.S.-China trade talks ongoing. The European Central Bank (ECB) ended its crisis-era monetary stimulus program with pledges to keep interest rates low for an extended period, while at the same time, the U.S. Federal Reserve (Fed) had planned to continue raising interest rates into 2019.
As the new year began, economic data have remained a mixed bag, and first quarter 2019 corporate earnings reports have included both high-profile disappointments and positive surprises, although expectations were lower heading into the quarter. Market sentiment shifted significantly after both the Fed and ECB turned remarkably more dovish in their interest rate projections and lowered their growth forecasts. In fact, neither central bank currently expects to raise their respective interest rates during 2019. While the U.S. and China initially appeared to be making progress on trade talks, negotiations have stalled more recently. While these events did reduce some of the markets’ uncertainty, downside risks still exist.
Nevertheless, we believe the likelihood of a near-term recession remains low. Global growth is indeed slowing, but it’s still positive. The U.S. economy remains strong, even in the face of late cycle pressures. Low unemployment and firming wages should continue to support consumer spending, and the November mid-term elections resulted in change, but no major surprises. In China, the government remains committed to using fiscal stimulus to offset softening exports. Europe also remains vulnerable to trade policy as well as Brexit uncertainty, but underlying strengths in European economies, including low unemployment that drives domestic demand, remain supportive of a mild expansion. In a slower growth environment, there are opportunities for investors who seek them more selectively.
We expect volatility and challenging conditions to persist in 2019 but also think there is potential for upside. You can prepare your investment portfolio by working with your financial advisor to review your goals, timeline and risk tolerance. On behalf of the other members of the Nuveen Fund Board, we look forward to continuing to earn your trust in the months and years ahead.
Sincerely,

Terence J. Toth
Chairman of the Board
May 24, 2019
4
Portfolio Managers’ Comments
NuveenAll-American Municipal Bond Fund
Nuveen Intermediate Duration Municipal Bond Fund
Nuveen Limited Term Municipal Bond Fund
Nuveen Short Term Municipal Bond Fund
These Funds feature portfolio management by Nuveen Asset Management, LLC (NAM), an affiliate of Nuveen, LLC. Portfolio managers John V. Miller, CFA, and Timothy T. Ryan, CFA, have managed the NuveenAll-American Municipal Bond Fund since 2010 and 2016, respectively. Paul L. Brennan, CFA, has managed the Nuveen Intermediate Duration Municipal Bond Fund since 2007 and the Nuveen Limited Term Municipal Bond Fund since 2006. Christopher L. Drahn, CFA, has managed the Nuveen Short Term Municipal Bond Fund since 2002.
Recently, the portfolio managers reviewed economic and market conditions, key investment strategies, and the Fund’s performance for the twelve-month reporting period ended March 31, 2019.
What factors affected the U.S. economy and the national municipal bond market during the twelve-month reporting period ended March 31, 2019?
The U.S. economy continued its solid expansion, with economic activity rebounding in early 2019 after a slump at the end of 2018. In the first quarter of 2019, gross domestic product (GDP), which measures the value of goods and services produced by the nation’s economy less the value of the goods and services used up in production, adjusted for price changes, grew at an annualized rate of 3.2%, according to the Bureau of Economic Analysis “advance” estimate. A jump in exports and a buildup of inventories helped offset slower consumer and business spending in the first three months of 2019. For the full year 2018, U.S. GDP growth came in at 2.9%, as economic activity cooled over the second half of 2018 after peaking at 4.2% (annualized) in the second quarter of 2018.
Consumer spending, the largest driver of the economy, remained well supported by low unemployment, wage gains and tax cuts. As reported by the Bureau of Labor Statistics, the unemployment rate fell to 3.8% in March 2019 from 4.0% in March 2018 and job gains averaged around 211,000 per month for the past twelve months. As the jobs market has tightened, average hourly earnings grew at an annualized rate of 3.2% in March 2019. However, falling energy prices led to a slower rate of inflation over the past twelve months. The Consumer Price Index (CPI) increased 1.9% over the twelve-month reporting period ended March 31, 2019 before seasonal adjustment, as reported by the Bureau of Labor Statistics.
Low mortgage rates and low inventory drove home prices higher during this recovery cycle. But the pace of price increases has slowed as mortgage rates drifted higher and homes have become less affordable. The S&P CoreLogic Case-Shiller U.S. National Home Price Index, which covers all nine U.S. census divisions, was up 4.0% year-over-year in February 2019 (most recent data
This material is not intended to be a recommendation or investment advice, does not constitute a solicitation to buy, sell or hold a security or an investment strategy and is not provided in a fiduciary capacity. The information provided does not take into account the specific objectives or circumstances of any particular investor, or suggest any specific course of action. Investment decisions should be made based on an investor’s objectives and circumstances and in consultation with his or her advisors.
Certain statements in this report are forward-looking statements. Discussions of specific investments are for illustration only and are not intended as recommendations of individual investments. The forward-looking statements and other views expressed herein are those of the portfolio managers as of the date of this report. Actual future results or occurrences may differ significantly from those anticipated in any forward-looking statements and the views expressed herein are subject to change at any time, due to numerous market and other factors. The Funds disclaim any obligation to update publicly or revise any forward-looking statements or views expressed herein.
For financial reporting purposes, the ratings disclosed are the highest rating given by one of the following national rating agencies: Standard & Poor’s (S&P), Moody’s Investors Service, Inc. (Moody’s) or Fitch, Inc. (Fitch). This treatment of split-rated securities may differ from that used for other purposes, such as for Fund investment policies. Credit ratings are subject to change. AAA, AA, A and BBB are investment grade ratings, while BB, B, CCC, CC, C and D are below investment grade ratings. Holdings designated N/R are not rated by these national rating agencies.
Bond insurance guarantees only the payment of principal and interest on the bond when due, and not the value of the bonds themselves, which will fluctuate with the bond market and the financial success of the issuer and the insurer. Insurance relates specifically to the bonds in the portfolio and not to the share prices of a Fund. No representation is made as to the insurers’ ability to meet their commitments.
Refer to the Glossary of Terms Used in this Report for further definition of the terms used within this section.
5
Portfolio Managers’ Comments(continued)
available at the time this report was prepared). The10-City and20-City Composites reported year-over-year increases of 2.6% and 3.0%, respectively.
As some data began pointing to slower momentum in the overall economy, the Federal Reserve (Fed) notably shifted its stance. From December 2015 through December 2018, the Fed had gradually lifted its main policy interest rate to prevent the economy from overheating. In its final meeting of 2018, the Fed indicated that two more rate hikes might be forthcoming in 2019, roiling the markets, which had expected a more dovish tone. However, as more recent data revealed a mixed picture of the economy, the Fed said it would adopt a more “patient” approach, signaling the possibility of no rate hikes in 2019. As expected, the Fed held rates steady at its January 2019 committee meeting. At its March 2019 meeting, the Fed’s forecast showed that additional rate hikes in 2019 were unlikely, and Chairman Powell indicated that the Fed’s next move could be either a rate cut or a rate hike. The Fed again kept rates unchanged, as expected, and announced it will discontinue rolling assets off its balance sheet sooner than expected.
During the twelve-month reporting period, geopolitical news remained a prominent market driver. The U.S. moved forward with tariffs on imported goods from China, as well as on steel and aluminum from Canada, Mexico and Europe. These countries announced retaliatory measures in kind, intensifying concerns about a trade war, although there have been some positive developments. In July 2018, the U.S. and the European Union announced they would refrain from further tariffs while they negotiate trade terms, and in October 2018, the U.S., Mexico and Canada agreed to a new trade deal to replace the North American Free Trade Agreement. At the November 2018G-20 summit, the U.S. and China settled on a90-day trade truce, and after the countries resumed trade talks in early 2019, President Trump said he would not increase the tariffs in March 2019 as planned. Brexit negotiations continued to be uncertain, as a deal was not passed in time for the original March 29, 2019 deadline. Prime Minister Theresa May faced significant difficulty getting a plan approved in Parliament, compelling the European Union to agree to an October 31, 2019 delay. Europe also contended with Italy’s new euroskeptic coalition government, the “yellow vest” protests in France, immigration policy concerns and political risk in Turkey. The Trump administration issued sanctions on Russian oligarchs and companies in April 2018 (and later eased some of the restrictions) and on Iran in November 2018 after withdrawing from the 2015 nuclear agreement. After topping a four-year high in October 2018, oil prices fell sharply through December 2018 on concerns of a global supply glut due to weaker global growth and the temporary exemptions from the Iranian oil ban granted to several countries. However, oil prices recovered much of those losses over the early months of 2019 as supply conditions looked tighter than expected. On the Korean peninsula, the leaders of South Korea and North Korea met during April 2018 and jointly announced a commitment toward peace, while the U.S. and North Korea held denuclearization summits in June 2018 and February 2019 without securing an agreement. In late December 2018, the U.S. government entered a35-day partial shutdown due to an impasse on border security funding but averted a second shutdown after the government passed a funding bill in February 2019.
Municipal bonds delivered positive performance in this reporting period. Interest rates were rising through much of the reporting period, as a strong economic backdrop kept the Fed on its course of monetary tightening. The10-year U.S. Treasury yield peaked at 3.24% in November 2018. However, in December 2018, market volatility spiked as uncertain trade policy, Brexit negotiations, and weak macro data in Europe and China weighed on the U.S. growth outlook. Equities and riskier segments of the bond market sold off sharply in the fourth quarter of 2018. After the Fed’s December meeting, investor expectations for a pause in rate increases drove repricing in the markets, pressuring long-term interest rates meaningfully lower through the end of the reporting period. While the U.S. Treasury yield curve flattened over this reporting period, the municipal yield curve “twisted” by flattening at the short end and steepening at the long end of the curve. For the twelve-month period overall, municipal bond yields were marginally lower, belying larger intra-period swings.
Supply and demand conditions in the municipal bond market were favorable to performance in this reporting period, particularly in the latter months. Issuance has been subdued since the passage of the Tax Cuts and Jobs Act of 2017. Because new issue advance refunding bonds are no longer tax exempt under the new tax law, the total supply of municipal bonds has decreased, boosting the scarcity value of existing municipal bonds. Municipal bond issuance nationwide totaled $421.9 billion in this reporting period, a 17.4% decrease from the issuance for the twelve-month reporting period ended March 31, 2018. Nevertheless, the overall low level of interest rates encouraged issuers to continue to actively refund their outstanding debt. In these transactions the issuers are issuing new bonds and taking the bond proceeds and redeeming (calling) old bonds. These refunding transactions have ranged from 40% to 60% of total issuance over the past few years. Thus, the net issuance (all bonds issued less bonds redeemed) is actually much lower than the gross issuance. So, while gross issuance volume has been strong, the net has not, and this was an overall positive technical
6
factor on municipal bond investment performance in recent years. Although the pace of refundings is slowing, net negative issuance is expected to continue.
Low global interest rates have continued to drive investors toward higherafter-tax yielding assets, including U.S. municipal bonds. The Fed’s pivot to a more dovish stance in early 2019 also brought investors back to fixed income markets, including municipal bonds, driving large inflows into the asset class in the early months of 2019. Additionally, as tax payers have begun to assess the impact of the 2017 tax law, which caps the state and local tax (SALT) deduction for individuals, demand fortax-exempt municipal bonds, especially in states with high income and/or property taxes, is expected to increase.
How did the Funds perform during the twelve-month reporting period ended March 31, 2019?
The tables in the Fund Performance, Expense Ratios and Effective Leverage Ratios section of this report provide each Fund’s total return performance information for theone-year, five-year andten-year and/or since-inception periods ended March 31, 2019. The returns for each Fund’s Class A Shares at net asset value (NAV) are compared with the performance of its corresponding benchmark and Lipper classification average.
During the reporting period, the Nuveen Limited Term Municipal Bond Fund outperformed its benchmark index and the NuveenAll-American Municipal Bond Fund performed essentially in line with its index. The Nuveen Intermediate Duration Municipal Bond Fund and the Nuveen Short Term Municipal Bond Fund both lagged their respective indexes. All four Funds outperformed their respective Lipper classification averages to varying degrees.
What strategies were used to manage the Funds during the reporting period and how did these strategies influence performance?
All of the Funds continued to employ the same fundamental investment strategies and tactics long relied upon by NAM. Our municipal bond portfolios are managed with a value-oriented approach and close input from NAM’s research team.
Below we highlight the specific factors influencing each Fund’s investment strategy, as well as how we managed each portfolio in light of recent market conditions.
Nuveen All American Municipal Bond Fund
The Nuveen All American Municipal Bond Fund’s Class A Shares at NAV performed in line with the S&P Municipal Bond Index and outperformed the Lipper General & Insured Municipal Debt Funds Classification Average for the twelve-month reporting period ended March 31, 2019.
Relative to the index, the Fund’s duration and yield curve positioning contributed to performance. As interest rates on municipal bonds declined overall, our longer-than-index duration (meaning the Fund was more sensitive to the beneficial effects of falling long-term rates) proved beneficial. More specifically, our overweight in bonds on the long end of the yield curve and simultaneous underweight in shorter-duration bonds contributed.
Sector allocation and security selection were positive factors. An overweight indedicated-tax bonds added value, in light of the category’s relative outperformance. The Fund also benefited from overweights in the hospital and transportation sectors, both of which outpaced the index.
Within the transportation category, we saw particularly good performance from airport-related issuers, including bonds for the LINXS automated people-mover system under construction at Los Angeles International Airport. We also benefited from holdings in San Francisco and Sacramento airport bonds. Another outperforming transportation-related issuer was Bronx Parking Development Company, an operator of parking facilities near Yankee Stadium. These bonds gained in value as investors have become more optimistic about the issuer’s underlying credit quality due to increased utilization of its facilities.
In the tobacco sector, we saw a mixed performance impact. On the positive side, our relative underweighting in the category contributed to performance, as the sector underperformed the index due to negative credit trends surrounding tobacco usage. In addition, our individual holdings in this sector underperformed, due to our limited exposure tozero-coupon tobacco bonds, which as a group performed especially well during the reporting period.
7
Portfolio Managers’ Comments(continued)
Several of our state and local general obligation (GO) positions were standout performers. At the state level, GO issues of Illinois, Washington and California were all meaningful contributors. On the local side, we saw strong results from Chicago GO and Chicago Board of Education bonds, which have benefited as investors have become more optimistic about the credit prospects for this financially challenged city. We also saw good results from various highly rated local government and school district bonds, as well as long-dated Californiazero-coupon issues.
Exposure to the nursing home sector added value, which included a position in Colorado Health and Finance bonds for the Colorado Senior Residences Project. Also boosting our results was exposure to the corporate-backed industrial development revenue bond sector, primarily due to strong performance from our investment in FirstEnergy Solutions, an energy supplier whose outlook for a financial recovery in bankruptcy is seen to have improved.
Although we experienced relatively few individual credit challenges in the portfolio, two positions stood out as notable detractors during the reporting period. First, in the multi-family housing area, our holding in Capital Trust Agency bonds for Gardens Apartments proved challenging. A second meaningful detractor was our holding in bonds of Lombard Convention Center. In both cases, the issuers were experiencing financial challenges that weighed on the securities’ prices.
Throughout the reporting period, we maintained our consistent management approach in seeking to generatetax-exempt income for shareholders. To accomplish this objective, we kept the portfolio’s duration at the longer end of our target range, so as to capitalize upon the higher yields available from longer-dated issues.
During the first half of the reporting period, we were more active than usual in adding higher quality debt to the portfolio, as we were finding better values in this part of the market in light of narrowing credit spreads. As the reporting period progressed, however, and credit spreads began to widen in the fourth quarter of the year, we were again finding increased value among lower-rated bonds and added a number of high yield opportunities at more attractive credit spreads.
As part of our typical investment process, we sought to maximize our allocation to bonds with lower and below investment grade credit ratings, which we regularly like for their higher yields. The Fund’s prospectus allows us to invest up to 20% of net assets in securities rated below BBB, which is the lowest credit tier of the investment grade universe. We often look to max out this exposure because of our confidence in Nuveen’s credit research capabilities.
During the reporting period, however, the supply of high yield bonds did not always grow as quickly as the Fund in light of new investment inflows. Accordingly, the constrained supply of high yield deals sometimes made it challenging to achieve our full allotment of below investment grade bonds. As of the end of the reporting period, we did remain relatively close to our threshold, with exposure to bonds rated BB and below at about 17% of the portfolio. As of March 31, 2019, consistent with our preference for higher yielding, lower rated debt, more than 60% of the portfolio was invested in either lower investment grade or below investment grade securities.
During the reporting period, we used Treasury futures, which had a negligible impact on the Fund’s performance.
Nuveen Intermediate Duration Municipal Bond Fund
The Nuveen Intermediate Duration Municipal Bond Fund’s Class A Shares at NAV underperformed the S&P Municipal Bond Intermediate Index while outperforming its Lipper Intermediate Municipal Debt Funds Classification Average for the twelve-month reporting period ended March 31, 2019.
For the full reporting period, investors in municipal bonds benefited from generally falling interest rates, especially in intermediate segments of the yield curve. Given the Fund’s natural emphasis on intermediate-duration municipal securities, this environment provided a positive backdrop for performance in absolute terms.
Meanwhile, relative to the S&P Municipal Bond Intermediate Index, sector positioning in two primary areas hampered the Fund’s performance. First, an overweight in the tobacco sector detracted from results. During the reporting period, tobacco bonds lagged the index, reflecting growing signs of a decline in tobacco consumption. Secondly, we maintained an overweight inpre-refunded bonds, whose very short maturities and high credit quality were detrimental factors in a market environment more often rewarding
8
bonds with the opposite characteristics. On the positive side, an overweight in single-family housing bonds added value, given the segment’s strong relative performance.
Overall, the Fund’s neutral interest rate positioning meant that duration had little overall impact on relative performance. We did, however, benefit from the yield curve positioning we employed to achieve that neutral stance. Specifically, our overweighting of bonds on the longer end of the intermediate yield curve added value, given these securities’ outperformance. This allocation was sufficiently helpful to overcome the negative impact of our simultaneous overweighting on the short end of the yield curve, as bonds in this part of the market lagged their longer-dated counterparts.
Credit quality positioning also contributed to relative performance. During the reporting period, bonds with lower investment grade and below investment grade credit ratings generally fared better than higher quality issues, especially in the first quarter of 2019, when investors became more comfortable assuming credit risk. Accordingly, our relative overweighting in bonds with credit ratings of A or lower contributed to results in light of these securities’ relative outperformance.
Regarding individual security selection, our allocation to bonds of FirstEnergy Solutions added particular value. These securities regained some of their losses from earlier reporting periods, as optimism grew about the company’s emergence from bankruptcy and the anticipated financial recoveries for bondholders.
While managing the Fund during the twelve-month reporting period, we focused on keeping the portfolio’s duration close to that of the benchmark. We believed this was a prudent strategy for now, in light of the Fed’s decision to pause its cycle of interest rate increases, even as we believed strong underlying economic data would not preclude rate hikes in the future. We achieved our neutral portfolio positioning by predominantly owning a balance of longer-intermediate bonds and very-short-dated issues and when owned together, these securities allowed us to achieve our desired average duration.
Given healthy investment inflows, we were relatively active in putting cash flow to work in the municipal bond market. New purchases reflected our pursuit of the Fund’s twin objectives: capital preservation and a high level of income for shareholders. When making new purchases, we continued to pay close attention to our duration target, as well as to the Fund’s sector and credit exposures. We were comfortable with the Fund’s existing allocations coming into the reporting period and thus pleased to have kept them relatively close to their starting points over the reporting period.
We continued to favor bonds with lower investment grade credit ratings when we identified favorable risk/reward trade-offs. One significant exception, however, was our purchase throughout the reporting period of bonds for state housing programs, many of which are higher rated. State housing bonds were providing particular value, in our opinion, which led us to increase the Fund’s exposure to this area.
Other categories in which we saw opportunity included the transportation sector, and especially airport issuers, which have benefited from increased air travel fueled by a strong economy; health care; and investor-owned utilities. Manytax-exempt utility bonds have short maturities, so these holdings allowed us to balance our longer-dated purchases as we sought to manage the portfolio’s duration.
Nuveen Limited Term Municipal Bond Fund
During the twelve-month reporting period ended March 31, 2019, the Nuveen Limited Term Municipal Bond Fund’s Class A Shares at NAV outperformed the S&P Municipal Bond Short-Intermediate Index and the Lipper Short-Intermediate Municipal Debt Funds Classification Average.
The Fund benefited from effective credit quality positioning. In a market environment that generally rewarded bonds with lower credit ratings over those with higher credit ratings, the portfolio’s overweight in bonds rated A and lower added to relative performance.
Sector and security selection also contributed to performance. Most notably, the Fund benefited from a relative underweight inpre-refunded bonds. These securities lagged the index, as their very short durations and high credit quality left them out of favor relative to longer-duration, lower quality bonds.
9
Portfolio Managers’ Comments(continued)
Regarding individual security selection, our allocation to bonds of FirstEnergy Solutions added value. These securities regained some of their losses from earlier reporting periods, as optimism grew about the company’s emergence from bankruptcy and the anticipated financial recoveries for bondholders. The Fund also benefited from its position in State of Illinois bonds, which gained significantly in value as investors appeared to become more optimistic about the state’s financial condition.
Meanwhile, duration and yield curve positioning had a mixed performance impact. Coming into the reporting period, the Fund was somewhat conservatively positioned from an interest rate standpoint, meaning our duration was lower than that of the index. This conservative positioning reflected our expectation that the Fed would raise rates several times in 2019, however, the Fed indicated that it did not plan to raise interest rates again in the near future. The municipal bond market rallied in response and the portfolio’s limited interest rate sensitivity subsequently weighed on relative performance. We did, however, benefit from effective yield curve positioning. Specifically, our overweight on the longer end of the limited-term municipal yield curve contributed to the Fund’s relative performance, given the outperformance of these securities. Tempering that positive effect was our overweight on the short end of the curve, as these securities lagged the index.
In managing the portfolio this reporting period, we remained focused on the Fund’s objectives of preserving capital and generating income for shareholders. Throughout the reporting period, we kept a close eye on the Fund’s duration. In the first half of the reporting period, we often emphasized shorter-duration bonds, as we wished to limit sensitivity to rising rates. In the second half of the reporting period, meanwhile, as the Fed’s intention to leave rates alone became clearer, we became more comfortable extending the Fund’s duration closer to a neutral stance. We accomplished this goal by often favoring longer-duration bonds in the final quarter of the reporting period.
In making new purchases during the reporting period, we added bonds across a variety of sectors. Highlights of these purchases included a variety of airport transportation, utility and health care bonds. When finding suitable opportunities to do so, we favored lower rated bonds we believed were offering a desirable risk/rewardtrade-off. Proceeds for new purchases generally came from new investment inflows and bond maturities.
Overall, however, we were comfortable with the Fund’s existing positioning coming into the reporting period, so when buying and occasionally selling bonds, we were successful in keeping the portfolio’s sector and credit quality exposures relatively consistent throughout the twelve- month reporting period.
Nuveen Short Term Municipal Bond Fund
The Nuveen Short Term Municipal Bond Fund’s Class A Shares at NAV underperformed the S&P Municipal Bond Short Index but outperformed the Lipper Short Municipal Debt Funds Classification Average for the twelve-month reporting period ended March 31, 2019.
The Fund benefited from its duration (interest rate) and yield curve positioning. Between the start of the reporting period last April 2018 and the late fall of 2018, municipal yields drifted higher. Beginning in December 2018, however, and continuing through the end of the reporting period, the municipal bond market rallied as yields declined. Over the course of the reporting period, we were modestly increasing the Fund’s duration, especially in the latter part of 2018. As municipal rates fell, this strategy added to the Fund’s result during the market rally late in the reporting period.
In particular, overweighting the longer end of our investment universe, specifically bonds with effective durations of three to five years, added to relative performance. A partly counterbalancing negative factor was exposure to bonds with very short durations, often with maturities of less than one year. We held these securities for cash-management purposes or, in the case of bonds with higher book yields, to support the Fund’s dividend.
Relative to the index, the Fund’s overweight in the industrial development revenue and health care sectors, two outperforming categories, contributed to performance. The Fund also benefitted from a relative underweight inpre-refunded bonds. These securities lagged the index, as their very short duration and high credit quality left them out of favor relative to longer duration, lower quality bonds.
10
Credit quality positioning added value. With lower quality bonds generally outperforming higher quality bonds during the reporting period, our overweighting in bonds with lower investment grade and below investment grade credit ratings, especially those rated between A to BB, contributed to relative performance.
Throughout the reporting period, we took advantage of opportunities to buy bonds subject to the alternative minimum tax (AMT). These securities, which added to the Fund’s relative performance this reporting period, typically come to market offering higher yields than comparably structurednon-AMT bonds. We liked these securities for their higher income, as well as our belief that demand for AMT bonds may increase over time, as fewer taxpayers find themselves subject to the tax in light of federal tax law changes. In our view, these bonds offered an attractive combination of higher income and potential for spread narrowing. OurAMT-bond additions this reporting period included various airport bonds, as well as certain student-loan and industrial development revenue issues.
Other notable purchases included prepaid natural gas bonds. (Municipalities issue prepaid gas bonds to generate proceeds used to lock in a price for natural gas. They are generally backed by a bank or a financial institution, so their credit quality tends to be tied to that institution’s credit.) Issuance of prepaid gas bonds has increased in recent years, particularly on the short end of the yield curve that represents this Fund’s investment universe, which opened up numerous such purchase opportunities.
In the first six months of the reporting period, we most often bought bonds at the longer end of our investment universe. In particular, we favored the three- to five-year portion of the yield curve for the better income available in that part of the market. Once we reached our duration target by the second half of the reporting period, we also began adding shorter-maturity bonds to the portfolio. We were more willing to buy bonds with durations as short as one year because of a flattening yield curve that made these additions relatively more attractive.
To pay for our purchases, we used the proceeds from new investment inflows, as well as from maturing bonds. We also periodically engaged intax-loss swaps, a strategy that involves selling bonds at a loss and then using the sale proceeds to buy similarly structured but better yielding bonds. With this strategy, we could improve the Fund’s income while simultaneously creating tax losses to apply against capital gains in the future.
An Update on FirstEnergy Solutions Corp.
FirstEnergy Solutions Corp. and all of its subsidiaries filed for protection under Chapter 11 of the U.S. Bankruptcy Code on April 1, 2018. FirstEnergy Solutions and its subsidiaries specialize in coal and nuclear energy production. It is one of the main energy producers in the state of Ohio and a major energy provider in Pennsylvania. Because of the challenging market environment for nuclear and coal power in the face of inexpensive natural gas, FirstEnergy Corp., FirstEnergy Solution’s parent announced in late 2016 that it would begin a strategic review of its generation assets. FirstEnergy Solutions is a unique corporate issuer in that the majority of its debt was issued in the municipal market to finance pollution control and waste disposal for its coal and nuclear plants. A substantial amount of bondholders, of which Nuveen Funds are included, entered into an “Agreement in Principal” with FirstEnergy Corp., to resolve potential claims that bondholders may have against FirstEnergy Corp. The agreement is subject to the approval of the FirstEnergy Corp. board of directors, FirstEnergy Solutions and the bankruptcy court.
In terms of FirstEnergy Solutions holdings, shareholders should note that the Nuveen All American Municipal al Bond Fund had 0.61% exposure, Nuveen Intermediate Duration Municipal Bond Fund had 1.25% exposure, Nuveen Limited Term Municipal Bond Fund had 1.51% exposure and the Nuveen Short Term Municipal Bond Fund had 0.10% exposure, which was a mix of unsecured and secured holdings.
11
Risk Considerations and Dividend Information
Risk Considerations
Nuveen All-American Municipal Bond Fund
Mutual fund investing involves risk; principal loss is possible. Debt or fixed income securities such as those held by the Fund, are subject to market risk, credit risk, interest rate risk, call risk, tax risk, political and economic risk, and income risk. As interest rates rise, bond prices fall. Credit risk refers to an issuers ability to make interest and principal payments when due. Below investment grade or high yield debt securities are subject to liquidity risk and heightened credit risk. In addition, the Fund periodically engages in a moderate amount of portfolio leverage and in doing so, assumes a higher level of risk in pursuit of its objectives. Leverage involves the risk that the Fund could lose more than its original investment and also increases the Fund’s exposure to volatility, interest rate risk and credit risk.
Nuveen Intermediate Duration Municipal Bond Fund
Mutual fund investing involves risk; principal loss is possible. Debt or fixed income securities such as those held by the Fund, are subject to market risk, credit risk, interest rate risk, call risk, tax risk, political and economic risk, and income risk. As interest rates rise, bond prices fall. Credit risk refers to an issuers ability to make interest and principal payments when due. Below investment grade or high yield debt securities are subject to liquidity risk and heightened credit risk. The Fund’s use of inverse floaters creates effective leverage. Leverage involves the risk that the Fund could lose more than its original investment and also increases the Fund’s exposure to volatility and interest rate risk.
Nuveen Limited Term Municipal Bond Fund
Mutual fund investing involves risk; principal loss is possible. Debt or fixed income securities such as those held by the Fund, are subject to market risk, credit risk, interest rate risk, call risk, tax risk, political and economic risk, and income risk. As interest rates rise, bond prices fall. Credit risk refers to an issuers ability to make interest and principal payments when due. Below investment grade or high yield debt securities are subject to liquidity risk and heightened credit risk. The Fund’s use of inverse floaters creates effective leverage. Leverage involves the risk that the Fund could lose more than its original investment and also increases the Fund’s exposure to volatility and interest rate risk.
Nuveen Short Term Municipal Bond Fund
Mutual fund investing involves risk; principal loss is possible. Debt or fixed income securities such as those held by the Fund, are subject to market risk, credit risk, interest rate risk, call risk, tax risk, political and economic risk, and income risk. As interest rates rise, bond prices fall. Credit risk refers to an issuers ability to make interest and principal payments when due. Below investment grade or high yield debt securities are subject to liquidity risk and heightened credit risk. The Fund’s use of inverse floaters creates effective leverage. Leverage involves the risk that the Fund could lose more than its original investment and also increases the Fund’s exposure to volatility and interest rate risk.
Dividend Information
Each Fund seeks to pay regular monthly dividends out of its net investment income at a rate that reflects its past and projected net income performance. To permit each Fund to maintain a more stable monthly dividend, the Fund may pay dividends at a rate that may be more or less than the amount of net income actually earned by the Fund during the period. Distributions to shareholders are determined on a tax basis, which may differ from amounts recorded in the accounting records. In instances where the monthly dividend exceeds the earned net investment income, the Fund would report a negative undistributed net ordinary income. Refer to Note 6 – Income Tax Information for additional information regarding the amounts of undistributed net ordinary income and undistributed net long-term capital gains and the character of the actual distributions paid by the Fund during the period.
12
All monthly dividends paid by each Fund during the current reporting period were paid from net investment income. If a portion of the Fund’s monthly distributions is sourced or comprised of elements other than net investment income, including capital gains and/or a return of capital, shareholders will be notified of those sources. For financial reporting purposes, the per share amounts of each Fund’s distributions for the reporting period are presented in this report’s Financial Highlights. For income tax purposes, distribution information for each Fund as of its most recent tax year end is presented in Note 6 – Income Tax Information within the Notes to Financial Statements of this report.
13
THIS PAGE INTENTIONALLY LEFT BLANK
14
Fund Performance, Expense Ratios and Effective Leverage Ratios
The Fund Performance, Expense Ratios and Effective Leverage Ratios for each Fund are shown within this section of the report.
Returns quoted represent past performance, which is no guarantee of future results. Investment returns and principal value will fluctuate so that when shares are redeemed, they may be worth more or less than their original cost. Current performance may be higher or lower than the performance shown. Total returns for a period of less than one year are not annualized. Returns at net asset value (NAV) would be lower if the sales charge were included. Returns assume reinvestment of dividends and capital gains. For performance, current to the most recent month-end visit Nuveen.com or call (800) 257-8787.
Returns do not reflect the deduction of taxes that a shareholder would pay on Fund distributions or the redemption of Fund shares. Income is generally exempt from regular federal income taxes. Some income may be subject to state and local income taxes and to the federal alternative minimum tax. Capital gains, if any, are subject to tax.
Returns may reflect fee waivers and/or expense reimbursements by the investment adviser during the periods presented. If any such waivers and/or reimbursements had not been in place, returns would have been reduced. See Notes to Financial Statements, Note 7—Management Fees and Other Transactions with Affiliates for more information.
Returns reflect differences in sales charges and expenses, which are primarily differences in distribution and service fees, and assume reinvestment of dividends and capital gains.
Comparative index and Lipper return information is provided for Class A Shares at NAV only.
The expense ratios shown reflect total operating expenses (before fee waivers and/or expense reimbursements, if any) as shown in the most recent prospectus. The expense ratios include management fees and other fees and expenses.
Leverage is created whenever a Fund has investment exposure (both reward and/or risk) equivalent to more than 100% of its investment capital. The effective leverage ratio shown for each Fund is the amount of investment exposure created either directly through borrowings or indirectly through inverse floaters, divided by the assets invested, including those assets that were purchased with the proceeds of the leverage, or referenced by the levered instrument. A Fund may from time to time borrow on a typically transient basis in connection with its day-to-day operations, primarily in connection with the need to pay cash out to redeeming shareholders or to settle portfolio trades. Such incidental borrowings, described generally in Notes to Financial Statements, Note 8—Borrowing Arrangements, are excluded from the calculation of a Fund’s effective leverage ratio.
15
Fund Performance, Expense Ratios and Effective Leverage Ratios (continued)
Nuveen All-American Municipal Bond Fund
Refer to the first page of this Fund Performance, Expense Ratios and Effective Leverage Ratios section for further explanation of the information included within this section. Refer to the Glossary of Terms Used in this Report for definitions of terms used within this section.
Fund Performance
Average Annual Total Returns as of March 31, 2019
| | | | | | | | | | | | |
| | | Average Annual | |
| | | 1-Year | | | 5-Year | | | 10-Year | |
Class A Shares at NAV | | | 5.11% | | | | 4.74% | | | | 6.69% | |
Class A Shares at maximum Offering Price | | | 0.71% | | | | 3.84% | | | | 6.23% | |
S&P Municipal Bond Index | | | 5.12% | | | | 3.73% | | | | 4.94% | |
Lipper General & Insured Municipal Debt Funds Classification Average | | | 4.69% | | | | 3.58% | | | | 4.95% | |
| | | |
Class C2 Shares | | | 4.60% | | | | 4.17% | | | | 6.11% | |
Class I Shares | | | 5.31% | | | | 4.95% | | | | 6.89% | |
| | | | | | | | | | | | |
| | | Average Annual | |
| | | 1-Year | | | 5-Year | | | Since
Inception | |
Class C Shares | | | 4.29% | | | | 3.90% | | | | 4.13% | |
Class R6 Shares | | | 5.40% | | | | N/A | | | | 2.54% | |
Since inception returns for Class C Shares and Class R6 Shares are from 2/10/14 and 6/30/16, respectively. Indexes and Lipper averages are not available for direct investment.
Class A Shares have a maximum 4.20% sales charge (Offering Price). Class A Share purchases of $250,000 or more are sold at net asset value without an up-front sales charge but may be subject to a contingent deferred sales charge (CDSC) of 1% if redeemed within eighteen months of purchase. Class C and Class C2 Shares have a 1% CDSC for redemptions within less than twelve months, which is not reflected in the total returns. Class R6 Shares have no sales charge and are available only to certain limited categories of investors as described in the prospectus. Class I Shares have no sales charge and may be purchased under limited circumstances or by specified classes of investors.
Expense Ratios as of Most Recent Prospectus
| | | | | | | | | | | | | | | | | | | | |
| | | Share Class | |
| | | Class A | | | Class C | | | Class C2 | | | Class R6 | | | Class I | |
Expense Ratios | | | 0.72% | | | | 1.52% | | | | 1.27% | | | | 0.48% | | | | 0.52% | |
Effective Leverage Ratio as of March 31, 2019
| | | | |
Effective Leverage Ratio | | | 2.93% | |
16
Growth of an Assumed $10,000 Investment as of March 31, 2019 – Class A Shares
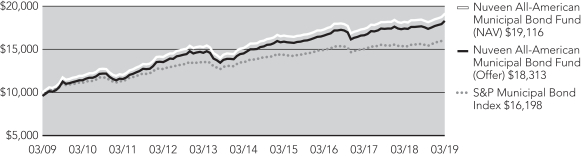
The graphs do not reflect the deduction of taxes that a shareholder may pay on Fund distributions or the redemption of Fund shares.
17
Fund Performance, Expense Ratios and Effective Leverage Ratios(continued)
Nuveen Intermediate Duration Municipal Bond Fund
Refer to the first page of this Fund Performance, Expense Ratios and Effective Leverage Ratios section for further explanation of the information included within this section. Refer to the Glossary of Terms Used in this Report for definitions of terms used within this section.
Fund Performance
Average Annual Total Returns as of March 31, 2019
| | | | | | | | | | | | |
| | | Average Annual | |
| | | 1-Year | | | 5-Year | | | 10-Year | |
Class A Shares at NAV | | | 5.29% | | | | 3.37% | | | | 4.31% | |
Class A Shares at maximum Offering Price | | | 2.14% | | | | 2.74% | | | | 3.99% | |
S&P Municipal Bond Intermediate Index | | | 5.48% | | | | 3.36% | | | | 4.43% | |
Lipper Intermediate Municipal Debt Funds Classification Average | | | 4.34% | | | | 2.70% | | | | 3.78% | |
| | | |
Class C2 Shares | | | 4.51% | | | | 2.78% | | | | 3.72% | |
Class I Shares | | | 5.37% | | | | 3.56% | | | | 4.50% | |
| | | | | | | | | | | | |
| | | Average Annual | |
| | | 1-Year | | | 5-Year | | | Since
Inception | |
Class C Shares | | | 4.35% | | | | 2.54% | | | | 2.58% | |
Since inception returns for Class C Shares are from 2/10/14. Indexes and Lipper averages are not available for direct investment.
Class A Shares have a maximum 3.00% sales charge (Offering Price). Class A Share purchases of $250,000 or more are sold at net asset value without an up-front sales charge but may be subject to a contingent deferred sales charge (CDSC) of 1% if redeemed within eighteen months of purchase. Class C and Class C2 Shares have a 1% CDSC for redemptions within less than twelve months, which is not reflected in the total returns. Class I Shares have no sales charge and may be purchased under limited circumstances or by specified classes of investors.
Expense Ratios as of Most Recent Prospectus
| | | | | | | | | | | | | | | | |
| | | Share Class | |
| | | Class A | | | Class C | | | Class C2 | | | Class I | |
Expense Ratios | | | 0.68% | | | | 1.48% | | | | 1.23% | | | | 0.48% | |
Effective Leverage Ratio as of March 31, 2019
| | | | |
Effective Leverage Ratio | | | 0.18% | |
18
Growth of an Assumed $10,000 Investment as of March 31, 2019 – Class A Shares
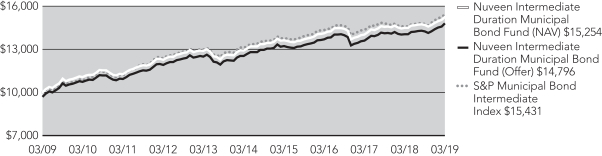
The graphs do not reflect the deduction of taxes that a shareholder may pay on Fund distributions or the redemption of Fund shares.
19
Nuveen Limited Term Municipal Bond Fund
Refer to the first page of this Fund Performance, Expense Ratios and Effective Leverage Ratios section for further explanation of the information included within this section. Refer to the Glossary of Terms Used in this Report for definitions of terms used within this section.
Fund Performance
Average Annual Total Returns as of March 31, 2019
| | | | | | | | | | | | |
| | | Average Annual | |
| | | 1-Year | | | 5-Year | | | 10-Year | |
Class A Shares at NAV | | | 4.27% | | | | 1.88% | | | | 2.74% | |
Class A Shares at maximum Offering Price | | | 1.64% | | | | 1.37% | | | | 2.48% | |
S&P Municipal Bond Short-Intermediate Index | | | 3.99% | | | | 2.01% | | | | 2.79% | |
Lipper Short-Intermediate Municipal Debt Funds Classification Average | | | 3.68% | | | | 1.63% | | | | 2.39% | |
| | | |
Class C2 Shares | | | 3.97% | | | | 1.54% | | | | 2.39% | |
Class I Shares | | | 4.46% | | | | 2.09% | | | | 2.95% | |
| | | | | | | | | | | | |
| | | Average Annual | |
| | | 1-Year | | | 5-Year | | | Since
Inception | |
Class C Shares | | | 3.52% | | | | 1.14% | | | | 1.09% | |
Since inception returns for Class C Shares are from 2/10/14. Indexes and Lipper averages are not available for direct investment.
Class A Shares have a maximum 2.50% sales charge (Offering Price). Class A Share purchases of $250,000 or more are sold at net asset value without an up-front sales charge but may be subject to a contingent deferred sales charge (CDSC) of 0.70% if redeemed within eighteen months of purchase. Class C and Class C2 Shares have a 1% CDSC for redemptions within less than twelve months, which is not reflected in the total returns. Class I Shares have no sales charge and may be purchased under limited circumstances or by specified classes of investors.
Expense Ratios as of Most Recent Prospectus
| | | | | | | | | | | | | | | | |
| | | Share Class | |
| | | Class A | | | Class C | | | Class C2 | | | Class I | |
Expense Ratios | | | 0.62% | | | | 1.42% | | | | 0.97% | | | | 0.42% | |
Effective Leverage Ratio as of March 31, 2019
| | | | |
Effective Leverage Ratio | | | 0.00% | |
20
Growth of an Assumed $10,000 Investment as of March 31, 2019 – Class A Shares
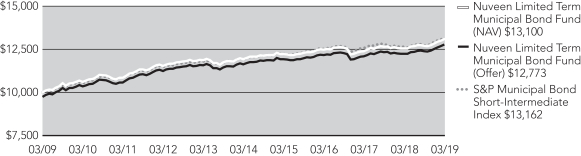
The graphs do not reflect the deduction of taxes that a shareholder may pay on Fund distributions or the redemption of Fund shares.
21
Fund Performance, Expense Ratios and Effective Leverage Ratios(continued)
Nuveen Short Term Municipal Bond Fund
Refer to the first page of this Fund Performance, Expense Ratios and Effective Leverage Ratios section for further explanation of the information included within this section. Refer to the Glossary of Terms Used in this Report for definitions of terms used within this section.
Fund Performance
Average Annual Total Returns as of March 31, 2019
| | | | | | | | | | | | |
| | | Average Annual | |
| | | 1-Year | | | 5-Year | | | 10-Year | |
Class A Shares at NAV | | | 2.42% | | | | 0.93% | | | | 1.83% | |
Class A Shares at maximum Offering Price | | | (0.18)% | | | | 0.42% | | | | 1.57% | |
S&P Municipal Bond Short Index | | | 2.66% | | | | 1.20% | | | | 1.64% | |
Lipper Short Municipal Debt Funds Classification Average | | | 2.18% | | | | 0.94% | | | | 1.36% | |
| | | |
Class I Shares | | | 2.62% | | | | 1.14% | | | | 2.02% | |
| | | | | | | | | | | | |
| | | Average Annual | |
| | | 1-Year | | | 5-Year | | | Since
Inception | |
Class C Shares | | | 1.53% | | | | 0.26% | | | | 0.22% | |
Class C2 Shares | | | 2.05% | | | | 0.60% | | | | 0.82% | |
Since inception returns for Class C and Class C2 Shares are from 2/10/14 and 8/31/11, respectively. Indexes and Lipper averages are not available for direct investment.
Class A Shares have a maximum 2.50% sales charge (Offering Price). Class A Share purchases of $250,000 or more are sold at net asset value without an up-front sales charge but may be subject to a contingent deferred sales charge (CDSC) of 0.70% if redeemed within twelve months. Class C and Class C2 Shares have a 1% CDSC for redemptions within less than twelve months, which is not reflected in the total returns. Class I Shares have no sales charge and may be purchased under limited circumstances or by specified classes of investors.
Expense Ratios as of Most Recent Prospectus
| | | | | | | | | | | | | | | | |
| | | Share Class | |
| | | Class A | | | Class C | | | Class C2 | | | Class I | |
Expense Ratios | | | 0.72% | | | | 1.52% | | | | 1.07% | | | | 0.51% | |
Effective Leverage Ratio as of March 31, 2019
| | | | |
Effective Leverage Ratio | | | 0.00% | |
22
Growth of an Assumed $10,000 Investment as of March 31, 2019 – Class A Shares
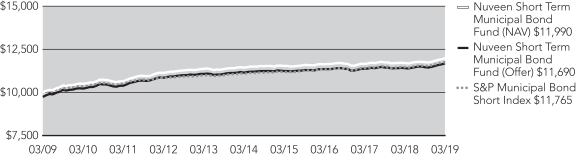
The graphs do not reflect the deduction of taxes that a shareholder may pay on Fund distributions or the redemption of Fund shares.
23
Yields as of March 31, 2019
Dividend Yield is the most recent dividend per share (annualized) divided by the offering price per share.
The SEC30-Day Yield is a standardized measure of a fund’s yield that accounts for the future amortization of premiums or discounts of bonds held in the fund’s portfolio. The SEC30-Day Yield is computed under an SEC standardized formula and is based on the maximum offer price per share. Subsidized yields reflect fee waivers and/or expense reimbursements from the investment adviser during the period. If any such waivers and/or reimbursements had not been in place, yields would have been reduced. Unsubsidized yields do not reflect waivers and/or reimbursements from the investment adviser during the period. If the fund did not receive a fee waiver/expense reimbursement during the period under its most recent agreement, subsidized and unsubsidized yields will be equal. Refer to the Notes to Financial Statements, Note 7 – Management Fees and Other Transactions with Affiliates for further details on the investment adviser’s most recent agreement with the Fund to waive fees and/or reimburse expenses, where applicable. Dividend Yield may differ from the SEC30-Day Yield because the fund may be paying out more or less than it is earning and it may not include the effect of amortization of bond premium.
The Taxable-Equivalent Yield represents the yield that must be earned on a fully taxable investment in order to equal the yield of the fund on an after-tax basis at an assumed tax rate. Your actual income tax rates may differ from the assumed rate. Taxable-Equivalent Yield also takes into account the percentage of the fund’s income generated and paid by the fund (based on payments made during the previous calendar year) that was not exempt from federal income tax. Separately, if the comparison were instead to investments that generate qualified dividend income, which is taxable at a rate lower than an individual’s ordinary graduated tax rate, the fund’s Taxable-Equivalent Yield would be lower.
Nuveen All-American Municipal Bond Fund
| | | | | | | | | | | | | | | | | | | | |
| | | Share Class | |
| | | Class A1 | | | Class C | | | Class C2 | | | Class R6 | | | Class I | |
Dividend Yield | | | 3.32% | | | | 2.69% | | | | 2.89% | | | | 3.65% | | | | 3.66% | |
SEC 30-Day Yield | | | 2.51% | | | | 1.84% | | | | 2.08% | | | | 2.85% | | | | 2.82% | |
Taxable-Equivalent Yield (24.0%)2 | | | 3.30% | | | | 2.42% | | | | 2.74% | | | | 3.75% | | | | 3.71% | |
Nuveen Intermediate Duration Municipal Bond Fund
| | | | | | | | | | | | | | | | |
| | | Share Class | |
| | | Class A1 | | | Class C | | | Class C2 | | | Class I | |
Dividend Yield | | | 2.63% | | | | 1.94% | | | | 2.20% | | | | 2.90% | |
SEC 30-Day Yield-Subsidized | | | 1.99% | | | | 1.27% | | | | 1.51% | | | | 2.25% | |
SEC 30-Day Yield-Unsubsidized | | | 1.55% | | | | 0.83% | | | | 1.07% | | | | 1.56% | |
Taxable-Equivalent Yield-Subsidized (24.0%)2 | | | 2.62% | | | | 1.67% | | | | 1.99% | | | | 2.96% | |
Taxable-Equivalent Yield-Unsubsidized (24.0%)2 | | | 2.04% | | | | 1.09% | | | | 1.41% | | | | 2.05% | |
Nuveen Limited Term Municipal Bond Fund
| | | | | | | | | | | | | | | | |
| | | Share Class | |
| | | Class A1 | | | Class C | | | Class C2 | | | Class I | |
Dividend Yield | | | 1.90% | | | | 1.14% | | | | 1.57% | | | | 2.12% | |
SEC 30-Day Yield | | | 1.58% | | | | 0.83% | | | | 1.27% | | | | 1.82% | |
Taxable-Equivalent Yield (24.0%)2 | | | 2.08% | | | | 1.09% | | | | 1.67% | | | | 2.39% | |
24
Nuveen Short Term Municipal Bond Fund
| | | | | | | | | | | | | | | | |
| | | Share Class | |
| | | Class A1 | | | Class C | | | Class C2 | | | Class I | |
Dividend Yield | | | 1.36% | | | | 0.66% | | | | 1.07% | | | | 1.60% | |
SEC 30-Day Yield | | | 1.33% | | | | 0.61% | | | | 1.05% | | | | 1.60% | |
Taxable-Equivalent Yield (24.0%)2 | | | 1.75% | | | | 0.80% | | | | 1.38% | | | | 2.11% | |
| 1 | The SEC Yield for Class A shares quoted in the table reflects the maximum sales load. Investors paying a reduced load because of volume discounts, investors paying no load because they qualify for one of the several exclusions from the load and existing shareholders who previously paid a load but would like to know the SEC Yield applicable to their shares on a going-forward basis, should understand that the SEC Yield effectively applicable to them would be higher than the figure quoted in the table. |
| 2 | The Taxable-Equivalent Yield is based on the Fund’s SEC 30-Day Yield on the indicated date and a federal income tax rate shown in the respective table above. |
25
Holding
Summaries as of March 31, 2019
This data relates to the securities held in each Fund’s portfolio of investments as of the end of the reporting period. It should not be construed as a measure of performance for the Fund itself. Holdings are subject to change.
For financial reporting purposes, the ratings disclosed are the highest rating given by one of the following national rating agencies: Standard & Poor’s, Moody’s Investors Service, Inc. or Fitch, Inc. This treatment of split-rated securities may differ from that used for other purposes, such as for Fund investment policies. Credit ratings are subject to change. AAA, AA, A and BBB are investment grade ratings; BB, B, CCC, CC, C and D are below investment grade ratings. Holdings designated N/R are not rated by these national rating agencies.
Refer to the Glossary of Terms Used in this Report for further definition of the terms used within this section.
Nuveen All-American Municipal Bond Fund
Fund Allocation
(% of net assets)
| | | | |
| | |
Long-Term Municipal Bonds | | | 100.2% | |
| |
Corporate Bonds | | | 0.0% | |
| |
Other Assets Less Liabilities | | | 2.0% | |
| |
Net Assets Plus Floating Rate Obligations | | | 102.2% | |
| |
Borrowings | | | (0.6)% | |
| |
Floating Rate Obligations | | | (1.6)% | |
| |
Net Assets | | | 100% | |
Bond Credit Quality
(% of total investment exposure)
| | | | |
| | |
U.S. Guaranteed | | | 6.9% | |
| |
AAA | | | 3.7% | |
| |
AA | | | 29.3% | |
| |
A | | | 26.0% | |
| |
BBB | | | 17.4% | |
| |
BB or Lower | | | 7.7% | |
| |
N/R (not rated) | | | 9.0% | |
| |
Total | | | 100% | |
Portfolio Composition
(% of total investments)
| | | | |
| | |
Transportation | | | 17.6% | |
| |
Health Care | | | 15.9% | |
| |
Tax Obligation/Limited | | | 15.3% | |
| |
Tax Obligation/General | | | 10.4% | |
| |
Education and Civic Organizations | | | 9.1% | |
| |
Utilities | | | 8.5% | |
| |
U.S. Guaranteed | | | 6.6% | |
| |
Water and Sewer | | | 6.4% | |
| |
Other | | | 10.2% | |
| |
Total | | | 100% | |
States and Territories
(% of total municipal bonds)
| | | | |
| | |
California | | | 17.7% | |
| |
New York | | | 11.3% | |
| |
Illinois | | | 9.4% | |
| |
Texas | | | 7.2% | |
| |
Florida | | | 5.4% | |
| |
Colorado | | | 5.2% | |
| |
Pennsylvania | | | 3.6% | |
| |
Wisconsin | | | 3.3% | |
| |
Washington | | | 2.7% | |
| |
Indiana | | | 2.5% | |
| |
Ohio | | | 2.3% | |
| |
Massachusetts | | | 2.0% | |
| |
Virginia | | | 1.9% | |
| |
Arizona | | | 1.7% | |
| |
Kentucky | | | 1.6% | |
| |
Missouri | | | 1.6% | |
| |
Tennessee | | | 1.5% | |
| |
Other | | | 19.1% | |
| |
Total | | | 100% | |
26
Holding Summariesas of March 31, 2019 (continued)
Nuveen Intermediate Duration Municipal Bond Fund
Fund Allocation
(% of net assets)
| | | | |
| | |
Long-Term Municipal Bonds | | | 95.9% | |
| |
Corporate Bonds | | | 0.0% | |
| |
Short-Term Municipal Bonds | | | 2.1% | |
| |
Other Assets Less Liabilities | | | 2.0% | |
| |
Net Assets | | | 100% | |
Bond Credit Quality
(% of total investment exposure)
| | | | |
| | |
U.S. Guaranteed | | | 7.2% | |
| |
AAA | | | 5.3% | |
| |
AA | | | 27.7% | |
| |
A | | | 33.8% | |
| |
BBB | | | 14.6% | |
| |
BB or Lower | | | 5.4% | |
| |
N/R (not rated) | | | 6.0% | |
| |
Total | | | 100% | |
Portfolio Composition
(% of total investments)
| | | | |
| | |
Tax Obligation/Limited | | | 17.1% | |
| |
Transportation | | | 15.8% | |
| |
Health Care | | | 14.5% | |
| |
Tax Obligation/General | | | 14.1% | |
| |
Utilities | | | 12.3% | |
| |
U.S. Guaranteed | | | 7.3% | |
| |
Other | | | 18.9% | |
| |
Total | | | 100% | |
States and Territories
(% of total municipal bonds)
| | | | |
| | |
Illinois | | | 13.2% | |
| |
Texas | | | 6.6% | |
| |
California | | | 6.1% | |
| |
New York | | | 6.0% | |
| |
New Jersey | | | 5.7% | |
| |
Pennsylvania | | | 5.6% | |
| |
Florida | | | 5.2% | |
| |
Ohio | | | 4.5% | |
| |
Indiana | | | 3.3% | |
| |
Wisconsin | | | 2.8% | |
| |
Colorado | | | 2.8% | |
| |
Arizona | | | 2.6% | |
| |
Louisiana | | | 2.4% | |
| |
Alabama | | | 2.3% | |
| |
Tennessee | | | 1.9% | |
| |
Oklahoma | | | 1.8% | |
| |
Nevada | | | 1.6% | |
| |
Michigan | | | 1.6% | |
| |
Georgia | | | 1.5% | |
| |
Kentucky | | | 1.5% | |
| |
Nebraska | | | 1.4% | |
| |
Other | | | 19.6% | |
| |
Total | | | 100% | |
27
Nuveen Limited Term Municipal Bond Fund
Fund Allocation
(% of net assets)
| | | | |
| | |
Long-Term Municipal Bonds | | | 97.3% | |
| |
Corporate Bonds | | | 0.0% | |
| |
Short-Term Municipal Bonds | | | 1.1% | |
| |
Other Assets Less Liabilities | | | 1.6% | |
| |
Net Assets | | | 100% | |
Bond Credit Quality
(% of total investment exposure)
| | | | |
| | |
U.S. Guaranteed | | | 2.0% | |
| |
AAA | | | 7.6% | |
| |
AA | | | 29.7% | |
| |
A | | | 39.4% | |
| |
BBB | | | 11.8% | |
| |
BB or Lower | | | 4.3% | |
| |
N/R (not rated) | | | 5.2% | |
| |
Total | | | 100% | |
Portfolio Composition
(% of total investments)
| | | | |
| | |
Utilities | | | 20.9% | |
| |
Tax Obligation/Limited | | | 17.1% | |
| |
Tax Obligation/General | | | 15.7% | |
| |
Health Care | | | 15.3% | |
| |
Transportation | | | 10.5% | |
| |
Education and Civic Organizations | | | 3.7% | |
| |
Other | | | 16.8% | |
| |
Total | | | 100% | |
States and Territories
(% of total municipal bonds)
| | | | |
| | |
Illinois | | | 11.0% | |
| |
New York | | | 6.3% | |
| |
Ohio | | | 6.0% | |
| |
Pennsylvania | | | 5.9% | |
| |
Texas | | | 5.4% | |
| |
New Jersey | | | 4.7% | |
| |
Louisiana | | | 4.7% | |
| |
Florida | | | 4.1% | |
| |
Indiana | | | 4.0% | |
| |
Connecticut | | | 4.0% | |
| |
California | | | 3.1% | |
| |
Oklahoma | | | 3.0% | |
| |
Kentucky | | | 2.8% | |
| |
Alabama | | | 2.6% | |
| |
Washington | | | 2.5% | |
| |
Arizona | | | 2.2% | |
| |
Massachusetts | | | 2.2% | |
| |
Michigan | | | 2.1% | |
| |
Georgia | | | 1.8% | |
| |
New Mexico | | | 1.7% | |
| |
Other | | | 19.9% | |
| |
Total | | | 100% | |
28
Holding Summariesas of March 31, 2019 (continued)
Nuveen Short Term Municipal Bond Fund
Fund Allocation
(% of net assets)
| | | | |
| | |
Long-Term Municipal Bonds | | | 97.7% | |
| |
Short-Term Municipal Bonds | | | 1.5% | |
| |
Other Assets Less Liabilities | | | 0.8% | |
| |
Net Assets | | | 100% | |
Bond Credit Quality
(% of total investment exposure)
| | | | |
| | |
U.S. Guaranteed | | | 0.2% | |
| |
AAA | | | 10.2% | |
| |
AA | | | 35.8% | |
| |
A | | | 38.0% | |
| |
BBB | | | 7.8% | |
| |
BB or Lower | | | 3.7% | |
| |
N/R (not rated) | | | 4.3% | |
| |
Total | | | 100% | |
Portfolio Composition
(% of total investments)
| | | | |
| | |
Transportation | | | 21.5% | |
| |
Tax Obligation/General | | | 16.1% | |
| |
Health Care | | | 14.6% | |
| |
Utilities | | | 14.2% | |
| |
Tax Obligation/Limited | | | 12.2% | |
| |
Education and Civic Organizations | | | 7.4% | |
| |
Other | | | 14.0% | |
| |
Total | | | 100% | |
States and Territories
(% of total municipal bonds)
| | | | |
| | |
Texas | | | 13.3% | |
| |
Minnesota | | | 11.3% | |
| |
New York | | | 7.7% | |
| |
New Jersey | | | 7.0% | |
| |
Colorado | | | 6.2% | |
| |
California | | | 5.2% | |
| |
Illinois | | | 5.0% | |
| |
Alabama | | | 4.3% | |
| |
Kentucky | | | 3.7% | |
| |
Missouri | | | 3.1% | |
| |
Wisconsin | | | 2.6% | |
| |
Pennsylvania | | | 2.3% | |
| |
Nevada | | | 2.0% | |
| |
Florida | | | 2.0% | |
| |
Arizona | | | 1.9% | |
| |
Washington | | | 1.7% | |
| |
Tennessee | | | 1.6% | |
| |
Other | | | 19.1% | |
| |
Total | | | 100% | |
29
Expense
Examples
As a shareholder of one or more of the Funds, you incur two types of costs: (1) transaction costs, including up-front and back-end sales charges (loads) or redemption fees, where applicable; and (2) ongoing costs, including management fees; distribution and service (12b-1) fees, where applicable; and other Fund expenses. The Examples below are intended to help you understand your ongoing costs (in dollars) of investing in the Funds and to compare these costs with the ongoing costs of investing in other mutual funds. The Examples below do not include the interest and related expenses from inverse floaters that are reflected in the financial statements later within this report, when applicable.
The Examples below are based on an investment of $1,000 invested at the beginning of the period and held through the period ended March 31, 2019.
The beginning of the period is April 1, 2018.
The information under “Actual Performance,” together with the amount you invested, allows you to estimate actual expenses incurred over the reporting period. Simply divide your account value by $1,000 (for example, an $8,600 account value divided by $1,000 = 8.60) and multiply the result by the cost shown for your share class, in the row entitled “Expenses Incurred During Period” to estimate the expenses incurred on your account during this period.
The information under “Hypothetical Performance,” provides information about hypothetical account values and hypothetical expenses based on each Fund’s actual expense ratio and an assumed rate of return of 5% per year before expenses, which is not the Fund’s actual return. The hypothetical account values and expenses may not be used to estimate the actual ending account balance or expense you incurred for the period. You may use this information to compare the ongoing costs of investing in the Fund and other funds. To do so, compare this 5% hypothetical example with the 5% hypothetical examples that appear in the shareholder reports of the other funds.
Please note that the expenses shown in the following tables are meant to highlight your ongoing costs only and do not reflect any transaction costs. Therefore, the hypothetical information is useful in comparing ongoing costs only, and will not help you determine the relative total costs of owning different funds or share classes. In addition, if these transaction costs were included, your costs would have been higher.
Nuveen All-American Municipal Bond Fund
| | | | | | | | | | | | | | | | | | | | |
| | | Share Class | |
| | | Class A | | | Class C | | | Class C2 | | | Class R6 | | | Class I | |
Actual Performance | | | | | | | | | | | | | | | | | | | | |
Beginning Account Value | | $ | 1,000.00 | | | $ | 1,000.00 | | | $ | 1,000.00 | | | $ | 1,000.00 | | | $ | 1,000.00 | |
Ending Account Value | | $ | 1,043.90 | | | $ | 1,039.80 | | | $ | 1,040.90 | | | $ | 1,044.80 | | | $ | 1,044.90 | |
Expenses Incurred During Period | | $ | 3.48 | | | $ | 7.57 | | | $ | 6.29 | | | $ | 2.31 | | | $ | 2.46 | |
Hypothetical Performance (5% annualized return before expenses) | | | | | | | | | | | | | | | | | | | | |
Beginning Account Value | | $ | 1,000.00 | | | $ | 1,000.00 | | | $ | 1,000.00 | | | $ | 1,000.00 | | | $ | 1,000.00 | |
Ending Account Value | | $ | 1,021.66 | | | $ | 1,017.65 | | | $ | 1,018.90 | | | $ | 1,022.81 | | | $ | 1,022.66 | |
Expenses Incurred During Period | | $ | 3.45 | | | $ | 7.49 | | | $ | 6.23 | | | $ | 2.28 | | | $ | 2.43 | |
For each class of the Fund, expenses are equal to the Fund’s annualized net expense ratio of 0.68%, 1.48%, 1.23%, 0.45%, 0.48% for Classes A, C, C2, R6 and I, respectively, multiplied by the average account value over the period, multiplied by 182/365 (to reflect theone-half year period).
30
Expense Examples(continued)
Nuveen Intermediate Duration Municipal Bond Fund
| | | | | | | | | | | | | | | | |
| | | Share Class | |
| | | Class A | | | Class C | | | Class C2 | | | Class I | |
Actual Performance | | | | | | | | | | | | | | | | |
Beginning Account Value | | $ | 1,000.00 | | | $ | 1,000.00 | | | $ | 1,000.00 | | | $ | 1,000.00 | |
Ending Account Value | | $ | 1,038.50 | | | $ | 1,034.40 | | | $ | 1,034.60 | | | $ | 1,039.40 | |
Expenses Incurred During Period | | $ | 3.42 | | | $ | 7.45 | | | $ | 6.22 | | | $ | 2.40 | |
Hypothetical Performance (5% annualized return before expenses) | | | | | | | | | | | | | | | | |
Beginning Account Value | | $ | 1,000.00 | | | $ | 1,000.00 | | | $ | 1,000.00 | | | $ | 1,000.00 | |
Ending Account Value | | $ | 1,021.71 | | | $ | 1,017.75 | | | $ | 1,018.95 | | | $ | 1,022.71 | |
Expenses Incurred During Period | | $ | 3.40 | | | $ | 7.38 | | | $ | 6.17 | | | $ | 2.38 | |
For each class of the Fund, expenses are equal to the Fund’s annualized net expense ratio of 0.67%, 1.46%, 1.22%, and 0.47% for Classes A, C, C2 and I, respectively, multiplied by the average account value over the period, multiplied by 182/365 (to reflect the one-half year period).
Nuveen Limited Term Municipal Bond Fund
| | | | | | | | | | | | | | | | |
| | | Share Class | |
| | | Class A | | | Class C | | | Class C2 | | | Class I | |
Actual Performance | | | | | | | | | | | | | | | | |
Beginning Account Value | | $ | 1,000.00 | | | $ | 1,000.00 | | | $ | 1,000.00 | | | $ | 1,000.00 | |
Ending Account Value | | $ | 1,030.30 | | | $ | 1,026.10 | | | $ | 1,028.40 | | | $ | 1,031.20 | |
Expenses Incurred During Period | | $ | 3.21 | | | $ | 7.21 | | | $ | 4.93 | | | $ | 2.19 | |
Hypothetical Performance (5% annualized return before expenses) | | | | | | | | | | | | | | | | |
Beginning Account Value | | $ | 1,000.00 | | | $ | 1,000.00 | | | $ | 1,000.00 | | | $ | 1,000.00 | |
Ending Account Value | | $ | 1,021.91 | | | $ | 1,017.95 | | | $ | 1,020.21 | | | $ | 1,022.91 | |
Expenses Incurred During Period | | $ | 3.19 | | | $ | 7.18 | | | $ | 4.91 | | | $ | 2.18 | |
For each class of the Fund, expenses are equal to the Fund’s annualized net expense ratio of 0.63%, 1.42%, 0.97% and 0.43% for Classes A, C, C2 and I, respectively, multiplied by the average account value over the period, multiplied by 182/365 (to reflect theone-half year period).
Nuveen Short Term Municipal Bond Fund
| | | | | | | | | | | | | | | | |
| | | Share Class | |
| | | Class A | | | Class C | | | Class C2 | | | Class I | |
Actual Performance | | | | | | | | | | | | | | | | |
Beginning Account Value | | $ | 1,000.00 | | | $ | 1,000.00 | | | $ | 1,000.00 | | | $ | 1,000.00 | |
Ending Account Value | | $ | 1,020.10 | | | $ | 1,015.10 | | | $ | 1,018.20 | | | $ | 1,021.00 | |
Expenses Incurred During Period | | $ | 3.65 | | | $ | 7.63 | | | $ | 5.41 | | | $ | 2.63 | |
Hypothetical Performance (5% annualized return before expenses) | | | | | | | | | | | | | | | | |
Beginning Account Value | | $ | 1,000.00 | | | $ | 1,000.00 | | | $ | 1,000.00 | | | $ | 1,000.00 | |
Ending Account Value | | $ | 1,021.46 | | | $ | 1,017.50 | | | $ | 1,019.70 | | | $ | 1,022.46 | |
Expenses Incurred During Period | | $ | 3.65 | | | $ | 7.64 | | | $ | 5.42 | | | $ | 2.64 | |
For each class of the Fund, expenses are equal to the Fund’s annualized net expense ratio of 0.72%, 1.51%, 1.07%, and 0.52% for Classes A, C, C2 and I, respectively, multiplied by the average account value over the period, multiplied by 182/365 (to reflect the one-half year period).
31
Report of Independent Registered Public Accounting Firm
To the Board of Trustees of Nuveen Municipal Trust and the Board of Directors of Nuveen Investment Funds, Inc., and Shareholders of NuveenAll-American Municipal Bond Fund, Nuveen Intermediate Duration Municipal Bond Fund, Nuveen Limited Term Municipal Bond Fund and Nuveen Short Term Municipal Bond Fund
Opinions on the Financial Statements
We have audited the accompanying statements of assets and liabilities, including the portfolios of investments, of NuveenAll-American Municipal Bond Fund, Nuveen Intermediate Duration Municipal Bond Fund and Nuveen Limited Term Municipal Bond Fund (three of the funds constituting Nuveen Municipal Trust) and Nuveen Short Term Municipal Bond Fund (one of the funds constituting Nuveen Investment Funds, Inc.) (hereafter collectively referred to as the “Funds”) as of March 31, 2019, the related statements of operations for the year ended March 31, 2019, the statements of changes in net assets for each of the two years in the period ended March 31, 2019, including the related notes, and the financial highlights for each of the periods indicated therein (collectively referred to as the “financial statements”). In our opinion, the financial statements present fairly, in all material respects, the financial position of each of the Funds as of March 31, 2019, the results of each of their operations for the year then ended, the changes in each of their net assets for each of the two years in the period ended March 31, 2019 and each of the financial highlights for each of the periods indicated therein, in conformity with accounting principles generally accepted in the United States of America.
Basis for Opinions
These financial statements are the responsibility of the Funds’ management. Our responsibility is to express an opinion on the Funds’ financial statements based on our audits. We are a public accounting firm registered with the Public Company Accounting Oversight Board (United States) (PCAOB) and are required to be independent with respect to the Funds in accordance with the U.S. federal securities laws and the applicable rules and regulations of the Securities and Exchange Commission and the PCAOB.
We conducted our audits of these financial statements in accordance with the standards of the PCAOB. Those standards require that we plan and perform the audit to obtain reasonable assurance about whether the financial statements are free of material misstatement, whether due to error or fraud.
Our audits included performing procedures to assess the risks of material misstatement of the financial statements, whether due to error or fraud, and performing procedures that respond to those risks. Such procedures included examining, on a test basis, evidence regarding the amounts and disclosures in the financial statements. Our audits also included evaluating the accounting principles used and significant estimates made by management, as well as evaluating the overall presentation of the financial statements. Our procedures included confirmation of securities owned as of March 31, 2019 by correspondence with the custodians and brokers; when replies were not received from brokers, we performed other auditing procedures. We believe that our audits provide a reasonable basis for our opinions.
PricewaterhouseCoopers LLP
Chicago, Illinois
May 29, 2019
We have served as the auditor of one or more investment companies in Nuveen Funds since 2002.
32
NuveenAll-American Municipal Bond Fund
Portfolio of Investments March 31, 2019
| | | | | | | | | | | | | | | | | | | | |
Principal
Amount (000) | | | Description (1) | | Optional Call
Provisions (2) | | | | | | Ratings (3) | | | Value | |
| | | | | |
| | | | LONG-TERM INVESTMENTS – 100.2% | | | | | | | | | | | | | | | | |
| | | | | |
| | | | MUNICIPAL BONDS – 100.2% | | | | | | | | | | | | | | | | |
| | | | | |
| | | | Alabama – 1.1% | | | | | | | | | | | | |
| | | | | |
| $ | 4,220 | | | Infirmary Health System Special Care Facilities Financing Authority of Mobile, Alabama, Revenue Bonds, Infirmary Health System, Inc, Series 2016A, 5.000%, 2/01/41 | | | 2/26 at 100.00 | | | | | | | | BBB+ | | | $ | 4,650,356 | |
| | | | | |
| | 14,175 | | | Lower Alabama Gas District, Alabama, Gas Project Revenue Bonds, Series 2016A, 5.000%, 9/01/46 | | | No Opt. Call | | | | | | | | A3 | | | | 17,616,407 | |
| | | | | |
| | 500 | | | Mobile Spring Hill College Educational Building Authority, Alabama, Revenue Bonds, Spring Hill College Project, Series 2015, 5.875%, 4/15/45 | | | 4/25 at 100.00 | | | | | | | | N/R | | | | 522,425 | |
| | | | | |
| | 12,295 | | | Southeast Alabama Gas Supply District, Alabama, Gas Supply Revenue Bonds, Project 1, Fixed Rate Series 2018A, 4.000%, 4/01/49 (Mandatory Put 4/01/24) | | | 1/24 at 100.27 | | | | | | | | A3 | | | | 13,135,240 | |
| | | | | |
| | 7,985 | | | Southeast Alabama Gas Supply District, Alabama, Gas Supply Revenue Bonds, Project 2, Fixed Rate Series 2018A, 4.000%, 6/01/49 (Mandatory Put 6/01/24) | | | 3/24 at 100.29 | | | | | | | | A3 | | | | 8,590,183 | |
| | 39,175 | | | Total Alabama | | | | | | | | | | | | | | | 44,514,611 | |
| | | | | |
| | | | Alaska – 0.2% | | | | | | | | | | | | |
| | | | | |
| | 3,855 | | | Alaska Municipal Bond Bank, General Obligation Bonds, Refunding Three Series 2016, 5.000%, 12/01/27 | | | No Opt. Call | | | | | | | | AA– | | | | 4,685,328 | |
| | | | | |
| | 2,000 | | | Northern Tobacco Securitization Corporation, Alaska, Tobacco SettlementAsset-Backed Bonds, Series 2006A, 5.000%, 6/01/32 | | | 4/19 at 100.00 | | | | | | | | B3 | | | | 1,999,960 | |
| | 5,855 | | | Total Alaska | | | | | | | | | | | | | | | 6,685,288 | |
| | | | | |
| | | | Arizona – 1.7% | | | | | | | | | | | | |
| | | | | |
| | 3,045 | | | Chandler Industrial Development Authority, Arizona, Revenue Bonds, Intel Corporation Project, Series 2007, 2.700%, 12/01/37 (Mandatory Put 8/14/23) (AMT) | | | No Opt. Call | | | | | | | | A+ | | | | 3,099,231 | |
| | | | | |
| | 500 | | | Gilbert Public Facilities Municipal Property Corporation, Arizona, Revenue Bonds, Series 2009, 5.500%, 7/01/27(Pre-refunded 7/01/19) | | | 7/19 at 100.00 | | | | | | | | AA+ (4) | | | | 504,965 | |
| | | | | |
| | | | Maricopa County Industrial Development Authority, Arizona, Hospital Revenue Bonds, HonorHealth, Series 2019A: | | | | | | | | | | | | | | | | |
| | 1,250 | | | 5.000%, 9/01/37 | | | 9/28 at 100.00 | | | | | | | | A2 | | | | 1,443,925 | |
| | 935 | | | 5.000%, 9/01/42 | | | 9/28 at 100.00 | | | | | | | | A2 | | | | 1,064,535 | |
| | | | | |
| | 2,500 | | | Maricopa County Union High School District 210 Phoenix, Arizona, General Obligation Bonds, School Improvement Project 2011 and 2017, Series 2018, 5.000%, 7/01/36 | | | 7/27 at 100.00 | | | | | | | | AAA | | | | 2,965,000 | |
| | | | | |
| | 215 | | | Maricopa County, Arizona, Hospital Revenue Bonds, Sun Health Corporation, Series 2005, 5.000%, 4/01/25(Pre-refunded 4/01/24) | | | 4/24 at 100.00 | | | | | | | | N/R (4) | | | | 235,305 | |
| | | | | |
| | 4,000 | | | Phoenix Civic Improvement Corporation, Arizona, Airport Revenue Bonds, Junior Lien Series 2010A, 5.000%, 7/01/31(Pre-refunded 7/01/20) | | | 7/20 at 100.00 | | | | | | | | A+ (4) | | | | 4,171,760 | |
| | | | | |
| | | | Phoenix Civic Improvement Corporation, Arizona, Revenue Bonds, Civic Plaza Expansion Project, Series 2005B: | | | | | | | | | | | | | | | | |
| | 1,650 | | | 5.500%, 7/01/31 – FGIC Insured | | | No Opt. Call | | | | | | | | AA | | | | 2,152,640 | |
| | 6,000 | | | 5.500%, 7/01/39 – FGIC Insured | | | No Opt. Call | | | | | | | | AA | | | | 8,142,780 | |
33
NuveenAll-American Municipal Bond Fund(continued)
Portfolio of Investments March 31, 2019
| | | | | | | | | | | | | | | | | | | | |
Principal
Amount (000) | | | Description (1) | | Optional Call
Provisions (2) | | | | | | Ratings (3) | | | Value | |
| | | | | |
| | | | Arizona(continued) | | | | | | | | | | | | |
| | | | | |
| $ | 610 | | | Phoenix Industrial Development Authority, Arizona, Education Facility Revenue Bonds, Choice Academies Charter Schools Project, Series 2012, 4.875%, 9/01/22 | | | No Opt. Call | | | | | | | | BB | | | $ | 624,908 | |
| | | | | |
| | 1,000 | | | Phoenix Industrial Development Authority, Arizona, Education Facility Revenue Bonds, Great Hearts Academies – Veritas Project, Series 2012, 6.400%, 7/01/47(Pre-refunded 7/01/21) | | | 7/21 at 100.00 | | | | | | | | N/R (4) | | | | 1,105,970 | |
| | | | | |
| | | | Pima County Industrial Development Authority, Arizona, Education Facility Revenue and Refunding Bonds, Edkey Charter Schools Project, Series 2013: | | | | | | | | | | | | | | | | |
| | 2,205 | | | 6.000%, 7/01/33 | | | 7/20 at 102.00 | | | | | | | | BB– | | | | 2,196,577 | |
| | 2,325 | | | 6.000%, 7/01/43 | | | 7/20 at 102.00 | | | | | | | | BB– | | | | 2,232,814 | |
| | 195 | | | 6.000%, 7/01/48 | | | 7/20 at 102.00 | | | | | | | | BB– | | | | 185,439 | |
| | | | | |
| | 440 | | | Pima County Industrial Development Authority, Arizona, Education Facility Revenue Bonds, Edkey Charter Schools Project, Series 2014A, 7.375%, 7/01/49 | | | 7/20 at 102.00 | | | | | | | | BB– | | | | 441,206 | |
| | | | | |
| | 400 | | | Pima County Industrial Development Authority, Arizona, Education Facility Revenue Bonds, San Tan Montessori School Project, Series 2016, 6.500%, 2/01/48, 144A | | | 2/24 at 100.00 | | | | | | | | N/R | | | | 411,272 | |
| | | | | |
| | 825 | | | Pima County Industrial Development Authority, Arizona, Education Revenue Bonds, Paradise Education Center Project, Series 2010, 6.000%, 6/01/40(Pre-refunded 6/01/19) | | | 6/19 at 100.00 | | | | | | | | N/R (4) | | | | 830,973 | |
| | | | | |
| | 3,705 | | | Pinal County Electrical District 3, Arizona, Electric System Revenue Bonds, Refunding Series 2011, 5.250%, 7/01/41(Pre-refunded 7/01/21) | | | 7/21 at 100.00 | | | | | | | | A+ (4) | | | | 4,008,217 | |
| | | | | |
| | | | Salt Verde Financial Corporation, Arizona, Senior Gas Revenue Bonds, Citigroup Energy Inc Prepay Contract Obligations, Series 2007: | | | | | | | | | | | | | | | | |
| | 1,000 | | | 5.250%, 12/01/28 | | | No Opt. Call | | | | | | | | A3 | | | | 1,225,550 | |
| | 13,155 | | | 5.000%, 12/01/32 | | | No Opt. Call | | | | | | | | A3 | | | | 16,230,507 | |
| | 7,675 | | | 5.000%, 12/01/37 | | | No Opt. Call | | | | | | | | A3 | | | | 9,607,028 | |
| | | | | |
| | | | Tempe Industrial Development Authority, Arizona, Revenue Bonds, Friendship Village of Tempe Project, Refunding Series 2012A: | | | | | | | | | | | | | | | | |
| | 2,590 | | | 6.000%, 12/01/27 | | | 12/21 at 100.00 | | | | | | | | N/R | | | | 2,758,609 | |
| | 1,080 | | | 6.000%, 12/01/32 | | | 12/21 at 100.00 | | | | | | | | N/R | | | | 1,141,279 | |
| | 1,100 | | | 6.250%, 12/01/42 | | | 12/21 at 100.00 | | | | | | | | N/R | | | | 1,164,163 | |
| | | | | |
| | 1,000 | | | University Medical Center Corporation, Tucson, Arizona, Hospital Revenue Bonds, Series 2011, 6.000%, 7/01/39(Pre-refunded 7/01/21) | | | 7/21 at 100.00 | | | | | | | | N/R (4) | | | | 1,096,010 | |
| | | | | |
| | 727 | | | Watson Road Community Facilities District, Arizona, Special Assessment Revenue Bonds, Series 2005, 6.000%, 7/01/30 | | | 5/19 at 100.00 | | | | | | | | N/R | | | | 718,160 | |
| | 60,127 | | | Total Arizona | | | | | | | | | | | | | | | 69,758,823 | |
| | | | | |
| | | | Arkansas – 0.0% | | | | | | | | | | | | |
| | | | | |
| | | | Benton County Public Facilities Board, Arkansas, Charter School Lease Revenue Bonds, BCCSO Project, Series 2010A: | | | | | | | | | | | | | | | | |
| | 500 | | | 5.750%, 6/01/30(Pre-refunded 6/01/20), 144A | | | 6/20 at 100.00 | | | | | | | | N/R (4) | | | | 524,060 | |
| | 1,020 | | | 6.000%, 6/01/40(Pre-refunded 6/01/20), 144A | | | 6/20 at 100.00 | | | | | | | | N/R (4) | | | | 1,072,010 | |
| | 1,520 | | | Total Arkansas | | | | | | | | | | | | | | | 1,596,070 | |
34
| | | | | | | | | | | | | | | | | | | | |
Principal
Amount (000) | | | Description (1) | | Optional Call
Provisions (2) | | | | | | Ratings (3) | | | Value | |
| | | | | |
| | | | California – 17.8% | | | | | | | | | | | | |
| | | | | |
| | | | Alameda Corridor Transportation Authority, California, Revenue Bonds, Refunding Second Subordinate Lien Series 2016B: | | | | | | | | | | | | | | | | |
| $ | 14,510 | | | 5.000%, 10/01/35 | | | 10/26 at 100.00 | | | | | | | | BBB+ | | | $ | 16,410,665 | |
| | 4,300 | | | 5.000%, 10/01/36 | | | 10/26 at 100.00 | | | | | | | | BBB+ | | | | 4,847,691 | |
| | 6,045 | | | 5.000%, 10/01/37 | | | 10/26 at 100.00 | | | | | | | | BBB+ | | | | 6,794,640 | |
| | | | | |
| | | | Alameda Corridor Transportation Authority, California, Revenue Bonds, Refunding Subordinate Lien Series 2004A: | | | | | | | | | | | | | | | | |
| | 2,350 | | | 0.000%, 10/01/20 – AMBAC Insured (ETM) | | | No Opt. Call | | | | | | | | Aaa | | | | 2,297,995 | |
| | 50 | | | 0.000%, 10/01/20 – AMBAC Insured | | | No Opt. Call | | | | | | | | BBB+ | | | | 48,156 | |
| | | | | |
| | 10,000 | | | Bay Area Toll Authority, California, Revenue Bonds, San Francisco Bay Area Toll Bridge, Subordinate Fixed Rate Series2017S-7, 4.000%, 4/01/38 | | | 4/27 at 100.00 | | | | | | | | AA– | | | | 10,683,100 | |
| | | | | |
| | 2,000 | | | Brentwood Infrastructure Financing Authority, California, Infrastructure Revenue Bonds, Refunding Subordinated Series 2014B, 5.000%, 9/02/36 | | | 9/24 at 100.00 | | | | | | | | N/R | | | | 2,248,560 | |
| | | | | |
| | 5,450 | | | California Educational Facilities Authority, Revenue Bonds, Chapman University, Series 2017B, 4.000%, 4/01/47 | | | 4/27 at 100.00 | | | | | | | | A2 | | | | 5,685,876 | |
| | | | | |
| | 12,060 | | | California Educational Facilities Authority, Revenue Bonds, Pepperdine University, Refunding Series 2016, 5.000%, 10/01/49 | | | 4/26 at 100.00 | | | | | | | | AA | | | | 13,829,081 | |
| | | | | |
| | 10,000 | | | California Health Facilities Financing Authority, California, Revenue Bonds, Sutter Health, Refunding Series 2017A, 5.000%, 11/15/48 | | | 11/27 at 100.00 | | | | | | | | AA– | | | | 11,548,800 | |
| | | | | |
| | 4,650 | | | California Health Facilities Financing Authority, California, Revenue Bonds, Sutter Health, Series 2016A, 5.000%, 11/15/41 | | | 11/25 at 100.00 | | | | | | | | AA– | | | | 5,300,535 | |
| | | | | |
| | 1,670 | | | California Health Facilities Financing Authority, Revenue Bonds, Children’s Hospital Los Angeles, Series 2017A, 5.000%, 8/15/42 | | | 8/27 at 100.00 | | | | | | | | BBB+ | | | | 1,893,546 | |
| | | | | |
| | 3,015 | | | California Health Facilities Financing Authority, Revenue Bonds, El Camino Hospital, Refunding Series 2015A, 5.000%, 2/01/40 | | | 2/25 at 100.00 | | | | | | | | AA | | | | 3,367,544 | |
| | | | | |
| | | | California Health Facilities Financing Authority, Revenue Bonds, El Camino Hospital, Series 2017: | | | | | | | | | | | | | | | | |
| | 1,395 | | | 5.000%, 2/01/30 | | | 2/27 at 100.00 | | | | | | | | AA | | | | 1,671,824 | |
| | 1,105 | | | 5.000%, 2/01/31 | | | 2/27 at 100.00 | | | | | | | | AA | | | | 1,311,182 | |
| | | | | |
| | 5,100 | | | California Health Facilities Financing Authority, Revenue Bonds, Providence Health & Services, Series 2009B, 5.500%, 10/01/39 | | | 10/19 at 100.00 | | | | | | | | AA– | | | | 5,198,124 | |
| | | | | |
| | 485 | | | California Health Facilities Financing Authority, Revenue Bonds, Providence Health & Services, Series 2014B, 5.000%, 10/01/44 | | | 10/24 at 100.00 | | | | | | | | AA– | | | | 546,323 | |
| | | | | |
| | 2,185 | | | California Health Facilities Financing Authority, Revenue Bonds, Saint Joseph Health System, Series 2013A, 5.000%, 7/01/37 | | | 7/23 at 100.00 | | | | | | | | AA– | | | | 2,434,134 | |
| | | | | |
| | 2,320 | | | California Health Facilities Financing Authority, Revenue Bonds, Sutter Health, Series 2013A, 5.000%, 8/15/52 | | | 8/23 at 100.00 | | | | | | | | AA– | | | | 2,542,558 | |
| | | | | |
| | 1,495 | | | California Municipal Finance Authority, Charter School Revenue Bonds, Palmdale Aerospace Academy Project, Series 2016A, 5.000%, 7/01/46, 144A | | | 7/26 at 100.00 | | | | | | | | BB | | | | 1,571,828 | |
| | | | | |
| | 3,255 | | | California Municipal Finance Authority, Mobile Home Park Revenue Bonds, Caritas Projects Series 2010A, 6.400%, 8/15/45(Pre-refunded 8/15/20) | | | 8/20 at 100.00 | | | | | | | | BBB (4) | | | | 3,460,423 | |
| | | | | |
| | | | California Municipal Finance Authority, Revenue Bonds, Biola University, Refunding Series 2017: | | | | | | | | | | | | | | | | |
| | 470 | | | 5.000%, 10/01/29 | | | 10/27 at 100.00 | | | | | | | | Baa1 | | | | 560,151 | |
| | 1,165 | | | 5.000%, 10/01/30 | | | 10/27 at 100.00 | | | | | | | | Baa1 | | | | 1,376,482 | |
35
NuveenAll-American Municipal Bond Fund(continued)
Portfolio of Investments March 31, 2019
| | | | | | | | | | | | | | | | | | | | |
Principal
Amount (000) | | | Description (1) | | Optional Call
Provisions (2) | | | | | | Ratings (3) | | | Value | |
| | | | | |
| | | | California(continued) | | | | | | | | | | | | |
| | | | | |
| | | | California Municipal Finance Authority, Revenue Bonds, Eisenhower Medical Center, Refunding Series 2017A: | | | | | | | | | | | | | | | | |
| $ | 7,745 | | | 5.000%, 7/01/42 | | | 7/27 at 100.00 | | | | | | | | Baa2 | | | $ | 8,686,560 | |
| | 7,385 | | | 5.000%, 7/01/47 | | | 7/27 at 100.00 | | | | | | | | Baa2 | | | | 8,216,108 | |
| | | | | |
| | 5,000 | | | California Municipal Finance Authority, Revenue Bonds, Eisenhower Medical Center, Refunding Series 2017B, 5.000%, 7/01/42 | | | 7/27 at 100.00 | | | | | | | | Baa2 | | | | 5,607,850 | |
| | | | | |
| | 29,900 | | | California Municipal Finance Authority, Revenue Bonds, Linxs APM Project, Senior Lien Series 2018A, 5.000%, 12/31/43 (AMT) | | | 6/28 at 100.00 | | | | | | | | BBB+ | | | | 34,036,964 | |
| | | | | |
| | | | California Municipal Finance Authority, Revenue Bonds, NorthBay Healthcare Group, Series 2017A: | | | | | | | | | | | | | | | | |
| | 1,000 | | | 5.000%, 11/01/30 | | | 11/26 at 100.00 | | | | | | | | BBB– | | | | 1,135,980 | |
| | 1,040 | | | 5.250%, 11/01/31 | | | 11/26 at 100.00 | | | | | | | | BBB– | | | | 1,181,700 | |
| | | | | |
| | | | California Municipal Finance Authority, Revenue Bonds, Community Medical Centers, Series 2017A: | | | | | | | | | | | | | | | | |
| | 1,750 | | | 5.000%, 2/01/42 | | | 2/27 at 100.00 | | | | | | | | A– | | | | 1,958,460 | |
| | 8,875 | | | 5.000%, 2/01/47 | | | 2/27 at 100.00 | | | | | | | | A– | | | | 9,885,330 | |
| | | | | |
| | 640 | | | California Pollution Control Financing Authority, Water Furnishing Revenue Bonds, San Diego County Water Authority Desalination Project Pipeline, Refunding Series 2019, 5.000%, 11/21/45, 144A | | | 1/29 at 100.00 | | | | | | | | Baa3 | | | | 736,358 | |
| | | | | |
| | 1,625 | | | California Pollution Control Financing Authority, Water Furnishing Revenue Bonds, San Diego County Water Authority Desalination Project Pipeline, Refunding Series 2019, 5.000%, 7/01/39, 144A | | | 1/29 at 100.00 | | | | | | | | Baa3 | | | | 1,890,379 | |
| | | | | |
| | 1,100 | | | California Public Finance Authority, Revenue Bonds, Henry Mayo Newhall Hospital, Series 2017, 5.000%, 10/15/37 | | | 10/26 at 100.00 | | | | | | | | BBB– | | | | 1,218,206 | |
| | | | | |
| | 1,000 | | | California State Public Works Board, Lease Revenue Bonds, Judicial Council of California, Various Projects Series 2011D, 5.000%, 12/01/20 | | | No Opt. Call | | | | | | | | A+ | | | | 1,057,790 | |
| | | | | |
| | 1,000 | | | California State Public Works Board, Lease Revenue Bonds, Various Capital Projects, Series2010A-1, 5.750%, 3/01/30(Pre-refunded 3/01/20) | | | 3/20 at 100.00 | | | | | | | | A+ (4) | | | | 1,040,470 | |
| | | | | |
| | 33,630 | | | California State University, Systemwide Revenue Bonds, Series 2018A, 5.000%, 11/01/48 | | | 11/28 at 100.00 | | | | | | | | Aa2 | | | | 39,899,641 | |
| | | | | |
| | 700 | | | California State, General Obligation Bonds, Tender Option Bond Trust 3162, 15.390%, 3/01/40 – AGM Insured (IF) (5) | | | 3/20 at 100.00 | | | | | | | | AA | | | | 788,669 | |
| | | | | |
| | 1,400 | | | California State, General Obligation Bonds, Various Purpose Series 2010, 5.250%, 3/01/30 | | | 3/20 at 100.00 | | | | | | | | AA– | | | | 1,446,802 | |
| | | | | |
| | 12,000 | | | California State, General Obligation Bonds, Various Purpose Series 2017, 5.000%, 8/01/46 | | | 8/26 at 100.00 | | | | | | | | AA– | | | | 13,860,240 | |
| | | | | |
| | 3,960 | | | California State, General Obligation Bonds, Various Purpose Series 2019, 5.000%, 4/01/49 | | | 4/29 at 100.00 | | | | | | | | AA– | | | | 4,727,844 | |
| | | | | |
| | 1,000 | | | California Statewide Communities Development Authority, California, Revenue Bonds, Loma Linda University Medical Center, Series 2014A, 5.500%, 12/01/54 | | | 12/24 at 100.00 | | | | | | | | BB | | | | 1,093,860 | |
| | | | | |
| | | | California Statewide Communities Development Authority, California, Revenue Bonds, Loma Linda University Medical Center, Series 2016A: | | | | | | | | | | | | | | | | |
| | 1,100 | | | 5.000%, 12/01/41, 144A | | | 6/26 at 100.00 | | | | | | | | BB | | | | 1,194,336 | |
| | 1,365 | | | 5.000%, 12/01/46, 144A | | | 6/26 at 100.00 | | | | | | | | BB | | | | 1,475,442 | |
| | 26,380 | | | 5.250%, 12/01/56, 144A | | | 6/26 at 100.00 | | | | | | | | BB | | | | 28,861,303 | |
| | | | | |
| | 5,800 | | | California Statewide Communities Development Authority, Pollution Control Revenue Bonds, Southern California Edison Company, Series 2006C, 2.625%, 11/01/33 (Mandatory Put 12/01/23) | | | No Opt. Call | | | | | | | | A– | | | | 5,781,904 | |
36
| | | | | | | | | | | | | | | | | | | | |
Principal
Amount (000) | | | Description (1) | | Optional Call
Provisions (2) | | | | | | Ratings (3) | | | Value | |
| | | | | |
| | | | California(continued) | | | | | | | | | | | | |
| | | | | |
| $ | 1,725 | | | California Statewide Communities Development Authority, Revenue Bonds, American Baptist Homes of the West, Series 2010, 5.750%, 10/01/25 | | | 10/19 at 100.00 | | | | | | | | BBB+ | | | $ | 1,759,155 | |
| | | | | |
| | 600 | | | California Statewide Communities Development Authority, Revenue Bonds, Front Porch Communities and Services Project, Series 2017A, 5.000%, 4/01/47 | | | 4/27 at 100.00 | | | | | | | | A | | | | 681,660 | |
| | | | | |
| | 2,900 | | | California Statewide Communities Development Authority, Revenue Bonds, John Muir Health, Series 2018A, 5.000%, 12/01/57 | | | 12/27 at 100.00 | | | | | | | | A+ | | | | 3,275,550 | |
| | | | | |
| | | | California Statewide Communities Development Authority, Student Housing Revenue Bonds, University of California, Irvine East Campus Apartments, PhaseIV-ACHF-Irvine, LLC, Series 2017: | | | | | | | | | | | | | | | | |
| | 4,000 | | | 5.000%, 5/15/47 | | | 5/27 at 100.00 | | | | | | | | Baa1 | | | | 4,508,160 | |
| | 2,750 | | | 5.000%, 5/15/50 | | | 5/27 at 100.00 | | | | | | | | Baa1 | | | | 3,091,193 | |
| | | | | |
| | | | California Statewide Community Development Authority, Revenue Bonds, Daughters of Charity Health System, Series 2005A: | | | | | | | | | | | | | | | | |
| | 825 | | | 5.750%, 7/01/30 | | | 5/19 at 100.00 | | | | | | | | CC | | | | 807,510 | |
| | 5,300 | | | 5.750%, 7/01/35 | | | 5/19 at 100.00 | | | | | | | | CC | | | | 5,200,254 | |
| | 2,000 | | | 5.500%, 7/01/39 | | | 5/19 at 100.00 | | | | | | | | CC | | | | 1,965,860 | |
| | | | | |
| | 4,955 | | | California Statewide Community Development Authority, Revenue Bonds, Los Angeles Jewish Home for the Aging-Fountainview Gonda, Series 2014A, 5.000%, 8/01/44 | | | 8/22 at 102.00 | | | | | | | | AA– | | | | 5,495,293 | |
| | | | | |
| | 400 | | | Davis Redevelopment Agency, California, Tax Allocation Bonds, Davis Redevelopment Project, Subordinate Series 2011A, 7.000%, 12/01/36 | | | 12/21 at 100.00 | | | | | | | | A+ | | | | 454,792 | |
| | | | | |
| | | | Department of Water and Power of the City of Los Angeles, California, Power System Revenue Bonds, Series 2018D: | | | | | | | | | | | | | | | | |
| | 7,500 | | | 5.000%, 7/01/43 | | | 7/28 at 100.00 | | | | | | | | AA | | | | 8,901,450 | |
| | 6,000 | | | 5.000%, 7/01/48 | | | 7/28 at 100.00 | | | | | | | | AA | | | | 7,081,440 | |
| | | | | |
| | 5,225 | | | Department of Water and Power of the City of Los Angeles, California, Power System Revenue Bonds, Series 2019A, 5.250%, 7/01/49 | | | 1/29 at 100.00 | | | | | | | | AA | | | | 6,334,268 | |
| | | | | |
| | 6,170 | | | Elk Grove Finance Authority, California, Special Tax Revenue Bonds, Refunding Series 2016, 5.000%, 9/01/46 | | | 9/26 at 100.00 | | | | | | | | N/R | | | | 6,714,934 | |
| | | | | |
| | 5,500 | | | Escondido Union School District, San Diego County, California, General Obligation Bonds, Election 2014 Series 2018B, 4.000%, 8/01/47 | | | 8/27 at 100.00 | | | | | | | | AAA | | | | 5,805,855 | |
| | | | | |
| | 510 | | | Etiwanda School District, California, Special Tax Bonds, Coyote Canyon Community Facilities District2004-1 Improvement Area 2, Series 2009, 6.500%, 9/01/32(Pre-refunded 9/01/19) | | | 9/19 at 100.00 | | | | | | | | N/R (4) | | | | 520,623 | |
| | | | | |
| | | | Foothill/Eastern Transportation Corridor Agency, California, Toll Road Revenue Bonds, Refunding Senior Lien Series 2015A: | | | | | | | | | | | | | | | | |
| | 1,695 | | | 0.000%, 1/15/33 | | | No Opt. Call | | | | | | | | A– | | | | 1,045,052 | |
| | 10,000 | | | 0.000%, 1/15/35 – AGM Insured | | | No Opt. Call | | | | | | | | AA | | | | 5,936,500 | |
| | | | | |
| | 1,385 | | | Fullerton Public Financing Authority, California, Tax Allocation Revenue Bonds, Series 2005, 5.000%, 9/01/27 – AMBAC Insured | | | 9/19 at 100.00 | | | | | | | | A | | | | 1,405,138 | |
| | | | | |
| | 6,285 | | | Golden State Tobacco Securitization Corporation, California, Tobacco Settlement Asset-Backed Bonds, Series2018A-1, 5.250%, 6/01/47 | | | 6/22 at 100.00 | | | | | | | | N/R | | | | 6,351,998 | |
| | | | | |
| | 46,250 | | | Golden State Tobacco Securitization Corporation, California, Tobacco Settlement Asset-Backed Revenue Bonds, First SubordinateSeries 2007B-1, 0.000%, 6/01/47 | | | 4/19 at 19.49 | | | | | | | | CCC+ | | | | 7,404,163 | |
| | | | | |
| | 1,000 | | | Jurupa Public Financing Authority, California, Special Tax Revenue Bonds, Superior Lien Series 2010A, 5.000%, 9/01/33 | | | 9/20 at 100.00 | | | | | | | | AA | | | | 1,041,900 | |
37
NuveenAll-American Municipal Bond Fund(continued)
Portfolio of Investments March 31, 2019
| | | | | | | | | | | | | | | | | | | | |
Principal
Amount (000) | | | Description (1) | | Optional Call
Provisions (2) | | | | | | Ratings (3) | | | Value | |
| | | | | |
| | | | California(continued) | | | | | | | | | | | | |
| | | | | |
| $ | 1,980 | | | Kern Community College District, California, General Obligation Bonds, Safety, Repair & Improvement, Election 2002 Series 2006, 0.000%, 11/01/23 – AGM Insured | | | No Opt. Call | | | | | | | | AA | | | $ | 1,822,511 | |
| | | | | |
| | 2,750 | | | Lammersville Joint Unified School District, San Joaquin County, California, Special Tax Bonds, Community Facilities District2014-1 Improvement Area 1 Mountain House School Facilities, Series 2017, 5.000%, 9/01/42 | | | 9/27 at 100.00 | | | | | | | | N/R | | | | 3,063,143 | |
| | | | | |
| | | | Long Beach, California, Harbor Revenue Bonds, Series 2017: | | | | | | | | | | | | | | | | |
| | 1,600 | | | 5.000%, 5/15/36 (AMT) | | | 5/27 at 100.00 | | | | | | | | AA | | | | 1,875,072 | |
| | 1,400 | | | 5.000%, 5/15/37 (AMT) | | | 5/27 at 100.00 | | | | | | | | AA | | | | 1,632,666 | |
| | 1,410 | | | 5.000%, 5/15/40 (AMT) | | | 5/27 at 100.00 | | | | | | | | AA | | | | 1,629,410 | |
| | | | | |
| | | | Los Angeles County Metropolitan Transportation Authority, California, Proposition C Sales Tax Revenue Bonds, Green Senior Lien Series 2019A: | | | | | | | | | | | | | | | | |
| | 9,330 | | | 5.000%, 7/01/39 | | | 7/28 at 100.00 | | | | | | | | AAA | | | | 11,279,503 | |
| | 10,340 | | | 5.000%, 7/01/44 | | | 7/28 at 100.00 | | | | | | | | AAA | | | | 12,359,505 | |
| | | | | |
| | 15,265 | | | Los Angeles Department of Airports, California, Revenue Bonds, Los Angeles International Airport, Subordinate Lien Series 2018C, 5.000%, 5/15/44 (AMT) | | | 11/27 at 100.00 | | | | | | | | AA– | | | | 17,672,443 | |
| | | | | |
| | 10,000 | | | Los Angeles Department of Airports, California, Revenue Bonds, Los Angeles International Airport, Subordinate Lien Series 2018D, 5.000%, 5/15/48 (AMT) | | | 5/29 at 100.00 | | | | | | | | AA– | | | | 11,758,700 | |
| | | | | |
| | | | Los Angeles Department of Water and Power, California, Waterworks Revenue Bonds, Series 2017A: | | | | | | | | | | | | | | | | |
| | 2,300 | | | 5.000%, 7/01/34 | | | 1/27 at 100.00 | | | | | | | | AA+ | | | | 2,745,901 | |
| | 2,500 | | | 5.000%, 7/01/35 | | | 1/27 at 100.00 | | | | | | | | AA+ | | | | 2,974,150 | |
| | | | | |
| | 7,500 | | | Los Angeles Department of Water and Power, California, Waterworks Revenue Bonds, Series 2018A, 5.000%, 7/01/48 | | | 1/28 at 100.00 | | | | | | | | AA+ | | | | 8,812,650 | |
| | | | | |
| | 1,000 | | | Los Angeles Harbors Department, California, Revenue Bonds, Series 2009B, 5.250%, 8/01/39(Pre-refunded 8/01/19) | | | 8/19 at 100.00 | | | | | | | | AA (4) | | | | 1,012,900 | |
| | | | | |
| | | | Los Angeles Unified School District, Los Angeles County, California, General Obligation Bonds, Election 2008Series 2018B-1: | | | | | | | | | | | | | | | | |
| | 8,945 | | | 5.000%, 7/01/34 – BAM Insured | | | 1/28 at 100.00 | | | | | | | | AA | | | | 10,755,915 | |
| | 7,475 | | | 5.000%, 7/01/38 | | | 1/28 at 100.00 | | | | | | | | AAA | | | | 8,882,244 | |
| | | | | |
| | | | Los Angeles, California, Wastewater System Revenue Bonds, Green Subordinate Series 2018A: | | | | | | | | | | | | | | | | |
| | 9,320 | | | 5.000%, 6/01/43 | | | 6/28 at 100.00 | | | | | | | | AA | | | | 11,123,140 | |
| | 16,990 | | | 5.000%, 6/01/48 | | | 6/28 at 100.00 | | | | | | | | AA | | | | 20,105,456 | |
| | | | | |
| | 2,500 | | | Los Angeles, California, Wastewater System Revenue Bonds, Refunding Green Subordinate Lien Series 2017B, 5.000%, 6/01/35 | | | 6/27 at 100.00 | | | | | | | | AA | | | | 3,016,750 | |
| | | | | |
| | 500 | | | Lynwood Redevelopment Agency, California, Tax Allocation Revenue Bonds, Project Area A, Subordinate Lien Series 2011A, 7.000%, 9/01/31 | | | 9/21 at 100.00 | | | | | | | | A | | | | 562,015 | |
| | | | | |
| | 3,000 | | | Madera County, California, Certificates of Participation, Children’s Hospital Central California, Series 2010, 5.375%, 3/15/36(Pre-refunded 3/15/20) | | | 3/20 at 100.00 | | | | | | | | AA– (4) | | | | 3,113,040 | |
| | | | | |
| | 1,000 | | | Manteca Financing Authority, California, Sewer Revenue Bonds, Series 2009, 5.750%, 12/01/36 | | | 12/19 at 100.00 | | | | | | | | AA | | | | 1,027,680 | |
| | | | | |
| | 1,000 | | | Modesto Irrigation District, California, Electric System Revenue Bonds, Refunding Series 2011A, 5.000%, 7/01/26 | | | 7/21 at 100.00 | | | | | | | | A+ | | | | 1,074,110 | |
| | | | | |
| | 2,565 | | | Morongo Band of Mission Indians, California, Enterprise Revenue Bonds, Series 2018A, 5.000%, 10/01/42, 144A | | | 10/28 at 100.00 | | | | | | | | BBB– | | | | 2,793,516 | |
38
| | | | | | | | | | | | | | | | | | | | |
Principal
Amount (000) | | | Description (1) | | Optional Call
Provisions (2) | | | | | | Ratings (3) | | | Value | |
| | | | | |
| | | | California(continued) | | | | | | | | | | | | |
| | | | | |
| | | | M-S-R Energy Authority, California, Gas Revenue Bonds, Citigroup Prepay Contracts, Series 2009A: | | | | | | | | | | | | | | | | |
| $ | 2,800 | | | 7.000%, 11/01/34 | | | No Opt. Call | | | | | | | | A | | | $ | 4,135,936 | |
| | 2,500 | | | 6.500%, 11/01/39 | | | No Opt. Call | | | | | | | | A | | | | 3,630,175 | |
| | | | | |
| | 13,750 | | | Ontario Redevelopment Financing Authority, San Bernardino County, California, Revenue Bonds, Redevelopment Project 1, Series 1993, 5.800%, 8/01/23 – NPFG Insured (ETM) | | | No Opt. Call | | | | | | | | N/R (4) | | | | 15,028,200 | |
| | | | | |
| | | | Orange County, California, Special Tax Bonds, Community Facilities District2016-1 Esencia Village, Series 2016A: | | | | | | | | | | | | | | | | |
| | 1,250 | | | 5.000%, 8/15/41 | | | 8/26 at 100.00 | | | | | | | | N/R | | | | 1,361,500 | |
| | 2,000 | | | 5.000%, 8/15/46 | | | 8/26 at 100.00 | | | | | | | | N/R | | | | 2,170,840 | |
| | | | | |
| | | | Palm Desert Redevelopment Agency, California, Successor Agency Redevelopment Project Area, Series 2017A: | | | | | | | | | | | | | | | | |
| | 500 | | | 5.000%, 10/01/28 – BAM Insured | | | 4/27 at 100.00 | | | | | | | | AA | | | | 616,530 | |
| | 500 | | | 5.000%, 10/01/30 – BAM Insured | | | 4/27 at 100.00 | | | | | | | | AA | | | | 605,630 | |
| | | | | |
| | 840 | | | Palm Drive Health Care District, Sonoma County, California, Certificates of Participation, Parcel Tax Secured Financing Program, Series 2010, 7.000%, 4/01/25 | | | 5/19 at 12.00 | | | | | | | | CCC+ | | | | 822,377 | |
| | | | | |
| | 1,740 | | | Palmdale, California, Special Tax Bonds, Community Facilities District2003-1, Anaverde Project, Series 2005A, 5.350%, 9/01/30 | | | 9/19 at 100.00 | | | | | | | | N/R | | | | 1,756,547 | |
| | | | | |
| | 3,000 | | | Palomar Pomerado Health Care District, California, Certificates of Participation, Series 2009, 6.625%, 11/01/29(Pre-refunded 11/01/19) | | | 11/19 at 100.00 | | | | | | | | N/R (4) | | | | 3,088,860 | |
| | | | | |
| | 1,710 | | | Perris Public Financing Authority, California, Tax Allocation Revenue Bonds, Housing Loan Series 2010A, 6.125%, 10/01/40 | | | 10/20 at 100.00 | | | | | | | | A | | | | 1,818,619 | |
| | | | | |
| | 3,775 | | | Poway Unified School District, San Diego County, California, General Obligation Bonds, School Facilities Improvement District2007-1, Election 2008 Series 2009A, 0.000%, 8/01/23 | | | No Opt. Call | | | | | | | | AA– | | | | 3,478,549 | |
| | | | | |
| | 5,500 | | | Poway Unified School District, San Diego County, California, General Obligation Bonds, School Facilities Improvement District2007-1, Series 2011A, 0.000%, 8/01/41 | | | No Opt. Call | | | | | | | | AA– | | | | 2,533,905 | |
| | | | | |
| | 15,000 | | | Rialto Unified School District, San Bernardino County, California, General Obligation Bonds, Series 2011A, 0.000%, 8/01/41 – AGM Insured (6) | | | 8/36 at 100.00 | | | | | | | | AA | | | | 15,864,300 | |
| | | | | |
| | 4,000 | | | Ridgecrest Redevelopment Agency, California, Ridgecrest Redevelopment Project Tax Allocation Bonds, Refunding Series 2010, 6.125%, 6/30/37(Pre-refunded 6/30/20) | | | 6/20 at 100.00 | | | | | | | | A– (4) | | | | 4,233,280 | |
| | | | | |
| | 5,775 | | | Riverside, California, Sewer Revenue Bonds, Refunding Series 2018A, 5.000%, 8/01/39 | | | 8/28 at 100.00 | | | | | | | | AA– | | | | 6,947,036 | |
| | | | | |
| | 715 | | | Roseville, California, Special Tax Bonds, Community Facilities District 1 Hewlett Packard Campus Oaks, Series 2016, 5.500%, 9/01/46 | | | 9/26 at 100.00 | | | | | | | | N/R | | | | 787,530 | |
| | | | | |
| | | | Sacramento County, California, Airport System Revenue Bonds, Refunding Senior Series 2018C: | | | | | | | | | | | | | | | | |
| | 4,305 | | | 5.000%, 7/01/37 (AMT) | | | 7/28 at 100.00 | | | | | | | | A+ | | | | 5,075,121 | |
| | 6,000 | | | 5.000%, 7/01/38 (AMT) | | | 7/28 at 100.00 | | | | | | | | A+ | | | | 7,051,860 | |
| | 5,000 | | | 5.000%, 7/01/39 (AMT) | | | 7/28 at 100.00 | | | | | | | | A+ | | | | 5,859,650 | |
| | | | | |
| | 860 | | | Sacramento, California, Special Tax Bonds, Community Facilities District05-1 College Square, Series 2007, 5.900%, 9/01/37 | | | 9/19 at 100.00 | | | | | | | | N/R | | | | 870,217 | |
39
NuveenAll-American Municipal Bond Fund(continued)
Portfolio of Investments March 31, 2019
| | | | | | | | | | | | | | | | | | | | |
Principal
Amount (000) | | | Description (1) | | Optional Call
Provisions (2) | | | | | | Ratings (3) | | | Value | |
| | | | | |
| | | | California(continued) | | | | | | | | | | | | |
| | | | | |
| | | | San Diego County Regional Airport Authority, California, Airport Revenue Bonds, Subordinate Series 2017A: | | | | | | | | | | | | | | | | |
| $ | 8,000 | | | 5.000%, 7/01/42 (AMT) | | | 7/27 at 100.00 | | | | | | | | A | | | $ | 9,165,200 | |
| | 2,500 | | | 5.000%, 7/01/47 | | | 7/27 at 100.00 | | | | | | | | A | | | | 2,900,125 | |
| | 3,615 | | | 5.000%, 7/01/47 (AMT) | | | 7/27 at 100.00 | | | | | | | | A | | | | 4,122,185 | |
| | | | | |
| | 6,895 | | | San Diego Public Facilities Financing Authority, California, Water Utility Revenue Bonds, Subordinate Lien Series 2018A, 5.250%, 8/01/47 | | | 8/28 at 100.00 | | | | | | | | Aa3 | | | | 8,334,676 | |
| | | | | |
| | | | San Diego Redevelopment Agency Successor Agency, California, Tax Allocation Bonds, Refunding Series 2017A: | | | | | | | | | | | | | | | | |
| | 1,815 | | | 5.000%, 9/01/36 | | | 9/26 at 100.00 | | | | | | | | AA | | | | 2,159,541 | |
| | 6,160 | | | 5.000%, 9/01/40 | | | 9/26 at 100.00 | | | | | | | | AA | | | | 7,238,246 | |
| | | | | |
| | 12,300 | | | San Francisco Airports Commission, California, Revenue Bonds, San Francisco International Airport, Second Series 2016B, 5.000%, 5/01/46 (AMT) | | | 5/26 at 100.00 | | | | | | | | A+ | | | | 13,896,663 | |
| | | | | |
| | 12,715 | | | San Francisco Airports Commission, California, Revenue Bonds, San Francisco International Airport, Second Series 2017A, 5.000%, 5/01/47 (AMT) | | | 5/27 at 100.00 | | | | | | | | A+ | | | | 14,547,994 | |
| | | | | |
| | 5,000 | | | San Francisco Airports Commission, California, Revenue Bonds, San Francisco International Airport, Second Series 2019A, 5.000%, 5/01/44 (AMT) | | | 5/29 at 100.00 | | | | | | | | A+ | | | | 5,889,750 | |
| | | | | |
| | 1,920 | | | San Francisco Airports Commission, California, Revenue Bonds, San Francisco International Airport, Second Series A of 2009, 4.900%, 5/01/29 | | | 11/19 at 100.00 | | | | | | | | A+ | | | | 1,961,645 | |
| | | | | |
| | 670 | | | San Francisco Redevelopment Finance Authority, California, Tax Allocation Revenue Bonds, Mission Bay North Redevelopment Project, Series 2009C, 6.500%, 8/01/39(Pre-refunded 8/01/19) | | | 8/19 at 100.00 | | | | | | | | A– (4) | | | | 681,370 | |
| | | | | |
| | 13,300 | | | San Joaquin Hills Transportation Corridor Agency, Orange County, California, Toll Road Revenue Bonds, Refunding Junior Lien Series 2014B, 5.250%, 1/15/44 | | | 1/25 at 100.00 | | | | | | | | BBB+ | | | | 14,622,552 | |
| | | | | |
| | 9,745 | | | San Joaquin Hills Transportation Corridor Agency, Orange County, California, Toll Road Revenue Bonds, Refunding Senior Lien Series 2014A, 5.000%, 1/15/44 | | | 1/25 at 100.00 | | | | | | | | A– | | | | 10,721,449 | |
| | | | | |
| | 2,000 | | | San Jose, California, Airport Revenue Bonds, Refunding Series 2017A, 5.000%, 3/01/22 (AMT) | | | No Opt. Call | | | | | | | | A | | | | 2,182,540 | |
| | | | | |
| | 440 | | | Santee Community Development Commission, California, Santee Redevelopment Project Tax Allocation Bonds, Series 2011A, 7.000%, 8/01/31(Pre-refunded 2/01/21) | | | 2/21 at 100.00 | | | | | | | | A (4) | | | | 484,876 | |
| | | | | |
| | 2,355 | | | Semitrophic Improvement District of Semitrophic Water Storage District, Kern County, California, Revenue Bonds, Refunding Series 2009A, 5.000%, 12/01/38(Pre-refunded 12/01/19) | | | 12/19 at 100.00 | | | | | | | | A+ (4) | | | | 2,410,460 | |
| | | | | |
| | 275 | | | Temecula Public Financing Authority, California, Special Tax Bonds, Community Facilities District16-01, Series 2017, 6.250%, 9/01/47, 144A | | | 9/27 at 100.00 | | | | | | | | N/R | | | | 282,945 | |
| | | | | |
| | 500 | | | Temecula Redevelopment Agency, California, Redevelopment Project 1 Tax Allocation Housing Bonds Series 2011A, 6.750%, 8/01/31(Pre-refunded 8/01/21) | | | 8/21 at 100.00 | | | | | | | | BBB+ (4) | | | | 561,480 | |
| | | | | |
| | 4,750 | | | Tobacco Securitization Authority of Southern California, Tobacco Settlement Asset-Backed Bonds, San Diego County Tobacco Asset Securitization Corporation, Senior Series 2006A, 5.125%, 6/01/46 | | | 4/19 at 100.00 | | | | | | | | B+ | | | | 4,750,523 | |
| | | | | |
| | 920 | | | Tustin Community Redevelopment Agency, California, Tax Allocation Housing Bonds Series 2010, 5.000%, 9/01/30 – AGM Insured(Pre-refunded 9/01/20) | | | 9/20 at 100.00 | | | | | | | | AA (4) | | | | 967,122 | |
40
| | | | | | | | | | | | | | | | | | | | |
Principal
Amount (000) | | | Description (1) | | Optional Call
Provisions (2) | | | | | | Ratings (3) | | | Value | |
| | | | | |
| | | | California(continued) | | | | | | | | | | | | |
| | | | | |
| $ | 3,500 | | | Upland, California, Certificates of Participation, San Antonio Regional Hospital, Series 2017, 5.000%, 1/01/47 | | | 1/28 at 100.00 | | | | | | | | BBB+ | | | $ | 3,905,265 | |
| | | | | |
| | 5,000 | | | Victor Valley Union High School District, San Bernardino County, California, General Obligation Bonds, Series 2009A, 0.000%, 8/01/31 – AGC Insured (6) | | | 8/26 at 100.00 | | | | | | | | AA | | | | 5,831,200 | |
| | | | | |
| | 1,500 | | | Western Placer Unified School District, Placer County, California, Certificates of Participation, Refunding Series 2009, 5.250%, 8/01/35 – AGM Insured(Pre-refunded 8/01/19) | | | 8/19 at 100.00 | | | | | | | | AA (4) | | | | 1,518,840 | |
| | | | | |
| | | | Westminster School District, Orange County, California, General Obligation Bonds, Series2009-A1: | | | | | | | | | | | | | | | | |
| | 2,485 | | | 0.000%, 8/01/26 – AGC Insured | | | No Opt. Call | | | | | | | | AA | | | | 2,126,241 | |
| | 1,405 | | | 0.000%, 8/01/28 – AGC Insured | | | No Opt. Call | | | | | | | | AA | | | | 1,127,007 | |
| | 2,920 | | | 0.000%, 8/01/29 – AGC Insured | | | No Opt. Call | | | | | | | | AA | | | | 2,255,233 | |
| | | | | |
| | | | William S. Hart Union High School District, Los Angeles County, California, Special Tax Bonds, Community Facilities District2015-1, Series 2017: | | | | | | | | | | | | | | | | |
| | 1,425 | | | 5.000%, 9/01/42 | | | 9/26 at 100.00 | | | | | | | | N/R | | | | 1,552,794 | |
| | 1,205 | | | 5.000%, 9/01/47 | | | 9/26 at 100.00 | | | | | | | | N/R | | | | 1,308,160 | |
| | 690,950 | | | Total California | | | | | | | | | | | | | | | 723,529,326 | |
| | | | | |
| | | | Colorado – 5.2% | | | | | | | | | | | | |
| | | | | |
| | 1,400 | | | Colorado Educational and Cultural Facilities Authority, Charter School Refunding Revenue Bonds, Pinnacle Charter School, Inc.K-8 Facility Project, Series 2013, 5.000%, 6/01/26 | | | 6/23 at 100.00 | | | | | | | | A+ | | | | 1,535,954 | |
| | | | | |
| | 2,065 | | | Colorado Educational and Cultural Facilities Authority, Charter School Revenue Bonds, Community Leadership Academy Project, Series 2008, 6.500%, 7/01/38 | | | 5/19 at 100.00 | | | | | | | | BB+ | | | | 2,068,696 | |
| | | | | |
| | 3,040 | | | Colorado Educational and Cultural Facilities Authority, Charter School Revenue Bonds, Community Leadership Academy, Inc Second Campus Project, Series 2013, 7.350%, 8/01/43 | | | 8/23 at 100.00 | | | | | | | | BB+ | | | | 3,437,146 | |
| | | | | |
| | 1,025 | | | Colorado Educational and Cultural Facilities Authority, Charter School Revenue Bonds, Crown Pointe Academy of Westminster Project, Chartered Through Adams County School District 50, Series 2009, 5.000%, 7/15/39 | | | 7/19 at 100.00 | | | | | | | | AA– | | | | 1,027,983 | |
| | | | | |
| | 2,500 | | | Colorado Educational and Cultural Facilities Authority, Charter School Revenue Bonds, Pinnacle Charter School, Inc. High School Project, Series 2010, 5.125%, 12/01/39 | | | 12/19 at 100.00 | | | | | | | | AA– | | | | 2,515,000 | |
| | | | | |
| | 3,000 | | | Colorado Health Facilities Authority, Colorado, Hospital Improvement Revenue Bonds, NCMC Inc., Series 2003A, 5.500%, 5/15/30 – AGM Insured(Pre-refunded 5/15/19) | | | 5/19 at 100.00 | | | | | | | | AA (4) | | | | 3,014,220 | |
| | | | | |
| | 6,570 | | | Colorado Health Facilities Authority, Colorado, Revenue Bonds, Adventist Health System/Sunbelt Obligated Group, Series 2018B, 5.000%, 11/15/48 (Mandatory Put 11/20/25) | | | No Opt. Call | | | | | | | | AA | | | | 7,793,203 | |
| | | | | |
| | 1,500 | | | Colorado Health Facilities Authority, Colorado, Revenue Bonds, American Baptist Homes Project, Series 2009A, 7.750%, 8/01/29(Pre-refunded 8/01/19) | | | 8/19 at 100.00 | | | | | | | | N/R (4) | | | | 1,530,225 | |
| | | | | |
| | 1,400 | | | Colorado Health Facilities Authority, Colorado, Revenue Bonds, Christian Living Neighborhoods Project, Refunding Series 2016, 5.000%, 1/01/37 | | | 1/24 at 102.00 | | | | | | | | N/R | | | | 1,498,854 | |
| | | | | |
| | 12,000 | | | Colorado Health Facilities Authority, Colorado, Revenue Bonds, Covenant Retirement Communities Inc., Refunding Series 2012A, 5.000%, 12/01/33 | | | 12/22 at 100.00 | | | | | | | | A– | | | | 12,890,640 | |
41
NuveenAll-American Municipal Bond Fund(continued)
Portfolio of Investments March 31, 2019
| | | | | | | | | | | | | | | | | | | | |
Principal
Amount (000) | | | Description (1) | | Optional Call
Provisions (2) | | | | | | Ratings (3) | | | Value | |
| | | | | |
| | | | Colorado(continued) | | | | | | | | | | | | |
| | | | | |
| $ | 725 | | | Colorado Health Facilities Authority, Colorado, Revenue Bonds, Evangelical Lutheran Good Samaritan Society Project, Series 2013, 5.625%, 6/01/43 | | | 6/23 at 100.00 | | | | | | | | BBB | | | $ | 797,391 | |
| | | | | |
| | 6,155 | | | Colorado Health Facilities Authority, Colorado, Revenue Bonds, Evangelical Lutheran Good Samaritan Society Project, Series 2013A, 5.000%, 6/01/45 | | | 6/25 at 100.00 | | | | | | | | A– | | | | 6,644,384 | |
| | | | | |
| | 3,000 | | | Colorado Health Facilities Authority, Colorado, Revenue Bonds, Parkview Medical Center, Refunding Series 2015B, 4.000%, 9/01/34 | | | 9/25 at 100.00 | | | | | | | | A3 | | | | 3,151,440 | |
| | | | | |
| | 3,000 | | | Colorado Health Facilities Authority, Colorado, Revenue Bonds, Sisters of Charity of Leavenworth Health Services Corporation, Refunding Composite Deal Series 2010B, 5.250%, 1/01/25 | | | 1/20 at 100.00 | | | | | | | | AA– | | | | 3,078,420 | |
| | | | | |
| | 1,100 | | | Colorado Health Facilities Authority, Colorado, Revenue Bonds, Total Longterm Care National Obligated Group Project, Series 2010A, 6.250%, 11/15/40(Pre-refunded 11/15/20) | | | 11/20 at 100.00 | | | | | | | | N/R (4) | | | | 1,181,246 | |
| | | | | |
| | 1,000 | | | Colorado International Center Metropolitan District 14, Denver, Colorado, Limited Tax General Obligation Bonds, Refunding & Improvement Series 2018, 5.875%, 12/01/46 | | | 12/23 at 13.00 | | | | | | | | N/R | | | | 1,080,250 | |
| | | | | |
| | 8,000 | | | Colorado State, Building Excellent Schools Today, Certificates of Participation, Series 2018N, 5.000%, 3/15/38 | | | 3/28 at 100.00 | | | | | | | | Aa2 | | | | 9,454,560 | |
| | | | | |
| | 1,000 | | | Compark Business Campus Metropolitan District, Douglas County, Colorado, General Obligation Bonds, Series 2012A, 6.750%, 12/01/39 | | | 12/22 at 100.00 | | | | | | | | N/R | | | | 1,038,520 | |
| | | | | |
| | 1,995 | | | Concord Metropolitan District, Douglas County, Colorado, General Obligation Bonds, Refunding Series 2010, 5.375%, 12/01/40 | | | 12/20 at 100.00 | | | | | | | | BBB+ | | | | 2,048,207 | |
| | | | | |
| | 1,730 | | | Denver City and County, Colorado, Airport System Revenue Bonds, Refunding Series 2010A, 5.000%, 11/15/21 | | | 11/20 at 100.00 | | | | | | | | AA– | | | | 1,832,589 | |
| | | | | |
| | 5,000 | | | Denver City and County, Colorado, Airport System Revenue Bonds, Subordinate Lien Series 2013A, 5.250%, 11/15/43 (AMT) | | | 11/23 at 100.00 | | | | | | | | A+ | | | | 5,518,250 | |
| | | | | |
| | | | Denver City and County, Colorado, Airport System Revenue Bonds, Subordinate Lien Series 2018A: | | | | | | | | | | | | | | | | |
| | 4,000 | | | 5.000%, 12/01/26 (AMT) | | | No Opt. Call | | | | | | | | A+ | | | | 4,807,600 | |
| | 10,510 | | | 5.000%, 12/01/34 (AMT) | | | 12/28 at 100.00 | | | | | | | | A+ | | | | 12,528,550 | |
| | 24,390 | | | 5.000%, 12/01/35 (AMT) | | | 12/28 at 100.00 | | | | | | | | A+ | | | | 28,947,027 | |
| | | | | |
| | 19,500 | | | Denver City and County, Colorado, Dedicated Tax Revenue Bonds, Improvement Series 2018A, 5.000%, 8/01/48 | | | 8/26 at 100.00 | | | | | | | | AA | | | | 22,370,205 | |
| | | | | |
| | | | Denver Convention Center Hotel Authority, Colorado, Revenue Bonds, Convention Center Hotel, Refunding Senior Lien Series 2016: | | | | | | | | | | | | | | | | |
| | 510 | | | 5.000%, 12/01/31 | | | 12/26 at 100.00 | | | | | | | | Baa2 | | | | 576,101 | |
| | 3,500 | | | 5.000%, 12/01/32 | | | 12/26 at 100.00 | | | | | | | | Baa2 | | | | 3,949,155 | |
| | 1,200 | | | 5.000%, 12/01/33 | | | 12/26 at 100.00 | | | | | | | | Baa2 | | | | 1,354,884 | |
| | 565 | | | 5.000%, 12/01/34 | | | 12/26 at 100.00 | | | | | | | | Baa2 | | | | 636,066 | |
| | 300 | | | 5.000%, 12/01/35 | | | 12/26 at 100.00 | | | | | | | | Baa2 | | | | 336,216 | |
| | | | | |
| | 11,555 | | | E-470 Public Highway Authority, Colorado, Senior Revenue Bonds, Series 1997B, 0.000%, 9/01/24 – NPFG Insured | | | No Opt. Call | | | | | | | | A | | | | 10,193,012 | |
| | | | | |
| | | | E-470 Public Highway Authority, Colorado, Senior Revenue Bonds, Series 2000B: | | | | | | | | | | | | | | | | |
| | 20 | | | 0.000%, 9/01/29 – NPFG Insured | | | No Opt. Call | | | | | | | | A | | | | 14,728 | |
| | 395 | | | 0.000%, 9/01/30 – NPFG Insured | | | No Opt. Call | | | | | | | | A | | | | 278,040 | |
| | 20 | | | 0.000%, 9/01/32 – NPFG Insured | | | No Opt. Call | | | | | | | | A | | | | 12,825 | |
| | 25 | | | 0.000%, 9/01/33 – NPFG Insured | | | No Opt. Call | | | | | | | | A | | | | 15,356 | |
| | | | | |
| | 9,890 | | | E-470 Public Highway Authority, Colorado, Toll Revenue Bonds, Series 2004A, 0.000%, 9/01/27 – NPFG Insured | | | No Opt. Call | | | | | | | | A | | | | 7,905,275 | |
42
| | | | | | | | | | | | | | | | | | | | |
Principal
Amount (000) | | | Description (1) | | Optional Call
Provisions (2) | | | | | | Ratings (3) | | | Value | |
| | | | | |
| | | | Colorado(continued) | | | | | | | | | | | | |
| | | | | |
| $ | 1,160 | | | El Paso County School District 49 Falcon, Colorado, Certificates of Participation, Series 2015, 5.000%, 12/15/28 | | | 12/25 at 100.00 | | | | | | | | Aa3 | | | $ | 1,369,345 | |
| | | | | |
| | 1,035 | | | Erie Farm Metropolitan District, Colorado, General Obligation Limited Tax Bonds, Series 2016A, 5.500%, 12/01/45 | | | 12/21 at 103.00 | | | | | | | | N/R | | | | 1,056,083 | |
| | | | | |
| | 1,764 | | | Fitzsimons Village Metropolitan District 1, Aurora, Arapahoe County, Colorado, Tax Increment Public Improvement Fee Supported Revenue Bonds, Series 2010A, 7.500%, 3/01/40 | | | 3/20 at 100.00 | | | | | | | | N/R | | | | 1,800,021 | |
| | | | | |
| | 1,365 | | | Foothills Metropolitan District, Fort Collins, Colorado, Special Revenue Bonds, Series 2014, 6.000%, 12/01/38 | | | 12/24 at 100.00 | | | | | | | | N/R | | | | 1,406,400 | |
| | | | | |
| | 720 | | | Fossil Ridge Metropolitan District 1, Lakewood, Colorado,Tax-Supported Revenue Bonds, Refunding Series 2010, 7.250%, 12/01/40 | | | 12/20 at 100.00 | | | | | | | | N/R | | | | 746,568 | |
| | | | | |
| | 3,600 | | | Fossil Ridge Metropolitan District No. 3, In the City of Lakewood, Jefferson County, Colorado, General Obligation Limited Tax Bonds, Series 2014, 5.000%, 12/01/44 | | | 12/20 at 100.00 | | | | | | | | BBB | | | | 3,672,648 | |
| | | | | |
| | 9,265 | | | Johnstown Plaza Metropolitan District, Colorado, Special Revenue Bonds, Series 2016A, 5.375%, 12/01/46 | | | 12/21 at 103.00 | | | | | | | | N/R | | | | 9,236,649 | |
| | | | | |
| | 2,025 | | | Park Creek Metropolitan District, Colorado, Senior Limited Property Tax Supported Revenue Bonds, Refunding Series 2009, 6.375%, 12/01/37 – AGC Insured(Pre-refunded 12/01/19) | | | 12/19 at 100.00 | | | | | | | | AA (4) | | | | 2,089,921 | |
| | | | | |
| | 620 | | | Park Creek Metropolitan District, Colorado, Senior Limited Property Tax Supported Revenue Bonds, Refunding Series 2015A, 5.000%, 12/01/45 | | | 12/25 at 100.00 | | | | | | | | A | | | | 677,871 | |
| | | | | |
| | 6,300 | | | Plaza Metropolitan District 1, Lakewood, Colorado, Tax Increment Revenue Bonds, Refunding Series 2013, 4.500%, 12/01/30, 144A | | | 12/22 at 100.00 | | | | | | | | N/R | | | | 6,466,572 | |
| | | | | |
| | | | Public Authority for Colorado Energy, Natural Gas Purchase Revenue Bonds, Colorado Springs Utilities, Series 2008: | | | | | | | | | | | | | | | | |
| | 2,170 | | | 6.250%, 11/15/28 | | | No Opt. Call | | | | | | | | A+ | | | | 2,753,361 | |
| | 3,580 | | | 6.500%, 11/15/38 | | | No Opt. Call | | | | | | | | A+ | | | | 5,220,965 | |
| | | | | |
| | | | Regional Transportation District, Colorado, Denver Transit Partners Eagle P3 Project Private Activity Bonds, Series 2010: | | | | | | | | | | | | | | | | |
| | 1,025 | | | 5.250%, 7/15/24 | | | 7/20 at 100.00 | | | | | | | | BBB+ | | | | 1,038,274 | |
| | 4,265 | | | 6.000%, 1/15/41 | | | 7/20 at 100.00 | | | | | | | | BBB+ | | | | 4,383,567 | |
| | | | | |
| | 575 | | | Sterling Hills West Metropolitan District, Arapahoe County, Colorado, General Obligation Bonds, Refunding & Improvement Series 2007, 5.000%, 12/01/39 | | | 12/27 at 100.00 | | | | | | | | Baa2 | | | | 638,739 | |
| | | | | |
| | 815 | | | Three Springs Metropolitan District 3, Durango, La Plata County, Colorado, Property Tax Supported Revenue Bonds, Series 2010, 7.750%, 12/01/39 | | | 12/20 at 100.00 | | | | | | | | N/R | | | | 833,289 | |
| | 193,869 | | | Total Colorado | | | | | | | | | | | | | | | 210,452,491 | |
| | | | | |
| | | | Connecticut – 0.5% | | | | | | | | | | | | |
| | | | | |
| | 860 | | | Connecticut Health and Educational Facilities Authority, Revenue Bonds, Healthcare Facility Expansion Church Home of Hartford Inc Project, Series 2016A, 5.000%, 9/01/53, 144A | | | 9/26 at 100.00 | | | | | | | | BB | | | | 891,760 | |
| | | | | |
| | 1,000 | | | Connecticut Health and Educational Facilities Authority, Revenue Bonds, Sacred Heart University, Series 2011G, 5.625%, 7/01/41(Pre-refunded 7/01/21) | | | 7/21 at 100.00 | | | | | | | | A (4) | | | | 1,090,090 | |
| | | | | |
| | 11,000 | | | Connecticut Health and Educational Facilities Authority, Revenue Bonds, Trinity Health Credit Group, Series 2016CT, 5.000%, 12/01/45 | | | 6/26 at 100.00 | | | | | | | | AA– | | | | 12,470,150 | |
43
NuveenAll-American Municipal Bond Fund(continued)
Portfolio of Investments March 31, 2019
| | | | | | | | | | | | | | | | | | | | |
Principal
Amount (000) | | | Description (1) | | Optional Call
Provisions (2) | | | | | | Ratings (3) | | | Value | |
| | | | | |
| | | | Connecticut(continued) | | | | | | | | | | | | |
| | | | | |
| $ | 1,675 | | | Connecticut State, Special Tax Obligation Bonds, Transportation Infrastructure Purposes Series 2015A, 5.000%, 8/01/35 | | | 8/25 at 100.00 | | | | | | | | A+ | | | $ | 1,861,109 | |
| | | | | |
| | 1,500 | | | Harbor Point Infrastructure Improvement District, Connecticut, Special Obligation Revenue Bonds, Harbor Point Project, Refunding Series 2017, 5.000%, 4/01/39, 144A | | | 4/27 at 100.00 | | | | | | | | N/R | | | | 1,606,035 | |
| | | | | |
| | 428 | | | Harbor Point Infrastructure Improvement District, Connecticut, Special Obligation Revenue Bonds, Harbor Point Project, Series 2010A, 7.000%, 4/01/22(Pre-refunded 4/01/20) | | | 4/20 at 100.00 | | | | | | | | N/R (4) | | | | 445,775 | |
| | | | | |
| | 1,800 | | | Stamford, Connecticut, Special Obligation Revenue Bonds, Mill River Corridor Project, Series 2011aA, 7.000%, 4/01/41(Pre-refunded 4/01/21) | | | 4/21 at 100.00 | | | | | | | | N/R (4) | | | | 1,989,558 | |
| | 18,263 | | | Total Connecticut | | | | | | | | | | | | | | | 20,354,477 | |
| | | | | |
| | | | Delaware – 0.1% | | | | | | | | | | | | |
| | | | | |
| | 1,000 | | | Delaware Economic Development Authority, Exempt Facility Revenue Bonds, Indian River Power LLC Project, Series 2010, 5.375%, 10/01/45 | | | 10/20 at 100.00 | | | | | | | | Baa3 | | | | 1,038,690 | |
| | | | | |
| | 1,000 | | | Delaware Economic Development Authority, Revenue Bonds, ASPIRA of Delaware Charter Operations, Inc. Project, Series 2016A, 5.000%, 6/01/46 | | | 6/26 at 100.00 | | | | | | | | BB+ | | | | 1,032,120 | |
| | | | | |
| | 2,450 | | | Delaware Health Facilities Authority, Revenue Bonds, Beebe Medical Center Project, Series 2018, 5.000%, 6/01/48 | | | 12/28 at 100.00 | | | | | | | | BBB | | | | 2,728,835 | |
| | | | | |
| | 600 | | | Kent County, Delaware, Student Housing & Dining Facility Revenue Bonds, Collegiate Housing Foundation – Dover LLC Delaware State University Project, Series 2018A, 5.000%, 7/01/58 | | | 1/28 at 100.00 | | | | | | | | BBB– | | | | 640,554 | |
| | 5,050 | | | Total Delaware | | | | | | | | | | | | | | | 5,440,199 | |
| | | | | |
| | | | District of Columbia – 0.4% | | | | | | | | | | | | |
| | | | | |
| | | | Metropolitan Washington D.C. Airports Authority, Airport System Revenue Bonds, Refunding Series 2018A: | | | | | | | | | | | | | | | | |
| | 8,470 | | | 5.000%, 10/01/33 (AMT) | | | 10/28 at 100.00 | | | | | | | | AA– | | | | 10,137,150 | |
| | 3,000 | | | 5.000%, 10/01/34 (AMT) | | | 10/28 at 100.00 | | | | | | | | AA– | | | | 3,577,860 | |
| | 3,000 | | | 5.000%, 10/01/35 (AMT) | | | 10/28 at 100.00 | | | | | | | | AA– | | | | 3,568,140 | |
| | 14,470 | | | Total District of Columbia | | | | | | | | | | | | | | | 17,283,150 | |
| | | | | |
| | | | Florida – 5.4% | | | | | | | | | | | | |
| | | | | |
| | | | Atlantic Beach, Florida, Healthcare Facilities Revenue Refunding Bonds, Fleet Landing Project, Series 2013A: | | | | | | | | | | | | | | | | |
| | 300 | | | 5.000%, 11/15/23 | | | No Opt. Call | | | | | | | | BBB | | | | 332,253 | |
| | 2,300 | | | 5.000%, 11/15/28 | | | 11/23 at 100.00 | | | | | | | | BBB | | | | 2,511,301 | |
| | | | | |
| | 1,250 | | | Bay County, Florida, Educational Facilities Revenue Refunding Bonds, Bay Haven Charter Academy, Inc Project, Series 2010A, 6.000%, 9/01/40 | | | 9/20 at 100.00 | | | | | | | | BBB | | | | 1,291,862 | |
| | | | | |
| | 445 | | | Boynton Village Community Development District, Florida, Special Assessment Bonds, Series2007-A1, 5.750%, 5/01/37 | | | 5/19 at 100.00 | | | | | | | | N/R | | | | 435,197 | |
| | | | | |
| | 6,000 | | | Cape Coral, Florida, Water and Sewer Revenue Bonds, Refunding Series 2011, 5.000%, 10/01/41 – AGM Insured(Pre-refunded 10/01/21) | | | 10/21 at 100.00 | | | | | | | | AA (4) | | | | 6,515,940 | |
| | | | | |
| | | | Capital Trust Agency, Florida, Multifamily Housing Revenue Bonds, The Gardens Apartments Project, Series 2015A: | | | | | | | | | | | | | | | | |
| | 1,500 | | | 4.750%, 7/01/40 | | | 7/25 at 100.00 | | | | | | | | B– | | | | 1,143,045 | |
| | 1,380 | | | 5.000%, 7/01/50 | | | 7/25 at 100.00 | | | | | | | | B– | | | | 1,031,495 | |
| | | | | |
| | 12,970 | | | Capital Trust Agency, Florida, Revenue Bonds, Provision CARES Proton Therapy Center, Orlando Project, Series 2018, 7.500%, 6/01/48, 144A | | | 6/28 at 100.00 | | | | | | | | N/R | | | | 13,684,128 | |
44
| | | | | | | | | | | | | | | | | | | | |
Principal
Amount (000) | | | Description (1) | | Optional Call
Provisions (2) | | | | | | Ratings (3) | | | Value | |
| | | | | |
| | | | Florida(continued) | | | | | | | | | | | | |
| | | | | |
| $ | 7,060 | | | Central Florida Expressway Authority, Revenue Bonds, Refunding Senior Lien Series 2016B, 4.000%, 7/01/39 | | | 7/26 at 100.00 | | | | | | | | A+ | | | $ | 7,502,591 | |
| | | | | |
| | 4,710 | | | Citizens Property Insurance Corporation, Florida, Personal and Commercial Lines Account Bonds, Senior Secured Series2012A-1, 5.000%, 6/01/19 | | | No Opt. Call | | | | | | | | AA | | | | 4,735,717 | |
| | | | | |
| | 1,125 | | | Cityplace Community Development District, Florida, Special Assessment and Revenue Bonds, Refunding Series 2012, 5.000%, 5/01/26 | | | No Opt. Call | | | | | | | | A | | | | 1,272,049 | |
| | | | | |
| | 1,000 | | | Clearwater, Florida, Water and Sewer Revenue Bonds, Series 2009A, 5.250%, 12/01/39 – AGC Insured(Pre-refunded 12/01/19) | | | 12/19 at 100.00 | | | | | | | | AA (4) | | | | 1,025,000 | |
| | | | | |
| | 1,000 | | | Coco Palms Community Development District, Miami-Dade County, Florida, Special Assessment Bonds, Series 2016, 5.000%, 5/01/46 | | | 5/27 at 100.00 | | | | | | | | N/R | | | | 1,025,350 | |
| | | | | |
| | 2,885 | | | Florida Development Finance Corporation, Educational Facilities Revenue Bonds, Bay Area Charter Foundation, LLC Projects, Series 2011A, 7.750%, 6/15/42 | | | 12/21 at 101.00 | | | | | | | | N/R | | | | 3,078,006 | |
| | | | | |
| | 1,570 | | | Florida Development Finance Corporation, Educational Facilities Revenue Bonds, Renaissance Charter School Income Projects, Series 2015A, 6.125%, 6/15/46, 144A | | | 6/25 at 100.00 | | | | | | | | N/R | | | | 1,635,045 | |
| | | | | |
| | 1,000 | | | Florida Development Finance Corporation, Educational Facilities Revenue Bonds, Renaissance Charter School, Inc Projects, Series 2010A, 6.000%, 9/15/30 | | | 9/20 at 100.00 | | | | | | | | BB+ | | | | 1,036,820 | |
| | | | | |
| | 500 | | | Florida Development Finance Corporation, Educational Facilities Revenue Bonds, Renaissance Charter School, Inc Projects, Series 2012A, 6.000%, 6/15/32, 144A | | | 6/22 at 100.00 | | | | | | | | N/R | | | | 512,655 | |
| | | | | |
| | 2,000 | | | Florida Development Finance Corporation, Educational Facilities Revenue Bonds, Renaissance Charter School, Inc Projects, Series 2013A, 8.500%, 6/15/44 | | | 6/23 at 100.00 | | | | | | | | N/R | | | | 2,290,660 | |
| | | | | |
| | 1,500 | | | Florida Development Finance Corporation, Educational Facilities Revenue Bonds, Renaissance Charter School, Inc Projects, Series 2014A, 6.125%, 6/15/44 | | | 6/24 at 100.00 | | | | | | | | N/R | | | | 1,591,830 | |
| | | | | |
| | | | Florida Development Finance Corporation, Educational Facilities Revenue Bonds, Renaissance Charter School, Inc. Projects, Series 2012A: | | | | | | | | | | | | | | | | |
| | 805 | | | 5.500%, 6/15/22, 144A | | | No Opt. Call | | | | | | | | N/R | | | | 818,130 | |
| | 1,100 | | | 6.125%, 6/15/43, 144A | | | 6/22 at 100.00 | | | | | | | | N/R | | | | 1,117,358 | |
| | | | | |
| | | | Florida Higher Educational Facilities Financing Authority, Revenue Bonds, Jacksonville University Project, Series2018A-1: | | | | | | | | | | | | | | | | |
| | 450 | | | 4.500%, 6/01/33, 144A | | | 6/28 at 100.00 | | | | | | | | N/R | | | | 473,449 | |
| | 550 | | | 4.750%, 6/01/38, 144A | | | 6/28 at 100.00 | | | | | | | | N/R | | | | 579,634 | |
| | | | | |
| | 6,800 | | | Florida Higher Educational Facilities Financing Authority, Revenue Bonds, Nova Southeastern University Project, Refunding Series 2012A, 5.000%, 4/01/27 | | | 4/22 at 100.00 | | | | | | | | A– | | | | 7,332,168 | |
| | | | | |
| | | | Florida Higher Educational Facilities Financing Authority, Revenue Bonds, Rollins College Project, Series 2012A: | | | | | | | | | | | | | | | | |
| | 1,210 | | | 5.000%, 12/01/30 | | | 12/22 at 100.00 | | | | | | | | A2 | | | | 1,334,013 | |
| | 1,000 | | | 5.000%, 12/01/31 | | | 12/22 at 100.00 | | | | | | | | A2 | | | | 1,101,180 | |
| | 3,000 | | | 5.000%, 12/01/37 | | | 12/22 at 100.00 | | | | | | | | A2 | | | | 3,287,610 | |
| | | | | |
| | 1,000 | | | Florida Housing Finance Agency, Housing Revenue Bonds, Stoddert Arms Apartments, Series 1996O, 6.300%, 9/01/36 – AMBAC Insured (AMT) | | | 5/19 at 100.00 | | | | | | | | N/R | | | | 1,001,510 | |
| | | | | |
| | 840 | | | Grand Bay at Doral Community Development District, Miami-Dade County, Florida, Special Assessment Bonds, South Parcel Assessment Area Project, Series 2016, 5.000%, 5/01/46 | | | 5/26 at 100.00 | | | | | | | | N/R | | | | 850,954 | |
45
NuveenAll-American Municipal Bond Fund(continued)
Portfolio of Investments March 31, 2019
| | | | | | | | | | | | | | | | | | | | |
Principal
Amount (000) | | | Description (1) | | Optional Call
Provisions (2) | | | | | | Ratings (3) | | | Value | |
| | | | | |
| | | | Florida(continued) | | | | | | | | | | | | |
| | | | | |
| $ | 3,130 | | | Hillsborough County Aviation Authority, Florida, Revenue Bonds, Tampa International Airport, Senior Lien Series 2015A, 5.000%, 10/01/44 (AMT) | | | 10/24 at 100.00 | | | | | | | | AA– | | | $ | 3,463,063 | |
| | | | | |
| | | | Jacksonville, Florida, Special Revenue Bonds, Refunding Series 2017A: | | | | | | | | | | | | | | | | |
| | 6,285 | | | 5.250%, 10/01/42 | | | 10/27 at 100.00 | | | | | | | | AA | | | | 7,359,672 | |
| | 3,930 | | | 5.250%, 10/01/47 | | | 10/27 at 100.00 | | | | | | | | AA | | | | 4,584,031 | |
| | | | | |
| | 735 | | | Lee County Industrial Development Authority, Florida, Charter School Revenue Bonds, Lee County Community Charter Schools, Series 2007A, 5.250%, 6/15/27 | | | 5/19 at 100.00 | | | | | | | | BB– | | | | 735,118 | |
| | | | | |
| | | | Lee County Industrial Development Authority, Florida, Charter School Revenue Bonds, Lee County Community Charter Schools, Series 2012A: | | | | | | | | | | | | | | | | |
| | 875 | | | 5.500%, 6/15/32 | | | 6/22 at 100.00 | | | | | | | | BB– | | | | 879,506 | |
| | 1,375 | | | 5.750%, 6/15/42 | | | 6/22 at 100.00 | | | | | | | | BB– | | | | 1,378,052 | |
| | | | | |
| | 6,875 | | | Martin County Health Facilities Authority, Florida, Hospital Revenue Bonds, Martin Memorial Medical Center, Series 2015, 5.000%, 11/15/45 | | | 11/24 at 100.00 | | | | | | | | A+ | | | | 7,419,294 | |
| | | | | |
| | | | Martin County Industrial Development Authority, Florida, Industrial Development Revenue Refunding Bonds, Indiantown Cogeneration LP, Series 2013: | | | | | | | | | | | | | | | | |
| | 885 | | | 3.950%, 12/15/21 (AMT), 144A | | | 6/20 at 100.00 | | | | | | | | BBB+ | | | | 902,231 | |
| | 9,500 | | | 4.200%, 12/15/25 (AMT), 144A | | | 6/20 at 100.00 | | | | | | | | BBB+ | | | | 9,680,500 | |
| | | | | |
| | 6,340 | | | Miami Beach Redevelopment Agency, Florida, Tax Increment Revenue Bonds, City Center/Historic Convention Village, Series 2015A, 5.000%, 2/01/44 – AGM Insured | | | 2/24 at 100.00 | | | | | | | | AA | | | | 7,076,835 | |
| | | | | |
| | 7,405 | | | Miami Beach, Florida, Stormwater Revenue Bonds, Refunding Series 2017, 5.000%, 9/01/47 | | | 9/22 at 100.00 | | | | | | | | AA– | | | | 8,054,122 | |
| | | | | |
| | 860 | | | Miami-Dade County Health Facility Authority, Florida, Hospital Revenue Bonds, Nicklaus Children’s Hospital, Refunding Series 2017, 5.000%, 8/01/36 | | | 8/27 at 100.00 | | | | | | | | A+ | | | | 991,726 | |
| | | | | |
| | | | Miami-Dade County, Florida, Aviation Revenue Bonds, Miami International Airport, Series2010A-1: | | | | | | | | | | | | | | | | |
| | 1,250 | | | 5.375%, 10/01/35(Pre-refunded 10/01/20) | | | 10/20 at 100.00 | | | | | | | | N/R (4) | | | | 1,321,262 | |
| | 335 | | | 5.375%, 10/01/35 | | | 10/20 at 100.00 | | | | | | | | A | | | | 352,534 | |
| | | | | |
| | 12,195 | | | Miami-Dade County, Florida, Aviation Revenue Bonds, Refunding Series 2015A, 5.000%, 10/01/38 (AMT) | | | 10/25 at 100.00 | | | | | | | | A | | | | 13,706,814 | |
| | | | | |
| | 1,040 | | | Miami-Dade County, Florida, Public Facilities Revenue Bonds, Jackson Health System, Series 2009, 5.625%, 6/01/34 – AGC Insured(Pre-refunded 6/01/19) (UB) (5) | | | 6/19 at 100.00 | | | | | | | | AA (4) | | | | 1,046,978 | |
| | | | | |
| | 22,160 | | | Miami-Dade County, Florida, Water and Sewer System Revenue Bonds, Series 2013A, 5.000%, 10/01/42 | | | 10/22 at 100.00 | | | | | | | | AA– | | | | 24,128,916 | |
| | | | | |
| | 7,500 | | | Orange County Health Facilities Authority, Florida, Hospital Revenue Bonds, Orlando Health, Inc, Series 2019A, 5.000%, 10/01/47 | | | 4/29 at 100.00 | | | | | | | | A+ | | | | 8,622,900 | |
| | | | | |
| | | | Orange County Health Facilities Authority, Florida, Revenue Bond, Mayflower Retirement Center, Refunding Series 2012: | | | | | | | | | | | | | | | | |
| | 550 | | | 4.500%, 6/01/27 | | | 6/21 at 100.00 | | | | | | | | A– | | | | 572,049 | |
| | 625 | | | 5.000%, 6/01/32 | | | 6/21 at 100.00 | | | | | | | | A– | | | | 650,706 | |
| | 750 | | | 5.000%, 6/01/36 | | | 6/21 at 100.00 | | | | | | | | A– | | | | 777,720 | |
| | 875 | | | 5.125%, 6/01/42 | | | 6/21 at 100.00 | | | | | | | | A– | | | | 906,535 | |
| | | | | |
| | 5,095 | | | Putnam County Development Authority, Florida, Pollution Control Revenue Bonds, Seminole Electric Cooperative, Inc. Project, Refunding Series 2018B, 5.000%, 3/15/42 | | | 5/28 at 100.00 | | | | | | | | A– | | | | 5,853,238 | |
46
| | | | | | | | | | | | | | | | | | | | |
Principal
Amount (000) | | | Description (1) | | Optional Call
Provisions (2) | | | | | | Ratings (3) | | | Value | |
| | | | | |
| | | | Florida(continued) | | | | | | | | | | | | |
| | | | | |
| $ | 1,006 | | | Riverbend West Community Development District, Florida, Special Assessment Bonds, Series 2016, 5.000%, 5/01/46 | | | 5/27 at 100.00 | | | | | | | | N/R | | | $ | 1,022,066 | |
| | | | | |
| | | | South Miami Health Facilities Authority, Florida, Hospital Revenue Bonds, Baptist Health Systems of South Florida Obligated Group, Series 2017: | | | | | | | | | | | | | | | | |
| | 5,000 | | | 5.000%, 8/15/31 | | | 8/27 at 100.00 | | | | | | | | AA– | | | | 5,980,700 | |
| | 3,655 | | | 5.000%, 8/15/47 | | | 8/27 at 100.00 | | | | | | | | AA– | | | | 4,188,484 | |
| | | | | |
| | 500 | | | Sumter County Industrial Development Authority, Florida, Hospital Revenue Bonds, Central Florida Health Alliance Projects, Series 2014A, 5.000%, 7/01/29 | | | 1/24 at 100.00 | | | | | | | | A– | | | | 558,120 | |
| | | | | |
| | 35 | | | Tampa, Florida, Health System Revenue Bonds, Baycare Health System, Series 2012A, 5.000%, 11/15/33 | | | 5/22 at 100.00 | | | | | | | | Aa2 | | | | 38,130 | |
| | | | | |
| | 290 | | | Tolomato Community Development District, Florida, Special Assessment Bonds, Convertible, Capital Appreciation, Series2012A-3, 0.000%, 5/01/40 (6) | | | 5/19 at 100.00 | | | | | | | | N/R | | | | 288,634 | |
| | | | | |
| | 210 | | | Tolomato Community Development District, Florida, Special Assessment Bonds, Convertible, Capital Appreciation, Series2012A-4, 0.000%, 5/01/40 (6) | | | 5/22 at 100.00 | | | | | | | | N/R | | | | 174,409 | |
| | | | | |
| | 170 | | | Tolomato Community Development District, Florida, Special Assessment Bonds, Hope Note, Series2007-3, 6.650%, 5/01/40 (7) | | | 5/19 at 100.00 | | | | | | | | N/R | | | | 2 | |
| | | | | |
| | 475 | | | Tolomato Community Development District, Florida, Special Assessment Bonds, Hope Note, Series2007A-2, 5.250%, 5/01/39 (7) | | | 5/19 at 100.00 | | | | | | | | N/R | | | | 5 | |
| | | | | |
| | 15 | | | Tolomato Community Development District, Florida, Special Assessment Bonds, Non Performing Parcel Series2007-1 RMKT, 6.650%, 5/01/40 | | | 5/19 at 100.00 | | | | | | | | N/R | | | | 14,126 | |
| | | | | |
| | 95 | | | Tolomato Community Development District, Florida, Special Assessment Bonds, Non Performing Parcel Series2007A-1 RMKT, 5.250%, 5/01/39 | | | 5/19 at 100.00 | | | | | | | | N/R | | | | 81,026 | |
| | | | | |
| | 435 | | | Tolomato Community Development District, Florida, Special Assessment Bonds, Refunding Series2015-1, 0.000%, 5/01/40 | | | 5/19 at 100.00 | | | | | | | | N/R | | | | 354,703 | |
| | | | | |
| | 270 | | | Tolomato Community Development District, Florida, Special Assessment Bonds, Refunding Series2015-2, 0.000%, 5/01/40 | | | 5/19 at 100.00 | | | | | | | | N/R | | | | 181,022 | |
| | | | | |
| | 290 | | | Tolomato Community Development District, Florida, Special Assessment Bonds, Refunding Series2015-3, 6.610%, 5/01/40 (7) | | | 5/19 at 100.00 | | | | | | | | N/R | | | | 3 | |
| | | | | |
| | 2,155 | | | Tolomato Community Development District, Florida, Special Assessment Bonds, Series 2006, 5.400%, 5/01/37 | | | 5/19 at 100.00 | | | | | | | | N/R | | | | 2,157,306 | |
| | | | | |
| | 250 | | | Venetian Community Development District, Sarasota County, Florida, Capital Improvement Revenue Bonds, Series2012-A1, 6.125%, 5/01/42 | | | 5/22 at 100.00 | | | | | | | | N/R | | | | 265,495 | |
| | | | | |
| | 1,500 | | | Venetian Community Development District, Sarasota County, Florida, Capital Improvement Revenue Bonds, Series2012-A2, 5.500%, 5/01/34 | | | 5/22 at 100.00 | | | | | | | | N/R | | | | 1,561,155 | |
| | | | | |
| | | | Volusia County Educational Facilities Authority, Florida, Revenue Bonds, Embry-Riddle Aeronautical University, Refunding Series 2017: | | | | | | | | | | | | | | | | |
| | 2,380 | | | 5.000%, 10/15/42 | | | 10/27 at 100.00 | | | | | | | | A3 | | | | 2,686,330 | |
| | 3,000 | | | 5.000%, 10/15/47 | | | 10/27 at 100.00 | | | | | | | | A3 | | | | 3,377,670 | |
| | | | | |
| | 13,000 | | | Volusia County Educational Facilities Authority, Florida, Revenue Bonds, Stetson University Inc Project, Series 2015, 5.000%, 6/01/40 | | | 6/25 at 100.00 | | | | | | | | A– | | | | 14,586,520 | |
| | | | | |
| | | | Wynnmere East Community Development District, Hillsborough County, Florida, Special Assessment Revenue Bonds, Series 2016: | | | | | | | | | | | | | | | | |
| | 470 | | | 5.125%, 5/01/36 | | | 5/28 at 100.00 | | | | | | | | N/R | | | | 480,533 | |
| | 930 | | | 5.500%, 5/01/46 | | | 5/28 at 100.00 | | | | | | | | N/R | | | | 979,448 | |
| | 203,951 | | | Total Florida | | | | | | | | | | | | | | | 219,986,639 | |
47
NuveenAll-American Municipal Bond Fund(continued)
Portfolio of Investments March 31, 2019
| | | | | | | | | | | | | | | | | | | | |
Principal
Amount (000) | | | Description (1) | | Optional Call
Provisions (2) | | | | | | Ratings (3) | | | Value | |
| | | | | |
| | | | Georgia – 1.2% | | | | | | | | | | | | |
| | | | | |
| | | | Atlanta Development Authority, Georgia, Senior Health Care Facilities Revenue Bonds, Georgia Proton Treatment Center Project, Current Interest Series2017A-1: | | | | | | | | | | | | | | | | |
| $ | 2,500 | | | 6.750%, 1/01/35 | | | 1/28 at 100.00 | | | | | | | | N/R | | | $ | 2,531,050 | |
| | 1,000 | | | 7.000%, 1/01/40 | | | 1/28 at 100.00 | | | | | | | | N/R | | | | 1,016,310 | |
| | | | | |
| | | | Atlanta, Georgia, Water and Wastewater Revenue Bonds, Refunding Series 2009B: | | | | | | | | | | | | | | | | |
| | 4,565 | | | 5.375%, 11/01/39 – AGM Insured(Pre-refunded 11/01/19) | | | 11/19 at 100.00 | | | | | | | | AA (4) | | | | 4,668,169 | |
| | 2,435 | | | 5.375%, 11/01/39 – AGM Insured | | | 11/19 at 100.00 | | | | | | | | AA | | | | 2,485,015 | |
| | | | | |
| | 10,000 | | | Fulton County Development Authority, Georgia, Revenue Bonds, Georgia Tech Athletic Association, Series 2011, 5.750%, 10/01/41 | | | 4/21 at 100.00 | | | | | | | | A+ | | | | 10,689,700 | |
| | | | | |
| | 1,100 | | | Georgia Municipal Electric Authority, Senior Lien General Power Revenue Bonds, Series 1993BB, 5.250%, 1/01/25 – NPFG Insured | | | No Opt. Call | | | | | | | | A1 | | | | 1,205,952 | |
| | | | | |
| | 1,000 | | | Lavonia Hospital Authority, Georgia, Revenue Anticipation Certificates, Ty Cobb Regional Medical Center , Series 2010, 6.000%, 12/01/40 – AGM Insured(Pre-refunded 12/01/20) | | | 12/20 at 100.00 | | | | | | | | AA (4) | | | | 1,073,480 | |
| | | | | |
| | | | Main Street Natural Gas Inc., Georgia, Gas Project Revenue Bonds, Series 2007A: | | | | | | | | | | | | | | | | |
| | 960 | | | 5.000%, 3/15/22 | | | No Opt. Call | | | | | | | | A+ | | | | 1,040,361 | |
| | 1,000 | | | 5.500%, 9/15/28 | | | No Opt. Call | | | | | | | | A+ | | | | 1,250,430 | |
| | | | | |
| | 5,000 | | | Municipal Electric Authority of Georgia, Project One Revenue Bonds, Subordinate Lien Series 2016A, 5.000%, 1/01/28 | | | 7/26 at 100.00 | | | | | | | | A2 | | | | 5,775,600 | |
| | | | | |
| | 1,590 | | | Private Colleges and Universities Authority, Georgia, Revenue Bonds, Mercer University, Series 2012A, 5.250%, 10/01/27 | | | 10/21 at 100.00 | | | | | | | | Baa1 | | | | 1,707,199 | |
| | | | | |
| | 13,120 | | | Private Colleges and Universities Authority, Georgia, Revenue Bonds, Savannah College of Art & Design Projects, Series 2014, 5.000%, 4/01/44 | | | 4/24 at 100.00 | | | | | | | | A3 | | | | 14,275,085 | |
| | | | | |
| | 1,000 | | | Savannah Economic Development Authority, Georgia, Revenue Bonds, Armstrong Atlantic State University, Windward Commons LLC Project, Series 2009, 5.000%, 6/15/39 – AGC Insured(Pre-refunded 6/15/19) | | | 6/19 at 100.00 | | | | | | | | AA (4) | | | | 1,006,950 | |
| | 45,270 | | | Total Georgia | | | | | | | | | | | | | | | 48,725,301 | |
| | | | | |
| | | | Guam – 0.2% | | | | | | | | | | | | |
| | | | | |
| | 1,020 | | | Government of Guam, Business Privilege Tax Bonds, Series 2011A, 5.000%, 1/01/31 | | | 1/22 at 100.00 | | | | | | | | BB | | | | 1,063,850 | |
| | | | | |
| | 2,000 | | | Guam Government Department of Education, Certificates of Participation, John F Kennedy High School Project, Series 2010A, 6.625%, 12/01/30 | | | 12/20 at 100.00 | | | | | | | | B+ | | | | 2,052,720 | |
| | | | | |
| | 1,005 | | | Guam Government Waterworks Authority, Water and Wastewater System Revenue Bonds, Series 2010, 5.625%, 7/01/40(Pre-refunded 7/01/20) | | | 7/20 at 100.00 | | | | | | | | A– (4) | | | | 1,055,622 | |
| | | | | |
| | 1,610 | | | Guam International Airport Authority, Revenue Bonds, Series 2013C, 6.375%, 10/01/43 (AMT) | | | 10/23 at 100.00 | | | | | | | | BBB+ | | | | 1,857,280 | |
| | 5,635 | | | Total Guam | | | | | | | | | | | | | | | 6,029,472 | |
| | | | | |
| | | | Hawaii – 0.3% | | | | | | | | | | | | |
| | | | | |
| | 1,500 | | | Hawaii Department of Budget and Finance, Special Purpose Revenue Bonds, Hawaii Pacific Health Obligated Group, Series 2013A, 5.500%, 7/01/43 | | | 7/23 at 100.00 | | | | | | | | AA– | | | | 1,676,085 | |
| | | | | |
| | 1,000 | | | Hawaii Department of Budget and Finance, Special Purpose Revenue Bonds, Hawaii Pacific University, Series 2013A, 6.875%, 7/01/43 | | | 7/23 at 100.00 | | | | | | | | BB | | | | 1,057,920 | |
48
| | | | | | | | | | | | | | | | | | | | |
Principal
Amount (000) | | | Description (1) | | Optional Call
Provisions (2) | | | | | | Ratings (3) | | | Value | |
| | | | | |
| | | | Hawaii(continued) | | | | | | | | | | | | |
| | | | | |
| | | | Hawaii Department of Budget and Finance, Special Purpose Senior Living Revenue Bonds, 15 Craigside Project, Series 2009A: | | | | | | | | | | | | | | | | |
| $ | 865 | | | 8.750%, 11/15/29(Pre-refunded 11/15/19) | | | 11/19 at 100.00 | | | | | | | | N/R (4) | | | $ | 902,671 | |
| | 1,250 | | | 9.000%, 11/15/44(Pre-refunded 11/15/19) | | | 11/19 at 100.00 | | | | | | | | N/R (4) | | | | 1,306,187 | |
| | | | | |
| | 4,545 | | | Hawaii State, Airport System Revenue Bonds, Series 2015A, 5.000%, 7/01/45 (AMT) | | | 7/25 at 100.00 | | | | | | | | AA– | | | | 5,066,857 | |
| | 9,160 | | | Total Hawaii | | | | | | | | | | | | | | | 10,009,720 | |
| | | | | |
| | | | Idaho – 0.2% | | | | | | | | | | | | |
| | | | | |
| | | | Idaho Health Facilities Authority, Revenue Bonds, Madison Memorial Hospital Project, Refunding Series 2016: | | | | | | | | | | | | | | | | |
| | 2,300 | | | 3.500%, 9/01/33 | | | 9/26 at 100.00 | | | | | | | | BB+ | | | | 2,130,674 | |
| | 205 | | | 5.000%, 9/01/37 | | | 9/26 at 100.00 | | | | | | | | BB+ | | | | 222,718 | |
| | | | | |
| | | | Idaho Health Facilities Authority, Revenue Bonds, Saint Luke’s Health System Project, Series 2018A: | | | | | | | | | | | | | | | | |
| | 2,435 | | | 5.000%, 3/01/36 | | | 9/28 at 100.00 | | | | | | | | A– | | | | 2,809,479 | |
| | 2,250 | | | 5.000%, 3/01/37 | | | 9/28 at 100.00 | | | | | | | | A– | | | | 2,581,515 | |
| | | | | |
| | 2,000 | | | Idaho Housing and Finance Association, Nonprofit Facilities Revenue Bonds, Idaho Arts Charter School, Inc. Project, Refunding Series 2016A, 5.000%, 12/01/38 | | | 12/26 at 100.00 | | | | | | | | BBB– | | | | 2,132,140 | |
| | 9,190 | | | Total Idaho | | | | | | | | | | | | | | | 9,876,526 | |
| | | | | |
| | | | Illinois – 9.4% | | | | | | | | | | | | |
| | | | | |
| | | | Bensenville, Illinois, General Obligation Bonds, Series 2011A: | | | | | | | | | | | | | | | | |
| | 1,295 | | | 5.000%, 12/15/30 – AGM Insured(Pre-refunded 12/15/21) | | | 12/21 at 100.00 | | | | | | | | AA (4) | | | | 1,411,705 | |
| | 705 | | | 5.000%, 12/15/30 – AGM Insured | | | 12/21 at 100.00 | | | | | | | | AA | | | | 749,944 | |
| | | | | |
| | | | Champaign, Illinois, General Obligation Sales Tax Bonds, Public Safety Series 1999: | | | | | | | | | | | | | | | | |
| | 1,140 | | | 8.250%, 1/01/21 – FGIC Insured | | | No Opt. Call | | | | | | | | Baa2 | | | | 1,260,224 | |
| | 1,275 | | | 8.250%, 1/01/22 – FGIC Insured | | | No Opt. Call | | | | | | | | Baa2 | | | | 1,483,259 | |
| | | | | |
| | 67,800 | | | Chicago Board of Education, Illinois, Dedicated Capital Improvement Tax Revenue Bonds, Series 2016, 6.000%, 4/01/46 | | | 4/27 at 100.00 | | | | | | | | A | | | | 78,662,916 | |
| | | | | |
| | 590 | | | Chicago Board of Education, Illinois, General Obligation Bonds, Dedicated Revenues Series 2012A, 5.000%, 12/01/42 | | | 12/22 at 100.00 | | | | | | | | BB– | | | | 605,777 | |
| | | | | |
| | 1,215 | | | Chicago Board of Education, Illinois, General Obligation Bonds, Dedicated Revenues, Project Series 2015C, 5.250%, 12/01/39 | | | 12/24 at 100.00 | | | | | | | | BB– | | | | 1,280,258 | |
| | | | | |
| | 35,090 | | | Chicago Board of Education, Illinois, General Obligation Bonds, Dedicated Revenues, Series 2016A, 7.000%, 12/01/44 | | | 12/25 at 100.00 | | | | | | | | BB– | | | | 41,080,214 | |
| | | | | |
| | 2,100 | | | Chicago Transit Authority, Illinois, Sales Tax Receipts Revenue Bonds, Series 2011, 5.250%, 12/01/40 | | | 12/21 at 100.00 | | | | | | | | AA | | | | 2,211,531 | |
| | | | | |
| | 1,550 | | | Chicago, Illinois, Certificates of Participation Tax Increment Bonds, River Point Plaza Redevelopment Project, Series 2018, 4.835%, 4/15/28, 144A | | | 1/23 at 100.00 | | | | | | | | N/R | | | | 1,553,922 | |
| | | | | |
| | 3,180 | | | Chicago, Illinois, General Airport Revenue Bonds, O’Hare International Airport, Senior Lien Series 2015C, 5.000%, 1/01/46 (AMT) | | | 1/25 at 100.00 | | | | | | | | A | | | | 3,494,566 | |
| | | | | |
| | 900 | | | Chicago, Illinois, General Obligation Bonds, Project & Refunding Series 2014A, 5.000%, 1/01/35 | | | 1/24 at 100.00 | | | | | | | | BBB+ | | | | 945,873 | |
| | | | | |
| | 8,805 | | | Chicago, Illinois, General Obligation Bonds, Project & Refunding Series 2017A, 6.000%, 1/01/38 | | | 1/27 at 100.00 | | | | | | | | BBB+ | | | | 10,057,335 | |
49
NuveenAll-American Municipal Bond Fund(continued)
Portfolio of Investments March 31, 2019
| | | | | | | | | | | | | | | | | | | | |
Principal
Amount (000) | | | Description (1) | | Optional Call
Provisions (2) | | | | | | Ratings (3) | | | Value | |
| | | | | |
| | | | Illinois(continued) | | | | | | | | | | | | |
| | | | | |
| $ | 920 | | | Chicago, Illinois, General Obligation Bonds, Project and Refunding Series 2003B, 5.500%, 1/01/33 | | | 1/25 at 100.00 | | | | | | | | BBB+ | | | $ | 1,011,301 | |
| | | | | |
| | 13,760 | | | Chicago, Illinois, General Obligation Bonds, Project and Refunding Series 2005D, 5.500%, 1/01/40 | | | 1/25 at 100.00 | | | | | | | | BBB+ | | | | 14,895,888 | |
| | | | | |
| | 125 | | | Chicago, Illinois, General Obligation Bonds, Project and Refunding Series 2009C, 5.000%, 1/01/34 | | | 5/19 at 100.00 | | | | | | | | BBB+ | | | | 125,243 | |
| | | | | |
| | | | Chicago, Illinois, General Obligation Bonds, Project Series 2011A: | | | | | | | | | | | | | | | | |
| | 400 | | | 5.250%, 1/01/35 | | | 1/21 at 100.00 | | | | | | | | BBB+ | | | | 409,932 | |
| | 1,035 | | | 5.000%, 1/01/40 | | | 1/21 at 100.00 | | | | | | | | BBB+ | | | | 1,052,543 | |
| | | | | |
| | 1,000 | | | Chicago, Illinois, General Obligation Bonds, Project Series 2012A, 5.000%, 1/01/33 | | | 1/22 at 100.00 | | | | | | | | BBB+ | | | | 1,033,520 | |
| | | | | |
| | 7,545 | | | Chicago, Illinois, General Obligation Bonds, Refunding Series 2007E, 5.500%, 1/01/42 | | | 1/25 at 100.00 | | | | | | | | BBB+ | | | | 8,146,488 | |
| | | | | |
| | 1,635 | | | Chicago, Illinois, General Obligation Bonds, Refunding Series 2009A, 5.000%, 1/01/22(Pre-refunded 1/01/20) | | | 1/20 at 100.00 | | | | | | | | BBB+ (4) | | | | 1,675,352 | |
| | | | | |
| | 1,320 | | | Chicago, Illinois, General Obligation Bonds, Refunding Series 2012C, 5.000%, 1/01/25 | | | 1/22 at 100.00 | | | | | | | | BBB+ | | | | 1,383,149 | |
| | | | | |
| | | | Chicago, Illinois, General Obligation Bonds, Refunding Series 2016C: | | | | | | | | | | | | | | | | |
| | 2,260 | | | 5.000%, 1/01/24 | | | No Opt. Call | | | | | | | | BBB+ | | | | 2,448,009 | |
| | 935 | | | 5.000%, 1/01/25 | | | No Opt. Call | | | | | | | | BBB+ | | | | 1,024,947 | |
| | 2,500 | | | 5.000%, 1/01/29 | | | 1/26 at 100.00 | | | | | | | | BBB+ | | | | 2,734,450 | |
| | 705 | | | 5.000%, 1/01/35 | | | 1/26 at 100.00 | | | | | | | | BBB+ | | | | 754,258 | |
| | 2,175 | | | 5.000%, 1/01/38 | | | 1/26 at 100.00 | | | | | | | | BBB+ | | | | 2,308,132 | |
| | | | | |
| | 2,200 | | | Chicago, Illinois, General Obligation Bonds, Series 2015A, 5.500%, 1/01/39 | | | 1/25 at 100.00 | | | | | | | | BBB+ | | | | 2,385,966 | |
| | | | | |
| | 715 | | | Chicago, Illinois, General Obligation Bonds, Variable Rate Demand Series 2007F, 5.500%, 1/01/42 | | | 1/25 at 100.00 | | | | | | | | BBB+ | | | | 772,000 | |
| | | | | |
| | 4,440 | | | Cook County, Illinois, General Obligation Bonds, Refunding Series 2010A, 5.250%, 11/15/33 | | | 11/20 at 100.00 | | | | | | | | AA– | | | | 4,626,702 | |
| | | | | |
| | 2,000 | | | Cook County, Illinois, Recovery Zone Facility Revenue Bonds, Navistar International Corporation Project, Series 2010, 6.750%, 10/15/40 | | | 10/20 at 100.00 | | | | | | | | BB | | | | 2,082,540 | |
| | | | | |
| | | | DeKalb, Kane, LaSalle, Lee, Ogle, Winnebago and Boone Counties Community College District 523, Illinois, General Obligation Bonds, Kishwaukee Community College, Series 2011B: | | | | | | | | | | | | | | | | |
| | 1,000 | | | 0.000%, 2/01/35 | | | 2/21 at 38.17 | | | | | | | | AA– | | | | 367,610 | |
| | 750 | | | 0.000%, 2/01/36 | | | 2/21 at 35.47 | | | | | | | | AA– | | | | 256,208 | |
| | | | | |
| | 575 | | | Harvey, Cook County, Illinois, Tax Increment Allocation Revenue Bonds, Amended Center Street Redevelopment Project Area, Series 2010, 7.500%, 12/01/19 | | | No Opt. Call | | | | | | | | N/R | | | | 586,218 | |
| | | | | |
| | 1,400 | | | Illinois Finance Authority, Charter School Revenue Bonds, Uno Charter School Network, Refunding and Improvement Series 2011A, 7.125%, 10/01/41 | | | 10/21 at 100.00 | | | | | | | | BB+ | | | | 1,473,724 | |
| | | | | |
| | 2,195 | | | Illinois Finance Authority, Revenue Bonds, Centegra Health System, Series 2014A, 5.000%, 9/01/34 | | | 9/24 at 100.00 | | | | | | | | AA+ | | | | 2,478,594 | |
| | | | | |
| | 1,255 | | | Illinois Finance Authority, Revenue Bonds, Central DuPage Health, Series 2009, 5.250%, 11/01/39(Pre-refunded 11/01/19) | | | 11/19 at 100.00 | | | | | | | | N/R (4) | | | | 1,281,719 | |
| | | | | |
| | | | Illinois Finance Authority, Revenue Bonds, Christian Homes Inc, Refunding Series 2010: | | | | | | | | | | | | | | | | |
| | 710 | | | 6.125%, 5/15/27(Pre-refunded 5/15/20) | | | 5/20 at 100.00 | | | | | | | | N/R (4) | | | | 745,408 | |
| | 1,290 | | | 6.125%, 5/15/27 | | | 5/20 at 100.00 | | | | | | | | BBB– | | | | 1,333,705 | |
50
| | | | | | | | | | | | | | | | | | | | |
Principal
Amount (000) | | | Description (1) | | Optional Call
Provisions (2) | | | | | | Ratings (3) | | | Value | |
| | | | | |
| | | | Illinois(continued) | | | | | | | | | | | | |
| | | | | |
| $ | 3,895 | | | Illinois Finance Authority, Revenue Bonds, Ingalls Health System, Series 2013, 4.250%, 5/15/43 | | | 5/22 at 100.00 | | | | | | | | Baa2 | | | $ | 3,966,434 | |
| | | | | |
| | 10,810 | | | Illinois Finance Authority, Revenue Bonds, Mercy Health Corporation, Series 2016, 5.000%, 12/01/40 | | | 6/26 at 100.00 | | | | | | | | A3 | | | | 11,862,137 | |
| | | | | |
| | 2,000 | | | Illinois Finance Authority, Revenue Bonds, Northwestern Memorial Hospital, Series 2009A, 5.375%, 8/15/24(Pre-refunded 8/15/19) | | | 8/19 at 100.00 | | | | | | | | N/R (4) | | | | 2,028,020 | |
| | | | | |
| | | | Illinois Finance Authority, Revenue Bonds, OSF Healthcare System, Refunding Series 2010A: | | | | | | | | | | | | | | | | |
| | 510 | | | 6.000%, 5/15/39 | | | 5/20 at 100.00 | | | | | | | | A | | | | 525,443 | |
| | 1,635 | | | 6.000%, 5/15/39(Pre-refunded 5/15/20) | | | 5/20 at 100.00 | | | | | | | | N/R (4) | | | | 1,714,281 | |
| | | | | |
| | 10,715 | | | Illinois Finance Authority, Revenue Bonds, OSF Healthcare System, Series 2015A, 5.000%, 11/15/45 | | | 11/25 at 100.00 | | | | | | | | A | | | | 11,723,817 | |
| | | | | |
| | 1,545 | | | Illinois Finance Authority, Revenue Bonds, Palos Community Hospital, Series 2010C, 5.125%, 5/15/35 | | | 5/20 at 100.00 | | | | | | | | AA– | | | | 1,588,214 | |
| | | | | |
| | | | Illinois Finance Authority, Revenue Bonds, Provena Health, Series 2009A: | | | | | | | | | | | | | | | | |
| | 25 | | | 7.750%, 8/15/34(Pre-refunded 8/15/19) | | | 8/19 at 100.00 | | | | | | | | N/R (4) | | | | 25,563 | |
| | 2,875 | | | 7.750%, 8/15/34(Pre-refunded 8/15/19) | | | 8/19 at 100.00 | | | | | | | | N/R (4) | | | | 2,939,774 | |
| | | | | |
| | 895 | | | Illinois Finance Authority, Revenue Bonds, Rehabilitation Institute of Chicago, Series 2013A, 5.500%, 7/01/28 | | | 7/23 at 100.00 | | | | | | | | A– | | | | 1,008,298 | |
| | | | | |
| | | | Illinois Finance Authority, Revenue Bonds, Rush University Medical Center Obligated Group, Series 2009C: | | | | | | | | | | | | | | | | |
| | 1,335 | | | 6.625%, 11/01/39(Pre-refunded 5/01/19) | | | 5/19 at 100.00 | | | | | | | | N/R (4) | | | | 1,340,460 | |
| | 1,665 | | | 6.625%, 11/01/39(Pre-refunded 5/01/19) (UB) (5) | | | No Opt. Call | | | | | | | | N/R (4) | | | | 1,671,810 | |
| | | | | |
| | 20 | | | Illinois Finance Authority, Revenue Bonds, Rush University Medical Center Obligated Group, Series 2015A, 4.000%, 11/15/39 | | | 5/25 at 100.00 | | | | | | | | AA– | | | | 20,520 | |
| | | | | |
| | 1,105 | | | Illinois Finance Authority, Revenue Bonds, Silver Cross Hospital and Medical Centers, Refunding Series 2015C, 5.000%, 8/15/35 | | | 8/25 at 100.00 | | | | | | | | Baa1 | | | | 1,228,340 | |
| | | | | |
| | 9,000 | | | Illinois Finance Authority, Revenue Bonds, Silver Cross Hospital and Medical Centers, Series 2009, 6.875%, 8/15/38(Pre-refunded 8/15/19) | | | 8/19 at 100.00 | | | | | | | | N/R (4) | | | | 9,175,230 | |
| | | | | |
| | 925 | | | Illinois Finance Authority, Revenue Bonds, Southern Illinois Healthcare Enterprises, Inc, Series 2005 Remarketed, 5.250%, 3/01/30 – AGM Insured(Pre-refunded 3/01/20) | | | 3/20 at 100.00 | | | | | | | | AA (4) | | | | 955,840 | |
| | | | | |
| | 4,000 | | | Illinois Finance Authority, Revenue Bonds, The Carle Foundation, Series 2011A, 6.000%, 8/15/41 | | | 8/21 at 100.00 | | | | | | | | AA– | | | | 4,343,160 | |
| | | | | |
| | | | Illinois Finance Authority, Revenue Bonds, The University of Chicago Medical Center, Series 2009B: | | | | | | | | | | | | | | | | |
| | 470 | | | 5.000%, 8/15/26(Pre-refunded 8/15/20) | | | 8/20 at 100.00 | | | | | | | | N/R (4) | | | | 491,488 | |
| | 930 | | | 5.000%, 8/15/26 | | | 8/20 at 100.00 | | | | | | | | AA– | | | | 968,204 | |
| | | | | |
| | 1,500 | | | Illinois Finance Authority, Revenue Bonds, The University of Chicago Medical Center, Series 2011C, 5.500%, 8/15/41(Pre-refunded 2/15/21) | | | 2/21 at 100.00 | | | | | | | | AA– (4) | | | | 1,606,995 | |
| | | | | |
| | 4,000 | | | Illinois Housing Development Authority, Multifamily Housing Revenue Bonds, GNMA Collateralized – Lifelink Developments, Series 2006, 4.850%, 4/20/41 (AMT) (UB) (5) | | | 5/19 at 100.00 | | | | | | | | AA+ | | | | 4,004,040 | |
| | | | | |
| | 7,335 | | | Illinois Sports Facility Authority, State Tax Supported Bonds, Refunding Series 2014, 5.250%, 6/15/31 – AGM Insured | | | 6/24 at 100.00 | | | | | | | | AA | | | | 8,191,581 | |
| | | | | |
| | 8,000 | | | Illinois State, General Obligation Bonds, January Series 2016, 5.000%, 1/01/30 | | | 1/26 at 100.00 | | | | | | | | BBB | | | | 8,622,320 | |
51
NuveenAll-American Municipal Bond Fund(continued)
Portfolio of Investments March 31, 2019
| | | | | | | | | | | | | | | | | | | | |
Principal
Amount (000) | | | Description (1) | | Optional Call
Provisions (2) | | | | | | Ratings (3) | | | Value | |
| | | | | |
| | | | Illinois(continued) | | | | | | | | | | | | |
| | | | | |
| $ | 5,000 | | | Illinois State, General Obligation Bonds, May Series 2014, 5.000%, 5/01/27 | | | 5/24 at 100.00 | | | | | | | | BBB | | | $ | 5,337,350 | |
| | | | | |
| | 5,325 | | | Illinois State, General Obligation Bonds, November Series 2016, 5.000%, 11/01/24 | | | No Opt. Call | | | | | | | | BBB | | | | 5,826,242 | |
| | | | | |
| | | | Illinois State, General Obligation Bonds, Series 2012A: | | | | | | | | | | | | | | | | |
| | 5,520 | | | 5.000%, 3/01/25 | | | 3/22 at 100.00 | | | | | | | | BBB | | | | 5,788,603 | |
| | 5,910 | | | 5.000%, 3/01/26 | | | 3/22 at 100.00 | | | | | | | | BBB | | | | 6,159,638 | |
| | 500 | | | 5.000%, 3/01/27 | | | 3/22 at 100.00 | | | | | | | | BBB | | | | 520,215 | |
| | | | | |
| | 1,440 | | | Illinois State, General Obligation Bonds, Series 2013, 5.250%, 7/01/28 | | | 7/23 at 100.00 | | | | | | | | BBB | | | | 1,533,902 | |
| | | | | |
| | 5,000 | | | Illinois State, Sales Tax Revenue Bonds, Build Illinois Series 2011, 5.000%, 6/15/28 | | | 6/21 at 100.00 | | | | | | | | A– | | | | 5,186,500 | |
| | | | | |
| | 3,000 | | | Lombard Public Facilities Corporation, Illinois, Conference Center and Hotel Revenue Bonds, First Tier Series2005A-2, 5.500%, 1/01/30 | | | 5/19 at 100.00 | | | | | | | | N/R | | | | 2,866,140 | |
| | | | | |
| | 875 | | | Metropolitan Pier and Exposition Authority, Illinois, McCormick Place Expansion Project Bonds, Refunding Series 2012A, 5.000%, 6/15/42 – NPFG Insured | | | 6/22 at 100.00 | | | | | | | | BBB | | | | 899,701 | |
| | | | | |
| | 1,280 | | | Metropolitan Pier and Exposition Authority, Illinois, McCormick Place Expansion Project Bonds, Refunding Series 2012B, 5.000%, 6/15/23 | | | 6/22 at 100.00 | | | | | | | | BBB | | | | 1,360,064 | |
| | | | | |
| | 5,400 | | | Metropolitan Pier and Exposition Authority, Illinois, McCormick Place Expansion Project Bonds, Refunding Series 2015B, 5.000%, 6/15/52 | | | 12/25 at 100.00 | | | | | | | | BBB | | | | 5,691,708 | |
| | | | | |
| | 1,225 | | | Metropolitan Pier and Exposition Authority, Illinois, McCormick Place Expansion Project Bonds, Series 2015A, 5.000%, 6/15/53 | | | 12/25 at 100.00 | | | | | | | | BBB | | | | 1,290,440 | |
| | | | | |
| | 8,025 | | | Metropolitan Pier and Exposition Authority, Illinois, Revenue Bonds, McCormick Place Expansion Project, Refunding Series 1996A, 0.000%, 12/15/21 – NPFG Insured | | | No Opt. Call | | | | | | | | Baa2 | | | | 7,470,392 | |
| | | | | |
| | 10,000 | | | Metropolitan Pier and Exposition Authority, Illinois, Revenue Bonds, McCormick Place Expansion Project, Series 2002A, 0.000%, 12/15/35 – AGM Insured | | | No Opt. Call | | | | | | | | AA | | | | 5,382,400 | |
| | | | | |
| | 1,841 | | | Plano, Illinois, Special Tax Bonds, Special Service Area 1 & 2 Lakewood Springs Project, Refunding Series 2014, 5.000%, 3/01/34 – AGM Insured | | | 3/24 at 100.00 | | | | | | | | AA | | | | 2,005,972 | |
| | | | | |
| | 845 | | | Quad Cities Regional Economic Development Authority, Illinois, Revenue Bonds, Augustana College, Series 2012, 4.750%, 10/01/29 | | | 10/22 at 100.00 | | | | | | | | Baa1 | | | | 905,874 | |
| | | | | |
| | 3,890 | | | Railsplitter Tobacco Settlement Authority, Illinois, Tobacco Settlement Revenue Bonds, Series 2010, 5.250%, 6/01/21 | | | No Opt. Call | | | | | | | | A | | | | 4,168,757 | |
| | | | | |
| | 4,450 | | | Regional Transportation Authority, Cook, DuPage, Kane, Lake, McHenry and Will Counties, Illinois, General Obligation Bonds, Series 2001A, 6.000%, 7/01/27 – FGIC Insured | | | No Opt. Call | | | | | | | | AA | | | | 5,580,389 | |
| | | | | |
| | | | Springfield, Illinois, Electric Revenue Bonds, Senior Lien Series 2015: | | | | | | | | | | | | | | | | |
| | 15,530 | | | 4.000%, 3/01/40 – AGM Insured | | | 3/25 at 100.00 | | | | | | | | AA | | | | 16,089,080 | |
| | 3,485 | | | 5.000%, 3/01/40 – AGM Insured | | | 3/25 at 100.00 | | | | | | | | AA | | | | 3,855,281 | |
| | | | | |
| | 5,000 | | | University of Illinois, Auxiliary Facilities System Revenue Bonds, Series 2013A, 4.000%, 4/01/32 | | | 4/23 at 100.00 | | | | | | | | A1 | | | | 5,167,450 | |
| | | | | |
| | 7,405 | | | University of Illinois, Health Services Facilities System Revenue Bonds, Series 2013, 6.000%, 10/01/42 | | | 10/23 at 100.00 | | | | | | | | A– | | | | 8,374,981 | |
| | 356,626 | | | Total Illinois | | | | | | | | | | | | | | | 383,654,178 | |
| | | | | |
| | | | Indiana – 2.5% | | | | | | | | | | | | |
| | | | | |
| | 695 | | | Chesterton, Indiana, Economic Development Revenue Bonds, Storypoint Chesterton Project, Series 2016, 6.250%, 1/15/43, 144A | | | 1/24 at 104.00 | | | | | | | | N/R | | | | 721,792 | |
52
| | | | | | | | | | | | | | | | | | | | |
Principal
Amount (000) | | | Description (1) | | Optional Call
Provisions (2) | | | | | | Ratings (3) | | | Value | |
| | | | | |
| | | | Indiana(continued) | | | | | | | | | | | | |
| | | | | |
| $ | 6,495 | | | Indiana Finance Authority, Hospital Revenue Bonds, Parkview Health, Series 2018A, 5.000%, 11/01/43 | | | 11/28 at 100.00 | | | | | | | | AA– | | | $ | 7,456,650 | |
| | | | | |
| | 5,215 | | | Indiana Bond Bank, Special Program Gas Revenue Bonds, JP Morgan Ventures Energy Corporation Guaranteed, Series 2007A, 5.250%, 10/15/20 | | | No Opt. Call | | | | | | | | A+ | | | | 5,468,814 | |
| | | | | |
| | 1,400 | | | Indiana Finance Authority, Educational Facilities Revenue Bonds, Drexel Foundation For Educational Excellence, Inc, Series 2009A, 6.625%, 10/01/29 | | | 10/19 at 100.00 | | | | | | | | B | | | | 1,411,788 | |
| | | | | |
| | | | Indiana Finance Authority, Educational Facilities Revenue Bonds, Lighthouse Academies of Indiana Inc Project, Series 2016: | | | | | | | | | | | | | | | | |
| | 2,475 | | | 7.000%, 12/01/34, 144A | | | 12/24 at 100.00 | | | | | | | | N/R | | | | 2,543,162 | |
| | 4,920 | | | 7.250%, 12/01/44, 144A | | | 12/24 at 100.00 | | | | | | | | N/R | | | | 5,052,151 | |
| | | | | |
| | | | Indiana Finance Authority, Educational Facilities Revenue Bonds, Lighthouse Academies of Northwest Indiana Inc Project, Series 2016: | | | | | | | | | | | | | | | | |
| | 3,710 | | | 7.000%, 12/01/34, 144A | | | 12/24 at 100.00 | | | | | | | | N/R | | | | 3,812,173 | |
| | 6,075 | | | 7.250%, 12/01/44, 144A | | | 12/24 at 100.00 | | | | | | | | N/R | | | | 6,238,174 | |
| | | | | |
| | 5,000 | | | Indiana Finance Authority, Educational Facilities Revenue Bonds, Rose Hulman Institute Of Technology Project, Series 2018, 4.000%, 6/01/44 | | | 12/28 at 100.00 | | | | | | | | A1 | | | | 5,175,250 | |
| | | | | |
| | 1,640 | | | Indiana Finance Authority, Educational Facilities Revenue Bonds, Valparaiso University Project, Series 2014, 5.000%, 10/01/39 | | | 10/24 at 100.00 | | | | | | | | A3 | | | | 1,811,872 | |
| | | | | |
| | 1,000 | | | Indiana Finance Authority, Hospital Revenue Bonds, Floyd Memorial Hospital and Health Services Project, Refunding Series 2010, 5.125%, 3/01/30(Pre-refunded 3/02/20) | | | 3/20 at 100.00 | | | | | | | | N/R (4) | | | | 1,031,840 | |
| | | | | |
| | 3,000 | | | Indiana Finance Authority, Hospital Revenue Bonds, Marion General Hospital Project, Series 2012A, 5.000%, 7/01/36 | | | 7/21 at 100.00 | | | | | | | | A+ | | | | 3,190,110 | |
| | | | | |
| | 9,215 | | | Indiana Finance Authority, Provate Activity Bonds, Ohio River Bridges East End Crossing Project, Series 2013A, 5.000%, 7/01/48 (AMT) | | | 7/23 at 100.00 | | | | | | | | A– | | | | 9,824,572 | |
| | | | | |
| | 15,205 | | | Indiana Finance Authority, Wastewater Utility Revenue Bonds, CWA Authority Project, First Lien Green Series 2016A, 5.000%, 10/01/46 | | | 10/26 at 100.00 | | | | | | | | AA | | | | 17,276,377 | |
| | | | | |
| | 8,000 | | | Indiana Finance Authority, Wastewater Utility Revenue Bonds, CWA Authority Project, Series 2014A, 5.000%, 10/01/40 | | | 10/24 at 100.00 | | | | | | | | AA | | | | 9,021,360 | |
| | | | | |
| | | | Knox County, Indiana, Economic Development Revenue and Refunding Bonds, Good Samaritan Hospital Project, Series 2012A: | | | | | | | | | | | | | | | | |
| | 1,530 | | | 5.000%, 4/01/26 | | | 4/22 at 100.00 | | | | | | | | Ba1 | | | | 1,615,451 | |
| | 1,400 | | | 5.000%, 4/01/27 | | | 4/22 at 100.00 | | | | | | | | Ba1 | | | | 1,474,662 | |
| | 1,560 | | | 5.000%, 4/01/29 | | | 4/22 at 100.00 | | | | | | | | Ba1 | | | | 1,636,721 | |
| | | | | |
| | | | Valparaiso, Indiana, Exempt Facilities Revenue Bonds, Pratt Paper LLC Project, Series 2013: | | | | | | | | | | | | | | | | |
| | 335 | | | 5.875%, 1/01/24 (AMT) | | | No Opt. Call | | | | | | | | N/R | | | | 366,507 | |
| | 9,185 | | | 7.000%, 1/01/44 (AMT) | | | 1/24 at 100.00 | | | | | | | | N/R | | | | 10,682,063 | |
| | | | | |
| | 5,000 | | | Vigo County Hospital Authority, Indiana, Hospital Revenue Bonds, Union Hospital, Inc, Series 2011, 8.000%, 9/01/41(Pre-refunded 9/01/21) | | | 9/21 at 100.00 | | | | | | | | N/R (4) | | | | 5,744,350 | |
| | 93,055 | | | Total Indiana | | | | | | | | | | | | | | | 101,555,839 | |
| | | | | |
| | | | Iowa – 0.5% | | | | | | | | | | | | |
| | | | | |
| | 2,275 | | | Ames, Iowa, Hospital Revenue Bonds, Mary Greeley Medical Center, Series 2011, 5.250%, 6/15/36(Pre-refunded 6/15/20) | | | 6/20 at 100.00 | | | | | | | | A2 (4) | | | | 2,373,189 | |
| | | | | |
| | 500 | | | Iowa Finance Authority, Health Facilities Revenue Bonds, Iowa Health System, Series 2008A, 5.250%, 8/15/29 – AGC Insured(Pre-refunded 8/15/19) | | | 8/19 at 100.00 | | | | | | | | A3 (4) | | | | 506,775 | |
53
NuveenAll-American Municipal Bond Fund(continued)
Portfolio of Investments March 31, 2019
| | | | | | | | | | | | | | | | | | | | |
Principal
Amount (000) | | | Description (1) | | Optional Call
Provisions (2) | | | | | | Ratings (3) | | | Value | |
| | | | | |
| | | | Iowa(continued) | | | | | | | | | | | | |
| | | | | |
| $ | 2,980 | | | Iowa Finance Authority, Iowa, Midwestern Disaster Area Revenue Bonds, Iowa Fertilizer Company Project, Refunding Series 2019, 3.125%, 12/01/22 (WI/DD, Settling 4/03/19) | | | 12/20 at 103.00 | | | | | | | | B+ | | | $ | 2,999,609 | |
| | | | | |
| | 5,375 | | | Iowa Finance Authority, Iowa, Midwestern Disaster Area Revenue Bonds, Iowa Fertilizer Company Project, Series 2013, 5.250%, 12/01/25 | | | 12/23 at 100.00 | | | | | | | | B+ | | | | 5,797,851 | |
| | | | | |
| | 1,015 | | | Iowa Finance Authority, Iowa, Midwestern Disaster Area Revenue Bonds, Iowa Fertilizer Company Project, Series 2016, 5.875%, 12/01/27, 144A | | | 6/19 at 105.00 | | | | | | | | B+ | | | | 1,068,917 | |
| | | | | |
| | 3,920 | | | Iowa Finance Authority, Iowa, Midwestern Disaster Area Revenue Bonds, Iowa Fertilizer Company Project, Series 2018A, 5.250%, 12/01/50 | | | 12/22 at 103.00 | | | | | | | | B+ | | | | 4,138,187 | |
| | | | | |
| | 1,000 | | | Iowa Student Loan Liquidity Corporation, Student Loan Revenue Bonds, Refunding Series2009-2, 5.500%, 12/01/25 | | | 12/19 at 100.00 | | | | | | | | AAA | | | | 1,022,930 | |
| | | | | |
| | 1,070 | | | Iowa Student Loan Liquidity Corporation, Student Loan Revenue Bonds, Senior Lien Series2011A-2, 5.750%, 12/01/28 (AMT) | | | 12/19 at 102.00 | | | | | | | | A | | | | 1,117,069 | |
| | | | | |
| | 2,045 | | | Iowa Tobacco Settlement Authority, Asset Backed Settlement Revenue Bonds, Series 2005C, 5.625%, 6/01/46 | | | 5/19 at 100.00 | | | | | | | | B | | | | 2,045,143 | |
| | 20,180 | | | Total Iowa | | | | | | | | | | | | | | | 21,069,670 | |
| | | | | |
| | | | Kansas – 0.2% | | | | | | | | | | | | |
| | | | | |
| | 1,500 | | | Hutchinson, Kansas, Hospital Facilities Revenue Bonds, Hutchinson Regional Medical Center, Inc, Series 2016, 5.000%, 12/01/36 | | | 12/26 at 100.00 | | | | | | | | Baa3 | | | | 1,639,155 | |
| | | | | |
| | 1,320 | | | Hutchinson, Kansas, Hospital Facilities Revenue Bonds, Hutchinson Regional Medical Center, Inc., Series 2016, 5.000%, 12/01/41 | | | 12/26 at 100.00 | | | | | | | | Baa3 | | | | 1,424,491 | |
| | | | | |
| | | | Kansas Development Finance Authority, Hospital Revenue Bonds, Adventist Health System/Sunbelt Obligated Group, Series 2009C: | | | | | | | | | | | | | | | | |
| | 100 | | | 5.500%, 11/15/29(Pre-refunded 11/15/19) | | | 11/19 at 100.00 | | | | | | | | N/R (4) | | | | 102,330 | |
| | 4,440 | | | 5.500%, 11/15/29 | | | 11/19 at 100.00 | | | | | | | | AA | | | | 4,539,234 | |
| | | | | |
| | 1,250 | | | Overland Park Development Corporation, Kansas, Second Tier Revenue Bonds, Overland Park Convention Center, Series 2007B, 5.125%, 1/01/22 – AMBAC Insured | | | 5/19 at 100.00 | | | | | | | | BB+ | | | | 1,251,875 | |
| | | | | |
| | 825 | | | Overland Park Transportation Development District, Kansas, Sales Tax Revenue Bonds, Oak Park Mall Project, Series 2010, 5.900%, 4/01/32 | | | 4/20 at 100.00 | | | | | | | | BBB | | | | 844,949 | |
| | 9,435 | | | Total Kansas | | | | | | | | | | | | | | | 9,802,034 | |
| | | | | |
| | | | Kentucky – 1.7% | | | | | | | | | | | | |
| | | | | |
| | | | Kentucky Bond Development Corporation, Transient Room Tax Revenue Bonds, Lexington Center Corporation Project, Series 2018A: | | | | | | | | | | | | | | | | |
| | 2,545 | | | 5.000%, 9/01/43 | | | 9/28 at 100.00 | | | | | | | | A2 | | | | 2,916,315 | |
| | 2,600 | | | 5.000%, 9/01/48 | | | 9/28 at 100.00 | | | | | | | | A2 | | | | 2,975,856 | |
| | | | | |
| | 6,345 | | | Kentucky Economic Development Finance Authority, Hospital Revenue Bonds, Baptist Healthcare System Obligated Group, Series 2011, 5.000%, 8/15/42 | | | 8/21 at 100.00 | | | | | | | | A | | | | 6,690,105 | |
| | | | | |
| | | | Kentucky Economic Development Finance Authority, Hospital Revenue Bonds, Owensboro Medical Health System, Series 2010A: | | | | | | | | | | | | | | | | |
| | 2,500 | | | 5.750%, 6/01/25(Pre-refunded 6/01/20) | | | 6/20 at 100.00 | | | | | | | | Baa3 (4) | | | | 2,620,300 | |
| | 2,480 | | | 6.000%, 6/01/30(Pre-refunded 6/01/20) | | | 6/20 at 100.00 | | | | | | | | Baa3 (4) | | | | 2,606,455 | |
| | | | | |
| | 2,630 | | | Kentucky Economic Development Finance Authority, Louisville Arena Project Revenue Bonds, Louisville Arena Authority, Inc., Series 2017A, 5.000%, 12/01/45 – AGM Insured | | | 12/27 at 100.00 | | | | | | | | AA | | | | 2,960,512 | |
54
| | | | | | | | | | | | | | | | | | | | |
Principal
Amount (000) | | | Description (1) | | Optional Call
Provisions (2) | | | | | | Ratings (3) | | | Value | |
| | | | | |
| | | | Kentucky(continued) | | | | | | | | | | | | |
| | | | | |
| $ | 5,655 | | | Kentucky Economic Development Finance Authority, Revenue Bonds, Next Generation Kentucky Information Highway Project, Senior Series 2015A, 5.000%, 7/01/37 | | | 7/25 at 100.00 | | | | | | | | BBB+ | | | $ | 6,188,606 | |
| | | | | |
| | | | Kentucky State Property and Buildings Commission, Revenue Bonds, Project 119, Series 2018: | | | | | | | | | | | | | | | | |
| | 2,000 | | | 5.000%, 5/01/35 | | | 5/28 at 100.00 | | | | | | | | A1 | | | | 2,311,780 | |
| | 2,500 | | | 5.000%, 5/01/36 | | | 5/28 at 100.00 | | | | | | | | A1 | | | | 2,879,400 | |
| | 4,000 | | | 5.000%, 5/01/37 | | | 5/28 at 100.00 | | | | | | | | A1 | | | | 4,582,280 | |
| | | | | |
| | | | Louisville/Jefferson County Metro Government, Kentucky, Health System Revenue Bonds, Norton Healthcare Inc, Series 2016A: | | | | | | | | | | | | | | | | |
| | 5,735 | | | 5.000%, 10/01/31 | | | 10/26 at 100.00 | | | | | | | | A+ | | | | 6,622,434 | |
| | 2,785 | | | 4.000%, 10/01/35 | | | 10/26 at 100.00 | | | | | | | | A+ | | | | 2,901,608 | |
| | | | | |
| | 5,000 | | | Pikeville, Kentucky, Hospital Revenue Bonds, Pikeville Medical Center, Inc Project, Improvement and Refunding Series 2011, 6.500%, 3/01/41 | | | 3/21 at 100.00 | | | | | | | | N/R | | | | 5,339,350 | |
| | | | | |
| | 12,750 | | | Public Energy Authority of Kentucky, Gas Supply Revenue Bonds, Series 2018A, 4.000%, 4/01/48 (Mandatory Put 4/01/24) | | | 1/24 at 100.37 | | | | | | | | A3 | | | | 13,695,412 | |
| | | | | |
| | 1,635 | | | Trimble County, Kentucky, Pollution Control Revenue Bonds, Louisville Gas and Electric Company Project, Series 2001B, 2.550%, 11/01/27 (Mandatory Put 5/03/21) (AMT) | | | No Opt. Call | | | | | | | | N/R | | | | 1,657,465 | |
| | 61,160 | | | Total Kentucky | | | | | | | | | | | | | | | 66,947,878 | |
| | | | | |
| | | | Louisiana – 0.9% | | | | | | | | | | | | |
| | | | | |
| | 65 | | | Louisiana Local Government Environmental Facilities and Community Development Authority, Revenue Bonds, Southgate Suites Retail Project, Series 2007B, 9.000%, 12/15/14 | | | No Opt. Call | | | | | | | | N/R | | | | 1 | |
| | | | | |
| | 2,000 | | | Louisiana Public Facilities Authority, Revenue Bonds, Christus Health, Refunding Series 2009A, 6.000%, 7/01/29 | | | 7/19 at 100.00 | | | | | | | | A+ (4) | | | | 2,021,040 | |
| | | | | |
| | 26,705 | | | Louisiana Public Facilities Authority, Dock and Wharf Revenue Bonds, Impala Warehousing (US) LLC Project, Series 2013, 6.500%, 7/01/36 (AMT), 144A | | | 7/23 at 100.00 | | | | | | | | N/R | | | | 29,265,208 | |
| | | | | |
| | 1,000 | | | Louisiana Public Facilities Authority, Revenue Bonds, Belle Chasse Educational Foundation Project, Series 2011, 6.750%, 5/01/41 | | | 5/21 at 100.00 | | | | | | | | BBB | | | | 1,050,560 | |
| | | | | |
| | 2,030 | | | Louisiana Public Facilities Authority, Revenue Bonds, Ochsner Clinic Foundation Project, Series 2015, 5.000%, 5/15/47 | | | 5/25 at 100.00 | | | | | | | | A3 | | | | 2,222,566 | |
| | | | | |
| | 1,050 | | | New Orleans, Louisiana, Sewerage Service Revenue Bonds, Refunding Series 2014, 5.000%, 6/01/44 | | | 6/24 at 100.00 | | | | | | | | A | | | | 1,133,160 | |
| | 32,850 | | | Total Louisiana | | | | | | | | | | | | | | | 35,692,535 | |
| | | | | |
| | | | Maine – 0.4% | | | | | | | | | | | | |
| | | | | |
| | | | Maine Health and Higher Educational Facilities Authority, Revenue Bonds, Maine General Medical Center, Series 2011: | | | | | | | | | | | | | | | | |
| | 2,000 | | | 6.750%, 7/01/36 | | | 7/21 at 100.00 | | | | | | | | BB | | | | 2,173,040 | |
| | 10,390 | | | 6.750%, 7/01/41 | | | 7/21 at 100.00 | | | | | | | | BB | | | | 11,244,474 | |
| | | | | |
| | 1,665 | | | Maine Health and Higher Educational Facilities Authority, Revenue Bonds, Series 2010A, 5.000%, 7/01/40 | | | 7/20 at 100.00 | | | | | | | | AA | | | | 1,722,542 | |
| | | | | |
| | | | Portland, Maine, General Airport Revenue Bonds, Refunding Series 2013: | | | | | | | | | | | | | | | | |
| | 460 | | | 5.000%, 7/01/26 | | | 7/23 at 100.00 | | | | | | | | BBB+ | | | | 508,341 | |
| | 1,000 | | | 5.000%, 7/01/27 | | | 7/23 at 100.00 | | | | | | | | BBB+ | | | | 1,102,390 | |
| | 15,515 | | | Total Maine | | | | | | | | | | | | | | | 16,750,787 | |
55
NuveenAll-American Municipal Bond Fund(continued)
Portfolio of Investments March 31, 2019
| | | | | | | | | | | | | | | | | | | | |
Principal
Amount (000) | | | Description (1) | | Optional Call
Provisions (2) | | | | | | Ratings (3) | | | Value | |
| | | | | |
| | | | Maryland – 0.4% | | | | | | | | | | | | |
| | | | | |
| $ | 14,350 | | | Maryland Health and Higher Educational Facilities Authority, Revenue Bonds, MedStar Health Issue, Series 2015, 5.000%, 8/15/42 (UB) (5) | | | 2/25 at 100.00 | | | | | | | | A | | | $ | 15,888,751 | |
| | | | | |
| | 1,000 | | | Maryland Health and Higher Educational Facilities Authority, Revenue Bonds, Patterson Park Public Charter School Issue, Series 2010, 5.750%, 7/01/30 | | | 7/19 at 100.00 | | | | | | | | BB+ | | | | 1,004,390 | |
| | 15,350 | | | Total Maryland | | | | | | | | | | | | | | | 16,893,141 | |
| | | | | |
| | | | Massachusetts – 2.0% | | | | | | | | | | | | |
| | | | | |
| | 8,620 | | | Massachusetts Bay Transportation Authority, Sales Tax Revenue Bonds, Senior Lien Capital Appreciation Series 2016A, 0.000%, 7/01/32 | | | 7/26 at 85.54 | | | | | | | | AA | | | | 5,914,182 | |
| | | | | |
| | 4,350 | | | Massachusetts Development Finance Agency, Health Care Facility Revenue Bonds, Adventcare Project, Series 2007A, 6.750%, 10/15/37 | | | 5/19 at 100.00 | | | | | | | | N/R | | | | 4,189,920 | |
| | | | | |
| | | | Massachusetts Development Finance Agency, Revenue Bonds, Boston Medical Center Issue, Series 2016E: | | | | | | | | | | | | | | | | |
| | 1,200 | | | 5.000%, 7/01/35 | | | 7/26 at 100.00 | | | | | | | | BBB | | | | 1,349,280 | |
| | 5,590 | | | 5.000%, 7/01/37 | | | 7/26 at 100.00 | | | | | | | | BBB | | | | 6,239,390 | |
| | | | | |
| | 10,410 | | | Massachusetts Development Finance Agency, Revenue Bonds, Emerson College, Series 2016A, 5.000%, 1/01/47 | | | 1/27 at 100.00 | | | | | | | | BBB+ | | | | 11,539,901 | |
| | | | | |
| | 1,500 | | | Massachusetts Development Finance Agency, Revenue Bonds, Emmanuel College, Series 2016A, 5.000%, 10/01/43 | | | 10/26 at 100.00 | | | | | | | | Baa2 | | | | 1,656,270 | |
| | | | | |
| | 1,035 | | | Massachusetts Development Finance Agency, Revenue Bonds, Loomis Communities, Series 2013A, 4.875%, 1/01/24 | | | 1/23 at 100.00 | | | | | | | | BBB | | | | 1,129,309 | |
| | | | | |
| | | | Massachusetts Development Finance Agency, Revenue Bonds, Wellforce Issue, Series 2019A: | | | | | | | | | | | | | | | | |
| | 2,500 | | | 5.000%, 7/01/39 | | | 1/29 at 100.00 | | | | | | | | BBB+ | | | | 2,865,250 | |
| | 10,165 | | | 5.000%, 7/01/44 | | | 1/29 at 100.00 | | | | | | | | BBB+ | | | | 11,550,591 | |
| | | | | |
| | | | Massachusetts Development Finance Agency, Revenue Bonds, Woods Hole Oceanographic Institution, Series 2018: | | | | | | | | | | | | | | | | |
| | 3,490 | | | 5.000%, 6/01/43 | | | 6/28 at 100.00 | | | | | | | | AA– | | | | 4,109,161 | |
| | 6,210 | | | 5.000%, 6/01/48 | | | 6/28 at 100.00 | | | | | | | | AA– | | | | 7,282,715 | |
| | | | | |
| | 6,665 | | | Massachusetts Health and Education Facilities Authority, Revenue Bonds, Partners HealthCare System, Tender Option Trust 2015-XF0047, 10.673%, 7/01/34 (IF) | | | 7/19 at 100.00 | | | | | | | | AA– | | | | 6,836,424 | |
| | | | | |
| | | | Massachusetts Health and Educational Facilities Authority, Revenue Bonds, Suffolk University, Refunding Series 2009A: | | | | | | | | | | | | | | | | |
| | 3,025 | | | 5.750%, 7/01/39(Pre-refunded 7/01/19) | | | 7/19 at 100.00 | | | | | | | | N/R (4) | | | | 3,056,884 | |
| | 1,525 | | | 5.750%, 7/01/39 | | | 7/19 at 100.00 | | | | | | | | Baa2 | | | | 1,540,692 | |
| | | | | |
| | 3,010 | | | Massachusetts State, General Obligation Bonds, Consolidated Loan, Series 2016A, 5.000%, 3/01/46 | | | 3/24 at 100.00 | | | | | | | | Aa1 | | | | 3,364,428 | |
| | | | | |
| | 5,000 | | | Massachusetts State, General Obligation Bonds, Consolidated Loan, Series 2017F, 5.000%, 11/01/43 | | | 11/27 at 100.00 | | | | | | | | Aa1 | | | | 5,857,250 | |
| | | | | |
| | 2,335 | | | Massachusetts Water Pollution Abatement Trust, Pooled Loan Program Bonds, Tender Option Bond Trust 2015-XF2181, 10.807%, 8/01/38 (IF) (5) | | | 8/19 at 100.00 | | | | | | | | AAA | | | | 2,406,171 | |
| | 76,630 | | | Total Massachusetts | | | | | | | | | | | | | | | 80,887,818 | |
| | | | | |
| | | | Michigan – 0.9% | | | | | | | | | | | | |
| | | | | |
| | 6,850 | | | Bay City, Bay County, Michigan, Unlimited Tax General Street Improvement Bonds, Series 1991, 0.000%, 6/01/21 – AMBAC Insured | | | No Opt. Call | | | | | | | | A+ | | | | 6,186,166 | |
56
| | | | | | | | | | | | | | | | | | | | |
Principal
Amount (000) | | | Description (1) | | Optional Call
Provisions (2) | | | | | | Ratings (3) | | | Value | |
| | | | | |
| | | | Michigan(continued) | | | | | | | | | | | | |
| | | | | |
| $ | 800 | | | Jackson County Hospital Finance Authority, Michigan, Hospital Revenue Bonds, WA Foote Memorial Hospital, Refunding Series2006B-2, 5.000%, 6/01/27 – AGM Insured(Pre-refunded 6/01/20) | | | 6/20 at 100.00 | | | | | | | | AA (4) | | | $ | 831,600 | |
| | | | | |
| | 10,115 | | | Michigan Finance Authority, Michigan, Revenue Bonds, Trinity Health Credit Group, Refunding Series 2016MI, 5.000%, 12/01/45 | | | 6/26 at 100.00 | | | | | | | | AA– | | | | 11,424,994 | |
| | | | | |
| | 270 | | | Michigan Finance Authority, Public School Academy Limited Obligation Revenue Bonds, Creative Montessori Academy Project, Series 2011, 6.125%, 5/01/21 | | | 5/19 at 100.00 | | | | | | | | BBB– | | | | 270,305 | |
| | | | | |
| | | | Michigan Finance Authority, Public School Academy Revenue Bonds, Detroit Service Learning Academy Project, Refunding Series 2011: | | | | | | | | | | | | | | | | |
| | 295 | | | 6.000%, 10/01/21 | | | No Opt. Call | | | | | | | | B | | | | 283,775 | |
| | 500 | | | 7.000%, 10/01/31 | | | 10/21 at 100.00 | | | | | | | | B | | | | 480,730 | |
| | 1,000 | | | 7.000%, 10/01/36 | | | 10/21 at 100.00 | | | | | | | | B | | | | 933,320 | |
| | | | | |
| | 2,485 | | | Michigan Finance Authority, Senior Lien Distributable State Aid Revenue Bonds, Charter County of Wayne Criminal Justice Center Project, Series 2018, 5.000%, 11/01/43 | | | 11/28 at 100.00 | | | | | | | | Aa3 | | | | 2,899,821 | |
| | | | | |
| | 1,550 | | | Michigan Housing Development Authority, Rental Housing Revenue Bonds, Series 2010A, 5.000%, 10/01/35 | | | 10/20 at 100.00 | | | | | | | | AA | | | | 1,606,978 | |
| | | | | |
| | 1,250 | | | Michigan Public Educational Facilities Authority, Limited Obligation Revenue Bonds, Chandler Park Academy Project, Series 2008, 6.500%, 11/01/35 | | | 5/19 at 100.00 | | | | | | | | BBB | | | | 1,251,750 | |
| | | | | |
| | 1,220 | | | Michigan Public Educational Facilities Authority, Limited Obligation Revenue Bonds, David Ellis Academy-West Charter School Project, Series 2007, 5.875%, 6/01/37 | | | 5/19 at 100.00 | | | | | | | | N/R | | | | 1,220,012 | |
| | | | | |
| | | | Michigan State Building Authority, Revenue Bonds, Facilities Program, Refunding Series2011-I-A: | | | | | | | | | | | | | | | | |
| | 750 | | | 5.375%, 10/15/41 | | | 10/21 at 100.00 | | | | | | | | Aa2 | | | | 811,980 | |
| | 2,000 | | | 5.500%, 10/15/45 | | | 10/21 at 100.00 | | | | | | | | Aa2 | | | | 2,169,320 | |
| | | | | |
| | | | Michigan State Hospital Finance Authority, Hospital Revenue Bonds, Henry Ford Health System, Refunding Series 2009: | | | | | | | | | | | | | | | | |
| | 500 | | | 5.625%, 11/15/29(Pre-refunded 11/15/19) | | | 11/19 at 100.00 | | | | | | | | N/R (4) | | | | 512,505 | |
| | 1,480 | | | 5.750%, 11/15/39(Pre-refunded 11/15/19) | | | 11/19 at 100.00 | | | | | | | | N/R (4) | | | | 1,518,140 | |
| | | | | |
| | 5,000 | | | Royal Oak Hospital Finance Authority, Michigan, Hospital Revenue Bonds, William Beaumont Hospital Obligated Group, Refunding Series 2014D, 5.000%, 9/01/39 | | | 3/24 at 100.00 | | | | | | | | A+ | | | | 5,482,100 | |
| | 36,065 | | | Total Michigan | | | | | | | | | | | | | | | 37,883,496 | |
| | | | | |
| | | | Minnesota – 1.1% | | | | | | | | | | | | |
| | | | | |
| | 310 | | | Baytown Township, Minnesota Charter School Lease Revenue Bonds, Saint Croix Preparatory Academy, Refunding Series 2016A, 4.000%, 8/01/41 | | | 8/26 at 100.00 | | | | | | | | BB+ | | | | 298,880 | |
| | | | | |
| | | | City of Ham Lake, Minnesota, Charter School Lease Revenue Bonds, DaVinci Academy Project,Series 2016A: | | | | | | | | | | | | | | | | |
| | 150 | | | 5.000%, 7/01/36 | | | 7/24 at 102.00 | | | | | | | | N/R | | | | 155,807 | |
| | 270 | | | 5.000%, 7/01/47 | | | 7/24 at 102.00 | | | | | | | | N/R | | | | 276,240 | |
| | | | | |
| | 4,050 | | | City of Milaca, Minnesota Refunding Revenue Bonds, Grandview Christian Home Project, Series 2016, 5.000%, 10/01/51 | | | 10/24 at 102.00 | | | | | | | | N/R | | | | 4,162,063 | |
| | | | | |
| | | | Columbus, Minnesota, Senior Housing Revenue Bonds, Richfield Senior Housing, Inc., Refunding Series 2015: | | | | | | | | | | | | | | | | |
| | 250 | | | 5.250%, 1/01/40 | | | 1/23 at 100.00 | | | | | | | | N/R | | | | 246,560 | |
| | 675 | | | 5.250%, 1/01/46 | | | 1/23 at 100.00 | | | | | | | | N/R | | | | 655,128 | |
57
NuveenAll-American Municipal Bond Fund(continued)
Portfolio of Investments March 31, 2019
| | | | | | | | | | | | | | | | | | | | |
Principal
Amount (000) | | | Description (1) | | Optional Call
Provisions (2) | | | | | | Ratings (3) | | | Value | |
| | | | | |
| | | | Minnesota(continued) | | | | | | | | | | | | |
| | | | | |
| | | | Dakota County Community Development Agency, Minnesota, Senior Housing Revenue Bonds, Walker Highview Hills LLC Project, Refunding Series 2016A: | | | | | | | | | | | | | | | | |
| $ | 1,555 | | | 5.000%, 8/01/46, 144A | | | 8/22 at 100.00 | | | | | | | | N/R | | | $ | 1,595,150 | |
| | 1,250 | | | 5.000%, 8/01/51, 144A | | | 8/22 at 100.00 | | | | | | | | N/R | | | | 1,280,312 | |
| | | | | |
| | 2,575 | | | Ham Lake, Minnesota Charter School Lease Revenue Bonds, Parnassus Preparatory School Project, Series 2016A, 5.000%, 11/01/47 | | | 11/26 at 100.00 | | | | | | | | BB | | | | 2,617,127 | |
| | | | | |
| | 3,000 | | | Minneapolis, Minnesota, Recovery Zone Facility Revenue Bonds, Mozaic Parking, LLC Project, Series 2010A, 8.500%, 1/01/41 | | | 1/21 at 100.00 | | | | | | | | N/R | | | | 3,051,120 | |
| | | | | |
| | 2,250 | | | Minnesota Higher Education Facilities Authority, Revenue Bonds, Saint Catherine University, Refunding Series 2018A, 5.000%, 10/01/45 | | | 10/28 at 100.00 | | | | | | | | Baa1 | | | | 2,515,680 | |
| | | | | |
| | 500 | | | Saint Paul Housing & Redevelopment Authority, Minnesota, Charter School Lease Revenue Bonds, Nova Classical Academy, Series 2016A, 4.125%, 9/01/47 | | | 9/24 at 102.00 | | | | | | | | BBB– | | | | 484,910 | |
| | | | | |
| | 16,825 | | | Saint Paul Port Authority, Minnesota, Solid Waste Disposal Revenue Bonds, Gerdau Saint Paul Steel Mill Project, Series2012-7, 4.500%, 10/01/37 (AMT), 144A | | | 10/22 at 100.00 | | | | | | | | BBB– | | | | 15,934,116 | |
| | | | | |
| | | | St Paul Housing and Redevelopment Authority, Minnesota, Hospital Revenue Bonds, HealthEast Inc, Series 2015A: | | | | | | | | | | | | | | | | |
| | 535 | | | 5.250%, 11/15/35(Pre-refunded 11/15/20) | | | 11/20 at 100.00 | | | | | | | | N/R (4) | | | | 566,437 | |
| | 235 | | | 5.000%, 11/15/44(Pre-refunded 11/15/25) | | | 11/25 at 100.00 | | | | | | | | N/R (4) | | | | 281,401 | |
| | | | | |
| | | | St. Paul Housing and Redevelopment Authority, Minnesota, Hospital Revenue Bonds, HealthEast Inc., Series 2015A: | | | | | | | | | | | | | | | | |
| | 2,500 | | | 5.000%, 11/15/27(Pre-refunded 11/15/25) | | | 11/25 at 100.00 | | | | | | | | N/R (4) | | | | 2,993,625 | |
| | 2,080 | | | 5.250%, 11/15/28(Pre-refunded 11/15/20) | | | 11/20 at 100.00 | | | | | | | | N/R (4) | | | | 2,202,221 | |
| | | | | |
| | 2,240 | | | Wayzata, Minnesota, Senior Housing Revenue Bonds, Folkestone Senior Living Community, Series 2012A, 6.000%, 5/01/47 | | | 5/19 at 102.00 | | | | | | | | N/R | | | | 2,288,922 | |
| | | | | |
| | 3,750 | | | Western Minnesota Municipal Power Agency, Power Supply Revenue Bonds, Series 2014A, 5.000%, 1/01/46 | | | 1/24 at 100.00 | | | | | | | | Aa3 | | | | 4,154,737 | |
| | 45,000 | | | Total Minnesota | | | | | | | | | | | | | | | 45,760,436 | |
| | | | | |
| | | | Mississippi – 0.1% | | | | | | | | | | | | |
| | | | | |
| | 5,000 | | | Mississippi Development Bank, Special Obligation Bonds, Gulfport Water and Sewer System Project, Series 2005, 5.250%, 7/01/24 – AGM Insured | | | No Opt. Call | | | | | | | | AA | | | | 5,642,150 | |
| | | | | |
| | | | Missouri – 1.6% | | | | | | | | | | | | |
| | | | | |
| | 3,185 | | | Bi-State Development Agency,Bi-State MetroLink District, Missouri, St Clair County Metrolink Extension Project Bonds, Refunding Series 2006, 5.250%, 7/01/27 – AGM Insured | | | No Opt. Call | | | | | | | | AA | | | | 3,950,228 | |
| | | | | |
| | 2,470 | | | Hanley Road Corridor Transportation Development District, Brentwood and Maplewood, Missouri, Transportation Sales Revenue Bonds, Refunding Series 2009A, 5.875%, 10/01/36 | | | 10/19 at 100.00 | | | | | | | | A– | | | | 2,504,852 | |
| | | | | |
| | 8,935 | | | Missouri Health and Educational Facilities Authority, Health Facilities Revenue Bonds, BJC Health System, Series 2015A, 4.000%, 1/01/45 | | | 1/25 at 100.00 | | | | | | | | AA | | | | 9,294,991 | |
| | | | | |
| | 1,250 | | | Missouri Health and Educational Facilities Authority, Revenue Bonds, Lutheran Senior Services Projects, Series 2011, 6.000%, 2/01/41 | | | 2/21 at 100.00 | | | | | | | | BBB | | | | 1,311,950 | |
| | | | | |
| | 4,455 | | | Missouri Health and Educational Facilities Authority, Revenue Bonds, Washington University, Tender Option Bond Trust 2015-XF0046, 10.752%, 11/15/39 (IF) | | | 11/19 at 100.00 | | | | | | | | AA+ | | | | 4,742,214 | |
58
| | | | | | | | | | | | | | | | | | | | |
Principal
Amount (000) | | | Description (1) | | Optional Call
Provisions (2) | | | | | | Ratings (3) | | | Value | |
| | | | | |
| | | | Missouri(continued) | | | | | | | | | | | | |
| | | | | |
| $ | 2,250 | | | Missouri Joint Municipal Electric Utility Commission, Power Project Revenue Bonds, Plum Point Project, Refunding Series 2014A, 5.000%, 1/01/28 | | | 1/25 at 100.00 | | | | | | | | A | | | $ | 2,604,870 | |
| | | | | |
| | 15,100 | | | Missouri Joint Municipal Electric Utility Commission, Power Project Revenue Bonds, Plum Point Project, Refunding Series 2015A, 4.000%, 1/01/35 | | | 1/26 at 100.00 | | | | | | | | A | | | | 16,178,593 | |
| | | | | |
| | | | Saint Louis Municipal Finance Corporation, Missouri, Leasehold Revenue Bonds, Convention Center, Series 2010A: | | | | | | | | | | | | | | | | |
| | 5,000 | | | 0.000%, 7/15/31 – AGC Insured | | | No Opt. Call | | | | | | | | AA | | | | 3,420,300 | |
| | 7,000 | | | 0.000%, 7/15/32 – AGC Insured | | | No Opt. Call | | | | | | | | AA | | | | 4,581,500 | |
| | 6,250 | | | 0.000%, 7/15/33 – AGC Insured | | | No Opt. Call | | | | | | | | AA | | | | 3,914,125 | |
| | 7,000 | | | 0.000%, 7/15/34 – AGC Insured | | | No Opt. Call | | | | | | | | AA | | | | 4,187,610 | |
| | 6,000 | | | 0.000%, 7/15/35 – AGC Insured | | | No Opt. Call | | | | | | | | AA | | | | 3,429,900 | |
| | 2,000 | | | 0.000%, 7/15/36 – AGC Insured | | | No Opt. Call | | | | | | | | AA | | | | 1,089,900 | |
| | | | | |
| | 1,288 | | | Saint Louis, Missouri, Tax Increment Financing Revenue Bonds, Fashion Square Redevelopment Project, Series 2008A, 6.300%, 8/22/26 | | | 9/19 at 100.00 | | | | | | | | N/R | | | | 1,284,883 | |
| | | | | |
| | 1,390 | | | Saint Louis, Missouri, Tax Increment Financing Revenue Notes, Marquette Building Redevelopment Project, Series2008-A, 6.500%, 1/23/28 | | | 5/19 at 100.00 | | | | | | | | N/R | | | | 810,731 | |
| | 73,573 | | | Total Missouri | | | | | | | | | | | | | | | 63,306,647 | |
| | | | | |
| | | | Montana – 0.4% | | | | | | | | | | | | |
| | | | | |
| | 2,505 | | | Montana Facilities Finance Authority, Montana, Health Facilities Revenue Bonds, Bozeman Deaconess Health Services Obligated Group, Series 2018, 5.000%, 6/01/48 | | | 6/28 at 100.00 | | | | | | | | A | | | | 2,874,538 | |
| | | | | |
| | 1,910 | | | Montana Facility Finance Authority, Healthcare Facility Revenue Bonds, Kalispell Regional Medical Center, Series 2018B, 5.000%, 7/01/43 | | | 7/28 at 100.00 | | | | | | | | BBB | | | | 2,123,041 | |
| | | | | |
| | 9,130 | | | Montana Facility Finance Authority, Revenue Bonds, Billings Clinic Obligated Group, Series 2018A, 5.000%, 8/15/48 | | | 8/28 at 100.00 | | | | | | | | AA– | | | | 10,637,637 | |
| | 13,545 | | | Total Montana | | | | | | | | | | | | | | | 15,635,216 | |
| | | | | |
| | | | Nebraska – 1.0% | | | | | | | | | | | | |
| | | | | |
| | 3,075 | | | Central Plains Energy Project, Nebraska, Gas Project 3 Revenue Bonds, Refunding Crossover Series 2017A, 5.000%, 9/01/30 | | | No Opt. Call | | | | | | | | A | | | | 3,646,858 | |
| | | | | |
| | 4,000 | | | Central Plains Energy Project, Nebraska, Gas Project 3 Revenue Bonds, Series 2012, 5.000%, 9/01/42 | | | 9/22 at 100.00 | | | | | | | | A | | | | 4,332,000 | |
| | | | | |
| | 1,740 | | | Douglas County Hospital Authority 2, Nebraska, Health Facilities Revenue Bonds, Nebraska Methodist Health System, Refunding Series 2015, 5.000%, 11/01/45 | | | 11/25 at 100.00 | | | | | | | | A | | | | 1,898,897 | |
| | | | | |
| | | | Omaha Public Power District, Nebraska, Separate Electric System Revenue Bonds, Nebraska City 2, Refunding Series 2016A: | | | | | | | | | | | | | | | | |
| | 18,465 | | | 5.000%, 2/01/46 (UB) (5) | | | 2/26 at 100.00 | | | | | | | | A+ | | | | 20,789,559 | |
| | 10,000 | | | 5.000%, 2/01/49 (UB) (5) | | | 2/26 at 100.00 | | | | | | | | A+ | | | | 11,223,800 | |
| | 37,280 | | | Total Nebraska | | | | | | | | | | | | | | | 41,891,114 | |
| | | | | |
| | | | Nevada – 1.5% | | | | | | | | | | | | |
| | | | | |
| | | | Carson City, Nevada, Hospital Revenue Bonds, Carson Tahoe Regional Healthcare Project, Series 2017A: | | | | | | | | | | | | | | | | |
| | 265 | | | 5.000%, 9/01/29 | | | 9/27 at 100.00 | | | | | | | | A– | | | | 309,414 | |
| | 750 | | | 5.000%, 9/01/30 | | | 9/27 at 100.00 | | | | | | | | A– | | | | 868,807 | |
| | 730 | | | 5.000%, 9/01/32 | | | 9/27 at 100.00 | | | | | | | | A– | | | | 832,492 | |
| | 1,965 | | | 5.000%, 9/01/42 | | | 9/27 at 100.00 | | | | | | | | A– | | | | 2,166,511 | |
| | 1,150 | | | 5.000%, 9/01/47 | | | 9/27 at 100.00 | | | | | | | | A– | | | | 1,263,850 | |
59
NuveenAll-American Municipal Bond Fund(continued)
Portfolio of Investments March 31, 2019
| | | | | | | | | | | | | | | | | | | | |
Principal
Amount (000) | | | Description (1) | | Optional Call
Provisions (2) | | | | | | Ratings (3) | | | Value | |
| | | | | |
| | | | Nevada(continued) | | | | | | | | | | | | |
| | | | | |
| $ | 13,600 | | | Clark County, Nevada, General Obligation Bonds, Stadium Improvement, Limited Tax Additionally Secured by Pledged Revenues, Series 2018A, 5.000%, 5/01/48 | | | 6/28 at 100.00 | | | | | | | | AA+ | | | $ | 15,878,952 | |
| | | | | |
| | 2,000 | | | Clark County, Nevada, Passenger Facility Charge Revenue Bonds, Las Vegas-McCarran International Airport, Series 2010A, 5.000%, 7/01/30 | | | 1/20 at 100.00 | | | | | | | | Aa3 | | | | 2,047,540 | |
| | | | | |
| | | | Henderson, Nevada, Limited Obligation Bonds, Local ImprovementDistrict T-18 Inspirada, Refunding Series 2016: | | | | | | | | | | | | | | | | |
| | 1,125 | | | 4.000%, 9/01/25 | | | No Opt. Call | | | | | | | | N/R | | | | 1,166,861 | |
| | 1,800 | | | 4.000%, 9/01/35 | | | 9/26 at 100.00 | | | | | | | | N/R | | | | 1,753,398 | |
| | | | | |
| | | | Las Vegas Redevelopment Agency, Nevada, Tax Increment Revenue Bonds, Series 2009A: | | | | | | | | | | | | | | | | |
| | 2,000 | | | 7.500%, 6/15/23(Pre-refunded 6/15/19) | | | 6/19 at 100.00 | | | | | | | | BBB+ (4) | | | | 2,023,740 | |
| | 1,500 | | | 8.000%, 6/15/30(Pre-refunded 6/15/19) | | | 6/19 at 100.00 | | | | | | | | BBB+ (4) | | | | 1,519,170 | |
| | | | | |
| | 2,500 | | | Las Vegas Valley Water District, Nevada, General Obligation Bonds, Refunding Series 2011C, 5.000%, 6/01/38 | | | 6/21 at 100.00 | | | | | | | | AA+ | | | | 2,657,725 | |
| | | | | |
| | 20,000 | | | Las Vegas Valley Water District, Nevada, General Obligation Bonds, Refunding Water Improvement Series 2016A, 5.000%, 6/01/46 (UB) (5) | | | 6/26 at 100.00 | | | | | | | | AA+ | | | | 22,871,600 | |
| | | | | |
| | | | Las Vegas, Nevada, Local Improvement Bonds, Special Improvement District 607 Providence, Refunding Series 2013: | | | | | | | | | | | | | | | | |
| | 110 | | | 4.000%, 6/01/19 | | | No Opt. Call | | | | | | | | N/R | | | | 110,204 | |
| | 95 | | | 4.000%, 6/01/20 | | | No Opt. Call | | | | | | | | N/R | | | | 96,338 | |
| | 745 | | | 4.000%, 6/01/21 | | | No Opt. Call | | | | | | | | N/R | | | | 761,889 | |
| | 340 | | | 5.000%, 6/01/23 | | | No Opt. Call | | | | | | | | N/R | | | | 362,984 | |
| | 200 | | | 4.250%, 6/01/24 | | | 6/23 at 103.00 | | | | | | | | N/R | | | | 205,972 | |
| | | | | |
| | 1,765 | | | Las Vegas, Nevada, Local Improvement Bonds, Special Improvement District 812 Summerlin Village 24, Series 2015, 5.000%, 12/01/31 | | | 12/25 at 100.00 | | | | | | | | N/R | | | | 1,830,640 | |
| | | | | |
| | | | Washoe County, Nevada, General Obligation Bonds, Reno-Sparks Convention & Visitors Authority, Refunding Series 2011: | | | | | | | | | | | | | | | | |
| | 20 | | | 5.000%, 7/01/32(Pre-refunded 7/01/21) | | | 7/21 at 100.00 | | | | | | | | N/R (4) | | | | 21,504 | |
| | 25 | | | 5.000%, 7/01/32(Pre-refunded 7/01/21) | | | 7/21 at 100.00 | | | | | | | | N/R (4) | | | | 26,880 | |
| | 365 | | | 5.000%, 7/01/32 | | | 7/21 at 100.00 | | | | | | | | Aa2 | | | | 390,627 | |
| | 53,050 | | | Total Nevada | | | | | | | | | | | | | | | 59,167,098 | |
| | | | | |
| | | | New Hampshire – 0.3% | | | | | | | | | | | | |
| | | | | |
| | 8,170 | | | National Finance Authority, New Hampshire, Resource Recovery Revenue Bonds, Covanta Project, Refunding Series 2018C, 4.875%, 11/01/42 (AMT), 144A | | | 7/23 at 100.00 | | | | | | | | B1 | | | | 8,337,321 | |
| | | | | |
| | 3,305 | | | New Hampshire Health and Education Facilities Authority, Revenue Bonds, Dartmouth College, Tender Option Bond Trust 2016-XL0025, 11.651%, 6/01/39 (IF) (5) | | | 6/19 at 100.00 | | | | | | | | N/R | | | | 3,366,341 | |
| | | | | |
| | | | New Hampshire Health and Education Facilities Authority, Revenue Bonds, Dartmouth-Hitchcock Obligated Group, Series 2018A: | | | | | | | | | | | | | | | | |
| | 1,000 | | | 5.000%, 8/01/34 | | | 2/28 at 100.00 | | | | | | | | A | | | | 1,165,800 | |
| | 725 | | | 5.000%, 8/01/36 | | | 2/28 at 100.00 | | | | | | | | A | | | | 835,802 | |
| | 13,200 | | | Total New Hampshire | | | | | | | | | | | | | | | 13,705,264 | |
| | | | | |
| | | | New Jersey – 1.5% | | | | | | | | | | | | |
| | | | | |
| | 4,510 | | | Camden County Improvement Authority, New Jersey, Health Care Redevelopment Revenue Bonds, Cooper Health System Obligated Group Issue, Series 2013A, 5.750%, 2/15/42 | | | 2/23 at 100.00 | | | | | | | | BBB+ | | | | 4,926,228 | |
60
| | | | | | | | | | | | | | | | | | | | |
Principal
Amount (000) | | | Description (1) | | Optional Call
Provisions (2) | | | | | | Ratings (3) | | | Value | |
| | | | | |
| | | | New Jersey(continued) | | | | | | | | | | | | |
| | | | | |
| $ | 1,335 | | | Manalapan-Englishtown Regional Board of Education, New Jersey, General Obligation Bonds, Series 2004, 5.750%, 12/01/21 – FGIC Insured | | | No Opt. Call | | | | | | | | A3 | | | $ | 1,469,087 | |
| | | | | |
| | 3,215 | | | New Jersey Economic Development Authority, Revenue Bonds, Motor Vehicle Surcharge, Refunding Series 2017A, 4.000%, 7/01/34 | | | 7/27 at 100.00 | | | | | | | | BBB+ | | | | 3,265,057 | |
| | | | | |
| | 9,090 | | | New Jersey Economic Development Authority, School Facilities Construction Bonds, Series 2016AAA, 5.500%, 6/15/29 | | | 12/26 at 100.00 | | | | | | | | A– | | | | 10,530,856 | |
| | | | | |
| | | | New Jersey Economic Development Authority, Special Facilities Revenue Bonds, Continental Airlines Inc, Series 1999: | | | | | | | | | | | | | | | | |
| | 1,000 | | | 5.125%, 9/15/23 (AMT) | | | 8/22 at 101.00 | | | | | | | | BB | | | | 1,080,630 | |
| | 1,650 | | | 5.250%, 9/15/29 (AMT) | | | 8/22 at 101.00 | | | | | | | | BB | | | | 1,802,526 | |
| | | | | |
| | 2,255 | | | New Jersey Economic Development Authority, Special Facilities Revenue Bonds, Continental Airlines Inc, Series 2000A & 2000B, 5.625%, 11/15/30 (AMT) | | | 3/24 at 101.00 | | | | | | | | BB | | | | 2,569,595 | |
| | | | | |
| | 835 | | | New Jersey Economic Development Authority, Student Housing Revenue Bonds, Provident Group-Montclair Properties LLC, Montclair State University Student Housing Project, Series 2010A, 5.750%, 6/01/31(Pre-refunded 6/01/20) | | | 6/20 at 100.00 | | | | | | | | N/R (4) | | | | 876,174 | |
| | | | | |
| | 600 | | | New Jersey Educational Facilities Authority, Revenue Bonds, University of Medicine and Dentistry of New Jersey, Refunding Series 2009B, 7.500%, 12/01/32(Pre-refunded 6/01/19) | | | 6/19 at 100.00 | | | | | | | | N/R (4) | | | | 605,856 | |
| | | | | |
| | 1,000 | | | New Jersey Health Care Facilities Financing Authority, Revenue Bonds, Princeton HealthCare System, Series 2016A, 5.000%, 7/01/31 | | | 7/26 at 100.00 | | | | | | | | AA | | | | 1,179,080 | |
| | | | | |
| | 1,460 | | | New Jersey Health Care Facilities Financing Authority, Revenue Bonds, University Hospital Issue, Refunding Series 2015A, 5.000%, 7/01/46 – AGM Insured | | | 7/25 at 100.00 | | | | | | | | AA | | | | 1,611,431 | |
| | | | | |
| | 1,335 | | | New Jersey Higher Education Assistance Authority, Student Loan Revenue Bonds, Tender Option Bond Trust 2016-XG0001, 16.020%, 6/01/30 – Insured (IF) (5) | | | 6/19 at 100.00 | | | | | | | | AAA | | | | 1,371,526 | |
| | | | | |
| | | | New Jersey Transportation Trust Fund Authority, Federal Highway Reimbursement Revenue Notes, Series 2018A: | | | | | | | | | | | | | | | | |
| | 1,475 | | | 5.000%, 6/15/30 | | | 6/26 at 100.00 | | | | | | | | A+ | | | | 1,674,081 | |
| | 1,035 | | | 5.000%, 6/15/31 | | | 6/26 at 100.00 | | | | | | | | A+ | | | | 1,168,857 | |
| | | | | |
| | 11,305 | | | New Jersey Transportation Trust Fund Authority, Transportation System Bonds, Series 2018A, 5.000%, 12/15/32 | | | 12/28 at 100.00 | | | | | | | | A– | | | | 12,733,839 | |
| | | | | |
| | 3,175 | | | New Jersey Turnpike Authority, Revenue Bonds, Series 2005A, 5.250%, 1/01/26 – AGM Insured | | | No Opt. Call | | | | | | | | AA | | | | 3,866,864 | |
| | | | | |
| | 1,000 | | | Newark Housing Authority, New Jersey, City-Secured Police Facility Revenue Bonds, South Ward Police Facility, Series 2009A, 5.750%, 12/01/30 – AGC Insured(Pre-refunded 12/01/19) | | | 12/19 at 100.00 | | | | | | | | A3 (4) | | | | 1,028,290 | |
| | | | | |
| | 1,760 | | | North Hudson Sewerage Authority, New Jersey, Gross Revenue Lease Certificates, Senior Lien Series 2012A, 5.000%, 6/01/23(Pre-refunded 6/01/22) | | | 6/22 at 100.00 | | | | | | | | N/R (4) | | | | 1,949,042 | |
| | | | | |
| | 2,000 | | | Passaic Valley Water Commission, New Jersey, Water System Revenue Bonds, Series 2003, 5.000%, 12/15/19 – AGM Insured | | | No Opt. Call | | | | | | | | AA | | | | 2,047,720 | |
| | | | | |
| | 6,165 | | | Tobacco Settlement Financing Corporation, New Jersey, Tobacco Settlement Asset-Backed Bonds, Series 2018B, 5.000%, 6/01/46 | | | 6/28 at 100.00 | | | | | | | | BBB | | | | 6,512,583 | |
| | 56,200 | | | Total New Jersey | | | | | | | | | | | | | | | 62,269,322 | |
61
NuveenAll-American Municipal Bond Fund(continued)
Portfolio of Investments March 31, 2019
| | | | | | | | | | | | | | | | | | | | |
Principal
Amount (000) | | | Description (1) | | Optional Call
Provisions (2) | | | | | | Ratings (3) | | | Value | |
| | | | | |
| | | | New Mexico – 0.2% | | | | | | | | | | | | |
| | | | | |
| $ | 3,000 | | | New Mexico Hospital Equipment Loan Council, First Mortgage Revenue Bonds, La Vida LLena Project, Series 2010A, 5.875%, 7/01/30 | | | 7/20 at 100.00 | | | | | | | | BBB | | | $ | 3,094,110 | |
| | | | | |
| | 3,070 | | | New Mexico Municipal Energy Acquisition Authority, Gas Supply Revenue Bonds, RefundingSub-Series 2014A, 5.000%, 11/01/39 (Mandatory Put 8/01/19) | | | 8/19 at 100.00 | | | | | | | | Aa2 | | | | 3,101,928 | |
| | 6,070 | | | Total New Mexico | | | | | | | | | | | | | | | 6,196,038 | |
| | | | | |
| | | | New York – 11.3% | | | | | | | | | | | | |
| | | | | |
| | 11,125 | | | Brooklyn Arena Local Development Corporation, New York, Payment in Lieu of Taxes Revenue Bonds, Barclays Center Project, Refunding Series 2016A, 5.000%, 7/15/42 | | | 1/27 at 100.00 | | | | | | | | BBB– | | | | 12,418,392 | |
| | | | | |
| | | | Brooklyn Arena Local Development Corporation, New York, Payment in Lieu of Taxes Revenue Bonds, Barclays Center Project, Series 2009: | | | | | | | | | | | | | | | | |
| | 1,100 | | | 6.000%, 7/15/30(Pre-refunded 1/15/20) | | | 1/20 at 100.00 | | | | | | | | AA+ (4) | | | | 1,139,479 | |
| | 7,745 | | | 6.375%, 7/15/43(Pre-refunded 1/15/20) | | | 1/20 at 100.00 | | | | | | | | AA+ (4) | | | | 8,045,583 | |
| | | | | |
| | | | Buffalo and Erie County Industrial Land Development Corporation, New York, Revenue Bonds, Charter School for Applied Technologies, Series 2017A: | | | | | | | | | | | | | | | | |
| | 500 | | | 4.500%, 6/01/27 | | | 6/24 at 103.00 | | | | | | | | BBB– | | | | 544,430 | |
| | 250 | | | 5.000%, 6/01/35 | | | 6/24 at 103.00 | | | | | | | | BBB– | | | | 271,542 | |
| | | | | |
| | 1,440 | | | Buffalo and Fort Erie Public Bridge Authority, New York, Toll Bridge System Revenue Bonds, Series 2017, 5.000%, 1/01/47 | | | 1/27 at 100.00 | | | | | | | | A+ | | | | 1,643,674 | |
| | | | | |
| | 2,500 | | | Build New York City Resource Corporation, New York, Revenue Bonds, Manhattan College, Series 2017, 5.000%, 8/01/47 | | | 8/27 at 100.00 | | | | | | | | A– | | | | 2,859,550 | |
| | | | | |
| | 4,450 | | | Dormitory Authority of the State of New York, New York State University Facilities Revenue Bonds, Series 2018A, 5.000%, 7/01/43 | | | 7/28 at 100.00 | | | | | | | | Aa3 | | | | 5,233,689 | |
| | | | | |
| | 8,145 | | | Dormitory Authority of the State of New York, Revenue Bonds, Icahn School of Medicine at Mount Sinai, Refunding Series 2015A, 5.000%, 7/01/45 | | | 7/25 at 100.00 | | | | | | | | A– | | | | 9,020,995 | |
| | | | | |
| | 4,955 | | | Dormitory Authority of the State of New York, Revenue Bonds, New School University, Series 2010, 5.500%, 7/01/43 – AGM Insured(Pre-refunded 7/01/20) | | | 7/20 at 100.00 | | | | | | | | AA (4) | | | | 5,202,651 | |
| | | | | |
| | | | Dormitory Authority of the State of New York, Revenue Bonds, Orange Regional Medical Center Obligated Group, Series 2017: | | | | | | | | | | | | | | | | |
| | 100 | | | 5.000%, 12/01/34, 144A | | | 6/27 at 100.00 | | | | | | | | BBB– | | | | 114,029 | |
| | 300 | | | 5.000%, 12/01/36, 144A | | | 6/27 at 100.00 | | | | | | | | BBB– | | | | 339,825 | |
| | | | | |
| | | | Dormitory Authority of the State of New York, Revenue Bonds, Teachers College, Series 2017: | | | | | | | | | | | | | | | | |
| | 500 | | | 5.000%, 7/01/29 | | | 7/27 at 100.00 | | | | | | | | A+ | | | | 605,120 | |
| | 175 | | | 5.000%, 7/01/32 | | | 7/27 at 100.00 | | | | | | | | A+ | | | | 207,070 | |
| | | | | |
| | 14,000 | | | Dormitory Authority of the State of New York, State Sales Tax Revenue Bonds, Series 2018A, 5.000%, 3/15/38 | | | 3/28 at 100.00 | | | | | | | | AA+ | | | | 16,692,760 | |
| | | | | |
| | | | Dormitory Authority of the State of New York, State Sales Tax Revenue Bonds, Series 2018C: | | | | | | | | | | | | | | | | |
| | 8,000 | | | 5.000%, 3/15/36 | | | 3/28 at 100.00 | | | | | | | | AA+ | | | | 9,605,840 | |
| | 10,000 | | | 5.000%, 3/15/37 | | | 3/28 at 100.00 | | | | | | | | AA+ | | | | 11,959,900 | |
| | | | | |
| | 1,365 | | | Hempstead Town Local Development Corporation, New York, Education Revenue Bonds, The Academy Charter School Project, Series 2017A, 6.240%, 2/01/47 | | | 2/27 at 100.00 | | | | | | | | N/R | | | | 1,395,344 | |
62
| | | | | | | | | | | | | | | | | | | | |
Principal
Amount (000) | | | Description (1) | | Optional Call
Provisions (2) | | | | | | Ratings (3) | | | Value | |
| | | | | |
| | | | New York(continued) | | | | | | | | | | | | |
| | | | | |
| | | | Hudson Yards Infrastructure Corporation, New York, Revenue Bonds, Senior Fiscal 2012 Series 2011A: | | | | | | | | | | | | | | | | |
| $ | 245 | | | 5.750%, 2/15/47(Pre-refunded 2/15/21) | | | 2/21 at 100.00 | | | | | | | | Aa2 (4) | | | $ | 264,451 | |
| | 155 | | | 5.750%, 2/15/47 | | | 2/21 at 100.00 | | | | | | | | Aa2 | | | | 166,202 | |
| | | | | |
| | 3,000 | | | Long Island Power Authority, New York, Electric System Revenue Bonds, Series 2008A, 6.000%, 5/01/33(Pre-refunded 5/01/19) | | | 5/19 at 100.00 | | | | | | | | A– (4) | | | | 3,010,920 | |
| | | | | |
| | | | Long Island Power Authority, New York, Electric System Revenue Bonds, Series 2011A: | | | | | | | | | | | | | | | | |
| | 1,000 | | | 5.000%, 5/01/36 – AGM Insured(Pre-refunded 5/01/21) | | | 5/21 at 100.00 | | | | | | | | AA (4) | | | | 1,072,490 | |
| | 1,980 | | | 5.000%, 5/01/38(Pre-refunded 5/01/21) | | | 5/21 at 100.00 | | | | | | | | A– (4) | | | | 2,123,530 | |
| | | | | |
| | | | Monroe County Industrial Development Corporation, New York, Revenue Bonds, University of Rochester Project, Series 2017A: | | | | | | | | | | | | | | | | |
| | 1,400 | | | 5.000%, 7/01/34 | | | 7/27 at 100.00 | | | | | | | | AA– | | | | 1,663,018 | |
| | 1,000 | | | 5.000%, 7/01/36 | | | 7/27 at 100.00 | | | | | | | | AA– | | | | 1,181,090 | |
| | 1,000 | | | 5.000%, 7/01/37 | | | 7/27 at 100.00 | | | | | | | | AA– | | | | 1,176,180 | |
| | | | | |
| | 7,100 | | | Monroe County Industrial Development Corporation, New York, Revenue Bonds, Rochester General Hospital Project, Series 2017, 5.000%, 12/01/46 | | | 12/26 at 100.00 | | | | | | | | A– | | | | 7,976,069 | |
| | | | | |
| | | | Nassau County Local Economic Assistance Corporation, New York, Revenue Bonds, Catholic Health Services of Long Island Obligated Group Project, Series 2014: | | | | | | | | | | | | | | | | |
| | 235 | | | 5.000%, 7/01/23 | | | No Opt. Call | | | | | | | | A– | | | | 263,623 | |
| | 300 | | | 5.000%, 7/01/24 | | | No Opt. Call | | | | | | | | A– | | | | 343,671 | |
| | 210 | | | 5.000%, 7/01/26 | | | 7/24 at 100.00 | | | | | | | | A– | | | | 239,509 | |
| | | | | |
| | | | New York City Industrial Development Agency, New York, Civic Facility Revenue Bonds, Bronx Parking Development Company, LLC Project, Series 2007: | | | | | | | | | | | | | | | | |
| | 3,000 | | | 5.750%, 10/01/37 (7) | | | 5/19 at 11.00 | | | | | | | | N/R | | | | 1,965,000 | |
| | 1,000 | | | 5.875%, 10/01/46 (7) | | | 5/19 at 11.00 | | | | | | | | N/R | | | | 655,000 | |
| | | | | |
| | 715 | | | New York City Industrial Development Agency, New York, Revenue Bonds, Yankee Stadium Project PILOT, Series 2009A, 7.000%, 3/01/49 – AGC Insured | | | 5/19 at 100.00 | | | | | | | | AA | | | | 718,368 | |
| | | | | |
| | 1,000 | | | New York City Municipal Water Finance Authority, New York, Water and Sewer System Second General Resolution Revenue Bonds, Fiscal 2017 Series DD, 5.000%, 6/15/47 | | | 12/26 at 100.00 | | | | | | | | AA+ | | | | 1,156,630 | |
| | | | | |
| | | | New York City Municipal Water Finance Authority, New York, Water and Sewer System Second General Resolution Revenue Bonds, Fiscal 2017 Series EE: | | | | | | | | | | | | | | | | |
| | 5,000 | | | 5.000%, 6/15/36 | | | 6/27 at 100.00 | | | | | | | | AA+ | | | | 5,930,450 | |
| | 5,000 | | | 5.000%, 6/15/37 | | | 6/27 at 100.00 | | | | | | | | AA+ | | | | 5,905,650 | |
| | | | | |
| | 18,515 | | | New York City Municipal Water Finance Authority, New York, Water and Sewer System Second General Resolution Revenue Bonds, Fiscal 2019Series DD-2, 5.250%, 6/15/49 | | | 6/28 at 100.00 | | | | | | | | AA+ | | | | 22,270,583 | |
| | | | | |
| | 1,000 | | | New York City Municipal Water Finance Authority, New York, Water and Sewerage System Revenue Bonds, Tender Option Bond Trust 2015-XF0097, 13.536%, 6/15/39 (IF) | | | 6/19 at 100.00 | | | | | | | | N/R | | | | 1,026,060 | |
| | | | | |
| | 5,000 | | | New York City Transitional Finance Authority, New York, Building Aid Revenue Bonds, Fiscal 2018,Series 2017S-1, 5.000%, 7/15/35 | | | 7/27 at 100.00 | | | | | | | | AA | | | | 5,936,900 | |
| | | | | |
| | 3,000 | | | New York City Transitional Finance Authority, New York, Building Aid Revenue Bonds, Fiscal 2018 SeriesSubseries S-4A, 5.000%, 7/15/33 | | | 7/28 at 100.00 | | | | | | | | AA | | | | 3,650,520 | |
63
NuveenAll-American Municipal Bond Fund(continued)
Portfolio of Investments March 31, 2019
| | | | | | | | | | | | | | | | | | | | |
Principal
Amount (000) | | | Description (1) | | Optional Call
Provisions (2) | | | | | | Ratings (3) | | | Value | |
| | | | | |
| | | | New York(continued) | | | | | | | | | | | | |
| | | | | |
| $ | 22,000 | | | New York City Transitional Finance Authority, New York, Building Aid Revenue Bonds, Fiscal 2019Subseries S-3A, 5.000%, 7/15/35 | | | 7/28 at 100.00 | | | | | | | | AA | | | $ | 26,545,200 | |
| | | | | |
| | 15,085 | | | New York City Transitional Finance Authority, New York, Building Aid Revenue Bonds, FiscalSeries 2016S-1, 5.000%, 7/15/43 | | | 1/26 at 100.00 | | | | | | | | AA | | | | 17,280,622 | |
| | | | | |
| | | | New York City Transitional Finance Authority, New York, Future Tax Secured Bonds, Subordinate Fiscal 2019Series A-1: | | | | | | | | | | | | | | | | |
| | 12,000 | | | 5.000%, 8/01/40 | | | 8/28 at 100.00 | | | | | | | | AAA | | | | 14,278,440 | |
| | 7,220 | | | 5.000%, 8/01/42 | | | 8/28 at 100.00 | | | | | | | | AAA | | | | 8,564,725 | |
| | | | | |
| | 14,965 | | | New York City, New York, General Obligation Bonds, Fiscal 2018Series E-1, 5.000%, 3/01/44 | | | 3/28 at 100.00 | | | | | | | | Aa1 | | | | 17,552,448 | |
| | | | | |
| | | | New York City, New York, General Obligation Bonds, Fiscal 2018Series F-1: | | | | | | | | | | | | | | | | |
| | 7,000 | | | 5.000%, 4/01/39 | | | 4/28 at 100.00 | | | | | | | | Aa1 | | | | 8,296,680 | |
| | 9,775 | | | 5.000%, 4/01/43 | | | 4/28 at 100.00 | | | | | | | | Aa1 | | | | 11,482,301 | |
| | 5,000 | | | 5.000%, 4/01/45 | | | 4/28 at 100.00 | | | | | | | | Aa1 | | | | 5,865,550 | |
| | | | | |
| | | | New York City, New York, General Obligation Bonds, Fiscal 2019Series D-1: | | | | | | | | | | | | | | | | |
| | 3,800 | | | 5.000%, 12/01/40 | | | 12/28 at 100.00 | | | | | | | | Aa1 | | | | 4,526,788 | |
| | 13,695 | | | 5.000%, 12/01/44 | | | 12/28 at 100.00 | | | | | | | | Aa1 | | | | 16,224,329 | |
| | | | | |
| | 20,730 | | | New York Liberty Development Corporation, New York, Liberty Revenue Bonds, 3 World Trade Center Project, Class 1 Series 2014, 5.000%, 11/15/44, 144A | | | 11/24 at 100.00 | | | | | | | | N/R | | | | 22,117,666 | |
| | | | | |
| | | | New York State Environmental Facilities Corporation, State Clean Water and Drinking Water Revolving Funds Revenue Bonds, New York City Municipal Water Finance Authority Projects-Second Resolution Bonds,: | | | | | | | | | | | | | | | | |
| | 24,465 | | | 5.000%, 6/15/42 | | | 6/27 at 100.00 | | | | | | | | AAA | | | | 28,771,819 | |
| | 15,000 | | | 5.000%, 6/15/46 | | | 6/27 at 100.00 | | | | | | | | AAA | | | | 17,563,350 | |
| | 7,820 | | | 5.000%, 6/15/48 | | | 6/28 at 100.00 | | | | | | | | AAA | | | | 9,265,840 | |
| | | | | |
| | 2,660 | | | New York Transportation Development Corporation, New York, Special Facility Revenue Bonds, American Airlines, Inc John F Kennedy International Airport Project, Refunding Series 2016, 5.000%, 8/01/31 (AMT) | | | 8/21 at 100.00 | | | | | | | | BB | | | | 2,771,055 | |
| | | | | |
| | 2,495 | | | New York Transportation Development Corporation, New York, Special Facility Revenue Bonds, American Airlines, Inc. John F Kennedy International Airport Project, Refunding Series 2016, 5.000%, 8/01/20 (AMT) | | | No Opt. Call | | | | | | | | BB | | | | 2,577,909 | |
| | | | | |
| | | | New York Transportation Development Corporation, New York, Special Facility Revenue Bonds, Delta Air Lines, Inc. – LaGuardia Airport Terminals C&D Redevelopment Project, Series 2018: | | | | | | | | | | | | | | | | |
| | 4,000 | | | 5.000%, 1/01/24 (AMT) | | | No Opt. Call | | | | | | | | Baa3 | | | | 4,487,840 | |
| | 10,515 | | | 5.000%, 1/01/27 (AMT) | | | No Opt. Call | | | | | | | | Baa3 | | | | 12,391,507 | |
| | 10,000 | | | 5.000%, 1/01/28 (AMT) | | | No Opt. Call | | | | | | | | Baa3 | | | | 11,940,700 | |
| | | | | |
| | | | New York Transportation Development Corporation, Special Facilities Bonds, LaGuardia Airport Terminal B Redevelopment Project, Series 2016A: | | | | | | | | | | | | | | | | |
| | 8,120 | | | 4.000%, 7/01/37 – AGM Insured (AMT) | | | 7/24 at 100.00 | | | | | | | | AA | | | | 8,398,922 | |
| | 6,060 | | | 5.000%, 7/01/46 (AMT) | | | 7/24 at 100.00 | | | | | | | | BBB | | | | 6,562,435 | |
| | 8,280 | | | 5.250%, 1/01/50 (AMT) | | | 7/24 at 100.00 | | | | | | | | BBB | | | | 9,034,474 | |
| | | | | |
| | 795 | | | Port Authority of New York and New Jersey, Special Project Bonds, JFK International Air Terminal LLC Project, Eighth Series 2010, 6.000%, 12/01/42 | | | 12/20 at 100.00 | | | | | | | | BBB+ | | | | 842,946 | |
64
| | | | | | | | | | | | | | | | | | | | |
Principal
Amount (000) | | | Description (1) | | Optional Call
Provisions (2) | | | | | | Ratings (3) | | | Value | |
| | | | | |
| | | | New York(continued) | | | | | | | | | | | | |
| | | | | |
| $ | 1,170 | | | Suffolk County Economic Development Corporation, New York, Revenue Bonds, Peconic Landing At Southold, Inc Project, Refunding Series 2010, 5.875%, 12/01/30 | | | 12/20 at 100.00 | | | | | | | | BBB– | | | $ | 1,232,735 | |
| | | | | |
| | | | Suffolk County, New York, General Obligation Bonds, Refunding Series 2017A: | | | | | | | | | | | | | | | | |
| | 4,000 | | | 5.000%, 2/01/25 – AGM Insured | | | No Opt. Call | | | | | | | | AA | | | | 4,640,240 | |
| | 5,000 | | | 5.000%, 2/01/26 – AGM Insured | | | No Opt. Call | | | | | | | | AA | | | | 5,894,150 | |
| | 3,675 | | | 5.000%, 2/01/27 – AGM Insured | | | No Opt. Call | | | | | | | | AA | | | | 4,402,246 | |
| | | | | |
| | 1,360 | | | Triborough Bridge and Tunnel Authority, New York, General Purpose Revenue Bonds, Refunding Subordinate Lien Series 2017A2, 5.000%, 11/15/42 | | | 5/27 at 100.00 | | | | | | | | AA– | | | | 1,589,650 | |
| | | | | |
| | 1,400 | | | Troy Capital Resource Corporation, New York, Revenue Bonds, Rensselaer Polytechnic Institute, Series 2010B, 5.000%, 9/01/20 | | | No Opt. Call | | | | | | | | A3 | | | | 1,463,644 | |
| | | | | |
| | 4,405 | | | TSASC Inc, New York, Tobacco Asset-Backed Bonds, Series 2006, 5.000%, 6/01/48 | | | 6/27 at 100.00 | | | | | | | | N/R | | | | 4,415,264 | |
| | | | | |
| | 8,000 | | | TSASC Inc., New York, Tobacco Settlement Asset-Backed Bonds, Fiscal 2017 Series A, 5.000%, 6/01/41 | | | 6/27 at 100.00 | | | | | | | | BBB+ | | | | 8,642,320 | |
| | | | | |
| | 5,200 | | | Westchester County Local Development Corporation, New York, Revenue Bonds, Westchester Medical Center Obligated Group Project, Refunding Series 2016, 5.000%, 11/01/46 | | | 11/25 at 100.00 | | | | | | | | Baa2 | | | | 5,692,596 | |
| | 403,195 | | | Total New York | | | | | | | | | | | | | | | 461,312,178 | |
| | | | | |
| | | | North Carolina – 0.3% | | | | | | | | | | | | |
| | | | | |
| | 1,780 | | | Charlotte, North Carolina, Water and Sewer System Refunding Bonds, Tender Option Bond Trust 2016-XL0012, 10.877%, 7/01/38 (IF) (5) | | | 7/20 at 100.00 | | | | | | | | N/R | | | | 1,988,741 | |
| | | | | |
| | 1,000 | | | North Carolina Eastern Municipal Power Agency, Power System Revenue Bonds, Refunding Series 1993B, 6.000%, 1/01/22 – FGIC Insured (ETM) | | | No Opt. Call | | | | | | | | Baa2 (4) | | | | 1,118,340 | |
| | | | | |
| | | | North Carolina Medical Care Commission, Retirement Facilities First Mortgage Revenue Bonds, Southminster Project, Refunding Series 2016: | | | | | | | | | | | | | | | | |
| | 335 | | | 5.000%, 10/01/31 | | | 10/24 at 102.00 | | | | | | | | N/R | | | | 362,309 | |
| | 890 | | | 5.000%, 10/01/37 | | | 10/24 at 102.00 | | | | | | | | N/R | | | | 946,568 | |
| | | | | |
| | | | North Carolina Turnpike Authority, Monroe Expressway Toll Revenue Bonds, Series 2017A: | | | | | | | | | | | | | | | | |
| | 1,930 | | | 5.000%, 7/01/47 | | | 7/26 at 100.00 | | | | | | | | BBB– | | | | 2,100,901 | |
| | 1,005 | | | 5.000%, 7/01/51 | | | 7/26 at 100.00 | | | | | | | | BBB– | | | | 1,091,330 | |
| | 4,310 | | | 5.000%, 7/01/54 | | | 7/26 at 100.00 | | | | | | | | BBB– | | | | 4,674,497 | |
| | 11,250 | | | Total North Carolina | | | | | | | | | | | | | | | 12,282,686 | |
| | | | | |
| | | | North Dakota – 0.3% | | | | | | | | | | | | |
| | | | | |
| | 2,585 | | | Burleigh County, North Dakota, Health Care Revenue Bonds, Saint Alexius Medical Center Project, Refunding Series 2012A, 5.000%, 7/01/38(Pre-refunded 7/01/22) | | | 7/22 at 100.00 | | | | | | | | N/R (4) | | | | 2,851,591 | |
| | | | | |
| | 2,060 | | | Burleigh County, North Dakota, Multi-County Sales Tax Revenue Bonds, Series 2015A, 3.750%, 11/01/34 – AGM Insured | | | 11/22 at 100.00 | | | | | | | | AA | | | | 2,112,612 | |
| | | | | |
| | | | Grand Forks, North Dakota, Health Care System Revenue Bonds, Altru Health System Obligated Group, Series 2012: | | | | | | | | | | | | | | | | |
| | 2,100 | | | 4.000%, 12/01/27 | | | 12/21 at 100.00 | | | | | | | | A– | | | | 2,161,488 | |
| | 3,535 | | | 5.000%, 12/01/32 | | | 12/21 at 100.00 | | | | | | | | A– | | | | 3,752,509 | |
| | 10,280 | | | Total North Dakota | | | | | | | | | | | | | | | 10,878,200 | |
65
NuveenAll-American Municipal Bond Fund(continued)
Portfolio of Investments March 31, 2019
| | | | | | | | | | | | | | | | | | | | |
Principal
Amount (000) | | | Description (1) | | Optional Call
Provisions (2) | | | | | | Ratings (3) | | | Value | |
| | | | | |
| | | | Ohio – 2.4% | | | | | | | | | | | | |
| | | | | |
| | | | Buckeye Tobacco Settlement Financing Authority, Ohio, Tobacco Settlement Asset-Backed Revenue Bonds, Senior Lien, Series2007A-2: | | | | | | | | | | | | | | | | |
| $ | 8,960 | | | 5.125%, 6/01/24 | | | 4/19 at 100.00 | | | | | | | | B– | | | $ | 8,553,216 | |
| | 12,920 | | | 5.875%, 6/01/30 | | | 4/19 at 100.00 | | | | | | | | B– | | | | 12,645,450 | |
| | 4,060 | | | 5.750%, 6/01/34 | | | 4/19 at 100.00 | | | | | | | | B– | | | | 3,925,777 | |
| | 20,260 | | | 5.875%, 6/01/47 | | | 4/19 at 100.00 | | | | | | | | B– | | | | 19,808,202 | |
| | | | | |
| | | | Butler County, Ohio, Hospital Facilities Revenue Bonds, UC Health, Series 2010: | | | | | | | | | | | | | | | | |
| | 3,000 | | | 5.250%, 11/01/29(Pre-refunded 11/01/20) | | | 11/20 at 100.00 | | | | | | | | A (4) | | | | 3,169,710 | |
| | 2,000 | | | 5.750%, 11/01/40(Pre-refunded 11/01/20) | | | 11/20 at 100.00 | | | | | | | | A (4) | | | | 2,128,680 | |
| | | | | |
| | 3,040 | | | Franklin County, Ohio, Healthcare Facilities Revenue Bonds, Ohio Presbyterian Retirement Services, Improvement Series 2010A, 5.625%, 7/01/26 | | | 7/20 at 100.00 | | | | | | | | BBB | | | | 3,136,064 | |
| | | | | |
| | 525 | | | Lake County, Ohio, Hospital Facilities Revenue Bonds, Lake Hospital System, Inc., Refunding Series 2008C, 5.625%, 8/15/29 | | | 5/19 at 100.00 | | | | | | | | A– | | | | 526,586 | |
| | | | | |
| | 5,820 | | | Lucas County, Ohio, Hospital Revenue Bonds, ProMedica Healthcare Obligated Group, Series 2011A, 6.000%, 11/15/41(Pre-refunded 11/15/21) | | | 11/21 at 100.00 | | | | | | | | Baa1 (4) | | | | 6,477,427 | |
| | | | | |
| | 1,500 | | | Middleburg Heights, Ohio, Hospital Facilities Revenue Bonds, Southwest General Health Center Project, Refunding Series 2011, 5.250%, 8/01/41 | | | 8/21 at 100.00 | | | | | | | | A2 | | | | 1,599,150 | |
| | | | | |
| | 3,500 | | | Montgomery County, Ohio, Health Care and Multifamily Housing Revenue Bonds, Saint Leonard, Refunding & improvement Series 2010, 6.375%, 4/01/30 | | | 4/20 at 100.00 | | | | | | | | BBB– | | | | 3,616,235 | |
| | | | | |
| | 3,700 | | | Ohio Air Quality Development Authority, Ohio, Air Quality Development Revenue Bonds, FirstEnergy Generation Corporation Project, Series 2009A, 5.700%, 8/01/20 (7) | | | No Opt. Call | | | | | | | | N/R | | | | 3,182,000 | |
| | | | | |
| | 2,500 | | | Ohio Air Quality Development Authority, Ohio, Pollution Control Revenue Bonds, FirstEnergy Generation Project, Refunding Series 2006A, 3.750%, 12/01/23 (7) | | | No Opt. Call | | | | | | | | N/R | | | | 2,150,000 | |
| | | | | |
| | 1,075 | | | Ohio Air Quality Development Authority, Ohio, Revenue Bonds, Pratt Paper Ohio, LLC Project, Series 2017, 4.250%, 1/15/38 (AMT), 144A | | | 1/28 at 100.00 | | | | | | | | N/R | | | | 1,110,798 | |
| | | | | |
| | 1,500 | | | Ohio Water Development Authority, Pollution Control Revenue Refunding Bonds, FirstEnergy Nuclear Generating Corporation Project, Series 2005B, 4.000%, 1/01/34 (Mandatory Put 7/01/21) (7) | | | No Opt. Call | | | | | | | | N/R | | | | 1,290,000 | |
| | | | | |
| | 700 | | | Ohio Water Development Authority, Pollution Control Revenue Refunding Bonds, FirstEnergy Nuclear Generating Corporation Project, Series 2008B, 3.625%, 10/01/33 (Mandatory Put 4/01/20) (7) | | | No Opt. Call | | | | | | | | N/R | | | | 602,000 | |
| | | | | |
| | 7,625 | | | Ohio Water Development Authority, Pollution Control Revenue Refunding Bonds, FirstEnergy Nuclear Generating Corporation Project, Series 2008C, 3.950%, 11/01/32 (Mandatory Put 5/01/20) (AMT) (7) | | | No Opt. Call | | | | | | | | N/R | | | | 6,557,500 | |
| | | | | |
| | | | Southeastern Ohio Port Authority, Hosptial Facilities Revenue Bonds, Memorial Health System Obligated Group Project, Refunding and Improvement Series 2012: | | | | | | | | | | | | | | | | |
| | 1,025 | | | 5.000%, 12/01/22 | | | No Opt. Call | | | | | | | | BB– | | | | 1,072,201 | |
| | 3,000 | | | 5.750%, 12/01/32 | | | 12/22 at 100.00 | | | | | | | | BB– | | | | 3,239,370 | |
| | 2,000 | | | 6.000%, 12/01/42 | | | 12/22 at 100.00 | | | | | | | | BB– | | | | 2,127,000 | |
| | | | | |
| | 700 | | | Toledo Lucas County Port Authority, Ohio, Revenue Bonds, StoryPoint Waterville Project, Series2016A-1, 6.125%, 1/15/34, 144A | | | 1/24 at 104.00 | | | | | | | | N/R | | | | 727,790 | |
66
| | | | | | | | | | | | | | | | | | | | |
Principal
Amount (000) | | | Description (1) | | Optional Call
Provisions (2) | | | | | | Ratings (3) | | | Value | |
| | | | | |
| | | | Ohio(continued) | | | | | | | | | | | | |
| | | | | |
| $ | 2,940 | | | Trumbull County, Ohio, Multifamily Housing Revenue Bonds, Royal Mall Apartments, Series 2007, 5.000%, 5/20/49 (AMT) | | | 5/19 at 101.00 | | | | | | | | Aa1 | | | $ | 2,969,870 | |
| | | | | |
| | | | Wood County, Ohio, Hospital Facilities Refunding and Improvement Revenue Bonds, Wood County Hospital Project, Series 2012: | | | | | | | | | | | | | | | | |
| | 2,000 | | | 5.000%, 12/01/27 | | | 12/22 at 100.00 | | | | | | | | Ba2 | | | | 2,130,620 | |
| | 2,695 | | | 5.000%, 12/01/32 | | | 12/22 at 100.00 | | | | | | | | Ba2 | | | | 2,829,588 | |
| | 97,045 | | | Total Ohio | | | | | | | | | | | | | | | 95,575,234 | |
| | | | | |
| | | | Oklahoma – 0.6% | | | | | | | | | | | | |
| | | | | |
| | 1,470 | | | Oklahoma City Airport Trust, Oklahoma, Revenue Bonds, Thirty-Third Series 2018, 5.000%, 7/01/47 (AMT) | | | 7/28 at 100.00 | | | | | | | | A+ | | | | 1,675,050 | |
| | | | | |
| | | | Oklahoma Development Finance Authority, Health System Revenue Bonds, OU Medicine Project, Series 2018B: | | | | | | | | | | | | | | | | |
| | 4,385 | | | 5.500%, 8/15/52 | | | 8/28 at 100.00 | | | | | | | | Baa3 | | | | 5,056,124 | |
| | 3,250 | | | 5.500%, 8/15/57 | | | 8/28 at 100.00 | | | | | | | | Baa3 | | | | 3,724,793 | |
| | | | | |
| | 2,500 | | | Oklahoma Development Finance Authority, Revenue Bonds, Provident Oklahoma Education ResourcesInc- Cross Village Student Housing Project, Series 2017, 5.000%, 8/01/52 | | | 8/27 at 100.00 | | | | | | | | BB | | | | 2,319,825 | |
| | | | | |
| | 9,090 | | | Tulsa Municipal Airport Trust, Oklahoma, Revenue Bonds, American Airlines Inc, Refunding Series 2015, 5.000%, 6/01/35 (Mandatory Put 6/01/25) (AMT) | | | 6/25 at 100.00 | | | | | | | | BB– | | | | 9,983,638 | |
| | 20,695 | | | Total Oklahoma | | | | | | | | | | | | | | | 22,759,430 | |
| | | | | |
| | | | Oregon – 0.5% | | | | | | | | | | | | |
| | | | | |
| | 8,500 | | | Deschutes County Hospital Facility Authority, Oregon, Hospital Revenue Bonds, Saint Charles Health System, Inc, Series 2016A, 5.000%, 1/01/48 | | | 1/26 at 100.00 | | | | | | | | A+ | | | | 9,411,200 | |
| | | | | |
| | | | Multnomah County Hospital Facilities Authority, Oregon, Revenue Bonds, Mirabella South Waterfront, Refunding Series 2014A: | | | | | | | | | | | | | | | | |
| | 1,855 | | | 5.400%, 10/01/44 | | | 10/24 at 100.00 | | | | | | | | N/R | | | | 1,993,383 | |
| | 1,600 | | | 5.500%, 10/01/49 | | | 10/24 at 100.00 | | | | | | | | N/R | | | | 1,723,104 | |
| | | | | |
| | 840 | | | Oregon Facilities Authority, Revenue Bonds, Concordia University Project, Series 2010A, 6.125%, 9/01/30(Pre-refunded 9/01/20), 144A | | | 9/20 at 100.00 | | | | | | | | N/R (4) | | | | 886,200 | |
| | | | | |
| | 360 | | | Oregon Housing and Community Services Department, Multifamily Housing Revenue Bonds, Refunding Series 2010A, 5.150%, 7/01/42 (AMT) | | | 1/20 at 100.00 | | | | | | | | Aaa | | | | 364,741 | |
| | | | | |
| | 7,155 | | | Port of Portland, Oregon, International Airport Revenue Bonds,Series 2010-20C, 5.000%, 7/01/27 (AMT) | | | 7/20 at 100.00 | | | | | | | | AA– | | | | 7,416,730 | |
| | 20,310 | | | Total Oregon | | | | | | | | | | | | | | | 21,795,358 | |
| | | | | |
| | | | Pennsylvania – 3.6% | | | | | | | | | | | | |
| | | | | |
| | 315 | | | Allegheny Country Industrial Development Authority, Pennsylvania, Environmental Improvement Revenue Bonds, United States Steel Corporation Project, Series 2012, 5.750%, 8/01/42 (AMT) | | | 8/22 at 100.00 | | | | | | | | BB– | | | | 318,484 | |
| | | | | |
| | 1,125 | | | Allegheny County Higher Education Building Authority, Pennsylvania, Revenue Bonds, Carlow University, Series 2011, 6.750%, 11/01/31(Pre-refunded 11/01/21) | | | 11/21 at 100.00 | | | | | | | | BBB (4) | | | | 1,269,652 | |
| | | | | |
| | | | Allentown Neighborhood Improvement Zone Development Authority, Pennsylvania, Tax Revenue Bonds, City Center Project, Series 2018: | | | | | | | | | | | | | | | | |
| | 500 | | | 5.000%, 5/01/23, 144A | | | No Opt. Call | | | | | | | | Ba3 | | | | 535,940 | |
| | 300 | | | 5.000%, 5/01/42, 144A | | | 5/28 at 100.00 | | | | | | | | Ba3 | | | | 325,404 | |
67
NuveenAll-American Municipal Bond Fund(continued)
Portfolio of Investments March 31, 2019
| | | | | | | | | | | | | | | | | | | | |
Principal
Amount (000) | | | Description (1) | | Optional Call
Provisions (2) | | | | | | Ratings (3) | | | Value | |
| | | | | |
| | | | Pennsylvania(continued) | | | | | | | | | | | | |
| | | | | |
| | | | Allentown Neighborhood Improvement Zone Development Authority, Pennsylvania, Tax Revenue Bonds, City Center Project, Subordinate Lien, Series 2018: | | | | | | | | | | | | | | | | |
| $ | 6,835 | | | 5.000%, 5/01/28, 144A | | | No Opt. Call | | | | | | | | N/R | | | $ | 7,270,595 | |
| | 1,580 | | | 5.375%, 5/01/42, 144A | | | 5/28 at 100.00 | | | | | | | | N/R | | | | 1,667,595 | |
| | | | | |
| | 3,750 | | | Beaver County Industrial Development Authority, Pennsylvania, Pollution Control Revenue Bonds, FirstEnergy Nuclear Generation Project, Refunding Series 2005A, 4.000%, 1/01/35 (Mandatory Put 7/01/21) (7) | | | No Opt. Call | | | | | | | | N/R | | | | 3,225,000 | |
| | | | | |
| | | | Beaver County Industrial Development Authority, Pennsylvania, Pollution Control Revenue Refunding Bonds, FirstEnergy Nuclear Generation Project, Series 2006A: | | | | | | | | | | | | | | | | |
| | 5,800 | | | 4.375%, 1/01/35(Mandatory Put 7/01/22) (7) | | | No Opt. Call | | | | | | | | N/R | | | | 5,800,000 | |
| | 455 | | | 3.500%, 4/01/41(Mandatory Put 6/01/20) (7) | | | No Opt. Call | | | | | | | | N/R | | | | 391,300 | |
| | | | | |
| | 2,000 | | | Beaver County Industrial Development Authority, Pennsylvania, Pollution Control Revenue Refunding Bonds, FirstEnergy Nuclear Generation Project, Series 2006B, 3.500%, 12/01/35 (Mandatory Put 6/01/20) (7) | | | No Opt. Call | | | | | | | | N/R | | | | 1,720,000 | |
| | | | | |
| | 1,545 | | | Cumberland County Municipal Authority, Pennsylvania, Revenue Bonds, Diakon Lutheran Social Ministries Project, Series 2015, 5.000%, 1/01/38 | | | 1/25 at 100.00 | | | | | | | | BBB+ | | | | 1,660,334 | |
| | | | | |
| | 5,500 | | | Delaware River Port Authority, New Jersey and Pennsylvania, Revenue Bonds, Series 2018A, 5.000%, 1/01/39 | | | 1/29 at 100.00 | | | | | | | | A+ | | | | 6,577,230 | |
| | | | | |
| | | | Montgomery County Higher Education and Health Authority, Pennsylvania, Revenue Bonds, Thomas Jefferson University, Series 2018A: | | | | | | | | | | | | | | | | |
| | 2,185 | | | 5.000%, 9/01/43 | | | 9/28 at 100.00 | | | | | | | | A+ | | | | 2,488,562 | |
| | 5,445 | | | 5.000%, 9/01/48 | | | 9/28 at 100.00 | | | | | | | | A+ | | | | 6,189,440 | |
| | | | | |
| | 705 | | | Montgomery County Industrial Development Authority, Pennsylvania, FHA Insured Mortgage Revenue Bonds, New Regional Medical Center Project, Series 2010, 5.375%, 8/01/38(Pre-refunded 8/01/20) | | | 8/20 at 100.00 | | | | | | | | N/R (4) | | | | 740,264 | |
| | | | | |
| | 910 | | | Montgomery County Industrial Development Authority, Pennsylvania, FHA Insured Mortgage Revenue Bonds, New Regional Medical Center Project, Tender Option Bond Trust 2017-XF2454, 13.692%, 8/01/24 (IF) (5) | | | 8/20 at 100.00 | | | | | | | | N/R | | | | 1,064,682 | |
| | | | | |
| | | | Montgomery County Industrial Development Authority, Pennsylvania, Health System Revenue Bonds, Albert Einstein Healthcare Network Issue, Series 2015A: | | | | | | | | | | | | | | | | |
| | 1,860 | | | 5.250%, 1/15/45 | | | 1/25 at 100.00 | | | | | | | | Ba1 | | | | 2,027,400 | |
| | 1,310 | | | 5.250%, 1/15/46 | | | 1/25 at 100.00 | | | | | | | | Ba1 | | | | 1,429,053 | |
| | | | | |
| | 1,650 | | | Pennsylvania Economic Development Financing Authority, Exempt Facilities Revenue Bonds, National Gypsum Company, Refunding Series 2014, 5.500%, 11/01/44 (AMT) | | | 11/24 at 100.00 | | | | | | | | N/R | | | | 1,734,711 | |
| | | | | |
| | 1,000 | | | Pennsylvania Economic Development Financing Authority, Exempt Facilities Revenue Refunding Bonds, PPL Energy Supply, LLC Project, Series 2009A, 6.400%, 12/01/38 | | | 9/25 at 100.00 | | | | | | | | B | | | | 1,022,570 | |
| | | | | |
| | 4,500 | | | Pennsylvania Economic Development Financing Authority, Governmental Lease Revenue Bonds, Forum Place Project, Series 2012, 5.000%, 3/01/34 | | | 3/22 at 100.00 | | | | | | | | A | | | | 4,723,110 | |
| | | | | |
| | 2,105 | | | Pennsylvania Economic Development Financing Authority, Health System Revenue Bonds , Albert Einstein Healthcare, Series 2009A, 6.250%, 10/15/23(Pre-refunded 10/15/19) | | | 10/19 at 100.00 | | | | | | | | N/R (4) | | | | 2,155,878 | |
68
| | | | | | | | | | | | | | | | | | | | |
Principal
Amount (000) | | | Description (1) | | Optional Call
Provisions (2) | | | | | | Ratings (3) | | | Value | |
| | | | | |
| | | | Pennsylvania(continued) | | | | | | | | | | | | |
| | | | | |
| | | | Pennsylvania Economic Development Financing Authority, Private Activity Revenue Bonds, Pennsylvania Rapid Bridge Replacement Project, Series 2015: | | | | | | | | | | | | | | | | |
| $ | 10,395 | | | 5.000%, 12/31/38 (AMT) | | | 6/26 at 100.00 | | | | | | | | BBB | | | $ | 11,454,043 | |
| | 3,750 | | | 5.000%, 6/30/42 (AMT) | | | 6/26 at 100.00 | | | | | | | | BBB | | | | 4,101,150 | |
| | | | | |
| | 1,200 | | | Pennsylvania Higher Educational Facilities Authority, Revenue Bonds, Edinboro University Foundation Student Housing Project, Series 2010, 5.800%, 7/01/30(Pre-refunded 7/01/20) | | | 7/20 at 100.00 | | | | | | | | N/R (4) | | | | 1,261,800 | |
| | | | | |
| | 7,405 | | | Pennsylvania Turnpike Commission, Turnpike Revenue Bonds,Series 2015A-1, 5.000%, 12/01/45 | | | 6/25 at 100.00 | | | | | | | | A+ | | | | 8,272,940 | |
| | | | | |
| | 15,000 | | | Pennsylvania Turnpike Commission, Turnpike Revenue Bonds, Subordinate Series 2009C, 6.250%, 6/01/33 – AGM Insured | | | 6/26 at 100.00 | | | | | | | | AA | | | | 18,627,000 | |
| | | | | |
| | | | Philadelphia Authority for Industrial Development, City Service Agreement Revenue Bonds, Series 2018: | | | | | | | | | | | | | | | | |
| | 2,500 | | | 5.000%, 5/01/36 | | | 5/28 at 100.00 | | | | | | | | A | | | | 2,894,425 | |
| | 2,250 | | | 5.000%, 5/01/37 | | | 5/28 at 100.00 | | | | | | | | A | | | | 2,594,812 | |
| | | | | |
| | 480 | | | Philadelphia Authority for Industrial Development, Pennsylvania, Revenue Bonds, Global Leadership Academy Project, Series 2010, 5.750%, 11/15/30 | | | 11/20 at 100.00 | | | | | | | | BB | | | | 491,962 | |
| | | | | |
| | 2,000 | | | Philadelphia Gas Works, Pennsylvania, Revenue Bonds, Ninth Series, 2010, 5.000%, 8/01/30(Pre-refunded 8/01/20) | | | 8/20 at 100.00 | | | | | | | | A (4) | | | | 2,091,560 | |
| | | | | |
| | 4,000 | | | Philadelphia, Pennsylvania, Airport Revenue Bonds, Refunding Series 2017B, 5.000%, 7/01/34 (AMT) | | | 7/27 at 100.00 | | | | | | | | A | | | | 4,638,200 | |
| | | | | |
| | 260 | | | Philadelphia, Pennsylvania, Airport Revenue Bonds, Series 2010A, 5.000%, 6/15/40 – AGM Insured | | | 6/20 at 100.00 | | | | | | | | AA | | | | 269,116 | |
| | | | | |
| | 2,380 | | | Philadelphia, Pennsylvania, General Obligation Bonds, Refunding Series 2011, 6.500%, 8/01/41(Pre-refunded 8/01/20) | | | 8/20 at 100.00 | | | | | | | | A (4) | | | | 2,533,843 | |
| | | | | |
| | 8,875 | | | Philadelphia, Pennsylvania, Water and Wastewater Revenue Bonds, Refunding Series 2012, 5.000%, 11/01/28 | | | 11/22 at 100.00 | | | | | | | | A+ | | | | 9,788,681 | |
| | | | | |
| | 2,400 | | | Pittsburgh and Allegheny County Sports and Exhibition Authority, Pennsylvania, Hotel Room Excise Tax Revenue Bonds, Refunding Series 2010, 5.000%, 2/01/30 – AGM Insured | | | 8/20 at 100.00 | | | | | | | | AA | | | | 2,490,648 | |
| | | | | |
| | 3,000 | | | Southeastern Pennsylvania Transportation Authority, Capital Grant Receipts Bonds, Federal Transit Administration Section 5309 Fixed Guideway Modernization Formula Funds, Series 2011, 5.000%, 6/01/28(Pre-refunded 6/01/21) | | | 6/21 at 100.00 | | | | | | | | AA– (4) | | | | 3,220,680 | |
| | | | | |
| | | | The Hospitals and Higher Education Facilities Authority of Philadelphia, Hospital Revenue Bonds, Temple University Health System Obligated Group, Series of 2017: | | | | | | | | | | | | | | | | |
| | 8,865 | | | 5.000%, 7/01/31 | | | 7/27 at 100.00 | | | | | | | | BBB– | | | | 9,909,386 | |
| | 5,400 | | | 5.000%, 7/01/34 | | | 7/27 at 100.00 | | | | | | | | BBB– | | | | 5,952,096 | |
| | | | | |
| | 1,930 | | | The Hospitals and Higher Education Facilities Authority of Philadelphia, Pennsylvania, Hospital Revenue Bonds, Temple University Health System Obligated Group, Series of 2017, 5.000%, 7/01/32 | | | 7/27 at 100.00 | | | | | | | | BBB– | | | | 2,142,435 | |
| | 133,465 | | | Total Pennsylvania | | | | | | | | | | | | | | | 147,071,981 | |
| | | | | |
| | | | South Carolina – 1.3% | | | | | | | | | | | | |
| | | | | |
| | 3,330 | | | Columbia, South Carolina, Stormwater System Revenue Bonds, City Stormwater Improvements, Green Series 2018, 5.000%, 2/01/48 | | | 2/28 at 100.00 | | | | | | | | AA+ | | | | 3,925,171 | |
69
NuveenAll-American Municipal Bond Fund(continued)
Portfolio of Investments March 31, 2019
| | | | | | | | | | | | | | | | | | | | |
Principal
Amount (000) | | | Description (1) | | Optional Call
Provisions (2) | | | | | | Ratings (3) | | | Value | |
| | | | | |
| | | | South Carolina(continued) | | | | | | | | | | | | |
| | | | | |
| $ | 325 | | | Greenville, South Carolina, Hospital Facilities Revenue Bonds, Series 1990, 6.000%, 5/01/20 | | | No Opt. Call | | | | | | | | A | | | $ | 331,906 | |
| | | | | |
| | 10,000 | | | Patriots Energy Group Financing Agency, South Carolina, Gas Supply Revenue Bonds, Series 2018A, 4.000%, 10/01/48 (Mandatory Put 2/01/24) | | | 11/23 at 100.30 | | | | | | | | Aa2 | | | | 10,811,800 | |
| | | | | |
| | 3,000 | | | South Carolina Jobs-Economic Development Authority, Hospital Revenue Bonds, Prisma Health Obligated Group, Series 2018A, 5.000%, 5/01/48 | | | 5/28 at 100.00 | | | | | | | | A | | | | 3,398,880 | |
| | | | | |
| | 5,000 | | | South Carolina Public Service Authority Santee Cooper Revenue Obligations, Refunding Series 2016B, 5.000%, 12/01/56 | | | 12/26 at 100.00 | | | | | | | | A+ | | | | 5,563,950 | |
| | | | | |
| | 7,140 | | | South Carolina Public Service Authority, Electric System Revenue Bonds, Santee Cooper, Refunding Series 2012D, 5.000%, 12/01/43 | | | 6/22 at 100.00 | | | | | | | | A+ | | | | 7,538,055 | |
| | | | | |
| | 2,385 | | | South Carolina Public Service Authority, Santee Cooper Revenue Obligations, Refunding Series 2014B, 5.000%, 12/01/31 | | | 6/24 at 100.00 | | | | | | | | A+ | | | | 2,649,520 | |
| | | | | |
| | 2,165 | | | South Carolina Public Service Authority, Santee Cooper Revenue Obligations, Refunding Series 2016A, 5.000%, 12/01/31 | | | 6/26 at 100.00 | | | | | | | | A+ | | | | 2,489,620 | |
| | | | | |
| | 2,000 | | | South Carolina Public Service Authority, Santee Cooper Revenue Obligations, Series 2013A, 5.500%, 12/01/33 | | | 12/23 at 100.00 | | | | | | | | A+ | | | | 2,249,280 | |
| | | | | |
| | 4,520 | | | South Carolina Public Service Authority, Santee Cooper Revenue Obligations, Series 2013E, 5.000%, 12/01/48 | | | 12/23 at 100.00 | | | | | | | | A+ | | | | 4,879,521 | |
| | | | | |
| | | | South Carolina State Ports Authority Revenue Bonds, Series 2018: | | | | | | | | | | | | | | | | |
| | 4,860 | | | 5.000%, 7/01/31 (AMT) | | | 7/28 at 100.00 | | | | | | | | A+ | | | | 5,798,806 | |
| | 3,760 | | | 5.000%, 7/01/32 (AMT) | | | 7/28 at 100.00 | | | | | | | | A+ | | | | 4,458,571 | |
| | 48,485 | | | Total South Carolina | | | | | | | | | | | | | | | 54,095,080 | |
| | | | | |
| | | | South Dakota – 0.1% | | | | | | | | | | | | |
| | | | | |
| | 2,500 | | | Rapid City, South Dakota, Airport Customer Facility Charge Revenue Bonds, Recovery Zone Facility Bond Series 2010B, 7.000%, 12/01/30 | | | 12/20 at 102.00 | | | | | | | | N/R | | | | 2,682,625 | |
| | | | | |
| | 1,000 | | | Rapid City, South Dakota, Airport Revenue Bonds, Passenger Facility Charge Supported, Refunding Series 2011A, 7.000%, 12/01/35 | | | 12/19 at 100.00 | | | | | | | | Baa3 | | | | 1,035,280 | |
| | | | | |
| | 910 | | | South Dakota Health and Educational Facilities Authority, Revenue Bonds, Sanford Health, Series 2015, 5.000%, 11/01/45 | | | 11/25 at 100.00 | | | | | | | | A+ | | | | 999,844 | |
| | 4,410 | | | Total South Dakota | | | | | | | | | | | | | | | 4,717,749 | |
| | | | | |
| | | | Tennessee – 1.5% | | | | | | | | | | | | |
| | | | | |
| | 3,670 | | | Blount County Public Building Authority, Tennessee, Local Government Public Improvement Loan Bonds, Washington County, Series2007B-12-A, 4.375%, 6/01/35 – SYNCORA GTY Insured(Pre-refunded 6/01/19) | | | 6/19 at 100.00 | | | | | | | | AA (4) | | | | 3,687,469 | |
| | | | | |
| | | | Chattanooga Health, Educational and Housing Facility Board, Tennessee, Revenue Bonds, Catholic Health Initiatives, Series 2008D: | | | | | | | | | | | | | | | | |
| | 510 | | | 6.000%, 10/01/23 | | | 5/19 at 100.00 | | | | | | | | BBB+ | | | | 511,882 | |
| | 1,500 | | | 6.125%, 10/01/28 | | | 5/19 at 100.00 | | | | | | | | BBB+ | | | | 1,505,670 | |
| | | | | |
| | 3,000 | | | Claiborne County, Tennessee, Industrial Development Board, Revenue Refunding Bonds, Lincoln Memorial University Project, Series 2009, 6.625%, 10/01/39 | | | 10/19 at 100.00 | | | | | | | | N/R | | | | 3,054,480 | |
| | | | | |
| | | | Greeneville Health and Educational Facilities Board, Tennessee, Hospital Revenue Bonds, Ballad Health, Series 2018A: | | | | | | | | | | | | | | | | |
| | 5,000 | | | 5.000%, 7/01/31 | | | 7/23 at 100.00 | | | | | | | | A | | | | 5,470,100 | |
| | 4,860 | | | 5.000%, 7/01/32 | | | 7/23 at 100.00 | | | | | | | | A | | | | 5,300,559 | |
| | 1,660 | | | 5.000%, 7/01/33 | | | 7/23 at 100.00 | | | | | | | | A | | | | 1,804,238 | |
| | 6,500 | | | 5.000%, 7/01/34 | | | 7/23 at 100.00 | | | | | | | | A | | | | 7,048,470 | |
70
| | | | | | | | | | | | | | | | | | | | |
Principal
Amount (000) | | | Description (1) | | Optional Call
Provisions (2) | | | | | | Ratings (3) | | | Value | |
| | | | | |
| | | | Tennessee(continued) | | | | | | | | | | | | |
| | | | | |
| $ | 8,500 | | | Memphis-Shelby County Airport Authority, Tennessee, Airport Revenue Bonds, Series 2018, 5.000%, 7/01/47 (AMT) | | | 7/28 at 100.00 | | | | | | | | A | | | $ | 9,736,835 | |
| | | | | |
| | 1,440 | | | Metropolitan Government of Nashville-Davidson County Health and Educational Facilities Board, Tennessee, Revenue Bonds, Belmont University Project, Series 2012, 5.000%, 11/01/26 | | | 11/21 at 100.00 | | | | | | | | A | | | | 1,544,558 | |
| | | | | |
| | 1,900 | | | Metropolitan Government of Nashville-Davidson County Health and Educational Facilities Board, Tennessee, Revenue Bonds, Knowledge Academy Charter School, Series 2017A, 5.500%, 6/15/37, 144A (7) | | | 6/27 at 100.00 | | | | | | | | N/R | | | | 1,514,566 | |
| | | | | |
| | 5,240 | | | Metropolitan Government of Nashville-Davidson County Health and Educational Facilities Board, Tennessee, Revenue Bonds, Vanderbilt University Medical Center, Series 2016A, 5.000%, 7/01/46 (UB) (5) | | | 7/26 at 100.00 | | | | | | | | Aa1 | | | | 5,857,482 | |
| | | | | |
| | | | Metropolitan Government of Nashville-Davidson County Health and Educational Facilities Board, Tennessee, Revenue Bonds, Vanderbilt University, Series 2009A: | | | | | | | | | | | | | | | | |
| | 215 | | | 5.000%, 10/01/39(Pre-refunded 10/01/19) | | | 10/19 at 100.00 | | | | | | | | N/R (4) | | | | 218,659 | |
| | 785 | | | 5.000%, 10/01/39(Pre-refunded 10/01/19) | | | 10/19 at 100.00 | | | | | | | | AA+ (4) | | | | 798,753 | |
| | | | | |
| | | | South Blount County Utility District, Tennessee, Waterworks Revenue Bonds, Improvement & Refunding Series 2009: | | | | | | | | | | | | | | | | |
| | 635 | | | 5.250%, 12/01/39 – AGM Insured(Pre-refunded 12/01/19) | | | 12/19 at 100.00 | | | | | | | | AA (4) | | | | 650,443 | |
| | 1,365 | | | 5.250%, 12/01/39 – AGM Insured | | | 12/19 at 100.00 | | | | | | | | AA | | | | 1,396,545 | |
| | | | | |
| | 1,000 | | | The Tennessee Energy Acquisition Corporation, Gas Revenue Bonds, Series 2006A, 5.250%, 9/01/21 | | | No Opt. Call | | | | | | | | A | | | | 1,067,880 | |
| | | | | |
| | 10,870 | | | The Tennessee Energy Acquisition Corporation, Gas Revenue Bonds, Series 2017A, 4.000%, 5/01/48 (Mandatory Put 5/01/23) | | | 5/23 at 100.43 | | | | | | | | A3 | | | | 11,501,330 | |
| | 58,650 | | | Total Tennessee | | | | | | | | | | | | | | | 62,669,919 | |
| | | | | |
| | | | Texas – 7.2% | | | | | | | | | | | | |
| | | | | |
| | | | Arlington Higher Education Finance Corporation, Texas, Education Revenue Bonds, Uplift Education, Series 2016A: | | | | | | | | | | | | | | | | |
| | 125 | | | 5.000%, 12/01/46 | | | 12/26 at 100.00 | | | | | | | | BBB– | | | | 134,886 | |
| | 740 | | | 5.000%, 12/01/51 | | | 12/26 at 100.00 | | | | | | | | BBB– | | | | 795,981 | |
| | | | | |
| | 10,000 | | | Arlington, Texas, Special Tax Revenue Bonds, Subordinate Lien Series 2018C, 5.000%, 2/15/48 – BAM Insured | | | 2/23 at 100.00 | | | | | | | | AA | | | | 10,792,900 | |
| | | | | |
| | | | Bexar County Hospital District, Texas, Certificates of Obligation, Refunding Limited Tax Series 2019: | | | | | | | | | | | | | | | | |
| | 1,195 | | | 5.000%, 2/15/34 | | | 2/28 at 100.00 | | | | | | | | Aa1 | | | | 1,433,271 | |
| | 5,555 | | | 5.000%, 2/15/37 | | | 2/28 at 100.00 | | | | | | | | Aa1 | | | | 6,564,066 | |
| | 1,730 | | | 5.000%, 2/15/39 | | | 2/28 at 100.00 | | | | | | | | Aa1 | | | | 2,032,144 | |
| | | | | |
| | 5,280 | | | Bexar County, Texas, Venue Project Revenue Bonds, Refunding Combined Venue Tax Series 2010, 5.500%, 8/15/49 – AGM Insured | | | 8/19 at 100.00 | | | | | | | | AA | | | | 5,351,438 | |
| | | | | |
| | 1,745 | | | Central Texas Regional Mobility Authority, Revenue Bonds, Senior Lien Series 2010, 5.750%, 1/01/25(Pre-refunded 1/01/20) | | | 1/20 at 100.00 | | | | | | | | A– (4) | | | | 1,799,060 | |
| | | | | |
| | 3,400 | | | Central Texas Regional Mobility Authority, Revenue Bonds, Senior Lien Series 2011, 6.250%, 1/01/46(Pre-refunded 1/01/21) | | | 1/21 at 100.00 | | | | | | | | A– (4) | | | | 3,667,546 | |
| | | | | |
| | 5,410 | | | Central Texas Regional Mobility Authority, Revenue Bonds, Senior Lien, Series 2018, 5.000%, 1/01/48 | | | 1/28 at 100.00 | | | | | | | | A– | | | | 6,112,867 | |
| | | | | |
| | 1,970 | | | Clifton Higher Education Finance Corporation, Texas, Education Revenue Bonds, Tejano Center for Community Concerns,Inc-Raul Yzaguirre School for Success, Refunding Series 2009A, 8.750%, 2/15/28 | | | 5/19 at 100.00 | | | | | | | | B | | | | 1,974,019 | |
71
NuveenAll-American Municipal Bond Fund(continued)
Portfolio of Investments March 31, 2019
| | | | | | | | | | | | | | | | | | | | |
Principal
Amount (000) | | | Description (1) | | Optional Call
Provisions (2) | | | | | | Ratings (3) | | | Value | |
| | | | | |
| | | | Texas(continued) | | | | | | | | | | | | |
| | | | | |
| $ | 2,745 | | | Clifton Higher Education Finance Corporation, Texas, Education Revenue Bonds, Idea Public Schools, Series 2012, 5.000%, 8/15/32 | | | 8/22 at 100.00 | | | | | | | | BBB+ | | | $ | 2,926,884 | |
| | | | | |
| | 1,250 | | | Clifton Higher Education Finance Corporation, Texas, Education Revenue Bonds, Idea Public Schools, Series 2013, 6.000%, 8/15/33 | | | 8/23 at 100.00 | | | | | | | | BBB+ | | | | 1,421,837 | |
| | | | | |
| | 2,500 | | | Clifton Higher Education Finance Corporation, Texas, Education Revenue Bonds, Uplift Education Charter School, Series 2014A, 4.250%, 12/01/34 | | | 12/24 at 100.00 | | | | | | | | BBB– | | | | 2,549,075 | |
| | | | | |
| | 9,700 | | | Clifton Higher Education Finance Corporation, Texas, Education Revenue Bonds, Uplift Education Charter School, Series 2015A, 5.000%, 12/01/50 | | | 6/25 at 100.00 | | | | | | | | BBB– | | | | 10,311,876 | |
| | | | | |
| | 12,265 | | | Dallas Area Rapid Transit, Texas, Sales Tax Revenue Bonds, Refunding Series 2016A, 5.000%, 12/01/46 (UB) (5) | | | 12/25 at 100.00 | | | | | | | | AA+ | | | | 13,948,126 | |
| | | | | |
| | | | Dallas-Fort Worth International Airport, Texas, Joint Revenue Bonds, Refunding Series 2011C: | | | | | | | | | | | | | | | | |
| | 3,500 | | | 5.000%, 11/01/24 | | | 11/20 at 100.00 | | | | | | | | A+ | | | | 3,704,365 | |
| | 1,500 | | | 5.000%, 11/01/25 | | | 11/20 at 100.00 | | | | | | | | A+ | | | | 1,585,650 | |
| | | | | |
| | 20 | | | Dallas-Fort Worth International Airport, Texas, Joint Revenue Bonds, Refunding Series 2012B, 5.000%, 11/01/35 | | | 11/20 at 100.00 | | | | | | | | A+ | | | | 20,978 | |
| | | | | |
| | 5,000 | | | Dallas-Fort Worth International Airport, Texas, Joint Revenue Bonds, Refunding Series 2012E, 5.000%, 11/01/42 (AMT) | | | 11/21 at 100.00 | | | | | | | | A+ | | | | 5,329,250 | |
| | | | | |
| | 1,720 | | | Fort Bend County Industrial Development Corporation, Texas, Revenue Bonds, NRG Energy Inc Project, Series 2012A RMKT, 4.750%, 5/01/38 | | | 11/22 at 100.00 | | | | | | | | Baa3 | | | | 1,768,951 | |
| | | | | |
| | 1,075 | | | Gulf Coast Industrial Development Authority, Texas, Solid Waste Disposal Revenue Bonds, Citgo Petroleum Corporation Project, Series 1995, 4.875%, 5/01/25 (AMT) | | | 10/22 at 100.00 | | | | | | | | BB | | | | 1,078,934 | |
| | | | | |
| | 8,585 | | | Harris County Cultural Education Facilities Finance Corporation, Texas, Revenue Refunding Bonds, Young Men’s Christian Association of the Greater Houston Area, Series 2013A, 5.000%, 6/01/33 | | | 6/23 at 100.00 | | | | | | | | Baa2 | | | | 9,056,832 | |
| | | | | |
| | 3,000 | | | Harrison County Health Facilities Development Corporation, Texas, Hospital Revenue Bonds, Good Shepherd Health System, Refunding Series 2010, 5.250%, 7/01/28(Pre-refunded 7/01/20) | | | 7/20 at 100.00 | | | | | | | | N/R (4) | | | | 3,134,220 | |
| | | | | |
| | 1,270 | | | Houston, Texas, Airport System Revenue Bonds, Refunding Subordinate Lien Series 2011A, 5.000%, 7/01/25 (AMT) | | | 7/21 at 100.00 | | | | | | | | A+ | | | | 1,357,719 | |
| | | | | |
| | 1,500 | | | Houston, Texas, Airport System Special Facilities Revenue Bonds, United Airlines Inc Terminal Improvement Project, Refunding Series 2015C, 5.000%, 7/15/20 (AMT) | | | No Opt. Call | | | | | | | | BB | | | | 1,546,080 | |
| | | | | |
| | 1,735 | | | Houston, Texas, Airport System Special Facilities Revenue Bonds, United Airlines Inc. Terminal Improvement Project, Refunding Series2015B-1, 5.000%, 7/15/30 (AMT) | | | 7/25 at 100.00 | | | | | | | | BB | | | | 1,915,006 | |
| | | | | |
| | 250 | | | Houston, Texas, Airport System Special Facilities Revenue Bonds, United Airlines, Inc Terminal E Project, Refunding Series 2014, 5.000%, 7/01/29 (AMT) | | | 7/24 at 100.00 | | | | | | | | BB | | | | 276,293 | |
| | | | | |
| | 8,755 | | | Houston, Texas, Combined Utility System Revenue Bonds, Refunding First Lien Series 2017B, 5.000%, 11/15/37 | | | 11/27 at 100.00 | | | | | | | | Aa2 | | | | 10,385,444 | |
| | | | | |
| | 1,955 | | | Houston, Texas, Hotel Occupancy Tax and Special Revenue Bonds, Convention and Entertainment Facilities Department, Refunding Series 2011A, 5.250%, 9/01/28 | | | 9/21 at 100.00 | | | | | | | | A | | | | 2,105,379 | |
| | | | | |
| | 335 | | | Houston, Texas, Hotel Occupancy Tax and Special Revenue Bonds, Convention and Entertainment Facilities Department, Refunding Series 2014, 5.000%, 9/01/34 | | | 9/24 at 100.00 | | | | | | | | A | | | | 375,083 | |
72
| | | | | | | | | | | | | | | | | | | | |
Principal
Amount (000) | | | Description (1) | | Optional Call
Provisions (2) | | | | | | Ratings (3) | | | Value | |
| | | | | |
| | | | Texas(continued) | | | | | | | | | | | | |
| | | | | |
| | | | Kerrville Health Facilities Development Corporation, Texas, Revenue Bonds, Sid Peterson Memorial Hospital Project, Series 2015: | | | | | | | | | | | | | | | | |
| $ | 1,360 | | | 5.000%, 8/15/30 | | | 8/25 at 100.00 | | | | | | | | A | | | $ | 1,529,728 | |
| | 1,280 | | | 5.000%, 8/15/35 | | | 8/25 at 100.00 | | | | | | | | A | | | | 1,411,187 | |
| | | | | |
| | 6,720 | | | Love Field Airport Modernization Corporation, Texas, Special Facilities Revenue Bonds, Southwest Airlines Company – Love Field Modernization Program Project, Series 2012, 5.000%, 11/01/28 (AMT) | | | 11/22 at 100.00 | | | | | | | | A3 | | | | 7,323,523 | |
| | | | | |
| | 1,800 | | | Lower Colorado River Authority, Texas, Transmission Contract Revenue Bonds, LCRA Transmission Services Corporation Project, Refunding Series 2018, 5.000%, 5/15/48 | | | 5/28 at 100.00 | | | | | | | | A+ | | | | 2,094,012 | |
| | | | | |
| | 3,020 | | | Mission Economic Development Corporation, Texas, Revenue Bonds, Natgasoline Project, Senior Lien Series 2018, 4.625%, 10/01/31 (AMT), 144A | | | 10/21 at 105.00 | | | | | | | | BB– | | | | 3,141,223 | |
| | | | | |
| | 4,590 | | | Mission Economic Development Corporation, Texas, Water Supply Revenue Bonds, Enviro Water Minerals Project, Green Bonds, Series 2015, 7.750%, 1/01/45 (AMT), 144A (7) | | | 1/26 at 102.00 | | | | | | | | N/R | | | | 4,131,000 | |
| | | | | |
| | | | New Hope Cultural Education Facilities Finance Corporation, Texas, Retirement Facility Revenue Bonds, Legacy at Willow Bend Project, Series 2016: | | | | | | | | | | | | | | | | |
| | 665 | | | 5.000%, 11/01/46 | | | 11/23 at 103.00 | | | | | | | | BBB– | | | | 694,380 | |
| | 805 | | | 5.000%, 11/01/51 | | | 11/23 at 103.00 | | | | | | | | BBB– | | | | 837,925 | |
| | | | | |
| | 570 | | | New Hope Cultural Education Facilities Finance Corporation, Texas, Retirement Facility Revenue Bonds, Legacy Midtown Park Project, Series 2018, 5.500%, 7/01/54 | | | 7/24 at 103.00 | | | | | | | | N/R | | | | 579,770 | |
| | | | | |
| | | | New Hope Cultural Education Facilities Finance Corporation, Texas, Retirement Facility Revenue Bonds, Methodist Retirement Communities Crestview Project, Series 2016: | | | | | | | | | | | | | | | | |
| | 1,100 | | | 5.000%, 11/15/36 | | | 11/24 at 102.00 | | | | | | | | BB+ | | | | 1,164,911 | |
| | 1,550 | | | 5.000%, 11/15/46 | | | 11/24 at 102.00 | | | | | | | | BB+ | | | | 1,623,888 | |
| | | | | |
| | 755 | | | New Hope Cultural Education Facilities Finance Corporation, Texas, Retirement Facility Revenue Bonds, Wesleyan Homes, Inc Project, Series 2014, 5.500%, 1/01/43 | | | 1/25 at 100.00 | | | | | | | | N/R | | | | 801,440 | |
| | | | | |
| | 8,455 | | | New Hope Cultural Education Facilities Finance Corporation, Texas, Retirement Facility Revenue Bonds, Westminster Project, Series 2016, 4.000%, 11/01/36 | | | 11/24 at 102.00 | | | | | | | | BBB+ | | | | 8,516,130 | |
| | | | | |
| | 30 | | | New Hope Cultural Education Facilities Finance Corporation, Texas, Student Housing Revenue Bonds,CHF-Collegiate Housing Corpus Christi II, L.L.C.-Texas A&M University-Corpus Christi Project, Series, 5.000%, 4/01/31 | | | 4/26 at 100.00 | | | | | | | | BB | | | | 30,765 | |
| | | | | |
| | | | New Hope Cultural Education Facilities Finance Corporation, Texas, Student Housing Revenue Bonds,CHF-Collegiate Housing Corpus Christi II,LLC-Texas A&M University-Corpus Christi Project, Series 2016A: | | | | | | | | | | | | | | | | |
| | 360 | | | 5.000%, 4/01/36 | | | 4/26 at 100.00 | | | | | | | | BB | | | | 363,384 | |
| | 65 | | | 5.000%, 4/01/48 | | | 4/26 at 100.00 | | | | | | | | BB | | | | 63,796 | |
| | | | | |
| | 6,625 | | | New Hope Cultural Education Facilities Finance Corporation, Texas, Student Housing Revenue Bonds,CHF-Collegiate Housing Foundation – College Station I LLC – Texas A&M University Project, Series 2014A, 4.100%, 4/01/34 – AGM Insured | | | 4/24 at 100.00 | | | | | | | | AA | | | | 6,930,412 | |
73
NuveenAll-American Municipal Bond Fund(continued)
Portfolio of Investments March 31, 2019
| | | | | | | | | | | | | | | | | | | | |
Principal
Amount (000) | | | Description (1) | | Optional Call
Provisions (2) | | | | | | Ratings (3) | | | Value | |
| | | | | |
| | | | Texas(continued) | | | | | | | | | | | | |
| | | | | |
| | | | New Hope Cultural Education Facilities Finance Corporation, Texas, Student Housing Revenue Bonds,CHF-Collegiate Housing Foundation – San Antonio 1, L.L.C. – Texas A&M University – San Antonio Project,: | | | | | | | | | | | | | | | | |
| $ | 1,275 | | | 5.000%, 4/01/31 | | | 4/26 at 100.00 | | | | | | | | BBB– | | | $ | 1,330,781 | |
| | 1,290 | | | 5.000%, 4/01/36 | | | 4/26 at 100.00 | | | | | | | | BBB– | | | | 1,323,682 | |
| | | | | |
| | 2,445 | | | New Hope Cultural Education Facilities Finance Corporation, Texas, Student Housing Revenue Bonds,CHF-Collegiate Housing Foundation – San Antonio 1, LLC – Texas A&M University – San Antonio Project,, 5.000%, 4/01/48 | | | 4/26 at 100.00 | | | | | | | | BBB– | | | | 2,460,770 | |
| | | | | |
| | 1,250 | | | New Hope Cultural Education Facilities Finance Corporation, Texas, Student Housing Revenue Bonds,CHF-Collegiate Housing Foundation – Stephenville II, LLC – Tarleton State University Project, Series 2014A, 5.000%, 4/01/34 | | | 4/24 at 100.00 | | | | | | | | BBB– | | | | 1,329,975 | |
| | | | | |
| | 3,000 | | | New Hope Cultural Education Facilities Finance Corporation, Texas, Student Housing Revenue Bonds,CHF-Collegiate Housing Galveston-Texas A&M University at Galveston Project, Series 2014A, 5.000%, 4/01/34 | | | 4/24 at 100.00 | | | | | | | | Baa3 | | | | 3,088,080 | |
| | | | | |
| | 10,000 | | | New Hope Cultural Education Facilities Finance Corporation, Texas, Student Housing Revenue Bonds, NCCD – College Station Properties LLC – Texas A&M University Project, Series 2015A, 5.000%, 7/01/47 | | | 7/25 at 100.00 | | | | | | | | B3 | | | | 9,265,900 | |
| | | | | |
| | 10,880 | | | North Texas Tollway Authority, Special Projects System Revenue Bonds, Convertible Capital Appreciation Series 2011C, 0.000%, 9/01/45(Pre-refunded 9/01/31) (6) | | | 9/31 at 100.00 | | | | | | | | N/R (4) | | | | 13,908,557 | |
| | | | | |
| | 2,000 | | | North Texas Tollway Authority, Special Projects System Revenue Bonds, Series 2011A, 5.500%, 9/01/41(Pre-refunded 9/01/21) | | | 9/21 at 100.00 | | | | | | | | N/R (4) | | | | 2,184,940 | |
| | | | | |
| | 560 | | | North Texas Tollway Authority, System Revenue Bonds, First Tier Series 2009A, 6.000%, 1/01/28 | | | 5/19 at 100.00 | | | | | | | | A+ | | | | 561,736 | |
| | | | | |
| | 4,410 | | | North Texas Tollway Authority, System Revenue Bonds, Refunding Second Tier, Series 2015A, 5.000%, 1/01/34 | | | 1/25 at 100.00 | | | | | | | | A | | | | 4,957,678 | |
| | | | | |
| | 4,395 | | | Port of Houston Authority, Harris County, Texas, General Obligation Bonds, Refunding Series 2018A, 5.000%, 10/01/32 (AMT) | | | 10/28 at 100.00 | | | | | | | | AAA | | | | 5,308,193 | |
| | | | | |
| | 2,695 | | | Port of Houston Authority, Harris County, Texas, General Obligation Bonds, Series2010D-1, 5.000%, 10/01/30 | | | 10/20 at 100.00 | | | | | | | | AAA | | | | 2,828,968 | |
| | | | | |
| | | | Reagan Hospital District of Reagan County, Texas, Limited Tax Revenue Bonds, Series 2014A: | | | | | | | | | | | | | | | | |
| | 655 | | | 5.000%, 2/01/29 | | | 2/24 at 100.00 | | | | | | | | Ba2 | | | | 695,296 | |
| | 1,805 | | | 5.000%, 2/01/34 | | | 2/24 at 100.00 | | | | | | | | Ba2 | | | | 1,879,528 | |
| | 385 | | | 5.125%, 2/01/39 | | | 2/24 at 100.00 | | | | | | | | Ba2 | | | | 399,145 | |
| | | | | |
| | 645 | | | SA Energy Acquisition Public Facilities Corporation, Texas, Gas Supply Revenue Bonds, Series 2007, 5.500%, 8/01/27 | | | No Opt. Call | | | | | | | | A | | | | 774,058 | |
| | | | | |
| | 9,030 | | | Southwest Higher Education Authority Inc, Texas, Revenue Bonds, Southern Methodist University, Refunding Series 2009, 5.000%, 10/01/36(Pre-refunded 10/01/19) | | | 10/19 at 100.00 | | | | | | | | AA– (4) | | | | 9,189,109 | |
| | | | | |
| | 5,950 | | | Stephen F Austin State University, Texas, Revenue Bonds, Refunding & Improvement Series 2016, 5.000%, 10/15/42 | | | 10/28 at 100.00 | | | | | | | | AA– | | | | 6,871,595 | |
| | | | | |
| | 3,435 | | | Tarrant County Cultural Education Facilities Finance Corporation Revenue Bonds, Texas, Christus Health, Refunding Series 2018B, 5.000%, 7/01/35 | | | 1/29 at 100.00 | | | | | | | | A+ | | | | 4,033,446 | |
74
| | | | | | | | | | | | | | | | | | | | |
Principal
Amount (000) | | | Description (1) | | Optional Call
Provisions (2) | | | | | | Ratings (3) | | | Value | |
| | | | | |
| | | | Texas(continued) | | | | | | | | | | | | |
| | | | | |
| | | | Tarrant County Cultural Education Facilities Finance Corporation, Texas, Hospital Revenue Bonds, Scott & White Healthcare Project, Series 2010: | | | | | | | | | | | | | | | | |
| $ | 70 | | | 5.500%, 8/15/45(Pre-refunded 8/15/20) | | | 8/20 at 100.00 | | | | | | | | N/R (4) | | | $ | 73,721 | |
| | 870 | | | 5.500%, 8/15/45(Pre-refunded 8/15/20) | | | 8/20 at 100.00 | | | | | | | | N/R (4) | | | | 916,249 | |
| | | | | |
| | 3,000 | | | Tarrant County Cultural Education Facilities Finance Corporation, Texas, Revenue Bonds, Texas Health Resources System, Series 2016A, 5.000%, 2/15/41 | | | 8/26 at 100.00 | | | | | | | | AA | | | | 3,398,310 | |
| | | | | |
| | 3,670 | | | Texas Municipal Gas Acquisition and Supply Corporation III, Gas Supply Revenue Bonds, Series 2012, 5.000%, 12/15/27 | | | 12/22 at 100.00 | | | | | | | | A3 | | | | 4,019,421 | |
| | | | | |
| | 845 | | | Texas Private Activity Bond Surface Transportation Corporation, Revenue Bonds, NTE Mobility Partners LLC North Tarrant Express Managed Lanes Project, Senior Lien Series 2009, 6.875%, 12/31/39 | | | 12/19 at 100.00 | | | | | | | | Baa2 | | | | 875,302 | |
| | | | | |
| | 10,115 | | | Texas Private Activity Bond Surface Transportation Corporation, Senior Lien Revenue Bonds, Blueridge Transportation Group, LLC SH 288 Toll Lanes Project, Series 2016, 5.000%, 12/31/40 (AMT) | | | 12/25 at 100.00 | | | | | | | | Baa3 | | | | 11,066,215 | |
| | | | | |
| | 7,300 | | | Texas Private Activity Bond Surface Transportation Corporation, Senior Lien Revenue Bonds, NTE Mobility Partners Segments 3 Segments 3A & 3B Facility, Series 2013, 6.750%, 6/30/43 (AMT) | | | 9/23 at 100.00 | | | | | | | | Baa3 | | | | 8,469,460 | |
| | | | | |
| | 7,800 | | | Texas Private Activity Bond Surface Transportation Corporation, Senior Lien Revenue Bonds, LBJ Infrastructure Group LLCIH-635 Managed Lanes Project, Series 2010, 7.000%, 6/30/40 | | | 6/20 at 100.00 | | | | | | | | Baa3 | | | | 8,274,630 | |
| | | | | |
| | 1,750 | | | Texas State, General Obligation Bonds, Water Financial Assistance, Tender Option Bond Trust 2015-XF0075, 13.617%, 8/01/34 (IF) | | | 8/19 at 100.00 | | | | | | | | AAA | | | | 1,826,300 | |
| | | | | |
| | | | Texas Transportation Commission, Central Texas Turnpike System Revenue Bonds, First Tier Refunding Series 2015B: | | | | | | | | | | | | | | | | |
| | 16,500 | | | 0.000%, 8/15/36 | | | 8/24 at 59.60 | | | | | | | | A– | | | | 8,133,840 | |
| | 7,000 | | | 0.000%, 8/15/37 | | | 8/24 at 56.94 | | | | | | | | A– | | | | 3,287,970 | |
| | | | | |
| | 10,000 | | | Texas Transportation Commission, Central Texas Turnpike System Revenue Bonds, Second Tier Refunding Series 2015C, 5.000%, 8/15/42 | | | 8/24 at 100.00 | | | | | | | | BBB+ | | | | 10,908,900 | |
| | | | | |
| | | | Travis County Health Facilities Development Corporation, Texas, Revenue Bonds, Westminster Manor, Series 2010: | | | | | | | | | | | | | | | | |
| | 600 | | | 7.000%, 11/01/30(Pre-refunded 11/01/20) | | | 11/20 at 100.00 | | | | | | | | N/R (4) | | | | 649,770 | |
| | 80 | | | 7.000%, 11/01/30 | | | 11/20 at 100.00 | | | | | | | | BBB+ | | | | 83,574 | |
| | | | | |
| | 500 | | | Uptown Development Authority, Houston, Texas, Tax Increment Contract Revenue Bonds, Infrastructure Improvement Facilities, Series 2009, 5.250%, 9/01/24(Pre-refunded 9/01/19) | | | 9/19 at 100.00 | | | | | | | | BBB (4) | | | | 507,530 | |
| | | | | |
| | 1,030 | | | Viridian Municipal Management District, Texas, Reinvest Zone 6 Tax Increment Revenue Bonds, Refunding Road Improvement Series 2015, 6.000%, 12/01/32 – BAM Insured | | | 12/24 at 100.00 | | | | | | | | AA | | | | 1,249,452 | |
| | | | | |
| | 1,135 | | | Viridian Municipal Management District, Texas, Reinvest Zone 6 Tax Increment Revenue Bonds, Refunding Utility Improvement Series 2015, 6.000%, 12/01/31 – BAM Insured | | | 12/24 at 100.00 | | | | | | | | AA | | | | 1,378,855 | |
| | 283,930 | | | Total Texas | | | | | | | | | | | | | | | 294,204,570 | |
| | | | | |
| | | | Utah – 1.3% | | | | | | | | | | | | |
| | | | | |
| | 20,000 | | | Salt Lake City, Utah, Airport Revenue Bonds, International Airport Series 2017A, 5.000%, 7/01/42 (AMT) | | | 7/27 at 100.00 | | | | | | | | A+ | | | | 22,818,800 | |
| | | | | |
| | 8,180 | | | Salt Lake City, Utah, Airport Revenue Bonds, International Airport Series 2018A, 5.000%, 7/01/43 (AMT) | | | 7/28 at 100.00 | | | | | | | | A+ | | | | 9,440,620 | |
75
NuveenAll-American Municipal Bond Fund(continued)
Portfolio of Investments March 31, 2019
| | | | | | | | | | | | | | | | | | | | |
Principal
Amount (000) | | | Description (1) | | Optional Call
Provisions (2) | | | | | | Ratings (3) | | | Value | |
| | | | | |
| | | | Utah(continued) | | | | | | | | | | | | |
| | | | | |
| $ | 7,000 | | | Utah County, Utah, Hospital Revenue Bonds, IHC Health Services Inc., Series 2018A, 5.000%, 5/15/41 | | | 5/26 at 100.00 | | | | | | | | AA+ | | | $ | 8,023,750 | |
| | | | | |
| | | | Utah State Charter School Finance Authority Charter School Revenue Bonds, Vista at Entrada School of Performing Arts and Technology) Series 2012: | | | | | | | | | | | | | | | | |
| | 475 | | | 5.600%, 7/15/22 | | | No Opt. Call | | | | | | | | BBB– | | | | 494,950 | |
| | 850 | | | 6.300%, 7/15/32 | | | 7/22 at 100.00 | | | | | | | | BBB– | | | | 912,016 | |
| | | | | |
| | 1,000 | | | Utah State Charter School Finance Authority, Charter School Revenue Bonds, Navigator Pointe Academy Project, Series 2010A, 5.625%, 7/15/40 | | | 7/20 at 100.00 | | | | | | | | BBB | | | | 1,012,780 | |
| | | | | |
| | 1,250 | | | Utah State Charter School Finance Authority, Charter School Revenue Bonds, North Davis Preparatory Academy, Series 2010, 6.250%, 7/15/30 | | | 7/20 at 100.00 | | | | | | | | BBB– | | | | 1,298,550 | |
| | | | | |
| | 1,135 | | | Utah State Charter School Finance Authority, Charter School Revenue Bonds, Paradigm High School, Series 2010A, 6.375%, 7/15/40 | | | 7/20 at 100.00 | | | | | | | | BB | | | | 1,155,237 | |
| | | | | |
| | | | Utah State Charter School Finance Authority, Revenue Bonds, George Washington Academy Project, Series 2011A: | | | | | | | | | | | | | | | | |
| | 1,950 | | | 7.750%, 7/15/31(Pre-refunded 7/15/21) | | | 7/21 at 100.00 | | | | | | | | N/R (4) | | | | 2,179,905 | |
| | 3,520 | | | 8.000%, 7/15/41(Pre-refunded 7/15/21) | | | 7/21 at 100.00 | | | | | | | | N/R (4) | | | | 4,008,189 | |
| | 45,360 | | | Total Utah | | | | | | | | | | | | | | | 51,344,797 | |
| | | | | |
| | | | Vermont – 0.1% | | | | | | | | | | | | |
| | | | | |
| | | | Vermont Educational and Health Buildings Financing Agency, Revenue Bonds, Vermont Law School Project, Series 2011A: | | | | | | | | | | | | | | | | |
| | 1,815 | | | 6.125%, 1/01/28(Pre-refunded 1/01/21) | | | 1/21 at 100.00 | | | | | | | | N/R (4) | | | | 1,953,938 | |
| | 1,000 | | | 6.250%, 1/01/33(Pre-refunded 1/01/21) | | | 1/21 at 100.00 | | | | | | | | N/R (4) | | | | 1,078,690 | |
| | 2,815 | | | Total Vermont | | | | | | | | | | | | | | | 3,032,628 | |
| | | | | |
| | | | Virginia – 1.9% | | | | | | | | | | | | |
| | | | | |
| | 10,000 | | | Metropolitan Washington Airports Authority, Virginia, Dulles Toll Road Revenue Bonds, Dulles Metrorail & Capital Improvement Projects, Refunding Second Senior Lien Series 2014A, 5.000%, 10/01/53 | | | 4/22 at 100.00 | | | | | | | | BBB+ | | | | 10,482,500 | |
| | | | | |
| | 3,745 | | | Metropolitan Washington Airports Authority, Virginia, Dulles Toll Road Revenue Bonds, Dulles Metrorail & Capital improvement Projects, Second Senior Lien Series 2009B, 0.000%, 10/01/31 – AGC Insured | | | No Opt. Call | | | | | | | | AA | | | | 2,479,864 | |
| | | | | |
| | 2,000 | | | Metropolitan Washington D.C. Airports Authority, Airport System Revenue Bonds, Refunding Bonds, Series 2011C, 5.000%, 10/01/26 (AMT) | | | 10/21 at 100.00 | | | | | | | | AA– | | | | 2,155,480 | |
| | | | | |
| | 1,020 | | | Peninsula Town Center Community Development Authority, Virginia, Special Obligation Bonds, Refunding Series 2018, 5.000%, 9/01/37, 144A | | | 9/27 at 100.00 | | | | | | | | N/R | | | | 1,086,229 | |
| | | | | |
| | 10,070 | | | Tobacco Settlement Financing Corporation of Virginia, Tobacco Settlement Asset Backed Bonds, Series 2007B1, 5.000%, 6/01/47 | | | 4/19 at 100.00 | | | | | | | | B– | | | | 9,970,206 | |
| | | | | |
| | 1,000 | | | Virginia College Building Authority, Educational Facilities Revenue Bonds, Marymount University Project, Green Series 2015B, 5.000%, 7/01/45, 144A | | | 7/25 at 100.00 | | | | | | | | BB+ | | | | 1,044,050 | |
| | | | | |
| | | | Virginia Small Business Financing Authority, Private Activity Revenue Bonds, Transform 66 P3 Project, Senior Lien Series 2017: | | | | | | | | | | | | | | | | |
| | 3,400 | | | 5.000%, 12/31/47 (AMT) | | | 6/27 at 100.00 | | | | | | | | BBB | | | | 3,736,770 | |
| | 15,715 | | | 5.000%, 12/31/49 (AMT) | | | 6/27 at 100.00 | | | | | | | | BBB | | | | 17,236,369 | |
| | 2,110 | | | 5.000%, 12/31/52 (AMT) | | | 6/27 at 100.00 | | | | | | | | BBB | | | | 2,307,960 | |
| | 9,750 | | | 5.000%, 12/31/56 (AMT) | | | 6/27 at 100.00 | | | | | | | | BBB | | | | 10,635,787 | |
| | | | | |
| | 5,500 | | | Virginia Small Business Financing Authority, Senior Lien Revenue Bonds, 95 Express Lanes LLC Project, Series 2012, 5.000%, 1/01/40 (AMT) | | | 1/22 at 100.00 | | | | | | | | BBB | | | | 5,808,605 | |
76
| | | | | | | | | | | | | | | | | | | | |
Principal
Amount (000) | | | Description (1) | | Optional Call
Provisions (2) | | | | | | Ratings (3) | | | Value | |
| | | | | |
| | | | Virginia(continued) | | | | | | | | | | | | |
| | | | | |
| | | | Virginia Small Business Financing Authority, Senior Lien Revenue Bonds, Elizabeth River Crossing, Opco LLC Project, Series 2012: | | | | | | | | | | | | | | | | |
| $ | 3,515 | | | 5.250%, 1/01/32 (AMT) | | | 7/22 at 100.00 | | | | | | | | BBB | | | $ | 3,764,565 | |
| | 6,515 | | | 5.500%, 1/01/42 (AMT) | | | 7/22 at 100.00 | | | | | | | | BBB | | | | 7,000,433 | |
| | 74,340 | | | Total Virginia | | | | | | | | | | | | | | | 77,708,818 | |
| | | | | |
| | | | Washington – 2.7% | | | | | | | | | | | | |
| | | | | |
| | 6,220 | | | Clark County Public Utility District 1, Washington, Electric System Revenue Bonds, Refunding Series 2011, 5.250%, 1/01/31(Pre-refunded 1/01/21) | | | 1/21 at 100.00 | | | | | | | | AA– (4) | | | | 6,619,511 | |
| | | | | |
| | 960 | | | FYI Properties, Washington, Lease Revenue Bonds, Washington State Department of Information Services Project, Tender Option Bond Trust 2016-XL0006, 15.382%, 6/01/34 (IF) (5) | | | 6/19 at 100.00 | | | | | | | | AA | | | | 984,998 | |
| | | | | |
| | 2,450 | | | King County Public Hospital District 4, Washington, General Obligation Bonds, Snoqualmie Valley Hospital, Refunding Improvement Series 2011, 7.000%, 12/01/40 | | | 12/21 at 100.00 | | | | | | | | N/R | | | | 2,535,138 | |
| | | | | |
| | 400 | | | Ocean Shores, Washington, Local Improvement District2007-01 Bonds, 2011, 7.250%, 2/01/31 | | | No Opt. Call | | | | | | | | BBB+ | | | | 491,752 | |
| | | | | |
| | 5,385 | | | Port of Seattle, Washington, Revenue Bonds, Intermediate Lien Series 2018A, 5.000%, 5/01/30 (AMT) | | | 5/27 at 100.00 | | | | | | | | AA– | | | | 6,361,085 | |
| | | | | |
| | | | Skagit County Public Hospital District 1, Washington, Revenue Bonds, Skagit Valley Hospital, Refunding & Improvement Series 2016: | | | | | | | | | | | | | | | | |
| | 3,825 | | | 5.000%, 12/01/30 | | | 12/26 at 100.00 | | | | | | | | Baa2 | | | | 4,336,900 | |
| | 1,950 | | | 5.000%, 12/01/31 | | | 12/26 at 100.00 | | | | | | | | Baa2 | | | | 2,196,012 | |
| | 4,000 | | | 5.000%, 12/01/32 | | | 12/26 at 100.00 | | | | | | | | Baa2 | | | | 4,481,920 | |
| | 1,120 | | | 5.000%, 12/01/37 | | | 12/26 at 100.00 | | | | | | | | Baa2 | | | | 1,231,384 | |
| | | | | |
| | 2,000 | | | Washington Health Care Facilities Authority, Revenue Bonds, Fred Hutchinson Cancer Research Center, Series 2011A, 5.625%, 1/01/35 | | | 1/21 at 100.00 | | | | | | | | A+ | | | | 2,102,300 | |
| | | | | |
| | 3,535 | | | Washington Health Care Facilities Authority, Revenue Bonds, Kadlec Regional Medical Center, Series 2010, 5.250%, 12/01/30(Pre-refunded 12/01/20) | | | 12/20 at 100.00 | | | | | | | | N/R (4) | | | | 3,748,337 | |
| | | | | |
| | | | Washington Health Care Facilities Authority, Revenue Bonds, Kadlec Regional Medical Center, Series 2012: | | | | | | | | | | | | | | | | |
| | 2,775 | | | 5.000%, 12/01/27(Pre-refunded 12/01/21) | | | 12/21 at 100.00 | | | | | | | | N/R (4) | | | | 3,021,559 | |
| | 2,435 | | | 5.000%, 12/01/42(Pre-refunded 12/01/21) | | | 12/21 at 100.00 | | | | | | | | N/R (4) | | | | 2,651,350 | |
| | | | | |
| | 1,600 | | | Washington Health Care Facilities Authority, Revenue Bonds, PeaceHealth, Refunding Series 2014A, 5.000%, 11/15/28 | | | 5/24 at 100.00 | | | | | | | | AA– | | | | 1,814,800 | |
| | | | | |
| | | | Washington Health Care Facilities Authority, Revenue Bonds, Yakima Valley Memorial Hospital Association, Series 2016: | | | | | | | | | | | | | | | | |
| | 6,000 | | | 5.000%, 12/01/41 | | | 12/26 at 100.00 | | | | | | | | Ba1 | | | | 6,450,180 | |
| | 5,930 | | | 5.000%, 12/01/46 | | | 12/26 at 100.00 | | | | | | | | Ba1 | | | | 6,348,955 | |
| | | | | |
| | 4,320 | | | Washington State Convention Center Public Facilities District, Lodging Tax Revenue Bonds, Series 2018, 5.000%, 7/01/43 | | | 7/28 at 100.00 | | | | | | | | A1 | | | | 4,952,016 | |
| | | | | |
| | | | Washington State Health Care Facilities Authority, Revenue Bonds, Central Washington Health Services Association, Series 2009: | | | | | | | | | | | | | | | | |
| | 1,155 | | | 6.250%, 7/01/24(Pre-refunded 7/01/19) | | | 7/19 at 100.00 | | | | | | | | N/R (4) | | | | 1,168,155 | |
| | 845 | | | 6.250%, 7/01/24 | | | 7/19 at 100.00 | | | | | | | | Baa1 | | | | 853,281 | |
| | 2,000 | | | 7.000%, 7/01/39(Pre-refunded 7/01/19) | | | 7/19 at 100.00 | | | | | | | | Baa1 (4) | | | | 2,026,200 | |
| | | | | |
| | 3,000 | | | Washington State Higher Education Facilities Authority, Revenue Bonds, Whitworth University, Series 2009, 5.375%, 10/01/29(Pre-refunded 10/01/19) | | | 10/19 at 100.00 | | | | | | | | Baa1 (4) | | | | 3,055,860 | |
77
NuveenAll-American Municipal Bond Fund(continued)
Portfolio of Investments March 31, 2019
| | | | | | | | | | | | | | | | | | | | |
Principal
Amount (000) | | | Description (1) | | Optional Call
Provisions (2) | | | | | | Ratings (3) | | | Value | |
| | | | | |
| | | | Washington(continued) | | | | | | | | | | | | |
| | | | | |
| | | | Washington State Housing Finance Commission, Nonprofit Refunding Revenue Bonds, Wesley Homes at Lea Hill Project, Series 2016: | | | | | | | | | | | | | | | | |
| $ | 1,155 | | | 5.000%, 7/01/41, 144A | | | 7/26 at 100.00 | | | | | | | | N/R | | | $ | 1,198,255 | |
| | 2,000 | | | 5.000%, 7/01/46, 144A | | | 7/26 at 100.00 | | | | | | | | N/R | | | | 2,068,620 | |
| | 3,805 | | | 5.000%, 7/01/51, 144A | | | 7/26 at 100.00 | | | | | | | | N/R | | | | 3,923,640 | |
| | | | | |
| | 1,100 | | | Washington State Housing Finance Commission,Non-Profit Revenue Bonds, Emerald Heights Project, Refunding 2013, 5.000%, 7/01/28 | | | 7/23 at 100.00 | | | | | | | | A– | | | | 1,210,594 | |
| | | | | |
| | 2,340 | | | Washington State Housing Finance Commission, Revenue Bonds, Riverview Retirement Community, Refunding Series 2012, 5.000%, 1/01/48 | | | 1/23 at 100.00 | | | | | | | | BBB– | | | | 2,403,320 | |
| | | | | |
| | | | Washington State, General Obligation Bonds, Various Purpose Series 2015B: | | | | | | | | | | | | | | | | |
| | 8,520 | | | 5.000%, 2/01/36 | | | 2/25 at 100.00 | | | | | | | | AA+ | | | | 9,748,584 | |
| | 20,415 | | | 5.000%, 2/01/38 | | | 2/25 at 100.00 | | | | | | | | AA+ | | | | 23,185,315 | |
| | 101,240 | | | Total Washington | | | | | | | | | | | | | | | 111,170,021 | |
| | | | | |
| | | | West Virginia – 0.5% | | | | | | | | | | | | |
| | | | | |
| | 15,500 | | | West Virginia Hospital Finance Authority, Hospital Revenue Bonds, Cabell Huntington Hospital, Inc. Project, Refunding & Improvement Series 2018A, 5.000%, 1/01/43 | | | 1/29 at 100.00 | | | | | | | | BBB+ | | | | 17,521,045 | |
| | | | | |
| | 1,020 | | | West Virginia Hospital Finance Authority, Hospital Revenue Bonds, Charleston Area Medical Center, Series 2009A, 5.625%, 9/01/32 | | | 9/19 at 100.00 | | | | | | | | Baa1 | | | | 1,033,648 | |
| | | | | |
| | 1,000 | | | West Virginia Hospital Finance Authority, Hospital Revenue Bonds, Thomas Health System, Inc., Series 2008, 6.500%, 10/01/28 (7) | | | 4/19 at 100.00 | | | | | | | | N/R | | | | 753,160 | |
| | | | | |
| | 1,585 | | | West Virginia Hospital Finance Authority, Hospital Revenue Bonds, West Virginia United Health System Obligated Group, Refunding & Improvement Series 2013A, 4.000%, 6/01/41 | | | 6/26 at 100.00 | | | | | | | | A | | | | 1,623,991 | |
| | 19,105 | | | Total West Virginia | | | | | | | | | | | | | | | 20,931,844 | |
| | | | | |
| | | | Wisconsin – 3.3% | | | | | | | | | | | | |
| | | | | |
| | 5,000 | | | Oneida Tribe of Indians of Wisconsin, Retail Sales Revenue Bonds, Series 2011-144A, 6.500%, 2/01/31, 144A | | | 5/19 at 102.00 | | | | | | | | BBB+ | | | | 5,115,150 | |
| | | | | |
| | 1,250 | | | Public Finance Authority of Wisconsin, Charter School Revenue Bonds, Cornerstone Charter Academy, North Carolina, Series 2016A, 5.000%, 2/01/36, 144A | | | 2/26 at 100.00 | | | | | | | | N/R | | | | 1,271,612 | |
| | | | | |
| | 2,155 | | | Public Finance Authority of Wisconsin, Charter School Revenue Bonds, North Carolina Charter Educational Foundation Project, Series 2016A, 5.000%, 6/15/46, 144A | | | 6/26 at 100.00 | | | | | | | | N/R | | | | 1,952,969 | |
| | | | | |
| | | | Public Finance Authority of Wisconsin, Charter School Revenue Bonds, Voyager Foundation Inc of North Carolina, Series 2012A: | | | | | | | | | | | | | | | | |
| | 195 | | | 5.500%, 10/01/22 | | | No Opt. Call | | | | | | | | Baa3 | | | | 204,346 | |
| | 375 | | | 6.000%, 10/01/32 | | | 10/22 at 100.00 | | | | | | | | Baa3 | | | | 402,923 | |
| | | | | |
| | | | Public Finance Authority of Wisconsin, Charter School Revenue Bonds, Voyager Foundation, Inc of North Carolina Project, Series 2014A: | | | | | | | | | | | | | | | | |
| | 1,080 | | | 5.000%, 10/01/34 | | | 10/22 at 100.00 | | | | | | | | Baa3 | | | | 1,121,710 | |
| | 500 | | | 5.125%, 10/01/45 | | | 10/22 at 100.00 | | | | | | | | Baa3 | | | | 516,045 | |
78
| | | | | | | | | | | | | | | | | | | | |
Principal
Amount (000) | | | Description (1) | | Optional Call
Provisions (2) | | | | | | Ratings (3) | | | Value | |
| | | | | |
| | | | Wisconsin(continued) | | | | | | | | | | | | |
| | | | | |
| | | | Public Finance Authority of Wisconsin, Conference Center and Hotel Revenue Bonds, Lombard Public Facilities Corporation, First Tier Series2018A-1: | | | | | | | | | | | | | | | | |
| $ | 11 | | | 0.000%, 1/01/47, 144A | | | No Opt. Call | | | | | | | | N/R | | | $ | 343 | |
| | 10 | | | 0.000%, 1/01/48, 144A | | | No Opt. Call | | | | | | | | N/R | | | | 298 | |
| | 9 | | | 0.000%, 1/01/49, 144A | | | No Opt. Call | | | | | | | | N/R | | | | 291 | |
| | 9 | | | 0.000%, 1/01/50, 144A | | | No Opt. Call | | | | | | | | N/R | | | | 280 | |
| | 9 | | | 0.000%, 1/01/51, 144A | | | No Opt. Call | | | | | | | | N/R | | | | 273 | |
| | 12 | | | 0.000%, 1/01/52, 144A | | | No Opt. Call | | | | | | | | N/R | | | | 353 | |
| | 11 | | | 0.000%, 1/01/53, 144A | | | No Opt. Call | | | | | | | | N/R | | | | 346 | |
| | 11 | | | 0.000%, 1/01/54, 144A | | | No Opt. Call | | | | | | | | N/R | | | | 333 | |
| | 11 | | | 0.000%, 1/01/55, 144A | | | No Opt. Call | | | | | | | | N/R | | | | 324 | |
| | 11 | | | 0.000%, 1/01/56, 144A | | | No Opt. Call | | | | | | | | N/R | | | | 315 | |
| | 518 | | | 5.500%, 7/01/56, 144A | | | 3/28 at 100.00 | | | | | | | | N/R | | | | 494,408 | |
| | 12 | | | 0.000%, 1/01/57, 144A | | | No Opt. Call | | | | | | | | N/R | | | | 347 | |
| | 11 | | | 0.000%, 1/01/58, 144A | | | No Opt. Call | | | | | | | | N/R | | | | 336 | |
| | 11 | | | 0.000%, 1/01/59, 144A | | | No Opt. Call | | | | | | | | N/R | | | | 326 | |
| | 11 | | | 0.000%, 1/01/60, 144A | | | No Opt. Call | | | | | | | | N/R | | | | 317 | |
| | 11 | | | 0.000%, 1/01/61, 144A | | | No Opt. Call | | | | | | | | N/R | | | | 311 | |
| | 10 | | | 0.000%, 1/01/62, 144A | | | No Opt. Call | | | | | | | | N/R | | | | 301 | |
| | 10 | | | 0.000%, 1/01/63, 144A | | | No Opt. Call | | | | | | | | N/R | | | | 293 | |
| | 10 | | | 0.000%, 1/01/64, 144A | | | No Opt. Call | | | | | | | | N/R | | | | 285 | |
| | 10 | | | 0.000%, 1/01/65, 144A | | | No Opt. Call | | | | | | | | N/R | | | | 279 | |
| | 11 | | | 0.000%, 1/01/66, 144A | | | No Opt. Call | | | | | | | | N/R | | | | 300 | |
| | 128 | | | 0.000%, 1/01/67, 144A | | | No Opt. Call | | | | | | | | N/R | | | | 3,591 | |
| | | | | |
| | | | Public Finance Authority of Wisconsin, Conference Center and Hotel Revenue Bonds, Lombard Public Facilities Corporation, Second Tier Series 2018B: | | | | | | | | | | | | | | | | |
| | 27 | | | 0.000%, 1/01/46, 144A | | | No Opt. Call | | | | | | | | N/R | | | | 851 | |
| | 27 | | | 0.000%, 1/01/47, 144A | | | No Opt. Call | | | | | | | | N/R | | | | 833 | |
| | 26 | | | 0.000%, 1/01/48, 144A | | | No Opt. Call | | | | | | | | N/R | | | | 821 | |
| | 26 | | | 0.000%, 1/01/49, 144A | | | No Opt. Call | | | | | | | | N/R | | | | 809 | |
| | 26 | | | 0.000%, 1/01/50, 144A | | | No Opt. Call | | | | | | | | N/R | | | | 792 | |
| | 28 | | | 0.000%, 1/01/51, 144A | | | No Opt. Call | | | | | | | | N/R | | | | 862 | |
| | 736 | | | 3.750%, 7/01/51, 144A | | | 3/28 at 100.00 | | | | | | | | N/R | | | | 679,012 | |
| | 28 | | | 0.000%, 1/01/52, 144A | | | No Opt. Call | | | | | | | | N/R | | | | 851 | |
| | 28 | | | 0.000%, 1/01/53, 144A | | | No Opt. Call | | | | | | | | N/R | | | | 834 | |
| | 27 | | | 0.000%, 1/01/54, 144A | | | No Opt. Call | | | | | | | | N/R | | | | 824 | |
| | 27 | | | 0.000%, 1/01/55, 144A | | | No Opt. Call | | | | | | | | N/R | | | | 807 | |
| | 27 | | | 0.000%, 1/01/56, 144A | | | No Opt. Call | | | | | | | | N/R | | | | 792 | |
| | 27 | | | 0.000%, 1/01/57, 144A | | | No Opt. Call | | | | | | | | N/R | | | | 782 | |
| | 26 | | | 0.000%, 1/01/58, 144A | | | No Opt. Call | | | | | | | | N/R | | | | 766 | |
| | 26 | | | 0.000%, 1/01/59, 144A | | | No Opt. Call | | | | | | | | N/R | | | | 757 | |
| | 26 | | | 0.000%, 1/01/60, 144A | | | No Opt. Call | | | | | | | | N/R | | | | 747 | |
| | 25 | | | 0.000%, 1/01/61, 144A | | | No Opt. Call | | | | | | | | N/R | | | | 733 | |
| | 25 | | | 0.000%, 1/01/62, 144A | | | No Opt. Call | | | | | | | | N/R | | | | 723 | |
| | 25 | | | 0.000%, 1/01/63, 144A | | | No Opt. Call | | | | | | | | N/R | | | | 709 | |
| | 25 | | | 0.000%, 1/01/64, 144A | | | No Opt. Call | | | | | | | | N/R | | | | 700 | |
| | 24 | | | 0.000%, 1/01/65, 144A | | | No Opt. Call | | | | | | | | N/R | | | | 692 | |
| | 24 | | | 0.000%, 1/01/66, 144A | | | No Opt. Call | | | | | | | | N/R | | | | 678 | |
| | 314 | | | 0.000%, 1/01/67, 144A | | | No Opt. Call | | | | | | | | N/R | | | | 8,786 | |
| | | | | |
| | | | Public Finance Authority of Wisconsin, Educational Facility Revenue Bonds, Cottonwood Classical Preparatory School in Albuquerque, New Mexico, Series 2012A: | | | | | | | | | | | | | | | | |
| | 1,610 | | | 6.000%, 12/01/32 | | | 12/22 at 100.00 | | | | | | | | N/R | | | | 1,635,180 | |
| | 5,000 | | | 6.250%, 12/01/42 | | | 12/22 at 100.00 | | | | | | | | N/R | | | | 5,066,250 | |
79
NuveenAll-American Municipal Bond Fund(continued)
Portfolio of Investments March 31, 2019
| | | | | | | | | | | | | | | | | | | | |
Principal
Amount (000) | | | Description (1) | | Optional Call
Provisions (2) | | | | | | Ratings (3) | | | Value | |
| | | | | |
| | | | Wisconsin(continued) | | | | | | | | | | | | |
| | | | | |
| $ | 1,940 | | | Public Finance Authority of Wisconsin, Exempt Facilities Revenue Bonds, National Gypsum Company Project, Refunding Series 2014, 5.250%, 4/01/30 (AMT) | | | 11/24 at 100.00 | | | | | | | | N/R | | | $ | 2,114,794 | |
| | | | | |
| | 3,845 | | | Public Finance Authority of Wisconsin, Exempt Facilities Revenue Bonds, National Gypsum Company Project, Refunding Series 2016, 4.000%, 8/01/35 (AMT) | | | 8/26 at 100.00 | | | | | | | | N/R | | | | 3,896,100 | |
| | | | | |
| | 10,000 | | | Public Finance Authority of Wisconsin, Limited Obligation PILOT Revenue Bonds, American Dream @ Meadowlands Project, Series 2017, 6.750%, 12/01/42, 144A | | | 12/27 at 100.00 | | | | | | | | N/R | | | | 11,645,600 | |
| | | | | |
| | 2,735 | | | Public Finance Authority of Wisconsin, Revenue Bonds, Alabama Gulf Coast Zoo, Series 2018A, 6.500%, 9/01/48 | | | 9/28 at 100.00 | | | | | | | | N/R | | | | 2,767,410 | |
| | | | | |
| | 1,575 | | | Public Finance Authority of Wisconsin, Revenue Bonds, Carolina International School, Series 2013A, 7.000%, 8/01/43, 144A | | | 8/23 at 100.00 | | | | | | | | BB+ | | | | 1,730,185 | |
| | | | | |
| | | | Public Finance Authority of Wisconsin, Revenue Bonds, Denver international Airport Great Hall Project, Series 2017: | | | | | | | | | | | | | | | | |
| | 1,320 | | | 5.000%, 9/30/37 (AMT) | | | 9/27 at 100.00 | | | | | | | | BBB | | | | 1,489,079 | |
| | 1,140 | | | 5.000%, 9/30/49 (AMT) | | | 9/27 at 100.00 | | | | | | | | BBB | | | | 1,263,268 | |
| | | | | |
| | 5,000 | | | Public Finance Authority, Wisconsin, Exempt Facilities Revenue Bonds, Celanese Project, Refunding Series 2016C, 4.300%, 11/01/30 (AMT) | | | 5/26 at 100.00 | | | | | | | | BBB– | | | | 5,188,400 | |
| | | | | |
| | 2,550 | | | Superior, Wisconsin, Limited Obligation Revenue Refunding Bonds, Midwest Energy Resources Company, Series 1991E, 6.900%, 8/01/21 – FGIC Insured | | | No Opt. Call | | | | | | | | Aa3 | | | | 2,839,935 | |
| | | | | |
| | 1,455 | | | Wisconsin Health and Educational Facilities Authority, Revenue Bonds, Aurora Health Care, Inc., Series 2010A, 5.250%, 4/15/24(Pre-refunded 4/15/20) | | | 4/20 at 100.00 | | | | | | | | AA (4) | | | | 1,509,955 | |
| | | | | |
| | 1,225 | | | Wisconsin Health and Educational Facilities Authority, Revenue Bonds, Beloit College, Series 2010A, 6.125%, 6/01/39(Pre-refunded 6/01/20) | | | 6/20 at 100.00 | | | | | | | | N/R (4) | | | | 1,289,214 | |
| | | | | |
| | 2,000 | | | Wisconsin Health and Educational Facilities Authority, Revenue Bonds, Froedtert Health, Inc. Obligated Group, Series 2017A, 4.000%, 4/01/39 | | | 4/27 at 100.00 | | | | | | | | AA | | | | 2,072,020 | |
| | | | | |
| | | | Wisconsin Health and Educational Facilities Authority, Revenue Bonds, Marshfield Clinic, Series 2012B: | | | | | | | | | | | | | | | | |
| | 35 | | | 4.500%, 2/15/40 | | | 2/22 at 100.00 | | | | | | | | A– | | | | 36,139 | |
| | 1,000 | | | 5.000%, 2/15/40 | | | 2/22 at 100.00 | | | | | | | | A– | | | | 1,044,440 | |
| | | | | |
| | 5,000 | | | Wisconsin Health and Educational Facilities Authority, Revenue Bonds, Marshfield Clinic, Series 2016A, 5.000%, 2/15/46 | | | 2/26 at 100.00 | | | | | | | | A– | | | | 5,489,000 | |
| | | | | |
| | 18,000 | | | Wisconsin Health and Educational Facilities Authority, Revenue Bonds, Mercy Alliance, Inc, Series 2012, 5.000%, 6/01/32 | | | 6/22 at 100.00 | | | | | | | | A3 | | | | 19,305,000 | |
| | | | | |
| | 7,000 | | | Wisconsin Health and Educational Facilities Authority, Revenue Bonds, Ministry Health Care, Inc, Refunding 2012C, 5.000%, 8/15/32(Pre-refunded 8/15/22) | | | 8/22 at 100.00 | | | | | | | | N/R (4) | | | | 7,772,660 | |
| | | | | |
| | 435 | | | Wisconsin Health and Educational Facilities Authority, Revenue Bonds, ProHealth Care, Inc Obligated Group, Refunding Series 2015, 5.000%, 8/15/39 | | | 8/24 at 100.00 | | | | | | | | A+ | | | | 478,396 | |
| | | | | |
| | 2,980 | | | Wisconsin Health and Educational Facilities Authority, Revenue Bonds, Rogers Memorial Hospital, Inc, Series 2014A, 5.000%, 7/01/34 | | | 7/24 at 100.00 | | | | | | | | A | | | | 3,273,649 | |
| | | | | |
| | 2,100 | | | Wisconsin Health and Educational Facilities Authority, Revenue Bonds, Rogers Memorial Hospital, Inc., Series 2014A, 4.350%, 7/01/36 | | | 7/21 at 100.00 | | | | | | | | A | | | | 2,126,775 | |
| | | | | |
| | 3,450 | | | Wisconsin Health and Educational Facilities Authority, Revenue Bonds, Three Pillars Senior Living Communities, Refunding Series 2013, 5.000%, 8/15/43 | | | 8/23 at 100.00 | | | | | | | | A | | | | 3,700,815 | |
80
| | | | | | | | | | | | | | | | | | | | |
Principal
Amount (000) | | | Description (1) | | Optional Call
Provisions (2) | | | | | | Ratings (3) | | | Value | |
| | | | | |
| | | | Wisconsin(continued) | | | | | | | | | | | | |
| | | | | |
| | | | Wisconsin Health and Educational Facilities Authority, Revenue Bonds, Woodland Hills Senior Housing Project, Series 2014: | | | | | | | | | | | | | | | | |
| $ | 5,000 | | | 5.000%, 12/01/34 | | | 12/22 at 102.00 | | | | | | | | N/R | | | $ | 5,240,550 | |
| | 4,435 | | | 5.000%, 12/01/44 | | | 12/22 at 102.00 | | | | | | | | N/R | | | | 4,627,834 | |
| | 4,225 | | | 5.250%, 12/01/49 | | | 12/22 at 102.00 | | | | | | | | N/R | | | | 4,450,953 | |
| | | | | |
| | 13,950 | | | Wisconsin Health and Educational Facilities Authority, Revenue Bonds, Gundersen Lutheran, Series 2011A, 5.250%, 10/15/39 | | | 10/21 at 100.00 | | | | | | | | AA– | | | | 14,882,139 | |
| | | | | |
| | | | Wisconsin Health and Educational Facilities Authority, Wisconsin, Revenue Bonds, Dickson Hollow Project Series 2014: | | | | | | | | | | | | | | | | |
| | 1,880 | | | 5.250%, 10/01/39 | | | 10/22 at 12.00 | | | | | | | | N/R | | | | 1,999,530 | |
| | 1,000 | | | 5.375%, 10/01/44 | | | 10/22 at 12.00 | | | | | | | | N/R | | | | 1,067,640 | |
| | 3,500 | | | 5.500%, 10/01/49 | | | 10/22 at 12.00 | | | | | | | | N/R | | | | 3,750,915 | |
| | 128,397 | | | Total Wisconsin | | | | | | | | | | | | | | | 135,546,991 | |
| | | | | |
| | | | Wyoming – 0.4% | | | | | | | | | | | | |
| | | | | |
| | 2,000 | | | Campbell County, Wyoming Solid Waste Facilities Revenue Bonds, Basin Electric Power Cooperative – Dry Fork Station Facilities, Series 2009A, 5.750%, 7/15/39 | | | 7/19 at 100.00 | | | | | | | | A | | | | 2,022,360 | |
| | | | | |
| | 4,500 | | | Natrona County, Wyoming, Hospital Revenue Bonds, Wyoming Medical Center Project, Series 2011, 6.350%, 9/15/31(Pre-refunded 3/15/21) | | | 3/21 at 100.00 | | | | | | | | A3 (4) | | | | 4,912,020 | |
| | | | | |
| | | | Teton County Hospital District, Wyoming, Hospital Revenue Bonds, St John’s Medical Center Project, Series 2011B: | | | | | | | | | | | | | | | | |
| | 800 | | | 5.500%, 12/01/27 | | | 12/21 at 100.00 | | | | | | | | A– | | | | 857,824 | |
| | 2,500 | | | 6.000%, 12/01/36 | | | 12/21 at 100.00 | | | | | | | | A– | | | | 2,704,325 | |
| | | | | |
| | 3,650 | | | West Park Hospital District, Wyoming, Hospital Revenue Bonds, Series 2011A, 7.000%, 6/01/40 | | | 6/21 at 100.00 | | | | | | | | BBB | | | | 3,916,048 | |
| | 13,450 | | | Total Wyoming | | | | | | | | | | | | | | | 14,412,577 | |
| $ | 3,798,691 | | | Total Municipal Bonds (cost $3,847,234,180) | | | | | | | | | | | | | | | 4,080,462,815 | |
| | | | | |
Principal
Amount (000) | | | Description (1) | | Coupon | | | Maturity | | | Ratings (3) | | | Value | |
| | | | | |
| | | | CORPORATE BONDS – 0.0% | | | | | | | | | | | | | | | | |
| | | | | |
| | | | Transportation – 0.0% | | | | | | | | | | | | |
| | | | | |
| $ | 130 | | | Las Vegas Monorail Company, Senior Interest Bonds (8), (9) | | | 5.500% | | | | 7/15/19 | | | | N/R | | | $ | 86,494 | |
| | | | | |
| | 37 | | | Las Vegas Monorail Company, Senior Interest Bonds (8), (9) | | | 5.500% | | | | 7/15/55 | | | | N/R | | | | 18,323 | |
| | 167 | | | Total Transportation | | | | | | | | | | | | | | | 104,817 | |
| | | | | |
| | | | Industrials – 0.0% | | | | | | | | | | | | |
| | | | | |
| | 729 | | | EWM P1 LLC (cash 15.000%, PIK 1.250%) (7), (9) | | | 15.000% | | | | 9/01/28 | | | | N/R | | | | 548,642 | |
| | | | | |
| | 50 | | | EWM P1 LLC (7), (9) | | | 15.000% | | | | 9/01/28 | | | | N/R | | | | 36,166 | |
| | 779 | | | Total Industrials | | | | | | | | | | | | | | | 584,808 | |
| $ | 946 | | | Total Corporate Bonds (cost $785,848) | | | | | | | | | | | | | | | 689,625 | |
| | | | Total Long-Term Investments (cost $3,848,020,028) | | | | | | | | | | | | | | | 4,081,152,440 | |
| | | | Borrowings – (0.6)% (10) | | | | | | | | | | | | | | | (23,800,000 | ) |
| | | | Floating Rate Obligations – (1.6)% | | | | | | | | | | | | | | | (65,870,000 | ) |
| | | | Other Assets Less Liabilities – 2.0% (11) | | | | | | | | | | | | | | | 81,452,555 | |
| | | | Net Assets – 100% | | | | | | | | | | | | | | $ | 4,072,934,995 | |
81
NuveenAll-American Municipal Bond Fund(continued)
Portfolio of Investments March 31, 2019
Investments in Derivatives
Futures Contracts
| | | | | | | | | | | | | | | | | | | | | | | | | | | | |
| Description | | Contract
Position | | | Number of
Contracts | | | Expiration
Date | | | Notional
Amount | | | Value | | | Unrealized
Appreciation
(Depreciation) | | | Variation
Margin
Receivable/
(Payable) | |
| U.S. Treasury10-year Note | | | Short | | | | (270 | ) | | | 6/19 | | | $ | (33,093,124 | ) | | $ | (33,539,063 | ) | | $ | (445,938 | ) | | $ | 75,938 | |
| (1) | All percentages shown in the Portfolio of Investments are based on net assets. |
| (2) | Optional Call Provisions: Dates (month and year) and prices of the earliest optional call or redemption. There may be other call provisions at varying prices at later dates. Certain mortgage-backed securities may be subject to periodic principal paydowns. Optional Call Provisions are not covered by the report of independent registered public accounting firm. |
| (3) | For financial reporting purposes, the ratings disclosed are the highest of Standard & Poor’s Group (“Standard & Poor’s”), Moody’s Investors Service, Inc. (“Moody’s”) or Fitch, Inc. (“Fitch”) rating. This treatment of split-rated securities may differ from that used for other purposes, such as for Fund investment policies. Ratings below BBB by Standard & Poor’s, Baa by Moody’s or BBB by Fitch are considered to be below investment grade. Holdings designated N/R are not rated by any of these national rating agencies. Ratings are not covered by the report of independent registered public accounting firm. |
| (4) | Backed by an escrow or trust containing sufficient U.S. Government or U.S. Government agency securities, which ensure the timely payment of principal and interest. |
| (5) | Investment, or portion of investment, has been pledged to collateralize the net payment obligations for investments in inverse floating rate transactions. |
| (6) | Step-up coupon bond, a bond with a coupon that increases (“steps up”), usually at regular intervals, while the bond is outstanding. The rate shown is the coupon as of the end of the reporting period. |
| (7) | Defaulted security. A security whose issuer has failed to fully pay principal and/or interest when due, or is under the protection of bankruptcy. |
| (8) | The tax-exempt municipal bonds previously held by the Fund were surrendered in conjunction with the issuer’s bankruptcy reorganization plan. In return, the Fund received one or more senior interest corporate bonds. |
| (9) | Investment valued at fair value using methods determined in good faith by, or at the discretion of, the Board. For fair value measurement disclosure purposes, investment classified as Level 3. See Notes to Financial Statements, Note 2 – Investment Valuation and Fair Value Measurements for more information. |
| (10) | Borrowings as a percentage of Total Investments is 0.6% |
| (11) | Other assets less liabilities includes the unrealized appreciation (depreciation) of certainover-the counter (“OTC”) derivatives as presented on the Statement of Assets and Liabilities, when applicable. The unrealized appreciation (depreciation) of OTC cleared and exchange-traded derivatives is recognized as part of cash collateral at brokers and/or the receivable or payable for variation margin as presented on the Statement of Assets and Liabilities, when applicable. |
| 144A | Investment is exempt from registration under Rule 144A of the Securities Act of 1933, as amended. These investments may only be resold in transactions exempt from registration, which are normally those transactions with qualified institutional buyers. |
| AMT | Alternative Minimum Tax |
| IF | Inverse floating rate security issued by a tender option bond (“TOB”) trust, the interest rate on which varies inversely with the Securities Industry Financial Markets Association (SIFMA) short-term rate, which resets weekly, or a similar short-term rate, and is reduced by the expenses related to the TOB trust. |
| PIK | Payment-in-kind (“PIK”) security. Depending on the terms of the security, income may be received in the form of cash, securities, or a combination of both. The PIK rate shown, where applicable, represents the annualized rate of the last PIK payment made by the issuer as of the end of the reporting period. |
| UB | Underlying bond of an inverse floating rate trust reflected as a financing transaction. See Notes to Financial Statements, Note 3 – Portfolio Securities and Investments in Derivatives. Inverse Floating Rate Securities for more information. |
| WI/DD | Investment, or portion of investment, purchased on a when-issued or delayed delivery basis. |
See accompanying notes to financial statements.
82
Nuveen Intermediate Duration Municipal Bond Fund
Portfolio of Investments March 31, 2019
| | | | | | | | | | | | | | | | | | | | |
Principal
Amount (000) | | | Description (1) | | Optional Call
Provisions (2) | | | | | | Ratings (3) | | | Value | |
| | | | | |
| | | | LONG-TERM INVESTMENTS – 95.9% | | | | | | | | | | | | | | | | |
| | | | | |
| | | | MUNICIPAL BONDS – 95.9% | | | | | | | | | | | | | | | | |
| | | | | |
| | | | Alabama – 2.3% | | | | | | | | | | | | |
| | | | | |
| $ | 7,630 | | | Alabama State Port Authority, Docks Facilities Revenue Bonds, Refunding Series 2017A, 5.000%, 10/01/31 – AGM Insured (AMT) | | | 10/27 at 100.00 | | | | | | | | AA | | | $ | 8,850,419 | |
| | | | | |
| | 6,665 | | | Black Belt Energy Gas District, Alabama, Gas PrePay Revenue Bonds, Project 3 Series 2018A, 4.000%, 12/01/48 (Mandatory Put 12/01/23) | | | 9/23 at 100.31 | | | | | | | | A3 | | | | 7,101,091 | |
| | | | | |
| | 22,395 | | | Black Belt Energy Gas District, Alabama, Gas Supply Revenue Bonds, Series 2016, 4.000%, 7/01/46 (Mandatory Put 6/01/21) | | | 3/21 at 100.59 | | | | | | | | Aa2 | | | | 23,315,659 | |
| | | | | |
| | 38,500 | | | Black Belt Energy Gas District, Alabama, Gas Supply Revenue Bonds, Series 2017A, 4.000%, 8/01/47 (Mandatory Put 7/01/22) | | | 4/22 at 100.52 | | | | | | | | Aa2 | | | | 40,817,700 | |
| | | | | |
| | 28,940 | | | Mobile Industrial Development Board, Alabama, Pollution Control Revenue Refunding Bonds, Alabama Power Company Barry Plan, Variable Rate Demand Obligations, Series 2008, 2.900%, 7/15/34 (Mandatory Put 12/12/23) | | | No Opt. Call | | | | | | | | A– | | | | 29,734,692 | |
| | | | | |
| | 2,440 | | | Mobile Spring Hill College Educational Building Authority, Alabama, Revenue Bonds, Spring Hill College Project, Series 2015, 5.000%, 4/15/27 | | | 4/25 at 100.00 | | | | | | | | N/R | | | | 2,523,765 | |
| | | | | |
| | | | Montgomery Medical Clinic Board, Alabama, Health Care Facility Revenue Bonds, Jackson Hospital & Clinic, Series 2015: | | | | | | | | | | | | | | | | |
| | 2,080 | | | 5.000%, 3/01/23 | | | No Opt. Call | | | | | | | | BBB | | | | 2,283,923 | |
| | 3,555 | | | 5.000%, 3/01/24 | | | No Opt. Call | | | | | | | | BBB | | | | 3,977,263 | |
| | 2,235 | | | 5.000%, 3/01/25 | | | No Opt. Call | | | | | | | | BBB | | | | 2,540,927 | |
| | 1,725 | | | 5.000%, 3/01/26 | | | No Opt. Call | | | | | | | | BBB | | | | 1,985,113 | |
| | | | | |
| | 12,295 | | | Southeast Alabama Gas Supply District, Alabama, Gas Supply Revenue Bonds, Project 1, Fixed Rate Series 2018A, 4.000%, 4/01/49 (Mandatory Put 4/01/24) | | | 1/24 at 100.27 | | | | | | | | A3 | | | | 13,135,240 | |
| | | | | |
| | 16,005 | | | Southeast Alabama Gas Supply District, Alabama, Gas Supply Revenue Bonds, Project 2, Fixed Rate Series 2018A, 4.000%, 6/01/49 (Mandatory Put 6/01/24) | | | 3/24 at 100.29 | | | | | | | | A3 | | | | 17,218,019 | |
| | | | | |
| | 1,000 | | | The Improvement District of the City of Mobile – McGowin Park Project, Alabama, Sales Tax Revenue Bonds, Series 2016A, 5.000%, 8/01/25 | | | No Opt. Call | | | | | | | | N/R | | | | 1,027,420 | |
| | 145,465 | | | Total Alabama | | | | | | | | | | | | | | | 154,511,231 | |
| | | | | |
| | | | Alaska – 0.4% | | | | | | | | | | | | |
| | | | | |
| | 10,000 | | | Alaska Housing Finance Corporation, Mortgage Revenue Bonds, General Series 2018B-II, 3.550%, 12/01/35 | | | 6/27 at 100.00 | | | | | | | | AA+ | | | | 10,248,400 | |
| | | | | |
| | 5,275 | | | Alaska Industrial Development and Export Authority, Loan Anticipation Revenue Notes, YKHC Project, Series 2017, 3.500%, 12/01/20 | | | 12/19 at 100.00 | | | | | | | | N/R | | | | 5,313,930 | |
| | | | | |
| | 3,000 | | | Alaska State, Sport Fishing Revenue Bonds, Refunding Series 2011, 5.000%, 4/01/21 | | | 4/20 at 100.00 | | | | | | | | A1 | | | | 3,097,170 | |
| | | | | |
| | 6,025 | | | Northern Tobacco Securitization Corporation, Alaska, Tobacco Settlement Asset-Backed Bonds, Series 2006A, 5.000%, 6/01/32 | | | 4/19 at 100.00 | | | | | | | | B3 | | | | 6,024,879 | |
83
Nuveen Intermediate Duration Municipal Bond Fund(continued)
Portfolio of Investments March 31, 2019
| | | | | | | | | | | | | | | | | | | | |
Principal
Amount (000) | | | Description (1) | | Optional Call
Provisions (2) | | | | | | Ratings (3) | | | Value | |
| | | | | |
| | | | Alaska(continued) | | | | | | | | | | | | |
| | | | | |
| $ | 5,065 | | | Valdez, Alaska, Marine Terminal Revenue Bonds, BP Pipelines Inc Project, Refunding Series 2003B, 5.000%, 1/01/21 | | | No Opt. Call | | | | | | | | A1 | | | $ | 5,341,498 | |
| | 29,365 | | | Total Alaska | | | | | | | | | | | | | | | 30,025,877 | |
| | | | | |
| | | | Arizona – 2.5% | | | | | | | | | | | | |
| | | | | |
| | 2,485 | | | Apache County Industrial Development Authority, Arizona, Pollution Control Revenue Bonds, Tucson Electric Power Company, Series 20102A, 4.500%, 3/01/30 | | | 3/22 at 100.00 | | | | | | | | A– | | | | 2,614,468 | |
| | | | | |
| | | | Arizona Health Facilities Authority, Hospital System Revenue Bonds, Phoenix Children’s Hospital, Refunding Series 2012A: | | | | | | | | | | | | | | | | |
| | 1,235 | | | 5.000%, 2/01/20 | | | No Opt. Call | | | | | | | | A1 | | | | 1,267,715 | |
| | 6,475 | | | 5.000%, 2/01/27 | | | 2/22 at 100.00 | | | | | | | | A1 | | | | 7,025,181 | |
| | | | | |
| | 3,280 | | | Arizona Industrial Development Authority, Arizona, Education Revenue Bonds, Legacy Traditional School Southwest Las Vegas Nevada Campus, Series 2018, 5.250%, 7/01/22, 144A | | | 7/19 at 101.00 | | | | | | | | N/R | | | | 3,267,274 | |
| | | | | |
| | | | Arizona Sports and Tourism Authority, Tax Revenue Bonds, Multipurpose Stadium Facility Project, Refunding Senior Series 2012A: | | | | | | | | | | | | | | | | |
| | 10,270 | | | 5.000%, 7/01/25 | | | 7/22 at 100.00 | | | | | | | | A1 | | | | 11,109,470 | |
| | 16,235 | | | 5.000%, 7/01/26 | | | 7/22 at 100.00 | | | | | | | | A1 | | | | 17,509,123 | |
| | 16,760 | | | 5.000%, 7/01/27 | | | 7/22 at 100.00 | | | | | | | | A1 | | | | 18,026,553 | |
| | | | | |
| | | | Arizona State, Certificates of Participation, Refunding Series 2019A: | | | | | | | | | | | | | | | | |
| | 5,570 | | | 5.000%, 10/01/26 (WI/DD, Settling 7/09/19) | | | No Opt. Call | | | | | | | | Aa3 | | | | 6,631,642 | |
| | 5,570 | | | 5.000%, 10/01/27 (WI/DD, Settling 7/09/19) | | | No Opt. Call | | | | | | | | Aa3 | | | | 6,733,016 | |
| | | | | |
| | | | Arizona State, State Lottery Revenue Bonds, Series 2010A: | | | | | | | | | | | | | | | | |
| | 5,165 | | | 5.000%, 7/01/19 – AGM Insured | | | No Opt. Call | | | | | | | | AA+ | | | | 5,209,419 | |
| | 5,015 | | | 5.000%, 7/01/20 – AGM Insured | | | No Opt. Call | | | | | | | | AA+ | | | | 5,231,598 | |
| | 6,130 | | | 5.000%, 7/01/21 – AGM Insured | | | 1/20 at 100.00 | | | | | | | | AA+ (4) | | | | 6,285,886 | |
| | 7,500 | | | 5.000%, 7/01/22 – AGM Insured | | | 1/20 at 100.00 | | | | | | | | AA+ (4) | | | | 7,690,725 | |
| | | | | |
| | 21,410 | | | Chandler Industrial Development Authority, Arizona, Revenue Bonds, Intel Corporation Project, Series 2005, 2.400%, 12/01/35 (Mandatory Put 8/14/23) | | | No Opt. Call | | | | | | | | A+ | | | | 21,749,134 | |
| | | | | |
| | 2,440 | | | Chandler Industrial Development Authority, Arizona, Revenue Bonds, Intel Corporation Project, Series 2007, 2.700%, 12/01/37 (Mandatory Put 8/14/23) (AMT) | | | No Opt. Call | | | | | | | | A+ | | | | 2,483,456 | |
| | | | | |
| | 6,000 | | | Gilbert Public Facilities Municipal Property Corporation, Arizona, Revenue Bonds, Series 2009, 5.500%, 7/01/27(Pre-refunded 7/01/19) | | | 7/19 at 100.00 | | | | | | | | AA+ (4) | | | | 6,059,580 | |
| | | | | |
| | 2,000 | | | Glendale Industrial Development Authority, Arizona, Revenue Bonds, Midwestern University, Refunding Series 2007, 5.000%, 5/15/26 | | | 5/22 at 100.00 | | | | | | | | A | | | | 2,179,260 | |
| | | | | |
| | 1,355 | | | Glendale Industrial Development Authority, Arizona, Revenue Bonds, Midwestern University, Refunding Series 2010, 5.000%, 5/15/21 | | | 5/20 at 100.00 | | | | | | | | A+ | | | | 1,404,322 | |
| | | | | |
| | 1,000 | | | Maricopa County Industrial Development Authority, Arizona, Hospital Revenue Bonds, HonorHealth, Series 2019A, 4.125%, 9/01/38 | | | 9/28 at 100.00 | | | | | | | | A2 | | | | 1,071,480 | |
| | | | | |
| | | | Northern Arizona University, System Revenue Bonds, Refunding Series 2014: | | | | | | | | | | | | | | | | |
| | 385 | �� | | 5.000%, 6/01/22 | | | No Opt. Call | | | | | | | | A+ | | | | 423,500 | |
| | 500 | | | 5.000%, 6/01/23 | | | No Opt. Call | | | | | | | | A+ | | | | 563,880 | |
| | | | | |
| | | | Phoenix Civic Improvement Corporation, Arizona, Airport Revenue Bonds, Junior Lien Series 2010A: | | | | | | | | | | | | | | | | |
| | 2,045 | | | 5.000%, 7/01/22(Pre-refunded 7/01/20) | | | 7/20 at 100.00 | | | | | | | | A+ (4) | | | | 2,132,812 | |
| | 10,400 | | | 5.000%, 7/01/40(Pre-refunded 7/01/20) | | | 7/20 at 100.00 | | | | | | | | A+ (4) | | | | 10,846,576 | |
84
| | | | | | | | | | | | | | | | | | | | |
Principal
Amount (000) | | | Description (1) | | Optional Call
Provisions (2) | | | | | | Ratings (3) | | | Value | |
| | | | | |
| | | | Arizona(continued) | | | | | | | | | | | | |
| | | | | |
| $ | 4,850 | | | Phoenix Industrial Development Authority, Arizona, Education Facility Revenue Bonds, Legacy Traditional Schools East Mesa and Cadence, Nevada Campuses, Series 2017A, 4.000%, 7/01/22, 144A | | | 7/19 at 101.00 | | | | | | | | N/R | | | $ | 4,800,481 | |
| | | | | |
| | 3,480 | | | Phoenix Industrial Development Authority, Arizona, Education Facility Revenue Bonds, Legacy Traditional Schools Phoenix/East Mesa and Cadence, Nevada Campuses, Series 2017B, 4.000%, 7/01/22, 144A | | | 7/19 at 101.00 | | | | | | | | N/R | | | | 3,444,434 | |
| | | | | |
| | 2,650 | | | Pima County Industrial Development Authority, Arizona, Revenue Bonds, Tucson Electric Power Company Project, Series 2013A, 4.000%, 9/01/29 | | | 3/23 at 100.00 | | | | | | | | A– | | | | 2,773,066 | |
| | | | | |
| | 1,000 | | | Pima County Industrial Development Authority, Arizona, Revenue Bonds, Tucson Electric Power Company, Series 2010A, 5.250%, 10/01/40 | | | 10/20 at 100.00 | | | | | | | | A– | | | | 1,043,620 | |
| | | | | |
| | 2,670 | | | Pima County, Arizona, Sewer Revenue Bonds, Series 2010, 5.000%, 7/01/24 – AGM Insured(Pre-refunded 7/01/20) | | | 7/20 at 100.00 | | | | | | | | AA (4) | | | | 2,784,650 | |
| | | | | |
| | 645 | | | Regional Public Transportation Authority, Arizona, Transportation Excise Tax Revenue Bonds, Maricopa County Public Transportation Fund Series 2014, 5.250%, 7/01/23 | | | No Opt. Call | | | | | | | | AA+ | | | | 741,163 | |
| | | | | |
| | 3,925 | | | Salt River Project Agricultural Improvement and Power District, Arizona, Electric System Revenue Bonds, Tender Option Bond Trust 2015-XF2192, 10.731%, 12/01/24 (IF) (5) | | | 12/21 at 100.00 | | | | | | | | AA | | | | 4,962,299 | |
| | | | | |
| | | | Salt Verde Financial Corporation, Arizona, Senior Gas Revenue Bonds, Citigroup Energy Inc Prepay Contract Obligations, Series 2007: | | | | | | | | | | | | | | | | |
| | 2,720 | | | 5.000%, 12/01/32 | | | No Opt. Call | | | | | | | | A3 | | | | 3,355,909 | |
| | 350 | | | 5.000%, 12/01/37 | | | No Opt. Call | | | | | | | | A3 | | | | 438,106 | |
| | | | | |
| | 1,350 | | | Sedona-Oak Creek Joint Unified School District 9, Coconino and Yavapi Counties, Arizona, General Obligation Bonds, School Improvement Project 2007, Series 2009B, 5.375%, 7/01/28 | | | 7/19 at 100.00 | | | | | | | | Aa2 (4) | | | | 1,362,812 | |
| | 162,865 | | | Total Arizona | | | | | | | | | | | | | | | 173,222,610 | |
| | | | | |
| | | | Arkansas – 0.5% | | | | | | | | | | | | |
| | | | | |
| | 1,000 | | | Arkansas State University, Student Fee Revenue Bonds, Jonesboro Campus, Series 2013, 5.000%, 12/01/33 | | | 12/23 at 100.00 | | | | | | | | A1 | | | | 1,122,920 | |
| | | | | |
| | | | Bentonville School District 006, Benton County, Arkansas, General Obligation Bonds, Refunding & Construction Series 2018B: | | | | | | | | | | | | | | | | |
| | 5,255 | | | 3.000%, 6/01/29 | | | 6/26 at 100.00 | | | | | | | | Aa2 | | | | 5,429,624 | |
| | 4,170 | | | 3.500%, 6/01/38 | | | 6/26 at 100.00 | | | | | | | | Aa2 | | | | 4,257,945 | |
| | | | | |
| | 560 | | | Fayetteville, Arkansas, Sales and Use Tax Revenue Bonds, Series 2006A, 4.500%, 11/01/19 – AGM Insured | | | 5/19 at 100.00 | | | | | | | | AA | | | | 561,344 | |
| | | | | |
| | 4,540 | | | Independence County, Arkansas, Pollution Control Revenue Bonds, Arkansas Power and Light Company Project, Series 2013, 2.375%, 1/01/21 | | | No Opt. Call | | | | | | | | A | | | | 4,575,276 | |
| | | | | |
| | | | Little Rock, Arkansas, Hotel and Restaurant Gross Receipts Tax Bonds, Series 2014: | | | | | | | | | | | | | | | | |
| | 500 | | | 5.000%, 7/01/22 | | | No Opt. Call | | | | | | | | A+ | | | | 550,255 | |
| | 800 | | | 5.000%, 7/01/23 | | | No Opt. Call | | | | | | | | A+ | | | | 903,008 | |
| | 1,610 | | | 5.000%, 7/01/26 | | | 7/24 at 100.00 | | | | | | | | A+ | | | | 1,853,883 | |
| | 1,485 | | | 5.000%, 7/01/28 | | | 7/24 at 100.00 | | | | | | | | A+ | | | | 1,700,369 | |
| | 1,935 | | | 5.000%, 7/01/29 | | | 7/24 at 100.00 | | | | | | | | A+ | | | | 2,210,467 | |
| | 1,000 | | | 5.000%, 7/01/30 | | | 7/24 at 100.00 | | | | | | | | A+ | | | | 1,138,940 | |
| | 4,585 | | | 5.000%, 7/01/34 | | | 7/24 at 100.00 | | | | | | | | A+ | | | | 5,179,491 | |
85
Nuveen Intermediate Duration Municipal Bond Fund(continued)
Portfolio of Investments March 31, 2019
| | | | | | | | | | | | | | | | | | | | |
Principal
Amount (000) | | | Description (1) | | Optional Call
Provisions (2) | | | | | | Ratings (3) | | | Value | |
| | | | | |
| | | | Arkansas(continued) | | | | | | | | | | | | |
| | | | | |
| | | | Pulaski County Public Facilities Board, Arkansas, Healthcare Revenue Bonds, Baptist Health, Series 2014: | | | | | | | | | | | | | | | | |
| $ | 2,125 | | | 5.000%, 12/01/25 | | | 12/24 at 100.00 | | | | | | | | A+ | | | $ | 2,469,441 | |
| | 1,780 | | | 5.000%, 12/01/27 | | | 12/24 at 100.00 | | | | | | | | A+ | | | | 2,049,955 | |
| | | | | |
| | 560 | | | Rogers, Arkansas, Sales and Use Tax Bonds, Improvement Series 2018B, 3.875%, 11/01/39 | | | 11/26 at 100.00 | | | | | | | | AA– | | | | 584,802 | |
| | | | | |
| | 1,000 | | | University of Arkansas, Various Facilities Revenue Bonds, UAMS Campus, Refunding Series 2014, 5.000%, 3/01/21 | | | No Opt. Call | | | | | | | | Aa2 | | | | 1,065,190 | |
| | 32,905 | | | Total Arkansas | | | | | | | | | | | | | | | 35,652,910 | |
| | | | | |
| | | | California – 5.9% | | | | | | | | | | | | |
| | | | | |
| | 1,565 | | | ABC Unified School District, Los Angeles County, California, General Obligation Bonds, Refunding Series 2003A, 4.900%, 2/01/20 – NPFG Insured | | | No Opt. Call | | | | | | | | A+ | | | | 1,609,509 | |
| | | | | |
| | 7,435 | | | California Health Facilities Financing Authority, Revenue Bonds, Adventist Health System/West, Refunding Series 2016A, 3.000%, 3/01/39 | | | 3/26 at 100.00 | | | | | | | | A+ | | | | 6,723,619 | |
| | | | | |
| | 515 | | | California Health Facilities Financing Authority, Revenue Bonds, Adventist Health System/West, Series 2009C, 5.125%, 3/01/20 | | | 5/19 at 100.00 | | | | | | | | A+ | | | | 516,385 | |
| | | | | |
| | | | California Health Facilities Financing Authority, Revenue Bonds, Children’s Hospital Los Angeles, Series 2017A: | | | | | | | | | | | | | | | | |
| | 1,200 | | | 5.000%, 8/15/35 | | | 8/27 at 100.00 | | | | | | | | BBB+ | | | | 1,389,180 | |
| | 1,845 | | | 5.000%, 8/15/36 | | | 8/27 at 100.00 | | | | | | | | BBB+ | | | | 2,126,971 | |
| | | | | |
| | | | California Municipal Finance Authority, Revenue Bonds, Linxs APM Project, Senior Lien Series 2018A: | | | | | | | | | | | | | | | | |
| | 5,835 | | | 3.250%, 12/31/32 – AGM Insured (AMT) | | | 6/28 at 100.00 | | | | | | | | AA | | | | 5,882,614 | |
| | 4,000 | | | 5.000%, 12/31/33 (AMT) | | | 6/28 at 100.00 | | | | | | | | BBB+ | | | | 4,671,360 | |
| | 5,000 | | | 5.000%, 12/31/34 (AMT) | | | 6/28 at 100.00 | | | | | | | | BBB+ | | | | 5,819,850 | |
| | | | | |
| | 15,000 | | | California Municipal Finance Authority, Solid Waste Disposal Revenue Bonds, Waste Management Inc, Series 2017A, 2.000%, 12/01/44 (Mandatory Put 12/01/20) (AMT) | | | No Opt. Call | | | | | | | | A– | | | | 15,018,300 | |
| | | | | |
| | 3,530 | | | California Pollution Control Financing Authority, Solid Waste Disposal Revenue Bonds, Waste Management Inc, Refunding Series 2015B-2, 3.125%, 11/01/40 (Mandatory Put 11/03/25) (AMT) | | | No Opt. Call | | | | | | | | A– | | | | 3,695,557 | |
| | | | | |
| | 16,835 | | | California Pollution Control Financing Authority, Solid Waste Disposal Revenue Bonds, Waste Management Inc, Series 2015A-1, 3.375%, 7/01/25 (AMT) | | | No Opt. Call | | | | | | | | A– | | | | 17,679,949 | |
| | | | | |
| | 12,305 | | | California Pollution Control Financing Authority, Solid Waste Disposal Revenue Bonds, Waste Management, Inc Project, Refunding Series 2015B-1, 3.000%, 11/01/25 (AMT) | | | No Opt. Call | | | | | | | | A– | | | | 12,640,557 | |
| | | | | |
| | 1,400 | | | California State Public Works Board, Lease Revenue Bonds, California State University, Various University Projects, Series 2010B-1, 5.375%, 3/01/25 | | | 3/20 at 100.00 | | | | | | | | Aa3 | | | | 1,447,866 | |
| | | | | |
| | 5,000 | | | California State Public Works Board, Lease Revenue Bonds, Various Capital Projects,Series 2009G-1, 5.250%, 10/01/24(Pre-refunded 10/01/19) | | | 10/19 at 100.00 | | | | | | | | A+ | (4) | | | 5,097,050 | |
| | | | | |
| | | | California State, Economic Recovery Revenue Bonds, Refunding Series 2009A: | | | | | | | | | | | | | | | | |
| | 2,115 | | | 5.000%, 7/01/20(Pre-refunded 7/01/19) | | | 7/19 at 100.00 | | | | | | | | AA+ | (4) | | | 2,134,098 | |
| | 3,830 | | | 5.250%, 7/01/21(Pre-refunded 7/01/19) | | | 7/19 at 100.00 | | | | | | | | AA+ | (4) | | | 3,866,921 | |
| | 2,195 | | | 5.250%, 7/01/21(Pre-refunded 7/01/19) | | | 7/19 at 100.00 | | | | | | | | AA+ | (4) | | | 2,216,160 | |
86
| | | | | | | | | | | | | | | | | | | | |
Principal
Amount (000) | | | Description (1) | | Optional Call
Provisions (2) | | | | | | Ratings (3) | | | Value | |
| | | | | |
| | | | California(continued) | | | | | | | | | | | | |
| | | | | |
| $ | 2,425 | | | California Statewide Communities Development Authority, California, Revenue Bonds, Loma Linda University Medical Center, Series 2014A, 5.250%, 12/01/29 | | | 12/24 at 100.00 | | | | | | | | BB | | | $ | 2,726,209 | |
| | | | | |
| | | | California Statewide Communities Development Authority, California, Revenue Bonds, Loma Linda University Medical Center, Series 2016A: | | | | | | | | | | | | | | | | |
| | 1,695 | | | 5.000%, 12/01/31, 144A | | | 6/26 at 100.00 | | | | | | | | BB | | | | 1,884,891 | |
| | 2,700 | | | 5.000%, 12/01/36, 144A | | | 6/26 at 100.00 | | | | | | | | BB | | | | 2,962,953 | |
| | | | | |
| | | | California Statewide Communities Development Authority, California, Revenue Bonds, Loma Linda University Medical Center, Series 2018A: | | | | | | | | | | | | | | | | |
| | 2,530 | | | 5.000%, 12/01/33, 144A | | | 6/28 at 100.00 | | | | | | | | BB | | | | 2,861,000 | |
| | 2,000 | | | 5.250%, 12/01/38, 144A | | | 6/28 at 100.00 | | | | | | | | BB | | | | 2,276,080 | |
| | | | | |
| | 915 | | | California Statewide Communities Development Authority, Revenue Bonds, Huntington Memorial Hospital, Refunding Series 2014B, 5.000%, 7/01/25 | | | 7/24 at 100.00 | | | | | | | | A– | | | | 1,055,087 | |
| | | | | |
| | 575 | | | California Statewide Community Development Authority, Revenue Bonds, Daughters of Charity Health System, Series 2005G, 5.500%, 7/01/22 | | | 5/19 at 100.00 | | | | | | | | CC | | | | 559,717 | |
| | | | | |
| | | | Culver City Redevelopment Agency, California, Tax Allocation Revenue Bonds, Redevelopment Project, Capital Appreciation Series 2011A: | | | | | | | | | | | | | | | | |
| | 7,475 | | | 0.000%, 11/01/26(Pre-refunded 11/01/21) | | | 11/21 at 66.91 | | | | | | | | AA– (4) | | | | 4,817,264 | |
| | 4,095 | | | 0.000%, 11/01/28(Pre-refunded 11/01/21) | | | 11/21 at 56.33 | | | | | | | | AA– (4) | | | | 2,221,660 | |
| | | | | |
| | | | Delano, California, Certificates of Participation, Delano Regional Medical Center, Series 2012: | | | | | | | | | | | | | | | | |
| | 2,725 | | | 5.000%, 1/01/22 | | | No Opt. Call | | | | | | | | BBB | | | | 2,859,615 | |
| | 2,860 | | | 5.000%, 1/01/23 | | | No Opt. Call | | | | | | | | BBB | | | | 3,045,614 | |
| | 1,635 | | | 5.000%, 1/01/24 | | | 1/23 at 100.00 | | | | | | | | BBB | | | | 1,742,583 | |
| | 1,325 | | | 5.000%, 1/01/25 | | | 1/23 at 100.00 | | | | | | | | BBB | | | | 1,413,046 | |
| | | | | |
| | 5,600 | | | Freddie Mac Multifamily ML Certificates, 3.400%, 1/25/36 | | | No Opt. Call | | | | | | | | AA+ | | | | 5,804,568 | |
| | | | | |
| | 33,905 | | | Golden State Tobacco Securitization Corporation, California, Tobacco Settlement Asset-Backed Bonds, Series 2018A-1, 3.500%, 6/01/36 | | | 6/22 at 100.00 | | | | | | | | BBB | | | | 34,005,359 | |
| | | | | |
| | 1,300 | | | Grant Joint Union High School District, Sacramento County, California, General Obligation Bonds, Capital Appreciation Election 2006 Series 2008, 0.000%, 8/01/26 – AGM Insured | | | No Opt. Call | | | | | | | | A1 | | | | 1,089,179 | |
| | | | | |
| | | | Lake Elsinore Public Financing Authority, California, Local Agency Revenue Bonds, Canyon Hills Improvement Area A & C, Series 2014C: | | | | | | | | | | | | | | | | |
| | 1,000 | | | 5.000%, 9/01/30 | | | 9/24 at 100.00 | | | | | | | | N/R | | | | 1,094,520 | |
| | 1,015 | | | 5.000%, 9/01/32 | | | 9/24 at 100.00 | | | | | | | | N/R | | | | 1,103,031 | |
| | 465 | | | 5.000%, 9/01/34 | | | 9/24 at 100.00 | | | | | | | | N/R | | | | 503,646 | |
| | | | | |
| | 5,030 | | | Lake Elsinore Redevelopment Agency, California, Special Tax Bonds, Community Facilities District90-2, Series 2007A, 4.500%, 10/01/24 – AGM Insured | | | 5/19 at 100.00 | | | | | | | | AA | | | | 5,041,217 | |
| | | | | |
| | 2,015 | | | Las Virgenes Unified School District, Los Angeles County, California, General Obligation Bonds, 2006 Election, Series 2009B, 0.000%, 8/01/27 | | | No Opt. Call | | | | | | | | Aa1 | | | | 1,673,619 | |
| | | | | |
| | 16,625 | | | Los Angeles County, California, Tax and Revenue Anticipation Notes, Series 2018, 4.000%, 6/28/19 | | | No Opt. Call | | | | | | | | N/R | | | | 16,725,249 | |
| | | | | |
| | | | Los Angeles Department of Airports, California, Revenue Bonds, Los Angeles International Airport, Subordinate Lien Series 2018D: | | | | | | | | | | | | | | | | |
| | 13,425 | | | 5.000%, 5/15/25 (AMT) | | | No Opt. Call | | | | | | | | AA– | | | | 15,855,730 | |
| | 9,085 | | | 5.000%, 5/15/27 (AMT) | | | No Opt. Call | | | | | | | | AA– | | | | 11,118,768 | |
87
Nuveen Intermediate Duration Municipal Bond Fund(continued)
Portfolio of Investments March 31, 2019
| | | | | | | | | | | | | | | | | | | | |
Principal
Amount (000) | | | Description (1) | | Optional Call
Provisions (2) | | | | | | Ratings (3) | | | Value | |
| | | | | |
| | | | California(continued) | | | | | | | | | | | | |
| | | | | |
| | | | Los Angeles Department of Water and Power, California, Power System Revenue Bonds, Series 2014B: | | | | | | | | | | | | | | | | |
| $ | 1,045 | | | 5.000%, 7/01/25 | | | 1/24 at 100.00 | | | | | | | | AA | | | $ | 1,215,387 | |
| | 5,000 | | | 5.000%, 7/01/43 | | | 1/24 at 100.00 | | | | | | | | AA | | | | 5,572,150 | |
| | | | | |
| | 5,555 | | | Los Angeles Unified School District, Los Angeles County, California, General Obligation Bonds, Election 2008 Series 2016A, 4.000%, 7/01/34 | | | 7/25 at 100.00 | | | | | | | | AAA | | | | 6,018,009 | |
| | | | | |
| | 10,000 | | | Los Angeles, California, General Obligation Bonds, Tax & Revenue Anticipation Notes, Series 2018, 4.000%, 6/27/19 | | | No Opt. Call | | | | | | | | N/R | | | | 10,059,100 | |
| | | | | |
| | | | Los Angeles, California, Special Tax Bonds, Community Facilities District 4, Playa Vista Phase I, Series 2014: | | | | | | | | | | | | | | | | |
| | 1,075 | | | 5.000%, 9/01/24 | | | No Opt. Call | | | | | | | | A+ | | | | 1,258,470 | |
| | 1,250 | | | 5.000%, 9/01/25 | | | 9/24 at 100.00 | | | | | | | | A+ | | | | 1,461,225 | |
| | 1,000 | | | 5.000%, 9/01/26 | | | 9/24 at 100.00 | | | | | | | | A+ | | | | 1,162,800 | |
| | | | | |
| | 400 | | | Menifee Union School District Public Financing Authority, California, Special Tax Revenue Bonds, Series 2016A, 5.000%, 9/01/29 – BAM Insured | | | 9/25 at 100.00 | | | | | | | | AA | | | | 469,148 | |
| | | | | |
| | 5,095 | | | Mount San Antonio Community College District, Los Angeles County, California, General Obligation Bonds, Election of 2008, Series 2013A, 0.000%, 8/01/28 (6) | | | 2/28 at 100.00 | | | | | | | | Aa1 | | | | 5,275,923 | |
| | | | | |
| | 12,580 | | | M-S-R Energy Authority, California, Gas Revenue Bonds, Citigroup Prepay Contracts, Series 2009A, 6.125%, 11/01/29 | | | No Opt. Call | | | | | | | | A | | | | 15,738,712 | |
| | | | | |
| | 10,290 | | | M-S-R Energy Authority, California, Gas Revenue Bonds, Citigroup Prepay Contracts, Series 2009C, 6.125%, 11/01/29 | | | No Opt. Call | | | | | | | | A | | | | 12,878,758 | |
| | | | | |
| | 545 | | | Northern Inyo County Local Hospital District, Inyo County, California, Revenue Bonds, Series 2010, 6.000%, 12/01/21 | | | 12/20 at 100.00 | | | | | | | | BB– | | | | 563,089 | |
| | | | | |
| | 8,000 | | | Palomar Pomerado Health, California, General Obligation Bonds, Convertible Capital Appreciation, Election 2004 Series 2010A, 0.000%, 8/01/40 (6) | | | 8/30 at 100.00 | | | | | | | | A2 | | | | 9,951,600 | |
| | | | | |
| | | | Palomar Pomerado Health, California, General Obligation Bonds, Series 2009A: | | | | | | | | | | | | | | | | |
| | 1,815 | | | 0.000%, 8/01/21 – AGC Insured | | | No Opt. Call | | | | | | | | AA | | | | 1,735,594 | |
| | 2,095 | | | 0.000%, 8/01/22 – AGC Insured | | | No Opt. Call | | | | | | | | AA | | | | 1,959,977 | |
| | 4,085 | | | 0.000%, 8/01/23 – AGC Insured | | | No Opt. Call | | | | | | | | AA | | | | 3,725,683 | |
| | | | | |
| | 7,000 | | | Placentia-Yorba Linda Unified School District, Orange County, California, Certificates of Participation, Refunding Series 2011, 6.000%, 10/01/25 – AGM Insured | | | 10/21 at 100.00 | | | | | | | | AA | | | | 7,772,450 | |
| | | | | |
| | 5,350 | | | Poway Unified School District, San Diego County, California, General Obligation Bonds, School Facilities Improvement District2007-1, Series 2011A, 0.000%, 8/01/34 | | | No Opt. Call | | | | | | | | AA– | | | | 3,292,711 | |
| | | | | |
| | 2,410 | | | Riverside County Redevelopment Agency Successor Agency, California, Tax Allocation Bonds, Refunding Series 2014A, 4.000%, 10/01/37 – AGM Insured | | | 10/24 at 100.00 | | | | | | | | AA | | | | 2,532,380 | |
| | | | | |
| | | | Riverside County Redevelopment Agency, California, Tax Allocation Bonds, Jurupa Valley Project Area, Series 2011B: | | | | | | | | | | | | | | | | |
| | 2,115 | | | 0.000%, 10/01/34 | | | No Opt. Call | | | | | | | | A | | | | 1,241,294 | |
| | 2,000 | | | 0.000%, 10/01/36 | | | No Opt. Call | | | | | | | | A | | | | 1,077,900 | |
| | | | | |
| | 5,000 | | | Sacramento County, California, Airport System Revenue Bonds, Senior Lien Series 2010, 5.000%, 7/01/40 | | | 7/20 at 100.00 | | | | | | | | A+ | | | | 5,196,750 | |
88
| | | | | | | | | | | | | | | | | | | | |
Principal
Amount (000) | | | Description (1) | | Optional Call
Provisions (2) | | | | | | Ratings (3) | | | Value | |
| | | | | |
| | | | California(continued) | | | | | | | | | | | | |
| | | | | |
| | | | San Joaquin Hills Transportation Corridor Agency, Orange County, California, Toll Road Revenue Bonds, Refunding Senior Lien Series 2014A: | | | | | | | | | | | | | | | | |
| $ | 5,000 | | | 5.000%, 1/15/29 | | | 1/25 at 100.00 | | | | | | | | A– | | | $ | 5,693,500 | |
| | 26,000 | | | 5.000%, 1/15/34 | | | 1/25 at 100.00 | | | | | | | | A– | | | | 29,039,140 | |
| | | | | |
| | 2,350 | | | San Jose Redevelopment Agency Successor Agency, California, Tax Allocation Bonds, Refunding Subordinate Series 2017B, 5.000%, 8/01/19 | | | No Opt. Call | | | | | | | | AA– | | | | 2,378,364 | |
| | | | | |
| | | | Santa Ana Financing Authority, California, Lease Revenue Bonds, Police Administration and Housing Facility, Series 1994A: | | | | | | | | | | | | | | | | |
| | 2,255 | | | 6.250%, 7/01/24 – NPFG Insured (ETM) | | | No Opt. Call | | | | | | | | Baa2 (4) | | | | 2,603,195 | |
| | 3,690 | | | 6.250%, 7/01/24 | | | No Opt. Call | | | | | | | | Baa2 | | | | 4,212,910 | |
| | | | | |
| | | | Santa Paula Utility Authority, California, Water Enterprise Revenue Bonds, Refunding Series 2010: | | | | | | | | | | | | | | | | |
| | 2,510 | | | 5.000%, 2/01/28 | | | 2/20 at 100.00 | | | | | | | | A+ | | | | 2,576,490 | |
| | 2,630 | | | 5.000%, 2/01/29 | | | 2/20 at 100.00 | | | | | | | | A+ | | | | 2,699,669 | |
| | 2,765 | | | 5.000%, 2/01/30 | | | 2/20 at 100.00 | | | | | | | | A+ | | | | 2,837,305 | |
| | | | | |
| | | | South Bayside Waste Management Authority, Solida Waste Enterprise Revenue Bonds, Shoreway Environmental Center, Series 2009A: | | | | | | | | | | | | | | | | |
| | 2,500 | | | 5.250%, 9/01/24 | | | 9/19 at 100.00 | | | | | | | | A+ | | | | 2,537,225 | |
| | 1,200 | | | 6.250%, 9/01/29 | | | 9/19 at 100.00 | | | | | | | | A+ | | | | 1,223,052 | |
| | | | | |
| | | | Tulare Local Health Care District, Tulare County, California, General Obligation Bonds, Series 2009B-1: | | | | | | | | | | | | | | | | |
| | 1,180 | | | 6.000%, 8/01/22 | | | 8/19 at 100.00 | | | | | | | | Ba3 | | | | 1,194,821 | |
| | 1,410 | | | 6.125%, 8/01/23 | | | 8/19 at 100.00 | | | | | | | | Ba3 | | | | 1,428,358 | |
| | 1,585 | | | 6.250%, 8/01/24 | | | 8/19 at 100.00 | | | | | | | | Ba3 | | | | 1,606,080 | |
| | 1,265 | | | 6.375%, 8/01/25 | | | 8/19 at 100.00 | | | | | | | | Ba3 | | | | 1,282,166 | |
| | 500 | | | 6.500%, 8/01/26 | | | 8/19 at 100.00 | | | | | | | | Ba3 | | | | 506,850 | |
| | | | | |
| | | | University of California, General Revenue Bonds, Limited Project Series 2018O: | | | | | | | | | | | | | | | | |
| | 4,595 | | | 5.000%, 5/15/32 | | | 5/28 at 100.00 | | | | | | | | AA– | | | | 5,692,010 | |
| | 3,635 | | | 5.000%, 5/15/33 | | | 5/28 at 100.00 | | | | | | | | AA– | | | | 4,473,558 | |
| | | | | |
| | 2,030 | | | Victor Elementary School District, San Bernardino County, California, General Obligation Bonds, Series 2002A, 0.000%, 8/01/23 – FGIC Insured | | | No Opt. Call | | | | | | | | Aa3 | | | | 1,861,774 | |
| | | | | |
| | 3,000 | | | Victor Valley Union High School District, San Bernardino County, California, General Obligation Bonds, Series 2009A, 0.000%, 8/01/31 – AGC Insured (6) | | | 8/26 at 100.00 | | | | | | | | AA | | | | 3,498,720 | |
| | | | | |
| | | | Washington Township Health Care District, California, Revenue Bonds, Refunding Series 2015A: | | | | | | | | | | | | | | | | |
| | 1,540 | | | 5.000%, 7/01/24 | | | No Opt. Call | | | | | | | | Baa1 | | | | 1,749,394 | |
| | 1,415 | | | 5.000%, 7/01/25 | | | No Opt. Call | | | | | | | | Baa1 | | | | 1,633,264 | |
| | 1,450 | | | 3.250%, 7/01/27 | | | 7/25 at 100.00 | | | | | | | | Baa1 | | | | 1,491,644 | |
| | 1,435 | | | 3.500%, 7/01/28 | | | 7/25 at 100.00 | | | | | | | | Baa1 | | | | 1,487,177 | |
| | 1,355 | | | 3.750%, 7/01/29 | | | 7/25 at 100.00 | | | | | | | | Baa1 | | | | 1,414,159 | |
| | | | | |
| | 2,500 | | | West Contra Costa Unified School District, Contra Costa County, California, General Obligation Bonds, Series 2008B, 6.000%, 8/01/25 | | | No Opt. Call | | | | | | | | AA– | | | | 3,170,775 | |
| | 385,525 | | | Total California | | | | | | | | | | | | | | | 405,427,261 | |
89
Nuveen Intermediate Duration Municipal Bond Fund(continued)
Portfolio of Investments March 31, 2019
| | | | | | | | | | | | | | | | | | | | |
Principal
Amount (000) | | | Description (1) | | Optional Call
Provisions (2) | | | | | | Ratings (3) | | | Value | |
| | | | | |
| | | | Colorado – 2.7% | | | | | | | | | | | | |
| | | | | |
| | | | Arapahoe County School District 6, Littleton, Colorado, General Obligation Bonds, Series 2019A: | | | | | | | | | | | | | | | | |
| $ | 1,860 | | | 5.500%, 12/01/29 | | | 12/28 at 100.00 | | | | | | | | Aa1 | | | $ | 2,427,839 | |
| | 1,250 | | | 5.500%, 12/01/30 | | | 12/28 at 100.00 | | | | | | | | Aa1 | | | | 1,620,000 | |
| | 1,650 | | | 5.500%, 12/01/32 | | | 12/28 at 100.00 | | | | | | | | Aa1 | | | | 2,119,441 | |
| | 1,250 | | | 5.500%, 12/01/33 | | | 12/28 at 100.00 | | | | | | | | Aa1 | | | | 1,599,663 | |
| | | | | |
| | 9,355 | | | Centerra Metropolitan District 1, Loveland, Colorado, Special Revenue Bonds, Refunding & Improvement Series 2017, 5.000%, 12/01/29, 144A | | | 12/22 at 103.00 | | | | | | | | N/R | | | | 10,033,144 | |
| | | | | |
| | 10,000 | | | Colorado Bridge Enterprise, Revenue Bonds, Central 70 Project, Senior Series 2017, 4.000%, 6/30/51 (AMT) | | | 12/27 at 100.00 | | | | | | | | A– | | | | 10,273,800 | |
| | | | | |
| | | | Colorado Educational and Cultural Facilities Authority, Revenue Bonds, Regis University Project, Refunding Series 2016: | | | | | | | | | | | | | | | | |
| | 1,910 | | | 5.000%, 10/01/25 | | | No Opt. Call | | | | | | | | Baa2 | | | | 2,180,781 | |
| | 1,705 | | | 3.125%, 10/01/31 | | | 10/25 at 100.00 | | | | | | | | Baa2 | | | | 1,631,412 | |
| | | | | |
| | 1,000 | | | Colorado Health Facilities Authority, Colorado, Hospital Improvement Revenue Bonds, NCMC Inc, Series 2003B, 6.000%, 5/15/26 – AGM Insured(Pre-refunded 5/15/19) | | | 5/19 at 100.00 | | | | | | | | AA (4) | | | | 1,005,340 | |
| | | | | |
| | 18,200 | | | Colorado Health Facilities Authority, Colorado, Hospital Revenue Bonds, Parkview Medical Center, Series 2016, 3.125%, 9/01/42 | | | 9/26 at 100.00 | | | | | | | | A3 | | | | 17,178,252 | |
| | | | | |
| | | | Colorado Health Facilities Authority, Colorado, Revenue Bonds, Catholic Health Initiatives, Series 2006A: | | | | | | | | | | | | | | | | |
| | 16,830 | | | 5.000%, 9/01/26 | | | 5/19 at 100.00 | | | | | | | | BBB+ | | | | 17,016,813 | |
| | 95 | | | 4.500%, 9/01/38 | | | 5/19 at 100.00 | | | | | | | | BBB+ | | | | 95,142 | |
| | | | | |
| | 4,045 | | | Colorado Health Facilities Authority, Colorado, Revenue Bonds, Catholic Health Initiatives, Series 2009B-1, 5.000%, 7/01/29 | | | 11/22 at 100.00 | | | | | | | | BBB+ | | | | 4,432,187 | |
| | | | | |
| | 350 | | | Colorado Health Facilities Authority, Colorado, Revenue Bonds, Evangelical Lutheran Good Samaritan Society Project, Series 2013, 5.500%, 6/01/33 | | | 6/23 at 100.00 | | | | | | | | BBB | | | | 385,774 | |
| | | | | |
| | 605 | | | Colorado Health Facilities Authority, Colorado, Revenue Bonds, Total Longterm Care National Obligated Group Project, Series 2010A, 5.250%, 11/15/20 (ETM) | | | No Opt. Call | | | | | | | | N/R (4) | | | | 625,873 | |
| | | | | |
| | 10,000 | | | Colorado Health Facilities Authority, Retirement Facilities Revenue Bonds, Liberty Heights, Series 1990B, 0.000%, 7/15/20 (ETM) | | | No Opt. Call | | | | | | | | AA+ (4) | | | | 9,793,400 | |
| | | | | |
| | 2,500 | | | Colorado Housing and Finance Authority, Single Family Mortgage Bonds, Class I Series 2019E, 3.600%, 11/01/39 (WI/DD, Settling 4/18/19) | | | 5/28 at 100.00 | | | | | | | | AAA | | | | 2,549,975 | |
| | | | | |
| | 1,500 | | | Delta County Memorial Hospital District, Colorado, Enterprise Revenue Bonds, Refunding Series 2010, 5.500%, 9/01/25 | | | 3/20 at 100.00 | | | | | | | | BB+ | | | | 1,537,080 | |
| | | | | |
| | 11,000 | | | Denver City and County, Colorado, Airport System Revenue Bonds, Series 2012B, 5.000%, 11/15/32 | | | 11/22 at 100.00 | | | | | | | | AA– | | | | 12,095,380 | |
| | | | | |
| | | | Denver City and County, Colorado, Airport System Revenue Bonds, Subordinate Lien Series 2018A: | | | | | | | | | | | | | | | | |
| | 15,000 | | | 5.000%, 12/01/24 (AMT) | | | No Opt. Call | | | | | | | | A+ | | | | 17,405,250 | |
| | 25,610 | | | 5.000%, 12/01/27 (AMT) | | | No Opt. Call | | | | | | | | A+ | | | | 31,238,822 | |
| | | | | |
| | 10,670 | | | Denver City and County, Colorado, Special Facilities Airport Revenue Bonds, United Airlines, Inc Project, Refunding Series 2017, 5.000%, 10/01/32 (AMT) | | | 10/23 at 100.00 | | | | | | | | BB | | | | 11,452,004 | |
| | | | | |
| | | | Denver Urban Renewal Authority, Colorado, Tax Increment Revenue Bonds, 9th and Colorado Urban Redevelopment Area, Series 2018A: | | | | | | | | | | | | | | | | |
| | 1,950 | | | 5.250%, 12/01/39, 144A | | | 12/23 at 103.00 | | | | | | | | N/R | | | | 1,996,800 | |
| | 820 | | | 5.250%, 12/01/39, 144A | | | 12/23 at 103.00 | | | | | | | | N/R | | | | 834,424 | |
90
| | | | | | | | | | | | | | | | | | | | |
Principal
Amount (000) | | | Description (1) | | Optional Call
Provisions (2) | | | | | | Ratings (3) | | | Value | |
| | | | | |
| | | | Colorado(continued) | | | | | | | | | | | | |
| | | | | |
| $ | 10,000 | | | E-470 Public Highway Authority, Colorado, Toll Revenue Bonds, Series 2004B, 0.000%, 3/01/36 – NPFG Insured | | | 9/20 at 41.72 | | | | | | | | A | | | $ | 3,995,100 | |
| | | | | |
| | | | El Paso County School District 20, Academy, Colorado, General Obligation Bonds, Refunding Series 2010: | | | | | | | | | | | | | | | | |
| | 1,525 | | | 5.000%, 12/15/20 | | | No Opt. Call | | | | | | | | Aa2 | | | | 1,613,847 | |
| | 2,215 | | | 5.000%, 12/15/21 | | | No Opt. Call | | | | | | | | Aa2 | | | | 2,416,631 | |
| | 1,530 | | | 5.000%, 12/15/22 | | | 12/21 at 100.00 | | | | | | | | Aa2 | | | | 1,668,847 | |
| | | | | |
| | 3,670 | | | Johnstown Plaza Metropolitan District, Colorado, Special Revenue Bonds, Series 2016A, 5.125%, 12/01/31 | | | 12/21 at 103.00 | | | | | | | | N/R | | | | 3,658,146 | |
| | | | | |
| | | | Plaza Metropolitan District 1, Lakewood, Colorado, Tax Increment Revenue Bonds, Refunding Series 2013: | | | | | | | | | | | | | | | | |
| | 1,335 | | | 5.000%, 12/01/19, 144A | | | No Opt. Call | | | | | | | | N/R | | | | 1,357,054 | |
| | 500 | | | 5.000%, 12/01/20, 144A | | | No Opt. Call | | | | | | | | N/R | | | | 519,730 | |
| | | | | |
| | 1,000 | | | Pueblo County School District 60, Pueblo, Colorado, General Obligation Bonds, Refunding Series 2009, 5.000%, 12/15/22 | | | No Opt. Call | | | | | | | | Aa2 | | | | 1,119,520 | |
| | | | | |
| | 975 | | | Regional Transportation District, Colorado, Denver Transit Partners Eagle P3 Project Private Activity Bonds, Series 2010, 6.000%, 1/15/41 | | | 7/20 at 100.00 | | | | | | | | BBB+ | | | | 1,002,105 | |
| | | | | |
| | | | Sand Creek Metropolitan District, Colorado, General Obligation Bonds, Refunding Series 2010A: | | | | | | | | | | | | | | | | |
| | 2,190 | | | 4.250%, 12/01/23 | | | 12/20 at 100.00 | | | | | | | | A | | | | 2,273,570 | |
| | 2,030 | | | 4.000%, 12/01/24 | | | 12/20 at 100.00 | | | | | | | | A | | | | 2,098,858 | |
| | | | | |
| | 1,000 | | | Spring Mesa Metropolitan District, Jefferson County, Colorado, General Obligation Bonds, Refunding Series 2015, 3.750%, 12/01/44 – AGC Insured | | | 12/25 at 100.00 | | | | | | | | AA | | | | 1,004,390 | |
| | 177,125 | | | Total Colorado | | | | | | | | | | | | | | | 184,256,394 | |
| | | | | |
| | | | Connecticut – 1.1% | | | | | | | | | | | | |
| | | | | |
| | 4,355 | | | Connecticut Health and Educational Facilities Authority, Revenue Bonds, Fairfield University, Series 2017R, 3.250%, 7/01/35 | | | 7/27 at 100.00 | | | | | | | | A– | | | | 4,310,579 | |
| | | | | |
| | 5,085 | | | Connecticut Health and Educational Facilities Authority, Revenue Bonds, Yale University, Series 2017B, 5.000%, 7/01/29 (Mandatory Put 7/01/20) | | | No Opt. Call | | | | | | | | AAA | | | | 5,296,892 | |
| | | | | |
| | 22,000 | | | Connecticut Health and Educational Facilities Authority, Revenue Bonds, Yale University, Variable Rate Demand Obligations,Series 1999-U1, 2.000%, 7/01/33 (Mandatory Put 2/08/22) | | | No Opt. Call | | | | | | | | AAA | | | | 22,225,060 | |
| | | | | |
| | 15,370 | | | Connecticut Health and Educational Facilities Authority, Revenue Bonds,Yale-New Haven Health Issue, Series 2010A-4, 2.000%, 7/01/49 (Mandatory Put 2/08/22) | | | No Opt. Call | | | | | | | | AAA | | | | 15,544,142 | |
| | | | | |
| | 1,040 | | | Connecticut Housing Finance Authority, Housing Mortgage Finance Program Bonds,Series 2018D-1, 4.000%, 11/15/38 | | | 11/27 at 100.00 | | | | | | | | AAA | | | | 1,091,345 | |
| | | | | |
| | 775 | | | Connecticut State, General Obligation Bonds, Refunding Series 2012C, 5.000%, 6/01/22 | | | No Opt. Call | | | | | | | | A1 | | | | 849,237 | |
| | | | | |
| | | | Connecticut State, General Obligation Bonds, Refunding Series 2018C: | | | | | | | | | | | | | | | | |
| | 11,025 | | | 3.000%, 6/15/19 | | | No Opt. Call | | | | | | | | A1 | | | | 11,055,208 | |
| | 1,360 | | | 5.000%, 6/15/22 | | | No Opt. Call | | | | | | | | A1 | | | | 1,491,798 | |
| | | | | |
| | 925 | | | Connecticut State, General Obligation Bonds, Refunding Series 2018F, 5.000%, 9/15/20 | | | No Opt. Call | | | | | | | | A1 | | | | 969,021 | |
| | | | | |
| | 2,570 | | | Connecticut State, General Obligation Bonds, Series 2013E, 5.000%, 8/15/22 | | | No Opt. Call | | | | | | | | A1 | | | | 2,831,318 | |
91
Nuveen Intermediate Duration Municipal Bond Fund(continued)
Portfolio of Investments March 31, 2019
| | | | | | | | | | | | | | | | | | | | |
Principal
Amount (000) | | | Description (1) | | Optional Call
Provisions (2) | | | | | | Ratings (3) | | | Value | |
| | | | | |
| | | | Connecticut(continued) | | | | | | | | | | | | |
| | | | | |
| $ | 1,345 | | | Connecticut State, General Obligation Bonds, Series 2019A, 5.000%, 4/15/23 (WI/DD, Settling 4/11/19) | | | No Opt. Call | | | | | | | | A | | | $ | 1,502,526 | |
| | | | | |
| | | | Connecticut State, Special Tax Obligation Bonds, Transportation Infrastructure Purposes, Refunding Series 20168C: | | | | | | | | | | | | | | | | |
| | 720 | | | 5.000%, 10/01/20 | | | No Opt. Call | | | | | | | | A+ | | | | 755,417 | |
| | 1,785 | | | 5.000%, 10/01/22 | | | No Opt. Call | | | | | | | | A+ | | | | 1,976,870 | |
| | 1,790 | | | 5.000%, 10/01/23 | | | No Opt. Call | | | | | | | | A+ | | | | 2,032,724 | |
| | | | | |
| | 750 | | | Eastern Connecticut Resource Recovery Authority, Solid Waste Revenue Bonds, Wheelabrator Lisbon Project, Series 1993A, 5.500%, 1/01/20 (AMT) | | | 5/19 at 100.00 | | | | | | | | A– | | | | 761,257 | |
| | | | | |
| | | | Stratford, Connecticut, General Obligation Bonds, Series 2014: | | | | | | | | | | | | | | | | |
| | 400 | | | 5.000%, 12/15/24 | | | 12/22 at 100.00 | | | | | | | | AA– | | | | 444,608 | |
| | 495 | | | 5.000%, 12/15/26 | | | 12/22 at 100.00 | | | | | | | | AA– | | | | 549,450 | |
| | 71,790 | | | Total Connecticut | | | | | | | | | | | | | | | 73,687,452 | |
| | | | | |
| | | | Delaware – 0.1% | | | | | | | | | | | | |
| | | | | |
| | 1,000 | | | Delaware Health Facilities Authority, Revenue Bonds, Bayhealth Medical Center Project, Series 2017A, 4.000%, 7/01/35 | | | 7/27 at 100.00 | | | | | | | | AA | | | | 1,076,220 | |
| | | | | |
| | | | Delaware Health Facilities Authority, Revenue Bonds, Nanticoke Memorial Hospital, Series 2013: | | | | | | | | | | | | | | | | |
| | 1,100 | | | 4.000%, 7/01/22 | | | No Opt. Call | | | | | | | | BBB+ | | | | 1,150,468 | |
| | 3,995 | | | 5.000%, 7/01/28 | | | 7/23 at 100.00 | | | | | | | | BBB+ | | | | 4,371,329 | |
| | 6,095 | | | Total Delaware | | | | | | | | | | | | | | | 6,598,017 | |
| | | | | |
| | | | District of Columbia – 1.0% | | | | | | | | | | | | |
| | | | | |
| | 3,880 | | | District of Columbia Student Dormitory Revenue Bonds, Provident Group – Howard Properties LLC Issue, Series 2013, 5.000%, 10/01/30 | | | 10/22 at 100.00 | | | | | | | | BB+ | | | | 4,010,562 | |
| | | | | |
| | 5,775 | | | District of Columbia Tobacco Settlement Corporation, Tobacco Settlement Asset-Backed Bonds, Series 2001, 6.500%, 5/15/33 | | | No Opt. Call | | | | | | | | A– | | | | 6,402,569 | |
| | | | | |
| | 159,565 | | | District of Columbia Tobacco Settlement Corporation, Tobacco Settlement Asset-Backed Bonds, Series 2006A, 0.000%, 6/15/46 | | | 5/19 at 18.84 | | | | | | | | N/R | | | | 25,086,809 | |
| | | | | |
| | | | District of Columbia, Hospital Revenue Bonds, Sibley Memorial Hospital, Series 2009: | | | | | | | | | | | | | | | | |
| | 420 | | | 6.500%, 10/01/20(Pre-refunded 10/01/19) | | | 10/19 at 100.00 | | | | | | | | N/R (4) | | | | 430,236 | |
| | 1,715 | | | 6.500%, 10/01/23(Pre-refunded 10/01/19) | | | 10/19 at 100.00 | | | | | | | | N/R (4) | | | | 1,756,795 | |
| | 825 | | | 6.500%, 10/01/24(Pre-refunded 10/01/19) | | | 10/19 at 100.00 | | | | | | | | N/R (4) | | | | 845,105 | |
| | | | | |
| | | | Metropolitan Washington DC Airports Authority, Airport System Revenue Bonds, Refunding Series 2018A: | | | | | | | | | | | | | | | | |
| | 5,465 | | | 5.000%, 10/01/26 (AMT) | | | No Opt. Call | | | | | | | | AA– | | | | 6,567,782 | |
| | 9,020 | | | 5.000%, 10/01/27 (AMT) | | | No Opt. Call | | | | | | | | AA– | | | | 10,983,203 | |
| | 4,150 | | | 5.000%, 10/01/28 (AMT) | | | No Opt. Call | | | | | | | | AA– | | | | 5,112,510 | |
| | 4,150 | | | 5.000%, 10/01/29 (AMT) | | | 10/28 at 100.00 | | | | | | | | AA– | | | | 5,076,363 | |
| | | | | |
| | | | Washington Metropolitan Area Transit Authority, District of Columbia, Gross Revenue Bonds, Series 2018: | | | | | | | | | | | | | | | | |
| | 1,250 | | | 5.000%, 7/01/25 | | | No Opt. Call | | | | | | | | AA– | | | | 1,490,875 | |
| | 1,000 | | | 5.000%, 7/01/26 | | | No Opt. Call | | | | | | | | AA– | | | | 1,217,030 | |
| | 1,300 | | | 5.000%, 7/01/27 | | | No Opt. Call | | | | | | | | AA– | | | | 1,610,037 | |
| | 198,515 | | | Total District of Columbia | | | | | | | | | | | | | | | 70,589,876 | |
92
| | | | | | | | | | | | | | | | | | | | |
Principal
Amount (000) | | | Description (1) | | Optional Call
Provisions (2) | | | | | | Ratings (3) | | | Value | |
| | | | | |
| | | | Florida – 4.3% | | | | | | | | | | | | |
| | | | | |
| $ | 12,835 | | | Broward County School Board, Florida, Certificates of Participation, Series 2015A, 5.000%, 7/01/25 | | | No Opt. Call | | | | | | | | Aa3 | | | $ | 15,233,092 | |
| | | | | |
| | | | Broward County, Florida, Airport System Revenue Bonds, Series 2015A: | | | | | | | | | | | | | | | | |
| | 10,000 | | | 5.000%, 10/01/34 (AMT) | | | 10/25 at 100.00 | | | | | | | | A+ | | | | 11,360,200 | |
| | 15,135 | | | 5.000%, 10/01/35 (AMT) | | | 10/25 at 100.00 | | | | | | | | A+ | | | | 17,145,382 | |
| | | | | |
| | | | Cape Coral, Florida, Utility Improvement Assessment Bonds, Refunding Various Areas Series 2017: | | | | | | | | | | | | | | | | |
| | 960 | | | 2.250%, 9/01/23 – AGM Insured | | | No Opt. Call | | | | | | | | AA | | | | 960,758 | |
| | 1,450 | | | 2.500%, 9/01/24 – AGM Insured | | | No Opt. Call | | | | | | | | AA | | | | 1,465,573 | |
| | 1,385 | | | 2.750%, 9/01/25 – AGM Insured | | | No Opt. Call | | | | | | | | AA | | | | 1,418,669 | |
| | 965 | | | 2.750%, 9/01/26 – AGM Insured | | | No Opt. Call | | | | | | | | AA | | | | 988,218 | |
| | 725 | | | 3.000%, 9/01/27 – AGM Insured | | | No Opt. Call | | | | | | | | AA | | | | 753,717 | |
| | | | | |
| | | | Cape Coral, Florida, Water and Sewer Revenue Bonds, Refunding Series 2015: | | | | | | | | | | | | | | | | |
| | 9,685 | | | 5.000%, 10/01/32 | | | 10/25 at 100.00 | | | | | | | | A+ | | | | 11,282,928 | |
| | 7,325 | | | 5.000%, 10/01/33 | | | 10/25 at 100.00 | | | | | | | | A+ | | | | 8,510,844 | |
| | | | | |
| | | | Citizens Property Insurance Corporation, Florida, Coastal Account Senior Secured Bonds, Series 2015A-1: | | | | | | | | | | | | | | | | |
| | 16,445 | | | 5.000%, 6/01/22 | | | 12/21 at 100.00 | | | | | | | | AA | | | | 17,835,918 | |
| | 14,640 | | | 5.000%, 6/01/25 | | | 12/24 at 100.00 | | | | | | | | AA | | | | 17,115,771 | |
| | | | | |
| | 275 | | | Citizens Property Insurance Corporation, Florida, High-Risk Account Revenue Bonds, Coastal Account Senior Secured Series 2011A-1, 5.000%, 6/01/19 | | | No Opt. Call | | | | | | | | AA | | | | 276,502 | |
| | | | | |
| | | | Citizens Property Insurance Corporation, Florida, Personal and Commercial Lines Account Bonds, Senior Secured Series 2012A-1: | | | | | | | | | | | | | | | | |
| | 370 | | | 5.000%, 6/01/19 | | | No Opt. Call | | | | | | | | AA | | | | 372,020 | |
| | 4,545 | | | 5.000%, 6/01/20 | | | No Opt. Call | | | | | | | | AA | | | | 4,720,255 | |
| | 1,600 | | | 5.000%, 6/01/21 | | | No Opt. Call | | | | | | | | AA | | | | 1,714,336 | |
| | | | | |
| | | | Collier County Educational Facilities Authority, Florida, Revenue Bonds, Hodges University, Refunding Series 2013: | | | | | | | | | | | | | | | | |
| | 2,200 | | | 4.750%, 11/01/23 | | | No Opt. Call | | | | | | | | BBB– | | | | 2,290,112 | |
| | 1,860 | | | 6.000%, 11/01/33 | | | 11/23 at 100.00 | | | | | | | | BBB– | | | | 2,037,035 | |
| | | | | |
| | 1,890 | | | Dade County Housing Finance Authority, Florida, Multifamily Mortgage Revenue Bonds, Siesta Pointe Apartments Project, Series 1997A, 5.750%, 9/01/29 – AGM Insured (AMT) | | | 5/19 at 100.00 | | | | | | | | Aaa | | | | 1,906,538 | |
| | | | | |
| | 1,000 | | | Davie, Florida, Educational Facilities Revenue Bonds, Nova Southeastern University Project, Refunding Series 2013A, 6.000%, 4/01/42 | | | 4/23 at 100.00 | | | | | | | | A– | | | | 1,128,130 | |
| | | | | |
| | 370 | | | Florida Development Finance Corporation, Educational Facilities Revenue Bonds, Classical Preparatory Incorporated Project, Series 2017A, 5.000%, 6/15/27, 144A | | | 6/26 at 100.00 | | | | | | | | N/R | | | | 377,826 | |
| | | | | |
| | 3,275 | | | Florida Governmental Utility Authority, Utility Revenue Bonds, Lake Aqua Utility System, Series 2013A, 4.250%, 10/01/33 | | | 10/22 at 100.00 | | | | | | | | A– | | | | 3,426,272 | |
| | | | | |
| | 2,710 | | | Florida Governmental Utility Authority, Utility Revenue Bonds, Pasco Aqua Utility System, Series 2013A, 4.250%, 10/01/33 | | | 10/22 at 100.00 | | | | | | | | A3 | | | | 2,842,546 | |
| | | | | |
| | | | Florida Higher Educational Facilities Financing Authority, Revenue Bonds, Nova Southeastern University Project, Refunding Series 2016: | | | | | | | | | | | | | | | | |
| | 1,250 | | | 5.000%, 4/01/32 | | | 4/26 at 100.00 | | | | | | | | A– | | | | 1,417,475 | |
| | 1,750 | | | 5.000%, 4/01/33 | | | 4/26 at 100.00 | | | | | | | | A– | | | | 1,979,023 | |
| | 5,965 | | | 5.000%, 4/01/34 | | | 4/26 at 100.00 | | | | | | | | A– | | | | 6,726,074 | |
| | 4,290 | | | 5.000%, 4/01/35 | | | 4/26 at 100.00 | | | | | | | | A– | | | | 4,813,637 | |
93
Nuveen Intermediate Duration Municipal Bond Fund(continued)
Portfolio of Investments March 31, 2019
| | | | | | | | | | | | | | | | | | | | |
Principal
Amount (000) | | | Description (1) | | Optional Call
Provisions (2) | | | | | | Ratings (3) | | | Value | |
| | | | | |
| | | | Florida(continued) | | | | | | | | | | | | |
| | | | | |
| $ | 4,785 | | | Florida Housing Finance Corporation, Homeowner Mortgage Revenue Bonds,Series 2017-1, 3.600%, 7/01/37 | | | 1/27 at 100.00 | | | | | | | | Aaa | | | $ | 4,881,896 | |
| | | | | |
| | 6,000 | | | Florida Housing Finance Corporation, Homeowner Mortgage Revenue Bonds,Series 2018-2, 4.050%, 7/01/38 | | | 1/28 at 100.00 | | | | | | | | Aaa | | | | 6,329,280 | |
| | | | | |
| | 1,140 | | | Florida Municipal Power Agency, Power Supply Revenue Bonds, All Requirements Project, Refunding Series 2016A, 5.000%, 10/01/30 | | | 10/26 at 100.00 | | | | | | | | A+ | | | | 1,359,974 | |
| | | | | |
| | 1,500 | | | Florida State Department of Children and Families, Certificates of Participation, South Florida Evaluation Treatment Project, Series 2005, 5.000%, 10/01/25 | | | 5/19 at 100.00 | | | | | | | | AA+ | | | | 1,504,005 | |
| | | | | |
| | 2,240 | | | Jacksonville, Florida, Capital Improvement Revenue Bonds, Refunding Series 2012, 5.000%, 10/01/20 | | | No Opt. Call | | | | | | | | AA | | | | 2,350,858 | |
| | | | | |
| | 1,940 | | | Jacksonville, Florida, Special Revenue Bonds, Series 20120C, 5.000%, 10/01/24 | | | 10/22 at 100.00 | | | | | | | | AA | | | | 2,154,118 | |
| | | | | |
| | 5,050 | | | JEA, Florida, Electric System Revenue Bonds, Subordinated Series Three 2017B, 5.000%, 10/01/27 | | | No Opt. Call | | | | | | | | AA | | | | 6,066,666 | |
| | | | | |
| | 7,005 | | | Lee County, Florida, Airport Revenue Bonds, Refunding Series 2011A, 5.375%, 10/01/32 – AGM Insured (AMT) | | | 8/21 at 100.00 | | | | | | | | AA | | | | 7,503,826 | |
| | | | | |
| | 6,000 | | | Miami-Dade County Educational Facilities Authority, Florida, Revenue Bonds, University of Miami, Series 2015A, 5.000%, 4/01/35 | | | 4/25 at 100.00 | | | | | | | | A– | | | | 6,727,500 | |
| | | | | |
| | 5,760 | | | Miami-Dade County Educational Facilities Authority, Florida, Revenue Bonds, University of Miami, Series 2018A, 5.000%, 4/01/53 | | | 4/28 at 100.00 | | | | | | | | A– | | | | 6,557,184 | |
| | | | | |
| | | | Miami-Dade County Expressway Authority, Florida, Toll System Revenue Bonds, Refunding Series 2014B: | | | | | | | | | | | | | | | | |
| | 2,455 | | | 5.000%, 7/01/24 | | | No Opt. Call | | | | | | | | A+ | | | | 2,845,492 | |
| | 1,265 | | | 5.000%, 7/01/27 | | | 7/24 at 100.00 | | | | | | | | A+ | | | | 1,451,853 | |
| | | | | |
| | | | Miami-Dade County, Florida, Aviation Revenue Bonds, Miami International Airport, Refunding Series 2012A: | | | | | | | | | | | | | | | | |
| | 925 | | | 5.000%, 10/01/20 (AMT) | | | No Opt. Call | | | | | | | | A | | | | 968,531 | |
| | 5,175 | | | 5.000%, 10/01/22 (AMT) | | | No Opt. Call | | | | | | | | A | | | | 5,718,323 | |
| | | | | |
| | | | Miami-Dade County, Florida, Aviation Revenue Bonds, Miami International Airport, Series 2010B: | | | | | | | | | | | | | | | | |
| | 3,000 | | | 5.000%, 10/01/24 | | | 10/20 at 100.00 | | | | | | | | A | | | | 3,153,720 | |
| | 6,305 | | | 5.000%, 10/01/41 | | | 10/20 at 100.00 | | | | | | | | A | | | | 6,578,259 | |
| | | | | |
| | | | Miami-Dade County, Florida, Special Obligation Bonds, Capital Asset Acquisition, Series 2010E: | | | | | | | | | | | | | | | | |
| | 1,975 | | | 5.000%, 4/01/21 | | | 4/20 at 100.00 | | | | | | | | AA | | | | 2,043,967 | |
| | 5,015 | | | 5.250%, 4/01/30 | | | 4/20 at 100.00 | | | | | | | | AA | | | | 5,193,835 | |
| | | | | |
| | 26,045 | | | Miami-Dade County, Florida, Water and Sewer System Revenue Bonds, Refunding Series 2017B, 3.125%, 10/01/39 | | | 10/27 at 100.00 | | | | | | | | AA– | | | | 25,681,151 | |
| | | | | |
| | 5,000 | | | Miami-Dade County, Florida, Water and Sewer System Revenue Bonds, Series 2010, 5.000%, 10/01/29 – AGM Insured(Pre-refunded 10/01/20) | | | 10/20 at 100.00 | | | | | | | | AA (4) | | | | 5,257,350 | |
| | | | | |
| | | | Orlando, Florida, Tourist Development Tax Revenue Bonds, 6th Cent Contract Payments, Refunding Senior Series 2017A: | | | | | | | | | | | | | | | | |
| | 4,000 | | | 5.000%, 11/01/32 – AGM Insured | | | 11/27 at 100.00 | | | | | | | | AA | | | | 4,707,240 | |
| | 2,000 | | | 5.000%, 11/01/34 – AGM Insured | | | 11/27 at 100.00 | | | | | | | | AA | | | | 2,331,520 | |
| | | | | |
| | 2,525 | | | Palm Beach County Health Facilities Authority, Florida, Hospital Revenue Bonds, BRCH Corporation Obligated Group, Refunding Series 2014, 5.000%, 12/01/31 | | | 12/24 at 100.00 | | | | | | | | A– | | | | 2,803,558 | |
94
| | | | | | | | | | | | | | | | | | | | |
Principal
Amount (000) | | | Description (1) | | Optional Call
Provisions (2) | | | | | | Ratings (3) | | | Value | |
| | | | | |
| | | | Florida(continued) | | | | | | | | | | | | |
| | | | | |
| $ | 4,235 | | | Palm Beach County School Board, Florida, Certificates of Participation, Series 2014B, 5.000%, 8/01/22 | | | No Opt. Call | | | | | | | | Aa3 | | | $ | 4,695,683 | |
| | | | | |
| | | | Palm Beach County Solid Waste Authority, Florida, Revenue Bonds, Refunding Series 2011: | | | | | | | | | | | | | | | | |
| | 175 | | | 5.000%, 10/01/25(Pre-refunded 10/01/21) | | | 10/21 at 100.00 | | | | | | | | N/R (4) | | | | 189,599 | |
| | 9,825 | | | 5.000%, 10/01/25 | | | 10/21 at 100.00 | | | | | | | | AA+ | | | | 10,623,871 | |
| | | | | |
| | 3,860 | | | South Broward Hospital District, Florida, Hospital Revenue Bonds, Refunding Series 2016, 2.750%, 5/01/31 | | | 5/26 at 100.00 | | | | | | | | AA | | | | 3,803,837 | |
| | | | | |
| | 4,830 | | | South Florida Water Management District, Certificates of Participation, Series 2015, 5.000%, 10/01/33 | | | 4/26 at 100.00 | | | | | | | | AA | | | | 5,606,471 | |
| | | | | |
| | | | Tampa, Florida, Cigarette Tax Allocation Bonds, H Lee Moffitt Cancer Center Project, Refunding & Capital Improvement Series 2012A: | | | | | | | | | | | | | | | | |
| | 615 | | | 5.000%, 9/01/22 | | | No Opt. Call | | | | | | | | A+ | | | | 679,821 | |
| | 2,600 | | | 5.000%, 9/01/23 | | | 9/22 at 100.00 | | | | | | | | A+ | | | | 2,874,040 | |
| | 1,270 | | | 3.125%, 9/01/24 | | | 9/22 at 100.00 | | | | | | | | A+ | | | | 1,319,136 | |
| | 1,290 | | | 5.000%, 9/01/25 | | | 9/22 at 100.00 | | | | | | | | A+ | | | | 1,420,561 | |
| | 1,500 | | | 5.000%, 9/01/27 | | | 9/22 at 100.00 | | | | | | | | A+ | | | | 1,648,170 | |
| | 1,980 | | | 5.000%, 9/01/28 | | | 9/22 at 100.00 | | | | | | | | A+ | | | | 2,175,584 | |
| | 6,135 | | | 4.000%, 9/01/33 | | | 9/22 at 100.00 | | | | | | | | A+ | | | | 6,403,774 | |
| | 270,320 | | | Total Florida | | | | | | | | | | | | | | | 295,709,504 | |
| | | | | |
| | | | Georgia – 1.5% | | | | | | | | | | | | |
| | | | | |
| | 5,010 | | | Atlanta, Georgia, Airport General Revenue Bonds, Refunding Series 2010C, 5.875%, 1/01/24 | | | 1/21 at 100.00 | | | | | | | | Aa3 | | | | 5,398,375 | |
| | | | | |
| | | | Atlanta, Georgia, Airport General Revenue Bonds, Refunding Series 2012B: | | | | | | | | | | | | | | | | |
| | 2,095 | | | 5.000%, 1/01/23 | | | 1/22 at 100.00 | | | | | | | | AA– | | | | 2,298,236 | |
| | 1,500 | | | 5.000%, 1/01/28 | | | 1/22 at 100.00 | | | | | | | | AA– | | | | 1,635,315 | |
| | | | | |
| | | | Atlanta, Georgia, Airport Passenger Facilities Charge and General Revenue Bonds, Refunding Subordinate Lien Series 2014A: | | | | | | | | | | | | | | | | |
| | 11,070 | | | 5.000%, 1/01/27 | | | 1/24 at 100.00 | | | | | | | | AA– | | | | 12,732,161 | |
| | 4,280 | | | 5.000%, 1/01/29 | | | 1/24 at 100.00 | | | | | | | | AA– | | | | 4,893,196 | |
| | 6,750 | | | 5.000%, 1/01/30 | | | 1/24 at 100.00 | | | | | | | | AA– | | | | 7,700,603 | |
| | | | | |
| | 14,810 | | | Atlanta, Georgia, Water and Wastewater Revenue Bonds, Refunding Series 2018C, 4.000%, 11/01/37 | | | 11/27 at 100.00 | | | | | | | | Aa2 | | | | 15,940,595 | |
| | | | | |
| | 2,215 | | | Burke County Development Authority, Georgia, Pollution Control Revenue Bonds, Georgia Power Company Vogtle Plant, First Series 2008, 1.650%, 11/01/48 (Mandatory Put 6/18/21) | | | No Opt. Call | | | | | | | | A– | | | | 2,179,582 | |
| | | | | |
| | | | Chatham County Hospital Authority, Georgia, Seven Mill Tax Pledge Refunding and Improvement Revenue Bonds, Memorial Health University Medical Center, Inc, Series 2012A: | | | | | | | | | | | | | | | | |
| | 3,340 | | | 5.000%, 1/01/23(Pre-refunded 1/01/22) | | | 1/22 at 100.00 | | | | | | | | N/R (4) | | | | 3,645,844 | |
| | 5,560 | | | 5.000%, 1/01/24(Pre-refunded 1/01/22) | | | 1/22 at 100.00 | | | | | | | | N/R (4) | | | | 6,069,129 | |
| | 8,990 | | | 5.000%, 1/01/25(Pre-refunded 1/01/22) | | | 1/22 at 100.00 | | | | | | | | N/R (4) | | | | 9,813,214 | |
| | | | | |
| | 1,250 | | | DeKalb County Hospital Authority, Georgia, Anticipation Certificates Revenue Bonds, DeKalb Medical Center, Inc Project, Series 2010, 6.000%, 9/01/30(Pre-refunded 9/01/20) | | | 9/20 at 100.00 | | | | | | | | N/R (4) | | | | 1,325,475 | |
| | | | | |
| | | | Georgia Housing and Finance Authority, Single Family Mortgage Bonds, Series 2018A: | | | | | | | | | | | | | | | | |
| | 2,455 | | | 3.600%, 12/01/33 | | | 6/27 at 100.00 | | | | | | | | AAA | | | | 2,562,504 | |
| | 6,510 | | | 3.850%, 12/01/38 | | | 6/27 at 100.00 | | | | | | | | AAA | | | | 6,737,134 | |
95
Nuveen Intermediate Duration Municipal Bond Fund(continued)
Portfolio of Investments March 31, 2019
| | | | | | | | | | | | | | | | | | | | |
Principal
Amount (000) | | | Description (1) | | Optional Call
Provisions (2) | | | | | | Ratings (3) | | | Value | |
| | | | | |
| | | | Georgia(continued) | | | | | | | | | | | | |
| | | | | |
| | | | Georgia Housing and Finance Authority, Single Family Mortgage Bonds, Series 2018B: | | | | | | | | | | | | | | | | |
| $ | 2,660 | | | 3.800%, 12/01/33 | | | 12/27 at 100.00 | | | | | | | | AAA | | | $ | 2,806,433 | |
| | 3,710 | | | 4.050%, 12/01/38 | | | 12/27 at 100.00 | | | | | | | | AAA | | | | 3,913,085 | |
| | | | | |
| | 6,350 | | | Georgia Housing and Finance Authority, Single Family Mortgage Bonds, Sub Series 2015A-1, 3.700%, 12/01/35 | | | 12/24 at 100.00 | | | | | | | | AAA | | | | 6,529,197 | |
| | | | | |
| | 2,785 | | | Municipal Gas Authority of Georgia, Gas Revenue Bonds, Gas Portfolio III Project, Series 2014U, 5.000%, 10/01/21 | | | No Opt. Call | | | | | | | | AA– | | | | 3,005,043 | |
| | | | | |
| | 955 | | | Rockdale County Development Authority, Georgia, Revenue Bonds, Pratt Paper, LLC Project, Refunding Series 2018, 4.000%, 1/01/38 (AMT), 144A | | | 1/28 at 100.00 | | | | | | | | N/R | | | | 969,058 | |
| | 92,295 | | | Total Georgia | | | | | | | | | | | | | | | 100,154,179 | |
| | | | | |
| | | | Guam – 0.1% | | | | | | | | | | | | |
| | | | | |
| | 4,060 | | | Guam Government Waterworks Authority, Water and Wastewater System Revenue Bonds, Series 2013, 5.500%, 7/01/43 | | | 7/23 at 100.00 | | | | | | | | A– | | | | 4,398,929 | |
| | | | | |
| | | | Hawaii – 0.9% | | | | | | | | | | | | |
| | | | | |
| | 5,005 | | | Hawaii Department of Budget and Finance, Special Purpose Revenue Bonds, Hawaii Pacific Health Obligated Group, Series 2010A, 5.250%, 7/01/30(Pre-refunded 7/01/20) | | | 7/20 at 100.00 | | | | | | | | AA– (4) | | | | 5,235,280 | |
| | | | | |
| | 1,025 | | | Hawaii Department of Budget and Finance, Special Purpose Revenue Bonds, Hawaii Pacific Health Obligated Group, Series 2010B, 5.625%, 7/01/30(Pre-refunded 7/01/20) | | | 7/20 at 100.00 | | | | | | | | AA– (4) | | | | 1,076,896 | |
| | | | | |
| | 10,785 | | | Hawaii Department of Budget and Finance, Special Purpose Revenue Bonds, Hawaiian Electric Company, Inc and Subsidiary Projects, Series 2017A, 3.100%, 5/01/26 (AMT) | | | No Opt. Call | | | | | | | | A– | | | | 10,949,687 | |
| | | | | |
| | | | Hawaii Department of Budget and Finance, Special Purpose Revenue Bonds, Queens Health Systems, Series 2015A: | | | | | | | | | | | | | | | | |
| | 5,500 | | | 5.000%, 7/01/26 | | | 7/25 at 100.00 | | | | | | | | AA– | | | | 6,463,655 | |
| | 4,510 | | | 5.000%, 7/01/27 | | | 7/25 at 100.00 | | | | | | | | AA– | | | | 5,279,992 | |
| | 7,825 | | | 5.000%, 7/01/28 | | | 7/25 at 100.00 | | | | | | | | AA– | | | | 9,126,063 | |
| | 9,180 | | | 5.000%, 7/01/29 | | | 7/25 at 100.00 | | | | | | | | AA– | | | | 10,677,166 | |
| | | | | |
| | 15,450 | | | Hawaiian Electric Company Inc. and Its Subsidiaries, Special Purpose Revenue Bonds, Department of Budget and Finance of the State of Hawaii, Series 2015, 3.250%, 1/01/25 (AMT) | | | No Opt. Call | | | | | | | | A– | | | | 15,849,383 | |
| | 59,280 | | | Total Hawaii | | | | | | | | | | | | | | | 64,658,122 | |
| | | | | |
| | | | Idaho – 0.3% | | | | | | | | | | | | |
| | | | | |
| | 560 | | | Boise City, Idaho, Airport Revenue Bonds, Aircraft Maintenance Facilities Project, Subordinate Series 2015, 3.750%, 9/01/32 (AMT) | | | 9/25 at 100.00 | | | | | | | | A2 | | | | 582,277 | |
| | | | | |
| | 3,100 | | | Idaho Health Facilities Authority, Revenue Bonds, Saint Luke’s Health System Project, Series 2014A, 4.125%, 3/01/37 | | | 3/24 at 100.00 | | | | | | | | A– | | | | 3,181,561 | |
| | | | | |
| | 1,000 | | | Idaho Housing and Finance Association, Nonprofit Facilities Revenue Bonds, Victory Charter School, Inc Project, Refunding Series 2016A, 5.000%, 7/01/39 | | | 7/26 at 100.00 | | | | | | | | BBB– | | | | 1,062,940 | |
| | | | | |
| | | | Madison County School District 321, Idaho, General Obligation Bonds, Sales Tax and Credit Enhancement Guaranty, Refunding Series 2014B: | | | | | | | | | | | | | | | | |
| | 2,595 | | | 5.000%, 8/15/21 | | | No Opt. Call | | | | | | | | Aaa | | | | 2,802,470 | |
| | 2,710 | | | 5.000%, 8/15/22 | | | No Opt. Call | | | | | | | | Aaa | | | | 3,014,685 | |
96
| | | | | | | | | | | | | | | | | | | | |
Principal
Amount (000) | | | Description (1) | | Optional Call
Provisions (2) | | | | | | Ratings (3) | | | Value | |
| | | | | |
| | | | Idaho(continued) | | | | | | | | | | | | |
| | | | | |
| $ | 12,005 | | | Nez Perce County, Idaho, Pollution Control Revenue Bonds, Potlatch Corporation Project, Refunding Series 2016, 2.750%, 10/01/24 | | | No Opt. Call | | | | | | | | BBB– | | | $ | 12,232,615 | |
| | 21,970 | | | Total Idaho | | | | | | | | | | | | | | | 22,876,548 | |
| | | | | |
| | | | Illinois – 12.9% | | | | | | | | | | | | |
| | | | | |
| | 2,215 | | | Bartlett, Illinois, Tax Increment Revenue Bonds, Barlett Quarry Redev Project, Senior Lien Series 2016, 4.000%, 1/01/24 | | | 1/22 at 100.00 | | | | | | | | N/R | | | | 2,181,952 | |
| | | | | |
| | | | Bolingbrook, Illinois, General Obligation Bonds, Refunding Series 2013A: | | | | | | | | | | | | | | | | |
| | 2,800 | | | 0.000%, 1/01/30 | | | 7/23 at 72.73 | | | | | | | | A2 | | | | 1,757,000 | |
| | 2,550 | | | 0.000%, 1/01/31 | | | 7/23 at 68.95 | | | | | | | | A2 | | | | 1,515,057 | |
| | 2,750 | | | 0.000%, 1/01/32 | | | 7/23 at 65.29 | | | | | | | | A2 | | | | 1,545,198 | |
| | 4,000 | | | 0.000%, 1/01/33 | | | 7/23 at 61.69 | | | | | | | | A2 | | | | 2,121,120 | |
| | | | | |
| | | | Cary, Illinois, Special Tax Bonds, Special Service Area 1, Refunding Series 2016: | | | | | | | | | | | | | | | | |
| | 432 | | | 2.150%, 3/01/23 – BAM Insured | | | No Opt. Call | | | | | | | | AA | | | | 430,030 | |
| | 447 | | | 2.350%, 3/01/24 – BAM Insured | | | No Opt. Call | | | | | | | | AA | | | | 445,328 | |
| | 964 | | | 2.700%, 3/01/26 – BAM Insured | | | 3/25 at 100.00 | | | | | | | | AA | | | | 964,386 | |
| | 1,052 | | | 2.900%, 3/01/28 – BAM Insured | | | 3/25 at 100.00 | | | | | | | | AA | | | | 1,043,531 | |
| | 973 | | | 3.050%, 3/01/30 – BAM Insured | | | 3/25 at 100.00 | | | | | | | | AA | | | | 977,583 | |
| | | | | |
| | | | Cary, Illinois, Special Tax Bonds, Special Service Area 2, Refunding Series 2016: | | | | | | | | | | | | | | | | |
| | 585 | | | 2.150%, 3/01/23 – BAM Insured | | | No Opt. Call | | | | | | | | AA | | | | 582,332 | |
| | 610 | | | 2.350%, 3/01/24 – BAM Insured | | | No Opt. Call | | | | | | | | AA | | | | 607,719 | |
| | 968 | | | 2.700%, 3/01/26 – BAM Insured | | | 3/25 at 100.00 | | | | | | | | AA | | | | 968,387 | |
| | 1,423 | | | 2.900%, 3/01/28 – BAM Insured | | | 3/25 at 100.00 | | | | | | | | AA | | | | 1,419,272 | |
| | 1,448 | | | 3.050%, 3/01/30 – BAM Insured | | | 3/25 at 100.00 | | | | | | | | AA | | | | 1,451,692 | |
| | | | | |
| | 29,585 | | | Chicago Board of Education, Illinois, Dedicated Capital Improvement Tax Revenue Bonds, Series 2016, 6.000%, 4/01/46 | | | 4/27 at 100.00 | | | | | | | | A | | | | 34,325,109 | |
| | | | | |
| | | | Chicago Board of Education, Illinois, Dedicated Capital Improvement Tax Revenue Bonds, Series 2017: | | | | | | | | | | | | | | | | |
| | 1,860 | | | 5.000%, 4/01/33 | | | 4/27 at 100.00 | | | | | | | | A | | | | 2,046,335 | |
| | 1,000 | | | 5.000%, 4/01/42 | | | 4/27 at 100.00 | | | | | | | | A | | | | 1,084,960 | |
| | | | | |
| | 1,150 | | | Chicago Board of Education, Illinois, Dedicated Capital Improvement Tax Revenue Bonds, Series 2018, 5.000%, 4/01/37 | | | 4/28 at 100.00 | | | | | | | | A | | | | 1,264,448 | |
| | | | | |
| | 10,900 | | | Chicago Board of Education, Illinois, General Obligation Bonds, Dedicated Revenues, Refunding Series 2017B, 7.000%, 12/01/42, 144A | | | 12/27 at 100.00 | | | | | | | | B+ | | | | 13,246,661 | |
| | | | | |
| | | | Chicago Board of Education, Illinois, General Obligation Bonds, Dedicated Revenues, Refunding Series 2017C: | | | | | | | | | | | | | | | | |
| | 3,125 | | | 5.000%, 12/01/27 | | | No Opt. Call | | | | | | | | BB– | | | | 3,411,875 | |
| | 12,385 | | | 5.000%, 12/01/30 | | | 12/27 at 100.00 | | | | | | | | BB– | | | | 13,521,943 | |
| | 5,270 | | | 5.000%, 12/01/34 | | | 12/27 at 100.00 | | | | | | | | BB– | | | | 5,670,573 | |
| | | | | |
| | 2,600 | | | Chicago Board of Education, Illinois, General Obligation Bonds, Dedicated Revenues, Refunding Series 2017D, 5.000%, 12/01/31 | | | 12/27 at 100.00 | | | | | | | | BB– | | | | 2,825,628 | |
| | | | | |
| | 3,655 | | | Chicago Board of Education, Illinois, General Obligation Bonds, Dedicated Revenues, Refunding Series 2017H, 5.000%, 12/01/36 | | | 12/27 at 100.00 | | | | | | | | BB– | | | | 3,905,770 | |
| | | | | |
| | | | Chicago Board of Education, Illinois, General Obligation Bonds, Dedicated Revenues, Refunding Series 2018A: | | | | | | | | | | | | | | | | |
| | 9,745 | | | 4.000%, 12/01/21 | | | No Opt. Call | | | | | | | | BB– | | | | 9,982,486 | |
| | 5,795 | | | 4.000%, 12/01/22 | | | No Opt. Call | | | | | | | | BB– | | | | 5,946,192 | |
97
Nuveen Intermediate Duration Municipal Bond Fund(continued)
Portfolio of Investments March 31, 2019
| | | | | | | | | | | | | | | | | | | | |
Principal
Amount (000) | | | Description (1) | | Optional Call
Provisions (2) | | | | | | Ratings (3) | | | Value | |
| | | | | |
| | | | Illinois(continued) | | | | | | | | | | | | |
| | | | | |
| | | | Chicago Board of Education, Illinois, General Obligation Bonds, Dedicated Revenues, Refunding Series 2018C: | | | | | | | | | | | | | | | | |
| $ | 1,200 | | | 5.000%, 12/01/22 | | | No Opt. Call | | | | | | | | BB– | | | $ | 1,272,444 | |
| | 2,885 | | | 5.000%, 12/01/23 | | | No Opt. Call | | | | | | | | BB– | | | | 3,084,555 | |
| | 2,300 | | | 5.000%, 12/01/24 | | | No Opt. Call | | | | | | | | BB– | | | | 2,472,224 | |
| | | | | |
| | 19,585 | | | Chicago Board of Education, Illinois, General Obligation Bonds, Dedicated Revenues, Series 2017A, 7.000%, 12/01/46, 144A | | | 12/27 at 100.00 | | | | | | | | B+ | | | | 23,710,972 | |
| | | | | |
| | | | Chicago Transit Authority, Illinois, Sales Tax Receipts Revenue Bonds, Series 2011: | | | | | | | | | | | | | | | | |
| | 3,530 | | | 5.250%, 12/01/25 | | | 12/21 at 100.00 | | | | | | | | AA | | | | 3,800,221 | |
| | 3,235 | | | 5.250%, 12/01/26 | | | 12/21 at 100.00 | | | | | | | | AA | | | | 3,469,667 | |
| | | | | |
| | | | Chicago, Illinois, General Airport Revenue Bonds, O’Hare International Airport, Senior Lien Refunding Series 2015A: | | | | | | | | | | | | | | | | |
| | 5,700 | | | 5.000%, 1/01/33 (AMT) | | | 1/25 at 100.00 | | | | | | | | A | | | | 6,384,855 | |
| | 4,225 | | | 5.000%, 1/01/34 (AMT) | | | 1/25 at 100.00 | | | | | | | | A | | | | 4,720,719 | |
| | | | | |
| | | | Chicago, Illinois, General Airport Revenue Bonds, O’Hare International Airport, Senior Lien Series 2018B: | | | | | | | | | | | | | | | | |
| | 2,500 | | | 5.000%, 1/01/36 | | | 1/29 at 100.00 | | | | | | | | A | | | | 2,967,325 | |
| | 3,000 | | | 5.000%, 1/01/37 | | | 1/29 at 100.00 | | | | | | | | A | | | | 3,546,120 | |
| | 4,000 | | | 5.000%, 1/01/38 | | | 1/29 at 100.00 | | | | | | | | A | | | | 4,711,760 | |
| | | | | |
| | 17,605 | | | Chicago, Illinois, General Obligation Bonds, Project & Refunding Series 2017A, 6.000%, 1/01/38 | | | 1/27 at 100.00 | | | | | | | | BBB+ | | | | 20,108,959 | |
| | | | | |
| | | | Chicago, Illinois, General Obligation Bonds, Refunding Series 2016C: | | | | | | | | | | | | | | | | |
| | 6,825 | | | 5.000%, 1/01/23 | | | No Opt. Call | | | | | | | | BBB+ | | | | 7,320,222 | |
| | 7,600 | | | 5.000%, 1/01/24 | | | No Opt. Call | | | | | | | | BBB+ | | | | 8,232,244 | |
| | 4,440 | | | 5.000%, 1/01/25 | | | No Opt. Call | | | | | | | | BBB+ | | | | 4,867,128 | |
| | 1,940 | | | 5.000%, 1/01/26 | | | No Opt. Call | | | | | | | | BBB+ | | | | 2,149,830 | |
| | | | | |
| | 1,525 | | | Cook County Community College District 508, Illinois, General Obligation Bonds, Chicago City Colleges, Series 2013, 5.000%, 12/01/24 | | | 12/23 at 100.00 | | | | | | | | A+ | | | | 1,640,565 | |
| | | | | |
| | | | Cook County, Illinois, General Obligation Bonds, Refunding Series 2012C: | | | | | | | | | | | | | | | | |
| | 2,600 | | | 5.000%, 11/15/20 | | | No Opt. Call | | | | | | | | AA– | | | | 2,723,630 | |
| | 2,780 | | | 5.000%, 11/15/21 | | | No Opt. Call | | | | | | | | AA– | | | | 2,988,778 | |
| | 2,400 | | | 5.000%, 11/15/22 | | | No Opt. Call | | | | | | | | AA– | | | | 2,640,432 | |
| | | | | |
| | | | Cook County, Illinois, General Obligation Bonds, Refunding Series 2016A: | | | | | | | | | | | | | | | | |
| | 5,250 | | | 5.000%, 11/15/20 | | | No Opt. Call | | | | | | | | AA– | | | | 5,499,637 | |
| | 2,260 | | | 5.000%, 11/15/21 | | | No Opt. Call | | | | | | | | AA– | | | | 2,429,726 | |
| | | | | |
| | | | Effingham and Clay Counties Community Unit School District Number 40, Effingham, Illinois, General Obligation Bonds, School Series 2019A: | | | | | | | | | | | | | | | | |
| | 1,000 | | | 4.000%, 12/01/30 – BAM Insured | | | 12/27 at 100.00 | | | | | | | | AA | | | | 1,082,150 | |
| | 1,000 | | | 4.000%, 12/01/34 – BAM Insured | | | 12/27 at 100.00 | | | | | | | | AA | | | | 1,054,230 | |
| | 1,395 | | | 4.000%, 12/01/35 – BAM Insured | | | 12/27 at 100.00 | | | | | | | | AA | | | | 1,463,578 | |
| | 1,455 | | | 4.000%, 12/01/36 – BAM Insured | | | 12/27 at 100.00 | | | | | | | | AA | | | | 1,517,420 | |
| | | | | |
| | 500 | | | Huntley, Illinois, Special Tax Bonds, Special Service Area 10, Refunding Series 2017, 2.800%, 3/01/25 – BAM Insured | | | No Opt. Call | | | | | | | | AA | | | | 504,190 | |
| | | | | |
| | | | Huntley, Illinois, Special Tax Bonds, Special Service Area 9, Refunding Series 2017: | | | | | | | | | | | | | | | | |
| | 875 | | | 2.400%, 3/01/23 – BAM Insured | | | No Opt. Call | | | | | | | | AA | | | | 875,245 | |
| | 925 | | | 2.600%, 3/01/24 – BAM Insured | | | No Opt. Call | | | | | | | | AA | | | | 927,498 | |
| | 1,025 | | | 3.000%, 3/01/26 – BAM Insured | | | No Opt. Call | | | | | | | | AA | | | | 1,042,159 | |
| | 1,055 | | | 3.150%, 3/01/27 – BAM Insured | | | 3/26 at 100.00 | | | | | | | | AA | | | | 1,070,952 | |
98
| | | | | | | | | | | | | | | | | | | | |
Principal
Amount (000) | | | Description (1) | | Optional Call
Provisions (2) | | | | | | Ratings (3) | | | Value | |
| | | | | |
| | | | Illinois(continued) | | | | | | | | | | | | |
| | | | | |
| $ | 1,050 | | | Illinois Finance Authority, Revenue Bonds, Advocate Health Care Network, Refunding Series 2014, 5.000%, 8/01/23 | | | No Opt. Call | | | | | | | | AA | | | $ | 1,191,813 | |
| | | | | |
| | 3,000 | | | Illinois Finance Authority, Revenue Bonds, Advocate Health Care Network, Series 2012, 5.000%, 6/01/42 | | | 6/22 at 100.00 | | | | | | | | AA | | | | 3,199,620 | |
| | | | | |
| | 6,400 | | | Illinois Finance Authority, Revenue Bonds, Ann & Robert H Lurie Children’s Hospital of Chicago, Refunding Series 2017, 4.000%, 8/15/39 | | | 8/27 at 100.00 | | | | | | | | AA | | | | 6,728,000 | |
| | | | | |
| | 2,000 | | | Illinois Finance Authority, Revenue Bonds, Art Institute of Chicago, Series 2016, 5.000%, 3/01/30 | | | 3/26 at 100.00 | | | | | | | | AA– | | | | 2,315,300 | |
| | | | | |
| | | | Illinois Finance Authority, Revenue Bonds, Ascension Health/fkaPresence Health Network, Series 2016C: | | | | | | | | | | | | | | | | |
| | 2,400 | | | 3.625%, 2/15/32 | | | 2/27 at 100.00 | | | | | | | | AA+ | | | | 2,484,600 | |
| | 10,000 | | | 3.750%, 2/15/34 | | | 2/27 at 100.00 | | | | | | | | AA+ | | | | 10,357,600 | |
| | 33,995 | | | 4.000%, 2/15/41 | | | 2/27 at 100.00 | | | | | | | | AA+ | | | | 35,512,877 | |
| | | | | |
| | 13,685 | | | Illinois Finance Authority, Revenue Bonds, Centegra Health System, Series 2012, 5.000%, 9/01/27 | | | 9/22 at 100.00 | | | | | | | | AA+ | | | | 15,078,133 | |
| | | | | |
| | | | Illinois Finance Authority, Revenue Bonds, Centegra Health System, Series 2014A: | | | | | | | | | | | | | | | | |
| | 475 | | | 5.000%, 9/01/26 | | | 9/24 at 100.00 | | | | | | | | AA+ | | | | 550,734 | |
| | 1,205 | | | 5.000%, 9/01/27 | | | 9/24 at 100.00 | | | | | | | | AA+ | | | | 1,392,426 | |
| | 775 | | | 5.000%, 9/01/29 | | | 9/24 at 100.00 | | | | | | | | AA+ | | | | 890,816 | |
| | 2,450 | | | 5.000%, 9/01/34 | | | 9/24 at 100.00 | | | | | | | | AA+ | | | | 2,766,540 | |
| | 2,815 | | | 4.625%, 9/01/39 | | | 9/24 at 100.00 | | | | | | | | AA+ | | | | 3,034,992 | |
| | 7,015 | | | 5.000%, 9/01/42 | | | 9/24 at 100.00 | | | | | | | | AA+ | | | | 7,778,513 | |
| | | | | |
| | | | Illinois Finance Authority, Revenue Bonds, Ingalls Health System, Series 2013: | | | | | | | | | | | | | | | | |
| | 1,390 | | | 5.000%, 5/15/23 | | | 5/22 at 100.00 | | | | | | | | Baa2 | | | | 1,508,470 | |
| | 1,120 | | | 5.000%, 5/15/25 | | | 5/22 at 100.00 | | | | | | | | Baa2 | | | | 1,211,694 | |
| | 1,175 | | | 5.000%, 5/15/26 | | | 5/22 at 100.00 | | | | | | | | Baa2 | | | | 1,267,931 | |
| | | | | |
| | | | Illinois Finance Authority, Revenue Bonds, Memorial Health System, Series 2019: | | | | | | | | | | | | | | | | |
| | 2,500 | | | 5.000%, 4/01/31 | | | 4/29 at 100.00 | | | | | | | | AA– | | | | 3,003,550 | |
| | 1,300 | | | 5.000%, 4/01/32 | | | 4/29 at 100.00 | | | | | | | | AA– | | | | 1,551,316 | |
| | 4,500 | | | 5.000%, 4/01/34 | | | 4/29 at 100.00 | | | | | | | | AA– | | | | 5,307,660 | |
| | 7,610 | | | 5.000%, 4/01/36 | | | 4/29 at 100.00 | | | | | | | | AA– | | | | 8,875,239 | |
| | | | | |
| | 5,165 | | | Illinois Finance Authority, Revenue Bonds, Mercy Health Corporation, Series 2016, 5.000%, 12/01/24 | | | No Opt. Call | | | | | | | | A3 | | | | 5,939,440 | |
| | | | | |
| | | | Illinois Finance Authority, Revenue Bonds, Northwest Community Hospital, Refunding Series 2016A: | | | | | | | | | | | | | | | | |
| | 2,370 | | | 5.000%, 7/01/33 | | | 7/26 at 100.00 | | | | | | | | A | | | | 2,701,279 | |
| | 3,170 | | | 5.000%, 7/01/34 | | | 7/26 at 100.00 | | | | | | | | A | | | | 3,598,235 | |
| | 5,000 | | | 5.000%, 7/01/35 | | | 7/26 at 100.00 | | | | | | | | A | | | | 5,660,150 | |
| | | | | |
| | 4,265 | | | Illinois Finance Authority, Revenue Bonds, OSF Healthcare System, Series 2009A, 7.000%, 11/15/29(Pre-refunded 5/15/19) | | | 5/19 at 100.00 | | | | | | | | A2 (4) | | | | 4,292,296 | |
| | | | | |
| | | | Illinois Finance Authority, Revenue Bonds, OSF Healthcare System, Series 2015A: | | | | | | | | | | | | | | | | |
| | 1,000 | | | 5.000%, 11/15/27 | | | 11/25 at 100.00 | | | | | | | | A | | | | 1,165,620 | |
| | 1,885 | | | 5.000%, 11/15/28 | | | 11/25 at 100.00 | | | | | | | | A | | | | 2,188,391 | |
| | 2,000 | | | 5.000%, 11/15/29 | | | 11/25 at 100.00 | | | | | | | | A | | | | 2,306,020 | |
| | | | | |
| | 4,000 | | | Illinois Finance Authority, Revenue Bonds, Roosevelt University Project, RefundingSeries 2009, 5.750%, 4/01/24(Pre-refunded 10/01/19) | | | 10/19 at 100.00 | | | | | | | | BB (4) | | | | 4,082,880 | |
99
Nuveen Intermediate Duration Municipal Bond Fund(continued)
Portfolio of Investments March 31, 2019
| | | | | | | | | | | | | | | | | | | | |
Principal
Amount (000) | | | Description (1) | | Optional Call
Provisions (2) | | | | | | Ratings (3) | | | Value | |
| | | | | |
| | | | Illinois(continued) | | | | | | | | | | | | |
| | | | | |
| $ | 2,950 | | | Illinois Finance Authority, Revenue Bonds, Roosevelt University, Series 2007, 5.400%, 4/01/27 | | | No Opt. Call | | | | | | | | N/R | | | $ | 2,951,445 | |
| | | | | |
| | 1,525 | | | Illinois Finance Authority, Revenue Bonds, Rush University Medical Center Obligated Group, Series 2009C, 6.375%, 11/01/29(Pre-refunded 5/01/19) | | | 5/19 at 100.00 | | | | | | | | N/R (4) | | | | 1,530,948 | |
| | | | | |
| | | | Illinois Finance Authority, Revenue Bonds, Silver Cross Hospital and Medical Centers, Refunding Series 2015C: | | | | | | | | | | | | | | | | |
| | 2,215 | | | 5.000%, 8/15/35 | | | 8/25 at 100.00 | | | | | | | | Baa1 | | | | 2,462,238 | |
| | 5,000 | | | 5.000%, 8/15/44 | | | 8/25 at 100.00 | | | | | | | | Baa1 | | | | 5,466,350 | |
| | | | | |
| | 5,000 | | | Illinois Finance Authority, Revenue Bonds, Silver Cross Hospital and Medical Centers, Series 2009, 6.875%, 8/15/38(Pre-refunded 8/15/19) | | | 8/19 at 100.00 | | | | | | | | N/R (4) | | | | 5,097,350 | |
| | | | | |
| | | | Illinois Finance Authority, Revenue Bonds, Southern Illinois Healthcare Enterprises, Inc, Refunding Series 2017C: | | | | | | | | | | | | | | | | |
| | 1,150 | | | 5.000%, 3/01/32 | | | 3/27 at 100.00 | | | | | | | | A+ | | | | 1,319,809 | |
| | 2,750 | | | 5.000%, 3/01/33 | | | 3/27 at 100.00 | | | | | | | | A+ | | | | 3,142,150 | |
| | 1,650 | | | 5.000%, 3/01/34 | | | 3/27 at 100.00 | | | | | | | | A+ | | | | 1,878,014 | |
| | 1,800 | | | 4.000%, 3/01/35 | | | 3/27 at 100.00 | | | | | | | | A+ | | | | 1,876,104 | |
| | | | | |
| | 2,350 | | | Illinois Health Facilities Authority, Revenue Bonds, Advocate Healthcare Network, Series 2003A Remarketing 07/21/16, 1.375%, 11/15/22 | | | 7/21 at 101.00 | | | | | | | | AA | | | | 2,321,565 | |
| | | | | |
| | | | Illinois State Toll Highway Authority, Toll Highway Senior Revenue Bonds, Refunding Series 2018A: | | | | | | | | | | | | | | | | |
| | 8,500 | | | 5.000%, 1/01/25 | | | No Opt. Call | | | | | | | | AA– | | | | 9,980,445 | |
| | 14,270 | | | 5.000%, 1/01/26 | | | No Opt. Call | | | | | | | | AA– | | | | 17,063,781 | |
| | | | | |
| | | | Illinois State, General Obligation Bonds, February Series 2014: | | | | | | | | | | | | | | | | |
| | 4,000 | | | 5.000%, 2/01/23 | | | No Opt. Call | | | | | | | | BBB | | | | 4,291,720 | |
| | 3,155 | | | 5.000%, 2/01/24 | | | No Opt. Call | | | | | | | | BBB | | | | 3,420,746 | |
| | 4,630 | | | 5.000%, 2/01/25 | | | 2/24 at 100.00 | | | | | | | | BBB | | | | 4,954,887 | |
| | 4,675 | | | 5.000%, 2/01/26 | | | 2/24 at 100.00 | | | | | | | | BBB | | | | 4,992,853 | |
| | 6,000 | | | 5.000%, 2/01/27 | | | 2/24 at 100.00 | | | | | | | | BBB | | | | 6,390,660 | |
| | | | | |
| | 2,485 | | | Illinois State, General Obligation Bonds, June Series 2016, 3.500%, 6/01/29 | | | 6/26 at 100.00 | | | | | | | | BBB | | | | 2,381,897 | |
| | | | | |
| | 12,200 | | | Illinois State, General Obligation Bonds, November Series 2016, 5.000%, 11/01/26 | | | No Opt. Call | | | | | | | | BBB | | | | 13,473,192 | |
| | | | | |
| | | | Illinois State, General Obligation Bonds, November Series 2017D: | | | | | | | | | | | | | | | | |
| | 13,705 | | | 5.000%, 11/01/23 | | | No Opt. Call | | | | | | | | BBB | | | | 14,871,158 | |
| | 3,850 | | | 5.000%, 11/01/25 | | | No Opt. Call | | | | | | | | BBB | | | | 4,246,896 | |
| | 935 | | | 3.250%, 11/01/26 | | | No Opt. Call | | | | | | | | BBB | | | | 908,306 | |
| | 500 | | | 5.000%, 11/01/26 | | | No Opt. Call | | | | | | | | BBB | | | | 552,180 | |
| | 5,225 | | | 5.000%, 11/01/27 | | | No Opt. Call | | | | | | | | BBB | | | | 5,799,489 | |
| | 5,030 | | | 5.000%, 11/01/28 | | | 11/27 at 100.00 | | | | | | | | BBB | | | | 5,554,176 | |
| | | | | |
| | | | Illinois State, General Obligation Bonds, Refunding Series 2012: | | | | | | | | | | | | | | | | |
| | 7,750 | | | 5.000%, 8/01/20 | | | No Opt. Call | | | | | | | | BBB | | | | 8,014,120 | |
| | 6,175 | | | 5.000%, 8/01/21 | | | No Opt. Call | | | | | | | | BBB | | | | 6,520,923 | |
| | 15,265 | | | 5.000%, 8/01/22 | | | No Opt. Call | | | | | | | | BBB | | | | 16,385,451 | |
| | 2,795 | | | 5.000%, 8/01/23 | | | No Opt. Call | | | | | | | | BBB | | | | 3,021,786 | |
| | 285 | | | 5.000%, 8/01/25 | | | 8/22 at 100.00 | | | | | | | | BBB | | | | 300,558 | |
| | | | | |
| | | | Illinois State, General Obligation Bonds, Series 2012A: | | | | | | | | | | | | | | | | |
| | 7,840 | | | 4.000%, 1/01/20 | | | No Opt. Call | | | | | | | | BBB | | | | 7,944,429 | |
| | 12,210 | | | 4.000%, 1/01/22 | | | No Opt. Call | | | | | | | | BBB | | | | 12,644,188 | |
100
| | | | | | | | | | | | | | | | | | | | |
Principal
Amount (000) | | | Description (1) | | Optional Call
Provisions (2) | | | | | | Ratings (3) | | | Value | |
| | | | | |
| | | | Illinois(continued) | | | | | | | | | | | | |
| | | | | |
| | | | Illinois State, General Obligation Bonds, Series 2013: | | | | | | | | | | | | | | | | |
| $ | 4,220 | | | 5.500%, 7/01/25 | | | 7/23 at 100.00 | | | | | | | | BBB | | | $ | 4,584,566 | |
| | 2,760 | | | 5.500%, 7/01/26 | | | 7/23 at 100.00 | | | | | | | | BBB | | | | 2,984,692 | |
| | 2,085 | | | 5.500%, 7/01/27 | | | 7/23 at 100.00 | | | | | | | | BBB | | | | 2,249,319 | |
| | | | | |
| | | | Illinois Toll Highway Authority, Toll Highway Revenue Bonds, Refunding Senior Lien Series 2014A: | | | | | | | | | | | | | | | | |
| | 1,765 | | | 5.000%, 12/01/21 | | | No Opt. Call | | | | | | | | AA– | | | | 1,919,102 | |
| | 3,345 | | | 5.000%, 12/01/22 | | | No Opt. Call | | | | | | | | AA– | | | | 3,740,814 | |
| | 4,110 | | | 5.000%, 1/01/33 | | | 1/23 at 100.00 | | | | | | | | AA– | | | | 4,515,862 | |
| | | | | |
| | | | Illinois Toll Highway Authority, Toll Highway Revenue Bonds, Refunding Senior Lien Series 2016A: | | | | | | | | | | | | | | | | |
| | 6,795 | | | 5.000%, 12/01/31 | | | 1/26 at 100.00 | | | | | | | | AA– | | | | 7,868,746 | |
| | 7,895 | | | 5.000%, 12/01/32 | | | 1/26 at 100.00 | | | | | | | | AA– | | | | 9,116,751 | |
| | | | | |
| | | | Illinois Toll Highway Authority, Toll Highway Revenue Bonds, Senior Lien Series 2014B: | | | | | | | | | | | | | | | | |
| | 11,000 | | | 5.000%, 1/01/36 | | | 1/24 at 100.00 | | | | | | | | AA– | | | | 12,267,530 | |
| | 6,115 | | | 5.000%, 1/01/37 | | | 1/24 at 100.00 | | | | | | | | AA– | | | | 6,813,211 | |
| | | | | |
| | 11,570 | | | Illinois Toll Highway Authority, Toll Highway Revenue Bonds, Senior Lien Series 2014D, 5.000%, 1/01/24 | | | No Opt. Call | | | | | | | | AA– | | | | 13,307,235 | |
| | | | | |
| | 10,550 | | | Illinois Toll Highway Authority, Toll Highway Revenue Bonds, Senior Lien Series 2015B, 5.000%, 1/01/37 | | | 1/26 at 100.00 | | | | | | | | AA– | | | | 12,045,884 | |
| | | | | |
| | | | Kane County Community Unit School District 304 Geneva, Illinois, General Obligation Bonds, Series 2007A: | | | | | | | | | | | | | | | | |
| | 1,955 | | | 9.000%, 1/01/22 – AGM Insured (ETM) | | | No Opt. Call | | | | | | | | AA | (4) | | | 2,336,381 | |
| | 6,615 | | | 9.000%, 1/01/22 – AGM Insured | | | No Opt. Call | | | | | | | | Aa2 | | | | 7,854,651 | |
| | 285 | | | 9.000%, 1/01/23 – AGM Insured (ETM) | | | No Opt. Call | | | | | | | | AA | (4) | | | 359,733 | |
| | 965 | | | 9.000%, 1/01/23 – AGM Insured | | | No Opt. Call | | | | | | | | Aa2 | | | | 1,210,882 | |
| | 1,210 | | | 9.000%, 1/01/25 – AGM Insured (ETM) | | | No Opt. Call | | | | | | | | AA | (4) | | | 1,679,577 | |
| | 3,940 | | | 9.000%, 1/01/25 – AGM Insured | | | No Opt. Call | | | | | | | | Aa2 | | | | 5,420,770 | |
| | | | | |
| | | | Kendall, Kane, and Will Counties Community Unit School District 308 Oswego, Illinois, General Obligation Bonds, Refunding School Series 2016: | | | | | | | | | | | | | | | | |
| | 5,000 | | | 5.000%, 2/01/34 | | | 2/26 at 100.00 | | | | | | | | AA | | | | 5,683,000 | |
| | 3,465 | | | 5.000%, 2/01/35 | | | 2/26 at 100.00 | | | | | | | | AA | | | | 3,928,305 | |
| | | | | |
| | | | LaSalle and Bureau Counties High School District 120 LaSalle-Peru, Illinois, General Obligation Bonds, School Building Series 2017: | | | | | | | | | | | | | | | | |
| | 1,485 | | | 5.000%, 12/01/30 – BAM Insured | | | 12/26 at 100.00 | | | | | | | | AA | | | | 1,734,584 | |
| | 1,165 | | | 5.000%, 12/01/31 – BAM Insured | | | 12/26 at 100.00 | | | | | | | | AA | | | | 1,353,299 | |
| | 1,645 | | | 5.000%, 12/01/32 – BAM Insured | | | 12/26 at 100.00 | | | | | | | | AA | | | | 1,901,192 | |
| | 1,725 | | | 5.000%, 12/01/33 – BAM Insured | | | 12/26 at 100.00 | | | | | | | | AA | | | | 1,991,357 | |
| | 1,815 | | | 5.000%, 12/01/34 – BAM Insured | | | 12/26 at 100.00 | | | | | | | | AA | | | | 2,087,885 | |
| | | | | |
| | 2,100 | | | Madison and Jersey Counties Community Unit School District 11, Alton, Illinois, General Obligation Bonds, Series 2002, 0.000%, 12/01/19 – AGM Insured | | | No Opt. Call | | | | | | | | AA | | | | 2,069,844 | |
| | | | | |
| | | | Madison County Community Unit School District 7 Edwardsville, Illinois, General Obligation Bonds, Series 2017A: | | | | | | | | | | | | | | | | |
| | 2,430 | | | 5.000%, 12/01/28 | | | 12/25 at 100.00 | | | | | | | | AA | | | | 2,756,689 | |
| | 2,500 | | | 5.000%, 12/01/29 | | | 12/25 at 100.00 | | | | | | | | AA | | | | 2,830,800 | |
101
Nuveen Intermediate Duration Municipal Bond Fund(continued)
Portfolio of Investments March 31, 2019
| | | | | | | | | | | | | | | | | | | | |
Principal
Amount (000) | | | Description (1) | | Optional Call
Provisions (2) | | | | | | Ratings (3) | | | Value | |
| | | | | |
| | | | Illinois(continued) | | | | | | | | | | | | |
| | | | | |
| $ | 1,500 | | | Madison, Macoupin, Jersey, Calhoun, Morgan, Scott, and Greene Counties Community College District 536, Illinois, General Obligation Bonds, Lewis & Clark Community College, Refunding Series 2017A, 5.000%, 11/01/31 – AGM Insured | | | 11/26 at 100.00 | | | | | | | | AA | | | $ | 1,721,715 | |
| | | | | |
| | | | McCook, Cook County, Illinois, General Obligation Bonds, Series 2008: | | | | | | | | | | | | | | | | |
| | 500 | | | 5.000%, 12/01/26 | | | 5/19 at 100.00 | | | | | | | | A– | | | | 500,855 | |
| | 1,000 | | | 5.100%, 12/01/28 | | | 5/19 at 100.00 | | | | | | | | A– | | | | 1,001,790 | |
| | | | | |
| | | | Metropolitan Pier and Exposition Authority, Illinois, McCormick Place Expansion Project Bonds, Refunding Series 2012B: | | | | | | | | | | | | | | | | |
| | 4,825 | | | 5.000%, 12/15/28 | | | 6/22 at 100.00 | | | | | | | | BBB | | | | 5,074,115 | |
| | 1,700 | | | 0.000%, 12/15/51 | | | No Opt. Call | | | | | | | | BBB | | | | 383,197 | |
| | | | | |
| | | | Metropolitan Pier and Exposition Authority, Illinois, McCormick Place Expansion Project Bonds, Series 2017B: | | | | | | | | | | | | | | | | |
| | 1,810 | | | 0.000%, 12/15/37 | | | No Opt. Call | | | | | | | | BBB | | | | 1,074,289 | |
| | 9,045 | | | 0.000%, 12/15/42 | | | 6/38 at 100.00 | | | | | | | | BBB | | | | 5,393,172 | |
| | 6,000 | | | 0.000%, 12/15/47 | | | 6/38 at 100.00 | | | | | | | | BBB | | | | 3,566,460 | |
| | | | | |
| | 28,425 | | | Metropolitan Pier and Exposition Authority, Illinois, Revenue Bonds, McCormick Place Expansion Project, Series 2002A, 0.000%, 12/15/29 – NPFG Insured | | | No Opt. Call | | | | | | | | BBB | | | | 19,377,607 | |
| | | | | |
| | | | Montgomery, Illinois, Lakewood Creek Project Special Assessment Bonds, Series 2018: | | | | | | | | | | | | | | | | |
| | 479 | | | 3.100%, 3/01/26 – BAM Insured | | | No Opt. Call | | | | | | | | AA | | | | 489,107 | |
| | 480 | | | 3.200%, 3/01/27 – BAM Insured | | | No Opt. Call | | | | | | | | AA | | | | 491,246 | |
| | 384 | | | 3.300%, 3/01/28 – BAM Insured | | | 3/27 at 100.00 | | | | | | | | AA | | | | 393,596 | |
| | 671 | | | 3.450%, 3/01/30 – BAM Insured | | | 3/27 at 100.00 | | | | | | | | AA | | | | 683,467 | |
| | | | | |
| | 2,270 | | | Peoria Public Building Commission, Illinois, School District Facility Revenue Bonds, Peoria County School District 150 Project, Series 2011, 0.000%, 12/01/24 | | | No Opt. Call | | | | | | | | A | | | | 1,945,549 | |
| | | | | |
| | 1,494 | | | Plano, Illinois, Special Tax Bonds, Special Service Area 1 & 2 Lakewood Springs Project, Refunding Series 2014, 5.000%, 3/01/29 – AGM Insured | | | 3/24 at 100.00 | | | | | | | | AA | | | | 1,646,971 | |
| | | | | |
| | | | Quad Cities Regional Economic Development Authority, Illinois, Revenue Bonds, Augustana College, Series 2012: | | | | | | | | | | | | | | | | |
| | 295 | | | 5.000%, 10/01/23 | | | 10/22 at 100.00 | | | | | | | | Baa1 | | | | 323,656 | |
| | 350 | | | 5.000%, 10/01/24 | | | 10/22 at 100.00 | | | | | | | | Baa1 | | | | 385,515 | |
| | | | | |
| | | | Railsplitter Tobacco Settlement Authority, Illinois, Tobacco Settlement Revenue Bonds, Series 2010: | | | | | | | | | | | | | | | | |
| | 7,785 | | | 5.250%, 6/01/21 | | | No Opt. Call | | | | | | | | A | | | | 8,342,873 | |
| | 12,395 | | | 5.500%, 6/01/23(Pre-refunded 6/01/21) | | | 6/21 at 100.00 | | | | | | | | N/R (4) | | | | 13,424,281 | |
| | | | | |
| | | | Railsplitter Tobacco Settlement Authority, Illinois, Tobacco Settlement Revenue Bonds, Series 2017: | | | | | | | | | | | | | | | | |
| | 3,900 | | | 5.000%, 6/01/25 | | | No Opt. Call | | | | | | | | A | | | | 4,543,734 | |
| | 5,000 | | | 5.000%, 6/01/26 | | | No Opt. Call | | | | | | | | A | | | | 5,924,050 | |
| | 3,000 | | | 5.000%, 6/01/27 | | | 6/26 at 100.00 | | | | | | | | A | | | | 3,538,260 | |
| | | | | |
| | | | Round Lake, Lake County, Illinois, Special Tax Bonds, Lakewood Grove Special Service Areas 1, 3 & 4, Refunding Series 2017: | | | | | | | | | | | | | | | | |
| | 1,283 | | | 3.700%, 3/01/29 – BAM Insured | | | 3/27 at 100.00 | | | | | | | | AA | | | | 1,339,644 | |
| | 1,073 | | | 3.800%, 3/01/30 – BAM Insured | | | 3/27 at 100.00 | | | | | | | | AA | | | | 1,120,555 | |
| | 1,897 | | | 4.000%, 3/01/33 – BAM Insured | | | 3/27 at 100.00 | | | | | | | | AA | | | | 1,986,785 | |
102
| | | | | | | | | | | | | | | | | | | | |
Principal
Amount (000) | | | Description (1) | | Optional Call
Provisions (2) | | | | | | Ratings (3) | | | Value | |
| | | | | |
| | | | Illinois(continued) | | | | | | | | | | | | |
| | | | | |
| | | | Saint Clair County, Illinois, General Obligation Bonds, Refunding Alternate Revenue Source Series 2009: | | | | | | | | | | | | | | | | |
| $ | 640 | | | 4.500%, 10/01/20(Pre-refunded 10/01/19) | | | 10/19 at 100.00 | | | | | | | | N/R (4) | | | $ | 649,312 | |
| | 360 | | | 4.500%, 10/01/20 | | | 10/19 at 100.00 | | | | | | | | AA– | | | | 365,476 | |
| | 730 | | | 5.000%, 10/01/22(Pre-refunded 10/01/19) | | | 10/19 at 100.00 | | | | | | | | N/R (4) | | | | 742,425 | |
| | 370 | | | 5.000%, 10/01/22 | | | 10/19 at 100.00 | | | | | | | | AA– | | | | 376,279 | |
| | | | | |
| | | | Southwestern Illinois Development Authority, Health Facility Revenue Bonds, Memorial Group, Inc, Series 2013: | | | | | | | | | | | | | | | | |
| | 2,565 | | | 7.125%, 11/01/43(Pre-refunded 11/01/23) | | | 11/23 at 100.00 | | | | | | | | N/R (4) | | | | 3,173,110 | |
| | 2,415 | | | 7.625%, 11/01/48(Pre-refunded 11/01/23) | | | 11/23 at 100.00 | | | | | | | | N/R (4) | | | | 3,040,509 | |
| | | | | |
| | 2,645 | | | Southwestern Illinois Development Authority, Local Government Program Revenue Bonds, Southwestern Illinois Flood District Council Project, Series 2016B, 4.000%, 10/15/40 | | | 10/25 at 100.00 | | | | | | | | A | | | | 2,738,739 | |
| | | | | |
| | | | Springfield, Illinois, Electric Revenue Bonds, Senior Lien Series 2015: | | | | | | | | | | | | | | | | |
| | 7,805 | | | 5.000%, 3/01/33 | | | 3/25 at 100.00 | | | | | | | | A | | | | 8,773,210 | |
| | 13,960 | | | 5.000%, 3/01/34 – AGM Insured | | | 3/25 at 100.00 | | | | | | | | AA | | | | 15,701,231 | |
| | 10,990 | | | 5.000%, 3/01/40 – AGM Insured | | | 3/25 at 100.00 | | | | | | | | AA | | | | 12,157,687 | |
| | | | | |
| | | | Sterling, Whiteside County, Illinois, General Obligation Bonds, Alternate Revenue Source, Series 2012: | | | | | | | | | | | | | | | | |
| | 3,205 | | | 4.000%, 11/01/21 | | | No Opt. Call | | | | | | | | A+ | | | | 3,379,961 | |
| | 2,830 | | | 4.000%, 11/01/22 | | | No Opt. Call | | | | | | | | A+ | | | | 3,037,241 | |
| | | | | |
| | | | Will and Kendall Counties Community Consolidated School District 202 Plainfield, Illinois, General Obligation Bonds, Series 2016C: | | | | | | | | | | | | | | | | |
| | 9,760 | | | 5.000%, 1/01/22 | | | No Opt. Call | | | | | | | | Aa2 | | | | 10,566,371 | |
| | 3,355 | | | 5.000%, 1/01/23 | | | No Opt. Call | | | | | | | | Aa2 | | | | 3,729,519 | |
| | 3,295 | | | 5.000%, 1/01/24 | | | No Opt. Call | | | | | | | | Aa2 | | | | 3,738,177 | |
| | 4,215 | | | 5.000%, 1/01/25 | | | No Opt. Call | | | | | | | | Aa2 | | | | 4,884,173 | |
| | | | | |
| | 5,675 | | | Will County Community High School District 210Lincoln-Way, Illinois, General Obligation Bonds, Series 2013B, 0.000%, 1/01/30 | | | No Opt. Call | | | | | | | | Ba1 | | | | 3,728,759 | |
| | | | | |
| | 5,000 | | | Will County, Illinois, General Obligation Bonds, Alternate Revenue Source, Series 2016, 5.000%, 11/15/41 | | | 11/25 at 100.00 | | | | | | | | AA+ | | | | 5,619,150 | |
| | | | | |
| | 4,890 | | | Williamson & Johnson Counties Community Unit School District 2, Marion, Illinois, Limited Tax General Obligation Lease Certificates, Series 2011, 7.000%, 10/15/22 | | | 10/19 at 103.00 | | | | | | | | A– | | | | 5,116,896 | |
| | | | | |
| | | | Winnebago-Boone Counties School District 205 Rockford, Illinois, General Obligation Bonds, Series 2013: | | | | | | | | | | | | | | | | |
| | 4,070 | | | 0.000%, 2/01/25 | | | No Opt. Call | | | | | | | | A+ | | | | 3,466,622 | |
| | 3,855 | | | 0.000%, 2/01/26 | | | No Opt. Call | | | | | | | | A+ | | | | 3,167,075 | |
| | 831,188 | | | Total Illinois | | | | | | | | | | | | | | | 884,661,023 | |
| | | | | |
| | | | Indiana – 3.2% | | | | | | | | | | | | |
| | | | | |
| | | | Carmel Redevelopment Authority, Indiana, County Option Income Tax Lease Rental Revenue Bonds, Refunding Series 2014B: | | | | | | | | | | | | | | | | |
| | 435 | | | 5.000%, 1/01/20 | | | No Opt. Call | | | | | | | | AA | | | | 446,227 | |
| | 1,035 | | | 5.000%, 7/01/20 | | | No Opt. Call | | | | | | | | AA | | | | 1,079,443 | |
| | 500 | | | 5.000%, 1/01/21 | | | No Opt. Call | | | | | | | | AA | | | | 529,790 | |
| | | | | |
| | 3,500 | | | Indiana Finance Authority, Educational Facilities Revenue Bonds, University of Indianapolis Project, Series 2017, 5.000%, 10/01/43 | | | 4/27 at 100.00 | | | | | | | | BBB+ | | | | 3,842,160 | |
103
Nuveen Intermediate Duration Municipal Bond Fund(continued)
Portfolio of Investments March 31, 2019
| | | | | | | | | | | | | | | | | | | | |
Principal
Amount (000) | | | Description (1) | | Optional Call
Provisions (2) | | | | | | Ratings (3) | | | Value | |
| | | | | |
| | | | Indiana(continued) | | | | | | | | | | | | |
| | | | | |
| | | | Indiana Finance Authority, Hospital Revenue Bonds, Major Hospital Project, Series 2014A: | | | | | | | | | | | | | | | | |
| $ | 1,130 | | | 3.500%, 10/01/26 | | | 10/23 at 100.00 | | | | | | | | A | | | $ | 1,169,042 | |
| | 500 | | | 5.000%, 10/01/29 | | | 10/23 at 100.00 | | | | | | | | A | | | | 551,240 | |
| | | | | |
| | 4,000 | | | Indiana Finance Authority, Lease Appropriation Bonds, Stadium Project, Refunding Series 2015A, 5.250%, 2/01/37 | | | 8/25 at 100.00 | | | | | | | | AA+ | | | | 4,703,720 | |
| | | | | |
| | 5,300 | | | Indiana Finance Authority, Wastewater Utility Revenue Bonds, CWA Authority Project, Series 2011B, 5.250%, 10/01/24 – AGM Insured | | | 10/21 at 100.00 | | | | | | | | AA | | | | 5,779,544 | |
| | | | | |
| | | | Indiana Finance Authority, Wastewater Utility Revenue Bonds, CWA Authority Project, Series 2014A: | | | | | | | | | | | | | | | | |
| | 715 | | | 5.000%, 10/01/22 | | | No Opt. Call | | | | | | | | AA | | | | 793,657 | |
| | 620 | | | 5.000%, 10/01/23 | | | No Opt. Call | | | | | | | | AA | | | | 704,934 | |
| | 625 | | | 5.000%, 10/01/24 | | | No Opt. Call | | | | | | | | AA | | | | 727,013 | |
| | 1,320 | | | 5.000%, 10/01/25 | | | 10/24 at 100.00 | | | | | | | | AA | | | | 1,541,470 | |
| | 1,710 | | | 5.000%, 10/01/26 | | | 10/24 at 100.00 | | | | | | | | AA | | | | 1,993,005 | |
| | 10,000 | | | 5.000%, 10/01/40 | | | 10/24 at 100.00 | | | | | | | | AA | | | | 11,276,700 | |
| | | | | |
| | 8,000 | | | Indiana Finance Authority, Water Utility Revenue Bonds, Citizens Energy Group Project, First Lien Series 2014A, 2.950%, 10/01/22 | | | 7/22 at 100.00 | | | | | | | | AA– | | | | 8,272,400 | |
| | | | | |
| | 1,065 | | | Indiana Health Facility Financing Authority, Revenue Bonds, Ascension Health Subordinate Credit Group, Series 2005A-8, 1.250%, 11/01/27 (Mandatory Put 5/01/20) | | | No Opt. Call | | | | | | | | AA | | | | 1,058,983 | |
| | | | | |
| | | | Indiana Municipal Power Agency, Power Supply System Revenue Bonds, Series 2013A: | | | | | | | | | | | | | | | | |
| | 2,750 | | | 5.250%, 1/01/33(Pre-refunded 7/01/23) | | | 7/23 at 100.00 | | | | | | | | A+ (4) | | | | 3,165,387 | |
| | 2,505 | | | 5.250%, 1/01/34(Pre-refunded 7/01/23) | | | 7/23 at 100.00 | | | | | | | | A+ (4) | | | | 2,883,380 | |
| | | | | |
| | 2,800 | | | Indianapolis Local Public Improvement Bond Bank, Indiana, Waterworks Project, Refunding Series 2006, 5.500%, 7/01/21 – NPFG Insured | | | No Opt. Call | | | | | | | | AA | | | | 3,039,568 | |
| | | | | |
| | 5,000 | | | Indianapolis Local Public Improvement Bond Bank, Indiana, Waterworks Project, Series 2007B, 5.250%, 7/01/23 – NPFG Insured | | | No Opt. Call | | | | | | | | AA | | | | 5,712,250 | |
| | | | | |
| | | | Indianapolis, Indiana, Gas Utility Distribution System Revenue Bonds, Refunding 2nd Lien Series 2013A: | | | | | | | | | | | | | | | | |
| | 7,900 | | | 5.250%, 8/15/28 | | | 8/23 at 100.00 | | | | | | | | AA | | | | 8,979,851 | |
| | 10,000 | | | 5.250%, 8/15/29 | | | 8/23 at 100.00 | | | | | | | | AA | | | | 11,326,100 | |
| | | | | |
| | | | Indianapolis, Indiana, Gas Utility Distribution System Revenue Bonds, Refunding 2nd Lien Series 2017A: | | | | | | | | | | | | | | | | |
| | 12,240 | | | 5.000%, 8/15/26 | | | No Opt. Call | | | | | | | | AA | | | | 14,902,445 | |
| | 6,620 | | | 5.000%, 8/15/27 | | | No Opt. Call | | | | | | | | AA | | | | 8,204,894 | |
| | | | | |
| | | | Indianapolis, Indiana, Thermal Energy System Revenue Bonds, Refunding First Lien Series 2014A: | | | | | | | | | | | | | | | | |
| | 500 | | | 5.000%, 10/01/27 | | | 10/24 at 100.00 | | | | | | | | A | | | | 574,065 | |
| | 720 | | | 5.000%, 10/01/28 | | | 10/24 at 100.00 | | | | | | | | A | | | | 825,804 | |
| | 1,000 | | | 5.000%, 10/01/29 | | | 10/24 at 100.00 | | | | | | | | A | | | | 1,143,550 | |
| | 1,360 | | | 5.000%, 10/01/31 | | | 10/24 at 100.00 | | | | | | | | A | | | | 1,544,402 | |
| | 1,215 | | | 5.000%, 10/01/33 | | | 10/24 at 100.00 | | | | | | | | A | | | | 1,377,251 | |
| | | | | |
| | 2,985 | | | Jasper County, Indiana, Pollution Control Revenue Refunding Bonds, Northern Indiana Public Service Company Project, Series 1994A Remarketed, 5.850%, 4/01/19 – NPFG Insured | | | No Opt. Call | | | | | | | | BBB+ | | | | 2,985,000 | |
104
| | | | | | | | | | | | | | | | | | | | |
Principal
Amount (000) | | | Description (1) | | Optional Call
Provisions (2) | | | | | | Ratings (3) | | | Value | |
| | | | | |
| | | | Indiana(continued) | | | | | | | | | | | | |
| | | | | |
| | | | Knox County, Indiana, Economic Development Revenue and Refunding Bonds, Good Samaritan Hospital Project, Series 2012A: | | | | | | | | | | | | | | | | |
| $ | 1,675 | | | 5.000%, 4/01/21 | | | No Opt. Call | | | | | | | | Ba1 | | | $ | 1,744,730 | |
| | 940 | | | 5.000%, 4/01/22 | | | No Opt. Call | | | | | | | | Ba1 | | | | 997,566 | |
| | 2,015 | | | 5.000%, 4/01/24 | | | 4/22 at 100.00 | | | | | | | | Ba1 | | | | 2,132,998 | |
| | | | | |
| | | | Lake County Building Corporation, Indiana, First Mortgage Bonds, Series 2012: | | | | | | | | | | | | | | | | |
| | 500 | | | 4.500%, 8/01/19 | | | No Opt. Call | | | | | | | | N/R | | | | 504,445 | |
| | 500 | | | 4.750%, 2/01/20 | | | No Opt. Call | | | | | | | | N/R | | | | 512,220 | |
| | 500 | | | 4.750%, 8/01/20 | | | No Opt. Call | | | | | | | | N/R | | | | 509,275 | |
| | 250 | | | 4.750%, 2/01/21 | | | No Opt. Call | | | | | | | | N/R | | | | 255,840 | |
| | 500 | | | 4.750%, 8/01/21 | | | No Opt. Call | | | | | | | | N/R | | | | 514,995 | |
| | 500 | | | 5.000%, 2/01/22 | | | No Opt. Call | | | | | | | | N/R | | | | 521,255 | |
| | 500 | | | 5.000%, 8/01/22 | | | 2/22 at 100.00 | | | | | | | | N/R | | | | 520,975 | |
| | 500 | | | 5.000%, 8/01/23 | | | 2/22 at 100.00 | | | | | | | | N/R | | | | 519,645 | |
| | 500 | | | 5.000%, 2/01/24 | | | 2/22 at 100.00 | | | | | | | | N/R | | | | 516,505 | |
| | | | | |
| | 33,040 | | | Richmond Hospital Authority, Indiana, Revenue Bonds, Reid Hospital Project, Refunding Series 2018B, 5.000%, 1/01/36 | | | 1/27 at 100.00 | | | | | | | | A– | | | | 37,222,534 | |
| | | | | |
| | 640 | | | Southwind Housing Inc, Evansville, Indiana, First Mortgage Revenue Bonds, Series 1978A, 7.125%, 11/15/21 (ETM) | | | 6/19 at 100.00 | | | | | | | | N/R (4) | | | | 695,552 | |
| | | | | |
| | | | Vanderburgh County,Indiana, Redevelopment District Tax Increment Revenue bonds, Refunding Series 2014: | | | | | | | | | | | | | | | | |
| | 1,040 | | | 5.000%, 2/01/25 | | | 8/24 at 100.00 | | | | | | | | A | | | | 1,195,106 | |
| | 1,000 | | | 5.000%, 2/01/26 | | | 8/24 at 100.00 | | | | | | | | A | | | | 1,152,960 | |
| | 1,805 | | | 5.000%, 2/01/27 | | | 8/24 at 100.00 | | | | | | | | A | | | | 2,068,295 | |
| | 1,750 | | | 5.000%, 2/01/29 | | | 8/24 at 100.00 | | | | | | | | A | | | | 1,994,195 | |
| | 2,700 | | | 5.000%, 2/01/31 | | | 8/24 at 100.00 | | | | | | | | A | | | | 3,055,806 | |
| | | | | |
| | 25,005 | | | Whiting, Indiana, Environmental Facilities Revenue Bonds, BP Products North America Inc Project, Series 2015, 5.000%, 11/01/45 (Mandatory Put 11/01/22) (AMT) | | | No Opt. Call | | | | | | | | A– | | | | 27,504,750 | |
| | | | | |
| | 20,625 | | | Whiting, Indiana, Environmental Facilities Revenue Bonds, BP Products North America Inc Project, Series 2016A, 5.000%, 3/01/46 (Mandatory Put 3/01/23) (AMT) | | | No Opt. Call | | | | | | | | A1 | | | | 22,810,012 | |
| | 194,535 | | | Total Indiana | | | | | | | | | | | | | | | 218,082,934 | |
| | | | | |
| | | | Iowa – 1.3% | | | | | | | | | | | | |
| | | | | |
| | | | Ames, Iowa, Hospital Revenue Bonds, Mary Greeley Medical Center, Series 2011: | | | | | | | | | | | | | | | | |
| | 1,015 | | | 5.250%, 6/15/25(Pre-refunded 6/15/20) | | | 6/20 at 100.00 | | | | | | | | A2 (4) | | | | 1,058,807 | |
| | 2,000 | | | 5.250%, 6/15/26(Pre-refunded 6/15/20) | | | 6/20 at 100.00 | | | | | | | | A2 (4) | | | | 2,086,320 | |
| | 3,135 | | | 5.250%, 6/15/27(Pre-refunded 6/15/20) | | | 6/20 at 100.00 | | | | | | | | A2 (4) | | | | 3,270,307 | |
| | 2,000 | | | 5.375%, 6/15/28(Pre-refunded 6/15/20) | | | 6/20 at 100.00 | | | | | | | | A2 (4) | | | | 2,089,300 | |
| | 2,035 | | | 5.500%, 6/15/29(Pre-refunded 6/15/20) | | | 6/20 at 100.00 | | | | | | | | A2 (4) | | | | 2,128,874 | |
| | 1,000 | | | 5.500%, 6/15/30(Pre-refunded 6/15/20) | | | 6/20 at 100.00 | | | | | | | | A2 (4) | | | | 1,046,130 | |
| | | | | |
| | | | Fort Dodge Community School District, Webster County, Iowa, School Infrastructure Sales, Services, and Use Tax Revenue Bonds, Series 2011: | | | | | | | | | | | | | | | | |
| | 1,830 | | | 5.000%, 1/01/23 – AGM Insured(Pre-refunded 1/01/21) | | | 1/21 at 100.00 | | | | | | | | AA (4) | | | | 1,939,672 | |
| | 1,890 | | | 5.000%, 1/01/24 – AGM Insured(Pre-refunded 1/01/21) | | | 1/21 at 100.00 | | | | | | | | AA (4) | | | | 2,003,268 | |
| | 1,520 | | | 5.000%, 1/01/25 – AGM Insured(Pre-refunded 1/01/21) | | | 1/21 at 100.00 | | | | | | | | AA (4) | | | | 1,611,094 | |
| | 1,000 | | | 5.000%, 1/01/26 – AGM Insured(Pre-refunded 1/01/21) | | | 1/21 at 100.00 | | | | | | | | AA (4) | | | | 1,059,930 | |
105
Nuveen Intermediate Duration Municipal Bond Fund(continued)
Portfolio of Investments March 31, 2019
| | | | | | | | | | | | | | | | | | | | |
Principal
Amount (000) | | | Description (1) | | Optional Call
Provisions (2) | | | | | | Ratings (3) | | | Value | |
| | | | | |
| | | | Iowa(continued) | | | | | | | | | | | | |
| | | | | |
| $ | 10,000 | | | Iowa Finance Authority, Health Facilities Revenue Bonds, UnityPoint Health Project, Series 2013A, 5.250%, 2/15/44 | | | 2/23 at 100.00 | | | | | | | | AA– | | | $ | 10,845,700 | |
| | | | | |
| | | | Iowa Finance Authority, Healthcare Revenue Bonds, Genesis Health System, Series 2013: | | | | | | | | | | | | | | | | |
| | 8,655 | | | 5.000%, 7/01/27 | | | 7/23 at 100.00 | | | | | | | | A1 | | | | 9,712,901 | |
| | 6,820 | | | 5.000%, 7/01/28 | | | 7/23 at 100.00 | | | | | | | | A1 | | | | 7,647,675 | |
| | | | | |
| | 5,025 | | | Iowa Finance Authority, Iowa, Midwestern Disaster Area Revenue Bonds, Iowa Fertilizer Company Project, Refunding Series 2019, 3.125%, 12/01/22 (WI/DD, Settling 4/03/19) | | | 12/20 at 103.00 | | | | | | | | B+ | | | | 5,058,064 | |
| | | | | |
| | 1,925 | | | Iowa Finance Authority, Iowa, Midwestern Disaster Area Revenue Bonds, Iowa Fertilizer Company Project, Series 2013, 5.250%, 12/01/25 | | | 12/23 at 100.00 | | | | | | | | B+ | | | | 2,076,440 | |
| | | | | |
| | 4,770 | | | Iowa Finance Authority, Iowa, Midwestern Disaster Area Revenue Bonds, Iowa Fertilizer Company Project, Series 2016, 5.875%, 12/01/26, 144A | | | 5/19 at 105.00 | | | | | | | | B+ | | | | 5,013,031 | |
| | | | | |
| | 6,445 | | | Iowa Finance Authority, Iowa, Midwestern Disaster Area Revenue Bonds, Iowa Fertilizer Company Project, Series 2018A, 5.250%, 12/01/50 | | | 12/22 at 103.00 | | | | | | | | B+ | | | | 6,803,729 | |
| | | | | |
| | 1,250 | | | Iowa Higher Education Loan Authority, Private College Facility Revenue Bonds, Upper Iowa University Project, Refunding Series 2010, 5.500%, 9/01/25(Pre-refunded 9/01/20) | | | 9/20 at 100.00 | | | | | | | | N/R (4) | | | | 1,318,587 | |
| | | | | |
| | 2,000 | | | Iowa State, Special Obligation Bonds, Prison Infrastructure Fund, Refunding Series 2010, 4.500%, 6/15/22(Pre-refunded 6/15/20) | | | 6/20 at 100.00 | | | | | | | | AA (4) | | | | 2,070,980 | |
| | | | | |
| | | | Iowa Tobacco Settlement Authority, Asset Backed Settlement Revenue Bonds, Series 2005C: | | | | | | | | | | | | | | | | |
| | 13,155 | | | 5.375%, 6/01/38 | | | 5/19 at 100.00 | | | | | | | | B+ | | | | 13,156,184 | |
| | 2,350 | | | 5.500%, 6/01/42 | | | 5/19 at 100.00 | | | | | | | | B+ | | | | 2,350,188 | |
| | 30 | | | 5.625%, 6/01/46 | | | 5/19 at 100.00 | | | | | | | | B | | | | 30,002 | |
| | | | | |
| | 1,940 | | | Iowa Tobacco Settlement Authority, Tobacco Asset-Backed Revenue Bonds, Series 2005B, 5.600%, 6/01/34 | | | 5/19 at 100.00 | | | | | | | | BB– | | | | 1,948,905 | |
| | 81,790 | | | Total Iowa | | | | | | | | | | | | | | | 86,326,088 | |
| | | | | |
| | | | Kansas – 0.7% | | | | | | | | | | | | |
| | | | | |
| | 14,655 | | | Burlington, Kansas, Environmental Improvement Revenue Bonds, Kansas City Power and Light Company Project, Refunding Series 1993A, 2.950%, 12/01/23 | | | 4/23 at 101.00 | | | | | | | | A | | | | 14,818,843 | |
| | | | | |
| | 11,000 | | | Burlington, Kansas, Environmental Improvement Revenue Bonds, Kansas City Power and Light Company Project, Refunding Series 1993B, 2.950%, 12/01/23 | | | 4/23 at 101.00 | | | | | | | | A | | | | 11,122,980 | |
| | | | | |
| | 355 | | | Johnson County Unified School District 512, Shawnee Mission, Kansas, General Obligation Bonds, Refunding Series 1996, 4.875%, 10/01/19 | | | No Opt. Call | | | | | | | | Aaa | | | | 360,932 | |
| | | | | |
| | | | Kansas Development Finance Authority, Hospital Revenue Bonds, Adventist Health System/Sunbelt Obligated Group, Series 2009C: | | | | | | | | | | | | | | | | |
| | 50 | | | 5.500%, 11/15/23(Pre-refunded 11/15/19) | | | 11/19 at 100.00 | | | | | | | | N/R (4) | | | | 51,165 | |
| | 2,150 | | | 5.500%, 11/15/23 | | | 11/19 at 100.00 | | | | | | | | AA | | | | 2,200,761 | |
| | | | | |
| | 1,850 | | | Kansas Development Finance Authority, Revenue Bonds, Kansas State Projects, Series 2007K, 4.500%, 11/01/19 – NPFG Insured | | | 5/19 at 100.00 | | | | | | | | Aa3 | | | | 1,854,422 | |
| | | | | |
| | 10,170 | | | Wichita, Kansas, Hospital Facilities Revenue Refunding and Improvement Bonds, Via Christi Health System Inc, Series 2011A – IV, 5.000%, 11/15/29(Pre-refunded 11/15/21) | | | 11/21 at 100.00 | | | | | | | | N/R (4) | | | | 11,045,230 | |
106
| | | | | | | | | | | | | | | | | | | | |
Principal
Amount (000) | | | Description (1) | | Optional Call
Provisions (2) | | | | | | Ratings (3) | | | Value | |
| | | | | |
| | | | Kansas(continued) | | | | | | | | | | | | |
| | | | | |
| | | | Wyandotte County/Kansas City Unified Government, Kansas, Utility System Revenue Bonds, Refunding & Improvement Series 2014A: | | | | | | | | | | | | | | | | |
| $ | 1,915 | | | 5.000%, 9/01/21 | | | No Opt. Call | | | | | | | | A+ | | | $ | 2,064,255 | |
| | 660 | | | 5.000%, 9/01/22 | | | No Opt. Call | | | | | | | | A+ | | | | 730,264 | |
| | 1,505 | | | 5.000%, 9/01/23 | | | No Opt. Call | | | | | | | | A+ | | | | 1,704,969 | |
| | 44,310 | | | Total Kansas | | | | | | | | | | | | | | | 45,953,821 | |
| | | | | |
| | | | Kentucky – 1.4% | | | | | | | | | | | | |
| | | | | |
| | 3,200 | | | Kentucky Economic Development Finance Authority, Hospital Revenue Bonds, Owensboro Health, Refunding Series 2017A, 5.000%, 6/01/37 | | | 6/27 at 100.00 | | | | | | | | Baa3 | | | | 3,495,904 | |
| | | | | |
| | 1,795 | | | Kentucky Economic Development Finance Authority, Hospital Revenue Bonds, Owensboro Medical Health System, Series 2015A, 4.500%, 6/01/46 | | | 6/25 at 100.00 | | | | | | | | Baa3 | | | | 1,841,975 | |
| | | | | |
| | 10 | | | Kentucky Economic Development Finance Authority, Revenue Bonds, Catholic Health Initiatives, Refunding Series 2009B, 2.700%, 5/01/39 (Mandatory Put 11/10/21) | | | No Opt. Call | | | | | | | | BBB+ | | | | 10,117 | |
| | | | | |
| | 7,000 | | | Lexington-Fayette Urban County Government Public Facilities Corporation, Kentucky State Lease Revenue Bonds, Eastern State Hospital Project, Series 2011A, 5.250%, 6/01/28 | | | 6/21 at 100.00 | | | | | | | | A1 | | | | 7,420,280 | |
| | | | | |
| | | | Louisville Regional Airport Authority, Kentucky, Airport System Revenue Bonds, Refunding Series 2014A: | | | | | | | | | | | | | | | | |
| | 1,320 | | | 5.000%, 7/01/26 (AMT) | | | 7/24 at 100.00 | | | | | | | | A+ | | | | 1,499,480 | |
| | 3,280 | | | 5.000%, 7/01/28 (AMT) | | | 7/24 at 100.00 | | | | | | | | A+ | | | | 3,694,822 | |
| | | | | |
| | | | Louisville/Jefferson County Metro Government, Kentucky, Revenue Bonds, Catholic Health Initiatives, Series 2012A: | | | | | | | | | | | | | | | | |
| | 10,130 | | | 5.000%, 12/01/35 | | | 6/22 at 100.00 | | | | | | | | N/R (4) | | | | 11,201,450 | |
| | 3,800 | | | 5.000%, 12/01/35 | | | 6/22 at 100.00 | | | | | | | | BBB+ | | | | 4,054,714 | |
| | | | | |
| | 3,105 | | | Louisville-Jefferson County Metropolitan Government, Kentucky, Pollution Control Revenue Bonds, Louisville Gas and Electric Company Project, Series 2005A, 2.200%, 2/01/35 (Mandatory Put 8/01/19) | | | 8/19 at 100.00 | | | | | | | | A1 | | | | 3,107,981 | |
| | | | | |
| | | | Murray, Kentucky, Hospital Facilities Revenue Bonds, Murray-Calloway County Public Hospital Corporation Project, Refunding Series 2016: | | | | | | | | | | | | | | | | |
| | 1,005 | | | 5.000%, 8/01/25 | | | No Opt. Call | | | | | | | | Baa3 | | | | 1,137,670 | |
| | 1,060 | | | 5.000%, 8/01/26 | | | No Opt. Call | | | | | | | | Baa3 | | | | 1,209,142 | |
| | 1,110 | | | 5.000%, 8/01/27 | | | 8/26 at 100.00 | | | | | | | | Baa3 | | | | 1,262,048 | |
| | 1,165 | | | 5.000%, 8/01/28 | | | 8/26 at 100.00 | | | | | | | | Baa3 | | | | 1,322,426 | |
| | 1,230 | | | 5.000%, 8/01/29 | | | 8/26 at 100.00 | | | | | | | | Baa3 | | | | 1,391,930 | |
| | 2,935 | | | 5.000%, 8/01/37 | | | 8/26 at 100.00 | | | | | | | | Baa3 | | | | 3,198,622 | |
| | | | | |
| | | | Pikeville, Kentucky, Hospital Revenue Bonds, Pikeville Medical Center, Inc Project, Improvement and Refunding Series 2011: | | | | | | | | | | | | | | | | |
| | 290 | | | 6.000%, 3/01/22(Pre-refunded 3/01/21) | | | 3/21 at 100.00 | | | | | | | | Baa2 (4) | | | | 314,125 | |
| | 965 | | | 6.000%, 3/01/22 | | | 3/21 at 100.00 | | | | | | | | Baa2 | | | | 1,029,954 | |
| | 305 | | | 6.250%, 3/01/23(Pre-refunded 3/01/21) | | | 3/21 at 100.00 | | | | | | | | Baa2 (4) | | | | 331,803 | |
| | 1,015 | | | 6.250%, 3/01/23 | | | 3/21 at 100.00 | | | | | | | | Baa2 | | | | 1,088,831 | |
| | 340 | | | 6.250%, 3/01/24(Pre-refunded 3/01/21) | | | 3/21 at 100.00 | | | | | | | | Baa2 (4) | | | | 369,879 | |
| | 1,115 | | | 6.250%, 3/01/24 | | | 3/21 at 100.00 | | | | | | | | Baa2 | | | | 1,193,931 | |
| | | | | |
| | 8,500 | | | Public Energy Authority of Kentucky, Gas Supply Revenue Bonds, Series 2018A, 4.000%, 4/01/48 (Mandatory Put 4/01/24) | | | 1/24 at 100.37 | | | | | | | | A3 | | | | 9,130,275 | |
| | | | | |
| | 12,890 | | | Public Energy Authority of Kentucky, Gas Supply Revenue Bonds, Series 2018B, 4.000%, 1/01/49 (Mandatory Put 1/01/25) | | | 10/24 at 100.24 | | | | | | | | A1 | | | | 14,013,235 | |
107
Nuveen Intermediate Duration Municipal Bond Fund(continued)
Portfolio of Investments March 31, 2019
| | | | | | | | | | | | | | | | | | | | |
Principal
Amount (000) | | | Description (1) | | Optional Call
Provisions (2) | | | | | | Ratings (3) | | | Value | |
| | | | | |
| | | | Kentucky(continued) | | | | | | | | | | | | |
| | | | | |
| $ | 11,000 | | | Public Energy Authority of Kentucky, Gas Supply Revenue Bonds,Series 2018C-1, 4.000%, 12/01/49 (Mandatory Put 6/01/25) | | | 3/25 at 100.19 | | | | | | | | A3 | | | $ | 11,919,490 | |
| | | | | |
| | | | University of Kentucky, General Receipts Bonds, Refunding Series 2018A: | | | | | | | | | | | | | | | | |
| | 6,945 | | | 3.000%, 10/01/34 | | | 4/26 at 100.00 | | | | | | | | AA | | | | 6,950,070 | |
| | 5,000 | | | 3.125%, 10/01/37 | | | 4/26 at 100.00 | | | | | | | | AA | | | | 5,004,250 | |
| | 90,510 | | | Total Kentucky | | | | | | | | | | | | | | | 97,194,404 | |
| | | | | |
| | | | Louisiana – 2.3% | | | | | | | | | | | | |
| | | | | |
| | | | East Baton Rouge Sewerage Commission, Louisiana, Revenue Bonds, Refunding Series 2014B: | | | | | | | | | | | | | | | | |
| | 970 | | | 5.000%, 2/01/23 | | | No Opt. Call | | | | | | | | AA | | | | 1,084,353 | |
| | 540 | | | 5.000%, 2/01/24 | | | No Opt. Call | | | | | | | | AA | | | | 616,696 | |
| | 800 | | | 5.000%, 2/01/25 | | | No Opt. Call | | | | | | | | AA | | | | 932,832 | |
| | | | | |
| | 585 | | | Jefferson Parish Hospital Service District 2, Louisiana, Hospital Revenue Bonds, East Jefferson General Hospital, Refunding Series 2011, 6.250%, 7/01/31 | | | 7/21 at 100.00 | | | | | | | | B | | | | 561,600 | |
| | | | | |
| | 475 | | | Louisiana Citizens Property Insurance Corporation, Assessment Revenue Bonds, Refunding Series 2012, 5.000%, 6/01/24 – AGM Insured(Pre-refunded 6/01/22) | | | 6/22 at 100.00 | | | | | | | | AA (4) | | | | 525,241 | |
| | | | | |
| | | | Louisiana Citizens Property Insurance Corporation, Assessment Revenue Bonds, Refunding Series 2016A: | | | | | | | | | | | | | | | | |
| | 17,490 | | | 5.000%, 6/01/25 | | | No Opt. Call | | | | | | | | A1 | | | | 20,698,540 | |
| | 16,740 | | | 5.000%, 6/01/26 | | | No Opt. Call | | | | | | | | A1 | | | | 20,190,951 | |
| | | | | |
| | | | Louisiana Local Government Environmental Facilities and Community Development Authority, Revenue Bonds, East Baton Rouge Sewerage Commission Projects, Subordinate Lien Series 2014A: | | | | | | | | | | | | | | | | |
| | 2,280 | | | 5.000%, 2/01/28 | | | 2/24 at 100.00 | | | | | | | | AA– | | | | 2,583,422 | |
| | 2,850 | | | 5.000%, 2/01/29 | | | 2/24 at 100.00 | | | | | | | | AA– | | | | 3,223,521 | |
| | 2,000 | | | 5.000%, 2/01/30 | | | 2/24 at 100.00 | | | | | | | | AA– | | | | 2,253,840 | |
| | | | | |
| | 30 | | | Louisiana Local Government Environmental Facilities and Community Development Authority, Revenue Bonds, Southgate Suites Retail Project, Series 2007B, 9.000%, 12/15/14 | | | No Opt. Call | | | | | | | | N/R | | | | — | |
| | | | | |
| | 20,940 | | | Louisiana Local Government Environmental Facilities and Community Development Authority, Revenue Bonds, Westlake Chemical Corporation Projects, Refunding Series 2017, 3.500%, 11/01/32 | | | 11/27 at 100.00 | | | | | | | | BBB | | | | 21,095,165 | |
| | | | | |
| | 1,000 | | | Louisiana Public Facilities Authority, Revenue Bonds, Archdiocese of New Orleans, Refunding Series 2017, 5.000%, 7/01/37 | | | 7/27 at 100.00 | | | | | | | | A+ | | | | 1,098,990 | |
| | | | | |
| | 3,210 | | | Louisiana Public Facilities Authority, Revenue Bonds, Entergy Louisiana, LLC Project, Refunding Series 2016A, 3.375%, 9/01/28 | | | 3/21 at 100.00 | | | | | | | | A | | | | 3,230,993 | |
| | | | | |
| | | | Louisiana Public Facilities Authority, Revenue Bonds, Ochsner Clinic Foundation Project, Refunding Series 2016: | | | | | | | | | | | | | | | | |
| | 25 | | | 5.000%, 5/15/30(Pre-refunded 5/15/26) | | | 5/26 at 100.00 | | | | | | | | N/R (4) | | | | 30,230 | |
| | 1,055 | | | 5.000%, 5/15/30 | | | 5/26 at 100.00 | | | | | | | | A3 | | | | 1,219,211 | |
| | 30 | | | 5.000%, 5/15/32(Pre-refunded 5/15/26) | | | 5/26 at 100.00 | | | | | | | | N/R (4) | | | | 36,276 | |
| | 3,410 | | | 5.000%, 5/15/32 | | | 5/26 at 100.00 | | | | | | | | A3 | | | | 3,898,585 | |
| | 40 | | | 5.000%, 5/15/33(Pre-refunded 5/15/26) | | | 5/26 at 100.00 | | | | | | | | N/R (4) | | | | 48,368 | |
| | 3,660 | | | 5.000%, 5/15/33 | | | 5/26 at 100.00 | | | | | | | | A3 | | | | 4,167,569 | |
108
| | | | | | | | | | | | | | | | | | | | |
Principal
Amount (000) | | | Description (1) | | Optional Call
Provisions (2) | | | | | | Ratings (3) | | | Value | |
| | | | | |
| | | | Louisiana(continued) | | | | | | | | | | | | |
| | | | | |
| | | | Louisiana Public Facilities Authority, Revenue Bonds, Ochsner Clinic Foundation Project, Refunding Series 2017: | | | | | | | | | | | | | | | | |
| $ | 1,265 | | | 5.000%, 5/15/28 | | | 5/27 at 100.00 | | | | | | | | A3 | | | $ | 1,504,351 | |
| | 1,000 | | | 5.000%, 5/15/29 | | | 5/27 at 100.00 | | | | | | | | A3 | | | | 1,180,540 | |
| | 1,155 | | | 5.000%, 5/15/30 | | | 5/27 at 100.00 | | | | | | | | A3 | | | | 1,352,886 | |
| | 1,750 | | | 5.000%, 5/15/31 | | | 5/27 at 100.00 | | | | | | | | A3 | | | | 2,035,337 | |
| | 3,210 | | | 5.000%, 5/15/42 | | | 5/27 at 100.00 | | | | | | | | A3 | | | | 3,607,912 | |
| | | | | |
| | | | Louisiana Stadium and Exposition District, Revenue Refunding Bonds, Senior Lien Series 2013A: | | | | | | | | | | | | | | | | |
| | 1,050 | | | 5.000%, 7/01/22 | | | No Opt. Call | | | | | | | | AA– | | | | 1,156,932 | |
| | 3,120 | | | 5.000%, 7/01/29 | | | 7/23 at 100.00 | | | | | | | | AA– | | | | 3,480,547 | |
| | 5,000 | | | 5.000%, 7/01/31 | | | 7/23 at 100.00 | | | | | | | | AA– | | | | 5,551,150 | |
| | 3,835 | | | 5.000%, 7/01/32 | | | 7/23 at 100.00 | | | | | | | | AA– | | | | 4,250,906 | |
| | | | | |
| | | | Louisiana State, Unclaimed Property Special Revenue Bonds, Interstate 49 North Project, Series 2013: | | | | | | | | | | | | | | | | |
| | 1,165 | | | 5.000%, 9/01/29 | | | 9/23 at 100.00 | | | | | | | | A+ | | | | 1,304,893 | |
| | 5,070 | | | 5.000%, 9/01/31 | | | 9/23 at 100.00 | | | | | | | | A+ | | | | 5,668,159 | |
| | 4,000 | | | 5.000%, 9/01/32 | | | 9/23 at 100.00 | | | | | | | | A+ | | | | 4,468,280 | |
| | | | | |
| | | | New Orleans, Louisiana, General Obligation Bonds, Refunding Series 2012: | | | | | | | | | | | | | | | | |
| | 4,140 | | | 5.000%, 12/01/19 | | | No Opt. Call | | | | | | | | AA– | | | | 4,231,370 | |
| | 3,940 | | | 5.000%, 12/01/20 | | | No Opt. Call | | | | | | | | AA– | | | | 4,147,008 | |
| | 5,400 | | | 5.000%, 12/01/21 | | | No Opt. Call | | | | | | | | AA– | | | | 5,852,304 | |
| | | | | |
| | | | New Orleans, Louisiana, General Obligation Bonds, Refunding Series 2015: | | | | | | | | | | | | | | | | |
| | 1,000 | | | 5.000%, 12/01/22 | | | No Opt. Call | | | | | | | | AA– | | | | 1,113,800 | |
| | 870 | | | 5.000%, 12/01/23 | | | No Opt. Call | | | | | | | | AA– | | | | 991,852 | |
| | 1,020 | | | 5.000%, 12/01/24 | | | No Opt. Call | | | | | | | | AA– | | | | 1,190,095 | |
| | 480 | | | 5.000%, 12/01/25 | | | No Opt. Call | | | | | | | | AA– | | | | 570,370 | |
| | 775 | | | 5.000%, 12/01/27 | | | 12/25 at 100.00 | | | | | | | | AA– | | | | 907,781 | |
| | | | | |
| | | | New Orleans, Louisiana, Sewerage Service Revenue Bonds, Refunding Series 2014: | | | | | | | | | | | | | | | | |
| | 1,200 | | | 5.000%, 6/01/20 | | | No Opt. Call | | | | | | | | A | | | | 1,245,132 | |
| | 250 | | | 5.000%, 6/01/24 | | | No Opt. Call | | | | | | | | A | | | | 284,855 | |
| | 500 | | | 5.000%, 6/01/25 | | | 6/24 at 100.00 | | | | | | | | A | | | | 573,925 | |
| | 500 | | | 5.000%, 6/01/26 | | | 6/24 at 100.00 | | | | | | | | A | | | | 571,550 | |
| | 600 | | | 5.000%, 6/01/27 | | | 6/24 at 100.00 | | | | | | | | A | | | | 683,088 | |
| | 380 | | | 5.000%, 6/01/28 | | | 6/24 at 100.00 | | | | | | | | A | | | | 432,003 | |
| | 570 | | | 5.000%, 6/01/29 | | | 6/24 at 100.00 | | | | | | | | A | | | | 646,585 | |
| | | | | |
| | | | New Orleans, Louisiana, Sewerage Service Revenue Bonds, Series 2015: | | | | | | | | | | | | | | | | |
| | 385 | | | 5.000%, 6/01/30 | | | 6/25 at 100.00 | | | | | | | | A | | | | 436,009 | |
| | 775 | | | 5.000%, 6/01/32 | | | 6/25 at 100.00 | | | | | | | | A | | | | 869,938 | |
| | 1,000 | | | 5.000%, 6/01/33 | | | 6/25 at 100.00 | | | | | | | | A | | | | 1,118,510 | |
| | 1,040 | | | 5.000%, 6/01/35 | | | 6/25 at 100.00 | | | | | | | | A | | | | 1,154,514 | |
| | | | | |
| | 500 | | | Port New Orleans Board of Commissioners, Louisiana, Revenue Bonds, Port Facilities, Refunding Series 2013B, 5.000%, 4/01/30 (AMT) | | | 4/23 at 100.00 | | | | | | | | A | | | | 546,270 | |
| | | | | |
| | 6,585 | | | Saint Charles Parish, Louisiana, Gulf Opportunity Zone Revenue Bonds, Valero Project, Series 2010, 4.000%, 12/01/40 (Mandatory Put 6/01/22) | | | No Opt. Call | | | | | | | | BBB | | | | 6,877,308 | |
| | 141,660 | | | Total Louisiana | | | | | | | | | | | | | | | 157,502,543 | |
| | | | | |
| | | | Maine – 0.2% | | | | | | | | | | | | |
| | | | | |
| | 1,100 | | | Maine Health and Higher Educational Facilities Authority Revenue Bonds, Eastern Maine Medical Center Obligated Group Issue, Series 2013, 5.000%, 7/01/43 | | | 7/23 at 100.00 | | | | | | | | BBB | | | | 1,164,438 | |
109
Nuveen Intermediate Duration Municipal Bond Fund(continued)
Portfolio of Investments March 31, 2019
| | | | | | | | | | | | | | | | | | | | |
Principal
Amount (000) | | | Description (1) | | Optional Call
Provisions (2) | | | | | | Ratings (3) | | | Value | |
| | | | | |
| | | | Maine(continued) | | | | | | | | | | | | |
| | | | | |
| | | | Maine Health and Higher Educational Facilities Authority Revenue Bonds, Eastern Maine Medical Center Obligated Group Issue, Series 2016A: | | | | | | | | | | | | | | | | |
| $ | 4,220 | | | 4.000%, 7/01/41 | | | 7/26 at 100.00 | | | | | | | | BBB | | | $ | 4,257,178 | |
| | 5,580 | | | 4.000%, 7/01/46 | | | 7/26 at 100.00 | | | | | | | | BBB | | | | 5,612,308 | |
| | | | | |
| | | | Maine Health and Higher Educational Facilities Authority, Revenue Bonds, Maine General Medical Center, Series 2011: | | | | | | | | | | | | | | | | |
| | 1,000 | | | 6.750%, 7/01/36 | | | 7/21 at 100.00 | | | | | | | | BB | | | | 1,086,520 | |
| | 3,850 | | | 6.750%, 7/01/41 | | | 7/21 at 100.00 | | | | | | | | BB | | | | 4,166,624 | |
| | | | | |
| | | | Portland, Maine, General Airport Revenue Bonds, Refunding Series 2013: | | | | | | | | | | | | | | | | |
| | 225 | | | 4.000%, 7/01/20 | | | No Opt. Call | | | | | | | | BBB+ | | | | 230,812 | |
| | 290 | | | 5.000%, 7/01/22 | | | No Opt. Call | | | | | | | | BBB+ | | | | 316,747 | |
| | 16,265 | | | Total Maine | | | | | | | | | | | | | | | 16,834,627 | |
| | | | | |
| | | | Maryland – 0.7% | | | | | | | | | | | | |
| | | | | |
| | | | Baltimore County, Maryland, Revenue Bonds, Oak Crest Village, Series 2016: | | | | | | | | | | | | | | | | |
| | 1,235 | | | 3.250%, 1/01/31 | | | 1/26 at 100.00 | | | | | | | | A | | | | 1,263,800 | |
| | 3,365 | | | 5.000%, 1/01/37 | | | 1/26 at 100.00 | | | | | | | | A | | | | 3,808,843 | |
| | | | | |
| | | | Baltimore, Maryland, Convention Center Hotel Revenue Bonds, Refunding Series 2017: | | | | | | | | | | | | | | | | |
| | 1,160 | | | 5.000%, 9/01/26 | | | No Opt. Call | | | | | | | | BBB– | | | | 1,347,143 | |
| | 1,760 | | | 5.000%, 9/01/27 | | | No Opt. Call | | | | | | | | BBB– | | | | 2,065,712 | |
| | 2,655 | | | 5.000%, 9/01/29 | | | 9/27 at 100.00 | | | | | | | | BBB– | | | | 3,070,906 | |
| | | | | |
| | | | Baltimore, Maryland, Revenue Bonds, Water Projects, Series 2013A: | | | | | | | | | | | | | | | | |
| | 500 | | | 5.000%, 7/01/21 | | | No Opt. Call | | | | | | | | AA– | | | | 537,860 | |
| | 1,000 | | | 5.000%, 7/01/26 | | | 1/24 at 100.00 | | | | | | | | AA– | | | | 1,142,360 | |
| | 1,715 | | | 5.000%, 7/01/27 | | | 1/24 at 100.00 | | | | | | | | AA– | | | | 1,952,184 | |
| | | | | |
| | 4,000 | | | Maryland Community Development Administration Department of Housing and Community Development, Residential Revenue Bonds, Series 2019A, 3.750%, 9/01/39 | | | 3/28 at 100.00 | | | | | | | | Aa2 | | | | 4,108,160 | |
| | | | | |
| | 250 | | | Maryland Economic Development Corporation, Economic Development Revenue Bonds, Transportation Facilities Project, Series 2010A, 5.750%, 6/01/35(Pre-refunded 6/01/20) | | | 6/20 at 100.00 | | | | | | | | N/R (4) | | | | 262,178 | |
| | | | | |
| | 1,000 | | | Maryland Economic Development Corporation, Student Housing Revenue Bonds, University of Maryland, College Park Project, Refunding Series 2016, 5.000%, 6/01/28 – AGM Insured | | | 6/26 at 100.00 | | | | | | | | AA | | | | 1,194,670 | |
| | | | | |
| | | | Maryland Health and Higher Educational Facilities Authority, Revenue Bonds, Mercy Medical Center, Series 2016A: | | | | | | | | | | | | | | | | |
| | 750 | | | 5.000%, 7/01/32 | | | 7/26 at 100.00 | | | | | | | | BBB | | | | 854,138 | |
| | 2,250 | | | 5.000%, 7/01/33 | | | 7/26 at 100.00 | | | | | | | | BBB | | | | 2,551,905 | |
| | 1,650 | | | 5.000%, 7/01/34 | | | 7/26 at 100.00 | | | | | | | | BBB | | | | 1,862,536 | |
| | 2,000 | | | 5.000%, 7/01/35 | | | 7/26 at 100.00 | | | | | | | | BBB | | | | 2,251,560 | |
| | 1,570 | | | 5.000%, 7/01/36 | | | 7/26 at 100.00 | | | | | | | | BBB | | | | 1,758,902 | |
| | | | | |
| | | | Maryland Health and Higher Educational Facilities Authority, Revenue Bonds, University of Maryland Medical System, Series 2010: | | | | | | | | | | | | | | | | |
| | 740 | | | 5.250%, 7/01/24(Pre-refunded 7/01/19) | | | 7/19 at 100.00 | | | | | | | | N/R (4) | | | | 746,801 | |
| | 1,260 | | | 5.250%, 7/01/24 | | | 7/19 at 100.00 | | | | | | | | A | | | | 1,270,219 | |
| | | | | |
| | 7,825 | | | Maryland Health and Higher Educational Facilities Authority, Revenue Bonds, Western Maryland Health, Series 2014, 5.250%, 7/01/25 | | | 7/24 at 100.00 | | | | | | | | BBB | | | | 8,996,402 | |
110
| | | | | | | | | | | | | | | | | | | | |
Principal
Amount (000) | | | Description (1) | | Optional Call
Provisions (2) | | | | | | Ratings (3) | | | Value | |
| | | | | |
| | | | Maryland(continued) | | | | | | | | | | | | |
| | | | | |
| $ | 2,155 | | | Rockville Mayor and Council, Maryland, Economic Development Revenue Bonds, Ingleside King Farm Project, TEMPS 45Series 2017C-3, 2.500%, 11/01/24 | | | 5/19 at 100.00 | | | | | | | | BB | | | $ | 2,155,065 | |
| | | | | |
| | 1,505 | | | Rockville Mayor and Council, Maryland, Economic Development Revenue Bonds, Ingleside King Farm Project, TEMPS 70Series 2017C-2, 3.000%, 11/01/25 | | | 5/20 at 100.00 | | | | | | | | BB | | | | 1,499,627 | |
| | | | | |
| | 1,005 | | | Rockville Mayor and Council, Maryland, Economic Development Revenue Bonds, Ingleside King Farm Project, TEMPS 85Series 2017C-1, 3.500%, 11/01/26 | | | 5/20 at 100.00 | | | | | | | | BB | | | | 1,008,588 | |
| | 41,350 | | | Total Maryland | | | | | | | | | | | | | | | 45,709,559 | |
| | | | | |
| | | | Massachusetts – 1.2% | | | | | | | | | | | | |
| | | | | |
| | 900 | | | Massachusetts Bay Transportation Authority, General Obligation Transportation System Bonds, Series 1991A, 7.000%, 3/01/21 – NPFG Insured | | | No Opt. Call | | | | | | | | Aa1 | | | | 969,120 | |
| | | | | |
| | 10,000 | | | Massachusetts Bay Transportation Authority, Sales Tax Revenue Bonds, Refunding Senior Lien Series 2004B, 5.250%, 7/01/20 | | | No Opt. Call | | | | | | | | AA | | | | 10,463,900 | |
| | | | | |
| | 1,570 | | | Massachusetts Department of Transportation, Metropolitan Highway System Revenue Bonds, Commonwealth Contract Assistance Secured, Refunding Series 2010B, 5.000%, 1/01/35 | | | 1/20 at 100.00 | | | | | | | | AA+ | | | | 1,608,261 | |
| | | | | |
| | 6,750 | | | Massachusetts Department of Transportation, Metropolitan Highway System Revenue Bonds, Refunding Senior Lien Series 2010B, 5.000%, 1/01/37 | | | 1/20 at 100.00 | | | | | | | | A+ | | | | 6,907,410 | |
| | | | | |
| | | | Massachusetts Development Finance Agency Revenue Bonds, Lawrence General Hospital Issue, Series 2014A: | | | | | | | | | | | | | | | | |
| | 835 | | | 5.000%, 7/01/26 | | | 7/24 at 100.00 | | | | | | | | BB+ | | | | 919,201 | |
| | 680 | | | 5.000%, 7/01/27 | | | 7/24 at 100.00 | | | | | | | | BB+ | | | | 747,408 | |
| | 925 | | | 5.000%, 7/01/28 | | | 7/24 at 100.00 | | | | | | | | BB+ | | | | 1,012,755 | |
| | 960 | | | 5.000%, 7/01/29 | | | 7/24 at 100.00 | | | | | | | | BB+ | | | | 1,047,254 | |
| | | | | |
| | 4,800 | | | Massachusetts Development Finance Agency Revenue Refunding Bonds, NewBridge on the Charles, Inc Issue, Series 2017, 4.000%, 10/01/32, 144A | | | 10/22 at 105.00 | | | | | | | | BB+ | | | | 4,795,008 | |
| | | | | |
| | 2,370 | | | Massachusetts Development Finance Agency, Health Care Facility Revenue Bonds, Adventcare Project, Series 2007A, 6.650%, 10/15/28 | | | 5/19 at 100.00 | | | | | | | | N/R | | | | 2,370,545 | |
| | | | | |
| | 1,530 | | | Massachusetts Development Finance Agency, Revenue Bonds, Boston Medical Center Issue, Series 2016E, 3.375%, 7/01/36 | | | 7/26 at 100.00 | | | | | | | | BBB | | | | 1,480,122 | |
| | | | | |
| | | | Massachusetts Development Finance Agency, Revenue Bonds, CareGroup Issue,Series 2018J-2: | | | | | | | | | | | | | | | | |
| | 2,255 | | | 5.000%, 7/01/33 | | | 7/28 at 100.00 | | | | | | | | A– | | | | 2,628,473 | |
| | 1,085 | | | 5.000%, 7/01/38 | | | 7/28 at 100.00 | | | | | | | | A– | | | | 1,242,889 | |
| | | | | |
| | | | Massachusetts Development Finance Agency, Revenue Bonds, Simmons University Issue, Series 2018L: | | | | | | | | | | | | | | | | |
| | 1,080 | | | 5.000%, 10/01/30 | | | 10/28 at 100.00 | | | | | | | | BBB+ | | | | 1,285,405 | |
| | 1,240 | | | 5.000%, 10/01/31 | | | 10/28 at 100.00 | | | | | | | | BBB+ | | | | 1,463,200 | |
| | 1,765 | | | 5.000%, 10/01/32 | | | 10/28 at 100.00 | | | | | | | | BBB+ | | | | 2,071,475 | |
| | | | | |
| | 4,250 | | | Massachusetts Development Finance Agency, Revenue Bonds, UMass Memorial Health Care Obligated Group Issue, Series 2017L, 3.625%, 7/01/37 | | | 7/27 at 100.00 | | | | | | | | A– | | | | 4,266,065 | |
111
Nuveen Intermediate Duration Municipal Bond Fund(continued)
Portfolio of Investments March 31, 2019
| | | | | | | | | | | | | | | | | | | | |
Principal
Amount (000) | | | Description (1) | | Optional Call
Provisions (2) | | | | | | Ratings (3) | | | Value | |
| | | | | |
| | | | Massachusetts(continued) | | | | | | | | | | | | |
| | | | | |
| $ | 4,125 | | | Massachusetts Development Finance Agency, Revenue Bonds, Wellforce Issue, Series 2019A, 4.000%, 7/01/37 | | | 1/29 at 100.00 | | | | | | | | BBB+ | | | $ | 4,255,639 | |
| | | | | |
| | | | Massachusetts Development Finance Authority, Revenue Bonds, Suffolk University, Series 2010: | | | | | | | | | | | | | | | | |
| | 915 | | | 4.500%, 7/01/21 | | | 7/20 at 100.00 | | | | | | | | Baa2 | | | | 944,545 | |
| | 1,780 | | | 4.500%, 7/01/22 | | | 7/20 at 100.00 | | | | | | | | Baa2 | | | | 1,835,412 | |
| | 1,705 | | | 4.625%, 7/01/23 | | | 7/20 at 100.00 | | | | | | | | Baa2 | | | | 1,759,287 | |
| | | | | |
| | | | Massachusetts Health and Educational Facilities Authority, Revenue Bonds, Springfield College, Series 2010: | | | | | | | | | | | | | | | | |
| | 500 | | | 5.125%, 10/15/22(Pre-refunded 10/15/19) | | | 10/19 at 100.00 | | | | | | | | N/R (4) | | | | 509,640 | |
| | 2,595 | | | 5.500%, 10/15/26(Pre-refunded 10/15/19) | | | 10/19 at 100.00 | | | | | | | | N/R (4) | | | | 2,650,196 | |
| | | | | |
| | | | Massachusetts Health and Educational Facilities Authority, Revenue Bonds, Suffolk University, Refunding Series 2009A: | | | | | | | | | | | | | | | | |
| | 1,940 | | | 6.000%, 7/01/24(Pre-refunded 7/01/19) | | | 7/19 at 100.00 | | | | | | | | N/R (4) | | | | 1,961,631 | |
| | 1,080 | | | 6.000%, 7/01/24 | | | 7/19 at 100.00 | | | | | | | | Baa2 | | | | 1,091,772 | |
| | | | | |
| | 2,485 | | | Massachusetts Housing Finance Agency, Single Family Housing Revenue Bonds,Series 2014-171, 3.850%, 12/01/34 | | | 6/24 at 100.00 | | | | | | | | AA+ | | | | 2,493,151 | |
| | | | | |
| | 15,000 | | | Massachusetts State, General Obligation Bonds, Revenue Anticipation Note Series 2018B, 4.000%, 5/23/19 | | | No Opt. Call | | | | | | | | N/R | | | | 15,054,300 | |
| | | | | |
| | 6,540 | | | Massachusetts State, Transportation Fund Revenue Bonds, Rail Enhancement Program, Series 2014A, 5.000%, 6/01/44 | | | 6/24 at 100.00 | | | | | | | | AA+ | | | | 7,346,186 | |
| | 81,660 | | | Total Massachusetts | | | | | | | | | | | | | | | 85,180,250 | |
| | | | | |
| | | | Michigan – 1.5% | | | | | | | | | | | | |
| | | | | |
| | | | Detroit Downtown Development Authority, Michigan, Tax Increment Refunding Bonds, Development Area 1 Projects, Series 1996B: | | | | | | | | | | | | | | | | |
| | 3,050 | | | 0.000%, 7/01/22 | | | No Opt. Call | | | | | | | | BB+ | | | | 2,632,913 | |
| | 2,650 | | | 0.000%, 7/01/23 | | | No Opt. Call | | | | | | | | BB+ | | | | 2,171,861 | |
| | 2,880 | | | 0.000%, 7/01/24 | | | No Opt. Call | | | | | | | | BB+ | | | | 2,233,958 | |
| | | | | |
| | 355 | | | Marquettte, Michigan, Electric Utility System Revenue Bonds, Refunding Series 2016A, 5.000%, 7/01/30 | | | 7/26 at 100.00 | | | | | | | | A | | | | 412,908 | |
| | | | | |
| | 4,850 | | | Michigan Finance Authority, Local Government Loan Program Revenue Bonds, Detroit Water & Sewerage Department Sewage Disposal System Local Project, Second Lien Series 2015C, 5.000%, 7/01/34 | | | 7/25 at 100.00 | | | | | | | | A | | | | 5,469,927 | |
| | | | | |
| | 14,000 | | | Michigan Finance Authority, State Aid Revenue Notes, Series 2018A-1, 4.000%, 8/20/19 | | | No Opt. Call | | | | | | | | N/R | | | | 14,125,300 | |
| | | | | |
| | 3,540 | | | Michigan Hospital Finance Authority, Revenue Bonds, Ascension Health Group, Series 2010B, 5.000%, 11/15/23 | | | 11/19 at 100.00 | | | | | | | | AA+ | | | | 3,608,074 | |
| | | | | |
| | 2,450 | | | Michigan Housing Development Authority, Rental Housing Revenue Bonds, Series 2018A, 3.800%, 10/01/38 | | | 10/27 at 100.00 | | | | | | | | AA | | | | 2,501,646 | |
| | | | | |
| | 4,000 | | | Michigan Housing Development Authority, Single Family Mortgage Revenue Bonds, Fixed Rate Series 2019A, 3.650%, 12/01/39 (WI/DD, Settling 4/11/19) | | | 6/28 at 100.00 | | | | | | | | AA+ | | | | 4,089,000 | |
| | | | | |
| | 5,000 | | | Michigan State Building Authority, Revenue Bonds, Facilities Program, RefundingSeries 2011-I-A, 5.000%, 10/15/28 | | | 10/21 at 100.00 | | | | | | | | Aa2 | | | | 5,386,700 | |
| | | | | |
| | 5,425 | | | Michigan State Building Authority, Revenue Bonds, Facilities Program, RefundingSeries 2011-II-A, 5.000%, 10/15/28 | | | 10/21 at 100.00 | | | | | | | | Aa2 | | | | 5,844,569 | |
112
| | | | | | | | | | | | | | | | | | | | |
Principal
Amount (000) | | | Description (1) | | Optional Call
Provisions (2) | | | | | | Ratings (3) | | | Value | |
| | | | | |
| | | | Michigan(continued) | | | | | | | | | | | | |
| | | | | |
| $ | 1,600 | | | Michigan State Trunk Line Fund Refunding Bonds, Series 2009, 5.000%, 11/01/23 | | | 11/19 at 100.00 | | | | | | | | AA+ | | | $ | 1,631,568 | |
| | | | | |
| | 4,750 | | | Romulus Community Schools, Wayne County, Michigan, General Obligation Bonds, Refunding Series 2013, 5.000%, 5/01/22 | | | No Opt. Call | | | | | | | | Aa1 | | | | 5,165,388 | |
| | | | | |
| | | | Royal Oak Hospital Finance Authority, Michigan, Hospital Revenue Bonds, William Beaumont Hospital Obligated Group, Refunding Series 2014D: | | | | | | | | | | | | | | | | |
| | 1,000 | | | 5.000%, 9/01/26 | | | 3/24 at 100.00 | | | | | | | | A+ | | | | 1,140,180 | |
| | 2,000 | | | 5.000%, 9/01/27 | | | 3/24 at 100.00 | | | | | | | | A+ | | | | 2,273,320 | |
| | 2,555 | | | 5.000%, 9/01/28 | | | 3/24 at 100.00 | | | | | | | | A+ | | | | 2,891,391 | |
| | 3,770 | | | 5.000%, 9/01/29 | | | 3/24 at 100.00 | | | | | | | | A+ | | | | 4,245,736 | |
| | 5,000 | | | 5.000%, 9/01/30 | | | 3/24 at 100.00 | | | | | | | | A+ | | | | 5,606,250 | |
| | 2,270 | | | 5.000%, 9/01/31 | | | 3/24 at 100.00 | | | | | | | | A+ | | | | 2,537,406 | |
| | | | | |
| | | | Walled Lake Consolidated School District, Oakland County, Michigan, General Obligation Bonds, Refunding Series 2011: | | | | | | | | | | | | | | | | |
| | 4,885 | | | 5.000%, 5/01/20 | | | No Opt. Call | | | | | | | | Aa1 | | | | 5,063,742 | |
| | 4,845 | | | 5.000%, 5/01/21 | | | 11/20 at 100.00 | | | | | | | | Aa1 | | | �� | 5,102,851 | |
| | 3,845 | | | 5.000%, 5/01/22 | | | 11/20 at 100.00 | | | | | | | | Aa1 | | | | 4,050,246 | |
| | | | | |
| | | | Wayne County Airport Authority, Michigan, Revenue Bonds, Detroit Metropolitan Wayne County Airport, Refunding Series 2015F: | | | | | | | | | | | | | | | | |
| | 3,750 | | | 5.000%, 12/01/32 (AMT) | | | 12/25 at 100.00 | | | | | | | | A | | | | 4,297,050 | |
| | 5,295 | | | 5.000%, 12/01/33 (AMT) | | | 12/25 at 100.00 | | | | | | | | A | | | | 6,046,572 | |
| | 5,000 | | | 5.000%, 12/01/34 (AMT) | | | 12/25 at 100.00 | | | | | | | | A | | | | 5,693,350 | |
| | 98,765 | | | Total Michigan | | | | | | | | | | | | | | | 104,221,906 | |
| | | | | |
| | | | Minnesota – 0.6% | | | | | | | | | | | | |
| | | | | |
| | 1,710 | | | Cass Lake Independent School District 115, Minnesota, General Obligation Bonds, School Building Refunding Series 2010A, 5.000%, 2/01/27 | | | 2/20 at 100.00 | | | | | | | | AAA | | | | 1,757,743 | |
| | | | | |
| | | | Duluth Economic Development Authority, Minnesota, Health Care Facilities Revenue Bonds, Essentia Health Obligated Group, Series 2018A: | | | | | | | | | | | | | | | | |
| | 885 | | | 5.000%, 2/15/33 | | | 2/28 at 100.00 | | | | | | | | A– | | | | 1,029,175 | |
| | 1,085 | | | 5.000%, 2/15/37 | | | 2/28 at 100.00 | | | | | | | | A– | | | | 1,244,256 | |
| | 8,085 | | | 4.250%, 2/15/43 | | | 2/28 at 100.00 | | | | | | | | A– | | | | 8,525,633 | |
| | 55 | | | 4.250%, 2/15/48 | | | 2/28 at 100.00 | | | | | | | | A– | | | | 57,774 | |
| | | | | |
| | | | Minneapolis-St Paul Metropolitan Airports Commission, Minnesota, Airport Revenue Bonds, Refunding Subordinate Lien Series 2014A: | | | | | | | | | | | | | | | | |
| | 2,590 | | | 5.000%, 1/01/25 | | | 1/24 at 100.00 | | | | | | | | A+ | | | | 2,975,055 | |
| | 2,005 | | | 5.000%, 1/01/32 | | | 1/24 at 100.00 | | | | | | | | A+ | | | | 2,253,380 | |
| | | | | |
| | 3,000 | | | Minnesota State, General Obligation Bonds, Various Purpose Series 2015A, 5.000%, 8/01/22 | | | No Opt. Call | | | | | | | | AAA | | | | 3,336,660 | |
| | | | | |
| | 8,790 | | | Minnesota State, General Obligation Bonds, Various Purpose Series 2016A, 5.000%, 8/01/20 | | | No Opt. Call | | | | | | | | AAA | | | | 9,196,010 | |
| | | | | |
| | 425 | | | Northern Municipal Power Agency, Minnesota, Electric System Revenue Bonds, Series 2013A, 4.000%, 1/01/28 | | | 1/23 at 100.00 | | | | | | | | A– | | | | 450,878 | |
| | | | | |
| | 1,150 | | | Rochester, Minnesota, Health Care Facilities Revenue Bonds, Olmsted Medical Center Project, Series 2013, 5.000%, 7/01/33 | | | 7/23 at 100.00 | | | | | | | | A | | | | 1,258,123 | |
| | | | | |
| | 2,060 | | | Saint Cloud, Minnesota, Health Care Revenue Bonds, CentraCare Health System, Refunding Series 2014B, 5.000%, 5/01/23 | | | No Opt. Call | | | | | | | | AA– | | | | 2,314,966 | |
| | | | | |
| | | | Saint Paul Housing and Redevelopment Authority, Minnesota, Health Care Revenue Bonds, Allina Health System, Series 2009A-1: | | | | | | | | | | | | | | | | |
| | 525 | | | 5.000%, 11/15/24(Pre-refunded 11/15/19) | | | 11/19 at 100.00 | | | | | | | | N/R (4) | | | | 536,114 | |
| | 490 | | | 5.000%, 11/15/24 | | | 11/19 at 100.00 | | | | | | | | AA– | | | | 500,158 | |
113
Nuveen Intermediate Duration Municipal Bond Fund(continued)
Portfolio of Investments March 31, 2019
| | | | | | | | | | | | | | | | | | | | |
Principal
Amount (000) | | | Description (1) | | Optional Call
Provisions (2) | | | | | | Ratings (3) | | | Value | |
| | | | | |
| | | | Minnesota(continued) | | | | | | | | | | | | |
| | | | | |
| $ | 6,580 | | | Saint Paul Independent School District 625, Ramsey County, Minnesota, Certificates of Participation, Series 2018B, 3.500%, 2/01/39 | | | 2/27 at 100.00 | | | | | | | | AAA | | | $ | 6,732,196 | |
| | | | | |
| | 295 | | | Saint Paul Port Authority, Minnesota, Lease Revenue Bonds, Regions Hospital Parking Ramp Project,Series 2007-1, 5.000%, 8/01/21 | | | 5/19 at 100.00 | | | | | | | | N/R | | | | 295,859 | |
| | 39,730 | | | Total Minnesota | | | | | | | | | | | | | | | 42,463,980 | |
| | | | | |
| | | | Mississippi – 0.6% | | | | | | | | | | | | |
| | | | | |
| | 6,570 | | | Mississippi Business Finance Corporation, Pollution Control Revenue, Mississippi Power, Series 2002, 3.200%, 9/01/28 | | | 3/24 at 100.00 | | | | | | | | A– | | | | 6,623,874 | |
| | | | | |
| | 8,190 | | | Mississippi Business Finance Corporation, Revenue Bonds, Mississippi Power Company Project, First Series 2010, 2.750%, 12/01/40 (Mandatory Put 12/09/21) | | | No Opt. Call | | | | | | | | A– | | | | 8,246,921 | |
| | | | | |
| | 13,545 | | | Mississippi Business Finance Corporation, Revenue Bonds, System Energy Resources, Inc Project, Refunding Series 2019, 2.500%, 4/01/22 | | | 4/21 at 100.00 | | | | | | | | BBB+ | | | | 13,605,546 | |
| | | | | |
| | 8,870 | | | Mississippi State, General Obligation Bonds, Series 2013B, 5.000%, 12/01/28(Pre-refunded 12/01/23) | | | 12/23 at 100.00 | | | | | | | | AA (4) | | | | 10,232,875 | |
| | 37,175 | | | Total Mississippi | | | | | | | | | | | | | | | 38,709,216 | |
| | | | | |
| | | | Missouri – 0.5% | | | | | | | | | | | | |
| | | | | |
| | 1,390 | | | Cape Girardeau County Industrial Development Authority, Missouri, Health Facilities Revenue Bonds, Southeasthealth, Series 2016A, 6.000%, 3/01/33 | | | 3/23 at 103.00 | | | | | | | | BBB– | | | | 1,585,851 | |
| | | | | |
| | 1,100 | | | Great Rivers Greenway Metropolitan Park & Recreation District, Missouri, Sales Tax Appropriation Bonds, Gateway Arch Project, Series 2014, 3.000%, 12/30/24 | | | 12/23 at 100.00 | | | | | | | | A+ | | | | 1,155,847 | |
| | | | | |
| | 1,000 | | | Grundy County Industrial Development Authority, Missouri, Health Facility Revenue Bonds, Wright Memorial Hospital, Series 2009, 5.600%, 9/01/21 | | | 9/19 at 100.00 | | | | | | | | BBB– | | | | 1,009,240 | |
| | | | | |
| | 1,465 | | | Missouri Health and Educational Facilities Authority, Educational Facilities Revenue Bonds, Saint Louis College of Pharmacy, Series 2013, 5.250%, 5/01/33 | | | 5/23 at 100.00 | | | | | | | | BBB+ | | | | 1,573,615 | |
| | | | | |
| | 220 | | | Missouri Health and Educational Facilities Authority, Educational Facilities Revenue Bonds, Saint Louis College of Pharmacy, Series 2015B, 4.000%, 5/01/32 | | | 11/23 at 100.00 | | | | | | | | BBB+ | | | | 224,272 | |
| | | | | |
| | 1,390 | | | Missouri Health and Educational Facilities Authority, Revenue Bonds, AT Still University of Health Sciences, Series 2014, 4.250%, 10/01/32 | | | 10/23 at 100.00 | | | | | | | | A– | | | | 1,469,452 | |
| | | | | |
| | | | Missouri Joint Municipal Electric Utility Commission, Power Project Revenue Bonds, Iatan 2 Project, Refunding Series 2014A: | | | | | | | | | | | | | | | | |
| | 1,330 | | | 5.000%, 1/01/25 | | | 1/24 at 100.00 | | | | | | | | A2 | | | | 1,519,246 | |
| | 2,525 | | | 5.000%, 1/01/26 | | | 1/24 at 100.00 | | | | | | | | A2 | | | | 2,879,359 | |
| | 1,000 | | | 5.000%, 1/01/32 | | | 1/24 at 100.00 | | | | | | | | A2 | | | | 1,120,290 | |
| | | | | |
| | 4,150 | | | Missouri Joint Municipal Electric Utility Commission, Power Project Revenue Bonds, Plum Point Project, Refunding Series 2014A, 5.000%, 1/01/23 | | | No Opt. Call | | | | | | | | A | | | | 4,635,592 | |
| | | | | |
| | 17,305 | | | Saint Louis, Missouri, Airport Revenue Bonds,Lambert-St Louis International Airport, Series 2005, 5.500%, 7/01/19 – NPFG Insured | | | No Opt. Call | | | | | | | | A2 | | | | 17,468,532 | |
| | | | | |
| | 1,155 | | | Stoddard County Industrial Development Authority, Missouri, Health Facility Revenue Bonds, Southeasthealth, Series 2016B, 6.000%, 3/01/37 | | | 3/23 at 103.00 | | | | | | | | BBB– | | | | 1,308,869 | |
| | 34,030 | | | Total Missouri | | | | | | | | | | | | | | | 35,950,165 | |
114
| | | | | | | | | | | | | | | | | | | | |
Principal
Amount (000) | | | Description (1) | | Optional Call
Provisions (2) | | | | | | Ratings (3) | | | Value | |
| | | | | |
| | | | Montana – 0.6% | | | | | | | | | | | | |
| | | | | |
| $ | 570 | | | Cascade County High School District A Great Falls, Montana, General Obligation Bonds, School Building Series 2017, 4.000%, 7/01/30 | | | 7/27 at 100.00 | | | | | | | | A+ | | | $ | 635,031 | |
| | | | | |
| | 1,500 | | | Cascade County High School District A Great Falls, Montana, General Obligation Bonds, School Building Series 2018, 5.000%, 7/01/38 | | | 7/28 at 100.00 | | | | | | | | A+ | | | | 1,770,990 | |
| | | | | |
| | 35,095 | | | Forsyth, Rosebud County, Montana, Pollution Control Revenue Refunding Bonds, Northwestern Corporation Colstrip Project, Series 2016, 2.000%, 8/01/23 | | | No Opt. Call | | | | | | | | A | | | | 35,229,063 | |
| | | | | |
| | 550 | | | Montana Facilities Finance Authority, Montana, Health Facilities Reveue Bonds, Bozeman Deaconess Health Services Obligated Group, Series 2018, 3.250%, 6/01/32 | | | 6/28 at 100.00 | | | | | | | | A | | | | 563,585 | |
| | | | | |
| | 2,500 | | | Montana Facility Finance Authority, Revenue Bonds, Sisters of Charity of Leavenworth Health Services Corporation, Composite Deal Series 2010B, 5.000%, 1/01/24 | | | 1/20 at 100.00 | | | | | | | | AA– | | | | 2,560,750 | |
| | 40,215 | | | Total Montana | | | | | | | | | | | | | | | 40,759,419 | |
| | | | | |
| | | | Nebraska – 1.4% | | | | | | | | | | | | |
| | | | | |
| | 5,000 | | | Central Plains Energy Project, Nebraska, Gas Project 4 Revenue Bonds, Series 2018A, 5.000%, 3/01/50 (Mandatory Put 1/01/24) | | | 10/23 at 100.43 | | | | | | | | A3 | | | | 5,544,650 | |
| | | | | |
| | 1,130 | | | Douglas County Hospital Authority 2, Nebraska, Health Facilities Revenue Bonds, Immanuel Obligated Group, Refunding Series 2010, 5.125%, 1/01/23 | | | 1/20 at 100.00 | | | | | | | | AA | | | | 1,156,623 | |
| | | | | |
| | 9,350 | | | Douglas County Hospital Authority 2, Nebraska, Hospital Revenue Bonds, Madonna Rehabilitation Hospital Project, Series 2014, 5.000%, 5/15/44 | | | 5/24 at 100.00 | | | | | | | | BBB+ | | | | 10,043,957 | |
| | | | | |
| | 665 | | | Douglas County School District 10 Elkhorn, Nebraska, General Obligation Bonds, Public Schools Series 2012, 4.000%, 6/15/23 | | | 6/22 at 100.00 | | | | | | | | AA– | | | | 713,272 | |
| | | | | |
| | 370 | | | Douglas County School District 10 Elkhorn, Nebraska, General Obligation Bonds, Public Schools Series 2015, 5.000%, 12/15/22 | | | No Opt. Call | | | | | | | | AA– | | | | 414,648 | |
| | | | | |
| | 1,000 | | | Lancaster County Hospital Authority 1, Nebraska, Health Facilities Revenue Bonds, Immanuel Obligated Group, Refunding Series 2010, 5.125%, 1/01/23 | | | 1/20 at 100.00 | | | | | | | | AA | | | | 1,023,560 | |
| | | | | |
| | 5,910 | | | Lincoln County Hospital Authority 1, Nebraska, Hospital Revenue and Refunding Bonds, Great Plains Regional Medical Center Project, Series 2012, 5.000%, 11/01/32 | | | 11/21 at 100.00 | | | | | | | | A– | | | | 6,285,403 | |
| | | | | |
| | | | Madison County Hospital Authority 1, Nebraska, Hospital Revenue Bonds, Faith Regional Health Services Project, Series 2018: | | | | | | | | | | | | | | | | |
| | 540 | | | 5.000%, 7/01/23 | | | No Opt. Call | | | | | | | | BBB | | | | 596,257 | |
| | 1,250 | | | 5.000%, 7/01/24 | | | No Opt. Call | | | | | | | | BBB | | | | 1,405,463 | |
| | 530 | | | 5.000%, 7/01/25 | | | No Opt. Call | | | | | | | | BBB | | | | 604,470 | |
| | 750 | | | 5.000%, 7/01/26 | | | 7/25 at 100.00 | | | | | | | | BBB | | | | 851,625 | |
| | 200 | | | 5.000%, 7/01/27 | | | 7/25 at 100.00 | | | | | | | | BBB | | | | 226,076 | |
| | 835 | | | 5.000%, 7/01/28 | | | 7/25 at 100.00 | | | | | | | | BBB | | | | 940,101 | |
| | 485 | | | 5.000%, 7/01/29 | | | 7/25 at 100.00 | | | | | | | | BBB | | | | 544,316 | |
| | 1,000 | | | 5.000%, 7/01/30 | | | 7/25 at 100.00 | | | | | | | | BBB | | | | 1,115,990 | |
| | 180 | | | 5.000%, 7/01/33 | | | 7/25 at 100.00 | | | | | | | | BBB | | | | 198,090 | |
| | | | | |
| | 13,725 | | | Nebraska Investment Finance Authority, Single Family Housing Revenue Bonds, Series 2015C, 3.900%, 9/01/35 | | | 9/24 at 100.00 | | | | | | | | AA+ | | | | 14,212,924 | |
| | | | | |
| | 3,980 | | | Nebraska Investment Finance Authority, Single Family Housing Revenue Bonds, Series 2018C, 3.750%, 9/01/38 | | | 9/27 at 100.00 | | | | | | | | AA+ | | | | 4,096,455 | |
115
Nuveen Intermediate Duration Municipal Bond Fund(continued)
Portfolio of Investments March 31, 2019
| | | | | | | | | | | | | | | | | | | | |
Principal
Amount (000) | | | Description (1) | | Optional Call
Provisions (2) | | | | | | Ratings (3) | | | Value | |
| | | | | |
| | | | Nebraska(continued) | | | | | | | | | | | | |
| | | | | |
| $ | 18,380 | | | Nebraska Investment Finance Authority, Single Family Housing Revenue Bonds, Series 2019A, 3.600%, 9/01/44 (WI/DD, Settling 4/30/19) | | | 3/28 at 100.00 | | | | | | | | AA+ | | | $ | 18,419,333 | |
| | | | | |
| | | | Nebraska Public Power District, General Revenue Bonds, Series 2012A: | | | | | | | | | | | | | | | | |
| | 1,485 | | | 5.000%, 1/01/23 | | | 1/22 at 100.00 | | | | | | | | A+ | | | | 1,619,378 | |
| | 1,510 | | | 5.000%, 1/01/24 | | | 1/22 at 100.00 | | | | | | | | A+ | | | | 1,645,356 | |
| | 950 | | | 5.000%, 1/01/25 | | | 1/22 at 100.00 | | | | | | | | A+ | | | | 1,033,828 | |
| | | | | |
| | 645 | | | Papillion-LaVista School District 27, Sarpy County, Nebraska, General Obligation Bonds, Series 2014, 5.000%, 12/01/22 | | | No Opt. Call | | | | | | | | Aa2 | | | | 722,793 | |
| | | | | |
| | 8,000 | | | Public Power Generation Agency, Nebraska, Whelan Energy Center Unit 2 Revenue Bonds, Refunding Series 2016A, 5.000%, 1/01/32 | | | 7/26 at 100.00 | | | | | | | | A2 | | | | 9,255,200 | |
| | | | | |
| | | | Scotts Bluff County Hospital Authority 1, Nebraska, Hospital Revenue Bonds, Regional West Medical Center Project, Refunding & Improvement Series 2016A: | | | | | | | | | | | | | | | | |
| | 3,660 | | | 5.250%, 2/01/28 | | | 2/27 at 100.00 | | | | | | | | BBB+ | | | | 4,146,414 | |
| | 1,355 | | | 5.250%, 2/01/29 | | | 2/27 at 100.00 | | | | | | | | BBB+ | | | | 1,530,974 | |
| | | | | |
| | 6,000 | | | Southeast Community College Area, Nebraska, Certificates of Participation, Series 2018, 3.375%, 12/15/37 | | | 6/28 at 100.00 | | | | | | | | Aa1 | | | | 6,049,620 | |
| | 88,885 | | | Total Nebraska | | | | | | | | | | | | | | | 94,396,776 | |
| | | | | |
| | | | Nevada – 1.6% | | | | | | | | | | | | |
| | | | | |
| | | | Clark County, Nevada, Airport Revenue Bonds, Jet Aviation Fuel Tax, Refunding Series 2013A: | | | | | | | | | | | | | | | | |
| | 2,000 | | | 5.000%, 7/01/22 (AMT) | | | No Opt. Call | | | | | | | | A+ | | | | 2,187,760 | |
| | 1,050 | | | 5.000%, 7/01/23 (AMT) | | | 1/23 at 100.00 | | | | | | | | A+ | | | | 1,170,026 | |
| | 1,905 | | | 5.000%, 7/01/24 (AMT) | | | 1/23 at 100.00 | | | | | | | | A+ | | | | 2,116,912 | |
| | | | | |
| | 8,220 | | | Clark County, Nevada, Airport Revenue Bonds, Junior Subordinate Lien Notes Series 2018A, 5.000%, 7/01/21 | | | No Opt. Call | | | | | | | | A+ | | | | 8,812,251 | |
| | | | | |
| | 21,050 | | | Clark County, Nevada, Airport Revenue Bonds, Subordinate Lien Series 2010B, 5.750%, 7/01/42 | | | 1/20 at 100.00 | | | | | | | | Aa3 | | | | 21,639,821 | |
| | | | | |
| | 5,275 | | | Clark County, Nevada, General Obligation Bonds, Refunding Flood Control Series 2014, 4.000%, 11/01/33 | | | 11/24 at 100.00 | | | | | | | | AA+ | | | | 5,640,083 | |
| | | | | |
| | | | Henderson, Nevada, Limited Obligation Bonds, Local Improvement DistrictT-18 Inspirada, Refunding Series 2016: | | | | | | | | | | | | | | | | |
| | 1,750 | | | 4.000%, 9/01/32 | | | 9/26 at 100.00 | | | | | | | | N/R | | | | 1,735,598 | |
| | 2,275 | | | 4.000%, 9/01/35 | | | 9/26 at 100.00 | | | | | | | | N/R | | | | 2,216,100 | |
| | | | | |
| | | | Las Vegas Valley Water District, Nevada, General Obligation Bonds, Refunding Series 2011C: | | | | | | | | | | | | | | | | |
| | 1,550 | | | 5.000%, 6/01/23 | | | 6/21 at 100.00 | | | | | | | | AA+ | | | | 1,662,468 | |
| | 1,000 | | | 5.000%, 6/01/24 | | | 6/21 at 100.00 | | | | | | | | AA+ | | | | 1,071,230 | |
| | 12,450 | | | 5.000%, 6/01/25 | | | 6/21 at 100.00 | | | | | | | | AA+ | | | | 13,321,749 | |
| | | | | |
| | | | Las Vegas Valley Water District, Nevada, General Obligation Bonds, Water Series 2012B: | | | | | | | | | | | | | | | | |
| | 2,125 | | | 5.000%, 6/01/24 | | | 6/22 at 100.00 | | | | | | | | AA+ | | | | 2,343,046 | |
| | 1,545 | | | 5.000%, 6/01/25 | | | 6/22 at 100.00 | | | | | | | | AA+ | | | | 1,700,365 | |
| | 2,000 | | | 5.000%, 6/01/26 | | | 6/22 at 100.00 | | | | | | | | AA+ | | | | 2,199,160 | |
| | | | | |
| | | | Las Vegas, Nevada, Local Improvement Bonds, Special Improvement District 607 Providence, Refunding Series 2013: | | | | | | | | | | | | | | | | |
| | 85 | | | 4.000%, 6/01/19 | | | No Opt. Call | | | | | | | | N/R | | | | 85,158 | |
| | 50 | | | 4.000%, 6/01/20 | | | No Opt. Call | | | | | | | | N/R | | | | 50,704 | |
| | 340 | | | 5.000%, 6/01/22 | | | No Opt. Call | | | | | | | | N/R | | | | 359,523 | |
116
| | | | | | | | | | | | | | | | | | | | |
Principal
Amount (000) | | | Description (1) | | Optional Call
Provisions (2) | | | | | | Ratings (3) | | | Value | |
| | | | | |
| | | | Nevada(continued) | | | | | | | | | | | | |
| | | | | |
| $ | 4,695 | | | Nevada State, General Obligation Bonds, Capital Improvement & Cultural Affairs, Refunding Series 2012B, 5.000%, 8/01/22 | | | No Opt. Call | | | | | | | | AA+ | | | $ | 5,215,394 | |
| | | | | |
| | 11,150 | | | Nevada State, General Obligation Bonds, Capital Improvement & Cultural Affairs, RefundingSeries 2013D-1, 5.000%, 3/01/22 | | | No Opt. Call | | | | | | | | AA+ | | | | 12,241,027 | |
| | | | | |
| | 12,065 | | | Washoe County, Nevada, Gas and Water Facilities Revenue Bonds, Sierra Pacific Power Company, Refunding Series 2016B, 3.000%, 3/01/36 (Mandatory Put 6/01/22) | | | No Opt. Call | | | | | | | | A+ | | | | 12,426,467 | |
| | | | | |
| | 3,000 | | | Washoe County, Nevada, Gas Facilities Revenue Bonds, Sierra Pacific Power Company Projects, Refunding Series 2016A, 1.500%, 8/01/31 (Mandatory Put 6/03/19) (AMT) | | | No Opt. Call | | | | | | | | A+ | | | | 2,997,330 | |
| | | | | |
| | | | Washoe County, Nevada, General Obligation Bonds, Reno-Sparks Convention & Visitors Authority, Refunding Series 2011: | | | | | | | | | | | | | | | | |
| | 3,265 | | | 5.000%, 7/01/22 | | | 7/21 at 100.00 | | | | | | | | AA | | | | 3,509,222 | |
| | 4,710 | | | 5.000%, 7/01/23 | | | 7/21 at 100.00 | | | | | | | | AA | | | | 5,059,812 | |
| | 103,555 | | | Total Nevada | | | | | | | | | | | | | | | 109,761,206 | |
| | | | | |
| | | | New Hampshire – 0.3% | | | | | | | | | | | | |
| | | | | |
| | 895 | | | Business Finance Authority of the State of New Hampshire, Water Facility Revenue Bonds, Pennichuck Water Works, Inc Project ,Series 2015A, 4.250%, 1/01/36 (AMT) | | | 1/26 at 100.00 | | | | | | | | A+ | | | | 931,417 | |
| | | | | |
| | 12,370 | | | New Hampshire Business Finance Authority, Pollution Control Revenue Bonds, United Illuminating Company, Refunding Series 2003A, 2.800%, 10/01/33 (Mandatory Put 10/02/23) | | | No Opt. Call | | | | | | | | A– | | | | 12,679,374 | |
| | | | | |
| | 5,725 | | | New Hampshire Health and Education Facilities Authority, Revenue Bonds, Dartmouth College, Refunding Series 2009, 5.250%, 6/01/39(Pre-refunded 6/01/19) | | | 6/19 at 100.00 | | | | | | | | AA+ (4) | | | | 5,760,438 | |
| | | | | |
| | 1,840 | | | New Hampshire Health and Education Facilities Authority, Revenue Bonds, Elliot Hospital, Series 2016, 5.000%, 10/01/38 | | | 10/26 at 100.00 | | | | | | | | A– | | | | 2,037,119 | |
| | | | | |
| | 845 | | | New Hampshire Health and Education Facilities Authority, Revenue Bonds, Southern New Hampshire Medical Center, Series 2016, 3.500%, 10/01/34 | | | 10/26 at 100.00 | | | | | | | | A– | | | | 861,866 | |
| | 21,675 | | | Total New Hampshire | | | | | | | | | | | | | | | 22,270,214 | |
| | | | | |
| | | | New Jersey – 5.5% | | | | | | | | | | | | |
| | | | | |
| | | | Camden County Improvement Authority, New Jersey, Health Care Redevelopment Revenue Bonds, Cooper Health System Obligated Group Issue, Refunding Series 2014A: | | | | | | | | | | | | | | | | |
| | 2,500 | | | 5.000%, 2/15/30 | | | 2/24 at 100.00 | | | | | | | | BBB+ | | | | 2,768,025 | |
| | 1,045 | | | 5.000%, 2/15/34 | | | 2/24 at 100.00 | | | | | | | | BBB+ | | | | 1,140,910 | |
| | | | | |
| | 8,535 | | | Gloucester County Pollution Control Financing Authority, New Jersey, Pollution Control Revenue Bonds, Logan Project, Refunding Series 2014A, 5.000%, 12/01/24 (AMT) | | | No Opt. Call | | | | | | | | BBB– | | | | 9,141,924 | |
117
Nuveen Intermediate Duration Municipal Bond Fund(continued)
Portfolio of Investments March 31, 2019
| | | | | | | | | | | | | | | | | | | | |
Principal
Amount (000) | | | Description (1) | | Optional Call
Provisions (2) | | | | | | Ratings (3) | | | Value | |
| | | | | |
| | | | New Jersey(continued) | | | | | | | | | | | | |
| | | | | |
| | | | New Jersey Economic Development Authority, Cigarette Tax Revenue Refunding Bonds, Series 2012: | | | | | | | | | | | | | | | | |
| $ | 5,555 | | | 5.000%, 6/15/19 | | | No Opt. Call | | | | | | | | BBB+ | | | $ | 5,589,330 | |
| | 5,905 | | | 5.000%, 6/15/20 | | | No Opt. Call | | | | | | | | BBB+ | | | | 6,114,864 | |
| | 13,995 | | | 5.000%, 6/15/21 | | | No Opt. Call | | | | | | | | BBB+ | | | | 14,871,227 | |
| | 2,465 | | | 5.000%, 6/15/22 | | | No Opt. Call | | | | | | | | BBB+ | | | | 2,683,005 | |
| | 1,100 | | | 5.000%, 6/15/22 | | | No Opt. Call | | | | | | | | AA | | | | 1,197,284 | |
| | 7,180 | | | 5.000%, 6/15/23 | | | 6/22 at 100.00 | | | | | | | | BBB+ | | | | 7,799,993 | |
| | 2,990 | | | 5.000%, 6/15/24 | | | 6/22 at 100.00 | | | | | | | | BBB+ | | | | 3,238,170 | |
| | 7,615 | | | 5.000%, 6/15/25 | | | 6/22 at 100.00 | | | | | | | | BBB+ | | | | 8,228,997 | |
| | 5,000 | | | 5.000%, 6/15/26 | | | 6/22 at 100.00 | | | | | | | | BBB+ | | | | 5,391,850 | |
| | 950 | | | 4.250%, 6/15/27 | | | 6/22 at 100.00 | | | | | | | | BBB+ | | | | 1,000,417 | |
| | 4,625 | | | 5.000%, 6/15/28 | | | 6/22 at 100.00 | | | | | | | | BBB+ | | | | 4,964,382 | |
| | | | | |
| | | | New Jersey Economic Development Authority, Private Activity Bonds, The Goethals Bridge Replacement Project, Series 2013: | | | | | | | | | | | | | | | | |
| | 1,350 | | | 5.000%, 1/01/28 (AMT) | | | 1/24 at 100.00 | | | | | | | | BBB | | | | 1,503,981 | |
| | 2,215 | | | 5.000%, 1/01/31 – AGM Insured (AMT) | | | 1/24 at 100.00 | | | | | | | | AA | | | | 2,457,144 | |
| | | | | |
| | 9,120 | | | New Jersey Economic Development Authority, Revenue Bonds, Motor Vehicle Surcharge, Refunding Series 2017A, 3.375%, 7/01/30 | | | 7/27 at 100.00 | | | | | | | | BBB+ | | | | 9,150,917 | |
| | | | | |
| | 25,000 | | | New Jersey Economic Development Authority, School Facilities Construction Bonds, Refunding Series 2015XX, 5.000%, 6/15/27 | | | 6/25 at 100.00 | | | | | | | | A– | | | | 27,834,000 | |
| | | | | |
| | 6,000 | | | New Jersey Economic Development Authority, Special Facility Revenue Bonds, Port Newark Container Terminal LLC Project, Refunding Series 2017, 5.000%, 10/01/47 (AMT) | | | 10/27 at 100.00 | | | | | | | | Ba1 | | | | 6,498,240 | |
| | | | | |
| | 350 | | | New Jersey Educational Facilities Authority, Revenue Bonds, Seton Hall University, Series 2016C, 3.000%, 7/01/41 | | | 7/26 at 100.00 | | | | | | | | A– | | | | 332,539 | |
| | | | | |
| | 2,000 | | | New Jersey Health Care Facilities Financing Authority, Revenue Bonds, Barnabas Health, Refunding Series 2014A, 5.000%, 7/01/44 | | | 7/24 at 100.00 | | | | | | | | AA– | | | | 2,241,400 | |
| | | | | |
| | 1,000 | | | New Jersey Health Care Facilities Financing Authority, Revenue Bonds, Saint Joseph’s Healthcare System Obligated Group Issue, Refunding Series 2016, 5.000%, 7/01/35 | | | 7/26 at 100.00 | | | | | | | | BBB– | | | | 1,109,990 | |
| | | | | |
| | | | New Jersey Higher Education Assistance Authority, Student Loan Revenue Bonds, Senior LienSeries 2017-1A: | | | | | | | | | | | | | | | | |
| | 4,415 | | | 3.500%, 12/01/29 (AMT) | | | 12/26 at 100.00 | | | | | | | | Aaa | | | | 4,593,189 | |
| | 11,705 | | | 3.750%, 12/01/31 (AMT) | | | 12/26 at 100.00 | | | | | | | | Aaa | | | | 12,191,928 | |
| | 11,975 | | | 4.000%, 12/01/32 (AMT) | | | 12/26 at 100.00 | | | | | | | | Aaa | | | | 12,610,034 | |
| | 5,000 | | | 3.750%, 12/01/33 (AMT) | | | 12/26 at 100.00 | | | | | | | | Aaa | | | | 5,161,000 | |
| | | | | |
| | 980 | | | New Jersey Housing and Mortgage Finance Agency, Single Family Housing Revenue Bonds, Series 2018A, 3.750%, 10/01/35 | | | 10/27 at 100.00 | | | | | | | | AA | | | | 1,018,828 | |
| | | | | |
| | | | New Jersey Transportation Trust Fund Authority, Federal Highway Reimbursement Revenue Notes, Series 2018A: | | | | | | | | | | | | | | | | |
| | 6,145 | | | 5.000%, 6/15/24 | | | No Opt. Call | | | | | | | | A+ | | | | 6,955,280 | |
| | 8,375 | | | 5.000%, 6/15/29 | | | 6/26 at 100.00 | | | | | | | | A+ | | | | 9,572,290 | |
| | 9,395 | | | 5.000%, 6/15/30 | | | 6/26 at 100.00 | | | | | | | | A+ | | | | 10,663,043 | |
| | 10,530 | | | 5.000%, 6/15/31 | | | 6/26 at 100.00 | | | | | | | | A+ | | | | 11,891,845 | |
| | | | | |
| | 1,440 | | | New Jersey Transportation Trust Fund Authority, Transportation System Bonds, Refunding Series 2006C, 0.000%, 12/15/31 – FGIC Insured | | | No Opt. Call | | | | | | | | A– | | | | 903,096 | |
| | | | | |
| | 5,240 | | | New Jersey Transportation Trust Fund Authority, Transportation System Bonds, Series 2003B, 5.250%, 12/15/19 | | | No Opt. Call | | | | | | | | A– | | | | 5,366,284 | |
118
| | | | | | | | | | | | | | | | | | | | |
Principal
Amount (000) | | | Description (1) | | Optional Call
Provisions (2) | | | | | | Ratings (3) | | | Value | |
| | | | | |
| | | | New Jersey(continued) | | | | | | | | | | | | |
| | | | | |
| $ | 10,630 | | | New Jersey Transportation Trust Fund Authority, Transportation System Bonds, Series 2010D, 5.000%, 12/15/23 | | | No Opt. Call | | | | | | | | A– | | | $ | 11,845,540 | |
| | | | | |
| | | | New Jersey Transportation Trust Fund Authority, Transportation System Bonds, Series 2011B: | | | | | | | | | | | | | | | | |
| | 4,860 | | | 5.500%, 6/15/31 | | | 6/21 at 100.00 | | | | | | | | A– | | | | 5,128,564 | |
| | 10,055 | | | 5.250%, 6/15/36 | | | 6/21 at 100.00 | | | | | | | | A– | | | | 10,502,950 | |
| | 585 | | | 5.000%, 6/15/42 | | | 6/21 at 100.00 | | | | | | | | A– | | | | 605,276 | |
| | | | | |
| | 14,000 | | | New Jersey Transportation Trust Fund Authority, Transportation System Bonds, Series 2012AA, 5.000%, 6/15/22 | | | No Opt. Call | | | | | | | | A– | | | | 15,147,580 | |
| | | | | |
| | 20,200 | | | New Jersey Transportation Trust Fund Authority, Transportation System Bonds, Series 2013A, 5.000%, 6/15/20 | | | No Opt. Call | | | | | | | | A– | | | | 20,930,836 | |
| | | | | |
| | 685 | | | New Jersey Transportation Trust Fund Authority, Transportation System Bonds, Series 2013AA, 5.000%, 6/15/36 | | | 6/23 at 100.00 | | | | | | | | A– | | | | 725,114 | |
| | | | | |
| | | | New Jersey Transportation Trust Fund Authority, Transportation System Bonds, Series 2015AA: | | | | | | | | | | | | | | | | |
| | 1,810 | | | 5.250%, 6/15/33 | | | 6/25 at 100.00 | | | | | | | | A– | | | | 2,000,141 | |
| | 1,850 | | | 5.250%, 6/15/34 | | | 6/25 at 100.00 | | | | | | | | A– | | | | 2,037,016 | |
| | | | | |
| | | | New Jersey Transportation Trust Fund Authority, Transportation System Bonds, Series 2018A: | | | | | | | | | | | | | | | | |
| | 2,000 | | | 5.000%, 12/15/23 | | | No Opt. Call | | | | | | | | A– | | | | 2,228,700 | |
| | 5,855 | | | 4.250%, 12/15/38 | | | 12/28 at 100.00 | | | | | | | | A– | | | | 6,024,209 | |
| | | | | |
| | 16,010 | | | New Jersey Transportation Trust Fund Authority, Transportation System Bonds, Series 2019AA, 3.750%, 6/15/33 | | | 12/28 at 100.00 | | | | | | | | A– | | | | 16,127,673 | |
| | | | | |
| | 5,615 | | | Salem County Pollution Control Financing Authority, New Jersey, Pollution Control Revenue Bonds, Chambers Project, Refunding Series 2014A, 5.000%, 12/01/23 (AMT) | | | No Opt. Call | | | | | | | | BBB– | | | | 5,999,178 | |
| | | | | |
| | | | South Jersey Port Corporation, New Jersey, Marine Terminal Revenue Bonds, Refunding Series 2012Q: | | | | | | | | | | | | | | | | |
| | 4,505 | | | 3.000%, 1/01/20 | | | No Opt. Call | | | | | | | | Baa1 | | | | 4,528,786 | |
| | 2,950 | | | 3.000%, 1/01/21 | | | No Opt. Call | | | | | | | | Baa1 | | | | 2,982,066 | |
| | | | | |
| | | | Tobacco Settlement Financing Corporation, New Jersey, Tobacco Settlement Asset-Backed Bonds, Series 2018A: | | | | | | | | | | | | | | | | |
| | 3,500 | | | 5.000%, 6/01/28 | | | No Opt. Call | | | | | | | | A– | | | | 4,171,440 | |
| | 3,085 | | | 5.000%, 6/01/30 | | | 6/28 at 100.00 | | | | | | | | A– | | | | 3,616,515 | |
| | 6,560 | | | 5.000%, 6/01/31 | | | 6/28 at 100.00 | | | | | | | | A– | | | | 7,627,378 | |
| | 6,000 | | | 5.000%, 6/01/35 | | | 6/28 at 100.00 | | | | | | | | A– | | | | 6,815,940 | |
| | 11,480 | | | 4.000%, 6/01/37 | | | 6/28 at 100.00 | | | | | | | | A– | | | | 11,674,471 | |
| | | | | |
| | | | Tobacco Settlement Financing Corporation, New Jersey, Tobacco Settlement Asset-Backed Bonds, Series 2018B: | | | | | | | | | | | | | | | | |
| | 25,600 | | | 3.200%, 6/01/27 | | | No Opt. Call | | | | | | | | BBB+ | | | | 26,401,792 | |
| | 2,770 | | | 5.000%, 6/01/46 | | | 6/28 at 100.00 | | | | | | | | BBB | | | | 2,926,173 | |
| | 352,300 | | | Total New Jersey | | | | | | | | | | | | | | | 376,232,744 | |
| | | | | |
| | | | New Mexico – 0.3% | | | | | | | | | | | | |
| | | | | |
| | 1,800 | | | New Mexico Mortgage Finance Authority, Single Family Mortgage Program Bonds, Class 1 Series 2018B, 3.750%, 7/01/38 | | | 7/27 at 100.00 | | | | | | | | Aaa | | | | 1,859,130 | |
| | | | | |
| | 5,250 | | | New Mexico Mortgage Finance Authority, Single Family Mortgage Program Bonds, Class 1 Series 2018C, 3.750%, 7/01/38 | | | 1/28 at 100.00 | | | | | | | | Aaa | | | | 5,411,385 | |
119
Nuveen Intermediate Duration Municipal Bond Fund(continued)
Portfolio of Investments March 31, 2019
| | | | | | | | | | | | | | | | | | | | |
Principal
Amount (000) | | | Description (1) | | Optional Call
Provisions (2) | | | | | | Ratings (3) | | | Value | |
| | | | | |
| | | | New Mexico(continued) | | | | | | | | | | | | |
| | | | | |
| $ | 14,850 | | | New Mexico Municipal Energy Acquisition Authority, Gas Supply Revenue Bonds, Refunding Sub-Series 2014A, 5.000%, 11/01/39 (Mandatory Put 8/01/19) | | | 8/19 at 100.00 | | | | | | | | Aa2 | | | $ | 15,004,440 | |
| | 21,900 | | | Total New Mexico | | | | | | | | | | | | | | | 22,274,955 | |
| | | | | |
| | | | New York – 5.2% | | | | | | | | | | | | |
| | | | | |
| | 4,060 | | | Brooklyn Arena Local Development Corporation, New York, Payment in Lieu of Taxes Revenue Bonds, Barclays Center Project, Series 2009, 6.000%, 7/15/30(Pre-refunded 1/15/20) | | | 1/20 at 100.00 | | | | | | | | AA+ (4) | | | | 4,205,713 | |
| | | | | |
| | | | Buffalo and Fort Erie Public Bridge Authority, New York, Toll Bridge System Revenue Bonds, Refunding Series 2014: | | | | | | | | | | | | | | | | |
| | 300 | | | 5.000%, 1/01/24 | | | No Opt. Call | | | | | | | | A+ | | | | 343,863 | |
| | 500 | | | 5.000%, 1/01/25 | | | No Opt. Call | | | | | | | | A+ | | | | 584,700 | |
| | | | | |
| | 5,130 | | | Dormitory Authority of the State of New York, Revenue Bonds, Marymount Manhattan College, Series 2009, 5.000%, 7/01/24 | | | 7/19 at 100.00 | | | | | | | | Baa2 | | | | 5,170,373 | |
| | | | | |
| | | | Dormitory Authority of the State of New York, Revenue Bonds, Orange Regional Medical Center Obligated Group, Series 2017: | | | | | | | | | | | | | | | | |
| | 1,900 | | | 5.000%, 12/01/25, 144A | | | No Opt. Call | | | | | | | | BBB– | | | | 2,206,185 | |
| | 1,400 | | | 5.000%, 12/01/27, 144A | | | 6/27 at 100.00 | | | | | | | | BBB– | | | | 1,650,236 | |
| | 1,300 | | | 5.000%, 12/01/29, 144A | | | 6/27 at 100.00 | | | | | | | | BBB– | | | | 1,514,773 | |
| | 1,500 | | | 5.000%, 12/01/32, 144A | | | 6/27 at 100.00 | | | | | | | | BBB– | | | | 1,723,560 | |
| | | | | |
| | 7,050 | | | Dormitory Authority of the State of New York, State and Local Appropriation Lease Bonds, Upstate Community Colleges, Series 2005A, 5.500%, 7/01/20– FGIC Insured | | | No Opt. Call | | | | | | | | AA | | | | 7,398,764 | |
| | | | | |
| | | | Dormitory Authority of the State of New York, State University Educational Facilities Revenue Bonds, Third General Resolution, Series 2012A: | | | | | | | | | | | | | | | | |
| | 10,055 | | | 5.000%, 5/15/24 | | | 5/22 at 100.00 | | | | | | | | AA | | | | 11,079,303 | |
| | 9,285 | | | 5.000%, 5/15/25 | | | 5/22 at 100.00 | | | | | | | | AA | | | | 10,218,978 | |
| | | | | |
| | | | Long Island Power Authority, New York, Electric System General Revenue Bonds, Series 2000A: | | | | | | | | | | | | | | | | |
| | 110 | | | 0.000%, 6/01/22 – AGM Insured | | | No Opt. Call | | | | | | | | AA | | | | 103,589 | |
| | 1,055 | | | 0.000%, 6/01/23 – AGM Insured | | | No Opt. Call | | | | | | | | AA | | | | 969,872 | |
| | | | | |
| | 5,400 | | | Long Island Power Authority, New York, Electric System General Revenue Bonds, Series 2014A, 5.000%, 9/01/34 | | | 9/24 at 100.00 | | | | | | | | A– | | | | 6,098,490 | |
| | | | | |
| | 200 | | | Long Island Power Authority, New York, Electric System Revenue Bonds, Refunding Series 2009A, 5.000%, 4/01/19 (ETM) | | | No Opt. Call | | | | | | | | N/R (4) | | | | 200,000 | |
| | | | | |
| | 1,235 | | | Long Island Power Authority, New York, Electric System Revenue Bonds, Series 2012B, 5.000%, 9/01/26 | | | 9/22 at 100.00 | | | | | | | | A– | | | | 1,354,783 | |
| | | | | |
| | | | Metropolitan Transportation Authority, New York, Transportation Revenue Bonds, Bond Anticipation Note Series 2018B-1, Subseries A-J: | | | | | | | | | | | | | | | | |
| | 11,000 | | | 5.000%, 5/15/20 | | | No Opt. Call | | | | | | | | N/R | | | | 11,390,390 | |
| | 8,160 | | | 5.000%, 5/15/20 | | | No Opt. Call | | | | | | | | N/R | | | | 8,449,598 | |
| | | | | |
| | 12,115 | | | Metropolitan Transportation Authority, New York, Transportation Revenue Bonds, Bond Anticipation Note Series 2018B-2, Subseries A-E, 5.000%, 5/15/21 | | | No Opt. Call | | | | | | | | N/R | | | | 12,897,508 | |
| | | | | |
| | 14,390 | | | Metropolitan Transportation Authority, New York, Transportation Revenue Bonds, Bond Anticipation Note Series 2018C Subseries2018C-2, 5.000%, 9/01/21 | | | No Opt. Call | | | | | | | | N/R | | | | 15,424,497 | |
120
| | | | | | | | | | | | | | | | | | | | |
Principal
Amount (000) | | | Description (1) | | Optional Call
Provisions (2) | | | | | | Ratings (3) | | | Value | |
| | | | | |
| | | | New York(continued) | | | | | | | | | | | | |
| | | | | |
| $ | 15,000 | | | Metropolitan Transportation Authority, New York, Transportation Revenue Bonds, Bond Anticipation Note Series 2019A, 4.000%, 2/03/20 | | | No Opt. Call | | | | | | | | N/R | | | $ | 15,287,100 | |
| | | | | |
| | | | Nassau County Local Economic Assistance Corporation, New York, Revenue Bonds, Catholic Health Services of Long Island Obligated Group Project, Series 2014: | | | | | | | | | | | | | | | | |
| | 1,500 | | | 5.000%, 7/01/28 | | | 7/24 at 100.00 | | | | | | | | A– | | | | 1,691,955 | |
| | 1,000 | | | 5.000%, 7/01/29 | | | 7/24 at 100.00 | | | | | | | | A– | | | | 1,123,850 | |
| | | | | |
| | | | Nassau County Local Economic Assistance Corporation, New York, Revenue Bonds, Catholic Health Services of Long Island Obligated Group Project, Series 2014B: | | | | | | | | | | | | | | | | |
| | 655 | | | 5.000%, 7/01/30 | | | 7/24 at 100.00 | | | | | | | | A– | | | | 730,508 | |
| | 2,455 | | | 5.000%, 7/01/32 | | | 7/24 at 100.00 | | | | | | | | A– | | | | 2,704,895 | |
| | | | | |
| | | | New York City Housing Development Corporation, New York, Multifamily Housing Revenue Bonds,Series 2009C-1: | | | | | | | | | | | | | | | | |
| | 3,500 | | | 5.550%, 11/01/39 | | | 5/19 at 100.00 | | | | | | | | AA+ | | | | 3,511,480 | |
| | 7,155 | | | 5.700%, 11/01/46 | | | 5/19 at 100.00 | | | | | | | | AA+ | | | | 7,179,327 | |
| | | | | |
| | 10,000 | | | New York City, New York, General Obligation Bonds, Fiscal 2003Series C-A RMKT, 5.000%, 8/01/19 | | | No Opt. Call | | | | | | | | Aa1 | | | | 10,115,400 | |
| | | | | |
| | 20,000 | | | New York City, New York, General Obligation Bonds, Fiscal 2015 Series A, 5.000%, 8/01/20 | | | No Opt. Call | | | | | | | | Aa1 | | | | 20,913,000 | |
| | | | | |
| | 6,995 | | | New York City, New York, General Obligation Bonds, Fiscal 2018 Series A, 5.000%, 8/01/19 | | | No Opt. Call | | | | | | | | Aa1 | | | | 7,075,722 | |
| | | | | |
| | | | New York State Housing Finance Agency, Affordable Housing Revenue Bonds, Climate Bond Certified/Green Bond Series 2018I: | | | | | | | | | | | | | | | | |
| | 900 | | | 3.625%, 11/01/33 | | | 11/27 at 100.00 | | | | | | | | Aa2 | | | | 933,489 | |
| | 2,000 | | | 3.875%, 11/01/38 | | | 11/27 at 100.00 | | | | | | | | Aa2 | | | | 2,066,500 | |
| | | | | |
| | 5,500 | | | New York State Housing Finance Agency, Affordable Housing Revenue Bonds, Climate Bond Certified/Green Bond Series 2019D, 2.050%, 5/01/23 | | | 1/21 at 100.00 | | | | | | | | Aa2 | | | | 5,508,635 | |
| | | | | |
| | 10,000 | | | New York State Housing Finance Agency, Affordable Housing Revenue Bonds, Refunding Series 2019C, 3.850%, 11/01/39 | | | 5/28 at 100.00 | | | | | | | | Aa2 | | | | 10,284,400 | |
| | | | | |
| | 2,500 | | | New York State Housing Finance Agency, Affordable Housing Revenue Bonds, Series 2019E, 2.125%, 11/01/23 | | | 8/21 at 100.00 | | | | | | | | Aa2 | | | | 2,504,925 | |
| | | | | |
| | 16,270 | | | New York State Thruway Authority, General Revenue Junior Indebtedness Obligations, Series 2013A, 5.000%, 5/01/19 | | | No Opt. Call | | | | | | | | A2 | | | | 16,315,068 | |
| | | | | |
| | | | New York Transportation Development Corporation, New York, Special Facility Revenue Bonds, Delta Air Lines, Inc – LaGuardia Airport Terminals C&D Redevelopment Project, Series 2018: | | | | | | | | | | | | | | | | |
| | 2,000 | | | 5.000%, 1/01/34 (AMT) | | | 1/28 at 100.00 | | | | | | | | Baa3 | | | | 2,318,140 | |
| | 15,510 | | | 4.000%, 1/01/36 (AMT) | | | 1/28 at 100.00 | | | | | | | | Baa3 | | | | 16,082,939 | |
| | | | | |
| | | | New York Transportation Development Corporation, New York, Special Facility Revenue Refunding Bonds, Terminal One Group Association, LP Project, Series 2015: | | | | | | | | | | | | | | | | |
| | 2,005 | | | 5.000%, 1/01/22 (AMT) | | | No Opt. Call | | | | | | | | A– | | | | 2,157,801 | |
| | 2,065 | | | 5.000%, 1/01/23 (AMT) | | | No Opt. Call | | | | | | | | A– | | | | 2,272,677 | |
121
Nuveen Intermediate Duration Municipal Bond Fund(continued)
Portfolio of Investments March 31, 2019
| | | | | | | | | | | | | | | | | | | | |
Principal
Amount (000) | | | Description (1) | | Optional Call
Provisions (2) | | | | | | Ratings (3) | | | Value | |
| | | | | |
| | | | New York(continued) | | | | | | | | | | | | |
| | | | | |
| | | | New York Transportation Development Corporation, Special Facilities Bonds, LaGuardia Airport Terminal B Redevelopment Project, Series 2016A: | | | | | | | | | | | | | | | | |
| $ | 1,440 | | | 5.000%, 7/01/30 (AMT) | | | 7/24 at 100.00 | | | | | | | | BBB | | | $ | 1,602,274 | |
| | 2,045 | | | 4.000%, 7/01/32 (AMT) | | | 7/24 at 100.00 | | | | | | | | BBB | | | | 2,125,962 | |
| | 8,075 | | | 4.000%, 7/01/33 (AMT) | | | 7/24 at 100.00 | | | | | | | | BBB | | | | 8,372,241 | |
| | 9,565 | | | 5.000%, 7/01/34 (AMT) | | | 7/24 at 100.00 | | | | | | | | BBB | | | | 10,531,926 | |
| | 11,975 | | | 5.000%, 7/01/41 (AMT) | | | 7/24 at 100.00 | | | | | | | | BBB | | | | 13,014,789 | |
| | 49,965 | | | 5.000%, 7/01/46 (AMT) | | | 7/24 at 100.00 | | | | | | | | BBB | | | | 54,107,598 | |
| | | | | |
| | 1,000 | | | Onondaga Civic Development Corporation, New York, Revenue Bonds, Saint Joseph’s Hospital Health Center Project, Series 2014A, 5.125%, 7/01/31(Pre-refunded 7/01/19) | | | 7/19 at 100.00 | | | | | | | | N/R (4) | | | | 1,008,880 | |
| | | | | |
| | 10,025 | | | Port Authority of New York and New Jersey, Consolidated Revenue Bonds, One Hundred Seventy Ninth Series 2013, 5.000%, 12/01/25 | | | 12/23 at 100.00 | | | | | | | | AA– | | | | 11,521,031 | |
| | | | | |
| | 795 | | | Port Authority of New York and New Jersey, Special Project Bonds, JFK International Air Terminal LLC Project, Eighth Series 2010, 6.000%, 12/01/42 | | | 12/20 at 100.00 | | | | | | | | BBB+ | | | | 842,946 | |
| | | | | |
| | | | Suffolk County Economic Development Corporation, New York, Revenue Bonds, Catholic Health Services of Long Island Obligated Group Project, Series 2014: | | | | | | | | | | | | | | | | |
| | 2,435 | | | 5.000%, 7/01/28 | | | 7/24 at 100.00 | | | | | | | | A– | | | | 2,746,607 | |
| | 2,695 | | | 5.000%, 7/01/29 | | | 7/24 at 100.00 | | | | | | | | A– | | | | 3,027,347 | |
| | 4,200 | | | 5.000%, 7/01/30 | | | 7/24 at 100.00 | | | | | | | | A– | | | | 4,684,176 | |
| | 2,100 | | | 5.000%, 7/01/31 | | | 7/24 at 100.00 | | | | | | | | A– | | | | 2,325,813 | |
| | 1,335 | | | 5.000%, 7/01/32 | | | 7/24 at 100.00 | | | | | | | | A– | | | | 1,470,890 | |
| | 3,080 | | | 5.000%, 7/01/33 | | | 7/24 at 100.00 | | | | | | | | A– | | | | 3,384,612 | |
| | 333,885 | | | Total New York | | | | | | | | | | | | | | | 354,530,078 | |
| | | | | |
| | | | North Carolina – 0.5% | | | | | | | | | | | | |
| | | | | |
| | 610 | | | North Carolina Capital Facilities Finance Agency, Revenue Bonds, The Methodist University, Series 2012, 3.750%, 3/01/24 | | | 3/22 at 100.00 | | | | | | | | BBB | | | | 622,493 | |
| | | | | |
| | | | North Carolina Eastern Municipal Power Agency, Power System Revenue Bonds, Series 2012B: | | | | | | | | | | | | | | | | |
| | 5,020 | | | 5.000%, 1/01/20 (ETM) | | | No Opt. Call | | | | | | | | N/R (4) | | | | 5,151,474 | |
| | 10,040 | | | 5.000%, 1/01/21 (ETM) | | | No Opt. Call | | | | | | | | N/R (4) | | | | 10,650,733 | |
| | | | | |
| | 1,430 | | | North Carolina Municipal Power Agency 1, Catawba Electric Revenue Bonds, Refunding Series 2009A, 5.000%, 1/01/26 | | | 5/19 at 100.00 | | | | | | | | A | | | | 1,433,446 | |
| | | | | |
| | 11,600 | | | North Carolina Municipal Power Agency 1, Catawba Electric Revenue Bonds, Series 2015C, 5.000%, 1/01/29 | | | 1/26 at 100.00 | | | | | | | | A | | | | 13,719,436 | |
| | | | | |
| | 200 | | | University of North Carolina, Greensboro, General Revenue Bonds, Series 2014, 4.000%, 4/01/19 | | | No Opt. Call | | | | | | | | Aa3 | | | | 200,000 | |
| | 28,900 | | | Total North Carolina | | | | | | | | | | | | | | | 31,777,582 | |
| | | | | |
| | | | North Dakota – 0.9% | | | | | | | | | | | | |
| | | | | |
| | | | Burleigh County, North Dakota, Health Care Revenue Bonds, Saint Alexius Medical Center Project, Series 2014A: | | | | | | | | | | | | | | | | |
| | 120 | | | 5.000%, 7/01/23(Pre-refunded 7/01/21) | | | 7/21 at 100.00 | | | | | | | | N/R (4) | | | | 128,885 | |
| | 1,240 | | | 5.000%, 7/01/26(Pre-refunded 7/01/21) | | | 7/21 at 100.00 | | | | | | | | N/R (4) | | | | 1,331,810 | |
| | 2,835 | | | 5.000%, 7/01/27(Pre-refunded 7/01/21) | | | 7/21 at 100.00 | | | | | | | | N/R (4) | | | | 3,044,903 | |
| | 1,485 | | | 5.000%, 7/01/28(Pre-refunded 7/01/21) | | | 7/21 at 100.00 | | | | | | | | N/R (4) | | | | 1,594,949 | |
| | 1,000 | | | 5.000%, 7/01/31(Pre-refunded 7/01/21) | | | 7/21 at 100.00 | | | | | | | | N/R (4) | | | | 1,074,040 | |
| | 2,955 | | | 5.000%, 7/01/35(Pre-refunded 7/01/21) | | | 7/21 at 100.00 | | | | | | | | N/R (4) | | | | 3,173,788 | |
122
| | | | | | | | | | | | | | | | | | | | |
Principal
Amount (000) | | | Description (1) | | Optional Call
Provisions (2) | | | | | | Ratings (3) | | | Value | |
| | | | | |
| | | | North Dakota(continued) | | | | | | | | | | | | |
| | | | | |
| $ | 2,755 | | | Fargo, North Dakota, Health System Revenue Bonds, Sanford Health, Refunding Series 2011, 6.250%, 11/01/31 | | | 11/21 at 100.00 | | | | | | | | A+ | | | $ | 3,077,225 | |
| | | | | |
| | 20,465 | | | Grand Forks, North Dakota, Health Care System Revenue Bonds, Altru Health System Obligated Group, Series 2012, 5.000%, 12/01/35 | | | 12/21 at 100.00 | | | | | | | | A– | | | | 21,643,989 | |
| | | | | |
| | | | Ward County Health Care, North Dakota, Revenue Bonds, Trinity Obligated Group, Series 2017C: | | | | | | | | | | | | | | | | |
| | 3,065 | | | 5.000%, 6/01/28 | | | No Opt. Call | | | | | | | | BBB– | | | | 3,573,514 | |
| | 3,000 | | | 5.000%, 6/01/29 | | | 6/28 at 100.00 | | | | | | | | BBB– | | | | 3,472,200 | |
| | 1,245 | | | 5.000%, 6/01/31 | | | 6/28 at 100.00 | | | | | | | | BBB– | | | | 1,420,881 | |
| | 3,480 | | | 5.000%, 6/01/34 | | | 6/28 at 100.00 | | | | | | | | BBB– | | | | 3,916,775 | |
| | 12,480 | | | 5.000%, 6/01/38 | | | 6/28 at 100.00 | | | | | | | | BBB– | | | | 13,824,595 | |
| | 56,125 | | | Total North Dakota | | | | | | | | | | | | | | | 61,277,554 | |
| | | | | |
| | | | Ohio – 4.4% | | | | | | | | | | | | |
| | | | | |
| | 1,900 | | | Allen County, Ohio, Hospital Facilities Revenue Bonds, Catholic Health Partners, Refunding and Improvement Series 2012A, 5.000%, 5/01/33 | | | 5/22 at 100.00 | | | | | | | | AA– | | | | 2,050,784 | |
| | | | | |
| | | | Buckeye Tobacco Settlement Financing Authority, Ohio, Tobacco Settlement Asset-Backed Revenue Bonds, Senior Lien, Series 2007A-2: | | | | | | | | | | | | | | | | |
| | 58,535 | | | 5.125%, 6/01/24 | | | 4/19 at 100.00 | | | | | | | | B– | | | | 55,877,511 | |
| | 3,295 | | | 5.375%, 6/01/24 | | | 4/19 at 100.00 | | | | | | | | B– | | | | 3,174,733 | |
| | 13,310 | | | 5.875%, 6/01/30 | | | 4/19 at 100.00 | | | | | | | | B– | | | | 13,027,162 | |
| | 18,875 | | | 5.750%, 6/01/34 | | | 4/19 at 100.00 | | | | | | | | B– | | | | 18,250,992 | |
| | | | | |
| | 5,450 | | | Cincinnati, Ohio, General Obligation Bonds, Various Purpose, Refunding & Improvement Series 2016A, 4.000%, 12/01/19 | | | No Opt. Call | | | | | | | | AA | | | | 5,539,598 | |
| | | | | |
| | | | Cleveland, Ohio, Airport System Revenue Bonds, Refunding Series 2016A: | | | | | | | | | | | | | | | | |
| | 1,525 | | | 5.000%, 1/01/28 – AGM Insured | | | 1/25 at 100.00 | | | | | | | | AA | | | | 1,749,297 | |
| | 2,230 | | | 5.000%, 1/01/29 – AGM Insured | | | 1/25 at 100.00 | | | | | | | | AA | | | | 2,554,086 | |
| | 2,000 | | | 5.000%, 1/01/30 – AGM Insured | | | 1/25 at 100.00 | | | | | | | | AA | | | | 2,276,800 | |
| | 1,800 | | | 5.000%, 1/01/31 – AGM Insured | | | 1/25 at 100.00 | | | | | | | | AA | | | | 2,048,094 | |
| | | | | |
| | | | Cleveland, Ohio, General Obligation Bonds, Series 2011: | | | | | | | | | | | | | | | | |
| | 1,700 | | | 5.000%, 12/01/22(Pre-refunded 12/01/19) | | | 12/19 at 100.00 | | | | | | | | AA+ (4) | | | | 1,739,695 | |
| | 1,780 | | | 5.000%, 12/01/23(Pre-refunded 12/01/19) | | | 12/19 at 100.00 | | | | | | | | AA+ (4) | | | | 1,821,563 | |
| | | | | |
| | 18,635 | | | Columbus, Ohio, General Obligation Bonds, Various Purpose Series 2018A, 5.000%, 4/01/32 | | | 10/28 at 100.00 | | | | | | | | AAA | | | | 23,026,338 | |
| | | | | |
| | 3,070 | | | Franklin County, Ohio, Revenue Bonds, CHE Trinity Health Credit Group, Variable Rate Demand Obligation Series 2013, 1.750%, 12/01/46 (Mandatory Put 8/01/19) | | | 8/19 at 100.00 | | | | | | | | AA– | | | | 3,070,368 | |
| | | | | |
| | 470 | | | Lake County, Ohio, Hospital Facilities Revenue Bonds, Lake Hospital System, Inc, Refunding Series 2008C, 5.500%, 8/15/24 | | | 5/19 at 100.00 | | | | | | | | A– | | | | 471,387 | |
| | | | | |
| | 7,450 | | | Muskingum County, Ohio, Hospital Facilities Revenue Bonds, Genesis HealthCare System Obligated Group Project, Series 2013, 5.000%, 2/15/27 | | | 2/23 at 100.00 | | | | | | | | BB+ | | | | 7,989,082 | |
| | | | | |
| | | | New Albany Community Authority, Ohio, Community Facilities Revenue Refunding Bonds, Series 2012C: | | | | | | | | | | | | | | | | |
| | 870 | | | 4.000%, 10/01/19 | | | No Opt. Call | | | | | | | | Aa3 | | | | 880,562 | |
| | 1,150 | | | 4.000%, 10/01/20 | | | No Opt. Call | | | | | | | | Aa3 | | | | 1,191,538 | |
| | 1,205 | | | 5.000%, 10/01/21 | | | No Opt. Call | | | | | | | | Aa3 | | | | 1,300,822 | |
| | 965 | | | 5.000%, 10/01/22 | | | No Opt. Call | | | | | | | | Aa3 | | | | 1,069,770 | |
123
Nuveen Intermediate Duration Municipal Bond Fund(continued)
Portfolio of Investments March 31, 2019
| | | | | | | | | | | | | | | | | | | | |
Principal
Amount (000) | | | Description (1) | | Optional Call
Provisions (2) | | | | | | Ratings (3) | | | Value | |
| | | | | |
| | | | Ohio(continued) | | | | | | | | | | | | |
| | | | | |
| $ | 2,940 | | | Ohio Air Quality Development Authority, Ohio, Air Quality Development Revenue Bonds, FirstEnergy Generation Corporation Project, Series 2009A, 5.700%, 8/01/20 (7) | | | No Opt. Call | | | | | | | | N/R | | | $ | 2,528,400 | |
| | | | | |
| | 1,400 | | | Ohio Air Quality Development Authority, Ohio, Pollution Control Revenue Bonds, FirstEnergy Generation Corporation Project, Refunding Series 2009B, 0.000%, 3/01/23 (7) | | | No Opt. Call | | | | | | | | N/R | | | | 1,204,000 | |
| | | | | |
| | 11,630 | | | Ohio Air Quality Development Authority, Ohio, Pollution Control Revenue Bonds, FirstEnergy Generation Corporation Project, Refunding Series 2009C, 5.625%, 6/01/18 (7) | | | No Opt. Call | | | | | | | | CCC+ | | | | 11,630,000 | |
| | | | | |
| | 28,740 | | | Ohio Air Quality Development Authority, Ohio, Pollution Control Revenue Bonds, FirstEnergy Generation Project, Refunding Series 2006A, 3.750%, 12/01/23 (7) | | | No Opt. Call | | | | | | | | N/R | | | | 24,716,400 | |
| | | | | |
| | 915 | | | Ohio Air Quality Development Authority, Ohio, Pollution Control Revenue Bonds, FirstEnergy Nuclear Generation Corporation Project, Refunding Series 2010A, 3.125%, 7/01/33 (7) | | | No Opt. Call | | | | | | | | N/R | | | | 786,900 | |
| | | | | |
| | 3,610 | | | Ohio Air Quality Development Authority, Ohio, Pollution Control Revenue Bonds, FirstEnergy Nuclear Generation Project, Refunding Series 2006B, 3.625%, 12/01/33 (Mandatory Put 6/01/20) (7) | | | No Opt. Call | | | | | | | | N/R | | | | 3,104,600 | |
| | | | | |
| | 250 | | | Ohio Air Quality Development Authority, Ohio, Pollution Control Revenue Bonds, FirstEnergy Nuclear Generation Project, Refunding Series 2008C, 3.950%, 11/01/32 (Mandatory Put 5/01/20) (AMT) (7) | | | No Opt. Call | | | | | | | | N/R | | | | 215,000 | |
| | | | | |
| | 1,020 | | | Ohio Air Quality Development Authority, Ohio, Pollution Control Revenue Bonds, FirstEnergy Nuclear Generation Project, Refunding Series 2009A, 4.375%, 6/01/33 (Mandatory Put 6/01/22) (7) | | | No Opt. Call | | | | | | | | N/R | | | | 1,020,000 | |
| | | | | |
| | 735 | | | Ohio Air Quality Development Authority, Ohio, Revenue Bonds, Pratt Paper Ohio, LLC Project, Series 2017, 3.750%, 1/15/28 (AMT), 144A | | | No Opt. Call | | | | | | | | N/R | | | | 766,870 | |
| | | | | |
| | 7,510 | | | Ohio State, General Obligation Bonds, Highway Capital Improvement Series 2012Q, 5.000%, 5/01/21 | | | No Opt. Call | | | | | | | | AAA | | | | 8,045,838 | |
| | | | | |
| | 7,000 | | | Ohio State, General Obligation Bonds, Refunding Common Schools Series 2011B, 4.000%, 9/15/21 | | | No Opt. Call | | | | | | | | AA+ | | | | 7,416,080 | |
| | | | | |
| | 24,230 | | | Ohio State, General Obligation Bonds, Refunding Common Schools Series 2014A, 5.000%, 9/15/19 | | | No Opt. Call | | | | | | | | AA+ | | | | 24,609,926 | |
| | | | | |
| | 8,160 | | | Ohio State, General Obligation Bonds, Refunding Higher Education Series 2012C, 5.000%, 8/01/21 | | | No Opt. Call | | | | | | | | AA+ | | | | 8,807,904 | |
| | | | | |
| | 8,760 | | | Ohio State, Hospital Revenue Bonds, University Hospitals Health System, Inc, Refunding Series 2016A, 5.000%, 1/15/41 | | | 1/26 at 100.00 | | | | | | | | A | | | | 9,738,755 | |
| | | | | |
| | 8,500 | | | Ohio Water Development Authority, Pollution Control Revenue Refunding Bonds, FirstEnergy Nuclear Generating Corporation Project, Series 2005B, 4.000%, 1/01/34 (Mandatory Put 7/01/21) (7) | | | No Opt. Call | | | | | | | | N/R | | | | 7,310,000 | |
| | | | | |
| | 3,855 | | | Ohio Water Development Authority, Pollution Control Revenue Refunding Bonds, FirstEnergy Nuclear Generating Corporation Project, Series 2006A, 3.000%, 5/15/19 (7) | | | No Opt. Call | | | | | | | | N/R | | | | 3,315,300 | |
| | | | | |
| | 2,355 | | | Ohio Water Development Authority, Pollution Control Revenue Refunding Bonds, FirstEnergy Nuclear Generating Corporation Project, Series 2006B, 4.000%, 12/01/33 (Mandatory Put 6/03/19) (7) | | | No Opt. Call | | | | | | | | N/R | | | | 2,025,300 | |
| | | | | |
| | 8,645 | | | Ohio Water Development Authority, Pollution Control Revenue Refunding Bonds, FirstEnergy Nuclear Generating Corporation Project, Series 2010A, 3.750%, 7/01/33 (Mandatory Put 7/01/20) (7) | | | No Opt. Call | | | | | | | | N/R | | | | 7,434,700 | |
124
| | | | | | | | | | | | | | | | | | | | |
Principal
Amount (000) | | | Description (1) | | Optional Call
Provisions (2) | | | | | | Ratings (3) | | | Value | |
| | | | | |
| | | | Ohio(continued) | | | | | | | | | | | | |
| | | | | |
| $ | 1,945 | | | Ohio Water Development Authority, Pollution Control Revenue Refunding Bonds, FirstEnergy Nuclear Generating Corporation Project, Series 2010C, 4.000%, 6/01/33 (Mandatory Put 6/03/19) (7) | | | No Opt. Call | | | | | | | | N/R | | | $ | 1,672,700 | |
| | | | | |
| | 5,450 | | | Ohio Water Development Authority, State of Ohio, Water Pollution Control Loan Fund, Series 2019A, 5.000%, 6/01/29 | | | 3/29 at 100.00 | | | | | | | | AAA | | | | 6,947,224 | |
| | | | | |
| | 12,010 | | | Ohio Water Development Authority, Water Pollution Control Loan Fund Revenue Bonds, Series 2014, 5.000%, 6/01/21 | | | No Opt. Call | | | | | | | | AAA | | | | 12,900,181 | |
| | | | | |
| | 2,470 | | | Tuscarawas County Economic Development and Finance Alliance, Ohio, Higher Education Facilities Revenue Bonds, Ashland University, Refunding & Improvement Series 2015, 5.375%, 3/01/27 | | | 3/25 at 100.00 | | | | | | | | N/R | | | | 2,541,358 | |
| | 298,345 | | | Total Ohio | | | | | | | | | | | | | | | 297,847,618 | |
| | | | | |
| | | | Oklahoma – 1.8% | | | | | | | | | | | | |
| | | | | |
| | | | Canadian County Educational Facilities Authority, Oklahoma, Educational Facilities Lease Revenue Bonds, Mustang Public Schools Project, Series 2012: | | | | | | | | | | | | | | | | |
| | 2,290 | | | 4.500%, 9/01/21 | | | No Opt. Call | | | | | | | | AA– | | | | 2,437,590 | |
| | 1,415 | | | 4.000%, 9/01/23 | | | 9/21 at 100.00 | | | | | | | | AA– | | | | 1,488,509 | |
| | | | | |
| | | | Cleveland County Educational Facilities Authority, Oklahoma, Educational Facilities Lease Revenue Bonds, Moore Public Schools Project, Series 2016: | | | | | | | | | | | | | | | | |
| | 2,940 | | | 5.000%, 6/01/21 | | | No Opt. Call | | | | | | | | A+ | | | | 3,142,919 | |
| | 7,545 | | | 5.000%, 6/01/22 | | | No Opt. Call | | | | | | | | A+ | | | | 8,289,767 | |
| | 3,080 | | | 5.000%, 6/01/23 | | | No Opt. Call | | | | | | | | A+ | | | | 3,466,910 | |
| | | | | |
| | | | Comanche County Educational Facilities Authority, Oklahoma, Educational Facilities Lease Revenue Bonds, Elgin Public Schools Project, Series 2017A: | | | | | | | | | | | | | | | | |
| | 1,470 | | | 5.000%, 12/01/28 | | | 12/27 at 100.00 | | | | | | | | A | | | | 1,758,987 | |
| | 1,410 | | | 5.000%, 12/01/31 | | | 12/27 at 100.00 | | | | | | | | A | | | | 1,654,847 | |
| | | | | |
| | | | Garfield County Educational Facilities Authority, Educational Facilities Lease Revenue Bonds, Enid Public Schools Project, Series 2016A: | | | | | | | | | | | | | | | | |
| | 3,165 | | | 5.000%, 9/01/30 | | | 9/26 at 100.00 | | | | | | | | A | | | | 3,698,018 | |
| | 3,145 | | | 5.000%, 9/01/31 | | | 9/26 at 100.00 | | | | | | | | A | | | | 3,650,622 | |
| | | | | |
| | 3,150 | | | Garvin County Educational Facilities Authority, Oklahoma, Lease Revenue Bonds, Wynnewood Public Schools Project, Series 2018, 3.625%, 9/01/36 | | | 9/28 at 100.00 | | | | | | | | A– | | | | 3,234,861 | |
| | | | | |
| | | | Lincoln County Educational Facilities Authority, Oklahoma, Lease Revenue Bonds, Stroud Public Schools Project, Series 2016: | | | | | | | | | | | | | | | | |
| | 1,000 | | | 5.000%, 9/01/20 | | | No Opt. Call | | | | | | | | A | | | | 1,046,330 | |
| | 2,115 | | | 5.000%, 9/01/22 | | | No Opt. Call | | | | | | | | A | | | | 2,313,662 | |
| | 1,000 | | | 5.000%, 9/01/23 | | | No Opt. Call | | | | | | | | A | | | | 1,117,110 | |
| | 1,870 | | | 5.000%, 9/01/24 | | | No Opt. Call | | | | | | | | A | | | | 2,129,911 | |
| | 2,490 | | | 5.000%, 9/01/26 | | | No Opt. Call | | | | | | | | A | | | | 2,926,547 | |
| | | | | |
| | | | McClain County Economic Development Authority, Oklahoma, Educational Facilities Lease Revenue Bonds, Purcell Public Schools Project, Series 2018: | | | | | | | | | | | | | | | | |
| | 1,280 | | | 5.000%, 9/01/30 | | | 9/28 at 100.00 | | | | | | | | A | | | | 1,564,058 | |
| | 1,565 | | | 5.000%, 9/01/34 | | | 9/28 at 100.00 | | | | | | | | A | | | | 1,871,787 | |
| | | | | |
| | | | Oklahoma Development Finance Authority, Health System Revenue Bonds, OU Medicine Project, Series 2018B: | | | | | | | | | | | | | | | | |
| | 6,045 | | | 5.000%, 8/15/33 | | | 8/28 at 100.00 | | | | | | | | Baa3 | | | | 6,916,024 | |
| | 16,530 | | | 5.000%, 8/15/38 | | | 8/28 at 100.00 | | | | | | | | Baa3 | | | | 18,585,340 | |
125
Nuveen Intermediate Duration Municipal Bond Fund(continued)
Portfolio of Investments March 31, 2019
| | | | | | | | | | | | | | | | | | | | |
Principal
Amount (000) | | | Description (1) | | Optional Call
Provisions (2) | | | | | | Ratings (3) | | | Value | |
| | | | | |
| | | | Oklahoma(continued) | | | | | | | | | | | | |
| | | | | |
| | | | Pontotoc County Educational Facilities Authority, Oklahoma, Facilities Lease Revenue Bonds, Ada Public Schools Project, Series 2014: | | | | | | | | | | | | | | | | |
| $ | 750 | | | 5.000%, 9/01/22 | | | No Opt. Call | | | | | | | | A– | | | $ | 817,860 | |
| | 500 | | | 3.000%, 9/01/23 | | | No Opt. Call | | | | | | | | A– | | | | 515,010 | |
| | 600 | | | 5.000%, 9/01/24 | | | No Opt. Call | | | | | | | | A– | | | | 681,756 | |
| | 1,505 | | | 5.000%, 9/01/25 | | | No Opt. Call | | | | | | | | A– | | | | 1,741,195 | |
| | | | | |
| | 3,210 | | | Tulsa Airports Improvement Trust, Oklahoma, General Airport Revenue Bonds, Series 2013A, 5.625%, 6/01/38 (AMT) | | | 6/23 at 100.00 | | | | | | | | AA | | | | 3,596,035 | |
| | | | | |
| | | | Tulsa County Industrial Authority, Oklahoma, Educational Facilities Lease Revenue Bonds, Broken Arrow Public Schools Project, Series 2016: | | | | | | | | | | | | | | | | |
| | 3,435 | | | 5.000%, 9/01/25 | | | 9/23 at 100.00 | | | | | | | | AA– | | | | 3,878,939 | |
| | 10,675 | | | 5.000%, 9/01/26 | | | 9/23 at 100.00 | | | | | | | | AA– | | | | 11,996,885 | |
| | | | | |
| | 1,595 | | | Tulsa County Industrial Authority, Oklahoma, Educational Facilities Lease Revenue Bonds, Broken Arrow Public Schools Project, Series 2019A, 5.000%, 9/01/29 | | | No Opt. Call | | | | | | | | AA– | | | | 1,984,355 | |
| | | | | |
| | | | Tulsa County Industrial Authority, Oklahoma, Educational Facilities Lease Revenue Bonds, Jenks Public Schools Project, Series 2015: | | | | | | | | | | | | | | | | |
| | 6,150 | | | 5.000%, 9/01/25 | | | No Opt. Call | | | | | | | | AA– | | | | 7,275,880 | |
| | 7,910 | | | 5.000%, 9/01/26 | | | 9/25 at 100.00 | | | | | | | | AA– | | | | 9,311,098 | |
| | | | | |
| | | | Weatherford Industrial Trust Educational, Oklahoma, Facilities Lease Revenue Bonds, Weatherford Public Schools Project, Series 2019: | | | | | | | | | | | | | | | | |
| | 2,000 | | | 5.000%, 3/01/29 | | | No Opt. Call | | | | | | | | A– | | | | 2,423,480 | |
| | 1,695 | | | 5.000%, 3/01/31 | | | 3/29 at 100.00 | | | | | | | | A– | | | | 2,020,406 | |
| | 2,500 | | | 5.000%, 3/01/33 | | | 3/29 at 100.00 | | | | | | | | A– | | | | 2,953,075 | |
| | 106,030 | | | Total Oklahoma | | | | | | | | | | | | | | | 120,489,773 | |
| | | | | |
| | | | Oregon – 0.9% | | | | | | | | | | | | |
| | | | | |
| | 1,750 | | | Benton and Linn Counties District School District 509J Corvallis, Oregon, General Obligation Bonds, Series 2018A, 0.000%, 6/15/38 | | | 6/28 at 100.00 | | | | | | | | AA+ | | | | 1,957,690 | |
| | | | | |
| | 1,190 | | | Clackamas Community College District, Oregon, General Obligation Bonds, Deferred Interest Series 2017A, 0.000%, 6/15/40 (6) | | | 6/27 at 100.00 | | | | | | | | Aa1 | | | | 1,297,493 | |
| | | | | |
| | 4,145 | | | Clackamas Community College District, Oregon, General Obligation Bonds, Series 2007, 5.000%, 6/15/20 – FGIC Insured | | | No Opt. Call | | | | | | | | Aa1 | | | | 4,317,183 | |
| | | | | |
| | | | Clackamas County School District 62, Oregon City, Oregon, General Obligation Bonds, Refunding Series 2018A: | | | | | | | | | | | | | | | | |
| | 1,665 | | | 0.000%, 6/15/34 | | | 6/28 at 79.31 | | | | | | | | AA+ | | | | 994,455 | |
| | 1,500 | | | 0.000%, 6/15/35 | | | 6/28 at 75.58 | | | | | | | | AA+ | | | | 844,215 | |
| | 1,000 | | | 0.000%, 6/15/37 | | | 6/28 at 69.16 | | | | | | | | AA+ | | | | 510,800 | |
| | 1,450 | | | 0.000%, 6/15/39 | | | 6/28 at 63.17 | | | | | | | | AA+ | | | | 670,524 | |
| | | | | |
| | 3,500 | | | Oregon Housing and Community Services Department, Mortgage Revenue Bonds, Single-Family Mortgage Program, Series 2017D, 3.450%, 1/01/38 | | | 1/27 at 100.00 | | | | | | | | Aa2 | | | | 3,563,945 | |
| | | | | |
| | 5,800 | | | Oregon Housing and Community Services Department, Mortgage Revenue Bonds, Single-Family Mortgage Program, Series 2018C, 3.900%, 7/01/38 | | | 7/27 at 100.00 | | | | | | | | Aa2 | | | | 6,057,230 | |
| | | | | |
| | 15,995 | | | Oregon State Business Development Commission, Recovery Zone Facility Revenue Bonds, Intel Corporation Project, 232 Series 2010, 2.400%, 12/01/40 (Mandatory Put 8/14/23) | | | No Opt. Call | | | | | | | | A+ | | | | 16,248,361 | |
| | | | | |
| | 4,000 | | | Oregon State Department of Transportation, Highway User Tax Revenue Bonds, Senior Lien Series 2009A, 5.000%, 11/15/22(Pre-refunded 5/15/19) | | | 5/19 at 100.00 | | | | | | | | AAA | | | | 4,016,840 | |
126
| | | | | | | | | | | | | | | | | | | | |
Principal
Amount (000) | | | Description (1) | | Optional Call
Provisions (2) | | | | | | Ratings (3) | | | Value | |
| | | | | |
| | | | Oregon(continued) | | | | | | | | | | | | |
| | | | | |
| $ | 11,120 | | | Oregon State Department of Transportation, Highway User Tax Revenue Bonds, Senior Lien Series 2013A, 5.000%, 11/15/38 | | | 11/23 at 100.00 | | | | | | | | AAA | | | $ | 12,517,117 | |
| | | | | |
| | | | Salem Hospital Facility Authority, Oregon, Revenue Bonds, Salem Hospital Project, Refunding Series 2016A: | | | | | | | | | | | | | | | | |
| | 3,425 | | | 5.000%, 5/15/32 | | | 5/26 at 100.00 | | | | | | | | AA– | | | | 3,958,820 | |
| | 1,925 | | | 5.000%, 5/15/33 | | | 5/26 at 100.00 | | | | | | | | AA– | | | | 2,216,079 | |
| | 58,465 | | | Total Oregon | | | | | | | | | | | | | | | 59,170,752 | |
| | | | | |
| | | | Pennsylvania – 5.4% | | | | | | | | | | | | |
| | | | | |
| | | | Allegheny County Hospital Development Authority, Pennsylvania, Revenue Bonds, Allegheny Health Network Obligated Group Issue, Series 2018A: | | | | | | | | | | | | | | | | |
| | 1,000 | | | 5.000%, 4/01/36 | | | 4/28 at 100.00 | | | | | | | | A | | | | 1,145,880 | |
| | 10,000 | | | 4.000%, 4/01/37 | | | 4/28 at 100.00 | | | | | | | | A | | | | 10,468,900 | |
| | 6,000 | | | 4.000%, 4/01/38 | | | 4/28 at 100.00 | | | | | | | | A | | | | 6,252,600 | |
| | 1,000 | | | 4.000%, 4/01/44 | | | 4/28 at 100.00 | | | | | | | | A | | | | 1,026,230 | |
| | | | | |
| | | | Allegheny County, Pennsylvania, General Obligation Bonds,Series C69-C70 of 2012: | | | | | | | | | | | | | | | | |
| | 1,000 | | | 5.000%, 12/01/25 | | | 12/22 at 100.00 | | | | | | | | AA– | | | | 1,112,300 | |
| | 4,000 | | | 5.000%, 12/01/37 | | | 12/22 at 100.00 | | | | | | | | AA– | | | | 4,379,040 | |
| | | | | |
| | 1,525 | | | Allentown Neighborhood Improvement Zone Development Authority, Pennsylvania, Tax Revenue Bonds, City Center Project, Series 2018, 5.000%, 5/01/28, 144A | | | No Opt. Call | | | | | | | | Ba3 | | | | 1,719,300 | |
| | | | | |
| | 1,200 | | | Beaver County Industrial Development Authority, Pennsylvania, Pollution Control Revenue Refunding Bonds, FirstEnergy Nuclear Generation Project, Series 2006A, 3.500%, 4/01/41 (Mandatory Put 6/01/20) (7) | | | No Opt. Call | | | | | | | | N/R | | | | 1,032,000 | |
| | | | | |
| | 2,880 | | | Beaver County Industrial Development Authority, Pennsylvania, Pollution Control Revenue Refunding Bonds, FirstEnergy Nuclear Generation Project, Series 2006B, 3.500%, 12/01/35 (Mandatory Put 6/01/20) (7) | | | No Opt. Call | | | | | | | | N/R | | | | 2,476,800 | |
| | | | | |
| | 7,770 | | | Beaver County Industrial Development Authority, Pennsylvania, Pollution Control Revenue Refunding Bonds, FirstEnergy Nuclear Generation Project, Series 2008A, 2.700%, 4/01/35 (7) | | | No Opt. Call | | | | | | | | N/R | | | | 6,682,200 | |
| | | | | |
| | 8,740 | | | Berks County Industrial Development Authority, Pennsylvania, Health System Revenue Bonds, Tower Health Project, Series 2017, 4.000%, 11/01/39 | | | 11/27 at 100.00 | | | | | | | | A | | | | 9,119,491 | |
| | | | | |
| | 1,315 | | | Bethel Park School District, Allegheny County, Pennsylvania, General Obligation Bonds, Series 2009, 4.125%, 8/01/20(Pre-refunded 8/01/19) | | | 8/19 at 100.00 | | | | | | | | Aa2 (4) | | | | 1,326,533 | |
| | | | | |
| | 1,000 | | | Capital Region Water, Pennsylvania, Water Revenue Bonds, Series 2018, 5.000%, 7/15/27 | | | No Opt. Call | | | | | | | | A+ | | | | 1,209,450 | |
| | | | | |
| | 39,480 | | | Commonwealth Financing Authority, Pennsylvania, State Appropriation Lease Bonds, Master Settlement, Series 2018, 4.000%, 6/01/39 – AGM Insured | | | 6/28 at 100.00 | | | | | | | | AA | | | | 41,500,586 | |
| | | | | |
| | | | Delaware County Authority, Pennsylvania, Revenue Bonds, Neumann University, Series 2010: | | | | | | | | | | | | | | | | |
| | 1,000 | | | 5.000%, 10/01/21 | | | 10/20 at 100.00 | | | | | | | | BBB | | | | 1,041,130 | |
| | 1,050 | | | 5.000%, 10/01/25 | | | 10/20 at 100.00 | | | | | | | | BBB | | | | 1,100,799 | |
127
Nuveen Intermediate Duration Municipal Bond Fund(continued)
Portfolio of Investments March 31, 2019
| | | | | | | | | | | | | | | | | | | | |
Principal
Amount (000) | | | Description (1) | | Optional Call
Provisions (2) | | | | | | Ratings (3) | | | Value | |
| | | | | |
| | | | Pennsylvania(continued) | | | | | | | | | | | | |
| | | | | |
| | | | Indiana County Hospital Authority, Pennsylvania, Hospital Revenue Bonds, Indiana Regional Medical Center, Series 2014A: | | | | | | | | | | | | | | | | |
| $ | 200 | | | 4.000%, 6/01/19 | | | No Opt. Call | | | | | | | | Ba1 | | | $ | 200,420 | |
| | 410 | | | 5.000%, 6/01/22 | | | No Opt. Call | | | | | | | | Ba1 | | | | 436,384 | |
| | 790 | | | 5.000%, 6/01/24 | | | 6/23 at 100.00 | | | | | | | | Ba1 | | | | 849,337 | |
| | 520 | | | 5.000%, 6/01/25 | | | 6/23 at 100.00 | | | | | | | | Ba1 | | | | 555,823 | |
| | 370 | | | 5.125%, 6/01/26 | | | 6/23 at 100.00 | | | | | | | | Ba1 | | | | 396,840 | |
| | 460 | | | 5.375%, 6/01/28 | | | 6/23 at 100.00 | | | | | | | | Ba1 | | | | 495,296 | |
| | | | | |
| | 12,575 | | | Lehigh County Industrial Development Authority, Pennsylvania, Pollution Control Revenue Bonds, Pennsylvania Power and Light Company, Series 2016A, 1.800%, 9/01/29 (Mandatory Put 9/01/22) | | | No Opt. Call | | | | | | | | A | | | | 12,348,398 | |
| | | | | |
| | 10,520 | | | Lehigh County Industrial Development Authority, Pennsylvania, Pollution Control Revenue Bonds, Pennsylvania Power and Light Company, Series 2016B, 1.800%, 2/15/27 (Mandatory Put 8/15/22) | | | No Opt. Call | | | | | | | | A | | | | 10,410,592 | |
| | | | | |
| | 3,140 | | | Luzerne County Industrial Development Authority, Pennsylvania, Guaranteed Lease Revenue Bonds, Series 2009, 7.750%, 12/15/27(Pre-refunded 12/15/19) | | | 12/19 at 100.00 | | | | | | | | N/R (4) | | | | 3,273,167 | |
| | | | | |
| | 5,900 | | | Montgomery County Industrial Development Authority, Pennsylvania, Pollution Control Revenue Bonds, PECO Energy Company Project, Refunding Series 1996A, 2.600%, 3/01/34 (Mandatory Put 9/01/20) | | | No Opt. Call | | | | | | | | BBB+ | | | | 5,913,806 | |
| | | | | |
| | 4,055 | | | Pennsylvania Economic Development Financing Authority, Exempt Facilities Revenue Bonds, Shippingport Project, First Energy Guarantor, Series 2005A, 3.750%, 12/01/40 (Mandatory Put 7/01/20) (7) | | | No Opt. Call | | | | | | | | N/R | | | | 3,487,300 | |
| | | | | |
| | 3,455 | | | Pennsylvania Economic Development Financing Authority, Exempt Facilities Revenue Bonds, Shippingport Project, First Energy Guarantor, Series 2006A, 2.550%, 11/01/41 (Mandatory Put 6/01/19) (7) | | | No Opt. Call | | | | | | | | N/R | | | | 2,971,300 | |
| | | | | |
| | 2,410 | | | Pennsylvania Economic Development Financing Authority, Health System Revenue Bonds , Albert Einstein Healthcare, Series 2009A, 6.250%, 10/15/23(Pre-refunded 10/15/19) | | | 10/19 at 100.00 | | | | | | | | N/R (4) | | | | 2,468,250 | |
| | | | | |
| | | | Pennsylvania Economic Development Financing Authority, Parking System Revenue Bonds, Capitol Region Parking System, Junior Guaranteed Series 2013B: | | | | | | | | | | | | | | | | |
| | 1,975 | | | 5.500%, 1/01/25 | | | 1/24 at 100.00 | | | | | | | | AA | | | | 2,274,292 | |
| | 2,265 | | | 5.500%, 1/01/26 | | | 1/24 at 100.00 | | | | | | | | AA | | | | 2,589,688 | |
| | 2,260 | | | 5.500%, 1/01/27 | | | 1/24 at 100.00 | | | | | | | | AA | | | | 2,575,134 | |
| | | | | |
| | | | Pennsylvania Economic Development Financing Authority, Parking System Revenue Bonds, Capitol Region Parking System, Junior Insured Series 2013C: | | | | | | | | | | | | | | | | |
| | 500 | | | 5.500%, 1/01/25 – AGM Insured | | | 1/24 at 100.00 | | | | | | | | AA | | | | 575,770 | |
| | 1,095 | | | 5.500%, 1/01/26 – AGM Insured | | | 1/24 at 100.00 | | | | | | | | AA | | | | 1,251,968 | |
| | 2,505 | | | 5.500%, 1/01/28 – AGM Insured | | | 1/24 at 100.00 | | | | | | | | AA | | | | 2,847,258 | |
| | 2,050 | | | 5.500%, 1/01/29 – AGM Insured | | | 1/24 at 100.00 | | | | | | | | AA | | | | 2,324,310 | |
| | 1,255 | | | 5.500%, 1/01/31 – AGM Insured | | | 1/24 at 100.00 | | | | | | | | AA | | | | 1,418,476 | |
| | | | | |
| | 10,500 | | | Pennsylvania Economic Development Financing Authority, Solid Waste Disposal Revenue Bonds, Waste Management Inc, Project, Series 2017A, 1.700%, 8/01/37 (Mandatory Put 8/03/20) (AMT) | | | No Opt. Call | | | | | | | | A– | | | | 10,435,950 | |
| | | | | |
| | 665 | | | Pennsylvania Economic Development Financing Authority, Unemployment Compensation Revenue Bonds, Series 2012B, 5.000%, 1/01/21 | | | 4/19 at 100.00 | | | | | | | | Aaa | | | | 666,084 | |
| | | | | |
| | 19,870 | | | Pennsylvania Housing Finance Agency, Single Family Mortgage Revenue Bonds,Series 2016-120, 3.100%, 10/01/36 | | | 10/25 at 100.00 | | | | | | | | AA+ | | | | 19,923,252 | |
128
| | | | | | | | | | | | | | | | | | | | |
Principal
Amount (000) | | | Description (1) | | Optional Call
Provisions (2) | | | | | | Ratings (3) | | | Value | |
| | | | | |
| | | | Pennsylvania(continued) | | | | | | | | | | | | |
| | | | | |
| $ | 8,950 | | | Pennsylvania Housing Finance Agency, Single Family Mortgage Revenue Bonds,Series 2016-121, 3.100%, 10/01/36 | | | 10/25 at 100.00 | | | | | | | | AA+ | | | $ | 8,973,986 | |
| | | | | |
| | 15,305 | | | Pennsylvania Housing Finance Agency, Single Family Mortgage Revenue Bonds, Series 2017-125A, 3.700%, 10/01/37 (AMT) | | | 4/27 at 100.00 | | | | | | | | AA+ | | | | 15,558,298 | |
| | | | | |
| | | | Pennsylvania Housing Finance Agency, Single Family Mortgage Revenue Bonds, Series 2019-128B: | | | | | | | | | | | | | | | | |
| | 6,585 | | | 3.500%, 10/01/34 | | | 10/27 at 100.00 | | | | | | | | AA+ | | | | 6,801,120 | |
| | 3,000 | | | 3.850%, 4/01/38 | | | 10/27 at 100.00 | | | | | | | | AA+ | | | | 3,100,770 | |
| | | | | |
| | | | Pennsylvania Turnpike Commission, Motor License Fund-Enhanced Turnpike Subordinate Special Revenue Bonds, Series 2014A: | | | | | | | | | | | | | | | | |
| | 2,095 | | | 0.000%, 12/01/34 (6) | | | 12/26 at 100.00 | | | | | | | | AA– | | | | 2,066,822 | |
| | 5,000 | | | 0.000%, 12/01/37 (6) | | | 12/26 at 100.00 | | | | | | | | AA– | | | | 4,932,300 | |
| | | | | |
| | 16,080 | | | Pennsylvania Turnpike Commission, Turnpike Revenue Bonds, Capital Appreciation Series 2009E, 6.375%, 12/01/38 | | | 12/27 at 100.00 | | | | | | | | A | | | | 20,364,998 | |
| | | | | |
| | | | Pennsylvania Turnpike Commission, Turnpike Revenue Bonds, Refunding Subordinate Second Series 2016B-2: | | | | | | | | | | | | | | | | |
| | 5,905 | | | 5.000%, 6/01/25 | | | No Opt. Call | | | | | | | | A3 | | | | 6,861,197 | |
| | 2,830 | | | 5.000%, 6/01/29 | | | 6/26 at 100.00 | | | | | | | | A3 | | | | 3,293,271 | |
| | 22,145 | | | 5.000%, 6/01/35 | | | 6/26 at 100.00 | | | | | | | | A3 | | | | 25,121,288 | |
| | | | | |
| | | | Pennsylvania Turnpike Commission, Turnpike Revenue Bonds, Refunding Subordinate Second Series 2017: | | | | | | | | | | | | | | | | |
| | 2,500 | | | 5.000%, 12/01/29 | | | 12/27 at 100.00 | | | | | | | | A3 | | | | 2,960,900 | |
| | 3,190 | | | 5.000%, 12/01/31 | | | 12/27 at 100.00 | | | | | | | | A3 | | | | 3,727,866 | |
| | | | | |
| | 5,000 | | | Pennsylvania Turnpike Commission, Turnpike Revenue Bonds, Refunding Subordinate Series 2016A, 5.000%, 12/01/36 | | | 12/26 at 100.00 | | | | | | | | A3 | | | | 5,686,150 | |
| | | | | |
| | | | Pennsylvania Turnpike Commission, Turnpike Revenue Bonds, Refunding Subordinate Third Series 2017: | | | | | | | | | | | | | | | | |
| | 3,495 | | | 5.000%, 12/01/31 | | | 12/27 at 100.00 | | | | | | | | A3 | | | | 4,084,292 | |
| | 2,250 | | | 5.000%, 12/01/32 | | | 12/27 at 100.00 | | | | | | | | A3 | | | | 2,620,237 | |
| | 2,000 | | | 4.000%, 12/01/36 | | | 12/27 at 100.00 | | | | | | | | A3 | | | | 2,118,120 | |
| | | | | |
| | 12,005 | | | Pennsylvania Turnpike Commission, Turnpike Revenue Bonds, Series 2015A-1, 5.000%, 12/01/24 | | | No Opt. Call | | | | | | | | A+ | | | | 14,056,294 | |
| | | | | |
| | 1,000 | | | Pennsylvania Turnpike Commission, Turnpike Revenue Bonds, Series 2016A-1, 5.000%, 12/01/28 | | | 6/26 at 100.00 | | | | | | | | A1 | | | | 1,184,930 | |
| | | | | |
| | 3,000 | | | Pennsylvania Turnpike Commission, Turnpike Revenue Bonds, Series 2017A-1, 5.000%, 12/01/36 | | | 12/27 at 100.00 | | | | | | | | A1 | | | | 3,523,920 | |
| | | | | |
| | 7,445 | | | Philadelphia Authority For Industrial Development, Pennsylvania, City Agreement Revenue Bonds, Cultural and Commercial Corridors Program, Refunding Series 2016A, 5.000%, 12/01/29 | | | 12/25 at 100.00 | | | | | | | | A | | | | 8,547,083 | |
| | | | | |
| | 3,025 | | | Philadelphia Gas Works, Pennsylvania, Revenue Bonds, Ninth
Series, 2010, 5.000%, 8/01/30(Pre-refunded 8/01/20) | | | 8/20 at 100.00 | | | | | | | | A (4) | | | | 3,163,484 | |
| | | | | |
| | | | Philadelphia, Pennsylvania, Airport Revenue Bonds, Refunding Series 2017B: | | | | | | | | | | | | | | | | |
| | 1,525 | | | 5.000%, 7/01/19 (AMT) | | | No Opt. Call | | | | | | | | A | | | | 1,536,621 | |
| | 3,100 | | | 5.000%, 7/01/20 (AMT) | | | No Opt. Call | | | | | | | | A | | | | 3,218,575 | |
| | 1,250 | | | 5.000%, 7/01/21 (AMT) | | | No Opt. Call | | | | | | | | A | | | | 1,334,338 | |
| | | | | |
| | 2,650 | | | Quakertown General Authority Health Facilities Revenue USDA Loan Anticipation Notes and Revenue Bonds for LifeQuest Obligated Group, Pennsylvania, Series 2017A, 3.125%, 7/01/21 | | | 7/19 at 100.00 | | | | | | | | N/R | | | | 2,621,830 | |
129
Nuveen Intermediate Duration Municipal Bond Fund(continued)
Portfolio of Investments March 31, 2019
| | | | | | | | | | | | | | | | | | | | |
Principal
Amount (000) | | | Description (1) | | Optional Call
Provisions (2) | | | | | | Ratings (3) | | | Value | |
| | | | | |
| | | | Pennsylvania(continued) | | | | | | | | | | | | |
| | | | | |
| $ | 9,745 | | | Sayre Healthcare Facility Authority, Pennsylvania, Revenue Bonds, Guthrie Healthcare System, Series 2007, 2.540%, 12/01/24(3-Month LIBOR*67% reference rate + 0.78% spread) (8) | | | 5/19 at 100.00 | | | | | | | | AA– | | | $ | 9,826,566 | |
| | | | | |
| | 4,585 | | | Scranton, Lackawanna County, Pennsylvania, General Obligation Notes, Series 2016, 5.000%, 11/15/26 | | | 5/24 at 100.00 | | | | | | | | BB+ | | | | 5,019,887 | |
| | | | | |
| | 2,355 | | | Scranton-Lackawanna Health and Welfare Authority, Pennsylvania, University Revenue Bonds, Marywood University, Series 2016, 3.375%, 6/01/26 | | | No Opt. Call | | | | | | | | BB+ | | | | 2,307,146 | |
| | | | | |
| | | | Southcentral Pennsylvania General Authority, Revenue Bonds, Hanover Hospital Inc, Series 2013: | | | | | | | | | | | | | | | | |
| | 1,400 | | | 5.000%, 12/01/19 | | | No Opt. Call | | | | | | | | A+ | | | | 1,430,898 | |
| | 730 | | | 5.000%, 12/01/20 | | | No Opt. Call | | | | | | | | A+ | | | | 768,106 | |
| | 1,105 | | | 5.000%, 12/01/21 | | | No Opt. Call | | | | | | | | A+ | | | | 1,193,953 | |
| | 1,625 | | | 5.000%, 12/01/22 | | | No Opt. Call | | | | | | | | A+ | | | | 1,801,995 | |
| | 1,705 | | | 5.000%, 12/01/23 | | | 6/23 at 100.00 | | | | | | | | A+ | | | | 1,916,267 | |
| | 1,795 | | | 5.000%, 12/01/24 | | | 6/23 at 100.00 | | | | | | | | A+ | | | | 2,013,595 | |
| | | | | |
| | | | Trinity Area School District, Washington County, Pennsylvania, General Obligation Bonds, Series 2012: | | | | | | | | | | | | | | | | |
| | 105 | | | 4.000%, 11/01/19 – AGM Insured (ETM) | | | No Opt. Call | | | | | | | | A2 (4) | | | | 106,511 | |
| | 60 | | | 4.000%, 11/01/19 – AGM Insured | | | No Opt. Call | | | | | | | | A2 | | | | 60,741 | |
| | | | | |
| | 3,435 | | | Washington County Industrial Development Authority, Pennsylvania, College Revenue Bonds, AICUP Financing Program-Washington and Jefferson College Project,Series 2017-PP5, 3.375%, 11/01/36 | | | 11/27 at 100.00 | | | | | | | | A– | | | | 3,444,206 | |
| | 348,680 | | | Total Pennsylvania | | | | | | | | | | | | | | | 369,630,895 | |
| | | | | |
| | | | Puerto Rico – 0.6% | | | | | | | | | | | | |
| | | | | |
| | 25 | | | Puerto Rico Aqueduct and Sewerage Authority, Revenue Bonds, Senior Lien Series 2008A, 6.000%, 7/01/44 | | | 5/19 at 100.00 | | | | | | | | Ca | | | | 25,094 | |
| | | | | |
| | | | Puerto Rico Sales Tax Financing Corporation, Sales Tax Revenue Bonds, Restructured 2018A-1: | | | | | | | | | | | | | | | | |
| | 1 | | | 0.000%, 7/01/24 | | | No Opt. Call | | | | | | | | N/R | | | | 841 | |
| | 7,459 | | | 0.000%, 7/01/27 | | | No Opt. Call | | | | | | | | N/R | | | | 5,571,053 | |
| | 15,557 | | | 0.000%, 7/01/29 | | | 7/28 at 98.64 | | | | | | | | N/R | | | | 10,334,826 | |
| | 27,782 | | | 0.000%, 7/01/31 | | | 7/28 at 91.88 | | | | | | | | N/R | | | | 16,470,003 | |
| | 15,565 | | | 0.000%, 7/01/33 | | | 7/28 at 86.60 | | | | | | | | N/R | | | | 8,279,490 | |
| | 326 | | | 4.500%, 7/01/34 | | | 7/25 at 100.00 | | | | | | | | N/R | | | | 330,411 | |
| | 66,715 | | | Total Puerto Rico | | | | | | | | | | | | | | | 41,011,718 | |
| | | | | |
| | | | Rhode Island – 0.3% | | | | | | | | | | | | |
| | | | | |
| | 4,350 | | | Rhode Island Health and Educational Building Corporation, Revenue Bonds, Care New England Health System, Series 2013A, 5.500%, 9/01/28(Pre-refunded 9/01/23) | | | 9/23 at 100.00 | | | | | | | | N/R (4) | | | | 5,056,005 | |
| | | | | |
| | 136,145 | | | Rhode Island Tobacco Settlement Financing Corporation, Tobacco Settlement Asset-Backed Bonds, Series 2007A, 0.000%, 6/01/52 | | | 4/19 at 14.11 | | | | | | | | CCC+ | | | | 14,056,971 | |
| | 140,495 | | | Total Rhode Island | | | | | | | | | | | | | | | 19,112,976 | |
| | | | | |
| | | | South Carolina – 0.9% | | | | | | | | | | | | |
| | | | | |
| | 5,770 | | | Greenville Hospital System Board of Trustees, South Carolina, Hospital Revenue Bonds, Series 2014B, 5.000%, 5/01/34 | | | 5/24 at 100.00 | | | | | | | | A | | | | 6,439,782 | |
130
| | | | | | | | | | | | | | | | | | | | |
Principal
Amount (000) | | | Description (1) | | Optional Call
Provisions (2) | | | | | | Ratings (3) | | | Value | |
| | | | | |
| | | | South Carolina(continued) | | | | | | | | | | | | |
| | | | | |
| | | | Lexington County Health Services District, Inc, South Carolina, Hospital Revenue Bonds, Lexington Medical Center, Series 2016: | | | | | | | | | | | | | | | | |
| $ | 1,000 | | | 5.000%, 11/01/34 | | | 5/26 at 100.00 | | | | | | | | A1 | | | $ | 1,124,540 | |
| | 1,170 | | | 5.000%, 11/01/35 | | | 5/26 at 100.00 | | | | | | | | A1 | | | | 1,312,108 | |
| | | | | |
| | 6,550 | | | Patriots Energy Group Financing Agency, South Carolina, Gas Supply Revenue Bonds, Series 2018A, 4.000%, 10/01/48 (Mandatory Put 2/01/24) | | | 11/23 at 100.30 | | | | | | | | Aa2 | | | | 7,081,729 | |
| | | | | |
| | | | South Carolina Jobs-Economic Development Authority, Hospital Revenue Bonds, Bon Secours Health System Obligated Group, Series 2012: | | | | | | | | | | | | | | | | |
| | 7,500 | | | 5.000%, 11/01/27(Pre-refunded 11/01/22) | | | 11/22 at 100.00 | | | | | | | | A+ (4) | | | | 8,378,325 | |
| | 1,275 | | | 5.000%, 11/01/29(Pre-refunded 11/01/22) | | | 11/22 at 100.00 | | | | | | | | A+ (4) | | | | 1,424,315 | |
| | | | | |
| | 1,850 | | | South Carolina Jobs-Economic Development Authority, Hospital Revenue Bonds, Bon Secours Health System Obligated Group, Series 2013, 5.000%, 11/01/20 (ETM) | | | No Opt. Call | | | | | | | | A+ (4) | | | | 1,948,957 | |
| | | | | |
| | | | South Carolina Jobs-Economic Development Authority, Economic Development Revenue Bonds, FMU Student Housing LLC – Francis Marion University Project, Series 2014A: | | | | | | | | | | | | | | | | |
| | 1,910 | | | 5.000%, 8/01/27 | | | 8/24 at 100.00 | | | | | | | | Baa3 | | | | 2,042,382 | |
| | 3,925 | | | 5.000%, 8/01/32 | | | 8/24 at 100.00 | | | | | | | | Baa3 | | | | 4,136,597 | |
| | | | | |
| | | | South Carolina Public Service Authority, Santee Cooper Revenue Obligations, Refunding & Improvement Series 2015A: | | | | | | | | | | | | | | | | |
| | 3,015 | | | 5.000%, 12/01/31 | | | 6/25 at 100.00 | | | | | | | | A+ | | | | 3,409,030 | |
| | 8,280 | | | 5.000%, 12/01/50 | | | 6/25 at 100.00 | | | | | | | | A+ | | | | 9,107,586 | |
| | | | | |
| | | | South Carolina Public Service Authority, Santee Cooper Revenue Obligations, Refunding Series 2016A: | | | | | | | | | | | | | | | | |
| | 7,015 | | | 5.000%, 12/01/29 | | | 6/26 at 100.00 | | | | | | | | A+ | | | | 8,144,415 | |
| | 3,875 | | | 5.000%, 12/01/31 | | | 6/26 at 100.00 | | | | | | | | A+ | | | | 4,456,017 | |
| | | | | |
| | 1,325 | | | Spartanburg Regional Health Services District, Inc, South Carolina, Hospital Refunding Revenue Bonds, Series 2012A, 5.000%, 4/15/32 | | | 4/22 at 100.00 | | | | | | | | A | | | | 1,415,869 | |
| | 54,460 | | | Total South Carolina | | | | | | | | | | | | | | | 60,421,652 | |
| | | | | |
| | | | South Dakota – 0.1% | | | | | | | | | | | | |
| | | | | |
| | | | South Dakota Building Authority, Revenue Bonds, Series 2013B: | | | | | | | | | | | | | | | | |
| | 525 | | | 5.000%, 6/01/22 | | | No Opt. Call | | | | | | | | AA+ | | | | 579,038 | |
| | 1,000 | | | 5.000%, 6/01/24 | | | 6/23 at 100.00 | | | | | | | | AA+ | | | | 1,131,200 | |
| | | | | |
| | 2,410 | | | South Dakota Health and Educational Facilities Authority, Revenue Bonds, Regional Health, Refunding Series 2017, 5.000%, 9/01/31 | | | 9/27 at 100.00 | | | | | | | | A1 | | | | 2,832,329 | |
| | | | | |
| | 1,000 | | | South Dakota Health and Educational Facilities Authority, Revenue Bonds, Sanford Health, Series 2009, 5.000%, 11/01/24 | | | 11/19 at 100.00 | | | | | | | | A+ | | | | 1,018,560 | |
| | | | | |
| | 3,000 | | | South Dakota Housing Development Authority, Homeownership Mortgage Revenue Bonds, Series 2019A, 3.800%, 11/01/39 | | | 5/28 at 100.00 | | | | | | | | AAA | | | | 3,094,980 | |
| | 7,935 | | | Total South Dakota | | | | | | | | | | | | | | | 8,656,107 | |
| | | | | |
| | | | Tennessee – 1.9% | | | | | | | | | | | | |
| | | | | |
| | 2,265 | | | Chattanooga Health, Educational and Housing Facility Board, Tennessee, Revenue Bonds, Catholic Health Initiatives, Series 2008D, 6.125%, 10/01/28 | | | 5/19 at 100.00 | | | | | | | | BBB+ | | | | 2,273,562 | |
131
Nuveen Intermediate Duration Municipal Bond Fund(continued)
Portfolio of Investments March 31, 2019
| | | | | | | | | | | | | | | | | | | | |
Principal
Amount (000) | | | Description (1) | | Optional Call
Provisions (2) | | | | | | Ratings (3) | | | Value | |
| | | | | |
| | | | Tennessee(continued) | | | | | | | | | | | | |
| | | | | |
| $ | 2,265 | | | Chattanooga-Hamilton County Hospital Authority, Tennessee, Hospital Revenue Bonds, Erlanger Health System, Refunding Series 2014A, 5.000%, 10/01/28 | | | 10/24 at 100.00 | | | | | | | | Baa2 | | | $ | 2,547,808 | |
| | | | | |
| | 3,460 | | | Claiborne County, Tennessee, Industrial Development Board, Revenue Refunding Bonds, Lincoln Memorial University Project, Series 2009, 6.125%, 10/01/29 | | | 10/19 at 100.00 | | | | | | | | N/R | | | | 3,521,415 | |
| | | | | |
| | | | Knox County Health, Educational and Housing Facilities Board, Tennessee, Revenue Bonds, University Health System, Inc, Series 2017: | | | | | | | | | | | | | | | | |
| | 3,250 | | | 5.000%, 4/01/29 | | | 4/27 at 100.00 | | | | | | | | BBB | | | | 3,698,142 | |
| | 2,500 | | | 5.000%, 4/01/30 | | | 4/27 at 100.00 | | | | | | | | BBB | | | | 2,826,550 | |
| | 2,725 | | | 5.000%, 4/01/31 | | | 4/27 at 100.00 | | | | | | | | BBB | | | | 3,062,764 | |
| | | | | |
| | | | Knox County Health, Educational and Housing Facility Board, Tennessee, Hospital Revenue Bonds, Covenant Health, Refunding Series 2012A: | | | | | | | | | | | | | | | | |
| | 1,300 | | | 4.000%, 1/01/23 | | | No Opt. Call | | | | | | | | A+ | | | | 1,398,319 | |
| | 2,110 | | | 5.000%, 1/01/24 | | | 1/23 at 100.00 | | | | | | | | A+ | | | | 2,347,143 | |
| | | | | |
| | | | Knox County Health, Educational and Housing Facility Board, Tennessee, Hospital Revenue Bonds, Covenant Health, Refunding Series 2012A: | | | | | | | | | | | | | | | | |
| | 1,400 | | | 4.000%, 1/01/22 | | | No Opt. Call | | | | | | | | A+ | | | | 1,479,534 | |
| | 3,180 | | | 5.000%, 1/01/23 | | | No Opt. Call | | | | | | | | A+ | | | | 3,534,983 | |
| | | | | |
| | | | Memphis and Shelby County Port Commission, Tennessee, Port Development Revenue Bonds, Series 2011: | | | | | | | | | | | | | | | | |
| | 1,480 | | | 5.250%, 4/01/23 | | | 4/21 at 100.00 | | | | | | | | AA | | | | 1,579,989 | |
| | 1,560 | | | 5.250%, 4/01/24 | | | 4/21 at 100.00 | | | | | | | | AA | | | | 1,664,754 | |
| | 1,240 | | | 5.250%, 4/01/25 | | | 4/21 at 100.00 | | | | | | | | AA | | | | 1,322,770 | |
| | | | | |
| | 4,430 | | | Memphis-Shelby County Sports Authority, Tennessee, Revenue Bonds, Memphis Arena, Refunding Series 2009A, 5.125%, 11/01/24 | | | 11/19 at 100.00 | | | | | | | | AA | | | | 4,518,777 | |
| | | | | |
| | | | Memphis-Shelby County Sports Authority, Tennessee, Revenue Bonds, Memphis Arena, Refunding Series 2009B: | | | | | | | | | | | | | | | | |
| | 1,000 | | | 5.500%, 11/01/20 | | | 11/19 at 100.00 | | | | | | | | AA | | | | 1,023,080 | |
| | 1,860 | | | 5.250%, 11/01/25 | | | 11/19 at 100.00 | | | | | | | | AA | | | | 1,898,614 | |
| | | | | |
| | 8,255 | | | Metropolitan Government of Nashville-Davidson County Health and Educational Facilities Board, Tennessee, Revenue Bonds, Vanderbilt University Medical Center, Series 2016A, 5.000%, 7/01/35 | | | 7/26 at 100.00 | | | | | | | | Aa1 | | | | 9,379,496 | |
| | | | | |
| | 1,200 | | | Tennessee Housing Development Agency, Residential Finance Program Bonds,Series 2015-1C, 3.950%, 7/01/35 | | | 1/25 at 100.00 | | | | | | | | AA+ | | | | 1,251,240 | |
| | | | | |
| | 5,265 | | | Tennessee Housing Development Agency, Residential Finance Program Bonds,Series 2018-3, 3.750%, 7/01/38 | | | 7/27 at 100.00 | | | | | | | | AA+ | | | | 5,461,121 | |
| | | | | |
| | 11,615 | | | Tennessee Housing Development Agency, Residential Finance Program Bonds,Series 2018-4, 3.900%, 7/01/38 | | | 1/28 at 100.00 | | | | | | | | AA+ | | | | 12,112,122 | |
| | | | | |
| | 10,000 | | | Tennessee Housing Development Agency, Residential Finance Program Bonds,Series 2019-1, 3.750%, 7/01/39 | | | 7/28 at 100.00 | | | | | | | | AA+ | | | | 10,380,500 | |
| | | | | |
| | 6,680 | | | The Tennessee Energy Acquisition Corporation, Gas Project Revenue Bonds, Series 2018, 4.000%, 11/01/49 (Mandatory Put 11/01/25) | | | 8/25 at 100.22 | | | | | | | | A3 | | | | 7,211,528 | |
| | | | | |
| | 13,380 | | | The Tennessee Energy Acquisition Corporation, Gas Revenue Bonds, Series 2006A, 5.250%, 9/01/20 | | | No Opt. Call | | | | | | | | A | | | | 13,919,080 | |
| | | | | |
| | 27,240 | | | The Tennessee Energy Acquisition Corporation, Gas Revenue Bonds, Series 2017A, 4.000%, 5/01/48 (Mandatory Put 5/01/23) | | | 5/23 at 100.43 | | | | | | | | A3 | | | | 28,822,099 | |
| | 119,660 | | | Total Tennessee | | | | | | | | | | | | | | | 127,235,390 | |
132
| | | | | | | | | | | | | | | | | | | | |
Principal
Amount (000) | | | Description (1) | | Optional Call
Provisions (2) | | | | | | Ratings (3) | | | Value | |
| | | | | |
| | | | Texas – 6.4% | | | | | | | | | | | | |
| | | | | |
| $ | 1,085 | | | Austin Convention Enterprises Inc, Texas, Convention Center Hotel Revenue Bonds, Refunding First Tier Series 2017A, 5.000%, 1/01/30 | | | 1/27 at 100.00 | | | | | | | | BBB+ | | | $ | 1,250,159 | |
| | | | | |
| | 3,370 | | | Central Texas Regional Mobility Authority, Revenue Bonds, Refunding Senior Lien Series 2013A, 5.000%, 1/01/33 | | | 1/23 at 100.00 | | | | | | | | A– | | | | 3,671,076 | |
| | | | | |
| | 3,445 | | | Central Texas Regional Mobility Authority, Revenue Bonds, Senior Lien Series 2011, 6.250%, 1/01/46(Pre-refunded 1/01/21) | | | 1/21 at 100.00 | | | | | | | | A– (4) | | | | 3,716,087 | |
| | | | | |
| | | | Central Texas Regional Mobility Authority, Revenue Bonds, Senior Lien, Series 2015A: | | | | | | | | | | | | | | | | |
| | 1,945 | | | 5.000%, 1/01/32 | | | 7/25 at 100.00 | | | | | | | | A– | | | | 2,213,780 | |
| | 1,390 | | | 5.000%, 1/01/33 | | | 7/25 at 100.00 | | | | | | | | A– | | | | 1,575,412 | |
| | 1,165 | | | 5.000%, 1/01/34 | | | 7/25 at 100.00 | | | | | | | | A– | | | | 1,316,963 | |
| | | | | |
| | | | Central Texas Regional Mobility Authority, Revenue Bonds, Senior Lien, Series 2016: | | | | | | | | | | | | | | | | |
| | 2,000 | | | 5.000%, 1/01/33 | | | 1/26 at 100.00 | | | | | | | | A– | | | | 2,283,640 | |
| | 1,650 | | | 5.000%, 1/01/35 | | | 1/26 at 100.00 | | | | | | | | A– | | | | 1,873,971 | |
| | | | | |
| | 865 | | | Clifton Higher Education Finance Corporation, Texas, Education Revenue Bonds, Idea Public Schools, Series 2012, 3.750%, 8/15/22 | | | No Opt. Call | | | | | | | | BBB+ | | | | 885,535 | |
| | | | | |
| | | | Conroe Independent School District, Montgomery County, Texas, General Obligation Bonds, Refunding School Building Series 2012: | | | | | | | | | | | | | | | | |
| | 5,200 | | | 5.000%, 2/15/26(Pre-refunded 2/15/21) | | | 2/21 at 100.00 | | | | | | | | Aaa | | | | 5,538,156 | |
| | 2,800 | | | 5.000%, 2/15/26 | | | 2/21 at 100.00 | | | | | | | | AAA | | | | 2,970,856 | |
| | | | | |
| | 5,500 | | | Dallas Area Rapid Transit, Texas, Sales Tax Revenue Bonds, Senior Lien Refunding Series 2019, 5.000%, 12/01/28 (WI/DD, Settling 4/09/19) | | | No Opt. Call | | | | | | | | AA+ | | | | 6,954,035 | |
| | | | | |
| | | | Dallas-Fort Worth International Airport, Texas, Joint Revenue Bonds, Refunding & Improvement Series 2016: | | | | | | | | | | | | | | | | |
| | 10,000 | | | 1.350%, 11/01/20 (AMT) , 144A | | | No Opt. Call | | | | | | | | A+ | | | | 9,859,300 | |
| | 20,000 | | | 1.600%, 11/01/21 (AMT) , 144A | | | No Opt. Call | | | | | | | | A+ | | | | 19,667,000 | |
| | | | | |
| | 9,295 | | | Dallas-Fort Worth International Airport, Texas, Joint Revenue Bonds, Refunding Series 2012B, 5.000%, 11/01/35 | | | 11/20 at 100.00 | | | | | | | | A+ | | | | 9,749,340 | |
| | | | | |
| | | | Fort Bend Independent School District, Fort Bend County, Texas, General Obligation Bonds, School Building Series 2009: | | | | | | | | | | | | | | | | |
| | 1,545 | | | 4.550%, 2/15/25(Pre-refunded 8/15/19) | | | 8/19 at 100.00 | | | | | | | | N/R (4) | | | | 1,561,794 | |
| | 455 | | | 4.550%, 2/15/25 | | | 8/19 at 100.00 | | | | | | | | AA+ | | | | 459,982 | |
| | | | | |
| | 11,750 | | | Grand Parkway Transportation Corporation, Texas, System Toll Revenue Bonds, Bond Anticipation Note Series 2014A, 5.000%, 2/01/23 | | | No Opt. Call | | | | | | | | A+ | | | | 13,112,060 | |
| | | | | |
| | 7,400 | | | Grand Parkway Transportation Corporation, Texas, System Toll Revenue Bonds, Subordinate Lien Series 2013B, 5.000%, 4/01/53 | | | 10/23 at 100.00 | | | | | | | | AA+ | | | | 8,013,090 | |
| | | | | |
| | | | Hale Center Education Facilities Corporation, Texas, Revenue Bonds, Wayland Baptist University Project, Improvement and Refunding Series 2010: | | | | | | | | | | | | | | | | |
| | 875 | | | 4.000%, 3/01/21 | | | No Opt. Call | | | | | | | | A– | | | | 906,684 | |
| | 550 | | | 4.000%, 3/01/22 | | | 3/21 at 100.00 | | | | | | | | A– | | | | 569,685 | |
| | 800 | | | 4.000%, 3/01/23 | | | 3/21 at 100.00 | | | | | | | | A– | | | | 827,712 | |
| | 440 | | | 4.250%, 3/01/25 | | | 3/21 at 100.00 | | | | | | | | A– | | | | 458,361 | |
| | | | | |
| | | | Harris County Cultural Education Facilities Finance Corporation, Texas, Hospital Revenue Bonds, Memorial Hermann Healthcare System, Refunding Series 2013A: | | | | | | | | | | | | | | | | |
| | 1,825 | | | 5.000%, 12/01/23 | | | 12/22 at 100.00 | | | | | | | | A+ | | | | 2,029,948 | |
| | 18,000 | | | 4.000%, 12/01/31 | | | 12/22 at 100.00 | | | | | | | | A+ | | | | 18,871,740 | |
133
Nuveen Intermediate Duration Municipal Bond Fund(continued)
Portfolio of Investments March 31, 2019
| | | | | | | | | | | | | | | | | | | | |
Principal
Amount (000) | | | Description (1) | | Optional Call
Provisions (2) | | | | | | Ratings (3) | | | Value | |
| | | | | |
| | | | Texas(continued) | | | | | | | | | | | | |
| | | | | |
| | | | Harris County Cultural Education Facilities Finance Corporation, Texas, Hospital Revenue Bonds, Memorial Hermann Healthcare System, Series 2014A: | | | | | | | | | | | | | | | | |
| $ | 5,215 | | | 5.000%, 12/01/26 | | | 12/24 at 100.00 | | | | | | | | A+ | | | $ | 6,030,052 | |
| | 4,025 | | | 5.000%, 12/01/27 | | | 12/24 at 100.00 | | | | | | | | A+ | | | | 4,635,431 | |
| | 3,000 | | | 5.000%, 12/01/28 | | | 12/24 at 100.00 | | | | | | | | A+ | | | | 3,446,370 | |
| | 6,115 | | | 5.000%, 12/01/29 | | | 12/24 at 100.00 | | | | | | | | A+ | | | | 6,989,812 | |
| | | | | |
| | 5,045 | | | Harris County Flood Control District, Texas, General Obligation Bonds, Refunding Contract Tax Series 2014A, 5.000%, 10/01/25 | | | 10/24 at 100.00 | | | | | | | | Aaa | | | | 5,940,639 | |
| | | | | |
| | 3,015 | | | Harris County Health Facilities Development Corporation, Texas, Hospital Revenue Bonds, St Luke’s Episcopal Hospital, Series 1991A, 6.750%, 2/15/21 (ETM) | | | 6/19 at 100.00 | | | | | | | | AA+ (4) | | | | 3,070,205 | |
| | | | | |
| | | | Harris County Metropolitan Transit Authority, Texas, Sales and Use Tax Revenue Bonds, Series 2009A: | | | | | | | | | | | | | | | | |
| | 5,120 | | | 5.000%, 11/01/22(Pre-refunded 11/01/19) | | | 11/19 at 100.00 | | | | | | | | AAA (4) | | | | 5,225,216 | |
| | 5,385 | | | 5.000%, 11/01/23(Pre-refunded 11/01/19) | | | 11/19 at 100.00 | | | | | | | | AAA (4) | | | | 5,495,662 | |
| | 5,660 | | | 5.000%, 11/01/24(Pre-refunded 11/01/19) | | | 11/19 at 100.00 | | | | | | | | AAA (4) | | | | 5,776,313 | |
| | | | | |
| | 2,320 | | | Harris County Metropolitan Transit Authority, Texas, Sales and Use Tax Revenue Bonds, Tender Option Bond Trust 2016-XG0054, 11.017%, 11/01/41 (IF) (5) | | | 11/21 at 100.00 | | | | | | | | AAA | | | | 2,835,086 | |
| | | | | |
| | | | Harris County-Houston Sports Authority, Texas, Revenue Bonds, Refunding Second Lien Series 2014C: | | | | | | | | | | | | | | | | |
| | 285 | | | 5.000%, 11/15/22 | | | No Opt. Call | | | | | | | | A3 | | | | 313,902 | |
| | 425 | | | 5.000%, 11/15/23 | | | No Opt. Call | | | | | | | | A3 | | | | 477,602 | |
| | | | | |
| | | | Harris County-Houston Sports Authority, Texas, Revenue Bonds, Refunding Senior Lien Series 2014A: | | | | | | | | | | | | | | | | |
| | 4,795 | | | 5.000%, 11/15/24 – AGM Insured | | | No Opt. Call | | | | | | | | AA | | | | 5,592,121 | |
| | 4,590 | | | 5.000%, 11/15/25 – AGM Insured | | | 11/24 at 100.00 | | | | | | | | AA | | | | 5,302,689 | |
| | 4,095 | | | 5.000%, 11/15/26 – AGM Insured | | | 11/24 at 100.00 | | | | | | | | AA | | | | 4,712,485 | |
| | 12,040 | | | 5.000%, 11/15/27 – AGM Insured | | | 11/24 at 100.00 | | | | | | | | AA | | | | 13,807,713 | |
| | | | | |
| | | | Harrison County Health Facilities Development Corporation, Hospital Revenue Bonds, Good Shepherd Health System, Refunding Series 2010: | | | | | | | | | | | | | | | | |
| | 2,270 | | | 5.000%, 7/01/19 (ETM) | | | No Opt. Call | | | | | | | | N/R (4) | | | | 2,288,728 | |
| | 2,380 | | | 5.000%, 7/01/20 (ETM) | | | No Opt. Call | | | | | | | | N/R (4) | | | | 2,479,175 | |
| | | | | |
| | 5,240 | | | Houston Independent School District, Harris County, Texas, General Obligation Bonds, Refunding Limited Tax Schoolhouse Series 2013A, 4.000%, 2/15/31 | | | 2/23 at 100.00 | | | | | | | | AAA | | | | 5,566,242 | |
| | | | | |
| | 11,815 | | | Houston Independent School District, Harris County, Texas, General Obligation Bonds, Refunding Schoolhouse Series 2016A, 4.000%, 2/15/34 | | | 2/26 at 100.00 | | | | | | | | AAA | | | | 12,855,901 | |
| | | | | |
| | | | Houston, Texas, Airport System Revenue Bonds, Refunding Subordinate Lien Series 2011B: | | | | | | | | | | | | | | | | |
| | 1,900 | | | 5.000%, 7/01/25 | | | 7/21 at 100.00 | | | | | | | | A+ | | | | 2,040,809 | |
| | 2,025 | | | 5.000%, 7/01/26 | | | 7/21 at 100.00 | | | | | | | | A+ | | | | 2,171,347 | |
| | | | | |
| | | | Houston, Texas, Airport System Revenue Bonds, Refunding Subordinate Lien Series 2012B: | | | | | | | | | | | | | | | | |
| | 18,675 | | | 5.000%, 7/01/31 | | | 7/22 at 100.00 | | | | | | | | A+ | | | | 20,366,581 | |
| | 5,000 | | | 5.000%, 7/01/32 | | | 7/22 at 100.00 | | | | | | | | A+ | | | | 5,444,700 | |
| | | | | |
| | 2,440 | | | Houston, Texas, Airport System Special Facilities Revenue Bonds, United Airlines, Inc Terminal E Project, Refunding Series 2014, 5.000%, 7/01/29 (AMT) | | | 7/24 at 100.00 | | | | | | | | BB | | | | 2,696,615 | |
134
| | | | | | | | | | | | | | | | | | | | |
Principal
Amount (000) | | | Description (1) | | Optional Call
Provisions (2) | | | | | | Ratings (3) | | | Value | |
| | | | | |
| | | | Texas(continued) | | | | | | | | | | | | |
| | | | | |
| | | | Houston, Texas, Combined Utility System Revenue Bonds, Refunding First Lien Series 2018D: | | | | | | | | | | | | | | | | |
| $ | 3,000 | | | 5.000%, 11/15/32 | | | 11/28 at 100.00 | | | | | | | | Aa2 | | | $ | 3,674,640 | |
| | 2,570 | | | 5.000%, 11/15/33 | | | 11/28 at 100.00 | | | | | | | | Aa2 | | | | 3,136,171 | |
| | | | | |
| | 6,000 | | | Houston, Texas, General Obligation Bonds, Refunding Public Improvement Series 2017A, 5.000%, 3/01/22 | | | No Opt. Call | | | | | | | | AA | | | | 6,569,100 | |
| | | | | |
| | | | Houston, Texas, Hotel Occupancy Tax and Special Revenue Bonds, Convention and Entertainment Project, Series 2001B: | | | | | | | | | | | | | | | | |
| | 8,005 | | | 0.000%, 9/01/22 – AMBAC Insured | | | No Opt. Call | | | | | | | | A | | | | 7,476,110 | |
| | 3,815 | | | 0.000%, 9/01/23 – AMBAC Insured | | | No Opt. Call | | | | | | | | A | | | | 3,472,756 | |
| | | | | |
| | 2,000 | | | Laredo Community College District, Webb County, Texas, General Obligation Bonds, Series 2014, 5.000%, 8/01/32 | | | 8/24 at 100.00 | | | | | | | | AA– | | | | 2,272,840 | |
| | | | | |
| | | | Love Field Airport Modernization Corporation, Texas, General Airport Revenue Bonds Series 2015: | | | | | | | | | | | | | | | | |
| | 1,000 | | | 5.000%, 11/01/26 (AMT) | | | 11/25 at 100.00 | | | | | | | | A1 | | | | 1,174,860 | |
| | 2,025 | | | 5.000%, 11/01/27 (AMT) | | | 11/25 at 100.00 | | | | | | | | A1 | | | | 2,368,258 | |
| | 1,570 | | | 5.000%, 11/01/28 (AMT) | | | 11/25 at 100.00 | | | | | | | | A1 | | | | 1,827,778 | |
| | 2,000 | | | 5.000%, 11/01/29 (AMT) | | | 11/25 at 100.00 | | | | | | | | A1 | | | | 2,317,780 | |
| | 2,000 | | | 5.000%, 11/01/30 (AMT) | | | 11/25 at 100.00 | | | | | | | | A1 | | | | 2,307,240 | |
| | | | | |
| | 1,800 | | | Love Field Airport Modernization Corporation, Texas, Special Facilities Revenue Bonds, Southwest Airlines Company, Series 2010, 5.250%, 11/01/40 | | | 11/20 at 100.00 | | | | | | | | A3 | | | | 1,874,718 | |
| | | | | |
| | 10,000 | | | Lower Colorado River Authority, Texas, Transmission Contract Revenue Bonds, LCRA Transmission Services Corporation Project, Refunding Series 2009, 5.500%, 5/15/36 | | | 5/19 at 100.00 | | | | | | | | A1 | | | | 10,047,700 | |
| | | | | |
| | | | Lower Colorado River Authority, Texas, Transmission Contract Revenue Bonds, LCRA Transmission Services Corporation Project, Refunding Series 2018: | | | | | | | | | | | | | | | | |
| | 2,135 | | | 5.000%, 5/15/21 | | | No Opt. Call | | | | | | | | A+ | | | | 2,284,984 | |
| | 1,845 | | | 5.000%, 5/15/22 | | | No Opt. Call | | | | | | | | A+ | | | | 2,032,360 | |
| | | | | |
| | | | McCamey County Hospital District, Texas, General Obligation Bonds, Series 2013: | | | | | | | | | | | | | | | | |
| | 3,045 | | | 5.000%, 12/01/25 | | | No Opt. Call | | | | | | | | B1 | | | | 3,291,523 | |
| | 2,720 | | | 5.250%, 12/01/28 | | | 12/25 at 100.00 | | | | | | | | B1 | | | | 2,922,667 | |
| | | | | |
| | 2,700 | | | Mission Economic Development Corporation, Texas, Revenue Bonds, Natgasoline Project, Senior Lien Series 2018, 4.625%, 10/01/31 (AMT), 144A | | | 10/21 at 105.00 | | | | | | | | BB– | | | | 2,808,378 | |
| | | | | |
| | | | North Central Texas Health Facilities Development Corporation, Texas, Revenue Bonds, Children’s Medical Center Dallas Project, Series 2012: | | | | | | | | | | | | | | | | |
| | 4,380 | | | 5.000%, 8/15/24(Pre-refunded 8/15/22) | | | 8/22 at 100.00 | | | | | | | | Aa2 (4) | | | | 4,871,086 | |
| | 4,720 | | | 5.000%, 8/15/25(Pre-refunded 8/15/22) | | | 8/22 at 100.00 | | | | | | | | Aa2 (4) | | | | 5,249,206 | |
| | 3,945 | | | 5.000%, 8/15/26(Pre-refunded 8/15/22) | | | 8/22 at 100.00 | | | | | | | | Aa2 (4) | | | | 4,387,313 | |
| | 7,025 | | | 5.000%, 8/15/27(Pre-refunded 8/15/22) | | | 8/22 at 100.00 | | | | | | | | Aa2 (4) | | | | 7,812,643 | |
| | | | | |
| | | | North Texas Tollway Authority, Special Projects System Revenue Bonds, Convertible Capital Appreciation Series 2011C: | | | | | | | | | | | | | | | | |
| | 3,855 | | | 0.000%, 9/01/43(Pre-refunded 9/01/31) (6) | | | 9/31 at 100.00 | | | | | | | | N/R (4) | | | | 4,516,595 | |
| | 9,130 | | | 0.000%, 9/01/45(Pre-refunded 9/01/31) (6) | | | 9/31 at 100.00 | | | | | | | | N/R (4) | | | | 11,671,427 | |
| | | | | |
| | | | North Texas Tollway Authority, Special Projects System Revenue Bonds, Current Interest Series 2011D: | | | | | | | | | | | | | | | | |
| | 8,655 | | | 5.250%, 9/01/25(Pre-refunded 9/01/21) | | | 9/21 at 100.00 | | | | | | | | N/R (4) | | | | 9,404,263 | |
| | 5,040 | | | 5.250%, 9/01/26(Pre-refunded 9/01/21) | | | 9/21 at 100.00 | | | | | | | | N/R (4) | | | | 5,476,313 | |
135
Nuveen Intermediate Duration Municipal Bond Fund(continued)
Portfolio of Investments March 31, 2019
| | | | | | | | | | | | | | | | | | | | |
Principal
Amount (000) | | | Description (1) | | Optional Call
Provisions (2) | | | | | | Ratings (3) | | | Value | |
| | | | | |
| | | | Texas(continued) | | | | | | | | | | | | |
| | | | | |
| $ | 870 | | | Sunnyvale School District, Texas, General Obligation Bonds, School Building Series 2007, 4.400%, 2/15/20 | | | 5/19 at 100.00 | | | | | | | | AAA | | | $ | 871,871 | |
| | | | | |
| | 4,830 | | | Tarrant County Cultural Education Facilities Finance Corporation, Texas, Hospital Revenue Bonds, Baylor Health Care System, Series 2011A, 5.000%, 11/15/30 | | | 11/21 at 100.00 | | | | | | | | AA– | | | | 5,180,561 | |
| | | | | |
| | 1,285 | | | Tarrant County Cultural Education Facilities Finance Corporation, Texas, Hospital Revenue Bonds, Hendrick Medical Center, Refunding Series 2013, 5.125%, 9/01/33 | | | 9/23 at 100.00 | | | | | | | | A | | | | 1,431,888 | |
| | | | | |
| | 3,000 | | | Texas Department of Housing and Community Affairs, Single Family Mortgage Revenue Bonds, Series 2018A, 4.125%, 9/01/38 | | | 9/27 at 100.00 | | | | | | | | AA+ | | | | 3,147,210 | |
| | | | | |
| | 5,000 | | | Texas Municipal Gas Acquisition and Supply Corporation III, Gas Supply Revenue Bonds, Series 2012, 5.000%, 12/15/21 | | | No Opt. Call | | | | | | | | A3 | | | | 5,357,450 | |
| | | | | |
| | 4,750 | | | Texas Private Activity Bond Surface Transportation Corporation, Senior Lien Revenue Bonds, Blueridge Transportation Group, LLC SH 288 Toll Lanes Project, Series 2016, 5.000%, 12/31/40 (AMT) | | | 12/25 at 100.00 | | | | | | | | Baa3 | | | | 5,196,690 | |
| | | | | |
| | 3,250 | | | Texas State, General Obligation Bonds, Transportation Commission Mobility Fund, Refunding Series 2014A, 5.000%, 10/01/22 | | | No Opt. Call | | | | | | | | AAA | | | | 3,626,285 | |
| | | | | |
| | 16,250 | | | Texas Transportation Commission, Central Texas Turnpike System Revenue Bonds, Second Tier Refunding Series 2015C, 5.000%, 8/15/31 | | | 8/24 at 100.00 | | | | | | | | BBB+ | | | | 18,115,500 | |
| | | | | |
| | | | Texas Transportation Commission, State Highway 249 System Revenue Bonds, First Tier Toll Series 2019A: | | | | | | | | | | | | | | | | |
| | 1,125 | | | 0.000%, 8/01/35 | | | 2/29 at 76.82 | | | | | | | | Baa3 | | | | 586,136 | |
| | 1,590 | | | 0.000%, 8/01/36 | | | 2/29 at 73.16 | | | | | | | | Baa3 | | | | 783,616 | |
| | 2,070 | | | 0.000%, 8/01/37 | | | 2/29 at 69.41 | | | | | | | | Baa3 | | | | 959,900 | |
| | 1,100 | | | 0.000%, 8/01/39 | | | 2/29 at 62.63 | | | | | | | | Baa3 | | | | 455,356 | |
| | | | | |
| | | | Val Verde County, Texas, Pass-Through Toll Revenue and Limited Tax Bonds, Series 2011: | | | | | | | | | | | | | | | | |
| | 2,900 | | | 4.000%, 8/15/19 | | | No Opt. Call | | | | | | | | A | | | | 2,924,186 | |
| | 3,015 | | | 4.000%, 8/15/20 | | | No Opt. Call | | | | | | | | A | | | | 3,107,591 | |
| | 3,135 | | | 4.000%, 8/15/21 | | | No Opt. Call | | | | | | | | A | | | | 3,254,976 | |
| | | | | |
| | 8,830 | | | Williamson County, Texas, General Obligation Bonds, Limited Tax Refunding Series 2012, 5.000%, 2/15/26 | | | 2/22 at 100.00 | | | | | | | | AAA | | | | 9,652,691 | |
| | 404,205 | | | Total Texas | | | | | | | | | | | | | | | 435,798,378 | |
| | | | | |
| | | | Utah – 0.2% | | | | | | | | | | | | |
| | | | | |
| | 6,345 | | | Riverton, Utah, Hospital Revenue Bonds, IHC Health Services, Inc, Series 2009, 5.000%, 8/15/41(Pre-refunded 8/15/19) | | | 8/19 at 100.00 | | | | | | | | AA+ (4) | | | | 6,426,851 | |
| | | | | |
| | | | Utah Associated Municipal Power Systems, Revenue Bonds, Horse Butte Wind Project, Series 2012A: | | | | | | | | | | | | | | | | |
| | 3,340 | | | 5.000%, 9/01/23(Pre-refunded 9/01/22) | | | 9/22 at 100.00 | | | | | | | | A (4) | | | | 3,713,412 | |
| | 2,000 | | | 5.000%, 9/01/25(Pre-refunded 9/01/22) | | | 9/22 at 100.00 | | | | | | | | A (4) | | | | 2,223,600 | |
| | 2,265 | | | 5.000%, 9/01/26(Pre-refunded 9/01/22) | | | 9/22 at 100.00 | | | | | | | | A (4) | | | | 2,518,227 | |
| | 13,950 | | | Total Utah | | | | | | | | | | | | | | | 14,882,090 | |
| | | | | |
| | | | Virginia – 1.4% | | | | | | | | | | | | |
| | | | | |
| | 10,755 | | | Fairfax County, Virginia, General Obligation Bonds, Refunding Public Improvement Series 2016A, 4.000%, 10/01/19 | | | No Opt. Call | | | | | | | | AAA | | | | 10,889,868 | |
| | | | | |
| | 10,000 | | | King George County Industrial Development Authority, Virginia, Solid Waste Disposal Revenue Bonds, King George Landfill, Inc Project, Variable Rate Demand Series 2003A, 2.500%, 6/01/23 (AMT) | | | No Opt. Call | | | | | | | | A– | | | | 10,000,900 | |
136
| | | | | | | | | | | | | | | | | | | | |
Principal
Amount (000) | | | Description (1) | | Optional Call
Provisions (2) | | | | | | Ratings (3) | | | Value | |
| | | | | |
| | | | Virginia(continued) | | | | | | | | | | | | |
| | | | | |
| $ | 9,785 | | | Loudoun County Economic Development Authority, Virginia, Lease Revenue Bonds, Metrorail Service District Improvement Silver Line Phase 2 Project, Series 2018, 2.000%, 4/01/22 | | | 4/20 at 100.00 | | | | | | | | AA+ | | | $ | 9,799,090 | |
| | | | | |
| | 1,730 | | | Madison County Industrial Development Authority, Virginia, Educational Facilities Revenue Bonds, Woodberry Forest School, Refunding Series 2016A, 3.000%, 10/01/46 | | | 10/25 at 100.00 | | | | | | | | Aa1 | | | | 1,663,827 | |
| | | | | |
| | 760 | | | Roanoke Economic Development Authority, Virginia, Residential Care Facility Mortgage Revenue Refunding Bonds, Virginia Lutheran Homes Brandon Oaks Project, Series 2012, 5.000%, 12/01/32 | | | 12/22 at 100.00 | | | | | | | | N/R | | | | 790,620 | |
| | | | | |
| | 1,185 | | | Stafford County Economic Development Authority, Virginia, Hospital Facilities Revenue Bonds, Mary Washington Healthcare Obligated Group, Refunding Series 2016, 3.125%, 6/15/31 | | | 6/26 at 100.00 | | | | | | | | A– | | | | 1,199,102 | |
| | | | | |
| | 710 | | | Virginia College Building Authority, Educational Facilities Revenue Bonds, Marymount University Project, Refunding Series 2015A, 5.000%, 7/01/45, 144A | | | 7/25 at 100.00 | | | | | | | | BB+ | | | | 741,276 | |
| | | | | |
| | 39,100 | | | Virginia Small Business Financing Authority, Private Activity Revenue Bonds, Transform 66 P3 Project, Senior Lien Series 2017, 5.000%, 12/31/52 (AMT) | | | 6/27 at 100.00 | | | | | | | | BBB | | | | 42,768,362 | |
| | | | | |
| | 6,835 | | | Virginia Small Business Financing Authority, Senior Lien Revenue Bonds, Elizabeth River Crossing, Opco LLC Project, Series 2012, 5.500%, 1/01/42 (AMT) | | | 7/22 at 100.00 | | | | | | | | BBB | | | | 7,344,276 | |
| | | | | |
| | 8,650 | | | Wise County Industrial Development Authority, Virginia, Solid Waste and Sewage Disposal Revenue Bonds, Virginia Electric and Power Company, Series 2009A, 2.150%, 10/01/40 (Mandatory Put 9/01/20) | | | No Opt. Call | | | | | | | | BBB+ | | | | 8,677,593 | |
| | 89,510 | | | Total Virginia | | | | | | | | | | | | | | | 93,874,914 | |
| | | | | |
| | | | Washington – 1.1% | | | | | | | | | | | | |
| | | | | |
| | 2,900 | | | Port of Seattle, Washington, Revenue Bonds, Refunding Intermediate Lien Series 2016, 5.000%, 2/01/29 | | | 2/26 at 100.00 | | | | | | | | AA– | | | | 3,426,408 | |
| | | | | |
| | 2,340 | | | Skagit County Public Hospital District 1, Washington, Revenue Bonds, Skagit Valley Hospital, Refunding & Improvement Series 2016, 5.000%, 12/01/37 | | | 12/26 at 100.00 | | | | | | | | Baa2 | | | | 2,572,713 | |
| | | | | |
| | 6,000 | | | Snohomish County School District 2, Everett, Washington, General Obligation Bonds, Series 2018, 5.000%, 12/01/19 | | | No Opt. Call | | | | | | | | AA+ | | | | 6,138,060 | |
| | | | | |
| | 6,000 | | | Washington Health Care Facilities Authority, Revenue Bonds, Fred Hutchinson Cancer Research Center, Series 2011A, 5.375%, 1/01/31 | | | 1/21 at 100.00 | | | | | | | | A+ | | | | 6,303,600 | |
| | | | | |
| | | | Washington Health Care Facilities Authority, Revenue Bonds, Fred Hutchinson Cancer Research Center, Series 2015: | | | | | | | | | | | | | | | | |
| | 2,730 | | | 5.000%, 1/01/26 | | | 7/25 at 100.00 | | | | | | | | A+ | | | | 3,190,851 | |
| | 1,285 | | | 5.000%, 1/01/27 | | | 7/25 at 100.00 | | | | | | | | A+ | | | | 1,494,571 | |
| | | | | |
| | | | Washington Health Care Facilities Authority, Revenue Bonds, PeaceHealth, Refunding Series 2014A: | | | | | | | | | | | | | | | | |
| | 1,295 | | | 5.000%, 11/15/22 | | | No Opt. Call | | | | | | | | AA– | | | | 1,442,617 | |
| | 2,035 | | | 5.000%, 11/15/24 | | | 5/24 at 100.00 | | | | | | | | AA– | | | | 2,331,540 | |
| | | | | |
| | | | Washington Health Care Facilities Authority, Revenue Bonds, Providence Saint Joseph Health, Series 2018B: | | | | | | | | | | | | | | | | |
| | 4,015 | | | 5.000%, 10/01/30 | | | 10/28 at 100.00 | | | | | | | | AA– | | | | 4,902,676 | |
| | 2,780 | | | 5.000%, 10/01/31 | | | 10/28 at 100.00 | | | | | | | | AA– | | | | 3,365,412 | |
| | 3,010 | | | 5.000%, 10/01/32 | | | 10/28 at 100.00 | | | | | | | | AA– | | | | 3,618,502 | |
| | 2,600 | | | 5.000%, 10/01/33 | | | 10/28 at 100.00 | | | | | | | | AA– | | | | 3,109,340 | |
137
Nuveen Intermediate Duration Municipal Bond Fund(continued)
Portfolio of Investments March 31, 2019
| | | | | | | | | | | | | | | | | | | | |
Principal
Amount (000) | | | Description (1) | | Optional Call
Provisions (2) | | | | | | Ratings (3) | | | Value | |
| | | | | |
| | | | Washington(continued) | | | | | | | | | | | | |
| | | | | |
| | | | Washington Health Care Facilities Authority, Revenue Bonds, Virginia Mason Medical Center, Series 2017: | | | | | | | | | | | | | | | | |
| $ | 5,120 | | | 5.000%, 8/15/29 | | | 8/27 at 100.00 | | | | | | | | BBB | | | $ | 5,897,216 | |
| | 5,000 | | | 5.000%, 8/15/34 | | | 8/27 at 100.00 | | | | | | | | BBB | | | | 5,596,400 | |
| | 5,765 | | | 5.000%, 8/15/36 | | | 8/27 at 100.00 | | | | | | | | BBB | | | | 6,393,039 | |
| | | | | |
| | | | Washington State Health Care Facilities Authority, Revenue Bonds, Central Washington Health Services Association, Series 2009: | | | | | | | | | | | | | | | | |
| | 1,845 | | | 6.250%, 7/01/24(Pre-refunded 7/01/19) | | | 7/19 at 100.00 | | | | | | | | N/R (4) | | | | 1,866,015 | |
| | 1,330 | | | 6.250%, 7/01/24 | | | 7/19 at 100.00 | | | | | | | | Baa1 | | | | 1,343,034 | |
| | 2,000 | | | 6.750%, 7/01/29(Pre-refunded 7/01/19) | | | 7/19 at 100.00 | | | | | | | | Baa1 (4) | | | | 2,025,180 | |
| | | | | |
| | 3,250 | | | Washington State Higher Education Facilities Authority, Revenue Bonds, Whitworth University, Series 2009, 5.125%, 10/01/24(Pre-refunded 10/01/19) | | | 10/19 at 100.00 | | | | | | | | Baa1 (4) | | | | 3,306,518 | |
| | | | | |
| | 4,415 | | | Whidbey Island Public Hospital District, Island County, Washington, General Obligation Bonds, Whidbey General Hospital, Series 2013, 5.500%, 12/01/33 | | | 12/22 at 100.00 | | | | | | | | Baa2 | | | | 4,736,191 | |
| | 65,715 | | | Total Washington | | | | | | | | | | | | | | | 73,059,883 | |
| | | | | |
| | | | West Virginia – 0.5% | | | | | | | | | | | | |
| | | | | |
| | 5,120 | | | West Virginia Economic Development Authority, Energy Revenue Bonds, Morgantown Energy Associates Project, Refunding Series 2016, 2.875%, 12/15/26 (AMT) | | | No Opt. Call | | | | | | | | Baa3 | | | | 5,032,397 | |
| | | | | |
| | 10,335 | | | West Virginia Economic Development Authority, Solid Waste Disposal Facilities Revenue Bonds, Appalachian Power Company – Amos Project, Series 2011A, 1.700%, 1/01/41 (Mandatory Put 9/01/20) (AMT) | | | No Opt. Call | | | | | | | | A– | | | | 10,296,244 | |
| | | | | |
| | 6,000 | | | West Virginia Economic Development Authority, Solid Waste Disposal Facilities Revenue Bonds, Appalachian Power Company – Amos Project, Seriess 2009A, 2.625%, 12/01/42 (Mandatory Put 6/01/22) | | | No Opt. Call | | | | | | | | A– | | | | 6,099,540 | |
| | | | | |
| | 6,000 | | | West Virginia Economic Development Authority, Solid Waste Disposal Facilities Revenue Bonds, Appalachian Power Company – Amos Project, Seriess 2009B, 2.625%, 12/01/42 (Mandatory Put 6/01/22) | | | No Opt. Call | | | | | | | | A– | | | | 6,099,540 | |
| | | | | |
| | 4,830 | | | West Virginia Economic Development Authority, Solid Waste Disposal Facilities Revenue Bonds, Wheeling Power Company – Mitchell Project, Series 2013A, 3.000%, 6/01/37 (Mandatory Put 4/01/22) (AMT) | | | No Opt. Call | | | | | | | | A– | | | | 4,876,996 | |
| | | | | |
| | 1,015 | | | West Virginia Hospital Finance Authority, Hospital Revenue Bonds, Charleston Area Medical Center, Series 2014A, 5.000%, 9/01/25 | | | 9/24 at 100.00 | | | | | | | | Baa1 | | | | 1,135,754 | |
| | 33,300 | | | Total West Virginia | | | | | | | | | | | | | | | 33,540,471 | |
| | | | | |
| | | | Wisconsin – 2.8% | | | | | | | | | | | | |
| | | | | |
| | 24,400 | | | Public Finance Authority of Wisconsin, Limited Obligation PILOT Revenue Bonds, American Dream @ Meadowlands Project, Series 2017, 6.500%, 12/01/37, 144A | | | 12/27 at 100.00 | | | | | | | | N/R | | | | 28,170,532 | |
| | | | | |
| | | | Public Finance Authority of Wisconsin, Revenue Bonds, Denver international Airport Great Hall Project, Series 2017: | | | | | | | | | | | | | | | | |
| | 2,000 | | | 5.000%, 9/30/37 (AMT) | | | 9/27 at 100.00 | | | | | | | | BBB | | | | 2,256,180 | |
| | 14,705 | | | 5.000%, 9/30/49 (AMT) | | | 9/27 at 100.00 | | | | | | | | BBB | | | | 16,295,052 | |
| | | | | |
| | 5,500 | | | Public Finance Authority of Wisconsin, Solid Waste Disposal Revenue Bonds, Waste Management Inc, Refunding Series 2016A-1, 2.625%, 11/01/25 (AMT) | | | No Opt. Call | | | | | | | | A– | | | | 5,525,740 | |
138
| | | | | | | | | | | | | | | | | | | | |
Principal
Amount (000) | | | Description (1) | | Optional Call
Provisions (2) | | | | | | Ratings (3) | | | Value | |
| | | | | |
| | | | Wisconsin(continued) | | | | | | | | | | | | |
| | | | | |
| $ | 7,770 | | | Public Finance Authority of Wisconsin, Solid Waste Disposal Revenue Bonds, Waste Management Inc, Refunding Series 2016A – 2, 2.875%, 5/01/27 (AMT) | | | 5/26 at 100.00 | | | | | | | | A– | | | $ | 7,848,555 | |
| | | | | |
| | 4,420 | | | Public Finance Authority, Wisconsin, Educational Revenue Bonds, Lake Norman Charter School, Series 2018A, 4.000%, 6/15/28, 144A | | | 6/26 at 100.00 | | | | | | | | BBB– | | | | 4,579,385 | |
| | | | | |
| | | | University of Wisconsin Hospitals and Clinics Authority, Revenue Bonds, Refunding Series 2013A: | | | | | | | | | | | | | | | | |
| | 335 | | | 5.000%, 4/01/20 | | | No Opt. Call | | | | | | | | AA– | | | | 346,189 | |
| | 470 | | | 5.000%, 4/01/22 | | | No Opt. Call | | | | | | | | AA– | | | | 514,650 | |
| | | | | |
| | | | Wisconsin Health & Educational Facs Authority, Health Facilities Revenue Bonds, UnityPoint Health Project, Series 2014A: | | | | | | | | | | | | | | | | |
| | 780 | | | 5.000%, 12/01/26 | | | 11/24 at 100.00 | | | | | | | | AA– | | | | 900,424 | |
| | 3,950 | | | 5.000%, 12/01/27 | | | 11/24 at 100.00 | | | | | | | | AA– | | | | 4,544,119 | |
| | | | | |
| | | | Wisconsin Health and Educational Facilities Authority, Revenue Bonds, Aurora Health Care, Inc, Series 2012A: | | | | | | | | | | | | | | | | |
| | 1,020 | | | 5.000%, 7/15/25(Pre-refunded 7/15/21) | | | 7/21 at 100.00 | | | | | | | | AA (4) | | | | 1,099,193 | |
| | 14,400 | | | 5.000%, 7/15/27 – AGM Insured(Pre-refunded 7/15/21) | | | 7/21 at 100.00 | | | | | | | | AA (4) | | | | 15,518,016 | |
| | | | | |
| | 2,060 | | | Wisconsin Health and Educational Facilities Authority, Revenue Bonds, Beloit College, Series 2010A, 6.000%, 6/01/30(Pre-refunded 6/01/20) | | | 6/20 at 100.00 | | | | | | | | N/R (4) | | | | 2,165,039 | |
| | | | | |
| | | | Wisconsin Health and Educational Facilities Authority, Revenue Bonds, Childrens Hospital of Wisconsin Inc, Series 2008B: | | | | | | | | | | | | | | | | |
| | 1,455 | | | 4.350%, 8/15/19 (ETM) | | | No Opt. Call | | | | | | | | N/R (4) | | | | 1,470,190 | |
| | 8,670 | | | 5.500%, 8/15/29(Pre-refunded 2/15/20) | | | 2/20 at 100.00 | | | | | | | | Aa3 (4) | | | | 8,963,653 | |
| | | | | |
| | 5,000 | | | Wisconsin Health and Educational Facilities Authority, Revenue Bonds, Marshfield Clinic Health System, Inc, Series 2017C, 5.000%, 2/15/47 | | | 2/27 at 100.00 | | | | | | | | A– | | | | 5,524,100 | |
| | | | | |
| | 1,000 | | | Wisconsin Health and Educational Facilities Authority, Revenue Bonds, Marshfield Clinic, Series 2012B, 5.000%, 2/15/40 | | | 2/22 at 100.00 | | | | | | | | A– | | | | 1,044,440 | |
| | | | | |
| | 420 | | | Wisconsin Health and Educational Facilities Authority, Revenue Bonds, Mercy Alliance, Inc, Series 2010A, 5.000%, 6/01/19 | | | No Opt. Call | | | | | | | | A3 | | | | 422,062 | |
| | | | | |
| | 2,715 | | | Wisconsin Health and Educational Facilities Authority, Revenue Bonds, Meriter Hospital Inc, Series 1992A, 6.000%, 12/01/22 – FGIC Insured | | | No Opt. Call | | | | | | | | A1 | | | | 2,887,484 | |
| | | | | |
| | 1,775 | | | Wisconsin Health and Educational Facilities Authority, Revenue Bonds, Ministry Health Care, Inc, Refunding 2012C, 5.000%, 8/15/24(Pre-refunded 8/15/22) | | | 8/22 at 100.00 | | | | | | | | N/R (4) | | | | 1,970,925 | |
| | | | | |
| | 4,365 | | | Wisconsin Health and Educational Facilities Authority, Revenue Bonds, ProHealth Care, Inc Obligated Group, Refunding Series 2015, 5.000%, 8/15/39 | | | 8/24 at 100.00 | | | | | | | | A+ | | | | 4,800,452 | |
| | | | | |
| | 2,850 | | | Wisconsin Health and Educational Facilities Authority, Revenue Bonds, Saint John’s Communities Inc, Series 2018A, 5.000%, 9/15/40 | | | 9/23 at 100.00 | | | | | | | | BBB– | | | | 2,966,309 | |
| | | | | |
| | | | Wisconsin Health and Educational Facilities Authority, Wisconsin, Revenue Bonds, ThedaCare Inc, Series 2015: | | | | | | | | | | | | | | | | |
| | 825 | | | 5.000%, 12/15/23 | | | No Opt. Call | | | | | | | | AA– | | | | 940,211 | |
| | 1,310 | | | 5.000%, 12/15/25 | | | 12/24 at 100.00 | | | | | | | | AA– | | | | 1,522,770 | |
139
Nuveen Intermediate Duration Municipal Bond Fund(continued)
Portfolio of Investments March 31, 2019
| | | | | | | | | | | | | | | | | | | | |
Principal
Amount (000) | | | Description (1) | | Optional Call
Provisions (2) | | | | | | Ratings (3) | | | Value | |
| | | | | |
| | | | Wisconsin(continued) | | | | | | | | | | | | |
| | | | | |
| | | | Wisconsin State, General Fund Annual Appropriation Revenue Bonds, Refunding Series 2009A: | | | | | | | | | | | | | | | | |
| $ | 8,145 | | | 6.000%, 5/01/27 | | | 5/19 at 100.00 | | | | | | | | Aa2 (4) | | | $ | 8,174,648 | |
| | 855 | | | 6.000%, 5/01/27(Pre-refunded 5/01/19) | | | 5/19 at 100.00 | | | | | | | | N/R (4) | | | | 858,112 | |
| | 4,740 | | | 5.750%, 5/01/33(Pre-refunded 5/01/19) | | | 5/19 at 100.00 | | | | | | | | Aa2 (4) | | | | 4,756,306 | |
| | 495 | | | 5.750%, 5/01/33(Pre-refunded 5/01/19) | | | 5/19 at 100.00 | | | | | | | | N/R (4) | | | | 496,703 | |
| | 1,805 | | | 6.000%, 5/01/33(Pre-refunded 5/01/19) | | | 5/19 at 100.00 | | | | | | | | Aa2 (4) | | | | 1,811,570 | |
| | 260 | | | 6.000%, 5/01/33(Pre-refunded 5/01/19) | | | 5/19 at 100.00 | | | | | | | | N/R (4) | | | | 260,946 | |
| | 35,170 | | | 6.000%, 5/01/36(Pre-refunded 5/01/19) | | | 5/19 at 100.00 | | | | | | | | Aa2 (4) | | | | 35,298,019 | |
| | | | | |
| | | | Wisconsin State, General Obligation Bonds, RefundingSeries 2014-2: | | | | | | | | | | | | | | | | |
| | 85 | | | 5.000%, 5/01/24(Pre-refunded 5/01/22) | | | 5/22 at 100.00 | | | | | | | | N/R (4) | | | | 93,652 | |
| | 5,785 | | | 5.000%, 5/01/24 | | | 5/22 at 100.00 | | | | | | | | Aa1 | | | | 6,369,169 | |
| | | | | |
| | | | Wisconsin State, Transportation Revenue Bonds,Series 2014-1: | | | | | | | | | | | | | | | | |
| | 1,110 | | | 5.000%, 7/01/24(Pre-refunded 7/01/19) | | | 7/19 at 100.00 | | | | | | | | AA+ (4) | | | | 1,119,657 | |
| | 3,355 | | | 5.000%, 7/01/25(Pre-refunded 7/01/19) | | | 7/19 at 100.00 | | | | | | | | AA+ (4) | | | | 3,384,189 | |
| | 4,000 | | | 5.000%, 7/01/26(Pre-refunded 7/01/19) | | | 7/19 at 100.00 | | | | | | | | AA+ (4) | | | | 4,034,800 | |
| | 178,000 | | | Total Wisconsin | | | | | | | | | | | | | | | 188,933,441 | |
| | | | | |
| | | | Wyoming – 0.2% | | | | | | | | | | | | |
| | | | | |
| | 5,500 | | | Sweetwater County, Wyoming, Hospital Revenue Bonds, Memorial Hospital Project, Refunding Series 2013A, 5.000%, 9/01/30 | | | 9/23 at 100.00 | | | | | | | | BB+ | | | | 5,842,100 | |
| | | | | |
| | 6,960 | | | Wyoming Community Development Authority, Housing Revenue Bonds, 2015 Series 6, 3.900%, 12/01/34 | | | 12/24 at 100.00 | | | | | | | | AA+ | | | | 7,244,942 | |
| | 12,460 | | | Total Wyoming | | | | | | | | | | | | | | | 13,087,042 | |
| $ | 6,435,908 | | | Total Municipal Bonds (cost $6,299,980,628) | | | | | | | | | | | | | | | 6,550,593,054 | |
| | | | | |
Principal
Amount (000) | | | Description (1) | | Coupon | | | Maturity | | | Ratings (3) | | | Value | |
| | | | | |
| | | | CORPORATE BONDS – 0.0% | | | | | | | | | | | | | | | | |
| | | | | |
| | | | Transportation – 0.0% | | | | | | | | | | | | |
| | | | | |
| $ | 200 | | | Las Vegas Monorail Company, Senior Interest Bonds (9), (10) | | | 5.500% | | | | 7/15/19 | | | | N/R | | | $ | 133,243 | |
| | | | | |
| | 57 | | | Las Vegas Monorail Company, Senior Interest Bonds (9), (10) | | | 5.500% | | | | 7/15/55 | | | | N/R | | | | 28,227 | |
| $ | 257 | | | Total Corporate Bonds (cost $10,984) | | | | | | | | | | | | | | | 161,470 | |
| | | | Total Long-Term Investments (cost $6,299,991,612) | | | | | | | | | | | | | | | 6,550,754,524 | |
| | | | | |
Principal
Amount (000) | | | Description (1) | | Optional Call
Provisions (2) | | | | | | Ratings (3) | | | Value | |
| | | | | |
| | | | SHORT-TERM INVESTMENTS – 2.1% | | | | | | | | | | | | | | | | |
| | | | | |
| | | | MUNICIPAL BONDS – 2.1% | | | | | | | | | | | | | | | | |
| | | | | |
| | | | National – 0.2% | | | | | | | | | | | | |
| | | | | |
| $ | 14,810 | | | BB&T Municipal Trust Pool Tax Exempt Lease Certificates Class C Series 2018, Variable Rate Demand Obligations, 2.920%, 11/01/21 (SIFMA reference rate + 0.80% spread), 144A (8), (11) | | | No Opt. Call | | | | | | | | A+ | | | $ | 14,810,000 | |
| | | | | |
| | 1,165 | | | BB&T Municipal Trust Pool Tax Exempt Lease Certificates Class D Series 2018, Variable Rate Demand Obligations, 3.120%, 7/31/23 (SIFMA reference rate + 1.00% spread), 144A (8), (11) | | | No Opt. Call | | | | | | | | A+ | | | | 1,165,000 | |
| | 15,975 | | | Total National | | | | | | | | | | | | | | | 15,975,000 | |
140
| | | | | | | | | | | | | | | | | | | | |
Principal
Amount (000) | | | Description (1) | | Optional Call
Provisions (2) | | | | | | Ratings (3) | | | Value | |
| | | | | |
| | | | Florida – 0.8% | | | | | | | | | | | | |
| | | | | |
| $ | 49,150 | | | Miami-Dade County School Board, Florida, Certificates of Participation, Variable Rate Demand Obligations, 1.730%, 5/01/37 (11) | | | 6/19 at 100.00 | | | | | | | | N/R | | | $ | 49,150,000 | |
| | | | | |
| | 4,195 | | | Miami-Dade County School Board, Florida, Certificates of Participation, Variable Rate Demand Obligations, Series 2013, 0.000%, 5/01/31, 144A (11) | | | No Opt. Call | | | | | | | | A-2 | | | | 4,195,000 | |
| | 53,345 | | | Total Florida | | | | | | | | | | | | | | | 53,345,000 | |
| | | | | |
| | | | New Jersey – 0.0% | | | | | | | | | | | | |
| | | | | |
| | 4,520 | | | New Jersey Turnpike Authority, Revenue Bonds, Variable Rate Demand Obligations, Tender Option Bond Floater Series 2017-ZM0566, 0.000%, 1/01/37 (11) | | | 1/28 at 100.00 | | | | | | | | A+ | | | | 4,520,000 | |
| | | | | |
| | | | New York – 0.7% | | | | | | | | | | | | |
| | | | | |
| | 16,800 | | | New York City Municipal Water Finance Authority, New York, Water and Sewer System Second General Resolution Revenue Bonds, Variable Rate Demand Obligations, Fiscal 2017 Adjustable Rate Series BB-1, 1.800%, 6/15/49 (11) | | | 5/19 at 100.00 | | | | | | | | VMIG-1 | | | | 16,800,000 | |
| | | | | |
| | 29,925 | | | New York City, New York, General Obligation Bonds, Variable Rate Demand Obligations, Fiscal 2018 Series B-5, 0.000%, 10/01/46 (11) | | | 6/19 at 100.00 | | | | | | | | VMIG-1 | | | | 29,925,000 | |
| | 46,725 | | | Total New York | | | | | | | | | | | | | | | 46,725,000 | |
| | | | | |
| | | | Ohio – 0.1% | | | | | | | | | | | | |
| | | | | |
| | 5,300 | | | Ohio State University, General Receipts Bonds, Variable Rate Demand Obligations, Series 2014B-2, 2.050%, 12/01/44 (11) | | | 7/19 at 100.00 | | | | | | | | VMIG-1 | | | | 5,300,000 | |
| | | | | |
| | | | Pennsylvania – 0.0% | | | | | | | | | | | | |
| | | | | |
| | 2,190 | | | Emmaus General Authority, Pennsylvania, Variable Rate Demand Obligations, Series 1996, 2.130%, 12/01/28 – AGM Insured (11) | | | 7/19 at 100.00 | | | | | | | | AA | | | | 2,190,000 | |
| | | | | |
| | | | Texas – 0.1% | | | | | | | | | | | | |
| | | | | |
| | 7,820 | | | Houston, Texas, Airport System Revenue Bonds, Refunding Subordinate Lien, Variable Rate Demand Obligations, Series 2010, 2.110%, 7/01/30 (11) | | | 6/30 at 100.00 | | | | | | | | AA+ | | | | 7,820,000 | |
| | | | | |
| | | | Utah – 0.2% | | | | | | | | | | | | |
| | | | | |
| | 12,470 | | | Murray City, Utah, Hospital Revenue Bonds, Variable Rate Demand Obligations, IHC Health Services, Inc, Series 2005D, 1.850%, 5/15/37 (11) | | | 5/19 at 100.00 | | | | | | | | VMIG-1 | | | | 12,470,000 | |
| $ | 148,345 | | | Total Short-Term Investments (cost $148,345,000) | | | | | | | | | | | | | | | 148,345,000 | |
| | | | Total Investments (cost $6,448,336,612) – 98.0% | | | | | | | | | | | | | | | 6,699,099,524 | |
| | | | Other Assets Less Liabilities – 2.0% | | | | | | | | | | | | | | | 133,681,795 | |
| | | | Net Assets – 100% | | | | | | | | | | | | | | $ | 6,832,781,319 | |
141
Nuveen Intermediate Duration Municipal Bond Fund(continued)
Portfolio of Investments March 31, 2019
| (1) | All percentages shown in the Portfolio of Investments are based on net assets. |
| (2) | Optional Call Provisions: Dates (month and year) and prices of the earliest optional call or redemption. There may be other call provisions at varying prices at later dates. Certain mortgage-backed securities may be subject to periodic principal paydowns. Optional Call Provisions are not covered by the report of independent registered public accounting firm. |
| (3) | For financial reporting purposes, the ratings disclosed are the highest of Standard & Poor’s Group (“Standard & Poor’s”), Moody’s Investors Service, Inc. (“Moody’s”) or Fitch, Inc. (“Fitch”) rating. This treatment of split-rated securities may differ from that used for other purposes, such as for Fund investment policies. Ratings below BBB by Standard & Poor’s, Baa by Moody’s or BBB by Fitch are considered to be below investment grade. Holdings designated N/R are not rated by any of these national rating agencies. Ratings are not covered by the report of independent registered public accounting firm. |
| (4) | Backed by an escrow or trust containing sufficient U.S. Government or U.S. Government agency securities, which ensure the timely payment of principal and interest. |
| (5) | Investment, or portion of investment, has been pledged to collateralize the net payment obligations for investments in inverse floating rate transactions. |
| (6) | Step-up coupon bond, a bond with a coupon that increases (“steps up”), usually at regular intervals, while the bond is outstanding. The rate shown is the coupon as of the end of the reporting period. |
| (7) | Defaulted security. A security whose issuer has failed to fully pay principal and/or interest when due, or is under the protection of bankruptcy. |
| (8) | Variable rate security. The rate shown is the coupon as of the end of the period. |
| (9) | The tax-exempt municipal bonds previously held by the Fund were surrendered in conjunction with the issuer’s bankruptcy reorganization plan. In return, the Fund received one or more senior interest corporate bonds. |
| (10) | Investment valued at fair value using methods determined in good faith by, or at the discretion of, the Board. For fair value measurement disclosure purposes, investment classified as Level 3. See Notes to Financial Statements, Note 2 – Investment Valuation and Fair Value Measurements for more information. |
| (11) | Investment has maturity of greater than one year, but has variable rate and/or demand features which qualify it as a short-term investment. The rate disclosed, as well as the reference rate and spread, where applicable, is that in effect as of the end of the reporting period. This rate changes periodically based on market conditions or a specified market index. |
| 144A | Investment is exempt from registration under Rule 144A of the Securities Act of 1933, as amended. These investments may only be resold in transactions exempt from registration, which are normally those transactions with qualified institutional buyers. |
| AMT | Alternative Minimum Tax |
| IF | Inverse floating rate security issued by a tender option bond (“TOB”) trust, the interest rate on which varies inversely with the Securities Industry Financial Markets Association (SIFMA) short-term rate, which resets weekly, or a similar short-term rate, and is reduced by the expenses related to the TOB trust. |
| LIBOR | London Inter-Bank Offered Rate |
| SIFMA | Securities Industry and Financial Market Association |
| WI/DD | Investment, or portion of investment, purchased on a when-issued or delayed delivery basis. |
See accompanying notes to financial statements.
142
Nuveen Limited Term Municipal Bond Fund
Portfolio of Investments March 31, 2019
| | | | | | | | | | | | | | | | | | | | |
Principal
Amount (000) | | | Description (1) | | Optional Call
Provisions (2) | | | | | | Ratings (3) | | | Value | |
| | | | | |
| | | | LONG-TERM INVESTMENTS – 97.3% | | | | | | | | | | | | | | | | |
| | | | | |
| | | | MUNICIPAL BONDS – 97.3% | | | | | | | | | | | | | | | | |
| | | | | |
| | | | Alabama – 2.6% | | | | | | | | | | | | |
| | | | | |
| $ | 9,790 | | | Black Belt Energy Gas District, Alabama, Gas PrePay Revenue Bonds, Project 3 Series 2018A, 4.000%, 12/01/48 (Mandatory Put 12/01/23) | | | 9/23 at 100.31 | | | | | | | | A3 | | | $ | 10,430,560 | |
| | | | | |
| | 32,945 | | | Black Belt Energy Gas District, Alabama, Gas Supply Revenue Bonds, Series 2016, 4.000%, 7/01/46 (Mandatory Put 6/01/21) | | | 3/21 at 100.59 | | | | | | | | Aa2 | | | | 34,299,369 | |
| | | | | |
| | 37,075 | | | Black Belt Energy Gas District, Alabama, Gas Supply Revenue Bonds, Series 2017A, 4.000%, 8/01/47 (Mandatory Put 7/01/22) | | | 4/22 at 100.52 | | | | | | | | Aa2 | | | | 39,306,915 | |
| | | | | |
| | 6,000 | | | Mobile Industrial Development Board, Alabama, Pollution Control Revenue Refunding Bonds, Alabama Power Company Barry Plan, Series 2007A, 1.850%, 6/01/34 (Mandatory Put 3/24/20) | | | No Opt. Call | | | | | | | | A1 | | | | 5,962,560 | |
| | | | | |
| | 23,435 | | | Mobile Industrial Development Board, Alabama, Pollution Control Revenue Refunding Bonds, Alabama Power Company Barry Plan, Variable Rate Demand Obligations, Series 2008, 2.900%, 7/15/34 (Mandatory Put 12/12/23) | | | No Opt. Call | | | | | | | | A– | | | | 24,078,525 | |
| | | | | |
| | 19,970 | | | Southeast Alabama Gas Supply District, Alabama, Gas Supply Revenue Bonds, Project 2, Fixed Rate Series 2018A, 4.000%, 6/01/49 (Mandatory Put 6/01/24) | | | 3/24 at 100.29 | | | | | | | | A3 | | | | 21,483,526 | |
| | 129,215 | | | Total Alabama | | | | | | | | | | | | | | | 135,561,455 | |
| | | | | |
| | | | Alaska – 0.4% | | | | | | | | | | | | |
| | | | | |
| | 4,575 | | | Alaska Industrial Development and Export Authority, Loan Anticipation Revenue Notes, YKHC Project, Series 2017, 3.500%, 12/01/20 | | | 12/19 at 100.00 | | | | | | | | N/R | | | | 4,608,763 | |
| | | | | |
| | | | Alaska Industrial Development and Export Authority, Power Revenue Bonds, Snettisham Hydroelectric Project, Refunding Series 2015: | | | | | | | | | | | | | | | | |
| | 1,655 | | | 5.000%, 1/01/24 (AMT) | | | No Opt. Call | | | | | | | | Baa2 | | | | 1,802,659 | |
| | 3,565 | | | 5.000%, 1/01/26 (AMT) | | | 7/25 at 100.00 | | | | | | | | Baa2 | | | | 3,940,466 | |
| | | | | |
| | 1,360 | | | Alaska State, Sport Fishing Revenue Bonds, Refunding Series 2011, 5.000%, 4/01/19 | | | No Opt. Call | | | | | | | | A1 | | | | 1,360,000 | |
| | | | | |
| | | | Anchorage, Alaska, General Obligation Bonds, Schools Series 2013A: | | | | | | | | | | | | | | | | |
| | 1,710 | | | 5.000%, 8/01/21 | | | No Opt. Call | | | | | | | | AAA | | | | 1,846,184 | |
| | 1,795 | | | 5.000%, 8/01/22 | | | No Opt. Call | | | | | | | | AAA | | | | 1,993,958 | |
| | | | | |
| | 940 | | | Northern Tobacco Securitization Corporation, Alaska, Tobacco Settlement Asset-Backed Bonds, Series 2006A, 4.625%, 6/01/23 | | | 4/19 at 100.00 | | | | | | | | A3 | | | | 940,235 | |
| | | | | |
| | 3,645 | | | Valdez, Alaska, Marine Terminal Revenue Bonds, BP Pipelines Inc Project, Refunding Series 2003C, 5.000%, 1/01/21 | | | No Opt. Call | | | | | | | | A1 | | | | 3,843,981 | |
| | 19,245 | | | Total Alaska | | | | | | | | | | | | | | | 20,336,246 | |
| | | | | |
| | | | Arizona – 2.2% | | | | | | | | | | | | |
| | | | | |
| | | | Arizona State, Certificates of Participation, Refunding Series 2019A: | | | | | | | | | | | | | | | | |
| | 4,430 | | | 5.000%, 10/01/26 (WI/DD, Settling 7/09/19) | | | No Opt. Call | | | | | | | | Aa3 | | | | 5,274,358 | |
| | 4,430 | | | 5.000%, 10/01/27 (WI/DD, Settling 7/09/19) | | | No Opt. Call | | | | | | | | Aa3 | | | | 5,354,984 | |
| | | | | |
| | 2,975 | | | Arizona State, Certificates of Participation, Series 2010A, 5.000%, 10/01/19 – AGM Insured | | | No Opt. Call | | | | | | | | AA | | | | 3,025,783 | |
143
Nuveen Limited Term Municipal Bond Fund(continued)
Portfolio of Investments March 31, 2019
| | | | | | | | | | | | | | | | | | | | |
Principal
Amount (000) | | | Description (1) | | Optional Call
Provisions (2) | | | | | | Ratings (3) | | | Value | |
| | | | | |
| | | | Arizona(continued) | | | | | | | | | | | | |
| | | | | |
| $ | 120 | | | Arizona State, State Lottery Revenue Bonds, Series 2010A, 5.000%, 7/01/20 – AGM Insured | | | No Opt. Call | | | | | | | | AA+ | | | $ | 125,183 | |
| | | | | |
| | 16,775 | | | Chandler Industrial Development Authority, Arizona, Revenue Bonds, Intel Corporation Project, Series 2005, 2.400%, 12/01/35 (Mandatory Put 8/14/23) | | | No Opt. Call | | | | | | | | A+ | | | | 17,040,716 | |
| | | | | |
| | 1,625 | | | Chandler Industrial Development Authority, Arizona, Revenue Bonds, Intel Corporation Project, Series 2007, 2.700%, 12/01/37 (Mandatory Put 8/14/23) (AMT) | | | No Opt. Call | | | | | | | | A+ | | | | 1,653,941 | |
| | | | | |
| | 1,500 | | | Chandler, Arizona, General Obligation Bonds, Refunding Series 2014, 5.000%, 7/01/24 | | | No Opt. Call | | | | | | | | AAA | | | | 1,753,320 | |
| | | | | |
| | 2,220 | | | Coconino County, Arizona, Pollution Control Revenue Bonds, Nevada Power Company Project, Refunding AMT Series 2017A, 1.800%, 9/01/32 (Mandatory Put 5/21/20) (AMT) | | | No Opt. Call | | | | | | | | A+ | | | | 2,214,517 | |
| | | | | |
| | 1,200 | | | Coconino County, Arizona, Pollution Control Revenue Bonds, Nevada Power Company Project, Refunding Series 2017B, 1.600%, 3/01/39 (Mandatory Put 5/21/20) | | | No Opt. Call | | | | | | | | A+ | | | | 1,194,360 | |
| | | | | |
| | | | Dysart Unified School District Number 89, Maricopa County, Arizona, General Obligation Bonds, Refunding Series 2014: | | | | | | | | | | | | | | | | |
| | 335 | | | 5.000%, 7/01/19 | | | No Opt. Call | | | | | | | | AAA | | | | 337,814 | |
| | 575 | | | 5.000%, 7/01/20 | | | No Opt. Call | | | | | | | | AAA | | | | 599,104 | |
| | 765 | | | 5.000%, 7/01/21 | | | No Opt. Call | | | | | | | | AAA | | | | 821,166 | |
| | | | | |
| | 14,500 | | | Maricopa County Industrial Development Authority, Arizona, Hospital Revenue Bonds, HonorHealth, Series 2019B, 5.000%, 9/01/45 (Mandatory Put 9/01/24) | | | No Opt. Call | | | | | | | | A2 | | | | 16,589,160 | |
| | | | | |
| | 11,000 | | | Maricopa County Pollution Control Corporation, Arizona, Pollution Control Revenue Refunding Bonds, Public Service Company of New Mexico Palo Verde Project, Series 2010A, 2.400%, 6/01/43 (Mandatory Put 6/01/20) | | | No Opt. Call | | | | | | | | BBB+ | | | | 11,018,700 | |
| | | | | |
| | | | Maricopa County Unified School District 60 Higley, Arizona, General Obligation Bonds, Refunding School Improvement Series��2015: | | | | | | | | | | | | | | | | |
| | 500 | | | 4.000%, 7/01/19 – AGM Insured | | | No Opt. Call | | | | | | | | AA | | | | 503,010 | |
| | 575 | | | 4.000%, 7/01/20 – AGM Insured | | | No Opt. Call | | | | | | | | AA | | | | 592,250 | |
| | 1,565 | | | 4.000%, 7/01/21 – AGM Insured | | | No Opt. Call | | | | | | | | AA | | | | 1,645,535 | |
| | 750 | | | 4.000%, 7/01/22 – AGM Insured | | | No Opt. Call | | | | | | | | AA | | | | 804,285 | |
| | | | | |
| | 1,270 | | | Maricopa County Unified School District 60 Higley, Arizona, General Obligation Bonds, School Improvement Project of 2013, Series 2014A, 4.000%, 7/01/24 | | | No Opt. Call | | | | | | | | Aa3 | | | | 1,406,017 | |
| | | | | |
| | | | Mesa, Arizona, General Obligation Bonds, Refunding Series 2012: | | | | | | | | | | | | | | | | |
| | 1,425 | | | 4.000%, 7/01/20 | | | No Opt. Call | | | | | | | | Aa2 | | | | 1,468,833 | |
| | 2,225 | | | 4.000%, 7/01/21 | | | No Opt. Call | | | | | | | | Aa2 | | | | 2,344,549 | |
| | 2,055 | | | 4.000%, 7/01/22 | | | No Opt. Call | | | | | | | | Aa2 | | | | 2,209,824 | |
| | | | | |
| | | | Mesa, Arizona, Street and Highway User Revenue Bonds, Refunding Series 2012: | | | | | | | | | | | | | | | | |
| | 2,415 | | | 5.000%, 7/01/21 | | | No Opt. Call | | | | | | | | AA | | | | 2,595,087 | |
| | 4,030 | | | 5.000%, 7/01/22 | | | No Opt. Call | | | | | | | | AA | | | | 4,457,905 | |
| | | | | |
| | 3,615 | | | Mesa, Arizona, Street and Highway User Revenue Bonds, Refunding Series 2015, 5.000%, 7/01/26 | | | 7/25 at 100.00 | | | | | | | | AA | | | | 4,287,824 | |
| | | | | |
| | | | Mesa, Arizona, Utility System Revenue Bonds, Refunding Series 2012: | | | | | | | | | | | | | | | | |
| | 5,370 | | | 5.000%, 7/01/20 | | | No Opt. Call | | | | | | | | Aa2 | | | | 5,601,232 | |
| | 6,115 | | | 5.000%, 7/01/21 | | | No Opt. Call | | | | | | | | Aa2 | | | | 6,575,215 | |
144
| | | | | | | | | | | | | | | | | | | | |
Principal
Amount (000) | | | Description (1) | | Optional Call
Provisions (2) | | | | | | Ratings (3) | | | Value | |
| | | | | |
| | | | Arizona(continued) | | | | | | | | | | | | |
| | | | | |
| $ | 295 | | | Pima County Industrial Development Authority, Arizona, Revenue Bonds, Tucson Electric Power Company Project, Series 2013A, 4.000%, 9/01/29 | | | 3/23 at 100.00 | | | | | | | | A– | | | $ | 308,700 | |
| | | | | |
| | | | Pinal County, Arizona, Pledged Revenue Obligations, Refunding Series 2014: | | | | | | | | | | | | | | | | |
| | 1,305 | | | 5.000%, 8/01/22 | | | No Opt. Call | | | | | | | | AA | | | | 1,446,501 | |
| | 2,000 | | | 5.000%, 8/01/23 | | | No Opt. Call | | | | | | | | AA | | | | 2,273,700 | |
| | 2,000 | | | 5.000%, 8/01/24 | | | No Opt. Call | | | | | | | | AA | | | | 2,324,620 | |
| | | | | |
| | 1,000 | | | Pinal County, Arizona, Pledged Revenue Obligations, Series 2014, 5.000%, 8/01/24 | | | No Opt. Call | | | | | | | | AA | | | | 1,162,310 | |
| | | | | |
| | 6,665 | | | The Industrial Development Authority of the County of Maricopa, Arizona, Revenue Bonds, Banner Health, Series 2017C, 5.000%, 1/01/48 (Mandatory Put 10/18/24) | | | No Opt. Call | | | | | | | | AA– | | | | 7,737,798 | |
| | 107,625 | | | Total Arizona | | | | | | | | | | | | | | | 116,748,301 | |
| | | | | |
| | | | Arkansas – 0.5% | | | | | | | | | | | | |
| | | | | |
| | 8,605 | | | Arkansas State, Federal Highway Grant Anticipation and Tax Revenue Bonds, Series 2013, 5.000%, 10/01/22 | | | No Opt. Call | | | | | | | | Aa1 | | | | 9,607,482 | |
| | | | | |
| | | | Crittenden County, Arkansas, Sales and Use Tax Revenue Bonds, Series 2017: | | | | | | | | | | | | | | | | |
| | 1,200 | | | 5.000%, 3/01/20 | | | No Opt. Call | | | | | | | | A | | | | 1,235,076 | |
| | 1,400 | | | 5.000%, 3/01/21 | | | No Opt. Call | | | | | | | | A | | | | 1,484,434 | |
| | | | | |
| | | | Little Rock, Arkansas, Hotel and Restaurant Gross Receipts Tax Bonds, Series 2014: | | | | | | | | | | | | | | | | |
| | 500 | | | 5.000%, 7/01/19 | | | No Opt. Call | | | | | | | | A+ | | | | 504,150 | |
| | 670 | | | 5.000%, 7/01/21 | | | No Opt. Call | | | | | | | | A+ | | | | 717,041 | |
| | | | | |
| | | | Pulaksi County Public Facilities Board, Arkansas, Health Facilities Revenue Bonds, CARTI Project, Series 2013: | | | | | | | | | | | | | | | | |
| | 890 | | | 4.000%, 7/01/19 | | | No Opt. Call | | | | | | | | BB+ | | | | 891,282 | |
| | 995 | | | 4.000%, 7/01/20 | | | No Opt. Call | | | | | | | | BB+ | | | | 1,002,880 | |
| | 1,020 | | | 4.000%, 7/01/21 | | | No Opt. Call | | | | | | | | BB+ | | | | 1,033,382 | |
| | 1,075 | | | 4.000%, 7/01/22 | | | No Opt. Call | | | | | | | | BB+ | | | | 1,089,050 | |
| | 1,180 | | | 5.250%, 7/01/27 | | | 7/23 at 100.00 | | | | | | | | BB+ | | | | 1,205,264 | |
| | 470 | | | 5.250%, 7/01/28 | | | 7/23 at 100.00 | | | | | | | | BB+ | | | | 479,818 | |
| | | | | |
| | | | Pulaski County Public Facilities Board, Arkansas, Healthcare Revenue Bonds, Baptist Health, Series 2014: | | | | | | | | | | | | | | | | |
| | 500 | | | 5.000%, 12/01/22 | | | No Opt. Call | | | | | | | | A+ | | | | 555,960 | |
| | 1,740 | | | 5.000%, 12/01/23 | | | No Opt. Call | | | | | | | | A+ | | | | 1,980,364 | |
| | 2,110 | | | 5.000%, 12/01/24 | | | No Opt. Call | | | | | | | | A+ | | | | 2,453,255 | |
| | 22,355 | | | Total Arkansas | | | | | | | | | | | | | | | 24,239,438 | |
| | | | | |
| | | | California – 3.0% | | | | | | | | | | | | |
| | | | | |
| | 17,400 | | | Bay Area Toll Authority, California, Revenue Bonds, San Francisco Bay Area Toll Bridge, Term Rate Series 2018A, 2.625%, 4/01/45 (Mandatory Put 4/01/26) | | | 10/25 at 100.00 | | | | | | | | AA | | | | 18,207,534 | |
| | | | | |
| | 7,965 | | | California Health Facilities Financing Authority, Revenue Bonds, Providence Saint Joseph Health,Series 2016B-3, 2.000%, 10/01/36 (Mandatory Put 10/01/25) | | | 10/25 at 100.00 | | | | | | | | AA– | | | | 8,041,145 | |
| | | | | |
| | 4,000 | | | California Health Facilities Financing Authority, Revenue Bonds, Saint Joseph Health System, Series 2013C, 5.000%, 7/01/43 (Mandatory Put 10/15/19) | | | No Opt. Call | | | | | | | | AA– | | | | 4,075,120 | |
| | | | | |
| | 19,790 | | | California Municipal Finance Authority, Revenue Bonds, Linxs APM Project, Senior Lien Series 2018A, 3.000%, 12/31/30 – AGM Insured (AMT) | | | 6/28 at 100.00 | | | | | | | | AA | | | | 19,775,949 | |
145
Nuveen Limited Term Municipal Bond Fund(continued)
Portfolio of Investments March 31, 2019
| | | | | | | | | | | | | | | | | | | | |
Principal
Amount (000) | | | Description (1) | | Optional Call
Provisions (2) | | | | | | Ratings (3) | | | Value | |
| | | | | |
| | | | California(continued) | | | | | | | | | | | | |
| | | | | |
| | | | California Municipal Finance Authority, Revenue Bonds, Community Medical Centers, Series 2017A: | | | | | | | | | | | | | | | | |
| $ | 1,565 | | | 5.000%, 2/01/22 | | | No Opt. Call | | | | | | | | A– | | | $ | 1,701,202 | |
| | 2,600 | | | 5.000%, 2/01/23 | | | No Opt. Call | | | | | | | | A– | | | | 2,899,338 | |
| | 1,920 | | | 5.000%, 2/01/24 | | | No Opt. Call | | | | | | | | A– | | | | 2,190,797 | |
| | 1,700 | | | 5.000%, 2/01/25 | | | No Opt. Call | | | | | | | | A– | | | | 1,979,208 | |
| | 2,000 | | | 5.000%, 2/01/26 | | | No Opt. Call | | | | | | | | A– | | | | 2,371,620 | |
| | 1,500 | | | 5.000%, 2/01/27 | | | No Opt. Call | | | | | | | | A– | | | | 1,806,390 | |
| | | | | |
| | 5,000 | | | California Municipal Finance Authority, Solid Waste Disposal Revenue Bonds, Waste Management Inc, Series 2017A, 2.000%, 12/01/44 (Mandatory Put 12/01/20) (AMT) | | | No Opt. Call | | | | | | | | A– | | | | 5,006,100 | |
| | | | | |
| | 3,365 | | | California Pollution Control Financing Authority, Solid Waste Disposal Revenue Bonds, Waste Management Inc, RefundingSeries 2015B-2, 3.125%, 11/01/40 (Mandatory Put 11/03/25) (AMT) | | | No Opt. Call | | | | | | | | A– | | | | 3,522,819 | |
| | | | | |
| | 5,875 | | | California Pollution Control Financing Authority, Solid Waste Disposal Revenue Bonds, Waste Management Inc,Series 2015A-1, 3.375%, 7/01/25 (AMT) | | | No Opt. Call | | | | | | | | A– | | | | 6,169,866 | |
| | | | | |
| | 6,440 | | | California Pollution Control Financing Authority, Solid Waste Disposal Revenue Bonds, Waste Management, Inc Project, RefundingSeries 2015B-1, 3.000%, 11/01/25 (AMT) | | | No Opt. Call | | | | | | | | A– | | | | 6,615,619 | |
| | | | | |
| | | | California State, Economic Recovery Revenue Bonds, Refunding Series 2009A: | | | | | | | | | | | | | | | | |
| | 260 | | | 5.250%, 7/01/21(Pre-refunded 7/01/19) | | | 7/19 at 100.00 | | | | | | | | AA+ (4) | | | | 262,506 | |
| | 125 | | | 5.250%, 7/01/21(Pre-refunded 7/01/19) | | | 7/19 at 100.00 | | | | | | | | AA+ (4) | | | | 126,205 | |
| | | | | |
| | 16,995 | | | California Statewide Communities Development Authority, Health Facility Revenue Bonds, Community Hospital of the Monterey Peninsula, Series 2012A, 1.870%, 6/01/23 | | | 5/19 at 100.00 | | | | | | | | N/R | | | | 17,003,837 | |
| | | | | |
| | 765 | | | California Statewide Communities Development Authority, Revenue Bonds, Huntington Memorial Hospital, Refunding Series 2014B, 5.000%, 7/01/24 | | | No Opt. Call | | | | | | | | A– | | | | 885,021 | |
| | | | | |
| | | | Delano, California, Certificates of Participation, Delano Regional Medical Center, Series 2012: | | | | | | | | | | | | | | | | |
| | 2,470 | | | 5.000%, 1/01/20 | | | No Opt. Call | | | | | | | | BBB | | | | 2,509,248 | |
| | 2,590 | | | 5.000%, 1/01/21 | | | No Opt. Call | | | | | | | | BBB | | | | 2,680,184 | |
| | | | | |
| | 2,900 | | | Freddie Mac Multifamily ML Certificates, 3.400%, 1/25/36 | | | No Opt. Call | | | | | | | | AA+ | | | | 3,005,937 | |
| | | | | |
| | 7,000 | | | Golden State Tobacco Securitization Corporation, California, Tobacco Settlement Asset-Backed Bonds,Series 2018A-1, 3.500%, 6/01/36 | | | 6/22 at 100.00 | | | | | | | | BBB | | | | 7,020,720 | |
| | | | | |
| | 500 | | | Lake Elsinore Public Financing Authority, California, Local Agency Revenue Bonds, Canyon Hills Improvement Area A & C, Series 2014C, 5.000%, 9/01/21 | | | No Opt. Call | | | | | | | | N/R | | | | 534,070 | |
| | | | | |
| | 5,010 | | | Los Angeles Department of Water and Power, California, Power System Revenue Bonds, Series 2018B, 5.000%, 1/01/22 | | | 12/21 at 100.00 | | | | | | | | AA | | | | 5,494,267 | |
| | | | | |
| | 2,765 | | | Los Angeles Department of Water and Power, California, Waterworks Revenue Bonds, Series 2013B, 5.000%, 7/01/22 | | | No Opt. Call | | | | | | | | AA+ | | | | 3,088,394 | |
| | | | | |
| | 4,375 | | | Los Angeles Unified School District, Los Angeles County, California, General Obligation Bonds, Election 2008 Series 2016A, 4.000%, 7/01/34 | | | 7/25 at 100.00 | | | | | | | | AAA | | | | 4,739,656 | |
| | | | | |
| | 2,700 | | | New Haven Unified School District, California, General Obligation Bonds, Refunding Series 2014A, 5.000%, 8/01/25 – BAM Insured | | | 8/24 at 100.00 | | | | | | | | AA | | | | 3,180,357 | |
146
| | | | | | | | | | | | | | | | | | | | |
Principal
Amount (000) | | | Description (1) | | Optional Call
Provisions (2) | | | | | | Ratings (3) | | | Value | |
| | | | | |
| | | | California(continued) | | | | | | | | | | | | |
| | | | | |
| | | | Newport-Mesa Unified School District, Orange County, California, General Obligation Bonds, Election 2000 Refunding Series 2020: | | | | | | | | | | | | | | | | |
| $ | 1,900 | | | 5.000%, 8/01/22 (WI/DD, Settling 5/05/20) | | | No Opt. Call | | | | | | | | Aaa | | | $ | 2,031,024 | |
| | 2,500 | | | 5.000%, 8/01/23 (WI/DD, Settling 5/05/20) | | | No Opt. Call | | | | | | | | Aaa | | | | 2,744,125 | |
| | | | | |
| | 2,960 | | | Palomar Pomerado Health Care District, California, Certificates of Participation, Series 2010, 5.250%, 11/01/21(Pre-refunded 11/01/20) | | | 11/20 at 100.00 | | | | | | | | Ba1 (4) | | | | 3,082,041 | |
| | | | | |
| | 80 | | | San Bernardino, California, GNMA Mortgage-Backed Securities Program Single Family Mortgage Revenue Refunding Bonds, Series 1990A, 7.500%, 5/01/23 (ETM) | | | No Opt. Call | | | | | | | | Aaa | | | | 89,610 | |
| | | | | |
| | 6,340 | | | San Francisco Airports Commission, California, Revenue Bonds, San Francisco International Airport, Refunding Second Series 2017D, 5.000%, 5/01/25 (AMT) | | | No Opt. Call | | | | | | | | A+ | | | | 7,477,840 | |
| | | | | |
| | 3,545 | | | Southern California Public Power Authority, Transmission Project Revenue Bonds, Southern Transmission Project, Subordinate Refunding Series 2015C, 5.000%, 7/01/24 | | | No Opt. Call | | | | | | | | AA | | | | 4,200,541 | |
| | | | | |
| | | | Washington Township Health Care District, California, Revenue Bonds, Refunding Series 2015A: | | | | | | | | | | | | | | | | |
| | 1,315 | | | 5.000%, 7/01/19 | | | No Opt. Call | | | | | | | | Baa1 | | | | 1,324,718 | |
| | 1,225 | | | 4.000%, 7/01/20 | | | No Opt. Call | | | | | | | | Baa1 | | | | 1,255,417 | |
| | 1,130 | | | 5.000%, 7/01/22 | | | No Opt. Call | | | | | | | | Baa1 | | | | 1,235,339 | |
| | 980 | | | 5.000%, 7/01/23 | | | No Opt. Call | | | | | | | | Baa1 | | | | 1,091,740 | |
| | 151,550 | | | Total California | | | | | | | | | | | | | | | 159,425,504 | |
| | | | | |
| | | | Colorado – 1.6% | | | | | | | | | | | | |
| | | | | |
| | 2,750 | | | Broomfield, Colorado, Sewer Activity Enterprise, Sewer and Wastewater Reclamation Revenue Bonds, Refunding Series 2012, 4.000%, 12/01/20 | | | No Opt. Call | | | | | | | | Aa3 | | | | 2,860,192 | |
| | | | | |
| | | | Centerra Metropolitan District 1, Loveland, Colorado, Special Revenue Bonds, Refunding & Improvement Series 2017: | | | | | | | | | | | | | | | | |
| | 765 | | | 5.000%, 12/01/20, 144A | | | No Opt. Call | | | | | | | | N/R | | | | 793,665 | |
| | 1,000 | | | 5.000%, 12/01/21, 144A | | | No Opt. Call | | | | | | | | N/R | | | | 1,055,270 | |
| | 1,425 | | | 5.000%, 12/01/22, 144A | | | No Opt. Call | | | | | | | | N/R | | | | 1,524,152 | |
| | | | | |
| | 1,000 | | | Colorado Health Facilities Authority, Colorado, Health Facilities Revenue Bonds, The Evangelical Lutheran Good Samaritan Society Project, Refunding Series 2017, 5.000%, 6/01/20 | | | No Opt. Call | | | | | | | | A– | | | | 1,032,530 | |
| | | | | |
| | 7,245 | | | Colorado Health Facilities Authority, Colorado, Revenue Bonds, Adventist Health, Sunbelt Obligated Group, Series 2014E, 5.000%, 11/15/24 | | | 5/24 at 100.00 | | | | | | | | AA | | | | 8,373,336 | |
| | | | | |
| | 3,025 | | | Colorado Health Facilities Authority, Colorado, Revenue Bonds, Catholic Health Initiatives, Series 2008D, 6.125%, 10/01/28 | | | 5/19 at 100.00 | | | | | | | | BBB+ | | | | 3,036,434 | |
| | | | | |
| | 16,975 | | | Colorado Health Facilities Authority, Colorado, Revenue Bonds, Catholic Health Initiatives,Series 2008D-3, 5.000%, 10/01/38 (Mandatory Put 11/12/21) | | | No Opt. Call | | | | | | | | BBB+ | | | | 18,158,667 | |
| | | | | |
| | | | Colorado Health Facilities Authority, Colorado, Revenue Bonds, Catholic Health Initiatives, Series 2011A: | | | | | | | | | | | | | | | | |
| | 5,205 | | | 5.000%, 2/01/20 | | | No Opt. Call | | | | | | | | BBB+ | | | | 5,335,021 | |
| | 4,830 | | | 5.000%, 2/01/21 | | | No Opt. Call | | | | | | | | BBB+ | | | | 5,087,342 | |
147
Nuveen Limited Term Municipal Bond Fund(continued)
Portfolio of Investments March 31, 2019
| | | | | | | | | | | | | | | | | | | | |
Principal
Amount (000) | | | Description (1) | | Optional Call
Provisions (2) | | | | | | Ratings (3) | | | Value | |
| | | | | |
| | | | Colorado(continued) | | | | | | | | | | | | |
| | | | | |
| | | | Colorado Health Facilities Authority, Colorado, Revenue Bonds, Evangelical Lutheran Good Samaritan Society Project, Series 2013A: | | | | | | | | | | | | | | | | |
| $ | 500 | | | 4.000%, 6/01/19 | | | No Opt. Call | | | | | | | | A– | | | $ | 501,620 | |
| | 1,000 | | | 4.000%, 6/01/20 | | | No Opt. Call | | | | | | | | A– | | | | 1,021,110 | |
| | 2,000 | | | 5.000%, 6/01/21 | | | No Opt. Call | | | | | | | | A– | | | | 2,116,560 | |
| | 2,300 | | | 5.000%, 6/01/22 | | | No Opt. Call | | | | | | | | A– | | | | 2,490,785 | |
| | 500 | | | 5.000%, 6/01/23 | | | No Opt. Call | | | | | | | | A– | | | | 552,235 | |
| | | | | |
| | 250 | | | Commerce City, Colorado, Sales and Use Tax Revenue Bonds, Series 2014, 2.000%, 8/01/19 – AGM Insured | | | No Opt. Call | | | | | | | | AA | | | | 250,268 | |
| | | | | |
| | | | Cornerstar Metropolitan District, Arapahoe County, Colorado, General Obligation Bonds, Limited Tax Convertible to Unlimited Tax, Refunding Series 2017A: | | | | | | | | | | | | | | | | |
| | 294 | | | 3.500%, 12/01/21 | | | No Opt. Call | | | | | | | | N/R | | | | 298,075 | |
| | 530 | | | 4.500%, 12/01/27 | | | 12/22 at 103.00 | | | | | | | | N/R | | | | 550,368 | |
| | | | | |
| | 1,500 | | | Denver City and County, Colorado, Airport System Revenue Bonds, Subordinate Lien Series 2013B, 5.000%, 11/15/19 | | | No Opt. Call | | | | | | | | A+ | | | | 1,531,845 | |
| | | | | |
| | 13,090 | | | Denver City and County, Colorado, Airport System Revenue Bonds, Subordinate Lien Series 2018A, 5.000%, 12/01/24 (AMT) | | | No Opt. Call | | | | | | | | A+ | | | | 15,188,981 | |
| | | | | |
| | | | E-470 Public Highway Authority, Colorado, Senior Revenue Bonds, Refunding Series 2015A: | | | | | | | | | | | | | | | | |
| | 1,060 | | | 5.000%, 9/01/19 | | | No Opt. Call | | | | | | | | A | | | | 1,073,367 | |
| | 1,175 | | | 5.000%, 9/01/20 | | | No Opt. Call | | | | | | | | A | | | | 1,222,376 | |
| | | | | |
| | | | Gardens on Havana Metropolitan District 3, Arapahoe County, Colorado, Special Revenue Bonds, Refunding Series 2017A: | | | | | | | | | | | | | | | | |
| | 1,765 | | | 3.625%, 12/01/21 | | | No Opt. Call | | | | | | | | N/R | | | | 1,798,041 | |
| | 3,705 | | | 4.625%, 12/01/27 | | | 12/22 at 103.00 | | | | | | | | N/R | | | | 3,858,943 | |
| | | | | |
| | 5,715 | | | Moffat County, Colorado, Pollution Control Revenue Bonds,Tri-State Generation and Transmission Association, Inc Project, Refunding Series 2009, 2.000%, 3/01/36 (Mandatory Put 10/03/22) | | | No Opt. Call | | | | | | | | A | | | | 5,654,935 | |
| | 79,604 | | | Total Colorado | | | | | | | | | | | | | | | 85,366,118 | |
| | | | | |
| | | | Connecticut – 3.9% | | | | | | | | | | | | |
| | | | | |
| | 12,000 | | | Connecticut Health and Educational Facilities Authority, Revenue Bonds, Yale University, Series 2013A, 1.000%, 7/01/42 (Mandatory Put 7/01/19) | | | No Opt. Call | | | | | | | | AAA | | | | 11,980,680 | |
| | | | | |
| | 6,925 | | | Connecticut Health and Educational Facilities Authority, Revenue Bonds, Yale University, Series 2015A, 2.050%, 7/01/35 (Mandatory Put 7/12/21) | | | No Opt. Call | | | | | | | | AAA | | | | 6,996,328 | |
| | | | | |
| | 20,260 | | | Connecticut Health and Educational Facilities Authority, Revenue Bonds, Yale University,Series 2016A-1, 1.000%, 7/01/42 (Mandatory Put 7/01/19) | | | No Opt. Call | | | | | | | | AAA | | | | 20,227,381 | |
| | | | | |
| | 5,650 | | | Connecticut Health and Educational Facilities Authority, Revenue Bonds, Yale University,Series 2017A-2, 5.000%, 7/01/42 (Mandatory Put 7/01/22) | | | No Opt. Call | | | | | | | | AAA | | | | 6,248,053 | |
| | | | | |
| | 22,150 | | | Connecticut Health and Educational Facilities Authority, Revenue Bonds, Yale University, Series 2017B, 5.000%, 7/01/37 (Mandatory Put 7/01/20) | | | No Opt. Call | | | | | | | | AAA | | | | 23,072,990 | |
| | | | | |
| | 44,435 | | | Connecticut Health and Educational Facilities Authority, Revenue Bonds, Yale University, Variable Rate Demand Obligations,Series 1999-U2, 2.000%, 7/01/33 (Mandatory Put 2/08/22) | | | No Opt. Call | | | | | | | | AAA | | | | 44,889,570 | |
| | | | | |
| | 42,630 | | | Connecticut Health and Educational Facilities Authority, Revenue Bonds,Yale-New Haven Health Issue,Series 2010A-4, 2.000%, 7/01/49 (Mandatory Put 2/08/22) | | | No Opt. Call | | | | | | | | AAA | | | | 43,112,998 | |
148
| | | | | | | | | | | | | | | | | | | | |
Principal
Amount (000) | | | Description (1) | | Optional Call
Provisions (2) | | | | | | Ratings (3) | | | Value | |
| | | | | |
| | | | Connecticut(continued) | | | | | | | | | | | | |
| | | | | |
| $ | 1,955 | | | Connecticut Housing Finance Authority, Housing Mortgage Finance Program Bonds,Series 2018D-1, 3.750%, 11/15/33 | | | 11/27 at 100.00 | | | | | | | | AAA | | | $ | 2,049,055 | |
| | | | | |
| | | | Connecticut State, General Obligation Bonds, Refunding Series 2018B: | | | | | | | | | | | | | | | | |
| | 5,220 | | | 5.000%, 4/15/21 | | | No Opt. Call | | | | | | | | A1 | | | | 5,553,506 | |
| | 7,115 | | | 5.000%, 4/15/22 | | | No Opt. Call | | | | | | | | A1 | | | | 7,770,505 | |
| | | | | |
| | | | Connecticut State, General Obligation Bonds, Refunding Series 2018C: | | | | | | | | | | | | | | | | |
| | 8,000 | | | 3.000%, 6/15/19 | | | No Opt. Call | | | | | | | | A1 | | | | 8,021,920 | |
| | 1,320 | | | 5.000%, 6/15/22 | | | No Opt. Call | | | | | | | | A1 | | | | 1,447,921 | |
| | | | | |
| | | | Connecticut State, General Obligation Bonds, Refunding Series 2018F: | | | | | | | | | | | | | | | | |
| | 1,025 | | | 5.000%, 9/15/20 | | | No Opt. Call | | | | | | | | A1 | | | | 1,073,780 | |
| | 600 | | | 5.000%, 9/15/21 | | | No Opt. Call | | | | | | | | A1 | | | | 645,840 | |
| | | | | |
| | 490 | | | Connecticut State, General Obligation Bonds, Series 2013C, 5.000%, 7/15/22 | | | No Opt. Call | | | | | | | | A1 | | | | 538,652 | |
| | | | | |
| | 1,835 | | | Connecticut State, General Obligation Bonds, Series 2019A, 5.000%, 4/15/23 (WI/DD, Settling 4/11/19) | | | No Opt. Call | | | | | | | | A | | | | 2,049,915 | |
| | | | | |
| | 5,000 | | | Connecticut State, Special Tax Obligation Bonds, Transportation Infrastructure Purposes Series 2013A, 5.000%, 10/01/20 | | | No Opt. Call | | | | | | | | A+ | | | | 5,244,400 | |
| | | | | |
| | | | Connecticut State, Special Tax Obligation Bonds, Transportation Infrastructure Purposes, Refunding Series 20168C: | | | | | | | | | | | | | | | | |
| | 580 | | | 5.000%, 10/01/20 | | | No Opt. Call | | | | | | | | A+ | | | | 608,530 | |
| | 1,605 | | | 5.000%, 10/01/22 | | | No Opt. Call | | | | | | | | A+ | | | | 1,777,521 | |
| | 1,530 | | | 5.000%, 10/01/23 | | | No Opt. Call | | | | | | | | A+ | | | | 1,737,468 | |
| | | | | |
| | 240 | | | Eastern Connecticut Resource Recovery Authority, Solid Waste Revenue Bonds, Wheelabrator Lisbon Project, Series 1993A, 5.500%, 1/01/20 (AMT) | | | 5/19 at 100.00 | | | | | | | | A– | | | | 243,602 | |
| | | | | |
| | | | New Haven, Connecticut, General Obligation Bonds, Refunding Series 2014B: | | | | | | | | | | | | | | | | |
| | 1,915 | | | 4.000%, 8/01/19 – AGM Insured | | | No Opt. Call | | | | | | | | AA | | | | 1,928,711 | |
| | 2,000 | | | 5.000%, 8/01/20 – AGM Insured | | | No Opt. Call | | | | | | | | AA | | | | 2,083,180 | |
| | | | | |
| | 890 | | | South Central Connecticut Regional Water Authority, Water System Revenue Bonds, Twenty-Ninth Series 2014, 5.000%, 8/01/22 | | | No Opt. Call | | | | | | | | AA– | | | | 988,034 | |
| | | | | |
| | | | Stratford, Connecticut, General Obligation Bonds, Series 2014: | | | | | | | | | | | | | | | | |
| | 395 | | | 3.000%, 12/15/19 | | | No Opt. Call | | | | | | | | AA– | | | | 398,650 | |
| | 525 | | | 5.000%, 12/15/21 | | | No Opt. Call | | | | | | | | AA– | | | | 569,153 | |
| | | | | |
| | | | West Haven, Connecticut, General Obligation Bonds, Series 2012: | | | | | | | | | | | | | | | | |
| | 2,095 | | | 5.000%, 8/01/22 – AGM Insured | | | No Opt. Call | | | | | | | | AA | | | | 2,278,082 | |
| | 2,000 | | | 5.000%, 8/01/23 – AGM Insured | | | 8/22 at 100.00 | | | | | | | | AA | | | | 2,187,100 | |
| | 1,000 | | | 5.000%, 8/01/25 – AGM Insured | | | 8/22 at 100.00 | | | | | | | | AA | | | | 1,087,550 | |
| | 201,385 | | | Total Connecticut | | | | | | | | | | | | | | | 206,811,075 | |
| | | | | |
| | | | Delaware – 0.1% | | | | | | | | | | | | |
| | | | | |
| | | | Delaware Health Facilities Authority, Revenue Bonds, Nanticoke Memorial Hospital, Series 2013: | | | | | | | | | | | | | | | | |
| | 1,905 | | | 5.000%, 7/01/19 | | | No Opt. Call | | | | | | | | BBB+ | | | | 1,917,173 | |
| | 2,000 | | | 5.000%, 7/01/20 | | | No Opt. Call | | | | | | | | BBB+ | | | | 2,062,620 | |
| | 275 | | | 5.000%, 7/01/21 | | | No Opt. Call | | | | | | | | BBB+ | | | | 290,128 | |
| | 4,180 | | | Total Delaware | | | | | | | | | | | | | | | 4,269,921 | |
| | | | | |
| | | | District of Columbia – 1.3% | | | | | | | | | | | | |
| | | | | |
| | 16,090 | | | District of Columbia, Income Tax Secured Revenue Bonds, Refunding Series 2009A, 5.000%, 12/01/24 | | | 12/19 at 100.00 | | | | | | | | AAA | | | | 16,461,357 | |
149
Nuveen Limited Term Municipal Bond Fund(continued)
Portfolio of Investments March 31, 2019
| | | | | | | | | | | | | | | | | | | | |
Principal
Amount (000) | | | Description (1) | | Optional Call
Provisions (2) | | | | | | Ratings (3) | | | Value | |
| | | | | |
| | | | District of Columbia(continued) | | | | | | | | | | | | |
| | | | | |
| $ | 10,000 | | | District of Columbia, Income Tax Secured Revenue Bonds, Series 2011G, 5.000%, 12/01/30 | | | 12/21 at 100.00 | | | | | | | | AAA | | | $ | 10,815,900 | |
| | | | | |
| | | | Metropolitan Washington DC Airports Authority, Airport System Revenue Bonds, Refunding Series 2018A: | | | | | | | | | | | | | | | | |
| | 8,165 | | | 5.000%, 10/01/22 (AMT) | | | No Opt. Call | | | | | | | | AA– | | | | 9,054,414 | |
| | 10,830 | | | 5.000%, 10/01/23 (AMT) | | | No Opt. Call | | | | | | | | AA– | | | | 12,313,602 | |
| | 8,875 | | | 5.000%, 10/01/24 (AMT) | | | No Opt. Call | | | | | | | | AA– | | | | 10,303,520 | |
| | 7,240 | | | 5.000%, 10/01/25 (AMT) | | | No Opt. Call | | | | | | | | AA– | | | | 8,560,431 | |
| | | | | |
| | 1,200 | | | Washington Metropolitan Area Transit Authority, District of Columbia, Gross Revenue Bonds, Series 2018, 5.000%, 7/01/24 | | | No Opt. Call | | | | | | | | AA– | | | | 1,400,028 | |
| | 62,400 | | | Total District of Columbia | | | | | | | | | | | | | | | 68,909,252 | |
| | | | | |
| | | | Florida – 3.7% | | | | | | | | | | | | |
| | | | | |
| | | | Broward County, Florida, Airport System Revenue Bonds, Series 2015A: | | | | | | | | | | | | | | | | |
| | 5,000 | | | 5.000%, 10/01/24 (AMT) | | | No Opt. Call | | | | | | | | A+ | | | | 5,773,700 | |
| | 5,000 | | | 5.000%, 10/01/25 (AMT) | | | No Opt. Call | | | | | | | | A+ | | | | 5,881,950 | |
| | 2,295 | | | 5.000%, 10/01/26 (AMT) | | | 10/25 at 100.00 | | | | | | | | A+ | | | | 2,695,225 | |
| | 4,110 | | | 5.000%, 10/01/27 (AMT) | | | 10/25 at 100.00 | | | | | | | | A+ | | | | 4,802,288 | |
| | | | | |
| | | | Broward County, Florida, Airport System Revenue Bonds, Series 2017: | | | | | | | | | | | | | | | | |
| | 1,080 | | | 5.000%, 10/01/20 (AMT) | | | No Opt. Call | | | | | | | | A+ | | | | 1,130,825 | |
| | 1,585 | | | 5.000%, 10/01/21 (AMT) | | | No Opt. Call | | | | | | | | A+ | | | | 1,707,806 | |
| | 1,000 | | | 5.000%, 10/01/23 (AMT) | | | No Opt. Call | | | | | | | | A+ | | | | 1,132,360 | |
| | | | | |
| | | | Cape Coral, Florida, Utility Improvement Assessment Bonds, Refunding Various Areas Series 2017: | | | | | | | | | | | | | | | | |
| | 960 | | | 1.650%, 9/01/19 – AGM Insured | | | No Opt. Call | | | | | | | | AA | | | | 959,501 | |
| | 935 | | | 1.900%, 9/01/20 – AGM Insured | | | No Opt. Call | | | | | | | | AA | | | | 933,953 | |
| | 960 | | | 2.000%, 9/01/21 – AGM Insured | | | No Opt. Call | | | | | | | | AA | | | | 957,955 | |
| | 1,225 | | | 2.125%, 9/01/22 – AGM Insured | | | No Opt. Call | | | | | | | | AA | | | | 1,221,496 | |
| | | | | |
| | | | Citizens Property Insurance Corporation, Florida, Coastal Account Senior Secured Bonds,Series 2015A-1: | | | | | | | | | | | | | | | | |
| | 5,030 | | | 5.000%, 6/01/20 | | | 12/19 at 100.00 | | | | | | | | AA | | | | 5,141,716 | |
| | 18,050 | | | 5.000%, 6/01/22 | | | 12/21 at 100.00 | | | | | | | | AA | | | | 19,576,669 | |
| | 10,480 | | | 5.000%, 6/01/25 | | | 12/24 at 100.00 | | | | | | | | AA | | | | 12,252,273 | |
| | | | | |
| | 395 | | | Citizens Property Insurance Corporation, Florida, High-Risk Account Revenue Bonds, Coastal Account Senior SecuredSeries 2011A-1, 5.000%, 6/01/19 | | | No Opt. Call | | | | | | | | AA | | | | 397,157 | |
| | | | | |
| | 5,000 | | | Florida Department of Transportation, Full Faith and CreditRight-of-Way Acquisition and Bridge Construction Bonds, Refunding Series 2015A, 5.000%, 7/01/23 | | | No Opt. Call | | | | | | | | AAA | | | | 5,700,950 | |
| | | | | |
| | 5,010 | | | Florida Housing Finance Corporation, Homeowner Mortgage Revenue Bonds,Series 2018-2, 3.750%, 7/01/33 | | | 1/28 at 100.00 | | | | | | | | Aaa | | | | 5,273,025 | |
| | | | | |
| | 5,880 | | | Florida Municipal Power Agency, Power Supply Revenue Bonds, All Requirements Project, Refunding Series 2016A, 5.000%, 10/01/20 | | | No Opt. Call | | | | | | | | A+ | | | | 6,180,880 | |
| | | | | |
| | 2,655 | | | Florida Municipal Power Agency, Revenue Bonds, Saint Lucie Project, Refunding Series 2011A, 5.000%, 10/01/20 | | | No Opt. Call | | | | | | | | A2 | | | | 2,790,856 | |
| | | | | |
| | 4,515 | | | Florida State Board of Education, Public Education Capital Outlay Bonds, Series 2010E, 5.000%, 6/01/19 | | | No Opt. Call | | | | | | | | AAA | | | | 4,540,871 | |
| | | | | |
| | 2,215 | | | Hillsborough County School District, Florida, Sales Tax Revenue Refunding Bonds, Series 2015B, 5.000%, 10/01/20 – AGM Insured | | | No Opt. Call | | | | | | | | AA | | | | 2,323,624 | |
150
| | | | | | | | | | | | | | | | | | | | |
Principal
Amount (000) | | | Description (1) | | Optional Call
Provisions (2) | | | | | | Ratings (3) | | | Value | |
| | | | | |
| | | | Florida(continued) | | | | | | | | | | | | |
| | | | | |
| | | | Manatee County School District, Florida, Sales Tax Revenue Bonds, Series 2017: | | | | | | | | | | | | | | | | |
| $ | 1,020 | | | 5.000%, 10/01/21 – AGM Insured | | | No Opt. Call | | | | | | | | AA | | | $ | 1,106,588 | |
| | 3,120 | | | 5.000%, 10/01/23 – AGM Insured | | | No Opt. Call | | | | | | | | AA | | | | 3,576,456 | |
| | 2,725 | | | 5.000%, 10/01/25 – AGM Insured | | | No Opt. Call | | | | | | | | AA | | | | 3,249,453 | |
| | 2,295 | | | 5.000%, 10/01/26 – AGM Insured | | | No Opt. Call | | | | | | | | AA | | | | 2,779,383 | |
| | 2,010 | | | 5.000%, 10/01/27 – AGM Insured | | | 4/27 at 100.00 | | | | | | | | AA | | | | 2,443,637 | |
| | 2,850 | | | 5.000%, 10/01/28 – AGM Insured | | | 4/27 at 100.00 | | | | | | | | AA | | | | 3,452,889 | |
| | 2,310 | | | 5.000%, 10/01/29 – AGM Insured | | | 4/27 at 100.00 | | | | | | | | AA | | | | 2,775,881 | |
| | | | | |
| | 2,525 | | | Manatee County, Florida, Revenue Bonds, Refunding & Improvement Series 2013, 5.000%, 10/01/20 | | | No Opt. Call | | | | | | | | AA+ | | | | 2,654,962 | |
| | | | | |
| | 355 | | | Martin County Industrial Development Authority, Florida, Industrial Development Revenue Refunding Bonds, Indiantown Cogeneration LP, Series 2013, 3.950%, 12/15/21 (AMT), 144A | | | 6/20 at 100.00 | | | | | | | | BBB+ | | | | 361,912 | |
| | | | | |
| | | | Miami-Dade County Expressway Authority, Florida, Toll System Revenue Bonds, Refunding Series 2014B: | | | | | | | | | | | | | | | | |
| | 3,040 | | | 5.000%, 7/01/20 | | | No Opt. Call | | | | | | | | A+ | | | | 3,167,437 | |
| | 2,315 | | | 5.000%, 7/01/21 | | | No Opt. Call | | | | | | | | A+ | | | | 2,486,032 | |
| | 1,805 | | | 5.000%, 7/01/22 | | | No Opt. Call | | | | | | | | A+ | | | | 1,992,431 | |
| | 4,000 | | | 5.000%, 7/01/23 | | | No Opt. Call | | | | | | | | A+ | | | | 4,527,280 | |
| | | | | |
| | 2,770 | | | Miami-Dade County School Board, Florida, Certificates of Participation, Series 2015D, 5.000%, 2/01/20 | | | No Opt. Call | | | | | | | | A+ | | | | 2,846,867 | |
| | | | | |
| | | | Miami-Dade County, Florida, Special Obligation Bonds, Capital Asset Acquisition, Series 2010E: | | | | | | | | | | | | | | | | |
| | 1,790 | | | 5.000%, 4/01/19 | | | No Opt. Call | | | | | | | | AA | | | | 1,790,000 | |
| | 1,880 | | | 5.000%, 4/01/20 | | | No Opt. Call | | | | | | | | AA | | | | 1,942,980 | |
| | | | | |
| | 5,280 | | | North Sumter County Utility Dependent District, Florida, Utility Revenue Bonds, Series 2010, 5.000%, 10/01/20 | | | No Opt. Call | | | | | | | | A+ | | | | 5,463,638 | |
| | | | | |
| | 10,000 | | | Orlando Utilities Commission, Florida, Utility System Revenue Bonds, Refunding Series 2017A, 5.000%, 10/01/27 (Mandatory Put 10/01/20) | | | No Opt. Call | | | | | | | | AA | | | | 10,466,100 | |
| | | | | |
| | | | Orlando, Florida, Tourist Development Tax Revenue Bonds, 6th Cent Contract Payments, Refunding Senior Series 2017A: | | | | | | | | | | | | | | | | |
| | 2,000 | | | 5.000%, 11/01/29 – AGM Insured | | | 11/27 at 100.00 | | | | | | | | AA | | | | 2,400,980 | |
| | 9,215 | | | 5.000%, 11/01/30 – AGM Insured | | | 11/27 at 100.00 | | | | | | | | AA | | | | 10,990,177 | |
| | | | | |
| | | | Palm Beach County Solid Waste Authority, Florida, Revenue Bonds, Refunding Series 2011: | | | | | | | | | | | | | | | | |
| | 85 | | | 5.000%, 10/01/25(Pre-refunded 10/01/21) | | | 10/21 at 100.00 | | | | | | | | N/R (4) | | | | 92,091 | |
| | 4,915 | | | 5.000%, 10/01/25 | | | 10/21 at 100.00 | | | | | | | | AA+ | | | | 5,314,639 | |
| | | | | |
| | | | Port Saint Lucie, Florida, Utility System Revenue Bonds, Refunding Series 2014: | | | | | | | | | | | | | | | | |
| | 550 | | | 5.000%, 9/01/20 | | | No Opt. Call | | | | | | | | AA– | | | | 576,504 | |
| | 500 | | | 5.000%, 9/01/22 | | | No Opt. Call | | | | | | | | AA– | | | | 553,230 | |
| | 510 | | | 5.000%, 9/01/23 | | | No Opt. Call | | | | | | | | AA– | | | | 578,692 | |
| | | | | |
| | | | South Miami Health Facilities Authority, Florida, Hospital Revenue Bonds, Baptist Health Systems of South Florida Obligated Group, Series 2017: | | | | | | | | | | | | | | | | |
| | 1,280 | | | 5.000%, 8/15/21 | | | No Opt. Call | | | | | | | | AA– | | | | 1,373,965 | |
| | 440 | | | 5.000%, 8/15/22 | | | No Opt. Call | | | | | | | | AA– | | | | 485,197 | |
| | 1,760 | | | 5.000%, 8/15/23 | | | No Opt. Call | | | | | | | | AA– | | | | 1,990,138 | |
| | 2,000 | | | 5.000%, 8/15/24 | | | No Opt. Call | | | | | | | | AA– | | | | 2,313,320 | |
| | 5,500 | | | 5.000%, 8/15/25 | | | No Opt. Call | | | | | | | | AA– | | | | 6,493,795 | |
151
Nuveen Limited Term Municipal Bond Fund(continued)
Portfolio of Investments March 31, 2019
| | | | | | | | | | | | | | | | | | | | |
Principal
Amount (000) | | | Description (1) | | Optional Call
Provisions (2) | | | | | | Ratings (3) | | | Value | |
| | | | | |
| | | | Florida(continued) | | | | | | | | | | | | |
| | | | | |
| $ | 5,780 | | | Tampa Bay, Florida, Regional Water Supply Authority, Utility System Revenue Bonds, Series 2015A, 5.000%, 10/01/26 | | | 10/25 at 100.00 | | | | | | | | AA+ | | | $ | 6,923,746 | |
| | | | | |
| | | | Tampa, Florida, Cigarette Tax Allocation Bonds, H Lee Moffitt Cancer Center Project, Refunding & Capital Improvement Series 2012A: | | | | | | | | | | | | | | | | |
| | 3,475 | | | 5.000%, 9/01/19 | | | No Opt. Call | | | | | | | | A+ | | | | 3,522,156 | |
| | 865 | | | 5.000%, 9/01/20 | | | No Opt. Call | | | | | | | | A+ | | | | 904,202 | |
| | 785 | | | 5.000%, 9/01/21 | | | No Opt. Call | | | | | | | | A+ | | | | 845,021 | |
| | | | | |
| | 545 | | | Tampa, Florida, Revenue Bonds, University of Tampa, Refunding Series 2015, 5.000%, 4/01/21 | | | No Opt. Call | | | | | | | | A– | | | | 579,727 | |
| | | | | |
| | 335 | | | Tolomato Community Development District, Florida, Special Assessment Bonds, Convertible, Capital Appreciation,Series 2012A-3, 0.000%, 5/01/40 (5) | | | 5/19 at 100.00 | | | | | | | | N/R | | | | 333,422 | |
| | | | | |
| | 115 | | | Tolomato Community Development District, Florida, Special Assessment Bonds, Convertible, Capital Appreciation,Series 2012A-4, 0.000%, 5/01/40 (5) | | | 5/22 at 100.00 | | | | | | | | N/R | | | | 95,510 | |
| | | | | |
| | 165 | | | Tolomato Community Development District, Florida, Special Assessment Bonds, Hope Note,Series 2007-3, 6.375%, 5/01/17 (6) | | | No Opt. Call | | | | | | | | N/R | | | | 2 | |
| | | | | |
| | 460 | | | Tolomato Community Development District, Florida, Special Assessment Bonds, RefundingSeries 2015-1, 0.000%, 5/01/40 | | | 5/19 at 100.00 | | | | | | | | N/R | | | | 375,089 | |
| | | | | |
| | 280 | | | Tolomato Community Development District, Florida, Special Assessment Bonds, RefundingSeries 2015-2, 0.000%, 5/01/40 | | | 5/19 at 100.00 | | | | | | | | N/R | | | | 187,726 | |
| | | | | |
| | 305 | | | Tolomato Community Development District, Florida, Special Assessment Bonds, RefundingSeries 2015-3, 6.610%, 5/01/40 (6) | | | 5/19 at 100.00 | | | | | | | | N/R | | | | 3 | |
| | 177,335 | | | Total Florida | | | | | | | | | | | | | | | 195,388,338 | |
| | | | | |
| | | | Georgia – 1.8% | | | | | | | | | | | | |
| | | | | |
| | 15,250 | | | Burke County Development Authority, Georgia, Pollution Control Revenue Bonds, Georgia Power Company Vogtle Plant, First Series 2008, 1.650%, 11/01/48 (Mandatory Put 6/18/21) | | | No Opt. Call | | | | | | | | A– | | | | 15,006,152 | |
| | | | | |
| | | | Burke County Development Authority, Georgia, Pollution Control Revenue Bonds, Georgia Power Company Vogtle Plant, First Series 2012: | | | | | | | | | | | | | | | | |
| | 7,085 | | | 1.850%, 12/01/49(Mandatory Put 8/22/19) | | | No Opt. Call | | | | | | | | A– | | | | 7,079,119 | |
| | 3,000 | | | 1.850%, 12/01/49(Mandatory Put 8/22/19) | | | No Opt. Call | | | | | | | | A– | | | | 2,997,510 | |
| | | | | |
| | 3,000 | | | Cobb County Development Authority, Georgia, Solid Waste Disposal Revenue Bonds, Georgia Waste Management Project, Series 2004B, 1.875%, 4/01/33 (Mandatory Put 10/01/19) | | | No Opt. Call | | | | | | | | A– | | | | 3,001,140 | |
| | | | | |
| | 1,515 | | | DeKalb County, Georgia, Water and Sewerage Revenue Bonds, Refunding Second Resolution Series 2013, 5.000%, 10/01/22 | | | No Opt. Call | | | | | | | | Aa3 | | | | 1,690,407 | |
| | | | | |
| | 8,000 | | | Floyd County Development Authority, Georgia, Pollution Control Revenue Bonds, Georgia Power Company Plant Hammond Project, First Series 2010, 2.350%, 7/01/22 (Mandatory Put 12/11/20) | | | No Opt. Call | | | | | | | | Baa1 | | | | 7,980,080 | |
| | | | | |
| | 11,440 | | | Georgia State, General Obligation Bonds, Series 2009D, 5.000%, 5/01/20(Pre-refunded 5/01/19) | | | 5/19 at 100.00 | | | | | | | | AAA | | | | 11,472,490 | |
| | | | | |
| | 10,580 | | | Georgia State, General Obligation Bonds, Series 2015A, 5.000%, 2/01/24 | | | No Opt. Call | | | | | | | | AAA | | | | 12,262,855 | |
| | | | | |
| | 5,000 | | | Georgia State, General Obligation Bonds, Series 2017A, 5.000%, 2/01/32 | | | 2/27 at 100.00 | | | | | | | | AAA | | | | 6,040,350 | |
| | | | | |
| | 4,355 | | | Georgia State, General Obligation Bonds, Tranche 1 Series 2016A, 5.000%, 2/01/25 | | | No Opt. Call | | | | | | | | AAA | | | | 5,170,430 | |
152
| | | | | | | | | | | | | | | | | | | | |
Principal
Amount (000) | | | Description (1) | | Optional Call
Provisions (2) | | | | | | Ratings (3) | | | Value | |
| | | | | |
| | | | Georgia(continued) | | | | | | | | | | | | |
| | | | | |
| $ | 6,015 | | | Georgia State, General Obligation Bonds, Tranche 2 Series 2016A, 5.000%, 2/01/28 | | | 2/26 at 100.00 | | | | | | | | AAA | | | $ | 7,264,496 | |
| | | | | |
| | 2,000 | | | Monroe County Development Authority, Georgia, Pollution Control Revenue Bonds, Georgia Power Company – Scherer Plant,Series 2009-2, 2.350%, 10/01/48 (Mandatory Put 12/11/20) | | | No Opt. Call | | | | | | | | A3 | | | | 1,995,020 | |
| | | | | |
| | 3,750 | | | Monroe County Development Authority, Georgia, Pollution Control Revenue Bonds, Gulf Power Company – Scherer Project, First Series 2010, 1.400%, 6/01/49 (Mandatory Put 9/19/19) | | | No Opt. Call | | | | | | | | A2 | | | | 3,738,600 | |
| | | | | |
| | 3,005 | | | Municipal Gas Authority of Georgia, Gas Revenue Bonds, Gas Portfolio III Project, Series 2014U, 5.000%, 10/01/19 | | | No Opt. Call | | | | | | | | AA– | | | | 3,054,943 | |
| | | | | |
| | 5,270 | | | Private Colleges and Universities Authority, Georgia, Revenue Bonds, Agnes Scott College, Refunding Series 2015B, 2.500%, 6/01/30 (Mandatory Put 6/01/19) | | | 5/19 at 100.00 | | | | | | | | A | | | | 5,270,580 | |
| | | | | |
| | 580 | | | Private Colleges and Universities Authority, Georgia, Revenue Bonds, Mercer University, Refunding Series 2012C, 5.000%, 10/01/20 | | | No Opt. Call | | | | | | | | Baa1 | | | | 605,137 | |
| | 89,845 | | | Total Georgia | | | | | | | | | | | | | | | 94,629,309 | |
| | | | | |
| | | | Hawaii – 0.7% | | | | | | | | | | | | |
| | | | | |
| | 17,130 | | | Hawaii Department of Budget and Finance, Special Purpose Revenue Bonds, Hawaiian Electric Company, Inc and Subsidiary Projects, Series 2017A, 3.100%, 5/01/26 (AMT) | | | No Opt. Call | | | | | | | | A– | | | | 17,391,575 | |
| | | | | |
| | | | Hawaii State, General Obligation Bonds, Series 2013EH: | | | | | | | | | | | | | | | | |
| | 6,850 | | | 5.000%, 8/01/21 (ETM) | | | No Opt. Call | | | | | | | | N/R (4) | | | | 7,392,040 | |
| | 65 | | | 5.000%, 8/01/21 (ETM) | | | No Opt. Call | | | | | | | | N/R (4) | | | | 70,143 | |
| | | | | |
| | 1,490 | | | Hawaiian Electric Company Inc. and Its Subsidiaries, Special Purpose Revenue Bonds, Department of Budget and Finance of the State of Hawaii, Series 2015, 3.250%, 1/01/25 (AMT) | | | No Opt. Call | | | | | | | | A– | | | | 1,528,517 | |
| | | | | |
| | 5,740 | | | Honolulu City and County, Hawaii, General Obligation Bonds, Refunding Series 2017D, 5.000%, 9/01/30 | | | 9/27 at 100.00 | | | | | | | | Aa1 | | | | 7,009,057 | |
| | | | | |
| | 2,150 | | | Honolulu City and County, Hawaii, Wastewater System Revenue Bonds, First Bond Resolution, Refunding Senior Series 2015B, 5.000%, 7/01/26 | | | 7/25 at 100.00 | | | | | | | | Aa2 | | | | 2,564,155 | |
| | 33,425 | | | Total Hawaii | | | | | | | | | | | | | | | 35,955,487 | |
| | | | | |
| | | | Idaho – 0.8% | | | | | | | | | | | | |
| | | | | |
| | | | Idaho Health Facilities Authority, Revenue Bonds, Saint Luke’s Health System Project, Series 2018A: | | | | | | | | | | | | | | | | |
| | 4,500 | | | 5.000%, 3/01/25 | | | No Opt. Call | | | | | | | | A– | | | | 5,228,730 | |
| | 6,020 | | | 5.000%, 3/01/26 | | | No Opt. Call | | | | | | | | A– | | | | 7,115,700 | |
| | 4,320 | | | 5.000%, 3/01/27 | | | No Opt. Call | | | | | | | | A– | | | | 5,181,322 | |
| | 4,815 | | | 5.000%, 3/01/29 | | | 9/28 at 100.00 | | | | | | | | A– | | | | 5,793,504 | |
| | 4,880 | | | 5.000%, 3/01/31 | | | 9/28 at 100.00 | | | | | | | | A– | | | | 5,775,480 | |
| | | | | |
| | 12,935 | | | Nez Perce County, Idaho, Pollution Control Revenue Bonds, Potlatch Corporation Project, Refunding Series 2016, 2.750%, 10/01/24 | | | No Opt. Call | | | | | | | | BBB– | | | | 13,180,248 | |
| | 37,470 | | | Total Idaho | | | | | | | | | | | | | | | 42,274,984 | |
153
Nuveen Limited Term Municipal Bond Fund(continued)
Portfolio of Investments March 31, 2019
| | | | | | | | | | | | | | | | | | | | |
Principal
Amount (000) | | | Description (1) | | Optional Call
Provisions (2) | | | | | | Ratings (3) | | | Value | |
| | | | | |
| | | | Illinois – 10.8% | | | | | | | | | | | | |
| | | | | |
| | | | Adams County School District 172, Quincy, Illinois, General Obligation Bonds, Series 2016: | | | | | | | | | | | | | | | | |
| $ | 250 | | | 4.000%, 2/01/20 – AGM Insured | | | No Opt. Call | | | | | | | | AA | | | $ | 254,510 | |
| | 250 | | | 4.000%, 2/01/21 – AGM Insured | | | No Opt. Call | | | | | | | | AA | | | | 258,663 | |
| | 580 | | | 4.000%, 2/01/22 – AGM Insured | | | No Opt. Call | | | | | | | | AA | | | | 609,957 | |
| | 1,290 | | | 5.000%, 2/01/25 – AGM Insured | | | No Opt. Call | | | | | | | | AA | | | | 1,482,713 | |
| | 1,455 | | | 5.000%, 2/01/27 – AGM Insured | | | 2/26 at 100.00 | | | | | | | | AA | | | | 1,688,862 | |
| | | | | |
| | | | Bourbonnais, Illinois, Industrial Project Revenue Bonds, Olivet Nazarene University Project, Series 2010: | | | | | | | | | | | | | | | | |
| | 535 | | | 5.000%, 11/01/20 (ETM) | | | No Opt. Call | | | | | | | | N/R (4) | | | | 552,634 | |
| | 2,645 | | | 5.125%, 11/01/25(Pre-refunded 11/01/20) | | | 11/20 at 100.00 | | | | | | | | N/R (4) | | | | 2,791,612 | |
| | | | | |
| | 422 | | | Cary, Illinois, Special Tax Bonds, Special Service Area 1, Refunding Series 2016, 2.000%, 3/01/22 – BAM Insured | | | No Opt. Call | | | | | | | | AA | | | | 417,269 | |
| | | | | |
| | | | Cary, Illinois, Special Tax Bonds, Special Service Area 2, Refunding Series 2016: | | | | | | | | | | | | | | | | |
| | 392 | | | 1.700%, 3/01/20 – BAM Insured | | | No Opt. Call | | | | | | | | AA | | | | 390,436 | |
| | 237 | | | 1.700%, 3/01/20 – BAM Insured | | | No Opt. Call | | | | | | | | AA | | | | 236,054 | |
| | 480 | | | 1.900%, 3/01/21 – BAM Insured | | | No Opt. Call | | | | | | | | AA | | | | 474,758 | |
| | 295 | | | 2.000%, 3/01/22 – BAM Insured | | | No Opt. Call | | | | | | | | AA | | | | 291,693 | |
| | | | | |
| | 19,250 | | | Chicago Board of Education, Illinois, General Obligation Bonds, Dedicated Revenues, Refunding Series 2017B, 6.750%, 12/01/30, 144A | | | 12/27 at 100.00 | | | | | | | | B+ | | | | 23,727,550 | |
| | | | | |
| | | | Chicago Board of Education, Illinois, General Obligation Bonds, Dedicated Revenues, Refunding Series 2017C: | | | | | | | | | | | | | | | | |
| | 5,000 | | | 5.000%, 12/01/19 | | | No Opt. Call | | | | | | | | BB– | | | | 5,076,650 | |
| | 7,080 | | | 5.000%, 12/01/20 | | | No Opt. Call | | | | | | | | BB– | | | | 7,348,120 | |
| | 8,340 | | | 5.000%, 12/01/21 | | | No Opt. Call | | | | | | | | BB– | | | | 8,754,998 | |
| | 12,000 | | | 5.000%, 12/01/22 | | | No Opt. Call | | | | | | | | BB– | | | | 12,724,440 | |
| | | | | |
| | | | Chicago Board of Education, Illinois, General Obligation Bonds, Dedicated Revenues, Refunding Series 2018A: | | | | | | | | | | | | | | | | |
| | 6,000 | | | 4.000%, 12/01/20 | | | No Opt. Call | | | | | | | | BB– | | | | 6,130,200 | |
| | 3,205 | | | 4.000%, 12/01/22 | | | No Opt. Call | | | | | | | | BB– | | | | 3,288,618 | |
| | | | | |
| | 4,800 | | | Chicago Board of Education, Illinois, General Obligation Bonds, Dedicated Revenues, Refunding Series 2018C, 5.000%, 12/01/22 | | | No Opt. Call | | | | | | | | BB– | | | | 5,089,776 | |
| | | | | |
| | 1,000 | | | Chicago, Illinois, General Airport Revenue Bonds, O’Hare International Airport, Refunding Senior Lien Series 2018A, 5.000%, 1/01/20 (AMT) | | | No Opt. Call | | | | | | | | A | | | | 1,024,150 | |
| | | | | |
| | 5,000 | | | Chicago, Illinois, General Airport Revenue Bonds, O’Hare International Airport, Senior Lien Refunding Series 2013A, 5.000%, 1/01/21 (AMT) | | | No Opt. Call | | | | | | | | A | | | | 5,278,300 | |
| | | | | |
| | | | Chicago, Illinois, General Airport Revenue Bonds, O’Hare International Airport, Senior Lien Series 2015B: | | | | | | | | | | | | | | | | |
| | 2,755 | | | 5.000%, 1/01/20 | | | No Opt. Call | | | | | | | | A | | | | 2,824,013 | |
| | 1,885 | | | 5.000%, 1/01/21 | | | No Opt. Call | | | | | | | | A | | | | 1,993,934 | |
| | | | | |
| | 5,000 | | | Chicago, Illinois, General Airport Revenue Bonds, O’Hare International Airport, Third Lien Refunding Series 2010C, 5.250%, 1/01/30 – AGC Insured | | | 1/20 at 100.00 | | | | | | | | AA | | | | 5,132,250 | |
| | | | | |
| | | | Chicago, Illinois, General Obligation Bonds, Refunding Series 2016C: | | | | | | | | | | | | | | | | |
| | 6,270 | | | 5.000%, 1/01/23 | | | No Opt. Call | | | | | | | | BBB+ | | | | 6,724,951 | |
| | 7,445 | | | 5.000%, 1/01/24 | | | No Opt. Call | | | | | | | | BBB+ | | | | 8,064,350 | |
| | 4,205 | | | 5.000%, 1/01/25 | | | No Opt. Call | | | | | | | | BBB+ | | | | 4,609,521 | |
| | 1,840 | | | 5.000%, 1/01/26 | | | No Opt. Call | | | | | | | | BBB+ | | | | 2,039,014 | |
154
| | | | | | | | | | | | | | | | | | | | |
Principal
Amount (000) | | | Description (1) | | Optional Call
Provisions (2) | | | | | | Ratings (3) | | | Value | |
| | | | | |
| | | | Illinois(continued) | | | | | | | | | | | | |
| | | | | |
| $ | 2,025 | | | Cook County Community College District 508, Illinois, General Obligation Bonds, Chicago City Colleges, Series 2013, 5.000%, 12/01/20 | | | No Opt. Call | | | | | | | | A+ | | | $ | 2,098,528 | |
| | | | | |
| | | | Cook County High School District 212 Leyden, Illinois, General Obligation Bonds, Limited Tax Series 2016C: | | | | | | | | | | | | | | | | |
| | 1,000 | | | 5.000%, 12/01/23 | | | No Opt. Call | | | | | | | | AA | | | | 1,131,460 | |
| | 1,800 | | | 5.000%, 12/01/25 | | | 12/24 at 100.00 | | | | | | | | AA | | | | 2,062,746 | |
| | | | | |
| | 2,830 | | | Cook County Township High School District 225 Northfield, Illinois, General Obligation Bonds, Series 2016A, 5.000%, 12/01/22 | | | No Opt. Call | | | | | | | | AAA | | | | 3,160,601 | |
| | | | | |
| | 4,750 | | | Cook County, Illinois, General Obligation Bonds, Refunding Series 2010A, 5.250%, 11/15/22 | | | 11/20 at 100.00 | | | | | | | | AA– | | | | 4,989,210 | |
| | | | | |
| | | | Cook County, Illinois, General Obligation Bonds, Refunding Series 2012C: | | | | | | | | | | | | | | | | |
| | 3,445 | | | 5.000%, 11/15/27 | | | 11/22 at 100.00 | | | | | | | | AA– | | | | 3,736,206 | |
| | 3,000 | | | 5.000%, 11/15/33 | | | 11/22 at 100.00 | | | | | | | | AA– | | | | 3,203,940 | |
| | | | | |
| | 2,940 | | | Cook County, Illinois, General Obligation Bonds, Refunding Series 2016A, 5.000%, 11/15/19 | | | No Opt. Call | | | | | | | | AA– | | | | 2,996,536 | |
| | | | | |
| | | | DuPage County School District 58 Downers Grove, Illinois, General Obligation Bonds, Limited Tax Capital Appreciation School Series 2018: | | | | | | | | | | | | | | | | |
| | 1,000 | | | 0.000%, 12/15/26 | | | No Opt. Call | | | | | | | | Aa1 | | | | 834,480 | |
| | 1,050 | | | 0.000%, 12/15/27 | | | No Opt. Call | | | | | | | | Aa1 | | | | 849,356 | |
| | | | | |
| | | | Huntley, Illinois, Special Tax Bonds, Special Service Area 9, Refunding Series 2017: | | | | | | | | | | | | | | | | |
| | 760 | | | 1.800%, 3/01/20 – BAM Insured | | | No Opt. Call | | | | | | | | AA | | | | 756,869 | |
| | 795 | | | 2.000%, 3/01/21 – BAM Insured | | | No Opt. Call | | | | | | | | AA | | | | 786,994 | |
| | 835 | | | 2.200%, 3/01/22 – BAM Insured | | | No Opt. Call | | | | | | | | AA | | | | 831,209 | |
| | | | | |
| | 20,800 | | | Illinois Development Finance Authority, Revenue Bonds, St Vincent de Paul Center Project, Series 2000A, 2.450%, 11/15/39 (Mandatory Put 3/03/26) | | | No Opt. Call | | | | | | | | AA+ | | | | 20,915,024 | |
| | | | | |
| | 2,750 | | | Illinois Educational Facilities Authority, Revenue Bonds, University of Chicago, Series 1998B, 1.875%, 7/01/25 (Mandatory Put 2/13/20) | | | No Opt. Call | | | | | | | | AA– | | | | 2,753,383 | |
| | | | | |
| | 19,475 | | | Illinois Finance Authority, Gas Supply Refunding Revenue Bonds, The Peoples Gas Light and Coke Company Project, Series 2010B, 1.875%, 2/01/33 (Mandatory Put 8/01/20) | | | No Opt. Call | | | | | | | | A | | | | 19,382,104 | |
| | | | | |
| | 11,300 | | | Illinois Finance Authority, Midwestern Disaster Area Industrial Development Revenue Bonds, Cargill, Incorporated Project, Series 2012, 1.750%, 11/01/38 (Mandatory Put 11/01/21) | | | No Opt. Call | | | | | | | | A | | | | 11,127,223 | |
| | | | | |
| | 1,010 | | | Illinois Finance Authority, Revenue Bonds, Advocate Health Care Network, Refunding Series 2014, 5.000%, 8/01/20 | | | No Opt. Call | | | | | | | | AA | | | | 1,054,733 | |
| | | | | |
| | 950 | | | Illinois Finance Authority, Revenue Bonds, Alexian Brothers Health System, Series 2010, 5.000%, 2/15/21(Pre-refunded 2/15/20) | | | 2/20 at 100.00 | | | | | | | | N/R (4) | | | | 978,092 | |
| | | | | |
| | 10,150 | | | Illinois Finance Authority, Revenue Bonds, Ascension Health Alliance Senior Credit Group,Series 2012E-1, 2.250%, 11/15/42 (Mandatory Put 4/29/22) | | | No Opt. Call | | | | | | | | AA+ | | | | 10,223,587 | |
| | | | | |
| | | | Illinois Finance Authority, Revenue Bonds, Ascension Health/fkaPresence Health Network, Series 2016C: | | | | | | | | | | | | | | | | |
| | 4,145 | | | 5.000%, 2/15/20 | | | No Opt. Call | | | | | | | | AA+ | | | | 4,253,350 | |
| | 5,605 | | | 5.000%, 2/15/21 | | | No Opt. Call | | | | | | | | AA+ | | | | 5,950,212 | |
| | 5,430 | | | 5.000%, 2/15/22 | | | No Opt. Call | | | | | | | | AA+ | | | | 5,935,913 | |
| | 4,000 | | | 5.000%, 2/15/23 | | | No Opt. Call | | | | | | | | AA+ | | | | 4,488,800 | |
155
Nuveen Limited Term Municipal Bond Fund(continued)
Portfolio of Investments March 31, 2019
| | | | | | | | | | | | | | | | | | | | |
Principal
Amount (000) | | | Description (1) | | Optional Call
Provisions (2) | | | | | | Ratings (3) | | | Value | |
| | | | | |
| | | | Illinois(continued) | | | | | | | | | | | | |
| | | | | |
| | | | Illinois Finance Authority, Revenue Bonds, Centegra Health System, Series 2012: | | | | | | | | | | | | | | | | |
| $ | 930 | | | 5.000%, 9/01/19 | | | No Opt. Call | | | | | | | | AA+ | | | $ | 943,243 | |
| | 8,665 | | | 5.000%, 9/01/27 | | | 9/22 at 100.00 | | | | | | | | AA+ | | | | 9,547,097 | |
| | | | | |
| | | | Illinois Finance Authority, Revenue Bonds, Centegra Health System, Series 2014A: | | | | | | | | | | | | | | | | |
| | 370 | | | 5.000%, 9/01/19 | | | No Opt. Call | | | | | | | | AA+ | | | | 375,269 | |
| | 770 | | | 5.000%, 9/01/20 | | | No Opt. Call | | | | | | | | AA+ | | | | 806,113 | |
| | 350 | | | 5.000%, 9/01/21 | | | No Opt. Call | | | | | | | | AA+ | | | | 377,538 | |
| | 770 | | | 5.000%, 9/01/22 | | | No Opt. Call | | | | | | | | AA+ | | | | 853,861 | |
| | 620 | | | 5.000%, 9/01/23 | | | No Opt. Call | | | | | | | | AA+ | | | | 705,200 | |
| | 2,240 | | | 5.000%, 9/01/24 | | | No Opt. Call | | | | | | | | AA+ | | | | 2,605,926 | |
| | 865 | | | 5.000%, 9/01/25 | | | 9/24 at 100.00 | | | | | | | | AA+ | | | | 1,006,306 | |
| | | | | |
| | | | Illinois Finance Authority, Revenue Bonds, Mercy Health Corporation, Series 2016: | | | | | | | | | | | | | | | | |
| | 2,500 | | | 5.000%, 12/01/21 | | | No Opt. Call | | | | | | | | A3 | | | | 2,692,450 | |
| | 2,770 | | | 5.000%, 12/01/22 | | | No Opt. Call | | | | | | | | A3 | | | | 3,057,221 | |
| | | | | |
| | | | Illinois Finance Authority, Revenue Bonds, Northwest Community Hospital, Refunding Series 2016A: | | | | | | | | | | | | | | | | |
| | 855 | | | 5.000%, 7/01/21 | | | No Opt. Call | | | | | | | | A | | | | 915,423 | |
| | 1,000 | | | 5.000%, 7/01/23 | | | No Opt. Call | | | | | | | | A | | | | 1,125,710 | |
| | 920 | | | 5.000%, 7/01/24 | | | No Opt. Call | | | | | | | | A | | | | 1,057,384 | |
| | | | | |
| | | | Illinois Finance Authority, Revenue Bonds, OSF Healthcare System, Series 2015A: | | | | | | | | | | | | | | | | |
| | 1,715 | | | 5.000%, 11/15/20 | | | No Opt. Call | | | | | | | | A | | | | 1,804,420 | |
| | 1,100 | | | 5.000%, 11/15/21 | | | No Opt. Call | | | | | | | | A | | | | 1,190,376 | |
| | | | | |
| | 1,190 | | | Illinois Finance Authority, Revenue Bonds, Rush University Medical Center Obligated Group, Series 2015A, 5.000%, 11/15/20 | | | No Opt. Call | | | | | | | | AA– | | | | 1,254,212 | |
| | | | | |
| | 405 | | | Illinois Finance Authority, Revenue Bonds, Silver Cross Hospital and Medical Centers, Series 2005, 5.250%, 8/15/19 – AGM Insured (ETM) | | | No Opt. Call | | | | | | | | AA (4) | | | | 410,488 | |
| | | | | |
| | 880 | | | Illinois Finance Authority, Revenue Bonds, Southern Illinois Healthcare Enterprises, Inc, Refunding Series 2017C, 5.000%, 3/01/25 | | | No Opt. Call | | | | | | | | A+ | | | | 1,010,363 | |
| | | | | |
| | | | Illinois Finance Authority, Revenue Bonds, Swedish Covenant Hospital, Series 2016A: | | | | | | | | | | | | | | | | |
| | 1,000 | | | 5.000%, 8/15/19 | | | No Opt. Call | | | | | | | | BBB | | | | 1,009,910 | |
| | 1,400 | | | 5.000%, 8/15/21 | | | No Opt. Call | | | | | | | | BBB | | | | 1,485,330 | |
| | 1,000 | | | 5.000%, 8/15/22 | | | No Opt. Call | | | | | | | | BBB | | | | 1,085,290 | |
| | 1,015 | | | 5.000%, 8/15/24 | | | No Opt. Call | | | | | | | | BBB | | | | 1,144,707 | |
| | 2,000 | | | 5.000%, 8/15/25 | | | No Opt. Call | | | | | | | | BBB | | | | 2,291,720 | |
| | 3,000 | | | 5.000%, 8/15/26 | | | No Opt. Call | | | | | | | | BBB | | | | 3,484,110 | |
| | | | | |
| | | | Illinois Finance Authority, Revenue Bonds, University of Chicago, Refunding Series 2014A: | | | | | | | | | | | | | | | | |
| | 1,045 | | | 5.000%, 10/01/19 | | | No Opt. Call | | | | | | | | AA+ | | | | 1,062,681 | |
| | 2,220 | | | 5.000%, 10/01/20 | | | No Opt. Call | | | | | | | | AA+ | | | | 2,331,910 | |
| | | | | |
| | 5,345 | | | Illinois Finance Authority, Revenue Bonds, University of Chicago, Series 2012A, 5.000%, 10/01/20 | | | No Opt. Call | | | | | | | | AA+ | | | | 5,614,441 | |
| | | | | |
| | 3,690 | | | Illinois Housing Development Authority, Homeowner Mortgage Revenue Bonds, Series 2018A, 3.500%, 8/01/31 | | | 8/27 at 100.00 | | | | | | | | AA | | | | 3,817,600 | |
156
| | | | | | | | | | | | | | | | | | | | |
Principal
Amount (000) | | | Description (1) | | Optional Call
Provisions (2) | | | | | | Ratings (3) | | | Value | |
| | | | | |
| | | | Illinois(continued) | | | | | | | | | | | | |
| | | | | |
| | | | Illinois Municipal Electric Agency, Power Supply System Revenue Bonds, Refunding Series 2015A: | | | | | | | | | | | | | | | | |
| $ | 4,035 | | | 5.000%, 2/01/20 | | | No Opt. Call | | | | | | | | A1 | | | $ | 4,145,962 | |
| | 10,930 | | | 5.000%, 2/01/21 | | | No Opt. Call | | | | | | | | A1 | | | | 11,552,682 | |
| | 5,070 | | | 5.000%, 2/01/22 | | | No Opt. Call | | | | | | | | A1 | | | | 5,501,001 | |
| | 2,600 | | | 5.000%, 2/01/25 | | | No Opt. Call | | | | | | | | A1 | | | | 3,022,370 | |
| | | | | |
| | 5,000 | | | Illinois State, General Obligation Bonds, December Series 2017A, 5.000%, 12/01/24 | | | No Opt. Call | | | | | | | | BBB | | | | 5,475,750 | |
| | | | | |
| | | | Illinois State, General Obligation Bonds, February Series 2014: | | | | | | | | | | | | | | | | |
| | 1,390 | | | 5.000%, 2/01/20 | | | No Opt. Call | | | | | | | | BBB | | | | 1,421,928 | |
| | 4,175 | | | 5.000%, 2/01/22 | | | No Opt. Call | | | | | | | | BBB | | | | 4,438,359 | |
| | | | | |
| | 3,320 | | | Illinois State, General Obligation Bonds, January Series 2016, 5.000%, 1/01/21 | | | No Opt. Call | | | | | | | | BBB | | | | 3,460,336 | |
| | | | | |
| | | | Illinois State, General Obligation Bonds, November Series 2017D: | | | | | | | | | | | | | | | | |
| | 350 | | | 5.000%, 11/01/21 | | | No Opt. Call | | | | | | | | BBB | | | | 371,599 | |
| | 20,275 | | | 5.000%, 11/01/22 | | | No Opt. Call | | | | | | | | BBB | | | | 21,866,385 | |
| | 25,985 | | | 5.000%, 11/01/23 | | | No Opt. Call | | | | | | | | BBB | | | | 28,196,064 | |
| | 10,815 | | | 5.000%, 11/01/24 | | | No Opt. Call | | | | | | | | BBB | | | | 11,833,016 | |
| | 6,950 | | | 3.250%, 11/01/26 | | | No Opt. Call | | | | | | | | BBB | | | | 6,751,577 | |
| | 15,250 | | | 5.000%, 11/01/27 | | | No Opt. Call | | | | | | | | BBB | | | | 16,926,737 | |
| | | | | |
| | 5,000 | | | Illinois State, General Obligation Bonds, October Series 2016, 5.000%, 2/01/21 | | | No Opt. Call | | | | | | | | BBB | | | | 5,221,200 | |
| | | | | |
| | 1,290 | | | Illinois State, General Obligation Bonds, Refunding Series 2007B, 5.250%, 1/01/20 | | | No Opt. Call | | | | | | | | BBB | | | | 1,319,051 | |
| | | | | |
| | 14,720 | | | Illinois State, General Obligation Bonds, Refunding Series 2010, 5.000%, 1/01/24 | | | 1/20 at 100.00 | | | | | | | | BBB | | | | 14,938,003 | |
| | | | | |
| | 4,120 | | | Illinois State, General Obligation Bonds, Refunding Series 2012, 5.000%, 8/01/20 | | | No Opt. Call | | | | | | | | BBB | | | | 4,260,410 | |
| | | | | |
| | | | Illinois State, General Obligation Bonds, Series 2013: | | | | | | | | | | | | | | | | |
| | 4,205 | | | 5.000%, 7/01/21 | | | No Opt. Call | | | | | | | | BBB | | | | 4,432,533 | |
| | 3,140 | | | 5.500%, 7/01/25 | | | 7/23 at 100.00 | | | | | | | | BBB | | | | 3,411,265 | |
| | | | | |
| | 6,220 | | | Illinois State, Sales Tax Revenue Bonds, Build Illinois, Junior Lien Series 2013, 5.000%, 6/15/19 | | | No Opt. Call | | | | | | | | A– | | | | 6,257,320 | |
| | | | | |
| | | | Illinois Toll Highway Authority, Toll Highway Revenue Bonds, Refunding Senior Lien Series 2014A: | | | | | | | | | | | | | | | | |
| | 1,615 | | | 5.000%, 12/01/20 | | | No Opt. Call | | | | | | | | AA– | | | | 1,704,503 | |
| | 1,750 | | | 5.000%, 12/01/21 | | | No Opt. Call | | | | | | | | AA– | | | | 1,902,793 | |
| | 2,100 | | | 5.000%, 12/01/22 | | | No Opt. Call | | | | | | | | AA– | | | | 2,348,493 | |
| | | | | |
| | 11,970 | | | Illinois Toll Highway Authority, Toll Highway Revenue Bonds, Senior Lien Series 2014D, 5.000%, 1/01/24 | | | No Opt. Call | | | | | | | | AA– | | | | 13,767,295 | |
| | | | | |
| | | | Kane County Community Unit School District 304 Geneva, Illinois, General Obligation Bonds, Refunding Series 2016: | | | | | | | | | | | | | | | | |
| | 2,520 | | | 5.000%, 1/01/26 | | | No Opt. Call | | | | | | | | AA+ | | | | 2,988,796 | |
| | 5,055 | | | 5.000%, 1/01/27 | | | 1/26 at 100.00 | | | | | | | | AA+ | | | | 5,946,247 | |
| | | | | |
| | | | LaSalle and Bureau Counties High School District 120 LaSalle-Peru, Illinois, General Obligation Bonds, School Building Series 2017: | | | | | | | | | | | | | | | | |
| | 980 | | | 5.000%, 12/01/21 – BAM Insured | | | No Opt. Call | | | | | | | | AA | | | | 1,060,487 | |
| | 1,000 | | | 5.000%, 12/01/22 – BAM Insured | | | No Opt. Call | | | | | | | | AA | | | | 1,109,670 | |
| | 1,085 | | | 5.000%, 12/01/23 – BAM Insured | | | No Opt. Call | | | | | | | | AA | | | | 1,233,851 | |
| | 1,235 | | | 5.000%, 12/01/26 – BAM Insured | | | No Opt. Call | | | | | | | | AA | | | | 1,482,420 | |
157
Nuveen Limited Term Municipal Bond Fund(continued)
Portfolio of Investments March 31, 2019
| | | | | | | | | | | | | | | | | | | | |
Principal
Amount (000) | | | Description (1) | | Optional Call
Provisions (2) | | | | | | Ratings (3) | | | Value | |
| | | | | |
| | | | Illinois(continued) | | | | | | | | | | | | |
| | | | | |
| | | | Madison County Community Unit School District 7 Edwardsville, Illinois, General Obligation Bonds, Series 2017A: | | | | | | | | | | | | | | | | |
| $ | 3,225 | | | 4.000%, 12/01/19 | | | No Opt. Call | | | | | | | | AA | | | $ | 3,272,827 | |
| | 2,100 | | | 4.000%, 12/01/20 | | | No Opt. Call | | | | | | | | AA | | | | 2,177,112 | |
| | | | | |
| | | | Metropolitan Pier and Exposition Authority, Illinois, McCormick Place Expansion Project Bonds, Series 2017B: | | | | | | | | | | | | | | | | |
| | 725 | | | 5.000%, 12/15/25 | | | No Opt. Call | | | | | | | | BBB | | | | 804,518 | |
| | 1,925 | | | 5.000%, 12/15/26 | | | No Opt. Call | | | | | | | | BBB | | | | 2,143,122 | |
| | 360 | | | 5.000%, 12/15/27 | | | No Opt. Call | | | | | | | | BBB | | | | 403,060 | |
| | 1,945 | | | 5.000%, 12/15/28 | | | 12/27 at 100.00 | | | | | | | | BBB | | | | 2,198,472 | |
| | 650 | | | 5.000%, 12/15/30 | | | 12/27 at 100.00 | | | | | | | | BBB | | | | 725,563 | |
| | | | | |
| | | | Montgomery, Illinois, Lakewood Creek Project Special Assessment Bonds, Series 2018: | | | | | | | | | | | | | | | | |
| | 290 | | | 2.300%, 3/01/21 – BAM Insured | | | No Opt. Call | | | | | | | | AA | | | | 290,702 | |
| | 387 | | | 2.450%, 3/01/22 – BAM Insured | | | No Opt. Call | | | | | | | | AA | | | | 389,039 | |
| | 386 | | | 2.850%, 3/01/24 – BAM Insured | | | No Opt. Call | | | | | | | | AA | | | | 390,400 | |
| | | | | |
| | | | Railsplitter Tobacco Settlement Authority, Illinois, Tobacco Settlement Revenue Bonds, Series 2010: | | | | | | | | | | | | | | | | |
| | 11,745 | | | 5.000%, 6/01/19 | | | No Opt. Call | | | | | | | | A | | | | 11,807,601 | |
| | 6,025 | | | 5.250%, 6/01/20 | | | No Opt. Call | | | | | | | | A | | | | 6,263,771 | |
| | 280 | | | 5.250%, 6/01/21 | | | No Opt. Call | | | | | | | | A | | | | 300,065 | |
| | | | | |
| | | | Railsplitter Tobacco Settlement Authority, Illinois, Tobacco Settlement Revenue Bonds, Series 2017: | | | | | | | | | | | | | | | | |
| | 4,250 | | | 5.000%, 6/01/22 | | | No Opt. Call | | | | | | | | A | | | | 4,648,905 | |
| | 2,015 | | | 5.000%, 6/01/23 | | | No Opt. Call | | | | | | | | A | | | | 2,256,095 | |
| | 2,525 | | | 5.000%, 6/01/24 | | | No Opt. Call | | | | | | | | A | | | | 2,886,328 | |
| | 5,920 | | | 5.000%, 6/01/25 | | | No Opt. Call | | | | | | | | A | | | | 6,897,155 | |
| | | | | |
| | 1,895 | | | Regional Transportation Authority, Cook, DuPage, Kane, Lake, McHenry and Will Counties, Illinois, General Obligation Bonds, Series 1990A, 7.200%, 11/01/20 – AMBAC Insured | | | No Opt. Call | | | | | | | | AA | | | | 2,006,123 | |
| | | | | |
| | 1,545 | | | Regional Transportation Authority, Cook, DuPage, Kane, Lake, McHenry and Will Counties, Illinois, General Obligation Bonds, Series 1994D, 7.750%, 6/01/19 – FGIC Insured | | | No Opt. Call | | | | | | | | AA | | | | 1,559,956 | |
| | | | | |
| | | | Round Lake, Lake County, Illinois, Special Tax Bonds, Lakewood Grove Special Service Areas 1, 3 & 4, Refunding Series 2017: | | | | | | | | | | | | | | | | |
| | 1,009 | | | 2.850%, 3/01/22 – BAM Insured | | | No Opt. Call | | | | | | | | AA | | | | 1,018,232 | |
| | 1,133 | | | 3.200%, 3/01/24 – BAM Insured | | | No Opt. Call | | | | | | | | AA | | | | 1,161,993 | |
| | 1,000 | | | 3.300%, 3/01/25 – BAM Insured | | | No Opt. Call | | | | | | | | AA | | | | 1,032,820 | |
| | 1,258 | | | 3.450%, 3/01/26 – BAM Insured | | | No Opt. Call | | | | | | | | AA | | | | 1,307,251 | |
| | 1,208 | | | 3.600%, 3/01/28 – BAM Insured | | | 3/27 at 100.00 | | | | | | | | AA | | | | 1,261,865 | |
| | | | | |
| | | | Southwestern Illinois Development Authority, Health Facility Revenue Bonds, Hospital Sisters Services, Inc Obligated Group, Series 2017A: | | | | | | | | | | | | | | | | |
| | 2,460 | | | 5.000%, 2/15/26 | | | No Opt. Call | | | | | | | | AA– | | | | 2,927,843 | |
| | 3,525 | | | 5.000%, 2/15/27 | | | No Opt. Call | | | | | | | | AA– | | | | 4,258,834 | |
| | | | | |
| | | | Springfield, Illinois, Electric Revenue Bonds, Senior Lien Series 2015: | | | | | | | | | | | | | | | | |
| | 2,495 | | | 5.000%, 3/01/20 | | | No Opt. Call | | | | | | | | A | | | | 2,566,557 | |
| | 2,765 | | | 5.000%, 3/01/21 | | | No Opt. Call | | | | | | | | A | | | | 2,928,522 | |
| | 2,565 | | | 5.000%, 3/01/22 | | | No Opt. Call | | | | | | | | A | | | | 2,792,233 | |
| | | | | |
| | 2,415 | | | Sterling, Whiteside County, Illinois, General Obligation Bonds, Alternate Revenue Source, Series 2012, 4.000%, 11/01/19 | | | No Opt. Call | | | | | | | | A+ | | | | 2,445,236 | |
158
| | | | | | | | | | | | | | | | | | | | |
Principal
Amount (000) | | | Description (1) | | Optional Call
Provisions (2) | | | | | | Ratings (3) | | | Value | |
| | | | | |
| | | | Illinois(continued) | | | | | | | | | | | | |
| | | | | |
| | | | Winnebago-Boone Counties School District 205 Rockford, Illinois, General Obligation Bonds, Series 2013: | | | | | | | | | | | | | | | | |
| $ | 1,450 | | | 0.000%, 2/01/21 | | | No Opt. Call | | | | | | | | A+ | | | $ | 1,390,072 | |
| | 6,220 | | | 0.000%, 2/01/22 | | | No Opt. Call | | | | | | | | A+ | | | | 5,810,600 | |
| | 6,820 | | | 0.000%, 2/01/23 | | | No Opt. Call | | | | | | | | A+ | | | | 6,196,038 | |
| | 541,047 | | | Total Illinois | | | | | | | | | | | | | | | 575,713,864 | |
| | | | | |
| | | | Indiana – 3.9% | | | | | | | | | | | | |
| | | | | |
| | | | Carmel Local Public Improvement Bond Bank, Indiana, Multipurpose Revenue Bonds, Series 2016: | | | | | | | | | | | | | | | | |
| | 1,215 | | | 5.000%, 7/15/19 | | | No Opt. Call | | | | | | | | AA | | | | 1,227,028 | |
| | 815 | | | 5.000%, 7/15/20 | | | No Opt. Call | | | | | | | | AA | | | | 851,072 | |
| | | | | |
| | 1,000 | | | Gary, Indiana, Revenue Anticipation Notes, Series 2019, 5.000%, 2/25/20 | | | 5/19 at 100.00 | | | | | | | | N/R | | | | 983,950 | |
| | | | | |
| | | | Hamilton Southeastern Consolidated School Building Corporation, Hamilton County, Indiana, First Mortgage Bonds, Refunding Series 2015D: | | | | | | | | | | | | | | | | |
| | 2,000 | | | 5.000%, 1/15/20 | | | No Opt. Call | | | | | | | | AA+ | | | | 2,053,820 | |
| | 1,000 | | | 5.000%, 7/15/20 | | | No Opt. Call | | | | | | | | AA+ | | | | 1,043,870 | |
| | | | | |
| | | | Hobart Building Corporation, Indiana, First Mortgage Revenue Bonds, Refunding Series 2016: | | | | | | | | | | | | | | | | |
| | 1,655 | | | 4.000%, 7/15/19 | | | No Opt. Call | | | | | | | | AA+ | | | | 1,666,304 | |
| | 1,540 | | | 4.000%, 7/15/20 | | | No Opt. Call | | | | | | | | AA+ | | | | 1,587,032 | |
| | 1,590 | | | 4.000%, 1/15/21 | | | No Opt. Call | | | | | | | | AA+ | | | | 1,656,605 | |
| | 2,200 | | | 5.000%, 1/15/22 | | | No Opt. Call | | | | | | | | AA+ | | | | 2,397,384 | |
| | | | | |
| | 13,000 | | | Indiana Bond Bank, Advance Purchase Funding Bonds, Common School Fund, Series 2019A, 4.000%, 1/03/20 | | | No Opt. Call | | | | | | | | N/R | | | | 13,219,310 | |
| | | | | |
| | 275 | | | Indiana Finance Authority, Educational Facilities Revenue Bonds, Drexel Foundation For Educational Excellence, Inc, Series 2009A, 6.000%, 10/01/21 | | | 10/19 at 100.00 | | | | | | | | B | | | | 277,019 | |
| | | | | |
| | 2,120 | | | Indiana Finance Authority, Hospital Revenue Bonds, Floyd Memorial Hospital and Health Services Project, Refunding Series 2010, 5.000%, 3/01/20 (ETM) | | | No Opt. Call | | | | | | | | N/R (4) | | | | 2,184,914 | |
| | | | | |
| | | | Indiana Finance Authority, Hospital Revenue Bonds, Major Hospital Project, Series 2014A: | | | | | | | | | | | | | | | | |
| | 1,075 | | | 4.000%, 10/01/20 | | | No Opt. Call | | | | | | | | A | | | | 1,104,218 | |
| | 435 | | | 4.000%, 10/01/21 | | | No Opt. Call | | | | | | | | A | | | | 454,436 | |
| | 145 | | | 5.000%, 10/01/23 | | | No Opt. Call | | | | | | | | A | | | | 161,740 | |
| | | | | |
| | | | Indiana Finance Authority, Hospital Revenue Bonds, Parkview Health System Obligated Group, Refunding Series 2012A: | | | | | | | | | | | | | | | | |
| | 30 | | | 5.000%, 5/01/19 | | | No Opt. Call | | | | | | | | N/R (4) | | | | 30,082 | |
| | 835 | | | 5.000%, 5/01/19 | | | No Opt. Call | | | | | | | | AA– | | | | 837,154 | |
| | 30 | | | 5.000%, 5/01/20 | | | No Opt. Call | | | | | | | | N/R (4) | | | | 31,085 | |
| | 735 | | | 5.000%, 5/01/20 | | | No Opt. Call | | | | | | | | AA– | | | | 760,527 | |
| | 65 | | | 5.000%, 5/01/21 | | | No Opt. Call | | | | | | | | N/R (4) | | | | 69,462 | |
| | 1,935 | | | 5.000%, 5/01/21 | | | No Opt. Call | | | | | | | | AA– | | | | 2,061,955 | |
| | | | | |
| | | | Indiana Finance Authority, Wastewater Utility Revenue Bonds, CWA Authority Project, Series 2014A: | | | | | | | | | | | | | | | | |
| | 375 | | | 5.000%, 10/01/19 | | | No Opt. Call | | | | | | | | AA | | | | 381,308 | |
| | 785 | | | 5.000%, 10/01/20 | | | No Opt. Call | | | | | | | | AA | | | | 823,496 | |
159
Nuveen Limited Term Municipal Bond Fund(continued)
Portfolio of Investments March 31, 2019
| | | | | | | | | | | | | | | | | | | | |
Principal
Amount (000) | | | Description (1) | | Optional Call
Provisions (2) | | | | | | Ratings (3) | | | Value | |
| | | | | |
| | | | Indiana(continued) | | | | | | | | | | | | |
| | | | | |
| | | | Indiana Finance Authority, Wastewater Utility Revenue Bonds, CWA Authority Project, Series 2015A: | | | | | | | | | | | | | | | | |
| $ | 680 | | | 5.000%, 10/01/20 | | | No Opt. Call | | | | | | | | AA | | | $ | 713,347 | |
| | 690 | | | 5.000%, 10/01/23 | | | No Opt. Call | | | | | | | | AA | | | | 784,523 | |
| | 1,000 | | | 5.000%, 10/01/24 | | | No Opt. Call | | | | | | | | AA | | | | 1,163,220 | |
| | 1,800 | | | 5.000%, 10/01/25 | | | 10/24 at 100.00 | | | | | | | | AA | | | | 2,102,004 | |
| | 1,240 | | | 5.000%, 10/01/26 | | | 10/24 at 100.00 | | | | | | | | AA | | | | 1,445,220 | |
| | 800 | | | 5.000%, 10/01/27 | | | 10/24 at 100.00 | | | | | | | | AA | | | | 931,032 | |
| | | | | |
| | 3,065 | | | Indiana Health Facility Financing Authority, Revenue Bonds, Ascension Health,Series 2005A-10, 1.500%, 11/01/27 (Mandatory Put 5/01/20) | | | No Opt. Call | | | | | | | | AA | | | | 3,055,836 | |
| | | | | |
| | 3,040 | | | Indiana Health Facility Financing Authority, Revenue Bonds, Ascension Health,Series 2005A-4, 1.500%, 10/01/27 (Mandatory Put 5/01/20) | | | No Opt. Call | | | | | | | | AA | | | | 3,030,910 | |
| | | | | |
| | 10,000 | | | Indiana Health Facility Financing Authority, Revenue Bonds, Ascension Health,Series 2011A-2, 2.000%, 11/15/36 (Mandatory Put 2/01/23) | | | No Opt. Call | | | | | | | | AA+ | | | | 10,051,200 | |
| | | | | |
| | 260 | | | Indiana State University Board of Trustees, Indiana State University Housing and Dining System Revenue Bonds, Series 2014, 4.000%, 4/01/22 | | | No Opt. Call | | | | | | | | AA– | | | | 278,320 | |
| | | | | |
| | | | Indianapolis Local Public Improvement Bond Bank, Indiana, Waterworks Project, Refunding Series 2006: | | | | | | | | | | | | | | | | |
| | 1,630 | | | 5.500%, 7/01/19 – NPFG Insured | | | No Opt. Call | | | | | | | | AA | | | | 1,646,023 | |
| | 3,690 | | | 5.500%, 1/01/20 – NPFG Insured | | | No Opt. Call | | | | | | | | AA | | | | 3,799,741 | |
| | | | | |
| | 8,000 | | | Indianapolis Local Public Improvement Bond Bank, Indiana, Waterworks Project, Series 2007B, 5.250%, 7/01/24 – NPFG Insured | | | No Opt. Call | | | | | | | | AA | | | | 9,367,760 | |
| | | | | |
| | 10,215 | | | Indianapolis, Indiana, Gas Utility Distribution System Revenue Bonds, Refunding 2nd Lien Series 2017A, 5.000%, 8/15/25 | | | No Opt. Call | | | | | | | | AA | | | | 12,188,844 | |
| | | | | |
| | | | Indianapolis, Indiana, Thermal Energy System Revenue Bonds, Refunding First Lien Series 2014A: | | | | | | | | | | | | | | | | |
| | 285 | | | 5.000%, 10/01/19 | | | No Opt. Call | | | | | | | | A | | | | 289,566 | |
| | 350 | | | 5.000%, 10/01/20 | | | No Opt. Call | | | | | | | | A | | | | 366,261 | |
| | 450 | | | 5.000%, 10/01/21 | | | No Opt. Call | | | | | | | | A | | | | 484,294 | |
| | 460 | | | 5.000%, 10/01/22 | | | No Opt. Call | | | | | | | | A | | | | 508,295 | |
| | 710 | | | 5.000%, 10/01/23 | | | No Opt. Call | | | | | | | | A | | | | 802,996 | |
| | 420 | | | 5.000%, 10/01/24 | | | No Opt. Call | | | | | | | | A | | | | 484,756 | |
| | 505 | | | 5.000%, 10/01/25 | | | 10/24 at 100.00 | | | | | | | | A | | | | 581,442 | |
| | 760 | | | 5.000%, 10/01/26 | | | 10/24 at 100.00 | | | | | | | | A | | | | 873,764 | |
| | | | | |
| | | | Indianapolis, Indiana, Thermal Energy System Revenue Bonds, Refunding First Lien Series 2016A: | | | | | | | | | | | | | | | | |
| | 1,910 | | | 5.000%, 10/01/21 | | | No Opt. Call | | | | | | | | A | | | | 2,055,561 | |
| | 4,400 | | | 5.000%, 10/01/22 | | | No Opt. Call | | | | | | | | A | | | | 4,861,956 | |
| | 10,000 | | | 5.000%, 10/01/23 | | | No Opt. Call | | | | | | | | A | | | | 11,309,800 | |
| | | | | |
| | 550 | | | Knox County, Indiana, Economic Development Revenue and Refunding Bonds, Good Samaritan Hospital Project, Series 2012A, 3.000%, 4/01/19 | | | No Opt. Call | | | | | | | | Ba1 | | | | 550,000 | |
| | | | | |
| | 12,500 | | | Mount Vernon, Indiana, Environmental Improvement Revenue Bonds, Southern Indiana Gas and Electric Company Project, Refunding Series 2015, 2.375%, 9/01/55 (Mandatory Put 9/01/20) (AMT) | | | No Opt. Call | | | | | | | | Aa3 | | | | 12,461,125 | |
| | | | | |
| | 1,000 | | | Richmond Hospital Authority, Indiana, Revenue Bonds, Reid Hospital Project, Refunding Series 2015A, 5.000%, 1/01/22 | | | No Opt. Call | | | | | | | | A | | | | 1,075,930 | |
| | | | | |
| | 2,665 | | | Rockport, Indiana, Pollution Control Revenue Refunding Bonds, Indiana Michigan Power Company Project, Series 2008D, 2.050%, 4/01/25 (Mandatory Put 6/01/21) | | | No Opt. Call | | | | | | | | A– | | | | 2,663,561 | |
160
| | | | | | | | | | | | | | | | | | | | |
Principal
Amount (000) | | | Description (1) | | Optional Call
Provisions (2) | | | | | | Ratings (3) | | | Value | |
| | | | | |
| | | | Indiana(continued) | | | | | | | | | | | | |
| | | | | |
| $ | 13,000 | | | Rockport, Indiana, Pollution Control Revenue Refunding Bonds, Indiana Michigan Power Company, Series 2002A, 2.750%, 6/01/25 | | | No Opt. Call | | | | | | | | A– | | | $ | 13,074,750 | |
| | | | | |
| | | | Vanderburgh County, Indiana, Redevelopment District Tax Increment Revenue bonds, Refunding Series 2014: | | | | | | | | | | | | | | | | |
| | 800 | | | 5.000%, 2/01/20 | | | No Opt. Call | | | | | | | | A | | | | 821,392 | |
| | 640 | | | 5.000%, 2/01/21 | | | No Opt. Call | | | | | | | | A | | | | 674,797 | |
| | 1,595 | | | 4.000%, 2/01/24 | | | No Opt. Call | | | | | | | | A | | | | 1,739,794 | |
| | | | | |
| | 7,500 | | | Warrick County, Indiana, Environmental Improvement Revenue Bonds, Southern Indiana Gas and Electric Company, Series 2015, 2.375%, 9/01/55 (Mandatory Put 9/01/20) (AMT) | | | No Opt. Call | | | | | | | | Aa3 | | | | 7,476,675 | |
| | | | | |
| | 32,285 | | | Whiting, Indiana, Environmental Facilities Revenue Bonds, BP Products North America Inc Project, Series 2008, 1.850%, 6/01/44 (Mandatory Put 10/01/19) | | | No Opt. Call | | | | | | | | A– | | | | 32,283,709 | |
| | | | | |
| | 10,000 | | | Whiting, Indiana, Environmental Facilities Revenue Bonds, BP Products North America Inc Project, Series 2015, 5.000%, 11/01/45 (Mandatory Put 11/01/22) (AMT) | | | No Opt. Call | | | | | | | | A– | | | | 10,999,700 | |
| | | | | |
| | 10,320 | | | Whiting, Indiana, Environmental Facilities Revenue Bonds, BP Products North America Inc Project, Series 2016A, 5.000%, 3/01/46 (Mandatory Put 3/01/23) (AMT) | | | No Opt. Call | | | | | | | | A1 | | | | 11,413,301 | |
| | | | | |
| | | | Zionsville Community Schools Building Corporation, Indiana, First Mortgage Bonds, Refunding Series 2014B: | | | | | | | | | | | | | | | | |
| | 2,020 | | | 3.000%, 7/15/19 – Insured | | | No Opt. Call | | | | | | | | AA | | | | 2,028,524 | |
| | 1,255 | | | 4.000%, 1/15/20 – Insured | | | No Opt. Call | | | | | | | | AA | | | | 1,279,309 | |
| | 197,345 | | | Total Indiana | | | | | | | | | | | | | | | 207,583,009 | |
| | | | | |
| | | | Iowa – 0.5% | | | | | | | | | | | | |
| | | | | |
| | | | Fort Dodge Community School District, Webster County, Iowa, School Infrastructure Sales, Services, and Use Tax Revenue Bonds, Series 2011: | | | | | | | | | | | | | | | | |
| | 1,380 | | | 5.000%, 1/01/20 – AGM Insured (ETM) | | | No Opt. Call | | | | | | | | AA (4) | | | | 1,415,618 | |
| | 1,245 | | | 5.000%, 1/01/22 – AGM Insured(Pre-refunded 1/01/21) | | | 1/21 at 100.00 | | | | | | | | AA (4) | | | | 1,319,613 | |
| | | | | |
| | 3,215 | | | Iowa Finance Authority, Iowa, Midwestern Disaster Area Revenue Bonds, Iowa Fertilizer Company Project, Refunding Series 2019, 3.125%, 12/01/22 (WI/DD, Settling 4/03/19) | | | 12/20 at 103.00 | | | | | | | | B+ | | | | 3,236,154 | |
| | | | | |
| | 4,900 | | | Iowa Finance Authority, Iowa, Midwestern Disaster Area Revenue Bonds, Iowa Fertilizer Company Project, Series 2013, 5.250%, 12/01/25 | | | 12/23 at 100.00 | | | | | | | | B+ | | | | 5,285,483 | |
| | | | | |
| | | | Iowa Finance Authority, Iowa, Midwestern Disaster Area Revenue Bonds, Iowa Fertilizer Company Project, Series 2016: | | | | | | | | | | | | | | | | |
| | 2,000 | | | 5.875%, 12/01/26, 144A | | | 5/19 at 105.00 | | | | | | | | B+ | | | | 2,101,900 | |
| | 4,775 | | | 5.875%, 12/01/27, 144A | | | 6/19 at 105.00 | | | | | | | | B+ | | | | 5,028,648 | |
| | | | | |
| | 9,730 | | | Iowa Finance Authority, Iowa, Midwestern Disaster Area Revenue Bonds, Iowa Fertilizer Company Project, Series 2018A, 5.250%, 12/01/50 | | | 12/22 at 103.00 | | | | | | | | B+ | | | | 10,271,572 | |
| | 27,245 | | | Total Iowa | | | | | | | | | | | | | | | 28,658,988 | |
| | | | | |
| | | | Kansas – 0.2% | | | | | | | | | | | | |
| | | | | |
| | | | Kansas Development Finance Authority, Revenue Bonds, Sisters of Charity of Leavenworth Health Services Corporation, Series 2010A: | | | | | | | | | | | | | | | | |
| | 1,090 | | | 5.000%, 1/01/20 (ETM) | | | No Opt. Call | | | | | | | | N/R (4) | | | | 1,117,719 | |
| | 185 | | | 5.000%, 1/01/20 | | | No Opt. Call | | | | | | | | AA– | | | | 189,677 | |
| | 1,295 | | | 5.000%, 1/01/23(Pre-refunded 1/01/20) | | | 1/20 at 100.00 | | | | | | | | N/R (4) | | | | 1,327,932 | |
| | 200 | | | 5.000%, 1/01/23 | | | 1/20 at 100.00 | | | | | | | | AA– | | | | 204,890 | |
161
Nuveen Limited Term Municipal Bond Fund(continued)
Portfolio of Investments March 31, 2019
| | | | | | | | | | | | | | | | | | | | |
Principal
Amount (000) | | | Description (1) | | Optional Call
Provisions (2) | | | | | | Ratings (3) | | | Value | |
| | | | | |
| | | | Kansas(continued) | | | | | | | | | | | | |
| | | | | |
| | | | Topeka Public Building Commission, Kansas, Revenue Bonds, Kansas Department of Administration – 10th and Jackson Projects, Series 2007A: | | | | | | | | | | | | | | | | |
| $ | 2,245 | | | 5.000%, 6/01/25 – NPFG Insured | | | 5/19 at 102.00 | | | | | | | | A+ | | | $ | 2,295,669 | |
| | 2,945 | | | 5.000%, 6/01/26 – NPFG Insured | | | 5/19 at 102.00 | | | | | | | | A+ | | | | 3,011,380 | |
| | | | | |
| | 2,000 | | | Wyandotte County/Kansas City Unified Government, Kansas, Utility System Revenue Bonds, Refunding & Improvement Series 2014A, 5.000%, 9/01/20 | | | No Opt. Call | | | | | | | | A+ | | | | 2,093,520 | |
| | 9,960 | | | Total Kansas | | | | | | | | | | | | | | | 10,240,787 | |
| | | | | |
| | | | Kentucky – 2.7% | | | | | | | | | | | | |
| | | | | |
| | 18,500 | | | Carroll County, Kentucky, Pollution Control Revenue Bonds, Kentucky Utilities Company Project, Refunding Series 2016A, 1.050%, 9/01/42 (Mandatory Put 9/01/19) | | | No Opt. Call | | | | | | | | A1 | | | | 18,435,990 | |
| | | | | |
| | | | Kentucky Economic Development Finance Authority, Hospital Revenue Bonds, Owensboro Health, Refunding Series 2017A: | | | | | | | | | | | | | | | | |
| | 1,500 | | | 5.000%, 6/01/21 | | | No Opt. Call | | | | | | | | Baa3 | | | | 1,579,605 | |
| | 1,375 | | | 5.000%, 6/01/22 | | | No Opt. Call | | | | | | | | Baa3 | | | | 1,478,593 | |
| | 6,000 | | | 5.000%, 6/01/24 | | | No Opt. Call | | | | | | | | Baa3 | | | | 6,678,000 | |
| | 4,200 | | | 5.000%, 6/01/25 | | | No Opt. Call | | | | | | | | Baa3 | | | | 4,730,250 | |
| | | | | |
| | 9,705 | | | Kentucky Economic Development Finance Authority, Revenue Bonds, Catholic Health Initiatives, Refunding Series 2009B, 2.700%, 5/01/39 (Mandatory Put 11/10/21) | | | No Opt. Call | | | | | | | | BBB+ | | | | 9,818,451 | |
| | | | | |
| | 6,000 | | | Kentucky State Property and Buildings Commission, Revenue Bonds, Project 112, Refunding Series 2016B, 5.000%, 11/01/19 | | | No Opt. Call | | | | | | | | A1 | | | | 6,115,560 | |
| | | | | |
| | 3,050 | | | Louisville and Jefferson County Metropolitan Government, Kentucky, General Obligation Bonds, Series 2015A, 5.000%, 12/01/20 | | | No Opt. Call | | | | | | | | AAA | | | | 3,223,667 | |
| | | | | |
| | | | Louisville/Jefferson County Metro Government, Kentucky, Revenue Bonds, Catholic Health Initiatives, Series 2012A: | | | | | | | | | | | | | | | | |
| | 5,025 | | | 5.000%, 12/01/19 | | | No Opt. Call | | | | | | | | BBB+ | | | | 5,126,505 | |
| | 2,100 | | | 3.500%, 12/01/20 | | | No Opt. Call | | | | | | | | BBB+ | | | | 2,152,395 | |
| | 3,025 | | | 5.000%, 12/01/23 | | | 6/22 at 100.00 | | | | | | | | BBB+ | | | | 3,303,663 | |
| | 2,970 | | | 5.000%, 12/01/24 | | | 6/22 at 100.00 | | | | | | | | BBB+ | | | | 3,249,269 | |
| | | | | |
| | 4,025 | | | Louisville-Jefferson County Metropolitan Government, Kentucky, Environmental Facilities Revenue, Louisville Gas & Electric Company Project, Refunding Series 2007A, 1.250%, 6/01/33 (Mandatory Put 6/03/19) | | | No Opt. Call | | | | | | | | A1 | | | | 4,020,653 | |
| | | | | |
| | 6,500 | | | Louisville-Jefferson County Metropolitan Government, Kentucky, Environmental Facilities Revenue, Louisville Gas & Electric Company Project, Refunding Series 2007B, 1.250%, 6/01/33 (Mandatory Put 6/03/19) | | | No Opt. Call | | | | | | | | A1 | | | | 6,492,980 | |
| | | | | |
| | 7,500 | | | Louisville-Jefferson County Metropolitan Government, Kentucky, Pollution Control Revenue Bonds, Louisville Gas and Electric Company Project, Series 2001B, 2.550%, 11/01/27 (Mandatory Put 5/03/21) (AMT) | | | No Opt. Call | | | | | | | | A1 | | | | 7,599,975 | |
| | | | | |
| | 2,020 | | | Louisville-Jefferson County Metropolitan Government, Kentucky, Pollution Control Revenue Bonds, Louisville Gas and Electric Company Project, Series 2005A, 2.200%, 2/01/35 (Mandatory Put 8/01/19) | | | 8/19 at 100.00 | | | | | | | | A1 | | | | 2,021,939 | |
| | | | | |
| | 4,520 | | | Oldham County School District Finance Corporation, Kentucky, School Building Revenue Bonds, Refunding Series 2016, 4.000%, 9/01/27 | | | No Opt. Call | | | | | | | | A1 | | | | 5,040,433 | |
162
| | | | | | | | | | | | | | | | | | | | |
Principal
Amount (000) | | | Description (1) | | Optional Call
Provisions (2) | | | | | | Ratings (3) | | | Value | |
| | | | | |
| | | | Kentucky(continued) | | | | | | | | | | | | |
| | | | | |
| | | | Pikeville, Kentucky, Hospital Revenue Bonds, Pikeville Medical Center, Inc Project, Improvement and Refunding Series 2011: | | | | | | | | | | | | | | | | |
| $ | 60 | | | 6.000%, 3/01/20 (ETM) | | | No Opt. Call | | | | | | | | Baa2 (4) | | | $ | 62,407 | |
| | 1,090 | | | 6.000%, 3/01/20 | | | No Opt. Call | | | | | | | | Baa2 | | | | 1,127,245 | |
| | 420 | | | 6.000%, 3/01/21 (ETM) | | | No Opt. Call | | | | | | | | Baa2 (4) | | | | 454,940 | |
| | 800 | | | 6.000%, 3/01/21 | | | No Opt. Call | | | | | | | | Baa2 | | | | 856,024 | |
| | | | | |
| | 12,750 | | | Public Energy Authority of Kentucky, Gas Supply Revenue Bonds, Series 2018A, 4.000%, 4/01/48 (Mandatory Put 4/01/24) | | | 1/24 at 100.37 | | | | | | | | A3 | | | | 13,695,412 | |
| | | | | |
| | 10,470 | | | Public Energy Authority of Kentucky, Gas Supply Revenue Bonds, Series 2018B, 4.000%, 1/01/49 (Mandatory Put 1/01/25) | | | 10/24 at 100.24 | | | | | | | | A1 | | | | 11,382,356 | |
| | | | | |
| | 5,000 | | | Public Energy Authority of Kentucky, Gas Supply Revenue Bonds,Series 2018C-1, 4.000%, 12/01/49 (Mandatory Put 6/01/25) | | | 3/25 at 100.19 | | | | | | | | A3 | | | | 5,417,950 | |
| | | | | |
| | 8,050 | | | Trimble County, Kentucky, Pollution Control Revenue Bonds, Louisville Gas and Electric Company Project, Series 2001B, 2.550%, 11/01/27 (Mandatory Put 5/03/21) (AMT) | | | No Opt. Call | | | | | | | | N/R | | | | 8,160,607 | |
| | | | | |
| | 6,765 | | | Trimble County, Kentucky, Pollution Control Revenue Bonds, Louisville Gas and Electric Company Project, Series 2002A, 2.300%, 9/01/26 (Mandatory Put 9/01/21) | | | No Opt. Call | | | | | | | | A1 | | | | 6,834,274 | |
| | | | | |
| | 4,915 | | | Warren County, Kentucky, Hospital Refunding Revenue Bonds, Bowling Green-Warren County Community Hospital Corporation, Series 2013, 5.000%, 4/01/23 | | | No Opt. Call | | | | | | | | A+ | | | | 5,386,447 | |
| | 138,335 | | | Total Kentucky | | | | | | | | | | | | | | | 144,445,590 | |
| | | | | |
| | | | Louisiana – 4.6% | | | | | | | | | | | | |
| | | | | |
| | 2,140 | | | East Baton Rouge Parish, Louisiana, Sales Tax Revenue Bonds, Road & Street Improvement, Refunding Series 2015, 5.000%, 8/01/22 | | | No Opt. Call | | | | | | | | AA– | | | | 2,364,721 | |
| | | | | |
| | | | Ernest NMorial-New Orleans Exhibition Hall Authority, Louisiana, Special Tax Bonds, Refunding Series 2014: | | | | | | | | | | | | | | | | |
| | 2,500 | | | 5.000%, 7/15/19 | | | No Opt. Call | | | | | | | | AA+ | | | | 2,523,725 | |
| | 2,070 | | | 5.000%, 7/15/20 | | | No Opt. Call | | | | | | | | AA+ | | | | 2,157,292 | |
| | | | | |
| | | | Louisiana Citizens Property Insurance Corporation, Assessment Revenue Bonds, Refunding Series 2015: | | | | | | | | | | | | | | | | |
| | 2,350 | | | 5.000%, 6/01/19 | | | No Opt. Call | | | | | | | | A1 | | | | 2,362,831 | |
| | 2,095 | | | 5.000%, 6/01/20 | | | No Opt. Call | | | | | | | | A1 | | | | 2,175,783 | |
| | 2,075 | | | 5.000%, 6/01/21 – AGM Insured | | | No Opt. Call | | | | | | | | AA | | | | 2,221,889 | |
| | 2,595 | | | 5.000%, 6/01/22 – AGM Insured | | | No Opt. Call | | | | | | | | AA | | | | 2,859,560 | |
| | | | | |
| | | | Louisiana Citizens Property Insurance Corporation, Assessment Revenue Bonds, Refunding Series 2016A: | | | | | | | | | | | | | | | | |
| | 33,390 | | | 5.000%, 6/01/23 | | | No Opt. Call | | | | | | | | A1 | | | | 37,785,126 | |
| | 9,000 | | | 5.000%, 6/01/24 | | | No Opt. Call | | | | | | | | A1 | | | | 10,431,360 | |
| | | | | |
| | | | Louisiana Local Government Environmental Facilities and Community Development Authority, Revenue Bonds, East Baton Rouge Parish Road Improvements Project, Series 2015: | | | | | | | | | | | | | | | | |
| | 1,545 | | | 5.000%, 8/01/19 | | | No Opt. Call | | | | | | | | AA | | | | 1,562,041 | |
| | 2,245 | | | 5.000%, 8/01/24 | | | No Opt. Call | | | | | | | | AA | | | | 2,595,781 | |
| | | | | |
| | 180 | | | Louisiana Local Government Environmental Facilities and Community Development Authority, Revenue Bonds, Livingston Parish North Park Project, Series 2008, 6.100%, 10/01/19 | | | 5/19 at 100.00 | | | | | | | | AA– | | | | 180,621 | |
| | | | | |
| | 30,145 | | | Louisiana Local Government Environmental Facilities and Community Development Authority, Revenue Bonds, Westlake Chemical Corporation Projects, Refunding Series 2017, 3.500%, 11/01/32 | | | 11/27 at 100.00 | | | | | | | | BBB | | | | 30,368,375 | |
163
Nuveen Limited Term Municipal Bond Fund(continued)
Portfolio of Investments March 31, 2019
| | | | | | | | | | | | | | | | | | | | |
Principal
Amount (000) | | | Description (1) | | Optional Call
Provisions (2) | | | | | | Ratings (3) | | | Value | |
| | | | | |
| | | | Louisiana(continued) | | | | | | | | | | | | |
| | | | | |
| | | | Louisiana Local Government Environmental Facilities and Community Development Authority, Revenue Bonds, Womans Hospital Foundation Project, Refunding Series 2017A: | | | | | | | | | | | | | | | | |
| $ | 1,000 | | | 3.000%, 10/01/22 | | | No Opt. Call | | | | | | | | A | | | $ | 1,034,510 | |
| | 1,800 | | | 5.000%, 10/01/23 | | | No Opt. Call | | | | | | | | A | | | | 2,030,796 | |
| | 1,070 | | | 5.000%, 10/01/24 | | | No Opt. Call | | | | | | | | A | | | | 1,233,164 | |
| | 3,000 | | | 4.000%, 10/01/25 | | | No Opt. Call | | | | | | | | A | | | | 3,332,310 | |
| | | | | |
| | 29,790 | | | Louisiana Public Facilities Authority, Hospital Revenue Bonds, Louisiana Children’s Medical Center Hospital,Series 2015A-1 Fixed Rate Mode, 5.000%, 6/01/45 (Mandatory Put 6/01/25) | | | No Opt. Call | | | | | | | | A+ | | | | 34,707,137 | |
| | | | | |
| | 7,165 | | | Louisiana Public Facilities Authority, Hospital Revenue Bonds, Louisiana Children’s Medical Center Hospital,Series 2015A-3 Term Rate Mode, 5.000%, 6/01/45 (Mandatory Put 6/01/23) | | | No Opt. Call | | | | | | | | A+ | | | | 8,025,302 | |
| | | | | |
| | | | Louisiana Public Facilities Authority, Revenue Bonds, Hurricane Recovery Program, Refunding Series 2014: | | | | | | | | | | | | | | | | |
| | 1,785 | | | 5.000%, 6/01/19 | | | No Opt. Call | | | | | | | | A1 | | | | 1,794,693 | |
| | 5,015 | | | 5.000%, 6/01/20 | | | No Opt. Call | | | | | | | | A1 | | | | 5,206,573 | |
| | | | | |
| | 1,040 | | | Louisiana Public Facilities Authority, Revenue Bonds, Ochsner Clinic Foundation Project, Refunding Series 2017, 5.000%, 5/15/22 | | | No Opt. Call | | | | | | | | A3 | | | | 1,133,340 | |
| | | | | |
| | 1,650 | | | Louisiana Public Facilities Authority, Revenue Bonds, Tulane University, Refunding Series 2016A, 5.000%, 12/15/21 | | | No Opt. Call | | | | | | | | A | | | | 1,791,504 | |
| | | | | |
| | | | Louisiana Public Facilities Authority, Revenue Bonds, University of New Orleans Research and Technology Foundation,Inc- Student Housing Project, Refunding Series 2014: | | | | | | | | | | | | | | | | |
| | 710 | | | 5.000%, 9/01/21 – AGM Insured | | | No Opt. Call | | | | | | | | AA | | | | 764,635 | |
| | 580 | | | 5.000%, 9/01/22 – AGM Insured | | | No Opt. Call | | | | | | | | AA | | | | 641,950 | |
| | 1,445 | | | 5.000%, 9/01/23 – AGM Insured | | | No Opt. Call | | | | | | | | AA | | | | 1,636,333 | |
| | 1,565 | | | 5.000%, 9/01/24 – AGM Insured | | | No Opt. Call | | | | | | | | AA | | | | 1,810,157 | |
| | | | | |
| | | | Louisiana Stadium and Exposition District, Revenue Refunding Bonds, Senior Lien Series 2013A: | | | | | | | | | | | | | | | | |
| | 1,600 | | | 5.000%, 7/01/19 | | | No Opt. Call | | | | | | | | AA– | | | | 1,613,072 | |
| | 1,115 | | | 5.000%, 7/01/20 | | | No Opt. Call | | | | | | | | AA– | | | | 1,160,748 | |
| | 7,265 | | | 5.000%, 7/01/26 | | | 7/23 at 100.00 | | | | | | | | AA– | | | | 8,159,322 | |
| | | | | |
| | | | Louisiana State, Gasoline and Fuels Tax Revenue Bonds, Refunding Second Lien Series 2017C: | | | | | | | | | | | | | | | | |
| | 2,520 | | | 5.000%, 5/01/29 | | | 11/27 at 100.00 | | | | | | | | AA– | | | | 3,077,248 | |
| | 3,000 | | | 5.000%, 5/01/30 | | | 11/27 at 100.00 | | | | | | | | AA– | | | | 3,641,040 | |
| | 3,070 | | | 5.000%, 5/01/31 | | | 11/27 at 100.00 | | | | | | | | AA– | | | | 3,705,858 | |
| | | | | |
| | | | Louisiana State, Gasoline and Fuels Tax Revenue Bonds, RefundingSeries 2012A-1: | | | | | | | | | | | | | | | | |
| | 80 | | | 5.000%, 5/01/19 | | | No Opt. Call | | | | | | | | Aa2 | | | | 80,223 | |
| | 95 | | | 5.000%, 5/01/20 | | | No Opt. Call | | | | | | | | Aa2 | | | | 98,393 | |
| | 3,570 | | | 5.000%, 5/01/21 | | | No Opt. Call | | | | | | | | Aa2 | | | | 3,817,115 | |
| | | | | |
| | 7,000 | | | Louisiana State, General Obligation Bonds, Refunding Series 2014C, 5.000%, 8/01/22 | | | No Opt. Call | | | | | | | | AA– | | | | 7,756,630 | |
| | | | | |
| | 900 | | | Louisiana State, General Obligation Bonds, Series 2012A, 5.000%, 8/01/19 (ETM) | | | No Opt. Call | | | | | | | | N/R (4) | | | | 910,170 | |
| | | | | |
| | 6,245 | | | Louisiana State, General Obligation Bonds, Series 2015A, 5.000%, 5/01/23 | | | No Opt. Call | | | | | | | | AA– | | | | 7,062,595 | |
164
| | | | | | | | | | | | | | | | | | | | |
Principal
Amount (000) | | | Description (1) | | Optional Call
Provisions (2) | | | | | | Ratings (3) | | | Value | |
| | | | | |
| | | | Louisiana(continued) | | | | | | | | | | | | |
| | | | | |
| | | | New Orleans, Louisiana, General Obligation Bonds, Refunding Series 2012: | | | | | | | | | | | | | | | | |
| $ | 2,860 | | | 5.000%, 12/01/19 | | | No Opt. Call | | | | | | | | AA– | | | $ | 2,923,120 | |
| | 2,500 | | | 5.000%, 12/01/20 | | | No Opt. Call | | | | | | | | AA– | | | | 2,631,350 | |
| | 3,600 | | | 5.000%, 12/01/21 | | | No Opt. Call | | | | | | | | AA– | | | | 3,901,536 | |
| | | | | |
| | | | New Orleans, Louisiana, General Obligation Bonds, Refunding Series 2015: | | | | | | | | | | | | | | | | |
| | 1,025 | | | 4.000%, 12/01/19 | | | No Opt. Call | | | | | | | | AA– | | | | 1,040,888 | |
| | 1,500 | | | 5.000%, 12/01/20 | | | No Opt. Call | | | | | | | | AA– | | | | 1,578,810 | |
| | 2,000 | | | 5.000%, 12/01/21 | | | No Opt. Call | | | | | | | | AA– | | | | 2,167,520 | |
| | | | | |
| | 7,900 | | | New Orleans, Louisiana, General Obligation Bonds, Series 1998, 5.500%, 12/01/21 – FGIC Insured | | | No Opt. Call | | | | | | | | A+ | | | | 8,330,866 | |
| | | | | |
| | | | New Orleans, Louisiana, Sewerage Service Revenue Bonds, Series 2015: | | | | | | | | | | | | | | | | |
| | 1,000 | | | 5.000%, 6/01/24 | | | No Opt. Call | | | | | | | | A | | | | 1,139,420 | |
| | 525 | | | 5.000%, 6/01/26 | | | 6/25 at 100.00 | | | | | | | | A | | | | 608,717 | |
| | | | | |
| | 1,100 | | | New Orleans, Louisiana, Water Revenue Bonds, Refunding Series 2014, 5.000%, 12/01/19 | | | No Opt. Call | | | | | | | | A– | | | | 1,124,277 | |
| | | | | |
| | 6,410 | | | Saint Charles Parish, Louisiana, Gulf Opportunity Zone Revenue Bonds, Valero Project, Series 2010, 4.000%, 12/01/40 (Mandatory Put 6/01/22) | | | No Opt. Call | | | | | | | | BBB | | | | 6,694,540 | |
| | | | | |
| | 2,295 | | | Shreveport, Louisiana, General Obligation Bonds, Series 2014, 5.000%, 9/01/21 | | | No Opt. Call | | | | | | | | A | | | | 2,462,581 | |
| | | | | |
| | | | Shreveport, Louisiana, Revenue Bonds, Independence Stadium Project, Refunding Series 2016: | | | | | | | | | | | | | | | | |
| | 1,000 | | | 3.000%, 3/01/21 – BAM Insured | | | No Opt. Call | | | | | | | | AA | | | | 1,022,850 | |
| | 1,000 | | | 5.000%, 3/01/22 – BAM Insured | | | No Opt. Call | | | | | | | | AA | | | | 1,090,970 | |
| | | | | |
| | | | Terrebonne Levee and Conservation District, Louisiana, Public Improvement Sales Tax Bonds, Series 2013: | | | | | | | | | | | | | | | | |
| | 1,710 | | | 5.000%, 7/01/21 | | | No Opt. Call | | | | | | | | A+ | | | | 1,824,587 | |
| | 1,680 | | | 5.000%, 7/01/22 | | | No Opt. Call | | | | | | | | A+ | | | | 1,841,045 | |
| | 224,510 | | | Total Louisiana | | | | | | | | | | | | | | | 246,197,000 | |
| | | | | |
| | | | Maryland – 0.5% | | | | | | | | | | | | |
| | | | | |
| | 8,155 | | | Maryland Economic Development Corporation, Revenue Bonds, Constellation Energy Group, Inc Projects, Adjustable Mode, Refunding Series 2006B, 2.550%, 12/01/25 (Mandatory Put 6/01/20) | | | No Opt. Call | | | | | | | | BBB+ | | | | 8,170,657 | |
| | | | | |
| | | | Maryland Economic Development Corporation, Student Housing Revenue Bonds, University of Maryland, College Park Project, Refunding Series 2016: | | | | | | | | | | | | | | | | |
| | 675 | | | 4.000%, 6/01/19 – AGM Insured | | | No Opt. Call | | | | | | | | AA | | | | 677,531 | |
| | 660 | | | 4.000%, 6/01/20 – AGM Insured | | | No Opt. Call | | | | | | | | AA | | | | 677,642 | |
| | | | | |
| | | | Maryland Health and Higher Educational Facilities Authority, Maryland, Hospital Revenue Bonds, Meritus Medical Center, Series 2015: | | | | | | | | | | | | | | | | |
| | 540 | | | 5.000%, 7/01/21 | | | No Opt. Call | | | | | | | | BBB+ | | | | 576,558 | |
| | 1,000 | | | 5.000%, 7/01/22 | | | No Opt. Call | | | | | | | | BBB+ | | | | 1,095,530 | |
| | 250 | | | 5.000%, 7/01/23 | | | No Opt. Call | | | | | | | | BBB+ | | | | 280,125 | |
| | 500 | | | 5.000%, 7/01/24 | | | No Opt. Call | | | | | | | | BBB+ | | | | 572,250 | |
| | | | | |
| | 4,000 | | | Maryland Health and Higher Educational Facilities Authority, Revenue Bonds, Western Maryland Health, Series 2014, 5.000%, 7/01/19 | | | No Opt. Call | | | | | | | | BBB | | | | 4,031,480 | |
| | | | | |
| | 4,400 | | | Montgomery County, Maryland, General Obligation Bonds, Consolidated Public Improvement Series 2018B, 5.000%, 11/01/29 | | | 11/28 at 100.00 | | | | | | | | AAA | | | | 5,545,452 | |
165
Nuveen Limited Term Municipal Bond Fund(continued)
Portfolio of Investments March 31, 2019
| | | | | | | | | | | | | | | | | | | | |
Principal
Amount (000) | | | Description (1) | | Optional Call
Provisions (2) | | | | | | Ratings (3) | | | Value | |
| | | | | |
| | | | Maryland(continued) | | | | | | | | | | | | |
| | | | | |
| $ | 1,895 | | | Rockville Mayor and Council, Maryland, Economic Development Revenue Bonds, Ingleside King Farm Project, TEMPS 45Series 2017C-3, 2.500%, 11/01/24 | | | 5/19 at 100.00 | | | | | | | | BB | | | $ | 1,895,057 | |
| | | | | |
| | 1,270 | | | Rockville Mayor and Council, Maryland, Economic Development Revenue Bonds, Ingleside King Farm Project, TEMPS 70Series 2017C-2, 3.000%, 11/01/25 | | | 5/20 at 100.00 | | | | | | | | BB | | | | 1,265,466 | |
| | | | | |
| | 845 | | | Rockville Mayor and Council, Maryland, Economic Development Revenue Bonds, Ingleside King Farm Project, TEMPS 85Series 2017C-1, 3.500%, 11/01/26 | | | 5/20 at 100.00 | | | | | | | | BB | | | | 848,017 | |
| | 24,190 | | | Total Maryland | | | | | | | | | | | | | | | 25,635,765 | |
| | | | | |
| | | | Massachusetts – 2.1% | | | | | | | | | | | | |
| | | | | |
| | 3,825 | | | Massachusetts Department of Transportation, Metropolitan Highway System Revenue Bonds, Refunding Senior Lien Series 2010B, 5.000%, 1/01/23 | | | 1/20 at 100.00 | | | | | | | | A+ | | | | 3,921,696 | |
| | | | | |
| | | | Massachusetts Development Finance Agency Revenue Bonds, Lawrence General Hospital Issue, Series 2014A: | | | | | | | | | | | | | | | | |
| | 595 | | | 5.000%, 7/01/19 | | | No Opt. Call | | | | | | | | BB+ | | | | 598,713 | |
| | 375 | | | 5.000%, 7/01/20 | | | No Opt. Call | | | | | | | | BB+ | | | | 386,321 | |
| | 555 | | | 5.000%, 7/01/21 | | | No Opt. Call | | | | | | | | BB+ | | | | 584,160 | |
| | 690 | | | 5.000%, 7/01/22 | | | No Opt. Call | | | | | | | | BB+ | | | | 740,356 | |
| | 625 | | | 5.000%, 7/01/23 | | | No Opt. Call | | | | | | | | BB+ | | | | 681,656 | |
| | 735 | | | 5.000%, 7/01/24 | | | No Opt. Call | | | | | | | | BB+ | | | | 812,675 | |
| | 795 | | | 5.000%, 7/01/25 | | | 7/24 at 100.00 | | | | | | | | BB+ | | | | 877,243 | |
| | | | | |
| | 1,500 | | | Massachusetts Development Finance Agency, Revenue Bonds, CareGroup Issue,Series 2018J-1, 5.000%, 7/01/25 | | | No Opt. Call | | | | | | | | A– | | | | 1,735,155 | |
| | | | | |
| | | | Massachusetts Development Finance Agency, Revenue Bonds, CareGroup Issue,Series 2018J-2: | | | | | | | | | | | | | | | | |
| | 2,775 | | | 5.000%, 7/01/29 | | | 7/28 at 100.00 | | | | | | | | A– | | | | 3,302,028 | |
| | 2,750 | | | 5.000%, 7/01/30 | | | 7/28 at 100.00 | | | | | | | | A– | | | | 3,248,987 | |
| | 2,495 | | | 5.000%, 7/01/31 | | | 7/28 at 100.00 | | | | | | | | A– | | | | 2,929,953 | |
| | 2,100 | | | 5.000%, 7/01/32 | | | 7/28 at 100.00 | | | | | | | | A– | | | | 2,456,454 | |
| | | | | |
| | | | Massachusetts Development Finance Agency, Revenue Bonds, Wellforce Issue, Series 2019A: | | | | | | | | | | | | | | | | |
| | 825 | | | 5.000%, 7/01/20 | | | No Opt. Call | | | | | | | | BBB+ | | | | 857,884 | |
| | 1,300 | | | 5.000%, 7/01/21 | | | No Opt. Call | | | | | | | | BBB+ | | | | 1,389,193 | |
| | 815 | | | 5.000%, 7/01/23 | | | No Opt. Call | | | | | | | | BBB+ | | | | 912,849 | |
| | | | | |
| | 4,985 | | | Massachusetts Health and Educational Facilities Authority, Revenue Bonds, Catholic Health East, Series 2009C, 6.250%, 11/15/32(Pre-refunded 5/15/19) | | | 5/19 at 100.00 | | | | | | | | AA– (4) | | | | 5,013,066 | |
| | | | | |
| | | | Massachusetts Health and Educational Facilities Authority, Revenue Bonds, Massachusetts Eye and Ear Infirmary, Series 2010C: | | | | | | | | | | | | | | | | |
| | 1,000 | | | 5.000%, 7/01/19 (ETM) | | | No Opt. Call | | | | | | | | N/R (4) | | | | 1,008,450 | |
| | 1,000 | | | 5.000%, 7/01/20 (ETM) | | | No Opt. Call | | | | | | | | N/R (4) | | | | 1,042,300 | |
| | | | | |
| | 20,105 | | | Massachusetts State, General Obligation Bonds, Consolidated LoanSeries 2014D-1, 1.050%, 8/01/43 (Mandatory Put 7/01/20) | | | No Opt. Call | | | | | | | | Aa1 | | | | 19,927,071 | |
| | | | | |
| | 14,000 | | | Massachusetts State, General Obligation Bonds, Refunding Series 2015A, 5.000%, 7/01/23 | | | No Opt. Call | | | | | | | | Aa1 | | | | 15,962,660 | |
| | | | | |
| | 16,400 | | | Massachusetts State, General Obligation Bonds, Revenue Anticipation Note Series 2018B, 4.000%, 5/23/19 | | | No Opt. Call | | | | | | | | N/R | | | | 16,459,368 | |
166
| | | | | | | | | | | | | | | | | | | | |
Principal
Amount (000) | | | Description (1) | | Optional Call
Provisions (2) | | | | | | Ratings (3) | | | Value | |
| | | | | |
| | | | Massachusetts(continued) | | | | | | | | | | | | |
| | | | | |
| $ | 17,000 | | | Massachusetts State, General Obligation Bonds, Series 2019B, 5.000%, 1/01/21 (WI/DD, Settling 5/03/19) | | | No Opt. Call | | | | | | | | Aa1 | | | $ | 17,957,780 | |
| | | | | |
| | 9,600 | | | Massachusetts State, Transportation Fund Revenue Bonds, Rail Enhancement Program, Series 2012A, 4.000%, 6/01/33 | | | 6/21 at 100.00 | | | | | | | | AA+ | | | | 9,971,904 | |
| | 106,845 | | | Total Massachusetts | | | | | | | | | | | | | | | 112,777,922 | |
| | | | | |
| | | | Michigan – 2.1% | | | | | | | | | | | | |
| | | | | |
| | 1,500 | | | Detroit-Wayne County Stadium Authority, Michigan, Wayne County Limited Tax General Obligation Bonds, Building Authority Stadium Refunding Series 2012, 5.000%, 10/01/19 – AGM Insured | | | No Opt. Call | | | | | | | | AA | | | | 1,522,980 | |
| | | | | |
| | | | Marquettte, Michigan, Electric Utility System Revenue Bonds, Refunding Series 2016A: | | | | | | | | | | | | | | | | |
| | 1,100 | | | 5.000%, 7/01/20 | | | No Opt. Call | | | | | | | | A | | | | 1,145,001 | |
| | 1,100 | | | 5.000%, 7/01/21 | | | No Opt. Call | | | | | | | | A | | | | 1,175,724 | |
| | | | | |
| | 1,835 | | | Michigan Finance Authority, Michigan, Revenue Bonds, Trinity Health Credit Group, Refunding Series 2017A, 5.000%, 12/01/21 | | | No Opt. Call | | | | | | | | AA– | | | | 1,994,718 | |
| | | | | |
| | 4,575 | | | Michigan Finance Authority, Revenue Bonds, Ascension Senior Credit Group, RefundingSeries 2016E-1, 1.100%, 11/15/46 (Mandatory Put 8/15/19) | | | No Opt. Call | | | | | | | | AA+ | | | | 4,565,576 | |
| | | | | |
| | 21,000 | | | Michigan Finance Authority, State Aid Revenue Notes,Series 2018A-1, 4.000%, 8/20/19 | | | No Opt. Call | | | | | | | | N/R | | | | 21,187,950 | |
| | | | | |
| | 15,000 | | | Michigan Hospital Finance Authority, Revenue Bonds, Ascension Health Senior Credit Group, RefundingSeries 2010F-1, 4.000%, 11/15/47 (Mandatory Put 6/01/23) | | | No Opt. Call | | | | | | | | AA+ | | | | 16,342,500 | |
| | | | | |
| | 6,200 | | | Michigan Housing Development Authority, Rental Housing Revenue Bonds, Series 2018A, 3.550%, 10/01/33 | | | 10/27 at 100.00 | | | | | | | | AA | | | | 6,386,930 | |
| | | | | |
| | | | Michigan Housing Development Authority, Single Family Mortgage Revenue Bonds, Fixed Rate Series 2018C: | | | | | | | | | | | | | | | | |
| | 3,505 | | | 3.550%, 6/01/29 | | | 12/27 at 100.00 | | | | | | | | AA+ | | | | 3,736,400 | |
| | 3,825 | | | 3.650%, 6/01/30 | | | 12/27 at 100.00 | | | | | | | | AA+ | | | | 4,044,746 | |
| | 3,810 | | | 3.700%, 12/01/30 | | | 12/27 at 100.00 | | | | | | | | AA+ | | | | 4,051,097 | |
| | | | | |
| | 1,805 | | | Michigan Housing Development Authority, Single Family Mortgage Revenue Bonds, Fixed Rate Series 2019A, 3.350%, 12/01/34 (WI/DD, Settling 4/11/19) | | | 6/28 at 100.00 | | | | | | | | AA+ | | | | 1,838,393 | |
| | | | | |
| | 5,000 | | | Michigan Housing Development Authority, Single Family Mortgage Revenue Bonds, Series 2016A, 3.100%, 12/01/31 | | | 6/26 at 100.00 | | | | | | | | AA+ | | | | 5,062,600 | |
| | | | | |
| | | | Michigan State Hospital Finance Authority, Revenue Bonds, Trinity Health Care Group, Refunding Series 2008C: | | | | | | | | | | | | | | | | |
| | 1,000 | | | 5.000%, 12/01/19 | | | No Opt. Call | | | | | | | | AA– | | | | 1,022,340 | |
| | 1,000 | | | 5.000%, 12/01/20 | | | No Opt. Call | | | | | | | | AA– | | | | 1,055,420 | |
| | 1,000 | | | 5.000%, 12/01/21 | | | No Opt. Call | | | | | | | | AA– | | | | 1,086,760 | |
| | | | | |
| | 6,030 | | | Michigan State Trunk Line Fund Refunding Bonds, Series 2009, 5.000%, 11/01/20 | | | 11/19 at 100.00 | | | | | | | | AA+ | | | | 6,150,781 | |
| | | | | |
| | 1,605 | | | Michigan State, General Obligation Bonds, Environmental Program, Series 2009A, 5.500%, 11/01/21(Pre-refunded 5/01/19) | | | 5/19 at 100.00 | | | | | | | | Aa1 (4) | | | | 1,610,136 | |
| | | | | |
| | 8,485 | | | Michigan Strategic Fund, Limited Obligation Pollution Control Revenue Refunding Bonds, Detroit Edison Company, Series 1995CC, 1.450%, 9/01/30 (Mandatory Put 9/01/21) | | | No Opt. Call | | | | | | | | Aa3 | | | | 8,248,268 | |
| | | | | |
| | 8,000 | | | Michigan Strategic Fund, Limited Obligation Revenue Bonds, Detroit Edison Project, Refunding Series 2008, 1.450%, 8/01/29 (Mandatory Put 9/01/21) | | | No Opt. Call | | | | | | | | Aa3 | | | | 7,776,800 | |
167
Nuveen Limited Term Municipal Bond Fund(continued)
Portfolio of Investments March 31, 2019
| | | | | | | | | | | | | | | | | | | | |
Principal
Amount (000) | | | Description (1) | | Optional Call
Provisions (2) | | | | | | Ratings (3) | | | Value | |
| | | | | |
| | | | Michigan(continued) | | | | | | | | | | | | |
| | | | | |
| | | | Plymouth-Canton Community School District, Wayne and Washtenaw Counties, Michigan, General Obligation Bonds, Refunding Series 2012A: | | | | | | | | | | | | | | | | |
| $ | 1,100 | | | 4.000%, 5/01/19 | | | No Opt. Call | | | | | | | | Aa1 | | | $ | 1,102,156 | |
| | 1,000 | | | 5.000%, 5/01/21 | | | No Opt. Call | | | | | | | | Aa1 | | | | 1,068,160 | |
| | | | | |
| | | | Plymouth-Canton Community School District, Wayne and Washtenaw Counties, Michigan, General Obligation Bonds, School Building & Site Series 2013A: | | | | | | | | | | | | | | | | |
| | 765 | | | 5.000%, 5/01/19 | | | No Opt. Call | | | | | | | | Aa3 | | | | 767,111 | |
| | 1,000 | | | 5.000%, 5/01/20 | | | No Opt. Call | | | | | | | | Aa3 | | | | 1,036,920 | |
| | | | | |
| | 2,525 | | | Royal Oak Hospital Finance Authority, Michigan, Hospital Revenue Bonds, William Beaumont Hospital Obligated Group, Refunding Series 2014D, 5.000%, 9/01/22 | | | No Opt. Call | | | | | | | | A+ | | | | 2,798,230 | |
| | | | | |
| | 4,975 | | | Walled Lake Consolidated School District, Oakland County, Michigan, General Obligation Bonds, Refunding Series 2011, 5.000%, 5/01/19 | | | No Opt. Call | | | | | | | | Aa1 | | | | 4,988,582 | |
| | 108,740 | | | Total Michigan | | | | | | | | | | | | | | | 111,766,279 | |
| | | | | |
| | | | Minnesota – 0.6% | | | | | | | | | | | | |
| | | | | |
| | | | Cass Lake Independent School District 115, Minnesota, General Obligation Bonds, School Building Refunding Series 2010A: | | | | | | | | | | | | | | | | |
| | 745 | | | 4.000%, 2/01/23 | | | 2/20 at 100.00 | | | | | | | | AAA | | | | 759,863 | |
| | 1,615 | | | 5.000%, 2/01/25 | | | 2/20 at 100.00 | | | | | | | | AAA | | | | 1,660,220 | |
| | 1,690 | | | 5.000%, 2/01/26 | | | 2/20 at 100.00 | | | | | | | | AAA | | | | 1,737,185 | |
| | | | | |
| | 1,680 | | | Minneapolis-St Paul Metropolitan Airports Commission, Minnesota, Airport Revenue Bonds, Refunding Subordinate Lien Series 2014A, 5.000%, 1/01/24 | | | No Opt. Call | | | | | | | | A+ | | | | 1,933,075 | |
| | | | | |
| | 2,500 | | | Minnesota Agricultural and Economic Development Board, Health Care Facilities Revenue Bonds, Essentia Health Obligated Group, RefundingSeries 2008C-1, 5.500%, 2/15/25 – AGC Insured | | | 2/20 at 100.00 | | | | | | | | AA | | | | 2,582,700 | |
| | | | | |
| | 19,420 | | | Minnesota State, 911 Revenue Bonds, Public Safety Radio Communication System Project, Series 2016, 5.000%, 6/01/20 | | | No Opt. Call | | | | | | | | AA+ | | | | 20,207,869 | |
| | | | | |
| | 895 | | | Northern Municipal Power Agency, Minnesota, Electric System Revenue Bonds, Series 2013A, 5.000%, 1/01/23 | | | No Opt. Call | | | | | | | | A– | | | | 999,035 | |
| | | | | |
| | 2,880 | | | Saint Cloud, Minnesota, Health Care Revenue Bonds, CentraCare Health System, Refunding Series 2014B, 5.000%, 5/01/22 | | | No Opt. Call | | | | | | | | AA– | | | | 3,155,357 | |
| | 31,425 | | | Total Minnesota | | | | | | | | | | | | | | | 33,035,304 | |
| | | | | |
| | | | Mississippi – 0.8% | | | | | | | | | | | | |
| | | | | |
| | 1,000 | | | Lowndes County, Mississippi, Solid Waste Disposal and Pollution Control Refunding Revenue Bonds (Weyerhaeuser Company Project), Series 1992A, 6.800%, 4/01/22 | | | No Opt. Call | | | | | | | | BBB | | | | 1,113,810 | |
| | | | | |
| | 6,865 | | | Mississippi Business Finance Corporation, Pollution Control Revenue, Mississippi Power, Series 2002, 3.200%, 9/01/28 | | | 3/24 at 100.00 | | | | | | | | A– | | | | 6,921,293 | |
| | | | | |
| | 9,385 | | | Mississippi Business Finance Corporation, Revenue Bonds, Mississippi Power Company Project, First Series 2010, 2.750%, 12/01/40 (Mandatory Put 12/09/21) | | | No Opt. Call | | | | | | | | A– | | | | 9,450,226 | |
| | | | | |
| | 20,430 | | | Mississippi Business Finance Corporation, Revenue Bonds, System Energy Resources, Inc Project, Refunding Series 2019, 2.500%, 4/01/22 | | | 4/21 at 100.00 | | | | | | | | BBB+ | | | | 20,521,322 | |
| | | | | |
| | 3,680 | | | Mississippi Hospital Equipment and Facilities Authority, Revenue Bonds, Baptist Memorial Healthcare, Series 2015A, 5.000%, 9/01/24 | | | No Opt. Call | | | | | | | | BBB+ | | | | 4,151,481 | |
| | 41,360 | | | Total Mississippi | | | | | | | | | | | | | | | 42,158,132 | |
168
| | | | | | | | | | | | | | | | | | | | |
Principal
Amount (000) | | | Description (1) | | Optional Call
Provisions (2) | | | | | | Ratings (3) | | | Value | |
| | | | | |
| | | | Missouri – 0.5% | | | | | | | | | | | | |
| | | | | |
| | | | Branson Industrial Development Authority, Missouri, Tax Increment Revenue Bonds, Branson Shoppes Redevelopment Project, Refunding Series 2017A: | | | | | | | | | | | | | | | | |
| $ | 745 | | | 3.000%, 11/01/20 | | | No Opt. Call | | | | | | | | N/R | | | $ | 748,539 | |
| | 765 | | | 4.000%, 11/01/22 | | | No Opt. Call | | | | | | | | N/R | | | | 788,937 | |
| | 755 | | | 4.000%, 11/01/23 | | | No Opt. Call | | | | | | | | N/R | | | | 780,202 | |
| | | | | |
| | 325 | | | Cape Girardeau County Industrial Development Authority, Missouri, Health Facilities Revenue Bonds, Southeasthealth, Series 2017A, 5.000%, 3/01/20 | | | No Opt. Call | | | | | | | | BBB– | | | | 333,213 | |
| | | | | |
| | | | Metropolitan St Louis Sewerage District, Missouri, Wastewater System Revenue Bonds, Series 2011B: | | | | | | | | | | | | | | | | |
| | 2,520 | | | 4.000%, 5/01/23(Pre-refunded 5/01/21) | | | 5/21 at 100.00 | | | | | | | | AAA | | | | 2,649,603 | |
| | 2,695 | | | 4.000%, 5/01/24(Pre-refunded 5/01/21) | | | 5/21 at 100.00 | | | | | | | | AAA | | | | 2,833,604 | |
| | | | | |
| | | | Missouri Health and Educational Facilities Authority, Educational Facilities Revenue Bonds, Saint Louis College of Pharmacy, Series 2013: | | | | | | | | | | | | | | | | |
| | 550 | | | 5.000%, 5/01/19 | | | No Opt. Call | | | | | | | | BBB+ | | | | 551,254 | |
| | 440 | | | 5.000%, 5/01/20 | | | No Opt. Call | | | | | | | | BBB+ | | | | 452,690 | |
| | 1,000 | | | 5.000%, 5/01/21 | | | No Opt. Call | | | | | | | | BBB+ | | | | 1,053,000 | |
| | 2,545 | | | 4.000%, 5/01/22 | | | No Opt. Call | | | | | | | | BBB+ | | | | 2,659,372 | |
| | 1,320 | | | 5.000%, 5/01/23 | | | No Opt. Call | | | | | | | | BBB+ | | | | 1,443,618 | |
| | | | | |
| | | | Missouri Joint Municipal Electric Utility Commission, Power Project Revenue Bonds, Plum Point Project, Refunding Series 2014A: | | | | | | | | | | | | | | | | |
| | 2,420 | | | 5.000%, 1/01/25 | | | No Opt. Call | | | | | | | | A | | | | 2,821,333 | |
| | 5,000 | | | 5.000%, 1/01/26 | | | 1/25 at 100.00 | | | | | | | | A | | | | 5,820,350 | |
| | | | | |
| | | | Saint Louis, Missouri, Airport Revenue Bonds,Lambert-St Louis International Airport, Refunding Series 2015: | | | | | | | | | | | | | | | | |
| | 1,700 | | | 5.000%, 7/01/20 | | | No Opt. Call | | | | | | | | A2 | | | | 1,769,751 | |
| | 1,725 | | | 5.000%, 7/01/21 | | | No Opt. Call | | | | | | | | A2 | | | | 1,850,856 | |
| | 1,000 | | | 5.000%, 7/01/22 | | | No Opt. Call | | | | | | | | A2 | | | | 1,103,510 | |
| | 1,085 | | | 5.000%, 7/01/23 | | | No Opt. Call | | | | | | | | A2 | | | | 1,226,603 | |
| | 26,590 | | | Total Missouri | | | | | | | | | | | | | | | 28,886,435 | |
| | | | | |
| | | | Montana – 0.7% | | | | | | | | | | | | |
| | | | | |
| | 30,720 | | | Forsyth, Rosebud County, Montana, Pollution Control Revenue Refunding Bonds, Northwestern Corporation Colstrip Project, Series 2016, 2.000%, 8/01/23 | | | No Opt. Call | | | | | | | | A | | | | 30,837,351 | |
| | | | | |
| | | | Lewis and Clark County School District 9 East Helena, Montana, General Obligation Bonds, Refunding Series 2018: | | | | | | | | | | | | | | | | |
| | 1,000 | | | 5.000%, 7/01/27 | | | No Opt. Call | | | | | | | | A+ | | | | 1,222,240 | |
| | 1,055 | | | 5.000%, 7/01/28 | | | No Opt. Call | | | | | | | | A+ | | | | 1,308,917 | |
| | 1,335 | | | 5.000%, 7/01/29 | | | 7/28 at 100.00 | | | | | | | | A+ | | | | 1,650,167 | |
| | | | | |
| | 1,295 | | | Montana Facility Finance Authority, Hospital Revenue Bonds, Benefits Health System Obligated Group, Refunding Series 2016, 5.000%, 2/15/21 | | | No Opt. Call | | | | | | | | A+ | | | | 1,370,822 | |
| | 35,405 | | | Total Montana | | | | | | | | | | | | | | | 36,389,497 | |
| | | | | |
| | | | Nebraska – 1.1% | | | | | | | | | | | | |
| | | | | |
| | 8,000 | | | Central Plains Energy Project, Nebraska, Gas Project 4 Revenue Bonds, Series 2018A, 5.000%, 3/01/50 (Mandatory Put 1/01/24) | | | 10/23 at 100.43 | | | | | | | | A3 | | | | 8,871,440 | |
| | | | | |
| | 4,590 | | | Douglas County Hospital Authority 2, Nebraska, Hospital Revenue Bonds, Madonna Rehabilitation Hospital Project, Series 2014, 5.000%, 5/15/21 | | | No Opt. Call | | | | | | | | BBB+ | | | | 4,854,201 | |
169
Nuveen Limited Term Municipal Bond Fund(continued)
Portfolio of Investments March 31, 2019
| | | | | | | | | | | | | | | | | | | | |
Principal
Amount (000) | | | Description (1) | | Optional Call
Provisions (2) | | | | | | Ratings (3) | | | Value | |
| | | | | |
| | | | Nebraska(continued) | | | | | | | | | | | | |
| | | | | |
| $ | 1,000 | | | Douglas County Hospital Authority 3, Nebraska, Health Facilities Revenue Bonds, Nebraska Methodist Health System, Refunding Series 2015, 5.000%, 11/01/22 | | | No Opt. Call | | | | | | | | A | | | $ | 1,104,040 | |
| | | | | |
| | 830 | | | Douglas County School District 10 Elkhorn, Nebraska, General Obligation Bonds, Public Schools Series 2012, 5.000%, 6/15/19 | | | No Opt. Call | | | | | | | | AA– | | | | 835,769 | |
| | | | | |
| | 1,000 | | | Lincoln County Hospital Authority 1, Nebraska, Hospital Revenue and Refunding Bonds, Great Plains Regional Medical Center Project, Series 2012, 3.500%, 11/01/27 | | | 11/21 at 100.00 | | | | | | | | A– | | | | 1,021,680 | |
| | | | | |
| | 2,000 | | | Nebraska Investment Finance Authority, Single Family Housing Revenue Bonds, Series 2019A, 3.150%, 9/01/34 (WI/DD, Settling 4/30/19) | | | 3/28 at 100.00 | | | | | | | | AA+ | | | | 2,011,500 | |
| | | | | |
| | 1,730 | | | Nebraska Public Power District, General Revenue Bonds,Series 2015A-2, 5.000%, 1/01/24 | | | 1/22 at 100.00 | | | | | | | | A+ | | | | 1,885,077 | |
| | | | | |
| | 1,645 | | | Papio-Missouri River Natural Resources District, Nebraska, Flood Protection and Water Quality Enhancement Revenue Bonds, Series 2017, 5.000%, 12/15/22 | | | 6/22 at 100.00 | | | | | | | | AA | | | | 1,820,110 | |
| | | | | |
| | 2,500 | | | Public Power Generation Agency, Nebraska, Whelan Energy Center Unit 2 Revenue Bonds, Refunding Series 2015A, 5.000%, 1/01/20 | | | No Opt. Call | | | | | | | | A2 | | | | 2,560,925 | |
| | | | | |
| | 3,130 | | | University of Nebraska Facilities Corporation, UNMC Cancer Center Bonds, Series 2014A, 5.000%, 2/15/21 | | | No Opt. Call | | | | | | | | Aa1 | | | | 3,329,944 | |
| | | | | |
| | 27,660 | | | Washington County, Nebraska, Wastewater and Solid Waste Disposal Facilities Revenue Bonds, Cargill Inc Project, Variable Rate Demand Series 2012, 2.375%, 9/01/30 (Mandatory Put 9/01/20) (AMT) | | | No Opt. Call | | | | | | | | A | | | | 27,865,514 | |
| | 54,085 | | | Total Nebraska | | | | | | | | | | | | | | | 56,160,200 | |
| | | | | |
| | | | Nevada – 0.7% | | | | | | | | | | | | |
| | | | | |
| | | | Clark County, Nevada, Airport Revenue Bonds, Jet Aviation Fuel Tax, Refunding Series 2013A: | | | | | | | | | | | | | | | | |
| | 1,000 | | | 5.000%, 7/01/20 (AMT) | | | No Opt. Call | | | | | | | | A+ | | | | 1,037,880 | |
| | 2,000 | | | 5.000%, 7/01/21 (AMT) | | | No Opt. Call | | | | | | | | A+ | | | | 2,132,660 | |
| | | | | |
| | 10,280 | | | Clark County, Nevada, Airport Revenue Bonds, Junior Subordinate Lien Notes Series 2018A, 5.000%, 7/01/21 | | | No Opt. Call | | | | | | | | A+ | | | | 11,020,674 | |
| | | | | |
| | 3,840 | | | Clark County, Nevada, Pollution Control Revenue Bonds, Nevada Power Company Project, Refunding Series 2017, 1.600%, 1/01/36 (Mandatory Put 5/21/20) | | | No Opt. Call | | | | | | | | A+ | | | | 3,821,952 | |
| | | | | |
| | 1,825 | | | Humboldt County, Nevada, Pollution Control Revenue Bonds, Sierra Pacific Power Company Projects, Refunding Series 2016A, 1.250%, 10/01/29 (Mandatory Put 6/03/19) | | | No Opt. Call | | | | | | | | A+ | | | | 1,822,609 | |
| | | | | |
| | 5,000 | | | Las Vegas Valley Water District, Nevada, General Obligation Bonds, Refunding Series 2011C, 5.000%, 6/01/24 | | | 6/21 at 100.00 | | | | | | | | AA+ | | | | 5,356,150 | |
| | | | | |
| | 10,000 | | | Washoe County, Nevada, Gas Facilities Revenue Bonds, Sierra Pacific Power Company Projects, Refunding Series 2016A, 1.500%, 8/01/31 (Mandatory Put 6/03/19) (AMT) | | | No Opt. Call | | | | | | | | A+ | | | | 9,991,100 | |
| | 33,945 | | | Total Nevada | | | | | | | | | | | | | | | 35,183,025 | |
| | | | | |
| | | | New Hampshire – 0.2% | | | | | | | | | | | | |
| | | | | |
| | 10,055 | | | New Hampshire Business Finance Authority, Pollution Control Revenue Bonds, United Illuminating Company, Refunding Series 2003A, 2.800%, 10/01/33 (Mandatory Put 10/02/23) | | | No Opt. Call | | | | | | | | A– | | | | 10,306,475 | |
170
| | | | | | | | | | | | | | | | | | | | |
Principal
Amount (000) | | | Description (1) | | Optional Call
Provisions (2) | | | | | | Ratings (3) | | | Value | |
| | | | | |
| | | | New Hampshire(continued) | | | | | | | | | | | | |
| | | | | |
| | | | New Hampshire Health and Education Facilities Authority, Revenue Bonds, Elliot Hospital, Series 2016: | | | | | | | | | | | | | | | | |
| $ | 600 | | | 5.000%, 10/01/19 | | | No Opt. Call | | | | | | | | A– | | | $ | 609,372 | |
| | 1,265 | | | 5.000%, 10/01/20 | | | No Opt. Call | | | | | | | | A– | | | | 1,321,470 | |
| | 1,185 | | | 5.000%, 10/01/21 | | | No Opt. Call | | | | | | | | A– | | | | 1,272,003 | |
| | 13,105 | | | Total New Hampshire | | | | | | | | | | | | | | | 13,509,320 | |
| | | | | |
| | | | New Jersey – 4.6% | | | | | | | | | | | | |
| | | | | |
| | 3,890 | | | Casino Reinvestment Development Authority, New Jersey, Parking Revenue Bonds, Series 2005A, 5.250%, 6/01/20 – NPFG Insured | | | 5/19 at 100.00 | | | | | | | | Baa2 | | | | 3,901,864 | |
| | | | | |
| | 1,950 | | | Gloucester County Pollution Control Financing Authority, New Jersey, Pollution Control Revenue Bonds, Logan Project, Refunding Series 2014A, 5.000%, 12/01/24 (AMT) | | | No Opt. Call | | | | | | | | BBB– | | | | 2,088,665 | |
| | | | | |
| | | | Millville, New Jersey, General Obligation Bonds, Improvement Series 2011: | | | | | | | | | | | | | | | | |
| | 1,445 | | | 5.000%, 11/01/19 – AGM Insured | | | No Opt. Call | | | | | | | | AA | | | | 1,473,857 | |
| | 920 | | | 5.000%, 11/01/20 – AGM Insured | | | No Opt. Call | | | | | | | | AA | | | | 969,505 | |
| | | | | |
| | | | New Jersey Economic Development Authority, Cigarette Tax Revenue Refunding Bonds, Series 2012: | | | | | | | | | | | | | | | | |
| | 245 | | | 4.000%, 6/15/19 | | | No Opt. Call | | | | | | | | BBB+ | | | | 246,024 | |
| | 5,000 | | | 5.000%, 6/15/19 | | | No Opt. Call | | | | | | | | BBB+ | | | | 5,030,900 | |
| | 10,990 | | | 5.000%, 6/15/20 | | | No Opt. Call | | | | | | | | BBB+ | | | | 11,380,585 | |
| | 2,825 | | | 5.000%, 6/15/21 | | | No Opt. Call | | | | | | | | BBB+ | | | | 3,001,873 | |
| | 1,425 | | | 5.000%, 6/15/22 | | | No Opt. Call | | | | | | | | BBB+ | | | | 1,551,027 | |
| | 520 | | | 5.000%, 6/15/22 | | | No Opt. Call | | | | | | | | AA | | | | 565,989 | |
| | 6,565 | | | 5.000%, 6/15/23 | | | 6/22 at 100.00 | | | | | | | | BBB+ | | | | 7,131,888 | |
| | 4,520 | | | 5.000%, 6/15/24 | | | 6/22 at 100.00 | | | | | | | | BBB+ | | | | 4,895,160 | |
| | 8,600 | | | 5.000%, 6/15/25 | | | 6/22 at 100.00 | | | | | | | | BBB+ | | | | 9,293,418 | |
| | 6,000 | | | 5.000%, 6/15/26 | | | 6/22 at 100.00 | | | | | | | | BBB+ | | | | 6,470,220 | |
| | 775 | | | 4.250%, 6/15/27 | | | 6/22 at 100.00 | | | | | | | | BBB+ | | | | 816,129 | |
| | | | | |
| | 7,240 | | | New Jersey Economic Development Authority, Revenue Bonds, Motor Vehicle Surcharge, Refunding Series 2017A, 3.375%, 7/01/30 | | | 7/27 at 100.00 | | | | | | | | BBB+ | | | | 7,264,544 | |
| | | | | |
| | 25,320 | | | New Jersey Economic Development Authority, School Facilities Construction Bonds, Refunding Series 2015XX, 5.000%, 6/15/21 | | | No Opt. Call | | | | | | | | A– | | | | 26,849,075 | |
| | | | | |
| | 17,000 | | | New Jersey Economic Development Authority, School Facilities Construction Bonds, Refunding Series 2016BBB, 5.000%, 6/15/22 | | | No Opt. Call | | | | | | | | A– | | | | 18,393,490 | |
| | | | | |
| | | | New Jersey Economic Development Authority, Sublease Revenue Bonds, New Jersey Transit Corporation Projects, Refunding Series 2017B: | | | | | | | | | | | | | | | | |
| | 5,000 | | | 5.000%, 11/01/20 | | | No Opt. Call | | | | | | | | A– | | | | 5,236,150 | |
| | 5,000 | | | 5.000%, 11/01/21 | | | No Opt. Call | | | | | | | | A– | | | | 5,353,900 | |
| | | | | |
| | 1,545 | | | New Jersey Educational Facilities Authority, Revenue Bonds, Montclair State University Issue, Series 2007A, 5.250%, 7/01/21 – AGC Insured | | | No Opt. Call | | | | | | | | AA | | | | 1,612,795 | |
| | | | | |
| | 350 | | | New Jersey Educational Facilities Authority, Revenue Bonds, University of Medicine and Dentistry of New Jersey, Refunding Series 2009B, 7.500%, 12/01/32(Pre-refunded 6/01/19) | | | 6/19 at 100.00 | | | | | | | | N/R (4) | | | | 353,416 | |
| | | | | |
| | 4,260 | | | New Jersey Health Care Facilities Financing Authority, New Jersey, Revenue Bonds, Saint Peters University Hospital, Refunding Series 2011, 5.000%, 7/01/19 | | | No Opt. Call | | | | | | | | BB+ | | | | 4,282,109 | |
| | | | | |
| | 2,000 | | | New Jersey Sports and Exposition Authority, State Contract Bonds, Refunding Series 2018A, 4.000%, 9/01/19 | | | No Opt. Call | | | | | | | | A– | | | | 2,016,040 | |
171
Nuveen Limited Term Municipal Bond Fund(continued)
Portfolio of Investments March 31, 2019
| | | | | | | | | | | | | | | | | | | | |
Principal
Amount (000) | | | Description (1) | | Optional Call
Provisions (2) | | | | | | Ratings (3) | | | Value | |
| | | | | |
| | | | New Jersey(continued) | | | | | | | | | | | | |
| | | | | |
| | | | New Jersey Transportation Trust Fund Authority, Federal Highway Reimbursement Revenue Notes, Series 2018A: | | | | | | | | | | | | | | | | |
| $ | 800 | | | 4.000%, 6/15/19 | | | No Opt. Call | | | | | | | | A+ | | | $ | 803,536 | |
| | 575 | | | 4.000%, 6/15/20 | | | No Opt. Call | | | | | | | | A+ | | | | 588,725 | |
| | 14,500 | | | 3.000%, 6/15/21 | | | No Opt. Call | | | | | | | | A+ | | | | 14,767,960 | |
| | 2,100 | | | 5.000%, 6/15/21 | | | No Opt. Call | | | | | | | | A+ | | | | 2,228,688 | |
| | 14,880 | | | 3.000%,��6/15/22 | | | No Opt. Call | | | | | | | | A+ | | | | 15,242,179 | |
| | 1,165 | | | 5.000%, 6/15/22 | | | No Opt. Call | | | | | | | | A+ | | | | 1,265,015 | |
| | 3,525 | | | 5.000%, 6/15/24 | | | No Opt. Call | | | | | | | | A+ | | | | 3,989,806 | |
| | 5,045 | | | 5.000%, 6/15/28 | | | 6/26 at 100.00 | | | | | | | | A+ | | | | 5,811,790 | |
| | 2,715 | | | 5.000%, 6/15/29 | | | 6/26 at 100.00 | | | | | | | | A+ | | | | 3,103,136 | |
| | | | | |
| | 1,000 | | | New Jersey Transportation Trust Fund Authority, Transportation System Bonds, Series 2018A, 5.000%, 6/15/19 | | | No Opt. Call | | | | | | | | A– | | | | 1,006,640 | |
| | | | | |
| | 1,125 | | | Parsippany-Troy Hills Township, New Jersey, General Obligation Bonds, Refunding Series 2012, 4.000%, 7/15/20 | | | No Opt. Call | | | | | | | | AA | | | | 1,161,990 | |
| | | | | |
| | 1,700 | | | Passaic Valley Sewer Commissioners, New Jersey, Sewer Revenue Bonds, Series 2010G, 5.750%, 12/01/22 | | | No Opt. Call | | | | | | | | A3 | | | | 1,922,972 | |
| | | | | |
| | 4,215 | | | Salem County Pollution Control Financing Authority, New Jersey, Pollution Control Revenue Bonds, Chambers Project, Refunding Series 2014A, 5.000%, 12/01/23 (AMT) | | | No Opt. Call | | | | | | | | BBB– | | | | 4,503,390 | |
| | | | | |
| | | | Tobacco Settlement Financing Corporation, New Jersey, Tobacco Settlement Asset-Backed Bonds, Series 2018A: | | | | | | | | | | | | | | | | |
| | 2,345 | | | 5.000%, 6/01/22 | | | No Opt. Call | | | | | | | | A | | | | 2,550,539 | |
| | 1,325 | | | 5.000%, 6/01/23 | | | No Opt. Call | | | | | | | | A | | | | 1,472,367 | |
| | 5,500 | | | 5.000%, 6/01/24 | | | No Opt. Call | | | | | | | | A | | | | 6,219,015 | |
| | 2,040 | | | 5.000%, 6/01/25 | | | No Opt. Call | | | | | | | | A | | | | 2,347,204 | |
| | 5,000 | | | 5.000%, 6/01/26 | | | No Opt. Call | | | | | | | | A | | | | 5,840,050 | |
| | 5,905 | | | 5.000%, 6/01/29 | | | 6/28 at 100.00 | | | | | | | | A– | | | | 6,985,084 | |
| | 2,735 | | | 4.000%, 6/01/37 | | | 6/28 at 100.00 | | | | | | | | A– | | | | 2,781,331 | |
| | | | | |
| | 17,800 | | | Tobacco Settlement Financing Corporation, New Jersey, Tobacco Settlement Asset-Backed Bonds, Series 2018B, 3.200%, 6/01/27 | | | No Opt. Call | | | | | | | | BBB+ | | | | 18,357,496 | |
| | | | | |
| | | | Union County, New Jersey, General Obligation Bonds, Refunding Series 2017: | | | | | | | | | | | | | | | | |
| | 6,695 | | | 3.000%, 3/01/28 | | | 9/25 at 100.00 | | | | | | | | Aaa | | | | 7,024,595 | |
| | 6,105 | | | 3.000%, 3/01/29 | | | 9/25 at 100.00 | | | | | | | | Aaa | | | | 6,355,793 | |
| | 232,180 | | | Total New Jersey | | | | | | | | | | | | | | | 246,507,924 | |
| | | | | |
| | | | New Mexico – 1.7% | | | | | | | | | | | | |
| | | | | |
| | 11,060 | | | Farmington, New Mexico, Pollution Control Revenue Bonds, Public Service Company of New Mexico San Juan and Four Corners Projects, Refunding Series 2016A, 1.875%, 4/01/33 (Mandatory Put 10/01/21) | | | No Opt. Call | | | | | | | | BBB+ | | | | 10,938,561 | |
| | | | | |
| | 26,000 | | | Farmington, New Mexico, Pollution Control Revenue Bonds, Public Service Company of New Mexico San Juan and Four Corners Projects, Refunding Series 2016B, 1.875%, 4/01/33 (Mandatory Put 10/01/21) | | | No Opt. Call | | | | | | | | BBB+ | | | | 25,714,520 | |
| | | | | |
| | 4,000 | | | Farmington, New Mexico, Pollution Control Revenue Bonds, Public Service Company of New Mexico San Juan Project, Refunding Series 2010B, 2.125%, 6/01/40 (Mandatory Put 6/01/22) | | | No Opt. Call | | | | | | | | BBB+ | | | | 3,963,000 | |
| | | | | |
| | 7,285 | | | Farmington, New Mexico, Pollution Control Revenue Bonds, Southern California Edison Company – Four Corners Project, Refunding Series 2005A, 1.875%, 4/01/29 (Mandatory Put 4/01/20) | | | No Opt. Call | | | | | | | | A– | | | | 7,235,462 | |
172
| | | | | | | | | | | | | | | | | | | | |
Principal
Amount (000) | | | Description (1) | | Optional Call
Provisions (2) | | | | | | Ratings (3) | | | Value | |
| | | | | |
| | | | New Mexico(continued) | | | | | | | | | | | | |
| | | | | |
| $ | 11,120 | | | Farmington, New Mexico, Pollution Control Revenue Bonds, Southern California Edison Company – Four Corners Project, Refunding Series 2005B, 1.875%, 4/01/29 (Mandatory Put 4/01/20) | | | No Opt. Call | | | | | | | | A– | | | $ | 11,044,384 | |
| | | | | |
| | 15,355 | | | New Mexico Municipal Energy Acquisition Authority, Gas Supply Revenue Bonds, Refunding Sub-Series 2014A, 5.000%, 11/01/39 (Mandatory Put 8/01/19) | | | 8/19 at 100.00 | | | | | | | | Aa2 | | | | 15,514,692 | |
| | | | | |
| | | | San Juan County, New Mexico, Gross Receipts Tax Revenue Bonds, Refunding Series 2015A: | | | | | | | | | | | | | | | | |
| | 1,340 | | | 5.000%, 6/15/19 | | | No Opt. Call | | | | | | | | A+ | | | | 1,348,951 | |
| | 1,305 | | | 5.000%, 6/15/20 | | | No Opt. Call | | | | | | | | A+ | | | | 1,356,182 | |
| | 1,455 | | | 5.000%, 6/15/21 | | | No Opt. Call | | | | | | | | A+ | | | | 1,551,627 | |
| | 1,510 | | | 5.000%, 6/15/22 | | | No Opt. Call | | | | | | | | A+ | | | | 1,655,338 | |
| | 1,565 | | | 5.000%, 6/15/23 | | | No Opt. Call | | | | | | | | A+ | | | | 1,757,166 | |
| | 1,625 | | | 5.000%, 6/15/24 | | | No Opt. Call | | | | | | | | A+ | | | | 1,865,906 | |
| | 1,690 | | | 5.000%, 6/15/25 | | | No Opt. Call | | | | | | | | A+ | | | | 1,982,184 | |
| | 1,760 | | | 5.000%, 6/15/26 | | | 6/25 at 100.00 | | | | | | | | A+ | | | | 2,051,984 | |
| | 87,070 | | | Total New Mexico | | | | | | | | | | | | | | | 87,979,957 | |
| | | | | |
| | | | New York – 5.8% | | | | | | | | | | | | |
| | | | | |
| | 500 | | | Buffalo and Fort Erie Public Bridge Authority, New York, Toll Bridge System Revenue Bonds, Refunding Series 2014, 5.000%, 1/01/22 | | | No Opt. Call | | | | | | | | A+ | | | | 544,965 | |
| | | | | |
| | | | Dormitory Authority of the State of New York, Mental Health Services Facilities Improvement Revenue Bonds, Series 2010A: | | | | | | | | | | | | | | | | |
| | 5 | | | 5.000%, 8/15/19 (ETM) | | | No Opt. Call | | | | | | | | N/R (4) | | | | 5,066 | |
| | 1,620 | | | 5.000%, 8/15/19 | | | No Opt. Call | | | | | | | | AA | | | | 1,640,525 | |
| | | | | |
| | 1,275 | | | Dormitory Authority of the State of New York, Revenue Bonds, Memorial Sloan-Kettering Cancer Center,Series 2012-1, 5.000%, 7/01/23 | | | 1/22 at 100.00 | | | | | | | | AA | | | | 1,395,424 | |
| | | | | |
| | 355 | | | Dormitory Authority of the State of New York, Revenue Bonds, NYU Hospitals Center, Series 2014, 5.000%, 7/01/23 | | | No Opt. Call | | | | | | | | A– | | | | 403,983 | |
| | | | | |
| | | | Dormitory Authority of the State of New York, Revenue Bonds, Orange Regional Medical Center Obligated Group, Series 2017: | | | | | | | | | | | | | | | | |
| | 1,500 | | | 4.000%, 12/01/19, 144A | | | No Opt. Call | | | | | | | | BBB– | | | | 1,518,060 | |
| | 1,000 | | | 4.000%, 12/01/20, 144A | | | No Opt. Call | | | | | | | | BBB– | | | | 1,029,430 | |
| | 1,200 | | | 4.000%, 12/01/21, 144A | | | No Opt. Call | | | | | | | | BBB– | | | | 1,255,044 | |
| | 1,000 | | | 5.000%, 12/01/22, 144A | | | No Opt. Call | | | | | | | | BBB– | | | | 1,096,270 | |
| | 2,000 | | | 5.000%, 12/01/23, 144A | | | No Opt. Call | | | | | | | | BBB– | | | | 2,239,260 | |
| | | | | |
| | | | Dormitory Authority of the State of New York, State Personal Income Tax Revenue Bonds, General Purpose Series 2012A: | | | | | | | | | | | | | | | | |
| | 5 | | | 5.000%, 12/15/21 (ETM) | | | No Opt. Call | | | | | | | | N/R (4) | | | | 5,476 | |
| | 12,280 | | | 5.000%, 12/15/21 | | | No Opt. Call | | | | | | | | AA+ | | | | 13,408,409 | |
| | | | | |
| | | | Long Island Power Authority, New York, Electric System General Revenue Bonds, Series 2000A: | | | | | | | | | | | | | | | | |
| | 400 | | | 0.000%, 6/01/19 – AGM Insured | | | No Opt. Call | | | | | | | | AA | | | | 398,988 | |
| | 515 | | | 0.000%, 6/01/21 – AGM Insured | | | No Opt. Call | | | | | | | | AA | | | | 495,677 | |
| | 640 | | | 0.000%, 6/01/22 – AGM Insured | | | No Opt. Call | | | | | | | | AA | | | | 602,701 | |
| | 1,315 | | | 0.000%, 6/01/23 – AGM Insured | | | No Opt. Call | | | | | | | | AA | | | | 1,208,893 | |
| | | | | |
| | 3,805 | | | Long Island Power Authority, New York, Electric System Revenue Bonds, Refunding Series 2009A, 5.000%, 4/01/19 (ETM) | | | No Opt. Call | | | | | | | | N/R (4) | | | | 3,805,000 | |
| | | | | |
| | 1,000 | | | Long Island Power Authority, New York, Electric System Revenue Bonds, Series 2012B, 5.000%, 9/01/21 | | | No Opt. Call | | | | | | | | A– | | | | 1,081,400 | |
173
Nuveen Limited Term Municipal Bond Fund(continued)
Portfolio of Investments March 31, 2019
| | | | | | | | | | | | | | | | | | | | |
Principal
Amount (000) | | | Description (1) | | Optional Call
Provisions (2) | | | | | | Ratings (3) | | | Value | |
| | | | | |
| | | | New York(continued) | | | | | | | | | | | | |
| | | | | |
| $ | 5,000 | | | Metropolitan Transportation Authority, New York, Dedicated Tax Fund Bonds, Climate Bond Certified, Refunding GreenSeries 2016B-2, 5.000%, 11/15/32 | | | 11/26 at 100.00 | | | | | | | | AA | | | $ | 5,964,900 | |
| | | | | |
| | 25,000 | | | Metropolitan Transportation Authority, New York, Transportation Revenue Bonds, Bond Anticipation NoteSeries 2018B-1, SubseriesA-J, 5.000%, 5/15/20 | | | No Opt. Call | | | | | | | | N/R | | | | 25,887,250 | |
| | | | | |
| | 10,000 | | | Metropolitan Transportation Authority, New York, Transportation Revenue Bonds, Bond Anticipation NoteSeries 2018B-2, SubseriesA-E, 5.000%, 5/15/21 | | | No Opt. Call | | | | | | | | N/R | | | | 10,645,900 | |
| | | | | |
| | 10,000 | | | Metropolitan Transportation Authority, New York, Transportation Revenue Bonds, Bond Anticipation Note Series 2019A, 4.000%, 2/03/20 | | | No Opt. Call | | | | | | | | N/R | | | | 10,191,400 | |
| | | | | |
| | 10,000 | | | Metropolitan Transportation Authority, New York, Transportation Revenue Bonds, Bond AnticipationSeries 2017C-2A, 4.000%, 5/15/19 | | | No Opt. Call | | | | | | | | N/R | | | | 10,029,000 | |
| | | | | |
| | 5,135 | | | Metropolitan Transportation Authority, New York, Transportation Revenue Bonds, Refunding Series 2012H, 5.000%, 11/15/20 | | | No Opt. Call | | | | | | | | AA– | | | | 5,409,517 | |
| | | | | |
| | | | Nassau County Local Economic Assistance Corporation, New York, Revenue Bonds, Catholic Health Services of Long Island Obligated Group Project, Series 2014B: | | | | | | | | | | | | | | | | |
| | 2,010 | | | 5.000%, 7/01/23 | | | No Opt. Call | | | | | | | | A– | | | | 2,254,818 | |
| | 1,030 | | | 5.000%, 7/01/24 | | | No Opt. Call | | | | | | | | A– | | | | 1,179,937 | |
| | 650 | | | 5.000%, 7/01/25 | | | 7/24 at 100.00 | | | | | | | | A– | | | | 743,808 | |
| | 1,000 | | | 5.000%, 7/01/26 | | | 7/24 at 100.00 | | | | | | | | A– | | | | 1,140,520 | |
| | 1,500 | | | 5.000%, 7/01/27 | | | 7/24 at 100.00 | | | | | | | | A– | | | | 1,700,955 | |
| | | | | |
| | | | New York City Housing Development Corporation, New York, Multifamily Housing Revenue Bonds, Sustainable NeighborhoodSeries 2018C-2A: | | | | | | | | | | | | | | | | |
| | 3,500 | | | 2.200%, 11/01/21 | | | 11/20 at 100.00 | | | | | | | | AA+ | | | | 3,523,625 | |
| | 34,500 | | | 2.350%, 7/01/22 | | | 3/21 at 100.00 | | | | | | | | AA+ | | | | 34,868,805 | |
| | 13,000 | | | 2.750%, 5/01/50(Mandatory Put 12/29/23) | | | 12/22 at 100.00 | | | | | | | | AA+ | | | | 13,234,520 | |
| | | | | |
| | 3,730 | | | New York City Housing Development Corporation, New York, Multifamily Housing Revenue Bonds, Sustainable NeighborhoodSeries 2019A-3A, 3.450%, 11/01/34 | | | 2/27 at 100.00 | | | | | | | | AA+ | | | | 3,837,872 | |
| | | | | |
| | 13,495 | | | New York City, New York, General Obligation Bonds, Fiscal 2008Series J-4, 5.000%, 8/01/24 | | | No Opt. Call | | | | | | | | Aa1 | | | | 15,767,693 | |
| | | | | |
| | 14,290 | | | New York State Energy Research and Development Authority, Pollution Control Revenue Bonds, New York State Electric and Gas Corporation, Series 2005A, 2.375%, 7/01/26 (Mandatory Put 5/01/20) (AMT) | | | No Opt. Call | | | | | | | | A– | | | | 14,412,322 | |
| | | | | |
| | 5,000 | | | New York State Energy Research and Development Authority, Pollution Control Revenue Bonds, Rochester Gas and Electric Corporation, Series 2004A, 2.875%, 5/15/32 (Mandatory Put 7/01/25) | | | No Opt. Call | | | | | | | | A1 | | | | 5,157,950 | |
| | | | | |
| | 50,000 | | | New York State Energy Research and Development Authority, Pollution Control Revenue Bonds, Rochester Gas and Electric Corporation, Series 2004B, 3.000%, 5/15/32 (Mandatory Put 7/01/25) (AMT) | | | No Opt. Call | | | | | | | | A1 | | | | 51,941,000 | |
| | | | | |
| | | | New York State Housing Finance Agency, Affordable Housing Revenue Bonds, Climate Bond Certified/Green Bond Series 2018I: | | | | | | | | | | | | | | | | |
| | 5,000 | | | 2.550%, 11/01/22 | | | 9/20 at 100.00 | | | | | | | | Aa2 | | | | 5,084,900 | |
| | 5,250 | | | 2.650%, 5/01/23 | | | 4/21 at 100.00 | | | | | | | | Aa2 | | | | 5,352,480 | |
| | 3,000 | | | 2.700%, 11/01/23 | | | 8/22 at 100.00 | | | | | | | | Aa2 | | | | 3,066,630 | |
| | | | | |
| | 9,100 | | | New York State Housing Finance Agency, Affordable Housing Revenue Bonds, Refunding Series 2019C, 3.500%, 11/01/34 | | | 5/28 at 100.00 | | | | | | | | Aa2 | | | | 9,355,528 | |
174
| | | | | | | | | | | | | | | | | | | | |
Principal
Amount (000) | | | Description (1) | | Optional Call
Provisions (2) | | | | | | Ratings (3) | | | Value | |
| | | | | |
| | | | New York(continued) | | | | | | | | | | | | |
| | | | | |
| $ | 5,000 | | | New York State Housing Finance Agency, Affordable Housing Revenue Bonds, Series 2018J, 2.500%, 5/01/22 | | | 6/20 at 100.00 | | | | | | | | Aa2 | | | $ | 5,027,100 | |
| | | | | |
| | | | New York State Housing Finance Agency, Affordable Housing Revenue Bonds, Series 2019E: | | | | | | | | | | | | | | | | |
| | 4,000 | | | 1.950%, 5/01/22 | | | 11/20 at 100.00 | | | | | | | | Aa2 | | | | 4,004,600 | |
| | 2,250 | | | 2.100%, 5/01/23 | | | 9/20 at 100.00 | | | | | | | | Aa2 | | | | 2,252,250 | |
| | | | | |
| | 5,455 | | | New York State Thruway Authority, General Revenue Junior Indebtedness Obligations, Series 2013A, 5.000%, 5/01/19 | | | No Opt. Call | | | | | | | | A2 | | | | 5,470,110 | |
| | | | | |
| | | | Suffolk County Economic Development Corporation, New York, Revenue Bonds, Catholic Health Services of Long Island Obligated Group Project, Series 2014: | | | | | | | | | | | | | | | | |
| | 500 | | | 5.000%, 7/01/25 | | | 7/24 at 100.00 | | | | | | | | A– | | | | 571,890 | |
| | 500 | | | 5.000%, 7/01/27 | | | 7/24 at 100.00 | | | | | | | | A– | | | | 567,250 | |
| | | | | |
| | | | TSASC Inc, New York, Tobacco Settlement Asset-Backed Bonds, Fiscal 2017 Series A: | | | | | | | | | | | | | | | | |
| | 1,285 | | | 5.000%, 6/01/20 | | | No Opt. Call | | | | | | | | A | | | | 1,330,605 | |
| | 3,000 | | | 5.000%, 6/01/21 | | | No Opt. Call | | | | | | | | A | | | | 3,192,540 | |
| | 2,500 | | | 5.000%, 6/01/22 | | | No Opt. Call | | | | | | | | A | | | | 2,728,775 | |
| | 3,335 | | | 5.000%, 6/01/23 | | | No Opt. Call | | | | | | | | A | | | | 3,723,994 | |
| | 1,900 | | | 5.000%, 6/01/26 | | | No Opt. Call | | | | | | | | A | | | | 2,227,408 | |
| | | | | |
| | | | Yonkers, New York, General Obligation Bonds, Refunding Series 2012C: | | | | | | | | | | | | | | | | |
| | 2,440 | | | 3.000%, 8/15/22 | | | No Opt. Call | | | | | | | | A | | | | 2,521,398 | |
| | 2,510 | | | 3.000%, 8/15/23 | | | No Opt. Call | | | | | | | | A | | | | 2,601,766 | |
| | 296,280 | | | Total New York | | | | | | | | | | | | | | | 309,105,587 | |
| | | | | |
| | | | North Carolina – 0.6% | | | | | | | | | | | | |
| | | | | |
| | 3,330 | | | Charlotte, North Carolina, Water and Sewer System Revenue Bonds, Refunding Series 2009, 5.250%, 7/01/22 | | | 7/19 at 100.00 | | | | | | | | AAA | | | | 3,360,436 | |
| | | | | |
| | | | North Carolina Municipal Power Agency 1, Catawba Electric Revenue Bonds, Refunding Series 2015A: | | | | | | | | | | | | | | | | |
| | 3,005 | | | 5.000%, 1/01/26 | | | No Opt. Call | | | | | | | | A | | | | 3,610,177 | |
| | 2,800 | | | 5.000%, 1/01/27 | | | 1/26 at 100.00 | | | | | | | | A | | | | 3,342,108 | |
| | | | | |
| | | | North Carolina State, Capital Improvement Limited Obligation Bonds, Series 2009A: | | | | | | | | | | | | | | | | |
| | 1,090 | | | 5.000%, 5/01/19 | | | No Opt. Call | | | | | | | | AA+ | | | | 1,093,074 | |
| | 3,605 | | | 5.000%, 5/01/21(Pre-refunded 5/01/19) | | | 5/19 at 100.00 | | | | | | | | AA+ (4) | | | | 3,615,238 | |
| | | | | |
| | 13,655 | | | Wake County, North Carolina, General Obligation Bonds, Refunding Series 2016A, 5.000%, 3/01/23 | | | No Opt. Call | | | | | | | | AAA | | | | 15,441,347 | |
| | | | | |
| | 235 | | | Wilmington, North Carolina, Limited Obligation Bonds, Refunding Series 2014A, 5.000%, 6/01/20 | | | No Opt. Call | | | | | | | | AA+ | | | | 244,534 | |
| | 27,720 | | | Total North Carolina | | | | | | | | | | | | | | | 30,706,914 | |
| | | | | |
| | | | North Dakota – 0.4% | | | | | | | | | | | | |
| | | | | |
| | | | Burleigh County, North Dakota, Health Care Revenue Bonds, Saint Alexius Medical Center Project, Series 2014A: | | | | | | | | | | | | | | | | |
| | 1,115 | | | 5.000%, 7/01/21 (ETM) | | | No Opt. Call | | | | | | | | N/R (4) | | | | 1,197,554 | |
| | 100 | | | 5.000%, 7/01/22(Pre-refunded 7/01/21) | | | 7/21 at 100.00 | | | | | | | | N/R (4) | | | | 107,404 | |
175
Nuveen Limited Term Municipal Bond Fund(continued)
Portfolio of Investments March 31, 2019
| | | | | | | | | | | | | | | | | | | | |
Principal
Amount (000) | | | Description (1) | | Optional Call
Provisions (2) | | | | | | Ratings (3) | | | Value | |
| | | | | |
| | | | North Dakota(continued) | | | | | | | | | | | | |
| | | | | |
| | | | Williston, North Dakota, County-Wide Public Safety Sales Tax Revenue Bonds, Series 2015A: | | | | | | | | | | | | | | | | |
| $ | 1,000 | | | 4.000%, 7/15/19 | | | No Opt. Call | | | | | | | | BBB+ | | | $ | 1,005,210 | |
| | 2,105 | | | 4.000%, 7/15/20 | | | No Opt. Call | | | | | | | | BBB+ | | | | 2,147,079 | |
| | 2,185 | | | 4.000%, 7/15/21 | | | No Opt. Call | | | | | | | | BBB+ | | | | 2,253,500 | |
| | 2,275 | | | 4.000%, 7/15/22 | | | No Opt. Call | | | | | | | | BBB+ | | | | 2,371,005 | |
| | 2,365 | | | 5.000%, 7/15/23 | | | 7/22 at 100.00 | | | | | | | | BBB+ | | | | 2,555,028 | |
| | 2,485 | | | 5.000%, 7/15/24 | | | 7/22 at 100.00 | | | | | | | | BBB+ | | | | 2,683,005 | |
| | 5,485 | | | 5.000%, 7/15/25 | | | 7/22 at 100.00 | | | | | | | | BBB+ | | | | 5,914,804 | |
| | | | | |
| | | | Williston, North Dakota, General Obligation Bonds, Refunding Improvement Series 2014: | | | | | | | | | | | | | | | | |
| | 725 | | | 4.000%, 5/01/19 | | | No Opt. Call | | | | | | | | A+ | | | | 726,298 | |
| | 800 | | | 4.000%, 5/01/20 | | | No Opt. Call | | | | | | | | A+ | | | | 818,824 | |
| | 800 | | | 4.000%, 5/01/21 | | | No Opt. Call | | | | | | | | A+ | | | | 832,552 | |
| | 21,440 | | | Total North Dakota | | | | | | | | | | | | | | | 22,612,263 | |
| | | | | |
| | | | Ohio – 5.9% | | | | | | | | | | | | |
| | | | | |
| | | | Akron, Bath and Copley Joint Township Hospital District, Ohio, Hospital Revenue Bonds, Children’s Hospital Medical Center, Improvement & Refunding Series 2012: | | | | | | | | | | | | | | | | |
| | 2,000 | | | 5.000%, 11/15/21 | | | No Opt. Call | | | | | | | | AA– | | | | 2,163,780 | |
| | 2,655 | | | 5.000%, 11/15/22 | | | 5/22 at 100.00 | | | | | | | | AA– | | | | 2,906,800 | |
| | | | | |
| | 6,000 | | | Allen County, Ohio, Hospital Facilities Revenue Bonds, Mercy Health, Series 2017A, 5.000%, 8/01/21 | | | No Opt. Call | | | | | | | | AA– | | | | 6,413,580 | |
| | | | | |
| | 20,000 | | | Allen County, Ohio, Hospital Facilities Revenue Bonds, Mercy Health, Series 2017B, 5.000%, 8/01/47 (Mandatory Put 5/05/22) | | | No Opt. Call | | | | | | | | A+ | | | | 21,925,000 | |
| | | | | |
| | | | Buckeye Tobacco Settlement Financing Authority, Ohio, Tobacco Settlement Asset-Backed Revenue Bonds, Senior Lien,Series 2007A-2: | | | | | | | | | | | | | | | | |
| | 66,660 | | | 5.125%, 6/01/24 | | | 4/19 at 100.00 | | | | | | | | B– | | | | 63,633,636 | |
| | 9,740 | | | 5.375%, 6/01/24 | | | 4/19 at 100.00 | | | | | | | | B– | | | | 9,384,490 | |
| | 5,875 | | | 5.875%, 6/01/30 | | | 4/19 at 100.00 | | | | | | | | B– | | | | 5,750,156 | |
| | 9,070 | | | 5.750%, 6/01/34 | | | 4/19 at 100.00 | | | | | | | | B– | | | | 8,770,146 | |
| | | | | |
| | | | Chillicothe, Ohio, Hospital Facilities Revenue Bonds, Adena Health System Obligated Group Project, Refunding & Improvement Series 2017: | | | | | | | | | | | | | | | | |
| | 1,000 | | | 5.000%, 12/01/21 | | | No Opt. Call | | | | | | | | A– | | | | 1,081,320 | |
| | 1,000 | | | 5.000%, 12/01/22 | | | No Opt. Call | | | | | | | | A– | | | | 1,110,800 | |
| | 1,225 | | | 5.000%, 12/01/24 | | | No Opt. Call | | | | | | | | A– | | | | 1,420,718 | |
| | 1,000 | | | 5.000%, 12/01/25 | | | No Opt. Call | | | | | | | | A– | | | | 1,179,370 | |
| | | | | |
| | | | Cleveland, Ohio, Airport System Revenue Bonds, Refunding Series 2016A: | | | | | | | | | | | | | | | | |
| | 725 | | | 5.000%, 1/01/20 – AGM Insured | | | No Opt. Call | | | | | | | | AA | | | | 743,277 | |
| | 950 | | | 5.000%, 1/01/21 – AGM Insured | | | No Opt. Call | | | | | | | | AA | | | | 1,003,894 | |
| | | | | |
| | | | Cleveland, Ohio, General Obligation Bonds, Series 2011: | | | | | | | | | | | | | | | | |
| | 1,470 | | | 5.000%, 12/01/19 | | | No Opt. Call | | | | | | | | AA+ | | | | 1,502,943 | |
| | 1,540 | | | 5.000%, 12/01/20 | | | 12/19 at 100.00 | | | | | | | | AA+ | | | | 1,574,712 | |
| | 1,620 | | | 5.000%, 12/01/21(Pre-refunded 12/01/19) | | | 12/19 at 100.00 | | | | | | | | AA+ (4) | | | | 1,657,827 | |
| | | | | |
| | 5,255 | | | Columbus, Ohio, General Obligation Bonds, Various Purpose Series 2018A, 5.000%, 4/01/30 | | | 10/28 at 100.00 | | | | | | | | AAA | | | | 6,565,912 | |
| | | | | |
| | 5,515 | | | Cuyahoga County, Ohio, Certificates of Participation, Convention Hotel Project, Series 2014, 5.000%, 12/01/20 | | | No Opt. Call | | | | | | | | AA– | | | | 5,802,883 | |
176
| | | | | | | | | | | | | | | | | | | | |
Principal
Amount (000) | | | Description (1) | | Optional Call
Provisions (2) | | | | | | Ratings (3) | | | Value | |
| | | | | |
| | | | Ohio(continued) | | | | | | | | | | | | |
| | | | | |
| | | | Fairfield County, Ohio, Hospital Facilities Revenue Bonds, Fairfield Medical Center Project, Series 2013: | | | | | | | | | | | | | | | | |
| $ | 1,015 | | | 5.000%, 6/15/19 | | | No Opt. Call | | | | | | | | Baa3 | | | $ | 1,020,877 | |
| | 1,000 | | | 5.000%, 6/15/21 | | | No Opt. Call | | | | | | | | Baa3 | | | | 1,059,720 | |
| | | | | |
| | 1,000 | | | Franklin County Convention Facilities Authority, Ohio, Excise Tax and Lease Revenue Bonds, Columbus City & Franklin County Lessees, Refunding Anticipation Series 2014, 5.000%, 12/01/23 | | | No Opt. Call | | | | | | | | Aa1 | | | | 1,140,060 | |
| | | | | |
| | 3,075 | | | Franklin County, Ohio, Revenue Bonds, CHE Trinity Health Credit Group, Variable Rate Demand Obligation Series 2013, 1.750%, 12/01/46 (Mandatory Put 8/01/19) | | | 8/19 at 100.00 | | | | | | | | AA– | | | | 3,075,369 | |
| | | | | |
| | | | Hamilton County, Ohio, Hospital Facilities Revenue Bonds, Cincinnati Children’s Hospital Medical Center, Refunding Series 2014S: | | | | | | | | | | | | | | | | |
| | 1,170 | | | 5.000%, 5/15/21 | | | No Opt. Call | | | | | | | | AA | | | | 1,252,707 | |
| | 340 | | | 5.000%, 5/15/22 | | | No Opt. Call | | | | | | | | AA | | | | 374,418 | |
| | 1,040 | | | 5.000%, 5/15/23 | | | No Opt. Call | | | | | | | | AA | | | | 1,174,680 | |
| | | | | |
| | 1,600 | | | Hamilton County, Ohio, Hospital Facilities Revenue Bonds, UC Health, Series 2014, 5.000%, 2/01/20 | | | No Opt. Call | | | | | | | | A | | | | 1,643,728 | |
| | | | | |
| | | | JobsOhio Beverage System, Ohio, Statewide Liquor Profits Revenue Bonds, Senior Lien Series 2013A: | | | | | | | | | | | | | | | | |
| | 2,600 | | | 5.000%, 1/01/20 | | | No Opt. Call | | | | | | | | AA | | | | 2,666,118 | |
| | 1,700 | | | 5.000%, 1/01/23 | | | No Opt. Call | | | | | | | | AA | | | | 1,904,833 | |
| | | | | |
| | 1,485 | | | Marysville, Union County, Ohio, General Obligation Bonds, Refunding Series 2007, 5.000%, 12/01/20 – AMBAC Insured | | | No Opt. Call | | | | | | | | Aa3 | | | | 1,537,094 | |
| | | | | |
| | 3,035 | | | Montgomery County, Ohio, Revenue Bonds, Catholic Health Initiatives, Series 2008D, 6.125%, 10/01/28 | | | 5/19 at 100.00 | | | | | | | | BBB+ | | | | 3,046,472 | |
| | | | | |
| | 10,000 | | | Montgomery County, Ohio, Revenue Bonds, Miami Valley Hospital, Series 2011A, 5.750%, 11/15/21 | | | 11/20 at 100.00 | | | | | | | | A | | | | 10,562,000 | |
| | | | | |
| | | | Muskingum County, Ohio, Hospital Facilities Revenue Bonds, Genesis HealthCare System Obligated Group Project, Series 2013: | | | | | | | | | | | | | | | | |
| | 270 | | | 5.000%, 2/15/20 | | | No Opt. Call | | | | | | | | BB+ | | | | 275,222 | |
| | 2,000 | | | 5.000%, 2/15/21 | | | No Opt. Call | | | | | | | | BB+ | | | | 2,081,020 | |
| | | | | |
| | 5,120 | | | Ohio Air Quality Development Authority, Ohio, Air Quality Development Revenue Bonds, FirstEnergy Generation Corporation Project, Series 2009A, 5.700%, 8/01/20 (6) | | | No Opt. Call | | | | | | | | N/R | | | | 4,403,200 | |
| | | | | |
| | 4,385 | | | Ohio Air Quality Development Authority, Ohio, Pollution Control Revenue Bonds, FirstEnergy Generation Corporation Project, Refunding Series 2009B, 0.000%, 3/01/23 (6) | | | No Opt. Call | | | | | | | | N/R | | | | 3,771,100 | |
| | | | | |
| | 3,820 | | | Ohio Air Quality Development Authority, Ohio, Pollution Control Revenue Bonds, FirstEnergy Generation Corporation Project, Refunding Series 2009C, 5.625%, 6/01/18 (6) | | | No Opt. Call | | | | | | | | CCC+ | | | | 3,820,000 | |
| | | | | |
| | 35,230 | | | Ohio Air Quality Development Authority, Ohio, Pollution Control Revenue Bonds, FirstEnergy Generation Project, Refunding Series 2006A, 3.750%, 12/01/23 (6) | | | No Opt. Call | | | | | | | | N/R | | | | 30,297,800 | |
| | | | | |
| | 1,015 | | | Ohio Air Quality Development Authority, Ohio, Pollution Control Revenue Bonds, FirstEnergy Nuclear Generation Corporation Project, Refunding Series 2010A, 3.125%, 7/01/33 (6) | | | No Opt. Call | | | | | | | | N/R | | | | 872,900 | |
| | | | | |
| | 35 | | | Ohio Air Quality Development Authority, Ohio, Pollution Control Revenue Bonds, FirstEnergy Nuclear Generation Project, Refunding Series 2006B, 3.125%, 1/01/34 (6) | | | No Opt. Call | | | | | | | | N/R | | | | 30,100 | |
177
Nuveen Limited Term Municipal Bond Fund(continued)
Portfolio of Investments March 31, 2019
| | | | | | | | | | | | | | | | | | | | |
Principal
Amount (000) | | | Description (1) | | Optional Call
Provisions (2) | | | | | | Ratings (3) | | | Value | |
| | | | | |
| | | | Ohio(continued) | | | | | | | | | | | | |
| | | | | |
| $ | 2,525 | | | Ohio Air Quality Development Authority, Ohio, Pollution Control Revenue Bonds, FirstEnergy Nuclear Generation Project, Refunding Series 2008B, 3.625%, 10/01/33 (Mandatory Put 4/01/20) (6) | | | No Opt. Call | | | | | | | | N/R | | | $ | 2,171,500 | |
| | | | | |
| | 1,040 | | | Ohio Air Quality Development Authority, Ohio, Revenue Bonds, Pratt Paper Ohio, LLC Project, Series 2017, 3.750%, 1/15/28 (AMT), 144A | | | No Opt. Call | | | | | | | | N/R | | | | 1,085,094 | |
| | | | | |
| | 3,250 | | | Ohio Housing Finance Agency, Residential Mortgage Revenue Bonds, Mortgage-Backed Securities Program, Series 2019A, 3.500%, 9/01/34 | | | 3/28 at 100.00 | | | | | | | | Aaa | | | | 3,382,698 | |
| | | | | |
| | 6,460 | | | Ohio State, General Obligation Bonds, Refunding Common Schools Series 2011A, 5.000%, 9/15/21 | | | No Opt. Call | | | | | | | | AA+ | | | | 6,998,958 | |
| | | | | |
| | 12,625 | | | Ohio State, General Obligation Bonds, Refunding Common Schools Series 2011C, 5.000%, 9/15/20 | | | No Opt. Call | | | | | | | | AA+ | | | | 13,255,745 | |
| | | | | |
| | 17,500 | | | Ohio State, Hospital Revenue Bonds, University Hospitals Health System, Inc, Series 2018C, 5.000%, 1/15/42 (Mandatory Put 9/15/21) | | | No Opt. Call | | | | | | | | A | | | | 18,823,875 | |
| | | | | |
| | 26,000 | | | Ohio State, Hospital Revenue Bonds, University Hospitals Health System, Inc, Series 2018D, 5.000%, 1/15/39 (Mandatory Put 9/15/23) | | | No Opt. Call | | | | | | | | A | | | | 29,351,400 | |
| | | | | |
| | 5,380 | | | Ohio Water Development Authority, Pollution Control Revenue Refunding Bonds, FirstEnergy Nuclear Generating Corporation Project, Series 2005B, 4.000%, 1/01/34 (Mandatory Put 7/01/21) (6) | | | No Opt. Call | | | | | | | | N/R | | | | 4,626,800 | |
| | | | | |
| | 3,315 | | | Ohio Water Development Authority, Pollution Control Revenue Refunding Bonds, FirstEnergy Nuclear Generating Corporation Project, Series 2006A, 3.000%, 5/15/19 (6) | | | No Opt. Call | | | | | | | | N/R | | | | 2,850,900 | |
| | | | | |
| | 2,245 | | | Ohio Water Development Authority, Pollution Control Revenue Refunding Bonds, FirstEnergy Nuclear Generating Corporation Project, Series 2006B, 4.000%, 12/01/33 (Mandatory Put 6/03/19) (6) | | | No Opt. Call | | | | | | | | N/R | | | | 1,930,700 | |
| | | | | |
| | 1,175 | | | Ohio Water Development Authority, Pollution Control Revenue Refunding Bonds, FirstEnergy Nuclear Generating Corporation Project, Series 2008B, 3.625%, 10/01/33 (Mandatory Put 4/01/20) (6) | | | No Opt. Call | | | | | | | | N/R | | | | 1,010,500 | |
| | | | | |
| | 7,135 | | | Ohio Water Development Authority, Pollution Control Revenue Refunding Bonds, FirstEnergy Nuclear Generating Corporation Project, Series 2010A, 3.750%, 7/01/33 (Mandatory Put 7/01/20) (6) | | | No Opt. Call | | | | | | | | N/R | | | | 6,136,100 | |
| | | | | |
| | 120 | | | Ohio Water Development Authority, Pollution Control Revenue Refunding Bonds, FirstEnergy Nuclear Generating Corporation Project, Series 2010C, 4.000%, 6/01/33 (Mandatory Put 6/03/19) (6) | | | No Opt. Call | | | | | | | | N/R | | | | 103,200 | |
| | | | | |
| | 1,000 | | | Western Reserve Port Authority, Ohio, Solid Waste Facility Revenue Bonds, Central Waste Inc, Series 2007A, 6.100%, 7/01/17 (AMT) (6) | | | No Opt. Call | | | | | | | | N/R | | | | 10 | |
| | 314,005 | | | Total Ohio | | | | | | | | | | | | | | | 312,328,142 | |
| | | | | |
| | | | Oklahoma – 3.0% | | | | | | | | | | | | |
| | | | | |
| | | | Canadian County Educational Facilities Authority, Oklahoma, Educational Facilities Lease Revenue Bonds, Mustang Public Schools Project, Series 2012: | | | | | | | | | | | | | | | | |
| | 1,435 | | | 4.000%, 9/01/19 | | | No Opt. Call | | | | | | | | AA– | | | | 1,449,723 | |
| | 4,185 | | | 4.500%, 9/01/20 | | | No Opt. Call | | | | | | | | AA– | | | | 4,355,748 | |
| | | | | |
| | | | Canadian County Educational Facilities Authority, Oklahoma, Educational Facilities Lease Revenue Bonds, Mustang Public Schools Project, Series 2017: | | | | | | | | | | | | | | | | |
| | 1,015 | | | 3.000%, 9/01/19 | | | No Opt. Call | | | | | | | | AA– | | | | 1,020,867 | |
| | 3,795 | | | 4.000%, 9/01/24 | | | No Opt. Call | | | | | | | | AA– | | | | 4,183,039 | |
178
| | | | | | | | | | | | | | | | | | | | |
Principal
Amount (000) | | | Description (1) | | Optional Call
Provisions (2) | | | | | | Ratings (3) | | | Value | |
| | | | | |
| | | | Oklahoma(continued) | | | | | | | | | | | | |
| | | | | |
| | | | Cleveland County Educational Facilities Authority, Oklahoma, Educational Facilities Lease Revenue Bonds, Moore Public Schools Project, Series 2016: | | | | | | | | | | | | | | | | |
| $ | 6,015 | | | 5.000%, 6/01/19 | | | No Opt. Call | | | | | | | | A+ | | | $ | 6,047,962 | |
| | 6,505 | | | 5.000%, 6/01/23 | | | No Opt. Call | | | | | | | | A+ | | | | 7,322,158 | |
| | | | | |
| | | | Cleveland County Educational Facilities Authority, Oklahoma, Educational Facilities Lease Revenue Bonds, Noble Public Schools Project, Series 2017: | | | | | | | | | | | | | | | | |
| | 1,315 | | | 4.000%, 9/01/20 | | | No Opt. Call | | | | | | | | A | | | | 1,357,619 | |
| | 1,250 | | | 5.000%, 9/01/29 | | | 9/27 at 100.00 | | | | | | | | A | | | | 1,493,700 | |
| | | | | |
| | 2,755 | | | Cleveland County Educational Facilities Authority, Oklahoma, Educational Facilities Lease Revenue Bonds, Norman Public Schools Project, Series 2014, 5.000%, 7/01/19 | | | No Opt. Call | | | | | | | | A+ | | | | 2,777,784 | |
| | | | | |
| | 1,000 | | | Comanche County Educational Facilities Authority, Oklahoma, Educational Facilities Lease Revenue Bonds, Elgin Public Schools Project, Series 2017A, 5.000%, 12/01/24 | | | No Opt. Call | | | | | | | | A | | | | 1,156,870 | |
| | | | | |
| | 2,150 | | | Creek County Educational Facilities Authority, Oklahoma, Lease Revenue Bonds, Sapulpa Public Schools Project, Series 2015, 5.000%, 9/01/20 | | | No Opt. Call | | | | | | | | A+ | | | | 2,250,211 | |
| | | | | |
| | 1,955 | | | Garfield County Educational Facilities Authority, Oklahoma, Educational Facilities Lease Revenue Bonds, Enid Public Schools Project, Series 2016A, 5.000%, 9/01/26 | | | No Opt. Call | | | | | | | | A | | | | 2,347,720 | |
| | | | | |
| | | | Garvin County Educational Facilities Authority, Oklahoma, Lease Revenue Bonds, Wynnewood Public Schools Project, Series 2018: | | | | | | | | | | | | | | | | |
| | 385 | | | 5.000%, 9/01/24 | | | No Opt. Call | | | | | | | | A– | | | | 439,778 | |
| | 310 | | | 5.000%, 9/01/25 | | | No Opt. Call | | | | | | | | A– | | | | 360,859 | |
| | 200 | | | 5.000%, 9/01/26 | | | No Opt. Call | | | | | | | | A– | | | | 236,554 | |
| | 450 | | | 5.000%, 9/01/27 | | | No Opt. Call | | | | | | | | A– | | | | 539,959 | |
| | 500 | | | 5.000%, 9/01/29 | | | 9/28 at 100.00 | | | | | | | | A– | | | | 604,995 | |
| | 350 | | | 5.000%, 9/01/30 | | | 9/28 at 100.00 | | | | | | | | A– | | | | 420,795 | |
| | 1,100 | | | 5.000%, 9/01/31 | | | 9/28 at 100.00 | | | | | | | | A– | | | | 1,309,924 | |
| | 300 | | | 5.000%, 9/01/32 | | | 9/28 at 100.00 | | | | | | | | A– | | | | 355,593 | |
| | | | | |
| | | | Grady County School Finance Authority, Oklahoma, Educational Facilities Lease Revenue Bonds, Minco Public Schools Project, Series 2018: | | | | | | | | | | | | | | | | |
| | 1,305 | | | 5.000%, 9/01/31 | | | 9/28 at 100.00 | | | | | | | | A– | | | | 1,535,045 | |
| | 1,000 | | | 5.000%, 9/01/32 | | | 9/28 at 100.00 | | | | | | | | A– | | | | 1,169,940 | |
| | 1,195 | | | 5.000%, 9/01/33 | | | 9/28 at 100.00 | | | | | | | | A– | | | | 1,394,099 | |
| | | | | |
| | | | Kay County Public Buildings Authority, Oklahoma, Educational Facilities Lease Revenue Bonds, Ponca City Public Schools Project, Series 2016: | | | | | | | | | | | | | | | | |
| | 5,015 | | | 5.000%, 9/01/20 | | | No Opt. Call | | | | | | | | A– | | | | 5,243,734 | |
| | 4,395 | | | 5.000%, 9/01/21 | | | No Opt. Call | | | | | | | | A– | | | | 4,697,596 | |
| | | | | |
| | | | Okarche Economic Development Authority, Oklahoma, Educational Facilities Lease Revenue Bonds, Okarche Public Schools Project, Series 2016: | | | | | | | | | | | | | | | | |
| | 1,035 | | | 5.000%, 9/01/21 | | | No Opt. Call | | | | | | | | A– | | | | 1,102,482 | |
| | 1,000 | | | 5.000%, 9/01/27 | | | 9/26 at 100.00 | | | | | | | | A– | | | | 1,176,680 | |
| | 1,030 | | | 5.000%, 9/01/28 | | | 9/26 at 100.00 | | | | | | | | A– | | | | 1,209,797 | |
| | | | | |
| | | | Oklahoma County Finance Authority, Oklahoma, Educational Facilities Lease Revenue Bonds, MidwestCity-Del City Public Schools Project, Series 2018: | | | | | | | | | | | | | | | | |
| | 1,500 | | | 5.000%, 10/01/21 | | | No Opt. Call | | | | | | | | A+ | | | | 1,618,140 | |
| | 425 | | | 5.000%, 10/01/22 | | | No Opt. Call | | | | | | | | A+ | | | | 470,381 | |
| | | | | |
| | | | Oklahoma County Finance Authority, Oklahoma, Educational Facilities Lease Revenue Bonds, Western Heights Public Schools Project, Series 2018A: | | | | | | | | | | | | | | | | |
| | 1,275 | | | 5.000%, 9/01/23 | | | No Opt. Call | | | | | | | | A+ | | | | 1,440,941 | |
| | 3,000 | | | 5.000%, 9/01/24 | | | No Opt. Call | | | | | | | | A+ | | | | 3,464,940 | |
179
Nuveen Limited Term Municipal Bond Fund(continued)
Portfolio of Investments March 31, 2019
| | | | | | | | | | | | | | | | | | | | |
Principal
Amount (000) | | | Description (1) | | Optional Call
Provisions (2) | | | | | | Ratings (3) | | | Value | |
| | | | | |
| | | | Oklahoma(continued) | | | | | | | | | | | | |
| | | | | |
| | | | Oklahoma Development Finance Authority, Health System Revenue Bonds, OU Medicine Project, Series 2018B: | | | | | | | | | | | | | | | | |
| $ | 575 | | | 5.000%, 8/15/22 | | | No Opt. Call | | | | | | | | Baa3 | | | $ | 624,824 | |
| | 2,295 | | | 5.000%, 8/15/24 | | | No Opt. Call | | | | | | | | Baa3 | | | | 2,583,344 | |
| | 1,850 | | | 5.000%, 8/15/25 | | | No Opt. Call | | | | | | | | Baa3 | | | | 2,116,326 | |
| | 1,000 | | | 5.000%, 8/15/26 | | | No Opt. Call | | | | | | | | Baa3 | | | | 1,160,640 | |
| | 3,650 | | | 5.000%, 8/15/27 | | | No Opt. Call | | | | | | | | Baa3 | | | | 4,292,035 | |
| | 1,000 | | | 5.000%, 8/15/28 | | | No Opt. Call | | | | | | | | Baa3 | | | | 1,185,570 | |
| | | | | |
| | 1,970 | | | Oklahoma Development Finance Authority, Solid Waste Disposal Revenue Bonds, Series 2004A, 2.375%, 12/01/21 | | | No Opt. Call | | | | | | | | A– | | | | 1,979,042 | |
| | | | | |
| | | | Pontotoc County Educational Facilities Authority, Oklahoma, Facilities Lease Revenue Bonds, Ada Public Schools Project, Series 2014: | | | | | | | | | | | | | | | | |
| | 525 | | | 5.000%, 9/01/19 | | | No Opt. Call | | | | | | | | A– | | | | 532,124 | |
| | 685 | | | 5.000%, 9/01/20 | | | No Opt. Call | | | | | | | | A– | | | | 716,243 | |
| | 745 | | | 5.000%, 9/01/21 | | | No Opt. Call | | | | | | | | A– | | | | 795,206 | |
| | | | | |
| | | | Rogers County Educational Facilities Authority, Oklahoma, Lease Revenue Bonds, Verdigris Public Schools Project, Series 2018: | | | | | | | | | | | | | | | | |
| | 1,675 | | | 3.000%, 9/01/20 | | | No Opt. Call | | | | | | | | A+ | | | | 1,704,798 | |
| | 1,780 | | | 3.000%, 9/01/22 | | | No Opt. Call | | | | | | | | A+ | | | | 1,847,266 | |
| | 5,245 | | | 4.000%, 9/01/24 | | | No Opt. Call | | | | | | | | A+ | | | | 5,784,134 | |
| | | | | |
| | | | Rogers County Industrial Development Authority, Oklahoma, Capital Improvement Revenue Bonds, Refunding Series 2017: | | | | | | | | | | | | | | | | |
| | 765 | | | 3.000%, 4/01/21 | | | No Opt. Call | | | | | | | | N/R | | | | 780,055 | |
| | 800 | | | 3.000%, 4/01/22 | | | No Opt. Call | | | | | | | | N/R | | | | 822,600 | |
| | 825 | | | 3.000%, 4/01/23 | | | No Opt. Call | | | | | | | | N/R | | | | 855,121 | |
| | 850 | | | 3.000%, 4/01/24 | | | No Opt. Call | | | | | | | | N/R | | | | 882,648 | |
| | 725 | | | 4.000%, 4/01/25 | | | No Opt. Call | | | | | | | | N/R | | | | 791,961 | |
| | 770 | | | 4.000%, 4/01/26 | | | 4/25 at 100.00 | | | | | | | | N/R | | | | 838,153 | |
| | 715 | | | 4.000%, 4/01/27 | | | 4/25 at 100.00 | | | | | | | | N/R | | | | 774,295 | |
| | | | | |
| | | | Stillwater Utilities Authority, Oklahoma, Utility System and Sales Tax Revenue Bonds, Series 2014A: | | | | | | | | | | | | | | | | |
| | 175 | | | 4.000%, 10/01/19 | | | No Opt. Call | | | | | | | | AA– | | | | 177,160 | |
| | 645 | | | 5.000%, 10/01/21 | | | No Opt. Call | | | | | | | | AA– | | | | 697,445 | |
| | | | | |
| | | | Texas County Development Authority, Oklahoma, Educational Facilities Lease Revenue Bonds, Guymon Public Schools Project, Series 2018: | | | | | | | | | | | | | | | | |
| | 1,370 | | | 5.000%, 12/01/19 | | | No Opt. Call | | | | | | | | A | | | | 1,398,948 | |
| | 1,000 | | | 4.000%, 12/01/21 | | | No Opt. Call | | | | | | | | A | | | | 1,055,180 | |
| | 850 | | | 4.000%, 12/01/23 | | | No Opt. Call | | | | | | | | A | | | | 924,494 | |
| | 1,100 | | | 5.000%, 12/01/25 | | | No Opt. Call | | | | | | | | A | | | | 1,288,353 | |
| | | | | |
| | 7,635 | | | Tulsa County Industrial Authority, Oklahoma, Educational Facilities Lease Revenue Bonds, Broken Arrow Public Schools Project, Series 2011, 5.000%, 9/01/19 | | | No Opt. Call | | | | | | | | AA– | | | | 7,741,814 | |
| | | | | |
| | 1,610 | | | Tulsa County Industrial Authority, Oklahoma, Educational Facilities Lease Revenue Bonds, Broken Arrow Public Schools Project, Series 2012, 4.000%, 9/01/22 | | | No Opt. Call | | | | | | | | AA– | | | | 1,732,730 | |
| | | | | |
| | | | Tulsa County Industrial Authority, Oklahoma, Educational Facilities Lease Revenue Bonds, Broken Arrow Public Schools Project, Series 2016: | | | | | | | | | | | | | | | | |
| | 1,065 | | | 5.000%, 9/01/22 | | | No Opt. Call | | | | | | | | AA– | | | | 1,181,362 | |
| | 6,340 | | | 5.000%, 9/01/23 | | | No Opt. Call | | | | | | | | AA– | | | | 7,205,473 | |
180
| | | | | | | | | | | | | | | | | | | | |
Principal
Amount (000) | | | Description (1) | | Optional Call
Provisions (2) | | | | | | Ratings (3) | | | Value | |
| | | | | |
| | | | Oklahoma(continued) | | | | | | | | | | | | |
| | | | | |
| | | | Tulsa County Industrial Authority, Oklahoma, Educational Facilities Lease Revenue Bonds, Broken Arrow Public Schools Project, Series 2019A: | | | | | | | | | | | | | | | | |
| $ | 5,915 | | | 5.000%, 9/01/27 | | | No Opt. Call | | | | | | | | AA– | | | $ | 7,208,374 | |
| | 10,000 | | | 5.000%, 9/01/28 | | | No Opt. Call | | | | | | | | AA– | | | | 12,336,300 | |
| | | | | |
| | | | Tulsa County Industrial Authority, Oklahoma, Educational Facilities Lease Revenue Bonds, Glenpool Public Schools Project, Series 2017A: | | | | | | | | | | | | | | | | |
| | 570 | | | 5.000%, 9/01/22 | | | No Opt. Call | | | | | | | | A+ | | | | 631,480 | |
| | 765 | | | 5.000%, 9/01/23 | | | No Opt. Call | | | | | | | | A+ | | | | 866,294 | |
| | 600 | | | 5.000%, 9/01/24 | | | No Opt. Call | | | | | | | | A+ | | | | 695,328 | |
| | 1,280 | | | 5.000%, 9/01/25 | | | No Opt. Call | | | | | | | | A+ | | | | 1,509,261 | |
| | | | | |
| | | | Tulsa County Industrial Authority, Oklahoma, Educational Facilities Lease Revenue Bonds, Jenks Public Schools Project, Series 2015: | | | | | | | | | | | | | | | | |
| | 2,100 | | | 5.000%, 9/01/21 | | | No Opt. Call | | | | | | | | AA– | | | | 2,265,753 | |
| | 2,000 | | | 5.000%, 9/01/22 | | | No Opt. Call | | | | | | | | AA– | | | | 2,218,520 | |
| | | | | |
| | | | Tulsa County Industrial Authority, Oklahoma, Educational Facilities Lease Revenue Bonds, Owasso Public Schools Project, Series 2018: | | | | | | | | | | | | | | | | |
| | 1,500 | | | 5.000%, 9/01/20 | | | No Opt. Call | | | | | | | | A+ | | | | 1,569,915 | |
| | 1,650 | | | 5.000%, 9/01/21 | | | No Opt. Call | | | | | | | | A+ | | | | 1,778,601 | |
| | 1,500 | | | 5.000%, 9/01/22 | | | No Opt. Call | | | | | | | | A+ | | | | 1,661,790 | |
| | 1,000 | | | 5.000%, 9/01/23 | | | No Opt. Call | | | | | | | | A+ | | | | 1,132,410 | |
| | | | | |
| | | | Weatherford Industrial Trust Educational, Oklahoma, Facilities Lease Revenue Bonds, Weatherford Public Schools Project, Series 2019: | | | | | | | | | | | | | | | | |
| | 1,200 | | | 5.000%, 3/01/23 | | | No Opt. Call | | | | | | | | A– | | | | 1,331,880 | |
| | 1,200 | | | 5.000%, 3/01/25 | | | No Opt. Call | | | | | | | | A– | | | | 1,385,652 | |
| | 1,625 | | | 5.000%, 3/01/27 | | | No Opt. Call | | | | | | | | A– | | | | 1,929,557 | |
| | 142,285 | | | Total Oklahoma | | | | | | | | | | | | | | | 157,546,092 | |
| | | | | |
| | | | Oregon – 1.2% | | | | | | | | | | | | |
| | | | | |
| | | | Benton and Linn Counties District School District 509J Corvallis, Oregon, General Obligation Bonds, Series 2018A: | | | | | | | | | | | | | | | | |
| | 1,800 | | | 0.000%, 6/15/21 | | | No Opt. Call | | | | | | | | AA+ | | | | 1,829,286 | |
| | 1,745 | | | 0.000%, 6/15/22 | | | No Opt. Call | | | | | | | | AA+ | | | | 1,829,510 | |
| | 1,785 | | | 0.000%, 6/15/23 | | | No Opt. Call | | | | | | | | AA+ | | | | 1,926,176 | |
| | 2,315 | | | 0.000%, 6/15/24 | | | No Opt. Call | | | | | | | | AA+ | | | | 2,542,264 | |
| | 1,305 | | | 0.000%, 6/15/25 | | | No Opt. Call | | | | | | | | AA+ | | | | 1,466,768 | |
| | 1,085 | | | 0.000%, 6/15/26 | | | No Opt. Call | | | | | | | | AA+ | | | | 1,243,790 | |
| | 1,000 | | | 0.000%, 6/15/27 | | | No Opt. Call | | | | | | | | AA+ | | | | 1,161,420 | |
| | | | | |
| | | | Clackamas and Washington Counties School District 3JT, Oregon, General Obligation Bonds, Refunding Series 2015: | | | | | | | | | | | | | | | | |
| | 11,045 | | | 5.000%, 6/15/25 | | | No Opt. Call | | | | | | | | AA+ | | | | 13,189,055 | |
| | 5,000 | | | 5.000%, 6/15/26 | | | 6/25 at 100.00 | | | | | | | | AA+ | | | | 5,954,350 | |
| | | | | |
| | | | Clackamas County School District 12, North Clackamas, Oregon, General Obligation Bonds, Series 2017B: | | | | | | | | | | | | | | | | |
| | 2,330 | | | 5.000%, 6/15/27 | | | No Opt. Call | | | | | | | | AA+ | | | | 2,893,394 | |
| | 2,000 | | | 5.000%, 6/15/28 | | | 6/27 at 100.00 | | | | | | | | AA+ | | | | 2,466,040 | |
| | | | | |
| | | | Clackamas County School District 12, North Clackamas, Oregon, General Obligation Bonds, Series 2018: | | | | | | | | | | | | | | | | |
| | 1,400 | | | 4.000%, 6/15/23 | | | No Opt. Call | | | | | | | | Aa1 | | | | 1,537,060 | |
| | 1,000 | | | 5.000%, 6/15/25 | | | No Opt. Call | | | | | | | | Aa1 | | | | 1,192,820 | |
| | | | | |
| | 11,400 | | | Oregon State Business Development Commission, Recovery Zone Facility Revenue Bonds, Intel Corporation Project, 232 Series 2010, 2.400%, 12/01/40 (Mandatory Put 8/14/23) | | | No Opt. Call | | | | | | | | A+ | | | | 11,580,576 | |
181
Nuveen Limited Term Municipal Bond Fund(continued)
Portfolio of Investments March 31, 2019
| | | | | | | | | | | | | | | | | | | | |
Principal
Amount (000) | | | Description (1) | | Optional Call
Provisions (2) | | | | | | Ratings (3) | | | Value | |
| | | | | |
| | | | Oregon(continued) | | | | | | | | | | | | |
| | | | | |
| $ | 7,500 | | | Oregon State Business Development Commission, 5.000%, 3/01/49 (Mandatory Put 3/01/22) (AMT) | | | No Opt. Call | | | | | | | | A+ | | | $ | 8,155,500 | |
| | | | | |
| | 1,050 | | | Oregon State Department of Transportation, Highway User Tax Revenue Bonds, Senior Lien Series 2009A, 5.000%, 11/15/22(Pre-refunded 5/15/19) | | | 5/19 at 100.00 | | | | | | | | AAA | | | | 1,054,420 | |
| | | | | |
| | 5,000 | | | Portland, Oregon, Tax Anticipation Notes, Fire & Police Disability and Retirement Fund, Series 2018, 4.000%, 6/26/19 | | | No Opt. Call | | | | | | | | N/R | | | | 5,028,850 | |
| | 58,760 | | | Total Oregon | | | | | | | | | | | | | | | 65,051,279 | |
| | | | | |
| | | | Pennsylvania – 5.8% | | | | | | | | | | | | |
| | | | | |
| | | | Allegheny County Hospital Development Authority, Pennsylvania, Revenue Bonds, Allegheny Health Network Obligated Group Issue, Series 2018A: | | | | | | | | | | | | | | | | |
| | 1,170 | | | 5.000%, 4/01/22 | | | No Opt. Call | | | | | | | | A | | | | 1,268,994 | |
| | 1,405 | | | 5.000%, 4/01/23 | | | No Opt. Call | | | | | | | | A | | | | 1,559,634 | |
| | 2,415 | | | 5.000%, 4/01/24 | | | No Opt. Call | | | | | | | | A | | | | 2,736,461 | |
| | 2,520 | | | 5.000%, 4/01/25 | | | No Opt. Call | | | | | | | | A | | | | 2,906,719 | |
| | 2,000 | | | 5.000%, 4/01/26 | | | No Opt. Call | | | | | | | | A | | | | 2,344,880 | |
| | 4,245 | | | 5.000%, 4/01/27 | | | No Opt. Call | | | | | | | | A | | | | 5,043,018 | |
| | | | | |
| | 1,000 | | | Allentown Neighborhood Improvement Zone Development Authority, Pennsylvania, Tax Revenue Bonds, City Center Project, Series 2018, 5.000%, 5/01/23, 144A | | | No Opt. Call | | | | | | | | Ba3 | | | | 1,071,880 | |
| | | | | |
| | | | Allentown School District, Lehigh County, Pennsylvania, General Obligation Bonds, Refunding Series 2016: | | | | | | | | | | | | | | | | |
| | 1,750 | | | 4.000%, 2/15/20 – AGM Insured | | | No Opt. Call | | | | | | | | AA | | | | 1,780,293 | |
| | 1,650 | | | 4.000%, 2/15/21 – AGM Insured | | | No Opt. Call | | | | | | | | AA | | | | 1,709,615 | |
| | | | | |
| | 5,055 | | | Beaver County Industrial Development Authority, Pennsylvania, Pollution Control Revenue Refunding Bonds, FirstEnergy Nuclear Generation Project, Series 2006B, 3.500%, 12/01/35 (Mandatory Put 6/01/20) (6) | | | No Opt. Call | | | | | | | | N/R | | | | 4,347,300 | |
| | | | | |
| | 4,865 | | | Beaver County Industrial Development Authority, Pennsylvania, Pollution Control Revenue Refunding Bonds, FirstEnergy Nuclear Generation Project, Series 2008A, 2.700%, 4/01/35 (6) | | | No Opt. Call | | | | | | | | N/R | | | | 4,183,900 | |
| | | | | |
| | 1,940 | | | Berks County Industrial Development Authority, Pennsylvania, Health System Revenue Bonds, Tower Health Project, Series 2017, 5.000%, 11/01/27 | | | No Opt. Call | | | | | | | | A | | | | 2,328,213 | |
| | | | | |
| | 1,000 | | | Capital Region Water, Pennsylvania, Water Revenue Bonds, Series 2018, 5.000%, 7/15/25 | | | No Opt. Call | | | | | | | | A+ | | | | 1,176,120 | |
| | | | | |
| | | | Centre County, Pennsylvania, General Obligation Bonds, Series 2012A: | | | | | | | | | | | | | | | | |
| | 40 | | | 3.000%, 7/01/19 (ETM) | | | No Opt. Call | | | | | | | | N/R (4) | | | | 40,137 | |
| | 1,080 | | | 3.000%, 7/01/19 | | | No Opt. Call | | | | | | | | AA | | | | 1,083,802 | |
| | | | | |
| | 1,250 | | | Chester, Delaware County, Pennsylvania, Tax and Revenue Anticipation Notes, Series 2019, 5.000%, 9/30/19, 144A | | | 7/19 at 100.00 | | | | | | | | N/R | | | | 1,251,700 | |
| | | | | |
| | 7,910 | | | Coatesville Area School District, Chester County, Pennsylvania, General Obligation Bonds, Series 2014A, 4.000%, 8/15/19 – BAM Insured | | | No Opt. Call | | | | | | | | AA | | | | 7,966,556 | |
| | | | | |
| | | | Commonwealth Financing Authority, Pennsylvania, State Appropriation Lease Bonds, Master Settlement, Series 2018: | | | | | | | | | | | | | | | | |
| | 2,000 | | | 5.000%, 6/01/21 | | | No Opt. Call | | | | | | | | A1 | | | | 2,134,080 | |
| | 2,000 | | | 5.000%, 6/01/22 | | | No Opt. Call | | | | | | | | A1 | | | | 2,190,300 | |
| | 2,515 | | | 5.000%, 6/01/23 | | | No Opt. Call | | | | | | | | A1 | | | | 2,819,139 | |
| | 3,175 | | | 5.000%, 6/01/24 | | | No Opt. Call | | | | | | | | A1 | | | | 3,637,725 | |
| | | | | |
| | 450 | | | Dallas Area Municipal Authority, Pennsylvania, Revenue Bonds, Misericordia University, Series 2014, 5.000%, 5/01/19 | | | No Opt. Call | | | | | | | | Baa3 | | | | 450,864 | |
182
| | | | | | | | | | | | | | | | | | | | |
Principal
Amount (000) | | | Description (1) | | Optional Call
Provisions (2) | | | | | | Ratings (3) | | | Value | |
| | | | | |
| | | | Pennsylvania(continued) | | | | | | | | | | | | |
| | | | | |
| | | | Delaware River Port Authority, New Jersey and Pennsylvania, Revenue Bonds, Refunding Series 2018B: | | | | | | | | | | | | | | | | |
| $ | 8,505 | | | 5.000%, 1/01/23 | | | No Opt. Call | | | | | | | | A+ | | | $ | 9,510,036 | |
| | 6,665 | | | 5.000%, 1/01/24 | | | No Opt. Call | | | | | | | | A+ | | | | 7,636,224 | |
| | | | | |
| | 13,475 | | | Lehigh County Industrial Development Authority, Pennsylvania, Pollution Control Revenue Bonds, Pennsylvania Power and Light Company, Series 2016A, 1.800%, 9/01/29 (Mandatory Put 9/01/22) | | | No Opt. Call | | | | | | | | A | | | | 13,232,180 | |
| | | | | |
| | 9,025 | | | Lehigh County Industrial Development Authority, Pennsylvania, Pollution Control Revenue Bonds, Pennsylvania Power and Light Company, Series 2016B, 1.800%, 2/15/27 (Mandatory Put 8/15/22) | | | No Opt. Call | | | | | | | | A | | | | 8,931,140 | |
| | | | | |
| | 375 | | | Luzerne County Industrial Development Authority, Pennsylvania, Guaranteed Lease Revenue Bonds, Series 2009, 7.500%, 12/15/19 (ETM) | | | No Opt. Call | | | | | | | | N/R (4) | | | | 390,251 | |
| | | | | |
| | 1,080 | | | Lycoming County Authority, Pennsylvania, Revenue Bonds, Pennsylvania College of Technology, Series 2012, 4.000%, 5/01/19 | | | No Opt. Call | | | | | | | | A | | | | 1,081,890 | |
| | | | | |
| | 1,400 | | | Monroe County Hospital Authority, Pennsylvania, Hospital Revenue Bonds, Pocono Medical Center, Series 2016, 5.000%, 7/01/20 | | | No Opt. Call | | | | | | | | A+ | | | | 1,452,850 | |
| | | | | |
| | 3,450 | | | Montgomery County Higher Education and Health Authority, Pennsylvania, Hospital Revenue Bonds, Abington Memorial Hospital Obligated Group, Series 2012A, 5.000%, 6/01/23(Pre-refunded 6/01/22) | | | 6/22 at 100.00 | | | | | | | | N/R (4) | | | | 3,803,659 | |
| | | | | |
| | 1,235 | | | Montgomery County Industrial Development Authority, Pennsylvania, Health System Revenue Bonds, Albert Einstein Healthcare Network Issue, Series 2015A, 5.000%, 1/15/20 | | | No Opt. Call | | | | | | | | Ba1 | | | | 1,259,712 | |
| | | | | |
| | 5,000 | | | Montgomery County Industrial Development Authority, Pennsylvania, Pollution Control Revenue Bonds, Exelon Generation Company, LLC Project, Refunding Series 2001B, 2.500%, 10/01/30 (Mandatory Put 4/01/20) | | | No Opt. Call | | | | | | | | BBB+ | | | | 5,008,350 | |
| | | | | |
| | 6,250 | | | Montgomery County Industrial Development Authority, Pennsylvania, Pollution Control Revenue Bonds, PECO Energy Company Project, Refunding Series 1994A, 2.550%, 6/01/29 (Mandatory Put 6/01/20) | | | No Opt. Call | | | | | | | | BBB+ | | | | 6,262,000 | |
| | | | | |
| | 5,000 | | | Montgomery County Industrial Development Authority, Pennsylvania, Pollution Control Revenue Bonds, PECO Energy Company Project, Refunding Series 1996A, 2.600%, 3/01/34 (Mandatory Put 9/01/20) | | | No Opt. Call | | | | | | | | BBB+ | | | | 5,011,700 | |
| | | | | |
| | 7,500 | | | Montgomery County Industrial Development Authority, Pennsylvania, Pollution Control Revenue Bonds, PECO Energy Company Project, Refunding Series 1999A, 2.500%, 10/01/30 (Mandatory Put 4/01/20) | | | No Opt. Call | | | | | | | | BBB+ | | | | 7,512,525 | |
| | | | | |
| | 504 | | | Northampton County Industrial Development Authority, Pennsylvania, Recovery Revenue Bonds, Northampton Generating Project, Senior Lien Series 2013A0 & AE2, 5.000%, 12/31/23 | | | 5/19 at 100.00 | | | | | | | | N/R | | | | 151,250 | |
| | | | | |
| | 107 | | | Northampton County Industrial Development Authority, Pennsylvania, Recovery Revenue Bonds, Northampton Generating Project, Senior Lien Taxable Series 2013B, 5.000%, 12/31/23 (cash 5.000%, PIK 5.000%) | | | No Opt. Call | | | | | | | | N/R | | | | 31,990 | |
| | | | | |
| | 5,945 | | | Pennsylvania Economic Development Financing Authority, Exempt Facilities Revenue Bonds, Shippingport Project, First Energy Guarantor, Series 2005A, 3.750%, 12/01/40 (Mandatory Put 7/01/20) (6) | | | No Opt. Call | | | | | | | | N/R | | | | 5,112,700 | |
| | | | | |
| | 3,565 | | | Pennsylvania Economic Development Financing Authority, Exempt Facilities Revenue Bonds, Shippingport Project, First Energy Guarantor, Series 2006A, 2.550%, 11/01/41 (Mandatory Put 6/01/19) (6) | | | No Opt. Call | | | | | | | | N/R | | | | 3,065,900 | |
183
Nuveen Limited Term Municipal Bond Fund(continued)
Portfolio of Investments March 31, 2019
| | | | | | | | | | | | | | | | | | | | |
Principal
Amount (000) | | | Description (1) | | Optional Call
Provisions (2) | | | | | | Ratings (3) | | | Value | |
| | | | | |
| | | | Pennsylvania(continued) | | | | | | | | | | | | |
| | | | | |
| $ | 8,750 | | | Pennsylvania Economic Development Financing Authority, Solid Waste Disposal Revenue Bonds, Waste Management Inc, Project, Series 2009, 2.800%, 12/01/33 (Mandatory Put 12/01/21) | | | No Opt. Call | | | | | | | | A– | | | $ | 8,889,300 | |
| | | | | |
| | | | Pennsylvania Economic Development Financing Authority, Unemployment Compensation Revenue Bonds, Series 2012B: | | | | | | | | | | | | | | | | |
| | 335 | | | 5.000%, 1/01/20 | | | 7/19 at 100.00 | | | | | | | | Aaa | | | | 337,881 | |
| | 365 | | | 5.000%, 7/01/20 | | | 7/19 at 100.00 | | | | | | | | Aaa | | | | 368,146 | |
| | | | | |
| | 2,300 | | | Pennsylvania Higher Educational Facilities Authority, Revenue Bonds, AICUP Financing Program-Mount Aloysius College Project,Series 2011R-1, 2.250%, 11/01/41 (Mandatory Put 5/01/21) | | | No Opt. Call | | | | | | | | A– | | | | 2,299,103 | |
| | | | | |
| | 2,250 | | | Pennsylvania Higher Educational Facilities Authority, Revenue Bonds, Association of Independent Colleges & Universities of Pennsylvania Financing Program, York College Project,Series 2014T-3, 2.850%, 5/01/34 (Mandatory Put 5/01/21) | | | No Opt. Call | | | | | | | | A– | | | | 2,279,070 | |
| | | | | |
| | | | Pennsylvania Higher Educational Facilities Authority, Revenue Bonds, Association of Independent Colleges and Universities of Pennsylvania Financing Program-Messiah College Project,Series 2001-14: | | | | | | | | | | | | | | | | |
| | 1,850 | | | 2.200%, 11/01/31(Mandatory Put 11/01/21) | | | No Opt. Call | | | | | | | | A– | | | | 1,839,196 | |
| | 3,500 | | | 2.720%, 11/01/31(Mandatory Put 5/01/21) | | | 11/19 at 100.00 | | | | | | | | A– | | | | 3,501,330 | |
| | | | | |
| | | | Pennsylvania Housing Finance Agency, Single Family Mortgage Revenue Bonds, Series 2017-125A: | | | | | | | | | | | | | | | | |
| | 3,390 | | | 3.000%, 4/01/27 (AMT) | | | No Opt. Call | | | | | | | | AA+ | | | | 3,452,376 | |
| | 3,345 | | | 3.050%, 10/01/27 (AMT) | | | 4/27 at 100.00 | | | | | | | | AA+ | | | | 3,411,733 | |
| | 8,750 | | | 3.400%, 10/01/32 (AMT) | | | 4/27 at 100.00 | | | | | | | | AA+ | | | | 8,789,287 | |
| | | | | |
| | 1,025 | | | Pennsylvania Housing Finance Agency, Single Family Mortgage Revenue Bonds, Series 2019-128A, 3.650%, 10/01/32 (AMT) | | | 10/27 at 100.00 | | | | | | | | AA+ | | | | 1,047,909 | |
| | | | | |
| | | | Pennsylvania Turnpike Commission, Turnpike Revenue Bonds, Refunding Subordinate SecondSeries 2016B-2: | | | | | | | | | | | | | | | | |
| | 2,390 | | | 5.000%, 6/01/21 | | | No Opt. Call | | | | | | | | A3 | | | | 2,550,226 | |
| | 15,000 | | | 5.000%, 6/01/22 | | | No Opt. Call | | | | | | | | A3 | | | | 16,422,300 | |
| | 23,660 | | | 5.000%, 6/01/23 | | | No Opt. Call | | | | | | | | A3 | | | | 26,480,745 | |
| | 12,485 | | | 5.000%, 6/01/24 | | | No Opt. Call | | | | | | | | A3 | | | | 14,264,986 | |
| | 8,095 | | | 5.000%, 6/01/24 – AGM Insured | | | No Opt. Call | | | | | | | | AA | | | | 9,334,830 | |
| | 5,630 | | | 5.000%, 6/01/25 | | | No Opt. Call | | | | | | | | A3 | | | | 6,541,666 | |
| | 4,265 | | | 5.000%, 6/01/29 | | | 6/26 at 100.00 | | | | | | | | A3 | | | | 4,963,180 | |
| | | | | |
| | 17,500 | | | Pennsylvania Turnpike Commission, Turnpike Revenue Bonds, Refunding Subordinate Series 2016, 5.000%, 6/01/20 | | | No Opt. Call | | | | | | | | A3 | | | | 18,172,700 | |
| | | | | |
| | 3,475 | | | Philadelphia Gas Works, Pennsylvania, Revenue Bonds, Refunding Fourteenth Series 2016, 5.000%, 10/01/20 | | | No Opt. Call | | | | | | | | A | | | | 3,646,457 | |
| | | | | |
| | 515 | | | Philadelphia Gas Works, Pennsylvania, Revenue Bonds, Twelfth Series 1990B, 7.000%, 5/15/20 – NPFG Insured (ETM) | | | No Opt. Call | | | | | | | | N/R (4) | | | | 531,212 | |
| | | | | |
| | | | Pittsburgh Public Parking Authority, Pennsylvania, Parking System Revenue Bonds, Refunding Series 2015A: | | | | | | | | | | | | | | | | |
| | 2,300 | | | 5.000%, 12/01/19 | | | No Opt. Call | | | | | | | | A+ | | | | 2,348,921 | |
| | 3,305 | | | 5.000%, 12/01/20 | | | No Opt. Call | | | | | | | | A+ | | | | 3,471,936 | |
| | 1,675 | | | 5.000%, 12/01/21 | | | No Opt. Call | | | | | | | | A+ | | | | 1,810,759 | |
| | 1,500 | | | 5.000%, 12/01/22 | | | No Opt. Call | | | | | | | | A+ | | | | 1,663,950 | |
| | | | | |
| | 2,285 | | | Quakertown General Authority Health Facilities Revenue USDA Loan Anticipation Notes and Revenue Bonds for LifeQuest Obligated Group, Pennsylvania, Series 2017A, 3.125%, 7/01/21 | | | 7/19 at 100.00 | | | | | | | | N/R | | | | 2,260,710 | |
184
| | | | | | | | | | | | | | | | | | | | |
Principal
Amount (000) | | | Description (1) | | Optional Call
Provisions (2) | | | | | | Ratings (3) | | | Value | |
| | | | | |
| | | | Pennsylvania(continued) | | | | | | | | | | | | |
| | | | | |
| $ | 2,035 | | | Scranton-Lackawanna Health and Welfare Authority, Pennsylvania, University Revenue Bonds, Marywood University, Series 2016, 3.375%, 6/01/26 | | | No Opt. Call | | | | | | | | BB+ | | | $ | 1,993,649 | |
| | | | | |
| | 2,515 | | | Southeastern Pennsylvania Transportation Authority, Capital Grant Receipts Bonds, Federal Transit Administration Section 5309 Fixed Guideway Modernization Formula Funds, Series 2011, 5.000%, 6/01/23 | | | No Opt. Call | | | | | | | | AA– | | | | 2,844,968 | |
| | | | | |
| | 1,180 | | | Southeastern Pennsylvania Transportation Authority, Capital Grant Receipts Bonds, Federal Transit Administration Section 5337 State of Good Repair Formula Program Funds, Refunding Series 2017, 5.000%, 6/01/24 | | | No Opt. Call | | | | | | | | AA– | | | | 1,365,767 | |
| | | | | |
| | | | Washington County Industrial Development Authority, Pennsylvania, College Revenue Bonds, AICUP Financing Program-Washington and Jefferson College Project,Series 2017-PP5: | | | | | | | | | | | | | | | | |
| | 1,045 | | | 5.000%, 11/01/21 | | | No Opt. Call | | | | | | | | A– | | | | 1,122,508 | |
| | 2,410 | | | 5.000%, 11/01/22 | | | No Opt. Call | | | | | | | | A– | | | | 2,649,337 | |
| | 2,530 | | | 5.000%, 11/01/23 | | | No Opt. Call | | | | | | | | A– | | | | 2,833,802 | |
| | 2,665 | | | 5.000%, 11/01/24 | | | No Opt. Call | | | | | | | | A– | | | | 3,043,217 | |
| | 2,550 | | | 5.000%, 11/01/25 | | | No Opt. Call | | | | | | | | A– | | | | 2,956,853 | |
| | | | | |
| | 3,270 | | | West Shore Area Authority, Cumberland County, Pennsylvania, Hospital Revenue Bonds, Holy Spirit Hospital of the Sisters of Christian Charity, Series 2011B, 5.625%, 1/01/32 | | | 1/22 at 100.00 | | | | | | | | AA | | | | 3,586,307 | |
| | 290,656 | | | Total Pennsylvania | | | | | | | | | | | | | | | 306,562,004 | |
| | | | | |
| | | | Rhode Island – 0.1% | | | | | | | | | | | | |
| | | | | |
| | | | Rhode Island Economic Development Corporation, Airport Revenue Bonds, Refunding Series 2013B: | | | | | | | | | | | | | | | | |
| | 700 | | | 5.000%, 7/01/19 | | | No Opt. Call | | | | | | | | A | | | | 703,822 | |
| | 1,165 | | | 5.000%, 7/01/20 | | | No Opt. Call | | | | | | | | A | | | | 1,206,929 | |
| | 1,360 | | | 5.000%, 7/01/21 | | | No Opt. Call | | | | | | | | A | | | | 1,449,583 | |
| | 3,225 | | | Total Rhode Island | | | | | | | | | | | | | | | 3,360,334 | |
| | | | | |
| | | | South Carolina – 0.9% | | | | | | | | | | | | |
| | | | | |
| | | | Greenville County School District, South Carolina, Installment Purchase Revenue Bonds, Building Equity Sooner Series 2012: | | | | | | | | | | | | | | | | |
| | 3,375 | | | 5.000%, 12/01/21 | | | No Opt. Call | | | | | | | | AA | | | | 3,672,439 | |
| | 4,910 | | | 5.000%, 12/01/22 | | | No Opt. Call | | | | | | | | AA | | | | 5,491,000 | |
| | | | | |
| | 1,745 | | | Greenwood Fifty School Facilities, Inc, South Carolina, Installment Purchase Revenue Bonds, Greenwood School District 50 Project, Refunding Series 2016, 5.000%, 12/01/19 – BAM Insured | | | No Opt. Call | | | | | | | | AA | | | | 1,785,624 | |
| | | | | |
| | | | Kershaw County Public Schools Foundation, South Carolina, Installment Purchase Revenue Bonds, Kershaw County School District, Refunding Series 2015: | | | | | | | | | | | | | | | | |
| | 1,075 | | | 5.000%, 12/01/19 | | | No Opt. Call | | | | | | | | A1 | | | | 1,100,026 | |
| | 600 | | | 5.000%, 12/01/20 | | | No Opt. Call | | | | | | | | A1 | | | | 634,674 | |
| | | | | |
| | 1,040 | | | Lexington County Health Services District, Inc, South Carolina, Hospital Revenue Bonds, Refunding Series 2011, 5.000%, 11/01/22 | | | 11/21 at 100.00 | | | | | | | | A1 | | | | 1,117,688 | |
| | | | | |
| | 350 | | | Lexington County Health Services District, Inc, South Carolina, Hospital Revenue Bonds, Refunding Series 2017, 5.000%, 11/01/26 | | | No Opt. Call | | | | | | | | A1 | | | | 416,332 | |
| | | | | |
| | 730 | | | McCormick County, South Carolina, Hospital Facilities Revenue Refunding and Improvement Bonds, McCormick Health Care Center Project, Series 2006, 8.000%, 3/01/21 (ETM) | | | No Opt. Call | | | | | | | | N/R (4) | | | | 787,458 | |
185
Nuveen Limited Term Municipal Bond Fund(continued)
Portfolio of Investments March 31, 2019
| | | | | | | | | | | | | | | | | | | | |
Principal
Amount (000) | | | Description (1) | | Optional Call
Provisions (2) | | | | | | Ratings (3) | | | Value | |
| | | | | |
| | | | South Carolina(continued) | | | | | | | | | | | | |
| | | | | |
| $ | 3,620 | | | Patriots Energy Group Financing Agency, South Carolina, Gas Supply Revenue Bonds, Series 2018A, 4.000%, 10/01/48 (Mandatory Put 2/01/24) | | | 11/23 at 100.30 | | | | | | | | Aa2 | | | $ | 3,913,871 | |
| | | | | |
| | 7,500 | | | Richland County, South Carolina, General Obligation Bonds, Transportation Sales & Use Tax, Anticipation Note Series 2019, 3.000%, 2/27/20 | | | No Opt. Call | | | | | | | | N/R | | | | 7,593,300 | |
| | | | | |
| | | | South Carolina Jobs-Economic Development Authority, Economic Development Revenue Bonds, FMU Student Housing LLC – Francis Marion University Project, Series 2014A: | | | | | | | | | | | | | | | | |
| | 1,020 | | | 5.000%, 8/01/22 | | | No Opt. Call | | | | | | | | Baa3 | | | | 1,061,596 | |
| | 1,035 | | | 5.000%, 8/01/24 | | | No Opt. Call | | | | | | | | Baa3 | | | | 1,105,960 | |
| | | | | |
| | | | South Carolina Jobs-Economic Development Authority, Hospital Revenue Bonds, Palmetto Health, Refunding Series 2013A: | | | | | | | | | | | | | | | | |
| | 1,450 | | | 5.250%, 8/01/24(Pre-refunded 8/01/23) | | | 8/23 at 100.00 | | | | | | | | N/R (4) | | | | 1,669,240 | |
| | 2,850 | | | 5.250%, 8/01/25(Pre-refunded 8/01/23) | | | 8/23 at 100.00 | | | | | | | | N/R (4) | | | | 3,280,920 | |
| | 3,500 | | | 5.250%, 8/01/26(Pre-refunded 8/01/23) | | | 8/23 at 100.00 | | | | | | | | N/R (4) | | | | 4,029,200 | |
| | 2,000 | | | 5.000%, 8/01/27(Pre-refunded 8/01/23) | | | 8/23 at 100.00 | | | | | | | | N/R (4) | | | | 2,281,560 | |
| | | | | |
| | 1,750 | | | South Carolina Public Service Authority, Santee Cooper Revenue Obligations, Refunding Series 2014C, 5.000%, 12/01/21 | | | No Opt. Call | | | | | | | | A+ | | | | 1,888,040 | |
| | | | | |
| | 1,425 | | | South Carolina Public Service Authority, Santee Cooper Revenue Obligations, Refunding Series 2015C, 5.000%, 12/01/19 (ETM) | | | No Opt. Call | | | | | | | | A+ (4) | | | | 1,457,789 | |
| | | | | |
| | 1,240 | | | South Carolina Public Service Authority, Santee Cooper Revenue Obligations, Refunding Series 2016A, 5.000%, 12/01/22 | | | No Opt. Call | | | | | | | | A+ | | | | 1,369,964 | |
| | | | | |
| | | | Sumter Two School Facilities, Inc, South Carolina, Installment Purchase Revenue Refunding Bonds, Sumter County School District 2 Project, Series 2016: | | | | | | | | | | | | | | | | |
| | 1,500 | | | 5.000%, 12/01/19 – BAM Insured | | | No Opt. Call | | | | | | | | AA | | | | 1,529,790 | |
| | 1,000 | | | 5.000%, 12/01/20 – BAM Insured | | | No Opt. Call | | | | | | | | AA | | | | 1,048,160 | |
| | 43,715 | | | Total South Carolina | | | | | | | | | | | | | | | 47,234,631 | |
| | | | | |
| | | | South Dakota – 0.1% | | | | | | | | | | | | |
| | | | | |
| | 455 | | | South Dakota Building Authority, Revenue Bonds, Series 2013B, 5.000%, 6/01/20 | | | No Opt. Call | | | | | | | | AA+ | | | | 473,082 | |
| | | | | |
| | | | South Dakota Health and Educational Facilities Authority, Revenue Bonds, Sanford Health, Series 2014B: | | | | | | | | | | | | | | | | |
| | 400 | | | 4.000%, 11/01/19 | | | No Opt. Call | | | | | | | | A+ | | | | 405,404 | |
| | 320 | | | 4.000%, 11/01/20 | | | No Opt. Call | | | | | | | | A+ | | | | 331,530 | |
| | 525 | | | 4.000%, 11/01/21 | | | No Opt. Call | | | | | | | | A+ | | | | 555,571 | |
| | 650 | | | 5.000%, 11/01/24 | | | No Opt. Call | | | | | | | | A+ | | | | 757,061 | |
| | | | | |
| | | | South Dakota Health and Educational Facilities Authority, Revenue Bonds, Sanford Health, Series 2015: | | | | | | | | | | | | | | | | |
| | 650 | | | 5.000%, 11/01/20 | | | No Opt. Call | | | | | | | | A+ | | | | 683,514 | |
| | 800 | | | 5.000%, 11/01/21 | | | No Opt. Call | | | | | | | | A+ | | | | 866,488 | |
| | 1,130 | | | 5.000%, 11/01/22 | | | No Opt. Call | | | | | | | | A+ | | | | 1,257,509 | |
| | 4,930 | | | Total South Dakota | | | | | | | | | | | | | | | 5,330,159 | |
| | | | | |
| | | | Tennessee – 1.1% | | | | | | | | | | | | |
| | | | | |
| | 1,510 | | | Harpeth Valley Utilities District, Davidson and Williamson Counties, Tennessee, Utilities Revenue Bonds, Refunding Series 2015, 4.000%, 9/01/20 | | | No Opt. Call | | | | | | | | AA+ | | | | 1,562,608 | |
186
| | | | | | | | | | | | | | | | | | | | |
Principal
Amount (000) | | | Description (1) | | Optional Call
Provisions (2) | | | | | | Ratings (3) | | | Value | |
| | | | | |
| | | | Tennessee(continued) | | | | | | | | | | | | |
| | | | | |
| | | | Knox County Health, Educational and Housing Facility Board, Tennessee, Hospital Revenue Bonds, Covenant Health, Refunding Series 2012A: | | | | | | | | | | | | | | | | |
| $ | 2,500 | | | 5.000%, 1/01/20 | | | No Opt. Call | | | | | | | | A+ | | | $ | 2,558,475 | |
| | 1,500 | | | 4.000%, 1/01/21 | | | No Opt. Call | | | | | | | | A+ | | | | 1,554,375 | |
| | | | | |
| | | | Knox County Health, Educational and Housing Facility Board, Tennessee, Hospital Revenue Bonds, East Tennessee Children’s Hospital, Series 2019: | | | | | | | | | | | | | | | | |
| | 2,325 | | | 5.000%, 11/15/32 | | | 2/29 at 100.00 | | | | | | | | A | | | | 2,782,979 | |
| | 2,810 | | | 5.000%, 11/15/33 | | | 2/29 at 100.00 | | | | | | | | A | | | | 3,334,711 | |
| | | | | |
| | | | Metropolitan Government of Nashville-Davidson County Health and Educational Facilities Board, Tennessee, Revenue Bonds, Belmont University Project, Series 2012: | | | | | | | | | | | | | | | | |
| | 1,070 | | | 4.000%, 11/01/19 | | | No Opt. Call | | | | | | | | A | | | | 1,084,830 | |
| | 810 | | | 4.000%, 11/01/20 | | | No Opt. Call | | | | | | | | A | | | | 839,565 | |
| | 500 | | | 4.000%, 11/01/21 | | | No Opt. Call | | | | | | | | A | | | | 528,205 | |
| | 1,030 | | | 5.000%, 11/01/22 | | | 11/21 at 100.00 | | | | | | | | A | | | | 1,108,558 | |
| | | | | |
| | | | Metropolitan Government of Nashville-Davidson County, Tennessee, Water and Sewerage Revenue Bonds, Subordinate Lien Refunding Series 2012: | | | | | | | | | | | | | | | | |
| | 2,615 | | | 5.000%, 7/01/21 | | | No Opt. Call | | | | | | | | AA– | | | | 2,810,001 | |
| | 1,870 | | | 5.000%, 7/01/22 | | | No Opt. Call | | | | | | | | AA– | | | | 2,064,798 | |
| | | | | |
| | 5,000 | | | Tennessee Housing Development Agency, Residential Finance Program Bonds,Series 2019-1, 3.400%, 7/01/34 | | | 7/28 at 100.00 | | | | | | | | AA+ | | | | 5,185,800 | |
| | | | | |
| | 8,680 | | | The Tennessee Energy Acquisition Corporation, Gas Project Revenue Bonds, Series 2018, 4.000%, 11/01/49 (Mandatory Put 11/01/25) | | | 8/25 at 100.22 | | | | | | | | A3 | | | | 9,370,668 | |
| | | | | |
| | 21,600 | | | The Tennessee Energy Acquisition Corporation, Gas Revenue Bonds, Series 2017A, 4.000%, 5/01/48 (Mandatory Put 5/01/23) | | | 5/23 at 100.43 | | | | | | | | A3 | | | | 22,854,528 | |
| | 53,820 | | | Total Tennessee | | | | | | | | | | | | | | | 57,640,101 | |
| | | | | |
| | | | Texas – 5.3% | | | | | | | | | | | | |
| | | | | |
| | | | Central Texas Regional Mobility Authority, Revenue Bonds, Senior Lien, Series 2016: | | | | | | | | | | | | | | | | |
| | 1,040 | | | 5.000%, 1/01/21 | | | No Opt. Call | | | | | | | | A– | | | | 1,094,226 | |
| | 1,430 | | | 5.000%, 1/01/22 | | | No Opt. Call | | | | | | | | A– | | | | 1,544,157 | |
| | 2,500 | | | 5.000%, 1/01/23 | | | No Opt. Call | | | | | | | | A– | | | | 2,766,625 | |
| | 3,560 | | | 5.000%, 1/01/24 | | | No Opt. Call | | | | | | | | A– | | | | 4,021,590 | |
| | | | | |
| | | | Corpus Christi Business and Job Development Corporation, Texas, Sales Tax Revenue Bonds, Arena Project, Refunding Series 2014: | | | | | | | | | | | | | | | | |
| | 1,000 | | | 5.000%, 9/01/21 | | | No Opt. Call | | | | | | | | AA | | | | 1,074,980 | |
| | 650 | | | 5.000%, 9/01/22 | | | No Opt. Call | | | | | | | | AA | | | | 717,379 | |
| | | | | |
| | 5,000 | | | Dallas Area Rapid Transit, Texas, Sales Tax Revenue Bonds, Senior Lien Refunding Series 2019, 5.000%, 12/01/24 (WI/DD, Settling 4/09/19) | | | No Opt. Call | | | | | | | | AA+ | | | | 5,880,900 | |
| | | | | |
| | | | Dallas-Fort Worth International Airport, Texas, Joint Revenue Bonds, Refunding & Improvement Series 2016: | | | | | | | | | | | | | | | | |
| | 9,690 | | | 1.350%, 11/01/20 (AMT) , 144A | | | No Opt. Call | | | | | | | | A+ | | | | 9,553,662 | |
| | 30,640 | | | 1.600%, 11/01/21 (AMT) , 144A | | | No Opt. Call | | | | | | | | A+ | | | | 30,129,844 | |
| | | | | |
| | | | Dallas-Fort Worth International Airport, Texas, Joint Revenue Bonds, Refunding Series 2012B: | | | | | | | | | | | | | | | | |
| | 2,595 | | | 5.000%, 11/01/20 | | | No Opt. Call | | | | | | | | A+ | | | | 2,734,222 | |
| | 5,000 | | | 5.000%, 11/01/21 | | | 11/20 at 100.00 | | | | | | | | A+ | | | | 5,302,500 | |
| | | | | |
| | 1,000 | | | Dallas-Fort Worth International Airport, Texas, Joint Revenue Bonds, Refunding Series 2014A, 5.250%, 11/01/26 (AMT) | | | 11/23 at 100.00 | | | | | | | | A+ | | | | 1,146,390 | |
187
Nuveen Limited Term Municipal Bond Fund(continued)
Portfolio of Investments March 31, 2019
| | | | | | | | | | | | | | | | | | | | |
Principal
Amount (000) | | | Description (1) | | Optional Call
Provisions (2) | | | | | | Ratings (3) | | | Value | |
| | | | | |
| | | | Texas(continued) | | | | | | | | | | | | |
| | | | | |
| $ | 18,000 | | | Grand Parkway Transportation Corporation, Texas, System Toll Revenue Bonds, Bond Anticipation Note Series 2014A, 5.000%, 2/01/23 | | | No Opt. Call | | | | | | | | A+ | | | $ | 20,086,560 | |
| | | | | |
| | 3,020 | | | Harris County Cultural Education Facilities Finance Corporation, Texas, Hospital Revenue Bonds, Memorial Hermann Healthcare System, Series 2014A, 5.000%, 12/01/24 | | | No Opt. Call | | | | | | | | A+ | | | | 3,516,548 | |
| | | | | |
| | | | Harris County-Houston Sports Authority, Texas, Revenue Bonds, Refunding Second Lien Series 2014C: | | | | | | | | | | | | | | | | |
| | 825 | | | 5.000%, 11/15/19 | | | No Opt. Call | | | | | | | | A3 | | | | 840,658 | |
| | 575 | | | 5.000%, 11/15/20 | | | No Opt. Call | | | | | | | | A3 | | | | 602,152 | |
| | 480 | | | 5.000%, 11/15/21 | | | No Opt. Call | | | | | | | | A3 | | | | 515,856 | |
| | | | | |
| | | | Harris County-Houston Sports Authority, Texas, Revenue Bonds, Refunding Senior Lien Series 2014A: | | | | | | | | | | | | | | | | |
| | 11,635 | | | 5.000%, 11/15/22 – AGM Insured | | | No Opt. Call | | | | | | | | AA | | | | 12,943,937 | |
| | 8,630 | | | 5.000%, 11/15/23 – AGM Insured | | | No Opt. Call | | | | | | | | AA | | | | 9,820,250 | |
| | 5,205 | | | 5.000%, 11/15/24 – AGM Insured | | | No Opt. Call | | | | | | | | AA | | | | 6,070,279 | |
| | | | | |
| | | | Houston, Texas, Airport System Revenue Bonds, Refunding & Subordinate Lien Series 2018C: | | | | | | | | | | | | | | | | |
| | 4,000 | | | 5.000%, 7/01/29 (AMT) | | | 7/28 at 100.00 | | | | | | | | AA | | | | 4,873,160 | |
| | 6,000 | | | 5.000%, 7/01/30 (AMT) | | | 7/28 at 100.00 | | | | | | | | AA | | | | 7,240,980 | |
| | 3,000 | | | 5.000%, 7/01/31 (AMT) | | | 7/28 at 100.00 | | | | | | | | AA | | | | 3,593,130 | |
| | | | | |
| | 2,250 | | | Houston, Texas, Airport System Revenue Bonds, Refunding Subordinate Lien Series 2011B, 5.000%, 7/01/20 | | | No Opt. Call | | | | | | | | A+ | | | | 2,345,760 | |
| | | | | |
| | 2,915 | | | Houston, Texas, Combined Utility System Revenue Bonds, Refunding First Lien Series 2014C, 5.000%, 5/15/20 | | | No Opt. Call | | | | | | | | AA | | | | 3,025,799 | |
| | | | | |
| | 1,250 | | | Houston, Texas, General Obligation Bonds, Refunding Public Improvement Series 2009A, 5.000%, 3/01/20 | | | 5/19 at 100.00 | | | | | | | | AA | | | | 1,253,225 | |
| | | | | |
| | | | Love Field Airport Modernization Corporation, Texas, General Airport Revenue Bonds Series 2015: | | | | | | | | | | | | | | | | |
| | 1,000 | | | 5.000%, 11/01/19 (AMT) | | | No Opt. Call | | | | | | | | A1 | | | | 1,019,200 | |
| | 1,000 | | | 5.000%, 11/01/20 (AMT) | | | No Opt. Call | | | | | | | | A1 | | | | 1,050,270 | |
| | 1,000 | | | 5.000%, 11/01/21 (AMT) | | | No Opt. Call | | | | | | | | A1 | | | | 1,077,840 | |
| | 1,720 | | | 5.000%, 11/01/22 (AMT) | | | No Opt. Call | | | | | | | | A1 | | | | 1,900,841 | |
| | 1,455 | | | 5.000%, 11/01/23 (AMT) | | | No Opt. Call | | | | | | | | A1 | | | | 1,643,932 | |
| | 1,500 | | | 5.000%, 11/01/24 (AMT) | | | No Opt. Call | | | | | | | | A1 | | | | 1,728,165 | |
| | | | | |
| | 10,000 | | | Matagorda County Navigation District Number One, Texas, Pollution Control Revenue Refunding Bonds, Central Power and Light Company Project, Series 2009A, 6.300%, 11/01/29 | | | 7/19 at 102.00 | | | | | | | | A– | | | | 10,304,300 | |
| | | | | |
| | 1,510 | | | McCamey County Hospital District, Texas, General Obligation Bonds, Series 2013, 4.000%, 12/01/21 | | | No Opt. Call | | | | | | | | B1 | | | | 1,535,262 | |
| | | | | |
| | 2,175 | | | Mission Economic Development Corporation, Texas, Revenue Bonds, Natgasoline Project, Senior Lien Series 2018, 4.625%, 10/01/31 (AMT), 144A | | | 10/21 at 105.00 | | | | | | | | BB– | | | | 2,262,304 | |
| | | | | |
| | | | North Central Texas Health Facilities Development Corporation, Texas, Revenue Bonds, Children’s Medical Center Dallas Project, Series 2012: | | | | | | | | | | | | | | | | |
| | 1,715 | | | 5.000%, 8/15/19 | | | No Opt. Call | | | | | | | | Aa2 | | | | 1,736,094 | |
| | 2,795 | | | 5.000%, 8/15/21 | | | No Opt. Call | | | | | | | | Aa2 | | | | 3,010,327 | |
| | 2,010 | | | 5.000%, 8/15/22 | | | No Opt. Call | | | | | | | | Aa2 | | | | 2,226,196 | |
| | 6,415 | | | 5.000%, 8/15/23(Pre-refunded 8/15/22) | | | 8/22 at 100.00 | | | | | | | | Aa2 (4) | | | | 7,134,250 | |
| | | | | |
| | 7,650 | | | North Texas Tollway Authority, Special Projects System Revenue Bonds, Current Interest Series 2011D, 5.000%, 9/01/24(Pre-refunded 9/01/21) | | | 9/21 at 100.00 | | | | | | | | N/R (4) | | | | 8,267,125 | |
188
| | | | | | | | | | | | | | | | | | | | |
Principal
Amount (000) | | | Description (1) | | Optional Call
Provisions (2) | | | | | | Ratings (3) | | | Value | |
| | | | | |
| | | | Texas(continued) | | | | | | | | | | | | |
| | | | | |
| | | | North Texas Tollway Authority, System Revenue Bonds, Refunding First Tier, Series 2014A: | | | | | | | | | | | | | | | | |
| $ | 4,030 | | | 5.000%, 1/01/22 | | | No Opt. Call | | | | | | | | A+ | | | $ | 4,396,972 | |
| | 4,945 | | | 5.000%, 1/01/23 | | | No Opt. Call | | | | | | | | A+ | | | | 5,544,631 | |
| | 7,045 | | | 5.000%, 1/01/24 | | | No Opt. Call | | | | | | | | A+ | | | | 8,092,380 | |
| | | | | |
| | | | North Texas Tollway Authority, System Revenue Bonds, Refunding First Tier, Series 2017A: | | | | | | | | | | | | | | | | |
| | 5,000 | | | 5.000%, 1/01/23 | | | No Opt. Call | | | | | | | | A+ | | | | 5,606,300 | |
| | 3,260 | | | 5.000%, 1/01/24 | | | 1/23 at 100.00 | | | | | | | | A+ | | | | 3,645,234 | |
| | 3,200 | | | 5.000%, 1/01/27 | | | 1/26 at 100.00 | | | | | | | | A+ | | | | 3,806,176 | |
| | | | | |
| | 2,470 | | | San Antonio, Texas, Electric and Gas System Revenue Bonds, Junior Lien Series 2015A, 2.250%, 2/01/33 (Mandatory Put 12/01/19) | | | No Opt. Call | | | | | | | | AA– | | | | 2,478,744 | |
| | | | | |
| | 3,825 | | | Texas Department of Housing and Community Affairs, Residential Mortgage Revenue Bonds, Premium Series 2019A, 3.500%, 7/01/34 | | | 7/28 at 100.00 | | | | | | | | Aaa | | | | 3,938,411 | |
| | | | | |
| | 5,500 | | | Texas Municipal Gas Acquisition and Supply Corporation III, Gas Supply Revenue Bonds, Series 2012, 5.000%, 12/15/20 | | | No Opt. Call | | | | | | | | A3 | | | | 5,764,495 | |
| | | | | |
| | 2,745 | | | Texas Southmost College District, Texas, General Obligation Bonds, Refunding Limited Tax Series 2014A, 5.000%, 2/15/20 | | | No Opt. Call | | | | | | | | AA– | | | | 2,826,664 | |
| | | | | |
| | 10,620 | | | Texas State, General Obligation Bonds, Tax & Revenue Anticipation Note Series 2018, 4.000%, 8/29/19 | | | No Opt. Call | | | | | | | | N/R | | | | 10,725,244 | |
| | | | | |
| | | | Texas Water Development Board, State Water Implementation Revenue Fund Bonds, Master Trust Taxable Series 2018A: | | | | | | | | | | | | | | | | |
| | 7,000 | | | 5.000%, 10/15/23 | | | No Opt. Call | | | | | | | | AAA | | | | 8,032,080 | |
| | 13,040 | | | 5.000%, 10/15/24 | | | No Opt. Call | | | | | | | | AAA | | | | 15,316,002 | |
| | 12,540 | | | 5.000%, 10/15/25 | | | No Opt. Call | | | | | | | | AAA | | | | 15,050,884 | |
| | 259,055 | | | Total Texas | | | | | | | | | | | | | | | 282,815,092 | |
| | | | | |
| | | | Utah – 0.1% | | | | | | | | | | | | |
| | | | | |
| | | | Utah Associated Municipal Power Systems, Revenue Bonds, Horse Butte Wind Project, Series 2012A: | | | | | | | | | | | | | | | | |
| | 1,250 | | | 5.000%, 9/01/19 | | | No Opt. Call | | | | | | | | A | | | | 1,267,125 | |
| | 1,090 | | | 5.000%, 9/01/20 | | | No Opt. Call | | | | | | | | A | | | | 1,140,500 | |
| | 2,065 | | | 5.000%, 9/01/21 | | | No Opt. Call | | | | | | | | A | | | | 2,222,373 | |
| | 4,405 | | | Total Utah | | | | | | | | | | | | | | | 4,629,998 | |
| | | | | |
| | | | Vermont – 0.0% | | | | | | | | | | | | |
| | | | | |
| | 725 | | | Vermont Educational and Health Buildings Financing Agency, Revenue Bonds, University of Vermont Medical Center Project, Series 2016A, 4.000%, 12/01/19 | | | No Opt. Call | | | | | | | | A+ | | | | 736,433 | |
| | | | | |
| | | | Virginia – 1.6% | | | | | | | | | | | | |
| | | | | |
| | 10,570 | | | Halifax County Industrial Development Authority, Virginia, Recovery Zone Facility Revenue Bonds, Virginia Electric & Power Company Project, Series 2010A, 2.150%, 12/01/41 (Mandatory Put 9/01/20) | | | No Opt. Call | | | | | | | | A2 | | | | 10,603,718 | |
| | | | | |
| | 1,000 | | | Hanover County, Virginia, General Obligation Bonds, Refunding & Public Improvement Series 2009, 5.000%, 7/15/19 | | | No Opt. Call | | | | | | | | AAA | | | | 1,010,040 | |
| | | | | |
| | 29,140 | | | Loudoun County Economic Development Authority, Virginia, Lease Revenue Bonds, Metrorail Service District Improvement Silver Line Phase 2 Project, Series 2018, 2.000%, 4/01/22 | | | 4/20 at 100.00 | | | | | | | | AA+ | | | | 29,181,962 | |
189
Nuveen Limited Term Municipal Bond Fund(continued)
Portfolio of Investments March 31, 2019
| | | | | | | | | | | | | | | | | | | | |
Principal
Amount (000) | | | Description (1) | | Optional Call
Provisions (2) | | | | | | Ratings (3) | | | Value | |
| | | | | |
| | | | Virginia(continued) | | | | | | | | | | | | |
| | | | | |
| $ | 6,505 | | | Louisa Industrial Development Authority, Virginia, Pollution Control Revenue Bonds, Virginia Electric and Power Company, Refunding Series 2008A, 1.750%, 11/01/35 (Mandatory Put 5/16/19) | | | No Opt. Call | | | | | | | | A2 | | | $ | 6,503,894 | |
| | | | | |
| | 5,240 | | | Norfolk Economic Development Authority, Virginia, Hospital Facility Revenue Bonds, Sentara Healthcare Systems, Refunding Series 2018A, 5.000%, 11/01/48 (Mandatory Put 11/01/28) | | | No Opt. Call | | | | | | | | AA | | | | 6,481,461 | |
| | | | | |
| | 1,875 | | | Peninsula Ports Authority of Virginia, Coal Terminal Revenue Bonds, Dominion Terminal Associates Project-DETC Issue, Refunding Series 2003, 1.550%, 10/01/33 (Mandatory Put 10/01/19) | | | No Opt. Call | | | | | | | | BBB | | | | 1,869,919 | |
| | | | | |
| | 1,000 | | | Virginia Small Business Financing Authority, Revenue Bonds, Hampton University, Refunding Series 2014, 5.000%, 10/01/19 | | | No Opt. Call | | | | | | | | A | | | | 1,016,770 | |
| | | | | |
| | 15,005 | | | Wise County Industrial Development Authority, Virginia, Solid Waste and Sewage Disposal Revenue Bonds, Virginia Electric and Power Company, Series 2009A, 2.150%, 10/01/40 (Mandatory Put 9/01/20) | | | No Opt. Call | | | | | | | | BBB+ | | | | 15,052,866 | |
| | | | | |
| | 11,990 | | | Wise County Industrial Development Authority, Virginia, Solid Waste and Sewage Disposal Revenue Bonds, Virginia Electric and Power Company, Series 2010A, 1.875%, 11/01/40 (Mandatory Put 6/01/20) | | | No Opt. Call | | | | | | | | A2 | | | | 11,983,645 | |
| | | | | |
| | 2,840 | | | York County Economic Development Authority, Virginia, Pollution Control Revenue Bonds, Virginia Electric and Power Company Project, Refunding Series 2009A, 1.875%, 5/01/33 (Mandatory Put 5/16/19) | | | No Opt. Call | | | | | | | | A2 | | | | 2,839,801 | |
| | 85,165 | | | Total Virginia | | | | | | | | | | | | | | | 86,544,076 | |
| | | | | |
| | | | Washington – 2.4% | | | | | | | | | | | | |
| | | | | |
| | 10,000 | | | Energy Northwest, Washington, Electric Revenue Bonds, Columbia Generating Station, Refunding Series 2015A, 5.000%, 7/01/23 | | | No Opt. Call | | | | | | | | Aa1 | | | | 11,388,600 | |
| | | | | |
| | 5,000 | | | Energy Northwest, Washington, Electric Revenue Bonds, Nuclear Project 1, Refunding Series 2015C, 5.000%, 7/01/25 | | | No Opt. Call | | | | | | | | Aa1 | | | | 5,970,050 | |
| | | | | |
| | 10,545 | | | Energy Northwest, Washington, Electric Revenue Bonds, Nuclear Project 1, Refunding Series 2017A, 5.000%, 7/01/27 | | | No Opt. Call | | | | | | | | Aa1 | | | | 13,059,877 | |
| | | | | |
| | | | King County Public Hospital District 1, Washington, Limited Tax General Obligation Bonds, Refunding Series 2016: | | | | | | | | | | | | | | | | |
| | 6,485 | | | 5.000%, 12/01/23 | | | No Opt. Call | | | | | | | | A2 | | | | 7,337,518 | |
| | 7,285 | | | 5.000%, 12/01/24 | | | No Opt. Call | | | | | | | | A2 | | | | 8,406,671 | |
| | | | | |
| | 1,005 | | | Port of Seattle, Washington, Revenue Bonds, Refunding Intermediate Lien Series 2015B, 5.000%, 3/01/20 | | | No Opt. Call | | | | | | | | AA– | | | | 1,036,145 | |
| | | | | |
| | | | Spokane Public Facilities District, Washington, Hotel, Motel, and Sales Use Tax Revenue Bonds, Refunding Series 2013B: | | | | | | | | | | | | | | | | |
| | 1,520 | | | 5.000%, 12/01/20 | | | No Opt. Call | | | | | | | | A+ | | | | 1,603,722 | |
| | 2,095 | | | 5.000%, 12/01/21 | | | No Opt. Call | | | | | | | | A+ | | | | 2,274,479 | |
| | | | | |
| | 3,000 | | | Washington Health Care Facilities Authority, Revenue Bonds, Fred Hutchinson Cancer Research Center, Series 2011A, 5.375%, 1/01/31 | | | 1/21 at 100.00 | | | | | | | | A+ | | | | 3,151,800 | |
| | | | | |
| | | | Washington Health Care Facilities Authority, Revenue Bonds, Fred Hutchinson Cancer Research Center, Series 2015: | | | | | | | | | | | | | | | | |
| | 1,500 | | | 5.000%, 1/01/21 | | | No Opt. Call | | | | | | | | A+ | | | | 1,580,565 | |
| | 5,730 | | | 5.000%, 1/01/22 | | | No Opt. Call | | | | | | | | A+ | | | | 6,203,413 | |
| | 1,950 | | | 5.000%, 1/01/24 | | | No Opt. Call | | | | | | | | A+ | | | | 2,210,384 | |
| | 1,310 | | | 5.000%, 1/01/25 | | | No Opt. Call | | | | | | | | A+ | | | | 1,513,364 | |
| | | | | |
| | 1,065 | | | Washington Health Care Facilities Authority, Revenue Bonds, PeaceHealth, Refunding Series 2014A, 5.000%, 11/15/21 | | | No Opt. Call | | | | | | | | AA– | | | | 1,153,928 | |
190
| | | | | | | | | | | | | | | | | | | | |
Principal
Amount (000) | | | Description (1) | | Optional Call
Provisions (2) | | | | | | Ratings (3) | | | Value | |
| | | | | |
| | | | Washington(continued) | | | | | | | | | | | | |
| | | | | |
| | | | Washington Health Care Facilities Authority, Revenue Bonds, Providence Health & Services, Series 2012B: | | | | | | | | | | | | | | | | |
| $ | 10,000 | | | 4.000%, 10/01/42(Mandatory Put 10/01/21) | | | No Opt. Call | | | | | | | | AA– | | | $ | 10,551,800 | |
| | 10,835 | | | 5.000%, 10/01/42(Mandatory Put 10/01/21) | | | No Opt. Call | | | | | | | | AA– | | | | 11,696,599 | |
| | | | | |
| | | | Washington Health Care Facilities Authority, Revenue Bonds, Providence Saint Joseph Health, Series 2018B: | | | | | | | | | | | | | | | | |
| | 1,250 | | | 5.000%, 10/01/25 | | | No Opt. Call | | | | | | | | AA– | | | | 1,485,525 | |
| | 1,850 | | | 5.000%, 10/01/26 | | | No Opt. Call | | | | | | | | AA– | | | | 2,236,150 | |
| | 3,010 | | | 5.000%, 10/01/27 | | | No Opt. Call | | | | | | | | AA– | | | | 3,691,283 | |
| | 2,100 | | | 5.000%, 10/01/28 | | | No Opt. Call | | | | | | | | AA– | | | | 2,611,392 | |
| | | | | |
| | 6,000 | | | Washington State Economic Development Finance Authority, Solid Waste Disposal Revenue Bonds, Waste Management Inc, Series 2008, 2.125%, 6/01/20, 144A | | | 9/19 at 100.00 | | | | | | | | A– | | | | 5,996,040 | |
| | | | | |
| | 1,450 | | | Washington State Housing Finance Commission,Non-Profit Housing Revenue Bonds, Bayview Manor Senior Project, TEMPS 70 Series 2016B, 2.800%, 7/01/21, 144A | | | 5/19 at 100.00 | | | | | | | | N/R | | | | 1,445,273 | |
| | | | | |
| | 20,175 | | | Washington State, General Obligation Bonds, Refunding Various PurposeSeries 2013R-13C, 5.000%, 7/01/21 | | | No Opt. Call | | | | | | | | AA+ | | | | 21,716,773 | |
| | 115,160 | | | Total Washington | | | | | | | | | | | | | | | 128,321,351 | |
| | | | | |
| | | | West Virginia – 0.6% | | | | | | | | | | | | |
| | | | | |
| | 3,710 | | | West Virginia Economic Development Authority, Energy Revenue Bonds, Morgantown Energy Associates Project, Refunding Series 2016, 2.875%, 12/15/26 (AMT) | | | No Opt. Call | | | | | | | | Baa3 | | | | 3,646,522 | |
| | | | | |
| | 6,000 | | | West Virginia Economic Development Authority, Solid Waste Disposal Facilities Revenue Bonds, Appalachian Power Company – Amos Project, Refunding Series 2015A, 2.550%, 3/01/40 (Mandatory Put 4/01/24) (WI/DD, Settling 4/01/19) | | | No Opt. Call | | | | | | | | A– | | | | 6,084,600 | |
| | | | | |
| | 6,765 | | | West Virginia Economic Development Authority, Solid Waste Disposal Facilities Revenue Bonds, Appalachian Power Company – Amos Project, Series 2011A, 1.700%, 1/01/41 (Mandatory Put 9/01/20) (AMT) | | | No Opt. Call | | | | | | | | A– | | | | 6,739,631 | |
| | | | | |
| | 4,010 | | | West Virginia Economic Development Authority, Solid Waste Disposal Facilities Revenue Bonds, Appalachian Power Company – Amos Project, Series 2009A, 2.625%, 12/01/42 (Mandatory Put 6/01/22) | | | No Opt. Call | | | | | | | | A– | | | | 4,076,526 | |
| | | | | |
| | 4,000 | | | West Virginia Economic Development Authority, Solid Waste Disposal Facilities Revenue Bonds, Appalachian Power Company – Amos Project, Series 2009B, 2.625%, 12/01/42 (Mandatory Put 6/01/22) | | | No Opt. Call | | | | | | | | A– | | | | 4,066,360 | |
| | | | | |
| | 4,095 | | | West Virginia Economic Development Authority, Solid Waste Disposal Facilities Revenue Bonds, Wheeling Power Company – Mitchell Project, Series 2013A, 3.000%, 6/01/37 (Mandatory Put 4/01/22) (AMT) | | | No Opt. Call | | | | | | | | A– | | | | 4,134,844 | |
| | | | | |
| | 1,030 | | | West Virginia Hospital Finance Authority, Hospital Revenue Bonds, Charleston Area Medical Center, Series 2014A, 5.000%, 9/01/24 | | | No Opt. Call | | | | | | | | Baa1 | | | | 1,160,841 | |
| | 29,610 | | | Total West Virginia | | | | | | | | | | | | | | | 29,909,324 | |
| | | | | |
| | | | Wisconsin – 1.5% | | | | | | | | | | | | |
| | | | | |
| | 980 | | | Public Finance Authority of Wisconsin, Senior Living Facility Revenue Bonds, Mary’s Woods at Marylhurst Inc, TEMPS 70Series 2017B-2, 3.500%, 11/15/23, 144A | | | 5/19 at 100.00 | | | | | | | | BB | | | | 980,372 | |
191
Nuveen Limited Term Municipal Bond Fund(continued)
Portfolio of Investments March 31, 2019
| | | | | | | | | | | | | | | | | | | | |
Principal
Amount (000) | | | Description (1) | | Optional Call
Provisions (2) | | | | | | Ratings (3) | | | Value | |
| | | | | |
| | | | Wisconsin(continued) | | | | | | | | | | | | |
| | | | | |
| $ | 840 | | | Public Finance Authority of Wisconsin, Senior Living Facility Revenue Bonds, Mary’s Woods at Marylhurst Inc, TEMPS 85Series 2017B-1, 3.950%, 11/15/24, 144A | | | 11/19 at 100.00 | | | | | | | | BB | | | $ | 844,578 | |
| | | | | |
| | 1,340 | | | Public Finance Authority of Wisconsin, Senior Living Facility Revenue Bonds, Mary’s Woods at Marylhurst Inc., TEMPS 50Series 2017B-3, 3.000%, 11/15/22, 144A | | | 5/19 at 100.00 | | | | | | | | BB | | | | 1,340,268 | |
| | | | | |
| | 5,165 | | | Public Finance Authority of Wisconsin, Solid Waste Disposal Revenue Bonds, Waste Management Inc, RefundingSeries 2016A-3, 2.000%, 7/01/29 (Mandatory Put 6/01/21) (AMT) | | | No Opt. Call | | | | | | | | A– | | | | 5,146,664 | |
| | | | | |
| | 10,000 | | | Public Finance Authority of Wisconsin, Solid Waste Disposal Revenue Bonds, Waste Management Inc, RefundingSeries 2017A-3, 1.950%, 9/01/27 (Mandatory Put 8/01/19) (AMT) | | | No Opt. Call | | | | | | | | A– | | | | 10,001,000 | |
| | | | | |
| | 950 | | | Wisconsin Health & Educational Facs Authority, Health Facilities Revenue Bonds, UnityPoint Health Project, Series 2014A, 5.000%, 12/01/19 | | | No Opt. Call | | | | | | | | AA– | | | | 969,826 | |
| | | | | |
| | 7,180 | | | Wisconsin Health and Educational Facilities Authority, Revenue Bonds, Ascension Health Alliance Senior Credit Group, Series 2013B, 1.375%, 11/15/38 (Mandatory Put 12/03/19) | | | No Opt. Call | | | | | | | | AA+ | | | | 7,166,358 | |
| | | | | |
| | 5,680 | | | Wisconsin Health and Educational Facilities Authority, Revenue Bonds, Aurora Health Care, Inc, Series 2010B, 5.000%, 7/15/19 (ETM) | | | No Opt. Call | | | | | | | | Aa3 (4) | | | | 5,736,402 | |
| | | | | |
| | 2,845 | | | Wisconsin Health and Educational Facilities Authority, Revenue Bonds, Aurora Health Care, Inc, Series 2012A, 5.000%, 7/15/27 – AGM Insured(Pre-refunded 7/15/21) | | | 7/21 at 100.00 | | | | | | | | AA (4) | | | | 3,065,886 | |
| | | | | |
| | 6,285 | | | Wisconsin Health and Educational Facilities Authority, Revenue Bonds, Hospital Sisters Services, Inc, Refunding Series 2014A, 5.000%, 11/15/22 | | | No Opt. Call | | | | | | | | AA– | | | | 6,992,062 | |
| | | | | |
| | 1,710 | | | Wisconsin Health and Educational Facilities Authority, Revenue Bonds, Medical College of Wisconsin, Inc, Series 2010, 5.000%, 12/01/19 | | | No Opt. Call | | | | | | | | AA– | | | | 1,748,663 | |
| | | | | |
| | 850 | | | Wisconsin Health and Educational Facilities Authority, Revenue Bonds, Mercy Alliance, Inc, Series 2010A, 5.000%, 6/01/19 | | | No Opt. Call | | | | | | | | A3 | | | | 854,174 | |
| | | | | |
| | | | Wisconsin Health and Educational Facilities Authority, Revenue Bonds, Ministry Health Care, Inc, Refunding 2012C: | | | | | | | | | | | | | | | | |
| | 420 | | | 5.000%, 8/15/20 (ETM) | | | No Opt. Call | | | | | | | | N/R (4) | | | | 439,492 | |
| | 1,480 | | | 5.000%, 8/15/21 (ETM) | | | No Opt. Call | | | | | | | | N/R (4) | | | | 1,597,231 | |
| | 55 | | | 5.000%, 8/15/23(Pre-refunded 8/15/22) | | | 8/22 at 100.00 | | | | | | | | N/R (4) | | | | 61,071 | |
| | | | | |
| | 3,150 | | | Wisconsin Health and Educational Facilities Authority, Revenue Bonds, ProHealth Care, Inc Obligated Group, Refunding Series 2015, 3.375%, 8/15/29 | | | 8/24 at 100.00 | | | | | | | | A+ | | | | 3,234,861 | |
| | | | | |
| | | | Wisconsin State, General Fund Annual Appropriation Revenue Bonds, Refunding Series 2009A: | | | | | | | | | | | | | | | | |
| | 7,230 | | | 5.250%, 5/01/20(Pre-refunded 5/01/19) | | | 5/19 at 100.00 | | | | | | | | Aa2 (4) | | | | 7,251,979 | |
| | 5 | | | 5.375%, 5/01/25(Pre-refunded 5/01/19) | | | 5/19 at 100.00 | | | | | | | | N/R (4) | | | | 5,016 | |
| | 40 | | | 5.375%, 5/01/25(Pre-refunded 5/01/19) | | | 5/19 at 100.00 | | | | | | | | Aa2 (4) | | | | 40,126 | |
| | 325 | | | 5.750%, 5/01/29(Pre-refunded 5/01/19) | | | 5/19 at 100.00 | | | | | | | | N/R (4) | | | | 326,118 | |
| | 2,550 | | | 5.750%, 5/01/29(Pre-refunded 5/01/19) | | | 5/19 at 100.00 | | | | | | | | Aa2 (4) | | | | 2,558,772 | |
| | | | | |
| | 9,000 | | | Wisconsin State, General Fund Annual Appropriation Revenue Bonds, Refunding Series 2019A, 5.000%, 5/01/22 | | | No Opt. Call | | | | | | | | Aa2 | | | | 9,931,680 | |
| | | | | |
| | | | Wisconsin State, Transportation Revenue Bonds,Series 2014-1: | | | | | | | | | | | | | | | | |
| | 5,000 | | | 5.000%, 7/01/21(Pre-refunded 7/01/19) | | | 7/19 at 100.00 | | | | | | | | AA+ (4) | | | | 5,043,500 | |
| | 675 | | | 5.000%, 7/01/22(Pre-refunded 7/01/19) | | | 7/19 at 100.00 | | | | | | | | AA+ (4) | | | | 680,873 | |
| | 1,770 | | | 5.000%, 7/01/23(Pre-refunded 7/01/19) | | | 7/19 at 100.00 | | | | | | | | AA+ (4) | | | | 1,785,399 | |
192
| | | | | | | | | | | | | | | | | | | | |
Principal
Amount (000) | | | Description (1) | | Optional Call
Provisions (2) | | | | | | Ratings (3) | | | Value | |
| | | | | |
| | | | Wisconsin(continued) | | | | | | | | | | | | |
| | | | | |
| | | | WPPI Energy, Wisconsin, Power Supply System Revenue Bonds, Refunding Series 2014A: | | | | | | | | | | | | | | | | |
| $ | 670 | | | 5.000%, 7/01/25 | | | 7/24 at 100.00 | | | | | | | | A1 | | | $ | 768,966 | |
| | 1,000 | | | 5.000%, 7/01/26 | | | 7/24 at 100.00 | | | | | | | | A1 | | | | 1,147,710 | |
| | 725 | | | 5.000%, 7/01/27 | | | 7/24 at 100.00 | | | | | | | | A1 | | | | 831,706 | |
| | 77,920 | | | Total Wisconsin | | | | | | | | | | | | | | | 80,550,753 | |
| $ | 4,877,892 | | | Total Municipal Bonds (cost $5,080,598,151) | | | | | | | | | | | | | | | 5,163,728,959 | |
| | | | | |
Principal
Amount (000) | | | Description (1) | | Coupon | | | Maturity | | | Ratings (3) | | | Value | |
| | | | | |
| | | | CORPORATE BONDS – 0.0% | | | | | | | | | | | | | | | | |
| | | | | |
| | | | Transportation – 0.0% | | | | | | | | | | | | |
| | | | | |
| $ | 123 | | | Las Vegas Monorail Company, Senior Interest Bonds (7), (8) | | | 5.500% | | | | 7/15/19 | | | | N/R | | | $ | 82,173 | |
| | | | | |
| | 35 | | | Las Vegas Monorail Company, Senior Interest Bonds (7), (8) | | | 5.500% | | | | 7/15/55 | | | | N/R | | | | 17,407 | |
| $ | 158 | | | Total Corporate Bonds (cost $6,773) | | | | | | | | | | | | | | | 99,580 | |
| | | | Total Long-Term Investments (cost $5,080,604,924) | | | | | | | | | | | | | | | 5,163,828,539 | |
| | | | | |
Principal
Amount (000) | | | Description (1) | | Optional Call
Provisions (2) | | | | | | Ratings (3) | | | Value | |
| | | | | |
| | | | SHORT-TERM INVESTMENTS – 1.1% | | | | | | | | | | | | | | | | |
| | | | | |
| | | | MUNICIPAL BONDS – 1.1% | | | | | | | | | | | | | | | | |
| | | | | |
| | | | National – 0.3% | | | | | | | | | | | | |
| | | | | |
| $ | 12,850 | | | BB&T Municipal Trust Pool Tax Exempt Lease Certificates Class C Series 2018, Variable Rate Demand Obligations, 2.920%, 11/01/21 (SIFMA reference rate + 0.80% spread), 144A (9), (10) | | | No Opt. Call | | | | | | | | A+ | | | $ | 12,850,000 | |
| | | | | |
| | | | Florida – 0.3% | | | | | | | | | | | | |
| | | | | |
| | 6,900 | | | Miami-Dade County School Board, Florida, Certificates of Participation, Variable Rate Demand Obligations, 1.730%, 5/01/37 (9) | | | 6/19 at 100.00 | | | | | | | | N/R | | | | 6,900,000 | |
| | | | | |
| | 10,000 | | | Miami-Dade County School Board, Florida, Certificates of Participation, Variable Rate Demand Obligations, Series 2013, 0.000%, 5/01/31, 144A (9) | | | No Opt. Call | | | | | | | | A-2 | | | | 10,000,000 | |
| | 16,900 | | | Total Florida | | | | | | | | | | | | | | | 16,900,000 | |
| | | | | |
| | | | Nevada – 0.1% | | | | | | | | | | | | |
| | | | | |
| | 5,780 | | | Clark County, Nevada, Airport Revenue Bonds, Variable Rate Demand Obligations, Subordinate Lien Series 2008D, 2.100%, 7/01/40 (WI/DD, Settling 4/04/19) (9) | | | 6/19 at 100.00 | | | | | | | | VMIG-1 | | | | 5,780,000 | |
| | | | | |
| | | | New York – 0.4% | | | | | | | | | | | | |
| | | | | |
| | 20,035 | | | New York City, New York, General Obligation Bonds, Variable Rate Demand Obligations, Fiscal 2018Series B-4, 0.000%, 10/01/46 (9) | | | 6/19 at 100.00 | | | | | | | | VMIG-1 | | | | 20,035,000 | |
| $ | 55,565 | | | Total Short-Term Investments (cost $55,565,000) | | | | | | | | | | | | | | | 55,565,000 | |
| | | | Total Investments (cost $5,136,169,924) – 98.4% | | | | | | | | | | | | | | | 5,219,393,539 | |
| | | | Other Assets Less Liabilities – 1.6% | | | | | | | | | | | | | | | 86,923,787 | |
| | | | Net Assets – 100% | | | | | | | | | | | | | | $ | 5,306,317,326 | |
193
Nuveen Limited Term Municipal Bond Fund(continued)
Portfolio of Investments March 31, 2019
| (1) | All percentages shown in the Portfolio of Investments are based on net assets. |
| (2) | Optional Call Provisions: Dates (month and year) and prices of the earliest optional call or redemption. There may be other call provisions at varying prices at later dates. Certain mortgage-backed securities may be subject to periodic principal paydowns. Optional Call Provisions are not covered by the report of independent registered public accounting firm. |
| (3) | For financial reporting purposes, the ratings disclosed are the highest of Standard & Poor’s Group (“Standard & Poor’s”), Moody’s Investors Service, Inc. (“Moody’s”) or Fitch, Inc. (“Fitch”) rating. This treatment of split-rated securities may differ from that used for other purposes, such as for Fund investment policies. Ratings below BBB by Standard & Poor’s, Baa by Moody’s or BBB by Fitch are considered to be below investment grade. Holdings designated N/R are not rated by any of these national rating agencies. Ratings are not covered by the report of independent registered public accounting firm. |
| (4) | Backed by an escrow or trust containing sufficient U.S. Government or U.S. Government agency securities, which ensure the timely payment of principal and interest. |
| (5) | Step-up coupon bond, a bond with a coupon that increases (“steps up”), usually at regular intervals, while the bond is outstanding. The rate shown is the coupon as of the end of the reporting period. |
| (6) | Defaulted security. A security whose issuer has failed to fully pay principal and/or interest when due, or is under the protection of bankruptcy. |
| (7) | The tax-exempt municipal bonds previously held by the Fund were surrendered in conjunction with the issuer’s bankruptcy reorganization plan. In return, the Fund received one or more senior interest corporate bonds. |
| (8) | Investment valued at fair value using methods determined in good faith by, or at the discretion of, the Board. For fair value measurement disclosure purposes, investment classified as Level 3. See Notes to Financial Statements, Note 2 – Investment Valuation and Fair Value Measurements for more information. |
| (9) | Investment has a maturity of greater than one year, but has variable rate and/or demand features which qualify it as a short-term investment. The rate disclosed, as well as the reference rate and spread, where applicable, is that in effect as of the end of the reporting period. This rate changes periodically based on market conditions or a specified market index. |
| (10) | Variable rate security. The rate shown is the coupon as of the end of the reporting period. |
| 144A | Investment is exempt from registration under Rule 144A of the Securities Act of 1933, as amended. These investments may only be resold in transactions exempt from registration, which are normally those transactions with qualified institutional buyers. |
| AMT | Alternative Minimum Tax |
| PIK | Payment-in-kind (“PIK”) security. Depending on the terms of the security, income may be received in the form of cash, securities, or a combination of both. The PIK rate shown, where applicable, represents the annualized rate of the last PIK payment made by the issuer as of the end of the reporting period. |
| SIFMA | Securities Industry and Financial Market Association |
| WI/DD | Investment, or portion of investment, purchased on a when-issued or delayed delivery basis. |
See accompanying notes to financial statements.
194
Nuveen Short Term Municipal Bond Fund
Portfolio of Investments March 31, 2019
| | | | | | | | | | | | | | | | |
Principal
Amount (000) | | | Description (1) | | Optional Call
Provisions (2) | | | Ratings (3) | | | Value | |
| | | | |
| | | | LONG-TERM INVESTMENTS – 97.7% | | | | | | | | | | | | |
| | | | |
| | | | MUNICIPAL BONDS – 97.7% | | | | | | | | | | | | |
| | | | |
| | | | Alabama – 4.3% | | | | | | | | | |
| | | | |
| $ | 6,335 | | | Black Belt Energy Gas District, Alabama, Gas PrePay Revenue Bonds, Project 3 Series 2018A, 4.000%, 12/01/48 (Mandatory Put 12/01/23) | | | 9/23 at 100.31 | | | | A3 | | | $ | 6,749,499 | |
| | | | |
| | 6,500 | | | Black Belt Energy Gas District, Alabama, Gas Supply Revenue Bonds, Series 2016, 4.000%, 7/01/46 (Mandatory Put 6/01/21) | | | 3/21 at 100.59 | | | | Aa2 | | | | 6,767,215 | |
| | | | |
| | 4,000 | | | Black Belt Energy Gas District, Alabama, Gas Supply Revenue Bonds, Series 2017A, 4.000%, 8/01/47 (Mandatory Put 7/01/22) | | | 4/22 at 100.52 | | | | Aa2 | | | | 4,240,800 | |
| | | | |
| | 7,335 | | | Southeast Alabama Gas Supply District, Alabama, Gas Supply Revenue Bonds, Project 2, Fixed Rate Series 2018A, 4.000%, 6/01/49 (Mandatory Put 6/01/24) | | | 3/24 at 100.29 | | | | A3 | | | | 7,890,920 | |
| | 24,170 | | | Total Alabama | | | | | | | | | | | 25,648,434 | |
| | | | |
| | | | Alaska – 0.8% | | | | | | | | | |
| | | | |
| | 1,660 | | | Alaska Industrial Development and Export Authority, Power Revenue Bonds, Snettisham Hydroelectric Project, Refunding Series 2015, 5.000%, 1/01/20 (AMT) | | | No Opt. Call | | | | Baa2 | | | | 1,687,988 | |
| | | | |
| | 1,565 | | | Alaska State, International Airport System Revenue Bonds, Refunding Series 2010A, 5.000%, 10/01/23 (AMT) | | | 10/20 at 100.00 | | | | A1 | | | | 1,638,289 | |
| | | | |
| | 1,350 | | | Alaska State, International Airport System Revenue Bonds, Refunding Series 2016C, 5.000%, 10/01/20 (AMT) | | | No Opt. Call | | | | A1 | | | | 1,413,328 | |
| | | | |
| | 5 | | | Northern Tobacco Securitization Corporation, Alaska, Tobacco Settlement Asset-Backed Bonds, Series 2006A, 4.625%, 6/01/23 | | | 4/19 at 100.00 | | | | A3 | | | | 5,001 | |
| | 4,580 | | | Total Alaska | | | | | | | | | | | 4,744,606 | |
| | | | |
| | | | Arizona – 1.9% | | | | | | | | | |
| | | | |
| | 1,320 | | | Chandler Industrial Development Authority, Arizona, Revenue Bonds, Intel Corporation Project, Series 2007, 2.700%, 12/01/37 (Mandatory Put 8/14/23) (AMT) | | | No Opt. Call | | | | A+ | | | | 1,343,509 | |
| | | | |
| | 1,545 | | | Glendale Industrial Development Authority, Arizona, Revenue Bonds, Midwestern University, Refunding Series 2010, 5.000%, 5/15/19 | | | No Opt. Call | | | | A+ | | | | 1,551,087 | |
| | | | |
| | 1,775 | | | Kyrene Elementary School District 28, Maricopa County, Arizona, School Improvement Bonds, Project 2010, Series 2013B, 4.000%, 7/01/19 | | | No Opt. Call | | | | Aa1 | | | | 1,785,863 | |
| | | | |
| | | | Maricopa County Industrial Development Authority, Arizona, Hospital Revenue Bonds, HonorHealth, Series 2019A: | | | | | | | | | | | | |
| | 450 | | | 5.000%, 9/01/22 | | | No Opt. Call | | | | A2 | | | | 497,120 | |
| | 500 | | | 5.000%, 9/01/23 | | | No Opt. Call | | | | A2 | | | | 565,300 | |
| | | | |
| | 1,000 | | | Phoenix Civic Improvement Corporation, Arizona, Airport Revenue Bonds, Senior Lien Series 2017A, 5.000%, 7/01/21 (AMT) | | | No Opt. Call | | | | AA– | | | | 1,072,270 | |
| | | | |
| | 1,200 | | | Salt Verde Financial Corporation, Arizona, Senior Gas Revenue Bonds, Citigroup Energy Inc Prepay Contract Obligations, Series 2007, 5.250%, 12/01/20 | | | No Opt. Call | | | | A3 | | | | 1,264,944 | |
| | | | |
| | 2,375 | | | Yavapai County Industrial Development Authority, Arizona, Solid Waste Disposal Revenue Bonds, Waste Management Inc., Series 2002, 2.800%, 6/01/27 (Mandatory Put 6/01/21) (AMT) | | | No Opt. Call | | | | A– | | | | 2,404,830 | |
| | | | |
| | 830 | | | Yuma Industrial Development Authority, Arizona, Hospital Revenue Bonds, Yuma Regional Medical Center, Series 2014A, 5.000%, 8/01/19 | | | No Opt. Call | | | | A | | | | 839,047 | |
| | 10,995 | | | Total Arizona | | | | | | | | | | | 11,323,970 | |
195
Nuveen Short Term Municipal Bond Fund(continued)
Portfolio of Investments March 31, 2019
| | | | | | | | | | | | | | | | |
Principal
Amount (000) | | | Description (1) | | Optional Call
Provisions (2) | | | Ratings (3) | | | Value | |
| | | | |
| | | | California – 5.2% | | | | | | | | | |
| | | | |
| $ | 5,605 | | | California Health Facilities Financing Authority, Revenue Bonds, Kaiser Permanente System, Series 2017C, 5.000%, 8/01/31 (Mandatory Put 11/01/22) | | | No Opt. Call | | | | AA– | | | $ | 6,266,446 | |
| | | | |
| | 3,000 | | | California Pollution Control Financing Authority,Series 2017A-1, 1.900%, 11/01/42 (Mandatory Put 7/15/19) (AMT), 144A | | | No Opt. Call | | | | BBB+ | | | | 3,000,180 | |
| | | | |
| | 1,000 | | | California Pollution Control Financing Authority, Solid Waste Disposal Revenue Bonds, Republic Services Inc, Series 2010A, 1.900%, 8/01/23 (Mandatory Put 8/01/19) (AMT), 144A | | | No Opt. Call | | | | BBB+ | | | | 1,000,100 | |
| | | | |
| | | | California School Finance Authority, California, Charter School Revenue Bonds, Aspire Public Schools, Refunding Series 2016: | | | | | | | | | | | | |
| | 695 | | | 5.000%, 8/01/19, 144A | | | No Opt. Call | | | | BBB | | | | 701,992 | |
| | 550 | | | 5.000%, 8/01/20, 144A | | | No Opt. Call | | | | BBB | | | | 571,071 | |
| | | | |
| | 2,875 | | | California State Public Works Board, Lease Revenue Bonds, Department of Corrections & Rehabilitation, Substance Abuse Treatment Facility & Corcoran II State Prison, Series 2014G, 5.000%, 1/01/20 | | | No Opt. Call | | | | A+ | | | | 2,950,296 | |
| | | | |
| | 4,000 | | | Golden State Tobacco Securitization Corporation, California, Tobacco Settlement Asset-Backed Bonds,Series 2017A-1, 5.000%, 6/01/21 | | | No Opt. Call | | | | A | | | | 4,268,600 | |
| | | | |
| | 2,990 | | | Mount San Antonio Community College District, Los Angeles County, California, General Obligation Bonds, Bond Anticipation Notes Series 2017, 0.000%, 4/01/22 | | | No Opt. Call | | | | Aa1 | | | | 2,840,081 | |
| | | | |
| | 7,465 | | | San Francisco Airports Commission, California, Revenue Bonds, San Francisco International Airport, Refunding Second Series 2017D, 5.000%, 5/01/23 (AMT) | | | No Opt. Call | | | | A+ | | | | 8,417,161 | |
| | | | |
| | 1,000 | | | San Francisco City and County Redevelopment Agency Successor Agency, California, Tax Allocation Bonds, Mission Bay South Redevelopment Project, Refunding Series 2016C, 5.000%, 8/01/21 | | | No Opt. Call | | | | A– | | | | 1,077,720 | |
| | 29,180 | | | Total California | | | | | | | | | | | 31,093,647 | |
| | | | |
| | | | Colorado – 6.1% | | | | | | | | | |
| | | | |
| | | | Adams and Arapahoe Counties Joint School District 28J, Aurora, Colorado, General Obligation Bonds, Series 2017A: | | | | | | | | | | | | |
| | 1,100 | | | 5.000%, 12/01/19 | | | No Opt. Call | | | | Aa2 | | | | 1,125,465 | |
| | 1,400 | | | 5.000%, 12/01/20 | | | No Opt. Call | | | | Aa2 | | | | 1,479,716 | |
| | | | |
| | | | BROMLEY PK MET DIST NO 2 COLO SR LTD TAX GO REF BDS: | | | | | | | | | | | | |
| | 250 | | | 5.000%, 12/01/21 – BAM Insured | | | No Opt. Call | | | | AA | | | | 270,058 | |
| | 550 | | | 5.000%, 12/01/22 – BAM Insured | | | No Opt. Call | | | | AA | | | | 609,703 | |
| | | | |
| | 276 | | | Centerra Metropolitan District 1, Loveland, Colorado, Special Revenue Bonds, Refunding & Improvement Series 2017, 2.700%, 12/01/19, 144A | | | No Opt. Call | | | | N/R | | | | 276,284 | |
| | | | |
| | 470 | | | Colorado Educational and Cultural Facilities Authority, Charter School Revenue Bonds, Vanguard School Project, Refunding & Improvement Series 2016, 4.000%, 6/15/20 | | | No Opt. Call | | | | A+ | | | | 481,487 | |
| | | | |
| | 1,685 | | | Colorado Educational and Cultural Facilities Authority, Revenue Bonds, Regis University Project, Refunding Series 2016, 5.000%, 10/01/19 | | | No Opt. Call | | | | Baa2 | | | | 1,708,876 | |
| | | | |
| | 1,200 | | | Colorado Health Facilities Authority, Colorado, Health Facilities Revenue Bonds, The Evangelical Lutheran Good Samaritan Society Project, Refunding Series 2017, 5.000%, 6/01/21 | | | No Opt. Call | | | | A– | | | | 1,270,200 | |
| | | | |
| | 1,750 | | | Colorado Health Facilities Authority, Colorado, Revenue Bonds, Catholic Health Initiatives,Series 2008-C2, 2.940%, 10/01/39 (Mandatory Put 11/12/20) | | | 5/20 at 100.00 | | | | BBB+ | | | | 1,757,612 | |
| | | | |
| | 2,035 | | | Colorado Health Facilities Authority, Colorado, Revenue Bonds, Catholic Health Initiatives,Series 2009B-3, 1.875%, 7/01/39 (Mandatory Put 11/06/19) | | | No Opt. Call | | | | BBB+ | | | | 2,032,171 | |
| | | | |
| | 600 | | | Colorado Health Facilities Authority, Colorado, Revenue Bonds, Evangelical Lutheran Good Samaritan Society Project, Series 2013A, 4.000%, 6/01/19 | | | No Opt. Call | | | | A– | | | | 601,944 | |
196
| | | | | | | | | | | | | | | | |
Principal
Amount (000) | | | Description (1) | | Optional Call
Provisions (2) | | | Ratings (3) | | | Value | |
| | | | |
| | | | Colorado(continued) | | | | | | | | | |
| | | | |
| $ | 1,000 | | | Colorado Health Facilities Authority, Colorado, Revenue Bonds, Sisters of Charity of Leavenworth Health Services Corporation, Refunding Composite Deal Series 2010B, 5.000%, 1/01/23 | | | 1/20 at 100.00 | | | | AA– | | | $ | 1,024,450 | |
| | | | |
| | 190 | | | Colorado Health Facilities Authority, Colorado, Revenue Bonds, Valley View Hospital Association, Series 2017A, 5.000%, 5/15/21 | | | No Opt. Call | | | | A– | | | | 201,710 | |
| | | | |
| | 2,000 | | | Denver City and County, Colorado, Airport System Revenue Bonds, Series 2017A, 5.000%, 11/15/19 (AMT) | | | No Opt. Call | | | | AA– | | | | 2,040,460 | |
| | | | |
| | 1,000 | | | Denver City and County, Colorado, Airport System Revenue Bonds, Subordinate Lien Series 2013A, 5.000%, 11/15/22 (AMT) | | | No Opt. Call | | | | A+ | | | | 1,108,420 | |
| | | | |
| | 5,000 | | | Denver City and County, Colorado, Airport System Revenue Bonds, Subordinate Lien Series 2018A, 5.000%, 12/01/22 (AMT) | | | No Opt. Call | | | | A+ | | | | 5,548,350 | |
| | | | |
| | 1,000 | | | Denver Convention Center Hotel Authority, Colorado, Revenue Bonds, Convention Center Hotel, Refunding Senior Lien Series 2016, 4.000%, 12/01/21 | | | No Opt. Call | | | | Baa2 | | | | 1,042,340 | |
| | | | |
| | 100 | | | Eaton Area Park and Recreation District, Colorado, General Obligation Limited Tax Bonds, Series 2015, 5.000%, 12/01/19 | | | No Opt. Call | | | | N/R | | | | 101,626 | |
| | | | |
| | 750 | | | El Paso County School District 2, Harrison, Colorado, General Obligation Bonds, Series 2019, 5.000%, 12/01/20 | | | No Opt. Call | | | | AA | | | | 792,705 | |
| | | | |
| | 2,000 | | | Grand River Hospital District, Garfield and Mesa Counties, Colorado, General Obligation Bonds, Series 2018, 5.000%, 12/01/21 – AGM Insured | | | No Opt. Call | | | | AA | | | | 2,168,620 | |
| | | | |
| | 4,000 | | | Moffat County, Colorado, Pollution Control Revenue Bonds,Tri-State Generation and Transmission Association, Inc Project, Refunding Series 2009, 2.000%, 3/01/36 (Mandatory Put 10/03/22) | | | No Opt. Call | | | | A | | | | 3,957,960 | |
| | | | |
| | 1,060 | | | Park Creek Metropolitan District, Colorado, Senior Limited Property Tax Supported Revenue Bonds, Refunding Series 2015A, 4.000%, 12/01/19 | | | No Opt. Call | | | | A | | | | 1,075,020 | |
| | | | |
| | | | Pueblo Urban Renewal Authority, Colorado, State Sales Tax Increment Revenue Bonds, Regional Tourism Project, Series 2017: | | | | | | | | | | | | |
| | 500 | | | 2.500%, 6/01/19 | | | No Opt. Call | | | | N/R | | | | 500,050 | |
| | 700 | | | 2.750%, 6/01/20 | | | No Opt. Call | | | | N/R | | | | 700,945 | |
| | 2,040 | | | 3.000%, 6/01/21 | | | No Opt. Call | | | | N/R | | | | 2,045,896 | |
| | | | |
| | 1,365 | | | University of Colorado Hospital Authority, Colorado, Revenue Bonds,Series 2017C-1, 4.000%, 11/15/47 (Mandatory Put 3/01/20) | | | 9/19 at 100.00 | | | | AA– | | | | 1,376,616 | |
| | | | |
| | 1,530 | | | Weld County School District RE1, Colorado, General Obligation Bonds, Series 2017, 5.000%, 12/15/20 | | | No Opt. Call | | | | AA | | | | 1,619,138 | |
| | 35,551 | | | Total Colorado | | | | | | | | | | | 36,917,822 | |
| | | | |
| | | | District of Columbia – 1.0% | | | | | | | | | |
| | | | |
| | | | Metropolitan Washington D.C. Airports Authority, Airport System Revenue Bonds, Refunding Series 2017: | | | | | | | | | | | | |
| | 2,475 | | | 5.000%, 10/01/20 (AMT) | | | No Opt. Call | | | | AA– | | | | 2,594,097 | |
| | 1,205 | | | 5.000%, 10/01/21 (AMT) | | | No Opt. Call | | | | AA– | | | | 1,300,520 | |
| | | | |
| | 2,175 | | | Washington Convention and Sports Authority, Washington D.C., Dedicated Tax Revenue Bonds, Refunding Senior Lien Series 2018A, 5.000%, 10/01/22 | | | No Opt. Call | | | | AA+ | | | | 2,417,404 | |
| | 5,855 | | | Total District of Columbia | | | | | | | | | | | 6,312,021 | |
| | | | |
| | | | Florida – 2.0% | | | | | | | | | |
| | | | |
| | 1,450 | | | Broward County, Florida, Airport System Revenue Bonds, RefundingSeries 2012P-1, 5.000%, 10/01/22 (AMT) | | | No Opt. Call | | | | A+ | | | | 1,604,309 | |
197
Nuveen Short Term Municipal Bond Fund(continued)
Portfolio of Investments March 31, 2019
| | | | | | | | | | | | | | | | |
Principal
Amount (000) | | | Description (1) | | Optional Call
Provisions (2) | | | Ratings (3) | | | Value | |
| | | | |
| | | | Florida(continued) | | | | | | | | | |
| | | | |
| $ | 1,000 | | | Broward County, Florida, Airport System Revenue Bonds, Series 2015A, 5.000%, 10/01/23 (AMT) | | | No Opt. Call | | | | A+ | | | $ | 1,132,360 | |
| | | | |
| | 415 | | | Broward County, Florida, Airport System Revenue Bonds, Series 2017, 5.000%, 10/01/21 (AMT) | | | No Opt. Call | | | | A+ | | | | 447,154 | |
| | | | |
| | 2,220 | | | Florida, Development Finance Corporation, Surface Transportation Facility Revenue Bonds, Brightline Passenger Rail Project – South Segment, Series 2017, 5.625%, 1/01/47 (AMT), 144A | | | 4/19 at 105.00 | | | | N/R | | | | 2,307,668 | |
| | | | |
| | 1,500 | | | Greater Orlando Aviation Authority, Florida, Orlando Airport Facilities Revenue Bonds, Refunding Priority Subordinated Series 2016, 5.000%, 10/01/21 (AMT) | | | No Opt. Call | | | | A+ | | | | 1,616,610 | |
| | | | |
| | 1,750 | | | Hillsborough County, Florida, Aviation Bonds, 5.000%, 10/01/22 (AMT) | | | No Opt. Call | | | | AA– | | | | 1,939,368 | |
| | | | |
| | 1,035 | | | Miami Health Facilities Authority, Florida, Health Facilities Revenue Bonds, Miami Jewish Health System Inc. Project, Series 2017, 5.000%, 7/01/22 | | | No Opt. Call | | | | BBB | | | | 1,105,866 | |
| | | | |
| | 1,000 | | | South Broward Hospital District, Florida, Hospital Revenue Bonds, Refunding Series 2015, 5.000%, 5/01/21 | | | No Opt. Call | | | | AA | | | | 1,067,740 | |
| | | | |
| | 860 | | | South Miami Health Facilities Authority, Florida, Hospital Revenue Bonds, Baptist Health Systems of South Florida Obligated Group, Series 2017, 5.000%, 8/15/21 | | | No Opt. Call | | | | AA– | | | | 923,133 | |
| | 11,230 | | | Total Florida | | | | | | | | | | | 12,144,208 | |
| | | | |
| | | | Georgia – 1.4% | | | | | | | | | |
| | | | |
| | 1,500 | | | Atlanta, Georgia, Tax Allocation Bonds, Beltline Project, Series 2016D, 5.000%, 1/01/21 | | | No Opt. Call | | | | A2 | | | | 1,579,755 | |
| | | | |
| | 515 | | | La Grange-Troup County Hospital Authority, Georgia, Revenue Anticipation Certificates, Wellstar Health System, Inc., Series 2017A, 5.000%, 4/01/20 | | | No Opt. Call | | | | A | | | | 531,995 | |
| | | | |
| | | | Liberty County Industrial Authority, Georgia, Revenue Bonds, Series 2014: | | | | | | | | | | | | |
| | 487 | | | 5.500%, 7/15/23 | | | 7/21 at 100.00 | | | | N/R | | | | 487,880 | |
| | 1,035 | | | 5.500%, 7/15/30 | | | 7/21 at 100.00 | | | | N/R | | | | 1,037,174 | |
| | 1,136 | | | 5.500%, 1/15/36 | | | 7/21 at 100.00 | | | | N/R | | | | 1,138,875 | |
| | | | |
| | 1,000 | | | Main Street Natural Gas Inc, Georgia, Gas Supply Revenue Bonds, Series 2019A, 5.000%, 5/15/21 | | | No Opt. Call | | | | A3 | | | | 1,056,710 | |
| | | | |
| | 2,470 | | | Main Street Natural Gas Inc., Georgia, Gas Supply Revenue Bonds, Variable Rate Demand Bonds Series 2018A, 4.000%, 9/01/22 | | | No Opt. Call | | | | Aa2 | | | | 2,634,551 | |
| | 8,143 | | | Total Georgia | | | | | | | | | | | 8,466,940 | |
| | | | |
| | | | Hawaii – 0.2% | | | | | | | | | |
| | | | |
| | 1,220 | | | Hawaii State, Harbor System Revenue Bonds, Series 2010B, 5.250%, 7/01/19 (AMT) | | | No Opt. Call | | | | AA– | | | | 1,230,443 | |
| | | | |
| | | | Idaho – 0.4% | | | | | | | | | |
| | | | |
| | | | Idaho Health Facilities Authority, Revenue Bonds, Madison Memorial Hospital Project, Refunding Series 2016: | | | | | | | | | | | | |
| | 800 | | | 4.000%, 9/01/19 | | | No Opt. Call | | | | BB+ | | | | 804,984 | |
| | 1,710 | | | 5.000%, 9/01/22 | | | No Opt. Call | | | | BB+ | | | | 1,842,491 | |
| | 2,510 | | | Total Idaho | | | | | | | | | | | 2,647,475 | |
| | | | |
| | | | Illinois – 5.0% | | | | | | | | | |
| | | | |
| | 400 | | | Board of Regents of Illinois State University, Auxiliary Facilities System Revenue Bonds, Series 2018A, 5.000%, 4/01/22 – AGM Insured | | | No Opt. Call | | | | AA | | | | 430,100 | |
| | | | |
| | 3,000 | | | Chicago Board of Education, Illinois, General Obligation Bonds, Dedicated Revenues, Refunding Series 2017E, 5.000%, 12/01/21 | | | No Opt. Call | | | | BB– | | | | 3,149,280 | |
| | | | |
| | 660 | | | Chicago Board of Education, Illinois, Unlimited Tax General Obligation Bonds, Dedicated Tax Revenues,Series 1998B-1, 0.000%, 12/01/20 – FGIC Insured | | | No Opt. Call | | | | Baa2 | | | | 628,841 | |
198
| | | | | | | | | | | | | | | | |
Principal
Amount (000) | | | Description (1) | | Optional Call
Provisions (2) | | | Ratings (3) | | | Value | |
| | | | |
| | | | Illinois(continued) | | | | | | | | | |
| | | | |
| $ | 5,000 | | | Chicago O’Hare International Airport, Illinois, 5.000%, 1/01/20 (AMT) | | | No Opt. Call | | | | A | | | $ | 5,120,750 | |
| | | | |
| | 2,000 | | | Chicago Transit Authority, Illinois, Capital Grant Receipts Revenue Bonds, Federal Transit Administration Section 5337 State of Good Repair Formula Funds, Refunding Series 2017, 5.000%, 6/01/20 | | | No Opt. Call | | | | A+ | | | | 2,068,160 | |
| | | | |
| | 475 | | | Chicago, Illinois, General Airport Revenue Bonds, O’Hare International Airport, Senior Lien Series 2015B, 5.000%, 1/01/20 | | | No Opt. Call | | | | A | | | | 486,899 | |
| | | | |
| | 1,200 | | | Cook County, Illinois, General Obligation Bonds, Refunding Series 2018, 5.000%, 11/15/21 | | | No Opt. Call | | | | AA– | | | | 1,290,120 | |
| | | | |
| | 100 | | | Illinois Finance Authority, Charter School Revenue Bonds, Intrinsic Charter Schools Belmont School Project, Series 2015A, 4.500%, 12/01/20, 144A | | | No Opt. Call | | | | N/R | | | | 100,536 | |
| | | | |
| | 500 | | | Illinois Finance Authority, Revenue Bonds, Benedictine University Project, Series 2013A, 5.000%, 10/01/19 | | | No Opt. Call | | | | BBB | | | | 505,495 | |
| | | | |
| | 340 | | | Illinois Finance Authority, Revenue Bonds, Centegra Health System, Series 2014A, 5.000%, 9/01/19 | | | No Opt. Call | | | | AA+ | | | | 344,842 | |
| | | | |
| | 1,095 | | | Illinois Finance Authority, Revenue Bonds, OSF Healthcare System, Series 2015A, 5.000%, 11/15/20 | | | No Opt. Call | | | | A | | | | 1,152,093 | |
| | | | |
| | 1,300 | | | Illinois Finance Authority, Revenue Bonds, Rush University Medical Center Obligated Group, Series 2015A, 5.000%, 11/15/19 | | | No Opt. Call | | | | AA– | | | | 1,327,118 | |
| | | | |
| | 1,250 | | | Illinois State Toll Highway Authority, Toll Highway Senior Revenue Bonds, Refunding Series 2018A, 5.000%, 1/01/22 | | | No Opt. Call | | | | AA– | | | | 1,362,413 | |
| | | | |
| | 5,375 | | | Illinois State, General Obligation Bonds, February Series 2014, 5.000%, 2/01/21 | | | No Opt. Call | | | | BBB | | | | 5,612,790 | |
| | | | |
| | 3,100 | | | Illinois State, General Obligation Bonds, November Series 2017D, 5.000%, 11/01/23 | | | No Opt. Call | | | | BBB | | | | 3,363,779 | |
| | | | |
| | 2,750 | | | Railsplitter Tobacco Settlement Authority, Illinois, Tobacco Settlement Revenue Bonds, Series 2017, 5.000%, 6/01/22 | | | No Opt. Call | | | | A | | | | 3,008,115 | |
| | 28,545 | | | Total Illinois | | | | | | | | | | | 29,951,331 | |
| | | | |
| | | | Indiana – 1.0% | | | | | | | | | |
| | | | |
| | 3,250 | | | Indiana Development Finance Authority, Solid Waste Disposal Revenue Refunding Bonds, Waste Management Inc. Project, Series 2001, 2.950%, 10/01/31 (Mandatory Put 10/01/21) (AMT) | | | No Opt. Call | | | | A– | | | | 3,250,000 | |
| | | | |
| | 2,810 | | | Rockport, Indiana, Pollution Control Revenue Refunding Bonds, Indiana Michigan Power Company Project, Series 2008D, 2.050%, 4/01/25 (Mandatory Put 6/01/21) | | | No Opt. Call | | | | A– | | | | 2,808,483 | |
| | 6,060 | | | Total Indiana | | | | | | | | | | | 6,058,483 | |
| | | | |
| | | | Iowa – 1.1% | | | | | | | | | |
| | | | |
| | 2,770 | | | Iowa Finance Authority, Healthcare Revenue Bonds, Genesis Health System, Refunding Series 2010, 5.000%, 7/01/20 | | | No Opt. Call | | | | A1 | | | | 2,876,673 | |
| | | | |
| | 500 | | | Iowa Finance Authority, Iowa, Midwestern Disaster Area Revenue Bonds, Iowa Fertilizer Company Project, Refunding Series 2019, 3.125%, 12/01/22 (WI/DD, Settling 4/03/19) | | | 12/20 at 103.00 | | | | B+ | | | | 503,290 | |
| | | | |
| | 125 | | | Iowa Finance Authority, Iowa, Midwestern Disaster Area Revenue Bonds, Iowa Fertilizer Company Project, Series 2016, 5.875%, 12/01/27, 144A | | | 6/19 at 105.00 | | | | B+ | | | | 131,640 | |
| | | | |
| | 145 | | | Iowa Finance Authority, Iowa, Midwestern Disaster Area Revenue Bonds, Iowa Fertilizer Company Project, Series 2018B, 5.250%, 12/01/50 (Mandatory Put 12/01/22) | | | 12/22 at 105.00 | | | | B+ | | | | 155,456 | |
| | | | |
| | 1,135 | | | Iowa Higher Education Loan Authority, Private College Facility Revenue Bonds, Drake University Project, Refunding Series 2016, 3.000%, 4/01/19 | | | No Opt. Call | | | | A– | | | | 1,135,000 | |
| | | | |
| | 1,130 | | | Johnston Community School District, Iowa, School Infrastructure Sales, Services and Use Tax Revenue Bonds, Series 2014, 5.000%, 7/01/19 | | | No Opt. Call | | | | AA | | | | 1,139,322 | |
199
Nuveen Short Term Municipal Bond Fund(continued)
Portfolio of Investments March 31, 2019
| | | | | | | | | | | | | | | | |
Principal
Amount (000) | | | Description (1) | | Optional Call
Provisions (2) | | | Ratings (3) | | | Value | |
| | | | |
| | | | Iowa(continued) | | | | | | | | | |
| | | | |
| $ | 700 | | | Xenia Rural Water District, Iowa, Water Revenue Bonds, Refunding Capital Loan Note Series 2016, 3.000%, 12/01/19 | | | No Opt. Call | | | | BBB+ | | | $ | 703,241 | |
| | 6,505 | | | Total Iowa | | | | | | | | | | | 6,644,622 | |
| | | | |
| | | | Kansas – 0.2% | | | | | | | | | |
| | | | |
| | | | Kansas Municipal Energy Agency, Power Project Revenue Bonds, Dogwood Project, Series 2018A: | | | | | | | | | | | | |
| | 500 | | | 5.000%, 4/01/22 – BAM Insured | | | No Opt. Call | | | | AA | | | | 547,500 | |
| | 500 | | | 5.000%, 4/01/23 – BAM Insured | | | No Opt. Call | | | | AA | | | | 560,740 | |
| | 1,000 | | | Total Kansas | | | | | | | | | | | 1,108,240 | |
| | | | |
| | | | Kentucky – 3.6% | | | | | | | | | |
| | | | |
| | 10,000 | | | Louisville and Jefferson County Metropolitan Sewer District, Kentucky, Sewer and Drainage System Revenue Bonds, Refunding Series 2016C, 5.000%, 5/15/20 | | | No Opt. Call | | | | AA | | | | 10,386,900 | |
| | | | |
| | 3,785 | | | Public Energy Authority of Kentucky, Gas Supply Revenue Bonds, Series 2018B, 4.000%, 1/01/49 (Mandatory Put 1/01/25) | | | 10/24 at 100.24 | | | | A1 | | | | 4,114,825 | |
| | | | |
| | 4,000 | | | Public Energy Authority of Kentucky, Gas Supply Revenue Bonds,Series 2018C-1, 4.000%, 12/01/49 (Mandatory Put 6/01/25) | | | 3/25 at 100.19 | | | | A3 | | | | 4,334,360 | |
| | | | |
| | 3,135 | | | Trimble County, Kentucky, Pollution Control Revenue Bonds, Louisville Gas and Electric Company Project, Series 2002A, 2.300%, 9/01/26 (Mandatory Put 9/01/21) | | | No Opt. Call | | | | A1 | | | | 3,167,102 | |
| | 20,920 | | | Total Kentucky | | | | | | | | | | | 22,003,187 | |
| | | | |
| | | | Louisiana – 1.4% | | | | | | | | | |
| | | | |
| | 505 | | | Louisiana Citizens Property Insurance Corporation, Assessment Revenue Bonds, Refunding Series 2015, 5.000%, 6/01/20 | | | No Opt. Call | | | | A1 | | | | 524,473 | |
| | | | |
| | 2,400 | | | Louisiana Offshore Terminal Authority, Deepwater Port Revenue Bonds, LOOP Inc Project, Variable RateSeries 2010B-1A, 2.000%, 10/01/40 (Mandatory Put 10/01/22) | | | No Opt. Call | | | | BBB+ | | | | 2,397,600 | |
| | | | |
| | 595 | | | Louisiana Public Facilities Authority, Revenue Bonds, Ochsner Clinic Foundation Project, Series 2015, 4.000%, 5/15/19 | | | No Opt. Call | | | | A3 | | | | 596,505 | |
| | | | |
| | | | Louisiana Stadium and Exposition District, Revenue Refunding Bonds, Senior Lien Series 2013A: | | | | | | | | | | | | |
| | 2,275 | | | 5.000%, 7/01/19 | | | No Opt. Call | | | | AA– | | | | 2,293,587 | |
| | 2,250 | | | 5.000%, 7/01/20 | | | No Opt. Call | | | | AA– | | | | 2,342,317 | |
| | 8,025 | | | Total Louisiana | | | | | | | | | | | 8,154,482 | |
| | | | |
| | | | Maryland – 0.2% | | | | | | | | | |
| | | | |
| | 915 | | | Maryland Health and Higher Educational Facilities Authority, Maryland, Hospital Revenue Bonds, Meritus Medical Center, Series 2015, 5.000%, 7/01/19 | | | No Opt. Call | | | | BBB+ | | | | 921,991 | |
| | | | |
| | | | Massachusetts – 0.6% | | | | | | | | | |
| | | | |
| | 715 | | | Massachusetts Development Finance Agency, Revenue Bonds, UMass Memorial Health Care, Series 2016I, 5.000%, 7/01/21 | | | No Opt. Call | | | | A– | | | | 763,406 | |
| | | | |
| | | | Massachusetts Educational Financing Authority, Education Loan Revenue Bonds, Issue K, Series 2017A: | | | | | | | | | | | | |
| | 375 | | | 4.000%, 7/01/20 (AMT) | | | No Opt. Call | | | | AA | | | | 384,825 | |
| | 1,000 | | | 4.000%, 7/01/21 (AMT) | | | No Opt. Call | | | | AA | | | | 1,045,360 | |
| | | | |
| | 1,550 | | | Massachusetts Educational Financing Authority, Education Loan Revenue Bonds, Series 2016J, 4.000%, 7/01/20 (AMT) | | | No Opt. Call | | | | AA | | | | 1,590,610 | |
| | 3,640 | | | Total Massachusetts | | | | | | | | | | | 3,784,201 | |
200
| | | | | | | | | | | | | | | | |
Principal
Amount (000) | | | Description (1) | | Optional Call
Provisions (2) | | | Ratings (3) | | | Value | |
| | | | |
| | | | Michigan – 0.9% | | | | | | | | | |
| | | | |
| $ | 1,705 | | | Michigan Finance Authority, Michigan, Revenue Bonds, Trinity Health Credit Group, Refunding Series 2017A, 5.000%, 12/01/22 | | | No Opt. Call | | | | AA– | | | $ | 1,904,178 | |
| | | | |
| | 1,440 | | | Michigan State Hospital Finance Authority, Revenue Bonds, McLaren Health Care Corporation, Refunding Series 2012A, 5.000%, 6/01/24 | | | 6/22 at 100.00 | | | | Aa3 | | | | 1,579,810 | |
| | | | |
| | 1,000 | | | Michigan State, Grant Anticipation Bonds, Refunding Federal Highway Series 2016, 5.000%, 3/15/21 | | | No Opt. Call | | | | AA | | | | 1,065,300 | |
| | | | |
| | 1,000 | | | Royal Oak Hospital Finance Authority, Michigan, Hospital Revenue Bonds, William Beaumont Hospital Obligated Group, Refunding Series 2014D, 5.000%, 9/01/23 | | | No Opt. Call | | | | A+ | | | | 1,137,420 | |
| | 5,145 | | | Total Michigan | | | | | | | | | | | 5,686,708 | |
| | | | |
| | | | Minnesota – 10.4% | | | | | | | | | |
| | | | |
| | 240 | | | Baytown Township, Minnesota Charter School Lease Revenue Bonds, Saint Croix Preparatory Academy, Refunding Series 2016A, 3.000%, 8/01/22 | | | No Opt. Call | | | | BB+ | | | | 239,542 | |
| | | | |
| | 380 | | | Brainerd, Minnesota, Electric Utility Revenue Bonds, Series 2014A, 3.000%, 12/01/20 – AGM Insured | | | No Opt. Call | | | | AA | | | | 388,569 | |
| | | | |
| | 745 | | | Chippewa County, Minnesota, Gross Revenue Hospital Bonds, Montevideo Hospital Project, Refunding Series 2016, 3.000%, 3/01/20 | | | No Opt. Call | | | | N/R | | | | 747,600 | |
| | | | |
| | 1,415 | | | City of Red Wing, Minnesota, General Obligation Bonds, Series 2018A, 5.000%, 2/01/23 | | | No Opt. Call | | | | Aa2 | | | | 1,591,875 | |
| | | | |
| | 805 | | | Dakota County Community Development Agency, Minnesota, Senior Housing Revenue Bonds, Walker Highview Hills LLC Project, Refunding Series 2016A, 2.500%, 8/01/21, 144A | | | No Opt. Call | | | | N/R | | | | 796,700 | |
| | | | |
| | 440 | | | Deephaven, Minnesota, Charter School Lease Revenue Bonds, Eagle Ridge Academy Project, Series 2016A, 4.000%, 7/01/21 | | | No Opt. Call | | | | BB+ | | | | 451,216 | |
| | | | |
| | 1,200 | | | Duluth Independent School District 709, Minnesota, Certificates of Participation, Refunding Series 2016A, 3.000%, 2/01/20 | | | No Opt. Call | | | | Aa2 | | | | 1,210,512 | |
| | | | |
| | 2,115 | | | Elk River Independent School District 728, Minnesota, General Obligation Bonds, Refunding School Building Series 2016A, 5.000%, 2/01/23 | | | No Opt. Call | | | | Aa2 | | | | 2,378,529 | |
| | | | |
| | 1,130 | | | Forest Lake, Minnesota, Charter School Lease Revenue Bonds, Lakes International Language Academy, Series 2019A, 4.375%, 8/01/29 | | | 8/27 at 102.00 | | | | BB+ | | | | 1,162,137 | |
| | | | |
| | 1,470 | | | Ham Lake, Minnesota Charter School Lease Revenue Bonds, Parnassus Preparatory School Project, Series 2016A, 3.000%, 11/01/21 | | | No Opt. Call | | | | BB | | | | 1,450,567 | |
| | | | |
| | 2,250 | | | Minneapolis Special School District 1, Hennepin County, Minnesota, General Obligation Bonds, School Building Series 2016A, 5.000%, 2/01/20 | | | No Opt. Call | | | | AAA | | | | 2,315,272 | |
| | | | |
| | 385 | | | Minneapolis, Minnesota, Charter School Lease Revenue Bonds, Twin Cities International Schools Project, Series 2017A, 3.750%, 12/01/22, 144A | | | No Opt. Call | | | | N/R | | | | 383,679 | |
| | | | |
| | 500 | | | Minneapolis, Minnesota, Charter School Lease Revenue Bonds, Yinghua Academy Project, Series 2013A, 6.000%, 7/01/33 | | | 7/23 at 100.00 | | | | BB+ | | | | 543,145 | |
| | | | |
| | 605 | | | Minneapolis, Minnesota, Tax Increment Revenue Bonds, Village at St. Anthony Falls Project, Refunding Series 2015, 3.000%, 3/01/20 | | | No Opt. Call | | | | N/R | | | | 606,240 | |
| | | | |
| | 1,000 | | | Minneapolis-St. Paul Metropolitan Airports Commission, Minnesota, Airport Revenue Bonds, Refunding Subordinate Lien Series 2014B, 5.000%, 1/01/25 (AMT) | | | 1/24 at 100.00 | | | | A+ | | | | 1,134,010 | |
| | | | |
| | | | Minneapolis-St. Paul Metropolitan Airports Commission, Minnesota, Airport Revenue Bonds, Senior Lien Series 2016C: | | | | | | | | | | | | |
| | 350 | | | 4.000%, 1/01/20 | | | No Opt. Call | | | | AA– | | | | 356,657 | |
| | 200 | | | 4.000%, 1/01/21 | | | No Opt. Call | | | | AA– | | | | 208,340 | |
| | | | |
| | 475 | | | Minnesota Higher Education Facilities Authority, Revenue Bonds, College of St. Benedict,Series 2016-8K, 3.000%, 3/01/20 | | | No Opt. Call | | | | Baa1 | | | | 478,843 | |
201
Nuveen Short Term Municipal Bond Fund(continued)
Portfolio of Investments March 31, 2019
| | | | | | | | | | | | | | | | |
Principal
Amount (000) | | | Description (1) | | Optional Call
Provisions (2) | | | Ratings (3) | | | Value | |
| | | | |
| | | | Minnesota(continued) | | | | | | | | | |
| | | | |
| $ | 1,250 | | | Minnesota Housing Finance Agency, Rental Housing Revenue Bonds, Series 2019A, 2.000%, 8/01/20 | | | 2/20 at 100.00 | | | | AA+ | | | $ | 1,252,000 | |
| | | | |
| | | | Minnesota Housing Finance Agency, Residential Housing Finance Bonds, Series 2017A: | | | | | | | | | | | | |
| | 370 | | | 1.400%, 7/01/19 (AMT) | | | No Opt. Call | | | | AA+ | | | | 369,537 | |
| | 1,150 | | | 1.700%, 1/01/21 (AMT) | | | No Opt. Call | | | | AA+ | | | | 1,143,928 | |
| | | | |
| | | | Minnesota Office of Higher Education, Supplemental Student Loan Program Revenue Bonds, Senior Series 2018: | | | | | | | | | | | | |
| | 500 | | | 5.000%, 11/01/22 (AMT) | | | No Opt. Call | | | | AA | | | | 549,110 | |
| | 400 | | | 5.000%, 11/01/23 (AMT) | | | No Opt. Call | | | | AA | | | | 447,660 | |
| | | | |
| | 2,210 | | | Minnesota Public Facilities Authority, State Clean Water Revolving Fund Revenue Bonds, Series 2010C, 5.000%, 3/01/21(Pre-refunded 3/01/20) | | | 3/20 at 100.00 | | | | AAA | | | | 2,280,742 | |
| | | | |
| | 4,695 | | | Minnesota State, General Obligation Bonds, Refunding Various Purpose Series 2016D, 5.000%, 8/01/22 | | | No Opt. Call | | | | AAA | | | | 5,221,873 | |
| | | | |
| | 2,210 | | | Minnesota State, General Obligation Bonds, Various Purpose Series 2013A, 5.000%, 8/01/21 | | | No Opt. Call | | | | AAA | | | | 2,386,535 | |
| | | | |
| | 2,020 | | | Moorhead, Minnesota, Educational Facilities Revenue Bonds, The Concordia College Corporation Project, Series 2016, 5.000%, 12/01/19 | | | No Opt. Call | | | | Baa1 | | | | 2,058,501 | |
| | | | |
| | 2,500 | | | Northern Municipal Power Agency, Minnesota, Electric System Revenue Bonds, Series 2017, 5.000%, 1/01/21 | | | No Opt. Call | | | | A– | | | | 2,645,375 | |
| | | | |
| | 9,150 | | | Rochester, Minnesota, Health Care Facilities Revenue Bonds, Mayo Clinic, Series 2011, 4.500%, 11/15/38 (Mandatory Put 11/15/21) | | | No Opt. Call | | | | AA | | | | 9,816,852 | |
| | | | |
| | 295 | | | Saint Cloud, Minnesota, Charter School Lease Revenue Bonds, Stride Academy Project, Series 2016A, 3.000%, 4/01/21 | | | No Opt. Call | | | | D | | | | 202,612 | |
| | | | |
| | 2,250 | | | Saint Cloud, Minnesota, Health Care Revenue Bonds, CentraCare Health System, Refunding Series 2014B, 5.000%, 5/01/23 | | | No Opt. Call | | | | AA– | | | | 2,528,482 | |
| | | | |
| | 95 | | | Saint Paul Housing & Redevelopment Authority, Minnesota, Charter School Lease Revenue Bonds, Community of Peace Academy Project, Refunding Series 2015A, 2.750%, 12/01/20 | | | No Opt. Call | | | | BBB– | | | | 95,801 | |
| | | | |
| | | | Saint Paul Park, Minnesota, Senior Housing and Health Care Revenue Bonds, Presbyterian Homes Bloomington Project, Refunding Series 2017: | | | | | | | | | | | | |
| | 820 | | | 3.000%, 9/01/20 | | | No Opt. Call | | | | N/R | | | | 828,159 | |
| | 500 | | | 3.000%, 9/01/21 | | | No Opt. Call | | | | N/R | | | | 506,755 | |
| | 500 | | | 3.000%, 9/01/22 | | | No Opt. Call | | | | N/R | | | | 507,635 | |
| | | | |
| | 415 | | | Sartell, Minnesota, Health Care Facilities Revenue Bonds, Country Manor Campus LLC Project, Refunding Series 2017, 3.000%, 9/01/22 | | | No Opt. Call | | | | N/R | | | | 418,532 | |
| | | | |
| | 3,515 | | | Sauk Rapids Independent School District 047, Benton County, Minnesota, General Obligation Bonds, Refunding School Building Series 2015A, 5.000%, 2/01/23 | | | No Opt. Call | | | | AAA | | | | 3,959,964 | |
| | | | |
| | 120 | | | Savage, Minnesota Charter School Lease Revenue Bonds, Aspen Academy Project, Series 2016A, 3.625%, 10/01/21 | | | No Opt. Call | | | | N/R | | | | 118,325 | |
| | | | |
| | 6,790 | | | South Washington County Independent School District 833, Minnesota, General Obligation Bonds, Refunding School Building Series 2018B, 5.000%, 2/01/22 | | | No Opt. Call | | | | Aa2 | | | | 7,426,291 | |
| | | | |
| | 1,330 | | | St. Paul Housing and Redevelopment Authority, Minnesota, Hospital Revenue Bonds, HealthEast Inc., Series 2015A, 5.000%, 11/15/19 (ETM) | | | No Opt. Call | | | | N/R (5) | | | | 1,358,156 | |
| | 58,790 | | | Total Minnesota | | | | | | | | | | | 62,566,258 | |
| | | | |
| | | | Missouri – 3.1% | | | | | | | | | |
| | | | |
| | 1,375 | | | Cape Girardeau County Industrial Development Authority, Missouri, Health Facilities Revenue Bonds, Saint Francis Medical Center, Series 2013A, 5.000%, 6/01/23 | | | 6/22 at 100.00 | | | | AA | | | | 1,506,711 | |
| | | | |
| | 400 | | | Cape Girardeau County Industrial Development Authority, Missouri, Health Facilities Revenue Bonds, Southeasthealth, Series 2017A, 5.000%, 3/01/21 | | | No Opt. Call | | | | BBB– | | | | 419,792 | |
202
| | | | | | | | | | | | | | | | |
Principal
Amount (000) | | | Description (1) | | Optional Call
Provisions (2) | | | Ratings (3) | | | Value | |
| | | | |
| | | | Missouri(continued) | | | | | | | | | |
| | | | |
| $ | 810 | | | Chesterfield Valley Transportation Development District, Missouri, Transportation Sales Tax Revenue Bonds, Series 2015, 3.250%, 5/15/28 | | | 5/23 at 100.00 | | | | A– | | | $ | 827,917 | |
| | | | |
| | 1,000 | | | Clay County Reorganized School DistrictR-1, Kearney, Missouri, General Obligation Bonds, School Building Series 2017, 5.000%, 3/01/22 | | | No Opt. Call | | | | AA+ | | | | 1,095,150 | |
| | | | |
| | 290 | | | Hanley/Eager Road Transportation Development District, Missouri, Revenue Bonds, Refunding Series 2016A, 2.375%, 3/01/21 | | | No Opt. Call | | | | N/R | | | | 289,753 | |
| | | | |
| | 1,000 | | | Missouri Health and Educational Facilities Authority, Revenue Bonds, Lutheran Senior Services Projects, Series 2016B, 4.000%, 2/01/20 | | | No Opt. Call | | | | BBB | | | | 1,013,140 | |
| | | | |
| | | | Plaza at Noah’s Ark Community Improvement District, Saint Charles, Missouri, Tax Increment and Improvement District Revenue Bonds, Series 2015: | | | | | | | | | | | | |
| | 775 | | | 2.750%, 5/01/19 | | | No Opt. Call | | | | N/R | | | | 775,000 | |
| | 500 | | | 3.000%, 5/01/20 | | | No Opt. Call | | | | N/R | | | | 500,780 | |
| | 300 | | | 3.250%, 5/01/21 | | | No Opt. Call | | | | N/R | | | | 301,902 | |
| | | | |
| | 1,000 | | | Saint Charles County Public Water Supply District 2, Missouri, Certificates of Participation, Refunding Series 2016B, 5.000%, 12/01/21 | | | No Opt. Call | | | | AA+ | | | | 1,088,950 | |
| | | | |
| | 640 | | | Saint Louis County Industrial Development Authority, Missouri, Health Facilities Revenue Bonds, Ranken-Jordan Project, Refunding & Improvement Series 2016, 4.000%, 11/15/20 | | | No Opt. Call | | | | N/R | | | | 650,157 | |
| | | | |
| | 5,055 | | | Saint Louis, Missouri, Airport Revenue Bonds,Lambert-St Louis International, Refunding Series 2017A, 5.000%, 7/01/22 – AGM Insured | | | No Opt. Call | | | | AA | | | | 5,591,740 | |
| | | | |
| | 2,425 | | | Saint Louis, Missouri, Airport Revenue Bonds,Lambert-St Louis International, Refunding Series 2017B, 4.000%, 7/01/20 – AGM Insured (AMT) | | | No Opt. Call | | | | AA | | | | 2,490,160 | |
| | | | |
| | 1,745 | | | Springfield, Missouri, Special Obligation Bonds, Refunding Series 2017B, 5.000%, 7/01/21 (AMT) | | | No Opt. Call | | | | Aa2 | | | | 1,857,570 | |
| | 17,315 | | | Total Missouri | | | | | | | | | | | 18,408,722 | |
| | | | |
| | | | Nebraska – 0.9% | | | | | | | | | |
| | | | |
| | 690 | | | Central Plains Energy Project, Nebraska, Gas Project 1 Revenue Bonds, Series 2007A, 5.250%, 12/01/21 | | | No Opt. Call | | | | A | | | | 741,426 | |
| | | | |
| | 1,685 | | | Douglas County Hospital Authority 3, Nebraska, Health Facilities Revenue Bonds, Nebraska Methodist Health System, Refunding Series 2015, 5.000%, 11/01/21 | | | No Opt. Call | | | | A | | | | 1,813,060 | |
| | | | |
| | | | Madison County Hospital Authority 1, Nebraska, Hospital Revenue Bonds, Faith Regional Health Services Project, Refunding Series 2017A: | | | | | | | | | | | | |
| | 1,000 | | | 4.000%, 7/01/20 | | | No Opt. Call | | | | BBB | | | | 1,023,210 | |
| | 1,555 | | | 5.000%, 7/01/22 | | | No Opt. Call | | | | BBB | | | | 1,690,238 | |
| | 4,930 | | | Total Nebraska | | | | | | | | | | | 5,267,934 | |
| | | | |
| | | | Nevada – 2.0% | | | | | | | | | |
| | | | |
| | 3,000 | | | Clark County, Nevada, Airport Revenue Bonds, Junior Subordinate Lien Notes Series 2017C, 5.000%, 7/01/21 (AMT) | | | No Opt. Call | | | | A+ | | | | 3,198,990 | |
| | | | |
| | 2,000 | | | Clark County, Nevada, Passenger Facility Charge Revenue Bonds, Las Vegas-McCarran International Airport, Refunding Series 2017B, 5.000%, 7/01/20 (AMT) | | | No Opt. Call | | | | Aa3 | | | | 2,077,020 | |
| | | | |
| | | | Henderson, Nevada, Limited Obligation Bonds, Local Improvement DistrictT-18 Inspirada, Refunding Series 2016: | | | | | | | | | | | | |
| | 1,890 | | | 4.000%, 9/01/20 | | | No Opt. Call | | | | N/R | | | | 1,927,517 | |
| | 480 | | | 2.000%, 9/01/21 | | | No Opt. Call | | | | N/R | | | | 472,526 | |
| | | | |
| | 1,410 | | | Las Vegas Valley Water District, Nevada, General Obligation Bonds, Refunding Series 2011C, 5.000%, 6/01/22 | | | 6/21 at 100.00 | | | | AA+ | | | | 1,512,944 | |
| | | | |
| | 1,080 | | | Las Vegas, Nevada, Local Improvement Bonds, Special Improvement District 812 Summerlin Village 24, Series 2015, 3.500%, 12/01/19 | | | No Opt. Call | | | | N/R | | | | 1,086,545 | |
203
Nuveen Short Term Municipal Bond Fund(continued)
Portfolio of Investments March 31, 2019
| | | | | | | | | | | | | | | | |
Principal
Amount (000) | | | Description (1) | | Optional Call
Provisions (2) | | | Ratings (3) | | | Value | |
| | | | |
| | | | Nevada(continued) | | | | | | | | | |
| | | | |
| $ | 1,790 | | | Nevada State, General Obligation Bonds, Capital Improvement & Refunding Series 2015E, 5.000%, 2/01/21 | | | No Opt. Call | | | | AA+ | | | $ | 1,901,338 | |
| | 11,650 | | | Total Nevada | | | | | | | | | | | 12,176,880 | |
| | | | |
| | | | New Jersey – 7.0% | | | | | | | | | |
| | | | |
| | | | Lacey Township School District, Ocean County, New Jersey, General Obligation Bonds, Refunding Series 2016: | | | | | | | | | | | | |
| | 1,585 | | | 4.000%, 4/01/19 – BAM Insured | | | No Opt. Call | | | | AA | | | | 1,585,000 | |
| | 1,665 | | | 4.000%, 4/01/20 – BAM Insured | | | No Opt. Call | | | | AA | | | | 1,705,210 | |
| | 1,330 | | | 5.000%, 4/01/21 – BAM Insured | | | No Opt. Call | | | | AA | | | | 1,419,349 | |
| | | | |
| | 7,000 | | | New Jersey Economic Development Authority, Revenue Bonds, Motor Vehicle Surcharge, Refunding Series 2017A, 5.000%, 7/01/23 – BAM Insured | | | No Opt. Call | | | | AA | | | | 7,780,080 | |
| | | | |
| | 2,000 | | | New Jersey Health Care Facilities Financing Authority, Revenue Bonds, Princeton HealthCare System, Series 2016A, 5.000%, 7/01/19 | | | No Opt. Call | | | | AA | | | | 2,016,540 | |
| | | | |
| | | | New Jersey Higher Education Assistance Authority, Senior Student Loan Revenue Bonds, Refunding Series 2018B: | | | | | | | | | | | | |
| | 1,000 | | | 5.000%, 12/01/20 (AMT) | | | No Opt. Call | | | | Aaa | | | | 1,050,720 | |
| | 2,500 | | | 5.000%, 12/01/21 (AMT) | | | No Opt. Call | | | | Aaa | | | | 2,695,150 | |
| | 6,500 | | | 5.000%, 12/01/22 (AMT) | | | No Opt. Call | | | | Aaa | | | | 7,166,705 | |
| | | | |
| | 4,365 | | | New Jersey Transportation Trust Fund Authority, Federal Highway Reimbursement Revenue Notes,Series 2016A-1, 5.000%, 6/15/20 | | | No Opt. Call | | | | A+ | | | | 4,520,787 | |
| | | | |
| | | | New Jersey Transportation Trust Fund Authority, Federal Highway Reimbursement Revenue Notes, Series 2018A: | | | | | | | | | | | | |
| | 1,335 | | | 5.000%, 6/15/22 | | | No Opt. Call | | | | A+ | | | | 1,449,610 | |
| | 3,000 | | | 5.000%, 6/15/23 | | | No Opt. Call | | | | A+ | | | | 3,328,650 | |
| | | | |
| | | | Tobacco Settlement Financing Corporation, New Jersey, Tobacco Settlement Asset-Backed Bonds, Series 2018A: | | | | | | | | | | | | |
| | 5,000 | | | 5.000%, 6/01/21 | | | No Opt. Call | | | | A | | | | 5,308,300 | |
| | 1,685 | | | 5.000%, 6/01/23 | | | No Opt. Call | | | | A | | | | 1,872,405 | |
| | 38,965 | | | Total New Jersey | | | | | | | | | | | 41,898,506 | |
| | | | |
| | | | New Mexico – 1.5% | | | | | | | | | |
| | | | |
| | 5,130 | | | New Mexico Municipal Energy Acquisition Authority, Gas Supply Revenue Bonds, Refunding Sub-Series 2014A, 5.000%, 11/01/39 (Mandatory Put 8/01/19) | | | 8/19 at 100.00 | | | | Aa2 | | | | 5,183,352 | |
| | | | |
| | | | Santa Fe County, New Mexico, Gross Receipts Tax Revenue Bonds, Capital Outlay Series 2017: | | | | | | | | | | | | |
| | 1,615 | | | 5.000%, 6/01/21 | | | No Opt. Call | | | | AA+ | | | | 1,731,118 | |
| | 2,110 | | | 5.000%, 6/01/22 | | | No Opt. Call | | | | AA+ | | | | 2,328,554 | |
| | 8,855 | | | Total New Mexico | | | | | | | | | | | 9,243,024 | |
| | | | |
| | | | New York – 7.6% | | | | | | | | | |
| | | | |
| | 1,770 | | | Chautauqua County Capital Resource Corporation, New York, Multi-Mode Revenue Bonds, Jamestown Center City Development Corporation Project, Guaranteed by the Gebbie Foundation, Series 2013B, 1.500%, 11/01/31 (Mandatory Put 4/30/20) | | | No Opt. Call | | | | AA– | | | | 1,763,982 | |
| | | | |
| | 14,030 | | | Dormitory Authority of the State of New York, State Sales Tax Revenue Bonds, Series 2016A. Groups A,B&C, 5.000%, 3/15/22 | | | No Opt. Call | | | | AA+ | | | | 15,455,027 | |
| | | | |
| | 1,765 | | | New York State Energy Research and Development Authority, Pollution Control Revenue Bonds, New York State Electric and Gas Corporation, Series 1994B, 2.000%, 2/01/29 (Mandatory Put 5/01/20) | | | No Opt. Call | | | | A– | | | | 1,773,084 | |
| | | | |
| | 3,000 | | | New York State Energy Research and Development Authority, Pollution Control Revenue Bonds, Rochester Gas and Electric Corporation, Series 2004C, 2.625%, 4/01/34 (Mandatory Put 7/03/23) | | | No Opt. Call | | | | A– | | | | 3,109,950 | |
204
| | | | | | | | | | | | | | | | |
Principal
Amount (000) | | | Description (1) | | Optional Call
Provisions (2) | | | Ratings (3) | | | Value | |
| | | | |
| | | | New York(continued) | | | | | | | | | |
| | | | |
| $ | 1,960 | | | New York State Thruway Authority, General Revenue Junior Indebtedness Obligations, Series 2013A, 5.000%, 5/01/19 | | | No Opt. Call | | | | A2 | | | $ | 1,965,429 | |
| | | | |
| | | | New York Transportation Development Corporation, New York, Special Facility Revenue Bonds, American Airlines, Inc. John F Kennedy International Airport Project, Refunding Series 2016: | | | | | | | | | | | | |
| | 5,000 | | | 5.000%, 8/01/19 (AMT) | | | No Opt. Call | | | | BB | | | | 5,043,800 | |
| | 3,985 | | | 5.000%, 8/01/20 (AMT) | | | No Opt. Call | | | | BB | | | | 4,117,422 | |
| | | | |
| | 1,210 | | | Port Authority of New York and New Jersey, Consolidated Revenue Bonds, One Hundred Eighty-Fifth Series 2014, 5.000%, 9/01/23 (AMT) | | | No Opt. Call | | | | AA– | | | | 1,374,620 | |
| | | | |
| | 5,000 | | | Port Authority of New York and New Jersey, Consolidated Revenue Bonds, One Hundred Ninety-Seventh Series 2016, 5.000%, 11/15/19 (AMT) | | | No Opt. Call | | | | AA– | | | | 5,103,950 | |
| | | | |
| | 1,880 | | | Troy Capital Resource Corporation, New York, Revenue Bonds, Rensselaer Polytechnic Institute, Series 2015, 4.000%, 8/01/19 | | | No Opt. Call | | | | A3 | | | | 1,894,269 | |
| | | | |
| | 3,055 | | | TSASC INC N Y, 4.000%, 6/01/19 | | | No Opt. Call | | | | A | | | | 3,065,387 | |
| | | | |
| | 1,225 | | | TSASC Inc, New York, Tobacco Settlement Asset-Backed Bonds, Fiscal 2017 Series A, 5.000%, 6/01/20 | | | No Opt. Call | | | | A | | | | 1,268,475 | |
| | 43,880 | | | Total New York | | | | | | | | | | | 45,935,395 | |
| | | | |
| | | | North Carolina – 0.8% | | | | | | | | | |
| | | | |
| | | | North Carolina Central University, General Revenue Bonds, Refunding Series 2016: | | | | | | | | | | | | |
| | 2,195 | | | 4.000%, 10/01/19 | | | No Opt. Call | | | | A3 | | | | 2,220,001 | |
| | 1,745 | | | 5.000%, 10/01/23 | | | No Opt. Call | | | | A3 | | | | 1,964,748 | |
| | | | |
| | 700 | | | North Carolina Medical Care Commission, Retirement Facilities First Mortgage Revenue Bonds, Southminster Project, Refunding Series 2016, 4.000%, 10/01/19 | | | No Opt. Call | | | | N/R | | | | 705,292 | |
| | 4,640 | | | Total North Carolina | | | | | | | | | | | 4,890,041 | |
| | | | |
| | | | North Dakota – 0.7% | | | | | | | | | |
| | | | |
| | 815 | | | Grand Forks, North Dakota, Health Care System Revenue Bonds, Altru Health System Obligated Group, Series 2017A, 5.000%, 12/01/19 | | | No Opt. Call | | | | A– | | | | 831,023 | |
| | | | |
| | | | Grand Forks, North Dakota, Senior Housing and Nursing Facilities Revenue Bonds, Valley Homes Obligated Group, Series 2016A: | | | | | | | | | | | | |
| | 575 | | | 4.000%, 12/01/19 | | | No Opt. Call | | | | N/R | | | | 580,095 | |
| | 630 | | | 4.500%, 12/01/20 | | | No Opt. Call | | | | N/R | | | | 642,732 | |
| | 585 | | | 4.750%, 12/01/21 | | | No Opt. Call | | | | N/R | | | | 605,229 | |
| | 1,245 | | | 5.000%, 12/01/22 | | | No Opt. Call | | | | N/R | | | | 1,311,271 | |
| | 3,850 | | | Total North Dakota | | | | | | | | | | | 3,970,350 | |
| | | | |
| | | | Ohio – 1.6% | | | | | | | | | |
| | | | |
| | 1,000 | | | Akron, Bath and Copley Joint Township Hospital District, Ohio, Hospital Facilities Revenue Bonds, Summa Health System, Refunding & Improvement Series 2016, 5.000%, 11/15/19 | | | No Opt. Call | | | | A– | | | | 1,018,420 | |
| | | | |
| | 845 | | | Butler County, Ohio, Hospital Facilities Revenue Bonds, UC Health, Refunding Series 2017, 4.000%, 11/15/22 | | | No Opt. Call | | | | A | | | | 909,034 | |
| | | | |
| | 685 | | | Ohio Air Quality Development Authority, Ohio, Pollution Control Revenue Bonds, FirstEnergy Generation Project, Refunding Series 2006A, 3.750%, 12/01/23 (4) | | | No Opt. Call | | | | N/R | | | | 589,100 | |
| | | | |
| | 2,310 | | | Ohio State, Hospital Revenue Bonds, University Hospitals Health System, Inc, Series 2018C, 5.000%, 1/15/42 (Mandatory Put 9/15/21) | | | No Opt. Call | | | | A | | | | 2,484,752 | |
| | | | |
| | 4,000 | | | Ohio State, Hospital Revenue Bonds, University Hospitals Health System, Inc, Series 2018D, 5.000%, 1/15/39 (Mandatory Put 9/15/23) | | | No Opt. Call | | | | A | | | | 4,515,600 | |
| | 8,840 | | | Total Ohio | | | | | | | | | | | 9,516,906 | |
205
Nuveen Short Term Municipal Bond Fund(continued)
Portfolio of Investments March 31, 2019
| | | | | | | | | | | | | | | | |
Principal
Amount (000) | | | Description (1) | | Optional Call
Provisions (2) | | | Ratings (3) | | | Value | |
| | | | |
| | | | Oklahoma – 0.4% | | | | | | | | | |
| | | | |
| $ | 1,005 | | | Cleveland County Educational Facilities Authority, Oklahoma, Educational Facilities Lease Revenue Bonds, Moore Public Schools Project, Series 2016, 5.000%, 6/01/20 | | | No Opt. Call | | | | A+ | | | $ | 1,043,632 | |
| | | | |
| | 425 | | | Oklahoma Development Finance Authority, Health System Revenue Bonds, OU Medicine Project, Series 2018B, 5.000%, 8/15/22 | | | No Opt. Call | | | | Baa3 | | | | 461,826 | |
| | | | |
| | 1,000 | | | Tulsa Airports Improvement Trust, Oklahoma, General Airport Revenue Bonds, Refunding Series 2015B, 5.000%, 6/01/20 – BAM Insured | | | No Opt. Call | | | | AA | | | | 1,036,320 | |
| | 2,430 | | | Total Oklahoma | | | | | | | | | | | 2,541,778 | |
| | | | |
| | | | Oregon – 0.4% | | | | | | | | | |
| | | | |
| | 2,000 | | | Oregon State Business Development Commission, 5.000%, 3/01/49 (Mandatory Put 3/01/22) (AMT) | | | No Opt. Call | | | | A+ | | | | 2,174,800 | |
| | | | |
| | | | Pennsylvania – 2.0% | | | | | | | | | |
| | | | |
| | 1,000 | | | Allegheny County Hospital Development Authority, Pennsylvania, Revenue Bonds, Allegheny Health Network Obligated Group Issue, Series 2018A, 5.000%, 4/01/22 | | | No Opt. Call | | | | A | | | | 1,084,610 | |
| | | | |
| | 800 | | | Centre County Hospital Authority, Pennsylvania, Hospital Revenue Bonds, Mount Nittany Medical Center Project, Series 2018A, 5.000%, 11/15/21 | | | No Opt. Call | | | | AA– | | | | 863,592 | |
| | | | |
| | 250 | | | Chester, Delaware County, Pennsylvania, Tax and Revenue Anticipation Notes, Series 2019, 5.000%, 9/30/19, 144A | | | 7/19 at 100.00 | | | | N/R | | | | 250,340 | |
| | | | |
| | 1,000 | | | Commonwealth Financing Authority, Pennsylvania, State Appropriation Lease Bonds, Master Settlement, Series 2018, 5.000%, 6/01/22 | | | No Opt. Call | | | | A1 | | | | 1,095,150 | |
| | | | |
| | 5,045 | | | Pennsylvania Turnpike Commission, Turnpike Revenue Bonds, Refunding Subordinate Series 2016, 5.000%, 6/01/21 | | | No Opt. Call | | | | A3 | | | | 5,383,217 | |
| | | | |
| | 400 | | | Philadelphia, Pennsylvania, Airport Revenue Bonds, Refunding Series 2017A, 5.000%, 7/01/22 | | | No Opt. Call | | | | A | | | | 441,268 | |
| | | | |
| | 1,515 | | | Pittsburgh Public Parking Authority, Pennsylvania, Parking System Revenue Bonds, Refunding Series 2015A, 5.000%, 12/01/19 | | | No Opt. Call | | | | A+ | | | | 1,547,224 | |
| | | | |
| | 635 | | | Pittsburgh, Pennsylvania, General Obligation Bonds, Series 2012A, 5.000%, 9/01/19 | | | No Opt. Call | | | | AA– | | | | 643,915 | |
| | | | |
| | 1,000 | | | The Hospitals and Higher Education Facilities Authority of Philadelphia, Pennsylvania, Hospital Revenue Bonds, Temple University Health System Obligated Group, Series of 2017, 5.000%, 7/01/20 | | | No Opt. Call | | | | BBB– | | | | 1,030,440 | |
| | 11,645 | | | Total Pennsylvania | | | | | | | | | | | 12,339,756 | |
| | | | |
| | | | Rhode Island – 0.4% | | | | | | | | | |
| | | | |
| | | | Rhode Island Health and Educational Building Corporation, Higher Education Facility Revenue Bonds, University of Rhode Island Auxiliary Enterprise, Refunding Series 2016B: | | | | | | | | | | | | |
| | 675 | | | 5.000%, 9/15/19 | | | No Opt. Call | | | | A+ | | | | 684,875 | |
| | 375 | | | 5.000%, 9/15/20 | | | No Opt. Call | | | | A+ | | | | 392,460 | |
| | | | |
| | 1,525 | | | Rhode Island Health and Educational Building Corporation, Hospital Financing Revenue Bonds, Lifespan Obligated Group, Refunding Series 2016, 5.000%, 5/15/20 | | | No Opt. Call | | | | BBB+ | | | | 1,575,173 | |
| | 2,575 | | | Total Rhode Island | | | | | | | | | | | 2,652,508 | |
| | | | |
| | | | South Carolina – 0.5% | | | | | | | | | |
| | | | |
| | 2,980 | | | South Carolina State Ports Authority, Revenue Bonds, Series 2018, 5.000%, 7/01/22 (AMT) | | | No Opt. Call | | | | A+ | | | | 3,271,593 | |
| | | | |
| | | | South Dakota – 0.3% | | | | | | | | | |
| | | | |
| | | | Sioux Falls, South Dakota, Health Facilities Revenue Bonds, Dow Rummel Village Project, Refunding Series 2016: | | | | | | | | | | | | |
| | 300 | | | 2.650%, 11/01/20 | | | No Opt. Call | | | | BB | | | | 301,245 | |
| | 200 | | | 3.000%, 11/01/21 | | | No Opt. Call | | | | BB | | | | 201,750 | |
206
| | | | | | | | | | | | | | | | |
Principal
Amount (000) | | | Description (1) | | Optional Call
Provisions (2) | | | Ratings (3) | | | Value | |
| | | | |
| | | | South Dakota(continued) | | | | | | | | | |
| | | | |
| $ | 585 | | | Sioux Falls, South Dakota, Health Facilities Revenue Bonds, Dow Rummel Village Project, Series 2017, 3.100%, 11/01/22 | | | No Opt. Call | | | | BB | | | $ | 587,750 | |
| | | | |
| | 485 | | | South Dakota Health and Educational Facilities Authority, Revenue Bonds, Sanford Health, Series 2015, 5.000%, 11/01/19 | | | No Opt. Call | | | | A+ | | | | 494,341 | |
| | 1,570 | | | Total South Dakota | | | | | | | | | | | 1,585,086 | |
| | | | |
| | | | Tennessee – 1.6% | | | | | | | | | |
| | | | |
| | 1,000 | | | Knox County Health, Educational and Housing Facility Board, Tennessee, Hospital Revenue Bonds, Covenant Health, Refunding Series 2012A, 5.000%, 1/01/21 | | | No Opt. Call | | | | A+ | | | | 1,053,350 | |
| | | | |
| | 2,610 | | | Memphis-Shelby Counties Airport Authority, Tennessee, Airport Revenue Bonds, Refunding Series 2011C, 5.000%, 7/01/19 (AMT) | | | No Opt. Call | | | | A | | | | 2,630,280 | |
| | | | |
| | 1,290 | | | Memphis-Shelby County Sports Authority, Tennessee, Revenue Bonds, Memphis Arena, Refunding Series 2009B, 5.500%, 11/01/20 | | | 11/19 at 100.00 | | | | AA | | | | 1,319,773 | |
| | | | |
| | 4,000 | | | Tennergy Corporation, Tennessee, Gas Revenue Bonds, Series 2019A, 5.000%, 2/01/50 (Mandatory Put 10/01/24) | | | 7/24 at 100.58 | | | | Aa2 | | | | 4,557,040 | |
| | 8,900 | | | Total Tennessee | | | | | | | | | | | 9,560,443 | |
| | | | |
| | | | Texas – 12.8% | | | | | | | | | |
| | | | |
| | 1,150 | | | Austin Convention Enterprises Inc., Texas, Convention Center Hotel Revenue Bonds, Refunding First Tier Series 2017A, 5.000%, 1/01/21 | | | No Opt. Call | | | | BBB+ | | | | 1,215,435 | |
| | | | |
| | 5,720 | | | Brazosport Independent School District, Brazoria County, Texas, General Obligation Bonds, School Building Series 2015, 5.000%, 2/15/20 | | | No Opt. Call | | | | Aaa | | | | 5,891,657 | |
| | | | |
| | 1,000 | | | Dallas-Fort Worth International Airport, Texas, Joint Revenue Bonds, Refunding Series 2013E, 5.000%, 11/01/22 (AMT) | | | No Opt. Call | | | | A+ | | | | 1,108,430 | |
| | | | |
| | 2,000 | | | Dallas-Fort Worth International Airport, Texas, Joint Revenue Bonds, Refunding Series 2014D, 5.000%, 11/01/22 (AMT) | | | No Opt. Call | | | | A+ | | | | 2,216,860 | |
| | | | |
| | 2,030 | | | El Paso, Texas, Airport Revenue Bonds, El Paso International Airport Series 2018, 5.000%, 8/15/23 (AMT) | | | No Opt. Call | | | | A+ | | | | 2,262,902 | |
| | | | |
| | 4,550 | | | Fort Worth Independent School District, Tarrant County, Texas, General Obligation Bonds, Refunding School Building Series 2015, 5.000%, 2/15/23 | | | No Opt. Call | | | | AAA | | | | 5,122,390 | |
| | | | |
| | 1,655 | | | Galveston Independent School District, Galveston County, Texas, General Obligation Bonds, Series 2018, 5.000%, 2/01/22 | | | No Opt. Call | | | | Aaa | | | | 1,810,090 | |
| | | | |
| | 5,000 | | | Grand Parkway Transportation Corporation, Texas, System Toll Revenue Bonds, Bond Anticipation Note Series 2014A, 5.000%, 2/01/23 | | | No Opt. Call | | | | A+ | | | | 5,579,600 | |
| | | | |
| | 3,000 | | | Harris County Cultural Education Facilities Finance Corporation, Texas, Hospital Revenue Bonds, Memorial Hermann Healthcare System, Refunding Series 2010A, 5.000%, 6/01/19 | | | No Opt. Call | | | | A+ | | | | 3,016,050 | |
| | | | |
| | 1,000 | | | Harris County-Houston Sports Authority, Texas, Revenue Bonds, Refunding Senior Lien Series 2014A, 5.000%, 11/15/20 | | | No Opt. Call | | | | A2 | | | | 1,051,490 | |
| | | | |
| | 2,260 | | | Houston Independent School District, Harris County, Texas, General Obligation Bonds, Refunding Schoolhouse Series 2016A, 5.000%, 2/15/21 | | | No Opt. Call | | | | AAA | | | | 2,403,510 | |
| | | | |
| | 1,700 | | | Houston, Texas, Airport System Revenue Bonds, Refunding & Subordinate Lien Series Series 2018A, 5.000%, 7/01/22 (AMT) | | | No Opt. Call | | | | A1 | | | | 1,866,345 | |
| | | | |
| | 4,210 | | | Houston, Texas, Airport System Revenue Bonds, Refunding & Subordinate Lien Series 2018C, 5.000%, 7/01/23 (AMT) | | | No Opt. Call | | | | AA | | | | 4,739,239 | |
| | | | |
| | 1,000 | | | Houston, Texas, Airport System Revenue Bonds, Refunding Subordinate Lien Series 2011A, 5.000%, 7/01/19 (AMT) | | | No Opt. Call | | | | A+ | | | | 1,008,020 | |
| | | | |
| | 5,000 | | | Houston, Texas, Combined Utility System Revenue Bonds, Refunding First Lien Series 2014C, 4.000%, 5/15/21 | | | No Opt. Call | | | | AA | | | | 5,256,100 | |
207
Nuveen Short Term Municipal Bond Fund(continued)
Portfolio of Investments March 31, 2019
| | | | | | | | | | | | | | | | |
Principal
Amount (000) | | | Description (1) | | Optional Call
Provisions (2) | | | Ratings (3) | | | Value | |
| | | | |
| | | | Texas(continued) | | | | | | | | | |
| | | | |
| $ | 5,000 | | | Houston, Texas, General Obligation Bonds, Refunding Public Improvement Series 2017A, 5.000%, 3/01/21 | | | No Opt. Call | | | | AA | | | $ | 5,321,050 | |
| | | | |
| | 5,000 | | | Humble Independent School District, Harris County, Texas, General Obligation Bonds, Refunding School Building Series 2015A, 5.250%, 2/15/23 | | | No Opt. Call | | | | AAA | | | | 5,679,700 | |
| | | | |
| | | | Love Field Airport Modernization Corporation, Texas, General Airport Revenue Bonds, Series 2017: | | | | | | | | | | | | |
| | 1,000 | | | 5.000%, 11/01/19 (AMT) | | | No Opt. Call | | | | A1 | | | | 1,019,200 | |
| | 1,500 | | | 5.000%, 11/01/20 (AMT) | | | No Opt. Call | | | | A1 | | | | 1,575,405 | |
| | | | |
| | 4,480 | | | Lower Colorado River Authority, Texas, Transmission Contract Revenue Bonds, LCRA Transmission Services Corporation Project, Refunding Series 2011A, 5.000%, 5/15/20 | | | No Opt. Call | | | | A1 | | | | 4,645,715 | |
| | | | |
| | 1,000 | | | Lubbock, Texas, General Obligation Bonds, Tax & Waterworks System Surplus Revenue Certificates of Obligation, Series 2015, 5.000%, 2/15/21 | | | No Opt. Call | | | | AA+ | | | | 1,061,400 | |
| | | | |
| | 4,000 | | | Matagorda County Navigation District 1, Texas, Pollution Control Revenue Bonds, Central Power & Light Company Project, Refunding Series 1996, 1.750%, 5/01/30 (Mandatory Put 9/01/20) (AMT) | | | No Opt. Call | | | | A– | | | | 3,966,240 | |
| | | | |
| | 2,000 | | | Mission Economic Development Corporation, Texas, Solid Waste Disposal Revenue Bonds, Republic Services Inc Project, Variable Rate Demand Obligation Series 2012, 1.900%, 1/01/26 (Mandatory Put 8/01/19) (AMT) | | | No Opt. Call | | | | BBB+ | | | | 2,000,200 | |
| | | | |
| | | | New Hope Cultural Education Facilities Finance Corporation, Texas, Retirement Facility Revenue Bonds, Methodist Retirement Communites Crestview Project, Series 2016: | | | | | | | | | | | | |
| | 690 | | | 2.000%, 11/15/19 | | | No Opt. Call | | | | BB+ | | | | 687,841 | |
| | 615 | | | 4.000%, 11/15/21 | | | No Opt. Call | | | | BB+ | | | | 630,916 | |
| | | | |
| | 325 | | | New Hope Cultural Education Facilities Finance Corporation, Texas, Student Housing Revenue Bonds,CHF-Collegiate Housing Foundation – College Station I LLC – Texas A&M University Project, Series 2014A, 4.000%, 4/01/19 – AGM Insured | | | No Opt. Call | | | | AA | | | | 325,000 | |
| | | | |
| | 2,000 | | | Texas State University System, Financing Revenue Bonds, Refunding Series 2017A, 5.000%, 3/15/20 | | | No Opt. Call | | | | Aa2 | | | | 2,065,960 | |
| | | | |
| | 2,500 | | | Texas State, General Obligation Bonds, Public Finance Authority, Refunding Series 2014A, 5.000%, 10/01/20 | | | No Opt. Call | | | | AAA | | | | 2,627,150 | |
| | | | |
| | 1,000 | | | Travis County, Texas, General Obligation Bonds, Refunding Limited Tax Series 2016A, 5.000%, 3/01/21 | | | No Opt. Call | | | | AAA | | | | 1,064,990 | |
| | 72,385 | | | Total Texas | | | | | | | | | | | 77,218,885 | |
| | | | |
| | | | Utah – 1.2% | | | | | | | | | |
| | | | |
| | 6,000 | | | Salt Lake City, Utah, Airport Revenue Bonds, International Airport Series 2018A, 5.000%, 7/01/23 (AMT) | | | No Opt. Call | | | | A+ | | | | 6,754,260 | |
| | | | |
| | | | Utah Charter School Finance Authority, Charter School Revenue Bonds, Utah Charter Academies Project, Series 2018: | | | | | | | | | | | | |
| | 335 | | | 4.000%, 10/15/22 | | | No Opt. Call | | | | AA | | | | 356,762 | |
| | 350 | | | 4.000%, 10/15/23 | | | No Opt. Call | | | | AA | | | | 377,590 | |
| | 6,685 | | | Total Utah | | | | | | | | | | | 7,488,612 | |
| | | | |
| | | | Virginia – 0.3% | | | | | | | | | |
| | | | |
| | 425 | | | Peninsula Ports Authority of Virginia, Coal Terminal Revenue Bonds, Dominion Terminal Associates Project-DETC Issue, Refunding Series 2003, 1.550%, 10/01/33 (Mandatory Put 10/01/19) | | | No Opt. Call | | | | BBB | | | | 423,848 | |
| | | | |
| | 1,160 | | | Wise County Industrial Development Authority, Virginia, Solid Waste and Sewage Disposal Revenue Bonds, Virginia Electric and Power Company, Series 2010A, 1.875%, 11/01/40 (Mandatory Put 6/01/20) | | | No Opt. Call | | | | A2 | | | | 1,159,385 | |
| | 1,585 | | | Total Virginia | | | | | | | | | | | 1,583,233 | |
208
| | | | | | | | | | | | | | | | |
Principal
Amount (000) | | | Description (1) | | Optional Call
Provisions (2) | | | Ratings (3) | | | Value | |
| | | | |
| | | | Washington – 1.7% | | | | | | | | | |
| | | | |
| | | | Port Everett, Washington, Revenue Bonds, Refunding Series 2016: | | | | | | | | | | | | |
| $ | 200 | | | 3.000%, 12/01/19 | | | No Opt. Call | | | | A1 | | | $ | 201,840 | |
| | 200 | | | 4.000%, 12/01/20 | | | No Opt. Call | | | | A1 | | | | 207,746 | |
| | 225 | | | 4.000%, 12/01/21 | | | No Opt. Call | | | | A1 | | | | 238,140 | |
| | | | |
| | 1,590 | | | Port of Seattle, Washington, General Obligation Bonds, Refunding Series 2011, 5.250%, 12/01/21 (AMT) | | | 6/21 at 100.00 | | | | AAA | | | | 1,706,388 | |
| | | | |
| | | | Port of Seattle, Washington, Revenue Bonds, Intermediate Lien Series 2015C: | | | | | | | | | | | | |
| | 3,500 | | | 5.000%, 4/01/19 (AMT) | | | No Opt. Call | | | | AA– | | | | 3,500,000 | |
| | 1,000 | | | 5.000%, 4/01/21 (AMT) | | | No Opt. Call | | | | AA– | | | | 1,062,910 | |
| | 1,000 | | | 5.000%, 4/01/24 (AMT) | | | No Opt. Call | | | | AA– | | | | 1,137,690 | |
| | | | |
| | 1,775 | | | Skagit County Public Hospital District 1, Washington, Revenue Bonds, Skagit Valley Hospital, Refunding & Improvement Series 2016, 4.000%, 12/01/21 | | | No Opt. Call | | | | Baa2 | | | | 1,858,301 | |
| | | | |
| | 500 | | | Washington State Health Care Facilities Authority, Revenue Bonds, Central Washington Health Services Association, Series 2009, 6.000%, 7/01/19 | | | No Opt. Call | | | | A– | | | | 503,965 | |
| | 9,990 | | | Total Washington | | | | | | | | | | | 10,416,980 | |
| | | | |
| | | | West Virginia – 0.6% | | | | | | | | | |
| | | | |
| | 1,000 | | | West Virginia Economic Development Authority, Solid Waste Disposal Facilities Revenue Bonds, Appalachian Power Company – Amos Project, Series 2011A, 1.700%, 1/01/41 (Mandatory Put 9/01/20) (AMT) | | | No Opt. Call | | | | A– | | | | 996,250 | |
| | | | |
| | 2,710 | | | West Virginia Economic Development Authority, Solid Waste Disposal Facilities Revenue Bonds, Wheeling Power Company – Mitchell Project, Series 2013A, 3.000%, 6/01/37 (Mandatory Put 4/01/22) (AMT) | | | No Opt. Call | | | | A– | | | | 2,736,368 | |
| | 3,710 | | | Total West Virginia | | | | | | | | | | | 3,732,618 | |
| | | | |
| | | | Wisconsin – 2.6% | | | | | | | | | |
| | | | |
| | 2,855 | | | Public Finance Authority of Wisconsin, Solid Waste Disposal Revenue Bonds, Waste Management Inc, Refunding Series 2016A-3, 2.000%, 7/01/29 (Mandatory Put 6/01/21) (AMT) | | | No Opt. Call | | | | A– | | | | 2,844,865 | |
| | | | |
| | 3,000 | | | Public Finance Authority of Wisconsin, Solid Waste Disposal Revenue Bonds, Waste Management Inc, RefundingSeries 2017A-1, 1.950%, 6/01/23 (Mandatory Put 5/01/19) (AMT) | | | No Opt. Call | | | | A– | | | | 3,000,300 | |
| | | | |
| | 3,600 | | | Wisconsin Health and Educational Facilities Authority, Revenue Bonds, Advocate Aurora Health Credit Group, Variable Rate Demand Series 2018B, 5.000%, 8/15/54 (Mandatory Put 1/25/23) | | | No Opt. Call | | | | AA | | | | 4,022,640 | |
| | | | |
| | 1,050 | | | Wisconsin Health and Educational Facilities Authority, Revenue Bonds, Agnesian HealthCare, Inc., Series 2017, 5.000%, 7/01/21 | | | No Opt. Call | | | | A+ | | | | 1,120,844 | |
| | | | |
| | | | Wisconsin Health and Educational Facilities Authority, Revenue Bonds, Franciscan Sisters of Christian Charity Sponsored Ministry, Series 2017A: | | | | | | | | | | | | |
| | 150 | | | 5.000%, 9/01/19 | | | No Opt. Call | | | | BBB– | | | | 151,785 | |
| | 330 | | | 5.000%, 9/01/21 | | | No Opt. Call | | | | BBB– | | | | 351,034 | |
| | | | |
| | | | Wisconsin Health and Educational Facilities Authority, Revenue Bonds, Saint John’s Communities Inc., Series 2018A: | | | | | | | | | | | | |
| | 500 | | | 4.000%, 9/15/21 | | | No Opt. Call | | | | BBB– | | | | 515,200 | |
| | 500 | | | 4.000%, 9/15/22 | | | No Opt. Call | | | | BBB– | | | | 520,280 | |
| | 455 | | | 4.000%, 9/15/23 | | | No Opt. Call | | | | BBB– | | | | 477,313 | |
| | | | |
| | 1,055 | | | Wisconsin Health and Educational Facilities Authority, Wisconsin, Revenue Bonds, Benevolent Corporation Cedar Community, Series 2017, 5.000%, 6/01/22 | | | No Opt. Call | | | | N/R | | | | 1,116,559 | |
| | | | |
| | 300 | | | Wisconsin Health and Educational Facilities Authority, Wisconsin, Revenue Bonds, Fort Healthcare, Series 2014, 4.000%, 5/01/19 | | | No Opt. Call | | | | BBB+ | | | | 300,435 | |
209
Nuveen Short Term Municipal Bond Fund(continued)
Portfolio of Investments March 31, 2019
| | | | | | | | | | | | | | | | |
Principal
Amount (000) | | | Description (1) | | Optional Call
Provisions (2) | | | Ratings (3) | | | Value | |
| | | | |
| | | | Wisconsin(continued) | | | | | | | | | |
| | | | |
| $ | 1,260 | | | Wisconsin Housing and Economic Development Authority, Home Ownership Revenue Bonds, Series 2015A, 1.950%, 9/01/19 (AMT) | | | No Opt. Call | | | | AA | | | $ | 1,259,622 | |
| | 15,055 | | | Total Wisconsin | | | | | | | | | | | 15,680,877 | |
| $ | 557,414 | | | Total Long-Term Investments (cost $584,614,290) | | | | | | | | | | | 588,963,996 | |
| | | | |
Principal
Amount (000) | | | Description (1) | | Optional Call
Provisions (2) | | | Ratings (3) | | | Value | |
| | | | |
| | | | SHORT-TERM INVESTMENTS – 1.5% | | | | | | | | | | | | |
| | | | |
| | | | MUNICIPAL BONDS – 1.5% | | | | | | | | | | | | |
| | | | |
| | | | Minnesota – 0.9% | | | | | | | | | |
| | | | |
| $ | 5,070 | | | Rochester, Minnesota, Health Care Facilities Revenue Bonds, Variable Rate Demand Obligations, Mayo Clinic Series 2008B, 2.100%, 11/15/38 (6) | | | 6/19 at 100.00 | | | | VMIG-1 | | | $ | 5,070,000 | |
| | | | |
| | | | Pennsylvania – 0.2% | | | | | | | | | |
| | | | |
| | 1,350 | | | Pennsylvania Economic Development Financing Authority, Solid Waste Disposal Revenue Bonds, Republic Services Inc Project, Variable Rate Demand Obligations, Refunding Series 2019A, 1.950%, 4/01/34 (AMT) (Mandatory Put 7/15/19) (6) | | | No Opt. Call | | | | A-2 | | | | 1,350,000 | |
| | | | |
| | | | Texas – 0.4% | | | | | | | | | |
| | | | |
| | 2,500 | | | Lower Neches Valley Authority, Texas, Industrial Development Corporation Exempt Facilities Revenue Bonds, ExxonMobil Project, Variable Rate Demand Obligations, Refunding Series 2001A, 1.800%, 11/01/29 (6) | | | 6/19 at 100.00 | | | | VMIG-1 | | | | 2,500,000 | |
| $ | 8,920 | | | Total Short-Term Investments (cost $8,920,000) | | | | | | | | | | | 8,920,000 | |
| | | | Total Investments (cost $593,534,290) – 99.2% | | | | | | | | | | | 597,883,996 | |
| | | | Other Assets Less Liabilities – 0.8% | | | | | | | | | | | 4,921,050 | |
| | | | Net Assets – 100% | | | | | | | | | | $ | 602,805,046 | |
| (1) | All percentages shown in the Portfolio of Investments are based on net assets. |
| (2) | Optional Call Provisions: Dates (month and year) and prices of the earliest optional call or redemption. There may be other call provisions at varying prices at later dates. Certain mortgage-backed securities may be subject to periodic principal paydowns. Optional Call Provisions are not covered by the report of independent registered public accounting firm. |
| (3) | For financial reporting purposes, the ratings disclosed are the highest of Standard & Poor’s Group (“Standard & Poor’s”), Moody’s Investors Service, Inc. (“Moody’s”) or Fitch, Inc. (“Fitch”) rating. This treatment of split-rated securities may differ from that used for other purposes, such as for Fund investment policies. Ratings below BBB by Standard & Poor’s, Baa by Moody’s or BBB by Fitch are considered to be below investment grade. Holdings designated N/R are not rated by any of these national rating agencies. Ratings are not covered by the report of independent registered public accounting firm. |
| (4) | Defaulted security. A security whose issuer has failed to fully pay principal and/or interest when due, or is under the protection of bankruptcy. |
| (5) | Backed by an escrow or trust containing sufficient U.S. Government or U.S. Government agency securities, which ensure the timely payment of principal and interest. |
| (6) | Investment has a maturity of greater than one year, but has variable rate and/or demand features which qualify it as a short-term investment. The rate disclosed, as well as the reference rate and spread, where applicable, is that in effect as of the end of the reporting period. This rate changes periodically based on market conditions or a specified market index. |
| 144A | Investment is exempt from registration under Rule 144A of the Securities Act of 1933, as amended. These investments may only be resold in transactions exempt from registration, which are normally those transactions with qualified institutional buyers. |
| AMT | Alternative Minimum Tax |
| WI/DD | Investment, or portion of investment, purchased on a when-issued or delayed delivery basis. |
See accompanying notes to financial statements.
210
Statement of Assets and Liabilities
March 31, 2019
| | | | | | | | | | | | | | | | |
| | | All-American | | | Intermediate
Duration | | | Limited Term | | | Short Term | |
Assets | | | | | | | | | | | | | | | | |
Long-term investments, at value (cost $3,848,020,028, $6,299,991,612, $5,080,604,924 and $584,614,290, respectively) | | $ | 4,081,152,440 | | | $ | 6,550,754,524 | | | $ | 5,163,828,539 | | | $ | 588,963,996 | |
Short-term investments, at value (cost approximates value) | | | — | | | | 148,345,000 | | | | 55,565,000 | | | | 8,920,000 | |
Cash | | | 129,391 | | | | 29,695,779 | | | | 4,610,810 | | | | 803,460 | |
Cash collateral at broker for investments in futures contracts(1) | | | 318,997 | | | | — | | | | — | | | | — | |
Receivable for: | | | | | | | | | | | | | | | | |
Interest | | | 56,019,254 | | | | 79,074,805 | | | | 58,490,879 | | | | 7,260,306 | |
Investments sold | | | 20,210,366 | | | | 122,575,713 | | | | 95,129,153 | | | | — | |
Variation margin on futures contracts | | | 75,938 | | | | — | | | | — | | | | — | |
Shares sold | | | 19,056,824 | | | | 22,667,633 | | | | 22,323,780 | | | | 3,109,725 | |
Other assets | | | 502,306 | | | | 716,268 | | | | 495,554 | | | | 78,201 | |
Total assets | | | 4,177,465,516 | | | | 6,953,829,722 | | | | 5,400,443,715 | | | | 609,135,688 | |
Liabilities | | | | | | | | | | | | | | | | |
Borrowings | | | 23,800,000 | | | | — | | | | — | | | | — | |
Floating rate obligations | | | 65,870,000 | | | | — | | | | — | | | | — | |
Payable for: | | | | | | | | | | | | | | | | |
Dividends | | | 2,905,530 | | | | 6,133,929 | | | | 2,861,173 | | | | 331,701 | |
Investments purchased | | | 2,980,000 | | | | 104,371,983 | | | | 79,772,437 | | | | 4,853,335 | |
Shares redeemed | | | 5,900,904 | | | | 6,082,702 | | | | 8,124,559 | | | | 641,393 | |
Accrued expenses: | | | | | | | | | | | | | | | | |
Management fees | | | 1,370,941 | | | | 2,235,894 | | | | 1,545,640 | | | | 211,427 | |
Directors/Trustees fees | | | 401,722 | | | | 658,980 | | | | 403,212 | | | | 39,146 | |
12b-1 distribution and service fees | | | 510,480 | | | | 168,519 | | | | 334,346 | | | | 35,491 | |
Other | | | 790,944 | | | | 1,396,396 | | | | 1,085,022 | | | | 218,149 | |
Total liabilities | | | 104,530,521 | | | | 121,048,403 | | | | 94,126,389 | | | | 6,330,642 | |
Net assets | | $ | 4,072,934,995 | | | $ | 6,832,781,319 | | | $ | 5,306,317,326 | | | $ | 602,805,046 | |
Class A Shares | | | | | | | | | | | | | | | | |
Net assets | | $ | 1,554,833,468 | | | $ | 603,262,375 | | | $ | 1,015,539,885 | | | $ | 156,525,537 | |
Shares outstanding | | | 134,033,798 | | | | 64,965,917 | | | | 91,638,186 | | | | 15,519,987 | |
Net asset value (“NAV”) per share | | $ | 11.60 | | | $ | 9.29 | | | $ | 11.08 | | | $ | 10.09 | |
Offering price per share (NAV per share plus maximum sales charge of 4.20%, 3.00%, 2.50% and 2.50%, respectively, of offering price) | | $ | 12.11 | | | $ | 9.58 | | | $ | 11.36 | | | $ | 10.35 | |
Class C Shares | | | | | | | | | | | | | | | | |
Net assets | | $ | 195,053,096 | | | $ | 48,181,853 | | | $ | 83,991,118 | | | $ | 6,879,208 | |
Shares outstanding | | | 16,816,085 | | | | 5,188,322 | | | | 7,607,032 | | | | 683,787 | |
NAV and offering price per share | | $ | 11.60 | | | $ | 9.29 | | | $ | 11.04 | | | $ | 10.06 | |
Class C2 Shares | | | | | | | | | | | | | | | | |
Net assets | | $ | 142,450,495 | | | $ | 43,300,200 | | | $ | 192,173,742 | | | $ | 6,146,824 | |
Shares outstanding | | | 12,274,186 | | | | 4,658,652 | | | | 17,380,464 | | | | 609,971 | |
NAV and offering price per share | | $ | 11.61 | | | $ | 9.29 | | | $ | 11.06 | | | $ | 10.08 | |
Class R6 Shares | | | | | | | | | | | | | | | | |
Net assets | | $ | 12,468,698 | | | $ | — | | | $ | — | | | $ | — | |
Shares outstanding | | | 1,069,444 | | | | — | | | | — | | | | — | |
NAV and offering price per share | | $ | 11.66 | | | $ | — | | | $ | — | | | $ | — | |
Class I Shares | | | | | | | | | | | | | | | | |
Net assets | | $ | 2,168,129,238 | | | $ | 6,138,036,891 | | | $ | 4,014,612,581 | | | $ | 433,253,477 | |
Shares outstanding | | | 186,113,222 | | | | 659,139,542 | | | | 363,560,459 | | | | 42,911,642 | |
NAV and offering price per share | | $ | 11.65 | | | $ | 9.31 | | | $ | 11.04 | | | $ | 10.10 | |
Net assets consist of: | | | | | | | | | | | | | | | | |
Capitalpaid-in | | $ | 3,910,559,215 | | | $ | 6,582,260,779 | | | $ | 5,227,336,079 | | | $ | 597,946,296 | |
Total distributable earnings | | | 162,375,780 | | | | 250,520,540 | | | | 78,981,247 | | | | 4,858,750 | |
Net assets | | $ | 4,072,934,995 | | | $ | 6,832,781,319 | | | $ | 5,306,317,326 | | | $ | 602,805,046 | |
Authorized shares – per class | | | Unlimited | | | | Unlimited | | | | Unlimited | | | | 2 billion | |
Par value per share | | $ | 0.01 | | | $ | 0.001 | | | $ | 0.01 | | | $ | 0.0001 | |
| (1) | Cash pledged to collateralize the net payment obligations for investments in derivatives is in addition to the Fund’s securities pledged as collateral as noted in the Fund’s Portfolio of Investments. |
See accompanying notes to financial statements.
211
Statement of Operations
Year Ended March 31, 2019
| | | | | | | | | | | | | | | | |
| | | All-American | | | Intermediate
Duration | | | Limited Term | | | Short Term | |
| | | | |
Investment Income | | $ | 167,130,838 | | | $ | 211,125,279 | | | $ | 130,345,503 | | | $ | 12,532,367 | |
| | | | |
Expenses | | | | | | | | | | | | | | | | |
| | | | |
Management fees | | | 15,481,687 | | | | 23,713,316 | | | | 16,890,840 | | | | 2,384,384 | |
| | | | |
12b-1 service fees – Class A Shares | | | 2,800,022 | | | | 1,107,300 | | | | 1,989,542 | | | | 312,981 | |
| | | | |
12b-1 distribution and service fees – Class C Shares | | | 1,869,767 | | | | 457,405 | | | | 875,171 | | | | 74,513 | |
| | | | |
12b-1 distribution and service fees – Class C2 Shares | | | 1,274,893 | | | | 394,612 | | | | 1,288,919 | | | | 39,298 | |
| | | | |
Shareholder servicing agent fees | | | 1,601,404 | | | | 2,668,194 | | | | 2,149,386 | | | | 215,219 | |
| | | | |
Interest expense | | | 1,488,962 | | | | 122,671 | | | | 188,742 | | | | 4,353 | |
| | | | |
Custodian fees | | | 450,912 | | | | 622,039 | | | | 516,877 | | | | 171,406 | |
| | | | |
Directors/Trustees fees | | | 119,577 | | | | 187,828 | | | | 152,524 | | | | 18,099 | |
| | | | |
Professional fees | | | 143,451 | | | | 189,956 | | | | 150,793 | | | | 60,387 | |
| | | | |
Shareholder reporting expenses | | | 227,060 | | | | 379,593 | | | | 259,116 | | | | 42,316 | |
| | | | |
Federal and state registration fees | | | 251,358 | | | | 319,993 | | | | 254,149 | | | | 86,697 | |
| | | | |
Other | | | 72,580 | | | | 81,827 | | | | 101,430 | | | | 12,264 | |
| | | | |
Total expenses | | | 25,781,673 | | | | 30,244,734 | | | | 24,817,489 | | | | 3,421,917 | |
| | | | |
Net investment income (loss) | | | 141,349,165 | | | | 180,880,545 | | | | 105,528,014 | | | | 9,110,450 | |
| | | | |
Realized and Unrealized Gain (Loss) | | | | | | | | | | | | | | | | |
| | | | |
Net realized gain (loss) from investments: | | | | | | | | | | | | | | | | |
| | | | |
Investments | | | (19,913,373 | ) | | | (2,783,240 | ) | | | (5,286,979 | ) | | | (621,363 | ) |
| | | | |
Futures contracts | | | (628,556 | ) | | | — | | | | — | | | | — | |
| | | | |
Change in net unrealized appreciation (depreciation) of: | | | | | | | | | | | | | | | | |
| | | | |
Investments | | | 73,406,492 | | | | 148,914,560 | | | | 114,801,312 | | | | 6,538,588 | |
| | | | |
Futures contracts | | | (445,938 | ) | | | — | | | | — | | | | — | |
| | | | |
Net realized and unrealized gain (loss) | | | 52,418,625 | | | | 146,131,320 | | | | 109,514,333 | | | | 5,917,225 | |
| | | | |
Net increase (decrease) in net assets from operations | | $ | 193,767,790 | | | $ | 327,011,865 | | | $ | 215,042,347 | | | $ | 15,027,675 | |
See accompanying notes to financial statements.
212
Statement of Changes in Net Assets
| | | | | | | | | | | | | | | | | | | | |
| | | All-American | | | | | | Intermediate Duration | |
| | | Year Ended
3/31/19 | | | Year Ended(1)
3/31/18 | | | | | | Year Ended
3/31/19 | | | Year Ended(1)
3/31/18 | |
| | | | | |
Operations | | | | | | | | | | | | | | | | | | | | |
| | | | | |
Net investment income (loss) | | $ | 141,349,165 | | | $ | 130,680,932 | | | | | | | $ | 180,880,545 | | | $ | 162,321,897 | |
| | | | | |
Net realized gain (loss) from: | | | | | | | | | | | | | | | | | | | | |
| | | | | |
Investments | | | (19,913,373 | ) | | | 1,291,351 | | | | | | | | (2,783,240 | ) | | | (3,256,612 | ) |
| | | | | |
Futures contracts | | | (628,556 | ) | | | — | | | | | | | | — | | | | — | |
| | | | | |
Change in net unrealized appreciation (depreciation) of: | | | | | | | | | | | | | | | | | | | | |
| | | | | |
Investments | | | 73,406,492 | | | | 18,862,245 | | | | | | | | 148,914,560 | | | | 20,623,966 | |
| | | | | |
Futures contracts | | | (445,938 | ) | | | — | | | | | | | | — | | | | — | |
| | | | | |
Net increase (decrease) in net assets from operations | | | 193,767,790 | | | | 150,834,528 | | | | | | | | 327,011,865 | | | | 179,689,251 | |
| | | | | |
Distributions to Shareholders(2) | | | | | | | | | | | | | | | | | | | | |
| | | | | |
Dividends(3) | | | | | | | | | | | | | | | | | | | | |
| | | | | |
Class A Shares | | | (50,446,500 | ) | | | (46,678,566 | ) | | | | | | | (15,325,260 | ) | | | (14,696,918 | ) |
| | | | | |
Class C Shares | | | (5,261,379 | ) | | | (5,114,685 | ) | | | | | | | (904,219 | ) | | | (921,534 | ) |
| | | | | |
Class C2 Shares | | | (5,152,395 | ) | | | (7,412,748 | ) | | | | | | | (1,176,490 | ) | | | (1,645,382 | ) |
| | | | | |
Class R6 Shares | | | (253,090 | ) | | | (255,706 | ) | | | | | | | — | | | | — | |
| | | | | |
Class I Shares | | | (77,130,331 | ) | | | (70,764,942 | ) | | | | | | | (157,314,478 | ) | | | (136,436,175 | ) |
| | | | | |
Decrease in net assets from distributions to shareholders | | | (138,243,695 | ) | | | (130,226,647 | ) | | | | | | | (174,720,447 | ) | | | (153,700,009 | ) |
| | | | | |
Fund Share Transactions | | | | | | | | | | | | | | | | | | | | |
| | | | | |
Proceeds from sale of shares | | | 1,336,662,890 | | | | 1,152,666,575 | | | | | | | | 2,686,032,240 | | | | 1,483,854,339 | |
| | | | | |
Proceeds from shares issued to shareholders due to
reinvestment of distributions | | | 102,559,302 | | | | 95,354,742 | | | | | | | | 110,724,041 | | | | 102,179,361 | |
| | | | | |
| | | 1,439,222,192 | | | | 1,248,021,317 | | | | | | | | 2,796,756,281 | | | | 1,586,033,700 | |
| | | | | |
Cost of shares redeemed | | | (1,136,957,452 | ) | | | (778,798,185 | ) | | | | | | | (1,537,445,232 | ) | | | (1,313,020,387 | ) |
| | | | | |
Net increase (decrease) in net assets from Fund share transactions | | | 302,264,740 | | | | 469,223,132 | | | | | | | | 1,259,311,049 | | | | 273,013,313 | |
| | | | | |
Net increase (decrease) in net assets | | | 357,788,835 | | | | 489,831,013 | | | | | | | | 1,411,602,467 | | | | 299,002,555 | |
| | | | | |
Net assets at the beginning of period | | | 3,715,146,160 | | | | 3,225,315,147 | | | | | | | | 5,421,178,852 | | | | 5,122,176,297 | |
| | | | | |
Net assets at the end of period | | $ | 4,072,934,995 | | | $ | 3,715,146,160 | | | | | | | $ | 6,832,781,319 | | | $ | 5,421,178,852 | |
| (1) | Prior period amounts have been conformed to current year presentation. See Notes to Financial Statements, Note 9 – New Accounting Pronouncements for further details. |
| (2) | The composition and per share amounts of the Fund’s distributions are presented in the Financial Highlights. The distribution information for the Fund as of its most recent tax year end is presented within the Notes to Financial Statements, Note 6 – Income Tax Information. |
| (3) | For the fiscal year ended March 31, 2018, the Fund’s distributions to shareholders were paid from net investment income. |
See accompanying notes to financial statements.
213
| | | | | | | | | | | | | | | | | | | | |
| | | Limited Term | | | | | | Short Term | |
| | | Year Ended
3/31/19 | | | Year Ended(1)
3/31/18 | | | | | | Year Ended
3/31/19 | | | Year Ended(1)
3/31/18 | |
| | | | | |
Operations | | | | | | | | | | | | | | | | | | | | |
| | | | | |
Net investment income (loss) | | $ | 105,528,014 | | | $ | 92,630,501 | | | | | | | $ | 9,110,450 | | | $ | 7,419,587 | |
| | | | | |
Net realized gain (loss) from: | | | | | | | | | | | | | | | | | | | | |
| | | | | |
Investments | | | (5,286,979 | ) | | | (3,916,685 | ) | | | | | | | (621,363 | ) | | | (96,922 | ) |
| | | | | |
Futures contracts | | | — | | | | — | | | | | | | | — | | | | — | |
| | | | | |
Change in net unrealized appreciation (depreciation) of: | | | | | | | | | | | | | | | | | | | | |
| | | | | |
Investments | | | 114,801,312 | | | | (23,367,486 | ) | | | | | | | 6,538,588 | | | | (3,639,418 | ) |
| | | | | |
Futures contracts | | | — | | | | — | | | | | | | | — | | | | — | |
| | | | | |
Net increase (decrease) in net assets from operations | | | 215,042,347 | | | | 65,346,330 | | | | | | | | 15,027,675 | | | | 3,683,247 | |
| | | | | |
Distributions to Shareholders(2) | | | | | | | | | | | | | | | | | | | | |
| | | | | |
Dividends(3) | | | | | | | | | | | | | | | | | | | | |
| | | | | |
Class A Shares | | | (18,889,874 | ) | | | (19,423,552 | ) | | | | | | | (2,046,710 | ) | | | (1,780,950 | ) |
| | | | | |
Class C Shares | | | (941,916 | ) | | | (1,015,265 | ) | | | | | | | (38,677 | ) | | | (21,260 | ) |
| | | | | |
Class C2 Shares | | | (3,531,968 | ) | | | (4,704,682 | ) | | | | | | | (66,263 | ) | | | (69,592 | ) |
| | | | | |
Class R6 Shares | | | — | | | | — | | | | | | | | — | | | | — | |
| | | | | |
Class I Shares | | | (73,007,938 | ) | | | (61,060,952 | ) | | | | | | | (6,151,997 | ) | | | (4,920,453 | ) |
| | | | | |
Decrease in net assets from distributions to shareholders | | | (96,371,696 | ) | | | (86,204,451 | ) | | | | | | | (8,303,647 | ) | | | (6,792,255 | ) |
| | | | | |
Fund Share Transactions | | | | | | | | | | | | | | | | | | | | |
| | | | | |
Proceeds from sale of shares | | | 2,340,031,019 | | | | 1,606,943,339 | | | | | | | | 307,629,211 | | | | 205,091,091 | |
| | | | | |
Proceeds from shares issued to shareholders due to reinvestment of distributions | | | 67,418,763 | | | | 62,665,786 | | | | | | | | 4,898,889 | | | | 3,757,905 | |
| | | | | |
| | | 2,407,449,782 | | | | 1,669,609,125 | | | | | | | | 312,528,100 | | | | 208,848,996 | |
| | | | | |
Cost of shares redeemed | | | (1,829,618,621 | ) | | | (1,641,262,696 | ) | | | | | | | (303,905,079 | ) | | | (258,058,494 | ) |
| | | | | |
Net increase (decrease) in net assets from Fund share transactions | | | 577,831,161 | | | | 28,346,429 | | | | | | | | 8,623,021 | | | | (49,209,498 | ) |
| | | | | |
Net increase (decrease) in net assets | | | 696,501,812 | | | | 7,488,308 | | | | | | | | 15,347,049 | | | | (52,318,506 | ) |
| | | | | |
Net assets at the beginning of period | | | 4,609,815,514 | | | | 4,602,327,206 | | | | | | | | 587,457,997 | | | | 639,776,503 | |
| | | | | |
Net assets at the end of period | | $ | 5,306,317,326 | | | $ | 4,609,815,514 | | | | | | | $ | 602,805,046 | | | $ | 587,457,997 | |
| (1) | Prior period amounts have been conformed to current year presentation. See Notes to Financial Statements, Note 9 – New Accounting Pronouncements for further details. |
| (2) | The composition and per share amounts of the Fund’s distributions are presented in the Financial Highlights. The distribution information for the Fund as of its most recent tax year end is presented within the Notes to Financial Statements, Note 6 – Income Tax Information. |
| (3) | For the fiscal year ended March 31, 2018, the Fund’s distributions to shareholders were paid from net investment income. |
See accompanying notes to financial statements.
214
THIS PAGE INTENTIONALLY LEFT BLANK
215
Financial Highlights
All-American
Selected data for a share outstanding throughout each period:
| | | | | | | | | | | | | | | | | | | | | | | | | | | | | | | | | | | | |
| | | | | |
| | | | | | Investment Operations | | | | | | Less Distributions | | | | |
| | | | | | | | | |
| Class (Commencement Date) | | Beginning
NAV | | | Net
Investment
Income
(Loss)(a) | | | Net
Realized/
Unrealized
Gain (Loss) | | | Total | | | | | | From
Net
Investment
Income | | | From
Accumulated
Net Realized
Gains | | | Total | | | Ending
NAV | |
| | | | | | | | |
Class A (10/88) | | | | | | | | | | | | | | | | | | | | | | | | | | | | | | | | | |
| | | | | | | | | |
Year Ended 3/31: | | | | | | | | | | | | | | | | | | | | | | | | | | | | | | | | | | | | |
| | | | | | | | | |
2019 | | $ | 11.44 | | | $ | 0.42 | | | $ | 0.15 | | | $ | 0.57 | | | | | | | $ | (0.41 | ) | | $ | — | | | $ | (0.41 | ) | | $ | 11.60 | |
| | | | | | | | | |
2018 | | | 11.34 | | | | 0.43 | | | | 0.10 | | | | 0.53 | | | | | | | | (0.43 | ) | | | — | | | | (0.43 | ) | | | 11.44 | |
| | | | | | | | | |
2017(h) | | | 11.80 | | | | 0.39 | | | | (0.46 | ) | | | (0.07 | ) | | | | | | | (0.39 | ) | | | — | | | | (0.39 | ) | | | 11.34 | |
| | | | | | | | | |
Year Ended 4/30: | | | | | | | | | | | | | | | | | | | | | | | | | | | | | | | | | | | | |
| | | | | | | | | |
2016 | | | 11.57 | | | | 0.43 | | | | 0.23 | | | | 0.66 | | | | | | | | (0.43 | ) | | | — | | | | (0.43 | ) | | | 11.80 | |
| | | | | | | | | |
2015 | | | 11.23 | | | | 0.46 | | | | 0.36 | | | | 0.82 | | | | | | | | (0.48 | ) | | | — | | | | (0.48 | ) | | | 11.57 | |
| | | | | | | | | |
2014 | | | 11.76 | | | | 0.49 | | | | (0.56 | ) | | | (0.07 | ) | | | | | | | (0.46 | ) | | | — | | | | (0.46 | ) | | | 11.23 | |
| | | | | | | | |
Class C (2/14) | | | | | | | | | | | | | | | | | | | | | | | | | | | | | | | | | |
| | | | | | | | | |
Year Ended 3/31: | | | | | | | | | | | | | | | | | | | | | | | | | | | | | | | | | | | | |
| | | | | | | | | |
2019 | | | 11.44 | | | | 0.33 | | | | 0.15 | | | | 0.48 | | | | | | | | (0.32 | ) | | | — | | | | (0.32 | ) | | | 11.60 | |
| | | | | | | | | |
2018 | | | 11.35 | | | | 0.33 | | | | 0.10 | | | | 0.43 | | | | | | | | (0.34 | ) | | | — | | | | (0.34 | ) | | | 11.44 | |
| | | | | | | | | |
2017(h) | | | 11.80 | | | | 0.31 | | | | (0.46 | ) | | | (0.15 | ) | | | | | | | (0.30 | ) | | | — | | | | (0.30 | ) | | | 11.35 | |
| | | | | | | | | |
Year Ended 4/30: | | | | | | | | | | | | | | | | | | | | | | | | | | | | | | | | | | | | |
| | | | | | | | | |
2016 | | | 11.58 | | | | 0.33 | | | | 0.23 | | | | 0.56 | | | | | | | | (0.34 | ) | | | — | | | | (0.34 | ) | | | 11.80 | |
| | | | | | | | | |
2015 | | | 11.24 | | | | 0.36 | | | | 0.37 | | | | 0.73 | | | | | | | | (0.39 | ) | | | — | | | | (0.39 | ) | | | 11.58 | |
| | | | | | | | | |
2014(e) | | | 10.99 | | | | 0.02 | | | | 0.32 | | | | 0.34 | | | | | | | | (0.09 | ) | | | — | | | | (0.09 | ) | | | 11.24 | |
| | | | | | | | |
Class C2 (6/93)(f) | | | | | | | | | | | | | | | | | | | | | | | | | | | | | | | | | |
| | | | | | | | | |
Year Ended 3/31: | | | | | | | | | | | | | | | | | | | | | | | | | | | | | | | | | | | | |
| | | | | | | | | |
2019 | | | 11.44 | | | | 0.36 | | | | 0.15 | | | | 0.51 | | | | | | | | (0.34 | ) | | | — | | | | (0.34 | ) | | | 11.61 | |
| | | | | | | | | |
2018 | | | 11.35 | | | | 0.36 | | | | 0.09 | | | | 0.45 | | | | | | | | (0.36 | ) | | | — | | | | (0.36 | ) | | | 11.44 | |
| | | | | | | | | |
2017(h) | | | 11.80 | | | | 0.33 | | | | (0.45 | ) | | | (0.12 | ) | | | | | | | (0.33 | ) | | | — | | | | (0.33 | ) | | | 11.35 | |
| | | | | | | | | |
Year Ended 4/30: | | | | | | | | | | | | | | | | | | | | | | | | | | | | | | | | | | | | |
| | | | | | | | | |
2016 | | | 11.58 | | | | 0.36 | | | | 0.23 | | | | 0.59 | | | | | | | | (0.37 | ) | | | — | | | | (0.37 | ) | | | 11.80 | |
| | | | | | | | | |
2015 | | | 11.24 | | | | 0.40 | | | | 0.36 | | | | 0.76 | | | | | | | | (0.42 | ) | | | — | | | | (0.42 | ) | | | 11.58 | |
| | | | | | | | | |
2014 | | | 11.76 | | | | 0.43 | | | | (0.55 | ) | | | (0.12 | ) | | | | | | | (0.40 | ) | | | — | | | | (0.40 | ) | | | 11.24 | |
| | | | | | | | | |
Class R6 (6/16) | | | | | | | | | | | | | | | | | | | | | | | | | | | | | | | | | | | | |
| | | | | | | | | |
Year Ended 3/31: | | | | | | | | | | | | | | | | | | | | | | | | | | | | | | | | | | | | |
| | | | | | | | | |
2019 | | | 11.49 | | | | 0.45 | | | | 0.15 | | | | 0.60 | | | | | | | | (0.43 | ) | | | — | | | | (0.43 | ) | | | 11.66 | |
| | | | | | | | | |
2018 | | | 11.39 | | | | 0.46 | | | | 0.09 | | | | 0.55 | | | | | | | | (0.45 | ) | | | — | | | | (0.45 | ) | | | 11.49 | |
| | | | | | | | | |
2017(g) | | | 12.09 | | | | 0.34 | | | | (0.71 | ) | | | (0.37 | ) | | | | | | | (0.33 | ) | | | — | | | | (0.33 | ) | | | 11.39 | |
| | | | | | | | |
Class I (2/97) | | | | | | | | | | | | | | | | | | | | | | | | | | | | | | | | | |
| | | | | | | | | |
Year Ended 3/31: | | | | | | | | | | | | | | | | | | | | | | | | | | | | | | | | | | | | |
| | | | | | | | | |
2019 | | | 11.49 | | | | 0.44 | | | | 0.15 | | | | 0.59 | | | | | | | | (0.43 | ) | | | — | | | | (0.43 | ) | | | 11.65 | |
| | | | | | | | | |
2018 | | | 11.39 | | | | 0.45 | | | | 0.10 | | | | 0.55 | | | | | | | | (0.45 | ) | | | — | | | | (0.45 | ) | | | 11.49 | |
| | | | | | | | | |
2017(h) | | | 11.85 | | | | 0.41 | | | | (0.46 | ) | | | (0.05 | ) | | | | | | | (0.41 | ) | | | — | | | | (0.41 | ) | | | 11.39 | |
| | | | | | | | | |
Year Ended 4/30: | | | | | | | | | | | | | | | | | | | | | | | | | | | | | | | | | | | | |
| | | | | | | | | |
2016 | | | 11.62 | | | | 0.45 | | | | 0.24 | | | | 0.69 | | | | | | | | (0.46 | ) | | | — | | | | (0.46 | ) | | | 11.85 | |
| | | | | | | | | |
2015 | | | 11.28 | | | | 0.49 | | | | 0.35 | | | | 0.84 | | | | | | | | (0.50 | ) | | | — | | | | (0.50 | ) | | | 11.62 | |
| | | | | | | | | |
2014 | | | 11.80 | | | | 0.51 | | | | (0.55 | ) | | | (0.04 | ) | | | | | | | (0.48 | ) | | | — | | | | (0.48 | ) | | | 11.28 | |
216
| | | | | | | | | | | | | | | | | | | | | | | | | | | | | | |
| | | | Ratios/Supplemental Data | |
| | | | | | | | | | Ratios to Average
Net Assets | | | | |
| | | | | | | |
Total
Return(b) | | | Ending
Net
Assets
(000) | | | | | | Expenses
Including
Interest(c) | | | Expenses
Excluding
Interest | | | | | | Net
Investment
Income
(Loss) | | | Portfolio
Turnover
Rate(d) | |
| | | | | | | |
| | | | | | | | | | | | | | | | | | | | | | | | | | | | | | |
| | | | | | | |
| | | | | | | | | | | | | | | | | | | | | | | | | | | | | | |
| | | | | | | |
| | 5.11 | % | | $ | 1,554,833 | | | | | | | | 0.73 | % | | | 0.69 | % | | | | | | | 3.68 | % | | | 29 | % |
| | | | | | | |
| | 4.66 | | | | 1,325,011 | | | | | | | | 0.72 | | | | 0.69 | | | | | | | | 3.69 | | | | 14 | |
| | | | | | | |
| | (0.66 | ) | | | 1,136,311 | | | | | | | | 0.73 | * | | | 0.70 | * | | | | | | | 3.66 | * | | | 24 | |
| | | | | | | |
| | | | | | | | | | | | | | | | | | | | | | | | | | | | | | |
| | | | | | | |
| | 5.85 | | | | 1,170,705 | | | | | | | | 0.70 | | | | 0.70 | | | | | | | | 3.68 | | | | 13 | |
| | | | | | | |
| | 7.38 | | | | 989,477 | | | | | | | | 0.71 | | | | 0.71 | | | | | | | | 4.01 | | | | 18 | |
| | | | | | | |
| | (0.42 | ) | | | 907,137 | | | | | | | | 0.72 | | | | 0.72 | | | | | | | | 4.46 | | | | 13 | |
| | | | | | | |
| | | | | | | | | | | | | | | | | | | | | | | | | | | | | | |
| | | | | | | |
| | | | | | | | | | | | | | | | | | | | | | | | | | | | | | |
| | | | | | | |
| | 4.29 | | | | 195,053 | | | | | | | | 1.53 | | | | 1.49 | | | | | | | | 2.88 | | | | 29 | |
| | | | | | | |
| | 3.76 | | | | 186,999 | | | | | | | | 1.52 | | | | 1.49 | | | | | | | | 2.89 | | | | 14 | |
| | | | | | | |
| | (1.38 | ) | | | 163,496 | | | | | | | | 1.52 | * | | | 1.49 | * | | | | | | | 2.87 | * | | | 24 | |
| | | | | | | |
| | | | | | | | | | | | | | | | | | | | | | | | | | | | | | |
| | | | | | | |
| | 5.04 | | | | 116,024 | | | | | | | | 1.50 | | | | 1.50 | | | | | | | | 2.86 | | | | 13 | |
| | | | | | | |
| | 6.54 | | | | 48,472 | | | | | | | | 1.51 | | | | 1.51 | | | | | | | | 3.09 | | | | 18 | |
| | | | | | | |
| | 3.06 | | | | 4,923 | | | | | | | | 1.50 | * | | | 1.50 | * | | | | | | | 3.39 | * | | | 13 | |
| | | | | | | |
| | | | | | | | | | | | | | | | | | | | | | | | | | | | | | |
| | | | | | | |
| | | | | | | | | | | | | | | | | | | | | | | | | | | | | | |
| | | | | | | |
| | 4.60 | | | | 142,450 | | | | | | | | 1.28 | | | | 1.24 | | | | | | | | 3.12 | | | | 29 | |
| | | | | | | |
| | 3.98 | | | | 217,048 | | | | | | | | 1.27 | | | | 1.24 | | | | | | | | 3.15 | | | | 14 | |
| | | | | | | |
| | (1.07 | ) | | | 264,617 | | | | | | | | 1.28 | * | | | 1.25 | * | | | | | | | 3.11 | * | | | 24 | |
| | | | | | | |
| | | | | | | | | | | | | | | | | | | | | | | | | | | | | | |
| | | | | | | |
| | 5.22 | | | | 308,100 | | | | | | | | 1.25 | | | | 1.25 | | | | | | | | 3.13 | | | | 13 | |
| | | | | | | |
| | 6.82 | | | | 328,649 | | | | | | | | 1.26 | | | | 1.26 | | | | | | | | 3.47 | | | | 18 | |
| | | | | | | |
| | (0.90 | ) | | | 353,220 | | | | | | | | 1.27 | | | | 1.27 | | | | | | | | 3.91 | | | | 13 | |
| | | | | | | |
| | | | | | | | | | | | | | | | | | | | | | | | | | | | | | |
| | | | | | | |
| | | | | | | | | | | | | | | | | | | | | | | | | | | | | | |
| | | | | | | |
| | 5.40 | | | | 12,469 | | | | | | | | 0.49 | | | | 0.45 | | | | | | | | 3.90 | | | | 29 | |
| | | | | | | |
| | 4.86 | | | | 6,725 | | | | | | | | 0.48 | | | | 0.45 | | | | | | | | 3.94 | | | | 14 | |
| | | | | | | |
| | (3.04 | ) | | | 6,674 | | | | | | | | 0.49 | * | | | 0.46 | * | | | | | | | 3.95 | * | | | 24 | |
| | | | | | | |
| | | | | | | | | | | | | | | | | | | | | | | | | | | | | | |
| | | | | | | |
| | | | | | | | | | | | | | | | | | | | | | | | | | | | | | |
| | | | | | | |
| | 5.31 | | | | 2,168,129 | | | | | | | | 0.53 | | | | 0.49 | | | | | | | | 3.88 | | | | 29 | |
| | | | | | | |
| | 4.86 | | | | 1,979,364 | | | | | | | | 0.52 | | | | 0.49 | | | | | | | | 3.89 | | | | 14 | |
| | | | | | | |
| | (0.47 | ) | | | 1,654,217 | | | | | | | | 0.53 | * | | | 0.50 | * | | | | | | | 3.86 | * | | | 24 | |
| | | | | | | |
| | | | | | | | | | | | | | | | | | | | | | | | | | | | | | |
| | | | | | | |
| | 6.05 | | | | 1,417,738 | | | | | | | | 0.50 | | | | 0.50 | | | | | | | | 3.88 | | | | 13 | |
| | | | | | | |
| | 7.57 | | | | 1,134,001 | | | | | | | | 0.51 | | | | 0.51 | | | | | | | | 4.21 | | | | 18 | |
| | | | | | | |
| | (0.14) | | | | 962,101 | | | | | | | | 0.52 | | | | 0.52 | | | | | | | | 4.66 | | | | 13 | |
| (a) | Per share Net Investment Income (Loss) is calculated using the average daily shares method. | |
| (b) | Total return is the combination of changes in NAV without any sales charge, reinvested dividend income at NAV and reinvested capital gains distributions at NAV, if any. Total returns are not annualized. | |
| (c) | The expense ratios reflect, among other things, the interest expense deemed to have been paid by the Fund on the floating rate certificates issued by the special purpose trusts for the self-deposited inverse floaters held by the Fund, where applicable, as described in Note 3 – Portfolio Securities and Investments in Derivatives, Inverse Floating Rate Securities and the interest expense and fees paid on borrowings, as described in Note 8 – Borrowing Arrangements. | |
| (d) | Portfolio Turnover Rate is calculated based on the lesser of long-term purchases or sales (as disclosed in Note 5 – Investment Transactions) divided by the average long-term market value during the period. | |
| (e) | For the period February 10, 2014 (commencement of operations) through April 30, 2014. | |
| (f) | Formerly Class C Shares and renamed to Class C2 Shares on February 10, 2014. | |
| (g) | For the period June 30, 2016 (commencement of operations) through March 31, 2017. | |
| (h) | For the eleven months ended March 31, 2017. | |
See accompanying notes to financial statements.
217
Financial Highlights(continued)
Intermediate Duration
Selected data for a share outstanding throughout each period:
| | | | | | | | | | | | | | | | | | | | | | | | | | | | | | | | | | | | |
| | | | | |
| | | | | | Investment Operations | | | | | | Less Distributions | | | | |
| | | | | | | | | |
| Class (Commencement Date) | | Beginning
NAV | | | Net
Investment
Income
(Loss)(a) | | | Net
Realized/
Unrealized
Gain (Loss) | | | Total | | | | | | From
Net
Investment
Income | | | From
Accumulated
Net Realized
Gains | | | Total | | | Ending
NAV | |
| | | | | | | | |
Class A (6/95) | | | | | | | | | | | | | | | | | | | | | | | | | | | | | | | | | |
| | | | | | | | | |
Year Ended 3/31: | | | | | | | | | | | | | | | | | | | | | | | | | | | | | | | | | | | | |
| | | | | | | | | |
2019 | | $ | 9.07 | | | $ | 0.26 | | | $ | 0.21 | | | $ | 0.47 | | | | | | | $ | (0.25 | ) | | $ | — | | | $ | (0.25 | ) | | $ | 9.29 | |
| | | | | | | | | |
2018 | | | 9.03 | | | | 0.27 | | | | 0.02 | | | | 0.29 | | | | | | | | (0.25 | ) | | | — | | | | (0.25 | ) | | | 9.07 | |
| | | | | | | | | |
2017(h) | | | 9.40 | | | | 0.23 | | | | (0.36 | ) | | | (0.13 | ) | | | | | | | (0.23 | ) | | | (0.01 | ) | | | (0.24 | ) | | | 9.03 | |
| | | | | | | | | |
Year Ended 4/30: | | | | | | | | | | | | | | | | | | | | | | | | | | | | | | | | | | | | |
| | | | | | | | | |
2016 | | | 9.22 | | | | 0.26 | | | | 0.18 | | | | 0.44 | | | | | | | | (0.26 | ) | | | — | | | | (0.26 | ) | | | 9.40 | |
| | | | | | | | | |
2015 | | | 9.13 | | | | 0.26 | | | | 0.10 | | | | 0.36 | | | | | | | | (0.27 | ) | | | — | | | | (0.27 | ) | | | 9.22 | |
| | | | | | | | | |
2014 | | | 9.38 | | | | 0.29 | | | | (0.26 | ) | | | 0.03 | | | | | | | | (0.28 | ) | | | — | | | | (0.28 | ) | | | 9.13 | |
| | | | | | | | | |
Class C (2/14) | | | | | | | | | | | | | | | | | | | | | | | | | | | | | | | | | | | | |
| | | | | | | | | |
Year Ended 3/31: | | | | | | | | | | | | | | | | | | | | | | | | | | | | | | | | | | | | |
| | | | | | | | | |
2019 | | | 9.08 | | | | 0.19 | | | | 0.20 | | | | 0.39 | | | | | | | | (0.18 | ) | | | — | | | | (0.18 | ) | | | 9.29 | |
| | | | | | | | | |
2018 | | | 9.03 | | | | 0.19 | | | | 0.04 | | | | 0.23 | | | | | | | | (0.18 | ) | | | — | | | | (0.18 | ) | | | 9.08 | |
| | | | | | | | | |
2017(h) | | | 9.40 | | | | 0.16 | | | | (0.35 | ) | | | (0.19 | ) | | | | | | | (0.17 | ) | | | (0.01 | ) | | | (0.18 | ) | | | 9.03 | |
| | | | | | | | | |
Year Ended 4/30: | | | | | | | | | | | | | | | | | | | | | | | | | | | | | | | | | | | | |
| | | | | | | | | |
2016 | | | 9.23 | | | | 0.18 | | | | 0.18 | | | | 0.36 | | | | | | | | (0.19 | ) | | | — | | | | (0.19 | ) | | | 9.40 | |
| | | | | | | | | |
2015 | | | 9.14 | | | | 0.19 | | | | 0.10 | | | | 0.29 | | | | | | | | (0.20 | ) | | | — | | | | (0.20 | ) | | | 9.23 | |
| | | | | | | | | |
2014(f) | | | 9.05 | | | | 0.01 | | | | 0.12 | | | | 0.13 | | | | | | | | (0.04 | ) | | | — | | | | (0.04 | ) | | | 9.14 | |
| | | | | | | | |
Class C2 (6/95)(g) | | | | | | | | | | | | | | | | | | | | | | | | | | | | | | | | | |
| | | | | | | | | |
Year Ended 3/31: | | | | | | | | | | | | | | | | | | | | | | | | | | | | | | | | | | | | |
| | | | | | | | | |
2019 | | | 9.09 | | | | 0.21 | | | | 0.19 | | | | 0.40 | | | | | | | | (0.20 | ) | | | — | | | | (0.20 | ) | | | 9.29 | |
| | | | | | | | | |
2018 | | | 9.04 | | | | 0.22 | | | | 0.04 | | | | 0.26 | | | | | | | | (0.21 | ) | | | — | | | | (0.21 | ) | | | 9.09 | |
| | | | | | | | | |
2017(h) | | | 9.41 | | | | 0.18 | | | | (0.35 | ) | | | (0.17 | ) | | | | | | | (0.19 | ) | | | (0.01 | ) | | | (0.20 | ) | | | 9.04 | |
| | | | | | | | | |
Year Ended 4/30: | | | | | | | | | | | | | | | | | | | | | | | | | | | | | | | | | | | | |
| | | | | | | | | |
2016 | | | 9.24 | | | | 0.21 | | | | 0.17 | | | | 0.38 | | | | | | | | (0.21 | ) | | | — | | | | (0.21 | ) | | | 9.41 | |
| | | | | | | | | |
2015 | | | 9.15 | | | | 0.22 | | | | 0.09 | | | | 0.31 | | | | | | | | (0.22 | ) | | | — | | | | (0.22 | ) | | | 9.24 | |
| | | | | | | | | |
2014 | | | 9.41 | | | | 0.24 | | | | (0.27 | ) | | | (0.03 | ) | | | | | | | (0.23 | ) | | | — | | | | (0.23 | ) | | | 9.15 | |
| | | | | | | | |
Class I (11/76) | | | | | | | | | | | | | | | | | | | | | | | | | | | | | | | | | |
| | | | | | | | | |
Year Ended 3/31: | | | | | | | | | | | | | | | | | | | | | | | | | | | | | | | | | | | | |
| | | | | | | | | |
2019 | | | 9.10 | | | | 0.28 | | | | 0.20 | | | | 0.48 | | | | | | | | (0.27 | ) | | | — | | | | (0.27 | ) | | | 9.31 | |
| | | | | | | | | |
2018 | | | 9.05 | | | | 0.29 | | | | 0.03 | | | | 0.32 | | | | | | | | (0.27 | ) | | | — | | | | (0.27 | ) | | | 9.10 | |
| | | | | | | | | |
2017(h) | | | 9.42 | | | | 0.25 | | | | (0.36 | ) | | | (0.11 | ) | | | | | | | (0.25 | ) | | | (0.01 | ) | | | (0.26 | ) | | | 9.05 | |
| | | | | | | | | |
Year Ended 4/30: | | | | | | | | | | | | | | | | | | | | | | | | | | | | | | | | | | | | |
| | | | | | | | | |
2016 | | | 9.25 | | | | 0.28 | | | | 0.17 | | | | 0.45 | | | | | | | | (0.28 | ) | | | — | | | | (0.28 | ) | | | 9.42 | |
| | | | | | | | | |
2015 | | | 9.16 | | | | 0.28 | | | | 0.10 | | | | 0.38 | | | | | | | | (0.29 | ) | | | — | | | | (0.29 | ) | | | 9.25 | |
| | | | | | | | | |
2014 | | | 9.41 | | | | 0.31 | | | | (0.26 | ) | | | 0.05 | | | | | | | | (0.30 | ) | | | — | | | | (0.30 | ) | | | 9.16 | |
218
| | | | | | | | | | | | | | | | | | | | | | | | | | |
| | | | Ratios/Supplemental Data | |
| | | | | | | | | | Ratios to Average
Net Assets(c) | | | | |
| | | | | | |
Total
Return(b) | | | Ending
Net
Assets
(000) | | | | | | Expenses
Including
Interest(d) | | | Expenses
Excluding
Interest | | | Net
Investment Income
(Loss) | | | Portfolio
Turnover
Rate(e) | |
| | | | | | |
| | | | | | | | | | | | | | | | | | | | | | | | | | |
| | | | | | |
| | | | | | | | | | | | | | | | | | | | | | | | | | |
| | | | | | |
| | 5.29 | % | | $ | 603,262 | | | | | | | | 0.67 | % | | | 0.67 | % | | | 2.86 | % | | | 15 | % |
| | | | | | |
| | 3.25 | | | | 525,754 | | | | | | | | 0.68 | | | | 0.68 | | | | 2.90 | | | | 18 | |
| | | | | | |
| | (1.40 | ) | | | 505,589 | | | | | | | | 0.69 | * | | | 0.69 | * | | | 2.70 | * | | | 24 | |
| | | | | | |
| | | | | | | | | | | | | | | | | | | | | | | | | | |
| | | | | | |
| | 4.83 | | | | 1,076,822 | | | | | | | | 0.68 | | | | 0.68 | | | | 2.77 | | | | 18 | |
| | | | | | |
| | 3.95 | | | | 773,091 | | | | | | | | 0.70 | | | | 0.70 | | | | 2.86 | | | | 19 | |
| | | | | | |
| | 0.39 | | | | 876,456 | | | | | | | | 0.70 | | | | 0.70 | | | | 3.20 | | | | 17 | |
| | | | | | |
| | | | | | | | | | | | | | | | | | | | | | | | | | |
| | | | | | |
| | | | | | | | | | | | | | | | | | | | | | | | | | |
| | | | | | |
| | 4.35 | | | | 48,182 | | | | | | | | 1.47 | | | | 1.47 | | | | 2.06 | | | | 15 | |
| | | | | | |
| | 2.56 | | | | 46,897 | | | | | | | | 1.48 | | | | 1.48 | | | | 2.11 | | | | 18 | |
| | | | | | |
| | (2.10 | ) | | | 45,483 | | | | | | | | 1.49 | * | | | 1.49 | * | | | 1.91 | * | | | 24 | |
| | | | | | |
| | | | | | | | | | | | | | | | | | | | | | | | | | |
| | | | | | |
| | 3.91 | | | | 35,070 | | | | | | | | 1.48 | | | | 1.48 | | | | 1.99 | | | | 18 | |
| | | | | | |
| | 3.14 | | | | 17,706 | | | | | | | | 1.50 | | | | 1.50 | | | | 2.03 | | | | 19 | |
| | | | | | |
| | 1.49 | | | | 2,412 | | | | | | | | 1.49 | * | | | 1.49 | * | | | 2.17 | * | | | 17 | |
| | | | | | |
| | | | | | | | | | | | | | | | | | | | | | | | | | |
| | | | | | |
| | | | | | | | | | | | | | | | | | | | | | | | | | |
| | | | | | |
| | 4.51 | | | | 43,300 | | | | | | | | 1.22 | | | | 1.22 | | | | 2.31 | | | | 15 | |
| | | | | | |
| | 2.82 | | | | 66,052 | | | | | | | | 1.23 | | | | 1.23 | | | | 2.36 | | | | 18 | |
| | | | | | |
| | (1.86 | ) | | | 85,193 | | | | | | | | 1.24 | * | | | 1.24 | * | | | 2.16 | * | | | 24 | |
| | | | | | |
| | | | | | | | | | | | | | | | | | | | | | | | | | |
| | | | | | |
| | 4.17 | | | | 101,168 | | | | | | | | 1.24 | | | | 1.24 | | | | 2.28 | | | | 18 | |
| | | | | | |
| | 3.40 | | | | 112,700 | | | | | | | | 1.25 | | | | 1.25 | | | | 2.32 | | | | 19 | |
| | | | | | |
| | (0.25 | ) | | | 126,951 | | | | | | | | 1.25 | | | | 1.25 | | | | 2.65 | | | | 17 | |
| | | | | | |
| | | | | | | | | | | | | | | | | | | | | | | | | | |
| | | | | | |
| | | | | | | | | | | | | | | | | | | | | | | | | | |
| | | | | | |
| | 5.37 | | | | 6,138,037 | | | | | | | | 0.47 | | | | 0.47 | | | | 3.06 | | | | 15 | |
| | | | | | |
| | 3.56 | | | | 4,782,475 | | | | | | | | 0.48 | | | | 0.48 | | | | 3.11 | | | | 18 | |
| | | | | | |
| | (1.22 | ) | | | 4,485,912 | | | | | | | | 0.49 | * | | | 0.49 | * | | | 2.91 | * | | | 24 | |
| | | | | | |
| | | | | | | | | | | | | | | | | | | | | | | | | | |
| | | | | | |
| | 4.91 | | | | 3,979,824 | | | | | | | | 0.49 | | | | 0.49 | | | | 3.02 | | | | 18 | |
| | | | | | |
| | 4.14 | | | | 3,574,561 | | | | | | | | 0.50 | | | | 0.50 | | | | 3.07 | | | | 19 | |
| | | | | | |
| | 0.59 | | | | 3,210,180 | | | | | | | | 0.50 | | | | 0.50 | | | | 3.40 | | | | 17 | |
| (a) | Per share Net Investment Income (Loss) is calculated using the average daily shares method. | |
| (b) | Total return is the combination of changes in NAV without any sales charge, reinvested dividend income at NAV and reinvested capital gains distributions at NAV, if any. Total returns are not annualized. | |
| (c) | The Fund has a fee waiver/expense reimbursement agreement with the Adviser, but did not receive a fee waiver/expense reimbursement during the periods presented herein. See Note 7 – Management Fees and Other Transactions with Affiliates, Management Fees for more information. | |
| (d) | The expense ratios reflect, among other things, the interest expense and fees paid on borrowings, as described in Note 8 – Borrowing Arrangements. | |
| (e) | Portfolio Turnover Rate is calculated based on the lesser of long-term purchases or sales (as disclosed in Note 5 – Investment Transactions) divided by the average long-term market value during the period. | |
| (f) | For the period February 10, 2014 (commencement of operations) through April 30, 2014. | |
| (g) | Formerly Class C Shares and renamed to Class C2 Shares on February 10, 2014. | |
| (h) | For the eleven months ended March 31, 2017. | |
See accompanying notes to financial statements.
219
Financial Highlights(continued)
Limited Term
Selected data for a share outstanding throughout each period:
| | | | | | | | | | | | | | | | | | | | | | | | | | | | | | | | | | | | |
| | | | | |
| | | | | | Investment Operations | | | | | | Less Distributions | | | | |
| | | | | | | | | |
| Class (Commencement Date) | | Beginning
NAV | | | Net
Investment
Income
(Loss)(a) | | | Net
Realized/
Unrealized
Gain(Loss) | | | Total | | | | | | From
Net
Investment
Income | | | From
Accumulated
Net Realized
Gains | | | Total | | | Ending
NAV | |
| | | | | | | | |
Class A (10/87) | | | | | | | | | | | | | | | | | | | | | | | | | | | | | | | | | |
| | | | | | | | | |
Year Ended 3/31: | | | | | | | | | | | | | | | | | | | | | | | | | | | | | | | | | | | | |
| | | | | | | | | |
2019 | | $ | 10.83 | | | $ | 0.23 | | | $ | 0.23 | | | $ | 0.46 | | | | | | | $ | (0.21 | ) | | $ | — | | | $ | (0.21 | ) | | $ | 11.08 | |
| | | | | | | | | |
2018 | | | 10.88 | | | | 0.21 | | | | (0.06 | ) | | | 0.15 | | | | | | | | (0.20 | ) | | | — | | | | (0.20 | ) | | | 10.83 | |
| | | | | | | | | |
2017(h) | | | 11.17 | | | | 0.17 | | | | (0.28 | ) | | | (0.11 | ) | | | | | | | (0.18 | ) | | | — | | | | (0.18 | ) | | | 10.88 | |
| | | | | | | | | |
Year Ended 4/30: | | | | | | | | | | | | | | | | | | | | | | | | | | | | | | | | | | | | |
| | | | | | | | | |
2016 | | | 11.10 | | | | 0.20 | | | | 0.08 | | | | 0.28 | | | | | | | | (0.21 | ) | | | — | | | | (0.21 | ) | | | 11.17 | |
| | | | | | | | | |
2015 | | | 11.12 | | | | 0.21 | | | | (0.02 | ) | | | 0.19 | | | | | | | | (0.21 | ) | | | — | | | | (0.21 | ) | | | 11.10 | |
| | | | | | | | | |
2014 | | | 11.27 | | | | 0.22 | | | | (0.16 | ) | | | 0.06 | | | | | | | | (0.21 | ) | | | — | | | | (0.21 | ) | | | 11.12 | |
| | | | | | | | |
Class C (2/14) | | | | | | | | | | | | | | | | | | | | | | | | | | | | | | | | | |
| | | | | | | | | |
Year Ended 3/31: | | | | | | | | | | | | | | | | | | | | | | | | | | | | | | | | | | | | |
| | | | | | | | | |
2019 | | | 10.78 | | | | 0.14 | | | | 0.24 | | | | 0.38 | | | | | | | | (0.12 | ) | | | — | | | | (0.12 | ) | | | 11.04 | |
| | | | | | | | | |
2018 | | | 10.83 | | | | 0.12 | | | | (0.06 | ) | | | 0.06 | | | | | | | | (0.11 | ) | | | — | | | | (0.11 | ) | | | 10.78 | |
| | | | | | | | | |
2017(h) | | | 11.12 | | | | 0.09 | | | | (0.28 | ) | | | (0.19 | ) | | | | | | | (0.10 | ) | | | — | | | | (0.10 | ) | | | 10.83 | |
| | | | | | | | | |
Year Ended 4/30: | | | | | | | | | | | | | | | | | | | | | | | | | | | | | | | | | | | | |
| | | | | | | | | |
2016 | | | 11.06 | | | | 0.12 | | | | 0.07 | | | | 0.19 | | | | | | | | (0.13 | ) | | | — | | | | (0.13 | ) | | | 11.12 | |
| | | | | | | | | |
2015 | | | 11.08 | | | | 0.15 | | | | (0.02 | ) | | | 0.13 | | | | | | | | (0.15 | ) | | | — | | | | (0.15 | ) | | | 11.06 | |
| | | | | | | | | |
2014(f) | | | 11.06 | | | | 0.01 | | | | 0.04 | | | | 0.05 | | | | | | | | (0.03 | ) | | | — | | | | (0.03 | ) | | | 11.08 | |
| | | | | | | | |
Class C2 (12/95)(g) | | | | | | | | | | | | | | | | | | | | | | | | | | | | | | | | | |
| | | | | | | | | |
Year Ended 3/31: | | | | | | | | | | | | | | | | | | | | | | | | | | | | | | | | | | | | |
| | | | | | | | | |
2019 | | | 10.80 | | | | 0.19 | | | | 0.24 | | | | 0.43 | | | | | | | | (0.17 | ) | | | — | | | | (0.17 | ) | | | 11.06 | |
| | | | | | | | | |
2018 | | | 10.85 | | | | 0.17 | | | | (0.06 | ) | | | 0.11 | | | | | | | | (0.16 | ) | | | — | | | | (0.16 | ) | | | 10.80 | |
| | | | | | | | | |
2017(h) | | | 11.13 | | | | 0.14 | | | | (0.28 | ) | | | (0.14 | ) | | | | | | | (0.14 | ) | | | — | | | | (0.14 | ) | | | 10.85 | |
| | | | | | | | | |
Year Ended 4/30: | | | | | | | | | | | | | | | | | | | | | | | | | | | | | | | | | | | | |
| | | | | | | | | |
2016 | | | 11.06 | | | | 0.17 | | | | 0.06 | | | | 0.23 | | | | | | | | (0.16 | ) | | | — | | | | (0.16 | ) | | | 11.13 | |
| | | | | | | | | |
2015 | | | 11.08 | | | | 0.17 | | | | (0.02 | ) | | | 0.15 | | | | | | | | (0.17 | ) | | | — | | | | (0.17 | ) | | | 11.06 | |
| | | | | | | | | |
2014 | | | 11.23 | | | | 0.18 | | | | (0.16 | ) | | | 0.02 | | | | | | | | (0.17 | ) | | | — | | | | (0.17 | ) | | | 11.08 | |
| | | | | | | | |
Class I (2/97) | | | | | | | | | | | | | | | | | | | | | | | | | | | | | | | | | |
| | | | | | | | | |
Year Ended 3/31: | | | | | | | | | | | | | | | | | | | | | | | | | | | | | | | | | | | | |
| | | | | | | | | |
2019 | | | 10.79 | | | | 0.25 | | | | 0.23 | | | | 0.48 | | | | | | | | (0.23 | ) | | | — | | | | (0.23 | ) | | | 11.04 | |
| | | | | | | | | |
2018 | | | 10.83 | | | | 0.23 | | | | (0.05 | ) | | | 0.18 | | | | | | | | (0.22 | ) | | | — | | | | (0.22 | ) | | | 10.79 | |
| | | | | | | | | |
2017(h) | | | 11.12 | | | | 0.19 | | | | (0.28 | ) | | | (0.09 | ) | | | | | | | (0.20 | ) | | | — | | | | (0.20 | ) | | | 10.83 | |
| | | | | | | | | |
Year Ended 4/30: | | | | | | | | | | | | | | | | | | | | | | | | | | | | | | | | | | | | |
| | | | | | | | | |
2016 | | | 11.05 | | | | 0.23 | | | | 0.06 | | | | 0.29 | | | | | | | | (0.22 | ) | | | — | | | | (0.22 | ) | | | 11.12 | |
| | | | | | | | | |
2015 | | | 11.06 | | | | 0.23 | | | | (0.01 | ) | | | 0.22 | | | | | | | | (0.23 | ) | | | — | | | | (0.23 | ) | | | 11.05 | |
| | | | | | | | | |
2014 | | | 11.21 | | | | 0.24 | | | | (0.16 | ) | | | 0.08 | | | | | | | | (0.23 | ) | | | — | | | | (0.23 | ) | | | 11.06 | |
220
| | | | | | | | | | | | | | | | | | | | | | | | | | | | | | | | | | | | | | | | | | |
| | | | Ratios/Supplemental Data | |
| | | | | | | | | | Ratios to Average
Net Assets Before Waiver/Reimbursement | | | | | | Ratios to Average
Net Assets After
Waiver/Reimbursement(c) | | | | |
| | | | | | | | | | |
Total
Return(b) | | | Ending
Net
Assets
(000) | | | | | | Expenses
Including
Interest(d) | | | Expenses
Excluding
Interest | | | Net
Investment
Income
(Loss) | | | | | | Expenses
Including
Interest(d) | | | Expenses
Excluding
Interest | | | Net
Investment
Income
(Loss) | | | Portfolio
Turnover
Rate(e) | |
| | | | | | | | | | |
| | | | | | | | | | | | | | | | | | | | | | | | | | | | | | | | | | | | | | | | | | |
| | | | | | | | | | |
| | | | | | | | | | | | | | | | | | | | | | | | | | | | | | | | | | | | | | | | | | |
| | | | | | | | | | |
| | 4.27 | % | | $ | 1,015,540 | | | | | | | | 0.63 | % | | | 0.63 | % | | | 2.07 | % | | | | | | | 0.63 | % | | | 0.63 | % | | | 2.07 | % | | | 27 | % |
| | | | | | | | | | |
| | 1.36 | | | | 998,226 | | | | | | | | 0.62 | | | | 0.62 | | | | 1.92 | | | | | | | | 0.62 | | | | 0.62 | | | | 1.92 | | | | 21 | |
| | | | | | | | | | |
| | (0.99 | ) | | | 1,094,434 | | | | | | | | 0.63 | * | | | 0.63 | * | | | 1.72 | * | | | | | | | 0.63 | * | | | 0.63 | * | | | 1.72 | * | | | 26 | |
| | | | | | | | | | |
| | | | | | | | | | | | | | | | | | | | | | | | | | | | | | | | | | | | | | | | | | |
| | | | | | | | | | |
| | 2.50 | | | | 1,208,642 | | | | | | | | 0.63 | | | | 0.63 | | | | 1.84 | | | | | | | | 0.63 | | | | 0.63 | | | | 1.84 | | | | 20 | |
| | | | | | | | | | |
| | 1.72 | | | | 1,168,646 | | | | | | | | 0.64 | | | | 0.64 | | | | 1.89 | | | | | | | | 0.64 | | | | 0.64 | | | | 1.89 | | | | 20 | |
| | | | | | | | | | |
| | 0.55 | | | | 1,279,131 | | | | | | | | 0.65 | | | | 0.65 | | | | 1.99 | | | | | | | | 0.65 | | | | 0.65 | | | | 1.99 | | | | 20 | |
| | | | | | | | | | |
| | | | | | | | | | | | | | | | | | | | | | | | | | | | | | | | | | | | | | | | | | |
| | | | | | | | | | |
| | | | | | | | | | | | | | | | | | | | | | | | | | | | | | | | | | | | | | | | | | |
| | | | | | | | | | |
| | 3.52 | | | | 83,991 | | | | | | | | 1.43 | | | | 1.43 | | | | 1.27 | | | | | | | | 1.43 | | | | 1.43 | | | | 1.27 | | | | 27 | |
| | | | | | | | | | |
| | 0.53 | | | | 93,327 | | | | | | | | 1.42 | | | | 1.42 | | | | 1.12 | | | | | | | | 1.42 | | | | 1.42 | | | | 1.12 | | | | 21 | |
| | | | | | | | | | |
| | (1.74 | ) | | | 112,035 | | | | | | | | 1.43 | * | | | 1.43 | * | | | 0.92 | * | | | | | | | 1.43 | * | | | 1.43 | * | | | 0.92 | * | | | 26 | |
| | | | | | | | | | |
| | | | | | | | | | | | | | | | | | | | | | | | | | | | | | | | | | | | | | | | | | |
| | | | | | | | | | |
| | 1.71 | | | | 90,330 | | | | | | | | 1.43 | | | | 1.43 | | | | 1.04 | | | | | | | | 1.36 | | | | 1.36 | | | | 1.11 | | | | 20 | |
| | | | | | | | | | |
| | 1.18 | | | | 51,973 | | | | | | | | 1.43 | | | | 1.43 | | | | 1.07 | | | | | | | | 1.18 | | | | 1.18 | | | | 1.32 | | | | 20 | |
| | | | | | | | | | |
| | 0.49 | | | | 9,695 | | | | | | | | 1.43 | * | | | 1.43 | * | | | 1.10 | * | | | | | | | 1.18 | * | | | 1.18 | * | | | 1.35 | * | | | 20 | |
| | | | | | | | | | |
| | | | | | | | | | | | | | | | | | | | | | | | | | | | | | | | | | | | | | | | | | |
| | | | | | | | | | |
| | | | | | | | | | | | | | | | | | | | | | | | | | | | | | | | | | | | | | | | | | |
| | | | | | | | | | |
| | 3.97 | | | | 192,174 | | | | | | | | 0.98 | | | | 0.98 | | | | 1.71 | | | | | | | | 0.98 | | | | 0.98 | | | | 1.71 | | | | 27 | |
| | | | | | | | | | |
| | 0.97 | | | | 292,436 | | | | | | | | 0.97 | | | | 0.97 | | | | 1.57 | | | | | | | | 0.97 | | | | 0.97 | | | | 1.57 | | | | 21 | |
| | | | | | | | | | |
| | (1.25 | ) | | | 383,282 | | | | | | | | 0.98 | * | | | 0.98 | * | | | 1.37 | * | | | | | | | 0.98 | * | | | 0.98 | * | | | 1.37 | * | | | 26 | |
| | | | | | | | | | |
| | | | | | | | | | | | | | | | | | | | | | | | | | | | | | | | | | | | | | | | | | |
| | | | | | | | | | |
| | 2.12 | | | | 461,558 | | | | | | | | 0.98 | | | | 0.98 | | | | 1.50 | | | | | | | | 0.98 | | | | 0.98 | | | | 1.50 | | | | 20 | |
| | | | | | | | | | |
| | 1.34 | | | | 528,287 | | | | | | | | 0.99 | | | | 0.99 | | | | 1.54 | | | | | | | | 0.99 | | | | 0.99 | | | | 1.54 | | | | 20 | |
| | | | | | | | | | |
| | 0.17 | | | | 623,242 | | | | | | | | 1.00 | | | | 1.00 | | | | 1.64 | | | | | | | | 1.00 | | | | 1.00 | | | | 1.64 | | | | 20 | |
| | | | | | | | | | |
| | | | | | | | | | | | | | | | | | | | | | | | | | | | | | | | | | | | | | | | | | |
| | | | | | | | | | |
| | | | | | | | | | | | | | | | | | | | | | | | | | | | | | | | | | | | | | | | | | |
| | | | | | | | | | |
| | 4.46 | | | | 4,014,613 | | | | | | | | 0.43 | | | | 0.43 | | | | 2.27 | | | | | | | | 0.43 | | | | 0.43 | | | | 2.27 | | | | 27 | |
| | | | | | | | | | |
| | 1.62 | | | | 3,225,826 | | | | | | | | 0.42 | | | | 0.42 | | | | 2.12 | | | | | | | | 0.42 | | | | 0.42 | | | | 2.12 | | | | 21 | |
| | | | | | | | | | |
| | (0.85 | ) | | | 3,012,577 | | | | | | | | 0.43 | * | | | 0.43 | * | | | 1.92 | * | | | | | | | 0.43 | * | | | 0.43 | * | | | 1.92 | * | | | 26 | |
| | | | | | | | | | |
| | | | | | | | | | | | | | | | | | | | | | | | | | | | | | | | | | | | | | | | | | |
| | | | | | | | | | |
| | 2.68 | | | | 2,744,568 | | | | | | | | 0.43 | | | | 0.43 | | | | 2.04 | | | | | | | | 0.43 | | | | 0.43 | | | | 2.04 | | | | 20 | |
| | | | | | | | | | |
| | 1.99 | | | | 2,221,891 | | | | | | | | 0.44 | | | | 0.44 | | | | 2.09 | | | | | | | | 0.44 | | | | 0.44 | | | | 2.09 | | | | 20 | |
| | | | | | | | | | |
| | 0.72 | | | | 1,781,216 | | | | | | | | 0.45 | | | | 0.45 | | | | 2.19 | | | | | | | | 0.45 | | | | 0.45 | | | | 2.19 | | | | 20 | |
| (a) | Per share Net Investment Income (Loss) is calculated using the average daily shares method. | |
| (b) | Total return is the combination of changes in NAV without any sales charge, reinvested dividend income at NAV and reinvested capital gains distributions at NAV, if any. Total returns are not annualized. | |
| (c) | After fee waiver and/or expense reimbursement from the Adviser, where applicable. During the fiscal years ended April 30, 2014 through April 30, 2016, the Adviser agreed to waive 0.25% of the 12b-1 distribution and/or service fees for Class C Shares through August 31, 2015. After August 31, 2015, the Adviser is no longer waiving fees or reimbursing expenses for Class C Shares. | |
| (d) | The expense ratios reflect, among other things, the interest expense and fees paid on borrowings, as described in Note 8 – Borrowing Arrangements. | |
| (e) | Portfolio Turnover Rate is calculated based on the lesser of long-term purchases or sales (as disclosed in Note 5 – Investment Transactions) divided by the average long-term market value during the period. | |
| (f) | For the period February 10, 2014 (commencement of operations) through April 30, 2014. | |
| (g) | Formerly Class C Shares and renamed to Class C2 Shares on February 10, 2014. | |
| (h) | For the eleven months ended March 31, 2017. | |
See accompanying notes to financial statements.
221
Financial Highlights(continued)
Short Term
Selected data for a share outstanding throughout each period:
| | | | | | | | | | | | | | | | | | | | | | | | | | | | | | | | | | | | |
| | | | | |
| | | | | | Investment Operations | | | | | | Less Distributions | | | | |
| | | | | | | | | |
| Class (Commencement Date) | | Beginning
NAV | | | Net
Investment
Income
(Loss)(a) | | | Net
Realized/
Unrealized
Gain(Loss) | | | Total | | | | | | From
Net
Investment
Income | | | From
Accumulated
Net Realized
Gains | | | Total | | | Ending
NAV | |
| | | | | | | | |
Class A (10/02) | | | | | | | | | | | | | | | | | | | | | | | | | | | | | | | | | |
| | | | | | | | | |
Year Ended 3/31: | | | | | | | | | | | | | | | | | | | | | | | | | | | | | | | | | | | | |
| | | | | | | | | |
2019 | | $ | 9.98 | | | $ | 0.14 | | | $ | 0.10 | | | $ | 0.24 | | | | | | | $ | (0.13 | ) | | $ | — | | | $ | (0.13 | ) | | $ | 10.09 | |
| | | | | | | | | |
2018 | | | 10.04 | | | | 0.11 | | | | (0.07 | ) | | | 0.04 | | | | | | | | (0.10 | ) | | | — | | | | (0.10 | ) | | | 9.98 | |
| | | | | | | | | |
2017(g) | | | 10.12 | | | | 0.09 | | | | (0.08 | ) | | | 0.01 | | | | | | | | (0.09 | ) | | | — | | | | (0.09 | ) | | | 10.04 | |
| | | | | | | | | |
Year Ended 4/30: | | | | | | | | | | | | | | | | | | | | | | | | | | | | | | | | | | | | |
| | | | | | | | | |
2016 | | | 10.11 | | | | 0.10 | | | | — | ** | | | 0.10 | | | | | | | | (0.09 | ) | | | — | | | | (0.09 | ) | | | 10.12 | |
| | | | | | | | | |
2015 | | | 10.15 | | | | 0.10 | | | | (0.04 | ) | | | 0.06 | | | | | | | | (0.10 | ) | | | — | | | | (0.10 | ) | | | 10.11 | |
| | | | | | | | | |
2014 | | | 10.20 | | | | 0.12 | | | | (0.05 | ) | | | 0.07 | | | | | | | | (0.12 | ) | | | — | | | | (0.12 | ) | | | 10.15 | |
| | | | | | | | |
Class C (2/14) | | | | | | | | | | | | | | | | | | | | | | | | | | | | | | | | | |
| | | | | | | | | |
Year Ended 3/31: | | | | | | | | | | | | | | | | | | | | | | | | | | | | | | | | | | | | |
| | | | | | | | | |
2019 | | | 9.96 | | | | 0.06 | | | | 0.09 | | | | 0.15 | | | | | | | | (0.05 | ) | | | — | | | | (0.05 | ) | | | 10.06 | |
| | | | | | | | | |
2018 | | | 10.02 | | | | 0.03 | | | | (0.07 | ) | | | (0.04 | ) | | | | | | | (0.02 | ) | | | — | | | | (0.02 | ) | | | 9.96 | |
| | | | | | | | | |
2017(g) | | | 10.11 | | | | 0.02 | | | | (0.09 | ) | | | (0.07 | ) | | | | | | | (0.02 | ) | | | — | | | | (0.02 | ) | | | 10.02 | |
| | | | | | | | | |
Year Ended 4/30: | | | | | | | | | | | | | | | | | | | | | | | | | | | | | | | | | | | | |
| | | | | | | | | |
2016 | | | 10.10 | | | | 0.03 | | | | 0.01 | | | | 0.04 | | | | | | | | (0.03 | ) | | | — | | | | (0.03 | ) | | | 10.11 | |
| | | | | | | | | |
2015 | | | 10.14 | | | | 0.06 | | | | (0.04 | ) | | | 0.02 | | | | | | | | (0.06 | ) | | | — | | | | (0.06 | ) | | | 10.10 | |
| | | | | | | | | |
2014(e) | | | 10.15 | | | | — | ** | | | 0.01 | | | | 0.01 | | | | | | | | (0.02 | ) | | | — | | | | (0.02 | ) | | | 10.14 | |
| | | | | | | | |
Class C2 (8/11)(f) | | | | | | | | | | | | | | | | | | | | | | | | | | | | | | | | | |
| | | | | | | | | |
Year Ended 3/31: | | | | | | | | | | | | | | | | | | | | | | | | | | | | | | | | | | | | |
| | | | | | | | | |
2019 | | | 9.97 | | | | 0.11 | | | | 0.09 | | | | 0.20 | | | | | | | | (0.09 | ) | | | — | | | | (0.09 | ) | | | 10.08 | |
| | | | | | | | | |
2018 | | | 10.03 | | | | 0.07 | | | | (0.06 | ) | | | 0.01 | | | | | | | | (0.07 | ) | | | — | | | | (0.07 | ) | | | 9.97 | |
| | | | | | | | | |
2017(g) | | | 10.11 | | | | 0.06 | | | | (0.08 | ) | | | (0.02 | ) | | | | | | | (0.06 | ) | | | — | | | | (0.06 | ) | | | 10.03 | |
| | | | | | | | | |
Year Ended 4/30: | | | | | | | | | | | | | | | | | | | | | | | | | | | | | | | | | | | | |
| | | | | | | | | |
2016 | | | 10.10 | | | | 0.06 | | | | 0.01 | | | | 0.07 | | | | | | | | (0.06 | ) | | | — | | | | (0.06 | ) | | | 10.11 | |
| | | | | | | | | |
2015 | | | 10.14 | | | | 0.06 | | | | (0.04 | ) | | | 0.02 | | | | | | | | (0.06 | ) | | | — | | | | (0.06 | ) | | | 10.10 | |
| | | | | | | | | |
2014 | | | 10.18 | | | | 0.08 | | | | (0.03 | ) | | | 0.05 | | | | | | | | (0.09 | ) | | | — | | | | (0.09 | ) | | | 10.14 | |
| | | | | | | | |
Class I (10/02) | | | | | | | | | | | | | | | | | | | | | | | | | | | | | | | | | |
| | | | | | | | | |
Year Ended 3/31: | | | | | | | | | | | | | | | | | | | | | | | | | | | | | | | | | | | | |
| | | | | | | | | |
2019 | | | 9.99 | | | | 0.16 | | | | 0.10 | | | | 0.26 | | | | | | | | (0.15 | ) | | | — | | | | (0.15 | ) | | | 10.10 | |
| | | | | | | | | |
2018 | | | 10.04 | | | | 0.13 | | | | (0.06 | ) | | | 0.07 | | | | | | | | (0.12 | ) | | | — | | | | (0.12 | ) | | | 9.99 | |
| | | | | | | | | |
2017(g) | | | 10.13 | | | | 0.11 | | | | (0.10 | ) | | | 0.01 | | | | | | | | (0.10 | ) | | | — | | | | (0.10 | ) | | | 10.04 | |
| | | | | | | | | |
Year Ended 4/30: | | | | | | | | | | | | | | | | | | | | | | | | | | | | | | | | | | | | |
| | | | | | | | | |
2016 | | | 10.11 | | | | 0.12 | | | | 0.01 | | | | 0.13 | | | | | | | | (0.11 | ) | | | — | | | | (0.11 | ) | | | 10.13 | |
| | | | | | | | | |
2015 | | | 10.15 | | | | 0.12 | | | | (0.04 | ) | | | 0.08 | | | | | | | | (0.12 | ) | | | — | | | | (0.12 | ) | | | 10.11 | |
| | | | | | | | | |
2014 | | | 10.20 | | | | 0.14 | | | | (0.05 | ) | | | 0.09 | | | | | | | | (0.14 | ) | | | — | | | | (0.14 | ) | | | 10.15 | |
222
| | | | | | | | | | | | | | | | | | | | | | | | | | | | | | | | | | |
| | | | Ratios/Supplemental Data | |
| | | | | | | | | | Ratios to Average
Net Assets Before
Waiver/Reimbursement | | | | | | Ratios to Average
Net Assets After
Waiver/Reimbursement(c) | | | | |
| | | | | | | | |
Total
Return(b) | | | Ending
Net
Assets
(000) | | | | | | Expenses | | | Net
Investment
Income
(Loss) | | | | | | Expenses | | | Net
Investment
Income
(Loss) | | | Portfolio
Turnover
Rate(d) | |
| | | | | | | | |
| | | | | | | | | | | | | | | | | | | | | | | | | | | | | | | | | | |
| | | | | | | | |
| | | | | | | | | | | | | | | | | | | | | | | | | | | | | | | | | | |
| | | | | | | | |
| | 2.42 | % | | $ | 156,526 | | | | | | | | 0.72 | % | | | 1.44 | % | | | | | | | 0.72 | % | | | 1.44 | % | | | 45 | % |
| | | | | | | | |
| | 0.41 | | | | 168,828 | | | | | | | | 0.72 | | | | 1.09 | | | | | | | | 0.72 | | | | 1.09 | | | | 28 | |
| | | | | | | | |
| | 0.08 | | | | 187,573 | | | | | | | | 0.71 | * | | | 0.97 | * | | | | | | | 0.71 | * | | | 0.97 | * | | | 44 | |
| | | | | | | | |
| | | | | | | | | | | | | | | | | | | | | | | | | | | | | | | | | | |
| | | | | | | | |
| | 1.01 | | | | 174,484 | | | | | | | | 0.71 | | | | 0.97 | | | | | | | | 0.71 | | | | 0.97 | | | | 24 | |
| | | | | | | | |
| | 0.57 | | | | 184,317 | | | | | | | | 0.71 | | | | 0.97 | | | | | | | | 0.71 | | | | 0.97 | | | | 36 | |
| | | | | | | | |
| | 0.74 | | | | 201,145 | | | | | | | | 0.71 | | | | 1.16 | | | | | | | | 0.71 | | | | 1.16 | | | | 35 | |
| | | | | | | | |
| | | | | | | | | | | | | | | | | | | | | | | | | | | | | | | | | | |
| | | | | | | | |
| | | | | | | | | | | | | | | | | | | | | | | | | | | | | | | | | | |
| | | | | | | | |
| | 1.53 | | | | 6,879 | | | | | | | | 1.52 | | | | 0.64 | | | | | | | | 1.52 | | | | 0.64 | | | | 45 | |
| | | | | | | | |
| | (0.37 | ) | | | 8,193 | | | | | | | | 1.52 | | | | 0.29 | | | | | | | | 1.52 | | | | 0.29 | | | | 28 | |
| | | | | | | | |
| | (0.73 | ) | | | 10,069 | | | | | | | | 1.51 | * | | | 0.17 | * | | | | | | | 1.51 | * | | | 0.17 | * | | | 44 | |
| | | | | | | | |
| | | | | | | | | | | | | | | | | | | | | | | | | | | | | | | | | | |
| | | | | | | | |
| | 0.41 | | | | 6,971 | | | | | | | | 1.51 | | | | 0.17 | | | | | | | | 1.38 | | | | 0.30 | | | | 24 | |
| | | | | | | | |
| | 0.22 | | | | 4,615 | | | | | | | | 1.50 | | | | 0.16 | | | | | | | | 1.05 | | | | 0.61 | | | | 36 | |
| | | | | | | | |
| | 0.08 | | | | 822 | | | | | | | | 1.57 | * | | | 0.18 | * | | | | | | | 1.08 | * | | | 0.63 | * | | | 35 | |
| | | | | | | | |
| | | | | | | | | | | | | | | | | | | | | | | | | | | | | | | | | | |
| | | | | | | | |
| | | | | | | | | | | | | | | | | | | | | | | | | | | | | | | | | | |
| | | | | | | | |
| | 2.05 | | | | 6,147 | | | | | | | | 1.06 | | | | 1.07 | | | | | | | | 1.06 | | | | 1.07 | | | | 45 | |
| | | | | | | | |
| | 0.05 | | | | 9,384 | | | | | | | | 1.07 | | | | 0.74 | | | | | | | | 1.07 | | | | 0.74 | | | | 28 | |
| | | | | | | | |
| | (0.25 | ) | | | 12,097 | | | | | | | | 1.06 | * | | | 0.62 | * | | | | | | | 1.06 | * | | | 0.62 | * | | | 44 | |
| | | | | | | | |
| | | | | | | | | | | | | | | | | | | | | | | | | | | | | | | | | | |
| | | | | | | | |
| | 0.65 | | | | 13,325 | | | | | | | | 1.06 | | | | 0.62 | | | | | | | | 1.06 | | | | 0.62 | | | | 24 | |
| | | | | | | | |
| | 0.22 | | | | 16,524 | | | | | | | | 1.06 | | | | 0.63 | | | | | | | | 1.06 | | | | 0.63 | | | | 36 | |
| | | | | | | | |
| | 0.48 | | | | 28,134 | | | | | | | | 1.06 | | | | 0.82 | | | | | | | | 1.06 | | | | 0.82 | | | | 35 | |
| | | | | | | | |
| | | | | | | | | | | | | | | | | | | | | | | | | | | | | | | | | | |
| | | | | | | | |
| | | | | | | | | | | | | | | | | | | | | | | | | | | | | | | | | | |
| | | | | | | | |
| | 2.62 | | | | 433,253 | | | | | | | | 0.52 | | | | 1.64 | | | | | | | | 0.52 | | | | 1.64 | | | | 45 | |
| | | | | | | | |
| | 0.69 | | | | 401,052 | | | | | | | | 0.51 | | | | 1.29 | | | | | | | | 0.51 | | | | 1.29 | | | | 28 | |
| | | | | | | | |
| | 0.14 | | | | 430,038 | | | | | | | | 0.51 | * | | | 1.17 | * | | | | | | | 0.51 | * | | | 1.17 | * | | | 44 | |
| | | | | | | | |
| | | | | | | | | | | | | | | | | | | | | | | | | | | | | | | | | | |
| | | | | | | | |
| | 1.29 | | | | 454,620 | | | | | | | | 0.51 | | | | 1.16 | | | | | | | | 0.51 | | | | 1.16 | | | | 24 | |
| | | | | | | | |
| | 0.75 | | | | 515,315 | | | | | | | | 0.50 | | | | 1.17 | | | | | | | | 0.50 | | | | 1.17 | | | | 36 | |
| | | | | | | | |
| | 0.92 | | | | 497,363 | | | | | | | | 0.51 | | | | 1.37 | | | | | | | | 0.51 | | | | 1.37 | | | | 35 | |
| (a) | Per share Net Investment Income (Loss) is calculated using the average daily shares method. | |
| (b) | Total return is the combination of changes in NAV without any sales charge, reinvested dividend income at NAV and reinvested capital gains distributions at NAV, if any. Total returns are not annualized. | |
| (c) | After fee waiver and/or expense reimbursement from the Adviser, where applicable. During the fiscal years ended April 30, 2014 through April 30, 2016, the Advisor agreed to waive 0.45% of the 12b-1 distribution and/or service fees for Class C Shares through August 31, 2015. After August 31, 2015, the Adviser is no longer waiving fees or reimbursing expenses for Class C Shares. | |
| (d) | Portfolio Turnover Rate is calculated based on the lesser of long-term purchases or sales (as disclosed in Note 5 – Investment Transactions) divided by the average long-term market value during the period. | |
| (e) | For the period February 10, 2014 (commencement of operations) through April 30, 2014. | |
| (f) | Formerly Class C Shares and renamed to Class C2 Shares on February 10, 2014. | |
| (g) | For the eleven months ended March 31, 2017. | |
| ** | Rounds to less than $0.01 per share. | |
See accompanying notes to financial statements.
223
Notes to Financial Statements
1. General Information and Significant Accounting Policies
General Information
Trust and Fund Information
Nuveen Municipal Trust and Nuveen Investment Funds, Inc. (each a “Trust” and collectively, the “Trusts”), are open-end management investment companies registered under the Investment Company Act of 1940 (the “1940 Act”), as amended. Nuveen Municipal Trust is comprised of Nuveen All-American Municipal Bond Fund (“All-American”), Nuveen Intermediate Duration Municipal Bond Fund (“Intermediate Duration”) and Nuveen Limited Term Municipal Bond Fund (“Limited Term”), among others, and Nuveen Investment Funds, Inc. is comprised of Nuveen Short Term Municipal Bond Fund (“Short Term”), among others, (each a “Fund” and collectively, the “Funds”), as diversified funds. Nuveen Municipal Trust was organized as a Massachusetts business trust on July 1, 1996. Nuveen Investment Funds, Inc. was incorporated in the State of Maryland on August 20, 1987. The Funds were each organized as a series of predecessor trusts or corporations prior to that date.
The end of the reporting period for the Funds is March 31, 2019, and the period covered by these Notes to Financial Statements is the fiscal year ended March 31, 2019 (the “current fiscal period”).
Investment Adviser
The Funds’ investment adviser is Nuveen Fund Advisors, LLC (the “Adviser”), a subsidiary of Nuveen, LLC (“Nuveen”). Nuveen is the investment management arm of Teachers Insurance and Annuity Association of America (TIAA). The Adviser has overall responsibility for management of the Funds, oversees the management of the Funds’ portfolios, manages the Funds’ business affairs and provides certain clerical, bookkeeping and other administrative services, and, if necessary, asset allocation decisions. The Adviser has entered into sub-advisory agreements with Nuveen Asset Management, LLC (the “Sub-Adviser”), a subsidiary of the Adviser, under which the Sub-Adviser manages the investment portfolios of the Funds.
Investment Objectives
All-American’s, Intermediate Duration’s and Limited Term’s investment objective is to provide as high a level of current interest income exempt from regular federal income taxes as is consistent with preservation of capital. Short Term’s investment objective is to provide current income that is exempt from federal income tax to the extent consistent with preservation of capital.
The Funds’ most recent prospectus provides further descriptions of each Fund’s investment objective, principal investment strategies, and principal risks.
Significant Accounting Policies
Each Fund is an investment company and follows accounting and reporting guidance under Financial Accounting Standards Board (FASB) Accounting Standards Codification (ASC) Topic 946 “Financial Services – Investment Companies.” The following is a summary of significant accounting policies followed by the Funds in the preparation of their financial statements in accordance with accounting principles generally accepted in the United States of America (“U.S. GAAP”).
Investment Transactions
Investment transactions are recorded on a trade date basis. Realized gains and losses from investment transactions are determined on the specific identification method, which is the same basis used for federal income tax purposes. Investments purchased on awhen-issued/delayed delivery basis may have extended settlement periods. Any investments so purchased are subject to market fluctuation during this period. The Funds have earmarked securities in their portfolios with a current value at least equal to the amount of the when-issued/delayed delivery purchase commitments.
As of the end of the reporting period, the Funds’ outstanding when-issued/delayed delivery purchase commitments were as follows:
| | | | | | | | | | | | | | | | |
| | | All-American | | | Intermediate Duration | | | Limited
Term | | | Short
Term | |
| Outstanding when-issued/delayed delivery purchase commitments | | $ | 2,980,000 | | | $ | 56,285,574 | | | $ | 59,737,437 | | | $ | 500,000 | |
Investment Income
Dividend income is recorded on the ex-dividend date. Non-cash dividends received in the form of stock, if any, are recognized on the ex-dividend date and recorded at fair value. Investment Income, is comprised of interest income, which reflects the amortization of premiums and includes accretion of discounts for financial reporting purposes, and is recorded on an accrual basis. Investment Income also reflects payment-in-kind (“PIK”) interest and paydown gains and losses, if any. PIK interest represents income received in the form of securities in lieu of cash.
224
Professional Fees
Professional fees presented on the Statement of Operations consist of legal fees incurred in the normal course of operations, audit fees, tax consulting fees and, in some cases, workout expenditures. Workout expenditures are incurred in an attempt to protect or enhance an investment, or to pursue other claims or legal actions on behalf of Fund shareholders. If a refund is received for workout expenditures paid in a prior reporting period, such amounts will be recognized as “Legal fee refund” on the Statement of Operations.
Dividends and Distributions to Shareholders
Dividends from net investment income, if any, are declared daily and distributed to shareholders monthly. Fund shares begin to accrue dividends on the business day after the day when the monies used to purchase Fund shares are collected by the transfer agent.
Net realized capital gains and/or market discount from investment transactions, if any, are declared and distributed to shareholders at least annually. Furthermore, capital gains are distributed only to the extent they exceed available capital loss carryforwards.
Distributions to shareholders of net investment income, net realized capital gains and/or market discount, if any, are recorded on the ex-dividend date. The amount and timing of distributions are determined in accordance with federal income tax regulations, which may differ from U.S. GAAP.
Share Classes and Sales Charges
Class A Shares are generally sold with anup-front sales charge and incur a 0.20% annual12b-1 service fee. Class A Share purchases of $250,000 or more are sold at net asset value (“NAV”) without anup-front sales charge but may be subject to a contingent deferred sales charge (“CDSC”) of 1% (0.70% for Limited Term and Short Term) if redeemed within eighteen months (twelve months for shares of Short Term) of purchase. Class C Shares are sold without anup-front sales charge but incur a 0.75% annual12b-1 distribution fee and a 0.25% annual12b-1 service fee. The Funds will issue Class C2 Shares upon the exchange of Class C2 Shares from another Nuveen mutual fund or for the purposes of dividend reinvestment, but Class C2 Shares are not available for new accounts or for additional investment into existing accounts. Class C2 Shares incur a 0.55% (0.35% for Limited Term and Short Term) annual12b-1 distribution fee and a 0.20% annual 12b-1 service fee. Class C and C2 Shares are subject to a CDSC of 1% if redeemed within twelve months of purchase. Class R6 Shares and Class I Shares are not subject to any sales charge or12b-1 distribution or service fees.
Multiclass Operations and Allocations
Income and expenses of the Funds that are not directly attributable to a specific class of shares are prorated among the classes based on the relative settled shares of each class. Expenses directly attributable to a class of shares are recorded to the specific class. Currently, the only expenses that are allocated on a class-specific basis are 12b-1 distribution and service fees.
Sub-transfer agent fees, which are recognized as a component of “Shareholder servicing agent fees” on the Statement of Operations, are not charged to Class R6 Shares and are prorated among the other classes based on their relative settled shares.
Realized and unrealized capital gains and losses of the Funds are prorated among the classes based on the relative net assets of each class.
Compensation
Neither Trust pays compensation directly to those of its directors/trustees who are affiliated with the Adviser or to its officers, all of whom receive remuneration for their services to each Trust from the Adviser or its affiliates. The Funds’ Board of Directors/Trustees (the “Board”) has adopted a deferred compensation plan for independent directors/trustees that enables directors/trustees to elect to defer receipt of all or a portion of the annual compensation they are entitled to receive from certain Nuveen-advised funds. Under the plan, deferred amounts are treated as though equal dollar amounts had been invested in shares of select Nuveen-advised funds.
Indemnifications
Under each Trust’s organizational documents, its officers and directors/trustees are indemnified against certain liabilities arising out of the performance of their duties to each Trust. In addition, in the normal course of business, each Trust enters into contracts that provide general indemnifications to other parties. Each Trust’s maximum exposure under these arrangements is unknown as this would involve future claims that may be made against each Trust that have not yet occurred. However, each Trust has not had prior claims or losses pursuant to these contracts and expects the risk of loss to be remote.
Netting Arrangements
In the ordinary course of business, the Funds may enter into transactions subject to enforceable International Swaps and Derivative Association, Inc. (“ISDA”) master agreements or other similar arrangements (“netting agreements”). Generally, the right to offset in netting agreements allows each Fund to offset certain securities and derivatives with a specific counterparty, when applicable, as well as any collateral received or delivered to that counterparty based on the terms of the agreements. Generally, each Fund manages its cash collateral and securities collateral on a counterparty basis.
The Funds’ investments subject to netting agreements as of the end of the reporting period, if any, are further described in Note 3 – Portfolio Securities and Investments in Derivatives.
225
Notes to Financial Statements(continued)
Use of Estimates
The preparation of financial statements in conformity with U.S. GAAP requires management to make estimates and assumptions that affect the reported amounts of assets and liabilities at the date of the financial statements and the reported amounts of increases and decreases in net assets from operations during the current fiscal period. Actual results may differ from those estimates.
2. Investment Valuation and Fair Value Measurements
The fair valuation input levels as described below are for fair value measurement purposes.
Fair value is defined as the price that would be received upon selling an investment or transferring a liability in an orderly transaction to an independent buyer in the principal or most advantageous market for the investment. A three-tier hierarchy is used to maximize the use of observable market data and minimize the use of unobservable inputs and to establish classification of fair value measurements for disclosure purposes. Observable inputs reflect the assumptions market participants would use in pricing the asset or liability. Observable inputs are based on market data obtained from sources independent of the reporting entity. Unobservable inputs reflect the reporting entity’s own assumptions about the assumptions market participants would use in pricing the asset or liability. Unobservable inputs are based on the best information available in the circumstances. The following is a summary of the three-tiered hierarchy of valuation input levels.
| | |
| Level 1 – | | Inputs are unadjusted and prices are determined using quoted prices in active markets for identical securities. |
| Level 2 – | | Prices are determined using other significant observable inputs (including quoted prices for similar securities, interest rates, credit spreads, etc.). |
| Level 3 – | | Prices are determined using significant unobservable inputs (including management’s assumptions in determining the fair value of investments). |
Prices of fixed-income securities are provided by an independent pricing service (“pricing service”) approved by the Board. The pricing service establishes a security’s fair value using methods that may include consideration of the following: yields or prices of investments of comparable quality, type of issue, coupon, maturity and rating, market quotes or indications of value from security dealers, evaluations of anticipated cash flows or collateral, general market conditions and other information and analysis, including the obligor’s credit characteristics considered relevant. These securities are generally classified as Level 2. In pricing certain securities, particularly less liquid and lower quality securities, the pricing service may consider information about a security, its issuer or market activity, provided by the Adviser. These securities are generally classified as Level 2 or Level 3 depending on the observability of the significant inputs.
Futures contracts are valued using the closing settlement price or, in the absence of such a price, the last traded price and are generally classified as Level 1.
Investments in investment companies are valued at their respective NAVs on valuation date and are generally classified as Level 1.
Certain securities may not be able to be priced by the pre-established pricing methods as described above. Such securities may be valued by the Board and/or its appointee at fair value. These securities generally include, but are not limited to, restricted securities (securities which may not be publicly sold without registration under the Securities Act of 1933, as amended) for which a pricing service is unable to provide a market price; securities whose trading has been formally suspended; debt securities that have gone into default and for which there is no current market quotation; a security whose market price is not available from apre-established pricing source; a security with respect to which an event has occurred that is likely to materially affect the value of the security after the market has closed but before the calculation of a Fund’s NAV (as may be the case in non-U.S. markets on which the security is primarily traded) or make it difficult or impossible to obtain a reliable market quotation; and a security whose price, as provided by the pricing service, is not deemed to reflect the security’s fair value. As a general principle, the fair value of a security would appear to be the amount that the owner might reasonably expect to receive for it in a current sale. A variety of factors may be considered in determining the fair value of such securities, which may include consideration of the following: yields or prices of investments of comparable quality, type of issue, coupon, maturity and rating, market quotes or indications of value from security dealers, evaluations of anticipated cash flows or collateral, general market conditions and other information and analysis, including the obligor’s credit characteristics considered relevant. These securities are generally classified as Level 2 or Level 3 depending on the observability of the significant inputs. Regardless of the method employed to value a particular security, all valuations are subject to review by the Board and/or its appointee.
The inputs or methodologies used for valuing securities are not an indication of the risks associated with investing in those securities. The following is a summary of each Fund’s fair value measurements as of the end of the reporting period:
| | | | | | | | | | | | | | | | |
| All-American | | Level 1 | | | Level 2 | | | Level 3 | | | Total | |
| Long-Term Investments*: | | | | | | | | | | | | | | | | |
Municipal Bonds | | $ | — | | | $ | 4,080,462,815 | | | $ | — | | | $ | 4,080,462,815 | |
Corporate Bonds | | | — | | | | — | | | | 689,625 | *** | | | 689,625 | |
| Investments in Derivatives | | | | | | | | | | | | | | | | |
Futures Contracts** | | | (445,938 | ) | | | — | | | | — | | | | (445,938 | ) |
| Total | | $ | (445,938 | ) | | $ | 4,080,462,815 | | | $ | 689,625 | | | $ | 4,080,706,502 | |
226
| | | | | | | | | | | | | | | | |
| Intermediate Duration | | Level 1 | | | Level 2 | | | Level 3 | | | Total | |
| Long-Term Investments*: | | | | | | | | | | | | | | | | |
Municipal Bonds | | $ | — | | | $ | 6,550,593,054 | | | $ | — | | | $ | 6,550,593,054 | |
Corporate Bonds | | | — | | | | — | | | | 161,470 | *** | | | 161,470 | |
| Short-Term Investments*: | | | | | | | | | | | | | | | | |
Municipal Bonds | | | — | | | | 148,345,000 | | | | — | | | | 148,345,000 | |
| Total | | $ | — | | | $ | 6,698,938,054 | | | $ | 161,470 | | | $ | 6,699,099,524 | |
| | | | |
| Limited Term | | | | | | | | | | | | |
| Long-Term Investments*: | | | | | | | | | | | | | | | | |
Municipal Bonds | | $ | — | | | $ | 5,163,728,959 | | | $ | — | | | $ | 5,163,728,959 | |
Corporate Bonds | | | — | | | | — | | | | 99,580 | *** | | | 99,580 | |
| Short-Term Investments*: | | | | | | | | | | | | | | | | |
Municipal Bonds | | | — | | | | 55,565,000 | | | | — | | | | 55,565,000 | |
| Total | | $ | — | | | $ | 5,219,293,959 | | | $ | 99,580 | | | $ | 5,219,393,539 | |
| | | | |
| Short Term | | | | | | | | | | | | |
| Long-Term Investments*: | | | | | | | | | | | | | | | | |
Municipal Bonds | | $ | — | | | $ | 588,963,996 | | | $ | — | | | $ | 588,963,996 | |
| Short-Term Investments*: | | | | | | | | | | | | | | | | |
Municipal Bonds | | | — | | | | 8,920,000 | | | | — | | | | 8,920,000 | |
Total | | $ | — | | | $ | 597,883,996 | | | $ | — | | | $ | 597,883,996 | |
| * | Refer to the Fund’s Portfolio of Investments for state and/or industry classifications, where applicable. |
| ** | Represents net unrealized appreciation (depreciation) as reported in the Fund’s Portfolio of Investments. |
| *** | Refer to the Fund’s Portfolio of Investments for securities classified as Level 3. |
3. Portfolio Securities and Investments in Derivatives
Portfolio Securities
Inverse Floating Rate Securities
Each Fund is authorized to invest in inverse floating rate securities. An inverse floating rate security is created by depositing a municipal bond (referred to as an “Underlying Bond”), typically with a fixed interest rate, into a special purpose tender option bond (“TOB”) trust (referred to as the “TOB Trust”) created by or at the direction of one or more Funds. In turn, the TOB Trust issues (a) floating rate certificates (referred to as “Floaters”), in face amounts equal to some fraction of the Underlying Bond’s par amount or market value, and (b) an inverse floating rate certificate (referred to as an “Inverse Floater”) that represents all remaining or residual interest in the TOB Trust. Floaters typically pay short-term tax-exempt interest rates to third parties who are also provided a right to tender their certificate and receive its par value, which may be paid from the proceeds of a remarketing of the Floaters, by a loan to the TOB Trust from a third party liquidity provider (“Liquidity Provider”), or by the sale of assets from the TOB Trust. The Inverse Floater is issued to a long term investor, such as one or more of the Funds. The income received by the Inverse Floater holder varies inversely with the short-term rate paid to holders of the Floaters, and in most circumstances the Inverse Floater holder bears substantially all of the Underlying Bond’s downside investment risk and also benefits disproportionately from any potential appreciation of the Underlying Bond’s value. The value of an Inverse Floater will be more volatile than that of the Underlying Bond because the interest rate is dependent on not only the fixed coupon rate of the Underlying Bond but also on the short-term interest paid on the Floaters, and because the Inverse Floater essentially bears the risk of loss (and possible gain) of the greater face value of the Underlying Bond.
The Inverse Floater held by a Fund gives the Fund the right to (a) cause the holders of the Floaters to tender their certificates at par (or slightly more than par in certain circumstances), and (b) have the trustee of the TOB Trust (the “Trustee”) transfer the Underlying Bond held by the TOB Trust to the Fund, thereby collapsing the TOB Trust.
The Fund may acquire an Inverse Floater in a transaction where it (a) transfers an Underlying Bond that it owns to a TOB Trust created by a third party or (b) transfers an Underlying Bond that it owns, or that it has purchased in a secondary market transaction for the purpose of creating an Inverse Floater, to a TOB Trust created at its direction, and in return receives the Inverse Floater of the TOB Trust (referred to as a “self-deposited Inverse Floater”). A Fund may also purchase an Inverse Floater in a secondary market transaction from a third party creator of the TOB Trust without first owning the Underlying Bond (referred to as an “externally-deposited Inverse Floater”).
An investment in a self-deposited Inverse Floater is accounted for as a “financing” transaction (i.e., a secured borrowing). For a self-deposited Inverse Floater, the Underlying Bond deposited into the TOB Trust is identified in the Fund’s Portfolio of Investments as “(UB) – Underlying bond of an inverse floating rate trust reflected as a financing transaction,” with the Fund recognizing as liabilities, labeled “Floating rate obligations” on the Statement of Assets and Liabilities, (a) the liquidation value of Floaters issued by the TOB Trust, and (b) the amount of any borrowings by the TOB Trust from a
227
Notes to Financial Statements(continued)
Liquidity Provider to enable the TOB Trust to purchase outstanding Floaters in lieu of a remarketing. In addition, the Fund recognizes in “Investment Income” the entire earnings of the Underlying Bond, and recognizes (a) the interest paid to the holders of the Floaters or on the TOB Trust’s borrowings, and (b) other expenses related to remarketing, administration, trustee, liquidity and other services to a TOB Trust, as a component of “Interest expense” on the Statement of Operations.
In contrast, an investment in an externally-deposited Inverse Floater is accounted for as a purchase of the Inverse Floater and is identified in the Fund’s Portfolio of Investments as “(IF) – Inverse floating rate investment.” For an externally-deposited Inverse Floater, a Fund’s Statement of Assets and Liabilities recognizes the Inverse Floater and not the Underlying Bond as an asset, and the Fund does not recognize the Floaters, or any related borrowings from a Liquidity Provider, as a liability. Additionally, the Fund reflects in “Investment Income” only the net amount of earnings on the Inverse Floater (net of the interest paid to the holders of the Floaters or the Liquidity Provider as lender, and the expenses of the Trust), and does not show the amount of that interest paid or the expenses of the TOB Trust as described above as interest expense on the Statement of Operations.
Fees paid upon the creation of a TOB Trust for self-deposited Inverse Floaters and externally-deposited Inverse Floaters are recognized as part of the cost basis of the Inverse Floater and are capitalized over the term of the TOB Trust.
As of the end of the reporting period, the aggregate value of Floaters issued by each Fund’s TOB Trust for self-deposited Inverse Floaters and externally-deposited Inverse Floaters was as follows:
| | | | | | | | |
| Floating Rate Obligations Outstanding | | All-American | | | Intermediate
Duration | |
| Floating rate obligations: self-deposited Inverse Floaters | | $ | 65,870,000 | | | $ | — | |
| Floating rate obligations: externally-deposited Inverse Floaters | | | 57,025,000 | | | | 12,490,000 | |
| Total | | $ | 122,895,000 | | | $ | 12,490,000 | |
During the current fiscal period, the average amount of Floaters (including any borrowings from a Liquidity Provider) outstanding, and the average annual interest rate and fees related to self-deposited Inverse Floaters, were as follows:
| | | | |
| Self-Deposited Inverse Floaters | | All-American | |
| Average floating rate obligations outstanding | | $ | 65,870,000 | |
| Average annual interest rate and fees | | | 2.07 | % |
TOB Trusts are supported by a liquidity facility provided by a Liquidity Provider pursuant to which the Liquidity Provider agrees, in the event that Floaters are (a) tendered to the Trustee for remarketing and the remarketing does not occur, or (b) subject to mandatory tender pursuant to the terms of the TOB Trust agreement, to either purchase Floaters or to provide the Trustee with an advance from a loan facility to fund the purchase of Floaters by the TOB Trust. In certain circumstances, the Liquidity Provider may otherwise elect to have the Trustee sell the Underlying Bond to retire the Floaters that were tendered and not remarketed prior to providing such a loan. In these circumstances, the Liquidity Provider remains obligated to provide a loan to the extent that the proceeds of the sale of the Underlying Bond are not sufficient to pay the purchase price of the Floaters.
The size of the commitment under the loan facility for a given TOB Trust is at least equal to the balance of that TOB Trust’s outstanding Floaters plus any accrued interest. In consideration of the loan facility, fee schedules are in place and are charged by the Liquidity Provider(s). Any loans made by the Liquidity Provider will be secured by the purchased Floaters held by the TOB Trust. Interest paid on any outstanding loan balances will be effectively borne by the Fund that owns the Inverse Floaters of the TOB Trust that has incurred the borrowing and may be at a rate that is greater than the rate that would have been paid had the Floaters been successfully remarketed.
As described above, any amounts outstanding under a liquidity facility are recognized as a component of “Floating rate obligations” on the Statement of Assets and Liabilities by the Fund holding the corresponding Inverse Floaters issued by the borrowing TOB Trust. As of the end of the reporting period, there were no loans outstanding under any such facility.
Each Fund may also enter into shortfall and forbearance agreements (sometimes referred to as a “recourse arrangement”) (TOB Trusts involving such agreements are referred to herein as “Recourse Trusts”), under which a Fund agrees to reimburse the Liquidity Provider for the Trust’s Floaters, in certain circumstances, for the amount (if any) by which the liquidation value of the Underlying Bond held by the TOB Trust may fall short of the sum of the liquidation value of the Floaters issued by the TOB Trust plus any amounts borrowed by the TOB Trust from the Liquidity Provider, plus any shortfalls in interest cash flows. Under these agreements, a Fund’s potential exposure to losses related to or on an Inverse Floater may increase beyond the value of the Inverse Floater as a Fund may potentially be liable to fulfill all amounts owed to holders of the Floaters or the Liquidity Provider. Any such shortfall amount in the aggregate is recognized as “Unrealized depreciation on Recourse Trusts” on the Statement of Assets and Liabilities.
228
As of the end of the reporting period, each Fund’s maximum exposure to the Floaters issued by Recourse Trusts for self-deposited Inverse Floaters and externally-deposited Inverse Floaters was as follows:
| | | | | | | | |
| Floating Rate Obligations-Recourse Trusts | | All-American | | | Intermediate
Duration | |
| Maximum exposure to Recourse Trusts: self-deposited Inverse Floaters | | $ | 65,870,000 | | | $ | — | |
| Maximum exposure to Recourse Trusts: externally-deposited Inverse Floaters | | | 26,525,000 | | | | 12,490,000 | |
| Total | | $ | 92,395,000 | | | $ | 12,490,000 | |
Zero Coupon Securities
A zero coupon security does not pay a regular interest coupon to its holders during the life of the security. Income to the holder of the security comes from accretion of the difference between the original purchase price of the security at issuance and the par value of the security at maturity and is effectively paid at maturity. The market prices of zero coupon securities generally are more volatile than the market prices of securities that pay interest periodically.
Investments in Derivatives
In addition to the inverse floating rate securities in which certain Funds may invest, which are considered portfolio securities for financial reporting purposes, each Fund is authorized to invest in certain derivative instruments. The Funds record derivative instruments at fair value, with changes in fair value recognized on the Statement of Operations, when applicable. Even though the Funds’ investments in derivatives may represent economic hedges, they are not considered to be hedge transactions for financial reporting purposes.
Futures Contracts
Upon execution of a futures contract, a Fund is obligated to deposit cash or eligible securities, also known as “initial margin,” into an account at its clearing broker equal to a specified percentage of the contract amount. Cash held by the broker to cover initial margin requirements on open futures contracts, if any, is recognized as “Cash collateral at brokers for investments in futures contracts” on the Statement of Assets and Liabilities. Investments in futures contracts obligate a Fund and the clearing broker to settle monies on a daily basis representing changes in the prior days“mark-to-market” of the open contracts. If a Fund has unrealized appreciation the clearing broker would credit the Fund’s account with an amount equal to appreciation and conversely if a Fund has unrealized depreciation the clearing broker would debit the Fund’s account with an amount equal to depreciation. These daily cash settlements are also known as “variation margin.” Variation margin is recognized as a receivable and/or payable for “Variation margin on futures contracts” on the Statement of Assets and Liabilities.
During the period the futures contract is open, changes in the value of the contract are recognized as an unrealized gain or loss by“marking-to- market” on a daily basis to reflect the changes in market value of the contract, which is recognized as a component of “Change in net unrealized appreciation (depreciation) of futures contracts” on the Statement of Operations. When the contract is closed or expired, a Fund records a realized gain or loss equal to the difference between the value of the contract on the closing date and value of the contract when originally entered into, which is recognized as a component of “Net realized gain (loss) from futures contracts” on the Statement of Operations.
Risks of investments in futures contracts include the possible adverse movement in the price of the securities or indices underlying the contracts, the possibility that there may not be a liquid secondary market for the contracts and/or that a change in the value of the contract may not correlate with a change in the value of the underlying securities or indices.
During the current fiscal period, All-American used U.S. Treasury futures to manage portfolio duration by shorting interest rate futures contracts.
The average notional amount of futures contracts outstanding during the current fiscal period was as follows:
| | | | |
| | | All-American | |
| Average notional amount of futures contracts outstanding* | | $ | 19,808,395 | |
| * | The average notional amount is calculated based on the absolute aggregate notional amount of contracts outstanding at the beginning of the current fiscal period and at the end of each fiscal quarter within the current fiscal period. |
| | | | | | | | | | | | | | |
| | | | | Location on the Statement of Assets and Liabilities | |
| | | | | Asset Derivative | | | (Liability) Derivative | |
Underlying
Risk Exposure | | Derivative Instrument | | Location | | Value | | | Location | | Value | |
All-American | | | | | | | | | | | | | | |
Interest Rate | | Futures Contracts | | Receivable for variation margin on futures contracts* | | $ | (445,938 | ) | | — | | $ | — | |
| * | Value represents unrealized appreciation (depreciation) of futures contracts as reported on the Fund’s Portfolio of Investments and not the asset and/or liability derivatives location as described in the table above. |
229
Notes to Financial Statements(continued)
The following table presents the amount of net realized gain (loss) and change in net unrealized appreciation (depreciation) recognized on futures contracts on the Statement of Operations during the current fiscal period, and the primary underlying risk exposure.
| | | | | | | | | | | | |
| Fund | | Underlying
Risk Exposure | | Derivative
Instrument | | Net Realized Gain (Loss)
from Futures Contracts | | | Change in Net Unrealized
Appreciation (Depreciation) of
Futures Contracts | |
| All-American | | Interest Rate | | Futures Contracts | | $ | (628,556 | ) | | $ | (445,938 | ) |
Market and Counterparty Credit Risk
In the normal course of business each Fund may invest in financial instruments and enter into financial transactions where risk of potential loss exists due to changes in the market (market risk) or failure of the other party to the transaction to perform (counterparty credit risk). The potential loss could exceed the value of the financial assets recorded on the financial statements. Financial assets, which potentially expose each Fund to counterparty credit risk, consist principally of cash due from counterparties on forward, option and swap transactions, when applicable. The extent of each Fund’s exposure to counterparty credit risk in respect to these financial assets approximates their carrying value as recorded on the Statement of Assets and Liabilities.
Each Fund helps manage counterparty credit risk by entering into agreements only with counterparties the Adviser believes have the financial resources to honor their obligations and by having the Adviser monitor the financial stability of the counterparties. Additionally, counterparties may be required to pledge collateral daily (based on the daily valuation of the financial asset) on behalf of each Fund with a value approximately equal to the amount of any unrealized gain above a pre-determined threshold. Reciprocally, when each Fund has an unrealized loss, the Funds have instructed the custodian to pledge assets of the Funds as collateral with a value approximately equal to the amount of the unrealized loss above a pre-determined threshold. Collateral pledges are monitored and subsequently adjusted if and when the valuations fluctuate, either up or down, by at least the pre-determined threshold amount.
4. Fund Shares
Transactions in Fund shares during the current and prior fiscal period were as follows:
| | | | | | | | | | | | | | | | |
| | | Year Ended
3/31/19 | | | Year Ended
3/31/18 | |
| All-American | | Shares | | | Amount | | | Shares | | | Amount | |
| Shares sold: | | | | | | | | | | | | | | | | |
Class A | | | 44,885,366 | | | $ | 510,454,387 | | | | 37,019,397 | | | $ | 428,622,217 | |
Class A – automatic conversion of Class C2 Shares | | | 369,166 | | | | 4,226,950 | | | | — | | | | — | |
Class C | | | 4,082,141 | | | | 46,333,449 | | | | 4,865,658 | | | | 56,353,003 | |
Class C2 | | | 274,332 | | | | 3,111,090 | | | | 263,858 | | | | 3,050,791 | |
Class R6 | | | 610,541 | | | | 6,998,807 | | | | 67,767 | | | | 786,901 | |
Class I | | | 67,092,270 | | | | 765,538,207 | | | | 57,132,588 | | | | 663,853,663 | |
| Shares issued to shareholders due to reinvestment of distributions: | | | | | | | | | | | | | | | | |
Class A | | | 3,766,619 | | | | 42,860,757 | | | | 3,401,312 | | | | 39,300,230 | |
Class C | | | 387,058 | | | | 4,403,986 | | | | 375,056 | | | | 4,333,762 | |
Class C2 | | | 351,352 | | | | 4,000,384 | | | | 497,955 | | | | 5,755,245 | |
Class R6 | | | 21,075 | | | | 241,184 | | | | 19,524 | | | | 226,550 | |
Class I | | | 4,468,238 | | | | 51,052,991 | | | | 3,942,440 | | | | 45,738,955 | |
| | | | 126,308,158 | | | | 1,439,222,192 | | | | 107,585,555 | | | | 1,248,021,317 | |
| Shares redeemed: | | | | | | | | | | | | | | | | |
Class A | | | (30,801,045 | ) | | | (349,410,608 | ) | | | (24,768,984 | ) | | | (286,496,721 | ) |
Class C | | | (3,998,324 | ) | | | (45,381,644 | ) | | | (3,304,098 | ) | | | (38,176,702 | ) |
Class C2 | | | (6,949,555 | ) | | | (79,294,817 | ) | | | (5,118,879 | ) | | | (59,115,147 | ) |
Class C2 – automatic conversion to Class A Shares | | | (368,844 | ) | | | (4,226,950 | ) | | | — | | | | — | |
Class R6 | | | (147,294 | ) | | | (1,682,675 | ) | | | (88,033 | ) | | | (1,028,505 | ) |
Class I | | | (57,735,354 | ) | | | (656,960,758 | ) | | | (34,004,158 | ) | | | (393,981,110 | ) |
| | | | (100,000,416 | ) | | | (1,136,957,452 | ) | | | (67,284,152 | ) | | | (778,798,185 | ) |
| Net increase (decrease) | | | 26,307,742 | | | $ | 302,264,740 | | | | 40,301,403 | | | $ | 469,223,132 | |
230
| | | | | | | | | | | | | | | | |
| | | Year Ended
3/31/19 | | | Year Ended
3/31/18 | |
| Intermediate Duration | | Shares | | | Amount | | | Shares | | | Amount | |
| Shares sold: | | | | | | | | | | | | | | | | |
Class A | | | 20,354,573 | | | $ | 185,136,034 | | | | 17,272,703 | | | $ | 158,825,881 | |
Class A – automatic conversion of Class C2 Shares | | | 122,797 | | | | 1,121,138 | | | | — | | | | — | |
Class C | | | 1,484,544 | | | | 13,509,150 | | | | 1,354,974 | | | | 12,458,508 | |
Class C2 | | | 93,556 | | | | 849,989 | | | | 74,153 | | | | 682,342 | |
Class I | | | 272,722,979 | | | | 2,485,415,929 | | | | 142,614,038 | | | | 1,311,887,608 | |
| Shares issued to shareholders due to reinvestment of distributions: | | | | | | | | | | | | | | | | |
Class A | | | 1,449,600 | | | | 13,210,677 | | | | 1,376,348 | | | | 12,632,323 | |
Class C | | | 85,424 | | | | 778,462 | | | | 86,752 | | | | 796,236 | |
Class C2 | | | 98,697 | | | | 899,888 | | | | 136,197 | | | | 1,251,527 | |
Class I | | | 10,487,256 | | | | 95,835,014 | | | | 9,510,022 | | | | 87,499,275 | |
| | | | 306,899,426 | | | | 2,796,756,281 | | | | 172,425,187 | | | | 1,586,033,700 | |
| Shares redeemed: | | | | | | | | | | | | | | | | |
Class A | | | (14,898,708 | ) | | | (135,493,790 | ) | | | (16,711,540 | ) | | | (153,692,907 | ) |
Class C | | | (1,548,756 | ) | | | (14,072,502 | ) | | | (1,310,640 | ) | | | (12,031,662 | ) |
Class C2 | | | (2,681,340 | ) | | | (24,445,304 | ) | | | (2,363,411 | ) | | | (21,715,833 | ) |
Class C2 – automatic conversion to Class A Shares | | | (122,663 | ) | | | (1,121,138 | ) | | | — | | | | — | |
Class I | | | (149,655,811 | ) | | | (1,362,312,498 | ) | | | (122,103,858 | ) | | | (1,125,579,985 | ) |
| | | | (168,907,278 | ) | | | (1,537,445,232 | ) | | | (142,489,449 | ) | | | (1,313,020,387 | ) |
| Net increase (decrease) | | | 137,992,148 | | | $ | 1,259,311,049 | | | | 29,935,738 | | | $ | 273,013,313 | |
| | |
| | | Year Ended
3/31/19 | | | Year Ended
3/31/18 | |
| Limited Term | | Shares | | | Amount | | | Shares | | | Amount | |
| Shares sold: | | | | | | | | | | | | | | | | |
Class A | | | 29,184,682 | | | $ | 318,224,542 | | | | 23,800,621 | | | $ | 260,779,546 | |
Class A – automatic conversion of Class C2 Shares | | | 196,511 | | | | 2,140,101 | | | | — | | | | — | |
Class C | | | 2,039,063 | | | | 22,105,146 | | | | 1,625,162 | | | | 17,719,092 | |
Class C2 | | | 136,046 | | | | 1,478,708 | | | | 208,515 | | | | 2,272,523 | |
Class I | | | 183,860,174 | | | | 1,996,082,522 | | | | 121,658,407 | | | | 1,326,172,178 | |
| Shares issued to shareholders due to reinvestment of distributions: | | | | | | | | | | | | | | | | |
Class A | | | 1,478,557 | | | | 16,130,854 | | | | 1,484,329 | | | | 16,250,187 | |
Class C | | | 73,469 | | | | 798,511 | | | | 78,676 | | | | 857,987 | |
Class C2 | | | 255,740 | | | | 2,781,883 | | | | 339,952 | | | | 3,711,728 | |
Class I | | | 4,388,095 | | | | 47,707,515 | | | | 3,838,044 | | | | 41,845,884 | |
| | | | 221,612,337 | | | | 2,407,449,782 | | | | 153,033,706 | | | | 1,669,609,125 | |
| Shares redeemed: | | | | | | | | | | | | | | | | |
Class A | | | (31,421,757 | ) | | | (342,314,498 | ) | | | (33,701,300 | ) | | | (368,920,362 | ) |
Class C | | | (3,159,190 | ) | | | (34,322,053 | ) | | | (3,392,100 | ) | | | (37,019,851 | ) |
Class C2 | | | (9,894,171 | ) | | | (107,597,791 | ) | | | (8,805,976 | ) | | | (96,323,551 | ) |
Class C2 – automatic conversion to Class A Shares | | | (197,052 | ) | | | (2,140,101 | ) | | | — | | | | — | |
Class I | | | (123,784,656 | ) | | | (1,343,244,178 | ) | | | (104,505,813 | ) | | | (1,138,998,932 | ) |
| | | | (168,456,826 | ) | | | (1,829,618,621 | ) | | | (150,405,189 | ) | | | (1,641,262,696 | ) |
| Net increase (decrease) | | | 53,155,511 | | | $ | 577,831,161 | | | | 2,628,517 | | | $ | 28,346,429 | |
231
Notes to Financial Statements(continued)
| | | | | | | | | | | | | | | | |
| | | Year Ended
3/31/19 | | | Year Ended
3/31/18 | |
| Short Term | | Shares | | | Amount | | | Shares | | | Amount | |
| Shares sold: | | | | | | | | | | | | | | | | |
Class A | | | 8,664,657 | | | $ | 86,445,049 | | | | 6,362,810 | | | $ | 63,817,044 | |
Class A – automatic conversion of Class C2 Shares | | | 6,129 | | | | 61,289 | | | | — | | | | — | |
Class C | | | 462,792 | | | | 4,602,316 | | | | 269,215 | | | | 2,698,720 | |
Class C2 | | | 27,088 | | | | 269,876 | | | | 141,314 | | | | 1,412,183 | |
Class I | | | 21,616,358 | | | | 216,250,681 | | | | 13,648,333 | | | | 137,163,144 | |
| Shares issued to shareholders due to reinvestment of distributions: | | | | | | | | | | | | | | | | |
Class A | | | 172,029 | | | | 1,720,393 | | | | 154,387 | | | | 1,549,712 | |
Class C | | | 3,380 | | | | 33,726 | | | | 1,808 | | | | 18,105 | |
Class C2 | | | 6,475 | | | | 64,673 | | | | 6,829 | | | | 68,475 | |
Class I | | | 307,594 | | | | 3,080,097 | | | | 211,215 | | | | 2,121,613 | |
| | | | 31,266,502 | | | | 312,528,100 | | | | 20,795,911 | | | | 208,848,996 | |
| Shares redeemed: | | | | | | | | | | | | | | | | |
Class A | | | (10,239,513 | ) | | | (102,425,941 | ) | | | (8,289,878 | ) | | | (83,240,102 | ) |
Class C | | | (605,187 | ) | | | (6,037,377 | ) | | | (453,547 | ) | | | (4,546,073 | ) |
Class C2 | | | (358,632 | ) | | | (3,581,329 | ) | | | (413,484 | ) | | | (4,141,821 | ) |
Class C2 – automatic conversion to Class A Shares | | | (6,135 | ) | | | (61,289 | ) | | | — | | | | — | |
Class I | | | (19,157,751 | ) | | | (191,799,143 | ) | | | (16,529,834 | ) | | | (166,130,498 | ) |
| | | | (30,367,218 | ) | | | (303,905,079 | ) | | | (25,686,743 | ) | | | (258,058,494 | ) |
| Net increase (decrease) | | | 899,284 | | | $ | 8,623,021 | | | | (4,890,832 | ) | | $ | (49,209,498 | ) |
5. Investment Transactions
Long-term purchases and sales (including maturities but excluding derivative transactions, where applicable) during the current fiscal period were as follows:
| | | | | | | | | | | | | | | | |
| | | All-
American | | | Intermediate
Duration | | | Limited
Term | | | Short
Term | |
| Purchases | | $ | 1,442,679,022 | | | $ | 2,155,406,436 | | | $ | 2,056,931,954 | | | $ | 366,257,683 | |
| Sales and maturities | | | 1,119,400,168 | | | | 900,088,514 | | | | 1,294,598,685 | | | | 259,594,184 | |
6. Income Tax Information
Each Fund is a separate taxpayer for federal income tax purposes. Each Fund intends to distribute substantially all of its net investment income and net capital gains to shareholders and to otherwise comply with the requirements of Subchapter M of the Internal Revenue Code applicable to regulated investment companies. Therefore, no federal income tax provision is required. Furthermore, each Fund intends to satisfy conditions that will enable interest from municipal securities, which is exempt from regular federal income tax, to retain such tax-exempt status when distributed to shareholders of the Funds. Net realized capital gains and ordinary income distributions paid by the Funds are subject to federal taxation.
For all open tax years and all major taxing jurisdictions, management of the Funds has concluded that there are no significant uncertain tax positions that would require recognition in the financial statements. Open tax years are those that are open for examination by taxing authorities (i.e., generally the last four tax year ends and the interim tax period since then). Furthermore, management of the Funds is also not aware of any tax positions for which it is reasonably possible that the total amounts of unrecognized tax benefits will significantly change in the next twelve months.
The following information is presented on an income tax basis. Differences between amounts for financial statement and federal income tax purposes are primarily due to timing differences in recognizing taxable market discount, timing differences in recognizing certain gains and losses on investment transactions and the treatment of investments in inverse floating rate securities reflected as financing transactions, if any. To the extent that differences arise that are permanent in nature, such amounts are reclassified within the capital accounts as detailed below. Temporary differences do not require reclassification. Temporary and permanent differences do not impact the NAVs of the Funds.
The tables below present the cost and unrealized appreciation (depreciation) of each Fund’s investment portfolio, as determined on a federal income tax basis, as of March 31, 2019.
For purposes of this disclosure, derivative tax cost is generally the sum of any upfront fees or premiums exchanged and any amounts unrealized for income statement reporting but realized in income and/or capital gains for tax reporting. If a particular derivative category does not disclose any tax unrealized appreciation or depreciation, the change in value of those derivatives have generally been fully realized for tax purposes.
232
| | | | | | | | | | | | | | | | |
| | | All-
American | | | Intermediate
Duration | | | Limited
Term | | | Short
Term | |
| Tax cost of investments | | $ | 3,778,338,085 | | | $ | 6,440,330,771 | | | $ | 5,129,552,520 | | | $ | 593,420,673 | |
| Gross unrealized: | | | | | | | | | | | | | | | | |
Appreciation | | | 242,812,744 | | | | 268,528,439 | | | | 103,518,892 | | | | 5,240,377 | |
Depreciation | | | (5,868,937 | ) | | | (9,759,686 | ) | | | (13,677,873 | ) | | | (777,054 | ) |
| Net unrealized appreciation (depreciation) of investments | | $ | 236,943,807 | | | $ | 258,768,753 | | | $ | 89,841,019 | | | $ | 4,463,323 | |
| | | | |
| | | All-
American | |
| Tax cost of futures contracts | | $ | (445,938 | ) |
| Net unrealized appreciation (depreciation) of futures contracts | | $ | — | |
Permanent differences, primarily due to federal taxes paid, taxable market discount and expiration of capital loss carryforwards, resulted in reclassifications among the Funds’ components of net assets as of March 31, 2019, the Funds’ tax year end.
The tax components of undistributed net tax-exempt income, net ordinary income and net long-term capital gains as of March 31, 2019, the Funds’ tax year end, were as follows:
| | | | | | | | | | | | | | | | |
| | | All-
American | | | Intermediate
Duration | | | Limited
Term | | | Short
Term | |
| Undistributed net tax-exempt income1 | | $ | 14,723,072 | | | $ | 28,811,589 | | | $ | 20,097,766 | | | $ | 2,629,170 | |
| Undistributed net ordinary income2 | | | 173,795 | | | | 204,558 | | | | 39,163 | | | | 1,204 | |
| Undistributed net long-term capital gains | | | — | | | | — | | | | — | | | | — | |
| 1 | Undistributed net tax-exempt income (on a tax basis) has not been reduced for the dividends declared during the period March 1, 2019 through March 31, 2019, and paid on April 1, 2019. |
| 2 | Net ordinary income consists of taxable market discount income and net short-term capital gains, if any. |
The tax character of distributions paid during the Funds’ tax years ended March 31, 2019 and March 31, 2018 was designated for purposes of the dividends paid deduction as follows:
| | | | | | | | | | | | | | | | |
| 2019 | | All-
American | | | Intermediate
Duration | | | Limited
Term | | | Short
Term | |
| Distributions from net tax-exempt income3 | | $ | 137,201,532 | | | $ | 170,967,589 | | | $ | 94,254,092 | | | $ | 8,133,742 | |
| Distributions from net ordinary income2 | | | 895,949 | | | | 688,743 | | | | 441,733 | | | | — | |
| Distributions from net long-term capital gains | | | — | | | | — | | | | — | | | | — | |
| | | | |
| 2018 | | All-
American | | | Intermediate
Duration | | | Limited
Term | | | Short
Term | |
| Distributions from net tax-exempt income | | $ | 127,290,281 | | | $ | 152,487,270 | | | $ | 85,078,646 | | | $ | 6,692,486 | |
| Distributions from net ordinary income2 | | | 1,159,105 | | | | 627,119 | | | | 803,097 | | | | 46,741 | |
| Distributions from net long-term capital gains | | | — | | | | — | | | | — | | | | — | |
| 2 | Net ordinary income consists of taxable market discount income and net short-term capital gains, if any. |
| 3 | The Funds hereby designate these amounts paid during fiscal year ended March 31, 2019, as Exempt Interest Dividends. |
As of March 31, 2019, the Funds’ tax year end, the Funds had unused capital losses carrying forward available for federal income tax purposes to be applied against future capital gains, if any. The capital losses are not subject to expiration.
| | | | | | | | | | | | | | | | |
| | | All-
American | | | Intermediate
Duration | | | Limited
Term | | | Short
Term | |
| Not subject to expiration: | | | | | | | | | | | | | | | | |
Short-term | | $ | 57,655,958 | | | $ | 12,385,181 | | | $ | 7,579,572 | | | $ | 248,748 | |
Long-term | | | 20,089,172 | | | | 8,731,861 | | | | 14,426,189 | | | | 1,167,863 | |
| Total | | $ | 77,745,130 | | | $ | 21,117,042 | | | $ | 22,005,761 | | | $ | 1,416,611 | |
As of March 31, 2019, the Funds’ tax year end, the following Funds’ capital loss carryforwards expired as follows:
| | | | | | | | |
| | | All-
American | | | Limited
Term | |
| Expired capital loss carryforwards | | $ | 881,168 | | | $ | 1,598,268 | |
233
Notes to Financial Statements(continued)
7. Management Fees and Other Transactions with Affiliates
Management Fees
Each Fund’s management fee compensates the Adviser for overall investment advisory and administrative services and general office facilities. The Sub-Adviser is compensated for its services to the Funds from the management fees paid to the Adviser.
Each Fund’s management fee consists of two components – a fund-level fee, based only on the amount of assets within each individual Fund, and a complex-level fee, based on the aggregate amount of all eligible fund assets managed by the Adviser. This pricing structure enables each Fund’s shareholders to benefit from growth in the assets within their respective Fund as well as from growth in the amount of complex-wide assets managed by the Adviser.
The annual Fund-level fee, payable monthly, for each Fund is calculated according to the following schedule:
| | | | | | | | | | | | | | | | |
| Average Daily Net Assets | | All-
American | | | Intermediate
Duration | | | Limited
Term | | | Short
Term | |
For the first $125 million | | | 0.3000 | % | | | 0.3000 | % | | | 0.2500 | % | | | 0.2500 | % |
For the next $125 million | | | 0.2875 | | | | 0.2875 | | | | 0.2375 | | | | 0.2375 | |
For the next $250 million | | | 0.2750 | | | | 0.2750 | | | | 0.2250 | | | | 0.2250 | |
For the next $500 million | | | 0.2625 | | | | 0.2625 | | | | 0.2125 | | | | 0.2125 | |
For the next $1 billion | | | 0.2500 | | | | 0.2500 | | | | 0.2000 | | | | 0.2000 | |
For the next $3 billion | | | 0.2250 | | | | 0.2250 | | | | 0.1750 | | | | 0.1750 | |
For the next $5 billion | | | 0.2000 | | | | 0.2000 | | | | 0.1500 | | | | 0.1500 | |
| For net assets of $10 billion and greater | | | 0.1875 | | | | 0.1875 | | | | 0.1375 | | | | 0.1375 | |
The annual complex-level fee, payable monthly, for each Fund is determined by taking the complex-level fee rate, which is based on the aggregate amount of “eligible assets” of all Nuveen funds as set forth in the schedule below, and for All-American, Intermediate Duration and Short Term, making, as appropriate, an upward adjustment to that rate based upon the percentage of the fund’s assets that are not “eligible assets.” The complex level fee schedule for each Fund is as follows:
| | | | |
| Complex-Level Eligible Asset Breakpoint Level* | | Effective Complex-Level Fee Rate at Breakpoint Level | |
| $55 billion | | | 0.2000 | % |
| $56 billion | | | 0.1996 | |
| $57 billion | | | 0.1989 | |
| $60 billion | | | 0.1961 | |
| $63 billion | | | 0.1931 | |
| $66 billion | | | 0.1900 | |
| $71 billion | | | 0.1851 | |
| $76 billion | | | 0.1806 | |
| $80 billion | | | 0.1773 | |
| $91 billion | | | 0.1691 | |
| $125 billion | | | 0.1599 | |
| $200 billion | | | 0.1505 | |
| $250 billion | | | 0.1469 | |
| $300 billion | | | 0.1445 | |
| * | The complex-level fee is calculated based upon the aggregate daily “eligible assets” of all Nuveen open-end and closed-end funds. Eligible assets do not include assets attributable to investments in other Nuveen funds or assets in excess of a determined amount (originally $2 billion) added to the Nuveen fund complex in connection with the Adviser’s assumption of the management of the former First American Funds effective January 1, 2011. Eligible assets include closed-end fund assets managed by the Adviser that are attributable to certain types of leverage. For these purposes, leverage includes the closed-end funds’ use of preferred stock and borrowings and certain investments in the residual interest certificates (also called inverse floating rate securities) in tender option bond (TOB) trusts, including the portion of assets held by the TOB trust that has been effectively financed by the trust’s issuance of floating rate securities, subject to an agreement by the Adviser as to certain funds to limit the amount of such assets for determining eligible assets in certain circumstances. As of March 31, 2019, the complex-level fee for each Fund was as follows: |
| | | | |
| Fund | | Complex-Level Fee | |
| All-American | | | 0.1628 | % |
| Intermediate Duration | | | 0.1628 | |
| Limited Term | | | 0.1588 | |
| Short Term | | | 0.1781 | |
The Adviser has agreed to waive fees and/or reimburse expenses (“Expense Cap”) of the following Funds so that total annual Fund operating expenses (excluding 12b-1 distribution and/or service fees, interest expenses, taxes, acquired fund fees and expenses, fees incurred in acquiring and disposing of portfolio securities and extraordinary expenses) do not exceed the average daily net assets of any class of Fund shares in the amounts and for the time periods stated in the following table. The expense limitation expiring July 31, 2020, may be terminated or modified prior to that date only with the approval of the Board. The expense limitations in effect thereafter may be terminated or modified only with the approval of shareholders of the Funds.
| | | | | | | | | | |
| Fund | | Temporary
Expense Cap | | | Temporary
Expense Cap
Expiration Date | | Permanent
Expense Cap | |
| Intermediate Duration | | | N/A | | | N/A | | | 0.75 | |
234
Other Transactions with Affiliates
Each Fund is permitted to purchase or sell securities from or to certain other funds managed by the Adviser (“inter-fund trade”) under specified conditions outlined in procedures adopted by the Board. These procedures have been designed to ensure that any inter-fund trade of securities by the Fund from or to another fund that is, or could be, considered an affiliate of the Fund under certain limited circumstances by virtue of having a common investment adviser (or affiliated investment adviser), common officer and/or common trustee complies with Rule 17a-7 of the 1940 Act. Further, as defined under these procedures, each inter-fund trade is effected at the current market price as provided by an independent pricing service. Unsettled inter-fund trades as of the end of the reporting period are recognized as a component of “Receivable for investments sold” and/or “Payable for investments purchased” on the Statement of Assets and Liabilities, when applicable.
During the current fiscal period, the following Funds engaged in inter-fund trades pursuant to these procedures as follows:
| | | | | | | | |
| Inter-Fund Trades | | All-
American | | | Short
Term | |
| Purchases | | $ | 10,210,102 | | | $ | 1,115,480 | |
| Sales | | | 10,238,865 | | | | — | |
During the current fiscal period, Nuveen Securities, LLC, (the “Distributor”), a wholly-owned subsidiary of Nuveen, collected sales charges on purchases of Class A Shares, the majority of which were paid out as concessions to financial intermediaries as follows:
| | | | | | | | | | | | | | | | |
| | | All-
American | | | Intermediate
Duration | | | Limited
Term | | | Short
Term | |
| Sales charges collected (Unaudited) | | $ | 3,434,188 | | | $ | 1,082,644 | | | $ | 798,953 | | | $ | 130,341 | |
| Paid to financial intermediaries (Unaudited) | | | 3,308,050 | | | | 1,050,199 | | | | 773,565 | | | | 127,489 | |
The Distributor also received 12b-1 service fees on Class A Shares, substantially all of which were paid to compensate financial intermediaries for providing services to shareholders relating to their investments.
During the current fiscal period, the Distributor compensated financial intermediaries directly with commission advances at the time of purchase as follows:
| | | | | | | | | | | | | | | | |
| | | All-
American | | | Intermediate
Duration | | | Limited
Term | | | Short
Term | |
| Commission advances (Unaudited) | | $ | 2,832,337 | | | $ | 1,025,307 | | | $ | 765,694 | | | $ | 123,434 | |
To compensate for commissions advanced to financial intermediaries, all 12b-1 service and distribution fees collected on Class C and Class C2 Shares during the first year following a purchase are retained by the Distributor. During the current fiscal period, the Distributor retained such 12b-1 fees as follows:
| | | | | | | | | | | | | | | | |
| | | All-
American | | | Intermediate
Duration | | | Limited
Term | | | Short
Term | |
| 12b-1 fees retained (Unaudited) | | $ | 417,228 | | | $ | 87,471 | | | $ | 118,758 | | | $ | 9,573 | |
The remaining 12b-1 fees charged to the Funds were paid to compensate financial intermediaries for providing services to shareholders relating to their investments.
The Distributor also collected and retained CDSC on share redemptions during the current fiscal period, as follows:
| | | | | | | | | | | | | | | | |
| | | All-
American | | | Intermediate
Duration | | | Limited
Term | | | Short
Term | |
| CDSC retained (Unaudited) | | $ | 184,472 | | | $ | 40,465 | | | $ | 136,318 | | | $ | 33,140 | |
8. Borrowing Arrangements
Committed Line of Credit
The Funds, along with certain other funds managed by the Adviser (“Participating Funds”), have established a 364-day, approximately $2.65 billion standby credit facility with a group of lenders, under which the Participating Funds may borrow for various purposes other than leveraging for investment purposes. Each Participating Fund is allocated a designated proportion of the facility’s capacity (and its associated costs, as described below) based upon a multi-factor assessment of the likelihood and frequency of its need to draw on the facility, the size of the Fund and its anticipated draws, and the potential importance of such draws to the operations and well-being of the Fund, relative to those of the other Funds. A Fund may effect draws on the facility in excess of its designated capacity if and to the extent that other Participating Funds have undrawn capacity. The credit facility expires in July 2019 unless extended or renewed.
235
Notes to Financial Statements(continued)
The credit facility has the following terms: a fee of 0.15% per annum on unused commitment amounts, and interest at a rate equal to the higher of (a) one-month LIBOR (London Inter-Bank Offered Rate) plus 1.00% per annum or (b) the Fed Funds rate plus 1.00% per annum on amounts borrowed. Participating Funds paid administration, legal and arrangement fees, which are recognized as a component of “Interest expense” on the Statement of Operations, and along with commitment fees, have been allocated among such Participating Funds based upon the relative proportions of the facility’s aggregate capacity reserved for them and other factors deemed relevant by the Adviser and the Board of each Participating Fund.
During the current fiscal period, the Funds utilized this facility. The Fund’s maximum outstanding balance during the utilization period was as follows:
| | | | | | | | | | | | | | | | |
| | | All-
American | | | Intermediate
Duration | | | Limited
Term | | | Short
Term | |
| Maximum Outstanding Balance | | $ | 33,900,000 | | | $ | 41,200,000 | | | $ | 63,700,000 | | | $ | 5,800,000 | |
During each Fund’s utilization periods, during the current fiscal period, the average daily balance outstanding and average annual interest rate on the Borrowings were as follows:
| | | | | | | | | | | | | | | | |
| | | All-
American | | | Intermediate
Duration | | | Limited
Term | | | Short
Term | |
| Average daily balance outstanding | | $ | 17,873,170 | | | $ | 19,305,555 | | | $ | 19,566,183 | | | $ | 5,800,000 | |
| Average annual interest rate | | | 3.32 | % | | | 3.13 | % | | | 3.02 | % | | | 2.98 | % |
Borrowings outstanding as of the end of the reporting period are recognized as “Borrowings” on the Statement of Assets and Liabilities.
9. New Accounting Pronouncements
Disclosure Update and Simplification
During August 2018, the Securities and Exchange Commission (the “SEC”) issued Final Rule ReleaseNo. 33-10532,Disclosure Update and Simplification (“Final Rule ReleaseNo. 33-10532”). Final Rule ReleaseNo. 33-10532 amends certain financial statement disclosure requirements to conform to U.S. GAAP. The amendments to Rule6-04.17 of RegulationS-X (balance sheet) remove the requirement to separately state the book basis components of net assets: undistributed (over-distribution of) net investment income (“UNII”), accumulated undistributed net realized gains (losses), and net unrealized appreciation (depreciation) at the balance sheet date. Instead, consistent with U.S. GAAP, funds will be required to disclose total distributable earnings. The amendments to Rule6-09 of RegulationS-X (statement of changes in net assets) remove the requirement to separately state the sources of distributions paid. Instead, consistent with U.S. GAAP, funds will be required to disclose the total amount of distributions paid, except that any tax return of capital must be separately disclosed. The amendments also remove the requirement to parenthetically state the book basis amount of UNII on the statement of changes in net assets.
The requirements of Final Rule ReleaseNo. 33-10532 are effective November 5, 2018, and the Fund’s Statement of Assets and Liabilities and Statement of Changes in Net Assets for the current reporting period have been modified accordingly. In addition, certain amounts within the Fund’s Statement of Changes in Net Assets for the prior fiscal period have been modified to conform to Final Rule ReleaseNo. 33-10532. For the prior fiscal period, the total amount of distributions paid to shareholders from net investment income and from accumulated net realized gains, if any, are recognized as “Dividends” on the Statement of Changes in Net Assets.
As of March 31, 2018, the Funds’ Statement of Changes in Net Assets reflected the following UNII balances.
| | | | | | | | | | | | | | | | |
| | | All-
American | | | Intermediate Duration | | | Limited
Term | | | Short
Term | |
| UNII at the end of the period | | $ | 4,174,189 | | | $ | 16,442,193 | | | $ | 9,527,794 | | | $ | 1,118,853 | |
Fair Value Measurement: Disclosure Framework
During August 2018, the FASB issued ASU 2018-13 (“ASU 2018-13”),Fair Value Measurement:Disclosure Framework – Changes to the Disclosure Requirements for Fair Value Measurements. ASU 2018-13 modifies the disclosures required by Topic 820, Fair Value Measurements. The amendments in ASU 2018-13 are effective for all entities for fiscal years, and interim periods within those fiscal years, beginning after December 15, 2019. During the current reporting period, management early implemented this guidance. This implementation did not have a material impact on the Funds’ financial statements.
236
Additional Fund Information(Unaudited)
| | | | | | | | | | |
| | | | | |
| | Fund Manager Nuveen Fund Advisors, LLC 333 West Wacker Drive Chicago, IL 60606 Sub-Adviser Nuveen Asset Management, LLC 333 West Wacker Drive Chicago, IL 60606 | | Independent Registered
Public Accounting Firm PricewaterhouseCoopers LLP One North Wacker Drive Chicago, IL 60606 Custodians State Street Bank & Trust
Company One Lincoln Street Boston, MA 02111 U.S. Bank National Association 1555 North RiverCenter Drive Suite 302 Milwaukee, WI 53212 | | Legal Counsel Chapman and Cutler LLP Chicago, IL 60603 | | Transfer Agent and
Shareholder Services DST Asset Manager Solutions, Inc. (DST) P.O. Box 219140 Kansas City, MO 64121-9140 (800) 257-8787 | | |
| | | | | | | | | | | | | | |
| | | | | |
| | | | | | | | | | |
| | |
| | Portfolio of Investments Information: Each Fund is required to file its complete schedule of portfolio holdings with the Securities and Exchange Commission (SEC) for the first and third quarters of each fiscal year as an exhibit to its report on Form N-PORT. You may obtain this information on the SEC’s website at http://www.sec.gov. | | |
| | | |
| | | | | | |
| | |
| | Nuveen Funds’ Proxy Voting Information: You may obtain (i) information regarding how each fund voted proxies relating to portfolio securities held during the most recent twelve-month period ended June 30, without charge, upon request, by calling Nuveen toll-free at (800) 257-8787 or on Nuveen’s website at www.nuveen.com and (ii) a description of the policies and procedures that each fund used to determine how to vote proxies relating to portfolio securities without charge, upon request, by calling Nuveen toll-free at (800) 257-8787. You may also obtain this information directly from the SEC. Visit the SEC on-line at http://www.sec.gov. | | |
| | | |
| | | | | | |
| | |
| | FINRA BrokerCheck: The Financial Industry Regulatory Authority (FINRA) provides information regarding the disciplinary history of FINRA member firms and associated investment professionals. This information as well as an investor brochure describing FINRA BrokerCheck is available to the public by calling the FINRA BrokerCheck Hotline number at (800) 289-9999 or by visiting www.FINRA.org. | | |
237
Glossary of Terms Used in this Report
(Unaudited)
Average Annual Total Return:This is a commonly used method to express an investment’s performance over a particular, usually multi-year time period. It expresses the return that would have been necessary each year to equal the investment’s actual cumulative performance (including change in NAV or offer price and reinvested dividends and capital gains distributions, if any) over the time period being considered.
Duration:Duration is a measure of the expected period over which a bond’s principal and interest will be paid, and consequently is a measure of the sensitivity of a bond’s (or bond fund’s) value to changes when market interest rates change. Generally, the longer a bond or fund’s duration, the more the price of the bond or fund will change as interest rates change.
Effective Leverage (Effective Leverage Ratio): Effective leverage is investment exposure created either directly through certain borrowings or indirectly through inverse floaters, divided by the assets invested, including those assets that were purchased with the proceeds of the leverage, or referenced by the levered instrument. The calculation of the Effective Leverage Ratio reflects borrowings effected on a long-term basis for investment purposes, but excludes borrowings that may occur, on a transient basis, in connection with a Fund’s day-to-day operations primarily in connection with the need to pay cash out to redeeming shareholders or to settle portfolio trades.
Gross Domestic Product (GDP): The total market value of all final goods and services produced in a country/region in a given year, equal to total consumer, investment and government spending, plus the value of exports, minus the value of imports.
Industrial Development Revenue Bond (IDR) – A unique type of revenue bond issued by a state or local government agency on behalf of a private sector company and intended to build or acquire factories or other heavy equipment and tools.
Inflation Linked Swap: A contractual agreement between two counterparties under which one party agrees to make periodic interest payments to the other for an agreed period of time based on a fixed rate (alternatively, a floating rate based on an interest rate index), while the other party agrees to make periodic payments based on a floating rate of interest based on the Consumer Price Index.
Inverse Floating Rate Securities: Inverse floating rate securities, also known as inverse floaters or tender option bonds (TOBs), are created by depositing a municipal bond, typically with a fixed interest rate, into a special purpose trust. This trust, in turn, (a) issues floating rate certificates typically paying short-term tax-exempt interest rates to third parties in amounts equal to some fraction of the deposited bond’s par amount or market value, and (b) issues an inverse floating rate certificate (sometimes referred to as an “inverse floater”) to an investor (such as a fund) interested in gaining investment exposure to a long-term municipal bond. The income received by the holder of the inverse floater varies inversely with the short-term rate paid to the floating rate certificates’ holders, and in most circumstances the holder of the inverse floater bears substantially all of the underlying bond’s downside investment risk. The holder of the inverse floater typically also benefits disproportionately from any potential appreciation of the underlying bond’s value. Hence, an inverse floater essentially represents an investment in the underlying bond on a leveraged basis.
Leverage: Leverage is created whenever a fund has investment exposure (both reward and/or risk) equivalent to more than 100% of the investment capital.
Lipper General & Insured Municipal Debt Funds Classification Average:Represents the average annualized total return for all reporting funds in the Lipper General & Insured Municipal Debt Funds Classification. Lipper returns account for the effects of management fees and assume reinvestment of distributions, but do not reflect any applicable sales charge.
238
Lipper Intermediate Municipal Debt Funds Classification Average:Represents the average annualized total return for all reporting funds in the Lipper Intermediate Municipal Debt Funds Classification. Lipper returns account for the effects of management fees and assume reinvestment of distributions, but do not reflect any applicable sales charge.
Lipper Short-Intermediate Municipal Debt Funds Classification Average:Represents the average annualized total return for all reporting funds in the Lipper Short-Intermediate Municipal Debt Funds Classification. Lipper returns account for the effects of management fees and assume reinvestment of distributions, but do not reflect any applicable sales charge.
Lipper Short Municipal Debt Funds Classification Average:Represents the average annualized total return for all reporting funds in the Lipper Short Municipal Debt Funds Classification. Lipper returns account for the effects of management fees and assume reinvestment of distributions, but do not reflect any applicable sales charges.
Net Asset Value (NAV) Per Share: A fund’s Net Assets is equal to its total assets (securities, cash and accrued earnings) less its total liabilities. For funds with multiple classes, Net Assets are determined separately for each share class. NAV per share is equal to the fund’s (or share class’) Net Assets divided by its number of shares outstanding.
Pre-Refundings:Pre-Refundings, also known as advance refundings or refinancings, occur when an issuer sells new bonds and uses the proceeds to fund principal and interest payments of older existing bonds. This process often results in lower borrowing costs for bond issuers.
S&P Municipal Bond Intermediate Index:An unleveraged, market value-weighted index containing all bonds in the S&P Municipal Bond Index that mature between 3 and 14.999 years. Index returns assume reinvestment of distributions but do not reflect any applicable sales charges or management fees.
S&P Municipal Bond Index: An unleveraged, market value-weighted index designed to measure the performance of the tax-exempt, investment-grade U.S. municipal bond market. Index returns assume reinvestment of distributions, but do not reflect any applicable sales charges or management fees.
S&P Municipal Bond Short Index: An unleveraged, market value-weighted index containing all of the bonds in the S&P Municipal Bond Index with maturities between 6 months and 3.999 years. Index returns assume reinvestment of distributions, but do not reflect any applicable sales charges or management fees.
S&P Municipal Bond Short-Intermediate Index:An unleveraged, market value-weighted index containing all bonds in the S&P Municipal Bond Index that mature between 1 and 7.999 years. Index returns assume reinvestment of distributions, but do not reflect any applicable sales charges or management fees.
Total Investment Exposure: Total investment exposure is a fund’s assets managed by the Adviser that are attributable to financial leverage. For these purposes, financial leverage includes a fund’s use of preferred stock and borrowings and investments in the residual interest certificates (also called inverse floating rate securities) in tender option bond (TOB) trusts, including the portion of assets held by a TOB trust that has been effectively financed by the trust’s issuance of floating rate securities.
Weighted Average Maturity: The average time to maturity of debt securities held in a Fund.
Weighted Average Portfolio Duration: The weighted average duration, including the effects of leverage, of a fund’s bonds and loans, which is a measure of the fund’s price sensitivity expressed in years.
Zero Coupon Bond: A zero coupon bond does not pay a regular interest coupon to its holders during the life of the bond. Income to the holder of the bond comes from accretion of the difference between the original purchase price of the bond at issuance and the par value of the bond at maturity and is effectively paid at maturity. The market prices of zero coupon bonds generally are more volatile than the market prices of bonds that pay interest periodically.
239
Annual Investment Management Agreement Approval Process
(Unaudited)
At a meeting held onMay 22-24, 2018 (the“May Meeting”), the Board of Trustees or Directors, as applicable (each, a“Board,” and each Trustee or Director, a“Board Member”) of the Funds, including the Board Members who are not “interested persons” (as defined under the Investment Company Act of 1940 (the“1940 Act”)) (the“Independent Board Members”), approved, for each of its respective Fund(s), the renewal of the management agreement (the“Investment Management Agreement”) with Nuveen Fund Advisors, LLC (the“Adviser”) pursuant to which the Adviser serves as investment adviser to such Fund and thesub-advisory agreement (the“Sub-Advisory Agreement”) with Nuveen Asset Management, LLC (the“Sub-Adviser”) pursuant to which theSub-Adviser serves as investmentsub-adviser to such Fund. Following an initialtwo-year period, the Board, including the Independent Board Members, is required under the 1940 Act to review and approve each Investment Management Agreement andSub-Advisory Agreement on behalf of the applicable Fund on an annual basis. The Investment Management Agreements andSub-Advisory Agreements are collectively referred to as the“Advisory Agreements”and the Adviser and theSub-Adviser are collectively, the“Fund Advisers” and each, a“Fund Adviser.”
In response to a request on behalf of the Independent Board Members by independent legal counsel, the Board received and reviewed prior to the May Meeting extensive materials specifically prepared for the annual review of Advisory Agreements by the Adviser as well as by Broadridge Financial Solutions, Inc. (“Broadridge”or“Lipper”), an independent provider of investment company data. The materials provided in connection with the annual review covered a breadth of subject matter including, but not limited to, a description of the nature, extent and quality of services provided by each Fund Adviser; a review of theSub-Adviser and the applicable investment team(s); an analysis of fund performance in absolute terms and as compared to the performance of certain peer funds and benchmarks with a focus on any performance outliers; an analysis of the fees and expense ratios of the Nuveen funds in absolute terms and as compared to those of certain peer funds with a focus on any expense outliers; a description of portfolio manager compensation; a review of the performance of various service providers; a description of various initiatives Nuveen had undertaken or continued during the year for the benefit of particular Nuveen fund(s) and/or the complex; a description of the profitability or financial data of Nuveen and the varioussub-advisers to the Nuveen funds; and a description of indirect benefits received by the Fund Advisers as a result of their relationships with the Nuveen funds. The Independent Board Members also received a memorandum from independent legal counsel outlining their fiduciary duties and legal standards in reviewing the Advisory Agreements. The Board Members held anin-person meeting onApril 10-11, 2018 (the“April Meeting”), in part, to review and discuss the performance of the Nuveen funds and the Adviser’s evaluation of the varioussub-advisers to the Nuveen funds. Prior to the May Meeting, the Board Members also received and reviewed supplemental information provided in response to questions posed by the Board Members.
The information prepared specifically for the annual review of the Advisory Agreements supplemented the information provided to the Board and its committees throughout the year. The Board and its committees met regularly during the year and the information provided and topics discussed were relevant to the review of the Advisory Agreements. Some of these reports and other data included, among other things, materials that outlined the investment performance of the Nuveen funds; strategic plans of the Adviser which may impact the services it provides to the Nuveen funds; the review of the Nuveen funds and applicable investment teams; compliance, regulatory and risk management matters; the trading practices of the varioussub-advisers; valuation of securities; fund expenses; payments to financial intermediaries, including12b-1 fees andsub-transfer agency fees; and overall market and regulatory developments. The Board further continued its practice of seeking to meet periodically with the varioussub-advisers to the Nuveen funds and their investment teams, when feasible. As a result, the Independent Board Members considered the review of the Advisory Agreements to be an ongoing process and employed the accumulated information, knowledge, and experience the Board Members had gained during their tenure on the boards governing the Nuveen funds and working with the Fund Advisers in their review of the Advisory Agreements. Throughout the year and during the annual review of Advisory Agreements, the Independent Board Members met in executive sessions with independent legal counsel and had the benefit of counsel’s advice.
In deciding to renew the Advisory Agreements, the Independent Board Members did not identify a particular factor as determinative, but rather the decision reflected the comprehensive consideration of all the information provided, and each Board Member may have attributed different levels of importance to the various factors and information considered in connection with the approval process. The following summarizes the principal factors, but not all the factors, the Board considered in deciding to renew the Advisory Agreements and its conclusions.
A. Nature, Extent and Quality of Services
In evaluating the renewal of the Advisory Agreements, the Independent Board Members received and considered information regarding the nature, extent and quality of the applicable Fund Adviser’s services provided to the respective Fund and the resulting performance of each Fund. With respect to the Adviser, the Board recognized the comprehensive set of management, oversight and administrative services the Adviser and its affiliates provided to manage and operate the Nuveen funds in a highly regulated industry. As illustrative, these services included, but were not limited to, product management; investment oversight, risk management and securities valuation services; fund accounting and administration services; board support and administration services; compliance and regulatory oversight services; and legal support.
240
In addition to the services necessary to operate and maintain the Nuveen funds, the Board recognized the Adviser’s continued program of improvements and innovations to make the Nuveen fund complex more relevant and attractive to existing and new investors and to accommodate the new and changing regulatory requirements in an increasingly complex regulatory environment. The Board noted that some of the initiatives the Adviser had taken over recent years to benefit the complex and particular Nuveen funds included, among other things:
| | • | | Fund Rationalizations – continuing efforts to rationalize the product line through mergers, liquidations and repositionings in seeking to enhance shareholder value over the years through increased efficiency, reduced costs, improved performance and revised investment approaches more relevant to current shareholder needs; |
| | • | | Product Innovations – developing product innovations and launching new products that will help the Nuveen fund complex offer a variety of products that will attract new investors and retain existing investors, such as launching the target term funds,exchange-traded funds (“ETFs”) andmulti-asset class funds; |
| | • | | Risk Management Enhancements – continuing efforts to enhance risk management, including enhancing reporting to increase the efficiency of risk monitoring, implementing programs to strengthen the ability to detect and mitigate operational risks, dedicating resources and staffing necessary to create standards to help ensure compliance with new liquidity requirements, and implementing a price verification system; |
| | • | | Additional Compliance Services – the continuing investment of significant resources, time and additional staffing to meet the various new regulatory requirements affecting the Nuveen funds over the past several years, the further implementation of unified compliance policies and processes, the development of additional compliance training modules, and the reorganization of the compliance team adding further depth to its senior leadership; and |
| | • | | Expanded Dividend Management Services – as the Nuveen fund complex has grown, the additional services necessary to manage the distributions of the varied funds offered and investing in automated systems to assist in this process. |
In addition to the services provided by the Adviser, the Board also noted the business related risks the Adviser incurred in managing the Nuveen funds, including entrepreneurial, legal and litigation risks.
The Board further considered the division of responsibilities between the Adviser and theSub-Adviser and the investment and compliance oversight over theSub-Adviser provided by the Adviser. The Board recognized that theSub-Adviser generally provided the portfolio advisory services for the Funds. The Board reviewed the Adviser’s analysis of theSub-Adviser which evaluated, among other things, the investment team, the members’ experience and any changes to the team during the year, the team’s assets under management, the stability and history of the organization, the team’s investment approach and the performance of the Funds over various periods. The Board noted that the Adviser recommended the renewal of theSub-Advisory Agreements.
Based on its review, the Board determined, in the exercise of its reasonable business judgment, that it was satisfied with the nature, extent and quality of services provided to the respective Funds under each applicable Advisory Agreement.
B. The Investment Performance of the Funds and Fund Advisers
As part of its evaluation of the services provided by the Fund Advisers, the Board considered the investment performance of each Fund. In this regard, the Board reviewed fund performance over the quarter,one-,three- andfive-year periods ending December 31, 2017 as well as performance data for the first quarter of 2018 ending March 31, 2018. Foropen-end Nuveen funds with multiple classes, the performance data was based on Class A shares and the performance of other classes should be substantially similar as they invest in the same portfolio of securities and differences in performance among the classes would be principally attributed to the variations in the expense structures of the classes. The Independent Board Members noted that they reviewed and discussed fund performance over various time periods with management at their quarterly meetings throughout the year and their review and analysis of performance during the annual review of Advisory Agreements incorporated such discussions.
The Board reviewed performance on an absolute basis and in comparison to the performance of peer funds (the“Performance Peer Group”) and recognized and/or customized benchmarks (i.e., generally benchmarks derived from multiple recognized benchmarks). The Board considered the Adviser’s analysis of each Nuveen fund’s performance, including, in particular, an analysis of the Nuveen funds determined to be performance outliers and the factors contributing to their underperformance.
In reviewing performance data, the Independent Board Members appreciated some of the inherent limitations of such data. In this regard, the Independent Board Members recognized that there may be limitations with the comparative data of certain peer groups or benchmarks as they may pursue objective(s), strategies or have other characteristics that are different from the respective Nuveen fund and therefore the performance results necessarily are different and limit the value of the comparisons. As an example, some funds may utilize leverage which may add to or detract from performance compared to an unlevered benchmark. The Independent Board Members also noted that management had ranked the relevancy of the peer group as low, medium or high to help the Board evaluate the value of the comparative peer performance data. The Board was aware that the performance data was measured as of a specific date and a different time period may reflect significantly different results and a period of underperformance can significantly impactlong-term performance figures. The Board further recognized that a shareholder’s experience in a Fund depends on his or her own holding period which may differ from that reviewed by the Independent Board Members.
241
Annual Investment Management Agreement Approval Process(Unaudited) (continued)
In their review of performance, the Independent Board Members focused, in particular, on the Adviser’s analysis of Nuveen funds determined to be underperforming performance outliers. The Independent Board Members noted that only a limited number of the Nuveen funds appeared to be underperforming performance outliers at the end of 2017 and considered the factors contributing to the respective fund’s performance and whether there were any performance concerns that needed to be addressed. The Board recognized that some periods of underperformance may only be temporary while other periods of underperformance may indicate a broader issue that may require a corrective action. Accordingly, with respect to any Nuveen funds for which the Board had identified performance issues, the Board monitors such funds closely until performance improves, discusses with the Adviser the reasons for such results, considers whether any steps are necessary or appropriate to address such issues, and reviews the results of any efforts undertaken.
For NuveenAll-American Municipal Bond Fund (the“All-American Fund”), the Board noted that the Fund ranked in the first quartile of its Performance Peer Group in theone-,three- andfive-year periods and outperformed its benchmark in such periods. The Board was satisfied with the Fund’s overall performance.
For Nuveen Intermediate Duration Municipal Bond Fund (the“Intermediate Duration Fund”), the Board noted that the Fund ranked in the first quartile of its Performance Peer Group in theone-,three- andfive-year periods. Although the Fund’s performance was below its benchmark in thefive-year period, the Fund outperformed its benchmark in theone- andthree-year periods. The Board was satisfied with the Fund’s overall performance.
For Nuveen Limited Term Municipal Bond Fund (the“Limited Term Fund”), the Board noted that the Fund ranked in the first quartile of its Performance Peer Group in theone-year period and second quartile in thethree- andfive-year periods. Although the Fund’s performance was below its benchmark in thethree- andfive-year periods, the Fund outperformed its benchmark in theone-year period. The Board was satisfied with the Fund’s overall performance.
For Nuveen Short Term Municipal Bond Fund (the“Short Term Fund”), the Board noted that the Fund ranked in the second quartile of its Performance Peer Group in theone- andthree-year periods and first quartile in thefive-year period. Although the Fund’s performance was below its benchmark in thethree- andfive-year periods, the Fund outperformed its benchmark in theone-year period. The Board was satisfied with the Fund’s overall performance.
C. Fees, Expenses and Profitability
1. Fees and Expenses
In its annual review, the Board considered the fees paid to the Fund Advisers and the total operating expense ratio of each Fund, before and after any undertaking by Nuveen to limit the Fund’s total annual operating expenses to certain levels. More specifically, the Independent Board Members reviewed, among other things, each Fund’s gross and net management fee rates (i.e., before and after expense reimbursements and/or fee waivers, if any) and net total expense ratio in relation to those of a comparable universe of funds (the“Peer Universe”) and to a more focused subset of comparable funds (the“Peer Group”) established by Broadridge. The Independent Board Members reviewed the methodology Broadridge employed to establish its Peer Universe and Peer Group and recognized that differences between the applicable fund and its respective Peer Universe and/or Peer Group may limit some of the value of the comparative data. The Independent Board Members also considered a fund’s operating expense ratio as it more directly reflected the shareholder’s costs in investing in the respective fund. In their review, the Independent Board Members considered, in particular, each fund with a net expense ratio of six basis points or higher compared to that of its peer average (each an“Expense Outlier Fund”). The Board noted that the number of Nuveen funds classified as an Expense Outlier Fund pursuant to the foregoing criteria had decreased over the past few years with only a limited number of the Nuveen funds identified as Expense Outlier Funds in 2017. The Independent Board Members reviewed an analysis as to the factors contributing to each such fund’s higher relative net expense ratio. Accordingly, in reviewing the comparative data between a fund and its peers, the Board generally considered the fund’s net expense ratio and fees to be higher if they were over 10 basis points higher, slightly higher if they were 6 to 10 basis points higher, in line if they were within approximately 5 basis points higher than the peer average and below if they were below the peer average of the Peer Group.
In their review of the fee arrangements for the Nuveen funds, the Independent Board Members considered the management fee schedules, including thecomplex-wide andfund-level breakpoint schedules, and the expense reimbursements and/or fee waivers provided by Nuveen for each fund, as applicable. The Independent Board Members noted that the management fees and/or expense caps of variousopen-end funds had been reduced in 2016 and thefund-level breakpoint schedules also had been revised in 2017 for certainopen-end funds resulting in the addition of more breakpoints in the management fee schedules of such funds. The Board considered that across the Nuveen fund complex, thecomplex-wide fee breakpoints reduced fees by $47.4 million andfund-level breakpoints reduced fees by $54.6 million in 2017. Further, fee caps and waivers for all applicable Nuveen funds saved an additional $16.7 million in fees for shareholders in 2017.
The Board considered thesub-advisory fees paid to theSub-Adviser, including any breakpoint schedule, and as described below, comparative data of the fees theSub-Adviser charges to other clients.
242
The Independent Board Members noted that: (a) the Short Term Fund had a net management fee slightly higher than its Peer Group average, but a net expense ratio in line with its Peer Group average; (b) theAll-American Fund had a net management fee and a net expense ratio below its Peer Group averages; and (c) the Limited Term Fund and the Intermediate Duration Fund each had a net management fee in line with its respective Peer Group average, but a net expense ratio below its respective Peer Group average.
Based on their review of the information provided, the Board determined that each Fund’s management fees (as applicable) to a Fund Adviser were reasonable in light of the nature, extent and quality of services provided to the Fund.
2. Comparisons with the Fees of Other Clients
In determining the appropriateness of fees, the Board also reviewed information regarding the fee rates the respective Fund Advisers charged for certain other types of clients and the type of services provided to these other clients. With respect to the Adviser and/or affiliatedsub-advisers to the municipal funds, such other clients may include retail and institutional managed accounts, passively managed ETFssub-advised by theSub-Adviser but that are offered by another fund complex and municipal managed accounts offered by an unaffiliated adviser.
The Board recognized that each Fund had an affiliatedsub-adviser and reviewed, among other things, the range of fees and average fee rates assessed for managed accounts. In addition to the comparative fee data, the Board also reviewed, among other things, a description of the different levels of services provided to other clients compared to the services provided to the Nuveen funds as well as the differences in portfolio investment policies, investor profiles, account sizes and regulatory requirements, all of which contribute to the variations in the fee schedules. In general, the Board noted that the higher fee levels reflect higher levels of services provided by Nuveen, increased investment management complexity, greater product management requirements and higher levels of business risk or some combination of these factors. The Board further considered that theSub-Adviser’s fee is essentially for portfolio management services and therefore more comparable to the fees it receives for retail wrap accounts and other externalsub-advisory mandates. The Board concluded the varying levels of fees were justified given, among other things, the inherent differences in the products and the level of services provided to the Nuveen funds versus other clients, the differing regulatory requirements and legal liabilities and the entrepreneurial risks incurred in sponsoring and advising a registered investment company.
3. Profitability of Fund Advisers
In conjunction with their review of fees, the Independent Board Members considered Nuveen’s level of profitability for its advisory services to the Nuveen funds for the calendar years 2017 and 2016. In considering profitability, the Independent Board Members reviewed the level of profitability realized by Nuveen including and excluding any distribution expenses incurred by Nuveen from its own resources. The Independent Board Members also reviewed a description of the expense allocation methodology employed to develop the financial information and a summary of the history of changes to the methodology over the years. For comparability purposes, the Board recognized that a prior year’s profitability would be restated to reflect any refinements to the methodology. The Independent Board Members were aware of the inherent limitations in calculating profitability as the use of different reasonable allocation methodologies may lead to significantly different results and in reviewing profitability margins over extended periods given the refinements to the methodology over time. The Board noted that two Independent Board Members, along with independent counsel, serve as the Board’s liaisons to review and discuss any proposed changes to the methodology prior to the full Board’s review.
In their review, the Independent Board Members evaluated, among other things, Nuveen’s adjusted operating margins, gross and net revenue margins(pre-tax andafter-tax) for advisory activities for the Nuveen funds, and the revenues, expenses, and net income(pre-tax andafter-tax and before distribution) of Nuveen for fund advisory services for each of the last two calendar years. The Independent Board Members also reviewed an analysis of the key drivers behind the changes in revenues and expenses that impacted profitability in 2017 versus 2016. The Board noted that Nuveen recently launched its ETF product line in 2016 and reviewed the revenues, expenses and operating margin from this product line.
In addition to reviewing Nuveen’s profitability in absolute terms, the Independent Board Members also examined comparative profitability data reviewing, among other things, the revenues, expenses and adjusted total company margins of other advisory firms that had publicly available information and comparable assets under management (based on asset size and asset composition) for 2017 and as compared to their adjusted operating margins for 2016. The Independent Board Members, however, recognized the difficulty in comparing the profitability of various fund managers given the limited public information available and the subjective nature of calculating profitability which may be affected by numerous factors including the fund manager’s organizational structure, types of funds, other lines of business, methodology used to allocate expenses and cost of capital. Nevertheless, considering such limitations and based on the information provided, the Board noted that Nuveen’s adjusted operating margins appeared reasonable when compared to the adjusted margins of the peers.
Aside from Nuveen’s profitability, the Board recognized that the Adviser is a subsidiary of Nuveen, LLC, the investment management arm of Teachers Insurance and Annuity Association of America (“TIAA”). As such, the Board also reviewed a balance sheet for TIAA reflecting its assets, liabilities and capital and contingency reserves for the 2017 and 2016 calendar years to consider the financial strength of TIAA.
243
Annual Investment Management Agreement Approval Process(Unaudited) (continued)
In reviewing profitability, the Independent Board Members also considered the profitability of the varioussub-advisers from their relationships with the respective Nuveen fund(s). The Independent Board Members reviewed theSub-Adviser’s revenues, expenses and revenue margins(pre- andpost-tax) for its advisory activities for the calendar year ended December 31, 2017. The Independent Board Members also reviewed a profitability analysis reflecting the revenues, expenses and revenue margin(pre- andpost-tax) by asset type for theSub-Adviser for the calendar year ending December 31, 2017 and thepre- andpost-tax revenue margin from 2017 and 2016.
In evaluating the reasonableness of the compensation, the Independent Board Members also considered any other ancillary benefits derived by the respective Fund Adviser from its relationship with the Nuveen funds as discussed in further detail below.
Based on a consideration of all the information provided, the Board noted that Nuveen’s and theSub-Adviser’s level of profitability was acceptable and not unreasonable in light of the services provided.
D. Economies of Scale and Whether Fee Levels Reflect These Economies of Scale
The Independent Board Members considered the extent to which economies of scale may be achieved as a Fund grows and whether these economies of scale have been shared with shareholders. Although the Board recognized that economies of scale are difficult to measure, the Independent Board Members noted that there are several methods that may be used in seeking to share economies of scale, including through breakpoints in the management fee schedule reducing the fee rates as asset levels grow, fee waivers and/or expense limitation agreements and the Adviser’s investment in its business which can enhance the services provided to the Nuveen funds. With respect to breakpoint schedules, because the Board had previously recognized that economies of scale may occur not only when the assets of a particular fund grow but also when the assets in the complex grow, the Nuveen funds generally pay the Adviser a management fee comprised of afund-level component and acomplex-level component each with its own breakpoint schedule, subject to certain exceptions. In general terms, the breakpoint schedule at the fund level reduces fees as assets in the particular fund pass certain thresholds and the breakpoint schedule at the complex level reduces fees on certain funds as the eligible assets in the complex pass certain thresholds. Subject to exceptions for certain Nuveen funds, the Independent Board Members reviewed thefund-level andcomplex-level fee schedules and any resulting savings in fees. The Board also recognized that thefund-level breakpoint schedule for certain Nuveen funds had been revised in 2016.
Aside from the breakpoint schedules, the Independent Board Members also reviewed the temporary and/or permanent expense caps applicable to certain Nuveen funds (including, for the Intermediate Duration Fund, its permanent expense cap) which may also serve as a means to share economies of scale. Based on the information provided, the Independent Board Members noted that the combination offund-level breakpoints,complex-level breakpoints andfund-specific fee waivers reflected a total of $118.6 million in fee reductions in 2017. In addition, the Independent Board Members recognized the Adviser’s continued reinvestment in its business through, among other things, improvements in technology, additional staffing, product innovations and other organizational changes designed to expand or enhance the services provided to the benefit of all of the Nuveen funds.
Based on its review, the Board concluded that the current fee arrangements together with the Adviser’s reinvestment in its business appropriately shared any economies of scale with shareholders.
E. Indirect Benefits
The Independent Board Members received and considered information regarding other benefits the respective Fund Adviser or its affiliates may receive as a result of their relationship with the Nuveen funds. The Independent Board Members reviewed the revenues that an affiliate of the Adviser received in 2017 as a result of serving as principal underwriter to theopen-end funds from12b-1 distribution and shareholder servicing fees (except for Nuveen’s Nushares ETFs which currently do not incur12b-1 fees).
In addition to the above, the Independent Board Members considered whether theSub-Adviser uses commissions paid by the Funds on portfolio transactions to obtain research products and other services (“soft dollar transactions”). The Board recognized that theSub-Adviser may benefit from research received frombroker-dealers that execute Fund portfolio transactions. The Board, however, noted that the benefits forsub-advisers transacting infixed-income securities may be more limited as such securities generally trade on a principal basis and therefore do not generate brokerage commissions. Further, the Board noted that although theSub-Adviser may benefit from the receipt of research and other services that it may otherwise have to pay for out of its own resources, the research may also benefit the Funds to the extent it enhances the ability of theSub-Adviser to manage the Funds or is acquired through the commissions paid on portfolio transactions of other funds or clients.
Based on their review, the Board concluded that any indirect benefits received by a Fund Adviser as a result of its relationship with the Funds were reasonable and within acceptable parameters.
F. Other Considerations
The Board Members did not identify any single factor discussed previously asall-important or controlling. The Board Members, including the Independent Board Members, concluded that the terms of each Advisory Agreement were fair and reasonable, that the respective Fund Adviser’s fees were reasonable in light of the services provided to each Fund and that the Advisory Agreements be renewed.
244
Trustees and Officers
(Unaudited)
The management of the Funds, including general supervision of the duties performed for the Funds by the Adviser, is the responsibility of the Board of Trustees of the Funds. The number of Trustees of the Funds is currently set at ten. None of the Trustees who are not “interested” persons of the Funds (referred to herein as “Independent Trustees”) has ever been a Trustee or employee of, or consultant to, Nuveen or its affiliates. The names and business addresses of the Trustees and officers of the Funds, their principal occupations and other affiliations during the past five years, the number of portfolios each oversees and other directorships they hold are set forth below.
The Funds’ Statement of Additional Information (“SAI”) includes more information about the Trustees. To request a free copy, call Nuveen Investments at (800)257-8787 or visit the Funds’ website at www.nuveen.com.
| | | | | | | | |
Name,
Year of Birth
& Address | | Position(s)
Held with
the Funds | | Year First
Elected or
Appointed (1) | | Principal Occupation(s)
Including other Directorships
During Past 5 Years | | Number of
Portfolios in
Fund Complex
Overseen by
Trustee |
| | | | | |
| Independent Trustees: | | | | | | | | |
Terence J. Toth 1959 333 W. Wacker Drive Chicago, IL 60606 | | Chairman and Trustee | | 2008 | | Formerly, aCo-Founding Partner, Promus Capital (2008-2017); Director, Fulcrum IT Service LLC (since 2010) and Quality Control Corporation (since 2012); member: Catalyst Schools of Chicago Board (since 2008) and Mather Foundation Board (since 2012), and chair of its investment committee; formerly, Director, Legal & General Investment Management America, Inc. (2008-2013); formerly, CEO and President, Northern Trust Global Investments (2004-2007); Executive Vice President, Quantitative Management & Securities Lending (2000-2004); prior thereto, various positions with Northern Trust Company (since 1994); formerly, Member, Northern Trust Mutual Funds Board (2005-2007), Northern Trust Global Investments Board (2004-2007), Northern Trust Japan Board (2004-2007), Northern Trust Securities Inc. Board(2003-2007) and Northern Trust Hong Kong Board (1997-2004). | | 168 |
Jack B. Evans 1948 333 W. Wacker Drive Chicago, IL 60606 | | Trustee | | 1999 | | Chairman (since 2019), formerly, President (1996-2019), The Hall-Perrine Foundation, a private philanthropic corporation; Director and Chairman, United Fire Group, a publicly held company; Director, Public member, American Board of Orthopaedic Surgery (since 2015); Life Trustee of Coe College and the Iowa College Foundation; formerly, PresidentPro-Tem of the Board of Regents for the State of Iowa University System; formerly, Director, Alliant Energy and The Gazette Company; formerly, Director, Federal Reserve Bank of Chicago; formerly, President and Chief Operating Officer, SCI Financial Group, Inc., a regional financial services firm. | | 168 |
William C. Hunter 1948 333 W. Wacker Drive Chicago, IL 60606 | | Trustee | | 2003 | | Dean Emeritus, formerly, Dean, Tippie College of Business, University of Iowa (2006-2012); Director of Wellmark, Inc. (since 2009); past Director (2005-2015), and past President (2010-2014) Beta Gamma Sigma, Inc., The International Business Honor Society; formerly, Director (2004-2018) of Xerox Corporation; Dean and Distinguished Professor of Finance, School of Business at the University of Connecticut (2003-2006); previously, Senior Vice President and Director of Research at the Federal Reserve Bank of Chicago (1995-2003); formerly, Director (1997-2007), Credit Research Center at Georgetown University. | | 168 |
245
Trustees and Officers(Unaudited) (continued)
| | | | | | | | |
Name,
Year of Birth
& Address | | Position(s)
Held with
the Funds | | Year First
Elected or
Appointed (1) | | Principal Occupation(s)
Including other Directorships
During Past 5 Years | | Number of
Portfolios in
Fund Complex
Overseen by
Trustee |
Albin F. Moschner 1952 333 W. Wacker Drive Chicago, IL 60606 | | Trustee | | 2016 | | Founder and Chief Executive Officer, Northcroft Partners, LLC, a management consulting firm (since 2012); Chairman (since 2019), and Director (since 2012), USA Technologies, Inc., a provider of solutions and services to facilitate electronic payment transactions (since 2012); formerly, Director, Wintrust Financial Corporation (1996-2016); previously, held positions at Leap Wireless International, Inc., including Consultant (2011-2012), Chief Operating Officer (2008-2011), and Chief Marketing Officer(2004-2008); formerly, President, Verizon Card Services division of Verizon Communications, Inc. (2000-2003); formerly, President, One Point Services at One Point Communications (1999-2000); formerly, Vice Chairman of the Board, Diba, Incorporated(1996-1997); formerly, various executive positions (1991-1996) and Chief Executive Officer (1995-1996) of Zenith Electronics Corporation. | | 168 |
John K. Nelson 1962 333 W. Wacker Drive Chicago, IL 60606 | | Trustee | | 2013 | | Member of Board of Directors of Core12 LLC (since 2008), a private firm which develops branding, marketing and communications strategies for clients; serves on The President’s Council, Fordham University (since 2010); and previously was a Director of The Curran Center for Catholic American Studies(2009-2018) formerly, senior external advisor to the financial services practice of Deloitte Consulting LLP (2012-2014); formerly, Chairman of the Board of Trustees of Marian University (2010 as trustee, 2011-2014 as Chairman); formerly, Chief Executive Officer of ABN AMRO N.V. North America, and Global Head of its Financial Markets Division (2007-2008); prior senior positions held at ABN AMRO include Corporate Executive Vice President and Head of GlobalMarkets-the Americas (2006-2007), CEO of Wholesale Banking-North America and Global Head of Foreign Exchange and Futures Markets (2001-2006), and Regional Commercial Treasurer and Senior Vice President Trading-North America (1996-2001); formerly, Trustee at St. Edmund Preparatory School in New York City. | | 168 |
Judith M. Stockdale 1947 333 W. Wacker Drive Chicago, IL 60606 | | Trustee | | 1997 | | Board Member, Land Trust Alliance (since 2013) and U.S. Endowment for Forestry and Communities (since 2013); formerly, Executive Director (1994-2012), Gaylord and Dorothy Donnelley Foundation; prior thereto, Executive Director, Great Lakes Protection Fund (1990-1994). | | 168 |
Carole E. Stone 1947 333 W. Wacker Drive Chicago, IL 60606 | | Trustee | | 2007 | | Former Director, Chicago Board Options Exchange (2006-2017), and C2 Options Exchange, Incorporated (2009-2017); Director, Cboe L.C. Global Markets, Inc., formerly, CBOE Holdings, Inc. (since 2010); formerly, Commissioner, New York State Commission on Public Authority Reform (2005-2010). | | 168 |
Margaret L. Wolff 1955 333 W. Wacker Drive Chicago, IL 60606 | | Trustee | | 2016 | | Formerly, member of the Board of Directors (2013-2017) of Travelers Insurance Company of Canada and The Dominion of Canada General Insurance Company (each, a part of Travelers Canada, the Canadian operation of The Travelers Companies, Inc.); formerly, Of Counsel, Skadden, Arps, Slate, Meagher & Flom LLP (Mergers & Acquisitions Group) (2005-2014); Member of the Board of Trustees of New York-Presbyterian Hospital (since 2005); Member (since 2004) and Chair (since 2015) of the Board of Trustees of The John A. Hartford Foundation (a philanthropy dedicated to improving the care of older adults); formerly, Member (2005-2015) and Vice Chair (2011-2015) of the Board of Trustees of Mt. Holyoke College. | | 168 |
246
| | | | | | | | |
Name,
Year of Birth
& Address | | Position(s)
Held with
the Funds | | Year First
Elected or
Appointed (1) | | Principal Occupation(s)
Including other Directorships
During Past 5 Years | | Number of
Portfolios in
Fund Complex
Overseen by
Trustee |
Robert L. Young(2) 1963 333 W. Wacker Drive Chicago, IL 60606 | | Trustee | | 2017 | | Formerly, Chief Operating Officer and Director, J.P. Morgan Investment Management Inc. (2010-2016); formerly, President and Principal Executive Officer (2013-2016), and Senior Vice President and Chief Operating Officer (2005-2010), of J.P. Morgan Funds; formerly, Director and various officer positions for J.P. Morgan Investment Management Inc. (formerly, JPMorgan Funds Management, Inc. and formerly, One Group Administrative Services) and JPMorgan Distribution Services, Inc. (formerly, One Group Dealer Services, Inc.) (1999-2017). | | 166 |
| | | | | | | | |
Name,
Year of Birth
& Address | | Position(s)
Held with
the Funds | | Year First
Elected or
Appointed (1) | | Principal Occupation(s)
Including other Directorships
During Past 5 Years | | Number of
Portfolios in
Fund Complex
Overseen by
Trustee |
| | | | | |
| Interested Trustee: | | | | | | | | |
Margo L. Cook(3) 1964 333 W. Wacker Drive Chicago, IL 60606 | | Trustee | | 2016 | | President (since 2017), formerly,Co-Chief Executive Officer andCo-President (2016-2017), formerly, Senior Executive Vice President of Nuveen Investments, Inc; Executive Vice President (since 2017) of Nuveen, LLC; President, Global Products and Solutions (since 2017), andCo-Chief Executive Officer (since 2015), formerly, Executive Vice President (2013-2015) of Nuveen Securities, LLC; President (since 2017), formerly,Co-President (2016-2017), formerly Senior Executive Vice President (2015-2016) of Nuveen Fund Advisors, LLC (Executive Vice President2011-2015); President (since 2017), Nuveen Alternative Investments, LLC; Chartered Financial Analyst. | | 168 |
| | | | | | |
Name,
Year of Birth
& Address | | Position(s)
Held with
the Funds | | Year First
Elected or
Appointed (4) | | Principal Occupation(s) During Past 5 Years |
| | | | |
| Officers of the Funds: | | | | | | |
Greg A. Bottjer 1971 333 W. Wacker Drive Chicago, IL 60606 | | Chief Administrative Officer | | 2016 | | Senior (since 2017) Managing Director (since 2011), formerly, Senior Vice President (2007-2010) of Nuveen; Senior (since 2017) Managing Director (since 2016) of Nuveen Fund Advisors, LLC; Chartered Financial Analyst. |
Mark J. Czarniecki 1979 901 Marquette Avenue Minneapolis, MN 55402 | | Vice President and Assistant Secretary | | 2013 | | Vice President and Assistant Secretary of Nuveen Securities, LLC (since 2016) and Nuveen Fund Advisors (since 2017); Vice President and Associate General Counsel of Nuveen (since 2013) and Vice President, Assistant Secretary and Associate General Counsel of Nuveen Asset Management (since March 2018). |
Diana R. Gonzalez 1978 333 West Wacker Drive Chicago, IL 60606 | | Vice President and Assistant Secretary | | 2017 | | Vice President and Assistant Secretary of Nuveen Fund Advisors, LLC (since 2017); Vice President and Associate General Counsel of Nuveen (since 2017); Associate General Counsel of Jackson National Asset Management (2012-2017). |
Nathaniel T. Jones 1979 333 W. Wacker Drive Chicago, IL 60606 | | Vice President and Treasurer | | 2016 | | Managing Director (since 2017), formerly, Senior Vice President (2016-2017), formerly, Vice President (2011- 2016) of Nuveen; Managing Director of Nuveen Fund Advisors, LLC; Chartered Financial Analyst. |
Walter M. Kelly 1970 333 W. Wacker Drive Chicago, IL 60606 | | Chief Compliance Officer and Vice President | | 2003 | | Managing Director (since 2017), formerly, Senior Vice President (2008-2017) of Nuveen Investments Holdings, Inc. |
247
Trustees and Officers(Unaudited) (continued)
| | | | | | |
Name,
Year of Birth
& Address | | Position(s)
Held with
the Funds | | Year First
Elected or
Appointed (4) | | Principal Occupation(s) During Past 5 Years |
Tina M. Lazar 1961 333 W. Wacker Drive Chicago, IL 60606 | | Vice President | | 2002 | | Managing Director (since 2017), formerly, Senior Vice President (2014-2017) of Nuveen Securities, LLC. |
Kevin J. McCarthy 1966 333 W. Wacker Drive Chicago, IL 60606 | | Vice President and Assistant Secretary | | 2007 | | Senior Managing Director (since 2017) and Secretary and General Counsel (since 2016) of Nuveen Investments, Inc., formerly, Executive Vice President (2016-2017) and Managing Director and Assistant Secretary (2008-2016); Senior Managing Director (since 2017) and Assistant Secretary (since 2008) of Nuveen Securities, LLC, formerly Executive Vice President (2016-2017) and Managing Director (2008-2016); Senior Managing Director (since 2017), Secretary (since 2016) andCo-General Counsel (since 2011) of Nuveen Fund Advisors, LLC, formerly, Executive Vice President (2016-2017), Managing Director (2008-2016) and Assistant Secretary (2007-2016); Senior Managing Director (since 2017), Secretary (since 2016) and Associate General Counsel (since 2011) of Nuveen Asset Management, LLC, formerly Executive Vice President (2016-2017) and Managing Director and Assistant Secretary (2011-2016); Senior Managing Director (since 2017) and Secretary (since 2016) of Nuveen Investments Advisers, LLC, formerly Executive Vice President (2016-2017); Vice President (since 2007) and Secretary (since 2016), formerly, Assistant Secretary, of NWQ Investment Management Company, LLC, Symphony Asset Management, LLC, Santa Barbara Asset Management, LLC and Winslow Capital Management, LLC (since 2010). Senior Managing Director (since 2017) and Secretary (since 2016) of Nuveen Alternative Investments, LLC. |
Christopher M. Rohrbacher 1971 333 W. Wacker Drive Chicago, IL 60606 | | Vice President and Secretary | | 2008 | | Managing Director (since 2017) and Assistant Secretary of Nuveen Securities, LLC; Managing Director (since 2017), formerly, Senior Vice President (2016-2017) and Assistant Secretary (since 2016) of Nuveen Fund Advisors, LLC. |
William A. Siffermann 1975 333 W. Wacker Drive Chicago, IL 60606 | | Vice President | | 2017 | | Managing Director (since 2017), formerly Senior Vice President (2016-2017) and Vice President (2011-2016) of Nuveen. |
Joel T. Slager 1978 333 W. Wacker Drive Chicago, IL 60606 | | Vice President and Assistant Secretary | | 2013 | | Fund Tax Director for Nuveen Funds (since 2013); previously, Vice President of Morgan Stanley Investment Management, Inc., Assistant Treasurer of the Morgan Stanley Funds (from 2010 to 2013). |
E. Scott Wickerham 1973 TIAA 730 Third Avenue New York, NY 10017 | | Vice President and Controller | | 2019 | | Senior Managing Director, Head of Fund Administration at Nuveen, LLC (since 2019), formerly, Managing Director; Principal Financial Officer, Principal Accounting Officer and Treasurer (since 2017) to the TIAA-CREF Funds, the TIAA-CREF Life Funds, the TIAA Separate AccountVA-1 and the Treasurer (since 2017) to the CREF Accounts; Senior Director, TIAA-CREF Fund Administration (2014-2015); has held various positions with TIAA since 2006. |
Gifford R. Zimmerman 1956 333 W. Wacker Drive Chicago, IL 60606 | | Vice President and Assistant Secretary | | 1988 | | Managing Director (since 2002), and Assistant Secretary of Nuveen Securities, LLC; Managing Director (since 2004) and Assistant Secretary (since 1994) of Nuveen Investments, Inc.; Managing Director (since 2002), Assistant Secretary (since 1997) andCo-General Counsel (since 2011) of Nuveen Fund Advisors, LLC; Managing Director, Assistant Secretary and Associate General Counsel of Nuveen Asset Management, LLC (since 2011); Vice President (since 2017), formerly, Managing Director (2003-2017) and Assistant Secretary (since 2003) of Symphony Asset Management LLC ; Managing Director and Assistant Secretary (since 2002) of Nuveen Investments Advisers, LLC; Vice President and Assistant Secretary of NWQ Investment Management Company, LLC (since 2002), Santa Barbara Asset Management, LLC (since 2006) and of Winslow Capital Management, LLC, (since 2010); Chartered Financial Analyst. |
| (1) | Trustees serve an indefinite term until his/her successor is elected or appointed. The year first elected or appointed represents the year in which the director was first elected or appointed to any fund in the Nuveen Fund Complex. |
| (2) | On May 25, 2017, Mr. Young was appointed as a Board Member, effective July 1, 2017. He is a Board Member of each of the Nuveen Funds, except Nuveen Diversified Dividend and Income Fund and Nuveen Real Estate Income Fund. |
| (3) | “Interested person” of the Trust, as defined in the 1940 Act, by reason of her position with Nuveen, LLC. and certain of its subsidiaries. |
| (4) | Officers serve one year terms through August of each year. The year first elected or appointed represents the year in which the officer was first elected or appointed to any fund in the Nuveen Fund Complex. |
248
Notes
249
Notes
250
Notes
251
Nuveen:
Serving Investors for Generations
Since 1898, financial advisors and their clients have relied on Nuveen to provide dependable investment solutions through continued adherence to proven, long-term investing principles. Today, we offer a range of high quality solutions designed to be integral components of a well-diversified core portfolio.
Focused on meeting investor needs.
Nuveen is the investment manager of TIAA. We have grown into one of the world’s premier global asset managers, with specialist knowledge across all major asset classes and particular strength in solutions that provide income for investors and that draw on our expertise in alternatives and responsible investing. Nuveen is driven not only by the independent investment processes across the firm, but also the insights, risk management, analytics and other tools and resources that a truly world-class platform provides. As a global asset manager, our mission is to work in partnership with our clients to create solutions which help them secure their financial future.
Find out how we can help you.
To learn more about how the products and services of Nuveen may be able to help you meet your financial goals, talk to your financial advisor, or call us at(800) 257-8787. Please read the information provided carefully before you invest. Investors should consider the investment objective and policies, risk considerations, charges and expenses of any investment carefully. Where applicable, be sure to obtain a prospectus, which contains this and other relevant information. To obtain a prospectus, please contact your securities representative or Nuveen, 333 W. Wacker Dr., Chicago, IL 60606. Please read the prospectus carefully before you invest or send money.
Learn more about Nuveen Funds at: www.nuveen.com/mutual-funds
| | |
Nuveen Securities, LLC, member FINRA and SIPC |
333 West Wacker Drive | Chicago, IL 60606 | www.nuveen.com | | MAN-NAT-0319D 838669-INV-Y-05/20 |
ITEM 2. CODE OF ETHICS.
As of the end of the period covered by this report, the registrant has adopted a code of ethics that applies to the registrant’s principal executive officer, principal financial officer, principal accounting officer or controller, or persons performing similar functions. There were no amendments to or waivers from the code during the period covered by this report. The registrant has posted the code of ethics on its website at www.nuveen.com/MutualFunds/ShareholderResources/FundGovernance.aspx. (To view the code, click on Code of Conduct.)
ITEM 3. AUDIT COMMITTEE FINANCIAL EXPERT.
As of the end of the period covered by this report, the registrant’s Board of Directors or Trustees (“Board”) determined that the registrant has at least one “audit committee financial expert” (as defined in Item 3 of Form N-CSR) serving on its Audit Committee. The registrant’s audit committee financial experts are Carole E. Stone, Jack B. Evans and William C. Hunter, who are “independent” for purposes of Item 3 of Form N-CSR.
Ms. Stone served for five years as Director of the New York State Division of the Budget. As part of her role as Director, Ms. Stone was actively involved in overseeing the development of the State’s operating, local assistance and capital budgets, its financial plan and related documents; overseeing the development of the State’s bond-related disclosure documents and certifying that they fairly presented the State’s financial position; reviewing audits of various State and local agencies and programs; and coordinating the State’s system of internal audit and control. Prior to serving as Director, Ms. Stone worked as a budget analyst/examiner with increasing levels of responsibility over a 30 year period, including approximately five years as Deputy Budget Director. Ms. Stone has also served as Chair of the New York State Racing Association Oversight Board, as Chair of the Public Authorities Control Board, as a Commissioner on the New York State Commission on Public Authority Reform and as a member of the Boards of Directors of several New York State public authorities. These positions have involved overseeing operations and finances of certain entities and assessing the adequacy of project/entity financing and financial reporting. Currently, Ms. Stone is on the Board of Directors of CBOE Holdings, Inc., of the Chicago Board Options Exchange, and of C2 Options Exchange. Ms. Stone’s position on the boards of these entities and as a member of both CBOE Holdings’ Audit Committee and its Finance Committee has involved, among other things, the oversight of audits, audit plans and preparation of financial statements.
Mr. Evans was formerly President and Chief Operating Officer of SCI Financial Group, Inc., a full service registered broker-dealer and registered investment adviser (“SCI”). As part of his role as President and Chief Operating Officer, Mr. Evans actively supervised the Chief Financial Officer (the “CFO”) and actively supervised the CFO’s preparation of financial statements and other filings with various regulatory authorities. In such capacity, Mr. Evans was actively involved in the preparation of SCI’s financial statements and the resolution of issues raised in connection therewith. Mr. Evans has also served on the audit committee of various reporting companies. At such companies, Mr. Evans was involved in the oversight of audits, audit plans, and the preparation of financial statements. Mr. Evans also formerly chaired the audit committee of the Federal Reserve Bank of Chicago.
Mr. Hunter was formerly a Senior Vice President at the Federal Reserve Bank of Chicago. As part of his role as Senior Vice President, Mr. Hunter was the senior officer responsible for all operations of each of the Economic Research, Statistics, and Community and Consumer Affairs units at the Federal Reserve Bank of Chicago. In such capacity, Mr. Hunter oversaw the subunits of the Statistics and Community and Consumer Affairs divisions responsible for the analysis and evaluation of bank and bank holding company financial statements and financial filings. Prior to serving as Senior Vice President at the Federal Reserve Bank of Chicago, Mr. Hunter was the Vice President of the Financial Markets unit at the Federal Reserve Bank of Atlanta where he supervised financial staff and bank holding company analysts who analyzed and evaluated bank and bank holding company financial statements. Mr. Hunter also currently serves on the Boards of Directors of Xerox Corporation and Wellmark, Inc. as well as on the Audit Committees of such Boards. As an Audit Committee member, Mr. Hunter’s responsibilities include, among other things, reviewing financial statements, internal audits and internal controls over financial reporting. Mr. Hunter also formerly was a Professor of Finance at the University of Connecticut School of Business and has authored numerous scholarly articles on the topics of finance, accounting and economics.
ITEM 4. PRINCIPAL ACCOUNTANT FEES AND SERVICES.
The following tables show the amount of fees that PricewaterhouseCoopers LLP, the Funds’ auditor, billed to the Funds during the Funds’ last two full fiscal years. The Audit Committee approved in advance all audit services and non-audit services that PricewaterhouseCoopers LLP, provided to the Funds, except for those non-audit services that were subject to the pre-approval exception under Rule 2-01 of Regulation S-X (the “pre-approval exception”). The preapproval exception for services provided directly to the Funds waives the pre-approval requirement for services other than audit, review or attest services if: (A) the aggregate amount of all such services provided constitutes no more than 5% of the total amount of revenues paid by the Funds during the fiscal year in which the services are provided; (B) the Funds did not recognize the services as non-audit services at the time of the engagement; and (C) the services are promptly brought to the Audit Committee’s attention, and the Committee (or its delegate) approves the services before the audit is completed.
The Audit Committee has delegated certain pre-approval responsibilities to its Chairman (or, in his absence, any other member of the Audit Committee).
| | | | | | | | | | | | | | | | |
Fiscal Year Ended March 31, 2019 | | Audit Fees Billed
to Funds1 | | | Audit-Related Fees
Billed to Funds2 | | | Tax Fees Billed
to Funds3 | | | All Other Fees
Billed to Funds 4 | |
Fund Name | | | | | | | | | | | | | | | | |
Nuveen Short Term Municipal Bond Fund | | | 21,030 | | | | 0 | | | | 0 | | | | 0 | |
| | | | | | | | | | | | | | | | |
Total | | $ | 21,030 | | | $ | 0 | | | $ | 0 | | | $ | 0 | |
| 1 | | “Audit Fees” are the aggregate fees billed for professional services for the audit of the Fund’s annual financial statements and services provided in connection with statutory and regulatory filings or engagements. |
| 2 | | “Audit-Related Fees” are the aggregate fees billed for assurance and related services reasonably related to the performance of the audit or review of financial statements that are not reported under “Audit Fees��. These fees include offerings related to the Fund’s common shares and leverage. |
| 3 | | “Tax Fees” are the aggregate fees billed for professional services for tax advice, tax compliance, and tax planning. These fees include: all global withholding tax services; excise and state tax reviews; capital gain, tax equalization and taxable basis calculations performed by the principal accountant. |
| 4 | | “All Other Fees” are the aggregate fees billed for products and services other than “Audit Fees”, “Audit-Related Fees” and “Tax Fees”. These fees represent all “Agreed-Upon Procedures” engagements pertaining to the Fund’s use of leverage. |
| | | | | | | | | | | | | | | | |
| | | Percentage Approved Pursuant to Pre-approval Exception | |
| | | Audit Fees Billed
to Funds | | | Audit-Related Fees
Billed to Funds | | | Tax Fees
Billed to Funds | | | All Other Fees
Billed to Funds | |
Fund Name | | | | | | | | | | | | | | | | |
Nuveen Short Term Municipal Bond Fund | | | 0 | % | | | 0 | % | | | 0 | % | | | 0 | % |
| | | | |
Fiscal Year Ended March 31, 2018 | | Audit Fees Billed
to Funds1 | | | Audit-Related Fees
Billed to Funds2 | | | Tax Fees
Billed to Funds 3 | | | All Other Fees
Billed to Funds 4 | |
Fund Name | | | | | | | | | | | | | | | | |
Nuveen Short Term Municipal Bond Fund | | | 20,922 | | | | 1,313 | | | | 0 | | | | 0 | |
| | | | | | | | | | | | | | | | |
Total | | $ | 20,922 | | | $ | 1,313 | | | $ | 0 | | | $ | 0 | |
| 1 | | “Audit Fees” are the aggregate fees billed for professional services for the audit of the Fund’s annual financial statements and services provided in connection with statutory and regulatory filings or engagements. |
| 2 | | “Audit-Related Fees” are the aggregate fees billed for assurance and related services reasonably related to the performance of the audit or review of financial statements that are not reported under “Audit Fees”. These fees include offerings related to the Fund’s common shares and leverage. |
| 3 | | “Tax Fees” are the aggregate fees billed for professional services for tax advice, tax compliance, and tax planning. These fees include: all global withholding tax services; excise and state tax reviews; capital gain, tax equalization and taxable basis calculations performed by the principal accountant. |
| 4 | | “All Other Fees” are the aggregate fees billed for products and services other than “Audit Fees”, “Audit-Related Fees” and “Tax Fees”. These fees represent all “Agreed-Upon Procedures” engagements pertaining to the Fund’s use of leverage. |
| | | | | | | | | | | | | | | | |
| | | Percentage Approved Pursuant to Pre-approval Exception | |
| | | Audit Fees Billed
to Funds | | | Audit-Related Fees
Billed to Funds | | | Tax Fees
Billed to Funds | | | All Other Fees
Billed to Funds | |
Fund Name | | | | | | | | | | | | | | | | |
Nuveen Short Term Municipal Bond Fund | | | 0 | % | | | 0 | % | | | 0 | % | | | 0 | % |
| | | | | | | | | | | | |
Fiscal Year Ended March 31, 2019 | | Audit-Related Fees
Billed to Adviser and
Affiliated Fund
Service Providers | | | Tax Fees Billed to
Adviser and
Affiliated Fund
Service Providers | | | All Other Fees
Billed to Adviser
and Affiliated Fund
Service Providers | |
Nuveen Investment Funds, Inc. | | $ | 0 | | | $ | 0 | | | $ | 0 | |
| |
| | | Percentage Approved Pursuant to Pre-approval Exception | |
| | | Audit-Related Fees
Billed to Adviser and
Affiliated Fund
Service Providers | | | Tax Fees Billed to
Adviser and
Affiliated Fund
Service Providers | | | All Other Fees
Billed to Adviser
and Affiliated Fund
Service Providers | |
| | | 0 | % | | | 0 | % | | | 0 | % |
| | | |
Fiscal Year Ended March 31, 2018 | | Audit-Related Fees
Billed to Adviser and
Affiliated Fund
Service Providers | | | Tax Fees Billed to
Adviser and
Affiliated Fund
Service Providers
| | | All Other Fees
Billed to Adviser
and Affiliated Fund
Service Providers | |
Nuveen Investment Funds, Inc. | | $ | 0 | | | $ | 0 | | | $ | 0 | |
| |
| | | Percentage Approved Pursuant to Pre-approval Exception | |
| | | Audit-Related Fees
Billed to Adviser and
Affiliated Fund
Service Providers | | | Tax Fees Billed to
Adviser and
Affiliated Fund
Service Providers | | | All Other Fees
Billed to Adviser
and Affiliated Fund
Service Providers | |
| | | 0 | % | | | 0 | % | | | 0 | % |
| | | | | | | | | | | | | | | | |
Fiscal Year Ended March 31, 2019 | | Total Non-Audit Fees
Billed to Trust | | | Total Non-Audit Fees
billed to Adviser and
Affiliated Fund Service
Providers (engagements
related directly to the
operations and financial
reporting of the Trust) | | | Total Non-Audit Fees
billed to Adviser and
Affiliated Fund Service
Providers (all other
engagements) | | | Total | |
Fund Name | | | | | | | | | | | | | | | | |
Nuveen Short Term Municipal Bond Fund | | | 0 | | | | 0 | | | | 0 | | | | 0 | |
| | | | | | | | | | | | | | | | |
Total | | $ | 0 | | | $ | 0 | | | $ | 0 | | | $ | 0 | |
“Non-Audit Fees billed to Fund” for both fiscal year ends represent “Tax Fees” and “All Other Fees” billed to Fund in their respective amounts from the previous table.
Less than 50 percent of the hours expended on the principal accountant’s engagement to audit the registrant’s financial statements for the most recent fiscal year were attributed to work performed by persons other than the principal accountant’s full-time, permanent employees.
| | | | | | | | | | | | | | | | |
Fiscal Year Ended March 31, 2018 | | Total Non-Audit Fees
Billed to Trust | | | Total Non-Audit Fees
billed to Adviser and
Affiliated Fund Service
Providers (engagements
related directly to the
operations and financial
reporting of the Trust) | | | Total Non-Audit Fees
billed to Adviser and
Affiliated Fund Service
Providers (all other
engagements) | | | Total | |
Fund Name | | | | | | | | | | | | | | | | |
Nuveen Short Term Municipal Bond Fund | | | 1,313 | | | | 0 | | | | 0 | | | | 1,313 | |
| | | | | | | | | | | | | | | | |
Total | | $ | 1,313 | | | $ | 0 | | | $ | 0 | | | $ | 1,313 | |
“Non-Audit Fees billed to Fund” for both fiscal year ends represent “Tax Fees” and “All Other Fees” billed to Fund in their respective amounts from the previous table.
Audit Committee Pre-Approval Policies and Procedures. Generally, the Audit Committee must approve (i) all non-audit services to be performed for the Funds by the Funds’ independent accountant and (ii) all audit and non-audit services to be performed by the Funds’ independent accountant for the Affiliated Fund Service Providers with respect to the operations and financial reporting of the Funds. Regarding tax and research projects conducted by the independent accountant for the Funds and Affiliated Fund Service Providers (with respect to operations and financial reports of the Trust), such engagements will be (i) pre-approved by the Audit Committee if they are expected to be for amounts greater than $10,000; (ii) reported to the Audit Committee Chairman for his verbal approval prior to engagement if they are expected to be for amounts under $10,000 but greater than $5,000; and (iii) reported to the Audit Committee at the next Audit Committee meeting if they are expected to be for an amount under $5,000.
ITEM 5. AUDIT COMMITTEE OF LISTED REGISTRANTS.
Not applicable to this registrant.
ITEM 6. SCHEDULE OF INVESTMENTS.
| a) | | See Portfolio of Investments in Item 1. |
ITEM 7. DISCLOSURE OF PROXY VOTING POLICIES AND PROCEDURES FORCLOSED-END
MANAGEMENT INVESTMENT COMPANIES.
Not applicable to this registrant.
ITEM 8. PORTFOLIO MANAGERS OFCLOSED-END MANAGEMENT INVESTMENT COMPANIES.
Not applicable to this registrant.
ITEM 9. PURCHASES OF EQUITY SECURITIES BYCLOSED-END MANAGEMENT INVESTMENT COMPANY AND AFFILIATED PURCHASERS.
Not applicable to this registrant.
ITEM 10. SUBMISSION OF MATTERS TO A VOTE OF SECURITY HOLDERS.
There have been no material changes to the procedures by which shareholders may recommend nominees to the registrant’s Board of Trustees implemented after the registrant last provided disclosure in response to this Item.
ITEM 11. CONTROLS AND PROCEDURES.
| | (a) | | The registrant’s principal executive and principal financial officers, or persons performing similar functions, have concluded that the registrant’s disclosure controls and procedures (as defined in Rule30a-3(c) under the Investment Company Act of 1940, as amended (the “1940 Act”) (17 CFR 270.30a-3(c))) are effective, as of a date within 90 days of the filing date of this report that includes the disclosure required by this paragraph, based on their evaluation of the controls and procedures required by Rule30a-3(b) under the 1940 Act (17 CFR 270.30a-3(b)) and Rules13a-15(b) or15d-15(b) under the Securities Exchange Act of 1934, as amended (the “Exchange Act”) (17 CFR 240.13a-15(b) or 240.15d-15(b)). |
| | (b) | | There were no changes in the registrant’s internal control over financial reporting (as defined in Rule30a-3(d) under the 1940 Act (17 CFR 270.30a-3(d)) that occurred during the period covered by this report that has materially affected, or is reasonably likely to materially affect, the registrant’s internal control over financial reporting. |
ITEM 12. DISCLOSURE OF SECURITIES LENDING ACTIVITIES FOR CLOSED-END MANAGEMENT INVESTMENT COMPANIES.
Not applicable.
ITEM 13. EXHIBITS.
File the exhibits listed below as part of this Form.
| | |
| (a)(1) | | Any code of ethics, or amendment thereto, that is the subject of the disclosure required by Item 2, to the extent that the registrant intends to satisfy the Item 2 requirements through filing of an exhibit: Not applicable because the code is posted on registrant’s website at www.nuveen.com/MutualFunds/ShareholderResources/FundGovernance.aspx and there were no amendments during the period covered by this report. (To view the code, click on Code of Conduct.) |
| |
| (a)(2) | | A separate certification for each principal executive officer and principal financial officer of the registrant as required byRule 30a-2(a) under the 1940 Act (17 CFR 270.30a-2(a)) in the exact form set forth below: SeeEX-99.CERT attached hereto. |
| |
| (a)(3) | | Any written solicitation to purchase securities under Rule23c-1 under the 1940 Act (17 CFR270.23c-1) sent or given during the period covered by the report by or on behalf of the registrant to 10 or more persons: Not applicable to this registrant. |
| |
| (a)(4) | | Change in the registrant’s independent public accountant. Not applicable. |
| |
| (b) | | If the report is filed under Section 13(a) or 15(d) of the Exchange Act, provide the certifications required by Rule30a-2(b) under the 1940 Act (17 CFR 270.30a-2(b)), Rule13a-14(b) or Rule15d-14(b) under the Exchange Act (17 CFR 240.13a-14(b) or 240.15d-14(b)), and Section 1350 of Chapter 63 of Title 18 of the United States Code (18 U.S.C. 1350) as an Exhibit. A certification furnished pursuant to this paragraph will not be deemed “filed” for purposes of Section 18 of the Exchange Act (15 U.S.C. 78r), or otherwise subject to the liability of that section. Such certification will not be deemed to be incorporated by reference into any filing under the Securities Act of 1933 or the Exchange Act, except to the extent that the registration specifically incorporates it by reference: SeeEX-99.906 CERT attached hereto. |
SIGNATURES
Pursuant to the requirements of the Securities Exchange Act of 1934 and the Investment Company Act of 1940, the registrant has duly caused this report to be signed on its behalf by the undersigned, thereunto duly authorized.
(Registrant) Nuveen Investment Funds, Inc.
| | |
| |
| By (Signature and Title) | | /s/ Christopher M. Rohrbacher |
| | Christopher M. Rohrbacher |
| | Vice President and Secretary |
Date: December 16, 2019
Pursuant to the requirements of the Securities Exchange Act of 1934 and the Investment Company Act of 1940, this report has been signed below by the following persons on behalf of the registrant and in the capacities and on the dates indicated.
| | |
| |
| By (Signature and Title) | | /s/ Greg A. Bottjer |
| | Greg A. Bottjer |
| | Chief Administrative Officer |
| | (principal executive officer) |
Date: December 16, 2019
| | |
| |
| By (Signature and Title) | | /s/ E. Scott Wickerham |
| | E. Scott Wickerham |
| | Vice President and Controller |
| | (principal financial officer) |
Date: December 16, 2019